A comparison of amphibian communities through time and from place to place in Bornean forests
26
A Comparison of Amphibian Communities through Time and From Place to Place in Bornean Forests Author(s): Robert F. Inger and Harold K. Voris Source: Journal of Tropical Ecology, Vol. 9, No. 4 (Nov., 1993), pp. 409-433 Published by: Cambridge University Press Stable URL: http://www.jstor.org/stable/2559471 . Accessed: 01/10/2014 11:21 Your use of the JSTOR archive indicates your acceptance of the Terms & Conditions of Use, available at . http://www.jstor.org/page/info/about/policies/terms.jsp . JSTOR is a not-for-profit service that helps scholars, researchers, and students discover, use, and build upon a wide range of content in a trusted digital archive. We use information technology and tools to increase productivity and facilitate new forms of scholarship. For more information about JSTOR, please contact [email protected]. . Cambridge University Press is collaborating with JSTOR to digitize, preserve and extend access to Journal of Tropical Ecology. http://www.jstor.org This content downloaded from 128.135.12.127 on Wed, 1 Oct 2014 11:21:00 AM All use subject to JSTOR Terms and Conditions
-
Upload
fieldmuseum -
Category
Documents
-
view
4 -
download
0
Transcript of A comparison of amphibian communities through time and from place to place in Bornean forests
A Comparison of Amphibian Communities through Time and From Place to Place in BorneanForestsAuthor(s): Robert F. Inger and Harold K. VorisSource: Journal of Tropical Ecology, Vol. 9, No. 4 (Nov., 1993), pp. 409-433Published by: Cambridge University PressStable URL: http://www.jstor.org/stable/2559471 .
Accessed: 01/10/2014 11:21
Your use of the JSTOR archive indicates your acceptance of the Terms & Conditions of Use, available at .http://www.jstor.org/page/info/about/policies/terms.jsp
.JSTOR is a not-for-profit service that helps scholars, researchers, and students discover, use, and build upon a wide range ofcontent in a trusted digital archive. We use information technology and tools to increase productivity and facilitate new formsof scholarship. For more information about JSTOR, please contact [email protected].
.
Cambridge University Press is collaborating with JSTOR to digitize, preserve and extend access to Journal ofTropical Ecology.
http://www.jstor.org
This content downloaded from 128.135.12.127 on Wed, 1 Oct 2014 11:21:00 AMAll use subject to JSTOR Terms and Conditions
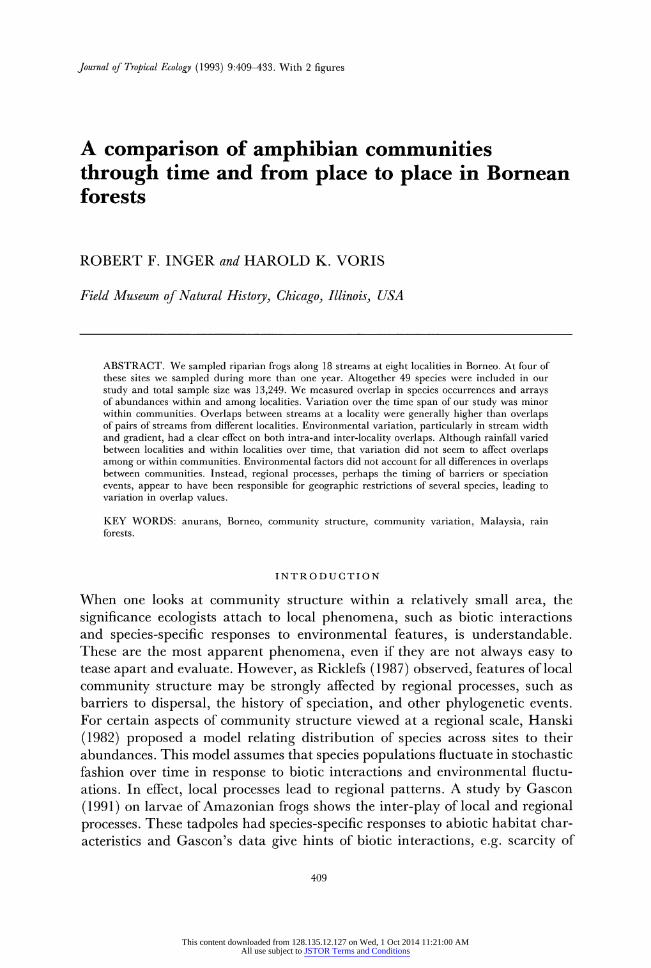
Journal of Tropical Ecology (1993) 9:409-433. With 2 figures
A comparison of amphibian communities through time and from place to place in Bornean forests
ROBERT F. INGER and HAROLD K. VORIS
Field Museum of Natural History, Chicago, Illinois, USA
ABSTRACT. We sampled riparian frogs along 18 streams at eight localities in Borneo. At four of these sites we sampled during more than one year. Altogether 49 species were included in our study and total sample size was 13,249. We measured overlap in species occurrences and arrays of abundances within and among localities. Variation over the time span of our study was minor within communities. Overlaps between streams at a locality were generally higher than overlaps of pairs of streams from different localities. Environmental variation, particularly in stream width and gradient, had a clear effect on both intra-and inter-locality overlaps. Although rainfall varied between localities and within localities over time, that variation did not seem to affect overlaps among or within communities. Environmental factors did not account for all differences in overlaps between communities. Instead, regional processes, perhaps the timing of barriers or speciation events, appear to have been responsible for geographic restrictions of several species, leading to variation in overlap values.
KEY WORDS: anurans, Borneo, community structure, community variation, Malaysia, rain forests.
INTRODUCTION
When one looks at community structure within a relatively small area, the significance ecologists attach to local phenomena, such as biotic interactions and species-specific responses to environmental features, is understandable. These are the most apparent phenomena, even if they are not always easy to tease apart and evaluate. However, as Ricklefs (1987) observed, features of local community structure may be strongly affected by regional processes, such as barriers to dispersal, the history of speciation, and other phylogenetic events. For certain aspects of community structure viewed at a regional scale, Hanski (1982) proposed a model relating distribution of species across sites to their abundances. This model assumes that species populations fluctuate in stochastic fashion over time in response to biotic interactions and environmental fluctu- ations. In effect, local processes lead to regional patterns. A study by Gascon (1991) on larvae of Amazonian frogs shows the inter-play of local and regional processes. These tadpoles had species-specific responses to abiotic habitat char- acteristics and Gascon's data give hints of biotic interactions, e.g. scarcity of
409
This content downloaded from 128.135.12.127 on Wed, 1 Oct 2014 11:21:00 AMAll use subject to JSTOR Terms and Conditions

410 ROBERT F. INGER AND HAROLD K. VORIS
co-occurrence of larval species, a typical local process. Yet the restriction of two larval forms to stream microhabitats is clearly a product of phylogenetic history. These two, Atelopus pulcher and Centrolenella oyampiensis, belong to genera all of whose larvae develop in streams (Duellman & Lynch 1969, McDiarmid, 1978) regardless of the distributions of other sympatric tadpoles of other genera.
Most studies of community structure in tropical amphibians have concen- trated on a single, relatively restricted area (e.g. Crump 1971, Gascon 1991, Heyer 1973, Inger 1969, Inger & Colwell 1977, Toft & Duellman 1979). That concentration perhaps explains the primary focus on local processes. In this paper we examine variation among Bornean amphibian communities across an area approximately 700 km wide, which obliges us to consider regional processes as well as local ones.
Our analysis is restricted to that segment of the Bornean amphibian commun- ity occurring along rain forest streams, species that spend their entire life cycles in this riparian habitat or that utilize streams for breeding and larval develop- ment. We begin with examination of variation over a 22-year period at one site, Nanga Tekalit, Sarawak (Figure 1, site 1), which provides a standard with which to evaluate variation over space. We then consider factors associated with variation from place to place.
1080 1100 1140 1180
60 ~~~~~~~~~~~~~~~~~~~~~~~~~60 .~~~~~~~~~~~~~1 .
SARAWAK 4 3
2~~~~~~~~~~~~~~~~~~~~~~~~~~~~~~~
20 C2
00, - F l l l0 300km 00
1080 1100 1140 1180
Figure 1. Map showing the eight localities in the Malaysian states of Sarawak (numbers 1-4) and Sabah (numbers 5-8) on the island of Borneo. The localities are (1) Nanga Tekalit, (2) Segaham, (3) Pesu, (4) Labang, (5) Mendolong, (6) Purulon, (7) Marak Parak, and (8) Danum.
This content downloaded from 128.135.12.127 on Wed, 1 Oct 2014 11:21:00 AMAll use subject to JSTOR Terms and Conditions

Variation among frog communities 411
SAMPLING SITES
Our sampling of stream frogs was conducted at eight localities in rain forests below 800 m in Borneo in the Malaysian states of Sabah and Sarawak (Figure 1, Table 1). Distances between localities range from 35 to 640 km (Table 2). Full details of these sites are given in Appendix A.
Sites differed in several ways:
(i) Topography. The only flat area was Labang (site 4, Figure 1). The rest were hilly (e.g. Danum, site 8) to steep (Purulon and Segaham, sites 2 and 6).
(ii) Elevation. All except Purulon and Mendolong (site 5) were below 300 m asl. The streams at Purulon are at 320-370 m and the one at Mendolong at 750 m.
(iii) Vegetation. The entire area of Mendolong included in this study had been selectively logged. The forest at Marak-Parak (site 7) was old (45-50 y) secondary growth that now has a high closed canopy. Labang was covered with flat, alluvial forest. Most of the area at Pesu and all the area at the remaining sites was well-drained, hilly, and covered with primary diptero- carp forest. There was a small area of swamp forest at Pesu (site 3), and both Danum and Nanga Tekalit (site 1) had a few flat areas.
(iv) Rainfall. Amount of rainfall during sampling periods varied greatly from site to site. The four in Sarawak had the most precipitation, with few months having <300 mm. In contrast, the sites in Sabah rarely had >300 mm.
(v) Streams. Regardless of amount of rainfall, all streams in this study were perennial. All became turbid after heavy rain, but only Sungai Seran at Labang was continually turbid. Sungai Seran was also the only low gradi- ent stream and the only one with a silt bottom. Stream widths vary from 3 to 25 m. Streams less than 8 m wide were under canopy, those 8-10 m partially under canopy. Banks of even the largest streams were under trees.
MATERIALS AND METHODS
Field procedures At each site work was divided between effort along streams and in the forest
proper. Data from the non-riparian work, which consisted of forest floor plots, search of buttress-enclosed areas, and night transects through the forest, are not used in this paper, but contribute to an understanding of the total fauna at each site. The riparian work included collecting and observing tadpoles by day and collecting and observing frogs during night transects. The data from the night transects along fixed segments (250-600 m) of streams form the basis of this paper. On streams at four of the localities, we marked stations at 15-30 m intervals with plastic flagging and recorded the position of each frog observed
This content downloaded from 128.135.12.127 on Wed, 1 Oct 2014 11:21:00 AMAll use subject to JSTOR Terms and Conditions

412 ROBERT F. INGER AND HAROLD K. VORIS
Cl t-- Cj Sc C11-
sHA d
A d
A on O cr
$- C) on tO LO 1- dz LOt- C1 0 o
Cl dld Ud ) dz 1 cr c
mmmm m mm m m m
Cl t- t0- N C) - m m U- _' Sc C + sH~~~~ ~~~ toco - boon cs oo cl e
C ld C; M M
Y Cd
on OI OI OI OI dzA OI m Oc0 l m mO O 451c Cl 1-1 1- 00 CS) 00 co c c 00 00 CS) CS Q ; mmmm m u - -
Cld
-. 9 bl)Q
9 .L, ~q h
Cld C SSSS 000 0C CO O0 0 0 0
Q ~ ~ ~~~~l $- C mm mm mm Q | | >< i _ _ _ _ _ _ _ _ __ _ _ _ _ _ _ _ _Cl
C; ~~~~~~~~~~~~~~~~~~~~~~~~~~~~~~~~~~~~~~~~~~~~~~~~~~~l H Y Y un~~b
n I -Y = f = E X 4 =~ld Cl
This content downloaded from 128.135.12.127 on Wed, 1 Oct 2014 11:21:00 AMAll use subject to JSTOR Terms and Conditions
Variation among frog communities 413
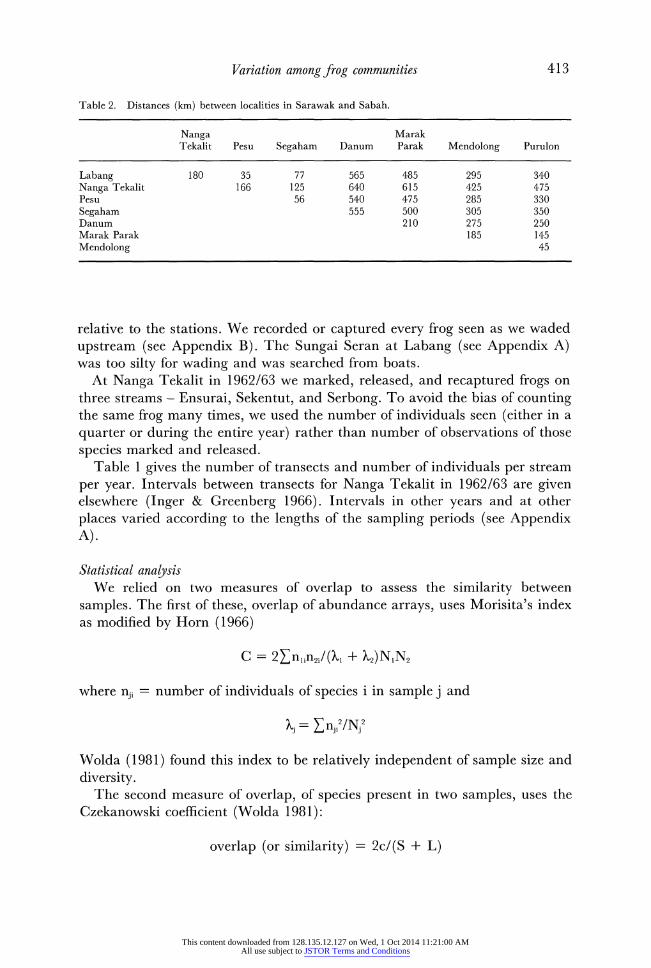
Table 2. Distances (km) between localities in Sarawak and Sabah.
Nanga Marak Tekalit Pesu Segaham Danum Parak Mendolong Purulon
Labang 180 35 77 565 485 295 340 Nanga Tekalit 166 125 640 615 425 475 Pesu 56 540 475 285 330 Segaham 555 500 305 350 Danum 210 275 250 Marak Parak 185 145 Mendolong 45
relative to the stations. We recorded or captured every frog seen as we waded upstream (see Appendix B). The Sungai Seran at Labang (see Appendix A) was too silty for wading and was searched from boats.
At Nanga Tekalit in 1962/63 we marked, released, and recaptured frogs on three streams - Ensurai, Sekentut, and Serbong. To avoid the bias of counting the same frog many times, we used the number of individuals seen (either in a quarter or during the entire year) rather than number of observations of those species marked and released.
Table 1 gives the number of transects and number of individuals per stream per year. Intervals between transects for Nanga Tekalit in 1962/63 are given elsewhere (Inger & Greenberg 1966). Intervals in other years and at other places varied according to the lengths of the sampling periods (see Appendix A).
Statistical analysis We relied on two measures of overlap to assess the similarity between
samples. The first of these, overlap of abundance arrays, uses Morisita's index as modified by Horn (1966)
C = 2Enjjn2i/(X1 + X2)NIN2
where nji = number of individuals of species i in sample j and
Xj= Enji2/Nj2
Wolda (1981) found this index to be relatively independent of sample size and diversity.
The second measure of overlap, of species present in two samples, uses the Czekanowski coefficient (Wolda 1981):
overlap (or similarity) = 2c/(S + L)
This content downloaded from 128.135.12.127 on Wed, 1 Oct 2014 11:21:00 AMAll use subject to JSTOR Terms and Conditions
414 ROBERT F. INGER AND HAROLD K. VORIS
where c = number of species common to the two samples S = number of species in smaller sample L = number of species in larger sample
As Wolda pointed out, most of the binary similarity coefficients have some weaknesses, but the Czekanowski increases linearly from zero to 1.0 as c increases, and is simple to calculate.
We have the impression that our estimate of the abundance array of the community on a stream approaches the 'true value' after about five transects. We have tested this assumption in the following way. We calculated the overlap between two of the most heavily sampled streams at Nanga Tekalit (site 1, Figure 1), Serbong, and Ensurai, using one transect drawn at random from the 36 on each stream in 1962/63. We then recalculated the overlap after adding a second transect drawn at random, repeating the process until we had overlaps based on five randomly drawn transects. We followed this procedure twice. Overlaps based on a single transect from each stream were 0.555 and 0.549 in the two sets, increasing to 0.774 and 0.842, respectively, when two transects were drawn from each stream, and reaching 0.812 and 0.839 after five transects. As the last values are 95-98% of the value (0.85) obtained from the full data set from each stream, we believe that our samples from every stream (see Table 1) in the study were adequate for our purposes.
For inter-locality measures of overlap, we summed data for a stream across all years of sampling before calculating overlaps of abundance arrays with another stream. We assessed the effect of this procedure on the overlaps between the Palum Tambun at Danum, Sabah (site 8, Figure 1), and each of the three streams at Nanga Tekalit, Sarawak, sampled during three years. Consequently, for the overlap of Palum Tambun (sampled 1986, 1989, 1990) with Sekentut (sampled 1962, 1970, 1984) we had nine new overlap values, and nine between Palum Tambun and Ensurai and between Palum Tambun and Serbong. For the Palum Tambun/Sekentut pair, the mean of the nine overlaps was 0.61 (SD = 0.11) compared with 0.65 when all years for a stream were combined. For Palum Tambun/Serbong the mean of nine was 0.51 (SD = 0.14) compared to 0.51 for years combined. The mean of nine for Palum Tambun/Ensurai, 0.44 (SD = 0.1 1), diverged further from the value for years combined, 0.54, but still close enough to justify combining years.
RESULTS AND DISCUSSION
Over short (within locality) or long distances (between localities), variation among these riparian frog communities might appear because of differences in general topography or vegetation, rainfall regimes (between localities), or phys- ical characteristics of streams (gradient, width, bottom characteristics, etc.). However, before accepting any observed differences between a pair of commu- nities as reflecting inter-community variation, it is necessary to consider that a
This content downloaded from 128.135.12.127 on Wed, 1 Oct 2014 11:21:00 AMAll use subject to JSTOR Terms and Conditions
Variation among frog communities 415
single community might vary over time. If the variation between two communit- ies is no greater than the variation over time within one of them, then the observed difference between the two communities may have only transient bio- logical significance. We therefore begin our analysis with an examination of variation within communities.
Our analysis has the following organization: (i) Variation over time within a stream, thus holding stream characteristics (width, gradient, etc.) and general environment constant, but allowing for the effects of temporal variation in rain- fall and species' behaviour over shorter (<year) or longer (>year) periods. (ii) Variation between streams at a locality, thus holding general environment (topography and vegetation) relatively constant but allowing for effects of differ- ences in stream characteristics. (iii) Comparison of the effects of time and dis- tance within a locality. This comparison is restricted to four streams at Nanga Tekalit that are similar in gradient, width, and bottom types, thus minimizing the effects of stream characteristics. (iv) Variation between communities over greater distances (i.e. at different localities), thus allowing for effects of differ- ences in general environment (topography and vegetation, rainfall) and in stream characteristics (width, gradient, etc.).
Variation within localities Nanga Tekalit (site 1, Figure 1). This is our largest data set in terms of numbers of individuals, numbers of streams, numbers of transects, and length of observa- tion time (Table 1). We use variation in it, among other things, as a standard against which to evaluate variation at other localities and overlaps between localities.
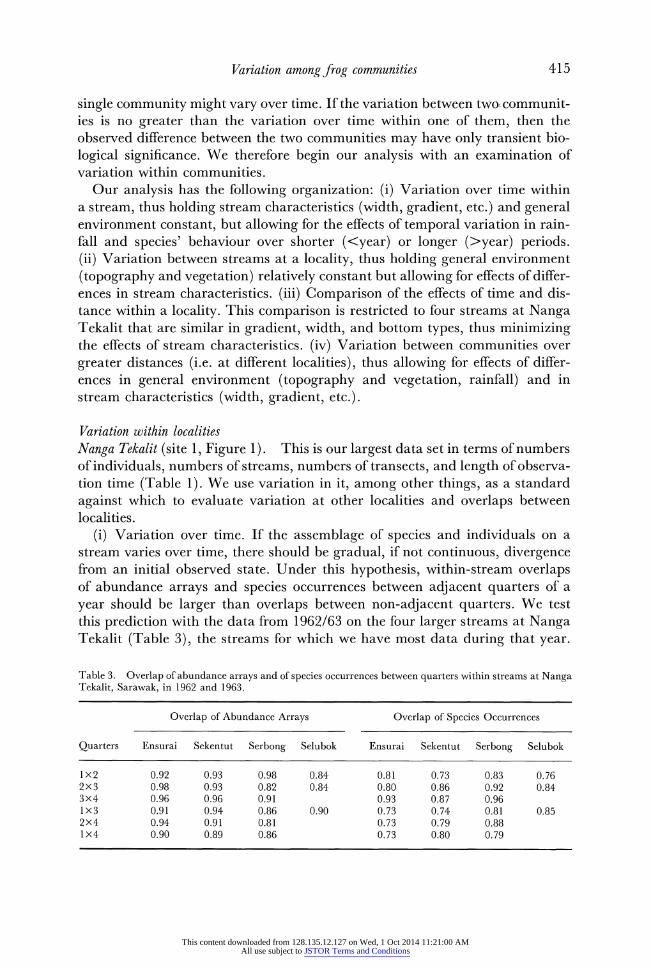
(i) Variation over time. If the assemblage of species and individuals on a stream varies over time, there should be gradual, if not continuous, divergence from an initial observed state. Under this hypothesis, within-stream overlaps of abundance arrays and species occurrences between adjacent quarters of a year should be larger than overlaps between non-adjacent quarters. We test this prediction with the data from 1962/63 on the four larger streams at Nanga Tekalit (Table 3), the streams for which we have most data during that year.
Table 3. Overlap of abundance arrays and of species occurrences between quarters within streams at Nanga Tekalit, Sarawak, in 1962 and 1963.
Overlap of Abundance Arrays Overlap of Species Occurrences
Quarters Ensurai Sekentut Serbong Selubok Ensurai Sekentut Serbong Selubok
1x2 0.92 0.93 0.98 0.84 0.81 0.73 0.83 0.76 2x3 0.98 0.93 0.82 0.84 0.80 0.86 0.92 0.84 3x4 0.96 0.96 0.91 0.93 0.87 0.96 1x3 0.91 0.94 0.86 0.90 0.73 0.74 0.81 0.85 2x4 0.94 0.91 0.81 0.73 0.79 0.88 1x4 0.90 0.89 0.86 0.73 0.80 0.79
This content downloaded from 128.135.12.127 on Wed, 1 Oct 2014 11:21:00 AMAll use subject to JSTOR Terms and Conditions
416 ROBERT F. INGER AND HAROLD K. VORIS
These are also the streams most similar in width, bottom types, and gradient. Overlaps of abundance arrays between adjacent quarters were slightly greater than between non-adjacent quarters, but the difference is not significant (Mann-Whitney test, single-tailed, P = 0.09). However, overlaps of species occurrences between adjacent quarters are significantly larger than those between non-adjacent quarters (Mann-Whitney test, single-tailed, P = 0.025).
Of the 16 species absent from these streams in one or several quarters (i.e. those that depressed between-quarter overlaps of species occurrences), nine were represented by <5 individuals during the entire year on one or more streams, and eight were found in only one or two quarters. Given these small numbers, even random distribution into quarters would drive down overlap in species occurrences. Consequently, neither measure of overlap provides convin- cing support for the hypothesis at this time scale.
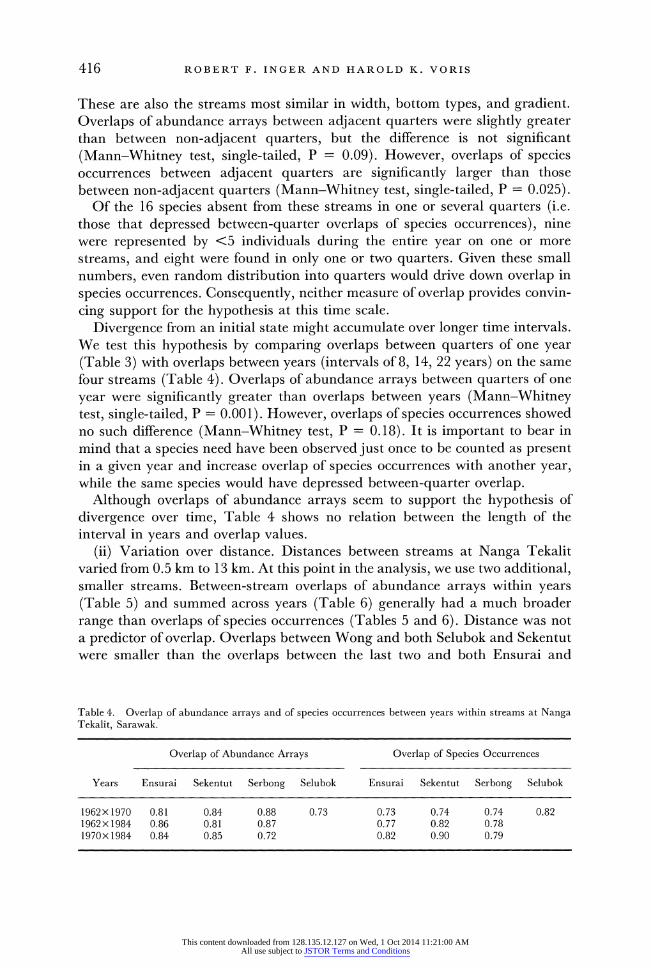
Divergence from an initial state might accumulate over longer time intervals. We test this hypothesis by comparing overlaps between quarters of one year (Table 3) with overlaps between years (intervals of 8, 14, 22 years) on the same four streams (Table 4). Overlaps of abundance arrays between quarters of one year were significantly greater than overlaps between years (Mann-Whitney test, single-tailed, P = 0.001). However, overlaps of species occurrences showed no such difference (Mann-Whitney test, P = 0.18). It is important to bear in mind that a species need have been observed just once to be counted as present in a given year and increase overlap of species occurrences with another year, while the same species would have depressed between-quarter overlap.
Although overlaps of abundance arrays seem to support the hypothesis of divergence over time, Table 4 shows no relation between the length of the interval in years and overlap values.
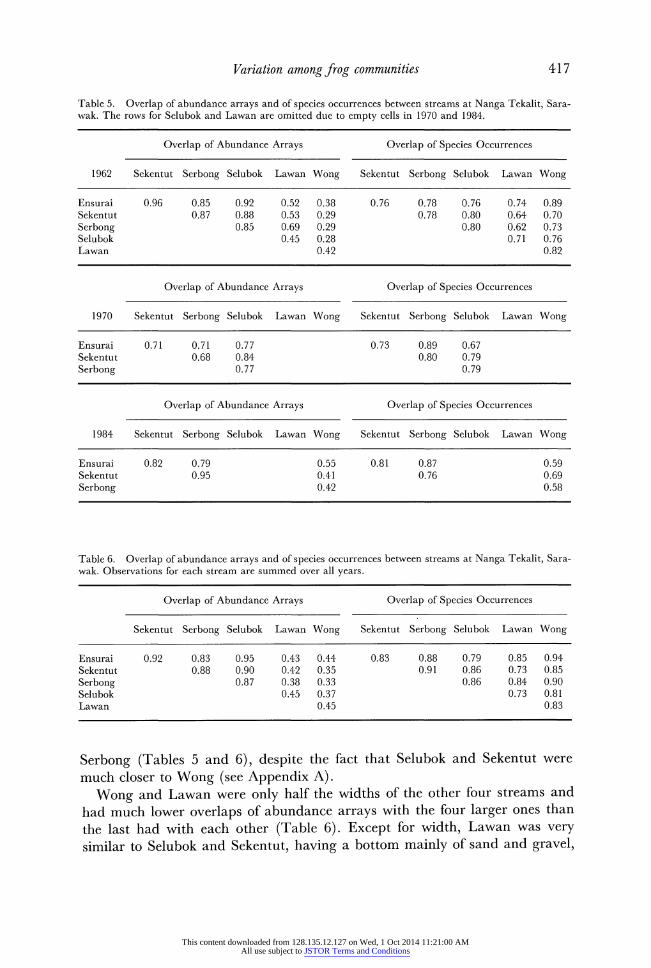
(ii) Variation over distance. Distances between streams at Nanga Tekalit varied from 0.5 km to 13 km. At this point in the analysis, we use two additional, smaller streams. Between-stream overlaps of abundance arrays within years (Table 5) and summed across years (Table 6) generally had a much broader range than overlaps of species occurrences (Tables 5 and 6). Distance was not a predictor of overlap. Overlaps between Wong and both Selubok and Sekentut were smaller than the overlaps between the last two and both Ensurai and
Table 4. Overlap of abundance arrays and of species occurrences between years within streams at Nanga Tekalit, Sarawak.
Overlap of Abundance Arrays Overlap of Species Occurrences
Years Ensurai Sekentut Serbong Selubok Ensurai Sekentut Serbong Selubok
1962x 1970 0.81 0.84 0.88 0.73 0.73 0.74 0.74 0.82 1962x 1984 0.86 0.81 0.87 0.77 0.82 0.78 1970x 1984 0.84 0.85 0.72 0.82 0.90 0.79
This content downloaded from 128.135.12.127 on Wed, 1 Oct 2014 11:21:00 AMAll use subject to JSTOR Terms and Conditions
Variation among frog communities 417
Table 5. Overlap of abundance arrays and of species occurrences between streams at Nanga Tekalit, Sara- wak. The rows for Selubok and Lawan are omitted due to empty cells in 1970 and 1984.
Overlap of Abundance Arrays Overlap of Species Occurrences
1962 Sekentut Serbong Selubok Lawan Wong Sekentut Serbong Selubok Lawan Wong
Ensurai 0.96 0.85 0.92 0.52 0.38 0.76 0.78 0.76 0.74 0.89 Sekentut 0.87 0.88 0.53 0.29 0.78 0.80 0.64 0.70 Serbong 0.85 0.69 0.29 0.80 0.62 0.73 Selubok 0.45 0.28 0.71 0.76 Lawan 0.42 0.82
Overlap of Abundance Arrays Overlap of Species Occurrences
1970 Sekentut Serbong Selubok Lawan Wong Sekentut Serbong Selubok Lawan Wong
Ensurai 0.71 0.71 0.77 0.73 0.89 0.67 Sekentut 0.68 0.84 0.80 0.79 Serbong 0.77 0.79
Overlap of Abundance Arrays Overlap of Species Occurrences
1984 Sekentut Serbong Selubok Lawan Wong Sekentut Serbong Selubok Lawan Wong
Ensurai 0.82 0.79 0.55 0.81 0.87 0.59 Sekentut 0.95 0.41 0.76 0.69 Serbong 0.42 0.58
Table 6. Overlap of abundance arrays and of species occurrences between streams at Nanga Tekalit, Sara- wak. Observations for each stream are summed over all years.
Overlap of Abundance Arrays Overlap of Species Occurrences
Sekentut Serbong Selubok Lawan Wong Sekentut Serbong Selubok Lawan Wong
Ensurai 0.92 0.83 0.95 0.43 0.44 0.83 0.88 0.79 0.85 0.94 Sekentut 0.88 0.90 0.42 0.35 0.91 0.86 0.73 0.85 Serbong 0.87 0.38 0.33 0.86 0.84 0.90 Selubok 0.45 0.37 0.73 0.81 Lawan 0.45 0.83
Serbong (Tables 5 and 6), despite the fact that Selubok and Sekentut were much closer to Wong (see Appendix A).
Wong and Lawan were only half the widths of the other four streams and had much lower overlaps of abundance arrays with the four larger ones than the last had with each other (Table 6). Except for width, Lawan was very similar to Selubok and Sekentut, having a bottom mainly of sand and gravel,
This content downloaded from 128.135.12.127 on Wed, 1 Oct 2014 11:21:00 AMAll use subject to JSTOR Terms and Conditions
418 ROBERT F. INGER AND HAROLD K. VORIS
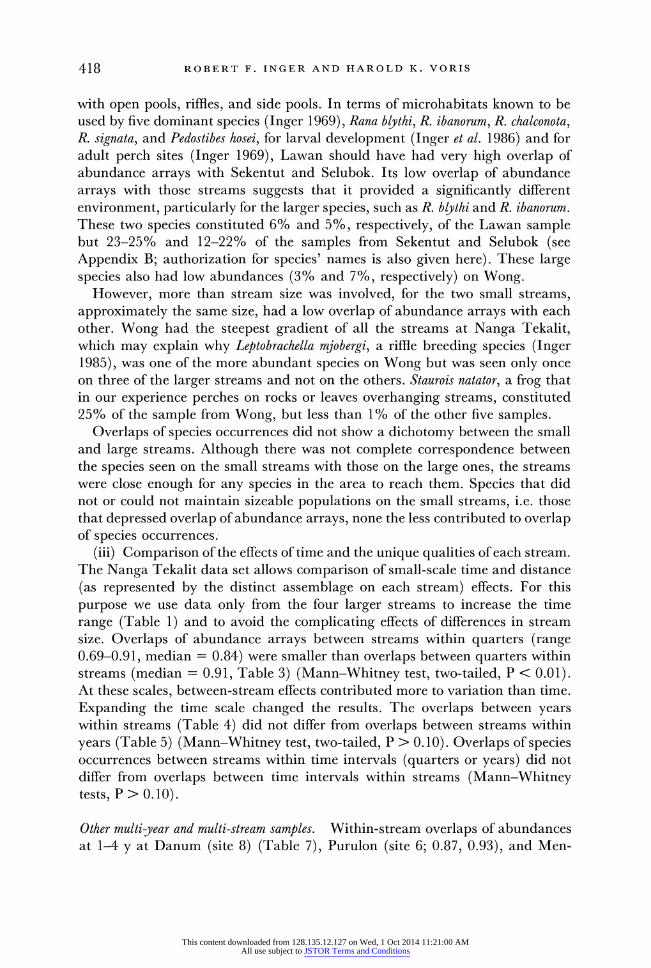
with open pools, riffles, and side pools. In terms of microhabitats known to be used by five dominant species (Inger 1969), Rana blythi, R. ibanorum, R. chalconota, R. signata, and Pedostibes hosei, for larval development (Inger et al. 1986) and for adult perch sites (Inger 1969), Lawan should have had very high overlap of abundance arrays with Sekentut and Selubok. Its low overlap of abundance arrays with those streams suggests that it provided a significantly different environment, particularly for the larger species, such as R. blythi and R. ibanorum. These two species constituted 6% and 5%, respectively, of the Lawan sample but 23-25% and 12-22% of the samples from Sekentut and Selubok (see Appendix B; authorization for species' names is also given here). These large species also had low abundances (3% and 7%, respectively) on Wong.
However, more than stream size was involved, for the two small streams, approximately the same size, had a low overlap of abundance arrays with each other. Wong had the steepest gradient of all the streams at Nanga Tekalit, which may explain why Leptobrachella mjobergi, a riffle breeding species (Inger 1985), was one of the more abundant species on Wong but was seen only once on three of the larger streams and not on the others. Staurois natator, a frog that in our experience perches on rocks or leaves overhanging streams, constituted 25% of the sample from Wong, but less than 1 % of the other five samples.
Overlaps of species occurrences did not show a dichotomy between the small and large streams. Although there was not complete correspondence between the species seen on the small streams with those on the large ones, the streams were close enough for any species in the area to reach them. Species that did not or could not maintain sizeable populations on the small streams, i.e. those that depressed overlap of abundance arrays, none the less contributed to overlap of species occurrences.
(iii) Comparison of the effects of time and the unique qualities of each stream. The Nanga Tekalit data set allows comparison of small-scale time and distance (as represented by the distinct assemblage on each stream) effects. For this purpose we use data only from the four larger streams to increase the time range (Table 1) and to avoid the complicating effects of differences in stream size. Overlaps of abundance arrays between streams within quarters (range 0.69-0.91, median = 0.84) were smaller than overlaps between quarters within streams (median = 0.91, Table 3) (Mann-Whitney test, two-tailed, P < 0.01). At these scales, between-stream effects contributed more to variation than time. Expanding the time scale changed the results. The overlaps between years within streams (Table 4) did not differ from overlaps between streams within years (Table 5) (Mann-Whitney test, two-tailed, P > 0.10). Overlaps of species occurrences between streams within time intervals (quarters or years) did not differ from overlaps between time intervals within streams (Mann-Whitney tests, P > 0.10).
Other multi-year and multi-stream samples. Within-stream overlaps of abundances at 1-4 y at Danum (site 8) (Table 7), Purulon (site 6; 0.87, 0.93), and Men-
This content downloaded from 128.135.12.127 on Wed, 1 Oct 2014 11:21:00 AMAll use subject to JSTOR Terms and Conditions

Variation among frog communities 419
Table 7. Overlap of abundance arrays and of species occurrences between years within streams at Danum, Sarah.
Overlap of Abundance Arrays Overlap of Species Occurrences
Palum Sapat Palum Sapat Years Cabin Tambun Kalison W6S5 Cabin Tambun Kalison W6S5
1986x 1989 0.85 0.68 0.77 0.72 1986x 1990 0.96 0.72 0.83 0.76 1989x 1990 0.90 0.80 0.74 0.64 0.83 0.76 0.86 0.83
dolong (site 5; 0.84, 0.93, 0.94) ranged from 0.64 to 0.96 (median = 0.85). As a set, they are smaller than the overlaps between quarters at Nanga Tekalit (Mann-Whitney test, single-tailed, P = 0.03), but did not differ from those between longer intervals at Nanga Tekalit (Mann-Whitney test, P > 0.20). Within-stream overlaps of species occurrences between years at Danum, Puru- lon (0.74, 0.84), and Mendolong (0.65-0.86) did not differ significantly from those at Nanga Tekalit (Mann-Whitney tests, P > 0.10).
Between-stream overlaps of abundances and of species occurrences at Puru- lon (0.97 and 0.89, respectively) were much higher than between streams at Danum (Table 8). The two streams at Purulon joined near the origins of the surveyed sections and were very smiliar in size, gradient, bottom substrate, and frequency of microhabitat types.
At Danum between-stream overlaps of both abundance arrays and species occurrences (Table 8) fell within the range of those among streams at Nanga Tekalit. As at Nanga Tekalit, distance between streams at Danum, varying between 1 and 12 km, did not account for differences in overlaps of abundances between streams. The Palum Tambun was much farther from the Cabin stream and Sepat Kalisan than from the stream at W6S5, yet had higher overlaps with the first two. Physical differences between these streams are not clearly related to their overlaps. All streams had mixtures of pools, riffles, and torrents, though W6S5 had a steeper gradient. Danum was the only site besides Nanga Tekalit where the data permitted a comparison of time and distance effects. Between-
Table 8. Overlap of abundance arrays and of species occurrences between streams at Danum, Sabah.
Overlap of Abundance Arrays Overlap of Species Occurrences
Palum Sapat Palum Sapat Tambum Kalison W6S5 Tambun Kalison W6S5
Cabin 0.73 0.65 0.84 0.76 0.83 0.74 Palum Tambur 0.83 0.65 0.83 0.90 Sapat Kalison 0.57 0.82
This content downloaded from 128.135.12.127 on Wed, 1 Oct 2014 11:21:00 AMAll use subject to JSTOR Terms and Conditions
420 ROBERT F. INGER AND HAROLD K. VORIS
year, within-stream overlaps both of abundance arrays and species occurrences (Table 7) were significantly higher than between-stream, within-year overlaps (Mann-Whitney tests, two-tailed, P < 0.05).
Summary of intra-locality variation (1) Within-stream overlaps (abundance arrays and species' occurrences)
between short intervals (3 months) were very high (tested at Nanga Tekalit only).
(2) Within-stream overlaps between years were also high (four localities), but at Nanga Tekalit were not as high as overlaps between 3-month intervals.
(3) Between-stream overlaps (abundance arrays and species' occurrences) were strongly affected by stream width and gradient.
(4) If stream characteristics did not vary, overlaps (abundance arrays and species' occurrences) between streams within years did not differ from over- laps between years within streams. This comparison was possible only at Nanga Tekalit.
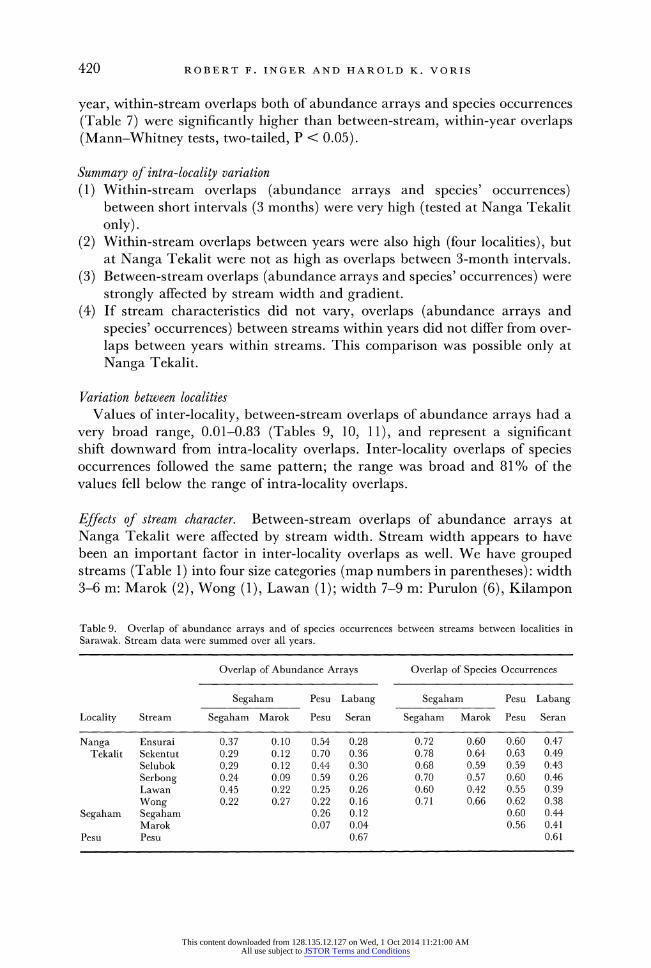
Variation between localities Values of inter-locality, between-stream overlaps of abundance arrays had a
very broad range, 0.01-0.83 (Tables 9, 10, 11), and represent a significant shift downward from intra-locality overlaps. Inter-locality overlaps of species occurrences followed the same pattern; the range was broad and 81% of the values fell below the range of intra-locality overlaps.
Effects of stream character. Between-stream overlaps of abundance arrays at Nanga Tekalit were affected by stream width. Stream width appears to have been an important factor in inter-locality overlaps as well. We have grouped streams (Table 1) into four size categories (map numbers in parentheses): width 3-6 m: Marok (2), Wong (1), Lawan (1); width 7-9 m: Purulon (6), Kilampon
Table 9. Overlap of abundance arrays and of species occurrences between streams between localities in Sarawak. Stream data were summed over all years.
Overlap of Abundance Arrays Overlap of Species Occurrences
Segaham Pesu Labang Segaham Pesu Labang
Locality Stream Segaham Marok Pesu Seran Segaham Marok Pesu Seran
Nanga Ensurai 0.37 0.10 0.54 0.28 0.72 0.60 0.60 0.47 Tekalit Sekentut 0.29 0.12 0.70 0.36 0.78 0.64 0.63 0.49
Selubok 0.29 0.12 0.44 0.30 0.68 0.59 0.59 0.43 Serbong 0.24 0.09 0.59 0.26 0.70 0.57 0.60 0.46 Lawan 0.45 0.22 0.25 0.26 0.60 0.42 0.55 0.39 Wong 0.22 0.27 0.22 0.16 0.71 0.66 0.62 0.38
Segaham Segaham 0.26 0.12 0.60 0.44 Marok 0.07 0.04 0.56 0.41
Pesu Pesu 0.67 0.61
This content downloaded from 128.135.12.127 on Wed, 1 Oct 2014 11:21:00 AMAll use subject to JSTOR Terms and Conditions

Variation among frog communities 421
ci)
= c0 666666
0
8~~~~~~r CO O O
b U bo O~~~~~~C Ln C1 oooo
U CO Lr "i 00 "i C
4--
U C _ O O- O a) 0 0
0 0 - eb?Omo
n 0: D 000000
bi) bi)
~~ Ci) -~~~ - C
.O~~~~Y ?) C) 0000
Cl) ~~~~~~~~~~~~~~~~l
cr 0 -ED *z
o ~~~~S E r~~C(.
This content downloaded from 128.135.12.127 on Wed, 1 Oct 2014 11:21:00 AMAll use subject to JSTOR Terms and Conditions
422 ROBERT F. INGER AND HAROLD K. VORIS
> C,4 C,4 r- CO (,c CO ",:il 00 CD ,Zt, C) (,c
C I-q Lq Lq Lq 1q
C14 co co co C) C14 CN co ,,:I, C14 Ln Ln
blo ho ho bn
m U-) 00 co C) (,c C,4 Ln C,4 C14 "i, U-) (z "i, Ln Ln
Ln CO C14 a) Cq CD co C,4 CO C,4 C,4 C,4 CO a) CO co co co
Ln 00 Ln 00 c (,c CO Ln r- Cc C,4 u U-) U-) U-) (10 Ln Ln Ln
u
00 cn U-) r- C14 00 cn C) Ln Ln Ln Ln Cn U-) U-) Ln o o Ln Ln
6666666666
u Cld Cld
u u C) r- C,4 cn r- r- C14 C) C) U-) 0) 0 -,- o o o Ln Ln o llll U-) U-) Cld C14 U-) U-) U-) C14 C14 C14
u v
Cld 00 r- -.11, (.0 00 U-) Ln 0) C,4 00 (.0
cn cn cn cn cn C14 CT - CT cn o o "t 1c (.0 Ln -o Cld Cld
Cld
Cld
u
4-1 4-1
;: -4 bp ;:I '4 bp C'd 4-1 -Y, Cld co
C's bp C's bp Cld m Cld m C'd v -, r 0 bp M Cld Cld m 4-1 v
4 v v v
l J-) J-) J-) C,-)
C's M 4-1 Cld Cld 4-1 bp bp Cd
Cld
j-,
C'd -14 Cd bn v 4.1
ct M m bp v M Ct M M $-- Q m z s.., U bp
Cld Cld Cld 0 t Cld 0 Cd C'd v Cf) .4 E- >, Cf) -4 4
This content downloaded from 128.135.12.127 on Wed, 1 Oct 2014 11:21:00 AMAll use subject to JSTOR Terms and Conditions

Variation among frog communities 423
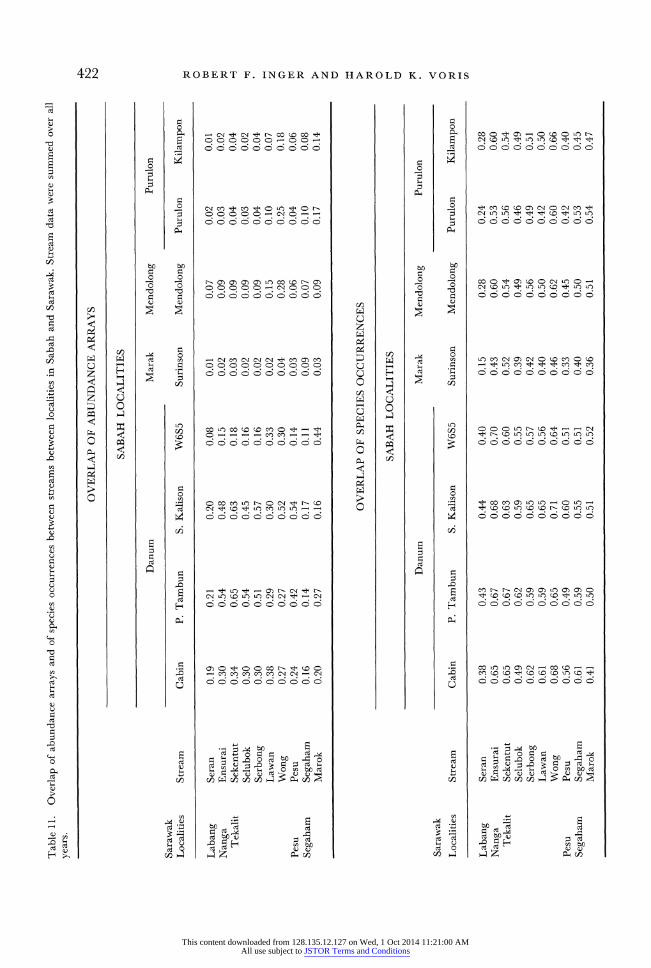
(6), Cabin (8), W6S5 (8), Sepat Kalisan (8); width 10-14 m: Pesu (3), Seran (4), Mendolong (5), Palum Tambun (8), and the four larger streams at Nanga Tekalit (1); width 25 m: Segaham (2). If stream width accounts for a significant part of the inter-locality variation, overlaps between streams within size categor- ies should be greater than overlaps between streams across size categories. Overlaps (grouped into four classes: <0.21, 0.21-0.40, 0.41-0.60, >0.60) within-size categories were significantly greater than those across size categories (chi-square = 19.4, df = 3, P < 0.01); 57% of the within-size category overlaps (n = 30) exceeded 0.40 compared to 17% of the between-size overlaps (n = 82).
Between-stream overlaps at Nanga Tekalit showed some effect of differences in stream gradients. If differences in gradients affect inter-locality overlaps, overlaps between streams of similar gradients should exceed those between streams of differing gradients. We grouped streams into the following gradient classes from steepest (A) to flat (E); A: Marok, Purulon, Kilampon, Mendolong; B: Surinsin, Segaham; C: W6S5, Wong; D: Pesu, Lawan, Ensurai, Sekentut, Selubok, Serbong, Cabin, Palum Tambun, Sepat Kalisan; E: Seran. Overlaps were grouped as in the preceding paragraph. Overlaps within gradient classes were significantly larger than those across classes (chi-square = 26.31, P < 0.01); 53% of the within-class overlaps (n = 30) exceeded 0.40, in contrast to 14% (n = 99) of the between-class overlaps.
Inter-locality overlaps of species occurrences gave slightly different results. Overlaps within-and between-width classes did not differ (chi-square = 4.94, P = 0.30). However, overlaps within gradient classes were significantly greater than overlaps between those classes (chi-square = 12.44, P < 0.02). We inter- pret these results as indicating that stream gradient had a greater effect than stream width on the occurrences of species.
The effect of stream gradient is best seen on the Seran, the only stream flowing through flat forest and the only one with turbid water and a silt bottom. These circumstances almost certainly account for the absence of any of the 15 species (27% of 55) in our data set that breed at riffles and torrents and have larvae that either attach to rocks or wriggle into interstices between rocks and gravel on stream bottoms. These 15 include all five species of Amolops (Inger 1966), three species of Ansonia (Inger 1992) four species of Leptobrachella, and three species scattered through other genera (Inger 1985, and unpublished data). An additional five species absent along the Seran have been observed elsewhere only at turbulent, rocky areas of other streams: Micrixalus baluensis, Philautus hosei, Rana hosei, Staurois latopalmatus, S. tuberilinguis (unpublished data).
The two streams at Segaham (Figure 1, locality 2) show interaction of stream width and gradient on overlap. Although the two streams, Marok (3 m) and Segaham (25 m), joined where they were sampled, their overlap of abundance arrays was only 0.07 and, though their overlap of species occurrences was higher (0.65) it was still lower than the overlaps at Nanga Tekalit. The five largest species at that locality were much more abundant on the Segaham (41% of the
This content downloaded from 128.135.12.127 on Wed, 1 Oct 2014 11:21:00 AMAll use subject to JSTOR Terms and Conditions
424 ROBERT F. INGER AND HAROLD K. VORIS
sample) than on the Marok (8%). Both are high gradient streams. However, the Marok consists of a series of small waterfalls separated by short pools over gravel and rock, whereas the Segaham has long stretches of foaming rapids over large boulders, the kind of habitat that supports populations of adult Rana hosei and Amolops cavitympanum and is used by tadpoles of A. cavitympanum and Bufo juxtasper. The last two species were five times more abundant and Rana hosei 20 times more abundant on the Segaham than on the Marok (Appendix B).
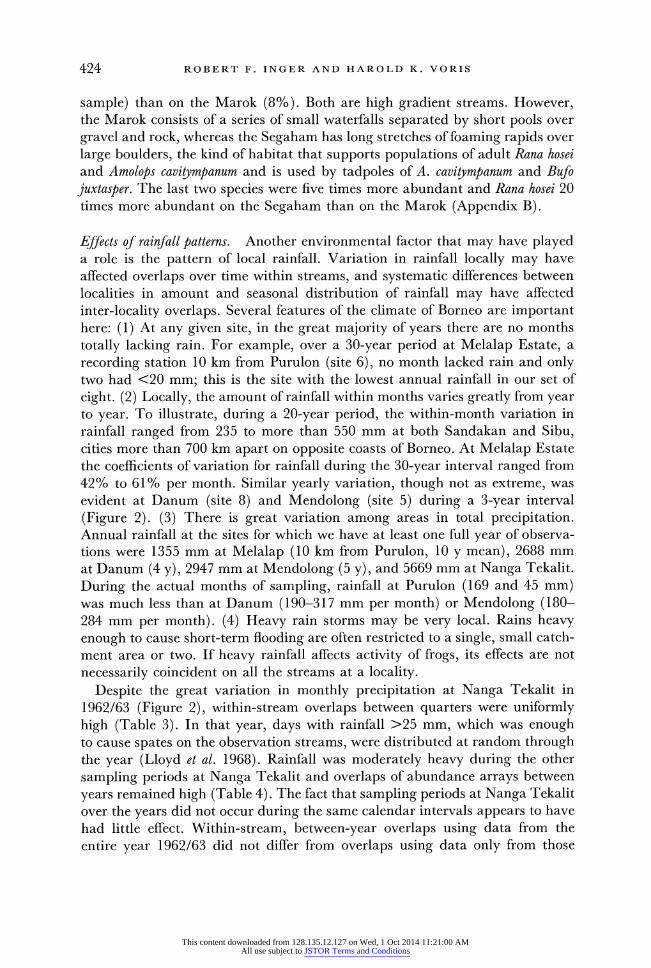
Effects of rainfall patterns. Another environmental factor that may have played a role is the pattern of local rainfall. Variation in rainfall locally may have affected overlaps over time within streams, and systematic differences between localities in amount and seasonal distribution of rainfall may have affected inter-locality overlaps. Several features of the climate of Borneo are important here: (1) At any given site, in the great majority of years there are no months totally lacking rain. For example, over a 30-year period at Melalap Estate, a recording station 10 km from Purulon (site 6), no month lacked rain and only two had <20 mm; this is the site with the lowest annual rainfall in our set of eight. (2) Locally, the amount of rainfall within months varies greatly from year to year. To illustrate, during a 20-year period, the within-month variation in rainfall ranged from 235 to more than 550 mm at both Sandakan and Sibu, cities more than 700 km apart on opposite coasts of Borneo. At Melalap Estate the coefficients of variation for rainfall during the 30-year interval ranged from 42% to 61% per month. Similar yearly variation, though not as extreme, was evident at Danum (site 8) and Mendolong (site 5) during a 3-year interval (Figure 2). (3) There is great variation among areas in total precipitation. Annual rainfall at the sites for which we have at least one full year of observa- tions were 1355 mm at Melalap (10 km from Purulon, 10 y mean), 2688 mm at Danum (4 y), 2947 mm at Mendolong (5 y), and 5669 mm at Nanga Tekalit. During the actual months of sampling, rainfall at Purulon (169 and 45 mm) was much less than at Danum (190-317 mm per month) or Mendolong (180- 284 mm per month). (4) Heavy rain storms may be very local. Rains heavy enough to cause short-term flooding are often restricted to a single, small catch- ment area or two. If heavy rainfall affects activity of frogs, its effects are not necessarily coincident on all the streams at a locality.
Despite the great variation in monthly precipitation at Nanga Tekalit in 1962/63 (Figure 2), within-stream overlaps between quarters were uniformly high (Table 3). In that year, days with rainfall >25 mm, which was enough to cause spates on the observation streams, were distributed at random through the year (Lloyd et al. 1968). Rainfall was moderately heavy during the other sampling periods at Nanga Tekalit and overlaps of abundance arrays between years remained high (Table 4). The fact that sampling periods at Nanga Tekalit over the years did not occur during the same calendar intervals appears to have had little effect. Within-stream, between-year overlaps using data from the entire year 1962/63 did not differ from overlaps using data only from those
This content downloaded from 128.135.12.127 on Wed, 1 Oct 2014 11:21:00 AMAll use subject to JSTOR Terms and Conditions

Variation among frog communities 425
RAIN IN mm (1987) 500 MELALAP RIVMENDOLONG * DANUM
400 _
300 X1
200 ----------------- - -
100 - - - - -- - -
10
J F M A M J J A S O N D
MONTH
RAIN IN mm (1988) 1000 - Nanga Tekallt 1963 LIMELALAP
ELIMENDOLONG EDANUM 800 - - - - - - - - - - - - - -
600 -
40
200 |
J F M A M J J A S 0 N D
MONTH
RAIN IN mm (1990) 700 MELALAP nMENDOLONG NDANUM
6 0 0 - - - - - - - - - - - - - - - -
500 -------------- --
400 - - - - - - - - - - - - - - -
300 - - - - - - - - - - - - -
200 -- - - - - -
100 -
0 J F M A M J J A SON D
MONTH
Figure 2. Monthly rainfall data for three years at three localities in Sabah. Melalap is 8 km from our sampled locality Purulon. The middle graph gives the monthly rainfall for Nanga Tekalit (Sarawak) in 1962/63.
This content downloaded from 128.135.12.127 on Wed, 1 Oct 2014 11:21:00 AMAll use subject to JSTOR Terms and Conditions
426 ROBERT F. INGER AND HAROLD K. VORIS
parts of 1962/63 matching the periods of work in 1970 and 1984 (Wilcoxon matched-pairs signed-ranks test, P > 0.05).
Although rainfall varied appreciably from year to year at Danum (Figure 2) and during sampling periods, there was no association between rainfall and amount of overlap within streams (Table 7). At Purulon rainfall during the second sampling period was less than 30% that in the first period (see above), yet overlaps between years were very high (0.87, 0.92). Similarly, at Mendolong between-year overlaps were high (0.84-0.94) despite variation in rainfall.
If differing amounts of rainfall (either at the time of sampling or annually) affect inter-locality overlaps significantly, overlaps between localities having similar rainfall should be larger than those between localities differing in amounts of rain. To test this hypothesis, holding stream gradient and width constant, we compare overlaps of abundance arrays between the four larger streams at Nanga Tekalit and Pesu (site 3), both areas with high rainfall, with overlaps between those streams and Palum Tambun at Danum (about half as much rain). Differences between the two sets of overlaps (see Tables 9 and 11) do not differ significantly (Mann-Whitney test, P > 0.20). All other inter- locality tests of rainfall effects are confounded by differences in gradient or stream width. However, overlaps of abundance arrays between Purulon and Mendolong (twice as much rain) were high (>0.60) despite differences in stream width. Also overlaps between Purulon streams and those at Danum (twice as much rain) were also high (0.54-0.83, Table 10) despite differences in gradient.
Restricted geographic distributions. In all the preceding analyses, a tacit assump- tion is that all species are available at all localities. There is evidence, on the contrary, that some species have limited geographic distributions within Borneo. For this part of the analysis, we use all frogs observed at a locality, whether on a surveyed stream or not, to establish presence in an area. General distribution is based on Inger (1966), Inger & Dring (1988), Inger & Stuebing (1992) and Matsui (1986). Abundances and distributions of species mentioned below are given in Appendix B.
One of the dominant species along streams in hilly areas of Sarawak, Rana ibanorum, is currently known only from Sarawak. Intensive, repeated search at Danum (site 8) in streams that provide appropriate habitats (clear streams having beds of sand, gravel, and rock) and at other similar streams 100 km south and 175 km west of Danum (field work by Inger) have failed to uncover this species in eastern Sabah. Bufo asper, abundant on streams at all four localit- ies in Sarawak, was also absent at Danum and the eastern Sabah localities referred to above, again, despite the presence of appropriate habitats. Other abundant stream-side species that appear to have geographically restricted dis- tributions, despite wider availability of suitable habitat, include Amolops phaeom- erus (found in central Sarawak) and A. whiteheadi (western Sabah). Altogether, 11 species (20%) in our data set depress inter-locality overlaps because of geographically, as distinguished from ecologically, restricted distributions.
This content downloaded from 128.135.12.127 on Wed, 1 Oct 2014 11:21:00 AMAll use subject to JSTOR Terms and Conditions
Variation among frog communities 427
Do these restricted ranges reflect historical processes or competitive interac- tions with ecologically similar species? We look for evidence of biotic interac- tions within groups of closely related species, which, as they are usually ecolo- gically homogeneous, are most likely to show competition. There were eight such groups in our sample, four of which were present in sufficient numbers for statistical analysis.
1. Rana ibanorum co-occurred with two related large species along streams at Nanga Tekalit (site 1) (Inger & Greenberg 1966). All three were absent from four streams in western Sabah that lacked suitable microhabitat. Correlations of relative abundances of these species in the 14 streams where at least one was present were positive. This suggests that the absence of R. ibanorum from appropriate habitat in eastern Sabah is independent of the distribution of the other two species.
2. The two large species of Bufo, asper and juxtasper, which form a distinct species group (Inger 1972), co-occurred on seven streams. As their abundances were negatively correlated (Spearman rs = -0.57, P < 0.01), the absence of B. asper from its usual habitat in eastern Sabah could be the result of competition.
3. The two species of Amolops having geographically restricted distributions (see above) each co-occurred with an abundant congener, poecilus in the case of phaeomerus and orphnocnemis in the case of whiteheadi. Larvae of phaeomerus and poecilus have been collected together in tadpole stations (Inger 1985) as have tadpoles of the other two (unpublished data). Relative abundances of whiteheadi and orphnocnemis were positively correlated, whereas abundances of phaeomerus and poecilus were negatively correlated though not at a significant level (P > 0.05). The distributions of whiteheadi and phaeomerus were not completely comple- mentary as neither occurred in eastern Sabah.
4. The three species of Staurois (Appendix B) co-occurred in four streams and in pairs or singly in the remaining 14 streams. Their relative abundances were positively correlated, which makes competition an unlikely explanation of the absence of S. tuberilinguis from streams at Danum and other streams in eastern Sabah that lie outside our study area.
The other groups having one or more species with geographically restricted ranges had small sample sizes (Appendix B). They include: three species of slender toads, Ansonia, one widely distributed and two absent from eastern Sabah though sympatric at two localities in Sarawak; two species of horned frogs, Megophrys, one apparently restricted to central Sarawak and sympatric with the second which was observed across the study area; and three species of small pelobatid toads, Leptobrachella, with one restricted to Sabah and two to Sarawak. As a genus, Leptobrachella exhibits strong altitudinal stratification (Inger & Stuebing 1992), suggesting that in this group competition may be important, if not universal. The other two groups show no evidence that biotic interactions play a role in their geographic restrictions.
According to Hanski (1982), for many organisms there is a positive correla- tion between local abundance and regional distribution; i.e. species tend to be either locally abundant and widespread ('core species') or locally rare and
This content downloaded from 128.135.12.127 on Wed, 1 Oct 2014 11:21:00 AMAll use subject to JSTOR Terms and Conditions
428 ROBERT F. INGER AND HAROLD K. VORIS
regionally scarce ('satellite species'). An earlier paper (Inger 1969) on the frogs of the streams at Nanga Tekalit noted that nine species accounted for >85% of observations and each contributed >3.5% of the sample. Hanski's model predicts that these nine species should have been equally abundant at Danum, where streams were very similar to those at Nanga Tekalit in width, gradient, and array of microhabitats. Yet at Danum these nine species constituted <40% of the total and four were completely absent: Amolops phaeomerus, Rana ibanorum, R. hosei, and Bufo asper. Hanski's model also predicts that locally rare species should not be ubiquitous; yet of the ten species that occurred at seven or all eight of our localities, six were rare (<1% of sample) at Nanga Tekalit and five were rare at Danum. The Bornean frogs do not fit Hanski's model.
Summary of between locality variation (1) Inter-locality overlaps of species abundances were strongly affected by
stream width and gradient. (2) Inter-locality overlaps of species' occurrences were affected by stream gradi-
ent but not by stream width. (3) The magnitude of inter-locality overlaps (abundance arrays and species'
occurrences) were not related to distance between localities. (4) Variation between localities in rainfall had little effect on overlap
(abundances and species' occurrences). (5) Inter-locality overlaps were affected by species that have geographically
restricted ranges that cannot be related to distribution of suitable microhab- itats or ecological competitors.
CONCLUSION
Variation over the time span of our study was relatively minor within commu- nities. In contrast, variation between communities was appreciable, but not strongly related to distance. Overlaps between pairs of streams at a locality, involving distances <13 km, were generally higher than overlaps of pairs of streams from different localities. Yet distances between localities, 45-640 km, were not correlated with overlap values. In part, the lack of correlation may be traced to ten species that occurred at seven or eight of the localities. The ubi- quity of these species reflects the similarity of some microhabitats across most or all of the territory studied.
Nonetheless, environmental variables had a clear effect on variation between communities. The principal factors were stream width and gradient, which affected both intra-and inter-locality overlaps. Perhaps the most striking example of the effect of differences in stream width was the overlap of abundance arrays (0.07) between the Segaham (25 m) and its tributary the Marok (2 m). The extreme example of effect of stream gradient was the Sungai Seran, the only stream flowing through flat terrain and the only one having a silt bottom and completely lacking riffles and torrents; it lacked all the species known to
This content downloaded from 128.135.12.127 on Wed, 1 Oct 2014 11:21:00 AMAll use subject to JSTOR Terms and Conditions
Variation among frog communities 429
breed in clear, turbulent water, i.e. roughly a quarter of the species in our study.
There were significant differences within and between localities in rainfall, both on an annual basis and at the times of sampling. Yet this variation did not account for differences in overlaps among communities.
Although environmental factors had strong effects on inter-locality overlaps, they do not account for all of the variation. At least 11 species have geographic- ally restricted ranges that cannot be explained on the basis of distribution of suitable microhabitats. Nine of these co-occur with at least one similar congener at one or more localities. Regional processes (sensu Ricklefs 1987), perhaps the existence or timing of barriers to dispersal or the timing of speciation events, appear to be responsible for their geographic restrictions rather than biotic interactions.
ACKNOWLEDGEMENTS
We wish to express our thanks to men of the Iban longhouse, Rumah Jimbong. Without their able assistance, none of the work at Nanga Tekalit would have taken place. We also wish to acknowledge Lucas Chin, Director, and Charles Leh, Zoologist, both of the Sarawak Museum, who arranged for government permits and eased many logistical problems. We are grateful to the authorities of Sabah Parks, Sabah Forest Industries, and Yayasan Sabah for permission to work in areas under their respective jurisdictions and for living accommoda- tions. We are also grateful to Sabah Parks and Universiti Kebangsaan Malaysia (Kampus Sabah) for provision of camping equipment, transportation, and logistical assistance. We thank R. B. Stuebing, F. L. Tan, and P. Yambun for assistance in the field and for many kindnesses. Professional colleagues, J. P. Bacon, S. Emerson, K. J. Frogner, W. Hosmer, D. Karns, F. W. King, J. C. Murphy, and P. Walker, helped us collect at various times. We are grateful to M. Lloyd and B. Zimmerman for helpful comments on the manuscript. We received valued technical assistance from A. Resetar. Field and laboratory work were partially supported by grants from the National Science Foundation, the Allen-Heath Memorial Foundation, and the National Geographic Society.
LITERATURE CITED
CRUMP, M. L. 1971. Quantitative analysis of the ecological distribution of a tropical herpetofauna. Occasional Papers, Museum of Natural History, University of Kansas 3:1-62.
DUELLMAN, W. E. & LYNCH, J. D. 1969. Descriptions of Atelopus tadpoles and their relevance to atelopo- did classification. Herpetologica 25:231-240.
GASCON, C. 1991. Populations and community-level analyses of species occurrences of Central Amazonian rainforest tadpoles. Ecology 72:1731-1746.
HANSKI, I. 1982. Dynamics of regional distribution: the core and satellite species hypothesis. Oikos 38:210- 221.
HEYER, W. R. 1973. Ecological interactions of frog larvae at a seasonal tropical location in Thailand. Journal of Herpetology 7:337-361.
This content downloaded from 128.135.12.127 on Wed, 1 Oct 2014 11:21:00 AMAll use subject to JSTOR Terms and Conditions

430 ROBERT F. INGER AND HAROLD K. VORIS
HORN, H. 1966. The measurement of 'overlap' in comparative ecological studies. American Naturalist 100:419- 424.
INGER, R. F. 1966. The systematics and zoogeography of the Amphibia of Borneo. Fieldiana: Zoology 52:1- 402.
INGER, R. F. 1969. Organization of communities of frogs along small rain forest streams in Sarawak. Journal of Animal Ecology 38:123-148.
INGER, R. F. 1972. Bufo of Eurasia. Pp. 108-118, 357-360 in Blair, F. W. (ed.). Evolution in the genus Bufo. University of Texas Press, Austin.
INGER, R. F. 1985. Tadpoles of the forested regions of Borneo. Fieldiana: Zoology (n.s.) 26:1-89. INGER, R. F. 1992. Variation of apomorphic characters in stream-dwelling tadpoles of the bufonid genus
Ansonia (Amphibia: Anura). Zoological Journal of the Linnean Society 105:225-237. INGER, R. F. & COLWELL, R. K. 1977. Organization of contiguous communities of amphibians and
reptiles in Thailand. Ecological Monographs 47:229-253. INGER, R. F. & DRING, J. 1988. Taxonomic and ecological relations of Bornean stream toads allied to
Ansonia leptopus (Guenther) (Anura: Bufonidae). Malayan Nature Journal 419:461-471. INGER, R. F. & GREENBERG, B. 1966. Ecological and competitive relations among three species of frog
(genus Rana). Ecology 47:746-759. INGER, R. F. & STUEBING, R. B. 1991. Frogs of Sabah. Sabah Parks Publication, no. 10. INGER, R. F. & STUEBING, R. B. 1992. The montane amphibian fauna of northwestern Borneo. Malayan
Nature Journal 46:41-51. INGER, R. F., VORIS, H. K. & FROGNER, K. J. 1986. Organization of a community of tadpoles in rain
forest streams in Borneo. Journal of Tropical Ecology 2:193-205. LLOYD, M., INGER, R. F. & KING, F. W. 1968. On the diversity of reptile and amphibian species in a
Bornean rain forest. American Naturalist 102:497-515. MATSUI, M. 1986. Three new species of Amolops from Borneo. Copeia 1986:623-630. McDIARMID, R. W. 1978. Evolution of parental care in frogs. Pp. 127-147 in Burkhardt, G. M. & Bekoff,
M. (eds). The development of behavior: comparative and evolutionary aspects. STPM Press, New York. RICKLEFS, R. E. 1987. Community diversity: relative roles of local and regional processes. Science 235:167-
171. TOFT, C. A. & DUELLMAN, W. E. 1979. Anurans of the lower Rio Llullapichis, Amazonian Peru: a
preliminary analysis of community structure. Herpetologica 35:71-77. WOLDA, H. 1981. Similarity indices, sample size and diversity. Oecologia 50:296-302.
Accepted 27 April 1993
This content downloaded from 128.135.12.127 on Wed, 1 Oct 2014 11:21:00 AMAll use subject to JSTOR Terms and Conditions
Variation among frog communities 431
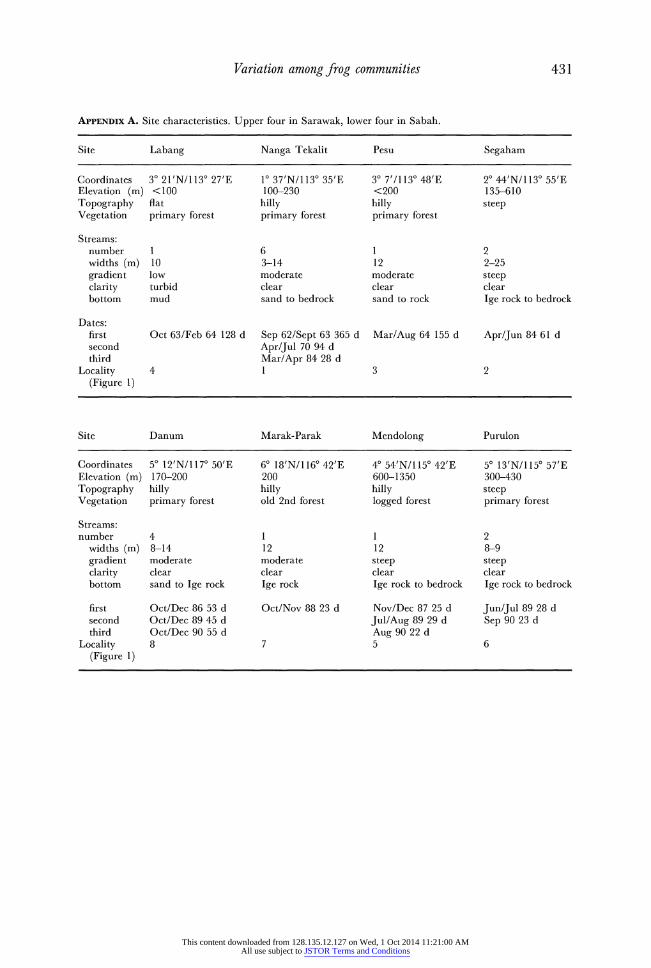
APPENDiX A. Site characteristics. Upper four in Sarawak, lower four in Sabah.
Site Labang Nanga Tekalit Pesu Segaham
Coordinates 30 21'N/1130 27'E 10 37'N/1130 35'E 30 7'/1130 48'E 20 44'N/1130 55'E Elevation (m) <100 100-230 <200 135-610 Topography flat hilly hilly steep Vegetation primary forest primary forest primary forest
Streams: number 1 6 1 2 widths (m) 10 3-14 12 2-25 gradient low moderate moderate steep clarity turbid clear clear clear bottom mud sand to bedrock sand to rock Ige rock to bedrock
Dates: first Oct 63/Feb 64 128 d Sep 62/Sept 63 365 d Mar/Aug 64 155 d Apr/Jun 84 61 d second Apr/Jul 70 94 d third Mar/Apr 84 28 d
Locality 4 1 3 2 (Figure 1)
Site Danum Marak-Parak Mendolong Purulon
Coordinates 50 12'N/1170 50'E 60 18'N/1160 42'E 40 54'N/1150 42'E 50 13'N/1150 57'E Elevation (m) 170-200 200 600-1350 300-430 Topography hilly hilly hilly steep Vegetation primary forest old 2nd forest logged forest primary forest
Streams: number 4 1 1 2
widths (m) 8-14 12 12 8-9 gradient moderate moderate steep steep clarity clear clear clear clear bottom sand to Ige rock Ige rock Ige rock to bedrock Ige rock to bedrock
first Oct/Dec 86 53 d Oct/Nov 88 23 d Nov/Dec 87 25 d Jun/Jul 89 28 d second Oct/Dec 89 45 d Jul/Aug 89 29 d Sep 90 23 d third Oct/Dec 90 55 d Aug 90 22 d
Locality 8 7 5 6 (Figure 1)
This content downloaded from 128.135.12.127 on Wed, 1 Oct 2014 11:21:00 AMAll use subject to JSTOR Terms and Conditions

432 ROBERT F. INGER AND HAROLD K. VORIS
APPENDiX B. List of species and specimens. Authorities for species names given in Inger (1966, 1985) and Inger & Stuebing (1991).
Nanga Tekalit Segaham
ANURAN SPECIES Ensurai Sekentut Serbong Selubok Wong Lawan Segaham Marok
Amolops cavioympanum 0 0 0 0 0 0 28 3 Amolops orphnocnemis 0 0 0 0 0 0 0 0 Amolops phaeomerus 90 83 330 107 2 0 1 1 Amolops poecilus 13 4 28 13 12 143 76 3 Amolops whiteheadi 0 0 0 0 0 0 0 0 Ansonia albomaculata 0 0 0 0 0 0 137 2 Ansonia leptopus 32 12 21 20 5 2 1 0 Ansonia longidigita 0 0 0 0 0 0 0 0 Ansonia spinulifer 0 0 0 0 0 0 0 3 Bufo asper 107 121 71 45 15 14 13 1 Bufo divergens 52 0 11 0 48 1 0 0 Bufo juxtasper 2 2 0 0 1 0 83 8 Chaperina fusca 0 0 0 0 0 0 0 0 Leptobrachella baluensis 0 0 0 0 0 0 0 0 Leptobrachella njobergi 0 1 1 1 17 0 0 96 Leptobrachella parva 0 0 0 0 0 0 0 4 Leptobrachella serasanae 0 0 0 0 0 0 0 0 Leptobrac/hium hendricksoni 0 0 0 0 0 0 0 0 Leptobrachium montanum 8 20 9 5 3 0 0 20 Leptobrachium nigrops 0 0 0 0 0 0 0 0 Leptolalax gracillis 1 3 5 3 7 1 3 0 Megophrys edwardinae 1 0 0 0 2 1 0 2 Megophrys nasuta 1 0 0 4 3 2 0 0
Micrixalus baluensis 1 0 0 0 1 0 1 12 Microphyia petrigena 14 2 1 0 1 2 0 0 Occidozyga baluensis 10 0 5 0 1 4 0 0 Pedostibes hosei 50 48 106 29 1 0 6 1 Pedostibes rugosus 0 0 0 0 0 0 2 0 Philautus disgregus 0 0 0 0 0 0 0 0 Philautus hosei 6 0 4 5 27 8 0 0 Philautus tectus 0 0 0 1 0 0 0 5 Rana baramica 0 0 0 0 0 0 0 0 Rana blythi 257 307 292 200 10 30 18 14 Rana chalconota 171 156 200 125 45 135 70 5 Rana glandulosa 0 0 0 0 0 0 0 0 Rana hosei 100 56 36 20 4 0 117 2 Rana ibanorum 247 141 199 191 25 22 26 0 Rana ingeri 12 82 43 44 1 18 3 0 Rana kuhli 12 14 9 17 16 55 0 78 Rana laticeps 0 0 0 0 0 0 0 2 Rana malesiana 0 0 0 0 0 0 0 0 Rana paramacrodon 0 0 0 0 0 0 0 0 Rana signata 69 150 272 23 10 11 2 1 Rhacophorus bimaculatus 1 0 0 0 0 0 0 0 Rhacophorus gauni 3 7 1 10 1 1 0 0 Rhacophorus pardalis 18 2 11 4 0 1 11 1
Staurois latopalmatus 1 7 6 3 4 2 5 0 Staurois natator 2 3 3 0 80 15 2 7 Staurois tuberlinguis 0 0 0 0 7 0 0 21
TOTALS 1281 1221 1664 870 349 468 605 292
This content downloaded from 128.135.12.127 on Wed, 1 Oct 2014 11:21:00 AMAll use subject to JSTOR Terms and Conditions
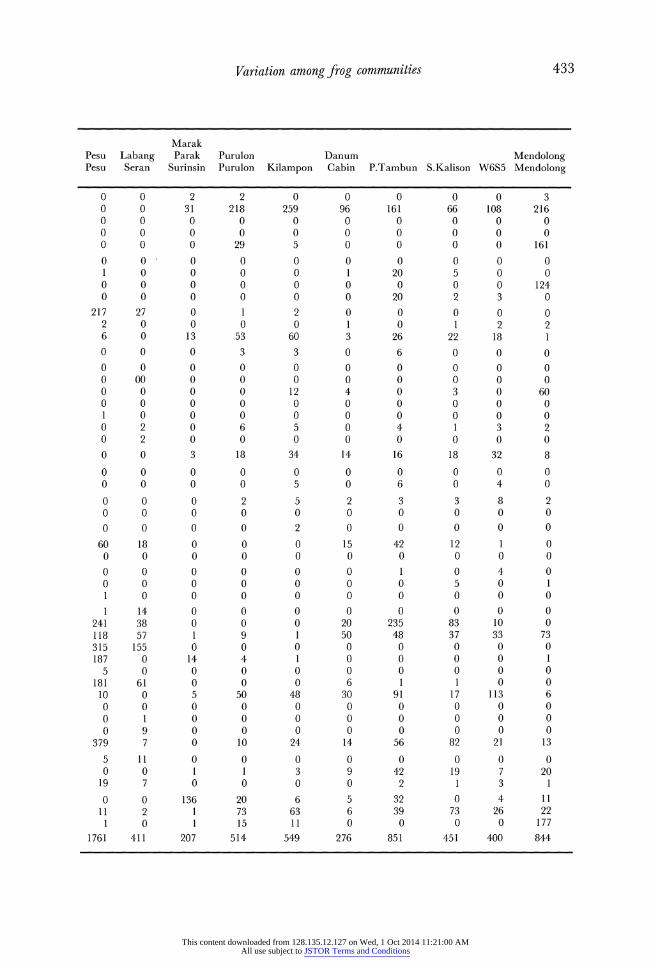
Variation among frog communities 433
Marak Pesu Labang Parak Purulon Danum Mendolong Pesu Seran Surinsin Purulon Kilampon Cabin P.Tambun S.Kalison W6S5 Mendolong
0 0 2 2 0 0 0 0 0 3 0 0 31 218 259 96 161 66 108 216 0 0 0 0 0 0 0 0 0 0 0 0 0 0 0 0 0 0 0 0 0 0 0 29 5 0 0 0 0 161 0 0 0 0 0 0 0 0 0 0 1 0 0 0 0 1 20 5 0 0 0 0 0 0 0 0 0 0 0 124 0 0 0 0 0 0 20 2 3 0
217 27 0 1 2 0 0 0 0 0 2 0 0 0 0 1 0 1 2 2 6 0 13 53 60 3 26 22 18 1 0 0 0 3 3 0 6 0 0 0 0 0 0 0 0 0 0 0 0 0 0 00 0 0 0 0 0 0 0 0 0 0 0 0 12 4 0 3 0 60 0 0 0 0 0 0 0 0 0 0 1 0 0 0 0 0 0 0 0 0 0 2 0 6 5 0 4 1 3 2 0 2 0 0 0 0 0 0 0 0 0 0 3 18 34 14 16 18 32 8 0 0 0 0 0 0 0 0 0 0 0 0 0 0 5 0 6 0 4 0
0 0 0 2 5 2 3 3 8 2 0 0 0 0 0 0 0 0 0 0
0 0 0 0 2 0 0 0 0 0 60 18 0 0 0 15 42 12 1 0 0 0 0 0 0 0 0 0 0 0
0 0 0 0 0 0 1 0 4 0 0 0 0 0 0 0 0 5 0 1 1 0 0 0 0 0 0 0 0 0
1 14 0 0 0 0 0 0 0 0 241 38 0 0 0 20 235 83 10 0 118 57 1 9 1 50 48 37 33 73 315 155 0 0 0 0 0 0 0 0 187 0 14 4 1 0 0 0 0 1
5 0 0 0 0 0 0 0 0 0 181 61 0 0 0 6 1 1 0 0 10 0 5 50 48 30 91 17 113 6 0 0 0 0 0 0 0 0 0 0 0 1 0 0 0 0 0 0 0 0 0 9 0 0 0 0 0 0 0 0
379 7 0 10 24 14 56 82 21 13 5 11 0 0 0 0 0 0 0 0 0 0 1 1 3 9 42 19 7 20
19 7 0 0 0 0 2 1 3 1 0 0 136 20 6 5 32 0 4 11 11 2 1 73 63 6 39 73 26 22 1 0 1 15 11 0 0 0 0 177
1761 411 207 514 549 276 851 451 400 844
This content downloaded from 128.135.12.127 on Wed, 1 Oct 2014 11:21:00 AMAll use subject to JSTOR Terms and Conditions