PLACE VALUE ANCHOR CHART
20
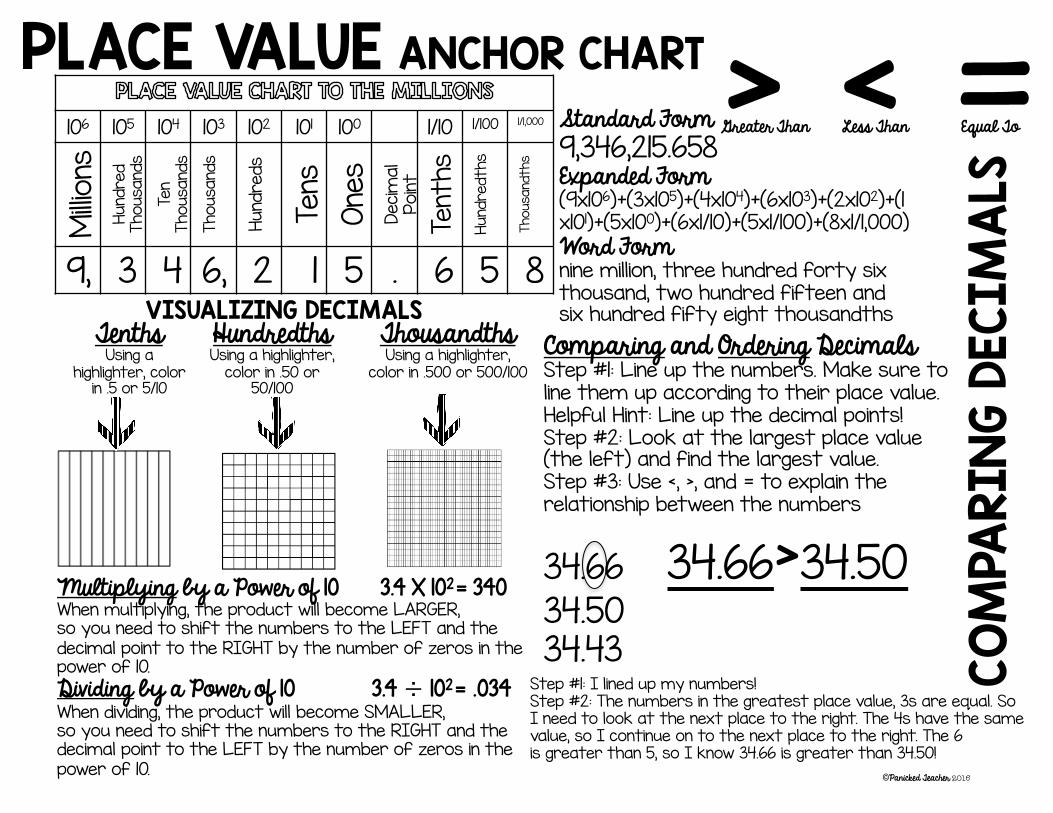
PLACE VALUE ANCHOR CHART 10 6 10 5 10 4 10 3 10 2 10 1 10 0 1/10 1/100 1/1,000 Millions Hundred Thousands Ten Thousands Thousands Hundreds Tens Ones Decimal Point Tenths Hundredths Thousandths 9, 3 4 6, 2 1 5 . 6 5 8 Standard Form 9,346,215.658 Expanded Form (9x10 6 )+(3x10 5 )+(4x10 4 )+(6x10 3 )+(2x10 2 )+(1 x10 1 )+(5x10 0 )+(6x1/10)+(5x1/100)+(8x1/1,000) Word Form nine million, three hundred forty six thousand, two hundred fifteen and six hundred fifty eight thousandths Tenths Using a highlighter, color in .5 or 5/10 Hundredths Using a highlighter, color in .50 or 50/100 Comparing and Ordering Decimals Step #1: Line up the numbers. Make sure to line them up according to their place value. Helpful Hint: Line up the decimal points! Step #2: Look at the largest place value (the left) and find the largest value. Step #3: Use <, >, and = to explain the relationship between the numbers 34.66 34.66 >34.50 34.50 34.43 Step #1: I lined up my numbers! Step #2: The numbers in the greatest place value, 3s are equal. So I need to look at the next place to the right. The 4s have the same value, so I continue on to the next place to the right. The 6 is greater than 5, so I know 34.66 is greater than 34.50! > < = Greater Than Less Than Equal To Multiplying by a Power of 10 3.4 X 10 2 = 340 When multiplying, the product will become LARGER, so you need to shift the numbers to the LEFT and the decimal point to the RIGHT by the number of zeros in the power of 10. Dividing by a Power of 10 3.4 ÷ 10 2 = .034 When dividing, the product will become SMALLER, so you need to shift the numbers to the RIGHT and the decimal point to the LEFT by the number of zeros in the power of 10. Thousandths Using a highlighter, color in .500 or 500/100 VISUALIZING DECIMALS COMPARING DECIMALS ©Panicked Teacher 2016
-
Upload
khangminh22 -
Category
Documents
-
view
0 -
download
0
Transcript of PLACE VALUE ANCHOR CHART
PLACE VALUE ANCHOR CHART
106 105 104 103 102 101 100 1/10 1/100 1/1,000
Milli
ons
Hund
red
Th
ousa
nds
Ten
Th
ousa
nds
Th
ousa
nds
Hund
reds
Tens
One
s
Deci
mal
Po
int
Tent
hs
Hund
redt
hs
Thou
sand
ths
9, 3 4 6, 2 1 5 . 6 5 8
Standard Form 9,346,215.658 Expanded Form (9x10⁶)+(3x10⁵)+(4x10⁴)+(6x10³)+(2x10²)+(1x101)+(5x100)+(6x1/10)+(5x1/100)+(8x1/1,000) Word Form nine million, three hundred forty six thousand, two hundred fifteen and six hundred fifty eight thousandths
Tenths Using a
highlighter, color in .5 or 5/10
Hundredths Using a highlighter,
color in .50 or 50/100
Comparing and Ordering Decimals Step #1: Line up the numbers. Make sure to line them up according to their place value. Helpful Hint: Line up the decimal points! Step #2: Look at the largest place value (the left) and find the largest value. Step #3: Use <, >, and = to explain the relationship between the numbers
34.66 34.66>34.50 34.50 34.43
Step #1: I lined up my numbers! Step #2: The numbers in the greatest place value, 3s are equal. So I need to look at the next place to the right. The 4s have the same value, so I continue on to the next place to the right. The 6 is greater than 5, so I know 34.66 is greater than 34.50!
> < = Greater Than Less Than Equal To
Multiplying by a Power of 10 3.4 X 102= 340 When multiplying, the product will become LARGER, so you need to shift the numbers to the LEFT and the decimal point to the RIGHT by the number of zeros in the power of 10. Dividing by a Power of 10 3.4 ÷ 102= .034 When dividing, the product will become SMALLER, so you need to shift the numbers to the RIGHT and the decimal point to the LEFT by the number of zeros in the power of 10.
Thousandths Using a highlighter,
color in .500 or 500/100
VISUALIZING DECIMALS
CO
MPA
RIN
G D
ECIM
ALS
©Panicked Teacher 2016
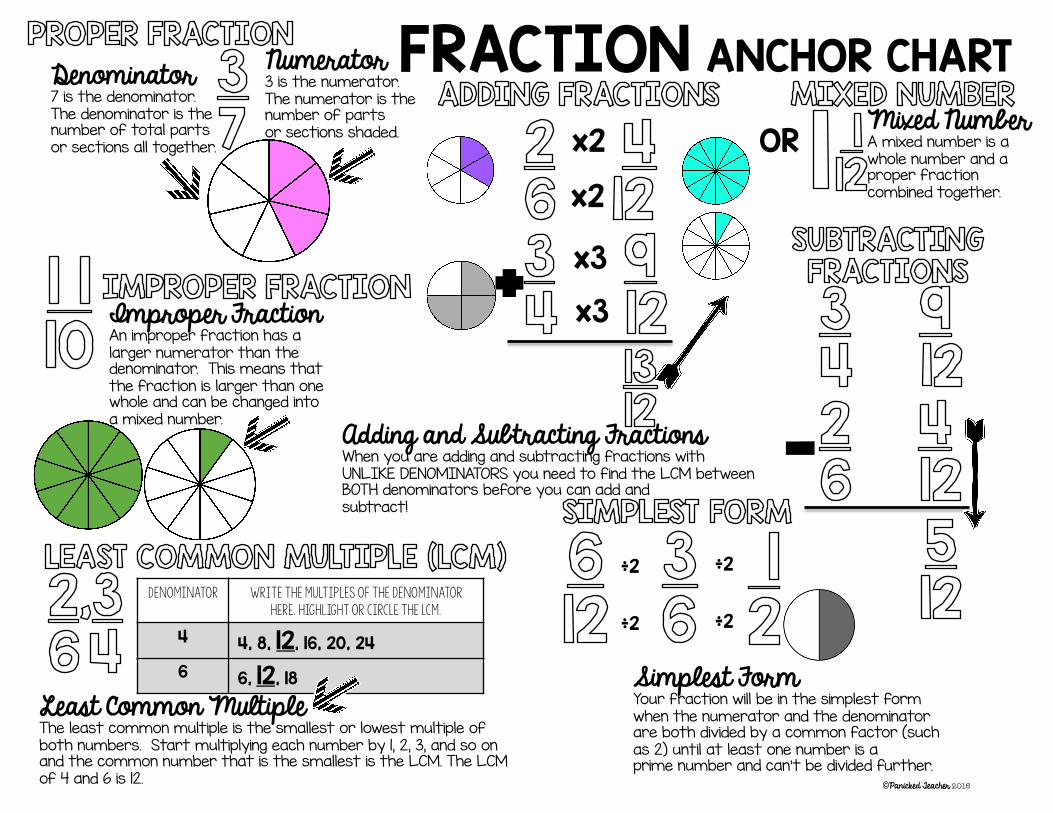
FRACTION ANCHOR CHART Numerator 3 is the numerator. The numerator is the number of parts or sections shaded.
Denominator 7 is the denominator. The denominator is the number of total parts or sections all together.
Improper Fraction An improper fraction has a larger numerator than the denominator. This means that the fraction is larger than one whole and can be changed into a mixed number.
Denominator Write the multiples of the denominator here. Highlight or circle the LCM.
4 4, 8, 12, 16, 20, 24
6 6, 12, 18
Least Common Multiple The least common multiple is the smallest or lowest multiple of both numbers. Start multiplying each number by 1, 2, 3, and so on and the common number that is the smallest is the LCM. The LCM of 4 and 6 is 12.
x3
x3
x2
x2
+
OR Mixed Number A mixed number is a whole number and a proper fraction combined together.
÷2 ÷2
÷2 ÷2
Simplest Form Your fraction will be in the simplest form when the numerator and the denominator are both divided by a common factor (such as 2) until at least one number is a prime number and can’t be divided further.
- Adding and Subtracting Fractions When you are adding and subtracting fractions with UNLIKE DENOMINATORS you need to find the LCM between BOTH denominators before you can add and subtract!
©Panicked Teacher 2016

MULTIPLICATION ANCHOR CHART
2 REGROUPING
5 3 Factor
2 7 Factor
3 7 1 1 0 6 0
1, 4 3 1 Product ADD THEM UP!
THOUSA
NDS
HUND
REDS
TENS
ONE
S
3 5 O
2 1
1 0 0 0
6 0
1, 4 3 1
x
53 times 27 equals 1,431 FACTOR X FACTOR = PRODUCT
+
ALG
ORIT
HM
AREA MODEL
50 3
20 7
350 21 1,000 60
5 3
2 7
1 0 0 6 3 2
5 1
3 1
1 4
LATTICE Multiplication
53 X 27
21 350 60
1,000 1,431
(7X3) (50X7) (20X3)
(50X20)
Partial Product
multiplication KEY WORDS *array *product *factor *groups of *multiple *rows of *times *equal groups *doubled *tripled *quadruple +
+
2
5 3
2 7
3 7 1
1 0 6 0
1 4 3 1
.
.
x +
Mul
tiply
ing
Decim
als
©Panicked Teacher 2016

DIVISION ANCHOR CHART
527 divided by 4 equals 131 R 3 DIVIDEND ÷ DIVISOR = QUOTIENT
1 3 1 R 3
4 5 2 7
- 4 ê ê
1 2
- 1 2
0 7
- 4
3
4 9 4 10 (10x4) -4 0 10 54 9 (9x4) -36 18 +4 (4x4) -16 2 10 + 9 + 4= 23
Partial Quotient 23 R 2
2 8 6 1
-0 1
1 6 - 1 2 4
4 8 - 4 8 0
Division Box 168÷6
Algorithm
Area Model 868÷7=124 7
100 10 10 4 868 -700 168
168 -70 98
98 -70 28
28 -28 0
For this division problem, you can find 10 groups of 4 in 94. So, since 10 x 4 equals 40, you subtract 40 from the dividend. Next, you think about how many groups of 4 you can find in 54. There are 9 groups of 4, or 36 in 54. The difference of 36 and 54 is 18. Finally, you need to think about how many group of 4 are in 18. Since there are 4 groups of 4 in 18, there are 2 left over. There is a remainder of 2.
©Panicked Teacher 2016
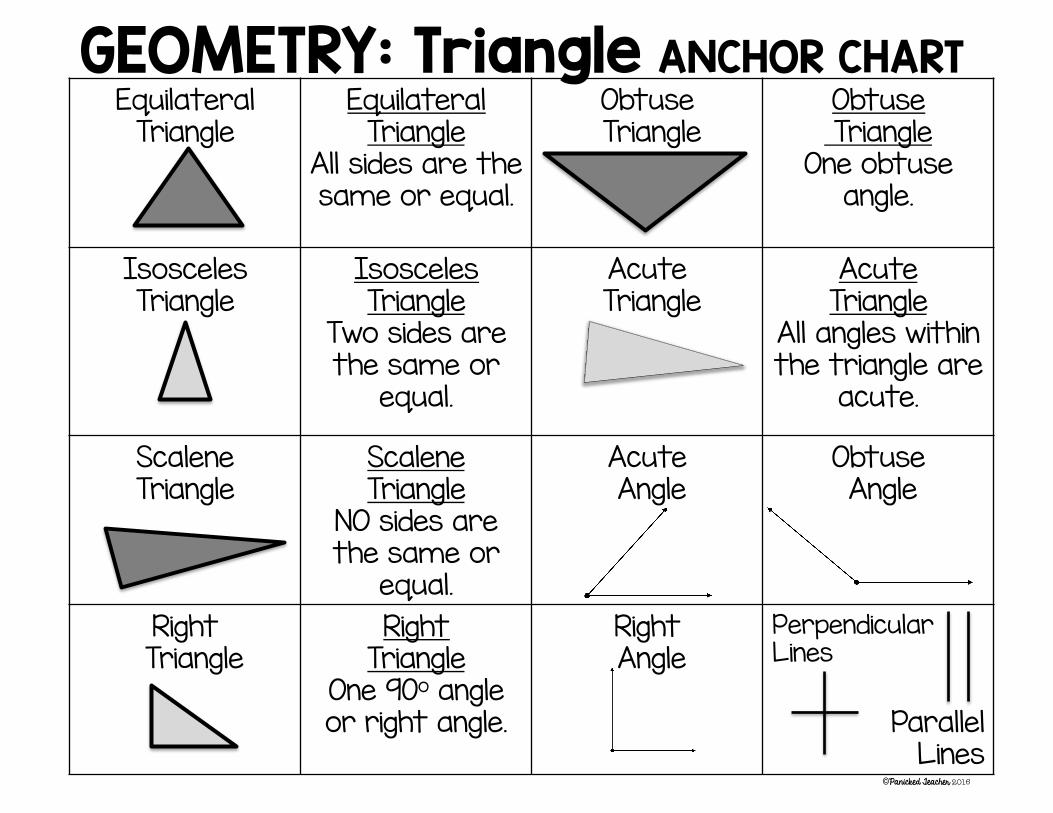
Equilateral Triangle
Equilateral Triangle
All sides are the same or equal.
Obtuse Triangle
Obtuse Triangle
One obtuse angle.
Isosceles Triangle
Isosceles Triangle
Two sides are the same or
equal.
Acute Triangle
Acute Triangle
All angles within the triangle are
acute.
Scalene Triangle
Scalene Triangle
NO sides are the same or
equal.
Acute Angle
Obtuse Angle
Right Triangle
Right Triangle
One 90o angle or right angle.
Right Angle
Perpendicular Lines
Parallel Lines
GEOMETRY: Triangle ANCHOR CHART
©Panicked Teacher 2016
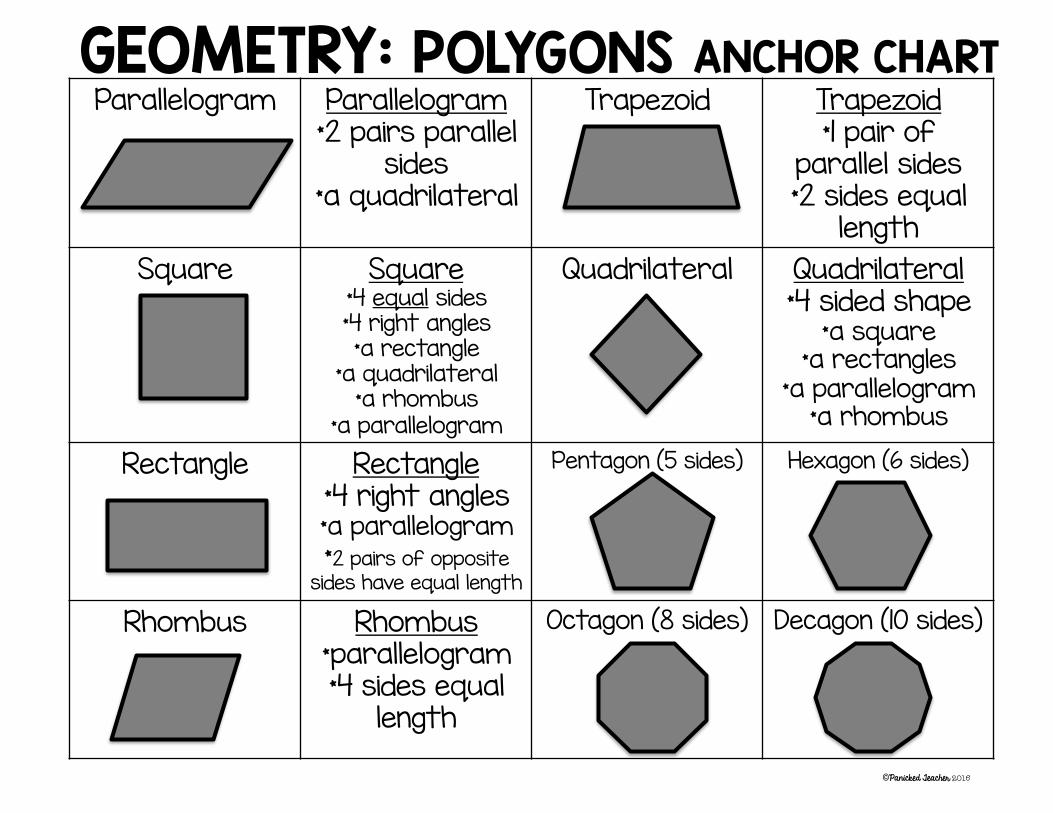
Parallelogram
Parallelogram *2 pairs parallel
sides *a quadrilateral
Trapezoid
Trapezoid *1 pair of
parallel sides *2 sides equal
length Square Square
*4 equal sides *4 right angles *a rectangle
*a quadrilateral *a rhombus
*a parallelogram
Quadrilateral
Quadrilateral *4 sided shape
*a square *a rectangles
*a parallelogram *a rhombus
Rectangle
Rectangle *4 right angles *a parallelogram *2 pairs of opposite
sides have equal length
Pentagon (5 sides)
Hexagon (6 sides)
Rhombus
Rhombus *parallelogram *4 sides equal
length
Octagon (8 sides)
Decagon (10 sides)
GEOMETRY: POLYGONS ANCHOR CHART
©Panicked Teacher 2016
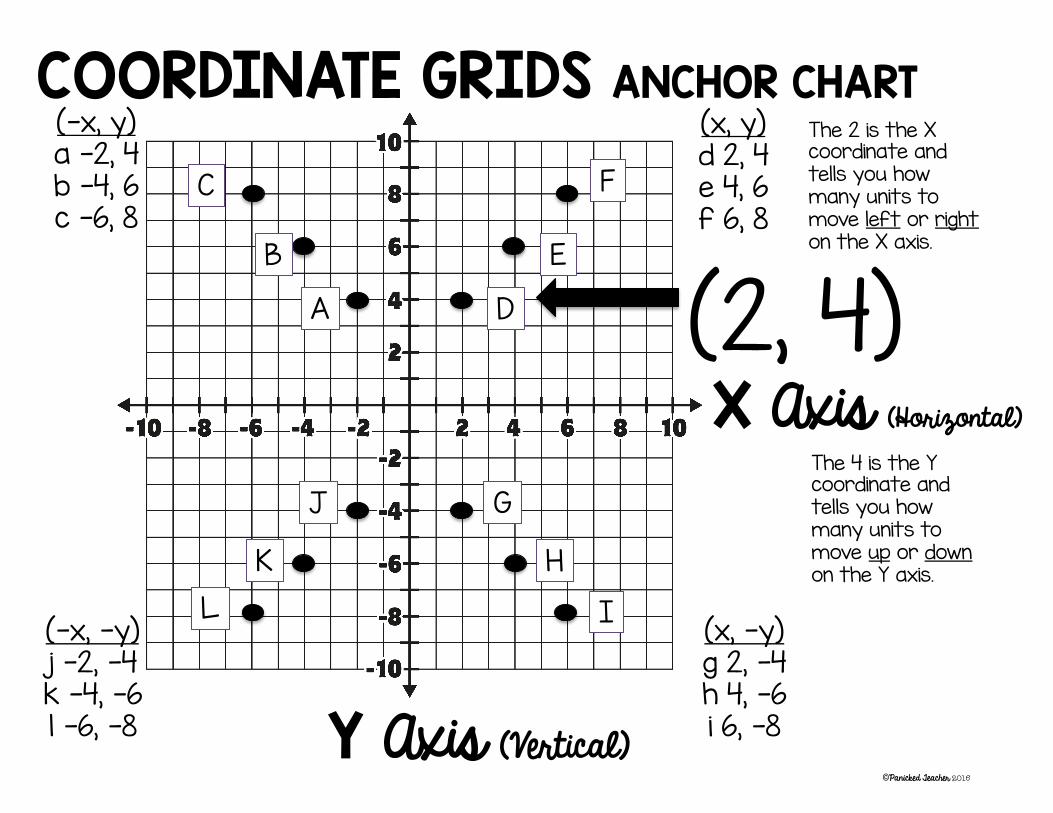
COORDINATE GRIDS ANCHOR CHART
(x, y) d 2, 4 e 4, 6 f 6, 8
(x, -y) g 2, -4 h 4, -6 i 6, -8
(-x, -y) j -2, -4 k -4, -6 l -6, -8
(-x, y) a -2, 4 b -4, 6 c -6, 8
A
B
C
D
E
F
G
H
I
J
K
L
X Axis (Horizontal)
Y Axis (Vertical)
The 2 is the X coordinate and tells you how many units to move left or right on the X axis.
(2, 4) The 4 is the Y coordinate and tells you how many units to move up or down on the Y axis.
©Panicked Teacher 2016
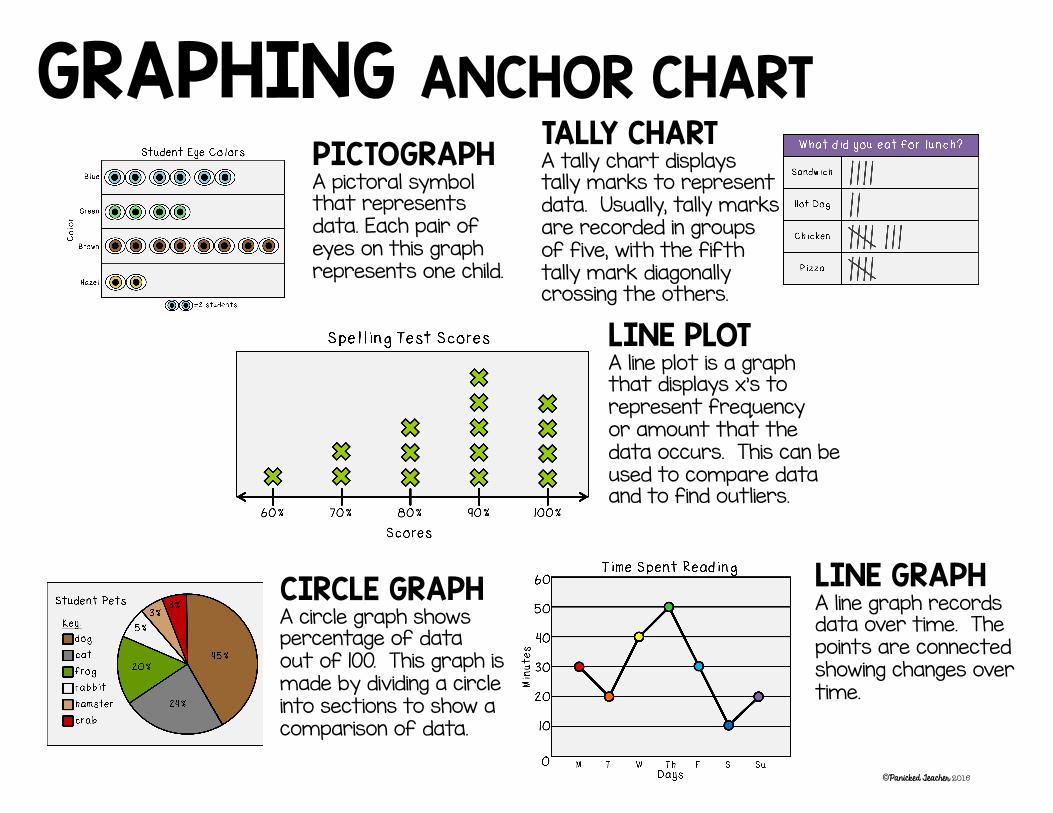
PICTOGRAPH A pictoral symbol that represents data. Each pair of eyes on this graph represents one child.
CIRCLE GRAPH A circle graph shows percentage of data out of 100. This graph is made by dividing a circle into sections to show a comparison of data.
LINE PLOT A line plot is a graph that displays x’s to represent frequency or amount that the data occurs. This can be used to compare data and to find outliers.
TALLY CHART A tally chart displays tally marks to represent data. Usually, tally marks are recorded in groups of five, with the fifth tally mark diagonally crossing the others.
LINE GRAPH A line graph records data over time. The points are connected showing changes over time.
GRAPHING ANCHOR CHART
©Panicked Teacher 2016
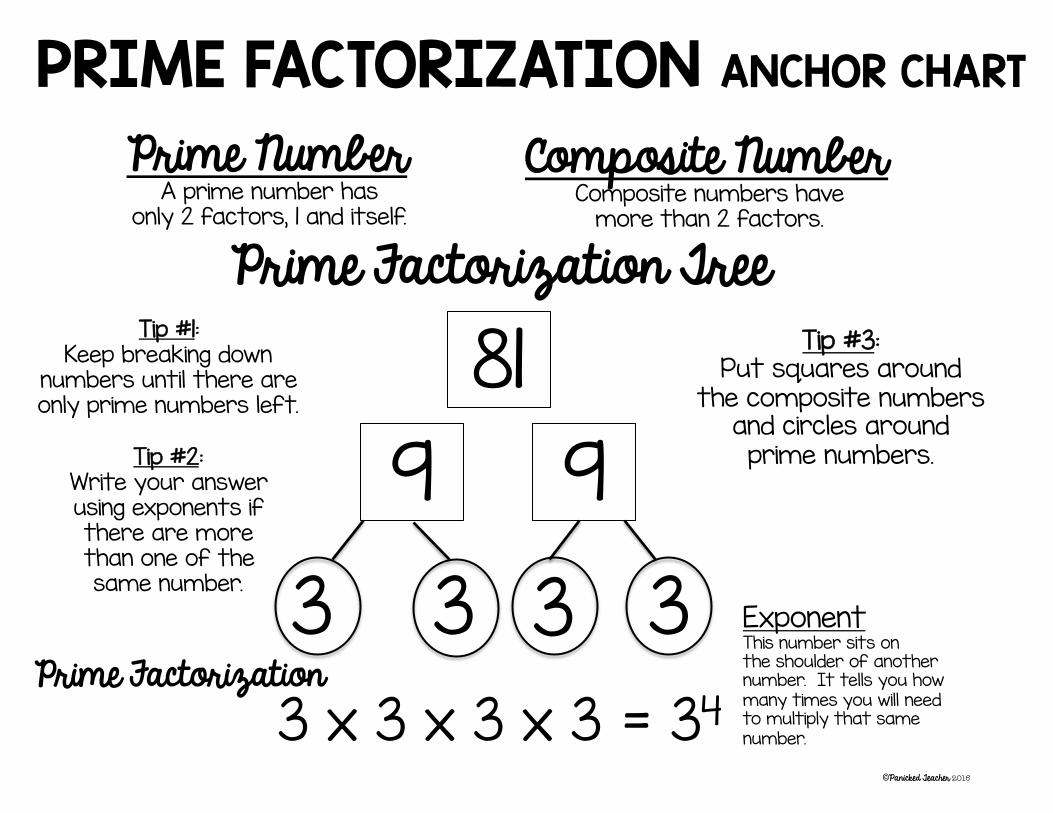
PRIME FACTORIZATION ANCHOR CHART
Prime Number A prime number has
only 2 factors, 1 and itself.
Composite Number Composite numbers have
more than 2 factors. Prime Factorization Tree
81 9 9
3 3 3 3 3 x 3 x 3 x 3 = 34
Tip #1: Keep breaking down
numbers until there are only prime numbers left.
Tip #2:
Write your answer using exponents if there are more than one of the same number.
Tip #3: Put squares around
the composite numbers and circles around prime numbers.
Exponent This number sits on the shoulder of another number. It tells you how many times you will need to multiply that same number.
Prime Factorization
©Panicked Teacher 2016
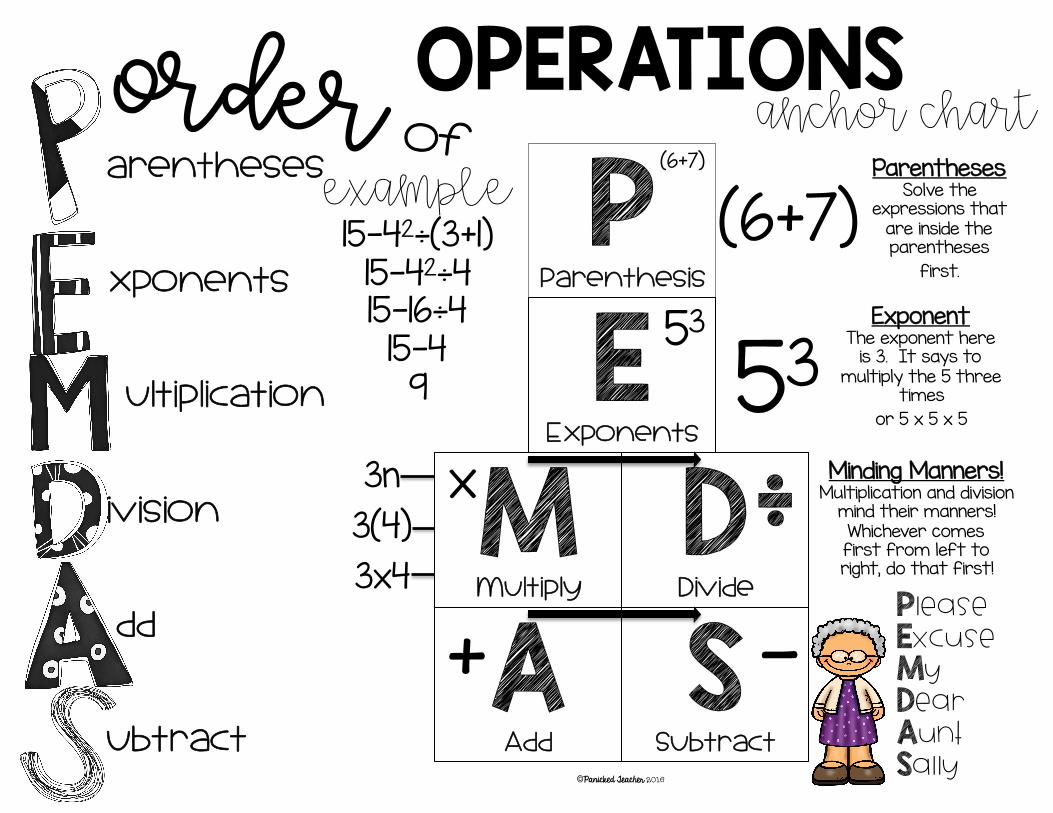
Order of OPERATIONS
OPERATIONS ANCHOR CHART
P E M D A S
arentheses xponents ultiplication ivision dd ubtract
P Parenthesis
E Exponents
M Multiply
A Add
D Divide
S Subtract
Minding Manners! Multiplication and division
mind their manners! Whichever comes first from left to right, do that first!
53 Exponent
The exponent here is 3. It says to
multiply the 5 three times
or 5 x 5 x 5
(6+7) Parentheses
Solve the expressions that
are inside the parentheses
first.
3n
3(4)
3x4
+ -
÷
53
(6+7)
x
example 15-42÷(3+1)
15-42÷4 15-16÷4 15-4 9
Please Excuse My Dear Aunt Sally
©Panicked Teacher 2016
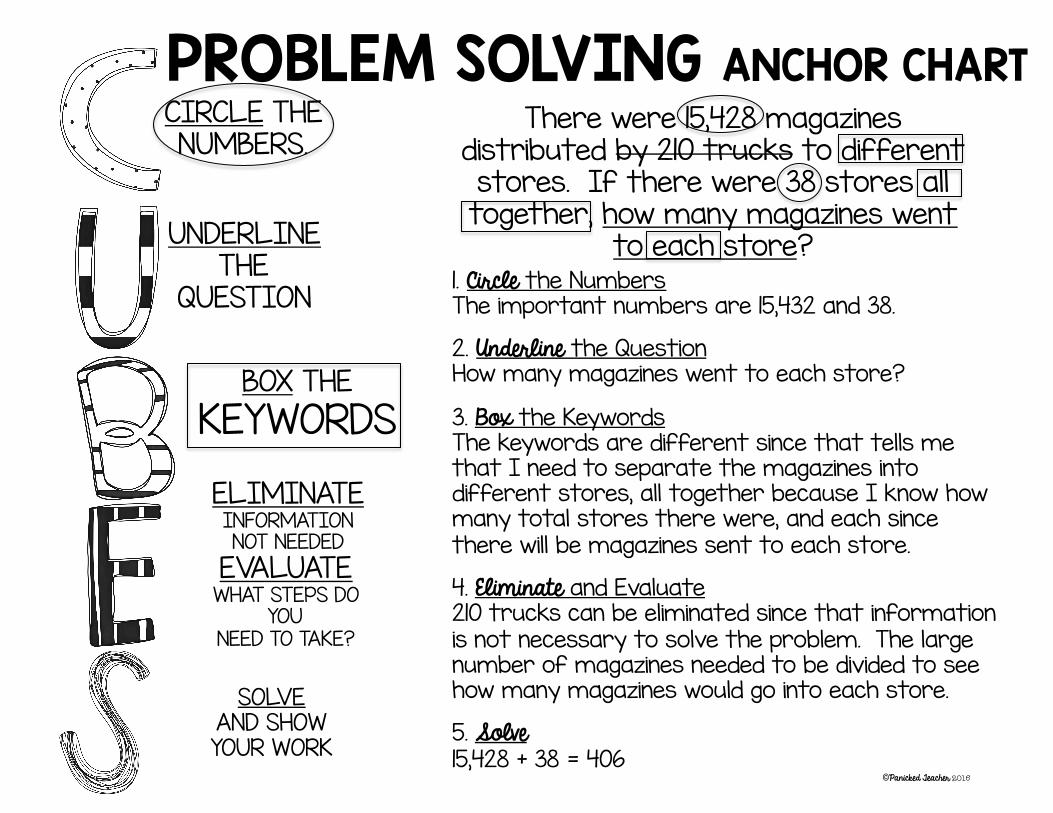
CIRCLE THE NUMBERS.
UNDERLINE THE
QUESTION
BOX THE KEYWORDS
ELIMINATE INFORMATION NOT NEEDED
SOLVE AND SHOW YOUR WORK
PROBLEM SOLVING ANCHOR CHART
There were 15,428 magazines distributed by 210 trucks to different stores. If there were 38 stores all together, how many magazines went
to each store?
EVALUATE WHAT STEPS DO
YOU NEED TO TAKE?
1. Circle the Numbers The important numbers are 15,432 and 38. 2. Underline the Question How many magazines went to each store? 3. Box the Keywords The keywords are different since that tells me that I need to separate the magazines into different stores, all together because I know how many total stores there were, and each since there will be magazines sent to each store. 4. Eliminate and Evaluate 210 trucks can be eliminated since that information is not necessary to solve the problem. The large number of magazines needed to be divided to see how many magazines would go into each store. 5. Solve 15,428 + 38 = 406
©Panicked Teacher 2016
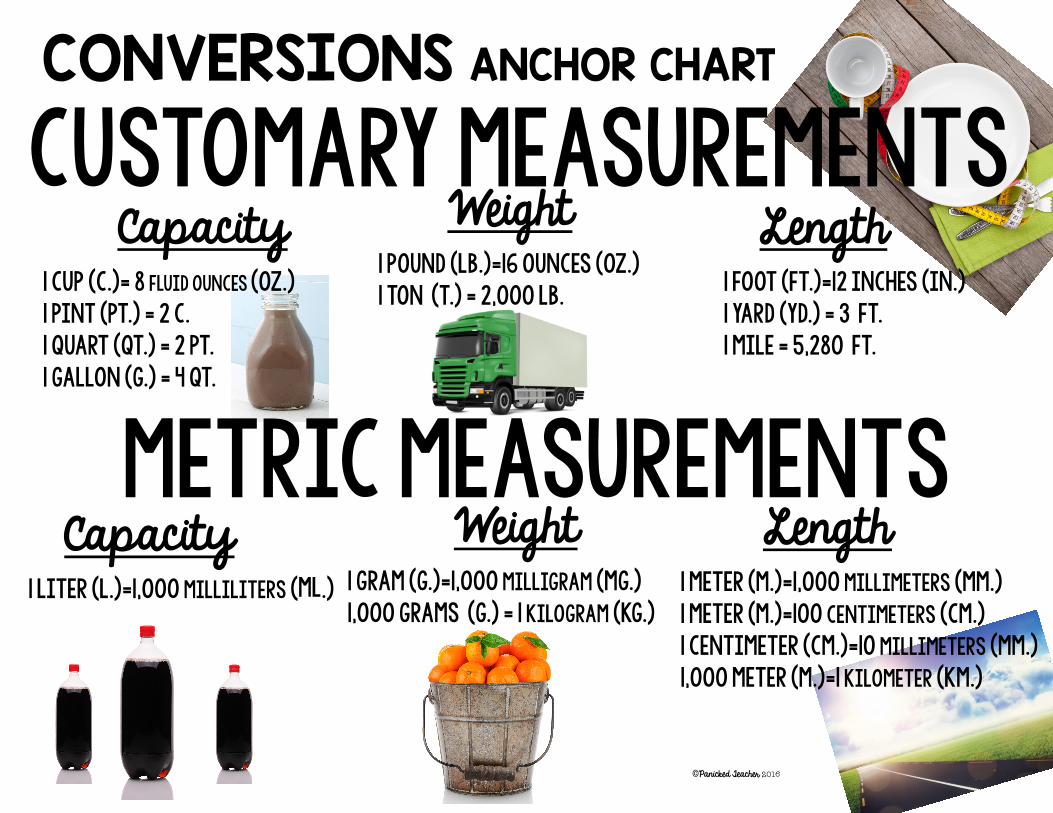
CONVERSIONS ANCHOR CHART
Capacity
1 CUP (C.)= 8 FLUID OUNCES (OZ.) 1 PINT (PT.) = 2 C. 1 QUART (QT.) = 2 PT. 1 GALLON (G.) = 4 QT.
Weight
1 POUND (LB.)=16 OUNCES (OZ.) 1 TON (T.) = 2,000 LB.
Length
1 FOOT (FT.)=12 INCHES (IN.) 1 YARD (YD.) = 3 FT. 1 MILE = 5,280 FT.
Capacity
1 LITER (L.)=1,000 MILLILITERS (ml.)
Weight
1 GRAM (G.)=1,000 MILLIGRAM (MG.) 1,000 GRAMS (G.) = 1 KILOGRAM (KG.)
Length
1 METER (M.)=1,000 MILLIMETERS (MM.) 1 METER (M.)=100 CENTIMETERS (CM.) 1 CENTIMETER (CM.)=10 MILLIMETERS (MM.) 1,000 METER (M.)=1 KILOMETER (KM.)
CUSTOMARY MEASUREMENTS
METRIC MEASUREMENTS
©Panicked Teacher 2016
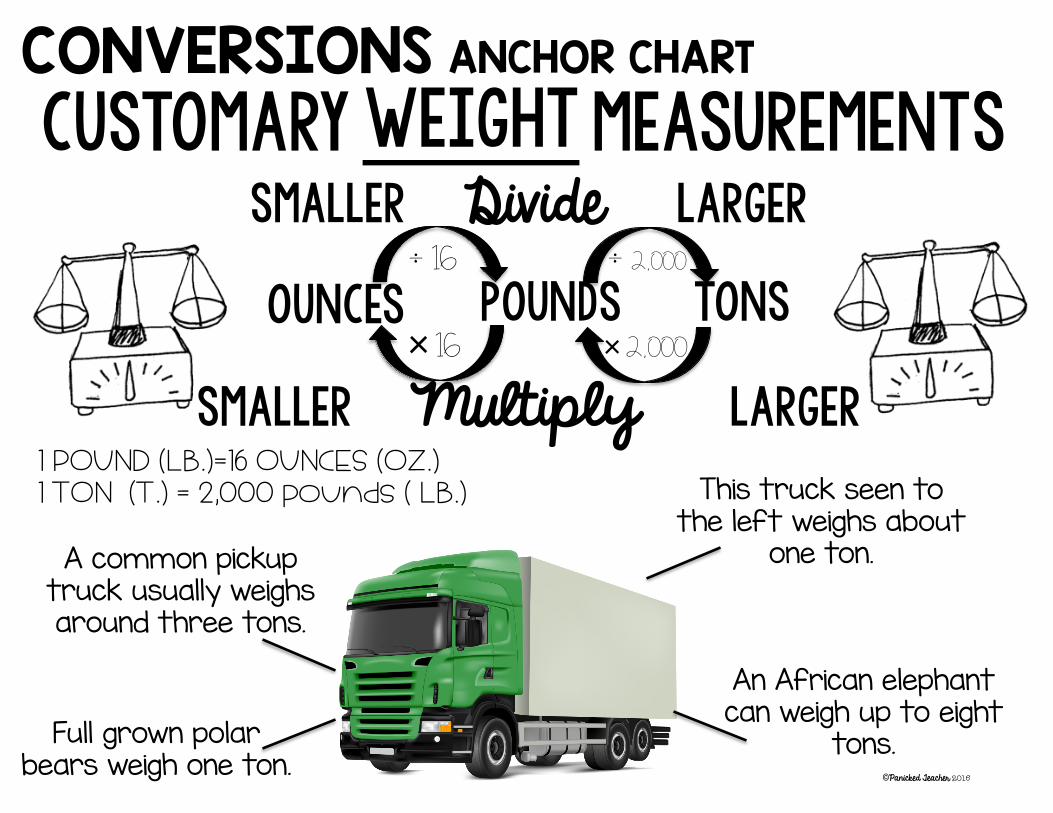
CUSTOMARY CAPACITY MEASUREMENTS SMALLER Divide LARGER
OUNCES pounds tons
SMALLER Multiply LARGER 1 POUND (LB.)=16 OUNCES (OZ.)
1 TON (T.) = 2,000 pounds ( LB.)
÷ 16 ÷ 2 ,000
×16 ×2 ,000
CONVERSIONS ANCHOR CHART
CUSTOMARY weight MEASUREMENTS
This truck seen to the left weighs about
one ton.
An African elephant can weigh up to eight
tons. Full grown polar bears weigh one ton.
A common pickup truck usually weighs around three tons.
©Panicked Teacher 2016
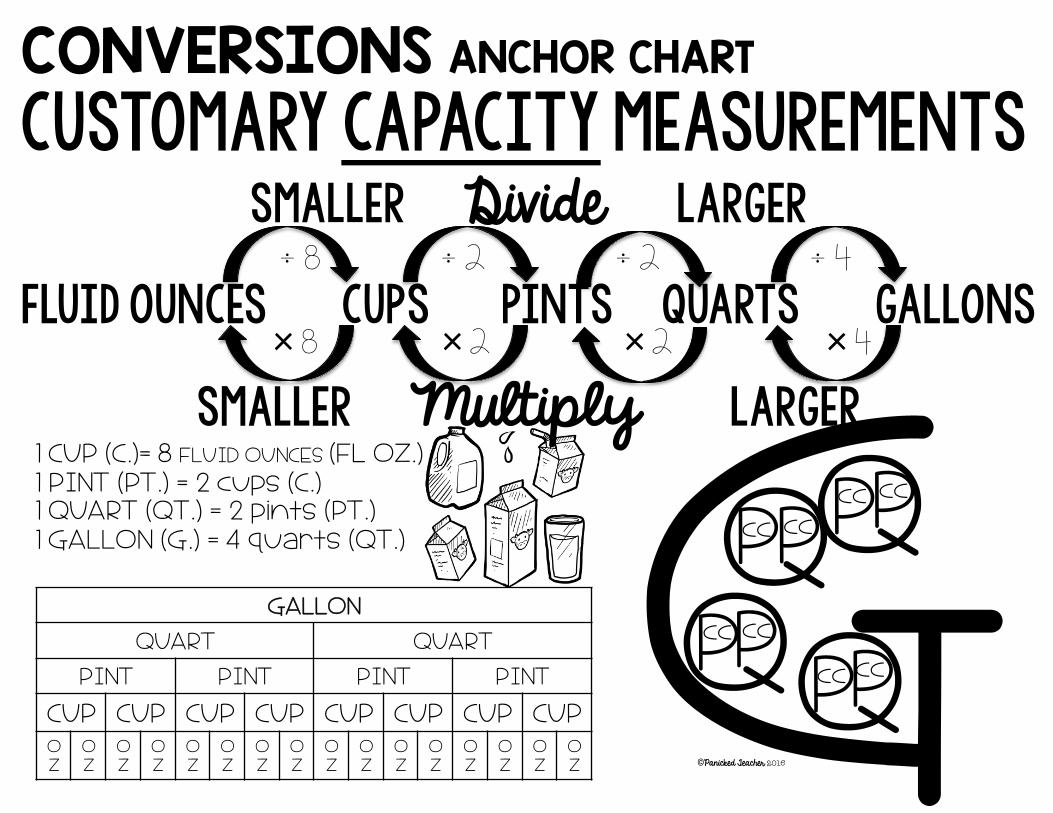
CONVERSIONS ANCHOR CHART
1 CUP (C.)= 8 FLUID OUNCES (FL OZ.) 1 PINT (PT.) = 2 cups (C.) 1 QUART (QT.) = 2 pints (PT.) 1 GALLON (G.) = 4 quarts (QT.)
CUSTOMARY CAPACITY MEASUREMENTS SMALLER Divide LARGER
FLUID OUNCES CUPS PINTS QUARTS GALLONS
SMALLER Multiply LARGER
÷ 8 ÷ 2 ÷ 2 ÷ 4
×8 ×2 ×2 ×4
G Q Q
Q Q P P P P
P P P P
cc cc cc cc
cc cc
cc cc
CUSTOMARY CAPACITY MEASUREMENTS
GALLON
QUART QUART
PINT PINT PINT PINT
CUP CUP CUP CUP CUP CUP CUP CUP OZ
OZ
OZ
OZ
OZ
OZ
OZ
OZ
OZ
OZ
OZ
OZ
OZ
OZ
OZ
OZ ©Panicked Teacher 2016
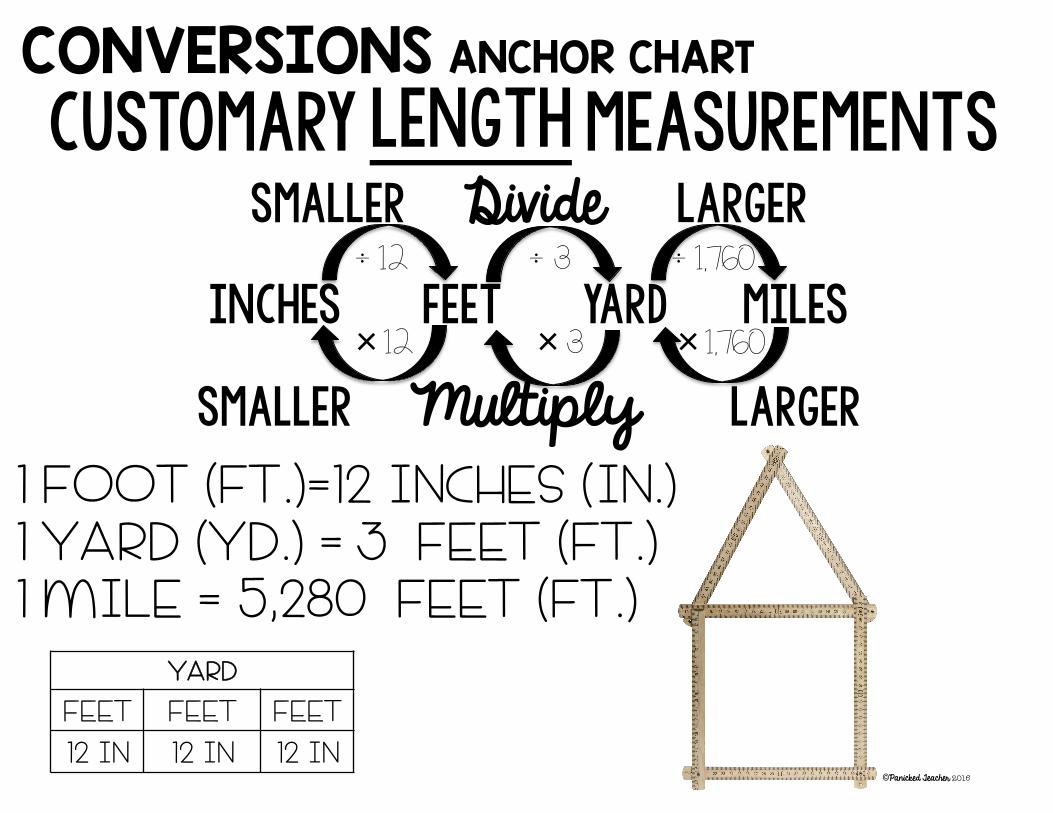
CUSTOMARY CAPACITY MEASUREMENTS SMALLER Divide LARGER
INCHES FEET YARD MILES
SMALLER Multiply LARGER
CONVERSIONS ANCHOR CHART
CUSTOMARY length MEASUREMENTS
1 FOOT (FT.)=12 INCHES (IN.) 1 YARD (YD.) = 3 FEET (FT.) 1 MILE = 5,280 FEET (FT.)
÷ 12 ÷ 3 ÷ 1 ,760
×12 ×3 ×1 ,760
YARD
FEET FEET FEET
12 IN 12 IN 12 IN ©Panicked Teacher 2016

CUSTOMARY CAPACITY MEASUREMENTS SMALLER Divide LARGER
MILLILITERS LITERS
SMALLER Multiply LARGER
÷ 2 ,000
×2 ,000
CONVERSIONS ANCHOR CHART
METRIC CAPACITY MEASUREMENTS
There are 2,000 milliliters in one liter
of soda.
There is one milliliter of liquid in a teaspoon
of liquid.
Liters and milliliters are used to measure liquids such as soda
and milk.
One gallon is equal to about 3.78 liters
(almost 4 liters) of liquid.
©Panicked Teacher 2016
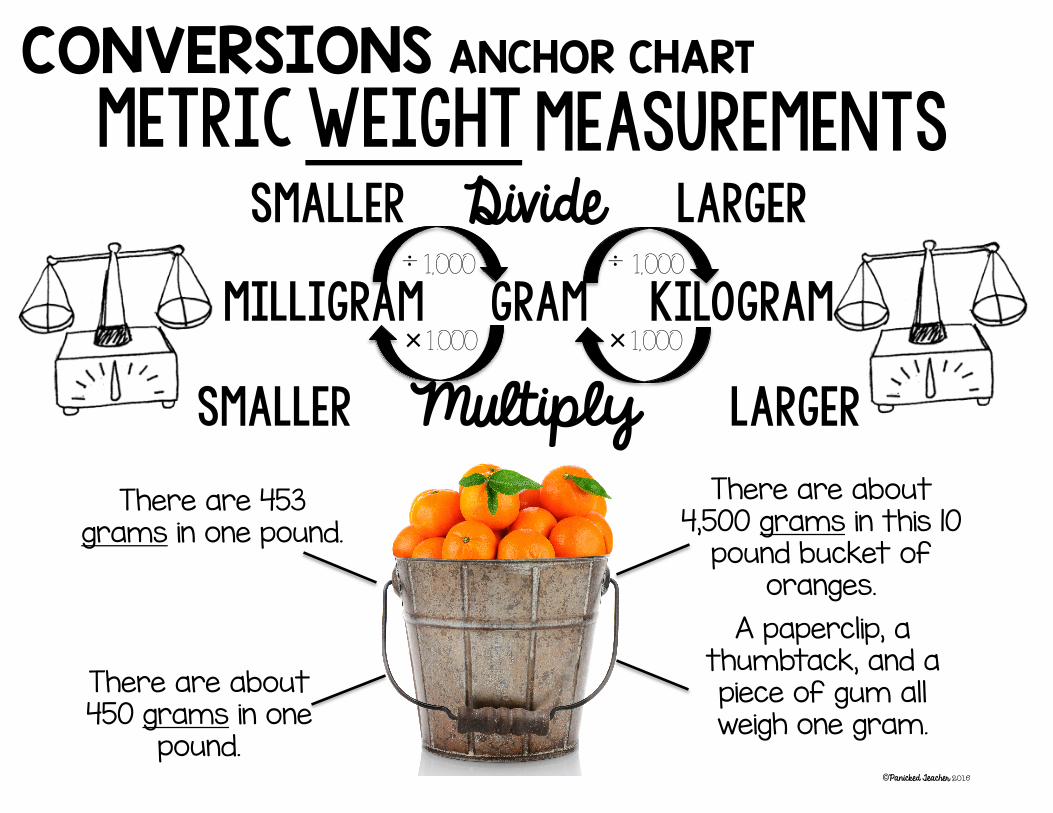
CUSTOMARY CAPACITY MEASUREMENTS SMALLER Divide LARGER
milligram gram kilogram
SMALLER Multiply LARGER
÷ 1 ,000 ÷ 1 ,000
×1 .000 ×1 ,000
CONVERSIONS ANCHOR CHART
metric weight MEASUREMENTS
There are about 450 grams in one
pound.
A paperclip, a thumbtack, and a piece of gum all weigh one gram.
There are 453 grams in one pound.
There are about 4,500 grams in this 10
pound bucket of oranges.
©Panicked Teacher 2016

CONVERSIONS ANCHOR CHART
CUSTOMARY CAPACITY MEASUREMENTS SMALLER Divide LARGER
millimeters centimeters meters kilometer
SMALLER Multiply LARGER
÷ 10 ÷ 100 ÷ 1 ,000
×10 ×100 ×1 ,000
metric length MEASUREMENTS
There are 4,688 kilometers
between New York and
California!
There are 614 kilometers
between Los Angeles and
San Francisco!
A football field is about 91 meters
long!
A standard 12 inch ruler is 30.5
centimeters long.
There are 25 millimeters in one
inch.
Did You Know...
©Panicked Teacher 2016

STRATEGIES ANCHOR CHART
Decomposing BREAKING NUMBERS INTO
HUNDREDS, TENS, AND ONES
237 + 125 200 + 100=300 30 + 20=50 7 + 5=12 300+50+12=362
Compensation 152 + 148
MAKE THE NUMBERS AS CLOSE TO A FRIENDLY NUMBER THAT ARE EASIER TO ADD
152-2=150 148+2=150 150+150=300 300-2=298 298+2=300
Making DOUBLES
20 + 24 ADD THE TWO DOUBLES TOGETHER
20+20=40 40+4=44
Friendly NUMBERS
19 + 6 MAKE 19 A FRIENDLY NUMBER THAT
IS EASIER TO VISUALIZE!
19 + 1 + 5 20 + 5=25
Place VALUE
46 + 36 BREAK APART 46 AND 36
40 + 6 AND 30 + 6 40+30=70 6+6=12 70+12=82
Making Models 25 x 4=100 25 25 25 25
Make a Table x 3
Input Output
5 15
7 21
9 27
Make a Chart MAKE A CHART TO
VISUALIZE INFORMATION
MATH
©Pa
nicke
d Te
ache
r 2016
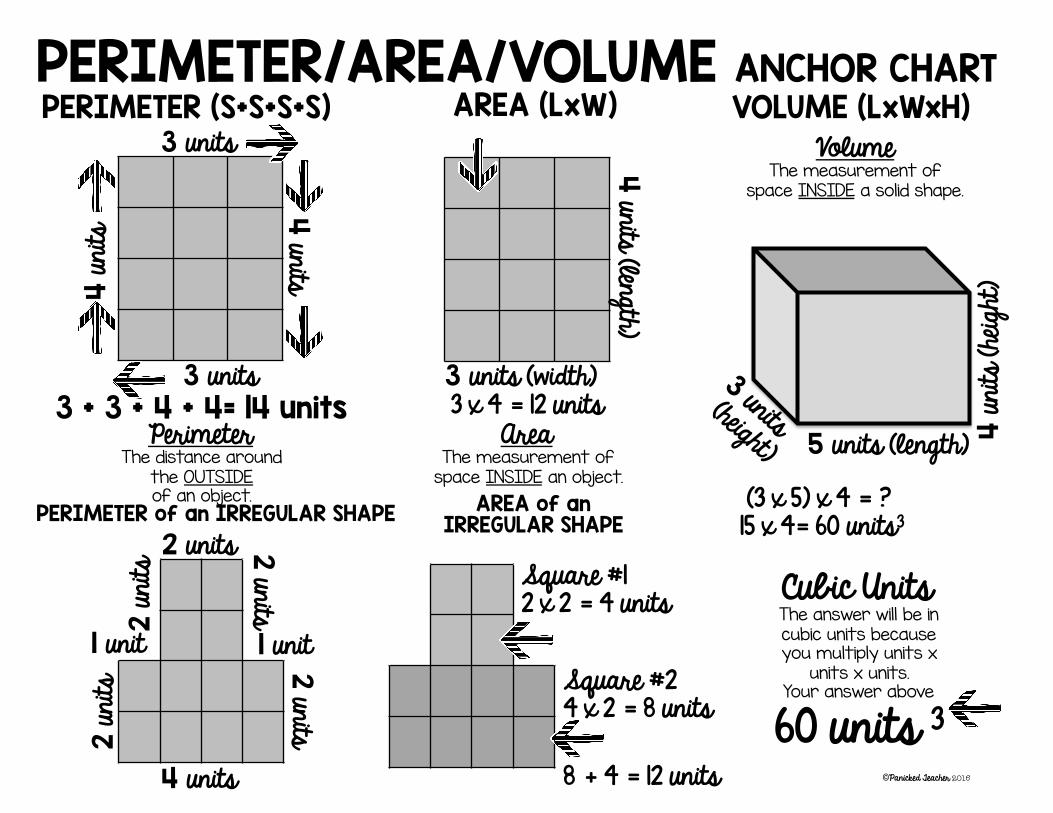
PERIMETER/AREA/VOLUME ANCHOR CHART
PERIMETER (S+S+S+S)
Perimeter The distance around
the OUTSIDE of an object.
3 + 3 + 4 + 4= 14 units
PERIMETER of an IRREGULAR SHAPE
2 units 2 units 2 units
2 un
its
2 un
its
4 units
1 unit 1 unit
3 units
4 units
AREA (LxW) 4 u
nits
3 units
Area The measurement of
space INSIDE an object.
AREA of an IRREGULAR SHAPE
Square #1 2 x 2 = 4 units
Square #2 4 x 2 = 8 units 8 + 4 = 12 units
3 x 4 = 12 units 3 units (width)
4 units (length)
Volume The measurement of
space INSIDE a solid shape.
VOLUME (LxWxH)
5 units (length) 4 u
nits (
heigh
t)
(3 x 5) x 4 = ? 15 x 4= 60 units3
Cubic Units The answer will be in cubic units because you multiply units x
units x units. Your answer above
60 units 3
©Panicked Teacher 2016