A combined optical and atomic force microscope for live cell investigations
7
Ultramicroscopy 106 (2006) 645–651 A combined optical and atomic force microscope for live cell investigations Josef Madl a , Sebastian Rhode a , Herbert Stangl b , Hannes Stockinger c , Peter Hinterdorfer a , Gerhard J. Schu¨tz a , Gerald Kada d, a Institute for Biophysics, Johannes Kepler University Linz, Altenbergerstr. 69, 4040 Linz, Austria b Institute for Medical Chemistry, Medical University Vienna, Wa ¨ hringerstr. 10, 1090 Vienna, Austria c Department of Molecular Immunology, Center for Biomolecular Medicine and Pharmacology, Medical University Vienna, Lazarettgasse 19, 1090 Vienna, Austria d Scientec, Mitterbauerweg 4, 4020 Linz, Austria Received 3 October 2005; accepted 1 December 2005 Abstract We present an easy-to-use combination of an atomic force microscope (AFM) and an epi-fluorescence microscope, which allows live cell imaging under physiological conditions. High-resolution AFM images were acquired while simultaneously monitoring either the fluorescence image of labeled membrane components, or a high-contrast optical image (DIC, differential interference contrast). By applying two complementary techniques at the same time, additional information and correlations between structure and function of living organisms were obtained. The synergy effects between fluorescence imaging and AFM were further demonstrated by probing fluorescence-labeled receptor clusters in the cell membrane via force spectroscopy using antibody-functionalized tips. The binding probability on receptor-containing areas identified with fluorescence microscopy (‘‘receptor-positive sites’’) was significantly higher than that on sites lacking receptors. r 2006 Elsevier B.V. All rights reserved. Keywords: Atomic force microscopy (AFM); Epi-fluorescence; Inverted microscope; Live cell imaging; Combined microscopy; Simultaneous operation 1. Introduction Single-molecule atomic force microscopy (AFM) and optical microscopy have given new insights into structure and function of biomolecules and living cells [1,2]. AFM has emerged into a technique capable of resolving molecular details of cell surfaces under ambient conditions [3]. In addition, AFM can be used for binding studies [4,5] and chemically specific imaging [6–9] by measuring the forces between a ligand tethered to an AFM cantilever and its corresponding binding partner on the sample surface. AFM imaging alone, however, is restricted to contrast mechanisms based on mechanical forces between probe and sample surface. Optical imaging techniques enable the spectroscopic discrimination of different species in a biological sample [1,10]. Common optical microscopy techniques like bright- field illumination, phase contrast [11], and especially differential interference contrast (DIC), reveal high-con- trast topography information, as well as location and/or distribution of internal structural features (of cell orga- nelles for instance). Combining optical methods with simultaneous AFM scanning gives a more comprehensive topology picture of cells. Fluorescence microscopy has proven to be a powerful tool for selective and specific visualization of labeled molecules down to the single-molecule level [1], rendering it possible to follow cellular processes and to monitor the dynamics of living cell components. The advantages and benefits of AFM and fluorescence microscopy complement each other, allowing a more detailed characterization of cellular structures and processes [12–14]. ARTICLE IN PRESS www.elsevier.com/locate/ultramic 0304-3991/$ - see front matter r 2006 Elsevier B.V. All rights reserved. doi:10.1016/j.ultramic.2005.12.020 Corresponding author. Tel.: +43 676 9345 134. E-mail address: [email protected] (G. Kada).
Transcript of A combined optical and atomic force microscope for live cell investigations

ARTICLE IN PRESS
0304-3991/$ - se
doi:10.1016/j.ul
�CorrespondiE-mail addre
Ultramicroscopy 106 (2006) 645–651
www.elsevier.com/locate/ultramic
A combined optical and atomic force microscopefor live cell investigations
Josef Madla, Sebastian Rhodea, Herbert Stanglb, Hannes Stockingerc, Peter Hinterdorfera,Gerhard J. Schutza, Gerald Kadad,�
aInstitute for Biophysics, Johannes Kepler University Linz, Altenbergerstr. 69, 4040 Linz, AustriabInstitute for Medical Chemistry, Medical University Vienna, Wahringerstr. 10, 1090 Vienna, Austria
cDepartment of Molecular Immunology, Center for Biomolecular Medicine and Pharmacology, Medical University Vienna,
Lazarettgasse 19, 1090 Vienna, AustriadScientec, Mitterbauerweg 4, 4020 Linz, Austria
Received 3 October 2005; accepted 1 December 2005
Abstract
We present an easy-to-use combination of an atomic force microscope (AFM) and an epi-fluorescence microscope, which allows live
cell imaging under physiological conditions. High-resolution AFM images were acquired while simultaneously monitoring either the
fluorescence image of labeled membrane components, or a high-contrast optical image (DIC, differential interference contrast). By
applying two complementary techniques at the same time, additional information and correlations between structure and function of
living organisms were obtained. The synergy effects between fluorescence imaging and AFM were further demonstrated by probing
fluorescence-labeled receptor clusters in the cell membrane via force spectroscopy using antibody-functionalized tips. The binding
probability on receptor-containing areas identified with fluorescence microscopy (‘‘receptor-positive sites’’) was significantly higher than
that on sites lacking receptors.
r 2006 Elsevier B.V. All rights reserved.
Keywords: Atomic force microscopy (AFM); Epi-fluorescence; Inverted microscope; Live cell imaging; Combined microscopy; Simultaneous operation
1. Introduction
Single-molecule atomic force microscopy (AFM) andoptical microscopy have given new insights into structureand function of biomolecules and living cells [1,2]. AFMhas emerged into a technique capable of resolvingmolecular details of cell surfaces under ambient conditions[3]. In addition, AFM can be used for binding studies [4,5]and chemically specific imaging [6–9] by measuring theforces between a ligand tethered to an AFM cantilever andits corresponding binding partner on the sample surface.AFM imaging alone, however, is restricted to contrastmechanisms based on mechanical forces between probeand sample surface.
e front matter r 2006 Elsevier B.V. All rights reserved.
tramic.2005.12.020
ng author. Tel.: +43676 9345 134.
ss: [email protected] (G. Kada).
Optical imaging techniques enable the spectroscopicdiscrimination of different species in a biological sample[1,10]. Common optical microscopy techniques like bright-field illumination, phase contrast [11], and especiallydifferential interference contrast (DIC), reveal high-con-trast topography information, as well as location and/ordistribution of internal structural features (of cell orga-nelles for instance). Combining optical methods withsimultaneous AFM scanning gives a more comprehensivetopology picture of cells.Fluorescence microscopy has proven to be a powerful
tool for selective and specific visualization of labeledmolecules down to the single-molecule level [1], renderingit possible to follow cellular processes and to monitor thedynamics of living cell components. The advantages andbenefits of AFM and fluorescence microscopy complementeach other, allowing a more detailed characterization ofcellular structures and processes [12–14].
ARTICLE IN PRESSJ. Madl et al. / Ultramicroscopy 106 (2006) 645–651646
In this study, we used a Chinese hamster ovary (CHO)cell line. These cells are advantageous for AFM imaging asthey adhere well to a solid support. In addition,mammalian autocrine cell lines tend to be more resistantto the onset of apoptosis [15], facilitating AFM imaging oflive cells over a longer period. In general, CHO cells arewidely used as expression systems for a number of proteinsin cell biology and research. They have been used in our labto study the uptake of individual high density lipoprotein(HDL) particles into living cells [16].
First, we demonstrated the feasibility of combining twotechniques in a simultaneous manner, AFM and DIC onglutaraldehyde-fixed CHO cells, and AFM and fluores-cence microscopy on live cells. DIC microscopy provided aview of internal structures of cells (organelles), simulta-neous AFM scanning revealed a high-resolution image ofthe cell surface down to the nanometer level [3]. Fluores-cence microscopy gave a detailed picture of the distributionof selectively labeled cell components that could becorrelated with AFM topography images.
In a second experiment, we used information obtainedfrom fluorescence microscopy to accurately position anantibody-modified tip above preselected cell membranereceptors. With this approach, receptor-positive sitesidentified via fluorescence staining could be selectivelyaddressed via molecular recognition force spectroscopy,thereby dramatically increasing the binding probability.Measured unbinding forces of antibody–antigen receptorpairs were about 75 pN at loading rates of about 10 nN/s,and were in the range of previously measured forcevalues [17].
2. Materials and methods
2.1. Cell culture and sample preparation
CHO cells lacking the low density lipoprotein (LDL)receptor (ldlA7 cells) [16], and expressing high levels ofrecombinant scavenger receptor class B type I (SRBI),ldlA7-SRBI cells were used in this study. The receptor wasfused with green fluorescent protein (eGFP), that has anabsorption maximum at 488 nm and an emission maximumat 508 nm.Cells were grown in medium A (1:1 v/v mixtureof Dulbecco’s minimal essential medium and Ham’s F-12medium with 100 units/ml streptomycin sulfate, see [16]for details) on 22 or 30mm glass slides in conventionalpetri dishes. The glass slides were mounted on the setupthrough a standard molecular imaging sample stage with aliquid cell.
The cells were rinsed with PBS buffer solution (150mMNaCl, pH 7.4) and kept in it throughout the measuringprocess at room temperature for AFM/fluorescence ima-ging experiments. Under these conditions, CHO cellssurvive for several hours (unpublished observations). ForAFM/DIC combination measurements and AFM forcespectroscopy, live CHO cells were fixed with 2% aqueousglutaraldehyde solution for 10min (DIC simultaneous with
AFM scanning) or 1min (force spectroscopy experiments),and washed carefully afterward with PBS buffer. Shorterfixation times were used for the combined fluorescence/force spectroscopy experiments in order to minimizeautofluorescence, arising mostly from glutaraldehyde fixa-tion. In addition, we applied 1mg/ml aqueous sodiumborohydride (NaBH4, in PBS buffer) for 2–5min after thefixation process to further decrease autofluorescence bychemically reducing free aldehyde groups [18]. Shorterfixation times also minimized degradation and inactivationof the SRBI receptors in the cell membrane and preservedtheir ability to specifically bind antibodies (unpublishedobservations, [19,20]).Finally, the cells on the glass coverslip were aligned with
the position of the AFM cantilever inside the illuminationarea of the inverted microscope.
2.2. Coupling of antibodies to AFM tips for force
spectroscopy experiments
Binding of ethanolamine-HCl (Sigma, Vienna, Austria)to silicon nitride levers (Veeco, Santa Barbara, USA), andsubsequent coupling of a heterobifunctional tether (poly-ethylene glycol derivative), synthesized in our lab, toamines on the tip surface was done as described in detail[6]. Affinity-purified polyclonal antibodies (anti-SRBI/II)were bound to the amino-reactive end of the tether in PBSbuffer for an incubation time of 2 h. Tips were subse-quently washed in the same buffer and stored in the coldroom until use.
2.3. Instrumentation
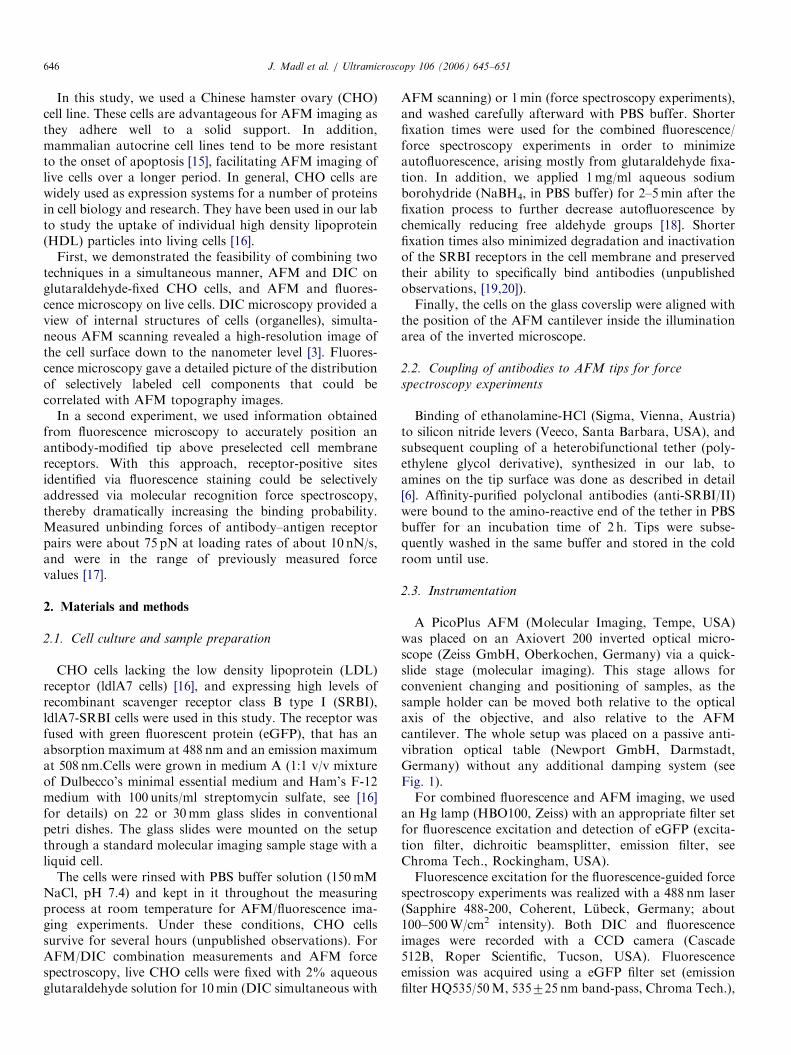
A PicoPlus AFM (Molecular Imaging, Tempe, USA)was placed on an Axiovert 200 inverted optical micro-scope (Zeiss GmbH, Oberkochen, Germany) via a quick-slide stage (molecular imaging). This stage allows forconvenient changing and positioning of samples, as thesample holder can be moved both relative to the opticalaxis of the objective, and also relative to the AFMcantilever. The whole setup was placed on a passive anti-vibration optical table (Newport GmbH, Darmstadt,Germany) without any additional damping system (seeFig. 1).For combined fluorescence and AFM imaging, we used
an Hg lamp (HBO100, Zeiss) with an appropriate filter setfor fluorescence excitation and detection of eGFP (excita-tion filter, dichroitic beamsplitter, emission filter, seeChroma Tech., Rockingham, USA).Fluorescence excitation for the fluorescence-guided force
spectroscopy experiments was realized with a 488 nm laser(Sapphire 488-200, Coherent, Lubeck, Germany; about100–500W/cm2 intensity). Both DIC and fluorescenceimages were recorded with a CCD camera (Cascade512B, Roper Scientific, Tucson, USA). Fluorescenceemission was acquired using a eGFP filter set (emissionfilter HQ535/50M, 535725 nm band-pass, Chroma Tech.),
ARTICLE IN PRESS
Fig. 1. View of a PicoPlus AFM mounted on top of an Axiovert 200
inverted microscope via a molecular imaging quickslide stage. Transmis-
sion light illumination from the top was used for DIC and standard optical
imaging, fluorescence was excited in an epi-fluorescence configuration via
different objectives (see Section 2). The sample plate is beyond the AFM
scanner (not visible).
J. Madl et al. / Ultramicroscopy 106 (2006) 645–651 647
and for combined fluorescence/force spectroscopymeasurements, a Cy3 filter set (emission filter HQ610/75M, 610738 nm band-pass, Chroma Tech.) was used inaddition. We used a 40x oil-immersion objective (Neo-Fluar, NA ¼ 1:3, Zeiss) for DIC microscopy, a 100x oil-immersion objective (Apochromat, NA ¼ 1:4, Zeiss) forfluorescence imaging, and a 60x water objective (NA ¼ 1:2,Olympus, Hamburg, Germany) for the fluorescence-guidedforce spectroscopy experiments. During the AFM scanningprocess or AFM tip-aligning procedure, respectively, imagesequences were recorded providing real-time and simulta-neous comparison of optical imaging with AFM measure-ments. These movies can be found in the supplemental
information. Switching between bright-field optical micro-scopy (including DIC and phase contrast) and fluorescencemicroscopy is effortless because of the optical access to thesample from both the top and the bottom.
For AFM imaging we used a PicoPlus multi-purpose large scanner (100 mm scan range) in contactmode (10 pN/nm silicon nitride cantilevers) at typicalscanning rates of 0.4–1 lines/s, requiring 4–10min for anentire scan. For force spectroscopy experiments, we usedthe same type of contact-mode levers, after functionaliza-tion with antibodies as described above.
3. Results and discussion
3.1. Simultaneous DIC and AFM imaging
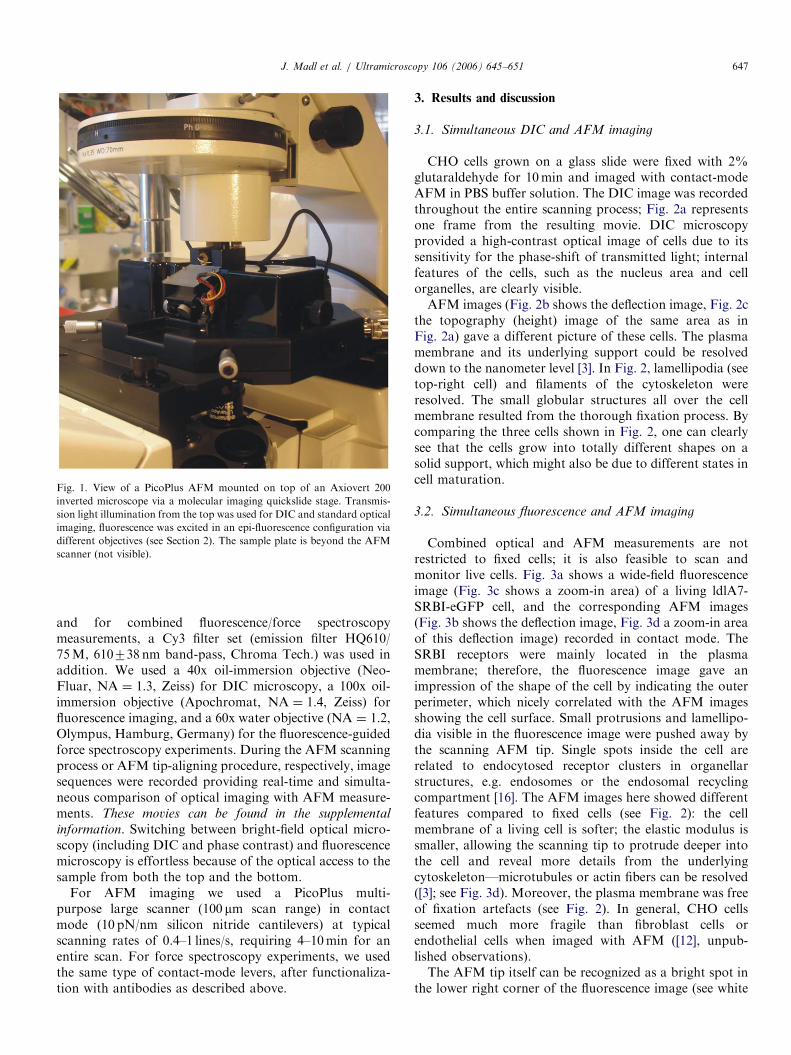
CHO cells grown on a glass slide were fixed with 2%glutaraldehyde for 10min and imaged with contact-modeAFM in PBS buffer solution. The DIC image was recordedthroughout the entire scanning process; Fig. 2a representsone frame from the resulting movie. DIC microscopyprovided a high-contrast optical image of cells due to itssensitivity for the phase-shift of transmitted light; internalfeatures of the cells, such as the nucleus area and cellorganelles, are clearly visible.AFM images (Fig. 2b shows the deflection image, Fig. 2c
the topography (height) image of the same area as inFig. 2a) gave a different picture of these cells. The plasmamembrane and its underlying support could be resolveddown to the nanometer level [3]. In Fig. 2, lamellipodia (seetop-right cell) and filaments of the cytoskeleton wereresolved. The small globular structures all over the cellmembrane resulted from the thorough fixation process. Bycomparing the three cells shown in Fig. 2, one can clearlysee that the cells grow into totally different shapes on asolid support, which might also be due to different states incell maturation.
3.2. Simultaneous fluorescence and AFM imaging
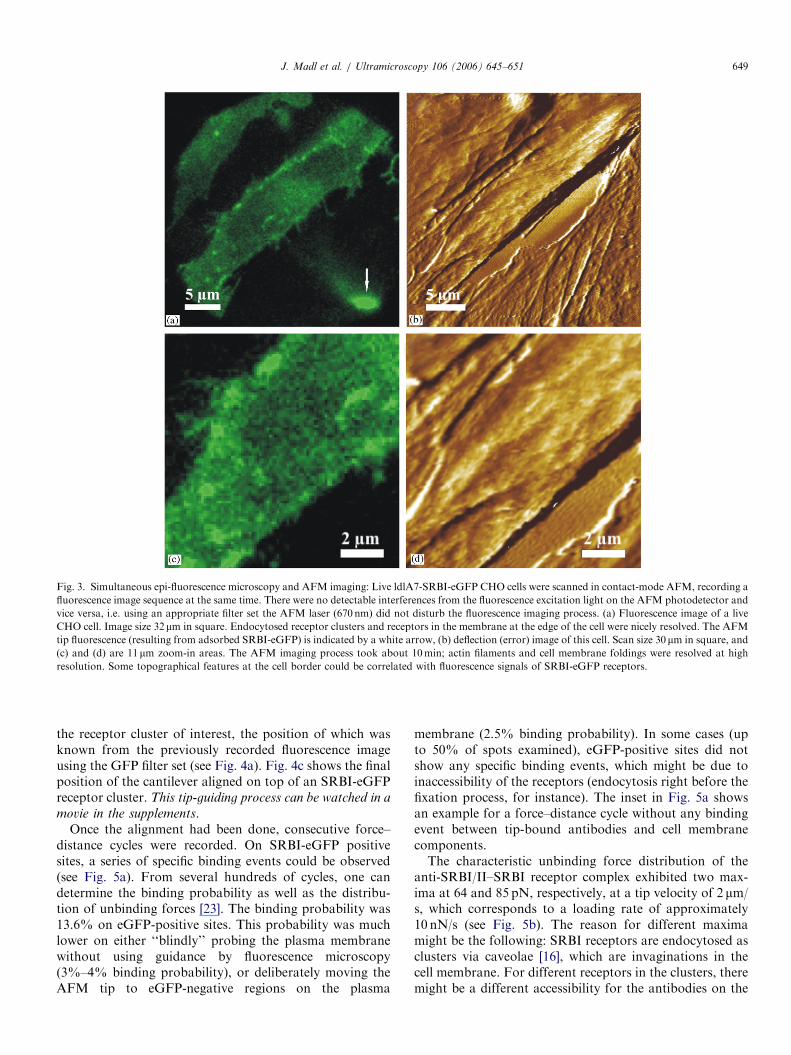
Combined optical and AFM measurements are notrestricted to fixed cells; it is also feasible to scan andmonitor live cells. Fig. 3a shows a wide-field fluorescenceimage (Fig. 3c shows a zoom-in area) of a living ldlA7-SRBI-eGFP cell, and the corresponding AFM images(Fig. 3b shows the deflection image, Fig. 3d a zoom-in areaof this deflection image) recorded in contact mode. TheSRBI receptors were mainly located in the plasmamembrane; therefore, the fluorescence image gave animpression of the shape of the cell by indicating the outerperimeter, which nicely correlated with the AFM imagesshowing the cell surface. Small protrusions and lamellipo-dia visible in the fluorescence image were pushed away bythe scanning AFM tip. Single spots inside the cell arerelated to endocytosed receptor clusters in organellarstructures, e.g. endosomes or the endosomal recyclingcompartment [16]. The AFM images here showed differentfeatures compared to fixed cells (see Fig. 2): the cellmembrane of a living cell is softer; the elastic modulus issmaller, allowing the scanning tip to protrude deeper intothe cell and reveal more details from the underlyingcytoskeleton—microtubules or actin fibers can be resolved([3]; see Fig. 3d). Moreover, the plasma membrane was freeof fixation artefacts (see Fig. 2). In general, CHO cellsseemed much more fragile than fibroblast cells orendothelial cells when imaged with AFM ([12], unpub-lished observations).The AFM tip itself can be recognized as a bright spot in
the lower right corner of the fluorescence image (see white
ARTICLE IN PRESS
Fig. 2. AFM imaging simultaneous with high-contrast optical microscopy (DIC): The AFM imaging process of glutaraldehyde-fixed CHO cells was
recorded using DIC microscopy. (a) DIC image—a single frame taken from the DIC movie sequence, image size is 80mm in square. The scanning AFM tip
is visible in the bottom-left corner; (b) deflection (error) AFM image of the same cells; (c) corresponding topography (height) AFM image. Three cells in
total were imaged in the scan area of 70mm in square, at about 3mm full height scale. Cell organelles (nucleus, globular cell compartments) and protrusions
were visualized in the DIC image. The AFM images showed the shape of the cells and the surface of the plasma membrane at high resolution—
protrusions, lamellipodia and connections between adjacent cells.
J. Madl et al. / Ultramicroscopy 106 (2006) 645–651648
arrow in Fig. 3a), originating from proteins (includingSRBI-eGFP) adsorbed during prior AFM scanning pro-cesses (for instance, lamellipodia ‘‘collected’’ by the tip).These tip contaminations did not have an apparentinfluence on the AFM contrast.
3.3. Fluorescence-guided Atomic Force Spectroscopy
Glutaraldehyde-fixed CHO cells were placed under thecombined AFM/fluorescence microscope. Fixation of thecells was necessary in order to prevent both endocytosisand diffusion of SRBI receptors, which is observed in livingcells [16]. Due to the gentle fixation procedure (1minfixation time), most of the SRBI receptors kept their nativeconformation and accessibility, and were still recognized bytheir corresponding antibodies (see Section 2 for details).Cantilevers functionalized with anti-SRBI/II antibodieswere used for the following force spectroscopy experi-
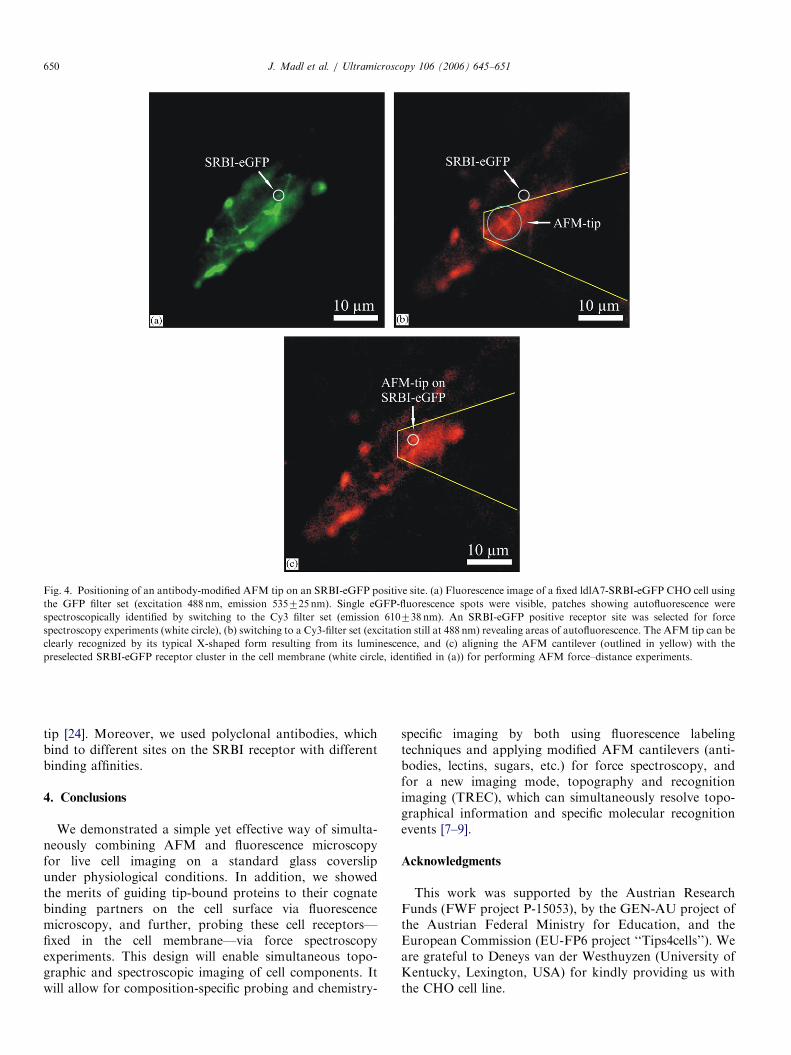
ments. First, the fluorescence image of the sample wasacquired (see Fig. 4a) using a GFP-filter set (535725 nmband-pass). Clusters of eGFP-SRBI receptors were clearlyresolved; we marked the position of one of these clusters(see white circle in Fig. 4a). Though autofluorescence of thefixed cells was reduced by applying NaBH4 [18], still severalareas showed autofluorescence; these could be identifiedspectroscopically by switching to a Cy3 filter set(610738 nm band-pass), which blocked the eGFP fluores-cence [21]. Furthermore, this filter set allowed us tovisualize the AFM tip position (Fig. 4b); an AFM tipmade of silicon nitride shows some autoluminescence (incontrast to silicon cantilevers) [22]. When the tip isilluminated with laser light (in our case, 488 nm), it emitslight at longer wavelengths up to 750 nm.On blocking theeGFP emission, the weak luminescence signal of the tipwas enough to visualize its position on the cell (Fig. 4b,X-shaped form), and it enabled us to move the tip above
ARTICLE IN PRESS
Fig. 3. Simultaneous epi-fluorescence microscopy and AFM imaging: Live ldlA7-SRBI-eGFP CHO cells were scanned in contact-mode AFM, recording a
fluorescence image sequence at the same time. There were no detectable interferences from the fluorescence excitation light on the AFM photodetector and
vice versa, i.e. using an appropriate filter set the AFM laser (670 nm) did not disturb the fluorescence imaging process. (a) Fluorescence image of a live
CHO cell. Image size 32mm in square. Endocytosed receptor clusters and receptors in the membrane at the edge of the cell were nicely resolved. The AFM
tip fluorescence (resulting from adsorbed SRBI-eGFP) is indicated by a white arrow, (b) deflection (error) image of this cell. Scan size 30 mm in square, and
(c) and (d) are 11 mm zoom-in areas. The AFM imaging process took about 10min; actin filaments and cell membrane foldings were resolved at high
resolution. Some topographical features at the cell border could be correlated with fluorescence signals of SRBI-eGFP receptors.
J. Madl et al. / Ultramicroscopy 106 (2006) 645–651 649
the receptor cluster of interest, the position of which wasknown from the previously recorded fluorescence imageusing the GFP filter set (see Fig. 4a). Fig. 4c shows the finalposition of the cantilever aligned on top of an SRBI-eGFPreceptor cluster. This tip-guiding process can be watched in a
movie in the supplements.Once the alignment had been done, consecutive force–
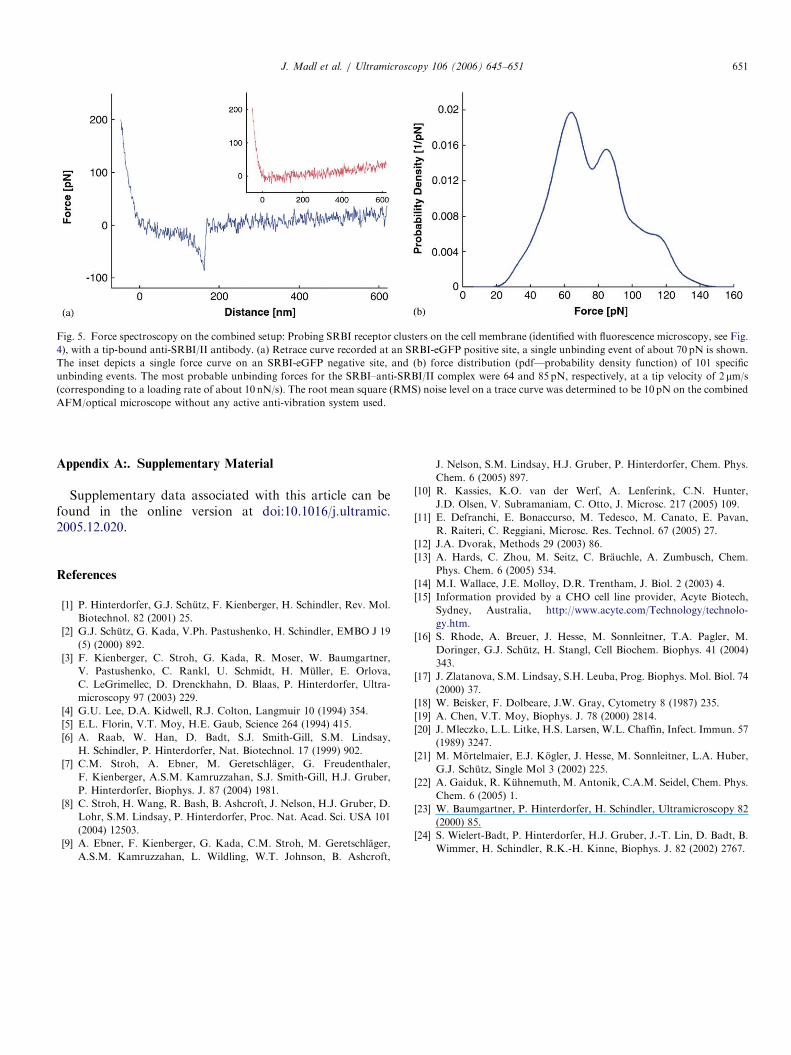
distance cycles were recorded. On SRBI-eGFP positivesites, a series of specific binding events could be observed(see Fig. 5a). From several hundreds of cycles, one candetermine the binding probability as well as the distribu-tion of unbinding forces [23]. The binding probability was13.6% on eGFP-positive sites. This probability was muchlower on either ‘‘blindly’’ probing the plasma membranewithout using guidance by fluorescence microscopy(3%–4% binding probability), or deliberately moving theAFM tip to eGFP-negative regions on the plasma
membrane (2.5% binding probability). In some cases (upto 50% of spots examined), eGFP-positive sites did notshow any specific binding events, which might be due toinaccessibility of the receptors (endocytosis right before thefixation process, for instance). The inset in Fig. 5a showsan example for a force–distance cycle without any bindingevent between tip-bound antibodies and cell membranecomponents.The characteristic unbinding force distribution of the
anti-SRBI/II–SRBI receptor complex exhibited two max-ima at 64 and 85 pN, respectively, at a tip velocity of 2 mm/s, which corresponds to a loading rate of approximately10 nN/s (see Fig. 5b). The reason for different maximamight be the following: SRBI receptors are endocytosed asclusters via caveolae [16], which are invaginations in thecell membrane. For different receptors in the clusters, theremight be a different accessibility for the antibodies on the
ARTICLE IN PRESS
Fig. 4. Positioning of an antibody-modified AFM tip on an SRBI-eGFP positive site. (a) Fluorescence image of a fixed ldlA7-SRBI-eGFP CHO cell using
the GFP filter set (excitation 488 nm, emission 535725 nm). Single eGFP-fluorescence spots were visible, patches showing autofluorescence were
spectroscopically identified by switching to the Cy3 filter set (emission 610738 nm). An SRBI-eGFP positive receptor site was selected for force
spectroscopy experiments (white circle), (b) switching to a Cy3-filter set (excitation still at 488 nm) revealing areas of autofluorescence. The AFM tip can be
clearly recognized by its typical X-shaped form resulting from its luminescence, and (c) aligning the AFM cantilever (outlined in yellow) with the
preselected SRBI-eGFP receptor cluster in the cell membrane (white circle, identified in (a)) for performing AFM force–distance experiments.
J. Madl et al. / Ultramicroscopy 106 (2006) 645–651650
tip [24]. Moreover, we used polyclonal antibodies, whichbind to different sites on the SRBI receptor with differentbinding affinities.
4. Conclusions
We demonstrated a simple yet effective way of simulta-neously combining AFM and fluorescence microscopyfor live cell imaging on a standard glass coverslipunder physiological conditions. In addition, we showedthe merits of guiding tip-bound proteins to their cognatebinding partners on the cell surface via fluorescencemicroscopy, and further, probing these cell receptors—fixed in the cell membrane—via force spectroscopyexperiments. This design will enable simultaneous topo-graphic and spectroscopic imaging of cell components. Itwill allow for composition-specific probing and chemistry-
specific imaging by both using fluorescence labelingtechniques and applying modified AFM cantilevers (anti-bodies, lectins, sugars, etc.) for force spectroscopy, andfor a new imaging mode, topography and recognitionimaging (TREC), which can simultaneously resolve topo-graphical information and specific molecular recognitionevents [7–9].
Acknowledgments
This work was supported by the Austrian ResearchFunds (FWF project P-15053), by the GEN-AU project ofthe Austrian Federal Ministry for Education, and theEuropean Commission (EU-FP6 project ‘‘Tips4cells’’). Weare grateful to Deneys van der Westhuyzen (University ofKentucky, Lexington, USA) for kindly providing us withthe CHO cell line.
ARTICLE IN PRESS
Fig. 5. Force spectroscopy on the combined setup: Probing SRBI receptor clusters on the cell membrane (identified with fluorescence microscopy, see Fig.
4), with a tip-bound anti-SRBI/II antibody. (a) Retrace curve recorded at an SRBI-eGFP positive site, a single unbinding event of about 70 pN is shown.
The inset depicts a single force curve on an SRBI-eGFP negative site, and (b) force distribution (pdf—probability density function) of 101 specific
unbinding events. The most probable unbinding forces for the SRBI–anti-SRBI/II complex were 64 and 85 pN, respectively, at a tip velocity of 2 mm/s
(corresponding to a loading rate of about 10 nN/s). The root mean square (RMS) noise level on a trace curve was determined to be 10 pN on the combined
AFM/optical microscope without any active anti-vibration system used.
J. Madl et al. / Ultramicroscopy 106 (2006) 645–651 651
Appendix A:. Supplementary Material
Supplementary data associated with this article can befound in the online version at doi:10.1016/j.ultramic.2005.12.020.
References
[1] P. Hinterdorfer, G.J. Schutz, F. Kienberger, H. Schindler, Rev. Mol.
Biotechnol. 82 (2001) 25.
[2] G.J. Schutz, G. Kada, V.Ph. Pastushenko, H. Schindler, EMBO J 19
(5) (2000) 892.
[3] F. Kienberger, C. Stroh, G. Kada, R. Moser, W. Baumgartner,
V. Pastushenko, C. Rankl, U. Schmidt, H. Muller, E. Orlova,
C. LeGrimellec, D. Drenckhahn, D. Blaas, P. Hinterdorfer, Ultra-
microscopy 97 (2003) 229.
[4] G.U. Lee, D.A. Kidwell, R.J. Colton, Langmuir 10 (1994) 354.
[5] E.L. Florin, V.T. Moy, H.E. Gaub, Science 264 (1994) 415.
[6] A. Raab, W. Han, D. Badt, S.J. Smith-Gill, S.M. Lindsay,
H. Schindler, P. Hinterdorfer, Nat. Biotechnol. 17 (1999) 902.
[7] C.M. Stroh, A. Ebner, M. Geretschlager, G. Freudenthaler,
F. Kienberger, A.S.M. Kamruzzahan, S.J. Smith-Gill, H.J. Gruber,
P. Hinterdorfer, Biophys. J. 87 (2004) 1981.
[8] C. Stroh, H. Wang, R. Bash, B. Ashcroft, J. Nelson, H.J. Gruber, D.
Lohr, S.M. Lindsay, P. Hinterdorfer, Proc. Nat. Acad. Sci. USA 101
(2004) 12503.
[9] A. Ebner, F. Kienberger, G. Kada, C.M. Stroh, M. Geretschlager,
A.S.M. Kamruzzahan, L. Wildling, W.T. Johnson, B. Ashcroft,
J. Nelson, S.M. Lindsay, H.J. Gruber, P. Hinterdorfer, Chem. Phys.
Chem. 6 (2005) 897.
[10] R. Kassies, K.O. van der Werf, A. Lenferink, C.N. Hunter,
J.D. Olsen, V. Subramaniam, C. Otto, J. Microsc. 217 (2005) 109.
[11] E. Defranchi, E. Bonaccurso, M. Tedesco, M. Canato, E. Pavan,
R. Raiteri, C. Reggiani, Microsc. Res. Technol. 67 (2005) 27.
[12] J.A. Dvorak, Methods 29 (2003) 86.
[13] A. Hards, C. Zhou, M. Seitz, C. Brauchle, A. Zumbusch, Chem.
Phys. Chem. 6 (2005) 534.
[14] M.I. Wallace, J.E. Molloy, D.R. Trentham, J. Biol. 2 (2003) 4.
[15] Information provided by a CHO cell line provider, Acyte Biotech,
Sydney, Australia, http://www.acyte.com/Technology/technolo-
gy.htm.
[16] S. Rhode, A. Breuer, J. Hesse, M. Sonnleitner, T.A. Pagler, M.
Doringer, G.J. Schutz, H. Stangl, Cell Biochem. Biophys. 41 (2004)
343.
[17] J. Zlatanova, S.M. Lindsay, S.H. Leuba, Prog. Biophys. Mol. Biol. 74
(2000) 37.
[18] W. Beisker, F. Dolbeare, J.W. Gray, Cytometry 8 (1987) 235.
[19] A. Chen, V.T. Moy, Biophys. J. 78 (2000) 2814.
[20] J. Mleczko, L.L. Litke, H.S. Larsen, W.L. Chaffin, Infect. Immun. 57
(1989) 3247.
[21] M. Mortelmaier, E.J. Kogler, J. Hesse, M. Sonnleitner, L.A. Huber,
G.J. Schutz, Single Mol 3 (2002) 225.
[22] A. Gaiduk, R. Kuhnemuth, M. Antonik, C.A.M. Seidel, Chem. Phys.
Chem. 6 (2005) 1.
[23] W. Baumgartner, P. Hinterdorfer, H. Schindler, Ultramicroscopy 82
(2000) 85.
[24] S. Wielert-Badt, P. Hinterdorfer, H.J. Gruber, J.-T. Lin, D. Badt, B.
Wimmer, H. Schindler, R.K.-H. Kinne, Biophys. J. 82 (2002) 2767.