
A City That Works for Everyone
163
Attachment E Los Angeles Rising: A City That Works for Everyone
-
Upload
khangminh22 -
Category
Documents
-
view
0 -
download
0
Transcript of A City That Works for Everyone
Attachment E
Los Angeles Rising: A City That Works forEveryone

A City That Works for EveryoneMarch 2.15
A report ay Economic RoundtableUCLA Labor CenterUCLA Institute for Research on Labor and Employment
nwifi;IT of,
ECONOMICPOUNDIAtiLL

Graphic design by Design Action, a worker-owned and managed cooperative and a union shop.affiliated with the Pacific Media Guild. Local 39521 Communication Workers of America, AFL-CIO.

LOS ANGELES RISINGA City that Works for Everyone
March 2015
Economic Roundtable
Daniel Flaming
Halil Toros
Yvonne Yen Liu
Patrick Burns
UCLA Labor Center
Lucero Herrera
Tia Koonse
Saba Waheed
UCLA Institute for Research on Labor and Employment
Robert Habans
Underwritten by the Los Angeles County Federation of Labor, AFL-CIO
Report available at: www.economicrt.org
28

Table of ContentsI. Executive Summary 7
Infographic 10
II. A City that Works for Everyone 13
A. Sustaining Wages 13
B. How Much, How Fast 13
C. Eroded Value of Wages 14
D. Income Inequality 15
E. Low Wages, High Cost of Living 15
F. Public Costs of Low Wages 17
G. Wage Theft 17
H. Research Issues 18
Ill. A Stimulus Effect for the Region 22
A. Estimates of Affected Workers 23
B. Demographics and Job Characteristics of Affected of Workers 24
C. Economic Boost to the Economy 31
D. Estimated Reduction in Public Assistance Spending 35
IV. Industry Resilience 38
A. Industries That Are Most Sensitive to Wage Increases 39
B. Studies of Unintended Consequences from Raising the Minimum Wage 55
C. LA Living Wage Case Study 57
V. Geography of Opportunity 62
A. Why Do Neighborhoods Matter for a Citywide Minimum Wage? 63
B. Mapping the Distribution of Impacts on Industries 64
C. Mapping the Distribution of Impacts to Residential Communities 68
D. Conclusion 70

VI. Parallel Expansions of Opportunities for Living Wages 80
A. DACA/DAPA Executive Actions 81
B. Proposition 47 Sentencing Reform 75
VII. Toward a Smart, Enforceable Policy 85
A. Best Practices from Other Cities 93
B. Benchmarks for Setting the Minimum Wage 96
C. Establishing Base/Ceiling and Incremental Increase 98
D. Enforcement 100
E. Dashboard: Tools to Manage Impacts 103
VIII. Literature Review 116
A. Elasticity in Hours of Employment 119
B. Price Elasticity 121
C. References 122
IX. Data Appendix

Executive SummaryLos Angeles Rising: A :',ity That Works for Everyone

For many, Los Angeles evokes images of year-round sunshine and celebrity, a dreamcity of wealth and possibility.Yet in reality, half of L.A. residents living in poverty are
employed, showing that low wages drive poverty as much as unemployment does.
This report assesses the benefits and consequences of raising Los Angeles's minimum
wage to $15.25.The result will be an increase of $5.9 billion in wages with a stimuluseffect for the region. Paying fair wages will be an adjustment for some businesses, but the
result will be a bigger, more sustainable and inclusive economy for Los Angeles.
A Low Wage City with a High Cost of LivingLos Angeles is a low-wage city with a high cost of living.
723,000 employed, working-age adults earn less than $15.25 an hour.
Twenty-two percent of those earning below $15.25 live in poverty.
Workers today earn less in purchasing power than they did 35 yearsago. Wages for low-wage earners, such as restaurant workers and retail
cashiers, have lost a third of their buying power over the past 30 years.
67 percent of Los Angeles households make just 29 percent of the city'sincome, while 7 percent hold 31 percent of the city's income.
Wage growth has not kept pace with costs.
Next to comparable cities, the cost of living in Los Angeles is among the
highest.Yet, Angelenos earn less than in any other comparable city.
San Francisco's cost of living is 20 percent higher, yet median earningsare 70 percent higher. Dallas's cost of living is 30 percent lower, yet
median earnings are the same. Chicago's cost of living is 10 percent
lower, yet median earnings are 20 percent higher.
Wage theft, or violations of basic labor laws, exacerbates already low
wages. More than half of garment workers and one-third of janitorial,
retail, and private household workers report minimum wage violations.
A Stimulus Effect for the RegionA $15.25 raise in minimum wage will increase earnings by $5.9 billion for 723,000 workersin 2019. Workers aren't the only ones who benefit from having more earnings in their
pockets. Businesses throughout the Los Angeles region will reap the rewards of increased
spending by households.The multiplier impacts of $15.25 results in increased spending at
neighborhood, service-oriented businesses such as health care, restaurants, and retail.
The stimulus effects for the region include:
Every dollar increase in the minimum wage results in $1.12 stimulus to
the economy.
The region will create 46,400 new jobs, of which 24,875 will be in the
City of Los Angeles.
State and local governments will receive $414 million in added revenue
and the federal government $546 million.
Public assistance expenditures will be reduced by $313 million a year
because higher wages will lift workers out of poverty.
LOS ANGELES RISING: A City that Works for Everyone 7

Resilient IndustriesIndustries in Los Angeles are predominantly resilient. Many industries have few low-
wage workers. Most that do employ low-wage workers are providing services to more
affluent residents who can adjust to price increases that may result from a higher
minimum wage. In these industries, Los Angeles residents provide services to other Los
Angeles residents, but do not earn enough to make ends meet.
>> 4/5 of low-wage jobs are doing face-to-face work that requires a
physical presence in Los Angeles.
Only 12 percent of low-wage jobs produce goods that leave the
local economy.
Evidence from studies of wage increases in Los Angeles and in other cities indicates
that businesses are able to make adjustments to moderate wage with minimal increases
in price and negligible impacts on employee hours and benefits. Savings from lower
turnover costs and increased productivity help balance the cost to businesses.
Los Angeles' wage increase to $15.25 is beyond the scope of past research, but because
it is spread over five years there are readily available tools for monitoring and managing
effects of the series of stepped wage increases. We identified seven industries that
particularly important to monitor during the five annual increments of wage increases:
Textile and apparel manufacturing
Temps, guards, and janitors
Home health care services
Residential care and nursing facilities
Child day care services
Restaurants and bars
Personal and repair services
These industries account for roughly a fifth of the jobs in Los Angeles. We see strength among
firms with over 100 employees in the seven industries that can help businesses adjust to higher
labor costs through investments in technology and human capital. Six of the seven industries are
in the service sector where consumer demand is expected to support necessary price increases.
Geography of OpportunityMapping impacts and benefits, we found that raising the minimum wage will
geographically address inequality. In particular, it has strong benefits on low-income areas
in the region. Many businesses that will feel the impact from higher wage are located in
higher income, economically resilient areas. Many businesses in low-income areas are likely
to benefit from a surge in purchasing power of low-income workers.
Because Los Angeles is a deeply integrated, multi-sited economy, the benefits will spread
beyond the city's boundaries to the broader region.
>>
Raising the wage will have a particularly strong ripple effect in low-
income areas where people receiving the wage raise live.
In South Los Angeles, for example, over 60,000 workers will see a wage
increase. Families in these areas will circulate this added income into the
local economy.
Raising the minimum wage will be an engine for economic recovery in low-income
neighborhoods and build a more inclusive, sustainable economy across the city.
8 LOS ANGELES RISING: A City that Works for Everyone
The labor force that finds jobs in Los Angeles is over a hundred times larger than that in
neighboring cities with the largest flows of workers across the city line. This means that
LA's action to raise the minimum wage is likely to influence wage levels beyond its borders
as businesses compete to attract and retain competent workers. There is a strong prospect
that higher wages will strengthen the city's capacity to attract the most capable workers,
pressuring neighboring businesses and cities to increase their minimum wage levels to
avoid losing their most productive labor force to Los Angeles.
Expanding Opportunities Parallel to Raising the WageTwo separate reform initiatives will act in parallel to help raise the wage floor and boost
employment and earnings for Los Angeles workers: (1) the Deferred Action for Childhood
Arrivals (DACA) and Deferred Action for Parents ofAmericans and Lawful Permanent
Residents (DAPA), and (2) Proposition 47, the Safe Neighborhoods and Schools Act.
Both programs will improve employment and earnings opportunities for low wage
workers, independent of the $15.25 increase.
DAPA and DACA are projected to raise wages for 15,000 eligible
workers above the $15.25 threshold.
We estimate that over 10,000 eligible persons in Los Angeles City will
reduce their convictions under Proposition 47 and gain access to much
broader employment opportunities.
Expanded employment opportunities are projected to add
$13.8 million in annual earnings for communities most impacted by
mass incarceration.
Consequence of InactionWithout action to raise the wage floor, the problems caused by incomes that are inadequate
to sustain working families will become more acute. The cost of living is continuing
to rise in Los Angeles and labor market projections by the California Employment
Development Department show that the number of low-wage jobs will grow faster than
the number of mid- and high-wage jobs. Inaction will mean that the share of the labor
force that does not receive sustaining pay will grow and the gap between stagnating low
wages and the cost of a basic standard of living in Los Angeles will continue to widen.
Toward a Smart, Enforceable PolicyAnalyzing the approaches of other municipalities to raising and enforcing their minimum
wage, we recommend the following best practices:
)) Phase minimum wage increases to allow the city to adapt.
Allow minimum wage to keep up with the cost of living.
Apply the raised wage to all workers with no exemptions or deferrals.
Enforce the wage with strong tools to enforce the wage, including
a funded city authority to address claims, meaningful sanctions, and
protection from retaliation.
We include tools to create a data dashboard to closely monitor the economic impacts of
raising the wage, so the City can monitor and remedy any unintended effects.
LOS ANGELES RISING: A City that Works for Everyone 9

Why LA \eeds a RaiseRaising the minimum wage to $15.25 will provide social andeconomic benefits to our region, LA will see a $5.9 billionincrease in worker earnings. Paying fair wages will be anadjustment for some businesses, but the result will be a bigger,more sustainable, and more inclusive economy for Los Angeles.
LA is Ahead in Inequality, But Lags in Wage Growth67% of Los Angeles households make just 29% of the city's income, while 7% of households hold 31% of the city's income.
The wages of restaurant workers and retail cashiers have lost
one third of their buying power over the past 30 years.
1979 = 81 2015=68C
LA's Wages Are Low, but the Cost of Living is HighLos Angeles is a low-wage city with a high cost of living. Though rent, food, and transportation costs are high,
Angelenos earn less than in any other other comparable city.
Cost of Living Compared to LAess ex ensive ore ex )ensive
San Francisco
Seattle
Chicago
Dallas
Philadelphia
Median Earnings Compared to LA
Seattle
San Francisco
Chicago
Dallas
Philadelphia
A Stimulus Effect for the Region---J lb
Raising the wage to 815.25/hour will put $5.0 billion •into pockets of LA workers.n .
These earnings will have a ripple effect across the local economy.
Every dollar increase in minimum wage generates 51,12 in economic stimulus.
More money to spend at local businesses. Adds 5414 million in tax revenue.
Creates 46,400 jobs for LA region,concentrated in the consumer-oriented
industries, such as restaurants, hospitals,
groceries, and retail.
N
10 LOS ANGELES RISING: A City that Works for Everyone

Address Inequality Across the CityMany businesses that will feel the impact from raising thewage are located in high income, economically resilient areas.
Employment in impactedconsumption establishments
Less Jobs
More Jobs
Average household income
under $70,000
_; over $70,000
Industries Are ResilientMany of LA's low wage jobs are service jobs that are
difficult to outsource or have high consumer demand. Inthese industries, Angelenos provide services to other
Angelenos, but do not earn enough to make ends meet.
800/11 of low wage jobs are face-to-face work.
•12112113071
Only 12% produce goods that leave the local economy.
rrrr
Multiple studies show that businessesare able to make adjustments with
minimal job losses and price increases.Employees stay longer at work and are
more productive.
Though some businesses will face challenges, the sharedeconomic growth is worth it.
Raising the minimum wage will produce a surge inpurchasing power that will reverberate throughout theregion, especially low-income communities.
Growth in community earnings
L j under 2%
pi 2 - 4%
III over 4%
Toward a Smart, Enforceable PolicyTo create a smart, enforceable policy, it's important to:
ma• Phase minimum wage increases to allow the
III city to adapt
4,01% Allow minimum wage to keep up with the cost
1' of living
A Apply the raised wage to as many Angelenos
as possible
M Have strong tools to enforce the wage
We have the tools to closely monitor the economic impactsof raising the wage, so we can shift and adapt to any
adverse effects.
LOS ANGELES RISING: A City that Works for Everyone 11

A City that Works for Everyone
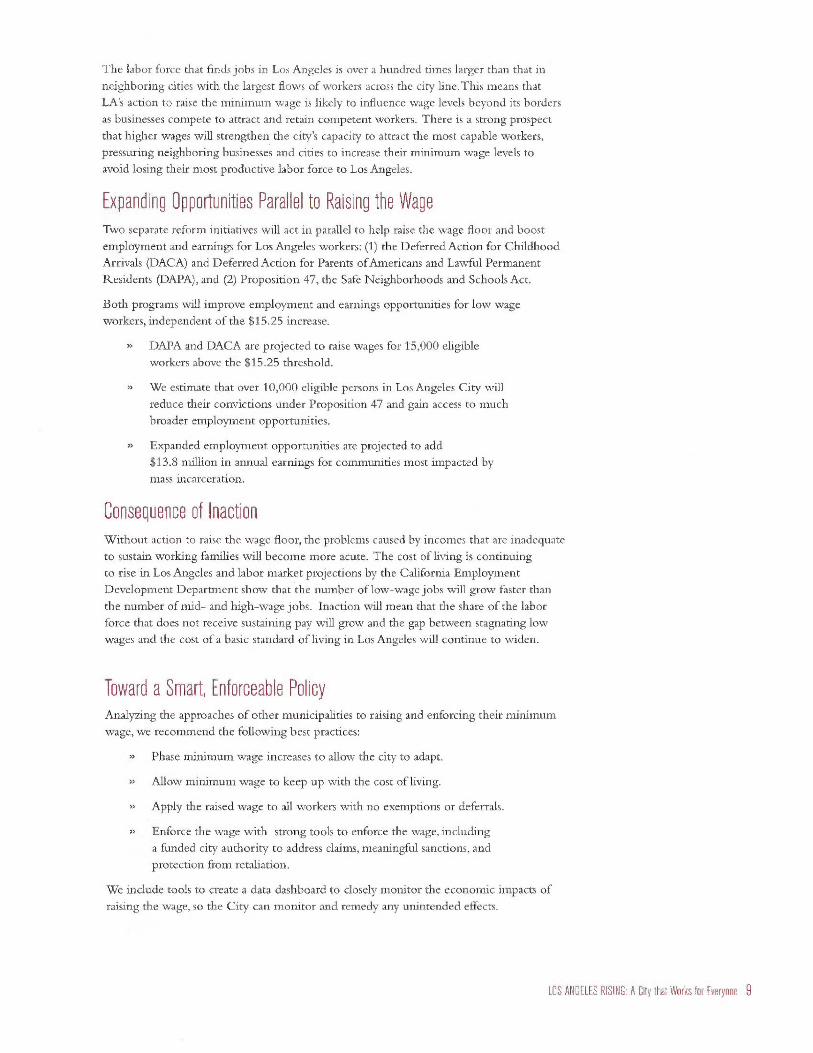
Sustaining WagesHalf of the 495,000 working-age residents of Los Angeles who live in poverty have jobs(Figure 2.1).This high rate of working poverty indicates that low wages drive povertyas much as unemployment does.When people do not have enough money to pay fortheir basic needs, their lives are stressful and chaotic. In Los Angeles, poverty wages trap aquarter-million working-age adults in these conditions.
Earnings of at least $15.25 per hour ($32,000 annually) are required for a single adult tosubsist in Los Angeles without public assistance.'Yet 729,000 employed, working-age LosAngeles residents (in contrast to workers employed, but not necessarily living in, L.A) earn
less than $15.25. Poverty wages carry high public costs.
Los Angeles needs to be a place that works for everyone.Workers who create wealth for
others need to receive a big enough share of that wealth to support a basic standard ofliving.The acute economic hardship faced by so many working Los Angeles families is a
clear sign that the wage floor is unrealistically low.
Figure 2.1: Employment and Poverty among City of Los Angeles Residents
IN POVERTY495,000 residents
16 to 64 Years of Age
WORKING WITH WAGES <$15.2729,000 residents
Source: Public Use Microdata Sample records front the 2009 to 2013 American Community Surveys. Data is for residents of
the City of Los Angeles who are 18 to 64 years of age.
How Much, How FastImproving the lives of low-wage workers is not a zero-sum game in which one person has to
lose for another to benefit.There is broad consensus that wages need to be raised. At the same
time, no one wants to see the economy damaged.The practical question boils down to how
much and how fast we can raise the minimum wage without harming the economy.
The values that guided this study include the need for objective evidence that identifies
729,000 employed,working-age LosAngeles residents earnless than 515.25 perhour.
We gathered objectiveevidence to identifyboth benefits andrisks of raising theminimum wage to515.25 by 2019.
LOS ANGELES RISING: A City that Works for Everyone 13

Workers today earn
less than comparableworkers did 35 yearsago.
both benefits and risks of raising the minimum wage to $15.25 by 2019.We offer practical
tools to closely monitor the effects—positive and negative—of the new minimum wage
over the course of annual increases. The key benchmarks for assessing the impact of a
higher minimum wage include effects on employment, revenue, and wages.
Eroded Value of Waces
10%
5%
0%
▪ -5%
g▪ -10%
-15%
-20%
-25%
-30%
-35%
-40%
-.- 95thPercentile
-.- 75thPercentile
50thPercentile
25thPercentile
5160.000
S150.000
5140.000
5130.000
5120.000
S110,000
S100.000
S90.000
580,000
S70.000
560.000
S50,000
S40.000
S30.000
S20,000
S10.000
Pay in 2014
Because of the increased cost of living and stagnant wages, workers today make less money
for the same work than in past decades. Changes in the buying power of wages since 1979
are shown in Figure 2.2.
Figure 2.2: Change since 1979 in the Buying Power ofWorkers' Pay
Sources: Public Use Microdata Sample records from the 1980 to 2000 decennial censuses, and from the 2005 to 2013
American Community Surveys. Wages adjusted to 2014 dollars. Data is for residents of the City of Los Angeles who are full-
time wage and salary workers. Full-time employment is at least 35 hours a week for at least 50 weeks a year. Workers with less
than $500 in annual earnings are excluded from the data.
If wages maintained the same buying power instead of increasing or decreasing, all
lines would overlap in a flat line along the 0% mark on the side axis. However, the
bottom three lines in the graph, representing three-quarters of the full-time labor force
(everyone who earns less than $67,000) all dip below zero because of the declining
buying power of wages. These workers earn less today than comparable workers did 35
years ago. The value of their wages has eroded.
As the steepest declines illustrate, workers who earn less experienced the greatest
erosion of their buying power. The green line represents the working poor, in the
bottom 25th percentile. These workers earn $22,000 a year. They fared worst, losing 32
percent of their buying power since 1979.
High-income workers were the only group whose buying power increased. The red
14 LOS ANGELES RISING: A City that Works for Everyone

line represents workers who earn more than 95 percent of the labor force, at $152,000
a year. They earn 12 percent more than their counterparts did in 1979.
Compared to a few decades ago, most Los Angeles workers are being paid less to
generate more wealth for their employers. This is an obstacle to economic stability.
Income InequalityInequality in Los Angeles is acute, and the divide is increasing, not diminishing. The 7
percent of households who earn more than $200,000 a year receive more income than the
bottom 67 percent combined, as shown in Figure 2.3. The top 12 percent receives more than
two and a half times as much income as the bottom half of households.
Projections of occupational growth over the coming decade by the State of California
show that occupations paying less than $15.25 an hour are expected to grow 15 percent
while occupations paying more than $15.25 are projected to grow only 11 percent.
35%
30%
25%
20%
15o
10%
5%
7% of households31% of incomeH
51% of households16% of income
<810K S10,00- S15K- S25K- S35K- S50K- S75K- S100K- S15OK- S200K+
S14K S24K S34K S49K S74K 899K 8149K $199K
III Percent of Households Percent of Household Income
Inaction on increasing the minimum wage would mean that the share of the labor force
that does not receive sustaining pay will grow and the gap between stagnating low wages
and the cost of a basic standard of living in Los Angeles will continue to widen.
Figure 2.3: City of Los Angeles Households and Income, 2013
Source: 2013 American Community Survey, Table S1901: Income in the Past 12 Months.
The advantages of a higher minimum wage include increased household buying power,
a more stable labor force, and the affirmation of fairness in an economy where we are all
interdependent and every segment of the labor force must be able to live decently for the
economy to be sustainable. These outcomes benefit everyone, not just those at the bottom.
Low Wages, High Cost of Living
The top 7 percent ofhouseholds who earnmore than $200,000a year receive moreincome than thebottom 67 percentcombined.
LOS ANGELES RISING: A City that Works for Everyone 15
Los Angeles is themost unaffordablecity in the nation - an
expensive place to liveand a cifficult city toearn a living wage.
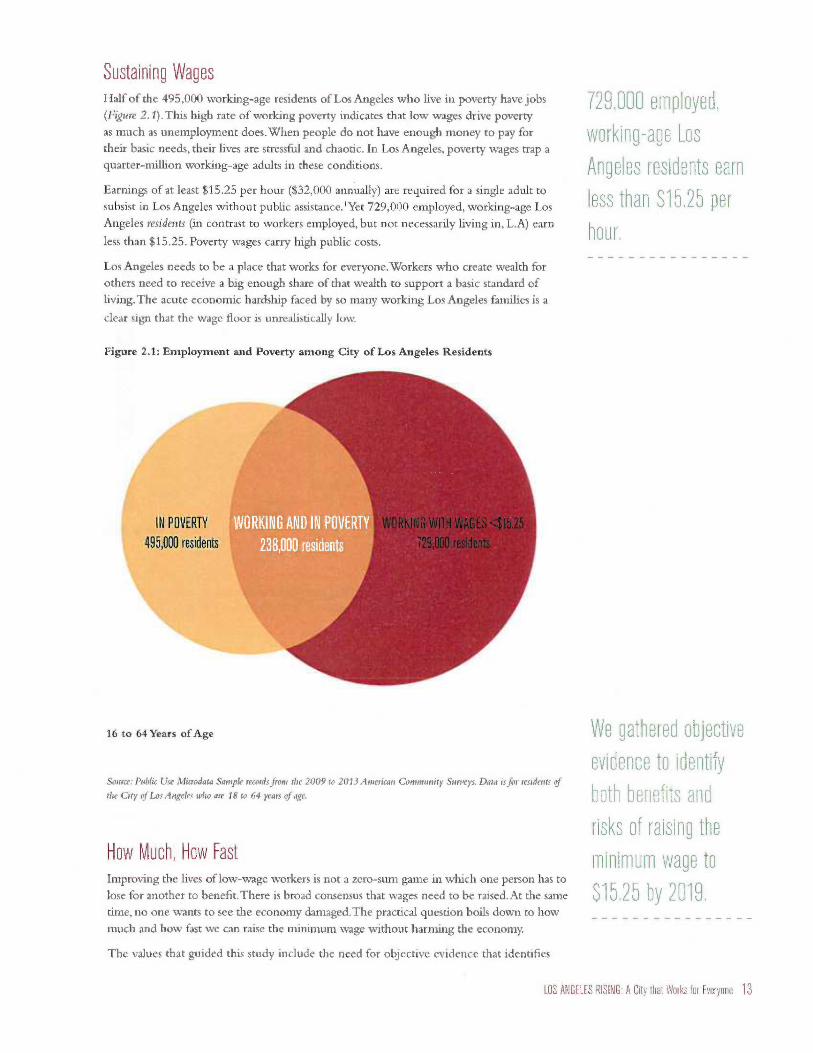
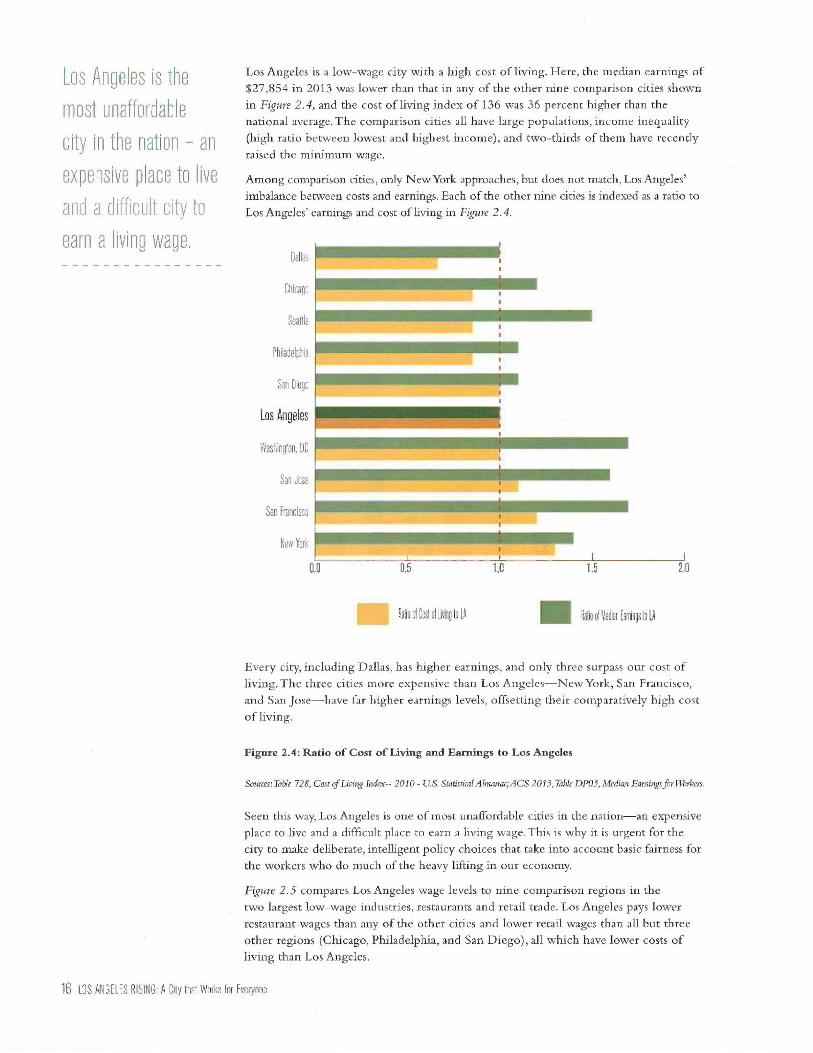
Los Angeles is a low-wage city with a high cost of living. Here, the median earnings of
$27,854 in 2013 was lower than that in any of the other nine comparison cities shown
in Figure 2.4, and the cost of living index of 136 was 36 percent higher than the
national average. The comparison cities all have large populations, income inequality
(high ratio between lowest and highest income), and two-thirds of them have recently
raised the minimum wage.
Among comparison cities, only NewYork approaches, but does not match, Los Angeles'
imbalance between costs and earnings. Each of the other nine cities is indexed as a ratio to
Los Angeles' earnings and cost of living in Figure 2.4.
Dallas
Chicago
Seattle
Philadelphia
San Diego
Los Angeles
Washington. DC
San Jose
San Francisco
hew York
im411111111111111111111111Niwwwww‘suim
imitiummum
Ad11111111111111
0 0 0.5
Ratio of Cost or Living to LA
--IMPTS11
1:0 1,5 2,0
III Ratio at Walla' Earnings to I.11
Every city, including Dallas, has higher earnings, and only three surpass our cost of
living. The three cities more expensive than Los Angeles—New York, San Francisco,
and San Jose—have far higher earnings levels, offsetting their comparatively high cost
of living.
Figure 2.4: Ratio of Cost of Living and Earnings to Los Angeles
Sources: Table 728, Cost of Living Index-- 2010 - U.S. Statistical Almanac; ACS 2013,Table DP03, Median Earnings for Workers.
Seen this way, Los Angeles is one of most unaffordable cities in the nation—an expensive
place to live and a difficult place to earn a living wage. This is why it is urgent for the
city to make deliberate, intelligent policy choices that take into account basic fairness for
the workers who do much of the heavy lifting in our economy.
Figure 2.5 compares Los Angeles wage levels to nine comparison regions in the
two largest low-wage industries, restaurants and retail trade. Los Angeles pays lower
restaurant wages than any of the other cities and lower retail wages than all but three
other regions (Chicago, Philadelphia, and San Diego), all which have lower costs of
living than Los Angeles.
16 LOS ANGELES RISING: A City that Works for Everyone
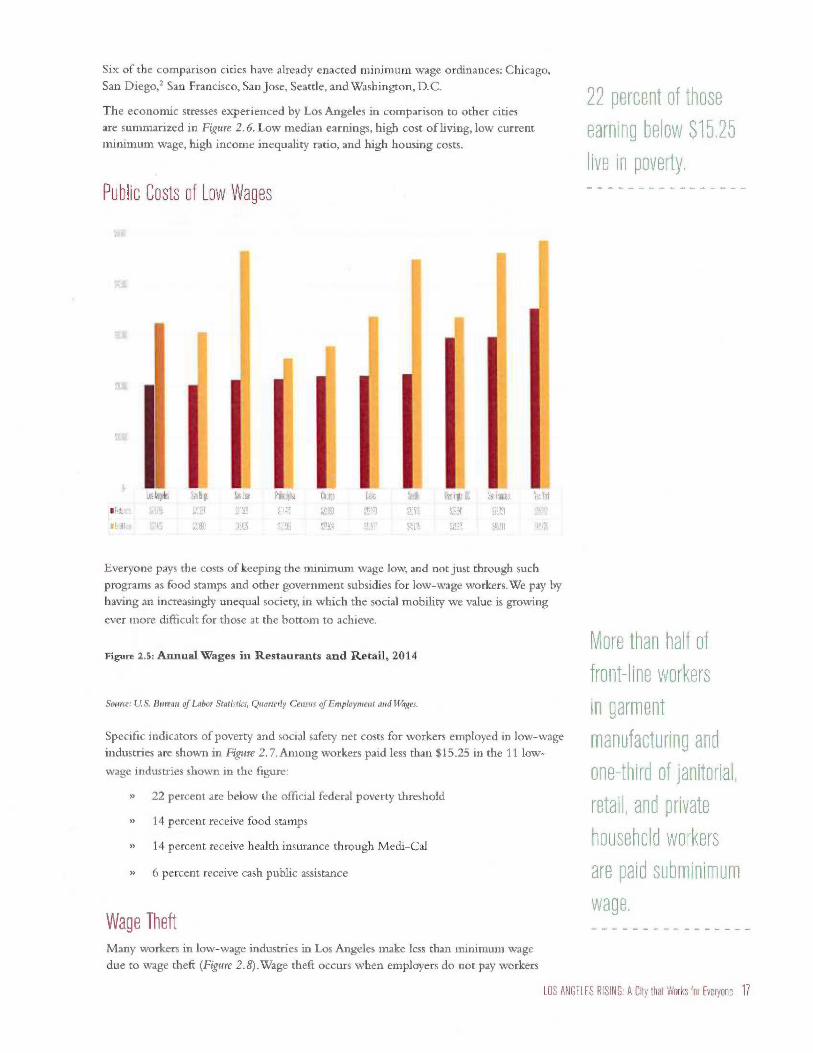
Six of the comparison cities have already enacted minimum wage ordinances: Chicago,San Diego,2 San Francisco, San Jose, Seattle, and Washington, D.C.
The economic stresses experienced by Los Angeles in comparison to other citiesare summarized in Figure 2.6. Low median earnings, high cost of living, low currentminimum wage, high income inequality ratio, and high housing costs.
Public Costs of Low War
Sin kg
SKV
Picipha
41.! SinS3
SF.Ki
Sirs flan:'.
0211 T7i5
Everyone pays the costs of keeping the minimum wage low, and not just through suchprograms as food stamps and other government subsidies for low-wage workers. We pay by
having an increasingly unequal society, in which the social mobility we value is growing
ever more difficult for those at the bottom to achieve.
Figure 2.5: Annual Wages in Restaurants and Retail, 2014
Source: U.S. Bureau of Labor Statistics, Quarterly Census of Employment and Wages.
Specific indicators of poverty and social safety net costs for workers employed in low-wage
industries are shown in Figure 2.7.Among workers paid less than $15.25 in the 11 low-
wage industries shown in the figure:
22 percent are below the official federal poverty threshold
14 percent receive food stamps
14 percent receive health insurance through Medi-Cal
6 percent receive cash public assistance
Wage TheftMany workers in low-wage industries in Los Angeles make less than minimum wage
due to wage theft (Figure 2.8).Wage theft occurs when employers do not pay workers
22 percent of thoseearning below $15.25live in poverty.
Vore than half offront-line workersin garmentmanufacturing andone-third of janitorial,retail, and privatehousehold workersare paid subminimumwage.
LOS ANGELES RISING: A City that Works for Everyone 17

according to the law. Common forms of wage theft are not paying the minimum wage,
non-payment of overtime, not paying for all the hours worked, not providing meal and rest
breaks and even not paying a worker at all.
Compounding the effects of low wages, wage theft in low-wage industries occurs more
frequently in Los Angeles than in any other city for which this information is available.
More than half of frontline workers in apparel manufacturing and close to a third of
Gil 000 ci io stauk wage Irw# !Tr"
Population (2013 Percent Median Earnings- in thousands) Foreign-Born (2013) (2013)
Cost of Living Index(2010)
Minimum Wage(2015)
Target MinimumWage (2019)
Income InequalityRatio (2012)
2-Bedroom FairMarket Rent
LOS ANGELES 3,884 39% $27,7114 136.4 $9.00 $15.25* 12.3 $1,294
NEW YORK 8.405 37% S37,188 182.9 58.15 511.50-815.00' 13.2 51,440
CHICAGO 2,718 21% 832.269 116.9 S8.25 S1300 12.5 S979
PHILADELPHIA 1.553 12% S29.998 126.5 5125 S725 11.8 S1.135
SAN DIEGO 1,355 26% 531,/01 132.3 59.00 511.50 8.9 51.354
DALLAS 1,257 24% S28.961 91.9 S7.25 51.25 11.2 S566
SAN JOSE 998 39% S45.373 156.1 810.00 510.00 8.8 51.649
SAN FRANCISCO 837 36% 847.428 164.0 S11.05 S15.00 166 51.956
SEATTLE 652 18% 840,638 121.4 S11.00 515.00 9.2 S1,123
WASHINGTON, DC 646 14% S46.401 140.1 S9.50 S11.50 . 13.3 S1.469
'Mrirrum wage mease mods
janitorial, retail, and private household jobs in Los Angeles report being paid less than the
state minimum wage.3 The core protection that most people take for granted-the right
to be paid at least the minimum wage-is absent for many low-wage workers.The breadth
of the problem, spanning most low-wage industries, as well as its harm to workers calls for
enforcement of wage standards that support a decent standard of living in Los Angeles.
Figure 2.6: Economic Indicators in Los Angeles and Nine Comparison Cities
Data sources: U.S. Census Bureau: State and County QuickFacts, U.S. Statistical Almanac, American Community
Survey 2013, Brookings Institute: Income Inequality 2012, U.S. Department of Housing and Urban Development,
Fair Market Rent Documentation 2014.
Research IssuesThe following chapters provide information about how a higher minimum wage will
affect workers and industries and conclude with recommendations about how the wage
floor should be raised. We analyze:
1. Economic benefits of raising the minimum wage to $15.25 by 2019;
2. Industries that will be most sensitive to a higher minimum wage and
factors that affect their resilience;
3. The geography of opportunity based on where workers are employed
and where they live;
18 LOS ANGELES RISING: A City that Works for Everyone

Figure 2.7: Poverty Rate and Social Safety Net Use by Los Angeles Workers Paid Less
than $15.25
la& & Appel
llamiesitreutoiRs
Constructim
Ike Heti Can
ky Care
PEard & Reilk
Reslairarits &
Food liorifacturrj
ALL LOVI-ViADE INDUSTRIES
temps. Dards. Janitors
Retail Trade
RE-t•VIlwt
111111111111111111P'
E111111.111.111111111111111111111
5111111111F"'11111111110111111111m-11111111PEINE--
09/u
MI In Poverty
10c0 20% 30% 0.30
•Food Stamps Medi-Cal IN Cash Aid
Source: American Community Survey PUMS 2009-2013. Unauthorized immigrant workers not included inMedi-Cal and cash aid indicators. Data is for City of Los Angeles residents with $500+ in wage and salary earnings.
4. Parallel expansion of opportunities for fair wages that are emerging as a
Figure 2.8: Minimum Wage Violation Rate in Los Angeles
Apparel Mfg.
Domestic Sri,
Janitorial Sri.
Retail
Auto Repair & Wash
Food & Furniture Mfg.
Grocery & Drug Stores
Restaurants & Hotels
Fine Construction
Nome Health Care
Transportation: & 1A/hls,
Education and social anistacce
10% 20% 30Vo 40% 50% 60%
Source: Ruth Milkman et al. 2010. "Wage Theft and Workplace Violations in Los Angeles: The Failure of Employment
and Labor Law for Low-Wage Workers." UCLA Institute for Research on Labor and Employment, p. 32.
WS ANGELES RISING: A City that Works for Everyone 19

result of DAPA, DACA, and Proposition 47;
5. Data tools for managing the new wage floor over five years of
incremental increases;
6. Trends and best practices from other cities and smart, enforceable
minimum wage policies.
1. California Budget Project. 2015. "Making Ends Meet: Family Budget Calculator?' http://www.
cbp.org/MakingEndsMeet/, (accessed February 26, 2015).
2. California Employment Development Department, Labor Market Information Division
(December 2014), 2012-2022 Occupational Employment Projections, Los Angeles-Long
Beach-Glendale Metropolitan Division, http://www.labormarketinfo.edd.ca.gov/county/
losangel.html (accessed March 9, 2015).
3. The San Diego ordinance will be implemented if voters approve it on a referendum in
June 2015.
4. Annette Bernhardt et al. 2009. "Broken Laws, Unprotected Workers:Violations of Employment
and Labor Laws in America's Cities?' National Employment Law Project, http://www.nelp.org/
page/-/brokenlaws/BrokenLawsReport2009.pdf?nocdn=1 (accessed February 26, 2015).
20 LOS ANGELES RISING: A City that Works for Everyone

LOS ANGELES RISING: A City that Works for Everyone 21

A Stimulus Effect for the Region
22 WS ANGELES RISING: A City that Works for Everyone

Estimates of Affected WorkersThe City of Los Angeles has a sprawling labor force of approximately 2 million workers
earning a median income of $26,000 according to the 2013 American Community Survey
(ACS). Given both the remarkable scale of this labor force and its demonstrably low
earnings, it is nearly certain that the proposed increase in the minimum wage will affect a
significant share of workers in the city.
In order to estimate the number of workers that will be impacted, we rely primarily on
data used to identify the home locations (census tracts) throughout California of workers
with jobs in the city, using the Longitudinal Employer-Household Dynamics (LEHD)
Origin- Destination Employment Statistics (LODES). Then we allocate the workers
identified in this data to the earnings distribution of workers by gender and ethnicity
using census tract earnings distributions available from the ACS. Finally, using the Public
Use Microdata Sample (PUMS) file of the ACS to derive the percentage of workers
impacted by the minimum wage thresholds, we estimate the number of workers affected.
We selected the census tract as our unit of analysis so that we might both assess data
and depict its geographic dimensions in a way that foregrounds detail at a clear and
substantive level. The database that was created overcomes limitations of existing data.
The American Community Survey is the richest source of information about individual
workers, but it is based on where workers live. Most other available data is at the
county level. The minimum wage ordinance will apply to workers employed in the
city, regardless of where they live. Roughly 700,000 residents of Los Angeles work in
other cities, and roughly 900,000 workers from other cities commute into Los Angeles
to work. Furthermore, the workers commuting into the city typically hold higher
paying jobs than workers living in the city. The database created for this study links rich
ACS data to the city's entire labor force, with detailed geographic information linked
to where both jobs and homes are located. A detailed description of the estimation
methodology is provided in the Data Appendix.
We begin this section by drawing a broad picture of employment in the city. Then we
show the number of workers affected by the proposed minimum wage increases. We
follow by depicting the size of the impact, and conclude with a brief description of the
demographic and employment characteristics of affected workers.
Table 3.1 City of Los Angeles Workers by Income Thresholds
City of Los AngelesWorkers
Total Jobs Low SJobs($0-$15K)
Mid $ Jobs($15K-$40K)
High $ Jobs($40K+)
All Jobs 1,708,000 424,000 559,000 725,000
Primary Jobs 1,520,000 278,000 522,000 719,000
Secondary Jobs 188,000 146,000 37,000 6,000
All Private Jobs 1,410,000 394,000 507,000 509,000
Private Primary Jobs 1,233,000 256,000 473,000 505,000
Secondary Private Jobs 177,000 138,000 34,000 4,000
Federal Jobs 18,000 0 3,000 15,000
State and Local Gov. Jobs 280,000 30.000 49,000 201,000
Source: U.S. Census Bureau, LODES data for 2011
3y 2_1E, the number
of workers affectec
by an increase in the
minimum wace will
have nearly douled to
723 OC
[OS ANGELES RISING: A City that Works for Everyone 23

The percentage of
resident workersbenefiting from the
higher minimum wage
is 10 percent higher
than for workers
communing in from
other areas.
Distribution of the jobs in the formal economy of the City of Los Angeles
The LODES database that was created was used to show in Table 3.1 that 1.708 million
people worked in the city in 2011, with about 1.4 million in the private sector and
300,000 in the public sector. Because we are interested in tracing the effect of an
increase of the minimum wage, we divide these employment figures into categories of
low, mid, and high-earning jobs and then focus on the first two groups comprised of
those making under $40,000 a year. We observe in Table 3.1 that 58 percent of the work
forcc almost 1 million workers are employed in low- and mid-earning jobs.
As we see from Table 3.2, more than half of workers in the City of Los Angeles commute
from other cities and counties. Among workers commuting into the city, roughly two-thirds
live in the balance of the county and one-third in other counties. In comparing the earnings
distributions of the lower-paid two groups we note a startling discrepancy: while resident
workers hold more than half of the city's low-earning jobs, workers from elsewhere occupy
more than 60 percent of the high-earning jobs in the city. In other words, while city resident
workers are employed in lower wage jobs, workers are coming from other localities for
higher paid jobs. This significant discrepancy between the earnings distributions of resident
and non-resident city workers is one of the reasons why we rely on the LODES database and
align it with ACS earnings distribution at the census tract level.
Table 3.2 Residency of LA City Workers by Income Thresholds
Residency of LA City Low $ Jobs High $ JobsWorkers Total Jobs % $0-$15K % $40K + ole
Los Angeles City 788,000 46 225,000 53 285,000 39
Other Cities and Counties 920,000 54 199,000 47 440,000 61
Total 1,708,000 424,000 725,000
Source: US. Census Bureau, LODES data for 2011
The earnings of city residents with jobs in the city are similar to the earnings of residents
with jobs outside of the city, as shown in Table 2. Looking at both Tables 3.1 and 3.2,
we observe that, besides the large group of almost 800,000 Angelinos both living and
working in the city, around 200,000 resident workers in low earning jobs are replaced by
comparable low-wage workers commuting in from other cities. The difference is in the
high paying jobs where we observe an additional 200,000 high-paid workers commuting
into to the city. The similar earnings profiles of Los Angeles residents employed in the city
and those employed in other cities are shown in Table 3.3.
Table 3.3 Work Places of LA City Residents
Work Places of LA City Low $ Jobs High $ JobsResidents Total Jobs 0/c $0-$15K % $40K + %
Los Angeles City 788,000 52% 225,000 52% 285,000 54%
Other Cities and Counties 714,000 48% 211,000 48% 243,000 46%
Total 1,502,000 100% 436,000 100% 528,000 100%
Source: U.S. Census Bureau, LODES data for 2011
24 LOS ANGELES RISING: A City that Works for Everyone

Estimated Number of Affected Workers
To estimate the number of workers who will be affected by the higher minimum wage, we
analyzed the earnings distribution in each home census tract of workers with a job in LACity, the gender and ethnicity of low- and mid-earning workers, and work status (full or
part-time). Because there are significant differences among gender and ethnic classes and
particularly between full-time and part-time workers, keeping these details in mind makesour estimation process more accurate.
After allocating all workers working in the city to the simulated wage distribution
as described above, we estimate, for each yearly phase-in step between the base year2014 and 2019, the number of workers that would be affected by the increase and theadditional wages they would receive as a result. We use PUMS data to estimate the
number of workers affected by a wage increase in each earning bracket using hourly
wages and hours worked. In building these estimates, we also adjust for projectedemployment growth in LA City based on the industrial composition of low and mid
earning jobs. More information on our methodology is given in the Data Appendix.
We present the estimated number of affected workers in Table 3.4 for three different
groups working in LA City—city residents, commuter workers from other cities in Los
Angeles County and from other counties. The first column shows the number of workersunder the $9.00 minimum wage that became effective in 2014.The next five columns
represent the numbers for the phased years between 2015 and 2019.The last column shows
the number of all jobs in the city in 2014.
The total number of workers receiving wage increases is estimated to be 723,000 by 2019.
This is a net increase of over 350,000 between 2014 and 2019.The numbers of affected
workers will almost double for all three earnings groups. In average we see that every
$1 increase in the minimum wage will raise the number of affected workers by 60,000
annually. However, we estimate that the rate of increase in the number of additional
workers affected will decrease over time. While the first year impact is approximately
80,000 additional workers, it drops to 40,000 in the final year.This estimate can be
attributed to the fact that there are more workers in the city working at wage levels in the
$9 to $12 range than in the range $12 to $15.range
Table 3.4 Estimated Number of Affected Workers Who Work in LA City by Residency
Residency of LA City $9.00 Year1 Year 2 Year 3 Year 4 Year 5 2019 LA CityWorkers California $10.25 $11.75 $13.25 $14.25 $15.25 Jobs
LA City 201.120 250,909 294,667 333,261 359,516 380,747 829,765
LA County 114,098 144,897 172,843 198,321 215,470 229,443 645,031
Other County 53,241 71,155 83,942 100,555 107,216 113.237 330,540
Total _ 368.460 466,961 551,452 _ 632,138 682,202 723,426 1,805,336
Source: Authors' analysis of LODES, ACS and PUMS data and ES-202 projections.
Table 3.5 demonstrates that from the initial wage increase in the first year to the final
increase in the fifth year, the percentage of workers affected by the proposed minimum
wage will almost double from 20 to 39 percent of the total number of workers in the
city. Among workers who reside in the city, the consequences are most striking: while 24
percent of resident workers are under the state's current $9.00 minimum wage, coverage
will increase to 45 percent by 2019 when the minimum wage rises to $15.25.The
percentage of resident workers benefiting from the higher minimum wage is 10 percent
higher than for workers communing in from other areas.
LOS ANGELES RISING: A City that Works for Everyone 25

E
Table 3.5 Percent Estimates of Affected Workers Who Work in LA
Residency of LA $9.00 Year1 Year 2 Year 3 Year 4 Year 5City Workers California $10.25 $11.75 $13.25 $14.25 $15.25
LA City 24% 30% 35% 40% 43% 45%
LA County 18% 22% 27% 30% 33% 35%
Other County 16% 21% 25% 30% 32% 34%
Total 20% 260/n 30% 35% 37% 39%
Source:Authors' analysis of LODES, ACS and PUMS data and ES-202 projections.
Combining the findings of Tables 3.4 and 3.5 in Figure 3.1 illustrates the trend of the
impact of raising the minimum wage over a five year period. The size of the bubbles
reflects the percent affected. The upward trend in workers receiving wage increases is
greatest among the city's resident workers.
Figure 3.1 Affected Workers by Year and Place of Residence Sized by Percent Affected
400,000 —
300,000 —
200,000 —
100,000 —
Los Angeles City
Los Angeles County
Other counties
Base Year Year 1 Year 2 Year 3 Year 4 Year 5
2014 2015 2016 2017 2018 2019
Source:Authors' analysis of LODES, ACS and PUMS data and ES-202 projections.
Finally, in Table 3.6, we present how these trends look by work status and earning levels.
The table shows the number of workers affected for 4 classes—those working full-time in
low and mid earning jobs and part-time workers in low and mid earning jobs.We observe
the largest impact for full time workers working in mid earning jobs--over half of the
total net increase followed by part-time workers working in low earning jobs.The rate of
increase is the highest among part-time workers working in low earning jobs, with the
number of covered workers increasing 13-fold.
26 WS ANGELES RISING: A City that Works for Everyone
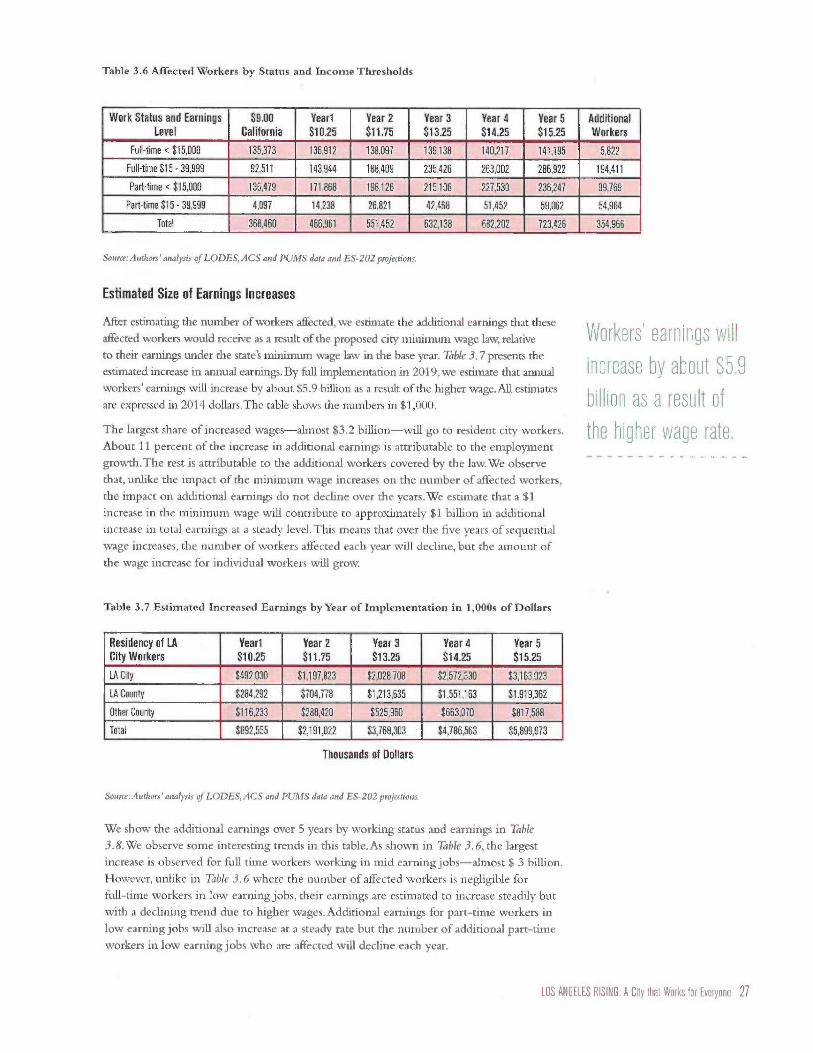
Table 3.6 Affected Workers by Status and Income Thresholds
Work Status and Earnings $9.00 Year1 Year 2 Year 3 Year 4 Year 5 AdditionalLevel California $10.25 $11.75 $13.25 $14.25 $15.25 Workers
Full-time < $15,000 135,373 136,912 138,097 139,138 140,217 141,195 5,822
Full-time $15 - 39,999 92,511 143,944 188,409 235,426 263,002 286,922 194,411
Part-time < $15,000 136,479 171,868 198,126 215,106 227,530 236,247 99,769
Part-time $15 - 39,999 4,097 14,238 26,821 42,468 51,452 59,062 54,964
Total 368,460 466,961 551,452 632,138 682,202 723,426 354,966
Source:Authors' analysis of LODES, ACS and PUMS data and ES-202 projections.
Estimated Size of Earnings Increases
After estimating the number of workers affected, we estimate the additional earnings that theseaffected workers would receive as a result of the proposed city minimum wage law, relativeto their earnings under the state's minimum wage law in the base year. Table 3.7 presents theestimated increase in annual earnings. By full implementation in 2019, we estimate that annualworkers' earnings will increase by about $5.9 billion as a result of the higher wage. All estimatesare expressed in 2014 dollars.The table shows the numbers in $1,000.
The largest share of increased wages-almost $3.2 billion-will go to resident city workers.About 11 percent of the increase in additional earnings is attributable to the employmentgrowth.The rest is attributable to the additional workers covered by the law.We observethat, unlike the impact of the minimum wage increases on the number of affected workers,the impact on additional earnings do not decline over the years.We estimate that a $1increase in the minimum wage will contribute to approximately $1 billion in additionalincrease in total earnings at a steady level.This means that over the five years of sequentialwage increases, the number of workers affected each year will decline, but the amount ofthe wage increase for individual workers will grow.
Table 3.7 Estimated Increased Earnings by Year of Implementation in 1,000s of Dollars
Residency of LA Year1 Year 2 Year 3 Year 4 Year 5City Workers $10.25 $11.75 $13.25 $14.25 $15.25
LA City $492,030 $1,197,823 $2,028,708 $2,572,330 $3,163,023
LA County $284,292 $704,778 $1,213,635 $1,551,163 $1,919,362
Other County $116,233 $288,420 $525,960 $663,070 $817,588
Total $892,555 _ $2,191,022 $3,768,303 $4,786,563 $5,899,973
Thousands of Dollars
Source: Authors' analysis of LODES, ACS and PUMS data and ES-202 projections.
We show the additional earnings over 5 years by working status and earnings in Table3.8.We observe some interesting trends in this table. As shown in Table 3.6, the largestincrease is observed for full time workers working in mid earning jobs-almost $ 3 billion.However, unlike in Table 3.6 where the number of affected workers is negligible forfull-time workers in low earning jobs, their earnings are estimated to increase steadily butwith a declining trend due to higher wages.Additional earnings for part-time workers inlow earning jobs will also increase at a steady rate but the number of additional part-time
workers in low earning jobs who are affected will decline each year.
Workers' earnings willincrease by about S5.9billion as a result ofthe higher wage rate.
LOS ANGELES RISING: A City that Works for Everyone 27

Wage
inc
reas
e in bil
lion
s
In Figure 3.2, we illustrate the different trends observed in Table 8.The size of the bubbles
reflects the number of affected workers. We can see the steep trend for full-time workers
working in mid-earning jobs relative to all other groups.
Table 3.8 Estimated Increased Earnings by Status and Income Thresholds
Work Status and Year1 Year 2 Year 3 Year 4 Year 5Earnings Level $10.25 $11.75 $13.25 $14.25 $15.25
Full-time < $15,000 $318,817 $670,562 $1,013,393 $1,205,609 $1,408,002
Full-time $15 - 39,999 $353,289 $956,544 $1,775,460 $2,327,028 $2,945,502
Part-time < $15,000 $191,401 $456,490 $731,419 $903,417 $1,083,048
Part-time $15 - 39,999 $29,048 $107,426 $248,031 $350,510 $463,421
Total $892,555 $2,191,022 $3,768,303 $4,786,563 $5,899,973
Thousands of Dollars
Source:Authors' analysis of LODES, ACS and PUMS data and ES-202 projections.
Figure 3.2 Wage Increase for Affected Workers by Status and Income Threshold
$3 - 1110 Full-time $15 - 39,999
$2 —••
0 Alik 0
‘11.
0 — 0 Part-time < $15,000
$0 0 •
I
0I I I
40
Year 1 Year 2 Year 3 Year 4 Year 52015 2016 2017 2018 2019
Source: Authors' analysis of LODES, ACS and RIMS data and ES-202 projections.
Full-time < $15,000
Part-time $15 - 39,999
Demographics and Job Characteristics of Affected of Workers
The demographic composition of affected workers is shown in Table 3.9.The table shows
three basic demographic characteristics—age, gender and ethnicity. The first two columns
show the proportion of affected workers in low-earnings industries for the base year-
2014, and the final year--2019. For example, we observe that in 2014, 61 percent of male
28 LOS ANGELES RISING: A City that Works for Everyone

workers in low-earning jobs were working at or below the state's minimum wage. In 2019,81 percent of this group will have been affected by the five sequential increases in theminimum wage. Columns 3 and 4 show these breakouts for mid earning jobs.The last twocolumns breakout the share of affected workers in each demographic group. For example,37 percent of all affected workers in low-earning jobs are between ages 16 and 25.
The share of low-earnings workers affected by the minimum wage will increase by 15-20percent in each demographic group by 2019. For example, over 90 percent of low-earningLatino workers will be affected by the wage increases.Among workers in mid earning jobs, whileall demographic groups show significant increases in coverage, the largest increase will be forLatino workers—from 18 percent affected in 2014 to 65 percent in 2019.Among low-earningsworkers, there will be above average coverage for younger, female, Latino and white workers.
The reason why not every worker with low earnings will be affected by the higherminimum wage is that some part-time workers have a high hourly wage but work so fewhours that their earnings are low.
Table 3.9 Demographics of Affected Workers
Low-paid Latinoworkers, especiallythose who are maleand younger, willbe affected mostimmediately anddeeply,
0/0 of Workers in Earnings Group% of Workers in
Column
Demographics
Low $ Jobs2014 %affected
Low $ Jobs2019 %affected
Mid $ Jobs2014 %affected
Mid $ Jobs2019 %affected
Low $Jobs
2019 %
Mid $Jobs
2019 %Age
Age 16 - 25 65% 80% 19% 60% 370/O 17%
Age 26 - 35 65% 77% 17% 53% 23% 31%
Age 36-4 65% 78% 18% 53% 15% 23%
Age 45 - 55 63% 78% 15% 53% 15% 19%
Age 56 & over 58% 73% 14% 49% 10% 10%
Gender
Male 61% 81% 17% 60% 45% 51%
Female 60% 83% 15% 54% 55% 49%
Race
Asian 59% 80% 17% 53% 13% 16%
Black 56% 80% 19% 52% 12% 12%
Latino 69% 91% 18% 65% 38% 52%
Other 59% 78% 24% 61% 2% 4%
White 53% 76% 11% 48% 35% 17%
Source:Authors' analysis of LODES, ACS and PUMS data
Table 3.10 shows the composition of affected workers by work status and earnings level.Thefirst two columns show the percent of each group that are affected in 2014 and 2019, andthe last two columns show their shares in the total. The proportion of low-earnings full-timeworkers not affected by the minimum wage drops dramatically from 37 percent to just 20percent over 5 years.The largest increase in the number of full-time workers affected, from 17to 48 percent, occurs among niid-earning workers. It is important to note that over the fiveyears, a large number of workers will move from the low-earnings group to the mid-earningsgroup, with its share of workers increasing from 25 to 40 percent. In contrast, the percentageof part-time workers in low-earning jobs leapt from 32 to 52 percent, but their share of thelabor force decreased from 37 to 32 percent. This is because the number of covered workersoverall will increase significantly over 5 years. So even though part-time workers in low-paidindustries are covered at a much higher rate, their share drops due to a higher rate of increase
LOS ANGELES RISING: A City that Works for Everyone 29

among full-time workers working in mid-earning jobs. We also estimate a significant increase
for part-time workers in mid-level earning jobs-their coverage increases from 1 to 10
percent, and their share increases from 1 to 8 percent.
Table 3.10 Composition of Affected Workers by Status and Earnings Level
% of Workers in Row, by Year % of Workers in Column
Work Status and Earnings % Affected 2014 % Affected 2019 % of Affected 2014 % of Affected 2019
Full-time < $15,000 32% 31% 37% 20%
Full-time $15 - 39,999 17% 48% 25% 40%
Part-time < $15,000 32% 52% 37% 32%
Part-time $15 - 39,999 1% 10% 1% 8%
Source:Authors' analysis of LODES,ACS and PUMS data and ES-202 projections.
Finally, in 'Ethic 3.11, we tabulate the industrial composition of affected workers.This table
incorporates projections of industry growth based on trends over the past 15 years in the City
of Los Angeles. It is important to note that these projections show higher rates of growth
in low-earnings jobs than in mid- and high-earnings jobs, indicating that regulation of the
minimum wage is important to prevent increased wage polarization.
Among low-earning workers, there are 10 percent to 30 percent increases in minimum wage
coverage.The coverage increase in mid-earning industries is much higher-in the range of 30
percent-55 percent. In 2019, the industrial composition of low and mid-level industries for
affected workers will not show much divergence, bu.t the share of low-earning employment,
such as in retail trade, education, hotels, and restaurants, is projected to be higher.
Table 3.11 Industrial Composition of Affected Workers
% of Workers in Earnings Group % of Workers in Column
Industry
Low $ Jobs2014 %affected
Low $ Jobs2019 %affected
Mid $ Jobs2014 %affected
Mid $ Jobs2019 %affected
Low $Jobs
2019 %
Mid $Jobs
2019 %
Agriculture & Nurseries 79% 90% 22% 75% 0.7% 0.7%
Construction 63% 82% 17% 58% 4.8% 6.1%
Mfg. Non-Durable 82% 93% 36% 74% 7.1% 8.3%
Manufacturing-Durable 72% 86% 20% 63% 3.1% 6.2%
Wholesale Trade 72% 87% 19% 63% 1.9% 3.6%
Retail Trade 65% 87% 18% 63% 16.3% 13.4%
Transp. & Warehousing 64% 83% 16% 58% 2.7% 4.7%
Information 55% 71% 10% 41% 2.0% 2.5%
Finance & Insurance 55% 76% 6% 43% 1.3% 2.3%
Real Estate 60% 79% 10% 52% 1.7% 2.2%
Professional Services 45% 69% 7% 37% 2.7% 2.7%
Administrative Services 65% 84% 22% 70% 6.6% 8.2%
Education 47% 75% 7% 36% 8.7% 3.9%
Health 60% 83% 11% 53% 10.6% 11.3%
Arts & Entertainment 51% 70% 7% 44% 2.8% 2.1%
Hotels & Restaurants 74% 91% 22% 66% 16.4% 12.9%
Other Services 64% 86% 20% 65% 8.5% 7.8%
Public Administration 61% 84% 11% 42% 1.8% 1.1%
Source: Authors' analysis of LODES, ACS and PUMS data and ES-202 projections.
30 LOS ANGELES RISING: A City that Works for Everyone

Figures 3.3 and 3.4 illustrate the change in coverage—the change in the proportion of
workers affected between 2014 and 2019.These tree maps show both the size of the
industry (the size of the block) and the rate of change in minimum wage coverage (the
block's coloring on a scale from blue for small change to red for large change.)
Figure 3.3 Distribution of Affected Workers among Low Wage Industries
Administrative Arts & Entertainment Hotels & RestaurantsServices
Dries
Construction
Finance & Insurance
Health
Other Services
Professional Services_
RealEstat
PublicAdminis-tration Transportation &
Warehousing
Manufacturing,Durable
ManufacturingNon-durable
Retail Trade
Source: Authors' analysis of LODES, ACS and PUMS data and ES-202 projections.
Among low-paid workers, education stands out with highest rate of increased minimum
wage coverage. Durable goods manufacturing stands in the other end.The larger industries
such as retail trade demonstrate a higher rate of coverage growth than hotels and restaurants.
Among mid-earning industries, the highest rate of change is in nurseries and
greenhouses, but this is a very small industry. Among larger industries, such as
administrative services, waste management, retail trade and repair and personal
services, the growth in minimum wage coverage is greater than in health and
education. Hotels and restaurants rank in the middle.
Comparing Figures 3.3 and 3.4 we also see that for some industries the change is
asymmetrical. For example, workers with education and professional services jobs will
be highly affected in low earning jobs but not for mid-level ones.The reverse is true for
administrative services and waste management and hotels and restaurants.
Economic Boost to the EconomyThe impacts of a $15.25 minimum wage will sustain not just the workers and families
who directly benefit from the raise, but also local businesses that gain from increased
household spending. Workers who receive the infusion of extra income, $3.1 billion for
residents of Los Angeles and $5.9 billion for the region by 2019, will have more money
to spend on basic needs such as groceries, health care, and car repair. In this section, we
calculate the ripple effects of the minimum wage by using an input-output model of Los
Angeles. The model takes into account all the nodes along the supply chain as a product
Wholeslae Trade1
Change in
workers affected
1111 10%
7-7 15%
20%
25%
IIII 30%
LOS ANGELES RISING: A City that Works for Everyone 31
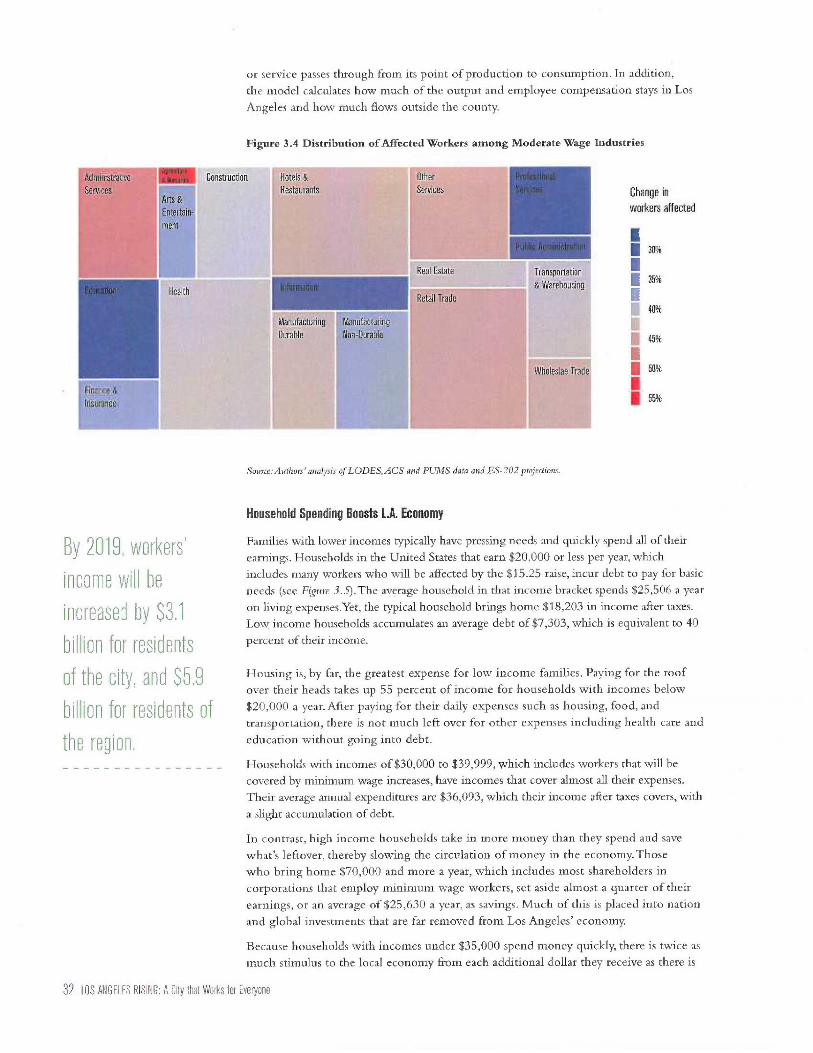
or service passes through from its point of production to consumption. In addition,
the model calculates how much of the output and employee compensation stays in Los
Angeles and how much flows outside the county.
Figure 3.4 Distribution of Affected Workers among Moderate Wage Industries
AdministrativeAgriculture& Nursuries Construction Hotels & Other
Services Restaurants Services WNWArts &Entertain-ment
Finance &insurance
Health
By 201E, workers'
income will be
increased by S3.1
billion for residents
of the city, and S5.9
billion for residents of
the region.
Information
ManufacturingDurable
ManufacturingNon-Durable
Real Estate
fes,777111liCOS
Public Administration
Retail Trade
1.1111.1111111111111
Transportation& Warehousing
Wholeslae Trade
•Source: Authors' analysis of LODES, ACS and PUMS data and ES-202 projections.
Change inworkers affected
T. 30%
35%
40%
45%
50%
55%
Household Spending Boosts L.Q. Economy
Families with lower incomes typically have pressing needs and quickly spend all of their
earnings. Households in the United States that earn $20,000 or less per year, which
includes many workers who will be affected by the $15.25 raise, incur debt to pay for basic
needs (see Figure 3.5). The average household in that income bracket spends $25,506 a year
on living expenses.Yet, the typical household brings home $18,203 in income after taxes.
Low income households accumulates an average debt of $7,303, which is equivalent to 40
percent of their income.
Housing is, by far, the greatest expense for low income families. Paying for the roof
over their heads takes up 55 percent of income for households with incomes below
$20,000 a year. After paying for their daily expenses such as housing, food, and
transportation, there is not much left over for other expenses including health care and
education without going into debt.
Households with incomes of $30,000 to $39,999, which includes workers that will be
covered by minimum wage increases, have incomes that cover almost all their expenses.
Their average annual expenditures are $36,093, which their income after taxes covers, with
a slight accumulation of debt.
In contrast, high income households take in more money than they spend and save
what's leftover, thereby slowing the circulation of money in the economy. Those
who bring home $70,000 and more a year, which includes most shareholders in
corporations that employ minimum wage workers, set aside almost a quarter of their
earnings, or an average of $25,630 a year, as savings. Much of this is placed into nation
and global investments that are far removed from Los Angeles' economy.
Because households with incomes under $35,000 spend money quickly, there is twice as
much stimulus to the local economy from each additional dollar they receive as there is
32 LOS ANGELES RISING: A City that Works for Everyone

from additional dollars received by households with incomes over $150,000. Additionalinformation about these multiplier effects is provided in the Data Appendix.
Figure 3.5: Expenditures of Low, Moderate, and Upper Income Households, U.S., 2013
$100,000
$80,000
$60,000
$40,000
$20,000
$-
II Expenses
III Income
$TK
$18K debt
income
$15,000to
$19,000
EntertainmentOther
Health careTransportation
Food
Housing
$$34K debtincome
1$30,000
to$39,999
Entertainment
Other
Health care
Transportation
Food
Housing
WOKincome
$27Ksavings
$70,000and
higher
Entertainment
Other
Health care
Transportation
Food
Housing
Source: Consumer Expenditure Survey, US. Bureau of Labor Statistics, Table 1202. Income before taxes: Annual expenditure
means, shares, standard errors, and coefficient of variation, Consumer Expenditure Survey, 2013. Data is fiv the United States.
Economic Stimulus from $15.25 Minimum Wage
We estimate that after taxes are paid, a $15.25 minimum wage in 2019 will result in $6.4billion in increased sales for the region, with $3.4 billion staying within the city (see
Figure 3.6: Additional Employment Supported by Minimum Wage Increases). This is an additionof $650 million in spending from multiplier effects on top of the increased wage. Forevery dollar increase in minimum wage earned by households, output in Los AngelesCounty rises by $1.12. The largest share of the increased spending will go to housingproviders (for rent or mortgage payments), almost 20 percent. Another 10 percent
goes towards medical care, a cost that many Angeleno families struggle to pay for (see
Establishing Base/Ceiling in Chapter 7).
The boost to spending is focused on consumer-oriented businesses that require face-to-faceinteractions. Real estate, health care, restaurants and retail are place-based businesses that servea client base that purchases goods and services within the vicinity of where they live (see
Geography of Opportunity, Chapter 5).A majority of the stimulus will benefit establishmentsthat serve Los Angeles residents.This added revenue will boost Los Angeles businesses, manyof them in neighborhoods that until now have had limited purchasing power.
The $15.25 minimum wage will sustain an estimated 46,400 new jobs through expendituresof increased earnings across the region (see Figure 3.7:Additional Employment Supported byMinimum Wage Increases).The bulk of the job creation will be in the City of Los Angeles,where industries that respond to increased household spending will add an estimated 24,875positions.This includes real estate, restaurants, hospitals, and retail.
By 2019, economicoutput will expandby more than half abillion dollars.
LOS ANGELES RISING: A City that Works for Everyone 33

Figure 3.6: Additional Employment Supported by Minimum Wage Increases
$3.0
a $2.0
$1.0
$0.0
im Household Spending Multiplier Effects
Added Worker Income$3.5
$3.0$2.8
$2.4
$2.2
$1.9
$1.3
$1.1
$0.5$0.4
City of ' A Beyond City of LA Beyond City of I A Beyond City of LA Beyond City of LA Beyond
Year 1 Year 2 Year 3 Year 4 Year 5($10.25) ($11.75) ($13.25) ($14.25) ($15.25)
Source: IMPLAN version 3.1 software with IMPLAN data for Los Angeles County in 2013.
Figure 3.7: Additional Employment Supported by Minimum Wage Increases
Addi
tona
l Job
s Su
ppor
ted
50,000
40,000
30,000
20,000
10,000
0
.Other Counties
. Balance of LA CountyCity of Los Angeles
17,231
Year 2($11.75)
29,635
Year 3($13.25)
37,643
Year 4($14.25)
Source: IMPLAN version 3.1 software with IMPLAN data for Los Angeles County in 2013
46,400
Year 5($15.25)
The region will benefit from increased employment starting with the first year the
minimum wage increase is implemented. More than 7,000 jobs will be created when the
minimum wage is raised to $10.25.The multiplier impacts increase over five years as the
wage floor rises. By 2019, not only will the city enjoy an estimated 24,875 more jobs, but
Los Angeles County will benefit from 15,095 in increased employment. Other counties
where Los Angeles workers may live or travel to will reap 6,430 new jobs.
Increased sales and employment are projected to generate $960 million in increased
public revenue by 2019. State and local governments will receive $414 million and the
34 LOS ANGELES RISING: A City that Works for Everyone

federal government $546 million. Social safety net programs such as Social Security, State
Disability Insurance,Worker's Compensation and Unemployment Insurance as well as the
general budgets of local, state and federal government will receive an infusion of new funds
to meet the needs of people in Los Angeles, the state and the nation.
Estimated Reduction in Public Assistance SpendingLos Angeles County public assistance programs cover a large population.The working
poor are a significant part of public aid recipients. In December 2013, there were
over 2,65 million persons receiving at least one type of aid (County of Los Angeles,
Department of Public Social Services, statistical report, December 2013). Medical
assistance recipients make up the largest group with over 1.87 million persons followed
by 1.77 million Cal-Fresh recipients.
We have estimated how the proposed minimum wage law will affect the public assistance
spending for three large programs-medical assistance (Medi-Cal), Cal-Fresh and cash
aid (CalWORKs and General Relief programs).We use PUMS data to estimate program
participation and average aid amounts in 2014, before minimum wage increases begin, and in
2019, after the final increment of increases. Then, we estimate the reduction in participation
rates and apply these numbers to our estimates of workers affected by the proposed minimum
wage law based on LODES data.We build all our estimations by gender, ethnicity and work
status-full-time vs. part-time to reflect significant differences among groups.A description
of the estimation methodology is provided in the Data Appendix.
Table 3.12 Estimated Reduction in Public Assistance Participation between 2014 and 2019
At the end offive years, publicassistance paymentswould be reduced byS314 million.
Gender-Ethnicity-Work Status0/0 of
AffectedCF part. %
2014CF %impact
Medi-Calpart. % 2014
Medi-Cal %impact
Cash aid part% 2014
Cash aid% Impact
Asian-Male-Full Time 4.3% 6.8% 4.4% 33.9% 2.9% 2.9% 2.2%
Asian-Male-Part Time 2.2% 7.8% 4.3% 33.4% 1.5% 2.2% 1.6%
Asian-Female-Full Time 4.3% 4.3% 3.2% 32.9% 4.2% 2.1% 0.0%
Asian-Female-Part Time 2.7% 7.2% 1.5% 34.8% 6.7% 2.3% 0.0%
Black-Male-Full Time 3.1% 15.8% 11.8% 34.8% 4.6% 3.2% 2.4%
Black-Male-Part Time 1.9% 22.9% 14.8% 36.8% 19.4% 8.6% 7.0%
Black-Female-Full Time 3.3% 22.1% 3.6% 39.4% 14.2% 7.8% 2.3%
Black-Female-Part Time 2.4% 28.6% 10.8% 43.6% 0.0% 14.6% 4.0%
Latino-Male-Full Time 14.8% 17.0% 7.2% 52.0% 10.5% 2.9% 1.1%
Latino-Male-Part Time 7.0% 17.3% 4.7% 47.6% 2.7% 4.2% 1.4%
Latino-Female-Full Time 14.0% 15.8% 9.2% 51.2% 14.1% 3.7% 1.6%
Latino-Female-Part Time 9.6% 20.1% 6.7% 54.5% 17.2% 6.3% 2.7%
Other-Male-Full Time 0.9% 11.3% 9.2% 31.4% 26.0% 2.6% 0.0%
Other-Male-Part Time 0.4% 14.4% 0.0% 25.6% 21.7% 10.2% 10.2%
Other-Female-Full Time 0.8% 8.4% 0.0% 32.6% 2.8% 3.9% 3.9%
Other-Female-Part Time 0.5% 12.2% 0.0% 26.1% 0.0% 3.9% 0.0%
White-Male-Full Time 7.0% 5.9% 3.3% 20.0% 9.1% 2.8% 0.0%
White-Male-Part Time 6.6% 7.4% 2.4% 19.5% 5.2% 3.1% 0.0%
White-Female-Full Time 6.8% 4.5% 2.2% 18.8% 3.9% 1.9% 0.6%
White-Female-Part Time 7.7% 7.9% 1.5% 20.5% 0.9% 4.0% 0.9%
Source: Authors' analysis of PUMS, ACS and LODES data
LOS ANGELES RISING: A City that Works for Everyone 35

The estimated reduction in public assistance expenditures for Cal-Fresh, Medi-Cal and
cash aid programs is shown in Table 3.12. We show the proportion of each gender-
ethnicity-work status sub-group in the total of 723,000 workers affected by the
minimum wage increase. The largest sub-group is Latino workers, making 45 percent
of the public assistance population affected by minimum wage increases. Next, we
show the participation rate of each sub-group in the Cal-Fresh program. Black female
workers with part-time jobs have the highest participation rate, close to 30 percent,
followed by other Black and Latino workers.We show the net impact of spending in
the Cal-Fresh program in column three, which we calculate by taking the difference
between participation rates in the base year (higher rate) and 2019 (lower rate) when
the minimum wage rises to $15.25. If the difference is not significant, we show it as no
impact with 0 percent.
We observe the largest reduction in Cal-Fresh payments among Black male workers,
Black female workers with part-time jobs and Latino female workers with full-time jobs.
The next four colunms show the participation rates and net reduction for Medi-Cal
and cash aid programs.We observe the highest participation in medical assistance among
Latino workers followed by Black and Asian workers. The reduction in medical assistance
resembles the impact in the Cal-Fresh program affecting the same groups at the highest
rates. The participation in cash aid programs is much lower and we observe the largest net
impact for part-time Black and Other male workers.
We show the estimated reduction in public assistance payments in Table 3.13. The numbers
are derived by applying average payment amounts to the net impact values we present
in Table 3.12. The last column shows the proportion of sub-groups in total reduction in
public assistance payments.
We estimate a total of $184.1 million reduction in Cal-Fresh payments by the end of full
implementation of the proposed minimum wage law.Within this total, Latino workers will
experience the largest decrease, $115 million, followed by Black workers.
We estimate a reduction in medical assistance payments of approximately $143 million.
Latino workers will experience the largest decrease, $65 million, followed by White
workers.We estimate that there will be a $14 million in reduction in cash payments. Over
all, we estimate a total annual reduction of $314 million in public assistance payments by
the end of the fifth year. Over 60 percent of the reduction is attributable to reduced public
assistance benefits for Latino workers whose increased earnings will lift them out of the
social safety net.
The total estimated savings of $314 million is not cumulative savings but savings in the
fifth year. There will be gradual increases in the reduction in public assistance payments
in each year. We project a linear increase as shown in table 3 that will yield a total of $942
million in savings over 5 years.
36 LOS ANGELES RISING: A City that Works for Everyone

3.13: Estimated Reduction in Public Assistance Payments in 2019
Gender-Ethnicity-Work Status Cal-FreshDecrease
Medi-CalDecrease
Cash aid Decrease
Total Public AidDecrease
% ofDecrease
Asian-Male-Full Time $5,719,893 $1,454,304 $318,267 $7,492,465 2.2%
Asian-Male-Part Time $3,369,532 $493,460 $24,468 $3,887,460 1.1%
Asian-Female-Full Time $5,622,014 $2,648,672 $0 $8,270,686 2.4%
Asian-Female-Part Time $1,750,426 $3,038.957 $0 $4,789,383 1.4%
Black-Male-Full Time $10,563,266 $2,994,222 $6,519 $13,564,007 4.0%
Black-Male-Part Time $4,666,242 $4,954,328 $67,833 $9,688,403 2.8%
Black-Female-Full Time $4,483,602 $8,349,711 $1,100,882 $13,934,195 4.1%
Black-Female-Part Time $9,302,629 $0 $3,506,269 $12,808,899 3.8%
Latino-Male-Full Time $39,351,896 $28,093,565 $1,161,286 $68,606,747 20.1%
Latino-Male-Part Time $12,073,036 $3,544,947 $954,443 $16,572,426 4.9%
Latino-Female-Full Time $43,597,725 $30,623,135 $2,206,046 $76,426,906 22.4%
Latino-Female-Part Time $21,910,690 $28,221,879 $3,211,469 $53,344,038 15.6%
Other-Male-Full Time $1,209,534 $3,242,042 $0 $4,451,577 1.3%
Other-Male-Part Time $0 $685,379 $0 $685,379 0.2%
Other-Female-Full Time $0 $668,559 $0 $668,559 0.2%
Other-Female-Part Time $0 $0 $0 $0 0.0%
White-Male-Full Time $9,953,450 $13,135,546 $0 $23,088,996 6.8%
White-Male-Part Time $3,782,276 $5,808,349 $0 $9,590,625 2.8%
White-Female-Full Time $4,073,463 $4,153,073 $230,795 $8,457,331 2.5%
White-Female-Part Time $2,664,603 $946,119 $1,286,623 $4,897,346 1.4%
Total $184,094,279 $143,056,247 $14,074,901 $341,225,426 2.2%
Source: Audio!, analysis of PUMS,ACS and LODES data
Table 3.14: Estimated Cumulative Reduction in Public Assistance Payments between
2014 and 2019
Year1 $10.25 Year 2 $11.75 Year 3 $13.25 Year 4 $14.25 Year 5 $15.25
Annual Reductions $62,800,000 $125,600,000 $188,400,000 $251,000,000 $314,000,000
Cumulative Reduction $62,800,000 $188,400,000 $376,800,000 $627,800,000 $941,800,000
Source: Authors' analysis of PUMS,ACS and LODES data
LOS ANGELES RISING: A City that Works for Everyone 37

Industry Resilience
38 LOS ANGELES RISING: A City that Works for Everyone

Industries that are Vost Sensitive to Wage Increases
Overview
Crosscurrents from a higher minimum wage will include new sources of economic stimulus Larc_er, more resilientas well as the need for significant adjustments by low-wage businesses. Information aboutlikely industry effects is a tool for anticipating and managing the impacts of a higher employers account forminimum wage.
We proceed from a detailed analysis of current industry employment, wages, profits, rates most jobs.of growth-decline, and value added within the region.These data are analyzed to identifysix different criteria for flagging industries that may be most stressed by increases in theminimum wage.
Application of these six criteria suggest that seven of 26 industries are likely to be mostsensitive to increases in the minimum wage. Mitigating factors for potential adverse impactson the seven industries are identified below.
Other chapters of this report identify and discuss additional factors that can shape industries'
success in maintaining robust employment while paying higher wages. First, the geographic
distribution of low-wage jobs — the share that are in communities that can readily absorbslight cost increases for needed services. Second, the local economic stimulus that results fromchanneling more business revenue into paying workers' wages. Third, the agility of employersin developing business models that factor in the requirement to pay sustaining wages.
Figure 4.1 — Number of Establishments and Employees in the City of Los Angeles Based
on Firm Size, 2011
1,000± Employees
500-999 Employees
250-499 Employees
100-249 Employees2 0
50-99 Employees3u1
20-49 Employees
10-19 Employees
5-9 Employees
8",
7%
7%1-4 Employees
<0,5 Employees 0.1%
-13C0
15%
15%
Percent ofEmployment
Percent ofEstablishments
55%
Mill 8%1 I 1 i 1 1 1
0% 10% 20% 30% 40% 50% 60%
Data source: Quarterly Census of Employment and Wages (QCEW). Private household employment excluded
LOS ANGELES RISING: A City that Works for Everyone 39

Establishments
with five or more
employees have a far
hic kher survival rate
than those that are
smaller.
At the establishment level, the effect of higher wages on employment levels is likely to
vary depending on whether establishments are large or small, industries are growing or
declining, wages are high or low, workers' wages consume a large or small share of firm
revenue, the amount of profit generated per worker is large or small, and the amount of
value created by each worker is large or small. Each of these factors is discussed below.
Effects of establishment size
Establishments of different sizes have different roles in the city's economic ecology. Small
employers are seedbeds of job generation and innovation as well as the source of most
business startups and closures. Larger, more resilient employers account for most jobs.
At the upper end of the size range, a tenth of one percent of employers have one
thousand or more employees, but they account for 20 percent of total employment.
Only 2 percent of establishments have 100 or more employees and they account for 50
percent of total employment. A table showing the size distribution of establishments in
each industry is provided in the Data Appendix.
The majority of businesses are small: 55 percent have four or fewer employees.
Combined, however, these establishments account for a minor share of total
employment, only 7 percent (Figure 4.1.) Eight percent are "micro-employers,"
employing one worker for five or fewer months and accounting for a tenth of one
percent of total employment.
Figure 4.2 One-Year Survival Rate by Establishment Size City of Los Angeles 2010 to 2011
ALL ESTABLISHMENTS
1,000+ Employees
500-999 Employees
250-499 Employees
100-249 Employees
50-99 Employees
20-49 Employees
89%
10-19 Employees rommumpomplaj 96%
5-9 Employees 95%
1-4 Employees lir lliffr 1 86%
<0.5 Employees 35%
11111111111111111111!
0% 25% 500/o 75% 100%Establishments Continuing Operations 2010 to 2011
Data source: Quarterly Census of Employment and Wages, QCEW, private households excluded.
Among households that report employees, 99.9 percent employ four or less people.
(Private household employment is not shown in Figures 4.1 to 4.4.) In setting the scope
40 LOS ANGELES RISING: A City that Works for Everyone
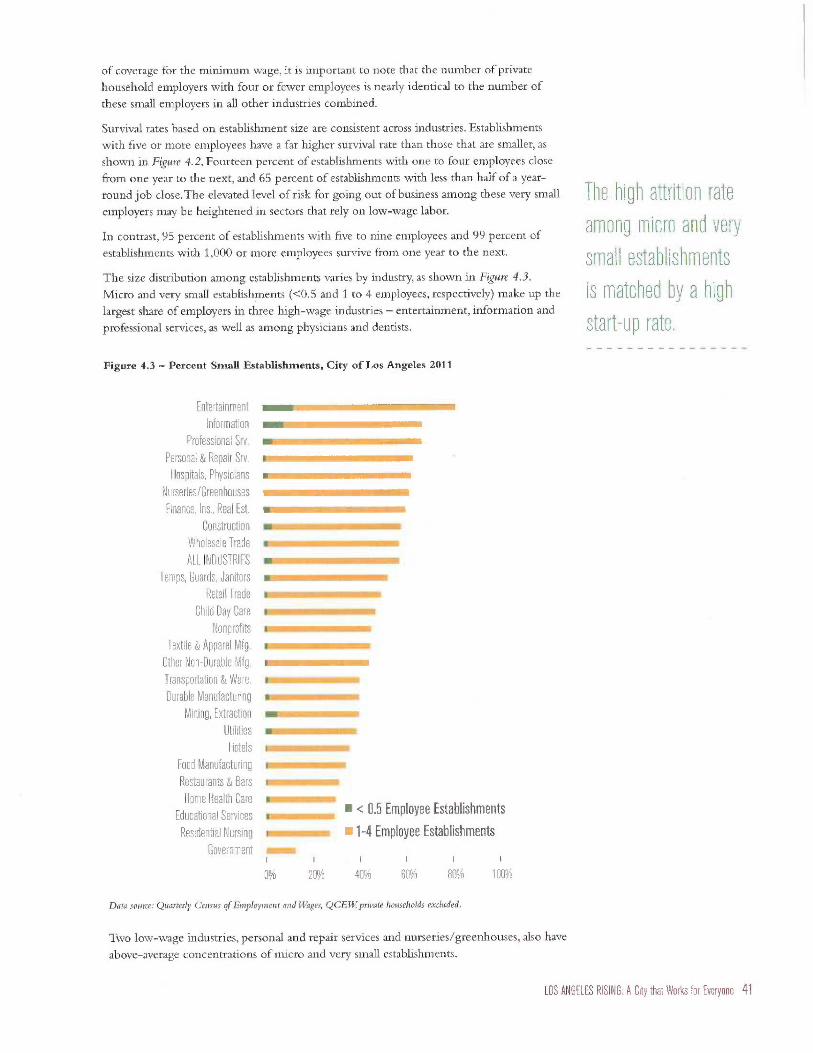
of coverage for the minimum wage, it is important to note that the number of private
household employers with four or fewer employees is nearly identical to the number of
these small employers in all other industries combined.
Survival rates based on establishment size are consistent across industries. Establishments
with five or more employees have a far higher survival rate than those that are smaller, as
shown in Figure 4.2. Fourteen percent of establishments with one to four employees close
from one year to the next, and 65 percent of establishments with less than half of a year-
round job close. The elevated level of risk for going out of business among these very small
employers may be heightened in sectors that rely on low-wage labor.
In contrast, 95 percent of establishments with five to nine employees and 99 percent of
establishments with 1,000 or more employees survive from one year to the next.
The size distribution among establishments varies by industry, as shown in Figure 4.3.
Micro and very small establishments (<0.5 and 1 to 4 employees, respectively) make up the
largest share of employers in three high-wage industries — entertainment, information and
professional services, as well as among physicians and dentists.
Figure 4.3 — Percent Small Establishments, City of Los Angeles 2011
EntertainmentInformation
Professional Srv.Personal & Repair Srv.Hospitals, Physicians
Nurseries/GreenhousesFinance, Ins., Real Est.
ConstructionWholesale TradeALL INDUSTRIES
Temps, Guards, JanitorsRetail Trade
Child Day CareNonprofits
Textile & Apparel Mfg.Other Non-Durable Mfg.Transportation & Ware.Durable Manufacturing
Mining, ExtractionUtilitiesHotels
Food ManufacturingRestaurants & BarsHome Health Care
Educational ServicesResidential Nursing
Government
118111111111111111111111111116
■ < 0.5 Employee Establishmentsnommomma111111111.1111111111•11111 L" 1-4 Employee EstablishmentsMN=
0% 20% 40% 60% 80% 100%
Data source: Quarterly Census of Employment and Wages, QCELV private households excluded.
Two low-wage industries, personal and repair services and nurseries/greenhouses, also have
above-average concentrations of micro and very small establishments.
The high attrition rate
among micro and very
small establishmentsis matched by a high
start-up rate.
LOS ANGELES RISING: A City that Works for Everyone 41

Four-fifths of all jogslocated in the Cityof Los Angeles areservice jobs that entailone person providingservices to anotherperson.
The high attrition rate among micro and very small establishments is matched by a highstart-up rate, as shown in Figure 4.4. Fifty percent of micro establishments and 22 percentof very small establishments have come into existence in the past year. These very smallemployers are a source of new jobs, business innovation and experimental responses tonew opportunities.
Figure 4.4 — Percent of Establishments that Are Start-Ups City of Los Angeles 2011
ALL ESTABLISHMENTS f 174c
1,000+ Employees 00
500-999 Employees III 3%
250-499 Employees Ill 3%
100-249 Employees • 3%
50-99 Employees MI 5%
20-49 Employees
10-19 Employees mil 7%
5-9 Employees
1-4 Employees
<0.5 Employees
I. 6%
22%
50%
in) 20% 40% 60%
% of Establishments in Size Group Starting in Past Year
Data source: Quarterly Census of Employment and Wages, QCELK private households excluded.
In the normal course of events, there is stability among large employers and a high rateof closures and start-ups among very small employers.This pattern should be monitoredduring the course of raising the minimum wage, to assess possible adverse effects andtiming of wage increases.
Following implementation of the minimum wage, higher concentrations of start-upsin low-income communities would be evidence that the increase in take-home pay isdiversifying and broadening business growth.
Industry size
One of the city's strengths is the diversity of its industries. The 26 industry sectors shown inFigure 4.5 are grouped based on homogeneous wage levels within sectors, with particularattention paid to providing more detailed breakouts of low-wage industries.' These 26sectors cover the entire range of industries in Los Angeles. Low-wage industries aredenoted by red bars.
42 LOS ANGELES RISING: A City that Works for Everyone

Four-fifths of all jobs located in the City of Los Angeles are service jobs that entail one
person providing services to another person. Education is the largest service employer,
followed by retail trade, health care, professional services, financial activities, restaurants and
bars, and government, as shown in Figure 4.5. Only one-fifth of jobs entail extracting raw
materials, making goods out of those materials, or moving goods.
Figure 4.5 - Industry Jobs Located in City of Los Angeles, 2011
Educational ServicesRetail Trade
Hospitals, PhysiciansProfessional Srv,
Finance, Ins., Real Est.Restaurants & Bars
GovernmentTemps, Guards, JanitorsPersonal & Repair Srv.Transportation & Ware,
Wholesale TradeInformationNonprofits
Durable ManufacturingConstruction
EntertainmentTextile & Apparel Mfg.
Residential NursingOther Non-Durable Mfg.
HotelsUtilities
Food ManufacturingHome Health Care
Child Day CareNurseries/Greenhouses
Mining & Extraction
159,584
137,368
122,677
121,411
117.094
113,776
99,148
87,668
87,460
68,749
68,661
67,060
60,399
47,586
35,990
34,233
29,196
26,562
▪ 19,49016.892
•• 13,628
no 10,269
. 9,001
■ 5,981
I 1,710
I 1,277
50,000 100,000 150,000 200,000
2011 Employment in LA City's Formal Economy
Data source: Quarterly census of Employment and Wages, QCEW Low-wage industries are denoted by red bars.
Industry growth trajectories
Because Los Angeles' industry structure changes steadily as markets for products and
services change, impacts to a particular industry are better understood in the context of
these growth dynamics.
The highest rates of industry growth over the past fifteen years hare been in personal
and repair services, mining,' home health care, child day care, restaurants, entertainment,
and professional services, as shown in Figure 4.6.3 There has been modest overall average
employment growth of 0.2 percent a year.This growth can potentially mitigate any drag
that may result from wage increases.
A few industries have significantly declined.The highest rate of decline is in textile and
apparel manufacturing, which has lost over half of its employment during the past fifteen
years, typically losing 3.8 percent of jobs it had in 1996 each year.The entire durable
manufacturing sector has lost 2.9 percent of jobs a year, non-durable manufacturing
excluding apparel and food has lost 2.7 percent of jobs a year, the information sector has
lost 2.4 percent of jobs a year, much of it attributable to job losses at newspapers, and
62 percent of thecity's full-time residentlabor force is alreadypaid at least S15.25an hour.
LOS ANGELES RISING: A City that Works for Everyone 43
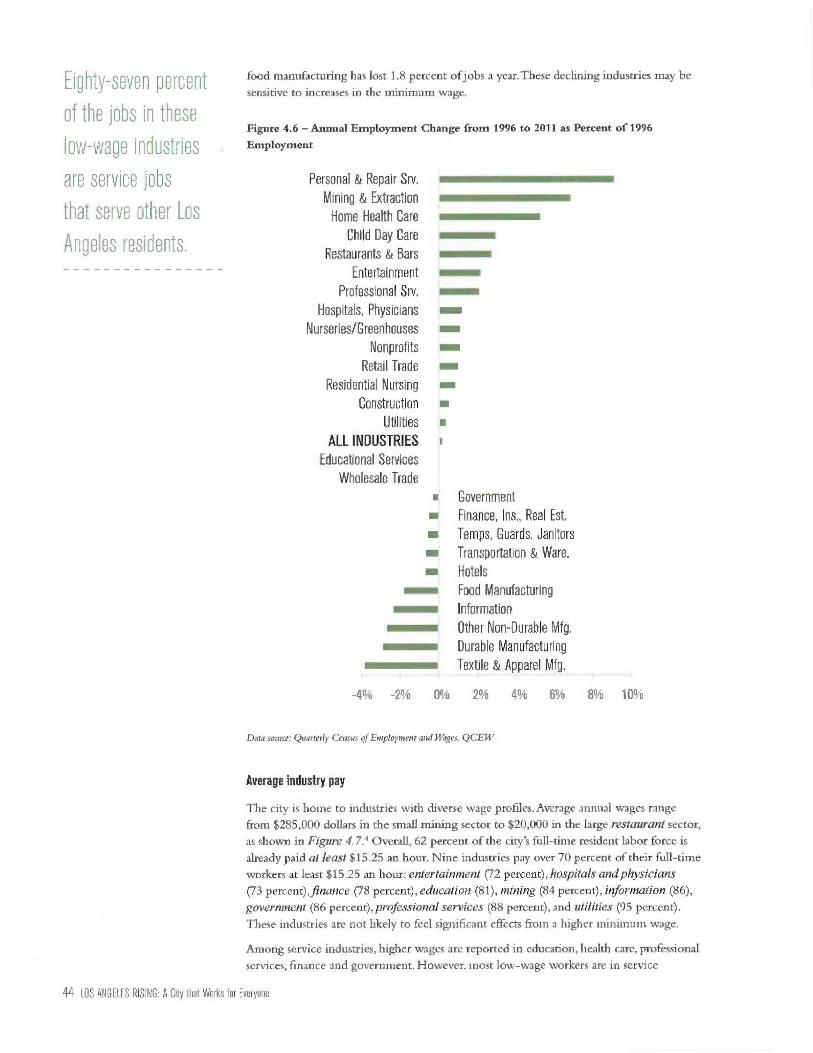
Eighty-seven percentof the jobs in theselow-wage industries
are service jobsthat serve other LosAngeles residents.
food manufacturing has lost 1.8 percent of jobs a year. These declining industries may be
sensitive to increases in the minimum wage.
Figure 4.6 — Annual Employment Change from 1996 to 2011 as Percent of 1996
Employment
Personal & Repair Srv.Mining & ExtractionHome Health Care
Child Day CareRestaurants & Bars
EntertainmentProfessional Srv.
Hospitals, PhysiciansNurseries/Greenhouses
NonprofitsRetail Trade
Residential NursingConstruction
UtilitiesALL INDUSTRIES
Educational ServicesWholesale Trade
A
AIM
GovernmentFinance, Ins., Real Est.Temps, Guards, JanitorsTransportation & Ware.HotelsFood ManufacturingInformationOther Non-Durable Mfg.Durable ManufacturingTextile & Apparel Mfg.
-4% -2% Ofl/o 1 L u 8% 10%
Data source: Quarterly Census of Employment and Wages, QCEW
Average industry pay
The city is home to industries with diverse wage profiles. Average annual wages range
from $285,000 dollars in the small mining sector to $20,000 in the large restaurant sector,
as shown in Figure 4.7.4 Overall, 62 percent of the city's full-time resident labor force is
already paid at least $15.25 an hour. Nine industries pay over 70 percent of their full-time
workers at least $15.25 an hour: entertainment (72 percent), hospitals and physicians
(73 percent),finance (78 percent), education (81), mining (84 percent), information (86),
government (86 percent), professional services (88 percent), and utilities (95 percent).
These industries are not likely to feel significant effects from a higher minimum wage.
Among service industries, higher wages are reported in education, health care, professional
services, finance and government. However, most low-wage workers are in service
44 LOS ANGELES RISING: A City that Works for Everyone

industries like retail trade and restaurants that provide services for improving the lives ofother Los Angeles residents. They prepare and serve food, sell goods at stores, clean offices,provide personal care, and transport people and goods to desired destinations.
Nine low wage industries, where average wages for all workers from line staff through topmanagers average under forty thousand dollars a year, are personal and repair services($20,000), child day care ($26,000), home health care ($31,000), nurseries/ greenhouses($32,000), textile and apparel manufacturing ($33,000), hotels (before the hotel minimumwage was enacted, $33,000), retail trade ($33,000), residential care and nursing facilities
($34,000), administrative support, waste management and remediation services (temp,guards, janitors - $38,000).
The percent of the city's resident labor force employed in each industry that earn less than the
current equivalent of $15.25 an hour in 2019 (estimated to be $13.93) is shown in Figure 4.8.6
The eight lowest-paying industries (Figure 4.7) show up in Figure 4.8, not surprisingly,
with the highest percentage of full-time workers earning less than $15.25 an hour. Food
manufacturing and construction also are in that low-wage list. Eighty-seven percent of the
jobs in these low-wage industries are service jobs that serve other Los Angeles residents
(with half or more workers earning less than $15.25).
Figure 4.7 — Average Annual Pay in City of Los Angeles Industries 2011 wages
adjusted to 2014 S
Mining & ExtractionInformation
EntertainmentUtilities
Finance, Ins., Real Est.Professional Srv.
NommiE AmmememmiS285
$116
S110
S108
5104
S92
Government S82
Hospitals, Physicians S67
Durable Manufacturing misimeimmim 884
ALL INDUSTRIES S60
Other Non-Durable Mfg. S60
Educational Services S56
Wholesale Trade S55
Transportation & Ware. 555
Construction S51
Nonprofits S46
Food Manufacturing S42
Temps, Guards, Janitors 538
Residential Nursing S34
Retail Trade 533
Hotels S33
Textile & Apparel Mfg. S33
Nurseries/Greenhouses S32
Home Health Care S31
Child Day Care emene S26
Personal & Repair Srv. S20
Restaurants & Bars S201 1 1 1 1 1 1
SO S25 S50 S75 S100 S125 8150
Annual Pay in Thousands of 2014 S
Data source: Quarterly Census of Employment and Wages, QCEW
Industries in LosAngeles Countyspend 30 percent of
revenue on employeecompensation,
LOS ANGELES RISING: A City that Works for Everyone 45

Industries in LosAngeles Countygenerate an average of541,000 in profit perworker,
Figure 4.8 — Percent of Full-Time Workers Residing in the City of Los Angeles Paid Less
than $15.25 an Hour
Nurseries/GreenhousesTextile & Apparel Mfg.
Restaurants & BarsFood Manufacturing
Personal & Repair Srv.Temps, Guards, Janitors
Child Day CareConstruction
Home Health CareHotels
Retail TradeResidential Nursing
Other Non-Durable Mfg.Durable ManufacturingTransportation & Ware.
Wholesale TradeALL INDUSTRIES
NonprofitsEntertainment
Hospitals, PhysiciansFinance, Ins., Real Est.Educational ServicesMining & Extraction
InformationGovernment
Professional Srv.Utilities
MIL 1111111111•1 76%
75%
11111MIMIIIIIIIIIILAIN 73%
66%
64%
59%
54%
50%
50%
49%
49%
47%
41%
41%
40%
40%
38%
36%
28%
27%
22%
19%
16%
14%
14%
Mil 12%
5%
0% 20%
Data source:American Community Survey PUMS 2009-2013
40% 60% 80%
Share of industry revenue used to compensate workers
The likely impact of minimum wage increases on establishments can be understood
more clearly by considering three other factors: industry revenues, measures of
economic value-added, and profit per worker. This data is available only at the county
level, but is valuable for understanding the financial environment of businesses in
the city.
The percent of industry revenue that goes toward compensating workers is shown in
Figure 4.9,7 with low-wage industries denoted by red bars.
On average, industries in Los Angeles County spend 30 percent of revenue on
employee compensation. However, some industries are more labor intensive than
others. Industries that spend above 30 percent average revenue for employee
compensation account for 24 percent of employment in the city. A sub-group of
these labor-intensive industries paying below-average wages includes residential nursing
care (62 percent), home health care (61 percent) temps, guards and janitors (52 percent),
child day care (50 percent), restaurants and bars (40 percent), nurseries/greenhouses (36
percent), and retail trade (36 percent).
46 LOS ANGELES RISING: A City that Works for Everyone
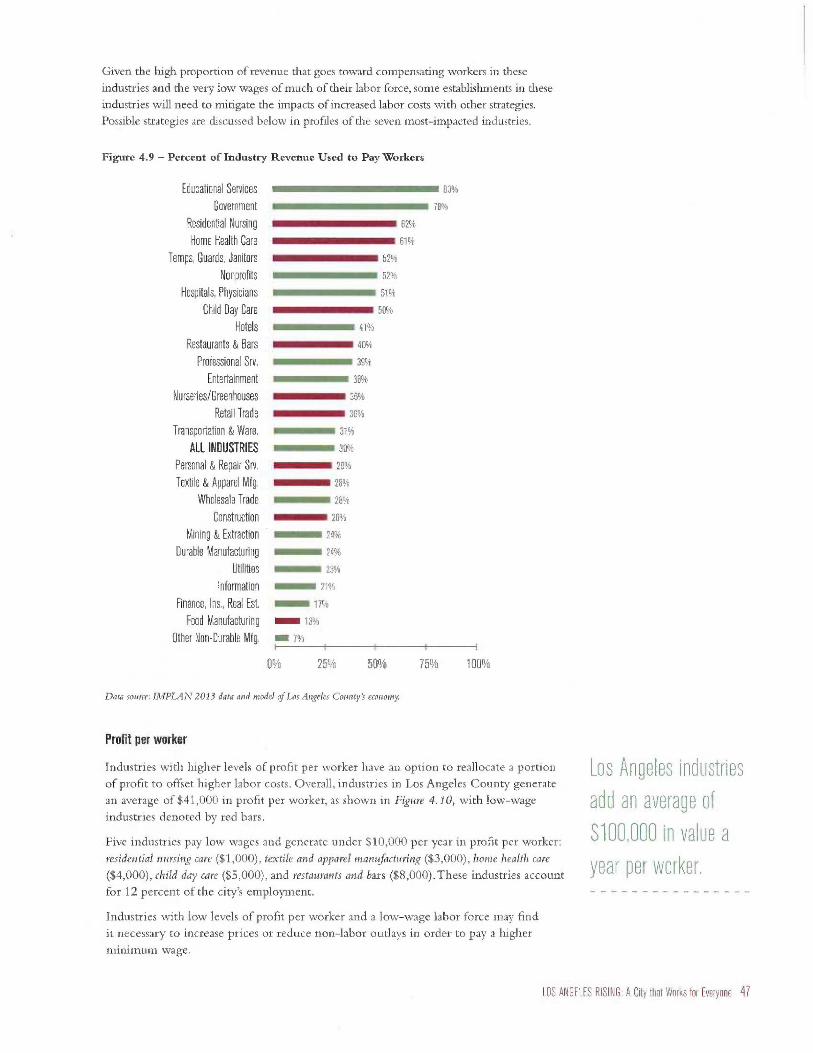
Given the high proportion of revenue that goes toward compensating workers in these
industries and the very low wages of much of their labor force, some establishments in these
industries will need to mitigate the impacts of increased labor costs with other strategies.
Possible strategies are discussed below in profiles of the seven most-impacted industries.
Figure 4.9 — Percent of Industry Revenue Used to Pay Workers
Educational ServicesGovernment
Residential NursingHome Health Care
Temps, Guards, JanitorsNonprofits
Hospitals, PhysiciansChild Day Care
HotelsRestaurants & Bars
Professional Srv.Entertainment
Nurseries/GreenhousesRetail Trade
Transportation & Ware.ALL INDUSTRIES
Personal & Repair Srv.Textile & Apparel Mfg.
Wholesale TradeConstruction
Mining & ExtractionDurable Manufacturing
UtilitiesInformation
Finance, Ins., Real Est.Food Manufacturing
Other Non-Durable Mfg.
iimiammommimisi 83%
78%
52%
52%
51%
50%
62%
61%
41%
40%
39%
38%
36%
36%
31%
30%
28%
28%
28%
26%
24%
24%
23%
21%
17%
— 13%
MO 7%
0% 25% 50% 75% 100%
Data source: IMPLAN 2013 data and model of Los Angeles County's economy.
Profit per worker
Industries with higher levels of profit per worker have an option to reallocate a portion
of profit to offset higher labor costs. Overall, industries in Los Angeles County generate
an average of $41,000 in profit per worker, as shown in Figure 4.10, with low-wage
industries denoted by red bars.
Five industries pay low wages and generate under $10,000 per year in profit per worker:
residential nursing care ($1,000), textile and apparel manufacturing ($3,000), home health care
($4,000), child day care ($5,000), and restaurants and bars ($8,000).These industries account
for 12 percent of the city's employment.
Industries with low levels of profit per worker and a low-wage labor force may find
it necessary to increase prices or reduce non-labor outlays in order to pay a higher
minimum wage.
Los Angeles industriesadd an averace of5100,000 in value ayear per worker.
LOS ANGELES RISING: A City that Works for Everyone 47

At least two low-wage
industries obtain a
substantial share of
their revenue from
govern Tent agencies.
Figure 4.10 — Profit per Worker
Information $221
Other Non-Durable Mfg. $156
Utilities $142
Mining & Extraction $114
Finance, Ins., Real Est. $110
Wholesale Trade $46
Professional Sit $46
ALL INDUSTRIES $41
Durable Manufacturing $35
Entertainment $29
Food Manufacturing $28
Nurseries/Greenhouses II= $22
Hotels NM $20
Personal & Repair Srv. MI $17
Construction =I $17
Retail Trade I= $16
Hospitals, Physicians $14
Transportation & Ware.• $12
Temps, Guards, Janitors• $12Restaurants & Bars ■ $8
Child Day Care ■ $5
Educational Services ■ $5
Home Health Care I $4
Textile & Apparel Mfg. I $3
Residential Nursing I $1
$0 $50 $100 $150 $200 $250
Profit per Worker in LA County, Thousands of 2014$
Data source: IMPLAN 2013 data and mode! of Los Angeles County's economy.
Value added per worker
Another important indicator to consider for assessing broader economic impacts on the City
and the region is the measure of value added per worker. Wages paid to workers who provide
the services that generate revenue comprise a major portion of value that establishments
create. The value created by industries roughly equates to the sum of profit, employee
compensation and taxes.' Los Angeles industries add an average of $100,000 in value a year
per worker, as shown in Figure 4.11, with low-wage industries denoted by red bars.
Low-wage, labor-intensive industries are likely to add low levels of value per worker.
Eight low-wage industries add less than $50,000 a year in value per worker: child day care
($33,000), home health care ($33,000), restaurants and bars ($36,000), residential nursing care
($41,000), personal and repair services ($43,000), temps, guards and janitors ($44,000), textile and
apparel manufacturing ($46,000), nurseries /greenhouses ($447,000).These industries account for
18 percent of the city's employment.
Low levels of added value are in large measure an outgrowth of low wages. Paying higher
wages for services that continue to be purchased by Los Angeles residents will increase the
economic value these industries contribute to the city and the region.
The success of service establishments in paying higher wages and thereby increasing the
amount of value they create will be shaped by the three factors identified earlier: the
geographic distribution of low-wage jobs, the local economic stimulus from channeling
more business revenue to paying workers' wages, and the agility of employers in developing
business models for paying sustaining wages.
48 LOS ANGELES RISING: A City that Works for Everyone
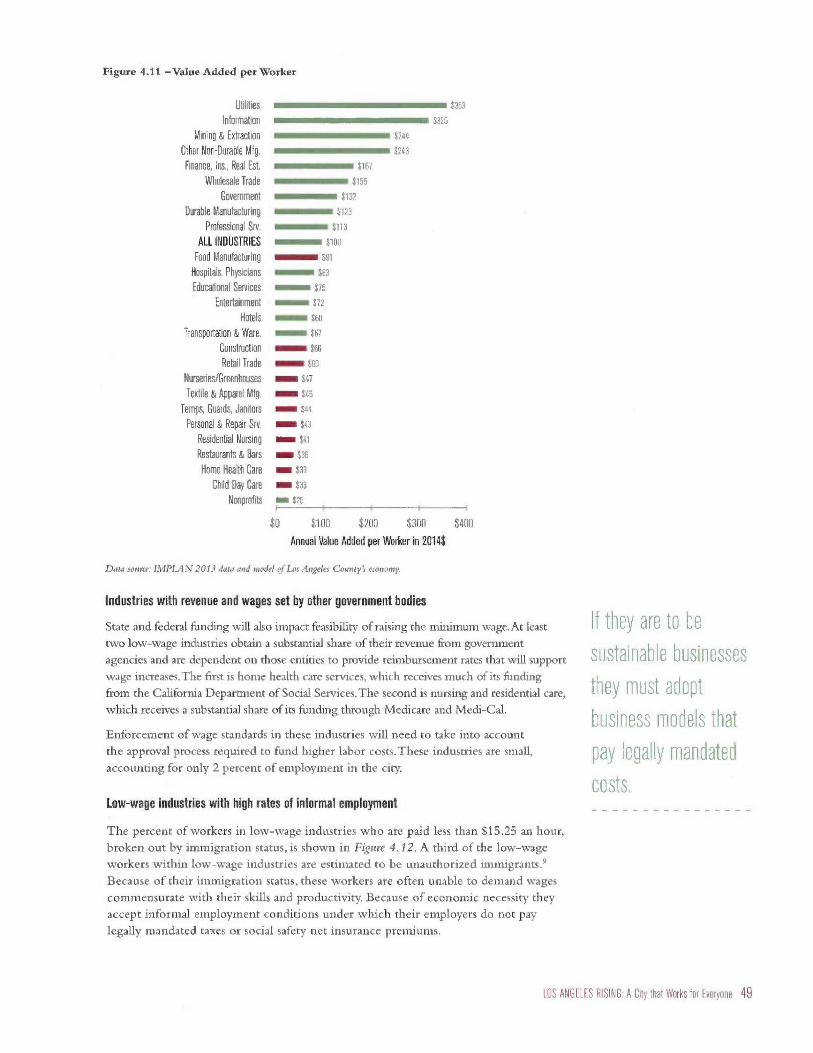
Figure 4.11 —Value Added per Worker
Utilities $363
Information $325
Mining & Extraction $244
Other Non-Durable Mfg, $243
Finance, Ins., Real Est. $167
Wholesale Trade $155
Government $132
Durable Manufacturing $123
Professional Srv. $113
ALL INDUSTRIES $100
Food Manufacturing $91
Hospitals, Physicians $83
Educational Services $75
Entertainment $72
Hotels $68
Transportation & Ware. $67
Construction $66
Retail Trade $60
Nurseries/Greenhouses — $47Textile & Apparel Mfg. $46
Temps, Guards, Janitors $44
Personal & Repair Srv. Min $43
Residential Nursing $41
Restaurants & Bars $36
Home Health Care ism $33
Child Day Care am $33
Nonprofits $26
$0 5100 $200 $300 $400
Annuai Value Added per Worker in 2014$
Data source: 1MPLAN 2013 data and model of Los Angeles County's economy.
Industries with revenue and wages set by other government bodies
State and federal funding will also impact feasibility of raising the minimum wage. At least
two low-wage industries obtain a substantial share of their revenue from government
agencies and are dependent on those entities to provide reimbursement rates that will support
wage increases.The first is home health care services, which receives much of its funding
from the California Department of Social Services.The second is nursing and residential care,
which receives a substantial share of its funding through Medicare and Medi-Cal.
Enforcement of wage standards in these industries will need to take into account
the approval process required to fund higher labor costs. These industries are small,
accounting for only 2 percent of employment in the city.
Low-wage industries with high rates of informal employment
The percent of workers in low-wage industries who are paid less than $15.25 an hour,
broken out by immigration status, is shown in Figure 4.12. A third of the low-wage
workers within low-wage industries are estimated to be unauthorized immigrants.'
Because of their immigration status, these workers are often unable to demand wages
commensurate with their skills and productivity. Because of economic necessity they
accept informal employment conditions under which their employers do not pay
legally mandated taxes or social safety net insurance premiums.
If they are to besustainable businessesthey must adoptbusiness models thatpay legally mandatedcosts.
LOS ANGELES RISING: A City that Works for Everyone 49

80% of businesses
employ ten or moreemployees. Theselarger, more resilientbusinesses are lesslikely to be disrupted
by raising theminimum wage.
Unauthorized immigrants account for much, but not all, of the informal workforce. An
earlier Economic Roundtable report estimated that 65 percent of the city's informal
workers are unauthorized immigrants.I° By this benchmark, the total share of informal
workers is roughly half again as large as the unauthorized share shown in Figure 4.12.
This report focuses primarily, but not exclusively, on workers in the formal economy
where employers comply with tax and labor laws. The prevalence of informal employment
in many low-wage industries means that enforcement of wage standards will often require
reforming long-standing business models of noncompliance with tax and labor laws. The
reality for employers that have gained an unfair competitive advantage by violating tax and
labor laws is that if they are to be sustainable businesses they must adopt business models
that pay legally mandated costs.
Wage levels for informal workers will also be improved by the administrative relief
programs Deferred Action for Childhood Arrivals (DACA) and Deferred Action for
Parents of Americans and Lawful Permanent Residents (DAPA).These impacts are
discussed in a later chapter.
Figure 4.12 — Percent of Industry Workers below $15.25 per Hour by Immigration Status
Apparel, TextileMfg.
Nurseries &Greenhouses
Restaurants &Bars
Food Mfg
Personal & RepairSrv.
Child Day Care
ALL LOW-WAGEINDUSTRIES
Home Health Care
Temps, Guards,Janitors
Retail Trade
ResidentialNursing
Construction
o
Unauthorized
■ Authorized
Percent of Workers in Industry Paid Less than $15.25
Data source: American Community Survey 2009-2013 Public Use Microdata Sample.
50 LOS ANGELES RISING: A City that Works for Everyone

Summary of industry effects
Indicators of industry sensitivity to a higher minimum wage are summarized in Table 4.1.Six areas of potential sensitivity are flagged when they are present for an industry.
1. Declining industries:Annual job loss of 1 percent or more of 1996employment in contrast to overall industry-wide annual growth that wasequivalent to 0.2% of 1996 employment.
2. Low-wage industries: Average pay that is 80 percent or less (<$48,094) ofthe average for all industries, which was $60,117.
3. Large sub-minimum labor force: Fifty-five percent or more of workers paidless than $15.25 (in 2019 dollars), compared to the citywide average of42 percent.
4. Labor intensive industries: Industries in which compensation to workers(wages and employee benefits) is equal to 40 percent or more of industryrevenue (i.e., output) in 2013.
5. Low profit industries: Industries in which profit per worker in 2013 wasless than $15,000.
6. Low productivity industries: Industries in which value added per worker in2013 was less than $60,000.
LOS ANGELES RISING: A City that Works for Everyone 51

Table 4.1: Indicators of Industry Sensitivity to Minimum Wage Increasess
Jobs in City of Los AngelesFormal Economy'
LA City ResidentWorkers2
Los Angeles County Industries, TotalEconomy'
Industry Most
SensitiveLA City jobs
2011Annual job chg. as% of 1996 emp.
AverageAnnualPay
% of workers paid less
than S15.25
Wages as
% of 2013
output
Profit per
worker 2013
Value added per
worker 2013
ALL INDUSTRIES 1,572,622 0.2% S60,117 42% 30% S41,340 5100,059
Nurseries/Greenhouses 1,710 1.1% S32,355 14% 36% S21,921 S46,866
Mining, Extraction 1,277 6.8% S285,416 14% 24% 8114,350 S243,762
Utilities 13,628 0.4% 5108,478 7% 23% 5175,464 5433,600
Construction 35,990 0.5% S50,752 48% 26% S16,727 S65,867
Other Non-Durable Mfg. 19,490 -2.7% S59,700 43% 7% S16,728 S243.200
Food Manufacturing 10,269 -1.8% S42,373 67% 13% S21619 90,931
Textile & Apparel Mfg. 29,196 -3.8% S32,720 77% 28% S3,436 546,488 ✓
Durable Manufacturing 47,586 -2.9% S64,407 40% 24% S34,996 5122,839
Wholesale Trade 68,661 0.0% S55,337 43% 28% S46,198 8155,264
Retail Trade 137,368 1.0% S33,148 57% 36% 515,689 860,174
Transportation & Ware. 68,749 -0.7% 554,840 41% 31% S21,443 576,116
Information 67,060 -2.4% S116,277 17% 21% 8220,972 5325,106
Finance, Ins., Real Est 117,094 -0.5% 8104,257 25% 17% 577,537 5128,369
Professional Srv. 121,411 2.1% S91,936 16% 39% S46,154 8112,824
Temps, Guards, Janitors 87,668 -0.6% S38,282 60% 52% 812,710 845,653 ✓
Educational Services 159,584 0.0% S56,373 30% 83% S4,175 S52,471
Hospitals, Physicians 122,677 1.2% 567,276 27% 51% 54.176 S82,854
Home Health Care 9.001 5.2% S30,797 61% 61% S3.855 S32,926 ✓
Residential Nursing 26,562 0.8% 534,071 54% 62% S3,856 S40,932 ✓
Nonprofits 60,399 1.1% 846,209 44% 52% S25,614
Child Day Care 5,987 2.9% S25,760 62% 50% S5,406 S32,650 ✓
Entertainment 34,233 2.1% 5110,228 32% 38% 528,819 871,705
Hotels 16,892 -0.7% S32,887 51% 41% S19,610 867,888
Restaurants & Bars 113.776 2.7% 519,682 71% 40% S7,974 S36,461 ✓
Personal & Repair Sry 87,460 9.1% S20,448 66% 29% 57,975 S43,253 ✓
Government 99,748 -0.3% 42,308 23% 78% 8105,950
Criteria for highlighting potential industry sensitivities:
1. Annual job loss as % of 1996 employment of 1% or more.
2. Average pay: pay 80% or less of the average for all industries (<$48,094).
3. Percent of workers below $15.25: 55% of workers below $13.93 in 2014 dollars, equivalent to $15.25 in 2019.
4. Worker pay as % of output 2013: labor costs that are 40% or more of output.
5. Profit per worker 2013: annual profit <$15,000 per worker in 2013, adjusted to 2014 dollars.
6. Value added per worker in 2013: value added of less than <$60,000 per worker.
7. Sensitivity flag: four or more highlighted impacts for an industry.
Data Notes:
1. Jobs in City of Los Angeles formal economy is from the source data for the Quarterly Census of Employment and Wages (KEW) and for jobs located in the city. Dollar values have been adjusted to 2014 dollars.
2. LA City resident workers data is from the American Community Survey PUMS 2009-2013 for workers living in the city. See the Methods Appendix for details. The percent of workers below $15.25 is based
2019 dollars, or $13.93 in current dollars.
3. Los Angeles County industry data is from IMPLAN data for Los Angeles County from 1998 through 2013. It includes all jobs, both formal and informal, located in the county. All dollar values have been
adjusted to 2014 dollars.
52 1 OS ANGELES RISING: A City that Works for Everyone

There are seven industries, together comprising 23 percent of wage and salary employment
in the city, that have four or more factors that indicate that some establishments,
particularly smaller ones, will probably be sensitive to a higher minimum wage.We have
flagged these industries for close monitoring throughout the five annual increments of
minimum wage increases. Each of these industries is discussed below.
1. Textile and apparel manufacturing: This industry accounts for two
percent of the city's jobs. Employment is declining at the same rate as
manufacturing overall. Average industry wages are a little over half of the
level in the city's overall labor market. Over three-quarters of workers
are paid less than $15.25 an hour. Profit per worker is less than a tenth of
the citywide average and value added per worker is less than half of the
citywide average and less than a third of the average for manufacturing.
Given that 93 percent of output is exported outside of Los Angeles
County, the industry will benefit less than service industries from the
local stimulus effects of a higher minimum wage.
Potential mitigating factor: This industry has strengths in quickly translating
new fashions into saleable garments and in the Made in LA image. Forty
percent of employment is in establishments with 100 or more employees.
These larger establishments may have the capacity to adapt to a more
capital- and technology-intensive business model that is less reliant of
low-wage labor.
2. Temps, Guards and Janitors (Administrative support; waste management and
remediation services): This industry accounts for six percent of the city's
jobs. Employment is declining slightly in contrast to overall city growth.
Average industry wages are a little over half of the level in the city's
overall labor market. Sixty percent of workers are paid less than $15.25
an hour.Worker pay consumes over half of industry revenue. Profit per
worker is less than a third of the citywide average, leaving little room to
reallocate profit to pay for higher wages.Value added per worker is less
than half of the citywide average.
Potential mitigating factors: Fifty-six percent of temps, guards and janitors
employment is in establishments with 100 or more employees that have
high resilience. All of the revenue for this industry comes from services
provided to other industries. These client industries are likely to have the
capacity to pay higher costs to offset wage increases.
3. Home Health Care Services: This industry accounts for half of one
percent of the city's jobs. Employment is growing at a much faster
rate than in the city overall and is likely to continue growing as the
population ages. Average industry wages are about half of the level in
the city's overall labor market. Sixty-one percent of workers are paid
less than $15.25 an hour.Worker pay consumes over sixty percent
of industry revenue. Profit per worker is less than a tenth of the
citywide average, leaving little room to reallocate profit to pay for
higher wages.Value added per worker is less than half of the citywide
average. Forty-two percent of employment is in establishments
with 100 or more employees that have high resilience. Much of the
revenue for this industry comes from the California Department of
Social Services.
Potential mitigating factor: Although there may be delay, the California
Department of Social Services is likely to raise compensation levels to
offset the cost of Los Angeles' higher minimum wage.
LOS ANGELES RISING: A City that Works for Everyone 53

4. Residential Care and Nursing Facilities: This industry accounts for two
percent of the city's jobs. Employment is growing faster than in the
city overall and is likely to continue growing as the population ages.
Average industry wages are about half of the level in the city's overall
labor market. Over half of workers are paid less than $15.25 an hour.
Worker pay consumes over sixty-two percent of industry revenue.
Profit per worker is less than a tenth of the citywide average, leaving
little room to reallocate profit to pay for higher wages.Value added
per worker is less than half of the citywide average. Sixty percent of
employment is in establishments with 100 or more employees that
have high resilience.
Potential mitigating factor: Much of the revenue for this industry
comes from Medicare and Medi-Cal. Although there may be delay,
reimbursement rates are likely to adjust to reflect prevailing labor costs in
Los Angeles.
5. Child Day Care Services: This industry accounts for less than half of one
percent of the city's jobs. Employment is growing at a much faster rate
than in the city overall. Average industry wages are very low — less than
half of the level in the city's overall labor market. Sixty-two percent of
workers are paid less than $15.25 an hour.Worker pay consumes half of
industry revenue. Profit per worker is slightly more than a tenth of the
citywide average, leaving little room to reallocate profit to pay for higher
wages.Value added per worker is a third of the citywide average. Only 14
percent of employment is in establishments with 100 or more employees
that have high resilience. This industry provides an essential service for
working parents.
Potential mitigating factor: It may prove to be the case that higher wages
for working parents will make it possible to offset higher labor costs
by increasing the price for child care services. As with other industries
that are sensitive to a higher wage floor, outcomes for this industry
should be monitored.
6. Restaurants and Bars: This industry accounts for seven percent of the
city's jobs. Employment is growing at a much faster rate than in the
city overall. Average industry wages are very low — less than a third
of the level in the city's overall labor market, although many jobs are
part time. Seventy-one percent of workers are paid less than $15.25
an hour. Worker pay consumes 40 percent of industry revenue.
Profit per worker is about a sixth of the citywide average, leaving
little room to reallocate profit to pay for higher wages.Value added
per worker is a third of the citywide average. Only 18 percent of
employment is in establishments with 100 or more employees that
have high resilience.
Potential mitigating factor: This industry provides a widely used and
appreciated service. It may prove to be the case that higher wages for
workers will have stimulus effects that increase consumption in this
industry despite the likelihood of some price increases.
7. Personal and Repair Services: This industry accounts for six percent of
the city's jobs. Employment is growing faster than in any other industry
shown in this analysis. Average industry wages are very low — about a
third of the level in the city's overall labor market.Two-thirds of workers
are paid less than $15.25 an hour. Profit per worker is about a fifth of the
citywide average, leaving little room to reallocate profit to pay for higher
54 LOS ANGELES RISING: A City that Works for Everyone
wages.Value added per worker is about half of the citywide average.
Only 21 percent of employment is in establishments with 100 or more
employees that have high resilience.
Potential mitigating factor: This industry provides widely used and
appreciated services, as evidenced by its unusually strong growth of
over nine percent a year. It may prove to be the case that higher wages
for workers will have stimulus effects that increase consumption in this
industry despite the likelihood of some price increases.
In summary, outcomes in a number of industries should be carefully monitored.
However, there is little evidence that potential job attrition in these industries will
outweigh the likely stimulus effect from: 1) retaining a greater share of industry revenue
in the region and 2) putting increased wages in the pockets of households that are
likely to quickly recycle all of their added income back into the local economy. Even
for apparel and textile manufacturing, possibly the most vulnerable industry, potential
job losses appear to be an acceptable trade-off for the benefits to workers from a higher
minimum wage.
The seven industries that are likely to be most sensitive to minimum wage increases
provide about a fifth of the city's jobs. Ninety-two percent of these jobs entail providing
needed face-to-face services for other Los Angeles residents and businesses. Sixty-nine
percent of these jobs are in growing industries. It is reasonable to anticipate that demand
for the services provided by these workers will remain resilient.
The most important conclusion to draw from this analysis of potential industry impacts
is that the economic outcomes from raising the minimum wage to $15.25 cannot be
known with certainty in advance of implementing the increases and that careful industry
monitoring of the effects of raising the wage floor is essential throughout the five years in
which sequential increases will occur. Later in the report we discuss methods for carrying
out this monitoring.
Studies of Unintended Consequences from wising the Vinimum WageA central tenet of classical economics is that an increase in the minimum wage leads to
unemployment. However, a landmark study comparing neighboring counties in New
Jersey and Pennsylvania, after New Jersey increased the minimum wage but Pennsylvania
did not, found that after the wage hike, employment in the fast food industry increased
more in New Jersey counties than in neighboring Pennsylvania counties." The authors,
David Card and Alan Krueger, found that fast food restaurants in New Jersey increased
employment by 13 percent relative to Pennsylvania restaurants.12
This was the beginning of new minimum wage research, much of it summarized in their
book Myth and Measurement, where the authors concluded, "The weight of this evidence
suggests that it is very unlikely that the minimum wage has a large, negative employment
effect.""This new school of minimum wage research has its detractors, among them David
Neumark and William Wascher, who adhere to the classical theory that raising the wage is
linked to job loss, particularly for teens."
It is beyond the scope of this report to summarize the strengths and weaknesses of the
debate around the minimum wage.'s What we attempt to do in this section is review
unintended consequences and assess the fit of existing studies in predicting outcomes
in Los Angeles. Hirsch, Kaufman, and Zelenska proposed that firms adjust to increased
labor costs through "channels of adjustment."'6The adjustments, commonly known as
unintended consequences, include changes to employment, benefits, productivity,
and prices.17
Some businesses willneed to adjust policiesregarding employment,benefits, procuctivityand prices, but theraise's economicstimulus is likely todrive new hiring.
LOS ANGELES RISING: A City that Works for Everyone 55
Employ ent and Hours
Much of the literature on minimum wage impacts is devoted to employment and hour
outcomes.As John Schmidt wrote, raising the wage doesn't increase the cost of hiring a
worker, but it does make every hour of labor more expensive for employers.18 Therefore,
one method of adjustment could be businesses decreasing the number of hours, instead of
reducing the number of employees.
Two studies approached the question from the national-level. One authored by Arindrajit
Dube,William Lester and Michael Reich compared adjacent counties that were separated
by state borders with different minimum wages.19 Dube and his coauthors examined
employment data from the Quarterly Census on Employment and Wages (QCEW) from
1990 to 2006 and found no negative impact on employment for workers in restaurants and
other low wage industries.They concluded,"The impact on hours is not likely to be large."
The second study by Sylvia Allegretto et al. expanded the data sets to include the American
Community Survey (ACS), Current Population Survey (CPS), Quarterly Workforce
Indicators (QWI), in addition to the QCEW, up to 2010.20 Allegretto and her coauthors
"found that the employment effects are small in magnitude for the range of increases that
have been implemented since 1990."
Benefits
Nonwage benefits account for roughly 25 percent of total compensation for workers.21
If wages increase, firms may reduce their spending on benefits for workers such as health
care, pensions, and training. Kosali Simon and Robert Kaestner used CPS data to look at
the impacts of minimum wage increases on employer provision of health insurance and
pensions from 1979 to 2000. They found that "our results show no strong evidence that
binding increases in minimum wages caused an offsetting decline in the provision of fringe
benefits or quality of working conditions."
Hire More Skilled Workers
A third adjustment employers may consider is a hiring preference for workers with higher skills
because of the increased wages. The result may be that young workers with less experience
and groups that already face barriers to employment, such as Black and Latino workers, may
be passed over for employment. Information provided earlier in this report showed that people
of color are over-represented in low-wage jobs and stand to benefit from increased household
income.Allegretto, Dube, and Reich also examined the employment impacts of raising
the wage on teens by race.' Using CPS data from 1990 to 2009,Allegretto et al. found no
statistically significant negative effects on teen employment or hours, by race or gender.
Productivity
Firms can implement efficiency measures to increase productivity and output of existing
workers, rather than decrease staffing. Hirsch, Kaufman, and Zelenska surveyed 66 managers
at fast food restaurants in Georgia and Alabama in 2009 after a series of increases in the
prior two years in the minimum wage. Less than a quarter of managers reported that they
planned to reduce employment to adjust to higher wages." Instead, 90 percent planned to
set higher performance standards for their workers in exchange for the higher wages.This
included asking workers for better attendance and on-time records, more proficiency in the
performing of job duties, and the addition of responsibilities.
Fast food store managers reported in interviews that they valued preserving employee
morale, in order to keep operations flowing smoothly and a positive customer service
experience for consumers. Therefore, managers avoided laying off workers and reducing
hours, activities they saw as detrimental to morale and productivity.
56 LOS ANGELES RISING: A City that Works for Everyone

Turnover Savings
Job separations and turnovers in personnel are costly for employers. Firms have toreallocate resource to hire and train a replacement for an employee that leaves.Turnovercosts vary by industry and geography, for hotel workers in Miami and NewYork the costsare $6,000 and $13,000 per worker, respectively." Pollin and Wicks-Lim estimated thatcosts for fast food workers are $4,700 per worker." These costs become savings for firmswhen the minimum wage is increased. Dube, Lester, and Reich calculated that for every 10percent increase in minimum wage, the decline in the turnover rate would be 2.2 percent.
Prices
Firms can pass on the increase in labor costs to the consumer through higher prices. Lemosreviewed 30 studies that looked at the price effects of minimum wage increases. She concludedthat "most studies reviewed above found that a 10 percent US minimum wage increase raisesfood prices by no more than 4 percent and overall prices by no more than 0.4 percent:''
Conclusion
The most authoritative and objective meta-analysis of economic research into the effectsof the minimum wage is the recently published book, "What Does the Minimum WageDo?" by Dale Belman and Paul J.Wolfson." The authors conclude that moderate increasesin the minimum wage have had little or no effect on employment and hours, howeverthey caution that current research does not speak to whether the same results will holdfor large increases in the minimum wage, such as are being considered in Los Angeles andother cities." The size of the increase being proposed moves beyond the scope of existingauthoritative economic research.This reality supports the need for the monitoring toolsrecommended later in this report.
Los Angeles Living Wage Case StudyIn 1997 the City of Los Angeles enacted a living wage law29 that raised the hourly wagesfor companies that are contracted by the city, receive economic subsidies from the city, orlease municipal land and property. The affected occupations included food servers, retailclerks, janitors, and parking attendants. The majority of the labor force were employed atthe Los Angeles or Ontario airports.
Almost 6,500 workers in 375 firms were affected by this increase and thousands more byits requirements that employees be given 12 paid and 10 unpaid days off.3° Employers weregiven incentives to provide health insurance to their workers. Firms were required to eitherpay a minimum of $8.50 per hour or $7.25 per hour plus a $1.25 contribution towardshealth benefits (in 1997 dollars).The living wage was indexed to the annual increase in thecity employee pension fund.
At the time, only a few cities in the United States had taken this step and the debate inLos Angeles was scrutinized closely on the national stage. At stake were the livelihood ofthousands of workers and families and their ability to make ends meet. Opponents assertedthat the legislation would reduce jobs and force businesses to leave the area.
The impacts of the living wage ordinance were documented and studied by a team ofresearchers in a multi-year project, which makes it a useful case study to predict outcomesfor the 2015 proposa1.31 Three surveys were collected of 320 workers and 82 employersaffected by the wage increase. In addition, a control group of 210 non-living age firmswere surveyed from similar industries, to compare the impacts of the raise.
Fairris, Runsten, Briones, and Goodheart found that the living wage increased earnings for10,000 jobs with minimal reductions in employment and hours.32 Most of the beneficiaries
The multiyear studyfound that "Living
Wage Ordinancescan provide tangiblebenefits to workers. „
with small negativeimpacts on business.'
LOS ANGELES RISING: A City that Works for Everyone 57

of the wage boost earned poverty-level wages and received a 20 percent earnings increase,
approximately $2,600 per year." One percent of all affected jobs, an estimated 112 jobs,
were reduced as a result. Employers were able to adjust to increased labor costs through
other channels of adjustment, similar to those discussed in the previous section.34 This
section will review the outcomes of those adjustments in Los Angeles.
A. - Employment and hours
Contrary to claims by opponents of the living wage, less than one percent of affected
jobs were reduced because of the living wage. Four out of five affected firms surveyed by
researchers did not reduce employment or hours. Only 11 firms out of the 82 surveyed
reported job cuts. The average reduction in staff was under 20 percent.
Two factors stood out for the firms who did lay off staff. First, firms with the highest
job loss, up to 40 percent of their workforce, were small in size. Firm size is a factor in
determining the continuity of a business when placed under the stress of a raised wage."
Analysis by the researchers found marginal significance in this factor.
The 11 firms that reduced staffing were in the social service, janitorial, and miscellaneous
industries.36 All but one of the firms were located in the nonprofit sector, which is
dependent on fixed revenue sources such as government contracts (see previous section).
These were agencies that provided services for homeless, for job seekers, the disabled, and
care for children. A child care center told researchers that three teachers were laid off from
a staff of eight.
B. - Benefits
The majority of affected firms did not reduce nonwage benefits, such as health coverage
and bonuses, however training didn't keep pace with the control group of employers.
Eighty-nine percent of firms surveyed did not reduce benefits.The 11 percent that did
change benefits, did so in the form of reducing or eliminating bonuses, health coverage,
merit raises, or free meals (for restaurant workers).When compared to unaffected firms,
employers impacted by the living wage increase offered less training for workers.
C. - Hire More Skilled Workers
Most of the firms, close to 80 percent, told researchers that their hiring standards did
not change after the living wage went into effect.The majority also reported that the
composition of the workforce did not change, in terms of race and gender.
D. - Productivity
A few firms made changes to equipment or machinery to increase the output of existing
workers.A janitorial company told researchers it purchased new machines and required
workers to increase their output.A food stand at the airport who was interviewed reported
that the business started tracking sales revenue per worker hour to streamline their operations.
E. - Turnover Savings
Replacing workers is an expensive cost of operations for businesses. Firms impacted by
the living wage enjoyed lower rates of employees leaving their positions, 21 percent,
while unaffected employers lost nearly half of their staff due to turnover. The researchers
calculated that, on average, affected firms saved 5 to 24 percent of the cost of increased
wages due to lower turnover. Unscheduled absenteeism was also lower in living wage firms
when compared to the control group.
58 WS ANGELES RISING: A City that Works for Everyone

F. - Prices
Half of the firms who responded to researchers reported that they were able to pass on
increased labor costs to the city through higher prices. Nine of these businesses passed on
the increase to the city.
G. - Conclusion
The report concluded,"our findings suggest that Living Wage Ordinances can provide tangible
benefits to workers in poor and low-income families, with small negative impacts on business."
1. Complete coding information for the 26 industry sectors is shown in the table below.
Chart Title Industry NAICS Codes ACS PUMS 2009-2013 Codes
IMPLAN 2013 Codes
Nurseries/Greenhouses Agriculture, Forestry, Fishing & Hunting 11 0170-0290 1-19
Mining & Extraction Mining, Oil & Gas Extraction 21 0370-0490 20-40
Utilities Utilities 22 0570-0690 41-51
Construction Construction 23 0770 52-64
Other Non-Durable Mfg. Other Non-Durable Manufacturing 312, 316, 322-326 1370-1390,1770-2390 106-110, 131-133, 146-198
Food Manufacturing Food Manufacturing 311 1070-1290 65-105
Textile & Apparel Mfg. Textile and Apparel Manufacturing 313-315 1470-1690 112-130
Durable Manufacturing Durable Manufacturing 321, 327-399 2470-3990 134-145, 199-394
Wholesale Trade Wholesale Trade 42 4070-4590 395
Retail Trade Retail Trade 44-45 4670-5790 396-407
Transportation & Ware. Transportation & Warehousing 48-49 6070-6390 408-416, 518
Information Information 51 6470-6780 417-432
Finance, Ins., Real Est. Finance, Insurance, Real Estate 52, 53, 55 6870-7190, 7570 433-446, 461
Professional Srv. Professional, Scientific & Technical Svcs. 54 7290-7490 447-460
Temps, Guards, Janitors Admin. Support; Waste Mgmnt. & Remediation Svcs. 56 7580-7790 462-471
Educational Services Educational Services 61 7860-7890 472-474
Hospitals, Physicians Other Health Care 6211-6215, 6219,622
7970-8090, 8180-8190 475-479, 481-482
Home Health Care Home Health Care Services 6216 8170 480
Residential Nursing Residential Care and Nursing Facilities 623 8270-8290 483-484
Nonprofits Nonprofits 6241-6243, 813 8370-8390, 9160-9190 485-486, 513-516
Child Day Care Child Day Care Services 6244 8470 487
Entertainment Arts, Entertainment, & Recreation 71 8560-8590 488-498
Hotels Hotels & Other Accommodations 721 8660-8670 499-500
Restaurants & Bars Restaurants and Bars 722 8680-8690 501-503
Personal & Repair Srv. Personal and Repair Services 811-812, 814 8770-9090, 9290 504-512, 517
Government Government 92 9370-9870 519-526, 531-536
2. Includes a very small industry base in crude petroleum extraction and mining construction sand
and gravel
LOS ANGELES RISING: A City that Works for Everyone 59

3. The rate of growth that is shown is the slope value of annual employment change from 1996 to
2011 as a percent of employment in 1996.This data includes jobs in the formal economy that
are located in the City of Los Angeles.
4. Annual wages are per job, not per worker, and include both full- and part-time jobs located in
the City of Los Angeles.
5. The American Community Survey is carried out at the homes of Los Angeles residents, so it
captures responses from workers in both the informal and formal economies with the likely
effect of showing somewhat lower wages than are shown in data for the formal economy that
was used for the preceding wage graph. For detailed information about data sources see the
Methods Appendix.
6. Based on a projected annual rate of inflation of two percent, the target of wage of $15.25 in
2019 is discounted by one percent for the second half of 2015, assuming that the first of five
annual minimum wage increases will take effect near the end of 2015, and then two percent
each following year from 2016 through 2019.The result is that the current value of the $15.25
minimum wage in 2019 is $13.93.
7. Data is for Los Angeles County in 2013.Worker compensation includes both wages and
employee benefits.Total industry outlays for worker compensation were computed as a percent
of industry output. For ease of explanation the term revenue is used in place of the term output.
Output represents the value of industry production. In IMPLAN these are annual production
estimates for the year of the data set and are in producer prices. For manufacturers this is sales
plus/minus change in inventory. For service sectors production equals sales. For Retail and
wholesale trade, output equals gross margin and not gross sales. IMPLAN Glossary, https://
implan. com/index.php?option= com_glossary&view = glossary&glossid=13 &Itemid= 1481
(accessed February 14, 2015).
8. Value added is the difference between total output and the cost of intermediate inputs. It
equals gross output (sales or receipts and other operating income, plus inventory change)
minus intermediate inputs (consumption of goods and services purchased from other
industries or imported).Value added consists of compensation of employees, taxes on
production and imports less subsidies, and gross operating surplus. IMPLAN Glossary, https://
implan.com/index.php?option=com_glossary&view=glossary&glossid=13&Itemid=1481
(accessed February 14, 2015).
9. This estimate is derived by applying 21 filters to American Community Survey 2009-2013 Public
Use Microdata Sample records to identify non-citizens who have a high probability of being
unauthorized immigrants. These filters are described in greater detail in the Methods Appendix.
10. Flaming, Daniel, Brent Haydamack and Pascale Joassart (2005), Hopeful Workers, Marginal
Jobs: LA's Off-The-Books Labor Force, Economic Roundtable, vvww.economicrt.org (accessed
March 2, 2015).
11. Kaufman, Bruce E. April 2010. "Institutional Economics and the Minimum Wage: Broadening
the Theoretical and Policy Debate." Industrial and Labor Relations Review.Vol. 63, No. 3.
12. Card, David and Alan B. Krueger. Oct. 1993. Minimum Wages and Employment:A Case Study
of the Fast Food Industry in New Jersey and Pennsylvania. NBER Working Paper #4509.
13. Schmitt, John. Feb. 2013.Why Does the Minimum Wage Have No Discernible Effect on
Employment. Center for Economic and Policy Research.
14. Neumark, David, JM Ian Salas, and William Wascher. 2014. More on recent evidence on the
effects of minimum wages in the United States. IZA Journal of Labor Policy. 3:24.
15. Two reviews of the literature include a quantitative meta-analysis by Hristos Doucouliagos
and T.D. Stanley in 2008, Publication Selection Bias in Minimum-Wage Research? A Meta-
Regression Analysis, Deakin University Working Paper SWP 2008/14. Dale Belman and Paul J.
Wolfson summarized the field in their 2014 book What Does the Minimum Wage Do, published
by WE. Upjohn Institute for Employment Research.
16. Hirsch, Barry T., Bruce E. Kaufman, and Tetyana Zelenska. Aug. 2013. Minimum Wage Channels
of Adjustment. IZA Discussion Paper No. 6132. Germany: Institute for the Study of Labor.
60 LOS ANGELES RISING: A City that Works for Everyone

17. The intended consequence of the minimum wage, Bruce Kaufman (2010) noted, was set forth
by the Fair Labor Standards Act with four direct goals: (1) eliminate labor standards so low that
they harm the ongoing efficiency, health, and well-being of workers; (2) prevent unrestrained
competition in labor markets from further lowering standards in affected industries or spreading
low standards to other industries; (3) prevent low labor standards from interfering with the
attainment of full employment or sustainable growth; and (4) eliminate low labor standards that
lead to labor disputes and divisive relations between employers and employees, thus further
harming economic activity.
18. Schmidt, John. Feb. 2013.
19. Dube, Arindrajit,T.William Lester, and Michael Reich. "Minimum Wage Effects Across State
Borders: Estimates Using Contiguous Counties." The Review of Economics and Statistics.
November 2010, 92(4), 945-964.
20. Allegretto, Sylvia et al. Sept. 2013. "Credible Research Designs for Minimum Wage Studies."
IRLE Working paper #148-13.
21. Simon, Kosali Ilayperuma and Robert Kaestner. Oct. 2004. "Do Minimum Wage Affect Non-
Wage Job Attributes? Evidence on Fringe Benefits." Industrial and Labor Relations Review.Vol.
58, No. 1.
22. Allegretto, Sylvia, Aridrajit Dube, and Michael Reich. April 2011. "Do Minimum Wages Really
Reduce Teen Employment? Accounting for Heterogeneity and Selectivity in State Panel Data.
IRLE Working Paper #166-08.
23. Hirsch, Kaufman, and Zelenska. Aug. 2013. p. 25.
24. • Hinkin and Tracey (2000) study cited by Pollin and Wicks-Lim (2015)
25. Pollin and Wicks-Lim
26. Lemos, Sara. May 2006.A Survey of the Effects of the Minimum Wage on Prices. Working
Paper No. 06/9.
27. Berman, Dale and Paul J.Wolfson (2014).What Does the Minimum Wage Do? W.E. Upjohn
Institute for Employment Research, Kalamazoo, Michigan.
28. Ibid, p. 401.
29. LAANE. (1997, September 13). Los Angeles City Living Wage Ordinance (1997). Retrieved
from hap: / /www.laane. org/whats-new / 1997 /09/13/living-wa ge-ordinances/
30. Fairris, David. (2005).The Impact of Living Wages on Employers:A Control Group Analysis of
the Los Angeles Ordinance. Industrial Relations.Vol. 44, No. 1.
31. Fairris, David, David Runsten, Carolina Briones, and Jessica Goodheart. (2005). Examining the
Evidence:The Impact of the Los Angeles Living Wage Ordinance on Workers and Businesses.
32. Ibid.
33. Ibid.
34. Hirsch, Barry Bruce E. Kaufman, and Tetyana Zelenska. (2013). Minimum Wage Channels of
Adjustment. IZA Discussion Paper No. 6132, Germany: Institute for the Study of Labor.
35. Aaronson, Daniel, Eric French, Isaac Sorkin. (2013). Firm Dynamics and the Minimum Wage: A
Putty-Clay Approach. Federal Reserve Bank of Chicago,Working Paper 26.
36. Fairris, Runsten, Briones, Goodheart. (2005).
LOS ANGELES RISING: A City that Works for Everyone 61

Geography of Opportunity
62 WS ANGELES RISING: A City that Works for Everyone

Geographic Distribution of ImpactsThe neighborhoods of Los Angeles will experience the effects of an increased minimum
wage in different ways.The distribution of these effects across the city will determine the
overall outcome from raising the wage floor. Given the size and diversity of the Los Angeles
economy, the industry and labor force composition of economic activity varies considerably
across the city and the broader metropolitan area.The city's residential neighborhoods are
distinguished by occupations and industries as well as by the wages and skill levels of their
resident workers. Although many residents of Los Angeles commute to jobs outside of the
city, the many residents of surrounding areas who commute into the city for work also stand
to benefit from a higher minimum wage.
This analysis of the ways the minimum wage will be experienced across the city and county
of Los Angeles comes with a disclaimer. Small-area business and employment data necessarily
sacrifices detail and accuracy for greater geographic resolution.' Relying on the method
reported in Chapter III to develop estimates at the census tract level, we use maps to illustrate
the likely potential of particular areas to experience increases in the spending power of
resident workers. Analyzing small-area data helps illuminate central questions about the effects
of increasing the minimum wage, such as
Where will most of the potential adverse effects occur, like increased
prices and higher labor costs? What is the capacity of these communities
to weather any price increases that result from raising the minimum wage?
Which communities will receive most of the benefits of an increased
minimum wage? Where is the greatest potential for increased earnings
among low-wage workers to support a local economic stimulus at the
neighborhood level?
Why Do Neighborhoods Matter for a Citywide Minimum Wage?Although local governments shape the labor market through policies, regulations, subsidies,
direct services, and infrastructure, labor markets do not neatly conform to municipal or
county boundaries. Markets for many inputs of economic activity — including labor — extend
to the scale of the urban region, especially in the sprawling, diverse, and deeply integrated
metropolitan area of Los Angeles.
While labor markets are regional in scope, the smaller landscapes of everyday interactions at
the neighborhood-level also matter to labor markets.The neighborhood-level effects from
restructuring household income amplify the consequences for areas with limited purchasing
power and employment opportunities in a manner analogous to regional multiplier effects.
Low-income workers who benefit from a minimum wage increase are much more likely
to spend their additional income than are higher-income individuals, who tend to save
or invest their money. Much of this added spending will take the form of highly localized
forms of consumption and everyday purchases, for example, at businesses like retail stores
and restaurants. In this manner, the minimum wage may act as a local economic stimulus in
communities where low-wage workers reside.
To be sure, the effect of dollars recycling through a neighborhood economy will be much
smaller, for example, than the multiplier effect for an entire metropolitan region. Part of each
dollar of additional spending will remain close to home, driving up localized demand for retail,
food, restaurants, and other services in and around the worker's neighborhood of residence.The
remaining part may "leak" out to surrounding areas as workers also make purchases in different
parts of the city. Since the variability of socioeconomic status and purchasing power is higher
across neighborhoods within a region than across regions themselves, a small but structural
increase in purchasing power could help correct the serial gaps in access to goods, services, and
job opportunities that contour the landscape of Los Angeles.
A small but structural
increase in purchasing
power will help correct
serial gaps in access
to Hods, services, and
job opportunities,
LOS ANGELES RISING: A City that Works for Everyone 63
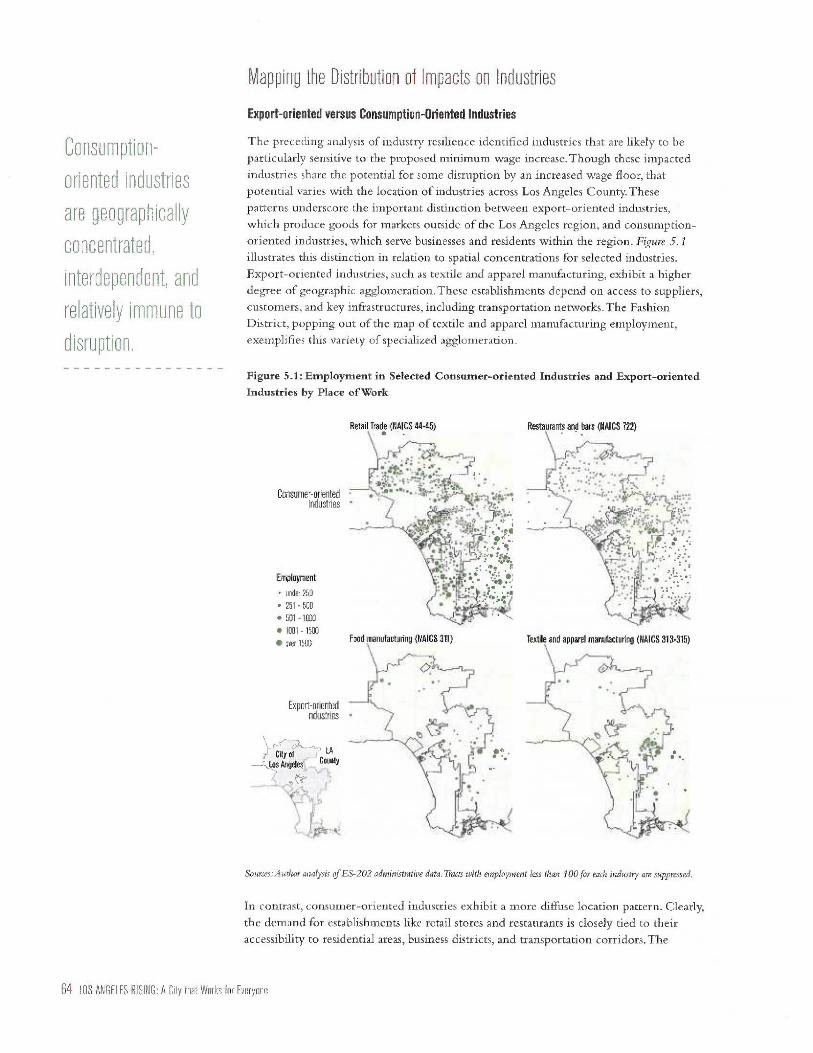
Consumption-
oriented industriesare [eographicallyconcentrated,
interdependent, andrelatively im -nune to
disruption.
Mapping the Distribution of Impacts on Industries
Export-oriented versus Consumption-Oriented Industries
The preceding analysis of industry resilience identified industries that are likely to beparticularly sensitive to the proposed minimum wage increase. Though these impactedindustries share the potential for some disruption by an increased wage floor, thatpotential varies with the location of industries across Los Angeles County. Thesepatterns underscore the important distinction between export-oriented industries,which produce goods for markets outside of the Los Angeles region, and consumption-oriented industries, which serve businesses and residents within the region. Figure 5.1illustrates this distinction in relation to spatial concentrations for selected industries.Export-oriented industries, such as textile and apparel manufacturing, exhibit a higherdegree of geographic agglomeration. These establishments depend on access to suppliers,customers, and key infrastructures, including transportation networks. The FashionDistrict, popping out of the map of textile and apparel manufacturing employment,exemplifies this variety of specialized agglomeration.
Figure 5.1: Employment in Selected Consumer-oriented Industries and Export-oriented
Industries by Place of Work
Retail Trade (NAICS 44-45) Restaurants and bars (NAICS 722)
Consumer-orientedindustries •
Employment
• under 250• 251 - 500
501 - 1000• 1001 - 1500• over 1500
Export-orientedindustries •
Food manufacturing (NAICS 311)
--- LACity of CountyLos Angeles., .
Textile and apparel manufacturing (NAICS 313-315)
Sources:Author analysis of ES-202 administrative data. Tracts with employment less than 100 for each industry are suppressed.
In contrast, consumer-oriented industries exhibit a more diffuse location pattern. Clearly,the demand for establishments like retail stores and restaurants is closely tied to theiraccessibility to residential areas, business districts, and transportation corridors. The
64 LOS ANGELES RISING: A City that Works for Everyone

distribution of jobs within consumption-oriented industries thus more closely parallelsthe distribution of population. To varying extents, establishments in industries thatprovide services to other local businesses will also cluster around business districts witha diverse range of service-sector tenants rather than around those associated with morespecialized sectors, like manufacturing. Still, even relatively diffuse consumption-orientedindustries are concentrated unevenly across the city. For example, the swath that extendsfrom Hollywood through the Westside has a consistently high level of concentration inretail. In contrast, South and Southeast Los Angeles have a clear gap in access to retail.
Export-Oriented Industries
In discussing effects of the minimum wage increase, the distinction between industriesoriented toward export and those oriented toward local consumption is crucial.To anextent, the former may be more footloose. Provided that adequate access to input andoutput markets, labor, and appropriate infrastructure exists elsewhere in the region, theseindustries could relocate outside of the city if labor costs increase beyond the cost ofrelocation. This possibility might be particularly acute for textile manufacturing, whichalready exhibits evidence of decline. For such labor-intensive producers with low margins,an increased minimum wage may inspire the shift to sites outside of the municipalboundary of Los Angeles.
Consumption-Oriented Industries
Industries that serve local consumption employ the highest numbers of low-wageworkers and account for the vast majority of impacted businesses.These industriesinteract with the city's geography quite differently and in ways that influence thefeasibility of raising the minimum wage. In particular, four features will shape their rolein the geographic distribution of minimum wage impacts.
First, consumption-oriented industries depend on accessibility to clients and customers.Therefore, they locate near residential areas and business concentrations. Less-specializedestablishments like restaurants, supermarkets, and laundromats depend on householdsand concentrations of other businesses to generate traffic.Teinps, guards, and janitorialbusinesses also require access to client businesses. If local demand from unaffected residentsand businesses remains strong, it is unlikely that these establishments will dramaticallydownsize or relocate without competitors or new entrants taking their place.
Second, even consumption-oriented industries are disproportionately located nearbusiness districts and major transportation corridors with large, diverse bases ofeconomic activity. Within the city of Los Angeles, about 60 percent of jobs in affectedindustries lie within 1.5 miles of Santa Monica Boulevard through the Westside, the110 through downtown Los Angeles, and the Ventura Freeway in San Fernando Valley.This suggests that, even if some businesses are adversely affected by the minimum wageincrease, this alone will not likely disrupt the existing employment base or the broadereconomic vitality of these areas of concentrated activity.
Third, though disproportionately dependent on low-wage workers who often travel fromtheir homes in lower-income areas of the city, jobs in affected consumption-orientedestablishments in many cases are located in or near high-income areas. Figure 5.2 illustratesthat most of the jobs in these industries are actually located near areas with high incomelevels, whereas some lower-income areas have a noticeable lack of such jobs.2 Census tractsthat rank in the top half of the income distribution and their adjacent neighboring tracts'account for 86 percent of jobs in affected consumption-oriented industries.These areashave considerable spending power and will stand to bear the brunt of price increases ifrestaurants and other firms pass labor costs on to consumers.
LOS ANGELES RISING: A City that Works for Everyone 65
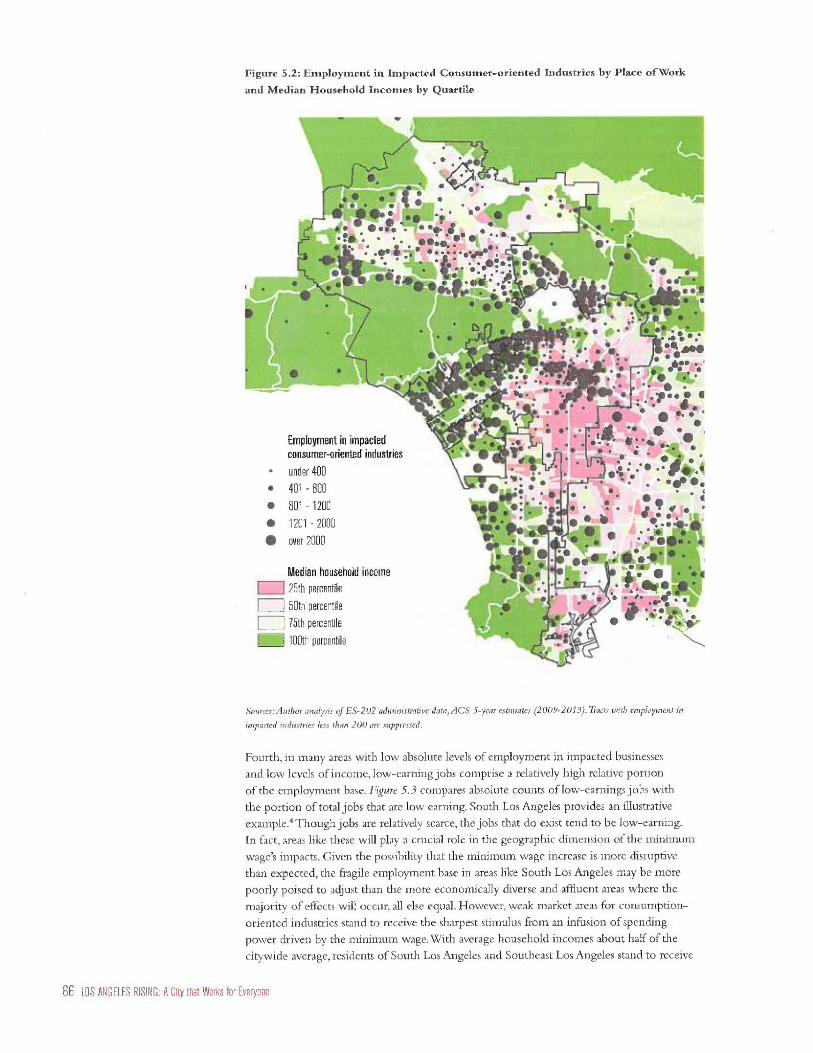
Figure 5.2: Employment in Impacted Consumer-oriented Industries by Place ofWork
and Median Household Incomes by Quartile
O
•
•
•
•
3
0 •
• • 'I' t •
0* • **. •••• • • A.,. _
p•
••
•° • • e
• .• • • • , es... .
.0041 •• • eye .L..• • ••*0
. •110: r.k •.oz.• • ow
mir•ye * •• *
• •
Employment in impactedconsumer-oriented industries
• under 400
•
•
401 - 800
801 - 1200
1201 - 2000
over 2000
Median household income
25th percentile
50th percentile
75th percentile
100th percentile
• *
•
•
• 0
• • .e•
•
•• • *•
• • •• • 0.• • • • e• • ••
•
41 0
• •
:•
• • *eco' •
*a el
•
• eIII ••
•*IP .=••••.*'al ON•••••.• • i •
I ••
•.7 • • • II
„„„-- . ' 4 • . • •IP • 41".• • . 4, -•
•• 4 •• • • •
't • : .•• .• #. s••.•, • ••• 40.••
• . 4•
•!• •C. 9 4,• •.. • i* •0.•••••••
{a, • • • *,,e, •. • !;ii • • • •,•••• : • •...•
Sources:Author analysis of ES-202 administrative data,ACS 5-year estimates (2009-2013).Tracts with employment in
impacted industries less than 200 are suppressed.
Fourth, in many areas with low absolute levels of employment in impacted businesses
and low levels of income, low-earning jobs comprise a relatively high relative portion
of the employment base. Figure 5.3 compares absolute counts of low-earnings jobs with
the portion of total jobs that are low earning. South Los Angeles provides an illustrative
example.` Though jobs are relatively scarce, the jobs that do exist tend to be low-earning.
In fact, areas like these will play a crucial role in the geographic dimension of the minimum
wage's impacts. Given the possibility that the minimum wage increase is more disruptive
than expected, the fragile employment base in areas like South Los Angeles may be more
poorly poised to adjust than the more economically diverse and affluent areas where the
majority of effects will occur, all else equal. However, weak market areas for consumption-
oriented industries stand to receive the sharpest stimulus from an infusion of spending
power driven by the minimum wage.With average household incomes about half of the
citywide average, residents of South Los Angeles and Southeast Los Angeles stand to receive
66 LOS ANGELES RISING: A City that Works for Everyone

a combined earnings boost of over 5 percent. In other words, many of the dollars counted
in the multiplier effect of the minimum wage increase will pass through local purchases
in these areas, closing the gap with areas that have a stronger existing employment base in
consumption-oriented industries. Will the minimum wage disrupt Los Angeles' more fragile
neighborhood economies, or will these communities experience an increase in demand that
will shore up the market for new and existing businesses? To examine this question, we turn
to the distribution of impacts at the site of residence for affected workers.
Figure 5.3: Comparison of Counts and Rates of Low-earnings Jobs by Place of Work, 2011
Count oflow earning jobsunder 200
• 201 - 400
• 401 - 600
• 601 - 1200
• Over 1200
Rate of totaljobs that are low-earning
under 20%
21 - 30%
IIII 31 - 40%
IIII 41 - 50%
- over 50%
Sources: Longitudinal Employer-Household Dynamics residence area files (2011). Tracts with counts below 150 are suppressed.
Figure 5.4: Low-earnings Jobs in Selected Industries by Place of Residence, 2011
Accomodation and Food Service (NAICS 72)
Low earnings jobsunder 30
• 31 -60
• 61 - 90
• over 90
Retail Trade (NAICS 44-45) Temps, guards, janitors (NAICS 56)
Sources: Longitudinal Employer-Household Dynamics residence area files (2011). Tracts with low-earnings employment less
than 150 are suppressed.
LOS ANGELES RISING: A City that Works for Everyone 67

A surge in purchasing
power will affect more
than 60 thousandworkers in South Los
Angeles alone andamplify economic
activity at theneighborhood level,
Mapping the Distribution of Impacts to Residential CommunitiesA central dynamic of the minimum wage increase is one of targeting. To what extent does a
minimum wage increase constitute a poverty alleviation strategy? This question may also be
applied at the level of neighborhoods and residential communities, particularly in low- and
moderate-income areas where residents will be more likely to spend any increase in their
income, and thereby recycle the money through nearby businesses.To the extent that a
higher minimum wage infuses weaker markets with spending power, such an infusion may
increase demand for new businesses, which suggests an indirect role for the minimum wage
increase as a job creator.
Figure 5.4 shows the place of residence of workers in selected low-earnings jobs in industries
that will be affected. Although low-earning workers reside in every portion of the city,
many of them commute from low-income areas. Moreover, low-wage workers in different
industries are sorted into different areas of town.Again, the minimum wage increase's effect
in each industry will leave its own imprint on the city's neighborhood landscape in the form
of increased spending power.
Projecting Benefits onto Los Angeles Communities
Although the issue of leakage highlights the potential imprecision of the minimum wage
increase, the possibility of augmented spending power underscores its efficacy as a mechanism
of community investment and economic inclusion.The census-tract level database described
earlier that links workers' place of residence to their place of work was used to allocate the
projected earnings increases due to the minimum wage increase to the census tract level. Figure
5.5 shows estimates of the total earnings increase as a result of the minimum wage proposal
for census tracts in Los Angeles County.Two increase scenarios are presented for comparison:
$13.25 and $15.25.5 These scenarios show that the earnings boost will be widespread
throughout the city and will extend into surrounding portions of the county. Many of the
lower-income portions of the city will stand to receive relatively large percentage increases in
earnings. Especially in weak markets for consumer-oriented industries, this incremental increase
will likely translate into an infusion of spending power into the neighborhood. In this sense, the
minimum wage increase may be efficient if it redirects additional earnings into neighborhood
contexts where this incremental gain will have the largest effect. The question is whether the
incremental gains will be large enough to make inroads into the structural conditions that
generate concentrations of weak markets for consumption-oriented industries, poor accessibility
to jobs, and geographically segmented labor markets in the first place.
Table 5.1 summarizes projected impacts for each of the city's 37 Community Plan Areas.6
The table allows the comparison of summary impacts of the minimum wage for both
businesses and residents of a given community. Many communities, such as Westlake or
Southeast Los Angeles, with average household incomes below the city average stand to
gain the highest boost in earnings. Table 5.2 presents related indicators for each community
as shares of citywide totals. Although every Community Plan Area will experience different
effects of the minimum wage, the tables underscore our overall conclusion: lower-income
communities will experience most of the benefits, and the largest share of potential risks to
businesses will fall in higher-income, more economically diverse communities.
A More Geographically Inclusive Labor MarketDuly noting the theoretical nature of the analysis, we can draw the following tentative
conclusions. First, in absolute terms, the majority of potential impacts at the site of consumer-
oriented business locations—possibly including reductions in hours and increases in prices—
will likely occur in proximity to large, diverse concentrations of businesses and, in many cases,
higher-income residential areas of the city.This underscores the case that strong markets and
68 LOS ANGELES RISING: A City that Works for Everyone

Figure 5.5: Estimates of Aggregate Tract-level Earnings Increases from the Minimum
Wage Proposals
$13.25 scenario
7.
Estimated tract-levelearnings increase
less than 1%
2%
3 - 4%IS 5 - 6%N. over 7%
Insufficient sample size
$15.25 scenario
Sources: Author analysis of Longitudinal Employer-Household Dynamics origin-destination and home area.files (2011) and
ACS 5-year estimates (2007-2011).A11 totals arc based on 2014 dollars.
LOS ANGELES RISING: A City that Works for Everyone 69

Raising in theminimum wagewill drive economicrecovery in low-income neighborhoodsand evolve a more
inclusive, sustainableeconomy across thecity,
strong consumer bases will likely carry the majority of affected businesses through a period of
adjustment. Export-oriented industries, particularly textile and apparel manufacturing, should
be monitored by taking into account any adjustments to the division of labor and pattern of
firm location across the city and surrounding areas.
Second, in some sections of the city, low-wage jobs account for a disproportionate share of
the employment base, even though a relatively small number of low-wage jobs are actually
located there. However, these same neighborhoods probably stand to benefit the most
from an increase in the spending power of their residents, especially in the realm of typical
consumption of goods and services, for example, restaurants, that draw on highly localized
market areas. As a result, consumption-oriented businesses in areas like South Los Angeles
may play a sentinel role for identifying costs and benefits of the minimum wage increase.
Third, effects of the earnings increase will radiate throughout Los Angeles's diverse
neighborhood economies —as well as beyond the city's borders, as we discuss in the next
section. Though the infusion of earnings income will be diffuse, many residents of the lower-
income sections of the city that send low-wage workers to various employment centers will
carry their higher earnings back to the neighborhoods where they live. Particularly in weaker
markets, these dollars will generate additional demand, potentially closing existing gaps in
nearby job opportunities and local consumption markets across the city's neighborhoods.
For these reasons, a rising wage floor will shift the landscape of opportunity across the
neighborhoods and employment concentrations in Los Angeles. In light of the existing
geography of low-wage work, some of the benefits will manifest as increased demand
for consumption-oriented goods in areas of the city with weak markets and scarce job
opportunities. Meanwhile, many of the potential costs to businesses and consumers will occur
in areas relatively resilient to such adjustments.The minimum wage increase will work toward
bringing all of Los Angeles into a more sustainable economy.
Baseline Analysis of Labor Market Flows between Los Angeles andSurrounding CitiesThe Los Angeles region provides a paradigmatic example of a deeply integrated,
multi-centered metropolitan economy. Extending beyond the 88 incorporated cities
of Los Angeles County, the Los Angeles labor market is regional in scope. Much of
the minimum wage's effects will extend far beyond the municipal boundaries of Los
Angeles, possibly reshaping flows of labor between the city of Los Angeles and its
surrounding municipalities. Below, we examine trends in flows of workers during the
baseline periods of 2008 and 2011, both to examine the character of regional labor
market integration and to illustrate the possibility for monitoring the effect of the
minimum wage after its implementation.
Job Flows between the City of Los Angeles and Other Cities between 2008 and 2011
Table 5.3 shows the job destination of Angelinos who commute to work outside of the
city by income thresholds as well as the change during the baseline period.The first three
columns show the number of Los Angeles resident workers in other cities, and the last
three columns reveal the change in number of workers between 2008 and 2011. We show
these measures for all jobs, as well as low- and mid-earning jobs.The table shows a selected
number of cities with significant number of Los Angeles City workers. Overall, we do not
observe a large change during the base period.
70 LOS ANGELES RISING: A City that Works for Everyone

Table 5.1: Impacts and Initial Income-levels by Community Plan Area
Area businesses Area residents
Community Plan AreaImpacted consumer-oriented jobs as a
percentage of total jobs
Area residents receivinga raise
Aggregate earningsincrease
Average household incomerelative to citywide
average
Sherman Oaks - Studio City - Toluca Lake - Cahuenga Pass 36% 9,702 1.3% 161%
Brentwood - Pacific Palisades 33% 4,357 0.5% 293%
Northeast Los Angeles 27% 21,938 3.0% 85%
Northridge 35% 6,614 2.1% 112%
Hollywood 41% 26,282 2.2% 101%
Canoga Park - Winnetka - Woodland Hills - West Hills 40% 15,512 2.0% 118%
Chatsworth - Porter Ranch 35% 9,402 2.0% 127%
Bel Air - Beverly Crest 33% 1,381 0.4% 370%
Harbor Gateway 35% 1,813 2.3% 78%
Westlake 30% 11,128 5.7% 48%
Encino - Tarzana 30% 7,628 1.5% 157%
Sunland - Tujunga - Lake View Terrace - Shadow Hills -East La Tuna Canyon
54% 5,895 2.4% 99%
Westwood 13% 2,925 0.7% 151%
Central City North 15% 2,204 4.1% 66%
Silver Lake - Echo Park - Elysian Valley 44% 8,187 2.6% 99%
Port of Los Angeles 13% - - -
San Pedro 43% 3,886 1.2% 95%
Sun Valley - La Tuna Canyon 25% 10,924 4.7% 82%
West Adams - Baldwin Hills - Leimert 40% 18,514 4.1% 68%
Westchester - Playa del Rey 35% 3,216 0.7% 145%
Los Angeles International Airport 19% 294 6.5% 61%
North Hollywood - Valley Village 51% 18,438 3.6% 84%
Southeast Los Angeles 24% 22,133 6.4% 50%
Sylmar 23% 7,973 3.8% 90%
Wilmington - Harbor City 24% 3,869 1.9% 78%
Palms - Mar Vista - Del Rey 43% 9,579 1.5% 109%
Arleta - Pacoima 35% 11,600 6.2% 77%
Venice 53% 3,078 0.9% 162%
Reseda - West Van Nuys 36% 13,022 3.4% 87%
Van Nuys - North Sherman Oaks 35% 20,370 3.6% 84%
Wilshire 45% 30,959 2.6% 94%
Boyle Heights 26% 7,129 5.3% 54%
Mission Hills - Panorama City - North Hills 39% 16,157 4.5% 78%
Granada Hills - Knollwood 52% 5,825 2.1% 119%
South Los Angeles 31% 26,547 5.2% 54%
West Los Angeles 32% 5,798 1.0% 153%
Central City 12% 2,934 2.6% 66%
Sources:Author analysis of Longitudinal Employer-1-1(mschold Dynamics origin-destination and home area files (2011),ACS 5-year estimates (2011).
LOS ANGELES RISING: A City that Works for Everyone 71

Table 5.2: Share of Citywide Jobs, Initial Income, and Impacts by Community Plan Area
Area businesses Area residents
Community Plan AreaJobs in allindustries
Jobs in impactedconsumerindustries
Jobsreceiving a
raise
Aggregateearningsincrease
Aggregate householdincome
Sherman Oaks - Studio City - Toluca Lake - CahuengaPass
2.8%3.4% 2.6% 2.4% 4.9%
Brentwood - Pacific Palisades 1.74 1.8% 1.2% 1.1% 5.5%
Northeast Los Angeles 3.5% 3.2% 5.8% 5.8% 4.7%
Northridge 1.5% 1.8% 1.8% 1.7% 1.9%
Hollywood 5.6% 7.7% 7.0% 6.7% 7.3%
Canoga Park - Winnetka - Woodland Hills - WestHills
5.0%6.8%
4.1ga 4.0% 5.5%
Chatsworth - Porter Ranch 3.5% 4.1% 2.5% 2.5% 3.1%
Bel Air - Beverly Crest 0.3% 0.3% 0.4% 0.3% 2.2%
Harbor Gateway 0.7% 0.8% 0.5% 0.5% 0.6%
Westlake 3.2% 3.2% 2.9% 3.1% 1.4%
Encino - Tarzana 2.7% 2.7% 2.0% 2.0% 3.6%
Sunland - Tujunga - Lake View Terrace - ShadowHills - East La Tuna Canyon
0.5%1.03/4 1.6% 1.5% 1.5%
Westwood 4.1% 1.7% 0.8% 0.7% 2.2%
Central City North 2.8% 1.5% 0.6% 0.6% 0.3%
Silver Lake - Echo Park - Elysian Valley 0.7% 1.0% 2.2% 2.1% 2.0%
Port of Los Angeles 0.3% 0.2% 0.0% 0.0% 0.0%
San Pedro 0.8% 1.1% 1.0% 1.0% 2.1%
Sun Valley - La Tuna Canyon 2.1% 1.8% 2.9% 2.9% 1.4%
West Adams - Baldwin Hills - Leimert 1.9% 2.6% 4.9% 5.0% 3.3%
Westchester - Playa del Rey 2.1% 2.5% 0.9% 0.8% 2.7%
Los Angeles International Airport 2.5% 1.6% 0.1% 0.1% 0.0%
North Hollywood - Valley Village 1.9% 3.2% 4.9% 4.8% 3.3%
Southeast Los Angeles 3.0% 2.5% 5.9% 6.1% 2.4%
Sylmar 1.3% 1.0% 2.1% 2.14 1.4%
Wilmington - Harbor City 1.2% 0.9% 1.0% 1.0% 1.3%
Palms - Mar Vista - Del Rey 1.6% 2.2% 2.5% 2.6% 4.2%
Arleta - Pacoima 1.0% 1.2% 3.1% 3.1% 1.2%
Venice 0.7% 1.2% 0.8% 0.8% 2.3%
Reseda - West Van Nuys 1.8% 2.1% 3.5% 3.4% 2.3%
Van Nuys - North Sherman Oaks 3.3% 3.9% 5.4% 5.4% 3.6%
Wilshire 7.8% 11.6% 8.2% 8.6% 8.4%
Boyle Heights 1.4% 1.2% 1.9% 1.9% 0.9%
Mission Hills - Panorama City - North Hills 1.8% 2.3% 4.3% 4.3% 2.3%
Granada Hills - Knollwood 0.6% 1.1% 1.5% 1.5% 1.8%
South Los Angeles 3.2% 3.3% 7.0% 7.1% 3.2%
West Los Angeles 4.6% 5.0% 1.5% 1.5% 4.0%
Central City 16.5% 6.6% 0.8% 0.8% 1.0%
Sour«.s:Author analysis Employer-Honsehold Dynamics 00;On-destination and residence area files (2011), /ICS 5-year estimates (201.3).
72 LOS ANGELES RISING: A City that Works for Everyone

Table 5.3 Work Places of Residents of the City of Los Angeles by Income Thresholds and
the Change in Employment between 2008 and 2011
City Total Jobs2011
Low $ Jobs2011
Mid $ Jobs2011
Change TotalJobs
Change Low$ Jobs
Change Mid$ Jobs
Agoura Hills 6,517 1,103 2,291 147 -147 -27
Beverly Hills 25,177 4,649 9,450 -2,467 -447 -952
Burbank 84,459 41,136 18,470 1,521 1,216 -1,352
Calabasas 4,265 1,063 1,614 -686 58 -306
Carson 9,021 1,991 4,190 -398 -19 -455
Commerce 21,957 3,258 12,823 -1,003 -567 -846
Compton 7,353 1,430 3,592 -446 72 -463
Culver City 28,369 12,992 6,904 -799 -292 -814
Downey 4,798 1,384 1,950 64 2 -110
East Los Angeles CDP 6,544 1,707 2,685 1,845 407 630
El Segundo 11,873 1,146 2,563 2,124 66 179
Gardena 5,443 1,282 2,727 484 118 20
Glendale 28,973 8,421 11,071 40 372 -732
Hawthorne 4,605 1,213 1,887 414 10 74
Huntington Park 3,306 1,089 1,438 539 144 78
Inglewood 8,380 2,363 3,767 295 41 69
Long Beach 17,325 5,270 5,443 -792 -362 -1,191
Monterey Park 3,880 967 1,627 554 102 84
Pasadena 19,122 4,556 6,604 -951 -554 -649
Redondo Beach 4,204 1,097 1,428 -575 -26 -178
Rosemead 2,890 531 858 1,359 26 242
San Fernando 4,160 869 2,109 -681 -170 -536
Santa Clarita 11,572 2,931 4,797 -1,024 -337 -545
Santa Fe Springs 4,300 661 2,045 -400 -59 -340
Santa Monica 36,641 7,439 11,879 -576 -507 -660
South Gate 5,930 2,180 2,698 3,482 1,599 1,396
Torrance 18,025 4,093 7,118 -236 -267 -629
West Hollywood 13,793 3,784 5,409 -5,046 -1,010 -1,005
Figure 5.6 illustrates these patterns for the cities where low-earnings residents of the
City of Los Angeles work. The sizes of the tiles reflect the relative number of low-
wage residents of the city of Los Angeles who work in each receiving city and the
color reflects the percentage change in employment between 2008 and 2011 for total
jobs. Burbank, the largest recipient of low-earnings Los Angeles residents, showed an
increase for 1,216. South Gate shows the largest increase, and West Hollywood shows
the largest decrease.
While considerable variation exists among the labor flows between neighboring cities and
Los Angeles during the 2008-2011 period, the overall trend has been a net flow of workers
from other cities to Los Angeles. The average net flow to the city was over 1,000 workers
for the cities included in in Table 5.4. Although many cities showed net increases, these
increases were attributed to high-paying jobs. As depicted in Figure 5.7, for low-paying
jobs, we observe a random pattern of job changes among different cities and an average
change of approximately zero. Thus, we do not observe any baseline trend for low- and
mid-paying jobs that will be affected by higher minimum wages.The dynamics after
implementation should be monitored with this finding in mind.
LOS ANGELES RISING: A City that Works for Everyone 73

Figure 5.6 Top Low-earnings Job Destinations for LA City Workers Sized by Total Low-
earnings Jobs and Colored by Change in Low Paid Employment between 2008 & 2011
Agoura Beverly HillsHills
Burbank
CalabasasCarson Culver City
CommerceCompton
Downey
io East Los
ElSegundo
Angeles COP
Gardena
Glendale Pasadena RedondoBeach Santa
Monterey Rosemead ClaritaPark San Fernando Oa)
Santa Fe Spring
Hawthorne Long Santa I
Huntington Beach Monica TorrancePark
Inglewood
AI
. ,
West -Hol! ...woo
;
Change
F -10000
l000I 2000
Table 5.4 Home Origins of Workers in the City of Los Angeles by Income Thresholds
and the Change in Employment between 2008 and 2011
City Total Jobs
2011
Low $ Jobs
2011
Mid $ Jobs
2011
Change Total
Jobs
Change Low
$ Jobs
Change Mid
$ Jobs
Alhambra 10,921 2,071 3,213 358 -323 -317
Altadena COP 6,059 1,247 1,349 908 143 32
Arcadia 6,902 1,141 1,603 782 20 -181
Beverly Hills 7,677 2,432 1,831 404 299 26
Burbank 21,022 5,778 5,732 1,832 602 -403
Carson 10,500 2,106 3,385 513 -326 -485
Compton 9,753 2,320 4,177 615 -262 -269
Culver City 9,230 1,898 2,302 568 78 -87
Downey 10,560 1,710 3,613 1,736 -79 89
East Los Angeles CDP 12,918 3,276 5,976 472 -239 -327
El Monte 7,334 1,537 2,670 311 -135 -198
Gardena 7,408 1,537 2,743 182 -222 -243
Glendale 32,546 8,591 9,877 2,112 433 -554
Hawthorne 12,419 2,606 5,680 -69 -459 -488
Inglewood 19,173 4,395 8,143 -176 -612 -817
Lancaster 11,171 2,310 3,580 3,145 410 461
Long Beach 27,557 5,266 8,807 3,107 -308 114
Palmdale 12,567 2,332 4,477 1,732 103 433
Pasadena 15,284 2,878 3,546 1,858 95 -82
Redondo Beach 8,598 1,325 1,687 707 45 -4
Santa Clarita 31,219 5,817 7,120 2,824 272 -193
Santa Monica 19,554 4,380 4,149 1,164 184 -30
74 [OS ANGELES RISING: A City that Works for Everyone

City Total Jobs2011
Low $ Jobs2011
Mid $ Jobs2011
Change TotalJobs
Change Low$ Jobs
Change Mid$ Jobs
South Gate 8,453 1,961 4,002 75 -127 -445
Torrance 13,716 2,329 3,577 759 -123 -248
West Covina 6,932 1,101 1,786 901 -55 -186
West Hollywood 9,766 2,979 2,289 621 321 -101
Figure 5.7 Home Origins ofWorkers from Other Cities Working in Low-earnings Jobs in
the City of Los Angeles Sized by Low Paid Jobs and Colored by Change in Low-earnings
Employment between 2008 & 2011
lhambra
AltadenaCDP
Arcadia
Carson
Downey
Beverly Hills
Burbank
Compton7
East LosAngeles CDP
CulverCity
El Monte
Gardena
Glendale
Long Beach
Palmdale Pasadena
Redondo Beach
Hawthor LInglewoodraltircaster
Santa Clarita
Santa South TorranceMonica Gate
WestCovina
West Hollywood
Another way of assessing the dynamics of labor flows is to observe the change
over time in the net balance of the flows between different municipalities. Table
5.5 compares the changing flows of workers between 2008 and 2011 in other
municipalities that both send workers to and receive workers from the city of
Los Angeles.
The first two columns show the inflow-outflow balance for each city—or the net
difference between the number of Angelinos "imported" as labor and the number of
residents "exported" to work in Los Angeles—in 2008 and 2011, respectively. Large
numbers indicate that the city sends large numbers of workers to these cities relative
to the number that it receives. We observe that the city has large balances (i.e., L.A. is a
net exporter) with the affluent, net-importing cities of Beverly Hills, Burbank, Culver
City and Santa Monica. Most of the remaining cities export more workers to the city
than they import. Santa Clarita, Inglewood and Long Beach are the largest
net exporters.
For each city included in the table, the city of Los Angeles exports an average of 1,700
workers. However, this large and positive balance is due to the four net-importing
cities noted above. Los Angeles imports an average of 2,800 workers from the
remaining cities.
Change
-800-4000
400800
LOS ANGELES RISING: A City that Works for Everyone 75

The third column shows the change in the net balances for all jobs between 2008 and
2011.Are Los Angeles's labor flows between each surrounding city trending in the
direction of importing or exporting workers? With a few exceptions, between 2008 and
2011, Los Angeles gained more workers from other cities, as reflected in positive net
changes to L.A.'s status as a regional importer of labor. This finding is verified in Figure 5.8,
where most of the cities show positive balances (shades of red) on average for cities with a
net balance change of 1,000 workers.
Table 5.5. Labor inflows and Outflows between Los Angeles City and Other
Cities-2008-2011 Period
City LAC Net
Balance
2008
LAC Net
Balance 2011
Change Net
Balance All
Jobs
LAC Net
Balance low
$ 2008
LAC Net
Balance Low
$ 2011
Change Net
Balance Low
$ Jobs
Agoura Hills 1,475 901 574 163 -208 371
Alhambra -6,713 -7,070 357 -1,104 -806 -298
Beverly Hills 20,371 17,500 2,871 2,963 2,217 746
Burbank 63,748 63,437 311 34,744 35,358 -614
Calabasas 370 -626 996 -170 -210 40
Carson -568 -1,479 911 -422 -115 -307
Commerce 21,852 20,735 1,117 3,569 2,986 583
Compton -1,339 -2,400 1,061 -1,224 -890 -334
Culver City 20,506 19,139 1,367 11,464 11,094 370
Downey -4,090 -5,762 1,672 -407 -326 -81
East Los Angeles CDP -7,747 -6,374 -1,373 -2,215 -1,569 -646
El Monte -3,808 -4,572 764 -911 -893 -18
El Segundo 7,308 9,225 -1,917 664 688 -24
Gardena -2,267 -1,965 -302 -595 -255 -340
Glendale -1,501 -3,573 2,072 -109 -170 61
Hawthorne -8,297 -7,814 -483 -1,862 -1,393 -469
Inglewood -11,264 -10,793 -471 -2,685 -2,032 -653
Lakewood -2,931 -4,220 1,289 -153 -186 33
Lancaster -5,139 -8,580 3,441 -1,042 -1,709 667
Long Beach -6,333 -10,232 3,899 58 4 54
Monrovia -1,869 -2,326 457 -359 -449 90
Norwalk -3,922 -4,475 553 -678 -624 -54
Palmdale -9,150 -10,624 1,474 -1,583 -1,666 83
Pasadena 6,647 3,838 2,809 2,327 1,678 649
Pico Rivera -4,055 -4,436 381 -718 -687 -31
Pomona -2,714 -3,408 694 -617 -663 46
Redondo Beach -3,112 -4,394 1,282 -157 -228 71
Rosemead -3,195 -1,900 -1,295 -734 -576 -158
Santa Clarita -15,799 -19,647 3,848 -2,277 -2,886 609
Santa Fe Springs 3,575 3,092 483 482 441 41
Santa Monica 18,827 17,087 1,740 3,750 3,059 691
South Gate -5,930 -2,523 -3,407 -1,507 219 -1,726
South Pasadena -805 -2,307 1,502 79 -63 142
Torrance 5,304 4,309 995 1,908 1,764 144
West Covina -4,368 -5,461 1,093 -496 -515 19
West Hollywood 9,694 4,027 5,667 2,136 805 1,331
76 LOS ANGELES RISING: A City that Works for Everyone

Figure 5.8. The change in net labor flow balance between LA City and Other Cities
between 2008 and 2011
Agoura Hills •
Alhambra
Burbank
Beverly Hills Culver City
Downey
•rail la
Cars
Monrovia
Norwalknomppr.iasas
)nCommerce Compton
L
East LosAngeles COP
ijPalmdale
PasadenaPicoRivera
El Monte Glendale
El Segundo
Gardena
Pomona
edondo 4each Rose
m
[Santa Fe Springs
Hawthorne
Inglewood
Santa Monica
Southsouth Pasadena
pate Torrance
Lake-wood
WestCovina
Consequently, the trend between 2008 and 2011 generally confirms that there is anincreasing net flow of all workers from other cities to the city of Los Angeles. However,the last three columns ofTable 5.5, which reflect the labor flows for low paid jobs, showthat this trend is more moderate when limited to low-wage workers.The average netchange was almost zero for cities included in the table, although L.A. had increasingbalances with some cities and decreasing balances with others. This picture is alsoreflected in Figure 5.9 where we observe both red and blue/gray shades showing positiveand negative net balances.
This examination of the baseline period from 2008 to 2011 suggests that the City of LosAngeles is an attractive labor market for mid- and high-paying jobs. For low-paying jobs,exchanges between the city of Los Angeles and its surrounding municipalities are morebalanced. Hence, we expect that higher minimum wage levels will nudge the pattern forflows of low-earnings workers closer to the pattern observed for mid- and high-earningsworkers. Favoring the prospect of higher earnings, low-wage jobs seekers may confinetheir search geographically to the city of Los Angeles. Eventually, low-wage workers withrelatively higher levels of productivity will rise to the front of hiring queues. The attendantshift in labor supply toward the Los Angeles market will pressure neighboring cities toincrease their minimum wage levels at the risk of losing their more productive labor forceto Los Angeles.
The labor force that finds jobs in Los Angeles is over a hundred times larger than thatin neighboring cities with the largest flows of workers across the city line. This meansthat L.A.'s action to raise the minimum wage is likely to influence wage levels beyond itsborders as businesses compete to attract and retain competent workers. There is a strongprospect that higher wages will strengthen the city's capacity to attract the most capableworkers, pressuring neighboring businesses and cities to raise wage levels to remaincompetitive.
In summary, this baseline analysis accentuates the various ways that the Los Angeles labormarket is deeply integrated with its surrounding communities across the region. Theserelationships vary across cities and across wage and skill levels. They also vary over time,
Net change
-4000-20000
200040006000
LOS ANGELES RISING: A City that Works for Everyone 77
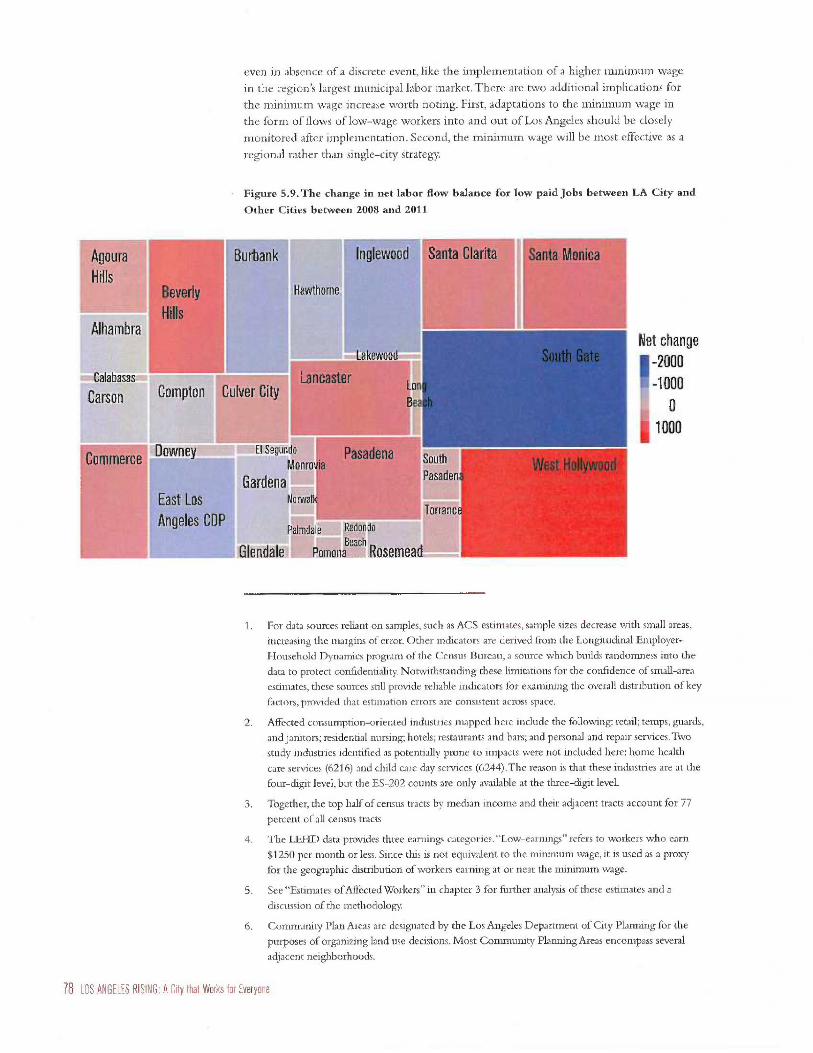
AgouraHills
1L—ALAlhambra
Calabasas
Carson
!mmerce
'Beverly .Hills
even in absence of a discrete event, like the implementation of a higher minimum wage
in the region's largest municipal labor market. There are two additional implications for
the minimum wage increase worth noting. First, adaptations to the minimum wage in
the form of flows of low-wage workers into and out of Los Angeles should be closely
monitored after implementation. Second, the minimum wage will be most effective as a
regional rather than single-city strategy.
• Figure 5.9. The change in net labor flow balance for low paid Jobs between LA City and
Other Cities between 2008 and 2011
Burbank
Compton Culver City
Downey El SegundoMonrovia
litGardena
East Los Norwalk
Palmdale BReeadcohndo
TorranceAngeles CDP
Glendale Pomona Rosemead —I
Santa Clarita Santa Monica
South Gate
Pasadena South'Pasadena
Net changer -2000-10000
1000
1. For data sources reliant on samples, such as ACS estimates, sample sizes decrease with small areas,
increasing the margins of error. Other indicators are derived from the Longitudinal Employer-
Household Dynamics program of the Census Bureau, a source which builds randomness into the
data to protect confidentiality. Notwithstanding these limitations for the confidence of small-area
estimates, these sources still provide reliable indicators for examining the overall distribution of key
factors, provided that estimation errors are consistent across space.
2. Affected consumption-oriented industries mapped here include the following: retail; temps, guards,
and janitors; residential nursing; hotels; restaurants and bars; and personal and repair services.Two
study industries identified as potentially prone to impacts were not included here: home health
care services (6216) and child care day services (6244).The reason is that these industries are at the
four-digit level, but the ES-202 counts are only available at the three-digit level.
3. Together, the top half of census tracts by median income and their adjacent tracts account for 77
percent of all census tracts
4. The LEHD data provides three earnings categories. "Low-earnings" refers to workers who earn
$1250 per month or less. Since this is not equivalent to the minimum wage, it is used as a proxy
for the geographic distribution of workers earning at or near the minimum wage.
5. See "Estimates ofAffected Workers" in chapter 3 for further analysis of these estimates and a
discussion of the methodology.
6. Community Plan Areas are designated by the Los Angeles Department of City Planning for the
purposes of organizing land use decisions. Most Community Planning Areas encompass several
adjacent neighborhoods.
78 LOS ANGELES RISING: A City that Works for Everyone

LOS ANGELES RISING: A City that Works for Everyone 79

Parallel Expansions of Opportunitiesfor Living Wages
80 LOS ANGELES RISING: A City that Works for Everyone

Higher minimum wages have the potential to lift Los Angeles's low-income neighborhoods
into a sustainable economy. Two other reforms are also important to consider because they
will make similar contributions to raising earning levels in low-income communities: (1)
the administrative relief programs, Deferred Action for Childhood Arrivals (DACA) and
Deferred Action for Parents of Americans and Lawful Permanent Residents (DAPA), and(2) California's Proposition 47.
The two reforms are parallel forces for raising the wage floor in Los Angeles. In this
chapter we estimate the number and current wages of undocumented workers who are
eligible for labor market inclusion as a result of DACA and DAPA, and then estimate future
annual wage gains for these workers as a result of their ability to compete for jobs in the
formal economy.
Reduced sentences under Proposition 47 are expected to soften wage and employment
penalties. We estimate the number of persons who will be eligible to expunge felony
offenses, project their employment rate and wage level, and estimate the amount of their
increased earnings.We then analyze how these projected wage increases may contribute to
raising the wage floor in Los Angeles independent of increases in the minimum wage.
DACA and DAPA
Overview
On November 20, 2014, the Obama administration announced the Immigration
Accountability Executive Action, which revised and expanded deferred action programs
for certain unauthorized immigrants and implemented other initiatives dealing with
border security, enforcement priorities, and entry of skilled workers.' Under the deferred
action programs, individuals approved for consideration are granted a renewable three-year
protection status from deportation proceedings and become eligible for work authorization
in the U.S. Table 6.1 illustrates DACA and DAPA eligibility requirements.
Table 6.1: DACA and DAPA Eligibility Requirements
Expanded Deferred Action forChildhood Arrivals
DACA
Deferred Action for Parents of Americansand Lawful Permanent Residents
DAPA
Have come to the U.S. before theirsixteenth birthday.
Have continuously lived in the U.S. sinceJanuary 1, 2010.
Have graduated high school or completed a GEDcertificate, or are in school.
Have not been convicted of certain criminal offenses.
Be the parent of a U.S. citizen or lawfulpermanent resident.
Have continuously lived in the U.S. sinceJanuary 1, 2010.
Have not been convicted of certain criminal offenses,including any felonies and some misdemeanors.
Source: US. Department of Homeland Security, 2014.
DACA was originally implemented on August 12, 2012.The 2014 revision eliminated
the age cap of 31 years at the time of application, and it changed the latest eligible year of
entry from 2007 to 2010. Approximately 1.5 million unauthorized persons will potentially
qualify for the expanded DACA program, in addition to 3.9 million parents eligible for
DAPA.2
Approximately 1.5million unauthorizedpersons will potentiallyqualify for theexpanded DACAprogram. 3.9 millionparents will be eligiblefor DAPA.
LOS ANGELES RISING: A City that Works for Everyone 81

Individuals eligible for
DAN and DAPA are
concentrated in low-
wage industries. The
median hourly wage
for a full-time DAPA-
or DACA-eligible
worker is Sla
In the city of Los Angeles, the impact of this administrative action will be both
positive and significant due to the high concentration of immigrants in the area (see
Figure 6.1). The city is home to almost half of all the DACA and DAPA beneficiaries
in Los Angeles County, and about 16 percent of all DAPA and DACA beneficiaries
in California.
Figure 6.1. Unauthorized Residents in the City of Los Angeles
160,000 Eligible for DAPA
Eligible by expanded DADA
Currently protected or eligible DACA
Not eligible
Source: ERt and UCLA Labor Center analysis of Public Use Microdata Sample (PUMS) data from the pooled 2009-2013
American Community Survey.
Profile of DACA- and DAPA-Eligible Workers
About 45 percent of Los Angeles's 500,000 unauthorized residents could potentially
qualify for DACA and DAPA. Of these, the overwhelming majority (-90 percent) are
Latino, with about two-thirds coming from Mexico and one-quarter from Central
America. Almost half of these individuals have no schooling or less than high school, and
they have an unemployment rate of 5.4 percent, below the overall unemployment rate
for the city at 6.7 percent.
Individuals eligible for DACA and DAPA are concentrated in low-wage industries, with
almost half (45 percent) in construction, manufacturing, and restaurants and bars. The
median hourly wage for a full-time DAPA- or DACA-eligible worker is $10, compared to
that of authorized workers at $17.
Median age for those who qualify for DACA is 24 and for DAPA is 38.About two-thirds
of the two groups combined are between the ages of 26 and 45, and 50 percent of these
individuals arrived by 1995.Table 6.2 provides a profile of the population eligible for
DACA and DAPA.
82 I.OS ANGELES RISING: A City that Works for Everyone

Table 6.2. Selected Characteristics of the DACA and DAPA Eligible Population in Los Angeles
DACA Eligible DAPA Eligible DAPA/DACA Combined
Total 60,098 159,196 219,294
Gender
Male 51% 47% 49%
Female 49% 53% 51%
RacelEthnicity
Latino 80% 92% 89%
White, Non-Hispanic 6% 2% 3%
Black, Non-Hispanic 1% 1% 1%
Asian 13% 5% 7%
Other 1% 1% 14
Top 5 Countries of Origin
Mexico 56% 64% 62%
El Salvador 11% 12% 12%
Guatemala 8% 12% 11%
Korea 5% 2% 3%
Philippines 4% 2% 2%
Age Categories
16-25 62% 5% 214
26-45 37% 76% 65%
45-55 .1% 17% 13%
56+ 0% 2% 2%
Educational Attainment
Less than HS 14% 63% 51%
High School Diploma 43% 23% 27%
Some College, BA or better 42% 15% 21%
Marital Status
Married 15% 59% 47%
Never married 81% 32% 45%
Wages
Median Annual Earnings, Full-TimeWorkers
$23,610 $20,418 $20,852
Median Hourly Wage, Full-TimeWorkers
$11.49 $9.93 $10.04
Unemployed 6.2% 5.1% 5.4%
Top 5 Industries
Manufacturing 10% 19% 17%
Construction 8% 16% 14%
Restaurants and Bars 18% 13% 14%
Retail 19% 10% 12%
Personal and Repair Services 8% 14% 12%
LOS ANGELES RISING: A City that Works for Everyone 83

About 75 percent ofDAD- and DAPA-eligible persons earnless than 515.25
per hour. After theirstatus change, 15,000workers will earnabove $15.25.
Estimated Impact on Wages and Employment
Many studies have examined the relationship between legalization of unauthorized
resident status and the labor market outcomes. Most have focused on the impact of the
Immigration, Reform, and Control Act (IRCA) of 1986, which granted temporary legal
residence to about 1.7 million undocumented immigrants who later became eligible for
U.S. citizenship. Although their findings are not uniform, these studies are generally in
agreement that, as a result of legalization, the wages of these individuals increased:
>> The U.S. Department of Labor Survey of Legalized Population (1996)
reported that overall, the wages of the recently legalized rose by 15
percent in the four to five years following legalization.' On average,
men experienced a 13.2 percent wage increase and women a 20.5
percent increase.
Francisco Rivera-Batiz found that the wages of male IRCA
beneficiaries increased 8.4 percent and that of female beneficiaries
increased by 13 percent.4
Catalina Amuedo-Dorantes, Cynthia Bansak, and Stephen Raphael
estimate that the real wages of male IRCA beneficiaries had increased by
9.3 percent; while for women the increase was 2.1 percent.'
Sherrie A. Kossoudji and Deborah Cobb-Clark found a 6 to 10 percent
increase in wages on average of individuals legalized under IRCA.'
Although DACA and DAPA do not confer legal residency or a path to citizenship, we can
assume that eligible individuals could potentially enjoy comparable wage increases as a result
of their legal status authorization. Based on the estimates found on the literature, we use a 15
percent wage increase to calculate increased earnings as a result of DACA and DAPA status.
We also assume that every individual who qualifies will apply for these deferred action
programs. However, in the two-plus years that DACA has been in place, the Migration
Policy Institute estimates that only 55 percent of those who met the criteria had applied
for relief. "Application costs, fear of self-identifying as unauthorized or potentially exposing
other unauthorized relatives to government scrutiny and lack of information about the
program and its temporary nature were among the barriers [for applying].."'
We begin by estimating the current wage distribution for individuals who qualify for
DACA and DAPA, using as points of reference those who make below the current
minimum wage at $9.00, and the two proposed new minimum wages, $13.25 and $15.25.
We then calculate new hourly wages based on our 15 percent estimate, and reassess the
new wage distribution, as shown in Table 6.3.
Table 6.3. Current and Projected Wage Distribution for DACA and DAPA Recipients
DACA Eligible DAPA Eligible DACA and DAPA EligibleCombined
Current Hourly Wage
Less than $9.00 38% 41% 40%
Less than $13.25 64% 68% 67%
Less than $15.25 72% 75% 75%
After 15% Increase
Less than $9.00 29% 28% 29%
Less than $13.25 55% 59% 58%
Less than $15.25 64% 68% 68%
84 LOS ANGELES RISING: A City that Works for Everyone
As can be seen, projected wage increases resulting from DACA or DAPA coverage
can shift the current wage distribution for workers who will potentially be affected by
changes in the minimum wage. For instance, currently, about 75 percent of the DACA-
and DAPA-eligible population is earning less than $15.25 per hour, but after the status
change and the projected wage increase take effect, this percentage drops by 7 points.
In other words, about 15,000 workers benefiting from DAPA and DACA are projected
to earn hourly wages above the $15.25 benchmark and will not be reliant on a higher
minimum wage to lift them above the $15.25 threshold.
This increase in wages of a small but significant portion of the workforce in Los Angeles
is one of the many factors raising the wage floor. Independent of increases in the
minimum wage, about 15 percent of workers in Los Angeles will likely experience an
increase in their wages, which will also translate into more tax revenue and increased
consumer purchasing power, benefiting the local economy.
Many currently undocumented workers are constrained by lack of legal status in the
jobs they can seek. Often these are in the informal sector, which results in lower wages.
However, as the IRCA experience illustrates, legalization and work authorization
increases the social mobility of previously unauthorized immigrants and allows changes
in occupations, improving the returns on human capital for these individuals, while—as a
recent report by the White House Council of Economic Advisers (CEA) shows—creating
a positive macroeconomic impact, as well as a positive effect on the wages of both
foreign-born and native-born workers.8
Proposition 47In 2014, California voters passed Proposition 47, the Safe Neighborhoods and Schools
Act, which reduces certain non-serious and nonviolent property and drug offenses from
felonies to misdemeanors. Prop 47 addresses what is known as "wobbler" sentencing,
when certain property crimes and drug offenses could be charged as either a felony or a
misdemeanor.The crimes covered under Prop 47 include petty theft, shoplifting, property
theft, writing bad checks, and check forgery all under $950 as well as drug possession
for personal use with no intent to distribute. It will reduce the number of California
residents convicted of felonies by more than 40,000 a year as well as allow those who
were previously convicted of felonies to reduce their convictions.' In Los Angeles County,
almost 10,000 people are expected to have their sentences reduced (Figure 6.2).10 The
savings from the reduction in the prison population will be reallocated to mental health
and substance use services, truancy and dropout prevention, and victim services.
A criminal record has negative effects on employment and earnings. Though
misdemeanor convictions will still impact wage and earnings growth, the penalty is
less for those with misdemeanors than those with felonies. We estimate that a reduced
sentence will soften wage and employment penalties and bring $13.8 million in earnings
back to the community. With a recidivism rate of 62 percent for those that have gone to
prison for nonviolent and non-serious felonies, economic and employment stability is key
to preventing recidivism and reducing crime.
Impact of Conviction on Employment and Earnings
A felony conviction or time in prison significantly reduces the ability of ex-offenders
to find jobs costing the U.S. economy an estimated $57 to $65 billion annually in lost
economic output."
Formerly incarcerated people and people with convictions face poor employment and
earnings prospects on release. Employers are often reluctant to hire individuals with a felony
record. Audit studies, where two candidates with similar profiles apply for a job but one has
Prop 47 will reducesentences for 10,000in Los Angeles County
and bring 51,6 millionin earnings intocommunities.
LOS ANGELES RISING: A City that Works for Everyone 85

Formerly incarceratedindividuals earn 10 to30 percent less thansomeone who has notbeen incarcerated,
a criminal conviction, have shown that employers are less likely to call back an individual
with a felony record.12 In a survey of over 600 employers in Los Angeles County, 40 percent
indicated that they will "probably" or "definitely" not be willing to hire an applicant with a
criminal record for a job not requiring a college degree." Employers may also be less likely
to take on the risk liability of hiring someone for jobs that involve interacting with the public
or handling cash." Other barriers include state laws and occupation licensing requirements
that prohibit people. with criminal records from certain jobs."
Figure 6.2: Estimated people with reduced penalities under Proposition 47 in Los
Angeles County, 2012
Forgerglrecks/Auess Cards40
Property Crimes
Marijuana134
Drug Offenses
Source: Criminal Justice Statistics Center(2013); Department ofJustice (2014) as cited in Center on Juvenile and Criminal
Justice "Proposition 47: Estimating Local Savings and Jail Population Reductions"
In addition, formerly incarcerated individuals also experience a wage penalty. It
is estimated that they earn 10 to 30 percent less than someone who has not been
incarcerated, and their earnings will experience 30 percent lower growth rate than an
equally qualified person who was not incarcerated." In a recent study,Western estimates
a formerly incarcerated man will lose $179,000 of what he would otherwise earn by
age 48.17 This is the case when age, education, school enrollment, region of residence,
and urban residence are statistically accounted for. The impact of incarceration can
be experienced years after the sentence is complete. Studies have found that formerly
detained youth have higher unemployment rates and receive lower wages a decade or
more after incarceration."
Race also is a factor in reducing earnings for individuals with convictions. Black and
Latino individuals who are incarcerated earn less or experience slower wage growth than
formerly incarcerated white people.19 In a study in Washington, even after controlling for
additional factors, formerly incarcerated black individuals earned 10 percent less than do
white individuals.20 It is also important to note that African American applicants without a
criminal record fare no better than whites just released from prison.21
86 LOS ANGELES RISING: A City that Works for Everyone

The Potential for Reduced Wage Penalties through Reduced Sentences
Research findings vary about the extent to which an arrest or conviction affects earnings,22but incarceration definitely has negative effects on an individual's economic prospects.23Not serving jail or prison time due to sentencing changes from Prop 47 will reduce theemployment stigma that comes with an incarceration history.
Even so, individuals with a misdemeanor conviction still face some employmentbarriers. Unless expunged, the conviction will show up on background checks, and amisdemeanor record can still bar a person from certain jobs and licenses. On the otherhand, the reclassification from felony to misdemeanor is likely to reduce some barriers toemployment.Whereas previous audit studies have shown that a felony record reduces thelikelihood of an employer calling back a potential recruit,24 a study in Minnesota foundthat a misdemeanor arrest did not disqualify a candidate from consideration.25 Furthermore,in a survey of over 600 employers in Los Angeles, researchers found that employers are lessaverse to hiring someone with a drug- or property-related crime,26 both of which fall intothe six crimes covered under Prop 47.
Through the criminal record expungement process, individuals who have committedoffenses and then served time in county jail or a period of probation can legally applyto have these past offenses erased from their public record. In Santa Clara County,expungement resulted in an additional $6,190 in an individual's income in the yearfollowing record clearance.27 Unfortunately, not everyone knows about the process or is
able to go through the legal steps to get their record expunged.
Earning mobility relies on stable, career jobs. As wages go up, an individual's propensity tocommit a crime decreases.28 Prop 47 is one step in alleviating post-conviction conditions thatreduce employment opportunities, which could further support the successful reintegration offormerly incarcerated individuals back into society by providing better wages.
Potential Economic Benefits of Prop 47 and a Minimum Wage Increase
Prop 47 will reduce the number of people convicted of felonies by more than 40,000 ayear across California and will reduce the number sentenced to prison by more than 3,000a year.2° It will also allow more than 9,000 people now in prison for felonies for low-levelcrimes to apply for reduced sentence and release.This includes about 1,500 people who are
serving extended sentences for a second strike for one of these offenses (see Table 6.4).30
Table 6.4: Number and Sentences for Felony Convictions for the Six Low-Level Crimes
in California, 2012
Numbers and Sentences for Six Low levelCrimes - Felony convictions- in CA, 2012
Probation only 16,300-17,300
County Jail + Probation 16,400-23,600
County Jail only 4,300-6,500
State Prison 3,500-5,200
Total 42,900-55,400
Number Convicted of Misdemeanors
8,700-12,900
Source: California Department of Corrections and Rehabilitation as provided by the bwislative Analyst's Office (2014),
FY12/13 CDCR Admissions. Data By Principal Offenses; California Department ofJustice, Hawkins Data Center as
provided by the Legislative Analyst's Office (2014); Convicted Offenses- 2010 & 2012- Type of Disposition by Qffensefor
Selected Offenses; as cited in Health Impact Partners (2014)
One individual earned
53,190 more a year
after their record was
expunged.
31.8 million in
additional earnings willsupport mostly low-
'none communities
of color impacted by
incarceration.
LOS ANGELES RISING: A City that Works for Everyone 87

As mentioned, formerly incarcerated people experience a wage penalty of 10 to 30
percent. We estimate that Prop 47 will decrease the impact of the conviction and thereby
the wage penalty experienced by formerly incarcerated individuals. The majority of
people who are convicted of felonies in California are young, men, and people of color
(Table 6.5).These communities are disproportionately affected by incarceration and,
in many cases, incur harsher wage penalties. Furthermore, the current recidivism rate
is 62 percent for people who have gone to prison for the six crimes." Economic and
employment stability is a strong intervention against recidivism and crime.
Table 6.5: Demographics Total Admissions to State Prison for a Felony Conviction 2013
;ale 93%
aimale 7%
Black 23%
White 25%
Latino 42%
Other 10%
18-29 43%
30-39 28%
40-49 18%
50 and above 11%
Source: California Department of Corrections and Rehabilitation (CDCR), Data Analysis Unit, Estimates and Statistical Analysis
Section. Characteristics of Felon New Admissions and Parole Violators Returned with a New Term: CalendarYear 2013
To understand the earning and economic benefits of a reduced sentence, we use existing
data on wage and employment penalties to estimate the lost earnings due to a felony
conviction in Los Angeles. Because there is currently no administrative data on wages for
people with felony convictions, we estimated earnings based on the entry-level wages.
Because Prop 47 reduces convictions but does not eliminate them, we estimate that a
reduced sentence will allow an individual to reduce only a portion of 10-30 percent penalty.
We compiled the total number of people convicted of a felony from the past 5 years. There
is on average 200,000 felony convictions in California every year.32 We narrowed down the
sample by 21 percent for those who have been convicted of the six convictions33 and by a
quarter for the percent of felony conviction in Los Angeles County' We used the county
to city proportion to reduce the LA County population by 39 percent.35 We further reduce
the sample for those who may not be employed due to factors such as recidivism by 15
percent36 for those on probation and 62 percent for those who spent time in jail or prison."
We then applied a 5 percent wage penalty, the amount a person with a reduced conviction
may be able to recover annually.We also estimate the total earnings recovered annually for
the city. Full details can be found in the Appendix.
Table 6.6 shows how reduced convictions have the potential to recover wages that will
be lost due to stigma and employment barriers. Affected individuals could see an increase
of $1,200 annually and a collective increase in earnings of $13.8 million as a result of
Prop 47.These additional earnings will support mostly low-income communities of
color affected by incarceration. Prop 47 is a first step in reducing the employment stigma
and opening up some opportunities. It allows people to reintegrate into the society and
contribute to their communities.There is a need for further positive policy that can
increase the wage floor for formerly incarcerated people.
88 LOS ANGELES RISING: A City that Works for Everyone

Table 6.6. Analysis of Recovered Earning Due to Prop 47
Estimates of individuals impacted by Prop 47 with felony convictions inLA City in the past five years 20,913
Subtract 62% of those that went to prison or jail for recidivism 12,615
Subtract 15% of those on probation for recidivism 11,486
Wage for entry level position (25th percentile) $11.53
Estimate 5% wage penalty annually $1,199.12
Total Annual Earnings Recovered by Prop 47 $13,772,545
Source: California Department ofJustice (2013). Occupational Employment Statistics (OES) 2013. Number and Sentences for
Felony Convictions for the Six Low-Level Crimes in California, 2012 via Health Impact Partners.
1. U.S. Citizenship and Immigration Services. "Executive Actions on Immigration." http://www.
uscis.gov/immigrationaction.
2. Robert Warren and Donald Derwin. 2015. "Beyond DAPA and DACA: Revisiting LegislativeReform in Light of Long Term Trends in Unauthorized Immigration to the States." Journal ofMigration and Human Security, vol. 3, no. 1.
3. Roger G. Kramer, Audrey Singer, and Shirley G. Smith. 1996. "Characteristics and Labor marketBehavior of the Legalized Population FiveYears Following Legalization."Washington, D.C., U.S.Department of Labor.
4. Franciso L. Rivera-Batiz. 1999. "Undocumented Workers in the Labor Market: An Analysisof the Earnings of Legal and Illegal Mexican Immigrants in the United States." Journal ofPopulation Economics, vol. 12, no. 1, 91-116.
5. Catalina Amuedo-Dorantes, Cynthia Bansak, and Steven Raphael. 2007. "Gender Differences inthe Labor Market: Impact of IRCA."American Economic Review, vol. 97, no. 2, 412-16.
LOS ANGELES RISING: A City that Works for Everyone 89

6. Sherrie A. Kossoudji and Deborah A. Cobb Clark. 2002. "Coming Out of the Shadows:
Learning about Legal Status and Wages from the Legalized Population." Journal of Labor
Economics, vol. 20, no. 3, 598-628, doi:10.1086/339611.
7. Migration Policy Institute. Press release. November 19, 2014. "As Many as 3.7 Million
Unauthorized Immigrants Could Get Relief from Deportation under Anticipated New
Deferred Action Program." http://www.migrationpolicy.org/news/mpi-many-37-million-
unauthorized-immigrants-could-get-relief-deportation-under-anticipated-new.
8. Executive Office of the President of the United States. November 2014. "The Economic Effects
of Administrative Action on Immigration?' http://www.whitehouse.gov/sites/default/files/
docs/cea_2014_economic_effects_of immigration_executive_action.pdf.
9. Legislative Analyst's Office. 2014. "Proposition 47: Criminal Sentences, Misdemeanor, Penalties.
Initiative Statute." Retrieved from: http: //www.la o. ca.gov/ballot/2014/prop-47-110414.pdf
10. Mike Males and Lizzie Buchen. 2014. "Proposition 47: Estimating Local Savings and Jail
Population Reductions." Center on Juvenile and Criminal Justice. Retrieved from: http://wvvw.
cjcj.org/uploads/cjcj/documents/proposition_47_county_estimates.pdf
11. John Schmitt and Kris Warner. 2010. Ex-Offenders and the Labor Market. Center for Economic
and Policy Research.
12. Devah Pager and Lincoln Quinlan. 2005."Walking the talk? What employers say versus what
they do." American Sociological Review, 70(3), 355-380. Devah Pager, Bruce Western, Bart
Bonikowski Jeff Manza, and Michale Sauder. 2009. Race at Work:The Realities of Race and
Criminal Record in the NYC Job Market. Inequality and Society: Social Science Perspectives
on Social Stratification.
13. Harry J. Holzer, Steven Raphael and Michael Stoll. 2003. Employer demand for ex-offenders:
Recent evidence from Los Angeles. Urban Institute. Retrieved from: http://www.urban.org/
uploadedpdf/410779_ExOffenders.pdf. Harry J. Holzer, Steven Raphael and Michael Stoll.
2004. How willing are employers to hire ex-offenders. Focus, 23(2), 40-43.
14. Harry J. Holzer. 2007. The labor market and young black men: Updating Moynihan's
perspective. The Annals of the American Academy of Political and Social Science, 621(1), 47-69.
15. American Bar Association. National Inventory of the Collateral Consequences of Conviction.
2014. Retrieved from: http://www.abacollateralconsequences.org/search/.
16. Western, B. 2002. The impact of incarceration on wage mobility and inequality. American
Sociological Review, 526-546. Harry J. Holzer, Steven Raphael and Michael Stoll. 2003.
Employment barriers facing ex-offenders. Center for the Study of Urban Poverty Working
Paper Series. Harry J. Holzer, Steven Raphael and Michael Stoll. 2004. Douglas N. Evans. 2014.
The Debt Penalty: Exposing the Financial Barriers to Offender Reintegration. John Jay College
of Criminal Justice. Retrieved from: http://justicefellowship.org/sites/default/files/The%20
Debt%20Penalty_John%20Jay_August%202014.pdf.
17. Bruce Western and Becky Pettit. 2010. Collateral costs: Incarceration's effect on economic
mobility. The Pew Charitable Trusts.
18. Bruce Western and Katherine Beckett. 1999. "How Unregulated Is the U.S. Labor Market:
The Penal System as a Labor Market Institution." American Journal of Sociology 104:1030-60.
Richard Freeman. 1991. "Crime and the Employment of Disadvantaged Youths."Working Paper
no. 3875, National Bureau of Economic Research.
19. Kecia R. Johnson and Jacqueline Johnson. 2012. "Racial Disadvantages and Incarceration:
Sources of Wage Inequality Among African America, Latino, and White Men?' Reinventing
Race, Reinventing Racism, 50, 271.
20. Christopher J. Lyons and Becky Pettit. 2011. "Compounded disadvantage: race, incarceration,
and wage growth." Social Problems, 58(2), 257-280.
21. Devah Pager, Bruce Western, Bart Bonikowski Jeff Manza, and Michale Sauder. 2009.
22. Jeffrey Grogger. 1995.The effect of arrests on the employment and earnings of young men.The
Quarterly Journal of Economics, 51-71. Bruce Western. 2002.
90 LOS ANGFI LS RISING: A City that Works for Everyone

23. Bruce Western. 2002. Bruce Western and Becky Pettit. 2010.
24. Devah Pager and Lincoln Quillian. 2005.
25. Christopher Uggen, Mike Vuolo, Sarah Lageson, Ebony Ruhland and Hilary Whitham. 2014.
"The Edge of Stigma: An Experimental Audit of Effects of Low-Level Criminal Records on
Employment:' Criminology, 52(4), 627-654.
26. Harry J. Holzer, Steven Raphael and Michael Stoll. 2006."Perceived Criminality, Criminal
Background Checks, and the Racial Hiring Practices of Employers". Journal of Law and
Economics, 49(2), 451-480.
27. Meyli Chapin , Alon Elhanan, Matthew Rillera, Audrey Solomon, and Tyler Woods. 2014.
"Cost Benefit Analysis of Criminal Record Expungement in Santa Clara County."
Stanford University. Retrieved from: https://publicpolicy.stanford.edu/publications/
cost-benefit-analysis-criminal-record-expungement-santa-clara-county
28. Jared Bernstein and Ellen Houston. 2000. "Crime and work: What we can learn from the
low-wage labor market." Economic Policy Institute. Bruce Western and Becky Pettit. 2000.
Incarceration and racial inequality in men's employment. Industrial & Labor Relations Review,
54(1), 3-16.
29. Kim Gilhuly, Holly Avey, Megan Gaydos, Jonathan Heller, Matthew Mellon. 2014.
Rehabilitating Corrections in California The Health Impacts of Proposition 47 Full Health
Impact Assessment Report. Health Impact Partners. Retrieved from: http://www.humanimpact.
org/projects/hia-case-stories/the-health-impacts-of-proposition-47/
30. ibid.
31. Kim Gilhuly, Holly Avey, Megan Gaydos, Jonathan Heller, Matthew Mellon. 2014.
32. Kamala D. Harris. 2013. Crime in California, 2013. California Department ofJustice.
33. Kim Gilhuly, Holly Avey, Megan Gaydos, Jonathan Heller, Matthew Mellon. 2014.
34. Mike Males and Lizzie Buchen. 2014. "Proposition 47"
35. U.S. Census Bureau: State and County QuickFacts. 2013.
36. Erinn J. Herberman and Thomas P. Bonczar. 2013. Probation and Parole in the United States,
2012. Bureau ofJustice Statistics. Retrieved from: http://www.bjs.gov/content/pub/pdf/
ppusl3.pdf (accessed on March 3,2015).
37. Kim Gilhuly, Holly Avey, Megan Gaydos, Jonathan Heller, Matthew Mellon. 2014.
LOS ANGELES RISING: A City that Works for Everyone 91

Toward a Smart, Enforceable Policy
92 LOS ANGELES RISING: A City that Works for Everyone
Best Practices from Other CitiesThis section reviews other municipalities' approaches to raising and enforcing
their minimum wage. It draws on interviews, literature, and commonalities across
jurisdictions to suggest a set of best practices. Best practices include the following:
>)
Phased increases that break large increases in the minimum wage
into incremental steps
Benchmarking the minimum wage against inflation
No (or very few) exemptions or deferrals
Wage theft enforcement
O Funding a city agency to receive and administer claims
O A menu of meaningful sanctions, including revocation of city-
issued business licenses, permits, or contracts; liens for unpaid
wages; fines; and criminal penalties
O Strong protection against retaliation
O Private rights of action
O Dedicated outreach and education
Monitor ongoing effects of increasing the wage floor
2014 was a banner year for local minimum wage ordinances. Nationwide, 12
municipalities raised their minimum wage, 7 in California alone, raising the total to
18 local minimum wage laws in the nation. Another 14 states raised their minimum
wage.' As of this writing, three cities are poised to follow suit, including Los Angeles,
New York, and Portland, Maine.
The following tables provide a quick comparison of the 18 current and 3 proposed
local minimum wage laws.2A comprehensive, detailed table of these provisions can be
found in the Appendix.
Minimum wage increases vary dramatically in magnitude, ranging from 13 to 65
percent. Municipalities tend to implement larger increases over time, gradually
phasing in higher wages over a period of up to seven years by an average of 12
percent per increase. A third of the municipalities (6 of 18) have implemented
minimum wage immediately without any phase-in wages. Another third will reach
their maximum increase in two to three years. The final third (5 of 18) will reach
their maximum in four to five years, and one outlier, Seattle, allows seven years for
businesses with fewer than 500 employees to reach the new minimum wage.
Nationwide, increased local minimum wages range from $8 to $12.25 per hour; by
2019, those wages will range from $8.50 to $15. The great majority (14 of 18) tie
their minimum wage to the Consumer Price Index (CPI) to increase annually, based
on the cost of inflation.
2014 was a banner
year for local minimum
wage ordinances: 12
cities (7 in California
alone) and 14 states
raised their wages.
Local minimum wage
increases apply to the
vast majority of work
performed within the
city, with very few
exceptions.
LOS ANGELES RISING: A City that Works for Everyone 93

Table 7.1. Overview of Current City Minimum Wage Laws
Starting WageNew Minimum
Wage0/0 Increase
Increase ReachedOver How Many Years
CPI?
Albuquerque, NM (2012)Ballot amended 2006 law
$7.50 $8.50 15% 0 (immediate) Y
Berkeley, CA (2014) $9.00 $12.53 39% 3 (2016) N
Bernalillo County, NM (2013) $7.50 $8.50 13% 2 (2015) Y
Chicago, IL (2014) $8.25 $13.00 58% 5 (2019) Y
Las Cruces, NM (2014) $7.50 $10.10 35% 5 (2019) Y
Louisville, KY (2014) $7.25 $9.00 24% 3 (2017) V
Montgomery County, MD (2013) $7.25 $11.50 58% 4 (2017) N
Mountain View, CA (2014) $9.00 $10.30 14% 0 (immediate) V
Oakland, CA (2014) $9.00 $12.25 36% 0 (immediate) Y
Prince George's County, MD (2013) $7.25 $11.50 58% 5 (2017) N
Richmond, CA (2014) $9.00 $12.30 37% 3 (2017) Y
San Diego, CA (2014)*ref erendized
$9.00 $11.50 28% 3 (2017) Y
San Francisco, CA (2014)*Ballot amended 2003 law
$10.74 $15.00 40% 5 (2018) Y
San Jose, CA (2012) $8.00 $10.00 25% 0 (immediate) Y
Santa Fe, NM (2003) $5.15 $8.50 65% 0 (immediate) Y
Seattle, WA (2014) $9.47 $15 58% 3 > 500 ee's < 7 years(2017)
N
Sunnyvale, CA (2014) $9.00 $10.30 14% 0 (immediate) Y
Washington, DC (2014) $8.25 $11.50 39% 3 (2016) Y
Note: Simplified Ames not adjusted to 2()14 dollars.
Table 7.2. Overview of Proposed City Minimum Wage Laws
StartingWage
New MinimumWage
% Increase % Increase Reached Over HowMany Years
CPI?
Los Angeles, CA Council Proposal $9.00 $15.25 69% 5 (2019) Y
Los Angeles, CA Mayoral Proposal $9.00 $13.25 47% 3 (2017) Y
NYC Governor Proposal $8.75 $11.50 31% 2 (2016) ?
NYC Mayoral Proposal $8.75 $15.00 71% 5 (2019) Y
Portland, ME $7.50 $10.78 44% 3 (2017) Y
Note: Simplified figures not adjusted to 2014 dollars.
Broad Application, \o (or Very Narrow) ExemptionsLocal minimum wage increases apply to the vast majority of work performed within thecity or county. Application and exemptions are explained below.
94 103 ANGELES RISING: A City that Works for Everyone

No Tipped Wage
California is one of six states nationwide that prohibit lower minimum wages for tipped
workers, commonly called "tipped wages."' In these six states, tipped workers must be
paid the same minimum wage as everyone else.4 Likewise, employers in California cannot
count health care or other forms of compensation toward payment of minimum wages and
employees must agree to any deductions in writing.'
Narrow Accommodations for Small Businesses
When raising the local minimum wage, some business groups and policy makers express
concern about the ability of small businesses to absorb increased labor costs.6 Only
Richmond exempts small employers outright, defined as those who pay for less than
800 hours in a two-week period (roughly 10 full-time employees). Santa Fe originally
exempted small employers but amended its law in 2007 to include all employers
regardless of size. San Francisco delayed application for small businesses in 2003, defined
as employers with 10 or fewer full- or part-time employees, for one year. (Its 2014 wage
increase contains no such provision.) Seattle allows two additional years for employers
with fewer than 500 employees to come into compliance.
Narrow Accommodations for Nonprofit Employers
No municipality exempts nonprofit employers categorically. Berkeley and San Francisco
opted to delay application for nonprofit employers for one year. Temporary or part-time
youth job programs operated by the government or nonprofits are exempted in Berkeley,
Richmond, San Francisco, and San Diego. Santa Fe exempts nonprofits funded primarily
by Medicaid waivers.
Nonprofits employ just 3 percent of the Los Angeles workforce.' While roughly one-third
(36 percent) of their employees make less than $15.25 an hour,' they make up a vastly
diverse group of employers, including such household names as University of Southern
California and Children's Hospital of Los Angeles, who respectively brought in over $3
billion and $565 million in revenue in 2011. For this reason, we do not recommend
categorical exemptions or deferrals of increased minimum wage for nonprofits.
Narrow Accommodations for Specific Classes of Workers
Very few individuals are exempt from coverage. Municipalities exempt varying narrow
categories of individuals, such as those exempt from minimum wages under state laws,
including apprentices, persons working fewer than two hours a week, and disabled
workers and on-call employees while on call as defined in the Fair Labor Standards Act. A
comprehensive chart in the Legal Appendix lists workers exempted from minimum wage
under local and state laws.
Broad Exemptions for State and Federal Government Employers
Most localities exempt federal and state employees to varying degrees to comply with
federal and state laws. Two of eight California cities, Mountain View and Sunnyvale,
expressly exempt state federal, county and school district employees.
Broad Exemptions for Collective Bargaining Agreements
To avoid conflict with federal law relating to union contracts, many municipalities
expressly exempt employers who have entered collective bargaining agreements
with employees. Those agreements must waive the minimum wage in clear and
unambiguous terms.
LOS ANGELES RISING: A City that Works for Everyone 95

The real value of
515,25 acjustec forinflation is Si 3,932.1
1
3enchmarks and Setting the Minimum Wage
Equity and Feasibility
The two key questions in setting the level of the minimum wage are, what is equitable?What is feasible? A World Bank report advises, "Set the minimum wage so as to providea minimum acceptable standard of living for low-paid workers but simultaneously ensure
that its 'bite' is limited, that is it does not cut too deeply into the wage distribution."9
A framework put forward by a Brookings Institute study for effective minimum wagepolicy recommends using half the local-area median wage for full-time workers as agauge for setting an appropriate level of the minimum wage. This target has importanthistorical precedence in the United States. In the 1960s, this ratio was 51 percent,reaching a high of 55 percent in 1968. Averaged over the 1960-1979 period, the ratiostood at 48 percent."
The Brookings study also recommends taking into account the local cost of living insetting the minimum wage. "When the regional price parity-adjusted minimum wagediffers considerably from the median wage-adjusted value, policymakers would do wellto consider the regional price information—perhaps splitting the difference between thetwo approaches."
The minimum wage proposal being acted on in Los Angeles includes five annualincreases over the existing statewide minimum wage. The dollar benchmark for eachannual increase is specified in current year dollars, although in reality the real value ofthese benchmarks will erode over the five years as a result of inflation. These benchmarksin current-year dollars and real dollars are shown in Figure 7.1.
The first proposed annual increase is to $10.25 in 2015, followed by four subsequentannual increases that reach $15.25 in 2019. However, the real value of the wage in 2019is estimated to be reduced to $13.93 because of inflation.
Three factors are relevant for assessing whether the Los Angeles economy can supportincreasing the minimum wage to $15.25 by 2019.
First, there is an unusually wide gap in Los Angeles between the median wage, thetypical wage of the middle worker, and the mean wage, the average for all workers.Median earnings in Los Angeles are only 44 percent of mean earnings, compared to 52percent for the United States." This indicates that median earnings understate the wealthand buying power of the region. Los Angeles may well be able to support a minimumwage that exceeds half of the median wage.
Second, the cost of living in Los Angeles is 36.1 percent higher than the nationalaverage, indicating that minimum wage benchmark may need to be adjusted to support aminimum acceptable standard of living."
Third, there will be five annual increases in the minimum wage, with each likely to
result in a higher wage distribution in the labor market.
The estimated mean and median hourly wage for full-time Los Angeles workers in2015 is shown in Figure 7.2.14 We estimate that the median hourly wage for full-timeLos Angeles workers is $24.83; when it is adjusted for cost of living parity, it increasesto $33.87.
Splitting the difference between the median wage and the parity wage results in anhourly wage of $29.35. Half of this hourly wage is $14.68.This benchmark for a $14.68minimum wage exceeds the value of $13.93 that the $15.25 wage is projected to havewhen it takes effect in 2019.
98 [OS ANG[LES RISING: A City that Works for Everyone

Figure 7.1.Value of the Minimum Wage Each Year with 2 Percent Inflation
$16
$14 $13.28812.60
Real V
alue o
f Mini
mum Wa
ge in Y
ear Im
plemen
ted $12 S11.40
S10.25
$10 sam
$8
$6
$4
$2
arty 2015 late 2015 2017 2018
S13.93
2019S9.00 810.25 81135 813.25 814.25 S15.25
Effective Year and Current Value of Minimum Wage Increases
Source: City ,f Los Angeles minimum wage proposal adjusted to account for 2 percent annual inflation.
Figure 7.2. Mean and Median Hourly Wage in Los Angeles County, 2015
S50
S45
S40
S35
S30
S25
S20
S15
810
S5
SOMean Hourly Wage Median Hourly Wage
NE Parity Wage
Full-time Wage
*e -, 2015 Wage
I. 2013 Wage
Data sources: OES wage survey 2013, Consumer Price Index for All Urban Consumers, Los Angeles region,American
Community Survey 2009-2013 Public Use Microdata Sample for City of Los Angeles residents, US. Census Bureau Cost of
Living Index.
LOS ANGELES RISING: A City that Works for Everyone 97

Angelenos' real
purchasing power has
steadily diminished
due to inflation. Los
Ageles needs to
index the minimum
wage to inflation to
keep up with the cost
of living.
Establishing Base/Ceiling and Incremental Increase
In this section, we recommend that Los Angeles adopt a base and a ceiling for minimum
wage raises indexed to inflation.
California first set its minimum wage in 1916, 22 years before the first federal minimum
wage, at 16 cents in nominal dollars. As we saw earlier, the real purchasing power of
the minimuin wage has steadily diminished because of inflation. The following table
shows that this decline began in 1968, marked by a decrease from $11.36 to $9.00 in
2014 dollars (Figure 7.3).15 Although the state increased the minimum several times
over the course of half a century, these bumps have not kept up with increases in the
cost of living. The value of the minimum wage continues to erode as the price of basic
necessities rises.
Figure 7.3. Los Angeles Minimum Wage in 2014 Dollars
S12
S10
S8
S6
S4
82
S
Sources: ERT analysis of California Department of Industrial Relations' History of California Minimum Wage and Bureau
of Labor Statistics' Consumer Price index for All Urban Consumers and Urban Wage Earners and Clerical Workers in Los
Angeles-Riverside-Orange County, California, 1982-1984 base.
Figure 7.4 illustrates increases in basic needs over the past four decades. Among basic
needs for Angeleno families, medical expenses rose most dramatically. This includes the
cost of prescription drugs and medical supplies, doctor's visits, and hospital care. In 1999,
one day in the hospital cost a Californian $1,408; in 2012, the daily bill totaled $3,002.16
Fuel and utilities prices have also increased rapidly.
To prevent wage erosion, we recommend that Los Angeles, like 14 of the 18
municipalities that have increased their minimum wages, keep pace with increases in
the cost of living by indexing the minimum wage to inflation after 2019. That means
that after 2019, the annual increases to the minimum wage will be based on the
Consumer Price Index for Urban Wage Earners and Clerical Work (CPI-W) in the
Los Angeles region.17
98 LOS ANGELES RISING: A City that Works for Everyone
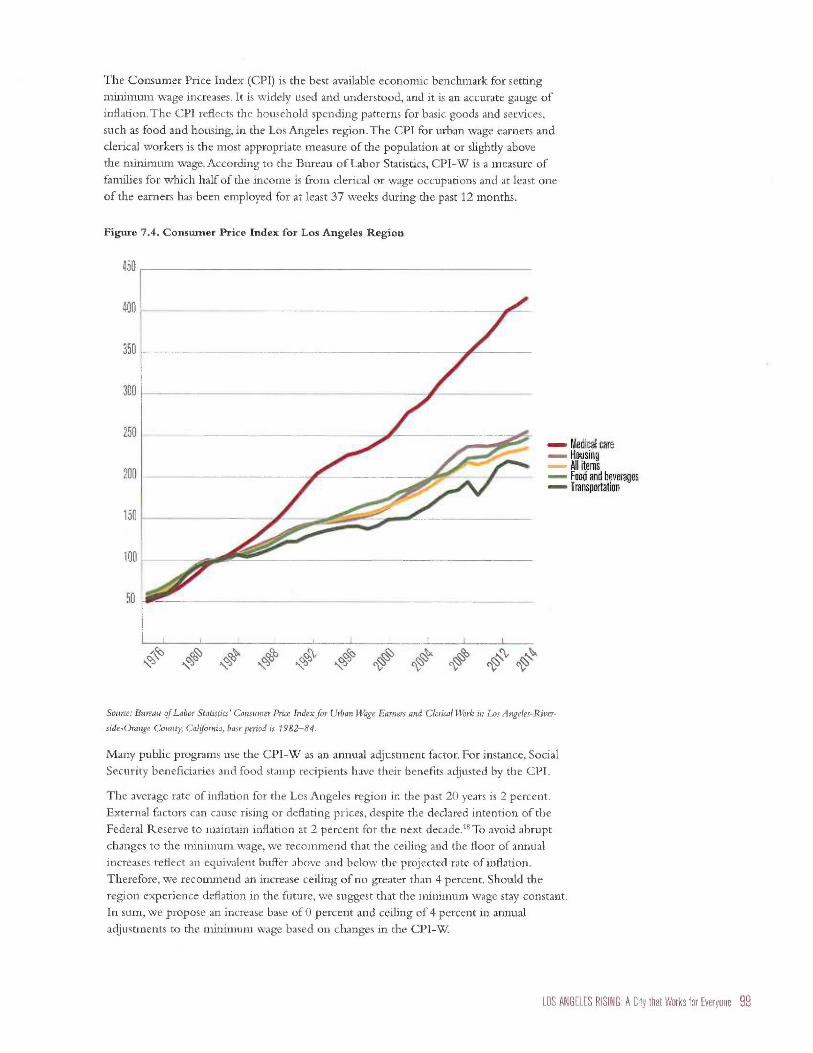
The Consumer Price Index (CPI) is the best available economic benchmark for settingminimum wage increases. It is widely used and understood, and it is an accurate gauge ofinflation. The CPI reflects the household spending patterns for basic goods and services,such as food and housing, in the Los Angeles region. The CPI for urban wage earners andclerical workers is the most appropriate measure of the population at or slightly abovethe minimum wage. According to the Bureau of Labor Statistics, CPI-W is a measure offamilies for which half of the income is from clerical or wage occupations and at least oneof the earners has been employed for at least 37 weeks during the past 12 months.
Figure 7.4. Consumer Price Index for Los Angeles Region
450
400
350
300
250
200
150
100
50
Source: Bureau of Labor Statistics' Consumer Price Index for Urban Wage Earners and Clerical Work in Los Angeles-River-
side-Orange County, California, base period is 1982-84.
Many public programs use the CPI-W as an annual adjustment factor. For instance, SocialSecurity beneficiaries and food stamp recipients have their benefits adjusted by the CPI.
The average rate of inflation for the Los Angeles region in the past 20 years is 2 percent.
External factors can cause rising or deflating prices, despite the declared intention of the
Federal Reserve to maintain inflation at 2 percent for the next decade." To avoid abruptchanges to the minimum wage, we recommend that the ceiling and the floor of annual
increases reflect an equivalent buffer above and below the projected rate of inflation.
Therefore, we recommend an increase ceiling of no greater than 4 percent. Should theregion experience deflation in the future, we suggest that the minimum wage stay constant.In sum, we propose an increase base of 0 percent and ceiling of 4 percent in annual
adjustments to the minimum wage based on changes in the CPI-W.
Medical careHousingAll itemsFood and beveragesTransportation
LOS ANGELES RISING: A City that Works for Everyone 99

Currently 6_ iercent
of Los Anceles
workers receive less
than the Tininiu-n
wace cue to wace
net,
EnforcementThis section addresses best practices to enforce minimum wage laws and stop wage
theft. Wage theft occurs any time a worker receives less than that to which he or
she is legally entitled. Most common forms of wage theft include failure to provide
minimum wage, overtime, or meal and rest breaks; requiring employees to work off-
the-clock without compensation; and illegal deductions from pay, often by deducting
tips from wages.19
Raising the minimum wage in Los Angeles has particular implications for wage theft
enforcement because Los Angeles has the highest rate of wage theft in the country.
Nationwide, 68 percent of low-wage workers experience wage theft in any given week.2°
In Los Angeles, that rate is 88.5 percent.21
Research related to wage theft has found:
30 percent of Los Angeles low-wage workers receive less than the
minimum wage in any given week22
Wage theft in Los Angeles is pervasive in 23 low-wage industries, from
car washes to garment factories to restaurants, but also includes retail,
and even banking and education23
Low-wage workers lose 12.5 percent of their income to wage theft,
more than $2,000 from an income of $16,50024
Workers in Los Angeles collect just 13 percent of what the State Labor
Commissioner says they're owed when they win wage claims for
unpaid wages.25
Like local minimum wage laws, local efforts to combat wage theft have increased
dramatically in recent years. Houston, Chicago, Miami, Santa Clara, San Francisco, Seattle,
and Washington, D.C. have implemented local wage theft ordinances irrespective of
increases to the minimum wage.26 In addition, stronger wage enforcement provisions have
accompanied local minimum wage increases.
Table 7.3 offers a bird's-eye view of the best wage enforcement practices across
municipalities. A comprehensive chart in the Appendix provides detailed information about
each provision across jurisdictions.We recommend that Los Angeles adopt all of them, as
no single approach addresses wage theft across industries and employers
Designate an Enforcement Agency
Most municipalities designate a city entity to enforce wage laws. Processes vary across
jurisdictions, but good enforcement results from designated funding, staffing, inter-
agency cooperation, and proactive investigation.27 Some, like Oakland, San Francisco,
San Diego, Seattle, and Washington D.C., receive and adjudicate claims for unpaid wages.
Others, like Chicago, Houston, and Santa Clara, don't receive claims, but task existing
city agencies with enforcing claims once a state court or agency has decided them.28
Although beyond the scope of this report to detail each city or county's enforcement
agency, in general very few cities rely solely on workers to enforce unpaid wages through
private lawsuits.
California cities in particular rely on city agencies to investigate claims for enforcement
of minimum wage laws. This is because the state agency tasked with investigating and
citing employers for unpaid wages, the Division of Labor Standards Enforcement's (DLSE)
Bureau of Field Enforcement, cannot enforce minimum wages that are higher than the
state minimum.29 Furthermore, it remains unclear whether the DLSE has authority to hear
claims for retaliation against workers for enforcing local minimum wage laws.3°
100 LOS ANGELES RISING: A City that Works for Everyone

Table 7.3. Enforcement across Jurisdictions
EnforcementAgency
Revoke Licenses/Permits/Contracts
Liens Posting &Payroll Access
Fines &Penalties
CriminalPenalties
PrivateRight ofAction
RetaliationProtection
Outreach &Education
Albuquerque, NM Y Y Y
Berkeley, CA Y Y Y Y Y Y Y
Bernalillo Cnty., NM Y Y
Chicago, IL Y Y Y Y Y Y
Houston, TX" Y Y y Y
Oakland, CA Y Y Y Y Y Y Y
Las Cruces, NM Y Y
Louisville, KY Y `I
Miami, FL* Y Y
Montgomery Cnty.,MD
Y Y
Mountain View, CA Y Y Y Y Y Y
Richmond, CA Y Y Y Y Y Y
San Diego, CA Y Y Y Y Y
San Francisco, CA Y V Y V Y V Y Y
San Jose, CA Y Y Y Y Y Y
Santa Clara, CA* Y Y Y
Santa Fe, NM Y Y Y Y Y Y
Seattle, WA Y Y `I Y Y Y Y
Sunnyvale, CA Y Y Y Y Y Y
Wash., D.C. Y Y Y v v Y Y Y
*No higher minimum wage but implemented wage theft enforcement provisions
Revoke, Suspend, and Terminate City-Issued Business Licenses, Permits, and Contracts
Most cities revoke, deny, or suspend the business licenses, permits, and contracts awarded by
the city (if any) until employers with outstanding unpaid wages come into compliance. For
employers whose business requires licenses, permits, or contracts with the city, this practice
provides a powerful incentive to comply with the law.31 Employers in the unregulated
economy, however, or those who unscrupulously abandon businesses to evade liability,
suffer little due to revoked licenses, permits, or contracts.32
Create Liens for Unpaid Wages
A lien is a temporary hold on the property of debtor until the debt is paid. Liens against
employer property such as real estate, accounts receivable, and inventory help guarantee that
workers receive unpaid wages." Liens are necessary because workers who win wage court
orders for unpaid wages seldom collect what they are owed. In California? 83 percent of
workers with final judgments for unpaid wages from the DLSE never collect any payment.34
San Francisco allows its Office of Labor Standards Enforcement to place a lien on employer
property for administrative fines and penalties, and Washington, D.C., allows workers and the
city to file a lien on employer property for both outstanding wages and fines.
A lien for unpaid wages is an increasingly popular tool," and we recommend they be
available as early in the claim process as possible to prevent employers and assets from
disappearing after a worker files a claim to recover wages.
LOS ANGELES RISING: A City that Works for Everyone 101

Notice to Employees and Access to Payroll Records
Almost all cities and counties require employers to post notice of wage requirements in
languages spoken by workers and to allow inspection of payroll records by employees,
advocates, and investigators.
Impose Stiff Fines, Citations, and Penalties
Likewise, almost all cities and counties issue administrative fines, citations, and penalties
greater than the state's. Hefty fees and fines generate revenue for the city, deter future
violations, and compensate victims enough to make it worth the trouble to file a complaint.36
Criminalize Wage Theft
Several municipalities (including Seattle and Santa Fe) criminalize wage theft as a
misdemeanor. Threat of jail time, bench warrants, and court fees and fines can deter
violators and bring uncooperative parties to the table.37
Create a Private Right of Action
Nearly every city has created a private right of action enabling workers to directly sue their
employers for unpaid wages.
Improve Anti-Retaliation Protection
Finally, the majority of cities and counties include heightened protection against retaliation. Fear
of retaliation stops wage theft enforcement by preventing workers from filing complaints or
cooperating with investigators.The best provisions to combat retaliation place the burden on
employers to justify their actions (called a "rebuttable presumption"), protect immigrant workers,
and protect the anonymity of workers who cooperate with investigators.38
Fund Outreach and Education
San Francisco and Seattle have dedicated resources to fund outreach and education to
workers and employers; San Diego plans to do the same.39 These cities direct funds to
community-based organizations with cultural and linguistic expertise, whose outreach builds
community trust and deepens awareness of wage laws.4o
Best Practices in Action: San Francisco's Success
The foregoing enforcement measures are quite recent, limiting data about their efficacy.
However, data from San Francisco, the oldest of these regimes, shows dramatically better
outcomes than those of the state. Statewide, just 17 percent of workers with final judgments
issued by the state's DLSE collect anything at all.41 San Francisco's Office of the Labor
Standards Enforcement (OLSE) collects flail back wages plus interest in 90.5 percent of cases.
As Table 7.4 indicates, San Francisco's OLSE has received 653 claims for unpaid minimum
wages since 2003, when the city first increased its minimum wage. It found that employers
owed wages in 423 of these cases. Only 10 employers failed to pay anything at all.
Table 7.4. San Francisco's OLSE Collections of Back Wages Owed, February 2004—July 2013
Cases in which OLSE found employer owed back wages 423 Percent of Cases
Back wages & interest collected 383 90.5
Employer making payments (as of July 2013) 30 7.1
Employer failed to pay all back wages & interest 10 2.4
Source: San Francisco OLSE Minimum Wage Ordinance Annual Report (2013).
102 LOS ANGELES RISING: A City that Works for Everyone
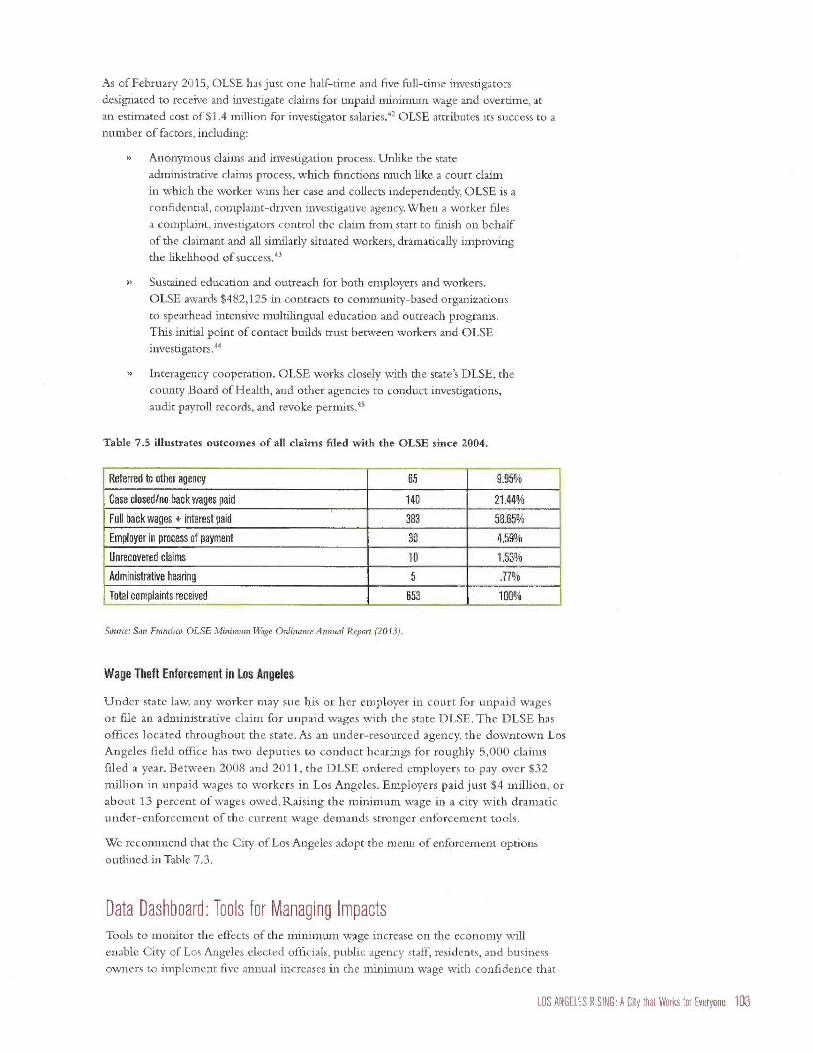
As of February 2015, OLSE has just one half-time and five full-time investigatorsdesignated to receive and investigate claims for unpaid minimum wage and overtime, atan estimated cost of $1.4 million for investigator salaries.42 OLSE attributes its success to anumber of factors, including:
Anonymous claims and investigation process. Unlike the stateadministrative claims process, which functions much like a court claimin which the worker wins her case and collects independently, OLSE is aconfidential, complaint-driven investigative agency. When a worker filesa complaint, investigators control the claim from start to finish on behalfof the claimant and all similarly situated workers, dramatically improvingthe likelihood of success.43
Sustained education and outreach for both employers and workers.OLSE awards $482,125 in contracts to community-based organizationsto spearhead intensive multilingual education and outreach programs.This initial point of contact builds trust between workers and OLSEinvestigators:"
Interagency cooperation. OLSE works closely with the state's DLSE, thecounty Board of Health, and other agencies to conduct investigations,audit payroll records, and revoke permits:6
Table 7.5 illustrates outcomes of all claims filed with the OLSE since 2004.
Referred to other agency 65 9.95%
Case closed/no back wages paid 140 21.44%
Full back wages + interest paid 383 58.65%
Employer in process of payment 30 4.59%
Unrecovered claims 10 1.53%
Administrative hearing 5 .77%
Total complaints received 653 100%
Source: San Francisco OLSE Minimum Wage Ordinance Annual Report (2013).
Wage Theft Enforcement in Los Angeles
Under state law, any worker may sue his or her employer in court for unpaid wagesor file an administrative claim for unpaid wages with the state DLSE. The DLSE hasoffices located throughout the state. As an under-resourced agency, the downtown LosAngeles field office has two deputies to conduct hearings for roughly 5,000 claimsfiled a year. Between 2008 and 2011, the DLSE ordered employers to pay over $32million in unpaid wages to workers in Los Angeles. Employers paid just $4 million, orabout 13 percent of wages owed. Raising the minimum wage in a city with dramatic
under-enforcement of the current wage demands stronger enforcement tools.
We recommend that the City of Los Angeles adopt the menu of enforcement options
outlined in Table 7.3.
Data Dashboard: Tools for Managing ImpactsTools to monitor the effects of the minimum wage increase on the economy willenable City of Los Angeles elected officials, public agency staff, residents, and businessowners to implement five annual increases in the minimum wage with confidence that
LOS ANGELES RISING: A City that Works for Everyone 103

Tools to monitorthe effects on theeconomy will enable
the City of LosAngeles to implement
increases in theminimum wage withconfidence
any unintended impacts can be identified and managed. We recommend that the city
monitor the impacts of these increases by comparing annual changes in Los Angeles's
economic performance to select regions in the following data points — comparisons we
refer to as the "Data Dashboard":
>>
>>
Business sales
Employment
Wages
The Data Dashboard provides benchmarks showing how the City of Los Angeles
performs in business sales, employment, and wages relative to the balance of Los
Angeles County and the State of California.The Dashboard uses public data from
the U.S. Census Bureau, U.S. Bureau of Labor Statistics, California Employment
Development Department, and California Board of Equalization, as well as
administrative data that the City government already collects. We recommend frequent
monitoring increments for geographic comparisons, as well as modeling a forecast of
the city's economic trends separately in order to asses 'outlier' years. We recommend
that the Legislative Analyst submit annual Data Dashboard updates to the Mayor's
Office and the City Council's Economic Development Committee to report on effects
of the minimum wage ordinance.
Los Angeles Today: Business Baselines before the Minimum Wage Increase
Taxable sales volume provides direct evidence about how well the retail economy
is adapting to increased labor costs. We recommend monitoring the following Data
Dashboard indicators about the city's business environment:
How much Revenue is Business Generating?
Recommended method: review taxable sales by city and industry
Recommended data source: California Board of Equalization, Taxable
Sales in California (Sales & Use Tax), quarterly
Breakouts by retail business types for taxable sales
Recommended comparison regions:
° Balance of Los Angeles County
° State of California
Baseline trend data for taxable sales in the City of Los Angeles appear in Figure 7.5,
alongside comparison regions. Percentage changes in taxable sales are remarkably similar
for the past 13 years in compared to the balance of the county and the state.The largest
negative variance between the City of Los Angeles and the balance of Los Angeles
County and the State of California is -2.8 percent in 2000 (Table 7.6).We recommend
using this negative variance of as a preliminary flag that calls for further examining
minimum wage impacts on the health of the local economy. In addition, we recommend
that the city have in place a more in-depth analysis of the Median Absolute Deviation
of business sales trends discussed later in this section, with breakouts by retail business
types. This additional analysis will equip the city to differentiate negative variation that
is attributable to anomalies in the city's economy from variation that is attributable to
anomalies in the comparison regions.
104 LOS ANGELES RISING: A City that Works for Everyone
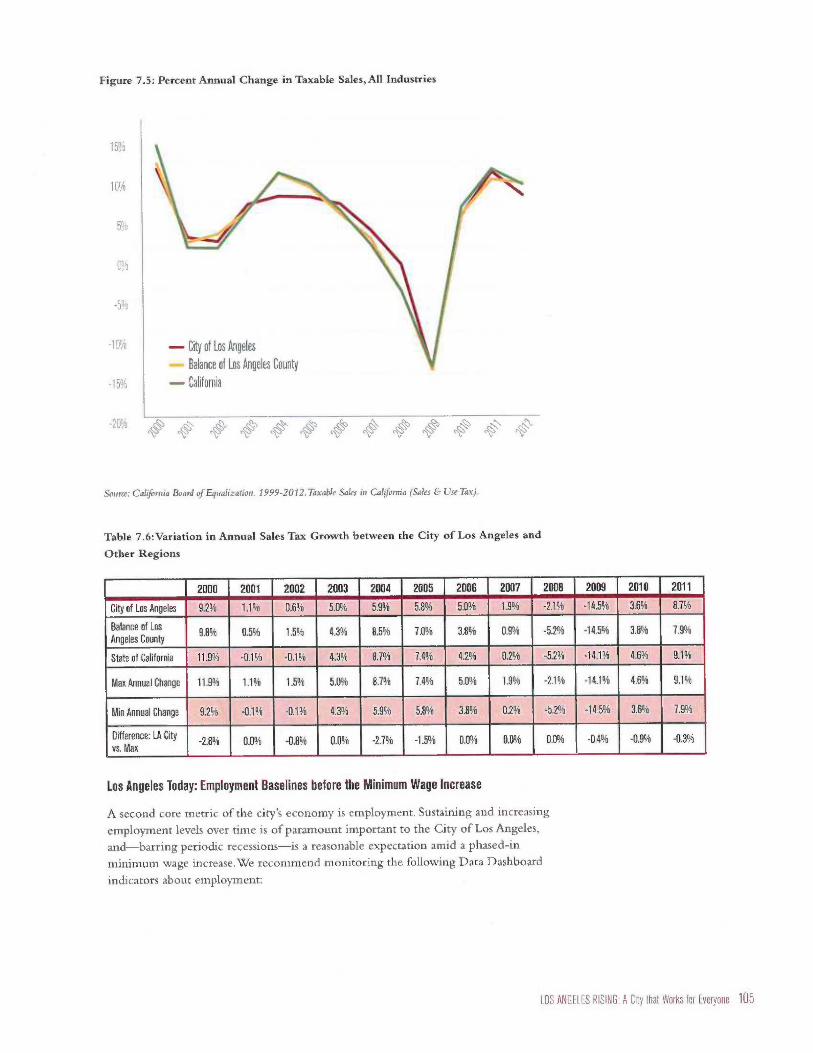
Figure 7.5: Percent Annual Change in Taxable Sales, All Industries
10%
0c:3
-YJ
-10%
-15%
- City of Los AngelesBalance of Los Angeles County- California
Source: Cal forma Board of Equalization. 1999-2012. Taxable Sales in California (Sales & Use Tax).
Table 7.6:Variation in Annual Sales Tax Growth between the City of Los Angeles and
Other Regions
2000 2001 2002 2003 2004 2005 2006 2007 2008 2009 2010 2011
City of Los Angeles 9.2% 1.1% 0.6% 5.0% 5.9% 5.8% 5.0% 1.9% -2.1% -14.5% 3.6% 8.7%
Balance of LosAngeles County
98% 0.5% 1.5% 4.3% 8.5% 7.0% 3.8% 0.9% -5.2% -14.5% 3.8% 7.9%
State of California 11.9% -0.1% -0.1% 4.3% 8.7% 7.4% 4.2% 0.2% -5.2% -14.1% 4.6% 9.1%
Max Annual Change 11.9% 1.1% 1.5% 5.0% 8.7% 7.4% 5.0% 1.9% -2.1% -14.1% 4.6% 9.1%
Min Annual Change 9.2% -0.1% -0.1% 4.3% 5.9% 5.8% 3.8% 0.2% -5.2% -14.5% 3.6% 7.9%
Difference: LA Cityvs. Max
-2.8% 0.0% -0.8% 0.0% -2.7% -1.5% 0.0% 0.0% 0.0% -0.4% -0.9% -0.3%
Los Angeles Today: Employment Baselines before the Minimum Wage Increase
A second core metric of the city's economy is employment. Sustaining and increasing
employment levels over time is of paramount important to the City of Los Angeles,
and-barring periodic recessions-is a reasonable expectation amid a phased-in
minimum wage increase. We recommend monitoring the following Data Dashboard
indicators about employment:
LOS ANGELES RISING: A City that Works for Everyone 105

1. Is Employment Growing or Shrinking?
O Recommended method: total employment, all industries, including
self-employment, with possible breakout by industry sector
• Recommended data sources: California Employment Development
Department, Quarterly Census of Employment and Wages,
confidential establishment-level data (ES-202); U.S. Census Bureau
County Business Patterns
• Recommended comparison regions:
• Balance of Los Angeles County
• State of California
2. Are People Working More or Less?
• Recommended method: weeks and hours worked for employed
persons, workers per family, and share of workers who are
self-employed
• Recommended source: US. Census Bureau,Arnerican Community
Survey, annual, US. Bureau of Labor Statistics, Nonemployer Statistics
• Recommended comparison regions:
• Balance of Los Angeles County
• State of California
Figure 7.6: Annual Employment Change, All Industries
4%
2%
0%
-2%
-4%
® City of Los Angeles
6% Balance of Los Angeles County- ---- California
80,/a co° 4\ cs 4`
Source: California Employment Development Department-Labor Market In ormation Division. 2000-2013. Quarterly
Census of Employment and Wages, including public (county) and confidential establishment-level data ES-202 (City of Los
Angeles) data series. Notes: (4) denotes estimates of City of Los Angeles and balance of LA County made for 2012 and 2013
based on 2011 county-level trends, in the absence of establishment-level data.
106 LOS ANGELES RISING: A City that Works for Everyone

Annual percentage changes in employment in the City of Los Angeles also have mirrored the
balance of Los Angeles County and the State of California, especially in recent years (Figure
7.6).The largest negative variance in annual employment change between the City of Los
Angeles and the balance of the county and the state over the past 13 years was -1.5 percent
in 2005 (Table 7.7).Wc recommend using this negative variance of as a preliminary flag
that calls for further examining minimum wage impacts on the health of the local economy.
We also recommend analyzing the median absolute deviation of employment trends, with
breakouts by industry sector, to provide insights for understanding how employment in the
city changes in relation to comparison economies.
Table 7.7:Variation in Employment Change between the City of Los Angeles and
Comparison Regions, State of California
2001 2002 2003 2004 2005 2006 2007 2008 2009 2010 2011 2012 2013
City of LosAngeles
1.100/a 0.10% -0.12% 1.22% 0.33% 1.62% 1.14% 0.04% -4.72% -2.74% 0.65% 2.43% 2.43%
Balance ofLos AngelesCounty
-0.98% -1.87% -1.48% 0.21% 1.37% 2.15% 0.81% -1.30% -6.36% -1.30% 0.70% 2.43% 2.43%
State ofCalifornia
0.41% -0.95% -0.24% 1.16% 1.82% 2.07% 0.91% -0.76% -5.77% -1.57% 0.90% 2.69% 2.79%
Max AnnualChange
1.1% 0.1°/b -0.1% 1.2% 1.8% 2.1% 1.1% 0.0% -4.7% -1.3% 0.9% 2.7% 2.8%
Min AnnualChange
-1.0% -1.9% -1.5% 0.2% 0.3% 1.6% 0.8% -1.3% -6.4% -2.7% 0.6% 2.4% 2.4%
Difference:LA City vs.Max
0.0% 0.0% 0.0% 0.0% -1.5% -0.5% 0.0% 0.0% 0.0% -1.4% -0.3% -0.3% -0.4%
Los Angeles Today: Wage Baselines before the Minimum Wage Increase
Along with employment levels, another core metric of the city's economy and its workers'
well-being is wages. Although the proposed minimum wage ordinance itself should boost
average wages across the City of Los Angeles, it is important to validate this expectation.
We recommend monitoring the following Data Dashboard elements about wages:
1. How Much Are People Earning?
O Recommended method: annual average, for all industries and
broken out by industry sector
O Recommended data sources: California Employment Development
Department, Quarterly Census of Employment and Wages,
confidential establishment-level data (ES-202); U.S. Census Bureau
County Business Patterns; U.S. Census,American Community Survey
O Recommended comparison regions:
■ Balance of Los Angeles County
■ State of California
Average wages change more dramatically year to year than employment or taxable
sales (Figure 7.7).We attributable some of this volatility to the two severe economic
recessions, but the City of Los Angeles nonetheless still roughly resembles the two
comparison regions. The largest negative variance in annual average wage change
between the City of Los Angeles and the balance of Los Angeles County and State of
California was -1.0 percent in 2009 and 2011 (Table 7.8).We recommend using this
LOS ANGELES RISING: A City that Works for Everyone 107

negative variance of as a preliminary flag that calls for further examining minimum \vage
impacts on the health of the local economy. We also recommend analyzing the median
absolute deviation of wage trends, with breakouts by industry sector, to provide insights
for understanding how wages in the city change in relation to comparison economies.
Comparisons between the City of Los Angeles and neighboring cities within the
county provide further insights, in addition to the county aggregate analysis featured
above. This analysis may reveal upward pressure on the city's immediate neighbors as
the minimum wage ordinance is implemented. Furthermore, disaggregated industry
and sector data can reveal wage differences across industries, not otherwise revealed in
data on all industries combined.
Figure 7.7: Annual Average Wages Change, All Industries
3%
2%
1 Rio
0%
-1%
-2%
- City of Los Angelesvalance of Losiingele.s_C.o.unty_. _
- California
Source: California Employment Development Department-Labor Market Information Division. 2000-2013. Quarterly
Census of Employment and14'ages, including public (county) and confidential establishment-level data ES-202 (City of Los
Angeles) data series. Notes: (*) denotes estimates of City of Los Angeles and balance of LA County made for 2012 and 2013
based on 2011 county-level trends, in the absence of establishment-level data.
Table 7.8: Annual Average Wages Change, All Industries
2001 2002 2003 2004 2005 2006 2007 2008 2009 2010 2011 2012 2013
City of Los Angeles 3.6% 1.6% 3.4% 4.3% 3.3% 3.9% 4.6% 3.2% -0.9% 4.3% 2.2% 3.2% 3.2%
Balance of Los AngelesCounty
2.1% 2.5% 3.8% 3.7% 3.7% 4.8% 4.1% 1.8% 0.0% 3.4% 2.7% 3.0% 3.0%
State of California 0.3% 0.2% 2.9% 4.7% 3.4% 4.5% 4.5% 1.7% 0.1% 3.4% 3.2% 3.2% 0.6%
Max Annual Change 3.6% 2.5% 3.8% 4.7% 3.7% 4.8% 4.6% 3.2% 0.1% 4.3% 3.2% 3.2% 3.2%
Min Annual Change 0.3% 0.2% 2.9% 3.7% 3.3% 3.9% 4.1% 1.7% -0.9% 3.4% 2.2% 3.0% 0.6%
Difference: LA Cityvs. Max
0.0% -0.9% -0.4% -0.4% -0.4% -0.9% 0.0% 0.0% -1.0% 0.0% -1.0% 0.0% 0.0%
108 LOS ANGELES RISING: A City that Works for Everyone

Differences in the Industrial Composition of Los Angeles and Comparison Regions
The economies of the balance of Los Angeles County and the State of California closely
resemble that of the City of Los Angeles since 2000, compared to other regions we studied,
including the City of Long Beach, Orange County, City of San Diego, San Diego County,
and the nine-county San Francisco Bay region. But the city has no exact twin: its mix of
employment broken out by industry is slightly different from the balance of the county and
the state (Figure 7.8), which appear to be the best points of comparison for the city.
Differences between the city and the two comparison regions include agricultural
employment, which is minimal within Los Angeles County while it remains significant
statewide (three percent). Manufacturing and Retail are a smaller share of employment in
the City of Los Angeles than in the balance of the county and the state, while the city has
a greater share of employment in education services. The city and state have similar shares
of employment in the public sector (six percent), while the balance of the county has only
two percent. These variations in industry sector-level employment can cause differences in
business cycle timing between the three areas, since slowdowns often originate in specific
industries before later affecting the overall economy.
Figure 7.8: Employment by Industry for the City of Los Angeles, Balance of County and State
100%
90%
80%
70%
60%
50%
40%
30%
20%
10%
0%City of LosAngeles
Balanceof LA Couty
California
• Government
• Personal & Repair Srv.
• Hotels & Restaurants
• Entertainment
-= Health Care & Social Asst.
• Educational Services
• Temps, Guards, Janitors
• Holding Companies
• Professional Srv.
■ Real Est., Rental & Leasing
et Fin. & Insurance
is Information
■Transp. & Warehousing
• Retail Trade
• Wholesale Trade
• Manufacturing
• Construction
• Utilities
• Mining
• Agriculture
Source: Cal!fornia Employment Development Department-Labor Market Information Division. 2000-2013. Quarterly
Census of Employment and Wages, including public (county) and confidential establishment-level data ES-202 (City of Los
Angeles) data series.
Investigating Changes in the City of Los Angeles' Economic Trends by Analyzing the MedianAbsolute Deviation of Data Dashboard Indicators
We are recommending a two-bell approach to identifying unintended consequences of
minimum wage increases.As just explained, the first bell is negative variation in annual
change in the city's taxable sales, employment or wages compared to the two comparison
regions that exceed the maximum negative variation that has occurred since 2001.
However, this technique does not explain the causes behind such changes. When a negative
change is initially flagged by the City of Los Angeles, it will be necessary to assess its
LOS ANGELES RISING: A City that Works for Everyone 109

significance through a deeper analysis of the dynamics behind it to determine if there is asecond bell — a problem linked to higher minimum wages.
To accomplish this, we recommend using multiple forecasting models to project trends for
data indicators such as taxable sales, employment and wages at the level of industry sectors,retail business types, and sub-city geographical scales.This procedure analyzes median
absolute deviation in existing baseline data to develop the model, then tests the modelusing past data, and after the model is refined and validated uses it to assess future outcomesfrom the three data dashboard monitoring elements.
The objective in doing this approach is to detect changes over time in the City of LosAngeles' economic trends so that any outlier that does not fit within the city's existing
trends—those falling outside the expected range on the basis of the prior years' pattern ofthe trend and seasonality—can be identified, as illustrated in Figure 7.9.These changes canbe additive outliers (an unusual value in the indicator series due to a temporary shock suchas a strike, extremely cold winter or random effects) and level shifts (a permanent shift,
either up or down, in the level of the indicator series showing a structural change).Theeffect of the proposed minimum wage increase can be a level shift and a forecasting model
may be needed to detect it for specific industries and geographies.
We recommend using forecasting models to decompose the observed historical data intotrend, seasonal, and irregular components and assign smoothing weights to the existing data
points according to how important they are in predicting future quarters' indicator values.Predicted data points should be estimated with upper/lower confidence interval boundsand plotted graphically to compare the current quarter's mean with previous means andpredicted means to identify the outliers—if the current quarter value is an outlier. This way,industries and geographies triggering the unusual behavior for the city can be identified.Please refer to our data appendix "Detecting Anomalous Behavior in Los Angeles'
Economic Performance" for detailed instructions.
Figure 7.9: Using Forecasting to Flag Data Points outside the Confidence Interval Bounds
GCS
30
25
20
15
10
5
0
• ActualPredicted Upper bound
1
•~
Lower bound
5 10
Time (years)
Source: Hypothetical data for illustration purposes only
••
--
I.
•I
Current valueoutside of thenormal range
FUTURE
110 10S ANGRES RISING: A City that Works for berme

How Soon Data Dashboard Elements Become Available
We recommend annual reporting intervals. Public agencies responsible for the economicdata cited in this section typically produce it annually, quarterly or monthly, and releaseit after some time lag due to the data collection process and subsequent data cleaningand adjustments (Figure 7.10). Building off of baseline data presented in this report, eachsubsequent data release can offer an additional window into the effects of a minimumwage ordinance, allowing City of Los Angeles officials to track the effects of this importantpolicy. These annual reports will be most informative in years three through five, when the
complete array of recommended data is available.
Figure 7.10: Chronology and Sources of Data Dashboard Elements
Dashboard
Item
Year 3
(2017)
Year 4
(2018)
Year 5
(2019)
Business
Quarterly
Taxable Sales,
Gross Receipts
Tax Registrants
Employment
Quarterly
Employment
Change by
Industry Sector
►
Quarterly
Wage Earnings
Earnings Change by
Industry Sector
Table notes:The Legend for data sources in Figure 7.10:
City of Los Angeles, Department of Finance, Business Tax Registry
CA Board of Equalization, Taxable Sales in California (Sales & Use Tax)
CA Employment Development Department, Quarterly Census ofEmployment and Wages
U.S. Census Bureau, American Community Survey
U.S. Census Bureau, County Business Patterns
1. National Conference of State Legislation, (2015, February 24). Review of state minimum
wages in 2014. Retrieved from http://www.ncsl.org/research/labor-and-employment/state-
minimum-wage-chart.aspx
2. San Diego's 2014 minimum wage ordinance will take effect if voters approve it on a referendum
in June 2016.
LOS ANGELES RISING: A City that Works for Everyone 111

3. United States Department of Labor (2015, January 1). Minimum Wages for Tipped Employees.
Re-trieved from http://vvww.dol.gov/whd/state/tipped.htm
4. Cal. Labor Code § 351; see also Henning v. Industrial Welfare Commission, 46 Cal.3d 1262,
1278 (1988).
5. Cal. Min.Wage Order 2014; Cal. Labor Code §§ 221, 224.
6. Interview with Gary Toebben, CEO Los Angeles Chamber of Commerce. (2015, February 18).
7. International Revenue Service, (2015, February 9). Exempt Organizations Business
Master file. Re-trieved from http://www.irs.gov/Charities-&-Non-Profits/
Exempt-Organizations-Business-Master-File-Extract-EO-BMF
8. Ibid.
9. Jan Rutkowski. 2003. "The Minimum Wage: Curse or Cure?" Human Development Econom-
ics, Europe and Central Asia Region,World Bank, http://siteresources.worldbank.org/
inteconeval/Resources/MinimumWageNoteJul03v2.pdf (ac-cessed February 26, 2015), p. 13.
10. Arindrajit Dube. 2014. "Designing Thoughtful Minimum Wage Policy at the State and Local
Levels." Brookings Institute, hap: //www.brookings. edu/research/papers/2014/06/19-
minimum-wage-policy-state-local-levels-dube (accessed February 26, 2015), pp. 1-2.
11. Ibid., p. 5.
12. American Community Survey 2013,Table 52001, Earnings in the Past 12 Months (in 2013
Inflation-Adjusted Dollars).
13. U.S. Census Bureau, Cost of Living Index,Table 728. Selected Urban Areas: Annual Average
2010, U.S. Statistical Almanac.
14. The estimated 2015 mean and median wage was computed by (1) increasing the 2013 OES
wage survey mean and median wage for Los Angeles County by 3.4 percent to account for
in-flation from 2013 to 2015; (2) increasing the mean wage by 23 percent and the median wage
by 32 percent to correct the effect of part-time workers in reducing hourly earnings in the OES
sur-vey, which treats all annual wages as full-time employment, dividing them by 2080 hours to
es-timate hourly wages-the correction factors were derived by comparing earnings reported in
ACS 2009 to 2013 for all workers to full-time workers; and (3) increasing earnings by 36.4 per-
cent to account for the higher cost of living in the Los Angeles region compared to the United
States.
15. Based on presentation by Manuel Pastor at Economic Sustainability Roundtable, October 15,
2014.
16. Kaiser Family Foundation. "Hospital Adjusted Expenses per Inpatient Day." Retrieved from
http://kff.org/other/state-indicator/expenses-per-inpatient-day/ (accessed on February 14,
2015).
17. Consumer Price Index. Bureau of Labor Statistics. Retrieved from http://www.b1s.gov/cpi/.
18. Federal Reserve Bank of Cleveland. 2015 (January 16)."Cleveland Fed Estimates of Infla-
tion Expectations." Retrieved from https://www.develandfed.org/en/Our%20Research/
Indicators%20and%20Data/Estimates%20e/020Inflation%20Expectations.aspx (accessed on
February 14, 2015).
19. Ruth Milkman et al. 2010. "Wage Theft and Workplace Violations in Los Angeles:The Failure of
Em-ployment and Labor Law for Low-Wage Workers." UCLA Institute for Research on Labor
and Emloyment, p. 2-3.
20. Annette Bernhardt et al. 2009. "Broken Laws, Unprotected Workers:Violations of Employment
and Labor Laws in America's Cities?' National Employment Law Project, p. 5.
21. Ruth Milkman et al. 2010, p. 30.
22. Ibid.
23. Ruth Milkman et al. 2010., p. 12, 40.
112 LOS ANGELES RISING: A City that Works for Everyone

24. Ibid., p. 4.
25. Author's analysis of Division of Labor Standards Enforcement wage claims adjudication unit
data from 2008-2011.
26. Houston Mun. Code, Ch. 15, Art. IV, "Wage Theft Ordinance" (2013); Chicago Mun. Code
Ch. 4-4-320 (2013); Miami-Dade County Mun. Code Ch. 22, "Wage Theft" (2010); Santa
Clara Bd. of Supervisors Pol-icy Manual Ch. 5, §§ 5.5.5.4 (2015); San Francisco Ord. 205-06,
"Minimum Wage Implementation and Enforcement" (2006); Seattle Ord. No. 123596, "Wage
Theft Ordinance" (2011);Washington D.C. Coun-cil Bill 200671, "Wage Theft Prevention
Amendment Act" (2014).
27. National Employment Law Project. 2011. "Winning Wage Justice: An Advocate's Guide to State
and City Policies to Fight Wage Theft." P. 41-49, 53-54.Consult the Appendix for a complete
table comparing these cities' agency processes and expenses.
28. "Winning Wage Justice: An Advocate's Guide to State and City Policies to Fight Wage Theft."
2011.p. 391.
29. Cal. Labor Code § 1197.1(a). Interview with David Baiter, DLSE Staff Attorney. (February 25,
2015.)
30. Interview with David Bell, Staff Attorney DLSE. (February 25, 2015.)
31. "Winning Wage Justice," p. 25- 27. Interview with David Baiter, DLSE StaffAttorney. Inter-view
with Steve Zrucky, Senior StaffAttorney Legal Aid Foundation of Los Angeles. (February 25, 2015.)
32. Interview with Matthew Sirolly, Director Wage Justice Center Director. (February 20, 2015.)
33. Ibid, p. 113-116
34. Eunice Cho et al. 2013. "HollowVictories:The Crisis in Collecting Unpaid Wages for
California's Workers. National Employment Law Project and UCLA Labor Center.
35. Maryland enacted prejudgment wage liens in 2013. Legislators in NewYork and Washington
intro-duced similar legislation this year. California introduced similar legislation last year. Md.
Labor and Em-ployment Code §§ 3-1101 et seq. (2013); New York S-2232 (A-5501), 2015-
2016 Reg. Sess. (2015);Wash. Sen. Bill 5567, 2015 Reg. Sess. (2015); Cal. A.B. 2416, 2013-2014
Reg. Sess. (2014).
36. "Winning Wage Justice," p. 19-20, 28-30.
37. Ibid, p. 34-36.
38. Ibid., p. 57-67.
39. San Francisco Office of Labor Standards Enforcement. 2013. Minimum Wage Ordinance Annual
Re-port 2012-2013. P. 14. City of Seattle. 2015. Proposed Budget for 2015-2016. P. 462-463.
http://www.seatde.gov/financedepartment/15proposedbudget/documents/OCR.pdf (accessed
March 2, 2015). San Diego's Office of the Independent Budget Analyst. 2014. Estimated Cost of
Enforcing Pro-posed New Minimum Wage and Sick Leave Laws. P. 8.
40. San Francisco Wage Theft Task Force. San Francisco Wage Theft Task Force Final Report.
2013. P. 23. Diego Rondon Ichikawa and Rebecca Smith. 2014. Delivering $15: Community-
Centered Wage and Hour Enforcement in Seattle. National Employment Law Project, p. 12.
41. "Hollow Victories," p. 2.
42. Authors' analysis of staff salaries of 5.5 Contract Compliance Officers (CCO) that enforce the
Minimum Wage Ordinance (MWO) and Paid Sick Leave Ordinance (PSLO). Salaries range
from $78,702 to $125,346. Office of the Mayor, City and County of San Francisco. "Proposed
Salary Ordinance as ofJune 2, 2014:' Page 9. http://sfcontroller.org/Modules/ShowDocuinent.
aspx?documentid=5390. (Accessed March 2, 2015.) Department of Human Resources, City and
County of San Francisco. "Class Specification Contract Compliance Officer II." http://www.
jobaps.com/SF/specs/classspecdisplay.asp?ClassNumber=2978 (Accessed March 2, 2015.)
43. San Francisco Office of Labor Standards Enforcement. 2013. Minimum Wage Ordinance Annual
Re-port 2012-2013. P. 6.
LOS ANGELES RISING: A City that Works tor Everyone 113

44. lbid, p. 14.
45. Ibid,p.15-16.
46. Cal. Labor Code §§ 90.3-90.5.Workers may also file claims with the U.S. Department of Labor's
Wage and Hour Division, but much less through this process than with the DLSE because
federal minimum wage and overtime laws provide lower wages California. See 29 U.S.C. § 206;
Cal. Lab. Code § 310.
47. Author's analysis of Division of Labor Standards Enforcement wage claims adjudication unit
data from 2008-2011.
48. Ibid.
49. For our Data Dashboard elements, we benchmark annual changes in the City of Los Angeles
against two similar regions. Our analysis of similarity between the City of Los Angeles and other
geographic areas in the state revealed the city's strongest association with the balance of Los
Angeles County and the state of California.
50. California Board of Equalization. 1999-2012.Taxable Sales in California (Sales & Use Tax). Data
for large cities are broken out into the following types of retail and food services:
O Home Furnishings and Appliance Stores
• Bldg. Material and Garden Equip. and Supplies
• Food and Beverage Stores
• Motor Vehicle and Parts Dealers
o Gasoline Stations
O Clothing and Clothing Accessories Stores
• General Merchandise Stores
o Food Services and Drinking Places
o Other Retail Group
o All Other Outlets
114 I OS ANGELES RISING: A City that Works for Everyone

LOS ANGELES RISING: A City that Works for Everyone 115

Literature Review
116 LOS ANGELES RISING: A City that Works for Everyone

Below is a synopsis of our literature review on unintended consequences of raising the
minimum wage (see Table 1: Studies of Unintended Consequences in Raising the Minimum
Wage). Our focus was on the adjustment channels firms undertake to pay increased labor
costs, therefore, the following criteria was applied for inclusion:
Study of enacted minimum wage increases, not projected estimates;
Measure of adjustment channels, including employment and hours,
prices, profits, nonwage benefits, human resource practices, and
productivity;
U.S.-based, but two studies looking at effects outside of the U.S. wereincluded because they addressed changes to firm profits (Drava, Machin,
and Van Reenen 2011 and Pacheco and Naiker 2006).
We found common methodological practices woven through the 18 studies. All used a
change in minimum wage as the experimental group, whether federal or state in scale. A
control group was based on either geography, such as an analogous county across a stateborder with different wage standards, or the time before the raise in income.
Table 1: Studies of Unintended Consequences in Raising the Minimum Wage
Aaronson, French, andSorkin (2013)
17% increase in CA(2001-2002), 26% in IL(2004-2005), 39% in NJ(2005-2006)
Quarterly Census of Fast foodEmployment and Wages restaurants(QCEW), Statistics of U.S.Businesses
• increase in firm closures by 4-7% in firsttwo years.
• No effect on employment.
• Firm closures increase by 4-7% points, butoffset by firm startups.
Allegretto, Dube, and Reich States with MW increases(2011)
Current PopulationSurvey (CPS)
1990-2009 • Small effect on employment, earnings, andhours.
• No hiring preference for older, moreexperienced teens.
• Positive significant effect on earnings forBlack and Latino teens, insignificant effecton employmentand hours.
Allegretto, Dube, Reich, and U.S. MW increase in threeZipperer (2013) steps (2007-2009)
CPS (1990-2012),American CommunitySurvey (2005-2011),Quarterly Workforce Indi-cators (QWI, 2000-2011),QCEW (1990-2010)
Teens, Restaurants Varies by data set • Insignificant negative effect on teenemployment.
• Significant positive effect on teen earnings.
• Small negative effect on restaurantemployment.
• Significant positive effect on restaurantearnings.
• Significant negative effects on turnover forteens and restaurant workers.
Card and Krueger (1995) New Jersey increased MW Survey of restaurantfrom $4.25 to $5.05 per hour owners or managersin 1992
Fast food restau- 1992rants
• NJ restaurants increased employmentrelative to PA by 13%.
• NJ average staffing wages increased by10%. No significant change in raises forNJ workers.
No significant reduction in free or reduced-price meals to NJ workers.
Food prices in NJ rose 3% faster than PA.
NJ restaurant openings slightly positivelinked to MW increase.
LOS ANGELES RISING: A City that Works for Everyone 117

Draca, Machin, and VanReenen (2011)
MW increase in UK (1999) Bureau Van Dijk's Finan-cial Analysis Made Easydatabase, Labor Force
Private firms 1999-2002 •
•Survey (comparable to
■CPS), British WorkplaceEmployment RelationsSurvey
Dube, Kaplan, Reich, andSu (2006)
National Retail Feder-ation, County Business
Retail 2001-2004 •
■Patterns (CBP)
Dube, Lester, and Reich(2010)
Contiguous county with MWincrease
QCEW, CBP, CPS Restaurants 1990-2006 •
•
Dube, Naidu, and Reich 26% increase in San Francis- QCEW, Survey of(2007) co (2004) restaurant owners or
managers
Restaurants
Significant decrease infirm profits.
No effect on employment or productivity.
22.7% decrease in profits in low wage firms.
Retail stores increased in SF.
Retail employment related to businesscycles, not MW increase.
No reduction in employment.
Spillover effects in earnings andemployment are insignificant.
• Slight negative impact to employment,statistically insignificant.
• Positive significant effect on earnings,positive insignificant effect on employment.
• Small 2.5% increase in restaurantemployment.
• Small 2.8% decrease in restaurant closures.
• Small 2.8% increase in restaurant prices.
• Significant 6.2% increase in fast food prices.
Giuliano (2013) U.S. MW increase in 1996and state MW variation
Retail firm's personnel Teensdata
1996-1998 • Significant increase in teenemployment, especially younger andmore affluent teens.
Hirsch, Kaufman, andZelenska (2011)
U.S. MW increase in threesteps: $5.15 to $5.85, to$6.55, to $7.25
Store-level payrollrecords, Survey of and in-terviews with restaurantmanagers
Quick-servicefranchiserestaurants
2007-2009 • Only 23% of managers planned toreduce workforce.
• 60% of managers planned to reducework hours.
• Price of combo meal increased by10.9%.
• Profit slowed after MW increase.
• Few managers planned to reducetraining.
• Separation rates fell from 10% to 5%.
• Payroll increases by 2% on averageover 3 years.
• Managers estimated 230/n of savingsthrough operational efficiencies
Increased wage compression.
• 90% of managers planned to imposehigher performance standards.
• More interest expressed by managersin hiring more experienced and olderworkers.
Meer and West (2013) States with MW increases Business DynamicsStatistics (BDS, 1977-2011), QVVI (1975-2012),QCEW (varies-2012)
Varies by data set • 10% MW increase, 1.7% decrease inemployment.
118 LOS ANGELES RISING: A City that Works for Everyone
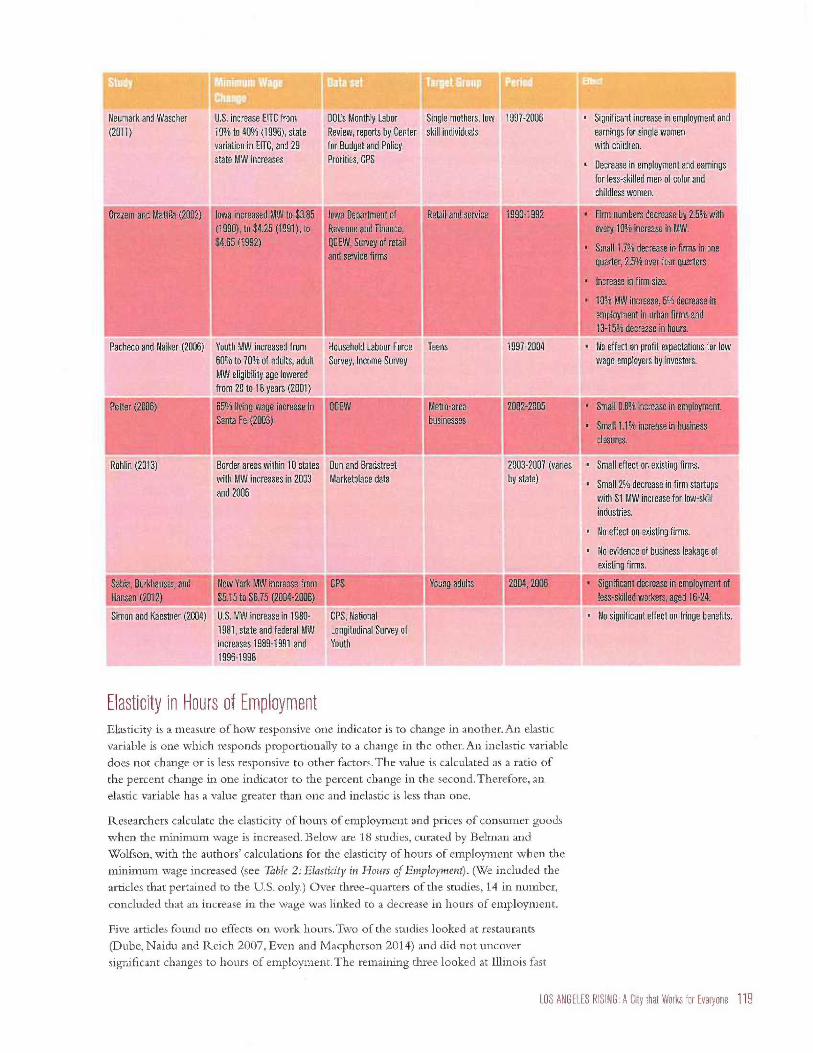
Neumark and Wascher U.S. increase EITC from DOL's Monthly Labor Single mothers, low 1997-2006 • Significant increase in employment and(2011) 10% to 40% (1996), state
variation in EITC, and 29state MW increases
Review, reports by Centerfor Budget and PolicyProrities, CPS
skill individuals earnings for single womenwith children.
• Decrease in employment and earningsfor less-skilled men of color andchildless women.
Orazem and Manila (2002) Iowa increased MW to $3.85(1990), to $4.25 (1991), to$4.65 (1992)
Iowa Department ofRevenue and Finance,QCEW, Survey of retailand service firms
Retail and service 1990-1992 • Firm numbers decrease by 2.5% withevery 10% increase in MW.
• Small 1.7% decrease in firms in onequarter, 2.5% over four quarters
• Increase in firm size.
• 10% MW increase, 6% decrease inemployment in urban firms and13-15% decrease in hours.
Pacheco and Naiker (2006) Youth MW increased from60% to 70% of adults, adult
Household Labour ForceSurvey, Income Survey
Teens 1997-2004 • No effect on profit expectations for lowwage employers by investors.
MW eligibility age loweredfrom 20 to 18 years (2001)
Potter (2006) 65% living wage increase inSanta Fe (2003)
QCEW Metro-areabusinesses
2002-2005 • Small 0.8% increase in employment.
• Small 1.1% increase in businessclosures.
Rohlin (2013) Border areas within 10 states Dun and Bradstreet 2003-2007 (varies • Small effect on existing firms.with MW increases in 2003and 2006
Marketplace data by state) • Small 2% decrease in firm startupswith $1 MW increase for low-skillindustries.
• No effect on existing firms.
• No evidence of business leakage ofexisting firms.
Sabia, Burkhauser, andHansen (2012)
New York MW increase from$5.15 to $6.75 (2004-2006)
CPS Young adults 2004, 2006 • Significant decrease in employment ofless-skilled workers, aged 16-24.
Simon and Kaestner (2004) U.S. MW increase in 1980- CPS, National • No significant effect on fringe benefits.1981, state and federal MWincreases 1989-1991 and
Longitudinal Survey ofYouth
1996-1998
Elasticity in Hours of EmploymentElasticity is a measure of how responsive one indicator is to change in another. An elastic
variable is one which responds proportionally to a change in the other. An inelastic variable
does not change or is less responsive to other factors. The value is calculated as a ratio of
the percent change in one indicator to the percent change in the second. Therefore, an
elastic variable has a value greater than one and inelastic is less than one.
Researchers calculate the elasticity of hours of employment and prices of consumer goods
when the minimum wage is increased. Below are 18 studies, curated by Belman and
Wolfson, with the authors' calculations for the elasticity of hours of employment when the
minimum wage increased (see Table 2: Elasticity in Hours of Employment). (We included the
articles that pertained to the U.S. only.) Over three-quarters of the studies, 14 in number,
concluded that an increase in the wage was linked to a decrease in hours of employment.
Five articles found no effects on work hours. Two of the studies looked at restaurants
(Dube, Naidu and Reich 2007, Even and Macpherson 2014) and did not uncover
significant changes to hours of employment. The remaining three looked at Illinois fast
LOS ANGELES RISING: A City that Works for Everyone 119
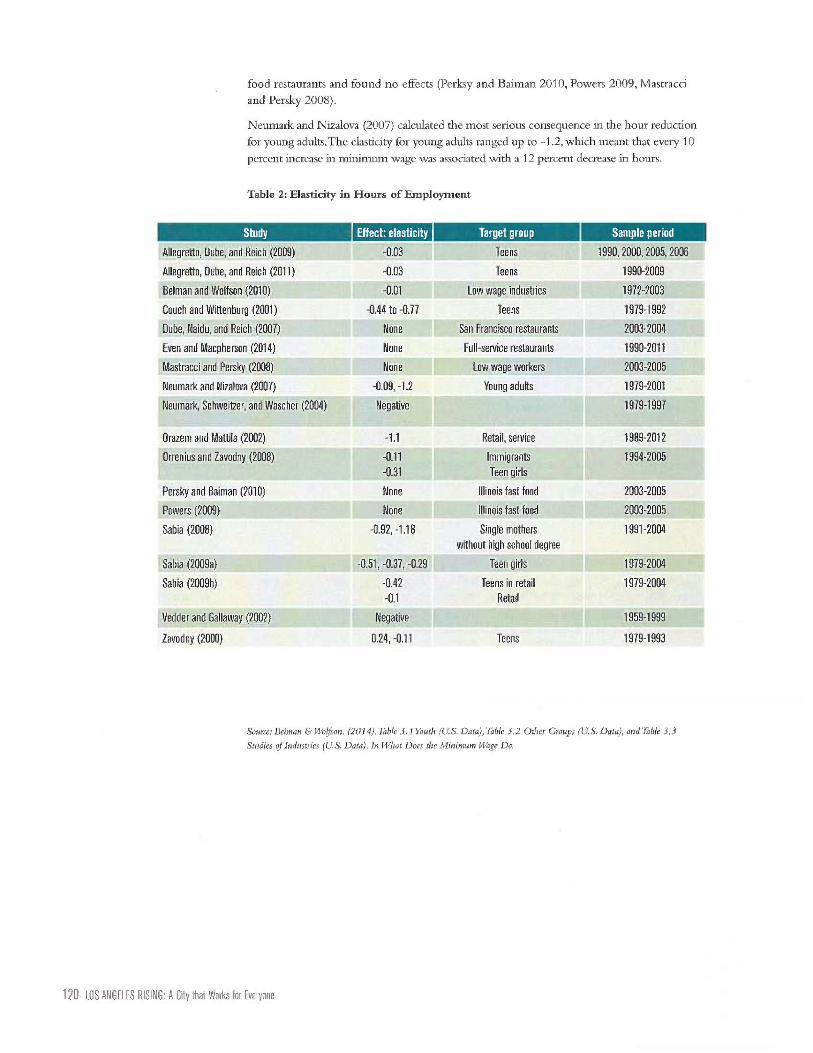
food restaurants and found no effects (Perksy and Baiman 2010, Powers 2009, Mastracci
and Persky 2008).
Neu.mark and Nizalova (2007) calculated the most serious consequence in the hour reduction
for young adults.The elasticity for young adults ranged up to —1.2, which meant that every 10
percent increase in minimum wage was associated with a 12 percent decrease in hours.
Table 2: Elasticity in Hours of Employment
Study Effect: elasticity Target group Sample period
Allegretto, Dube, and Reich (2009) -0.03 Teens 1990, 2000, 2005, 2006
Allegretto, Dube, and Reich (2011) -0.03 Teens 1990-2009
Belman and Wolfson (2010) -0.01 Low wage industries 1972-2003
Couch and Wittenburg (2001) -0.44 to -0.77 Teens 1979-1992
Dube, Naidu, and Reich (2007) None San Francisco restaurants 2003-2004
Even and Macpherson (2014) None Full-service restaurants 1990-2011
Mastracci and Persky (2008) None Low wage workers 2003-2005
Neumark and Nizalova (2007) -0.09, -1.2 Young adults 1979-2001
Neumark, Schweitzer, and Wascher (2004) Negative 1979-1997
Orazem and Mattila (2002) -1.1 Retail, service 1989-2012
Orrenius and Zavodny (2008) -0.11-0.31
ImmigrantsTeen girls
1994-2005
Persky and Baiman (2010) None Illinois fast food 2003-2005
Powers (2009) None Illinois fast food 2003-2005
Sabia (2008) -0.92, -1.18 Single motherswithout high school degree
1991-2004
Sabia (2009a) -0.51, -0.37, -0.29 Teen girls 1979-2004
Sabia (2009b) -0.42-0.1
Teens in retailRetail
1979-2004
Vedder and Gallaway (2002) Negative 1959-1999
Zavodny (2000) 0.24, -0.11 Teens 1979-1993
Source: Behnan &WOon. (2014). Table 3.1 Youth (US. Data), Table .3.2 Other Groups (US. Data), and Table 3.3
Studies of Industries (U.S. Data). In What Does the Minimum Wage Do.
120 LOS ANGELES RISING: A City that Works for Everyone
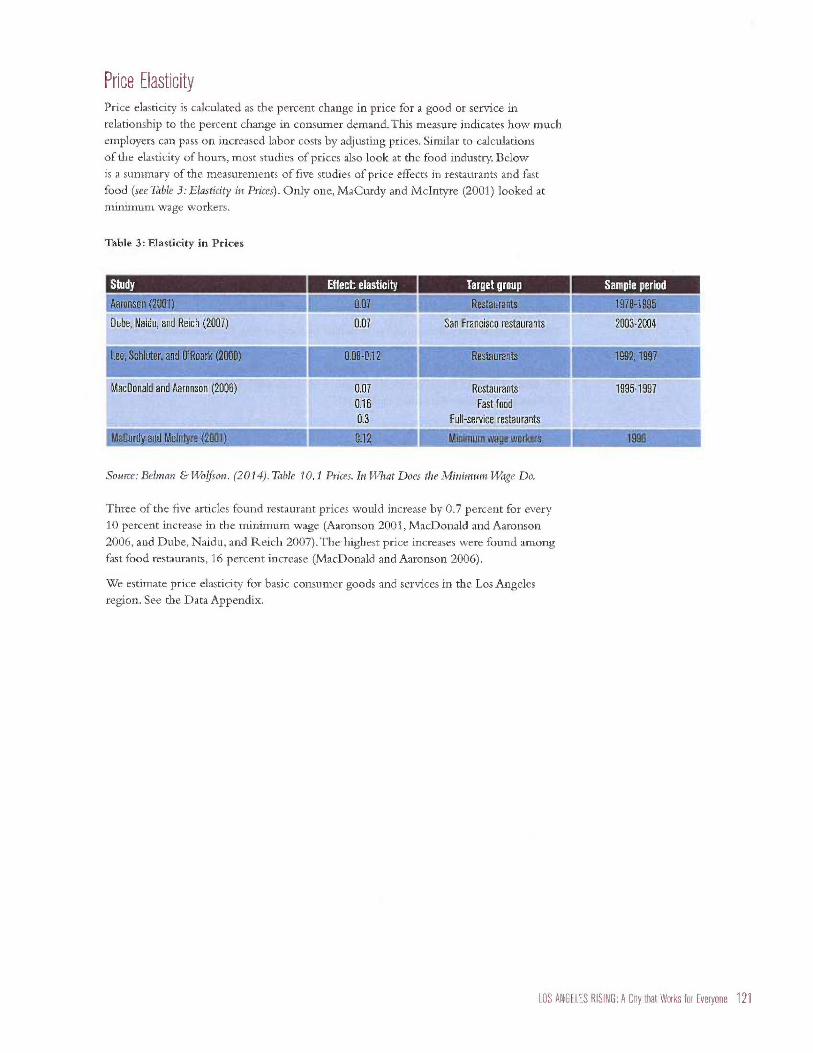
Price ElasticityPrice elasticity is calculated as the percent change in price for a good or service inrelationship to the percent change in consumer demand. This measure indicates how muchemployers can pass on increased labor costs by adjusting prices. Similar to calculationsof the elasticity of hours, most studies of prices also look at the food industry Belowis a summary of the measurements of five studies of price effects in restaurants and fastfood (see Table 3: Elasticity in Prices). Only one, MaCurdy and McIntyre (2001) looked atminimum wage workers.
Table 3: Elasticity in Prices
Study
Aaronson (2001)
Dube, Naidu, and Reich (2007)
Effect: elasticity Target group
017 11P Restaurants
0.07 San Francisco restaurants
Sample period
1978-1995
2003-2004
Lee, Schluter, and [Roark (2000) 0.08-0.12 Restaurants 1992, 1997
MacDonald and Aaronson (2006) 0.070.16
0.3 MaMaCurdy and McIntyre (2001) AxLimik
RestaurantsFast food
Full-service restaurants
Minimum wage workers
1995-1997
1996
Source: Belrnan & Wolfson. (2014). Table 10.1 Prices. In What Does the Minimum Wage Do.
Three of the five articles found restaurant prices would increase by 0.7 percent for every10 percent increase in the minimum wage (Aaronson 2001, MacDonald and Aaronson2006, and Dube, Naidu, and Reich 2007). The highest price increases were found amongfast food restaurants, 16 percent increase (MacDonald and Aaronson 2006).
We estimate price elasticity for basic consumer goods and services in the Los Angelesregion. See the Data Appendix.
LOS ALIGHTS RISING: A City that Works for Everyone 121

ReferencesAaronson, Daniel. (2001). "Price Pass-through and the Minimum Wage." The Review of Economics and
Statistics.Vol. 83, No. 1, pp. 158-169.
Aaronson, Daniel, Eric French, and Isaac Sorkin. (2013). "Firm Dynamics and the Minimum Wage: A
Putty-Clay Approach?' Federal Reserve Bank of Chicago Working Pap er.WP 2013-26.
Allegretto, Sylvia, Arindrajit Dube, and Michael Reich. (2009)."Spatial Heterogeneity and Minimum
Wages: Employment Estimates for Teens Using Cross-State Commuting Zones." IRLE Working
Paper No. 181-09.
Allegretto, Sylvia, Arindrajit Dube, and Michael Reich. (2011). "Do Minimum Wages Really Reduce
Teen Employment? Accounting for Heterogeneity and Selectivity in State Panel Data. IRLE Working
Paper No. 166-08.
Allegretto, Sylvia, Arindrajit Dube, Michael Reich, and Ben Zipperer. (2013). "Credible Research
Designs for Minimum Wage Studies." IRLE Working Paper No. 148-13.
Belman, Dale and Paul J.Wolfson. (2014). What Does the Minimum Wage Do? Kalamazoo, MI:W.E.
Upjohn Institute for Employment Research.
Card, David and Alan B. Krueger. (1995). "Time-Series Minimum-Wage Studies:A Meta-analysis:'
The. American Economic Review.Vol. 85, No. 2, Papers and proceedings of the 107th annual meeting of
the American Economic Association, pp. 238-243.
Couch, Kenneth and David Wittenburg. (2001). "The Response of Hours ofWork to Increases in the
Minimum Wage." Southern Economics Journal.Vol. 68, No. 1, pp. 171-177.
Draca, Mirko, Stephen Machin, and John Van Reenen. (2011). "Minimum Wages and Firm
Profitability." American Economic Journal: Applied Economics.Vol. 3, No. 1, pp. 129-151.
Dube,Arindrajit, Ethan Kaplan, Michael Reich, and Felix Su. (2006). "Do Businesses Flee Citywide
Minimum Wages? Evidence from San Francisco and Santa Fe?' IIR Policy Brief.
Dube, Arindrajit,T.William Lester, and Michael Reich. (2010). "Minimum Wage Effects Across State
Borders: Estimates Using Contiguous Counties." The Review of Economics and Statistics.Vol. 92, No. 4,
pp. 945-964.
Dube, Arindrajit, Suresh Naidu, and Michael Reich. (2007). "The Economic Effects of a Citywide
Minimum Wage." Industrial & Labor Relations Review.Vol. 60, No. 4.
Even, William E. and David A. Macpherson. (2014). "The Effect of the Tipped Minimum Wage on
Employees in the U.S. Restaurant Industry." Southern Economics Journal.Vol. 80, No. 3, pp. 633-655.
Giuliano, Laura. (2013). "Minimum Wage Effects of Employment, Substitution, and Teenage Labor
Supply: Evidence from Personnel Data."Journal of Labor Economics.Vol. 31, No. 1, pp. 155-194.
Hirsch, Barry T., Bruce E. Kaufman, and Tetyana Zelenska. (2011). "Minimum Wage Channels of
Adjustment." IZA Discussion Paper No. 6132.
Lee, Chinkook, Gerald Schluter, and Brian O'Roark. (2000). "Minimum Wage and Food Prices: An
Analysis of Price Pass-Through Effects." International Food and Agribusiness Management Review.Vol. 3,
No. 1, pp. 111-128.
MacDonald, ames and Daniel Aaronson. (2006). "How Firms Construct Price Changes: Evidence
from Restaurant Responses to Increased Minimum Wages." American Journal ofAgricultural Economics.
Vol. 88, No. 2, pp. 292-307.
MaCurdy, Thomas and Frank McIntyre. (2001). Winners and Losers of Federal and State Minimum Wages.
Washington, DC: Employment Policies Institute.
Mastracci, Sharon H. and Joseph Persky. (2008). "Effects of State Minimum Wage Increases on
Employment, Hours, Earnings of Low-Wage Workers in Illinois." Journal of Regional Analysis and
Policy. Vol. 38, No. 3, pp. 268-278.
Meer, Jonathan and Jeremy West. (2013). "Effects of the Minimum Wage on Employment Dynamics."
NBER Working Paper No. 19262.
122 LOS ANGELES RISING: A City that Works for Everyone

Neumark, David and Olena Nizalova. (2007). "Minimum Wage Effects in the Longer Runjournal of
Human Resources.Vol. 42, No. 2, pp. 435-452.
Neumark, David and William Wascher. (2011). "Does a Higher Minimum Wage Enhance the
Effectiveness of the Earned Income Tax Credit?" Industrial and Labor Relations Review. Vol. 64, No. 4,
pp. 712-746.
Neumark, David, Mark Schweitzer, and William Wascher. (2004). "Minimum Wage Effects
throughout the Wage Distribution." Journal of Human Resources.Vol. 39, No. 2, pp. 425-450.
Orazem, Peter F. and J. Peter Mattila. (2002). "Minimum Wage Effects on Hours, Employment, and
Number of Firms:The Iowa Case."Journal of Labor Research.Vol. 23 No. 1, pp. 3-23.
Orrenius, Pia M. and Madeline Zavodny. (2008). "The Effect of Minimum Wages on Immigrants'
Employment and Earnings." Industrial and Labor Relations Review.Vol. 61, No. 4, pp. 544-563.
Pacheo, Gail A. and V. Naiker. (2006). "Impact of the Minimum Wage on Expected Profits."
International Review of Applied Economics.Vol. 20, No. 4, pp. 469-490.
Persky, Joseph and Ron Baiman. (2010). "Do State Minimum Wage Laws Reduce Employment?
Mixed Messages from Fast Food Outlets in Illinois and Indiana." Journal of Regional Analysis and Policy.
Vol. 40, No. 2, pp. 132-142.
Potter, Nicholas. (2006). "Measuring the Employment Impacts of the Living Wage Ordinance in
Santa Fe, New Mexico." Albuquerque, NM: University of New Mexico, Bureau of Business and
Economic Research.
Powers, Elizabeth T. (2009). "The Impact of Minimum-Wage Increases: Evidence from Fast-Food
Establishments in Illinois and Indiana." Journal of Labor Research.Vol. 30, No. 4, pp. 365-394.
Rohlin, Shawn M. (2013). "State minimum wages and business location: Evidence from a refined
border approach." Journal of Urban Economics.Vol. 69, pp. 103-117.
Sabiajoseph J. (2008). "Minimum Wages and the Economic Well Being of Single Mothers." Journal of
Policy Analysis and Management.Vol. 27, No. 4, pp. 848-866.
Sabiajoseph J. (2009a). "Identifying Minimum Wage Effects: New Evidence from the Monthly CPS
Data." Industrial Relations.Vol. 48, No. 2, pp. 311-328.
Sabiajoseph J. (2009b). "The Effects of Minimum Wage Increases on Retail Employment and Hours:
New Evidence from the Monthly CPS Data Journal of Labor Relations.Vol. 30, No. 1, pp. 75-97.
Sabia, Joseph J., Richard V. Burkhauser, and Benjamin Hansen. (2012). "Are the Effects of Minimum
Wage Increases Always Small? New Evidence from a Case Study of NewYork State." Industrial and
Labor Relations Review.Vol. 65, No. 2, pp. 350-376.
Simon, Kosali I. and Robert Kaestner. (2004). "Do Minimum Wages Affect Non-Wage Job
Attributes? Evidence on Fringe Benefits." Industrial and Labor Relations Review.Vol. 58, No. 1, pp.
52-70.
Vedder, Richard and Lowell Gallaway. (2002). "The Minimum Wage and Poverty among Full-Time
Workers"Journal of Labor Research.Vol. 23, No. 1, pp. 41-49.
Zavodny, Madeline. (2000). "The Effect of the Minimum Wage on Employment and Hours." Labour
Economics.Vol. 7, No. 6, pp. 729-750.
LOS ANGELES RISING: A City that Works for Everyone 123

Data Appendix
124 LOS ANGELES RISING: A City that Works for Everyone

Guide to Appendix Sections
Chapter II: Methodology for Using the American Community Survey 2009-2013 Public Use Microdata Sample
Chapter III: Data and Methods Appendix
Chapter III: Economic Multiplier Effects from Dollars Received by Householdsat Different Income Levels
Chapter IV: Establishment Size Distribution
Chapter V: Tables of Geographic Distribution of Impacts by Los Angeles CityCouncil Districts
Chapter V: Methodology for Geographic Distribution of Impacts
Chapter VI: DAPA/DACA Methodology
Chapter VI: Proposition 47 Methodology
Chapter VII: Dashboard Appendix - Detecting Anomalous Behavior in LosAngeles' Economic Performance
Chapter VII: Legal Tables: Detailed Local Minimum Wage Increase Schedules
Chapter VII: Legal Tables: Application and Exemptions in Local MinimumWage Increases
Chapter VII: Legal Tables: Detailed Local Wage Enforcement
LOS ANGELES RISING: A City that Works for Everyone 125

Chapter II: Methodology for Using the American Community Survey2009-2013 Public Use Vicrodata Sample
The American Community Survey (ACS) Public Use Microdata Sample (PUMS)provides detailed information about workers based on place of residence. The 2009 to
2013 data set provides a five percent sample of the population, with 189,908 weighted
records for residents of the City of Los Angeles. These records include demographicdetails and information about hours and weeks worked, class of worker, occupation,industry, and earnings. This provides the most detailed information available estimatingthe hourly wages of workers and for understanding the attributes of low-wage workers.
The critical limitation of this data is that it is based on where workers live, not where they
work. This is a major limitation since more than half of the workers with jobs in the city
do not live in the city. The overall data strategy for this report was to:
Use ACS PUMS data to understand the attributes of workers.Use the Longitudinal Employer-Household Dynamics (LEHD) Origin-Destination Employment Statistics (LODES) to identify the size, place ofresidence and broad characteristics of the labor force employed in the City of LosAngeles (methodology for building this data set is described later).Use common data variables in ACS PUMS and LODES data to extrapolatedetailed worker attributes shown in ACS PUMS records onto the labor forceshown in LODES data.
Filtering that was applied to ACS PUMS data to narrow the records as closely as possibleto workers who both live and work in the city, and thus are most representative of the
city's labor force was as follows:
Public Use Microdata Area (PUMA) place of residence within the City of LosAngeles.Place of Work PUMA limited as closely as possible to the City of Los Angeles.
Place of Work PUMAs encompass much larger geographic areas than place ofresidence PUMAs, but with 2009 to 2011 survey records it was possible toexclude many non-city areas of the County of Los Angeles as well as all areasoutside of Los Angeles County. For 2012 to 2013 survey records there is a singleplace of work PUMA that encompasses all of Los Angeles County, making itpossible only to exclude workers employed outside of the county. Thiscombination of place of residence and place of work PUMA filters provides thebest sample possible of workers employed in the city.Age — no filters. There are only a small number of workers younger than 18 in
the labor force but many workers over 65 years of age. Older workers haveabove-average earnings, so age filters have the effect of skewing earningsdownwards.Weeks and hours worked — no filters. There are both low- and high-hours
outliers, but excluding outliers has the effect of skewing earnings downwards.Hourly wage — no filters. There are both low- and high-wage outliers, butexcluding outliers has the effect of skewing earnings downwards.Class of worker — the sample was limited to workers with wage and salaryearnings. Roughly five percent of workers have both wage and self-employmentearnings. Hours worked were reduced to reflect the ratio of wage and salaryearnings to self-employment earnings.Amount of earnings — workers with less than $500 in wage and salary earnings inthe year were excluded in order to exclude workers with extremely marginallabor force connections who were likely to skew earnings data downwards.
126 LOS ANGELES RISING: A City that Works for Everyone

Chapter III: Data and Methods Appendix
In this appendix, we document our methodology to estimate the number of workers
affected by the proposed minimum wage law, as well as the estimated increase in earnings.
The appendix includes sections on data sources, comparison of the two main data sources
used and the process for estimating the number of workers affected and the increase in
earnings—section IIIA of the report. The appendix also describes the demographic and job
characteristics covered in section IIIB of the report as well as the estimation of reduction in
public spending—section IIID of the report.
Data Sources and Sample Definition
We use two main data sources provided by Census Bureau in our study. These are theLongitudinal Employment-Household Dynamics (LEHD) Origin- DestinationEmployment Statistics (LODES) and the American Community survey (ACS) 5-yearestimates. Two files are complementary data products that can be used to conducteconomic, demographic and geographical analysis. A detailed description of PUMS, themain data product of ACS is presented elsewhere in this Appendix.
In Section III, we use the 2009-2013 PUMS data with different coverages in different
analysis as noted below. In addition to PUMS, we also use ACS 2011 (5-year estimates)B20005 detailed tables which provide cross-tabs of earnings in the past 12 months for eachethnicity level we used—Asian, Black, Latino, Other and White by sex and workexperience at the census tract level. Work experience refers to worked full-time, year
round and other, where other represents the part-time workers. Earnings are available in
20 brackets starting with $1 to $2,499. We use the bottom 13 brackets which correspondto low and mid earning levels of the LODES data as elaborated below.
The LODES data provides three data files that we used. The main one is the Origin-
Destination (OD) data that provides detailed counts of where workers live, where workerswork, and the origins and destinations trips to work at the census tract and block level.These counts are derived from a variety of both public and confidential data sources,including unemployment insurance records. To protect confidentiality, noise infusion is
applied to workplace totals, and synthetic data methods are applied to residential locations.
As a result of the fuzziness built into the data, its reliability is limited for very smallgeographies, like the census block, the lowest unit for which the data is available.
However, when aggregated to larger areas, like census tracts, the aggregated countsbecome more accurate by reducing the variance of small-area counts. We use tract-level
counts throughout the analysis. These data provide three earnings breakdowns that we use
as follows: Low earning jobs—jobs with earnings $1,250 per month or less; mid-earning
jobs—jobs with earnings $1251 to $3333 per month, and high-eanungjobs--jobs with
earnings greater than $3333 per month.
OD data sets do not include more detailed information on workers. We get the labor flow
between census tracts and the number of workers by three earning levels as noted. In
order to derive the gender, ethnicity and industry information, we use the Residence Area
Characteristics (RAC) data which provides jobs by home census tract. RAC data providesseparate data files for each earning level showing the number of jobs by gender, ethnicity
and two digit NAICS industry sector.
I For a comparison of ACS and LODES data products, see Graham, Matthew R., Kutzbach, Mark j., McKenzie,Brian. 2014. Design Comparison of LODES and ACS Commuting Data Products. Census Bureau.
LOS ANGELES RISING: A City that Works for Everyone 127
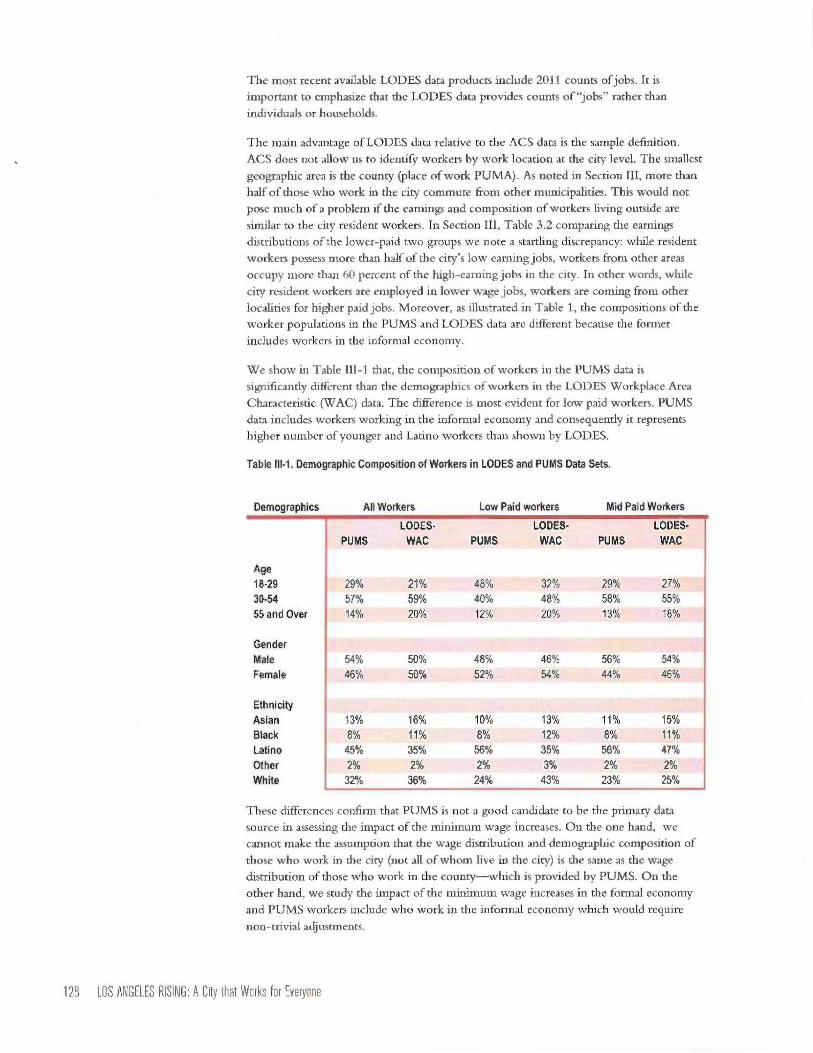
The most recent available LODES data products include 2011 counts of jobs. It is
important to emphasize that the LODES data provides counts of "jobs" rather than
individuals or households.
The main advantage of LODES data relative to the ACS data is the sample definition.
ACS does not allow us to identify workers by work location at the city level. The smallest
geographic area is the county (place of work PUMA). As noted in Section III, more than
half of those who work in the city commute from other municipalities. This would not
pose much of a problem if the earnings and composition of workers living outside are
similar to the city resident workers. In Section III, Table 3.2 comparing the earnings
distributions of the lower-paid two groups we note a startling discrepancy: while resident
workers possess more than half of the city's low earning jobs, workers from other areas
occupy more than 60 percent of the high-earning jobs in the city. In other words, while
city resident workers are employed in lower wage jobs, workers are coming from other
localities for higher paid jobs. Moreover, as illustrated in Table 1, the compositions of the
worker populations in the PUMS and LODES data are different because the former
includes workers in the informal economy.
We show in Table III-1 that, the composition of workers in the PUMS data is
significantly different than the demographics of workers in the LODES Workplace Area
Characteristic (WAC) data. The difference is most evident for low paid workers. PUMS
data includes workers working in the informal economy and consequently it represents
higher number of younger and Latino workers than shown by LODES.
Table III-1. Demographic Composition of Workers in LODES and PUMS Data Sets.
Demographics All Workers Low Paid workers Mid Paid Workers
Age18-2930-5455 and Over
GenderMaleFemale
EthnicityAsianBlackLatinoOtherWhite
PUMSLODES-WAC PUMS
LODES-WAC PUMS
LODES-WAC
29%57%
21%59%
48%40%
32%48%
29%58%
27%55%
14% 20% 12% 20% 13% 18%
54% 50% 48% 46% 56% 54%46% 50% 52% 54% 44% 46%
13%8%45%
16%11%35%
10%8%56%
13%12%35%
11%8%56%
15%11%47%
2% 2% 2% 3% 2% 2%32% 36% 24% 43% 23% 25%
These differences confirm that PUMS is not a good candidate to be the primary data
source in assessing the impact of the minimum wage increases. On the one hand, we
cannot make the assumption that the wage distribution and demographic composition of
those who work in the city (not all of whom live in the city) is the same as the wage
distribution of those who work in the county—which is provided by PUMS. On the
other hand, we study the impact of the minimum wage increases in the formal economy
and PUMS workers include who work in the informal economy which would require
non-trivial adjustments.
128 LOS ANGELES RISING: A City that Works for Everyone

Because of these limitations, we use LODES data as the primary data source and PUMSdata to complement it in certain areas as described below. Using LODES data at the
census tract level not only provides accurate results relying on work of place job counts at
the tract level, it also provides us to present a more accurate spatial representation of the
data as shown in Chapter 5.
The Methodology of Estimating the Number of Affected workers and Size of
Earnings Increases
First we estimate the number of workers working in the city in each home census tract and
then simulate the tract level wage distribution right before the proposed minimum wage
law would go into effect, and finally estimate the number of workers affected by the increase
and their additional earnings.
We start our method by processing the 2011 LODES California OD data for all
employment. We identify all home census tracts in the city and county with resident
workers working in Los Angeles City. For other counties, for simplicity, we use county
level data rather than census tract level. Numbers of smaller counties are aggregated into a
residual category. We only use the job counts for low and mid earning jobs. The final
data show approximately 1.7 million workers working in the city as tabulated in Section
III, Table 3.2. The data is comprised of 16 other county counts and 2,333 census tracts
counts in the Los Angeles County.
The next step is to allocate these workers in identified counties and census tracts to
earning brackets to estimate the number of workers affected by minimum wage increases.
We prepare the LODES data in 10 different classes for the two earning classes—low and
mid earning jobs. These classes are 2gender and 5 ethnicity categories. Then, each census
tract count is divided into 20 cells making it very granular. Since LODES does not
provide the cross-tabulation of gender and ethnicity, we assume that gender distribution is
even among 5 ethnic groups.
We allocate job counts by these 20 strata to the ACS B-20005 detail table data which is
described above. ACS tables provide the wage distribution of all workers working in a
given census tract by the same strata. However, we face two caveats in this process. First,
ACS data also' provides the data by work status—full-time and part-time while LODES
data does not. Second, ACS data includes self-employed which need to be removed.
We used PUMS data to make the self-employment adjustment. This step is necessary, self-
employed persons earn lower wages and would introduce a bias to the wage distribution if
included. LODES data only includes workers with wages and salaries. We use PUMS data
to derive the percent self-employed by gender, ethnicity, work status and 13 earning
brackets. We estimate the self-employment proportions at the PUMA level for all workers
with the exception of other counties where count level rates are estimated. Then, we
apply these proportions to ACS data to remove the self-employed from each census tract.
We also use PUMS data to derive the proportions of workers employed full-time and
part-time by gender and ethnicity and earnings bracket at the PUMA level.
Next, using the estimated work status proportions, we allocate the jobs derived from the
LODES data by gender and ethnicity. We distribute the low earning jobs to the bottom 7
brackets and mid earning jobs to the next 6 brackets of the ACS data in each census tract.
This process gives us job counts of workers working in the city by 20 strata--2 gender, 2
work status and 5 ethnicity categories for 13 earning brackets.
After simulating the wage distribution in each census tract by the 20 strata, our final step is
to estimate how many workers in these tracts will be affected by the minimum wage
increases for each yearly phase-in step. This process requires the knowledge of hourly
LOS ANGELES RISING: A City that Works for Everyone 129

wage and ACS data only provides the earning ranges of these workers. We use PUMS
data to accomplish this final task.
We include all workers who earned more than $500, live in the city and work in the
county. Then, we derive the same 13 earning brackets ACS provides. Hourly wage
variable is not readily available in the PUMS data and need to be estimated as described
elsewhere in this Appendix. It is computed by dividing annual earnings by the product of
weeks worked last year and hours worked per week. This computation is subject to
measurement error as recognized by researchers. We observe many workers with hourly
wages below the statutory minimum wage level. We assume that these are low-wage
workers and the measurement error is attributed to reporting of weeks and hours worked.
After computing the hourly wage variable, wages are adjusted by inflation rate to derive
real minimum wage levels for each year between 2015 and 2019. The base period is 2009
with the minimum wage level of $9. This process is also described elsewhere in this
Appendix. After deriving these thresholds, the next step is to estimate what percent of
workers in a given earnings bracket will be affected by the minimum wage increase. In
other words, what percent of the workers earn less than the minimum age in a given year?
This step is necessary because we observe workers in low earning brackets with wage
levels above minimum wage for working part-time. We also observe workers in higher
brackets with wages around minimum wage because of working long hours. Moreover, in
middle brackets, we may have workers earning below and above the next minimum wage
threshold.
We present these percentages in Table 2. We observe that, among part-time workers the
percent of workers to be affected tapers off after the bracket $12,500-$15,000 in 2015—
the first phased-in year. The proportions of workers who will be impacted in lower
brackets are in the 50-70 percent range. These numbers increase significantly in 2019—
the last phase-in year. The tapering off point moves to around $20,000 and the range of
proportions for lower brackets rises to 50-80 percent.
We observe a larger shift for full-time workers. While in 2015, we estimate that almost all
workers below $20,000 annual earnings will be affected, this threshold increases to almost
$30,000 in 2019. Table 111-2 shows these proportions at the summary level. We estimate
and use percent affected at the gender, ethnicity and work status levels separately for
higher accuracy.
Table 111-2. Percent of Workers to be affected by Minimum Wage Increases by Work Status in 2015 and
2019.
Work/ $0- $2.5- $5- $7.5- $10- $12.5- $15- $17.5- $20- $22.5 $25- $30- $35-Year $2.5 $5 $7.5 $10 $12.5 $15 $17.5 $20 $22.5 -$25 $30 $35 $40
PT-2015 70% 56% 63% 61% 50% 45% 21% 6% 3% 2% 1% 0% 0%FT-2015 50% 92% 96% 98% 99% 100% 99% 93% 39% 11% 6% 3% 1%PT-2019 80% 72% 74% 77% 72% 71% 61% 50% 31% 19% 7% 3% 1%FT-2019 62% 94% 97% 99% 99% 100% 100% 99% 99% 99% 81% 14% 7%
After estimating the percent affected by 20 strata we use, the final step is to
estimate the number of workers to be affected in each census tract. We derive
these numbers by applying these proportions to the number of workers identified
in the earlier step by linking LODES jobs to ACS wage distribution. We make
these derivations for each year of the implementation of the proposed minimum
wage law between 2015 and 2019.
130 LOS ANGELES RISING: A City that Works for Everyone

After estimating the number of workers that will be affected by the phase-in
increases, we estimate the additional wages they would receive as a result of
higher wage levels. We estimate additional earnings by using median annual
working hours we derive from the PUMS data by gender, ethnicity and work
status for each earnings bracket.
We do not apply any adjustment for wage growth other than the proposed
increases in minimum wage levels. However, we apply a final adjustment to our
estimates of the number of workers affected, to account for the employment
growth in the city during this period. We make this adjustment, first for the
period of 2012-2014 since LODES data is from 2011. Then we make projections
from 2014 to 2019 for the implementation years.
We observe that, based on the ES 202 data between 2000 and 2011, the
employment growth in the low-wage industries are higher than the overall
employment growth. Rather than labeling industries as low wage and high-wage
sectors and apply their growth rates to city workers, we use the growth rates of
industries where low and mid wage city workers work.
We use LODES WAC data to derive the distribution of industries where city
workers work in low and mid wage jobs—by 2 digit NAICS sector codes. We
make one adjustment by splitting the manufacturing industry into durable and
non-durable sectors and assuming that low and mid wage earners from LODES
work primarily in non-durable manufacturing. After deriving the distribution of
workers by industry, we get the weighted average of the growth rates of this
distribution. This way the composite growth rate reflects the growth where these
workers work. We estimate that, based on the ES-202 2001-2011 growth rates by
industry, the employment growth in the city for low and mid wage earners was
8.8 percent between 2012 and 2014. Then, we project a uniform .065 percent
annual growth for the next five years base on the historical trend of the weighted
average we derived. For the total employment growth in the city, we use the
average for all industries and estimated a 5.8 percent growth between 2012 and
2014 and .032 percent annual increase for the next five years.
We do not make any adjustments for potential positive or negative changes in
employment due to the minimum wage increase.
Demographic and Job Characteristics of Workers Affected by the Minimum
Wage Increase
We use both LODES and PUMS data to present the characteristics of workers
affected by the proposed minimum wage law. Gender and ethnicity distributions
are derived from the 2011 LODES data. We use PUMS data to get the age
distribution as well as the work status—part-time vs. full-time work. We also used
the PUMS data to show the industry distribution of workers to be affected.
Estimating the Reduction in Public Spending
We use PUMS data in Section IIID to estimate the reduction in public spending
as a result of minimum wage increase. We assessed the impact on three public
welfare programs. These programs are—Cal Fresh—formerly known as Food
LOS ANGELES RISING: A City that Works for Everyone 131

Stamps; cash aid which covers Ca1WORKs (TANF) aid to families and General
Relief aid to individuals; and Medi-Cal program providing medical assistance to
Californians.
The value of Cal-Fresh benefits depends on the size of your eligible household
and other eligibility factors. PUMS data only shows if a person received this
benefit or not. It does not show the value of the aid. Hence, we use average Cal-
Fresh benefits by household size available Los Angeles County Department of
Social Services where the average benefit is $194 for one person and $511 for
three persons. Since, Cal-Fresh payments are made to a family, not to individuals,
we make an adjustment for two-worker families to remove duplicate payments.
Similarly, PUMS data merely shows a flag for Medi-Cal eligibility and does not
provide the amount of benefits. We used average annual Medi-Cal spending
amounts for 2011 available from the California Health Care Almanac.' The source
shows that, in California the average annual spending is $2,174 for adults and
$1,636 for children. We estimate medical assistance payments based on the
number of adults and children in a household with a worker to be affected by the
minimum wage increase.
Actual cash aid amounts are available from the PUMS data and we use these
amounts to estimate the reduction in cash aid.
To estimate the impact of public spending, first we derive the participation rates
for all three programs in 2014, before the implementation of the law. These rates
give us a baseline rate of participation for workers earning minimum wage. Then,
we derive the participation rates for those workers who make in the range of
$14.25 to $15.25. We assume that, after five years, when the minimum wage
increases to $15.25 the public program participation will resemble this group.
These rates are our estimates for 2019 for all workers who will be affected by the
minimum wage increase. Then we used the difference in participation rates as the
rate of decline in program benefits and estimated the total value of reduction in
public spending by multiplying the reduction by benefit values described above.
2 • •mCahfora Health Care Almanac, May 2013, Health Care Foundation.
132 LOS ANGELES RISING: A City that Works for Everyone

Chapter III: Economic Multiplier Effects from Dollars Received byHouseholds at Different Income Levels
The economic model of Los Angeles County provided by IMPLAN software and data for2013 was used to simulate the effect on economic output in the county when householdsat different income levels receive $1,000,000. Because households with incomes under$35,000 spend money quickly, there is twice as much stimulus to the local economy fromeach additional dollar they receive as there is from additional dollars received byhouseholds with incomes over $150,000. These simulation results are shown below intable and chart form.
Table 111-3: Economic Output Generated by $1,000,000 in Household Income
Less than$10k/year
2.96% $1,235,670
$10-$15k/year 4.62% $1,238,116
$15-$25k/year 14.44% $1,257,142
$25-$35k/year 15.11% $1,237,700
$35-$50k/year 18.38% $1,178,911
$50-$75k/year 20.95% $1,075,883
$75-$100k/year 10.69% $984,801
$100-$150k/year 8.38% $937,686
$150k orMore/year
4.47% $600,701
OVERALL IMPACT 11.51% $1,115,111
$1,400,000
$1,200,000
$1,000,000
$800,000
$600,000
$400,000
$200,000
$0
Impact on Economic Output in Los Angeles County from $1 MillionIncome to Different Household Income Groups
k k C l k C 0 ,..60,2. se ) 6, c,:k ,,,t. 0, A cia a,\A- \A \A- \A- \A- \A- \A- \A- \-k q ",0' 0- 4;4' 0' 0' le'A 0 ti) e ,),4, % ,., ., 4.7 t, ,,.. cy ,..). .b. , !., l V-
t.4- 44''041 t2N. 4) 0
e\, t)
LOS ANGELES RISING: A City that Works for Everyone 133
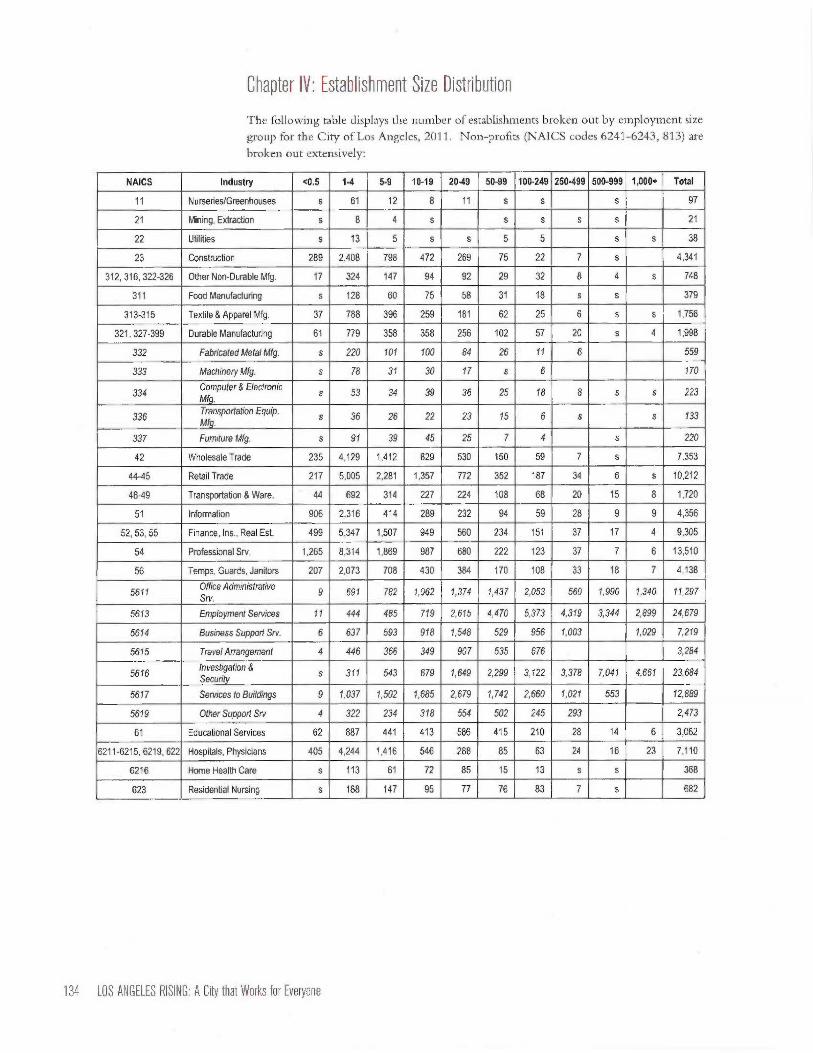
Chapter IV: Establishment Size Distribution
The following table displays the number of establishments broken out by employment size
group for the City of Los Angeles, 2011. Non-profits (NAICS codes 6241-6243, 813) are
broken out extensively:
NAICS Industry <0.5 1-4 5-9 10-19 20.49 50-99 100.249 250-499 500-999 1,000+ Total
11 Nurseries/Greenhouses s 61 12 8 11 s s s 97
21 Mining, Extraction s 8 4 s s s s s 21
22 Utilities s 13 5 s s 5 5 s s 38
23 Construction 289 2,408 798 472 269 75 22 7 s 4,341
312, 316, 322-326 Other Non-Durable Mfg. 17 324 147 94 92 29 32 8 4 s 748
311 Food Manufacturing s 128 60 75 58 31 18 s s 379
313-315 Textile & Apparel Mfg. 37 788 396 259 181 62 25 6 s s 1,756
321, 327-399 Durable Manufacturing 61 779 358 358 256 102 57 20 s 4 1,998
332 Fabricated Metal Mfg. s 220 101 100 84 26 11 6 559
333 Machinery Mfg. s 78 31 30 17 s 6 170
334Computer & Electronicfg.
s 53 34 39 36 25 18 8 s s 223
336Tran
g. sportation Equip.
Ms 36 26 22 23 15 6 s s 133
337 Furniture Mfg. s 91 39 45 25 7 4 s 220
42 Wholesale Trade 235 4,129 1,412 829 530 150 59 7 s 7,353
44-45 Retail Trade 217 5,005 2,281 1,357 772 352 187 34 6 s 10,212
48-49 Transportation & Ware. 44 692 314 227 224 108 68 20 15 8 1,720
51 Information 906 2,316 414 289 232 94 59 28 9 9 4,356
52, 53, 55 Finance, Ins., Real Est. 499 5,347 1,507 949 560 234 151 37 17 4 9,305
54 Professional Srv. 1,265 8,314 1,869 987 680 222 123 37 7 6 13,510
56 Temps, Guards, Janitors 207 2,073 708 430 384 170 108 33 18 7 4,138
5611Office AdministrativeSrv.
9 691 782 1,062 1,374 1,437 2,053 560 1,990 1,340 11,297
5613 Employment Services 11 444 485 719 2,615 4,470 5,373 4,319 3,344 2,899 24,679
5614 Business Support Srv. 6 637 593 918 1,548 529 956 1,003 1,029 7,219
5615 Travel Arrangement 4 446 366 349 907 535 676 3,284
5616investigation &Security
s 311 543 679 1,649 2,299 3,122 3,378 7,041 4,661 23,684
5617 Services to Buildings 9 1,037 1,502 1,685 2,679 1,742 2,660 1,021 553 12,889
5619 Other Support Sry 4 322 234 318 554 502 245 293 2,473
61 Educational Services 62 887 441 413 586 415 210 28 14 6 3,062
6211-6215, 6219, 622 Hospitals, Physicians 405 4,244 1,416 546 288 85 63 24 16 23 7,110
6216 Home Health Care s 113 61 72 85 15 13 s s 368
623 Residential Nursing s 188 147 95 77 76 83 7 s 682
134 LOS ANGELES RISING: A City that Works for Everyone
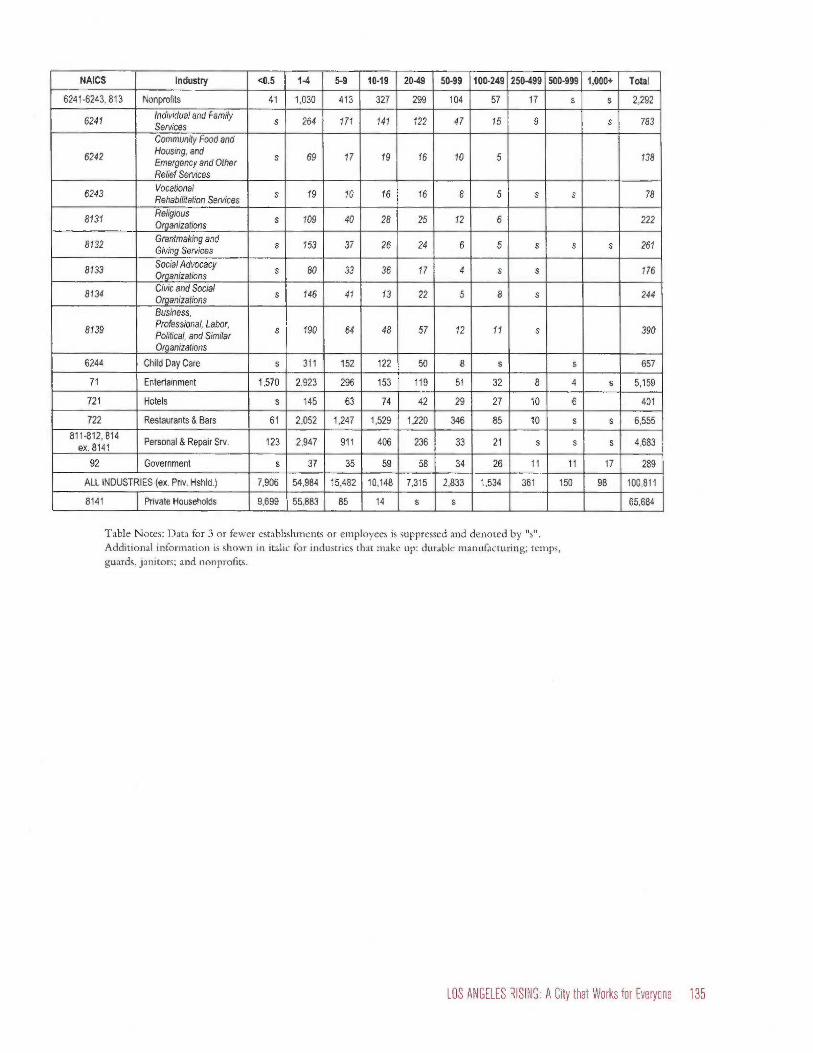
NAICS Industry <0.5 1-4 5-9 10-19 20-49 50-99 100-249 250.499 500-999 1,000+ Total
6241-6243, 813 Nonprofits 41 1,030 413 327 299 104 57 17 s s 2,292
6241Individual and FamilyServices
s 264 171 141 122 47 15 9 s 783
6242
Community Food andHousing, andEmergency and OtherRelief Services
s 69 17 19 16 10 5 138
6243VocationalRehabilitation Services
s 19 10 16 16 8 5 s s 78
8131ReligiousOrganizations
s 109 40 28 25 12 6 222
8132Grantmaking andGiving Services
s 153 37 26 24 6 5 s s s 261
8133Social AdvocacyOrganizations
s 80 33 36 17 4 s s 176
8134Civic and SocialOrganizations
s 146 41 13 22 5 8 s 244
8139
Business,Professional, Labor,Political, and SimilarOrganizations
s 190 64 48 57 12 11 s 390
6244 Child Day Care s 311 152 122 50 8 s s 657
71 Entertainment 1,570 2,923 296 153 119 51 32 8 4 s 5,159
721 Hotels s 145 63 74 42 29 27 10 6 401
722 Restaurants & Bars 61 2,052 1,247 1,529 1,220 346 85 10 s s 6,555
811-812, 814ex. 8141
Personal & Repair Srv. 123 2,947 911 406 236 33 21 s s s 4,683
92 Government s 37 35 59 58 34 26 11 11 17 289
ALL INDUSTRIES (ex. Priv. Hshld.) 7,906 54,984 15,482 10,148 7,315 2,833 1,534 361 150 98 100,811
8141 Private Households 9,699 55,883 85 14 s s 65,684
Table Notes: Data for 3 or fewer establishments or employees is suppressed and denoted by "s".
Additional information is shown in italic for industries that make up: durable manufacturing; temps,
guards, janitors; and nonprofits.
LOS ANGELES RISING: A City that Works for Everyone 135

Chapter V: Tables of Geographic Distribution of Impacts by Los Angeles
City Council Districts
Table V-1. Impacts and Initial Income-levels by City Council District
District
District businesses District residents
Impacted consumer-oriented jobs as a
percentage of total jobs
District residentsreceiving a raise
Aggregateearningsincrease
Average householdincome relative tocitywide average
1 27% 26,438 4.9% 60%
2 44% 33,259 3.1% 97%
3 39% 26,255 2.5% 110%
4 39% 29,319 1.5% 137%
5 33% 21,207 1.0% 158%
6 31% 31,698 4.8% 74%
7 33% 26,633 3.8% 88%
8 48% 22,331 4.7% 59%
9 21% 21,719 6.2% 49%
10 44% 29,110 4.1% 70%
11 32% 19,419 0.9% 169%
12 38% 25,321 2.0% 124%
13 32% 31,061 3.9% 66%
14 14% 20,216 3.1% 75%
15 31% 13,268 2.0% 80%
Sources: Author analysis of Longitudinal Employer-Household Dynamics origin-destination and residence area
files (2011), ACS 5-year estimates (2011).
Table V-2. Share of Citywide Jobs, Initial Income, and Impacts by City Council District
District businesses District residents
DistrictJobs in allindustries
Jobs in impactedconsumerindustries
Jobsreceiving a
raise
Aggregateearningsincrease
Aggregatehouseholdincome
1 6.7% 6.1% 7.0% 7.3% 3.8%
2 3.9% 5.6% 8.8% 8.6% 6.8%
3 6.8% 8.8% 7.0% 6.9% 7.4%
4 7.3% 9.4% 7.8% 7.6% 12.7%
5 12.2% 13.3% 5.6% 5.5% 13.5%
6 4.8% 4.9% 8.4% 8.6% 4.1%
7 3.3% 3.7% 7.1% 7.0% 4.5%
8 1.2% 1.9% 5.9% 5.9% 3.2%
9 4.2% 3.0% 5.8% 6.0% 2.2%
10 4.1% 6.1% 7.7% 8.0% 5.2%
11 9.5% 10.1% 5.1% 5.1% 14.7%
12 5.9% 7.6% 6.7% 6.5% 8.2%
13 6.0% 6.4% 8.2% 8.2% 4.9%
14 21.0% 9.9% 5.4% 5.4% 4.4%
15 3.2% 3.3% 3.5% 3.5% 4.5%
Sources: Author analysis of Longitudinal Employer-Household Dynamics origin-destination and residence area
files (2011), ACS 5-year estimates (2013).
136 LOS ANGELES RISING: A City that Works for Everyone

Chapter V: Methodology for Geographic Distribution of Impacts
Small-area data enables us to engage the dynamics of residential neighborhoods andagglomerations of businesses. We argue that these geographical dynamics will shape thedistribution of both positive and negative effects of the minimum wage increase on theeconomy of Los Angeles. This is an important question. However, as we note in ChapterV, small-area data usually implies a trade-off. In most cases, higher degrees of geographicalprecision imply lower levels of reliability of estimates. Since we emphasize cartographicvisualizations of the distribution of indicators of relevance to the minimum wage proposaland only directly report numbers at a higher scale of geographic aggregation than thecensus tract (e.g., the Community Plan Area), these inherent data limitations areacceptable provided that errors are consistent over space. Each of our primary sources fordata illustrates and deals with these issues in different ways:
The Census Bureau's Longitudinal Employment-Household Dynamics(LEHD): The LEHD provides detailed information on where workers live,where workers work, and where workers commute that is derived from a varietyof both public and confidential data sources, including unemployment insurancerecords. The maps rely on the analysis of LODES and OD files described indetail in the Appendix for Chapter III.ES-202 Unemployment Insurance data for covered businesses: We use theES-202 employment data reported at the establishment level to map specificindustries. This data provides the basis for analyses contained in other sections ofthe report; for mapping purposes, we used this source to derive counts ofemployment for 2011 at the level of three-digit NAICS codes and summarized atthe census tract-level to simplify cartographic representation and to protect theconfidentiality of establishments.The Census Bureau's American Community Survey 5-year estimates: TheCensus Bureau's American Community Survey is an ongoing survey ofindividuals and households that focuses on a broad range of topics, includingdemographics, economic characteristics, and housing. Estimates are released everyyear, but census tract-level estimates are only available from the 5-year sampleproduct, which combines responses from each of the five preceding years toreduce sample error. For example, the most recent 2013 product includesresponses from the 2009 to 2013 calendar years. In most cases, we used the mostrecent data product, derived from surveys taken from 2009 to 2015. However, inanalysis the combines ACS estimates with the most recent available LEHDcounts from 2011, we used the 2011 product (surveys collected from 2007 to2011).
To maintain consistency, all cartographic visualizations present data at the census tractlevel. Additional sources of publically available geospatial data provided layers used in theanalysis and design of the maps: Census Tiger/line files, City of Los Angeles Departmentof City Planning, and the County of Los Angeles GIS data portal. All maps were producedusing ESRI ArcGIS.
Additional explanation for each of the maps is described below.
Figure 5.1. Employment in Impacted Consumer-oriented Industries byPlace of Work and Median Household Incomes by Quartile: Employmentcounts were derived from Economic Roundtable's ES-202 database ofestablishments covered by unemployment insurance and geocoded to addresses.To protect confidentiality, Economic Roundtable summarized counts ofemployment for each 3-digit NAICS code at the census tract level, which wereused to produce the maps. These 3-digit counts were then aggregated to matchthe industries flagged as particularly affected by the minimum wage proposal anddefined in Chapter IV.
LOS ANGELES RISING: A City that Works for Everyone 137
Figure 5.2. Employment in Impacted Consumer-oriented Industries byPlace of Work and Median Household Incomes by Quartile: Medianhousehold income data was derived from the 2013 ACS 5-year estimates (tableS1903). Impacted consumer-oriented industries in these maps differ from thedefinitions used in Chapter 3, primarily because of limitations of the data.Affected consumption-oriented industries mapped here include the following:retail; temps, guards, and janitors; residential nursing; hotels; restaurants and bars;and personal and repair services (additional definition for each of these sectors,and their corresponding NAICS codes, are presented in Chapter IV). Two studyindustries identified as potentially prone to impacts were excluded from thesemaps: home health care services (6216) and child care day services (6244). Theseindustries are identified at the four-digit level, but the ES-202 counts are onlyavailable at the three-digit level.
Figure 5.3. Comparison of Counts and Rates of Low-earnings Jobs by Placeof Work, 2011: These data were derived from the LEHD Workplace AreaCharacteristics (WAC) file. The rates show low-earnings jobs as a percentage ofall jobs. The numerator is the tract-level count of low-earning jobs, which theLEHD data defines as jobs with earnings $1250 per month or less. Thedenominator is the count of all jobs. Because the counts are derived from "jobs"and not "primary jobs" individual workers may be counted twice.
Figure 5.4. Low-earnings Jobs in Selected Industries by Place of Residence,2011: These data were derived from the LEHD Residence Area Characteristics(RAC) file. The rates show low-earnings jobs as a percentage of all jobs. Again,because the counts are derived from "jobs" and not "primary jobs" individualworkers may be counted twice. The numerator is the tract-level count of low-earning jobs, which the LEHD data defines as jobs with earnings $1250 permonth or less. All industries are defined using 2-digit NAICS codes.
Figure 5.6. Estimates of Aggregate Tract-level Earnings Increases from theMinimum Wage Proposals: This map depicts the estimated size of earningsincreases from Chapter III for all residents of each census tract, and themethodology for generating these estimates is described above. To meaningfullydepict the distribution of these increases, we normalized the estimated earningsincrease by converting it info a percentage of baseline aggregate earnings levels.Tract-level earnings include the aggregate earnings of all workers who residewithin the census tract. Using 2011 ACS 5-year estimates (table S2001), wemultiplied the mean earnings by the population 16 year or older with earnings todetermine aggregate earnings for each census tract. This total was then adjustedto 2014 dollars in the same manner used in Chapter III. The map thus depicts thetotal estimated earnings increase per tract as a percentage of initial earnings from2011, adjusted to 2014 dollars.
Table 5.1 and Table 5.2 summarize the estimates, as well as other key indicators, for eachof the 35 Community Plan Areas adopted by the Los Angeles Department of CityPlanning. Community Plan Areas are used to guide the physical development ofneighborhoods by establishing the goals and policies for land use. Additional informationabout the definition and establishment of these geographic units may be found on thedepartment's website.
138 LOS ANGELES RISING: A City that Works for Everyone

Chapter VI: DAPA/DACA Vethodology
To impute documentation status for each person in the California portion of the U.S.Census Bureau's American Community Survey (ACS), 5-Year Public Use MicrodataSample 2009-2013, we draw on the methods developed by the Center for MigrationStudies of New York, as described in "Democratizing Data about Unauthorized Residentsin the United States: Estimates and Public Use Data, 2010 to 2013".3 This approach usesa series of 'logical edits' to identify as many legal residents as possible based on theresponses in the ACS. As such, we took every non-citizen, non-Cuban, foreign-bornrespondent in the ACS sample and assigned to each of these respondents an initialdocumentation status based on the following 'logical edits':
0
Year of entry on or before 1982;
Served in the military;
Worked in the public sector;
Had an occupation that require legal status, such as a police officer, a firefighter,or a pilot;
Received social security or disability payments;
Received food stamps but did not have a child in the house (who could havebeen the legal source of the assistance);
Immigrated as adults and were currently enrolled in higher education on thegrounds that they were likely student visa holders;
Received Medicare and were older than 65;
Received Veterans Affair Care, or Indian Health Services;
• Married to a U.S. Citizen;
Aged 60 years or greater at year of entry; and
• Immediate relatives of US citizens (mother, father, biological or adopted son).
Once we applied these logical edits to the data, we derived independent populationcontrols by country of origin, using the estimates provided by Center for MigrationStudies for the State of California. We calibrated our estimates to match the country oforigin guidelines, using random sampling to minimize selection bias.
After we obtained state-level estimates of the undocumented population, we proceeded totag undocumented individuals who are likely to benefit from the Deferred Action forParents of Americans and Lawful Permanent Residents (DAPA). To do this, we taggedindividual responses in the ACS who:
» Had a son or daughter who is a citizen or lawful permanent resident; and
» Entered the U.S. before 2010.
We followed a similar process to identify potential Deferred Action for Childhood Arrivals(DACA) recipients, tagging individual respondents who:
» Entered the U.S. before 2010;
» Entered before reaching the age of 16;
3 Warren, R. 2014. "Democratizing Data about Unauthorized Residents in the United States:Estimates and Public-Use Data, 2010 to 2013." Journal on Migration and Human Security, 2(4),305-328. doi: http://dx.doi.org/10.14240/jmhs.v2i4.38
LOS ANGELES RISING: A City that Works for Everyone 139

Were currently in school, or had graduated or obtained a certificate ofcompletion from high school or a general education development (GED)certificate.
Finally, to account for undercounting for the undocumented population in censussurveys,' we reweighted all the foreign-born observations by 10 percent.
Chapter VI: Proposition 47 Methodology
In order to understand the added earnings and related economic benefits of a reduced
sentence under California Proposition 47, we used existing data on wage and employment
penalties to estimate the lost earnings due to a felony conviction in Los Angeles.
We compiled the number of people with felony convictions for the past five years in
California' and reduced the population using the following filters, corresponding to the
columns in Table VI-1:
b. In their health impact assessment of Prop 47, Human Impact Partners estimates
that the six crimes covered under Prop 47 account for 21 to 27 percent of the
total felony convictions in California.' Therefore, we reduced the sample to 21
percent of the statewide population.
c. One quarter of the population affected by Prop 47 is in Los Angeles County,' so
we reduced the statewide sample by 25 percent to represent the county.
d. We narrowed the sample to the City of Los Angeles proportion of Los Angeles
County population —39 percent—based on the U.S. Census total population
estimate.'
4 See Marcelli, E. A. and Ong P. "Estimating the Sources of the 2000 Census Undercount amongForeign-born Mexicans In Los Angeles County." Paper presented at the Annual PopulationAssociation of America meetings, Atlanta, Georgia, May 10, 2002.
5 Kamala D. Harris. 2013. Crime in California, 2013. California Department ofJustice.
6 Kim Gilhuly, Holly Avey, Megan Gaydos, Jonathan Heller, Matthew Mellon. 2014.Rehabilitating Corrections in California: The Health Impacts of Proposition 47 Full Health ImpactAssessment Report. Human Impact Partners. Retrieved from:http://www.humanimpact.org/projects/hia-case-stories/the-health-impacts-of-proposition-47/
7 Mike Males and Lizzie Buchen. 2014. "Proposition 47: Estimating Local Savings and JailPopulation Reductions." Center on Juvenile and Criminal Justice. Retrieved from:http://www.00.org/uploads/cjcj/documents/proposition 47 county estimates.pdf
8 U.S. Census Bureau: State and County QuickFacts. 2013. Retrieved from:http://quickfacts.census.gov/qfd/states/00000.html (accessed on March 3, 2015).
140 LOS ANGELES RISING: A City that Works for Everyone

Table VI-1: Estimates of the Numbers of People Convicted of Crimes Covered by Prop 47,
in Los Angeles County and the City of Los Angeles, 2009-2013
YearTotal Felony Convictionsin the State of California
(a)
Persons Convicted ofPersons
Six Crimes* Affected by Prop 47 (b) (21% ofTotal Convictions)
in Los AngelesCount(c) (25% of the
State)
Persons in the City ofLos Angeles (d) (39% of
LA County)
2013 213,390 44,812 11,203 4,369
2012 202,413 42,507 10,627 4,144
2011 195,821 41,122 10,281 4,009
2010 201,820 42,382 10,596 4,132
2009 207,959 43,671 10,918 4,258
Total 20,913
Sources: (a) California Department ofJustice 2013. (b) Human Impact Partners 2014 (c) Center on
Juvenile and Criminal Justice 2014 (d) US Census Quickfacts 2013. *The six low-level crimes for
which sentencing is affected by Prop 47 are: (1) Petty theft of money or property valued between
$50 and $950 (2) Shoplifting of property valued at less than $950 (3) Receiving stolen property
valued at less than $950 (4) Writing bad checks of less than 5950 (5) Check forgery of less than $950
(6) Drug possession for personal use with no intent to distribute.
We used estimates of the types of sentences individuals received for the crimes covered
under Prop 479 and split up the City of Los Angeles sample proportionately (TableVI-2).
Table VI-2: Sentences for Felony Convictions for Six Low-Level Crimes in California,
Number and Percent, 2012
Numbers and Sentences forSix Low Level Crimes - Felony
Convictions
Middle point of rangesin first column
Percent Distribution
Probation only 16,300-17,300 16,800 36%
County Jail + Probation 16,400-23,600 20,000 43%
County Jail only 4,300-6,500 5,400 12%
State Prison 3,500-5,200 4,350 9%
Total 42,900-55,400 100%
Source: California Department of Corrections and Rehabilitation as provided by the Legislative
Analyst's Office (2014), FY12/13 CDCR Admissions. Data By Principal Offenses; California
Department ofJustice, Hawkins Data Center as provided by the Legislative Analyst's Office (2014);
Convicted Offenses- 2010 & 2012- Type of Disposition by Offense for Selected Offenses; as cited in
Health Impact Partners (2014).
We used the percentage distribution in Table VI-2 to further reduce the population due
to recidivism, based on whether individuals served time or had probation (Table VI-3):
• Of those that served time (64 percent), we cut the population by 62 percent.°
9 Kim Gilhuly, Holly Avey, Megan Gaydos, Jonathan Heller, Matthew Mellon. 2014.
1° ibid.
LOS ANGELES RISING: A City that Works for Everyone 141

• Of those that only had probation (36 percent), we cut the population by 15
percent."
Table VI-3: Sample Exclusions due to Recidivism
Number of people thathad some prison/jail
time or probation only.
Number of PeopleExcluded
Total/RevisedTotal
Estimates of individuals impacted by Prop 47 withfelony convictions in City of Los Angeles within thepast five years
20,913
64% of Individuals That went to prison or jail 13,384
Of those the 64% went to jail or prison, reduce theexcluded amount by 62% to account for recidivism(individuals going to jail 2+ times in the past fiveyears)
-8,298 12,615
36% of Individuals sentenced to probation only 7,529
Of the 36% on probation, exclude 15% forrecidivism (individuals going to jail 2+ times in thepast five years)
-1,129 11,486
Source: Top row figure calculated earlier in Table VI-1, with subsequent calculations by the
authors.
We calculated the earnings and related economic benefits of a reduced sentence under
Prop 47 using existing data on wage and employment penalties to estimate the lost
earnings due to a felony conviction in Los Angeles. Because there is currently no
administrative data available on wages of people with felony convictions, we estimated
earnings based on the entry-level wages found in the Occupational Employment Statistics
(OES).12 Studies on wages found that formerly incarcerated individuals experience a wage
penalty of 10 to 30 percent.13 Because Prop 47 reduces convictions but does not
eliminate them, we estimated that a reduced sentence will allow an individual to reduce
only a portion of wage penalty. We applied a 5 percent wage penalty, as the amount a
person with a reduced conviction may be able to recover annually. We then estimated
the total earnings recovered for the city.
Table VI-4 shows how people with reduced convictions have the potential to recover
wages that will be lost due to stigma and employment barriers. Affected individuals could
•Emil J. Herberman and Thomas P. Bonczar. 2013. Probation and Parole in the United States,2012. Bureau of Justice Statistics. Retrieved from:http://www.bjs.gov/content/pub/pdf/ppusl3.pdf (accessed on March 3, 2015).
12 U.S. Bureau of Labor Statistics. Occupational Employment Statistics. May 2013. Metropolitanand Nonmetropolitan Area Occupational Employment and Wage Estimates, adjusted to 2014dollars.
13 Western, B. 2002. The impact of incarceration on wage mobility and inequality. AmericanSociological Review, 526-546. Harry J. Holzer, Steven Raphael and Michael Stoll. 2003.Employment barriers facing ex-offenders. Center for the Study of Urban Poverty Working PaperSeries. Harry J. Holzer, Steven Raphael and Michael Stoll. 2004. Douglas N. Evans. 2014. TheDebt Penalty: Exposing the Financial Barriers to Offender Reintegration. John Jay College ofCriminal Justice. Retrieved from:http://justicefellowship.org/sites/default/files/The%20Debt%20Penalty John%20Jay August%202014.01
142 LOS ANGELES RISING: A City that Works for Everyone

see an increase of almost $1,200 annually and a collective increase in earnings of almost$13.8 million as a result of Prop 47.
Table VI-4: Amount of Wages Recovered due to Reduce Sentencing, City of LosAngeles
Category Amount
Estimates of individuals impacted by Prop 47 with felony convictionsin LA City within the past five years
20,913
Exclude 62% of those that went to prison or jail for recidivism 12,615
Exclude 15% of those on probation for recidivism 11,486
Estimated hourly wage for individuals impacted by Prop 47(entry level, 25th percentile used as proxy)
5% wage penalty on hourly wage
$11.53
- $.58
Estimated 5% wage penalty on annual wage,recoverable now under Prop 47
$1,199.12
Total Earnings Recovered by Prop 47(11,486 persons x $1,199.12)
$13,772,545
Source: Top three rows' figures calculated earlier in Table VI-3, with subsequent calculations by theauthors.
Chapter VII: Dashboard Appendix - Detecting Anomalous 3ehavior in LosAngeles' Economic Performance
If the City of Los Angeles' performance in sales, employment and wages are affected
negatively and significantly after the minimum wage implementation, it is desirable to
detect these unusual observations rapidly so that some review and fine-tuning adjustmentscan be made. Even though there are several powerful formal outlier detection methods—those typically depend on making distributional assumptions—real-world data may notfollow specific distributions and these methods require sophisticated test statistics.
Hence, we recommend an informal test which is simpler but delivers a robust method to
detect anomalous behavior in any of the economic indicators we recommend: taxablesales, employment and wages. Instead of hypothesis testing, informal tests generate
objective criteria such as an interval or a cut-off level and any observations beyond thecriterion are considered an outlier.
The most common way of finding an outlier is to label a data point that is more than twostandard deviations from the mean as an outlier. Assuming a normal distribution of
observed indicator data between the City of Los Angeles, the balance of the county and
the state, this method would detect extreme values beyond 95 percent of all data points.
However, the presence of outliers is likely to have a strong effect on the mean andstandard deviation, making this method unreliable.
A better approach is to use the median absolute deviation (MAD) which is robust against
the outliers and not affected by the sample size. It is the median of the absolute values ofthe differences between the median and each data point
MAD = c * MED (I xi - MED(xi) )
where xi refers to data points and MED refers to the median. "c" is a constant =1.4826
assuming a normal distribution. This constant can be modified if the data appears not
LOS ANGELES RISING: A City that Works for Everyone 143

normal. If the underlying distribution is close to normal, then we may expect that
approximately 95 percent of data points are less than 2 standard deviations from the center,
so 2 is a good outlier cutoff that we adopt. If the adjusted MAD value of a data point
(MAD * 1.4826) is greater than 2 then we label this point is an outlier.
In the following example section we use quarterly employment data series between 2001
and 2011 from California Employment Development Department, Quarterly Census of
Employment and Wages to identify an anomalous behavior applying the MAD approach
we described above. The data is presented in the data appendix for Los Angeles City and 4
comparison regions—rest of the county, the State excluding Los Angeles County and
Orange and San Diego Counties. We use quarterly employment growth rates defined as
percent growth between a quarter and the same quarter in the previous period. Hence the
data covers 40 quarters—Q1 of 2002 through Q4 of 2011. The growth rates of these
regions, along with our outlier analysis discussed in this appendix, are presented further
below in tables.
We may observe three different scenarios in detecting anomalous behavior. First, the City
of Los Angeles may have experienced an unusual behavior over a period of time while no
unusual trends are observed in other areas. Second, a single comparison region may have
gone through an unusual growth or recession while the city not. Third, all comparison
regions may have experienced an unusual time like the 2008 recession.
Figure VII-1: The City of Los Angeles' median absolute deviation (MAD) of employment change,
compared to the Balance of Los Angeles County, State, Orange and San Diego Counties
City_MIAD
7
6
4 —
3
2
01 1 I 1 1 I 1 1 1 1 1 1 1 1 1 I I 1 I I 1 I 1 1 1 1 1 1 1 1 I 1 1 1 I 1 I 1 1 1
,(5,p0N
8 p, 1,:c,", "cil 3 3 5 N 3 27, O' 3 5 '08 3 3
N 3 3 b-
N 3 3 3
N 3 3 5
N 8 3 3
N 3
C'
(NO
C') ,rkr) f§ N- co co CO CO 0", 0 0 0 0
§ cs,0 0 0 0N N N0 0 8 8 E! 8 8 8 '8 8 8 8 8 2, 8 8 8 888 8 8EEZSEEEE;i)
NNNNNNCVNNNNNNNNNNNNNNNNNNNNN
Quarter
— City_MAD — LA County MAD — CA MAD OC_KAC
In Figure VII-1, we show the MAD series of the quarterly employment growth for all five
regions. We observe that, all series follow a similar path historically. They stay below the
cutoff level of 2 standard deviations from the mean (shown as the red horizontal line) until
the last quarter of 2008. Then, all regions show significant change in their rates of
employment growth due to the Great Recession, moving above the cut-offlevel for
several quarters and then by the 2nd quarter of 2010 they once again go below the red
line, with the exception of the city. The City of Los Angeles' recovered late and took
144 LOS ANGELES RISING: A City that Works for Everyone

another 3 quarters to behave as other regions. Hence, we can conclude that since all seriesexceeded the cut-off level at the time of recession, there was no anomalous behaviorattributable to any region.
We can see this employment trends picture clearer if we isolate our comparison betweentwo regions. Figure VII-2 shows the MAD series for the City of Los Angeles (City_MAD)
and the balance of the county (Cnty_MAD), as well as the difference of their growth rates
(City_Cnty_MAD). Once again, we see that during the 2008 recession both series exceedthe red line but note that their difference did not. This confirms that, the unusual
recessionary period affected both geographic areas similarly—though with varyingimpact—so that the difference in growth rates (City_Cnty_MAD) did not show anomaly.
Figure VII-2: The City of Los Angeles' median absolute deviation (MAD) of employment change,
compared to the Balance of Los Angeles County, and their Difference
City_MAD
6
5
4
3
2
1
0I 1 1 1 I I I I I I I I I I I I 1 I I I I 1 I I I I I I I I I I I I I 1 I I I ICA co vr c•I -ca CV `LT c ntr CO CNI VI C.4 CNI V'
0000000000000000000000000000000000000000
a6IMICACnigCn8MCNIACCIAANNTA CHNICNI4.3ar8ar6NERIN ilac)acp ac.;a—a—a— R—Quarter
— City JAAD — Cnty_tvIAD city_Cnty_MAD
Finally, in Figure VII-3, we add Santa Clara County to demonstrate how an anomaly
behavior observed in only one region can be captured with this approach. Since Santa
Clara County experienced the dot.com recession from 2001 to 2002, severely affectingthe Bay Area but not Southern California, we observe that the Santa Clara MAD series
(SC_MAD) was above the cut-off point during this time while the rest of the areas werenot. This confirms that, the anomaly was only attributable to Santa Clara.
LOS ANGELES RISING: A City that Works for Everyone 145

Figure VII-3: The City of Los Angeles' median absolute deviation (MAD) of employment change,
compared to the Balance of Los Angeles County, State, Orange, San Diego and Santa Clara
Counties
City_MAD
7 --
1 —
II I II I I I I I T i I 1 I I I I I I r III I I [I'll I I I II II ri—p , 8 8 3 5 N 8 3 5 N 00 r N 8 3 5 N 8 3 0N 8 0r N 8 3 5 N 8 05 N 8 3N N c, 0, CO ,r nr kn 1,0 40 (0 C) CO N N. CO OD OD CO C, 0) CD AD) CD CD CD CD T-
8 8 8 g C) 8 C) 8 8 C) g 8. 8 8 C)
g g 8 8 8 8 8 8 g 23 ZS ES CSCJ N CA N CA CA CA CV N CA N N
N N
CV CA CA CA N N N CV N N CA N N N
CV N N N N
N N N N N
CV CA
Quarter
— City_MAD — LA County MAD - CA_MAC 0 C_MAC - — SC I !AC
146 LOS ANGELES RISING: A City that Works for Everyone
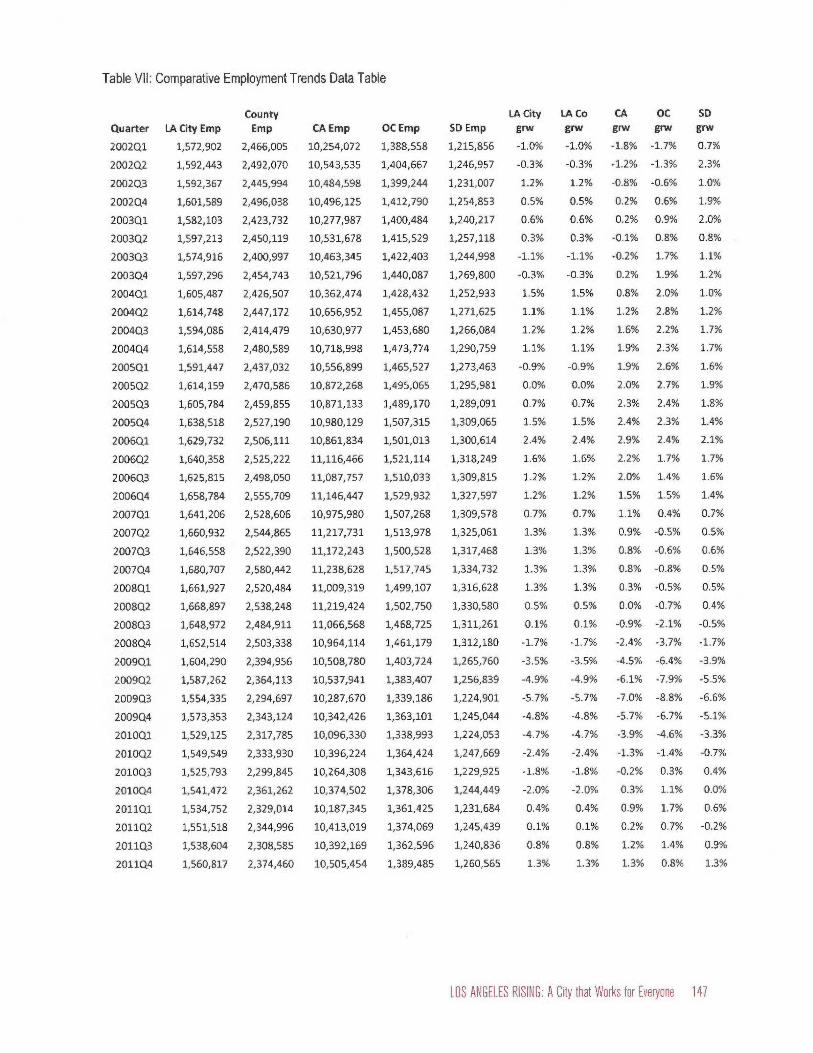
Table VII: Comparative Employment Trends Data Table
Quarter LA City Emp
CountyEmp CA Emp OC Emp SD Emp
LA City
grw
LA Cogrw
CA
grw
OC
grw
SDgrw
200201 1,572,902 2,466,005 10,254,072 1,388,558 1,215,856 -1.0% -1.0% -1.8% -1.7% 0.7%
200202 1,592,443 2,492,070 10,543,535 1,404,667 1,246,957 -0.3% -0.3% -1.2% -1.3% 2.3%
200203 1,592,367 2,445,994 10,484,598 1,399,244 1,231,007 1.2% 1.2% -0.8% -0.6% 1.0%
200204 1,601,589 2,496,038 10,496,125 1,412,790 1,254,853 0.5% 0.5% 0.2% 0.6% 1.9%
2003Q1 1,582,103 2,423,732 10,277,987 1,400,484 1,240,217 0.6% 0.6% 0.2% 0.9% 2.0%
200302 1,597,213 2,450,119 10,531,678 1,415,529 1,257,118 0.3% 0.3% -0.1% 0.8% 0.8%
200303 1,574,916 2,400,997 10,463,345 1,422,403 1,244,998 -1.1% -1.1% -0.2% 1.7% 1.1%
200304 1,597,296 2,454,743 10,521,796 1,440,087 1,269,800 -0.3% -0.3% 0.2% 1.9% 1.2%
200401 1,605,487 2,426,507 10,362,474 1,428,432 1,252,933 1.5% 1.5% 0.8% 2.0% 1.0%
200402 1,614,748 2,447,172 10,656,952 1,455,087 1,271,625 1.1% 1.1% 1.2% 2.8% 1.2%
2004Q3 1,594,086 2,414,479 10,630,977 1,453,680 1,266,084 1.2% 1.2% 1.6% 2.2% 1.7%
200404 1,614,558 2,480,589 10,718,998 1,473,774 1,290,759 1.1% 1.1% 1.9% 2.3% 1.7%
200501 1,591,447 2,437,032 10,556,899 1,465,527 1,273,463 -0.9% -0.9% 1.9% 2.6% 1.6%
200502 1,614,159 2,470,586 10,872,268 1,495,065 1,295,981 0.0% 0.0% 2.0% 2.7% 1.9%
2005Q3 1,605,784 2,459,855 10,871,133 1,489,170 1,289,091 0.7% 0.7% 2.3% 2.4% 1.8%
200504 1,638,518 2,527,190 10,980,129 1,507,315 1,309,065 1.5% 1.5% 2.4% 2.3% 1.4%
200601 1,629,732 2,506,111 10,861,834 1,501,013 1,300,614 2.4% 2.4% 2.9% 2.4% 2.1%
200602 1,640,358 2,525,222 11,116,466 1,521,114 1,318,249 1.6% 1.6% 2.2% 1.7% 1.7%
200603 1,625,815 2,498,050 11,087,757 1,510,033 1,309,815 1.2% 1.2% 2.0% 1.4% 1.6%
2006Q4 1,658,784 2,555,709 11,146,447 1,529,932 1,327,597 1.2% 1.2% 1.5% 1.5% 1.4%
2007Q1 1,641,206 2,528,606 10,975,980 1,507,268 1,309,578 0.7% 0.7% 1.1% 0.4% 0.7%
200702 1,660,932 2,544,865 11,217,731 1,513,978 1,325,061 1.3% 1.3% 0.9% -0.5% 0.5%
200703 1,646,558 2,522,390 11,172,243 1,500,528 1,317,468 1.3% 1.3% 0.8% -0.6% 0.6%
200704 1,680,707 2,580,442 11,238,628 1,517,745 1,334,732 1.3% 1.3% 0.8% -0.8% 0.5%
2008Q1 1,661,927 2,520,484 11,009,319 1,499,107 1,316,628 1.3% 1.3% 0.3% -0.5% 0.5%
200802 1,668,897 2,538,248 11,219,424 1,502,750 1,330,580 0.5% 0.5% 0.0% -0.7% 0.4%
200803 1,648,972 2,484,911 11,066,568 1,468,725 1,311,261 0.1% 0.1% -0.9% -2.1% -0.5%
200804 1,652,514 2,503,338 10,964,114 1,461,179 1,312,180 -1.7% -1.7% -2.4% -3.7% -1.7%
200901 1,604,290 2,394,956 10,508,780 1,403,724 1,265,760 -3.5% -3.5% -4.5% -6.4% -3.9%
200902 1,587,262 2,364,113 10,537,941 1,383,407 1,256,839 -4.9% -4.9% -6.1% -7.9% -5.5%
200903 1,554,335 2,294,697 10,287,670 1,339,186 1,224,901 -5.7% -5.7% -7.0% -8.8% -6.6%
200904 1,573,353 2,343,124 10,342,426 1,363,101 1,245,044 -4.8% -4.8% -5.7% -6.7% -5.1%
201001 1,529,125 2,317,785 10,096,330 1,338,993 1,224,053 -4.7% -4.7% -3.9% -4.6% -3.3%
201002 1,549,549 2,333,930 10,396,224 1,364,424 1,247,669 -2.4% -2.4% -1.3% -1.4% -0.7%
2010Q3 1,525,793 2,299,845 10,264,308 1,343,616 1,229,925 -1.8% -1.8% -0.2% 0.3% 0.4%
201004 1,541,472 2,361,262 10,374,502 1,378,306 1,244,449 -2.0% -2.0% 0.3% 1.1% 0.0%
201101 1,534,752 2,329,014 10,187,345 1,361,425 1,231,684 0.4% 0.4% 0.9% 1.7% 0.6%
201102 1,551,518 2,344,996 10,413,019 1,374,069 1,245,439 0.1% 0.1% 0.2% 0.7% -0.2%
201103 1,538,604 2,308,585 10,392,169 1,362,596 1,240,836 0.8% 0.8% 1.2% 1.4% 0.9%
201104 1,560,817 2,374,460 10,505,454 1,389,485 1,260,565 1.3% 1.3% 1.3% 0.8% 1.3%
LOS ANGELES RISING: A City that Works for Everyone 147

Table VII: Comparative Employment Trends Data Table (continued)
Quarter
CountyDiff
CADiff
OCDiff
SDDiff City_MAD
CountyMAD CA_MAD OC_MAD SD_MAD
200201 1.6% 0.8% 0.7% -1.7% 128.8% 158.6% 125.5% 113.6% 15.5%
200202 1.8% 0.9% 1.0% -2.6% 67.0% 127.3% 86.3% 97.8% 127.1%
200203 2.6% 1.9% 1.8% 0.1% 58.9% 91.7% 63.9% 65.7% 16.7%
200204 1.2% 0.3% -0.1% -1.4% 0.6% 51.9% 6.9% 5.7% 94.5%
200301 2.3% 0.4% -0.3% -1.4% 8.6% 108.5% 4.3% 5.6% 100.7%
200302 2.0% 0.4% -0.5% -0.5% 16.4% 106.7% 24.7% 1.6% 3.2%
200303 0.7% -0.9% -2.8% -2.2% 139.0% 115.7% 30.0% 43.4% 24.9%
200304 1.4% -0.5% -2.2% -1.5% 66.3% 105.0% 3.7% 56.6% 29.7%
200401 1.4% 0.7% -0.5% 0.5% 87.1% 3.2% 30.3% 59.6% 15.2%
200402 1.2% -0.1% -1.7% -0.1% 53.7% 16.7% 51.9% 97.5% 26.5%
200403 0.7% -0.4% -1.0% -0.5% 64.2% 22.6% 76.2% 69.2% 73.6%
200404 0.0% -0.8% -1.3% -0.6% 52.2% 50.9% 92.2% 75.9% 69.8%
200501 -1.3% -2.8% -3.5% -2.5% 119.6% 15.2% 92.3% 88.1% 68.8%
200502 -1.0% -2.1% -2.8% -2.0% 46.0% 45.3% 100.8% 95.3% 93.0%
200503 -1.1% -1.5% -1.7% -1.1% 21.7% 98.5% 114.8% 80.7% 84.4%
200504 -0.4% -1.0% -0.8% 0.1% 87.6% 98.4% 125.2% 72.9% 49.5%
200601 -0.4% -0.5% 0.0% 0.3% 168.6% 153.5% 151.9% 79.8% 111.9%
200602 -0.6% -0.6% -0.1% -0.1% 99.8% 117.6% 114.1% 47.6% 75.7%
200603 -0.3% -0.7% -0.2% -0.4% 66.8% 79.7% 99.2% 31.4% 66.1%
200604 0.1% -0.3% -0.3% -0.2% 65.9% 55.2% 71.0% 36.1% 49.3%
200701 -0.2% -0.3% 0.3% 0.0% 19.1% 41.9% 43.8% 15.3% 14.1%
200702 0.5% 0.3% 1.7% 0.7% 67.4% 35.0% 35.5% 57.4% 29.2%
200703 0.3% 0.5% 1.9% 0.7% 69.3% 46.4% 26.8% 65.0% 23.3%
200704 0.4% 0.5% 2.1% 0.8% 73.3% 46.0% 30.6% 72.9% 27.4%
200801 1.6% 1.0% 1.8% 0.7% 68.1% 28.3% 0.2% 60.8% 27.3%
200802 0.7% 0.5% 1.2% 0.1% 0.6% 24.7% 17.2% 70.3% 37.9%
200803 1.6% 1.1% 2.3% 0.6% 29.9% 95.3% 73.7% 135.7% 115.5%
200804 1.3% 0.8% 2.0% 0.0% 190.1% 181.8% 161.7% 212.0% 221.9%
200901 1.5% 1.1% 2.9% 0.4% 347.4% 296.6% 285.5% 337.1% 411.7%
200902 2.0% 1.2% 3.1% 0.7% 472.4% 404.9% 375.4% 412.0% 558.3%
200903 1.9% 1.3% 3.1% 0.8% 546.8% 450.6% 432.1% 453.7% 649.5%
200904 1.6% 0.9% 1.9% 0.3% 463.5% 378.3% 351.6% 353.7% 521.2%
201001 -1.5% -0.8% -0.1% -1.4% 454.3% 195.3% 248.9% 254.0% 362.1%
201002 -1.1% -1.0% -1.0% -1.6% 251.4% 83.3% 97.2% 100.2% 138.0%
201003 -2.1% -1.6% -2.2% -2.2% 204.0% 3.2% 31.4% 19.4% 38.5%
201004 -2.8% -2.3% -3.1% -2.0% 220.7% 34.8% 0.2% 17.8% 78.5%
201101 -0.1% -0.5% -1.3% -0.3% 10.4% 18.1% 35.0% 44.4% 19.9%
201102 -0.3% 0.0% -0.6% 0.3% 31.6% 17.5% 8.6% 1.6% 89.9%
201103 0.5% -0.4% -0.6% 0.0% 31.0% 12.1% 55.2% 31.9% 3.2%
201104 0.7% 0.0% 0.4% 0.0% 67.5% 22.4% 56.2% 3.4% 38.8%
148 LOS ANGELES RISING: A City that Works for Everyone

Table VII: Comparative Employment Trends Data Table (continued)
Quarter
200201
2002Q2
200203
200204
200301
200302
200303
200304
200441
2004Q2
200443
200404
200501
200502
2005Q3
200544
200601
2006Q2
200643
200644
200701
200702
200703
200744
200841
200802
200803
200844
200941
200902
200943
200904
201001
201042
201043
201004
201101
201102
201103
201104
Cnty Diff
MAD
73.5%
84.8%
142.6%
46.7%
122.6%
100.3%
12.6%
58.0%
56.4%
46.1%
6.3%
38.1%
CA_diff_MAD
86.8%
90.2%
190.4%
35.0%
39.5%
45.2%
79.1%
42.8%
68.5%
2.7%
30.7%
69.6%
OC_diff SD_diff
_MAD _MAD
43.2% 174.1%
SC Emp
917,436
914,544
896,160
893,815
857,877
858,785
841,003
852,383
833,733
847,449
841,092
857,883
840,725
852,412
854,481
872,089
865,964
878,544
876,388
892,246
885,573
897,350
893,530
911,065
905,649
912,982
902,676
904,263
867,459
852,579
830,384
845,590
828,487
844,674
838,748
858,934
852,604
864,618
865,537
883,577
SC grw
-2.6%
-2.0%
-1.4%
-0.7%
-1.7%
-1.7%
-1.8%
-1.7%
0.1%
-0.1%
0.6%
1.1%
0.4%
1.0%
1.9%
1.9%
2.8%
2.2%
1.6%
1.1%
0.9%
0.8%
1.0%
1.0%
-0.3%
-0.3%
-1.5%
-3.0%
-5.0%
-6.9%
-7.7%
-6.4%
-3.2%
-1.3%
0.2%
0.8%
0.5%
0.5%
0.4%
0.6%
SC Diff
11.2%
10.7%
9.9%
7.0%
7.1%
6.4%
5.1%
4.4%
4.3%
2.4%
1.2%
0.4%
-1.7%
-0.6%
-0.9%
-0.2%
-0.6%
-1.4%
-1.3%
-1.1%
-1.6%
-0.9%
-0.7%
-0.8%
-1.0%
-1.3%
-0.9%
-0.9%
0.7%
1.7%
2.3%
1.7%
-0.2%
-1.4%
-2.8%
-3.6%
-2.5%
-2.2%
-2.4%
-1.6%
SC MAD
450.2%
405.6%
330.0%
253.0%
251.3%
237.5%
239.6%
186.8%
123.5%
71.6%
25.4%
3.4%
3.4%
5.4%
29.5%
31.7%
78.5%
80.7%
63.3%
54.5%
52.9%
48.6%
42.2%
47.5%
53.0%
34.7%
9.8%
51.7%
172.2%
SC Diff MAD
645.1%
613.5%
573.2%
416.9%
419.2%
382.3%
309.7%
272.2%
268.1%
166.4%
100.7%
58.9%
57.7%
1.5%
11.3%
25.9%
2.9%
43.0%
36.1%
23.0%
49.4%
12.8%
1.6%
7.5%
19.2%
33.2%
12.3%
15.2%
75.9%
128.8%
158.4%
127.4%
24.8%
43.3%
119.0%
160.3%
102.7%
85.9%
92.5%
52.3%
62.8% 276.8%
102.9%
0.8%
7.1%
17.7%
138.4%
109.2%
20.0%
82.5%
44.6%
59.3%
176.6%
140.1%
83.1%
34.6%
6.6%
1.1%
0.7%
6.6%
22.7%
98.8%
108.4%
119.7%
103.0%
72.1%
127.5%
116.0%
160.8%
169.1%
170.7%
109.3%
3.5%
45.8%
107.4%
159.1%
61.9%
23.3%
22.9%
31.0%
21.1%
150.6%
148.2%
48.5%
238.1%
152.7%
58.4%
2.2%
44.2%
54.5%
132.6% 256.0% 269.1%
207.1%110.3%
121.1%
68.0%
70.4%
81.7%
61.6%
32.4%
53.7%
6.3%
18.7%
15.0%
72.0%
12.3%
75.5%
52.7%
67.0%
99.3%
95.5%
73.8%
143.6%
117.8%
185.8%
189.9%
139.3%
84.7%
40.0%
53.3%
65.0%
20.5%
27.0%
38.7%
54.9%
53.1%
97.3%
50.2%
110.0%
78.9%
108.7%
118.6%
129.7%
89.8%
66.4%
92.2%
147.3%
111.2%
15.7%
38.6%
2.1%
31.4%
11.4%
10.0%
89.8%
84.7%
95.0%
88.3%
15.4%
76.6%
9.7%
52.1%
80.2%
101.9%
44.4%
145.1%
173.4%
255.6%
303.9%
251.1%
181.8%
58.0%
9.2%
29.0%
75.3%
56.2%
85.2%
73.9%
239.6%
210.1%238.2% 216.5%
48.3%
64.6%
7.5%
9.2%
44.8%
2.7%
32.7%
5.3%
19.8%
42.2%
3.1%
4.0%
Variable names appearing in the table above:
• Quarter: Year and quarter of the data. These employment data are recorded
monthly, so the quarterly figure is typically the average of the three months in
each quarter.
• LA City Emp: Total employment of the City of Los Angeles
LOS ANGELES RISING: A City that Works for Everyone 149

• County Emp: Total employment of the balance of Los Angeles County,
excluding the City of Los Angeles
• CA Emp: Total employment of the State of California
• OC Emp: Total employment of Orange County
• SD Emp: Total employment of San Diego County
• LA City grw: Employment growth rate of the City of Los Angeles, compared to
the same quarter one year prior
• LA Co grw: Employment growth rate of the balance of Los Angeles County,
excluding the City of Los Angeles, compared to the same quarter one year prior
• CA grw: Employment growth rate of the State of California, compared to the
same quarter one year prior
• OC grw: Employment growth rate of Orange County, compared to the same
quarter one year prior
• SD grw: Employment growth rate of San Diego County, compared to the same
quarter one year prior
• County Diff: Difference in the Percentage Employment Growth Rate between
the City of Los Angeles and the balance of Los Angeles County
• CA Diff: Difference in the Percentage Employment Growth Rate between the
City of Los Angeles and the State of California
• OC Diff: Difference in the Percentage Employment Growth Rate between the
City of Los Angeles and Orange County
• SD Diff : Difference in the Percentage Employment Growth Rate between the
City of Los Angeles and San Diego County
• City_MAD: City of Los Angeles median absolute deviation (MAD), the median
of the absolute values of the differences between the median and each data point
• County MAD: Balance of Los Angeles County median absolute deviation
(MAD)
• CA_MAD: State of California median absolute deviation (MAD)
• OC_MAD: Orange County median absolute deviation (MAD)
• SD_MAD: San Diego County median absolute deviation (MAD)
• Cnty Diff MAD: Median absolute deviation (MAD) of the Difference in the
Percentage Employment Growth Rate between the City of Los Angeles and the
balance of Los Angeles County
• CA_diff MAD: Median absolute deviation (MAD) of the Difference in the
Percentage Employment Growth Rate between the City of Los Angeles and the
State of California
• OC_diff MAD: Median absolute deviation (MAD) of the Difference in the
Percentage Employment Growth Rate between the City of Los Angeles and
Orange County
• SD_diff MAD: Median absolute deviation (MAD) of the Difference in the
Percentage Employment Growth Rate between the City of Los Angeles and San
Diego County
• SC Emp: Total employment of Santa Clara County
• SC grw: Employment growth rate of Santa Clara County, compared to the same
quarter one year prior
• SC Diff: Difference in the Percentage Employment Growth Rate between the
City of Los Angeles and Santa Clara County
• SC MAD: Santa Clara County median absolute deviation (MAD)
• SC Diff MAD: Median absolute deviation (MAD) of the Difference in the
Percentage Employment Growth Rate between the City of Los Angeles and
Santa Clara County
150 LOS ANGELES RISING: A City that Works for Everyone

Chapter VII: Detailed Local Minimum Wage Increase Schedules
YearBaseYear
eyeIncrease
SIncreaseI
Increase2
SIncrease3
Albuqurque 2012 S7.50 S8.60 14.67% S1.10
Berkeley 2014 S9.00 S10.00 11.11% S1.00 S11.00 10.00% S1.00 S12.53
Bernalillo County 2013 S7.50 88.00 6.67% S0.50 S8.50 6.25% S0.50
Chicago 2014 S8.25 510.00 21.21% S1.75 511.00
Las Cruces 2014 S7.50 S8.40 12.00% S0.90 S9.20
Louisville 2014 S7.25 S9.00 24.14% S1.75
Montgomery 2013 S7.25 S6.40 15.86% S1.15
Mountain View 2014 S9.00 S10.30 14.44% S1.30
NYC (proposed) 2015 S9.00 S13.00 44.44% 54.00
Oakland 2014 S9.00 S12.25 36.11% 53.25
Prince George 2013 S7.25 S8.40 15.86% 51.15
Richmond 2014 S9.00 S9.60 6.67% S0.60 S11.52 20.00% S1.92 S12.30
San Diego 2014 S9.00 S9.75 8.33% S0.75 $10.50 7.69% S0.75 S11.50
San Francisco 2014 S10.74 S11.05 2.89% S0.31 S12.25 10.86% S1.20 S13.00
San Jose 2012 S8.00 S10.00 25.00% S2.00
Santa Fe 2003 S5.15 S8.50 65.05% S3.35
Seattle 2014 S9.47 S11.00 16.16% S1.53 S13.00 18.18% S2.00 $15.00
Sunnyvale 2014 S9.00 S10.30 14.44% S1.30
Washington DC 2014 S8.25 S9.50 15.15% S1.25 S10.50 10.53% S1.00 S11.50
Average $8.27 S9.79 18.42% S1.52 $11.04 12.73% S1.20 $12.00
Total phased 46
Increase average 1128%
IIncrease7
13.91% S1.53 No
Yes
10.00% S1.00 S13 18% 52.00 Yes
9.52% S0.80 S10.10 10% S0.90 Yes
Yes
511.50 36.90% $3.10 No
Yes
S15.00 15.38% $2.00 Yes
Yes
811.50 36.90% S3.10 No
6.77% S0.78 Yes
9.52% S1.00 Yes
6.12% S0.75 S14.00 7.69% S1.00 S15.00 7% S1.00 Yes
Yes
Yes
15.38% S2.00 No
Yes
9.52% S1.00 Yes
8.74% 110.75% S13.00 8.30% $2.30 S12.70 12% S1.30
Increase4
SIncrease5
Year4
Increase6
1YoIncrease8
SIncrease9
Indexedto CPI
Yes
LOS ANGELES RISING: A City that Works for Everyone 151

Chapter VII: Application and Exemptions in Local Minimum Wage Increases
PIM Employer Defined Employer Exemptions Employee Exemptions
Albuquerque, NM "Any person, partnership, association, corporation, business trust, None.
legal representative, or any other entity, or group of persons or
entities. including corporate officers or executives, who is required to
have a business license or business registration from the City of
Albuquerque and who directly or indirectly or through an agent or any
other person including, but not limited to, through a subsidiary or
through the services of a temporary services agency, a staffing
agency. a building services contractor, or any similar entity, employs
or exercises control over the wages. hours or working conditions of
any employee." Includes the City of Albuquerque. Albuquerque, N.M.,
Mun. Code Art. 12. § 13-12-2 (2015).
Persons working for covered employer fewer than 2 hours per week
within the city; interns working for academic credit; work-study
students; employees exempted under state statute. Id.
Berkeley, CA "Any person, including corporate officers or executives. as defined in
§ 18 of the California Labor Code, who directly or indirectly through
another person, including through the services of a temporary
employment agency, staffing agency. subcontractor or similar entity,
employs or exercises control over the wages, hours. or working
conditions of any Employee, or any person receiving or holding a
business license through Title 9 of the Berkeley Municipal Code."
Berkeley, Cal.. Ord. No. 7,352-N.S. § 13.99.030(D) (July 1, 2014).
Bernalillo County "Any person, who is required to have a business registration from
the county and who directly or indirectly or through an agent or any
other person including, but not limited to. through a subsidiary or
through the services of a temporary services agency, a staffing
agency. a building services contractor, or any similar entity, employs
or exercises control over the wages. hours or working conditions of
any employee. 'Employer' shall include the county." Bernalillo
County, N.M., Mun. Code Div. 6. § 2-219 (2015).
Chicago, IL Any individual, partnership, association, corporation, limited liability
company, business trust, or any person or group of persons that
gainfully employs at least one Covered Employee. To qualify as an
Employer. such individual, group. or entity must (1) maintain a
business facility within the geographic boundaries of the City and/or
(2) be subject to one or more of the license reguirements in Title 4
of this Code. Chi., Ill.. Ord. No. 02014-9680 § 1-24-010 (Dec. 2,2014).
Las Cruces, NM
Nonprofit corporations have one additional year
to comply with minimum wage requirements.
Id. § 13,99.040(B). Employers who have
entered collective bargaining agreements with
clear and unambiguous waiver. Id. § 13.99.050.
None.
Employers without a businesses facility within
the City of Chicago. Id.
Any individual, partnership, association, corporation, business trust, U.S. government, state government, and other
legal representative or any organized group of persons employing one local government employers. Id.
or more employees at any one time, acting directly or indirectly in the
interests of an employer in relation to an employee and shall include
the City, businesses having contracts with the City in excess of
S30.000 which provide services to or on behalf of the City, and
businesses which are required to have a City issued business license.
Las Cruces, N.M., "Minimum Wage Ordinance," Mun. Code Art. III. §
14-61 (2015).
Persons working for covered employer fewer than 2 hours per week
within the city: work-study students; persons exempted from
minimum wage under state statute. Id. § 13.99,030(C). On-call
employees as defined under Fair Labor Standards Act while on-call;
job training program participants under 25 years old in job training
programs operated by nonprofits or governmental agencies. Id. §
13.99.130.
Persons working for covered employer fewer than 2 hours per week
within the unincorporated areas of the county: interns working for
academic credit; work-study students; employees exempted under
state statute. Id. Sec 2-219. Persons employed by a parent, spouse,
or sibling of employers; babysitters working in employer's home:
persons under age 16. Id. § 2-220.
Persons working for covered employer fewer than 2 hours in two
weeks within the city (although compensated time spent within the
City includes but is not limited to travel, calls, deliveries, etc.);domestic workers; persons under age 24 working in a publicly
subsidized summer or other temporary employment program operated
by a non-profit or government agency; persons working in a publicly
subsidized transitional employment program for hard-to-employ
populations administered by a non-profit or government agency;
newspaper delivery persons; state, local, county, school district. park
district, transit authority, city colleges, housing authority, and building
commission employees; workers exempted under state statute. Id. §1-24-010. -050.
Individuals employed in a bona fide executive, administrative or
professional capacity and forepersons, superintendents and
supervisors: volunteers; students enrolled in primary or secondary
school working after hours or on vacation; registered apprentices or
learners otherwise provided by law: persons 18 years or under; G.I.
bill trainees while under training. Id. § 14-61(A)-(G).
152 LOS ANGELES RISING: A City that Works for Everyone
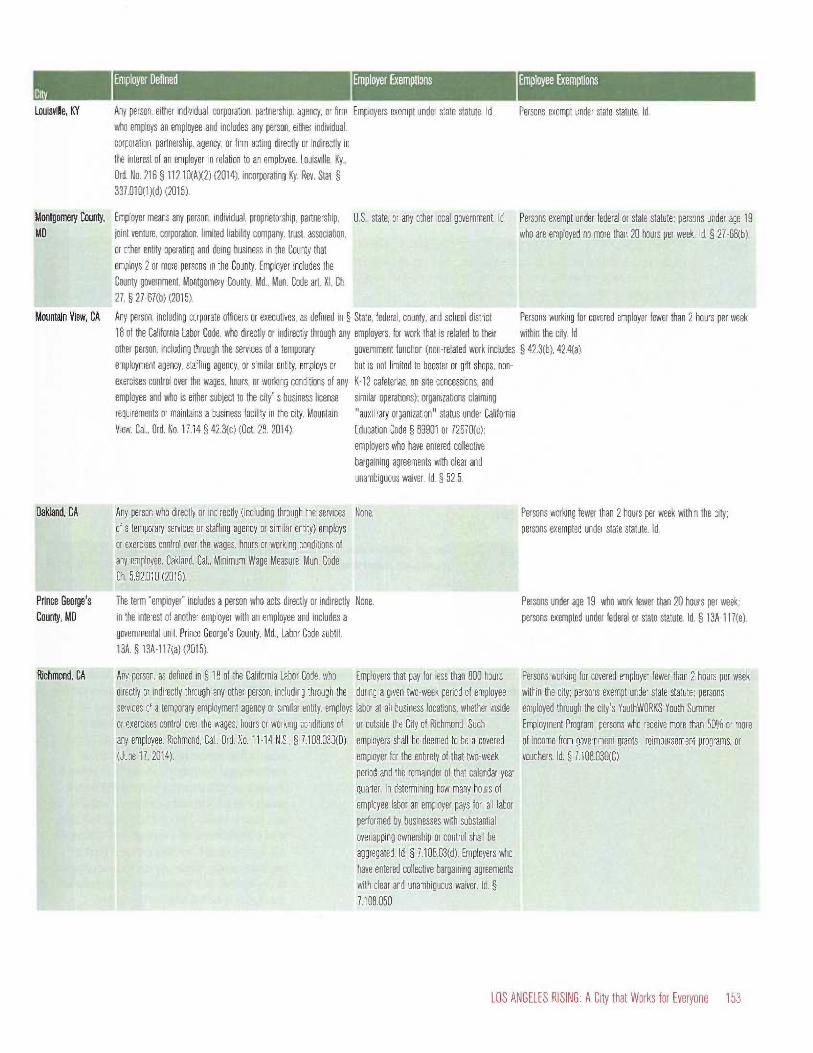
NMIEmployer Defined Employer Exemptions Employee Exemptions
Louisville, KY
Montgomery County,MD
Mountain View, CA
Any person, either individual, corporation. partnership. agency, or firm Employers exempt under state statute. Id.who employs an employee and includes any person, either individual,corporation. partnership, agency, or firm acting directly or indirectly inthe interest of an employer in relation to an employee. Louisville, Ky.,Ord. No. 216 § 112.10(AX2) (2014), incorporating Ky. Rev. Stat. §337.010(1)(d) (2015).
Employer means any person, individual. proprietorship. partnership,joint venture, corporation, limited liability company, trust. association.or other entity operating and doing business in the County thatemploys 2 or more persons in the County. Employer includes theCounty government. Montgomery County, Md.. Mun. Code aft XI, Ch.27, § 27-67(b) (2015).
Any person, including corporate officers or executives. as defined in §18 of the California Labor Code, who directly or indirectly through anyother person. including through the services of a temporaryemployment agency, staffing agency, or similar entity, employs orexercises control over the wages, hours, or working conditions of anyemployee and who is either subject to the city' s business licenserequirements or maintains a business facility in the city. MountainView, Cal., Ord. No. 17.14 § 42.3(c) (Oct. 28.2014).
Persons exempt under state statute. Id.
U.S.. state, or any other local government. Id. Persons exempt under federal or state statute: persons under age 19who are employed no more than 20 hours per week. Id. § 27-68(b).
State, federal, county, and school districtemployers, for work that is related to theirgovernment function (non-related work includesbut is not limited to booster or gift shops, non-K-12 cafeterias. on-site concessions, andsimilar operations): organizations claiming"auxilliary organization" status under CaliforniaEducation Code § 89901 or 72670(c);employers who have entered collectivebargaining agreements with clear andunambiguous waiver. Id. § 52.5.
Oakland, CA Any person who directly or indirectly (including through the services None.of a temporary services or staffing agency or similar entity) employsor exercises control over the wages, hours or working conditions ofany employee. Oakland, Cal., Minimum Wage Measure. Mun. CodeCh. 5.92.010 (2015).
Prince George'sCounty, MD
The term "employer" includes a person who acts directly or indirectly None.in the interest of another employer with an employee and includes agovernmental unit. Prince George's County. Md.. Labor Code subtit.13A. § 13A-117(a) (2015).
Persons working for covered employer fewer than 2 hours per weekwithin the city. Id§ 42.3(b), 42.4(a).
Persons working fewer than 2 hours per week within the city;persons exempted under state statute. Id.
Persons under age 19 who work fewer than 20 hours per week:persons exempted under federal or state statute. Id. § 13A-117(e).
Richmond, CA Any person, as defined in § 18 of the California Labor Code, whodirectly or indirectly through any other person. including through theservices of a temporary employment agency or similar entity. employsor exercises control over the wages, hours or working conditions ofany employee. Richmond, Cal.. Ord. No. 11-14 N.S., § 7.108.030(D)(June 17.2014).
Employers that pay for less than 800 hoursduring a given two-week period of employeelabor at all business locations, whether insideor outside the City of Richmond. Suchemployers shall be deemed to be a coveredemployer for the entirety of that two-weekperiod and the remainder of that calendar yearquarter. In determining how many hours ofemployee labor an employer pays for, all laborperformed by businesses with substantialoverlapping ownership or control shall beaggregated. Id. § 7.108.03(d). Employers whohave entered collective bargaining agreementswith clear and unambiguous waiver. Id. §7.108.050.
Persons working for covered employer fewer than 2 hours per weekwithin the city: persons exempt under state statute: personsemployed through the city's YouthWORKS Youth SummerEmployment Program; persons who receive more than 50% or moreof income from government grants , reimbursement programs. orvouchers. Id. § 7.108.030(C).
LOS ANGELES RISING: A City that Works for Everyone 153

Employer Defined Employer Exemptions Employee Exemptions
San Diego, CA Employer means any person or persons, as defined in California
Labor Code § 18, who exercises control over the wages, hours, or
working conditions of any employee, or suffers or permits the
employee to work, or engages the employee. San Diego, Cal.. Ord. No.
20390, § 39.0104 (Aug. 18.2014).
Persons receiving services under the California
In-Home Supportive Services program pursuant
to Welfare and Institutions Code § 12300. Id.
Persons working for covered employer fewer than 2 hours per week
within the city: persons exempted under state statute, including Labor
Code 1191 and 1191.5 which exempt specific mentally or physically
handicapped persons: participants in Welfare-to-Work Programs:youth working on a publicly subsidized short-term youth employment
program: student employees: camp counselors or program
coordinators of camps defined in Labor Code § 1182.4. Id. §39.0104(c).
San Francisco, CA Any person, as defined in § 18 of the California Labor Code, Employers who have entered collective
including corporate officers or executives, who directly or indirectly bargaining agreements with clear and
through any other person, including through the services of a unambiguous waiver. Id. § 12.R.8.
temporary employment agency or similar entity, employs or exercises
control over the wages, hours or working conditions of any employee.
Includes the city and MSS Public Authority. S.F., Cal., Ord. No.
140687, Amending S.F. Mun. Code § 12R.3 (July 17, 2014).
Persons working for covered employer fewer than 2 hours per week
within the city: persons exempted under state statute. Id. § 12.R.3.
Persons designated as "Government Employees" will be paid S12.25
in May, 2015, thereafter increased by inflation. These include persons
who are under age 18 and employed in a publicly subsidized after-
school or summer employee training or apprenticeship program;persons in a publicly subsidized position, over age 55, at a non-profit
organization that provides social welfare services as a core mission to
persons over the age of 55. Id. § 12.R.3, 12.R.4(b).
San Jose, CA Any person, including corporate officers or executives, as defined in § Employers who have entered collective
18 of the California Labor Code, who directly or indirectly through any bargaining agreements with clear and
other person, including through the services of a temporary unambiguous waiver. Id. § 4.100.050.
employment agency. staffing agency or similar entity, employs or
exercises control over the wages, hours or working conditions of any
employee and who is either subject to the Business License Tax
Chapter 4.76 of the Municipal Code or maintains a facility in the City.
San Jose, Cal. Min. Wage Ord., Ch. 4.100. § 4.100.030(B)
(November 12, 2012).
Santa Fe, NM Businesses required to have a business license or registration from
the city of Santa Fe. Santa Fe, N.M., Mun. Code § 28-1.5(A)(4)
(2015).
Seattle, WA Any individual, partnership, association, corporation, business trust.
any person or group of persons acting directly or indirectly in the
interest of an employer in relation to an employee. Seattle, Wash.,
Mun. Code Ch. 14.19.010(H) (2015).
Nonprofits organizations whose primary source
of funds is from Medicaid waivers. Id. § 28-
1.5(D).
or "Schedule 2 Employers" with fewer than 500
employees follow a slower wage increase
schedule that provides until 2021 to pay S15
per hour. Id. § 14.19.010(U), 14.19.020.
Persons working for covered employer fewer than 2 hours per week
within the city; persons exempted under state statute. Id. §4.100.030(B).
Persons who are employed by Santa Fe businesses but not working
in city of Santa Fe: persons related by blood or marriage to their
employer; any person with possessory interest in business: interns
working for academic credit: persons fulfilling court-orderedcommunity service; apprentices with non-profits. Id.
Persons working less than 2 hours per week within the city. Id. §
14.19.020(A). Work-study students: hand harvest laborers paid on a
piece rate basis; casual labor in or about a private home, unless
performed in the course of the employer's trade, business, or
profession: volunteers: newspaper delivery persons: any individual
engaged in forest protection and fire prevention activities; any
individual employed by any charitable institution for development of
character or citizenship or promoting health or physical fitness or
providing or sponsoring recreational opportunities or facilities for
young people or members of the armed forces of the United States;
on-call employees while on-call; any resident inmate, or patient of a
state, county, or municipal correctional, detention, treatment orrehabilitative institution; elected or appointed officials or employee of
the state legislature: vessel operating crews of the Washington state
ferries operated by the Washington State Department of
Transportation or foreign vessel. Id. Sec 2.14.19.010(G), incorporating
by reference Seattle Mun. Code Ch. 12.A.28.200.
154 LOS ANGELES RISING: A City that Works for Everyone

Employer Defined Employer Exemptions Employee Exemptions
Sunnyvale, CA Any person, including corporate officers or executives, as defined in §18 of the California Labor Code, who directly or indirectly through anyother person, including through the services of a temporaryemployment agency, staffing agency or similar entity, employs orexercises control over the wages. hours or working conditions of anyEmployee and who is either subject to the Business License Tax inChapter 5.04 of the Sunnyvale Municipal Code or maintains a facilityin the City. Sunnyvale, Cal., Mun. Code Ch. 3.80.030 (2015).
Federal, state, school district, and auxiliaryorganizations under Education Code §s72670(c) and 89901. Id. § 30.80.030(d).
Persons working fewer than 2 hours per week within the city:persons exempted under state statute. Id. § 30.80.030(b).
Washington, DC Any individual, partnership, association, corporation, business trust, or The United States and the District of Columbia. Volunteers. casual babysitters: persons working less than 50% ofany person or group of persons acting directly or indirectly in the Id. § 32-1002(3) their time in the District. Id. § 32-1002, 1003.interest of an employer in relation to an employee. Wash. D.C. Code§ 32-1002(3) (2015).
LOS ANGELES RISING: A City that Works for Everyone 155

Chapter VII: Detailed Local Wage Enforcement
CityAlbuquer-que, NM
Berkeley,CA
BernalIllo,NM
EnforcementAgency
Revoke Li- Liens Posting and Fines and Penalties Criminalcenses/ Payroll Access PenaltiesPermits/Contracts
Private Right ofAction
RetaliationProtection
OutreachandEducation
he city shall have theuthority to coordinatenplementation andnforcement of thistole and may prom-'gate appropriateuidelines or rules foruch purposes. Albu-uerque. N.M., Mun.ode Art 12, § 13-2-25(A) (2015).
N/A N/A Notices in English andSpanish; payroll records for3 years. Id. § 13-12-4.
N/A N/A Any employee receivingless than the wage towhich the employee isentitled under this articlemay bring a civil actionand recover attorney'sfees. Id. at 13-12-5(8).
In any case where an N/Aemployee has beendischarged in retalia-tion for exercisingrights under this arti-cle, the period of viola-tion extends from theday of discharge untilthe day the employeeis reinstated, the daythe employee agreesto waive reinstatementor, in the case of anemployee who may notbe rehired, from theday of discharge untilthe day legal judgmentis final. Id.
The Department of Fi- The city may revoke N/Anance is authorized to or suspend permits,enforce this minimum certificates, permits,wage ordinance, in- or licenses until vio-eluding receiving, in- lations are remedied.vestigating, and adju- Id. § 13.99.090(D)dicating confidential (2014).claims for violations.Berkeley, Cal., Ord.No. 7.352-N.S. §13.99.030(D) (July 1,2014).
Notice in any languagespoken by at least 5% ofthe employees at the work-place or job site. includingemployer's name. address,and telephone number inwriting; retain payroll rec-ords for 4 years and allowthe city access to suchrecords. Failure to allow in-spection or inadequate rec-ords triggers presumptionthat employee's account ofhow much he or she waspaid shall be presumed tobe accurate, absent clearand convincing evidenceotherwise. Violation of this§ requires public notice offailure to comply in a formdetermined by the city andS500 citation per violation.Id. § 13.99.060(C),13.99.090(A)(1Xb).
Failure to pay minimum N/Awage: S50 per employeeper day of violation; addi-tional S50 per employeeper day for repeat offend-ers. Id. § 19.99.090(E). Re-taliation: S1.000 per em-ployee. Id. §19.99.090(A)(1Xa). Viola-tion of notice and payrollrequirements: S500 per vi-olation. Id. §19.99.090(A)(1Xb).
Any person aggrieved bya violation of this Chapteror any entity a memberof which is aggrieved bya violation of this Chap-ter, or any other personor entity acting on behalfof the public as providedfor under applicable statelaw, may bring a civil ac-tion and recover attor-neys' fees and costs. Id.§ 13.99.090 (B).
Applies to employersand any other partywho takes adverse ac-tion against employeeswho file a complaint,inform any personabout alleged noncom-pliance, or inform of orassist any person'srights under this ordi-nance. Adverse actionwithin 90 days raisesrebuttable presumptionof retaliation. Id. §13.99.070.
The county shall have N/Athe authority to coor-dinate implementationand enforcement ofthis division and maypromulgate appropri-ate guidelines or rulesfor such purposes.Bernelillo County,N.M.. Mun. Code Div.6, § 2-222(a) (2015).
N/A Notices in English andSpanish: retain payroll rec-ords for 3 years. Id. § 2-221.
N/A N/A Any employee receiving N/Aless than the wage towhich the employee isentitled under this divi-sion may bring a civil ac-tion and recover attor-ney's fees.Id. § 2-222(6).
N/A
156 LOS ANGELES RISING: A City that Works for Everyone

Enforcement Revoke Li- Liens Posting and Fines and Penalties Criminal Private Right of Retaliation OutreachAgency censes/ Payroll Access Penalties Action Protection and
Permits/ EducationCity ContractsChicago, IL
Houston,TX
Oakland,CA
The department ofbusiness affairs andconsumer protection.Chilli., Ord. No.02014-9680 § 1-24-090 (Dec. 2.2014).
Licenses shall be de-nied if applicant vio-lated any federal orstate wage and hourlaw in preceding 5years prior to appli-cation, or Chicagominimum wage lawin preceding 2 yearsprior to application.Id. § 4-4-320.
N/A
Office of Inspector Employers with con- N/AGeneral receives, in- tracts with the city ofvestigates. and adjudi- Houston who violatecates wage theft corn- this wage theft ordi-plaints. Houston, nance will be in-Tex., Code of Ordi- cluded in a wagenances, Ch. 15, Art theft database thatIV. § 15-62 (2015). will prevent themThe finance director from obtaining occu-shall create and main- pational licenses.fain on the city's Id. § 15-65(B).website a publicly ac-cessible database ofall employers withcontracts with the cityof Houston that haveviolated state wageand hour laws in theprevious 5 years. Id. §15-63.
City officials are au-thorized to inspectpayroll, investigatecomplaints of non-compliance, and ren-der decisions on themerits of such com-plaints. The City is au-thorized to award thesame relief in its pro-ceedings as a courtmay award. Oakland,Cal.. Minimum WageMeasure, Mun. CodeCh. 5.92.050(E). (F)(2015).
The city is permitted N/Ato consider violationsof this chapter whenit awards city con-tracts and land usepermits. Id.§5.92.050(F).
Post notice and provide no- Each violation: S500 -lice with first paycheck. Id. S1.000 per day. Id. § 1-§ 1-24-070(b). 14-100.
N/A
Notice in any languagespoken by at least 10% ofthe employees: retain pay-roll records for 3 years andprovide to each employeeupon request: allow accessto city representatives. §5.92.050(C)
Employers found to have vi- N/Aelated state wage and hourlaw within 5 years prior toapplication to contract withthe City, will be included ina publicly available wagetheft database and remainineligible for any City con-tracts. Id. § 15-65(A).
Civil penalties of S1.000 N/Aper violation available incourt. Id. § 5.92.050(8).City officials may consider.to extent permitted by law,employer's violation when itawards city contracts. landuse approvals, and otherentitlements to expand oroperate within the city. Id.§ 5.92.050(F).
Employee may recover ina civil action 3 times theamount of any underpay-ment. together with costsand attorney's fees. Id. §1-24-110.
N/A
Any person claimingharm from a violationmay bring an actionagainst the employer incourt and recover civilpenalties of S1.000 perviolation and attorney'sfees. Id. § 5.92.050(8).
Protects employeeswho disclose, report,or testify about viola-tions, among otheracts, from adverse ac-tion. including termina-tion, denial of promo-tion, negative evalua-tions. schedulechanges, work assign-ments, and other acts.Id. § 1-24-080.
N/A
Employers who retali- N/Aate against employeesthat file a wage theftcomplaint will be listedon the public databaseas violators and ineligi-ble for city contractsfor five years. Id. §15-64(E).
Protects employees S178.000 inwho make a cam- education andplaint, participate in outreach toany city proceedings. employers andor use any remedies in employees.this § from adverse Office of theaction. including dis- City Auditor.charge. reduced cam- 2014. Citypensation, or other Auditor's In-discrimination. Dis- partial Finan-charge within the 120 vial Analysisdays of any employee of Measurewho submits a cam- FF.plaint must be provenunlawful by clear andconvincing evidence.likewise prohibits em-ployers from fundingminimum wage in-crease by reducingemployee compensa-tion or fringe benefits.Id. § 5.92.050 (A).
LOS ANGELES RISING: A City that Works for Everyone 157

Enforcement Revoke Li- Liens Posting and Fines and Penalties Criminal Private Right of Retaliation OutreachAgency censes/ Payroll Access Penalties Action Protection and
Permits/ EducationContracts
Las Cruces, None specified.NM
N/A N/A Notices in English andSpanish: retain payroll rec-ords for 3 years This rec-ords must be retain for atleast three years: allow ac-cess to city or its design-ees. Failure to allow accessor inadequate records cre-ates presumption of wageviolation, unless employercan prove otherwise byclear and convincing evi-dence.Las Cruces. N.M., "Mini-mum Wage Ordinance."Mun. Code Art. III. § 14-63(2015).
N/A N/A Any employees receivingless than the minimumwage has the right tobring a civil action incourt, and recover attor-ney's fees. Id. § 14-64(B).
N/A N/A
Louisville, Louisville Metro Gov- N/A N/A N/A Civil penalty of 8100 per N/A Employee who is paid N/A N/AKY ernment shall issue a employee per day of viola- less than the minimum
citation for failure to lion. Id.. wage can bring a civilpay civil penalties action against the em-owed to employees. ployer for the full corn-and initiate civil action pensation of lost wages.in court to collect the Id. § IV(DX1).penalty. Louisville, Ky..Ord. No. 216. §VI(D)(2) (Dec. 18,2014).
Miami, FL Miami-Dade County N/Aappoints a hearing en-aminer to receive andadjudicate complaintsof wage theft.Miami. Fla.. Code ofOrdinances. Ch. 22. §22-3 (2015). Com-plaints can be filed atMiami-Dade County'sConsumer ProtectionMediation Center. See"Wage Theft Pro-gram." Miami-Dadegovernment website.http://ww.miami-dade.gov/busi-ness/wage-theft.asp(last accessed Mar.12, 2015).
N/A N/A Employthe lostthe amwagesof Courfor all
ers must reinstitutewages three timesaunt of the backand pay the Boardity Commissionersidministrative costs.
N/A N/A
Miami ',ode, of OrdinancesCh. 22.§ 22-5 (1)(A)-(B).
Mont-gom- The Director of the The Director may re- N/A N/A N/Aery, MD Office of Human for the decision to
Rights receives. ad- any state or countyministers. and concili- agency that issued aates complaints. If license or franchiseconciliation is not to violators. or con-forthcoming within 90 tracts with violators.days. the Director for- Id. § 27-7(j).wards the complaintto the Human Rela-tions Commission.which appoints a casereview board to con-duct a hearing and is-sue a final decisionenforceable in court.Montgomery CountyCode, Ch. 7. Article XI§ 27-70 et seq.(2015).
N/A N/A
N/A N/A Protects employees N/Awho lawfully opposeany violation, file acomplaint, testify, as-sist, or participate inany enforcement pro-ceeding. Id. § 27-68(d)(1).
158 LOS ANGELES RISING: A City that Works for Everyone
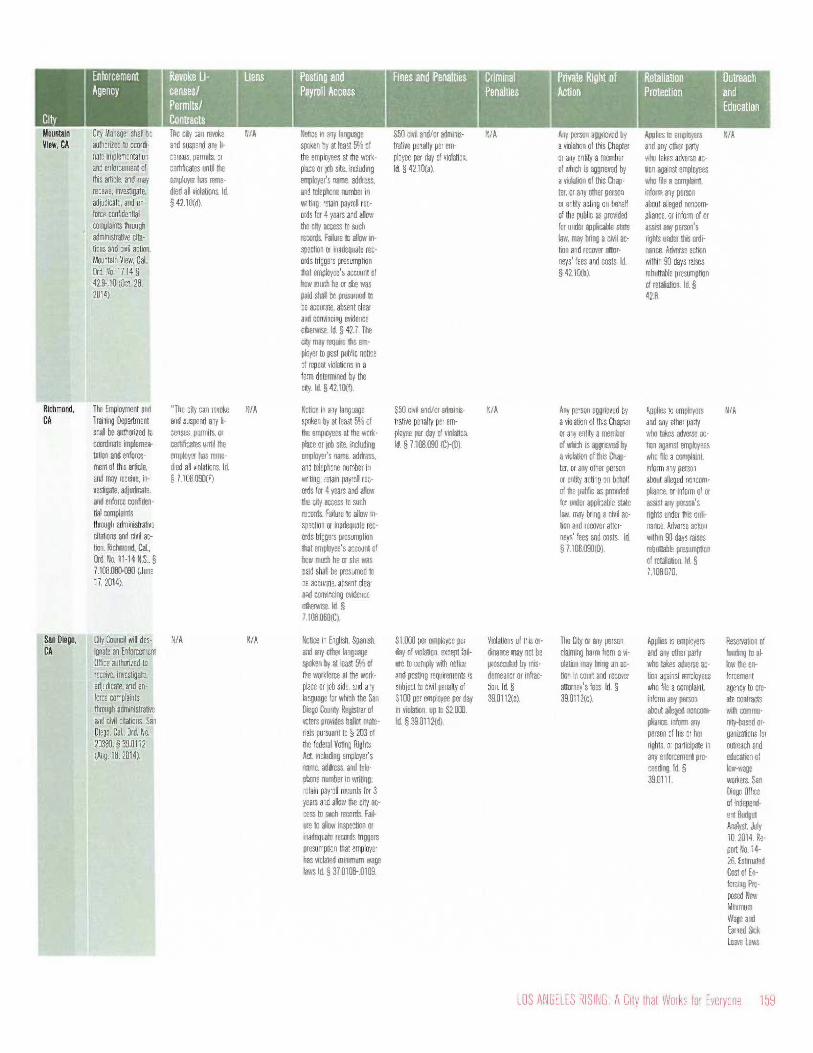
MountainView, CA
Richmond,CA
San Diego,CA
EnforcementAgency
Li-censes/Permits/Contracts
City Manager shalt be The city can revokeauthorized to coordi- and suspend any li-nate implementation censer. permits. orand enforcement of certificates until thethis article, and may employer has reme-receive, investigate, died all violations. Id.adjudicate, and en- § 42.10(d).force confidentialcomplaints throughadministrative cita-tions and civil action.Mountain View, Cal.,Ord. No. 17.14 §42.9-.10 (Oct. 28,2014).
II
The Employment andTraining Departmentshall be authorized tocoordinate implemen-tation and enforce-ment of this article.and may receive. in-vestigate, adjudicate,and enforce confiden-tial complaintsthrough administrativecitations and civil ac-tion. Richmond. Cal.,Ord. No. 11-14 NS.. §7.108.080-090 (June17, 2014).
Liens
N/A
"The city can revoke N/Aand suspend any li-censes, permits, orcertificates until theemployer has reme-died all violations. Id.§ 7.108.090(F).
City Council will des- N/Aignate an EnforcementOffice authorized toreceive, investigate,adjudicate, and en-force complaintsthrough administrativeand civil citations. Sa:Diego. Cal., Ord. No.20390, § 39.0112(Aug. 18. 2014).
Posting andPayroll Access
Notice in any languagespoken by at least 5% ofthe employees at the work-place or job site. includingemployer's name. address,and telephone number inwriting: retain payroll rec-ords for 4 years and allowthe city access to suchrecords. Failure to allow in-spection or inadequate rec-ords triggers presumptionthat employee's account ofhow much he or she waspaid shall be presumed tobe accurate, absent clearand convincing evidenceotherwise. Id. § 42.7. Thecity may require the em-ployer to post public noticeof repeat violations in aform determined by thecity. Id. § 42.10(f).
Notice in any languagespoken by at least 5% ofthe employees at the work-place or job site. includingemployer's name, address.and telephone number inwriting: retain payroll rec-ords for 4 years and allowthe city access to suchrecords. Failure to allow in-spection or inadequate rec-ords triggers presumptionthat employee's account ofhow much he or she waspaid shall be presumed tobe accurate. absent clearand convincing evidenceotherwise. Id. §7.108.060(C).
N/A Notice in English. Spanish,and any other languagespoken by at least 5% ofthe workforce at the work-place or job side. and anylanguage for which the SanDiego County Registrar ofvoters provides ballot mate-rials pursuant to § 203 ofthe federal Voting RightsAct. including employer'sname. address. and tele-phone number in writing:retain payroll records for 3years and allow the city ac-cess to such records. Fail-ure to allow inspection orinadequate records triggerspresumption that employerhas violated minimum wagelaws Id. § 37.0108-.0109.
Fines and Penalties
S50 civil and/or adminis-trative penalty per em-ployee per day of violation.Id. § 42.10(a).
CriminalPenalties
N/A
S50 civil and/or adminis- N/Atrative penalty per em-ployee per day of violation.Id. § 7.108.090 (C)-(D).
S1,000 per employee perday of violation. except fail-ure to comply with noticeand posting requirements issubject to civil penalty of5100 per employee per dayin violation, up to S2,000.Id. § 39.0112(d).
Private Right ofAction
Any person aggrieved bya violation of this Chapteror any entity a memberof which is aggrieved bya violation of this Chap-ter. or any other personor entity acting on behalfof the public as providedfcr under applicable statelaw, may bring a civil ac-tion and recover attor-neys' fees and costs. Id.§ 42.10(b).
Any person aggrieved bya violation of this Chapteror any entity a memberof which is aggrieved bya violation of this Chap-ter, or any other personor entity acting on behalfcf the public as providedfor under applicable statelaw. may bring a civil ac-tion and recover attor-neys' fees and costs. Id.§ 7.108.090(D).
Violations of this or- The City or any persondinance may not be claiming harm from a vi-prosecuted by mis- olation may bring an ac-demeanor or infrac- lion in court and recoverlion. Id. § attorney's fees. Id. §39.0112(e). 39.0112(c).
RetaliationProtection
Applies to employersand any other partywho takes adverse ac-tion against employeeswho file a complaint.inform any personabout alleged noncom-pliance. or inform of orassist any person'srights under this ordi-nance. Adverse actionwithin 90 days raisesrebuttable presumptioncf retaliation. Id. §42.8.
OutreachandEducation
N/A
Applies to employers N/Aand any other partywho takes adverse ac-tion against employeeswhc file a complaint.inform any personabout alleged noncom-pliance, or inform of orassist any person'stights under this ordi-nance. Adverse actionwithin 90 days raisesrebuttable presumptionof retaliation. Id. §7.108.070.
Applies to employersand any other partywho takes adverse ac-tion against employeeswho file a complaint.inform any personabout alleged noncom-pliance. infomi anyperson of his or herrights. or participate inany enforcement pro-ceeding. Id. §39.0111.
Reservation offunding to al-low the en-forcementagency to cre-ate contractswith commu-nity-based or-ganizations foroutreach andeducation oflow-wageworkers. SanDiego Officeof Independ-ent BudgetAnalyst. July10. 2014. Re-port No. 14-26. EstimatedCost of En-forcing Pro-posed NewMinimumWage andEarned SickLeave Laws.
LOS ANGELES RISING: A City that Works fot Everyone 159

Enforcement Revoke Li- Liens Posting and Fines and Penalties Criminal Private Right of Retaliation OutreachAgency censes/ Payroll Access Penalties Action Protection and
Permits/ EducationCity ContractsSan Fran-cisco, CA
San Jose,CA
The Mayor and Boardof Supervisors shalltake steps to studyand enact additionalenforcement tools andcollaboration amongall city. state. and fed-eral agencies and de-parhnents. The Officeof Labor StandardsEnforcement shall beauthorized to coordi-nate implementationand enforcement ofthis article. and mayreceive. investigate.adjudicate. and en-force confidentialcomplaints throughadministrative cita-tions and civil action.S.F.. Cal.. Ord. No.140687. AmendingS.F. Mun. Cede §12R.07(a)-(b) (July17. 2014).
The city can revokeor suspend licenses,permits. or certifi-cates from a violatingemployer until the vi-olation is remedied.Id. § 12R.7(c)(2).
The failure ofany person topay a penaltyassessed byadministrativecitation withinthe time spec-ified on the ci-tation consti-tutes a debt tothe City. TheCity may file acivil action.create and im-pose liens asset forth be-low. or pursueany other legalremedy to col-lect suchmoney." Id. §1211.17(c).
The Office of Equality "Except where pro- N/AAssurance shall be hibited by state orauthorized to coordi- federal law, CityHate implementation agencies or depart-and enforcement of ments may revoke orthis article, and may suspend any regis-receive. investigate. tration certificates.adjudicate. and en- permits or licensesforce confidential held or requested bycomplaints through the Employer untiladministrative cita- such time as the vio-tions and civil action.. Wien is remedied"Id.San Jose. Cal, Min. § 4.100.090(D).Wage Ord.. Ch. 4.100.§ 4.100.080-.090(November 12.2012).
Notice in English, Spanish,and Chinese, and any otherlanguage spoken by atleast 5% of the employeesat the work-place or jobsite, including employer'sname, address, and tele-phone number in writing:retain payroll records for 4years and allow the city ac-cess to such records. Fail-ure to allow inspection orinadequate records triggerspresumption of violation,absent clear and convincingevidence otherwise. Id. §128.5. The city may requirethe employer to post publicnotice of repeat violationsin a form determined bythe city. Id. § 12R.7(f).
S50 administrative or civilpenalty in court per em-ployee per day of violation;an additional S50 per em-ployee per day of violationin agency cost assess-ments: S500 fine for failureto post notice, provide toemployees. post public no-tice of violation if so or-dered, provide employer'sname. address, and tele-phone number in writing,maintain payroll records forfour years. or allow access:81.000 fine for retaliation.Penalties increase by 50%for each subsequent viola-tion, for a maximum ofS5,000 or 810,000 if cita-tion for retaliation is issued.Enforcement costs to notcount toward maximum. d.§ 12.R.16(b).
N/A The Agency, the City At-torney, any person ag-grieved by a violation ofthis Chapter, any entity amember of which is ag-grieved by a violation ofthis Chapter, or any otherperson or entity acting onbehalf of the public asprovided for under appli-cable state law, maybring a civil action incourt and recover civilpenalties of S50 per em-ployee per day of viola-tion and attorney's fees.Id. § 12R7(d) (2014).
Applies to employersand any other partywho takes adverse ac-tion against employeeswho file a complaint,inform any personabout alleged noncom-pliance, or inform of orassist any person'srights under this ordi-nance. Adverse actionwithin 90 days raisesrebuttable presumptionof retaliation. Id. §12R.16(b).
The Office ofLabor Stand-ards Enforce-ment shall es-tablish a com-munity-basedoutreach pro-gram to con-duct educa-tion and out-reach to em-ployees. Inpartnershipwith organiza-tions involvedin the com-munity-basedoutreach pro-gram. the Of-fice of LaborStandardsshall createoutreach ma-terials that aredesigned forworkers inparticular in-dustries. Id.§12R.25.
Notice in any languagespoken by at least 5% ofthe employees at the work-place or job site. includingemployer's name. address,and telephone number inwriting; retain payroll rec-ords for 4 years and allowthe city access to suchrecords. Failure to allow in-spection or inadequate rec-ords triggers presumptionthat employee's account ofhow much he or she waspaid shall be presumed tobe accurate, absent clearand convincing evidenceotherwise. Id. § 4.100.060(2012). The city may re-quire the employer to postpublic notice of repeat vio-taboos in a form deter-mined by the city. Id. §4.100.090(F).
S50 civil and/or adminis- N/Atrative penalty per em-ployee per day of violation.Id. § 4.100.090(6).
Any person aggrieved bya violation of this Chap-ter, any entity a memberof which is aggrieved bya violation of this Chap-ter, or any other personor entity acting on behalfof the public as providedfor under applicable statelaw, may bring a civil ac-tion in court and recovera civil penalty of S50 peremployee per day of vio-lation and attorney's fees.Id. § 4.100.090(8).
Applies to employers N/Aand any other partywho takes adverse ac-tion against employeeswho file a complaint,inform any personabout alleged noncom-pliance, or inform of orassist any person'srights under this ordi-nance. Adverse actionwithin 90 days raisesrebuttable presumptionof retaliation. Id. §4.100.070 (2013).
160 LOS ANGELES RISING: A City that Works for Evelyne

Enforcement Revoke Li- Liens Posting and Fines and Penalties Criminal Private Right of Retaliation OutreachAgency censes/ Payroll Access Penalties Action Protection and
Permits/ EducationCity ContractsSanta ClaraCounty, CA
It is the policy of theCounty of Santa ClaraBoard of Supervisorsthat all parties con-tracting with theCounty must complywith all applicablefederal, state, and lo-cal wage and hourlaws, including. butnot limited to, theFederal Fair LaborStandards Act, theCalifornia Labor Code,and any MinimumWage Ordinance en-acted by the Countyor any city within theCounty of Santa Clara.County of Santa ClaraBoard of SupervisorsPolicy Manual Chapter5. § 5.5.5.4 (2015).
County Board of Su-pervisors may dis-qualify or lower bid-ding score of poten-tial contractor, orcancel current con-tract of employerwho has been foundin previous 5 yearsto have violated wageand hour laws, wheredetermination wasmade by a court orby final administra-tive action of an in-vestigatory govern-ment agency.Id.§5.5.4(1). Inaccu-rate or incompletedisclosures by bid-ders constitute a ma-terial breach of theWage Theft Preven-tion Policy and mayresult in disqualifica-tion from all Countysolicitation and con-tracting processes.Id.§5.5.4(2)
N/A
Santa Fe.I U.
NMThe City Manager isauthorized to receive,investigate, adjudicatecomplaints, and initi-ate administrative andcivil enforcementSanta Fe. N.M.. Mun.Code § 28-1.8(A)(2015).
"The city manager Nalso has the power toorder termination ofany and all economicbenefit derived byany offending partyfrom the city and hasthe power to revokethe employer's busi-ness license or regis-tration. Id.§28-1.8(A).
Seattle, WA The Department of Fi- N/Anice and Adminis-trative Services shallbe authorized to coor-dinate implementationand enforcement ofthis article, and mayreceive. investigate,adjudicate, and en-force confidentialcomplaints throughadministrative cita-tions and civil action.Seattle, Wash., Mun.Code Ch. 14.19.060(2015).
/A
N/A
N/A
Notice in English and Span-ish: failure to comply shallbe considered grounds forsuspension. revocation, ortermination of the businesslicense or registration."11§28-1.11
Notice in English, Spanish.and any other languagescommonly spoken by em-ployees at the particularworkplace or job site: retainpayroll records for 3 years.Id.§14.90.060(C).
Where Contractor or anysubcontractor it employs toperform work under thisagreement has been foundin violation of any applica-ble wage and hour law by afinal judgment. decision, ororder of a court or govern-ment agency. the Countyreserves the right to with-hold payment to Contractoruntil such judgment, deci-sion, or order has been sat-isfied in full. Id. § 5.5.4(5)
Employers may be subjectto civil fines for each of-fense. Id.§288-1.8(6).
Notice and posting viola-tions: S125 for the first vio-lation and S250 for subse-quent violations. Id. §14.19.060(FX1). Interferingwith the investigation of theDirector into wage theftclaims: S1000 -S5000. Id.§ 14.19.060(F)(2). Violationof minimum wage: warningand a fine of up to 5500.The civil fine assessed for asecond violation is up toS1.000 per employee or anamount equal to ten per-cent of the total amount ofunpaid wages, whichever isgreater. for first violation: athird violation brings a fineof up to S5000 by theabove formula. The maxi-mum civil penalty isS20.000 per employee. Id.§14.19.060(F)(3).
N/A
Employers failing topay the minimumwage will be guiltyof a misdemeanorand, upon conviction,for each offense maybe subject to finesand imprisonmentId. § 28-1.8(8).
A person is guilty ofmisdemeanor theft ifhe or she knowinglysecures the perfor-mance of servicesby agreeing to pro-vide compensationand, after the ser-vices are render-ed.fails to make fulland complete pay-ment, with intent toavoid payment forservices. Seattle,Wash., Wage TheftOrdinance. Mun.Code §12A.08.060(4)(2015).
N/A
The city. any individualaggrieved by a violationof this §, or any entitythe members of whichhave been aggrieved by aviolation of this §, maybring a civil action incourt and recover attor-ney's fees. Id. § 28-1.8(C).
Each employee has theright to file a charge orbring a civil action if theminimum wage or mini-mum compensation isnot paid.Id.§14.29.060(C)(1).
N/A N/A
Applies tc any em- N/Aployer or employer'sagent or representativewho takes adverse ac-tion against employeeswho communicate in-formation regardingrights under this §.Taking adverse actionagainst an individualwithin 60 days shallraise a rebuttable pre-sumption of retaliation.Id. § 28-1.6(A)-(B).
Applies to an employer Establisheswho discharges. worker andthreatens, harasses. employer out-demotes. penalizes. or reach and ed-in any other manner nation pro-discriminate or retail- grams throughate against an em- contracts withployee who files an 501(c)3 com-oral or written com- munity-basedplaint, informs his or organizationsher employer, union, or and businesssimilar organization. associations.cooperates with an in- Id. § 1(10)vestigation, opposes (2014).any violation of thisChapter, or informsothers about rights. Id.§ 14.19.060(BX2).
LOS ANGELES RISING: A City that Works for Everyone 161

Enforcement Revoke Li-Liens Posting and Fines and Penalties Criminal Private Right of Retaliation OutreachAgency censes/ Payroll Access Penalties Action Protection and
Permits/ Education
City ContractsCity officials are au-thorized to inspectpayroll. receive, inves-tigate, and adjudicatecomplaints, and initi-ate administrative andcivil enforcement. TheCity of SunnyvaleSunnyvale. Cal., Mun.Code Ordinance No.3047-14 Ch.3.80.080-.090(2014).
Except where Lidupprohib-
ited by state or fed-eral law. City agen-cies or departmentsmay revoke or sus-pend any registrationcertificates, permitsor licenses held orrequested by theEmployer until suchtime as the violationis remedied. Id. §3.8.80.090(d).
outioly-
vale,CA
N/API/ t1 Notice In the City's top
three languages, includingemployer's name. address,and telephone number inwriting: retain payroll rec-ords for 4 years and allowthe city access to suchrecords. Failure to allow in-spection or inadequate rec-ords triggers presumption -that employee's account ofhow much he or she waspaid shall be presumed tobe accurate, absent clearand convincing evidenceotherwise. Id. § 3.80.060.
Wash- The Mayor shall en- The mayor will sus- If the em-ington, force and administer pond business li- player refuses
D.C. the provisions of this censes of violators or fails tochapter and may hold who refuse to pay or- comply withhearings and other- ders for unpaid the adminis-wise investigate any wages. Wash, D.C., trative order orviolations of this Wage Theft Proven- conciliationchapter and institute tion Act 20-265, § agreement.actions for the pay- B(a)(i) (Jan. 15, the Mayor orment of wages, liqui- 2014). An employer the complain-dated damages, and found to be in viola- ant may rec-penalties provided lion of this § more ord a lien andhereunder. Wash.. than twice in a 2- may sue inD.C.. Code § 32-1306 year period shall be the Superior(2015). subject to debarment Court of the
in effect against any District of Co-successor corpora- lumbia for aTian or business en- remedy, en-tity that has one or forcemeat, ormore of the same assessment orprincipals or officers collection of aas the employer civil penalty.against whom the Wage Theftdebarment was im- Preventionposed is engaged in Act. Id.§the same or equiva- 8(g)(1).lent trade or activity.Wash., D.C. Code §32-1331.11.
Notice to employees.Wash.. D.C. Code § 32-1009(a).
NIAOUU cave ZIIIU/U1 dUIIIIIIIJ-
trative penalty per em-ployee per day of violation.Id. § 3.80.090(a).
Administrative penalties ofS50 per employee per dayof violation for first-time vi-olators, or S100 per em-ployee per day for subse-quent violations of the min-imum wage, living wage, orwage payment act. Retalia-tion: S1,000 - S10,000.Failure to maintain or allowaccess to payroll records:S500. Failure to provideitemized wage statements:S500. Failure to notice em-ployees of investigation:S500. Failure to post noticeof minimum wage: S100for each day. Administrativefines and penalties will bedeposited in special fundfor wage and hour enforce-ment. Wage Theft Preven-tion Act, id. § 8(e)(3).
Any employer who,having the ability topay. willfully fails tocomply, shall for the1st offense be pun-ished by a fine ofnot more than S300,or by imprisonmentof not more than 30days. or in the dis-cretion of the court.by both such fineand imprisonment;and for any subse-quent offense shallbe punished by afine of not morethan S1.000 or byimprisonment of notmore than 90 days,or in the discretionof the court, by bothsuch fine and im-prisonment. Wash.,D.C. Code § 32-1307.
Any person aggrieved bya violation of this Chap-ter, any entity a memberof which is aggrieved bya violation of this Chap-ter, or any other personor entity acting on behalfof the public as providedfor under applicable statelaw, may bring a civil ac-tion in court and recoverattorney's fees. Id. §3.80.090(b).
Any employee acting onbehalf of the employeeand other employees whoare similarly situated maybring action for damagesin court, and recover at-torney's fees. Id. § 32-1012(b)-(c).
Applies to employersand any other partywho takes adverse ac-tion against employeeswho file a complaint,inform any personabout alleged noncom-pliance, or inform of orassist any person'srights under this ordi-nance. Adverse actionwithin 90 days raisesrebuttable presumptionof retaliation.Id.§3.08.070.
N/A
Applies to employers N/Awho take adverseagainst employeeswho complain to em-ployer, make a com-plaint to a governmentagency, or cooperatein an investigation.Punishable by up toS10,000 in civil or ad-ministrative penalties.Wage Theft PreventionAct, id. § 10(a)-(c).
162 LOS ANGELES RISING: A City that Works for Everyone