A case study of Thai consumer behavior toward energy drinks
114
EFO705 – “Changing consumer’s attitude of energy drinks in Thailand market” -A case study of Thai consumer behavior toward energy drinks- Master Thesis in Business Studies Authors Group: 2789 Suratssawadee Kuptanon (870113) Thanathorn Pichittachakul (831226) Supervisor Peter Selegård Examiner Ole Liljefors Date of submission: 3 th June 2011
-
Upload
khangminh22 -
Category
Documents
-
view
0 -
download
0
Transcript of A case study of Thai consumer behavior toward energy drinks
EFO705 – “Changing consumer’s attitude of energy drinks in Thailand
market”
-A case study of Thai consumer behavior toward energy drinks-
Master Thesis in Business Studies
Authors
Group: 2789
Suratssawadee Kuptanon (870113)
Thanathorn Pichittachakul (831226)
Supervisor
Peter Selegård
Examiner
Ole Liljefors
Date of submission: 3th June 2011
II
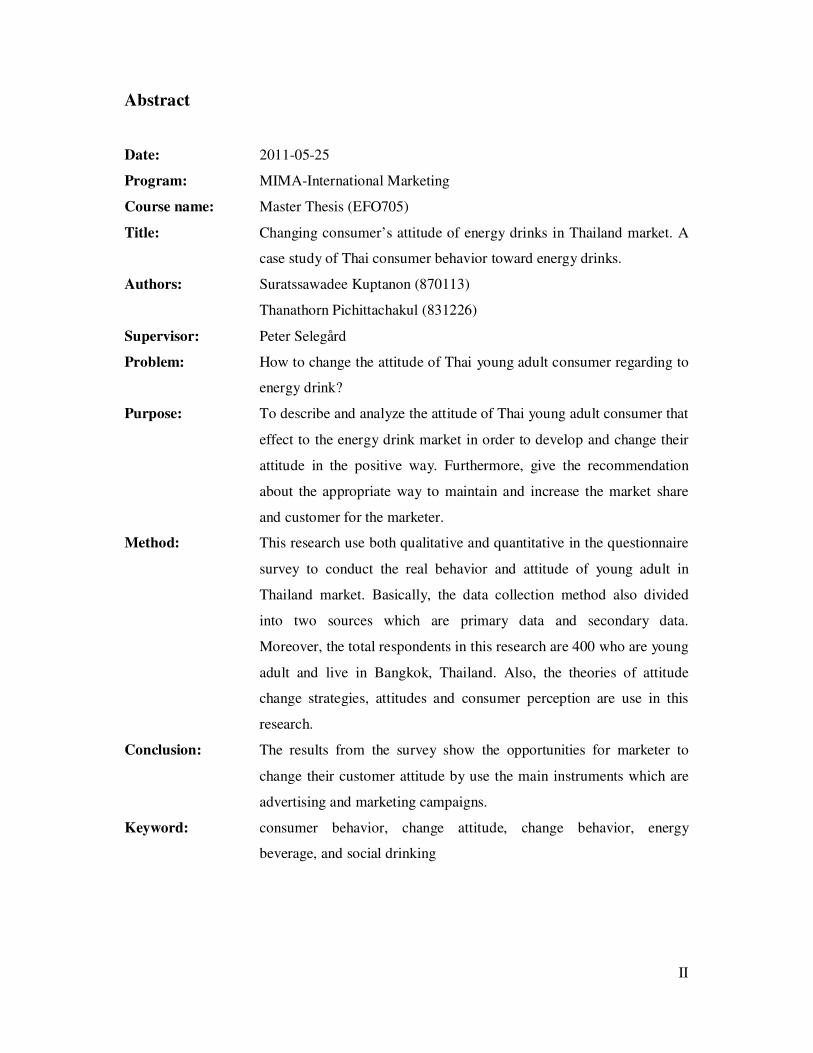
Abstract
Date: 2011-05-25
Program: MIMA-International Marketing
Course name: Master Thesis (EFO705)
Title: Changing consumer’s attitude of energy drinks in Thailand market. A
case study of Thai consumer behavior toward energy drinks.
Authors: Suratssawadee Kuptanon (870113)
Thanathorn Pichittachakul (831226)
Supervisor: Peter Selegård
Problem: How to change the attitude of Thai young adult consumer regarding to
energy drink?
Purpose: To describe and analyze the attitude of Thai young adult consumer that
effect to the energy drink market in order to develop and change their
attitude in the positive way. Furthermore, give the recommendation
about the appropriate way to maintain and increase the market share
and customer for the marketer.
Method: This research use both qualitative and quantitative in the questionnaire
survey to conduct the real behavior and attitude of young adult in
Thailand market. Basically, the data collection method also divided
into two sources which are primary data and secondary data.
Moreover, the total respondents in this research are 400 who are young
adult and live in Bangkok, Thailand. Also, the theories of attitude
change strategies, attitudes and consumer perception are use in this
research.
Conclusion: The results from the survey show the opportunities for marketer to
change their customer attitude by use the main instruments which are
advertising and marketing campaigns.
Keyword: consumer behavior, change attitude, change behavior, energy
beverage, and social drinking

III
Acknowledgement
Over the period of conducting this paper, we have encounters lots of constraints and
difficulties. Without the helping hands, we would never accomplish the mission. Therefore,
we would like to dedicate this acknowledgement page for those that have contributed to our
research.
First of all, we would like to express gratitude to the project adviser, Peter Selegård, for being
generously instructive all along the semester. The appreciation also goes to the authors’ main
and side opponents from group 2675 for their suggestions which are valuable for this paper.
We also would like to thank all those who took the time to answer our questionnaire. Lastly,
thanks for our family that always support us and give the opportunity to write this paper.
Suratssawadee Kuptanon (870113)
Thanathorn Pichittachakul (831226)

I
Table of contents
List of abbreviations ............................................................................................................ IV
List of Figure ....................................................................................................................... V
List of table ........................................................................................................................ VI
1. Introduction ....................................................................................................................... 1
1.1 Background ................................................................................................................. 1
1.2 Problem Statement ...................................................................................................... 2
1.3 Strategic question ........................................................................................................ 2
1.4 Research question ........................................................................................................ 2
1.5 Purpose ....................................................................................................................... 2
1.6 Scope of research......................................................................................................... 3
1.7 Target Audiences ......................................................................................................... 3
1.8 Disposition .................................................................................................................. 3
2. Conceptual framework ...................................................................................................... 5
2.1 Consumer perception and brand perception ................................................................. 5
2.2 Promotion .................................................................................................................... 6
2.3 Integrated Marketing communications (IMC) .............................................................. 7
2.4 Brand Position ............................................................................................................. 9
2.5 Attitude ..................................................................................................................... 10
2.6 Attitude change strategies .......................................................................................... 10
3. Methods and research design ........................................................................................... 12
3.1 Selection of topic ....................................................................................................... 13
3.2 Literature Review ...................................................................................................... 13
3.2.1 Methods for the critical literature review ........................................................... 13
3.2.2 Keywords ......................................................................................................... 13
3.2.3 Database/Website .............................................................................................. 13
II
3.2.4 Mapping and describing the literature ................................................................. 14
Mapping ...................................................................................................................... 14
Reasoning for selected literature .................................................................................. 15
3.2.5 Critical literature review ..................................................................................... 15
A Study of attitude towards energy drinks in Thailand ................................................. 15
Energy Beverage ......................................................................................................... 17
A Structural Theory of Attitude Dynamics................................................................... 17
Behavior Management and Behavioral Change ............................................................ 17
Young adults’ social drinking as explained by an augmented theory of planned behavior
.................................................................................................................................... 18
Consumer response to gift promotion. ......................................................................... 19
IMC: a consumer psychological perspective ................................................................ 19
Relationship of Consumer Attitude and Brand ............................................................. 20
3.3 Research Method ....................................................................................................... 21
3.3.1 Primary Data....................................................................................................... 21
3.3.2 Level of Scale and type of scale .......................................................................... 23
3.3.3 Reliability Test ................................................................................................... 24
3.3.4 Validity of research ............................................................................................. 25
3.3.5 Interpret of mean value. ...................................................................................... 26
3.3.6 Secondary Data. .................................................................................................. 26
4. Empirical Finding........................................................................................................... 28
4.1 Primary Finding......................................................................................................... 28
4.2 Secondary Finding ..................................................................................................... 40
5. Analysis .......................................................................................................................... 42
5.1 The 4 factors that influence on Thai young adult to buy energy drinks ....................... 42
5.1.1Brand Perception ................................................................................................. 42
5.1.2 Promotion ........................................................................................................... 43

III
5.1.3 Integrated Marketing Communication (IMC) ...................................................... 45
5.1.4 Brand Positioning ............................................................................................... 47
5.2 The perception and attitude of Thai young adult towards energy drinks ..................... 49
5.2.1 A cognitive component ........................................................................................ 49
5.2.2 An affective component ....................................................................................... 50
5.2.3 A behavioral (conative) component ..................................................................... 51
6. Conclusion ...................................................................................................................... 53
7. Recommendation ............................................................................................................ 55
Bibliography: ....................................................................................................................... V
Appendixes ......................................................................................................................... XI
IV
List of abbreviations
Ads = Advertising
CIA = Central Intelligence Agency
CSR = Corporate Social Responsibility
EBs = Energy beverages
IMC = Integrated Marketing Communication
PBF = Positive Behavior Facilitation
TPB = The Theory of Planned Behavior
V
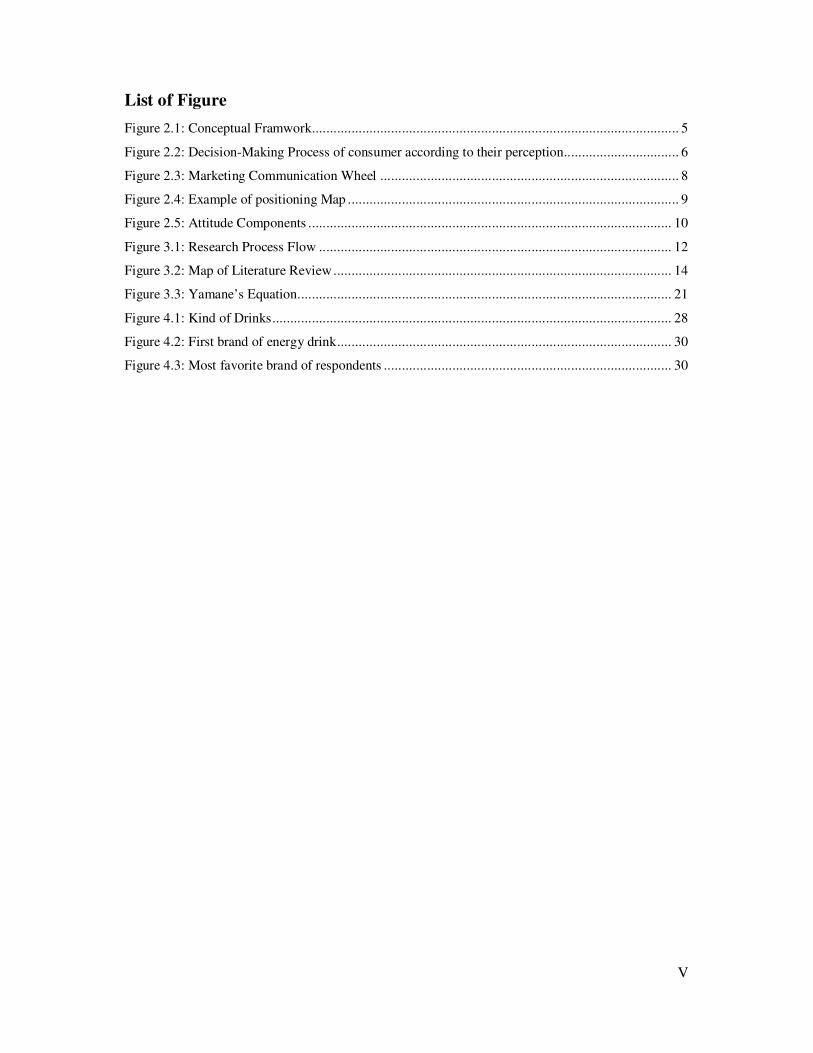
List of Figure
Figure 2.1: Conceptual Framwork...................................................................................................... 5
Figure 2.2: Decision-Making Process of consumer according to their perception ................................ 6
Figure 2.3: Marketing Communication Wheel ................................................................................... 8
Figure 2.4: Example of positioning Map ............................................................................................ 9
Figure 2.5: Attitude Components ..................................................................................................... 10
Figure 3.1: Research Process Flow .................................................................................................. 12
Figure 3.2: Map of Literature Review .............................................................................................. 14
Figure 3.3: Yamane’s Equation ........................................................................................................ 21
Figure 4.1: Kind of Drinks ............................................................................................................... 28
Figure 4.2: First brand of energy drink ............................................................................................. 30
Figure 4.3: Most favorite brand of respondents ................................................................................ 30
VI
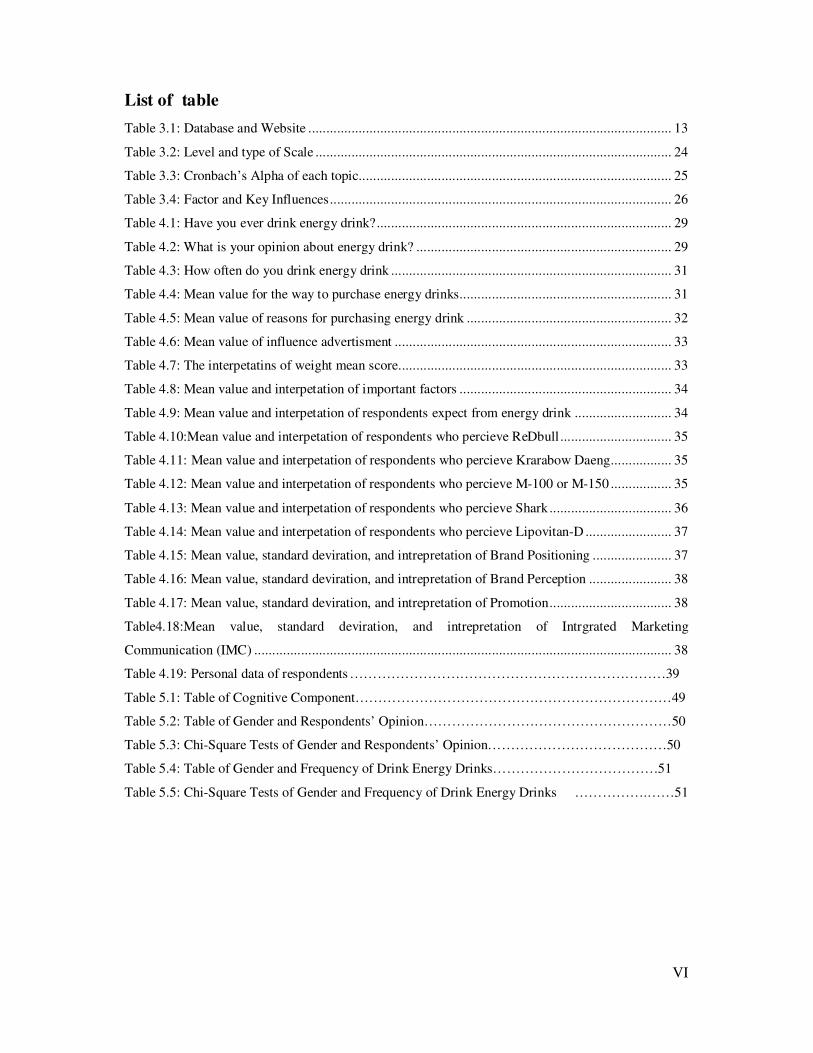
List of table
Table 3.1: Database and Website ..................................................................................................... 13
Table 3.2: Level and type of Scale ................................................................................................... 24
Table 3.3: Cronbach’s Alpha of each topic....................................................................................... 25
Table 3.4: Factor and Key Influences ............................................................................................... 26
Table 4.1: Have you ever drink energy drink? .................................................................................. 29
Table 4.2: What is your opinion about energy drink? ....................................................................... 29
Table 4.3: How often do you drink energy drink .............................................................................. 31
Table 4.4: Mean value for the way to purchase energy drinks........................................................... 31
Table 4.5: Mean value of reasons for purchasing energy drink ......................................................... 32
Table 4.6: Mean value of influence advertisment ............................................................................. 33
Table 4.7: The interpetatins of weight mean score ............................................................................ 33
Table 4.8: Mean value and interpetation of important factors ........................................................... 34
Table 4.9: Mean value and interpetation of respondents expect from energy drink ........................... 34
Table 4.10:Mean value and interpetation of respondents who percieve ReDbull ............................... 35
Table 4.11: Mean value and interpetation of respondents who percieve Krarabow Daeng................. 35
Table 4.12: Mean value and interpetation of respondents who percieve M-100 or M-150 ................. 35
Table 4.13: Mean value and interpetation of respondents who percieve Shark .................................. 36
Table 4.14: Mean value and interpetation of respondents who percieve Lipovitan-D ........................ 37
Table 4.15: Mean value, standard deviration, and intrepretation of Brand Positioning ...................... 37
Table 4.16: Mean value, standard deviration, and intrepretation of Brand Perception ....................... 38
Table 4.17: Mean value, standard deviration, and intrepretation of Promotion .................................. 38
Table4.18:Mean value, standard deviration, and intrepretation of Intrgrated Marketing
Communication (IMC) .................................................................................................................... 38
Table 4.19: Personal data of respondents ……………………………………………………………39
Table 5.1: Table of Cognitive Component……………………………………………………………49
Table 5.2: Table of Gender and Respondents’ Opinion………………………………………………50
Table 5.3: Chi-Square Tests of Gender and Respondents’ Opinion…………………………………50
Table 5.4: Table of Gender and Frequency of Drink Energy Drinks………………………………51
Table 5.5: Chi-Square Tests of Gender and Frequency of Drink Energy Drinks …………….……51

1
1. Introduction
According to CIA World Fact book, 2011, Thailand located in Southeastern Asia, which has
the total population approximately 66,720,153. It can generate to three age structures; 0-14
years = 19.9%, 15-64 years = 70.9%, 65 years and over = 9.2%. This number shows that the
second category is the biggest part of Thailand population, so the main customer of food and
drink business will be this category. Moreover, the traditional food of Thailand consists of
rice in every meal also has the unique combinations of seasoning such as hot and spicy
(Advameg, 2011). Therefore, the temperature of Thailand is hot so many of drinks in
Thailand which will contain ice because people would like to refreshing coolness
(Famouswonders, 2011).
Although, there are many kinds of drinks in Thailand like other country in the world but it did
not have the unique drink pattern because Thai people concentrate on food more than drink
and absorb the beverage products from other country. However, Thailand also has their own
famous energy drink called “Krating Daeng” or “Red Bull” in the world market but this two
brands are not from the same company, because Mr.Chaleo Yoovidhya from T.C.
Pharmaceutical Company discovered Krating Daeng. Furthermore, Dietrich Mateschitz from
Austria founded Red Bull GmbH with 49 percent partner of Mr.Chaleo Yoovidhya and his
son (Fundinguniverse, 2006).
1.1 Background
Nowadays the market of energy drink in Thailand is mighty powerful. The estimated
consumption of energy drink per person is 11.5 liters that place in top five highest consumers
includes Austria, Ireland, New Zealand, Slovenia and Kuwait (Asia Food Journal, 2008).
There are many famous brands in the market such as M 150 with the highest market share
about 55%, Red Bull and Carabao Daeng with 20% (Food Industry Network, 2011). The
view market share of its about 15,000 billion baht (1 USD = 30.41 baht) in 2008 (Gazebo,
2008) and this rate are rising up each year. On the other hand, the image of energy drink for
Thai young adult is negative because Thai people thought that the people who drink energy
drink is blue collar like a truck driver or construction worker. In addition, blue collar market
in Thailand already becomes saturated then many companies try to expand their market to
teenagers and white collar workers by mixing with other beverage (Fit, 2011).
2
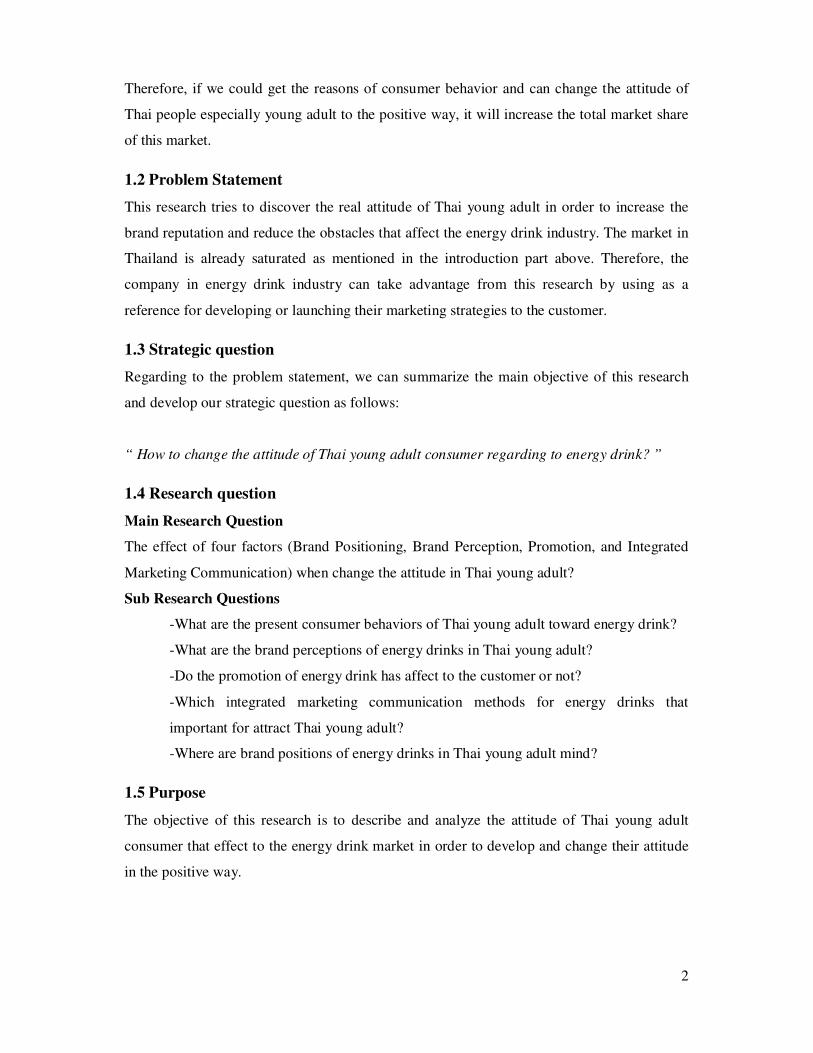
Therefore, if we could get the reasons of consumer behavior and can change the attitude of
Thai people especially young adult to the positive way, it will increase the total market share
of this market.
1.2 Problem Statement
This research tries to discover the real attitude of Thai young adult in order to increase the
brand reputation and reduce the obstacles that affect the energy drink industry. The market in
Thailand is already saturated as mentioned in the introduction part above. Therefore, the
company in energy drink industry can take advantage from this research by using as a
reference for developing or launching their marketing strategies to the customer.
1.3 Strategic question
Regarding to the problem statement, we can summarize the main objective of this research
and develop our strategic question as follows:
“ How to change the attitude of Thai young adult consumer regarding to energy drink? ”
1.4 Research question
Main Research Question
The effect of four factors (Brand Positioning, Brand Perception, Promotion, and Integrated
Marketing Communication) when change the attitude in Thai young adult?
Sub Research Questions
-What are the present consumer behaviors of Thai young adult toward energy drink?
-What are the brand perceptions of energy drinks in Thai young adult?
-Do the promotion of energy drink has affect to the customer or not?
-Which integrated marketing communication methods for energy drinks that
important for attract Thai young adult?
-Where are brand positions of energy drinks in Thai young adult mind?
1.5 Purpose
The objective of this research is to describe and analyze the attitude of Thai young adult
consumer that effect to the energy drink market in order to develop and change their attitude
in the positive way.
3
1.6 Scope of research
To answer the main research objective and also the research questions, the main answer will
come from Thai young adult who live in Bangkok. The total population in Bangkok is
approximately 5,716,248 when compares the 76 provinces in country out of the total
population in Thailand (Cps, 2009). Thus, we choose only Thai young adult in Bangkok to be
our target. The other areas of Thailand will not include in this research. Moreover, the real
attitude of them will be the main key to analyze and change into the positive way that
benefits to energy drink market.
1.7 Target Audiences
According to this research is trying to study the real attitude of Thai young adult and change
them into the positive way. Therefore, the outcome of this research will beneficial to the
private sector which is the marketing manager or business owner of energy drink company
because the present market of Thailand is already saturate as shown in the introduction part
above, so this research will benefit for someone who interested in the real attitude of new
customer (Thai young adult) and would like to change the target market. In addition, the
government sector also has benefit from this research also because it will increase country
cash flow from the second beverage market of Thailand (Fit, 2011).
1.8 Disposition
This part gives the readers more understand about the research which contains the
explanation of each part by divided into different chapter. This research divided into 7
chapters as follows.
Firstly, is introduction chapter which included problem statement, strategic question, research
question, purpose, scope of research, and target audience for make the clear point of view for
the reader to follow this research. Secondly, is conceptual framework part that presents the
theories about consumer perception, attitude, as well as attitude change strategies. To make
the readers more understand about what are theories that already used in this research.
Thirdly, is methods and research design chapter which included topic selection, literature
review, research method and also effective factors to change young adult’s attitude. Likewise,
this chapter definitely focused on the sample size of this research for launching questionnaire
to do research.
Fourthly, is empirical finding chapter. We already divided into two parts which are primary
finding (SPSS) and secondary finding (The Internet). We collected the data from respondents
and calculated them by using SPSS program for primary finding. Furthermore, we already

4
gathered the information from the Internet to support the primary finding. Next chapter is
analysis chapter. We already separated into two part which included the four factors that
influence Thai young adult to buy energy drink as well as the perception and attitude of Thai
young adult towards energy drinks by comparing with the different variables.
Lastly, the sixth chapter and seventh chapter are conclusion and recommendation. In
conclusion part is concluded the whole part and result of the research and analysis are
presented. The recommendation chapter will be presented the recommend from the authors
by creating the marketing strategy for suitable with the energy drink in Thailand market.
5
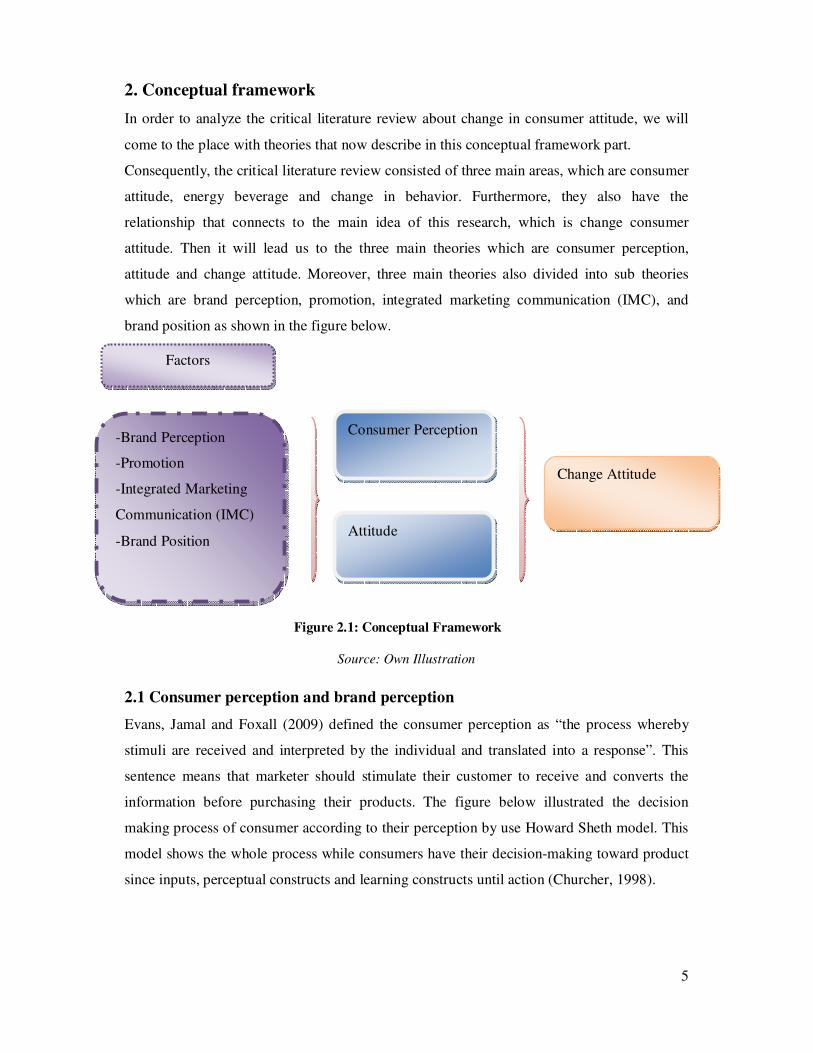
2. Conceptual framework
In order to analyze the critical literature review about change in consumer attitude, we will
come to the place with theories that now describe in this conceptual framework part.
Consequently, the critical literature review consisted of three main areas, which are consumer
attitude, energy beverage and change in behavior. Furthermore, they also have the
relationship that connects to the main idea of this research, which is change consumer
attitude. Then it will lead us to the three main theories which are consumer perception,
attitude and change attitude. Moreover, three main theories also divided into sub theories
which are brand perception, promotion, integrated marketing communication (IMC), and
brand position as shown in the figure below.
Source: Own Illustration
2.1 Consumer perception and brand perception
Evans, Jamal and Foxall (2009) defined the consumer perception as “the process whereby
stimuli are received and interpreted by the individual and translated into a response”. This
sentence means that marketer should stimulate their customer to receive and converts the
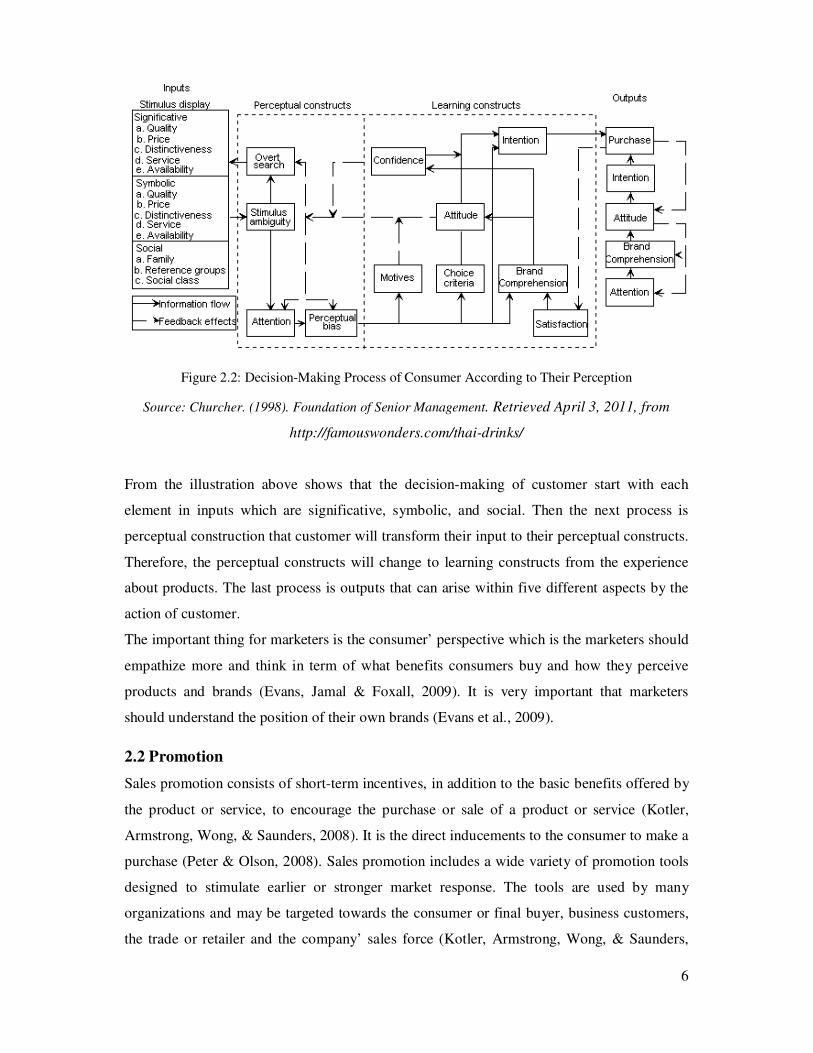
information before purchasing their products. The figure below illustrated the decision
making process of consumer according to their perception by use Howard Sheth model. This
model shows the whole process while consumers have their decision-making toward product
since inputs, perceptual constructs and learning constructs until action (Churcher, 1998).
Consumer Perception
Attitude
Change Attitude
-Brand Perception
-Promotion
-Integrated Marketing
Communication (IMC)
-Brand Position
Figure 2.1: Conceptual Framework
Factors
6
Figure 2.2: Decision-Making Process of Consumer According to Their Perception
Source: Churcher. (1998). Foundation of Senior Management. Retrieved April 3, 2011, from
http://famouswonders.com/thai-drinks/
From the illustration above shows that the decision-making of customer start with each
element in inputs which are significative, symbolic, and social. Then the next process is
perceptual construction that customer will transform their input to their perceptual constructs.
Therefore, the perceptual constructs will change to learning constructs from the experience
about products. The last process is outputs that can arise within five different aspects by the
action of customer.
The important thing for marketers is the consumer’ perspective which is the marketers should
empathize more and think in term of what benefits consumers buy and how they perceive
products and brands (Evans, Jamal & Foxall, 2009). It is very important that marketers
should understand the position of their own brands (Evans et al., 2009).
2.2 Promotion
Sales promotion consists of short-term incentives, in addition to the basic benefits offered by
the product or service, to encourage the purchase or sale of a product or service (Kotler,
Armstrong, Wong, & Saunders, 2008). It is the direct inducements to the consumer to make a
purchase (Peter & Olson, 2008). Sales promotion includes a wide variety of promotion tools
designed to stimulate earlier or stronger market response. The tools are used by many
organizations and may be targeted towards the consumer or final buyer, business customers,
the trade or retailer and the company’ sales force (Kotler, Armstrong, Wong, & Saunders,
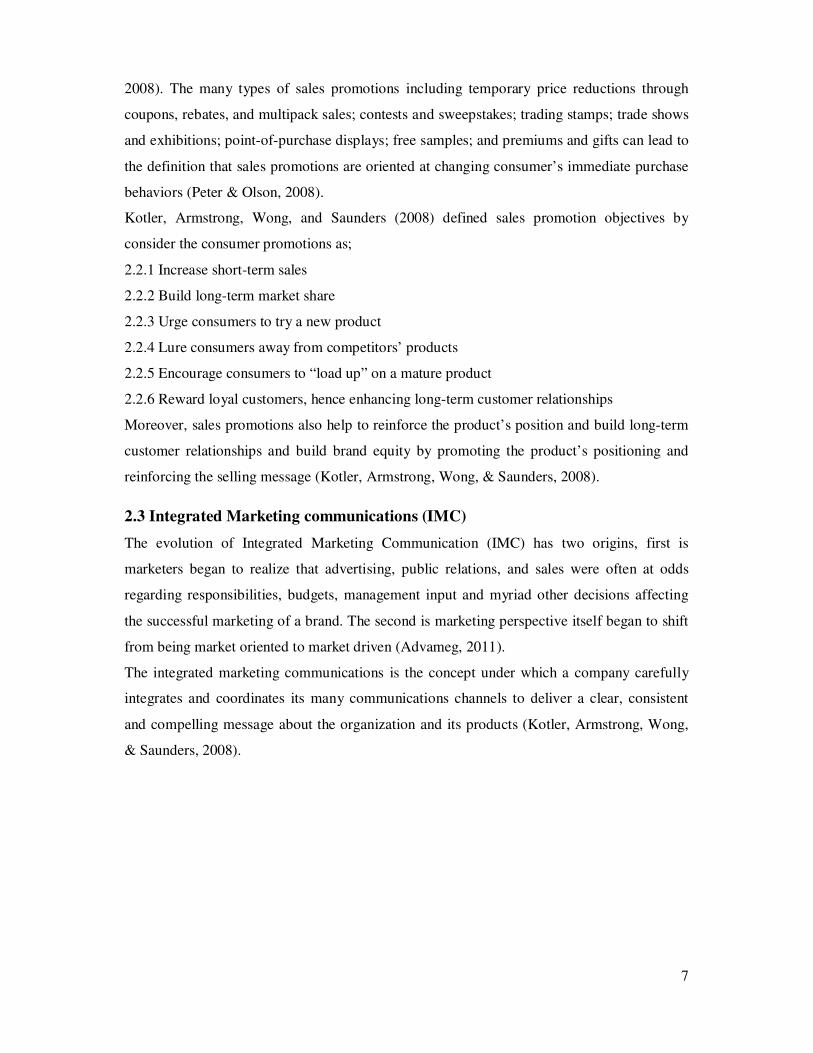
7
2008). The many types of sales promotions including temporary price reductions through
coupons, rebates, and multipack sales; contests and sweepstakes; trading stamps; trade shows
and exhibitions; point-of-purchase displays; free samples; and premiums and gifts can lead to
the definition that sales promotions are oriented at changing consumer’s immediate purchase
behaviors (Peter & Olson, 2008).
Kotler, Armstrong, Wong, and Saunders (2008) defined sales promotion objectives by
consider the consumer promotions as;
2.2.1 Increase short-term sales
2.2.2 Build long-term market share
2.2.3 Urge consumers to try a new product
2.2.4 Lure consumers away from competitors’ products
2.2.5 Encourage consumers to “load up” on a mature product
2.2.6 Reward loyal customers, hence enhancing long-term customer relationships
Moreover, sales promotions also help to reinforce the product’s position and build long-term
customer relationships and build brand equity by promoting the product’s positioning and
reinforcing the selling message (Kotler, Armstrong, Wong, & Saunders, 2008).
2.3 Integrated Marketing communications (IMC)
The evolution of Integrated Marketing Communication (IMC) has two origins, first is
marketers began to realize that advertising, public relations, and sales were often at odds
regarding responsibilities, budgets, management input and myriad other decisions affecting
the successful marketing of a brand. The second is marketing perspective itself began to shift
from being market oriented to market driven (Advameg, 2011).
The integrated marketing communications is the concept under which a company carefully
integrates and coordinates its many communications channels to deliver a clear, consistent
and compelling message about the organization and its products (Kotler, Armstrong, Wong,
& Saunders, 2008).
8
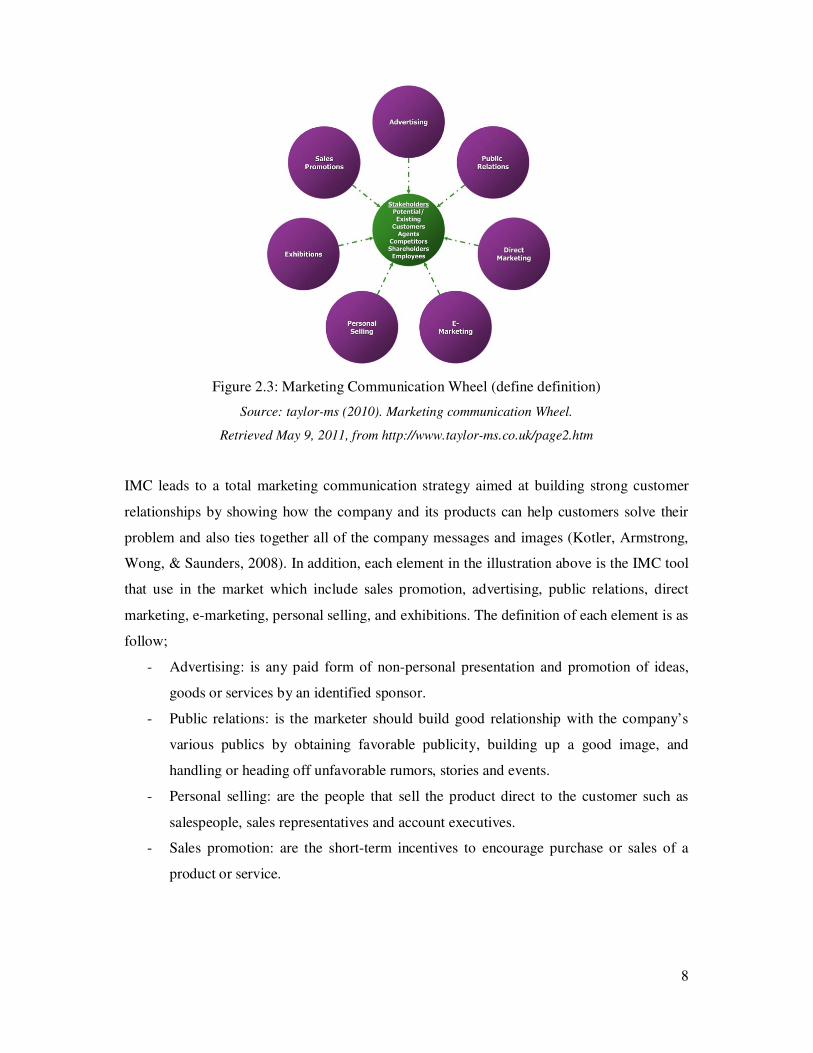
Figure 2.3: Marketing Communication Wheel (define definition)
Source: taylor-ms (2010). Marketing communication Wheel.
Retrieved May 9, 2011, from http://www.taylor-ms.co.uk/page2.htm
IMC leads to a total marketing communication strategy aimed at building strong customer
relationships by showing how the company and its products can help customers solve their
problem and also ties together all of the company messages and images (Kotler, Armstrong,
Wong, & Saunders, 2008). In addition, each element in the illustration above is the IMC tool
that use in the market which include sales promotion, advertising, public relations, direct
marketing, e-marketing, personal selling, and exhibitions. The definition of each element is as
follow;
- Advertising: is any paid form of non-personal presentation and promotion of ideas,
goods or services by an identified sponsor.
- Public relations: is the marketer should build good relationship with the company’s
various publics by obtaining favorable publicity, building up a good image, and
handling or heading off unfavorable rumors, stories and events.
- Personal selling: are the people that sell the product direct to the customer such as
salespeople, sales representatives and account executives.
- Sales promotion: are the short-term incentives to encourage purchase or sales of a
product or service.

9
- E-marketing: can also called online marketing which the company efforts to market
products and services and build relationship with customer via internet (Kotler et el.,
2008).
- Direct marketing: is a channel free approach for marketer to distribute and
communicate with their customer. Therefore, the company should create their
strategies to dealing with their customer directly (Marketing teacher, 2000-2011).
- Exhibitions: are the human activities, enterprises, undertaken for definite reasons and
in order to achieve certain specified results. The results of exhibitions can perform by
human thought and activity (Beier & Dambock, 2011).
2.4 Brand Position
The positioning is the process that marketers create an image of the product and its quality in
customers’ minds and the most effective way of positioning a company’s product is to know
the customer segment and concentrate on understanding the target group, and creates an
image that matches with customers’ needs and wants (Ghauri & Cateora, 2010). Peter and
Olsen (2008) argued that the position strategies can be accomplished by developing a
coherent strategy that may involve all of the marketing mix elements.
Figure 2.4: Example of Positioning Map
Source: smartkpis (2010), Posioning Map. Retrieved May 9, 2011,from
http://www.smartkpis.com/blog/tag/perceptual-maps/
Therefore, marketers should plan their differentiation and positioning strategies and prepare
perceptual positioning maps, which show consumer perceptions of their brands versus
competing products on important buying dimensions as shown in the figure 2.4 above about
the example position of brand in the market (Kotler, Armstrong, Wong, & Saunders, 2008).

10
2.5 Attitude
The second theory that we use in this research is attitudes. There are a lot of definitions of
attitude and this topic is already study more than a century. But all of them have one thing in
common that is the person’s overall evaluation of a concept (Peter & Olson, 2008). In
addition, an attitude has three components: cognitive (beliefs), affective (emotions) and
conative (intentions):
A cognitive component – consists of individual’s beliefs or knowledge about an issue
or and object.
An affective component – consists of individual’s feelings (positive and negative) or
emotions about the issue of the object.
A behavioral (conative) component – consists of how individual actions to the object
based on what they know about it and how they feel about it (Evans, Jamal and
Foxall, 2009).
Figure 2.5: Attitude Components
Source: Eduinn (2010). Tricomponent Attitude Model. Retrieved April 3, 2011, from
http://www.eduinn.pk/2010/06/edureadings-tricomponent-attitude-model.html
2.6 Attitude change strategies
The attitude-change strategies are the last theory in this research. This theory consists of four
categories that are:
Adding a new salient belief – to the existing beliefs that consumers have about product or
brand.
11
Changing the strength of already salient beliefs – marketer should increase or decrease the
strength about positive and negative attributes and consequences of consumer.
Changing the evaluative aspect of an existing strongly held belief – by linking a more
positive, higher-ordered consequence to the attribute.
Make an existing favorable belief more salient – by convincing consumers that the attribute is
more self-relevant than it seemed (Peter & Olson, 2008).

12
3. Methods and research design
This section showed how the research is developed by divided into difference topics as
shown in the illustration below;
Figure 3.1: Research process flow
Source: Own illustration
13
3.1 Selection of topic
Despite the second largest proportion in the Thai beverage market, the Thai consumers still
have the negative attitude of this beverage. Most of them are perceived that this kind of
beverage is served for the specific consumers such as blue collar only. This is the attractive
point that the authors would like to know what the reasons behind this point are. Moreover,
this research can help the energy drink company to expand their business to the other market
segment that is young adult. Because the total population of young adult in Thailand are more
than other age structure as mentioned in the introduction part.
3.2 Literature Review
3.2.1 Methods for the critical literature review
At this point, we choose keywords and databases operated for our research as follows;
3.2.2 Keywords
Below are keywords that were selected five keywords to use operating for literature reviews.
Consumer behavior
Change attitude
Change behavior
Energy beverage
Social drinking
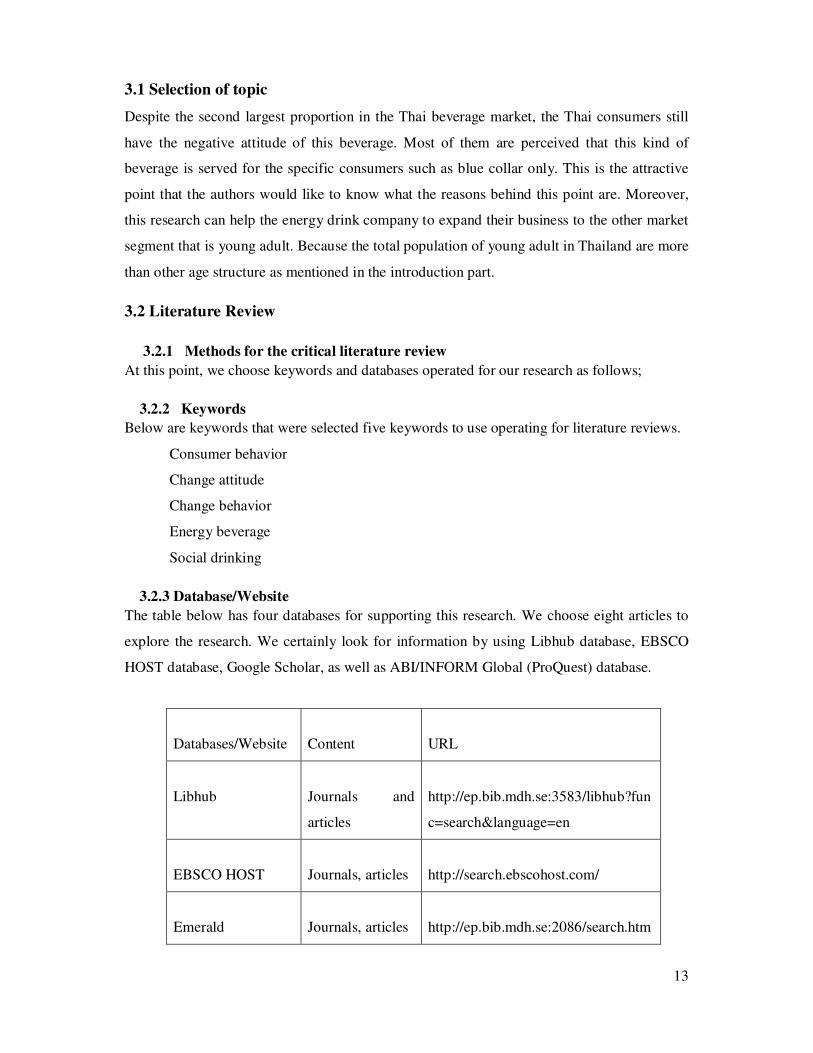
3.2.3 Database/Website
The table below has four databases for supporting this research. We choose eight articles to
explore the research. We certainly look for information by using Libhub database, EBSCO
HOST database, Google Scholar, as well as ABI/INFORM Global (ProQuest) database.
Databases/Website
Content
URL
Libhub
Journals and
articles
http://ep.bib.mdh.se:3583/libhub?fun
c=search&language=en
EBSCO HOST
Journals, articles
http://search.ebscohost.com/
Emerald
Journals, articles
http://ep.bib.mdh.se:2086/search.htm
14
Table 3.1: Databases and Websites
Source: Own Illustration
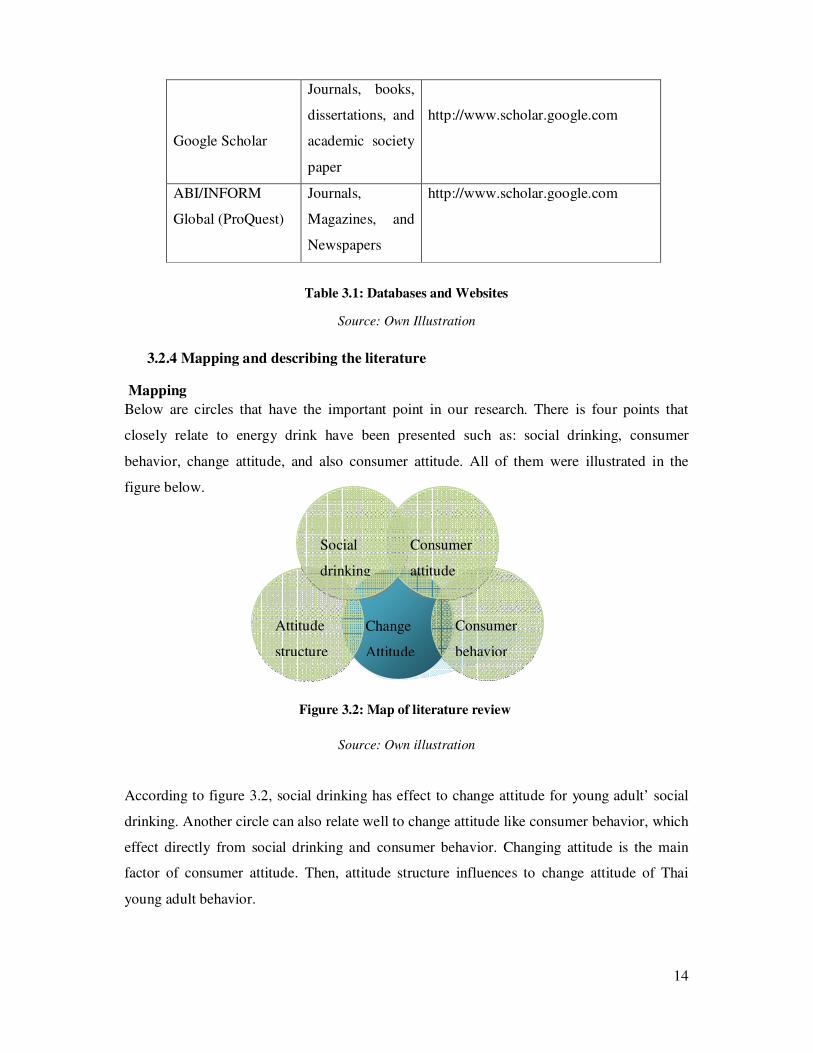
3.2.4 Mapping and describing the literature
Mapping
Below are circles that have the important point in our research. There is four points that
closely relate to energy drink have been presented such as: social drinking, consumer
behavior, change attitude, and also consumer attitude. All of them were illustrated in the
figure below.
Source: Own illustration
According to figure 3.2, social drinking has effect to change attitude for young adult’ social
drinking. Another circle can also relate well to change attitude like consumer behavior, which
effect directly from social drinking and consumer behavior. Changing attitude is the main
factor of consumer attitude. Then, attitude structure influences to change attitude of Thai
young adult behavior.
Google Scholar
Journals, books,
dissertations, and
academic society
paper
http://www.scholar.google.com
ABI/INFORM
Global (ProQuest)
Journals,
Magazines, and
Newspapers
http://www.scholar.google.com
Change
Attitude
Attitude
structure
Consumer
behavior
Consumer
attitude
Social
drinking
Figure 3.2: Map of literature review

15
Reasoning for selected literature
According to research question, we have to find the information to support research question,
hence we have to select eight literatures to relevant with the topic. We tried to choose many
articles that have reliable and strength to the point for the research as follows; Energy
Beverage, A Structural Theory of Attitude Dynamics, Behavior Management and Behavioral
Change, Young Adults’ Social Drinking as Explained by An Augmented Theory of Planned
Behavior, Relationship of Consumer Attitude and Brand, A Study of attitude towards energy
drinks in Thailand, Consumer responses to gift promotion as well as relationship of consumer
attitude and brand. These literatures have shown the deep research evidence. Besides, we
quite concern of date published of each literature because the information will up to date.
Thus, we will choose the literature reviews since 2007 to 2011.
3.2.5 Critical literature review
The most essential but also complex in the research is a critical literature review that is
correct and direct to a specific field or interest (An, 2011). Therefore, we also tried to find the
literatures that correct and direct to our research topic. Furthermore, the overall of eight
literatures are described about the attitude, energy drink and consumer behavior. In
consequence, the explanation below is the brief conclusion of each literature that related to
our research.
A Study of attitude towards energy drinks in Thailand
Authors: Asiraphot V. and Waleetroncheepsawat W.
This literature is about a study of attitudes towards energy drinks in Thailand. According to
Asiraphot & Waleetroncheepsawat (2009), the authors have mentioned the energy drinks
which they have studied. Their objective is to help its manufacturing to understand how each
group think of energy drink in order that the entrepreneur would get beneficial from this
research to make an adaptation for increasing satisfaction to provide their consumer that have
different groups. Moreover, the authors have studied the attitude of consumer in many
perspectives such as the product, price, distribution channel, as well as promotion.
They have chosen six theories to analyze their research. There are the demographic of
respondents, personal data and frequencies of consumption, overall attitude towards
marketing mix, personal data and attitudes towards marketing mix, consuming frequencies
and attitude towards product, price, and promotion as well as non-consumers at different
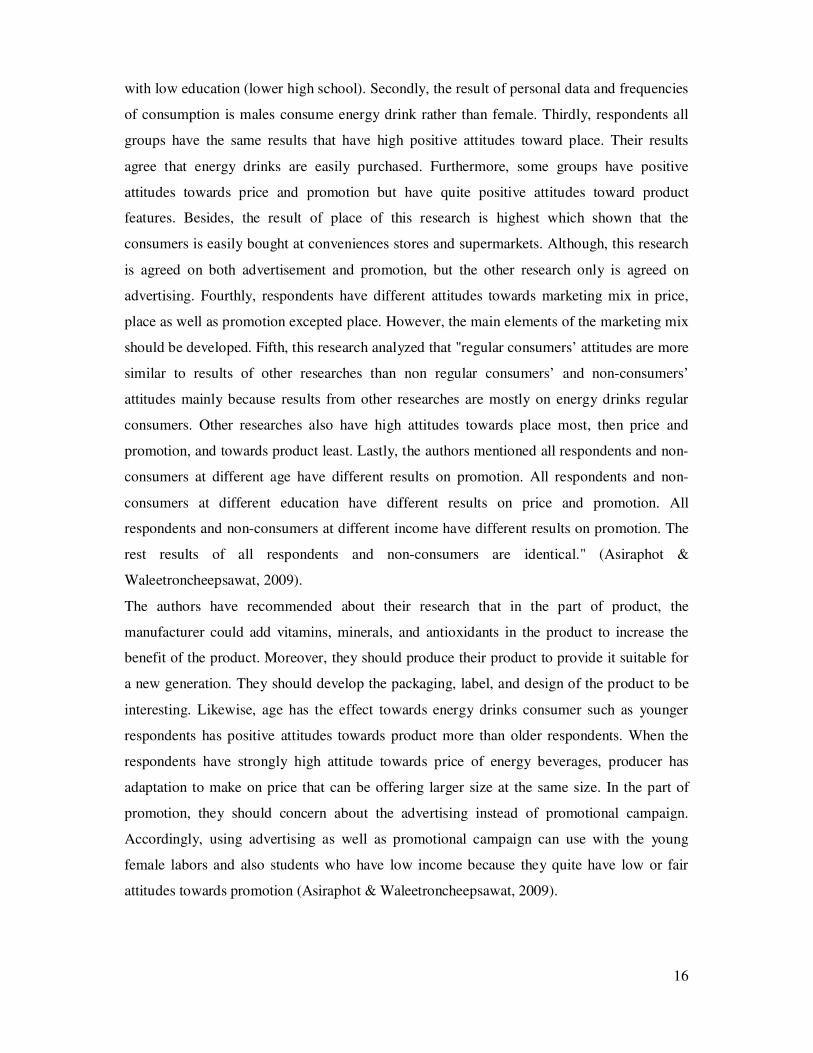
demographic features and their attitudes. Firstly, in the majority of their respondents are
female and young with high education (upper high school) but they have to compare the other
research about the demographic as well. The majority of respondents are male and young
16
with low education (lower high school). Secondly, the result of personal data and frequencies
of consumption is males consume energy drink rather than female. Thirdly, respondents all
groups have the same results that have high positive attitudes toward place. Their results
agree that energy drinks are easily purchased. Furthermore, some groups have positive
attitudes towards price and promotion but have quite positive attitudes toward product
features. Besides, the result of place of this research is highest which shown that the
consumers is easily bought at conveniences stores and supermarkets. Although, this research
is agreed on both advertisement and promotion, but the other research only is agreed on
advertising. Fourthly, respondents have different attitudes towards marketing mix in price,
place as well as promotion excepted place. However, the main elements of the marketing mix
should be developed. Fifth, this research analyzed that "regular consumers’ attitudes are more
similar to results of other researches than non regular consumers’ and non-consumers’
attitudes mainly because results from other researches are mostly on energy drinks regular
consumers. Other researches also have high attitudes towards place most, then price and
promotion, and towards product least. Lastly, the authors mentioned all respondents and non-
consumers at different age have different results on promotion. All respondents and non-
consumers at different education have different results on price and promotion. All
respondents and non-consumers at different income have different results on promotion. The
rest results of all respondents and non-consumers are identical." (Asiraphot &
Waleetroncheepsawat, 2009).
The authors have recommended about their research that in the part of product, the
manufacturer could add vitamins, minerals, and antioxidants in the product to increase the
benefit of the product. Moreover, they should produce their product to provide it suitable for
a new generation. They should develop the packaging, label, and design of the product to be
interesting. Likewise, age has the effect towards energy drinks consumer such as younger
respondents has positive attitudes towards product more than older respondents. When the
respondents have strongly high attitude towards price of energy beverages, producer has
adaptation to make on price that can be offering larger size at the same size. In the part of
promotion, they should concern about the advertising instead of promotional campaign.
Accordingly, using advertising as well as promotional campaign can use with the young
female labors and also students who have low income because they quite have low or fair
attitudes towards promotion (Asiraphot & Waleetroncheepsawat, 2009).

17
Energy Beverage
Authors: Higgins JP, Tuttle TD, Higgins CL.
In various countries, exercise is recovery again in the present time, which has the benefit to
prevent who are concerned fatness. Thus, energy drinks or called “sport drinks”. Firstly,
energy drinks were developed to provide electrolyte and carbohydrate replacement.
Subsequently, energy beverages (EBs) included stimulants and additives in most gyms and
grocery. Moreover, target of EBs is primarily that toward young men and openly promoting
psychoactive, performance enhancing, as well as stimulatory effects. The energy drinks have
many components such as: Caffeine, Taurine, Glucuronductone, B-vitamins, Guarana,
Ginseng, Sugar, L-carnitine, Ginkgo biloba, as well as antioxidants. Thus, the energy drink is
quite useful some people but some people should get the any advising from the physician
especially patients because EBs extremely included many ingredients. which it can lead to
harmful effects and possibly death. Thereto, it is the risk of hearth disease and hypertension
as well (Higgins, Tuttle and Higgins, 2010).
A Structural Theory of Attitude Dynamics
Authors: Milton J. Rosenberg
According to Rosenberg (2011), he said that attitudes can be change by modify in either the
beliefs or feelings which connected with people. It divided two types for changing by used
structure theory as follows; First changes is population of person that has varying effect of
their attitude toward some social object there exist correlate and consistent variation in beliefs
about the object and also support to the theoretical proposition, which structure consistency is
a basic condition for the appearance of the attitude change. The second type changes in
feeling toward objects were influenced among hypnosis and in the posthypnotic. This article
shows us about the structure theory of attitude dynamics that have developed by way of
elaboration as well as extension of this comprehension. Thereto, this literature review is
about the attitude concept, which is restricted to the notion of emotional “einstellung”. It can
be characterized as either “positive” or “negative” as Rosenberg said (Rosenberg, 2011).
Behavior Management and Behavioral Change
Authors: Edna Olive
The goal of Positive Behavior Facilitation is “to support adults in understanding the
differences between behavior management and supporting the behavior change of another
person which can divide into two-fold” (Olive, 2007). Firstly, is the awareness which is
critical addressing behavior and it is the first point continuum of creation. Secondly, adults
used their relationship and created environment to support their behavior change. It is
18
impossible that adults would change behavior of another person. In addition, behavior
management bases on two ordinary concepts. There are positive reinforcement and also
negative reinforcement. Thus, PBF will be effectively, if it requires a balanced and structured
combination of behavior management as well as supporting behavior change which there are
quite required awareness as well. Although a supporting behavior change is motivated for
others to change but they may not be motivated to change. According this literature, research
has distinctly shown that some environment has to first be well-managed if learning is to take
place (Dreikurs, Cassel, & Ferguson, 2004; Nelesen). Thus, Olive, 2007 concluded
“understanding about the differences between behaviour management and behaviour change
can help adult”. Moreover, If the authors have already chosen to support the behavior change
of adult or youth, they have to remind that they are making a commitment and choice that
requires more than the typical responses to behaviour. Furthermore, commitment to
supporting the change of youth requires somehow create the time in an already full schedule
to create meaningful relationships with youth. In addition, it is essential to understand and
accept that the environment in which youth are asked to function and behave can make a
dramatic difference in their willingness or resistance to change (Olive, 2007).
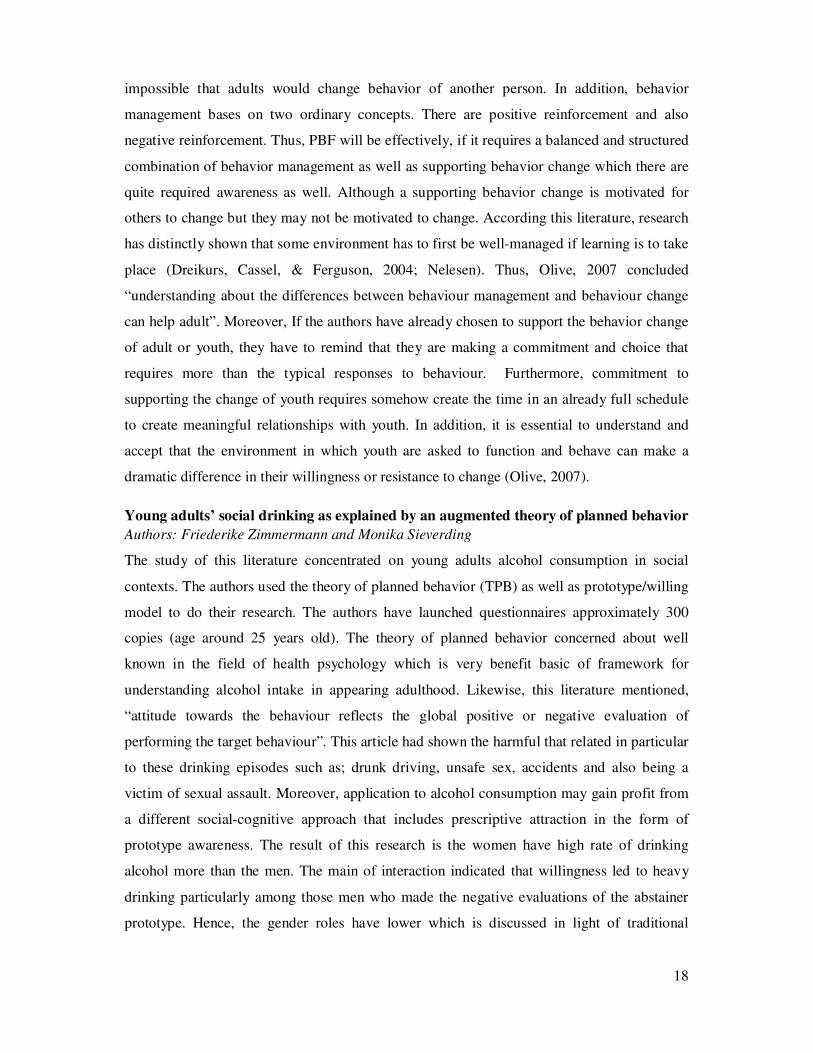
Young adults’ social drinking as explained by an augmented theory of planned behavior
Authors: Friederike Zimmermann and Monika Sieverding
The study of this literature concentrated on young adults alcohol consumption in social
contexts. The authors used the theory of planned behavior (TPB) as well as prototype/willing
model to do their research. The authors have launched questionnaires approximately 300
copies (age around 25 years old). The theory of planned behavior concerned about well
known in the field of health psychology which is very benefit basic of framework for
understanding alcohol intake in appearing adulthood. Likewise, this literature mentioned,
“attitude towards the behaviour reflects the global positive or negative evaluation of
performing the target behaviour”. This article had shown the harmful that related in particular
to these drinking episodes such as; drunk driving, unsafe sex, accidents and also being a
victim of sexual assault. Moreover, application to alcohol consumption may gain profit from
a different social-cognitive approach that includes prescriptive attraction in the form of
prototype awareness. The result of this research is the women have high rate of drinking
alcohol more than the men. The main of interaction indicated that willingness led to heavy
drinking particularly among those men who made the negative evaluations of the abstainer
prototype. Hence, the gender roles have lower which is discussed in light of traditional
19
gender roles and also current trends in alcohol consumption (Zimmermann & Sieverding,
2010).
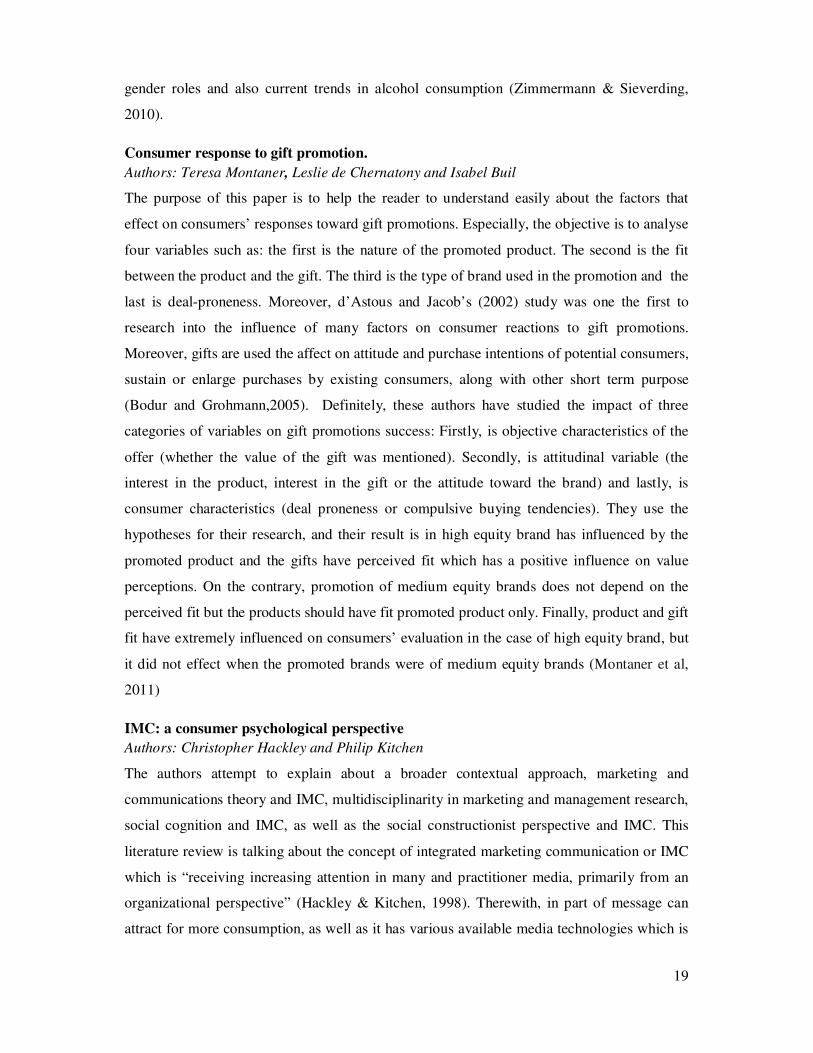
Consumer response to gift promotion.
Authors: Teresa Montaner, Leslie de Chernatony and Isabel Buil
The purpose of this paper is to help the reader to understand easily about the factors that
effect on consumers’ responses toward gift promotions. Especially, the objective is to analyse
four variables such as: the first is the nature of the promoted product. The second is the fit
between the product and the gift. The third is the type of brand used in the promotion and the
last is deal-proneness. Moreover, d’Astous and Jacob’s (2002) study was one the first to
research into the influence of many factors on consumer reactions to gift promotions.
Moreover, gifts are used the affect on attitude and purchase intentions of potential consumers,
sustain or enlarge purchases by existing consumers, along with other short term purpose
(Bodur and Grohmann,2005). Definitely, these authors have studied the impact of three
categories of variables on gift promotions success: Firstly, is objective characteristics of the
offer (whether the value of the gift was mentioned). Secondly, is attitudinal variable (the
interest in the product, interest in the gift or the attitude toward the brand) and lastly, is
consumer characteristics (deal proneness or compulsive buying tendencies). They use the
hypotheses for their research, and their result is in high equity brand has influenced by the
promoted product and the gifts have perceived fit which has a positive influence on value
perceptions. On the contrary, promotion of medium equity brands does not depend on the
perceived fit but the products should have fit promoted product only. Finally, product and gift
fit have extremely influenced on consumers’ evaluation in the case of high equity brand, but
it did not effect when the promoted brands were of medium equity brands (Montaner et al,
2011)
IMC: a consumer psychological perspective
Authors: Christopher Hackley and Philip Kitchen
The authors attempt to explain about a broader contextual approach, marketing and
communications theory and IMC, multidisciplinarity in marketing and management research,
social cognition and IMC, as well as the social constructionist perspective and IMC. This
literature review is talking about the concept of integrated marketing communication or IMC
which is “receiving increasing attention in many and practitioner media, primarily from an
organizational perspective” (Hackley & Kitchen, 1998). Therewith, in part of message can
attract for more consumption, as well as it has various available media technologies which is
20
quite effect on consumer perceptions (Dawson, 1996). Doubtless, reflection in common
models of the communications process such as hierarchy of effects indicate that the most
important feature of marketing communication content are reasonable attraction based on
product features. Hackley and Kitchen, 1998 said “ If knowledge or information is the prime
mover in consumer reaction to advertising or other forms of marketing communication, then
favorable product information would seem to be the most powerful element of message
content”. Thereto, if the organization will have the powerful meaning of message, they
should have “creativity” to design communication to customer. In conclusion, IMC has a
rationale in consumer psychology from two perspectives: firstly, it depends on consumers
build their meanings from within a flow of organizational communication excess time as
single, then secondly, creativity is influenced on consumer perspective as well as it has the
powerful meaning relation to the object concerned which is brand and organization in the
consumer’s social environment (Hackley & Kitchen, 1998).
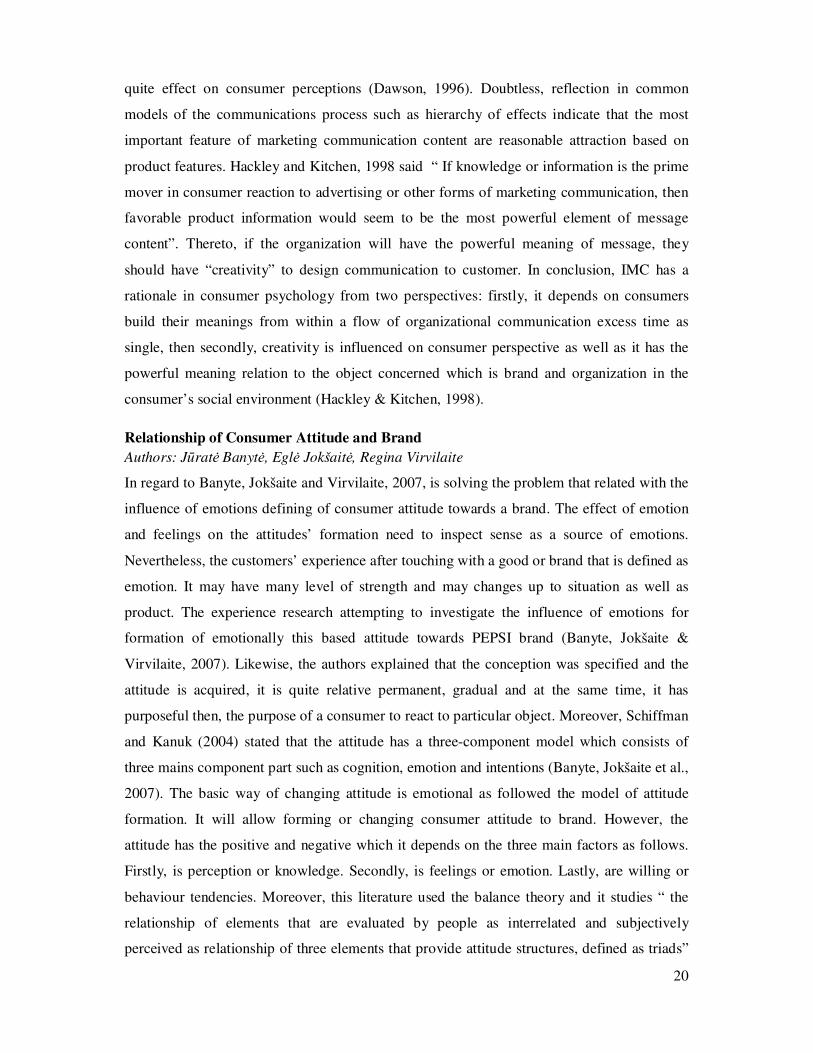
Relationship of Consumer Attitude and Brand
Authors: Jūratė Banytė, Eglė Jokšaitė, Regina Virvilaite
In regard to Banyte, Jokšaite and Virvilaite, 2007, is solving the problem that related with the
influence of emotions defining of consumer attitude towards a brand. The effect of emotion
and feelings on the attitudes’ formation need to inspect sense as a source of emotions.
Nevertheless, the customers’ experience after touching with a good or brand that is defined as
emotion. It may have many level of strength and may changes up to situation as well as
product. The experience research attempting to investigate the influence of emotions for
formation of emotionally this based attitude towards PEPSI brand (Banyte, Jokšaite &
Virvilaite, 2007). Likewise, the authors explained that the conception was specified and the
attitude is acquired, it is quite relative permanent, gradual and at the same time, it has
purposeful then, the purpose of a consumer to react to particular object. Moreover, Schiffman
and Kanuk (2004) stated that the attitude has a three-component model which consists of
three mains component part such as cognition, emotion and intentions (Banyte, Jokšaite et al.,
2007). The basic way of changing attitude is emotional as followed the model of attitude
formation. It will allow forming or changing consumer attitude to brand. However, the
attitude has the positive and negative which it depends on the three main factors as follows.
Firstly, is perception or knowledge. Secondly, is feelings or emotion. Lastly, are willing or
behaviour tendencies. Moreover, this literature used the balance theory and it studies “ the
relationship of elements that are evaluated by people as interrelated and subjectively
perceived as relationship of three elements that provide attitude structures, defined as triads”

21
(Banyte et al. 2007). Furthermore, this literature has mentioned about Fishbein’s model of
attitude towards an object as Solomon et al. (2002) stated chosing only four ways that can
change consumer’s attitude. The first is Emphasize relative advantages. The second is
strengthening conceivable relationship of the product and its attribution. Next is Introduce
new attributes. The last is change the opinion about the competitor.
M. Lindstrom has presented sensual theory which it concentrates all the attention to the five
senses such as: sight, hearing, smell touch and taste which have influence to change attitude
towards product or service (Linstrom, 2005). In conclusion, the emotional and senses have
the effect to change consumer emotional as well as consumer attitude on product as this
literature.
According to eight articles, energy drink included stimulants and additives in most gyms and
grocery which will be suitable some group. But they should get any advising from a
physician because it has many ingredients such as Caffeine, Taurine, Glucuronductone, B-
vitamins, Guarana, Ginseng, Sugar, L-carnitine, Ginkgo biloba, as well as antioxidants. Thus,
it makes customers have a negative attitude, they can change attitude by having belief and
awareness as well. Moreover, integrated marketing communication, and also gift promotion
will be factors to support the theory of attitude change that has effect to perception to
customers which probably can influence to change attitude of customers toward energy drink.
From the result of literature review, the customers have the positive attitude toward energy
drink. Hence, we will try to accumulate these articles to have in finding part, then it has to
support our analysis having result to be the same direction.
3.3 Research Method
3.3.1 Primary Data.
The population samples for this research are teenager age between 18-25 years old (CHLA,
2010). We decided to collect the samples around 550 people and the expect respondent are
not less than 400. We decided to use Yamane’s formula to calculate sampling size as follows;
(Israel, 2009)
Source: srael (2009). Using Formulas To Calculate A Sample Size.
Retrieved April 15, 2011, from http://edis.ifas.ufl.edu/pd006
Figure3.3 : Yamane’s equation
22
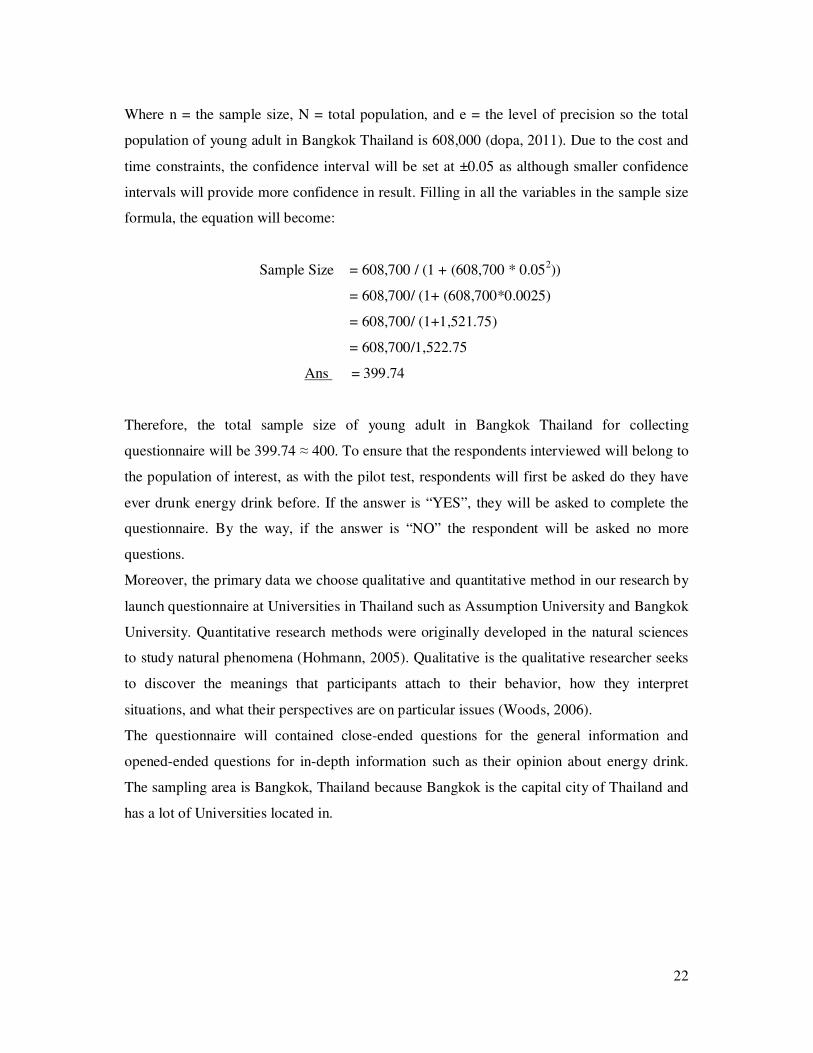
Where n = the sample size, N = total population, and e = the level of precision so the total
population of young adult in Bangkok Thailand is 608,000 (dopa, 2011). Due to the cost and
time constraints, the confidence interval will be set at ±0.05 as although smaller confidence
intervals will provide more confidence in result. Filling in all the variables in the sample size
formula, the equation will become:
Sample Size = 608,700 / (1 + (608,700 * 0.052))
= 608,700/ (1+ (608,700*0.0025)
= 608,700/ (1+1,521.75)
= 608,700/1,522.75
Ans = 399.74
Therefore, the total sample size of young adult in Bangkok Thailand for collecting
questionnaire will be 399.74 ≈ 400. To ensure that the respondents interviewed will belong to
the population of interest, as with the pilot test, respondents will first be asked do they have
ever drunk energy drink before. If the answer is “YES”, they will be asked to complete the
questionnaire. By the way, if the answer is “NO” the respondent will be asked no more
questions.
Moreover, the primary data we choose qualitative and quantitative method in our research by
launch questionnaire at Universities in Thailand such as Assumption University and Bangkok
University. Quantitative research methods were originally developed in the natural sciences
to study natural phenomena (Hohmann, 2005). Qualitative is the qualitative researcher seeks
to discover the meanings that participants attach to their behavior, how they interpret
situations, and what their perspectives are on particular issues (Woods, 2006).
The questionnaire will contained close-ended questions for the general information and
opened-ended questions for in-depth information such as their opinion about energy drink.
The sampling area is Bangkok, Thailand because Bangkok is the capital city of Thailand and
has a lot of Universities located in.

23
3.3.2 Level of Scale and type of scale
The level of scale can divide into four categories which are nominal, ordinal, interval, and
ratio. The meaning of each category is;
- Nominal: scale in nominal can measure by something in common but cannot
described. It can contain the number like in ordinal but can only use for categorize
such as employees.
- Ordinal: the items in ordinal scale can rank by order and defined by assigning
numbers to them to show their relative position. It can show only the sequence and
cannot do arithmetic with ordinal numbers.
- Interval: this data can measure by use a scale in which each position is equidistant
from one another. It also has the limitation that are cannot be multiplied or divided.
- Ratio: this scale can be compare as multiples of one another and the number zero has
meaning. The number in ratio scale can multiply and divided (Change Minds, 2002-
2011a).
In this research, we use seven type of scale according to each question in questionnaire. The
definition for each of them can describe as follow;
- Checklist question: the respondents can checking off items on provided multiple
answers in one question and each question is fixed-alternative question.
- Simple-dichotomy question: the respondents can choose one of two alternatives in
fixed-alternative question.
- Open-ended response question: the question will contain some problem and asks the
respondents to answer in their own words.
-Determinant-choice question: the question will contain multiple alternatives that
allow the respondents choose only one answer.
- Frequency-determinant question: the general frequency of occurrence will appear in
this type of scale (Textbook Exchange Canada, 2004-2008).
- Comparative rating scale: this question will allow the respondents to make their own
rating as a series of relative judgments or comparisons with a benchmark (Design and
Marketing Dictionary, 2009).
- Likert scale: the respondents will choose one option that best aligns with their view.
The scale is an ordered and one-dimensional scale such as 1-5 which is strongly
disagree to strongly agree (Changing Minds, 2002-2011b).
24
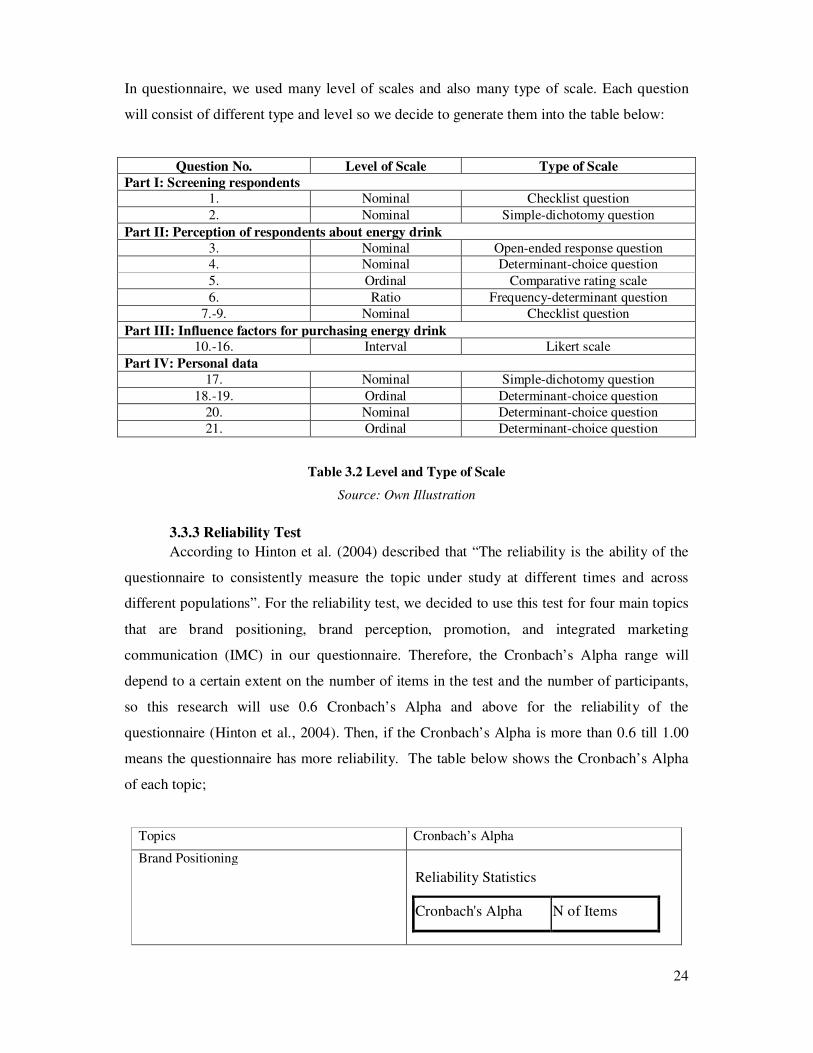
In questionnaire, we used many level of scales and also many type of scale. Each question
will consist of different type and level so we decide to generate them into the table below:
Question No. Level of Scale Type of Scale
Part I: Screening respondents
1. Nominal Checklist question
2. Nominal Simple-dichotomy question
Part II: Perception of respondents about energy drink
3. Nominal Open-ended response question 4. Nominal Determinant-choice question
5. Ordinal Comparative rating scale
6. Ratio Frequency-determinant question
7.-9. Nominal Checklist question
Part III: Influence factors for purchasing energy drink
10.-16. Interval Likert scale
Part IV: Personal data
17. Nominal Simple-dichotomy question
18.-19. Ordinal Determinant-choice question
20. Nominal Determinant-choice question
21. Ordinal Determinant-choice question
Table 3.2 Level and Type of Scale
Source: Own Illustration
3.3.3 Reliability Test
According to Hinton et al. (2004) described that “The reliability is the ability of the
questionnaire to consistently measure the topic under study at different times and across
different populations”. For the reliability test, we decided to use this test for four main topics
that are brand positioning, brand perception, promotion, and integrated marketing
communication (IMC) in our questionnaire. Therefore, the Cronbach’s Alpha range will
depend to a certain extent on the number of items in the test and the number of participants,
so this research will use 0.6 Cronbach’s Alpha and above for the reliability of the
questionnaire (Hinton et al., 2004). Then, if the Cronbach’s Alpha is more than 0.6 till 1.00
means the questionnaire has more reliability. The table below shows the Cronbach’s Alpha
of each topic;
Topics Cronbach’s Alpha
Brand Positioning
Reliability Statistics
Cronbach's Alpha N of Items

25
.642 8
Brand Perception
Reliability Statistics
Cronbach's Alpha N of Items
.742 5
Promotion
Reliability Statistics
Cronbach's Alpha N of Items
.871 5
Integrated Marketing Communication (IMC)
Reliability Statistics
Cronbach's Alpha N of Items
.772 6
Table 3.3: Cronbach’s Alpha of each topic
Source: Own Illustration
The table above shows that every factors in the questionnaire is reliable because all data from
Cronbach’s Alpha are more than 0.6.
3.3.4 Validity of research
The effective research must contain the validity both in qualitative and quantitative research.
Therefore, the validity in qualitative research depends on the honesty, depth, richness, and
scope of the data achieved along with the participants approached, the extent of triangulation
and the disinterestedness or objectivity of the researcher. Moreover, the validity in
quantitative research can be improved through careful sampling, appropriate instrumentation
and appropriate statistical treatments of the data (Cohen, Manion and Morrison, 2000).
This research uses questionnaire survey for collecting the data from the respondents because
it is the appropriate method to gain in-depth data from the respondents such as their comment
and attitude. Besides, the questions in questionnaire are from the factors of literature and

26
theories in the books and key influences are from the authors’ perspective which related to
the factors. The SPSS program also uses in this research for analyze the data from
respondents because we would like to gain more details of the data.
3.3.5 Interpret of mean value.
The mean values that shown in the empirical findings part are the indicators for measure the
total number of respondents who preferred each choice in the questionnaire. The more of
mean value means the more of respondents who choose each choice and the less of mean
value means the opposite way. In addition, the mean value will equal to 1.00 and the nearest
mean score is the most option that respondents choose.
3.3.6 Secondary Data.
In part of secondary data, we choose eight articles to support with our research because it
makes our report has more reliable to analyze data.
Therewith, this research will relate to the theories that applicable to the topic such as
consumer behavior, perception, as well as attitude from the theories above. Besides, the data
information in this research will be use as an implementation along with statistical program
(SPSS) for analyze and reach a conclusion.
Effective factors to change Thai young adult’s attitude.
A list of key variables influences Thai young adult to change their attitude toward energy
drinks in the positive way. Moreover, all of them are from the literature reviews and theories
above. These factors will be test in the questionnaire to identify which are the effective
factors that can increase and change Thai young adult mind.
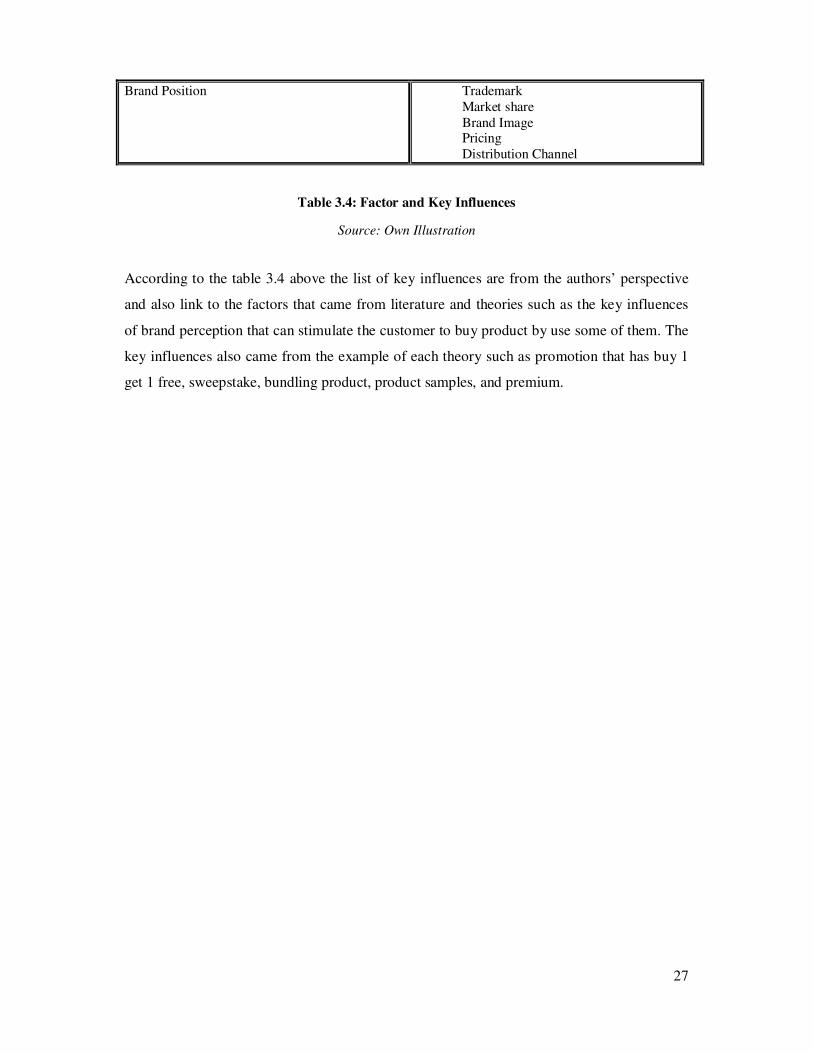
Factors Key Influences
Brand Perception Adding more flavors Adding more ingredients e.g. Glucose Packaging Design Adding more aroma
Promotion Buy 1 get 1 free Sweepstakes Bundling Product Product Samples Premium
IMC (Integrated Marketing Communication) Sport Channel Product Placement Sponsorship Billboard/Poster Radio Newspaper/Magazines
27
Brand Position Trademark Market share Brand Image Pricing Distribution Channel
Table 3.4: Factor and Key Influences
Source: Own Illustration
According to the table 3.4 above the list of key influences are from the authors’ perspective
and also link to the factors that came from literature and theories such as the key influences
of brand perception that can stimulate the customer to buy product by use some of them. The
key influences also came from the example of each theory such as promotion that has buy 1
get 1 free, sweepstake, bundling product, product samples, and premium.
28
4. Empirical Finding
4.1 Primary Finding
The primary finding is the result from the questionnaire survey. In this part we will describe
the data according to the structure of questionnaire that has four parts which are Part1:
Screening respondents, Part2: Perception of respondents about energy drink, Part3: Influence
factors for purchasing energy drink, and Part4: Personal data. Therefore, we already collected
400 completed questionnaires from Universities in Bangkok, Thailand for processing the data
below.
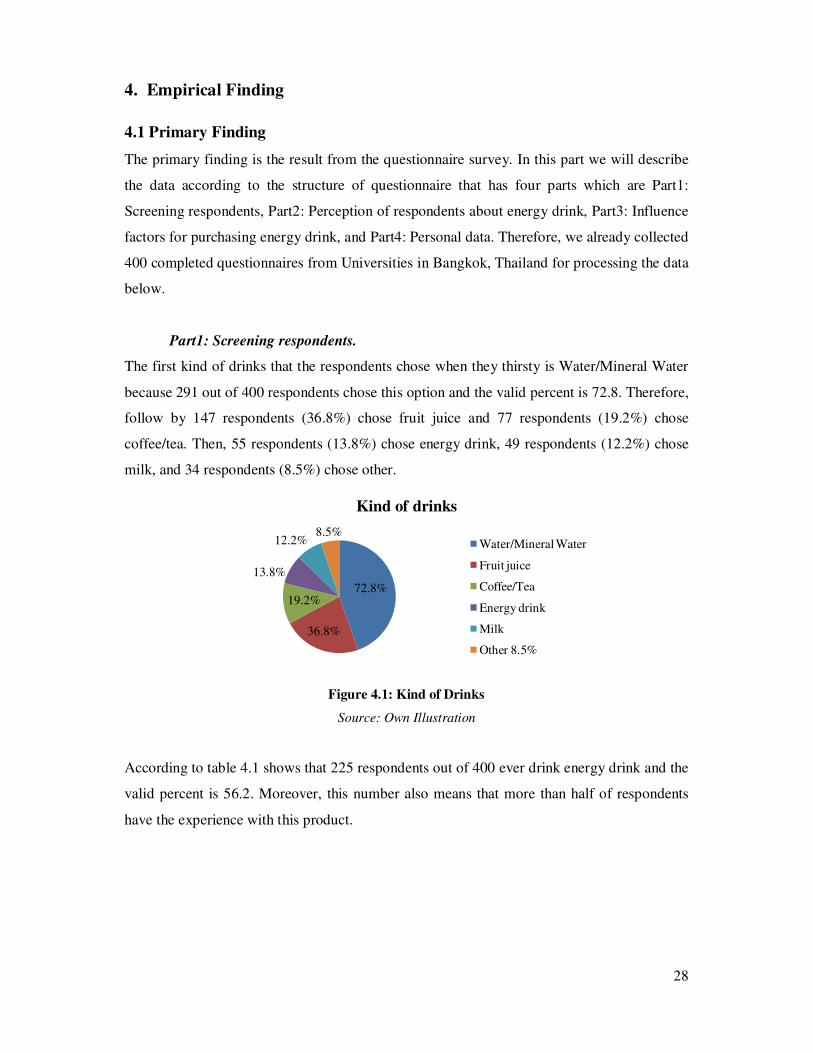
Part1: Screening respondents.
The first kind of drinks that the respondents chose when they thirsty is Water/Mineral Water
because 291 out of 400 respondents chose this option and the valid percent is 72.8. Therefore,
follow by 147 respondents (36.8%) chose fruit juice and 77 respondents (19.2%) chose
coffee/tea. Then, 55 respondents (13.8%) chose energy drink, 49 respondents (12.2%) chose
milk, and 34 respondents (8.5%) chose other.
Figure 4.1: Kind of Drinks
Source: Own Illustration
According to table 4.1 shows that 225 respondents out of 400 ever drink energy drink and the
valid percent is 56.2. Moreover, this number also means that more than half of respondents
have the experience with this product.
72.8%
36.8%
19.2%
13.8%
12.2%8.5%
Kind of drinks
Water/Mineral Water
Fruit juice
Coffee/Tea
Energy drink
Milk
Other 8.5%
29
Have you ever drink energy drink?
Frequency Percent
Valid
Percent
Cumulative
Percent
Valid Yes 225 56.2 56.2 56.2
No 175 43.8 43.8 100.0
Total 400 100.0 100.0
Table 4.1: Have you ever drink energy drink?
Source: Own Illustration
Part 2: Perception of respondents about energy drink
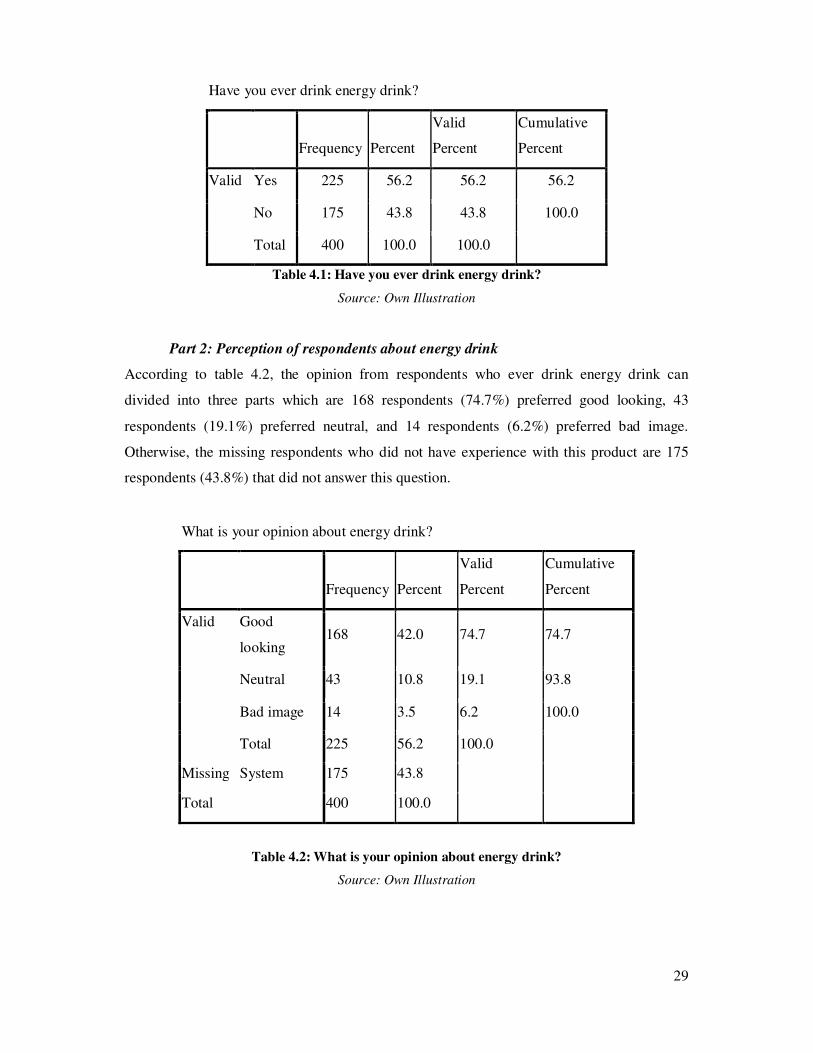
According to table 4.2, the opinion from respondents who ever drink energy drink can
divided into three parts which are 168 respondents (74.7%) preferred good looking, 43
respondents (19.1%) preferred neutral, and 14 respondents (6.2%) preferred bad image.
Otherwise, the missing respondents who did not have experience with this product are 175
respondents (43.8%) that did not answer this question.
What is your opinion about energy drink?
Frequency Percent
Valid
Percent
Cumulative
Percent
Valid Good
looking 168 42.0 74.7 74.7
Neutral 43 10.8 19.1 93.8
Bad image 14 3.5 6.2 100.0
Total 225 56.2 100.0
Missing System 175 43.8
Total 400 100.0
Table 4.2: What is your opinion about energy drink?
Source: Own Illustration
30
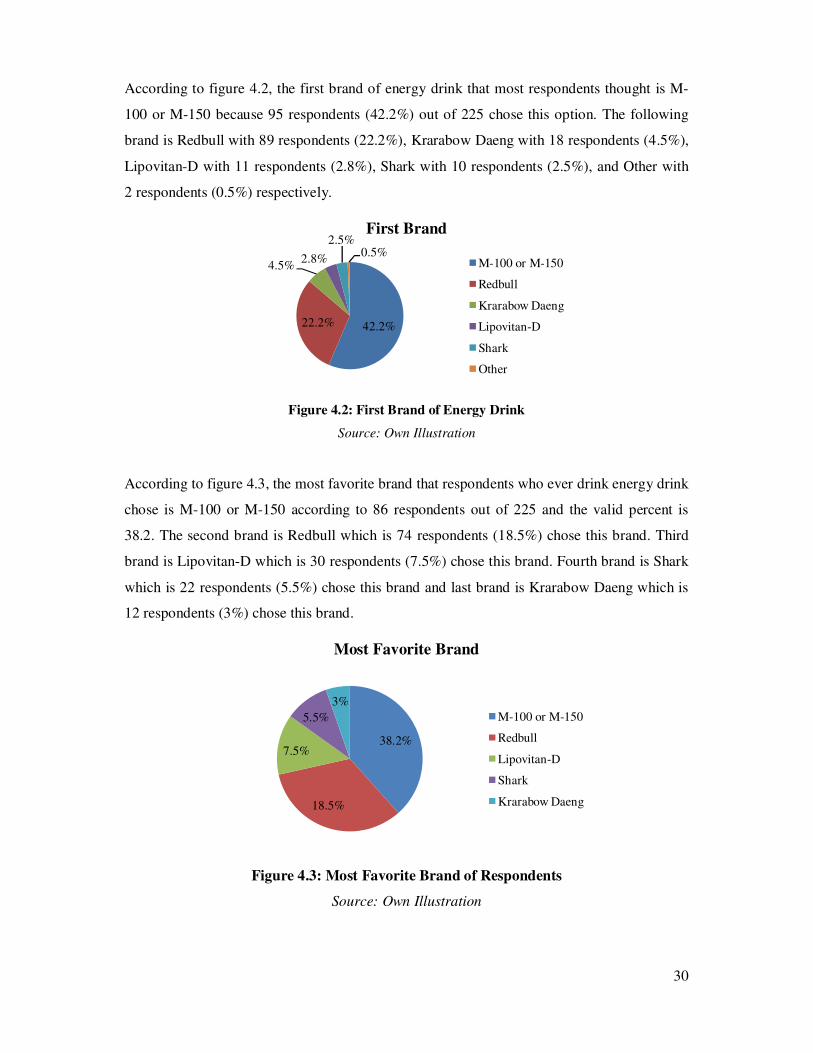
According to figure 4.2, the first brand of energy drink that most respondents thought is M-
100 or M-150 because 95 respondents (42.2%) out of 225 chose this option. The following
brand is Redbull with 89 respondents (22.2%), Krarabow Daeng with 18 respondents (4.5%),
Lipovitan-D with 11 respondents (2.8%), Shark with 10 respondents (2.5%), and Other with
2 respondents (0.5%) respectively.
Figure 4.2: First Brand of Energy Drink
Source: Own Illustration
According to figure 4.3, the most favorite brand that respondents who ever drink energy drink
chose is M-100 or M-150 according to 86 respondents out of 225 and the valid percent is
38.2. The second brand is Redbull which is 74 respondents (18.5%) chose this brand. Third
brand is Lipovitan-D which is 30 respondents (7.5%) chose this brand. Fourth brand is Shark
which is 22 respondents (5.5%) chose this brand and last brand is Krarabow Daeng which is
12 respondents (3%) chose this brand.
Figure 4.3: Most Favorite Brand of Respondents
Source: Own Illustration
42.2%22.2%
4.5%2.8%
2.5%0.5%
First Brand
M-100 or M-150
Redbull
Krarabow Daeng
Lipovitan-D
Shark
Other
38.2%
18.5%
7.5%
5.5%
3%
Most Favorite Brand
M-100 or M-150
Redbull
Lipovitan-D
Shark
Krarabow Daeng
31
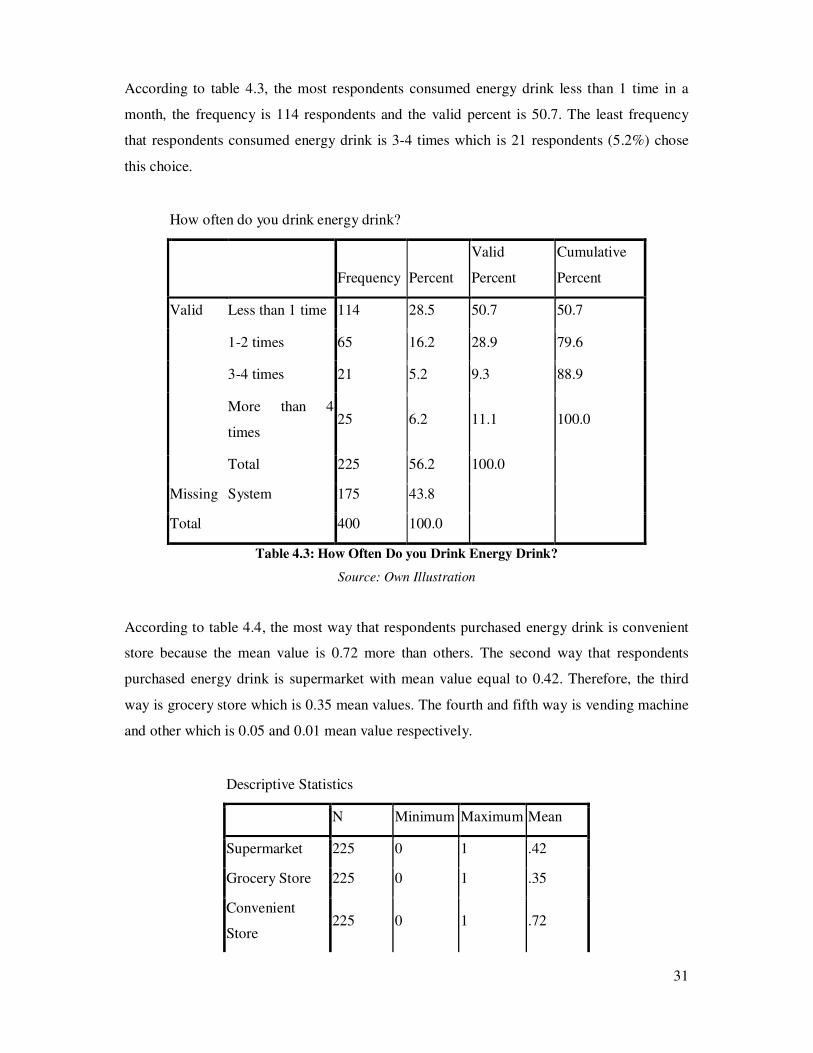
According to table 4.3, the most respondents consumed energy drink less than 1 time in a
month, the frequency is 114 respondents and the valid percent is 50.7. The least frequency
that respondents consumed energy drink is 3-4 times which is 21 respondents (5.2%) chose
this choice.
How often do you drink energy drink?
Frequency Percent
Valid
Percent
Cumulative
Percent
Valid Less than 1 time 114 28.5 50.7 50.7
1-2 times 65 16.2 28.9 79.6
3-4 times 21 5.2 9.3 88.9
More than 4
times 25 6.2 11.1 100.0
Total 225 56.2 100.0
Missing System 175 43.8
Total 400 100.0
Table 4.3: How Often Do you Drink Energy Drink?
Source: Own Illustration
According to table 4.4, the most way that respondents purchased energy drink is convenient
store because the mean value is 0.72 more than others. The second way that respondents
purchased energy drink is supermarket with mean value equal to 0.42. Therefore, the third
way is grocery store which is 0.35 mean values. The fourth and fifth way is vending machine
and other which is 0.05 and 0.01 mean value respectively.
Descriptive Statistics
N Minimum Maximum Mean
Supermarket 225 0 1 .42
Grocery Store 225 0 1 .35
Convenient
Store 225 0 1 .72

32
Vending
Machine 225 0 1 .05
Other 225 0 1 .01
Valid N
(listwise) 225
Table 4.4: Mean Value for The Way to Purchase Energy Drink
Source: Own Illustration
According to table 4.5, the most reason that respondents purchase energy drink rather than
other kind of drinking is awake because the mean value is 0.67 more than others. The second
reason is being exhausted which mean value is 0.47. The third reason is refresh which mean
value is 0.28. Mixed with liquors is the fourth reason which is 0.16 mean values. The last
reason is thirsty and other which mean value is 0.08 and 0.04 respectively.
Descriptive Statistics
N Minimum Maximum Mean
Awake 225 0 1 .67
Being Exhausted 225 0 1 .47
Thirsty 225 0 1 .08
Mixed with
liquors 225 0 1 .16
Refresh 225 0 1 .28
Other 225 0 1 .04
Valid N
(listwise) 225
Table 4.5: Mean Value of Reasons for Purchasing Energy Drink
Source: Own Illustration
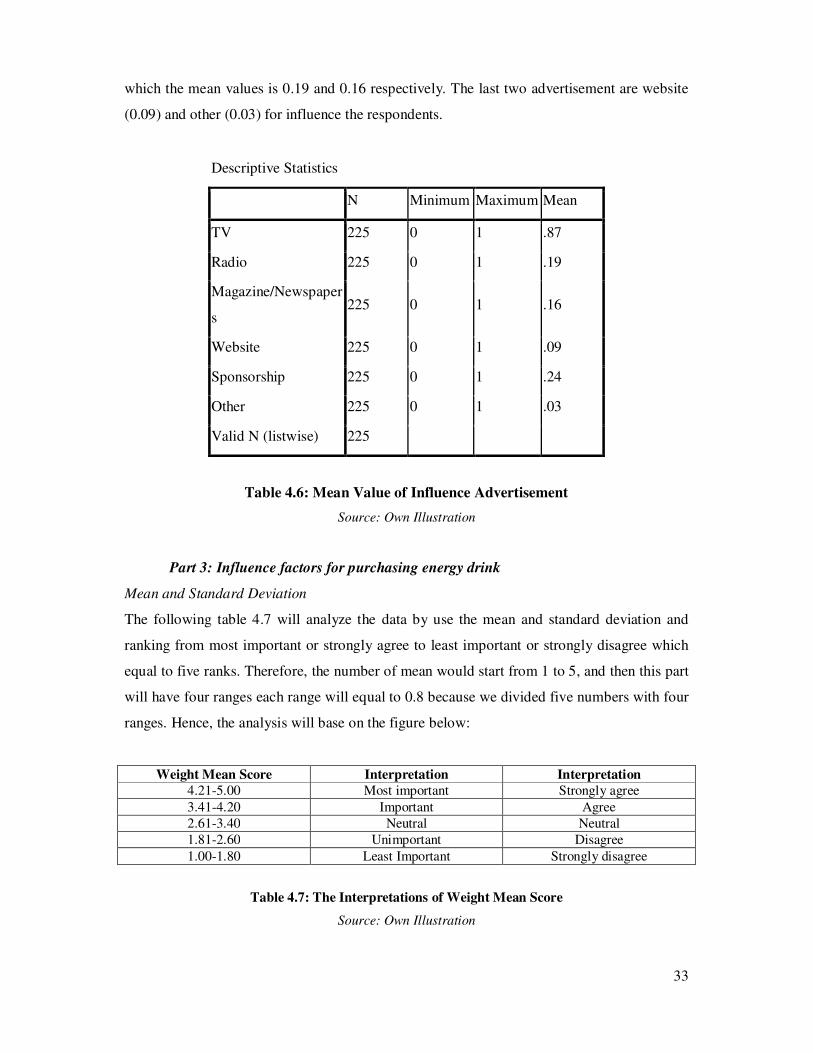
According to table 4.6, the most advertisement that influenced respondents to recognize is
TV advertisement because the mean value is 0.87 and the second is sponsorship that got 0.24.
The following advertisement that influence respondents are radio and magazine/newspapers
33
which the mean values is 0.19 and 0.16 respectively. The last two advertisement are website
(0.09) and other (0.03) for influence the respondents.
Descriptive Statistics
N Minimum Maximum Mean
TV 225 0 1 .87
Radio 225 0 1 .19
Magazine/Newspaper
s 225 0 1 .16
Website 225 0 1 .09
Sponsorship 225 0 1 .24
Other 225 0 1 .03
Valid N (listwise) 225
Table 4.6: Mean Value of Influence Advertisement
Source: Own Illustration
Part 3: Influence factors for purchasing energy drink
Mean and Standard Deviation
The following table 4.7 will analyze the data by use the mean and standard deviation and
ranking from most important or strongly agree to least important or strongly disagree which
equal to five ranks. Therefore, the number of mean would start from 1 to 5, and then this part
will have four ranges each range will equal to 0.8 because we divided five numbers with four
ranges. Hence, the analysis will base on the figure below:
Weight Mean Score Interpretation Interpretation
4.21-5.00 Most important Strongly agree
3.41-4.20 Important Agree
2.61-3.40 Neutral Neutral
1.81-2.60 Unimportant Disagree
1.00-1.80 Least Important Strongly disagree
Table 4.7: The Interpretations of Weight Mean Score
Source: Own Illustration

34
According to table 4.8, the respondents chose six factors that importance for them when they
drink energy drink which is taste (3.88), quality of product (4.02), reasonable price (3.72),
available (3.59), advertising (3.58), and famous of brand (3.76). The neutral factors for
respondents are variety of product (3.09) and promotion (3.14).
Important factors Mean value Interpretation
Variety of product 3.09 Neutral
Taste 3.88 Important
Quality of product 4.02 Important
Reasonable price 3.72 Important
Available 3.59 Important
Promotion 3.14 Neutral
Advertising 3.58 Important Famous of brand 3.76 Important
Table 4.8: Mean Value and Interpretation of Important Factors
Source: Own Illustration
According to the table 4.9 below, shows that taste (4.41) and quality of product (4.23) are the
main expect from respondents because they strongly agree with the reasons. Moreover,
reasonable price (3.96), available (3.73), advertising (3.63), and famous of brand (3.81) got
agree rank from the respondents. Therefore, variety of product (3.37) and promotion (3.36)
are the last expect from the respondents which are neutral.
Respondents expect Mean value Interpretation
Variety of product 3.37 Neutral
Taste 4.41 Strongly agree Quality of product 4.23 Strongly agree
Reasonable price 3.96 Agree
Available 3.73 Agree
Promotion 3.36 Neutral
Advertising 3.63 Agree
Famous of brand 3.81 Agree
Table 4.9: Mean Value and Interpretation of Respondents Expect from Energy Drink
Source: Own Illustration
The following table 4.10, the respondents who perceive Redbull concern and agree about
variety of product (3.50), taste (3.66), quality of product (3.82), reasonable price (3.63),
available (3.86), advertising (3.71), and famous of brand (4.02). A promotion (3.29) is the
last thing that respondents concern about when perceive Redbull which is neutral.
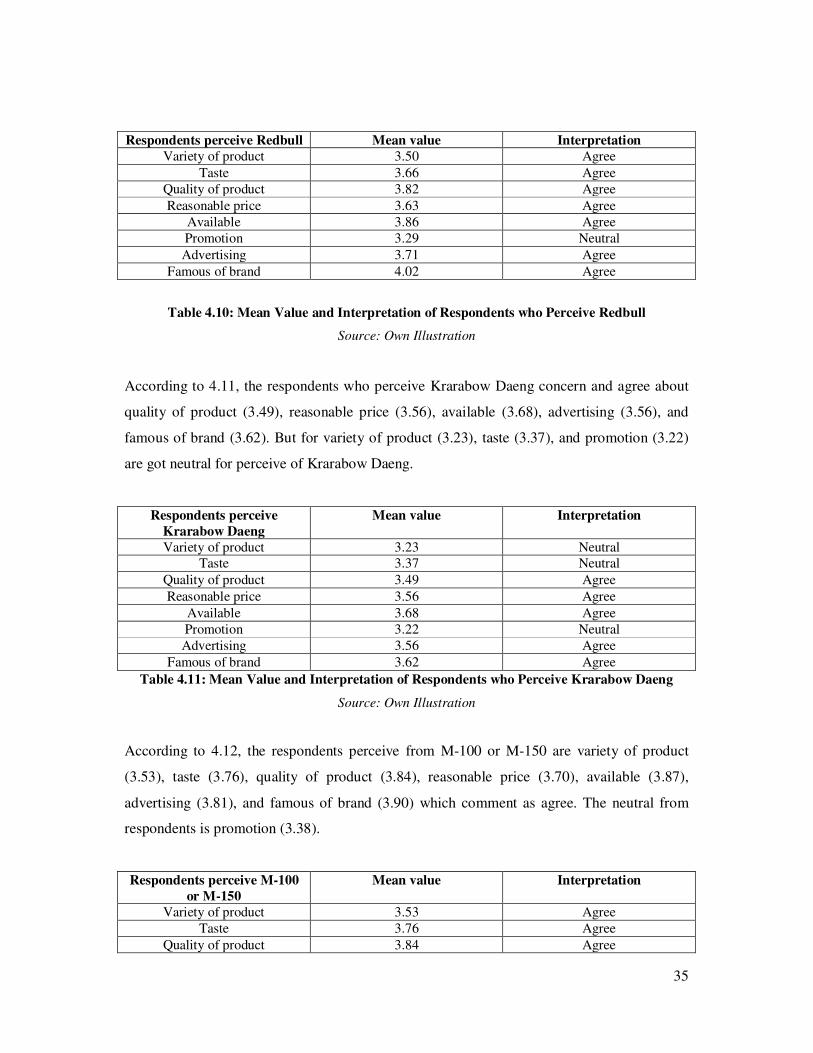
35
Respondents perceive Redbull Mean value Interpretation
Variety of product 3.50 Agree
Taste 3.66 Agree
Quality of product 3.82 Agree
Reasonable price 3.63 Agree
Available 3.86 Agree
Promotion 3.29 Neutral
Advertising 3.71 Agree
Famous of brand 4.02 Agree
Table 4.10: Mean Value and Interpretation of Respondents who Perceive Redbull
Source: Own Illustration
According to 4.11, the respondents who perceive Krarabow Daeng concern and agree about
quality of product (3.49), reasonable price (3.56), available (3.68), advertising (3.56), and
famous of brand (3.62). But for variety of product (3.23), taste (3.37), and promotion (3.22)
are got neutral for perceive of Krarabow Daeng.
Respondents perceive
Krarabow Daeng
Mean value Interpretation
Variety of product 3.23 Neutral Taste 3.37 Neutral
Quality of product 3.49 Agree
Reasonable price 3.56 Agree
Available 3.68 Agree
Promotion 3.22 Neutral
Advertising 3.56 Agree
Famous of brand 3.62 Agree
Table 4.11: Mean Value and Interpretation of Respondents who Perceive Krarabow Daeng
Source: Own Illustration
According to 4.12, the respondents perceive from M-100 or M-150 are variety of product
(3.53), taste (3.76), quality of product (3.84), reasonable price (3.70), available (3.87),
advertising (3.81), and famous of brand (3.90) which comment as agree. The neutral from
respondents is promotion (3.38).
Respondents perceive M-100
or M-150
Mean value Interpretation
Variety of product 3.53 Agree
Taste 3.76 Agree
Quality of product 3.84 Agree
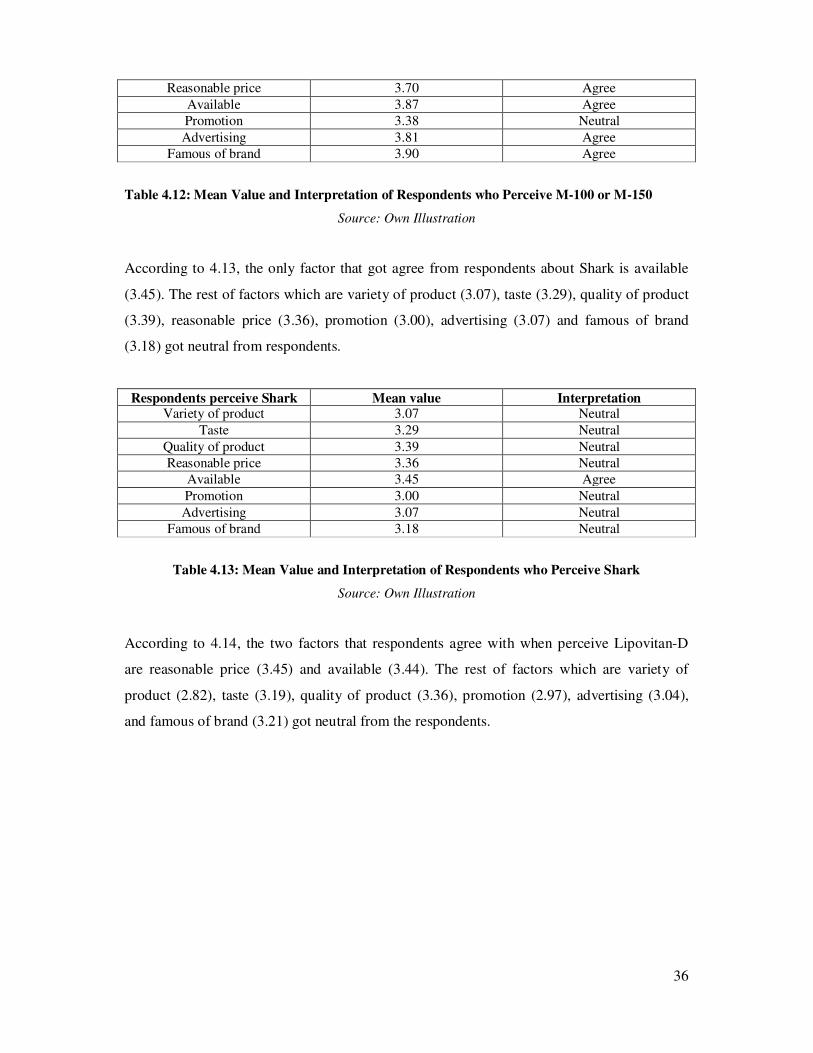
36
Reasonable price 3.70 Agree
Available 3.87 Agree
Promotion 3.38 Neutral
Advertising 3.81 Agree
Famous of brand 3.90 Agree
Table 4.12: Mean Value and Interpretation of Respondents who Perceive M-100 or M-150
Source: Own Illustration
According to 4.13, the only factor that got agree from respondents about Shark is available
(3.45). The rest of factors which are variety of product (3.07), taste (3.29), quality of product
(3.39), reasonable price (3.36), promotion (3.00), advertising (3.07) and famous of brand
(3.18) got neutral from respondents.
Respondents perceive Shark Mean value Interpretation Variety of product 3.07 Neutral
Taste 3.29 Neutral
Quality of product 3.39 Neutral
Reasonable price 3.36 Neutral
Available 3.45 Agree
Promotion 3.00 Neutral
Advertising 3.07 Neutral
Famous of brand 3.18 Neutral
Table 4.13: Mean Value and Interpretation of Respondents who Perceive Shark
Source: Own Illustration
According to 4.14, the two factors that respondents agree with when perceive Lipovitan-D
are reasonable price (3.45) and available (3.44). The rest of factors which are variety of
product (2.82), taste (3.19), quality of product (3.36), promotion (2.97), advertising (3.04),
and famous of brand (3.21) got neutral from the respondents.

37
Respondents perceive
Lipovitan-D
Mean value Interpretation
Variety of product 2.82 Neutral
Taste 3.19 Neutral
Quality of product 3.36 Neutral
Reasonable price 3.45 Agree
Available 3.44 Agree
Promotion 2.97 Neutral
Advertising 3.04 Neutral
Famous of brand 3.21 Neutral
Table 4.14: Mean Value and Interpretation of Respondents who Perceive Lipovitan-D
Source: Own Illustration
Mean and Standard Deviation for each topic
Brand Positioning
The respondents agree with most of all statements in brand positioning because the mean
value is equal to the range of agree in the interpretation of weight mean score but for the
statement “If some brand lowers their price, it means the quality was lower too.” got neutral
from the respondents because the mean value is only 3.24.
Brand Positioning Mean Value Standard Deviation Interpretation
The trademark of energy drinks have affect to my purchasing decision.
4.08 0.730 Agree
I will buy only the well-known brand. 4.00 0.806 Agree
The image of each brand has effect to my purchasing decision.
3.99 0.827 Agree
The price of energy drink fits with my budget.
3.79 0.839 Agree
The price of energy drink is not expensive when compare with other kind of drink.
3.79 0.838 Agree
The price of energy drinks is suitable with their quality.
3.83 0.793 Agree
If some brand lowers their price, it means the quality was lower too.
3.24 1.169 Neutral
It will easy for me to buy energy drink. 3.55 1.103 Agree
Table 4.15: Mean Value, Standard Deviation and Interpretation of Brand Positioning
Source: Own Illustration
Brand Perception
The respondents agree with all statements in brand perception and the mean values are equal
to the interpretation of weight mean score which is agree.

38
Brand Perception Mean Value Standard Deviation Interpretation
I will buy energy drink when they added more flavor.
3.62 1.323 Agree
I will buy energy drink when they added more ingredients.
3.44 0.964 Agree
The package of energy drink influences me to buy.
3.60 0.996 Agree
I will buy energy drink when they added more aromas.
3.42 1.015 Agree
I will buy energy drink when I need more energy.
3.81 0.902 Agree
Table 4.16: Mean Value, Standard Deviation and Interpretation of Brand Perception
Source: Own Illustration
Promotion
The respondents agree with only two statements which are “I will buy energy drink when I
see buy 1 get 1 free promotion.” and “If they have product sample, I will test and buy it.” But
the rest of them got neutral because the mean value did not reach the level.
Promotion Mean Value Standard Deviation Interpretation
I will buy energy drink when I see buy 1 get 1 free promotion.
3.46 1.107 Agree
The sweepstake influences me to buy energy drink.
3.24 1.068 Neutral
I will buy energy drink if they bundling with other product.
3.19 1.078 Neutral
If they have product sample, I will test and buy it. 3.50 1.050 Agree
I will buy energy drink if they have premium. 3.36 1.102 Neutral
Table 4.17: Mean Value, Standard Deviation and Interpretation of Promotion
Source: Own Illustration
Integrated Marketing Communication (IMC)
The respondents agree with all statements in integrated marketing communication (IMC)
because the mean values are equal to the range of interpretation of weight mean score.
Integrated Marketing Communication
(IMC)
Mean Value Standard Deviation Interpretation
I always see advertising of energy drink. 4.08 0.800 Agree
The advertising of energy drink is attractive.
3.74 0.837 Agree
The advertising can influence me to buy 3.52 0.931 Agree

39
energy drink.
Energy drinks always have many advertisements.
3.64 0.858 Agree
Energy drinks have many ways to communicate with the customers.
3.58 0.895 Agree
I always heard the news about energy drink.
3.60 0.931 Agree
Table 4.18: Mean Value, Standard Deviation and Interpretation of Integrated Marketing
Communication (IMC)
Source: Own Illustration
Part4: The personal data
The figure below shows the data that the main respondents are male which is 213 respondents
and age between 18-25 years for over 400 respondents. Moreover, most of respondents were
graduate bachelor degree and have monthly income from 6,001-9,000 baht.
Personal Data Amount Percentage
Gender Male Female
213 187
53.2 46.8
Age 18-25 years
400
100
Education High School Bachelor Degree Master Degree Doctoral Other
50 313 34 - 3
12.5 78.2 8.5 -
0.8
Occupation Student
400
100
Monthly income Lower than 6,000 baht 6,001-9,000 baht 9,001-15,000 baht 15,001-20,000 baht 20,001-25,000 baht 25,001-30,000 baht More than 30,001 baht
106 114 98 48 17 11 6
26.5 28.5 24.5 12.0 4.2 2.8 1.5
Table 4.19: Personal Data of Respondents
Source: Own Illustration

40
4.2 Secondary Finding
We definitely find topics that have related with promotion, brand position, Brand perception,
and Integrated Marketing Communication or called IMC that can link and support our
literature review and analysis part.
Brand positioning and Brand perception
Energy drink is quite popular for blue collar but they have hold only target to make their
profit. Otherwise, all companies have to invest their cost heavy about promotion and
advertising. Nowadays market share of Thai energy drink industry is approximately 15
billion (456.15 million dollars) (Gazebo, 2008). Even though, the market share is quite high
competition but its price is just 7 - 10 Baht (0.23 – 0.33 Us) (MK11A, 2008).
Brand image of energy drink is absolutely bad image because the image of energy drink is
adhered to the lower level people or worker groups. Thus, it is quite difficult to expand the
teenager or business group although, the businessman is turning to drink the energy drink
(positioning, 2005). Between, Energy drink will be shown in the bottle or can beverage which
most energy drink are carbonated drinks that have component in huge amounts of caffeine
and sugar with additional ingredients, such amino acids (e.g. taurine). From these ingredients,
it can make the people have conveyed strength, power, and also sexuality (Wong, 2006).
Integrated Marketing Communication (IMC) and Brand promotion
Integrated Marketing Communication was called IMC which means “a simple concept. It
ensures that all forms of communications and messages are carefully linked together” (MMC,
2010). Thai business marketer has to adapt from advertising to public relation, along with
new marketing which is IMC because it can force its product and brand to access to target
group. Although, Thailand has restriction about alcoholic that control the broadcast of
advertisement but exclude for energy drink business that can probably have advertisement
(na-vigator, 2010). In the meantime, each brand especially concerns about created the
recognizability under the concept of a good citizen, the nationalism, and sweepstake a prize
which included its sale promotion as well as Road show to launch a product sample
(gotomanager, 2008).
According to a report from Euromonitor International report in 2009, Osotsapa in Thailand is
representative seller for providing Lipovitan-D and M-150 which are the well-known brand
in Thailand. Osotsapa has maintained marketing budget at 300 million baht and also strategy
to promote its brands by way of various media channels such as using presenters to gain
41
popularity with teenagers and in part of Red Bull or Krating Daeng was under operation by
TC industry company Ltd. Both of two companies tried to increase the market shared of
energy drink by being the sponsor and providing any campaigns. (Bechter, 2009) For
example, M-150 has a game that gained their customer to join with them under campaign “M
Gang Big Gift Big Friends” which is about compete to take a photo and create slogan and the
winner will get Iphone4 as well (M-150, 2010).
In the present time, it is not easy for Red Bull that will gain the large market shared. It is not
trying to directly compete in the same way but they have tried to launch TV advertising for
gaining popular in teenager that created and targeted brand awareness. Later, the employing
students and DJs to host parties achieved drinking quickly which is quite popular mixer with
vodka and a drug-free way to enjoy night party by without loss of energy (freshegg, 2010).
Regarding to Euromonitor International report in 2009, marketing of Red Bull has associated
with extreme sport and auto racing which are trendy product. Accordingly, Thai energy drink
campaign is quite focused on Thai identity and national pride as a formula that has proven
popular for all categories of product in Thailand (Bechter, 2009). Furthermore, The Red Bull
Air Race to the Red Bull Street Style 2008 is one of event that was the world’s best freestyle
soccer players. It happens in Sao Paulo in Brazil in November (freshegg, 2010). Likewise, the
energy drink of Thailand sector is quite successful marketing and advertising campaigns
including lucky draws, road shows, advertisement to strength brand perception as well as
CSR (corporate social responsibility) (Bechter, 2009).
42
5. Analysis
In this chapter, the authors decided to divide this chapter into two parts that are;
- The 4 factors that influence Thai young adult to buy energy drinks which are brand
perception, promotion, integrated marketing communication (IMC), and brand
position.
- The perception and attitude of Thai young adult towards energy drinks by compare
with the different variables.
All of the analysis parts will base on the theories and the data that we collected from the
respondents and interpret them to this part.
5.1 The 4 factors that influence on Thai young adult to buy energy drinks
5.1.1Brand Perception
From independent sample t-test between the respondents that ever or never drink energy
drinks and brand perception. The result shows that some sub factors in brand perception have
different but only of them are no different between two sets of data. It means that each of
them got the significant level higher and lower than 0.05 which are;
I will buy energy drink when they added more flavor got Levene’s test for equality of
variences is 0.611 more than 0.05 means equal varience was assumed. Significant for
equal varience assumed is 0.028 less than 0.05. It means that there is different
between added more flavor and who ever or never drink energy drinks.
If the marketers added more flavor to energy drink it will increase the amount of customer to
buy this product because most of respondents prefer this option in the questionnaire. The
more flavor of energy drink will motivate the respondents to buy and consume this product.
I will buy energy drink when they added more ingredients got Levene’s test for
equality of variences is 0.481 more than 0.05 means equal varience was assumed.
Significant for equal varience assumed is 0.038 less than 0.05. It means that there is
different between added more ingredients and who ever or never drink energy drinks.
This statistical term shows that if the marketers added more ingredients in energy drink, it
will motivate the respondents to buy the product because most of respondents concern about
this issue.
The package of energy drink influences me to buy got Levene’s test for equality of
variences is 0.216 more than 0.05 means equal varience was assumed. Significant for
equal varience assumed is 0.038 less than 0.05. It means that there is different
between influences package and who ever or never drink energy drinks.
43
The package of energy drink will influence the respondents to buy energy drinks because the
result from the questionnaire shows that most respondents concern about this issue so the
marketers should develop the unique package design to gain more customer and profit.
I will buy energy drink when they added more aromas got Levene’s test for equality
of variences is 0.587 more than 0.05 means equal varience was assumed. Significant
for equal varience assumed is 0.548 more than 0.05. It means that there is no different
between added more aromas and who ever or never drink energy drinks.
If the marketers added more aromas to energy drink it will not have any effect to buying
decision of the respondents because they did not concern too much about this issue. In the
other hand, the marketers would not concern much about this issue.
I will buy energy drink when I need more energy got Levene’s test for equality of
variences is 0.014 less than 0.05 means equal varience was not assumed. Significant
for equal varience not assumed is 0.000 less than 0.05. It means that there is different
between buy energy drink when need more energy and who ever or never drink
energy drinks.
The respondents will buy energy drink when they need more energy for their activities. The
reason for proof this sentence is the most respondents agree with this topic and the marketers
should concern more about this issue to gain more customer and profit.
In conclusion, the most of sub topics in brand perception which is added more flavor, added
more ingredients, package, and the respondents will buy energy drinks when they need more
energy have effect to the respondents when they decided to buy energy drinks. Then the
analysis of the data above can show that the customer or respondents always prefer about the
benefits that they get from the product, so the marketers should concern more about the
benefits that the customer will get and assume about what is the real benefits that customer
want.
5.1.2 Promotion
From independent sample t-test between the respondents that ever or never drink energy
drinks and promotion. The result shows that four sub factors in promotion have no different
and only one sub factor is different between two sets of data. It means that each of them got
the significant level higher and lower than 0.05 which are;
I will buy energy drink when I see buy 1 get 1 free promotion got Levene’s test for
equality of variences is 0.809 more than 0.05 means equal varience was assumed.
Significant for equal varience assumed is 0.062 more than 0.05. It means that there is

44
no different between buy 1 get 1 promotion and who ever or never drink energy
drinks.
The statistical term shows that buy 1 get 1 promotion for who ever or never drink energy
drinks has not effect to buying decision of the respondents when they saw this kind of
promotion and the respondents still buy the product even though the marketer do not use this
promotion.
The sweepstake influences me to buy energy drink got Levene’s test for equality of
variences is 0.272 more than 0.05 means equal varience was assumed. Significant for
equal varience assumed is 0.374 more than 0.05. It means that there is no different
between sweepstake and who ever or never drink energy drinks.
The sweepstake does not have any effect to the buying decision of the respondents and they
still buy the product even though the marketer does not use this kind of promotion.
I will buy energy drink if they bundling with other product got Levene’s test for
equality of variences is 0.402 more than 0.05 means equal varience was assumed.
Significant for equal varience assumed is 0.338 more than 0.05. It means that there is
no different between bundling product and who ever or never drink energy drinks.
The product bundling in the store does not have effect to the buying decision of respondents
because the conclusion of their answer is in the same direction and they still buy this product
without the product bundling promotion.
If they have product sample, I will test and buy it got Levene’s test for equality of
variences is 0.696 more than 0.05 means equal varience was assumed. Significant for
equal varience assumed is 0.056 more than 0.05. It means that there is no different
between product sample and who ever or never drink energy drinks.
The statistical term shows that the product sample does not have effect to buying decision of
respondents and they still buy this product without this kind of promotion. But if the marketer
offer the interest campaign that can motivate the respondents to test and buy the product
because the amount of significant for equal varience assumed is nearest to 0.05.
I will buy energy drink if they have premium got Levene’s test for equality of
variences is 0.059 more than 0.05 means equal varience was assumed. Significant for
equal varience assumed is 0.011 less than 0.05. It means that there is different
between premium and who ever or never drink energy drinks.
The premium that came with energy drink can influence the respondents to buy the product
so if the marketers increase this kind of promotion, the amount of customer who buy this
product will increase too.
45
In conclusion, the only one factor of promotion that can influence the respondents to buy
energy drink is premium and the other kinds of promotion such as buy 1 get 1 free and
bundling product do not have any effect to motivate respondents to buy. Therefore, the
marketers should focus on the premium when concern about promotion of this product to
increase the profit and gain more customer. Hence, the promotional tools have less effect to
the respondents when they decide to buy the product because the effect will happen with the
only one factor out of five.
5.1.3 Integrated Marketing Communication (IMC)
From independent sample t-test between the respondents that ever or never drink energy
drinks and integrated marketing communication (IMC). The result shows that five sub factors
in integrated marketing communication have no different and only one sub factor is different
between two sets of data. It means that each of them got the significant level higher and lower
than 0.05 which are;
I always see advertising of energy drink got Levene’s test for equality of variences is
0.332 more than 0.05 means equal varience was assumed. Significant for equal
varience assumed is 0.314 more than 0.05. It means that there is no different between
always see advertising and who ever or never drink energy drinks.
The advertising that launch in the market now cannot reach to the respondents because most
of them did not seen the advertisement frequently. Therefore, the marketers should provide
more advertising or media channel to attract more customers and create the recognition from
the customer.
The advertising of energy drink is attractive got Levene’s test for equality of
variences is 0.896 more than 0.05 means equal varience was assumed. Significant for
equal varience assumed is 0.147 more than 0.05. It means that there is no different
between attractive advertising and who ever or never drink energy drinks.
The statistical term shows that the advertising of energy drinks in the market now are not
attractive and the customer did not pay attention to them. So the marketers should re-
production about the advertising for gain more attention from the customer.
The advertising can influence me to buy energy drinks got Levene’s test for equality
of variences is 0.270 more than 0.05 means equal varience was assumed. Significant
for equal varience assumed is 0.041 less than 0.05. It means that there is different
between influence advertising to buy energy drinks and who ever or never drink
energy drinks.

46
Even though the advertising in the market now are not attractive for the customer but it also
influence the customer to buy energy drinks because the advertisement show about the
product and brand with the celebrities so this reason will motivate the customer to buy
product.
Energy drink always have many advertisement got Levene’s test for equality of
variences is 0.973 more than 0.05 means equal varience was assumed. Significant for
equal varience assumed is 0.202 more than 0.05. It means that there is no different
between many advertisements and who ever or never drink energy drinks.
The result shows that the advertisements in the market now are not in the appropriate level
for gain attention or motivate the customer to buy product. So the marketers should provide
more advertisement in different media channel to gain more attention from the customer.
Energy drinks have many ways to communicate with the customers got Levene’s test
for equality of variences is 0.690 more than 0.05 means equal varience was assumed.
Significant for equal varience assumed is 0.279 more than 0.05. It means that there is
no different between communicate way and who ever or never drink energy drinks.
The result in this factor is relate to the previous factor because there are less medium that can
send the advertising message to the respondents. It means that the advertising now has the
limitation such as it did not cover the entire medium that customer pay attention. Then the
marketers should increase the media channel to cover all of communication way.
I always heard the news about energy drink got Levene’s test for equality of variences
is 0.107 more than 0.05 means equal varience was assumed. Significant for equal
varience assumed is 0.160 more than 0.05. It means that there is no different between
news about energy drink and who ever or never drink energy drinks.
Due to the less medium that customer recognize so the news about energy drinks that spread
to the respondents or customer will less too. Therefore, the opportunities to promote energy
drinks will reduce and do not reach the level of expectation of the marketers.
In conclusion, the marketers should develop more about the integrated marketing
communication to their customer because most of respondents agree in the same direction
that now the advertisement in the market are not in the appropriate level. It means that IMC
of energy drinks now cannot build customer relationship and cannot improve image and
convey the messages to the customer.

47
5.1.4 Brand Positioning
From independent sample t-test between the respondents that ever or never drink energy
drinks and brand positioning. The result shows that four sub factors in brand positioning have
no different and other four sub factor is different between two sets of data. It means that each
of them got the significant level higher and lower than 0.05 which are;
The trademark of energy drinks have affect to my purchasing decision got Levene’s
test for equality of variences is 0.309 more than 0.05 means equal varience was
assumed. Significant for equal varience assumed is 0.031 less than 0.05. It means that
there is different between affect of trademark and who ever or never drink energy
drinks.
The respondents gave their attention to the trademark of energy drinks when they purchase
the product. Hence, the marketers should focus on their position in the market and use this
reason as the opportunity to gain more customers.
I will buy only the well-known brand got Levene’s test for equality of variences is
0.634 more than 0.05 means equal varience was assumed. Significant for equal
varience assumed is 0.003 less than 0.05. It means that there is different between
well-known brand and who ever or never drink energy drinks.
The statistical term shows that the customers or respondents will buy only the well-known
brand of energy drinks so the marketers should present their brand and create brand
recognition to gain more customers.
The image of each brand has effect to my purchasing decision got Levene’s test for
equality of variences is 0.647 more than 0.05 means equal varience was assumed.
Significant for equal varience assumed is 0.040 less than 0.05. It means that there is
different between brand image and who ever or never drink energy drinks.
The result proof that the customer or respondents always see the brand image before make a
purchase, so the marketer should create brand image in the customer mind to gain more
profit.
The price of energy drink fits with my budget got Levene’s test for equality of
variences is 0.208 more than 0.05 means equal varience was assumed. Significant for
equal varience assumed is 0.075 more than 0.05. It means that there is no different
between price fits and who ever or never drink energy drinks.
The statistical term means that the price of energy drinks did not fit to the budget of
respondents or customer, so the marketers should develop more about the price rate and make
it more suitable to the customer.

48
The price of energy drink is not expensive when compare with other kind of drink got
Levene’s test for equality of variences is 0.183 more than 0.05 means equal varience
was assumed. Significant for equal varience assumed is 0.141 more than 0.05. It
means that there is no different between inexpensive price and who ever or never
drink energy drinks.
The result shows that the price of energy drinks are expensive in the customer or respondents
mind and the marketers should concern more about this issue because it related to the
previous topic that is price of energy drinks did not fit to the budget.
The price of energy drinks is suitable with their quality got Levene’s test for equality
of variences is 0.570 more than 0.05 means equal varience was assumed. Significant
for equal varience assumed is 0.542 more than 0.05. It means that there is no different
between suitable price and who ever or never drink energy drinks.
The respondents thought that the price and quality are opposite direction. This means that the
marketer can do two things to improve their brand position. First, reduce their price to the
level that customer can accept. The second is improving the quality of energy drinks to
balance with the price of them.
If some brand lowers their price, it means the quality was lower too got Levene’s test
for equality of variences is 0.233 more than 0.05 means equal varience was assumed.
Significant for equal varience assumed is 0.343 more than 0.05. It means that there is
no different between low price low quality and who ever or never drink energy drinks.
The statistical term shows that if some brands reduce their price, it does not means that the
quality will lower too and the customer still believe that the quality of product is stable. Then
the marketer can use this fact to create difference position from the other brand for gain more
customers.
It will easy for me to buy energy drink got Levene’s test for equality of variences is
0.013 less than 0.05 means equal varience was not assumed. Significant for equal
varience not assumed is 0.000 less than 0.05. It means that there is different between
easy to buy and who ever or never drink energy drinks.
The result from the respondents’ proof that it will easy for them to buy energy drinks, so the
marketers should launch more marketing campaign to attract the customer and gain more
profit.
In conclusion, brand positioning in Thailand young adult mind are good for the trademark,
brand image and well-known brand but they are sensitive about the price. So if the marketers

49
can manage and develop brand position with the suitable price it can gain more customers.
Thereto, all sub factors are proof that the brand position in customer mind is in the positive
way so this will be the opportunity for marketers to expand their product and attract young
adult market to gain more customers and increase the market share.
5.2 The perception and attitude of Thai young adult towards energy drinks
The attitude of Thai young adult can divided into three parts according to the theory in
conceptual framework part, so the authors will analyze the data according to each part which
is;
5.2.1 A cognitive component
The statistical data of individual believe in energy drinks can generate in the table below;
The expect of respondents
Lower Or Higher
Significant Level
Which equal variences?
Significant Level
The Differences
Interpretation
Variety of product
Higher 0.507 Equal variences assumed
0.565 No different
Expect to have variety of product.
Taste Higher 0.863 Equal variences assumed
0.162 No different
Expect to have good taste.
Quality of product
Higher 0.737 Equal variences assumed
0.901 No different
Expect to have good quality.
Reasonable price
Higher 0.061 Equal variences assumed
0.486 No different
Expect to have reasonable price.
Available Higher 0.257 Equal variences assumed
0.166 No different
Expect to have more available.
Promotion Lower 0.010 Equal variences not assumed
0.625 No different
Expect to have more promotion.
Advertising Higher 0.167 Equal variences assumed
0.005 Different Did not expect about advertising.
Famous of brand
Higher 0.476 Equal variences assumed
0.026 Different Did not expect about famous.
Table 5.1: Table of Cognitive Component
Source: Own Illustration
In conclusion, we can analyze the cognitive component of respondents or customer according
to their believe in each factor of energy drinks which is they expect the energy drinks to have

50
more about variety of product, taste, quality of product, reasonable price, available, and
promotion. So, all of them will affect to the knowledge and believe of respondents and if the
marketers do something about each factor, it will impact and change the respondents’ attitude
toward energy drinks. But they did not expect about advertising and famous of brand, it
means both of them did not have any effect to their belief.
5.2.2 An affective component
The tables below show the statistical test of gender and the respondents’ opinion which is
related to the affective component of attitude;
What is your opinion about energy drinks?
Good Looking Neutral Bad Image
Gender: Male Female
102 66
29 14
8 6
Total 168 43 14
Table 5.2: Table of Gender and Respondents’ Opinion
Source: Own Illustration
Chi-Square Tests
Value df
Asymp. Sig.
(2-sided)
Pearson Chi-Square .792a 2 .673
Likelihood Ratio .803 2 .669
Linear-by-Linear
Association .071 1 .790
N of Valid Cases 225
a. 0 cells (.0%) have expected count less than 5. The
minimum expected count is 5.35.
Table 5.3: Chi-Square Tests of Gender and Respondents’ Opinion
Source: Own Illustration
The table 5.3 shows that p-value of gender and respondents’ opinion more than 0.05 which is
0.673. It means there is relationship between gender and what the opinion about energy
drinks is.

51
The table 5.3 shows that the statistical statement means that most of male and female have
positive feeling about energy drinks (168 respondents), 43 respondents have neutral feeling,
and only 14 respondents out of 225 respondents have negative feeling about energy drinks.
So, it will easy for the marketers to change the customers’ feeling because small amount of
respondents have negative feeling. Therefore, gender does not have any effect to the feeling
of energy drinks.
5.2.3 A behavioral (conative) component
The tables below show the relationship between gender and the respondents’ action to an
energy drinks which are related to the attitude theory and we divided their action into three
parts;
5.2.3.1 How often that respondent drinks energy drink
How often do you drink energy drink?
Less than 1 time 1-2 times 3-4 times More than 4 times
Gender: Male Female
64 50
41 24
13 8
21 4
Total 114 65 21 25
Table 5.4: Table of Gender and Frequency of Drink Energy Drinks
Source: Own Illustration
Chi-Square Tests
Value df
Asymp. Sig.
(2-sided)
Pearson Chi-Square 6.809a 3 .078
Likelihood Ratio 7.495 3 .058
Linear-by-Linear
Association 5.736 1 .017
N of Valid Cases 225
a. 0 cells (.0%) have expected count less than 5. The
minimum expected count is 8.03.
Table 5.5: Chi-Square Tests of Gender and Frequency of Drink Energy Drinks
Source: Own Illustration
52
Table 5.5 shows that most of respondents (114 respondents) drink energy drinks less than one
time in a month. And the p-value is more than 0.05 which is 0.078 it means there is
relationship between gender and frequency of drink energy drinks. Then, we can analyze that
now the frequency of drink energy drinks is low even if they know about the product but
consume rate is in the opposite direction. However, it has the opportunity for marketers to
change their attitude because consume less is better than did not consume, so the amount will
increase if marketers can create the motivation to drink.
5.2.3.2 The way that respondents purchase energy drinks
As shown in the empirical finding part that the most way that respondents purchase energy
drinks is convenient store. This fact is related to the rapid growth of convenient store in
Thailand which is equal to 10,962 stores in year 2010 (Thai Shuang Hyong, 2010). Then
most of respondents will buy energy drinks from the convenient store rather than other store
and the distribution method that each energy drinks company did are already in the
appropriate way.
5.2.3.3 The reasons to purchase energy drinks
The most reason of the respondents to purchase energy drinks that shows in the empirical
finding part is awake. Then we can assume that most of them need the energy drink to make
them awake from feeling asleep and have energy to do activities in their life. Therefore, it
will be compatible with the main benefit of energy drinks that is containing the energy for the
customer.
Finally, the respondents action toward energy drinks will need more develop from the
marketers because the response of them for the frequency of drink are low, the distribution
way is not good enough, and the main reason for drink is only awake.
53
6. Conclusion
According to the data in finding and analysis part show that most of young adult in Thailand
had experience about energy drinks. But the first kind of drinks in their mind is water/mineral
water not energy drinks.
However, the attitude of them among energy drinks is in the positive way that is good
looking which is opposite to the frequency of drink that is less than 1 time in a month. And
the easiest way to purchase energy drinks is convenient store because there are a lot of
convenient store in Thailand as shown in the analysis part above.
Furthermore, the major reason for young adult to purchase energy drinks rather than other
kind of drinks is they would like to be awake because energy drinks contain caffeine more
than a cup of coffee.
The most advertisement that can create motivation to young adult to recognize is TV
advertisement. Meanwhile, the important factors for them to consume energy drinks are taste,
quality of product, reasonable price, available place, advertising, and famous of brand. But
they expect that energy drinks can improve about taste and quality of product.
The brand positioning of energy drinks in young adult mind is in good position and price of
energy drinks does not have effect to their brand position. In brand perception, all reasons in
this topic will influence them to buy more products.
Nonetheless, the only three promotions that effect to young adult purchasing decision which
are buy 1 get 1 free, premium, and product sample. And they agree with all statements in
integrated marketing communication (IMC) that already effective to them.
The analysis part of four factors that influence Thai young adult to buy energy drinks show
the fact about the attitude of customer which always seeking for the benefits from energy
drinks in brand perception. Furthermore, the most promotion strategy that customer concern
is premium and follow by buy 1 get 1 free and product sample.
54
However, the integrated marketing communications (IMC) for now are not in the appropriate
level and cannot motivate them to purchase more. Lastly is brand positioning that they are
sensitive about the price but the overall of brand position are in the positive way.
In analysis of perception and attitude show that customer beliefs and knowledge among
energy drinks are high between each factors according to the theory. Therefore, an affective
component also in the positive way from the customer perspective about energy drinks. Also,
a behavioral (conative) component of customer can conclude that frequency rate of consume
energy drinks is low, the effective way to buy is convenience store, and the main reason to
buy is only awake.
55
7. Recommendation
In the final part of this report, we will give the suggestion about attitude change strategies
according to the theory in conceptual framework part and that can benefits to the target
audience.
According to the theory of attitude change strategies we can give the recommendation by
follow four categories that will benefit to the marketer who would like to change their
customer attitude especially Thai young adult.
Adding new salient belief
Even though the existing belief of customer among energy drink is in the positive way which
is good looking but the frequency of purchase is in the opposite direction. Then the result will
come up with negative response from the customer.
The marketer should create more attractive advertising or marketing campaign that can
influence and change their attitude about product such as in the secondary finding show about
the attractive campaign, because now the advertisings in Thailand are not attractive enough.
The marketer of each brand should cooperate together about this issue and replace new belief
to them.
Changing the strength of already salient beliefs
After adding new belief, the second task is changing the strength of already salient beliefs by
maintain the customer who already consume the product and launching new products that can
gain more customer such as change the package to attract more female customer and come up
with fruity flavor to gain more young adult drinkers.
Moreover, the present strong beliefs of customer now are the way to purchase energy drinks
which is convenience store. Then the marketer should concern more about this kind of
distribution channel such as give the reward to the owner of convenience store that has
highest sale volume in a month to motivate them to cooperate with company.
Therefore, the next strong belief is the advertisement which is TV advertising. The marketer
should develop the attractive advertising that easy for customer to recognize and influence
them to buy such as use celebrities in the ads by show that even celebrities will drink energy
drinks.
56
Changing the evaluative aspect of an existing strongly held belief
In this topic the marketer should link the positive benefit of energy drinks that is provide
energy to other benefits that customer will get because the existing customer belief that
energy drinks already gave them only the power to do their activities such as add collagen
ingredient to make them feel more positive about the product and not contain only bad effect
to their health.
Make an existing favorable belief more salient
This topic is similar to the previous topic but the duty of marketer is try to increase the belief
of customer about the positive attitude of them among energy drinks and use them to gain
more profit and increase brand perception such as show the benefits that customer will get
from energy drinks in the ads such as friends from sports or benefits that they will receive
from the existing ingredients. The important thing in this topic is the marketer must not tell
the negative effect in the ads but always tell about the positive way.
In addition, it has a lot of opportunities for marketer to change the attitude of their customer
in Thailand market. Therefore, the main focus should be the advertising and marketing
campaign. Then, marketer should use the advertising in the appropriate way to change their
attitude and turn the person who has negative attitude to be the customer. Moreover, from the
finding and analysis part we can divide the attitude of customer in two directions which are
actual experience and social bias. Therefore, the appropriate way to deal with actual
experience is the marketer should redesign the offering by come up with new flavor or
change the product attribute to gain more customer. And for the social bias, marketer should
create new product within the same brand for new segment or niche market such as gay or
student because this segment is new and each energy drinks company is not concern about
this segment in the present market. This new target customer will make more profit and new
opportunities for the company which concern about this segment.
Bibliography:
Book:
Cohen, L., Manion, L., & Morrison, K., 2000. Research methods in education (5th
ed.). London: Routhledgefalmer.
Evans, M., Jamal, A., & Foxall, G. (2009). Consumer Behavior. Chichester: John
Wiley & Sons Ltd.
Ghauri, P.N., & Cateora, P. (2010). International Marketing (3rd ed.). Maidenhead:
McGraw-Hill Companies, Inc.
Hinton, P.R., Brownlow, C., McMurray, I., & Cozens, B. (2004). SPSS Explained.
Hove: Routledge.
Kotler, P., Armstrong, G., Wong, V., & Saunders, J. (2008). Principles of Marketing.
Harlow: Pearson Education Limited.
Peter, J.P., & Olson, J.C. (2008). Consumer Behavior and Marketing Strategy (8th
ed.). McGraw-Hill Companies, Inc.
Master Thesis:
Asiraphot, V, & Waleetorncheepsawat, W (2009). A Study of attitude towards energy
drinks in Thailand. Unpublished master’s thesis, Mälardalen University, Västerås
Article:
Bechter, PH.D C. (2009). Devising a Marketing Strategy for the Thailand Market
Journal:
Asia Food Journal (2008). Thailand leads in energy drinks consumption per person.
Bodur, H.O. and Grohmann, B. (2005), “Consumer responses to gift receipt in
business-to-business consumer contexts”, Psychology and Marketing, 22(5), 441-56.
VI
Banyte, J., Jokšaite, E., & Virvilaite, R. (2007). Relationship of Consumer Attitude
and Brand: Emotional Aspect, Engineering Economics, 52(2), 65-77
Beier, J. and Dambock, S. (2011). The role of exhibitions in the marketing mix,
University of Cooperative Education, 2
d’Astous, A. and Jacob, I. (2002), “Understanding consumer reactions to premium-
based promotional offers”, European Journal of Marketing, 36 (11/12), 1270-86.
Dawson, C. (1996), “Television advertising – in need of reinventional”, International
Journal of Advertising, 15(2), 302-13.
Dreikurs, R., Cassel, P., & Ferguson, E. (2004). Discipline without tears: How to
reduce conßict and establish coopera- tion in the classroom. Hoboken, NJ: Wiley.
HIGGINS, J. P., TUTTLE, T.D., & HIGGINS, C.L. (2010). Energy Beverages:
Content and Safety, Energy beverages, 85(11), 1033-1041, doi:10.4065/mcp
Hackley, C. & Kitchen, P. (1998). “IMC: a consumer psychological perspective”,
Marketing Intelligence & Planing, 16(3), 229-235
Hohmann, U. (2005). Quantitative Methods in Education Research. Centre for
teaching mathemetics, Retrieved from
http://www.edu.plymouth.ac.uk/resined/Quantitative/quanthme.htm
Livette, M. (2006). A marketing perspective of private sector retirement housing and
the effectiveness of the buyer behaviour of its purchasers, Property Management, 24
(4), 383 – 396.
Lindstrom, M. Brand Sense. Kogan Page Limited, 2005. 237
Montaner, T. Chernatony, L.d. & Buil, I. (2011), “Consumer response to gift
promotions”, Journal of Product & Brand Management, 20, 101-110.
VII
ROSENBERG. (2011), A Structural Theory of Attitude Dynamics, American
Association for Public Opinion Research, 24 (2), 319-340
Solomon, M. Consumer Behaviour. A Europien Perspective /M. Solomon, G.
Bamossy, S. Askegaard. Prentice Hall, 2002, 126-153.
Nelsen, J., Lott, L., & Glenn, H.S. (2000). Positive discipline in the classroom:
Developing mutual respect, cooperation, and responsibility in your classroom (3rd
ed.). Rocklin, CA: Prima Publishing.
Olive, E. (2007), Behavior management and behavioral change,
PositiveBehaviorFacilitation Tool#3, 1-6
Woods, P. (2006), Qualitative Research. Educational research in action. Retrieved
from
http://www.edu.plymouth.ac.uk/resined/qualitative%20methods%202/qualrshm.htm
Zimmermann, F. & Sieverding, M. (2010), Young adults' social drinking as explained
by an augmented theory of planned behaviour: The roles of prototypes, willingness,
and gender, The Oritish Psychological Society, 15, 561-581.
Website :
Advameg (2011). Food in every country. Retrieved April 15, 2011, from
http://www.foodbycountry.com/Spain-to-Zimbabwe-Cumulative-Index/Thailand.html
Advameg (2011b). Marketing communication. Retrieved May 10, 2011, from
http://www.referenceforbusiness.com/management/Log-Mar/Marketing-
Communication.html
Central Intelligence Agency (2011). The world factbook. Retrieved April 3, 2011,
from https://www.cia.gov/library/publications/the-world-factbook/geos/th.html
VIII
CHLA (2010). Teen Impact. Retrieved May 18, 2011, from
http://www.chla.org/site/c.ipINKTOAJsG/b.3768089/
Cps (2009). Statistic of total population in Thailand. Retrieved June 4, 2011, from
http://www.cps.chula.ac.th/pop_info_2551/Image+Data/Thailand_demographic_data/
TDD/pic_th_is_thai_demo_data-People_Statistics.html
Changing Minds (2002-2011a). Types of data. Retrieved June 6, 2011, from
http://changingminds.org/explanations/research/measurement/types_data.htm
Changing Minds (2002-2011b). Likert Scale. Retrieved June 6, 2011, from
http://changingminds.org/explanations/research/measurement/likert_scale.htm
Design and Marketing Dictionary (2009). Comparative rating scale. Retrieved June 6,
2011, from http://design-marketing-dictionary.blogspot.com/2010/01/comparative-
rating-scale.html
Dopa (2011). Department of Provincial Administration. Retrieved April 19, 2011,
from http://www.dopa.go.th/
Eduinn (2010). Tricomponent Attitude Model. Retrieved April 3, 2011, from
http://www.eduinn.pk/2010/06/edureadings-tricomponent-attitude-model.html
Famouswonders (2011). Thai Drink. Retrieved April 3, 2011, from
http://famouswonders.com/thai-drinks/
Fit (2011). 7 Most Valuable of Thai’s Beverage Market. Retrieved April 3, 2011,
from
http://www.foodindustrythailand.com/v17/index.php?option=com_content&view=arti
cle&id=1039:yeast&catid=34:branding-and-marketing&Itemid=138
IX
Foodbycountry (2001). GEOGRAPHIC SETTING AND ENVIRONMENT.
Retrieved April 3, 2011, from http://www.foodbycountry.com/Spain-to-Zimbabwe-
Cumulative-Index/Thailand.html
Fundinguniverse (2002). Company Perspective. Retrieved April 3, 2011, from
http://www.fundinguniverse.com/company-histories/Red-Bull-GmbH-Company-
History.html
Gazebo (2008). Critical of energy drink. Retrieved April 3, 2011, from
http://inside.cm.mahidol.ac.th/mkt/index.php?option=com_content&view=article&id
=119:2008-09-05-15-11-52&catid=1:mk-articles&Itemid=11
Gotomanager (2008). Energy drink increases brand image by teenager. Retrieved
May 9, 2011, from http://www.gotomanager.com/news/details.aspx?id=79157
Israel (2009). Using Formulas To Calculate A Sample Size.
Retrived April 15, 2011, from http://edis.ifas.ufl.edu/pd006
Lrs (2001). Methodology. Retrieved April 3, 2011, from
http://lrs.ed.uiuc.edu/tse-portal/literaturereview/junghyun-an-literature-
review/literature-review.html
MK11A (2008). Critical of energy drink. Retrieved May 8, 2011 from
http://inside.cm.mahidol.ac.th/mkt/index.php?option=com_content&view=article&id
=119:2008-09-05-15-11-52&catid=1:mk-articles&Itemid=11
MMC (2009). What is IMC?. Retrieved May 9, 2011, from
http://www.multimediamarketing.com/mkc/marketingcommunications/
Marketing Teacher (2000-2011). Direct Marketing. Retrieved June 6, 2011, from
http://marketingteacher.com/lesson-store/lesson-direct-marketing.html
M-150 (2010). M Gang Big Gift Big Friends . Retrieved May 9, 2011, from
X
http://www.m-150.com/activity_miniiphone/
Na-vigator (2010). Created brand by IMC. Retrieved May 9, 2011, 2011, from
http://www.na-vigator.com/business-management/marketing/173-branding-with-crm
Positioning (2005). Stimulus marketing of energy drinks in 2005. Retrieved May 8,
201, from http://www.positioningmag.com/prnews/prnews.aspx?id=27651
Smartkpis (2010), Posioning Map. Retrieved May 9, 2011, from
http://www.smartkpis.com/blog/tag/perceptual-maps/
Taylor-ms (2010). Marketing communication Wheel. Retrieved May 9, 2011, from
http://www.taylor-ms.co.uk/page2.htm
Textbook Exchange Canada (2004-2008). Questionnaire design. Retrieved June 6,
2011, from http://www.textbookexchange.ca/marketingresearchcheatsheet.html
Thai Shuang Hyong (2010). Rapid growth of Thai convenient store more than 42%
within 5 years. Retrieved May 19, 2011, from
http://www.121easy.com/content.php?id=1130
Wong (2006). Energy drink. Retrieved May 9, 2011, from
http://altmedicine.about.com/od/completeazindex/a/energy_drinks.htm

XI
Appendixes
Appendix A: Questionnaire (English version)
QUESTIONNAIRE
This questionnaire has been developed by Mälardalen University Student to
use for EFO705: Master Thesis in semester 2/2010. Please give us some few minutes
of your time to answer this questionnaire. All of your information will be treated with
high confidentially and use for education purpose only. Please complete all question
by mark “�” in the ▢ or space given below the following question.
Thank you for your kind cooperation
1. Which kind of drinks would you preferred, when you thirsty? (Can choose more
than one)
▢ Water/Mineral Water ▢ Fruit Juice
▢ Coffee/Tea ▢ Milk
▢ Energy Drink ▢ Other, (Please specify)__________________
2. Have you ever drink energy drink?
▢ Yes
▢ No (Go to question no.10)
3. What is your opinion about energy drink?
_____________________________________________________________________
_____________________________________________________________________
4. When talking about energy drink, which brand do you think first? (Choose only
one)
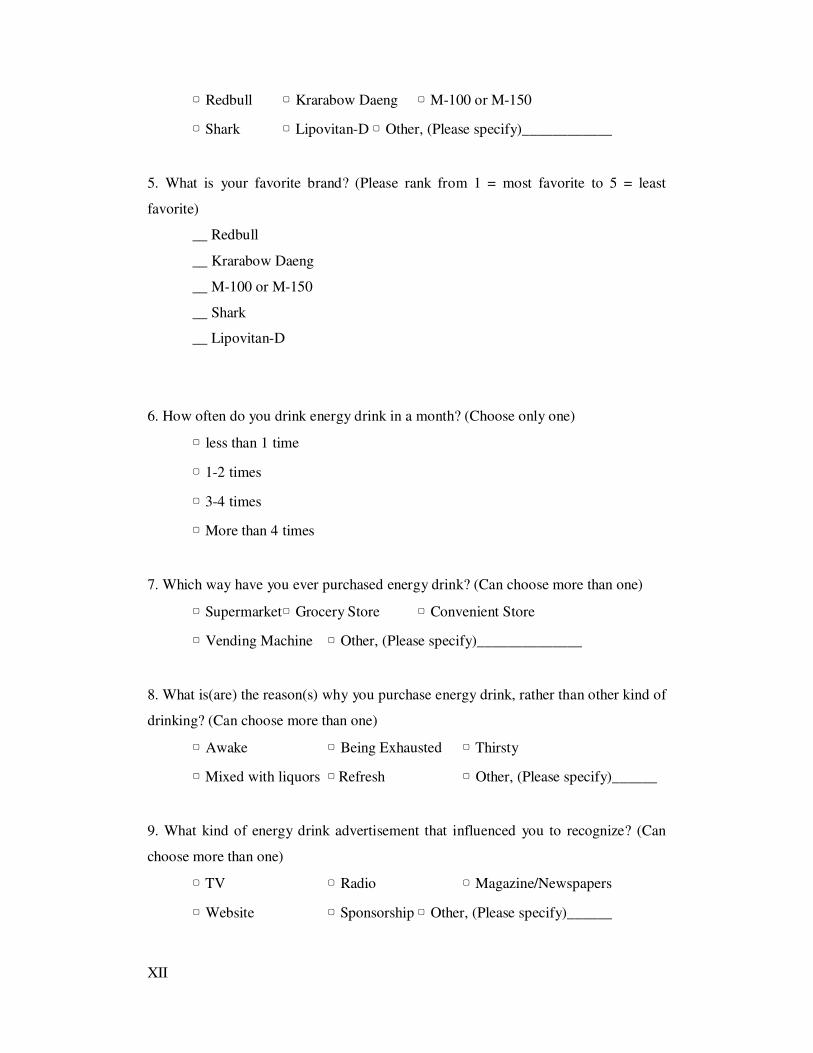
XII
▢ Redbull ▢ Krarabow Daeng ▢ M-100 or M-150
▢ Shark ▢ Lipovitan-D ▢ Other, (Please specify)____________
5. What is your favorite brand? (Please rank from 1 = most favorite to 5 = least
favorite)
__ Redbull
__ Krarabow Daeng
__ M-100 or M-150
__ Shark
__ Lipovitan-D
6. How often do you drink energy drink in a month? (Choose only one)
▢ less than 1 time
▢ 1-2 times
▢ 3-4 times
▢ More than 4 times
7. Which way have you ever purchased energy drink? (Can choose more than one)
▢ Supermarket ▢ Grocery Store ▢ Convenient Store
▢ Vending Machine ▢ Other, (Please specify)______________
8. What is(are) the reason(s) why you purchase energy drink, rather than other kind of
drinking? (Can choose more than one)
▢ Awake ▢ Being Exhausted ▢ Thirsty
▢ Mixed with liquors ▢ Refresh ▢ Other, (Please specify)______
9. What kind of energy drink advertisement that influenced you to recognize? (Can
choose more than one)
▢ TV ▢ Radio ▢ Magazine/Newspapers
▢ Website ▢ Sponsorship ▢ Other, (Please specify)______
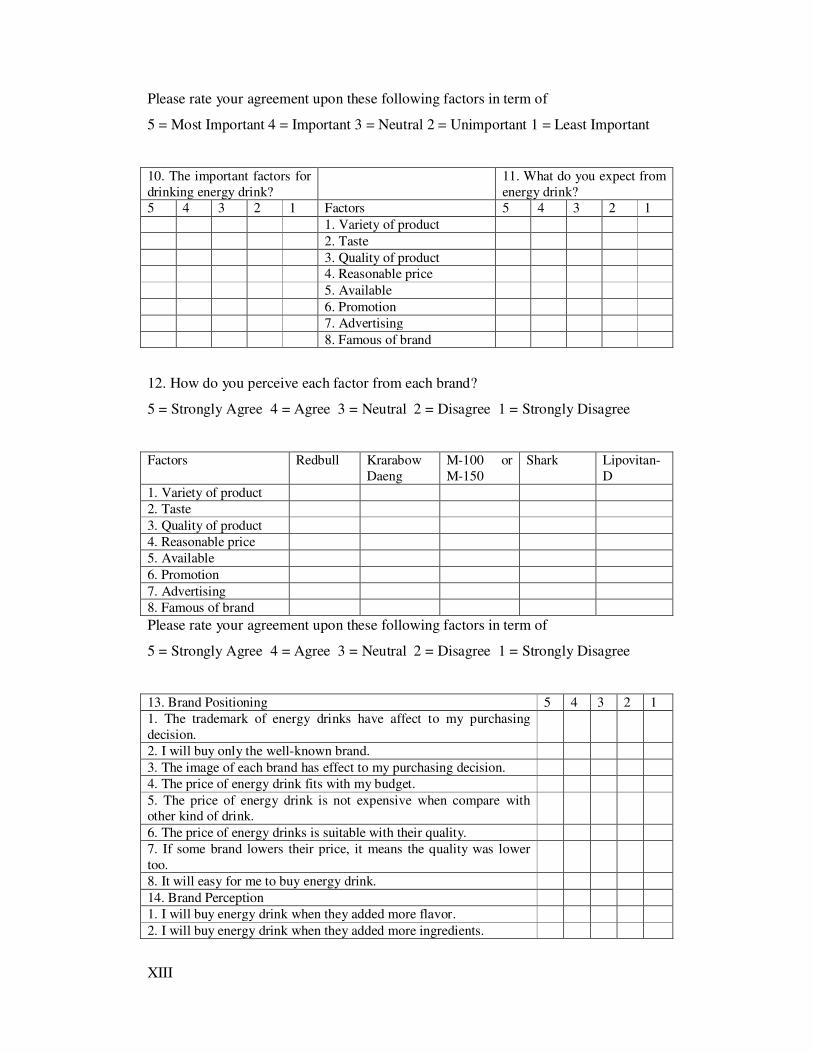
XIII
Please rate your agreement upon these following factors in term of
5 = Most Important 4 = Important 3 = Neutral 2 = Unimportant 1 = Least Important
10. The important factors for drinking energy drink?
11. What do you expect from energy drink?
5 4 3 2 1 Factors 5 4 3 2 1
1. Variety of product
2. Taste
3. Quality of product 4. Reasonable price
5. Available
6. Promotion
7. Advertising
8. Famous of brand
12. How do you perceive each factor from each brand?
5 = Strongly Agree 4 = Agree 3 = Neutral 2 = Disagree 1 = Strongly Disagree
Factors Redbull Krarabow Daeng
M-100 or M-150
Shark Lipovitan-D
1. Variety of product
2. Taste
3. Quality of product
4. Reasonable price
5. Available
6. Promotion
7. Advertising
8. Famous of brand
Please rate your agreement upon these following factors in term of
5 = Strongly Agree 4 = Agree 3 = Neutral 2 = Disagree 1 = Strongly Disagree
13. Brand Positioning 5 4 3 2 1
1. The trademark of energy drinks have affect to my purchasing decision.
2. I will buy only the well-known brand.
3. The image of each brand has effect to my purchasing decision.
4. The price of energy drink fits with my budget.
5. The price of energy drink is not expensive when compare with other kind of drink.
6. The price of energy drinks is suitable with their quality.
7. If some brand lowers their price, it means the quality was lower too.
8. It will easy for me to buy energy drink.
14. Brand Perception
1. I will buy energy drink when they added more flavor.
2. I will buy energy drink when they added more ingredients.

XIV
3. The package of energy drink influences me to buy.
4. I will buy energy drink when they added more aromas.
5. I will buy energy drink when I need more energy.
15. Promotion
1. I will buy energy drink when I see buy 1 get 1 free promotion.
2. The sweepstake influences me to buy energy drink.
3. I will buy energy drink if they bundling with other product.
4. If they have product sample, I will test and buy it.
5. I will buy energy drink if they have premium.
16. Integrated Marketing Communication (IMC)
1. I always see advertising of energy drink.
2. The advertising of energy drink is attractive.
3. The advertising can influence me to buy energy drink.
4. Energy drinks always have many advertisements.
5. Energy drinks have many ways to communicate with the customers.
6. I always heard the news about energy drink.
Personal Data
17. Gender
▢ Male ▢ Female
18. Age
▢ Lower than 18 years ▢ 18-25 years ▢ 26-33 years
▢ 34-40 years ▢ More than 40 years
19. Education
▢ High School ▢ Bachelor Degree ▢ Master Degree
▢ Doctoral ▢ Other, (Please specify)_____________
20. Occupation
▢ Student ▢ Government ▢ Employee
▢ Own Business ▢ Other, (Please specify)_____________
21. Monthly Income
XV
▢ Lower than 6,000 baht ▢ 6,001-9,000 baht
▢ 9,001-15,000 baht ▢ 15,001-20,000 baht
▢ 20,001-25,000 baht ▢ 25,001-30,000 baht
▢ More than 30,001 baht
XVI
Appendix B: Questionnaire (Thai version)
แบบสอบถาม
แบบสอบถามชดน�จดทาโดยนกศกษาจากมหาวทยาลย Mälardalen University ประเทศสวเดน
ซ0งใชสาหรบวชาEFO705: Master Thesis ในภาคการศกษา 2/2010 กรณาสละเวลาเพยงไมก0นาทของทาน
ในการตอบแบบสอบถามชดน� ขอมลทกอยางของทานจะถกเกบเปนความลบและใชสาหรบการศกษา
เทาน�น กรณาตอบคาถามทกขอโดยการ “�” ใน “�” หรอ พ�นท0วางในคาถามแตละขอ
ขอบพระคณทกทานท0กรณาใหความรวมมอ
1. เคร0องด0มชนดใดท0ทานตองการเม0อทานมความรสกกระหายน�า (สามารถเลอกตอบไดมากกวา 1
ขอ)
� น�าด0ม/น�าแร � น�าผลไม
� ชา/กาแฟ � นม
� เคร0องด0มบารงกาลง � อ0นๆ, (กรณาระบ)_________________
2. คณเคยด0มเคร0องด0มบารงกาลงหรอไม?
� เคย � ไมเคย (ขามไปขอ 10.)
3. คณมความคดเหนอยางไรเก0ยวกบเคร0องด0มบารงกาลง?
4. เม0อพดถงเคร0องด0มบารงกาลง ย0หออะไรท0จะมาเปนอนดบแรกในใจคณ? (สามารถตอบไดเพยง
ขอเดยว)
XVII
� กระทงแดง � คาราบาวแดง � เอม100/เอม150
� Shark � ลโพวตน ด � อ0นๆ, (กรณาระบ)_______________
5. เคร0องด0มบารงกาลงย0หออะไรท0คณชอบมากท0สด? (กรณาเรยงลาดบจาก 1=ชอบมากท0สด ไปถง
5=ชอบนอยท0สด)
__กระทงแดง
__คาราบาวแดง
__เอม100/เอม150
__Shark
__ลโพวตน ด
6. คณด0มเคร0องด0มบารงกาลงบอยแคไหนภายในระยะเวลา 1 เดอน? (สามารถตอบไดเพยงขอเดยว)
� นอยกวา 1 คร� ง � 1-2 คร� ง
� 3-4 คร� ง � มากกวา 4 คร� ง
7. โดยปกตคณซ�อเคร0องด0มบารงกาลงจากท0ใด? (สามารถเลอกตอบไดมากกวา 1 ขอ)
� ซปเปอรมารเกต � รานขายของชา � รานสะดวกซ�อ
� เคร0องจาหนายอตโนมต � อ0นๆ, (กรณาระบ)_______________
8. อะไรคอเหตผลท0ทาใหคณซ�อเคร0องด0มบารงกาลงมากกวาเคร0องด0มชนดอ0นๆ? (สามารถ
เลอกตอบไดมากกวา 1 ขอ)
� ตองการต0นตว � เตมพลงงาน � กระหายน�า
� ผสมกบเคร0องด0มชนดอ0น � ตองการความสดช0น
� อ0นๆ, (กรณาระบ)_____________
9. ส0อโฆษณาชนดใดท0ทาใหคณสามารถจดจาไดมากท0สด? (สามารถเลอกตอบไดมากกวา 1 ขอ)
� โฆษณาโทรทศน � วทย

XVIII
�หนงสอพมพ/นตยสาร � อนเตอรเนท
� สปอนเซอรรายการตางๆ � อ0นๆ, (กรณาระบ)________________
กรณาระบความคดเหนของคณท0มตอปจจยดงตอไปน�
= สาคญท0สด 4 = สาคญ 3 = ปานกลาง 2 = ไมสาคญ 1 = สาคญนอยท0สด
10.ปจจยท0สาคญในการด0มเคร0องด0มบารงกาลง?
11.คณคาดหวงอะไรจากเคร0องด0มบารงกาลง?
5 4 3 2 1 ปจจยตางๆ 5 4 3 2 1
1.มผลตภณฑใหเลอกเยอะ
2.รสชาต
3.คณภาพของสนคา
4.ราคาสมเหตสมผล
5.สถานท0จาหนาย
6.โปรโมช0นตางๆ
7.การโฆษณา
8.ความมช0อเสยงของย0หอ
12. คณมความคาดหวงอยางไรในปจจยดงตอไปน� ท0มผลตอแตละย0หอ?
5 = เหนดวยอยางย0ง 4 = เหนดวย 3 = ปานกลาง 2 = ไมเหนดวย 1 = ไมเหนดวยอยางย0ง
ปจจยตางๆ กระทงแดง คาราบาวแดง
เอม100 /
เอม150
Shark ลโพวตนด
1.มผลตภณฑใหเลอกเยอะ
2.รสชาต
3.คณภาพของสนคา
4.ราคาสมเหตสมผล
5.สถานท0จาหนาย
6.โปรโมช0นตางๆ
7.การโฆษณา
8.ความมช0อเสยงของย0หอ
กรณาแสดงความคดเหนของคณเก0ยวกบปจจยตางๆดงตอไปน�
5 = เหนดวยอยางย0ง 4 = เหนดวย 3 = ปานกลาง 2 = ไมเหนดวย 1 = ไมเหนดวยอยางย0ง
13. ตาแหนงของแบรนด 5 4 3 2 1
เคร0องหมายการคาของเคร0องด0มบารงกาลงมผลตอการตดสนใจซ�อ
ฉนจะซ�อแตย0หอท0รจกเทาน�น
XIX
ภาพลกษณของแตละย0หอมผลตอการตดสนใจซ�อของฉน
ราคาของเคร0องด0มบารงกาลงพอดกบรายไดของฉน
ราคาของเคร0องด0มบารงกาลงไมแพงจนเกนไปเม0อเปรยบเทยบกบเคร0องด0มอ0นๆ
ราคาของเคร0องด0มบารงกาลงเหมาะสมกบคณภาพ
เม0อมย0หอใดย0หอหน0งลดราคาหมายความวาคณภาพตองลดลงไปดวย
มนงายมากสาหรบฉนในการซ�อเคร0 องด0มบารงกาลง
14. การรบรของลกคาท�มตอแบรนด
ฉนจะซ�อเคร0องด0มบารงกาลงถาหากมการเพ0มรสชาต
ฉนจะซ�อเคร0องด0มบารงกาลงถาหากมการเพ0มสวนผสมอ0นๆ
บรรจภณฑของเคร0องด0มบารงกาลงกระตนใหฉนตดสนใจซ�อ
ฉนจะซ�อเคร0องด0มบารงกาลงถาหากมการเพ0มกล0นหอม
ฉนจะซ�อเคร0องด0มบารงกาลงถาหากฉนมการใชพลงงานรางกายและตองการพลงงานเพ0ม
15. โปรโมช�น
ฉนจะซ�อเคร0องด0มบารงกาลงหากมการซ�อ 1 แถม 1
การจบฉลากชงโชคกระตนใหฉนซ�อเคร0องด0มบารงกาลง
ฉนจะซ�อเคร0องด0มบารงกาลงหากมการขายคกบสนคาชนดอ0นๆ
หากมการใหทดลองชม ฉนจะทาการทดลองและซ�อสนคา
ฉนจะซ�อเคร0องด0มบารงกาลงหากมการแจกของแถม
16. การส�อสารการตลาดแบบบรณาการ (IMC)
ฉนมกจะเหนโฆษณาของเคร0องด0มบารงกาลงตามส0อตางๆ
การโฆษณาของเคร0องด0มบารงกาลงเปนท0นาสนใจ
การโฆษณาของเคร0องด0มบารงกาลงกระตนใหฉนซ�อสนคา
เคร0องด0มบารงกาลงแตละย0หอมกจะมโฆษณาท0หลากหลาย
เคร0องด0มบารงกาลงย0หอตางๆมการตดตอส0อสารกบลกคาท0หลากหลาย
ฉนมกจะไดยนขาวเก 0ยวกบเคร0องด0มบารงกาลงเสมอ
ขอมลท0วไป
17. เพศ
� ชาย � หญง
18. อาย
� ต0ากวา 18 ป � 18-25 ป � 26-33 ป
� 34-40 ป � 41 ปข�นไป
19. การศกษา
� มธยมศกษา � ปรญญาตร � ปรญญาโท
� ปรญญาเอก � อ0นๆ, (กรณาระบ)_____________
XX
20. อาชพ
� นกเรยน/นกศกษา � รบราชการ � พนกงานบรษท
� ธรกจสวนตว � อ0นๆ, (กรณาระบ)______________
21. รายไดตอเดอน
� ต0ากวา 6,000 บาท � 6,001-9,000 บาท � 9,001-15,000 บาท
� 15,001-20,000 บาท � 20,001-25,000 บาท � 25,001-30,000 บาท
� มากกวา 30,001 บาท

XXI
Appendix C: Questionnaire Result
Part I: Screening Respondents
Water/Mineral Water
Frequency Percent
Valid
Percent
Cumulative
Percent
Valid Don't choose 109 27.2 27.2 27.2
Choose 291 72.8 72.8 100.0
Total 400 100.0 100.0
Fruit Juice
Frequency Percent
Valid
Percent
Cumulative
Percent
Valid Don't choose 253 63.2 63.2 63.2
Choose 147 36.8 36.8 100.0
Total 400 100.0 100.0
Coffee/Tea
Frequency Percent
Valid
Percent
Cumulative
Percent
Valid Don't choose 323 80.8 80.8 80.8
Choose 77 19.2 19.2 100.0
Total 400 100.0 100.0
Milk
Frequency Percent
Valid
Percent
Cumulative
Percent
Valid Don't choose 351 87.8 87.8 87.8
Choose 49 12.2 12.2 100.0
Total 400 100.0 100.0
Energy Drink

XXII
Frequency Percent
Valid
Percent
Cumulative
Percent
Valid Don't choose 345 86.2 86.2 86.2
Choose 55 13.8 13.8 100.0
Total 400 100.0 100.0
Other
Frequency Percent
Valid
Percent
Cumulative
Percent
Valid Don't choose 366 91.5 91.5 91.5
Choose 34 8.5 8.5 100.0
Total 400 100.0 100.0
Have you ever drink energy drink?
Frequency Percent
Valid
Percent
Cumulative
Percent
Valid Yes 225 56.2 56.2 56.2
No 175 43.8 43.8 100.0
Total 400 100.0 100.0
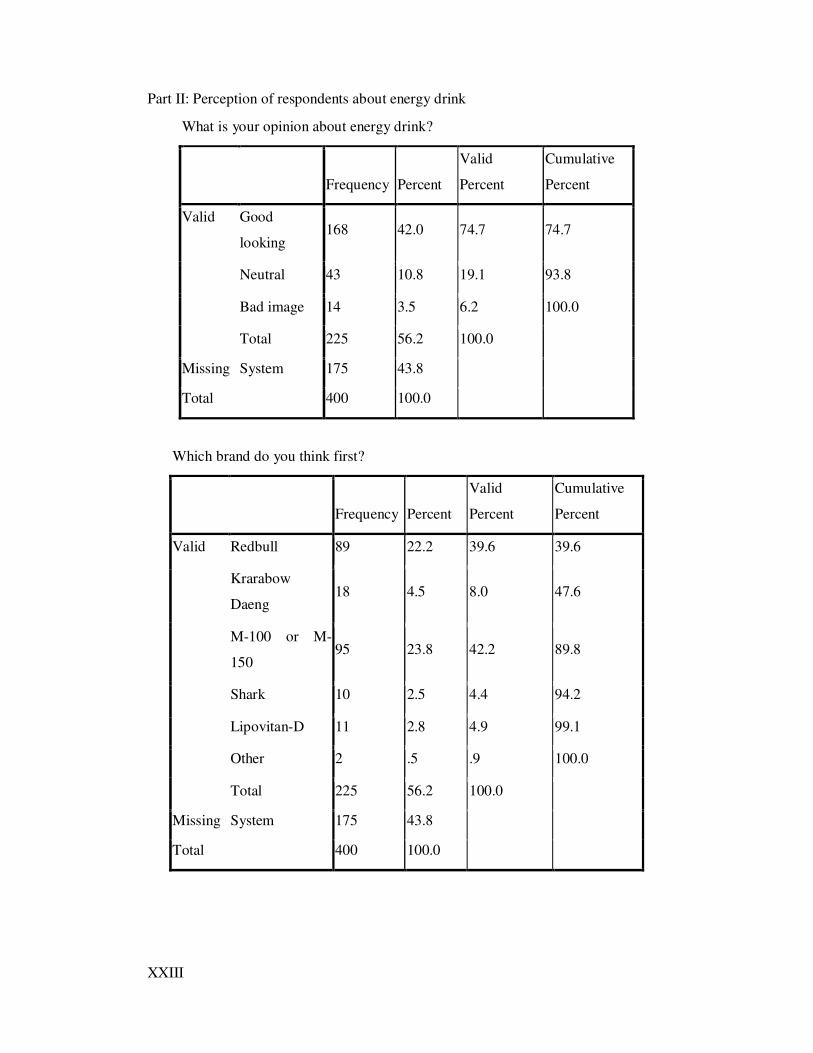
XXIII
Part II: Perception of respondents about energy drink
What is your opinion about energy drink?
Frequency Percent
Valid
Percent
Cumulative
Percent
Valid Good
looking 168 42.0 74.7 74.7
Neutral 43 10.8 19.1 93.8
Bad image 14 3.5 6.2 100.0
Total 225 56.2 100.0
Missing System 175 43.8
Total 400 100.0
Which brand do you think first?
Frequency Percent
Valid
Percent
Cumulative
Percent
Valid Redbull 89 22.2 39.6 39.6
Krarabow
Daeng 18 4.5 8.0 47.6
M-100 or M-
150 95 23.8 42.2 89.8
Shark 10 2.5 4.4 94.2
Lipovitan-D 11 2.8 4.9 99.1
Other 2 .5 .9 100.0
Total 225 56.2 100.0
Missing System 175 43.8
Total 400 100.0
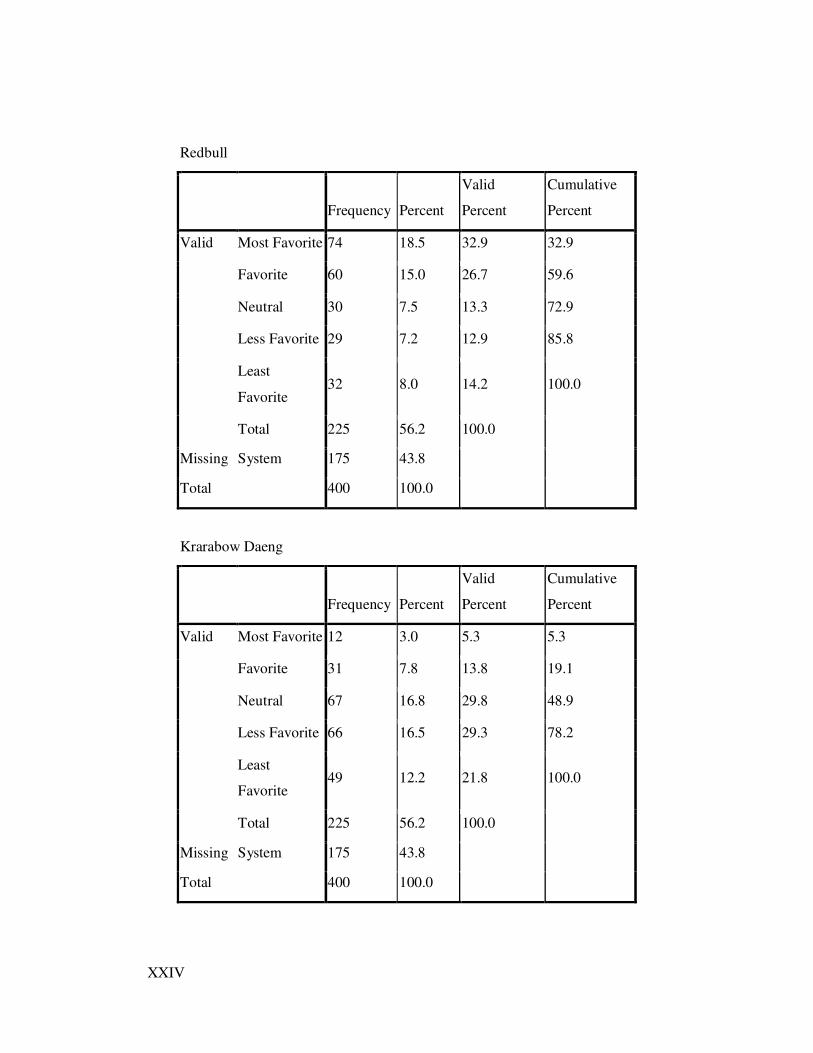
XXIV
Redbull
Frequency Percent
Valid
Percent
Cumulative
Percent
Valid Most Favorite 74 18.5 32.9 32.9
Favorite 60 15.0 26.7 59.6
Neutral 30 7.5 13.3 72.9
Less Favorite 29 7.2 12.9 85.8
Least
Favorite 32 8.0 14.2 100.0
Total 225 56.2 100.0
Missing System 175 43.8
Total 400 100.0
Krarabow Daeng
Frequency Percent
Valid
Percent
Cumulative
Percent
Valid Most Favorite 12 3.0 5.3 5.3
Favorite 31 7.8 13.8 19.1
Neutral 67 16.8 29.8 48.9
Less Favorite 66 16.5 29.3 78.2
Least
Favorite 49 12.2 21.8 100.0
Total 225 56.2 100.0
Missing System 175 43.8
Total 400 100.0
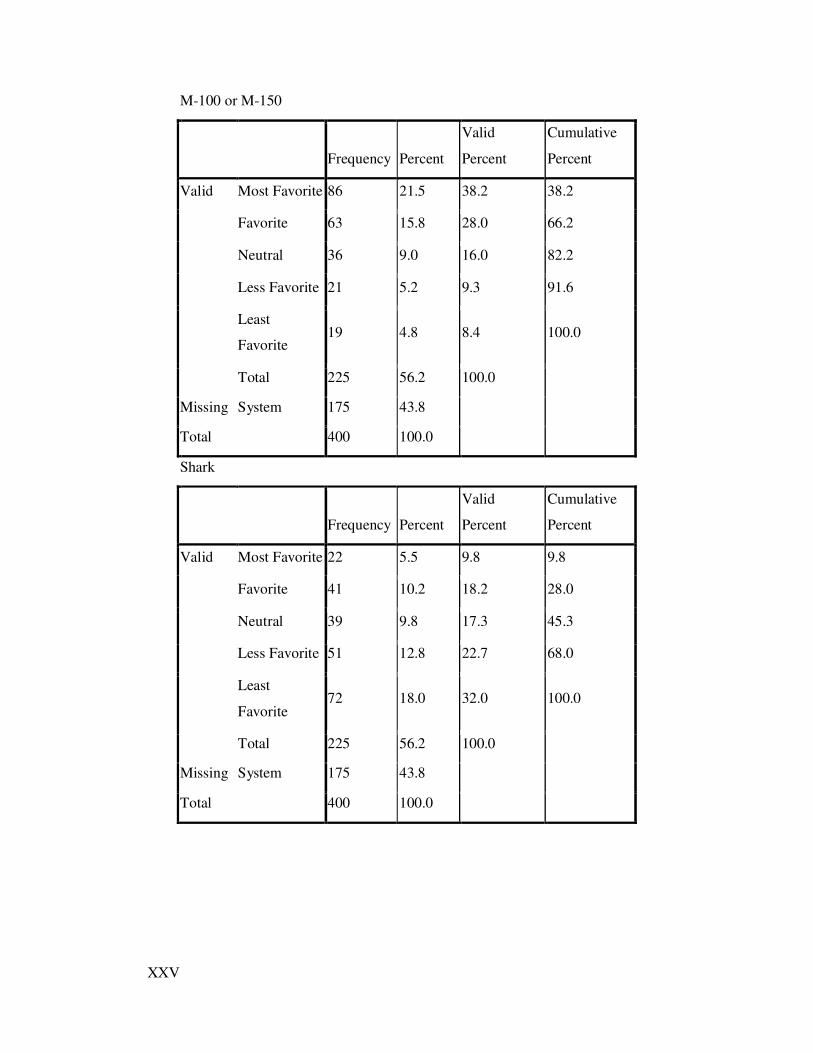
XXV
M-100 or M-150
Frequency Percent
Valid
Percent
Cumulative
Percent
Valid Most Favorite 86 21.5 38.2 38.2
Favorite 63 15.8 28.0 66.2
Neutral 36 9.0 16.0 82.2
Less Favorite 21 5.2 9.3 91.6
Least
Favorite 19 4.8 8.4 100.0
Total 225 56.2 100.0
Missing System 175 43.8
Total 400 100.0
Shark
Frequency Percent
Valid
Percent
Cumulative
Percent
Valid Most Favorite 22 5.5 9.8 9.8
Favorite 41 10.2 18.2 28.0
Neutral 39 9.8 17.3 45.3
Less Favorite 51 12.8 22.7 68.0
Least
Favorite 72 18.0 32.0 100.0
Total 225 56.2 100.0
Missing System 175 43.8
Total 400 100.0

XXVI
Lipovitan-D
Frequency Percent
Valid
Percent
Cumulative
Percent
Valid Most Favorite 30 7.5 13.3 13.3
Favorite 31 7.8 13.8 27.1
Neutral 54 13.5 24.0 51.1
Less Favorite 57 14.2 25.3 76.4
Least
Favorite 53 13.2 23.6 100.0
Total 225 56.2 100.0
Missing System 175 43.8
Total 400 100.0
How often do you drink energy drink?
Frequency Percent
Valid
Percent
Cumulative
Percent
Valid Less than 1 time 114 28.5 50.7 50.7
1-2 times 65 16.2 28.9 79.6
3-4 times 21 5.2 9.3 88.9
More than 4
times 25 6.2 11.1 100.0
Total 225 56.2 100.0
Missing System 175 43.8
Total 400 100.0
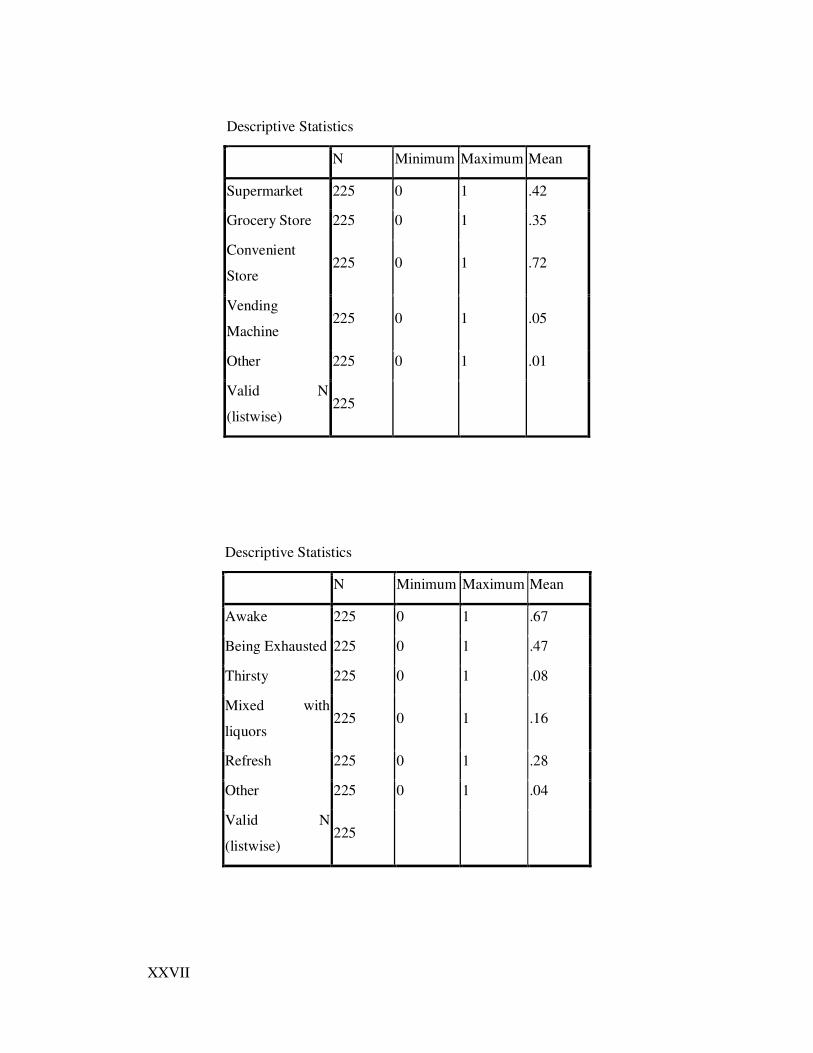
XXVII
Descriptive Statistics
N Minimum Maximum Mean
Supermarket 225 0 1 .42
Grocery Store 225 0 1 .35
Convenient
Store 225 0 1 .72
Vending
Machine 225 0 1 .05
Other 225 0 1 .01
Valid N
(listwise) 225
Descriptive Statistics
N Minimum Maximum Mean
Awake 225 0 1 .67
Being Exhausted 225 0 1 .47
Thirsty 225 0 1 .08
Mixed with
liquors 225 0 1 .16
Refresh 225 0 1 .28
Other 225 0 1 .04
Valid N
(listwise) 225

XXVIII
Descriptive Statistics
N Minimum Maximum Mean
TV 225 0 1 .87
Radio 225 0 1 .19
Magazine/Newspaper
s 225 0 1 .16
Website 225 0 1 .09
Sponsorship 225 0 1 .24
Other 225 0 1 .03
Valid N (listwise) 225
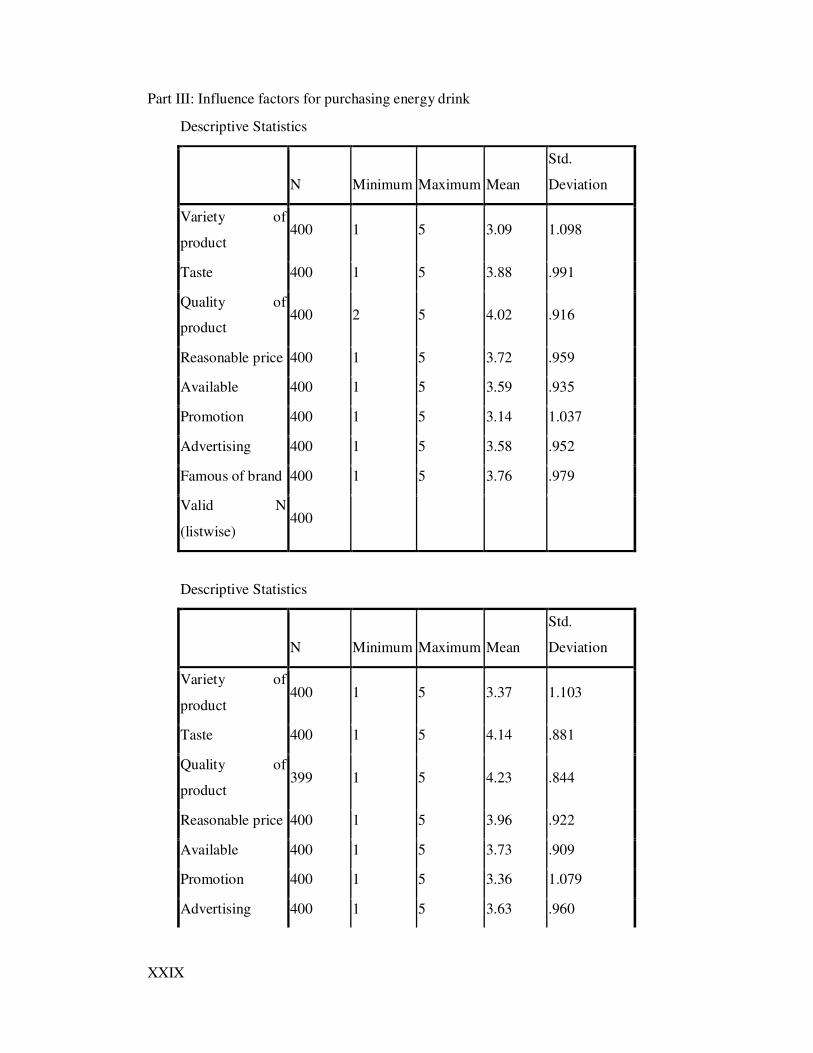
XXIX
Part III: Influence factors for purchasing energy drink
Descriptive Statistics
N Minimum Maximum Mean
Std.
Deviation
Variety of
product 400 1 5 3.09 1.098
Taste 400 1 5 3.88 .991
Quality of
product 400 2 5 4.02 .916
Reasonable price 400 1 5 3.72 .959
Available 400 1 5 3.59 .935
Promotion 400 1 5 3.14 1.037
Advertising 400 1 5 3.58 .952
Famous of brand 400 1 5 3.76 .979
Valid N
(listwise) 400
Descriptive Statistics
N Minimum Maximum Mean
Std.
Deviation
Variety of
product 400 1 5 3.37 1.103
Taste 400 1 5 4.14 .881
Quality of
product 399 1 5 4.23 .844
Reasonable price 400 1 5 3.96 .922
Available 400 1 5 3.73 .909
Promotion 400 1 5 3.36 1.079
Advertising 400 1 5 3.63 .960
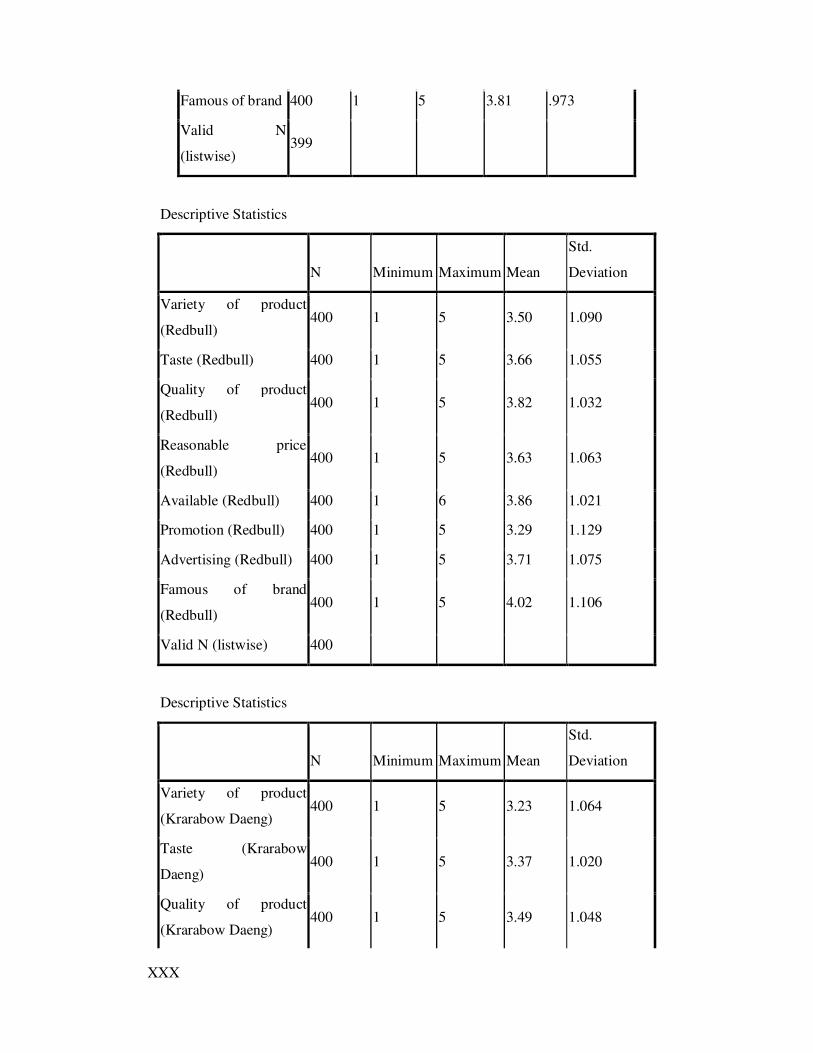
XXX
Famous of brand 400 1 5 3.81 .973
Valid N
(listwise) 399
Descriptive Statistics
N Minimum Maximum Mean
Std.
Deviation
Variety of product
(Redbull) 400 1 5 3.50 1.090
Taste (Redbull) 400 1 5 3.66 1.055
Quality of product
(Redbull) 400 1 5 3.82 1.032
Reasonable price
(Redbull) 400 1 5 3.63 1.063
Available (Redbull) 400 1 6 3.86 1.021
Promotion (Redbull) 400 1 5 3.29 1.129
Advertising (Redbull) 400 1 5 3.71 1.075
Famous of brand
(Redbull) 400 1 5 4.02 1.106
Valid N (listwise) 400
Descriptive Statistics
N Minimum Maximum Mean
Std.
Deviation
Variety of product
(Krarabow Daeng) 400 1 5 3.23 1.064
Taste (Krarabow
Daeng) 400 1 5 3.37 1.020
Quality of product
(Krarabow Daeng) 400 1 5 3.49 1.048
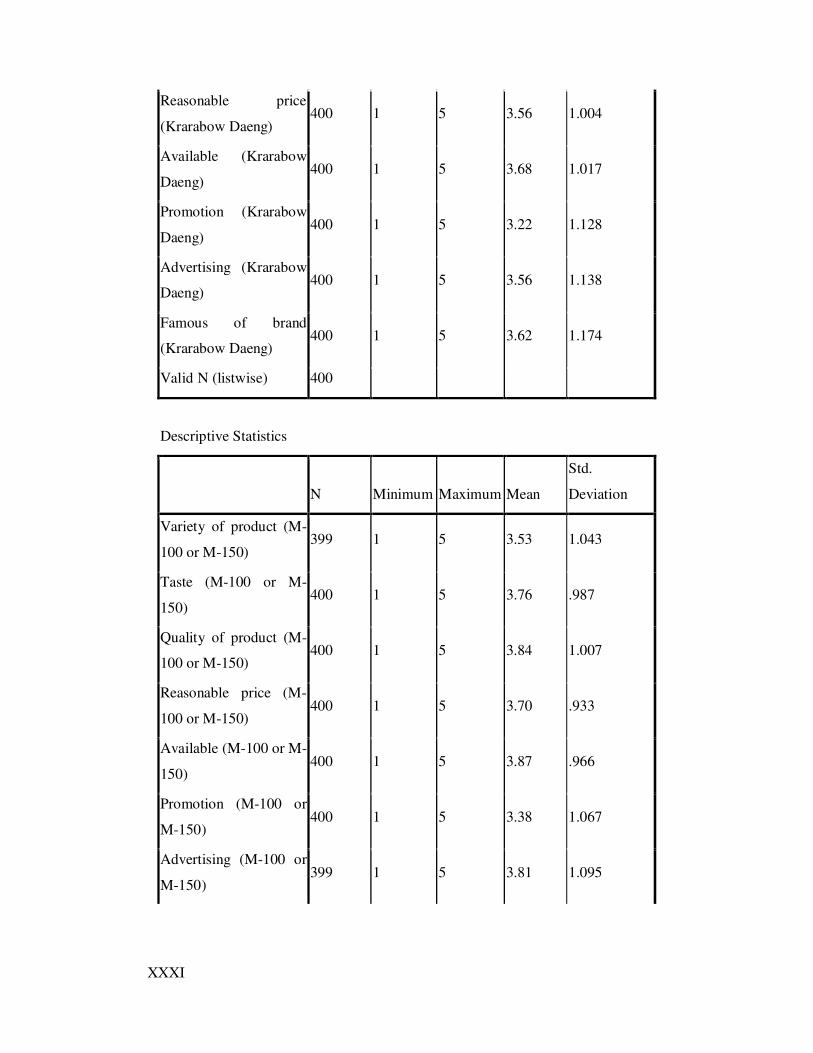
XXXI
Reasonable price
(Krarabow Daeng) 400 1 5 3.56 1.004
Available (Krarabow
Daeng) 400 1 5 3.68 1.017
Promotion (Krarabow
Daeng) 400 1 5 3.22 1.128
Advertising (Krarabow
Daeng) 400 1 5 3.56 1.138
Famous of brand
(Krarabow Daeng) 400 1 5 3.62 1.174
Valid N (listwise) 400
Descriptive Statistics
N Minimum Maximum Mean
Std.
Deviation
Variety of product (M-
100 or M-150) 399 1 5 3.53 1.043
Taste (M-100 or M-
150) 400 1 5 3.76 .987
Quality of product (M-
100 or M-150) 400 1 5 3.84 1.007
Reasonable price (M-
100 or M-150) 400 1 5 3.70 .933
Available (M-100 or M-
150) 400 1 5 3.87 .966
Promotion (M-100 or
M-150) 400 1 5 3.38 1.067
Advertising (M-100 or
M-150) 399 1 5 3.81 1.095

XXXII
Famous of brand (M-
100 or M-150) 400 1 5 3.90 1.110
Valid N (listwise) 398
Descriptive Statistics
N Minimum Maximum Mean
Std.
Deviation
Variety of product
(Shark) 400 1 43 3.07 2.300
Taste (Shark) 400 1 5 3.29 1.102
Quality of product
(Shark) 400 1 5 3.39 1.107
Reasonable price
(Shark) 400 1 5 3.36 1.064
Available (Shark) 400 1 5 3.45 1.110
Promotion (Shark) 400 1 5 3.00 1.177
Advertising (Shark) 400 1 5 3.07 1.166
Famous of brand
(Shark) 400 1 5 3.18 1.169
Valid N (listwise) 400
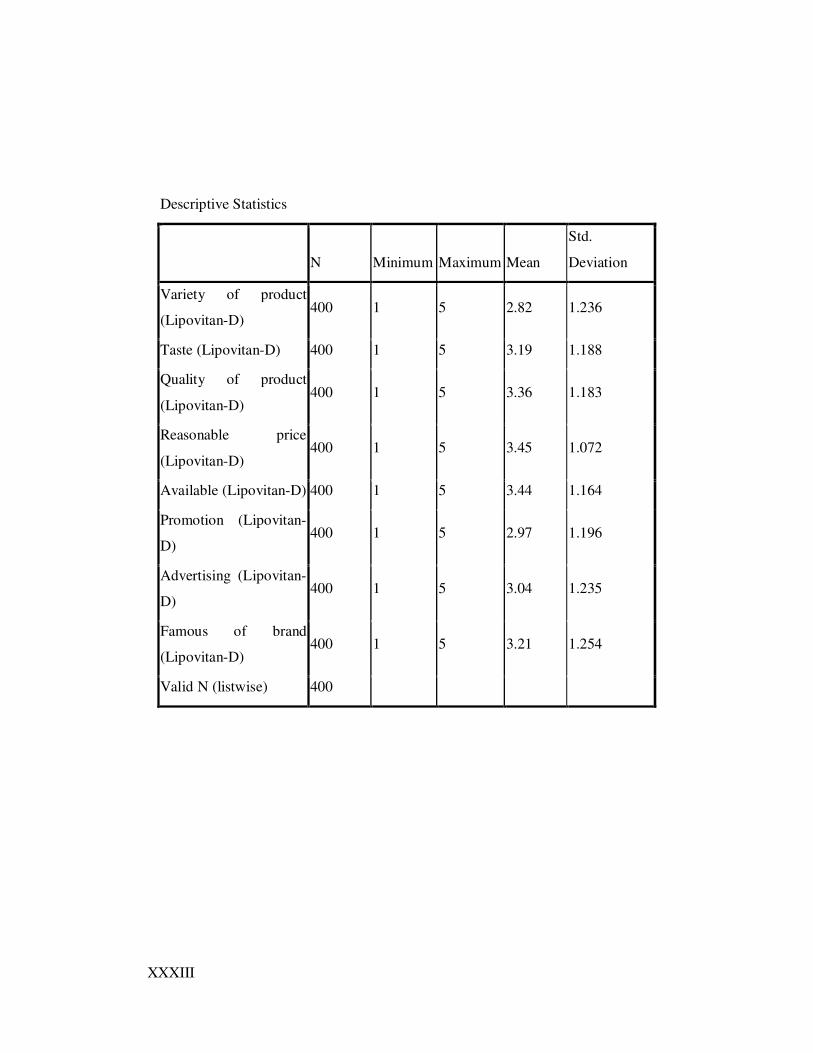
XXXIII
Descriptive Statistics
N Minimum Maximum Mean
Std.
Deviation
Variety of product
(Lipovitan-D) 400 1 5 2.82 1.236
Taste (Lipovitan-D) 400 1 5 3.19 1.188
Quality of product
(Lipovitan-D) 400 1 5 3.36 1.183
Reasonable price
(Lipovitan-D) 400 1 5 3.45 1.072
Available (Lipovitan-D) 400 1 5 3.44 1.164
Promotion (Lipovitan-
D) 400 1 5 2.97 1.196
Advertising (Lipovitan-
D) 400 1 5 3.04 1.235
Famous of brand
(Lipovitan-D) 400 1 5 3.21 1.254
Valid N (listwise) 400

XXXIV
Brand Positioning
Reliability Statistics
Cronbach's Alpha N of Items
.642 8
Brand Perception
Reliability Statistics
Cronbach's Alpha N of Items
.742 5
Promotion
Reliability Statistics
Cronbach's Alpha N of Items
.871 5
Integrated Marketing Communication (IMC)
Reliability Statistics
Cronbach's Alpha N of Items
.772 6

XXXV
Descriptive Statistics
N Minimum Maximum Mean
Std.
Deviation
The trademark of
energy drinks have
afffect to my purchasing
decision?
400 1 5 4.08 .730
I will buy only the well-
known brand. 400 1 5 4.00 .806
The image of each
brand has effect to my
purchasing decision.
400 1 5 3.99 .827
The price of energy
drink fits with my
budget.
400 1 5 3.79 .839
The price of energy
drink is not expensive
when compare together.
400 1 5 3.79 .838
The price of energy
drink is suitable with
their quality.
400 1 5 3.83 .793
If some brand lowers
their price, it means the
quality was lower too.
400 1 5 3.24 1.169

XXXVI
It will easy for me to
buy energy drink. 400 1 5 3.55 1.103
Valid N (listwise) 400
Descriptive Statistics
N Minimum Maximum Mean
Std.
Deviation
I will buy energy drink
when they added more
flavor.
400 1 21 3.62 1.323
I will buy energy drink
when they added more
ingredients.
400 1 5 3.44 .964
The package of energy
drink influences me to
buy.
400 1 5 3.60 .996
I will buy energy drink
when they added more
aromas.
400 1 5 3.42 1.015
I will buy energy drink
when I need more
energy.
400 1 5 3.81 .902
Valid N (listwise) 400
Descriptive Statistics
N Minimum Maximum Mean
Std.
Deviation
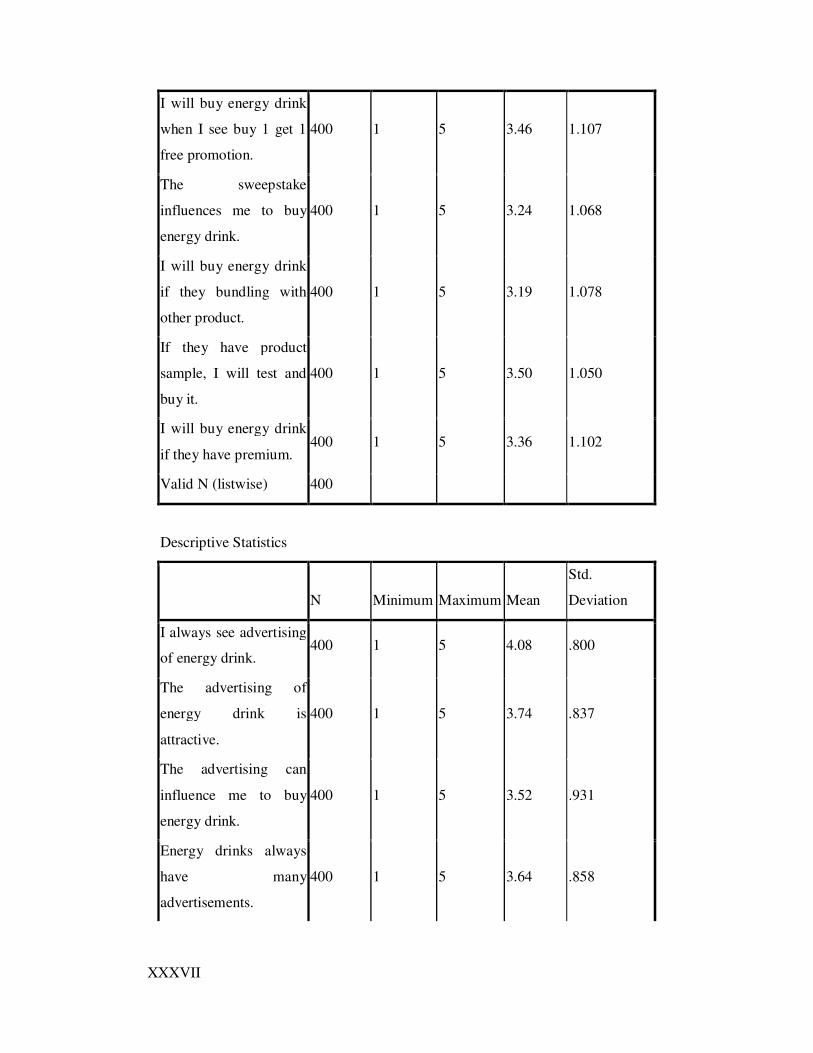
XXXVII
I will buy energy drink
when I see buy 1 get 1
free promotion.
400 1 5 3.46 1.107
The sweepstake
influences me to buy
energy drink.
400 1 5 3.24 1.068
I will buy energy drink
if they bundling with
other product.
400 1 5 3.19 1.078
If they have product
sample, I will test and
buy it.
400 1 5 3.50 1.050
I will buy energy drink
if they have premium. 400 1 5 3.36 1.102
Valid N (listwise) 400
Descriptive Statistics
N Minimum Maximum Mean
Std.
Deviation
I always see advertising
of energy drink. 400 1 5 4.08 .800
The advertising of
energy drink is
attractive.
400 1 5 3.74 .837
The advertising can
influence me to buy
energy drink.
400 1 5 3.52 .931
Energy drinks always
have many
advertisements.
400 1 5 3.64 .858
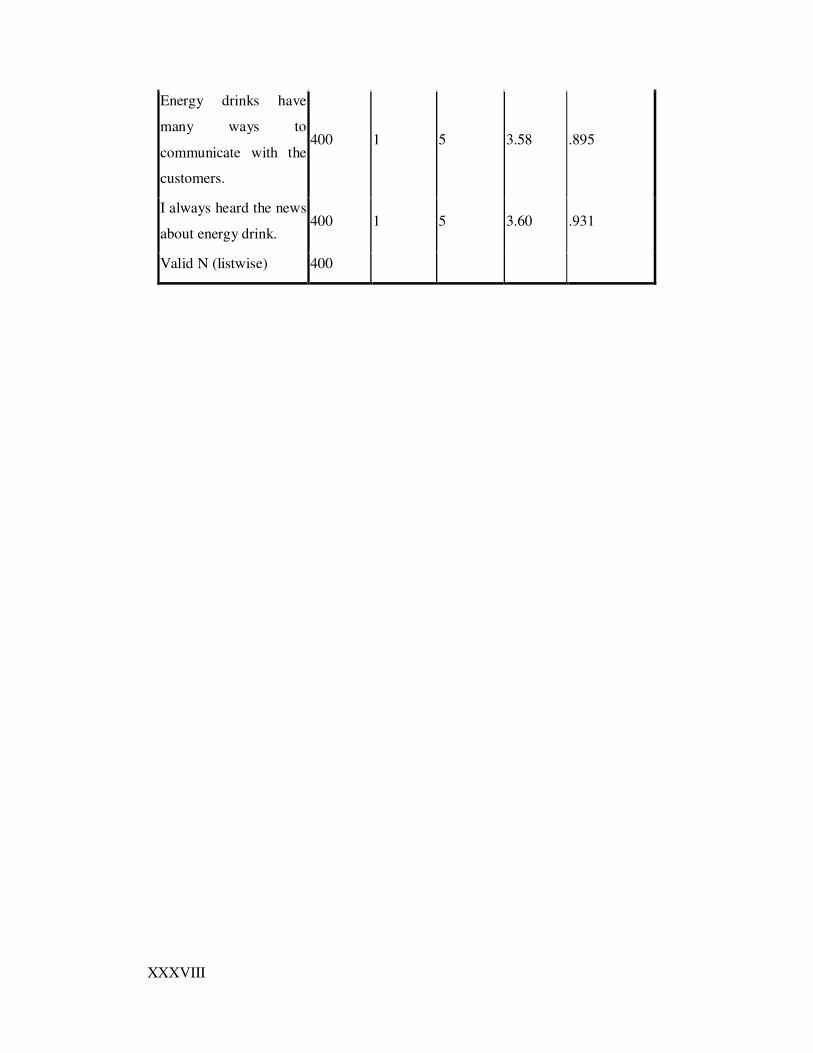
XXXVIII
Energy drinks have
many ways to
communicate with the
customers.
400 1 5 3.58 .895
I always heard the news
about energy drink. 400 1 5 3.60 .931
Valid N (listwise) 400
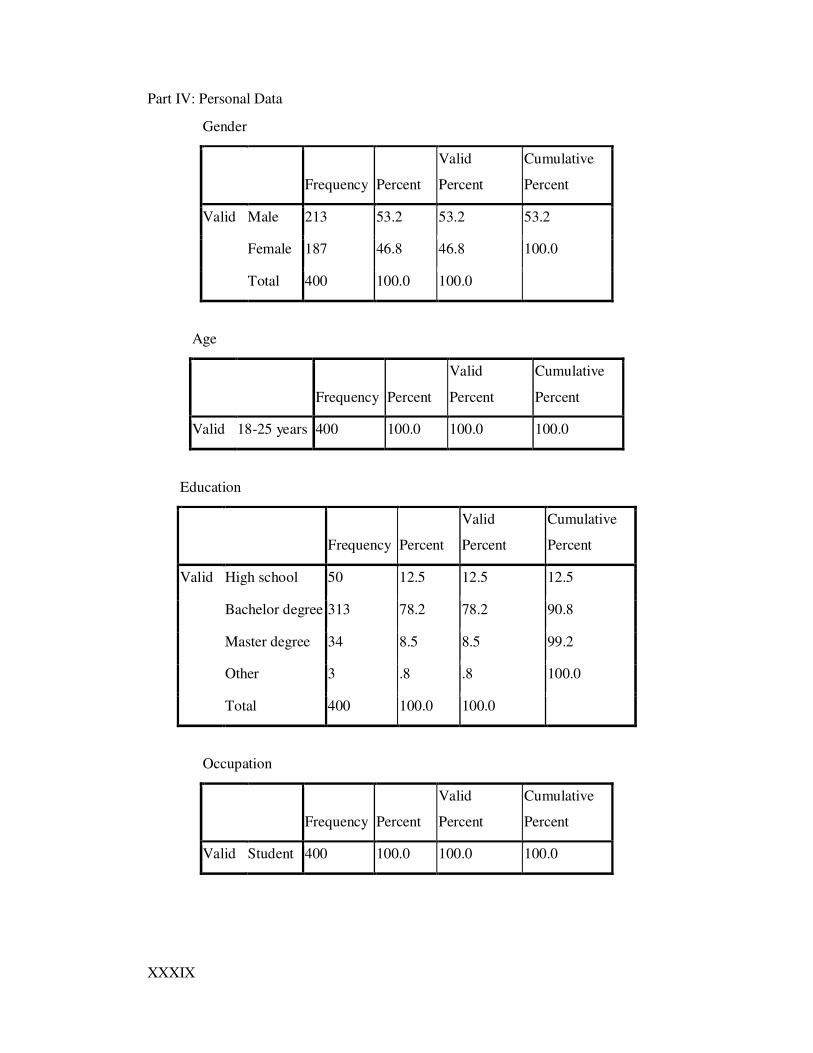
XXXIX
Part IV: Personal Data
Gender
Frequency Percent
Valid
Percent
Cumulative
Percent
Valid Male 213 53.2 53.2 53.2
Female 187 46.8 46.8 100.0
Total 400 100.0 100.0
Age
Frequency Percent
Valid
Percent
Cumulative
Percent
Valid 18-25 years 400 100.0 100.0 100.0
Education
Frequency Percent
Valid
Percent
Cumulative
Percent
Valid High school 50 12.5 12.5 12.5
Bachelor degree 313 78.2 78.2 90.8
Master degree 34 8.5 8.5 99.2
Other 3 .8 .8 100.0
Total 400 100.0 100.0
Occupation
Frequency Percent
Valid
Percent
Cumulative
Percent
Valid Student 400 100.0 100.0 100.0

XL
Monthly Income
Frequency Percent
Valid
Percent
Cumulative
Percent
Valid Lower than 6,000
baht 106 26.5 26.5 26.5
6,001-9,000 baht 114 28.5 28.5 55.0
9,001-15,000 baht 98 24.5 24.5 79.5
15,001-20,000 baht 48 12.0 12.0 91.5
20,001-25,000 baht 17 4.2 4.2 95.8
25,001-30,000 baht 11 2.8 2.8 98.5
More than 30,001
baht 6 1.5 1.5 100.0
Total 400 100.0 100.0

XLI
Independent Samples Test
Levene's
Test for
Equality of
Variances t-test for Equality of Means
F Sig. t df
Sig.
(2-
tailed)
Mean
Difference
Std. Error
Difference
95%
Confidence
Interval of the
Difference
Lower Upper
I will buy
energy drink
when they
added more
flavor.
Equal
variances
assumed
.259 .611 2.205 398 .028 .221 .100 .024 .418
Equal
variances
not
assumed
2.192 365.170 .029 .221 .101 .023 .419
I will buy
energy drink
when they
added more
ingredients.
Equal
variances
assumed
.496 .481 2.087 398 .038 .202 .097 .012 .392
Equal
variances
not
assumed
2.095 379.345 .037 .202 .096 .012 .391
The package
of energy
drink
Equal
variances
assumed
1.538 .216 2.077 398 .038 .208 .100 .011 .404
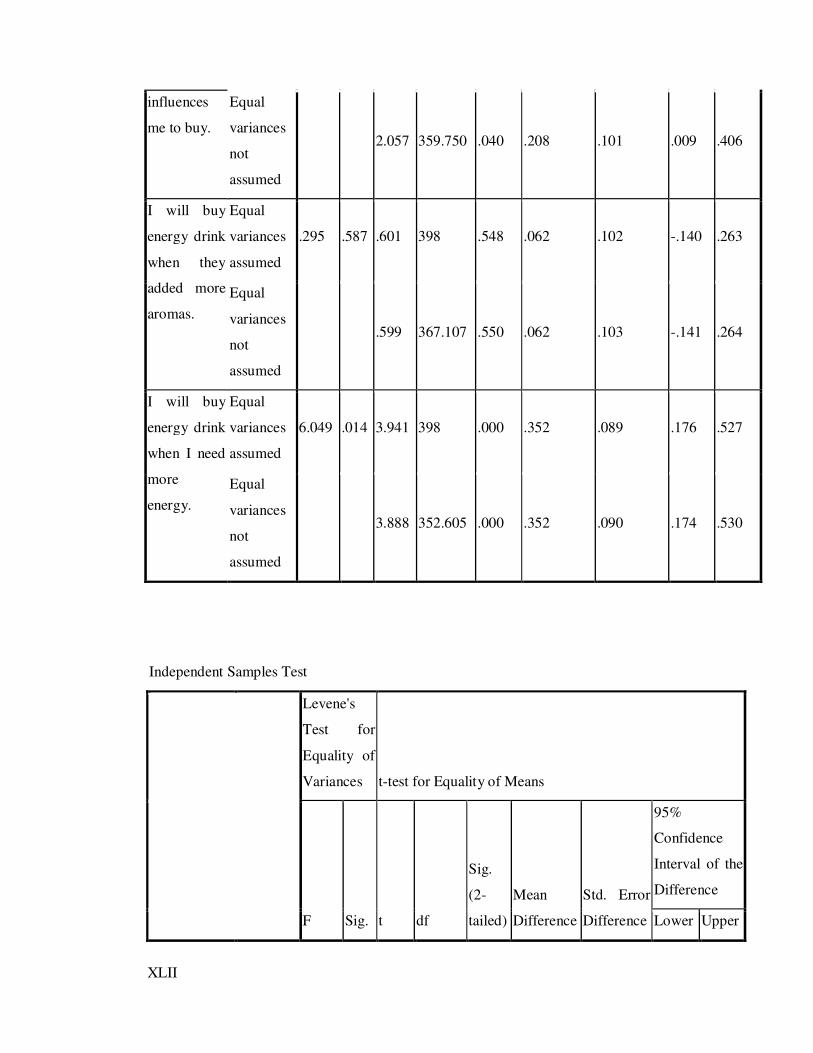
XLII
influences
me to buy.
Equal
variances
not
assumed
2.057 359.750 .040 .208 .101 .009 .406
I will buy
energy drink
when they
added more
aromas.
Equal
variances
assumed
.295 .587 .601 398 .548 .062 .102 -.140 .263
Equal
variances
not
assumed
.599 367.107 .550 .062 .103 -.141 .264
I will buy
energy drink
when I need
more
energy.
Equal
variances
assumed
6.049 .014 3.941 398 .000 .352 .089 .176 .527
Equal
variances
not
assumed
3.888 352.605 .000 .352 .090 .174 .530
Independent Samples Test
Levene's
Test for
Equality of
Variances t-test for Equality of Means
F Sig. t df
Sig.
(2-
tailed)
Mean
Difference
Std. Error
Difference
95%
Confidence
Interval of the
Difference
Lower Upper

XLIII
I will buy
energy drink
when I see
buy 1 get 1
free
promotion.
Equal
variances
assumed
.058 .809 1.872 398 .062 .208 .111 -.011 .427
Equal
variances
not
assumed
1.861 365.285 .064 .208 .112 -.012 .428
The
sweepstake
influences
me to buy
energy drink.
Equal
variances
assumed
1.210 .272 .890 398 .374 .096 .108 -.116 .308
Equal
variances
not
assumed
.880 356.849 .379 .096 .109 -.118 .310
I will buy
energy drink
if they
bundling
with other
product.
Equal
variances
assumed
.703 .402 .958 398 .338 .104 .109 -.109 .318
Equal
variances
not
assumed
.949 359.200 .343 .104 .110 -.112 .320
If they have
product
sample, I will
test and buy
it.
Equal
variances
assumed
.152 .696 1.920 398 .056 .203 .105 -.005 .410
Equal
variances
not
assumed
1.912 368.167 .057 .203 .106 -.006 .411
I will buy
energy drink
if they have
Equal
variances
assumed
3.577 .059 2.567 398 .011 .283 .110 .066 .500
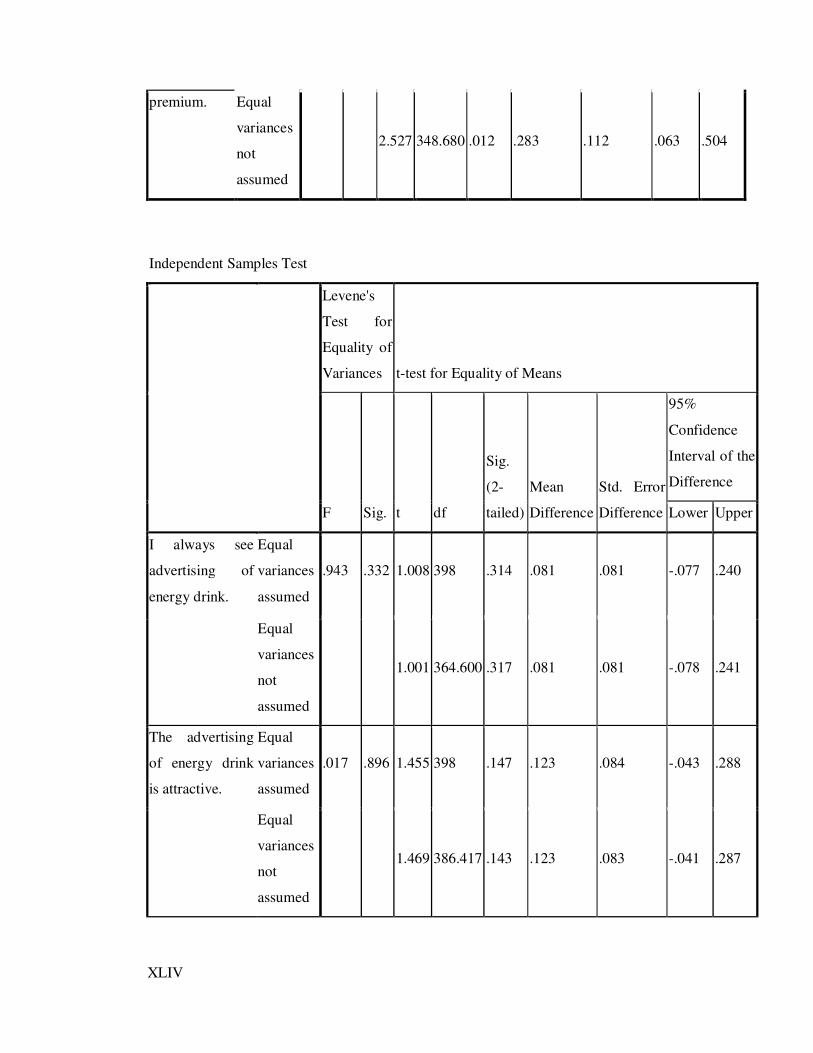
XLIV
premium. Equal
variances
not
assumed
2.527 348.680 .012 .283 .112 .063 .504
Independent Samples Test
Levene's
Test for
Equality of
Variances t-test for Equality of Means
F Sig. t df
Sig.
(2-
tailed)
Mean
Difference
Std. Error
Difference
95%
Confidence
Interval of the
Difference
Lower Upper
I always see
advertising of
energy drink.
Equal
variances
assumed
.943 .332 1.008 398 .314 .081 .081 -.077 .240
Equal
variances
not
assumed
1.001 364.600 .317 .081 .081 -.078 .241
The advertising
of energy drink
is attractive.
Equal
variances
assumed
.017 .896 1.455 398 .147 .123 .084 -.043 .288
Equal
variances
not
assumed
1.469 386.417 .143 .123 .083 -.041 .287

XLV
The advertising
can influence me
to buy energy
drink.
Equal
variances
assumed
1.219 .270 2.052 398 .041 .192 .093 .008 .375
Equal
variances
not
assumed
2.026 354.522 .043 .192 .095 .006 .378
Energy drinks
always have
many
advertisements.
Equal
variances
assumed
.001 .973 1.279 398 .202 .110 .086 -.059 .280
Equal
variances
not
assumed
1.287 382.429 .199 .110 .086 -.058 .279
Energy drinks
have many ways
to communicate
with the
customers.
Equal
variances
assumed
.159 .690 1.084 398 .279 .098 .090 -.080 .275
Equal
variances
not
assumed
1.089 380.218 .277 .098 .090 -.079 .274
I always heard
the news about
energy drink.
Equal
variances
assumed
2.616 .107 1.409 398 .160 .132 .094 -.052 .316
Equal
variances
not
assumed
1.435 393.954 .152 .132 .092 -.049 .313

XLVI
Independent Samples Test
Levene's
Test for
Equality
of
Variances t-test for Equality of Means
F Sig. t df
Sig.
(2-
tailed
)
Mean
Differenc
e
Std. Error
Differenc
e
95%
Confidence
Interval of
the
Difference
Lowe
r
Uppe
r
The
trademark
of energy
drinks
have
afffect to
my
purchasin
g
decision?
Equal
variance
s
assumed
1.03
7
.30
9
2.15
9 398 .031 .158 .073 .014 .302
Equal
variance
s not
assumed
2.16
4
377.27
3 .031 .158 .073 .014 .302
I will buy
only the
well-
known
brand.
Equal
variance
s
assumed
.228 .63
4
2.96
0 398 .003 .238 .080 .080 .396
Equal
variance
s not
assumed
2.98
1
383.03
4 .003 .238 .080 .081 .395

XLVII
The
image of
each
brand has
effect to
my
purchasin
g
decision.
Equal
variance
s
assumed
.210 .64
7
2.05
7 398 .040 .171 .083 .008 .334
Equal
variance
s not
assumed
2.05
5
372.96
2 .041 .171 .083 .007 .334
The price
of energy
drink fits
with my
budget.
Equal
variance
s
assumed
1.59
1
.20
8
1.78
4 398 .075 .150 .084 -.015 .316
Equal
variance
s not
assumed
1.81
3
392.03
1 .071 .150 .083 -.013 .314
The price
of energy
drink is
not
expensive
when
compare
together.
Equal
variance
s
assumed
1.77
8
.18
3
1.47
5 398 .141 .124 .084 -.041 .290
Equal
variance
s not
assumed
1.46
0
358.22
4 .145 .124 .085 -.043 .292
The price
of energy
drink is
suitable
Equal
variance
s
assumed
.324 .57
0 .611 398 .542 .049 .080 -.108 .206

XLVIII
with their
quality.
Equal
variance
s not
assumed
.611 373.65
5 .542 .049 .080 -.109 .206
If some
brand
lowers
their
price, it
means the
quality
was lower
too.
Equal
variance
s
assumed
1.42
4
.23
3 .949 398 .343 .112 .118 -.120 .343
Equal
variance
s not
assumed
.953 380.50
4 .341 .112 .117 -.119 .342
It will
easy for
me to buy
energy
drink.
Equal
variance
s
assumed
6.26
5
.01
3
4.02
9 398 .000 .439 .109 .225 .654
Equal
variance
s not
assumed
3.95
3
343.25
1 .000 .439 .111 .221 .658
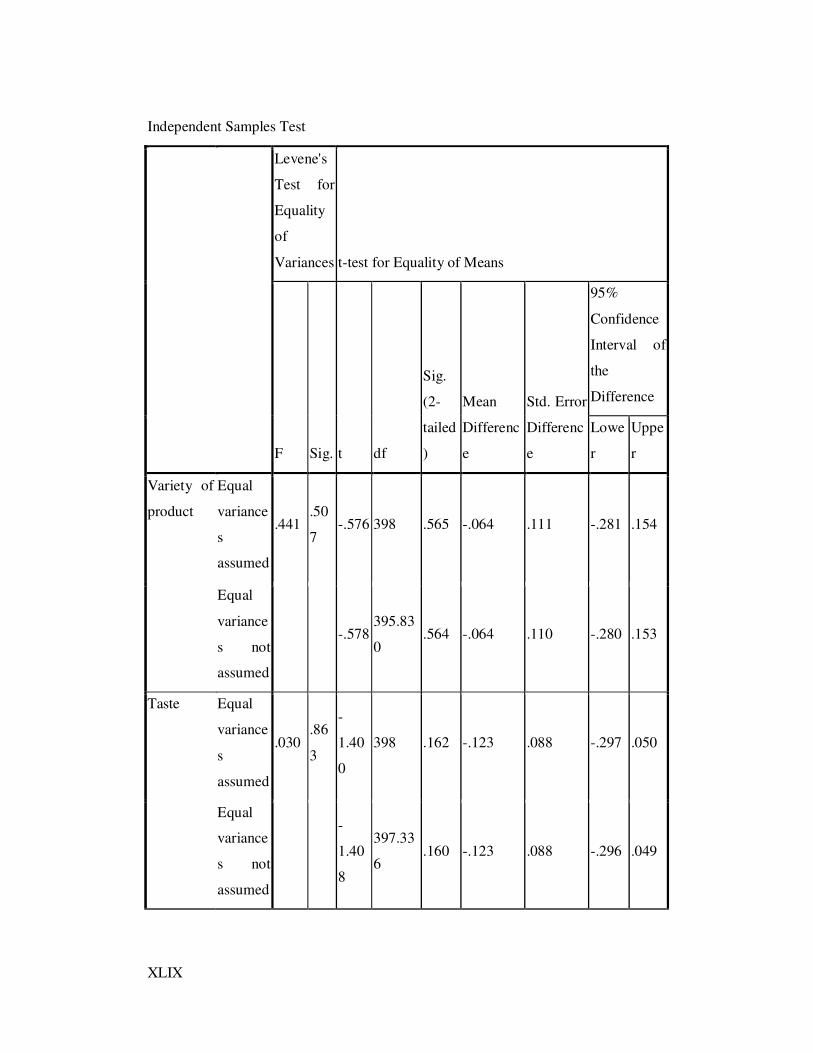
XLIX
Independent Samples Test
Levene's
Test for
Equality
of
Variances t-test for Equality of Means
F Sig. t df
Sig.
(2-
tailed
)
Mean
Differenc
e
Std. Error
Differenc
e
95%
Confidence
Interval of
the
Difference
Lowe
r
Uppe
r
Variety of
product
Equal
variance
s
assumed
.441 .50
7 -.576 398 .565 -.064 .111 -.281 .154
Equal
variance
s not
assumed
-.578 395.83
0 .564 -.064 .110 -.280 .153
Taste Equal
variance
s
assumed
.030 .86
3
-
1.40
0
398 .162 -.123 .088 -.297 .050
Equal
variance
s not
assumed
-
1.40
8
397.33
6 .160 -.123 .088 -.296 .049
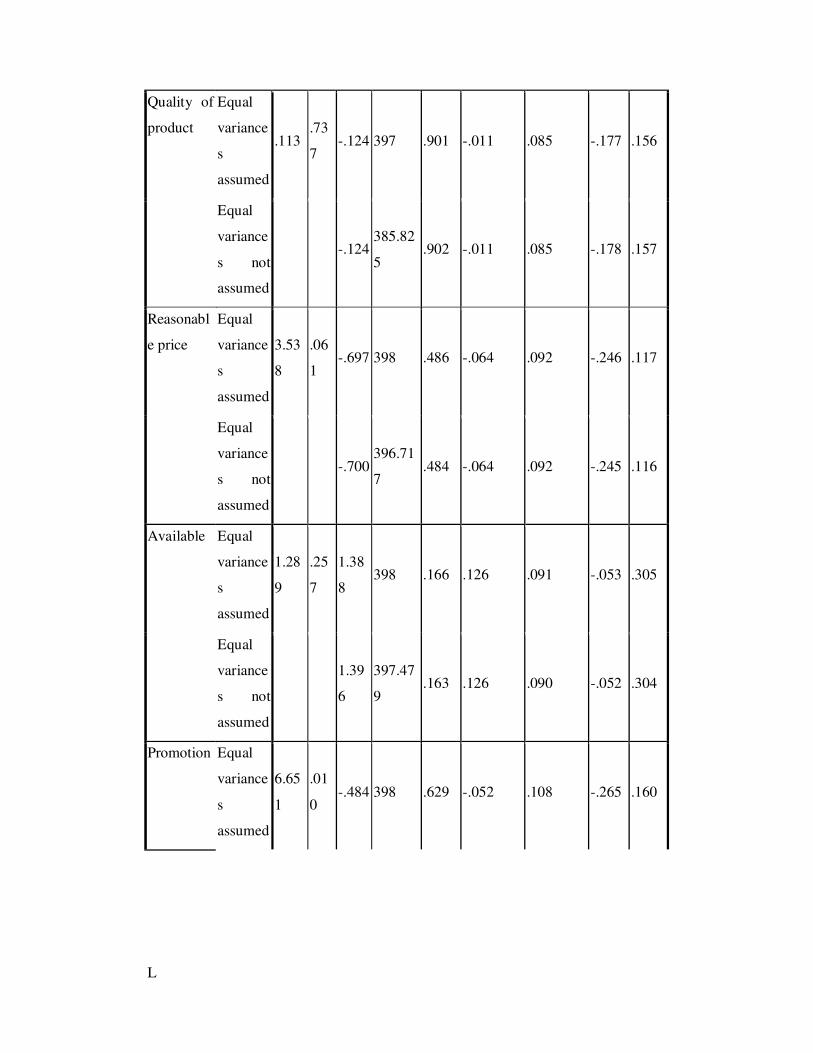
L
Quality of
product
Equal
variance
s
assumed
.113 .73
7 -.124 397 .901 -.011 .085 -.177 .156
Equal
variance
s not
assumed
-.124 385.82
5 .902 -.011 .085 -.178 .157
Reasonabl
e price
Equal
variance
s
assumed
3.53
8
.06
1 -.697 398 .486 -.064 .092 -.246 .117
Equal
variance
s not
assumed
-.700 396.71
7 .484 -.064 .092 -.245 .116
Available Equal
variance
s
assumed
1.28
9
.25
7
1.38
8 398 .166 .126 .091 -.053 .305
Equal
variance
s not
assumed
1.39
6
397.47
9 .163 .126 .090 -.052 .304
Promotion Equal
variance
s
assumed
6.65
1
.01
0 -.484 398 .629 -.052 .108 -.265 .160
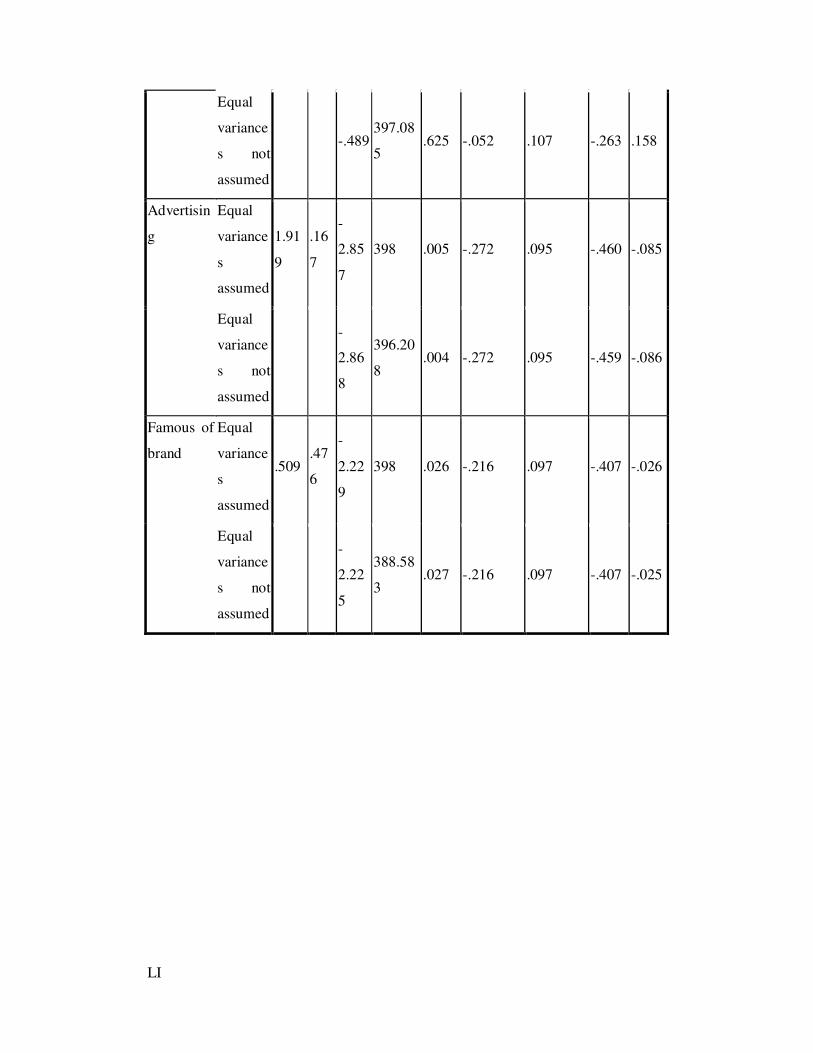
LI
Equal
variance
s not
assumed
-.489 397.08
5 .625 -.052 .107 -.263 .158
Advertisin
g
Equal
variance
s
assumed
1.91
9
.16
7
-
2.85
7
398 .005 -.272 .095 -.460 -.085
Equal
variance
s not
assumed
-
2.86
8
396.20
8 .004 -.272 .095 -.459 -.086
Famous of
brand
Equal
variance
s
assumed
.509 .47
6
-
2.22
9
398 .026 -.216 .097 -.407 -.026
Equal
variance
s not
assumed
-
2.22
5
388.58
3 .027 -.216 .097 -.407 -.025
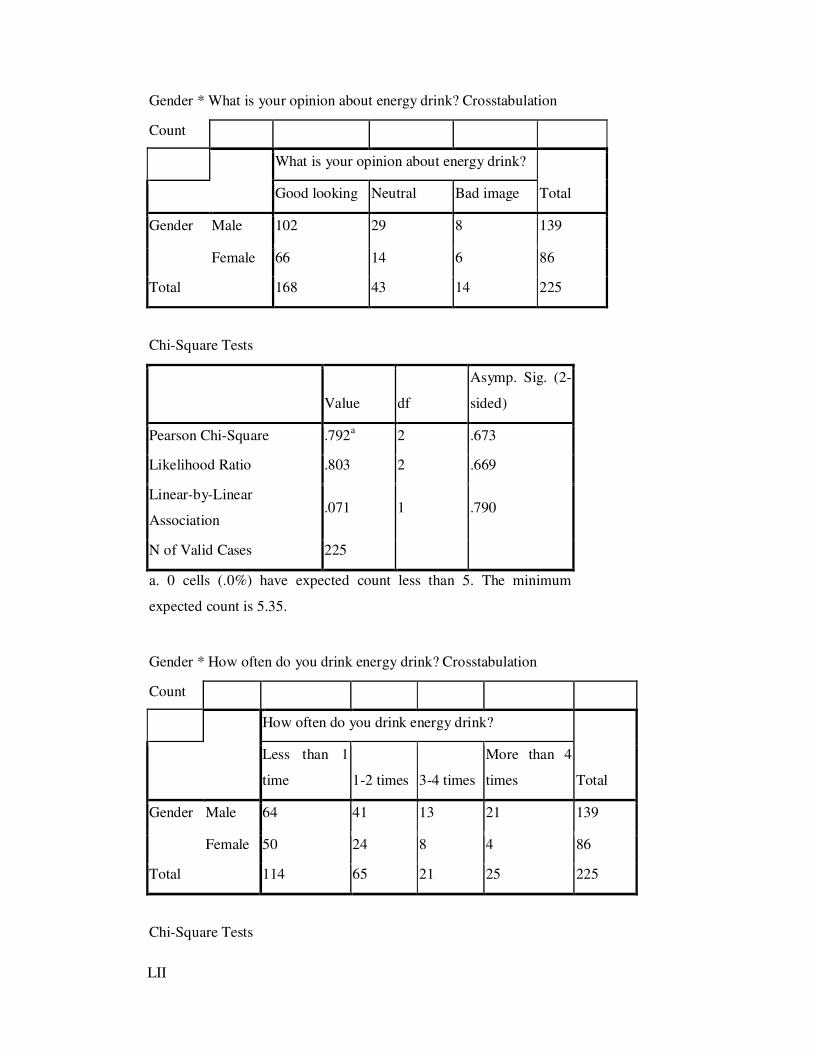
LII
Gender * What is your opinion about energy drink? Crosstabulation
Count
What is your opinion about energy drink?
Total Good looking Neutral Bad image
Gender Male 102 29 8 139
Female 66 14 6 86
Total 168 43 14 225
Chi-Square Tests
Value df
Asymp. Sig. (2-
sided)
Pearson Chi-Square .792a 2 .673
Likelihood Ratio .803 2 .669
Linear-by-Linear
Association .071 1 .790
N of Valid Cases 225
a. 0 cells (.0%) have expected count less than 5. The minimum
expected count is 5.35.
Gender * How often do you drink energy drink? Crosstabulation
Count
How often do you drink energy drink?
Total
Less than 1
time 1-2 times 3-4 times
More than 4
times
Gender Male 64 41 13 21 139
Female 50 24 8 4 86
Total 114 65 21 25 225
Chi-Square Tests

LIII
Value df
Asymp. Sig.
(2-sided)
Pearson Chi-Square 6.809a 3 .078
Likelihood Ratio 7.495 3 .058
Linear-by-Linear
Association 5.736 1 .017
N of Valid Cases 225
a. 0 cells (.0%) have expected count less than 5. The
minimum expected count is 8.03.