
Langston-DeMott, Brooke, Ph.D. “Reading is Power!” Critical ...
Upload
khangminh22Category
view
2download
0
C 2
PARTICIPATION OF THE PRIVATE SECTOR IN POWER SUB-SECTOR IN KENYA: A CASE STUDY OF BROOKE BOND (K) LTD IN KERICHO DISTRICT, K E N Y A //
V
By
) Keter K. Willy, B.A (Hons), UON
A THESIS SUBMITTED IN PARTIAL FULFILLMENT FOR THE DEGREE OF MASTER OF ARTS (PLANNING) IN THE DEPARTMENT OF URBAN AND REGIONAL PLANNING, UNIVERSITY OF NAIROBI.
AUGUST 2001 NAIROBI,KENYA
University of NAIROBI Library
0342392 8
O A r / i / r - ^
4 0 0

11
DECLARATION
This thesis is my original work and has not been presented for a degree in any otherUniversity. t f t t
Signed .......o&l
O KETER K. WILLY (Candidate)
This thesis has been submitted for examination with my approval as UniversitySupervisor.
Signed....... ’cS’a C?- *^ ^ DR. GEORGE NGUGI
(Supervisor)
JUNE, 2001

Ill
DEDICATIONThis work is dedicated to my old grandparents, Solomon Kiplelei Arap Sinei (96) and Martha Taputany Sinei (89).

IV
ACKNOWLEDGEMENTS
This research would not have been successfully completed without assistance and
contribution of many individuals and institutions. It is not possible to name all of them.
Nevertheless, I am particularly indebted to the University of Nairobi for offering me a
scholarship to pursue the Postgraduate Programme in the University.
Special thanks to Messrs Henya H. and Ogada Martin, Electrical Engineers with BBK,
for their valuable information which forms the core of the study. I would also like to
thank the academic staff of the Department of Urban and Regional Planning, particularly
Dr. J Mochache and Mr. Z Maleche, for the valuable criticism and constructive
comments which helped in the improvement of this work.
I sincerely wish to thank my supervisor, Dr George Ngugi, for his guidance and
contribution from the time of proposal development to the end of this study. 1 am
indebted to Ms Rakeli Waema, of Department of Mathematics for the important role she
played in scanning photographs, formatting and editing of this work. I would like not to
forget Mr. Sogomo for availing his personal computer at a crucial stage of this work.
I am also indebted to my cousins, Rosemary, Wesley, Florence and Mercy for their
continued encouragement and support during the period I was in college. I would also

V
thank my parents, Samwel Lelei and Ruth Lelei for their continued love and support from
the day I was born to date.
Last but not least, I sincerely thank my wife, Mrs. Monica Keter, for the support she has
always given me, particularly during the period I was pursuing the Postgraduate course.
She was able to take good care of the family during my absence. To my classmates and
others I have not mentioned their names-thank you very much and God bless you.
KETER. K. WILLY

VI
ABSTRACT
Recent discussion of approaches to power sub-sector improvement in the energy sector in
developing countries have tended to concentrate exclusively on privatization of the public
power utilities. There is need for substantive studies on the ways to improve the level of
efficiency in the sub-sector. This study provides an overview of the issues and/or
challenges related to the private sector participation in the power sub-sector in Kenya.
From the very limited number of private companies having their own power production
projects existing in Kenya ;Brooke Bond (k)Ltd in Kericho has been one of the most
active in small-scale power production.
The main objective of this study was to find out the role the private sector could play in
the power industry. The extent of power generation by the company was assessed in the
context of supply and demand .The guiding principal of the study was that production of
power by the company for its own consumption is ,in itself participation.
Chapter one of the study presents the introduction which include statement of the
problem ,the scope of the study ,study objectives and study assumptions. Chapter two
reviews energy sector’s current status in the world. Chapter three examines the various
issues which determines the location and/or sitting of power stations. Further, it bring out
various attributes associated with different power sources ,and the consideration in their
location. The chapter ends by coming up with a conceptual model which outlines the way
the private sector should be involved in the power industry. The concept of multi-regional
and multi-sectoral approach to power generation, distribution and transmission is
Vll
discussed. This is focused on diverse renewable power resources prevailing in different
regions.
Chapter four presents background information of the study area. The physical
characteristics of the study area are discussed ,as they relate to generation of power from
hydro. Chapter five explains the methodology which was used in undertaking the study.
Chapter six examines production of power by the company .It evaluates the generation of
power by the company and the amount it imports from the national utility. The study
found out that the company can generate power efficiently for its own consumption.
The problem of formulation of relevant institutional and legal framework is discussed in
chapter seven. The study suggests the various ways of incorporating the private power
producers into the national utility system or supply power at regional level. The study
gives recommendations on the ways which power development can be planned ,which
involves the private sector ;directly or indirectly. Lessons leamt from the case study are
outlined in this chapter. The study concluded that the private sector has a role to play in
power industry ;and therefore the various renewable energy sources at different regions
can be harnessed for power production by not only the public institution(s)but also the
private sector.

Vlll
CONTENTS
List of tables.................................................................................... .............. xiList of Maps and Diagrams............................................................. .............. X1List of Figures.................................................................................. xuList of Plates..................................................................................... xiiAbbreviations and Acronyms...................................................................... x”iOperational Definitions................................................................................... xiy
CHAPTER ONE INTRODUCTION1.0 Introduction................................................................................ 11.1 Research Problem and justification of the study........................ 21.2 Key Research Questions............................................................ 41.3 . Study Objectives ...................................................................... 41.4 Study Assumptions ............................................................. 51.5 Scope of the Study..................................................................... 61.6 Limitations of the Study............................................................. 6
CHAPTER TWO LITERATURE REVIEW2.0 A Review Of Global Energy Status.................................................... 22.01 Introduction.......................................................................................... 22.02 Alternative Sources of Energy in the World.......................................92.03 Hydropower: A General Review.......................................... ............ 122.04 Power Generation systems in Developing Countries............ ............. 142.05 Energy Sector in Kenya..................................................................... 182.06 Historical Development of Power sub-sector in Kenya..................... 192.07 Sources of Electricity in Kenya............................................ .............212.08 Current electricity generation Capacity in Kenya................. ............232.09 Recent development in Power sub-sector in Kenya............. - ...........26
2.1 Theoretical Framework......................................................... ............. 272.11 Introduction.......................................................................................... 272.12 Planning and Economic Analysis in Power Generation........................272.13 Planning for Power Generation station.................................. ................ 312.14 Planning for small scale and unconventional Power Sources................ 322.15 Micro-power systems at Regional Level................................ ................ 332.16 Institutional Reforms in the Power Sub-sector...................... .................35

2.17 Liberalization of Power sub-sector in Kenya........................................... 372.18 Private Participation in the Power sector: Recent trends...........................372.19 Towards a Paradigm of Multi-regional and Multi-sectoral approach in
Power Generation, Distribution and Transmission....................................... 392.3 Summary......................................................................................................41
CHAPTER THREE.STUDY METHODOLOGY3.0 Introduction................................................................................................ 423.1 Sampling Design........................................................................................ 433.2 Methods of data Collection........................................................................ 43
3.2.1 Primary data..................................................................................... 433.2.2 Secondary Data................................................................................ 44
3.3 Data Analysis Methods and Presentations................................................. 45
CHAPTER FOURBACKGROUND OF THE STUDY AREA
4.0 Introduction4.1 Position and Size of the Study Area................................................................. 444.2 Topography and Hydrology............................................................................... 444.3 Geology.............................................................................................................. 454.4 Soils.................................................................................................................... 454.5 Climate............................................................................................................... 464.6 Forestry.............................................................................................................. 584.7 Historical Development of BBK........................................................................ 594.8 Estates and factories........................................................................................... 604.9 Development of Power Generation Stations by BBK........................................ 634.10 BBK'S power Generation Systems: The Case of Jamji Power Station.............. 624.11 Summary............................................................................................................. 62
CHAPTER FIVEPOWER GENERATION, DISTRIBUTION AND TRASMISSION
5.0 Introduction....................................................................................................... 645.1 Power generation By the Company vis-a vis Power
Import from KPLC........................................................................................... 645.11 Hydropower generation by BBK( 1998-2000).....................................665.12 Correlation of Hydropower Generation and the
Amount of Rainfall received in the area (2000)................................. 685.2 Diesel Power Generation (1998-2000)...............................................................705.3 KPLC Power Import (1998-2000)..................................................................... 745.4 Summary: Power Generation by Source............................................................ 775.5 Electricity Distribution by BBK and KPLC....................................................... 77
5.5.1 Electricity Distribution by BBK............................................................ 775.5.2 Partial Distribution of 11KV in Kericho District by KPLC..................81

5.6 Costs and Benefits of Private sector involvement in Power sub-sector.......83>.7 Cost benefits of own Generated Power by BBK.............................................84
5.7.1 Power Generation cost (1998-2000)...................................................845.7.2 Cost Comparison of Power Generation (1998-2000)..........................87
1.8 The Impacts of Environmental Degradation in the rivercatchments and sub-catchments on Hydropower Generation....................... 89
5.9 Local Area Power Supply............................................................................... 915.10 The possibility of local area power supply by BBK.....................................935.11 Summary................................. 94
CHAPTER SIXPLANNING IMPLICATIONS AND RECOMMENDATIONS
.0 Introduction......................................................................................................96
.1 Recommendations........................................................................................... 986.11 Private Sector Involvement in Power sub-sector in Kenya:The way forward.............................................................................................1006.12 Purchasing Power from Private Producers..............................................102
CHAPTER SEVEN0 Summary............................................................................................................ 104
7.01 Power savings to the National Utility..................................................... 1061 Conclusion........................................................................................................... 106
Bibliography........................................................................................................ I l lAppendices..........................................................................................................111
X/
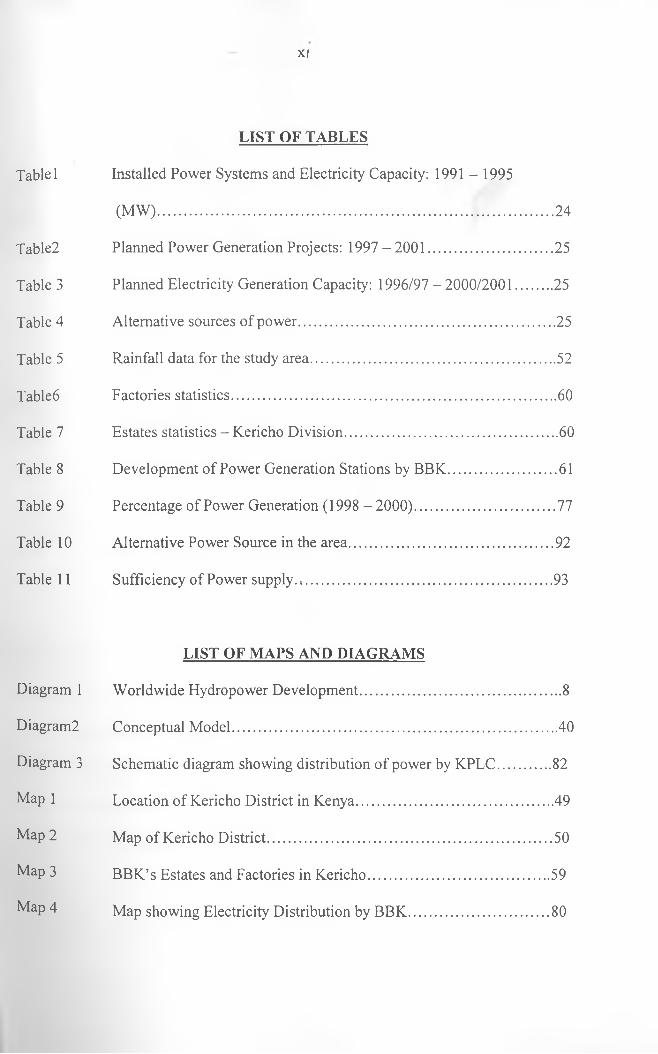
LIST OF TABLES
Table 1 Installed Power Systems and Electricity Capacity: 1991 - 1995
(MW)...................................................................................................24
Table2 Planned Power Generation Projects: 1997 - 2001.............................. 25
Table 3 Planned Electricity Generation Capacity: 1996/97 - 2000/2001........ 25
Table 4 Alternative sources of power...............................................................25
Table 5 Rainfall data for the study area.............................................................. 52
Table6 Factories statistics................................................................................60
Table 7 Estates statistics - Kericho Division...................................................... 60
Table 8 Development of Power Generation Stations by BBK............................ 61
Table 9 Percentage of Power Generation (1998 - 2000).................................... 77
Table 10 Alternative Power Source in the area....................................................92
Table 11 Sufficiency of Power supply. s............................................................. 93
LIST OF MAPS AND DIAGRAMS
Diagram 1 Worldwide Hydropower Development................................................... 8
Diagram2 Conceptual Model.................................................................................. 40
Diagram 3 Schematic diagram showing distribution of power by KPLC.............82
Map 1 Location of Kericho District in Kenya................................................ 49
Map 2 Map of Kericho District...................................................................... 50
Map 3 BBK’s Estates and Factories in Kericho............................................. 59
Map 4 Map showing Electricity Distribution by BBK................................... 80
xii
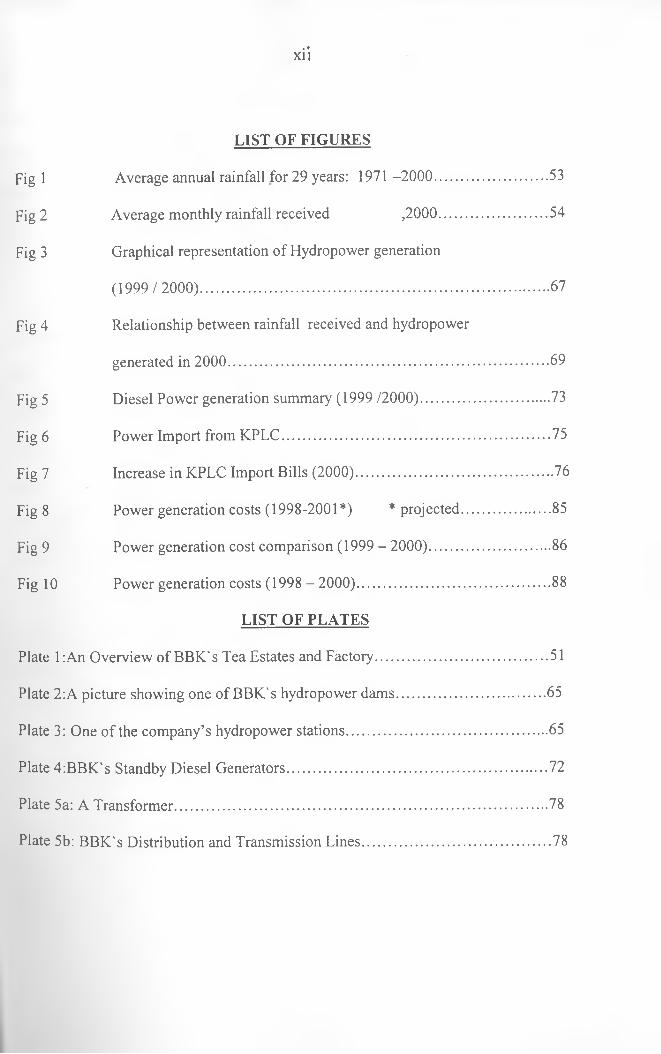
LIST OF FIGURES
Fig 1 Average annual rainfall for 29 years: 1971 -2000..............................53
Fig 2 Average monthly rainfall received ,2000............................54
Fig 3 Graphical representation of Hydropower generation
(1999/2000)....................................................................................... 67
Fig 4 Relationship between rainfall received and hydropower
generated in 2000...................... 69
Fig 5 Diesel Power generation summary (1999 /2000)................................. 73
Fig 6 Power Import from KPLC.................................................................... 75
Fig 7 Increase in KPLC Import Bills (2000).................................................. 76
Fig 8 Power generation costs (1998-2001*) * projected........................85
Fig 9 Power generation cost comparison (1999 - 2000).................................86
Fig 10 Power generation costs (1998 - 2000)..................................................88
LIST OF PLATES
Plate l:An Overview of BBK's Tea Estates and Factory...........................................51
Plate 2:A picture showing one of BBK's hydropower dams.....................................65
Plate 3: One of the company’s hydropower stations..................................................65
Plate 4:BBK's Standby Diesel Generators................................................................. 72
Plate 5a: A Transformer............................................................................................ 78
Plate 5b: BBK's Distribution and Transmission Lines................................................78

Xlll
Plate 6: one of the Company’s Tea Factories supplied with own power....................79
Plate 7:One of the housing estates supplied with own generated electricity.............. 79
Plate 8: Human settlement in the sub-catchment of one of the rivers draining
into the hydro as dams may lead to siltation as a outcome of soil................90
Abbreviations and Acronyms
IPP Independent Power Producer
KWH Kilowatt Hour
BOOT Built - Own - Operate - Transfer
BOO Built - Own - Operate
IFC International Finance Corporation
UNEP United Nations Environmental Programme
UNDP United Nations Development Programme
NDP National Development Plan
KPLC Kenya Power and Lighting Company
BBK Brooke Bond Kenya.

XIV
Operational definitions
Backup power Reserve power for special circumstances,
such as an emergency or systems failure.
Business interruption stoppage of normal business operations.
Independent Power Producers - Private power producers who have
developed power plants, typically on a
project finance basis, to sell power to an
existing utility or directly to distributors or
large consumers.
Non-utility generators Power producers other than public utilities.
Peak power The maximum non-instantaneous electric
power in a specified period of time.
Plant downtime time when the power plant is not producing
Power because of a schedule or forced
Outage or shutdown.
Power purchaser the entity purchasing power from a private
power developer. Usually the public utility
of the host country is the power purchaser.
Private power developer an individual, group or company that
develops power plant (s) on a private basis
to own, operate, lease and / or transfer.
Tax holidays Exceptions from some or all taxes for a
specified period of time.

1
CHAPTER ONE
INTRODUCTION
1.0 Introduction
Efficient networks of physical infrastructure in both rural and urban areas are, indeed, crucial
and/or important requirement of any economy to grow. The acceleration of industrialization and
faster development in agriculture, commercial sector and other sectors of the economy calls for
the increased provision and efficient management of the energy sector among others (National
Development Plan, 1997)
Most governments recognize the over-riding importance of the energy sector and this is
demonstrated by the heavy investment made by various governments on the sector. Despite the
fact that most countries have succeeded in increasing the provision of energy, especially
electricity, in the developing countries the deteriorating quality of facilities now in place, and the
problem of unpredictable weather patterns (in the case of Hydropower generation) poses a
challenge to the governments. The weak economic bases worsen this situation (Askin, 1976).
Further, development of new facilities to generate power and operation and proper maintenance
of the existing ones have been constrained. One of the reasons include the ever growing demand
Tor power arising from rapid population growth industrialization; coupled with poor planning
md/or management capacity in the energy sector. Moreover, the monopoly in the provision of
ower by the governments in the past has had serious implication in the current energy sector
■atus, particularly in power sub-sector(World Bank, 1996)

2
j l Research Problems and Justification of the Study
It is noted that in Kenya the current electric generation is not adequate, with demand regularly
exceeding the supply particularly during the peak hours. The supply problem is especially worse
during dry seasons (drought) when the dam levels are low and / or when some of the generating
plants break down or are out of service for maintenance (NDP, 1997).
On such occasion power has to be rationed. Such rationing normally has harmful effects on the
productivity of most sectors of the economy and thus discourages additional investments in the
country(Daily Nation May 2000). The year 2000 was a trying period in Kenya's energy sector,
especially in terms of power generation. The country was on the brink of severest power
deficiency ever - the consequence of an unprecedented fall in the water levels of Masinga dam,
the main reservoir of power generation plants on Tana River.
The situation lead to a power shortfall of 100MW in the national power generation capacity from
690MW to about 590MW. The country missed long rains for two successive years. The
situation was further worsened by the fact that the levels were at unprecedented low levels at the
time when the long rainy season had passed (Daily Nation, May 2000)
n power generation systems, hydropower is important only next to thermal power in terms of
lectricity generation. Approximately a third of the total power of the world is met by
ydropower generation (Mitchell, R, 2000). In Kenya, electric power generated from hydros
irrently accounts for nearly 75 percent of the total domestic installed capacity(NDP,1997). It is
3rth noting that due to the problem of unpredictable climatic conditions, especially rainfall,

3
provision of power from hydropower generating stations is curtailed. The encouragement of
provision of power by the private sector through diversified sources would add some wattage to
the national grid, which would then be utilized in other areas of development. Even if the private
generator does not supply power to the national grid, still power would be saved by not
supplying power to the organization generating its own power from the national grid. Further,
companies which are located in climatically favourable areas will be able to generate power
without any problem by utilizing natural resources which can be harnessed for power generation.
For example areas which receive relatively adequate rainfall throughout the year can develop a
mini- hydropower station.
It is for the above reasons that one concludes that in order to address the problem of power
deficit in this country, the private sector should be supported in its effort to develop power
generation plants, be they hydro or other sources, by providing them with favourable incentives.
Power generated could be for their own consumption or to supply the national grid through
contractual agreements.
This study gives a detailed evaluation of the role and / or participation of the private sector in the
power sub-sector by taking Brooke Bond (K) Ltd as a case study. The study will attempt to
Investigate the various problems, which hinder the private participation in power production
nd/or expanding their generation capacity. An attempt will be made to find out the capacity the
Ompany produce at the moment and inquire whether there is a deficit or surplus of power
fainst the potential capacity it can produce. The study will also examine the various
portunities the company has which can assist in enhancing power production.

r 4
analysis has been done to compare what is supplied with from the national grid and what is
pr0duced in case of power rationing/power failure from the national grid; and the savings made
it utilizes its own power. Finally, the study has shed light on the role of the government in
0Vver sub-sector; opportunities and constraints it offers in the industry and therefore how it
relates to the Independent Power Producers (IPPs).
j 2 Key Research Questions
Specifically, the study poses the following questions:-
a) How feasible, effective and sustainable is the generation distribution and transmission of
electricity by the private generator at micro level?
What lessons can be learned from the experiences of participation by the private sector in
the power sub-sector at the micro level?
What are the economic and management experiences from a successful local private
power generator, and therefore what lessons can be learned from the case study?
(»
(c)
J.3 Study Objectives
fhe main goal of the study is to provide a conceptual foundation and/or framework on which
jower generation distribution and transmission at small-scale level by the private sector may be
i0sed on in future with respect to planning policies and practice in the power sub-sector.
Tiree specific objectives have been outlined: -
) Finding out the power capacity, which the company generates with, regard to demand and/or
supply from its power generation stations.
5
ii) Establishing the possibility of a private power generator to supply power at a local level;
without connecting to the national grid.
(ii) Finding out whether encouragement and/or planning for small-scale power generation,
distribution and transmission by the private sector could be realized effectively if
government provides legal framework to encourage the private sector participation.
1.4 Study Assumptions
The power sub-sector in Kenya has not been privatised nor has it been totally liberalized.
Therefore, it is imperative to make various assumptions, which could guide the study throughout
to the end. Therefore, the study is based on three basic assumptions. These are:-
(i) The sub- sector is on the process of being privatized/liberalized.
(ii) The government, through Electricity Regulatory Board, remains the sole agent, which
determines the rates/tariffs in power sale to the consumers.
(iii) Policies and regulations on multi-regional/multi-sectoral generation, distribution and
transmission of power have been formulated.
In order to address the research questions above the following hypothetical statements are made,
hat:
Participation of the private sector in power sub-sector will lead to
Improved /increased efficiency in power supply in the country.
Planning and/or encouragement of power provision by the private sector will influence
other developments in their neighbourhood hence contribute towards regional growth
and development.

6
1.5 Scope of Study
The study will be confined to Brooke Bond Tea Estates and its environs. It is important to note
that the tea estates in this case comprise of the Factories, Offices, Residential estates and other
facilities. The focus of this study will be on the electric power generation, distribution and
transmission by the company for its utilization. The dams for the hydroelectric power generation
are located on the rivers passing through the tea estates.
Its conceptual scope is limited to the provision of a comprehensive approach towards planning
for and encouragement of the provision of power by the private sector either for their own
consumption and / or for supply to the national grid to boost national supply.
1.6 Limitations of the study.
In undertaking this study, the researcher experienced various constraints, which affected the
output to the study. The study was undertaken at a time when the country was experiencing
problems it power industry. There was low rainfall amount received in the country over two
consecutive years and this hydropower generation, which the country relies on .As a result there
was difficulty in getting information from relevant authorities because of the fear that it could be
bused for sinister motives.
The researcher also had financial constraints in undertaking the study .The little financial
resources offered by the university for research purposes were inadequate. However, the study
sets a foundationfor, which other related studies could be undertaken in Kenya in the future so
that problems in the power industry can be addressed.

7
CHAPTER TWO.
2.0 A Review of Global Energy Status.
2.01 Introduction
It is important to note that energy requirements of almost all countries are indeed spiraling up
inexorably. In order to get a general idea of energy status in the world, the 1972 figures have
been used for illustration purposes.The total generated energy in the entire world for 1972 wqs
5620 TWH (1 TWH = 1 billion KWH). During the period of 1971-1972 the increase of energy
was about 400 TWH (Sharma, 1991). This represents approximately 8 per cent increase, and this
would mean that the output would be, approximately, doubled every 10 years. Out of this;
hydro-energy was 1290 TWH and nuclear energy was 57 TWH, that is about 23 percent and 1
percent respectively. The bulk of the remaining power was from fossil fuels. It should be noted
that the bulk of this energy was generated and consumed; surprisingly, by two countries, the
USA and Russia (former USSR).
According to Sharma, consumption figures for USA in 1973 was 1856 TWH while
consumption for the former USSR in the same year was 1000 TWH. This represents about 50
percent of the total generated energy of the world for that year. The share of hydro in the above
in the above figures is 272 TWH and 160 TWH respectively. Total installed hydro-capacity of
USA was 61.3 GW (1 GW = 1 million KW) from the 1973 figures(Sharma,1991).The total
;loba.l hydropower installed capacity in the world is about 650,000Mw. This is against an
jstimated total exploitable world’s hydro-energy in the order of 11,000 TWH per year but
early88 percent still remains untapped (Sharma, 1991). The diagram below shows the
'orldwide hydropower situation (1998).

8
Diagram 1: Worldwide hydropower development-1998.
NorthAmerica
Europe , 0/o1 1 / 9 *
SouthAmerica
18%Africa2%
Installed Capacity approx. 650,000 MW
Under Construction approx. 135,000 MW
dot *o<V_
Undeveloped Potential approx. 1,500,000 to
2,000,000 MW
Europe North America 5% 6 %
Africa17%
Source:Head, C. (2000) Pg 3.

9
2,02 Alternative Sources of Energy in the World.
Over the last century, one of the most salient features of the evolution of energy consumption
throughout the world has been the emergency of fossil fuels, coal, crude oil and natural gas - as
the primary source of energy. Several trends have characterized the world energy development
since the World War II (Hagel III, J, 1976). These include, high growth rates in aggregate
energy demand accompanied by ample reserves of energy sources; a progressive shift from coal
to crude oil as a primary fossil fuel, the rapid emergence of natural gas in overall energy
consumption and unanticipated delays in the commercial development of the major short-term
alternative to fossil fuels - nuclear energy. Emphasis should be placed the enormous degree of
uncertainty involved in any comparative economic evaluation of alternative energy sources.
Such an analysis requires the forecasting of total energy demand and the evaluation of relative
resource economics involving the various forms of energy, consumer prices, and investment
requirements and operating costs.
Oil has supplied the major share of the world energy demand growth since 1950(David
!p.C,1984). This is primarily due to flexibility and economic advantage of oil in serving a broad
spectrum of energy needs. Another alternative source of energy is natural gas. The geography
Of natural gas production displays certain similarities with the crude oil situation. Demand for
tatural gas will remain high in view of its desirable qualities as fuel(David R.C1984).
|°al offers the major short-term alternative energy source to crude oil and natural gas,
| lcularly for power generation and industrial use. It also represents the most abundantly
pliable fossil fuel, over the long term in the world (Hagel III, J, 1976). But despite vast
10
untapped reserves in most parts of the world, coal has rapidly been declining in terms of its
share of the total energy consumption in each of the major consuming regions. The relative
decline in coal's position in the supply of energy can be attributed to three factors:-
1 Increasing competition from petroleum, natural gas and other more convenient sources of
energy.
2. Environmental legislation restricting the use of high-sulphur, coal and
3. Increased production costs (Hagel,1976).
The history of the commercial development of nuclear energy has paradoxically been
characterized by continuing enthusiasm regarding its long-term potential accompanied by
persistent disappointment over its actual attainments (Hagel,1976). Optimistic projections of the
contribution of nuclear energy to overall power supply often obscure the fact that so far the only
practical commercial application of nuclear energy will be largely limited to this one sector of
energy supply, and its long-term contribution will depend on the relative importance of electric
power in the advanced industrial economies(Askin,1979).
In terms of electric power generation, the cost comparison among alternative sources are
lifficult to make, and attempts to compare the economic costs of electric power generation from
fe convectional fossil fuel plants, hydroelectric power plants and from various models of
Uclear reactors have encountered great obstacles. For example, the different cost structures of
jrious nuclear models relative to convectional power plants is a significant issue. Moreover,
fnparisons between nuclear-generated electricity and fossil-fuel generated electricity, among
p r Sources of generation that are restricted to economic estimates, ignoring the broader factors
|ch will have substantial role in determining the pace of commercial nuclear development.

11
In addition to convectional fossil fuels and nuclear energy source, there are a number of other
alternative energy sources that have considerable potential for development. Of these,
geothermal energy is perhaps the most readily accessible. Geothermal energy is the product of
heat radiated from the interior of the earth, which accumulates in subterranean reservoirs in the
form of steam, hot water or hot rocks. The commercial exploitation of high-quality geothermal
steam for electric power generation in, for example, USA provides sufficient experience to
permit compilation of comprehensive cost figures for the electric generating plants(OECF,1995).
The commercial development of all varieties of geothermal reservoirs will require an active
exploration programme supplemented by a research programme to develop more accurate
exploration techniques. This source of power is to be utilised in Kenya.
Another alternative source of energy is the solar energy(World Bank, 1996). The enormous
potential represented by solar energy has always fascinated researchers interested in developing a
'.virtually inexhaustible supply of energy that would not generate the pollution associated with
more convectional forms of energy. There have been numerous suggestions regarding the
possibility of building large-scale solar-powered generation systems. Most of these systems
involve the collection of solar energy through focused concentrators spread over large areas of
the earth's surface, the storage of the resulting high-temperature/ heat in salt or metal tanks, and
fie use of convectional steam turbines and alternators to generate electricity.
I number of alternatives may also be available for more indirect utilization of solar energy: new
■signs for windmills. Wind energy provides one of the earliest sources of mechanical power
lough such devices as windmills and sailing shifts. Wind energy has proved to be a viable

!2
substitute for convectional fuels in the large-scale generation of electricity as the case now in
Germany and Netherlands. Commercially available wind-powered generators are generally in
low wattage and they supply the power needs of farmhouses or remote locations. Wind-powered
systems have environmental advantages of a "clean" power source.
2.03 Hydropower: A General Review
Hydropower is, indeed, important only next to thermal power in terms of electricity generation
(Goodland, 1994). It is noted that approximately a third of the total power of the world is met by
hydropower generation (Sharma, 1991). There are countries in the world where almost entire
power production is hydro-based. For example, in Norway the hydropower constitutes more
j than 99 per cent of the total installed capacity. In Kenya electric power generated from hydro
currently accounts for nearly 75 per cent of the total domestic installed capacity.
Available estimates indicate that, of the total hydro potential of the entire world is 5,000 GW
with lull utilization (Sharma, 1991). If it is compared to the installed capacity of about 2,000
pW, then it is realized that approximately 60 per cent are still untapped. Surprisingly, even in
countries like France; where convectional hydropower is fully developed, large scale
Bevelopment in pumped storage schemes is still being developed. There are various inherent
Idvantages, which make water attractive for power generation (Sharma, 1991).
jhese include inter alia: - ] ) ||
ne use of water as a source of energy has an advantage in that water is a renewable
resource. Water passes through turbines, without decreasing its utility in any way

13
Subsequently down stream. It still remains capable of being utilised in other things e.g.
irrigation and domestic use. The running costs of the hydropower installation are
relatively low as compared to the thermal stations or the nuclear power stations. The
hydropower plant is simple in concept and self-contained in its operation. Its system
reliability is, therefore, greater than of other power sources.
(2) Modem hydropower equipment has a great life expectancy and can easily last 50 years or
more. This can be compared with the effective life of hardly 30 years of, say, a nuclear
station.
(3) The modem developments in hydro-turbines have made it possible to utilize a variety of
turbines to suit a variety of conditions.
(4) Hydropower also provides ancillary benefits like recreation, fishery, etc, incase of run-of-
river plants and additional uses like irrigation and flood control where a storage reservoir
is contemplated.
There are, on the other hand, some limitations on the use of Hydropower project. Besides being
capital intensive and consequently the rate of return being low, they depend upon natural flows
in rivers. Since the flow is extremely variable, the dependable power is considerably less
Jompared to the total capacity.
fie power grid has to be capable of catering to the maximum demand rate of power. This is
l° Wn as the Peak-Load. It is noted that the Peak-Load demand may be present for only a short
liod. It is customary to distinguish the demand in two parts i.e. the base load demand, which is
| ent f°r most part of the year against the peaks or daily peaks.
14
In grid system, the general planning is such that some stations may be run as base-load stations
while some others may be run as peak load stations. This is the issue, which this study tries to
address. For example, the private sector with extra power can supplement the national power
grid system during peak hours, and therefore these stations can serve as peak load stations. The
questions, which arise, are how to operate the general system to which a number of powerhouses
feed. This again needs careful analysis. As far as hydropower is considered there basic
principles can be used:-
(a) Load sharing by hydro ought to be maximum. In Kenya, during the long rains, the flow
is at its maximum and advantage of this natural flow has to be taken. On the other hand,
the load on the national hydro-systems must be as less as possible when the season is dry
and the reservoirs are depleting.
(b) In effecting load sharing, advantage ought to be taken of the fact that the hydropower is
naturally suited for peaking purposes.
((c) The privately owned hydro plants and other sources could provide peaking power for
limited hours of the day and, therefore, need to be assessed for possible utilization.
1.04 Power Generation Systems in Developing Countries
lower generation systems in developing countries particularly Africa, are relatively small, a
r ult °f low levels of electricity consumption. For instances, 3 TWH in 1971 and 81 TWH in
|9 l, that is, a fraction of the hydroelectric potential of the site of Inga in Democratic Republic
I Congo (DRC). On a per capita basis, consumption has risen and fallen with GDP: from 134
f 11 ln 1971 to 247 KWH in 1980 and 200 KWH in 1971 to 247 in 1980 and 200 KWH in

15
1991 (Covarrubias, A.J, 1996). These figures are less than 580KWH for China and 350 KWH
for India but congruent with Africa’s low level of development and predominance of its rural
sector.
According to Covarrubias, A.J. (1996), in most countries in Africa consumption of commercial
energy is very low and remains so upto a per capita income of $1,000. Further, the share of
electricity of commercial energy consumption does not exceed 25 percent except in very
industrialized countries that are poor in fossil fuel.
It is noted that power consumption has been more resilient to economic recession in Nigeria
where prices are highly subsidized and in poor countries like Burundi and Tanzania where
industrial demand, which is GDP elastic, is low. Power supply seems to have been a constraint
to development only in Ghana and Guinea where consumption fell because of frequent massive
power outages.
Power generation and therefore supply, should not, as a rule, lag behind or race ahead of
economic growth. Many LDCs have tried to use the sub-sector as a leading edge of development
ky setting unduly low power prices with an aim of spurring economic growth. Electricity
generation is very capital intensive and therefore this policy has proven unaffordable, even in
pedium and high-income countries.
I most developing countries, unit generation costs are on the high side. Power distribution is
1° exPensive in cities because of low levels of consumption and in rural areas where the cost
| ally doubles. The priority for the power sub-sector of developing countries, particularly

16
Africa, is not to catch up with accelerated economic growth, as is the case in East Asia, or repair
the environmental damage caused by high-energy intensity and demand for restructuring as i”
Eastern Europe. The challenge lies primarily in meeting effective demand without adding to
public funds for social sectors such as education and health.
According to UNEP (1985), the commitment to development, rather than growth, as a soci°"
economic objective has major implications with regards to power generation in develops
countries. In terms of economic development increased power generation means abilityt0
produce the necessities and amenities of life. Further it noted that the relationship bet#en
power generation and economic development is a dynamic one in which the amount, type ^
speed of economic growth are mutually dependent variables of the quantity, kind and price of
commercial power available (UNEP, 1985).
It is noted that increasing costs of generation, transmission and distribution facilities, l°n8
gestation periods encountered in the development of these facilities and ^resources limitations as
well as factors that adversely affect the extension of electricity grid to, fo r example rural areas 1S
a major problem. Generally, the use of power grew along with the dev^l°Pment processat
rate of 10 per cent a year from 1950 to 1974 in developing countries and at 8 per cent since ther'*-
(UNEP, 1986). About 25 per cent of the developing countries commercial primary energy is use^
for electricity production (World Bank 1980). In Malaysia, for instance, efficiency ia th-^
production of electricity in power stations has been increased (UNEP 19^6).

According to IEEE, recommended practice for emergency and standby power systems (IEEE,
1974), power was less critical. If power was interrupted oftenly, another source could be found.
However, with advent of solid-state electronics and computers, the need for continuous, high
quality electric power became critical. It is noted that many installations require uninterrupted
power (IEEE, 1974) but interruption of power in most developing countries has been common.
Lakervi (1989) states that a reliable electricity supply is one of the prerequisites for the modem
way of life. He, therefore, explains that it is very important for an electricity supply utility to
have good contacts at three planning level (i.e. National level or Provincial level and Municipal
level as well as with individual private companies). This concept seems to be lacking in most of
developing countries where the state is the sole player in the power sub-sector.
According to UN (1973), an electricity supply system cannot be reliable unless some spare plant
is provided for use when other plants are out of service for unforeseen reasons. It Further states
that the amount of spare plant expressed as a percentage of the maximum load will depend upon
several factors such as the number and capacity of plant units in the system and the degree of
their reliability and their interconnection.
In any country, the generation and distribution of electrical power provides the life blood of
successful economic and social development (UN, 1993). Therefore, the availability of cheap
30 efficient power, coupled with the natural resources of any nation contributes to the economic
social well being of the nation as a whole. According to United Nations report on energy
(1993), since the early 1950s, the power systems of many countries have been expanded to meet

18
the increasing demands of both industrial and domestic power users. The place of worldwide
power generation development accelerated throughout the 1960s and 1970s before slowing down
in the last decade; and now accelerating again as we start the new century.
Many of the power plants operating in the developing countries are, indeed, now approaching the
age when decisions have to be made to either retire them or replace them with new, prove
modern equipment and systems, or to extend the useful and reliable life of the existing facilities
(UN, 1993). It is noted that in many cases, this seeks to improve the performance and operation
of the rehabilitated equipment. As power plant age, the performance deterioration becomes
apparent in two principal ways. Net power generated by the facility is gradually reduced and the
reliability of the overall plant decreases.
/
2.05 Energy Sector in Kenya
According to the National Development Plan (1997) presently, major sources of energy in Kenya
are petroleum fuels, electricity, wood and fuel (i.e. fuel wood and charcoal) and, to a lesser
extent, solar energy, wind, ethanol, coal and biogas. However, though there are greater
potentials of developing most of these energy sources, petroleum fuels and electricity are
currently the major sources of commercial energy.
Statistics indicate that the Kenya's total demand for industrial and commercial energy has been
rising steadily from 2.6 million Tonnes Of Oi1 Equivalents (TOES) in 1991 to over 3.0 million
TOES in 1995. This represents a growth of 3.7 percent per annum. It is noted that energy
imported from other countries comprise mainly of crude petroleum, coal, coke as well as hydro-

electric energy, which is imported from Uganda,
of the total commercial energy used, leaving 0
Energy imported constitutes about 72 perc^
balance of 28 percent to be supplied fr^
domestic sources i.e. from hydro and geothermal C,iergy sources.
, , .fces, totaling an annual average of 830,00oElectricity from both hydro and geothermal so^
, ,/enya satisfying around 29 percent of the totaTOES in one of the major sources ol energy in f
from hydro, petroleum and geothermal account demand (NDP, 1997). It is noted that production >'
lectricity consumption with a balance of aboutfor approximately 94 percent of the total Kenyan «
6 percent being imported annually from the neight°uring Ugan
en ^ mr in Kenya.2.06 Historical Development of Power Sub-Sec1
parted in 1875, when the Sultan of Zanzibar, Development of the power sub-sector in Kenya 5
, , to light up his house and the nearby streets.Seyyid Bargash, acquire d a generator from Eurof
>e a wealthy businessman in Mombasa then. The generator was later sold to All EsmailJee j ev/J
M from the colonial government to supply In 1904, a Mr. Clement Hirtizart got exclusive W
itY SUppiy started with the supply to Nairobielectricity in Nairobi..Therefore the start of elect
_ • . -.and the operation of a single diesel generatorfrok a small hydroelectric station ta Ruiru in 190 ■
at Mombasa in 1909.
In 1908, Nairobi Electricity Power and Lighting Siplicate was formed. The Company installed a
jjmately 26 kms away from Nairobi City,tohydroelectric power station on Ruiru River, app 1S11. , , , T year, Mombasa Electric Power andsupply power to the towrn and its suburbs. jn the A

Lighting Company Limited (a new company) and Jevanjee agreed to sell to the former the
generator in Zanzibar and a new era of development started.
In 1922, East Africa Power and Lighting Company (now KPLC) was incorporated and it
acquired Nairobi Electric Power and Lighting Syndicate and the Mombasa Electric Power and
Lighting Company. In 1932, the East Africa Power and Lighting Company expanded its activity
to Tanganyika (now Tanzania) in its aim to be truly "East African", by acquiring controlling
interest in the Tanganyika Electricity Supply Company Limited (TANESCO).
In 1936, power generation and distribution licenses were granted to East Africa Power and
Lighting Company by the government of Uganda. In 1948, Uganda government formed Uganda
Electricity Board (UEB) and invited (EAPLC) to purchase electricity power in bulk. The
installed capacity in Kenya then was 85.4MW. In 1954, the Kenya Power Company (KPC) was
incorporated with the responsibility of distributing the country's bulk electricity generated
capacity. An additional 30 MW was acquired from (UEB) through a contract signed in 1955.
In 1960, EAPLC acquired the Nyeri electricity undertaking; operated then by the Director of
Trade and Supplies (a government body) in order to synchronize the power supply and
distribution system. In 1963, Kenya acquired independence status from the colonial government.
East Africa Power and Lighting Company installed lamps in the new station near Wilson Airport
for the Uhuru celebration. In 1964, the Tana River Development Company was formed to
explore natural resources along Tana River including hydroelectric power resources. Until 1997,
I e company owned Kamburu, Kindaruma and Gitaru Power Stations.
21
In 1973, the government initiated rural development programme (Re p ) and EAPLC was
appointed to be the executing agent. In 1974, Tana River Development Authority Was formed to
develop land and water resources (including hydropower generation) in the Tana basin It later
changed its name to Tana and Athi River Development Authority (TARDA) after incorporating
Athi River into its activities in 1981. In 1983, East Africa Power and Lighting Company was
renamed Kenya Power and Lighting Company.
In 1997, KPLC and KPC were finally separated in the energy sector restructuring. Generating
assets, which were managed by KPLC, TARDA and Kerio Valley Development Authority
(KVDA) were taken by Kenya Power and Lighting Company Ltd. In the Same exercise KPLC
was mandated to handle transmission and distribution of electricity while Rpc handles
generation of electricity from all state-owned power stations. In the same year) two independent
power producers invested in the liberalised power sub-sector. This include Westmont Power
Company Ltd (43MW) and Ibeafrica (EA) Ltd (44.3 MW). In 1998, KPC Was renamed Kenya
Electricity Generating Company (KenGen).
2.07 Sources of Electricity in Kenya
Electric power generation in Kenya is mainly from hydro, thermal and geothermal plants
Hydroelectric supply currently accounts for 629 megawatts (MW) or neariy 75 percent 0f tpe
total domestic installed capacity of 822MW. The thermal oil accounts for approximately 18
Percent of the total energy. Electricity from geothermal energy at the Olkaria plant in the Rift
Valley supplies 5.4 percent of the total capacity (45.0 MW) (NDP, 1997). With regard to
hydroelectric power development is clear that there is great deal of untapped waterpower

22
potential in the country as yet. For example, water potential for power generation is not fully
utilized. Year in, year out, a lot of water goes into wastage essentially in the Western Region of
the country with relatively more rains throughout the year.
As far as river-wise potential is concerned, the two of the great river systems in Kenya namely
River Sondu, Nzoia River and Yala River in Western Kenya have, for long, been un-exploited
for their power potential. The rate of development of hydropower in Kenya is less than 10% per
year and nowhere comparable to the 7 per cent rate achieved by the developed nations of the
world.
Against this background, the growth rate seems to be inadequate. One reason (seems) for this is
that perhaps hydropower generation is a public sector activity in which the private sector has no
contribution to make. It would look as if the whole Kenya policy, on power sub-sector
development would need a fresh review, with focus on diversification power sources and
participation of the private sector in power sub-sector.
In addition, Kenyan Government signed an agreement with Uganda in 1954 to import an average
of about 30MW annually. According to the National Development Plan (1997), the total
installed electricity capacity has grown over the last 10 years from 572 MW in 1985 to 822 MW
in 1995, including supply from Uganda. It is noted that this growth was as a result of the
development of extra power projects namely: Turkwell (106 MW) and Kiambere (144 MW)
hydro plants and the Kipevu (30 MW) gas turbine plant. Electricity generation for a period of 10
years 1984/85 to 1994/95 increased from 2160 Gigawatt hours (GWH) to 3866 GWH

2 3
respectively. According to NDP (1997), it is projected that by this year (2001) demand for
electricity will have grown to an average of 4.9 percent per annum.
2.08 Current Electricity Generation Capacity in Kenya
It is noted that the Kenya's current electric generation capacity is not adequate, with demand
regularly exceeding the supply. The problem is particularly worse during the dry seasons when
the dam reservoir levels are low and when some of the generating plants break down or are out
of service for maintenance. On such occasions power has had to be rationed. Such rationing
normally has harmful effects on the productivity of most sectors of the economy and discourages
additional investments in the country. The year 2000 was a trying moment in Kenya's energy
sector. The country was on the brink of the severest power disruption ever - the consequence of
an unprecedented fall in water levels at Masinga Dam, the main reservoir of power generation
plants on the Tana River.
The situation led to a power fall of 100MW in the national power generation capacity from
690MW to 590MW. The country missed long rains for two consecutive years. The situation
was worsened by the fact that the levels were unprecedentedly low at the time of the year when
the long rainy season had passed (Daily Nation, May 2000).

2 4
Table 1: Installed Power Systems and Electricity Capacity*. 1991 - 1995 (MW)**
Source 1991 1992 1993 1994 1995
Hydro 629 629 629 629 629
Thermal Oil 168 144 144 147 148
Geothermal 45 45 45 45 45
Total 842 818 818 821 822
Note: * includes imports from Uganda ** 1 Megawatt (MW) =
1000 Kilowatts = 1 million Watts
Source: National Development Plan, 1997 - 2001.
The government had foreseen the problems in the power sub-sector and in order to alleviate this
problem, five major projects with a combined capacity of 338MW were to be added to the
system during the period 1997-2001. These projects include Kipevu 1 diesel plant (75MW),
Olkaria II geothermal plant (64 MW), Sondu-Muriu Hydro plant (60 MW), Kipevu diesel plant
(75 MW) and Olkaria II geothermal plant (64 MW).
Table 2: Planned Power Generation Projects: 1997 - 2001.
Project Generation capacity (MW)
Kipevu I Diesel Plant 75
Olkaria II geothermal plant 64
Sondu Miriu Hydro plant 60
Kipevu II Diesei 75
Olkaria II Geothermal plant 64
Total 338
Source: Kenya National Power Development Plan (1997)

2 5
Table 3: Planned Electricity Capacity: 1996/97 - 2000/2001
Source Fiscal Year Ending June
1996/97 1997/98 1998/99 1999/2000 2000/2001
"Hydro* 629.0 629.0 629.0 702.0 702.0
"Geothermal 45.0 45.0 45.0 109.0 173.0
"Thermal steam 76.0 76.0 76.0 63.0 63.0
Diesel 48.0 98.0 98.0 244.0 244.0
"Wind turbine 0.35 0.35 0.35 0.35 0.35
Total capacity ** 798.4 848.4
do ** Cffoot
848.4 1118.4 1182.4
conditions and plant maintenance and outages.
Source: NDP, 1997-2001
According to the Ministry of Energy, the first projects, Sondu-Miriu, Kipevu I, and Olkaria II
would be implemented by the government through the public sector enterprises while the other
two projects are to be implemented by the private sector, commonly referred to as the
independent power producers (IPPS).
Table 4. Alternative Sources of Power in Kenya.
Source Location Percentage of total capacity generated
Hydro-power ♦ Along rivers Tana, Turkwel 72.3Geothermal (a local resource ♦ Olkaria in NaivashaWind power (a local resource ♦ Marsabit 5.65
♦ Ngong hills in Nairobi 0.04Thermal power ♦ Kipevu power station in
Mombasa7.16
Gas Turbine ♦ Kipevu in Mombasa♦ Nairobi South power station
3.77
Diesel power generation ♦ Moyale♦ Mandera♦ Garissa♦ Lodwar♦ Marsabit
0.001
Source: KPLC, 2000
2 6
2 09 Recent Developments in Power Sub-Sector in Kenya.
Kenya has long stated its quest to achieve industrialized nation by the year 2020 (NDP,1997). It
is with this in mind that she liberalized the economy and licensed independent power producers
(IPPs). As stated earlier, it is only when the infrastructure is intact that the industrialization
process and proceed smoothly. In the power sub-sector, the government has found various
private investment partners in power or power generation. Examples include Westmont Power
Co. Ltd, Ibeafrica (EA) Ltd, Wartsila NSD (EA) Ltd, Orpower Inc., Aggreko and Cummins.
In September 1997, Wartsila Corporation established a fully owned subsidiary company, Warsila
NSD Eastern Africa Limited (NSDEA), in Nairobi to identify and develop available
opportunities in the power sector in the region in cooperation with governmental institutions and
local investors. In a short span of three years, Warsila NSD (EA) Ltd. had installed power
solutions in East Africa adding up to 50MW (WNSDEA, 2000). In Kenya, the company has put
proposals to put power plants for Nakuru and Eldoret.
Further, the funding of the 74MW diesel powered Kipevu II station has been finalised. The
Kenyan government signed up for the project with Wartsila NSD Corporation in 1998 and state
owned Kenya Power and Lighting Company agreed to buy electricity from the station for 20
years, while Caltex Oil Company agreed to supply the station regularly with diesel fuel for five
years. It is noted that Kipevu II will be built and managed under a ‘Build, Own and Operate’
formula by Tsavo Power Company Limited. With Wartsila, Commonwealth Development
Corporation, energy global Power Limited and industrial promotion services (K) as partners.

27
2.1 Theoretical Framework.
2.11 Introduction
Debates and Theories surrounding the deregulatory of electricity generation and supply industry
and the introduction of competition have become topical almost worldwide. Therefore the
question, which arises, is whether restructuring and deregulation of the industry will lead to
cheaper and reliable electricity for all consumers. This means that deregulation of power sector
will result in regulators exercising less control over generation choices and an opportunity
therefore for the private sector or small scale independent power producers to make signjflcant
impact on the industry with generation facilities situated closer to the source of the demand
Morse (1997) outlines regulatory policy regarding distributed generation by utilities and the
impact of restructuring. A distinction is drawn between distributed generation with generation
source on the customer side of the meter (self-generation or single net metering) and distributed
generation facilities with the generation source on the utility’s side of the meter. Morse argues
that in a restructured industry with generation, transmission and distribution and ancillary
services largely separated, distributed generation on the supply side of the meter proves
problematic from the regulators point of view. The consideration of implications of electricity
industry restructuring of distributed generation by utilities is only beginning in some African
Countries.
•12 Planning and Economic Analysis in Power Generation
II is important to note that the utility policy decision relevant to a power plant must depend on
the analysis of the utility's system as a whole, considering such factors as:-
28
+ Expected load growth both short term and long term
+ Installed generating capacity and availability to meet present and future deman<3s including
reserves required to cover scheduled maintenance
» The possibility of purchasing excess or extn power from the nearby gene*^torS
« The revenues expected from power sub-sector n future.
According to UN (1993), utility planning groups is the energy sector should j-eview ^ o s t of these
factors continually and report to utility management on the electrical generatlr^g capacity
required to meet present and projected futurt demands. Computer a^aiy d s u t ility power
systems is the principal tool of system planners in tracking past performer06 Wlt > respect to
demand and projected future demands.
Based on technical and economic considerations, the potentials in pow^r svib'sector investment
in developing countries is dictated by certain key factors. These include:^
(i) Availability of Alternative Local Sources of Electricity
In developing countries, electricity is obtained mainly from hydropovver. akU-indance of
hydroelectric resources in a specific country gives impetus to the develo£>mgPt0 IS Resource of
power. However, its success depends entirely on climatic conditions, f^arti^31 ac*a equate and
reliable rainfall.
(ii) Trends in Production and Demand of Ektricity
Although certain major trends have developed over the last decade tb -^ afe^lte ^ clear, (e.g.
electricity production has grown fastest in Asia, followed by Latin Arr^ej-jc^ and Afr "ii-ica), there
are a number of issues that requires feasibility study (e.g. private power ^ ene,at’°n’ aststrit>uti°n

29
and transmission; and sectoral/ regional use of electricity) in order to forecast where the greatest
potential may exist in developing countries.
In general, a predictable growth in the use of electricity by the industrial sector should be an
indicator that the private sector involvement in power generation industry among other
opportunities should be examined.
(ji) Constraints to be considered
It is important that certain constraints must be considered in planning for the power development
by the private sector and should be taken into consideration. Of particular importance are the
location of such firms with respect to the available climatic conditions, physiographical analysis,
the capital-intensity nature of such projects and the difficulty in obtaining financing and political
conditions, which effect the stability of governments in developing countries. All those factors
that can encourage or discourage foreign investment, particularly in the energy sector.
Therefore, in terms of policy considerations, it is noted that in developing countries where
significant industrial growth is planned (e.g. industrialization by the year 2020 in Kenya), the
private and /or non governmental agencies should be encouraged to invest in power sub-sector
wherever it is economically employed and what barriers need to be removed to encourage more
'nvestment in power sub-sector.
maH-scale power system is sometimes feasible in light industrial applications of the type that
F ^ d be common in developing countries such as sugar industries, dairy processing, tea
^dustries among others. There may be vast opportunities for this type of encouragement in

30
developing countries. Generation of power by private firms with export of excess electricity to
the grid is certainly feasible in developing countries with some industry. However a significant
barrier to the involvement of the private sector in power sub-sector in developing countries may
be internal politics and policy-oriented constraints. In most of these countries, the electric utility
is a branch of the government and is responsible for all the power generation in the country (UN,
1993). Allowing other entities, whether they are private companies or other government
branches to generate electricity for retail consumption may foster resistance from the utility.
According to UN report on energy (1993), political obstacles such as these are often the ones that
are the most difficult to overcome.
According to UN (1993), the development of government policies and a legislative and/or
regulatory framework to oversee and promote the private sector in power generation requires the
alternation of various issues, which includes regulatory provisions, tax and investment credits,
fuel use issues and environmental issues. Regulatory provisions include topics such as
ownership restrictions, interconnection requirements and monetary incentives applicable to the
production of power by the private sub-sector.
Currently, utilities and electricity generating plants in many developing countries are
government owned and/ or subsidized. Legislation concerning power generation by non
government entities and private producers (industrial or independent cogeneration projects) have
not been developed. Once this initial barrier is overcome, markets for excess power must be
available for the sub-sector to be attractive (UN, 1993). Connection to the utility grid would be
beneficial and would provide this market.
It is noted that in the generation of electricity, the highest efficiency is obtained in hydropower
plants - 60 to 70 per cent in smaller units and up to 90 percent in larger, sophisticated plants
(UNEP, 1986), Electrical power generation in thermal plant is, however, thermodynamically
inefficient with energy loses at over 60 per cent. The average efficiency of stream power plants
is between 30 to 40 per cent, gas turbines between 20 to 30 per cent, diesel power plants between
30 to 37 percent and convectional nuclear plants, 30 to 60 per cent (UNEP, 1986).
The optimization of the operation of power plants and use of suitable tariff structures,
particularly in the pricing peak loads, has considerable potentials for electricity conservation
(Elmahgary, 1976). Many developing countries are responding to the potential for efficiency in
the power sub-sector (UNEP, 1986). According to (Hagel III, J, 1976), the field of electric
power generation emerges as a crucial focus for research and development programmes in
energy efficient technology. This is because electric power plants are responsible for a high and
growing share of primary full demand.
2.13 Planning for Power Generation Stations
According to Cope D.R. et al. (1984), establishment of a power generation station goes through
four distinct stages of development: Planning, Construction, Operation and Commissioning. The
search for sites to put up power station involves a number of phases and criteria: -
(a) Area search:
This involves a comprehensive study thousand square kilometers in order to identify
potential sites, its opportunities and constraints. An important criteria used is based on
3 2
the nature of regional demands relative to the national system (Cope. D. R. et al, 1984).
Factors such as the extent of regional self-sufficiency are taken into account. In this
respect, trends, which are likely to affect the demand in future such as prospects for
future industrial growth, should be considered.
(b) Site selection/ conflict resolution:
This stage involves the selection of specific sites for which consent may be applied.
According to Cope, D.R (1984) special features may be taken into consideration. These
include the local economy, the amenity value of the area and the political implications of
developing a power station in that location which may be local or national.
(c) Detailed technical investigations of alternative sites. All stations need a sizeable area of
occasionally level and with sub-soil conditions suitable for foundation construction.
2.14 Planning for Small Scale and Unconventional Power Sources.
In view of the environmental advantages of small-scale power sources, particularly hydro, the
balance between big and small hydro merits more analysis. It is argued that several smaller
hydros may damage the environment and society more than or large project (Goodland, R.
1994).
However, if suitably sited, small-scale and unconventional power sources should be compared
with other large-scale power generation alternatives. Privately owned renewable energy
generators can sell surplus of the power they produce to the public utility.
33
The renewable energy generators include:
j) Non-dam (or very low head) axial tube turbines within rivers.
ii) Small generating systems (including water wheels)
iii) Solar elsewhere in the country (includes photovoltaic, tidal, wind, and hydrogen from
splitting water molecules).
iv) Biomass energy production (Biomass plantations, alcohol, garbage and sewage).
Many tropical forest countries contain dry sunny or even desert regions where solar powered
electric plants can be sited to serve the region. The solar powered plants do occupy 1/10th to the
l/20th the land of even the best hydro chemical and often can put otherwise unproductive land to
sustainable use. Similarly, Sahel and other plains and steppe often have steady year-round
winds. Such systems are already economical in comparisons with hydro when the value of
inundated forests or other land is internalized, even imperfectly. Therefore, small-scale and
unconventional privately owned power sources should be among the sources to be considered
when planning for increased generation in power sub-sector in order to increase national power
suPply. (Goodland, 1994)
2.15 Micro-Power Systems at Regional level.
Electrification programs have centred almost exclusively on grid electrification, while this is cost
effective for high-density loads, planners have often overlooked the alternatives. The generation
and supply costs of electricity can be reduced by working with lower service standards, but other
°Ptions are available (Munasinghe, 1987).

pecentralized, isolated distribution systems have been common for several decades in remote
population centers; and in most developing countries predate the establishment of grids (World
panic, 1996).Such systems were serving numerous villages and towns in ,for example ,Northern
Ghana a before the grid extensions in the 1980s.
Electricity supply from renewable Energy sources which regions are endowed will provide
attractive scenario, which the private sector can venture in the power production. Energy from
solar, Wind, Micro-hydro schemes has become attractive in regions where the solar isolation,
wind regime, and hydro resources are suitable. Electricity for local distribution can not an also be
generated from such fuels as Biomass, depending on local availability of resources(World
Bank, 1996).
Micro-hydro electric power systems can be one of the cheapest option for providing electricity to
regions that are far away from the grid to be connected to it, and can sometimes also supply the
grid. Micro-hydro systems privately owned could both serve the local demand and feed into the
central grid. Another aspect of micro-hydro is the care needed when selecting a site, given the
variation of in stream flows during the year and from river to river. Costs vary significantly
depending on the site and terrain.
The development of micro-grids at regional level, whatever their primary source of energy
requires a significant level of community consensus and support regarding such factors as
hilling, service and organization.

3 5
Local participation is a key ingredient in planning and designing of such isolated systems, in
their implementation, and in their day-to-day operation(World Bank, 1996).This is self-evident
in the case of small local systems that are as a result of local self -help or private initiative.
However, even isolated systems put in place by a national program are more efficient if they
exist or involve the local consumers and the private sector investors.
Central grid systems can also benefit from the local private participation in regional power
generation and distribution .In Bangladesh, for example locally managed rural electric
cooperatives are responsible for distributing the power they purchase from a local mini-power
system.
2.16 Institutional Reforms in the Power Sub- Sector.
Institutional reforms on the electric power sector are being introduced in many countries (Bacon,
1995). The aim of the reforms is to increase efficiency to their electricity industries and attract
ntore private sector involvement. According to the World Bank (1996) the reforms include :
• Reducing government’s role by separating policy making from regulation and operation
of utilities.
• Establishing transparent regulatory systems with predictable price -setting rules and
procedures.
• Putting power sub-sector on commercial basis, preferably as companies under a
commercial code.
• Encouraging direct investment and competition in generation and distribution.
M,4IRQffrAOU L . J r t A t f V

36
The pace and depth of energy sector reforms have intensified in developing countries In
Africa, governments are increasing the need to reform as they come to understand that to
discouragereform un the regions could leave them behind and discourage private
involvement unless they commit changes (World Bank, 1993 a, b, 1994d and internal
reports).
One of the major problems in electric power sub-sector in many countries which have
initiated reforms is that private investors have been mainly interested in generation, not
distribution .In these circumstances, the power industry will require public involvement for
some time; and as with the general institutional reforms, much will depend on the individual
country’s circumstances. The following are some possibilities in institutional reform
programme:
> Public involvement in distribution should continue, with regulations requiring private
sector producers of power to expand in ways consistent with achieving satisfactory
financial rates of return to investment.
> Joint public-private investments in distribution, with the same regulatory requirement
as the first option.
When the distribution company is privately owned, a regulatory requirement to
expand service, coupled with permission to meet financial requirements out of
specific tariffs.
> Full price liberalization of the private investors in power distribution, with regulators
acting as monitors of the prices and the efficiency of service ,the latter being the
expansion of service where it is viable.
37
> Encouragement of the formation of electricity cooperatives, the private development
of micro-grids, or both.
2.17 Liberalization of Power Sub-Sector in Kenya.
The government of Kenya embarked on liberalization of electricity power generation since
1996. The policy paper of 1996/1998 on power sub-sector spells out the roles of the independent
power producers in power sub-sector. The paper highlights the major steps to be taken in the
power sub-sector. This includes unbundling of KPLC, liberalization of power sub-sector and
encouragement of the private sector in power sub-sector.
In Kenya, there are four major independent power producers. These are Ibeafrica (56MW),
Westmont Kenya (43.5 MW), Orpower 4 (12 MW) and Tsavo power (75 MW). The entry of
these independent producers into the power industry was in the spirit of liberalization of the sub
sector. Further, liberalization and/or privatization of power sub-sector is also highlighted in the
national Poverty Eradication plan (1999-2015).
However, a policy, which will allow different players in the industry to operate in different
regions; and supply power in those areas, has not been formulated. The government o f Kenya is
currently undertaking a study to look into the viability of such arrangements.
2.18 Private Participation in the Power Sector: Recent Trends.
^ is noted that over the last ten years or so, a growing number of developing countries have
°Pened their electricity industries to the private sector. The new wave of policy reforms designed
to Promote private participation has been due to three important forces.

38
- I The need to expand the capacity and / or increase the reliability of the systems,
k) The public sector budget constraints.
c) The positive results of the early experiments with private participation in Chile and the
United Kingdom.
Between 1990 and 1997, it is noted that sixty -two developing countries introduced private
participation in the power sub-sector to varying degrees (World Bank -FPSIN, 1998) The
degrees range from Management contracts for the state -owned utility in Mali to the privatization
of most sector operations in Argentina, Bolivia and Hungary. However, before 1990, private
participation in power sub-sector in developing countries was limited to Chile (which introduced
comprehensive reforms in the 1980s to create a competitive Private market.) and a few isolated
cases in other cases in the countries.
With this background the private participation in power sub-sector has grown substantially since
1990, with electricity becoming one of the leading infrastructure sectors in attracting private
investment. Although 62 developing countries have made at least some progress in introducing
private participation in electricity, the breadth and depth of the private participation remain
uneven. The most successful countries have been those that have found the political will to
Abandon a long history of subsidized tariffs and to establish regulatory frameworks that offer
credible commitments to investors.
2.19 Towards a Paradigm of Multiregional and Multisectoral approach in Po\ver
Generation, Distribution and Transmission.
The rising demand of power has imposes serious strains on power supply systems, and as
result, we have severe tensions in the national economy. One of the possible strategies of copjjj©
with this situation could be to promote multi-regional and multi-sectoral power generati0n
transmission and distribution.
This can be achieved by formulating policies, which fosters this goal; to exploit dome$tjc
resources at regional level and actively involve the private participants in power sub-sector. Qn
one hand, generated power can be supplied directly to the consumers at the regional level. Qn
the other hand, various generating power systems can be combined into effective grid.The
individual projects associated with such strategies (as in the case with BBK’s projects) ^
usually small in scale. However, existence of such small-scale projects can result in comply
system and thus cause large impacts. (Lakshmana, I.R et al 1985:6). At the local level, tj]e
project may create new settlements or boomtowns, depending on the nature and location oftta
activity source.
Other consequences may emerge as the need to invest in services and infrastructure increa$es
such as distribution networks, transportation systems, Housing, Hospitals, Schools, etc; as \vej]
as public capital and private and public services.The relationships shown on the model (3.6n
could play a fundamental role and the analysis is explicitly dynamic. The conceptual model has
een designed to aid such development of power sector system. This will ensure that there isno
0ver-reliance on national power generation sources and, therefore, improve efficiency in po\ver
sub-sector.

Diagram 2: CONCEPTUAL MODEL.
Source: M odified from Lalcshmanan T.R and Johnasson B. (eds.), 1985.

41
j j Summary.
promthe literature review, one thing is clear that the g ro^h in the energy sector (particularly the
leSs a major effort is initiated to develop and apply new technologies capable of improving
power supply. The most critical area of accelerated imptovement 0f energy supply is the power
generation, distribution and transmission. Other areas of research and development may improve
the efficiency of electric power by not only developing bew technologies for the generation and
new models for distribution and transmission of electrjcjty; but also involve the private sector
in the development initiated in the sub-sector.
Non-governmental and/or private has a role to play jn the sub-sector. The potential for
generation, distribution and transmission of power by tl\e private sector in developing countries
should be looked into. This may be approached not only from t^e national context but also from
the regional perspective. However, there are barriers ^ o th legal and institutional) to power
development by the Non-governmental agencies. These barriers have to do with the economics
of investments and politics. The barriers need to be add^essecj jn order to open up the sub-sector
f°r significant opportunities to increased participation o ^ tbe private sector in power industry in
the developing countries.
AnaJysis of the criteria employed in selection of a p o w ^ r generafion system has been discussed
m«is chapter. Therefore, in planning of development o% a power generation system inany given
pjpon, it is imp0rtant that the attributes as well as th ^ e possible constraints are exhaustively
B v*ed . This will enable a power planner to come up w \_bh a feasible and realistic decision as
regardlhe type of power system to be developed .The^ power system to be developed will be
region.
4 2
C H APTER TH R EE
STUDY METHODOLOGY
Introduction.
tjj this chapter, the research methodology used in this study is explained. The study draws both
primary and secondary data. The methodology used includes collection of data, analysis and the
interpretation of the results obtained. Use of interview schedules and direct observation in the
field constitutes primary data. Designed questionnaires and unstructured questionnaires were
used.
The designed questionnaires had both open ended and closed-ended questions. Open-ended
questions were used in order to elicit incisive information from the respondent(s). This was
intended to make them speak more openly and freely. This type of questionnaire(s) had also
closed-ended questions and were executed to the business community in the immediate
neighbouring towns and residents of adjacent villages. The aim this questionnaire was to know
their opinion regarding the supply of power from the state’s power utility vis-a-vis the problems
they encounter on the supply. The same method was used to get information from various
lnstitutions in the area, which uses electricity.
^ the other hand the unstructured questionnaire was administered to the officials of the ■L
ctrical department of the company and the officers of Kenya Power and Lighting Company.
*s method enabled the respondents to express themselves fully and give comprehensive and
[ ^ed information on various issues on the power supply in the area.

43
focussed discussions were held with officials from Electricity Regulatory Board, Ministry of
Energy and Kenya Electricity Generating Company.
3.1 Sampling Design
The comparative study area (i.e. the area supplied within power from KPLC) was purposively
clustered based on villages. From the clusters simple random technique was applied in
administering the questionnaires. The number of copies administered to each village was
proportional to the relative size of the particular village, population density and, indeed, the
number of household supplied with electricity. The reason why clustered and simple random
sampling technique was used is to enable the researcher to come up with fairly non-biased data
3.2 Methods of Data Collection
In this study, two types of data were collected and analyzed i.e. the primary data and the
secondary data. In order to obtain this data, various methods and techniques were used.
3.2.1 Primary Data
a) Field Observation
This comprised of field observation of various features that were relevant to the study by the
researcher. Observation features were either recorded in the field notebook or take a photograph
°f any feature relevant to the study.
^Questionnaires
^ administering the questionnaires, the researcher or research assistant asked the question as per
l e questionnaire and the respondent could answer. The researcher could then record the
44
questionnaire appropriately as per the answer given by the respondent. This method was
necessary because some of the respondents were unable to read the questionnaire or could not
understand the questions. However, those who could read and understand the questions would
fill in the questionnaire on their own. Three types of questionnaires were developed i.e. for the
business community, for the households and one for institutions. Institutions comprised of
schools and hospitals.
b) Personal Interviews
Unstructured questionnaire was administered to the officials of the electrical engineering
department of the company and those of Kenya Power and Lighting Company. However this
questionnaire was supplemented by focussed discussed on areas, which could warrant detailed
explanation, or those aspects which required detailed explanation. The focussed discussion
yielded more information than the use of questionnaires with closed-ended questions. However,
for analytical purposes it is often difficult to analyze this data quantitatively due to the varied
answers given by the respondent(s). Therefore, qualitative technique of analysis is used in this
respect. It is on this basis that the researcher designed more closed-ended questions than open-
ended questions ones in the other three sets of questionnaires (i.e. household, institutional and
business questionnaires.
T2.2 Secondary Data
Secondary data was obtained from various relevant sources in order to explain what could not be
obtained from the field. The information was used to fill the gaps and also to explain information

46
CHAPTER FOUR
BACKGROUND OF THE STUDY AREA
4.0 Introduction
This chapter gives the description of the study area in terms of its geographical setting, which
favoured directly or indirectly the development of power generation project by BBK. It also
covers the position of the district, which the study falls, its topography, Hydrology, Geology,
Climate, Land and Soils.
4.1 Position and size of the study area.
The study area is located in Kericho District in western region of Kenya. Kericho District is
one of the 18 districts of the Rift Valley province. It lies between Longitude 35 degrees 02'
and 35 degrees 40’ east and between Equator and Latitude 0 23' S. The District is bordered
by Nakuru to the East, Uashi Gishu to the North, Nandi to the Northwest, Koibatek to the
NorthEast and Bomet and Bureti to the South. It is also bordered to the west by Nyando,
Nyamira and Rachuonyo Districts to the Southwest. The study area borders Kericho
Municipality to the east and is adjacent to Kericho-Kisumu road. It covers an area of about
13000Ha and the area shaded in map 2 shows this.
4-2 Topography and Hydrology.
The topography and hydrology of the study area can be understood by describing the
toPography and hydrology of the entire district .In terms of topography ,the district slopes
s west, and consequently rivers drain in that direction. All the rivers in the district are

47
perennial and have adequate potential for exploitation. Small streams and tributaries join up
to form major rivers and this characterizes the central parts of the district. These rivers
include Kipchorian, originating from western part of Mau Forest and flowing through
Londiani, Kipkelion and Chilchilla divisions to join River Nyando on the Kericho / Kisumu
districts border. River Yurith flows through Bureti and Roret divisions of Bomet Districts to
join river sondu on Kericho/Homabay border. Rivers Kipturet and Timbilil both flow
through Londiani and Chilchila Division from Tindiret Forest before joining River Nyando
which flows along the Kericho / Kisumu border. Other rivers include Kiptaret, Timbilil,
Maramara and Malaget.
The area is characterized by various tributaries which merge to form larger rivers The north
eastern part of the study area forms the catchments area of many rivers in the entire district
The area is densely forest and it slopes gently towards the south and the southwest part of the
study area. The rivers are characterized by rapid falls of which some have been harnessed by
Brooke Bond (K) Ltd for hydroelectric power generation.
4.3 Geology
Between the Mau-Escarpment, and the lowlands of Kisumu District, a hilly shelf is formed.
The central part of the district rises eastwards towards 3000M high Mau Ridge. The district
ls endowed with volcanic as well as igneous and metamorphic rocks. This is because it lies
ln Lake Victoria basin and the Rift Valley.

48
4.4 Soils
More than 90 percent of soils in the district are developed on basic igneous rocks or on ashes
and other Pyroclastic rocks of relatively young volcanoes. The soil type found in the district
is mainly clay and loam soils. These are well-drained, deep, dark reddish brown of moderate
to high fertility with acid Humic topsoil. There are also soils which are developed on
‘poorer’ rock but which are enriched by volcanic ashes.
Mountain and hill units in the northern parts of the district have shallow to moderate deep
Ando-eutric and Humic Cambisols. Volcanic foot ridges, south and east of Kericho, have
Mollic Andosols and Ando-humic and Humic Nitisols, which are extremely deep. West of
Kipkelion has soils which do not differ significantly from the soils of the mountain and hill
units having shallow to moderate deep Humic Cambisols. Soils of the uplands on the basic
igneous rocks are extremely deep. Clay soils occupy about 47 percent of the district. They
are mainly found in the central part of the district.
4.5 Climate.
The climate of Kericho District can be described as highland sub-tropical climate with
moderate temperatures, low evaporation rates and relatively high rainfall in the lower
highland areas, particularly in the tea growing zones. At the upper highland areas, the
temperatures are high with high evaporation and low rainfall. Rainfall is highest in the lower
highland zone of Ainamoi and Belgut Divisions while the upper highland covering Kipkelion
and Londiani is drier and receives low rainfall. Tables 6, 7b and 7c show climatic data taken
at a weather station within the tea zone of the district.

A9
MAP 1 LOCATION OF KERICHO DISTRICT IN KENYA

50
m a p a I OfATI ON O F BEOOKF. BOND IN THE DISTRICT.i
y L ‘
» ~ v
- - ■- Divisirmcrl'Boundary"*™™B B B K Estates
Km oL_
SCALE10 15
—1----- 1— 10 _u i5_l_ if
SOURCE KEUiCHO DEVELOPMENT PLAN ( 1997-200’.)
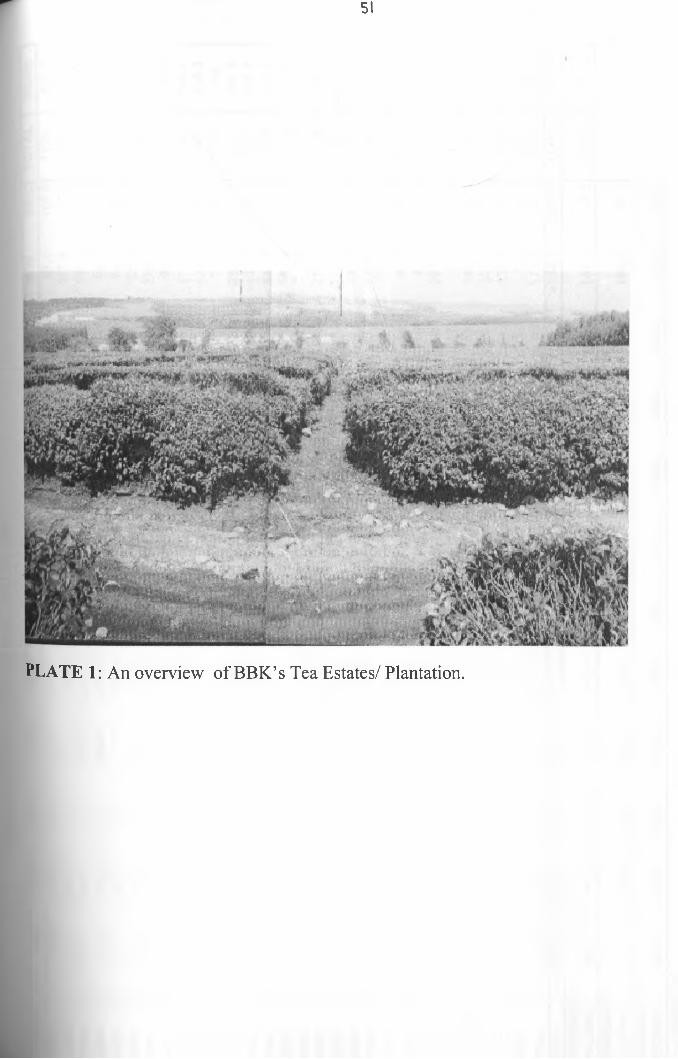
51
PLATE 1: An overview of BBK’s Tea Estates/ Plantation.

K E R IC H O D IV IS IO N : R A IN F A L L <m m ) - 1371 T O 2000
YEAR 7 j m T FEB MAR APR MAY JUN JUL AUG SEP OCT NOV DEC TOTAL ' MEAN
1971 94.3 14.4 36.4 270.2 278.8 227.5 175.3 370 152.6 116.4 87.1 105.6 1929 160.71972 91.9 167.1 109.3 128.3 236.6 217.4 119.5 149.9 105.3 109.7 217.5 97.6 1850 154.21973 179.1 183.1 39.1 168.8 241.6 191.7 90 180.7 166 118.5 132.2 32.8 1724 143.61974 48.5 32.8 211.1 285.6 239.2 153.9 209.7 101.9 165.2 116.4 62.7 45.4 1672 139.41975 11.6 56.5 183.2 275 217.5 97.6 147.3 267.1 228.6 150.7 55.8 59.6 1751 145.91976 32.9 86.5 79.5 181.1 280.4 178.8 153 204.9 114.1 47.7 125.9 76.1 1561 130.11977 204.4 95.7 139.6 275.4 243.9 227.2 148.7 129.9 124.5 166.8 270.6 78.6 2105 175.41978 104.7 200.4 306.9 303.3 178.6 171.2 106.7 178.4 176.7 187.6 89.7 146.9 2151 179.31979 110.6 190.4 129.6 184.9 255.1 201.2 100.7 157.9 94.9 38.3 117.1 84.2 1665 138.71980 70.4 39.3 155.1 217.2 291.1 139.1 113.5 141.2 137.4 80.4 139.4 39.3 1563 130.31981 34.1 74.6 254.3 299.8 225.6 114.7 173.3 145.1 220.4 108.2 72.7 53.7 1777 1481982 46.2 63.1 94.6 241.4 372.2 129.6 105.3 205.2 125.5 186.2 288.9 152.4 2011 167.61983 67.4 54.6 62.5 250.9 181.9 183.2 131.4 184 172.1 238.8 107.5 67.8 1702 141.81984 82.6 52.1 39.8 244.8 138.7 97.6 152.7 180.5 89.1 130.1 137.8 83.4 1429 119.11985 69.6 104.6 170 324.5 217.7 97.8 184 153.8 128.9 51.2 145.8 56.5 1704 1421986 33.6 80.1 98.9 239.1 234.1 109.8 108.4 91 103.1 69.7 69 103.8 1341 111.71987 74.2 93.8 189.6 185.1 243.5 225.7 98.1 109.9 94 96.7 217.8 41.3 1670 139.11988 173.9 76.4 167.7 343.9 226.2 139.4 147.7 236 182 188.5 106.1 42.5 2030 169.21989 36.4 122.1 257.6 237.6 220.4 80 119.8 150.5 193.6 178.7 109.5 172.4 1879 156.61990 77.1 196.9 278.1 283.8 196.2 85.9 98.6 141.6 112.8 115.1 112.6 84.3 1783 148.61991 163.3 54.3 136.7 194.6 220.4 175.4 97.4 196.1 114.7 151.1 77.3 46 1627 135.61992 21.1 88.3 79.4 211.9 199 186.5 178.2 181.2 140.7 194 86.8 104.9 1672 139.31993 148.3 125.6 67 123.8 269.8 179.4 92.1 91.7 86.6 106 97.2 71.4 1459 121.61994 39.2 98.6 200.3 266.2 328 172 146.9 173 131.5 1231 266.7 41.7 1985 165.41995 33.7 118.6 169.2 234.5 248.7 190.1 112.2 116 189.3 175 189 79.8 1856 154.71996 112.9 171.2 201.7 256.9 227.7 109.6 178.1 129.4 198.7 126 168.3 59.8 1940 161.71997 81.1 1.6 74.6 321.6 120 119.4 154 147.8 29.5 213.6 359.3 243.4 1867 155.61998 201.2 121 64.3 260 230.5 167.1 116.3 136.3 144.1 254.2 138.4 25.3 1859 154.91999 128 22 282.2 206.1 207.8 123.3 112.8 171.1 149.9 179.1 106 61.2 1750 145.82000 26.5 28.8 100.1 165.8 194.1 165.4 147.2 157.6 146.1 160 173.8 164.9 1465 122.1
cnNJ
TOTAL 2573 2785.7 4278.3 7016.3 6771.2 4492.1 3871.7 4822.1 4071.8 4115.7 4154.7 2357.7 43895 152.4
29 YR MEAN 1971-2000
10 YR MEAN1 990 -2 0 0 0
25 YR MEAN 1975-2000
88.7 96.1 147.5 241.9 233.5 154.9 133.5 166.3 140.4 141.9 143.3 81.3 1769.3
1 00 .7 99 .0 109.4 ZOO.9 224. l e a .s 1 GO.2 81 .8
86.4 95.5 155.3 246.5 231 148.1 131.1 160.8 139.3 142.2 146.2 83.1
147.4
Source: BBK.2000

F i j i - MEAN ANNUAL RAINFALL: 1971 - 2000
cn
A ^ A^5 A ^ a5^ a '® ^ A * A ^ oS qO ' op op qP <& q9> d ? o t'1 cx^ op cJP c$P oS c>P c$P r© $ & & & tpy & & & & >°P &> fP fP N# £P & >°P >°P & >°? N# &> N# ^ ^ N# ^> ^
YEAR

AVERAGE MONTHLY RAINFALL: 2000
<a :
J A N F E B M A R A P R M A Y J U N J U L
M O N T H S
A U G S E P O C T N O V D E C
Source: BBK, 2000

55
Generally, the district receives rainfall and it is influenced by altitude. The rainfall is well
distributed except for the short dry season between January and February. April and May ar
the wettest months. However, there is no real break between short and long rains in the
whole district. The total annual rainfall ranges from 1700MM to 2020MM per annum
The temperatures of the district range from about 16 degrees centigrade to about 20 degrees
centigrade. The coldest month is usually July with an average about 16 degrees centigrade
while the hot season starts around December to February with temperature ranging frorp
about 16.9 degrees centigrade to 18.6 degrees centigrade. Altitude is the main cause of
temperature variation in the district.
The study area receives an average annual rainfall of 1800mm.Table 5 shows the rainfall
amount received in the area for 29 years (1971-2000).The lowest amount recorded during
this period in 1986,when the area received about 1300mm of rainfall. There has never been
much variation in the amount received, but there has been a gradual decline over the years
Figure is a graph showing the annual rainfall pattern of the amount received in the study area
from 1971 to 2000.
Monthly rainfall received in the study area is about 152 mm. Figure 2 shows the monthly
rainfall patterns for the year 2000The area receives rainfall throughout the year (unmodal
pattern). However, amount received usually drops during the months of January, February
and March every year.

F-'
56
4.6 Forestry.
, • , . , f water catchment areas. In 1996 thpForests play an important role in the maintenance o i WcU ’ 1C l^tal
area covered by gazetted forest in Kericho District WaS 67,9^ hich indigenous (natnraj
forest) occupied 53,004.79 ha. The area has reduced due t0 ' W cb has taken in the
recent past. The government, tea estates and TelcorP Kenya 0 est plantations (Keric}^
District Development Plan, 1997-2001).
The study area is adjacent to one of the large forest in the r forest. It borders thjs
forest to the east .The forest extends towards the sout w be ^ayo Tea zones
However, the company has its own forests and/or wo°^ots’ ^ StS ^°r Wood used
in the tea factories. Woodlots owned by the company const'tU tke total l^ d
coverage of the land it owns. The woodlots exists in Pockets 0 *n tbe tea Plantations
(see plate 1)
4.7 Historical Development of Brooke Bond
The history of Brooke Bond Kenya Limited (BBK) starts fr0,Tl Arthur Brooke, then
only 24 years, having saved $ 400 opened a shop in Manc ester’ gdom. His main aim
was to sell tea over the counter for cash. Other items he S(dd ’n ^ e ^ ° ^ ee and Sugar.
Emphasizing Quality, Reliability and Economy, Art!# Brooke shops in Liverpool,
Leeds and Bradford. In 1892, he formed a companyand t0°k “ t0 t0 beCOme "Brooke
Bond and Company Limited”. By 1925, the company had gr°vvn rapidly and set up its own
branches in Egypt and East Africa.

57
The coming of Brooke Bond to Kenya is linked with Tom Rutter's hunting safari in 1914. Tom
was in-charge of Brooke Bond in Calcutta, India. During the hunting mission, he found out that
Hast Africa was a potential market for Indian teas. In 1922, a sales office for Brooke Bond India
was opened in Mombasa. By 1924, the group realized that there was considerable potential for
growing tea in Kenya. During the same year, the company acquired approximately 400 hectares
of land at Limuru and built a Factory. Acquisition of Kericho Estates followed almost
immediately.
In 1927, BBK's first major Tea Factory was completed at Kerenga. By 1928, the company
stopped importation of tea into Kenya. In 1938, Associated Tea Growers of East Africa
(ATGEA) was formed and Brooke Bond appointed Blenders, Packers and Distributors for
ATGEA. In 1941 and 1944, Brooke Bond Tanganyika Branch and Uganda Branch, respectively,
were established. In 1970, the activities of Brooke Bond East Africa were officially
divisionalized into Brooke Bond Liebig Kenya Limited (previously Kenya Tea Company). In
1971, the group acquired Buret Tea Company, which comprised of Chemogo, Chemosit and
Kaptien Estates. Kituamba Coffee Estate in Central province was also acquired by the company.
In 1982, the company became Brooke Bond (Kenya) limited after the sell of "liebig" by Brooke
Bond Group in United Kingdom.
ft is important to note that today BBK is one of the largest commercial enterprises in Kenya
Providing employment to more than 20,000 people. The company is a significant foreign
exchange earner for Kenya having risen from Kshs 0.25 million in 1972 to Kshs 1 billion in
^4. Today, foreign exchange stands at about Ksh.5.5 billion p.a.

58
4.8 Estates and Factories.
Estates and factories of BBK are grouped in two divisions i.e Kericho division and Central
division. Kericho Division land holding is 13,085 hectares and Central division covers a land
size of 1016.2 hectares. The total land holdings of Brooke Bond stands at 14,101.2 hectares.
BBK owns 20 Tea Estates plus 8 factories (seven are in Kericho division) manufacturing an
average of 32 million kilograms of made tea per annum. Table 7 and Table 8 show the statistics
for the factories and estates respectively, for the company in Kericho.
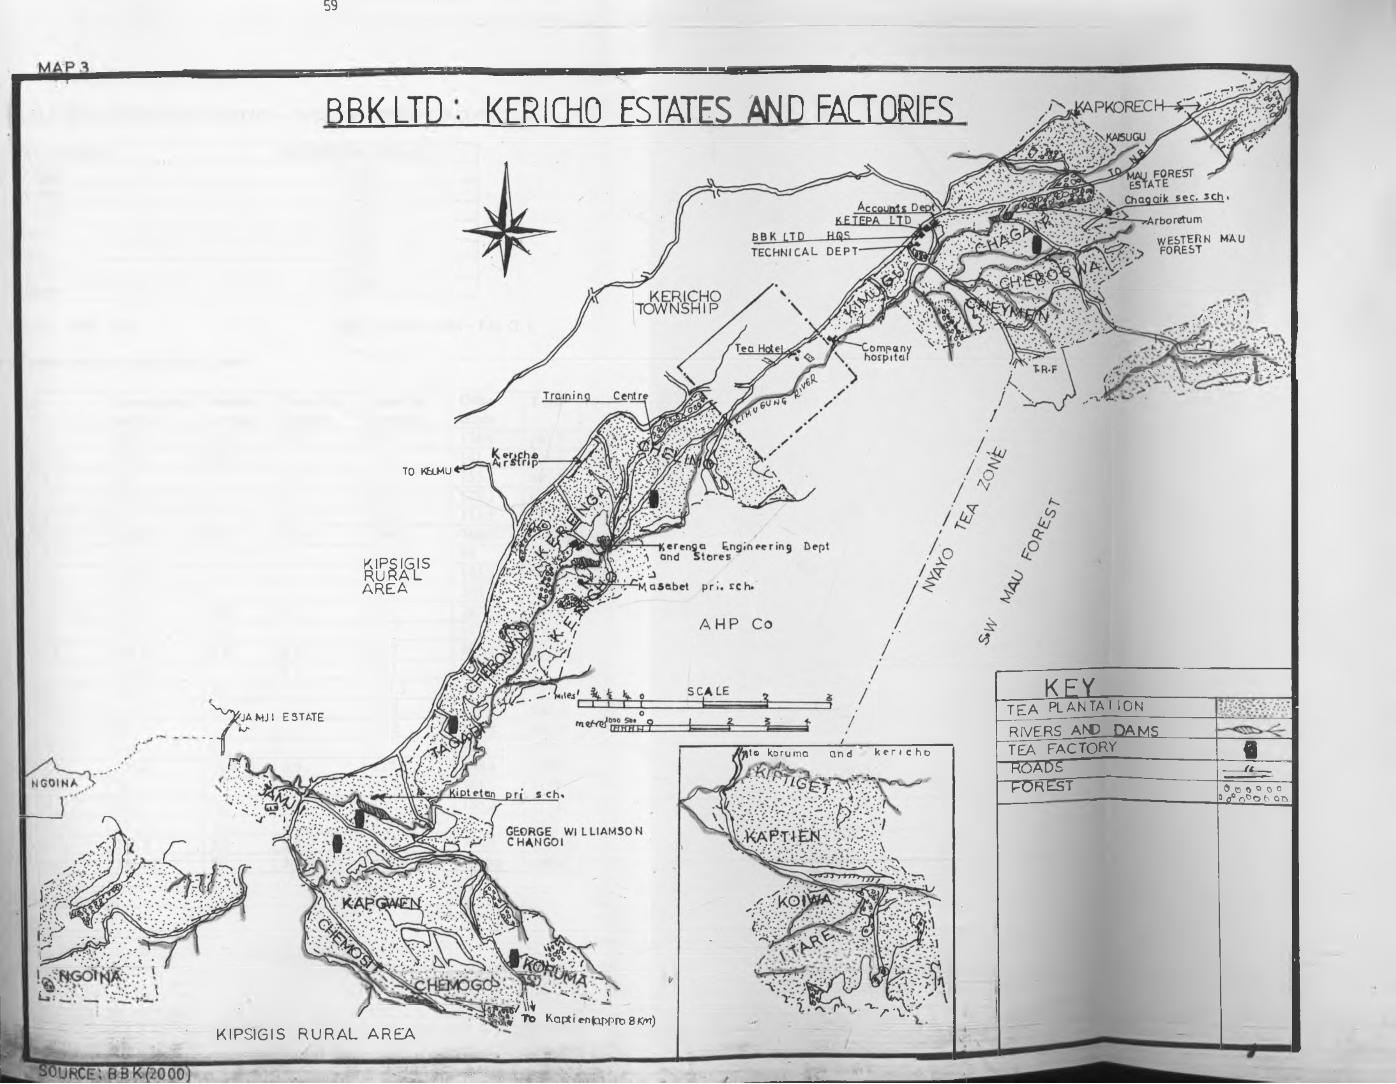
59
BBK LTD KERICHO ESTATES AND FACTORIES
^ > J A H J I ESTATE
- - C
y< .*• 51;*»:. / /.■:.•.? ? * 1«w_ _ - T\» ’• • ym ♦ yy
(* • “ ?'• v^ t T'vv V.' •:.v '.s vA V v ^ t -^V*
TO KBXU
i w '*. • ; v x..;*.* . v
« SA R E A
Uto koruma and k e r i e h b
_ kj.t y f
VV * la--'V' •• > “ T ,A\ ^ * «*1 Jpr/\UIV 7,0 Kaptten(ar>prt>8ttn)
KIPSIG IS R U R A L A R E A
r -Ur.
K E Y _______________T E A PLANTATION
RIVERS AND—DAjylSTEA FACTORY •
“ R O A D S " - i t —" T O R E S T ' & O ft O 0 o
0 a°nOoh on
* v f * L ~ : '■ :? & » * + l 4 \» £ V

60
TABLE 7: FACTORIES STATISTICS - KERICHO DIVISION (1997)
FACTORIES MAXIMUM INTAKEChagaik 123,200Kimugu 70,400Kericho 115,500Tagabi 66,000Jamji 11,000Koruma 66,000Kimari 151,800
Source: BBK, 2000 NB: Factories units - KG. G. L
TABLE 8: ESTATES STATISTICS - 1997
Tea Eucalyptus for fuel
Wattle for fuel
Trees for Timber
Land to develop
Otherlands
Total
371.6 100.1 7.2 15.4 8.6 178.6 681.5370 130.3 25.8 7.1 141 674.9324.5 5.4 - 1.8 - 155.5 487.2478 79.5 - 2.7 87.5 179.3 827362.4 67 2.5 35.1 114.3 581.31907.2 382.3 33 22.4 138.3 768.7 3251.9374.8 51.1 - - 51.7 93 570.6334.7 106.4 - - - 165.5 606.6371.2 52.6 - - - 209.7 633.5383.5 191.1 308 5.5 263.5 847.4310.5 67.4 2.6 - - 171.5 5521774.7 468.6 6.4 5.5 51.7 903.2 3210.1494.3 180.6 0.9 18.1 167.1 861494.2 334.7 4.5 - 111.5 45.1 1350377.1 31.8 4.9 - 38.4 116 568.2421.4 76.1 - - 59.5 123.9 680.9420.4 114.4 3 - - 76.3 614.12207.4 737.6 12.4 0.9 227.5 888.4 4074.2691.3 99.2 - - 33.6 365.1 1189.2416.5 99.2 2.2 0.4 10.1 185.2 713.6
J98.7 27.2 3 5.4 4.1 207.6 646J506.5 225.5 5.2 5.8 47.8 757.9 2548.8L7395T8 1814.1 57 34.6 465.3 3318.2 13085
^°Urce- BBK, 2000
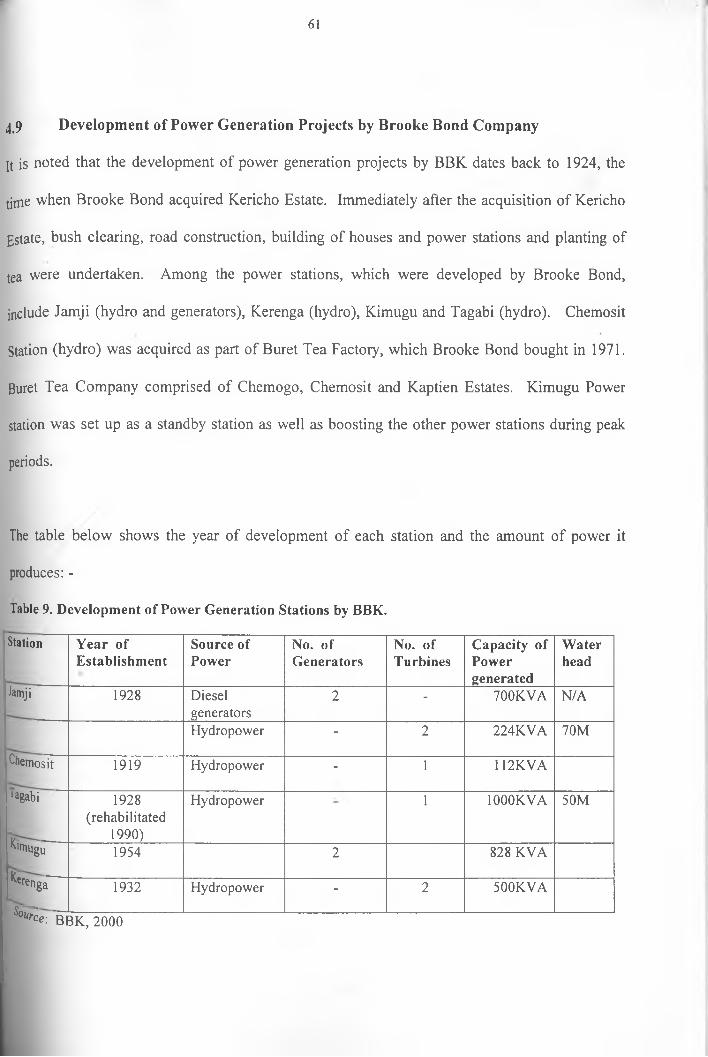
61
4.9 Development of Power Generation Projects by Brooke Bond Company
jt is noted that the development of power generation projects by BBK dates back to 1924, the
time when Brooke Bond acquired Kericho Estate. Immediately after the acquisition of Kericho
Estate, bush clearing, road construction, building of houses and power stations and planting of
tea were undertaken. Among the power stations, which were developed by Brooke Bond,
include Jamji (hydro and generators), Kerenga (hydro), Kimugu and Tagabi (hydro). Chemosit
Station (hydro) was acquired as part of Buret Tea Factory, which Brooke Bond bought in 1971.
Buret Tea Company comprised of Chemogo, Chemosit and Kaptien Estates. Kimugu Power
station was set up as a standby station as well as boosting the other power stations during peak
periods.
The table below shows the year of development of each station and the amount of power it
produces: -
Table 9. Development of Power Generation Stations by BBK.
Station Year of Establishment
Source of Power
No. of Generators
No. of Turbines
Capacity ofPowergenerated
Waterhead
Jamji 1928 Dieselgenerators
2 - 700KVA N/A
Hydropower - 2 224KVA 70M
Chemosit 1919 Hydropower - 1 112KVA
•agabi 1928(rehabilitated
1990)
Hydropower 1 1000KVA 50M
K'mugu 1954 2 828 KVA
renga 1932 Hydropower - 2 500KVA
W e; g BK, 2000

62
4.10 BBK'S Power Generation Sytem: The Case of Jamji Power Station.
Por illustration purposes, hydropower generation data for Jamji station for 1998, 1999 and 2000
are used. In 1998,hydropower units generate at Jamji station were about 4 million KWH, and
about 3.5 million KWH and 2.9KWH in 1999 and 2000 respectively. From these figures it is
evident that the amount of power generated from hydro for the last three years have been
declining. This can be explained by two important factors. First, deforestation has been
undertaken in the forests around the study area and in the neighboring regions. This has had
implications on the amount of rainfall received in the area. Secondly, the hydro dams were
constructed many years ago (see table 9) and therefore siltation and eutrophicaton has taken
place over time. Therefore the water holding capacity of the dams has declined.
4.11 Summary.
From the background information, it is observed that the study area is suitable for hydropower
generation. This argument is supported by the fact that the area receives adequate and reliable
rainfall throughout the year. There have been insignificant rainfall fluctuation of amount
received in the area as is indicate by the rainfall data for the last 29 years .In addition, the area
receives reliable and well distributed rainfall throughout the year with only a short period of two
months with relatively low rainfall.
Forests play an important role in maintenance and/or conservation of water catchments areas
•The study area is well surrounded with forests (both natural and exotic), which explains the
reas°n why the area receives adequate and reliable rainfall throughout year. In addition tea
Plantation do influence the climate of the area.

^gniperatures are relatively low hence there is not any acute evaporation in the dams. Therefore
^e physiological characteristics of the study area can enable construction of hydropower
generation system s of any scale. However, it is beyond the scope of this study to establish the
geological requirements, which favours the construction of a hydropower dam.
63

64
CHAPTER FIVE
POWER GENERATION DISTRIBUTION AND TRANSMISSION BY BBK.
- IntroductionL/
js observed that out of the seven factories in Kericho Division, the company supplies six
ctories with its own generated power. It is only one estate, which is supplied with power from
national grid (KPLC). According to the Company’s Electrical Engineer, the power they
fierate is sufficient for smooth operation of the factories. The company generates about 82
rcent of which 2% constitutes the back up power from diesel power generation used when
wer outage occurs in the national grid supply system. Nevertheless, the company is supplied
r
A?r
YI r j t h 18 per cent of its total power requirements from KPLC.The company has potentials of
1 ^panding its power generation systems to produce surplus power. However, according to the
engineer in-charge, the company is not interested in expanding its power generation systems
because the power it generates at the moment is adequate for its consumption.
| 5-1 Power Generation by the Company vis-a-vis Power Import from KPLC
In order to relate the power generated by the company and the power it imported from the
| national grid, statistics for 1998, 1999 and 2000 have been used deliberately. This is because
this period, there was severe shortage of power supply in the country. Therefore, the
J 3 °f the company-generated power in relation to the imports from the national grid would
cl 1clear picture of the role the private sector can play in power sub-sector, particularly whenere j
IS nat*onal power deficit.
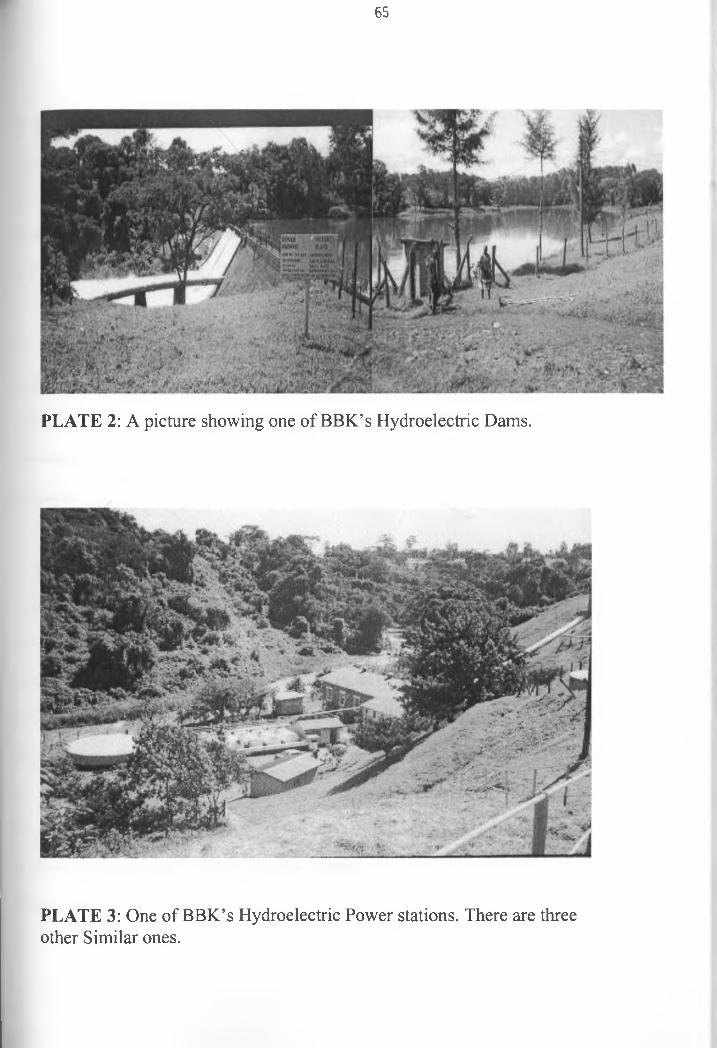
65
PLATE 2: A picture showing one of BBK’s Hydroelectric Dams.
PLATE 3: One of BBK’s Hydroelectric Power stations. There are three other Similar ones.

66
5.1.1 Hydropower Generation by BBK {1998 - 2000}
It is noted that from 1998, hydropower generation declined and this is attributed to the
persistence of drought upto the year 2000. In 1998, the company was able to generate about
10,800,000 KWH from its hydropower stations. This consequently dropped to about 9,300,000
KWH and 8,750,000 KWH in 1999 and 2000 respectively.
On monthly basis, January 1998 recorded the highest figure of about 1,000,000 KWH. This
gradually declined to about 680,000 KWH in April because of the dry spell between January and
April. The amount of power generated gradually increased from May upto October and started
to decline again. (See table 10). This corresponds with the amount of rainfall received during
that year.
It can be noted that the amount of rainfall received annually dictates the level of power
generated from the hydropower stations. In 1999, the highest amount generated was in the
month of August and the least amount was on the month of February. Similarly, in the year
2000, the highest figure was recorded in October; about 1,100,600 KWH and the least amount of
power generated was about 220,000 KWH in February.Figure 3a and 3b shows graphical
representation of power generation for 1999 and 2000. From these graphs, it is noted that when
the area received adequate rainfall, hydropower generated was over and above the budgeted
target. However, if the rainfall is insufficient or when there is drought, hydropower generated is
lower than the budgeted. In this case, the company has to supplement it with diesel power
generation.
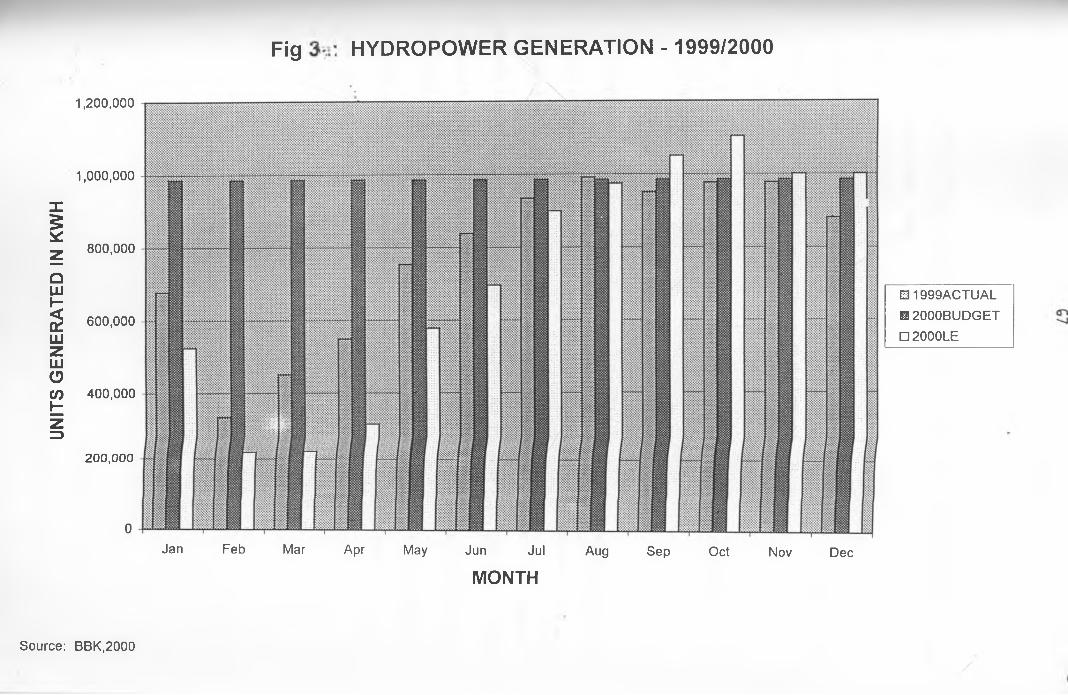
UN
ITS
GE
NE
RA
TED
IN
KW
HFig HYDROPOWER GENERATION - 1999/2000
1,200,000
1,000,000
800,000
600,000
400,000
200,000
0
B1999ACTUAL H 2000BUDGET
□ 2000LE
Jan Feb Mar Apr May Jun Jul Aug Sep Oct Nov Dec
MONTH
Source: BBK.2000
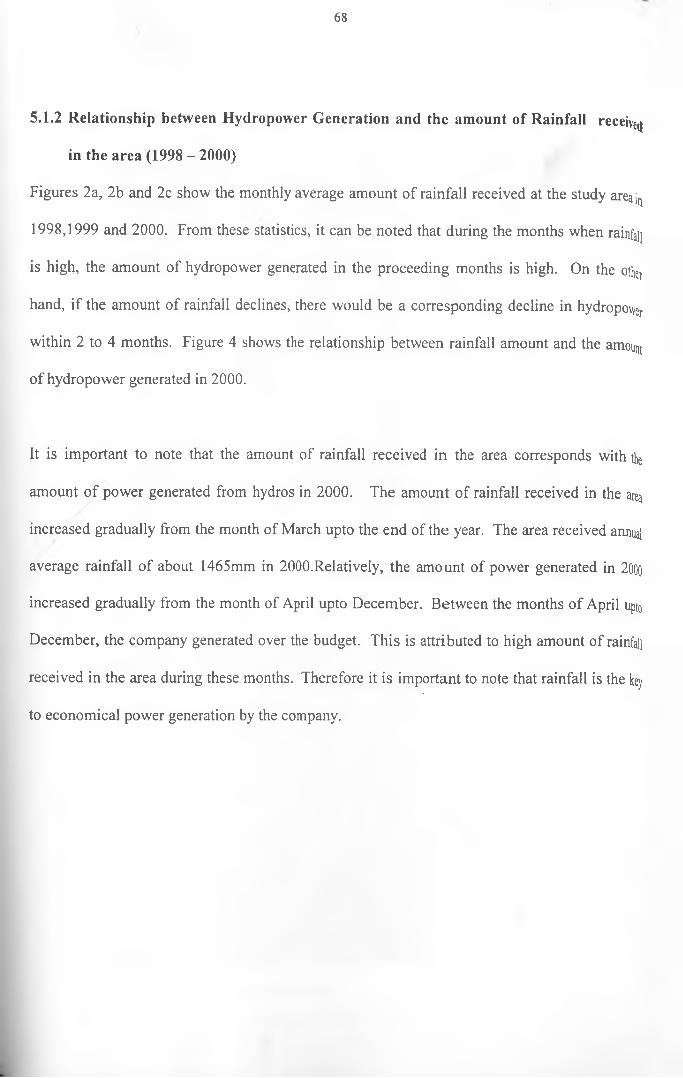
68
5.1.2 Relationship between Hydropower Generation and the amount of Rainfall receive
in the area (1998 - 2000)
Figures 2a, 2b and 2c show the monthly average amount of rainfall received at the study areajn
1998,1999 and 2000. From these statistics, it can be noted that during the months when rainfall
is high, the amount of hydropower generated in the proceeding months is high. On the other
hand, if the amount of rainfall declines, there would be a corresponding decline in hydropower
within 2 to 4 months. Figure 4 shows the relationship between rainfall amount and the amount
of hydropower generated in 2000.
It is important to note that the amount of rainfall received in the area corresponds with the
amount of power generated from hydros in 2000. The amount of rainfall received in the area
increased gradually from the month of March upto the end of the year. The area received annual
average rainfall of about 1465mm in 2000.Relatively, the amount of power generated in 2000
increased gradually from the month of April upto December. Between the months of April upt0
December, the company generated over the budget. This is attributed to high amount of rainfall
received in the area during these months. Therefore it is important to note that rainfall is the key
to economical power generation by the company.

RELATIO NSHIP BETW EEN RA IN FALL RECEIVED AND H YD R O P O W ER G E N E R A TE D IN 2000
AVERAGE MONTHLY RAINFALL: 2000
zoz<_ j
< 100
2
• ' " V >
S $ i S
■ M m
§1 Si 111m i % •. .1
s •% SBSsS«Si
P i l l ini-• : s.>
:■■■. • **?
>*': >:•;:*: '
• • ■ %
1 |
x ;;
* ;.v
■;.y>
_
|:
v . - * - •>
.
n >y.■: x':
i |
JAN FEB MAR APR MAY JUN JUL AUG SEP OCT NOV DEC
MONTHS0 RAINFALL IN MM
Source: BBK.2000

70
5.2 Diesel Power Generation: 1998-2000
As mentioned earlier, the company generates power from diesel generator to supplement
hydropower and the KPLC’S imported power. The amount of power genented using diesel
power generators is, therefore, expected to correspond in variation with the mount of power
generated from hydro and imports from KPLC. This correspondence is expecttd to be inversely
related. Diesel power generated constitutes about 2 percent of the total powertonsumed by the
company. The amount of power generated using diesel generators has beenon the rise from
1998 to 2000. However, in 1999, the amount generated dropped because of metianical problems
with the generators. In 1998, Diesel generated power amounted to about 282J00 KWH. This
amount dropped to about 266,000 KWH in 1999 and then shot up to about 682000 KWH in the
year 2000.
/
It can be noted from Fig. 4 that the actual amount of power generated was b4w the budgeted
level and this was between the months of January and May in the year 2000. firing this period,
power rationing had not been effected by KenGen. In Fig 6, it is observed thathe actual power
imports from KPLC were between 500,000 KWH and 650,000 KWH in the nonths of January
and May.
In the year 2000, diesel power generation was highest in the monbth of June nd this amounted
to about 15000KWH.During the same month ,power imports from KPLC draped from about
^OOOOKWH to about 250000KWH.The imports gradually dropped below theludgeted level of
about 220000KWH ,in the preceeding months (June to November).In 199!, there was less
deration of power from the diesel generators except for the month of March ai April. In the

71
same months, the amount of power imported from KPLC was relatively high. This is attributed
to low hydropower generation capacity in the same period.
The company had budgeted to generate upto 40,000 KWH on monthly basis for the year 2000.
However, it generated over and above the planned budget from June to December. From the
month of June, there was scheduled power rationing by KPLC hence diesel generators operated
for long hours to generate supplementary power to add to the little power the company imported
from KPLC. During the same period, there was increased tea production due to sufficient
rainfall received in the area. Figure 5 gives a graphical summary of the amount of power
generated using diesel for 1999 and 2000. The graph shows the actual power generated for the
two years and the planned budget for the year 2000.
/

72
PLATE 4:A Diesel Generator: The company uses Diesel Generators to generate Power when there is Power failure from KPLC.
m m

UN
ITS
GE
NE
RA
TED
(K
WH
)Fig 5 : DIESEL POWER GENERATION -1999/2000
160,000
140.000
120.000
100,000
80,000
60,000
40.000
20.000
0Jan Feb Mar Apr May Jun Jul Aug Sep Oct Nov Dec
MONTH
E31999ACTUAL El 2000BUDGET □ 2000ACTUAL
Source: BBK.2000

74
5.3 KPLC Power Import: 1998 - 2000
jn 1998, the company imported about 2,370,000 KWH from KPLC. The highest amount of
power imports was in April. During this month, the amount of power generated from the hydros
was the lowest (see table 11). This corresponds to relatively high amount of diesel generation in
the same month. The lowest figure recorded for KPLC power import was in November.
In 1999, the lowest amount of power import from KPLC was in June and the highest was in
April (see table 18). There was a gradual increase in the amount of power imported from KPLC
from January to April. In the year 2000, the lowest amount of power imported from KPLC was
in August (67,160 KWH). The highest was in the month of January (575,630 KWH). The rains
had reduced from December to April and therefore less hydropower was generated.
In the year 2000, it is noted that the company spent over and above the budgeted K.PLC Import
bills between January and June. The company had planned to spend a maximum of about Kshs
1.5 million on monthly basis on power imports. However, from January upto June, it spent
between Kshs 1.5 million and Kshs 5 million on monthly basis (see figure 7). During this
period, the hydropower generation was below the planned budget (Figure 3b).
From July upto September, the company was operating within its budget scope. However, the
c°st of electricity shot up and this made the company to spent more than the planned budget
between the month of October and December.
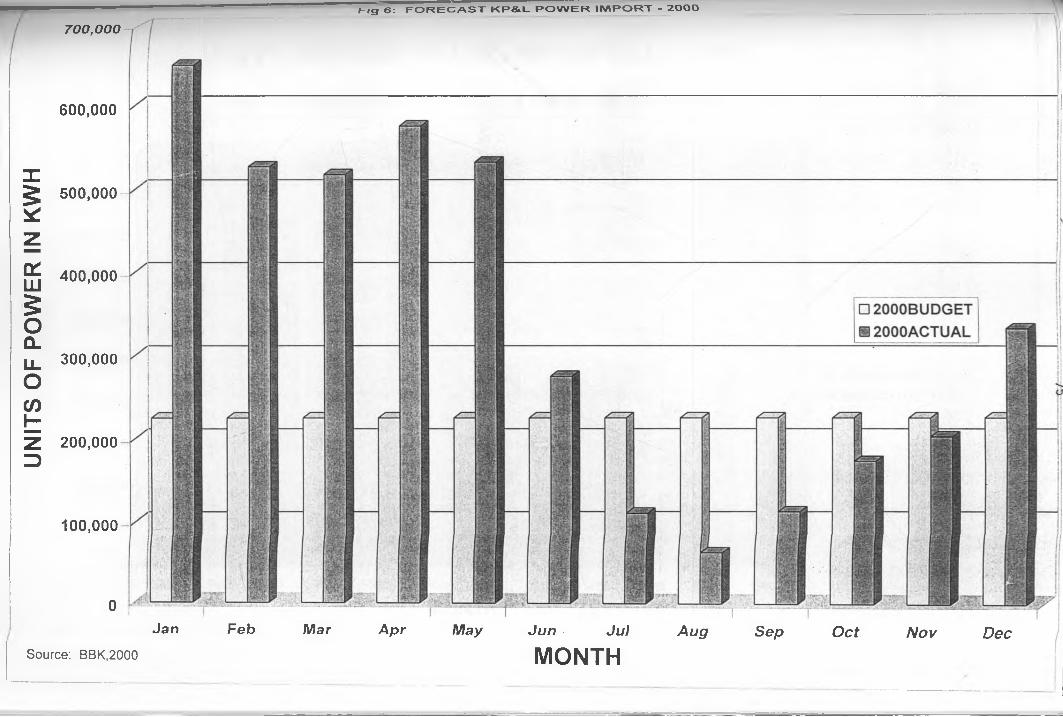
UNIT
S O
F PO
WER
IN K
WH
7 0 0 , 0 0 0
Feb Mar
Fig 6: FO R E C A S T KP&L RO W ER IM P O R T - 2000
600,000
500,000
400,000
300,000
200,000
100,000
0Jan
Source: BBK.2000
A pr May Jun ■ Ju)
MONTHAug S e p O c t Nov D ec
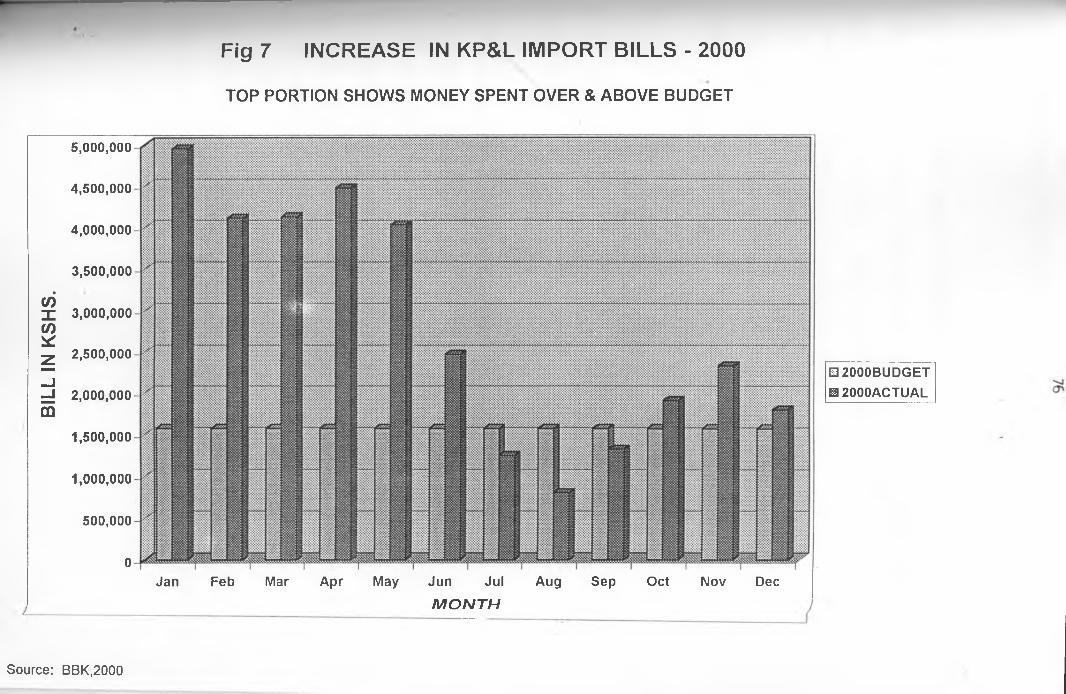
BILL
IN K
SHS.
Fig 7 INCREASE IN KP&L IMPORT BILLS - 2000
TOP PORTION SHOWS MONEY SPENT OVER & ABOVE BUDGET
5.000. 000
4.500.000
4.000. 000
3.500.000
3.000. 000
2.500.000
2.000. 000
1.500.000
1,000,000
500,000
0Jan Feb Mar Apr May Jun Jul Aug Sep Oct Nov Dec
M O N T H
E2000BUDGET E3 2000ACTUAL
Source: BBK,2000

77
5 4 Summary: Power Generation by Source
prom the statistics given, it is important to note that hydropower has played an important role in
generating power to the company. It constitutes a higher percentage of power generation. Diesel
generation constitutes the least amount of power generated.
The Table below summarizes the percentage power generation for the last three years:
Table 10:
~ YEAR HYDRO(%) DIESEL (%) KPLC(%)
1998 80.2 2.1 17.3
1999 94.2 2.7 3.1
2000 65.4 5.1 29.5
Source: BBK, 2 0 0 0
5.5 Electricity Distribution by BBK and KPLC
5.5.1 Electricity Distribution by BBK
Map 5 and 6 shows the 11KV distribution and transmission network of power generated by
BBK. The transmission lines, the transformers and all other electrical accessories within its
distribution system belong to the company. It also transmits and distributes power extensively
Wlthin its jurisdiction without seeking permission from KPLC or Ministry of Energy.
power is supplied to the factories and estates. The amount consumed at specific points are
°'Vn 0n the maps. A total of about 8025 KVA is distributed within the company’s network.

79
PLATE 5a: A Transformer.
PLATE 5b: Distribution and Transmission lines: The Company generates, distributes and transmits power to all its Estates and Factories. It owns the entire electrical system including the cables and transformers.

79
PLATE 6: One of the Tea factories the company supplies its own Generated power.
^LATE 7: One of the Housing Estate: The company supplies Electricity to aU its housing Estates.

LEGENDESTATE/FACTORY POWER
Koruma1. Koruma Water Pump2. Koruma Dispensary3. Koruma FactoryKapkwen Estate5. Kapkwen Manager's house6. Kapkwen OfficeJamii7. Jamji nursery8. Jamji K.I.T Co.9. Spare line - Koruma lineChemogo10. General Manager, ChemogoChemosit11. Chemosit Club12. Chemosit Store13. Chemosit step-up14. Chemosit power houseJamii15-171 Jamji Factory18 Jamji Estates Clerk HouseJamii Power House and Dams19/20 Jamji power house21 Spare Jamji Power House22 Jamji Power House23 Jamji Power House24 Jamji Power House25 J a m ji Power HouseTagabi Estate and Factory26 Lower Tagabi Staff Houses27 Lower Tagabi Canteen28 Tagabi Factory Manager’s House29 Tagabi Estate Office30/31 Tagabi Factory32 Tagabi Hydro33 Tagabi Water PumpChebown Estate34 Chebown Manager's House35A/36 Chebown offices35B Chebown Special HallKerenga Power House and Dam37 Kerenga Power House38/39 Kerenga Power House
Kerenga Engineering Department50 KVA 40 Lower Camp - Kerenga 30 KVA10 KVA 41 Main Engineering Staff Houses 50 KVA500 KVA Masabet Estate
42 Masabet Staff Houses 20 KVA5 KVA 43 Masabet Canteen 5 KVA5 KVA Kerenga
44,-45 Engineering and Quarry 200 KVA100 KVA Kerenga Estate100 KVA 46 Kerenga Senior Management House 20 KVA20 KVA 47 Kapndege Office 25 KVA
Kericho Estate5 KVA 49 - 52 Kericho Factory 200 KVA
Kericho Estate20 KVA 53 Kericho Water Pump 100 KVA50 KVA 54 Manager's House 25 KVA100 KVA 55 Training Centre 50 KVA11KV/415 56/57 Chelimo Office and Water Pump 50/20
56 Manager's House 5 KVA2(300) KVA Accounts
15 KVA 58 Accounts Department 50 KVA59 Accounts Camp 25 KVA
630 KVA 60 Central Hospital 100 KVA315 KVA Kimugu350 KVA 61 Kimugu AVR 2 units500 KVA 62 Kimugu Water Pump 25 KVA50 KVA 63/64 Power House 410 KVA750 KVA 65 Factory 500 KVA
66 Ex Dr. Rotich's House 25 KVA50 KVA 67 BBK Head Office 200 KVA5 KVA Chagaik Estates5 KVA 70 AVR 2 Units25 KVA 71 Houses 10 KVA300 KVA Kapkorech Estate1000KVA 72 Fence 10 KVA25 KVA 73 Factory 25 KVA
Chagaik5 KVA 74 Pump House 30 KVA10 KVA 75 Chagaik Housing 75 KVA50 KVA 76/77 Factory 200 KVA
50 KVA250 KVA
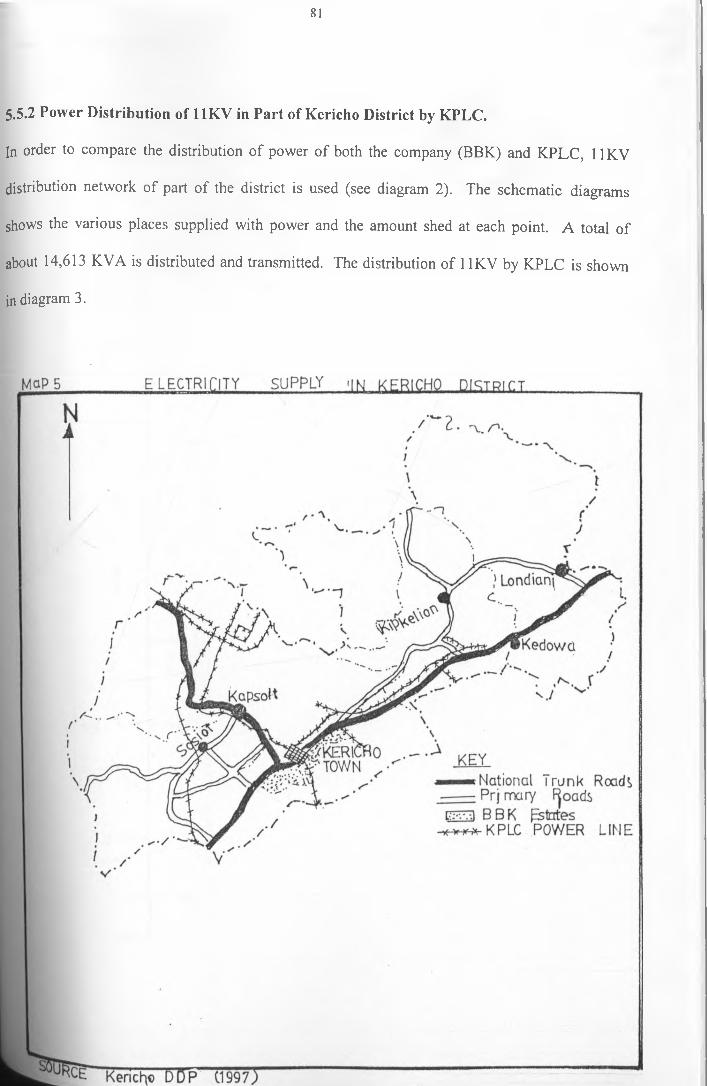
81
5.5.2 Power Distribution of 11KV in Part of Kericho District by KPLC.
In order to compare the distribution of power of both the company (BBK) and KPLC, 11KV
distribution network of part of the district is used (see diagram 2). The schematic diagrams
shows the various places supplied with power and the amount shed at each point. A total of
about 14,613 KVA is distributed and transmitted. The distribution of 11KV by KPLC is shown
in diagram 3.

: ' LEGEND
__j AREA SERVED POWERSUrrLIED1 Sosiot Market 315KVA 49 T.Sambu - 100 KVA 97 Sanik Bakery 2- 200 KVA2 Sosiot G.School 50KVA 50 Alfania Koech- 50 KVA 98 Mulcmbc Hotel- 100 KVA3 Itanda 50 KVA 51 Moses Sambu- 50 KVA 99 Waterworks 150 KVA4 Sosiot Water supply 50 KVA 52 Eli Sigei - 25 KVA 100 Motor Mart- 315 KVA5 Rebecca Soi & Others 15 KVA 53 Joseph Taiam- 25 KVA 101 New Prison- 25 KVA6 Loice Mitei & Others 15 KVA 54 Belgut Brothers- 200 KVA 102 R.C.Mission- 200 KVA7 Z.Bengat & Others 15 KVA 55 Somali Village- 200 KVA 103 Tea Hotel- 100 KVA8 Cheptenyc B.School 15 KVA 56 NHC Houses- 200 KVA 104 j'.Tca Research W.Pump 100 KVA9 Koskey’s Family 5 KVA 57 NHC Sewage Pump 100 KVA 105 ■ Tea Research Houses 15 KVA10 Kebenet Applicants 50 KVA 58 Remand Home- 100 KVA 106 Tea Research Institute 50 KVA11 Tegat Water Pump- 50 KVA 59 Spencon (K) Ltd- 200 KVA 107 Tea Research Foundation 50 KVA12 D.O Ngetich- 15 KVA 60 Sewage works- 315 KVA 108 Cheymen/Cheboswa 15 KVA13 Kipkoiyan- 15 KVA 61 Spencon (K) Ltd water pump200 KVA 109 Three House KCO 5 KVA14 Tegat Tea Factory- 630 KVA 62 Reuben Yegon- 50 KVA 110 S/Services- 100 KVA15 Kebenet Applicants 25 KVA 63 Kericho Water supply 200 KVA 111 S.Kenduiywa- 50 KVA16 Kebenet Applicants 3 50 KVA 64 Keongo W.Group- 50 KVA 112 Major Koech- 25 KVA17 Chereres Applicants 1 50 KVA 65 John Langat- 50 KVA 113 R.Towett - 50 KVA18 Chcreres Applicants 2 50 KVA - 66 CLLR Koskey- 50 KVA 114 Ketepa Ltd- 630 KVA19 Chereres Applicants 3 50 KVA 67 Kapcheptoror Church 50 KVA 115 Kapkugcrwet Market 100 KVA20 Chereres Applicants 4 50 KVA 68 Keongo Primary School 50 KVA 116 Telcom Earth Station 630 KVA21 Kipsolu Sec. School 50 KVA 69 Keongo Village TX1 25 KVA 117 Mau Forest Water Pump 50 KVA22 Kipsolu Village- 15 KVA 70 Keongo Village TX2 50 KVA 118 Mau Forest House- 50 KVA23 Kipsolu Happy Church 15 KVA 71 Hon Ngeny- 15 KVA 119 Mau Forest Factory 50 KVA24 S.Chcpkwony- 15 KVA 72 E.F.Sulvan- 50 KVA 120 Kaisugu Staff Houses 50 KVA25 ] .K.Cheruiyot- 50 KVA 73 Kerego Pri. School - 15 KVA 121 Kaisugu W/Pump- 50 KVA26 Simon Too (8385) 50 KVA 74 Canic Dairy- 315 KVA 122 Kaisugu Pri. School 15 KVA27 Kapsimotwa Village 15 KVA 75 Cllr Kilel- 15 KVA 123 John Koech- 15 KVA28 Tech-Gaa W.Group 50 KVA 76 Kipchimchim Market 50 KVA 124 Kaisugu Tea Factory 630 KVA29 Kaptororiet Church 50 KVA 77 Ainamoi Market- 200 KVA 125 Kapkatungor Estate 50 KVA30 D.Chcmaigut- 5 KVA 78 Ainamoi Health Centre 50 KVA 126 KapkatungOr W/Pump 25 KVA31 Tegat Village- 25 KVA 79 Ainamoi Sec. School 50 KVA 127 Chepsir Pri. School 100 KVA32 Kaplemeiwet Village 25 KVA 80 Joel Sang- 50 KVA 128 Sogobet Pri School 50 KVA33 Ayub Chepkwony 50 KVA 81 Kipchimchim Sec. School 50 KVA 129 Kipyemit Pri. School 15 KVA34 Kapsoiyo School- 50 KVA 82 E.Chebelyon- 15 KVA 130 Chesincndc Pri. School 100 KVA35 Susumyet Village 25 KVA 83 Z.Byegon- 83 KVA 131 Chcpseon Sec. School 50 KVA36 Kakiptui Village- 25 KVA 84 Siloam Hospital- 315 KVA 132 Chepseon Applicants 100 KVA37 Kakintui Health Centre 50 KVA 85 Mortgage Housing 100 KVA 133 Chcsinende Market 1 315 KVA38 Kinsieis G.School water pump25 KVA 86 Derby Avenue (9303) 50 KVA 134 Chepseon Polytechnic 50 KVA39 Simon Too (6335)- 50 KVA 87 Derby Avenue (9302) 25 KVA 135 Chesincndc Market 2 50 KVA40 John Kauria- 25 KVA 88 Kericho T.Sec. School 15 KVA 136 Chesumot Ltd- 200 KVA41 Kipsigis Girls School 50 KVA 89 District Hospital 200 KVA 137 Kericho T.T.College 100 KVA42 M.O.W Camp- 100 KVA 90 Patronic Service- 100 KVA 138 Timsales - 200 KVA43 A.Maseri - 15 KVA 91 Kenyatta Road- 315 KVA 139 ToBBK - KVA44 Kapsuser Market- 100 KVA 92 Wagon Works- 200 KVA 140 Kericho T. Exchange 630 KVA45 F.Bett’s water pump 50 KVA 93 Garage - 315 KVA46 Kapsirwon W.Group 50 KVA 94 Kenya Beer Agency 100 KVA47 Veterinary Dept.- 200 KVA 95 A.Chepkwony- 200 KVA48 World G.Mission (KHBC) 100 KVA 96 Sanik Bakery 1- 630 KVA

83
5.6 Costs and Benefits of Private Sector Involvement in Sub-sector
The possibility of introducing competition into power sub-sector is due to the crucial steps for
the whole power restructuring strategy. A crucial step in assessing the extent to which
competition is being effective is to see whether sales prices have been reduced. The key to the
issue is the mechanism by which competition takes place. A very important aspect of the power
market is that the existence of several privately owned companies do not by itself necessarily
introduce competition. There is also the element of power saving to the national grid by those
who consume their power. This is beneficial to the sub-sector.
For competition to be effective in reducing costs and constraining the existing state owned
companies to perform effectively, the incumbents must perceive a district possibility of losing
sales to a rival who undercuts them. Such a rival may be an established firm or a potential new
entrant. Experience from large power systems in countries where reforms have taken place (e.g.
England and Wales, Norway, Chile), the generators bid to supply power on a daily or even half-
hourly basis. This constant bidding is the first dimension that allows competition to be effective.
If costs can be cut, then the possibility exists of immediately forcing rival out of the way and
supplying instead. The use of prices to gain market share is the hallmark of competition and has
the crucial aspect that the benefits are passed on to consumers through the lower prices.
HoWever> such a system is too complex for smaller systems and for economies of lower levels of
' eI°Pment like Kenya. So a contract system could be used for selling power from the private
In most countries where IPPs have been introduced, contracts are either ‘take or pay’
84
or based on dispatching according to the indexed cost formula. But such contracts do not lead to
competition between the IPPs and the existing plants to improve their efficiency of operation.
5 7 Cost - Benefits of Own Power Generation by BBK
In terms of generation costs, it is noted that the company has the benefit of low cost in generating
power from its plants. The amount they could be paying to the national utility could be
enormous had it not have its own power plants. However, the company incurs a lot of expenses
when the supply from the national utility is not adequate; and therefore it has to supplement it
through diesel power generation.
5.7.1 Power Generation Costs: 1998 - 2000
The company has been enjoying low cost in generating power from its hydros compared to diesel
power generation (see Figure 8). Between 1998 and the year 2000, annual generation cost of
power from KPLC has been increasing gradually. This is attributed to the low annual rainfall
received between this periods which forced the company to import more power to supplement its
own-generated power from hydros. Figure 9 on power generation costs indicate that diesel
I iteration is the most costly in terms of power generation. This is attributed to high fuel and
Ports costs. The fuel costs has been on increase in the past three years. Generally, it is noted that
*ere has been an annual increase in generation costs from 1998 upto 2000.

UN
IT C
OS
T (K
SH
S./K
WH
)Fig 8: POWER GENERATION COSTS 1998 TO 2000
7T)
-
mmmmmmmmmMiliwilliiiiii
HYDRO
EYR1998HYR1999 □ YR2000□ YR2001 AE
4.51
KP&L
1.933.64
4.89
6.246.8 19.49
17.135.85
SOURCE OF POWER
HYR19988YR1999□ YR2000□ YR2001 AE CPcn
Source: BBK,2000

Fig 9: PO W ER G E N ER A TIO N(COST COMPARISON 1999 & 2000)
x5*coXCO*
3hCOoo
0 2000 ■ 1998
DIESEL KP&LSOURCE
HYDRO
COo~>
Source: BBK.2000

87
5.7.2 Cost Comparison of Power Generation: 1998-2000
The cost distribution by power source (Figure 10) shows that the generation costs incurred on
power imported from KPLC is comparatively higher than the cost of generation from the
company’s owned diesel and hydro plants. In 1998, the cost of generation from national utility
power was about Kshs 12,000,000 compared to about Kshs 4,000,000 and Kshs 9,000,000 for
diesel and hydropower generation respectively. The company had budgeted for about Kshs
19.000. 000 for KPLC power imports in the year 2000 but the actual figure was about Kshs
32.000. 000. Similarly, the budget for hydropower and diesel power generation was about Kshs
15.000. 000 and Kshs 8,000,000 respectively. This actually went up to about Kshs 14,000,000
for diesel power generation and about Kshs 16,000,000 for hydropower generation. However
hydropower and diesel power generation costs were comparatively lower that the KPLC costs.
Therefore, Figure 9 shows the cost comparison of power generation for 1999 and 2000. It is
noted that the generation cost per unit is more when power is generated from diesel generators.
Generation cost per unit when power is from hydro is comparatively low. Therefore, this implies
that the company can save a lot if the generation of power per unit is cheaper. Nevertheless, the
generation of power from hydro is determined by the amount of rainfall received in the area,
from the statistics, it can be concluded that the company enjoys the cost benefits if it generates
its own power compared to importing power from the national utility.

CO
ST
IN K
SH
S
18,848,38
3,969,20116,850,64:
mum0,731,372
15,731,9718,974,
Fig 10: POWER GENERATION COSTS 1998 TO 2000COST DISTRIBUTION BY POWER SOURCE
□ KP&L ® DIESEL m HYDRO
1998 1999 2000BUDGET 2000LE
PERIOD
70,000,000-1f
r ;.r .
I l l i i l l l i l i i S i
60,000,000- % v N ^ • •. s
50,000,000-
sy::
40,000,000- "x'x*
30,000,000 -y
20,000,000
10,000,000
Source: BBK.2000

89
5.8 The Impacts of Environmental Degradation in the River Catchment and Sub-
Catchments on Hydropower Generation
power projects are becoming subject to criteria requiring ecological sustainability, maintenance
of local social structure and a reliance on indigenous knowledge. The environmental impact on
electricity generation is site, scale and technology specific. The technology chosen determines
the scale and site to a large degree. Therefore, recognition is being given to the fact that the
human impact on the natural environment must be minimized.
It is noted that the activities, which are taking place upstream of the location of hydropower
stations by the company, are detrimental to the sustainability of the stations. The forest
clearance at Chelimo area paved way for human settlement and agricultural activities (see plate
8). People do farming in the land lots, which they were allocated. This results in soil erosion,
which drains into the hydropower dams down-stream. The long-term effect of soil erosion and
Ae eventual siltation of the dams is that their water storage capacity will be depleted. Moreover,
continued siltation of the dam will eventually result in eutrophication of the dams. The
generation capacity of power will be adversely affected.
In addition Reforestation which has taken place outside the study area has had implications on
thee amount of rainfall received in the area.There has been deforestation in there part of Mau
forest ,01enguruoni and Ndoinet area in Nakuru district.These areas constitute the main
hatchment area of the region.Decline in the amount of rainfall in the region can be explaineb by
foe defostation of the indeginous forest in these areas to pave way for human settlement.

^0
PLATE 8: Human settlement at the catchment areas of the rivers draining into the Hydro Dams might have long term effects on performance of the Hydro Dams due to Siltation.
plate 9: A river draining into one of the Hydro Dams.
k
r91
g 9 Local Area Power Supply.
■foe research sort to find out from the business community, households and instituti^ns t ie r
Opinion(s) on a number of issues on power supply and demand. Questionnaire were
administered to 40 different businesses in the towns adjacent to the company. These were
fCericho town, Kapkugerwet and Kapsuser. Fifteen questionnaires were administere< t0
households and institutions.
Businesses were grouped into two broad categories: Non-Engineering related and En^ineermS
related businesses. Non-Engineering related businesses constituted 52.5% and the E n ^ neerin8
related businesses constitute 47.5% of the total number of respondents. Each business enterprise
had about 10 employees.
The entrepreneurs were asked to state the days when their business does well. Out of tota*
respondents; 27.5% stated that they make good business during weekdays and 12.5% stated that
they make good business during the weekends. However, 60% of the respondents st^ te< ^ at
they make good business during both weekdays and weekends.
In addition, 75% of all the businesses and 93% of households were supplied with p ower by
pPLC and they relied wholly on this source. However, 25% of business community were
^PPlied with power by KPLC; and in case of power outage, they generated their ow^1 power.
| s category comprise of 6.3% of households interviewed. Those who stated t^a t they
"^ted their own power complained of high cot of own-generation due to high cost of ueb

92
The respondents were asked to state the duration of power utilization and 95% of the business
community stated that they utilized power for more than 5 hours per day. This group comprised
0f 93.8% of household respondents.
power cuts and/or blackouts
A question was asked on the frequency of power cuts/blackouts. All the respondents stated that
they experience power cuts/blackouts. But 90% of the business community respondent’s stated
that power cuts/blackouts do occur during weekdays with 70% stating that power cuts occur
during the afternoons.
The findings from the question show that the business persons experience power cuts/blackout
when the business is expected to be good. The data collected indicates that business is good
during the weekdays and weekends and this is the time when they experience power
cuts/blackout. The research sort to find out the best possible source of power which can be
harnessed in the region. Their responses were as shown in the table below:-
Table 11: Alternative Power Source in the Area
POWER SOURCE
Wee:Field Study,2000.
NO. OF RESPONDENTS
23
40
PERCENTAGE
57.5
17.5
2.5
22.5
100
TOTAL
23
40

93
A question was asked to inquire the adequacy of power supply. It is noted that 16 house*10
respondents answered this question with 87.5% stating that the supply is not satisfactory. The
reason they gave is that power cuts often occur when power is most
Tablel2 Sufficiency of Power Supply
'po you think the current supply of
jjower is adequate?
No. of Household respondents
Percentage Total
Yes 1 6.7 1
No 14 93.3 14
Total 15 100 15
It is also noted that among the schools and hospitals interviewed, 100 per cent of those supf?^ec*
with electricity from KPLC complained of power outages. But the company h o s f? ^ ’
dispensaries, schools and residential estates have never experience any power outages.
The company sponsored schools have never loss time due to power black out whereas tf10^
supplied by KPLC stated that they loose more than one hour in case of power black out
occurrence. **•
**•10 The Possibility of Local Area Power Supply by BBK
study revealed that with the appropriate legal and institutional framework, it is possibl e t0
^Ve local area supply (localized power generation, distribution and transmission). ^ s
^utioned earlier, such a system will enjoy the economies of scale in terms of minimizatio^,1
! loss as a result of long distant power transmission.
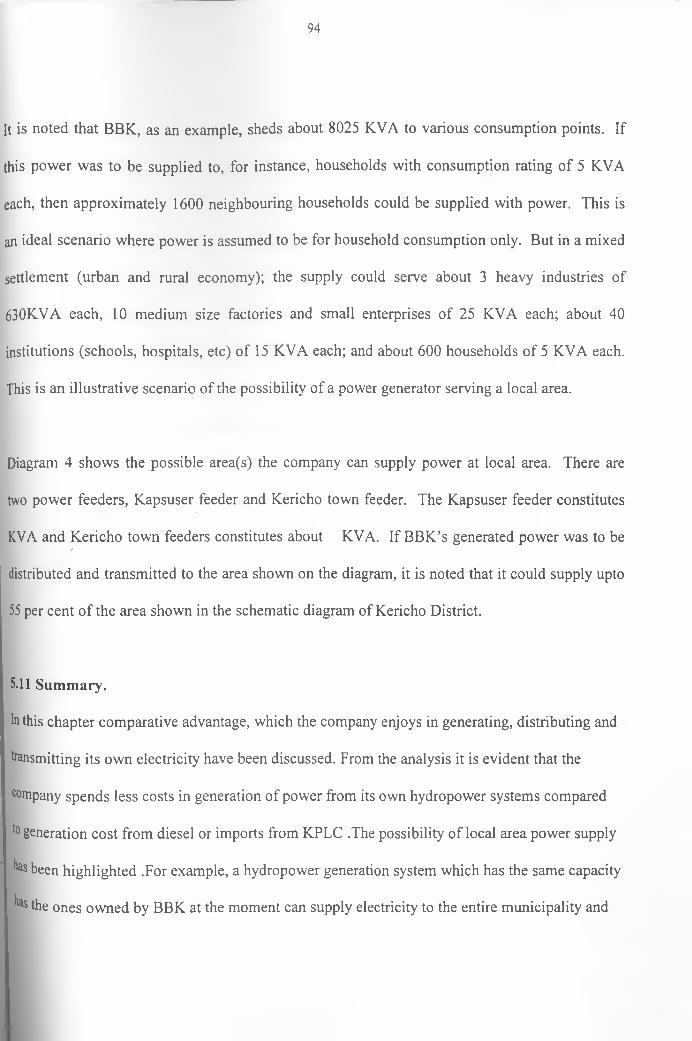
94
It is noted that BBK, as an example, sheds about 8025 KVA to various consumption points. If
this power was to be supplied to, for instance, households with consumption rating of 5 KVA
each, then approximately 1600 neighbouring households could be supplied with power. This is
an ideal scenario where power is assumed to be for household consumption only. But in a mixed
settlement (urban and rural economy); the supply could serve about 3 heavy industries of
630KVA each, 10 medium size factories and small enterprises of 25 KVA each; about 40
institutions (schools, hospitals, etc) of 15 KVA each; and about 600 households of 5 KVA each.
This is an illustrative scenario of the possibility of a power generator serving a local area.
Diagram 4 shows the possible area(s) the company can supply power at local area. There are
two power feeders, Kapsuser feeder and Kericho town feeder. The Kapsuser feeder constitutes
KVA and Kericho town feeders constitutes about KVA. If BBK’s generated power was to be/
distributed and transmitted to the area shown on the diagram, it is noted that it could supply upto
55 per cent of the area shown in the schematic diagram of Kericho District.
5.11 Summary.
In this chapter comparative advantage, which the company enjoys in generating, distributing and
transmitting its own electricity have been discussed. From the analysis it is evident that the
company spends less costs in generation of power from its own hydropower systems compared
to generation cost from diesel or imports from KPLC .The possibility of local area power supply
*las been highlighted .For example, a hydropower generation system which has the same capacity
^ the ones owned by BBK at the moment can supply electricity to the entire municipality and

95
its surrounding environs. This indicates that with a larger power generating system, the whole
district and even the neighbouring districts can be supplied with locally generated electricity.
Environmental conservation and management is key to sustainable power generation from
natural resources, particularly hydropower system. Environmental degradation in the river
catchm ents and sub-catchments of the study area ha been pointed out to be a major constraint
now and in future in the development and management of power systems by the company .In the
study, however, river discharge analysis could not be done to asses the river flows. This was
because of lack of data on river discharges of the area.

96
CHAPTER SIX
PLANNING IMPLICATIONS AND RECOMMENDATIONS
Introduction
This chapter discusses how proper planning and use of appropriate technology can help to reduce
power supply / demand imbalances, especially by the private sector. The government can
borrow these experiences in order to foster development in the power sub-sector. For example,
an alluminium smelter, consume large amounts of electricity. Others, for example a Sugar Mill
may be electrically self - reliant (or even produce surplus). Hence, in between lies a range of
industrial and service sector users, all of who influence the demand for electricity and, thereby,
the needed supply. The illustrations will form the basis of the way forward in the power sector
in Kenya, and, therefore, will highlight some of the possible proposals.
Agriculture, for which this study was based, represents one area of comparative advantage for
many developing countries for power generation. For instance, Mumias Sugar Company has
undertaken a project on co-generation of power generation in Kenya. Therefore, generation of
power by the private organizations would be an important development in the power sub-sector.
The positive impacts of such an arrangement could be realized if many of the organizations are
ln their electricity needs. If well developed with more efficient generation equipment, there can
^ sufficient electricity production to even allow the organizations to sell electricity offsite
Th,Ht*lea sector is another area, which can be involved in power generation. It is noted that tea is
&0tyn areas of relatively high and reliable rainfall throughout the year, ranging between
97
]800mm upto 2200mm per annum. The crop does well in highland areas characterized by
adulating land. These characteristics are favourable for the development of hydroelectric
power generation, as is the case with Brooke Bond (K) Ltd in Kericho. In this case, the amount
0f rainfall received throughout the year becomes significant.
Cement industry is another important industrial sector, which requires large amounts of energy
mostly in the form of heat, but also some electricity, which is used to drive motors. While great
strides have been made in reducing the amount of energy required to produce cement, further
gains in the form of electricity co-generation are possible. A cogeneration equipment can be
installed which would allow the industry to utilize waste heat in order to produce a certain
percentage of its total electricity needs. Such a project has been undertaken in Korea and it has
been quite successful and, indeed, economically attractive. Similar technology may be
considered in Kenya in future in order to address electricity demand.
Although Kenya has considerable power generation potential, private developers have not been
involved in sizeable power generation projects, particularly hydropower projects. The private
sector tends to take cautious approach to involvement in these kinds of projects. It is noted that
large power projects are capital-intensive and often require more than one source of funding,
^vate companies usually prefer to utilize non-recourse financing, since their aim is to produce
P°Wer for their own consumption and, therefore, enhance production. *
*n °rder to address the problem of power deficit in Kenya comprehensively, both national and
Clonal multi-regional) perspectives are generally needed. The regional, multi-regional

98
perspectives are generally needed. The regional, multi-regional and national considerations
should be complied with multi-sectoral approach in power generation and / or provision. This
means that providing them with the necessary incentives should encourage other players in the
sector, other than the government.
Although previously, attempts in this direction have not met, immediate acceptance, especially in
developing countries, continued efforts might eventually indicate whether or not the current
policies in the power sector are supported by efficiency and / or distribution arguments.
There are a number of factors that could influence on the participation of the private sector in
power generation in Kenya. These include, among others: -
♦ Market opportunity, which indicates that there is a clear need for additional capacity if the
country is to industrialize fast.
♦ Enormous amounts of capital will be needed by the government to meet expected future
electricity demand.
♦ Inability of the government to fund all the electricity need(s) and, therefore, the private sector
will begin to play an important role in at least the generation aspects of the sector.
♦ The state agency, which regulates power utility in Kenya - Electricity Regulatory Board of
Kenya, has clearly encouraged private power participation.
kl Recommendations
The study has been carried out in order to highlight the potentials and the constraints that impede
development and / or participation of private sector in power generation. It is clear from the
study that the private sector can be an important player in power generation, a factor that is
99
especially relevant for the financially pressed public sectors in Kenya today. Private powCr
producers also tend to operate more efficiently than publicly owned facilities, since the/
normally accept responsibility for project risks, such as construction cost overrun ;and efficied*
operation of the plant(s).
however, the macroeconomic, legal and regulatory environments in Kenya do not encourag^
competitive proposals for investment in private generation of power. This research therefore
come up with recommendations, which cultivate the requisite investment environment, and i / 1
developing the mechanisms and procedures that need to solicit and evaluate internationally
competitive proposals for an orderly private power development and / or participation.
It is emphasized that the success or failure of participation of the private sector in power industi^/
in Kenya will depend on the stability of macroeconomic environment. In particular, the policy/
makers and political leaders must agree on the role that the private sector should have in th ^
electric power industry, and, therefore, they must develop laws, regulations and mechanisms tcP
facilitate private power projects. If encouragement of private power development is to b ^
realized, the sector should be structured to create competition. This is an issue, which it is hopec/^
^ the current reforms towards privatization of the power sub-sector in Kenya will address.
In the
e*istin
basis
initial stage, competition can be established without restructuring but by perm itting
8 public utility to purchase surplus power from local private producer(s) on a competitive^
Further, since power generation activities can be competitive, it could be possible to
100
reduce the need for regulation. On the other hand, power transmission, which is considered to
retain the characteristics of a monopoly, should be subject to regulation. For example, a separate
transmission company can be responsible for purchasing power on a competitive basis from
diverse generators, for operating the grid and for the load dispatch.
Regulatory process should be institutionalized in order to reduce the number of conditions that
need to be incorporated in the contractual agreements for private power producers. Therefore,
published procedures should be provided; including the specific steps and approvals needed for
private power development. Professional management, institutional independence and
predictable pricing mechanisms are essential to an effective regulatory function. This means that
the regulatory structure should ensure that the financial viability and creditworthiness of utilities.
6.1.1 Private sector involvement in power sector in Kenya: The way forward.
It is noted that with the exceptions, the power utilities in Kenya are government owned
integrated monopolies responsible for generation, transmission and /or distribution of all
electricity that they produce. Varying degrees of competition already exist in the running of even
the most integrated power utilities, as for instance to construct facilities, to contract out certain
functions and so on.
One of the tenets policy of the restructuring of the power sub-sector in Kenya should embrace is
that exposure to markets and competition should be increased in order to enhance sector
Performance. In particular, recognition that not all of the activities involved in the privation of
infrastructure services is a national monopoly to achieving greater efficiency. For greater
cfficiency in the power sub-sector the following tenets of a new policy should be fostered.

101
a) Competition in Generation.
It is important to note that the small size of the power systems and the weakness of the regulatory/
frameworks in Kenya make it difficult to recommend their break up (unbundling). Unbundling
generations from transmission and wholesale competition for generation are complex affairs.
Therefore the fragmentation of the generation systems into several prices for competition should
emerge, and a trend toward smaller plants and less capital-intensive generation, should be
encouraged.
This model assumes that the economies of sale in the generation can be obtained in the spirit of
sub-sector fragmentation or are less important than the efficiency brought by competition. In this
respect, independent power producers might be able to compete with utility-based generation in
specific circumstances. So there is need to review the barriers to their entry in the power industry
and the rules for pricing their outfit.
b) Decentralization of Generation and Distribution
The weaknesses that prevail at the national level in the formal governance system of the power
sub-sector in Kenya suggest less sophisticated decentralized community based supply. Whether
in education, health, water supply and sanitation, rehabilitation, or supply of new housing, this
mode of service delivery has elicited responsible behavior and good cost recovery from
beneficiaries and responsive supply by producers.
decentralized community based low Voltage power supply is worth exploring, but it should
delude most traditional generation technologies except mini-hydro, wind power and solar

! 02
power. However, decentralization has one draw back in the eyes of many, it often translates into
markedly different power prices from one area to the next; significant departure from the
prevailing practice of natural tariff for small consumers. This is an issue, which should be
addressed by the electricity a regulatory Board, as a sole regulator in the power sector.
6.1.2 Purchasing Power from Private Producers
Another very important issue for commercial viability of power projects is the tariffs structure.
The most common pricing approach followed in private power agreements (as in China) is the
two-part tariff, comprising a capacity charge, which is designed to recover the capital or fixed
costs of the plant, and an energy charge, which varies with the net amount of energy in Kilowatts
Hours actually delivered by the power producer to the purchasing utility. The government can
adjust these rates by providing various incentives and penalties and through indexation, which
provides the producer, operations and maintenance operator, and the projects debt and equity
sponsors with greater certainty that their costs and earnings will not erode during the life of the
project because of factors beyond their control.
Power generation projects involve risks for all parties - the power purchaser, the project
developer, and the tenders. The development of private projects can go on successfully only
w'th an appropriate allocation of risks. One of the main reasons many private power projects in
developing countries have not progressed has been an inability to meet the requirements of
j Anders, notably the provision of guarantees from government covering the power purchasers'
0 ''gations, foreign exchange risk and so on. Therefore, if the private power projects have to

! 03
succeed, the ability of the parties to agree on how risks will be shared is often the key to
initiating a successful participation of the private sector in power sub-sector.
It is noted that availability of a bulk power market, in addition, to the market from sales to the
existing public utility, can provide additional economic benefits and incentives to private power
producer and retail consumers. The private producer can have an opportunity to obtain
additional revenues through sales and other bulk users. Private participation in a bulk power
market also requires the following authorities and conditions: -
♦ Legislative authority for sale of electricity by the private sectors to consumers other than a
utility power purchaser.
♦ Legislative authority for private access to transmission and distribution systems.
♦ Establishment of conditions under which power utility or other owners of bulk transmission
systems wheel power from private generators.
♦ Establishment of a clear transmission pricing mechanism.
♦ Legislative Authority for generation, transmission and distribution of power at Regional level
by Private Producers.
From the study, it can be realized that the argument based on the economies of scale in power
projects may not be valid, therefore, it is important to provide additional motivation for power
generation by the private sector. If there is to be a role of the private sector in power sector, its
justification must be based on the three roles: - Mobilization of private capital for power
development, Development of new sources of power generation, or Improved economic
efficiency.
104
CHAPTER SEVEN
SUMMARY AND CONCLUSION
7.0 Summary.
There are various advantages of private sector involvement in power sub-sector. One of the
advantages is that, given the desperate need for investments by the governments in the energy
sector and the shortage of public capital, the idea of private capital flowing into the sector is
attractive. However, such an investment must have an element of additionality involved.
Another possible advantage of private sector involvement in power sub-sector is the possible
new sources of power that can be opened up. For instance, some power projects may be
considered too small (as the case with power projects for BBK) to be developed effectively by a
large public utility. Alternatively, Industry or Agriculture may be able to employ cogeneration
technologies that are not available for traditional power plants.
A case in mind is, for example, Mumias Sugar Company in Kenya, which generates power
using cane by-products (burgass). In this case, private sector involvement can bring additional
capacity into production of power from sources, which are economically efficient, but not readily
available to publicly owned utilities.
It is pointed out that power generated by a private enterprise need not necessarily be distributed
to the national grid; but if it is able to serve itself with power sufficiently, it will have saved
Power to the national grid and, therefore the saved power can be consumed in other sectors of the
economy.

105
Perhaps the most persuasive argument in favour of private participation in power sub-sector is
that of the improved economic efficiencies. Such efficiencies might ccme about, when improved
maintenance results in physical capital being more efficient or l0 og- lived. Besides this
overheads may be somewhat lower in the private sector. Whichever \y y, to the extent that profit
motive induces, the private sector to improve efficiency, the economy ^ f a country benefits in the
long run.
It is worth noting that since the establishment of the Electricity Regulatory Board the
government has embarked on a new wave of reform decisions aimed at creating the necessary
structures to apply the law and key principles of market orientation such as efficiency and
competition in the power sub-sector.
These decisions include the separation of generation from transmission operations and
establishment of competition in generation of power. This gives the private sector a chance in
the power sub-sector to not only generate but also diversify power sour pes. This is an important
aspect, particularly in Kenya where hydropower generation constitutes 75% of the total installed
capacity. This has been (as mentioned earlier) subject to climatic conditions particularly rainfall
The serious power shortages of 1999/2000 in Kenya, worsened by the declining economic
development should spark the government's interest in tapping the potential private sector in the
Power sub-sector development. However, the main problem that should be addressed is the need
for long-term market and tariff commitments due to sector's capital-intensive nature.
106
7.01 Power Savings to the National Power Utility.
It is important to note that the concept of ‘participation’ in this study do not necessarily n ^ a n
that a power producer generates power that is supplied to the national grid. In this con te^, a
private generator who generates power for own consumption will have participated in the poyver
industry. This means that the private producer will have saved a certain amount of power to ,h e
national grid. That power can then be supplied to other needy areas by the national utility.
Brooke Bond (K) Ltd distributes about 8025 KVA of power to all its estates and factories.
amount of power is generated from its own power generation stations. This implies that t he
company saves upto 8025 KVA to the national grid (which it could have, otherwise imported jfor
its use).As indicated earlier, if the company was allowed to transmit and distribute power it co^ld
supply a portion in any given region( based on its current capacity). The company has ^ e
potentials to expand the generating systems. Therefore this implies that it can supply a relative ly
large area in a region.
7.1 Conclusion.
The case study has revealed important issues "that call for planning in the power sub-sector. It is
important to note that every power source or System has unique characteristics, which favours ts
development. For instance, in planning for h ydropower generation systems, various factors
taken into consideration. These factors dictatte the siting of power stations. Factors consider £<d
' include topograp hy, rainfall amount, temperature, river catchments and sub-catchments,
quantities of water in rivers and their tributaries in the proposed site, river discharges and soo(-T-
The same applies to other power generation soources.

107
Therefore, it is important that potential sources of power peculiar to different regions ^hould be
identified. These sources can therefore be harnessed to generate power to be utilised these
areas or to be supplied to the national grid. Wind and solar power, for example, cal1 he best
suited in arid areas in the tropics. This is because these areas receive long hours of sunshine and
sufficient wind blow to run turbines to generate power. A multitude of such small-scal^ sources
of power can sum up to substantial amount of power.
Kericho District, where the case study is based, enjoys adequate and reliable rainfall thfou§hout
the year. The rainfall data reveals that the area received more than 1300mm of rainfall d u a l ly
for the last 29 years. The area is characterised by valleys and hills, some of which Provide
suitable sites for hydropower generating stations. Private power investors can harness t^ese
characteristics with a bias towards hydropower generation.
Another aspect, which is important in planning for the location power system, based on existing
natural resources, is the economies of scale in power supply. It is noted that the fisher the
consumer of power from the source, the higher the amount of power lost through distribut*on
transmission. Therefore, more power is lost in supplying a dispersed settlement than a
concentrated settlement. Regional power generation, distribution and transmission would ensure
that less power is lost.The private sector can establish power generation systems at region#! eve
and supply power within that region. For instance, financially able Municipal Counc^s can
develop a power system to supply power within the municipality or township.
108
In conclusion, various concerns have been discussed as pertains to the role of the private\to (
in power generation. The findings and the discussions highlighted that the participation%
private sector in power generation can make an important contribution to development o f.%
sector infrastructure in Kenya. This can be either directly or indirectly- It is important toStress
that Kenya's power sector would remain attractive to private developers/investors as kV
there is:-
(i)
(ii)
(iii)
The initiation and or implementation of power sector reform in a tran^
process, where potential investors in the Kenyan power sector can ass^
scope, direction and schedule of reforms.
Clarification and streamlining of the process of obtaining power project anq
approvals particularly for the power investors who want to ventur^
W
intfcommercial power generation.
Development of mechanisms for and increased access to financial assistah
all power projects by the local investors.
(iv) Commercialization of various power companies and / or power generate^
will be off-takers from private power projects, and
Provision of power developers to direct access to customers so that they are able to be ,
Market risk in the future. This could be debatable in a developing country. However, it is .
the ways of encouraging the private sector participation in power sector -
However, Covarrubias, A.J. (1996) argues that as with other infrastructure sectors, owne% ,*ip O'
P°Wer sector assets by private entrepreneurs (assuming their interest ccould be elicited) n \y be ^
P°litical and economic issue in many developing countries. Nevertheless* privatisation of *\ e

109
segments of the operations appears possible, especially power generation. Private operators can
be expected to invest in almost any country if they succeed in hedging their perceived risks.

no
BIBLIOGRAPHY
1. Askin, A.B (1979) How energy affects economy, Lexington Books Toronto.
2. David R.C.et al (1984) Energy Policy and Land-use Planning, Pergamon,N.Y.
Energy Sector Management Assistant Programmes, Nairobi, Kenya.
3. Glen,D.J ((1992) Private Sector Electricity in Developing Countries. Supply and
Demand. A discussion paper, IFC, Washington D.C.
4. Goodland, R 941 Ethical Priorities in Environmentally sustainable Energy
systems: The case of Tropical Hydropower, World Bank, Washington D.C.
5. Hagel III, J (1976) Alternative Energy Strategies: Constraints and Opportunities,
Praeger, New York.
6. Inversin.A.R.(1994) New Designs for Rural Electrification:Private-Sector
experiences in NepakWashington D.C.
7. Isham.Jonathan.et aid 995)’Does Participation Improve performance ?
Establishment casualty with Subjective Data:The World Economic Review
9,Washington D.C.
8. ROKH9871 Kenya National Power Development Plan: 1986-2000,
UNDP/World Bank:
9. Lakshmanan, T.R and Johansson, B (edts) (1985) Large Scale Energy Projects.
Assessment of Regional Consequences, NHC, New York.
10. Morse, J (1997) Regulatory Policy Regarding Distribution by Utilities: The
impact of Restructuring. The Energy Journal: Special issue Distributed
Resources: Towards a new paradigm in the Electricity Business. Power Sector
Policy Paper,Washington D.C.
I l l
11. ROK (1997), Jericho District Development Plan (1997 - 2001), Government
Printers, Nairobi.
12. ROK (1997), National Development Plan. Government Printers, Nairobi.
13. Rothman, M. (2000J Measuring and Appropriating Rents from Hydro electrical
power Development.World Bank, Washington D.C.
14. UNEP (1985) Energy Supply/Demand in Rural areas in Developing Countries.
Energy Report Series, Nairobi, Kenya.
15. UNEP (1986) Energy conservation in developing countries. Energy Report
Series, Nairobi Kenya.
16. United Nations (1993) Power cogeneration, energy sector. New York.
17. World Bank (1993b and c) The World Bank’s Role in the Electric power
sector.Policy Paper,Washington D.C.
18. World Bank (1996) Rural Energy and Development improving Energy Supply
for Two Billion People. A World Bank publication, World Bank, Washington
D.C
19. World Bank (2000) The Private Sector and Power Generation in China,
discussion paper No. 406. Energy and Mining sector unit East Asia and Pacific
Region, Washington, D.C.
20. World Bank and USAID (1994) Submission and Evaluation of Proposals for
private power generation projects in developing countries. Industry and Energy
Department occasional paper No. 2, Washington, D.C.
21. World Bank (1993a) Energy Efficiency and Conservation in the Developing
Countries. Washington D.C.

112
22. World Bank-ESMAP[Energy Sector Management Programme^ 1991b llndia
Mini-Hvdro Development on Irrigation Dams and Canal Drops Pre-Investment
Studv.3 vols.No 139a-cl91,ESMAP SERIES ,Washington D.C.

UNIVERSITY OF NAIROBI
FACULTY OF ARCHITECTURE, DESIGN AND DEVELOPMENT.
DEPT. OF URBAN AND REGIONAL PLANNING
BUSINESS COMMUNITY QUESTIONNAIRE
Questionnaire No........................................................ .............................................
Name of Interviewer...............................................................................................
Date of Interview......................................................................................................
Name of the Village/Sub-Location.........................................................................
Name of Respondent...............................................................................................
Position of Respondent...........................................................................................
1. What type of business do you run?
2. When do you experience good business?
(i) Weekdays (ii) Weekends (iii) Public holidays
3. How many people are employed in your business?................
4. How much do you incur in terms of their wages/salaries? Ksh
5. What source(s) of power do you utilize in your business........
(i) Own solar power
(ii) Own generation
(iii) Commercial power
(iv) Others (specify)
Where do you get the power from?
(0 States commercial power
(ii) Private producer
(ui) Own generation
Of 0) and/or (ii) go to 6 and i f (iii) go to 7)
• How much do you pay for the power consumed? Ksh per month.

! 14
per month.8. How much do you spend to generate own power? Ksh
9. For what purpose do you consume power?
(i) Cooking
(ii) Lighting
(iii) Industrial production
(iv) Appliances/equipment
(v) Others (specify)
10. How many hours per day do you utilize the power?
(i) Less than 2 hours
(ii) Between 2-5 hours
(iii) More than 5 hours
11. What power conservation measures do you employ in your business to save the amount of
power consumed?
(i) ..............................................................................................................................
(ii) .............................................................................................................................
(iii) .............................................................................................................................
(iv) .............................................................................................................................12. Do you experience power cuts/blackouts?
Yes □ No □
13. If yes, when do power cuts/blackouts occur most frequently?
(i) Mornings
(ii) Afternoons
(iii) Evenings/nights
14. Which days do you experience power cuts/blackouts
(i) Week-day(s)
(ii) Week-end(s)
(iii) Public Holidays
15. How many times do you experience power cuts/blackouts per week?...............times
16. Can you describe the problems that occur in your business when you have power
cut/blackouts...................................................................................................................

115
17. Can you approximately state how much useful time you lose because of power
cuts/blackouts? For example, do you have to close down the business temporarily?
Etc..............................................................................................................................
18. Can you explain briefly the long term consequences of power cuts/blackouts in your
business?.......................................................................................................................
19. What other alternative sources of power can be harnessed in this area?
Hydro I I Solar □ Thermal □
Wind C D
other (specify)...............................................

1 1 6c
UNIVERSITY OF NAIROBI
FACULTY OF ARCHITECTURE - DESIGN AND DEVELOPMENT
DEPARTMENT OF URBAN AND REGIONAL PLANING
HOUSEHOLD QUESTIONNAIRE
Questionnaire No.:...............................................Date of Interview:...............................
Name of Interviewer:.......................................................................................................
Name of Village/Estatc;...................................................................................................Name of Sub-Location/Ward:.........................................................................................
A PERSONAL INFORMATION
1. Name of the respondent:........................................................................................
2. Sex (Male/Female):.............................................................................................
3. Age:........................................................ .............................................................
4. Marital Status:.....................................................................................................
5. Household Size:..................................................................................................
6. Occupation:.........................................................................................................
7. Household Head Income:.....................................................................................
What are the other sources of income in the family?..........................................

! 17
9. Record the household characteristics in the table below using the c ^ es 8*ven:HA11 HA22 HA33 HA44 HA55 HA66 HA77 HA88Name Sex Household Age Marital Educational Where Occupation
M/F Status Status Level born-- /
-- /
_/
--- /
__/
— /
— /
— /
— y
HA33 - household Status01 - Household Head02 - Spouse of Household Head
03 - Child of Household Head
04 - Others
HA55 - Marital Status05 - Married
06 - Unmarried
07 - Separated
08 - Divorced
09 - Widowed
10 - Polygamous
HA66 - Educational Level11 - None12 - Primary13 - Secondary
14 - Higher Education
HA88 - Occupation r Farmer
HA77 - Where born15 - Within the Division16 - Within the District
17 - Outside the District
20 - Employee 22 - Unemployed 24 - Others (S p ^ '^

118
10 What is the type of house?
a) Permanent (Stone/Brick + Corrugated iron sheets or Tiles)
b) Semi-permanent (Mud-walls + Corrugated iron sheets)
c) Temporary (Mud-wall + Grass Thatch)
B. LAND AND LAND-USE
11. Is your land (i) Bought?
(ii) Inherited?
(iii) Rented?
(iv) Squatted?
12. Do you have a title deed?
Yes No
13. What is the size of your land?.
C. ELECTRICITY SUPPLY AND CONSUMPTION
14. What sources of power do you use?
(i) Solar
(ii) Own generator
(iii) Commercial power
(iv) Other (Specify)
I f (iii) goto 16.
15. When did electricity first reached your house?................
16. Where do you get the electricity from
(i) State’s commercial power (KPLC)
(ii) Private producer
(iii) Own generator
(iv) Others (Specify)lf (i) or (ii) go to 17 and if (iii) go to 18
acres

119
17. How much do you pay for electricity?.............................................Ksh. per month
18. How much do you spent generate own power?..................................................Ksh
19. What activities do you carry out using electricity in your house/farm?
Irrigation ____
Welding
Cooking ____
Lighting/Security ____
Others (Specify) ____
20. How many hours per day do you utilize electricity?
(i) Less than 2 hours
(ii) Between 2 - 5 hours
(iii) More than 5 hours
21. What conservation measures do you undertake to save on the amount of power
consumed?..............................................................................................
22. Do you experience power cuts/blackouts
Yes | | No |
‘3. If yes, when do power cuts/blackouts occur most frequently
(i) Mornings (ii) Afternoons (iii) Evening/nights
How many times do you experience power cuts/blackouts?............times per week

1 20
Can you describe the problems that you experience when you have power-cuts /
blackouts?..............................................................................................................
Can you approximately state how much useful time you lose because of power
cuts/blackouts? For instance, do you have to change your activity programme?
In the case of power cut/blackout how much extra costs do you incur for alternative
source of lighting or power source? Ksh......... ......................................
Do you think the current supply of power is adequate?
Yes No
What other alternative sources of power can be used in this area?
Hydro Solar Thermal
Wind Other

121
UNIVERSITY OF NAIROBI
f a c u l t y o f a r c h it e c t u r e , d e s ig n a n d d e v e l o p m e n t
d e p t , o f u r b a n a n d r e g io n a l p l a n n in g .
INSTITUTIONAL q u e s t io n n a ir e
{SCHOOLS}
Questionnaire N o ..................................... .......................... Date of interviewName of the Interviewer...................................................................................
Name of the Village/Sub-Location...................................................................
Name of Institution............................................................................................
Name of the respondent.....................................................Position................
(1) Who sponsors this institutions?
(i) Government □
(ii) Religious organization EH
(iii) Company □
(iv) Others (specify) EH
2. How many people does the institution cater for?
(a) Teachers.......................................... ....................................................
(b) Students............................................ ....................................................
(c) Others...................................................................................................
3. Does the students reside in the institution*?
Yes | | No [ |
4- What sources of power does the institution* use? (Tick where appropriate)
(i) Commercial power□
(ii) Own solar power □
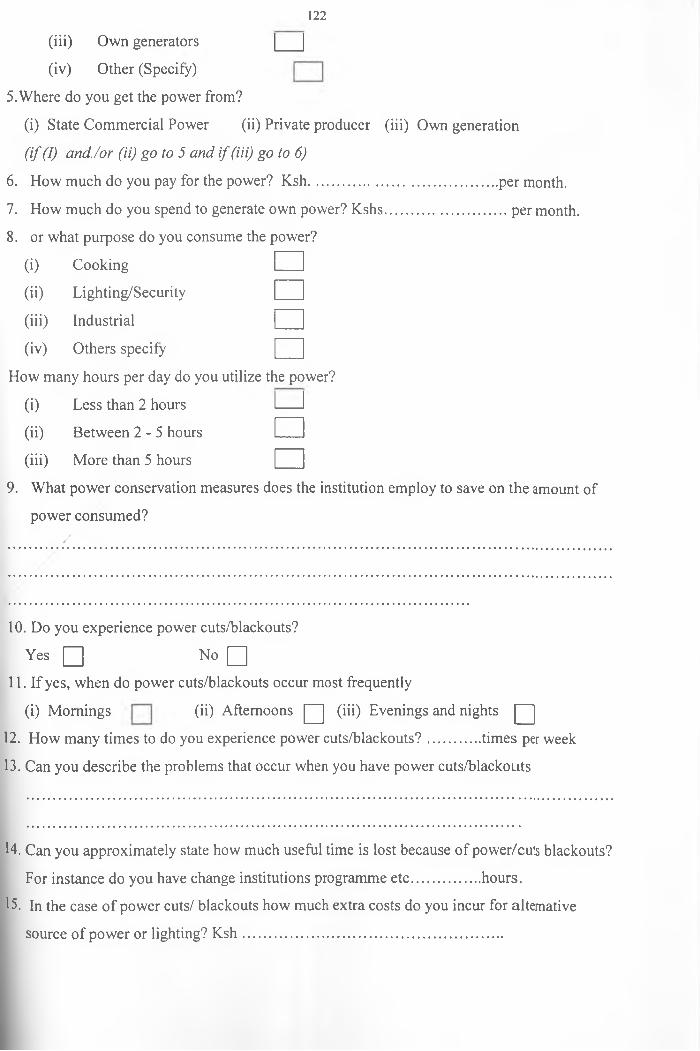
1 2 2
(iii) Own generators |___ |
(iv) Other (Specify)
5.Where do you get the power from?
(i) State Commercial Power (ii) Private producer (iii) Own generation
(if (I) and./or (ii) go to 5 and if (iii) go to 6)
6. How much do you pay for the power? Ksh............................................... per month.
7. How much do you spend to generate own power? Kshs..............................per month.
8. or what purpose do you consume the power?
(i) Cooking □
(H) Lighting/Security □
(iii) Industrial □(iv) Others specify □
How many hours per day do you utilize the power?
(0 Less than 2 hours l___ 1
(ii) Between 2 -5 hours □
(iii) More than 5 hours □9. What power conservation measures does the institution employ to save on the amount of
power consumed?/ -
10. Do you experience power cuts/blackouts?
Yes Q No Q
11. If yes, when do power cuts/blackouts occur most frequently
(i) Mornings (ii) Afternoons Q (iii) Evenings and nights Q
12. How many times to do you experience power cuts/blackouts?.............times per week
13. Can you describe the problems that occur when you have power cuts/blackouts
14. Can you approximately state how much useful time is lost because of power/cuts blackouts?
For instance do you have change institutions programme etc.................hours.
15. In the case of power cuts/ blackouts how much extra costs do you incur for alternative
source of power or lighting? Ksh.................................................................

1 2 3
16. Can you explain briefly the consequences of power cuts/blackouts in your
institutions....................................................................................................
17. What alternative sources of power can be used in this area?
Hydro □ Solar Q Thermal □Wind □ Other specify Q
/

124
UNIVERSITY OF NAIROBI
FACULTY OF ARCHITECTURE, DESIGN AND DEVELOPMENT
DEPT. OF URBAN AND REGIONAL PLANNING.
INSTITUTIONAL QUESTIONNAIRE
{HOSPITALS}
Questionnaire N o ................................................................ Date of interview
Name of the Interviewer..................................................................................
Name of the Village/Sub-Location..................................................................
Name of Institution...........................................................................................
Name of the respondent....................................................Position................
1. Who sponsors this hospital?
(a) Government □(b) Religious organization □(c) Company □(d) Others (specify) □
2. How many patients does the hospital cater for? (on average/day)
(a) In-Patients............................................................................................
(b) Out-Patients........................................................................................
3. What sources of power does the hospital use? (Tick where appropriate)
(a) Commercial power □(b) Own solar power □(c) Own generators □(d) Other (specify) □
4. Where do you get the power?

125
(i) State Commercial Power (ii) Private producer (iii) Own generation
(if (0 and/or (ii) go to 6 and if (iii) go to 7)
How much do you pay for the power? Ksh................................................per month.
How much do you spend to generate own power? Ksh..............................per month.
For what purpose do you consume the power?
(a) cooking I------1
(b) Lighting/security □
(c) Equipment/Apparatus I I
(d) Others (specify) I I
8 How many hours per day do you utilize the power?
(a) Less than 2 hours □
(b) Between 2-5 hours | |
(c) More than 5 hours | |
9 What power conservation measures does the institutions employ to save on the amount of
power consumed?.....................................................................................
10 Do you experience power cuts/blackouts?
- Yes Q No Q
11 If yes, when do power cuts/blackouts occur most frequently
(i) Mornings Q (ii) Afternoons Q (iii) Evenings and nights
12. How many times to do you experience power cuts/blackouts?............. times per week.
13. Can you describe the problems that occur when you have power cuts/blackouts
14 Do some equipment/apparatus in your hospital use power?
Yes j“~j No
15 If yes, what do you do incase of power cut/blackouts?

126
Can you explain briefly the consequences of power cuts/blackouts in your hospital
What alternative sources of power can be used in this area?Hydro |~ j Solar Q Thermal □Wind Q Other specify Q
/
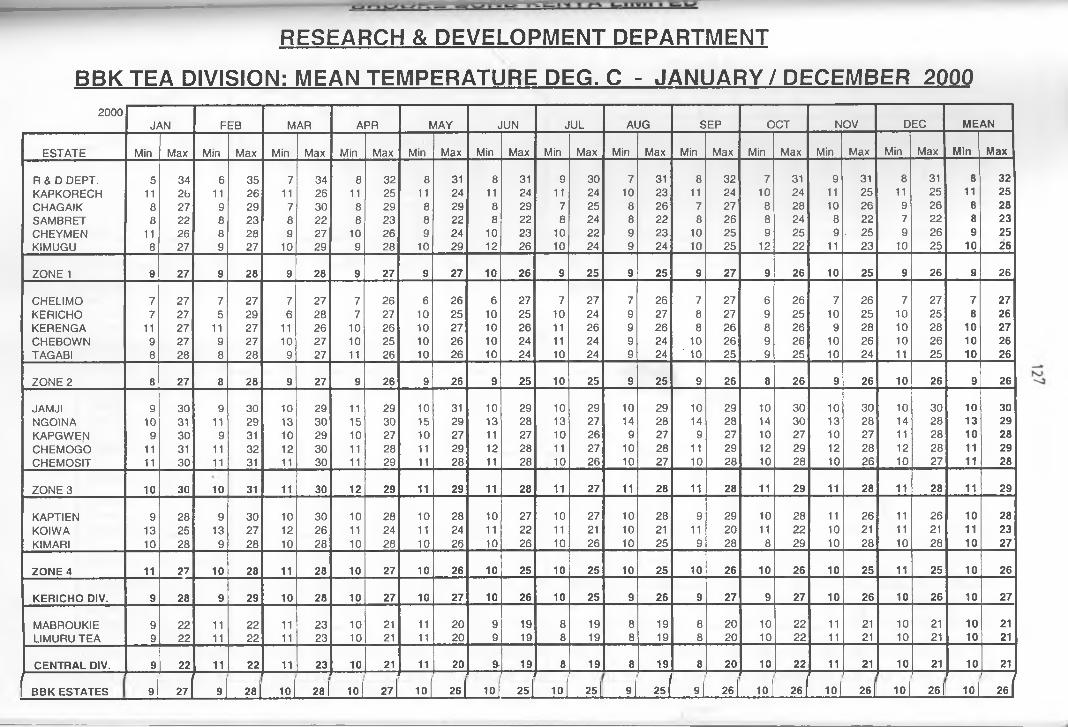
RESEARCH & DEVELOPMENT DEPARTMENT
BBK TEA DIVISION: MEAN TEMPERATURE DEG. C - JANUARY / DECEMBER 20002 0 0 0
JAN FEB M AR APR M A Y JU N JU L A U G S E P O C T N O V D EC M E A N
E S T A T E Min M ax Min M ax Min M ax Min M ax Min M ax Min M ax Min M ax Min M ax Min M ax Min M ax Min M ax Min M ax M in M ax
R & D D E P T . 5 34 6 35 7 34 8 32 8 31 8 31 9 3 0 7 31 8 32 7 31 9 31 8 31 8 32
K A P K O R E C H 11 2b 11 2 6 11 26 11 25 11 24 11 24 11 24 10 23 11 24 10 24 11 25 11 25 11 25
C H A G A IK 8 2 7 9 29 7 3 0 8 29 8 29 8 29 7 25 8 26 7 27 8 28 10 26 9 26 8 28
S A M B R E T 8 22 8 2 3 8 22 8 23 8 22 8 22 8 24 8 22 8 26 8 24 8 22 7 22 8 23
C H E Y M E N 11 26 8 28 9 27 10 26 9 24 10 23 10 22 9 23 10 2 5 9 2 5 9 . 2 5 9 26 9 25
K IM U G U 8 2 7 9 27 10 29 9 28 10 29 12 26 10 24 9 24 10 25 12 22 11 23 10 25 10 26
Z O N E 1 9 27 9 28 9 28 9 27 9 27 10 26 9 25 9 25 9 27 9 26 10 25 9 26 9 26
C H E L IM O 7 27 7 27 7 27 7 2 6 6 26 6 27 7 27 7 26 7 2 7 6 26 7 26 7 27 7 27K E R IC H O 7 27 5 29 6 28 7 27 10 25 10 25 10 24 9 2 7 8 2 7 9 2 5 10 25 10 25 8 26K E R E N G A 11 2 7 11 27 11 26 10 26 10 2 7 10 26 11 26 9 2 6 8 26 8 26 9 28 10 2 8 10 27C H E B O W N 9 27 9 27 10 27 10 25 10 26 10 24 11 24 9 24 10 26 9 26 10 26 10 2 6 10 26TA G A B I 8 28 8 28 9 27 11 26 10 26 10 24 10 24 9 24 10 25 9 25 10 24 11 25 10 26
Z O N E 2 8 27 8 28 9 27 9 26 9 26 9 25 10 25 9 25 9 26 8 26 9 26 10 26 9 26
JAM JI 9 30 9 30 10 29 11 29 10 31 10 29 10 29 10 29 10 29 10 3 0 10 3 0 10 3 0 10 30N G O IN A 10 31 11 29 13 30 15 30 15 29 13 28 13 27 14 28 14 28 14 3 0 13 28 14 2 8 13 29
K A P G W E N 9 30 9 31 10 29 10 27 10 27 11 27 10 2 6 9 27 9 27 10 27 10 27 11 28 10 28
C H E M O G O 11 31 11 32 12 3 0 11 28 11 29 12 28 11 2 7 10 28 11 29 12 29 12 28 12 28 11 29
C H E M O S IT 11 30 11 31 11 30 11 29 11 28 11 28 10 26 10 27 10 28 10 28 10 26 10 27 11 28
Z O N E 3 10 30 10 31 11 30 12 29 11 29 11 28 11 27 11 28 11 28 11 29 11 28 11 28 11 29
K A P TIE N 9 28 9 3 0 10 3 0 10 28 10 28 10 27 10 27 10 2 8 9 29 10 2 8 11 26 11 2 6 10 28
K O IW A 13 25 13 2 7 12 2 6 11 24 11 24 11 22 11 21 10 21 11 2 0 11 22 10 21 11 21 11 23K IM A R I 10 28 9 2 8 10 28 10 28 10 26 10 26 10 26 10 25 9 28 8 29 10 28 10 28 10 27
Z O N E 4 11 27 10 28 11 28 10 27 10 26 10 25 10 25 10 25 10 26 10 26 10 25 11 25 10 26
K E R IC H O D IV. 9 28 9 29 10 28 10 27 10 27 10 26 10 25 9 26 9 27 9 27 10 26 10 26 10 27
M A B R O U K IE 9 22 11 22 11 23 10 21 11 2 0 9 19 8 19 8 19 8 2 0 10 22 11 21 10 21 10 21
L IM U R U T E A 9 22 11 22 11 23 10 21 11 20 9 19 8 19 8 19 8 20 10 22 11 21 10 21 10 21
C E N T R A L DIV. 9 22 11 22 11 23 10 21 11 20 9- 19 8 19 8 19 8 20 10 22 11 21 10 21 10 21
( i I / /| B B K E S TA T E S 9 27 9 2 8 1 10 28 | 10 _ 2 7 | 10 _ 2 e J 10 _ 2 s J 10 ___ 2 5 j 9 _ 2 s J 9 2 6 1 10 26 | 10 2 6 1 10 2 6 1 10 _ 2 6 j

R E S E A R C H & DEVELOPMENT DEPARTMENT
BBK TEA DIVISION: MEAN TEMPERATURE DEG. C - JANUARY / DECEMBER 19991999
JA N FEB M AR A P R M A Y JU N JU L A lJG S EP 0 C T N O V D EC M E A N
E S TA TE Min M ax M in M ax M in M ax M in M ax M in M ax M in M ax M in M ax Min M ax M in M ax Min M ax Min M ax M in M ax M in M ax
R & D DEPT. 6 33 6 35 7 32 7 31 6 31 6 31 6 30 7 30 7 31 8 30 9 31 7 31 7 31
K A P K O R E C H 11 24 11 25 11 25 11 25 11 25 10 23 11 23 11 23 11 24 11 24 12 24 11 24 11 24
C H A G A IK 10 26 9 27 10 27 10 26 10 26 10 26 10 25 9 25 10 25 10 26 10 28 9 26 10 26
S A M B R E T 8 24 8 24 8 24 8 23 8 22 8 22 8 22 8 22 7 22 7 24 7 23 7 22 8 23
C H E Y M E N 13 25 13 26 13 25 12 24 11 25 11 25 11 22 12 23 11 24 12 24 11 24 12 25 12 24
K IM U G U 10 27 9 29 11 28 11 27 10 26 10 26 10 26 11 26 10 25 10 25 10 26 10 25 10 26
ZO N E 1 10 27 9 28 10 27 10 26 9 26 9 26 9 25 10 25 9 25 10 26 10 26 9 26 10 26
C H E L IM O 7 27 8 27 7 26 6 25 4 25 5 26 6 26 6 26 6 26 7 26 7 26 7 26 6 26
K E R IC H O 9 26 7 28 7 28 7 27 9 25 7 27 7 25 8 26 8 27 7 27 7 27 7 26 8 27
K E R E N G A 7 30 7 32 7 32 7 32 7 27 7 26 7 26 11 27 11 26 11 26 11 27 11 28 9 28
C H E B O W N 10 28 9 30 11 25 10 25 10 24 10 24 9 24 10 24 10 25 10 25 10 25 10 25 10 25
TA G A B I 9 27 9 29 11 25 10 25 9 25 8 25 9 24 9 24 9 25 10 25 10 25 9 25 9 25
ZO N E 2 8 28 8 29 9 27 8 27 8 25 7 26 8 25 9 25 9 26 9 26 9 26 9 26 8 26
JA M JI 10 29 9 31 12 27 11 26 11 26 10 26 10 26 11 26 11 26 11 26 11 26 10 27 11 27
N G O IN A 13 32 13 34 14 28 14 28 12 28 13 28 12 26 14 29 13 26 13 28 14 29 11 23 13 28
K A P G W E N 11 28 11 29 11 27 9 27 9 26 9 26 9 26 10 27 9 27 9 26 10 27 11 27 10 27
C H E M O G O 11 27 13 25 13 25 13 24 15 27 15 26 12 26 11 26 11 28 12 26 12 26 12 27 13 26
C H E M O S IT 10 30 10 31 10 28 10 27 10 27 11 28 10 30 11 27 11 29 11 27 11 27 11 28 11 28
ZO N E 3 11 29 11 30 12 27 11 26 11 27 12 27 11 27 11 27 11 27 11 27 12 27 11 26 11 27
K A P T IE N 9 29 10 30 11 28 10 27 10 26 10 22 9 26 10 27 10 27 10 26 10 27 9 26 10 27
K O IW A 11 23 11 32 10 21 11 22 11 22 11 23 11 22 11 21 11 22 11 22 11 22 11 22 11 23
K IM A R I 9 28 9 29 10 25 10 25 10 23 11 20 10 24 10 24 9 24 10 26 11 24 10 25 10 25
ZO N E 4 10 27 10 30 10 25 10 25 10 24 11 22 10 24 10 24 10 24 10 25 11 24 10 24 10 25
K E R IC H O DIV. 10 28 10 29 10 27 10 26 10 26 10 25 9 25 10 25 10 26 10 26 10 26 10 26 10 26
M A B R O U K IE 10 25 10 25 11 23 11 21 10 20 9 25 8 16 9 18 9 20 10 21 9 18 11 20 10 21
L IM U R U TE A 10 25 10 25 11 23 11 21 10 20 9 25 8 16 9 18 9 20 10 21 9 18 11 20 10 21
C E N T R A L DIV. 10 25 10 25 11 23 11 21 10 20 9 25 8 16 9 18 9 20 10 21 9 18 11 20 10 21
B B K E S T A TE S 10 27 10 29 10 26 10 26 10 25 10 25 9 24 10 25 10 25 10 25 10 25 10 25 10 26
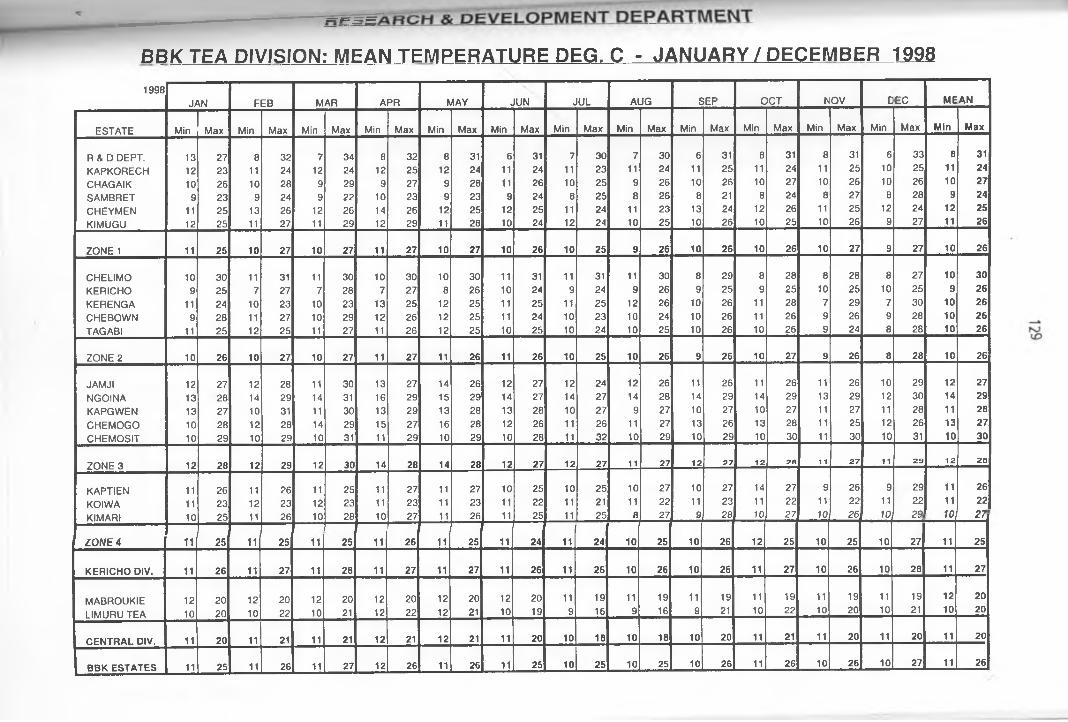
BBK TEA DIVISION: MEAN TEMPERATURE DEG. C - JANUARY / DECEMBER 19981998
JA N FE B M AR A PR M A Y JU N JU L A U G SEP O C T N o v c EC ME A N
E S TA TE M in M ax M in M ax Min M ax M in M ax M in M ax M in M ax M in M ax M in M ax M in M ax M in M ax M in M ax M in M ax M in M a x
R & D DEPT. 13 27 8 32 7 34 8 32 8 31 6 31 7 30 7 30 6 31 8 31 8 31 6 33 8 31
K A P K O R E C H 12 23 11 24 12 24 12 25 12 24 11 24 11 23 11 24 11 25 11 24 11 25 10 25 11 24
C H A G A IK 10 26 10 28 9 29 9 27 9 28 11 26 10 25 9 26 10 26 10 27 10 26 10 26 10 27
S A M B R E T 9 23 9 24 9 22 10 23 9 23 9 24 8 25 8 26 8 21 8 24 8 27 8 28 9 24
C H E Y M E N 11 25 13 26 12 26 14 26 12 25 12 25 11 24 11 23 13 24 12 26 11 25 12 24 12 25
K IM U G U 12 25 11 27 11 29 12 29 11 28 10 24 12 24 10 25 10 26 10 25 10 26 9 27 11 26
ZO N E 1 11 25 10 27 10 27 11 27 10 27 10 26 10 25 9 26 10 26 10 26 10 27 9 27 10 26
C H E L IM O 10 30 11 31 11 30 10 30 10 30 11 31 11 31 11 30 8 29 8 28 8 28 8 27 10 30
K E R IC H O 9 25 7 27 7 28 7 27 8 26 10 24 9 24 9 26 9 25 9 25 10 25 10 25 9 26
K E R E N G A 11 24 10 23 10 23 13 25 12 25 11 25 11 25 12 26 10 26 11 28 7 29 7 30 10 26
C H E B O W N 9 28 11 27 10 29 12 26 12 25 11 24 10 23 10 24 10 26 11 26 9 26 9 28 10 26
TA G A B I 11 25 12 25 11 27 11 26 12 25 10 25 10 24 10 25 10 26 10 26 9 24 8 28 10 26
ZO N E 2 10 26 10 27 10 27 11 27 11 26 11 26 10 25 10 26 9 26 10 27 9 26 8 28 10 26
JA M JI 12 27 12 28 11 30 13 27 14 26 12 27 12 24 12 26 11 26 11 26 11 26 10 29 12 27
N G O IN A 13 28 14 29 14 31 16 29 15 29 14 27 14 27 14 28 14 29 14 29 13 29 12 30 14 29
K A P G W E N 13 27 10 31 11 30 13 29 13 28 13 28 10 27 9 27 10 27 10 27 11 27 11 28 11 28
C H E M O G O 10 28 12 28 14 29 15 27 16 28 12 26 11 26 11 27 13 26 13 28 11 25 12 26 13 27
C H E M O S IT 10 29 10 29 10 31 11 29 10 29 10 28 11 32 10 29 10 29 10 30 11 30 10 31 10 30
ZO N E 3 12 28 12 29 12 30 14 28 14 28 12 27 12 27 11 27 12 27 12 28 11 27 11 29 12 28
K A P T IE N 11 26 11 26 11 25 11 27 11 27 10 25 10 25 10 27 10 27 14 27 9 26 9 29 n 26
K O IW A 11 23 12 23 12 23 11 23 11 23 11 22 11 21 11 22 11 23 11 22 11 22 11 22 11 22
K IM A R I 10 25 11 26 10 28 10 27 11 26 11 25 11 25 8 27 9 28 10 27 10 26 10— 23 10 2 7
Z O N E 4 11 25 11 25 11 25 11 26 11 25 11 24 11 24 10 25 10 26 12 25 10 25 10 27 1 1 25
K E R IC H O DIV. 11 26 11 27 11 28 11 27 11 27 11 26 11 26 10 26 10 26 11 27 10 26 10 28 11 27
M A B R O U K IE 12 20 12 20 12 20 12 20 12 20 12 20 11 19 11 19 11 19 11 19 11 19 11 19 12 20
L IM U R U T E A 10 20 10 22 10 21 12 22 12 21 10 19 9 16 9 16 9 21 10 22 10 20 10 21 10 20
C E N T R A L DIV. 11 20 11 21 11 21 12 21 12 21 11 20 10 18 10 18 10 20 11 21 11 20 11 20 11 20
B B K E ST A TE S 11 25 11 26 11 27 12 26 11 26 11 25 10 25 10 25 10 26 11 26 10 26 10 27 11 26

ELECTRICAL GENERATION ANALYSIS (S ta t is tic a l S u m m a ry )
H y d ro U n its : 1 9 9 8 _____________________________________________________
STATIONS JAMJI KERENGA CHEMOSIT TAGABI TOTAL1 2 3 4 1 2 1 1
JANUARY 60,018 48,828 153,800 79,330 129,260 74,040 0 483,400 1,028,676
FEBRUARY 51,555 42,108 136,420 141,945 113,675 64,585 0 399,700 949,988
MARCH 32,331 25,881 148,190 152,370 52,695 22,805 0 335,600 769,872
APRIL 18,039 14,703 119,350 143,145 36,620 39,965 0 303,700 675,522
MAY 8,145 51,288 160,460 168,700 126,595 69,260 0 376,600 961,048
JUNE 0 47,991 149,035 156,920 121,475 72,305 0 377,100 924,826
JULY 0 50,157 154,960 161,310 124,695 75,605 0 406,300 973,027
AUGUST 0 48,462 149,695 157,125 123,940 74,425 0 390,500 944,147
SEPTEMBER 17,523 42,315 134,815 145,870 116,870 72,880 0 379,600 909,873
OCTOBER 46,794 28,893 142,755 151,720 116,995 77,030 0 427,400 991,587
NOVEMBER 58,350 32,601 142,360 146,545 2,325 73,700 0 416,100 871,981
DECEMBER 56,622 0 138,745 147,310 0 74,360 0 372,700 789,737
TOTAL 349,377 433,227 1,730,585 1,752,290 1,065,145 790,960 0 4,668,700 10,790,284
Source: BBK, 2000
j
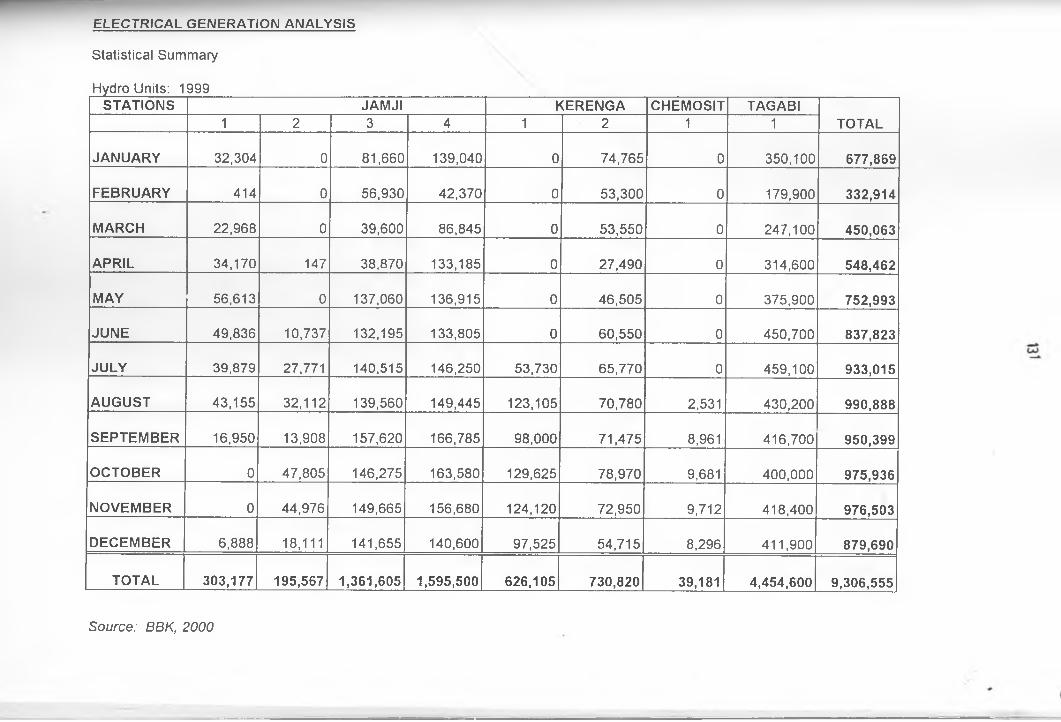
ELECTRICAL GENERATION ANALYSIS
Statistical Summary
Hydro Units: 1999STATIONS JAMJI KERENGA CHEMOSIT TAGABI
TOTAL1 2 3 4 1 2 1 1
JANUARY 32,304 0 81,660 139,040 0 74,765 0 350,100 677,869
FEBRUARY 414 0 56,930 42,370 0 53,300 0 179,900 332,914
MARCH 22,968 0 39,600 86,845 0 53,550 0 247,100 450,063
APRIL 34,170 147 38,870 133,185 0 27,490 0 314,600 548,462
MAY 56,613 0 137,060 136,915 0 46,505 0 375,900 752,993
JUNE 49,836 10,737 132,195 133,805 0 60,550 0 450,700 837,823
JULY 39,879 27,771 140,515 146,250 53,730 65,770 0 459,100 933,015
AUGUST 43,155 32,112 139,560 149,445 123,105 70,780 2,531 430,200 990,888
SEPTEMBER 16,950 13,908 157,620 166,785 98,000 71,475 8,961 416,700 950,399
OCTOBER 0 47,805 146,275 163,580 129,625 78,970 9,681 400,000 975,936
NOVEMBER 0 44,976 149,665 156,680 124,120 72,950 9,712 418,400 976,503
DECEMBER 6,888 18,111 141,655 140,600 97,525 54,715 8,296 411,900 879,690
TOTAL 303,177 195,567 1,361,605 1,595,500 626,105 730,820 39,181 4,454,600 9,306,555
Source: BBK, 2000

ELECTRICAL. GENERATION ANALYSIS
Statistical Summary
Hydro Units: 2 0 0 0 ___________________________________
STATIONS JAMJI KERENGA CHEMOSIT TAGABI1 2 3 4 1 2 1 1 TOTAL
JANUARY 858 438 109,695 36,480 26,305 47,255 0 302,700 523,731
FEBRUARY 0 0 27,415 24,475 19,580 19,030 0 130,300 220,800
MARCH 780 558 20,910 32,975 3,030 45 0 166,600 224,898
APRIL 0 0 28,285 41,075 37,435 9,525 0 197,200 313,520
MAY 102 174 46,900 82,365 67,765 23,185 0 357,100 577,591
JUNE 12,765 3,954 68,300 84,830 84,155 23,165 863 416,400 696,432
JULY 29,820 25,437 138,850 137,740 74,065 54,645 0 437,800 898,357
AUGUST 37,857 31,851 134,740 128,585 103,305 56,470 122 481,000 973,930
SEPTEMBER 53,781 42,615 142,305 144,025 119,985 66,490 2,581 477,200 1,048,982
OCTOBER 57,180 45,723 155,190 157,465 126,270 61,665 399 498,800 1,102,692
NOVEMBER 46,941 36,144 155,590 163,360 123,075 59,795 0 496,900 1,081,805
DECEMBER 53,655 42,480 164,260 160,725 119,975 61,200 0 494,500 1,096,795
TOTAL 293,739 229,374 1,192,440 1,194,100 904,945 482,470 3,965 4,456,500 8,759,533
Source: BBK, 2000

133
Diesel Units: 1998
STATION J A M J I K IM U G U TOTAL5 6 1 2
JAN UARY 0 0 3 5 , 0 9 0 3 0 , 6 4 0 65,730
FEBRU AR Y 0 0 9 , 8 2 0 1 1 , 7 5 0 21,570
M ARCH 0 0 1 4 , 5 4 0 2 8 , 0 9 0 42,630
APRIL 0 0 2 7 , 1 6 0 3 6 , 9 1 0 64,070
MAY 0 0 8 , 7 4 0 5 , 0 2 0 13,760
JUNE 0 0 9 , 4 5 0 6 , 6 6 0 16,110
JULY 0 0 5 , 6 4 0 4 , 4 9 0 10,130
AU G U ST 0 0 4 , 1 8 0 5 , 4 7 0 9,650
SEPTEM BER 0 0 1 , 6 7 0 4 , 2 6 0 5,930
O CTO BER 0 0 2 , 3 1 0 7 5 0 3,060
NO VEM BER 0 0 7 , 4 2 0 4 , 7 9 0 12,210
DECEM BER 0 0 6 , 8 5 0 1 0 , 2 4 0 17,090
TOTAL 0 0 132,870 149,070 281,940
Source: BBK, 2000

Diesel Units: 1999
STATION J A M J I K I M U G U TOTAL
JANUARY
5 6 1 2
0 0 8 , 7 3 0 9 , 1 7 0 17,900
FEBRUARY 0 0 2 , 1 0 0 6 , 8 3 0 8,930
MARCH 0 0 2 2 , 7 8 0 3 0 , 6 8 0 53,460
APRIL 0 0 3 5 , 6 4 0 3 7 , 6 1 0 73,250
MAY 0 0 6 , 7 3 0 5 , 3 7 0 12,100
JUNE 0 0 2 , 3 0 0 1 , 9 7 0 4,270
JULY 0 0 1 , 2 8 0 1 , 6 1 0 2,890
AUGUST 0 0 5 , 6 9 0 9 , 3 1 0 15,000
SEPTEMBER 0 0 1 3 , 0 9 0 1 5 , 8 0 0 28,890
OCTOBER 0 0 0 1 5 , 3 4 0 15,340
NOVEMBER 0 0 0 1 3 , 0 2 0 13,020
DECEMBER 8 7 0 1 , 1 7 0 0 1 8 , 9 4 0 20,980
TOTAL 870 1,170 98,340 165,650 266,030
Source: BBK, 2000
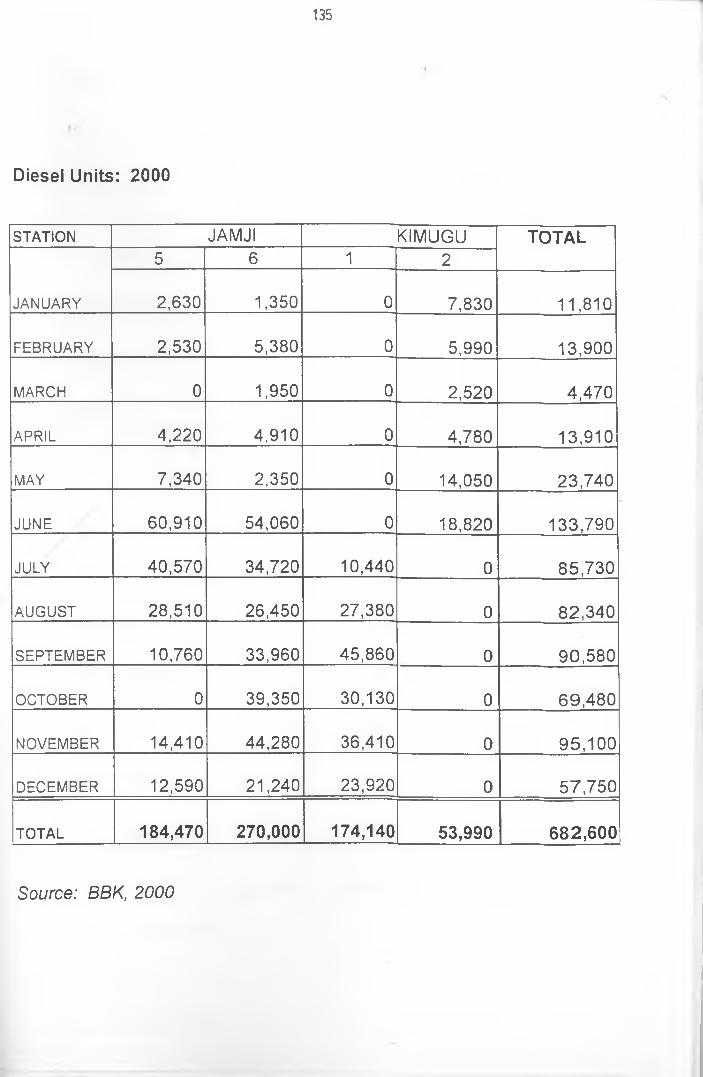
135
Diesel Units: 2000
STATION J A M J I K I M U G U TOTAL
JANUARY
5 6 1 2
2 , 6 3 0 1 , 3 5 0 0 7 , 8 3 0 1 1 , 8 1 0
FEBRUARY 2 , 5 3 0 5 , 3 8 0 0 5 , 9 9 0 1 3 , 9 0 0
MARCH 0 1 , 9 5 0 0 2 , 5 2 0 4 , 4 7 0
APRIL 4 , 2 2 0 4 , 9 1 0 0 4 , 7 8 0 1 3 , 9 1 0
MAY 7 , 3 4 0 2 , 3 5 0 0 1 4 , 0 5 0 2 3 , 7 4 0
JUNE 6 0 , 9 1 0 5 4 , 0 6 0 0 1 8 , 8 2 0 1 3 3 , 7 9 0
JULY 4 0 , 5 7 0 3 4 , 7 2 0 1 0 , 4 4 0 0 8 5 , 7 3 0
AUGUST 2 8 , 5 1 0 2 6 , 4 5 0 2 7 , 3 8 0 0 8 2 , 3 4 0
SEPTEMBER 1 0 , 7 6 0 3 3 , 9 6 0 4 5 , 8 6 0 0 9 0 , 5 8 0
OCTOBER 0 3 9 , 3 5 0 3 0 , 1 3 0 0 6 9 , 4 8 0
NOVEMBER 1 4 , 4 1 0 4 4 , 2 8 0 3 6 , 4 1 0 0 9 5 , 1 0 0
DECEMBER 1 2 , 5 9 0 2 1 , 2 4 0 2 3 , 9 2 0 0 5 7 , 7 5 0
TOTAL 184,470 270,000 174,140 53,990 682,600
Source: BBK, 2000
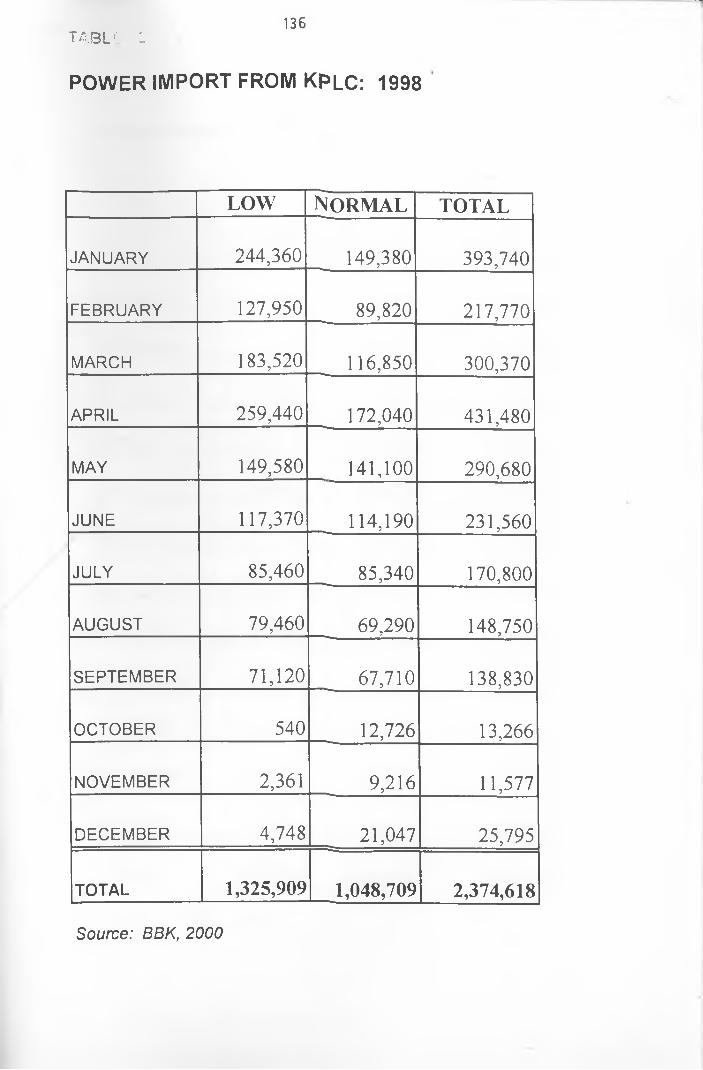
tabu: :1 3 6
POWER IMPORT FROM KPLC: 1998
LOW N o r m a l TOTAL
JANUARY 2 4 4 , 3 6 0 1 4 9 , 3 8 0 3 9 3 , 7 4 0
FEBRUARY 1 2 7 , 9 5 0 8 9 , 8 2 0 2 1 7 , 7 7 0
MARCH 1 8 3 , 5 2 0 1 1 6 , 8 5 0 3 0 0 , 3 7 0
APRIL 2 5 9 , 4 4 0 1 7 2 , 0 4 0 4 3 1 , 4 8 0
MAY 1 4 9 , 5 8 0 1 4 1 , 1 0 0 2 9 0 , 6 8 0
JUNE 1 1 7 , 3 7 0 1 1 4 , 1 9 0 2 3 1 , 5 6 0
JULY 8 5 , 4 6 0 8 5 , 3 4 0 1 7 0 , 8 0 0
AUGUST 7 9 , 4 6 0 6 9 , 2 9 0 1 4 8 , 7 5 0
SEPTEMBER 7 1 , 1 2 0 6 7 , 7 1 0 1 3 8 , 8 3 0
OCTOBER 5 4 0 1 2 , 7 2 6 1 3 , 2 6 6
NOVEMBER 2 , 3 6 1 9 , 2 1 6 1 1 , 5 7 7
DECEMBER 4 , 7 4 8 2 1 , 0 4 7 2 5 , 7 9 5
TOTAL 1,325,909 1,048,709 2,374,618
Source: BBK, 2000

137
POWER IMPORT FROM KPLC: 1999
LOW NORM AL TOTAL
JAN UARY 4 , 1 9 7 2 3 , 3 1 9 2 7 , 5 1 6
FEBRUARY 5 , 9 1 9 2 8 , 4 7 5 3 4 , 3 9 4
MARCH 6 , 8 4 3 2 9 , 7 8 6 3 6 , 6 2 9
APRIL 8 , 4 7 6 4 1 , 3 5 0 4 9 , 8 2 6
MAY 2 , 8 5 0 1 3 , 0 8 0 1 5 , 9 3 0
JUNE 2 , 1 6 5 7 , 4 5 1 9 , 6 1 6
JULY 3 , 7 7 5 1 5 , 4 1 6 1 9 , 1 9 1
AU G U ST 5 , 8 4 9 5 , 1 6 7 1 1 , 0 1 6
SEPTEM BER 1 1 , 6 0 9 9 , 6 1 8 2 1 , 2 2 7
O CTO BER 1 1 , 2 2 0 1 1 , 7 4 1 2 2 , 9 6 1
NO VEM BER 1 2 , 2 0 5 9 , 9 6 4 2 2 , 1 6 9
DECEM BER 1 9 , 6 1 6 2 0 , 8 5 8 4 0 , 4 7 4
TOTAL 94,724 216,225 310,949
Source: BBK, 2000

138
TABLE 18
POWER IMPORT FROM KPLC: 2000
LOW NORM AL TOTAL
JAN UARY 2 6 9 , 8 4 0 3 0 5 , 7 9 0 5 7 5 , 6 3 0
FEBRU AR Y 2 3 9 , 1 9 0 2 5 3 , 7 7 0 4 9 2 , 9 6 0
M ARCH 2 9 4 , 1 3 0 2 9 2 , 4 2 0 5 8 6 , 5 5 0
APRIL 2 5 6 , 6 6 0 3 1 1 , 4 3 0 5 6 8 , 0 9 0
MAY 2 0 5 , 1 7 0 2 6 2 , 0 4 0 4 6 7 , 2 1 0
JUNE 7 6 , 5 5 0 1 8 7 , 4 9 0 2 6 4 , 0 4 0
JULY 2 2 , 1 8 0 7 0 , 8 0 0 9 2 , 9 8 0
AU G U ST 1 5 , 4 4 0 5 1 , 7 2 0 6 7 , 1 6 0
SEPTEM BER 4 1 , 6 7 0 9 1 , 2 3 0 1 3 2 , 9 0 0
O CTO BER 5 1 , 6 6 0 1 0 4 , 8 2 0 1 5 6 , 4 8 0
NO VEM BER 7 6 , 8 3 0 1 4 6 , 8 2 0 2 2 3 , 6 5 0
DECEM BER 1 0 5 , 3 0 0 2 2 6 , 5 3 0 3 3 1 , 8 3 0
TOTAL 1,654,620 2,304,860 3,959,480
Source: BBK, 2000

HYDROPOWER GENERATION IN 2000
X£*
xLU£oCL
oCO
1,200,000
1,000,000
800,000
600,000
400,000
200,000
0Jan Feb Mar Apr May Jun Jul Aug Sep Oct Nov Dec
MONTH
H 2000BUDGET
0 2OOOLE
co
Source-. BBK.,2000

UN
ITS
OF
PO
WE
R I
N K
V\/h
PROJECTED INCREASE (KWH) IN DIESEL POWER GENERATION - 2000
5 5o $
r- )
t O 1
M O N T H
E3 2000BUDGET
E2000ACTUAL

KP&L POWER BILLS 1999 / 2000
(/)XCO*
</)oo
; i ; i n ' i i M i l m i i i .i ;
iiyxoXV‘A*?i?l
6 ,000,000
M 1999ACTUAL
SI 2000BUDG ET
□ 2000ACTUAL
1,000,000
5,000,000
4,000,000
3,000,000
2 , 000,000
Jan Feb Mar Apr May Jun JulNVOUTH
Aug Sep Oct Nov Dec
Copyright © 2022 FDOKUMEN