NTROLLER OF BUDGET - Kericho County
361
ROLLER OF BUDGET
-
Upload
khangminh22 -
Category
Documents
-
view
0 -
download
0
Transcript of NTROLLER OF BUDGET - Kericho County

OFFICE OF THE CONTROLLER OF BUDGET
BUDGET IMPLEMENTATION REVIEW REPORT
COUNTY GOVERNMENTS BUDGET IMPLEMENTATION REVIEW REPORT, HALF YEAR, FY 2016/17
C
M
Y
CM
MY
CY
CMY
K
March-COVER-FRONT.pdf 1 3/7/2019 5:55:49 PM

THE REPUBLIC OF KENYA
OFFICE OF THE CONTROLLER OF BUDGET
COUNTY GOVERNMENTS BUDGET IMPLEMENTATION REVIEW REPORT
FIRST HALF
FINANCIAL YEAR 2018/19
FEBRUARY, 2019

iii
COUNTY GOVERNMENTS BUDGET IMPLEMENTATION REVIEW REPORT FOR THE FIRST HALF OF FY2018/19
PREFACE
It is my pleasure to present the County Budget Implementation Review Report (CBIRR) for the first half of the Financial Year (FY) 2018/19. This report has been prepared in conformity with Article 228 (6) of the Constitution of Kenya, 2010 and Section 9 of the Controller of Budget (COB) Act, 2016 which require the Controller of Budget to submit to each House of Parliament a report on the implementation of the budgets of the national and county governments every four months.
The report provides information on budget implementation by the forty seven county governments for the period from July to December, 2018. It contains analyses of county government budgets, revenue and expenditure out-turn for the reporting period, and also compares performance with that of a similar period in the previous financial year in order to assess progress.
This report is based on analysis of the approved County Governments Budgets, receipts into the County Revenue Funds, withdrawals from the County Revenue Funds, financial reports from the County Governments, data generated from the Integrated Financial Management Information System (IFMIS) and information obtained by the Office of the Controller of Budget (OCOB) in the course of overseeing budget implementation. The report highlights some of the key issues that hampered effective budget implementation, some of which were identified in previous reports. They included: delay in disbursement of equitable share of revenue raised nationally by the National Treasury, and low absorption of development funds.
The production of this report was made possible through collective efforts between staff from OCOB and those from the County Treasuries. I therefore, take this opportunity to appreciate all staff who were involved in the preparation of this report for their dedication and commitment.
It is my hope that readers of this report, especially, Parliament, the public and key stakeholders will find it informative and useful in promoting transparency and accountability in the use of the public funds. The Office will continue to publish regular reports on budget implementation by County Governments in order to provide basis for effective assessment and engagement on budget implementation.
Mrs. Agnes Odhiambo, CBS
CONTROLLER OF BUDGET

iv
COUNTY GOVERNMENTS BUDGET IMPLEMENTATION REVIEW REPORT FOR THE FIRST HALF OF FY2018/19
TABLE OF CONTENTS
PREFACE ................................................................................................................................................ II
ACRONYMS ........................................................................................................................................ XV
EXECUTIVE SUMMARY .............................................................................................................XVII
KEY HIGHLIGHTS ..........................................................................................................................XIX
1 INTRODUCTION ...........................................................................................................................1
2 FINANCIAL ANALYSIS OF OVERALL BUDGET PERFORMANE IN THE FIRST HALF OF FY 2018/19 ..............................................................................................22.1 Introduction .......................................................................................................................................................... 2
2.2 Revenue Analysis .................................................................................................................................................. 2
2.3 Revenue Out-turn ................................................................................................................................................. 2
2.4 Own Source Revenue ........................................................................................................................................... 3
2.5 Funds Released to the Counties .......................................................................................................................... 4
2.6 Funds released to Counties from the Consolidated Fund ................................................................................ 4
2.7 Funds Released to County Operational Accounts ............................................................................................ 4
2.8 Expenditure Analysis........................................................................................................................................... 6
2.9 Development Expenditure ................................................................................................................................... 7
2.10 Recurrent Expenditure ........................................................................................................................................ 9
2.11 Personnel Emoluments ........................................................................................................................................ 9
2.12 Operations and Maintenance Expenditure ....................................................................................................... 9
2.13 Review of MCAs Committee Sitting Allowances ............................................................................................ 10
2.14 Review of Expenditure on Domestic and Foreign Travels ............................................................................. 11
3 BUDGET PERFORMANCE BY COUNTY .............................................................................133.1 Baringo County .................................................................................................................................................. 13
3.2 Bomet County ..................................................................................................................................................... 19
3.3 Bungoma County ................................................................................................................................................ 26
3.4 Busia County ...................................................................................................................................................... 34
3.5 Elgeyo Marakwet County .................................................................................................................................. 40
3.6 Embu County ...................................................................................................................................................... 47
3.7 Garissa County ................................................................................................................................................... 54
3.8 Homa Bay County .............................................................................................................................................. 61
3.9 Isiolo County ....................................................................................................................................................... 69
3.10 Kajiado County .................................................................................................................................................. 75
3.11 Kakamega County ............................................................................................................................................. 82
3.12 Kericho County .................................................................................................................................................. 88
3.13 Kiambu County .................................................................................................................................................. 95
3.14 KilifiCounty ..................................................................................................................................................... 102
3.15 Kirinyaga County ............................................................................................................................................ 109
v
COUNTY GOVERNMENTS BUDGET IMPLEMENTATION REVIEW REPORT FOR THE FIRST HALF OF FY2018/19
3.16 Kisii County ...................................................................................................................................................... 115
3.17 Kisumu County ................................................................................................................................................ 123
3.18 Kitui County ..................................................................................................................................................... 129
3.19 Kwale County ................................................................................................................................................... 136
3.20 Laikipia County ............................................................................................................................................... 144
3.21 Lamu County .................................................................................................................................................... 150
3.22 Machakos County ............................................................................................................................................. 157
3.23 Makueni County ............................................................................................................................................... 164
3.24 Mandera County .............................................................................................................................................. 170
3.25 Marsabit County .............................................................................................................................................. 177
3.26 Meru County..................................................................................................................................................... 185
3.27 Migori County .................................................................................................................................................. 191
3.28 Mombasa County ............................................................................................................................................. 198
3.29 Murang’a County ............................................................................................................................................. 205
3.30 Nairobi City County ........................................................................................................................................ 213
3.31 Nakuru County ................................................................................................................................................. 218
3.32 Nandi County .................................................................................................................................................... 226
3.33 Narok County ................................................................................................................................................... 232
3.34 Nyamira County ............................................................................................................................................... 239
3.35 Nyandarua County ........................................................................................................................................... 247
3.36 Nyeri County ..................................................................................................................................................... 253
3.37 Samburu County .............................................................................................................................................. 260
3.38 Siaya County ..................................................................................................................................................... 267
3.39 Taita Taveta County ......................................................................................................................................... 273
3.40 Tana River County ........................................................................................................................................... 281
3.41 Tharaka Nithi County ..................................................................................................................................... 287
3.42 Trans Nzoia County ......................................................................................................................................... 293
3.43 Turkana County ............................................................................................................................................... 300
3.44 Uasin Gishu County ......................................................................................................................................... 307
3.45 Vihiga County ................................................................................................................................................... 314
3.46 Wajir County .................................................................................................................................................... 320
3.47 West Pokot County ........................................................................................................................................... 327
4 KEY CHALLENGES AND RECOMMENDATIONS .........................................................3344.1 High Expenditure on Personnel Emoluments ............................................................................................... 334
4.2 Under-performance in Own Source Revenue Collection ............................................................................. 334
4.3 Delays in Disbursement of Equitable Share by the National Treasury ...................................................... 334
4.4 DelaysinSubmissionofFinancialReportstotheOfficeoftheControllerofBudget .............................. 334
4.5 Failure to budget for all conditional grants as contained in CARA, 2018 ................................................. 335
5 CONCLUSION .............................................................................................................................336

vi
COUNTY GOVERNMENTS BUDGET IMPLEMENTATION REVIEW REPORT FOR THE FIRST HALF OF FY2018/19
LIST OF TABLES
Table 2.1: Monthly Own Source Revenue Collection for the Period July-December 2018 .......................................................................3
Table 2.2: The Exchequer Issues to the County Assembly and the County Executive for the First
Half of FY 2018/19 (Kshs. Million) .................................................................................................................................................5
Table 2.3: Expenditure by Economic Classification in the First Quarter of FY 2018/19 ...........................................................................6
Table 2.4: County Budget Allocation, Expenditure and Absorption Rate in the First Half of FY 2018/19 ............................................8
Table 2.5 : Budget Allocation, Expenditure and Absorption Rate of MCAs Committee Sitting
Allowance in the First Half of FY 2018/19 ...................................................................................................................................10
Table 2.6: Expenditure on Domestic and Foreign Travels by the County Assembly and the County
Executive in the First Half of FY 2018/19 (Kshs. Million) .........................................................................................................11
Table 3.1 : Baringo County, Conditional Grants/Loans Received in the First Half of FY 2018/19 .........................................................14
Table 3.2: Baringo County, List of Development Projects with the Highest Expenditure in the FY 2018/19 .......................................18
Table 3.3: Baringo County, Budget Performance by Department .............................................................................................................18
Table 3.4: Bomet County, Conditional Grants Received in the First Half of FY 2018/19 .......................................................................21
Table 3.5: Bomet County, List of Development Projects with the Highest Expenditure in the FY 2018/19 ........................................ 25
Table 3.6: Bomet County, Budget Performance by Department .............................................................................................................. 25
Table 3.7: Bungoma County, Conditional Grants/Loans Received in the First Half of FY 2018/19 ..................................................... 28
Table 3.8: Bungoma County, List of Development Projects with the Highest Expenditure in the FY 2018/19 ....................................32
Table 3.9: Bungoma County, Budget Performance by Department ...........................................................................................................32
Table 3.10: Busia County, Conditional Grants/Loans Received in the First Half of FY 2018/19 .............................................................35
Table 3.11: Busia County, List of Development Projects with the Highest Expenditure in the FY 2018/19 ...........................................39
Table 3.12: Busia County, Budget Performance by Department .................................................................................................................39
Table 3.13: Elgeyo Marakwet County, Conditional Grants/Loans Received in the First Half of FY 2018/19 ....................................... 42
Table 3.14: Elgeyo Marakwet County, List of Development Projects with the Highest Expenditure in the FY 2018/19 ..................... 46
Table 3.15: Elgeyo Marakwet County, Budget Performance by Department ........................................................................................... 46
Table 3.16 : Embu County, Conditional Grants/Loans Received in the First Half of FY 2018/19 ........................................................... 49
Table 3.17: Embu County, List of Development Projects with the Highest Expenditure in the FY 2018/19 ..........................................53
Table 3.18: Embu County, Budget Performance by Department .................................................................................................................53
Table 3.19: Garissa County, Conditional Grants/Loans Received in the First Half of FY 2018/19 ......................................................... 56
Table 3.20: Garissa County, List of Development Projects with the Highest Expenditure in the FY 2018/19 ....................................... 60
Table 3.21: Garissa County, Budget Performance by Department ............................................................................................................. 60
Table 3.22: Homa Bay County, Conditional Grants/Loans Received in the First Half of FY 2018/19 ................................................... 63
Table 3.23: Homa Bay County, List of Development Projects with the Highest Expenditure in the FY 2018/19 ................................. 67
Table 3.24: Homa Bay County, Budget Performance by Department ....................................................................................................... 67
Table 3.25: Isiolo County, Conditional Grants/Loans Received in the First Half of FY 2018/19 .............................................................71
Table 3.26: Isiolo County, Budget Performance by Department ..................................................................................................................74
Table 3.27: Kajiado County, Conditional Grants/Loans Received in the First Half of FY 2018/19 ........................................................ 77
Table 3.28: Kajiado County, List of Development Projects with the Highest Expenditure in the FY 2018/19 ...................................... 80
Table 3.29: Kajiado County, Budget Performance by Department ............................................................................................................ 80
Table 3.30: Kakamega County, Conditional Grants/Loans Received in the First Half of FY 2018/19 ................................................... 84
Table 3.31: Kakamega County, List of Development Projects with the Highest Expenditure in the FY 2018/19 ................................. 87
Table 3.32: Kakamega County, Budget Performance by Department ....................................................................................................... 87

vii
COUNTY GOVERNMENTS BUDGET IMPLEMENTATION REVIEW REPORT FOR THE FIRST HALF OF FY2018/19
Table 3.33: Kericho County, Conditional Grants/Loans Received in the First Half of FY 2018/19 ........................................................ 90
Table 3.34: Kericho County, Budget Performance by Department ............................................................................................................ 94
Table 3.35: Kiambu County, Conditional Grants/Loans Received in the First Half of FY 2018/19........................................................ 97
Table 3.36: Kiambu County, List of Development Projects with the Highest Expenditure in the FY 2018/19.................................... 100
Table 3.37: Kiambu County, Budget Performance by Department .......................................................................................................... 100
Table 3.38: Kilifi County, Conditional Grants/Loans Received in the First Half of FY 2018/19 .......................................................... 103
Table 3.39: Kilifi County, List of Development Projects with the Highest Expenditure in the FY 2018/19 ........................................ 107
Table 3.40: Kilifi County, Budget Performance by Department ................................................................................................................ 107
Table 3.41: Kirinyaga County, Conditional Grants/Loans Received in the First Half of FY 2018/19 ...................................................111
Table 3.42: Kirinyaga County, List of Development Projects with the Highest Expenditure in the FY 2018/19 .................................114
Table 3.43: Kirinyaga County, Budget Performance by Department .......................................................................................................114
Table 4.44: Kisii County, Conditional Grants/Loans Received in the First Half of FY 2018/19 ............................................................117
Table 3.45: Kisii County, List of Development Projects with the Highest Expenditure in the FY 2018/19 ..........................................121
Table 3.46: Kisii County, Budget Performance by Department .................................................................................................................121
Table 3.47: Kisumu County, Conditional Grants/Loans Received in the First Half of FY 2018/19 ...................................................... 125
Table 3.48: Kisumu County, List of Development Projects with the Highest Expenditure in the FY 2018/19 .................................... 128
Table 3.49: Kisumu County, Budget Performance by Department .......................................................................................................... 128
Table 3.50: Kitui County, Conditional Grants/Loans Received in the First Half of FY 2018/19 ............................................................131
Table 3.51: Kitui County, List of Development Projects with the Highest Expenditure in the FY 2018/19 ..........................................135
Table 3.52: Kitui County, Budget Performance by Department ................................................................................................................135
Table 3.53: Kwale County, Conditional Grants/Loans Received in the First Half of FY 2018/19. ........................................................ 139
Table 3.54: Kwale County, List of Development Projects with the Highest Expenditure in the FY 2018/19 ........................................142
Table 3.55: Kwale County, Budget Performance by Department ..............................................................................................................142
Table 3.56: Laikipia County, Conditional Grants/Loans Received in the First Half of FY 2018/19 ..................................................... 146
Table 3.57: Laikipia County, List of Development Projects with the Highest Expenditure in the FY 2018/19 ....................................149
Table 3.58: Laikipia County, Budget Performance by Department ............................................................................................................149
Table 3.59: Lamu County, Conditional Grants/Loans Received in the First Half of FY 2018/19 ..........................................................153
Table 3.60: Lamu County, Budget Performance by Department .............................................................................................................. 156
Table 3.61: Machakos County, Conditional Grants/Loans Received in the First Half of FY 2018/19 ...................................................159
Table 3.62: Machakos County, List of Development Projects with the Highest Expenditure in the FY 2018/19 .................................162
Table 3.63: Machakos County, Budget Performance by Department .......................................................................................................162
Table 3.64: Makueni County, Conditional Grants/Loans Received in the First Half of FY 2018/19 .................................................... 166
Table 3.65: Makueni County, List of Development Projects with the Highest Expenditure in the FY 2018/19 ...................................169
Table 3.66: Makueni County, Budget Performance by Department .........................................................................................................169
Table 3.67: Mandera County, Conditional Grants/Loans Received in the First Half of FY 2018/19 .....................................................173
Table 3.68: Mandera County, List of Development Projects with the Highest Expenditure in the FY 2018/19 ...................................176
Table 3.69: Mandera County, Budget Performance by Department .........................................................................................................176
Table 3.70: Marsabit County, Conditional Grants/Loans Received in the First Half of FY 2018/19 .....................................................179
Table 3.71: Marsabit County, List of Development Projects with the Highest Expenditure in the FY 2018/19 ...................................183
Table 3.72: Marsabit County, Budget Performance by Department ..........................................................................................................183
Table 3.73: Meru County, Conditional Grants/Loans Received in the First Half of FY 2018/19 ...........................................................187
Table 3.74: Meru County, List of Development Projects with the Highest Expenditure in the FY 2018/19 ........................................ 190
Table 3.75: Meru County, Budget Performance by Department .............................................................................................................. 190

viii
COUNTY GOVERNMENTS BUDGET IMPLEMENTATION REVIEW REPORT FOR THE FIRST HALF OF FY2018/19
Table 3.76: Migori County, Conditional Grants/Loans Received in the First Half of FY 2018/19 ........................................................ 193
Table 3.77: Migori County, List of Development Projects with the Highest Expenditure in the First Half of FY 2018/19 ................ 197
Table 3.78: Migori County, Budget Performance by Department ............................................................................................................ 197
Table 3.79: Mombasa County, Conditional Grants/Loans Received in the First Half of FY 2018/19 ..................................................200
Table 3.80: Mombasa County, List of Development Projects with the Highest Expenditure in the FY 2018/19 ................................204
Table 3.81: Mombasa County, Budget Performance by Department .......................................................................................................204
Table 3.82: Murang’a County, Conditional Grants/Loans Received in the First Half of FY 2018/19 ...................................................207
Table 3.83: Murang’a County, List of Development Projects with the Highest Expenditure in the FY 2018/19 ..................................211
Table 3.84: Murang’a County, Budget Performance by Department ........................................................................................................211
Table 3.85: Nairobi City County, Conditional Grants/Loans Received in the First Half of FY 2018/19 ...............................................214
Table 3.86: Nairobi City County, Budget Performance by Department ...................................................................................................217
Table 3.87: Nakuru County, Conditional Grants/Loans Received in the First Half of FY 2018/19 ......................................................220
Table 3.88: Nakuru County, List of Development Projects with the Highest Expenditure in the FY 2018/19 ....................................224
Table 3.89: Nakuru County, Budget Performance by Department ..........................................................................................................224
Table 3.90: Nandi County, Conditional Grants/Loans Received in the First Half of FY 2018/19 .........................................................228
Table 3.91: Nandi County, List of Development Projects with the Highest Expenditure in the FY 2018/19 ........................................231
Table 3.92: Nandi County, Budget Performance by Department ..............................................................................................................231
Table 3.93: Narok County, Conditional Grants/Loans Received in the First Half of FY 2018/19 .........................................................234
Table 3.94: Narok County, List of Development Projects with the Highest Expenditure in the FY 2018/19 ....................................... 238
Table 3.95: Narok County, Budget Performance by Department ............................................................................................................. 238
Table 3.96: Nyamira County, Conditional Grants/Loans Received in the First Half of FY 2018/19 .................................................... 241
Table 3.97: Nyamira County, List of Development Projects with the Highest Expenditure in the FY 2018/19 .................................. 245
Table 3.98: Nyamira County, Budget Performance by Department ......................................................................................................... 245
Table 3.99: Nyandarua County, Conditional Grants/Loans Received in the First Half of FY 2018/19 ................................................249
Table 3.100: Nyandarua County, List of Development Projects with the Highest Expenditure in the FY 2018/19 .............................. 252
Table 3.101: Nyandarua County, Budget Performance by Department .................................................................................................... 252
Table 3.102: Nyeri County, Conditional Grants/Loans Received in the First Half of FY 2018/19 .......................................................... 255
Table 3.103: Nyeri County, List of Development Projects with the Highest Expenditure in the FY 2018/19 ........................................ 259
Table 3.104: Nyeri County, Budget Performance by Department .............................................................................................................. 259
Table 3.105: Samburu County, Conditional Grants/Loans Received in the First Half of FY 2018/19 .................................................... 262
Table 3.106: Samburu County, List of Development Projects with the Highest Expenditure in the FY 2018/19 ..................................266
Table 3.107: Samburu County, Budget Performance by Department .........................................................................................................266
Table 3.108: Siaya County, Conditional Grants/Loans Received in the First Half of FY 2018/19 ..........................................................269
Table 3.111: Siaya County, List of Development Projects with the Highest Expenditure in the FY 2018/19 ........................................ 272
Table 3.112: Siaya County, Budget Performance by Department ............................................................................................................... 272
Table 3.113: Taita Taveta County, Conditional Grants/Loans Received in the First Half of FY 2018/19 ............................................... 275
Table 3.114: Taita Taveta County, List of Development Projects with the Highest Expenditure in the FY 2018/19 ............................. 279
Table 3.115: Taita Taveta County, Budget Performance by Department ................................................................................................... 279
Table 3.116: Tana River County, Conditional Grants/Loans Received in the First Half of FY 2018/19 .................................................282
Table 3.117: Tana River County, Budget Performance by Department .....................................................................................................286
Table 3118: Tharaka Nithi County, Conditional Grants/Loans Received in the First Half of FY 2018/19 ...........................................289
Table 3.119: Tharaka Nithi County, List of Development Projects with the Highest Expenditure in the FY 2018/19 .........................292

ix
COUNTY GOVERNMENTS BUDGET IMPLEMENTATION REVIEW REPORT FOR THE FIRST HALF OF FY2018/19
Table 3.120: Tharaka Nithi County, Budget Performance by Department ...............................................................................................292
Table 3.121: Trans Nzoia County, Analysis of Conditional Grants Received in the first quarter of FY 2018/19 .................................. 295
Table 3.122: Trans Nzoia County, List of Development Projects with the Highest Expenditure in the FY 2018/19 .............................299
Table 3.123: Trans Nzoia County, Budget Performance by Department ...................................................................................................299
Table 3.124: Turkana County, Conditional Grants/Loans Received in the First Half of FY 2018/19 .....................................................302
Table 3.125: Turkana County, Budget Performance by Department ..........................................................................................................306
Table 3.126: Uasin Gishu County, Conditional Grants/Loans Received in the First Half of FY 2018/19 ..............................................309
Table 3.127: Uasin Gishu County, List of Development Projects with the Highest Expenditure in the FY 2018/19 .............................312
Table 3.128: Uasin Gishu County, Budget Performance by Department ...................................................................................................312
Table 3.129: Vihiga County, Conditional Grants Received in the First Half of FY 2018/19 .....................................................................315
Table 3.130: Vihiga County, List of Development Projects with the Highest Expenditure in the FY 2018/19 .......................................319
Table 3.131: Vihiga County, Budget Performance by Department .............................................................................................................319
Table 3.132: Wajir County, Conditional Grants/Loans Received in the First Half of FY 2018/19 .......................................................... 322
Table 3.133: Wajir County, Budget Performance by Department ............................................................................................................... 326
Table 3.134: West Pokot County, Conditional Grants/Loans Received in the First Half of FY 2018/19 ................................................ 328
Table 3.135: West Pokot County, List of Development Projects with the Highest Expenditure in the FY 2018/19 ...............................332
Table 3.136: West Pokot County, Budget Performance by Department .....................................................................................................332

x
COUNTY GOVERNMENTS BUDGET IMPLEMENTATION REVIEW REPORT FOR THE FIRST HALF OF FY2018/19
LIST OF FIGURES
Figure 3.1: Baringo County Sources of Budget Financing in FY 2018/19 ..................................................................................................13
Figure 3.2: Baringo County, Trend in Own Source Revenue Collection for the First Half of FY
2013/14 to the First Half of FY 2018/19 ........................................................................................................................................14
Figure 3.3: Baringo County, Expenditure by Economic Classification .......................................................................................................16
Figure 3.4: Baringo County, Operations and Maintenance Expenditure by Major Categories in the First Half of FY 2018/19 ..........17
Figure 3.5: Bomet County Expected Sources of Budget Financing in FY 2018/19 .................................................................................. 20
Figure 3.6: Bomet County, Trend in Own Source Revenue Collection from the First Half of FY
2013/14 to the First Half of FY 2018/19 ........................................................................................................................................21
Figure 3.6: Bomet County, Expenditure by Economic Classification......................................................................................................... 23
Figure 3.7: Bomet County, Operations and Maintenance Expenditure by Major Categories in the First Quarter of FY 2018/19 ..... 24
Figure 3.8: Bungoma County Expected Sources of Budget Financing in FY 2018/19 ............................................................................. 27
Figure 3.9: Bungoma County, Trend in Own Source Revenue Collection for the First Half from FY 2013/14 to FY 2018/19 .......... 28
Figure 3.10: Bungoma County, Expenditure by Economic Classification ................................................................................................... 30
Figure 3.11: Bungoma County, Operations and Maintenance Expenditure by Major Categories in the First Half of FY 2018/19 .......31
Figure 3.12: Busia County Sources of Budget Financing in FY 2018/19 ..................................................................................................... 34
Figure 3.13: Busia County, Trend in Own-Source Revenue Collection for the First Half of FY 2013/14
to the First Half of FY 2018/19 .......................................................................................................................................................35
Figure 3.14: Busia County, Expenditure by Economic Classification ...........................................................................................................37
Figure 3.15: Busia County, Operations and Maintenance Expenditure by Major Categories in the First Half of FY 2018/19 ............. 38
Figure 3.16: Elgeyo Marakwet County Expected Sources of Budget Financing in FY 2018/19 ................................................................41
Figure 3.17: Elgeyo Marakwet County, Trend in Own Source Revenue Collection for the First Half
from FY 2013/14 to FY 2018/19.................................................................................................................................................... 42
Figure 3.18: Elgeyo Marakwet County, Expenditure by Economic Classification .....................................................................................44
Figure 3.19: Elgeyo Marakwet County, Operations and Maintenance Expenditure by Major
Categories in the First Half of FY 2018/19 ...................................................................................................................................45
Figure 3.20 : Embu County, Expected Sources of Budget Financing in FY 2018/19 ................................................................................... 48
Figure 3.21 : Embu County, Trend in Own Source Revenue Collection from the First Half of FY
2013/14 to the First Half of FY 2018/19 ....................................................................................................................................... 49
Figure 3.22: Embu County, Expenditure by Economic Classification ...........................................................................................................51
Figure 3.23: Embu County, Operations and Maintenance Expenditure by Major Categories in the First Half of FY 2018/19 .............52
Figure 3.24: Garissa County Expected Sources of Budget Financing in FY 2018/19 ..................................................................................55
Figure 3.25: Garissa County, Trend in Own Source Revenue Collection for the First Half from FY 2013/14 to FY 2018/19 .............. 56
Figure 3.26: Garissa County, Expenditure by Economic Classification ....................................................................................................... 58
Figure3.27: Garissa County, Operations and Maintenance Expenditure by Major Categories in the First Half of FY 2018/19 .......... 59
Figure 3.28: Homa Bay County, Sources of Budget Financing in FY 2018/19 ............................................................................................ 62
Figure 3.29: Homa Bay County, Trend in Own-Source Revenue Collection for the First Half of FY
2013/14 to the First Half of FY 2018/19 ....................................................................................................................................... 63
Figure 3.30: Homa Bay County, Expenditure by Economic Classification ................................................................................................. 65
Figure 3.31: HomaBay County, Operations and Maintenance Expenditure by Major Categories in the First Half of FY 2018/19 ..... 66
Figure 3.32: Isiolo County Expected Sources of Budget Financing in FY 2018/19 .................................................................................... 69
Figure 3.33: Isiolo County, Trend in Own Source Revenue Collection to the First Half of FY 2018/19 .................................................. 70

xi
COUNTY GOVERNMENTS BUDGET IMPLEMENTATION REVIEW REPORT FOR THE FIRST HALF OF FY2018/19
Figure 3.34: Isiolo County, Expenditure by Economic Classification ........................................................................................................... 72
Figure 3.35: Isiolo County, Operations and Maintenance Expenditure by Major Categories in the First Half of FY 2018/19 ............. 73
Figure 3.36: Kajiado County Sources of Budget Financing in FY 2018/19 ...................................................................................................76
Figure 3.37: Kajiado County, Trend in Own-Source Revenue Collection for the First Half of FY
2013/14 to the First Half of FY 2018/19 ....................................................................................................................................... 77
Figure 3.38: Kajiado County, Expenditure by Economic Classification....................................................................................................... 78
Figure 3.39: Kajiado County, Operations and Maintenance Expenditure by Major Categories in the First Half of FY 2018/19 ......... 79
Figure 3.40: Kakamega County Sources of Budget Financing in FY 2018/19 ............................................................................................ 82
Figure 3.41: Kakamega County, Trend in Own-Source Revenue Collection for the First Half of FY
2013/14 to the First Half of FY 2018/19 ....................................................................................................................................... 83
Figure 3.42: Kakamega County, Expenditure by Economic Classification ................................................................................................. 85
Figure 3.43: Kakamega County, Operations and Maintenance Expenditure by Major Categories in the First Half of FY 2018/19 .... 86
Figure 3.44: Kericho County Sources of Budget Financing in FY 2018/19 ................................................................................................. 89
Figure 3.45: Kericho County, Trend in Own-Source Revenue Collection for the First Half from
FY 2013/14 to Half of FY 2018/19 ................................................................................................................................................ 90
Figure 3.46: Kericho County, Expenditure by Economic Classification ...................................................................................................... 92
Figure 3.47: Kericho County, Operations and Maintenance Expenditure by Major Categories in the First Half of FY 2018/19 ......... 93
Figure 3.48: Kiambu County Expected Sources of Budget Financing in FY 2018/19................................................................................ 95
Figure 3.49: Kiambu County, Trend in Own Source Revenue Collection for the First Half from FY 2013/14 to FY 2018/19 ............. 96
Figure 3.50: Kiambu County, Expenditure by Economic Classification ...................................................................................................... 98
Figure 3.51: Kiambu County, Operations and Maintenance Expenditure by Major Categories in the First Half of FY 2018/19 ........ 99
Figure 3.52: Kilifi County Sources of Budget Financing in FY 2018/19 .................................................................................................... 102
Figure 3.53: Kilifi County, Trend in Own-Source Revenue Collection for the First Half of FY 2013/14
to the First Half of FY 2018/19 .................................................................................................................................................... 103
Figure 3.54: Kilifi County, Expenditure by Economic Classification ......................................................................................................... 105
Figure 3.55: Kilifi County, Operations and Maintenance Expenditure by Major Categories in the First Half of FY 2018/19 ........... 106
Figure 3.56: Kirinyaga County Expected Sources of Budget Financing in FY 2018/19 .......................................................................... 109
Figure 3.57: Kirinyaga County, Trend in Own Source Revenue Collection for the First Half from FY 2013/14 to FY 2018/19 .........110
Figure 3.58: Kirinyaga County, Expenditure by Economic Classification .................................................................................................112
Figure 3.59: Kirinyaga County, Operations and Maintenance Expenditure by Major Categories in the First Half of FY 2018/19 ....113
Figure 3.60: Kisii County Sources of Budget Financing in FY 2018/19 ......................................................................................................116
Figure 3.61: Kisii County, Trend in Own-Source Revenue Collection for the First Half of FY 2013/14
to the First Half of FY 2018/19 .....................................................................................................................................................117
Figure 3.62: Kisii County, Expenditure by Economic Classification ...........................................................................................................119
Figure 3.63: Kisii County, Operations and Maintenance Expenditure by Major Categories in the First Half of FY 2018/19 ............ 120
Figure 3.64: Kisumu County, Sources of Budget Financing in FY 2018/19 .............................................................................................. 123
Figure 3.65: Kisumu County, Trend in Own-Source Revenue Collection for the First Half of FY
2013/14 to the First Half of FY 2018/19 ..................................................................................................................................... 124
Figure 3.66: Kisumu County, Expenditure by Economic Classification .................................................................................................... 126
Figure 3.67: Kisumu County, Operations and Maintenance Expenditure by Major Categories in the First Half of FY 2018/19 ....... 127
Figure 3.68: Kitui County, Expected Sources of Budget Financing in FY 2018/19 .................................................................................. 130
Figure 3.69: Kitui County, Trend in Own Source Revenue Collection for the First Half from FY 2013/14 to FY 2018/19 .................131
Figure 3.70: Kitui County, Expenditure by Economic Classification ..........................................................................................................133

xii
COUNTY GOVERNMENTS BUDGET IMPLEMENTATION REVIEW REPORT FOR THE FIRST HALF OF FY2018/19
Figure 3.71: Kitui County, Operations and Maintenance Expenditure by Major Categories in the First Half of FY 2018/19 ............ 134
Figure 3.72: Kwale County, Expected Sources of Budget Financing in FY 2018/19 ................................................................................ 137
Figure 3.73: Kwale County, Trend in Own Source Revenue Collection from the First Half of FY
2013/14 to the First Half of FY 2018/19 ..................................................................................................................................... 138
Figure 3.74: Kwale County, Expenditure by Economic Classification ....................................................................................................... 140
Figure 3.75: Kwale County, Operations and Maintenance Expenditure by Major Categories in the First Half of FY 2018/19 ...........141
Figure 3.76: Laikipia County Sources of Budget Financing in FY 2018/19 ............................................................................................... 144
Figure 3.77: Laikipia County, Trend in Own-Source Revenue Collection for the First Half of FY
2013/14 to the First Half of FY 2018/19 ......................................................................................................................................145
Figure 3.78: Laikipia County, Expenditure by Economic Classification .....................................................................................................147
Figure 3.79: Laikipia County, Operations and Maintenance Expenditure by Major Categories in the First Half of FY 2018/19 ...... 148
Figure 3.80: Lamu County Sources of Budget Financing in FY 2018/19 ....................................................................................................151
Figure 3.81: Lamu County, Trend in Own-Source Revenue Collection for the First Half of FY
2013/14 to the First Half of FY 2018/19 ......................................................................................................................................152
Figure 3.82: Lamu County, Expenditure by Economic Classification ........................................................................................................ 154
Figure 3.83: Lamu County, Operations and Maintenance Expenditure by Major Categories in the First Half of FY 2018/19 ...........155
Figure 3.84: Machakos County Expected Sources of Budget Financing in FY 2018/19 ...........................................................................157
Figure 3.85: Machakos County, Trend in Own Source Revenue Collection for the First Half from FY 2013/14 to FY 2018/19 ....... 158
Figure 3.86: Machakos County, Expenditure by Economic Classification ................................................................................................ 160
Figure 3.87: Machakos County, Operations and Maintenance Expenditure by Major Categories in the First Half of FY 2018/19 ....161
Figure 3.88: Makueni County Sources of Budget Financing in FY 2018/19 ............................................................................................. 164
Figure 3.89: Makueni County, Trend in Own-Source Revenue Collection for the First Half of FY
2013/14 to the First Half of FY 2018/19 ......................................................................................................................................165
Figure 3.90: Makueni County, Expenditure by Economic Classification ...................................................................................................167
Figure 3.91: Makueni County, Operations and Maintenance Expenditure by Major Categories in the First Half of FY 2018/19 ..... 168
Figure 3.92: Mandera County, Expected Sources of Budget Financing in FY 2018/19 ............................................................................171
Figure 3.93: Mandera County, Trend in Own Source Revenue Collection from the First Half of FY
2013/14 to the First Half of FY 2018/19 ......................................................................................................................................172
Figure 3.94: Mandera County, Expenditure by Economic Classification ...................................................................................................174
Figure 3.95: Mandera County, Operations and Maintenance Expenditure by Major Categories in the First Half of FY 2018/19 ......175
Figure 3.96: Marsabit County Expected Sources of Budget Financing in FY 2018/19 .............................................................................178
Figure 3.97: Marsabit County, Trend in Own Source Revenue Collection for the First Half from FY 2013/14 to FY 2018/19 ...........179
Figure 3.98: Marsabit County, Expenditure by Economic Classification ....................................................................................................181
Figure 3.99: Marsabit County, Operations and Maintenance Expenditure by Major Categories in the First Half of FY 2018/19 ......182
Figure 3.100: Meru County, Sources of Budget Financing in FY 2018/19 ....................................................................................................185
Figure 3.101: Meru County, Trend in Own-Source Revenue Collection for the First Half from FY
2013/14 to the First Half of FY 2018/19 ......................................................................................................................................186
Figure 3.102: Meru County, Expenditure by Economic Classification......................................................................................................... 188
Figure 3.103: Meru County, Operations and Maintenance Expenditure by Major Categories in the First Half of FY 2018/19 ............189
Figure 3.104: Migori County Sources of Budget Financing in FY 2018/19 ................................................................................................. 192
Figure 3.105: Migori County, Trend in Own-Source Revenue Collection for the First Half of FY
2013/14 to the First Half of FY 2018/19 ..................................................................................................................................... 193
Figure 3.106: Migori County, Expenditure by Economic Classification ...................................................................................................... 195

xiii
COUNTY GOVERNMENTS BUDGET IMPLEMENTATION REVIEW REPORT FOR THE FIRST HALF OF FY2018/19
Figure 3.107: Migori County, Operations and Maintenance Expenditure by Major Categories in the First Half of FY 2018/19 ......... 196
Figure 3.108: Mombasa County, Expected Sources of Budget Financing in FY 2018/19 .......................................................................... 199
Figure 3.109: Mombasa County, Trend in Own Source Revenue Collection for the First Half from FY 2013/14 to FY 2018/19 ........200
Figure 3.110: Mombasa County, Expenditure by Economic Classification .................................................................................................202
Figure 3.111: Mombasa County, Operations and Maintenance Expenditure by Major Categories in the First Half of FY 2018/19 ...203
Figure 3.112: County Expected Sources of Budget Financing in FY 2018/19 .................................................................206
Figure 3.113: Murang’a County, Trend in Own Source Revenue Collection for the First Half from FY 2013/14 to FY 2018/19.........207
Figure 3.114: Murang’a County, Expenditure by Economic Classification .................................................................................................209
Figure 3.115: Murang’a County, Operations and Maintenance Expenditure by Major Categories in the First Half of FY 2018/19 .....210
Figure 3.116: Nairobi City County Sources of Budget Financing in FY 2018/19 .........................................................................................213
Figure 3.117: Nairobi City County: Trend in Own-Source Revenue Collection for the First Half of FY
2013/14 to the First Half of FY 2018/19 ......................................................................................................................................214
Figure 3.118: Nairobi City County, Expenditure by Economic Classification..............................................................................................215
Figure 3.119: Nairobi City County, Operations and Maintenance Expenditure by Major Categories
in the First Half of FY 2018/19 .....................................................................................................................................................216
Figure 3.120: Nakuru County Sources of Budget Financing in FY 2018/19 .................................................................................................219
Figure 3.121: Nakuru County, Trend in Own-Source Revenue Collection for the First Half of FY
2013/14 to the First Half of FY 2018/19 .....................................................................................................................................220
Figure 3.122: Nakuru County, Expenditure by Economic Classification .....................................................................................................222
Figure 3.123: Nakuru County, Operations and Maintenance Expenditure by Major Categories in the First Half of FY 2018/19 .......223
Figure 3.124: Nandi County Sources of Budget Financing in FY 2018/19 ...................................................................................................226
Figure 3.125: Nandi County, Trend in Own-Source Revenue Collection for the First Half of FY
2013/14 to the First Half of FY 2018/19 .....................................................................................................................................227
Figure 3.126: Nandi County, Expenditure by Economic Classification .......................................................................................................229
Figure 3.127: Nandi County, Operations and Maintenance Expenditure by Major Categories in the First Half of FY 2018/19 ..........230
232
Figure 3128 : Narok County Expected Sources of Budget Financing in FY 2018/19. ............................................................................... 233
Figure 3.129: Narok County, Trend in Own-Source Revenue Collection for the First Half of FY
2013/14 to the First Half of FY 2018/19 .....................................................................................................................................234
Figure 3.130: Narok County, Expenditure by Economic Classification ....................................................................................................... 236
Figure 3.131: Narok County, Operations and Maintenance Expenditure by Major Categories in the First Half of FY 2018/19 .......... 237
Figure 3.132: Nyamira County Sources of Budget Financing in FY 2018/19 ..............................................................................................240
Figure 3.133: Nyamira County, Trend in Own-Source Revenue Collection for the First Half of FY
2013/14 to the First Half of FY 2018/19 ..................................................................................................................................... 241
Figure 3.134: Nyamira County, Expenditure by Economic Classification ................................................................................................... 243
Figure 3.135: Nyamira County, Operations and Maintenance Expenditure by Major Categories in the First Half of FY 2018/19 .....244
Figure 3.136: Nyandarua County Sources of Budget Financing in FY 2018/19 .......................................................................................... 247
Figure 3.137: Nyandarua County, Trend in Own-Source Revenue Collection for the First Half of FY
2013/14 to the First Half of FY 2018/19 .....................................................................................................................................248
Figure 3.138: Nyandarua County, Expenditure by Economic Classification ...............................................................................................250
Figure 3.139: Nyandarua County, Operations and Maintenance Expenditure by Major
Categories in the First Half of FY 2018/19 ................................................................................................................................ 251
Figure 3.140: Nyeri County Sources of Budget Financing in FY 2018/19 ...................................................................................................254

xiv
COUNTY GOVERNMENTS BUDGET IMPLEMENTATION REVIEW REPORT FOR THE FIRST HALF OF FY2018/19
Figure 3.141: Nyeri County, Trend in Own-Source Revenue Collection for the First Half of FY 2013/14
to the First Half of FY 2018/19 .................................................................................................................................................... 255
Figure 3.142: Nyeri County, Expenditure by Economic Classification ........................................................................................................ 257
Figure 3.143: Nyeri County, Operations and Maintenance Expenditure by Major Categories in the First Half of FY 2018/19 ........... 258
Figure 3.144: Samburu County Expected Sources of Budget Financing in FY 2018/19 ............................................................................ 261
Figure 3.145: Samburu County, Trend in Own Source Revenue Collection for the First Half from FY 2013/14 to FY 2018/19 ......... 262
Figure 3.146: Samburu County, Expenditure by Economic Classification ..................................................................................................264
Figure 3.147: Samburu County, Operations and Maintenance Expenditure by Major Categories in the First Half of FY 2018/19 ..... 265
Figure 3.148: Siaya County Sources of Budget Financing in FY 2018/19 .................................................................................................... 267
Figure 3.149: Siaya County, Trend in Own-Source Revenue Collection for the First Half of FY 2013/14
to the First Half of FY 2018/19 ....................................................................................................................................................268
Figure 3.150: Siaya County, Expenditure by Economic Classification ......................................................................................................... 270
Figure 3.151: Siaya County, Operations and Maintenance Expenditure by Major Categories in the First Half of FY 2018/19 ........... 271
Figure 3.152: Taita Taveta County Sources of Budget Financing in FY 2018/19......................................................................................... 274
Figure 3.153: Taita Taveta County, Trend in Own-Source Revenue Collection for the First Half of FY
2013/14 to the First Half of FY 2018/19 ..................................................................................................................................... 275
Figure 3.153: Taita Taveta County, Expenditure by Economic Classification ............................................................................................. 277
Figure 3.154: Taita Taveta County, Operations and Maintenance Expenditure by Major Categories in the First Half of FY 2018/19 278
Figure 3.155: County, Expected Sources of Budget Financing in FY 2018/19 ............................................................................................ 281
Figure 3.156: Tana River County, Trend in Own Source Revenue Collection to the First Half of FY 2018/19 ......................................282
Figure 3.157: Tana River County, Expenditure by Economic Classification ...............................................................................................284
Figure 3.158: Tana River County, Operations and Maintenance Expenditure by Major
Categories in the First Half of FY 2018/19 ................................................................................................................................285
Figure 3.159: Tharaka Nithi County Sources of Budget Financing in FY 2018/19 .....................................................................................287
Figure 3.160: Tharaka Nithi County, Trend in Own-Source Revenue Collection for the First Half of
FY 2013/14 to the First Half of FY 2018/19 ...............................................................................................................................288
Figure 3.161: Tharaka Nithi County, Expenditure by Economic Classification ..........................................................................................290
Figure 3.162: Tharaka Nithi County, Operations and Maintenance Expenditure by Major Categories in
the First Half of FY 2018/19 .........................................................................................................................................................291
Figure 3.163: Trans Nzoia County Expected Sources of Budget Financing in FY 2018/19 .......................................................................294
Figure 3.164: Trans Nzoia County, Trend in Own Source Revenue Collection from the First Half of
FY 2013/14 to the First Half of FY 2018/19 ............................................................................................................................... 295
Figure 3.165: Trans Nzoia County, Expenditure by Economic Classification .............................................................................................297
Figure 3.166: Trans Nzoia County, Operations and Maintenance Expenditure by Major
Categories in the First Half of FY 2018/19 ................................................................................................................................ 298
Figure 3.167: Turkana County, Expected Sources of Budget Financing in FY 2018/19 ............................................................................. 301
Figure 3.168: Turkana County, Trend in Own Source Revenue Collection to the First Half of FY 2018/19 ...........................................302
Figure 3.169: Turkana County, Expenditure by Economic Classification ....................................................................................................304
Figure 3.170: Turkana County, Operations and Maintenance Expenditure by Major Categories in the First Half of FY 2018/19 ......305
Figure 3.171: Uasin Gishu County Expected Sources of Budget Financing in FY 2018/19 ......................................................................307
Figure 3.172: Uasin Gishu County, Trend in Own Source Revenue Collection for the First Half from FY 2013/14 to FY 2018/19 ....308
Figure 3.173: Uasin Gishu County, Expenditure by Economic Classification ..............................................................................................310

xv
COUNTY GOVERNMENTS BUDGET IMPLEMENTATION REVIEW REPORT FOR THE FIRST HALF OF FY2018/19
Figure 3.174: Uasin Gishu County, Operations and Maintenance Expenditure by
Major Categories in the First Half of FY 2018/19 ....................................................................................................................311
Figure 3.175: Vihiga County Expected Sources of Budget Financing in FY 2018/19 .................................................................................314
Figure 3.176: Vihiga County, Trend in Own-Source Revenue Collection for the First Half of FY
2013/14 to the First Half of FY 2018/19 ......................................................................................................................................315
Figure 3.177: Vihiga County, Expenditure by Economic Classification .......................................................................................................317
Figure 3.178: Vihiga County, Operations and Maintenance Expenditure by Major Categories in the First Half of FY 2018/19 ..........318
Figure 3.179 : Wajir County Sources of Budget Financing in FY 2018/19 .....................................................................................................321
Figure 3.180: Wajir County, Trend in Own-Source Revenue Collection for the First Half of FY 2013/14
to the First Half of FY 2018/19 .................................................................................................................................................... 322
Figure 3.181: Wajir County, Expenditure by Economic Classification ......................................................................................................... 324
Figure 3.182: Wajir County, Operations and Maintenance Expenditure by Major Categories in the First Half of FY 2018/19 ........... 325
Figure 3.183: West Pokot County Sources of Budget Financing in FY 2018/19 .......................................................................................... 327
Figure 3.184: West Pokot County, Trend in Own-Source Revenue Collection for the First Half of FY
2013/14 to the First Half of FY 2018/19 ..................................................................................................................................... 328
Figure 3.185: West Pokot County, Expenditure by Economic Classification............................................................................................... 330
Figure 3.186: West Pokot County, Operations and Maintenance Expenditure
by Major Categories in the First Half of FY 2018/19 ................................................................................................................331

xvi
COUNTY GOVERNMENTS BUDGET IMPLEMENTATION REVIEW REPORT FOR THE FIRST HALF OF FY2018/19
ACRONYMS
ADP Annual Development Plan
A-I-A Appropriations-in-Aid
CA County Assembly
CARA County Allocation of Revenue Act
CBEF County Budget and Economic Forum
CBIRR County Budget Implementation Review Report
CBK Central Bank of Kenya
CBROP County Budget Review and Outlook Paper
CEC County Executive Committee
CFSP County Fiscal Strategy Paper
CECM-F County Executive Committee Member for Finance
CIDP County Integrated Development Plan
COB Controller of Budget
CRF County Revenue Fund
DANIDA Danish International Development Agency
EU European Union
ECDE Early Childhood Development Education
FAO Food and Agriculture Organization
FY Financial Year
IB Internet Banking
ICT Information Communication Technology
IDA International Development Association
IDEAS Instruments for Devolution Advice and Support
IFMIS Integrated Financial Management Information System
IPPD Integrated Payroll Personnel Database
KASP Kenya Agricultural Support Programme
KCSAP Kenya Climate Smart Agriculture Project

xvii
COUNTY GOVERNMENTS BUDGET IMPLEMENTATION REVIEW REPORT FOR THE FIRST HALF OF FY2018/19
KDSP Kenya Devolution Support Programme
Kshs Kenya Shillings
MCA Member of County Assembly
NARIGP National Agricultural and Rural Inclusive Growth Project
O&M Operations and Maintenance
OCOB Office of the Controller of Budget
PE Personnel Emoluments
PFM Public Finance Management
SRC Salaries and Remuneration Commission
WSDP Water & Sanitation Development Project

xviii
COUNTY GOVERNMENTS BUDGET IMPLEMENTATION REVIEW REPORT FOR THE FIRST HALF OF FY2018/19
EXECUTIVE SUMMARY
This County Budget Implementation Review Report (CBIRR) covers the first six months of the Financial Year (FY) 2018/19. It has been prepared in fulfilment of the requirements of Article 228 (6) of the Constitution of Kenya, 2010 and Section 9 of the Controller of Budget Act, 2016 and highlights status of budget implementation by the Counties by presenting information on revenue and expenditure performance against annual budget and comparison with performance in the first six months of FY 2017/18.
The aggregate budget estimates for the 47 County Governments in FY 2018/19 is Kshs.463.93 billion comprising of Kshs.276.44 billion (59.6 per cent) for recurrent expenditure and Kshs.187.49 billion (40.4 per cent) for development activities. In order to finance the budget, county governments expect to receive Kshs.314 billion as equitable share of revenue raised nationally, Kshs.25.5 billion as conditional grants from the National Government, Kshs.36.98 billion as conditional grants from Development Partners, generate Kshs.51.32 billion from own sources of revenue, and Kshs.46.12 billion cash balance from FY 2017/18.
The total funds available to the County Governments in the first half of FY 2018/19 amounted to Kshs.224.65 billion. This amount consisted of Kshs.115.14 billion as equitable share of revenue raised nationally, Kshs.15.37 billion as revenue raised from own sources, Kshs.613.57 million for the Transforming Health Systems for Universal Car Project (World Bank), Kshs.11.46 billion as IDA (World Bank) credit for the Kenya Urban Support Project (KUSP), and Kshs.46.12 billion cash balance from FY 2017/18.
The aggregate own source revenue raised by County Governments of Kshs.15.37 billion was 29.9 per cent of the annual target of Kshs.51.32 billion, and was an improvement of 54.5 per cent compared to Kshs.9.95 billion generated in a similar period of FY 2017/18, which was 18.1 per cent of the annual revenue target. Counties that raised a higher proportion of actual own source revenue against annual target were; Narok, Samburu, and Isiolo at 74.1 per cent, 68.7 per cent and 57.8 per cent respectively. On the contrary, counties that recorded the lowest proportion of own source revenue against annual targets were Kisii at 12.7 per cent, Wajir at 13.1 per cent and Kericho at 13.5 per cent.
During the reporting period, the Controller of Budget (COB) authorised withdrawal of Kshs.145.11 billion from the County Revenue Funds (CRF) to the various County Operational Accounts. This amount comprised of Kshs.117.13 billion (80.7 per cent) for recurrent expenditure and Kshs.27.97 billion (19.3 per cent) for development activities. The authorised withdrawal was an improvement of 32.5 per cent from Kshs.109.45 billion released in a similar period of FY 2017/18. Kiambu County received the highest amount from its CRF account to the operational accounts at Kshs.6.20 billion followed by Nairobi City County and Nakuru County at Kshs.6.15 billion and Kshs.5.69 billion respectively.
The total expenditure in the first six months of FY 2018/19 was Kshs.136.98 billion representing an absorption rate of 29.5 per cent of the total annual County Governments’ budgets. This was an improvement from an absorption rate of 25.9 per cent attained in a similar period of FY 2017/18 when total expenditure was Kshs.104.36 billion. The expenditure comprised of Kshs.112.25 billion for recurrent expenditure (40.6 per cent of the annual recurrent budget) and Kshs.24.73 billion for development expenditure (13.2 per cent of the annual development budget).
Analysis of expenditure by economic classification shows that Kshs.80.02 billion (58.4 per cent) was spent on personnel emoluments, Kshs.32.23 billion (23.5 per cent) on operations and maintenance, and Kshs.24.73 billion (18.1 per cent) on development activities. The personnel emoluments of Kshs.80.02 billion was an increase from Kshs.66.48 billion incurred in the first half of FY 2017/18. Analysis of personnel emoluments as a percentage of total expenditure by county shows that Wajir County, Baringo County, and Nyamira County recorded the highest percentage at 89.3 per cent, 76.5 per cent and 75.7 per cent respectively. The development expenditure of Kshs.24.73 billion represented an absorption rate of 13.2 per cent of the annual

xix
COUNTY GOVERNMENTS BUDGET IMPLEMENTATION REVIEW REPORT FOR THE FIRST HALF OF FY2018/19
development budget, and was an increase from 8 per cent, reported in a similar period of FY 2017/18, when development expenditure was Kshs.11.36 billion. Two Counties, namely; Isiolo and Wajir did not report any expenditure on development activities.
During the reporting period, the Office identified the key challenges that affected budget execution by County Governments. These incuded; high expenditure on personnel emoluments, delay in submissions of financial reports to the Office of the Controller of Budget by County Treasuries contrary to Section 166 and 168 of the PFM Act, 2012, under-performance in own source revenue collection compared to annual target, and delay by the National Treasury to disburse the equitable share of revenue raised nationally.
The Office recommends that County Governments should establish an optimal staffing level to ensure that personnel expenditure is within 35 per cent of the County’s total revenue as provided in Regulation 25 (1) of the Public Finance Management (County Governments) Regulations, 2015. Further, County Treasuries should develop and implement strategies to enhance own source revenue collection, and ensure compliance with PFM Act, 2012 on submission of financial and non-financial reports to the OCOB. Finally, the National Treasury should disburse the equitable share of revenue raised nationally in a timely manner in order to enhance budget execution by the Counties.

xx
COUNTY GOVERNMENTS BUDGET IMPLEMENTATION REVIEW REPORT FOR THE FIRST HALF OF FY2018/19
KEY HIGHLIGHTS
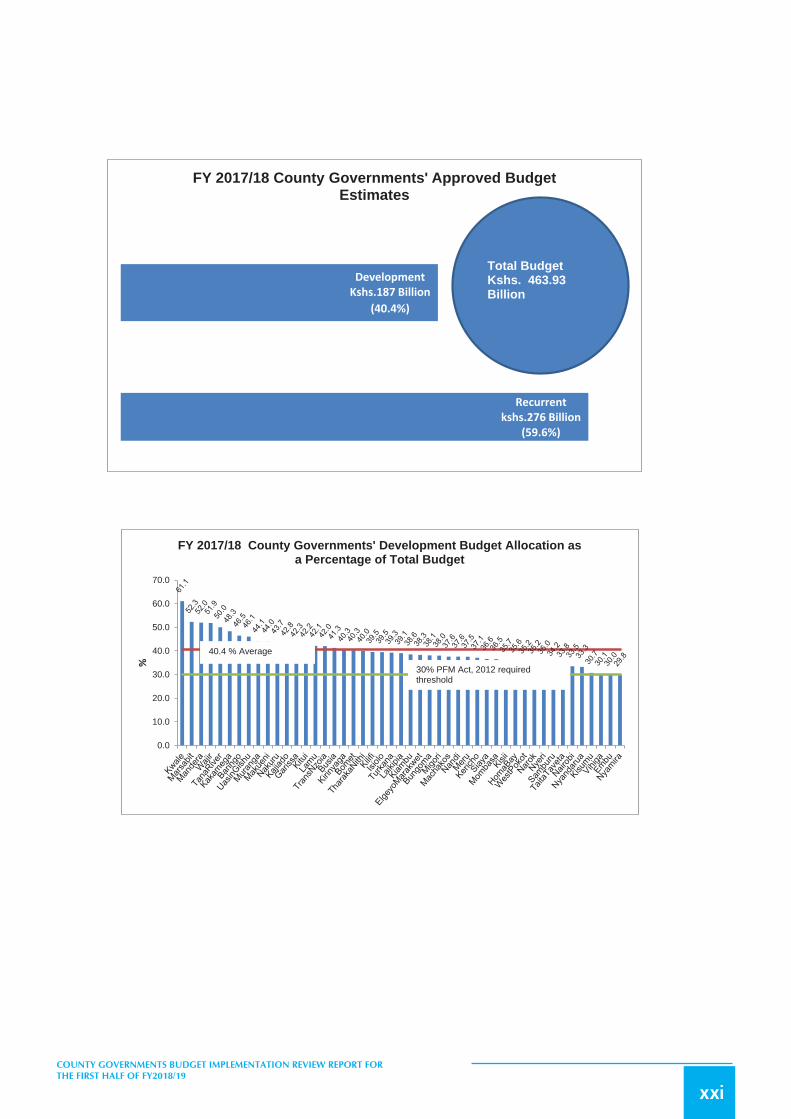
xxi
COUNTY GOVERNMENTS BUDGET IMPLEMENTATION REVIEW REPORT FOR THE FIRST HALF OF FY2018/19
Recurrentkshs.276 Billion
(59.6%)
DevelopmentKshs.187 Billion
(40.4%)
FY 2017/18 County Governments' Approved Budget Estimates
Total BudgetKshs. 463.93 Billion
0.0
10.0
20.0
30.0
40.0
50.0
60.0
70.0
%
FY 2017/18 County Governments' Development Budget Allocation as a Percentage of Total Budget
30% PFM Act, 2012 required threshold
40.4 % Average

xxii
COUNTY GOVERNMENTS BUDGET IMPLEMENTATION REVIEW REPORT FOR THE FIRST HALF OF FY2018/19
Exchequer Issues in the First Half of FY 2018/19
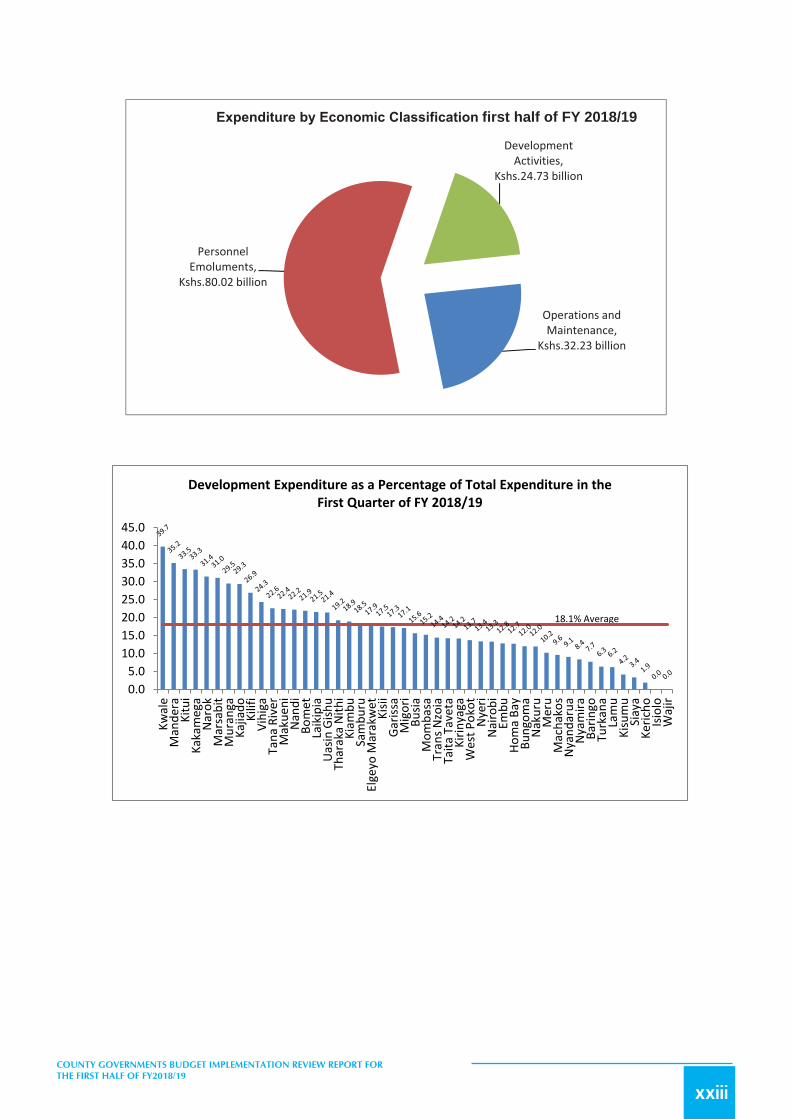
xxiii
COUNTY GOVERNMENTS BUDGET IMPLEMENTATION REVIEW REPORT FOR THE FIRST HALF OF FY2018/19
first half of FY 2018/19
0.05.0
10.015.020.025.030.035.040.045.0
Kwal
eM
ande
raKi
tui
Kaka
meg
aN
arok
Mar
sabi
tM
uran
gaKa
jiado
Kilif
iVi
higa
Tana
Riv
erM
akue
niN
andi
Bom
etLa
ikip
iaU
asin
Gish
uTh
arak
a N
ithi
Kiam
buSa
mbu
ruEl
geyo
Mar
akw
etKi
siiGa
rissa
Mig
ori
Busia
Mom
basa
Tran
s Nzo
iaTa
ita T
avet
aKi
rinya
gaW
est P
okot
Nye
riN
airo
biEm
buHo
ma
Bay
Bung
oma
Nak
uru
Mer
uM
acha
kos
Nya
ndar
uaN
yam
iraBa
ringo
Turk
ana
Lam
uKi
sum
uSi
aya
Keric
hoIs
iolo
Waj
ir
Development Expenditure as a Percentage of Total Expenditure in the First Quarter of FY 2018/19
18.1% Average

1
COUNTY GOVERNMENTS BUDGET IMPLEMENTATION REVIEW REPORT FOR THE FIRST HALF OF FY2018/19
1 INTRODUCTION
Article 228 (4) and (6) of the Constitution of Kenya, 2010 and Section 9 of the Controller of Budget Act, 2016 mandate the Office of the Controller of Budget (OCOB) to oversee and report implementation of the budgets of both the National and County Governments. Specifically, the Controller of Budget is required to authorize withdrawals from public funds and also report on budget implementation to each House of Parliament every four months. This report has been prepared in fulfilment of this requirement and presents the progress made on budget implementation by the 47 County governments in the first half of the Financial Year (FY) 2018/19.
The report provides information on budget implementation by the 47 Counties and covers the period from July to December, 2018. It contains analyses on County budgets, own-source revenue generated, fiscal transfers from the National Government and expenditure, and is based on reports on financial and non-financial performance from the County Governments, which were submitted in line with Section 166 and 168 of the Public Finance Management (PFM) Act, 2012; the County Allocation of Revenue Act (CARA), 2018, data obtained from the Integrated Financial Management Information System (IFMIS), and information obtained by the Office in the course of overseeing budget implementation.
The structure of this report proceeds as follows: Chapter one offers the introduction while Chapter two provides the overall analysis of revenue and expenditure performance, which is compared with annual targets. Expenditure is categorised into recurrent and development expenditure. Recurrent expenditure is further disaggregated into Personnel Emoluments (PE) and Operations and Maintenance (O&M), and absorption rate, which is computed as percentage of expenditure against the approved annual budget estimates is used to measure performance.
Chapter three presents the County-specific performance. It covers information on budget allocation, revenue, exchequer issues received and expenditure incurred in the first half of FY 2018/19. It also highlights the progress made in implementing recommendations made in prior reports issued by the OCOB and identifies the issues that continued to negatively affect budget execution in the reporting period.
The cross-cutting challenges that affected budget implementation by County Governments are presented in chapter four, which also contains recommendations aimed at addressing the challenges so as to enhance smooth execution of budgets. Lastly, chapter five provides the conclusion.

2
COUNTY GOVERNMENTS BUDGET IMPLEMENTATION REVIEW REPORT FOR THE FIRST HALF OF FY2018/19
2 FINANCIAL ANALYSIS OF OVERALL BUDGET PERFORMANE IN THE FIRST HALF OF FY 2018/19
2.1 IntroductionThis chapter presents analysis of the aggregate budget performance by the counties in the first half of FY 2018/19.
2.2 Revenue AnalysisIn FY 2018/19, the combined County governments’ budgets approved by the County Assemblies amounted to Kshs.463.93 billion and comprised of Kshs.276.44 billion (59.6 per cent) allocated to recurrent expenditure and Kshs.187.49 billion (40.4 per cent) for development expenditure.
In order to finance the budgets, county governments expect to receive Kshs.314 billion as equitable share of revenue raised nationally, Kshs.25.5 billion as total conditional grants from the National Government, Kshs.36.98 billion as conditional grants from Development Partners, generate Kshs.51.32 billion from own sources of revenue, and Kshs.46.12 billion cash balance from FY 2017/18. Conditional grants from the National Government comprise of Kshs.9.4 billion for Leasing of Medical Equipment, Kshs.4.33 billion for Level 5 Hospitals, Kshs.8.27 billion from the Road Maintenance Fuel Levy Fund, Kshs.900 million for compensation of User Fee Foregone, Kshs.2 billion for Rehabilitation of Village Polytechnics, Kshs.605 million for Construction of County Headquarters in Isiolo, Lamu, Nyandarua, Tana River and Tharaka Nithi Counties.
The Conditional grants from Development Partners comprise of Kshs.3.64 billion for Transforming Health Systems for the Universal Car Project from the World Bank, Kshs.2.95 billion credit from the International Development Association (World Bank) for the National Agricultural and Rural Inclusive Growth Project (NARIGP), Kshs.3.04 billion from IDA for the Kenya Climate Smart Agriculture Project (KCSAP), and Kshs.2.3 billion credit from IDA for Kenya Devolution Support Project (KDSP) “Level 1 grant”. Other grants are; Kshs.11.46 billion credit from IDA for Kenya Urban Support Project (KUSP), Kshs.1.01 billion grant from DANIDA for the Universal Healthcare in Devolved System Program, Kshs.1.04 billion grant from the EU for the Instruments for Devolution Advice and Support (IDEAS) program, Kshs.3.8 billion credit from IDA for the Water & Sanitation Development Project (WSDP), Kshs.4 billion credit from IDA for Kenya Devolution Support Project (KDSP) “Level 2 grant”, Kshs.1 billion for the Sweden-Agricultural Sector Development Support Programme (ASDSP), Kshs.880 million for the EU-Water Tower Protection and Climate Change Mitigation and Adaption Programme (WaTER), and Kshs.1.84 billion credit from IDA for the Kenya Urban Support Project (KUSP) - Urban Institutional Grants (UIG).
2.3 Revenue Out-turnThe total funds available to the County Governments in the first six months of FY 2018/19 amounted to Kshs.224.65 billion. This amount comprised of Kshs.115.14 billion as equitable share of revenue, Kshs.613.57 million for Transforming Health Systems for Universal Car Project (World Bank), Kshs.11.46 billion credit from IDA (World Bank) for the Kenya Urban Support Project (KUSP), Kshs.15.37 billion as revenue raised from own revenue sources, and Kshs.46.12 billion cash balance from FY 2017/18.
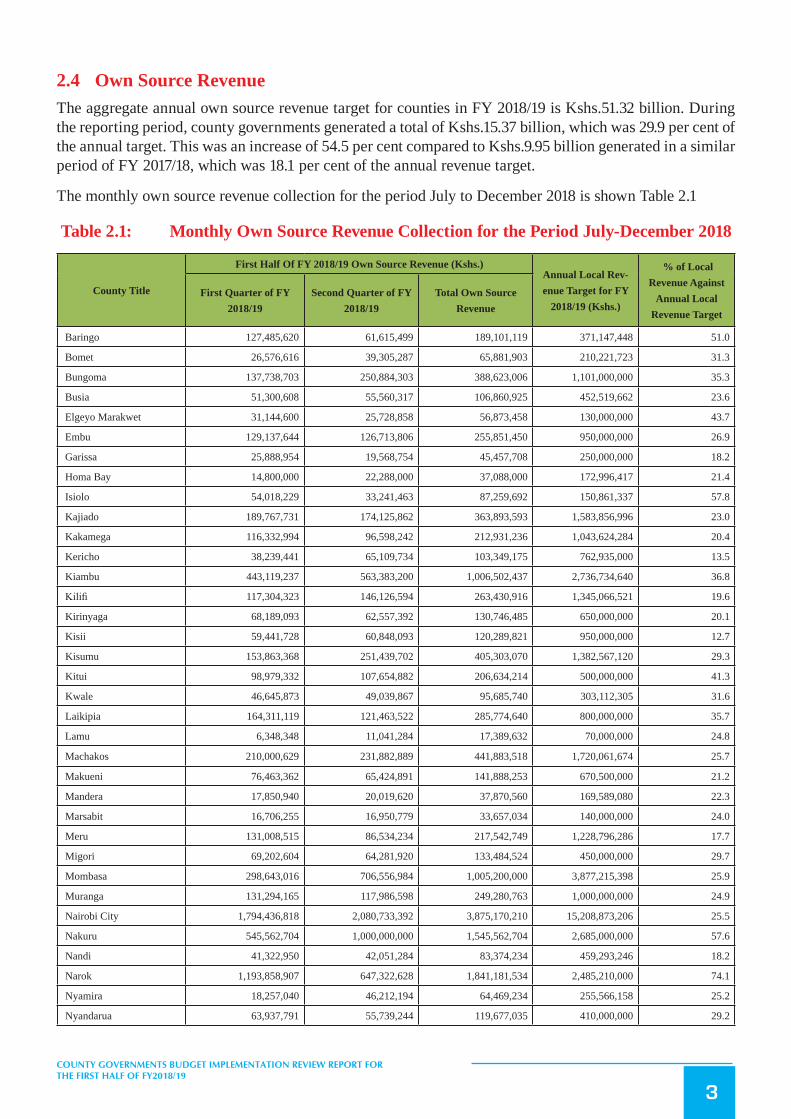
3
COUNTY GOVERNMENTS BUDGET IMPLEMENTATION REVIEW REPORT FOR THE FIRST HALF OF FY2018/19
2.4 Own Source RevenueThe aggregate annual own source revenue target for counties in FY 2018/19 is Kshs.51.32 billion. During the reporting period, county governments generated a total of Kshs.15.37 billion, which was 29.9 per cent of the annual target. This was an increase of 54.5 per cent compared to Kshs.9.95 billion generated in a similar period of FY 2017/18, which was 18.1 per cent of the annual revenue target.
The monthly own source revenue collection for the period July to December 2018 is shown Table 2.1
Table 2.1: Monthly Own Source Revenue Collection for the Period July-December 2018
County Title
First Half Of FY 2018/19 Own Source Revenue (Kshs.)Annual Local Rev-enue Target for FY
2018/19 (Kshs.)
% of Local Revenue Against
Annual Local Revenue Target
First Quarter of FY 2018/19
Second Quarter of FY 2018/19
Total Own Source Revenue
Baringo 127,485,620 61,615,499 189,101,119 371,147,448 51.0
Bomet 26,576,616 39,305,287 65,881,903 210,221,723 31.3
Bungoma 137,738,703 250,884,303 388,623,006 1,101,000,000 35.3
Busia 51,300,608 55,560,317 106,860,925 452,519,662 23.6
Elgeyo Marakwet 31,144,600 25,728,858 56,873,458 130,000,000 43.7
Embu 129,137,644 126,713,806 255,851,450 950,000,000 26.9
Garissa 25,888,954 19,568,754 45,457,708 250,000,000 18.2
Homa Bay 14,800,000 22,288,000 37,088,000 172,996,417 21.4
Isiolo 54,018,229 33,241,463 87,259,692 150,861,337 57.8
Kajiado 189,767,731 174,125,862 363,893,593 1,583,856,996 23.0
Kakamega 116,332,994 96,598,242 212,931,236 1,043,624,284 20.4
Kericho 38,239,441 65,109,734 103,349,175 762,935,000 13.5
Kiambu 443,119,237 563,383,200 1,006,502,437 2,736,734,640 36.8
Kilifi 117,304,323 146,126,594 263,430,916 1,345,066,521 19.6
Kirinyaga 68,189,093 62,557,392 130,746,485 650,000,000 20.1
Kisii 59,441,728 60,848,093 120,289,821 950,000,000 12.7
Kisumu 153,863,368 251,439,702 405,303,070 1,382,567,120 29.3
Kitui 98,979,332 107,654,882 206,634,214 500,000,000 41.3
Kwale 46,645,873 49,039,867 95,685,740 303,112,305 31.6
Laikipia 164,311,119 121,463,522 285,774,640 800,000,000 35.7
Lamu 6,348,348 11,041,284 17,389,632 70,000,000 24.8
Machakos 210,000,629 231,882,889 441,883,518 1,720,061,674 25.7
Makueni 76,463,362 65,424,891 141,888,253 670,500,000 21.2
Mandera 17,850,940 20,019,620 37,870,560 169,589,080 22.3
Marsabit 16,706,255 16,950,779 33,657,034 140,000,000 24.0
Meru 131,008,515 86,534,234 217,542,749 1,228,796,286 17.7
Migori 69,202,604 64,281,920 133,484,524 450,000,000 29.7
Mombasa 298,643,016 706,556,984 1,005,200,000 3,877,215,398 25.9
Muranga 131,294,165 117,986,598 249,280,763 1,000,000,000 24.9
Nairobi City 1,794,436,818 2,080,733,392 3,875,170,210 15,208,873,206 25.5
Nakuru 545,562,704 1,000,000,000 1,545,562,704 2,685,000,000 57.6
Nandi 41,322,950 42,051,284 83,374,234 459,293,246 18.2
Narok 1,193,858,907 647,322,628 1,841,181,534 2,485,210,000 74.1
Nyamira 18,257,040 46,212,194 64,469,234 255,566,158 25.2
Nyandarua 63,937,791 55,739,244 119,677,035 410,000,000 29.2

4
COUNTY GOVERNMENTS BUDGET IMPLEMENTATION REVIEW REPORT FOR THE FIRST HALF OF FY2018/19
County Title
First Half Of FY 2018/19 Own Source Revenue (Kshs.)Annual Local Rev-enue Target for FY
2018/19 (Kshs.)
% of Local Revenue Against
Annual Local Revenue Target
First Quarter of FY 2018/19
Second Quarter of FY 2018/19
Total Own Source Revenue
Nyeri 170,264,077 160,757,830 331,021,907 1,000,000,000 33.1
Samburu 87,248,352 87,248,352 174,496,703 254,031,228 68.7
Siaya 27,628,284 36,330,000 63,958,284 275,000,000 23.3
Taita Taveta 66,827,522 57,419,785 124,247,307 300,000,000 41.4
Tana River 9,522,294 11,256,280 20,778,574 60,000,000 34.6
Tharaka Nithi 44,347,211 39,964,044 84,311,255 300,000,000 28.1
Trans Nzoia 36,234,629 41,221,772 77,456,401 500,000,000 15.5
Turkana 36,361,611 33,559,561 69,921,172 250,000,000 28.0
Uasin Gishu 157,220,822 125,609,483 282,830,305 1,200,000,000 23.6
Vihiga 30,251,751 32,633,794 62,885,545 153,592,702 40.9
Wajir 12,693,040 13,517,043 26,210,083 200,000,000 13.1
West Pokot 27,044,075 20,955,925 48,000,000 152,370,189 31.5
Total 7,414,822,924 8,186,465,184 15,369,404,590 51,321,742,620 29.9
Source: County Treasuries
During the period under review, the Nairobi City County generated the highest amount of own source revenue at Kshs.3.88 billion, followed by Narok and Nakuru at Kshs.1.84 billion and Kshs.1.55 billion respectively. The Counties that generated the lowest amount were Wajir, Tana River and Lamu at Kshs.26.21 million, Kshs.20.78 million, and Kshs.17.39 million respectively.
Analysis of own source revenue as a proportion of the annual revenue target indicates that, Narok, Samburu, and Isiolo Counties recorded the highest proportions at 74.1 per cent, 68.7 per cent and 57.8 per cent respectively. Conversely, Kisii at 12.7 per cent, Wajir at 13.1 per cent and Kericho at 13.5 recorded the lowest proportion of own source revenue against annual target.
2.5 Funds Released to the Counties
2.6 Funds released to Counties from the Consolidated FundIn the first half of FY 2018/19, the Controller of Budget (COB) approved transfer of Kshs.115.14 billion from the Consolidated Fund to the various County Revenue Funds (CRFs) as equitable share of revenue and grants for Level 5 Hospitals, in accordance with Article 206 (4) of the Constitution.
During the same period, Counties received Kshs.613.57 million as World Bank loan for Transforming Health Systems for the Universal Care Project and Kshs.11.46 billion as World Bank grant for Kenya Urban Support Project (KUSP). Fund disbursement was made directly to the individual County Revenue Fund Accounts.
2.7 Funds Released to County Operational AccountsDuring the reporting period, the COB authorised withdrawal of Kshs.145.11 billion from the County Revenue Funds to the County Governments’ County Operational Accounts. The transfers comprised of Kshs.117.13 billion (80.7 per cent) for recurrent expenditure and Kshs.27.97 billion (19.3 per cent) for development expenditure and represented an increase by 32.5 per cent from Kshs.109.45 billion released in a similar period of FY 2017/18.
From the Kshs.117.13 billion released for recurrent activities, Kshs.22.42 billion was for the County Assemblies while Kshs.94.72 billion went to the County Executives. The development exchequer comprised of Kshs.4.26 billion for the County Assemblies and Kshs.23.71 billion for the County Executives.

5
COUNTY GOVERNMENTS BUDGET IMPLEMENTATION REVIEW REPORT FOR THE FIRST HALF OF FY2018/19
The exchequer issues to the County Assembly and the County Executive in the first six months of FY 2018/19 are shown in Table 2.2
Table 2.2: The Exchequer Issues to the County Assembly and the County Executive for the First Half of FY 2018/19 (Kshs. Million)
County
COUNTY ASSEMBLY (KSHS. MILLION)
COUNTY EXECUTIVE (KSHS. MILLION)
COMBINED EXCHEQUER ISSUES (KSHS. MILLION)
Rec Dev Total Rec Dev Total Rec Dev Total
A B C=A+B D E F=D+E G=A+D H=B+E I=G+H
Baringo 278.10 - 278.10 1,777.41 184.38 1,961.79 2,055.51 184.38 2,239.89
Bomet 302.00 - 302.00 2,089.39 600.78 2,690.16 2,391.39 600.78 2,992.16
Bungoma 458.87 56.33 515.20 2,921.14 372.72 3,293.86 3,380.02 429.05 3,809.06
Busia 320.00 - 320.00 1,715.18 674.62 2,389.80 2,035.18 674.62 2,709.80
Elgeyo/Marak-wet
302.64 - 302.64 1,192.72 387.51 1,580.22 1,495.35 387.51 1,882.86
Embu 191.55 - 191.55 1,578.78 271.46 1,850.24 1,770.33 271.46 2,041.79
Garissa 330.40 - 330.40 2,663.69 - 2,663.69 2,994.09 - 2,994.09
Homa Bay 303.00 - 303.00 1,887.34 305.00 2,192.34 2,190.34 305.00 2,495.34
Isiolo 195.00 - 195.00 1,106.52 77.19 1,183.71 1,301.52 77.19 1,378.71
Kajiado 277.60 40.44 318.04 2,016.18 474.40 2,490.57 2,293.78 514.84 2,808.62
Kakamega 405.72 - 405.72 2,519.79 2,099.95 4,619.74 2,925.51 2,099.95 5,025.46
Kericho 364.02 - 364.02 1,674.23 81.78 1,756.01 2,038.24 81.78 2,120.02
Kiambu 413.37 - 413.37 4,992.36 797.39 5,789.75 5,405.73 797.39 6,203.12
Kilifi 263.66 385.00 648.66 2,541.16 27.40 2,568.56 2,804.82 412.40 3,217.22
Kirinyaga 320.03 27.60 347.63 1,602.53 287.59 1,890.13 1,922.57 315.19 2,237.76
Kisii 428.18 10.09 438.27 3,077.89 819.83 3,897.71 3,506.07 829.91 4,335.98
Kisumu 291.00 - 291.00 3,026.28 132.62 3,158.91 3,317.28 132.62 3,449.91
Kitui 283.91 - 283.91 2,546.48 1,258.55 3,805.03 2,830.39 1,258.55 4,088.94
Kwale 311.58 17.41 328.99 2,374.28 1,145.45 3,519.73 2,685.85 1,162.86 3,848.71
Laikipia 220.90 - 220.90 1,779.80 598.24 2,378.04 2,000.70 598.24 2,598.94
Lamu 164.02 - 164.02 727.70 159.58 887.28 891.72 159.58 1,051.30
Machakos 1,949.39 - 1,949.39 137.36 - 137.36 2,086.75 - 2,086.75
Makueni 320.23 5.83 326.06 1,910.70 641.78 2,552.48 2,230.93 647.61 2,878.54
Mandera 375.90 - 375.90 2,408.53 1,658.65 4,067.18 2,784.43 1,658.65 4,443.08
Marsabit 215.00 - 215.00 1,856.71 1,138.49 2,995.20 2,071.71 1,138.49 3,210.20
Meru 473.92 4.51 478.42 3,409.33 208.20 3,617.54 3,883.25 212.71 4,095.96
Migori 290.00 - 290.00 1,812.92 1,207.95 3,020.87 2,102.92 1,207.95 3,310.87
Mombasa 222.95 - 222.95 3,582.23 794.87 4,377.11 3,805.19 794.87 4,600.06
Murang’a 255.00 12.00 267.00 2,151.05 1,233.60 3,384.64 2,406.05 1,245.60 3,651.64
Nairobi City 305.90 - 305.90 5,402.81 437.10 5,839.91 5,708.71 437.10 6,145.81
Nakuru 3,628.01 1,640.82 5,268.83 412.70 5.10 417.80 4,040.71 1,645.92 5,686.63
Nandi 321.13 2.00 323.13 2,067.59 814.22 2,881.81 2,388.72 816.22 3,204.94
Narok 3,639.31 1,509.00 5,148.31 385.00 10.00 395.00 4,024.31 1,519.00 5,543.31
Nyamira 261.52 3.08 264.60 1,769.56 216.97 1,986.53 2,031.08 220.05 2,251.13
Nyandarua 300.25 20.02 320.27 1,529.60 356.13 1,885.74 1,829.86 376.15 2,206.01
Nyeri 268.10 1.72 269.82 2,003.25 284.08 2,287.33 2,271.35 285.80 2,557.15
Samburu 166.81 - 166.81 1,093.64 194.00 1,287.64 1,260.46 194.00 1,454.46
Siaya 332.20 - 332.20 1,804.97 253.50 2,058.47 2,137.17 253.50 2,390.67
Taita/Taveta 220.88 - 220.88 1,323.37 216.77 1,540.14 1,544.25 216.77 1,761.02

6
COUNTY GOVERNMENTS BUDGET IMPLEMENTATION REVIEW REPORT FOR THE FIRST HALF OF FY2018/19
County
COUNTY ASSEMBLY (KSHS. MILLION)
COUNTY EXECUTIVE (KSHS. MILLION)
COMBINED EXCHEQUER ISSUES (KSHS. MILLION)
Rec Dev Total Rec Dev Total Rec Dev Total
A B C=A+B D E F=D+E G=A+D H=B+E I=G+H
Tana River 249.00 525.93 774.93 1,275.11 19.00 1,294.11 1,524.11 544.93 2,069.05
Tharaka –Nithi 157.71 - 157.71 1,366.83 333.71 1,700.54 1,524.54 333.71 1,858.25
Trans Nzoia 307.04 - 307.04 2,031.45 871.16 2,902.61 2,338.49 871.16 3,209.65
Turkana 562.00 - 562.00 1,960.18 840.08 2,800.25 2,522.18 840.08 3,362.25
Uasin Gishu 328.36 - 328.36 1,972.59 685.90 2,658.49 2,300.95 685.90 2,986.85
Vihiga 299.48 - 299.48 2,027.48 267.33 2,294.81 2,326.95 267.33 2,594.29
Wajir 326.33 - 326.33 1,864.17 - 1,864.17 2,190.50 - 2,190.50
West Pokot 216.00 - 216.00 1,350.31 266.09 1,616.40 1,566.31 266.09 1,832.40
Total 22,417.96 4,261.77 26,679.73 94,720.29 23,711.11 118,431.40 117,138.25 27,972.88 145,111.13
Source: County Treasuries and OCOB
Kiambu County received the highest amount from its CRF account to the operational accounts at Kshs.6.20 billion followed by Nairobi City County and Nakuru County at Kshs.6.15 billion and Kshs.5.69 billion respectively. Counties that received the lowest releases were; Samburu at Kshs.1.45 billion, Isiolo at 1.38 billion and Lamu at Kshs.1.05 billion.
2.8 Expenditure AnalysisThe total expenditure by County governments was Kshs.136.98 billion representing an absorption rate of 29.5 per cent of the total annual County Governments Budgets. This was an increase from an absorption rate of 25.9 per cent attained in a similar period of FY 2017/18 where total expenditure was Kshs.104.36 billion.
Recurrent expenditure was Kshs.112.25 billion, representing 40.6 per cent of the annual recurrent budget and an increase from 36 per cent reported in a similar period of FY 2017/18. Development expenditure amounted to Kshs.24.73 billion, representing an absorption rate of 13.2 per cent and an increase from 8 per cent attained in the first half of FY 2017/18 where total development expenditure was Kshs.11.36 billion. The analysis of expenditure by economic classification in the first half of FY 2018/19 is provided in Table 2.3.
Table2.3: ExpenditurebyEconomicClassificationintheFirstQuarterofFY2018/19
County Title Personnel Emoluments
(Kshs.) Operations &
Maintenance (Kshs.) Development Expenditure
(Kshs.) Total Expenditure (Kshs.)
A B C D=A+B+C
Baringo 1,603,707,148 332,186,864 161,381,684 2,097,275,696
Bomet 1,422,218,027 510,112,208 541,326,521 2,473,656,756
Bungoma 2,719,736,878 1,049,612,788 514,312,620 4,283,662,287
Busia 1,410,909,101 611,737,957 374,969,456 2,397,616,514
Elgeyo/Marakwet 1,185,770,315 294,564,254 322,135,204 1,802,469,773
Embu 956,969,548 322,550,560 187,937,692 1,467,457,800
Garissa 2,163,670,620 431,249,485 544,027,945 3,138,948,050
Homa Bay 1,464,071,869 613,289,843 302,745,337 2,380,107,049
Isiolo 623,825,176 322,563,452 - 946,388,627
Kajiado 774,565,557 763,979,133 638,143,166 2,176,687,856
Kakamega 2,565,476,671 613,769,586 1,589,433,788 4,768,680,045
Kericho 1,357,675,576 641,237,241 38,941,569 2,037,854,386
Kiambu 3,222,337,466 1,025,435,298 990,517,376 5,238,290,140
Kilifi 959,714,896 913,387,625 689,119,567 2,562,222,088

7
COUNTY GOVERNMENTS BUDGET IMPLEMENTATION REVIEW REPORT FOR THE FIRST HALF OF FY2018/19
County Title Personnel Emoluments
(Kshs.) Operations &
Maintenance (Kshs.) Development Expenditure
(Kshs.) Total Expenditure (Kshs.)
A B C D=A+B+C
Kirinyaga 1,137,640,334 541,321,761 277,403,856 1,956,365,951
Kisii 2,518,540,567 909,734,638 728,402,207 4,156,677,412
Kisumu 1,897,580,270 561,960,911 107,340,542 2,566,881,723
Kitui 2,002,834,979 844,309,245 1,431,972,705 4,279,116,929
Kwale 878,266,747 516,898,989 920,196,643 2,315,362,379
Laikipia 1,480,013,364 335,918,159 498,157,983 2,314,089,506
Lamu 579,106,924 263,150,722 55,775,000 898,032,646
Machakos 2,524,283,049 706,171,550 344,566,254 3,575,020,853
Makueni 1,714,689,589 945,651,072 766,916,102 3,427,256,763
Mandera 1,489,157,471 1,391,277,067 1,564,230,462 4,444,665,000
Marsabit 1,231,037,260 424,089,055 745,183,659 2,400,309,975
Meru 2,599,166,944 1,016,686,653 411,646,476 4,027,500,073
Migori 1,353,970,409 741,794,509 432,186,367 2,527,951,285
Mombasa 2,374,390,000 1,572,720,000 708,370,000 4,655,480,000
Murang’a 1,675,720,883 414,555,094 873,998,404 2,964,274,381
Nairobi City 7,014,105,074 2,247,978,915 1,420,017,048 10,682,101,037
Nakuru 3,030,450,140 1,027,931,239 550,850,751 4,609,232,130
Nandi 1,645,752,316 784,633,299 694,233,716 3,124,619,331
Narok 2,182,067,312 1,086,990,393 1,497,995,005 4,767,052,710
Nyamira 1,725,202,798 362,621,137 190,492,534 2,278,316,469
Nyandarua 1,012,556,942 501,462,869 150,899,469 1,664,919,281
Nyeri 1,721,964,686 451,554,798 335,837,477 2,509,356,961
Samburu 912,215,966 218,865,286 256,351,961 1,387,433,213
Siaya 1,350,664,287 607,431,106 67,884,023 2,025,979,417
Taita/Taveta 1,147,881,953 651,258,546 298,778,344 2,097,918,843
Tana River 750,128,595 578,934,116 388,164,543 1,717,227,254
Tharaka -Nithi 1,054,961,116 313,836,009 326,040,848 1,694,837,973
Trans Nzoia 1,287,618,746 670,685,393 330,007,650 2,288,311,789
Turkana 2,017,339,693 1,386,770,307 230,490,000 3,634,600,000
Uasin Gishu 1,488,160,082 696,195,701 594,546,749 2,778,902,532
Vihiga 925,905,555 416,914,537 431,518,565 1,774,338,657
Wajir 1,956,610,944 233,888,219 - 2,190,499,163
West Pokot 913,379,524 358,602,018 202,400,030 1,474,381,572
Total 80,024,013,367 32,228,469,608 24,727,847,299 136,980,330,273
Source: County Treasuries and OCOBs
The Counties that attained the highest total expenditure were; Nairobi City at Kshs.10.68 billion, Kiambu at Kshs.5.24 billion and Narok at Kshs.4.77 billion. The lowest expenditure was recorded by Samburu, Isiolo and Lamu at Kshs.1.28 billion, Kshs.946.39 million and Kshs.898.03 million respectively.
Review of cumulative expenditure by economic classification showed that Kshs.80.02 billion (58.4 per cent) was incurred on personnel emoluments, Kshs.32.23 billion (23.5 per cent) on operations and maintenance and Kshs.24.73 billion (18.1 per cent) on development activities.
2.9 Development ExpenditureCounty governments incurred Kshs.24.73 billion on development activities, representing an absorption rate of 13.2 per cent of the annual development budget, which is an increase from 8 per cent, reported in a similar period of FY 2017/18, when development expenditure was Kshs.11.36 billion.

8
COUNTY GOVERNMENTS BUDGET IMPLEMENTATION REVIEW REPORT FOR THE FIRST HALF OF FY2018/19
Analysis of county budgets and expenditure in the first half of FY 2018/19 is provided in Table 2.4.
Table 2.4: County Budget Allocation, Expenditure and Absorption Rate in the First Half of FY 2018/19
CountyBudget Estimates (Kshs. Million) Expenditure (Kshs. Million) Recurrent
Absorption Rate (%)
Development Absorption Rate (%)
Overall Absorption
RateRec Dev Total Rec Dev Total
A B C=A+B D E F=D+E G=D/A*100 H=E/B*100 I=F/C*100
Baringo 4,296.12 3,733.25 8,029.37 1,935.89 161.38 2,097.28 45.1 4.3 26.1
Bomet 4,399.93 2,969.87 7,369.80 1,932.33 541.33 2,473.66 43.9 18.2 33.6
Bungoma 8,052.68 4,956.84 13,009.52 3,769.35 514.31 4,283.66 46.8 10.4 32.9
Busia 5,106.71 3,596.93 8,703.64 2,022.65 374.97 2,397.62 39.6 10.4 27.5
Elgeyo/Marakwet
3,096.02 1,924.00 5,020.01 1,480.33 322.14 1,802.47 47.8 16.7 35.9
Embu 4,507.47 1,933.08 6,440.55 1,279.52 187.94 1,467.46 28.4 9.7 22.8
Garissa 5,760.03 4,219.86 9,979.89 2,594.92 544.03 3,138.95 45.1 12.9 31.5
Homa Bay 4,976.89 2,755.20 7,732.09 2,077.36 302.75 2,380.11 41.7 11.0 30.8
Isiolo 3,146.60 2,053.91 5,200.51 946.39 - 946.39 30.1 - 18.2
Kajiado 5,444.39 4,069.65 9,514.04 1,538.54 638.14 2,176.69 28.3 15.7 22.9
Kakamega 7,499.28 7,008.47 14,507.75 3,179.25 1,589.43 4,768.68 42.4 22.7 32.9
Kericho 4,518.23 2,665.89 7,184.12 1,998.91 38.94 2,037.85 44.2 1.5 28.4
Kiambu 9,595.65 6,027.43 15,623.08 4,247.77 990.52 5,238.29 44.3 16.4 33.5
Kilifi 8,719.58 5,700.40 14,419.98 1,873.10 689.12 2,562.22 21.5 12.1 17.8
Kirinyaga 3,671.39 2,481.53 6,152.92 1,678.96 277.40 1,956.37 45.7 11.2 31.8
Kisii 7,708.07 4,288.73 11,996.80 3,428.28 728.40 4,156.68 44.5 17.0 34.6
Kisumu 6,384.89 2,833.00 9,217.89 2,459.54 107.34 2,566.88 38.5 3.8 27.8
Kitui 6,805.63 4,969.60 11,775.23 2,847.14 1,431.97 4,279.12 41.8 28.8 36.3
Kwale 4,764.23 7,468.68 12,232.92 1,395.17 920.20 2,315.36 29.3 12.3 18.9
Laikipia 4,052.92 2,599.70 6,652.62 1,815.93 498.16 2,314.09 44.8 19.2 34.8
Lamu 2,604.90 1,897.47 4,502.38 842.26 55.78 898.03 32.3 2.9 19.9
Machakos 7,630.30 4,600.80 12,231.11 3,230.45 344.57 3,575.02 42.3 7.5 29.2
Makueni 5,895.51 4,630.21 10,525.72 2,660.34 766.92 3,427.26 45.1 16.6 32.6
Mandera 6,423.74 6,955.00 13,378.75 2,880.43 1,564.23 4,444.67 44.8 22.5 33.2
Marsabit 4,127.00 4,526.51 8,653.51 1,655.13 745.18 2,400.31 40.1 16.5 27.7
Meru 7,807.57 4,692.02 12,499.60 3,615.85 411.65 4,027.50 46.3 8.8 32.2
Migori 5,294.41 3,245.60 8,540.01 2,095.76 432.19 2,527.95 39.6 13.3 29.6
Mombasa 8,626.12 4,965.65 13,591.77 3,947.11 708.37 4,655.48 45.8 14.3 34.3
Murang’a 4,927.54 3,883.24 8,810.78 2,090.28 874.00 2,964.27 42.4 22.5 33.6
Nairobi City
21,473.79 10,836.45 32,310.24 9,262.08 1,420.02 10,682.10 43.1 13.1 33.1
Nakuru 10,319.90 7,995.85 18,315.75 4,058.38 550.85 4,609.23 39.3 6.9 25.2
Nandi 5,106.58 3,077.66 8,184.24 2,430.39 694.23 3,124.62 47.6 22.6 38.2
Narok 6,264.42 3,400.48 9,664.90 3,269.06 1,498.00 4,767.05 52.2 44.1 49.3
Nyamira 4,578.54 1,947.89 6,526.43 2,087.82 190.49 2,278.32 45.6 9.8 34.9
Nyandarua 4,217.28 2,102.37 6,319.64 1,514.02 150.90 1,664.92 35.9 7.2 26.3
Nyeri 5,522.00 2,976.13 8,498.13 2,173.52 335.84 2,509.36 39.4 11.3 29.5
Samburu 3,856.21 2,004.91 5,861.12 1,131.08 256.35 1,387.43 29.3 12.8 23.7
Siaya 4,442.42 2,565.17 7,007.59 1,958.10 67.88 2,025.98 44.1 2.6 28.9
Taita/Taveta 3,870.33 1,975.30 5,845.63 1,799.14 298.78 2,097.92 46.5 15.1 35.9

9
COUNTY GOVERNMENTS BUDGET IMPLEMENTATION REVIEW REPORT FOR THE FIRST HALF OF FY2018/19
CountyBudget Estimates (Kshs. Million) Expenditure (Kshs. Million) Recurrent
Absorption Rate (%)
Development Absorption Rate (%)
Overall Absorption
RateRec Dev Total Rec Dev Total
A B C=A+B D E F=D+E G=D/A*100 H=E/B*100 I=F/C*100
Tana River 4,573.56 4,573.56 9,147.12 1,329.06 388.16 1,717.23 29.1 8.5 18.8
Tharaka -Nithi
3,430.29 2,290.71 5,721.00 1,368.80 326.04 1,694.84 39.9 14.2 29.6
Trans Nzoia 4,437.33 3,214.43 7,651.76 1,958.30 330.01 2,288.31 44.1 10.3 29.9
Turkana 8,218.31 5,317.15 13,535.46 3,404.11 230.49 3,634.60 41.4 4.3 26.9
Uasin Gishu 5,356.51 4,574.04 9,930.55 2,184.36 594.55 2,778.90 40.8 13.0 28.0
Vihiga 4,502.56 1,938.08 6,440.64 1,342.82 431.52 1,774.34 29.8 22.3 27.5
Wajir 6,342.70 6,832.99 13,175.69 2,190.50 - 2,190.50 34.5 - 16.6
West Pokot 4,081.98 2,217.24 6,299.22 1,271.98 202.40 1,474.38 31.2 9.1 23.4
Total 276,438.54 187,492.92 463,931.46 112,252.48 24,727.85 136,980.33 40.6 13.2 29.5
Source: OCOB and County Treasuries
Kakamega County recorded the highest expenditure on development activities at Kshs.1.59 billion, followed by Mandera County and Narok County at Kshs.1.56 billion and Kshs.1.49 billion respectively. Two counties, namely; Isiolo and Wajir did not report any expenditure on development activities. Further information on development projects undertaken by counties is provided in chapter three.
2.10 Recurrent ExpenditureThe Counties incurred an aggregate of Kshs.112.25 billion or 81.9 per cent of the total expenditure on recurrent activities. This expenditure represents 40.6 per cent of the annual county governments’ budget for recurrent activities and an increase from 36 per cent recorded in a similar period of FY 2017/18 when expenditure stood at Kshs.93 billion.
Analysis of the expenditure shows that, Nairobi City County attained the highest expenditure on recurrent activities at Kshs.9.26 billion, followed by Kiambu and Nakuru Counties at Kshs.4.25 billion and Kshs.4.06 billion respectively. The lowest recurrent expenditure was recorded by Samburu, Isiolo and Lamu Counties at Kshs.1.13 billion, Kshs.946.39 million and Kshs.842.26 million respectively.
2.11 Personnel EmolumentsDuring the first half of FY 2018/19, the County Governments incurred Kshs.80.02 billion on personnel emoluments, representing 71.3 per cent of the total recurrent expenditure and 58.4 per cent of total expenditure. This was an increase from Kshs.66.48 billion incurred in the first half of FY 2017/18 when personnel expenditure translated to 64.1 per cent of the total expenditure.
Nairobi City County reported the highest expenditure on personnel emoluments at Kshs.7.01 billion, followed by Kiambu and Nakuru Counties at Kshs.3.22 billion and Kshs.3.03 billion respectively. Analysis of personnel emoluments as a percentage of total expenditure shows that, Wajir, Baringo and Nyamira Counties recorded the highest percentage at 89.3 per cent, 76.5 per cent and 75.7 per cent respectively.
2.12 Operations and Maintenance ExpenditureDuring the reporting period, a total of Kshs.32.23 billion was incurred on operations and maintenance, which translated to 23.5 per cent of total expenditure. Counties that reported the highest expenditure on operations and maintenance in absolute terms were Nairobi City at Kshs.2.25 billion, Mombasa at Kshs.1.57 billion and Mandera at Kshs.1.39 billion. Analysis of the expenditure on operations and maintenance as a proportion of the total expenditure indicated that Turkana County attained the highest proportion at 38.2 per cent, followed by Kilifi and Kajiado Counties at 35.6 per cent and 35.1 per cent respectively.

10
COUNTY GOVERNMENTS BUDGET IMPLEMENTATION REVIEW REPORT FOR THE FIRST HALF OF FY2018/19
2.13 Review of MCAs Committee Sitting AllowancesCounty Assemblies incurred Kshs.1.08 billion on MCAs committee sitting allowances compared to the approved budget allocation of Kshs.2.78 billion. This expenditure translated to 38.9 per cent of the approved budget and an increase by 156.5 per cent compared to a similar period of FY 2017/18 when a total of Kshs.422.06 million was incurred.
Table 2.5 shows the County budgetary allocation and expenditure on MCAs committee sitting allowances in the first six months of FY 2018/19.
Table 2.5 : Budget Allocation, Expenditure and Absorption Rate of MCAs Committee Sitting Allowance in the First Half of FY 2018/19
MCA Committee Sitting Allowances
CountyBudgetary Allocation
(Kshs)Expenditure (Kshs) Absorption % No. of MCAs
Average monthly sitting allowance per MCA
(Kshs)
A B C=B/A*100 D E=B/D/6
Baringo 30,000,000 1,507,201 5.0 46 5,460.87
Bomet 20,732,000 10,900,120 52.6 37 49,099.64
Bungoma 113,691,719 35,847,957 31.5 61 97,945.24
Busia 113,529,600 35,032,422 30.9 54 108,124.76
Elgeyo/Marakwet 43,097,328 18,346,900 42.6 34 89,935.78
Embu 31,500,000 5,945,306 18.9 35 28,310.98
Garissa 121,213,200 32,871,802 27.1 49 111,808.85
Homa Bay 98,342,000 15,450,400 15.7 61 42,214.21
Isiolo 26,532,950 11,888,150 44.8 18 110,075.46
Kajiado 17,250,000 8,834,447 51.2 42 35,057.33
Kakamega 134,784,000 66,897,473 49.6 88 126,699.76
Kericho 81,535,200 21,979,583 27.0 48 76,318.00
Kiambu 100,000,000 46,072,000 46.1 93 82,566.31
Kilifi 96,844,800 31,049,100 32.1 56 92,408.04
Kirinyaga 80,000,000 15,762,047 19.7 34 77,264.94
Kisii 94,822,400 47,411,100 50.0 70 112,883.57
Kisumu 55,106,000 21,137,019 38.4 49 71,894.62
Kitui 65,936,000 23,965,258 36.3 55 72,621.99
Kwale 60,956,000 22,803,475 37.4 34 111,781.74
Laikipia 15,000,000 8,595,212 57.3 24 59,688.97
Lamu 18,000,000 6,752,800 37.5 19 59,235.09
Machakos 80,214,903 10,012,800 12.5 60 27,813.33
Makueni 67,992,093 26,437,200 38.9 49 89,922.45
Mandera 41,760,000 23,387,200 56.0 49 79,548.30
Marsabit 35,489,098 10,262,000 28.9 31 55,172.04
Meru 101,935,200 43,230,114 42.4 69 104,420.57
Migori - 32,058,000 - 57 93,736.84
Mombasa 43,705,600 22,710,200 52.0 43 88,024.03
Murang’a 66,955,200 25,953,059 38.8 50 86,510.20
Nairobi City 66,560,000 61,339,078 92.2 128 79,868.59
Nakuru 111,000,000 55,677,358 50.2 79 117,462.78
Nandi 38,103,996 16,476,800 43.2 40 68,653.33

11
COUNTY GOVERNMENTS BUDGET IMPLEMENTATION REVIEW REPORT FOR THE FIRST HALF OF FY2018/19
MCA Committee Sitting Allowances
CountyBudgetary Allocation
(Kshs)Expenditure (Kshs) Absorption % No. of MCAs
Average monthly sitting allowance per MCA
(Kshs)
A B C=B/A*100 D E=B/D/6
Narok 53,813,760 12,843,350 23.9 48 44,594.97
Nyamira 66,643,200 22,754,551 34.1 37 102,497.98
Nyandarua 57,219,200 20,817,948 36.4 40 86,741.45
Nyeri 80,371,200 21,447,000 26.7 45 79,433.33
Samburu 25,466,200 18,586,018 73.0 28 110,631.06
Siaya 47,929,600 24,099,100 50.3 43 93,407.36
Taita/Taveta 32,448,000 16,216,295 50.0 35 77,220.45
Tana River 39,951,600 7,898,000 19.8 23 57,231.88
Tharaka –Nithi 28,370,000 8,751,071 30.8 21 69,452.94
Trans Nzoia 69,297,600 15,510,400 22.4 40 64,626.67
Turkana 81,764,000 13,700,000 16.8 48 47,569.44
Uasin Gishu 37,509,398 21,587,000 57.6 48 74,954.86
Vihiga 44,678,400 27,290,150 61.1 39 116,624.57
Wajir 23,751,000 19,562,292 82.4 46 70,877.87
West Pokot 21,156,314 14,996,350 70.9 34 73,511.52
Total 2,782,958,759 1,082,653,106 38.9 2237 80,662.58
Source: OCOB and County Treasuries
From Table 2.5 above, the Kakamega County Assembly recorded higher expenditure on committee sitting allowance than the Salaries and Remuneration Commission (SRC) recommended monthly ceiling of Kshs.124,800.
2.14 Review of Expenditure on Domestic and Foreign TravelsThe County Governments spent Kshs.6.51 billion on domestic and foreign travel during the reporting period. This expenditure comprised of Kshs.5.68 billion on domestic travel and Kshs.826.42 million on foreign travel and was an increase of 89 per cent compared to Kshs.3.77 billion incurred in a similar period of FY 2017/18.
The expenditure on domestic and foreign travels by both the County Assembly and the County Executive in the first six months of FY 2018/19 is presented in Table 2.6.
Table 2.6: Expenditure on Domestic and Foreign Travels by the County Assembly and the County Executive in the First Half of FY 2018/19 (Kshs. Million)
CountyCounty Assembly (Kshs. Million) County Executive (Kshs. Million) Total Expenditure (Kshs. Million)
Domestic Exp.
Foreign Exp.
TotalDomestic
Exp.Foreign
Exp.Total
Domestic Exp.
Foreign Exp.
Total
A B C=B+A D E F=D+E G=A+D H=B+E I=G+H
Baringo 32.81 4.66 37.47 13.01 4.63 17.64 45.82 9.29 55.11
Bomet 27.81 7.38 35.19 62.27 4.68 66.95 90.08 12.06 102.14
Bungoma 14.16 0.91 15.06 143.45 10.58 154.03 157.61 11.49 169.10
Busia 50.03 6.49 56.52 36.33 10.94 47.27 86.36 17.43 103.79
Elgeyo/Marak-wet
37.63 3.97 41.60 4.15 1.39 5.53 41.78 5.36 47.13
Embu 61.52 - 61.52 20.22 1.49 21.70 81.73 1.49 83.22
Garissa 60.54 - 60.54 166.32 2.45 168.77 226.87 2.45 229.32

12
COUNTY GOVERNMENTS BUDGET IMPLEMENTATION REVIEW REPORT FOR THE FIRST HALF OF FY2018/19
CountyCounty Assembly (Kshs. Million) County Executive (Kshs. Million) Total Expenditure (Kshs. Million)
Domestic Exp.
Foreign Exp.
TotalDomestic
Exp.Foreign
Exp.Total
Domestic Exp.
Foreign Exp.
Total
A B C=B+A D E F=D+E G=A+D H=B+E I=G+H
Homa Bay 53.93 - 53.93 117.41 - 117.41 171.35 - 171.35
Isiolo 36.18 2.77 38.96 46.81 5.20 52.01 82.99 7.97 90.96
Kajiado 56.79 17.77 74.56 58.98 10.56 69.54 115.77 28.33 144.10
Kakamega 77.84 - 77.84 54.01 9.92 63.93 131.85 9.92 141.77
Kericho 70.13 5.53 75.67 61.75 - 61.75 131.88 5.53 137.42
Kiambu 78.68 33.00 111.67 63.84 22.28 86.12 142.51 55.28 197.79
Kilifi 35.79 3.05 38.84 48.68 9.79 58.47 84.47 12.84 97.31
Kirinyaga 66.91 17.11 84.02 25.86 5.75 31.61 92.77 22.85 115.63
Kisii 59.19 10.69 69.88 232.33 21.52 253.85 291.52 32.21 323.73
Kisumu 55.03 2.83 57.86 114.42 13.83 128.26 169.45 16.66 186.12
Kitui 59.59 - 59.59 124.80 - 124.80 184.40 - 184.40
Kwale 78.13 17.06 95.20 38.19 6.04 44.23 116.32 23.11 139.43
Laikipia 33.27 1.54 34.81 57.92 0.79 58.71 91.19 2.33 93.52
Lamu 26.42 12.24 38.67 33.90 0.92 34.82 60.33 13.16 73.49
Machakos 45.30 2.43 47.73 38.88 9.02 47.90 84.17 11.45 95.62
Makueni 31.54 3.54 35.08 57.13 7.97 65.10 88.67 11.51 100.19
Mandera 19.63 12.49 32.12 38.85 8.82 47.67 58.48 21.31 79.79
Marsabit 38.19 11.59 49.77 53.61 6.97 60.58 91.80 18.56 110.36
Meru 129.13 31.27 160.40 35.61 1.58 37.19 164.73 32.85 197.59
Migori 34.43 5.52 39.94 208.37 2.62 210.99 242.80 8.14 250.94
Mombasa 2.20 21.30 23.50 60.05 26.41 86.46 62.25 47.71 109.96
Murang’a 73.77 - 73.77 55.94 1.81 57.74 129.70 1.81 131.51
Nairobi City 19.02 23.43 42.44 138.33 18.82 157.15 157.35 42.24 199.59
Nakuru 43.06 0.00 43.06 62.68 0.00 62.68 105.74 0.00 105.74
Nandi 26.73 14.02 40.75 74.04 19.38 93.42 100.76 33.41 134.17
Narok 102.15 0.00 102.15 102.15 0.00 102.15 204.29 0.00 204.29
Nyamira 57.36 10.55 67.91 61.07 11.74 72.82 118.43 22.30 140.73
Nyandarua 39.54 6.89 46.43 68.54 7.46 76.00 108.07 14.36 122.43
Nyeri 75.66 21.53 97.19 26.92 0.83 27.75 102.58 22.36 124.94
Samburu 17.12 18.81 35.93 38.90 3.38 42.28 56.02 22.19 78.21
Siaya 51.94 1.71 53.65 94.91 20.04 114.95 146.85 21.75 168.60
Taita/Taveta 77.14 42.17 119.30 103.57 27.99 131.57 180.71 70.16 250.87
Tana River 38.81 5.86 44.67 55.14 23.04 78.18 93.95 28.90 122.85
Tharaka –Nithi 32.75 12.64 45.39 18.85 3.14 21.99 51.60 15.77 67.38
Trans Nzoia 49.17 17.00 66.17 16.51 3.36 19.87 65.67 20.36 86.04
Turkana 134.18 3.63 137.82 102.91 13.17 116.08 237.09 16.81 253.90
Uasin Gishu 37.74 14.06 51.81 54.51 12.20 66.72 92.26 26.26 118.52
Vihiga 71.74 - 71.74 57.23 6.22 63.45 128.97 6.22 135.19
Wajir 30.98 7.87 38.85 46.06 - 46.06 77.04 7.87 84.91
West Pokot 50.97 10.66 61.63 82.96 1.71 84.68 133.93 12.37 146.31
Total 2,402.65 445.96 2,848.61 3,278.36 380.47 3,658.83 5,681.01 826.42 6,507.44
Source: OCOB and County Treasuries
Kisii County incurred the highest expenditure on domestic and foreign travel at Kshs.323.73 million, followed by Turkana and Migori at Kshs.253.90 million and Kshs.250.94 million respectively.
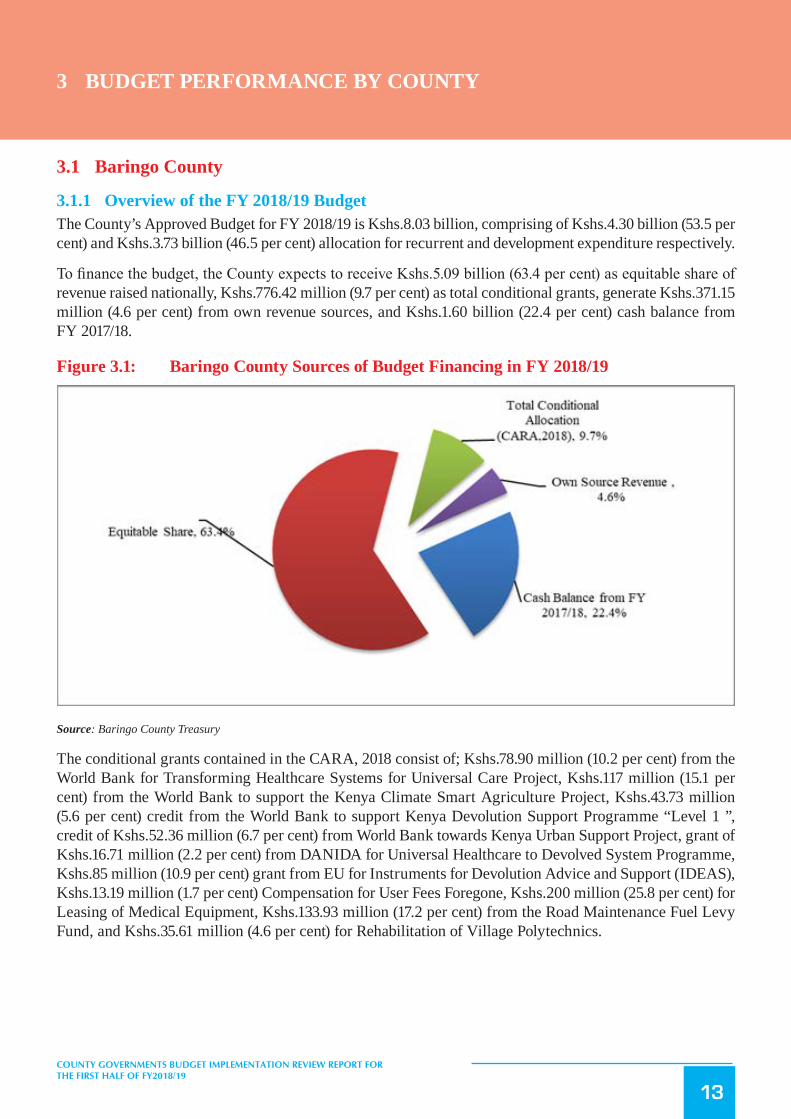
13
COUNTY GOVERNMENTS BUDGET IMPLEMENTATION REVIEW REPORT FOR THE FIRST HALF OF FY2018/19
3 BUDGET PERFORMANCE BY COUNTY
3.1 Baringo County
3.1.1 Overview of the FY 2018/19 BudgetThe County’s Approved Budget for FY 2018/19 is Kshs.8.03 billion, comprising of Kshs.4.30 billion (53.5 per cent) and Kshs.3.73 billion (46.5 per cent) allocation for recurrent and development expenditure respectively.
To finance the budget, the County expects to receive Kshs.5.09 billion (63.4 per cent) as equitable share of revenue raised nationally, Kshs.776.42 million (9.7 per cent) as total conditional grants, generate Kshs.371.15 million (4.6 per cent) from own revenue sources, and Kshs.1.60 billion (22.4 per cent) cash balance from FY 2017/18.
Figure 3.1: Baringo County Sources of Budget Financing in FY 2018/19
Source: Baringo County Treasury
The conditional grants contained in the CARA, 2018 consist of; Kshs.78.90 million (10.2 per cent) from the World Bank for Transforming Healthcare Systems for Universal Care Project, Kshs.117 million (15.1 per cent) from the World Bank to support the Kenya Climate Smart Agriculture Project, Kshs.43.73 million (5.6 per cent) credit from the World Bank to support Kenya Devolution Support Programme “Level 1 ”, credit of Kshs.52.36 million (6.7 per cent) from World Bank towards Kenya Urban Support Project, grant of Kshs.16.71 million (2.2 per cent) from DANIDA for Universal Healthcare to Devolved System Programme, Kshs.85 million (10.9 per cent) grant from EU for Instruments for Devolution Advice and Support (IDEAS), Kshs.13.19 million (1.7 per cent) Compensation for User Fees Foregone, Kshs.200 million (25.8 per cent) for Leasing of Medical Equipment, Kshs.133.93 million (17.2 per cent) from the Road Maintenance Fuel Levy Fund, and Kshs.35.61 million (4.6 per cent) for Rehabilitation of Village Polytechnics.

14
COUNTY GOVERNMENTS BUDGET IMPLEMENTATION REVIEW REPORT FOR THE FIRST HALF OF FY2018/19
3.1.2 Revenue AnalysisDuring the first half of FY 2018/19, the County received Kshs.1.07 billion as equitable share of revenue raised nationally, Kshs.183.85 million as total conditional grants, raised Kshs.189.10 million from own source revenue, and had a cash balance of Kshs.1.61 billion from FY 2017/18. The total funds available for the period amounted to Kshs.3.04 billion.
Figure 3.2 shows the half yearly trend in own-source revenue collection from FY 2013/14 to FY 2018/19.
Figure 3.2: Baringo County, Trend in Own Source Revenue Collection for the First Half of FY 2013/14 to the First Half of FY 2018/19
92.15
118.22 129.68
150.71 146.68
189.10
-
20
40
60
80
100
120
140
160
180
200
FY 2013/14 FY 2014/15 FY 2015/16 FY 2016/17 FY 2017/18 FY 2018/19
Ksh
s. M
illio
n
First Half of the Financial Year
Source: Baringo County Treasury
During the first half of FY 2018/19, the County generated a total of Kshs.189.10 million from own-source revenue sources. This amount was an increase of 28.9 per cent when compared to Kshs.146.68 million realised during the same period of FY 2017/18 and represented 51 per cent of the annual target.
3.1.3 Conditional GrantsThe County received Kshs.183.84 million as conditional grants as shown in Table 3.1 .
Table 3.1 : Baringo County, Conditional Grants/Loans Received in the First Half of FY 2018/19
S/No. Grants/LoansAnnual Alloca-tion per CARA,
2018 (Kshs)
Annual Budget Allocation for FY
2018/19 (Kshs)
Actual Receipts in First Half
of FY 2018/19 (Kshs)
Actual Receipts as Percentage of Annual
Allocation (%)
A Grants/Loans contained in CARA, 2018
1Compensation for User Fee Foregone-National Government
13,191,000 13,191,000 - -
2 Leasing of Medial Equipment-National Government 200,000,000 200,000,000 - -
3 Road Maintenance Fuel Levy-National Government 133,931,014 133,931,014 - -

15
COUNTY GOVERNMENTS BUDGET IMPLEMENTATION REVIEW REPORT FOR THE FIRST HALF OF FY2018/19
S/No. Grants/LoansAnnual Alloca-tion per CARA,
2018 (Kshs)
Annual Budget Allocation for FY
2018/19 (Kshs)
Actual Receipts in First Half
of FY 2018/19 (Kshs)
Actual Receipts as Percentage of Annual
Allocation (%)
A Grants/Loans contained in CARA, 2018
4Rehabilitation of Village Polytechnics-National Government
35,605,000 35,605,000 -
5Transforming Health Systems for Universal Care Project- World Bank
78,899,347 78,899,347 7,793,305 9.9
6 Kenya Climate Smart Agriculture Project-World Bank 117,000,000 117,000,000 - -
7Kenya Devolution Support Project (KDSP) “Level 1 Grant”-World Bank
43,729,455 43,729,455 42,084,111 96.2
8 Kenya Urban Support Project (KUSP)-World Bank 52,360,500 52,360,500 52,360,500 100.0
9 Universal Healthcare Project-DANIDA 16,706,250 16,706,250 8,353,125 50.0
10Instruments for Devolution Advice and Support (IDEAS)-EU
85,000,000 85,000,000 73,254,422 86.2
Total 776,422,566 776,422,566 183,845,463 23.7
Source: Baringo County Treasury
Analysis of the revenue from conditional grants indicates that, the County received the highest percentage of receipts to annual allocation from the DANIDA grant followed by the Kenya Urban Support project. The receipts accounted for 86.2 per cent and 100 per cent of annual allocation respectively.
3.1.4 Exchequer IssuesTo finance implementation of the budget, the Controller of Budget approved withdrawal of Kshs.2.24 billion from the CRF account. The withdrawals represented 27.9 per cent of the Approved Budget and translated to an increase of 16.7 per cent from Kshs.1.92 billion approved in the first half of FY 2017/18. This comprised of Kshs.2.06 billion (91.8 per cent) to fund recurrent expenditure and Kshs.184.38 million (8.2 per cent) for development activities.
3.1.5 Overall Expenditure ReviewThe County government spent a total of Kshs.2.10 billion on both recurrent and development activities. This expenditure represented 93.6 per cent of the total funds released from the CRF account and was an increase of 15.4 per cent from Kshs.1.82 billion spent in the first half of FY 2017/18. The expenditure excluded outstanding commitments as at 31st December, 2018.
Expenditure on recurrent activities amounted to Kshs.1.94 billion while that on development activities was Kshs.161.38 million. The recurrent expenditure was 93.6 per cent of the funds released for recurrent activities, while development expenditure was 87.5 per cent of funds released for development activities.
The recurrent expenditure represented 45.1 per cent of the annual recurrent budget an increase from 41.8 per cent recorded in the first half of FY 2017/18. Development expenditure recorded an absorption rate of 4.3 per cent, which was a decrease from 5.7 per cent attained in the first half of FY 2017/18. Figure 3.3 presents a comparison between the total expenditure in the first half of FY 2018/19 and the first half of the FY 2017/18.

16
COUNTY GOVERNMENTS BUDGET IMPLEMENTATION REVIEW REPORT FOR THE FIRST HALF OF FY2018/19
Figure3.3: BaringoCounty,ExpenditurebyEconomicClassification
Source: Baringo County Treasury
3.1.6 Analysis of Recurrent ExpenditureThe total recurrent expenditure of Kshs.1.94 billion comprised of Kshs.1.60 billion (82.8 per cent) incurred on personnel emoluments and Kshs.332.19 million (17.2 per cent) on operations and maintenance as shown in Figure 3.3.
Expenditure on personnel emoluments represented an increase of 21.7 per cent compared to the first half of FY 2017/18 when the County spent Kshs.1.32 billion, and was 76.5 per cent of total expenditure for the period. Figure 3.4 shows a summary of operations and maintenance expenditure by major categories.

17
COUNTY GOVERNMENTS BUDGET IMPLEMENTATION REVIEW REPORT FOR THE FIRST HALF OF FY2018/19
Figure 3.4: Baringo County, Operations and Maintenance Expenditure by Major Categories in the First Half of FY 2018/19
Source: Baringo County Treasury
The County spent Kshs.1.51 million on MCAs’ committee sitting allowances for the 46 MCAs against the annual budget allocation of Kshs.30 million. This amount represented a decline of 80.6 per cent compared to Kshs.7.75 million spent in a similar period of FY 2017/18. The average monthly sitting allowance translated to Kshs.5,461 per MCA against the SRC’s recommended monthly ceiling of Kshs.124,800.
Expenditure on domestic travel amounted to Kshs.45.82 million and comprised of Kshs.32.81 million spent by the County Assembly and Kshs.13.01 million spent by the County Executive. This represented 2.4 per cent of total recurrent expenditure.
3.1.7 Development ExpenditureThe total development expenditure of Kshs.161.38 million represented 4.3 per cent of the annual development budget of Kshs.3.73 billion. Table 3.2 provides a summary of development projects with the highest expenditure in the first half of the financial year.

18
COUNTY GOVERNMENTS BUDGET IMPLEMENTATION REVIEW REPORT FOR THE FIRST HALF OF FY2018/19
Table 3.2: Baringo County, List of Development Projects with the Highest Expenditure in the FY 2018/19
S/No. Project Name Project LocationProject Budget
(Kshs.)Project Expenditure in First Half of FY 2018/19 (Kshs.)
Absorption Rate (%)
1 Upgrading of C55-mlimani saw mill Ravine Ward 15,880,600 8,045,088 50.7
2 Upgrading of Chemolingot Town road Ribkwo Ward 15,846,463 5,263,911 33.2
3 Opening of Kabirmet-Rorobai-Kibingor Marigat Ward 4,982,200 4,618,656 92.7
4 Rehabilitation of Chambai Releng road Saimo Kipsaraman Ward
5,244,360 4,288,056 81.8
5 Lelabei footbridge construction Barwessa Ward 4,000,000 3,998,492 100.0
6 Andama-Osiemon-Kwa Thuku road routine maintenance
Andama-Osiemon- 3,500,000 3,496,800 99.9
7 Kabarnet Town Cabro parking Kabarnet Ward 3,200,000 3,192,900 99.8
8 Cheplambus-Lelbatai-Nduoro road maintenance
Tenges Ward 4,069,860 3,114,194 76.5
9 Kaptoroboni sesiani and arusin ECD Classrooms
Kaptoroboni sesiani 3,000,000 3,003,588 100.1
10 C55 Juction-Sagat road works Lembus Perkerra Ward 2,989,221 2,981,282 99.7
Source: Baringo County Treasury
3.1.8 Budget Performance by County DepartmentTable 3.3 shows a summary of budget estimates and budget performance by department in the first half of FY 2018/19.
Table 3.3: Baringo County, Budget Performance by Department
Department
Annual Budget Allocation in FY 2018/19
(Kshs. Million)
Exchequer Issues in First Half of FY 2018/19 (Kshs. Million)
Expenditure in First Half of FY 2018/19
(Kshs. Million)
Expenditure to Exchequer Issues
(%)
Absorption Rate (%)
Rec Dev Rec Dev Rec Dev Rec Dev Rec Dev
County Assembly 655.24 45 278.1 - 263.66 - 94.8 - 40.2 0
Governor/County Executive services
435.37 93.42 196.77 - 155.2 - 78.9 - 35.6 0
County Treasury Services 274.17 12.6 114.92 4.1 114.92 4.01 100 97.8 41.9 31.8
Transport and Infrastructure
61.47 851.84 30.63 79.67 22.23 77.23 72.6 96.9 36.2 9.1
Industrialization, Commerce and Tourism
77.63 70.69 38.72 1.57 28.85 1.56 74.5 99.6 37.2 2.2
Education, Sports, Culture & Art
344.48 337.41 140.64 24.23 134.69 22.63 95.8 93.4 39.1 6.7
Health 30.6 105.47 15.44 8.45 12.52 7 81.1 82.8 40.9 6.6
Housing & Urban Development
1,940.71 767.72 1,005.99 22.16 1,028.1 21.89 102.2 98.8 53 2.9
Agriculture, Livestock, Fisheries & Marketing
77.18 210.56 37.85 21.9 29.45 9.83 77.8 44.9 38.2 4.7
Youth, Gender & Social Security Services
246.89 467.76 131.09 9.84 80.94 4.77 61.7 48.5 32.8 1
Water & Irrigation 119.65 709.27 49.14 8.45 49.13 8.44 100 99.9 41.1 1.2
Environment & Natural Resources
32.72 61.5 16.22 4.01 16.21 4 100 99.9 49.5 6.5
TOTAL 4,296.11 3,733.24 2,055.51 184.38 1,935.90 161.36 94.2 87.5 45.1 4.3
Source: Baringo County Treasury

19
COUNTY GOVERNMENTS BUDGET IMPLEMENTATION REVIEW REPORT FOR THE FIRST HALF OF FY2018/19
Analysis of expenditure by department shows the Department of Treasury Services recorded the highest absorption rate of development budget at 31.8 per cent while the County Assembly and the Office of the Governor did not incur any development expenditure. The Department of Environment & Natural Resources had the highest percentage of recurrent expenditure to recurrent budget at 49.5 per cent while the Department of Youth, Gender & Social Security Services had the lowest at 32.8 per cent.
3.1.9 Key Observations and RecommendationsThe County has made progress in addressing some of the challenges previously identified as affecting budget implementation. Some of the progress made included:
i. Improvement in the use of IFMIS to process financial transactions.ii. Improvement of own-source revenue collection. The County collected Kshs.189.10 million during
the first half of FY 2018/19 which was an increase of 28.9 per cent from Kshs.146.68 million realised in a similar period of the FY 2017/18.
Despite the above progress, the following challenges continued to hamper effective budget implementation;
1. Delay by Fund Administrators to submit financial reports on the established County Funds contrary to Section 168 of the PFM Act, 2012.
2. Late submission of financial reports by the County Treasury, which affected timely preparation of budget implementation reports contrary to Section 166 of the PFM Act, 2012.
3. Failure to constitute the County Budget and Economic Forum as required by Section 137 of the PFM Act, 2012 for consultation in the budget making process.
4. High expenditure on personnel emoluments which represented 76.5 per cent of total expenditure in the reporting period. This may affect execution of other key programmes if not contained at a sustainable level.
The County should implement the following recommendations in order to improve budget execution;
1. All Funds Administrators should provide quarterly financial reports on County established Funds in line with Section 168 of the PFM Act, 2012.
2. The County Treasury should ensure timely preparation and submission of financial reports in line with Section 166 of PFM Act, 2012.
3. The County should establish the County Budget and Economic Forum in line with Section 137 of the PFM Act, 2012.
4. The County Public Service Board should come up with strategies to contain the wage at a sustainable level.
3.2 Bomet County
3.2.1 Overview of the FY 2018/19 BudgetThe County’s FY 2018/19 Approved Budget was Kshs.7.37 billion, comprising of Kshs.4.40 billion (60 per cent) and Kshs.2.97 billion (40 per cent) allocation for recurrent and development expenditure respectively.
To finance the budget, the County expects to receive Kshs.5.93 billion (81 per cent) as equitable share of revenue raised nationally, Kshs.895.09 million (11.7 per cent) as total conditional grants, generate Kshs.210.22 million (2.9 per cent) from own revenue sources, and Kshs.329.89 million (4.5 per cent) cash balance from FY 2017/18.

20
COUNTY GOVERNMENTS BUDGET IMPLEMENTATION REVIEW REPORT FOR THE FIRST HALF OF FY2018/19
Figure 3.5: Bomet County Expected Sources of Budget Financing in FY 2018/19
Source: Bomet County Treasury
The conditional grants contained in the CARA, 2018 consist of; Kshs.86.41 million (6.5 per cent) to support the Transformation of Health Systems for Universal Care Project, Kshs.117 million (8.8 per cent) from IDA (World Bank) towards Kenya Climate Smart Agriculture Project, credit of Kshs.44.89 million (3.4 per cent) from (World Bank) to support Kenya Devolution Support Programme “Level 1 Grant”, credit of Kshs.208.33 million (15.7 per cent) from (World Bank ) for Kenya Urban Support Project, Kshs.17.62 million (1.3 per cent) grant from DANIDA for Universal Healthcare to Devolved System Programme, Kshs.16.71 million (1.3 per cent) from the National government as Compensation for User Fees Foregone, Kshs.200 million (15 per cent) for Leasing of Medical Equipment, Kshs.156.25 million (11.7 per cent) from the Road Maintenance Fuel Levy Fund, and Kshs.47.88 million (3.6 per cent) for Rehabilitation of Village Polytechnics,
The County did not budget for Kshs.41.2 million from IDA (World Bank) Kenya Urban Support Project (KUSP) and Kshs.20.49 million from Swedish Agricultural Sector Development Support programme (ASDSP).
3.2.2 Revenue AnalysisDuring the first half of FY 2018/19, the County received Kshs.2.05 billion as equitable share of revenue raised nationally, Kshs.211.99 million as conditional grants, raised Kshs.65.88 million from own source revenue, and had a cash balance of Kshs.1.07 billion from FY 2017/18. The total available funds amounted to Kshs.3.4 billion. Figure 3.6 Provides the quarterly trend in own source revenue collection from FY 2013/14 to the first quarter of FY 2018/19.

21
COUNTY GOVERNMENTS BUDGET IMPLEMENTATION REVIEW REPORT FOR THE FIRST HALF OF FY2018/19
Figure 3.6: Bomet County, Trend in Own Source Revenue Collection from the First Half of FY 2013/14 to the First Half of FY 2018/19
Source: Bomet County Treasury
During the first half of FY 2018/19, the County generated a total of Kshs. 65.88 million as own-source revenue, representing an increase of 28 per cent compared to Kshs.51.47 million generated in the first half of FY 2017/18, and represented 31.4 per cent of the annual target.
3.2.3 Conditional GrantsThe County received Kshs.211.99 million as conditional grants as shown in Table 3.4 .
Table 3.4: Bomet County, Conditional Grants Received in the First Half of FY 2018/19
S/No. Grants/LoansAnnual Alloca-tion per CARA,
2018 (Kshs)
Annual Budget Allocation for FY
2018/19 (Kshs)
Actual receipts in Half Year of FY 2018/19 (in
Kshs.)
Actual Receipts as Percentage of Annu-
al Allocation (%)
Grants Contained in the CARA, 2018
1Kenya Urban Support Project (KUSP)- IDA (World Bank)
41,200,000 - - -
2Compensation for User Fee Foregone-National Government
16,713,356 16,713,356 - -
3Leasing of Medical Equipment-National Government
200,000,000 200,000,000 - -
4Road Maintenance Fuel Levy-National Government
156,252,849 156,252,849 - -
5Rehabilitation of Village Polytechnics-National Government
47875000 47,875,000 - -
6Transforming Health Systems for Universal Care Project-IDA (World Bank)
86,405,581 86,405,581 7,809,340 9
7Kenya Climate Smart Agriculture Project (KCSAP)-World Bank
117,000,000 117,000,000 35,841,567 30.6

22
COUNTY GOVERNMENTS BUDGET IMPLEMENTATION REVIEW REPORT FOR THE FIRST HALF OF FY2018/19
Grants Contained in the CARA, 2018
S/No. Grants/LoansAnnual Alloca-tion per CARA,
2018 (Kshs)
Annual Budget Allocation for FY
2018/19 (Kshs)
Actual receipts in Half Year of FY 2018/19 (in
Kshs.)
Actual Receipts as Percentage of Annu-
al Allocation (%)
Grants Contained in the CARA, 2018
9Sweden Agricultural Sector Development Support programme (ASDSP) -Sweden
20,485,395 - - -
Total 916,772,674 895,087,279 211,985,707 23.7
Source: Bomet County Treasury
Analysis of the revenue from conditional grants indicates that, the County received the highest percentage of receipts to annual allocation from the Kenya Urban Support project followed by the grant from Kenya Climate Smart Agriculture project. The receipts accounted for 80.8 per cent and 30.6 per cent of annual allocation respectively.
3.2.4 Exchequer IssuesThe Controller of Budget approved withdrawal of Kshs.2.99 billion from the CRF account, which was 40.6 per cent of the Approved Budget. This amount represented an increase of 37.8 per cent from Kshs.2.17 million approved in the first half of FY 2017/18. This comprised of Kshs.2.39 billion (80 per cent) for recurrent expenditure and Kshs.600.78 million (20 per cent) for development activities.
3.2.5 Overall Expenditure ReviewThe County spent Kshs.2.47 billion, which was 82.6 per cent of the total funds released for operations. This was an increase of 15.4 per cent from Kshs.2.14 billion spent in the first half of FY 2017/18.
A total of Kshs.1.93 billion was spent on recurrent activities while Kshs.514.33 million was spent on development activities. The recurrent expenditure was 80.8 per cent of the funds released for recurrent activities, while development expenditure was 90.1 per cent of funds released for development activities. The expenditure excluded outstanding commitments which amounted to Kshs.42.05 million for development activities and Kshs.84.42 million for recurrent expenditure as at December 31, 2018.
The recurrent expenditure represented 43.9 per cent of the annual recurrent budget, a decrease from 50.4 per cent recorded in the first half of FY 2017/18. Development expenditure recorded an absorption rate of 18.2 per cent, which was an increase from 3.4 per cent attained in the first half of FY 2017/18. Figure 3.6 presents a comparison between the total expenditure in the first half quarter of FY 2018/19 and the first half quarter of FY 2017/18.

23
COUNTY GOVERNMENTS BUDGET IMPLEMENTATION REVIEW REPORT FOR THE FIRST HALF OF FY2018/19
Figure3.6: BometCounty,ExpenditurebyEconomicClassification
Source: Bomet County Treasury
3.2.6 Analysis of Recurrent ExpenditureThe total recurrent expenditure of Kshs.1.93 billion comprised of Kshs.1.42 billion (73.6 per cent) incurred on personnel emoluments and Kshs.510.11 million (26.4 per cent) on operations and maintenance as shown in Figure 3.6.
Expenditure on personnel emoluments represented a decrease of 19.4 per cent compared to the first half quarter of FY 2017/18 when the County spent Kshs.1.76 billion, and was 57.5 per cent of total expenditure in the first quarter of FY 2018/19. Figure 3.7 shows a summary of operations and maintenance expenditure by major categories.

24
COUNTY GOVERNMENTS BUDGET IMPLEMENTATION REVIEW REPORT FOR THE FIRST HALF OF FY2018/19
Figure 3.7: Bomet County, Operations and Maintenance Expenditure by Major Categories in the First Quarter of FY 2018/19
Source: Bomet County Treasury
The County spent Kshs.10.90 million on MCAs’ committee sitting allowances to the 37 MCAs against the annual budget allocation of Kshs.22.73 million. This was an increase of 291.3 per cent compared to Kshs.2.79 million spent in the first half quarter of FY 2017/18. The average monthly sitting allowance was Kshs.49,100 per MCA compared to SRC’s recommended monthly ceiling of Kshs.124,800.
Expenditure on domestic travel amounted to Kshs.90.08 million and comprised of Kshs.27.81 million spent by the County Assembly and Kshs.62.27 million by the County Executive. This represented 4.7 per cent of total recurrent expenditure and was a decrease of 12.6 per cent compared to Kshs.103.08 million spent in the first half of FY 2017/18.
3.2.7 Development Expenditure AnalysisThe total development expenditure of Kshs.541.33 million represented 18.2 per cent of the annual development budget of Kshs.2.97 billion. Table 3.5 provides a summary of development projects with the highest expenditure in the first quarter of the financial year.

25
COUNTY GOVERNMENTS BUDGET IMPLEMENTATION REVIEW REPORT FOR THE FIRST HALF OF FY2018/19
Table 3.5: Bomet County, List of Development Projects with the Highest Expenditure in the FY 2018/19
S/No. Project Name Project Location Project Budget (Kshs.)Project Expenditure in First Half of FY
2018/19 (Kshs.)
Absorption Rate (%)
1 Construction of Roads Across Wards 350,074,413 105,191,875 30
2 Development Of Water Supply Sotik, Chepalungu, Konoin, Bomet East, Bomet Central
255,361,471 32,078,730 13
3ECD Infrastructure development Across Wards
123,000,000 10,601,811 9
4Hospital/ Dispensary Development
Bomet Maternity wing, Mulot Dis-pensary
68,000,000 539,071 1
5 Purchase of Ambulance(2) Longisa Hospital 30,000,000 23,200,000 77
6 Hire of Transport -Ambulances Headquarters 30,000,000 19,424,690 65
7Industrial Development- Jua kali
Kametori, Kipraisi, Nyatembe, Chebelion etc.
20,000,000 1,375,728 7
8Construction of Building Veterinary offices
Headquarters 13,500,000 3,712,155 27
9Cooperative Societies Developments
Across Wards 13,500,000 3,712,155 27
10Development of ICT infrastructure
Merigi, Kiptenden, Embomos, Kapkures
10,000,000 1,597,400 16
Source: Bomet County Treasury
3.2.8 Budget and Budget Performance Analysis by DepartmentTable 3.6 shows a summary of budget estimates and budget performance by department in the first half quarter of FY 2018/19.
Table 3.6: Bomet County, Budget Performance by Department
DepartmentBudget Allocation (Kshs.
Million)
Exchequer Issues in First Half of FY 2018/19 (Kshs. Mil-lion)
Expenditure in First Half of FY 2018/19
(Kshs. Million)
Expenditure to Exchequer Issues
(%)
Absorption Rate (%)
Rec Dev Rec Dev Rec Dev Rec Dev Rec Dev
County Executives 526.71 - 230.94 - 201.07 - 87.1 - 38.2 -
Public Service Board 59.72 - 34.26 - 35.24 - 102.9 - 59.0 -
Administration 274.88 184.97 194.01 14.07 189.17 - 97.5 - 68.8 -
ICT 46.20 - 24.87 - 12.65 8.06 50.9 - 27.4 -
Finance 280.21 10.43 175.95 - 170.11 - 96.7 - 60.7 -
Economic Planning 151.39 - 46.00 - 36.57 - 79.5 - 24.2 -
Lands, Public and Environment
167.49 312.73 85.09 173.93 102.24 173.89 120.2 100 61 55.6
Youth, Sports, Gender and Culture
161.94 91.00 46.11 - 41.04 - 89.0 - 25.3 -
Agriculture, Livestock and Cooperatives
228.08 304.40 659.69 12.82 86.24 12.40 13.1 96.7 37.8 4.1
Education and Vocational Trainings
464.26 153.99 118.24 13.85 292.71 10.60 247.6 76.5 63 6.9
Trade, Energy, Tourism and Industry
68.18 208.71 88.32 9.61 13.95 7.77 15.8 80.9 20.5 3.7

26
COUNTY GOVERNMENTS BUDGET IMPLEMENTATION REVIEW REPORT FOR THE FIRST HALF OF FY2018/19
Department
Budget Allocation (Kshs. Million)
Exchequer Issues in First Half of FY 2018/19 (Kshs. Mil-lion)
Expenditure in First Half of FY 2018/19
(Kshs. Million)
Expenditure to Exchequer Issues
(%)
Absorption Rate (%)
Rec Dev Rec Dev Rec Dev Rec Dev Rec Dev
Medical Services and Public Health
1,077.59 386.76 84.66 46.75 500.44 45.45 591.1 97.2 46.4 11.8
Roads, Transport and Public Works
171.33 656.33 30.83 270.88 56.95 249.27 184.7 92.0 33.2 38.0
County Assembly 593.55 300 302 - 142.17 1.68 47.1 - 24.0 0.6
Total 4,399.93 2,969.87 2,391.39 600.78 1,932.33 541.33 80.8 90.1 43.9 18.2
Source: Bomet County Treasury
Analysis of budget performance by department shows that, the Department of Lands, Public and Environment attained the highest absorption rate of development budget at 55.6 per cent. The Department of Administration recorded the highest percentage of recurrent expenditure to recurrent budget at 68.8 per cent while the Department of Trade and energy had the lowest at 20.5 per cent.
3.2.9 Key Observations and RecommendationsThe County has made progress in addressing some of the challenges previously identified as affecting budget implementation. Some of the progress made included:
i. The County has embraced the use of IFMIS in processing financial transactions.ii. Establishment of an Internal Audit Committee in compliance to Section 155 of the PFM Act, 2012.
Despite the above progress, the following challenges continued to hamper effective budget implementation;
1. Delay in disbursement of the equitable share of revenue raised by the National Treasury.2. Failure by Fund Administrators to submit expenditure reports on the established County Funds
contrary to Section 168 of the PFM Act, 2012.3. The County experienced challenges with IFMIS as a result of down times and poor internet
connectivity. This delayed payments to suppliers.The County should implement the following recommendations in order to improve budget execution;
1. The County Treasury should liaise with the National Treasury to ensure that funds allocated to the County are released in a timely manner in line with CARA, 2018.
2. The County Executive Committee Member for Finance (CECM-F) should designate substantive Administrators for all established County Funds and ensure quarterly reports are prepared and submitted in line with Section 116 of the PFM Act, 2012.
3. The County Treasury should liaise with the IFMIS directorate to address the poor internet connectivity and system down times to enhance efficiency in processing financial transactions.
3.3 Bungoma County
3.3.1 Overview of the FY 2018/19 BudgetThe County’s Approved supplementary Budget for FY 2018/19 is Kshs.13.01 billion, comprising of Kshs.8.05 billion (61.9 per cent) and Kshs.4.96 billion (38.1 per cent) allocation for recurrent and development expenditure respectively.

27
COUNTY GOVERNMENTS BUDGET IMPLEMENTATION REVIEW REPORT FOR THE FIRST HALF OF FY2018/19
To finance the budget, the County expects to receive Kshs.8.95 billion (68.8 per cent) as equitable share of revenue raised nationally, Kshs.1.25 billion (9.6 per cent) as total conditional grants, generate Kshs.1.10 billion (8.5 per cent) from own source revenue, Kshs.1.26 billion (9.7 per cent) cash balance from FY 2017/18 and Kshs.456.52 million (3.5 per cent) as other revenues expected during the year.
Figure 3.8: Bungoma County Expected Sources of Budget Financing in FY 2018/19
Source: Bungoma County Treasury
The conditional grants contained in the CARA, 2018 consist of; Kshs.100 million (8.6 per cent) for Transforming Healthcare Systems for Universal Care Project, loan of Kshs.140.44 million (12.1 per cent) from IDA (World Bank) for National Agricultural and Rural Inclusive Growth Project, Kshs.58.33 million (5.0 per cent) from IDA (World Bank) as credit for Kenya Devolution Support Programme “Level 1 grant”, Kshs.300.98 million (25.9 per cent) from IDA (World Bank ) as credit for Kenya Urban Support Project, Kshs.29.36 million (2.5 per cent) grant from DANIDA for Universal Healthcare to Devolved System Programme, Kshs.32.84 million (2.8 per cent) Compensation for User Fees Foregone, Kshs.200 million (17.2 per cent) for Leasing of Medical Equipment, Kshs.235.62 million (20.2 per cent) from the Road Maintenance Fuel Levy Fund, Kshs.65.50 million (5.6 per cent) for Rehabilitation of Village Polytechnics, Kshs.80.00 million (6.1 per cent) grant from EU for Water Tower Protection and Climate Change Mitigation and Adaption Programme, Kshs.22.40 million (1.7 per cent) Agricultural Sector Development Support Programme (ASDSP) and grant for Kshs.41.20 million (3.2 per cent) to finance Kenya Urban Support Project (KUSP).
The County also budgeted to receive Kshs.41.12 million grant for Agriculture, Livestock, Fisheries and co-op development (NARGP) programme, Kshs.76.28 million grant for Development of Youth Polytechnics, Kshs.239.13 million grant for Roads and Public Works: RMLF, and Kshs.99.99 million as grant for Sirisia Hospital grant.
3.3.2 Revenue AnalysisDuring the first half of FY 2018/19, the County received Kshs.3.12 billion as equitable share of revenue raised nationally, Kshs.388.47 million as total conditional grants, raised Kshs.388.62 million from own source revenue, and had a cash balance of Kshs.1.26 billion from FY 2017/18. The total available funds amounted to Kshs.5.15 billion.
Figure 3.9 shows the half yearly trend in own source revenue collection from the first half FY 2013/14 to the first half of FY 2018/19.

28
COUNTY GOVERNMENTS BUDGET IMPLEMENTATION REVIEW REPORT FOR THE FIRST HALF OF FY2018/19
Figure 3.9: Bungoma County, Trend in Own Source Revenue Collection for the First Half from FY 2013/14 to FY 2018/19
Source: Bungoma County Treasury
During the first half of FY 2018/19, the County generated a total of Kshs.388.62 million as own-source revenue. The own-source revenue collected during the period represented an increase of 73.1 per cent compared to Kshs.224.52 million realised during the same period of the FY 2017/18 and represented 35.3 per cent of the annual target.
3.3.3 Conditional GrantsThe County received Kshs.388.47 million as conditional grants as shown in Table 3.7 .
Table 3.7: Bungoma County, Conditional Grants/Loans Received in the First Half of FY 2018/19
S/No Grants/Loans
Annual Allocation per CARA, 2018
(Kshs)
Annual Budget Allocation for FY
2018/19 (Kshs)
Actual receipts in Half Year of FY 2018/19 (Kshs.)
Actual Receipts as Percentage of
Annual Allocation (%)
A Grants Contained in the CARA, 2018
1 Road Maintenance Fuel Levy-National Government 235,619,376 235,619,376 54,658,605 23.2
2Leasing of Medical Equipment-National Government
200,000,000 200,000,000 - -
3National Agricultural and Rural Inclusive Growth Project -(World Bank)
140,435,163 140,435,163 5,737,704 4.1
4Transforming Healthcare Systems for Universal Care Project-World Bank
100,000,000 115,388,909 27,098,735 27.1
5 Kenya Urban Support Project-World Bank 300,977,100 340,977,100 300,977,100 100.0
6 Rehabilitation of Village Polytechnics 65,500,000 65,500,000 - -
7Kenya Devolution Support Project (KDSP) “Level 1 grant”-World Bank
58,329,310 74,742,377 - -

29
COUNTY GOVERNMENTS BUDGET IMPLEMENTATION REVIEW REPORT FOR THE FIRST HALF OF FY2018/19
S/No Grants/Loans
Annual Allocation per CARA, 2018
(Kshs)
Annual Budget Allocation for FY
2018/19 (Kshs)
Actual receipts in Half Year of FY 2018/19 (Kshs.)
Actual Receipts as Percentage of
Annual Allocation (%)
A Grants Contained in the CARA, 2018
9Universal Healthcare to Devolved System Programme- DANIDA
29,362,500 41,551,298 - -
Sub Total 1,163,060,756 1,247,051,530 388,472,144 33.4
B Other Grants
10Agriculture, Livestock, Fisheries and Co-op Development (NARGP)
- 41,115,415 - -
11 Development of youth polytechnics - 76,276,635 - -
12 Sirisia Hospital grant - 99,999,945 - -
13 Roads and Public works: RMLF - 239,129,429 - -
Sub Total - 456,521,424 - -
Total 1,163,060,756 1,703,572,954 388,472,144 33.4
Source: Bungoma County Treasury
Analysis of the revenue from conditional grants indicates that, the County received the highest percentage of receipts to annual allocation from the Kenya Urban Support project. The receipt accounted for 100 per cent per cent of annual allocation respectively.
3.3.4 Exchequer IssuesTo finance the budget, the Controller of Budget approved the withdrawal of Kshs.3.81 billion from the CRF account. The withdrawals represented 29.3 per cent of the Approved Budget and translates to an increase of 69.5 per cent from Kshs.2.25 billion approved in the first half of FY 2017/18 and comprised of Kshs.3.38 billion (88.7 per cent) to fund recurrent expenditure and Kshs.429.05 million (11.3 per cent) for development activities.
3.3.5 Overall Expenditure ReviewThe County government spent a total of Kshs.4.28 billion on recurrent and development activities. The total expenditure represented 112.5 per cent of the total funds released from the CRF account and was an increase of 46.4 per cent from Kshs.2.93 billion spent in the first half of FY 2017/18. The expenditure excluded outstanding commitments as at December 31st 2018 which amounted to Kshs.352.01 million for development activities and Kshs.170.08 million for recurrent expenditure.
Expenditure on recurrent activities amounted to Kshs.3.77 million while Kshs.514.32 million was spent on development activities. The recurrent expenditure was 111.5 per cent of the funds released for recurrent activities, while development expenditure was 119.9 per cent of funds released for development activities.
The recurrent expenditure represented 46.8 per cent of the annual recurrent budget, an increase from 34.8 per cent recorded in the first half of FY 2017/18. Development expenditure recorded an absorption rate of 10.4 per cent, which was an increase from 9 per cent attained in the first half of FY 2017/18.Figure 3.10 presents a comparison between the total expenditure in the first half of FY 2018/19 and first half of the FY 2017/18.

30
COUNTY GOVERNMENTS BUDGET IMPLEMENTATION REVIEW REPORT FOR THE FIRST HALF OF FY2018/19
Figure3.10: BungomaCounty,ExpenditurebyEconomicClassification
Source: Bungoma County Treasury
3.3.6 Analysis of Recurrent ExpenditureThe total recurrent expenditure of Kshs.3.77 billion comprised of Kshs.2.72 billion (72.2 per cent) incurred on personnel emoluments and Kshs.1.05 billion (27.8 per cent) on operations and maintenance as shown in Figure 3.10.
Expenditure on personnel emoluments represented an increase of 47.8 per cent compared to the first half of FY 2017/18 when the County spent Kshs.1.84 billion, and was 63.5 per cent of total expenditure in the first half of FY 2018/19. Figure 3.11 shows a summary of operations and maintenance expenditure by major categories.

31
COUNTY GOVERNMENTS BUDGET IMPLEMENTATION REVIEW REPORT FOR THE FIRST HALF OF FY2018/19
Figure 3.11: Bungoma County, Operations and Maintenance Expenditure by Major Categories in the First Half of FY 2018/19
Source: Bungoma County Treasury
The County spent Kshs.35.85 million to cater for the committee sitting allowances for the 61 MCAs against the annual budget allocation of Kshs.113.69 million. This represented an increase of 26.3 per cent compared to Kshs.28.37 million spent in a similar period of FY 2017/18. The average monthly sitting allowance translated to Kshs.97, 945 per MCA against the SRC’s recommended monthly ceiling of Kshs.124,800.
Expenditure on domestic travel amounted to Kshs.157.61 million and comprised of Kshs.14.16 million spent by the County Assembly and Kshs.143.45 million spent by the County Executive, and represented 4.2 per cent of total recurrent expenditure.
3.3.7 Development ExpenditureThe total development expenditure of Kshs.514.32 million represented 10.4 per cent of the annual development budget of Kshs.4.96 billion. Table 3.8 provides a summary of development projects with the highest expenditure in the first half of the financial year.

32
COUNTY GOVERNMENTS BUDGET IMPLEMENTATION REVIEW REPORT FOR THE FIRST HALF OF FY2018/19
Table 3.8: Bungoma County, List of Development Projects with the Highest Expenditure in the FY 2018/19
S/No. Project Name Project Location Project Budget (Kshs.)Project Expenditure in First Half of FY
2018/19 (Kshs.)
Absorption Rate (%)
1 Routine Maintenance of Roads County wide 474,748,805 164,060,902 35
2Construction of casualty department, parking Bay and walk ways at Bun-goma County
Bungoma County Re-ferral Hospital
49,030,810 49,030,810 100
3 Conditional Grants for VTCS County wide 76,176,625 26,665,000 35
4 Construction of Perimeter wall fenceBungoma County Re-ferral Hospital
32,463,132 32,463,132 100
5Construction of storm water drainage in Bungoma town
Bungoma Town 37,257,250 12,737,530 34
6 Distribution of ECDE books Kanduyi 6,256,500 6,256,500 100
7 Drainage services County wide 11,000,000 990,000 9
Source: Bungoma County Treasury
3.3.8 Budget Performance by County DepartmentTable 3.9 shows a summary of budget estimates and budget performance by department in the first half of FY 2018/19.
Table 3.9: Bungoma County, Budget Performance by Department
Department
Annual Budget Allo-cation in FY 2018/19
(Kshs. Million)
Exchequer Issues in First Half of FY 2018/19 (Kshs. Million)
Expenditure in First Half of FY 2018/19
(Kshs. Million)
Expenditure to Exchequer Issues
(%)
Absorption Rate (%)
Rec Dev Rec Dev Rec Dev Rec Dev Rec DevAgriculture, Live-stock, Fisheries and Co-operative Development 461.50 574.63 188.84 8.55 151.35 14.29
80.2 167.1 32.8 2.5
Tourism, Forest-ry, Environment, Water and Natural Resources 164.16 505.42 92.21 28.68 88.03 21.27
95.5 74.2 53.6 4.2
Roads and Public Works 187.36 1,678.94 93.84 194.31 79.90 357.37
85.1 183.9 42.6 21.3
Education 1,048.13 491.56 453.11 87.08 463.98 32.92 102.4 37.8 44.3 6.7Health and Sani-tation 2,986.83 378.21 1,060.90 2.33 1,513.84 1.21
142.7 51.8 50.7 0.3
Trade, Energy and Industrialization 49.31 252.17 18.42 14.37 16.88 14.66
91.6 102.0 34.2 5.8
Land, Urban and Physical Planning 126.87 510.70 31.83 2.71 27.49 15.31
86.4 564.5 21.7 3
Gender and Culture 121.64 173.54 58.35 - 64.06 - 109.8 - 52.7 -
Finance and Plan-ning 969.62 27.39 484.37 20.35 492.68 20.35
101.7 100 50.8 74.3
County Public Service 49.57 26.42 - 23.60 -
89.3 - 47.6 -
Governors & D/Governor’s Office 442.42 - 204.70 - 208.77 -
102 - 47.2 -

33
COUNTY GOVERNMENTS BUDGET IMPLEMENTATION REVIEW REPORT FOR THE FIRST HALF OF FY2018/19
Department
Annual Budget Allo-cation in FY 2018/19
(Kshs. Million)
Exchequer Issues in First Half of FY 2018/19 (Kshs. Million)
Expenditure in First Half of FY 2018/19
(Kshs. Million)
Expenditure to Exchequer Issues
(%)
Absorption Rate (%)
Rec Dev Rec Dev Rec Dev Rec Dev Rec DevPublic Adminis-tration& County Secretary 543.01 79.32 199.35 1.59 159.26 2.01
79.9 126.4 29.3 2.5
Housing 26.28 28.45 8.82 12.74 8.36 - 94.8 - 31.8 -County Assembly 874.98 256.51 458.87 56.33 471.14 34.92 102.7 62.0 53.8 13.6TOTAL 8,051.67 4,956.84 3,380.02 429.05 3,769.35 514.31 111.5 119.9 46.8 10.4
Source: Bungoma County Treasury
Analysis of expenditure by department shows the Department of Finance and Planning recorded the highest absorption rate of development budget at 74.3 per cent while the Department of Gender and Culture and the Department of Housing did not incur any development expenditure. The County Assembly had the highest percentage of recurrent expenditure to recurrent budget at 53.8 per cent while the Department of Land, Urban and Physical Planning had the lowest at 21.7 per cent.
3.3.9 Key Observations and RecommendationsThe County has made progress in addressing some of the challenges previously identified as affecting budget implementation. Some of the progress made included:
i. Improvement in the collection of own-source revenue from Kshs.224.52 million in the first half of FY 2017/18 to Kshs.388.62 million in the reporting period.
ii. Timely submission of quarterly reports by the County Government in line with Section 166 of the PFM Act, 2012.
Despite the above progress, the following challenges continued to hamper effective budget implementation;
1. A high wage bill that increased by 47.8 per cent from Kshs.1.84 billion in the first half of FY 2017/18 to Kshs.2.72 billion in the period under review.
2. Slow implementation of development activities during the first half of FY 2018/19. The County spent Kshs.500.02 million, which represented 10.4 per cent of the annual development budget of Kshs.4.96 billion against the expected absorption rate of 50 per cent.
3. Delay by Fund Administrators to submit expenditure reports on the established County Funds which included reports for Bursary Fund, Women Empowerment Fund, Youth Empowerment Fund and People with Disability Fund. This is contrary to Section 168 of the PFM Act, 2012.
4. The County Government reported gross expenditure of Kshs.4.28 billion, which was above the approved exchequer issues of Kshs.3.81 billion. This is an indication that the County may be spending own-source revenue at source in contravention of Section 109 of the PFM Act, 2012.
5. Large outstanding imprest to staff during the reporting period. The County staff had outstanding imprest amounting to Kshs 204.02 million as of 31st December, 2018.
The County should implement the following recommendations in order to improve budget execution;
1. The County Public Service Board should establish an optimal staffing structure in order to manage the wage bill.
2. The County should identify and address issues that cause delays in the implementation of development projects.
3. The Fund Administrator should ensure timely submission of expenditure reports in line with Section 168 of the PFM Act, 2012.

34
COUNTY GOVERNMENTS BUDGET IMPLEMENTATION REVIEW REPORT FOR THE FIRST HALF OF FY2018/19
4. The County should ensure adherence with Section 109 of the PFM Act, 2012 and bank all revenue receipts intact into the CRF account.
5. The County Treasury should ensure strict adherence to financial regulations on management of imprest staff.
3.4 Busia County
3.4.1 Overview of the FY 2018/19 BudgetThe County’s FY 2018/19 Approved Supplementary Budget was Kshs.8.70 billion, comprising of Kshs.5.11 billion (58.7 per cent) and Kshs.3.60 billion (41.3 per cent) allocation for recurrent and development expenditure respectively.
To finance the budget, the County expects to receive Kshs.5.97 billion (68.5 per cent) as equitable share of revenue raised nationally, Kshs.627.6 million (7.2 per cent) as total conditional grants, generate Kshs.452.52 million (5.2 per cent) from own sources, and Kshs.1.66 billion (19 per cent) cash balance from FY 2017/18.
Figure 3.12: Busia County Sources of Budget Financing in FY 2018/19
Source: Busia County Treasury
The conditional grants/loans contained in the CARA, 2018 consist of; Kshs.86.62 million (9 per cent) for Transforming Health Systems for Universal Care Project, Kshs.117 million (12.1 per cent) from IDA (World Bank) for Kenya Climate Smart Agriculture Project, Kshs.47.39 million (4.9 per cent) from IDA (World Bank) credit for Kenya Devolution Support Programme “Level 1 grant”, Kshs.101.07 million (10.5 per cent) from IDA (World Bank ) credit for Kenya Urban Support Project, Kshs.19.54 million (2 per cent) grant from DANIDA for Universal Healthcare to Devolved System Programme, Kshs.16.93 million (1.8 per cent) as Compensation for User Fees Foregone, Kshs.200 million (20.8 per cent) for Leasing of Medical Equipment, Kshs.157.62 million (16.4 per cent) from the Road Maintenance Fuel Levy Fund, and Kshs.61.96 million (6.4 per cent) for Rehabilitation of Village Polytechnics.
In addition, the County budgeted to receive Kshs.20 million as grant from Kenya Urban Institutional Grant Programme.

35
COUNTY GOVERNMENTS BUDGET IMPLEMENTATION REVIEW REPORT FOR THE FIRST HALF OF FY2018/19
3.4.2 Revenue AnalysisDuring the first half of FY 2018/19, the County received Kshs.2.71 billion as equitable share of revenue raised nationally, Kshs.150.22 million as total conditional grants, raised Kshs.106.86 million from own-source revenue, and had a cash balance of Kshs.1.66 billion from FY 2017/18. The total funds available for the period amounted to Kshs.3.76 billion.
Figure 3.13 shows the half yearly trend in own-source revenue collection from FY 2013/14 to FY 2018/19.
Figure 3.13: Busia County, Trend in Own-Source Revenue Collection for the First Half of FY 2013/14 to the First Half of FY 2018/19
45
Source: Busia County Treasury
During the first half of FY 2018/19, the County generated a total of Kshs 106.86 million from own-
source revenue. This amount was an increase of 158.4 per cent when compared to Kshs.37.5 million
realised during the same period of FY 2017/18 and represented 23.6 per cent of the annual target.
1.4.3 Conditional Grants The County received Kshs.150.05 million as conditional grants as shown in Table 0.10Table 0.10.
Table 0.10: Busia County, Conditional Grants/Loans Received in the First Half of FY 2018/19
S/No Grants/Loans
Annual Allocation per CARA, 2018
(Kshs)
Annual Budget
Allocation for FY 2018/19
(Kshs)
Actual Receipts in Half Year of FY
2018/19 (Kshs.)
Actual Receipts as Percentage of
Annual Allocation (%)
A Grants Contained in the CARA, 2018
1 Compensation for User Fee
Foregone-National Government 16,934,085 16,934,085 - -
2 Leasing of Medical Equipment-
National Government 200,000,000 - - -
3 Road Maintenance Fuel Levy Fund-
National Government 157,619,376 157,079,584 - -
4 Rehabilitation of Village
Polytechnics-National Government 61,960,000 61,960,000 - -
59.50 64.99
83.38
71.61
37.51
106.86
-
20
40
60
80
100
120
FY 2013/14 FY 2014/15 FY 2015/16 FY 2016/17 FY 2017/18 FY 2018/19
Ksh
s. M
illio
n
First Half of the Financial Year
Source: Busia County Treasury
During the first half of FY 2018/19, the County generated a total of Kshs.106.86 million from own-source revenue. This amount was an increase of 158.4 per cent when compared to Kshs.37.5 million realised during the same period of FY 2017/18 and represented 23.6 per cent of the annual target.
3.4.3 Conditional GrantsThe County received Kshs.150.05 million as conditional grants as shown in Table 3.10.
Table 3.10: Busia County, Conditional Grants/Loans Received in the First Half of FY 2018/19
S/No Grants/LoansAnnual Alloca-tion per CARA,
2018 (Kshs)
Annual Budget Allocation for FY
2018/19 (Kshs)
Actual Receipts in Half Year of FY 2018/19 (Kshs.)
Actual Receipts as Percentage of Annu-
al Allocation (%)
A Grants Contained in the CARA, 2018
1Compensation for User Fee Foregone-Na-tional Government
16,934,085 16,934,085 - -
2Leasing of Medical Equipment-National Government
200,000,000 - - -
3Road Maintenance Fuel Levy Fund-National Government
157,619,376 157,079,584 - -
4Rehabilitation of Village Polytechnics-Na-tional Government
61,960,000 61,960,000 - -
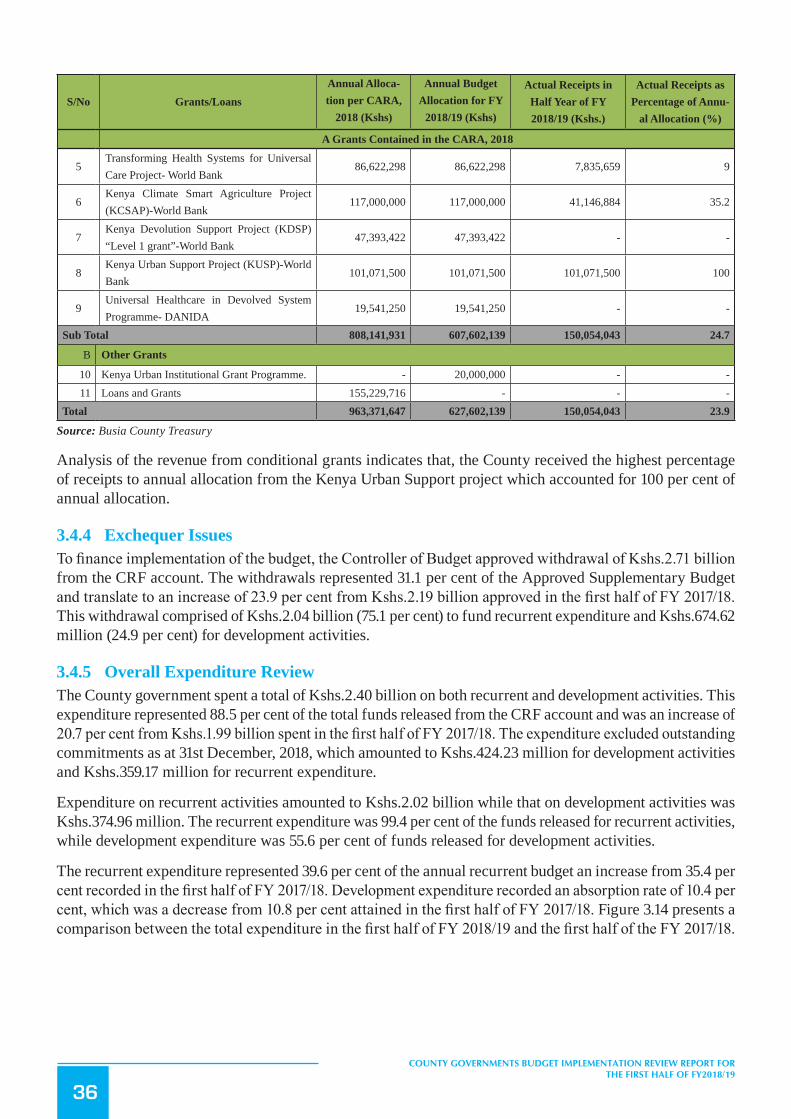
36
COUNTY GOVERNMENTS BUDGET IMPLEMENTATION REVIEW REPORT FOR THE FIRST HALF OF FY2018/19
S/No Grants/LoansAnnual Alloca-tion per CARA,
2018 (Kshs)
Annual Budget Allocation for FY
2018/19 (Kshs)
Actual Receipts in Half Year of FY 2018/19 (Kshs.)
Actual Receipts as Percentage of Annu-
al Allocation (%)
A Grants Contained in the CARA, 2018
5Transforming Health Systems for Universal Care Project- World Bank
86,622,298 86,622,298 7,835,659 9
6Kenya Climate Smart Agriculture Project (KCSAP)-World Bank
117,000,000 117,000,000 41,146,884 35.2
7Kenya Devolution Support Project (KDSP) “Level 1 grant”-World Bank
47,393,422 47,393,422 - -
8Kenya Urban Support Project (KUSP)-World Bank
101,071,500 101,071,500 101,071,500 100
9Universal Healthcare in Devolved System Programme- DANIDA
19,541,250 19,541,250 - -
Sub Total 808,141,931 607,602,139 150,054,043 24.7
B Other Grants
10 Kenya Urban Institutional Grant Programme. - 20,000,000 - -11 Loans and Grants 155,229,716 - - -
Total 963,371,647 627,602,139 150,054,043 23.9
Source: Busia County Treasury
Analysis of the revenue from conditional grants indicates that, the County received the highest percentage of receipts to annual allocation from the Kenya Urban Support project which accounted for 100 per cent of annual allocation.
3.4.4 Exchequer IssuesTo finance implementation of the budget, the Controller of Budget approved withdrawal of Kshs.2.71 billion from the CRF account. The withdrawals represented 31.1 per cent of the Approved Supplementary Budget and translate to an increase of 23.9 per cent from Kshs.2.19 billion approved in the first half of FY 2017/18. This withdrawal comprised of Kshs.2.04 billion (75.1 per cent) to fund recurrent expenditure and Kshs.674.62 million (24.9 per cent) for development activities.
3.4.5 Overall Expenditure ReviewThe County government spent a total of Kshs.2.40 billion on both recurrent and development activities. This expenditure represented 88.5 per cent of the total funds released from the CRF account and was an increase of 20.7 per cent from Kshs.1.99 billion spent in the first half of FY 2017/18. The expenditure excluded outstanding commitments as at 31st December, 2018, which amounted to Kshs.424.23 million for development activities and Kshs.359.17 million for recurrent expenditure.
Expenditure on recurrent activities amounted to Kshs.2.02 billion while that on development activities was Kshs.374.96 million. The recurrent expenditure was 99.4 per cent of the funds released for recurrent activities, while development expenditure was 55.6 per cent of funds released for development activities.
The recurrent expenditure represented 39.6 per cent of the annual recurrent budget an increase from 35.4 per cent recorded in the first half of FY 2017/18. Development expenditure recorded an absorption rate of 10.4 per cent, which was a decrease from 10.8 per cent attained in the first half of FY 2017/18. Figure 3.14 presents a comparison between the total expenditure in the first half of FY 2018/19 and the first half of the FY 2017/18.

37
COUNTY GOVERNMENTS BUDGET IMPLEMENTATION REVIEW REPORT FOR THE FIRST HALF OF FY2018/19
Figure3.14: BusiaCounty,ExpenditurebyEconomicClassification
Source: Busia County Treasury
3.4.6 Analysis of Recurrent ExpenditureThe total recurrent expenditure of Kshs.2.02 billion comprised of Kshs.1.41 billion (69.8 per cent) incurred on personnel emoluments and Kshs.611.74 million (30.2 per cent) on operations and maintenance as shown in Figure 3.14.
Expenditure on personnel emoluments represented an increase of 2.5 per cent compared to the first half of FY 2017/18 when the County spent Kshs.1.14 billion, and was 58.8 per cent of total expenditure for the period. Figure 3.15 shows a summary of operations and maintenance expenditure by major categories.

38
COUNTY GOVERNMENTS BUDGET IMPLEMENTATION REVIEW REPORT FOR THE FIRST HALF OF FY2018/19
Figure 3.15: Busia County, Operations and Maintenance Expenditure by Major Categories in the First Half of FY 2018/19
Source: Busia County Treasury
The County spent Kshs.35.03 million on MCAs’ committee sitting allowances for the 54 MCAs against the annual budget allocation of Kshs.113.53 million. This amount represented an increase of 330.5 per cent compared to Kshs.8.13 million spent in a similar period of FY 2017/18. The average monthly sitting allowance translated to Kshs.108,124 per MCA against the SRC’s recommended monthly ceiling of Kshs.124,800.
Expenditure on domestic travel amounted to Kshs.86.36 million and comprised of Kshs.50.03 million spent by the County Assembly and Kshs.36.33 million spent by the County Executive and represented 4.2 per cent of total recurrent expenditure.
3.4.7 Development ExpenditureThe total development expenditure of Kshs.374.97 million represented 10.4 per cent of the annual development budget of Kshs.3.59 billion. Table 3.11 provides a summary of development projects with the highest expenditure in the first half of the financial year.

39
COUNTY GOVERNMENTS BUDGET IMPLEMENTATION REVIEW REPORT FOR THE FIRST HALF OF FY2018/19
Table 3.11: Busia County, List of Development Projects with the Highest Expenditure in the FY 2018/19
S/No. Project Name Project LocationProject Budget
(Kshs.)
Project Expendi-ture in First Half
of FY 2018/19 (Kshs.)
Absorption Rate (%)
1 Major Roads Works Headquarters 368,811,120 106,397,487 29
2 Maintenance of Roads, Ports and Jetties Headquarters 444,516,245 87,306,081 20
3 Other Infrastructure and Civil Works All Wards 2,306,797,115 71,488,748 3
4 Construction of Buildings-Others Education Headquarters 85,275,884 52,312,773 61
5Non Residential Buildings (Offices, Schools, Hospitals etc.)
Headquarters 36,215,782 17,177,332 47
6Maintenance Of Plant, Machinery & Equip-ment(Including Lifts)
Works Headquarters 25,342,955 10,912,119 43
7 Grants To Cultural Groups Headquarters 87,707,600 9,334,012 11
8 Purchase of Civil Works Headquarters 64,422,252 7,337,464 11
9Agricultural Materials Supplies and Small Equipment
Across the wards 15,463,750 6,503,290 42
10 Purchase of Tractors Samia and Bunyala 10,781,600 6,200,150 58
Source: Busia County Treasury
3.4.8 Budget Performance by County DepartmentTable 3.12 shows a summary of budget estimates and budget performance by department in the first half of FY 2018/19.
Table 3.12: Busia County, Budget Performance by Department
Department
Annual Budget Allo-cation in FY 2018/19
(Kshs. Million)
Exchequer Issues in First Half of FY 2018/19 (Kshs. Million)
Expenditure in First Half of FY 2018/19
(Kshs. Million)
Expenditure to Exchequer Issues
(%)
Absorption Rate (%)
Rec Dev Rec Dev Rec Dev Rec Dev Rec DevAgriculture and Animal Resources
214.70 303.12 105.90 38.43 75.06 45.84 70.9 119.3 35.0 15.1
Trade, Cooperatives and Industrialization
58.95 138.04 26.67 5.62 14.34 2.54 53.8 45.2 24.3 1.8
Educational and Voca-tional Training
473.42 277.89 150.48 50.58 85.10 73.74 56.6 145.8 18.0 26.5
Finance, Economic Planning and ICT
1,441.31 75.61 344.86 11.60 671.59 - 194.7 - 46.6 -
Youth, Culture, Sports, Tourism and Social Services
76.95 110.59 55.13 8.55 29.00 21.36 52.6 249.9 37.7 19.3
Roads, Public Works, Energy and Transport
74.56 1,121.13 38.35 330.87 9.03 206.37 23.5 62.4 12.1 18.4
Public Service Manage-ment
50.57 - 22.56 - 3.32 - 14.7 - 6.6 -

40
COUNTY GOVERNMENTS BUDGET IMPLEMENTATION REVIEW REPORT FOR THE FIRST HALF OF FY2018/19
Department
Annual Budget Allo-cation in FY 2018/19
(Kshs. Million)
Exchequer Issues in First Half of FY 2018/19 (Kshs. Million)
Expenditure in First Half of FY 2018/19
(Kshs. Million)
Expenditure to Exchequer Issues
(%)
Absorption Rate (%)
Rec Dev Rec Dev Rec Dev Rec Dev Rec DevLands, Housing and Urban Development
112.94 360.12 30.84 116.17 7.13 7.28 23.1 6.3 6.3 2.0
Water, Environment and Natural Resources
126.13 510.54 54.56 71.71 14.14 7.34 25.9 10.2 11.2 1.4
Health and Sanitation 1,365.74 613.78 749.22 41.10 734.56 9.41 98.0 22.9 53.8 1.5
County Public Service Board
48.36 - 19.39 - 4.76 - 24.5 - 9.8 -
The Governorship 334.59 16.10 117.23 - 80.34 1.10 68.5 - 24.0 6.8
County Assembly 728.50 70.00 320.00 - 294.28 - 92.0 - 40.4 -
Total 5,106.71 3,596.93 2,035.18 674.62 2,022.65 374.97 100.7 55.6 40.1 10.4
Source: Busia County Treasury
Analysis of expenditure by department shows the Department of Educational and Vocational Training recorded the highest absorption rate of development budget at 26.5 per cent followed by the Department of Youth, Sports, Culture, Sports, Tourism and Social Sciences at 19.3 cent. The Department of Health and Sanitation had the highest percentage of recurrent expenditure to its recurrent budget at 53.8 per cent while the Department of Housing and Urban Development had the lowest at 6.3 per cent.
3.4.9 Key Observations and RecommendationsThe County has made progress in addressing some of the challenges previously identified as affecting budget implementation. Some of the progress made included:
i. Improvement in the human capacity through continuous training of key County staffs.ii. Improvement in the collection of own-source revenue compared to a similar period in FY 2017/18.
Despite the above progress, the following challenges continued to hamper effective budget implementation:
1. Delay in disbursement of the equitable share of revenue raised by the National Treasury.2. Delay by Fund Administrators to submit expenditure reports on the established County Funds contrary
to Section 168 of the PFM Act, 2012.
The County should implement the following recommendations in order to improve budget execution;
1. The County Treasury should liaise with the National Treasury to ensure that funds allocated to the County are released in a timely manner in line with the CARA, 2018.
2. The County Treasury should ensure timely preparation and submission of financial reports in line with Section 166 of PFM Act, 2012.
3.5 Elgeyo Marakwet County
3.5.1 Overview of the FY 2018/19 BudgetThe County’s Approved Budget for FY 2018/19 is Kshs.5.02 billion, comprising of Kshs.3.10 billion (61.7 per cent) and Kshs.1.92 billion (38.3 per cent) allocation for recurrent and development expenditure respectively.
To finance the budget, the County expects to receive Kshs.3.77 billion (75.1 per cent) as equitable share of revenue raised nationally, Kshs.657.3 million (13.1 per cent) as total conditional grants, generate Kshs.130 million (2.6 per cent) from own source of revenue, and Kshs.464.71 million (9.3 per cent) cash balance from FY 2017/18.

41
COUNTY GOVERNMENTS BUDGET IMPLEMENTATION REVIEW REPORT FOR THE FIRST HALF OF FY2018/19
Figure 3.16: Elgeyo Marakwet County Expected Sources of Budget Financing in FY 2018/19
Source: Elgeyo Marakwet County Treasury
The conditional grants contained in the CARA (Amendment), 2018 consist of; Kshs.50 million (6.3 per cent) for Transforming Health Systems for Universal Care Project, Kshs.117 million (14.7 per cent) from IDA (World Bank) for Kenya Climate Smart Agriculture Project, Kshs.38.55 million (4.8 per cent) from IDA (World Bank) as credit for Kenya Devolution Support Programme “Level 1 grant”, Kshs.89.8 million (11.3 per cent) from IDA (World Bank ) as credit for Kenya Urban Support Project, Kshs.12.15 million (1.5 per cent) grant from DANIDA for Universal Healthcare to Devolved System Programme, Kshs.80 million (10 per cent) grant from EU credit for Water Tower Protection and Climate Change Mitigation and adoption Programme (Water), Kshs.41.20 million (5.2 per cent) from IDA (World Bank) as credit for the Kenya Urban Support Project (KUSP)-Urban Institutional Grants (UIG) including balance from FY 2017/18, Kshs.19.41 million (2.4 per cent) from Sweden as credit for the Agricultural Sector Development Support Programme (ASDSP) including balance from FY 2017/18, Kshs.8.8 million (1.1 per cent) as Compensation for User Fees Foregone, Kshs.200 million (25.1 per cent) for Leasing of Medical Equipment, Kshs.99.21 million (12.4 per cent) from the Road Maintenance Fuel Levy Fund, and Kshs.41.8 million (5.2 per cent) for Rehabilitation of Village Polytechnics.
3.5.2 Revenue AnalysisDuring the first half of FY 2018/19, the County received Kshs.1.17 billion as equitable share of revenue raised nationally, Kshs.133.85 million as total conditional grants, raised Kshs.56.87 million from own source revenue, and had a cash balance of Kshs.464.71 million from FY 2017/18. The total available funds amounted to Kshs.1.82 billion.
Figure 3.17 shows the half yearly trend in own source revenue collection from the first half FY 2013/14 to the first half of FY 2018/19.

42
COUNTY GOVERNMENTS BUDGET IMPLEMENTATION REVIEW REPORT FOR THE FIRST HALF OF FY2018/19
Figure 3.17: Elgeyo Marakwet County, Trend in Own Source Revenue Collection for the First Half from FY 2013/14 to FY 2018/19
Source: Elgeyo Marakwet County Treasury
During the first half of FY 2018/19, the County generated a total of Kshs.56.87 million as own-source revenue. The own-source revenue collected during the period represented an increase of 29.6 per cent compared to Kshs.43.88 million realised during the same period of the FY 2017/18 and represented 43.7 per cent of the annual target.
3.5.3 Conditional GrantsThe County received Kshs.133.85 million as conditional grants as shown in Table 3.13 .
Table 3.13: Elgeyo Marakwet County, Conditional Grants/Loans Received in the First Half of FY 2018/19
S/No Grants/LoansAnnual Alloca-
tion, per CARA, 2018 (Kshs)
Annual Budget Allocation for FY
2018/19 (Kshs)
Actual receipts in Half Year of FY 2018/19 (in
Kshs.)
Actual Receipts as Percentage of Annu-
al Allocation (%)
A Grants Contained in the CARA, 20181 Leasing of Medical Equipment 200,000,000 200,000,000 - -
2Kenya Climate Smart Agriculture Project (KCSAP)
117,000,000 117,000,000 31,698,328 27.1
3 Road Maintenance Fuel Levy 99,208,158 99,208,158 - -
4 Kenya Urban Support Project (KUSP) 89,802,100 89,802,100 89,802,100 100
5Water Tower Protection and Climate Change Miti-gation and adoption Programme (Water)
80,000,000 - - -
6Transforming Health Systems for Universal Care Project (World Bank)
50,000,000 50,000,000 6,277,493 12.6

43
COUNTY GOVERNMENTS BUDGET IMPLEMENTATION REVIEW REPORT FOR THE FIRST HALF OF FY2018/19
S/No Grants/LoansAnnual Alloca-
tion, per CARA, 2018 (Kshs)
Annual Budget Allocation for FY
2018/19 (Kshs)
Actual receipts in Half Year of FY 2018/19 (in
Kshs.)
Actual Receipts as Percentage of Annu-
al Allocation (%)
A Grants Contained in the CARA, 20187 Rehabilitation of Village Polytechnics 41,800,000 41,800,000 - -
8Kenya Urban Support Project (KUSP)-Urban In-stitutional Grants (UIG)+Bal c/f in FY 2017/18
41,200,000 - - -
9Kenya Devolution Support Project (KDSP) “Level 1 grant”
38,552,919 38,552,919 - -
10Agricultural Sector Development Support Pro-gramme (ASDSP) + Bal c/f in FY 2017/18
19,408,938 - - -
11Universal Healthcare in Devolved System Pro-gramme- DANIDA
12,150,000 12,150,000 6,075,000 50.0
12 Compensation for User Fee Foregone 8,788,919 8,788,919 - -
Total 797,911,034 657,302,096 133,852,921 5.2
Source: Elgeyo Marakwet County Treasury
Analysis of the revenue from conditional grants indicates that, the County received the highest percentage of receipts to annual allocation from the Kenya Urban Support project followed by the DANIDA grant. The receipt accounted for 100 per cent and 50 per cent of annual allocation respectively.
3.5.4 Exchequer IssuesTo finance the budget, the Controller of Budget approved the withdrawal of Kshs.1.88 billion from the CRF account. The withdrawal represented 37.5 per cent of the Approved Budget and translated to an increase of 40.3 per cent from Kshs.1.34 billion approved in the first half of FY 2017/18. This amount comprised of Kshs.1.50 billion (79.4 per cent) for recurrent expenditure and Kshs.387.51 million (20.6 per cent) for development activities.
3.5.5 Overall Expenditure ReviewThe County government spent a total of Kshs.1.80 billion on recurrent and development activities. The total expenditure represented 95.7 per cent of the total funds released from the CRF account and was an increase of 37.4 per cent from Kshs.1.31 billion spent in the first half of FY 2017/18. The expenditure excluded outstanding commitments as at December 31st 2018 which amounted to Kshs.436.86 million for development activities and Kshs.6 million for recurrent expenditure.
Expenditure on recurrent activities amounted to Kshs.1.48 billion while Kshs.322.14 million was spent on development activities. The recurrent expenditure was 99 per cent of the funds released for recurrent activities, while development expenditure was 83.1 per cent of funds released for development activities.
The recurrent expenditure represented 47.8 per cent of the annual recurrent budget was an increase from 44.2 per cent recorded in the first half of FY 2017/18. Development expenditure recorded an absorption rate of 16.7 per cent, which was an increase from 10.5 per cent attained in the first half of FY 2017/18. Figure 3.18 presents a comparison between the total expenditure in the first half of FY 2018/19 and the first half of FY 2017/18.
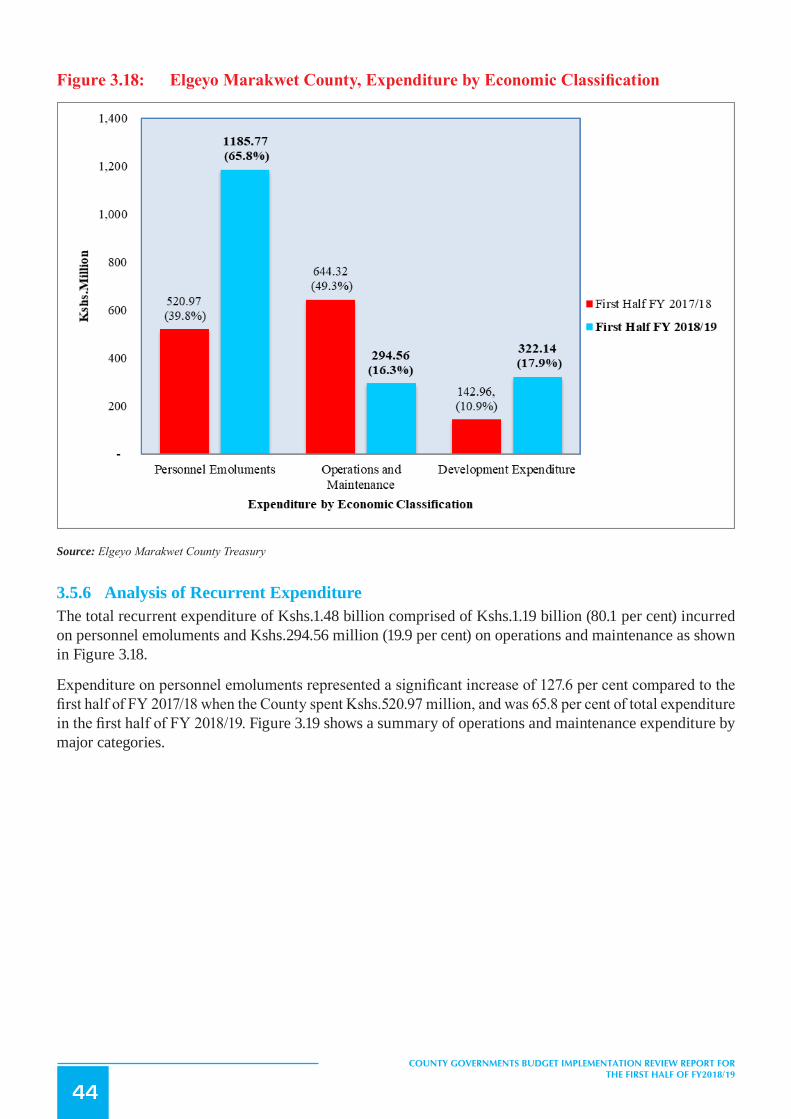
44
COUNTY GOVERNMENTS BUDGET IMPLEMENTATION REVIEW REPORT FOR THE FIRST HALF OF FY2018/19
Figure3.18: ElgeyoMarakwetCounty,ExpenditurebyEconomicClassification
Source: Elgeyo Marakwet County Treasury
3.5.6 Analysis of Recurrent ExpenditureThe total recurrent expenditure of Kshs.1.48 billion comprised of Kshs.1.19 billion (80.1 per cent) incurred on personnel emoluments and Kshs.294.56 million (19.9 per cent) on operations and maintenance as shown in Figure 3.18.
Expenditure on personnel emoluments represented a significant increase of 127.6 per cent compared to the first half of FY 2017/18 when the County spent Kshs.520.97 million, and was 65.8 per cent of total expenditure in the first half of FY 2018/19. Figure 3.19 shows a summary of operations and maintenance expenditure by major categories.

45
COUNTY GOVERNMENTS BUDGET IMPLEMENTATION REVIEW REPORT FOR THE FIRST HALF OF FY2018/19
Figure 3.19: Elgeyo Marakwet County, Operations and Maintenance Expenditure by Major Categories in the First Half of FY 2018/19
Source: Elgeyo Marakwet County Treasury
The County spent Kshs.18.35 million to cater for the MCAs’ committee sitting allowances for the 34 MCAs against the annual budget allocation of Kshs.43.10 million. This represented an increase of 140.5 per cent compared to Kshs.7.63 million spent in a similar period of FY 2017/18. The average monthly sitting allowance translated to Kshs.89,936 per MCA against the SRC’s recommended monthly ceiling of Kshs.124,800.
Expenditure on domestic travel amounted to Kshs.41.78 million and comprised of Kshs.37.63 million spent by the County Assembly and Kshs.4.15 million spent by the County Executive. This represented 0.8 per cent of total recurrent expenditure and was a significant increase of 118.9 per cent compared to Kshs.19.09 million spent in the first half of FY 2017/18.
3.5.7 Development ExpenditureThe total development expenditure of Kshs.322.14 million represented 16.7 per cent of the annual development budget of Kshs.1.92 billion. Table 3.14 provides a summary of development projects with the highest expenditure in the first half of the financial year.

46
COUNTY GOVERNMENTS BUDGET IMPLEMENTATION REVIEW REPORT FOR THE FIRST HALF OF FY2018/19
Table 3.14: Elgeyo Marakwet County, List of Development Projects with the Highest Expenditure in the FY 2018/19
S/No. Project Name Project Location Annual Project Budget (Kshs.)
First Half expen-diture (Kshs.)
Absorption Rate (%)
1 Hire of Excavator for excavating-Cut to spoil Koitilial - Matira Road
Arror Ward 3,999,975 3,999,975 100
2 Mogil Water Project Sambirir 3,995,690 3,995,690 100
3 Mogil Water Project Sambirir 3,995,690 3,995,690 100
4 Hire of lorries to dump gravel in Chepkorio Ward Roads
Chepkorio 3,285,350 3,285,350 100
5 Hire of lorries to dump gravel in Chepkorio Ward Roads
Chepkorio 3,132,050 3,132,050 100
6 Kapkitony Water Project Kabiemit 3,000,000 2,836,080 94.5
7 Nerkwo-Cheptongei-III Water Sup-ply
Moiben/ Kuserwo 2,811,700 2,811,700 100
8 Kipriria Water Project Kabiemit 3,000,000 2,730,800 91.0
9 Kapterit Water project Sengwer 4,000,000 2,601,800 65.0
10 Kapsowar Water Project Kapsowar 11,561,565 2,508,210 21.7
Source: Elgeyo Marakwet County Treasury
3.5.8 Budget Performance by County DepartmentTable 3.15 shows a summary of budget estimates and budget performance by department in the first half of FY 2018/19.
Table 3.15: Elgeyo Marakwet County, Budget Performance by Department
Department
Annual Budget Alloca-tion in FY 2018/19
(Kshs. Million)
Exchequer Issues in First Half of FY 2018/19
(Kshs. Million)
Expenditure in First Half of FY 2018/19
(Kshs. Million)
Expenditure to Exchequer Issues
(%)
Absorption Rate (%)
Rec Dev Rec Dev Rec Dev Rec Dev Rec Dev
County Assembly 566.84 - 302.64 - 299.48 - 99.0 - 52.8 -Office of the Governor 158.23 - 73.68 - 72.51 - 98.4 - 45.8 -Finance and Economic planning
212.43 - 87.76 -
87.77 - 100.0 - 41.3 -
Agriculture, and Irri-gation
108.93 231.87 46.52 61.14
45.97 19.01 98.8 31.1 42.2 8.2
Education and Tech. Training
213.67 276.64 87.51 40.52
86.86 66.07 99.3 163.1 40.7 23.9
Health and Sanitation 1,356.07 496.88 665.52 33.44 665.12 23.29 99.9 69.6 49.0 4.7
Water, Lands, Environ-ment & Climate Change
73.72 371.73 35.06 162.08
33.87 83.72 96.6 51.7 45.9 22.5
Roads, Public Works and Transport
64.5 333.80 30.12 50.68
29.42 90.70 97.7 179.0 45.6 27.2
Tourism, Culture, Wild-life, Trade & Industry
34 28.46 16.11 8.64
14.60 6.55 90.6 75.8 42.9 23

47
COUNTY GOVERNMENTS BUDGET IMPLEMENTATION REVIEW REPORT FOR THE FIRST HALF OF FY2018/19
Department
Annual Budget Alloca-tion in FY 2018/19
(Kshs. Million)
Exchequer Issues in First Half of FY 2018/19
(Kshs. Million)
Expenditure in First Half of FY 2018/19
(Kshs. Million)
Expenditure to Exchequer Issues
(%)
Absorption Rate (%)
Rec Dev Rec Dev Rec Dev Rec Dev Rec Dev
Youth Affairs, Sports, ICT & Social Services
34.91 90.63 15.52 18.21
15.17 19.96 97.7 109.6 43.5 22
Public Service Man-agement & County Administration
114.80 52.27
62.30 12.81
60.87 12.81 97.7 100 53.0 24.5
County Public Service Board
59.53 - 25.25
-22.83
-90.4
-38.4 -
Livestock Production, Fisheries & Cooperative Development
98.38 41.72
47.39-
45.88 0.02 96.8-
46.6 -
TOTAL 3,096.02 1,924.00 1,495.35 387.51 1,480.35 322.14 99.0 83.1 47.8 16.7
Source: Elgeyo Marakwet County Treasury
Analysis of the revenue from conditional grants indicate that, the County received the highest percentage of receipts to annual allocation from the Kenya Urban Support project, EU grant for IDEAS and the DANIDA grant. The receipts accounted for 100 per cent, 43.8 per cent and 34.6 per cent of annual allocation respectively.
3.5.9 Key Observations and RecommendationsThe County has made progress in addressing some of the challenges previously identified as affecting budget implementation. Some of the progress made included:
i. Timely submission of quarterly reports by the County Government entities to the Office of the Controller of Budget in line with Section 166 of the PFM Act, 2012.
ii. Improvement in absorption of development budget. In the reporting period, the County attained an absorption rate of 16.7 per cent compared to 10.5 per cent in a similar period of FY 2017/18.
iii. Improvement in own source collection by 29.6 per cent from Kshs.43.88 million in the first half of FY 2017/18 to Kshs.56.87 million in the reporting period
Despite the above progress, the following challenges continued to hamper effective budget implementation;
1. High wage bill which accounted for 65.8 per cent of the total expenditure during the reporting period thus constraining funding to other programmes.
2. Failure to budget for all conditional grants as provided for in CARA (Amendment), 2018.
The County should implement the following recommendations in order to improve budget execution;
1. The County Public Service Board should develop an optimal staffing structure and devise strategies to address the escalating wage bill.
2. The County should budget for the conditional grants as provided for in the CARA (Amendment), 2018.
3.6 Embu County
3.6.1 Overview of the FY 2018/19 BudgetThe County’s Approved Budget for FY 2018/19 is Kshs.6.44 billion, comprising of Kshs.4.51 billion (70 per cent) and Kshs.1.93 billion (30 per cent) allocation for recurrent and development expenditure respectively.

48
COUNTY GOVERNMENTS BUDGET IMPLEMENTATION REVIEW REPORT FOR THE FIRST HALF OF FY2018/19
To finance the budget, the County expects to receive Kshs.4.46 billion (69.2 per cent) as equitable share of revenue raised nationally, Kshs.1.03 billion (16 per cent) as total conditional grants and generate Kshs.950 million (14.8 per cent) from own source of revenue. The County did not budget for cash balance from FY 2017/18 in the approved budget, which amounted to Kshs.389.88 million.
Figure 3.20 : Embu County, Expected Sources of Budget Financing in FY 2018/19
Source: Embu County Treasury
The conditional grants contained in the CARA, 2018 consist of; Kshs.50 million (4.8 per cent) for Transforming Health Systems for Universal Care Project, Kshs.140.22 million (13.6 per cent) from IDA (World Bank) credit for National Agricultural and Rural Inclusive Growth Project, Kshs.40.60 million (3.9 per cent) from IDA (World Bank) credit for Kenya Devolution Support Programme “Level 1 grant”, Kshs.119.89 million (11.6 per cent) from IDA (World Bank ) credit for Kenya Urban Support Project, Kshs.13.77 million (1.3 per cent) grant from DANIDA for Universal Healthcare to Devolved System Programme, Kshs.301.04 million (29.2 per cent) to Level-5 Hospital, Kshs.10.72 million (1 per cent) Compensation for User Fees Foregone, Kshs.200 million (19.4 per cent) for Leasing of Medical Equipment, Kshs.117.40 million (11.4 per cent) from the Road Maintenance Fuel Levy Fund, and Kshs.37.90 million (3.7 per cent) for Rehabilitation of Village Polytechnics.
3.6.2 Revenue AnalysisDuring the first half of FY 2018/19, the County received Kshs.1.31 billion as equitable share of revenue raised nationally, Kshs.237.51 million as total conditional grants, raised Kshs.255.85 million from own source revenue, and had a cash balance of Kshs.389.88 million from FY 2017/18. The total available funds amounted to Kshs.2.19 billion.
Figure 3.21 shows the half yearly trend in own source revenue collection from the first half FY 2013/14 to the first half of FY 2018/19.

49
COUNTY GOVERNMENTS BUDGET IMPLEMENTATION REVIEW REPORT FOR THE FIRST HALF OF FY2018/19
Figure 3.21 : Embu County, Trend in Own Source Revenue Collection from the First Half of FY 2013/14 to the First Half of FY 2018/19
Source: Embu County Treasury
During the first half of FY 2018/19, the County generated a total of Kshs.255.85 million as own-source revenue. The own-source revenue collected during the period represented an increase from Kshs.125.77 million realised during the same period of the FY 2017/18 and represented 26.9 per cent of the annual target.
3.6.3 Conditional GrantsThe County received Kshs.237.51 million as conditional grants as shown in Table 3.16.
Table 3.16 : Embu County, Conditional Grants/Loans Received in the First Half of FY 2018/19
S/No Grants/LoansAnnual Allocation, per CARA, 2018
(Kshs)
Annual Budget Allo-cation for FY 2018/19
(Kshs)
Actual receipts in
Half Year of FY 2018/19 (in Kshs.)
Actual Receipts as Percentage of Annual Alloca-
tion (%)
A Grants Contained in the CARA, 2018
1 Level - 5 Hospital 301,040,462 301,040,462 90,229,642 30
2 Leasing of Medical Equipment 200,000,000 200,000,000 - -
3 National Agricultural and Rural Inclusive Growth Project (NARIGP) 140,435,163 140,435,163 - -
4 Kenya Urban Support Project (KUSP) 119,892,100 119,892,100 119,892,100 100
5 Road Maintenance Fuel Levy 117,396,321 117,396,321 - -
6 Transforming Health Systems for Universal Care Project (WB) 50,000,000 50,000,000 20,502,971 41
7 Kenya Devolution Support Project (KDSP) “Lev-el 1 grant” 40,595,727 40,595,727 - -
8 Rehabilitation of Village Polytechnics 37,900,000 37,900,000 - -
9 DANIDA Grant 13,770,000 13,770,000 6,885,000 50

50
COUNTY GOVERNMENTS BUDGET IMPLEMENTATION REVIEW REPORT FOR THE FIRST HALF OF FY2018/19
S/No Grants/LoansAnnual Allocation, per CARA, 2018
(Kshs)
Annual Budget Allo-cation for FY 2018/19
(Kshs)
Actual receipts in
Half Year of FY 2018/19 (in Kshs.)
Actual Receipts as Percentage of Annual Alloca-
tion (%)
10 Compensation for User Fee Foregone 10,724,225 10,724,225 - -
Total 1,031,753,998 1,031,753,998 237,509,713 23.0
Source: Embu County Treasury
Analysis of revenue from conditional grants indicated that, the County received the highest percentage of receipts to annual allocation from the Kenya Urban Support project and the DANIDA grant. The receipts accounted for 100 per cent, and 50 per cent of annual allocation respectively.
3.6.4 Exchequer IssuesTo finance the budget, the Controller of Budget approved the withdrawal of Kshs.2.04 billion from the CRF account. The withdrawals represented 31.7 per cent of the Approved Budget and translated to an increase of 28 per cent from Kshs.1.60 billion approved in the first half of FY 2017/18. This comprised of Kshs.1.77 billion (86.7 per cent) for recurrent expenditure and Kshs.271.49 million (13.3 per cent) for development activities.
3.6.5 Overall Expenditure ReviewThe County government spent a total of Kshs.1.47 billion on recurrent and development activities. The total expenditure represented 71.9 per cent of the total funds released from the CRF account and was a decline of 9.8 per cent from Kshs.1.63 billion spent in the first half of FY 2017/18. The expenditure excluded outstanding commitments as at December 31st 2018 which amounted to Kshs.833.42 million for development activities and Kshs.529.10 million for recurrent expenditure.
Expenditure on recurrent activities amounted to Kshs.1.28 billion while Kshs.187.94 million was spent on development activities. The recurrent expenditure was 72.3 per cent of the funds released for recurrent activities, while development expenditure was 69.2 per cent of funds released for development activities.
The recurrent expenditure represented 28.4 per cent of the annual recurrent budget, a decrease from 42.6 per cent recorded in the first half of FY 2017/18. Figure 3.22 presents a comparison between the total expenditure in the first half of FY 2018/19 and the first half of the FY 2017/18.

51
COUNTY GOVERNMENTS BUDGET IMPLEMENTATION REVIEW REPORT FOR THE FIRST HALF OF FY2018/19
Figure3.22: EmbuCounty,ExpenditurebyEconomicClassification
Source: Embu County Treasury
3.6.6 Analysis of Recurrent ExpenditureThe total recurrent expenditure of Kshs.1.28 billion comprised of Kshs.956.97 million (74.8 per cent) incurred on personnel emoluments and Kshs.322.55 million (25.2 per cent) on operations and maintenance as shown in Figure 3.22. The personnel emolument does not include the December 2018 salaries for the County Executive staff as this was processed and paid in January, 2019.
Expenditure on personnel emoluments represented a decrease of 32 per cent compared to the first half of FY 2017/18 when the County spent Kshs.1.42 billion, and was 65.2 per cent of total expenditure in the first half of FY 2018/19. Figure 3.23 shows a summary of operations and maintenance expenditure by major categories.

52
COUNTY GOVERNMENTS BUDGET IMPLEMENTATION REVIEW REPORT FOR THE FIRST HALF OF FY2018/19
Figure 3.23: Embu County, Operations and Maintenance Expenditure by Major Categories in the First Half of FY 2018/19
Source: Embu County Treasury
The County spent Kshs.5.95 million to cater for the MCAs’ committee sitting allowances for the 34 MCAs and the Speaker, against the annual budget allocation of Kshs.31.5 million. This represented a decline of 56 per cent compared to Kshs.13.5 million spent in a similar period of FY 2017/18. The average monthly sitting allowance translated to Kshs. 28,311 per MCA against the SRC’s recommended monthly ceiling of Kshs.124,800.
Expenditure on domestic travel amounted to Kshs.81.74 million and comprised of Kshs.61.52 million spent by the County Assembly and Kshs.20.22 million spent by the County Executive. This represented 6.4 per cent of total recurrent expenditure and was an increase of 81.2 per cent compared to Kshs.45.09 million spent in the first half of FY 2017/18.
3.6.7 Development ExpenditureThe total development expenditure of Kshs.187.94 million represented 9.7 per cent of the annual development budget of Kshs.1.93 billion. Table 3.17 provides a summary of development projects with the highest expenditure in the first half of the financial year.

53
COUNTY GOVERNMENTS BUDGET IMPLEMENTATION REVIEW REPORT FOR THE FIRST HALF OF FY2018/19
Table 3.17: Embu County, List of Development Projects with the Highest Expenditure in the FY 2018/19
S/No. Project Name Project LocationProject Expenditure in
First Half of FY 2018/19 (Kshs.)
1 Upgrading to Bitumen - Kwa Mutoi - Nduuri Road Runyenjes Central 49,288,317
2 Upgrading to Bitumen of Uchumi - Kiambuthi - Minni Inn Road Kirimari 9,957,295
3 Construction of Badea Phase 1 Kirimari 7,632,521
4 Installation of Milk Processing Equipment County Wide 3,994,750
5 Construction of Microwave Incinerator Building Kirimari 3,967,331
6 Conditional Allocation For Development of Youth Polytechnics (Vocational Training Centres Works) County Wide 3,964,319
7 Construction of Maternity at Mbondoni Dispensary Phase Two Makima 3,862,811
8 Expansion and rehabilitation of Muchonoke Earth dam Evurore 3,590,430
9 Borehole Drilling, High Raised Storage Tank/Electrification/Water Point at Malikini Market (Nhinguni - Mwea Ward ) Mwea 3,494,152
10 Proposed Construction of Kiogoma Drift Muminji Ward Muminji 3,426,567
11 Construction of Irenge Drift - Muminji Muminji 3,426,567
Source: Embu County Treasury
3.6.8 Budget Performance by County DepartmentTable 3.18 shows a summary of budget estimates and budget performance by department in the first half of FY 2018/19.
Table 3.18: Embu County, Budget Performance by Department
Department
Annual Budget Allo-cation in FY 2018/19
(Kshs. Million)
Exchequer Issues in First Half of
FY 2018/19 (Kshs. Million)
Expenditure in First Half of FY 2018/19
(Kshs. Million)
Expenditure to Exchequer Issues
(%)Absorption rate (%)
Rec Dev Rec Dev Rec Dev Rec Dev Rec Dev
Agriculture, Livestock, Fisheries & Coops 326.34 150.67 27.28 105.80 70.79 3.99 259.5 3.8 21.7 2.7
County Assembly 592.74 45.00 132.08 - 253.56 - 192 - 42.8 -
County Public Service Board 34.13 - 191.55 - 12.19 - 6.4 - 35.7 -
Education, Youth Em-powerment & Sports 559.12 185.77 23.57 - 91.90 5.46 389.8 >100 16.4 2.9
Embu Level 5 Hospital 193.92 236.53 448.39 - 58.17 16.17 13.0 >100 30.0 6.8
Finance & Economic Planning 138.54 15.97 54.03 - 10.71 - 19.8 - 7.7 -
Gender, Culture, Chil-dren and Social Services 10.86 61.14 78.34 - 2.35 - 3 - 21.6 -
Health and Sanitation 1,806.87 214.84 103.76 - 458.94 20.46 442.3 >100 25.4 9.5
Infrastructure & Public Works 67.54 615.13 12.55 - 9.11 118.84 72.6 >100 13.5 19.3
Lands, Physical Plan-ning & Urban Devpt. 58.75 137.05 9.58 - 4.12 9.72 43 >100 7.0 7.1
Office of Governor 159.37 - 127.55 - 57.44 - 45 - 36.0 -Public Service & Ad-ministration 474.45 21.06 17.82 - 233.58 - 1,310.9 - 49.2 -
Trade, Tourism & Indus-trialization 23.97 92.52 513.93 55.66 2.68 9.70 0.5 17.4 11.2 10.5
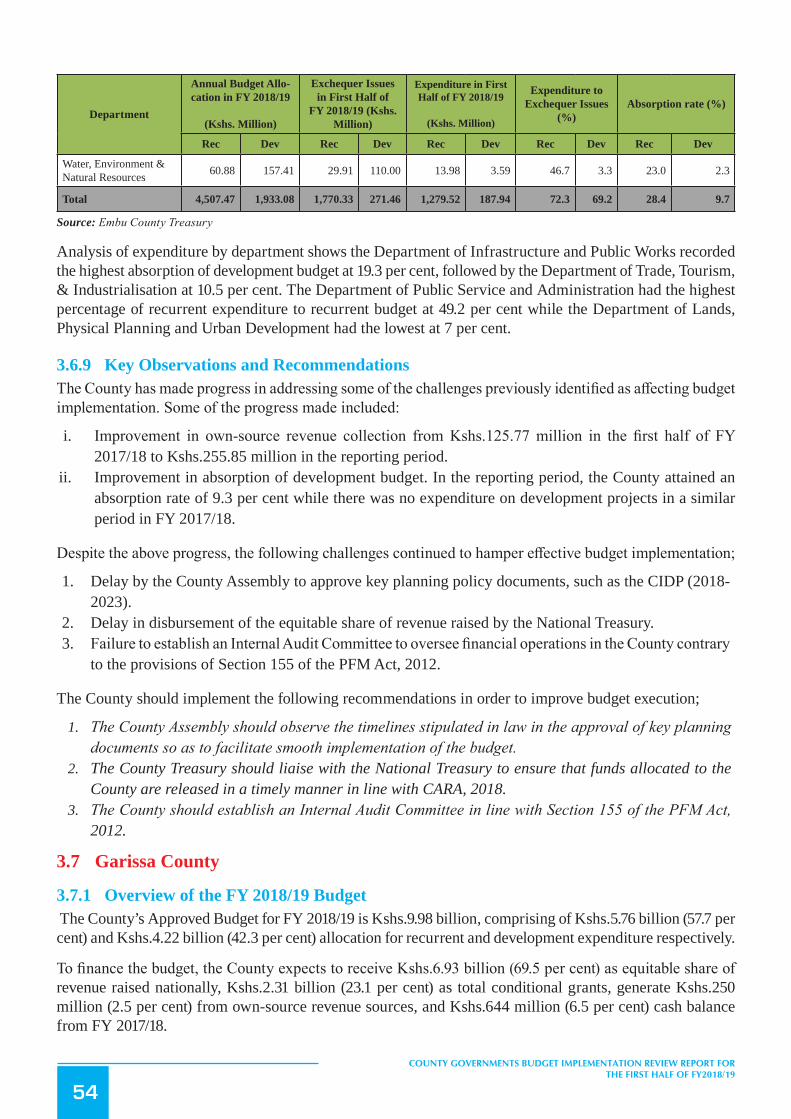
54
COUNTY GOVERNMENTS BUDGET IMPLEMENTATION REVIEW REPORT FOR THE FIRST HALF OF FY2018/19
Department
Annual Budget Allo-cation in FY 2018/19
(Kshs. Million)
Exchequer Issues in First Half of
FY 2018/19 (Kshs. Million)
Expenditure in First Half of FY 2018/19
(Kshs. Million)
Expenditure to Exchequer Issues
(%)Absorption rate (%)
Rec Dev Rec Dev Rec Dev Rec Dev Rec Dev
Water, Environment & Natural Resources 60.88 157.41 29.91 110.00 13.98 3.59 46.7 3.3 23.0 2.3
Total 4,507.47 1,933.08 1,770.33 271.46 1,279.52 187.94 72.3 69.2 28.4 9.7
Source: Embu County Treasury
Analysis of expenditure by department shows the Department of Infrastructure and Public Works recorded the highest absorption of development budget at 19.3 per cent, followed by the Department of Trade, Tourism, & Industrialisation at 10.5 per cent. The Department of Public Service and Administration had the highest percentage of recurrent expenditure to recurrent budget at 49.2 per cent while the Department of Lands, Physical Planning and Urban Development had the lowest at 7 per cent.
3.6.9 Key Observations and RecommendationsThe County has made progress in addressing some of the challenges previously identified as affecting budget implementation. Some of the progress made included:
i. Improvement in own-source revenue collection from Kshs.125.77 million in the first half of FY 2017/18 to Kshs.255.85 million in the reporting period.
ii. Improvement in absorption of development budget. In the reporting period, the County attained an absorption rate of 9.3 per cent while there was no expenditure on development projects in a similar period in FY 2017/18.
Despite the above progress, the following challenges continued to hamper effective budget implementation;
1. Delay by the County Assembly to approve key planning policy documents, such as the CIDP (2018-2023).
2. Delay in disbursement of the equitable share of revenue raised by the National Treasury.3. Failure to establish an Internal Audit Committee to oversee financial operations in the County contrary
to the provisions of Section 155 of the PFM Act, 2012.
The County should implement the following recommendations in order to improve budget execution;
1. The County Assembly should observe the timelines stipulated in law in the approval of key planning documents so as to facilitate smooth implementation of the budget.
2. The County Treasury should liaise with the National Treasury to ensure that funds allocated to the County are released in a timely manner in line with CARA, 2018.
3. The County should establish an Internal Audit Committee in line with Section 155 of the PFM Act, 2012.
3.7 Garissa County
3.7.1 Overview of the FY 2018/19 Budget The County’s Approved Budget for FY 2018/19 is Kshs.9.98 billion, comprising of Kshs.5.76 billion (57.7 per cent) and Kshs.4.22 billion (42.3 per cent) allocation for recurrent and development expenditure respectively.
To finance the budget, the County expects to receive Kshs.6.93 billion (69.5 per cent) as equitable share of revenue raised nationally, Kshs.2.31 billion (23.1 per cent) as total conditional grants, generate Kshs.250 million (2.5 per cent) from own-source revenue sources, and Kshs.644 million (6.5 per cent) cash balance from FY 2017/18.

55
COUNTY GOVERNMENTS BUDGET IMPLEMENTATION REVIEW REPORT FOR THE FIRST HALF OF FY2018/19
Figure 3.24: Garissa County Expected Sources of Budget Financing in FY 2018/19
Source: Garissa County Treasury
The conditional grants contained in the CARA, 2018 consist of; Kshs.100 million (4.3 per cent) for Transforming Health Systems for Universal Care Project, Kshs.150 million (6.5 per cent) from IDA (World Bank) for Kenya Climate Smart Agriculture Project, Kshs.47.74 million (2.1 per cent) from IDA (World Bank) credit for Kenya Devolution Support Programme “Level 1 grant”, Kshs.233.51 million (10.1 per cent) from IDA (World Bank ) credit for Kenya Urban Support Project, Kshs.22.33 million (1 per cent) grant from DANIDA for Universal Healthcare to Devolved System Programme, Kshs.1 billion (43.3 per cent from IDA (World Bank) credit for Water & Sanitation Development Project (WSDP) and, Kshs.344.74 million (14.9 per cent) to Garissa Level-5 Hospital, Kshs.12.96 million (0.6 per cent) as Compensation for User Fees Foregone, Kshs.200 million (8.7 per cent) for Leasing of Medical Equipment, Kshs.182.71 million (7.9 per cent) from Road Maintenance Fuel Levy, and Kshs.35.36 million (1.5 per cent) for Grants to Youth Polytechnics.
3.7.2 Revenue AnalysisDuring the first half of FY 2018/19, the County received Kshs.2.47 billion as equitable share of revenue raised nationally, Kshs.315.68 million as total conditional grants. In addition, the County government raised Kshs.45.47 million from own source revenue, and had a cash balance of Kshs.1.12 billion from FY 2017/18. The total available funds amounted to Kshs.3.95 billion.
Figure 3.25 shows the half yearly trend in own source revenue collection from the first half FY 2013/14 to the first half of FY 2018/19.

56
COUNTY GOVERNMENTS BUDGET IMPLEMENTATION REVIEW REPORT FOR THE FIRST HALF OF FY2018/19
Figure 3.25: Garissa County, Trend in Own Source Revenue Collection for the First Half from FY 2013/14 to FY 2018/19
Source: Garissa County Treasury
During the first half of FY 2018/19, the County generated a total of Kshs.45.46 million as own-source revenue. The own-source revenue collected during the period represented an increase of 78.7 per cent from Kshs.25.4 million realised during the same period of the FY 2017/18 and represented 18.2 per cent of the annual target.
3.7.3 Conditional GrantsThe County received Kshs.315.67 million as conditional grants as shown in Table 3.19.
Table 3.19: Garissa County, Conditional Grants/Loans Received in the First Half of FY 2018/19
S/No. Grants/LoansAnnual Allocation, per CARA, 2018
(Kshs)
Annual Budget Allocation for FY
2018/19 (Kshs)
Actual Receipts in First Half
of FY 2018/19 (Kshs)
Actual Receipts as Percentage of
Annual Allocation (%)
A Grants/Loans contained in CARA, 2018
1 Level- 5 Hospitals 344,739,884 344,739,884 15,052,023 4.4
2Transforming Health Systems for Universal Care Project- (World Bank)
100,000,000 100,000,000 107,225 0.10
3Kenya Climate Smart Agriculture Proj-ect-IDA (World Bank)
150,000,000 150,000,000 55,847,540 37.2
4Kenya Devolution Support Programme “Level 1 grant”- IDA (World Bank)
47,735,752 47,735,752 - -
5Kenya Urban Support Project- IDA (World Bank
233,506,000 233,506,000 233,506,087 100
6Universal Healthcare to Devolved System Programme- DANIDA-
22,325,625 22,325,625 11,162,813 50

57
COUNTY GOVERNMENTS BUDGET IMPLEMENTATION REVIEW REPORT FOR THE FIRST HALF OF FY2018/19
S/No. Grants/LoansAnnual Allocation, per CARA, 2018
(Kshs)
Annual Budget Allocation for FY
2018/19 (Kshs)
Actual Receipts in First Half
of FY 2018/19 (Kshs)
Actual Receipts as Percentage of
Annual Allocation (%)
A Grants/Loans contained in CARA, 2018
Total 2,329,335,255 898,307,261 315,675,687 13.6
Source: Garissa County Treasury
Analysis of the revenue from conditional grants indicates that, the County received the highest percentage of receipts to annual allocation from the Kenya Urban Support project and the DANIDA grant. The receipts accounted for 100 per cent, 50 per cent of annual allocation respectively.
3.7.4 Exchequer IssuesTo finance the budget, the Controller of Budget approved the withdrawal of Kshs 3.68 billion from the CRF account. The withdrawals represented 36.9 per cent of the Approved Budget and translate to an increase of 50.8 per cent from Kshs.2.44 billion approved in the first half of FY 2017/18. This comprised of Kshs.2.99 billion (81.3 per cent) to fund recurrent expenditure and Kshs.682.76 million (18.7 per cent) for development activities.
3.7.5 Overall Expenditure ReviewThe County government spent a total of Kshs.3.14 billion on recurrent and development activities. The total expenditure represented 85.3 per cent of the total funds released from the CRF account and was an increase of 29.8 per cent from Kshs.2.42 billion spent in the first half of FY 2017/18. The expenditure excluded outstanding commitments as at December 31st 2018 which amounted to Kshs.455.23 million for development activities and Kshs.563.56 million for recurrent expenditure.
Expenditure on recurrent activities amounted to Kshs.2.59 billion while Kshs.544.03 million was spent on development activities. The recurrent expenditure was 86.6 per cent of the funds released for recurrent activities, while development expenditure was 79.7 per cent of funds released for development activities.
The recurrent expenditure represented 44.9 per cent of the annual recurrent budget, an increase from 43.2 per cent recorded in the first half of FY 2017/18. Development expenditure recorded an absorption rate of 12.9 per cent, while there was no expenditure on development activities in a similar period of FY 2017/18. Figure 3.26 presents a comparison between the total expenditure in the first half of FY 2018/19 and the first half of the FY 2017/18.

58
COUNTY GOVERNMENTS BUDGET IMPLEMENTATION REVIEW REPORT FOR THE FIRST HALF OF FY2018/19
Figure3.26: GarissaCounty,ExpenditurebyEconomicClassification
Source: Garissa County Treasury
3.7.6 Analysis of Recurrent ExpenditureThe total recurrent expenditure of Kshs.2.59 billion comprised of Kshs.2.16 billion (83.4 per cent) incurred on personnel emoluments and Kshs.431.25 million (16.6 per cent) on operations and maintenance as shown in Figure 3.26.
Expenditure on personnel emoluments represented an increase of 52.1 per cent compared to the first half of FY 2017/18 when the County spent Kshs.1.42 billion, and was 68.9 per cent of total expenditure in the first half of FY 2018/19. Figure 3.27 shows a summary of operations and maintenance expenditure by major categories.

59
COUNTY GOVERNMENTS BUDGET IMPLEMENTATION REVIEW REPORT FOR THE FIRST HALF OF FY2018/19
Figure3.27: Garissa County, Operations and Maintenance Expenditure by Major Categories in the First Half of FY 2018/19
Source: Garissa County Treasury
The County spent Kshs.32.87 million to cater for the committee sitting allowances for the 49 MCAs’ against the annual budget allocation of Kshs.121.21 million. This represented an increase of 395 per cent compared to Kshs.6.64 million spent in a similar period of FY 2017/18. The average monthly sitting allowance translated to Kshs.111, 809 per MCA against the SRC’s recommended monthly ceiling of Kshs.124,800.
Expenditure on domestic travel amounted to Kshs.226.86 million and comprised of Kshs.60.54 million spent by the County Assembly and Kshs.166.32 million spent by the County Executive.
3.7.7 Development ExpenditureThe total development expenditure of Kshs.544.03 million represented 12.9 per cent of the annual development budget of Kshs.4.22 billion. Table 3.20 provides a summary of development projects with the highest expenditure in the first half of the financial year.

60
COUNTY GOVERNMENTS BUDGET IMPLEMENTATION REVIEW REPORT FOR THE FIRST HALF OF FY2018/19
Table 3.20: Garissa County, List of Development Projects with the Highest Expenditure in the FY 2018/19
S/No. Project Name Project LocationAnnual Project Bud-
get (Kshs.)First Half Ex-
penditure (Kshs.)Absorption Rate
(%)
1 Proposed Construction of Bura SCA Offices
Bura 67,746,378 37,501,543 55
2 Proposed Construction of Township Sub County Administration Offices
Garissa 275,521,642 35,276,035 13
3 Proposed Construction of Masalani Sub County Administration offices
Masalani 89,338,394 30,482,833 34
4 Routine maintenance of Bura-ali road Ijara 29,644,990 18,365,517 62
5 Improvement of Fafi/Ijara Road Fafi/Ijara 95,125,800 18,200,789 19
6 Augmentation of Masalani water supply
Masalani 23,963,280 11,636,291 49
7 Routine maintenance of Sankuri-Ab-disemet Road
Balambala 18,260,870 10,578,538 58
8 Routine maintenance of Sheikh Has-san-Dertu
Garissa 14,500,005 8,250,415 57
9 Routine maintenance of Gababa-Junc-tion Road
Garissa 20,018,120 7,429,311 37
10 Sankuri Water Supply Sankuri 16,105,338 6,623,540 41
Source: Garissa County Treasury
3.7.8 Budget Performance by County DepartmentTable 3.21 shows a summary of budget estimates and budget performance by department in the first half of FY 2018/19.
Table 3.21: Garissa County, Budget Performance by Department
Department
Annual Budget Allo-cation in FY 2018/19
(Kshs. Million)
Exchequer Issues in First Half of FY 2018/19 (Kshs.
Million)
Expenditure in First Half of FY 2018/19
(Kshs. Million)
Expenditure to Ex-chequer Issues (%)
Absorption Rate (%)
Rec Dev Rec Dev Rec Dev Rec Dev Rec Dev
Agriculture, Live-stock and Co-op-erative
210.27 370 163.69 82.98 159.90 70.40 97.7 84.8 76.0 19.0
Environment, Ener-gy and Natural
52.50 30 26.41 - 25.10 - 95.0 - 47.8 -
Roads and Trans-port
83.36 100 35.88 - 33.22 - 92.6 - 39.9 -
Trade, Enterprises Development and Tourism
88.94 170 55.47 54.20 54.78 50.20 98.8 92.6 61.6 29.5
Health and Sani-tation
2,161.47 520 1,154.98 - 838.24 - 72.6 - 38.8 -
Education and Labour
653.15 75.36 332.79 63.32 331.20 59.84 99.5 94.5 50.7 79.4
County Assembly 711.00 70 330.40 - 326.17 - 98.7 - 45.9 -
Executive Services 276.34 180 131.37 178.76 130.29 165.69 99.2 92.7 47.1 92.1

61
COUNTY GOVERNMENTS BUDGET IMPLEMENTATION REVIEW REPORT FOR THE FIRST HALF OF FY2018/19
Department
Annual Budget Allo-cation in FY 2018/19
(Kshs. Million)
Exchequer Issues in First Half of FY 2018/19 (Kshs.
Million)
Expenditure in First Half of FY 2018/19
(Kshs. Million)
Expenditure to Ex-chequer Issues (%)
Absorption Rate (%)
Rec Dev Rec Dev Rec Dev Rec Dev Rec Dev
Finance and Eco-nomic planning
979.72 300 286.18 - 280.72 - 98.1 - 28.7 -
Gender, Social ser-vices and sports
76.59 281 64.23 - 63.10 - 98.2 - 82.4 -
Water and Irrigation 171.61 1,680 171.33 70 165.60 52.00 96.7 74.3 96.5 3.1
Land ,Housing and Urban
244.19 443.51 178.70 233.51 170.90 145.90 95.6 62.5 70.0 32.9
County Public services Board
51.04 - 16.68 - 15.70 - 94.1 - 30.8 -
Total 5,760.18 4,219.87 2,948.11 682.77 2,594.92 544.03 88.0 79.7 45.0 12.9
Source: Garissa County Treasury
Analysis of expenditure by department shows that the Executive Services Department recorded the highest absorption rate of development budget at 92.1 per cent followed by Department of Education and Labour at 79.4 per cent. The Department of Water & Irrigation had the highest percentage of recurrent expenditure to recurrent budget at 96.5 per cent while the Department of Finance and Economic Planning had the lowest at 28.7 per cent.
3.7.9 Key Observations and RecommendationsThe County has made progress in addressing some of the challenges previously identified as affecting budget implementation. Some of the progress made included:
i. Improvement in absorption of development budget compared to a similar period of FY 2017/18.ii. Although the own source revenue represented 18.2 per cent of annual target, it was an improvement
of 78.7 per cent compared to a similar period in FY 2017/18
Despite the above progress, the following challenges continued to hamper effective budget implementation:
1. Failure to establish an Internal Audit Committee to oversee financial operations in the County contrary to Section 155 of the PFM Act, 2012.
2. High personnel emolument costs, which accounted for 68.9 per cent of total expenditure during the reporting period. A high wage bill may affect implementation of development projects.
The County should implement the following recommendations in order to improve budget execution;
1. The County should establish an Internal Audit Committee in line with Section 155 of the PFM Act, 2012.
2. The County Public Service Board should establish and implement an optimal staffing structure in order to manage the wage bill.
3.8 Homa Bay County
3.8.1 Overview of the FY 2018/19 BudgetThe County’s FY 2018/19 Approved Supplementary Budget is Kshs.7.73 billion, comprising of Kshs.4.97 billion (64.4 per cent) and Kshs 2.76 billion (35.6 per cent) allocation for recurrent and development expenditure respectively.

62
COUNTY GOVERNMENTS BUDGET IMPLEMENTATION REVIEW REPORT FOR THE FIRST HALF OF FY2018/19
To finance the budget, the County expects to receive Kshs.6.69 billion (86.5 per cent) as equitable share of revenue raised nationally, Kshs.870.9 million (11.3 per cent) as total conditional grants, generate Kshs.173 million (2.2 per cent) from own-source revenue. The County did not budget for cash balance from FY 2017/18 which amounted to Kshs.591.16 million.
Figure 3.28: Homa Bay County, Sources of Budget Financing in FY 2018/19
Source: Homa Bay County Treasury
The conditional grants contained in the CARA, 2018 consist of; include Kshs.200 million (23.2 per cent) for Leasing of Medical Equipment, Kshs.176.09 million (20.4 per cent) from the Road Maintenance Fuel Levy Fund, Kshs.140.44 million (16.3 per cent) as World Bank loan for National Agriculture and Rural Inclusive Growth Project, Kshs.119.36 million (13.8 per cent) for Kenya Urban Support Project, Kshs.85.82 million (9.9 per cent) World Bank loan for Transforming Health System for Universal Care Project, Kshs.49.5 million (5.7 per cent) for the World Bank Kenya Devolution Support Programme, Kshs.46.68 million (5.4 per cent) for Rehabilitation of Village Polytechnics, Kshs.21.87 million (2.5 per cent) grant from DANIDA for Universal Healthcare to Devolved System Programme, and Kshs.22.18 million (2.6 per cent) as Compensation for User Fee Foregone.
3.8.2 Revenue AnalysisDuring the first half of FY 2018/19, the County received Kshs.2.07 billion as equitable share of revenue raised nationally, Kshs.156.44 million as total conditional grants, raised Kshs.37.09 million from own-source revenue, and had a cash balance of Kshs.591.16 million from FY 2017/18. The total funds available for the period amounted to Kshs.2.86 billion.
Figure 3.29 shows the half yearly trend in own-source revenue collection from FY 2013/14 to FY 2018/19.
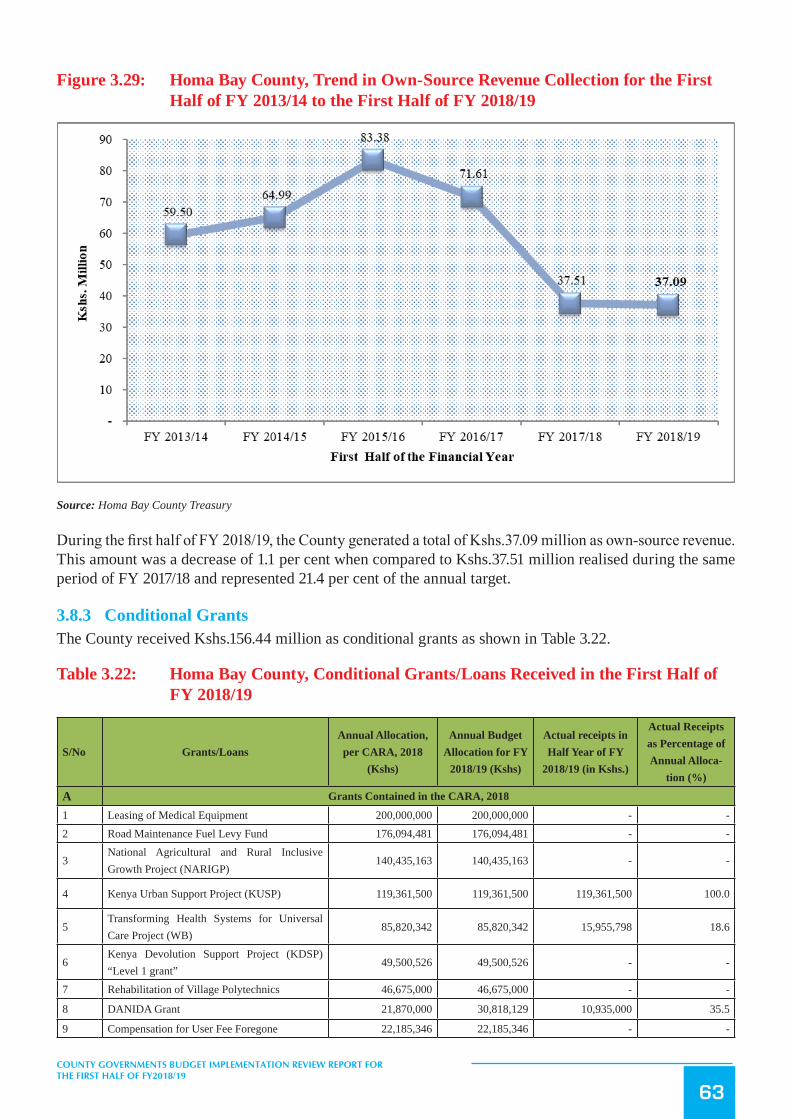
63
COUNTY GOVERNMENTS BUDGET IMPLEMENTATION REVIEW REPORT FOR THE FIRST HALF OF FY2018/19
Figure 3.29: Homa Bay County, Trend in Own-Source Revenue Collection for the First Half of FY 2013/14 to the First Half of FY 2018/19
Source: Homa Bay County Treasury
During the first half of FY 2018/19, the County generated a total of Kshs.37.09 million as own-source revenue. This amount was a decrease of 1.1 per cent when compared to Kshs.37.51 million realised during the same period of FY 2017/18 and represented 21.4 per cent of the annual target.
3.8.3 Conditional GrantsThe County received Kshs.156.44 million as conditional grants as shown in Table 3.22.
Table 3.22: Homa Bay County, Conditional Grants/Loans Received in the First Half of FY 2018/19
S/No Grants/LoansAnnual Allocation, per CARA, 2018
(Kshs)
Annual Budget Allocation for FY
2018/19 (Kshs)
Actual receipts in Half Year of FY
2018/19 (in Kshs.)
Actual Receipts as Percentage of Annual Alloca-
tion (%)
A Grants Contained in the CARA, 2018
1 Leasing of Medical Equipment 200,000,000 200,000,000 - -2 Road Maintenance Fuel Levy Fund 176,094,481 176,094,481 - -
3National Agricultural and Rural Inclusive Growth Project (NARIGP)
140,435,163 140,435,163 - -
4 Kenya Urban Support Project (KUSP) 119,361,500 119,361,500 119,361,500 100.0
5Transforming Health Systems for Universal Care Project (WB)
85,820,342 85,820,342 15,955,798 18.6
6Kenya Devolution Support Project (KDSP) “Level 1 grant”
49,500,526 49,500,526 - -
7 Rehabilitation of Village Polytechnics 46,675,000 46,675,000 - -
8 DANIDA Grant 21,870,000 30,818,129 10,935,000 35.5
9 Compensation for User Fee Foregone 22,185,346 22,185,346 - -

64
COUNTY GOVERNMENTS BUDGET IMPLEMENTATION REVIEW REPORT FOR THE FIRST HALF OF FY2018/19
S/No Grants/LoansAnnual Allocation, per CARA, 2018
(Kshs)
Annual Budget Allocation for FY
2018/19 (Kshs)
Actual receipts in Half Year of FY
2018/19 (in Kshs.)
Actual Receipts as Percentage of Annual Alloca-
tion (%)
A Grants Contained in the CARA, 2018
Sub Total 861,942,358 870,890,487 146,252,298 16.8
B Other Grants
10 UN Habitat- Nyakwere Market Upgrade - - 10,188,000 -Total 861,942,358.0 870,890,487.0 156,440,298.0 18.0
Source: Homa Bay County Treasury
Analysis of the revenue from conditional grants indicate that, the County received the highest percentage of receipts to annual allocation from the Kenya Urban Support project, EU grant for IDEAS and the DANIDA grant. The receipts accounted for 100 per cent, 43.8 per cent and 34.6 per cent of annual allocation respectively.
3.8.4 Exchequer IssuesTo finance implementation of the budget, the Controller of Budget approved withdrawal of Kshs.2.50 billion from the CRF account. The withdrawals represented 32.3 per cent of the Approved Budget and translate to an increase of 2.5 per cent from Kshs.2.43 billion approved in the first half of FY 2017/18. This comprised of Kshs.2.19 billion (87.8 per cent) to fund recurrent expenditure and Kshs.305 million (12.2 per cent) for development activities.
3.8.5 Overall Expenditure ReviewThe County government spent a total of Kshs.2.38 billion on both recurrent and development activities. This expenditure represented 95.4 per cent of the total funds released from the CRF account and was a decrease of 0.6 per cent from Kshs.2.39 billion spent in the first half of FY 2017/18. The expenditure excluded outstanding commitments as at 31st December, 2018, which amounted to Kshs.537.01 million for development activities and Kshs.52.32 million for recurrent expenditure.
Expenditure on recurrent activities amounted to Kshs.2.08 billion while that on development activities was Kshs.302.75 million. The recurrent expenditure was 94.8 per cent of the funds released for recurrent activities, while development expenditure was 99.3 per cent of funds released for development activities.
The recurrent expenditure represented 41.7 per cent of the annual recurrent budget an increase from 41.4 per cent recorded in the first half of FY 2017/18. Development expenditure recorded an absorption rate of 11.0 per cent, which was a decrease from 15.1 per cent attained in the first half of FY 2017/18. Figure 3.30 presents a comparison between the total expenditure in the first half of FY 2018/19 and the first half of the FY 2017/18.

65
COUNTY GOVERNMENTS BUDGET IMPLEMENTATION REVIEW REPORT FOR THE FIRST HALF OF FY2018/19
Figure3.30: HomaBayCounty,ExpenditurebyEconomicClassification
Source: Homa Bay County Treasury
3.8.6 Analysis of Recurrent ExpenditureThe total recurrent expenditure of Kshs.2.08 billion comprised of Kshs.1.46 billion (70.5 per cent) incurred on personnel emoluments and Kshs.613.29 million (29.5 per cent) on operations and maintenance as shown in Figure 3.30.
Expenditure on personnel emoluments represented a decrease of 6.3 per cent compared to the first half of FY 2017/18 when the County spent Kshs.1.56 billion, and was 61.5 per cent of total expenditure for the period. Figure 3.31 shows a summary of operations and maintenance expenditure by major categories.

66
COUNTY GOVERNMENTS BUDGET IMPLEMENTATION REVIEW REPORT FOR THE FIRST HALF OF FY2018/19
Figure 3.31: HomaBay County, Operations and Maintenance Expenditure by Major Categories in the First Half of FY 2018/19
Source: Homa Bay County Treasury
The County spent Kshs.15.45 million on MCAs’ committee sitting allowances for the 61 MCA against the annual budget allocation of Kshs.98.34million. This amount represented an increase of 50.9 per cent compared to Kshs.10.24 million spent in a similar period of FY 2017/18. The average monthly sitting allowance translated to Kshs.42,214 per MCA against the SRC’s recommended monthly ceiling of Kshs.124,800.
Expenditure on domestic travel amounted to Kshs.171.35 million and comprised of Kshs.53.94 million spent by the County Assembly and Kshs.117.41 million spent by the County Executive and represented 8.2 per cent of total recurrent expenditure.
3.8.7 Development ExpenditureThe total development expenditure of Kshs.302.75 million represented 11 per cent of the annual development budget of Kshs.2.76 billion. Table 3.23 provides a summary of development projects with the highest expenditure in the first half of the financial year.
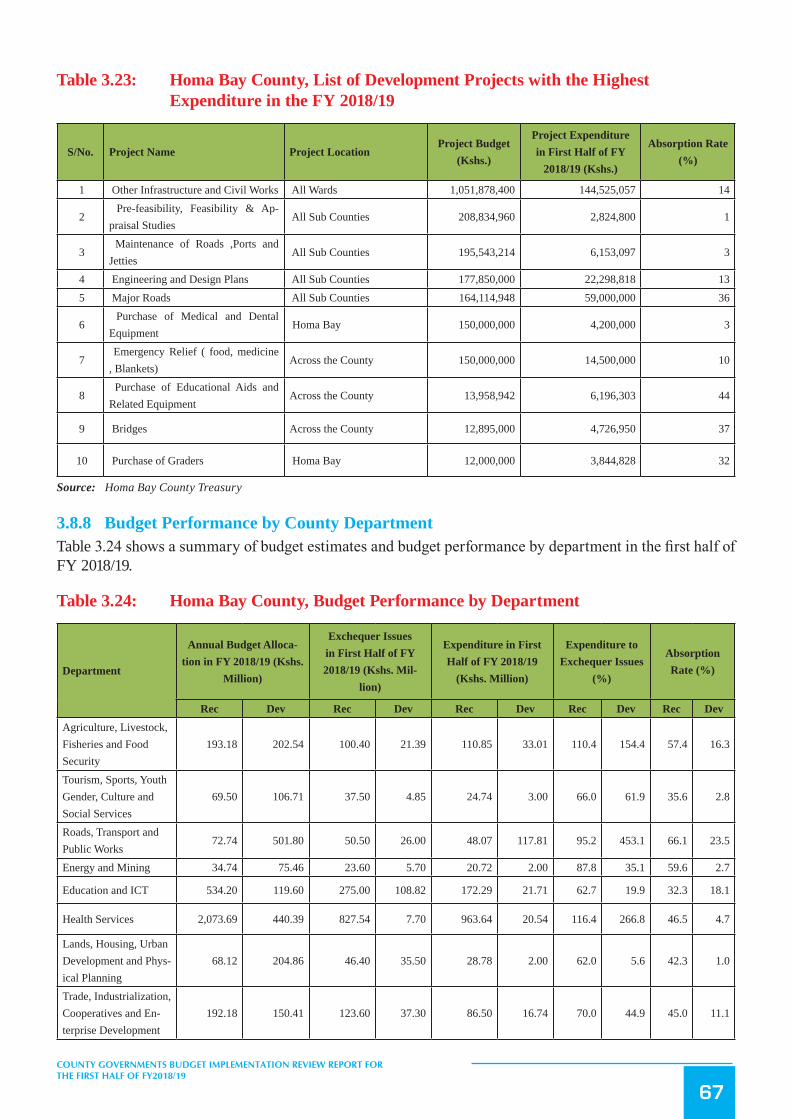
67
COUNTY GOVERNMENTS BUDGET IMPLEMENTATION REVIEW REPORT FOR THE FIRST HALF OF FY2018/19
Table 3.23: Homa Bay County, List of Development Projects with the Highest Expenditure in the FY 2018/19
S/No. Project Name Project LocationProject Budget
(Kshs.)
Project Expenditure in First Half of FY
2018/19 (Kshs.)
Absorption Rate (%)
1 Other Infrastructure and Civil Works All Wards 1,051,878,400 144,525,057 14
2 Pre-feasibility, Feasibility & Ap-praisal Studies
All Sub Counties 208,834,960 2,824,800 1
3 Maintenance of Roads ,Ports and Jetties
All Sub Counties 195,543,214 6,153,097 3
4 Engineering and Design Plans All Sub Counties 177,850,000 22,298,818 13 5 Major Roads All Sub Counties 164,114,948 59,000,000 36
6 Purchase of Medical and Dental Equipment
Homa Bay 150,000,000 4,200,000 3
7 Emergency Relief ( food, medicine , Blankets)
Across the County 150,000,000 14,500,000 10
8 Purchase of Educational Aids and Related Equipment
Across the County 13,958,942 6,196,303 44
9 Bridges Across the County 12,895,000 4,726,950 37
10 Purchase of Graders Homa Bay 12,000,000 3,844,828 32
Source: Homa Bay County Treasury
3.8.8 Budget Performance by County DepartmentTable 3.24 shows a summary of budget estimates and budget performance by department in the first half of FY 2018/19.
Table 3.24: Homa Bay County, Budget Performance by Department
Department
Annual Budget Alloca-tion in FY 2018/19 (Kshs.
Million)
Exchequer Issues in First Half of FY 2018/19 (Kshs. Mil-
lion)
Expenditure in First Half of FY 2018/19
(Kshs. Million)
Expenditure to Exchequer Issues
(%)
Absorption Rate (%)
Rec Dev Rec Dev Rec Dev Rec Dev Rec DevAgriculture, Livestock, Fisheries and Food Security
193.18 202.54 100.40 21.39 110.85 33.01 110.4 154.4 57.4 16.3
Tourism, Sports, Youth Gender, Culture and Social Services
69.50 106.71 37.50 4.85 24.74 3.00 66.0 61.9 35.6 2.8
Roads, Transport and Public Works
72.74 501.80 50.50 26.00 48.07 117.81 95.2 453.1 66.1 23.5
Energy and Mining 34.74 75.46 23.60 5.70 20.72 2.00 87.8 35.1 59.6 2.7
Education and ICT 534.20 119.60 275.00 108.82 172.29 21.71 62.7 19.9 32.3 18.1
Health Services 2,073.69 440.39 827.54 7.70 963.64 20.54 116.4 266.8 46.5 4.7
Lands, Housing, Urban Development and Phys-ical Planning
68.12 204.86 46.40 35.50 28.78 2.00 62.0 5.6 42.3 1.0
Trade, Industrialization, Cooperatives and En-terprise Development
192.18 150.41 123.60 37.30 86.50 16.74 70.0 44.9 45.0 11.1

68
COUNTY GOVERNMENTS BUDGET IMPLEMENTATION REVIEW REPORT FOR THE FIRST HALF OF FY2018/19
Department
Annual Budget Alloca-tion in FY 2018/19 (Kshs.
Million)
Exchequer Issues in First Half of FY 2018/19 (Kshs. Mil-
lion)
Expenditure in First Half of FY 2018/19
(Kshs. Million)
Expenditure to Exchequer Issues
(%)
Absorption Rate (%)
Rec Dev Rec Dev Rec Dev Rec Dev Rec DevWater, Environment and Natural Resources
152.77 311.99 98.20 57.74 61.45 32.53 62.6 56.3 40.2 10.4
Finance, Economic Planning and Service Delivery
111.15 503.12 80.40 - 62.59 24.79 77.8 - 56.3 4.9
Office of the Governor 533.92 78.00 211.00 - 238.19 28.12 112.9 - 44.6 36.1County Public Service Board
33.43 1.00 13.20 - 9.73 0.50 73.7 - 29.1 50.0
County Assembly 907.26 59.32 303 - 249.80 82.4 - 27.5 -
Total 4,976.89 2,755.20 2,190.34 305.00 2,077.36 302.75 94.8 99.3 41.7 11.0
Source: Homa Bay County Treasury
Analysis of expenditure by department shows the County Public Service Board recorded the highest absorption rate of development budget at 50 per cent while the County Assembly did not incur any development expenditure. The Department of Roads, Transport and Public Works had the highest percentage of recurrent expenditure to recurrent budget at 66.1 per cent while the County Assembly had the lowest at 27.5 per cent.
3.8.9 Key Observations and RecommendationsThe County has made progress in addressing some of the challenges previously identified as affecting budget implementation. Some of the progress made included:
i. Establishment of the County Budget and Economic Forum (CBEF) in line with Section 137 of the PFM Act, 2012.
Despite the above progress, the following challenges continued to hamper effective budget implementation;
1. Late submission of financial reports by the County Treasury, which affected timely preparation of budget implementation reports contrary to Section 166 of the PFM Act, 2012.
2. Failure by the County to budget for the unspent cash balance from FY 2017/18 of Kshs.591.16 million. This affected payment of pending bills.
3. High wage bill which accounted for 61.7 per cent of the total expenditure during the reporting period thus constraining funding to other programmes.
4. Spending of own-source revenue at source in contravention of Section 109 of the PFM Act 2012. From analysis of bank statements and expenditure returns, the Office noted that the Department of Trade, Industrialisation, Cooperatives and Enterprise Development did not bank all its revenue receipts, specifically liquor licencing fees into the CRF account.
5. Failure by the County to budget for the UN-Habitat grant of Kshs.10.19 million which was received during the reporting period.
The County should implement the following recommendations in order to improve budget execution;
1. The County Treasury should ensure timely preparation and submission of financial reports in line with Section 166 of PFM Act, 2012.
2. The County should budget for the unspent cash balance from FY 2017/18 in the Supplementary Budget.
3. The County Public Service Board should establish an optimal staffing structure in order to manage the wage bill.

69
COUNTY GOVERNMENTS BUDGET IMPLEMENTATION REVIEW REPORT FOR THE FIRST HALF OF FY2018/19
4. The County should adhere to Section 109 of the PFM Act, 2012 and bank all revenue receipts intact into the CRF account.
5. The County should budget for all revenue streams in the Supplementary Budget.
3.9 Isiolo County
3.9.1 Overview of the FY 2018/19 BudgetThe County’s FY 2018/19 Approved Supplementary Budget is Kshs.5.20 billion, comprising of Kshs.3.15 billion (60.5 per cent) and Kshs.2.05 billion (39.5 per cent) allocation for recurrent and development expenditure respectively.
To finance the budget, the County expects to receive Kshs.3.93 billion (75.5 per cent) as equitable share of revenue raised nationally, Kshs.696.97 million (13.4 per cent) as total conditional grants, generate Kshs.150.86 million (2.9 per cent) from own source of revenue, and Kshs.418.66 million (8.1 per cent) cash balance from FY 2017/18.
Figure 3.32: Isiolo County Expected Sources of Budget Financing in FY 2018/19
Source: Isiolo County Treasury
The conditional grants contained in the CARA, 2018 consist of; Kshs.66.23 million (9.8 per cent) for Transforming Health Systems for Universal Care Project, Kshs.150 million (22.3 per cent) from IDA (World Bank) for Kenya Climate Smart Agriculture Project, Kshs.38,67 million (5.7 per cent) from IDA (World Bank) credit for Kenya Devolution Support Programme “Level 1 grant”, Kshs.93.97 million (13.9 per cent) from IDA (World Bank ) credit for Kenya Urban Support Project, Kshs.12.66 million (1.9 per cent) as grant from DANIDA for Universal Healthcare to Devolved System Programme, Kshs.22.03 million (3.3 per cent) grant from Sweden Agricultural Sector Development Support Programme (ASDSP), Kshs.41.20 million (6.1 per cent) from IDA (World Bank) credit for Kenya Urban Support Project ( FY 2017/18 and 2018/19), Kshs.121 million (18 per cent) Supplement for Construction of County Headquarters, Kshs.3.47 million (0.5 per cent) as Compensation for User Fees Foregone, Kshs.103.34 million (15.3 per cent) from the Road Maintenance Fuel Levy Fund, and Kshs.21.24 million (3.2 per cent) for Rehabilitation of Village Polytechnics.

70
COUNTY GOVERNMENTS BUDGET IMPLEMENTATION REVIEW REPORT FOR THE FIRST HALF OF FY2018/19
The County also budgeted to receive Kshs.9.02 million as grant for Food and Agriculture Organization of the United Nations-Livestock grant programme, which is not contained in the CARA, 2018.
3.9.2 Revenue AnalysisDuring the first half of FY 2018/19, the County received Kshs.1.22 billion as equitable share of revenue raised nationally, Kshs.238.82 million as total conditional grants, raised Kshs.87.26 million from own source revenue, and had a cash balance of Kshs.418.66 million from FY 2017/18. The total available funds amounted to Kshs.1.96 billion.
Figure 3.33 shows the half yearly trend in own source revenue collection from the first half of FY 2013/14 to the first half of FY 2018/19.
Figure 3.33: Isiolo County, Trend in Own Source Revenue Collection to the First Half of FY 2018/19
Source: Isiolo County Treasury
During the first half of FY 2018/19, the County generated a total of Kshs.87.26 million as own-source revenue. This amount represented an increase of 62.4 per cent over the Kshs.53.73 million realised during the same period of the FY 2017/18 and was 57.8 per cent of the annual target.
3.9.3 Conditional GrantsThe County received Kshs.238.82 million as conditional grants as shown in Table 3.25.

71
COUNTY GOVERNMENTS BUDGET IMPLEMENTATION REVIEW REPORT FOR THE FIRST HALF OF FY2018/19
Table 3.25: Isiolo County, Conditional Grants/Loans Received in the First Half of FY 2018/19
S/No Grants
Annual Allocation, per CARA, 2018
(Kshs)
Annual Budget Allocation for
FY 2018/19 (Kshs)
Actual Re-ceipts in Half
Year of FY 2018/19 (Kshs.)
Actual Receipts as Percentage of Annual Alloca-
tion (%)A Grants Contained in the CARA, 2018
1 Kenya Climate Smart Agriculture Project (KCSAP) 150,000,000 150,000,000 32,966,823 222 Supplement for Construction of County Headquarters 121,000,000 121,000,000 - -3 Road Maintenance Fuel Levy 103,341,833 103,341,833 - -4 Kenya Urban Support Project (KUSP) 93,968,100 93,968,100 93,968,100 100
5Transforming Health Systems for Universal Care Proj-ect- (WB)
66,229,830 66,229,830 6,188,976
6Kenya Devolution Support Project (KDSP) “Level 1 grant”
38,668,826 38,668,826 4,853,724 12.6
7 Rehabilitation of Village Polytechnics 21,235,000 21,235,000 - -
8 DANIDA Grant 12,656,250 12,656,250 6,328,125 50
9 Compensation for User Fee Foregone 3,472,461 3,472,461 - -10 Urban Support Project- 41,200,000 41,200,000 - -
11 Road Levy Fund balance from FY2017/18 - 23,164,758 23,164,758 100
12Sweden Agricultural Sector Development Support Pro-gramme (ASDSP)
22,028,970 22,028,970 - -
Sub Total 673,801,270 696,966,028 167,470,506 24
B Other Grants
13Food and Agriculture Organization of the United Na-tions-Livestock grant
- 9,023,720 - -
14 Universal Health Care Project - - 71,349,047 -Sub Total - 9,023,720 71,349,047 -Total 673,801,270.0 705,989,748.0 238,819,553.4 33.8
Source: Isiolo County Treasury
Analysis of the revenue from conditional grants indicate that, the County received the highest percentage of receipts to annual allocation from the Kenya Urban Support project, Road Levy Fund grant and the DANIDA grant. The receipts accounted for 100 per cent, 100 per cent and 50 per cent of annual allocation respectively.
3.9.4 Exchequer IssuesTo finance the budget, the Controller of Budget approved the withdrawal of Kshs.1.38 billion from the CRF account. The withdrawals represented 26.5 per cent of the Approved Budget and translate to an increase of 37.5 per cent from Kshs.1 billion approved in the first half of FY 2017/18. This comprised of Kshs.1.30 billion (94.4 per cent) to fund recurrent expenditure and Kshs.77.19 million (5.6 per cent) for development activities.
3.9.5 Overall Expenditure ReviewThe County government spent a total of Kshs.946.39 million on recurrent activities. The total expenditure represented 68.6 per cent of the total funds released from the CRF account and was a decline of 7.3 per cent from Kshs.1.02 billion spent in the first half of FY 2017/18. The expenditure excluded outstanding commitments as at December 31st 2018 which amounted to Kshs.13.72 million for recurrent expenditure.
Expenditure on recurrent activities amounted to Kshs.946.39 million. There was no development expenditure. The recurrent expenditure was 72.7 per cent of the funds released for recurrent activities. The recurrent

72
COUNTY GOVERNMENTS BUDGET IMPLEMENTATION REVIEW REPORT FOR THE FIRST HALF OF FY2018/19
expenditure represented 30.1 per cent of the annual recurrent budget, a decrease from 34.1 per cent recorded in the first half of FY 2017/18.Figure 3.34 presents a comparison between the total expenditure in the first half of FY 2018/19 and the first half of the FY 2017/18.
Figure3.34: IsioloCounty,ExpenditurebyEconomicClassification
Source: Isiolo County Treasury
3.9.6 Analysis of Recurrent ExpenditureThe total recurrent expenditure of Kshs.946.39 million comprised of Kshs.623.83 million (65.9 per cent) incurred on personnel emoluments and Kshs.322.56 million (34.1 per cent) on operations and maintenance as shown in Figure 3.34.
Expenditure on personnel emoluments represented a decrease of 18.8 per cent compared to the first half of FY 2017/18 when the County spent Kshs.768.20 million, and was 65.9 per cent of total expenditure in the first half of FY 2018/19. Figure 3.35 shows a summary of operations and maintenance expenditure by major categories.

73
COUNTY GOVERNMENTS BUDGET IMPLEMENTATION REVIEW REPORT FOR THE FIRST HALF OF FY2018/19
Figure 3.35: Isiolo County, Operations and Maintenance Expenditure by Major Categories in the First Half of FY 2018/19
Source: Isiolo County Treasury
The County spent Kshs.11.89 million on MCAs’ committee sitting allowances for the 18 MCAs against the annual budget allocation of Kshs.26.53 million. This represented an increase of 222.3 per cent compared to Kshs.3.69 million spent in a similar period of FY 2017/18. The average monthly sitting allowance translated to Kshs.110,075 per MCA against the SRC’s recommended monthly ceiling of Kshs.124,800.
Expenditure on domestic travel amounted to Kshs.82.99 million and comprised of Kshs.36.18 million spent by the County Assembly and Kshs.46.81 million spent by the County Executive. This represented 8.8 per cent of total recurrent expenditure and was an increase of 88.8 per cent compared to Kshs.48.33 million spent in the first half of FY 2017/18.
3.9.7 Development ExpenditureThere was no development expenditure during the reporting period.
3.9.8 Budget Performance by County DepartmentTable 3.26 shows a summary of budget estimates and budget performance by department in the first half of FY 2018/19.

74
COUNTY GOVERNMENTS BUDGET IMPLEMENTATION REVIEW REPORT FOR THE FIRST HALF OF FY2018/19
Table 3.26: Isiolo County, Budget Performance by Department
Department
Annual Budget Alloca-tion in FY 2018/19 (Kshs.
Million)
Exchequer Issues in First Half of FY 2018/19 (Kshs. Mil-
lion)
Expenditure in First Half of FY 2018/19
(Kshs. Million)
Expenditure to Exchequer Issues
(%)
Absorption Rate (%)
Rec Dev Rec Dev Rec Dev Rec Dev Rec Dev County Assembly 415.28 85.00 195.00 - 160.99 - 82.6 - 38.8 - Office of the Gov-ernor
277.21 50.00 127.92 - 76.68 - 59.9 - 27.7 -
County Public Ser-vice Board
74.32 - 31.71 - 9.80 - 30.9 - 13.2 -
County Secretary 25.94 3.94 11.28 - 3.14 - 27.8 - 12.1 - Administration and PSM
125.47 29.80 17.00 - 3.32 - 19.5 - 2.6 -
Delivery Unit 10.48 - 0.68 - 0.52 - 76.5 - 5.0 - Office of the Deputy Governor
24.00 - 7.93 - 2.02 - 25.5 - 8.4 -
Cohesion, Intergov-ernmental Relations, Aid Coordination, Di-saster Management
44.54 - 19.90 - 18.57 - 93.3 - 41.7 -
Finance and Eco-nomic Planning
220.09 300.91 128.10 - 32.04 - 25.0 - 14.6 -
Special Programmes and ICT
160.06 47.45 28.13 - 13.41 - 47.7 - 8.4 -
Economic Planning 42.65 - - - 7.75 - - - 18.2 - Lands and Physical Planning
24.02 34.39 8.46 - 6.55 - 77.4 - 27.3 -
Roads and Infra-structure
15.60 205.23 4.03 23.16 3.59 - 89.1 - 23.0 -
Public Works and Housing
26.47 10.00 7.95 - 7.30 - 91.8 - 27.6 -
Municipal Adminis-tration
63.17 296.47 4.10 - 2.90 - 70.8 - 4.6 -
Agriculture 53.68 223.00 21.26 5.56 11.64 - 54.8 - 21.7 -
Livestock, Veterinary and Fisheries
102.08 74.91 47.80 - 26.60 - 55.6 - 26.1 -
Education and Voca-tional Training
225.21 89.97 76.00 32.97 66.84 - 88.0 - 29.7 -
Youth and Sports 21.95 179.50 3.43 15.50 2.41 - 70.1 - 11.0 - Culture and Social Services
19.42 17.10 6.18 - 4.18 - 67.6 - 21.5 -
Tourism and Wildlife Management
144.30 20.87 63.84 - 27.27 - 42.7 - 18.9 -
Trade, Industries, Cooperatives
25.37 6.75 10.27 - 7.58 - 73.7 - 29.9 -
Water and Irrigation 60.27 103.87 39.44 - 18.33 - 46.5 - 30.4 - Environment and Natural Resources
34.43 15.68 18.86 - 3.20 - 16.9 - 9.3 -
Health Services 910.58 259.08 422.27 - 429.79 - 101.8 - 47.2 -Total 3,146.60 2,053.91 1,301.52 77.19 946.39 - 72.7 - 30.1 -
Source: Isiolo County Treasury

75
COUNTY GOVERNMENTS BUDGET IMPLEMENTATION REVIEW REPORT FOR THE FIRST HALF OF FY2018/19
Analysis of expenditure by departments shows that the Department of Health Services had the highest percentage of recurrent expenditure to its recurrent budget at 47.2 per cent while the Department of Administration and Public Service Management had the lowest at 2.6 per cent.
3.9.9 Key Observations and RecommendationsThe County has made progress in addressing some of the challenges previously identified as affecting budget implementation. Some of the progress made included:
i. Improvement in own-source revenue collection by 62.4 per cent compared to a similar period of the FY 201718.
Despite the above progress, the following challenges continued to hamper effective budget implementation;
1. Late submission of financial reports to the Controller of Budget by the County Treasury, which affected timely preparation of budget implementation reports.
2. Delay in implementation of development projects as evidenced by failure to report any development expenditure during the first half of FY 2018/19.
3. Failure by Fund Administrators to submit expenditure reports of the County Assembly Members Car Loan Fund, and the County Bursary Funds contrary to Section 168 of the PFM Act, 2012.
4. Failure to establish an Internal Audit Committee to oversee financial operations contrary to Section 155 of PFM Act 2012.
5. Failure to constituted the County Budget and Economic Forum (CBEF) in line with Section 137 of the PFM Act, 2012 for consultation in the budget making process.
The County should implement the following recommendations in order to improve budget execution;
1. The County Treasury should ensure timely preparation and submission of financial reports in line with section 166 of PFM Act, 2012.
2. The County should prioritize implementation of the development activities.3. The Bursary and County Assembly Members Car Loan, Administrators should ensure timely
submission of expenditure reports in line with Section 168 of the PFM Act, 2012.4. The County should establish an Internal Audit Committee in line with Section 155 of the PFM Act,
2012.5. The County should establish the CBEF in line with Section 137 of the PFM Act, 2012.
3.10 Kajiado County
3.10.1 Overview of the FY 2018/19 BudgetThe Approved Budget for FY 2018/19 was Kshs.9.51 billion, comprising of Kshs.5.44 billion (57.2 per cent) and Kshs.4.07 billion (42.8 per cent) allocation for recurrent and development expenditure respectively.
To finance the budget, the County expects to receive Kshs.5.99 billion (63 per cent) as equitable share of revenue raised nationally, Kshs.732.78 million (7.7 per cent) as total conditional grants, generate Kshs.1.58 billion (16.6 per cent) from own sources, and Kshs.1.20 billion (12.6 per cent) cash balance from FY 2017/18.
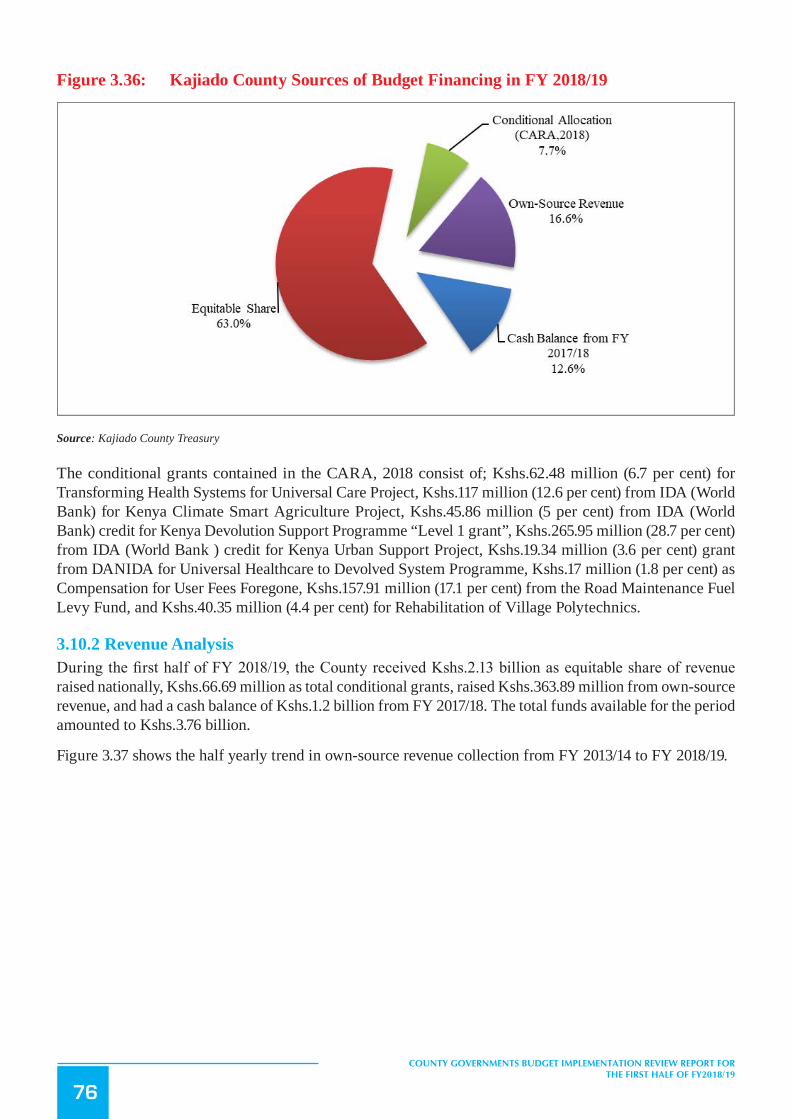
76
COUNTY GOVERNMENTS BUDGET IMPLEMENTATION REVIEW REPORT FOR THE FIRST HALF OF FY2018/19
Figure 3.36: Kajiado County Sources of Budget Financing in FY 2018/19
Source: Kajiado County Treasury
The conditional grants contained in the CARA, 2018 consist of; Kshs.62.48 million (6.7 per cent) for Transforming Health Systems for Universal Care Project, Kshs.117 million (12.6 per cent) from IDA (World Bank) for Kenya Climate Smart Agriculture Project, Kshs.45.86 million (5 per cent) from IDA (World Bank) credit for Kenya Devolution Support Programme “Level 1 grant”, Kshs.265.95 million (28.7 per cent) from IDA (World Bank ) credit for Kenya Urban Support Project, Kshs.19.34 million (3.6 per cent) grant from DANIDA for Universal Healthcare to Devolved System Programme, Kshs.17 million (1.8 per cent) as Compensation for User Fees Foregone, Kshs.157.91 million (17.1 per cent) from the Road Maintenance Fuel Levy Fund, and Kshs.40.35 million (4.4 per cent) for Rehabilitation of Village Polytechnics.
3.10.2 Revenue AnalysisDuring the first half of FY 2018/19, the County received Kshs.2.13 billion as equitable share of revenue raised nationally, Kshs.66.69 million as total conditional grants, raised Kshs.363.89 million from own-source revenue, and had a cash balance of Kshs.1.2 billion from FY 2017/18. The total funds available for the period amounted to Kshs.3.76 billion.
Figure 3.37 shows the half yearly trend in own-source revenue collection from FY 2013/14 to FY 2018/19.

77
COUNTY GOVERNMENTS BUDGET IMPLEMENTATION REVIEW REPORT FOR THE FIRST HALF OF FY2018/19
Figure 3.37: Kajiado County, Trend in Own-Source Revenue Collection for the First Half of FY 2013/14 to the First Half of FY 2018/19
Source: Kajiado County Treasury
During the first half of FY 2018/19, the County generated a total of Kshs.363.89 million from own-source revenue sources. This amount was an increase of 54.7 per cent when compared to Kshs.138.59 million realised during the same period of FY 2017/18 and represented 23 per cent of the annual target.
3.10.3 Conditional GrantsThe County received Kshs.66.69 million as conditional grants as shown in Table 3.27.
Table 3.27: Kajiado County, Conditional Grants/Loans Received in the First Half of FY 2018/19
S/No Grants Contained in the CARA, 2018Annual Alloca-
tion, per CARA, 2018 (Kshs)
Annual Budget Allocation for FY
2018/19 (Kshs)
Actual receipts in Half Year of FY
2018/19 (in Kshs.)
Actual Receipts as Percentage of Annu-
al Allocation (%)
1 Compensation for User Fee Foregone 16,995,365 16,955,365 - -
2 Leasing of Medial Equipment 200,000,000 - - -
3 Road Maintenance Fuel Levy 157,906,319 157,906,319 - -
4 Rehabilitation of Village Polytechnics 40,345,000 40,345,000 - -
5 Transforming Health Systems for Universal Care Project (WB)
62,478,710 62,478,710 15,717,778 25.2
6Kenya Climate Smart Agriculture Project (KCSAP)
117,000,000 117,000,000 34,359,919 29.4
7Kenya Devolution Support Project (KDSP) “Level 1 grant”
45,860,424 45,860,424 - -
8 Kenya Urban Support Project (KUSP) 265,950,300 265,960,300 - -
9 DANIDA Grant 19,338,750 26,277,348 16,607,973 63.2
10Agriculture Sector Development Support Pro-gramme (ASDSP)
20,305,981 - - -
Total 946,180,849 732,783,466 66,685,670 9.1
Source: Kajiado County Treasury

78
COUNTY GOVERNMENTS BUDGET IMPLEMENTATION REVIEW REPORT FOR THE FIRST HALF OF FY2018/19
Analysis of the revenue from conditional grants indicates that, the County received the highest percentage of receipts to annual allocation from the DANIDA grant which accounted for 63.2 per cent of annual allocation.
3.10.4 Exchequer IssuesTo finance implementation of the budget, the Controller of Budget approved withdrawal of Kshs.2.81 billion from the CRF account. The withdrawals represented 29.5 per cent of the Approved Budget and translate to an increase of 41.9 per cent from Kshs.1.63 billion approved in the first half of FY 2017/18. This comprised of Kshs.2.29 billion (81.7 per cent) to fund recurrent expenditure and Kshs.514.84 million (18.3 per cent) for development activities.
3.10.5 Overall Expenditure ReviewThe County government spent a total of Kshs.2.18 billion on both recurrent and development activities. This expenditure represented 77.5 per cent of the total funds released from the CRF account and was an increase of 36.1 per cent from Kshs.1.59 billion spent in the first half of FY 2017/18. The expenditure excluded outstanding commitments as at 31st December, 2018, which amounted to Kshs.77.63 million for development activities and Kshs.208.54 million for recurrent expenditure.
Expenditure on recurrent activities amounted to Kshs.1.54 billion while that on development activities was Kshs.638.14 million. The recurrent expenditure was 67.1 per cent of the funds released for recurrent activities, while development expenditure was 124 per cent of funds released for development activities.
The recurrent expenditure represented 28.3 per cent of the annual recurrent budget and was a decrease from 32.8 per cent recorded in the first half of FY 2017/18. Development expenditure recorded an absorption rate of 15.7 per cent, which was an increase from 9 per cent attained in the first half of FY 2017/18. Figure 3.38 presents a comparison between the total expenditure in the first half of FY 2018/19 and the first half of the FY 2017/18.
Figure3.38: KajiadoCounty,ExpenditurebyEconomicClassification
Source: Kajiado County Treasury
3.10.6 Analysis of Recurrent ExpenditureThe total recurrent expenditure of Kshs.1.54 billion comprised of Kshs.774.57 million (50.3 per cent) incurred on personnel emoluments and Kshs.763.98 million (49.7 per cent) on operations and maintenance as shown in Figure 3.38.
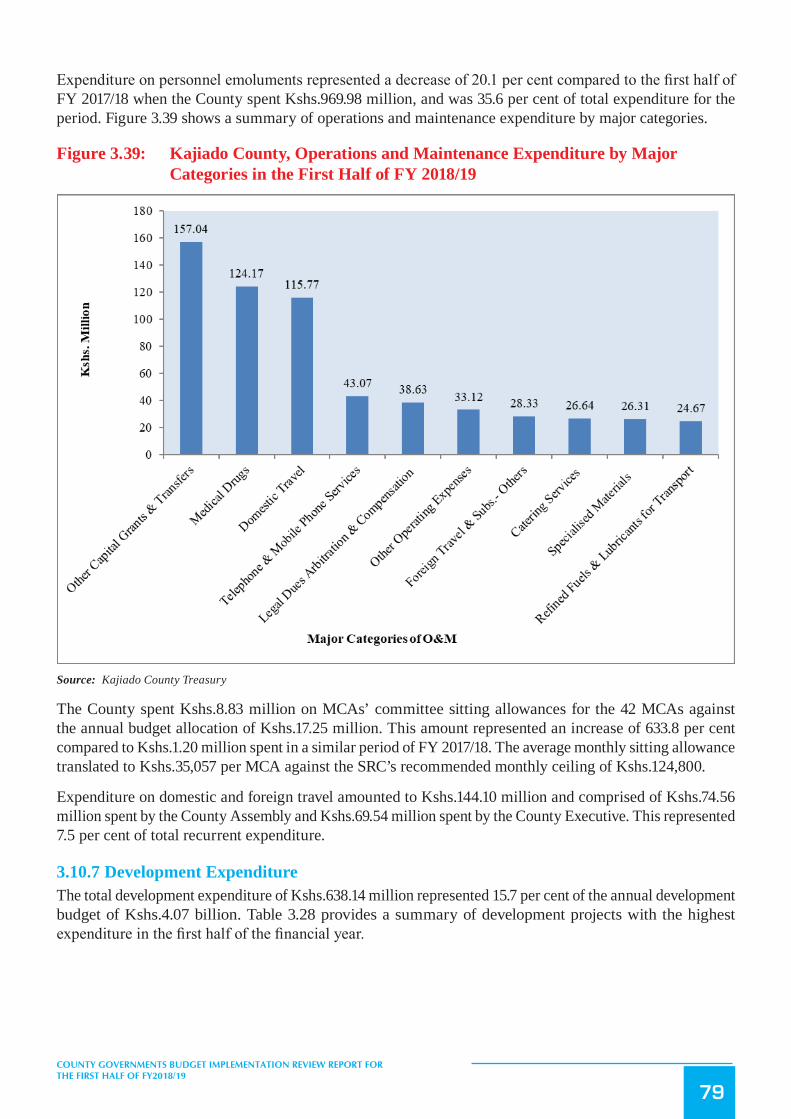
79
COUNTY GOVERNMENTS BUDGET IMPLEMENTATION REVIEW REPORT FOR THE FIRST HALF OF FY2018/19
Expenditure on personnel emoluments represented a decrease of 20.1 per cent compared to the first half of FY 2017/18 when the County spent Kshs.969.98 million, and was 35.6 per cent of total expenditure for the period. Figure 3.39 shows a summary of operations and maintenance expenditure by major categories.
Figure 3.39: Kajiado County, Operations and Maintenance Expenditure by Major Categories in the First Half of FY 2018/19
Source: Kajiado County Treasury
The County spent Kshs.8.83 million on MCAs’ committee sitting allowances for the 42 MCAs against the annual budget allocation of Kshs.17.25 million. This amount represented an increase of 633.8 per cent compared to Kshs.1.20 million spent in a similar period of FY 2017/18. The average monthly sitting allowance translated to Kshs.35,057 per MCA against the SRC’s recommended monthly ceiling of Kshs.124,800.
Expenditure on domestic and foreign travel amounted to Kshs.144.10 million and comprised of Kshs.74.56 million spent by the County Assembly and Kshs.69.54 million spent by the County Executive. This represented 7.5 per cent of total recurrent expenditure.
3.10.7 Development ExpenditureThe total development expenditure of Kshs.638.14 million represented 15.7 per cent of the annual development budget of Kshs.4.07 billion. Table 3.28 provides a summary of development projects with the highest expenditure in the first half of the financial year.

80
COUNTY GOVERNMENTS BUDGET IMPLEMENTATION REVIEW REPORT FOR THE FIRST HALF OF FY2018/19
Table 3.28: Kajiado County, List of Development Projects with the Highest Expenditure in the FY 2018/19
S/No. Project Name Project LocationProject Budget
(Kshs.)
Project Expenditure in First Half of FY
2018/19 (Kshs.)
Absorption Rate (%)
1 Construction of Ngong Sport Complex Ngong 198,464,940 16,000,096 8
2 Maternity Wing and Wards at Kajiado Referral Hospital
Ildamat 66,467,983 21,621,588 33
3 Construction of Dining Hall at Olkejuado High School
Dalalekutuk 36,980,846 13,102,432 35
4 Fencing of TARDA Farm in Emali Kenyewa/Poka 29,575,082 15,887,638 545 Ongata Rongai Town Road Ongata Rongai 18,493,648 10,710,280 586 World Medical Relief HQ 14,308,812 14,308,812 100
7 Supply and Deliver of GIS and Related Equipment
HQ 13,007,792 13,007,792 100
8 Construction of Kajiado Market Ildamat 12,947,108 9,812,672 76
9 Olgumi Box Culvert Oloosirkon/Sholinke 9,976,568 9,976,568 100
10 Perimeter Fence at Kitengela Stadium Oloosirkon/Sholinke 9,838,888 9,838,888 100
Source: Kajiado County Treasury
3.10.8 Budget Performance by County DepartmentTable 3.29 shows a summary of budget estimates and budget performance by department in the first half of FY 2018/19.
Table 3.29: Kajiado County, Budget Performance by Department
Department
Annual Budget Allo-cation in FY 2018/19
(Kshs. Million)
Exchequer Issues in First Half of FY 2018/19 (Kshs. Mil-lion)
Expenditure in First Half of FY 2018/19 (Kshs.
Million)
Expenditure to Exchequer Issues
(%)
Absorption Rate (%)
Rec Dev Rec Dev Rec Dev Rec Dev Rec DevOffice of the Governor & Deputy Governor
303.58 - 123.36 - 82.82 - 67.1 - 27.3 -
County Public Service Board
98.85 - 43.93 - 19.81 - 45.1 - 20.0 -
Education & Voca-tional Training
453.56 291.85 220.56 51.71 120.59 14.50 54.7 28.0 26.6 5.0
Medical Services, Public Health & Sanitation
1,986.38 386.50 878.17 36.96 560.15 24.50 63.8 66.3 28.2 6.3
Youth, Sports, Gender & Social Services
145.98 31.50 33.88 - 48.45 - 143.0 - 33.2 -
Agriculture, Live-stock, Fisheries & Cooperative Devel-opment
340.50 266.00 198.36 29.57 80.15 - 40.4 - 23.5 -
Water, Irrigation, Environment & Natural Resources
198.30 371.00 111.92 35.55 58.64 - 52.4 - 29.6 -

81
COUNTY GOVERNMENTS BUDGET IMPLEMENTATION REVIEW REPORT FOR THE FIRST HALF OF FY2018/19
Department
Annual Budget Allo-cation in FY 2018/19
(Kshs. Million)
Exchequer Issues in First Half of FY 2018/19 (Kshs. Mil-lion)
Expenditure in First Half of FY 2018/19 (Kshs.
Million)
Expenditure to Exchequer Issues
(%)
Absorption Rate (%)
Rec Dev Rec Dev Rec Dev Rec Dev Rec DevRoads, Transport, Public Works, Hous-ing & Energy
144.21 831.91 79.69 66.11 42.81 - 53.7 - 29.7 -
Public Service, Administration & Citizen Participation
438.87 30.00 117.50 - 69.37 3.36 59.0 - 15.8 11.2
County Treasury 551.74 1,259.44 156.74 244.68 151.11 543.91 96.4 222.3 27.4 43.2Trade, Culture, Tourism & Wildlife
76.28 103.50 24.98 9.81 15.50 10.04 62.0 102.3 20.3 9.7
Lands & Physical Planning
79.01 397.96 27.08 - 15.71 - 58.0 - 19.9 -
County Assembly 627.13 100 277.60 40.44 279.32 41.83 100.6 103.4 44.5 41.8Total 5444.39 4,069.65 2,293.78 514.84 1,544.43 638.14 67.3 124.0 28.4 15.7
Source: Kajiado County Treasury
Analysis of expenditure by department shows that the County Treasury recorded the highest absorption rate of development budget at 43.2 per cent followed by the Department of Public Service, Science Administration & Citizen Participation at 11.2 per cent. The County Assembly had the highest percentage of recurrent expenditure to recurrent budget at 44.5 per cent while the Department of Public Service, Administration & Citizen Participation had the lowest at 15.8 per cent.
3.10.9 Key Observations and RecommendationsThe County has made progress in addressing some of the challenges previously identified as affecting budget implementation. Some of the progress made included:
i. Improvement in own source revenue collection by over 100 per cent from Kshs.164.84 million generated in the first half of FY 2017/18 to Kshs.363.89 million in the reporting period.
ii. Improvement in the absorption of development budget compared to a similar period in FY 2017/18.
Despite the above progress, the following challenges continued to hamper effective budget implementation;
1. The County has not constituted the County Budget and Economic Forum (CBEF) as required by Section 137 of the PFM Act, 2012 for consultation in the budget process.
2. Failure to designate Fund Administrators for the county funds contrary to Section 116 of the PFM Act, 2012 which has led to delays in submission of expenditure reports contrary to Section 168 of the PFM Act, 2012.
3. Failure to budget for all conditional grants as per CARA, 2018.The County should implement the following recommendations in order to improve budget execution;
1. The County should establish an effective CBEF in line with Section 137 of the PFM Act, 2012.2. The County Executive Committee Member for Finance should designate Administrators for the
County Funds in line with Section 116 of the PFM Act, 2012 and also ensure timely submission of expenditure reports in line with Section 168 of the PFM Act, 2012.
3. The County should prepare a Supplementary Budget to align conditional grants to the CARA, 2018.

82
COUNTY GOVERNMENTS BUDGET IMPLEMENTATION REVIEW REPORT FOR THE FIRST HALF OF FY2018/19
3.11 Kakamega County
3.11.1 Overview of the FY 2018/19 BudgetThe County’s Approved Budget for FY 2018/19 is Kshs.14.51 billion, comprising of Kshs.7.50 billion (51.7 per cent) and Kshs.7.01 billion (48.3 per cent) allocation for recurrent and development expenditure respectively.
To finance the budget, the County expects to receive Kshs.10.33 billion (71.2 per cent) as equitable share of revenue raised nationally, Kshs.1.51 billion (10.4 per cent) as total conditional grants, generate Kshs.1.04 billion (7.2 per cent) from own sources, Kshs.14.43 million (0.1 per cent) in other revenues and Kshs.1.61 billion (11.1 per cent) cash balance from FY 2017/18.
Figure 3.40: Kakamega County Sources of Budget Financing in FY 2018/19
Source: Kakamega County Treasury
The conditional grants contained in the CARA, 2018 consist of; Kshs.100.00 million (5.4 per cent) for Transforming Health Systems for Universal Care Project, Kshs.117 million (6.3 per cent) from IDA (World Bank) for Kenya Climate Smart Agriculture Project, Kshs.63.51 million (3.4 per cent) from IDA (World Bank) credit for Kenya Devolution Support Programme “Level 1 grant”, Kshs.389.12 million (21 per cent) from IDA (World Bank ) as credit for Kenya Urban Support Project, Kshs.33.31 million (1.8 per cent) grant from DANIDA for Universal Healthcare to Devolved System Programme, Kshs.427.28 million (23 per cent) to Level-5 Hospital, Kshs.37.79 million (2 per cent) as Compensation for User Fees Foregone, Kshs.272 million (14.7 per cent) from the Road Maintenance Fuel Levy Fund, and Kshs.69.91 million (4.6 per cent) for Rehabilitation of Village Polytechnics.
In addition, the County budgeted to receive Kshs.14.43 million as grant for Kenya Agricultural Support Programme (KASP), which is not contained in the CARA, 2018.
3.11.2 Revenue AnalysisDuring the first half of FY 2018/19, the County received Kshs.3.20 billion as equitable share of revenue raised nationally, Kshs.675.37 million as total conditional grants, raised Kshs.212.93 million from own-source revenue, and had a cash balance of Kshs.1.3 billion from FY 2017/18. The total funds available for the period amounted to Kshs.5.39 billion.

83
COUNTY GOVERNMENTS BUDGET IMPLEMENTATION REVIEW REPORT FOR THE FIRST HALF OF FY2018/19
Figure 3.41 shows the half yearly trend in own-source revenue collection from FY 2013/14 to FY 2018/19.
Figure 3.41: Kakamega County, Trend in Own-Source Revenue Collection for the First Half of FY 2013/14 to the First Half of FY 2018/19
Source: Kakamega County Treasury
During the first half of FY 2018/19, the County generated a total of Kshs.212.93 million from own-source revenue sources. This amount was an increase of 61.3 per cent when compared to Kshs.132 million realised during the same period of FY 2017/18 and represented 20.4 per cent of the annual target.
3.11.3 Conditional GrantsThe County received Kshs.675.37 million as conditional grants as shown in Table 3.30.
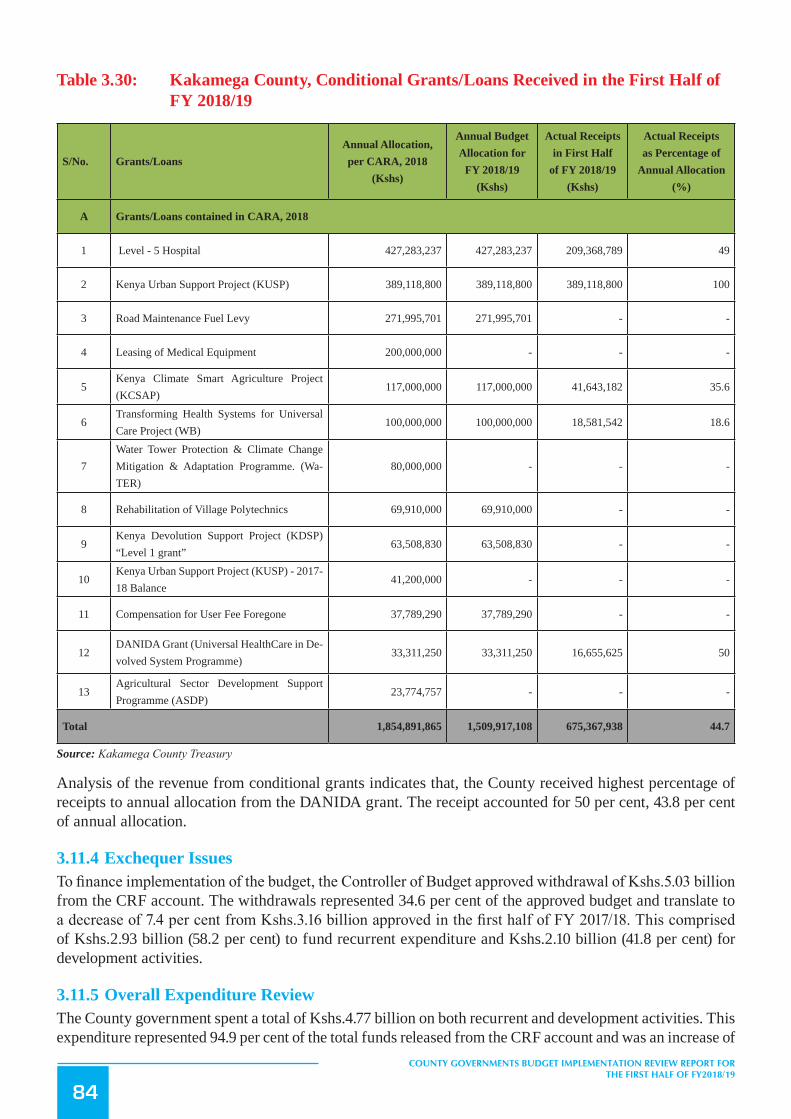
84
COUNTY GOVERNMENTS BUDGET IMPLEMENTATION REVIEW REPORT FOR THE FIRST HALF OF FY2018/19
Table 3.30: Kakamega County, Conditional Grants/Loans Received in the First Half of FY 2018/19
S/No. Grants/LoansAnnual Allocation, per CARA, 2018
(Kshs)
Annual Budget Allocation for
FY 2018/19 (Kshs)
Actual Receipts in First Half
of FY 2018/19 (Kshs)
Actual Receipts as Percentage of
Annual Allocation (%)
A Grants/Loans contained in CARA, 2018
1 Level - 5 Hospital 427,283,237 427,283,237 209,368,789 49
2 Kenya Urban Support Project (KUSP) 389,118,800 389,118,800 389,118,800 100
3 Road Maintenance Fuel Levy 271,995,701 271,995,701 - -
4 Leasing of Medical Equipment 200,000,000 - - -
5Kenya Climate Smart Agriculture Project (KCSAP)
117,000,000 117,000,000 41,643,182 35.6
6Transforming Health Systems for Universal Care Project (WB)
100,000,000 100,000,000 18,581,542 18.6
7Water Tower Protection & Climate Change Mitigation & Adaptation Programme. (Wa-TER)
80,000,000 - - -
8 Rehabilitation of Village Polytechnics 69,910,000 69,910,000 - -
9Kenya Devolution Support Project (KDSP) “Level 1 grant”
63,508,830 63,508,830 - -
10Kenya Urban Support Project (KUSP) - 2017-18 Balance
41,200,000 - - -
11 Compensation for User Fee Foregone 37,789,290 37,789,290 - -
12DANIDA Grant (Universal HealthCare in De-volved System Programme)
33,311,250 33,311,250 16,655,625 50
13Agricultural Sector Development Support Programme (ASDP)
23,774,757 - - -
Total 1,854,891,865 1,509,917,108 675,367,938 44.7
Source: Kakamega County Treasury
Analysis of the revenue from conditional grants indicates that, the County received highest percentage of receipts to annual allocation from the DANIDA grant. The receipt accounted for 50 per cent, 43.8 per cent of annual allocation.
3.11.4 Exchequer IssuesTo finance implementation of the budget, the Controller of Budget approved withdrawal of Kshs.5.03 billion from the CRF account. The withdrawals represented 34.6 per cent of the approved budget and translate to a decrease of 7.4 per cent from Kshs.3.16 billion approved in the first half of FY 2017/18. This comprised of Kshs.2.93 billion (58.2 per cent) to fund recurrent expenditure and Kshs.2.10 billion (41.8 per cent) for development activities.
3.11.5 Overall Expenditure ReviewThe County government spent a total of Kshs.4.77 billion on both recurrent and development activities. This expenditure represented 94.9 per cent of the total funds released from the CRF account and was an increase of

85
COUNTY GOVERNMENTS BUDGET IMPLEMENTATION REVIEW REPORT FOR THE FIRST HALF OF FY2018/19
15.7 per cent from Kshs.4.12 billion spent in the first half of FY 2017/18. The expenditure excluded outstanding commitments as at 31st December, 2018, which amounted to Kshs.147.42 million for development activities and Kshs.110 million for recurrent expenditure.
Expenditure on recurrent activities amounted to Kshs.3.18 billion while that on development activities was Kshs.1.59 billion. The recurrent expenditure was 108.7 per cent of the funds released for recurrent activities, while development expenditure was 75.7 per cent of funds released for development activities.
The recurrent expenditure represented 42.4 per cent of the annual recurrent budget and was a decrease from 48 per cent recorded in the first half of FY 2017/18. Development expenditure recorded an absorption rate of 22.7 per cent, which was an increase from 13.4 per cent attained in the first half of FY 2017/18. Figure 3.42 presents a comparison between the total expenditure in the first half of FY 2018/19 and the first half of FY 2017/18.
Figure3.42: KakamegaCounty,ExpenditurebyEconomicClassification
Source: Kakamega County Treasury
3.11.6 Analysis of Recurrent ExpenditureThe total recurrent expenditure of Kshs.3.18 billion comprised of Kshs.2.57 billion (80.7 per cent) incurred on personnel emoluments and Kshs.613.77 million (19.3 per cent) on operations and maintenance as shown in Figure 3.42.
Expenditure on personnel emoluments represented a decrease of 4.5 per cent compared to the first half of FY 2017/18 when the County spent Kshs.2.69 billion, and was 53.8 per cent of total expenditure for the period. Figure 3.43 shows a summary of operations and maintenance expenditure by major categories.

86
COUNTY GOVERNMENTS BUDGET IMPLEMENTATION REVIEW REPORT FOR THE FIRST HALF OF FY2018/19
Figure 3.43: Kakamega County, Operations and Maintenance Expenditure by Major Categories in the First Half of FY 2018/19
Source: Kakamega County Treasury
The County spent Kshs.66.90 million on MCAs’ committee sitting allowances for the 90 MCAs against the annual budget allocation of Kshs.134.78 million. This amount represented an increase of 17.1 per cent compared to Kshs.57.12 million spent in a similar period of FY 2017/18. The average monthly sitting allowance translated to Kshs.123,884 per MCA against the SRC’s recommended monthly ceiling of Kshs.124,800.
Expenditure on domestic travel amounted to Kshs.131.85 million and comprised of Kshs.77.84 million spent by the County Assembly and Kshs.54.01 million spent by the County Executive. This represented 4.1 per cent of total recurrent expenditure and was an increase of 54.9 per cent compared to Kshs.91.54 million spent in the first half of FY 2017/18.
3.11.7 Development ExpenditureThe total development expenditure of Kshs.1.59 billion represented 22.7 per cent of the annual development budget of Kshs.7.01 billion. Table 3.31 provides a summary of development projects with the highest expenditure in the first half of the financial year.

87
COUNTY GOVERNMENTS BUDGET IMPLEMENTATION REVIEW REPORT FOR THE FIRST HALF OF FY2018/19
Table 3.31: Kakamega County, List of Development Projects with the Highest Expenditure in the FY 2018/19
S/No. Project name Project LocationAnnual Project Budget (Kshs.)
Half Year Expenditure (Kshs.)
Absorption rate (%)
1 Bitumen Road Spread across the county 520,000,000 365,473,361 70.32 10 km per ward roads-Ward based Spread across the county 300,000,000 202,365,990 67.53 Kakamega Teaching and Referral Kakamega Town 400,000,000 165,103,722 41.34 Road Maintenance Fuel Levy Fund Spread across the county 271,995,701 99,369,039 36.55 Enterprise Resource Planning System Headquarters 88,000,000 80,600,663 91.66 ECD Centres-ward based Spread across the county 215,000,000 67,989,488 31.67 Electrification-ward based Spread across the county 130,000,000 60,861,000 46.8
8Imarisha Afya ya Mama na Mtoto Pro-gramme
Spread across the county 100,000,000 60,000,000 60.0
9 Bukhungu Stadium Kakamega Town 400,000,000 56,002,157 14.010 Bridges Spread across the county 72,000,000 44,269,814 61.5
Source: Kakamega County Treasury
3.11.8 Budget Performance by County DepartmentTable 3.32 shows a summary of budget estimates and budget performance by department in the first half of FY 2018/19.
Table 3.32: Kakamega County, Budget Performance by Department
Department
Annual Budget Allo-cation in FY 2018/19
(Kshs. Million)
Exchequer Issues in First Half of FY 2018/19 (Kshs. Million)
Expenditure in First Half of FY 2018/19 (Kshs.
Million)
Expenditure to Exchequer
Issues (%)
Absorption Rate (%)
Rec Dev Rec Dev Rec Dev Rec Dev Rec Dev
Office of the Gov-ernor
200.58 93.00 95.41 2.79 72.40 2.79 75.9 100.0 36.1 3
Public Service and Administration
5,209.01 159.51 2,032.96 33.94 2,394.11 17.29 117.8 50.9 46.0 10.8
County Treasury and Economic Planning
233.19 205.00 81.45 60.06 40.94 27.71 50.3 46.1 17.6 13.5
Environment, Natu-ral Resources, Water & Forestry
41.56 361.00 5.90 20.35 9.19 20.21 155.7 99.3 22.1 5.6
Labour, Social Services, Youth and Sports
45.31 511.00 16.20 62.02 13.05 62.58 80.6 100.9 28.8 12.2
Transport, Infrastruc-ture & Public Works
44.93 1,598.00 11.88 1,016.93 3.32 772.34 27.9 75.9 7.4 48.3
Lands, Housing, Urban Areas and Physical Planning
136.07 566.62 50.27 22.04 30.98 13.91 61.6 63.1 22.8 2.5
Health Services 382.95 1,470.00 174.45 555.79 144.14 335.95 82.6 60.4 37.6 22.9
Agriculture, Live-stock, Fisheries and Cooperatives
61.38 701.43 9.39 92.40 13.34 86.44 142.1 93.5 21.7 12.3
Industrialization, Trade and Tourism
27.42 365.00 3.75 40.84 3.97 51.60 105.8 126.3 14.5 14.1

88
COUNTY GOVERNMENTS BUDGET IMPLEMENTATION REVIEW REPORT FOR THE FIRST HALF OF FY2018/19
Department
Annual Budget Allo-cation in FY 2018/19
(Kshs. Million)
Exchequer Issues in First Half of FY 2018/19 (Kshs. Million)
Expenditure in First Half of FY 2018/19 (Kshs.
Million)
Expenditure to Exchequer
Issues (%)
Absorption Rate (%)
Rec Dev Rec Dev Rec Dev Rec Dev Rec Dev
Education, Science & Technology & ICT
34.15 782.91 10.75 109.77 7.23 118.00 67.3 107.5 21.2 15.1
Public service Board 29.82 - 15.00 - 22.08 147.2 - 74.0 -
ICT, E-government & Communication
54.20 145 12.39 83.01 16.86 80.60 136.1 97.1 31.1 55.6
County Assembly 998.72 50.00 405.72 - 418.46 - 103.1 - 41.9 -
TOTAL 7,499.28 7,008.47 2,925.51 2,099.94 3,190.07 1,589.42 109.0 75.7 42.5 22.7
Source: Kakamega County Treasury
Analysis of expenditure by department shows that the Department of ICT, E-Government and Communication recorded the highest absorption rate of development budget at 55.6 per cent while the County Assembly did not have expenditure on development activities. The Public Service Board had the highest percentage of recurrent expenditure to its recurrent budget at 74.0 per cent while the Department of Transport, Infrastructure & Public Works had the lowest at 7.4 per cent.
3.11.9 Key Observations and RecommendationsThe County has made progress in addressing some of the challenges previously identified as affecting budget implementation. Some of the progress made included:
i. Improvement in the collection of own-source revenue, which was 61.3 per cent higher than that attained in a similar period of FY 2017/18.
ii. Improvement in absorption of development budget, which stood at 22.7 per cent as compared to 13.4 per cent in a similar period FY 2017/18.
Despite the above progress, the following challenges continued to hamper effective budget implementation;
1. Delay in disbursement of the equitable share of revenue by the National Treasury.2. Failure by Fund Administrators to submit expenditure reports on the Car Loan and Mortgage Fund,
Bursary and Scholarship Fund, and Imarisha Maisha ya Mama na Mtoto Fund contrary to Section 168 of the PFM Act, 2012.
The County should implement the following recommendations in order to improve budget execution;
1. The County Treasury should liaise with the National Treasury to ensure that funds allocated to the County are released in a timely manner in line with CARA 2018.
2. Fund Administrators of the Car Loan and Mortgage Fund, Bursary and Scholarship Fund, and the Imarisha Maisha ya Mama na Mtoto Fund should ensure timely submission of expenditure reports in line with Section 168 of the PFM Act, 2012.
3.12 Kericho County
3.12.1 Overview of the FY 2018/19 BudgetThe County’s Approved Budget for FY 2018/19 is Kshs.7.18 billion, comprising of Kshs.4.52 billion (62.9 per cent) and Kshs.2.67 billion (37.1 per cent) allocation for recurrent and development expenditure respectively.

89
COUNTY GOVERNMENTS BUDGET IMPLEMENTATION REVIEW REPORT FOR THE FIRST HALF OF FY2018/19
To finance the budget, the County expects to receive Kshs.5.71 billion (79.5 per cent) as equitable share of revenue raised nationally, Kshs.706.38 million (9.8 per cent) as total conditional grants, and generate Kshs.762.94 million (10.6 per cent) from own source revenue. The County did not budget for cash balance from FY 2017/18 which amounted to Kshs.1.13 billion.
Figure 3.44: Kericho County Sources of Budget Financing in FY 2018/19
Source: Kericho County Treasury
The conditional grants contained in the CARA, 2018 consist of; Kshs.256.30 million (36.3 per cent) from IDA (World Bank) credit for Kenya Urban Support Project, Kshs.150.46 million (21.3 per cent) from the Road Maintenance Fuel Levy Fund, Kshs.117 million (16.6 per cent) from IDA (World Bank) for Kenya Climate Smart Agriculture Project, Kshs.61.51 million (8.7 per cent) for Transforming Health Systems for Universal Care Project, Kshs.44.54 million (6.3 per cent) from IDA (World Bank) as credit for the Kenya Devolution Support Programme “Level 2 grant”, Kshs.41 million (5.8 per cent) for Rehabilitation of Youth Polytechnics, Kshs.18.05 million (2.6 per cent) Compensation for User Fees Foregone, and Kshs.17.52 million (2.5 per cent) as grant from DANIDA for Universal Healthcare to Devolved System Programme.
3.12.2 Revenue AnalysisDuring the first half of FY 2018/19, the County received Kshs.1.2 billion as equitable share of revenue raised nationally, Kshs.315.16 million as total conditional grants, raised Kshs.103.35 million from own-source revenue, and had a cash balance of Kshs.1.13 billion from FY 2017/18. The total funds available for the period amounted to Kshs.2.75 billion.
Figure 3.45 shows the half yearly trend in own-source revenue collection from FY 2013/14 to FY 2018/19.

90
COUNTY GOVERNMENTS BUDGET IMPLEMENTATION REVIEW REPORT FOR THE FIRST HALF OF FY2018/19
Figure 3.45: Kericho County, Trend in Own-Source Revenue Collection for the First Half from FY 2013/14 to Half of FY 2018/19
Source: Kericho County Treasury
During the first half of FY 2018/19, the County generated a total of Kshs.103.35 million as own-source revenue. This amount was an increase of 33.6 per cent when compared to Kshs.77.38 million realised during the same period of FY 2017/18, and represented 13.8 per cent of the annual target.
3.12.3 Conditional GrantsThe County received Kshs.315.16 million as conditional grants as shown in Table 3.33.
Table 3.33: Kericho County, Conditional Grants/Loans Received in the First Half of FY 2018/19
S/No. Grants/LoansAnnual Allocation, per CARA, 2018
(Kshs)
Annual Budget Allocation for FY
2018/19 (Kshs)
Actual Receipts in First Half
of FY 2018/19 (Kshs)
Actual Receipts as Percentage of Annu-
al Allocation (%)
A Grants/Loans contained in CARA, 2018
1IDA (World Bank) -Kenya Urban Support Project
256,299,000 256,299,000 256,299,000 100.0
2 Road Maintenance Fuel Levy Fund 150,465,707 150,465,707 - -
3IDA (World Bank)-Kenya Climate Smart Agriculture Project
117,000,000 117,000,000 42,837,552 36.6
4World Bank-Transforming Health Systems for Universal Care Project
61,507,974 61,507,974 7,264,046 11.8
5IDA (World Bank) Kenya Devolution Sup-port Programme “Level 2 grant”
44,538,343 44,538,343 - -
6 Rehabilitation of Village Polytechnics 41,005,000 41,005,000 - -
7 Compensation for User Fee Foregone 18,048,789 18,048,789 - -

91
COUNTY GOVERNMENTS BUDGET IMPLEMENTATION REVIEW REPORT FOR THE FIRST HALF OF FY2018/19
S/No. Grants/LoansAnnual Allocation, per CARA, 2018
(Kshs)
Annual Budget Allocation for FY
2018/19 (Kshs)
Actual Receipts in First Half
of FY 2018/19 (Kshs)
Actual Receipts as Percentage of Annu-
al Allocation (%)
A Grants/Loans contained in CARA, 2018
8DANIDA - Universal Healthcare to De-volved System Programme
17,516,250 17,516,250 8,758,125 50.0
Total 706,381,063 706,381,063 315,158,723 44.6
Source: Kericho County Treasury
Analysis of the revenue from conditional grants indicates that, the County received the highest percentage of receipts to annual allocation from the Kenya Urban Support project, and the DANIDA grant. The receipts accounted for 100 per cent, 50 per cent and 34.6 per cent of annual allocation respectively.
3.12.4 Exchequer IssuesTo finance implementation of the budget, the Controller of Budget approved withdrawal of Kshs.2.12 billion from the CRF account. The withdrawal represented 29.5 per cent of the Approved Budget and translated to an increase of 17.9 per cent from Kshs.1.80 billion approved in the first half of FY 2017/18. This comprised of Kshs.2.04 billion (96.1 per cent) to fund recurrent expenditure and Kshs.81.78 million (3.9 per cent) for development activities.
3.12.5 Overall Expenditure ReviewThe County government spent a total of Kshs.2.04 billion on both recurrent and development activities. This expenditure represented 96.1 per cent of the total funds released from the CRF account and was an increase of 30.1 per cent from Kshs.1.57 billion spent in the first half of FY 2017/18. The expenditure excluded outstanding commitments as at 31st December, 2018, which amounted to Kshs.229.12 million for development activities and Kshs.173.01 million for recurrent expenditure.
Expenditure on recurrent activities amounted to Kshs.2 billion while that on development activities was Kshs.38.94 million. The recurrent expenditure was 98.1 per cent of the funds released for recurrent activities, while development expenditure was 47.6 per cent of funds released for development activities.
The recurrent expenditure represented 44.2 per cent of the annual recurrent budget and was an increase from 30.7 per cent recorded in the first half of FY 2017/18. Development expenditure recorded an absorption rate of 1.5 per cent, which was a decrease from 10.9 per cent attained in the first half of FY 2017/18. Figure 3.46 presents a comparison between the total expenditure in the first half of FY 2018/19 and the first half of the FY 2017/18.

92
COUNTY GOVERNMENTS BUDGET IMPLEMENTATION REVIEW REPORT FOR THE FIRST HALF OF FY2018/19
Figure3.46: KerichoCounty,ExpenditurebyEconomicClassification
Source: Kericho County Treasury
3.12.6 Analysis of Recurrent ExpenditureThe total recurrent expenditure of Kshs.2 billion comprised of Kshs.1.36 billion (67.9 per cent) incurred on personnel emoluments and Kshs.641.24 million (32.1 per cent) on operations and maintenance as shown in Figure 3.46.
Expenditure on personnel emoluments represented an increase of 33.1 per cent compared to the first half of FY 2017/18 when the County spent Kshs.1.02 billion, and was 66.6 per cent of total expenditure for the period. Figure 3.47 shows a summary of operations and maintenance expenditure by major categories.

93
COUNTY GOVERNMENTS BUDGET IMPLEMENTATION REVIEW REPORT FOR THE FIRST HALF OF FY2018/19
Figure 3.47: Kericho County, Operations and Maintenance Expenditure by Major Categories in the First Half of FY 2018/19
Source: Kericho County Treasury
The County spent Kshs.21.98 million on MCAs’ committee sitting allowances for the 48 MCAs against the annual budget allocation of Kshs.81.54 million. This amount represented an increase of 311.3 per cent compared to Kshs.5.34 million spent in a similar period of FY 2017/18. The average monthly sitting allowance translated to Kshs.76,318 per MCA against the SRC’s recommended monthly ceiling of Kshs.124,800.
Expenditure on domestic travel amounted to Kshs.131.88 million and comprised of Kshs.70.13 million spent by the County Assembly and Kshs.61.75 million spent by the County Executive. This represented 6.6 per cent of total recurrent expenditure and was an increase of 110.3 per cent compared to Kshs.62.71 million spent in the first half of FY 2017/18.
3.12.7 Development ExpenditureThe development expenditure during the reporting period of Kshs.38.94 million comprised of Kshs.23.03 million from World Bank for Transforming Health Systems for Universal Care and Kshs.15.91 million from DANIDA grant. The entire development expenditure was recorded by the Department of Health.

94
COUNTY GOVERNMENTS BUDGET IMPLEMENTATION REVIEW REPORT FOR THE FIRST HALF OF FY2018/19
3.12.8 Budget Performance by County DepartmentTable 3.34 shows a summary of budget estimates and budget performance by department in the first half of FY 2018/19.
Table 3.34: Kericho County, Budget Performance by Department
Department
Annual Budget Allo-cation in FY 2018/19
(Kshs. Million)
Exchequer Issues in First Half of FY 2018/19 (Kshs. Million)
Expenditure in First Half of FY 2018/19 (Kshs.
Million)
Expenditure to Exchequer
Issues (%)
Absorption Rate (%)
Rec Dev Rec Dev Rec Dev Rec Dev Rec Dev
County Assembly Services 661.43 102.00 364.02 - 363.12 - 99.8 - 54.9 -
Public Service and Admin-istration
284.03 10.23 136.51 - 128.70 - 94.3 - 45.3 -
Office of the Governor & Deputy Governor
130.98 - 64.94 - 95.81 - 147.5 - 73.2 -
County Public Service Board
61.59 - 23.80 - 20.66 - 86.8 - 33.5 -
Finance & Economic Planning
325.54 344.53 89.65 - 110.01 - 122.7 - 33.8 -
Agriculture, Livestock Development & Fisheries
205.36 191.09 88.33 42.84 83.49 - 94.5 - 40.7 -
Environment, Water, Ener-gy & Natural Resources
131.77 214.30 69.54 - 56.91 - 81.8 - 43.2 -
Education, Youth, Culture & Social services
403.30 147.00 106.00 - 113.88 - 107.4 - 28.2 -
Health Services 1,985.36 380.04 999.25 38.94 909.50 38.94 91.0 100 45.8 10.2
Land, Housing & Physical Planning
76.07 475.98 19.33 - 25.15 - 130.1 - 33.1 -
Public Works, Roads & Transport
74.87 651.13 29.23 - 33.54 - 114.7 - 44.8 -
ICT & E-Government 107.20 118.56 21.08 - 30.09 - 142.7 - 28.1 -
Trade, Industrialization, Tourism, Wildlife & Coop-erative Development
70.73 31.02 26.57 - 28.04 - 105.5 - 39.6 -
TOTAL 4,518.23 2,665.89 2,038.24 81.78 1,998.91 38.94 98.1 47.6 44.2 1.5
Source: Kericho County Treasury
Analysis of expenditure by department shows the Office of the Governor & Deputy Governor had the highest percentage of recurrent expenditure to recurrent budget at 73.2 per cent while the Department of ICT & E-Government posted the lowest at 28.1 per cent.
3.12.9 Key Observations and RecommendationsThe County has made progress in addressing some of the challenges previously identified as affecting budget implementation. Some of the progress made included:
i. Improvement in own-source revenue collection by 33.6 per cent from Kshs.77.38 million generated in the first half of FY 2017/18 to Ksh.103.35 million in the reporting period.
i. Continuous improvement in utilization of IFMIS and the Internet Banking platform to process financial transactions.
Despite the above progress, the following challenges continued to hamper effective budget implementation;
1. High wage bill, which has increased by 33.1 per cent from Kshs.1.02 billion in the first half FY
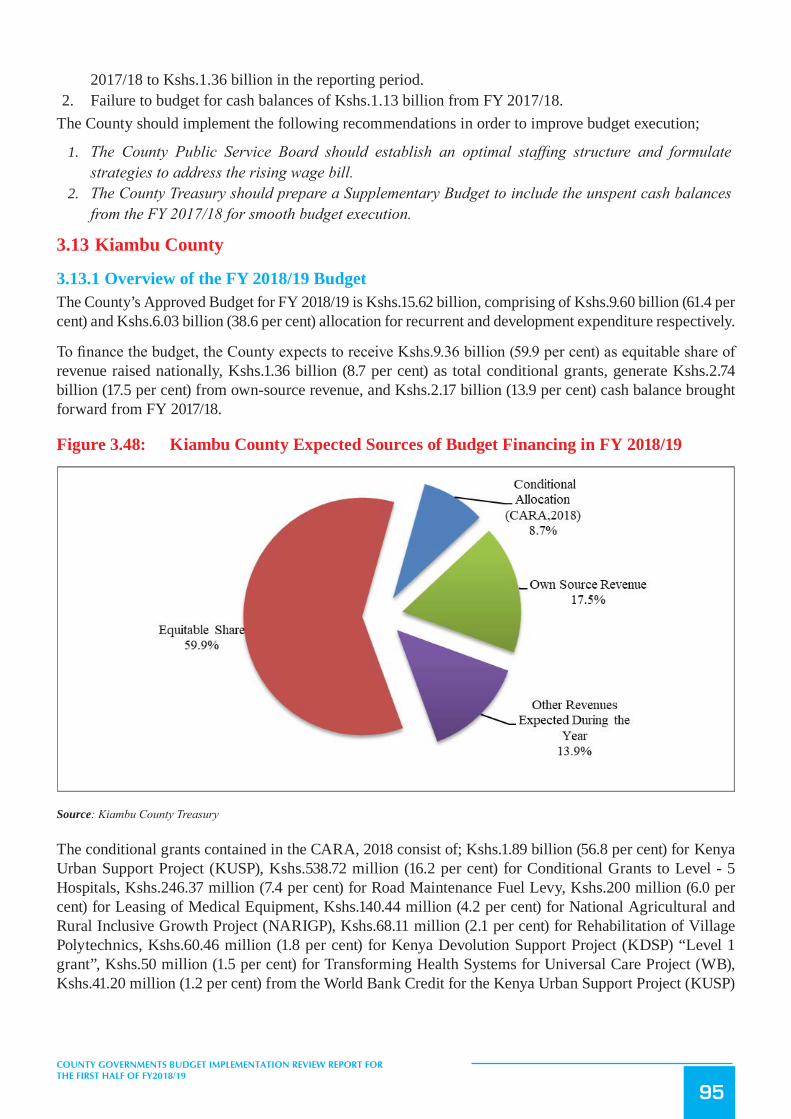
95
COUNTY GOVERNMENTS BUDGET IMPLEMENTATION REVIEW REPORT FOR THE FIRST HALF OF FY2018/19
2017/18 to Kshs.1.36 billion in the reporting period.2. Failure to budget for cash balances of Kshs.1.13 billion from FY 2017/18.
The County should implement the following recommendations in order to improve budget execution;
1. The County Public Service Board should establish an optimal staffing structure and formulate strategies to address the rising wage bill.
2. The County Treasury should prepare a Supplementary Budget to include the unspent cash balances from the FY 2017/18 for smooth budget execution.
3.13 Kiambu County
3.13.1 Overview of the FY 2018/19 BudgetThe County’s Approved Budget for FY 2018/19 is Kshs.15.62 billion, comprising of Kshs.9.60 billion (61.4 per cent) and Kshs.6.03 billion (38.6 per cent) allocation for recurrent and development expenditure respectively.
To finance the budget, the County expects to receive Kshs.9.36 billion (59.9 per cent) as equitable share of revenue raised nationally, Kshs.1.36 billion (8.7 per cent) as total conditional grants, generate Kshs.2.74 billion (17.5 per cent) from own-source revenue, and Kshs.2.17 billion (13.9 per cent) cash balance brought forward from FY 2017/18.
Figure 3.48: Kiambu County Expected Sources of Budget Financing in FY 2018/19
Source: Kiambu County Treasury
The conditional grants contained in the CARA, 2018 consist of; Kshs.1.89 billion (56.8 per cent) for Kenya Urban Support Project (KUSP), Kshs.538.72 million (16.2 per cent) for Conditional Grants to Level - 5 Hospitals, Kshs.246.37 million (7.4 per cent) for Road Maintenance Fuel Levy, Kshs.200 million (6.0 per cent) for Leasing of Medical Equipment, Kshs.140.44 million (4.2 per cent) for National Agricultural and Rural Inclusive Growth Project (NARIGP), Kshs.68.11 million (2.1 per cent) for Rehabilitation of Village Polytechnics, Kshs.60.46 million (1.8 per cent) for Kenya Devolution Support Project (KDSP) “Level 1 grant”, Kshs.50 million (1.5 per cent) for Transforming Health Systems for Universal Care Project (WB), Kshs.41.20 million (1.2 per cent) from the World Bank Credit for the Kenya Urban Support Project (KUSP)

96
COUNTY GOVERNMENTS BUDGET IMPLEMENTATION REVIEW REPORT FOR THE FIRST HALF OF FY2018/19
Urban Institutional Grants (UIG), Kshs.34.67 million (1 per cent) for compensation for User Fee Foregone, Kshs.32.40 million (1.0 per cent) for DANIDA Grant, and Kshs.20.47 million (0.6 per cent) for the Agricultural Sector Development Support Programme (ASDSP) II supported by Sweden.
The County also budgeted to receive Kshs.2.17 billion as grant for Loans and Grants, which is not contained in the CARA, 2018
3.13.2 Revenue AnalysisDuring the first half of FY 2018/19, the County received Kshs.3.84 billion as equitable share of revenue raised nationally, Kshs.1.94 million as total conditional grants, raised Kshs.1.01 billion from own source revenue, and had a cash balance of Kshs.774.03 million from FY 2017/18. The total available funds amounted to Kshs.7.55 billion.
Figure 3.49 shows the half yearly trend in own source revenue collection from the first half FY 2013/14 to the first half of FY 2018/19.
Figure 3.49: Kiambu County, Trend in Own Source Revenue Collection for the First Half from FY 2013/14 to FY 2018/19
Source: Kiambu County Treasury
During the first half of FY 2018/19, the County generated a total of Kshs.1.01 billion as own-source revenue. The own-source revenue collected during the period represented an increase of 94.2 per cent as compared to Kshs.518.28 million realised during the same period of the FY 2017/18 and represented 36.8 per cent of the annual target.
3.13.3 Conditional GrantsThe County received Kshs.1.94 billion as conditional grants as shown in Table 3.35.

97
COUNTY GOVERNMENTS BUDGET IMPLEMENTATION REVIEW REPORT FOR THE FIRST HALF OF FY2018/19
Table 3.35: Kiambu County, Conditional Grants/Loans Received in the First Half of FY 2018/19
S/No Grants/LoansAnnual Allocation, per CARA, 2018
(Kshs)
Annual Budget Allocation for
FY 2018/19 (Kshs)
Actual Receipts in Half Year
of FY 2018/19 (Kshs.)
Actual Receipts as Percentage of
Annual Allocation (%)
A Grants Contained in the CARA, 20181 Kenya Urban Support Project (KUSP) 1,885,993,000 - 1,885,993,000 1002 Level - 5 Hospital 538,716,763 538,716,763 26,935,838 5.0
3 Road Maintenance Fuel Levy 246,366,927 246,366,927 - -
4 Leasing of Medical Equipment 200,000,000 200,000,000 - -
5National Agricultural and Rural Inclusive Growth Project (NARIGP)
140,435,163 - - -
6 Rehabilitation of Village Polytechnics 68,110,000 68,110,000 - -
7Kenya Devolution Support Project (KDSP) “Level 1 grant”
60,455,156 272,000,000 - -
8Transforming Health Systems for Universal Care Project (WB)
50,000,000 - 7,416,464 14.8
9IDA World Bank Credit; Kenya Urban Support Proj-ect (KUSP) Urban Institutional Grants (UIG)
41,200,000 34,671,542 - -
10 Compensation for User Fee Foregone 34,671,542 - 16,200,000 46.7
11 DANIDA Grant 32,400,000 - - -
12Sweden Agricultural Sector Development Support Programme(ASDSP) II
20,468,461 - - -
Sub Total 3,318,817,012 1,359,865,232 1,936,545,302 58.4
B Other Grants
13 Loans and Grants - 2,169,283,320 - -Sub Total - 2,169,283,320 - -Total 3,318,817,012 3,529,148,552 1,936,545,302 54.9
Source: Kiambu County Treasury
Analysis of the revenue from conditional grants indicates that, the County received the highest percentage of receipts to annual allocation from the Kenya Urban Support project. The receipt accounted for 100 per cent of annual allocation.
3.13.4 Exchequer IssuesTo finance the budget, the Controller of Budget approved the withdrawal of Kshs.6.20 billion from the CRF account. The withdrawal represented 39.7 per cent of the Approved Budget and translates to an increase of 35.2 per cent from Kshs.4.59 billion approved in the first half of FY 2017/18. This amount comprised of Kshs.5.41 billion (87.1 per cent) to fund recurrent expenditure and Kshs.797.39 million (12.9 per cent) for development activities.
3.13.5 Overall Expenditure ReviewThe County government spent a total of Kshs.5.24 billion on recurrent and development activities. The total expenditure represented 84.4 per cent of the total funds released from the CRF account and was an increase of 24.9 per cent from Kshs.4.19 billion spent in the first half of FY 2017/18. The expenditure excluded outstanding commitments as at December 31st 2018 which amounted to Kshs.534.57 million for development activities and Kshs.314.23 million for recurrent expenditure.

98
COUNTY GOVERNMENTS BUDGET IMPLEMENTATION REVIEW REPORT FOR THE FIRST HALF OF FY2018/19
Expenditure on recurrent activities amounted to Kshs.4.25 billion while Kshs.990.52 million was spent on development activities. The recurrent expenditure was 78.6 per cent of the funds released for recurrent activities, while development expenditure was 124.2 per cent of funds released for development activities.
The recurrent expenditure represented 44.3 per cent of the annual recurrent budget, an increase from 35.4 per cent recorded in the first half of FY 2017/18. Development expenditure recorded an absorption rate of 16.4 per cent, which was a decrease from 21.4 per cent attained in the first half of FY 2017/18.Figure 3.50 presents a comparison between the total expenditure in the first half of FY 2018/19 and the first half of FY 2017/18.
Figure3.50: KiambuCounty,ExpenditurebyEconomicClassification
Source: Kiambu County Treasury
3.13.6 Analysis of Recurrent ExpenditureThe total recurrent expenditure of Kshs.4.25 billion comprised of Kshs.3.22 billion (75.9 per cent) incurred on personnel emoluments and Kshs.1.03 billion (24.1 per cent) on operations and maintenance as shown in Figure 3.50.
Expenditure on personnel emoluments represented an increase of 30.8 per cent compared to the first half of FY 2017/18 when the County spent Kshs.2.46 billion, and was 61.5 per cent of total expenditure in the first half of FY 2018/19. Figure 3.51 shows a summary of operations and maintenance expenditure by major categories.

99
COUNTY GOVERNMENTS BUDGET IMPLEMENTATION REVIEW REPORT FOR THE FIRST HALF OF FY2018/19
Figure 3.51: Kiambu County, Operations and Maintenance Expenditure by Major Categories in the First Half of FY 2018/19
Source: Kiambu County Treasury
The County spent Kshs.46.07 million on MCAs’ committee sitting allowances for the 93 MCAs against the annual budget allocation of Kshs.100.00 million. This represented an increase of 45 per cent compared to Kshs.31.77 million spent in a similar period of FY 2017/18. The average monthly sitting allowance translated to Kshs.82,566 per MCA against the SRC’s recommended monthly ceiling of Kshs.124,800.
Expenditure on domestic travel amounted to Kshs.142.51 million and comprised of Kshs.78.68 million spent by the County Assembly and Kshs.63.84 million spent by the County Executive. This represented 3.4 per cent of total recurrent expenditure and was an increase of 13.9 per cent compared to Kshs.122.65 million spent in the first half of FY 2017/18.
3.13.7 Development ExpenditureThe total development expenditure of Kshs.990.52 million represented 16.4 per cent of the annual development budget of Kshs.6.03 billion. Table 3.36 provides a summary of development projects with the highest expenditure in the first half of the financial year.

100
COUNTY GOVERNMENTS BUDGET IMPLEMENTATION REVIEW REPORT FOR THE FIRST HALF OF FY2018/19
Table 3.36: Kiambu County, List of Development Projects with the Highest Expenditure in the FY 2018/19
S/No. Project Name Project LocationProject Budget
(Kshs.)
Project Expenditure in First Half of FY
2018/19 (Kshs.)
Absorption Rate (%)
1 Githunguri-Ndumberi road Githunguri 340,801,794 318,760,290 93.5
2Construction of Gatitu junction and other roads
Thika 221,005,870 162,034,72273.3
3 Rural access roads All wards 600,000,000 120,000,000 20.0 4 Fuel levy roads All wards 168,716,800 107,171,690 63.5
5A2 Junction Kimbo Matangini
Kimbo 170,552,896 93,929,41155.1
6 Thogoto-Ndaire road Thogoto 181,452,510 81,327,181 44.8
7Construction of Githunguri CBD roads
Githunguri 103,997,581 78,019,22475.0
8Construction of an elevated steel tank.
Cianda, Sigona, Kanyara, Ngoliba Community Borehole, Ngecha Community –Limuru, Mwana Mukia Water Project- Limuru, Munyaka- Juja, Kwa Mutiso , Ruiru Level Hospital, Lari Ward- Kabunge , Uthiru Primary, Ha Gitonga Bore-hole, Muthurwa -Karuri
55,563,868 51,723,628
93.1
9Purchase of vehicles and equpment
Headquarters 65,857,070 39,057,07059.3
10Construction of fire sta-tions Limuru, Githunguri, Kiambu
Limuru, Githunguri, Kiambu 61,605,198 37,193,15060.4
11 Road C64-C65 Githunguri 145,346,505 33,623,810 23.1
Source: Kiambu County Treasury
3.13.8 Budget Performance by County DepartmentTable 3.37 shows a summary of budget estimates and budget performance by department in the first half of FY 2018/19.
Table 3.37: Kiambu County, Budget Performance by Department
Department
Annual Budget Allo-cation in FY 2018/19
(Kshs. Million)
Exchequer Issues in First Half of
FY 2018/19 (Kshs. Million)
Expenditure in First Half of FY 2018/19
(Kshs. Million)
Expenditure to Ex-chequer Issues (%)
Absorption Rate (%)
Rec Dev Rec Dev Rec Dev Rec Dev Rec Dev
County Assembly 1,200.86 55.00 413.37 - 339.20 - 82.1 28.2 -
County Executive 332.52 8.56 235.14 - 158.90 3.34 67.6 47.8 39.0
County Public Service Board
74.32 - 63.15 - 17.43 - 27.6 23.5
Finance and Econ. Plan-ning
1,267.52 121.71 661.15 7.26 449.17 9.46 67.9 130.3 35.4 7.8
Administrative & Public Service
535.73 135.50 421.56 4.32 226.07 - 53.6 - 42.2 -
Agriculture, Crop Pro-duction and Irrigation
239.26 150.82 219.16 59.31 90.83 7.84 41.4 13.2 38.0 5.2

101
COUNTY GOVERNMENTS BUDGET IMPLEMENTATION REVIEW REPORT FOR THE FIRST HALF OF FY2018/19
Department
Annual Budget Allo-cation in FY 2018/19
(Kshs. Million)
Exchequer Issues in First Half of
FY 2018/19 (Kshs. Million)
Expenditure in First Half of FY 2018/19
(Kshs. Million)
Expenditure to Ex-chequer Issues (%)
Absorption Rate (%)
Rec Dev Rec Dev Rec Dev Rec Dev Rec DevWater, Environment & Natural Resources
237.47 325.94 212.17 99.73 99.59 62.55 46.9 62.7 41.9 19.2
Health Services 3,962.09 967.47 1,915.75 88.22 2,219.18 148.31 115.8 168.1 56.0 15.3
Education, Youth, Sports Culture, & Social Service
944.20 623.38 600.62 44.47 384.80 51.53 64.1 115.9 40.8 8.3
Lands, Physical Planning & Housing
146.15 2,067.37 132.85 36.93 53.55 22.40 40.3 60.7 36.6 1.1
Trade, Tourism, Industry & Cooperative
119.48 294.39 101.53 12.91 34.76 37.59 34.2 291.2 29.1 12.8
Roads, Transport & Pub-lic Works
296.80 1,126.47 215.40 444.24 135.55 647.51 62.9 145.8 45.7 57.5
Livestock, Fisheries and Marketing
239.26 150.82 213.88 - 38.74 - 18.1 16.2 -
TOTAL 9,595.65 6,027.43 5,405.73 797.39 4,247.77 990.52 78.6 124.2 44.3 16.4
Source: Kiambu County Treasury
Analysis of expenditure by department shows the Department of Roads, Transport & Public Works recorded the highest absorption rate of development budget at 57.5 per cent. The Department of Health Services had the highest percentage of recurrent expenditure to recurrent budget at 56 per cent while the Department of Livestock, Fisheries and Marketing had the lowest at 16.2 per cent.
3.13.9 Key Observations and RecommendationsThe County has made progress in addressing some of the challenges previously identified as affecting budget implementation. Some of the progress made included:
i. Improvement in the own-source revenue collection by 94.2 per cent from Kshs.518.26 million generated in the first half of FY2017/18 to Kshs.1.01 billion in the reporting period.
Despite the above progress, the following challenges continued to hamper effective budget implementation;
1. Inaccuracies in financial reporting by the County Treasury whereby, financial reports on development activities indicated an expenditure of Kshs.990.52 million while the submitted schedule of development projects implemented in the same period reflected an expenditure of Kshs.1.12 billion.
2. Late submission of financial reports by the County Treasury to the COB, which affected timely preparation of budget implementation review reports.
3. Failure to budget for all conditional grants as contained in CARA, 2018.The County should implement the following recommendations in order to improve budget execution;
1. The County Treasury should enhance internal controls and ensure all reports are adequately reviewed for accurate reporting.
2. The County Treasury should ensure timely preparation and submission of financial returns in line with Section 166 of the PFM Act, 2012.
3. The County should budget for all revenue streams as contained in the CARA, 2018.
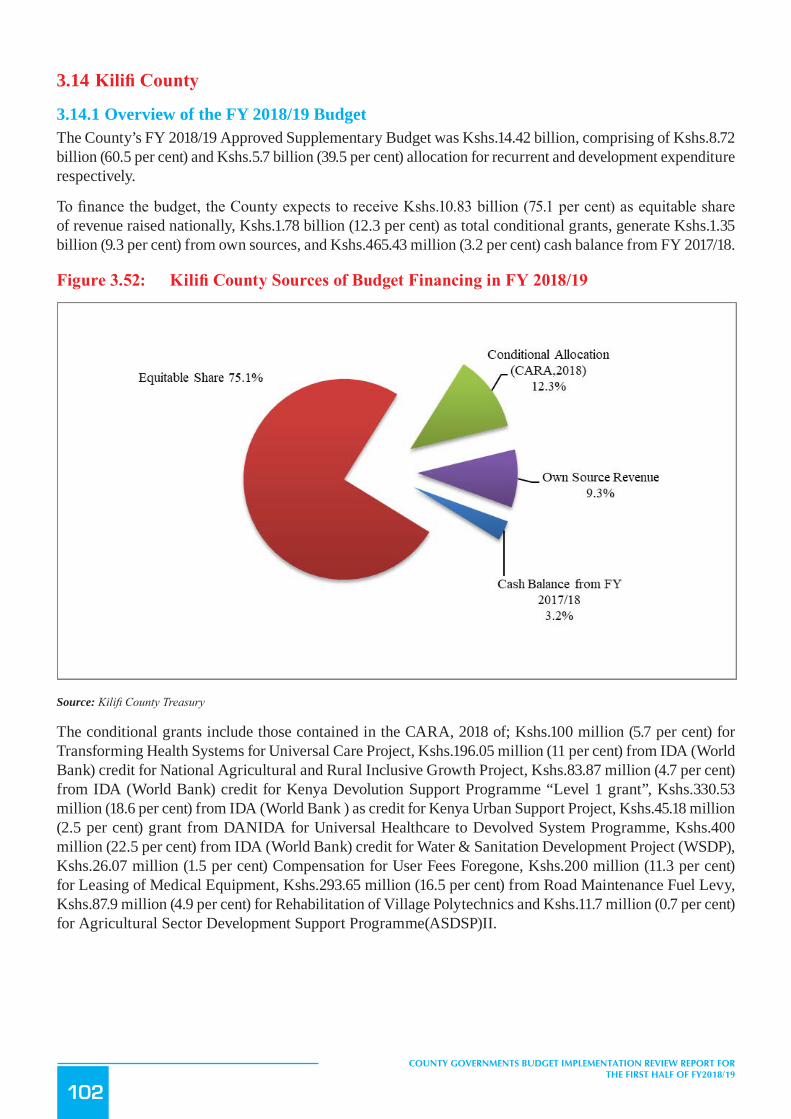
102
COUNTY GOVERNMENTS BUDGET IMPLEMENTATION REVIEW REPORT FOR THE FIRST HALF OF FY2018/19
3.14 KilifiCounty
3.14.1 Overview of the FY 2018/19 BudgetThe County’s FY 2018/19 Approved Supplementary Budget was Kshs.14.42 billion, comprising of Kshs.8.72 billion (60.5 per cent) and Kshs.5.7 billion (39.5 per cent) allocation for recurrent and development expenditure respectively.
To finance the budget, the County expects to receive Kshs.10.83 billion (75.1 per cent) as equitable share of revenue raised nationally, Kshs.1.78 billion (12.3 per cent) as total conditional grants, generate Kshs.1.35 billion (9.3 per cent) from own sources, and Kshs.465.43 million (3.2 per cent) cash balance from FY 2017/18.
Figure3.52: KilifiCountySourcesofBudgetFinancinginFY2018/19
Source: Kilifi County Treasury
The conditional grants include those contained in the CARA, 2018 of; Kshs.100 million (5.7 per cent) for Transforming Health Systems for Universal Care Project, Kshs.196.05 million (11 per cent) from IDA (World Bank) credit for National Agricultural and Rural Inclusive Growth Project, Kshs.83.87 million (4.7 per cent) from IDA (World Bank) credit for Kenya Devolution Support Programme “Level 1 grant”, Kshs.330.53 million (18.6 per cent) from IDA (World Bank ) as credit for Kenya Urban Support Project, Kshs.45.18 million (2.5 per cent) grant from DANIDA for Universal Healthcare to Devolved System Programme, Kshs.400 million (22.5 per cent) from IDA (World Bank) credit for Water & Sanitation Development Project (WSDP), Kshs.26.07 million (1.5 per cent) Compensation for User Fees Foregone, Kshs.200 million (11.3 per cent) for Leasing of Medical Equipment, Kshs.293.65 million (16.5 per cent) from Road Maintenance Fuel Levy, Kshs.87.9 million (4.9 per cent) for Rehabilitation of Village Polytechnics and Kshs.11.7 million (0.7 per cent) for Agricultural Sector Development Support Programme(ASDSP)II.

103
COUNTY GOVERNMENTS BUDGET IMPLEMENTATION REVIEW REPORT FOR THE FIRST HALF OF FY2018/19
3.14.2 Revenue AnalysisDuring the first half of FY 2018/19, the County received Kshs.3.36 billion as equitable share of revenue raised nationally, Kshs.488 million as total conditional grants, raised Kshs.263.43 million from own-source revenue, and had a cash balance of Kshs.180.51 million from FY 2017/18. The total funds available for the period amounted to Kshs.4.29 billion.
Figure 3.53 shows the half yearly trend in own-source revenue collection from FY 2013/14 to FY 2018/19.
Figure3.53: KilifiCounty,TrendinOwn-SourceRevenueCollectionfortheFirstHalfofFY 2013/14 to the First Half of FY 2018/19
Source: Kilifi County Treasury
During the first half of FY 2018/19, the County generated a total of Kshs.263.43 million from own-source revenue sources. This amount was an increase of 60.9 per cent when compared to Kshs.163.77 million realised during the same period of FY 2017/18 and represented 19.6 per cent of the annual target.
3.14.3 Conditional GrantsThe County received Kshs.488 million as conditional grants during the reporting period as shown in Table 3.38.
Table3.38: KilifiCounty,ConditionalGrants/LoansReceivedintheFirstHalfofFY2018/19
S/No Grants/LoansAnnual Allocation per CARA, 2018 Allocation (Kshs)
Annual Budget Allocation for
FY2018/19 (Kshs)
Actual Receipts in First Half of FY 2018/19 (Kshs)
Actual Receipts as Percentage of Annu-al Allocation (%)
A Grants Contained in the CARA, 2018
1Water and Sanitation Development Project (WSDP)
400,000,000 400,000,000 - -
2 Kenya Urban Support Programme (KUSP) 330,534,500 330,534,500 330,534,500 100
3 Road Maintenance Fuel Levy Fund 285,223,455 293,653,336 - -

104
COUNTY GOVERNMENTS BUDGET IMPLEMENTATION REVIEW REPORT FOR THE FIRST HALF OF FY2018/19
S/No Grants/LoansAnnual Allocation per CARA, 2018 Allocation (Kshs)
Annual Budget Allocation for
FY2018/19 (Kshs)
Actual Receipts in First Half of FY 2018/19 (Kshs)
Actual Receipts as Percentage of Annu-al Allocation (%)
A Grants Contained in the CARA, 2018
5World Bank Loan for National Agricultural & Rural Inclusive Project
140,435,163 196,045,018 55,000,000 28.1
6World Bank Loan for Transforming Health Systems for Universal Care (WB) (THSUC)
100,000,000 101,527,335 33,046,561 32.5
7WB -Kenya Devolution Support Programme (KDSP)
61,148,106 83,874,401 22,726,295 27.1
8Development of Youth Polytechnics/Rehabili-tation of Village Polytechnic
53,035,000 87,896,049 - -
9 DANIDA Grant 33,361,875 45,178,279 28,497,342 63.110 Compensation for User Fee Foregone 25,969,864 26,072,672 13,196,299 50.6
11Agricultural Sector Development Support Pro-gramme(ASDSP)II
23,653,874 11,700,590 5,000,000 42.7
Total 1,653,361,837 1,776,482,180 488,000,997 27.5
Source: Kilifi County Treasury
Analysis of the revenue from conditional grants indicates that, the County received the highest percentage of receipts to annual allocation from the Kenya Urban Support project and the DANIDA grant. The receipts accounted for 100 per cent and 63.1 per cent of annual allocation respectively.
3.14.4 Exchequer IssuesTo finance implementation of the budget, the Controller of Budget approved withdrawal of Kshs.3.22 billion from the CRF account. The withdrawals represented 22.3 per cent of the Approved Supplementary Budget and translated to a decrease of 0.3 per cent from Kshs.3.23 billion approved in the first half of FY 2017/18. This comprised of Kshs.2.8 billion (87.2 per cent) to fund recurrent expenditure and Kshs.412.4 million (12.8 per cent) for development activities.
3.14.5 Overall Expenditure ReviewThe County government spent a total of Kshs.2.56 billion on both recurrent and development activities. This expenditure represented 79.6 per cent of the total funds released from the CRF account and was a decrease of 36.9 per cent from Kshs.4.06 billion spent in the first half of FY 2017/18. The expenditure excluded outstanding commitments as at 31st December, 2018, which amounted to Kshs.544.01 million for development activities and Kshs.327.71 million for recurrent expenditure.
Expenditure on recurrent activities amounted to Kshs.1.87 billion while that on development activities was Kshs.689.12 million. The recurrent expenditure was 66.8 per cent of the funds released for recurrent activities, while development expenditure was 167.1 per cent of funds released for development activities. Development expenditure included payments for activities done in FY 2017/18 which was paid in the current financial year.
The recurrent expenditure represented 21.5 per cent of the annual recurrent budget was a decrease from 30.3 per cent recorded in the first half of FY 2017/18. Development expenditure recorded an absorption rate of 12.1 per cent, which was a decrease from 42.1 per cent attained in the first half of FY 2017/18. Figure 3.54 presents a comparison between the total expenditure in the first half of FY 2018/19 and the first half of FY 2017/18.

105
COUNTY GOVERNMENTS BUDGET IMPLEMENTATION REVIEW REPORT FOR THE FIRST HALF OF FY2018/19
Figure3.54: KilifiCounty,ExpenditurebyEconomicClassification
Source: Kilifi County Treasury
3.14.6 Analysis of Recurrent ExpenditureThe total recurrent expenditure of Kshs.1.87 billion comprised of Kshs.959.71 million (51.2 per cent) incurred on personnel emoluments and Kshs.913.39 million (48.8 per cent) on operations and maintenance as shown in Figure 3.54.
Expenditure on personnel emoluments represented a decrease of 25.3 per cent compared to the first half of FY 2017/18 when the County spent Kshs.1.28 billion, and was 31.6 per cent of total expenditure for the period. Figure 3.55 shows a summary of operations and maintenance expenditure by major categories.

106
COUNTY GOVERNMENTS BUDGET IMPLEMENTATION REVIEW REPORT FOR THE FIRST HALF OF FY2018/19
Figure3.55: KilifiCounty,OperationsandMaintenanceExpenditurebyMajorCategories in the First Half of FY 2018/19
Source: Kilifi County Treasury
The County spent Kshs.31.05 million on MCAs’ committee sitting allowances for the 54 MCAs against the annual budget allocation of Kshs.96.84 million. This amount represented an increase of 384.6 per cent compared to Kshs.6.41 million spent in a similar period of FY 2017/18. The average monthly sitting allowance translated to Kshs. 95,831 per MCA against the SRC’s recommended monthly ceiling of Kshs.124,800.
Expenditure on domestic travel amounted to Kshs.84.47 million and comprised of Kshs.35.79 million spent by the County Assembly and Kshs.48.68 million spent by the County Executive. This represented 4.5 per cent of total recurrent expenditure and was an increase of 5 per cent compared to Kshs.80.41 million spent in the first half of FY 2017/18.
3.14.7 Development ExpenditureThe total development expenditure of Kshs.689.12 million represented 12.1 per cent of the annual development budget of Kshs.5.7 billion. Table 3.39 provides a summary of development projects with the highest expenditure in the first half of the financial year.

107
COUNTY GOVERNMENTS BUDGET IMPLEMENTATION REVIEW REPORT FOR THE FIRST HALF OF FY2018/19
Table3.39: KilifiCounty,ListofDevelopmentProjectswiththeHighestExpenditureinthe FY 2018/19
S/No. Project Name Project LocationAnnual project Budget (Kshs.)
Half Year Expenditure
(Kshs.)
Absorption Rate (%)
1 Construction of Hospital Complex Kilifi HQ 209,696,959 40,924,960 19.5
2 Completion of the upgrading to Cabro standards A7 (BP petrol station) /A7 (Ta-mani jua) road.
Malindi Town/Sabaki 60,000,000 60,000,000 100.0
3 Completion of Mtwapa dispensary Mtwapa 5,000,000 5,000,000 100.0
4 Construction of six Bed General Ward at Mariakani
Mariakani 14,648,000 5,468,360 37.3
5 Completion of Dongo Kundu dispensary and construction of 2 No. toilets
Dabaso 3,000,000 3,646,228 121.5
6 Cowdry dispensary - Construction of modern maternity wing, pediatric ward, laboratory
Chembe Kibabamche 18,000,000 6,873,063 38.2
7 Completion of Kilifi County Hospital Funeral home
HQ 20,000,000 8,660,618 43.3
8 Construction of Assembly Main Block Offices
Malindi 171,166,800 47,125,350 27.5
9Provision of Teaching & Learning Mate-rials
All County 22,377,478 18,512,000 82.7
10 Kibao Cha Fundisa Road Adu 50,000,000 18,345,632 36.7
11 Completion of Mariakani Highrise Mariakani 13,580,602 5,167,442 38.1
Source: Kilifi County Treasury
3.14.8 Budget Performance by County DepartmentTable 3.40 shows a summary of budget estimates and budget performance by department in the first half of FY 2018/19.
Table3.40: KilifiCounty,BudgetPerformancebyDepartment
DepartmentBudget Allocation
(Kshs. Million)
Exchequer Issues in First Half of FY 2018/19 (Kshs. Million)
Expenditure in First Half of FY 2018/19
(Kshs. Million)
Expenditure to Exchequer Issues
(%)
Absorption Rate (%)
Rec Dev Rec Dev Rec Dev Rec Dev Rec DevCounty Assembly 903.51 311.17 263.66 27.40 254.08 83.96 96.4 306.4 28.1 27.0Office of the Governor 366.40 - 94.68 - 73.99 - 78.2 - 20.2 -County Attorney 121.51 - 29.88 - 30.48 - 102.0 - 25.1 -Finance 585.07 18.81 143.24 - 81.74 - 57.1 - 14.0 -Economic Planning 51.13 - 9.85 - 3.74 - 38.0 - 7.3 -
Agriculture 570.59 183.47 118.19 60.00 60.77 15.90 51.4 26.5 10.7 8.7
Livestock 28.50 131.80 - - 4.82 14.17 - - 16.9 10.7
Fisheries 28.80 59.23 - - 4.02 - - - 14.0 -Water and Sanitation 187.83 985.63 103.95 16.78 51.03 80.44 49.1 479.5 27.2 8.2Environment, Natural Resources And Wildlife
86.72 69.50 13.74 - 20.32 0.53 147.9 - 23.4 0.8
Education Sports & Youth Affairs
1,058.78 848.48 337.73 38.56 233.80 78.67 69.2 204.0 22.1 9.3

108
COUNTY GOVERNMENTS BUDGET IMPLEMENTATION REVIEW REPORT FOR THE FIRST HALF OF FY2018/19
DepartmentBudget Allocation
(Kshs. Million)
Exchequer Issues in First Half of FY 2018/19 (Kshs. Million)
Expenditure in First Half of FY 2018/19
(Kshs. Million)
Expenditure to Exchequer Issues
(%)
Absorption Rate (%)
Rec Dev Rec Dev Rec Dev Rec Dev Rec DevInformation, Communi-cation & Technology
37 10 - - 5.43 - - - 14.7 -
Medical Services 2,815.78 847.79 1,050.97 120.26 681.14 136.20 64.8 113.3 24.2 16.1
Public Health 267.69 - 70.57 - 55.24 - 78.3 20.6
Roads, Transport and Public Works
428.76 1,166.59 223.34 120.82 75.04 247.66 33.6 205 17.5 21.2
Lands and Energy 151.39 56.80 36.48 - 30.68 - 84.1 20.3 -
Physical Planning ,Urban Development and Housing
52.36 498.41 9.34 - 2.63 - 28.1 5.0 -
Gender, Culture, Social Services and Sports
149.44 252.99 40.38 - 9.65 - 23.9 6.5 -
Trade and Tourism 111.34 191.90 34.03 28.58 27.17 31.60 79.8 110.5 24.4 16.5Cooperatives Develop-ment
9.57 - - - 1.71 - 17.8 -
County Public Service Board
66.87 - 28.82 - 18.39 - 63.8 27.5 -
Devolution, Public Service and Disaster Management
640.53 67.84 195.96 - 147.27 - 75.2 23.0 -
Total 8,719.58 5,700.40 2,804.82 412.40 1,873.10 689.12 66.8 167.1 21.5 12.1
Source: Kilifi County Treasury
According to the data from the County Treasury, the County Assembly recorded the highest absorption rate of development budget at 27 per cent, followed by the Department of Roads, Transport and Public Works at 21.2 per cent. County Assembly had the highest percentage of recurrent expenditure to recurrent budget at 25.1 per cent while the Department of Physical Planning, Urban Development and Housing had the lowest at 5 per cent.
3.14.9 Key Observations and RecommendationsThe County has made progress in addressing some of the challenges previously identified as affecting budget implementation. Some of the progress made included:
i. Improved capacity of technical staff in the Finance Department through training.ii. Improved internet connectivity, resulting into effective use of IFMIS.
Despite the above progress, the following challenges continued to hamper effective budget implementation;
1. Low absorption of development budget, which was 12.1 per cent compared to 42.1 per cent in a similar period in FY 2017/18.
2. Delay in disbursement of the equitable share of revenue raised by the National Treasury.3. Submission of incomplete financial reports by the County Treasury, which affected timely preparation
of budget implementation reports as the returns had to be returned for correction.4. Low own-source revenue collection which was 19.6 per cent of the annual target of Kshs.1.35 billion.
The County should implement the following recommendations in order to improve budget execution;
1. The County should institute mechanisms to enhance absorption of development funds.2. The County Treasury should liaise with the National Treasury to ensure that funds allocated to the

109
COUNTY GOVERNMENTS BUDGET IMPLEMENTATION REVIEW REPORT FOR THE FIRST HALF OF FY2018/19
county are released in a timely manner in line with the CARA, 2018.3. The County Treasury should ensure adequate internal review of financial returns and statements
before submission to oversight institutions. The returns should also be prepared and submitted in line with Section 166 of PFM Act, 2012.
4. The County should enhance own source revenue collection.
3.15 Kirinyaga County
3.15.1 Overview of the FY 2018/19 BudgetThe County’s Approved Budget for FY 2018/19 is Kshs.6.15 billion, comprising of Kshs.3.67 billion (59.7 per cent) and Kshs.2.48 billion (40.3 per cent) allocation for recurrent and development expenditure respectively.
To finance the budget, the County expects to receive Kshs.4.11 billion (66.9 per cent) as equitable share of revenue raised nationally, Kshs.489.39 million (8 per cent) as total conditional grants, generate Kshs.650 million (10.6 per cent) from own source of revenue, and Kshs.900.12 million (14.6 per cent) cash balance from FY 2017/18.
Figure 3.56: Kirinyaga County Expected Sources of Budget Financing in FY 2018/19
Source: Kirinyaga County Treasury
The conditional grants contained in the CARA, 2018 consist of; Kshs.50 million (7.3 per cent) for Transforming Health Systems for Universal Care Project, Kshs.140.44 million (20.4 per cent) from IDA (World Bank) credit for National Agricultural and Rural Inclusive Growth Project, Kshs.41.08 million (6.0 per cent) from IDA (World Bank) credit for Kenya Devolution Support Programme “Level 1 grant”, Kshs.71.30 million (10.8 per cent) from IDA (World Bank ) credit for Kenya Urban Support Project, Kshs.14.78 million (2.1 per cent) grant from DANIDA for Universal Healthcare to Devolved System Programme, Kshs.11.28 million (1.6 per cent) as Compensation for User Fees Foregone, Kshs.108.30 million (15.7 per cent) from the Road Maintenance Fuel Levy Fund, Kshs.52.21 million (10.7 per cent) for Rehabilitation of Village Polytechnics, and Kshs.41.20 million from IDA (World Bank) as credit for Kenya Urban Support Project-Urban institution grant plus balance carried forward from FY 2017/18, and Kshs.16.50 million for Agricultural Sector Development Support Programme (ASDSP).

110
COUNTY GOVERNMENTS BUDGET IMPLEMENTATION REVIEW REPORT FOR THE FIRST HALF OF FY2018/19
3.15.2 Revenue AnalysisDuring the first half of FY 2018/19, the County received Kshs.1.28 billion as equitable share of revenue raised nationally, Kshs.83.99 million as total conditional grants, raised Kshs.130.75 million from own source revenue, and had a cash balance of Kshs.831.68 million from FY 2017/18. The total available funds amounted to Kshs.2.32 billion.
Figure 3.57 shows the half yearly trend in own source revenue collection from the first half of FY 2013/14 to the first half of FY 2018/19.
Figure 3.57: Kirinyaga County, Trend in Own Source Revenue Collection for the First Half from FY 2013/14 to FY 2018/19
Source: Kirinyaga County Treasury
During the first half of FY 2018/19, the County generated a total of Kshs.130.75 million as own-source revenue. This amount represented an increase of 84.6 per cent when compared to Kshs.70.81 million realised during the same period in the FY 2017/18, and represented 20.1 per cent of the annual target.
3.15.3 Conditional GrantsThe County received Kshs.83.99 million as conditional as shown in Table 3.41.

111
COUNTY GOVERNMENTS BUDGET IMPLEMENTATION REVIEW REPORT FOR THE FIRST HALF OF FY2018/19
Table 3.41: Kirinyaga County, Conditional Grants/Loans Received in the First Half of FY 2018/19
S/No. Grants/LoansAnnual Allocation per CARA, 2018 Allocation (Kshs)
Annual Budget Allocation for
FY2018/19 (Kshs)
Actual Receipts in First Half
of FY 2018/19 (Kshs)
Actual Receipts as Percentage of Annual Alloca-
tion (%)
A Grants/Loans contained in CARA, 2018
1 Compensation for User Fee Foregone 11,282,570 11,282,570 - -
2 Leasing of Medial Equipment 200,000,000 - - -
3 Road Maintenance Fuel Levy 108,302,240 108,302,240 - -4 Rehabilitation of Village Polytechnics 52,210,000 52,210,000 - -
5Transforming Health Systems for Universal Care Project (WB)
50,000,000 50,000,000 5,303,285 10.6
6National Agricultural and Rural Inclusive Growth Project (NARIGP)
140,435,163 140,435,163 - -
7Kenya Devolution Support Project (KDSP) “Level 1 grant”
41,078,830 41,078,830 - -
8 Kenya Urban Support Project (KUSP) 71,302,200 71,302,200 71,302,200 1009 DANIDA Grant 14,782,500 14,782,500 7,391,250 50Total 689,393,503 489,393,503 83,996,735 17.2
Source: Kirinyaga County Treasury
Analysis of the revenue from conditional grants indicates that, the County received the highest percentage of receipts to annual allocation from the Kenya Urban Support project and the DANIDA grant. The receipts accounted for 100 per cent and 50 per cent of annual allocation respectively.
3.15.4 Exchequer IssuesTo finance the budget, the Controller of Budget approved the withdrawal of Kshs.2.24 billion from the CRF account. The withdrawals represented 36.4 per cent of the Approved Budget and translate to an increase of 47.6 per cent from Kshs.1.52 billion approved in the first half of FY 2017/18. This comprised of Kshs.1.92 billion (85.9 per cent) to fund recurrent expenditure and Kshs.315.19 million (14.1 per cent) for development activities.
3.15.5 Overall Expenditure ReviewThe County government spent a total of Kshs.1.96 billion on recurrent and development activities. The total expenditure represented 87.4 per cent of the total funds released from the CRF account and was an increase of 30.9 per cent from Kshs.1.49 billion spent in the first half of FY 2017/18. The expenditure excluded outstanding commitments as at December 31st 2018 which amounted to Kshs.61.27 million for development activities and Kshs.89.72 million for recurrent expenditure.
Expenditure on recurrent activities amounted to Kshs.1.68 billion while Kshs.277.4 million was spent on development activities. The recurrent expenditure was 87.3 per cent of the funds released for recurrent activities, while development expenditure was 88.0 per cent of funds released for development activities.
The recurrent expenditure represented 45.7 per cent of the annual recurrent budget, an increase from 44.6 per cent recorded in the first half of FY 2017/18. Development expenditure recorded an absorption rate of 11.2 per cent while there was no development expenditure in the first half of FY 2017/18.Figure 3.58 presents a comparison between the total expenditure in the first half of FY 2018/19 and the first half of FY 2017/18.

112
COUNTY GOVERNMENTS BUDGET IMPLEMENTATION REVIEW REPORT FOR THE FIRST HALF OF FY2018/19
Figure3.58: KirinyagaCounty,ExpenditurebyEconomicClassification
Source: Kirinyaga County Treasury
3.15.6 Analysis of Recurrent ExpenditureThe total recurrent expenditure of Kshs.1.68 billion comprised of Kshs.1.14 billion (67.8 per cent) incurred on personnel emoluments and Kshs.541.32 million (32.2 per cent) on operations and maintenance as shown in Figure 3.58.
Expenditure on personnel emoluments represented a decrease of 7 per cent compared to the first half of FY 2017/18 when the County spent Kshs.1.22 billion, and was 58.2 per cent of total expenditure in the first half of FY 2018/19. Figure 3.59 shows a summary of operations and maintenance expenditure by major categories.
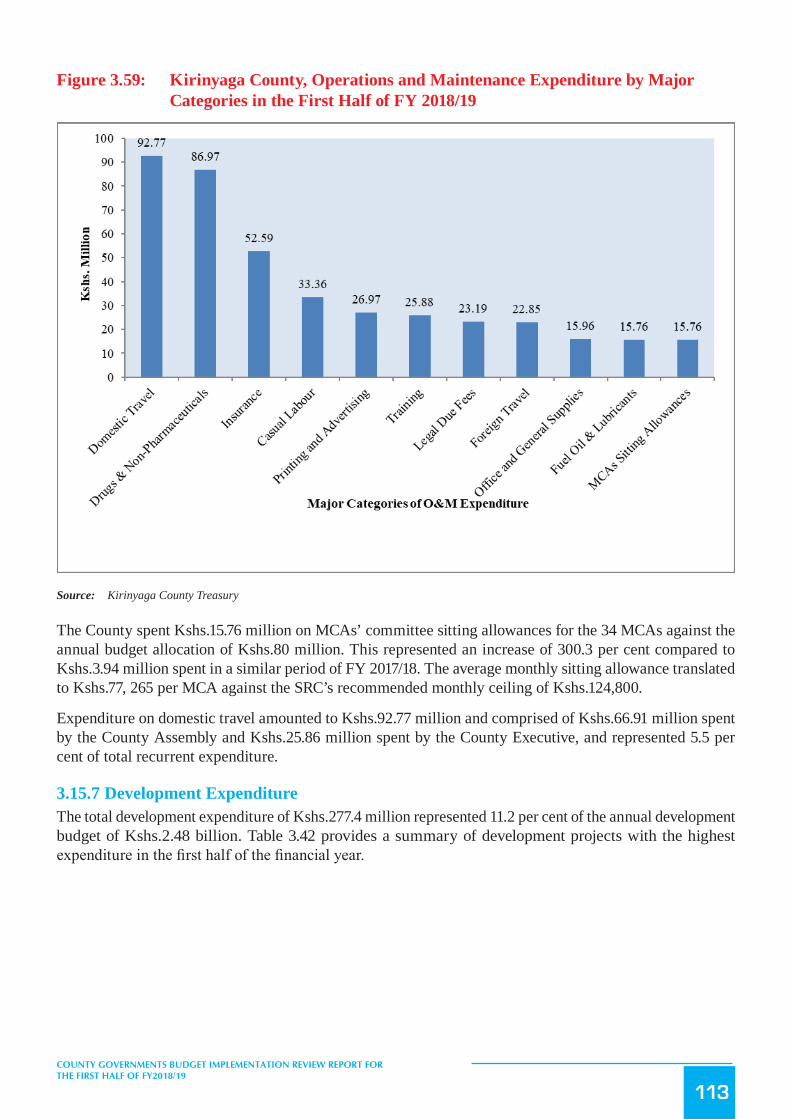
113
COUNTY GOVERNMENTS BUDGET IMPLEMENTATION REVIEW REPORT FOR THE FIRST HALF OF FY2018/19
Figure 3.59: Kirinyaga County, Operations and Maintenance Expenditure by Major Categories in the First Half of FY 2018/19
Source: Kirinyaga County Treasury
The County spent Kshs.15.76 million on MCAs’ committee sitting allowances for the 34 MCAs against the annual budget allocation of Kshs.80 million. This represented an increase of 300.3 per cent compared to Kshs.3.94 million spent in a similar period of FY 2017/18. The average monthly sitting allowance translated to Kshs.77, 265 per MCA against the SRC’s recommended monthly ceiling of Kshs.124,800.
Expenditure on domestic travel amounted to Kshs.92.77 million and comprised of Kshs.66.91 million spent by the County Assembly and Kshs.25.86 million spent by the County Executive, and represented 5.5 per cent of total recurrent expenditure.
3.15.7 Development ExpenditureThe total development expenditure of Kshs.277.4 million represented 11.2 per cent of the annual development budget of Kshs.2.48 billion. Table 3.42 provides a summary of development projects with the highest expenditure in the first half of the financial year.

114
COUNTY GOVERNMENTS BUDGET IMPLEMENTATION REVIEW REPORT FOR THE FIRST HALF OF FY2018/19
Table 3.42: Kirinyaga County, List of Development Projects with the Highest Expenditure in the FY 2018/19
S/No. Project Name Project Location Annual project Budget (Kshs.)
Half Year Expendi-ture (Kshs.)
Absorption Rate (%)
1 Access Roads County Wide 119,561,364 94,591,577 79.12 Other Infrastructural Works County Wide 175,820,216 63,686,329 36.2
3 Purchase of Software County H/Qs/Kerugoya 28,351,923 26,619,580 93.9
5 Non Residential Building Kerugoya 43,317,442 25,084,259 57.9
6 Purchase of Vaccine and Sera County H/Qs20,600,000 14,100,000 68.4
7 Purchase of Trucks and Trailers County H/Qs7,625,000 5,999,700 78.7
8 Water Supplies and Sewerages Kianyaga14,958,274 1,168,400 7.8
9 Specialised Materials County H/Qs 4,052,675 997,600 24.6
10 Maintenance of Machinery County wide 1,000,000 653,610 65.4
Source: Kirinyaga County Treasury
3.15.8 Budget Performance by County DepartmentTable 3.43 shows a summary of budget estimates and budget performance by department in the first half of FY 2018/19.
Table 3.43: Kirinyaga County, Budget Performance by Department
Department
Annual Budget Allo-cation in FY 2018/19
(Kshs. Million)
Exchequer Issues in First Half of FY 2018/19
(Kshs. Million)
Expenditure in First Half of FY 2018/19
(Kshs. Million)
Expenditure to Exchequer Issues
(%)
Absorption Rate (%)
Rec Dev Rec Dev Rec Dev Rec Dev Rec Dev
County Assembly 601.73 158.32 320.03 27.60 320.03 25.08 100.0 90.9 53.2 15.8County Executive Ser-vices
461.17 250.00 214.23 51.12 180.05 44.50 84.0 87.1 39.0 17.8
Finance and Economic planning
304.65 38.39 163.95 13.30 140.04 13.30 85.4 100.0 46.0 34.7
Medical Services 1,628.82 598.17 944.79 32.47 810.96 24.59 85.8 75.7 49.8 4.1Education 241.20 37.06 45.35 - 45.35 100 - 18.8 -
Agriculture 173.43 191.18 102.24 14.10 83.47 14.10 81.6 100 48.1 7.4
Gender/Culture &Social Services
37.54 33.71 21.14 0.995 12.41 0.99 58.7 100 33.1 3.0
Youth and Sports 19.51 50.49 12.50 1.49 6.41 1.49 51.3 100 32.8 3.0
Trade & Co-operative Development
4.31 165.08 13.03 8.12 11.30 8.12 86.7 100 261.9 4.9
Environment and natu-ral resources
76.23 158.22 39.85 8.44 35.88 7.17 90 85 47.1 4.5
Physical Planning and Housing
19.69 115.91 9.58 - 6.93 - 72.3 - 35.2 -
Transport and Infra-structure
64.29 685.01 35.86 157.56 26.13 138.05 72.9 87.6 40.6 20.2
Total 3,632.57 2,481.53 1,922.57 315.19 1,678.96 277.40 87.3 88.0 46.2 11.2
Source: Kirinyaga County Treasury

115
COUNTY GOVERNMENTS BUDGET IMPLEMENTATION REVIEW REPORT FOR THE FIRST HALF OF FY2018/19
Analysis of expenditure by department shows that the Department of Finance and Economic Planning and the Department of Transport and Infrastructure recorded the highest absorption rate of development budget at 34.7 per cent and 20.2 per sent respectively. The Department of Trade & Co-operatives reported recurrent expenditure of KShs.11.3 million against the budget allocation of Kshs.4.3 million. This should be regularised before the end of the financial year.
3.15.9 Key Observations and RecommendationsThe County has made progress in addressing some of the challenges previously identified as affecting budget implementation. Some of the progress made included:
i. Establishment of Internal Audit Committee in line with Section 155 (5) of the PFM Act, 2012.ii. Improvement in the administration and reporting on the established funds in line with Section 116
and 168 of the PFM Act , 2012
Despite the above progress, the following challenges continued to hamper effective budget implementation;
1. Huge wage bill which accounted for 58.2 per cent of the total expenditure during the reporting period thus constraining funding of other programmes.
2. Delay in disbursement of the equitable share of revenue raised by the National Treasury.3. Failure to budget for pending bills under the development budget.
The County should implement the following recommendations in order to improve budget execution;
1. The County Public Service Board should develop and implement an optimal staffing structure to address the escalating wage bill.
2. The County Treasury should liaise with the National Treasury to ensure that funds allocated to the County are released in a timely manner in line with CARA 2018.
3. The County should verify all development pending bills and budget for them appropriately.
3.16 Kisii County
3.16.1 Overview of the FY 2018/19 BudgetThe County’s Approved Supplementary Budget for FY 2018/19 is Kshs.12 billion, comprising of Kshs.7.71 billion (64.3 per cent) and Kshs.4.29 billion (35.7 per cent) allocation for recurrent and development expenditure respectively.
To finance the budget, the County expects to receive Kshs.7.69 billion (64.1 per cent) as equitable share of revenue raised nationally, Kshs.1.50 billion (12.5 per cent) as total conditional grants, generate Kshs.950 million (7.9 per cent) from own sources, Kshs.1.81 billion (15.1 per cent) cash balance from FY 2017/18, and Kshs.48 million (0.4 per cent) from other revenue sources.

116
COUNTY GOVERNMENTS BUDGET IMPLEMENTATION REVIEW REPORT FOR THE FIRST HALF OF FY2018/19
Figure 3.60: Kisii County Sources of Budget Financing in FY 2018/19
Source: Kisii County Treasury
The conditional grants contained in the CARA, 2018 consist of; Kshs.74.16 million (5.1 per cent) for Transforming Health Systems for Universal Care Project, Kshs.140.44 million (9.9.7 per cent) from IDA (World Bank) credit for National Agricultural and Rural Inclusive Growth Project, Kshs.53.94 million (3.7 per cent) from IDA (World Bank) credit for Kenya Devolution Support Programme “Level 1 grant”, Kshs.164.05 million (11.4 per cent) from IDA (World Bank ) credit for Kenya Urban Support Project, Kshs.24.91 million (1.7 per cent) grant from DANIDA for Universal Healthcare to Devolved System Programme, Kshs.70 million (4.8 per cent) grant from EU for Instruments for Devolution Advice and Support (IDEAS), Kshs.417.57 million (28.9 per cent) to Level-5 Hospital, Kshs.26.14 million (1.8 per cent) as Compensation for User Fees Foregone, Kshs.200 million (13.8 per cent) for Leasing of Medical Equipment, Kshs.203.38 million (14.1 per cent) from Road Maintenance Fuel Levy Fund, and Kshs.70.09 million (4.9 per cent) for Rehabilitation of Village Polytechnics.
The County also budgeted to receive Kshs.40 million as Urban Institutional grant and Kshs.8.46 million as Agricultural Sector Development Support Programme (ASDSP –SIDA) programme.
3.16.2 Revenue AnalysisDuring the first half of FY 2018/19, the County received Kshs.2.27 billion as equitable share of revenue raised nationally, Kshs.373.51 million as total conditional grants, raised Kshs.120.29 million from own-source revenue, and had a cash balance of Kshs.1.64 billion from FY 2017/18. The total funds available for the period amounted to Kshs.4.40 billion.
Figure 3.61 shows the half yearly trend in own-source revenue collection from FY 2013/14 to FY 2018/19.

117
COUNTY GOVERNMENTS BUDGET IMPLEMENTATION REVIEW REPORT FOR THE FIRST HALF OF FY2018/19
Figure 3.61: Kisii County, Trend in Own-Source Revenue Collection for the First Half of FY 2013/14 to the First Half of FY 2018/19
Source: Kisii County Treasury
The County generated a total of Kshs.120.29 million as own-source revenue during the first half of FY 2018/19. This amount was an increase of 71.1 per cent when compared to Kshs 70.30 million realised during the same period of FY 2017/18 and represented 12.7 per cent of the annual target.
3.16.3 Conditional GrantsThe County received Kshs.373.51 million as conditional grants as shown in Table 4.44.
Table 4.44: Kisii County, Conditional Grants/Loans Received in the First Half of FY 2018/19
S/No. Grants/Loans Annual Allocation per CARA, 2018 Allocation (Kshs)
Annual Budget Allocation for
FY2018/19 (Kshs)
Actual Receipts in First Half of FY 2018/19 (Kshs)
Actual Receipts as Percentage of
Annual Allocation (%)
A Grants/Loans contained in CARA, 20181 Conditional Grants to Level- 5 Hospitals 417,572,254 417,572,254 135,710,983 32.52 Compensation for User Fee Foregone 26,138,997 26,138,997 - -3 Leasing of Medical Equipment 200,000,000 200,000,000 - -
4 Road Maintenance Fuel Levy Fund 203,376,725 203,376,725 - -
5 Rehabilitation of Village Polytechnics 70,090,000 70,090,000 - -6 World Bank-Transforming Health Systems
for Universal Care Project74,159,514 74,159,514 13,128,256 17.7
7 IDA (World Bank) -National Agricultural and Rural Inclusive Growth Project
140,435,163 140,435,163 - -
8 IDA (World Bank) Kenya Devolution Sup-port Programme “Level 1 grant”
53,938,093 53,938,093 - -

118
COUNTY GOVERNMENTS BUDGET IMPLEMENTATION REVIEW REPORT FOR THE FIRST HALF OF FY2018/19
S/No. Grants/Loans Annual Allocation per CARA, 2018 Allocation (Kshs)
Annual Budget Allocation for
FY2018/19 (Kshs)
Actual Receipts in First Half of FY 2018/19 (Kshs)
Actual Receipts as Percentage of
Annual Allocation (%)
A Grants/Loans contained in CARA, 20189 IDA (World Bank) -Kenya Urban Support
Project164,053,800 164,053,800 164,053,800 100.0
10 DANIDA - Universal Healthcare to De-volved System Programme
24,907,500 36,171,944 12,453,750 34.4
11 EU- Instruments for Devolution Advice and Support (IDEAS)
70,000,000 110,000,000 48,161,217 43.8
12 Urban Institutional Grant - 40,000,000 - -13 SIDA -Agricultural Sector Development
Support Programme- 8,455,986 - -
Sub Total 1,444,672,046 1,495,936,490 373,508,006 25Other Grants
14 Urban Institutional Grant - 40,000,000 - -15 ASDSP -SIDA - 8,455,986 - -Sub-Total - 48,455,986 - -Total 1,444,672,046 1,544,392,476 373,508,006 24.2
Source: Kisii County Treasury
Analysis of the revenue from conditional grants indicates that, the County received the highest percentage of receipts to annual allocation from the Kenya Urban Support project which accounted for 100 per cent of annual allocation.
3.16.4 Exchequer IssuesTo finance the budget, the Controller of Budget approved withdrawal of Kshs.4.34 billion from the CRF account. The withdrawals represented 36.1 per cent of the Approved Budget and translated to an increase of 72.2 per cent from Kshs.2.52 billion approved in the first half of FY 2017/18. This comprised of Kshs.3.51 billion (80.9 per cent) for recurrent expenditure and Kshs.829.91 million (19.1 per cent) for development activities.
3.16.5 Overall Expenditure ReviewThe County government spent a total of Kshs.4.16 billion on both recurrent and development activities. This expenditure represented 95.9 per cent of the total funds released from the CRF account and was an increase 68.7 per cent from Kshs.2.46 billion spent in the first half of FY 2017/18. The expenditure excluded outstanding commitments as at 31st December, 2018, which amounted to Kshs.93.88 million for development activities and Kshs.27.45 million for recurrent expenditure.
Expenditure on recurrent activities amounted to Kshs.3.43 billion while that on development activities was Kshs.728.40 million. The recurrent expenditure was 97.1 per cent of the funds released for recurrent activities, while development expenditure was 87.8 per cent of funds released for development activities.
The recurrent expenditure represented 44.5 per cent of the annual recurrent budget and was an increase from 35.4 per cent recorded in the first half of FY 2017/18. Development expenditure recorded an absorption rate of 17 per cent, which was an increase from 3.5 per cent attained in the first half of FY 2017/18. Figure 3.62 presents a comparison between the total expenditure in the first half of FY 2018/19 and the first half of FY 2017/18.

119
COUNTY GOVERNMENTS BUDGET IMPLEMENTATION REVIEW REPORT FOR THE FIRST HALF OF FY2018/19
Figure3.62: KisiiCounty,ExpenditurebyEconomicClassification
Source: Kisii County Treasury
3.16.6 Analysis of Recurrent ExpenditureThe total recurrent expenditure of Kshs.3.43 billion comprised of Kshs.2.52 billion (73.5 per cent) incurred on personnel emoluments and Kshs.909.73 million (26.5 per cent) on operations and maintenance as shown in Figure 3.62.
Expenditure on personnel emoluments represented an increase of 27.4 per cent compared to the first half of FY 2017/18 when the County spent Kshs.1.98 billion, and was 60.6 per cent of total expenditure for the period. Figure 3.63 shows a summary of operations and maintenance expenditure by major categories.

120
COUNTY GOVERNMENTS BUDGET IMPLEMENTATION REVIEW REPORT FOR THE FIRST HALF OF FY2018/19
Figure 3.63: Kisii County, Operations and Maintenance Expenditure by Major Categories in the First Half of FY 2018/19
Source: Kisii County Treasury
The County spent Kshs.47.41 million on MCAs’ committee sitting allowances for the 70 MCAs against the annual budget allocation of Kshs.94.82 million. This amount represented an increase of 469 per cent compared to Kshs.8.33 million spent in a similar period of FY 2017/18. The average monthly sitting allowance translated to Kshs.112,884 per MCA against the SRC’s recommended monthly ceiling of Kshs.124,800.
Expenditure on domestic travel amounted to Kshs.291.52 million and comprised of Kshs.59.19 million spent by the County Assembly and Kshs.232.33 million spent by the County Executive. This represented 8.5 per cent of total recurrent expenditure and was an increase of 82.7 per cent compared to Kshs.159.57 million spent in the first half of FY 2017/18.
3.16.7 Development ExpenditureThe total development expenditure of Kshs.728.40 million represented 17 per cent of the annual development budget of Kshs.4.29 billion. Table 3.45 provides a summary of development projects with the highest expenditure in the first half of the financial year.

121
COUNTY GOVERNMENTS BUDGET IMPLEMENTATION REVIEW REPORT FOR THE FIRST HALF OF FY2018/19
Table 3.45: Kisii County, List of Development Projects with the Highest Expenditure in the FY 2018/19
S/No. Project Name Project LocationAnnual Project Bud-
get (Kshs.)Half Year Expen-
diture (Kshs.)Absorption Rate
(%)
1 Artificial Insemination Programme Countywide (All 45 wards)
70,000,000 61,654,175 88.1
2 Purchase of Drilling Rig and other Equipment
County Headquarters (Public Works)
83,000,000 41,500,000 50.0
3 Completion of Gusii Stadium Kisii Town 45,000,000 29,389,724 65.3
4 Construction of Casualty / Theatre at Marani Level 4 Hospital
Marani ward 30,000,000 16,947,260 56.5
5 Construction of Perimeter Wall at Kisii Level 5 Hospital
KTRH (Kisii Town) 28,500,000 14,892,503 52.2
6 Construction of MCAs’ Offices County Assembly Headquarters
40,000,000 10,087,409 25.2
7 Integrated Strategic Urban Develop-ment Plan
Bomachoge Chache (Ogembo)
43,000,000 9,595,875 22.3
8 Kisii Main Stage - Getare Road Kitutu Chache South (Getare)
30,000,000 8,837,808 29.5
9 Development of Integrated County Management Information System (ERP) for all Departments
County Headquarters 20,000,000 8,782,560 43.9
10 Establishment of Basic Human Anatomy Laboratory at Kisii Level 5 Hospital
KTRH (Kisii Town) 9,000,000 7,771,162 86.3
Source: Kisii County Treasury
3.16.8 Budget Performance by County DepartmentTable 3.46 shows a summary of budget estimates and budget performance by department in the first half of FY 2018/19.
Table 3.46: Kisii County, Budget Performance by Department
Department
Budget Allocation (Kshs. Million)
Exchequer Issues in First Half of FY 2018/19 (Kshs. Mil-
lion)
Expenditure in First Half of FY 2018/19
(Kshs. Million)
Expenditure to Exchequer
Issues (%)
Absorption Rate (%)
Rec Dev Rec Dev Rec Dev Rec Dev Rec Dev
County Assembly 961.84 250.00 453.18 10.09 397.47 10.09 87.7 100.0 41.3 4.0County Executive and Pub-lic Service Board
460.48 25.00 235.71 3.57 221.36 3.57 93.9 100.0 48.1 14.3
Finance and Economic Planning
1,197.77 181.73 526.64 17.84 521.49 17.84 99.0 100.0 43.5 9.8
Agriculture and Cooperative Development
348.25 525.99 155.21 180.44 141.29 103.78 91.0 57.5 40.6 19.7
Energy, Water, Environment and Natural Resources
195.73 307.60 61.25 66.51 56.06 45.52 91.5 68.4 28.6 14.8
Education, Youth Affairs and Social Development
607.89 251.38 225.80 37.87 226.07 8.05 100.1 21.3 37.2 3.2
County Health Services 2,686.15 989.81 1,370.00 141.38 1,381.02 170.88 100.8 120.9 51.4 17.3

122
COUNTY GOVERNMENTS BUDGET IMPLEMENTATION REVIEW REPORT FOR THE FIRST HALF OF FY2018/19
Department
Budget Allocation (Kshs. Million)
Exchequer Issues in First Half of FY 2018/19 (Kshs. Mil-
lion)
Expenditure in First Half of FY 2018/19
(Kshs. Million)
Expenditure to Exchequer
Issues (%)
Absorption Rate (%)
Rec Dev Rec Dev Rec Dev Rec Dev Rec Dev
Lands, Physical Planning and Urban Development
108.20 247.40 44.38 52.09 35.53 48.92 80.0 93.9 32.8 19.8
Roads, Public Works and Transport
195.45 878.14 65.03 255.18 63.41 255.18 97.5 100.0 32.4 29.1
Trade Development, Indus-try and Tourism
94.58 147.96 26.47 10.24 21.12 10.24 79.8 100.0 22.3 6.9
Culture and Social Services 95.00 173.00 52.86 33.30 47.31 33.30 89.5 100.0 49.8 19.2Kisii Town Urban Area 139.28 194.46 30.63 3.04 40.76 2.67 133.1 87.7 29.3 1.4Administration and Stake-holder Management
617.45 116.25 283.90 18.36 275.39 18.36 97.0 100.0 44.6 15.8
TOTAL 7,708.07 4,288.73 3,531.07 829.91 3,428.28 728.40 97.1 87.8 44.5 17.0
Source: Kisii County Treasury
Analysis of expenditure by department shows the Department of Roads, Public Works and Transport recorded the highest absorption of development budget at 29.1 per cent while the Kisii Town Urban Area recorded the least absorption at 1.4 per cent. The County Health Services Department had the highest percentage of recurrent expenditure to recurrent budget at 51.4 per cent while the Department of Trade Development, Industry and Tourism had the lowest at 22.3 per cent.
3.16.9 Key Observations and RecommendationsThe County has made progress in addressing some of the challenges previously identified as affecting budget implementation. Some of the progress made included:
i. Improvement in the absorption of development budget from 3.5 per cent in the first half of FY 2017/18 to 17 per cent in the period under review.
ii. Timely submission of financial reports by the County Treasury to the Office of the Controller of Budget in line with Section 166 of the PFM Act, 2012.
Despite the above progress, the following challenges continued to hamper effective budget implementation;
1. High wage bill of Kshs.2.52 billion, which increased by 27.4 per cent compared to a similar period in FY 2017/18 and accounted for 60.6 per cent of the total expenditure in the first half of FY 2018/19.
2. Under-performance in own-source revenue collection which represented 12.7 per cent of annual target. This may hamper effective budget implementation.
3. Delay in disbursement of equitable share of revenue raised by the National Treasury.
The County should implement the following recommendations in order to improve budget execution;
1. The County Public Service Board should ensure an optimal staffing structure in order to ensure a sustainable wage bill.
2. The County Treasury should formulate and implement strategies to enhance own source revenue collection.
3. The County Treasury should liaise with the National Treasury to ensure that funds allocated to the County are released in timely manner in line with CARA, 2018.

123
COUNTY GOVERNMENTS BUDGET IMPLEMENTATION REVIEW REPORT FOR THE FIRST HALF OF FY2018/19
3.17 Kisumu County
3.17.1 Overview of the FY 2018/19 BudgetThe County’s Approved Budget for FY 2018/19 is Kshs.9.22 billion, comprising of Kshs.6.38 billion (69.3 per cent) and Kshs.2.83 billion (30.7 per cent) allocation for recurrent and development expenditure respectively.
To finance the budget, the County expects to receive Kshs.6.91 billion (74.9 per cent) as equitable share of revenue raised nationally, Kshs.927.32 million (10.1 per cent) as total conditional grants, and generate Kshs.1.38 billion (15 per cent) from own revenue sources.
Figure 3.64: Kisumu County, Sources of Budget Financing in FY 2018/19
Source: Kisumu County Treasury
The conditional grants contained in the CARA, 2018 consist of; Kshs.67.36 million (3.5 per cent) for Transforming Health Systems for Universal Care Project, Kshs.49.64 million (2.6 per cent) from IDA (World Bank) credit for Kenya Devolution Support Programme “Level 1 grant”, Kshs.21.97 million (1.1 per cent) grant from DANIDA for Universal Healthcare to Devolved System Programme, Kshs.90 million (4.7 per cent) grant from EU for Instruments for Devolution Advice and Support- (IDEAS), Kshs.369.02 million (19.1 per cent) to Kitui Level-5 Hospital, Kshs.21.30 million (1.1 per cent) Compensation for User Fees Foregone, Kshs.242.06 million (9.4 per cent) from the Road Maintenance Fuel Levy Fund, and Kshs.41.65 million (2.2 per cent) for Rehabilitation of Village Polytechnics.
3.17.2 Revenue AnalysisDuring the first half of FY 2018/19, the County received Kshs.1.45 billion as equitable share of revenue raised nationally, Kshs.1.06 billion as total conditional grants, raised Kshs.405.3 million from own-source revenue, and had a cash balance of Kshs.1.44 billion from FY 2017/18. The total funds available for the period amounted to Kshs.4.35 billion.
Figure 3.65 shows the half yearly trend in own-source revenue collection from FY 2013/14 to FY 2018/19.

124
COUNTY GOVERNMENTS BUDGET IMPLEMENTATION REVIEW REPORT FOR THE FIRST HALF OF FY2018/19
Figure 3.65: Kisumu County, Trend in Own-Source Revenue Collection for the First Half of FY 2013/14 to the First Half of FY 2018/19
Source: Kisumu County Treasury
During the first half of FY 2018/19, the County generated a total of Kshs.405.3 million as own-source revenue sources. This amount was an increase of 66.3 per cent when compared to Kshs.243.7 million realised during the same period of FY 2017/18 and represented 29.3 per cent of the annual target.
3.17.3 Conditional GrantsThe County received Kshs.1.06 billion as conditional grants as shown in Table 3.47.

125
COUNTY GOVERNMENTS BUDGET IMPLEMENTATION REVIEW REPORT FOR THE FIRST HALF OF FY2018/19
Table 3.47: Kisumu County, Conditional Grants/Loans Received in the First Half of FY 2018/19
S/No Grants/LoansAnnual Alloca-
tion, per CARA, 2018 (Kshs)
Annual Budget Allocation for FY
2018/19 (Kshs)
Actual receipts in Half Year of FY 2018/19 (in
Kshs.)
Actual Receipts as Percentage of
Annual Allocation (%)
A Grants Contained in the CARA, 2018
1World Bank credit for Kenya Urban Support Project (KUSP)
773,573,300 - 773,573,300 -
2 Kisumu Level 5 Hospital 369,017,341 369,017,341 18,450,867 5.0
3Conditional Allocation from the Road Main-tenance Fuel Levy Fund
181,881,624 242,061,249 43,056,542 17.8
4World Bank Grant for Kenya Climate Smart Agriculture Project (KCSAP)
117,000,000 - - -
5EU Grant for Instrument for Devolution Ad-vice & Support (IDEAS)
90,000,000 156,000,000 58,304,401 37.4
6World Bank credit for Transforming Health Systems for Universal Care Project
67,364,355 46,312,993 39,654,018 85.6
7World Bank credit for Kenya Devolution Support Project (KDSP) - Level 1
49,642,674 46,361,941 - -
8 Rehabilitation of Youth Polytechnics 41,650,000 30,000,000 20,159,586 67.2
9 Compensation for User Fees Foregone 21,299,489 21,165,550 2,128,751 10.1
10DANIDA grant - Universal Healthcare for Devolved System Program
21,971,250 16,403,019 10,985,625 67.0
Sub Total 1,733,400,033 927,322,093 966,313,090 104.2
B Other Grants
11 Universal Health Care - - 91,525,545 -
Total 1,733,400,033 927,322,093 1,057,838,635 114.1
Source: Kisumu County Treasury
Analysis of the revenue from conditional grants indicates that, the County received the highest percentage of receipts to annual allocation from the Transforming Health Systems for Universal care Project grant. The receipt accounted for 85.6 per cent of annual allocation.
3.17.4 Exchequer IssuesTo finance implementation of the budget, the Controller of Budget approved withdrawal of Kshs.3.45 billion from the CRF account. The withdrawal represented 37.4 per cent of the Approved Budget and translated to an increase of 85 per cent from Kshs.1.87 billion approved in the first half of FY 2017/18. This comprised of Kshs.3.32 billion (96.2 per cent) to fund recurrent expenditure and Kshs.132.62 million (3.8 per cent) for development activities.
3.17.5 Overall Expenditure ReviewThe County government spent a total of Kshs.2.57 billion on both recurrent and development activities. This expenditure represented 74.4 per cent of the total funds released from the CRF account and was an increase of 27 per cent from Kshs.2.02 billion spent in the first half of FY 2017/18.
Expenditure on recurrent activities amounted to Kshs.2.46 billion while that on development activities was Kshs.107.34 million. The recurrent expenditure was 74.1 per cent of the funds released for recurrent activities, while development expenditure was 80.9 per cent of funds released for development activities.
The recurrent expenditure represented 38.5 per cent of the annual recurrent budget an increase from 30.5 per cent recorded in the first half of FY 2017/18. Development expenditure recorded an absorption rate of

126
COUNTY GOVERNMENTS BUDGET IMPLEMENTATION REVIEW REPORT FOR THE FIRST HALF OF FY2018/19
3.8 per cent, while there was no expenditure on development activities in the first half of FY 2017/18. Figure 3.66 presents a comparison between the total expenditure in the first half of FY 2018/19 and the first half of the FY 2017/18.
Figure3.66: KisumuCounty,ExpenditurebyEconomicClassification
Source: Kisumu County Treasury
3.17.6 Analysis of Recurrent ExpenditureThe total recurrent expenditure of Kshs.2.57 billion comprised of Kshs.1.9 billion (77.2 per cent) incurred on personnel emoluments and Kshs.561.96 million (22.8 per cent) on operations and maintenance as shown in Figure 3.66.
Expenditure on personnel emoluments represented an increase of 32.4 per cent compared to the first half of FY 2017/18 when the County spent Kshs.1.43 billion, and was 73.9 per cent of total expenditure for the period. Figure 3.67 shows a summary of operations and maintenance expenditure by major categories.
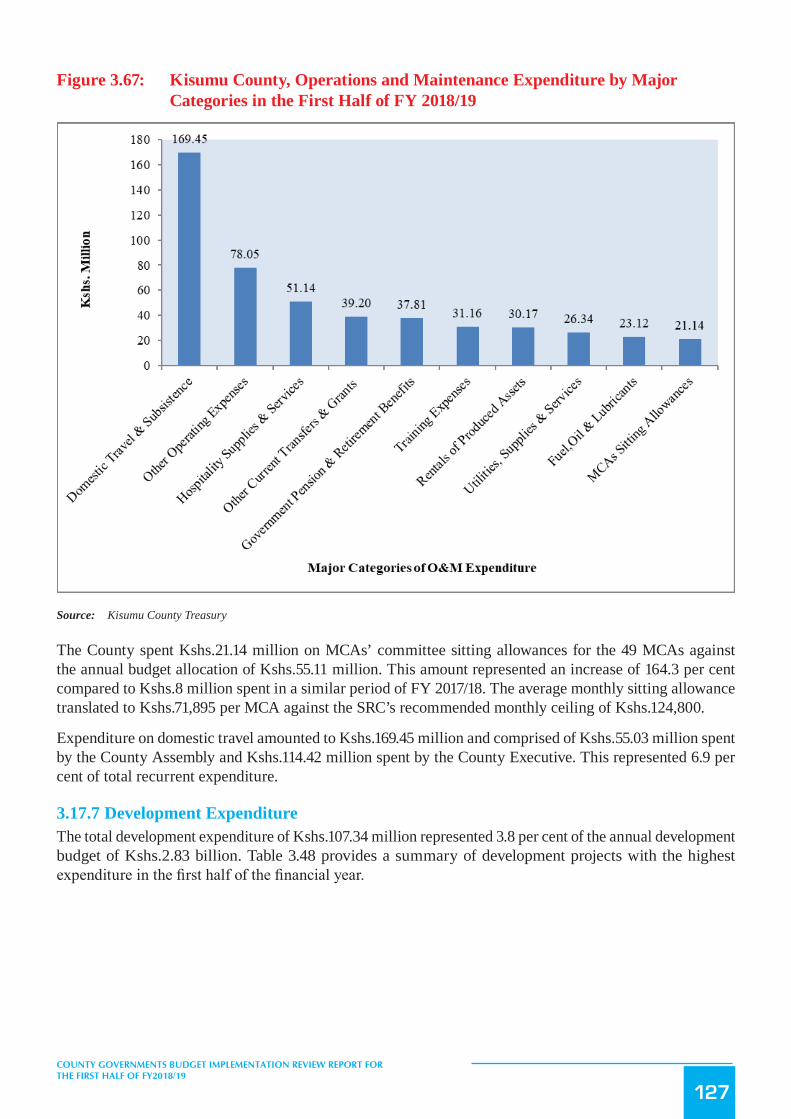
127
COUNTY GOVERNMENTS BUDGET IMPLEMENTATION REVIEW REPORT FOR THE FIRST HALF OF FY2018/19
Figure 3.67: Kisumu County, Operations and Maintenance Expenditure by Major Categories in the First Half of FY 2018/19
Source: Kisumu County Treasury
The County spent Kshs.21.14 million on MCAs’ committee sitting allowances for the 49 MCAs against the annual budget allocation of Kshs.55.11 million. This amount represented an increase of 164.3 per cent compared to Kshs.8 million spent in a similar period of FY 2017/18. The average monthly sitting allowance translated to Kshs.71,895 per MCA against the SRC’s recommended monthly ceiling of Kshs.124,800.
Expenditure on domestic travel amounted to Kshs.169.45 million and comprised of Kshs.55.03 million spent by the County Assembly and Kshs.114.42 million spent by the County Executive. This represented 6.9 per cent of total recurrent expenditure.
3.17.7 Development ExpenditureThe total development expenditure of Kshs.107.34 million represented 3.8 per cent of the annual development budget of Kshs.2.83 billion. Table 3.48 provides a summary of development projects with the highest expenditure in the first half of the financial year.

128
COUNTY GOVERNMENTS BUDGET IMPLEMENTATION REVIEW REPORT FOR THE FIRST HALF OF FY2018/19
Table 3.48: Kisumu County, List of Development Projects with the Highest Expenditure in the FY 2018/19
S/No. Project Name Project LocationProject Expenditure in First Half
of FY 2018/19 (Kshs.)
1 Kachok dumpsite Rehabilitation Kachok 39,144,200
2 Valuation Roll County wide 18,560,000
3 Constraction of Huduma Centre at Nyando Nyando 8,122,308
4 Constraction of Huduma Centre at Seme Seme 7,124,935
5 Ahero Youth Polytechnic Ahero 5,370,000
6 Rotary Youth Polytechnic Rotary 4,717,616
7 Akado Youth Polytechnic Akado 3,060,000
8 Katito Youth Polytechnic Katito 1,860,000
9 Kitambo Youth Polytechnic Kitambo 1,740,000
10 Wachara Youth Polytechnic Wachara 1,635,000
Source: Kisumu County Treasury
3.17.8 Budget Performance by County DepartmentTable 3.49 shows a summary of budget estimates and budget performance by department in the first half of FY 2018/19.
Table 3.49: Kisumu County, Budget Performance by Department
Department
Annual Budget Alloca-tion in FY 2018/19 (Kshs.
Million)
Exchequer Issues in First Half of FY 2018/19 (Kshs. Mil-lion)
Expenditure in First Half of FY 2018/19
(Kshs. Million)
Expenditure to Exchequer Issues
(%)
Absorption Rate (%)
Rec Dev Rec Dev Rec Dev Rec Dev Rec Dev
Agriculture, Livestock and Fisheries
282.84 104.40 138.64 - 112.33 - 81 - 39.7 -
City of Kisumu 693.01 267.86 354.59 39.14 294.21 - 83 - 42.5 -Kisumu County Public Service Board
81.26 - 42.94 - 30.02 - 69.9 - 36.9 -
Education, Gender, Youth, Human Resource Development, ICT and Social Services
268.36 247.77 142.33 8.49 111.83 27.43 78.6 323.2 41.7 11.1
Office of the Governor and County Administra-tion
442.75 199.76 267.67 - 156.85 - 58.6 - 35.4 -
Health Services 2,845.05 300.78 1,440.79 - 1,223.95 15.25 84.9 - 43.0 5.1
Economic Planning 66.96 74.17 38.29 10.01 17.96 - - -
Tourism, Culture, Sports and Information
89.08 77.10 51.91 - 13.68 - 26.4 - 15.4 -
Roads, Transport and Public Works
182.20 599.98 102.60 - 58.41 3.76 56.9 - 32.1 0.6
Lands, Housing and Physical Planning
43.89 116.90 21.88 16.67 3.82 18.56 17.5 111.3 8.7 15.9
Business, Energy and In-dustry
119.70 381.32 69.58 58.30 27.31 - 39.3 - 22.8 0.0
Finance 436.31 173.60 272.28 - 99.14 42.34 36.4 - 22.7 24.4

129
COUNTY GOVERNMENTS BUDGET IMPLEMENTATION REVIEW REPORT FOR THE FIRST HALF OF FY2018/19
Department
Annual Budget Alloca-tion in FY 2018/19 (Kshs.
Million)
Exchequer Issues in First Half of FY 2018/19 (Kshs. Mil-lion)
Expenditure in First Half of FY 2018/19
(Kshs. Million)
Expenditure to Exchequer Issues
(%)
Absorption Rate (%)
Rec Dev Rec Dev Rec Dev Rec Dev Rec DevWater, Environment and Natural Resources
148.66 238.60 82.76 - 40.91 - 49.4 - 27.5 -
County Assembly 684.80 50.76 291.00 - 269.12 - 92.5 - 39.3 -TOTAL 6,385 2,833 3,317 132.62 2,459 107.34 74.1 80.9 38.5 3.8
Source: Kisumu County Treasury
Analysis of expenditure by department shows the Department of Finance recorded the highest absorption rate of development budget at 24.4 per cent. The Department of Health Services had the highest percentage of recurrent expenditure to recurrent budget at 43 per cent.
3.17.9 Key Observations and RecommendationsThe County has made progress in addressing some of the challenges previously identified as affecting budget implementation. Some of the progress made included:
i. Timely submission of quarterly financial reports to the Office of Controller of Budget in line with Section 166 of the PFM Act, 2012.
ii. Improvement in own source revenue collection by 66.3 per cent compared to a similar period in FY 2017/18.
During the period under review, the office identified the following challenges that affected budget implementation:
1. Failure to factor in Kshs.1.44 billion cash balance from the FY 2017/18 in the approved budget.2. Failure by Hospitals and Health Centres to account for expenditure on capital and current transfers
from the County Treasury through IFMIS.3. Delay in disbursement of equitable share of revenue raised by the National Treasury.
The County should implement the following recommendations in order to improve budget execution;
1. The County should prepare a Supplementary Budget to factor in the Kshs.1.44 billion cash balance from the FY 2017/18.
2. The County Treasury should liaise with IFMIS Directorate to build capacity and ensure use of IFMIS at all the Hospitals.
3. The County Treasury should liaise with the National Treasury to ensure that the funds allocated to the County are released in timely manner.
3.18 Kitui County
3.18.1 Overview of the FY 2018/19 BudgetThe Approved Budget for FY 2018/19 is Kshs.11.78 billion, comprising of Kshs.6.81 billion (57.8 per cent) and Kshs.4.97 billion (42.2 per cent) allocation for recurrent and development expenditure respectively.
To finance the budget, the County expects to receive Kshs.8.73 billion (74.1 per cent) as equitable share of revenue raised nationally,Kshs.910.08 million (7.7 per cent) as total conditional grants, generateKshs.500 million (4.2 per cent) from own revenue sources, and Kshs.1.64 billion (13.9 per cent) cash balance from FY 2017/18.

130
COUNTY GOVERNMENTS BUDGET IMPLEMENTATION REVIEW REPORT FOR THE FIRST HALF OF FY2018/19
Figure 3.68: Kitui County, Expected Sources of Budget Financing in FY 2018/19
Source: Kitui County Treasury
The conditional grants contained in the CARA, 2018 consist of; Kshs.100 million (11 per cent) for Transforming Health Systems for Universal Care Project, Kshs.140.44 million (15.4 per cent) from IDA (World Bank) credit for National Agricultural and Rural Inclusive Growth Project, Kshs.57.46 million (6.3 per cent) from IDA (World Bank) credit for Kenya Devolution Support Programme “Level 1 grant”, Kshs.272.37 million (29.9 per cent) from IDA (World Bank ) credit for Kenya Urban Support Project, Kshs.29 million (3.2 per cent) grant from DANIDA for Universal Healthcare to Devolved System Programme, Kshs.22.5 million (2.5 per cent) Compensation for User Fees Foregone, Kshs.229.83 million (25.3 per cent) from Road Maintenance Fuel Levy Fund, and Kshs.58.47 million (6.4 per cent) for Rehabilitation of Village Polytechnics
3.18.2 Revenue AnalysisDuring the first half of FY 2018/19, the County received Kshs.2.97 billion as equitable share of revenue raised nationally, Kshs.263.07 million as total conditional grants, raised Kshs.206.63 million from own-source revenue, and had a cash balance of Kshs.895.63 million from FY 2017/18. The total available funds amounted to Kshs.4.33 billion.
Figure 3.69 shows the half yearly trend in own source revenue collection from the first half FY 2013/14 to the first half of FY 2018/19.
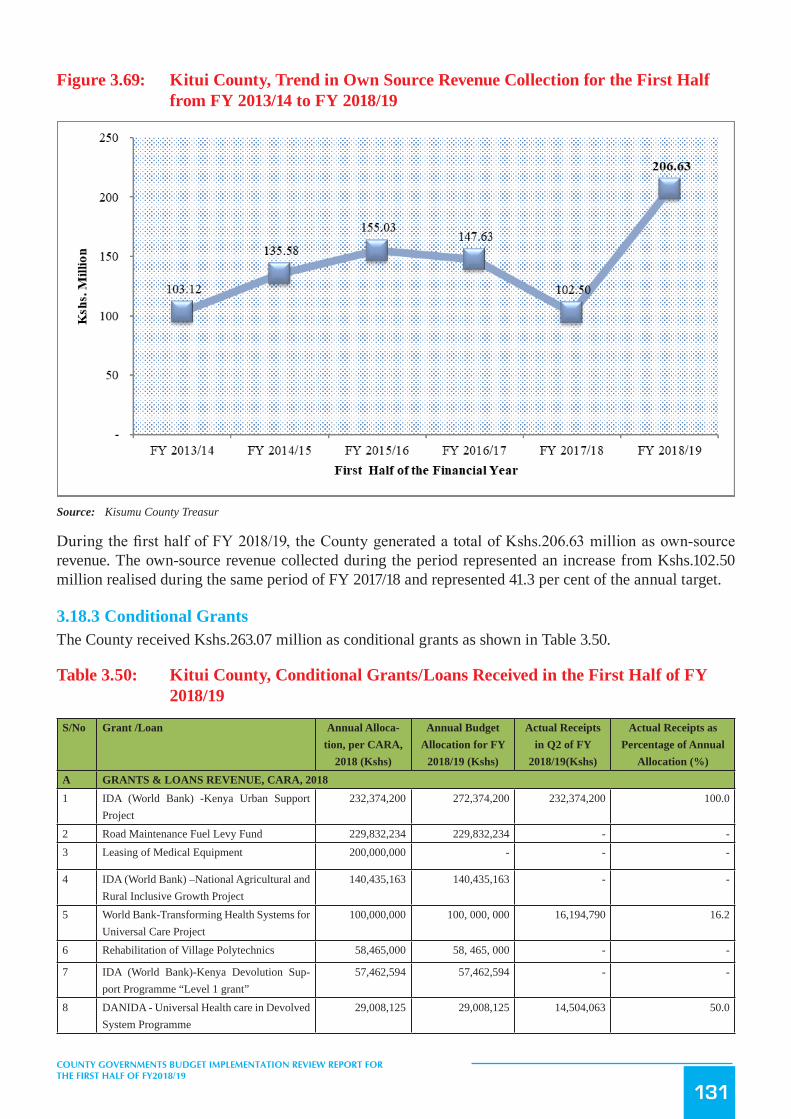
131
COUNTY GOVERNMENTS BUDGET IMPLEMENTATION REVIEW REPORT FOR THE FIRST HALF OF FY2018/19
Figure 3.69: Kitui County, Trend in Own Source Revenue Collection for the First Half from FY 2013/14 to FY 2018/19
Source: Kisumu County Treasur
During the first half of FY 2018/19, the County generated a total of Kshs.206.63 million as own-source revenue. The own-source revenue collected during the period represented an increase from Kshs.102.50 million realised during the same period of FY 2017/18 and represented 41.3 per cent of the annual target.
3.18.3 Conditional GrantsThe County received Kshs.263.07 million as conditional grants as shown in Table 3.50.
Table 3.50: Kitui County, Conditional Grants/Loans Received in the First Half of FY 2018/19
S/No Grant /Loan Annual Alloca-tion, per CARA,
2018 (Kshs)
Annual Budget Allocation for FY
2018/19 (Kshs)
Actual Receipts in Q2 of FY
2018/19(Kshs)
Actual Receipts as Percentage of Annual
Allocation (%)A GRANTS & LOANS REVENUE, CARA, 20181 IDA (World Bank) -Kenya Urban Support
Project232,374,200 272,374,200 232,374,200 100.0
2 Road Maintenance Fuel Levy Fund 229,832,234 229,832,234 - -3 Leasing of Medical Equipment 200,000,000 - - -
4 IDA (World Bank) –National Agricultural and Rural Inclusive Growth Project
140,435,163 140,435,163 - -
5 World Bank-Transforming Health Systems for Universal Care Project
100,000,000 100, 000, 000 16,194,790 16.2
6 Rehabilitation of Village Polytechnics 58,465,000 58, 465, 000 - -
7 IDA (World Bank)-Kenya Devolution Sup-port Programme “Level 1 grant”
57,462,594 57,462,594 - -
8 DANIDA - Universal Health care in Devolved System Programme
29,008,125 29,008,125 14,504,063 50.0

132
COUNTY GOVERNMENTS BUDGET IMPLEMENTATION REVIEW REPORT FOR THE FIRST HALF OF FY2018/19
S/No Grant /Loan Annual Alloca-tion, per CARA,
2018 (Kshs)
Annual Budget Allocation for FY
2018/19 (Kshs)
Actual Receipts in Q2 of FY
2018/19(Kshs)
Actual Receipts as Percentage of Annual
Allocation (%)A GRANTS & LOANS REVENUE, CARA, 20189 Compensation for User Fee Foregone 22,499,906 22,499,906 - -Total 1,070,077,222 751,612,222 263,073,053 24.6
Source: Kitui County Treasury
Analysis of the revenue from conditional grants indicates that, the County received the highest percentage of receipts to annual allocation from the DANIDA grant. The receipts accounted for 50 per cent of annual allocation.
3.18.4 Exchequer IssuesTo finance the budget, the Controller of Budget approved the withdrawal of Kshs.4.09 billion from the CRF account. The withdrawals represented 34.8 per cent of the Approved Budget and translated to an increase of 58.5 per cent from Kshs.2.58 billion approved in the first half of FY 2017/18. This amount comprised of Kshs.2.83 billion (69.2 per cent) to fund recurrent expenditure and Kshs.1.26 billion (30.8 per cent) for development activities.
3.18.5 Overall Expenditure ReviewThe County government spent a total of Kshs.4.28 billion on recurrent and development activities. The total expenditure represented 104.6 per cent of the total funds released from the CRF account and was an increase of 100.3 per cent from Kshs.2.14 billion spent in the first half of FY 2017/18.The expenditure excluded outstanding commitments as at December 31st 2018 which amounted to Kshs.843.85 million for development activities and Kshs.363.34 million for recurrent expenditure.
Expenditure on recurrent activities amounted to Kshs.2.85 billion while Kshs.1.43 billion was spent on development activities. The recurrent expenditure was 100.6 per cent of the funds released for recurrent activities, while development expenditure was 113.8 per cent of funds released for development activities.
The recurrent expenditure represented 41.8 per cent of the annual recurrent budget, an increase from 32.6 per cent recorded in the first half of FY 2017/18. Development expenditure recorded an absorption rate of 28.8 per cent, which was an increase from 2.8 per cent attained in the first half of FY 2017/18.Figure 3.70 presents a comparison between the total expenditure in the first half of FY 2018/19 and the first half of the FY 2017/18.
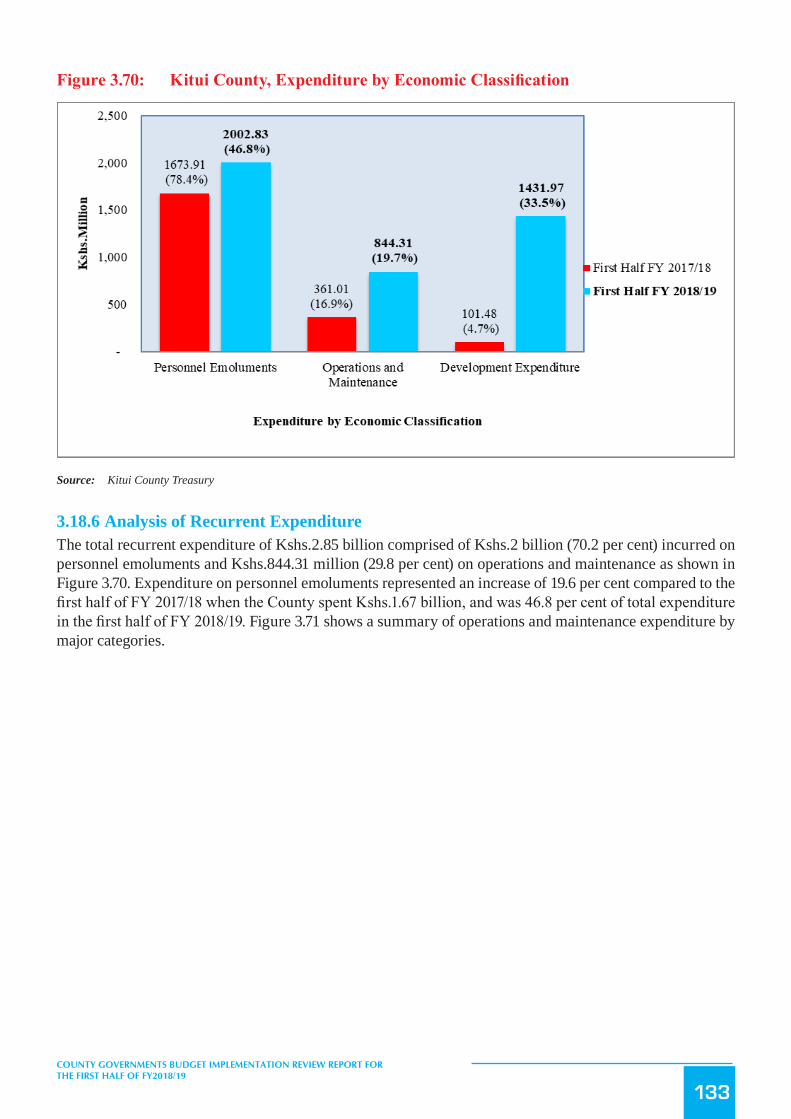
133
COUNTY GOVERNMENTS BUDGET IMPLEMENTATION REVIEW REPORT FOR THE FIRST HALF OF FY2018/19
Figure3.70: KituiCounty,ExpenditurebyEconomicClassification
Source: Kitui County Treasury
3.18.6 Analysis of Recurrent ExpenditureThe total recurrent expenditure of Kshs.2.85 billion comprised of Kshs.2 billion (70.2 per cent) incurred on personnel emoluments and Kshs.844.31 million (29.8 per cent) on operations and maintenance as shown in Figure 3.70. Expenditure on personnel emoluments represented an increase of 19.6 per cent compared to the first half of FY 2017/18 when the County spent Kshs.1.67 billion, and was 46.8 per cent of total expenditure in the first half of FY 2018/19. Figure 3.71 shows a summary of operations and maintenance expenditure by major categories.

134
COUNTY GOVERNMENTS BUDGET IMPLEMENTATION REVIEW REPORT FOR THE FIRST HALF OF FY2018/19
Figure 3.71: Kitui County, Operations and Maintenance Expenditure by Major Categories in the First Half of FY 2018/19
Source: Kitui County Treasury
The County spent Kshs.23.97 million on MCAs’ committee sitting allowances for the 55 MCAs against the annual budget allocation of Kshs.65.94 million. This represented an increase of 296.7 per cent compared to Kshs.6.04 million spent in a similar period of FY 2017/18. The average monthly sitting allowance translated to Kshs.72,622 per MCA against the SRC’s recommended monthly ceiling of Kshs.124,800.
Expenditure on domestic travel amounted to Kshs.184.40 million and comprised of Kshs.59.59 million spent by the County Assembly and Kshs.124.80 million spent by the County Executive. This represented 6.5 per cent of total recurrent expenditure and was an increase of 103 per cent compared to Kshs.90.85 million spent in the first half of FY 2017/18.
3.18.7 Development ExpenditureThe total development expenditure of Kshs.1.43 billion represented 28.8 per cent of the annual development budget of Kshs.4.97 billion. Table 3.51 provides a summary of development projects with the highest expenditure in the first half of the financial year.

135
COUNTY GOVERNMENTS BUDGET IMPLEMENTATION REVIEW REPORT FOR THE FIRST HALF OF FY2018/19
Table 3.51: Kitui County, List of Development Projects with the Highest Expenditure in the FY 2018/19
S/No. Project Name Project LocationAnnual Project Budget (Kshs.)
First Half Expen-diture (Kshs.)
Absorption Rate (%)
1Supply and installation of CT Scan ma-chine and accessories
Kitui Central 80,000,000 46,747,747 58.4
2Supply, installation and commissioning of machines at Kitui Garment Factory
Kitui Central 66,416,000 26,416,000 39.8
3Upgrading to Bitumen standards Oil Lib-ya-Jubilee College Road
Kitui Central 51,450,952 21,056,833 40.9
4 Supply and delivery of Horticulture seeds County wide 32,138,405 32,138,405 1005 Construction of Mekyuyu earth dam Kitui South 7,515,130 7,515,130 1006 Construction of Kalisasi borehole Mwingi Central 3,989,394 3,989,394 100
7 Construction of Kisuini earth dam Kitui Rural 5,421,740 4,337,392 80.0
8Refurbishment of Kavalyani playground Phase 1
Mwingi West 3,797,202 3,657,528 96.3
9Fencing and installation of goal posts at Nzalae community grounds
Kitui West 2,827,060 2,827,060 100
10Construction of ECDE classroom at Kyo-ea Centre
Mwingi North 945,210 945,210 100
Source: Kitui County Treasury
3.18.8 Budget Performance by County DepartmentTable 3.52 shows a summary of budget estimates and budget performance by department in the first half of FY 2018/19.
Table 3.52: Kitui County, Budget Performance by Department
Department
Annual Budget Allo-cation in FY 2018/19
(Kshs. Million)
Exchequer Issues in First Half of FY 2018/19 (Kshs. Million)
Expenditure in First Half of FY 2018/19
(Kshs. Million)
Expenditure to Exchequer Issues
(%)
Absorption rate (%)
Rec Dev Rec Dev Rec Dev Rec Dev Rec Dev
Office of the Gover-nor
583.43 825.00 250.85 216.90 248.75 248.81 99.2 114.7 42.6 30.2
Administration & Co-ordination of County Affairs
373.00 - 174.73 - 170.22 - 97.4 - 45.6 -
County Treasury 458.17 107.46 160.91 - 137.84 2.43 85.7 - 30.1 2.3Health and Sanitation 2, 420.27 506.98 1,023.36 175.84 1,177.72 191.81 115.1 109.1 48.7 37.8Basic Education, ICT and Youth Develop-ment
548.37 160.47 241.88 25.30 213.65 46.20 88.3 182.6 39.0 28.8
Trade, Co-operatives and Investments
102.84 644.2 56.91 112.42 31.16 110.39 54.7 98.2 30.3 17.1
Lands, Infrastructure, Housing and Urban Development
325.45 789.07 172.72 83.96 170.05 225.95 98.5 269.1 52.3 28.6
Tourism, Sports and Culture
148.05 124.08 55.67 10.21 62.53 21.57 112.3 211.3 42.2 17.4
Agriculture, Water and Livestock
494.84 1, 219.84 246.18 358.64 215.40 520.39 87.5 145.1 43.5 42.7
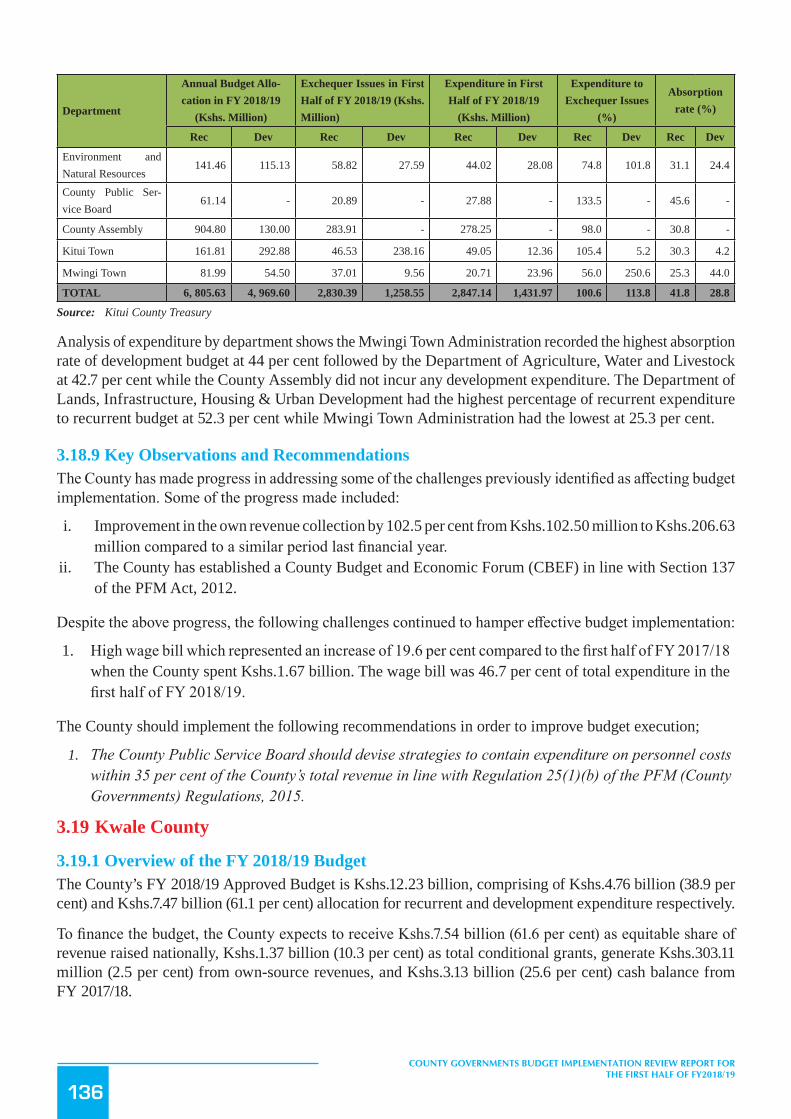
136
COUNTY GOVERNMENTS BUDGET IMPLEMENTATION REVIEW REPORT FOR THE FIRST HALF OF FY2018/19
Department
Annual Budget Allo-cation in FY 2018/19
(Kshs. Million)
Exchequer Issues in First Half of FY 2018/19 (Kshs. Million)
Expenditure in First Half of FY 2018/19
(Kshs. Million)
Expenditure to Exchequer Issues
(%)
Absorption rate (%)
Rec Dev Rec Dev Rec Dev Rec Dev Rec Dev
Environment and Natural Resources
141.46 115.13 58.82 27.59 44.02 28.08 74.8 101.8 31.1 24.4
County Public Ser-vice Board
61.14 - 20.89 - 27.88 - 133.5 - 45.6 -
County Assembly 904.80 130.00 283.91 - 278.25 - 98.0 - 30.8 -
Kitui Town 161.81 292.88 46.53 238.16 49.05 12.36 105.4 5.2 30.3 4.2
Mwingi Town 81.99 54.50 37.01 9.56 20.71 23.96 56.0 250.6 25.3 44.0
TOTAL 6, 805.63 4, 969.60 2,830.39 1,258.55 2,847.14 1,431.97 100.6 113.8 41.8 28.8
Source: Kitui County Treasury
Analysis of expenditure by department shows the Mwingi Town Administration recorded the highest absorption rate of development budget at 44 per cent followed by the Department of Agriculture, Water and Livestock at 42.7 per cent while the County Assembly did not incur any development expenditure. The Department of Lands, Infrastructure, Housing & Urban Development had the highest percentage of recurrent expenditure to recurrent budget at 52.3 per cent while Mwingi Town Administration had the lowest at 25.3 per cent.
3.18.9 Key Observations and RecommendationsThe County has made progress in addressing some of the challenges previously identified as affecting budget implementation. Some of the progress made included:
i. Improvement in the own revenue collection by 102.5 per cent from Kshs.102.50 million to Kshs.206.63 million compared to a similar period last financial year.
ii. The County has established a County Budget and Economic Forum (CBEF) in line with Section 137 of the PFM Act, 2012.
Despite the above progress, the following challenges continued to hamper effective budget implementation:
1. High wage bill which represented an increase of 19.6 per cent compared to the first half of FY 2017/18 when the County spent Kshs.1.67 billion. The wage bill was 46.7 per cent of total expenditure in the first half of FY 2018/19.
The County should implement the following recommendations in order to improve budget execution;
1. The County Public Service Board should devise strategies to contain expenditure on personnel costs within 35 per cent of the County’s total revenue in line with Regulation 25(1)(b) of the PFM (County Governments) Regulations, 2015.
3.19 Kwale County
3.19.1 Overview of the FY 2018/19 BudgetThe County’s FY 2018/19 Approved Budget is Kshs.12.23 billion, comprising of Kshs.4.76 billion (38.9 per cent) and Kshs.7.47 billion (61.1 per cent) allocation for recurrent and development expenditure respectively.
To finance the budget, the County expects to receive Kshs.7.54 billion (61.6 per cent) as equitable share of revenue raised nationally, Kshs.1.37 billion (10.3 per cent) as total conditional grants, generate Kshs.303.11 million (2.5 per cent) from own-source revenues, and Kshs.3.13 billion (25.6 per cent) cash balance from FY 2017/18.

137
COUNTY GOVERNMENTS BUDGET IMPLEMENTATION REVIEW REPORT FOR THE FIRST HALF OF FY2018/19
Figure 3.72: Kwale County, Expected Sources of Budget Financing in FY 2018/19
Source: Kwale County Treasury
The conditional grants contained in the CARA, 2018 consist of; Kshs.98.18 million (7.4 per cent) for Transforming Health Systems for Universal Care Project, Kshs.140.44 million (10.6 per cent) from IDA (World Bank) as credit for National Agricultural and Rural Inclusive Growth Project, Kshs.50.75 million (3.8 per cent) from IDA (World Bank) credit for Kenya Devolution Support Programme “Level 1 grant”, Kshs.50 million (3.8 per cent) from IDA (World Bank ) credit for Kenya Urban Support Project, Kshs.24.30 million (1.8 per cent) grant from DANIDA for Universal Healthcare to Devolved System Programme, Kshs.45 million (3.4 per cent) grant from EU for Instruments for Devolution Advice and Support- IDEAS), Kshs.400 million (30.1 per cent) from IDA (World Bank) as credit for Water & Sanitation Development Project (WSDP), Kshs.15.21 million (1.2 per cent) Compensation for User Fees Foregone, Kshs.200 million (14.9 per cent) for Leasing of Medical Equipment, Kshs.198.42 million (15.1 per cent) from the Road Maintenance Fuel Levy Fund, and Kshs.41.86 million (3.2 per cent) for Rehabilitation of Village Polytechnics
The County also budgeted to receive Kshs.110 million as EU grant for Construction of Kombani Market project, which is not contained in the CARA, 2018.
3.19.2 Revenue AnalysisDuring the first half of FY 2018/19, the County received Kshs.2.34 billion as equitable share of revenue raised nationally, Kshs.127.61 million as total conditional grants, raised Kshs.95.69 million from own source revenue, and had a cash balance of Kshs.2.12 billion from FY 2017/18. The total available funds amounted to Kshs.4.67 billion.
Figure 3.73 shows the half yearly trend in own source revenue collection from the first half of FY 2013/14 to the first half of FY 2018/19.

138
COUNTY GOVERNMENTS BUDGET IMPLEMENTATION REVIEW REPORT FOR THE FIRST HALF OF FY2018/19
Figure 3.73: Kwale County, Trend in Own Source Revenue Collection from the First Half of FY 2013/14 to the First Half of FY 2018/19
Source: Kwale County Treasury
During the first half of FY 2018/19, the County generated a total of Kshs.95.69 million as own-source revenue. The own-source revenue collected during the period represented an increase of 91.1 per cent from Kshs.50.08 million realised during the same period of the FY 2017/18 and represented 31.6 per cent of the annual target.
3.19.3 Conditional GrantsThe County received Kshs.126.61 million as conditional as shown in Table 3.53.
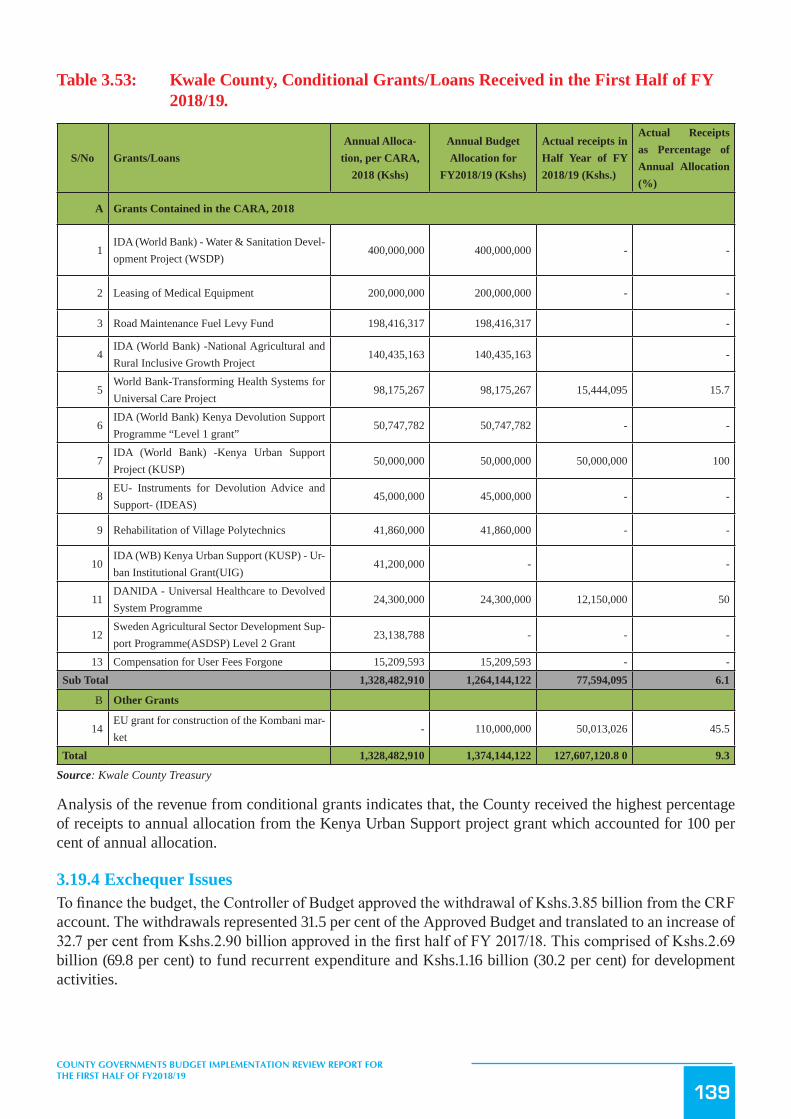
139
COUNTY GOVERNMENTS BUDGET IMPLEMENTATION REVIEW REPORT FOR THE FIRST HALF OF FY2018/19
Table 3.53: Kwale County, Conditional Grants/Loans Received in the First Half of FY 2018/19.
S/No Grants/LoansAnnual Alloca-
tion, per CARA, 2018 (Kshs)
Annual Budget Allocation for
FY2018/19 (Kshs)
Actual receipts in Half Year of FY 2018/19 (Kshs.)
Actual Receipts as Percentage of Annual Allocation (%)
A Grants Contained in the CARA, 2018
1IDA (World Bank) - Water & Sanitation Devel-opment Project (WSDP)
400,000,000 400,000,000 - -
2 Leasing of Medical Equipment 200,000,000 200,000,000 - -
3 Road Maintenance Fuel Levy Fund 198,416,317 198,416,317 -
4IDA (World Bank) -National Agricultural and Rural Inclusive Growth Project
140,435,163 140,435,163 -
5World Bank-Transforming Health Systems for Universal Care Project
98,175,267 98,175,267 15,444,095 15.7
6IDA (World Bank) Kenya Devolution Support Programme “Level 1 grant”
50,747,782 50,747,782 - -
7IDA (World Bank) -Kenya Urban Support Project (KUSP)
50,000,000 50,000,000 50,000,000 100
8EU- Instruments for Devolution Advice and Support- (IDEAS)
45,000,000 45,000,000 - -
9 Rehabilitation of Village Polytechnics 41,860,000 41,860,000 - -
10IDA (WB) Kenya Urban Support (KUSP) - Ur-ban Institutional Grant(UIG)
41,200,000 - -
11DANIDA - Universal Healthcare to Devolved System Programme
24,300,000 24,300,000 12,150,000 50
12Sweden Agricultural Sector Development Sup-port Programme(ASDSP) Level 2 Grant
23,138,788 - - -
13 Compensation for User Fees Forgone 15,209,593 15,209,593 - -Sub Total 1,328,482,910 1,264,144,122 77,594,095 6.1
B Other Grants
14EU grant for construction of the Kombani mar-ket
- 110,000,000 50,013,026 45.5
Total 1,328,482,910 1,374,144,122 127,607,120.8 0 9.3
Source: Kwale County Treasury
Analysis of the revenue from conditional grants indicates that, the County received the highest percentage of receipts to annual allocation from the Kenya Urban Support project grant which accounted for 100 per cent of annual allocation.
3.19.4 Exchequer IssuesTo finance the budget, the Controller of Budget approved the withdrawal of Kshs.3.85 billion from the CRF account. The withdrawals represented 31.5 per cent of the Approved Budget and translated to an increase of 32.7 per cent from Kshs.2.90 billion approved in the first half of FY 2017/18. This comprised of Kshs.2.69 billion (69.8 per cent) to fund recurrent expenditure and Kshs.1.16 billion (30.2 per cent) for development activities.

140
COUNTY GOVERNMENTS BUDGET IMPLEMENTATION REVIEW REPORT FOR THE FIRST HALF OF FY2018/19
3.19.5 Overall Expenditure ReviewThe County government spent a total of Kshs.2.32 billion on recurrent and development activities. The total expenditure represented 61.3 per cent of the total funds released from the CRF account and was an increase of 30.2 per cent from Kshs.2.14 billion spent in the first half of FY 2017/18. The expenditure excluded outstanding commitments as at December 31st 2018 which amounted to Kshs.1.57 billion for development activities and Kshs.39.51 million for recurrent expenditure.
Expenditure on recurrent activities amounted to Kshs.1.40 billion while Kshs.920.20 million was spent on development activities. The recurrent expenditure was 51.9 per cent of the funds released for recurrent activities, while development expenditure was 79.1 per cent of funds released for development activities.
The recurrent expenditure represented 29.3 per cent of the annual recurrent budget, a decrease from 32.6 per cent recorded in the first half of FY 2017/18. Development expenditure recorded an absorption rate of 12.3 per cent, which was an increase from 11.2 per cent attained in the first half of FY 2017/18.Figure 3.74 presents a comparison between the total expenditure in the first half of FY 2018/19 and the first half of FY 2017/18.
Figure3.74: KwaleCounty,ExpenditurebyEconomicClassification
Source: Kwale County Treasury
3.19.6 Analysis of Recurrent ExpenditureThe total recurrent expenditure of Kshs.1.40 billion comprised of Kshs.878.27 billion (63 per cent) incurred on personnel emoluments and Kshs.516.90 million (37 per cent) on operations and maintenance as shown in Figure 3.74.
Expenditure on personnel emoluments represented a decrease of 24.5 per cent compared to the first half of FY 2017/18 when the County spent Kshs.1.16 billion, and was 37.9 per cent of total expenditure in the first half of FY 2018/19. Figure 3.75 shows a summary of operations and maintenance expenditure by major categories.

141
COUNTY GOVERNMENTS BUDGET IMPLEMENTATION REVIEW REPORT FOR THE FIRST HALF OF FY2018/19
Figure 3.75: Kwale County, Operations and Maintenance Expenditure by Major Categories in the First Half of FY 2018/19
Source: Kwale County Treasury
The County spent Kshs.22.80 million on MCAs’ committee sitting allowances for the 34 MCAs against the annual budget allocation of Kshs.60.96 million. This represented an increase of 84.7 per cent compared to Kshs.12.35 million spent in a similar period of FY 2017/18. The average monthly sitting allowance translated to Kshs.111,782 per MCA against the SRC’s recommended monthly ceiling of Kshs.124,800.
Expenditure on domestic travel amounted to Kshs.116.32 million and comprised of Kshs.78.13 million spent by the County Assembly and Kshs.38.19 million spent by the County Executive. This represented 8.3 per cent of total recurrent expenditure and was an increase of 63.2 per cent compared to Kshs.84.33 million spent in the first half of FY 2017/18.
3.19.7 Development ExpenditureThe total development expenditure of Kshs.920.20 million represented 12.3 per cent of the annual development budget of Kshs.7.47 billion. Table 3.54 provides a summary of development projects with the highest expenditure in the first half of the financial year.

142
COUNTY GOVERNMENTS BUDGET IMPLEMENTATION REVIEW REPORT FOR THE FIRST HALF OF FY2018/19
Table 3.54: Kwale County, List of Development Projects with the Highest Expenditure in the FY 2018/19
S/No. Project Name Project LocationProject Budget
(Kshs.)
Project Expenditure in First Half of FY 2018/19
(Kshs.)
Absorption Rate (%)
1 Flagship Project 2-Build 3 Dams ( Mwakalanga, Dziweni Gitegemee, & Kizingo Dams)
Mwereni, Ndavaya and Mackinon wards
220,000,000 57,867,240 26.3
2Construction of Governor Resi-dence
Golini Ward 149,216,375 22,445,021 15.0
3 Improvement Marere Godoni Kwale water pipeline
Marere Ward 45,000,000 22,272,000 49.5
4 Designed & installed backbone fi-bre optic network infrastructure
Kwale 18,396,057 18,396,056 100.0
5 Installation of LAN-Headquarter Kwale 14,779,078 14,779,078 100.0
6 Construction Kombani Rehab Wall Kombani Ward 9,699,980 4,214,280 43.4
7 Rehabilitated Ndavaya - Mtumwa (12 KM)- KRB
Ndavaya Ward 8,783,200 8,733,200 99.4
8 Building Main Drug Store at Msambweni Hospital
Ramisi Ward 7,985,080 4,800,806 60.1
9 Ukunda YP Admin Block Ukunda Ward 7,648,692 7,648,692 100.0
10 Build Market stalls at Nyumba Mbovu
Puma Ward 5,995,810 5,995,810 100.0
Source: Kwale County Treasury
3.19.8 Budget Performance by County DepartmentTable 3.55 shows a summary of budget estimates and budget performance by department in the first half of FY 2018/19.
Table 3.55: Kwale County, Budget Performance by Department
Department
Annual Budget Allo-cation in FY 2018/19
(Kshs. Million)
Exchequer Issues in First Half of FY 2018/19 (Kshs. Million)
Expenditure in First Half of FY 2018/19
(Kshs. Million)
Expenditure to Exchequer
Issues (%)
Absorption Rate (%)
Rec Dev Rec Dev Rec Dev Rec Dev Rec Dev
Office Of The Governor 210.93 257.15 93.46 22.45 31.59 22.45 33.8 100 15.0 8.7
Public Service & Admin-istration
275.65 75.94 183.04 13.82 53.20 13.82 29.1 100 19.3 18.2
Finance & Economic Planning
467.80 62.06 217.60 5.83 109.63 - 50.4 0.0 23.4 0.0
Agriculture ,Livestock And Fisheries
178.22 396.71 92.81 69.52 29.24 13.41 31.5 19.3 16.4 3.4
Education, Research And HR Development
760.69 1,294.94 520.72 228.99 190.19 176.27 36.5 77.0 25.0 13.6
Health Services 1,845.53 1,164.74 1,012.28 172.08 558.53 165.84 55.2 96.4 30.3 14.2
Trade and Cooperative Development
71.58 241.72 32.92 30.06 14.09 15.02 42.8 50.0 19.7 6.2
ICT & Tourism 61.64 126.57 25.61 36.83 13.04 30.88 50.9 83.8 21.2 24.4

143
COUNTY GOVERNMENTS BUDGET IMPLEMENTATION REVIEW REPORT FOR THE FIRST HALF OF FY2018/19
Department
Annual Budget Allo-cation in FY 2018/19
(Kshs. Million)
Exchequer Issues in First Half of FY 2018/19 (Kshs. Million)
Expenditure in First Half of FY 2018/19
(Kshs. Million)
Expenditure to Exchequer
Issues (%)
Absorption Rate (%)
Rec Dev Rec Dev Rec Dev Rec Dev Rec Dev
Community Develop-ment, Youth & Women Empowerment & Social Services
117.97 380.07 72.56 24.12 37.78 20.51 52.1 85.0 32.0 5.4
Infrastructure & Public Works
97.61 1,194.33 61.38 242.88 35.64 199.51 58.1 82.1 36.5 16.7
Land, Environment & Natural Resources
51.65 235.31 18.85 76.35 14.84 22.31 78.7 29.2 28.7 9.5
Water & Urban Planning 65.43 1,809.35 43.04 222.53 16.01 218.28 37.2 98.1 24.5 12.1
County Assembly 559.53 229.80 311.58 17.41 291.37 21.90 93.5 125.8 52.1 9.5
Total 4,764.23 7,468.68 2,685.85 1,162.86 1,395.17 920.20 51.9 79.1 29.3 12.3
Source: Kwale County Treasury
Analysis of expenditure by department shows that the Department of ICT and Tourism recorded the highest absorption of development budget at 24.4 per cent while the Department of Finance and Economic Planning did not incur any development expenditure. The County Assembly had the highest percentage of recurrent expenditure to recurrent budget at 52.1 per cent while Office of the Governor had the lowest at 15 per cent.
3.19.9 Observations and RecommendationsThe County has made progress in addressing some of the challenges previously identified as affecting budget implementation. Some of the progress made included:
i. Improvement in own source revenue collection by 91.1 per cent compared to a similar period in FY 2017/18.
Despite the above progress, the following challenges continued to hamper effective budget implementation:
1. Frequent IFMIS down time, which slowed down approval of procurement requests and payments to suppliers.
2. Late submission of financial reports and statements by the County Treasury to the Office of Controller contrary to Section 166 of the PFM Act, 2012.
3. Failure to budget for all conditional grants as contained in CARA,2018

144
COUNTY GOVERNMENTS BUDGET IMPLEMENTATION REVIEW REPORT FOR THE FIRST HALF OF FY2018/19
The County should implement the following recommendations in order to improve budget execution;
1. The County Treasury should liaise with the IFMIS Directorate for support in utilization of IFMIS and E-procurement module.
2. The County Treasury should comply with the law and ensure that financial returns and statements are submitted in line with Section 166 of the PFM Act, 2012.
3. The County should prepare a Supplementary Budget and budget for all the conditional grants in CARA, 2018.
3.20 Laikipia County
3.20.1 Overview of the FY 2018/19 BudgetThe County’s Approved Budget for FY 2018/19 is Kshs.6.65 billion, comprising of Kshs.4.05 billion (60.9 per cent) and Kshs.2.6 billion (39.1 per cent) allocation for recurrent and development expenditure respectively.
To finance the budget, the County expects to receive Kshs.4.11 billion (61.8 per cent) as equitable share of revenue raised nationally, Kshs.822.91 million (12.4 per cent) as total conditional grants, Kshs.116.32 million (1.7 per cent) as other revenue sources, generate Kshs.800 million (12 per cent) from own revenue sources including Hospital Facility Improvement Fund, and Kshs.800 million (12 per cent) cash balance-pending bills from FY 2017/18.
Figure 3.76: Laikipia County Sources of Budget Financing in FY 2018/19
Source: Laikipia County Treasury
The conditional grants contained in the CARA, 2018 consist of; Kshs.67 million (7.1 per cent) for Transforming Health Systems for Universal Care Project, Kshs.18 million (1.9 per cent) from IDA (World Bank) as credit for National Agricultural and Rural Inclusive Growth Project, Kshs.117 million (12.5 per cent) from IDA (World Bank) for Kenya Climate Smart Agriculture Project, Kshs.41.12 million (4.4 per cent) from IDA (World Bank) as credit for Kenya Devolution Support Programme “Level 1 grant”, Kshs.90 million (9.6 per cent) from IDA (World Bank ) as credit for Kenya Urban Support Project, Kshs.15.09 million (1.6 per cent) grant from DANIDA for Universal Healthcare to Devolved System Programme, Kshs.90 million (9.6 per cent) grant from EU for Instruments for Devolution Advice and Support- IDEAS), Kshs.37 million (3.9

145
COUNTY GOVERNMENTS BUDGET IMPLEMENTATION REVIEW REPORT FOR THE FIRST HALF OF FY2018/19
per cent) for Kenya Devolution Support Project (KDSP) “Level 2 grant”, Kshs.9.97 million (1.1 per cent) as Compensation for User Fees Foregone, Kshs.200 million (21.3 per cent) for Leasing of Medical Equipment, Kshs.109.13 million (11.6 per cent) from the Road Maintenance Fuel Levy Fund, and Kshs.28.5 million (3 per cent) for Rehabilitation of Village Polytechnics.
The County also budgeted to receive Kshs.111.14 million (11.8 per cent) for Kenya Devolution Support Project (KDSP) “Investment” and Kshs.5.18 million (0.6 per cent) from UNICEF, which are not contained in CARA, 2018.
3.20.2 Revenue AnalysisDuring the first half of FY 2018/19, the County received Kshs.1.47 billion as equitable share of revenue raised nationally, Kshs.318.86 million as total conditional grants, raised Kshs.285.77 million from own-source revenue, and had a cash balance of Kshs.545.37 million from FY 2017/18. The total funds available for the period amounted to Kshs.2.73 billion.
Figure 3.77 shows the half yearly trend in own-source revenue collection from FY 2013/14 to FY 2018/19.
Figure 3.77: Laikipia County, Trend in Own-Source Revenue Collection for the First Half of FY 2013/14 to the First Half of FY 2018/19
Source: Laikipia County Treasury
During the first half of FY 2018/19, the County generated a total of Kshs.285.77 million from own-source revenue sources. This amount was an increase of 74.9 per cent when compared to Kshs.163.35 million realised during the same period of FY 2017/18 and represented 35.7 per cent of the annual target.
The Office noted that, the first quarter own source revenue collection was indicated as Kshs.113.11 million instead of earlier reported amount of Kshs.164.31 million. The County Treasury should therefore, reconcile the own source revenue collection as reported in the First and Second Quarter Financial Statements for FY 2018/19.

146
COUNTY GOVERNMENTS BUDGET IMPLEMENTATION REVIEW REPORT FOR THE FIRST HALF OF FY2018/19
3.20.3 Conditional GrantsThe County received Kshs.318.86 million as conditional grants during the reporting period as shown in Table 3.56.
Table 3.56: Laikipia County, Conditional Grants/Loans Received in the First Half of FY 2018/19
S/No. Grants/Loans Annual Alloca-tion, per CARA,
2018 (Kshs)
Annual Budget Allocation for FY
2018/19 (Kshs)
Actual Receipts in First Half
of FY 2018/19 (Kshs)
Actual Receipts as Percentage of
Annual Allocation (%)
A Grants/Loans contained in CARA, 2018
1 Compensation for User Fee Foregone 15,209,593 9,968,208 - -
2 Leasing of Medical Equipment 200,000,000 200,000,000 - -3 Road Maintenance Fuel Levy 198,416,317 109,128,974 26,143,057 24
4 Rehabilitation of Village Polytechnics 41,860,000 28,525,000 - -
5 Transforming Health Systems for Universal Care Project (WB)
67,077,728 67,077,728 6,427,476 9.6
6 National Agricultural and Rural Inclusive Growth Project (NARIGP)
- 18,000,000 - -
7 Kenya Climate Smart Agriculture Project (KCSAP)
117,000,000 117,000,000 39,402,608 33.7
8 Kenya Devolution Support Project (KDSP) “Level 1 grant”
41,121,027 41,121,027 - -
9 Kenya Urban Support Project (KUSP) 50,000,000 90,000,000 50,000,000 55.610 DANIDA Grant 15,086,250 15,086,250 7,543,125 5011 EU –IDEAS Grant 90,000,000 90,000,000 73,027,291 81.112 Kenya Devolution Support Project (KDSP)
“Level 2 grant”- 37,000,000 - -
Sub Total 835,770,915 822,907,187 202,543,55724.6
13 Kenya Devolution Support Project (KDSP) “In-vestment”
- 111,140,605 111,140,605 100
14 UNICEF - 5,177,150 5,177,350 100Sub Total - 116,317,955 116,317,955 100Total 835,770,915 939,224,942 318,861,512 33.9
Source: Laikipia County Treasury
Analysis of the revenue from conditional grants indicates that, the County received the highest percentage of receipts to annual allocation from the Kenya Urban Support project and the EU-IDEAS grant. The receipts accounted for 55.6 per cent and 81.1 per cent of annual allocation respectively.
3.20.4 Exchequer IssuesTo finance implementation of the budget, the Controller of Budget approved withdrawal of Kshs.2.6 billion from the CRF account. The withdrawals represented 39.1 per cent of the Approved Budget and translated to an increase of 30.9 per cent from Kshs.1.79 billion approved in the first half of FY 2017/18. This amount comprised of Kshs.2 billion (77 per cent) to fund recurrent expenditure and Kshs.598.2million (23 per cent) for development activities.

147
COUNTY GOVERNMENTS BUDGET IMPLEMENTATION REVIEW REPORT FOR THE FIRST HALF OF FY2018/19
3.20.5 Overall Expenditure ReviewThe County government spent a total of Kshs.2.31 billion on both recurrent and development activities. This expenditure represented 89.04 per cent of the total funds released from the CRF account and was an increase of 60.2 per cent from Kshs.1.39 billion spent in the first half of FY 2017/18.
Expenditure on recurrent activities amounted to Kshs.1.82 billion while that on development activities was Kshs.498.14 million. The recurrent expenditure was 90.8 per cent of the funds released for recurrent activities, while development expenditure was 83.3 per cent of funds released for development activities.
The recurrent expenditure represented 44.8 per cent of the annual recurrent budget, and an increase and was from 43.4 per cent recorded in the first half of FY 2017/18. Development expenditure recorded an absorption rate of 83.27 per cent, which was an increase from 21.9 per cent attained in the first half of FY 2017/18. Figure 3.78 presents a comparison between the total expenditure in the first half of FY 2018/19 and first half of FY 2017/18.
Figure3.78: LaikipiaCounty,ExpenditurebyEconomicClassification
Source: Laikipia County Treasury
3.20.6 Analysis of Recurrent ExpenditureThe total recurrent expenditure of Kshs.1.82 billion comprised of Kshs.1.48 billion (81.5 per cent) incurred on personnel emoluments and Kshs.335.9 million (14.5 per cent) on operations and maintenance as shown in Figure 3.78.
Expenditure on personnel emoluments represented an increase of 117.8 per cent compared to the first half of FY 2017/18 when the County spent Kshs.679.66 million, and was 64 per cent of total expenditure for the period. Figure 3.79 shows a summary of operations and maintenance expenditure by major categories.

148
COUNTY GOVERNMENTS BUDGET IMPLEMENTATION REVIEW REPORT FOR THE FIRST HALF OF FY2018/19
Figure 3.79: Laikipia County, Operations and Maintenance Expenditure by Major Categories in the First Half of FY 2018/19
Source: Laikipia County Treasury
The County spent Kshs.8.6 million on MCAs’ committee sitting allowances for the MCAs against the annual budget allocation of Kshs.15 million. This amount represented an increase of 329.8 per cent compared to Kshs.2 million spent in a similar period of FY 2017/18. The average monthly sitting allowance translated to Kshs.59,688 per MCA against the SRC’s recommended monthly ceiling of Kshs.124,800.
Expenditure on domestic travel amounted to Kshs.91.19 million and comprised of Kshs.32.27 million spent by the County Assembly and Kshs.57.92 million spent by the County Executive, and represented 48.3 per cent of total recurrent expenditure.
3.20.7 Development ExpenditureThe total development expenditure of Kshs.498.14 million represented 20.1 per cent of the annual development budget of Kshs.2.48 billion. Table 3.57 provides a summary of development projects with the highest expenditure in the first half of the financial year.

149
COUNTY GOVERNMENTS BUDGET IMPLEMENTATION REVIEW REPORT FOR THE FIRST HALF OF FY2018/19
Table 3.57: Laikipia County, List of Development Projects with the Highest Expenditure in the FY 2018/19
S/No. Project Name Project LocationHalf Year expenditure (Kshs.)
1Construction of a workshop for Rumuruti vocational training cen-tre
Rumuruti 29,112,018
2 Construction of 120 bed mother-child unit Igwamiti 20,000,0003 Construction of 120 bed mother-child unit Nanyuki 20,000,000
4 Commissioning of Dispensaries (Ethi,Seria,Timau,Naiperere)Mukogodo East & West, Marmanet, Umande
15,000,000
5 Construction of Theatre at Doldol Hospital Mukogodo East 15,000,000
6 Construction of Theatre at Ndindika Hospital Githiga 15,000,000
7 Construction of Theatre at Lamuria Health Centre Tigithi 15,000,000
Source: Laikipia County Treasury
3.20.8 Budget Performance by County DepartmentTable 3.58 shows a summary of budget estimates and budget performance by department in the first half of FY 2018/19.
Table 3.58: Laikipia County, Budget Performance by Department
Department
Annual Budget Allo-cation in FY 2018/19
(Kshs. Million)
Exchequer Issues in First Half of FY 2018/19 (Kshs. Million)
Expenditure in First Half of FY 2018/19
(Kshs. Million)
Expenditure to Exchequer Issues
(%)
Absorption rate (%)
Rec Dev Rec Dev Rec Dev Rec Dev Rec Dev
County Administra-tion
2,735.64 68.90 1,431.06 - 1,436.52 - 100.4 - 52.5 -
Finance and Plan-ning
310.62 815.36 146.22 304.48 136.25 364.13 93.2 119.6 43.9 44.7
Health 315.76 555.47 155.86 24.26 71.74 92.21 46.0 380.1 22.7 16.6Agriculture 41.90 309.50 10.62 127.31 8.47 3.25 79.8 2.6 20.2 1.1
Infrastructure 65.80 304.13 10.93 102.29 15.80 26.58 144.6 26.0 24.0 8.7
Education 78.50 83.53 11.55 28.53 9.21 - 79.8 - 11.7 -
Trade & Industrial-ization
16.50 135.00 3.68 10.00 9.26 10.00 251.9 100.0 56.1 7.4
Water 22.20 206.50 9.90 1.37 6.53 1.97 66.0 143. 29.4 1.0
County Assembly 466.00 5.00 220.90 - 122.22 - 55.3 - 26.2 -
TOTAL 4,052.92 2,483.38 2,000.70 598.24 1,816.00 498.14 90.8 83.3 44.8 20.1
Source: Laikipia County Treasury
Analysis of expenditure by department shows that the Department of Finance and Health recorded the highest absorption rate of development budget at 44.7 and 16.6 per cent respectively while the County Assembly and County Administration did not incur any development expenditure. The Department Trade & Industrialization had the highest percentage of recurrent expenditure to its recurrent budget at 56.1 per cent while the Department of Agriculture had the lowest at 20.2 per cent.
3.20.9 Key Observations and RecommendationsThe County has made progress in addressing some of the challenges previously identified as affecting budget implementation. Some of the progress made included:
150
COUNTY GOVERNMENTS BUDGET IMPLEMENTATION REVIEW REPORT FOR THE FIRST HALF OF FY2018/19
i. Establishment of an Audit Committee in line with Section 155 of the PFM Act, 2012.ii. Establishment of the County Budget and Economic Forum in line with Section 137 of the PFM Act,
2012.
Despite the above progress, the following challenges continued to hamper effective budget implementation;
1. Late submission of financial reports by the County Treasury, which affected timely preparation of budget implementation reports contract to Section 166 of the PFM Act, 2012.
2. Failure by Fund Administrators of the County Executive Car & Mortgage Fund, County Bursary and Scholarship Fund, and the Co-operative Fund and Enterprise Fund to submit quarterly reports contrary to Section 168 of the PFM Act, 2012.
3. High wage bill that increased by 117.8 per cent compared to a similar period of FY 2017/18. This may affect implementation of key programmes and projects.
The County should implement the following recommendations in order to improve budget execution;
1. The County Treasury should ensure timely preparation and submission of financial reports in line with Section 166 of PFM Act, 2012.
2. All Funds Administrators should provide quarterly financial statements for County Funds in line with Section 168 of the PFM Act, 2012.
3. The County Public Service Board should establish and implement an optimal staffing structure in order to maintain the wage bill within sustainable levels.
3.21 Lamu County
3.21.1 Overview of the FY 2018/19 BudgetThe County’s Approved Budget for FY 2018/19 is Kshs.4.50 billion, comprising of Kshs.2.60 billion (57.9 per cent) and Kshs.1.90 billion (42.1 per cent) allocation for recurrent and development expenditure respectively.
To finance the budget, the County expects to receive Kshs.3.55 billion (78.8 per cent) as equitable share of revenue raised nationally, Kshs.540.18 million (12.0 per cent) as total conditional grants, generate Kshs.70 million (1.6 per cent) from own sources, and Kshs.344 million (7.6 per cent) cash balance from FY 2017/18.

151
COUNTY GOVERNMENTS BUDGET IMPLEMENTATION REVIEW REPORT FOR THE FIRST HALF OF FY2018/19
Figure 3.80: Lamu County Sources of Budget Financing in FY 2018/19
Source: Lamu County Treasury
The conditional grants contained in the CARA, 2018 consist of; Kshs.50 million (6.8 per cent) for Transforming Health Systems for Universal Care Project, Kshs.150 million (20.3 per cent) from IDA (World Bank) for Kenya Climate Smart Agriculture Project, Kshs.33.79 million (4.6 per cent) from IDA (World Bank) credit for Kenya Devolution Support Programme “Level 1 grant”, Kshs.50 million (6.8 per cent) from IDA (World Bank ) credit for Kenya Urban Support Project, Kshs.8.30 million (1.1 per cent) grant from DANIDA for Universal Healthcare to Devolved System Programme, Kshs.121 million (16.3 per cent) as Supplement for Construction of County Headquarters, Kshs.2.45 million (0.3 per cent) as Compensation for User Fees Foregone,Kshs.93.42 million (12.6 per cent) from Road Maintenance Fuel Levy, and Kshs.31.21 million (4.2 per cent) for Rehabilitation of Village Polytechnics, and Kshs.200 million for Leasing of Medical Equipment.
3.21.2 Revenue AnalysisDuring the first half of FY 2018/19, the County received Kshs.1.10 billion as equitable share of revenue raised nationally, Kshs.112.34 million as total conditional grants, raised Kshs.17.39 million from own-source revenue, and had a cash balance of Kshs.344 million from FY 2017/18. The total funds available for the period amounted to Kshs.1.57 billion.
Figure 3.81 shows the half yearly trend in own-source revenue collection from FY 2013/14 to FY 2018/19.

152
COUNTY GOVERNMENTS BUDGET IMPLEMENTATION REVIEW REPORT FOR THE FIRST HALF OF FY2018/19
Figure 3.81: Lamu County, Trend in Own-Source Revenue Collection for the First Half of FY 2013/14 to the First Half of FY 2018/19
Source: Lamu County Treasury
During the first half of FY 2018/19, the County generated a total of Kshs.17.39 million from own-source revenue. This amount was an increase of 21.1 per cent when compared to Kshs.13.90 million realised during the same period of FY 2017/18 and represented 24.8 per cent of the annual target.
3.21.3 Conditional GrantsThe County received Kshs.112.34 million as conditional grants as shown in Table 3.59.

153
COUNTY GOVERNMENTS BUDGET IMPLEMENTATION REVIEW REPORT FOR THE FIRST HALF OF FY2018/19
Table 3.59: Lamu County, Conditional Grants/Loans Received in the First Half of FY 2018/19
S/No Grants/LoansAnnual Allocation, per CARA, 2018
(Kshs)
Annual Budget Allocation for FY
2018/19 (Kshs)
Actual receipts in Half Year of FY 2018/19 (in
Kshs.)
Actual Receipts as Percentage of Annual Alloca-tion (%)
A Grants Contained in the CARA, 2018
1Kenya Climate Smart Agriculture Project (KCSAP)
150,000,000 150,000,000 53,806,243 35.9
2Supplement for Construction of County Head-quarters
121,000,000 121,000,000 - -
3 Road Maintenance Fuel Levy 93,421,016 93,421,016 - -
4Transforming Health Systems for Universal Care Project (WB)
50,000,000 50,000,000 4,387,382 8.8
5 Kenya Urban Support Project (KUSP) 50,000,000 50,000,000 50,000,000 100.0
6Kenya Devolution Support Project (KDSP) “Level 1 grant”
33,793,559 33,793,559 - -
7 Rehabilitation of Village Polytechnics 31,210,000 31,210,000 - -
8 DANIDA Grant 8,302,500 8,302,500 4,151,250 50.0
9 Compensation for User Fee Foregone 2,451,034 2,451,034 - -Total 540,178,109 540,178,109 112,344,875 20.8
Source: Lamu County Treasury
Analysis of the revenue from conditional grants indicates that, the County received the highest percentage of receipts to annual allocation from the Kenya Urban Support project and the DANIDA grant. The receipts accounted for 100 per cent and 50 per cent of annual allocation respectively.
3.21.4 Exchequer IssuesTo finance implementation of the budget, the Controller of Budget approved withdrawal of Kshs 1.05 billion from the CRF account. The withdrawals represented 23.3 per cent of the Approved Budget and translate to an increase of 25.1 per cent from Kshs.840.23 million approved in the first half of FY 2017/18. This amount comprised of Kshs.891.72 million (84.8 per cent) to fund recurrent expenditure and Kshs.159.58 million (15.2 per cent) for development activities.
3.21.5 Overall Expenditure ReviewThe County government spent a total of Kshs.898.03 million on both recurrent and development activities. This expenditure represented 85.4 per cent of the total funds released from the CRF account and was an increase of 32.8 per cent from Kshs.676.45 million spent in the first half of FY 2017/18. The expenditure excluded outstanding commitments as at 31st December, 2018, which amounted to Kshs.70.62 million for development activities and Kshs.42.98 million for recurrent expenditure.
Expenditure on recurrent activities amounted to Kshs.842.26 million while that on development activities was Kshs.55.76 million. The recurrent expenditure was 94.5 per cent of the funds released for recurrent activities, while development expenditure was 35 per cent of funds released for development activities.
The recurrent expenditure represented 32.3 per cent of the annual recurrent budget a decrease from 34.4 per cent recorded in the first half of FY 2017/18. Development expenditure recorded an absorption rate of 2.9 per cent, which was a decrease from 3.6 per cent attained in the first half of FY 2017/18.
Figure 3.82 presents a comparison between the total expenditure in the first half of FY 2018/19 and the first half of the FY 2017/18.

154
COUNTY GOVERNMENTS BUDGET IMPLEMENTATION REVIEW REPORT FOR THE FIRST HALF OF FY2018/19
Figure3.82: LamuCounty,ExpenditurebyEconomicClassification
Source: Lamu County Treasury
3.21.6 Analysis of Recurrent ExpenditureThe total recurrent expenditure of Kshs.842.26 million comprised of Kshs.579.11 million (68.8 per cent) incurred on personnel emoluments and Kshs.263.15 million (31.2 per cent) on operations and maintenance as shown in Figure 3.82.
Expenditure on personnel emoluments represented an increase of 20.9 per cent compared to the first half of FY 2017/18 when the County spent Kshs.478.98 million, and was 64.5 per cent of total expenditure for the period.
Figure 3.83: shows a summary of operations and maintenance expenditure by major categories.

155
COUNTY GOVERNMENTS BUDGET IMPLEMENTATION REVIEW REPORT FOR THE FIRST HALF OF FY2018/19
Figure 3.83: Lamu County, Operations and Maintenance Expenditure by Major Categories in the First Half of FY 2018/19
Source: Lamu County Treasury
The County spent Kshs.6.75 million on MCAS’ committee sitting allowances for the 19 MCAs against the annual budget allocation of Kshs.18 million. This amount represented an increase of 230.3 per cent compared to Kshs.2.04 million spent in a similar period of FY 2017/18. The average monthly sitting allowance translated to Kshs.59, 235 per MCA against the SRC’s recommended monthly ceiling of Kshs.124,800.
Expenditure on domestic travel amounted to Kshs.60.33 million and comprised of Kshs.26.42 million spent by the County Assembly and Kshs.33.91 million spent by the County Executive. This represented 7.2 per cent of total recurrent expenditure and was an increase 79.9 per cent compared to Kshs.33.53 million spent in the first half of FY 2017/18.
3.21.7 Development ExpenditureThe total development expenditure of Kshs.55.78 million represented 2.9 per cent of the annual development budget of Kshs.1.90 billion. This expenditure comprised of Kshs.54 million spent on street lighting and Kshs.1.78 million on purchase of educational materials.
3.21.8 Budget Performance by County DepartmentTable 3.60 shows a summary of budget estimates and budget performance by department in the first half of FY 2018/19.

156
COUNTY GOVERNMENTS BUDGET IMPLEMENTATION REVIEW REPORT FOR THE FIRST HALF OF FY2018/19
Table 3.60: Lamu County, Budget Performance by Department
Department
Annual Budget Allo-cation in FY 2018/19
(Kshs. Million)
Exchequer Issues in First Half of FY 2018/19 (Kshs. Mil-lion)
Expenditure in First Half of FY 2018/19 (Kshs.
Million)
Expenditure to Exchequer Issues
(%)
Absorption rate (%)
Rec Dev Rec Dev Rec Dev Rec Dev Rec Dev
County Assembly 404.00 250.00 164.02 - 137.49 - 83.8 - 34 -
County Executive, County Public Service and Disas-ter Management
415.20 282.44 126.93 - 121.78 - 95.9 - 29.3 -
Finance, Strategy and Eco-nomic Planning
164.63 - 44.64 - 39.48 - 88.4 - 24 -
Agriculture and Irrigation 100.18 333.20 30.26 53.81 24.09 - 79.6 - 24.1 -Lands, Physical planning and Infrastructure Devel-opment
80.37 593.42 33.59 104.00 29.46 54.00 87.7 51.9 36.7 9.1
Education, Vocational Training, Youth Affairs, Culture, Gender and Social Services
318.79 128.21 92.75 1.78 87.70 1.78 94.6 100 27.5 1.4
Health, Environment, Nat-ural resources and Sanita-tion
965.10 258.50 340.82 - 355.87 - 104.4 - 36.9 -
Fisheries, Livestock and Co-operative Development
82.10 31.70 32.09 - 23.97 - 74.7 - 29.2 -
Trade, Tourism and Indus-trialization
29.18 20.00 7.70 - 4.83 - 62.7 - 16.6 -
Public Service Board 45.35 - 18.92 - 17.59 - 93 - 38.8 -
Total 2,604.90 1,897.47 891.72 159.58 842.26 55.78 94.5 34.95 32.3 2.9
Source: Lamu County TreasuryAnalysis of expenditure by department shows the Department of Lands, Physical Planning and Infrastructure Development recorded the highest absorption rate of development budget at 9.1 followed by the Department of Education, Vocational Training, Youth Affairs, Culture, Gender and Social Services at 1.4 per cent while all the other departments did not incur any development expenditure. The County Public Service Board had the highest percentage of recurrent expenditure to recurrent budget at 38.8 per cent while the Department of Trade, Tourism and Industrialization had the lowest at 16.6 per cent.
3.21.9 Key Observations and RecommendationsThe County has made progress in addressing some of the challenges previously identified as affecting budget implementation. Some of the progress made included:
i. Establishment of the County Budget and Economic Forum (CBEF) in line with Section 137 of the PFM Act, 2012.
ii. Establishment of an Internal Audit Committee in line with Section 155 of the PFM Act, 2012.iii. Improvement in the use of IFMIS and Internet Banking Platform in processing financial transactions.
Despite the above progress, the following challenges continued to hamper effective budget implementation;
1. High wage bill that has increased by 20.9 per cent from Kshs.478.98 million in the first half of FY 2017/18 to Kshs.579.11 million during the period under review.
2. Operational delays and IFMIS connectivity challenges, which slowed approvals of procurement

157
COUNTY GOVERNMENTS BUDGET IMPLEMENTATION REVIEW REPORT FOR THE FIRST HALF OF FY2018/19
requests and payment to suppliers.3. Late submission of financial reports by the County Treasury, which affected timely preparation of the
budget implementation report by the OCOB contrary to Section 166 of the PFM Act, 2012.
The County should implement the following recommendations in order to improve budget execution;
1. The County Public Service Board should establish an optimal staffing structure in order to ensure a sustainable wage bill.
2. The County Treasury to liaise with IFMIS Directorate for intervention measures and support in utilization of IFMIS and E-procurement module.
3. The County Treasury should ensure timely preparation and submission of financial reports in line with Section 166 of PFM Act, 2012.
3.22 Machakos County
3.22.1 Overview of the FY 2018/19 BudgetThe County’s Approved Budget for FY 2018/19 was Kshs.12.23 billion, comprising of Kshs.7.63 billion (62.4 per cent) and Kshs.4.60 billion (37.6 per cent) allocation for recurrent and development expenditure respectively.
To finance the budget, the County expects to receive Kshs.8.32 billion (61 per cent) as equitable share of revenue raised nationally, Kshs.2.19 billion (16.1 per cent) as total conditional grants, and generate Kshs.1.72 billion (12.6 per cent) from own revenue sources. The County did not budget for Kshs.1.41 billion (10.4 per cent) cash balance from FY 2017/18.
Figure 3.84: Machakos County Expected Sources of Budget Financing in FY 2018/19
Source: Machakos County Treasury
The conditional grants contained in the CARA, 2018 consist of; Kshs.1.02 billion (46.5 per cent) from IDA (World Bank) credit for Kenya Urban Support Project, Kshs.383.58 million (17.5 per cent) for Level-5 Hospitals, Kshs.219.08 million (10 per cent) from the Road Maintenance Fuel Levy Fund, Kshs.200 million (9.1 per cent) Leasing of Medical Equipment, Kshs.117 million (5.3 per cent) from IDA (World Bank) as credit for Kenya Climate Smart Agriculture Project (KCSAP), Kshs.95.40 million (4.4 per cent) World Bank Loan for Transforming Health System for Universal Care System, Kshs.54.30 million (2.5 per cent) for

158
COUNTY GOVERNMENTS BUDGET IMPLEMENTATION REVIEW REPORT FOR THE FIRST HALF OF FY2018/19
Rehabilitation of Village Polytechnics, Kshs.53.42 million (2.4 per cent) from IDA (World Bank) credit for Kenya Devolution Support Programme “Level 1 grant”, Kshs.24.81 million (1.1 per cent) from DANIDA, and Kshs.24.13 million (1.1 per cent) as Compensation for User Fee Foregone.
The County received Kshs.84.03 million as grant for Universal Health Coverage (UHC) programme during the reporting period, which is not contained in the CARA, 2018.
3.22.2 Revenue AnalysisDuring the first half of FY 2018/19, the County received Kshs.3.18 billion as equitable share of revenue raised nationally, Kshs.1.16 billion as total conditional grants, raised Kshs.441.90 million from own source revenue, and had a cash balance of Kshs.1.41 billion from FY 2017/18. The total available funds amounted to Kshs.6.20 billion.
Figure 3.85 shows the half yearly trend in own source revenue collection from the first half of FY 2013/14 to the first half of FY 2018/19.
Figure 3.85: Machakos County, Trend in Own Source Revenue Collection for the First Half from FY 2013/14 to FY 2018/19
Source: Machakos County Treasury
During the first half of FY 2018/19, the County generated a total of Kshs.441.90 million as own-source revenue. This amount was an increase of 102.1 per cent from Kshs.301.49 million realised during the same period of the FY 2017/18 and represented 25.7 per cent of the annual target.
3.22.3 Conditional GrantsThe County received Kshs.1.16 billion as conditional grants in the first half of the financial year 2018/19 disaggregated as shown in Table 3.61.

159
COUNTY GOVERNMENTS BUDGET IMPLEMENTATION REVIEW REPORT FOR THE FIRST HALF OF FY2018/19
Table 3.61: Machakos County, Conditional Grants/Loans Received in the First Half of FY 2018/19
S/No Grants/LoansAnnual Alloca-
tion, per CARA, 2018 (Kshs)
Annual Budget Allocation for
FY 2018/19 (Kshs)
Actual receipts in Half Year of FY
2018/19 (in Kshs.)
Actual Receipts as Percentage of Annu-
al Allocation (%)
A Grants Contained in the CARA, 2018
1IDA (World Bank) -Kenya Urban Support Proj-ect
1,018,320,500 1,018,320,500 1,018,320,500 100
2 Conditional Grants to Level- 5 Hospitals 383,583,815 383,583,815 - -
3 Road Maintenance Fuel Levy Fund 219,084,683 219,084,683 - -
4 Leasing of Medical Equipment 200,000,000 200,000,000 - -
5IDA (World Bank) -Kenya Climate Smart Ag-riculture Project
117,000,000 117,000,000 41,070,411 35.1
6World Bank-Transforming Health Systems for Universal Care Project
95,401,875 95,401,875 8,165,513 8.6
7IDA (World Bank) -National Agricultural and Rural Inclusive Growth Project
54,295,000 54,295,000 - -
8 Rehabilitation of Village Polytechnics 53,423,784 53,423,784 - -
9IDA (World Bank) Kenya Devolution Support Programme “Level 1 grant”
24,806,250 24,806,250 12,403,125 50.0
10DANIDA - Universal Healthcare to Devolved System Programme
24,129,039 24,129,039 - -
11 Universal Health Coverage (UHC) Grants - - 84,033,068 -
Total 2,190,044,946 2,190,044,946 1,163,992,617 53.1
Source: Machakos County Treasury
Analysis of the revenue from conditional grants indicates that, the County received the highest percentage of receipts to annual allocation from the Kenya Urban Support project and the Kenya Devolution Support Programme grant. The receipts accounted for 100 per cent and 50 per cent of annual allocation respectively.
3.22.4 Exchequer IssuesTo finance the budget, the Controller of Budget approved the withdrawal of Kshs.4.13 billion from the CRF account. The withdrawals represented 33.8 per cent of the Approved Budget and translates to a an increase of 148.1 per cent from Kshs.2.74 billion approved in the first half of FY 2017/18 and comprised of Kshs.3.74 billion (90.5 per cent) to fund recurrent expenditure and Kshs.393.94 million (9.5 per cent) for development activities.
3.22.5 Overall Expenditure ReviewThe County government spent a total of Kshs.3.58 billion on recurrent and development activities. The total expenditure represented 87 per cent of the total funds released from the CRF account and was an increase of 28 per cent from Kshs.2.81 billion spent in the first half of FY 2017/18. The expenditure excluded outstanding commitments as at December 31st 2018 which amounted to Kshs.798.01 million for development activities and Kshs.156.19 million for recurrent expenditure.
Expenditure on recurrent activities amounted to Kshs.3.23 billion while Kshs.344.57 million was spent on development activities. The recurrent expenditure was 86.5 per cent of the funds released for recurrent activities, while development expenditure was 87.5 per cent of funds released for development activities.

160
COUNTY GOVERNMENTS BUDGET IMPLEMENTATION REVIEW REPORT FOR THE FIRST HALF OF FY2018/19
The recurrent expenditure represented 42.3 per cent of the annual recurrent budget, an increase from 39.3 per cent recorded in the first half of FY 2017/18. Development expenditure recorded an absorption rate of 7.5 per cent, which was an increase from 1.9 per cent attained in the first half of FY 2017/18.Figure 3.86 presents a comparison between the total expenditure in the first half of FY 2018/19 and the first half of the FY 2017/18.
Figure3.86: MachakosCounty,ExpenditurebyEconomicClassification
Source: Machakos County Treasury
3.22.6 Analysis of Recurrent ExpenditureThe total recurrent expenditure of Kshs.3.23 billion comprised of Kshs.2.52 billion (78.1 per cent) incurred on personnel emoluments and Kshs.706.17 million (21.9 per cent) on operations and maintenance as shown in Figure 3.86.
Expenditure on personnel emoluments represented an increase of 9.6 per cent compared to the first half of FY 2017/18 when the County spent Kshs.2.30 billion, and was 70.6 per cent of total expenditure in the first half of FY 2018/19. Figure 3.87 shows a summary of operations and maintenance expenditure by major categories.

161
COUNTY GOVERNMENTS BUDGET IMPLEMENTATION REVIEW REPORT FOR THE FIRST HALF OF FY2018/19
Figure 3.87: Machakos County, Operations and Maintenance Expenditure by Major Categories in the First Half of FY 2018/19
Source: Machakos County Treasury
The County spent Kshs.10.01 million to cater for the MCAs’ committee sitting allowances for the 60 MCAs against the annual budget allocation of Kshs.80.21 million. This represented an increase of 113.7 per cent compared to Kshs.4.69 million spent in a similar period of FY 2017/18. The average monthly sitting allowance translated to Kshs.27,813 per MCA against the SRC’s recommended monthly ceiling of Kshs.124,800.
Expenditure on domestic travel amounted to Kshs.213.21 million and comprised of Kshs.69.90 million spent by the County Assembly and Kshs.143.90 million spent by the County Executive. This represented 6.6 per cent of total recurrent expenditure.
3.22.7 Development ExpenditureThe total development expenditure of Kshs.344.57 million represented 7.5 per cent of the annual development budget of Kshs.4.60 billion. Table 3.62 provides a summary of development projects with the highest expenditure in the first half of the financial year.

162
COUNTY GOVERNMENTS BUDGET IMPLEMENTATION REVIEW REPORT FOR THE FIRST HALF OF FY2018/19
Table 3.62: Machakos County, List of Development Projects with the Highest Expenditure in the FY 2018/19
S/No. Project NameProject Loca-tion
Project Budget (Kshs.)
Project Expendi-ture in First Half
of FY 2018/19 (Kshs.)
Absorp-tion rate
(%)
1 Construction of Nthngululu Dam Yatta 150,000,000 46,406,868.30 30.9
2Construction of a 12 storey building at the Machakos New City.
Machakos 394,999,999 41,407,638 10.5
3Construction of Government building at The Machakos New City
Machakos 399,640,361 34,165,960 8.5
4 Construction of Mumbuni Dam Kibauni 78,000,000 19,915,410.90 25.5
5 Construction of Machakos County Office Machakos 287,110,237 14,971,734 5.2
6 Routine Maintenance of Kithini – Vota road Machakos 21,339,957 12,494,431 58.5
7 Routine Maintenance of Kenol-Mutwani-Lukenya road Yatta 11,225,331 11,211,046 99.9
8Construction of Machakos Conference facility at Machakos People’s Park
Machakos 74,170,816 10,830,451 14.6
9 Routine Maintenance at Kathiani – Kangundo Road Kangundo 16,211,916 9,994,316 61.6
10Installation of drainage facilities at Kituluni-Kitambaasye road
Matungulu 9,806,000 9,732,800 99.3
Source: Machakos County Treasury.
3.22.8 Budget Performance by County DepartmentTable 3.63 shows a summary of budget estimates and budget performance by department in the first half of FY 2018/19.
Table 3.63: Machakos County, Budget Performance by Department
Department
Annual Budget Alloca-tion in FY 2018/19 (Kshs.
Million)
Exchequer Issues in First Half of FY 2018/19 (Kshs. Mil-lion)
Expenditure in First Half of FY 2018/19
(Kshs. Million)
Expenditure to Exchequer
Issues (%)
Absorption rate (%)
Rec Dev Rec Dev Rec Dev Rec Dev Rec Dev
Office of the Governor 605.72 6.83 201 - 182.66 3.31 90.9 - 30.2 48.5
Public Service, Labour and ICT
433.74 12.70 270 - 2,367.81 - 875.9 - 545.9 -
Trade, Investment, Eco-nomic Planning, Industri-alization and Energy
135.11 91.58 68 - 18.81 - 27.8 - 13.9 -
Finance and Revenue Management
393.94 11.80 189 - 41.88 - 22.2 - 10.6 -
Decentralized Units, County Administration, Environment & Solid Waste mgt.
374.83 31.00 251 - 24.16 - 9.6 - 6.4 -

163
COUNTY GOVERNMENTS BUDGET IMPLEMENTATION REVIEW REPORT FOR THE FIRST HALF OF FY2018/19
Department
Annual Budget Alloca-tion in FY 2018/19 (Kshs.
Million)
Exchequer Issues in First Half of FY 2018/19 (Kshs. Mil-lion)
Expenditure in First Half of FY 2018/19
(Kshs. Million)
Expenditure to Exchequer
Issues (%)
Absorption rate (%)
Rec Dev Rec Dev Rec Dev Rec Dev Rec Dev
Agriculture, NR, Live-stock, Water & Irrigation Development
502.63 665.61 287 108 22.23 80.59 7.7 74.8 4.4 12.1
Health and Emergency Services
3,545.37 748.44 1,787 80 145.06 21.83 8.1 27.4 4.1 2.9
Transport, Roads, Public Works and Housing
187.10 1,436.30 120 190 50.06 230.32 41.8 121.2 26.8 16.0
Education, Youth and So-cial Welfare
295.22 289.30 77 16 5.69 2.64 7.4 16.0 1.9 0.9
Lands, Energy & Urban development
97.20 1,054.32 59 - 13.54 5.88 23.1 - 13.9 0.6
Tourism, Sports and Cul-ture
81.27 14.92 60 - 6.31 - 10.6 - 7.8 -
County Public Service Board
41.40 2.01 25 - 0.54 - 2.1 - 1.3 -
County Assembly 936.78 236.00 340 - 351.70 - 103.4 - 37.5 -Total 7,630.31 4,600.81 3,734.35 393.95 3,230.45 344.57 86.5 87.5 42.3 7.5
Source: Machakos County Treasury
Analysis of expenditure by department shows that the Office of the Governor recorded the highest absorption rate of development budget at 48.5 per cent followed by the Department of Transport, Roads, Public Works, and Housing at 16 per cent. The Department of Public Service, Labour and ICT had the highest percentage of recurrent expenditure to recurrent budget at 545.9 per cent while the County Public Service Board had the lowest at 1.3 per cent. The recurrent expenditure by the Department of Public works, ICT and Labour exceeded the approved recurrent estimates as all wages bills are irregularly charged by the department.
3.22.9 Key Observations and RecommendationsThe County has made progress in addressing some of the challenges previously identified as affecting budget implementation. Some of the progress made included:
i. Establishment of the Internal Audit Committee in line with Section 155 of the PFM Act, 2012.ii. Improved performance in own-source revenue collection by 46.6 per cent from Kshs.301.49 million
in the first half of FY 2017/18 to Kshs.441.88 million in the first half of FY 2018/19.
Despite the above progress, the following challenges continued to hamper effective budget implementation;
1. A high wage bill that increased by 9.6 per cent from Kshs.2.30 billion in the first half of FY 2017/18 to Kshs.2.52 billion in the first half of FY 2018/19. The wage bill accounted for 70.6 per cent of total expenditure in the reporting period.
2. Delays by Fund Administrators of both the County Assembly and the County Executive Funds to submit expenditure reports contrary to Section 168 of the PFM Act, 2012.
3. Late submission of financial reports to the Controller of Budget by the County Treasury contrary to Section 166 of the PFM Act, 2012, which affected timely preparation of budget implementation review report by the OCOB.
The County should implement the following recommendations in order to improve budget execution;
1. The County Public Service Board should establish an optimal staffing structure in order to manage the ballooning wage bill.

164
COUNTY GOVERNMENTS BUDGET IMPLEMENTATION REVIEW REPORT FOR THE FIRST HALF OF FY2018/19
2. The CECM-F should ensure the Fund Administrators prepare and submits expenditure reports on the in line with Section 168 of the PFM Act, 2012.
3. The County Treasury should ensure timely preparation and submission of financial reports in line with Section 166 of PFM Act, 2012.
3.23 Makueni County
3.23.1 Overview of the FY 2018/19 BudgetThe County’s Approved Supplementary Budget for FY 2018/19 is Kshs.10.53 billion, comprising of Kshs.5.90 billion (56 per cent) and Kshs.4.63 billion (44 per cent) allocation for recurrent and development expenditure respectively.
To finance the budget, the County expects to receive Kshs.7.13 billion (67.7 per cent) as equitable share of revenue raised nationally, Kshs.1.24 billion (11.8 per cent) as total conditional grants, generate Kshs.670.5 million (6.4 per cent) from own sources, and Kshs.1.49 billion (14.1 per cent) cash balance from FY 2017/18.
Figure 3.88: Makueni County Sources of Budget Financing in FY 2018/19
Source: Makueni County Treasury
The conditional grants include those contained in the CARA, 2018 of; Kshs.100 million (10.7 per cent) for Transforming Health Systems for Universal Care Project, Kshs.140.44 million (15 per cent) from IDA (World Bank) as credit for National Agricultural and Rural Inclusive Growth Project, Kshs.50.75 million (5.4 per cent) from IDA (World Bank) as credit for Kenya Devolution Support Programme (KDSP) “Level 1 grant”, Kshs.136.26 million (14.6 per cent) from IDA (World Bank ) as credit for Kenya Urban Support Project, Kshs.22.88 million (2.4 per cent) as grant from DANIDA for Universal Healthcare to Devolved System Programme, Kshs.45 million (4.8 per cent) as grant from EU for Instruments for Devolution Advice and Support- IDEAS), Kshs.19.44 million (2.1 per cent) as Compensation for User Fees Foregone, Kshs.200 million (21.4 per cent) for Leasing of Medical Equipment, Kshs.187.67 million (20.1 per cent) from the Road Maintenance Fuel Levy Fund, and Kshs.31.57 million (3.4 per cent) for Rehabilitation of Village Polytechnics.

165
COUNTY GOVERNMENTS BUDGET IMPLEMENTATION REVIEW REPORT FOR THE FIRST HALF OF FY2018/19
In addition, the County also budgeted to receive Kshs.168.58 million as KDSP grant, Kshs.9.48 million for DANIDA Grant, Kshs.21.55 million for Agriculture Sector Support Development Programme, Kshs.66 million as EU grant for Instruments for Devolution Advice and Support, and Kshs.40 million for Kenya Urban Support Programme Urban Institutional Grant which are not contained in the CARA, 2018.
3.23.2 Revenue AnalysisDuring the first half of FY 2018/19, the County received Kshs.2.2 billion as equitable share of revenue raised nationally, Kshs.374.38 million as total conditional grants, raised Kshs.141.89 million from own-source revenue, and had a cash balance of Kshs.1.09 billion from FY 2017/18. The total funds available for the period amounted to Kshs.3.81 billion.
Figure 3.89 shows the half yearly trend in own-source revenue collection from FY 2013/14 to FY 2018/19.
Figure 3.89: Makueni County, Trend in Own-Source Revenue Collection for the First Half of FY 2013/14 to the First Half of FY 2018/19
Source: Makueni County Treasury
During the first half of FY 2018/19, the County generated a total of Kshs.141.89 million as own-source revenue. This amount was an increase of 26.4 per cent when compared to Kshs.112.27 million realised during the same period of FY 2017/18 and represented 21.2 per cent of the annual target.
3.23.3 Conditional GrantsThe County received Kshs.374.38 million as conditional grants as shown in Table 3.64.

166
COUNTY GOVERNMENTS BUDGET IMPLEMENTATION REVIEW REPORT FOR THE FIRST HALF OF FY2018/19
Table 3.64: Makueni County, Conditional Grants/Loans Received in the First Half of FY 2018/19
S/No. Grants/LoansAnnual Alloca-tion, per CARA, 2018 (Kshs)
Annual Bud-get Allocation for FY 2018/19 (Kshs)
Actual receipts in Half Year of FY 2018/19 (in
Kshs.)
Actual Receipts as
Percentage of Annual Alloca-
tion (%)A Grants Contained in the CARA, 2018
1 Leasing of Medical Equipment 200,000,000 200,000,000 - -
2 Road Maintenance Fuel Levy 187,668,766 187,668,766 - -
3National Agricultural and Rural Inclusive Growth Project (NARIGP)
140,435,163 140,435,163 - -
4 Kenya Urban Support Project (KUSP) - WB 136,261,600 136,261,600 136,261,600 100.0
5Transforming Health Systems for Universal Care Project (WB)
100,000,000 100,000,000 9,285,335 9.3
6Kenya Devolution Support Project (KDSP) “Lev-el 1 grant”
50,750,604 50,750,604 - -
7 EU Grant 45,000,000 45,000,000 - -
8 Rehabilitation of Village Polytechnics 31,570,000 31,570,000 - -
9 DANIDA Grant 22,882,500 22,882,500 11,441,250 50.0
10 Compensation for User Fee Foregone 19,435,760 19,435,760 -Sub Total 934,004,393 934,004,393 156,988,185 16.8
B Other Grants (Non-CARA)
11 Investment Grant - KDSP - 168,575,682 168,575,682 100.0
12EU Grant for instrument for Devolution Advice and support
- 66,000,000 48,818,153 74.0
13Kenya Urban Support Programme - Urban insti-tutional Grant
- 40,000,000 - -
14Agriculture Sector Support Development Pro-gramme- Donor funds
- 21,551,135 - -
15DANIDA Grant (Universal Healthcare in De-volved System Program) - FY 2017/18 Funds
- 9,479,639 - -
Sub Total - 305,606,456 217,393,835 71.1Total 934,004,393 1,239,610,849 374,382,020 30.2
Source: Makueni County Treasury
Analysis of the revenue from conditional grants indicates that, the County received the highest percentage of receipts to annual allocation from the Kenya Urban Support project and the DANIDA grant. The receipts accounted for 100 per cent and 50 per cent of annual allocation respectively.
3.23.4 Exchequer IssuesTo finance implementation of the budget, the Controller of Budget approved withdrawal of Kshs.2.88 billion from the CRF account. The withdrawal represented 27.3 per cent of the Supplementary Budget and translated to an increase of 23.2 per cent from Kshs.2.34 billion approved in the first half of FY 2017/18. This amount comprised of Kshs.2.23 billion (77.5 per cent) to fund recurrent expenditure and Kshs.647.61 million (22.5 per cent) for development activities.
3.23.5 Overall Expenditure ReviewThe County government spent a total of Kshs.3.43 billion on both recurrent and development activities. This expenditure represented 119.1 per cent of the total funds released from the CRF account and was an increase of 53.7 per cent from Kshs.2.23 billion spent in the first half of FY 2017/18.
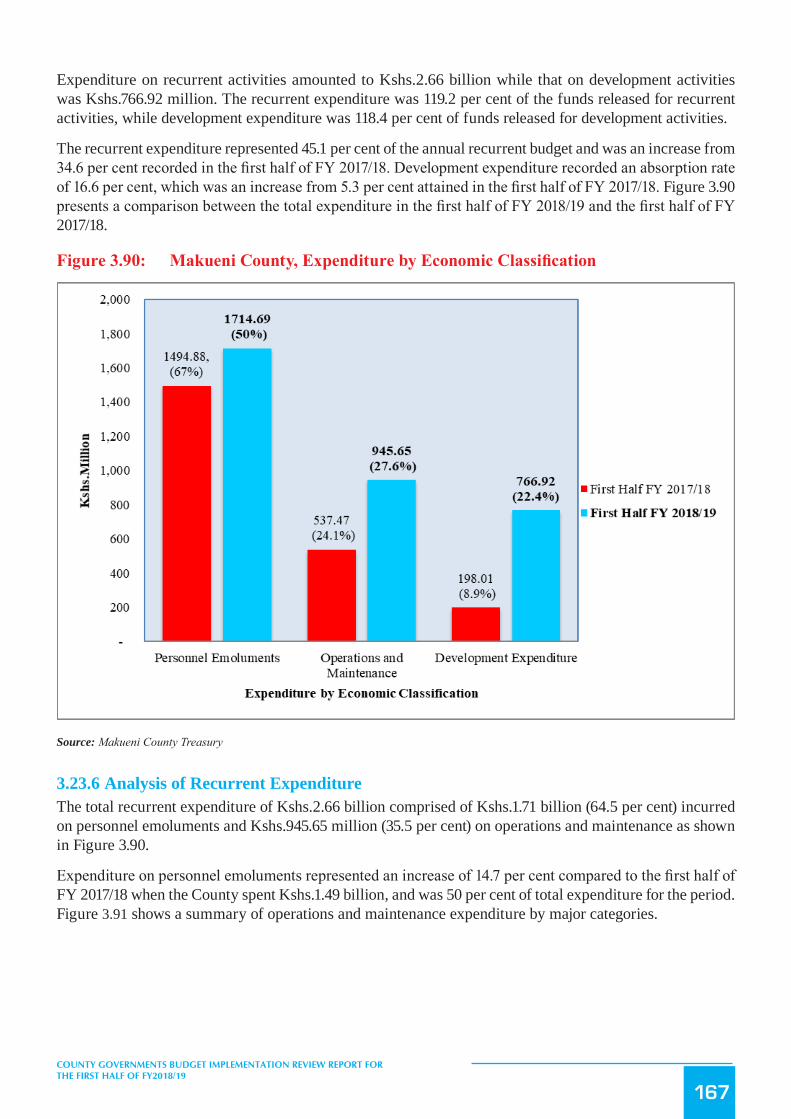
167
COUNTY GOVERNMENTS BUDGET IMPLEMENTATION REVIEW REPORT FOR THE FIRST HALF OF FY2018/19
Expenditure on recurrent activities amounted to Kshs.2.66 billion while that on development activities was Kshs.766.92 million. The recurrent expenditure was 119.2 per cent of the funds released for recurrent activities, while development expenditure was 118.4 per cent of funds released for development activities.
The recurrent expenditure represented 45.1 per cent of the annual recurrent budget and was an increase from 34.6 per cent recorded in the first half of FY 2017/18. Development expenditure recorded an absorption rate of 16.6 per cent, which was an increase from 5.3 per cent attained in the first half of FY 2017/18. Figure 3.90 presents a comparison between the total expenditure in the first half of FY 2018/19 and the first half of FY 2017/18.
Figure3.90: MakueniCounty,ExpenditurebyEconomicClassification
Source: Makueni County Treasury
3.23.6 Analysis of Recurrent ExpenditureThe total recurrent expenditure of Kshs.2.66 billion comprised of Kshs.1.71 billion (64.5 per cent) incurred on personnel emoluments and Kshs.945.65 million (35.5 per cent) on operations and maintenance as shown in Figure 3.90.
Expenditure on personnel emoluments represented an increase of 14.7 per cent compared to the first half of FY 2017/18 when the County spent Kshs.1.49 billion, and was 50 per cent of total expenditure for the period. Figure 3.91 shows a summary of operations and maintenance expenditure by major categories.

168
COUNTY GOVERNMENTS BUDGET IMPLEMENTATION REVIEW REPORT FOR THE FIRST HALF OF FY2018/19
Figure 3.91: Makueni County, Operations and Maintenance Expenditure by Major Categories in the First Half of FY 2018/19
Source: Makueni County Treasury
The County reported Kshs.26.44 million on MCAs’ committee sitting allowances for the 49 MCAs (including the Speaker) against the annual budget allocation of Kshs.67.99 million. This amount represented an increase of 265.6 per cent compared to Kshs.7.23 million spent in a similar period of FY 2017/18. The average monthly sitting allowance translated to Kshs.89,922 per MCA against the SRC’s recommended monthly ceiling of Kshs.124,800.
Expenditure on domestic travel amounted to Kshs.88.67 million and comprised of Kshs.31.54 million spent by the County Assembly and Kshs.57.13 million spent by the County Executive. This represented 3.3 per cent of total recurrent expenditure.
3.23.7 Development ExpenditureThe total development expenditure of Kshs.766.92 million represented 16.6 per cent of the annual development budget of Kshs.4.63 billion. Table 3.65 provides a summary of development projects with the highest expenditure in the first half of the financial year.

169
COUNTY GOVERNMENTS BUDGET IMPLEMENTATION REVIEW REPORT FOR THE FIRST HALF OF FY2018/19
Table 3.65: Makueni County, List of Development Projects with the Highest Expenditure in the FY 2018/19
S/No. Project Name Project LocationAnnual Project Bud-
get (Kshs.)Half Year Expenditure
(Kshs.)Absorption Rate (%)
1 Universal Health Care Programme Across the County 150,000,000 126,097,303 84.1
2 Construction of Thwake bridge substructures Kalawa 75,000,000 73,772,724 98.4
3 EU Grant for Instrument for Devolution Advice and support Across the County 111,000,000 48,818,153 44.0
4 Roads upgrade programme - ward - fuel levy funding Across the County 39,082,714 32,226,918 82.5
5 Transforming Health Systems for Universal Care Project (WB) Across the County 100,000,000 30,287,868 30.3
6 Completion of Guesthouse (Under Department of Transport and Infrastructure) Wote/ Nziu 19,993,542 19,330,614 96.7
7IDA (World Bank) credit (National Agricultural and Rural Inclusive Growth Project (NARIGP)
Across the County 158,929,463 19,118,260 12.0
8 Conditional Allocation for Development of Youth Polytechnics All wards 47,643,027 16,073,027 33.7
9Makueni Fruit Processing Plant - Operationalization (Reconstituting Line & other operations)
Nzaui/ Kilili/ Kalamba 81,521,713 14,169,896 17.4
10Nguu Masumba NLC - Land issues (Department of Lands, Urban Planning and Mining)
Nguu/ Masumba 14,215,750 12,406,290 87.3
Source: Makueni County Treasury
3.23.8 Budget Performance by County DepartmentTable 3.66 shows a summary of budget estimates and budget performance by department in the first half of FY 2018/19.
Table 3.66: Makueni County, Budget Performance by Department
Department
Annual Budget Allo-cation in FY 2018/19
(Kshs. Million)
Exchequer Issues in First Half of FY
2018/19 (Kshs. Million)
Expenditure in First Half of FY 2018/19
(Kshs. Million)
Expenditure to Exchequer
Issues (%)
Absorption Rate (%)
Rec Dev Rec Dev Rec Dev Rec Dev Rec Dev
County Assembly 746.36 101.09 320.23 5.83 255.06 6.14 79.7 105.4 34.2 6.1Office of Governor 163.88 - 48.41 - 63.84 - 131.9 39.0
Office of the Deputy Governor
8.45 - 2.18 - 2.12 - 97.3 25.1 -
County Attorney’s Office 26.09 - 6.96 - 8.54 - 122.7 32.7 -County Public Service Board
61.24 10 28.18 - 23.65 - 83.9 38.6 -
County Secretary Office 381.73 - 195.13 - 194.68 - 99.8 51.0 -Devolution, Administra-tion, Participatory Devel-opment& Public Service
249.78 19.76 90.35 - 108.07 0.70 - - - -
Finance & Socio- Econom-ic Planning
576.15 371.32 115.82 - 300.96 0.07 259.8 ∞ 52.2 -
Agriculture, Irrigation, Livestock & Fisheries Development
240.03 816.34 94.23 72.83 117.30 116.80 124.5 160.4 48.9 14.3

170
COUNTY GOVERNMENTS BUDGET IMPLEMENTATION REVIEW REPORT FOR THE FIRST HALF OF FY2018/19
Department
Annual Budget Allo-cation in FY 2018/19
(Kshs. Million)
Exchequer Issues in First Half of FY
2018/19 (Kshs. Million)
Expenditure in First Half of FY 2018/19
(Kshs. Million)
Expenditure to Exchequer
Issues (%)
Absorption Rate (%)
Rec Dev Rec Dev Rec Dev Rec Dev Rec Dev
Water, Environment and Climate Change
164.38 1,055.94 64.04 164.93 63.90 142.06 99.8 86.1 38.9 13.5
Education, Youth & ICT 349.61 310.18 110.74 25.56 133.74 50.21 120.8 196.4 38.3 16.2Health Services 2,583.85 748.46 1,021.66 137.91 1,243.20 187.22 121.7 135.8 48.1 25.0Lands, Urban Planning and Mining
60.14 250.07 22.05 159.05 18.62 21.54 84.4 13.5 31.0 8.6
Transport & Infrastructure 174.85 798.70 70.98 58.61 82.99 224.45 116.9 383.0 47.5 28.1Trade, Tourism & Coop-eratives
50.56 92.68 18.85 12.88 18.37 8.48 97.5 65.9 36.3 9.2
Gender and Social Services 58.40 55.66 21.11 10.01 25.27 9.23 119.7 92.2 43.3 16.6
TOTAL 5,895.51 4,630.21 2,230.93 647.61 2,660.34 766.92 119.2 118.4 45.1 16.6
Source: Makueni County Treasury
Analysis of expenditure by department shows the Department of Transport and Infrastructure recorded the highest absorption rate of development budget at 28.1 per cent while the County Public Service Board did not incur any development expenditure. The Department of Finance and Socio-Economic Planning had the highest percentage of recurrent expenditure to recurrent budget at 52.2 per cent while the Office of the Deputy Governor had the lowest at 25.1 per cent.
3.23.9 Key Observations and RecommendationsThe County has made progress in addressing some of the challenges previously identified as affecting budget implementation. Some of the progress made included:
i. Increase in the absorption of development budget from 5.3 per cent in the first half of FY 2017/18 to 16.6 per cent in the reporting period.
ii. Improvement in own source revenue performance by 26.4 per cent when compared to a similar period of FY 2017/18.
Despite the above progress, the following challenges continued to hamper effective budget implementation;
1. Delay in disbursement of the equitable share of revenue raised by the National Treasury.2. Delay by Fund Administrators of Bursary, Emergency Fund, Car Loan & Mortgage (County
Assembly) to submit quarterly expenditure reports on established County Funds contrary to Section 168 of the PFM Act, 2012.
The County should implement the following recommendations in order to improve budget execution;
1. The County Treasury should liaise with the National Treasury to ensure that funds allocated to the County are released in a timely manner in line with the CARA, 2018.
2. All Funds Administrators should provide quarterly financial statements for County Funds in line with Section 168 of the PFM Act, 2012.
3.24 Mandera County
3.24.1 Overview of the FY 2018/19 BudgetThe County’s Approved Budget for FY 2018/19 is Kshs.13.38 billion, comprising of Kshs.6.42 billion (48 per cent) and Kshs.6.96 billion (52 per cent) allocation for recurrent and development expenditure respectively.
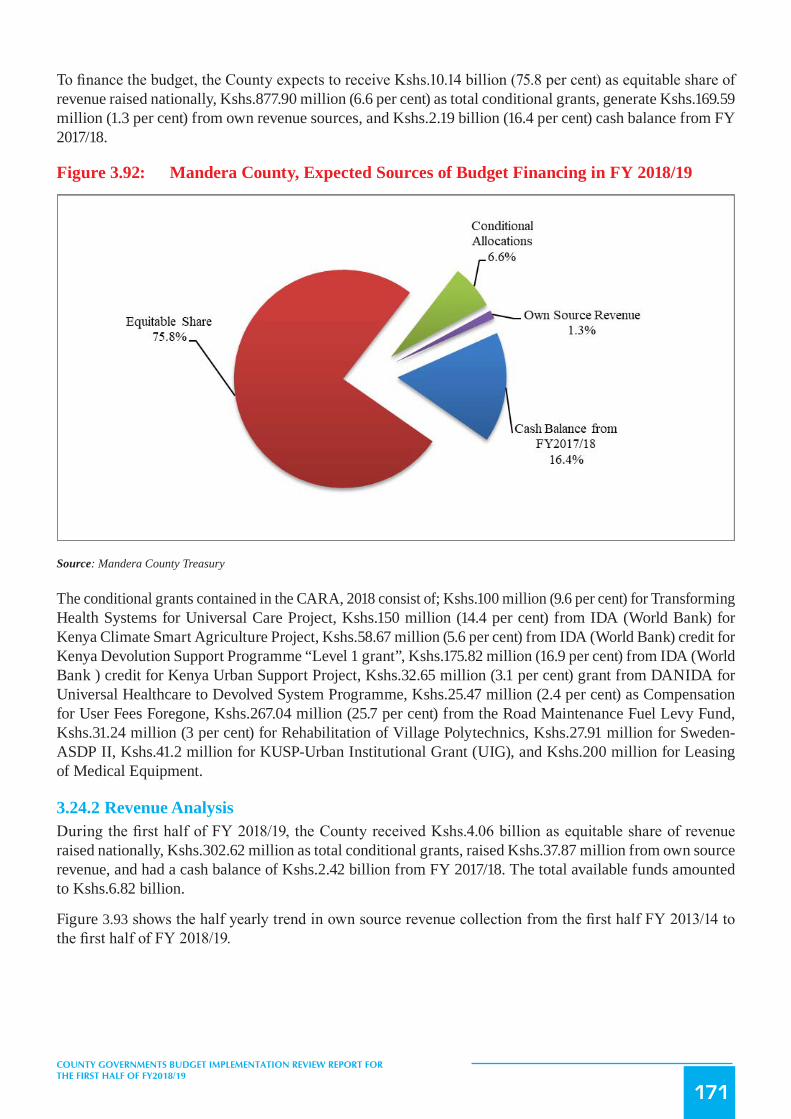
171
COUNTY GOVERNMENTS BUDGET IMPLEMENTATION REVIEW REPORT FOR THE FIRST HALF OF FY2018/19
To finance the budget, the County expects to receive Kshs.10.14 billion (75.8 per cent) as equitable share of revenue raised nationally, Kshs.877.90 million (6.6 per cent) as total conditional grants, generate Kshs.169.59 million (1.3 per cent) from own revenue sources, and Kshs.2.19 billion (16.4 per cent) cash balance from FY 2017/18.
Figure 3.92: Mandera County, Expected Sources of Budget Financing in FY 2018/19
Source: Mandera County Treasury
The conditional grants contained in the CARA, 2018 consist of; Kshs.100 million (9.6 per cent) for Transforming Health Systems for Universal Care Project, Kshs.150 million (14.4 per cent) from IDA (World Bank) for Kenya Climate Smart Agriculture Project, Kshs.58.67 million (5.6 per cent) from IDA (World Bank) credit for Kenya Devolution Support Programme “Level 1 grant”, Kshs.175.82 million (16.9 per cent) from IDA (World Bank ) credit for Kenya Urban Support Project, Kshs.32.65 million (3.1 per cent) grant from DANIDA for Universal Healthcare to Devolved System Programme, Kshs.25.47 million (2.4 per cent) as Compensation for User Fees Foregone, Kshs.267.04 million (25.7 per cent) from the Road Maintenance Fuel Levy Fund, Kshs.31.24 million (3 per cent) for Rehabilitation of Village Polytechnics, Kshs.27.91 million for Sweden-ASDP II, Kshs.41.2 million for KUSP-Urban Institutional Grant (UIG), and Kshs.200 million for Leasing of Medical Equipment.
3.24.2 Revenue AnalysisDuring the first half of FY 2018/19, the County received Kshs.4.06 billion as equitable share of revenue raised nationally, Kshs.302.62 million as total conditional grants, raised Kshs.37.87 million from own source revenue, and had a cash balance of Kshs.2.42 billion from FY 2017/18. The total available funds amounted to Kshs.6.82 billion.
Figure 3.93 shows the half yearly trend in own source revenue collection from the first half FY 2013/14 to the first half of FY 2018/19.

172
COUNTY GOVERNMENTS BUDGET IMPLEMENTATION REVIEW REPORT FOR THE FIRST HALF OF FY2018/19
Figure 3.93: Mandera County, Trend in Own Source Revenue Collection from the First Half of FY 2013/14 to the First Half of FY 2018/19
Source: Mandera County Treasury
During the first half of FY 2018/19, the County generated a total of Kshs.37.87 million as own-source revenue. The own-source revenue collected during the period represented an increase from Kshs.20.47 million realised during the same period of FY 2017/18 and represented 22.3 per cent of the annual target.
3.24.3 Conditional GrantsThe County received Kshs.302.62 million as conditional grants as shown in Table 3.67.

173
COUNTY GOVERNMENTS BUDGET IMPLEMENTATION REVIEW REPORT FOR THE FIRST HALF OF FY2018/19
Table 3.67: Mandera County, Conditional Grants/Loans Received in the First Half of FY 2018/19
S/No Grant/ LoanAnnual Allocation, per CARA, 2018
(Kshs)
Annual Budget Allocation for FY
2018/19 (Kshs)
Actual Receipts in the First Half of FY
2018/19 (Kshs)
Actual Receipts as Percentage
of Annual Allo-cation (%)
1 Compensation for User Fee Foregone 25,474,920 25,474,920 - -
2 Leasing of Medical Equipment 200,000,000 - - -3 Road Maintenance Fuel Levy 267,035,293 267,035,293 - -
4 Rehabilitation of Village Polytechnics 31,240,000 31,240,000 - -
5Transforming Health Systems for Universal Care Project-World Bank
100,000,000 100,000,000 39,283,686 39.3
6National Agricultural and Rural Inclusive Growth Project (NARIGP)
- 37,000,000 - -
7Kenya Climate Smart Agriculture Project (KCSAP)
150,000,000 150,000,000 54,858,856 36.6
8Kenya Devolution Support Project (KDSP) “Level 1 grant”
58,673,488 58,673,488 - -
9 Kenya Urban Support Project (KUSP) 175,819,500 175,819,500 175,819,500 100
10 DANIDA Grant 32,653,125 32,653,125 32,653,125 10011 Sweden –ASDP II 27,908,979 - - -12 KUSP-Urban Institutional Grant (UIG) 41,200,000 - - -
Total 1,110,005,305 877,896,326 302,615,167 34.5
Source: Mandera County Treasury
Analysis of the revenue from conditional grants indicates that, the County received the highest percentage of receipts to annual allocation from the Kenya Urban Support project and the DANIDA grant. The receipts accounted for 100 per cent and 100 per cent of annual allocation respectively.
3.24.4 Exchequer IssuesTo finance the budget, the Controller of Budget approved the withdrawal of Kshs.4.44 billion from the CRF account. The withdrawals represented 33.2 per cent of the Approved Budget and translates to a an increase of 36.1 per cent from Kshs.3.26 billion approved in the first half of FY 2017/18 and comprised of Kshs.2.78 billion (62.7 per cent) to fund recurrent expenditure and Kshs.1.66 billion (37.3 per cent) for development activities.
3.24.5 Overall Expenditure ReviewThe County government spent a total of Kshs.4.44 billion on recurrent and development activities. The total expenditure represented 100 per cent of the total funds released from the CRF account and was an increase of 67.9 per cent from Kshs.2.65 billion spent in the first half of FY 2017/18.
Expenditure on recurrent activities amounted to Kshs.2.88 billion while Kshs.1.56 billion was spent on development activities. The recurrent expenditure was 103.4 per cent of the funds released for recurrent activities, while development expenditure was 94.3 per cent of funds released for development activities.
The recurrent expenditure represented 44.8 per cent of the annual recurrent budget, an increase from 34.9 per cent recorded in the first half of FY 2017/18. Development expenditure recorded an absorption rate of 22.5 per cent, which was an increase from 8.3 per cent attained in the first half of FY 2017/18.Figure 3.94 presents a comparison between the total expenditure in the first half of FY 2018/19 and the first half of FY 2017/18.
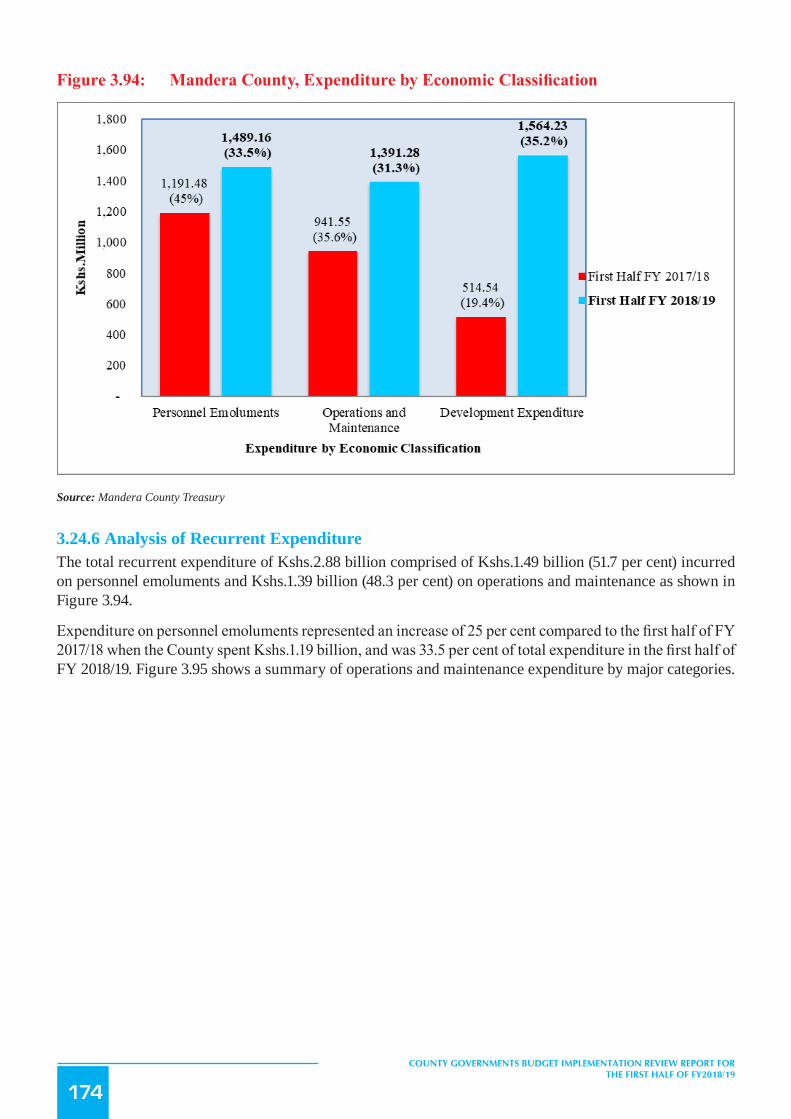
174
COUNTY GOVERNMENTS BUDGET IMPLEMENTATION REVIEW REPORT FOR THE FIRST HALF OF FY2018/19
Figure3.94: ManderaCounty,ExpenditurebyEconomicClassification
Source: Mandera County Treasury
3.24.6 Analysis of Recurrent ExpenditureThe total recurrent expenditure of Kshs.2.88 billion comprised of Kshs.1.49 billion (51.7 per cent) incurred on personnel emoluments and Kshs.1.39 billion (48.3 per cent) on operations and maintenance as shown in Figure 3.94.
Expenditure on personnel emoluments represented an increase of 25 per cent compared to the first half of FY 2017/18 when the County spent Kshs.1.19 billion, and was 33.5 per cent of total expenditure in the first half of FY 2018/19. Figure 3.95 shows a summary of operations and maintenance expenditure by major categories.
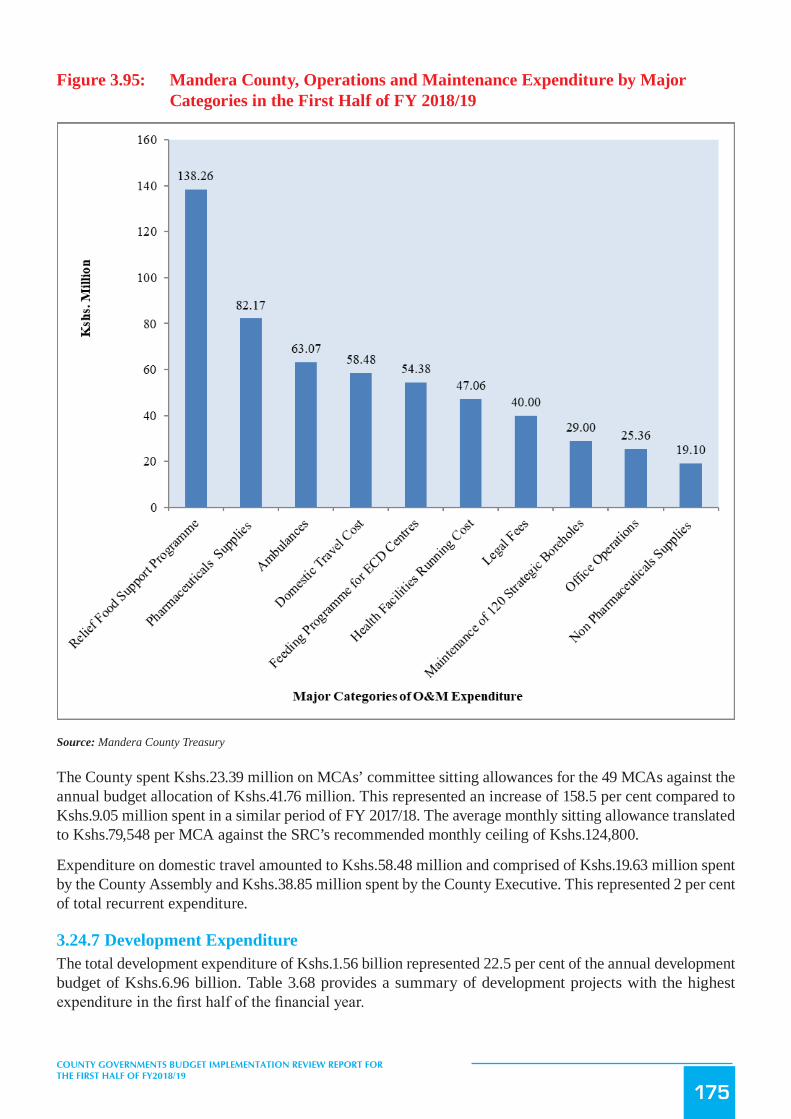
175
COUNTY GOVERNMENTS BUDGET IMPLEMENTATION REVIEW REPORT FOR THE FIRST HALF OF FY2018/19
Figure 3.95: Mandera County, Operations and Maintenance Expenditure by Major Categories in the First Half of FY 2018/19
Source: Mandera County Treasury
The County spent Kshs.23.39 million on MCAs’ committee sitting allowances for the 49 MCAs against the annual budget allocation of Kshs.41.76 million. This represented an increase of 158.5 per cent compared to Kshs.9.05 million spent in a similar period of FY 2017/18. The average monthly sitting allowance translated to Kshs.79,548 per MCA against the SRC’s recommended monthly ceiling of Kshs.124,800.
Expenditure on domestic travel amounted to Kshs.58.48 million and comprised of Kshs.19.63 million spent by the County Assembly and Kshs.38.85 million spent by the County Executive. This represented 2 per cent of total recurrent expenditure.
3.24.7 Development ExpenditureThe total development expenditure of Kshs.1.56 billion represented 22.5 per cent of the annual development budget of Kshs.6.96 billion. Table 3.68 provides a summary of development projects with the highest expenditure in the first half of the financial year.
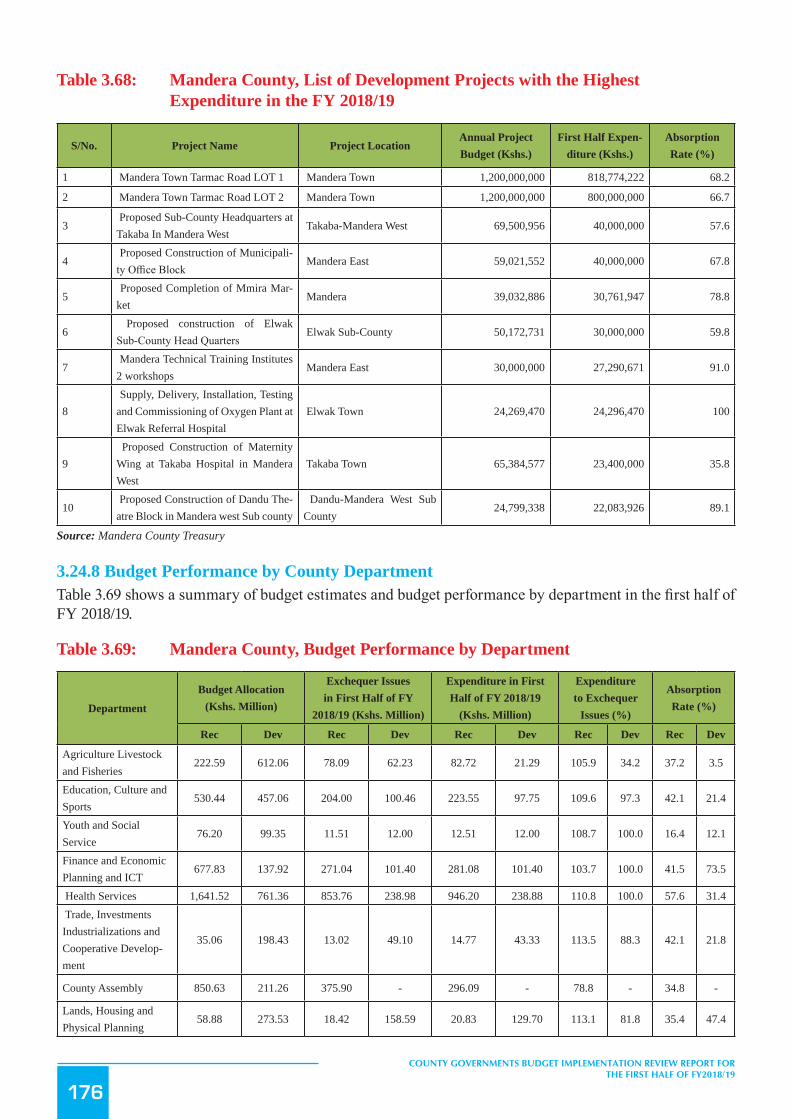
176
COUNTY GOVERNMENTS BUDGET IMPLEMENTATION REVIEW REPORT FOR THE FIRST HALF OF FY2018/19
Table 3.68: Mandera County, List of Development Projects with the Highest Expenditure in the FY 2018/19
S/No. Project Name Project LocationAnnual Project Budget (Kshs.)
First Half Expen-diture (Kshs.)
Absorption Rate (%)
1 Mandera Town Tarmac Road LOT 1 Mandera Town 1,200,000,000 818,774,222 68.2
2 Mandera Town Tarmac Road LOT 2 Mandera Town 1,200,000,000 800,000,000 66.7
3 Proposed Sub-County Headquarters at Takaba In Mandera West
Takaba-Mandera West 69,500,956 40,000,000 57.6
4 Proposed Construction of Municipali-ty Office Block
Mandera East 59,021,552 40,000,000 67.8
5 Proposed Completion of Mmira Mar-ket
Mandera 39,032,886 30,761,947 78.8
6 Proposed construction of Elwak Sub-County Head Quarters
Elwak Sub-County 50,172,731 30,000,000 59.8
7 Mandera Technical Training Institutes 2 workshops
Mandera East 30,000,000 27,290,671 91.0
8 Supply, Delivery, Installation, Testing and Commissioning of Oxygen Plant at Elwak Referral Hospital
Elwak Town 24,269,470 24,296,470 100
9 Proposed Construction of Maternity Wing at Takaba Hospital in Mandera West
Takaba Town 65,384,577 23,400,000 35.8
10 Proposed Construction of Dandu The-atre Block in Mandera west Sub county
Dandu-Mandera West Sub County
24,799,338 22,083,926 89.1
Source: Mandera County Treasury
3.24.8 Budget Performance by County DepartmentTable 3.69 shows a summary of budget estimates and budget performance by department in the first half of FY 2018/19.
Table 3.69: Mandera County, Budget Performance by Department
Department
Budget Allocation (Kshs. Million)
Exchequer Issues in First Half of FY
2018/19 (Kshs. Million)
Expenditure in First Half of FY 2018/19
(Kshs. Million)
Expenditure to Exchequer
Issues (%)
Absorption Rate (%)
Rec Dev Rec Dev Rec Dev Rec Dev Rec Dev
Agriculture Livestock and Fisheries
222.59 612.06 78.09 62.23 82.72 21.29 105.9 34.2 37.2 3.5
Education, Culture and Sports
530.44 457.06 204.00 100.46 223.55 97.75 109.6 97.3 42.1 21.4
Youth and Social Service
76.20 99.35 11.51 12.00 12.51 12.00 108.7 100.0 16.4 12.1
Finance and Economic Planning and ICT
677.83 137.92 271.04 101.40 281.08 101.40 103.7 100.0 41.5 73.5
Health Services 1,641.52 761.36 853.76 238.98 946.20 238.88 110.8 100.0 57.6 31.4 Trade, Investments Industrializations and Cooperative Develop-ment
35.06 198.43 13.02 49.10 14.77 43.33 113.5 88.3 42.1 21.8
County Assembly 850.63 211.26 375.90 - 296.09 - 78.8 - 34.8 -
Lands, Housing and Physical Planning
58.88 273.53 18.42 158.59 20.83 129.70 113.1 81.8 35.4 47.4

177
COUNTY GOVERNMENTS BUDGET IMPLEMENTATION REVIEW REPORT FOR THE FIRST HALF OF FY2018/19
Department
Budget Allocation (Kshs. Million)
Exchequer Issues in First Half of FY
2018/19 (Kshs. Million)
Expenditure in First Half of FY 2018/19
(Kshs. Million)
Expenditure to Exchequer
Issues (%)
Absorption Rate (%)
Rec Dev Rec Dev Rec Dev Rec Dev Rec Dev
Office of the Governor and Deputy Governor
629.42 - 233.55 - 250.90 - 107.4 - 39.9-
County Public Service Board
64.06 - 27.24 - 29.64 - 108.8 - 46.3-
Public Service, Man-agement and Devolved Unit
1,181.42 358.79 490.45 - 507.25 - 103.4 - 42.9 -
Public Works Roads and Transport
103.45 2,257.43 37.93 483.78 41.33 467.76 108.9 96.7 39.9 20.7
Water, Environment and Natural Resources
352.24 1,587.81 169.52 452.12 173.57 452.12 102.4 100.0 49.3 28.5
TOTAL 6,423.74 6,955.00 2,784.43 1,658.65 2,880.43 1,564.23 103.4 94.3 44.8 22.5
Source: Mandera County Treasury
Analysis of expenditure by department shows the Department of Finance and Economic Planning and ICT recorded the highest absorption rate of development budget at 73.5 per cent while the County Assembly and the Department of Public Service, Management and Devolved Unit did not incur any development expenditure. The Department of Health Services had the highest percentage of recurrent expenditure to recurrent budget at 57.6 per cent while the Department of Gender, Youth and Social Service had the lowest at 16.4 per cent.
3.24.9 Key Observations and RecommendationsThe County has made progress in addressing some of the challenges previously identified as affecting budget implementation. Some of the progress made included:
i. Timely submission of quarterly financial reports to the Controller of Budget by the County Government entities in line with Section 166 of the PFM Act, 2012.
ii. Improvement of own-source revenue collection from Kshs.20.47 million in the first half of FY 2017/18 to Kshs.37.87 million in the reporting period.
Despite the above progress, the following challenges continued to hamper effective budget implementation;
1. Failure to budget for all conditional grants as per CARA, 2018.
The County should implement the following recommendations in order to improve budget execution;
1. The County should prepare a Supplementary Budget to align conditional grants to the CARA, 2018.
3.25 Marsabit County
3.25.1 Overview of the FY 2018/19 BudgetThe County’s FY 2018/19 Approved Supplementary Budget was Kshs.8.65 billion, comprising of Kshs.4.13 billion (47.7 per cent) and Kshs.4.53 billion (52.3 per cent) allocation for recurrent and development expenditure respectively.
To finance the budget, the County expects to receive Kshs.7 billion (80.9 per cent) as equitable share of revenue raised nationally, Kshs.678.33 million (7.8 per cent) as total conditional grants, generate Kshs.140 million (1.6 per cent) from own source of revenue, and Kshs.832.97 million (9.6 per cent) cash balance from FY 2017/18.

178
COUNTY GOVERNMENTS BUDGET IMPLEMENTATION REVIEW REPORT FOR THE FIRST HALF OF FY2018/19
Figure 3.96: Marsabit County Expected Sources of Budget Financing in FY 2018/19
Source: Marsabit County Treasury
The conditional grants contained in the CARA, 2018 consist of; Kshs.100 million (11.5 per cent) for Transforming Health Systems for Universal Care Project, Kshs.150 million (17.3 per cent) from IDA (World Bank) for Kenya Climate Smart Agriculture Project, Kshs.48.99 million (5.6 per cent) from IDA (World Bank) as credit for Kenya Devolution Support Programme “Level 1 grant”, Kshs.50 million (5.8 per cent) from IDA (World Bank ) as credit for Kenya Urban Support Project, Kshs.22.07 million (2.5 per cent) as grant from DANIDA for Universal Healthcare to Devolved System Programme, Kshs.80 million (9.2 per cent) as grant from EU for Instruments for Devolution Advice and Support- (IDEAS), Kshs.6.64 million (0.8 per cent) as Compensation for User Fees Foregone, Kshs.184.36 million (21.2 per cent) from Road Maintenance Fuel Levy, and Kshs.26.28 million (3.0 per cent) for Rehabilitation of Village Polytechnics.
3.25.2 Revenue AnalysisDuring the first half of FY 2018/19, the County received Kshs.2.17 billion as equitable share of revenue raised nationally, Kshs.255.51 million as total conditional grants, raised Kshs.33.66 million from own source revenue, and had a cash balance of Kshs.832.97 million from FY 2017/18. The total available funds amounted to Kshs.3.29 billion.
Figure 3.97 shows the half yearly trend in own source revenue collection from the first half FY 2013/14 to the first half of FY 2018/19.

179
COUNTY GOVERNMENTS BUDGET IMPLEMENTATION REVIEW REPORT FOR THE FIRST HALF OF FY2018/19
Figure 3.97: Marsabit County, Trend in Own Source Revenue Collection for the First Half from FY 2013/14 to FY 2018/19
Source: Marsabit County Treasury
During the first half of FY 2018/19, the County generated a total of Kshs 33.66 million as own-source revenue. The own-source revenue collected during the period represented an increase of Kshs 3 per cent compared to Kshs. 32.64 million generated during the same period of the FY 2017/18 and represented 24 per cent of the annual target.
3.25.3 Conditional GrantsThe County received Kshs.255.51 million as conditional grants in the first half of the FY 2018/19 as shown in Table 3.70.
Table 3.70: Marsabit County, Conditional Grants/Loans Received in the First Half of FY 2018/19
S/No GrantsAnnual Allocation, per CARA, 2018
(Kshs)
Annual Budget Allocation for FY
2018/19 (Kshs)
Actual receipts in Half Year of FY
2018/19 (in Kshs.)
Actual Re-ceipts as Per-centage of An-nual Allocation (%)
A Grants Contained in the CARA, 2018
1 Compensation for User Fee Foregone 6,643,714 6,643,714 -
2 Leasing of Medical Equipment 200,000,000 - - -
3 Road Maintenance Fuel Levy Fund 184,361,828 184,361,828 39,329,315 21.3
4 Rehabilitation of Village Polytechnics 26,275,000 26,275,000 - -
5Transforming Health Systems for Universal Care Project (WB)
100,000,000 100,000,000 34,242,032 34.2
6Kenya Climate Smart Agriculture Project (KCSAP)
150,000,000 150,000,000 50,891,757 33.9
7Kenya Devolution Support Project (KDSP) “Level 1 grant”
48,985,872 48,985,872 - -

180
COUNTY GOVERNMENTS BUDGET IMPLEMENTATION REVIEW REPORT FOR THE FIRST HALF OF FY2018/19
S/No GrantsAnnual Allocation, per CARA, 2018
(Kshs)
Annual Budget Allocation for FY
2018/19 (Kshs)
Actual receipts in Half Year of FY
2018/19 (in Kshs.)
Actual Re-ceipts as Per-centage of An-nual Allocation (%)
A Grants Contained in the CARA, 2018
8 Kenya Urban Support Project (KUSP) 50,000,000 50,000,000 50,000,000 100.0
9 DANIDA Grant 22,072,500 22,072,500 11,036,250 50.010 EU Grant ( IDEAS) 80,000,000 90,000,000 70,007,619 77.8
Total 868,338,914 678,338,914 255,506,973 37.7
Source: Marsabit County Treasury
Analysis of the revenue from conditional grants indicates that, the County received the highest percentage of receipts to annual allocation from the Kenya Urban Support project and the EU grant. The receipts accounted for 100 per cent and 77.8 per cent of annual allocation respectively.
3.25.4 Exchequer IssuesTo finance the budget, the Controller of Budget approved the withdrawal of Kshs.3.21 billion from the CRF account. The withdrawal represented 37.1 per cent of the Approved Budget and translates to an increase of 61.1 per cent from Kshs.1.99 billion approved in the first half of FY 2017/18 and comprised of Kshs.2.07 billion (64.5 per cent) to fund recurrent expenditure and Kshs.1.14 billion (35.5 per cent) for development activities.
3.25.5 Overall Expenditure ReviewThe County government spent a total of Kshs.2.40 billion on recurrent and development activities. The total expenditure represented 74.8 per cent of the total funds released from the CRF account and was an increase of 43 per cent from Kshs.1.68 billion spent in the first half of FY 2017/18.
Expenditure on recurrent activities amounted to Kshs.1.66 billion while Kshs.745.18 million was spent on development activities. The recurrent expenditure was 79.9 per cent of the funds released for recurrent activities, while development expenditure was 65.5 per cent of funds released for development activities.
The recurrent expenditure represented 40.1 per cent of the annual recurrent budget, an increase from 36.5 per cent recorded in the first half of FY 2017/18. Development expenditure recorded an absorption rate of 16.5 per cent, which was an increase from 5.3 per cent attained in the first half of FY 2017/18.Figure 3.98 presents a comparison between the total expenditure in the first half of FY 2018/19 and first half of the FY 2017/18.

181
COUNTY GOVERNMENTS BUDGET IMPLEMENTATION REVIEW REPORT FOR THE FIRST HALF OF FY2018/19
Figure3.98: MarsabitCounty,ExpenditurebyEconomicClassification
Source: Marsabit County Treasury
3.25.6 Analysis of Recurrent ExpenditureThe total recurrent expenditure of Kshs.1.66 billion comprised of Kshs.1.23 billion (74.4 per cent) incurred on personnel emoluments and Kshs.424.09 million (25.6 per cent) on operations and maintenance as shown in Figure 3.98.
Expenditure on personnel emoluments represented an increase of 20.4 per cent compared to the first half of FY 2017/18 when the County spent Kshs.1.02 billion, and was 51.3 per cent of total expenditure in the first half of FY 2018/19. Figure 3.99 shows a summary of operations and maintenance expenditure by major categories.

182
COUNTY GOVERNMENTS BUDGET IMPLEMENTATION REVIEW REPORT FOR THE FIRST HALF OF FY2018/19
Figure 3.99: Marsabit County, Operations and Maintenance Expenditure by Major Categories in the First Half of FY 2018/19
Source: Marsabit County Treasury
The County spent Kshs.10.26 million to cater for the MCAs’ committee sitting allowances for the 30 MCAs against the annual budget allocation of Kshs.35.49 million. This represented an increase of 162.5 per cent compared to Kshs.3.91 million spent in a similar period of FY 2017/18. The average monthly sitting allowance translated to Kshs.55,172 per MCA against the SRC’s recommended monthly ceiling of Kshs.124,800.
Expenditure on domestic and foreign travel amounted to Kshs.110.36 million and comprised of Kshs.49.77 million spent by the County Assembly and Kshs.60.58 million spent by the County Executive and represented 6.7 per cent of total recurrent expenditure.
3.25.7 Development ExpenditureThe total development expenditure of Kshs.745.18 million represented 16.5 per cent of the annual development budget of Kshs.4.53 billion. Table 3.71 provides a summary of development projects with the highest expenditure in the first half of the financial year.

183
COUNTY GOVERNMENTS BUDGET IMPLEMENTATION REVIEW REPORT FOR THE FIRST HALF OF FY2018/19
Table 3.71: Marsabit County, List of Development Projects with the Highest Expenditure in the FY 2018/19
S/No. Project Name Project LocationProject Budget
(Kshs.)
Project Expendi-ture in First Half
of FY 2018/19 (Kshs.)
Absorption Rate (%)
1 Drugs & Non-pharmaceuticals supplies Countywide 133,000,000 24,013,749 18.1 2 Supply & delivery of relief foods commodities Countywide 180,000,000 22,294,750 12.4 3 Development of Marsabit Stadium Pavilion Saku Sub-county 15,200,000 15,109,833 99.4
4 Drilling of Balachaloki Borehole of 200 m depth North-Horr sub-coun-ty
8,000,000 7,989,19099.9
5 Construction of Kalacha water supply North-Horr sub-coun-ty
7,000,000 6,486,991 92.7
6Feasibility Study Environment & Engineering Design of Moyale Town Roads
Moyale Sub-county 6,000,000 5,514,580 91.9
7Spot Improvement works on Walda Dad-ach-Elele-Yashare Road
Moyale Sub-county 5,000,000 4,999,457 100.0
8Sports Improvement works on Hurri Hills Balesa Road
North Horr Sub-coun-ty
5,000,000 4,999,091 100.0
9Erection & Completion of Dormitory Block at Saku Vtc
Saku Sub-county 4,500,000 4,496,740 99.9
10Rehabilitation of Masonry tank, pump house, piping & 15m long trough Bori borehole
Moyale sub-county 5,000,000 4,087,490 81.7
Source: Marsabit County Treasury
3.25.8 Budget Performance by County DepartmentTable 3.72 shows a summary of budget estimates and budget performance by department in the first half of FY 2018/19.
Table 3.72: Marsabit County, Budget Performance by Department
Department
Annual Budget Allo-cation in FY 2018/19
(Kshs. Million)
Exchequer Issues in First Half of FY 2018/19 (Kshs. Million)
Expenditure in First Half of FY 2018/19 (Kshs.
Million)
Expenditure to Exchequer
Issues (%)
Absorption Rate (%)
Rec Dev Rec Dev Rec Dev Rec Dev Rec Dev
County Assem-bly
647.59 154.09 215.00 - 194.71 - 90.6 - 30.1 -
County Execu-tive Services
531.44 476.76 261.18 173.54 213.34 143.83 81.7 82.9 40.1 30.2
Finance Manage-ment Services
378.99 10.00 222.91 - 93.41 - 41.9 - 24.6 0.0
A g r i c u l t u r e , Livestock and Fisheries
186 436.93 112.65 178.01 77.70 14.28 69.0 8.0 41.8 3.3
County Public Service
90 2.31 42.80 - 29.95 - 70.0 - 33.3 -
Education Youth Affairs
259 444.74 136.24 173.91 112.26 83.08 82.4 47.8 43.3 18.7
County Health Services
1,192.24 943.78 629.10 293.12 621.43 139.83 98.8 47.7 52.1 14.8
Administration and ICT
339.20 15.30 167.10 - 133.93 7.55 80.2 - 39.5 49.4

184
COUNTY GOVERNMENTS BUDGET IMPLEMENTATION REVIEW REPORT FOR THE FIRST HALF OF FY2018/19
Department
Annual Budget Allo-cation in FY 2018/19
(Kshs. Million)
Exchequer Issues in First Half of FY 2018/19 (Kshs. Million)
Expenditure in First Half of FY 2018/19 (Kshs.
Million)
Expenditure to Exchequer
Issues (%)
Absorption Rate (%)
Rec Dev Rec Dev Rec Dev Rec Dev Rec Dev
Physical Plan-ning and Devel-opment
140.00 299.15 69.82 68.00 41.43 64.06 59.3 94.2 29.6 21.4
Roads and Public Works
77.00 557.25 47.34 - 35.27 60.58 74.5 - 45.8 10.9
Water Services 130.04 895.73 79.23 179.77 51.27 208.20 64.7 115.8 39.4 23.2Trade and Indus-try
83.50 139.09 46.55 64.64 26.76 2.40 57.5 3.7 32.0 1.7
Tourism, Culture and Social Ser-vices
72.00 151.37 41.80 7.50 23.67 21.38 56.6 285 32.9 14.1
Total 4,127.00 4,526.51 2,071.71 1,138.49 1,655.13 745.18 79.9 65.5 40.1 16.5
Source: Marsabit County Treasury
Analysis of expenditure by department shows that the Department of Administration and ICT recorded the highest absorption rate of development budget at 49.4 per cent while the County Assembly and Department of Finance Management Services and the County Public Service did not incur any development expenditure. The Department of Health Services had the highest percentage of recurrent expenditure to its recurrent budget at 52.1 per cent while the Department of Finance and Management Services had the lowest at 24.6 per cent.
3.25.9 Key Observations and RecommendationsThe County has made progress in addressing some of the challenges previously identified as affecting budget implementation. Some of the progress made included:
i. Establishment of an Internal Audit Department and strengthening of the internal audit function in line with Section 155 of the PFM Act, 2012.
Despite the above progress, the following challenges continued to hamper effective budget implementation;
1. Under-performance in own source revenue collection which represented 24 per cent of the annual target.
2. Delay by Fund Administrators to submit expenditure reports of the Car Loan and Mortgage Fund, County Assembly Members Car Loan and Mortgage Fund and the Bursary Fund contrary to Section 168 of the PFM Act, 2012.
3. Delay in disbursement of the equitable share of revenue raised by the National Treasury.4. Late submission of financial reports by the County Treasury, which affected timely preparation of
budget implementation reports by OCOB contrary to Section 166 of the PFM Act, 2012.5. Failure to constitute the County Budget and Economic Forum (CBEF) contrary to Section 137 of the
PFM Act, 2012 for consultation in the budget making process
The County should implement the following recommendations in order to improve budget execution;
1. The County Treasury should develop and implement strategies to enhance own-source revenue collection.
2. All Fund Administrators should submit financial returns in line with Section 168 of the PFM Act, 2012.
3. The National Treasury should ensure timely disbursement of funds in line with CARA, 2018.4. The County Treasury should ensure timely preparation and submission of financial reports in line
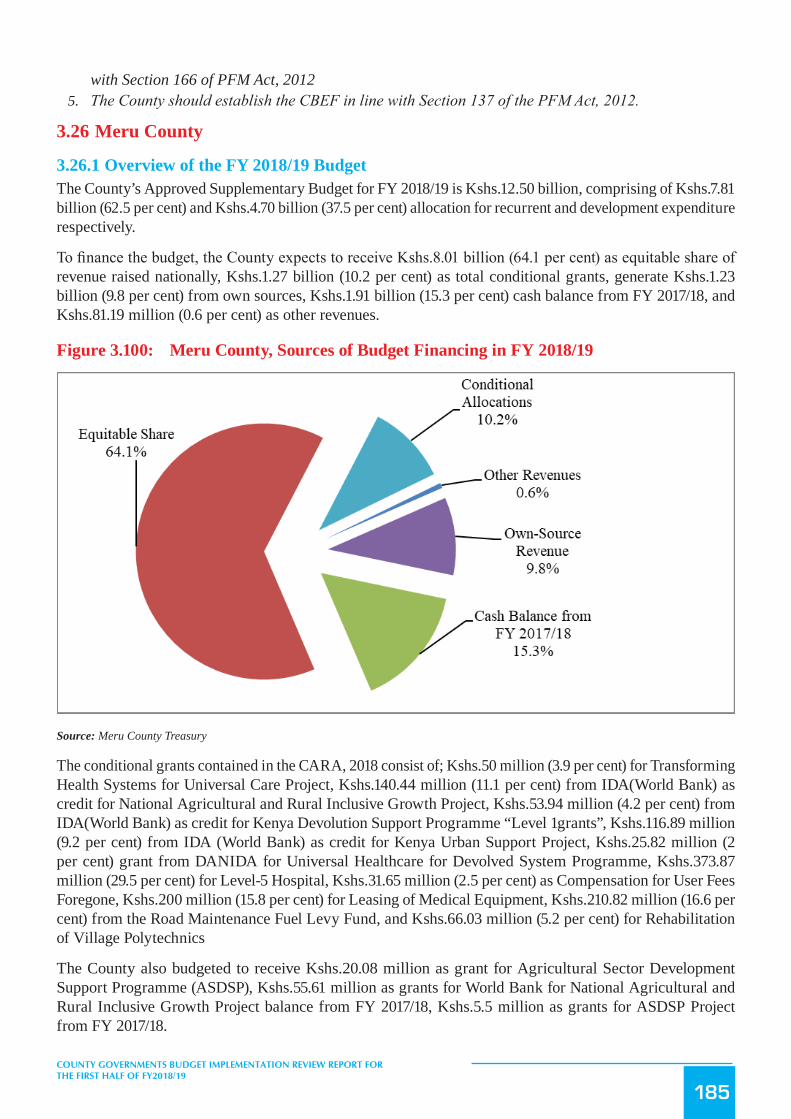
185
COUNTY GOVERNMENTS BUDGET IMPLEMENTATION REVIEW REPORT FOR THE FIRST HALF OF FY2018/19
with Section 166 of PFM Act, 20125. The County should establish the CBEF in line with Section 137 of the PFM Act, 2012.
3.26 Meru County
3.26.1 Overview of the FY 2018/19 BudgetThe County’s Approved Supplementary Budget for FY 2018/19 is Kshs.12.50 billion, comprising of Kshs.7.81 billion (62.5 per cent) and Kshs.4.70 billion (37.5 per cent) allocation for recurrent and development expenditure respectively.
To finance the budget, the County expects to receive Kshs.8.01 billion (64.1 per cent) as equitable share of revenue raised nationally, Kshs.1.27 billion (10.2 per cent) as total conditional grants, generate Kshs.1.23 billion (9.8 per cent) from own sources, Kshs.1.91 billion (15.3 per cent) cash balance from FY 2017/18, and Kshs.81.19 million (0.6 per cent) as other revenues.
Figure 3.100: Meru County, Sources of Budget Financing in FY 2018/19
Source: Meru County Treasury
The conditional grants contained in the CARA, 2018 consist of; Kshs.50 million (3.9 per cent) for Transforming Health Systems for Universal Care Project, Kshs.140.44 million (11.1 per cent) from IDA(World Bank) as credit for National Agricultural and Rural Inclusive Growth Project, Kshs.53.94 million (4.2 per cent) from IDA(World Bank) as credit for Kenya Devolution Support Programme “Level 1grants”, Kshs.116.89 million (9.2 per cent) from IDA (World Bank) as credit for Kenya Urban Support Project, Kshs.25.82 million (2 per cent) grant from DANIDA for Universal Healthcare for Devolved System Programme, Kshs.373.87 million (29.5 per cent) for Level-5 Hospital, Kshs.31.65 million (2.5 per cent) as Compensation for User Fees Foregone, Kshs.200 million (15.8 per cent) for Leasing of Medical Equipment, Kshs.210.82 million (16.6 per cent) from the Road Maintenance Fuel Levy Fund, and Kshs.66.03 million (5.2 per cent) for Rehabilitation of Village Polytechnics
The County also budgeted to receive Kshs.20.08 million as grant for Agricultural Sector Development Support Programme (ASDSP), Kshs.55.61 million as grants for World Bank for National Agricultural and Rural Inclusive Growth Project balance from FY 2017/18, Kshs.5.5 million as grants for ASDSP Project from FY 2017/18.

186
COUNTY GOVERNMENTS BUDGET IMPLEMENTATION REVIEW REPORT FOR THE FIRST HALF OF FY2018/19
3.26.2 Revenue AnalysisDuring the first half of FY 2018/19, the County received Kshs.2.63 billion as equitable share of revenue raised nationally, Kshs.135.13 million as total conditional grants, raised Kshs.217.54 million as own-source revenue, and had a cash balance of Kshs.1.22 billion from FY 2017/18. The total funds available for the period amounted to Kshs.4.21 billion.
Figure 3.101 shows the half yearly trend in own-source revenue collection from FY 2013/14 to FY 2018/19.
Figure 3.101: Meru County, Trend in Own-Source Revenue Collection for the First Half from FY 2013/14 to the First Half of FY 2018/19
Source: Meru County Treasury
During the first half of FY 2018/19, the County generated a total of Kshs.217.54 million as own-source revenue. This amount was an increase of 177.9 per cent when compared to Kshs.78.29 million realised during the same period of FY 2017/18 and represented 17.7 per cent of the annual target.
3.26.3 Conditional GrantsThe County received Kshs.135.13 million as conditional grants as shown in Table 3.73.

187
COUNTY GOVERNMENTS BUDGET IMPLEMENTATION REVIEW REPORT FOR THE FIRST HALF OF FY2018/19
Table 3.73: Meru County, Conditional Grants/Loans Received in the First Half of FY 2018/19
S/No. Grant or Loan Details
Annual Allocation, per CARA, 2018
(Kshs)
Annual Budget Allocation for
FY 2018/19 (Kshs)
Actual Receipts in First Half of FY 2018/19 (Kshs)
Actual Receipts as Percentage of Annual Alloca-tion (%)
1 Level- 5 Hospital 373,872,832 373,872,832 - -
2 Compensation for User Fee Foregone 31,648,428 31,648,428 - -
3 Leasing of Medical Equipment 200,000,000 200,000,000 - -
4 Road Maintenance Fuel Levy Fund 210,817,337 210,817,337 - -
5 Rehabilitation of Village Polytechnics 66,025,000 66,025,000 - -
6Transforming Health Systems for Universal Care Project- World Bank
50,000,000 50,000,000 5,330,281 10.7
7National Agricultural and Rural Inclusive Growth Project- IDA (World Bank)
140,435,163 140,435,163 - -
8Kenya Devolution Support Programme “Level 1 grant” -IDA (World Bank)
53,939,835 53,939,835 - -
9 Kenya Urban Support Project -IDA(World Bank) 116,890,200 116,890,200 116,890,200 100
10DANIDA - Universal Healthcare to Devolved System Programme
25,818,750 25,818,750 12,909,375 50
11 Agricultural Sector Development Support Pro-gramme- (ASDSP)
- 20,075,209 - -
12Agricultural and Rural Inclusive Growth Project Balance B/F 2017-18
- 55,609,855 - -
13 ASDSP Project Balance B/F 2017-18 - 5,500,000 - -TOTAL 1,269,447,545 1,350,632,609 135,129,856 10
Source: Meru County Treasury
Analysis of the revenue from conditional grants indicates that, the County received the highest percentage of receipts to annual allocation from the Kenya Urban Support project and the DANIDA grant. The receipts accounted for 100 per cent and 50 per cent of annual allocation respectively.
3.26.4 Exchequer IssuesTo finance implementation of the budget, the Controller of Budget approved withdrawal of Kshs.4.10 billion from the CRF account. The withdrawal represented 32.8 per cent of the Approved Supplementary Budget and translated to an increase of 45.9 per cent from Kshs.2.81 billion approved in the first half of FY 2017/18. This comprised of Kshs.3.88 billion (49.7 per cent) to fund recurrent activities and Kshs.212.71 million (4.5 per cent) for development activities.
3.26.5 Overall Expenditure ReviewThe County government spent a total of Kshs.4.03 billion on both recurrent and development activities. This expenditure represented 98.3 per cent of the total funds released from the CRF account and was an increase of 73 per cent from Kshs.2.33 billion spent in the first half of FY 2017/18. The expenditure excluded outstanding commitments as at 31st December, 2018, which amounted to Kshs.338.01 million for development activities and Kshs.138.69 million for recurrent expenditure.
Expenditure on recurrent activities amounted to Kshs.3.62 billion while that on development activities was Kshs.411.65 million. The recurrent expenditure was 93.1 per cent of the funds released for recurrent activities, while development expenditure was 193.5 per cent of funds released for development activities.

188
COUNTY GOVERNMENTS BUDGET IMPLEMENTATION REVIEW REPORT FOR THE FIRST HALF OF FY2018/19
The recurrent expenditure represented 46.3 per cent of the annual recurrent budget and was an increase from 34.2 per cent recorded in the first half of FY 2017/18. Development expenditure recorded an absorption rate of 8.8 per cent, while there was no development expenditure in the first half of FY 2017/18. Figure 3.102 presents a comparison between the total expenditure in the first half of FY 2018/19 and the first half of FY 2017/18.
Figure3.102: MeruCounty,ExpenditurebyEconomicClassification
Source: Meru County Treasury
3.26.6 Analysis of Recurrent ExpenditureThe total recurrent expenditure of Kshs.3.62 billion comprised of Kshs.2.60 billion (71.9 per cent) incurred on personnel emoluments and Kshs.1.02 billion (28.1 per cent) on operations and maintenance as shown in Figure 3.102.
Expenditure on personnel emoluments represented an increase of 20.6 per cent compared to the first half of FY 2017/18 when the County spent Kshs.2.15 billion, and was 64.5 per cent of total expenditure for the period. Figure 3.103 shows a summary of operations and maintenance expenditure by major categories.

189
COUNTY GOVERNMENTS BUDGET IMPLEMENTATION REVIEW REPORT FOR THE FIRST HALF OF FY2018/19
Figure 3.103: Meru County, Operations and Maintenance Expenditure by Major Categories in the First Half of FY 2018/19
Source: Meru County Treasury
The County spent Kshs.43.23 million on MCAs’ committee sitting allowances for the 69 MCAs against the annual budget allocation of Kshs.101.94 million. This amount represented an increase of 915.98 per cent compared to Kshs.4.23 million spent in a similar period of FY 2017/18. The average monthly sitting allowance translated to Kshs.104,421 per MCA against the SRC’s recommended monthly ceiling of Kshs.124,800.
Expenditure on domestic and foreign travel amounted to Kshs.197.59 million and comprised of Kshs.160.40 million spent by the County Assembly and Kshs.37.19 million spent by the County Executive. This represented 5.5 per cent of total recurrent expenditure.
3.26.7 Development ExpenditureThe total development expenditure of Kshs.411.65 million represented 8.8 per cent of the annual development budget of Kshs.4.69 billion. Table 3.74 provides a summary of development projects with the highest expenditure in the first half of the financial year.

190
COUNTY GOVERNMENTS BUDGET IMPLEMENTATION REVIEW REPORT FOR THE FIRST HALF OF FY2018/19
Table 3.74: Meru County, List of Development Projects with the Highest Expenditure in the FY 2018/19
S/No. Project Name Project LocationAnnual Project Budget (Kshs.)
Half Year Ex-p e n d i t u r e (Kshs.)
Absorption Rate (%)
1 Construction of Office Block Headquarters 120,000,000 45,000,000 37.5
2Routine Maintenance of Mwiciume- Ngon-go-Kinoro road
Abogeta East 30,159,497 21,204,360 70.3
3 Meru Youth Services Municipality 19,500,000 19,500,000 1004 Construction of Iraru water project Abogeta East 28,808,745 17,543,000 60.95 Upgrading of the Kanyakine loop road Abogeta East 16,311,815 16,306,894 1006 Upgrading of Gitimbine-Majengo loop road Municipality 39,604,798 16,025,456 40.57 Supply of the Medical Equipment Municipality 190,398,231 13,537,005 7.1
8 Murera gate – Rhino camp road Kianjai Road 28,404,925 11,766,280 41.4
9Capital transfer to National Agricultural and Rural Inclusive Growth Project (NARIGP)
Headquarter 140,435,163 10,365,588 7.4
10Rehabilitation of Mariara river catchment area
Abothuguchi West and Central
9,992,200 9,992,200 100
Source: Meru County Treasury
3.26.8 Budget Performance by County DepartmentTable 3.75 shows a summary of budget estimates and budget performance by department in the first half of FY 2018/19.
Table 3.75: Meru County, Budget Performance by Department
Department
Annual Budget Allo-cation in FY 2018/19
(Kshs. Million)
Exchequer Issues in First Half of FY 2018/19 (Kshs. Mil-lion)
Expenditure in First Half of FY 2018/19
(Kshs. million)
Expenditure to Exchequer
Issues (%)
Absorption rate (%)
Rec Dev Rec Dev Rec Dev Rec Dev Rec Dev
County Assembly 937.22 82.00 473.92 4.51 473.92 4.51 100 100 50.6 5.5Office of the Governor 334.87 10.50 171.16 - 92.38 - 54 - 27.6 -County Finance, Economic Planning and ICT
951.26 245.91 442.42 45.00 425.73 45.00 96.2 100 44.8 18.3
Agriculture, Livestock and Fisheries
356.98 469.21 179.16 3.47 168.78 66.59 94.2 1917 47.8 14.2
Water and Sanitation 115.29 861.35 62.93 17.54 49.29 24.81 78.3 141.4 42.7 2.9
Education, Technology, Gen-der, Culture & Social Devel-opment
940.03 245.00 375.09 - 299.90 - 80 - 31.9 -
Health Services 2,986.93 643.50 1,542.09 17.77 1,593.02 17.77 103.3 100 53.3 2.8Lands, Physical Planning, Ur-ban Development and Public Works
109.83 341.70 72.72 96.89 37.77 - 51.9 - 34.4 -
Public Services, Administra-tion and Legal Affairs
686.13 - 416.28 - 367.86 - 88.4 - 53.6 -
Roads, Transport and Energy 101.13 1,349.65 36.83 3.11 30.39 168.25 82.5 5412.4 30.1 12.5Trade, Investment, Industrial-ization, Tourism and Coopera-tive Development
86.60 210.78 42.76 10.73 34.84 38.90 81.5 356.9 40.2 18.2
Youth Affairs and Sports 145.30 156.91 42.17 3.70 28.53 33.26 67.7 898.9 19.6 21.2

191
COUNTY GOVERNMENTS BUDGET IMPLEMENTATION REVIEW REPORT FOR THE FIRST HALF OF FY2018/19
Department
Annual Budget Allo-cation in FY 2018/19
(Kshs. Million)
Exchequer Issues in First Half of FY 2018/19 (Kshs. Mil-lion)
Expenditure in First Half of FY 2018/19
(Kshs. million)
Expenditure to Exchequer
Issues (%)
Absorption rate (%)
Rec Dev Rec Dev Rec Dev Rec Dev Rec Dev
Public Services Board 21.67 - 8.07 - 7.93 - 98.2 - 36.6 -Environment, Wildlife & Nat-ural Resources
34.32 75.52 17.65 9.99 5.54 13.17 31.4 131.8 16.1 17.4
TOTAL 7,807.57 4,692.02 3,883.25 212.71 3,615.85 411.65 93.1 193.5 46.3 8.8
Source: Meru County Treasury
Analysis of expenditure by department shows the Department of Youth Affairs and Sport recorded the highest absorption rate of development budget at 21.2 per cent. The Department of Public Services, Administration and Legal Affairs had the highest percentage of the recurrent expenditure to recurrent budget at 53.6 per cent while the Department of Environment, Wildlife and Natural Resources had the lowest at 16.1 per cent.
3.26.9 Key Observations and RecommendationsThe County has made progress in addressing some of the challenges previously identified as affecting budget implementation. Some of the progress made included:
i. Improvement in absorption of development budget. In the reporting period, the County attained an absorption rate of 8.8 per cent while there was no expenditure on development activities in a similar period FY 2017/18.
ii. Improvement in own-source revenue collection from Kshs.78.29 million in the first half of FY 2017/18 to Kshs.217.54 million in the reporting period.
Despite the above progress, the following challenges continued to hamper effective budget implementation;
1. Delayed disbursement of funds by the National Treasury during the period under review which affected the budget implementation.
2. High wage bill that increased by 20.6 per cent from Kshs.2.15 billion in the first half of FY 2017/18 to Kshs.2.6 billion in the reporting period.
The County should implement the following recommendations in order to improve budget execution;
1. The National Treasury should ensure timely disbursement of funds to Counties for smooth budget implementation.
2. The County Public Services Board should establish an optimal staffing structure in order to ensure a sustainable wage bill.
3.27 Migori County
3.27.1 Overview of the FY 2018/19 BudgetThe County’s Approved Budget for FY 2018/19 is Kshs.8.54 billion, comprising of Kshs.5.29 billion (62 per cent) and Kshs.3.25 billion (38 per cent) allocation for recurrent and development expenditure respectively.
To finance the budget, the County expects to receive Kshs.6.72 billion (78.7 per cent) as equitable share of revenue raised nationally, Kshs.1.37 billion (16 per cent) as total conditional grants, and generate Kshs.450 million (5.3 per cent) from own sources.

192
COUNTY GOVERNMENTS BUDGET IMPLEMENTATION REVIEW REPORT FOR THE FIRST HALF OF FY2018/19
Figure 3.104: Migori County Sources of Budget Financing in FY 2018/19
Source: Migori County Treasury
The conditional grants include those contained in the CARA, 2018 of; Kshs.100 million (7.4 per cent) for Transforming Health Systems for Universal Care Project, Kshs.140.44 million (10.4 per cent) from IDA (World Bank) credit for National Agricultural and Rural Inclusive Growth Project, Kshs.49.61 million (3.7 per cent) from IDA (World Bank) credit for Kenya Devolution Support Programme “Level 1 grant”, Kshs.518.37 million (38.4 per cent) from IDA (World Bank ) as credit for Kenya Urban Support Project, Kshs.21.67 million (1.6 per cent) as grant from DANIDA for Universal Healthcare to Devolved System Programme, Kshs.90 million (6.7 per cent) grant from EU for Instruments for Devolution Advice and Support- IDEAS), Kshs.21.66 million (1.6 per cent) Compensation for User Fees Foregone, Kshs.200 million (14.8 per cent) for Leasing of Medical Equipment, Kshs.176.92 million (13.1 per cent) from the Road Maintenance Fuel Levy Fund, and Kshs.31.75 million (2.4 per cent) for Rehabilitation of Village Polytechnics.
3.27.2 Revenue AnalysisDuring the first half of FY 2018/19, the County received Kshs.2.08 billion as equitable share of revenue raised nationally, Kshs.647.73 million as total conditional grants, raised Kshs.133.48 million as own-source revenue, and had a cash balance of Kshs.599.33 million from FY 2017/18. The total funds available for the period amounted to Kshs.3.46 billion.
Figure 3.105 shows the half yearly trend in own-source revenue collection from FY 2013/14 to FY 2018/19.

193
COUNTY GOVERNMENTS BUDGET IMPLEMENTATION REVIEW REPORT FOR THE FIRST HALF OF FY2018/19
Figure 3.105: Migori County, Trend in Own-Source Revenue Collection for the First Half of FY 2013/14 to the First Half of FY 2018/19
Source: Migori County Treasury
During the first half of FY 2018/19, the County generated a total of Kshs.133.48 million as own-source revenue. This amount was an increase of 150.4 per cent when compared to Kshs.53.30 million realised during the same period of FY 2017/18, and represented 29.7 per cent of the annual target.
3.27.3 Conditional GrantsThe County received Kshs.647.73 million as conditional grants as shown in Table 3.76.
Table 3.76: Migori County, Conditional Grants/Loans Received in the First Half of FY 2018/19
S/No. Grants/LoansAnnual Allocation, per CARA, 2018
(Kshs)
Annual Budget Allocation for
FY 2018/19 (Kshs)
Actual Receipts in
First Half of FY 2018/19
(Kshs)
Actual Receipts as Percentage of Annu-
al Allocation (%)
A Grants/Loans contained in CARA, 2018
1 Compensation for User Fee Foregone 21,655,884 21,655,884 - -2 Leasing of Medical Equipment 200,000,000 200,000,000 - -
3 Road Maintenance Fuel Levy Fund 176,921,216 176,921,216 44,235,684 25.0
4 Rehabilitation of Village Polytechnics 31,750,000 31,750,000 - -
5World Bank-Transforming Health Systems for Uni-versal Care Project
100,000,000 100,000,000 23,592,136 23.6
6IDA (World Bank) -National Agricultural and Rural Inclusive Growth Project
140,435,163 140,435,163 - -
7IDA (World Bank) Kenya Devolution Support Pro-gramme “Level 1 grant”
49,609,593 49,609,593 - -
8 IDA (World Bank) -Kenya Urban Support Project 518,367,800 558,367,800 518,367,800 92.8
9DANIDA - Universal Healthcare to Devolved Sys-tem Programme
21,667,500 21,667,500 10,833,750 50

194
COUNTY GOVERNMENTS BUDGET IMPLEMENTATION REVIEW REPORT FOR THE FIRST HALF OF FY2018/19
S/No. Grants/LoansAnnual Allocation, per CARA, 2018
(Kshs)
Annual Budget Allocation for
FY 2018/19 (Kshs)
Actual Receipts in
First Half of FY 2018/19
(Kshs)
Actual Receipts as Percentage of Annu-
al Allocation (%)
A Grants/Loans contained in CARA, 2018
10EU- Instruments for Devolution Advice and Sup-port- IDEAS)
90,000,000 70,000,000 50,704,556 72.4
Total 1,350,407,156 1,370,407,356 647,733,926 47.3
Source: Migori County Treasury
Analysis of the revenue from conditional grants indicates that, the County received the highest disbursements for Kenya Urban Support Project and the IDEAS project. These receipts accounted for 92.8 per cent and 72.4 per cent of the annual allocation respectively.
3.27.4 Exchequer IssuesTo finance implementation of the budget, the Controller of Budget approved withdrawal of Kshs.3.31 billion from the CRF account. The withdrawals represented 38.8 per cent of the Approved Budget and translated to an increase of 67 per cent from Kshs.1.98 billion approved in the first half of FY 2017/18. This comprised of Kshs.2.10 billion (63.5 per cent) to fund recurrent expenditure and Kshs.1.21 billion (36.5 per cent) for development activities.
3.27.5 Overall Expenditure ReviewThe County government spent a total of Kshs.2.53 billion on both recurrent and development activities. This expenditure represented 76.4 per cent of the total funds released from the CRF account and was an increase of 32.3 per cent from Kshs.1.91 billion spent in the first half of FY 2017/18. The expenditure excluded outstanding commitments as at 31st December, 2018, which amounted to Kshs.271.28 million for development activities and Kshs.131.27 million for recurrent expenditure.
Expenditure on recurrent activities amounted to Kshs.2.10 billion while that on development activities was Kshs.432.19 million. The recurrent expenditure was 99.7 per cent of the funds released for recurrent activities, while development expenditure was 35.8 per cent of funds released for development activities.
The recurrent expenditure represented 39.6 per cent of the annual recurrent budget and was a decrease from 43.8 per cent recorded in the first half of FY 2017/18. Development expenditure recorded an absorption rate of 13.3 per cent, which was a decrease from 15.6 per cent attained in the first half of FY 2017/18. Figure 3.106 presents a comparison between the total expenditure in the first half of FY 2018/19 and the first half of FY 2017/18.

195
COUNTY GOVERNMENTS BUDGET IMPLEMENTATION REVIEW REPORT FOR THE FIRST HALF OF FY2018/19
Figure3.106: MigoriCounty,ExpenditurebyEconomicClassification
Source: Migori County Treasury
3.27.6 Analysis of Recurrent ExpenditureThe total recurrent expenditure of Kshs.2.10 billion comprised of Kshs.1.35 billion (64.6 per cent) incurred on personnel emoluments and Kshs.741.79 million (35.4 per cent) on operations and maintenance as shown in Figure 3.106.
Expenditure on personnel emoluments represented an increase of 23.8 per cent compared to the first half of FY 2017/18 when the County spent Kshs.1.09 billion, and was 53.6 per cent of total expenditure for the period. Figure 3.107 shows a summary of operations and maintenance expenditure by major categories.

196
COUNTY GOVERNMENTS BUDGET IMPLEMENTATION REVIEW REPORT FOR THE FIRST HALF OF FY2018/19
Figure 3.107: Migori County, Operations and Maintenance Expenditure by Major Categories in the First Half of FY 2018/19
Source: Migori County Treasury
The County spent Kshs.32.06 million on MCAs’ committee sitting allowances for the 57 MCAs. The Assembly did not explicitly budget for this expenditure in FY 2018/19. This amount represented an increase of 986.3 per cent compared to Kshs.2.95 million spent in a similar period of FY 2017/18. The average monthly sitting allowance translated to Kshs.93,737 per MCA against the SRC’s recommended monthly ceiling of Kshs.124,800.
Expenditure on domestic travel amounted to Kshs.242.80 million and comprised of Kshs.34.43 million spent by the County Assembly and Kshs.208.37 million spent by the County Executive. This represented 11.6 per cent of total recurrent expenditure and was an increase of 54 per cent compared to Kshs.157.67 million spent in the first half of FY 2017/18.
3.27.7 Development ExpenditureThe total development expenditure of Kshs.432.19 million represented 13.3 per cent of the annual development budget of Kshs.3.25 billion. Table 3.77 provides a summary of development projects with the highest expenditure in the first half of the financial year.

197
COUNTY GOVERNMENTS BUDGET IMPLEMENTATION REVIEW REPORT FOR THE FIRST HALF OF FY2018/19
Table 3.77: Migori County, List of Development Projects with the Highest Expenditure in the First Half of FY 2018/19
S/No. Project Name Project LocationAnnual Project Budget (Kshs.)
Half Year Ex-p e n d i t u r e (Kshs.)
A b s o r p t i o n Rate (%)
1 Supply and Installation of Floodlights Countywide 59,000,000 58,443,500 99.1
2 Upgrade to Bitumen Standard of Uriri - Oria Road
Uriri Sub- County 105,562,867 50,000,000 47.4
3 Integrated Plan for Migori Town County Headquarters 44,972,838 17,561,164 39.0
4 Rehabilitation of Migori Water Supply (Ombo Borehole)
Suna East Sub- County 14,636,400 14,636,400 100
5 Access Road to Nyakona River Nyatike Sub - County 12,523,893 12,523,893 100
6 Construction of Amenity Ward at Migori County Referral Hospital
Migori County Referral Hospital
16,990,428 11,235,100 66.1
7 Construction of Ward Administrator’s Office Rabuor (Suna East Sub-County)
13,000,000 11,140,000 85.7
8 Equiping and Distribution of Kematare Borehole
Masaba Ward 10,814,933 10,814,933 100
9 Purchase of Motor Grader 180 - 200HP County Headquarters 27,671,000 10,000,000 36.1
10 Opening and Spot Improvement of Nyangere - Lisori Road
Nyatike Sub - County 9,518,061 9,518,061 100
Source: Migori County Treasury
3.27.8 Budget Performance by County DepartmentTable 3.78 shows a summary of budget estimates and budget performance by department in the first half of FY 2018/19.
Table 3.78: Migori County, Budget Performance by Department
Department
Annual Budget Allo-cation in FY 2018/19
(Kshs. Million)
Exchequer Issues in First Half of FY 2018/19 (Kshs. Mil-lion)
Expenditure in First Half of FY 2018/19 (Kshs.
Million)
Expenditure to Exchequer
Issues (%)
Absorption Rate (%)
Rec Dev Rec Dev Rec Dev Rec Dev Rec Dev
Agriculture, Livestock, Fish-eries and Veterinary
420.72 152.58 159.17 47.15 103.05 19.01 64.7 40.3 24.5 12.5
Trade, Industrialization, Cooperative Development and Tourism
76.04 39.27 35.44 4.28 27.07 - 76.4 - 35.6 -
Health 1,489.06 471.00 699.67 60.09 799.13 19.16 114.2 31.9 53.7 4.1Education, Youth Develop-ment, Sports, Culture and Social Services
300.34 113.25 184.14 22.89 188.11 0.78 102.2 3.4 62.6 0.7
Public Works, Roads and Transport
63.43 1,044.42 28.97 378.14 28.19 174.13 97.3 46.0 44.4 16.7
Lands, Housing and Physical Planning
118.04 621.86 43.42 573.72 28.11 43.80 64.7 7.6 23.8 7.0
Environment, Disaster Man-agement and Forestry
153.91 26.15 44.52 5.83 19.91 8.13 44.7 139.4 12.931.1
Finance and Economic Planning
582.50 189.00 237.97 1.93 293.80 - 123.5 - 50.4 -
Public Service Management 668.55 176.20 247.27 50.01 179.97 16.84 72.8 33.7 26.9 9.6

198
COUNTY GOVERNMENTS BUDGET IMPLEMENTATION REVIEW REPORT FOR THE FIRST HALF OF FY2018/19
Department
Annual Budget Allo-cation in FY 2018/19
(Kshs. Million)
Exchequer Issues in First Half of FY 2018/19 (Kshs. Mil-lion)
Expenditure in First Half of FY 2018/19 (Kshs.
Million)
Expenditure to Exchequer
Issues (%)
Absorption Rate (%)
Rec Dev Rec Dev Rec Dev Rec Dev Rec Dev
County Executive 536.24 8.70 95.30 0.53 99.15 - 104.0 - 18.5 -
County Assembly 787.25 100.00 290.00 - 306.92 - 105.8 39.0 -
Water and Energy 98.32 303.16 37.04 63.36 22.35 150.34 60.3 237.3 22.7 49.6
TOTAL 5,294.40 3,245.59 2,102.92 1,207.95 2,095.76 432.19 99.7 35.8 39.6 13.3
Source: Migori County Treasury
Analysis of expenditure by department shows the Department of Water and Energy recorded the highest absorption rate of development budget at 49.6 per cent. The Department of Education, Youth Development, Sports, Culture and Social Services had the highest percentage of recurrent expenditure to recurrent budget at 62.6 per cent while the Department of Environment, Disaster Management and Forestry had the lowest at 12.9 per cent.
3.27.9 Key Observations and RecommendationsThe County has made progress in addressing some of the challenges previously identified as affecting budget implementation. Some of the progress made included:
i. Improvement in own source revenue collection by 150.4 per cent from Kshs.53.30 million collected in the first half of FY 2017/18 to Kshs.133.48 million collected in the period under review.
ii. Timely submission of financial reports by the County Treasury to the Controller of Budget.
Despite the above progress, the following challenges continued to hamper effective budget implementation;
1. High wage bill at Kshs.1.35 billion, which increased by 23.8 per cent compared to a similar period of the last financial year and accounted for 53.6 per cent of the total expenditure for the first half of FY2018/19.
2. High expenditure on domestic travel which increased by 54 per cent from Kshs.157.67 million in the first six months of FY 2017/18 to Kshs.242.80 million in the reporting period.
The County should implement the following recommendations in order to improve budget execution;
1. The County Public Service Board should ensure an optimal staffing structure in order to manage the wage bill.
2. The County Treasury should ensure that expenditure on non- essential budget items is rationalised to provide more resources for development projects.
3.28 Mombasa County
3.28.1 Overview of the FY 2018/19 BudgetThe Approved Budget for FY 2018/19 was Kshs.13.59 billion, comprising of Kshs.8.63 billion (63.5per cent) and Kshs.4.97 billion (36.5 per cent) allocation for recurrent and development expenditure respectively.
To finance the budget, the County expects to receive Kshs.8.23 billion (60.5 per cent) as equitable share of revenue raised nationally, Kshs.1.48 billion (10.9 per cent) as total conditional grants, generate Kshs.3.87 billion (28.5 per cent) from own revenue sources.

199
COUNTY GOVERNMENTS BUDGET IMPLEMENTATION REVIEW REPORT FOR THE FIRST HALF OF FY2018/19
Figure 3.108: Mombasa County, Expected Sources of Budget Financing in FY 2018/19
Source: Mombasa County Treasury
The conditional grants contained in the CARA, 2018 consist of; Kshs.50 million (3.4 per cent) for Transforming Health Systems for Universal Care Project, Kshs.103.14 million (6.9 per cent) from IDA (World Bank) credit for Kenya Devolution Support Programme “Level 1 grant”, Kshs.35.6 million (2.4 per cent) grant from DANIDA for Universal Healthcare to Devolved System Programme, Kshs.600 million (40.3 per cent) from IDA (World Bank) credit for the Kenya Devolution Support Programme “Level 2 grant”, Kshs.388.44 million (26.1 per cent) to Level-5 Hospital, Kshs.23.38 million (1.6 per cent) Compensation for User Fees Foregone, ,Kshs.216.60 million (14.6 per cent) from Road Maintenance Fuel Levy, and Kshs.39.89 million (2.7 per cent) for Rehabilitation of Village Polytechnics, Kshs.30.69 million ( 2.0 per cent) for National Agricultural and Rural Inclusive Growth Project ( NARIGP).
The County also budgeted to receive Kshs.103.14 million as grant for Kenya Devolution Support Project “level 1 grant”, and Kshs.35.59 million as DANIDA grant.
3.28.2 Revenue AnalysisDuring the first half of FY 2018/19, the County received Kshs.4.60 billion as equitable share of revenue raised nationally, Kshs.140.64 million as total conditional grants, raised Kshs.1 billion from own source revenue. The total available funds amounted to Kshs.5.75 billion. Figure3.109 shows the half yearly trend in own source revenue collection from the first half FY 2013/14 to the first half of FY 2018/19.

200
COUNTY GOVERNMENTS BUDGET IMPLEMENTATION REVIEW REPORT FOR THE FIRST HALF OF FY2018/19
Figure 3.109: Mombasa County, Trend in Own Source Revenue Collection for the First Half from FY 2013/14 to FY 2018/19
Source: Mombasa County Treasury
During the first half of FY 2018/19, the County generated a total of Kshs.1.00 billion as own-source revenue. This amount was an increase of 73.8 per cent up from Kshs.578.23 million realised during the same period of the FY 2017/18 and represented 25.9 per cent of the annual target.
3.28.3 Conditional GrantsThe County received Kshs.140.64 million as conditional grants as shown in Table 3.79.
Table 3.79: Mombasa County, Conditional Grants/Loans Received in the First Half of FY 2018/19
S/No. Grants/LoansAnnual Allocation, per CARA, 2018
(Kshs)
Annual Budget Allocation for FY
2018/19 (Kshs)
Actual Re-ceipts in First
Half of FY 2018/19 (Kshs)
Actual Receipts as Percentage of Annual Alloca-
tion (%)
A Grants/Loans contained in CARA, 2018
1 Level- 5 Hospitals 388,439,306 388,439,306 134,372,619 34.6
2 Compensation for User Fee Foregone 23,385,934 - - -
3 Leasing of Medical Equipment 200,000,000 - -
4 Road Maintenance Fuel Levy Fund 216,604,497 216,604,479 - -
5 Rehabilitation of Village Polytechnics 65,710,000 - - -
6World Bank-Transforming Health Systems for Uni-versal Care Project
107,425,868 50,000,000 769,901 1.5
7IDA (World Bank) Kenya Devolution Support Pro-gramme “Level 1 grant”
600,000,000 600,000,000 - --
8 IDA (World Bank) -Kenya Urban Support Project 53,000,000 35,591,582 -
9Kenya Devolution Support Programme “Level 2 grant”
27,337,500 - - -

201
COUNTY GOVERNMENTS BUDGET IMPLEMENTATION REVIEW REPORT FOR THE FIRST HALF OF FY2018/19
S/No. Grants/LoansAnnual Allocation, per CARA, 2018
(Kshs)
Annual Budget Allocation for FY
2018/19 (Kshs)
Actual Re-ceipts in First
Half of FY 2018/19 (Kshs)
Actual Receipts as Percentage of Annual Alloca-
tion (%)
A Grants/Loans contained in CARA, 2018
10Agricultural Sector Development Support Pro-gramme II
50,000,000 - 5,500,000 -
Total 1,706,088,105 1,487,756,493 140,642,520 9.5
Source: Mombasa County Treasury
Analysis of revenue from conditional grants in the period under review indicates that, the County received Kshs.134.37 million for Mombasa Level 5 Hospital, Kshs.769,901 from the World Bank-Transforming Health Systems for Universal Care Project, and Kshs.5.5 million for Agriculture ASDP II.
3.28.4 Exchequer IssuesTo finance the budget, the Controller of Budget approved the withdrawal of Kshs.4.60 billion from the CRF account. The withdrawals represented 33.9 per cent of the Approved Budget and translated to an increase of 40.7 per cent from Kshs.3.27 billion approved in the first half of FY 2017/18. This comprised of Kshs.3.81 billion (82.8 per cent) to fund recurrent expenditure and Kshs.794.87 million (17.2 per cent) for development activities.
3.28.5 Overall Expenditure ReviewThe County government spent a total of Kshs.4.65 billion on recurrent and development activities. The total expenditure represented 101.1 per cent of the total funds released from the CRF account and was an increase of 35.9 per cent from Kshs.3.42 billion spent in the first half of FY 2017/18. The expenditure excluded outstanding commitments as at December 31st 2018 which amounted to Kshs.671.90 million for development activities and Kshs.1.23 billion for recurrent expenditure.
Expenditure on recurrent activities amounted to Kshs.3.95 billion while Kshs.708.37 million was spent on development activities. The recurrent expenditure was 103.7 per cent of the funds released for recurrent activities, while development expenditure was 89.1 per cent of funds released for development activities.
The recurrent expenditure represented 46.9 per cent of the annual recurrent budget, an increase from 30.6 per cent recorded in the first half of FY 2017/18. Development expenditure recorded an absorption rate of 14.3 per cent, which was a decrease from 20.2 per cent attained in the first half of FY 2017/18. Figure 3.110 presents a comparison between the total expenditure in the first half of FY 2018/19 and the first half of the FY 2017/18.

202
COUNTY GOVERNMENTS BUDGET IMPLEMENTATION REVIEW REPORT FOR THE FIRST HALF OF FY2018/19
Figure3.110: MombasaCounty,ExpenditurebyEconomicClassification
Source: Mombasa County Treasury
3.28.6 Analysis of Recurrent ExpenditureThe total recurrent expenditure of Kshs.3.95 billion comprised of Kshs.2.37 billion (60.2 per cent) incurred on personnel emoluments and Kshs.1.57 billion (39.8 per cent) on operations and maintenance as shown in Figure 3.110.
Expenditure on personnel emoluments represented an increase of 31.1 per cent compared to the first half of FY 2017/18 when the County spent Kshs.1.81 billion, and was 51 per cent of total expenditure in the first half of FY 2018/19. Figure 3.111 shows a summary of operations and maintenance expenditure by major categories.
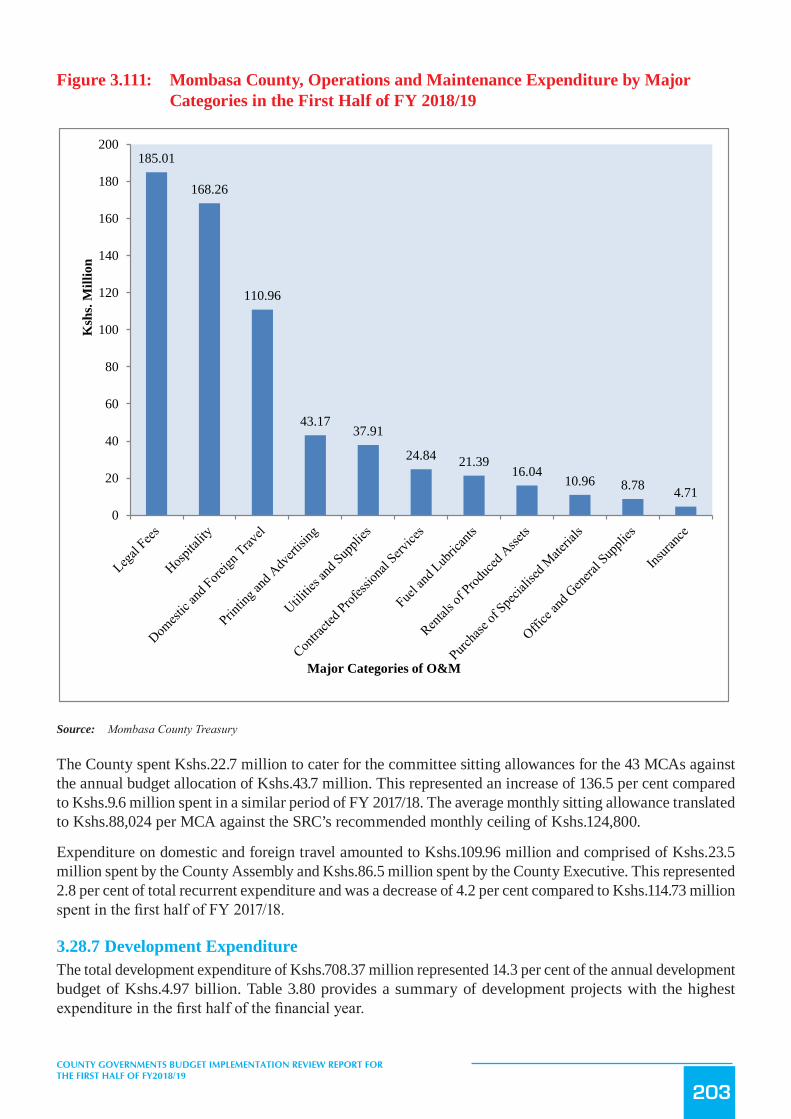
203
COUNTY GOVERNMENTS BUDGET IMPLEMENTATION REVIEW REPORT FOR THE FIRST HALF OF FY2018/19
Figure 3.111: Mombasa County, Operations and Maintenance Expenditure by Major Categories in the First Half of FY 2018/19
Figure 1: Mombasa County, Operations and Maintenance Expenditure by Major Categories in the First Half of FY 2018/19
Source: Mombasa County Treasury Figure 2:Murang’a County, Expenditure by Economic Classification
185.01
168.26
110.96
43.1737.91
24.84 21.3916.04
10.96 8.78 4.71
0
20
40
60
80
100
120
140
160
180
200
Ksh
s. M
illio
n
Major Categories of O&M
Source: Mombasa County Treasury
The County spent Kshs.22.7 million to cater for the committee sitting allowances for the 43 MCAs against the annual budget allocation of Kshs.43.7 million. This represented an increase of 136.5 per cent compared to Kshs.9.6 million spent in a similar period of FY 2017/18. The average monthly sitting allowance translated to Kshs.88,024 per MCA against the SRC’s recommended monthly ceiling of Kshs.124,800.
Expenditure on domestic and foreign travel amounted to Kshs.109.96 million and comprised of Kshs.23.5 million spent by the County Assembly and Kshs.86.5 million spent by the County Executive. This represented 2.8 per cent of total recurrent expenditure and was a decrease of 4.2 per cent compared to Kshs.114.73 million spent in the first half of FY 2017/18.
3.28.7 Development ExpenditureThe total development expenditure of Kshs.708.37 million represented 14.3 per cent of the annual development budget of Kshs.4.97 billion. Table 3.80 provides a summary of development projects with the highest expenditure in the first half of the financial year.

204
COUNTY GOVERNMENTS BUDGET IMPLEMENTATION REVIEW REPORT FOR THE FIRST HALF OF FY2018/19
Table 3.80: Mombasa County, List of Development Projects with the Highest Expenditure in the FY 2018/19
S/No. Project Name Project LocationProject Budget
(Kshs.)
Project Expendi-ture in First Half of FY 2018/19 (Kshs.)
Absorption rate (%)
1 Routine maintenance of Mikindani Estate Road Jomvu 41,156,696 32,616,392 79.22 Routine maintenance of Miritini Estate Road Jomvu 19,708,622 15,756,654 79.93 Routine maintenance of Mji Mpya and Kambi Road Nyali 24,880,004 15,018,970 60.4
4 Improvement to gravel standards of Paster lai Wa-ter-Vescon Estate Road
Kisauni 15,027,169 12,183,644 81.1
5 Maintenance of Ziwani & Mji Mpya Road Nyali 13,542,956 7,309,612 54.06 Routine maintenance of Migadini Estate Road Changamwe 14,863,596 7,212,478 48.5
7Improvement of Karama-Kwamhindi-Makongeni Road
Nyali 14,032,224 6,481,109 46.2
8Improvement to gravel standards of Kiembeni Police to Kiembeni Upperhill Road
Kisauni 13,023,640 6,423,600 49.3
9Improvement of Jamvi la Wageni Road to cabro stan-dard
Mvita 15,074,252 4,987,188 33.1
10Drain cleaning works along Lunga Lunga Mtongwe Road
Likoni 3,778,362 3,778,362 100.0
Source: Mombasa County Treasury
3.28.8 Budget Performance by County DepartmentTable 3.81 shows a summary of budget estimates and budget performance by department in the first half of FY 2018/19.
Table 3.81: Mombasa County, Budget Performance by Department
Department
Annual Budget Alloca-tion in FY 2018/19 (Kshs.
Million)
Exchequer Issues in First Half of FY 2018/19 (Kshs. Million)
Expenditure in First Half of FY 2018/19
(Kshs. Million)
Expenditure to Exchequer
Issues (%)
Absorption Rate (%)
Rec Dev Rec Dev Rec Dev Rec Dev Rec DevCounty Executive 382.87 88.42 213.12 - 168.98 2.98 79.3 - 44.1 3.4County Assembly 632.74 45.77 247.22 - 78.22 - 31.6 - 12.4 -Public Service Board 132.39 21.63 47.19 - 33.30 - 70.6 - 25.2 -Finance and Economic Planning
1,107.52 302.44 454.09 176.99 809.49 167.77 178.3 94.8 73.1 55.5
Energy, Environment and Waste Management
509.80 410.37 230.29 - 218.19 45.29 94.7 - 42.8 11.0
Education 578.51 244.49 133.29 2.25 133.29 2.02 100.0 89.8 23.0 0.8
Health 2,454.38 240.25 1,580.56 134.37 1,553.88 - 98.3 63.3 -Water and Sanitation 137.28 767.05 15.32 - 14.01 - 91.4 - 10.2 -Youth, Gender and Sports
230.29 1,269.84 89.21 1.41 83.97 1.48 94.1 105 36.5 0.1
Trade and Cooperative Development
405.46 95.63 153.77 - 149.65 - 97.3 - 36.9 -
Lands, Housing and Physical Planning
226.40 221.20 90.73 - 76.81 20.66 84.7 - 33.9 9.3
Transport and Infra-structure Development
468.59 837.85 100.40 479.85 94.73 418.86 94.4 87.3 20.2 50.0

205
COUNTY GOVERNMENTS BUDGET IMPLEMENTATION REVIEW REPORT FOR THE FIRST HALF OF FY2018/19
Department
Annual Budget Alloca-tion in FY 2018/19 (Kshs.
Million)
Exchequer Issues in First Half of FY 2018/19 (Kshs. Million)
Expenditure in First Half of FY 2018/19
(Kshs. Million)
Expenditure to Exchequer
Issues (%)
Absorption Rate (%)
Rec Dev Rec Dev Rec Dev Rec Dev Rec DevAgriculture and Fisher-ies Development
236.38 266.59 77.07 - 90.86 44.11 117.9 - 38.4 16.5
Devolution 919.79 158.06 372.92 - 441.69 5.20 118.4 - 48.0 3.3
Total 8,422.40 4,969.59 3,805.18 794.87 3,947.07 708.37 103.7 89.1 46.9 14.3
Source: Mombasa County Treasury
Analysis of expenditure by department shows the Department of Finance and Economic Planning recorded the highest absorption rate of development budget at 55.5 per cent followed by the Department of Transport and Infrastructure Development at 50 per cent. The Department of Finance and Economic Planning had the highest percentage of recurrent expenditure to recurrent budget at 73.1 per cent while the Department of Water and Sanitation had the lowest at 10.2 per cent.
3.28.9 Key Observations and RecommendationsThe County has made progress in addressing some of the challenges previously identified as affecting budget implementation. Some of the progress made included:
i. Timely submission of financial reports to the Office of the Controller of Budget by the County Treasury in line with Section 166 of the PFM Act, 2012.
ii. Reduction in travel expenditure by 4.2 per cent from Kshs.114.73 million in the first half of FY 2017/18 to Kshs.109.96 million in the reporting period.
Despite the above progress, the following challenges continued to hamper effective budget implementation;
1. High wage bill that has increased by 31 per cent from Kshs.1.81 million in the first half of FY 2017/18 to Kshs.2.37 billion in the period under review.
2. Under-performance in own-source revenue collection which stood at 25.9 of the total annual budget projection.
The County should implement the following recommendations in order to improve budget execution;
1. The County Public Service Board should develop an optimal staffing structure and devise strategies to address the escalating wage bill.
2. The CECM-F should develop and implement strategies to mobilise own-source revenue.
3.29 Murang’a County
3.29.1 Overview of the FY 2018/19 BudgetThe County’s Approved Budget for FY 2018/19 is Kshs.8.81 billion, comprising of Kshs.4.93 billion (55.9 per cent) and Kshs.3.88 billion (44.1 per cent) allocation for recurrent and development expenditure respectively.
To finance the budget, the County expects to receive Kshs.6.25 billion (70.9 per cent) as equitable share of revenue raised nationally, Kshs.572.24 million (6.5 per cent) as total conditional grants, generate Kshs.1.0 billion (11.3 per cent) from own source of revenue, Kshs750 million (8.5per cent) cash balance from FY 2017/18, and Kshs.239.94 million as other revenues expected during the year.

206
COUNTY GOVERNMENTS BUDGET IMPLEMENTATION REVIEW REPORT FOR THE FIRST HALF OF FY2018/19
Figure 3.112: County Expected Sources of Budget Financing in FY 2018/19
Source: Murang’a County Treasury
The conditional grants contained in the CARA, 2018 consist of; Kshs.50 million (6 per cent) for Transforming Health Systems for Universal Care Project, Kshs.140.44 million (16.9 per cent) from IDA (World Bank) credit for National Agricultural and Rural Inclusive Growth Project, Kshs.48.24 million (5.8 per cent) from IDA (World Bank) credit for Kenya Devolution Support Programme “Level 1 grant”, Kshs.62.44 million (7.5per cent) from IDA (World Bank ) credit for Kenya Urban Support Project, Kshs.20.76 million (2.5 per cent) as grant from DANIDA for Universal Healthcare to Devolved System Programme, Kshs.20.14 million (2.4 per cent) as Compensation for User Fees Foregone,Kshs.164.52 million (19.8 per cent) from Road Maintenance Fuel Levy, and Kshs.65.71 million (11.5 per cent) for Rehabilitation of Village Polytechnics, and Kshs.41.20 million (4.9 per cent) for IDA (World Bank) as credit for Kenya Urban Support Project-Urban institution grant plus balance carried forward in FY 2017/8.
The County also budgeted to receive Kshs.40 million as Urban Institution Grant Programme, Kshs.41.21 million for Ad Valorem Levy, Kshs.19.05 million (2.3 per cent) for Agricultural Sector Development Support Programme (ASDSP).
3.29.2 Revenue AnalysisDuring the first half of FY 2018/19, the County received Kshs.2.56 billion as equitable share of revenue raised nationally, Kshs.76.25 million as total conditional grants, raised Kshs.249.28 million from own source revenue, and had a cash balance of Kshs.1.03 billion from FY 2017/18. The total available funds amounted to Kshs.3.91 billion.

207
COUNTY GOVERNMENTS BUDGET IMPLEMENTATION REVIEW REPORT FOR THE FIRST HALF OF FY2018/19
Figure 3.113 shows the half yearly trend in own source revenue collection from the first half FY 2013/14 to the first half of FY 2018/19.
Figure 3.113: Murang’a County, Trend in Own Source Revenue Collection for the First Half from FY 2013/14 to FY 2018/19
Source: Murang’a County Treasury
During the first half of FY 2018/19, the County generated a total of Kshs.249.28 million as own-source revenue. This amount represented an increase of 135.4 per cent compared to Kshs.105.91 million realised during the same period of the FY 2017/18 and was 24.9 per cent of the annual target.
3.29.3 Conditional GrantsThe County received Kshs.76.25 million as conditional grants as shown in Table 3.82.
Table 3.82: Murang’a County, Conditional Grants/Loans Received in the First Half of FY 2018/19
S/No. Grants/LoansAnnual Allocation, per
CARA, 2018 (Kshs)
Annual Budget Allocation for FY
2018/19 (Kshs)
Actual Receipts in
First Half of FY 2018/19
(Kshs)
Actual Receipts as Percentage of
Annual Allocation (%)
A Grants/Loans contained in CARA, 2018
1 Compensation for User Fee Foregone 20,138,691 20,138,691 - -
2 Leasing of Medical Equipment 200,000,000 - - -
3 Road Maintenance Fuel Levy Fund 164,520,196 164,520,196 - -
4 Rehabilitation of Village Polytechnics 65,710,000 65,710,000 - -
5World Bank-Transforming Health Systems for Universal Care Project
50,000,000 50,000,000 3,431,424 6.9
6IDA (World Bank) -National Agricultural and Rural Inclusive Growth Project
140,435,163 140,435,163 - -

208
COUNTY GOVERNMENTS BUDGET IMPLEMENTATION REVIEW REPORT FOR THE FIRST HALF OF FY2018/19
S/No. Grants/LoansAnnual Allocation, per
CARA, 2018 (Kshs)
Annual Budget Allocation for FY
2018/19 (Kshs)
Actual Receipts in
First Half of FY 2018/19
(Kshs)
Actual Receipts as Percentage of
Annual Allocation (%)
A Grants/Loans contained in CARA, 2018
7IDA (World Bank) Kenya Devolution Sup-port Programme “Level 1 grant”
48,244,593 48,244,593 - -
8IDA (World Bank) -Kenya Urban Support Project
62,437,600 62,437,600 62,437,600 100
9DANIDA - Universal Healthcare to De-volved System Programme
20,756,250 20,756,250 10,378,125 50
10EU- Instruments for Devolution Advice and Support- IDEAS)
48,244,593 48,244,593 - -
11Agricultural Sector development support programme (ASDSP)
19,046,832 - - -
12IDA (World Bank) as credit for Kenya Ur-ban Support Project-Urban institution grant plus balance carried forward in FY 2017/8
41,200,000 - - -
Total 832,489,325 572,242,493 76,247,149 13.3
Source: Murang’a County Treasury
Analysis of the revenue from conditional grants indicates that, the County received the highest percentage of receipts to annual allocation from the Kenya Urban Support project and the DANIDA grant. The receipts accounted for 100 per cent and 50 per cent of annual allocation respectively.
3.29.4 Exchequer IssuesTo finance the budget, the Controller of Budget approved the withdrawal of Kshs.3.65 billion from the CRF account. The withdrawals represented 41.4 per cent of the Approved Budget and translated to an increase of 42.1 per cent from Kshs.2.57 billion approved in the first half of FY 2017/18. This comprised of Kshs.2.41 billion (65.9 per cent) to fund recurrent expenditure and Kshs.1.25 billion (34.1 per cent) for development activities.
3.29.5 Overall Expenditure ReviewThe County government spent a total of Kshs.2.96 billion on recurrent and development activities. The total expenditure represented 81.2 per cent of the total funds released from the CRF account and was an increase of 5.7 per cent from Kshs.2.80 billion spent in the first half of FY 2017/18. The expenditure excluded outstanding commitments as at December 31st 2018 which amounted to Kshs.114.06 million for development activities and Kshs.35.16 million for recurrent expenditure.
Expenditure on recurrent activities amounted to Kshs.2.09 billion while Kshs.873.99 million was spent on development activities. The recurrent expenditure was 86.9 per cent of the funds released for recurrent activities, while development expenditure was 70.2 per cent of funds released for development activities.
The recurrent expenditure represented 42.4 per cent of the annual recurrent budget, an increase from 38.9 per cent recorded in the first half of FY 2017/18. Development expenditure recorded an absorption rate of 22.5 per cent, which was an increase from 21.9 per cent attained in the first half of FY 2017/18 Figure 3.114 presents a comparison between the total expenditure in the first half of FY 2018/19 and the first half of the FY 2017/18.

209
COUNTY GOVERNMENTS BUDGET IMPLEMENTATION REVIEW REPORT FOR THE FIRST HALF OF FY2018/19
Figure3.114: Murang’aCounty,ExpenditurebyEconomicClassification
Source: Murang’a County Treasury
Figure 3: Tana River County, Operations and Maintenance Expenditure by Major
Categories in the First Half of FY 2018/19
1633.14(58.2%)
461.82(16.5%)
709.45(25.3%)
1675.72(56.5%)
414.56(14%)
873.99(29.5%)
-
200
400
600
800
1,000
1,200
1,400
1,600
1,800
Personnel Emoluments Operations andMaintenance
Development Expenditure
Ksh
s.Mill
ion
Expenditure by Economic Classification
First Half FY 2017/18
First Half FY 2018/19
Key
Source: Murang’a County Treasury
3.29.6 Analysis of Recurrent ExpenditureThe total recurrent expenditure of Kshs.2.09 billion comprised of Kshs.1.68 billion (80.4 per cent) incurred on personnel emoluments and Kshs.414.56 million (19.6 per cent) on operations and maintenance as shown in Figure 3.114.
Expenditure on personnel emoluments represented an increase of 2.6 per cent compared to the first half of FY 2017/18 when the County spent Kshs.1.63 billion, and was 56.5 per cent of total expenditure in the first half of FY 2018/19.
Figure 3.115 shows a summary of operations and maintenance expenditure by major categories.

210
COUNTY GOVERNMENTS BUDGET IMPLEMENTATION REVIEW REPORT FOR THE FIRST HALF OF FY2018/19
Figure 3.115: Murang’a County, Operations and Maintenance Expenditure by Major Categories in the First Half of FY 2018/19
Source: Murang’a County Treasury
The County spent Kshs.25.95 million to cater for the committee sitting allowances for the 50 MCAs against the annual budget allocation of Kshs.66.96 million. This represented an increase of 1141.6 per cent compared to Kshs.2.09 million spent in a similar period of FY 2017/18. The average monthly sitting allowance translated to Kshs.86,510 per MCA against the SRC’s recommended monthly ceiling of Kshs.124,800.
Expenditure on domestic travel amounted to Kshs.129.70 million and comprised of Kshs.73.77 million spent by the County Assembly and Kshs.55.94 million spent by the County Executive. This represented 6.2 per cent of total recurrent expenditure.
3.29.7 Development ExpenditureThe total development expenditure of Kshs.873.99 million represented 22.5 per cent of the annual development budget of Kshs.3.88 billion. Table 3.83 provides a summary of development projects with the highest expenditure in the first half of the financial year.

211
COUNTY GOVERNMENTS BUDGET IMPLEMENTATION REVIEW REPORT FOR THE FIRST HALF OF FY2018/19
Table 3.83: Murang’a County, List of Development Projects with the Highest Expenditure in the FY 2018/19
S/No. Project Name Project LocationProject Budget
(Kshs.)
Project Expenditure in First Half of FY 2018/19
(Kshs.)1 Maintenance of Roads 227,761,534 199,958,161 87.8
2 Infrastructural & Civil Works 295,769,228 179,793,743 60.83 Specialised Material 37,500,000 29,287,192 78.14 Purchase of Certified Crop Seeds 106,250,000 18,110,500 175 Refurbishment of Non Residential Building 25,000,000 16,579,755 66.36 Cooperative Societies 50,000,000 13,934,064 27.9
7 Youth Programme 15,000,000 10,273,955 68.5
8 Energy development programme-Electricity 10,000,000 9,406,563 94.19 Breeding Stock 72,500,000 8,772,120 12.1
Source: Murang’a County Treasuryy
3.29.8 Budget Performance by County DepartmentTable 3.84 shows a summary of budget estimates and budget performance by department in the first half of FY 2018/19.
Table 3.84: Murang’a County, Budget Performance by Department
Department
Annual Budget Allo-cation in FY 2018/19
(Kshs. Million)
Exchequer Issues in First Half of FY 2018/19 (Kshs. Mil-lion)
Expenditure in First Half of FY 2018/19
(Kshs. Million)
Expenditure to Exchequer
Issues (%)
Absorption Rate (%)
Rec Dev Rec Dev Rec Dev Rec Dev Rec Dev
County Assembly 686.38 207.65 255.00 12.00 255.00 12.00 100.0 100 37.2 5.8Governorship, County Coordination and Administration
236.08 - 11.86 - 106.55 898.1 45.1
Finance, Information Technology 198.54 49.16 82.17 6.62 76.80 6.62 93.5 100 38.7 13.5Agriculture, Livestock and Fisheries
206.09 699.09 88.83 175.53 88.83 61.41 100 35 43.1 8.8
Energy, Transport and Infrastructure 98.24 1,138.27 45.00 358.35 40.37 358.35 89.7 100 41.1 31.5
Commerce, Trade, Industry and Tourism 24.05 187.91 7.06 35.49 7.06 33.42 100.0 94.2 29.4 17.8
Health and Sanitation 2,104.28 838.58 1,086.22 433.84 1,020.65 334.6 94 77.1 48.5 39.9Lands, Housing and Physical Planning 20.26 139.44 10.90 62.44 3.69 33.8 - 18.2 0.0
Public Service Administration 914.09 - 446.40 - 298.02 66.8 32.6 -
Education and Technical Training 291.75 477.78 197.50 123.74 141.83 29.98 71.8 24.2 48.6 6.3

212
COUNTY GOVERNMENTS BUDGET IMPLEMENTATION REVIEW REPORT FOR THE FIRST HALF OF FY2018/19
Department
Annual Budget Allo-cation in FY 2018/19
(Kshs. Million)
Exchequer Issues in First Half of FY 2018/19 (Kshs. Mil-lion)
Expenditure in First Half of FY 2018/19
(Kshs. Million)
Expenditure to Exchequer
Issues (%)
Absorption Rate (%)
Rec Dev Rec Dev Rec Dev Rec Dev Rec Dev
Youth, Culture, Gender, Social Services & Cooperatives
102.34 110.35 53.47 35.93 32.71 35.93 61.2 100 32.0 32.6
Environment & Nat. Resources 17.50 35.00 7.61 1.65 5.67 1.65 74.5 100 32.4 4.7
Public Service Board 27.95 - 7.25 - 13.11 - 180.8 46.9 -
Total 4,927.54 3,883.24 2,299.27 1,245.60 2,090.28 874 90.9 70.2 42.4 22.5
Source: Murang’a County Treasury
Analysis of expenditure by department shows the Department of Health and Sanitation recorded the highest absorption rate of development budget at 39.9 per cent while The Department of Lands, Housing and Physical Planning did not incur any development expenditure. The Department of Education and Technical Training had the highest percentage of recurrent expenditure to recurrent budget at 48.6 per cent while the Department of Lands, Housing and Physical Planning had the lowest at 18.2 per cent.
3.29.9 Key Observations and RecommendationsThe County has made progress in addressing some of the challenges previously identified as affecting budget implementation. Some of the progress made included:
i. Improvement in human capacity through continuous training.ii. Improved absorption of development budget by 23.2 per cent from Kshs.709.45 million incurred in a
similar period of FY 2017/18 to Ksh.873.99 million.
Despite the above progress, the following challenges continued to hamper effective budget implementation;
1. A high wage bill, which accounted for 56.5 per cent of the total expenditure during the reporting period thus constraining funding of other programmes.
2. Delay in disbursement of the equitable share of revenue raised by the National Treasury.3. Under performance in own revenue collection which was at 24.9 per cent of the annual target.4. Late Submission of financial reports by the County Treasury, which affected timely preparation of
budget implementation review reports.
The County should implement the following recommendations in order to improve budget execution;
1. The County Public Service Board should establish an optimal staffing structure in order to manage the wage bill.
2. The County Treasury should liaise with the National Treasury to ensure that funds allocated to the County are released in a timely manner in line with CARA, 2018.
3. The County should develop and implement strategies to enhance own revenue collection.4. The County Treasury should ensure timely preparation and submission of financial reports in line
with Section 166 of PFM Act, 2012.

213
COUNTY GOVERNMENTS BUDGET IMPLEMENTATION REVIEW REPORT FOR THE FIRST HALF OF FY2018/19
3.30 Nairobi City County
3.30.1 Overview of the FY 2018/19 BudgetThe County’s Approved Budget for FY 2018/19 is Kshs.32.31 billion, comprising of Kshs.21.47 billion (66.5 per cent) and Kshs.10.84 billion (33.5 per cent) allocation for recurrent and development expenditure respectively.
To finance the budget, the County expects to receive Kshs.15.80 billion (48 per cent) as equitable share of revenue raised nationally, Kshs.719.33 million (2.2 per cent) as total conditional grants, generate Kshs.15.21 billion (46.2 per cent) from own-source revenue, Kshs.287.84 million from liquor license fees, and Kshs.300 million cash balance from FY 2017/18.
Figure 3.116: Nairobi City County Sources of Budget Financing in FY 2018/19
Source: Nairobi City County Treasury
The conditional grants contained in the CARA, 2018 consist of; Kshs.79.42 million (8.4 per cent) as Compensation for User Fees Foregone, Kshs.415.85 million (44 per cent) as Road Maintenance Fuel Levy Fund, Kshs.34.57 million (3.7 per cent) for Rehabilitation of Village Polytechnics, Kshs.54.43 million (5.8 per cent) for Transforming Health Systems for Universal Care Project (WB), Kshs.83.42 million (8.8 per cent) grant for Kenya Devolution Support Project (KDSP) “Level 1 grant”, and Kshs.51.64 million (5.5 per cent) grant from DANIDA, and Kshs.200 million for Leasing of Medical Equipment.
3.30.2 Revenue AnalysisDuring the first half of FY 2018/19, the County received Kshs.4.90 billion as equitable share of revenue raised nationally, Kshs.25.82 million as total conditional grants, raised Kshs.3.88 billion from own-source revenue, and received Kshs.105.42 million from other sources. The total funds available for the period amounted to Kshs.8.90 billion.
Figure 3.117 shows the half yearly trend in own-source revenue collection from FY 2013/14 to FY 2018/19.

214
COUNTY GOVERNMENTS BUDGET IMPLEMENTATION REVIEW REPORT FOR THE FIRST HALF OF FY2018/19
Figure 3.117: Nairobi City County: Trend in Own-Source Revenue Collection for the First Half of FY 2013/14 to the First Half of FY 2018/19
Source: Nairobi City County Treasury
During the first half of FY 2018/19, The County generated a total of Kshs.3.88 billion from own-source revenue sources. This amount was an increase of 19.9 per cent when compared to Kshs.3.11 billion realised during the same period of FY 2017/18 and represented 25.5 per cent of the annual target.
3.30.3 Conditional GrantsThe County received Kshs.25.82 million as conditional grants as shown in Table 3.85.
Table 3.85: Nairobi City County, Conditional Grants/Loans Received in the First Half of FY 2018/19
S /No.
Grant/LoansAnnual Allocation per CARA, 2018
(Kshs)
Annual Budget Allocation for FY
2018/19 (Kshs)
Actual Receipts in First Half
of FY 2018/19 (Kshs)
Actual Receipts as Percentage of Annual Alloca-
tion (%)
Grants/Loans contained in CARA, 2018
1 Compensation for User Fee Foregone 79,423,251 79,423,251 - -
2 Leasing of Medial Equipment 200,000,000 - - -
3 Road Maintenance Fuel Levy 415,847,530 415,847,530 - -
4 Rehabilitation of Village Polytechnics 34,570,000 34,570,000 - -
5Transforming Health Systems for Universal Care Proj-ect (WB)
54,429,184 54,429,184 - -
6Kenya Devolution Support Project (KDSP) “Level 1 grant”
83,424,144 83,424,144 - -
7 DANIDA Grant 51,637,500 51,637,500 25,818,750 50.0
8Agricultural Sector Development Support Programme (ASDSP)
25,659,140 - - -
Total 919,331,609 719,331,609 25,818,750 3.6
Source: Nairobi City County Treasury

215
COUNTY GOVERNMENTS BUDGET IMPLEMENTATION REVIEW REPORT FOR THE FIRST HALF OF FY2018/19
Analysis of the revenue from conditional grants indicates that, the County received the highest percentage of receipts to annual allocation from the DANIDA grant. The receipt accounted for 50 per cent and 63.1 per cent of annual allocation.
3.30.4 Exchequer IssuesTo finance implementation of the budget, the Controller of Budget approved withdrawal of Kshs.6.15 billion from the CRF account. The withdrawals represented 18.7 per cent of the Approved Budget and translate to a decrease of 37 per cent from Kshs.9.75 billion approved in the first half of FY 2017/18. This comprised of Kshs.5.71 billion (92.9 per cent) to fund recurrent expenditure and Kshs.437.10 million (7.1 per cent) for development activities.
3.30.5 Overall Expenditure ReviewThe County government spent a total of Kshs.10.68 billion on both recurrent and development activities. This expenditure represented 173.8 per cent of the total funds released from the CRF account and was an increase of 1.9 per cent from Kshs.10.48 billion spent in the first half of FY 2017/18. The expenditure included outstanding commitments as at 31st December, 2018.
Expenditure on recurrent activities amounted to Kshs.9.26 billion while that on development activities was Kshs.1.42 billion. The recurrent expenditure was 162.2 per cent of the funds released for recurrent activities, while development expenditure was 324.9 per cent of funds released for development activities.
The recurrent expenditure represented 43.1 per cent of the annual recurrent budget and was an increase from 29.2 per cent recorded in the first half of FY 2017/18. Development expenditure recorded an absorption rate of 13.1 per cent, which was an increase from 4.3 per cent attained in the first half of FY 2017/18. Figure 3.118 presents a comparison between the total expenditure in the first half of FY 2018/19 and the first half of the FY 2017/18.
Figure3.118: NairobiCityCounty,ExpenditurebyEconomicClassification
Source: Nairobi City County Treasury

216
COUNTY GOVERNMENTS BUDGET IMPLEMENTATION REVIEW REPORT FOR THE FIRST HALF OF FY2018/19
3.30.6 Analysis of Recurrent ExpenditureThe total recurrent expenditure of Kshs.9.26 billion comprised of Kshs.7.01 billion (75.7 per cent) incurred on personnel emoluments and Kshs.2.25 billion (24.3 per cent) for operations and maintenance as shown in Figure 3.118.
Expenditure on personnel emoluments represented an increase of 5.9 per cent compared to the first half of FY 2017/18 when the County spent Kshs.6.63 billion, and was 65.7 per cent of total expenditure for the period. Figure 3.119 shows a summary of operations and maintenance expenditure by major categories.
Figure 3.119: Nairobi City County, Operations and Maintenance Expenditure by Major Categories in the First Half of FY 2018/19
Source: Nairobi City County Treasury
The County spent Kshs.62.45 million on MCAs’ committee sitting allowances for the 128 MCAs against the annual budget allocation of Kshs.66.56 million. This amount represented an increase of 251.3 per cent compared to Kshs.17.46 million spent in a similar period of FY 2017/18. The average monthly sitting allowance translated to Kshs.79,869 per MCA against the SRC’s recommended monthly ceiling of Kshs.124,800.
Expenditure on domestic travel amounted to Kshs.157.35 million and comprised of Kshs.19.02 million spent by the County Assembly and Kshs.138.33 million spent by the County Executive.
3.30.7 Development ExpenditureThe total development expenditure of Kshs.1.42 billion represented 13.1 per cent of the annual development budget of Kshs.10.84 billion. The County did not provide a report on development projects

217
COUNTY GOVERNMENTS BUDGET IMPLEMENTATION REVIEW REPORT FOR THE FIRST HALF OF FY2018/19
3.30.8 Budget Performance by DepartmentTable 3.86 provides a summary of budget estimates and budget performance by department in the first half of FY 2018/19.
Table 3.86: Nairobi City County, Budget Performance by Department
Department
Annual Budget Alloca-tion in FY 2018/19 (Kshs.
Million)
Exchequer Issues in First Half of FY 2018/19 (Kshs. Million)
Expenditure in Q1 of FY 2018/19 (Kshs. Million)
Expenditure to Exchequer
Issues (%)
Absorption Rate (%)
Rec Dev Rec Dev Rec Dev Rec Dev Rec Dev
County Public Ser-vice Board
54.62 5.00 13.13 - 16.61 - 126.5 - 30.4 -
Office of Governor & Deputy Governor
4,462.17 90.00 1,340.71 - 2,279.21 4.66 170.0 - 51.1 5.2
ICT, E-Govt. & Public Communica-tions
239.43 188.00 374.10 - 95.56 9.65 25.5 - 39.9 5.1
Finance & Econom-ic Planning
2,130.56 154.00 566.66 - 1,005.44 - 177.4 - 47.2 -
Health 6,323.58 601.36 1,737.55 - 2,402.89 7.31 138.3 - 38.0 1.2Urban Planning and Lands
369.82 132.50 165.03 - 180.72 0.77 109.5 - 48.9 0.6
Public Works Trans-port & Infrastruc-ture
1,206.18 5,405.00 266.04 421.70 523.64 1,052.07 196.8 249.5 43.4 19.5
Education, Youth Affairs, Sports, Cul-ture & Social Ser-vices
1,647.37 473.00 297.34 15.40 451.43 55.57 151.8 361.0 27.4 11.7
Trade, Commerce, Tourism & Cooper-atives
491.43 318.00 184.11 - 204.02 0.97 110.8 - 41.5 0.3
Public Service Management
1,112.57 70.00 77.94 - 203.14 - 260.6 - 18.3 -
Agriculture, Live-stock Development, Fisheries & Forestry
372.57 149.00 75.83 - 117.30 - 154.7 - 31.5 -
Environment, Wa-ter, Energy & Natu-ral Resources
1,357.05 962.50 247.17 - 1,046.90 13.77 423.6 - 77.1 1.4
Urban Renewal and Housing
89.27 320.60 52.65 - 49.56 - 94.1 - 55.5 0.0
Ward Development Fund
25.66 1,212.50 4.57 - 6.76 273.61 147.8 - 26.3 22.6
Liquor Licensing Board
204.84 83.00 - - 124.92 - - - 61.0 -
Emergency Fund - 80.00 - - - - - - - -
County Assembly 1,386.67 592.00 305.90 - 553.98 1.64 181.1 - 40 0.3
TOTAL 21,473.79 10,836.45 5,708.71 437.10 9,262.08 1,420.02 162.2 324.9 43.1 13.1
Source: Nairobi City County Treasury
Analysis of expenditure by department shows that the Ward Development Fund recorded the highest absorption rate of development budget at 22.6 per cent followed by the Department of Public Works, Transport and

218
COUNTY GOVERNMENTS BUDGET IMPLEMENTATION REVIEW REPORT FOR THE FIRST HALF OF FY2018/19
Infrastructure at 19.5 per cent. The Department of Environment, Water, and Energy & Natural Resources had the highest percentage of recurrent expenditure to recurrent budget at 77.1 per cent while there was no expenditure reported on the Emergency Fund.
3.30.9 Key Observations and RecommendationsThe County has made progress in addressing some of the challenges previously identified as affecting budget implementation. Some of the progress made included:
i. Improvement in own-source revenue collection by 19.9 per cent from Kshs.3.11 billion in a similar period in FY 2017/18 to Kshs.3.87 billion in the reporting period.
Despite the above progress, the following challenges continued to hamper effective budget implementation;
1. Failure by the County Treasury to submit a report on development projects, including the geographical location of projects to the Controller of Budget.
2. The County’s wage bill has remained high, accounting for 65.7 per cent of the total expenditure in the first half of FY 2018/19.
The County should implement the following recommendations in order to improve budget execution;
1. The County Treasury should put in systems to ensure requested financial information is provided in a timely manner to all oversight institutions.
2. The County Public Service Board should establish an optimal staffing structure in order to manage the wage bill.
3.31 Nakuru County
3.31.1 Overview of the FY 2018/19 BudgetThe County’s FY 2018/19 Approved Budget is Kshs18.32 billion, comprising of Kshs.10.32 billion (56.3 per cent) and Kshs.8.0 billion (43.7 per cent) allocation for recurrent and development expenditure respectively.
To finance the budget, the County expects to receive Kshs.9.45 billion (51.6 per cent) as equitable share of revenue raised nationally, Kshs.2.32 billion (12.7 per cent) as total conditional grants, generate Kshs.2.0 billion (10.9 per cent) from local revenue sources, and Kshs.3.86 billion (21.1 per cent) cash balance brought forward from FY 2017/18. The county also planned to collect Kshs.685 million (3.7 per cent) as Facility Improvement Fund.

219
COUNTY GOVERNMENTS BUDGET IMPLEMENTATION REVIEW REPORT FOR THE FIRST HALF OF FY2018/19
Figure 3.120: Nakuru County Sources of Budget Financing in FY 2018/19
Source: Nakuru County Treasury
The conditional grants contained in the CARA, 2018 consist of; Kshs.95.04 million (4.1 per cent) for Transforming Health Systems for Universal Care Project, Kshs.140.44 million (6 per cent) from IDA (World Bank) credit for National Agricultural and Rural Inclusive Growth Project, Kshs.1.08 billion (46.7 per cent) from IDA (World Bank ) credit for Kenya Urban Support Project, Kshs.31.08 million (1.3 per cent) grant from DANIDA for Universal Healthcare to Devolved System Programme, Kshs.60.28 million (2.6 per cent) from IDA (World Bank) credit for the Kenya Devolution Support Programme “Level 2 grant”, Kshs.373.87 million (16.1 per cent) to Level-5 Hospital, Kshs.38.72 million (1.7 per cent) as Compensation for User Fees Foregone, Kshs.200 million (8.6 per cent) for Leasing of Medical Equipment, Kshs.248.85 million (10.7 per cent) from Road Maintenance Fuel Levy, and Kshs.47.8 million (2.1 per cent) for Rehabilitation of Village Polytechnics.
The County did not budget for Kshs.21.9 million from ASDPS and Kshs.41.2 million from World Bank Urban Support Program as contained in the revised CARA, 2018.
3.31.2 Revenue AnalysisDuring the first half of FY 2018/19, the County received Kshs.2.0 billion as equitable share of revenue raised nationally, Kshs.1.17 billion as total conditional grants, raised Kshs.1 billion from own-source revenue, and had a cash balance of Kshs.3.89 billion from FY 2017/18. The total funds available for the period amounted to Kshs.8.01 billion.
Figure 3.121 shows the half yearly trend in own-source revenue collection from FY 2013/14 to FY 2018/19.

220
COUNTY GOVERNMENTS BUDGET IMPLEMENTATION REVIEW REPORT FOR THE FIRST HALF OF FY2018/19
Figure 3.121: Nakuru County, Trend in Own-Source Revenue Collection for the First Half of FY 2013/14 to the First Half of FY 2018/19
Source: Nakuru County Treasury
During the first half of FY 2018/19, the County generated a total of Kshs.1.55 billion as own-source revenue. This amount was an increase of 32.1 per cent when compared to Kshs.757.03 million realised during the same period of FY 2017/18 and represented 37.4 per cent of the annual target.
3.31.3 Conditional GrantsThe County received Kshs.1.17 billion as conditional grants during the reporting period as shown in Table 3.87.
Table 3.87: Nakuru County, Conditional Grants/Loans Received in the First Half of FY 2018/19
S/No GrantsAnnual Allocation per
CARA, 2018 (Kshs)
Annual Budget Allo-cation for FY 2018/19
(Kshs)
Actual receipts in Half Year of FY 2018/19 (Kshs.)
Actual Receipts as Percentage of Annual Alloca-tion (%)
A Grants Contained in the CARA, 2018
1Kenya Urban Support Project (KUSP)
1,084,843,300 1,084,843,300 1,084,843,300 100
2Conditional Grants to Level - 5 Hospitals
373,872,832 373,872,832 - -
3 Road Maintenance Fuel Levy 248,847,131 248,847,131 - -
4 Leasing of Medical Equipment 200,000,000 200,000,000 - -
5National Agricultural and Rural Inclusive Growth Project (NA-RIGP)
140,435,163 140,435,163 - -
6Transforming Health Systems for Universal Care Project (WB)
95,036,352 95,036,351 27,755,760 29.2
7Kenya Devolution Support Proj-ect (KDSP) “Level 2 grant”
60,282,958 60,282,958 - -

221
COUNTY GOVERNMENTS BUDGET IMPLEMENTATION REVIEW REPORT FOR THE FIRST HALF OF FY2018/19
S/No GrantsAnnual Allocation per
CARA, 2018 (Kshs)
Annual Budget Allo-cation for FY 2018/19
(Kshs)
Actual receipts in Half Year of FY 2018/19 (Kshs.)
Actual Receipts as Percentage of Annual Alloca-tion (%)
A Grants Contained in the CARA, 2018
8Rehabilitation of Village Poly-technics
47,800,000 47,800,000 - -
9Compensation for User Fee Fore-gone
38,723,265 38,723,265 - -
10 DANIDA Grant 31,083,750 31,083,750 57,438,910 185
Sub Total 2,320,924,751 2,320,924,750 1,170,037,970 50.4
B Other Grants
11 Sweden (ASDSP) 21,983,635 - - -
12World bank Kenya Urban Sup-port Project (KUSP)
41,200,000 - - -
Sub Total 63,183,635 - - -
Total 2,384,108,386.0 2,320,924,750.0 1,170,037,970 50.4
Source: Nakuru County Treasury
Analysis of the revenue from conditional grants indicates that, the County received funds from Kenya Urban Support Program and a grant from DANIDA. The receipts accounted for 100 per cent and 185 per cent of the annual allocation respectively.
3.31.4 Exchequer IssuesTo finance implementation of the budget, the Controller of Budget approved withdrawal of Kshs.5.27 billion from the CRF account. The withdrawals represented 28.8 per cent of the Approved Budget and translate to an increase of 40.2 per cent from Kshs.3.76 billion approved in the first half of FY 2017/18 and comprised of Kshs.3.63 billion (68.1 per cent) to fund recurrent expenditure and Kshs.1.64 billion (31.1 per cent) for development activities.
3.31.5 Overall Expenditure ReviewThe County government spent a total of Kshs.4.61 billion on both recurrent and development activities. This expenditure represented 87.5 per cent of the total funds released from the CRF account and was an increase of 51.8 per cent from Kshs.3.03 billion spent in the first half of FY 2017/18. The expenditure excluded outstanding commitments as at 31st December, 2018, which amounted to Kshs.1.41 billion for development activities and Kshs.25.94 million for recurrent expenditure.
Expenditure on recurrent activities amounted to Kshs.4.06 billion while that on development activities was Kshs.550.85 million. The recurrent expenditure was 111.9 per cent of the funds released for recurrent activities, while development expenditure was 33.6 per cent of funds released for development activities.
The recurrent expenditure represented 39.3 per cent of the annual recurrent budget and was an increase from 7.1 per cent recorded in the first half of FY 2017/18. Development expenditure recorded an absorption rate of 6.9 per cent, which was an increase from nil per cent attained in the first half of FY 2017/18. Figure 3.122 presents a comparison between the total expenditure in the first half of FY 2018/19 and the first half of the FY 2017/18.

222
COUNTY GOVERNMENTS BUDGET IMPLEMENTATION REVIEW REPORT FOR THE FIRST HALF OF FY2018/19
Figure3.122: NakuruCounty,ExpenditurebyEconomicClassification
2417.15(79.7%)
615.08(20.3%)
0, (0%)
3030.45(65.7%)
1027.93(22.3%)
550.85(12%)
-
500
1,000
1,500
2,000
2,500
3,000
3,500
Personnel Emoluments Operations andMaintenance
Development Expenditure
Ksh
s.Mill
ion
Expenditure by Economic Classification
First Half FY 2017/18
First Half FY 2018/19
Source: Nakuru County Treasury
3.31.6 Analysis of Recurrent ExpenditureThe total recurrent expenditure of Kshs.4.06 billion comprised of Kshs.3.03 billion (74.7 per cent) incurred on personnel emoluments and Kshs.1.03 billion (25.3 per cent) on operations and maintenance as shown in Figure 3.122.
Expenditure on personnel emoluments represented an increase of 25 per cent compared to the first half of FY 2017/18 when the County spent Kshs.2.42 billion and was 65.7 per cent of total expenditure for the period. Figure 3.123: shows a summary of operations and maintenance expenditure by major categories.

223
COUNTY GOVERNMENTS BUDGET IMPLEMENTATION REVIEW REPORT FOR THE FIRST HALF OF FY2018/19
Figure 3.123: Nakuru County, Operations and Maintenance Expenditure by Major Categories in the First Half of FY 2018/19
Source: Nakuru County Treasury
The County spent Kshs.55.68 million on MCAs’ committee sitting allowances for the 79 MCAs against the annual budget allocation of Kshs.110 million. This amount represented an increase of 733.6 per cent compared to Kshs.6.68 million spent in a similar period of FY 2017/18. The average monthly sitting allowance translated to Kshs.117,462 per MCA against the SRC’s recommended monthly ceiling of Kshs.124,800.
Expenditure on domestic travel amounted to Kshs.105.74 million and comprised of Kshs.43.06 million spent by the County Assembly and Kshs.62.68 million spent by the County Executive. This represented 2.7 per cent of total recurrent expenditure and was an increase 100.5 per cent compared to Kshs.64.51 million spent in the first half of FY 2017/18.
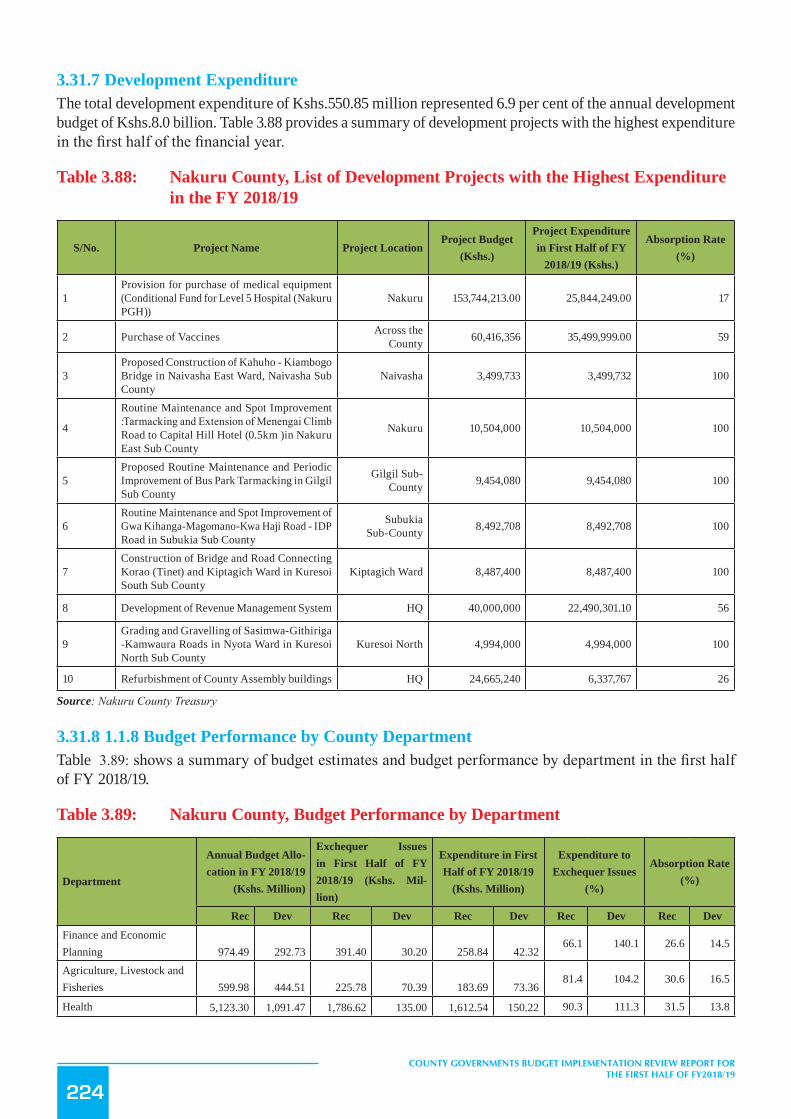
224
COUNTY GOVERNMENTS BUDGET IMPLEMENTATION REVIEW REPORT FOR THE FIRST HALF OF FY2018/19
3.31.7 Development ExpenditureThe total development expenditure of Kshs.550.85 million represented 6.9 per cent of the annual development budget of Kshs.8.0 billion. Table 3.88 provides a summary of development projects with the highest expenditure in the first half of the financial year.
Table 3.88: Nakuru County, List of Development Projects with the Highest Expenditure in the FY 2018/19
S/No. Project Name Project LocationProject Budget
(Kshs.)
Project Expenditure in First Half of FY
2018/19 (Kshs.)
Absorption Rate (%)
1Provision for purchase of medical equipment (Conditional Fund for Level 5 Hospital (Nakuru PGH))
Nakuru 153,744,213.00 25,844,249.00 17
2 Purchase of Vaccines Across the County 60,416,356 35,499,999.00 59
3Proposed Construction of Kahuho - Kiambogo Bridge in Naivasha East Ward, Naivasha Sub County
Naivasha 3,499,733 3,499,732 100
4
Routine Maintenance and Spot Improvement :Tarmacking and Extension of Menengai Climb Road to Capital Hill Hotel (0.5km )in Nakuru East Sub County
Nakuru 10,504,000 10,504,000 100
5Proposed Routine Maintenance and Periodic Improvement of Bus Park Tarmacking in Gilgil Sub County
Gilgil Sub-County 9,454,080 9,454,080 100
6Routine Maintenance and Spot Improvement of Gwa Kihanga-Magomano-Kwa Haji Road - IDP Road in Subukia Sub County
Subukia Sub-County 8,492,708 8,492,708 100
7Construction of Bridge and Road Connecting Korao (Tinet) and Kiptagich Ward in Kuresoi South Sub County
Kiptagich Ward 8,487,400 8,487,400 100
8 Development of Revenue Management System HQ 40,000,000 22,490,301.10 56
9Grading and Gravelling of Sasimwa-Githiriga -Kamwaura Roads in Nyota Ward in Kuresoi North Sub County
Kuresoi North 4,994,000 4,994,000 100
10 Refurbishment of County Assembly buildings HQ 24,665,240 6,337,767 26
Source: Nakuru County Treasury
3.31.8 1.1.8 Budget Performance by County DepartmentTable 3.89: shows a summary of budget estimates and budget performance by department in the first half of FY 2018/19.
Table 3.89: Nakuru County, Budget Performance by Department
Department
Annual Budget Allo-cation in FY 2018/19
(Kshs. Million)
Exchequer Issues in First Half of FY 2018/19 (Kshs. Mil-lion)
Expenditure in First Half of FY 2018/19
(Kshs. Million)
Expenditure to Exchequer Issues
(%)
Absorption Rate (%)
Rec Dev Rec Dev Rec Dev Rec Dev Rec Dev
Finance and Economic Planning 974.49 292.73 391.40 30.20 258.84 42.32
66.1 140.1 26.6 14.5
Agriculture, Livestock and Fisheries 599.98 444.51 225.78 70.39 183.69 73.36
81.4 104.2 30.6 16.5
Health 5,123.30 1,091.47 1,786.62 135.00 1,612.54 150.22 90.3 111.3 31.5 13.8

225
COUNTY GOVERNMENTS BUDGET IMPLEMENTATION REVIEW REPORT FOR THE FIRST HALF OF FY2018/19
Department
Annual Budget Allo-cation in FY 2018/19
(Kshs. Million)
Exchequer Issues in First Half of FY 2018/19 (Kshs. Mil-lion)
Expenditure in First Half of FY 2018/19
(Kshs. Million)
Expenditure to Exchequer Issues
(%)
Absorption Rate (%)
Rec Dev Rec Dev Rec Dev Rec Dev Rec DevYouth, Culture, Gender, Sports and Social Services 345.87 118.63 66.27 - 100.04 -
151.0 28.9 -
Lands, Physical Planning and Housing 140.26 1,350.37 58.06 1,084.84 51.73 -
89.1 0.0 36.9 -
Infrastructure 307.23 2,129.97 114.00 473.41 76.71 154.21 67.3 32.6 25.0 7.2
Public Service Management 768.93 52.00 293.42 - 269.33 - 91.8 35.0 -
Trade, Industry and Tourism
171.77 365.50 43.81 - 26.32 -60.1 15.3 -
Education, Vocational Training, ICT and Govern-ment 346.15 853.50 74.62 - 18.48 42.23
24.8 5.3 4.9
Office of the Governor and Deputy Governor 171.86 103.86 74.44 - 30.01 1.15
40.3 17.5 1.1
County Public Service Board 50.13 4.41 22.67 - 17.09 3.50
75.4 34.1 79.4
County Assembly 999.54 287.46 427.70 5.10 279.94 56.35 65.5 1104.9 28.0 19.6
Total 10,319.82 7,995.85 3,700.24 1,821.99 3,030.45 550.86 81.9 30.2 29.4 6.9
Source: Nakuru County Treasury
Analysis of expenditure by department shows that the Country Public Service Board had the highest absorption rate of development budget at 79.4 per cent while the departments of Youth Culture Gender and Sports, Lands Physical Planning and Housing, Public Service Management and Trade Industry and Tourism did not incur any development expenditure. The Department of Lands, Physical Planning and Housing had the highest percentage of recurrent expenditure to its recurrent budget at 36.9 per cent while the Department of Education Vocational Training, CT and E-Government and Urban Development had the lowest at 5.3 per cent.
3.31.9 Key Observations and RecommendationsThe County has made progress in addressing some of the challenges previously identified as affecting budget implementation. Some of the progress made included:
i. Improvement in the own-source revenue from Kshs.757.03 million collected in same period of FY 2017/18 to Kshs.1.55 billion in FY 2018/19.
ii. Increased absorption of development budget to Kshs.550.85 million in FY 2018/19. There was no development expenditure in the same period of FY 2017/18.
Despite the above progress, the following challenges continued to hamper effective budget implementation;
1. Huge wage bill that amounted to Kshs.3.03 billion and accounting for 65.7 per cent of the total expenditure for the reporting period.
2. Delay in disbursement of equitable share of revenue raised by the National Treasury.
The County should implement the following recommendations in order to improve budget execution;
1. The County needs to address the high wage bill.2. The County should liaise with National Treasury in order to ensure timely disbursement of funds.
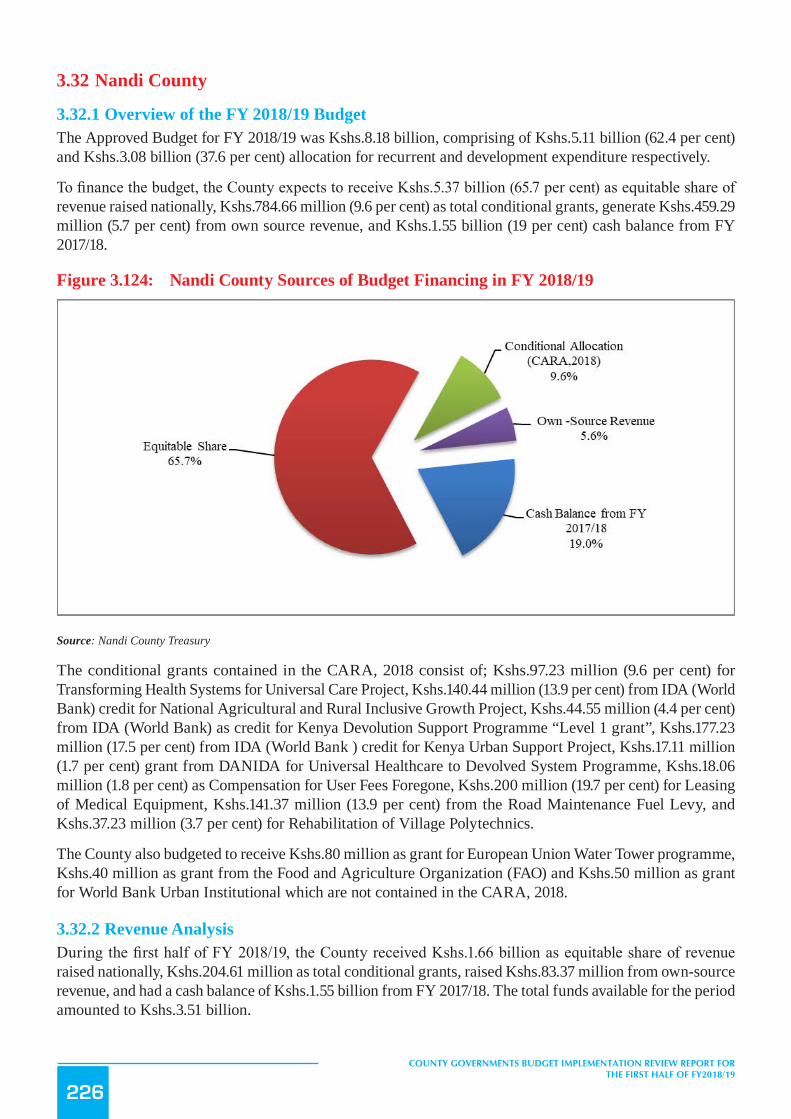
226
COUNTY GOVERNMENTS BUDGET IMPLEMENTATION REVIEW REPORT FOR THE FIRST HALF OF FY2018/19
3.32 Nandi County
3.32.1 Overview of the FY 2018/19 BudgetThe Approved Budget for FY 2018/19 was Kshs.8.18 billion, comprising of Kshs.5.11 billion (62.4 per cent) and Kshs.3.08 billion (37.6 per cent) allocation for recurrent and development expenditure respectively.
To finance the budget, the County expects to receive Kshs.5.37 billion (65.7 per cent) as equitable share of revenue raised nationally, Kshs.784.66 million (9.6 per cent) as total conditional grants, generate Kshs.459.29 million (5.7 per cent) from own source revenue, and Kshs.1.55 billion (19 per cent) cash balance from FY 2017/18.
Figure 3.124: Nandi County Sources of Budget Financing in FY 2018/19
Source: Nandi County Treasury
The conditional grants contained in the CARA, 2018 consist of; Kshs.97.23 million (9.6 per cent) for Transforming Health Systems for Universal Care Project, Kshs.140.44 million (13.9 per cent) from IDA (World Bank) credit for National Agricultural and Rural Inclusive Growth Project, Kshs.44.55 million (4.4 per cent) from IDA (World Bank) as credit for Kenya Devolution Support Programme “Level 1 grant”, Kshs.177.23 million (17.5 per cent) from IDA (World Bank ) credit for Kenya Urban Support Project, Kshs.17.11 million (1.7 per cent) grant from DANIDA for Universal Healthcare to Devolved System Programme, Kshs.18.06 million (1.8 per cent) as Compensation for User Fees Foregone, Kshs.200 million (19.7 per cent) for Leasing of Medical Equipment, Kshs.141.37 million (13.9 per cent) from the Road Maintenance Fuel Levy, and Kshs.37.23 million (3.7 per cent) for Rehabilitation of Village Polytechnics.
The County also budgeted to receive Kshs.80 million as grant for European Union Water Tower programme, Kshs.40 million as grant from the Food and Agriculture Organization (FAO) and Kshs.50 million as grant for World Bank Urban Institutional which are not contained in the CARA, 2018.
3.32.2 Revenue AnalysisDuring the first half of FY 2018/19, the County received Kshs.1.66 billion as equitable share of revenue raised nationally, Kshs.204.61 million as total conditional grants, raised Kshs.83.37 million from own-source revenue, and had a cash balance of Kshs.1.55 billion from FY 2017/18. The total funds available for the period amounted to Kshs.3.51 billion.

227
COUNTY GOVERNMENTS BUDGET IMPLEMENTATION REVIEW REPORT FOR THE FIRST HALF OF FY2018/19
Figure 3.125 shows the half yearly trend in own-source revenue collection from FY 2013/14 to FY 2018/19.
Figure 3.125: Nandi County, Trend in Own-Source Revenue Collection for the First Half of FY 2013/14 to the First Half of FY 2018/19
Source: Nandi County Treasury
During the first half of FY 2018/19, the County generated a total of Kshs.83.37 million from own-source revenue sources. This amount was an increase of 44.7 per cent when compared to Kshs.57.63 million realised during the same period of FY 2017/18 and represented 18.2 per cent of the annual target.
3.32.3 Conditional GrantsThe County received Kshs.204.61 million as conditional grants during the reporting period as shown in Table 3.90.

228
COUNTY GOVERNMENTS BUDGET IMPLEMENTATION REVIEW REPORT FOR THE FIRST HALF OF FY2018/19
Table 3.90: Nandi County, Conditional Grants/Loans Received in the First Half of FY 2018/19
S/No GrantsAnnual Allocation, per CARA, 2018
(Kshs)
Annual Budget Allocation for
FY 2018/19 (Kshs)
Actual receipts in Half Year of FY 2018/19 (in Kshs.)
Actual Receipts as Percentage of Annual Allocation (%)
A Grants Contained in the CARA, 2018
1 Compensation for User Fee Foregone 18,063,363 18,086,363 -
2 Leasing of Medical Equipment 200,000,000 200,000,000 -
3 Road Maintenance Fuel Levy Fund 141,371,626 141,371,626 -
4 Rehabilitation of Village Polytechnics 37,255,000 37,255,000 -
5World Bank-Transforming Health Systems for Uni-versal Care Project
97,229,498 97,229,498 18,820,472 19.4
6IDA (World Bank) -National Agricultural and Ru-ral Inclusive Growth Project
140,435,163 140,435,163 -
7IDA (World Bank) Kenya Devolution Support Pro-gramme “Level 1 grant”
44,551,044 44,551,044 -
8 IDA (World Bank) -Kenya Urban Support Project 177,231,700 88,615,580 177,231,700 200.0
9DANIDA - Universal Healthcare to Devolved Sys-tem Programme
17,111,250 17,111,250 8,555,625 50.0
10 Kenya Urban Support Project (KUSP) 41,200,000 50,000,000 -
Sub Total
11 Sweden-Agricultural Sector Development Support - 19,236,534 - -
12EU -Water Tower Protection and Climate Change Mitigation and Adaptation Programme
- 80,000,000 - -
13Grant from the Food and Agriculture Organization (FAO)
- 40,000,000 -
Total 1,013,685,178 973,892,058 204,607,797 26.1
Source: Nandi County Treasury
Analysis of the revenue from conditional grants indicate that, the County received the highest percentage of receipts to annual allocation from the Kenya Urban Support project, EU grant for IDEAS and the DANIDA grant. The receipts accounted for 100 per cent, 43.8 per cent and 34.6 per cent of annual allocation respectively.
3.32.4 Exchequer IssuesTo finance implementation of the budget, the Controller of Budget approved withdrawal of Kshs.3.20 billion from the CRF account. The withdrawals represented 39.2 per cent of the Approved Budget and translated to an increase of 94.1 per cent from Kshs.1.65 billion approved in the first half of FY 2017/18. This amount comprised of Kshs.2.39 billion (74.5 per cent) to fund recurrent expenditure and Kshs.816.22 million (25.5 per cent) for development activities.
3.32.5 Overall Expenditure ReviewThe County government spent a total of Kshs.3.12 billion on both recurrent and development activities. This expenditure represented 97.5 per cent of the total funds released from the CRF account and was an increase of

229
COUNTY GOVERNMENTS BUDGET IMPLEMENTATION REVIEW REPORT FOR THE FIRST HALF OF FY2018/19
91.1 per cent from Kshs.1.64 billion spent in the first half of FY 2017/18. The expenditure excluded outstanding commitments as at 31st December, 2018, which amounted to Kshs.858.62 million for development activities and Kshs.146.9 million for recurrent expenditure.
Expenditure on recurrent activities amounted to Kshs.2.43 billion while Kshs.694.23 million was spent on development activities. The recurrent expenditure was 101.8 per cent of the funds released for recurrent activities, while development expenditure was 85.1 per cent of funds released for development activities.
The recurrent expenditure represented 47.6 per cent of the annual recurrent budget was an increase from 35.6 per cent recorded in the first half of FY 2017/18. Development expenditure recorded an absorption rate of 22.6 per cent, while there was no development expenditure in the first half of FY 2017/18. Figure 3.126 presents a comparison between the total expenditure in the first half of FY 2018/19 and the first half of the FY 2017/18.
Figure3.126: NandiCounty,ExpenditurebyEconomicClassification
Source: Nandi County Treasury
3.32.6 Analysis of Recurrent ExpenditureThe total recurrent expenditure of Kshs.2.43 billion comprised of Kshs.1.65 billion (67.7 per cent) incurred on personnel emoluments and Kshs.784.63 million (32.3 per cent) on operations and maintenance as shown in Figure 3.126.
Expenditure on personnel emoluments represented an increase of 45.8 per cent compared to the first half of FY 2017/18 when the County spent Kshs.1.13 billion, and was 52.7 per cent of total expenditure for the period. Figure 3.127 shows a summary of operations and maintenance expenditure by major categories.

230
COUNTY GOVERNMENTS BUDGET IMPLEMENTATION REVIEW REPORT FOR THE FIRST HALF OF FY2018/19
Figure 3.127: Nandi County, Operations and Maintenance Expenditure by Major Categories in the First Half of FY 2018/19
Source: Nandi County Treasury
The County spent Kshs.16.48 million on MCAs’ committee sitting allowances for the 40 MCAs against the annual budget allocation of Kshs.38.10 million. This amount represented an increase of 118.1 per cent compared to Kshs.7.55 million spent in a similar period of FY 2017/18. The average monthly sitting allowance translated to Kshs.68,653 per MCA against the SRC’s recommended monthly ceiling of Kshs.124,800.
Expenditure on domestic & foreign travel amounted to Kshs.134.17 million and comprised of Kshs.40.75 million spent by the County Assembly and Kshs.93.42 million spent by the County Executive. This represented 4.1 per cent of total recurrent expenditure.
3.32.7 Development ExpenditureThe total development expenditure of Kshs.694.23 million represented 22.6 per cent of the annual development budget of Kshs.3.08 billion. Table 3.91 provides a summary of development projects with the highest expenditure in the first half of the financial year.

231
COUNTY GOVERNMENTS BUDGET IMPLEMENTATION REVIEW REPORT FOR THE FIRST HALF OF FY2018/19
Table 3.91: Nandi County, List of Development Projects with the Highest Expenditure in the FY 2018/19
S/No. Project Name Project location Project budget (Kshs.)Project Expenditure in First Half of FY
2018/19 (Kshs.)
Absorption Rate (%)
1 Access Roads County Wide 470,290,966 338,878,598 72.1 2 Water Supplies and Sewages County Wide 279,000,000 84,929,084 30.4
3 Construction of ECDE County Wide 222,645,000 41,915,074 18.8
4 Purchase of Certified Seeds ATC Kaimosi 30,000,000 12,771,426 42.6
5 Construction of Youth Empowerment Centre Kapsabet 30,000,000 11,694,023 39.0
6 Purchase of Medical & Dental Equipment Kapsabet 50,000,000 10,115,118 20.2
7 Construction of Bridges and Foot Bridges County Wide 30,000,000 6,269,529 20.9
Source: Nandi County Treasury
3.32.8 Budget Performance by County DepartmentTable 3.92 shows a summary of budget estimates and budget performance by department in the first half of FY 2018/19.
Table 3.92: Nandi County, Budget Performance by Department
Department
Annual Budget Allo-cation in FY 2018/19
(Kshs. Million)
Exchequer Issues in First Half of FY 2018/19 (Kshs. Million)
Expenditure in First Half of FY 2018/19
(Kshs. Million)
Expenditure to Exchequer Issues
(%)
Absorption Rate (%)
Rec Dev Rec Dev Rec Dev Rec Dev Rec Dev
Office of the Governor & Deputy Governor 427.33 85.00 193.64 4.74 173.39 7.70 89.5 162.6 40.6 9.1
Finance and Economic Planning 972.64 131.40 355.35 8.34 341.24 8.75 96.0 104.9 35.1 6.7
Devolved Units and Special Programmes 320.58 152.62 188.33 93.72 122.85 11.71 65.2 12.5 38.3 7.7
Health and Sanitation 1,578.55 360.50 719.04 34.23 1,069.09 43.53 148.7 127.2 67.7 12.1
Agriculture, Livestock and Fisheries 303.69 449.72 188.75 125.70 134.02 92.12 71.0 73.3 44.1 20.5
Tourism, Culture and Co-operative Development 58.44 55.00 22.67 - 16.00 - 70.6 - 27.4 -
Youth, Gender and Social Services 60.88 121.00 34.71 16.32 10.78 18.75 31.1 114.9 17.7 15.5
Education Research and Vocational Training 322.76 288.90 182.66 79.31 98.11 41.92 53.7 52.9 30.4 14.5
Lands, Environment and Natural Resources 145.68 334.25 48.62 74.82 37.75 89.56 77.6 119.7 25.9 26.8
Roads Transport and Public Works 193.77 723.47 91.69 377.05 66.70 373.25 72.7 99.0 34.4 51.6
Trade and Industrial Development 57.80 112.30 25.94 - 23.20 4.96 89.4 - 40.1 4.4
Public Service and Labour 33.29 - 16.17 - 13.05 - 80.7 - 39.2 -

232
COUNTY GOVERNMENTS BUDGET IMPLEMENTATION REVIEW REPORT FOR THE FIRST HALF OF FY2018/19
Department
Annual Budget Allo-cation in FY 2018/19
(Kshs. Million)
Exchequer Issues in First Half of FY 2018/19 (Kshs. Million)
Expenditure in First Half of FY 2018/19
(Kshs. Million)
Expenditure to Exchequer Issues
(%)
Absorption Rate (%)
Rec Dev Rec Dev Rec Dev Rec Dev Rec Dev
County Assembly 631.18 263.50 321.13 2.00 324.78 2 101.1 100 51.5 0.8
Total 5,106.58 3,077.66 2,388.72 816.22 2,430.96 694.23 101.8 85.1 47.6 22.6
Source: Nandi County Treasuryy
Analysis of expenditure by department shows the Department of Roads Transport and Public Works recorded the highest absorption rate of development budget at 51.6 per cent while the Department of Tourism, Culture and Co-operative Development did not incur any development expenditure. The Department of Health and Sanitation had the highest percentage of recurrent expenditure to recurrent budget at 67.7 per cent while the Department of Youth, Gender and Social Services had the lowest at 17.7 per cent.
3.32.9 Key Observations and RecommendationsThe County has made progress in addressing some of the challenges previously identified as affecting budget implementation. Some of the progress made included:
i. Establishment of the County Budget and Economic Forum (CBEF) in line with Section 137 of the PFM Act, 2012.
ii. Improvement in the use of IFMIS and the Internet Banking platform to process financial transactions.
Despite the above progress, the following challenges continued to hamper effective budget implementation;
1. High expenditure on personnel emoluments which increased by 45.8 per cent from Kshs.1.13 billion in first half of FY 2017/18 to Kshs.1.65 billion in the reporting period.
2. Delay in disbursement of the equitable share of revenue raised by the National Treasury.3. Failure to establish an Internal Audit Committee to oversee financial operations in the County contrary
to Section 155 of the PFM Act, 2012.The County should implement the following recommendations in order to improve budget execution;
1. The County Public Service Board should devise strategies to contain expenditure on personnel costs within 35 per cent of the County’s total revenue in line with Regulation 25(1)(b) of the PFM (County Governments) Regulations, 2015.
2. The County Treasury should liaise with the National Treasury to ensure that funds allocated to the County are released in a timely manner in line with CARA, 2018.
3. The County should establish an Internal Audit Committee in line with Section 155 of the PFM Act, 2012.
3.33 Narok County
3.33.1 Overview of the FY 2018/19 BudgetThe County’s Approved Budget for FY 2018/19 was Kshs.9.66 billion, comprising of Kshs.6.26 billion (64.8 per cent) and Kshs.3.4 billion (35.2 per cent) allocation for recurrent and development expenditure respectively.
To finance the budget, the County expects to receive Kshs.6.37 billion (66 per cent) as equitable share of revenue raised nationally, Kshs.805.48 million (8.3 per cent) as total conditional grants, generate Kshs.2.48 billion (25.7 per cent) from own revenue sources. The County did not budget for Kshs.619.05 million cash balance from FY 2017/18.

233
COUNTY GOVERNMENTS BUDGET IMPLEMENTATION REVIEW REPORT FOR THE FIRST HALF OF FY2018/19
Figure 3128 : Narok County Expected Sources of Budget Financing in FY 2018/19.
Source: Narok County Treasury
The conditional grants contained in the CARA, 2018 consist of; Kshs.30.8 million (3.8 per cent) for rehabilitation od village polytechnics, Kshs.167.83 million (20.8 per cent) from Road Maintenance Levy Fund, Kshs.20.6 Million (2.6 per cent) for Health Centre and Dispensaries User Fees Foregone, grant for Kshs.200 million (24.8 per cent) for Leasing of Medical Equipment, Kshs. 49.04 million (6.09 per cent) as grants to support Kenya Devolution Support Programme (KDSP), Kshs.74.9 million (9.3 per cent) grant from Kenya Urban Support Programme, Kshs.100 million (12.4 per cent) World Bank grant to support Transformation of Health Systems, Kshs.140.4 million (17.4 per cent) World Bank credit to support National Agricultural and Rural Inclusive Growth Project and Kshs.21.8 million (2.7 per cent) grant from DANIDA to finance Universal Healthcare in the County. The County also received Kshs.199.99 million being NHIF disbursement which has been treated as revenue income not contained in the CARA, 2018.
3.33.2 Revenue AnalysisDuring the first half of FY 2018/19, the County received Kshs.2.74 billion as equitable share of revenue raised nationally, Kshs.122.81 million as total conditional grants, Kshs.200 million as revenue from NHIF, raised Kshs.1.84 billion from own-source revenue streams, and Kshs.619.05 million cash balance from FY 2017/18. The total funds available for the period amounted to Kshs.5.52 billion.

234
COUNTY GOVERNMENTS BUDGET IMPLEMENTATION REVIEW REPORT FOR THE FIRST HALF OF FY2018/19
Figure 3.129: Narok County, Trend in Own-Source Revenue Collection for the First Half of FY 2013/14 to the First Half of FY 2018/19
Source: Narok County Treasury
During the first half of FY 2018/19, the County generated a total of Kshs.1.84 billion as own-source revenue. This amount was an increase of 51.1 per cent when compared to Kshs.1.22 billion realised during the same period of FY 2017/18 and represented 74.1 per cent of the annual target.
3.33.3 Conditional GrantsThe County received Kshs.122.8 million as conditional grants during the reporting period as shown in Table 3.93.
Table 3.93: Narok County, Conditional Grants/Loans Received in the First Half of FY 2018/19
S/No. Grants/LoansAnnual Allocation, per CARA, 2018
(Kshs)
Annual Budget Allocation for
FY 2018/19 (Kshs)
Actual Re-ceipts in First
Half of FY 2018/19 (Kshs)
Actual Receipts as Percentage of Annu-
al Allocation (%)
A Grants/Loans contained in CARA, 2018
1Rehabilitation of Village Polytechnics-National Government
30,820,000 30,820,000 - -
2Road Maintenance Fuel Levy-National Govern-ment
167,827,135 167,827,135 - -
3Compensation for User Fees Foregone-National Government
20,595,297 20,595,297 - -
4Leasing of Medical Equipment-National Gov-ernment
200,000,000 200,000,000 - -
5Kenya Devolution Support Programme-World Bank
49,037,031 49,037,031 - -

235
COUNTY GOVERNMENTS BUDGET IMPLEMENTATION REVIEW REPORT FOR THE FIRST HALF OF FY2018/19
S/No. Grants/LoansAnnual Allocation, per CARA, 2018
(Kshs)
Annual Budget Allocation for
FY 2018/19 (Kshs)
Actual Re-ceipts in First
Half of FY 2018/19 (Kshs)
Actual Receipts as Percentage of Annu-
al Allocation (%)
A Grants/Loans contained in CARA, 2018
6 Kenya Urban Support Programme-World Bank 74,905,300 74,905,300 74,905,300 100.0
7Transforming Healthcare Systems for Universal Care Project-World Bank
100,000,000 100,000,000 36,974,292 37.0
8Agricultural & Rural Inclusive Growth Proj-ect-World Bank
140,435,163 140,435,163 - -
9Universal Healthcare in Devolved Systems- DANIDA
21,870,000 21,870,000 10,935,000 50.0
Total 805,489,926 805,489,926 122,814,592 15.2
Source: Narok County Treasuryy
Analysis of the revenues from conditional grants and loans to the County shows that, the County government received grants and loans to finance the following programmes/projects: Kenya Urban Support Program (KUSP), Kshs.74.90 million; Transformation of Healthcare Systems for Universal Care Project, Kshs.36.97 million; and Universal Healthcare in Devolved Systems Project, Kshs.10.93 million.
3.33.4 Exchequer IssuesTo finance implementation of the budget, the Controller of Budget approved withdrawal of Kshs.5.14 billion from the CRF account. The withdrawals represented 53.3 per cent of the Approved Budget and translated to an increase of 29.2 per cent from Kshs.3.98 billion approved in the first half of FY 2017/18. This comprised of Kshs.3.63 billion (70.7 per cent) to fund recurrent expenditure and Kshs.1.51 billion (29.3 per cent) for development activities.
3.33.5 Overall Expenditure ReviewThe County government spent a total of Kshs.4.77 billion on both recurrent and development activities. This expenditure represented 92.6 per cent of the total funds released from the CRF account and was an increase of 19.7 per cent from Kshs.3.98 billion spent in the first half of FY 2017/18. The expenditure excluded outstanding commitments as at 31st December, 2018, which amounted to Kshs.1.10 billion for development activities and Kshs.506 million for recurrent expenditure.
Expenditure on recurrent activities amounted to Kshs.3.26 billion while that on development activities was Kshs.1.49 billion. The recurrent expenditure was 89.8 per cent of the funds released for recurrent activities, while development expenditure was 99.3 per cent of funds released for development activities.
The recurrent expenditure represented 52.2 per cent of the annual recurrent budget a decrease from 55.6 per cent recorded in the first half of FY 2017/18. Development expenditure recorded an absorption rate of 44.1 per cent, which was an increase from 12.1 per cent attained in the first half of FY 2017/18. Figure 3.130 presents a comparison between the total expenditure in the first half of FY 2018/19 and the first half of the FY 2017/18.

236
COUNTY GOVERNMENTS BUDGET IMPLEMENTATION REVIEW REPORT FOR THE FIRST HALF OF FY2018/19
Figure3.130: NarokCounty,ExpenditurebyEconomicClassification
Source: Narok County Treasury
3.33.6 Analysis of Recurrent ExpenditureThe total recurrent expenditure of Kshs.3.26 billion comprised of Kshs.2.18 billion (45.8 per cent) incurred on personnel emoluments and Kshs.1.08 billion (22.8 per cent) on operations and maintenance as shown in Figure 3.131
Expenditure on personnel emoluments represented an increase of 34.1 per cent compared to the first half of FY 2017/18 when the County spent Kshs.1.62 billion, and was 45.8 per cent of total expenditure for the period.

237
COUNTY GOVERNMENTS BUDGET IMPLEMENTATION REVIEW REPORT FOR THE FIRST HALF OF FY2018/19
Figure 3.131: Narok County, Operations and Maintenance Expenditure by Major Categories in the First Half of FY 2018/19
Source: Narok County Treasury
The County spent Kshs.12.8 million on MCAs’ committee sitting allowances for the 48 MCAs and the speaker against the annual budget allocation of Kshs.53.81 million. The average monthly sitting allowance translated to Kshs.44,594 per MCA against the SRC’s recommended monthly ceiling of Kshs.124,800.
Expenditure on domestic travel amounted to Kshs.166.12 million and comprised of Kshs.102.15 million spent by the County Assembly and Kshs.63.98 million spent by the County Executive. This represented 5.1 per cent of total recurrent expenditure.
3.33.7 Development ExpenditureThe total development expenditure of Kshs.1.49 billion represented 44.1 per cent of the annual development budget of Kshs.3.4 billion. Table 3.94 provides a summary of development projects with the highest expenditure in the first half of the financial year.

238
COUNTY GOVERNMENTS BUDGET IMPLEMENTATION REVIEW REPORT FOR THE FIRST HALF OF FY2018/19
Table 3.94: Narok County, List of Development Projects with the Highest Expenditure in the FY 2018/19
S/No. Project Name Project LocationAnnual Project Bud-
get (Kshs.)Half Year Expen-
diture (Kshs.)Absorption Rate (%)
1 Roads infrastructure Narok south, North, East, Kilgoris 976,147,135 540,708,234 55.4
2 Civil works and infrastructure Narok south, North, East, Kilgoris 459,312,435 275,229,006 59.9
3 Acquisition of roads & civil works machines County Head Quarters 228,000,000 230,037,238 100.9
4 Buildings infrastructure-education Narok south, North, East, Kilgoris 352,799,000 241,024,426 68.3
5 Transfers to Bursary fund & Maasai Mara County Head Quarters 569,375,110 110,800,000 19.5
6 Rehabilitation of Mara & Markets yards Narok south, North, East, Kilgoris 130,000,000 100,196,100 77.1
Source: Narok County Treasury
3.33.8 Budget Performance by County DepartmentTable 3.95 shows a summary of budget estimates and budget performance by department in the first half of FY 2018/19.
Table 3.95: Narok County, Budget Performance by Department
Department
Budget Allocation (Kshs. Million)
Exchequer Issues in First Half of FY 2018/19 (Kshs. Million)
Expenditure in First Half of FY 2018/19
(Kshs. Million)
Expenditure to Exchequer
Issues (%)
Absorption Rate (%)
Rec Dev Rec Dev Rec Dev Rec Dev Rec Dev
County Assembly 674.49 200.0 385.00 10.0 321.54 9.54 83.5 95.4 47.7 4.8Office of the Governor 278.88 - 218.02 - 204.56 - 93.8 - 73.4 -
Finance and Economic Planning 564.33 386.56 389.14 - 380.51 80.08 97.8 - 67.4 20.7
Roads, Transport and Public works 191.34 976.15 128.82 633.12 122.05 631.32 94.7 99.7 63.8 64.7
Education, Youth , Sports, Culture & Social Services
915.51 444.93 413.97 348.88 400.26 339.85 96.7 97.4 43.7 76.4
Environment Protection, Energy, Water and Natural resources
89.53 225.50 58.12 115.0 56.38 42.20 97.0 36.7 63.0 18.7
County Public service Board 71.37 - 48.60 - 46.91 - 96.5 - 65.7 -
Agriculture, Livestock and Fisheries
313.33 504.37 204.91 194.0 185.99 193.45 90.8 99.7 59.4 38.4
Health and Sanitation 2,010.51 251.41 1,087.83 91.00 916.88 88.45 84.3 97.2 45.6 35.2
Lands, Housing, Physical Planning and Urban Development
80.50 192.90 51.67 65.00 44.96 62.95 87.0 96.8 55.9 32.6
Tourism and Wildlife 61.99 130.86 40.78 33.00 36.30 31.56 89.0 95.6 58.6 24.1
County Administration and Public Service Management
924.15 38.55 561.71 19.00 552.72 18.60 98.4 97.9 59.8 48.2

239
COUNTY GOVERNMENTS BUDGET IMPLEMENTATION REVIEW REPORT FOR THE FIRST HALF OF FY2018/19
Department
Budget Allocation (Kshs. Million)
Exchequer Issues in First Half of FY 2018/19 (Kshs. Million)
Expenditure in First Half of FY 2018/19
(Kshs. Million)
Expenditure to Exchequer
Issues (%)
Absorption Rate (%)
Rec Dev Rec Dev Rec Dev Rec Dev Rec Dev
Trade and Industrialization 88.51 49.26 50.75 - - - - - - -
TOTAL 6,264.44 3,400.49 3,639.32 1,509.00 3,269.06 1,498.00 89.8 99.3 52.2 44.1
Source: Narok County Treasury
Analysis of expenditure by department shows that the Department of Education, Youth, Sports, Culture & Social Services recorded the highest absorption rate of development budget at 74.6 per cent, followed by the Department of Roads, Transport and Public works at 64.7 per cent.
3.33.9 Key Observations and RecommendationsThe County has made progress in addressing some of the challenges previously identified as affecting budget implementation. Some of the progress made included:
i. Improvement in the collection of own source revenue by 51.1 per cent compared to a similar period in FY 2017/18.
ii. Improvement in the absorption of the development budget compared to a similar period in FY 2017/18.
Despite the above progress, the following challenges continued to hamper effective budget implementation:
1. IFMIS connectivity challenges and frequent down time affected processing of payments to suppliers.2. Failure to budget for all the conditional grants as per CARA, 2018.
The County should implement the following recommendations in order to improve budget execution;
1. The County Treasury should liaise with the IFMIS Directorate for support in order to address the IFMIS challenges.
2. The County should budget for all conditional grants as contained in CARA, 2018.
3.34 Nyamira County
3.34.1 Overview of the FY 2018/19 BudgetThe County’s Approved Budget for FY 2018/19 was Kshs.6.53 billion, comprising of Kshs.4.58 billion (70.2 per cent) and Kshs.1.95 billion (29.8 per cent) allocation for recurrent and development expenditure respectively.
To finance the budget, the County expects to receive Kshs.4.77 billion (14.5 per cent) as equitable share of revenue raised nationally, Kshs.554.77 million (8.5 per cent) as total conditional grants, generate Kshs.255.57 million (3.9 per cent) from own sources, and Kshs.943.29 million (14.5 per cent) cash balance from FY 2017/18.

240
COUNTY GOVERNMENTS BUDGET IMPLEMENTATION REVIEW REPORT FOR THE FIRST HALF OF FY2018/19
Figure 3.132: Nyamira County Sources of Budget Financing in FY 2018/19
Source: Nyamira County Treasury
The conditional grants include those contained in the CARA, 2018 consist of; Kshs.50 million (6.6 per cent) for Transforming Health Systems for Universal Care Project, Kshs.140.44 million (18.6 per cent) from IDA (World Bank) credit for National Agricultural and Rural Inclusive Growth Project, Kshs.42.38 million (5.6 per cent) from IDA (World Bank) as credit for Kenya Devolution Support Programme “Level 1 grant”, Kshs.114.71 million (15.2 per cent) from IDA (World Bank ) credit for Kenya Urban Support Project, Kshs.15.49 million (2.1 per cent) grant from DANIDA for Universal Healthcare to Devolved System Programme, Kshs.13.18 million (1.7 per cent) Compensation for User Fees Foregone, Kshs.200 million (26.5 per cent) for Leasing of Medical Equipment, Kshs.125.66 million (16.6 per cent) from the Road Maintenance Fuel Levy, and Kshs.52.92 million (7.0 per cent) for Rehabilitation of Village Polytechnics.
3.34.2 Revenue AnalysisDuring the first half of FY 2018/19, the County received Kshs.1.48 billion as equitable share of revenue raised nationally, Kshs.130.95 million as total conditional grants, raised Kshs.49.90 million from own-source revenue, and had a cash balance of Kshs.1.31 million from FY 2017/18. The total funds available for the period amounted to Kshs.2.99 billion.
Figure 3.133 shows the half yearly trend in own-source revenue collection from FY 2013/14 to FY 2018/19.

241
COUNTY GOVERNMENTS BUDGET IMPLEMENTATION REVIEW REPORT FOR THE FIRST HALF OF FY2018/19
Figure 3.133: Nyamira County, Trend in Own-Source Revenue Collection for the First Half of FY 2013/14 to the First Half of FY 2018/19
Source: Nyamira County Treasury
During the first half of FY 2018/19, the County generated a total of Kshs.64.47 million from own-source revenue sources. This amount was an increase of 133.5 per cent when compared to Kshs.27.61 million realised during the same period of FY 2017/18 and represented 25.2 per cent of the annual target. The first quarter FY 2018/19 own revenue was revised from Kshs.18.26 million to Kshs.32.82 million after recognising revenue from public health fees.
3.34.3 Conditional GrantsThe County received Kshs.130.95 million as conditional grants during the reporting period as shown in Table 3.96.
Table 3.96: Nyamira County, Conditional Grants/Loans Received in the First Half of FY 2018/19
S/No. Grants/LoansAnnual Allocation, per CARA, 2018
(Kshs)
Annual Budget Allocation for
FY 2018/19 (Kshs)
Actual Receipts in
First Half of FY 2018/19
(Kshs)
Actual Receipts as Percentage of Annu-
al Allocation (%)
A Grants/Loans contained in CARA, 2018
1National Agricultural and Rural Inclusive Growth Project (NARIGP)
140,435,163 140,435,163 - -
2 Road Maintenance Fuel Levy 125,663,667 125,663,667 - -
3 Kenya Urban Support Project (KUSP) 114,705,300 114,705,300 114,705,300 100.0
4 Rehabilitation of Village Polytechnics 52,915,000 52,915,000 - -
5Transforming Health Systems for Universal Care Project (WB)
50,000,000 50,000,000 8,501,050 17.0
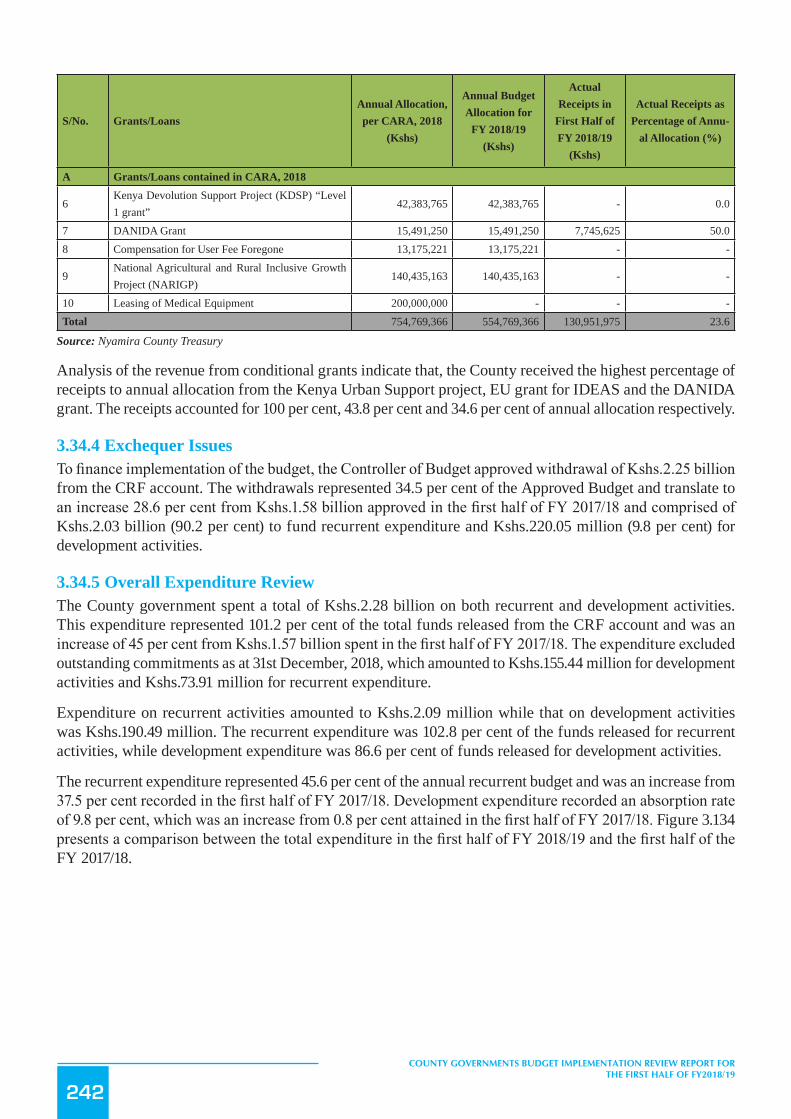
242
COUNTY GOVERNMENTS BUDGET IMPLEMENTATION REVIEW REPORT FOR THE FIRST HALF OF FY2018/19
S/No. Grants/LoansAnnual Allocation, per CARA, 2018
(Kshs)
Annual Budget Allocation for
FY 2018/19 (Kshs)
Actual Receipts in
First Half of FY 2018/19
(Kshs)
Actual Receipts as Percentage of Annu-
al Allocation (%)
A Grants/Loans contained in CARA, 2018
6Kenya Devolution Support Project (KDSP) “Level 1 grant”
42,383,765 42,383,765 - 0.0
7 DANIDA Grant 15,491,250 15,491,250 7,745,625 50.08 Compensation for User Fee Foregone 13,175,221 13,175,221 - -
9National Agricultural and Rural Inclusive Growth Project (NARIGP)
140,435,163 140,435,163 - -
10 Leasing of Medical Equipment 200,000,000 - - -Total 754,769,366 554,769,366 130,951,975 23.6
Source: Nyamira County Treasury
Analysis of the revenue from conditional grants indicate that, the County received the highest percentage of receipts to annual allocation from the Kenya Urban Support project, EU grant for IDEAS and the DANIDA grant. The receipts accounted for 100 per cent, 43.8 per cent and 34.6 per cent of annual allocation respectively.
3.34.4 Exchequer IssuesTo finance implementation of the budget, the Controller of Budget approved withdrawal of Kshs.2.25 billion from the CRF account. The withdrawals represented 34.5 per cent of the Approved Budget and translate to an increase 28.6 per cent from Kshs.1.58 billion approved in the first half of FY 2017/18 and comprised of Kshs.2.03 billion (90.2 per cent) to fund recurrent expenditure and Kshs.220.05 million (9.8 per cent) for development activities.
3.34.5 Overall Expenditure ReviewThe County government spent a total of Kshs.2.28 billion on both recurrent and development activities. This expenditure represented 101.2 per cent of the total funds released from the CRF account and was an increase of 45 per cent from Kshs.1.57 billion spent in the first half of FY 2017/18. The expenditure excluded outstanding commitments as at 31st December, 2018, which amounted to Kshs.155.44 million for development activities and Kshs.73.91 million for recurrent expenditure.
Expenditure on recurrent activities amounted to Kshs.2.09 million while that on development activities was Kshs.190.49 million. The recurrent expenditure was 102.8 per cent of the funds released for recurrent activities, while development expenditure was 86.6 per cent of funds released for development activities.
The recurrent expenditure represented 45.6 per cent of the annual recurrent budget and was an increase from 37.5 per cent recorded in the first half of FY 2017/18. Development expenditure recorded an absorption rate of 9.8 per cent, which was an increase from 0.8 per cent attained in the first half of FY 2017/18. Figure 3.134 presents a comparison between the total expenditure in the first half of FY 2018/19 and the first half of the FY 2017/18.

243
COUNTY GOVERNMENTS BUDGET IMPLEMENTATION REVIEW REPORT FOR THE FIRST HALF OF FY2018/19
Figure3.134: NyamiraCounty,ExpenditurebyEconomicClassification
Source: Nyamira County Treasury
3.34.6 Analysis of Recurrent ExpenditureThe total recurrent expenditure of Kshs.2.09 billion comprised of Kshs.1.73 billion (82.6 per cent) incurred on personnel emoluments and Kshs.362.62 million (17.4 per cent) on operations and maintenance as shown in Figure 3.134.
Expenditure on personnel emoluments represented an increase of 36.1 per cent compared to the first half of FY 2017/18 when the County spent Kshs.1.27 billion, and was 75.7 per cent of total expenditure for the period. Figure 3.135 shows a summary of operations and maintenance expenditure by major categories.

244
COUNTY GOVERNMENTS BUDGET IMPLEMENTATION REVIEW REPORT FOR THE FIRST HALF OF FY2018/19
Figure 3.135: Nyamira County, Operations and Maintenance Expenditure by Major Categories in the First Half of FY 2018/19
118.43
55.94
38.95 36.8823.58 22.75 22.30 18.88 13.96 10.93
0
20
40
60
80
100
120
140
Ksh
s. M
illio
n
Major Categories of O&M
Source: Nyamira County Treasury
The County spent Kshs.22.75 million on MCAs’ committee sitting allowances for the 37 MCAs against the annual budget allocation of Kshs.66.64 million. This amount represented an increase of 244.4 per cent compared to Kshs.6.61 million spent in a similar period of FY 2017/18. The average monthly sitting allowance translated to Kshs.102,498 per MCA against the SRC’s recommended monthly ceiling of Kshs.124,800.
Expenditure on domestic travel amounted to Kshs.118.43 million and comprised of Kshs.57.36 million spent by the County Assembly and Kshs.61.07 million spent by the County Executive. This represented 5.7 per cent of total recurrent expenditure.
3.34.7 Development ExpenditureThe total development expenditure of Kshs.190.49 million represented 9.8 per cent of the annual development budget of Kshs.1.95 billion. Table 3.97 provides a summary of development projects with the highest expenditure in the first half of the financial year.

245
COUNTY GOVERNMENTS BUDGET IMPLEMENTATION REVIEW REPORT FOR THE FIRST HALF OF FY2018/19
Table 3.97: Nyamira County, List of Development Projects with the Highest Expenditure in the FY 2018/19
S/No. Project Name Project LocationAnnual Project Budget (Kshs.)
Half Year Expendi-ture (Kshs.)
Absorption Rate (%)
1Proposed Construction of Amenity Block with the Doctor’s Plaza at Nyamira Referral (Female and Male Wards)
Nyamira Town 126,000,000 6,259,890 5
2Youth Polytechnic Education Support Pro-gramme In Collaboration With The Ministry of Education (National Government)
County Wide 52,915,950 25,410,000 48
3Civil Works for the Construction and Completion of Nyambaria I Water Supply
Magombo 13,215,000 11,252,805 85.2
4Proposed Construction of Car Parking Lots Be-tween Nyamira County Referral Hospital and Huduma Centre
Nyamira Town 13,000,000 7,800,000 60
5Civil Works for the Construction and Completion of Raitigo II Water Supply
Raitigo 8,500,000 4,766,505 56.1
6 Proposed Repair and Maintenance of (D209) Eng. Chencha-Simbaut M.C Junc-Dam-Kamau Junction Road
Nyansiongo 4,022,800 4,022,800 100
7 Refurbishment of Staff Quarters Block at Nyam-ira County Referral Hospital
Nyamira Town 4,000,000 4,000,000 100
8 Proposed Repair and Maintenance of (D225) Onseka - Eturungi Junction -Amakura Prim Sch - Mokomoni Junc -Road
Kiabonyoru 3,895,620 3,895,620 100
9Completion of Typical 3 No. ECDE Classrooms & Pit Latrine at Rianyakangi Primary School
Rianyakangi 3,710,000 3,701,131 99.8
10Completion of Typical 3 No. ECD Classrooms and Pit Latrine at Rianyakangi Primary School
Kiabonyoru 3,701,131 3,701,131 100
Source: Nyamira County Treasury
3.34.8 Budget Performance by County DepartmentTable 3.98 shows a summary of budget estimates and budget performance by department in the first half of FY 2018/19.
Table 3.98: Nyamira County, Budget Performance by Department
Department
Annual Budget Allo-cation in FY 2018/19
(Kshs. Million)
Exchequer Issues in First Half of FY 2018/19 (Kshs. Mil-lion)
Expenditure in First Half of FY 2018/19
(Kshs. Million)
Expenditure to Exchequer Issues
(%)
Absorption Rate (%)
Rec Dev Rec Dev Rec Dev Rec Dev Rec Dev
County Assembly 587.43 200.00 261.52 3.08 260.85 3.08 99.7 100.0 44.4 1.5
County Executive 477.37 202.64 - 173.10 - 85.4 - 36.3 -
Finance & Economic Plan-ning
361.02 140.00 146.74 - 151.48 0.91 103.2 - 42.0 0.7
Agriculture, Livestock & Fisheries
309.32 102.28 102.39 0.90 121.17 28.89 118.3 3,209.9 39.2 28.2
Environment, Water, Natural Resources, Mining & Energy
114.92 198.52 52.17 27.19 55.13 39.37 105.7 144.8 48.0 19.8

246
COUNTY GOVERNMENTS BUDGET IMPLEMENTATION REVIEW REPORT FOR THE FIRST HALF OF FY2018/19
Department
Annual Budget Allo-cation in FY 2018/19
(Kshs. Million)
Exchequer Issues in First Half of FY 2018/19 (Kshs. Mil-lion)
Expenditure in First Half of FY 2018/19
(Kshs. Million)
Expenditure to Exchequer Issues
(%)
Absorption Rate (%)
Rec Dev Rec Dev Rec Dev Rec Dev Rec Dev
Education & Youth Empow-erment
457.80 199.42 166.01 13.34 191.56 15.41 115.4 115.5 41.8 7.7
Health Services 1,649.55 199.00 781.60 13.59 830.90 14.65 106.3 107.8 50.4 7.4Lands, Housing & Physical Planning
81.30 276.41 42.58 129.37 38.39 - 90.2 0.0 47.2 -
Roads, Transport & Public Works
113.21 447.25 58.00 20.29 50.67 16.57 87.4 81.7 44.8 3.7
Trade, Tourism, Industriali-sation & Cooperative Devel-opment
53.09 87.00 27.15 7.53 26.93 19.81 99.2 263.0 50.7 22.8
Sports, Gender, Culture & Social Services
59.05 92.85 26.90 4.75 24.22 51.80 90.0 1,090.5 41.0 55.8
County Public Service Board 59.07 - 37.82 - 20.96 - 55.4 - 35.5 -
Public Service Management 255.42 51.64 125.56 - 142.47 113.5 - 55.8 -
TOTAL 4,578.54 1,994.36 2,031.08 220.05 2,087.82 190.49 102.8 86.6 45.6 9.6
Source: Nyamira County Treasury
Analysis of expenditure by department shows the Department of Sports, Gender, Culture & Social Services recorded the highest absorption rate of development budget at 55.8 per cent while the Department of Lands, Housing & Physical Planning and that of Public Service Management did not incur any development expenditure. The Department of Public Service Management had the highest percentage of recurrent expenditure to recurrent budget at 55.8 per cent while the County Public Service Board had the lowest at 35.5 per cent.
3.34.9 Key Observations and RecommendationsThe County has made progress in addressing some of the challenges previously identified as affecting budget implementation. Some of the progress made included:
i. Improvement in own source revenue collection by 133.5 per cent compared to that realised during the same period of FY 2017/18.
ii. Improvement in absorption of development budget from 0.8 per cent attained in the first half of FY 2017/18 to 9.8 per cent in the reporting period.
iii. Harmonisation of key economic planning documents, such as CIDP, ADP, and CFSP, which promoted smooth budget implementation.
Despite the above progress, the following challenges continued to hamper effective budget implementation;
1. Delay in disbursement of the equitable share of revenue raised by the National Treasury.2. The County’s wage bill has remained high at 75.7 per cent of total expenditure for the period and
has increased by 36.1 per cent from Kshs.1.27 billion spent in first half of FY 2017/18 to Kshs.1.73 billion in the reporting period.
3. Delay by Fund Administrators of the County Assembly Car & Mortgage Fund, County Executive Car & Mortgage Fund as well as the Bursary Fund to submit financial reports contrary to Section 168 of the PFM Act, 2012.
4. Delay in implementation of development activities during first half of FY 2018/19. The County spent Kshs.190.49 million on development projects which represents 9.8 per cent of the annual development

247
COUNTY GOVERNMENTS BUDGET IMPLEMENTATION REVIEW REPORT FOR THE FIRST HALF OF FY2018/19
budget of Kshs.1.95 billion.The County should implement the following recommendations in order to improve budget execution;
1. The County should liaise with the National Treasury to ensure that funds allocated to the County are released in a timely manner in line with the CARA, 2018.
2. The County Public Service Board should establish an optimal staffing structure to ensure a sustainable wage bill.
3. All Fund Administrators should submit quarterly financial statements in line with Section 168 of the PFM Act, 2012.
4. The County should identify and address issues that caused delay in implementation of development projects.
3.35 Nyandarua County
3.35.1 Overview of the FY 2018/19 BudgetThe County’s Approved Budget for FY 2018/19 was Kshs.6.32 billion, comprising of Kshs.4.22 billion (66.7 per cent) and Kshs.2.10 billion (33.3 per cent) allocation for recurrent and development expenditure respectively.
To finance the budget, the County expects to receive Kshs.4.93 billion (78 per cent) as equitable share of revenue raised nationally, Kshs.979.84 million (15.5 per cent) as total conditional grants (CARA), Kshs.70 million (1.1 per cent) as other conditional grants not contained in the CARA, 2018, and generate Kshs.410 million (6.5 per cent) from own source.
Figure 3.136: Nyandarua County Sources of Budget Financing in FY 2018/19
Source: Nyandarua County Treasury
The conditional grants contained in the CARA, 2018 consist of; Kshs.50 million (5.5 per cent) for Transforming Health Systems for Universal Care Project, Kshs.117 million (12.9 per cent) from IDA (World Bank) for Kenya Climate Smart Agriculture Project, Kshs.43.07 million (4.7 per cent) from IDA (World Bank) credit for Kenya Devolution Support Programme “Level 1 grant”, Kshs.135.54 million (14.9 per cent) from IDA (World Bank ) credit for Kenya Urban Support Project, Kshs.16 million (1.8 per cent) grant from DANIDA for Universal Healthcare to Devolved System Programme, Kshs.45 million (4.9 per cent) as grant from EU for Instruments for Devolution Advice and Support- IDEAS), Kshs.121 million (13.3 per cent) Supplement for Construction of County Headquarters, Kshs.12.74 million (1.4 per cent) Compensation for User Fees
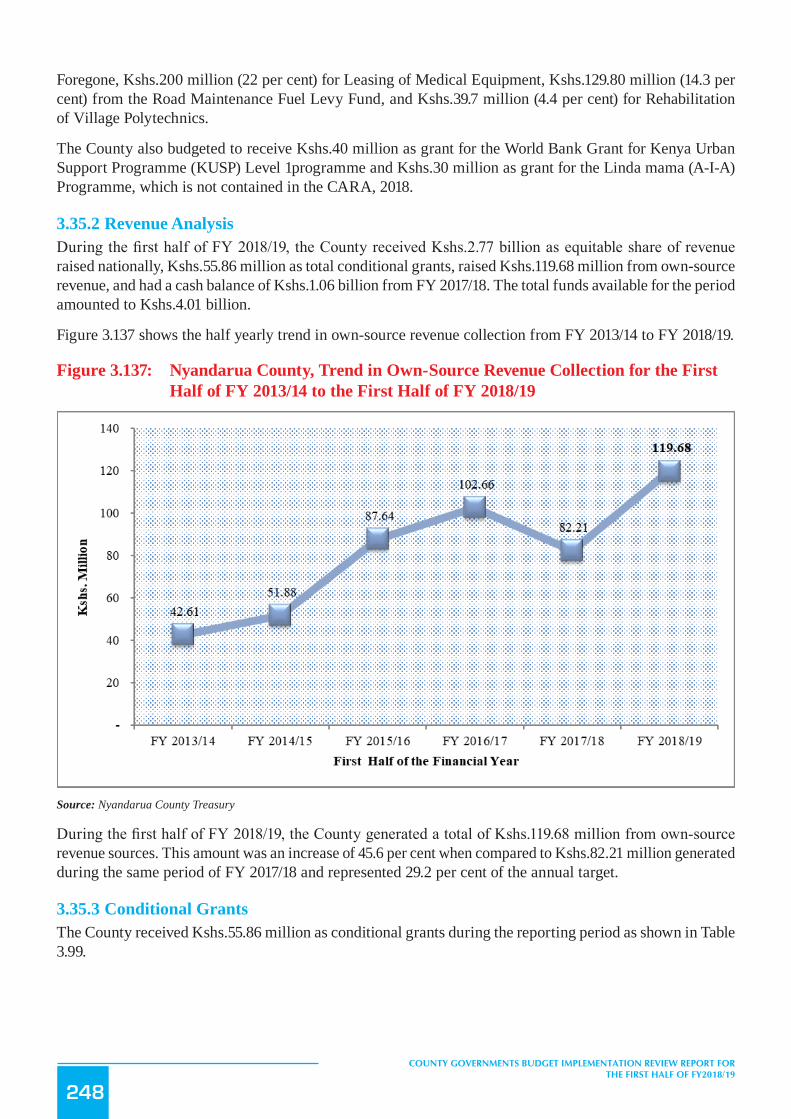
248
COUNTY GOVERNMENTS BUDGET IMPLEMENTATION REVIEW REPORT FOR THE FIRST HALF OF FY2018/19
Foregone, Kshs.200 million (22 per cent) for Leasing of Medical Equipment, Kshs.129.80 million (14.3 per cent) from the Road Maintenance Fuel Levy Fund, and Kshs.39.7 million (4.4 per cent) for Rehabilitation of Village Polytechnics.
The County also budgeted to receive Kshs.40 million as grant for the World Bank Grant for Kenya Urban Support Programme (KUSP) Level 1programme and Kshs.30 million as grant for the Linda mama (A-I-A) Programme, which is not contained in the CARA, 2018.
3.35.2 Revenue AnalysisDuring the first half of FY 2018/19, the County received Kshs.2.77 billion as equitable share of revenue raised nationally, Kshs.55.86 million as total conditional grants, raised Kshs.119.68 million from own-source revenue, and had a cash balance of Kshs.1.06 billion from FY 2017/18. The total funds available for the period amounted to Kshs.4.01 billion.
Figure 3.137 shows the half yearly trend in own-source revenue collection from FY 2013/14 to FY 2018/19.
Figure 3.137: Nyandarua County, Trend in Own-Source Revenue Collection for the First Half of FY 2013/14 to the First Half of FY 2018/19
Source: Nyandarua County Treasury
During the first half of FY 2018/19, the County generated a total of Kshs.119.68 million from own-source revenue sources. This amount was an increase of 45.6 per cent when compared to Kshs.82.21 million generated during the same period of FY 2017/18 and represented 29.2 per cent of the annual target.
3.35.3 Conditional GrantsThe County received Kshs.55.86 million as conditional grants during the reporting period as shown in Table 3.99.

249
COUNTY GOVERNMENTS BUDGET IMPLEMENTATION REVIEW REPORT FOR THE FIRST HALF OF FY2018/19
Table 3.99: Nyandarua County, Conditional Grants/Loans Received in the First Half of FY 2018/19
S/No. Grants/LoansAnnual Alloca-tion per CARA,
2018 (Kshs)
Annual Budget Al-location for FY 2018/19
(Kshs)
Actual receipts in First Half of FY 2018/19
(in Kshs.)
Actual Receipts as Percentage of Annual
Allocation (%)
Grants contained in CARA,2018
1Supplement for Construction of County Headquar-ters
121,000,000 121,000,000 - -
2 Compensation for User Fee Foregone 12,735,922 12,735,922 - -
3 Leasing of Medical Equipment 200,000,000 200,000,000 - -
4 Road Maintenance Fuel Levy 129,797,341 129,797,341 32,641,949 25.1
5 Rehabilitation of Village Polytechnics 39,700,000 39,700,000 5,798,328 15.1
6Transforming Health Systems for Universal Care Project (WB)
50,000,000 50,000,000 17,240,363 34.5
7 Kenya Climate Smart Agriculture Project (KCSAP) 117,000,000 117,000,000 - -
8Kenya Devolution Support Project (KDSP) “Level 1 grant”
43,069,316 43,069,316 - -
9 Kenya Urban Support Project (KUSP) 135,543,400 135,543,400 135,543,400 100
10 DANIDA Grant 15,997,500 15,997,500 - -
11 EU Grant 45,000,000 45,000,000 - -
Sub Total 909,843,479 909,843,479 55,860,640 6.1
Other Grants
12World Bank Grant for Kenya Urban Support Pro-gramme (KUSP) Level 1
41,200,000 40,000,000 - -
13 Linda mama (A-I-A) - 30,000,000 - -
Sub Total - 70,000,000 - -
Total 909,843,479 979,843,479 55,860,640 5.7
Source: Nyandarua County Treasury
Analysis of the revenue from conditional grants indicate that, the County received the highest percentage of receipts to annual allocation from the Kenya Urban Support project, EU grant for IDEAS and the DANIDA grant. The receipts accounted for 100 per cent, 43.8 per cent and 34.6 per cent of annual allocation respectively.
3.35.4 Exchequer IssuesTo finance implementation of the budget, the Controller of Budget approved withdrawal of Kshs.2.21 billion from the CRF account. The withdrawals represented 34.9 per cent of the Approved Budget and translate to an increase of 56.9 per cent from Kshs.1.41 billion approved in the first half of FY 2017/18. This amount comprised of Kshs.1.83 billion (82.9 per cent) to fund recurrent expenditure and Kshs.376.15 million (17.1 per cent) for development activities.
3.35.5 Overall Expenditure ReviewThe County government spent a total of Kshs.1.67 billion on both recurrent and development activities. This expenditure represented 75.5 per cent of the total funds released from the CRF account and was a increase of 22.4 per cent from Kshs.1.36 billion spent in the first half of FY 2017/18. The expenditure excluded outstanding commitments as at 31st December, 2018, which amounted to Kshs.27.51 million for development activities and Kshs.189.32 million for recurrent expenditure.

250
COUNTY GOVERNMENTS BUDGET IMPLEMENTATION REVIEW REPORT FOR THE FIRST HALF OF FY2018/19
Expenditure on recurrent activities amounted to Kshs.1.51 billion while that on development activities was Kshs.150.90 million. The recurrent expenditure was 82.7 per cent of the funds released for recurrent activities, while development expenditure was 40.1 per cent of funds released for development activities.
The recurrent expenditure represented 35.9 per cent of the annual recurrent budget and was an increase from 23.9 per cent recorded in the first half of FY 2017/18. Development expenditure recorded an absorption rate of 7.2 per cent, while there was no expenditure on development activities in the first half of FY 2017/18. Figure 3.138 presents a comparison between the total expenditure in the first half of FY 2018/19 and the first half of FY 2017/18.
Figure3.138: NyandaruaCounty,ExpenditurebyEconomicClassification
Source: Nyandarua County Treasury
3.35.6 Analysis of Recurrent ExpenditureThe total recurrent expenditure of Kshs.1.51 billion comprised of Kshs.1.01 billion (66.9 per cent) incurred on personnel emoluments and Kshs.501.46 million (33.1 per cent) on operations and maintenance as shown in Figure 3.138.
Expenditure on personnel emoluments represented a decrease of 2.2 per cent compared to the first half of FY 2017/18 when the County spent Kshs.1.04 billion, and was 60.8 per cent of total expenditure for the period. Figure 3.139 shows a summary of operations and maintenance expenditure by major categories.

251
COUNTY GOVERNMENTS BUDGET IMPLEMENTATION REVIEW REPORT FOR THE FIRST HALF OF FY2018/19
Figure 3.139: Nyandarua County, Operations and Maintenance Expenditure by Major Categories in the First Half of FY 2018/19
Source: Nyandarua County Treasury
The County spent Kshs.20.82 million on MCAs’ committee sitting allowances for the 40 MCAs against the annual budget allocation of Kshs.57.22 million. This amount represented an increase of 319.1 per cent compared to Kshs.4.97 million spent in a similar period of FY 2017/18. The average monthly sitting allowance translated to Kshs.86,741 per MCA against the SRC’s recommended monthly ceiling of Kshs.124,800.
Expenditure on domestic travel amounted to Kshs.108.07 million and comprised of Kshs.39.54 million spent by the County Assembly and Kshs.68.54 million spent by the County Executive and represented 7.1 per cent of total recurrent expenditure.
3.35.7 Development ExpenditureThe total development expenditure of Kshs.150.90 million represented 7.2 per cent of the annual development budget of Kshs.2.10 billion. Table 3.100 provides a summary of development projects with the highest expenditure in the first half of the financial year.

252
COUNTY GOVERNMENTS BUDGET IMPLEMENTATION REVIEW REPORT FOR THE FIRST HALF OF FY2018/19
Table 3.100: Nyandarua County, List of Development Projects with the Highest Expenditure in the FY 2018/19
S/No. Project Name Project Budget (Kshs.)Project Expenditure in
First Half of FY 2018/19 (Kshs.)
Absorption Rate (%)
1 Fuel Levy Fund 129,797,341 25,712,452 19.82 Construction of an Office Block 186,000,000 20,016,489 10.83 Number 3 bridge 4,000,000 4,000,000 100.04 Mugoiri Rd 2,500,000 2,500,000 100.05 Nandarasi-Kitriri sub-location assorted Road 3,000,000 2,435,030 81.26 Baraka Rd 2,000,000 2,000,000 100.0
7 MC Dan Rd 2,500,000 1,984,160 79.4
8 JJ Davis-Blue City 3,000,000 1,981,570 66.1
9 Flyover-Kento Rd 1,900,000 1,900,000 100.0
10 AIC Kangodo Rd 2,000,000 1,845,304 92.311 Kayole Wakagwa Rd 1,900,000 1,800,000 94.7
Source: Nyandarua County Treasury
3.35.8 Budget Performance by County DepartmentTable 3.101 shows a summary of budget estimates and budget performance by department in the first half of FY 2018/19.
Table 3.101: Nyandarua County, Budget Performance by Department
Department
Annual Budget Allo-cation in FY 2018/19
(Kshs. Million)
Exchequer Issues in First Half of FY 2018/19 (Kshs. Mil-lion)
Expenditure in First Half of FY 2018/19
(Kshs. Million)
Expenditure to Exchequer
Issues (%)
Absorption Rate (%)
Rec Dev Rec Dev Rec Dev Rec Dev Rec Dev
Transport, Energy & Public Works
61.99 777.85 27.86 132.84 34.17 126.01 122.6 94.9 55.1 16.2
Agriculture Livestock & Fisheries
91.00 236.78 15.39 82.88 11.61 - 75.5 - 12.8 -
County Assembly 643.47 186.00 300.25 20.02 291.47 20.02 97.1 100.0 45.3 10.8
County Attorney 8.98 1.00 0.84 - 1.20 - 143.6 - 13.4 -
County Public Service Board
10.23 - 4.68 - 2.28 - 48.6 - 22.3 -
Education, Gender, Youth, Culture and Social Services
74.59 107.50 12.15 - 13.97 - 114.9 - 18.7 -
Finance & Economic De-velopment
475.96 - 348.05 - 84.71 -
Governor’s Office & Ser-vice Delivery
111.59 - 42.80 - 44.41 - 103.7 - 39.8 -
Health Services 597.01 128.45 94.38 4.87 60.66 4.87 64.3 100 10.2 3.8
Industrialization Cooper-atives, Trade & Enterprise Development
23.22 147.07 7.22 - 4.33 - 60.0 - 18.7 -
Lands, Housing & Physical Planning
62.25 252.59 9.71 135.54 7.59 - 78.1 - 12.2 -

253
COUNTY GOVERNMENTS BUDGET IMPLEMENTATION REVIEW REPORT FOR THE FIRST HALF OF FY2018/19
Department
Annual Budget Allo-cation in FY 2018/19
(Kshs. Million)
Exchequer Issues in First Half of FY 2018/19 (Kshs. Mil-lion)
Expenditure in First Half of FY 2018/19
(Kshs. Million)
Expenditure to Exchequer
Issues (%)
Absorption Rate (%)
Rec Dev Rec Dev Rec Dev Rec Dev Rec Dev
Public Administration & ICT
37.73 - 11.11 - 9.75 - 87.8 - 25.8 -
The County Secretary 1,920.32 - 924.24 - 890.86 - 96.4 - 46.4 -
Water , Environment, Tour-ism &Natural resources
58.77 210.62 12.64 - 26.71 - 211.2 - 45.4 -
Youth, Sports and Arts 40.16 54.50 18.52 - 30.31 - 163.7 - 75.5 -
Total 4,217.28 2,102.37 1,829.86 376.15 1,514.02 150.90 82.7 40.1 35.9 7.2
Source: Nyandarua County Treasury
Analysis of expenditure by department shows the Department of Transport Energy and Public recorded the highest absorption rate of development budget at 16.2 per cent followed by the County Assembly and the Health Services department at 10.8 per cent and 3.8 per cent respectively the other departments did not incur any development expenditure. The Department of Youth Sports and the Arts had the highest percentage of recurrent expenditure to recurrent budget at 75.5 per cent while the Health Services Department had the lowest at 10.2 per cent.
3.35.9 Key Observations and RecommendationsThe County has made progress in addressing some of the challenges previously identified as affecting budget implementation. Some of the progress made included:
i. Improvement in own-source revenue collection by 45.6 per cent when compared to the same period in FY 2017/18
Despite the above progress, the following challenges continued to hamper effective budget implementation;
1. Delay in disbursement of the equitable share of revenue raised by the National Treasury.2. High wage bill which represented 60.8 per cent of the total expenditure in the reporting period.
The County should implement the following recommendations in order to improve budget execution;
1. The County Treasury should liaise with the National Treasury to ensure that funds allocated to the County are released in line with the CARA, 2018.
2. The County Public Service Board should devise strategies to ensure the wage bill is sustainable.
3.36 Nyeri County
3.36.1 Overview of the FY 2018/19 BudgetThe County’s Approved Supplementary Budget for FY 2018/19 is Kshs.8.50 billion, comprising of Kshs.5.52 billion (65 per cent) and Kshs.2.96 billion (35 per cent) allocation for recurrent and development expenditure respectively.
To finance the budget, the County expects to receive Kshs.5.02 billion (59.1 per cent) as equitable share of revenue raised nationally, Kshs.1.08 billion (12.8 per cent) as total conditional grants, generate Kshs.1 billion (11.8 per cent) from own sources, and Kshs.1.38 billion (16.3 per cent) cash balance from FY 2017/18.

254
COUNTY GOVERNMENTS BUDGET IMPLEMENTATION REVIEW REPORT FOR THE FIRST HALF OF FY2018/19
Figure 3.140: Nyeri County Sources of Budget Financing in FY 2018/19
Source: Nyeri County Treasury
The conditional grants contained in the CARA, 2018 consist of; Kshs.50 million (4.6 per cent) for Transforming Health Systems for Universal Care Project, Kshs.117.0 million (10.8 per cent) from IDA (World Bank) for Kenya Climate Smart Agriculture Project, Kshs.43.74 million (4 per cent) from IDA (World Bank) credit for Kenya Devolution Support Programme “Level 1 grant”, Kshs.276.64 million (25.5 per cent) from IDA (World Bank) as credit for Kenya Urban Support Project, Kshs.16.6 million (1.5 per cent) grant from DANIDA for Universal Healthcare to Devolved System Programme, Kshs.407.86 million (37.5 per cent) to the Nyeri Level-5 Hospital, Kshs.13.7 million (1.3 per cent) as Compensation for User Fees Foregone, Kshs.132.28 million (12.2 per cent) from the Road Maintenance Fuel Levy Fund, and Kshs.28.79 million (2.6 per cent) for Rehabilitation of Village Polytechnics.
3.36.2 Revenue AnalysisDuring the first half of FY 2018/19, the County received Kshs.1.06 billion as equitable share of revenue raised nationally, Kshs.426.76 million as total conditional grants, raised Kshs.331.02 million from own-source revenue, and had a cash balance of Kshs.1.39 billion from FY 2017/18. The total funds available for the period amounted to Kshs.3.2 billion.
Figure 3.141 shows the half yearly trend in own-source revenue collection from FY 2013/14 to FY 2018/19.

255
COUNTY GOVERNMENTS BUDGET IMPLEMENTATION REVIEW REPORT FOR THE FIRST HALF OF FY2018/19
Figure 3.141: Nyeri County, Trend in Own-Source Revenue Collection for the First Half of FY 2013/14 to the First Half of FY 2018/19
Source: Nyeri County Treasury
During the first half of FY 2018/19, the County generated a total of Kshs.331.02 million from own-source revenue. This amount was an increase of 20.7 per cent when compared to Kshs.274.18 million realised during the same period of FY 2017/18 and represented 33.1 per cent of the annual target.
3.36.3 Conditional GrantsThe County received Kshs.426.76 million as conditional grants as shown in Table 3.102.
Table 3.102: Nyeri County, Conditional Grants/Loans Received in the First Half of FY 2018/19
S/No. Grants/Loans Annual Allocation, per CARA, 2018
(Kshs)
Annual Budget Allocation for
FY 2018/19 (Kshs)
Actual Receipts in First Half of FY 2018/19 (Kshs)
Actual Receipts as Percentage
of Annual Allo-cation (%)
A Grants/Loans contained in CARA, 2018
1 Level- 5 Hospitals 407,861,272 407,861,272 20,393,064 5
2 Compensation for User Fee Foregone 13,701,379 13,701,379 -
3 Road Maintenance Fuel Levy Fund 132,277,544 132,277,544 33,719,250 25.5
4 Rehabilitation of Village Polytechnics 28,795,000 28,795,000 - -
5 World Bank-Transforming Health Systems for Universal Care Project
50,000,000 50,000,000 15,081,053 30.2
6 IDA (World Bank) -Kenya Climate Smart Agri-culture Project
117,000,000 117,000,000 40,980,203 35
7 IDA (World Bank) Kenya Devolution Support Programme “Level 1 grant”
117,000,000 117,000,000 40,980,203 35

256
COUNTY GOVERNMENTS BUDGET IMPLEMENTATION REVIEW REPORT FOR THE FIRST HALF OF FY2018/19
S/No. Grants/Loans Annual Allocation, per CARA, 2018
(Kshs)
Annual Budget Allocation for
FY 2018/19 (Kshs)
Actual Receipts in First Half of FY 2018/19 (Kshs)
Actual Receipts as Percentage
of Annual Allo-cation (%)
A Grants/Loans contained in CARA, 2018
8 IDA (World Bank) -Kenya Urban Support Proj-ect
236,639,100 276,639,100 236,639,100 100
9 DANIDA - Universal Healthcare to Devolved System Programme
16,605,000 16,605,000 - -
10 Universal Health Care (UHC) -World Bank - - 79,947,195 -Total 1,086,620,293 1,086,620,293 426,759,864 39.3
Source: Nyeri County Treasury
Analysis of the revenue from conditional grants indicate that, the County received the highest percentage of receipts to annual allocation from the Kenya Urban Support project, EU grant for IDEAS and the DANIDA grant. The receipts accounted for 100 per cent, 43.8 per cent and 34.6 per cent of annual allocation respectively.
3.36.4 Exchequer IssuesTo finance implementation of the budget, the Controller of Budget approved withdrawal of Kshs.2.56 billion from the CRF account. The withdrawals represented 30.1 per cent of the Approved Supplementary Budget and translate to an increase of 34.5 per cent from Kshs1.9 billion approved in the first half of FY 2017/18. This comprised of Kshs.2.27 billion (88.8 per cent) to fund recurrent expenditure and Kshs.285.80 million (11.2 per cent) for development activities.
3.36.5 Overall Expenditure ReviewThe County government spent a total of Kshs.2.51 billion on both recurrent and development activities. This expenditure represented 98.1 per cent of the total funds released from the CRF account and was an increase of 46.5 per cent from Kshs.1.71 billion spent in the first half of FY 2017/18. The expenditure excluded outstanding commitments as at 31st December, 2018, which amounted to Kshs.641.29 million for development activities and Kshs.138.31 million for recurrent expenditure.
Expenditure on recurrent activities amounted to Kshs.2.17 billion while that on development activities was Kshs.335.84 million. The recurrent expenditure was 95.7 per cent of the funds released for recurrent activities, while development expenditure was 117.5 per cent of funds released for development activities.
The recurrent expenditure represented 39.4 per cent of the annual recurrent budget and was an increase from 31.1 per cent recorded in the first half of FY 2017/18. Development expenditure recorded an absorption rate of 11.3 per cent, while there was no expenditure in the first half of FY 2017/18. Figure 3.142 presents a comparison between the total expenditure in the first half of FY 2018/19 and the first half of FY 2017/18.

257
COUNTY GOVERNMENTS BUDGET IMPLEMENTATION REVIEW REPORT FOR THE FIRST HALF OF FY2018/19
Figure3.142: NyeriCounty,ExpenditurebyEconomicClassification
Source: Nyeri County Treasury
3.36.6 Analysis of Recurrent ExpenditureThe total recurrent expenditure of Kshs.2.17 billion comprised of Kshs.1.72 billion (79.2 per cent) incurred on personnel emoluments and Kshs.451.55 million (20.8 per cent) on operations and maintenance as shown in Figure 3.142.
Expenditure on personnel emoluments represented an increase of 31.7 per cent compared to the first half of FY 2017/18 when the County spent Kshs.1.31 billion, and was 68.6 per cent of total expenditure for the period. Figure 3.143 shows a summary of operations and maintenance expenditure by major categories.

258
COUNTY GOVERNMENTS BUDGET IMPLEMENTATION REVIEW REPORT FOR THE FIRST HALF OF FY2018/19
Figure 3.143: Nyeri County, Operations and Maintenance Expenditure by Major Categories in the First Half of FY 2018/19
Source: Nyeri County Treasury
The County spent Kshs.21.45 million on MCAs’ committee sitting allowances for the 45 MCAs against the annual budget allocation of Kshs.80.37 million. This amount represented an increase of 358.7 per cent compared to Kshs.4.68 million spent in a similar period of FY 2017/18. The average monthly sitting allowance translated to Kshs.79,433 per MCA against the SRC’s recommended monthly ceiling of Kshs.124,800.
Expenditure on domestic travel amounted to Kshs.102.58 million and comprised of Kshs.75.66 million spent by the County Assembly and Kshs.26.92 million spent by the County Executive and represented 4.7 per cent of total recurrent expenditure.
3.36.7 Development ExpenditureThe total development expenditure of Kshs.335.84 million represented 11.3 per cent of the annual development budget of Kshs.2.97 billion. Table 3.103 provides a summary of development projects with the highest expenditure in the first half of the financial year.

259
COUNTY GOVERNMENTS BUDGET IMPLEMENTATION REVIEW REPORT FOR THE FIRST HALF OF FY2018/19
Table 3.103: Nyeri County, List of Development Projects with the Highest Expenditure in the FY 2018/19
S/No. Project name Project LocationAnnual Project Bud-get (Kshs.)
Half Year Expendi-ture (Kshs.)
Absorption Rate (%)
1 Recarpeting of Kimathi Way Rware 53,872,650 47,599,480 88
2 Roads improvement Rthegu, Gakawa, Konyu, Mugunda, Rware, Mweiga
45,603,981 45,603,981 100
3 Preparation - Spacial Plan County-wide 29,832,949.00 29,832,949 1004 Purchase of Lime County-wide 18,152,747.00 18,152,747 100
5 Construction-Youth Polytechnic Workshop
Iriani, Kirimukuyu, Kabaru, Aguthi, Mukurwe-ini West, Endarasha
15,458,627 15,458,627 100
6 Construction and Renovation of EDCE Centres
Mweiga, Konyu, Magutu, Kabaru, Ruguru, Kirim-ukuyu, Gikondi, Aguthi, Wamagana, Mukurwe-ini West, Thegu, Rware, Mu-gunda, Rugi, Endarasha, Magutu
15,367,774 15,367,774 100
7 Bus park improvement Karatina & Mukurwe-ini 9,216,826 9,216,826 100
8 Agricultural Materials & Small Equipment
County-wide 6,176,670 6,176,670 100
9 Markets Improvement Nyeri Town & Ihururu 5,189,173 5,189,173 100
10 Supply of Seedlings & Fingerings County-wide 3,248,050 3,248,050 100
Source: Nyeri County Treasury
3.36.8 Budget Performance by County DepartmentTable 3.104 shows a summary of budget estimates and budget performance by department in the first half of FY 2018/19.
Table 3.104: Nyeri County, Budget Performance by Department
Department
Annual Budget Allo-cation in FY 2018/19 (Kshs. Million)
Exchequer Issues in First Half of FY 2018/19 (Kshs. Mil-lion)
Expenditure in First Half of FY 2018/19 (Kshs. Million)
Expenditure to Exchequer Issues (%)
Absorption rate (%)
Rec Dev Rec Dev Rec Dev Rec Dev Rec Dev
Office of the Governor & Deputy Governor
155.68 53.10 70.57 - 42.30 - 59.9 - 27.2 0.0
Office of the County Sec-retary
222.58 15.19 28.64 - 15.32 - 53.5 - 6.9 0.0
Finance and Economic Planning
493.99 381.19 188.50 179.00 153.53 166.17 81.4 92.8 31.1 43.6
Lands, Physical Planning, Housing and Urbanization
52.61 357.55 21.05 - 15.06 0.61 71.6 - 28.6 0.2
Health, Public Health and sanitation
2,449.64 284.55 1,143.71 16.88 1,243.07 3.57 108.7 21.1 50.7 1.3
Gender and Social Services 123.24 20.38 27.78 - 18.91 - 68.1 - 15.3 0.0
County Public Service, Ad-ministration & Youth Affairs
182.57 5.00 78.91 - 80.62 - 102.2 - 44.2 0.0
Agriculture, Livestock and Fisheries
366.28 204.72 131.49 13.00 122.14 15.32 92.9 117.8 33.3 7.5

260
COUNTY GOVERNMENTS BUDGET IMPLEMENTATION REVIEW REPORT FOR THE FIRST HALF OF FY2018/19
Department
Annual Budget Allo-cation in FY 2018/19 (Kshs. Million)
Exchequer Issues in First Half of FY 2018/19 (Kshs. Mil-lion)
Expenditure in First Half of FY 2018/19 (Kshs. Million)
Expenditure to Exchequer Issues (%)
Absorption rate (%)
Rec Dev Rec Dev Rec Dev Rec Dev Rec Dev
Trade, Culture, Tourism & Cooperative Development
62.99 119.37 22.70 - 10.43 - 46.0 - 16.6 0.0
Education, Science and Technology
413.26 163.30 159.58 30.60 104.87 36.53 65.7 119.4 25.4 22.4
Water, Environment & Natural resources
139.55 320.31 50.47 - 52.87 - 104.8 - 37.9 -
County Public Service Board
41.22 - 15.75 - 12.67 - 80.5 - 30.7 -
Transport, Public Works & Infrastructure
158.94 1,046.46 66.48 44.60 38.61 111.93 58.1 251.0 24.3 10.7
County Assembly 659.45 5.00 268.10 1.72 263.10 1.72 98.1 100.0 39.9 34.4
TOTAL 5,522.00 2,976.13 2,273.72 285.80 2,173.52 335.84 95.6 117.5 39.4 11.3
Source: Nyeri County Treasury
Analysis of expenditure by department shows the Department of Finance & Economic Planning recorded the highest absorption rate of development budget at 43.6 per cent followed by the County Assembly at 34.4 per cent. The County Assembly had the highest percentage of recurrent expenditure to recurrent budget at 39.9 per cent while the Office of the County Secretary had the lowest at 6.9 per cent.
3.36.9 Key Observations and RecommendationsThe County has made progress in addressing some of the challenges previously identified as affecting budget implementation. Some of the progress made included:
i. Compliance with Section 116 of the PFM Act, 2012 by ensuring that legislation establishing County Public Funds is gazetted.
ii. Improvement in own-source revenue collection compared to a similar period of FY 2017/18.iii. Improvement in the absorption of development budget compared to a similar period of FY 2017/18.
Despite the above progress, the following challenges continued to hamper effective budget implementation;
1. Failure by the National Treasury to disburse the equitable share of revenue raised nationally as per CARA, 2018.
2. Late submission of financial reports by the County Treasury, which affected timely preparation of budget implementation report contrary to section 166 of the PFM Act, 2012.
The County should implement the following recommendations in order to improve budget execution;
1. The County Treasury should liaise with the National Treasury to ensure that allocated funds are released in a timely manner in line with CARA, 2018.
2. The County Treasury should ensure observance of the government expenditure timelines and put in place mechanisms for adherence with Section 166 of the PFM Act, 2012.
3.37 Samburu County
3.37.1 Overview of the FY 2018/19 BudgetThe County’s Approved Supplementary Budget for FY 2018/19 is Kshs.5.86 billion, comprising of Kshs.3.86 billion (65.8 per cent) and Kshs.2 billion (34.2 per cent) allocation for recurrent and development expenditure respectively.

261
COUNTY GOVERNMENTS BUDGET IMPLEMENTATION REVIEW REPORT FOR THE FIRST HALF OF FY2018/19
To finance the budget, the County expects to receive Kshs.4.43 billion (76 per cent) as equitable share of revenue raised nationally, Kshs.811.22 million (14 per cent) as total conditional grants, generate Kshs.254.03 million (4 per cent) from own source of revenue, andKshs.367.47 million (6 per cent) cash balance from FY 2017/18.
Figure 3.144: Samburu County Expected Sources of Budget Financing in FY 2018/19
Source: Samburu County Treasury
The conditional grants contained in the CARA, 2018 consist of;Kshs.97.14 million (20.5 per cent) for Transforming Health Systems for Universal Care Project, Kshs.140.44 million (29.7 per cent) from IDA (World Bank) as credit for National Agricultural and Rural Inclusive Growth Project, Kshs.39.33 million (8.3 per cent) from IDA (World Bank) as credit for Kenya Devolution Support Programme “Level 1 grant”, Kshs.50 million (10.6 per cent) from IDA (World Bank) as credit for Kenya Urban Support Project, Kshs.12.76 million (2.7 per cent) grant from DANIDA for Universal Healthcare to Devolved System Programme, Kshs.70 million (14.8 per cent) grant from EU for Instruments for Devolution Advice and Support (IDEAS), Kshs.41.2 million (8.7 per cent) from IDA (World Bank) as credit for the Kenya Devolution Support Programme “Level 2 grant”.
3.37.2 Revenue AnalysisDuring the first half of FY 2018/19, the County received Kshs.1.45 billion as equitable share of revenue raised nationally, Kshs.125.72 million as total conditional grants, raised Kshs.174.5 million from own source revenue. The total available funds amounted to Kshs.1.75 billion.
Figure 3.145 shows the half yearly trend in own source revenue collection from the first half FY 2013/14 to the first half of FY 2018/19.

262
COUNTY GOVERNMENTS BUDGET IMPLEMENTATION REVIEW REPORT FOR THE FIRST HALF OF FY2018/19
Figure 3.145: Samburu County, Trend in Own Source Revenue Collection for the First Half from FY 2013/14 to FY 2018/19
Source: Samburu County Treasury
During the first half of FY 2018/19, the County generated a total of Kshs.174.50 million as own-source revenue. The own-source revenue collected during the period represented an increase of 22.7 per cent compared to Kshs.142.2 million realised during the same period of the FY 2017/18 and represented 68.7 per cent of the annual target.
3.37.3 Conditional GrantsThe County received Kshs.125.72 million as conditional grants as shown in Table 3.105.
Table 3.105: Samburu County, Conditional Grants/Loans Received in the First Half of FY 2018/19
S/No GrantsAnnual Allocation
per CARA, 2018 (in Kshs)
Annual Budget Allocation for FY
2018/19 (Kshs)
Actual Receipts in Half Year of FY 2018/19 (in Kshs.)
Actual Receipts as Percentage of Annual Alloca-tion (%)
A Grants Contained in the CARA, 2018
1Agriculture Sector Development Support Pro-gramme (ASDSP)
18,839,203 18,839,203 - -
2Compensation for User Fee Foregone
5,235,578 5,235,578 - -
3 Leasing of Medial Equipment 200,000,000 200,000,000 - -
4 ADSP 22,652,198 - - -
5 Road Maintenance Fuel Levy 116,569,586 116,569,586 46,441,197 39.8
6 Rehabilitation of Village Polytechnics 20,905,000 20,905,000 -

263
COUNTY GOVERNMENTS BUDGET IMPLEMENTATION REVIEW REPORT FOR THE FIRST HALF OF FY2018/19
S/No GrantsAnnual Allocation
per CARA, 2018 (in Kshs)
Annual Budget Allocation for FY
2018/19 (Kshs)
Actual Receipts in Half Year of FY 2018/19 (in Kshs.)
Actual Receipts as Percentage of Annual Alloca-tion (%)
A Grants Contained in the CARA, 2018
8National Agricultural and Rural Inclusive Growth Project (NARIGP)
140,435,163 140,435,163 - -
9Kenya Devolution Support Project (KDSP) “Level 1 grant”
39,330,852 39,330,852 - -
10 Kenya Urban Support Project (KUSP) 50,000,000 50,000,000 50,000,000 100.011 DANIDA Grant 12,757,500 12,757,500 6,378,750 50.0
12 EU Grant 70,000,000 70,000,000 -
13IDA (World Bank) Kenya Urban Support Proj-ect - Urban Institutional Grants
41,200,000 40,000,000 -
Total 835,068,690 811,216,492 125,719,747 15.5
Source: Samburu County Treasury
Analysis of the revenue from conditional grants indicate that, the County received the highest percentage of receipts to annual allocation from the Kenya Urban Support Project, which accounted for 100 per cent of annual allocation.
3.37.4 Exchequer IssuesTo finance the budget, the Controller of Budget approved the withdrawal of Kshs.1.45 billion from the CRF account. The withdrawals represented 27.4 per cent of the Approved Budget and translated to a decrease of 20.1 per cent from Kshs.1.82 billion approved in the first half of FY 2017/18. This comprised of Kshs.1.26 billion (86.7 per cent) to fund recurrent expenditure and Kshs.194 million (13.3 per cent) for development activities.
3.37.5 Overall Expenditure ReviewThe County government spent a total of Kshs.1.39 billion on recurrent and development activities. The total expenditure represented 95.4 per cent of the total funds released from the CRF account and was a decline of 8.7 per cent from Kshs.1.52 billion spent in the first half of FY 2017/18. The expenditure excluded outstanding commitments as at December 31st 2018 which amounted to Kshs.247.67 million for development activities and Kshs.184.08 million for recurrent expenditure.
Expenditure on recurrent activities amounted to Kshs.1.13 billion while Kshs.256.35 million was spent on development activities. The recurrent expenditure was 87.7 per cent of the funds released for recurrent activities, while development expenditure was 132.1 per cent of funds released for development activities.
The recurrent expenditure represented 29.3 per cent of the annual recurrent budget, a decrease from 41.2 per cent recorded in the first half of FY 2017/18. Development expenditure recorded an absorption rate of 12.8 per cent, which was a decrease from 13.7 per cent attained in the first half of FY 2017/18. Figure 3.146 presents a comparison between the total expenditure in the first half of FY 2018/19 and the first half of the FY 2017/18.

264
COUNTY GOVERNMENTS BUDGET IMPLEMENTATION REVIEW REPORT FOR THE FIRST HALF OF FY2018/19
Figure3.146: SamburuCounty,ExpenditurebyEconomicClassification
Source: Samburu County Treasury
3.37.6 Analysis of Recurrent ExpenditureThe total recurrent expenditure of Kshs.1.13 billion comprised of Kshs.912.22 billion (80.6 per cent) incurred on personnel emoluments and Kshs.218.87 million (19.4 per cent) on operations and maintenance as shown in Figure 3.146.
Expenditure on personnel emoluments represented an increase of 41.3 per cent compared to the first half of FY 2017/18 when the County spent Kshs.645.68 million, and was 65.7 per cent of total expenditure in the first half of FY 2018/19. Figure 3.147 shows a summary of operations and maintenance expenditure by major categories.

265
COUNTY GOVERNMENTS BUDGET IMPLEMENTATION REVIEW REPORT FOR THE FIRST HALF OF FY2018/19
Figure 3.147: Samburu County, Operations and Maintenance Expenditure by Major Categories in the First Half of FY 2018/19
Source: Samburu County Treasury
The County spent Kshs.18.59 million to cater for the MCAs’ committee sitting allowances for the 28 MCAs against the annual budget allocation of Kshs.25.47 million. This represented a decline of 32.9 per cent compared to Kshs.27.69 million spent in a similar period of FY 2017/18. The average monthly sitting allowance translated to Kshs.110,631 per MCA against the SRC’s recommended monthly ceiling of Kshs.124,800.
Expenditure on domestic travel amounted to Kshs.56.02 million and comprised of Kshs.17.12 million spent by the County Assembly and Kshs.38.90 million spent by the County Executive. This represented 5per cent of total recurrent expenditure and was a decrease of 9.2 per cent compared to Kshs.61.71 million spent in the first half of FY 2017/18.
3.37.7 Development ExpenditureThe total development expenditure of Kshs.256.35 million represented 12.8 per cent of the annual development budget of Kshs.1.93 billion. Table 3.106 provides a summary of development projects with the highest expenditure in the first half of the financial year.

266
COUNTY GOVERNMENTS BUDGET IMPLEMENTATION REVIEW REPORT FOR THE FIRST HALF OF FY2018/19
Table 3.106: Samburu County, List of Development Projects with the Highest Expenditure in the FY 2018/19
S/No. Project Name Project Budget (Kshs.)Project Expenditure in
First Half of FY 2018/19 (Kshs.)
Absorption Rate (%)
1 Residential Buildings (including hostels) 10,761,338 2,988,834 27.8
2 Non-Residential Buildings (offices, schools, hospi-tals, etc.)
242,021,549 29,808,466 12.3
3 Construction of Buildings 275,569,634 34,496,604 12.5
4 Major Roads 68,000,000 16,710,429 24.6
5 Access Roads 144,200,000 21,534,500 14.9
6 Construction of Roads 97,500,000 18,560,858 19.0
7 Bridges Constructed 23,009,174 8,165,625 35.5
8 Other Infrastructure and Civil Works 507,674,244 78,413,520 15.4
9 Purchase of Medical and Dental Equipment 236,558,825 28,245,648 11.9
10 Purchase of ICT Networking and Communication Equipment
46,160,890 11,455,464 24.8
Source: Samburu County Treasury
3.37.8 Budget Performance by County DepartmentTable 3.107 shows a summary of budget estimates and budget performance by department in the first half of FY 2018/19.
Table 3.107: Samburu County, Budget Performance by Department
Department
Annual Budget Allo-cation in FY 2018/19
(Kshs. Million)
Exchequer Issues in First Half of FY 2018/19 (Kshs. Mil-lion)
Expenditure in First Half of FY 2018/19
(Kshs. Million)
Expenditure to Exchequer
Issues (%)
Absorption Rate (%)
Rec Dev Rec Dev Rec Dev Rec Dev Rec Dev
County Assembly 474.01 75.00 166.81 - 166.81 - 100.0 - 35.2 -
County Executive 420.25 17.90 131.03 - 131.03 7.44 100.0 - 31.2 41.6
Finance & Economic planning 638.60 44.16 161.34 - 161.34 9.49 100.0 - 25.3 21.5
Agriculture, Livestock, Veterinary & Fisheries 327.73 278.83 96.99 28.00 96.99 17.66 100.0 63.1 29.6 6.3
Environment & Natural Resources 171.49 302.16 66.81 32.00 65.16 40.37 97.5 126.2 38.0 13.4
Education, Youth Affairs & Social Development 364.05 175.10 105.70 - 105.70 8.85 100.0 - 29.0 5.1
County Health Services 887.51 342.11 407.57 43.00 407.57 46.54 100.0 108.2 45.9 13.6
Lands, Physical Planning and Ur-ban Development
128.48 126.66 38.37 13.00 21.55 8.79 56.2 67.6 16.8 6.9
County Transport, Public Works and Water Services 116.73 431.74 31.90 53.00 31.35 56.95 98.3 107.5 26.9 13.2
Trade, Tourism, Cooperatives and Enterprise Development 190.94 171.55 53.93 25.00 45.36 53.75 84.1 215.0 23.8 31.3
Culture, Social Services and Gender 136.43 39.69 - - 47.89 6.52 - - 35.1 16.4
TOTAL 3,856.21 2,004.91 1,260.45 194.00 1,131.08 256.35 89.7 132.1 29.3 12.8
Source: Samburu County Treasury

267
COUNTY GOVERNMENTS BUDGET IMPLEMENTATION REVIEW REPORT FOR THE FIRST HALF OF FY2018/19
According to the data from the County Treasury, the Department of Trade, Tourism, Cooperatives and Enterprise Development recorded the highest absorption rate of development budget at 31.3 per cent while the County Assembly did not incur any development expenditure. The County Health Services Department had the highest percentage of recurrent expenditure to recurrent budget at 45.9 per cent while the Department of Lands, Physical Planning and Urban Development had the lowest at 16.8 per cent.
3.37.9 Key Observations and RecommendationsThe County has made progress in addressing some of the challenges previously identified as affecting budget implementation. Some of the progress made included:
i. Improvement in own source revenue collection from Kshs.142.2 million realised in a similar period of FY 2017/18 to Kshs.174.5 million in the reporting period.
ii. Improved internet connectivity, resulting into effective use of IFMIS.
Despite the above progress, the following challenges continued to hamper effective budget implementation;
1. The County’s wage bill has remained high, having increased by 41.3 per cent from Kshs.645.68 million in the first half of FY 2017/18 to Kshs.912.22 million in the period under review.
The County should implement the following recommendations in order to improve budget execution;
1. The County Public Service Board should establish an optimal staffing structure in order to ensure a sustainable wage bill.
3.38 Siaya County
3.38.1 Overview of the FY 2018/19 BudgetThe County’s Approved Budget for FY 2018/19 is Kshs.7.01 billion, comprising of Kshs.4.44 billion (63.4 per cent) and Kshs.2.56 billion (36.6 per cent) allocation for recurrent and development expenditure respectively.
To finance the budget, the County expects to receive Kshs.6.03 billion (86 per cent) as equitable share of revenue raised nationally, Kshs.703.79 million (10 per cent) as total conditional grants and generate Kshs.275 million (3.9 per cent) from own sources of revenue.
Figure 3.148: Siaya County Sources of Budget Financing in FY 2018/19
Source: Siaya County Treasury

268
COUNTY GOVERNMENTS BUDGET IMPLEMENTATION REVIEW REPORT FOR THE FIRST HALF OF FY2018/19
The conditional grants contained in the CARA, 2018 consist of; Kshs.56.76 million (8.1 per cent) for Transforming Health Systems for Universal Care Project, Kshs.117 million (16.6 per cent) from IDA (World Bank) for Kenya Climate Smart Agriculture Project, Kshs.46.08 million (6.5 per cent) from IDA (World Bank) credit for Kenya Devolution Support Programme “Level 1 grant”, Kshs.50 million (7.1 per cent) from IDA (World Bank ) credit for Kenya Urban Support Project, Kshs.18.53 million (2.6 per cent) as grant from DANIDA for Universal Healthcare to Devolved System Programme, Kshs.18.19 million (2.6 per cent) as Compensation for User Fees Foregone, Kshs.200 million (28.4 per cent) for Leasing of Medical Equipment, Kshs.158.73 million (22.6 per cent) from Road Maintenance Fuel Levy, and Kshs.38.5 million (5.5 per cent) for Rehabilitation of Village Polytechnics
3.38.2 Revenue AnalysisDuring the first half of FY 2018/19, the County received Kshs.1.87 billion as equitable share of revenue raised nationally, Kshs.101.11 million as total conditional grants, raised Kshs.63.96 million from own-source revenue, and had a cash balance of Kshs.1.24 billion from FY 2017/18. The total funds available for the period amounted to Kshs.3.27 billion.
Figure 3.149 shows the half yearly trend in own-source revenue collection from FY 2013/14 to FY 2018/19.
Figure 3.149: Siaya County, Trend in Own-Source Revenue Collection for the First Half of FY 2013/14 to the First Half of FY 2018/19
Source: Siaya County Treasury
During the first half of FY 2018/19, the County generated a total of Kshs.63.96 million from own-source revenue sources. This amount was an increase of 56.7 per cent when compared to Kshs.40.82 million realised during the same period of FY 2017/18 and represented 23.3 per cent of the annual target.
3.38.3 Conditional GrantsThe County received Kshs.101.11 million as conditional grants as shown in Table 3.108

269
COUNTY GOVERNMENTS BUDGET IMPLEMENTATION REVIEW REPORT FOR THE FIRST HALF OF FY2018/19
Table 3.108: Siaya County, Conditional Grants/Loans Received in the First Half of FY 2018/19
S/No. GrantsAnnual Allocation per CARA, 2018
(Kshs)
Annual Bud-get Allocation for FY 2018/19
(Kshs)
Actual Receipts in Half Year of FY
2018/19 (in Kshs.)
Actual Receipts as Percentage
of Annual Allo-cation (%)
Grants/Loans contained in CARA, 20181 Leasing of Medical Equipment Grant 200,000,000 200,000,000 - -
2 Conditional Allocation from the Road Maintenance Fuel Levy Fund 158,733,053 158,733,053 - -
3 World Bank Grant for Kenya Climate Smart Agri-culture Project (KCSAP) 117,000,000 117,000,000 38,278,224 32.7
4 World Bank credit for Transforming Health Systems for Universal Care Project 56,758,154 56,758,154 3,569,181 6.3
5 World Bank credit for Kenya Urban Support Project (KUSP) 50,000,000 50,000,000 50,000,000 100
6 World Bank credit for Kenya Devolution Support Project (KDSP) - Level 1 46,076,429 46,076,429 - -
7 Conditional Allocation for Rehabilitation of Youth Polytechnics 38,500,000 38,500,000 - -
8 DANIDA grant - Universal Healthcare for Devolved System Program 18,528,750 18,528,750 9,264,375 50
9 Compensation for User Fees Foregone 18,194,808 18,194,808 - -
Total 703,791,194 703,791,194 101,111,780 14.4
Source: Siaya County Treasury
Analysis of the revenue from conditional grants indicate that, the County received the highest percentage of receipts to annual allocation from the Kenya Urban Support Project, which accounted for 100 per cent, of annual allocation.
3.38.4 Exchequer IssuesTo finance implementation of the budget, the Controller of Budget approved withdrawal of Kshs.2.39 billion from the CRF account. The withdrawals represented 34.1 per cent of the Approved Budget and translate to an increase of 68 per cent from Kshs.1.42 billion approved in the first half of FY 2017/18. This amount comprised of Kshs.2.14 billion (89.4 per cent) to fund recurrent expenditure and Kshs.253.5 million (10.6 per cent) for development activities.
3.38.5 Overall Expenditure ReviewThe County government spent a total of Kshs.2.03 billion on both recurrent and development activities. This expenditure represented 84.7 per cent of the total funds released from the CRF account and was an increase of 70.6 per cent from Kshs.1.19 billion spent in the first half of FY 2017/18.
Expenditure on recurrent activities amounted to Kshs.1.96 billion while that on development activities was Kshs.67.88 million. The recurrent expenditure was 91.6 per cent of the funds released for recurrent activities, while development expenditure was 26.8 per cent of funds released for development activities.
The recurrent expenditure represented 44.1 per cent of the annual recurrent budget an increase from 25.2 per cent recorded in the first half of FY 2017/18. Development expenditure recorded an absorption rate of 2.6 per cent, while there was no expenditure on development activities in the first half of FY 2017/18. Figure 3.150 presents a comparison between the total expenditure in the first half of FY 2018/19 and the first half of the FY 2017/18.

270
COUNTY GOVERNMENTS BUDGET IMPLEMENTATION REVIEW REPORT FOR THE FIRST HALF OF FY2018/19
Figure3.150: SiayaCounty,ExpenditurebyEconomicClassification
Source: Siaya County Treasury
3.38.6 Analysis of Recurrent ExpenditureThe total recurrent expenditure of Kshs.1.96 billion comprised of Kshs.1.35 billion (69 per cent) incurred on personnel emoluments and Kshs.607.43 million (31 per cent) on operations and maintenance as shown in Figure 3.150.
Expenditure on personnel emoluments represented an increase of 58.5 per cent compared to the first half of FY 2017/18 when the County spent Kshs.852.11 million, and was 66.7 per cent of total expenditure for the period. Figure 3.151 shows a summary of operations and maintenance expenditure by major categories.

271
COUNTY GOVERNMENTS BUDGET IMPLEMENTATION REVIEW REPORT FOR THE FIRST HALF OF FY2018/19
Figure 3.151: Siaya County, Operations and Maintenance Expenditure by Major Categories in the First Half of FY 2018/19
Source: Siaya County Treasury
The County spent Kshs.24.1 million on MCAs’ committee sitting allowances for the 43 MCAs against the annual budget allocation of Kshs.47.93 million. This amount represented an increase of 647 per cent compared to Kshs.3.23 million spent in a similar period of FY 2017/18. The average monthly sitting allowance translated to Kshs.93,407 per MCA against the SRC’s recommended monthly ceiling of Kshs.124,800.
Expenditure on domestic and foreign travel amounted to Kshs.168.6 million and comprised of Kshs.53.65 million spent by the County Assembly and Kshs.114.95 million spent by the County Executive. This represented 7.5 per cent of total recurrent expenditure.
3.38.7 Development ExpenditureThe total development expenditure of Kshs.67.88 million represented 2.6 per cent of the annual development budget of Kshs.2.57 billion. Table 3.111 provides a summary of development projects with the highest expenditure in the first half of the financial year.
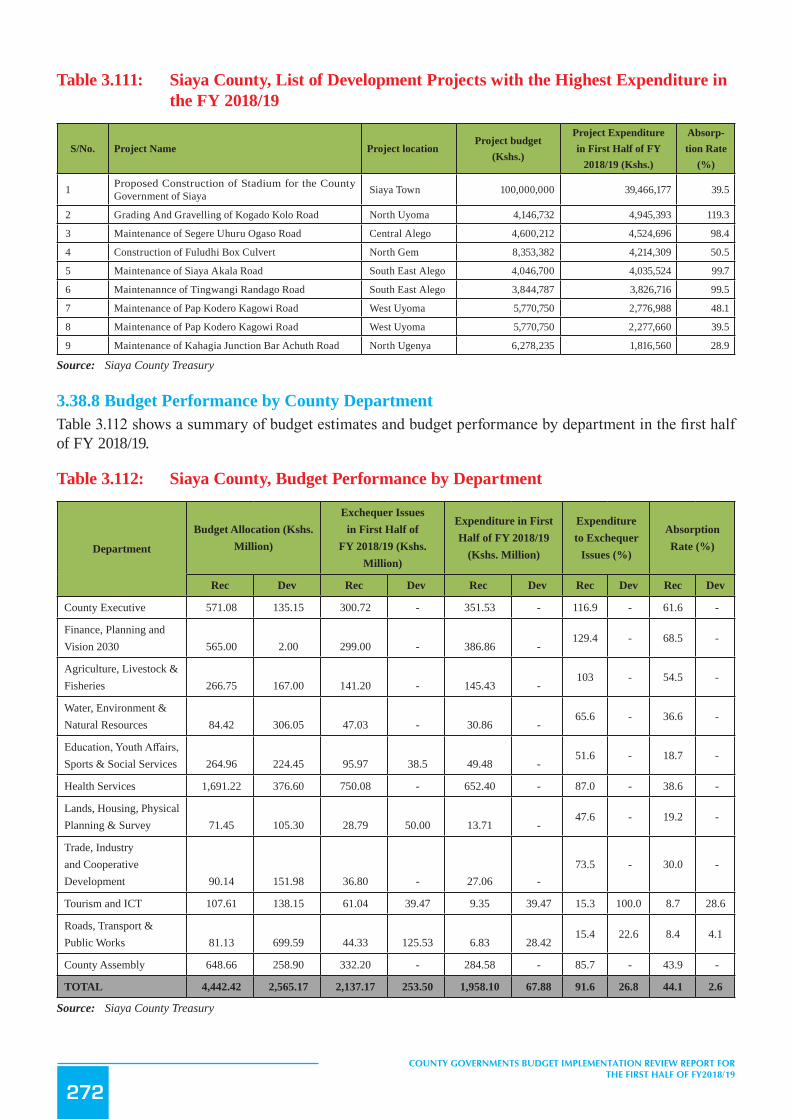
272
COUNTY GOVERNMENTS BUDGET IMPLEMENTATION REVIEW REPORT FOR THE FIRST HALF OF FY2018/19
Table 3.111: Siaya County, List of Development Projects with the Highest Expenditure in the FY 2018/19
S/No. Project Name Project locationProject budget
(Kshs.)
Project Expenditure in First Half of FY
2018/19 (Kshs.)
Absorp-tion Rate
(%)
1 Proposed Construction of Stadium for the County Government of Siaya Siaya Town 100,000,000 39,466,177 39.5
2 Grading And Gravelling of Kogado Kolo Road North Uyoma 4,146,732 4,945,393 119.3
3 Maintenance of Segere Uhuru Ogaso Road Central Alego 4,600,212 4,524,696 98.4
4 Construction of Fuludhi Box Culvert North Gem 8,353,382 4,214,309 50.5
5 Maintenance of Siaya Akala Road South East Alego 4,046,700 4,035,524 99.7
6 Maintenannce of Tingwangi Randago Road South East Alego 3,844,787 3,826,716 99.5
7 Maintenance of Pap Kodero Kagowi Road West Uyoma 5,770,750 2,776,988 48.1
8 Maintenance of Pap Kodero Kagowi Road West Uyoma 5,770,750 2,277,660 39.5
9 Maintenance of Kahagia Junction Bar Achuth Road North Ugenya 6,278,235 1,816,560 28.9
Source: Siaya County Treasury
3.38.8 Budget Performance by County DepartmentTable 3.112 shows a summary of budget estimates and budget performance by department in the first half of FY 2018/19.
Table 3.112: Siaya County, Budget Performance by Department
Department
Budget Allocation (Kshs. Million)
Exchequer Issues in First Half of
FY 2018/19 (Kshs. Million)
Expenditure in First Half of FY 2018/19
(Kshs. Million)
Expenditure to Exchequer
Issues (%)
Absorption Rate (%)
Rec Dev Rec Dev Rec Dev Rec Dev Rec Dev
County Executive 571.08 135.15 300.72 - 351.53 - 116.9 - 61.6 -
Finance, Planning and Vision 2030 565.00 2.00 299.00 - 386.86 -
129.4 - 68.5 -
Agriculture, Livestock & Fisheries 266.75 167.00 141.20 - 145.43 -
103 - 54.5 -
Water, Environment & Natural Resources 84.42 306.05 47.03 - 30.86 -
65.6 - 36.6 -
Education, Youth Affairs, Sports & Social Services 264.96 224.45 95.97 38.5 49.48 -
51.6 - 18.7 -
Health Services 1,691.22 376.60 750.08 - 652.40 - 87.0 - 38.6 -
Lands, Housing, Physical Planning & Survey 71.45 105.30 28.79 50.00 13.71 -
47.6 - 19.2 -
Trade, Industry and Cooperative Development 90.14 151.98 36.80 - 27.06 -
73.5 - 30.0 -
Tourism and ICT 107.61 138.15 61.04 39.47 9.35 39.47 15.3 100.0 8.7 28.6
Roads, Transport & Public Works 81.13 699.59 44.33 125.53 6.83 28.42
15.4 22.6 8.4 4.1
County Assembly 648.66 258.90 332.20 - 284.58 - 85.7 - 43.9 -
TOTAL 4,442.42 2,565.17 2,137.17 253.50 1,958.10 67.88 91.6 26.8 44.1 2.6
Source: Siaya County Treasury

273
COUNTY GOVERNMENTS BUDGET IMPLEMENTATION REVIEW REPORT FOR THE FIRST HALF OF FY2018/19
Analysis of expenditure by department shows the Department of Tourism and ICT recorded the highest absorption rate of development budget at 28.6 per cent followed by the Department of Roads, Transport & Public Works at 4.1 per cent. The Department of Finance, Planning and Vision 2030 had the highest percentage of recurrent expenditure to recurrent budget at 68.5 per cent while the Department of Roads, Transport & Public Works had the lowest at 8.4 per cent.
3.38.9 Key Observations and RecommendationsDuring the period under review, the office identified the following challenges that affected budget implementation:
1. Delay in disbursement of the equitable share of revenue raised by the National Treasury.2. IFMIS connectivity challenges, which slowed down approval of procurement requests and payment
to suppliers.3. Failure to factor in Kshs.1.24 billion cash balance from the FY 2017/18 in the current financial year’s
budget.4. Failure to establish an Internal Audit Committee to oversee financial operations in the County contrary
to Section 155 of the PFM Act, 2012.5. Failure to constitute a County Budget and Economic Forum (CBEF) as per the requirement of Section
137 of the PFM Act, 2012 for consultation in the budget process.
The County should implement the following recommendations in order to improve budget execution;
1. The County Treasury should liaise with the National Treasury to ensure that funds allocated to the County are released in a timely manner in line with CARA, 2018.
2. The County should liaise with the IFMIS Directorate to address IFMIS connectivity challenges.3. The County should prepare a Supplementary Budget and factor in the Kshs.1.24 billion cash balance
from FY 2017/18.4. The County should establish an Internal Audit Committee and also strengthen the internal audit
function in line with Section 155 of the PFM Act, 2012.5. The County should constitute a County Budget and Economic Forum (CBEF) in line with Section 137
of the PFM Act, 2012.
3.39 Taita Taveta County
3.39.1 Overview of the FY 2018/19 BudgetThe County’s Approved Budget for FY 2018/19 is Kshs.5.85 billion, comprising of Kshs.3.87 billion (66.2 per cent) and Kshs.1.97 billion (33.8per cent) allocation for recurrent and development expenditure respectively.
To finance the budget, the County expects to receive Kshs.4.05 billion (59.1 per cent) as equitable share of revenue raised nationally, Kshs.1.18 billion (12.8 per cent) as total conditional grants, generate Kshs.300 million (11.8 per cent) from own revenue sources, and Kshs.311.66 million (16.3 per cent) cash balance from FY 2017/18.

274
COUNTY GOVERNMENTS BUDGET IMPLEMENTATION REVIEW REPORT FOR THE FIRST HALF OF FY2018/19
Figure 3.152: Taita Taveta County Sources of Budget Financing in FY 2018/19.
Source: Taita Taveta County Treasury
The conditional grants contained in the CARA, 2018 consist of; Kshs.50 million (4.8 per cent) for Transforming Health Systems for Universal Care Project, Kshs.117 million (14.3 per cent) from IDA (World Bank) for Kenya Climate Smart Agriculture Project, Kshs.39.33 million (4.8 per cent) from IDA (World Bank) credit for Kenya Devolution Support Programme “Level 1 grant”, Kshs.50 million (6.1 per cent) from IDA (World Bank ) credit for Kenya Urban Support Project, Kshs.13.06 million (1.6 per cent) as grant from DANIDA for Universal Healthcare to Devolved System Programme, Kshs.90 million (11 per cent) grant from EU for Instruments for Devolution Advice and Support (IDEAS), Kshs.400 million (48.7 per cent) from IDA (World Bank) credit for Water & Sanitation Development Project (WSDP), Kshs.41.2 million (5 per cent) from IDA (World Bank) as credit for the Kenya Devolution Support Programme “Level 2 grant”, and Kshs.19.99 million (2.4 per cent) as grant from Sweden for Agriculture sector Development support programme (ASDSP).
In addition, the County also budgeted to receive Kshs.131.73 million (11.1 per cent) from the Road Maintenance Fuel Levy, Kshs.5.3 million (0.4 per cent) as Compensation for User Fees Foregone, Kshs.99.42 million (8.4 per cent) for Rehabilitation of Village Polytechnics and Kshs.136.77 million(11.6 per cent ) as Grant from other Development Partners.
3.39.2 Revenue AnalysisDuring the first half of FY 2018/19, the County received Kshs.1.26 billion as equitable share of revenue raised nationally, Kshs.172.76 million as total conditional grants, raised Kshs.124.25 million from own-source revenue, and had a cash balance of Kshs.311.66 million from FY 2017/18. The total funds available for the period amounted to Kshs.1.85 billion.
Figure 3.153 shows the half yearly trend in own-source revenue collection from FY 2013/14 to FY 2018/19.

275
COUNTY GOVERNMENTS BUDGET IMPLEMENTATION REVIEW REPORT FOR THE FIRST HALF OF FY2018/19
Figure 3.153: Taita Taveta County, Trend in Own-Source Revenue Collection for the First Half of FY 2013/14 to the First Half of FY 2018/19
Source: Taita Taveta County Treasury
During the first half of FY 2018/19, the County generated a total of Kshs.124.25 million from own-source revenue sources. This amount was an increase of 95.1 per cent when compared to Kshs.63.69 million realised during the same period of FY 2017/18, and represented 41.4 per cent of the annual target.
3.39.3 Conditional GrantsThe County received Kshs.172.76 million as conditional grants during the reporting period as shown in Table 3.113.
Table 3.113: Taita Taveta County, Conditional Grants/Loans Received in the First Half of FY 2018/19
S/No Grants/LoansAnnual Allocation, per CARA, 2018
(Kshs)
Annual Budget Allocation for FY
2018/19 (Kshs)
Actual receipts in Half Year of FY
2018/19 (in Kshs.)
Actual Receipts as Percentage of
Annual Allocation (%)
A Grants Contained in the CARA, 2018
1Water and Sanitation Development Project (WSDP)
400,000,000 399,994,798 -
2Kenya Climate Smart Agriculture Project (KCSAP)
117,000,000 117,000,000 40,805,066 34.9
3EU Grant (instruments for Devolution Advice and Support IDEAS)
90,000,000 90,000,000 51,979,709 57.8
4 Kenya Urban Support Project (KUSP) 50,000,000 50,000,000 50,000,000 100
5Transforming Health Systems for Universal Care Project (WB)
50,000,000 50,000,000 9,093,409 18.2
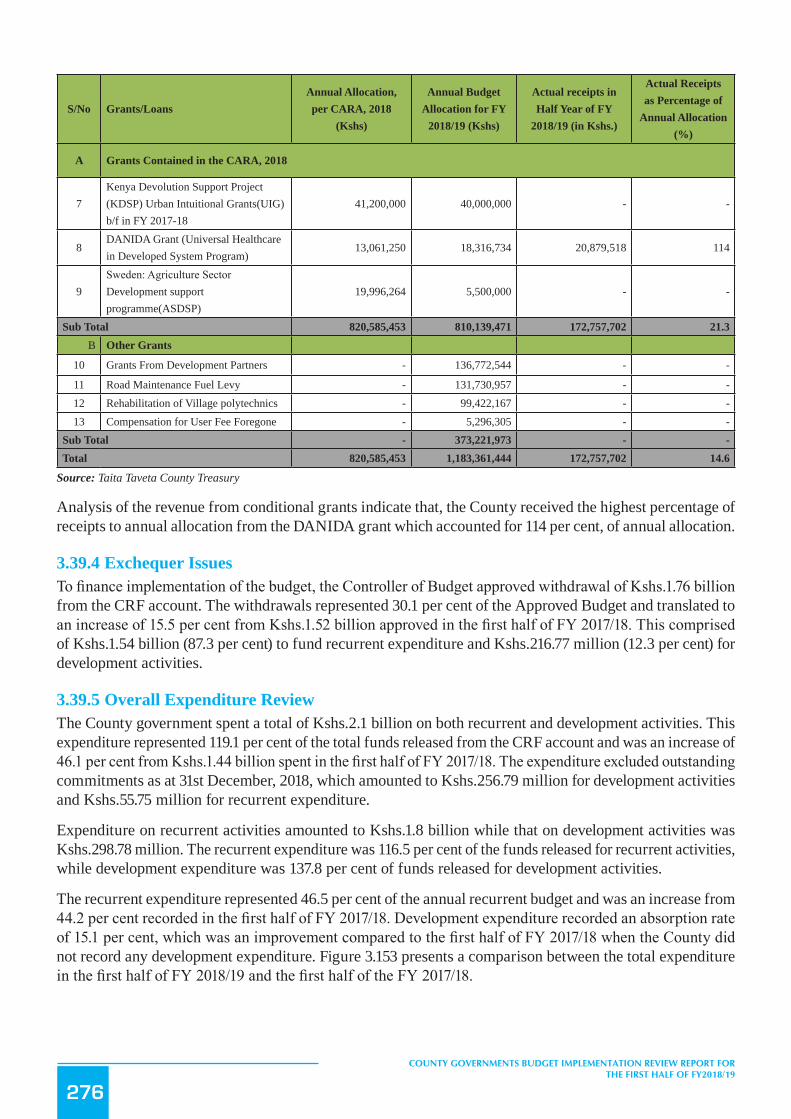
276
COUNTY GOVERNMENTS BUDGET IMPLEMENTATION REVIEW REPORT FOR THE FIRST HALF OF FY2018/19
S/No Grants/LoansAnnual Allocation, per CARA, 2018
(Kshs)
Annual Budget Allocation for FY
2018/19 (Kshs)
Actual receipts in Half Year of FY
2018/19 (in Kshs.)
Actual Receipts as Percentage of
Annual Allocation (%)
A Grants Contained in the CARA, 2018
7Kenya Devolution Support Project (KDSP) Urban Intuitional Grants(UIG) b/f in FY 2017-18
41,200,000 40,000,000 - -
8DANIDA Grant (Universal Healthcare in Developed System Program)
13,061,250 18,316,734 20,879,518 114
9Sweden: Agriculture Sector Development support programme(ASDSP)
19,996,264 5,500,000 - -
Sub Total 820,585,453 810,139,471 172,757,702 21.3B Other Grants
10 Grants From Development Partners - 136,772,544 - -
11 Road Maintenance Fuel Levy - 131,730,957 - -12 Rehabilitation of Village polytechnics - 99,422,167 - -13 Compensation for User Fee Foregone - 5,296,305 - -
Sub Total - 373,221,973 - -Total 820,585,453 1,183,361,444 172,757,702 14.6
Source: Taita Taveta County Treasury
Analysis of the revenue from conditional grants indicate that, the County received the highest percentage of receipts to annual allocation from the DANIDA grant which accounted for 114 per cent, of annual allocation.
3.39.4 Exchequer IssuesTo finance implementation of the budget, the Controller of Budget approved withdrawal of Kshs.1.76 billion from the CRF account. The withdrawals represented 30.1 per cent of the Approved Budget and translated to an increase of 15.5 per cent from Kshs.1.52 billion approved in the first half of FY 2017/18. This comprised of Kshs.1.54 billion (87.3 per cent) to fund recurrent expenditure and Kshs.216.77 million (12.3 per cent) for development activities.
3.39.5 Overall Expenditure ReviewThe County government spent a total of Kshs.2.1 billion on both recurrent and development activities. This expenditure represented 119.1 per cent of the total funds released from the CRF account and was an increase of 46.1 per cent from Kshs.1.44 billion spent in the first half of FY 2017/18. The expenditure excluded outstanding commitments as at 31st December, 2018, which amounted to Kshs.256.79 million for development activities and Kshs.55.75 million for recurrent expenditure.
Expenditure on recurrent activities amounted to Kshs.1.8 billion while that on development activities was Kshs.298.78 million. The recurrent expenditure was 116.5 per cent of the funds released for recurrent activities, while development expenditure was 137.8 per cent of funds released for development activities.
The recurrent expenditure represented 46.5 per cent of the annual recurrent budget and was an increase from 44.2 per cent recorded in the first half of FY 2017/18. Development expenditure recorded an absorption rate of 15.1 per cent, which was an improvement compared to the first half of FY 2017/18 when the County did not record any development expenditure. Figure 3.153 presents a comparison between the total expenditure in the first half of FY 2018/19 and the first half of the FY 2017/18.
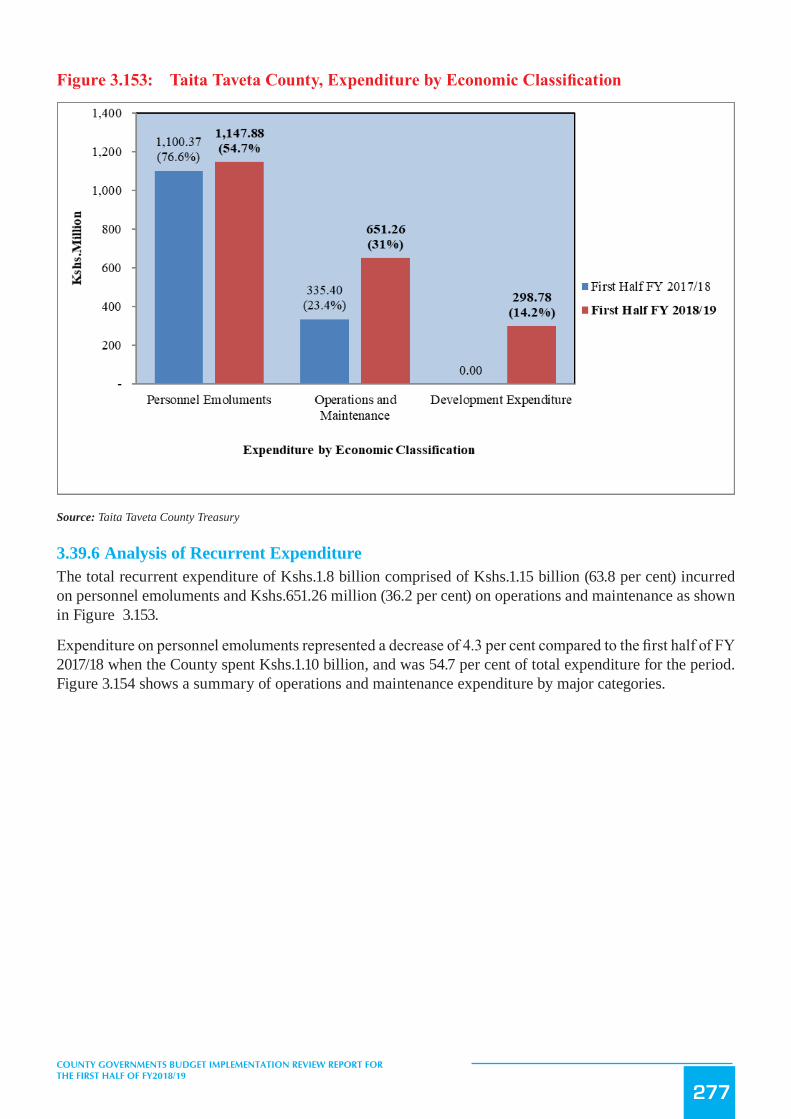
277
COUNTY GOVERNMENTS BUDGET IMPLEMENTATION REVIEW REPORT FOR THE FIRST HALF OF FY2018/19
Figure3.153: TaitaTavetaCounty,ExpenditurebyEconomicClassification
Source: Taita Taveta County Treasury
3.39.6 Analysis of Recurrent ExpenditureThe total recurrent expenditure of Kshs.1.8 billion comprised of Kshs.1.15 billion (63.8 per cent) incurred on personnel emoluments and Kshs.651.26 million (36.2 per cent) on operations and maintenance as shown in Figure 3.153.
Expenditure on personnel emoluments represented a decrease of 4.3 per cent compared to the first half of FY 2017/18 when the County spent Kshs.1.10 billion, and was 54.7 per cent of total expenditure for the period. Figure 3.154 shows a summary of operations and maintenance expenditure by major categories.

278
COUNTY GOVERNMENTS BUDGET IMPLEMENTATION REVIEW REPORT FOR THE FIRST HALF OF FY2018/19
Figure 3.154: Taita Taveta County, Operations and Maintenance Expenditure by Major Categories in the First Half of FY 2018/19
Source: Taita Taveta County Treasury
The County spent Kshs.16.22 million on MCAs’ committee sitting allowances for the 35 MCAs against the annual budget allocation of Kshs.32.45 million. This amount represented a decline of 7.3 per cent compared to Kshs.17.49 million spent in a similar period of FY 2017/18. The average monthly sitting allowance translated to Kshs.77,220 per MCA against the SRC’s recommended monthly ceiling of Kshs.124,800.
Expenditure on domestic and foreign travel amounted to Kshs.250.87 million and comprised of Kshs.119.30 million spent by the County Assembly and Kshs.131.57 million spent by the County Executive. This represented 14 per cent of total recurrent expenditure and was an increase of 53.3 per cent compared to Kshs.163.61 million spent in the first half of FY 2017/18.
3.39.7 Development ExpenditureThe total development expenditure of Kshs.298.78 million represented 15.1 per cent of the annual development budget of Kshs.1.98 billion. Table 3.114 provides a summary of development projects with the highest expenditure in the first half of the financial year.

279
COUNTY GOVERNMENTS BUDGET IMPLEMENTATION REVIEW REPORT FOR THE FIRST HALF OF FY2018/19
Table 3.114: Taita Taveta County, List of Development Projects with the Highest Expenditure in the FY 2018/19
S/No. Project Name Project LocationProject Budget
(Kshs.)
Project Expenditure in First Half of FY
2018/19 (Kshs.)
Absorption Rate (%)
1 Water Projects & Bore Hole County Wide 158,500,000 27,400,863 17.3
2 Construction and Maintenance of Access Roads County Wide 131,730,957 35,937,249 27.3
3 Refurbishment of County Assembly Headquarter Headquarters 105,000,000 30,309,437 28.9
4 Construction of ECD Classrooms County Wide 100,801,967 33,750,597 33.5
5 VTC Capitation & support programme County Wide 99,422,167 56,925,887 57.3
6 Completion and maintenance of access roads County Wide 85,725,000 35,937,249
41.9
7
Purchase of Artificial Insemination Semen Kit, Vacancies and Certified Crop Seed Headquarters 50,759,706 16,783,422 33.1
8 Purchase of ICT Networking and Communication Equipment Headquarters 23,700,000 1,564,300 6.6
Source: Taita Taveta County Treasury
3.39.8 Budget Performance by County DepartmentTable 3.115 shows a summary of budget estimates and budget performance by department in the first half of FY 2018/19.
Table 3.115: Taita Taveta County, Budget Performance by Department
Department
Annual Budget Allocation in FY
2018/19 (Kshs. Million)
Exchequer Issues in First Half of FY 2018/19 (Kshs. Million)
Expenditure in First Half of FY 2018/19
(Kshs. Million)
Expenditure to Exchequer Issues
(%)
Absorption Rate (%)
Rec Dev Rec Dev Rec Dev Rec Dev Rec Dev
County Assembly 590.00 105.00 220.88 - 349.34 30.31 158.2 - 59.2 28.9
Administration and Devolution
2,268.83 6.00 942.86 0.86 1,014.58 - 107.6 - 44.7 0.0
The Governor’s and Deputy Governor’s Office
111.99 32.70 58.02 4.71 78.91 1.56 136.0 33.1 70.5 4.8
Finance and Economic Planning
231.95 5.00 88.72 0.60 126.49 - 142.6 - 54.5 -
Agriculture, Livestock and Fisheries
45.64 285.74 23.05 51.35 11.49 16.78 49.8 32.7 25.2 5.9
Water and Irrigation 19.92 558.49 9.67 22.82 6.53 27.40 67.5 120.1 32.8 4.9
Education and Libraries 204.15 227.92 61.61 18.64 53.63 90.68 87.0 486.5 26.3 39.8
Health Services 222.76 169.99 94.88 34.75 119.65 42.15 126.1 121.3 53.7 24.8

280
COUNTY GOVERNMENTS BUDGET IMPLEMENTATION REVIEW REPORT FOR THE FIRST HALF OF FY2018/19
Department
Annual Budget Allocation in FY
2018/19 (Kshs. Million)
Exchequer Issues in First Half of FY 2018/19 (Kshs. Million)
Expenditure in First Half of FY 2018/19
(Kshs. Million)
Expenditure to Exchequer Issues
(%)
Absorption Rate (%)
Rec Dev Rec Dev Rec Dev Rec Dev Rec Dev
Trade, Tourism and Cooperative Development
37.06 53.80 13.67 7.75 10.09 24.85 73.8 320.6 27.2 46.2
County Public Service Board
17.30 5.45 - 9.01 - 165.3 - 52.1 -
Public Works, Housing and Infrastructure
27.36 280.76 10.07 46.39 5.51 64.30 54.7 138.6 20.1 22.9
Lands, Environment and Natural Resources
63.79 89.00 6.99 5.61 13.92 0.75 199.1 13.3 21.8 0.8
Mining 9.11 6.70 2.89 1.08 - - - - - -Youth, Gender, Sports, Culture and Social Services
20.45 154.20 5.49 22.20 - - - - - -
TOTAL 3,870.31 1,975.30 1,544.25 216.76 1,799.15 298.78 116.5 137.8 46.5 15.1
Source: Taita Taveta County Treasury
Analysis of expenditure by department shows that the Department of Trade, Tourism and Cooperative Development recorded the highest absorption rate of development budget at 46.2 per cent while the Administration, Finance & Planning, Mining and Department of Youth, Gender, Sports, Culture & Social Services did not incur any development expenditure. The Office of the Governor and Deputy Governor had the highest percentage of recurrent expenditure to recurrent budget at 70.5 per cent while the Department of Mining and the Department of Youth, Gender, Sports, Culture and Social Services did not spend during the reporting period.
3.39.9 Key Observations and RecommendationsThe County has made progress in addressing some of the challenges previously identified as affecting budget implementation. Some of the progress made included:
i. Improvement in own revenue collection by 95.1 per cent from Kshs.63.69 million in the First Half of FY 2017/18 to Kshs.124.25 million in the reporting period.
ii. Improved internet connectivity, which has enhanced effective use of IFMIS.
Despite the above progress, the following challenges continued to hamper effective budget implementation;
1. High wage bill, which accounted for 54.7 per cent of the total expenditure during the reporting period thus constraining funding of other programs.
2. Delay by the County Treasury to submit quarterly financial returns to Office of the Controller of budget Contrary to Section 166 of PFM Act 2012.
3. Non-adherence with Section 136(2) of PFM Act on the requirement to deposit unspent funds at the end of the financial year into the County Revenue Account maintained at the Central Bank of Kenya.
4. Delay by the National Treasury to disburse the equitable share of revenue raised nationally, which affected implementation of the development budget.
The County should implement the following recommendations in order to improve budget execution;
1. The County Public Service Board should develop an optimal staffing structure and device strategies to address the escalating wage bill.
2. The County Treasury should ensure the quarterly returns are submitted in line with Section 166 of the PFM Act, 2012.

281
COUNTY GOVERNMENTS BUDGET IMPLEMENTATION REVIEW REPORT FOR THE FIRST HALF OF FY2018/19
3. The County Treasury and the County Assembly should ensure all unspent funds at the close of a financial year are deposited into the CRF in line with Section 136(2) of the PFM Act 2012.
4. The County Treasury should liaise with the National Treasury to ensure timely disbursement of funds.
3.40 Tana River County
3.40.1 Overview of the FY 2018/19 BudgetThe County’s Approved Budget for FY 2018/19 is Kshs.7.31 billion comprising of Kshs.4.57 billion (62.6 per cent) and Kshs.2.74 billion (37.4per cent) allocation for recurrent and development expenditure respectively.
To finance the budget, the County expects to receive Kshs.5.56 billion (76.0 per cent) as equitable share of revenue raised nationally, Kshs.739.43 million (10.1 per cent) as total conditional grants, generate Kshs.60 million (0.8 per cent) from own source of revenue, and Kshs.952.98 million (13 per cent) cash balance from FY 2017/18.
Figure 3.155: County, Expected Sources of Budget Financing in FY 2018/19
Source: Tana River County Treasury
The conditional grants contained in the CARA, 2018 consist of; Kshs.100 million (12.1 per cent) for Transforming Health Systems for Universal Care Project, (World Bank) Kshs.150 million (18.1 per cent) from IDA (World Bank) for Kenya Climate Smart Agriculture Project, Kshs.44 million (5.3 per cent) from IDA (World Bank) credit for Kenya Devolution Support Programme “Level 1 grant”, Kshs.50 million (6 per cent) from IDA (World Bank ) credit for Kenya Urban Support Project, Kshs.17.92 million (2.2 per cent) grant from DANIDA for Universal Healthcare to Devolved System Programme, Kshs.80 million (9.7 per cent) as grant from EU for Instruments for Devolution Advice and Support (IDEAS), Kshs.80 million (9.7 per cent) EU grant, Kshs.153.57 million (34.7 per cent) from the Road Maintenance Fuel Levy Fund, Kshs.121 million (28.7 per cent) Supplement for Construction of County Headquarters, Kshs.5.68 million (1.3 per cent) Compensation for User Fees Foregone, Kshs.17.92 million (4.2 per cent) being DANIDA grant, and Kshs.24.49 million (5.8 per cent) for Rehabilitation of Village Polytechnics.
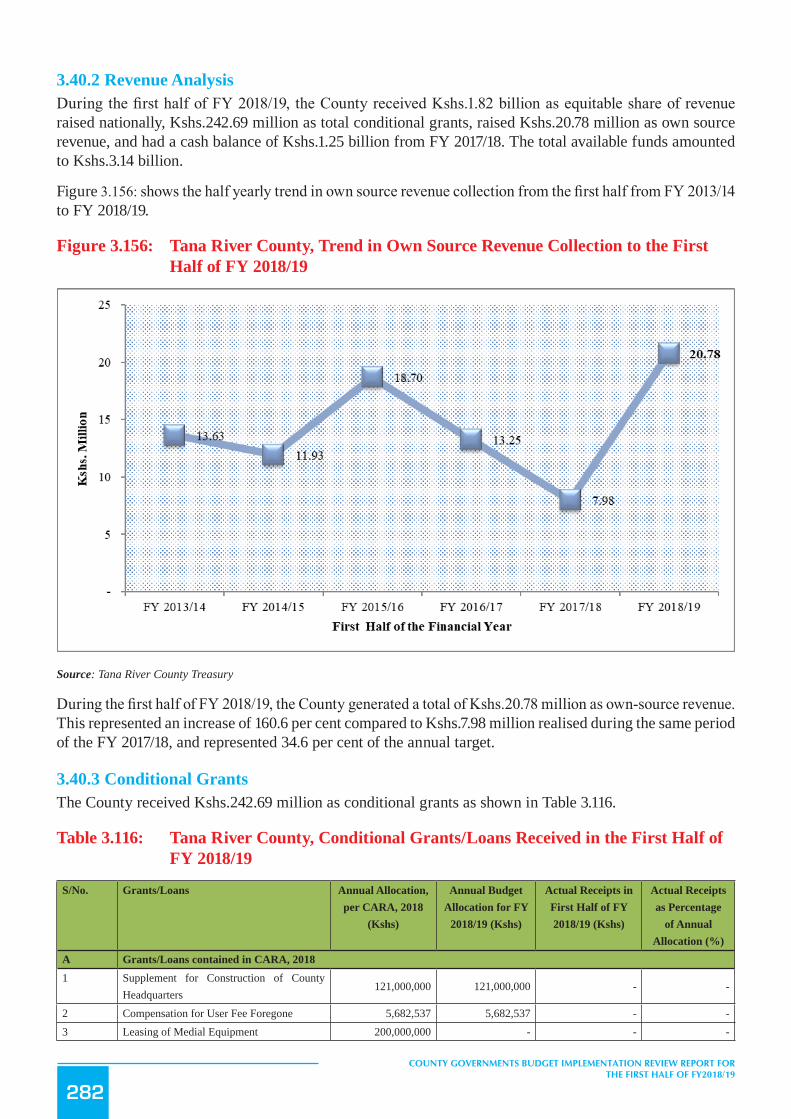
282
COUNTY GOVERNMENTS BUDGET IMPLEMENTATION REVIEW REPORT FOR THE FIRST HALF OF FY2018/19
3.40.2 Revenue AnalysisDuring the first half of FY 2018/19, the County received Kshs.1.82 billion as equitable share of revenue raised nationally, Kshs.242.69 million as total conditional grants, raised Kshs.20.78 million as own source revenue, and had a cash balance of Kshs.1.25 billion from FY 2017/18. The total available funds amounted to Kshs.3.14 billion.
Figure 3.156: shows the half yearly trend in own source revenue collection from the first half from FY 2013/14 to FY 2018/19.
Figure 3.156: Tana River County, Trend in Own Source Revenue Collection to the First Half of FY 2018/19
Source: Tana River County Treasury
During the first half of FY 2018/19, the County generated a total of Kshs.20.78 million as own-source revenue. This represented an increase of 160.6 per cent compared to Kshs.7.98 million realised during the same period of the FY 2017/18, and represented 34.6 per cent of the annual target.
3.40.3 Conditional GrantsThe County received Kshs.242.69 million as conditional grants as shown in Table 3.116.
Table 3.116: Tana River County, Conditional Grants/Loans Received in the First Half of FY 2018/19
S/No. Grants/Loans Annual Allocation, per CARA, 2018
(Kshs)
Annual Budget Allocation for FY
2018/19 (Kshs)
Actual Receipts in First Half of FY 2018/19 (Kshs)
Actual Receipts as Percentage
of Annual Allocation (%)
A Grants/Loans contained in CARA, 20181 Supplement for Construction of County
Headquarters121,000,000 121,000,000 - -
2 Compensation for User Fee Foregone 5,682,537 5,682,537 - -3 Leasing of Medial Equipment 200,000,000 - - -

283
COUNTY GOVERNMENTS BUDGET IMPLEMENTATION REVIEW REPORT FOR THE FIRST HALF OF FY2018/19
S/No. Grants/Loans Annual Allocation, per CARA, 2018
(Kshs)
Annual Budget Allocation for FY
2018/19 (Kshs)
Actual Receipts in First Half of FY 2018/19 (Kshs)
Actual Receipts as Percentage
of Annual Allocation (%)
A Grants/Loans contained in CARA, 2018
4 Road Maintenance Fuel Levy 146,332,034 146,332,034 146,332,034 1005 Rehabilitation of Village Polytechnics 24,490,000 24,490,000 - -6 Transforming Health Systems for Universal
Care Project (WB)100,000,000 100,000,000 5,808,959 5.8
7 Kenya Climate Smart Agriculture Project (KCSAP)
150,000,000 150,000,000 31,585,475 21.5
8 Kenya Devolution Support Project (KDSP) “Level 1 grant”
44,003,842 44,003,842 - -
9 Kenya Urban Support Project (KUSP) 50,000,000 50,000,000 50,000,000 10010 DANIDA Grant 17,921,250 17,921,250 8,960,625 5011 EU Grant 80,000,000 80,000,000 -` -
12 Sweden- Agricultural Sector Development Support Programme (ASDP) II + Bal c/f in FY 2017/18
24,526,177 - - -
13 IDA- Kenya Urban Support Project -Urban Institutional Grant + Bal C/F in FY 2017/18
41,200,000 - - -
Total 1,005,155,840 739,429,663 242,687,093 32.8
Source: Tana River County Treasury
Analysis of revenue from conditional grants in the period under review indicates that, the County received the highest amount from the Road Maintenance Fuel Levy, the Kenya Urban Support Programme and the Kenya Climate Smart Agricultural Project. The receipts accounted for 100 per cent, 100 per cent, and 21.5 per cent of the annual allocation respectively.
3.40.4 Exchequer IssuesTo finance the budget, the Controller of Budget approved the withdrawal of Kshs.2.07 billion from the CRF account. The withdrawals represented 28.3 per cent of the Approved Budget and translated to an increase of 68.2 per cent from Kshs.1.23 billion approved in the first half of FY 2017/18. This comprised of Kshs.1.29 billion (73.7 per cent) to fund recurrent expenditure and Kshs.774.93 million (26.3 per cent) for development activities.
3.40.5 Overall Expenditure ReviewThe County government spent a total of Kshs.1.72 billion on recurrent and development activities. The total expenditure represented 86.3 per cent of the total funds released from the CRF account and was an increase of 70.3 per cent from Kshs.1.04 billion spent in the first half of FY 2017/18. The expenditure excluded outstanding commitments as at December 31st 2018 which amounted to Kshs.156.69 million for development activities and Kshs.101.45 million for recurrent expenditure.
Expenditure on recurrent activities amounted to Kshs.1.33 billion while Kshs.388.16 million was spent on development activities. The recurrent expenditure was 87.2 per cent of the funds released for recurrent activities, while development expenditure was 71.2 per cent of funds released for development activities.
The recurrent expenditure represented 29.1 per cent of the annual recurrent budget, a decrease from 29.2 per cent recorded in the first half of FY 2017/18. Development expenditure recorded an absorption rate of 14.2 per cent, which was an increase from 2.5 per cent attained in the first half of FY 2017/18. Figure 3.157 presents a comparison between the total expenditure in the first half of FY 2018/19 and the first half of the FY 2017/18.

284
COUNTY GOVERNMENTS BUDGET IMPLEMENTATION REVIEW REPORT FOR THE FIRST HALF OF FY2018/19
Figure3.157: TanaRiverCounty,ExpenditurebyEconomicClassification
Source: Tana River County Treasury
3.40.6 Analysis of Recurrent ExpenditureThe total recurrent expenditure of Kshs.1.33 billion comprised of Kshs.750.13 million (56.4 per cent) incurred on personnel emoluments and Kshs.578.93 million (43.6 per cent) on operations and maintenance as shown in Figure 3.157.
Expenditure on personnel emoluments represented an increase of 47.6 per cent compared to the first half of FY 2017/18 when the County spent Kshs.508.3 million, and was 43.7 per cent of total expenditure in the first half of FY 2018/19. Figure 3.158 shows a summary of operations and maintenance expenditure by major categories.

285
COUNTY GOVERNMENTS BUDGET IMPLEMENTATION REVIEW REPORT FOR THE FIRST HALF OF FY2018/19
Figure 3.158: Tana River County, Operations and Maintenance Expenditure by Major Categories in the First Half of FY 2018/19
Source: Tana River County Treasury
118.12
93.95
28.90
13.51 11.917.90 4.98 3.97 2.73 2.46
0
20
40
60
80
100
120
140
Ksh
s. M
illio
n
Major Categories of O&M Expenditure
Source: Tana River County Treasury
The County spent Kshs.7.9 million to cater for the committee sitting allowances for the 23 MCAs against the annual budget allocation of Kshs.27 million. This represented a decrease of 62 per cent compared to Kshs.20.78 million spent in a similar period of FY 2017/18. The average monthly sitting allowance translated to Kshs.57,232 per MCA against the SRC’s recommended monthly ceiling of Kshs.124,800.
Expenditure on domestic travel amounted to Kshs.93.95 million and comprised of Kshs.38.81 million spent by the County Assembly and Kshs.55.14 million spent by the County Executive. This represented 7.1 per cent of total recurrent expenditure.
3.40.7 Development ExpenditureThe total development expenditure of Kshs.388.16 million represented 14.2 per cent of the annual development budget of Kshs.2.74 billion. The County Treasury did not provide a list of development projects undertaken during the reporting period.

286
COUNTY GOVERNMENTS BUDGET IMPLEMENTATION REVIEW REPORT FOR THE FIRST HALF OF FY2018/19
3.40.8 Budget Performance by County DepartmentTable 3.117 shows a summary of budget estimates and budget performance by department in the first half of FY 2018/19.
Table 3.117: Tana River County, Budget Performance by Department
Department
Annual Budget Allocation in FY
2018/19 (Kshs. Million)
Exchequer Issues in First Half of
FY 2018/19 (Kshs. Million)
Expenditure in First Half of FY 2018/19
(Kshs. Million)
Expenditure to Exchequer
Issues (%)
Absorption rate (%)
Rec Dev Rec Dev Rec Dev Rec Dev Rec Dev
County Assembly HQ 509.82 200.00 249.00 19.00 249.43 6.89 100.2 36.3 48.9 3.4Office of the Governor 507.36 - 139.42 - 139.24 - 99.9 - 27.4 -
Finance & Economic Planning
415.68 150.00 53.67 13.26 57.75 2.04 107.6 15.4 13.9 1.4
Public Service, Admin& Public Participation
343.64 66.50 122.05 - 28.38 - 23.3 - 8.3 -
Trade, Tourism, Wildlife, Coop Dev, Weights & Measures
228.84 160.00 31.83 25.81 39.87 25.00 125.2 96.9 17.4 15.6
Agriculture & Rural Development, Lands and Physical Planning, Livestock, Veterinary and Fisheries
410.96 404.74 115.71 85.99 54.55 3.71 47.1 4.3 13.3 0.9
Culture, Gender, Youth, Sports and Social Services
83.80 92.50 35.77 4.75 12.00 3.71 33.5 78.1 14.3 4.0
Education, Vocational Training
408.71 219.99 94.64 98.21 64.07 12.82 67.7 13.1 15.7 5.8
Medical Services, Public Health and Sanitation
1,181.31 200.80 516.62 32.59 516.03 13.64 99.9 41.8 43.7 6.8
County Cohesion & Special Programmes
260.63 10.00 68.27 - 48.45 - 71.0 - 18.6 -
Roads, Transport, Public Works, Housing & Urbanization
113.55 969.72 49.81 265.32 76.83 320.35 154.2 120.7 67.7 33.0
Water, Irrigation, Environment and Natural Resources
109.26 262.40 47.31 - 42.48 - 89.8 - 38.9 -
Total 4,573.56 2,736.65 1,524.11 544.93 1,329.06 388.16 87.2 71.2 29.1 14.2
Source: Tana River County Treasury
According to the data from the County Treasury, the Department of Roads, Transport, Public Works, Housing & Urbanization recorded the highest absorption of development budget at 33 per cent, followed by the Department of Trade, Tourism, Wildlife, Coop Dev, Weights & Measures at 15.6 per cent. The Department of Roads, Transport, Public Works, Housing & Urbanization had the highest percentage of recurrent expenditure to recurrent budget at 67.7 per cent while the Department of Public Service, Admin& Public Participation had the lowest at 8.3 per cent.
3.40.9 Key Observations and RecommendationsThe County has made progress in addressing some of the challenges previously identified as affecting budget implementation. Some of the progress made included:

287
COUNTY GOVERNMENTS BUDGET IMPLEMENTATION REVIEW REPORT FOR THE FIRST HALF OF FY2018/19
i. Improvement in own source revenue collection by 160.6 per cent compared to a similar period in FY 2017/18
ii. Improvement in the absorption of development budget compared to a similar period in FY 2017/18.
Despite the above progress, the following challenges continued to hamper effective budget implementation;
1. Failure by the County Treasury to provide a report on development projects undertaken in the reporting period to the Office of the Controller of Budget.
2. Failure to budget for all conditional grants as per CARA, 2018.The County should implement the following recommendations in order to improve budget execution;
1. The County Treasury should put in mechanisms to ensure that public financial data is kept in an accessible manner for ease of retrieval when requested by oversight institutions.
2. The County should budget for all conditional grants as contained in CARA, 2018.
3.41 Tharaka Nithi County
3.41.1 Overview of the FY 2018/19 BudgetThe County’s Approved Supplementary Budget for FY 2018/19 is Kshs5.72 billion, comprising of Kshs.3.43billion (60 per cent) and Kshs.2.29 billion (40 per cent) allocation for recurrent and development expenditure respectively.
To finance the budget, the County expects to receive Kshs.3.64 billion (63.7 per cent) as equitable share of revenue raised nationally, Kshs.1.03 billion (18 per cent) as total conditional grants, generate Kshs.300 million (5.2 per cent) from own sources, and Kshs.749.93 million (13.1 per cent) cash balance from FY 2017/18.
Figure 3.159: Tharaka Nithi County Sources of Budget Financing in FY 2018/19
Source: Tharaka Nithi County Treasury
The conditional grants include those contained in the CARA, 2018 of; Kshs.50 million (18.7 per cent) for Transforming Health Systems for Universal Care Project, Kshs.117 million (43.7 per cent) from IDA (World Bank) for Kenya Climate Smart Agriculture Project, Kshs.38.54 million (14.4 per cent) from IDA (World

288
COUNTY GOVERNMENTS BUDGET IMPLEMENTATION REVIEW REPORT FOR THE FIRST HALF OF FY2018/19
Bank) credit for Kenya Devolution Support Programme “Level 1 grant”, Kshs.50 million (18.7 per cent) from IDA (World Bank ) credit for Kenya Urban Support Project, Kshs.12.35 million (4.6 per cent) as grant from DANIDA for Universal Healthcare to Devolved System Programme,, Kshs.8.21 million (0.8 per cent) Compensation for User Fees Foregone, Kshs.128.1 million (12.5 per cent) from Road Maintenance Fuel Levy, Kshs.78.21 million (7.6 per cent) for Rehabilitation of Village Polytechnics, Kshs.12.35 million(1.2 per cent) ASDP Grant and Kshs. 453.36 (44.1 per cent) million as other conditional grants.
3.41.2 Revenue AnalysisDuring the first half of FY 2018/19, the County received Kshs.1.12 billion as equitable share of revenue raised nationally, Kshs.102.37 million as total conditional grants, raised Kshs.84.31 million from own-source revenue, and had a cash balance of Kshs.749.93 million from FY 2017/18. The total funds available for the period amounted to Kshs.2.06 billion.
Figure 3.160 shows the half yearly trend in own-source revenue collection from FY 2013/14 to FY 2018/19.
Figure 3.160: Tharaka Nithi County, Trend in Own-Source Revenue Collection for the First Half of FY 2013/14 to the First Half of FY 2018/19
Source: Tharaka Nithi County Treasury
During the first half of FY 2018/19, the County generated a total of Kshs.84.31 million from own-source revenue. This amount was an increase of 131 per cent when compared to Kshs.36.49 million realised during the same period of FY 2017/18 and represented 28.1 per cent of the annual target.
3.41.3 Conditional GrantsThe County received Kshs.102.37 million as conditional grants during the reporting period as shown in Table 3.118.

289
COUNTY GOVERNMENTS BUDGET IMPLEMENTATION REVIEW REPORT FOR THE FIRST HALF OF FY2018/19
Table 3118: Tharaka Nithi County, Conditional Grants/Loans Received in the First Half of FY 2018/19
S/No. Grants/Loans
Annual Allocation per CARA, 2018
Allocation (in Kshs)
Annual Budget Allocation for FY
2018/19 (Kshs)
Actual receipts in Half Year of FY 2018/19 (Kshs.)
Actual Receipts as Percentage of Annual Alloca-tion (%)
A Grants Contained in the CARA, 2018
1Supplement for Construction of County Head-quarters
121,000,000 - - --
2 Compensation for User Fee Foregone 8,218,119 8,218,119 - --
3 Leasing of Medial Equipment 200,000,000 - - -
4 Road Maintenance Fuel Levy 95,901,220 128,101,220 - -
5 Rehabilitation of Village Polytechnics 40,090,000 78,211,638 - -
6Transforming Health Systems for Universal Care Project (WB)
50,000,000 50,000,000 6,636,793 13.3
7National Agricultural and Rural Inclusive Growth Project (NARIGP)
117,000,000 - -
8Kenya Climate Smart Agriculture Project (KCSAP)
117,000,000 117,000,000 39,557,498 33.8
9Kenya Devolution Support Project (KDSP) “Level 1 grant”
38,536,081 77,072,162 - -
10 Kenya Urban Support Project (KUSP) 50,000,000 92,000,000 50,000,000 54.3
11 DANIDA Grant 12,352,500 12,352,500 6,176,250 50.0
12 Other Conditional Grants - 453,361,325 - -
13Agriculture Sector Development Support Pro-gramme
- 12,352,500 - -
Total 850,097,920 1,028,669,464 102,370,541 10.0
Source: Tharaka Nithi County Treasury
Analysis of the revenue from conditional grants indicates that, the County received disbursements from the Kenya Urban Support Project, grant from DANIDA and grant from Kenya Climate Smart Agriculture Project. These receipts accounted for 54.0 per cent, 50 per cent, and 33.8 per cent of the annual allocation respectively.
3.41.4 Exchequer IssuesTo finance implementation of the budget, the Controller of Budget approved withdrawal of Kshs.1.86 billion from the CRF account. The withdrawals represented 32.5 per cent of the Supplementary Budget and translate to an increase of 14.9 per cent from Kshs.1.36 billion approved in the first half of FY 2017/18. This comprised of Kshs.1.52 billion (82 per cent) to fund recurrent expenditure and Kshs.333.71 million (18 per cent) for development activities.
3.41.5 Overall Expenditure ReviewThe County government spent a total of Kshs.1.69 billion on both recurrent and development activities. This expenditure represented 91.2 per cent of the total funds released from the CRF account and was an increase of 56 per cent from Kshs.1.11 billion spent in the first half of FY 2017/18. The expenditure excluded outstanding commitments as at 31st December, 2018, which amounted to Kshs.99.42 million for development activities and Kshs.84.84 million for recurrent expenditure.

290
COUNTY GOVERNMENTS BUDGET IMPLEMENTATION REVIEW REPORT FOR THE FIRST HALF OF FY2018/19
Expenditure on recurrent activities amounted to Kshs.1.36 billion while that on development activities was Kshs.326.04 million. The recurrent expenditure was 89.8 per cent of the funds released for recurrent activities, while development expenditure was 97.7 per cent of funds released for development activities.
The recurrent expenditure represented 39.9 per cent of the annual recurrent budget and was an increase from 38.8 per cent recorded in the first half of FY 2017/18. Development expenditure recorded an absorption rate of 14.2 per cent, which was an improvement compared to the first half of FY 2017/18 when there was no development expenditure. Figure3.161 presents a comparison between the total expenditure in the first half of FY 2018/19 and the first half of the FY 2017/18.
Figure3.161: TharakaNithiCounty,ExpenditurebyEconomicClassification
Source: Tharaka Nithi County Treasury
3.41.6 Analysis of Recurrent ExpenditureThe total recurrent expenditure of Kshs.1.36 billion comprised of Kshs.1.05 billion (77.1 per cent) incurred on personnel emoluments and Kshs.313.83 million (22.9 per cent) on operations and maintenance as shown in Figure 3.161.
Expenditure on personnel emoluments represented a decrease of 0.1 per cent compared to the first half of FY 2017/18 when the County spent Kshs.1.06 billion, and was 62.2 per cent of total expenditure for the period. Figure 3.162:shows a summary of operations and maintenance expenditure by major categories.
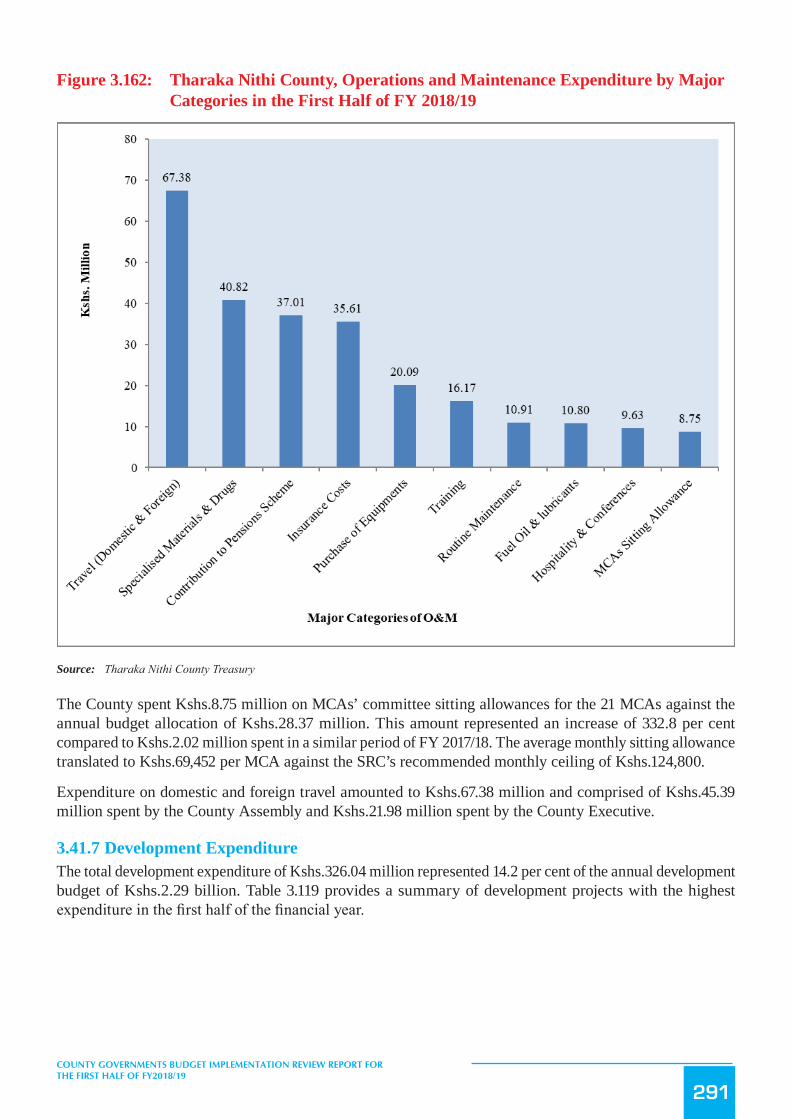
291
COUNTY GOVERNMENTS BUDGET IMPLEMENTATION REVIEW REPORT FOR THE FIRST HALF OF FY2018/19
Figure 3.162: Tharaka Nithi County, Operations and Maintenance Expenditure by Major Categories in the First Half of FY 2018/19
Source: Tharaka Nithi County Treasury
The County spent Kshs.8.75 million on MCAs’ committee sitting allowances for the 21 MCAs against the annual budget allocation of Kshs.28.37 million. This amount represented an increase of 332.8 per cent compared to Kshs.2.02 million spent in a similar period of FY 2017/18. The average monthly sitting allowance translated to Kshs.69,452 per MCA against the SRC’s recommended monthly ceiling of Kshs.124,800.
Expenditure on domestic and foreign travel amounted to Kshs.67.38 million and comprised of Kshs.45.39 million spent by the County Assembly and Kshs.21.98 million spent by the County Executive.
3.41.7 Development ExpenditureThe total development expenditure of Kshs.326.04 million represented 14.2 per cent of the annual development budget of Kshs.2.29 billion. Table 3.119 provides a summary of development projects with the highest expenditure in the first half of the financial year.

292
COUNTY GOVERNMENTS BUDGET IMPLEMENTATION REVIEW REPORT FOR THE FIRST HALF OF FY2018/19
Table 3.119: Tharaka Nithi County, List of Development Projects with the Highest Expenditure in the FY 2018/19
S/No. Project Name Project Location Project Budget (Kshs.)Project Expenditure in First Half of FY 2018/19 (Kshs.)
Absorption Rate (%)
1 Construction of Garbage Incin-erator
karingani ward 40,000,000 34,998,500 87
2 Construction of Vetlab Marimanti ward 20,000,000 9,972,751 50
3 Construction of ATI (Comple-tion)
Igambang’ombe Ward 28,000,000 20,816,767 74
4 Construction of Grain Store Mukothima ward 23,000,000 16,949,190 74 5 Construction of ECDE classes County wide 32,590,000 14,852,028 46 6 Roads Grading and Civil Works County wide 277,500,000 98,984,621 36
7 Construction of Bus Park Chogoria ward 10,000,000 3,835,516 38
8 Chuka KMTC,OPD and Labo-ratory
Karingani ward 144,000,000 63,363,503 44
9 Marimanti OPD and Gate Marimanti ward 15,000,000 12,750,000 85
10 Domestic Payables from Previ-ous FY
County wide 276,124,808 48,818,253 18
Source: Tharaka Nithi County Treasury
3.41.8 Budget Performance by County DepartmentTable 3.120 shows a summary of budget estimates and budget performance by department in the first half of FY 2018/19.
Table 3.120: Tharaka Nithi County, Budget Performance by Department
Department
Annual Budget Alloca-tion in FY 2018/19 (Kshs.
Million)
Exchequer Issues in First Half of FY 2018/19
(Kshs. Million)
Expenditure in First Half of FY 2018/19
(Kshs. Million)
Expenditure to Exchequer Issues
(%)
Absorption Rate (%)
Rec Dev Rec Dev Rec Dev Rec Dev Rec DevCounty Assembly 352.00 17.00 157.71 - 158.38 - 100.4 - 45.0 0.0County Executive 154.43 - 55.27 - 64.27 - 116.3 0.0 41.6 0.0Finance and Economic Planning
291.27 276.12 80.65 49.42 55.73 48.82 69.1 98.8 19.1 17.7
Agriculture 107.43 227.00 55.88 86.58 69.42 37.77 124.2 43.6 64.6 16.6Environment and Natu-ral Resource
1.02 35.00 - 35 - 35.00 0.0 100.0 0.0 100
Education, Cultural and Vocational Training
230.03 107.59 59.19 7.46 47.88 14.85 80.9 199.0 20.8 13.8
Medical Services 1,476.03 313.70 781.61 69.55 775.43 76.11 99.2 109.4 52.5 24.3
Physical Planning And Land
129.22 225.50 33.33 4.53 12.70 4.54 38.1 100 9.8 2
Roads, Transport, Hous-ing, Public Works
49.69 809.80 14.45 71.19 8.56 98.98 59.3 139 17.2 12.2
Administration and Public Services
261.06 - 128.10 - 120.35 - 93.9 - 46.1 -
Trade, Industry and Cooperatives
94.65 - 48.77 - 9.66 - 19.8 - 10.2 -

293
COUNTY GOVERNMENTS BUDGET IMPLEMENTATION REVIEW REPORT FOR THE FIRST HALF OF FY2018/19
Department
Annual Budget Alloca-tion in FY 2018/19 (Kshs.
Million)
Exchequer Issues in First Half of FY 2018/19
(Kshs. Million)
Expenditure in First Half of FY 2018/19
(Kshs. Million)
Expenditure to Exchequer Issues
(%)
Absorption Rate (%)
Rec Dev Rec Dev Rec Dev Rec Dev Rec DevWater Services and Irrigation
51.24 162.00 16.41 - 14.87 - 90.6 - 29.0 -
County Public Services Board
12.46 - 6.69 - 4.57 - 68.2 - 36.7 -
Livestock, Veterinary and Fisheries Develop-ment
71.90 55.00 35.29 9.97 14.67 9.97 41.6 100 20.4 18.1
Public Health and San-itation
61.49 - 18.96 - 1.27 - 6.7 - 2.1 -
Energy and ICT 38.36 24.00 6.20 - 5.96 - 96.1 - 15.5 -Youth ,Culture, Sport and Tourism
48.02 38.00 26.02 - 5.07 - 19.5 - 10.6 -
TOTAL 3,430.29 2,290.71 1,524.54 333.71 1,368.80 326.04 89.8 97.7 39.9 14.2
Source: Tharaka Nithi County Treasury
Analysis of expenditure by department shows the Department of Environment and Natural Resource attained the highest absorption rate of development budget at 100 per cent followed by the Department of Medical Services at 24.3 per cent. The Department of Agriculture had the highest percentage of recurrent expenditure to recurrent budget at 64.6 per cent while the Department of Environment and Natural resource did not incur any recurrent expenditure.
3.41.9 Key Observations and Recommendationsi. The County has made progress in addressing some of the challenges previously identified as affecting
budget implementation. Some of the progress made included:ii. Improvement in own-source revenue collection by 131 per cent from Ksh.36.49 million in a similar
period in FY 2017/18 to Ksh.84.31 million in the reporting period.iii. Establishment of the County Budget and Economic Forum (CBEF) in line with Section 137 of the
PFM Act, 2012.iv. Establishment of Internal audit Committee in line with Section 155 (5) of the PFM Act, 2012.
Despite the above progress, the following challenges continued to hamper effective budget implementation:
1. Delay by the National Treasury to disburse the equitable share of revenue raised nationally, which affected implementation on planned activities.
2. High wage bill that has accounted for 62.2 per cent of the total expenditure in the reporting period.The County should implement the following recommendations in order to improve budget execution;
1. The County Treasury should liaise with the National Treasury so as to ensure that funds allocated to the County are released in a timely manner in line with the CARA, 2018.
2. The County Public Service Board should establish an optimal staffing structure in order to ensure a sustainable wage bill.
3.42 Trans Nzoia County
3.42.1 Overview of the FY 2018/19 BudgetThe County’s Approved Budget for FY 2018/19 is Kshs.7.65 billion, comprising of Kshs.4.44 billion (58 per cent) and Kshs.3.21 billion (42 per cent) allocation for recurrent and development expenditure respectively.

294
COUNTY GOVERNMENTS BUDGET IMPLEMENTATION REVIEW REPORT FOR THE FIRST HALF OF FY2018/19
To finance the budget, the County expects to receive Kshs.5.62 billion (73.5 per cent) as equitable share of revenue raised nationally, Kshs.827.93 million (10.8 per cent) as total conditional grants, generate Kshs.500 million (6.5 per cent) from own-source revenue , and Kshs.703.23 million (9.2 per cent) cash balance from FY 2017/18.
Figure 3.163: Trans Nzoia County Expected Sources of Budget Financing in FY 2018/19
Source: Trans Nzoia County Treasury
The conditional grants contained in the CARA, 2018 consist of; Kshs.100 million (9.7 per cent) for Transforming Health Systems for Universal Care Project, Kshs.140.44 million (13.7 per cent) from IDA (World Bank) credit for National Agricultural and Rural Inclusive Growth Project, Kshs.46.46 million (4.5 per cent) from IDA (World Bank) credit for Kenya Devolution Support Programme “Level 1 grant”, Kshs.299.11 million (29.1 per cent) from IDA (World Bank ) as credit for Kenya Urban Support Project, Kshs.18.93 million (1.8 per cent) grant from DANIDA for Universal Healthcare to Devolved System Programme, Kshs.21.30 million (2.1 per cent) Compensation for User Fees Foregone, Kshs.147.99 million (14.4 per cent) from the Road Maintenance Fuel Levy Fund, Kshs.53.71 million (5.2 per cent) for Rehabilitation of Village Polytechnics, and Kshs.200 million for leasing of medical equipment.
3.42.2 Revenue AnalysisDuring the first half of FY 2018/19, the County received Kshs.3.06 billion as equitable share of revenue raised nationally, Kshs.318.39 million as total conditional grants, raised Kshs.77.46 million from own source revenue, and had a cash balance of Kshs.703.23 million from FY 2017/18. The total available funds amounted to Kshs.4.15 billion.
Figure 3.164: shows the quarterly trend in own source revenue collection from FY 2013/14 to the half of FY 2018/19.

295
COUNTY GOVERNMENTS BUDGET IMPLEMENTATION REVIEW REPORT FOR THE FIRST HALF OF FY2018/19
Figure 3.164: Trans Nzoia County, Trend in Own Source Revenue Collection from the First Half of FY 2013/14 to the First Half of FY 2018/19
Source: Trans Nzoia County Treasury
During the first half of FY 2018/19, the County generated a total of Kshs.77.46 million from own-source revenue sources. This amount was an increase of 395.6 per cent compared to Kshs.15.63 million generated in the first half of FY 2017/18 and represented 15.5 per cent of the annual target.
3.42.3 Conditional GrantsThe County received Kshs.318.28 million as conditional grants as shown in Table 3.121.
Table3.121: TransNzoiaCounty,AnalysisofConditionalGrantsReceivedinthefirstquarter of FY 2018/19
S/No. Grants/LoansAnnual Allocation per CARA, 2018 Alloca-
tion (in Kshs)
Annual Budget Allocation for FY
2018/19 (Kshs)
Actual receipts in the FY 2018/19
(Kshs)
Actual Receipts as Percentage of Annual Alloca-
tion (%)A Grants Contained in the CARA, 2018
1IDA (World Bank) -Kenya Urban Support Project
299,106,900 299,106,900 299,106,900 100
2DANIDA - Universal Healthcare to De-volved System Programme
18,933,750 18,933,750 9,466,875 50
3World Bank-Transforming Health Systems for Universal Care Project
100,000,000 100,000,000 9,817,216 10
4 Compensation for User Fee Foregone 21,304,915 21,304,915 - 0
5 Leasing of Medical Equipment 200,000,000 - - 0
6 Road Maintenance Fuel Levy Fund 147,985,503 147,985,503 - 0
7 Rehabilitation of Village Polytechnics 53,710,000 53,710,000 - 0
8IDA (World Bank) -National Agricultural and Rural Inclusive Growth Project
140,435,163 140,435,163 - 0

296
COUNTY GOVERNMENTS BUDGET IMPLEMENTATION REVIEW REPORT FOR THE FIRST HALF OF FY2018/19
S/No. Grants/LoansAnnual Allocation per CARA, 2018 Alloca-
tion (in Kshs)
Annual Budget Allocation for FY
2018/19 (Kshs)
Actual receipts in the FY 2018/19
(Kshs)
Actual Receipts as Percentage of Annual Alloca-
tion (%)A Grants Contained in the CARA, 2018
9IDA (World Bank) Kenya Devolution Sup-port Programme “Level 1 grant”
46,456,661 46,456,661 -
Total 1,027,932,892 827,932,892 318,390,991 31
Source: Trans Nzoia County Treasury
Analysis of the revenue from conditional grants indicate that, the County received the highest percentage of receipts to annual allocation from the Kenya Urban Support project, EU grant for IDEAS and the DANIDA grant. The receipts accounted for 100 per cent, 43.8 per cent and 34.6 per cent of annual allocation respectively.
3.42.4 Exchequer IssuesTo finance the implementation of the budget, the Controller of Budget approved withdrawal of Kshs.3.21 billion from the CRF account. The withdrawal represented 42 per cent of the Approved Budget and translates to an increase of 57.4 per cent from Kshs.2.04 million approved in the first half of FY 2018/19. This comprised of Kshs.2.34 billion (72.9 per cent) to fund recurrent expenditure and Kshs.871.16 million (27.1 per cent) for development activities.
3.42.5 Overall Expenditure ReviewThe County government spent a total of Kshs.2.29 billion on both recurrent and development activities. This expenditure represented 71.3 per cent of the total funds released from the CRF account and was an increase of 50.7 per cent from Kshs.1.52 billion spent in the first half of FY 2017/18. The expenditure excluded outstanding commitments as at 31st December, 2018, which amounted to Kshs.271.07 million for development activities and Kshs.121.03 million for recurrent expenditure.
Expenditure on recurrent activities amounted to Kshs.1.96 billion while that on development activities was Kshs.330.01 million. The recurrent expenditure was 83.7 per cent of the funds released for recurrent activities, while development expenditure was 37.9 per cent of funds released for development activities.
The recurrent expenditure represented 44.1 per cent of the annual recurrent budget, an increase from 31 per cent recorded in the first half of FY 2017/18. Development expenditure recorded an absorption rate of 10.3 per cent, an increase from 6 per cent attained in the first half of FY 2017/18. Figure 3.165 presents a comparison between the total expenditure in the first half of FY 2018/19 and the first quarter of the FY 2017/18.

297
COUNTY GOVERNMENTS BUDGET IMPLEMENTATION REVIEW REPORT FOR THE FIRST HALF OF FY2018/19
Figure3.165: TransNzoiaCounty,ExpenditurebyEconomicClassification
Source: Trans Nzoia County Treasury
3.42.6 Analysis of Recurrent ExpenditureThe total recurrent expenditure of Kshs.1.96 billion comprised of Kshs.1.29 billion (65.8 per cent) incurred on personnel emoluments and Kshs.670.69 million (34.2 per cent) on operations and maintenance as shown in Figure 3.165.
Expenditure on personnel emoluments represented an increase of 26 per cent compared to the first half of FY 2017/18 when the County spent Kshs.1.02 billion, and was 56.3 per cent of total expenditure in the first half of FY 2018/19. Figure 3.166 shows a summary of operations and maintenance expenditure by major categories.

298
COUNTY GOVERNMENTS BUDGET IMPLEMENTATION REVIEW REPORT FOR THE FIRST HALF OF FY2018/19
Figure 3.166: Trans Nzoia County, Operations and Maintenance Expenditure by Major Categories in the First Half of FY 2018/19
Source: Trans Nzoia County Treasury
The County spent Kshs.15.51 million on MCAs’ committee sitting allowances to the 39 MCAs and the speaker against the annual budget allocation of Kshs.69.30 million. This was an increase compared Kshs.0.96 spent in the first half of FY 2017/18. The average monthly sitting allowance was Kshs.64,626 per MCA compared to SRC’s recommended monthly ceiling of Kshs.124,800.
Expenditure on domestic travel amounted to Kshs.65.67 million and comprised of Kshs.49.17 million spent by the County Assembly and Kshs.16.51 million by the County Executive and represented 2.9 per cent of total recurrent expenditure.
3.42.7 Development Expenditure AnalysisThe total development expenditure of Kshs.330.01 million represented 10.3 per cent of the annual development budget of Kshs.3.21 billion. Table 3.122 provides a summary of development projects with the highest expenditure in the first half of the financial year.
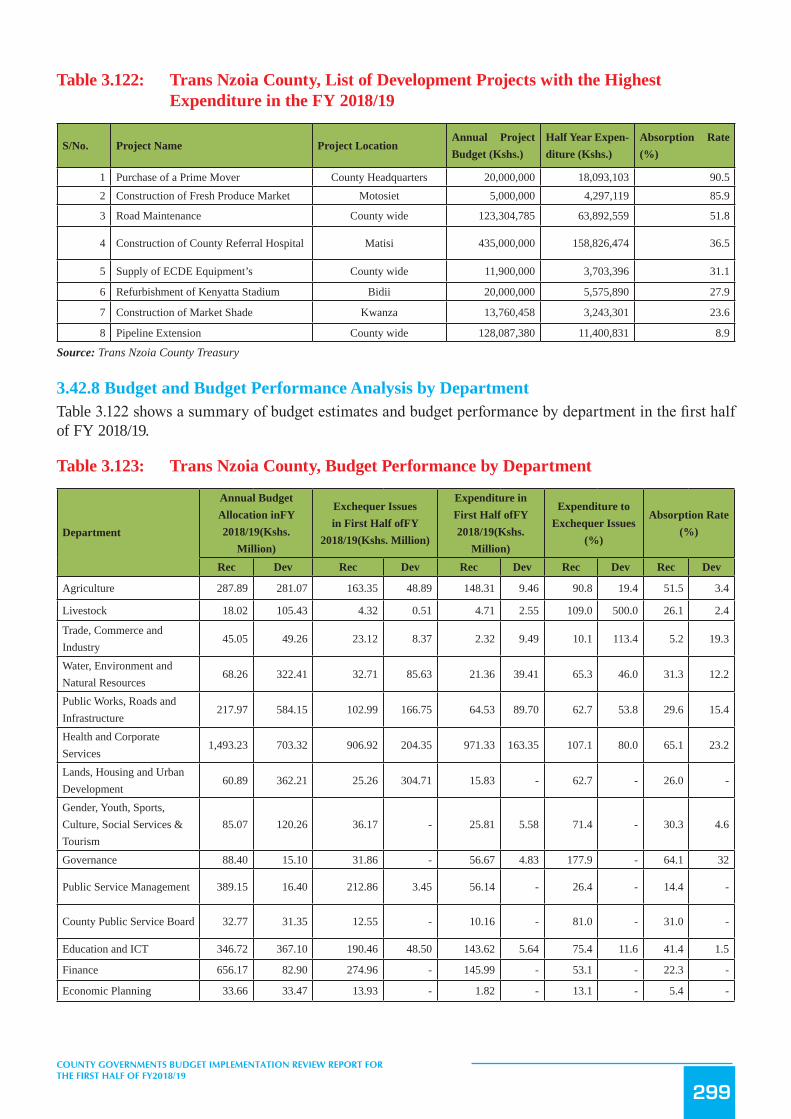
299
COUNTY GOVERNMENTS BUDGET IMPLEMENTATION REVIEW REPORT FOR THE FIRST HALF OF FY2018/19
Table 3.122: Trans Nzoia County, List of Development Projects with the Highest Expenditure in the FY 2018/19
S/No. Project Name Project LocationAnnual Project Budget (Kshs.)
Half Year Expen-diture (Kshs.)
Absorption Rate (%)
1 Purchase of a Prime Mover County Headquarters 20,000,000 18,093,103 90.52 Construction of Fresh Produce Market Motosiet 5,000,000 4,297,119 85.9
3 Road Maintenance County wide 123,304,785 63,892,559 51.8
4 Construction of County Referral Hospital Matisi 435,000,000 158,826,474 36.5
5 Supply of ECDE Equipment’s County wide 11,900,000 3,703,396 31.1
6 Refurbishment of Kenyatta Stadium Bidii 20,000,000 5,575,890 27.9
7 Construction of Market Shade Kwanza 13,760,458 3,243,301 23.6
8 Pipeline Extension County wide 128,087,380 11,400,831 8.9
Source: Trans Nzoia County Treasury
3.42.8 Budget and Budget Performance Analysis by DepartmentTable 3.122 shows a summary of budget estimates and budget performance by department in the first half of FY 2018/19.
Table 3.123: Trans Nzoia County, Budget Performance by Department
Department
Annual Budget Allocation inFY 2018/19(Kshs.
Million)
Exchequer Issues in First Half ofFY
2018/19(Kshs. Million)
Expenditure in First Half ofFY 2018/19(Kshs.
Million)
Expenditure to Exchequer Issues
(%)
Absorption Rate (%)
Rec Dev Rec Dev Rec Dev Rec Dev Rec Dev
Agriculture 287.89 281.07 163.35 48.89 148.31 9.46 90.8 19.4 51.5 3.4
Livestock 18.02 105.43 4.32 0.51 4.71 2.55 109.0 500.0 26.1 2.4
Trade, Commerce and Industry
45.05 49.26 23.12 8.37 2.32 9.49 10.1 113.4 5.2 19.3
Water, Environment and Natural Resources
68.26 322.41 32.71 85.63 21.36 39.41 65.3 46.0 31.3 12.2
Public Works, Roads and Infrastructure
217.97 584.15 102.99 166.75 64.53 89.70 62.7 53.8 29.6 15.4
Health and Corporate Services
1,493.23 703.32 906.92 204.35 971.33 163.35 107.1 80.0 65.1 23.2
Lands, Housing and Urban Development
60.89 362.21 25.26 304.71 15.83 - 62.7 - 26.0 -
Gender, Youth, Sports, Culture, Social Services & Tourism
85.07 120.26 36.17 - 25.81 5.58 71.4 - 30.3 4.6
Governance 88.40 15.10 31.86 - 56.67 4.83 177.9 - 64.1 32
Public Service Management 389.15 16.40 212.86 3.45 56.14 - 26.4 - 14.4 -
County Public Service Board 32.77 31.35 12.55 - 10.16 - 81.0 - 31.0 -
Education and ICT 346.72 367.10 190.46 48.50 143.62 5.64 75.4 11.6 41.4 1.5
Finance 656.17 82.90 274.96 - 145.99 - 53.1 - 22.3 -
Economic Planning 33.66 33.47 13.93 - 1.82 - 13.1 - 5.4 -

300
COUNTY GOVERNMENTS BUDGET IMPLEMENTATION REVIEW REPORT FOR THE FIRST HALF OF FY2018/19
Department
Annual Budget Allocation inFY 2018/19(Kshs.
Million)
Exchequer Issues in First Half ofFY
2018/19(Kshs. Million)
Expenditure in First Half ofFY 2018/19(Kshs.
Million)
Expenditure to Exchequer Issues
(%)
Absorption Rate (%)
Rec Dev Rec Dev Rec Dev Rec Dev Rec Dev
County Assembly 614.08 140 307.04 - 289.71 - 94.4 - 47.2 -
TOTAL 4,437.33 3,214.43 2,338.49 871.16 1,958.31 330.01 83.7 37.9 44.1 10.3
Source: Trans Nzoia County Treasury
Analysis of expenditure by department shows the Department of Governance recorded the highest absorption rate of development budget at 32 per cent. The Department of Health and Corporate Services had the highest percentage of recurrent expenditure to recurrent budget at 65.1 per cent while the Department of Trade, Commerce and Industry had the lowest at 5.2 per cent.
3.42.9 Key Observations and RecommendationsThe County has made progress in addressing some of the challenges previously identified as affecting budget implementation. Some of the progress made included:
i. Improvement in own source of revenue collection by 106.5 per cent from Kshs.37.52 million in the first half of FY 2017/18 to Kshs.77.46 million in the first half of FY 2018/19.
Despite the above progress, the following challenges continued to hamper effective budget implementation;
1. Late submission of financial reports to the OCOB by the County Treasury, which affected timely preparation of budget implementation report contrary to Section 166 of the PFM Act, 2012.
2. Slow implementation of development activities during the first half of FY 2018/19. The County spent 10.3 per of the annual development budget of Kshs.3.21 billion against the expected absorption rate of 50 per cent.
3. High wage bill that has increased by 26 per cent from Kshs.1.02 billion in the first half of FY 2017/18 to Kshs.1.29 billion during the period under review.
4. Failure to establish an Internal Audit Committee to oversee financial operations in the County contrary to the provisions of Section 155 of the PFM Act, 2012.
The County should implement the following recommendations in order to improve budget execution;
1. The County Treasury should ensure timely preparation and submission of financial reports in line with Section 166 of PFM Act, 2012.
2. The County should identify and address issues that cause delays in implementation of development projects.
3. The County Public Service Board should establish an optimal staffing structure in order to ensure a sustainable wage bill.
4. The County should establish an Internal Audit Committee in line with Section 155 of the PFM Act, 2012.
3.43 Turkana County
3.43.1 Overview of the FY 2018/19 BudgetThe County’s FY 2018/19 approved Budget was Kshs.13.54 billion, comprising of Kshs.8.22 billion (60.7 per cent) and Kshs.5.32 billion (39.3 per cent) allocation for recurrent and development expenditure respectively.

301
COUNTY GOVERNMENTS BUDGET IMPLEMENTATION REVIEW REPORT FOR THE FIRST HALF OF FY2018/19
To finance the budget, the County expects to receive Kshs.10.07 billion (77.7 per cent) as equitable share of revenue raised nationally, Kshs.969.16 million (7.5 per cent) as total conditional grants, generate Kshs.250 million (1.9 per cent) from own source of revenue, Kshs.1.55 billion (11.9 per cent) cash balance from FY 2017/18, and Kshs.131.23 million as other revenues expected during the year.
Figure 3.167: Turkana County, Expected Sources of Budget Financing in FY 2018/19
Source: Turkana County Treasury
The conditional grants contained in the CARA, 2018 consist of; Kshs.100 million (10.3 per cent) for Transforming Health Systems for Universal Care Project, Kshs.140.44 million (14.5 per cent) from IDA (World Bank) credit for National Agricultural and Rural Inclusive Growth Project, Kshs.65.45 million (6.8 per cent) from IDA (World Bank) as credit for Kenya Devolution Support Programme “Level 1 grant”, Kshs.95.02 million (9.8 per cent) from IDA (World Bank ) as credit for Kenya Urban Support Project, Kshs.33.77 million (3.5 per cent) as grant from DANIDA for Universal Healthcare to Devolved System Programme, Kshs.25.63 million (2.6 per cent) Compensation for User Fees Foregone, Kshs.200 million (20.6 per cent) for Leasing of Medical Equipment, Kshs.283.57 million (29.3 per cent) from the Road Maintenance Fuel Levy Fund, and Kshs.25.29 million (2.6 per cent) for Rehabilitation of Village Polytechnics.
3.43.2 Revenue AnalysisDuring the first half of FY 2018/19, the County received Kshs.3.5 billion as equitable share of revenue raised nationally, Kshs.150.54 million as total conditional grants, raised Kshs.69.92 million from own source revenue, and had a cash balance of Kshs.1.55 million from FY 2017/18. The total available funds amounted to Kshs.5.4 billion.
Figure 3.168 shows the half yearly trend in own source revenue collection from the first half FY 2013/14 to the first half of FY 2018/19.

302
COUNTY GOVERNMENTS BUDGET IMPLEMENTATION REVIEW REPORT FOR THE FIRST HALF OF FY2018/19
Figure 3.168: Turkana County, Trend in Own Source Revenue Collection to the First Half of FY 2018/19
Source: Turkana County Treasury
During the first half of FY 2018/19, the County generated a total of Kshs.69.92 million as own-source revenue. The own-source revenue collected during the period represented an increase from Kshs.61.03 million realised during the same period of the FY 2017/18 and represented 28 per cent of the annual target.
3.43.3 Conditional GrantsThe County received Kshs.150.54 million as conditional grants as shown in Table 3.124.
Table 3.124: Turkana County, Conditional Grants/Loans Received in the First Half of FY 2018/19
S/No Grants/LoansAnnual Allocation, per CARA, 2018
(Kshs)
Annual Budget Allocation for FY
2018/19 (Kshs)
Actual receipts in Half Year of FY 2018/19 (in Kshs.)
Actual Receipts as Percentage of Annu-al Allocation (%)
A Grants Contained in the CARA, 2018
1 Compensation for User Fee Foregone 25,634,941 25,634,941 - -
2 Leasing of Medical Equipment 200,000,000 200,000,000 - -
3 Road Maintenance Fuel Levy 283,569,986 283,569,986 - -
4 Rehabilitation of Village Polytechnics 25,285,000 25,285,000 - -
5Transforming Health Systems for Univer-sal Care Project (WB)
100,000,000 100,000,000 19,316,375 19.3
6National Agricultural and Rural Inclusive Growth Project (NARIGP)
140,435,163 140,435,163 - -
7Kenya Devolution Support Project (KDSP) “Level 1 grant”
65,446,016 65,446,016 - -

303
COUNTY GOVERNMENTS BUDGET IMPLEMENTATION REVIEW REPORT FOR THE FIRST HALF OF FY2018/19
S/No Grants/LoansAnnual Allocation, per CARA, 2018
(Kshs)
Annual Budget Allocation for FY
2018/19 (Kshs)
Actual receipts in Half Year of FY 2018/19 (in Kshs.)
Actual Receipts as Percentage of Annu-al Allocation (%)
A Grants Contained in the CARA, 2018
8 Kenya Urban Support Project (KUSP) 95,023,200 95,023,200 95,023,200 100
9 DANIDA Grant 33,766,875 33,766,875 36,199,813 107.2Total 969,161,181 969,161,181 150,539,388 13.5
Source: Turkana County Treasury
Analysis of the revenue from conditional grants indicate that, the County received the highest percentage of receipts to annual allocation from the DANIDA grant, the Kenya Urban Support Project, and the World Bank’s Transforming Health Systems for Universal Care Project. The receipts accounted for 107.2 per cent, 100 per cent and 19.3 per cent of annual allocation respectively.
3.43.4 Exchequer IssuesTo finance the budget, the Controller of Budget approved the withdrawal of Kshs.3.36 billion from the CRF account. The withdrawals represented 24.8 per cent of the Approved Budget and translated to an increase of 23 per cent from Kshs.2.73 billion approved in the first half of FY 2017/18 and comprised of Kshs.2.52 billion (75 per cent) to fund recurrent expenditure and Kshs.840.08 million (25 per cent) for development activities.
3.43.5 Overall Expenditure ReviewThe County government spent a total of Kshs.1 billion on recurrent and development activities. The total expenditure represented 30 per cent of the total funds released from the CRF account and was a decline of 61.9 per cent from Kshs.2.63 billion spent in the first half of FY 2017/18. The county did not report on pending bills during the reporting period.
Expenditure on recurrent activities amounted to Kshs.2.8 billion while Kshs.230.49 million was spent on development activities. The recurrent expenditure was 99.7 per cent of the funds released for recurrent activities, while development expenditure was 62.4 per cent of funds released for development activities.
The recurrent expenditure represented 34.1 per cent of the annual recurrent budget, an increase from 30.3 per cent recorded in the first half of FY 2017/18. Development expenditure recorded an absorption rate of 4.3 per cent, which was a decrease from 11.1 per cent attained in the first half of FY 2017/18. Figure 3.169 presents a comparison between the total expenditure in the first half of FY 2018/19 and the first half of the FY 2017/18.

304
COUNTY GOVERNMENTS BUDGET IMPLEMENTATION REVIEW REPORT FOR THE FIRST HALF OF FY2018/19
Figure3.169: TurkanaCounty,ExpenditurebyEconomicClassification
Source: Turkana County Treasury
3.43.6 Analysis of Recurrent ExpenditureThe total recurrent expenditure of Kshs.2.8 billion comprised of Kshs.2.02 billion (59.3 per cent) incurred on personnel emoluments and Kshs.1.39 billion (40.7 per cent) on operations and maintenance as shown in Figure 3.169.
Expenditure on personnel emoluments represented an increase of 45.5 per cent compared to the first half of FY 2017/18 when the County spent Kshs.1.39 billion, and was 55.5 per cent of total expenditure in the first half of FY 2018/19. Figure 3.170 shows a summary of operations and maintenance expenditure by major categories.

305
COUNTY GOVERNMENTS BUDGET IMPLEMENTATION REVIEW REPORT FOR THE FIRST HALF OF FY2018/19
Figure 3.170: Turkana County, Operations and Maintenance Expenditure by Major Categories in the First Half of FY 2018/19
Source: Turkana County Treasury
The County spent Kshs.13.7 million to cater for the MCAs’ committee sitting allowances for the 48 MCAs against the annual budget allocation of Kshs.81.76 million. This represented a decline of 47.4 per cent compared to Kshs.26.07 million spent in a similar period of FY 2017/18. The average monthly sitting allowance translated to Kshs.47,569 per MCA against the SRC’s recommended monthly ceiling of Kshs.124,800.
Expenditure on domestic travel amounted to Kshs.237.09 million and comprised of Kshs.134.18 million spent by the County Assembly and Kshs.102.91 million spent by the County Executive and represented 8.4 per cent of total recurrent expenditure.
3.43.7 Development ExpenditureThe total development expenditure of Kshs.230.49 million represented 4.3 per cent of the annual development budget of Kshs.5.32 billion. The County did not submit a summary of development projects in the first half of the financial year.

306
COUNTY GOVERNMENTS BUDGET IMPLEMENTATION REVIEW REPORT FOR THE FIRST HALF OF FY2018/19
3.43.8 Budget Performance by County DepartmentTable 3.125 shows a summary of budget estimates and budget performance by department in the first half of FY 2018/19.
Table 3.125: Turkana County, Budget Performance by Department
Department
Annual Budget Allo-cation in FY 2018/19
(Kshs. Million)
Exchequer Issues in First Half of FY 2018/19 (Kshs. Mil-lion)
Expenditure in First Half of FY 2018/19
(Kshs. Million)
Expenditure to Exchequer
Issues (%)
Absorption Rate (%)
Rec Dev Rec Dev Rec Dev Rec Dev Rec DevGovernance (Office of the Governor and Liaison)
320.2 243.14 70.1 122.1 - 174.2 38.1 -
Office of the Deputy Gov-ernor
21.14 - 11.1 7.13 - 64.2 33.7 -
County Attorney 80.27 10 42.03 48.41 - 115.2 60.3 -
Finance and Planning 490.48 463.01 193.25 162.11 13.38 83.9 33.1 2.9
Water Services, Environ-ment and Mineral Resourc-es
53.67 600.77 - 30.44 29.98 32.83 - 107.9 55.9 5.5
Health & Sanitation Ser-vices
888.29 623.79 298.85 90.04 179.84 66.55 60.2 73.9 20.2 10.7
Trade, Gender and Youth Affairs
104.43 492.25 - 11.42 22.44 32.84 - 287.6 21.5 6.7
Education, Sports and So-cial Protection
664.63 715.56 210.39 68.11 215.48 67.97 102.4 99.8 32.4 9.5
Public Services, Decentral-ized Administration & Di-saster Management
4,240.96 180.35 2,131.24 2,000.90 - 93.9 47.2 -
Infrastructure Transport & Public Works
42.93 515.82 23.3 173.73 22.79 12.92 97.8 7.4 53.1 2.5
Agriculture, Pastoral Econ-omy & Fisheries
168.22 617.74 29.82 54.84 4 183.9 32.6 0.6
Tourism, Culture and Natu-ral Resources
115.9 166.23 17.9 25.2 - 140.8 21.7 -
Lands, Energy, Housing & Urban Areas Mgt.
65.97 236.21 17.66 95.02 20.1 - 113.8 30.5 -
County Public Service Board
121.93 - - 14.18 - - 11.6
County Assembly 839.3 452.28 476 478.61 - 100.5 57.0 -
Total 8,218.32 5,317.15 3,521.64 468.76 3,404.11 230.49 96.7 49.2 41.4 4.3
Source: Turkana County Treasury
According to the data from the County Treasury, the Health and Sanitation Services recorded the highest absorption rate of development budget at 10.7 per cent followed by the Department of Education, Sports and Social Protection at 9.5 per cent. The County Attorney had the highest percentage of recurrent expenditure to recurrent budget at 60.3 per cent while the County Public Service Board had the lowest at 11.6 per cent.
3.43.9 Key Observations and RecommendationsThe County has made progress in addressing some of the challenges previously identified as affecting budget implementation. Some of the progress made included:
i. Improved capacity of technical staff through training.ii. Improved internet connectivity, resulting into effective use of IFMIS.

307
COUNTY GOVERNMENTS BUDGET IMPLEMENTATION REVIEW REPORT FOR THE FIRST HALF OF FY2018/19
Despite the above progress, the following challenges continued to hamper effective budget implementation;
1. Low absorption of development budget. In the reporting period, the County attained an absorption rate of 4.3 per cent compared to to the expected target of 50 per cent for the half year.
2. The County’s wage bill has remained high, having increased by 45.5 per cent from Kshs.1.39 billion in the first half of FY 2017/18 to Kshs.2.02 billion in the period under review.
The County should implement the following recommendations in order to improve budget execution;
1. The County should put mechanisms in place to enhance absorption of development funds.2. The County Public Service Board should establish an optimal staffing structure in order to ensure a
sustainable wage bill.
3.44 Uasin Gishu County
3.44.1 Overview of the FY 2018/19 BudgetThe County’s FY 2018/19 Approved Supplementary Budget was Kshs.9.93 billion, comprising of Kshs.5.36 billion (54.0 per cent) and Kshs.4.57 billion (46.0 per cent) allocation for recurrent and development expenditure respectively.
To finance the budget, the County expects to receive Kshs.5.93 billion (59.7 per cent) as equitable share of revenue raised nationally, Kshs.1.29 billion (13.0 per cent) as total conditional grants, generate Kshs.1.20 billion (12.0 per cent) from own source of revenue, and Kshs.1.50 billion (15.1 per cent) cash balance from FY 2017/18.
Figure 3.171: Uasin Gishu County Expected Sources of Budget Financing in FY 2018/19
Source: Uasin Gishu County Treasury
The conditional grants contained in the CARA, 2018 consist of; Kshs.630.15 million (48.7 per cent) from IDA (World Bank ) credit for Kenya Urban Support Project, Kshs.156.25 million (12.1 per cent) from Road Maintenance Fuel Levy, Kshs.117.00 million (9.0 per cent) from IDA (World Bank) for Kenya Climate Smart Agriculture Project, Kshs.81.89 million (6.3 per cent) for Transforming Health Systems for Universal Care Project, Kshs.46.74 million (3.6 per cent) from IDA (World Bank) as credit for Kenya Devolution Support

308
COUNTY GOVERNMENTS BUDGET IMPLEMENTATION REVIEW REPORT FOR THE FIRST HALF OF FY2018/19
Programme Project (KDSP) “Level 1 grant”, Kshs.45 million (3.5 per cent) as EU grant- Instruments for Devolution Advice and Support (IDEAS), Kshs.33.25 million (2.6 per cent) for Rehabilitation of Village Polytechnics and Kshs.20.81 million (1.6) per cent from Compensation of User Fees Foregone and Kshs.19.14 million (1.5 per cent) from DANIDA grant for Universal Healthcare in Devolved System Programme.
The County also budgeted to receive Kshs.135.00 million (10.4 per cent) as grant from IDA (World Bank) Kenya Climate Smart -Water, which is not contained in the CARA, 2018 and had rolled over of DANIDA of Kshs.8.24 million (0.6 per cent).
3.44.2 Revenue AnalysisDuring the first half of FY 2018/19, the County received Kshs.1.25 billion as equitable share of revenue raised nationally, Kshs.68.12 million as total conditional grants, raised Kshs.282.83 million from own source revenue, and had a cash balance of Kshs.1.50 billion from FY 2017/18. The total available funds amounted to Kshs.3.10 billion.
Figure 3.172 shows the half yearly trend in own source revenue collection from the first half FY 2013/14 to the first half of FY 2018/19.
Figure 3.172: Uasin Gishu County, Trend in Own Source Revenue Collection for the First Half from FY 2013/14 to FY 2018/19
Source: Uasin Gishu County Treasury
During the first half of FY 2018/19, the County generated a total of Kshs.282.83 million as own-source revenue. The own-source revenue collected during the period represented an increase of 37.3 per cent when compared to Kshs.206 million realised during the same period of the FY 2017/18 and represented 23.6 per cent of the annual target.
3.44.3 Conditional GrantsThe County received Kshs.68.12 million as conditional as shown in Table 3.126.

309
COUNTY GOVERNMENTS BUDGET IMPLEMENTATION REVIEW REPORT FOR THE FIRST HALF OF FY2018/19
Table 3.126: Uasin Gishu County, Conditional Grants/Loans Received in the First Half of FY 2018/19
S/No. Grants/LoansAnnual Allocation, per CARA, 2018
(Kshs)
Annual Budget Allocation for FY
2018/19 (Kshs)
Actual Receipts in First Half of FY 2018/19 (Kshs)
Actual Receipts as Percentage of Annual Alloca-
tion (%)A Grants/Loans contained in CARA, 2018
1IDA (World Bank) Kenya Urban Sup-port Project
630,147,900 630,147,900 630,147,900 100
2 Road Maintenance Fuel Levy 156,252,849 156,252,849 - -
3IDA (World Bank) Kenya Climate Smart Agriculture Project
117,000,000 117,000,000 40,941,086 35.0
4Transforming Health Systems for Uni-versal Care Project
81,893,450 81,893,450 8,741,477 10.7
5IDA (World Bank) Kenya Devolution Support Project *Level 1 grant*
46,739,163 46,739,163 - -
6EU Grant –Instruments for Devolution Advice and Support (IDEAS).
45,000,000 45,000,000 - -
7 Rehabilitation of Youth polytechnics 33,250,000 33,250,000 8,868,153 26.78 Compensation of User Fees Foregone 20,813,065 20,813,065 - -
9DANIDA grant for Universal Health-care in Devolved System Programme
19,136,250 27,379,194 9,568,125 34.9
10IDA (World Bank) Kenya Climate Smart -Water
- 135,000,000 - -
Total 1,150,232,577 1,293,475,521 698,266,741 5.3
Source: Uasin Gishu County Treasury
Analysis of revenue from conditional grants in the period under review indicates that, the County received disbursements from IDA-Kenya Urban Support Project, IDA (World Bank) Kenya Climate Smart Agriculture Project, and grant for Transforming Health Systems for Universal Care Project, Rehabilitation of Youth Polytechnics and DANIDA Grant for Universal healthcare in Devolved System Programme. The receipts accounted for100 per cent, 35.0 per cent, 10.7 per cent, 26.7 per cent and 34.9 per cent of the annual allocation respectively.
3.44.4 Exchequer IssuesTo finance the budget, the Controller of Budget approved the withdrawal of Kshs.2.99 billion from the CRF account. The withdrawals represented 30.1 per cent of the Approved Budget and translates to a an increase of 7.9 per cent from Kshs.1.77 billion approved in the first half of FY 2017/18. This amount comprised of Kshs.2.30 billion (76.9 per cent) to fund recurrent expenditure and Kshs.685.90 million (23.1 per cent) for development activities.
3.44.5 Overall Expenditure ReviewThe County government spent a total of Kshs.2.78 billion on recurrent and development activities. The total expenditure represented 93 per cent of the total funds released from the CRF account and was an increase of 141.7 per cent from Kshs.1.15 billion spent in the first half of FY 2017/18. The expenditure excluded outstanding commitments as at December 31st 2018 which amounted to Kshs.669.39 million for development activities and Kshs.297.98 million for recurrent expenditure.
Expenditure on recurrent activities amounted to Kshs.2.18 billion while Kshs.594.55 million was spent on development activities. The recurrent expenditure was 94.9 per cent of the funds released for recurrent activities, while development expenditure was 86.7 per cent of funds released for development activities.

310
COUNTY GOVERNMENTS BUDGET IMPLEMENTATION REVIEW REPORT FOR THE FIRST HALF OF FY2018/19
The recurrent expenditure represented 40.8 per cent of the annual recurrent budget, an increase from 18.5 per cent recorded in the first half of FY 2017/18. Development expenditure recorded an absorption rate of 13.0 per cent, which was an increase from 8.9 per cent attained in the first half of FY 2017/18.Figure 3.173 presents a comparison between the total expenditure in the first half of FY 2018/19 and the first half of FY 2017/18.
Figure3.173: UasinGishuCounty,ExpenditurebyEconomicClassification
Source: Uasin Gishu County Treasury
3.44.6 Analysis of Recurrent ExpenditureThe total recurrent expenditure of Kshs.2.18 billion comprised of Kshs.1.49 billion (68.1 per cent) incurred on personnel emoluments and Kshs.696.20 million (31.9 per cent) on operations and maintenance as shown in Figure 3.173.
Expenditure on personnel emoluments represented an increase of 177.3 per cent compared to the first half of FY 2017/18 when the County spent Kshs.536.72 million, and was 53.6 per cent of total expenditure in the first half of FY 2018/19. Figure 3.174 shows a summary of operations and maintenance expenditure by major categories.

311
COUNTY GOVERNMENTS BUDGET IMPLEMENTATION REVIEW REPORT FOR THE FIRST HALF OF FY2018/19
Figure 3.174: Uasin Gishu County, Operations and Maintenance Expenditure by Major Categories in the First Half of FY 2018/19
Source: Uasin Gishu County Treasury
The County spent Kshs.21.59 million to cater for the MCAs’ committee sitting allowances for the 48 MCAs against the annual budget allocation of Kshs.37.51 million. This represented an increase of 328.4 per cent compared to Kshs.5.04 million spent in a similar period of FY 2017/18. The average monthly sitting allowance translated to Kshs.74,955 per MCA against the SRC’s recommended monthly ceiling of Kshs.124,800.
Expenditure on domestic and foreign travel amounted to Kshs.118.52 million and comprised of Kshs.51.80 million spent by the County Assembly and Kshs.66.72 million spent by the County Executive and represented 5.4 per cent of total recurrent expenditure.
3.44.7 Development ExpenditureThe total development expenditure of Kshs.594.55 million represented 13 per cent of the annual development budget of Kshs.4.57 billion. Table 3.127 provides a summary of development projects with the highest expenditure in the first half of the financial year.

312
COUNTY GOVERNMENTS BUDGET IMPLEMENTATION REVIEW REPORT FOR THE FIRST HALF OF FY2018/19
Table 3.127: Uasin Gishu County, List of Development Projects with the Highest Expenditure in the FY 2018/19
S/No. Project Name Project LocationAnnual Project Bud-
get (Kshs.)
First Half Expenditure
(Kshs.)
Absorption Rate (%)
1.
Supply and Delivery of 4No. long arm Excavators and Supply and Delivery of 3No. Heavy duty tracked Dozers with ripper SD model
County Headquarters 422,147,523 227,300,000 53.8
2.Supply, delivery, testing and Commis-sioning of 32 Boreholes
County Wide 132,500,000 74,264,298 56.0
3.Supply, Delivery of Specialized plants (Two wheeled Back Hoe loaders )
County Headquarters 21,500,000 20,840,000 96.9
4.Purchase of Educational Aids and Relat-ed Equipment
All Wards 21,029,360 21,000,000 99.9
5.Purchase of Agricultural Machinery and Equipment
AMS Station 62,703,802 11,609,000 19.5
6. Supply of FMD Disease Vaccines Countywide 15,666,125 9,975,000 63.77 Acquisition of Land (Land Banking) County Wide 85,970,000 9,000,000 10.5
8.Proposed Construction of 70 beds mater-nity at West Health Centre
Huruma 24,000,000 7,368,575 30.7
9.Construction of Chemalal-Kipkenyo Bridge
Kipkenyo 6,548,408 6,139,996 93.8
10.Construction of Kiborokwo –Kapnge-tuny Bridge
Segero/Barsombe 9,826,012 6,139,996 62.5
Source: Uasin Gishu County Treasury
3.44.8 Budget Performance by County DepartmentTable 3.128 shows a summary of budget estimates and budget performance by department in the first half of FY 2018/19.
Table 3.128: Uasin Gishu County, Budget Performance by Department
Department
Annual Budget Allo-cation in FY 2018/19
(Kshs. Million)
Exchequer Issues in First Half of FY 2018/19 (Kshs. Mil-lion)
Expenditure in First Half of FY 2018/19
(Kshs. Million)
Expenditure to Exchequer
Issues (%)
Absorption Rate (%)
Rec Dev Rec Dev Rec Dev Rec Dev Rec Dev
Governor’s Office 115.94 - 58.89 - 54.39 - 92.4 - 46.9 -Finance 401.94 - 131.76 - 141.70 - 107.5 - 35.3 -Public Service Management 611.33 30.27 301.30 - 240.24 - 79.7 - 39.3 -ICT and E-Government 36.96 47.14 17.75 0.80 23.34 0.80 131.5 100.0 63.1 1.7Roads, Transport, Energy and Public Works
412.31 553.93 190.98 204.09 167.06 149.78 87.5 73.4 40.5 27.0
Lands and Housing 59.51 519.97 28.53 29.80 24.77 30.00 86.80 100.7 41.6 5.8
Water, Environment, Natu-ral Resources, Tourism and Wildlife Management
130.68 900.61 58.96 211.93 53.77 190.65 91.2 90.0 41.2 21.2
Health Services 1,974.61 258.53 852.63 19.47 838.74 28.70 98.4 147.4 42.5 11.1
Agriculture 228.41 369.29 119.88 92.26 141.64 49.37 118.1 53.5 62.0 13.4
Trade, Investment and Indus-trialization
14.70 263.64 6.38 23.96 8.89 27.00 139.4 112.7 60.5 10.2

313
COUNTY GOVERNMENTS BUDGET IMPLEMENTATION REVIEW REPORT FOR THE FIRST HALF OF FY2018/19
Department
Annual Budget Allo-cation in FY 2018/19
(Kshs. Million)
Exchequer Issues in First Half of FY 2018/19 (Kshs. Mil-lion)
Expenditure in First Half of FY 2018/19
(Kshs. Million)
Expenditure to Exchequer
Issues (%)
Absorption Rate (%)
Rec Dev Rec Dev Rec Dev Rec Dev Rec Dev
Education, Culture and So-cial Services
382.12 119.21 131.46 25.97 161.46 25.97 122.8 100.0 42.3 21.8
County Public Service Board 32.85 - 13.39 - 14.07 - 105.0 - 42.8 -County Assembly 671.97 109.80 328.36 - 254.02 - 77.4 - 37.8 -Economic Planning 72.50 - 17.21 - 10.38 - 60.3 - 14.3 -Devolution and Public Ad-ministration
35.00 208.85 12.58 - 16.55 - 131.6 - 47.3 -
Youth Affairs, Gender and Sports Development
89.58 178.52 21.10 13.72 18.64 13.32 88.3 97.1 20.8 7.5
Cooperatives and Enterprise Development
16.88 65.91 3.64 3.46 3.32 7.97 91.1 230.6 19.7 12.1
Livestock Development and Fisheries
12.93 195.19 2.85 26.76 2.67 40.84 93.7 152.6 20.7 20.9
Physical Planning and Urban Development
56.34 753.20 3.29 33.68 8.70 30.15 264.1 89.5 15.4 4.0
TOTAL 5,356.51 4,574.04 2,300.95 685.90 2,184.34 594.55 94.9 86.7 40.8 13.0
Source: Uasin Gishu County Treasury
Analysis of expenditure by department shows the Department of Roads, Transport, Energy and Public Works recorded the highest absorption rate of development budget at 27 per cent while the Departments of the Public Service Management, County Assembly and Devolution & Public Administration did not incur any development expenditure. The Department of ICT and E-Government had the highest percentage of recurrent expenditure to recurrent budget at 63.1 per cent while the Department of Economic Planning had the lowest at 14.3 per cent.
3.44.9 Key Observations and RecommendationsThe County has made progress in addressing some of the challenges previously identified as affecting budget implementation. Some of the progress made included:
i. Improvement in the absorption of development budget by 179.1 per cent from Kshs.212.99 million in the first half of FY 2017/18 to Kshs.594.55 million in the period under review.
Despite the above progress, the following challenges continued to hamper effective budget implementation;
1. High wage bill that has increased by 177.3 per cent from Kshs.536.72 million in the first half of FY 2017/18 to Kshs.1.49 billion in the period under review.
2. The County Assembly did not comply with the requirement to ensure all payments are processed through IFMIS and Internet Banking platform. The expenditure report from the County Assembly shows that a total of Kshs.343.52 million was incurred during the period under review. However, only Kshs.254.02 million could be supported by the IFMIS system.
The County should implement the following recommendations in order to improve budget execution;
1. The County Public Service Board should establish an optimal staffing structure in order to ensure a sustainable wage bill.
2. The County Assembly should ensure that all financial transactions are made on IFMIS and payments made online through the Internet Banking platform at the Central Bank of Kenya.

314
COUNTY GOVERNMENTS BUDGET IMPLEMENTATION REVIEW REPORT FOR THE FIRST HALF OF FY2018/19
3.45 Vihiga County
3.45.1 Overview of the FY 2018/19 BudgetThe County’s Approved Budget for FY 2018/19 is Kshs.6.44 billion, comprising of Kshs.4.50 billion (70 per cent) and Kshs.1.94 billion (30 per cent) allocation for recurrent and development expenditure respectively.
To finance the budget, the County expects to receive Kshs.4.77 billion (74.1 per cent) as equitable share of revenue raised nationally, Kshs.1.06 billion (6.1 per cent) as total conditional grants, generate Kshs.153.67 million (2.4 per cent) from local revenue sources, andKshs.1.08 billion (16.8 per cent) cash balance from FY 2017/18.
Figure 3.175: Vihiga County Expected Sources of Budget Financing in FY 2018/19
Source: Vihiga County Treasury
The conditional grants contained in the CARA, 2018 consist of; Kshs.49.37 million (7.8 per cent) for Transforming Health Systems for Universal Care Project, Kshs.50 million (7.9 per cent) from IDA (World Bank) credit for National Agricultural and Rural Inclusive Growth Project, Kshs.67.91 million (10.7 per cent) as World Bank loan to supplement Free maternity Health care, Kshs.14.78 million (2.3 per cent) grant from DANIDA for Universal Healthcare to Devolved System Programme, Kshs.26.78 million (4.2 per cent) from IDA (World Bank) credit for the Kenya Devolution Support Programme “Level 2 grant, Kshs.12.93 million (2.0 per cent) Compensation for User Fees Foregone, Kshs.117.24 million (18.4 per cent) from the Road Maintenance Fuel Levy Fund, and Kshs.54.15 million (8.5 per cent) for Rehabilitation of Village Polytechnics.
3.45.2 Revenue AnalysisDuring the first half of FY 2018/19, the County received Kshs936.35 million as equitable share of revenue raised nationally, Kshs.311.92 million as total conditional grants, raised Kshs.62.89 million from own source revenue, and had a cash balance of Kshs.1.33 billion from FY 2017/18. The total available funds amounted to Kshs.2.64billion.
Figure 3.176 shows the half yearly trend in own source revenue collection from the first half FY 2013/14 to the first half of FY 2018/19.

315
COUNTY GOVERNMENTS BUDGET IMPLEMENTATION REVIEW REPORT FOR THE FIRST HALF OF FY2018/19
Figure 3.176: Vihiga County, Trend in Own-Source Revenue Collection for the First Half of FY 2013/14 to the First Half of FY 2018/19
Source: Vihiga County Treasury
During the first half of FY 2018/19, the County generated a total of Kshs.62.89 million as own-source revenue. The own-source revenue collected during the period represented an increase from Kshs.41.89 million realised during the same period of the FY 2017/18 and represented 40.9 per cent of the annual target.
3.45.3 Conditional GrantsThe County received Kshs.311.92 million as conditional grants as shown in Table 3.129.
Table 3.129: Vihiga County, Conditional Grants Received in the First Half of FY 2018/19
S/No Grants/LoansAnnual Allocation, per
CARA, 2018 (Kshs)
Annual Budget Alloca-tion for
FY 2018/19 (Kshs)
Actual receipts in Half Year of FY 2018/19 (in
Kshs.)
Actual Receipts as Percentage of Annual Alloca-
tion (%)
A Grants Contained in the CARA, 2018
1 Compensation for User Fee Foregone 12,657,201 19,158,582 - -
2 Leasing of Medical Equipment 200,000,000 - - -
3 Road Maintenance Fuel Levy 117,396,321 212,686,815 29,340,225 -
4 Rehabilitation of Village Polytechnics 55,000,000 70,891,386 - -
5Transforming Health Systems for Universal Care Project (WB)
73,956,778 73,172,815 18,091,517 24.7
6National Agricultural and Rural Inclu-sive Growth Project (NARIGP)
140,435,163 193,368,318 -
7Kenya Devolution Support Project (KDSP) “Level 1 grant”
41,604112 75,302,439 - -

316
COUNTY GOVERNMENTS BUDGET IMPLEMENTATION REVIEW REPORT FOR THE FIRST HALF OF FY2018/19
8 Kenya Urban Support Project (KUSP) 250,950,700 250,950,700 250,950,700 100.0
9 DANIDA Grant 14,782,500 20,930,173 13,538,923 64.7
10Water and Sanitation Development Project (WSDP)
80,000,000 80,000,000 - -
Sub Total 945,178,663 996,461,228 311,921,365 31.3
B Other Grants
11Agricultural Sector Development Support Programme(ADSP)
12,661,321 18,161,321 - -
12 Urban Planning-(WORLD BANK) 41,200,000 41,200,000 - -
Sub Total 53,861,321 59,361,321 0.0
Total 1,040,644,096 1,055,822,549 311,921,365 29.5
Source: Vihiga County Treasury
Analysis of the revenue from conditional grants indicate that, the County received the highest percentage of receipts to annual allocation from the Kenya Urban Support project, EU grant for IDEAS and the DANIDA grant. The receipts accounted for 100 per cent, 43.8 per cent and 34.6 per cent of annual allocation respectively.
3.45.4 Exchequer IssuesTo finance the budget, the Controller of Budget approved the withdrawal of Kshs.2.37 billion from the CRF account, which was 36.8 per cent of the Approved Budget. This amount represent an increaseof 30.4 per cent from Kshs.1.65 billion approved in the first half of FY 2017/18and comprised of Kshs.2.17 billion (91.6 per cent) to fund recurrent expenditure and Kshs198.44 million 8.4per cent) for development activities.
3.45.5 Overall Expenditure ReviewThe County government spent a total of Kshs.1.77 billion on recurrent and development activities. The total expenditure represented 74.7per cent of the total funds released from the CRF account and was an increase/ decline of 50.8 per cent from Kshs.868.66 million spent in the first half of FY 2017/18.The expenditure excluded outstanding commitments as at December 31st 2018 which amounted to Kshs.36.6 million for development activities and Kshs.73.8 million for recurrent expenditure.
Expenditure on recurrent activities amounted to Kshs.1.34 billion while Kshs.431.52 million was spent on development activities. The recurrent expenditure was 63.8 per cent of the funds released for recurrent activities, while development expenditure was 161.4 per cent of funds released for development activities.
The recurrent expenditure represented 29.8 per cent of the annual recurrent budget, an increase from 26per cent recorded in the first half of FY 2017/18. Development expenditure recorded an absorption rate of 22.3 per cent, which was an increasefrom 0.0per cent attained in the first half of FY 2017/18.Figure 3.177: presents a comparison between the total expenditure in the first half of FY 2018/19 and the first half of the FY 2017/18.

317
COUNTY GOVERNMENTS BUDGET IMPLEMENTATION REVIEW REPORT FOR THE FIRST HALF OF FY2018/19
Figure3.177: VihigaCounty,ExpenditurebyEconomicClassification
Source: Vihiga County Treasury
3.45.6 Analysis of Recurrent ExpenditureThe total recurrent expenditure of Kshs.1.34 billion comprised of Kshs.925.91 million (69 per cent) incurred on personnel emoluments and Kshs.416.91 million (31 per cent) on operations and maintenance as shown in Figure 3.177:.
Expenditure on personnel emoluments represented an increase of 45.6 per cent compared to the first half of FY 2017/18 when the County spent Kshs.635.88 million, and was 52.2 per cent of total expenditure in the first half of FY 2018/19. Figure 3.178 shows a summary of operations and maintenance expenditure by major categories.

318
COUNTY GOVERNMENTS BUDGET IMPLEMENTATION REVIEW REPORT FOR THE FIRST HALF OF FY2018/19
Figure 3.178: Vihiga County, Operations and Maintenance Expenditure by Major Categories in the First Half of FY 2018/19
Source: Vihiga County Treasury
The County spent Kshs.27.29 million on MCAs’ committee sitting allowances for the 39 MCAs against the annual budget allocation of Kshs.44.68 million. This represented an increase of 96.4 per cent compared to Kshs.0.97 million spent in a similar period of FY 2017/18. The average monthly sitting allowance translated to Kshs.116,625 per MCA against the SRC’s recommended monthly ceiling of Kshs.124,800.
Expenditure on domestic travel amounted to Kshs.128.97 million and comprised of Kshs.71.74 million spent by the County Assembly and Kshs.57.22 million spent by the County Executive. This represented 32.4 per cent of total recurrent expenditure and was an increase of 58.5 per cent compared to Kshs.56.12 million spent in the first half of FY 2017/18.
3.45.7 Development ExpenditureThe total development expenditure of Kshs.413.52 million represented 22.3 per cent of the annual development budget of Kshs.1.94 billion. Table 3.130 provides a summary of development projects with the highest expenditure in the first half of the financial year.

319
COUNTY GOVERNMENTS BUDGET IMPLEMENTATION REVIEW REPORT FOR THE FIRST HALF OF FY2018/19
Table 3.130: Vihiga County, List of Development Projects with the Highest Expenditure in the FY 2018/19
S/No. Project Name Project Budget (Kshs.)Project Expenditure in First Half of FY 2018/19 (Kshs.)
Absorption Rate (%)
1Overhaul of Other Infrastructure and Civil Works 1,049,331,971 264,325,915
25
2Purchase of Fire fighting Vehicles and Equipment 37,000,000 37,000,000
100
3 Construction of Buildings 68,649,700 30,166,209 44
4Purchase of Educational Aids and Related Equipment 12,600,000 23,314,541
185
5 Rehabilitation &Renovation - 158,238,026 18,354,930 12
6 Purchase of Lighting Equipment 18,800,000 17,141,360 91
7 Bridges 9,821,753 12,173,675 124
8 Purchase of Certified Seeds 47,000,000 9,369,000 20
9 Purchase of Animals and Breeding Stock 13,131,250 6,000,000 46
10Residential Buildings (including hostels) 45,000,000 5,000,000
11
Source: Vihiga County Treasury
3.45.8 Budget Performance by County DepartmentTable 3.131 shows a summary of budget estimates and budget performance by department in the first half of FY 2018/19.
Table 3.131: Vihiga County, Budget Performance by Department
Department
Annual Budget Allo-cation for FY 2018/19
(Kshs. Million)
Exchequer Issues in First Half of FY 2018/19 (Kshs. Mil-lion)
Expenditure in First Half of FY 2018/19
(Kshs. Million)
Expenditure to Exchequer
Issues (%)
Absorption rate (%)
Rec Dev Rec Dev Rec Dev Rec Dev Rec Dev
Office of The Governor 453.08 40.80 208.41 - 109.65 - 52.6 - 24.2 0.0
Finance & Economic Planning
499.73 132.12 156.01 - 115.31 - 73.9 - 23.1 0.0
Agriculture, Livestock, Fisheries &Cooperatives
165.10 232.50 72.21 31.46 52.73 32.13 73.0 102.1 31.9 13.8
Health Services 1,313.15 321.79 651.30 60.64 536.26 78.91 82.3 130.1 40.8 24.5
Education, Science, Techni-cal and Vocational Training
489.33 232.15 167.73 26.13 215.77 41.67 128.6 159.5 44.1 17.9
Gender, Culture, Youth, Sports and Social Services
158.87 87.00 93.94 - 31.27 - 33.3 - 19.7 -
Trade, Industry, Tourism and Entrepreneurship.
98.07 46.93 28.18 1.07 13.94 2.14 49.5 200.0 14.2 4.6
County Public Service Board
52.57 - 26.19 - 9.74 - 37.2 - 18.5 -
Environment, Water, Energy & Natural Resources.
86.85 71.11 38.70 7.86 32.88 23.83 85.0 303.2 37.9 33.5
Transport, Infrastructure & Communication
186.83 567.20 79.26 135.12 67.35 245.24 85.0 181.5 36.0 43.2

320
COUNTY GOVERNMENTS BUDGET IMPLEMENTATION REVIEW REPORT FOR THE FIRST HALF OF FY2018/19
Department
Annual Budget Allo-cation for FY 2018/19
(Kshs. Million)
Exchequer Issues in First Half of FY 2018/19 (Kshs. Mil-lion)
Expenditure in First Half of FY 2018/19
(Kshs. Million)
Expenditure to Exchequer
Issues (%)
Absorption rate (%)
Rec Dev Rec Dev Rec Dev Rec Dev Rec Dev
Physical Planning, Land and Housing
70.93 67 31.88 2.94 21.95 2.60 68.9 88.4 30.9 3.9
County Assembly 560.96 94.03 299.48 - 241.66 - 80.7 - 43.1 -
Administration and Coordi-nation of County Affairs
367.10 45.44 174.19 2.11 145.78 5.00 83.7 237.0 39.7 11
Total 4,502.57 1,938.07 2,027.48 267.33 1,594.29 431.52 78.6 161.4 35.4 22.3
Source: Vihiga County Treasury
Analysis of expenditure by department shows that the Department of Transport, Infrastructure & Communication recorded the highest absorption rate of development budget at 43.2 per cent followed by the Department of Environment, Water, Energy & Natural Resources at 33.5 per cent. The Department of Education, Science, Technical and Vocational Training had the highest percentage of recurrent expenditure to recurrent budget at 44.1 per cent while the Department of Trade, Industry, Tourism and Entrepreneurship had the lowest at 14.2 per cent.
3.45.9 Key Observations and RecommendationsThe County has made progress in addressing some of the challenges previously identified as affecting budget implementation. Some of the progress made included:
i. Decentralising IFMIS to County departments and training of staff on use of IFMIS.ii. Establishing of the Audit Committee in line with Section 155 of the PFM Act, 2012.iii. Increase in own-source revenue collection by 50.1 per cent as compared to the same period of FY
2017/18.iv. Establishment of the County Budget and Economic Forum in line with Section 137 of PFM Act, 2012.
Despite the above progress, the following challenges continued to hamper effective budget implementation;
1. E-Procurement challenges which delayed procurement requests, project implementation and supplier payments.
2. High wage bill which impacts negatively on development projects.
The Department will continue to implement the following recommendations in order to improve budget execution;
1. Liaise with National Treasury for technical assistance as well as organize for more staff trainings on E-procurement.
2. The County Public Service Board should establish an optimal staffing structure in order to ensure a sustainable wage bill.
3.46 Wajir County
3.46.1 Overview of the FY 2018/19 BudgetThe County’s Approved Budget for FY 2018/19 is Kshs.13.17 billion, comprising of Kshs.6.34 billion (48.1 per cent) and Kshs.6.83 billion (51.9 per cent) allocation for recurrent and development expenditure respectively.

321
COUNTY GOVERNMENTS BUDGET IMPLEMENTATION REVIEW REPORT FOR THE FIRST HALF OF FY2018/19
To finance the budget, the County expects to receive Kshs.8.48 billion (64.3 per cent) as equitable share of revenue raised nationally, Kshs.1.88 billion (14.3 per cent) as total conditional grants, generate Kshs.200 million (1.5 per cent) from local revenue sources, and Kshs.2.62 billion (19.9 per cent) cash balance brought forward from FY 2017/18.
Figure 3.179 : Wajir County Sources of Budget Financing in FY 2018/19
Source: Wajir County Treasury
The conditional grants contained in the CARA, 2018 consist of; Kshs.100 million (5.3 per cent) for Transforming Health Systems for Universal Care Project, Kshs.25 million (1.3 per cent) from IDA (World Bank) credit for National Agricultural and Rural Inclusive Growth Project, Kshs.150 million (8 per cent) from IDA (World Bank) for Kenya Climate Smart Agriculture Project, Kshs.53.40 million (2.8 per cent) from IDA (World Bank) as credit for Kenya Devolution Support Programme “Level 1 grant”, Kshs.205.6 million (10.9 per cent) from IDA (World Bank ) as credit for Kenya Urban Support Project, Kshs.38.8 million (2.1 per cent) grant from DANIDA for Universal Healthcare to Devolved System Programme, Kshs.45 million (2.4 per cent) grant from EU for Instruments for Devolution Advice and Support (IDEAS), Kshs.1 billion(53.2 per cent) from IDA (World Bank) as credit for Water & Sanitation Development Project (WSDP) , Kshs.15.78 million (0.8 per cent) Compensation for User Fees Foregone, Kshs.223.22 million (11.9 per cent) from the Road Maintenance Fuel Levy Fund, and Kshs.21.29 million (1.1 per cent) for Rehabilitation of Village Polytechnics.
3.46.2 Revenue AnalysisDuring the first half of FY 2018/19, the County received Kshs.2.85 billion as equitable share of revenue raised nationally, Kshs.38.4 million as total conditional grants, raised Kshs.26.21 million from own-source revenue, and had a cash balance of Kshs.1.53 million from FY 2017/18. The total funds available for the period amounted to Kshs.4.4 billion.
Figure 3.180 shows the half yearly trend in own-source revenue collection from FY 2013/14 to FY 2018/19.

322
COUNTY GOVERNMENTS BUDGET IMPLEMENTATION REVIEW REPORT FOR THE FIRST HALF OF FY2018/19
Figure 3.180: Wajir County, Trend in Own-Source Revenue Collection for the First Half of FY 2013/14 to the First Half of FY 2018/19
Source: Wajir County Treasury
During the first half of FY 2018/19, the County generated a total of Kshs.26.21 million from own-source revenue. This amount was a decrease of 5 per cent when compared to Kshs.36.12 million realised during the same period of FY 2017/18 and represented 13.1 per cent of the annual target.
3.46.3 Conditional GrantsThe County received Kshs.38.4 million as conditional grants as shown in Table 3.132.
Table 3.132: Wajir County, Conditional Grants/Loans Received in the First Half of FY 2018/19
S/No. Grants/LoansAnnual Allocation per CARA, 2018 Alloca-
tion (Kshs)
Annual Budget Allocation for FY
2018/19 (Kshs)
Actual receipts in Half Year of FY 2018/19 (Kshs.)
Actual Receipts as Percentage of Annual Alloca-tion (%)
A Grants Contained in the CARA, 2018
1Compensation for User Fee Foregone-National Government
15,784,997 15,784,997 - -
2Road Maintenance Fuel Levy-National Govern-ment
223,218,356 223,218,356 - -
3Rehabilitation of Village Polytechnics-National Government
21,295,000 21,295,000 - -
4Transforming Health Systems for Universal Care Project- World Bank
100,000,000 100,000,000 24,771,251 24.8
5National Agricultural and Rural Inclusive Growth Project (NARIGP)-World Bank
25,000,000 25,000,000 - -
6Kenya Climate Smart Agriculture Project (KCSAP)-World Bank
150,000,000 150,000,000 - -
7Kenya Devolution Support Project (KDSP) “Level 1 grant”
53,401,112 53,401,112 - -

323
COUNTY GOVERNMENTS BUDGET IMPLEMENTATION REVIEW REPORT FOR THE FIRST HALF OF FY2018/19
S/No. Grants/LoansAnnual Allocation per CARA, 2018 Alloca-
tion (Kshs)
Annual Budget Allocation for FY
2018/19 (Kshs)
Actual receipts in Half Year of FY 2018/19 (Kshs.)
Actual Receipts as Percentage of Annual Alloca-tion (%)
A Grants Contained in the CARA, 2018
8 Kenya Urban Support Project (KUSP) 205,643,500 205,643,500 - -
9 DANIDA Grant 38,772,225 38,772,225 13,643,438 35.2
10 EU Grant 45,000,000 45,000,000 - -
11Water and Sanitation Development Project (WSDP)
1,000,000,000 1,000,000,000 - -
Total 1,878,115,190 1,878,115,190 38,414,689 2.0
Source: Wajir County Treasury
Analysis of the revenue from conditional grants indicate that, the County received the highest percentage of receipts to annual allocation from the Kenya Urban Support project, EU grant for IDEAS and the DANIDA grant. The receipts accounted for 100 per cent, 43.8 per cent and 34.6 per cent of annual allocation respectively.
3.46.4 Exchequer IssuesTo finance implementation of the budget, the Controller of Budget approved withdrawal of Kshs.2.19 billion from the CRF account. The withdrawals represented 16.6 per cent of the Approved Budget and translate to an an increase of 32.3 per cent from Kshs.1.65 billion approved in the first half of FY 2017/18 and comprised of Kshs.2.2 billion (100 per cent) to fund recurrent expenditure.
3.46.5 Overall Expenditure ReviewThe County government spent a total of Kshs.2.17 billion on both recurrent and development activities. This expenditure represented 99.1 per cent of the total funds released from the CRF account and was an increase of 31.2 per cent from Kshs.1.66 billion spent in the first half of FY 2017/18. The expenditure excluded outstanding commitments as at 31st December, 2018, which amounted to Kshs.20.6 million for recurrent expenditure.
Expenditure on recurrent activities amounted to Kshs.2.17 million while there was no development expenditure. The recurrent expenditure was 99.1 per cent of the funds released for recurrent activities, while development expenditure was 0 per cent of funds released for development activities.
The recurrent expenditure represented 34.2 per cent of the annual recurrent budget and was an increase from 31.2 per cent recorded in the first half of FY 2017/18. Figure 3.181 presents a comparison between the total expenditure in the first half of FY 2018/19 and the first half of the FY 2017/18.

324
COUNTY GOVERNMENTS BUDGET IMPLEMENTATION REVIEW REPORT FOR THE FIRST HALF OF FY2018/19
Figure3.181: WajirCounty,ExpenditurebyEconomicClassification
Source: Wajir County Treasury
3.46.6 Analysis of Recurrent ExpenditureThe total recurrent expenditure of Kshs.2.17 billion comprised of Kshs.1.96 billion (89.3 per cent) incurred on personnel emoluments and Kshs.233.9million (10.7 per cent) on operations and maintenance as shown in Figure 3.181.
Expenditure on personnel emoluments represented an increase of 61.3 per cent compared to the first half of FY 2017/18 when the County spent Kshs.1.2 billion, and was 89.3 per cent of total expenditure for the period. Figure 3.182: shows a summary of operations and maintenance expenditure by major categories.

325
COUNTY GOVERNMENTS BUDGET IMPLEMENTATION REVIEW REPORT FOR THE FIRST HALF OF FY2018/19
Figure 3.182: Wajir County, Operations and Maintenance Expenditure by Major Categories in the First Half of FY 2018/19
Source: Wajir County Treasury
The County spent Kshs.19.6 million on MCAs’ committee sitting allowances for the 46 MCAs against the annual budget allocation of Kshs.23.75 million. This amount represented an increase of 596 per cent compared to Kshs.2.8 million spent in a similar period of FY 2017/18. The average monthly sitting allowance translated to Kshs.70,878 per MCA against the SRC’s recommended monthly ceiling of Kshs.124,800.
Expenditure on domestic travel amounted to Kshs.84.91 million and comprised of Kshs.38.8 million spent by the County Assembly and Kshs.46.1 million spent by the County Executive. This represented 4 per cent of total recurrent expenditure and was 60 per cent compared to Kshs.50.9 million spent in the first half of FY 2017/18.
3.46.7 Development ExpenditureThere was no development expenditure in the reporting period.
3.46.8 Budget Performance by County DepartmentTable 3.133 shows a summary of budget estimates and budget performance by department in the first half of FY 2018/19.
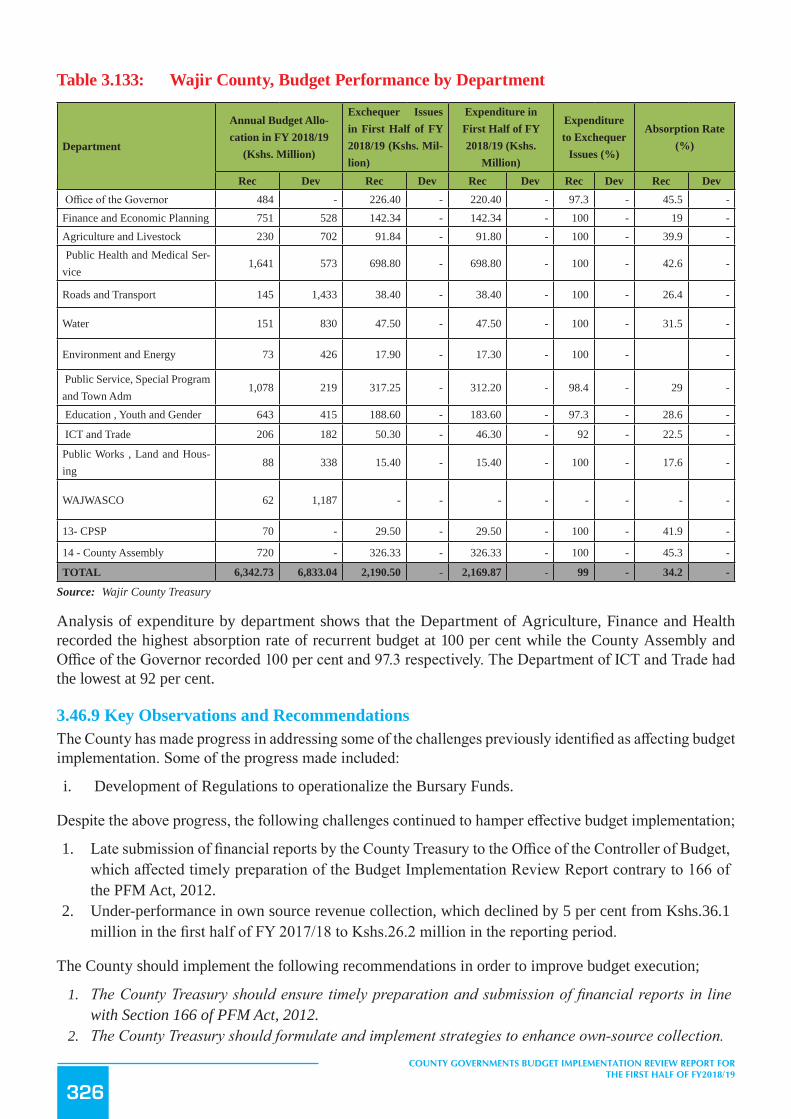
326
COUNTY GOVERNMENTS BUDGET IMPLEMENTATION REVIEW REPORT FOR THE FIRST HALF OF FY2018/19
Table 3.133: Wajir County, Budget Performance by Department
Department
Annual Budget Allo-cation in FY 2018/19
(Kshs. Million)
Exchequer Issues in First Half of FY 2018/19 (Kshs. Mil-lion)
Expenditure in First Half of FY 2018/19 (Kshs.
Million)
Expenditure to Exchequer
Issues (%)
Absorption Rate (%)
Rec Dev Rec Dev Rec Dev Rec Dev Rec Dev Office of the Governor 484 - 226.40 - 220.40 - 97.3 - 45.5 -Finance and Economic Planning 751 528 142.34 - 142.34 - 100 - 19 -Agriculture and Livestock 230 702 91.84 - 91.80 - 100 - 39.9 - Public Health and Medical Ser-vice
1,641 573 698.80 - 698.80 - 100 - 42.6 -
Roads and Transport 145 1,433 38.40 - 38.40 - 100 - 26.4 -
Water 151 830 47.50 - 47.50 - 100 - 31.5 -
Environment and Energy 73 426 17.90 - 17.30 - 100 - -
Public Service, Special Program and Town Adm
1,078 219 317.25 - 312.20 - 98.4 - 29 -
Education , Youth and Gender 643 415 188.60 - 183.60 - 97.3 - 28.6 -
ICT and Trade 206 182 50.30 - 46.30 - 92 - 22.5 -
Public Works , Land and Hous-ing
88 338 15.40 - 15.40 - 100 - 17.6 -
WAJWASCO 62 1,187 - - - - - - - -
13- CPSP 70 - 29.50 - 29.50 - 100 - 41.9 -
14 - County Assembly 720 - 326.33 - 326.33 - 100 - 45.3 -
TOTAL 6,342.73 6,833.04 2,190.50 - 2,169.87 - 99 - 34.2 -
Source: Wajir County Treasury
Analysis of expenditure by department shows that the Department of Agriculture, Finance and Health recorded the highest absorption rate of recurrent budget at 100 per cent while the County Assembly and Office of the Governor recorded 100 per cent and 97.3 respectively. The Department of ICT and Trade had the lowest at 92 per cent.
3.46.9 Key Observations and RecommendationsThe County has made progress in addressing some of the challenges previously identified as affecting budget implementation. Some of the progress made included:
i. Development of Regulations to operationalize the Bursary Funds.
Despite the above progress, the following challenges continued to hamper effective budget implementation;
1. Late submission of financial reports by the County Treasury to the Office of the Controller of Budget, which affected timely preparation of the Budget Implementation Review Report contrary to 166 of the PFM Act, 2012.
2. Under-performance in own source revenue collection, which declined by 5 per cent from Kshs.36.1 million in the first half of FY 2017/18 to Kshs.26.2 million in the reporting period.
The County should implement the following recommendations in order to improve budget execution;
1. The County Treasury should ensure timely preparation and submission of financial reports in line with Section 166 of PFM Act, 2012.
2. The County Treasury should formulate and implement strategies to enhance own-source collection.

327
COUNTY GOVERNMENTS BUDGET IMPLEMENTATION REVIEW REPORT FOR THE FIRST HALF OF FY2018/19
3.47 West Pokot County
3.47.1 Overview of the FY 2018/19 BudgetThe County’s Approved Supplementary Budget for FY 2018/19 was Kshs.6.30 billion, comprising of Kshs.4.08 billion (64.8 per cent) and Kshs.2.2 billion (35.2 per cent) allocation for recurrent and development expenditure respectively.
To finance the budget, the County expects to receive Kshs.4.79 billion (76.0 per cent) as equitable share of revenue raised nationally, Kshs.467.72 million (7.4 per cent) as total conditional grants, generate Kshs.152.37 million (2.4 per cent) from own sources, Kshs.574.97 million (9.1 per cent) cash balance from FY 2017/18 and Kshs.41.56 million as other revenue sources expected in the year.
Figure 3.183: West Pokot County Sources of Budget Financing in FY 2018/19
Source: West Pokot County Treasury
The conditional grants contained in the CARA, 2018 consist of; Kshs.100 million (10.3 per cent) for Transforming Health Systems for Universal Care Project, Kshs.117 million (12 per cent) from IDA (World Bank) for Kenya Climate Smart Agriculture Project, Kshs.42.92 million (4.4 per cent) from IDA (World Bank) as credit for Kenya Devolution Support Programme “Level 1 grant”, Kshs.73.39 million (7.5 per cent) from IDA (World Bank ) as credit for Kenya Urban Support Project, Kshs.15.90 million (1.6 per cent) as grant from DANIDA for Universal Healthcare to Devolved System Programme, Kshs.70 million (7.2 per cent) grant from EU for Instruments for Devolution Advice and Support (IDEAS), Kshs.22.09 million (2.3 per cent) for Sweden-Agricultural Sector Development Support Programme (ASDSP) II, Kshs.80 million (8.2 per cent) grant from EU for water tower protection and climate change mitigation and adaptation programme, Kshs.41.2 million (4.2 per cent) credit from IDA (World Bank) to support the Kenya Urban Support Project (KUSP), Kshs.12.13 million (1.2 per cent) Compensation for User Fees Foregone, Kshs.200 million (20.5 per cent) for Leasing of Medical Equipment, Kshs.129.80 million (13.3 per cent) for the Road Maintenance Fuel Levy Fund, and Kshs.28.89 million (3.1 per cent) for Rehabilitation of Village Polytechnics.
In addition, the County also budgeted to receive a Kshs.1.55 million grant for UNICEF grant for Repair of Boreholes Programme, which is not contained in the CARA, 2018.

328
COUNTY GOVERNMENTS BUDGET IMPLEMENTATION REVIEW REPORT FOR THE FIRST HALF OF FY2018/19
3.47.2 Revenue AnalysisDuring the first half of FY 2018/19, the County received Kshs.1.53 billion as equitable share of revenue raised nationally, Kshs.134.35 million as total conditional grants, raised Kshs.48 million from own-source revenue, and had a cash balance of Kshs.574.97 million from FY 2017/18. The total funds available for the period amounted to Kshs.2.24 billion.
Figure 3.184 shows the half yearly trend in own-source revenue collection from FY 2013/14 to FY 2018/19.
Figure 3.184: West Pokot County, Trend in Own-Source Revenue Collection for the First Half of FY 2013/14 to the First Half of FY 2018/19
Source: West Pokot County Treasury
During the first half of FY 2018/19, the County generated a total of Kshs.48 million as own-source revenue. This amount was an increase of 38.8 per cent when compared to Kshs.34.75 million realised during the same period of FY 2017/18 and represented 31.5 per cent of the annual target.
3.47.3 Conditional GrantsThe County received Kshs.134.35 million as conditional grants as shown in Table 3.134.
Table 3.134: West Pokot County, Conditional Grants/Loans Received in the First Half of FY 2018/19
S/No Grants/Loans
Annual Alloca-tion per CARA, 2018 Allocation
(in Kshs)
Annual Budget Allocation for FY
2018/19 (Kshs)
Actual receipts in Half Year of FY 2018/19 (Kshs.)
Actual Re-ceipts as Per-centage of Annual Allo-cation (%)
A Grants Contained in the CARA, 2018
1Compensation for Use Fees Foregone-National Government
12,128,484 12,128,484 - -

329
COUNTY GOVERNMENTS BUDGET IMPLEMENTATION REVIEW REPORT FOR THE FIRST HALF OF FY2018/19
S/No Grants/Loans
Annual Alloca-tion per CARA, 2018 Allocation
(in Kshs)
Annual Budget Allocation for FY
2018/19 (Kshs)
Actual receipts in Half Year of FY 2018/19 (Kshs.)
Actual Re-ceipts as Per-centage of Annual Allo-cation (%)
A Grants Contained in the CARA, 2018
3Kenya Urban Support Project (KUSP)-IDA (World Bank)
41,200,000 - - -
4Road Maintenance Fuel Levy-National Govern-ment
129,797,341 129,797,341 - -
5Rehabilitation of Village Polytechnics-National Government
28,885,000 28,885,000 - -
6Transforming Health Systems for Universal Care Project-World Bank
100,000,000 100,000,000 13,487,351 13.5
7Kenya Climate Smart Agriculture Project (KCSAP)-World Bank
117,000,000117,000,000
39,517,239 33.8
8Kenya Devolution Support Project (KDSP) “Level 1 grant”
42,917,54642,917,546
13,487,351 31.4
9 Kenya Urban Support Project (KUSP)-World Bank 73,392,300 73,392,300 73,392,300 100
10Universal Healthcare in Devolved System Pro-gramme- DANIDA
15,896,25015,896,250
7,948,125 50
11Instruments for Devolution Advice and Support (IDEAS)-EU
70,000,00077,504,904
- -
12Agricultural Sector Development Support Pro-gramme (ASDSP)-Sweden
22,091,862-
-
13Water Tower Protection and Climate Change Miti-gation and Adaption-EU
80,000,000-
- -
Sub Total 933,308,783 597,521,825 134,345,015
B Other Grants
14 UNICEF Grant for repair of boreholes - 1,554,500 - -
15 Urban Institutional Grants (UIG)-IDA 41,200,000 40,000,000 - -
Sub Total
Total 974,508,783 639,076,325 134,345,014 13.8
Source: West Pokot County Treasury
Analysis of the revenue from conditional grants indicate that, the County received the highest percentage of receipts to annual allocation from the Kenya Urban Support project, EU grant for IDEAS and the DANIDA grant. The receipts accounted for 100 per cent, 43.8 per cent and 34.6 per cent of annual allocation respectively.
3.47.4 Exchequer IssuesTo finance implementation of the budget, the Controller of Budget approved withdrawal of Kshs.1.83 billion from the CRF account. The withdrawals represented 29.1 per cent of the Approved Supplementary Budget and translate to an increase of 51.5 per cent from Kshs.1.21 billion approved in the first half of FY 2017/18 and comprised of Kshs.1.62 billion (85.5 per cent) to fund recurrent expenditure and Kshs.216 million (14.5 per cent) for development activities.
3.47.5 Overall Expenditure ReviewThe County government spent a total of Kshs.1.47 billion on both recurrent and development activities. This expenditure represented 80.5 per cent of the total funds released from the CRF account and was an increase of 27.2 per cent from Kshs.1.16 billion spent in the first half of FY 2017/18. The expenditure excluded outstanding commitments as at 31st December, 2018, which amounted to Kshs.317.12 million for development activities.

330
COUNTY GOVERNMENTS BUDGET IMPLEMENTATION REVIEW REPORT FOR THE FIRST HALF OF FY2018/19
Expenditure on recurrent activities amounted to Kshs.1.27 billion while that on development activities was Kshs.202.4 million. The recurrent expenditure was 81.2 per cent of the funds released for recurrent activities, while development expenditure was 76.1 per cent of funds released for development activities.
The recurrent expenditure represented 31.2 per cent of the annual recurrent budget a decrease from 33.4 per cent recorded in the first half of FY 2017/18. Development expenditure recorded an absorption rate of 9.1 per cent, while there was no expenditure on development activities in the first half of FY 2017/18. Figure 3.185 presents a comparison between the total expenditure in the first half of FY 2018/19 and the first half of the FY 2017/18.
Figure3.185: WestPokotCounty,ExpenditurebyEconomicClassification
Source: West Pokot County Treasury
3.47.6 Analysis of Recurrent ExpenditureThe total recurrent expenditure of Kshs.1.27 billion comprised of Kshs.913.38 million (71.8 per cent) incurred on personnel emoluments and Kshs.358.60 million (28.2 per cent) on operations and maintenance as shown in Figure 3.185.
Expenditure on personnel emoluments represented an increase of 1.2 per cent compared to the first half of FY 2017/18 when the County spent Kshs.902.55 million, and was 62 per cent of total expenditure for the period. 3.186 shows a summary of operations and maintenance expenditure by major categories.

331
COUNTY GOVERNMENTS BUDGET IMPLEMENTATION REVIEW REPORT FOR THE FIRST HALF OF FY2018/19
Figure 3.186: West Pokot County, Operations and Maintenance Expenditure by Major Categories in the First Half of FY 2018/19
Source: West Pokot County Treasury
The County spent Kshs.15 million on MCAs’ committee sitting allowances for the 34 MCAs against the annual budget allocation of Kshs.21.16 million. This amount represented an increase of 608.4 per cent compared to Kshs.2.11 million spent in a similar period of FY 2017/18. The average monthly sitting allowance translated to Kshs.73,512 per MCA against the SRC’s recommended monthly ceiling of Kshs.124,800.
Expenditure on domestic travel amounted to Kshs.133.93 million and comprised of Kshs.50.97 million spent by the County Assembly and Kshs.82.96 million spent by the County Executive. This represented 10.5 per cent of total recurrent expenditure and was an increase of 66.6 per cent compared to Kshs.87.8 million spent in the first half of FY 2017/18.
3.47.7 Development ExpenditureThe total development expenditure of Kshs.202.4 million represented 9.1 per cent of the annual development budget of Kshs.2.12 billion. Table 3.135 provides a summary of development projects with the highest expenditure in the first half of the financial year.

332
COUNTY GOVERNMENTS BUDGET IMPLEMENTATION REVIEW REPORT FOR THE FIRST HALF OF FY2018/19
Table 3.135: West Pokot County, List of Development Projects with the Highest Expenditure in the FY 2018/19
S/No. Project Name Project LocationProject Budget
(Kshs.)
Project Expenditure in First Half of FY 2018/19
(Kshs.)
1 Nasukuta Livestock Development Centre West Pokot 77,504,904 77,504,904
3 Office Partitioning Nairobi Office 17,700,000 8,769,078
4 Supply of Solar Powered Vaccine Fridges Kapenguria - 5,400,000
5 Chesta - Kapatet Road Chesta 3,480,000 4,601,256
6 Sigor - Akiriamet Road Sigor 1,740,000 4,449,868
7 Weiwei - Tamkal Road Weiwei 3,480,000 4,178,550
8 Blood Tank Equipment Kapenguria 13,000,000 3,698,276
9 Chepareria - Chepturguny Road Chepareria 3,693,353 3,693,353
10 Construction of Operating Theatre at Kacheliba Kacheliba 7,300,000 3,682,241
Source: West Pokot County Treasury
3.47.8 Budget Performance by County DepartmentTable 3.136 shows a summary of budget estimates and budget performance by department in the first half of FY 2018/19.
Table 3.136: West Pokot County, Budget Performance by Department
Department
Annual Budget Allo-cation in FY 2018/19
(Kshs. Million)
Exchequer Issues in First Half of FY 2018/19 (Kshs. Million)
Expenditure in First Half of FY 2018/19
(Kshs. Million)
Expenditure to Exchequer Issues
(%)
Absorption rate (%)
Rec Dev Rec Dev Rec Dev Rec Dev Rec DevCounty Executive 439.03 40.62 163.94 - 110.09 8.77 67.2 - 25.1 21.6Finance and Economic Planning
277.11 - 79.51 - 99.24 - 124.8 - 35.8 -
Public Works , Trans-port and Infrastructure
79.14 401.64 30.17 108.86 21.09 59.87 69.9 55.0 26.7 14.9
Health, Sanitation and Emergencies
1,256.36 480.16 608.71 22.33 546.10 60.00 89.7 268.7 43.5 12.5
Education and Techni-cal training
590.68 186.70 140.04 17.89 96.97 - 69.2 - 16.4 -
Agriculture and Irriga-tion
114.41 175.73 39.88 39.52 52.37 - 131.3 - 45.8 -
Pastoral Economy 107.93 199.71 46.70 77.50 34.38 77.50 73.6 100 31.9 38.8
Trade, Industrializa-tion, Investment and Cooperative Develop-ment
58.24 70.22 20.77 - 22.42 0.99 108.0 - 38.5 1.4
Land, Housing ,Physi-cal Planning and Urban Development
78.40 133.14 33.80 - 19.81 - 58.6 - 25.3 -
Water development, Environment and Nat-ural Resources
87.81 171.37 33.43 - 36.41 4.03 108.9 - 41.5 2.4

333
COUNTY GOVERNMENTS BUDGET IMPLEMENTATION REVIEW REPORT FOR THE FIRST HALF OF FY2018/19
Department
Annual Budget Allo-cation in FY 2018/19
(Kshs. Million)
Exchequer Issues in First Half of FY 2018/19 (Kshs. Million)
Expenditure in First Half of FY 2018/19
(Kshs. Million)
Expenditure to Exchequer Issues
(%)
Absorption rate (%)
Rec Dev Rec Dev Rec Dev Rec Dev Rec DevYouths, Sports, Tour-ism, Gender and Social services
72.72 127.85 37.71 - 27.77 - 73.6 - 38.2 -
Public Service ,ICT and Decentralized Units
231.62 22.10 55.49 - 57.67 - 103.9 - 24.9 -
Special Programmes and Directorates
119.08 65.00 60.17 - 54.54 - 90.6 - 45.8 -
County Assembly 569.46 143.00 216.00 - 221.25 - 102.4 - 38.9 -
Total 4,081.98 2,217.24 1,566.31 266.09 1,400.11 211.16 89.4 79.4 34.3 9.5
Source: West Pokot County Treasury
Analysis of expenditure by department shows that the Department of Pastoral Economy recorded the highest absorption rate of development budget at 38.8 per cent while seven other Departments did not incur any development expenditure. The Department of Special Programmes and Directorates and the Department of Agriculture and Irrigation had the highest percentage of recurrent expenditure to its recurrent budget at 45.8 per cent while the Department of Education and Technical Training had the lowest at 16.4 per cent.
3.47.9 Key Observations and RecommendationsThe County has made progress in addressing some of the challenges previously identified as affecting budget implementation. Some of the progress made included:
i. Improvement in absorption of development funds compared to a similar period in FY 2017/18.
Despite the above progress, the following challenges continued to hamper effective budget implementation;
1. Late submission of financial reports by the County Treasury, which affected timely preparation of budget implementation reports by the OCOB.
2. High wage bill, which increased by 1.2 per cent from Kshs.902.55 million in first half of FY 2017/18 to Kshs.913.38 million in the period under review.
3. Under performance in own-source revenue collection, which was 31.5 per cent of the annual target.
The County should implement the following recommendations in order to improve budget execution;
1. The County Treasury should ensure timely preparation and submission of financial reports in line with Section 166 of PFM Act, 2012.
2. The County Public Service Board should establish and adopt an optimal staffing structure in order to ensure a sustainable wage bill.
3. The County should develop and implement strategies to enhance own source revenue collection.

334
COUNTY GOVERNMENTS BUDGET IMPLEMENTATION REVIEW REPORT FOR THE FIRST HALF OF FY2018/19
4 KEY CHALLENGES AND RECOMMENDATIONS
This chapter highlights cross-cutting issues that affected budget implementation in the first half of FY 2018/19 and also includes appropriate recommendations aimed at addressing the challenges in order to enhance smooth budget execution. The cross-cutting challenges included:
4.1 High Expenditure on Personnel EmolumentsRegulation 25 (1) (b) of the Public Finance Management (County Governments) Regulations, 2015 sets a limit of the County Government’s expenditure on wages and benefits at 35 per cent of the County’s total revenue.
On aggregate, county governments spent Kshs.80.02 billion on personnel emoluments (PE), which accounted for 58.4 per cent of the total expenditure for the period and an increase from Kshs.66.48 billion incurred in a similar period of FY 2017/18 when the personnel expenditure translated to 64.1 per cent of the total expenditure.
County Governments should ensure that expenditure on personnel emoluments is contained at sustainable levels and in compliance with Regulation 25 (1) (b) of the Public Finance Management (County Governments) Regulations, 2015.
4.2 Under-performance in Own Source Revenue CollectionArticle 209 (3) of the Constitution allows County Governments to impose property rates, entertainment taxes and any other tax that a county is authorised to impose by an Act of Parliament.
During the reporting period, the County Governments generated a total of Kshs.15.37 billion, which was 29.9 per cent of the annual target of Kshs.51.32 billion against an expected performance of 50 per cent. The under-performance of own source revenue collection implies that some planned activities may not be implemented in the financial year as budgets will not be fully financed.
Counties should develop and implement strategies to mobilize own source revenue.
4.3 Delays in Disbursement of Equitable Share by the National TreasuryIn the first half of FY 2018/19, the National Treasury disbursed a total of Kshs.115.14 billion to the Counties as equitable share of revenue raised nationally, which accounted for 36.7 per cent of the annual equitable share of revenue of Kshs.314 billion.
It is recommended that, the National Treasury should disburse funds to the Counties on a timely basis to ensure budget implementation is not adversely affected.
4.4 DelaysinSubmissionofFinancialReportstotheOfficeoftheControllerofBudgetSection 166 (4) of the PFM Act, 2012 requires the County Treasury to prepare and submit financial reports to the Office of the Controller of Budget not later than one month after the end of each quarter. Further, Section 168 of the PFM Act, 2012 requires designated Fund Administrators of a County established Fund to submit financial reports to the Controller of Budget, not later than fifteen days after the end of each quarter.
During the period under review, the Office noted that, there were delays in submission of quarterly financial reports by Counties, leading to late publication of the County Budget Implementation Review Report (CBIRR).
County Governments should therefore, ensure timely preparation and submission of financial reports in line with Section 166 (4) and 168 of the PFM Act, 2012 and Section 16 of the Controller of Budget Act, 2016.

335
COUNTY GOVERNMENTS BUDGET IMPLEMENTATION REVIEW REPORT FOR THE FIRST HALF OF FY2018/19
4.5 Failure to budget for all conditional grants as contained in CARA, 2018The County Allocation of Revenue Act, 2018 provides for yearly allocation to the 47 county governments. The allocations include the equitable share of revenue raised nationally and conditional allocations from the National Government and Development Partners.
Some County governments failed to include some conditional grants in their Approved Budgets because of delay in the approval of CARA, 2018 by Parliament.
The Office recommends that Counties should align their budgets to allocations contained in CARA, 2018 through Supplementary Budgets. Further, Parliament should come up with strategies to ensure the annual County Allocation of Revenue Bill is approved in a timely manner.
336
COUNTY GOVERNMENTS BUDGET IMPLEMENTATION REVIEW REPORT FOR THE FIRST HALF OF FY2018/19
5 CONCLUSION
This report has been prepared in fulfilment of Article 228 (6) of the Constitution of Kenya, 2010 and Section 9 of the Controller of Budget Act, 2016. It provides information on the status of budget implementation in the first half of the FY 2018/19 by County Governments. It indicates the progress made during the reporting period and also identifies the challenges that hindered effected budget implementation.
The approved budget estimates for the 47 County governments for FY 2018/19 amounted to Kshs.463.93 billion and comprised of Kshs.276.44 billion (59.6 per cent) for recurrent expenditure and Kshs.187.49 billion (40.4 per cent) for development expenditure, which conforms to Section 107 (2(b)) of the PFM Act, 2012, that requires at least 30 per cent of budget must be allocated for development programs. To finance the budget, County Governments expect to receive Kshs.314 billion as equitable share of revenue raised nationally, Kshs.25.5 billion as conditional grants from the National Government, Kshs.36.98 billion as conditional grants from Development Partners, generate Kshs.51.32 billion as own source revenue, and had Kshs.46.12 billion cash balance from FY 2017/18.
During the first half of FY 2018/19, the County Governments spent a total of Kshs.136.98 billion, which represents absorption of 29.5 per cent, and was an increase from the absorption rate of 25.9 per cent in the first half of FY 2017/18. A total of Kshs.112.25 billion was spent on recurrent expenditure and Kshs.24.73 billion on development activities against the recurrent budget of Kshs.276.44 billion and development budget of Kshs.187.49 billion. Development expenditure translated to an absorption rate of 13.2 per cent while recurrent expenditure was 40.6 per cent of the annual budget for recurrent expenditure.
This report has also identified challenges which hampered effective budget execution during the reporting period, they included; high expenditure on Personnel Emoluments, Under-performance of own source revenue collection which translated to 29.9 per cent of annual target, delays in the disbursement of equitable share by the National Treasury, late submission of quarterly financial reports to the Office of the Controller of Budget which is contrary to Section 166 and 168 of the PFM Act, 2012, and failure to budget for all conditional grants as contained in the CARA, 2018. The report has provided appropriate recommendations on how to address the identified challenges in order to enhance smooth execution of the budget in the future.


OFFICE OF THE CONTROLLER OF BUDGET
BUDGET IMPLEMENTATION REVIEW REPORT
COUNTY GOVERNMENTS BUDGET IMPLEMENTATION REVIEW REPORT, HALF YEAR, FY 2016/17
C
M
Y
CM
MY
CY
CMY
K
March-COVER-FRONT.pdf 1 3/7/2019 5:55:49 PM