budget hearings - County Of Sonoma
422
BUDGET HEARINGS FY 2016-2017 COUNTY OF SONOMA June 13-24, 2016
-
Upload
khangminh22 -
Category
Documents
-
view
0 -
download
0
Transcript of budget hearings - County Of Sonoma

BUDGET HEARINGSFY 2016-2017
COUNTY OF SONOMA
June 13-24, 2016

Page | 1
COUNTY OF SONOMA
OFFICE OF THE COUNTY ADMINISTRATOR 575 ADMINISTRATION DRIVE – ROOM 104A
SANTA ROSA, CALIFORNIA 95403-2888 TELEPHONE (707) 565-2431
FAX (707) 565-3778
VERONICA A. FERGUSON
COUNTY ADMINISTRATOR
CHRISTINA RIVERA DEPUTY COUNTY ADMINISTRATOR
REBECCA WACHSBERG DEPUTY COUNTY ADMINISTRATOR
June 13, 2016 TO: Members of the Board of Supervisors FROM: Veronica A. Ferguson, County Administrator SUBJECT: FY 2016-17 Supplemental Budget and Budget Hearing Package Enclosed for your consideration is the FY 2016-2017 Supplemental Budget and Budget Hearing Package. In addition to the 2nd year FY 2016-2017 Recommended Budget, which maintains core services, the County Administrator’s staff has worked with departments to put forward supplemental actions in the amount of $19.6 million financed by $11.8 million in increased revenues and reimbursements and $7.8 million in available fund balances. Adjustments include the addition of 35.7 positions mostly in Health Services for behavioral health services needs associated with the Crisis Stabilization Unit expansion. These supplemental budget recommendations are made through the lens of the Board’s 2016 priorities as well as departmental priorities that advance the County’s strategic plan. They are summarized here by strategic goal area, further outlined in this package, and supported by all of the County department and agency heads. Budget Hearing Package This package contains materials for the FY 2016-2017 Budget Hearings, with many providing supporting documentation for the requested Supplemental Budget recommendation. These materials include the following, listed by tab: 1. Budget Hearings Schedule The Budget Hearings begin on Monday, June 13 at 8:30 a.m. and have been publicly noticed to continue from day-to-day not to exceed fourteen (14) calendar days but may be concluded earlier in accordance with the law. Attachment 1 contains a more detailed schedule and will be updated after Board action on Monday morning. In order to advance county residents engagement, this year’s Budget Hearings schedule include an evening session dedicated for the Development Services Budget group and it is scheduled to begin at 4:30 p.m. on Wednesday, June 15, 2016. 2. Supplemental Budget Adjustments The supplemental adjustments to the Recommended Budget increase total expenditures by $19.6 million financed by improved revenue sources such as repayment from Dry Creek Rancheria, available Sheriff’s Office Asset Forfeiture funds, AB 109 Safety Realignment, improved state and federal funding for Behavioral Health services, and revised Reinvestment & Revitalization revenues derived from the dissolution of former Redevelopment Agencies. The purpose of these adjustments is to update the Budget contained in the published Recommended Budget document to accommodate changes which

Page | 2
may have occurred after the document went to print. In addition, these adjustments also reflect the opportunity to make recommended investments consistent with Board priorities beyond those contained in the 2nd year revised Recommended FY 2016-2017 Budget. Should the Board adopt the recommended changes in the Supplemental Budget Adjustments, there will be a beginning balance of about $5 million in General Fund Contingencies, for the Board’s use in the Budget Hearings and, as needed, throughout the coming year. 3. County Reserves This section provides a status of the County’s General Reserve currently established at $49 million or 11.4% of the current FY 2015-2016 General Fund Adopted Budget revenues totaling $431 million. The attachment provides estimated contributions and recommendations necessary to achieve the Board’s established 15% Reserve target by FY 2019-2020. Attachment 3 highlights Budget Adoption Resolution language authorizing the County Administrator and the Auditor-Controller-Tax Collector to transfer up to $4 million into the General Fund reserve from year end General Fund savings in excess of the $15.1 million required to balance the Recommended & Supplemental Changes for FY 2016-2017. Should that level of fund balance not be achieved, staff will return with recommendation to reduce contingencies. 4. Position Allocations/Over 12-months Vacancies Review The FY 2016-2017 2nd year revised Recommended Budget includes allocation of a total of 4,147.4 full-time equivalent positions. This is comprised of 4,111.7 full-time equivalent positions in the published document and 35.7 new positions in the supplemental adjustments. The full position allocation list is included in Exhibit C of the Adopted Budget resolution. This list will be updated to reflect any Board actions in the Budget Hearings and included as Exhibit C to the resolution adopting the Budget. One of the Board adopted Financial Policies is to eliminate positions vacant over 12 months. Total active vacancies were 54.95 full-time equivalents of which 2.05 are recommended for deletion. The remaining 52.9 vacancies have been filled, a recruitment/job class study is underway, or the position is being filled at a different capacity. In addition, consistent with the Board’s interest to maintain an appropriate span of control for managers to meet best practices and maximize the organization’s effectiveness, Attachment 4 includes data confirming the County’s 1:9 ratio target. Representing that on average across the county for every 1 manager there are 9 line team members. 5. New Revenues Attachment 5 provides an update to the Mid-Year Budget Policy Workshop revenue enhancement discussion presented on March 8, 2016, intended to ensure long-term fiscal stability, and address priority initiatives for which a funding plan has not yet been identified. The enclosed report reviews new revenue opportunities in the area of Transient Occupancy Tax (TOT) and User Sales Tax, and recommends placing a TOT Measure on the November ballot for the public’s consideration. 6. State Budget May Revise County Impacts Attachment 6 provides estimates of the anticipated impacts on the County of the Governor’s revised state budget and the President’s federal budget. The most notable potential impacts of the Governor’s budget are: • Lack of adequate funding for Continuum of Care Reform set forth in AB 403; • $1.1 billion available statewide from the new Managed Care Organization tax; and • $3.1 billion in cap and trade revenues to fund environmental protection and natural resources
programs.

Page | 3
Potential impacts of the proposed state and federal budgets have not been included in the Recommended Budget or supplemental adjustments. Based on the outcome of the state and federal appropriations processes, budget adjustments may be warranted and will be presented to the Board for consideration during the consolidated budget adjustments. 7. Pension Reform Update Attachment 7 brings forward information on several items as directed in the Board’s Pension Reform reports. They include information on the annual rate setting and the most recent actuary valuation report of the pension system, 10% cost containment target update, and information on what would be needed to achieve a 95% funding level in the pension system trust 8. Other Post-Employment Benefits (OPEB) Valuation Changes As introduced during the March 2016 Budget Policy and Mid-Year Review, the Government Accounting Standards Board (GASB) has issued statements 74 and 75 which replace the valuation parameters initially established by GASB. Attachment 8 provides an overview of the valuation requirement changes and presents GASB 74/75 calculation results based on the June 2015 actuary valuation. 9. Tribal Update Attachment 9 reviews the history and intent of the agreements with the Federated Indians of Graton Rancheria and the Dry Creek Rancheria Band of Pomo Indians, which provide funding to mitigate casino impacts, an accounting of payments to date and fund balances, and recommendations for further mitigation action with available funding.
To date, the Graton Mitigation Fund has received $10.6 million in total revenues and expended $7.5 million on mitigation measures including law enforcement, dispatch services, tribal relations, health services, fire and emergency services, and pass through funding to the impacted cities to address public safety. In addition to these ongoing mitigation measures, staff recommends a community engagement process to determine appropriate investments to address public safety issues and health, human services and socioeconomic impacts.
The Dry Creek Mitigation Fund has received $25 million since 2002, $20.8 million of which has been expended to date on mitigation measures including law enforcement, waste management, and tribal relations. For the $4.2 million received in December 2015, staff recommends that the General Fund be reimbursed for the aforementioned mitigation measures during the time they were not covered by the Tribe, and that the remainder be used to fund a Geyserville Specific Plan and follow-up projects. 10. Advertising Budget This section provides information and recommendations based upon Board direction from the May 3, 2016 meeting, as well as discussion on the recommended Supplemental Adjustments as reviewed by the Board’s Advertising Liaison Committee on May 25, 2016. It includes 10,000 Degrees, Category E, and Sonoma County Landmarks Commission 11. Reinvestment & Revitalization Fund Use Recommendations On March 29, 2016, the Board provided policy direction to staff regarding the use of Reinvestment and Revitalization Funds, which are monies returned to the General Fund as a result of the dissolution of redevelopment agencies. Attachment 11 summarizes the programs and projects recommended for FY 2016-2017. The Reinvestment & Revitalization (R&R) funds net of Supplemental Budget requests reflect approximately $900,000 in the available fund balance for the Board’s consideration under the R&R Uses Policy.

Page | 4
12. Community Corrections Partnership (CCP) – Annual Recommended Budget Materials Attachment 12 is the annual recommended budget totaling $13.5 million from the Community Corrections Partnership programming the 2011 Realignment funds from the state. As part of the Probation Department budget presentation, the Board of Supervisors will be asked to approve the CCP Public Safety Realignment Plan for FY 2016-2017. 13. Sheriff Office Helicopter Replacement The 1996 helicopter is approaching 10,000 hours of flight, which marks a significant maintenance and repair threshold. This, along with Federal Aviation Administration requirements for avionic upgrades by 2020, result in the recommendation to purchase a new helicopter. Attachment 13 presents staff’s analysis and recommendation to replace Sheriff’s Office Helicopter unit 1996 Bell 407 single-engine with a twin engine helicopter. As part of the supplemental budget, the Board of Supervisors will be asked to appropriate $2.9 million of asset forfeiture funds as a down payment for a new helicopter. If approved, staff will begin a Request for Proposal process for this purchase, and will return to the Board with a specific financing plan for the remaining costs. 14. Draft Resolutions Adopting the Budget at the Conclusion of the Public Hearings Attachment 14 includes the needed resolutions for Budget adoption. These resolutions comply with state law to adopt the FY 2016-2017 Budget appropriations. Resolutions are based upon the County Administrator’s Recommended Budget, Supplemental Budget Adjustments, and any further actions directed by the Board during the Budget Hearings. The first resolution references the following: • Changes to the Recommended Budget directed by the Board during the Hearings (Exhibit A) • Supplemental Budget Recommendations (Attachment 2) • List of entities governed by the Board whose Budget is being adopted (Exhibit B) • Position allocation list for FY 2015-2016 including time or projected limited positions (Exhibit C) In addition, the first resolution authorizes Auditor-Controller-Treasurer-Tax Collector and County Administrator staff to take a number of actions needed to implement the adoption of the FY 2016-2017 Budget, complete actions to close out the current FY 2015-2016, and re-budget unused appropriations linked to multi-year encumbered contracts rolling forward into the new year. In addition, should FY 2015-2016 year-end unrestricted General Fund balance exceed the $15.1 million FY 2016-2017 requirement, as noted before, language authorizes staff to first, transfer up to $4 million to reserve; second, designate up to $8 million for Capital Projects; and third, execute advance pension payments to the Sonoma County Retirement Association with dollars remaining.
Finally, as in past years, the resolution contains findings for on-going efforts to remove access barriers under the Americans with Disabilities Act, as well as language with respect to the Sonoma County Water Agency and the Warm Springs Dam Project. The Agency levies a tax at a rate necessary to pay the indebtedness to ensure a continuation of the benefits of the Warm Springs Dam/Russian River Project. Conclusion Consistent with the Board of Supervisors’ priorities, the Recommended Budget and associated supplemental adjustments result in a FY 2016-2017 Budget plan focusing on important strategic investments while implementing or improving direct services to the community necessary to achieve the County’s vision of a beautiful, thriving, and sustainable community for all.

Page | 5
The Board is requested to: 1) Approve the FY 2016-2017 Supplemental Budget Adjustments. 2) Select Budgets to be moved to Consent, and approve the Budget Hearings Schedule. 3) Conduct the Public Hearings and direct staff to make any changes to the Recommended Budget, as
the Board so desires. 4) Adopt the concurrent resolution adopting the FY 2016-2017 Budget appropriations, and approving
position allocations for all entities governed by the Board of Supervisors/Directors/Commissioners. 5) Adopt the resolution adopting the FY 2016-2017 Budget for the Sonoma Valley County Sanitation
District.

1
Budget Hearings Schedule

Printed on: Friday, June 10, 2016 (version 4)
P a g e | 1
Budget Hearing Schedule 2016-2017 Monday, June 13, 2016
8: 30 a.m. 1) County Administrator Opening Remarks 2) Budget Overview Presentation. 3) Straw Vote on Supplemental Budget Adjustments 4) Board Selection of Budgets to be moved to Consent (no presentation), and schedule affirmation. 5) Public Comment on Consent Budgets and Supplemental Budget Changes
Break DEPARTMENTAL BUDGET PRESENTATIONS/PUBLIC COMMENT
Health & Human Services Human Services (page 97) Health Services (page 91) In Home Support Services – Public Authority (page 103)
Department of Child Support Services (page 107)
Other County Services Agricultural Preservation & Open Space District (page 153) Agriculture/Weights Measures (page 159) U.C. Cooperative Extension (page 163) Fairgrounds (page 167)
Advertising (page 171) Independent Office of Law Enforcement Review & Outreach (IOLERO) (page 175) Clerk-Recorder-Assessor Budget Presentation (page 63)
Tuesday, June 14, 2016
8:30 a.m. Board of Supervisor’s Business Meeting http://sonomacounty.ca.gov/Board-of-Supervisors/Calendar/
Tuesday, June 14, 2016
1:30 p.m. County Staff Recap DEPARTMENTAL BUDGET PRESENTATIONS/PUBLIC COMMENT
Justice Services Court Support and Grand Jury (page 69) Probation Department (page 73)
Approve AB 109 Community Corrections Partnership Plan District Attorney (page 77) Public Defender (page 81) Sheriff-Coroner (page 85)
Receive Sheriff’s Office Helicopter Replacement Report

Printed on: Friday, June 10, 2016 (version 4)
P a g e | 2
Wednesday, June 15, 2016 ***Evening Session*** 4:30 p.m. County Staff Recap
Accept Reinvestment & Revitalization Five Year Use Plan DEPARTMENTAL BUDGET PRESENTATIONS/PUBLIC COMMENT
Development Services Permit and Resource Management (page 113) Community Development Commission (page 117)
Receive Updated Reinvestment & Revitalization Five Year Use Plan Fire and Emergency Services (page 123) Transportation and Public Works (page 129) Sonoma County Water Agency (page 135) Economic Development Department (page 141) Regional Parks (page 145)
Thursday, June 16, 2016
8:30 a.m. President Armiñana’s Gold Resolution Presentation
County Staff Recap
Continuation of Budget Hearings as needed thereafter beginning with County Administrator Recap of Board actions to date and then continuing with individual departmental budgets as necessary.
DEPARTMENTAL BUDGET PRESENTATIONS/PUBLIC COMMENT Administration & Fiscal Services
Board of Supervisors/County Administrator (page 29) County Counsel (page 35) Human Resources (page 39) General Services (page 43) Information Systems (page 47) Non-Departmental (page 51) Auditor-Controller-Treasurer-Tax Collector (page 57)
Capital Projects (page 181)
Board Final Deliberations and Adoption of Budget Resolutions
Budget Wrap-Up (unless hearing continues, as needed, to June 20-24, 2016)

2
Supplemental Budget Adjustments

ATTACHMENT B
Supplemental Adjustments to FY 2016-17
Page - 1
Administrative and Fiscal Services
Auditor-Controller-Treasurer-Tax Collector - General FundAdd 1.0 FTE Assistant Auditor Controller and delete 1.0 FTE Assistant Treasurer Tax Collector classification to establish a management structure that provides for greater flexibility and strengthens the organization now and into the future.
0.00 0 0 0
Clerk-Recorder-Assessor - Other FundTransfer $20,000 in expenditures and revenues from Micrographics to Recorder Operations to cover staff time spent on assisting public with using micrographic media; and increase expenditure appropriations by $10,000 in Property Tax Administration Program from available fund balance to cover baseline equipment needs, and $4,000 in Assessor's Property Characteristics Data from available fund balance for monthly operational cost for the electronic delivery management system (EDMS).
0.00 33,530 20,000 13,530
Board of Supervisors / County Administrator - General FundReceive a $30,000 operating transfer from the Graton Mitigation Fund to reimburse County Administrator’s Office tribal relations staff work. See tab 9 for details.
0.00 0 30,000 (30,000)
Increase expenditures to program staff succession efforts. 0.00 250,000 0 250,000
Non-Departmental - General FundIncrease transfers to Transportation and Public Works - District Formation by $100,000 to continue support for Cloverdale Fire Protection Districts, and by $100,0000 to provide continued support for the Fire Services Project, including consultant services and Local Area Formation Commission costs .
0.00 200,000 0 200,000
Reimburse the General Fund with $3,113,257 from the Dry Creek Tribal Mitigation fund to offset costs associated with the Dry Creek Tribe's River Rock Casino. See tab 9 for details.
0.00 0 3,113,257 (3,113,257)
Reduce expenditures for employee relations legal services by $250,000. FY 16-17 is an off-cycle year for Memorandum of Understanding negotiations with employee bargaining groups; therefore, demand for legal services from outside contract counsel will be lower than the prior fiscal year.
0.00 (250,000) 0 (250,000)
Non-Departmental - Other FundTransfer $3,113,257 from the Dry Creek Mitigation Fund to the General Fund to reimburse law enforcement, tribal relations, and waste management services costs associated with the Dry Creek Tribe’s River Rock Casino during FY 14-15, FY 15-16, and the first half of FY 16-17. Transfer $30,000 from the Graton Mitigation Fund to the County Administrator’s Office to fund tribal relations staff work, including contract negotiation, contract administration, and community outreach. Appropriate $30,000 within the Graton Mitigation Fund for legal services associated with tribal relations, including contract negotiation, drafting, and administration. See tab 9 for details.
0.00 3,173,257 0 3,173,257
SUPPLEMENTALS FOR BOARD CONSIDERATION
FTE Gross Expenditure Revenue & Reimbursement
Net Cost

ATTACHMENT B
Supplemental Adjustments to FY 2016-17
Page - 2
FTE Gross Expenditure Revenue & Reimbursement
Net Cost
Non-Departmental - Other Fund (cont'd)Increase reimbursements to the Community Development Commission to augment funding for existing contracts: $100,000 to Sonoma County Legal Aid; and $100,000 to Social Advocates for Youth (SAY). See tab 11 for details.
0.00 200,000 0 200,000
Justice Services
Court Support - Other FundDecrease appropriations from Courthouse Construction fund balance for MADF Connection Corridor to reflect adjustments that will be made at the end of June to the FY 2015-16 budget for design contract.
0.00 (320,000) 0 (320,000)
Sheriff - General FundIncrease appropriations by $135,000 for higher than anticipated permanent salary and benefit costs in Detention, which fully is offset with an increase in Prop 69 DNA Collection and Identification revenue; appropriate asset forfeiture funds of $94,000 for a Bomb Unit canine and $85,000 to relocate the Specialized Emergency Response Team armory; both of which are funded through asset forfeiture funds.
0.00 314,000 314,000 0
Appropriate additional General Fund net cost for a total of $3,525,000 to offset increases in personnel costs.
0.00 3,524,920 0 3,524,920
Sheriff - Other FundAppropriate asset forfeiture funds of $94,000 for a Bomb Unit canine and $85,000 to relocate the Specialized Emergency Response Team armory.
0.00 179,000 0 179,000
Expenditure increases to allow for the down payment of the helicopter replacement, totaling $2,953,000. Funded by Federal Asset Forfeiture revenue increases; $1,142,000, and $1,811,000 in available fund balance in the State Asset Forfeiture fund. See tab 13 for details.
0.00 2,953,109 1,142,208 1,810,901
Health and Human ServicesHealth Services- General FundIncrease appropriations by $149,000 for Special Projects Director position supporting the Sonoma Development Center closure to be funded 65% with General Fund support; funded by Non-Departmental in the recommended budget.
0.00 149,094 0 149,094

ATTACHMENT B
Supplemental Adjustments to FY 2016-17
Page - 3
FTE Gross Expenditure Revenue & Reimbursement
Net Cost
Health Services- Other FundDecrease expenditures by $149,000 for the Special Projects Director which is now being supported 65% by General Fund. Results in an increase in Realignment Fund Balance by $149,000.
0.00 (149,094) 0 (149,094)
Increase appropriations and associated revenues by $180,000 to add a 1.00 FTE Clinical Psychologist for Behavioral Health Youth and Family Services. This position will be funded by Probation Department to expand integrated mental health services to better serve juvenile and adult offenders.
1.00 180,000 180,000 0
Make the following position changes: -Convert 1.0 Health Information Specialist II from Permanent to Time-Limited through 6/30/18 to support the implementation of the Tobacco Retail Licensing program; -Convert the following positions funded by AB109 from Time-Limited to Permanent, resulting in a net zero FTE change: 1.0 Eligibility Worker II, 1.70 Behavioral Health Clinician, 0.45 Staff Psychiatrist, 0.15 Forensic Psychiatrist, 0.10 Psychiatric Nurse, 1.0 AODS Specialist. Conversion is needed as the Public Safety Realignment funds are established in perpetuity and these positions are necessary to conduct core components of AB109. -Extend 1.0 Department Information System Specialist II to 6/30/18 to support the implementation of additional modules for its Avatar system and Sonoma Web Infrastructure for Treatment Services (SWITS) application needed for the implementation of the Drug Medi-Cal Organized Delivery System 1115 Waiver. Results in a net zero FTE change. -Add 1.0 Department Information System Specialist II allocations for Administration Unit. The position will be funded with existing resources in Environmental Health to increase efficiency and advance data system needs.
1.00 0 0 0
Human Services- Other FundConvert 1.0 Employment & Training Coordinator funded by AB109 Public Safety Realignment from Time-Limited to Permanent, resulting in a net zero FTE change. Conversion is needed as the Public Safety Realignment funds are established in perpetuity and this position is necessary to conduct core components of AB109. See tab 12 for details.
0.00 0 0 0
Development ServicesCommunity Development Commission - Other FundProgram available Reinvestment and Revitalization funds to augment existing contracts: $100,000 to Sonoma County Legal Aid to expand tenant legal assistance; and $100,000 to Social Advocates for Youth (SAY) to support homeless youth at the SAY Dream Center. See tab 11 for details.
0.00 200,000 200,000 0
PRMD - General FundIncrease funding from the Advertising Program for PRMD to contract with private security firm to provide night/weekend vacation rental code enforcement in the amount of $95,940, from Advertising contingencies. See tab 10 for details.
0.00 95,940 95,940 0

ATTACHMENT B
Supplemental Adjustments to FY 2016-17
Page - 4
FTE Gross Expenditure Revenue & Reimbursement
Net Cost
Economic Development Board - Other FundIncrease appropriations from the Advertising Program to the Economic Development Department for salary adjustment, including benefits, for the reclassification of Department Program Manager to Business Development Manager, from Advertising contingencies. See tab 10 for details.
0.00 44,384 0 44,384
Transportation and Public Works - Other FundIncrease revenue and expenditure appropriations in the District Formation Fund from Non-Departmental to provide continued consultant services for the Fire Service Project.
0.00 200,000 200,000 0
Other ServicesAdvertising - Other Fund
0.00 (210,324) 0 (210,324)
0.00 165,940 0 165,940
Capital Projects
Capital Projects - Other FundsDecrease appropriations for MADF Connection Corridor to reflect appropriation of Courthouse Construction Fund balance that will be made at the end of June to the FY 2015-16 budget for design contract.
0.00 (320,000) (320,000) 0
TOTAL 2.00 10,613,756 4,975,405 5,638,351
Decrease contingencies $210,324, thereby allowing an increase in appropriations to add funds - 10,000 Degrees Program in the amount of $50,000 and Sonoma County Landmarks Commission in the amount of $10,000; increase base allocation for Category E Supervisorial District allocations in the total amount of $10,000; provide $96,000 in funding to PRMD to contract with private security firm to provide night/weekend vacation rental code enforcement; available net cost of $44,000 will be used to cover the cost in the Economic Development Department for a salary adjustment. See tab 10 for details.

ATTACHMENT B
Supplemental Adjustments to FY 2016-17
Page - 5
FTE Gross Expenditure Revenue & Reimbursement
Net Cost
Administrative and Fiscal Services
Clerk-Recorder-Assessor - General Fund0.00 100,000 0 100,000
(100,000) 0 (100,000)
Clerk-Recorder-Assessor - Other FundBased on established Board policy eliminate over 12 months vacancy of 1.0 Micrographic Technician II; costs were not included in the Recommended budget, so no financial change is needed. See tab 4 for details.
-1.00 0 0 0
Non Departmental - Other FundIncrease reimbursements to the Community Development Commission (CDC) by $325,000 to mitigate loss of State Emergency Solutions Grant funding. The remaining $522,000 of the overall $847,000 requirement will be funded by the CDC's available Reinvestment and Revitalization fund balance (5/3/16, Board item #16). See tab 11 for details.
0.00 325,124 0 325,124
Increase Tobacco Deallocated fund transfers by $251,745 to finance the full amount of Human Services Department's Youth Ecology Corp contract to be expended over three years (6/14/16, Board Item #26).
0.00 251,745 0 251,745
Increase expenditure appropriations by $330,000 to transfer Reinvestment and Revitalization funds to Transportation and Public Works' Roads Division for installation of a traffic signal at railroad crossings for the Penngrove Pedestrian Safety Improvement project (3/29/16, Board Item #29). See tab 11 for details.
0.00 330,000 0 330,000
Justice ServicesProbation - General FundAdd a 1.0 FTE Administrative Aide to support Pre-Trial Services, funded by AB109 Public Safety Realignment, approved by the Community Corrections Partnership in March 2016; replace one Executive Secretary position with one Administrative Aide position to more accurately reflect the duties of the position; no cost change. See tab 12 for details.
1.00 121,557 121,557 0
Probation - Other FundIncrease expenditures in the AB109 Public Safety Realignment fund to fund the addition of the 1.0 Administrative Aide being added to Probation's General Fund for pre-trial services support. See tab 12 for details.
0.00 121,557 0 121,557
Establish appropriations of $100,000 for the new e-Recording fund's budget for FY 16-17 from collection of fees for the first page of document recordings that went in effect on 7/1/15 and necessary for ongoing operational costs of the electronic recording delivery system that was implemented on 3/21/16; and reduce appropriations by ($100,000) in Recorder Operations to reflect decrease in e-Recording fees and associated operational costs that will now be reflected in newly established e-Recording fund (4/21/15 & 8/25/15).
SUPPLEMENTALS FOLLOWING PRIOR BOARD DIRECTION
ATTACHMENT B
Supplemental Adjustments to FY 2016-17
Page - 6
FTE Gross Expenditure Revenue & Reimbursement
Net Cost
Health and Human Services
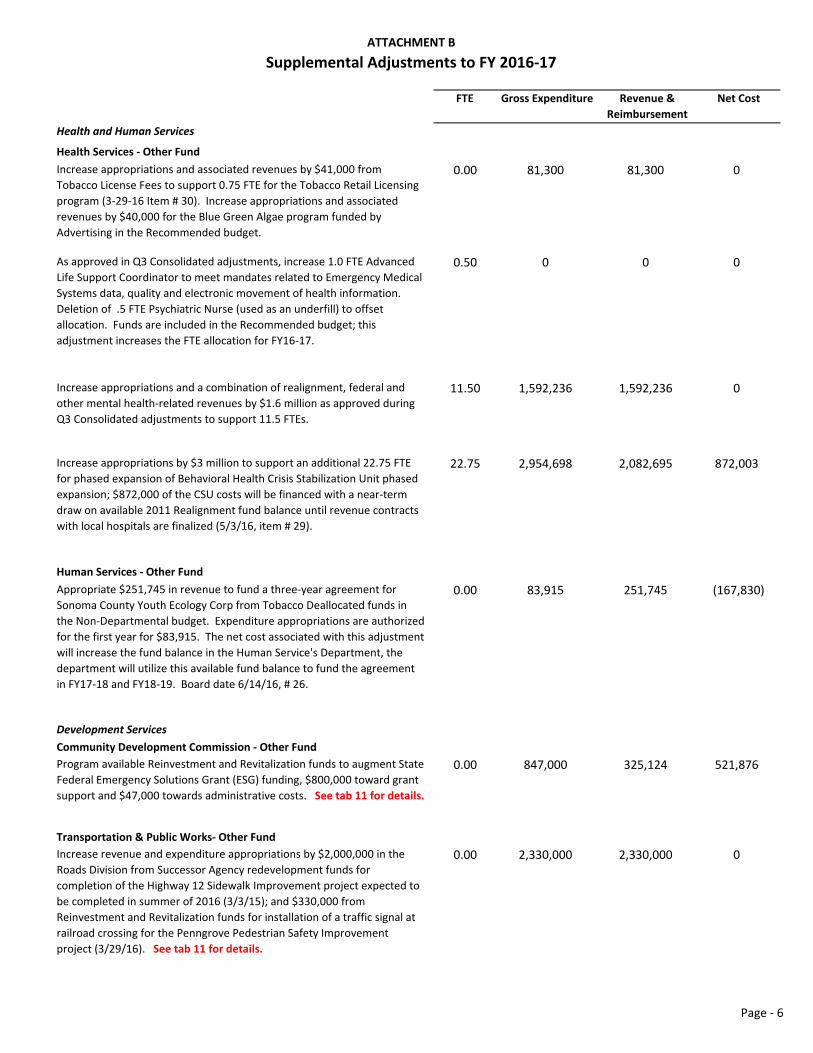
Health Services - Other FundIncrease appropriations and associated revenues by $41,000 from Tobacco License Fees to support 0.75 FTE for the Tobacco Retail Licensing program (3-29-16 Item # 30). Increase appropriations and associated revenues by $40,000 for the Blue Green Algae program funded by Advertising in the Recommended budget.
0.00 81,300 81,300 0
As approved in Q3 Consolidated adjustments, increase 1.0 FTE Advanced Life Support Coordinator to meet mandates related to Emergency Medical Systems data, quality and electronic movement of health information. Deletion of .5 FTE Psychiatric Nurse (used as an underfill) to offset allocation. Funds are included in the Recommended budget; this adjustment increases the FTE allocation for FY16-17.
0.50 0 0 0
Increase appropriations and a combination of realignment, federal and other mental health-related revenues by $1.6 million as approved during Q3 Consolidated adjustments to support 11.5 FTEs.
11.50 1,592,236 1,592,236 0
Increase appropriations by $3 million to support an additional 22.75 FTE for phased expansion of Behavioral Health Crisis Stabilization Unit phased expansion; $872,000 of the CSU costs will be financed with a near-term draw on available 2011 Realignment fund balance until revenue contracts with local hospitals are finalized (5/3/16, item # 29).
22.75 2,954,698 2,082,695 872,003
Human Services - Other FundAppropriate $251,745 in revenue to fund a three-year agreement for Sonoma County Youth Ecology Corp from Tobacco Deallocated funds in the Non-Departmental budget. Expenditure appropriations are authorized for the first year for $83,915. The net cost associated with this adjustment will increase the fund balance in the Human Service's Department, the department will utilize this available fund balance to fund the agreement in FY17-18 and FY18-19. Board date 6/14/16, # 26.
0.00 83,915 251,745 (167,830)
Development ServicesCommunity Development Commission - Other FundProgram available Reinvestment and Revitalization funds to augment State Federal Emergency Solutions Grant (ESG) funding, $800,000 toward grant support and $47,000 towards administrative costs. See tab 11 for details.
0.00 847,000 325,124 521,876
Transportation & Public Works- Other FundIncrease revenue and expenditure appropriations by $2,000,000 in the Roads Division from Successor Agency redevelopment funds for completion of the Highway 12 Sidewalk Improvement project expected to be completed in summer of 2016 (3/3/15); and $330,000 from Reinvestment and Revitalization funds for installation of a traffic signal at railroad crossing for the Penngrove Pedestrian Safety Improvement project (3/29/16). See tab 11 for details.
0.00 2,330,000 2,330,000 0

ATTACHMENT B
Supplemental Adjustments to FY 2016-17
Page - 7
FTE Gross Expenditure Revenue & Reimbursement
Net Cost
Other ServicesAgricultural Commissioner - General FundBased on established Board policy eliminate over 12 months vacancy of .05 Agricultural Biologist-Standard Specialist III; costs were not included in the Recommended budget, so no financial change is needed. See tab 4 for details.
-0.05 0 0 0
UCCE - General FundBased on established Board policy eliminate over 12 months vacancy of 1.0 Senior Agricultural Program Assistant. See tab 4 for details.
-1.00 (104,659) 0 (104,659)
TOTAL 33.70 8,934,473 6,784,657 2,149,816
TOTAL SUPPLEMENTAL ADJUSTMENTS 35.70 19,548,229 11,760,062 7,788,167
General Fund -0.05 4,300,852 3,674,754 626,098Release of Community Local Law Enforcement Set Aside (389,000)
General Fund NET Total: 237,098Other Funds 35.75 15,247,377 8,085,308 7,162,069
All Funds 35.70 19,548,229 11,760,062 7,788,167

3
County Reserves

COUNTY OF SONOMA OFFICE OF THE COUNTY ADMINISTRATOR 575 ADMINISTRATION DRIVE – ROOM 104A
SANTA ROSA, CALIFORNIA 95403-2888 TELEPHONE (707) 565-2431
FAX (707) 565-3778
VERONICA A. FERGUSON
COUNTY ADMINISTRATOR
CHRISTINA RIVERA DEPUTY COUNTY ADMINISTRATOR
REBECCA WACHSBERG DEPUTY COUNTY ADMINISTRATOR
June 13, 2016
To: Members of the Board of Supervisors
From: Veronica A. Ferguson, County Administrator
Re: Suggested Annual General Fund Reserve Contributions
Under County’s Strategic Plan Invest in the Future goal are the Board established “Ensure the long-term fiscal health of the County“ as one of the Board’s 2016 Priorities, which specifically includes increasing reserves. To date, the General Fund Reserve stands at $49,053,495 or 11% of the $441.4 million FY 2016-2017 revised recommended General Fund budgeted revenues.
The following table presents the County’s current General Fund reserve and Staff’s recommendations to move towards the 15% target.
FY 2015-16 FY 2016-17 FY 2017-18 FY 2018-19 FY 2019-20 GENERAL FUND Adopted Recomm Projected Projected Projected
REVENUES $431,182,225 $442,103,000 $457,576,605 $466,728,137 $474,895,879
Contribution Required $3,998,865 $6,432,599 $5,856,981 $5,892,443 RESERVE $49,053,495 $53,052,360 $59,484,959 $65,341,939 $71,234,382 % of Revenues 11.4% 12.0% 13.0% 14.0% 15.0%
RECOMMENDATION: Increase the General Fund Reserve level to 12%, or by approximately $4 million, through the use of available fund balance. The Budget Adoption Resolution provides authority language to add to Reserves should the year-end General Fund final balance exceed the amount required to finance the FY 2016-2017 Recommended Budget.

4
Position Allocations Over 12-months
Vacancies Review

Page | 1
COUNTY OF SONOMA
OFFICE OF THE COUNTY ADMINISTRATOR 575 ADMINISTRATION DRIVE – ROOM 104A
SANTA ROSA, CALIFORNIA 95403-2888 TELEPHONE (707) 565-2431
FAX (707) 565-3778
VERONICA A. FERGUSON
COUNTY ADMINISTRATOR
CHRISTINA RIVERA DEPUTY COUNTY ADMINISTRATOR
REBECCA WACHSBERG DEPUTY COUNTY ADMINISTRATOR
June 13, 2016
To: Members of the Board of Supervisors
From: Veronica A. Ferguson, County Administrator
Re: Over 12-Months Vacancy Position Review and Management to Line Staff Ratio Review
The FY 2016-2017 Revised Recommended Budget includes 4,111.70 full-time equivalent position allocations and 35.70 new full-time equivalent (FTE) positions in the supplemental adjustments for a total of 4,147.40 full-time equivalent positions. The full position allocation list is included as Exhibit C (Tab 17) of the Resolution adopting the FY 2016-2017 Budget. This list will be updated to reflect any Board actions during the Budget Hearings.
12- Month Vacancy Review One of the Board adopted Financial Policies is to eliminate positions vacant for longer than 12 months. A total of 54.95 FTEs have been vacant for more than 12 months. Of that total, 2.05 FTEs are recommended for deletion through Supplemental budget changes. The remaining 52.9 FTE vacancies represent positions for which departments anticipate recruitment, a job class study, or the position is being filled at a different level/capacity. A summary of the analysis by department is enclosed.
Management to Line Staff Ratio Review The Board has also expressed an interest in maintaining an appropriate span of control for managers to meet best practices and maximize the organization’s effectiveness. The attached table provides statistics by department and below is a summary of the current ratios. Over the last several years, the County has maintained a ratio of approximately 90/10 – with 90% of the County’s work force being line staff and 10% being management. Both the recommended budget and supplemental adjustments maintain this approximate ratio.
FY 2015-2016 Supplemental
FY 2016-2017 Recommended
FY 2016-2017 Supplemental
Management* 437.75 439.75 440.75
Line Staff* 3,670.95 3,671.95 3,706.65
Total FTE 4,108.70 4,111.70 4,147.40
10.65% / 89.35% 10.70 % / 89.30% 10.63% / 89.37%
* NOTE: The adjusted line and management staff figures reflect the shifting of job classes that are management by virtue of their bargaining units, but routinely do not supervise other staff.
Enclosures: Over 12-Months Position Vacancies Review; Management to Line Staff Statistics

Over 12 months Position Vacancies Review June 13, 2016
Page | 2
RECOMMENDED FOR DELETION* Department Position
Agricultural Commissioner
.05 Agricultural Biologist-Standard Specialist III
Clerk-Recorder-Assessor 1.0 Micrographic Technician II UCCE 1.0 Senior Agricultural Program Assistant 2.05 FTEs * Excludes 2.0 FTE deleted in the Human Services Department FY 2016-2017 Revised Recommended Budget.
REMAINING VACANCIES Department Position Status
ACTTC 1.0 Accountant II 1.0 Accounting Technician .20 Accountant-Auditor II
Position filled. Holding pending determination of continuous support for client funded support. Anticipates increase to work hours utilizing .20 vacancy.
Agricultural Preservation & Open Space District
.25 Administrative Aide 1.0 Open Space District
Technician
Current employee working .75 FTE, planned 1.00 FTE recruitment upon retirement. Holding pending completion of classification and compensation study.
Board of Supervisors .63 Board of Supervisors Aide
Current employees working .62 FTE and .75 FTE. Holding pending increased office support needs.
County Counsel .25 Legal Assistant Confidential 1.95 Deputy County Counsel IV
Employees working partial time have employment rights to 1.0 FTE.
Child Support Services 1.0 Child Support Officer II 1.0 Child Support Officer III 1.0 Senior Legal Processor 1.0 Child Support Financial
Worker II 1.0 Assistant Director Child
Support Services
Planned recruitment. Planned recruitment. Planned recruitment. Planned recruitment. Planned recruitment.
Clerk-Recorder-Assessor 1.02 Appraiser III Position was filled. Community Development Commission
.50 Employment Housing Counselor
.20 Senior Community Development Specialist
Hold pending outcome of organizational restructure study.
District Attorney 1.0 Deputy District Attorney IV Position used for a job-share assignment. Fairgrounds 1.0 Accounting Technician
2.0 Maintenance Worker .25 Senior Simulcast Attendant .75 Simulcast Attendant
Planned recruitment. Planned recruitment. Current employee working .75 FTE, anticipates increase to work hours utilizing .25 vacancy. Holding pending determination of Jockey Club needs.

Over 12 months Position Vacancies Review June 13, 2016
Page | 3
Department Position Status General Services 1.0 Department Analyst Utilizing extra-help, planned recruitment. Department of Health Services
1.0 Department Information Systems Specialist II
.20 Department Analyst 1.0 Environmental Health
Technician .10 Public Health Nurse II 1.0 Public Health Nurse II .05 Public Health Aide II .10 Senior Office Assistant .25 Senior Public Health Nurse 1.0 Animal Control Officer II 1.0 Animal Care Assistant 1.0 Animal Care Assistant .50 Nurse Practitioner-Physician’s
Assistant .55 Staff Nurse II .30 Staff Nurse II 1.0 Administrative Services
Officer 1.18 Forensic Psychiatrist 1.0 Senior Client Support
Specialist .42 Staff Psychiatrist 1.0 Health Program Manager
Filled by temporary promotion, planned recruitment. Holding pending determination of continuous support for data gathering and analysis needs. Utilizing extra-help, planned recruitment. Current employee working .90 FTE, planned 1.00 FTE recruitment upon retirement. New recruitment underway. Holding pending caseloads increase. Holding pending caseloads increase. Current employee working .75 FTE, will increase to 1.0 FTE upon Medical Therapy Program move to new permanent sites. New recruitment underway. Planned recruitment. New recruitment underway. Planned recruitment. New recruitment underway. New recruitment underway. Planned recruitment. Continuous recruitment. Position filled. Continuous recruitment. Filled by temporary promotion.
Human Resources 1.0 Senior Office Assistant- Confidential
1.0 Administrative Aide- Confidential
Reclassified to Human Resources Technician, planned recruitment. Reclassified to Risk Management Analyst I/II, planned recruitment.
Human Services .10 Employment & Training Counselor II
.10 Home Care Support Specialist
.20 Account Clerk II
.50 Employment & Training Counselor II
Partially filled. Freezing position for planned salary savings.

Over 12 months Position Vacancies Review June 13, 2016
Page | 4
Department Position Status Information Systems 1.0 Information Technology
Analyst II 1.0 Systems Software Analyst 1.0 Geographic Information
Technician II 1.0 Senior Business Systems
Analyst 1.0 Reprographics Technician II
Currently under-filled with an Information Technology Analyst I. Recruitment underway. Planned recruitment. Planned recruitment. Position will be reclassified and moved to Records as part of the Reprographics Division closure.
Permit and Resources Management
.25 Planner III 1.0 Department Analyst 1.0 Senior Environmental Health
Specialist
Employee working partial time has employment rights to 1.0 FTE. Planned recruitment. To be filled with temporary employee. Planned recruitment.
Probation .25 Probation Assistant .13 Department Analyst 1.0 Probation Industries Crew
Supervisor 1.0 Probation Officer III
Partially filled. Partially filled. Recruitment underway. Recruitment underway.
Regional Parks 1.0 Park Planner II 1.0 Planning Technician
Planned recruitment. Planned recruitment.
Transportation & Public Works
1.0 Vegetation Specialist 1.0 Maintenance Worker II 1.0 Maintenance Worker III 1.0 Right of Way Manager .22 Air Quality Specialist III
Holding pending certainty of State’s gas tax revenue. Planned recruitments. Planned recruitment. Partial vacancy due to an extended reduced schedule related to maternity leave.
Water Agency 1.0 Water Agency Div Mgr – Envir Res & Public Affairs
1.0 Water Agency Programs Specialist II
.25 Water Agency Senior Environmental Specialist
Filled by temporary promotion. Planned recruitment. Current employee working .75 FTE, anticipates increase to work hours utilizing .25 vacancy.
UCCE .25 Department Program Manager
Employee working partial time has employment rights to 1.0 FTE.
52.9 FTE

Man
agem
ent t
o Li
ne S
taff
Rat
io
Allo
cFT
E%
Tot
alAl
loc
FTE
% T
otal
Allo
cFT
E%
Tot
alAl
loc
FTE
% T
otal
Allo
cFT
E%
Tot
alAl
loc
FTE
% T
otal
Agric
ultu
ral-C
omm
issi
oner
s Off
ice
28.3
084
.98%
5.00
15.0
2%33
.30
28.3
084
.98%
5.00
15.0
2%33
.30
28.2
584
.96%
5.00
15.0
4%33
.25
Audi
tor-
Cont
rolle
r72
.00
77.4
2%21
.00
22.5
8%93
.00
72.0
077
.42%
21.0
022
.58%
93.0
072
.00
77.4
2%21
.00
22.5
8%93
.00
Depa
rtm
ent o
f Chi
ld S
uppo
rt S
ervi
ces
91.5
094
.82%
5.00
5.18
%96
.50
91.5
094
.82%
5.00
5.18
%96
.50
91.5
094
.82%
5.00
5.18
%96
.50
Cler
k Re
cord
er A
sses
sor
97.7
589
.89%
11.0
010
.11%
108.
7597
.75
89.8
9%11
.00
10.1
1%10
8.75
96.7
589
.79%
11.0
010
.21%
107.
75Co
mm
unity
Dev
elop
men
t Com
mis
sion
35.0
081
.40%
8.00
18.6
0%43
.00
35.0
081
.40%
8.00
18.6
0%43
.00
35.0
081
.40%
8.00
18.6
0%43
.00
Boar
d of
Sup
ervi
sors
10.0
047
.62%
11.0
052
.38%
21.0
010
.00
47.6
2%11
.00
52.3
8%21
.00
10.0
047
.62%
11.0
052
.38%
21.0
0Co
unty
Adm
inis
trat
or's
Off
ice
12.5
558
.24%
9.00
41.7
6%21
.55
12.5
558
.24%
9.00
41.7
6%21
.55
12.5
558
.24%
9.00
41.7
6%21
.55
Coun
ty C
ouns
el35
.25
83.4
3%7.
0016
.57%
42.2
535
.25
83.4
3%7.
0016
.57%
42.2
535
.25
83.4
3%7.
0016
.57%
42.2
5Di
stric
t Att
orne
ys O
ffic
e11
3.75
91.1
8%11
.00
8.82
%12
4.75
113.
7591
.18%
11.0
08.
82%
124.
7511
3.75
91.1
8%11
.00
8.82
%12
4.75
Econ
omic
Dev
elop
men
t Boa
rd3.
7532
.61%
7.75
67.3
9%11
.50
3.75
32.6
1%7.
7567
.39%
11.5
03.
7532
.61%
7.75
67.3
9%11
.50
Fire
and
Em
erge
ncy
Serv
ices
Dep
artm
ent
16.7
567
.68%
8.00
32.3
2%24
.75
16.7
567
.68%
8.00
32.3
2%24
.75
16.7
567
.68%
8.00
32.3
2%24
.75
Gen
eral
Ser
vice
s Dep
artm
ent
100.
5083
.40%
20.0
016
.60%
120.
5010
0.50
83.4
0%20
.00
16.6
0%12
0.50
100.
5083
.40%
20.0
016
.60%
120.
50De
part
men
t of H
ealth
Ser
vice
s53
0.70
88.3
5%70
.00
11.6
5%60
0.70
530.
7088
.35%
70.0
011
.65%
600.
7056
6.45
88.8
6%71
.00
11.1
4%63
7.45
Hum
an R
esou
rces
Dep
artm
ent
45.0
073
.77%
16.0
026
.23%
61.0
045
.00
73.7
7%16
.00
26.2
3%61
.00
45.0
073
.77%
16.0
026
.23%
61.0
0Hu
man
Ser
vice
s Dep
artm
ent
872.
5593
.97%
56.0
06.
03%
928.
5587
2.55
93.9
7%56
.00
6.03
%92
8.55
872.
5593
.97%
56.0
06.
03%
928.
55IH
SS P
ublic
Aut
horit
y0.
000.
00%
1.00
100.
00%
1.00
0.00
0.00
%1.
0010
0.00
%1.
00In
d O
ffic
e of
Law
Enf
Rev
iew
& O
utre
ach
1.00
50.0
0%1.
0050
.00%
2.00
1.00
50.0
0%1.
0050
.00%
2.00
Info
rmat
ion
Syst
ems D
epar
tmen
t96
.50
82.8
3%20
.00
17.1
7%11
6.50
96.5
082
.83%
20.0
017
.17%
116.
5096
.50
82.8
3%20
.00
17.1
7%11
6.50
Perm
it Re
sour
ce M
anag
emen
t Dep
artm
ent
108.
0090
.76%
11.0
09.
24%
119.
0010
8.00
90.7
6%11
.00
9.24
%11
9.00
108.
0090
.76%
11.0
09.
24%
119.
00Pr
obat
ion
Depa
rtm
ent
270.
6093
.76%
18.0
06.
24%
288.
6027
0.60
93.7
6%18
.00
6.24
%28
8.60
271.
6093
.78%
18.0
06.
22%
289.
60Pu
blic
Def
ende
r's O
ffic
e46
.00
92.0
0%4.
008.
00%
50.0
046
.00
92.0
0%4.
008.
00%
50.0
046
.00
92.0
0%4.
008.
00%
50.0
0Re
gion
al P
arks
Dep
artm
ent
79.0
089
.77%
9.00
10.2
3%88
.00
79.0
089
.77%
9.00
10.2
3%88
.00
79.0
089
.77%
9.00
10.2
3%88
.00
Sher
iff61
8.50
94.7
9%34
.00
5.21
%65
2.50
618.
5094
.79%
34.0
05.
21%
652.
5061
8.50
94.7
9%34
.00
5.21
%65
2.50
So C
o Ag
Pre
serv
and
Ope
n Sp
ace
Dist
rict
22.5
081
.82%
5.00
18.1
8%27
.50
22.5
081
.82%
5.00
18.1
8%27
.50
22.5
081
.82%
5.00
18.1
8%27
.50
Wat
er A
genc
y18
4.75
81.4
8%42
.00
18.5
2%22
6.75
184.
7581
.48%
42.0
018
.52%
226.
7518
4.75
81.4
8%42
.00
18.5
2%22
6.75
Tran
spor
tatio
n an
d Pu
blic
Wor
ks15
1.00
88.3
0%20
.00
11.7
0%17
1.00
151.
0088
.30%
20.0
011
.70%
171.
0015
1.00
88.3
0%20
.00
11.7
0%17
1.00
UC
Coop
erat
ive
Exte
nsio
n5.
0071
.43%
2.00
28.5
7%7.
005.
0071
.43%
2.00
28.5
7%7.
004.
0066
.67%
2.00
33.3
3%6.
00Fa
irgro
unds
23.7
577
.24%
7.00
22.7
6%30
.75
23.7
577
.24%
7.00
22.7
6%30
.75
23.7
577
.24%
7.00
22.7
6%30
.75
Tota
l FTE
3670
.95
89.3
5%43
7.75
10.6
5%41
08.7
036
71.9
589
.30%
439.
7510
.70%
4111
.70
3706
.65
89.3
7%44
0.75
10.6
3%41
47.4
0
Line
201
6/20
17
Supp
lem
enta
lM
GT
2016
/201
7 Su
pple
men
tal
Tota
l Al
loc
FTE
2016
/17
Supp
Tota
l Al
loc
FTE
2016
/17
Reco
mm
Depa
rtm
ent
MG
T 20
16/2
017
Reco
mm
ende
d
Line
201
5/20
16
Supp
lem
enta
l w
ith A
djus
tmen
ts
MG
T 20
15/2
016
Supp
lem
enta
l w
ith A
djus
tmen
ts
Tota
l Al
loc
FTE
2015
/16
Supp
Adj
Line
201
6/20
17
Reco
mm
ende
d
Page | 5

5
New Revenues

Page | 1
COUNTY OF SONOMA
OFFICE OF THE COUNTY ADMINISTRATOR 575 ADMINISTRATION DRIVE – ROOM 104A
SANTA ROSA, CALIFORNIA 95403-2888 TELEPHONE (707) 565-2431
FAX (707) 565-3778
VERONICA A. FERGUSON
COUNTY ADMINISTRATOR
CHRISTINA RIVERA DEPUTY COUNTY ADMINISTRATOR
REBECCA WACHSBERG DEPUTY COUNTY ADMINISTRATOR
June 13, 2016 To: Members of the Board of Supervisors From: Veronica A. Ferguson, County Administrator Re: New Revenue Initiatives For FY 2016-2017 Within the Mid-Year Budget Update presented on March 8, 2016, your Board received staff’s policy recommendations regarding the County’s long-term fiscal stability. Those recommendations were supported by discussions of priority investment areas, unmet County needs and potential revenue enhancement strategies. TRANSIENT OCCUPANCY TAX Among the strategies discussed was an adjustment to the Transient Occupancy Tax (TOT) levied in the County’s unincorporated areas and currently set at 9%. Other jurisdictions, such as Napa County and the Cities of Healdsburg, Rohnert Park and Windsor, have established TOT rates of 12%. Sonoma County is a world-class tourism destination, greeting five million visitors each year who enjoy our natural beauty, participate in our recreational opportunities, visit our museums and attractions, and avail themselves of our outstanding hospitality and dining experiences. Welcoming increasing numbers of guests each year requires proportionally greater investments in Sonoma County’s public service infrastructure, including roads, parks, law enforcement, and fire protection services. Growth in the tourism sector, which includes 20,000 employees, also places additional demands on our communities’ housing stock. Each 1% increase in the TOT rate is estimate to yield an additional $1.6 million in general revenue to address tourism’s increasing impacts on County operations. Adjusting Sonoma County’s TOT from 9% to the 12% rate comparable with that of other jurisdictions would therefore augment annual general revenues by approximately $4.6 million. Because the TOT is a general tax, the Board of Supervisors may allocate its proceeds for the support of any legitimate County expense, including support for workforce / affordable housing, further progress on the County’s Long-Term Roads Program, and purposes set forth in the Board’s Advertising and Promotions Policy. General Fund expenses for Fire Services, Parks, and the Sheriff’s Department in FY 2016-2017 increased nearly $4 million from the prior year. LOCAL TRANSACTION AND USE (SALES) TAX Another revenue strategy explored by staff was an increase to the Local Transaction and Use (Sales) Tax, imposed on the retail sale or use of tangible personal property. The state sales tax is 7.50%, and state

Page | 2
statue limits combined local sales taxes to an additional 2%, for a total sales tax of 9.5%. Increasing the 2% rate cap within a jurisdiction would require state legislative approval. Such approval has been obtained by several jurisdictions. AB 464, introduced by Assembly Members Mullin and Gordon on February 23, 2015, proposed increasing the local sales tax cap from 2% to 3% for all jurisdictions statewide. Although AB 464 passed both houses of the Legislature with the support of the Sonoma County delegation, Governor Brown vetoed the bill on August 17, citing, “…all the taxes being discussed and proposed for the 2016 ballot.” The veto message noted the Governor’s previous willingness to approve tax cap increases for individual counties. Indeed, on October 7, the Governor approved SB 705, which authorized a cap increase for San Mateo County. Assembly Bill 2119 (Stone) became effective on January 1, 2015. The legislation authorizes the Board of Supervisors to levy, increase, or extend a transactions and use tax throughout the entire county or within the unincorporated area of the county, if approved by the qualified voters of the entire county if levied on the entire county, or of the unincorporated area of the county if levied on the unincorporated area of the county. This bill would require the revenues derived from the imposition of this tax to only be used within the area for which the tax was approved by the qualified voters. As shown in the following table, the highest current combined sales tax rate in any Sonoma County city is 9.25%, in the City of Cotati. Any countywide increase would therefore be limited to 0.25%, pursuant to state law’s 9.5% limit, including the 2% local sales tax cap.
A countywide 0.25% sales tax increase would generate $20 million in additional General Fund revenue countywide each year, of which approximately $3.7 million would be attributed to sales tax collected in unincorporated areas of the County and $16.3 million to sales tax collected in the County’s nine cities. However, as noted in the table above, the current combined sales tax rate in the unincorporated area of Sonoma County is 8.25%. Therefore, the margin of available local tax growth in the unincorporated areas is 1.25%. Applying a 1.00% general sales tax increase in the County’s unincorporated areas would generate approximately $15 million for County purposes each year; a 1.25% general sales tax increase would generate approximately $18.6 million annually.
CURRENT TAX MEASURES County Cloverdale Cotati Healdsburg Petaluma Rohnert Park Santa Rosa Sebastopol Sonoma Windsor
State - Sales & Use Tax 7.50% 7.50% 7.50% 7.50% 7.50% 7.50% 7.50% 7.50% 7.50% 7.50%
Cotati - Measure G 1.00%Rohnert Park - Measure A 0.50% Sonoma - Measure J 0.50% Santa Rosa - Measure P 0.25% Healdsburg - Measure V 0.50% Sonoma County - Measure M(SCTA)
0.25% 0.25% 0.25% 0.25% 0.25% 0.25% 0.25% 0.25% 0.25% 0.25%
Sonoma County - Measure Q(SMART)
0.25% 0.25% 0.25% 0.25% 0.25% 0.25% 0.25% 0.25% 0.25% 0.25%
Sonoma County - Measure F(Ag & Open Space)
0.25% 0.25% 0.25% 0.25% 0.25% 0.25% 0.25% 0.25% 0.25% 0.25%
Santa Rosa - Measure O 0.25% Sebastopol - Measure Y 0.25% Sebastopol - Measure T 0.50%
Current Sales Tax by Jurisdiction 8.25% 8.25% 9.25% 8.75% 8.25% 8.75% 8.75% 9.00% 8.75% 8.25%
Available Local Tax Growth 1.25% 1.25% 0.25% 0.75% 1.25% 0.75% 0.75% 0.50% 0.75% 1.25%

Page | 3
At this writing, various community groups are exploring special sales tax measures, including 0.125%, or 1/8¢, in support of County Parks; 0.125% in support of library services; and 0.25%, or 1/4¢, in support of early childhood development initiatives. Further, the question remains whether or not to again submit a ballot measure funding road improvements. Any of these measures would, on adoption, count against the 2% local tax cap discussed above. General sales taxes, allowing the revenue to be spent on any government purpose, would require approval by a simple majority of voters casting ballots on the measure, whereas a special sales tax, which limits revenue usage to purposes stated in the enabling ordinance, would require approval by a 2/3 supermajority of voters casting ballots. RECOMMENDATION Staff recommends moving forward with adjusting the Transient Occupancy Tax to the 12% level consistent with other jurisdictions, supporting the County in its response to tourism’s impact on services and operations. To propose changes to the TOT, or adopt any sales tax measure at the 2016 General Election, it would be necessary for your Board to act prior to a deadline of August 12, 2016. Ordinance adoption requires two readings by your Board, following publication of a public hearing notice five days prior to the hearing / first reading. Board of Supervisors meetings are currently scheduled for June 21, July 12, July 10, August 2 and August 9. Based on that schedule, following are the specific steps necessary to adopt an ordinance placing such a measure on the November 8, 2016 ballot:
1. Publish a public hearing notice, along with a summary of the proposed ordinance, five days prior to the public hearing (Publication date as early as June 16, but no later than July 28, 2016).
2. Conduct a public hearing to consider an ordinance imposing or amending such a tax. The ordinance, if adopted, would be placed on the ballot at the November 8, 2016, election (Meeting date as early as June 21, but no later than August 2, 2016).
3. Adopt a resolution introducing, reading the title of and waiving further reading of a proposed ordinance imposing or amending such a tax (Meeting date as early as June 21, but no later than August 2, 2016).
4. Adopt proposed ordinance imposing or amending such a tax in Sonoma County. The ordinance, if adopted, will be placed on the ballot at the November 8, 2016, election, and will become effective if it is approved by the voters. (Meeting date as early as July 12, but no later than August 9, 2016)

6
State Budget May Revise County Impacts

P a g e | 1
COUNTY OF SONOMA
OFFICE OF THE COUNTY ADMINISTRATOR 575 ADMINISTRATION DRIVE – ROOM 104A
SANTA ROSA, CALIFORNIA 95403-2888 TELEPHONE (707) 565-2431
FAX (707) 565-3778
VERONICA A. FERGUSON
COUNTY ADMINISTRATOR
CHRISTINA RIVERA DEPUTY COUNTY ADMINISTRATOR
REBECCA WACHSBERG DEPUTY COUNTY ADMINISTRATOR
June 13, 2016 To: Members of the Board of Supervisors
From: Veronica A. Ferguson, County Administrator
Re: County Impact Summary – State and Federal Budget
Sonoma County’s budget and service delivery is impacted each year by the state and federal budgets, which pose both opportunities and challenges to local operations. Governor Brown’s proposed State Budget was released in January and revised in May with updated revenue projections for FY 2016-2017. President Obama released his proposed FY 2016-2017 Federal Budget in February. These budgets serve as a guide to lawmakers for the adoption a final budget. The most impactful elements of both budgets are laid out below. The summary table displays positive fiscal impacts and funding opportunities in green, and budgetary reductions or challenges in orange, and is followed by a brief description of each notable impact or opportunity.
State Budget Impacts Summary
Program or Service Statewide Impact Sonoma County Impact
Heal
th a
nd H
uman
Ser
vice
s
County Share-of-Cost for Affordable Care Act Newly Eligibles (Federal cost share reduction from 100% to 95%)
$740.2 million general fund cost increase
Up to $175,000 revenue decrease
Medi-Cal Expansion for Undocumented Children
$145 million in funding 170,000 children eligible
$5 million increased costs for up 750 additional children (full state and federal reimbursement unknown)
Substance Use Disorder Residential Treatment Services
$90.9 million in funding
$4.25 million Serve 1,200 additional residents
Mental Health Performance Outcomes System $11.9 million Opportunity
Continuum of Care Reform (AB 403 Group Home Reform) $94.9 million Unknown budgetary
impact

P a g e | 2
State Budget Impacts Summary
Program or Service Statewide Impact Sonoma County Impact
Communicable Disease $1.6 million + 14 FTE Indirect service benefit
Managed Care Organization Tax $1.6 billion Unknown budgetary impact
Developmental Center Closure $146.6 million $24.5 million
Medi-Cal Administration $169 million over baseline
$1.7 million over $22.5 million baseline
CalWORKs Single Allocation Decrease by 5.28%
Decrease by 4.6% $1 million reduction
CalFresh 3.3% increase $200,000 increase
In-Home Supportive Services (IHSS) Impose 3.5% inflation factor on counties
Must pay 3.5% inflation factor $500,000 increased expenses
Just
ice
Serv
ices
Proposition 47 Implementation $29.3 million Opportunity
Community Corrections Performance Incentives Fund $125.3 million Decrease by 11%
$86,000 reduction
Envi
ronm
enta
l Pro
tect
ion
and
N
atur
al R
esou
rces
Transformational Climate Communities Program $100 million
Opportunity for disadvantaged community
Wetlands and Watersheds Restoration / CalEcoRestore $60 million Opportunity for Russian
River restoration
Healthy Forests $150 million Opportunity for wild land - urban interface areas
State Parks Funding Amount for local governments not yet available
Opportunity
Low Carbon Road Program $100 million Opportunity to expand bike trails along commuter corridors

P a g e | 3
State Budget Impacts Summary
Program or Service Statewide Impact Sonoma County Impact Tr
ansp
orta
tion
Infr
astr
uctu
re State Transit Assistance (STA)
Low diesel fuel cost leads to decreased STA sales tax revenue
$300,000 reduction
Highway Users Tax Account (HUTA)
25% decrease over two years (FY 2015-2016 & 2016-2017)
$5.8 million reduction (FY 2015-2016 & 2016-2017)
Federal Budget Impacts Summary
Program or Service National Impact Sonoma County Impact
Bodega Bay Dredging N/A $5,032,000 (includes FY 2015-2016 work plan addition of $747,000)
Heal
th a
nd H
uman
Ser
vice
s
Workforce Innovation and Opportunity Act (WIOA)
$138 million 5% increase Opportunity
Behavioral Health Care $500 million Opportunity
Substance Use Services $1 billion new funding Opportunity
Child Care Services $82 billion over 10 years Opportunity
Early Education $75 billion over 10 years Opportunity
Food Safety $1.6 billion Opportunity
Senior Services 3% increase Opportunity
State Budget
On May 13, 2016, Governor Brown released the May Revision to his 2016-2017 budget proposal. At his press conference Governor Brown summed up much of his proposed budget stating, “The surging tide of revenue has begun to turn. Quoting from Aesop’s fable of the ant and the grasshopper: ‘It is best to prepare for the days of necessity.’”
Both income tax and sales tax are lower than expected and the May Revision now estimates that overall tax revenues will be $1.9 billion lower than previously anticipated. Further, Proposition 30 taxes will be expiring and even passage of the new proposition in November is not expected to offset this loss. By the time the State Budget is enacted in June, the economy will have been expanding for seven straight

P a g e | 4
years, which is two years longer than the average economic recovery. These current and future shortages are coupled with new spending including on the Managed Care Organization (MCO) Tax, commitments to disability services, higher payments to Medi-Cal providers, reduction of the debt and the new minimum wage legislation. With Proposition 30 taxes set to expire, a period of economic recovery coming to an end, and new spending commitments, the Governor has urged fiscal restraint.
The May Revision highlights include:
• $122 billion in general fund expenditures. • Rainy day fund contributions for 2016-2017 will increase 81.4% over the 2015-2016
contribution, though reduced from the January proposed budget. • Unemployment reached 5.4% in March and job growth is now slowing. • Personal incomes will increase slightly faster than the 5% a year for the next two years as
estimated in the January proposed budget. • Inflation will remain at 2% or less. • State general fund revenue growth is estimated to be 4.8% year-over-year through 2019-2020. • Sales and use tax revenue will decrease by $218 million in 2015-2016 and $215 million in
2016-2017. • Property tax revenues will increase 5.9% in 2015-2016 and 6.2% in 2016-2017, slightly higher
than the January estimates.
The Health and Human Services proposed budget is $136 billion, consisting of $33.7 billion of state general funds, $18.8 billion of special funds, and the remainder in federal matching funds.
• County Share-of-Cost for ACA Newly Eligibles. Under the Affordable Care Act (ACA), the federal government currently pays 100% of the cost of the newly eligibles. Beginning in 2017, the federal government’s share of cost will reduce from 100% to 95%, increasing state general fund costs by $740.2 million. Those newly eligibles for which the County Department of Health Services currently receives 100% reimbursement will reduce to 95% in January 2017. The Health Department anticipates this will result in a slight reduction to the amount of Federal Financial Participation (FFP) draw down (by about $125k to $175k) relative to the amount received in FY 2015-2016.
• Expansion for Undocumented Children. The Governor’s budget includes funding of $145 million for the expansion of full-scope Medi-Cal coverage to an estimated 170,000 undocumented children in the state beginning on May 1, 2016. The May Revision added $45 million, bringing the total to nearly $190 million to serve an additional 15,000 children. It is estimated that Sonoma County is home to 8.8% of the undocumented population in the State of California and the number of undocumented children in the County requiring access to specialty mental health services is estimated at 750. The Behavioral Health Division estimates it will cost approximately $5 million to serve these additional patients, which would consist of $1.75 million in local match and $3.25 million in federal match. The Division anticipates increased reimbursement from 2011 Behavioral Health Realignment Early and Periodic Screening, Diagnostic, and Treatment (EPSDT) to cover the local match. If the federal government agrees to provide sufficient matching funds, the Division’s additional costs could be fully offset. However, it is still unclear whether both the state and federal governments will fully reimburse the County Health Department which is required to pay the upfront cost of these services.

P a g e | 5
• Substance Use Disorder Residential Treatment Services. The budget proposes $90.9 million in funding for expanded substance use disorder (SUD) residential treatment services under the new Drug Medi-Cal Organized Delivery System waiver. When the January proposed budget was released, the County’s Behavioral Health Division estimated that the waiver program would generate approximately $650k in new state general fund funding and $3.6 million in new FFP funding to be used to enhance and expand the County’s SUD services system of care. As reflected in the May Revise, this impact will be postponed as there are delays in rate setting at the federal level. Services are now expected to begin around January 1, 2017. The Division will leverage its existing level of local match which will allow it to provide SUD services to approximately 1,200 more local residents.
• Mental Health Performance Outcomes System. Funding of $11.9 million is proposed to implement a Performance Outcomes System to track outcomes of Medi-Cal Specialty Mental Health Services for children and youth. The budget includes funding for counties to assist in collecting data and training staff to improve reporting on participant outcomes. The County Health Department will continue to track this funding opportunity.
• Continuum of Care Reform (AB 403 Group Home Reform). The budget includes $94.9 million in funding to implement the Continuum of Care Reform (CCR) set forth in AB 403. AB 403 reclassifies juvenile treatment facilities and transitions from the use of group homes for children in foster care and probation to the use of short term residential treatment centers. The Governor’s budget included minor proposals for some small programs but flat funding for foster parent recruitment and retention and no funding increase for the components of the CCR effort and AB 403. The May Revise includes updated costs to implement several components of CCR and AB 403, including an increase for program administration and foster care grants to support the new rate structure. Still the funding to the County Human Services Department and the Department of Health Services is woefully inadequate to address increased costs. The Departments, through participation with various county associations, will continue to work with the state to ensure it receives sufficient funding for services required under AB 403.
• Communicable Disease. The proposed budget provides an additional $1.6 million of general fund revenues and 14 positions in the California Department of Public Health to enhance state lab capacity for increased disease surveillance and testing for communicable disease. While this will not result in additional revenue to the Sonoma County Health Department, it will increase the state’s disease surveillance capacity and turnaround times for state conducted testing which will increase the efficacy and efficiency of the County Department.
• Managed Care Organization (MCO) Tax. In 2013, SB 78 authorized a tax on the operating revenue of Medi-Cal managed care plans known as the MCO tax. The federal government determined the tax was impermissible under federal Medicaid regulations. A new MCO tax (SBX2 2 and ABX2 1) that complies with federal rules passed in February providing an additional $1.1 billion in funds generated through taxes on all managed care plans, down slightly from the Governor’s January budget of $1.3 billion. Included in the MCO tax reform package is $287 million for various developmental services programs including rate adjustments for community-based providers serving individuals with developmental disabilities. In addition, the May Revision included language to (1) extend special managed care provisions to Medi-Cal eligible individuals that are transitioning from developmental centers into the community; (2) provide an exemption to allow developmental center employees working at facilities slated for closure to go through the process of becoming community-based service providers; and (3) provide retention incentives for developmental center staff during the closure process to maintain

P a g e | 6
services during the transition. Ultimately, it will be up to Department of Developmental Services (DDS) to determine how much Sonoma County will receive.
• Developmental Center Closure. The proposed budget includes $146.6 million in funding to assist in the development of community resources for placement of current developmental center residents, including $24.5 million of state general fund for the development of resources within Sonoma County. This funding is in addition to the potential MCO tax revenues that could assist with providing services at the Center site.
• Realignment Revenues. In support of 1991 Realignment, the January proposed budget estimated a 4.4% increase in FY 2015-2016 and a 5.3% increase in FY 2016-2017 in sales tax revenues. In addition, Vehicle License Fees (VLF) revenues for 1991 Realignment were estimated to increase by 3% in FY 2015-2016 and 3.4% in FY 2016-2017. The May Revise stated that the sales tax portion will slow compared to the January budget, while the VLF revenues are expected to be stronger. In support of 2011 Realignment, the January proposed budget and May Revision project a 5.1% increase in FY 2015-2016 and 5.2% in FY 2016-2017 in 2011 Realignment revenue for Health and Human Service programs. The Department of Health Services anticipates up to $700,000 in additional funding in FY 2016-2017, though it has not been budgeted as the timing of the revenue is still unknown.
• Medi-Cal Administration. The January proposed budget and May revision include a $169 million augmentation in FY 2016-2017, which is expected to continue in FY 2017-2018. For the upcoming fiscal year Sonoma County Human Services Department (HSD) is expecting a $1.7 million augmentation over baseline funding levels. Recently, the state notified counties that they would not be able to claim federal matching funds on prior year Medi-Cal over-expenditures. This could result in a loss of $1.3 million in revenue projected for HSD in FY 2016-2017.
• CalWORKs. With the decline in the CalWORKs caseload, the CalWORKs Single Allocation in the January proposed budget was expected to decrease statewide by 5.28%, which included a decrease in Employment Services of 5.2%, a decrease of 4.16% in Stage 1 child care, and a 24% decrease in Cal-Learn. Subsidized Employment, Housing Support and Family Stabilization were expected to maintain level funding. The May Revise expects slightly lower CalWORKs administration and Employment Services revenues, while funding for Family Stabilization and Cal-Learn are now expected to increase slightly. The May Revise also includes a 1.4% increase to CalWORKs assistance grants effective October 1, 2016. Sonoma County HSD is expecting a net decrease of 4.6% in total CalWORKs funding, which comes to an estimated $1 million reduction. The decrease would likely be mitigated by a FY 2016-2017 mid-year allocation.
• CalFresh. The CalFresh caseload continues its steady increase. The Governor’s budget included a 3.3% increase in the CalFresh administrative funding allocation. Although there is still an increase projected from prior year funding, the May Revise shows slightly lower revenues than the January budget, despite a steadily increasing CalFresh caseload. HSD anticipates an increase of more than $200,000, plus a possible additional mid-year allocation.
• In-Home Supportive Services (IHSS). The Governor’s proposed budget continues the restoration of a 7% reduction in service hours for IHSS beneficiaries. The budget assumes counties will pay a 3.5% inflation factor required under statute. HSD expenditures are expected to increase approximately $500,000 due to 3.5% inflation rate. The May Revision has no impact on Sonoma County’s Maintenance of Effort (MOE).

P a g e | 7
Overall, Justice Services will not experience a significant impact from the Governor’s proposed budget and many funding proposals for which Sonoma County is eligible are consistent with past years, for example, AB 109 funding for Public Safety Realignment and SB 678 funding for probation’s evidence-based prevention and intervention efforts.
• Proposition 47 Implementation. Proposition 47, approved by the voters in November 2014, reduced certain property and drug crimes from felonies to misdemeanors, shifting responsibility for the offenders from the state to counties. The state’s resulting cost savings are deposited into a new special fund, the Safe Neighborhoods and Schools Funds (SNSF), to be spent on mental health and substance use services, truancy and dropout prevention, and victim services. The Department of Finance estimates net savings of $39.4 million to be deposited into SNSF and made available for grants, which is an increase of $10.2 million compared to the estimate in the Governor’s budget. The County will pursue grant opportunities once funds are made available.
• Community Corrections Performance Incentives Fund (CCPIF). SB 678, passed in 2009, authorized the state to allocate money each year from the State Corrections Performance Incentives Fund to CCPIFs in each county to reduce recidivism through evidence-based programs. The May Revision shows funding for Sonoma County is projected to be reduced 11%, or $86k, from FY 2015-2016 estimates. Although the revised formula reduces Sonoma County’s allocation, the methodology for determining the allocation was developed to stabilize the funding over the long term.
The Governor’s budget, consistent in the May Revision, proposes to appropriate $3.1 billion in cap and trade revenues, which will be used to fund a wide variety of opportunities for greenhouse gas (GHG) reduction, including the following proposals to fund environmental protection and natural resources programs that present important funding opportunities for Sonoma County. The May Revision also added $1 million in General Fund to support local agencies with facilitation services for implementation of the Sustainable Groundwater Management Act.
• Transformational Climate Communities Program. The budget dedicates $100 million to disadvantaged communities for energy, transportation, water, waste reduction, and other GHG reducing projects. Sonoma County Regional Parks will look to work with local communities to pursue grant opportunities related to climate change and its impacts as well as effects on disadvantaged communities.
• Wetlands and Watershed Restoration/CalEcoRestore. Wetlands and watershed restoration projects would receive $60 million under the proposed budget. In Sonoma County there is an opportunity for this funding to assist with needed work along the Russian River that the County has already begun. Regional Parks, the Agricultural Preservation and Open Space District, and the Water Agency are in collaboration on a $16 million project to create a partnership to restore the Russian River and connect communities to the river. There is also work being done for storm water retention in Sonoma Valley and Laguna Mark West, and the restoration of vernal pools in Sonoma Valley Regional Park including the Curreri addition. The Natural Resources Division will pursue grant and other funding opportunities related to this vital ecosystem. In addition, Regional Parks and the Pepperwood Preserve have begun a collaborative effort to track specific climate change impacts on the combined Pepperwood, Mark West, and Porter Creek watersheds.
• Healthy Forests. The Governor’s budget dedicates $150 million to be administered by CAL Fire for wild land-urban interface areas. Sonoma County Regional Park’s Natural Resources Division

P a g e | 8
will pursue grant and other funding opportunities related to healthy forests in several Regional Park properties that are key to the wild land-urban interface including Shiloh, Hood, North Sonoma Mountain, Foothill, and Helen Putnam Regional Parks.
• Increased Funding to State Parks. The Governor’s budget continues to strengthen the state parks system through a variety of funding sources. Regional Parks has a demonstrated track record of applying and receiving grant funds provided and administered by State Parks for enhancements and improvements to park lands (e.g. Taylor Mountain). The County will continue to monitor and compete for funding opportunities. If the County assumes management of Bodega Head, a part of Sonoma Coast State Park, there will be funding opportunities for restoration and innovative co-management.
• Department of Transportation/Caltrans-Increased Funding for Low Carbon Road Program. The proposed budget contains $100 million of cap and trade revenues for the Low Carbon Road Program. Regional Parks has demonstrated a track record of applying and receiving grant funds for alternative transportation options including bike trails along commuter corridors (e.g. Sonoma Valley Trail Feasibility Study) and will continue to pursue these opportunities.
The Governor’s proposed budget and the May Revision continue to emphasize the need to find a solution to the state’s transportation infrastructure and to invest $36 billion in transportation over the next decade. Still, decreased funding sources will present a challenge to Sonoma County as evidenced below.
• Highway Users Tax Account (HUTA). HUTA, the primary source of funding for local road maintenance, continues to decrease as increases in fuel consumption only partially offset the dropping price of gasoline. The current estimates reflect a $7.8 million reduction in New HUTA 2103 revenue to Sonoma County over a two year period, a 67% decrease from average funding levels from 2010-2015. With increases in other sections of HUTA, the resulting impact is an estimated $5.8 million reduction for Sonoma County over FY 2015-2016 and FY 2016-2017.
• State Transit Assistance (STA). There is an anticipated reduction in State Transit Assistance (STA) funds due to decreased sales tax revenue from the low cost of diesel fuel. The preliminary FY 2016-2017 revenue estimate is $300,000 below the FY 2015-2016 anticipated funding levels. Sonoma County Transit has available Transportation Development Act reserve funds that will be used to make up this anticipated reduction for FY 2016-17. Continued reduction of STA funds beyond FY 2017-2018, may necessitate service reductions in FY 2018-2019.
Federal Budget
President Obama released his proposed budget for FY 2016-2017 on February 9, 2016. The President’s budget proposes funding numerous programmatic areas in Health and Human Services that could impact Sonoma County. For many of these opportunities, the specific fiscal and programmatic impacts to the County will be determined as the appropriations process progresses, which is likely to significantly affect the final program spending allocations. It is anticipated that many programs may be funded in FY 2016-2017 under a Continuing Resolution that will continue their funding at FY 2015-2016 levels. The County will continue to monitor the appropriations process and seek funding opportunities as they become available, particularly in the program areas below.
• Workforce Innovation and Opportunity Act (WIOA). The federal budget helps to realize the goals of WIOA by funding the core Department of Labor (DOL) WIOA formula grants at their full authorized level of $138 million, a 5% increase over the 2016 enacted level.

P a g e | 9
• Behavioral Health. The federal budget includes $500 million in new mandatory funding to help engage individuals with serious mental illness in care, improve access to care by increasing service capacity and the behavioral health workforce, and ensure that behavioral health care systems work for everyone.
• Substance Use. $1 billion in new mandatory funding will be made available over two years to expand access to treatment for prescription drug abuse and heroin use, and includes funding to continue and increase current efforts to expand state-level prescription drug overdose prevention strategies, increase the availability of medication-assisted treatment programs, improve access to the overdose-reversal drug naloxone, and support targeted enforcement activities.
• Emergency Preparedness. The proposed budget expands funding to $915 million for emergency preparedness related to natural and man-made threats, disasters, outbreaks, and epidemics.
• Child Care. To increase the number of child receiving child care, improve the child care workforce, and implement new health and safety requirements, the budget proposes $82 billion in funding over 10 years.
• Early Education. The proposed budget provides funding for the Preschool for All Initiative (PAI) in the amount of $75 billion over 10 years, for Preschool Development Grants (PDG) in the amount of $350 million, and $80 million for other early education programs.
• Food Safety. The President’s budget would provide $1.6 billion in funding for programs related to enhancing the nation’s food safety program including funding for the Food and Drug Administration and the Centers for Disease Control (CDC), for implementation of the Food Safety Modernization Act, and for CDC activities related to monitoring, surveillance, data analysis, and dissemination of guidance and training of state health departments.
• Senior Services. The President’s budget assumes an increase from 2016 final levels under the Elder Justice Act and a 3% increase in Older Americans Act funding.
Bodega Bay Dredging. In the Department of Defense-US Army Corp of Engineers Civil Works Budget for FY 2016-2017, $4.285 million is proposed largely to conduct maintenance dredging of the entry channel. Additionally, $747,000 is provided in the FY 2015-2016 work plan the Corps submitted to Congress in February to complete all pre-dredging activities. Dredging the harbor at Bodega Bay is crucial to the County and impacts the economy, access and protection of natural resources, as well as public safety. Bodega Bay generates tens of millions of dollars from tourism as well as a commercial fishing fleet, provides access to incredible natural resources like the Cordell Bank & Greater Farallones National Marine Sanctuary, and addresses public safety as it serves as a base of operations for the US Coast Guard. These funds will allow for completion of a major portion of the necessary work to maintain the harbor, although an additional amount, estimated to be $2.5 million, will need to be secured in the FY 2016-2017 work plan or FY 2017-2018 budget to complete dredging of the remainder of the Harbor.

7
Pension Reform Update

Page | 1
COUNTY OF SONOMA
OFFICE OF THE COUNTY ADMINISTRATOR 575 ADMINISTRATION DRIVE – ROOM 104A
SANTA ROSA, CALIFORNIA 95403-2888 TELEPHONE (707) 565-2431
FAX (707) 565-3778
VERONICA A. FERGUSON
COUNTY ADMINISTRATOR
CHRISTINA RIVERA DEPUTY COUNTY ADMINISTRATOR
REBECCA WACHSBERG DEPUTY COUNTY ADMINISTRATOR
June 13, 2016
To: Members of the Board of Supervisors
From: Veronica A. Ferguson, County Administrator
Re: Pension Reform Reporting This report covers several elements called for in the Board’s Pension Reform efforts: 1) a detailed presentation on the status of the retirement system as a part of the annual contribution rate setting process; 2) updated cost containment projections and funded ratio calculations; and 3) FY 2015-16 pension reform accomplishments.
Contribution Rates The first element of this report is the annual rate setting process for employer and employee contribution rates to the retirement system. Attached is the report that will be included in the June 14, 2016 regular Board meeting agenda. It covers the employer and employee contribution rates that have been approved by the Board of Retirement for the fiscal year beginning July 1, 2016. While these rates have been approved by the Board of Retirement, they are also presented to the Board of Supervisors each year for approval as well. If the Board of Supervisors does not approve the rates, they become effective after 90 days as a matter of law. In the event that the Board of Supervisors had questions or concerns about the rates, they could request that the Board of Retirement consider the questions or concerns and determine if any changes to the approved rates should be made.
The rates are based upon an actuarial valuation of the Sonoma County Employees’ Retirement Association (SCERA) retirement fund that is performed each year. This valuation provides a calculation of the total liability of the system and the funding necessary to pay for that liability over time in accordance with applicable law and policy determinations on a number of factors and assumptions by the Board of Retirement. The valuation calculations are also performed in accordance with actuarial and accounting standards. The result is used to generate the contribution rates for the employee and the employer to be collected as a percentage of employee payroll.
The rates for FY 2016-17 are based on the December 31, 2014 actuarial valuation. The current FY 2015-16 employer contribution rates, based on the 2013 valuation, range between 13.71% - 26.42% of payroll for the different benefit plans (Legacy Plan A General/Safety and PEPRA Plan B General/Safety). For FY 2016-17, the employer contribution rates dropped across the board between .64% - 1.47%, resulting in a new range of 12.79% - 24.95%. The current FY 2015-16 employee contribution rates range between 7.39% - 11.08% of payroll for the different benefit plans. For FY 2016-17, employee contribution rates were essentially unchanged, with the exception of a .90% increase for PEPRA Plan B Safety employees. The new employee contribution rates for FY 2016-17 range between 7.37% - 11.98% of payroll. Additional information and detailed rate tables can be found in the attached June 14, 2016 Board report.

Page | 2
Sonoma County Employees’ Retirement Association Retirement (SCERA) 2015 Actuarial Valuation In an effort to increase general public understanding of the retirement system, SCERA and its actuary, Segal Consulting, will present highlights from the system’s most recent December 31, 2015 actuarial valuation at the June 14, 2016 Board of Supervisors meeting. Since the results of the most recent valuation form the basis of the contribution rates for the fiscal year beginning 18 months following the date of the valuation, the 2015 valuation will provide some insight on contribution rates for FY 2017-18. The system’s actuary will also provide more information about how they calculate the contribution rates. Segal Consulting presented its 2015 Actuarial Valuation and Review report to the SCERA Retirement Board on May 05, 2016. The primary purpose of the valuation report is to determine whether SCERA’s assets, in conjunction with employer and member contributions, will be sufficient to provide prescribed benefits to members of the retirement system. The goal of the valuation is to establish contributions that fully fund the retirement system’s liabilities. Segal analyzes several variables in its valuation: benefit formulas and provisions; demographic characteristics of active members, inactive vested members, retired members, and other beneficiaries; assets of the plan; economic assumptions regarding future salary increases and investment earnings; and other actuarial factors, such as employee terminations and retirements. The December 31, 2015 actuarial valuation reflects changes in economic and demographic assumptions compared to the prior year’s report. The changes, along with plan experience, result in a net increase to the retirement fund’s Unfunded Actuarial Accrued Liability (UAAL). The total UAAL of the retirement system—which includes County agencies, the Superior Court, and Valley of the Moon—increased from $343.0 million by $62.9 million to $405.9 million, on an actuarial Valuation Value of Assets (VVA) basis. The UAAL increase was primarily caused by: lowering of the discount rate from 7.50% to 7.25%; reducing the assumed inflation rate for payroll from 3.25% to 3.00%; and demographic changes to the plan’s participant population. The increased UAAL will impact all three employers participating in the plan in the form of higher contribution rates. Based on the 2015 actuarial valuation, the aggregate employer contribution rates are expected to increase by 2.29% of payroll. For the County, this rate increase is expected to impact the future FY 2017-2018 budget, due to the 18-month time lag. Compared to the 2014 valuation, the average contribution rates for employees participating in the plan will remain essentially unchanged. County Share of UAAL Each of SCERA’s three employer entities—County, Superior Court, and Valley of the Moon—are responsible for covering their respective proportionate share of the retirement fund’s overall unfunded liability. Per the UAAL Amortization Schedule (Appendix E) in Segal’s 12/31/2015 valuation, the County is responsible for $371.2 million, or 91.4%, of the overall UAAL of $405.9 million. To comply with GASB 67, SCERA’s actuary calculates the system’s Net Pension Liability (NPL) as the difference between its Total Pension Liability and its Fiduciary
County; 371,156,000
; 91%
Court; 28,801,000 ;
7%
VOM; 5,965,000 ;
2%
Chart 1: UAAL Share as of 12/31/15

Page | 3
Net Position. The NPL closely approximates the UAAL calculated on a Market Value of Assets (MVA) basis, as opposed to the aforementioned VVA basis. SCERA’s overall Net Pension Liability (NPL) as of December 31, 2014 was reported as $216.8 million in the actuarial report. As cited in Sonoma County’s 2014-2015 Comprehensive Annual Financial Report (CAFR), the County’s proportionate share of the total $216.8 million NPL was equal to $191.1 million (including the Sonoma County Water Agency and Community Development Commission). Based upon the latest 2015 actuarial valuation, the NPL of the retirement system has grown to $412.9 million. The official calculation to determine the County’s proportionate share of the December 31, 2015 NPL has not been completed as of the date of this report; however, it is reasonable to assume it will increase compared to the prior year. Pension Obligation Bonds In addition to SCERA’s reported UAAL, the County also pays for unfunded pension liabilities via its debt service on several Pension Obligation Bonds, which were issued to refinance UAAL obligations to SCERA. The bonds were issued by the County on three separate occasions when the interest rate difference between SCERA and the bond market afforded an opportunity for significant savings over the 20-year payment period used both by the system and the bond market. Table 1 below summarizes the County’s Pension Obligation Bond issuances:
Unfunded Pension-related Liability When the County’s share of retirement system UAAL as of 12/31/2015, $371,156,000, is added to the outstanding POB balance of $425,250,000, the County’s total unfunded pension liability equals $796,406,000. Chart 2 on the next page presents a 5-year history of the County’s total unfunded pension-related liability, including the year-over-year percentage changes.
Based upon the County’s established debt payment schedules, the POB component of unfunded pension-related liability will decrease by an average of $30.4 million each year over the next decade. The County’s share of SCERA’s UAAL may be subject to more volatility in the future, because it will continue to be impacted (positively and negatively) by actual investment returns and actuarial experience.
True Interest
CostTerm
(Years)Final
Maturity Principal Interest Total1993 POB 6.72% 20 2013 97,400,000 96,115,491 193,515,491 - Series 2003A 4.80% 20 2023 210,200,000 135,937,276 346,137,276 129,150,000 Series 2003B 5.18% 20 2023 21,000,000 20,876,800 41,876,800 21,000,000 Series 2010A 5.90% 20 2030 289,335,000 242,871,900 532,206,900 275,100,000 Grand Total 617,935,000 495,801,468 1,113,736,468 425,250,000
Outstanding Principal
Balance as of 12/31/15
Table 1: Summary of Pension Obligation Bonds
Debt Issuance
Bond Information Total Debt Issuance

Page | 4
Pension Reform Cost Containment Update To address the adverse course that Sonoma County pension costs had been on throughout the prior decade, in 2011, the Board of Supervisors approved work toward three main goals: Contain Costs, Maintain Market Competitiveness and Workforce Stability, and Increase Accountability and Transparency. The Cost Containment goal entailed setting a target for reducing pension-related costs to 10% of total salary and benefit expenditures within 10 years. The fiscal year beginning July 2023 (FY 2023-2024) was initially assumed to be the target year for meeting the 10% goal.
On January 27, 2015, County Administrator staff presented an updated pension cost projection to the Board, based upon the latest actuarial information (from December 31, 2013) available at that point in time. The updated January 2015 projection chart showed an updated trend line forecasting the ratio of pension costs, which included retirement contributions and POB debt service, as a percent of total salaries and benefits. The forecast indicated that the County was on track to attain a ratio of 11.4% by FY 2023-2024, shy of the 10% target.
For this latest June 2016 update to the Board, the 10% target projection chart has been updated using the latest information from SCERA’s December 31, 2015 actuarial valuation, as well as rate forecasts from Segal Consulting’s Illustration of Employer Contribution Rates, UAAL and Funding Percentages - Addendum, dated May 04, 2016. Segal’s letter is provided as an attachment to this report. The updated forecast is captured in Chart 3 below:

Page | 5
The main takeaway from this updated projection is that the 10% target is not expected to be achieved until FY 2030-2031. Compared to the January 2015 report, there are several primary causes for the 10% target being pushed out to FY 2030-2031:
• The actual investment rate of return in 2015 was 1.4%, lower than the 7.50% discount rate.
• The assumed discount rate for all years after 2015 has been lowered from 7.50% to 7.25%.
• The original projection reflected continuation of employees’ 3.03% (General) and 3.00% (Safety) contributions towards the UAAL beyond FY 2023-2024. The May 2016 update assumes these contributions would sunset in FY 2023-2024 per the most recent Memorandums of Understanding negotiated with bargaining units. This assumption could change in the future depending upon the outcome of future labor negotiations.
Although attainment of the 10% cost containment goal is anticipated to occur later than initially estimated, it is important to note that the County is still on a more sustainable path than the pre-PEPRA cost growth trajectory, represented by the “2011 Status Quo Trajectory” line in Chart 3. This latest projection is intended to serve as an illustration, not a prediction, of what might occur if all current actuarial economic and non-economic assumptions from the 2015 valuation are realized over time. This projection does not reflect potential future changes to the assumed discount rate, actual investment returns, mortality assumptions, demographics of participants, or other actuarial factors. If any of these factors change in the future based on actual experience, they could have favorable or unfavorable impacts. Consequently, the timeline for achieving the 10% target would also adjust.

Page | 6
Chart 4 examines the May 2016 projection and breaks the trend line into its primary liability components: 2003 POB, 2010 POB, and Normal Cost & UAAL:
Based on this more detailed look at the individual liability components, under the current set of actuarial assumptions, the 10% target is expected to be attainable when both the 2003 and 2010 POB debts are fully paid. Chart 5 on the following page presents the County’s projected future annual pension costs in absolute dollars, rather than as a ratio of pension costs divided by total salaries and benefits. This chart helps communicate that pension costs are estimated to gradually rise each fiscal year at a rate commensurate with assumed inflation of the County’s payroll costs. The estimated POB costs in Chart 3 include estimated principal and interest payments based upon the County’s established debt payment schedule for these issuances. The most sizable decreases in future annual pension costs occur in FY 2023-24 and FY 2030-31 when the 2003 and 2010 Pension Obligation Bonds, respectively, are each paid off. The estimated normal cost and UAAL costs were calculated by multiplying projected pensionable payroll times the contribution rates in Segal’s Employer Contribution Rates, dated May 4, 2016 (provided as an attachment to this report).

Page | 7
Retirement Plan Funded Ratio In 2015, the Board approved a policy that supported funding the employee retirement system each year at a ratio of between 95% - 105% actuarial assets to liabilities. Working from the latest valuation report, the funded ratio of the plan was 84.9% as of 12/31/2015, based on an actuarial value of assets (VVA basis). The total amount of funding needed to bring the retirement fund to a 95% ratio of assets to liabilities would be $271.2 million. This figure, divided by 4 years, equals the annual pension liability amount of $67.8 million cited in the table of unmet needs being presented to the Board during the June 2016 budget hearings.
Chart 4 on the next page presents a recent 4-year history of the retirement system’s funded ratio on a VVA basis. The funding ratio improved for two years straight, before declining in the latest 2015 valuation, due to the same factors cited earlier in this report that caused the growth in the UAAL. It should be noted that Exhibit 2C in Segal’s letter dated May 4, 2016 to SCERA contains projected funding ratios in future years. If all actuarial assumptions are realized each year moving forward, including investment returns, the system is on a path to reach the 95% funded level in December 2027. Any potential future changes to the assumed discount rate, mortality assumptions, or actual investment returns would impact this trajectory, so this data point is provided for illustrative purposes only.

Page | 8
FY 2015-16 Pension Reform Accomplishments
Employee Sharing of Normal Cost
During FY 2015-16, County staff began the process of negotiating with its various employee bargaining groups to implement a 50/50 sharing of normal cost between the County (as employer) and employees currently participating in Legacy Plan A. The implementation of equal normal cost sharing will be phased in over the next two fiscal years, with an anticipated completion in 2018. Under the California Public Employees’ Pension Reform Act of 2013 (PEPRA), Plan B employees already contribute 50% of their normal cost. As a result of the negotiated changes, future year SCERA actuarial valuations are expected to show an increase to the Legacy Plan A employees’ contribution rates (for both general and safety members), and a corresponding decrease to the County’s employer contribution rate.
Formation of Citizens Advisory Pension Committee
In November 2011, the Board of Supervisors approved several goals and strategies to reduce Sonoma County’s pension system costs and ensure a fair, equitable, and sustainable pension system. As part of this effort, the Board directed staff to explore establishment of an Independent Citizens Committee to review and propose policy changes to control pension system costs. In September 2015, the Board authorized creation of the new Sonoma County Independent Citizens Advisory Committee on Pension Matters, and appointed all seven initial members (all still serving as of June 2016). The Committee has been charged with accomplishing two main tasks: 1) evaluating the County’s progress towards achieving its stated pension reform goals (containing costs, maintaining market competitiveness, and increasing accountability and transparency); and 2) developing their own new pension reform recommendations for the Board’s consideration. From October 2015 through June 2016, the Committee has convened 20 meetings subject to the Brown Act and open to the public. In addition, the individual Committee members have each devoted significant time to learning about the complexities and intricacies of Sonoma County’s pension system.

Page | 9
Next Steps Receive Pension Committee Report and Analyze Recommendations The Independent Citizens Advisory Committee on Pension Matters’ final report will be submitted to the Clerk of the Board on June 21, 2016, with a public presentation to the Board of Supervisors tentatively scheduled for July 12, 2016. After receiving the Committee’s report and analyzing the findings and recommendations therein, County staff will consult with the Board and immediately begin developing an action plan for implementation of further reform efforts deemed most urgent. Develop a Comprehensive Strategy for Future Labor Negotiations In consultation with the Board, County staff will work on a comprehensive labor negotiation strategy to inform the next round of bargaining with represented employees in 2017. The strategy should outline a cohesive approach that treats employees fairly and equitably, while also identifying specific negotiation parameters intended to reduce pension and other-post employment liability costs borne by the County. Potential Accelerated Payment towards Unfunded Actuarial Accrued Liability in FY 2016-17 In January 2015, the Board of Supervisors approved a $3.5 million one-time advanced payment to SCERA in an effort to reduce the UAAL associated with the County’s pension benefits. For FY 2016-2017, the County Administrator’s Office will continue to monitor the County’s actual retirement contribution expenditures against budgeted appropriations. As part of midyear or third quarter budget updates, the CAO may submit a request to the Board of Supervisors for authorization to apply cost savings towards an additional one-time UAAL payment. If the recommendation is ultimately approved by the Board, the County Administrator’s Office would subsequently work with the Auditor-Controller to implement midyear increases to the retirement rates collected via payroll from all departments. The accelerated payroll collections would then be swept at year-end and sent to SCERA as an additional payment towards the UAAL. By making a one-time payment towards UAAL, the County would not only reduce the total outstanding liability, but also avoid the 7.25% in assumed compounding interest that the retirement system assesses the UAAL each year over an amortization period of 20 years.
Enclosures: 1: Board Report, Retirement Rates for FY 2016-2017, dated June 14, 2016. 2: Resolution #133 of the Retirement Board approving employee and employer contribution rates for FY
2016-2017, dated May 26, 2016. 3: Sonoma County Employees’ Retirement Association Actuarial Valuation and Review as of December
31, 2015, prepared by Segal Consulting, dated April 27, 2016. 4: Segal Consulting Letter, Illustrations of Employer Contribution Rates, UAAL and Funding Percentages
– Addendum, dated May 4, 2016.

Revision No. 20151201-1
County of Sonoma Agenda Item
Summary Report
Agenda Item Number: (This Section for use by Clerk of the Board Only.)
Clerk of the Board 575 Administration Drive Santa Rosa, CA 95403
To: Board of Supervisors
Board Agenda Date: June 14, 2016 Vote Requirement: Majority
Department or Agency Name(s): Retirement and County Administrator’s Office
Staff Name and Phone Number: Supervisorial District(s):
Julie Wyne, Retirement Administrator, SCERA (707) 565-8103 Nikolas Klein, Administrative Analyst, County Administrator’s Office, (707) 565-5312
Countywide
Title: Retirement Rates for Fiscal Year 2016-2017 and Actuarial Valuation Update
Recommended Actions:
1. Approve the Sonoma County Employees’ Retirement Association employer and employee contribution rates for Fiscal Year 2016-2017.
2. Approve the County’s Pension Obligation Bond debt service employer contribution rates for Fiscal Year 2016-2017.
3. Receive an update on the December 31, 2015 actuarial valuation of the SCERA retirement fund.
Executive Summary:
This item will provide an update on three main topics related to the Sonoma County Employees’ Retirement Association (SCERA) retirement system: presentation of employer and employee retirement and Pension Obligation Bond (POB) contribution rates for Fiscal Year 2016-17; and summarization of key points from the most recent 2015 actuarial valuation and review of the retirement fund. Background As part of ongoing efforts by the County and SCERA to improve public understanding of the retirement system, the Board of Supervisors has requested that each year’s actuarial valuation be presented for discussion after it has been formally reviewed and approved by the SCERA Retirement Board. The valuation calculates the total outstanding liabilities of the system at the close of each calendar year, and it is used to set employer and employee contribution rates for the fiscal year period beginning 18 months later. The reason for this delay is to allow sufficient time to prepare and review the valuation, and to allow for programming the resulting contribution rates into the County’s annual budget. The FY 2016-2017 rates being presented to the Board of Supervisors in this report are based upon SCERA’s

Revision No. 20151201-1
actuarial valuation as of December 31, 2014, which was presented to the board last June. Since the actuarial valuation for the 2015 calendar year was recently completed, it is also included as Attachment #2 to this report and available to review. Fiscal Year 2016-2017 Employer and Employee Retirement Contribution Rates Each year the Board of Supervisors reviews and adopts employer and employee retirement contribution rates for the coming fiscal year in accordance with determinations made by SCERA’s Board of Retirement. The Board of Retirement annually requires an actuarial valuation of the retirement fund to be performed as authorized by Section 31453 of the California Government Code. An actuarial report was previously prepared by SCERA’s contracted actuarial firm, Segal Consulting (Segal), as of December 31, 2014. Based on that actuarial valuation, Segal reported to the Board of Retirement as to the funding adequacy of the retirement system, and the contribution rates required to fund it. The Board of Retirement in turn recommends that the County’s Board of Supervisors approve the following Fiscal Year 2016-2017 employer retirement contribution rates based on the 2014 actuarial valuation, pursuant to Retirement Board Resolution # 133, dated May 26, 2016:
Table 1: FY 16-17 Employer Retirement Contribution Rates County Tier Effective Date General Safety
Legacy Plan A 07/05/16 17.74% 24.95% PEPRA Plan B 07/05/16 12.79% 18.75%
The Legacy Plan A rates apply to all County employees hired prior to the Public Employee Pension Reform Act (PEPRA) implementation date of January 01, 2013. The Plan A rate also applies to certain employees hired after that date, but who are eligible for reciprocity with another qualified retirement system. The PEPRA Plan B rates apply to all new employees not eligible for reciprocity who are hired after the implementation date. In addition to the SCERA retirement contribution rates, the County also budgets payroll contributions to service debt from its 2003 and 2010 Pension Obligation Bond (POB) issuances. The County’s Auditor-Controller generates the contribution rates for the Pension Obligation Bonds. The rates were calculated by applying the $43 million in total payroll-based applicable debt service due in FY 2016-2017 to the estimated total pensionable payroll. The estimated FY 2016-17 pensionable payroll of $314.9 million used for the 2010 bond calculation includes the County and all other agencies governed by the Board; the estimated FY 2016-17 pensionable payroll of $327.4 million for the 2003 Series A bond calculation also includes the Superior Court as part of the base. Due to different shares of the underlying obligations that were refinanced, the calculations result in slightly different rates for general and safety members in the retirement system. All of the contribution rate components are summarized together in Table 2 below to provide a complete picture of the total employer retirement rate (excluding Other Post-Employment Health Benefits). Compared to the current FY 2015-2016 employer retirement rates, the SCERA employer contribution rates are declining year-over-year across the board for all plans and tiers. The estimated POB rates are changing slightly year-over-year based on the estimated debt payments for both bond issuances, in accordance with their respective 20-year amortization schedules.

Revision No. 20151201-1
The impact of all employer rate changes results in a slight net decrease of the total combined retirement rates for all plans and tiers.
Table 3 below presents the employee contribution rates that will also be implemented for FY 2016-17. The table shows the average contribution rates for Legacy Plan A members (General and Safety); however, it is important to note that these employees actually pay different rates depending on their respective age of entry into the retirement system. Resolution #133 of the Retirement Board, included as Attachment #1 to this report, contains the full list of Legacy Plan A employee contribution rates by entry age. Members with lower entry ages pay lower contribution rates relative to members entering at older ages, because it is assumed the former will pay into the system for a longer period of time than the latter. All New PEPRA Plan B employees contribute at the same rate, which is 50% of their normal cost, irrespective of entry age. Employee contribution rates for Legacy Plan A members remain unchanged year-over-year; however, the rate for the PEPRA Plan B Safety members increased due to demographic changes of the member population.
Rate Element General Safety General SafetySCERA Rates 17.74% 24.95% 12.79% 18.75%POB Rates (2003) 6.29% 7.13% 6.29% 7.13%POB Rates (2010) 6.90% 7.15% 6.90% 7.15%Total Employer Rate 30.93% 39.23% 25.98% 33.03%
Rate Element General Safety General SafetySCERA Rates 18.65% 26.42% 13.71% 19.39%POB Rates (2003) 6.31% 7.15% 6.31% 7.15%POB Rates (2010) 6.97% 7.25% 6.97% 7.25%Total Employer Rate 31.93% 40.82% 26.99% 33.79%
Rate Element General Safety General SafetySCERA Rates -0.91% -1.47% -0.92% -0.64%POB Rates (2003) -0.02% -0.02% -0.02% -0.02%POB Rates (2010) -0.07% -0.10% -0.07% -0.10%Total Employer Rate -1.00% -1.59% -1.01% -0.76%
Plan B - PEPRA
Year-over-Year ChangePlan A - Legacy Plan B - PEPRA
Table 2 - Retirement and POB Employer Contribution RatesFY 16-17 Recommended Rates
Plan A - Legacy Plan B - PEPRA
FY 15-16 Rates (Approved June 2015)Plan A - Legacy

Revision No. 20151201-1
Sonoma County Employees’ Retirement Association Retirement Fund 2015 Actuarial Valuation Segal Consulting presented its 2015 Actuarial Valuation and Review report to the SCERA Retirement Board on May 05, 2016. The primary purpose of the valuation report is to determine whether SCERA’s assets, in conjunction with employer and member contributions, will be sufficient to provide prescribed benefits to members of the retirement system. The goal of the valuation is to establish contributions that fully fund the retirement system’s liabilities. Segal analyzes several variables in its valuation: benefit formulas and provisions; demographic characteristics of active members, inactive vested members, retired members, and other beneficiaries; assets of the plan; economic assumptions regarding future salary increases and investment earnings; and other actuarial factors, such as employee terminations and retirements. The December 31, 2015 actuarial valuation reflects changes in economic and demographic assumptions compared to the prior year’s report. The changes, along with plan experience, result in a net increase to the retirement fund’s Unfunded Actuarial Accrued Liability (UAAL). The total UAAL of the retirement system—which includes County agencies, the Superior Court, and Valley of the Moon—is increasing from $343.0 million by $62.9 million to $405.9 million. The UAAL increase was primarily caused by: lowering of the discount rate from 7.50% to 7.25%; reducing the Consumer Price Index inflation rate from 3.25% to 3.00%; and demographic changes to the plan’s participant population.
Rate Element General Safety General SafetyRetirement Rate 9.11% 9.03% 7.37% 11.98%Additional Rate to Cover Unfunded Actuarial Accrued Liability (UAAL) from Enhanced Benefits
3.03% 3.00% 3.03% 3.00%
Total Employee Rate 12.14% 12.03% 10.40% 14.98%
Rate Element General Safety General SafetyRetirement Rate 9.11% 9.03% 7.39% 11.08%Enhanced Benefit UAAL Rate 3.03% 3.00% 3.03% 3.00%Total Employee Rate 12.14% 12.03% 10.42% 14.08%
Rate Element General Safety General SafetyRetirement Rate 0.00% 0.00% -0.02% 0.90%Enhanced Benefit UAAL Rate 0.00% 0.00% 0.00% 0.00%Total Employee Rate 0.00% 0.00% -0.02% 0.90%
Year-over-Year ChangePlan A - Legacy Plan B - PEPRA
FY 16-17 Recommended RatesPlan A - Legacy Plan B - PEPRA
Table 3 - Employee Retirement and POB Contribution Rates
FY 15-16 Rates (Approved June 2015)Plan A - Legacy Plan B - PEPRA

Revision No. 20151201-1
The increased UAAL will impact all three employers participating in the plan in the form of higher contribution rates. Based on the 2015 actuarial valuation, the aggregate employer contribution rates are expected to increase by 2.29% of payroll, which is expected to adversely impact the County’s future FY 2017-2018 budget. Compared to the 2014 valuation, the average contribution rates for employee participants remains essentially unchanged, since their rates scale with the plan’s normal cost. The County is in the process of negotiating with its various employee bargaining groups to implement a 50/50 share of normal cost for employees currently participating in the Legacy Plan A. The implementation of equal normal cost sharing will be phased in over the next two fiscal years, with an anticipated completion in 2018. Under the California Public Employees’ Pension Reform Act of 2013 (PEPRA), Plan B employees already contribute 50% of their normal cost. As a result of the negotiated changes, future SCERA actuarial valuations are expected to show an increase to the Legacy Plan A employees’ contribution rates, and a corresponding decrease to the County’s employer contribution rate.
Prior Board Actions:
06-16-2015: Fiscal Year 2015-2016 Retirement Contribution Rates Resolution approved and pension update received. Other actions: Annual retirement contribution rates routinely approved by the Board of Supervisors.
Strategic Plan Alignment Goal 4: Civic Services and Engagement
Discussing the annual actuarial valuation of the retirement system with the Board of Supervisors helps improve transparency and public understanding of pension matters.
Fiscal Summary - FY 16-17
Expenditures Funding Source(s)
Budgeted Amount $ County General Fund $
Add Appropriations Reqd. $ State/Federal $
$ Fees/Other $
$ Use of Fund Balance $
$ Contingencies $
$ $
Total Expenditure $ Total Sources $
Narrative Explanation of Fiscal Impacts (If Required):
The combined FY 2016-2017 retirement and Pension Obligation Bond employer contribution rates being recommended for approval in this report do not exceed the assumed contribution rates used to develop the FY 2015-2017 Year 2 Recommended Budget; therefore, approving these rates will not have a fiscal impact.

Revision No. 20151201-1
Staffing Impacts
Position Title (Payroll Classification)
Monthly Salary Range
(A – I Step)
Additions (Number)
Deletions (Number)
n/a
Narrative Explanation of Staffing Impacts (If Required):
None.
Attachments:
Attachment 1 – Resolution #133 of the Retirement Board approving employee and employer contribution rates for FY 2016-2017, dated May 26, 2016.
Attachment 2 – Sonoma County Employees’ Retirement Association Actuarial Valuation and Review as of December 31, 2015, prepared by Segal Consulting.
Related Items “On File” with the Clerk of the Board:
None.

RESOLUTION # 133
DATE May 28, 2016
RESOLUTION OF THE SONOMA COUNTY EMPLOYEES' RETIREMENT BOARD
AUTHORIZING ADOPTION OF COUNTY OF SONOMA EMPLOYEE AND EMPLOYER
CONTRIBUTION RATES.
WHEREAS, the Board of Retirement of the Sonoma County Employees' Retirement Association
(SCERA) has caused an annual actuarial valuation study of SCERA to be conducted as authorized by
Section 31453 of the California Government Code; and
WHEREAS, actuarial analyses were performed and actuarial reports were prepared by the
actuarial firm of Segal Consulting based on conditions as of December 31, 2014, with adjustments of
employer contribution rates for County Legacy Plan A and PEPRA Plan B general and safety members;
and
WHEREAS, the Board of Retirement upon the basis of the valuation, actuarial analysis and
recommendations of the actuaries, recommends adoption of employer and employee contribution rates for
the County of Sonoma as follows:
RETIREMENT EMPLOYER CONTRIBUTION RATES PERCENTAGE FOR
FISCAL YEAR 2016/2017
(Based on the 12/31/14 Actuarial Report)
COUNTY
Retirement Rates Legacy Plan A General Safety
07/05/16 17.74% 24.95%
Retirement Rates PEPRA Plan B General Safety
07/05/16 12.79% 18.75%
EMPLOYEE CONTRIBUTION RATES FOR FISCAL YEAR 2016/2017
General and safety member contribution rates effective July 5, 2016 will be as shown in Appendix A.
NOW, THEREFORE, BE IT RESOLVED that, in accordance with Section 31453 of the
California Government Code, the retirement employer and employee contribution rates as set forth above
for the County of Sonoma shall be hereby ordered into effect on the first full pay period after July 1,
2016, or as soon as considered practical by the Retirement Administration.
RETIREMENT BOARD TRUSTEES:
Baker Dunk X Gossman X Jahn Absent Pels X
Rabbitt Absent
Querijero X
Tambe X
Williams X
Williamson X
Ayes 7
Noes 0
Abstain 0
Absent 2
SO ORDERED


Sonoma County Employees’ Retirement Association Actuarial Valuation and Review as of December 31, 2015
This report has been prepared at the request of the Board of Retirement to assist in administering the Fund. This valuation report may not otherwise be copied or reproduced in any form without the consent of the Board of Retirement and may only be provided to other parties in its entirety. The measurements shown in this actuarial valuation may not be applicable for other purposes. Copyright © 2016 by The Segal Group, Inc. All rights reserved.
The Segal Company 100 Montgomery Street, Suite 500 San Francisco, CA 94104 T 415.263.8200 F 415.263.8290 www.segalco.com
April 27, 2016
Board of Retirement Sonoma County Employees' Retirement Association 433 Aviation Boulevard, Suite 100 Santa Rosa, CA 95403
Dear Board Members:
We are pleased to submit this Actuarial Valuation and Review as of December 31, 2015. It summarizes the actuarial data used in the valuation, establishes the funding requirements for the fiscal year beginning July 1, 2017 and analyzes the preceding year’s experience.
This report was prepared in accordance with generally accepted actuarial principles and practices at the request of the Board to assist in administering the Plan. The census and financial information on which our calculations were based was prepared by SCERA. That assistance is gratefully acknowledged.
The measurements shown in this actuarial valuation may not be applicable for other purposes. Future actuarial measurements may differ significantly from the current measurements presented in this report due to such factors as the following: plan experience differing from that anticipated by the economic or demographic assumptions; changes in economic or demographic assumptions; increases or decreases expected as part of the natural operation of the methodology used for these measurements (such as the end of an amortization period); and changes in plan provisions or applicable law.
The actuarial calculations were completed under the supervision of Andy Yeung, ASA, MAAA, FCA, Enrolled Actuary. We are members of the American Academy of Actuaries and we meet the Qualification Standards of the American Academy of Actuaries to render the actuarial opinion herein. To the best of our knowledge, the information supplied in the actuarial valuation is complete and accurate. Further, in our opinion, the assumptions as approved by the Board are reasonably related to the experience of and the expectations for the Plan.
We look forward to reviewing this report at your next meeting and to answering any questions.
Sincerely,
Segal Consulting, a Member of The Segal Group, Inc.
By: Paul Angelo, FSA, MAAA, FCA, EA Andy Yeung, ASA, MAAA, FCA, EA Senior Vice President and Actuary Vice President and Actuary
EK/hy

SECTION 1 SECTION 2 SECTION 3 SECTION 4
VALUATION SUMMARY VALUATION RESULTS SUPPLEMENTAL INFORMATION REPORTING INFORMATION
Purpose .......................................... i Significant Issues in Valuation
Year ...................................... ii Summary of Key Valuation Results
............................................ vii Summary of Key Valuation
Demographic and Financial Data ..................................... ix
A. Member Data ......................... 1 B. Financial Information ............ 4 C. Actuarial Experience ............. 8 D. Employer And Member
Contributions ...................... 13 E. Funded Ratio ....................... 20 F. Volatility Ratios .................. 22
EXHIBIT A Table of Plan Coverage i. General Plan A ............................ 23 ii. General Plan B ........................... 24 iii. Safety Plan A............................. 25 iv. Safety Plan B ............................. 26
EXHIBIT B Members in Active Service and Projected Average Compensation as of December 31, 2015 i. General Plan A ............................ 27 ii. General Plan B ........................... 28 iii. Safety Plan A............................. 29 iv. Safety Plan B ............................. 30
EXHIBIT C Reconciliation of Member Data – December 31, 2014 to December 31, 2015 .......................................... 31
EXHIBIT D Summary Statement of Income and Expenses on an Actuarial Value Basis .................................... 32
EXHIBIT E Summary Statement of Plan Assets ............................................. 33
EXHIBIT F Actuarial Balance Sheet .................. 34
EXHIBIT G Summary of Reported Reserve Information as of December 31, 2015................................................ 35
EXHIBIT H Development of Unfunded Actuarial Accrued Liability for Year Ended December 31, 2015 ..... 36
EXHIBIT I Section 415 Limitations .................. 37
EXHIBIT J Definitions of Pension Terms ......... 38
EXHIBIT I Summary of Actuarial Valuation Results ............................................. 40
EXHIBIT II Schedule of Employer Contributions ................................... 42
EXHIBIT III Actuarial Assumptions and Actuarial Cost Method .................... 43
EXHIBIT IV Summary of Plan Provisions ............ 59
Appendix A Member Contribution Rates ............. 66
Appendix B Schedule of Additional (non-SCERA) Employer Contributions ... 73
Appendix C Average Employer Contribution Rates ................................................ 74
Appendix D Reserves ........................................... 75
Appendix E Amortization Schedule for UAAL ... 76

SECTION 1: Valuation Summary for the Sonoma County Employees’ Retirement Association
i
Purpose This report has been prepared by Segal Consulting (Segal) to present a valuation of the Sonoma County Employees’ Retirement Association as of December 31, 2015. The valuation was performed to determine whether the assets and contributions are sufficient to provide the prescribed benefits. The contribution requirements presented in this report are based on:
The benefit provisions of the Retirement Association, as administered by the Board of Retirement;
The characteristics of covered active members, inactive vested members, retired members and beneficiaries as of December 31, 2015, provided by the Retirement Association;
The assets of the Plan as of December 31, 2015, provided by the Retirement Association;
Economic assumptions regarding future salary increases and investment earnings; and
Other actuarial assumptions, regarding employee terminations, retirement, death, etc.
One of the general goals of an actuarial valuation is to establish contributions that fully fund the Association’s liabilities, and that, as a percentage of payroll, remain as level as possible for each generation of active members. Annual actuarial valuations measure the progress toward this goal, as well as test the adequacy of the contribution rates. In preparing this valuation, we have employed generally accepted actuarial methods and assumptions to evaluate the Association’s assets, liabilities and future contribution requirements. Our calculations are based upon member data and financial information provided to us by the Association’s staff. This information has not been audited by us, but it has been reviewed and found to be reasonably consistent, both internally and with prior years’ information. The contribution requirements are determined as a percentage of payroll. The Association’s employer rates provide for both normal cost and a contribution to amortize any unfunded or overfunded actuarial accrued liabilities. Consistent with previous valuations, we have applied the funding policy adopted by the Board to amortize the Association’s outstanding balance of the December 31, 2007 unfunded actuarial accrued liability (UAAL) as well as any new UAAL established on each subsequent actuarial valuation after the December 31, 2007 valuation over separate 20-year declining periods. The rates calculated in this report may be adopted by the Board for the fiscal year that extends from July 1, 2017 through June 30, 2018.

SECTION 1: Valuation Summary for the Sonoma County Employees’ Retirement Association
ii
Significant Issues in Valuation Year The following key findings were the result of this actuarial valuation:
The results of this valuation reflect changes in the economic and non-economic actuarial assumptions studied by Segal and adopted by the Board for the December 31, 2015 valuation. The Board adopted a 7.25% investment return assumption for this valuation. The other changes in assumptions were documented in our Review of Economic Actuarial Assumptions dated September 30, 2015 and in our Actuarial Experience Study dated October 2, 2015 and are also outlined in Section 4, Exhibit III of this report. These assumption changes resulted in an increase in the aggregate employer contribution rate of 2.29% of payroll and no change to the aggregate average employee contribution rate.1
The ratio of the valuation value of assets to actuarial accrued liabilities decreased from 86.3% to 84.9%. The funded ratio measured on a market value basis decreased from 91.4% to 84.7%. The Association’s UAAL increased from $343.0 million as of December 31, 2014 to $405.9 million as of December 31, 2015. The increase in UAAL is primarily due to the change in the actuarial assumptions in the December 31, 2015 valuation. A complete reconciliation of the Association’s unfunded actuarial accrued liability is provided in Section 3, Exhibit H.
The average employer contribution rate calculated in this valuation increased from 18.76% of payroll to 20.38% of payroll. This change was primarily due to: (i) change in actuarial assumptions, offset to some degree by (ii) investment return (after “smoothing”) higher than the 7.50% return assumption used in the December 31, 2014 valuation, (iii) lower than expected individual salary increases during 2014, (iv) decrease in UAAL rate due to higher than expected increases in total payroll, (v) actual contributions more than expected, (vi) demographic changes, (vii) County’s additional UAAL payment, and (viii) other experience gains. A complete reconciliation of the Association’s aggregate employer rate is provided in Section 2, Subsection D (see Chart 14).
The average member rate calculated in this valuation has decreased from 11.75% of payroll to 11.72% of payroll primarily due to demographic changes. A complete reconciliation of the Association’s average member rate is provided in Section 2, Subsection D (see Chart 15).
As indicated in Section 2, Subsection B (see Chart 7) of this report, the total unrecognized investment loss as of December 31, 2015 was $6.9 million (as compared to an unrecognized gain of $126.3 million in the December 31, 2014 valuation). This investment loss will be recognized in the determination of the actuarial value of assets for funding purposes over the next few years, and will offset a portion of any investment gains that may occur after December 31, 2015. This implies that earning the assumed rate of investment return of 7.25% per year (net of expenses) on a market
1 It should be noted that some of the individual employee rates go down slightly (General Plan A for the County and the Court) while others go up slightly.
Reference: Pg. 43
Reference: Pg. 36 Reference: Pg. 20
Reference: Pg. 18
Reference: Pg. 19
Reference: Pg. 6

SECTION 1: Valuation Summary for the Sonoma County Employees’ Retirement Association
iii
value basis will result in investment losses on the actuarial value of assets in the next few years. Therefore, if the actual market return is equal to the assumed 7.25% rate and all other actuarial assumptions are met, the contribution requirements would generally increase in the next few years. The potential impact associated with the deferred investment gains may be illustrated as follows:
If the net deferred losses were recognized immediately and entirely in the valuation value of assets, the funded ratio would decrease from 84.9% to 84.7%.
If the net deferred losses were recognized immediately and entirely in the valuation value of assets, the aggregate employer rate would increase from 20.4% to 20.5%.
The amount of deferred returns that would be recognized in each of the next four valuations is provided at the bottom of page 6. It should be noted that according to that schedule, the Association would recognize two years’ of deferred gains (each of which is greater than the current deferred loss of $6.9 million) followed next by the recognition of two years’ of deferred losses (each of which is less than the current net deferred loss of $6.9 million). We believe it would be appropriate to take the $6.9 million in deferred losses and instead recognize those in four level amounts of about $1.7 million each year. This would reduce the volatility associated with the pattern of deferred loss recognition and result in both more stable projected funded ratios (on a valuation basis) and more level employer contribution rates. We would be available to work with the Association staff to develop that recommendation for the Board’s consideration well in advance of the next valuation.
The actuarial valuation report as of December 31, 2015 is based on financial information as of that date. Changes in the value of assets subsequent to that date are not reflected. Declines in asset values will increase the actuarial cost of the plan, while increases will decrease the actuarial cost of the plan.
Safety-County members pay an additional contribution amount equal to 3.00% of payroll effective February 1, 2005.
General-County and General-Court members pay an additional contribution amount equal to 3.03% of payroll from July 1, 2004 to June 30, 2024. Effective July 1, 2024, the employer contribution rate will have to increase to offset for this expiration of the 3.03% rate paid by the General-County and General-Court members.
In this report, we have provided the amount of transfer that would be required to “true-up” the COLA and the Retired Member reserves so that the reserves after the “true-up” are equal to the present value of the COLA and retiree benefits for members currently receiving such benefits.
Effective with the December 31, 2007 valuation, we have calculated a separate Normal Cost rate for Safety – VOM based on the demographics of Safety employees of VOM. Any new Safety UAAL will continue to be allocated to Safety – County and Safety – VOM based on their proportions of payroll to the total Safety payroll. However, the County’s
Reference: Pg. 6
Reference: Pg. 35
Reference: Pg. 16

SECTION 1: Valuation Summary for the Sonoma County Employees’ Retirement Association
iv
additional UAAL payment ($3,553,289.392 as of August 3, 2015) has been split between General and Safety and only used to reduce the County’s UAAL.
Effective with the restatement of the December 31, 2012 contribution rates, we have calculated a separate Normal Cost rate for General Plan A – County. Note that the Normal Cost rate for all other General employers continues to be developed on a pooled basis. However, starting with this valuation, we have adjusted the Normal Cost rate for General Plan A – VOM relative to that paid by General Plan A – Court. As stated in our Actuarial Experience Study dated October 2, 2015, this adjustment is to reflect SCERA’s determination that the cashout cost paid by members in General Plan A – VOM should no longer be adjusted by a factor of 91%. Previously, the cashout cost paid by members, which is used to develop the member rates for both General Plan A – VOM and General Plan A – Court, were adjusted by a factor of 91% to represent the exclusion of the cashout of sick leave. These assumptions are outlined in Section 4, Exhibit III.
Similar to Safety, any new General UAAL will continue to be allocated to General – County, General – Court and General – VOM based on the proportions of their payroll to the total General payroll. However, the County’s additional UAAL payment ($3,553,289.392 as of August 3, 2015) has been allocated between General and Safety and only used to reduce the County’s UAAL.
Impact of Future Experience on Contribution Rates
Future contribution requirements may differ from those determined in the valuation because of: difference between actual experience and anticipated experience; changes in actuarial assumptions or methods; changes in statutory provisions; and difference between the contribution rates determined by the valuation and those adopted by the Board.
2 This amount when adjusted with interest at the assumed earnings rate of 7.5% is $3,661,000 as of December 31, 2015.
Reference: Pg. 15

SECTION 1: Valuation Summary for the Sonoma County Employees’ Retirement Association
v
Important Information about Actuarial Valuations
In order to prepare an actuarial valuation, Segal Consulting (“Segal”) relies on a number of input items. These include:
Plan benefits Plan provisions define the rules that will be used to determine benefit payments, and those rules, or the interpretation of them, may change over time. It is important to keep Segal informed with respect to plan provisions and administrative procedures, and to review the plan description in this report (as well as the plan summary included in our funding valuation report) to confirm that Segal has correctly interpreted the plan provisions.
Participant data An actuarial valuation for a plan is based on data provided to the actuary by SCERA. Segal does not audit such data for completeness or accuracy, other than reviewing it for obvious inconsistencies compared to prior data and other information that appears unreasonable. It is important for Segal to receive the best possible data and to be informed about any known incomplete or inaccurate data.
Assets This valuation is based on the market value of assets as of the valuation date, as provided by SCERA.
Actuarial assumptions In preparing an actuarial valuation, Segal projects the benefits to be paid to existing plan participants for the rest of their lives and the lives of their beneficiaries. This projection requires actuarial assumptions as to the probability of death, disability, withdrawal, and retirement of each participant for each year. In addition, the benefits projected to be paid for each of those events in each future year reflect actuarial assumptions as to salary increases and cost-of-living adjustments. The projected benefits are then discounted to a present value, based on the assumed rate of return that is expected to be achieved on the plan’s assets. There is a reasonable range for each assumption used in the projection and the results may vary materially based on which assumptions are selected. It is important for any user of an actuarial valuation to understand this concept. Actuarial assumptions are periodically reviewed to ensure that future valuations reflect emerging plan experience. While future changes in actuarial assumptions may have a significant impact on the reported results, that does not mean that the previous assumptions were unreasonable.

SECTION 1: Valuation Summary for the Sonoma County Employees’ Retirement Association
vi
The user of Segal’s actuarial valuation (or other actuarial calculations) should keep the following in mind:
The valuation is prepared at the request of the Board to assist the sponsors of the Fund in preparing items related to the pension plan in their financial reports. Segal is not responsible for the use or misuse of its report, particularly by any other party.
An actuarial valuation is a measurement of the plan’s assets and liabilities at a specific date. Accordingly, except where otherwise noted, Segal did not perform an analysis of the potential range of future financial measures. The actual long-term cost of the plan will be determined by the actual benefits and expenses paid and the actual investment experience of the plan.
If SCERA is aware of any event or trend that was not considered in this valuation that may materially change the results of the valuation, Segal should be advised, so that we can evaluate it.
Segal does not provide investment, legal, accounting, or tax advice. Segal’s valuation is based on our understanding of applicable guidance in these areas and of the plan’s provisions, but they may be subject to alternative interpretations. The Board should look to their other advisors for expertise in these areas.
As Segal Consulting has no discretionary authority with respect to the management or assets of SCERA, it is not a fiduciary in its capacity as actuaries and consultants with respect to SCERA.

SECTION 1: Valuation Summary for the Sonoma County Employees’ Retirement Association
vii
Summary of Key Valuation Results (Dollar amounts in thousands) December 31, 2015 December 31, 2014
Employer Contribution Rates: Estimated Estimated Total Rate Annual Amount(1) Total Rate Annual Amount(1) General Plan A – County 19.01% $37,450 17.81% $35,085 General Plan A– Court 29.96% 3,438 28.87% 3,313 General Plan A– Valley of the Moon 18.34% 42 16.58% 38 General Plan B – County 13.90% 8,365 12.86% 7,739 General Plan B – Court 23.87% 468 23.18% 455 General Plan B – Valley of the Moon 12.28% 7 10.89% 6 Safety Plan A – County 28.61% 16,569 25.06% 14,514 Safety Plan A – Valley of the Moon 35.33% 1,350 32.52% 1,243 Safety Plan B – County 21.60% 1,441 18.86% 1,259 Safety Plan B – Valley of the Moon 22.76% 46 20.49% 41 All Categories combined 20.38% 69,176 18.76% 63,693
Average Member Contribution Rates(2): Estimated Estimated Total Rate Annual Amount(1) Total Rate Annual Amount(1) General Plan A – County (Average Entry Age: 36) 11.93% $23,502 11.99% $23,620 General Plan A – Court (Average Entry Age: 36) 12.24% 1,405 12.30% 1,411 General Plan A – Valley of the Moon (Average Entry Age: 52) 12.13% 28 11.91% 28 General Plan B – County 10.43% 6,277 10.40% 6,259 General Plan B – Court 10.43% 205 10.40% 204 General Plan B – Valley of the Moon 7.40% 4 7.37% 4 Safety Plan A – County (Average Entry Age: 30) 12.07% 6,990 12.03% 6,967 Safety Plan A – Valley of the Moon (Average Entry Age: 34) 10.30% 394 10.14% 388 Safety Plan B – County 14.36% 958 14.98% 1,000 Safety Plan B – Valley of the Moon 10.04% 20 10.36% 21 All Categories combined 11.72% 39,783 11.75% 39,902
(1) Based on December 31, 2015 projected annual compensation. (2) Includes an additional 3.03% and 3.00% of payroll for General (County and Court) and Safety-County members, respectively.

SECTION 1: Valuation Summary for the Sonoma County Employees’ Retirement Association
viii
Summary of Key Valuation Results – continued (Dollar amounts in thousands) December 31, 2015 December 31, 2014
Funded Status: Actuarial accrued liability (AAL) $2,694,979 $2,510,253 Valuation value of assets (VVA)(3) 2,289,057 2,167,210 Market value of assets (MVA)(3) 2,282,127 2,293,475 Funded percentage on a VVA basis 84.9% 86.3% Funded percentage on a MVA basis 84.7% 91.4% Unfunded Actuarial Accrued Liability on a VVA basis 405,922 343,043 Unfunded Actuarial Accrued Liability on a MVA basis 412,852 216,778
Key Assumptions: Interest rate 7.25% 7.50% Inflation rate 3.00% 3.25% Across the board salary increase 0.50% 0.75%
(3) Excludes non-valuation reserves.

SECTION 1: Valuation Summary for the Sonoma County Employees’ Retirement Association
ix
Summary of Key Valuation Demographic and Financial Data December 31, 2015 December 31, 2014 Percentage Change
Active Members: Number of members 4,071 3,922 3.8% Average age 45.7 46.0 N/A Average service 9.6 9.8 N/A Projected total compensation $339,516,784 $324,418,882 4.7% Average projected compensation $83,399 $82,718 0.8%
Retired Member and Beneficiaries: Number of members: Service retired 3,513 3,409 3.1% Disability retired 610 606 0.7% Beneficiaries 530 491 7.9% Total 4,653 4,506 3.3% Average age 68.0 67.8 N/A Average monthly benefit $2,691 $2,645 1.7%
Vested Terminated Members: Number of terminated vested members(1) 1,047 975 7.4% Average age 46.1 46.4 N/A
Summary of Financial Data (dollar amounts in thousands): Market value of assets $2,282,127 $2,293,475 -0.5% Return on market value of assets 1.37% 5.18% N/A Actuarial value of assets $2,289,057 $2,167,210 5.6% Return on actuarial value of assets 7.65% 9.71% N/A Valuation value of assets $2,289,057 $2,167,210 5.6% Return on valuation value of assets 7.65% 9.71% N/A
(1) Includes members who choose to leave their contributions on deposit even though they have less than five years of service.

SECTION 2: Valuation Results for the Sonoma County Employees’ Retirement Association
1
The Actuarial Valuation and Review considers the number and demographic characteristics of covered members, including active members, vested terminated members, retired members and beneficiaries.
This section presents a summary of significant statistical data on these member groups.
More detailed information for this valuation year and the preceding valuation can be found in Section 3, Exhibits A, B, and C.
A. MEMBER DATA
A historical perspective of how the member population has changed over the past ten valuations can be seen in this chart.
CHART 1 Member Population: 2006 – 2015
Year Ended December 31
Active Members
Vested Terminated Members(1)
Retired Members and Beneficiaries
Ratio of Non-Actives to Actives
2006 4,212 729 3,095 0.91
2007 4,246 763 3,282 0.95
2008 4,193 853 3,399 1.01
2009 3,984 881 3,570 1.12
2010 3,780 904 3,780 1.24
2011 3,587 919 4,021 1.38
2012 3,620 876 4,258 1.42
2013 3,833 918 4,394 1.39
2014 3,922 975 4,506 1.40
2015 4,071 1,047 4,653 1.40
(1) Includes members who choose to leave their contributions on deposit even though they have less than five years of service.

SECTION 2: Valuation Results for the Sonoma County Employees’ Retirement Association
2
0
100
200
300
400
500
600
700
0200400600800
1,0001,2001,4001,6001,800
Active Members Plan costs are affected by the age, years of service and compensation of active members. In this year’s valuation, there were 4,071 active members with an average age of 45.7, average years of service of 9.6 years and average projected compensation of $83,399. The 3,922 active members in the prior valuation had an average age of 46.0, average service of 9.8 years and average projected compensation of $82,718.
Among the active members, there were none with unknown age.
Inactive Members In this year’s valuation, there were 1,047 members with a vested right to a deferred or immediate vested benefit or entitled to a return of their member contributions versus 975 in the prior valuation.
These graphs show a distribution of active members by age and by years of service.
CHART 2
Distribution of Active Members by Age as of December 31, 2015
CHART 3
Distribution of Active Members by Years of Service as of December 31, 2015

SECTION 2: Valuation Results for the Sonoma County Employees’ Retirement Association
3
0100200300400500600700800900
Disability
Service0
200
400
600
800
1,000
1,200
Retired Members and Beneficiaries As of December 31, 2015, 4,123 retired members and 530 beneficiaries were receiving total monthly benefits of $12,519,042. For comparison, in the previous valuation, there were 4,015 retired members and 491 beneficiaries receiving monthly benefits of $11,917,933.
These graphs show a distribution of the current retired members based on their monthly amount and age, by type of pension.
CHART 4
Distribution of Retired Members by Type and by Monthly Amount as of December 31, 2015
CHART 5
Distribution of Retired Members by Type and by Age as of December 31, 2015
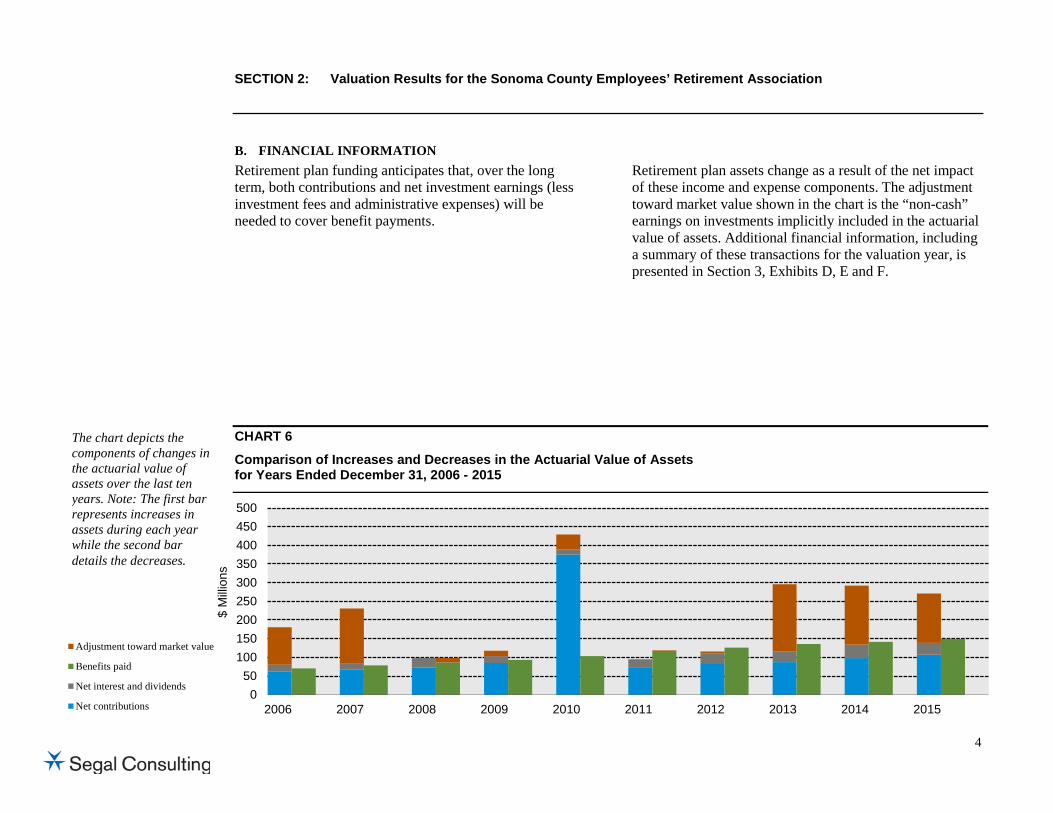
SECTION 2: Valuation Results for the Sonoma County Employees’ Retirement Association
4
050
100150200250300350400450500
2006 2007 2008 2009 2010 2011 2012 2013 2014 2015
$ M
illion
s
Adjustment toward market value
Benefits paid
Net interest and dividends
Net contributions
Retirement plan funding anticipates that, over the long term, both contributions and net investment earnings (less investment fees and administrative expenses) will be needed to cover benefit payments.
Retirement plan assets change as a result of the net impact of these income and expense components. The adjustment toward market value shown in the chart is the “non-cash” earnings on investments implicitly included in the actuarial value of assets. Additional financial information, including a summary of these transactions for the valuation year, is presented in Section 3, Exhibits D, E and F.
B. FINANCIAL INFORMATION
The chart depicts the components of changes in the actuarial value of assets over the last ten years. Note: The first bar represents increases in assets during each year while the second bar details the decreases.
CHART 6
Comparison of Increases and Decreases in the Actuarial Value of Assets for Years Ended December 31, 2006 - 2015

SECTION 2: Valuation Results for the Sonoma County Employees’ Retirement Association
5
It is desirable to have level and predictable plan costs from one year to the next. For this reason, the Board of Retirement has approved an asset valuation method that gradually adjusts to market value. Under this method, the full value of market fluctuations is not recognized in a single year and, as a result, the asset value and the plan costs are more stable.
The amount of the adjustment to recognize market value is treated as income, which may be positive or negative. Realized and unrealized gains and losses are treated equally and, therefore, the sale of assets has no immediate effect on the actuarial value.
The determination of the actuarial and valuation value of assets is provided on the following page.
The following are points of note in the asset smoothing method used by the actuary in developing the actuarial value and valuation value of assets: (1) the non-investment cash flow included contributions received, benefit payments and administrative expenses made during the last calendar year and (2) the amount subject to smoothing is the actual market return earned during the last calendar year that was in excess/below the expected return on the valuation value of assets

SECTION 2: Valuation Results for the Sonoma County Employees’ Retirement Association
6
The chart shows the determination of the actuarial and valuation value of assets as of the valuation date.
CHART 7
Determination of Actuarial and Valuation Value of Assets for Year Ended December 31, 2015
Plan Year Ending Actual Return Expected Return Investment Deferred Deferred
December 31 On Market Value On Valuation Value Gain/(Loss) Factor Return 2011 $4,854,307 $144,723,796 $(139,869,489) 0.0 $0 2012 242,604,327 142,862,439 99,741,888 0.2 19,948,378 2013 370,312,599 137,296,052 233,016,547 0.4 93,206,619 2014 117,662,316 149,497,548 (31,835,232) 0.6 (19,101,139) 2015 34,589,119 160,818,143 (126,229,024) 0.8 (100,983,219)
1. Total Deferred Return $(6,929,361) 2. Net Market Value of Assets 2,282,127,429 3. Actuarial Value of Assets (Item 2 – Item 1) $2,289,056,790 4. Ratio of Actuarial Value to Market Value 100.3% 5. Non-Valuation Reserves and Other Adjustments a. Interest Fluctuation Reserve $0 b. Undistributed Reserve 0 c. Negative Contingency Reserve (Before Any Transfer) (490,104,376) d. Transfer to True-Up Reserves (1,256,614) e. Negative Contingency Reserve (After Transfers) (Item 5c + Item 5d) (491,360,990) f. Total (Item 5a + Item 5b + Max (Item 5e,0)) $0 6. Valuation Value of Assets (Item 3 – Item 5f) $2,289,056,790
The amounts of deferred return as of December 31, 2015 to be recognized in each subsequent valuation are as follows:
December 31, 2016 $34,938,837 December 31, 2017 14,990,458 December 31, 2018 (31,612,851) December 31, 2019 (25,245,805) Total $(6,929,361)

SECTION 2: Valuation Results for the Sonoma County Employees’ Retirement Association
7
1.0
1.2
1.4
1.6
1.8
2.0
2.2
2.4
2006 2007 2008 2009 2010 2011 2012 2013 2014 2015
$ Bi
llions
Market Value
Actuarial Value
Valuation Value
The market value, actuarial value, and valuation value of assets are representations of the SCERA’s financial status. As investment gains and losses are gradually taken into account, the actuarial value of assets tracks the market value of assets, but with less volatility. The valuation value of assets is the actuarial value, excluding any non-valuation reserves. The valuation asset value is significant because SCERA’s liabilities are compared to these assets to determine what portion, if any, remains unfunded. Amortization of the unfunded actuarial accrued liability is an important element in determining the contribution requirement.
This chart shows the change in market value, actuarial value and valuation value over the past ten years.
CHART 8
Market Value, Actuarial Value and Valuation Value of Assets as of December 31, 2006 – 2015

SECTION 2: Valuation Results for the Sonoma County Employees’ Retirement Association
8
To calculate the required contribution, assumptions are made about future events that affect the amount and timing of benefits to be paid and assets to be accumulated. Each year actual experience is measured against the assumptions. If overall experience is more favorable than anticipated (an actuarial gain), the contribution requirement will decrease from the previous year. On the other hand, the contribution requirement will increase if overall actuarial experience is less favorable than expected (an actuarial loss).
Taking account of experience gains or losses in one year without making a change in assumptions reflects the belief that the single year’s experience was a short-term development and that, over the long term, experience will return to the original assumptions. For contribution requirements to remain stable, assumptions should approximate experience.
If assumptions are changed, the contribution requirement is adjusted to take into account a change in experience anticipated for all future years.
The total experience gain was $22.2 million, a gain of $3.3 million from investments (after smoothing and relative to a return of 7.50% assumed in the December 31, 2014 valuation), a gain of $3.5 million from contribution experience and a gain of $15.4 million from all other sources. The gain from all other sources was 0.6% of the actuarial accrued liability. A discussion of the major components of the actuarial experience is on the following pages.
C. ACTUARIAL EXPERIENCE
CHART 9 Actuarial Experience for Year Ended December 31, 2015
1. Net gain from investments on valuation value of assets(1) $3,307,000
2. Net gain from contribution experience 3,519,000
3. Net gain from other experience(2) 15,375,000
4. Net experience gain: (1) + (2) + (3) $22,201,000
(1) Details in Chart 10.
(2) See Section 3, Exhibit H.
This chart provides a summary of the actuarial experience during the past year.

SECTION 2: Valuation Results for the Sonoma County Employees’ Retirement Association
9
Investment Rate of Return A major component of projected asset growth is the assumed rate of return. The assumed return should represent the expected long-term rate of return, based on SCERA’s investment policy. For valuation purposes, the assumed rate of return on the valuation value of assets was 7.50% based on the December 31, 2014 valuation. The actual rate of return on a (“smoothed”) valuation basis for the 2015 plan year was 7.65%.
Since the actual return for the year on the valuation value of assets was more than the assumed return, SCERA experienced an actuarial gain during the year ended December 31, 2015 with regard to its investments.
For this valuation, there is no difference between the return on the valuation value of assets and the return on the actuarial value of assets.
CHART 10 Investment Experience for Year Ended December 31, 2015 – Valuation Value, Actuarial Value and Market Value of Assets
Valuation Value Actuarial Value Market Value
1. Actual return $164,257,165 $164,257,165 $31,063,205
2. Average value of assets $2,146,004,861 $2,146,004,861 $2,272,269,460
3. Actual rate of return: (1) ÷ (2) 7.65% 7.65% 1.37%
4. Assumed rate of return 7.50% 7.50% 7.50%
5. Expected return: (2) x (4) 160,950,364 160,950,364 170,420,209
6. Actuarial gain/(loss): (1) – (5) $3,306,801 $3,306,801 $(139,357,004)
This chart shows the gain/(loss) due to investment experience.

SECTION 2: Valuation Results for the Sonoma County Employees’ Retirement Association
10
One measure of actuarial experience is to see how the assumed investment rate of return has compared to actual experience over time. The chart below shows the rate of return on an actuarial, valuation and market basis for the last ten years.
Based on future expectations, we have lowered the assumed rate of return of 7.50% to 7.25% for this valuation.
CHART 11 Investment Return – Actuarial Value, Valuation Value and Market Value: 2006 – 2015 (Dollar amount in thousands)
Valuation Value
Investment Return(1) Actuarial Value Investment
Return(1) Market Value
Investment Return(1) Year Ended
December 31 Amount Percent Amount Percent Amount Percent
2006 $102,056 8.02% $118,855 9.33% $193,809 14.64%
2007 111,564 8.15% 163,919 11.86% 126,599 8.40%
2008 70,012 4.75% 13,753 0.90% -556,235 -34.33%
2009 32,771 2.13% 32,771 2.13% 224,056 21.28%
2010 54,093 3.27% 54,093 3.27% 207,173 15.23%
2011 19,508 1.04% 19,508 1.04% 1,179 0.07%
2012 33,652 1.82% 33,652 1.82% 239,065 14.16%
2013 208,550 11.38% 208,550 11.38% 366,462 19.49%
2014 193,799 9.71% 193,799 9.71% 114,072 5.18%
2015 164,257 7.65% 164,257 7.65% 31,063 1.37%
Five-Year Average Return 6.24% 6.24% 7.79%
Ten-Year Average Return 5.74% 5.82% 5.20%
(1) Net of administrative and investment expenses.

SECTION 2: Valuation Results for the Sonoma County Employees’ Retirement Association
11
-40%
-30%
-20%
-10%
0%
10%
20%
30%
2006 2007 2008 2009 2010 2011 2012 2013 2014 2015
Market Value
Actuarial Value
Valuation Value
Subsection B described the actuarial asset valuation method that gradually takes into account fluctuations in the market value rate of return. The effect of this is to stabilize the actuarial rate of return, which contributes to leveling pension plan costs.
This chart illustrates how this leveling effect has actually worked over the last ten years.
CHART 12
Market, Actuarial and Valuation Rates of Return for Years Ended December 31, 2006 - 2015

SECTION 2: Valuation Results for the Sonoma County Employees’ Retirement Association
12
Other Experience There are other differences between the expected and the actual experience that appear when the new valuation is compared with the projections from the previous valuation.
These may include:
the extent of turnover among the participants,
retirement experience (earlier or later than expected),
mortality (more or fewer deaths than expected),
the number of disability retirements, and
salary increases different than assumed.
The net gain from this other experience for the year ended December 31, 2015 amounted to $15.4 million, which was 0.6% of the actuarial accrued liability. See Exhibit H for a detailed development of the changes in the Unfunded Actuarial Accrued Liability.

SECTION 2: Valuation Results for the Sonoma County Employees’ Retirement Association
13
Employer contributions consist of two components:
Normal Cost The annual contribution rate that, if paid annually from a member’s first year of membership through the year of retirement, would accumulate to the amount necessary to fully fund the member's retirement-related benefits. Accumulation includes annual crediting of interest at the assumed investment earning rate. The contribution rate is determined as a level percentage of the member’s career compensation.
Contribution to the Unfunded Actuarial Accrued Liability (UAAL) The annual contribution rate that, if paid annually over the UAAL amortization
period, would accumulate to the amount necessary to fully fund the UAAL. Accumulation includes annual crediting of interest at the assumed investment earning rate. The contribution (or rate credit in the case of a negative unfunded actuarial accrued liability) is calculated to remain as a level percentage of future active member payroll (including payroll for new members as they enter the Association) assuming a constant number of active members. In order to remain as a level percentage of payroll, amortization payments (credits) are scheduled to increase at the annual rate of 3.50% (i.e., 3.00% inflation plus 0.50% across-the-board salary increase). The outstanding balance of the December 31, 2007 UAAL as well as any new UAAL established on each subsequent valuation after December 31, 2007 is amortized over separate 20-year declining periods. The UAAL established as a result of including as pensionable salary a cash allowance of $3.45 per hour for General-County and Safety-County members only is amortized over a 20-year declining period with 12 years remaining as of December 31, 2015.
The recommended employer contributions are provided on Charts 13a and 13b.
D. EMPLOYER AND MEMBER CONTRIBUTIONS

SECTION 2: Valuation Results for the Sonoma County Employees’ Retirement Association
14
Member Contributions: Normal Cost Plan A Members Articles 6 and 6.8 of the 1937 Act define the methodology to be used in the
calculation of member basic contribution rates for General Plan A members and Safety Plan A members, respectively. The basic contribution rate is determined so that the accumulation of a member’s basic contributions made in a given year until a certain age will be sufficient to fund an annuity at that age that is equal to 1/100 of Final Average Compensation for General and Safety members. That age is 55 for General members and 50 for Safety members. It is assumed that contributions are made annually at the same rate, starting at entry age. Accumulation includes semi-annual crediting of interest at one-half of the assumed investment earning rate. The member contribution rates are provided in Appendix A.
Plan B Members Pursuant to Section 7522.30(a) of the Government Code, CalPEPRA members are required to contribute at least 50% of the Normal Cost rate. We have assumed that exactly 50% of the Normal Cost would be paid by the new members. Also of note is that based on our recommendation, SCERA has decided to use the discretion made available by AB1380 to no longer round the member’s contribution rate to the nearest ¼% as previously required by the California Public Employees’ Pension Reform Act of 2013 (CalPEPRA).
Contribution to the Unfunded Actuarial Accrued Liability (UAAL) General County and Court members pay an additional contribution amount equal to
3.03% of payroll for a 20-year period from July 1, 2004 to June 30, 2024 while Safety-County members (excluding Valley of the Moon) pay an additional contribution amount equal to 3.00% of payroll effective February 1, 2005. These rates are subtracted from the employer’s UAAL rates, after adjustment for refundability.

SECTION 2: Valuation Results for the Sonoma County Employees’ Retirement Association
15
CHART 13a Recommended Employer Contribution Rates (Dollar Amounts in Thousands)
December 31, 2015 Actuarial Valuation December 31, 2014 Actuarial Valuation
General Plan A-County Members Rate Estimated Annual
Amount(1) Rate Estimated Annual
Amount(1) Normal Cost 12.51% $24,645 12.32% $24,270 UAAL 6.50% 12,805 5.49% 10,815 Total Contribution 19.01% $37,450 17.81% $35,085
General Plan A-Court Members Normal Cost 13.49% $1,548 13.06% $1,499 UAAL 16.47% 1,890 15.81% 1,814 Total Contribution 29.96% $3,438 28.87% $3,313
General Plan A-Valley of the Moon Members Normal Cost 13.46% $31 13.06% $30 UAAL 4.88% 11 3.52% 8 Total Contribution 18.34% $42 16.58% $38
General Plan B-County Members Normal Cost 7.40% $4,453 7.37% $4,435 UAAL 6.50% 3,912 5.49% 3,304 Total Contribution 13.90% $8,365 12.86% $7,739
General Plan B-Court Members Normal Cost 7.40% $145 7.37% $145 UAAL 16.47% 323 15.81% 310 Total Contribution 23.87% $468 23.18% $455
General Plan B-Valley of the Moon Members Normal Cost 7.40% $4 7.37% $4 UAAL 4.88% 3 3.52% 2 Total Contribution 12.28% $7 10.89% $6
(1) Amounts are in thousands and are based on December 31, 2015 projected annual payroll (also in thousands) as shown on page 16.

SECTION 2: Valuation Results for the Sonoma County Employees’ Retirement Association
16
CHART 13a (continued) Recommended Employer Contribution Rates (Dollar Amounts in Thousands)
December 31, 2015 Actuarial Valuation December 31, 2014 Actuarial Valuation
Safety Plan A-County Members Rate Estimated Annual
Amount(1) Rate Estimated Annual
Amount(1) Normal Cost 18.37% $10,639 18.18% $10,529 UAAL 10.24% 5,930 6.88% 3,985 Total Contribution 28.61% $16,569 25.06% $14,514
Safety Plan A-Valley of the Moon Members Normal Cost 22.61% $864 22.39% $856 UAAL 12.72% 486 10.13% 387 Total Contribution 35.33% $1,350 32.52% $1,243
Safety Plan B-County Members Normal Cost 11.36% $758 11.98% $800 UAAL 10.24% 683 6.88% 459 Total Contribution 21.60% $1,441 18.86% $1,259
Safety Plan B-Valley of the Moon Members Normal Cost 10.04% $20 10.36% $21 UAAL 12.72% 26 10.13% 20 Total Contribution 22.76% $46 20.49% $41
All Categories Combined Normal Cost 12.70% $43,107 12.54% $42,589 UAAL 7.68% 26,069 6.22% 21,104 Total Contribution 20.38% $69,176 18.76% $63,693
(1) Amounts are in thousands and are based on December 31, 2015 projected annual payroll (also in thousands): General Plan A-County $196,999 General Plan A-Court 11,475 General Plan A-Valley of the Moon 231 General Plan B-County 60,181 General Plan B-Court 1,963 General Plan B-Valley of the Moon 56 Safety Plan A-County 57,915 Safety Plan A-Valley of the Moon 3,823 Safety Plan B-County 6,674 Safety Plan B-Valley of the Moon 201 Total $339,518

SECTION 2: Valuation Results for the Sonoma County Employees’ Retirement Association
17
CHART 13b Breakdown of the Employers’ Plus Employees’ Normal Cost Contributions to Fund for Each Type of Benefit
Elements of Normal Cost for Plan A Members Normal Cost All
General Safety-County Safety-Valley of the Moon Overall
Service Retirement 82% 63% 65% 77% Vested Termination and Ordinary Withdrawal 10% 8% 6% 10% Non Service and Service Connected Disability 7% 29% 29% 13% Non Service and Service Connected Death 1% 0% 0% 0% Total Employer Plus Employee Normal Cost 100% 100% 100% 100%
Elements of Normal Cost for Plan B Members Normal Cost All
General Safety-County Safety-Valley of the Moon Overall
Service Retirement 79% 55% 57% 75% Vested Termination and Ordinary Withdrawal 10% 10% 10% 10% Non Service and Service Connected Disability 10% 35% 33% 14% Non Service and Service Connected Death 1% 0% 0% 1% Total Employer Plus Employee Normal Cost 100% 100% 100% 100%

SECTION 2: Valuation Results for the Sonoma County Employees’ Retirement Association
18
The contribution rates as of December 31, 2015 are based on all of the data described in the previous sections, the actuarial assumptions described in Section 4, and the Plan provisions adopted at the time of preparation of the Actuarial Valuation. They include all changes affecting future costs, adopted benefit changes, actuarial gains and losses and changes in the actuarial assumptions.
Reconciliation of Recommended Contribution The chart below details the changes in the recommended contribution from the prior valuation to the current year’s valuation
% CHART 14 Reconciliation of Recommended Contribution from December 31, 2014 to December 31, 2015 (Dollar Amounts in Thousands)
Contribution Rate Estimated Annual
Dollar Cost(1)
Recommended Average Employer Contribution Rate as of December 31, 2014 18.76% $63,693
Effect of investment gain(2) -0.07% $(238)
Effect of difference in actual versus expected individual salary increases -0.26% (883)
Effect of decrease in UAAL rate from higher than expected increases in total payroll -0.10% (340)
Effect of difference between actual and expected contributions(3) -0.07% (238)
Effect of demographic changes -0.01% (34)
Effect of changes in actuarial assumptions 2.29% 7,775
Effect of County’s additional UAAL payment -0.10% (340)
Effect of other experience gains -0.06% (219)
Subtotal 1.62% $5,483
Recommended Average Employer Contribution Rate as of December 31, 2015 20.38% $69,176 (1) Based on December 31, 2015 projected annual payroll of $339,518. (2) Return on valuation assets was 7.65% and therefore was more than the 7.50% assumed in the December 31, 2014 valuation. (3) Includes impact of 18-month delay in rate implementation, phase-in of the impact of the changes in actuarial assumptions on the employer contribution
rate (if any) and difference between normal cost and UAAL contributions due to actual payroll more than expected during 2015.
The chart reconciles the contribution from the prior valuation to the amount determined in this valuation.

SECTION 2: Valuation Results for the Sonoma County Employees’ Retirement Association
19
Reconciliation of Recommended Contribution Rate The chart below details the changes in the aggregate member contribution rate from the prior valuation to the current year’s valuation.
The chart reconciles the member contribution from the prior valuation to the amount determined in this valuation.
CHART 15 Reconciliation of Recommended Member Contribution from December 31, 2014 to December 31, 2015
General Plan A-County
Contribution Rate (1)
General Plan A-Court
Contribution Rate (1)
General Plan A-Valley of the Moon
Contribution Rate
Safety Plan A-County
Contribution Rate (2)
Safety Plan A-Valley of the Moon
Contribution Rate
Recommended Average Member Contribution Rate as of December 31, 2014(3) 11.99% 12.30% 11.91% 12.03% 10.14%
Effect of demographic changes 0.00% 0.00% 0.00% 0.00% 0.00%
Effect of actuarial assumptions -0.06% -0.06% 0.22% 0.04% 0.16%
Recommended Average Member Contribution Rate as of December 31, 2015(4) 11.93% 12.24% 12.13% 12.07% 10.30%
General Plan
B-County Contribution
Rate (1)
General Plan B-Court
Contribution Rate (1)
General Plan B-Valley of the Moon
Contribution Rate
Safety Plan B-County
Contribution Rate (2)
Safety Plan B-Valley of the Moon
Contribution Rate
Total Contribution
Rate
Recommended Average Member Contribution Rate as of December 31, 2014 10.40% 10.40% 7.37% 14.98% 10.36% 11.75%
Effect of demographic changes -0.11% -0.11% -0.11% -0.81% -0.35% -0.03%
Effect of actuarial assumptions 0.14% 0.14% 0.14% 0.19% 0.03% 0.00%
Recommended Average Member Contribution Rate as of December 31, 2015 10.43% 10.43% 7.40% 14.36% 10.04% 11.72%
(1) Rates include an additional 3.03% of payroll. (2) Rates include an additional 3.00% of payroll. (3) The above rates are based on average entry age. The weighted average member contribution rates as of December 31, 2014 are 11.94%, 12.25%, 11.60% and 9.13% for
General-County, other General (i.e., Court and Valley of the Moon), Safety-County and Safety-Valley of the Moon, respectively. (4) The above rates are based on average entry age. The weighted average member contribution rates as of December 31, 2015 are 11.86%, 12.12%, 11.59% and 9.00% for
General-County, other General (i.e., Court and Valley of the Moon), Safety-County and Safety-Valley of the Moon, respectively.

SECTION 2: Valuation Results for the Sonoma County Employees’ Retirement Association
20
55%
60%
65%
70%
75%
80%
85%
90%
95%
100%
105%
2006 2007 2008 2009 2010 2011 2012 2013 2014 2015
Market Value Basis
Valuation Value Basis
A critical piece of information regarding the Plan’s financial status is the funded ratio. This ratio compares the valuation value of assets to the actuarial accrued liabilities of the Plan as calculated. High ratios indicate a well-funded plan with assets sufficient to pay most benefits. Lower ratios may indicate recent changes to benefit structures, funding of the plan below actuarial requirements, poor asset performance, or a variety of other factors.
The chart below depicts a history of the funded ratios for this plan.
The funded status measures shown in this valuation are appropriate for assessing the need for or amount of future contributions. However, they are not necessarily appropriate for assessing the sufficiency of Plan assets to cover the estimated cost of settling the Plan’s benefit obligations. As the chart below shows, the measures are different depending on whether the valuation or market value of assets is used.
E. FUNDED RATIO
CHART 16
Funded Ratio for Plan Years Ending December 31, 2006 - 2015

SECTION 2: Valuation Results for the Sonoma County Employees’ Retirement Association
21
(1) Source: December 31, 2006 Comprehensive Annual Financial Report
CHART 17
Schedule of Funding Progress
(Dollar Amounts in Thousands)
Actuarial Valuation
Date
Valuation Value
of Assets (a)
Actuarial Accrued Liability
(AAL) (b)
Unfunded/ (Overfunded)
AAL (UAAL) (b) - (a)
Funded Ratio
(a) / (b)
Covered Payroll
(c)
UAAL as a Percentage of
Covered Payroll
[(b) - (a)] / (c) 12/31/2006(1) $1,369,669 $1,509,083 $139,414 90.8% $273,548 51.0% 12/31/2007 1,476,496 1,653,847 177,351 89.3% 292,772 60.6% 12/31/2008 1,540,461 1,842,404 301,943 83.6% 334,391 90.3% 12/31/2009 1,564,970 1,967,058 402,088 79.6% 322,484 124.7% 12/31/2010 1,890,874 2,139,460 248,586 88.4% 323,601 76.8% 12/31/2011 1,867,117 2,220,520 353,403 84.1% 308,644 114.5% 12/31/2012 1,856,847 2,351,087 494,240 79.0% 302,764 163.2% 12/31/2013 2,016,781 2,466,224 449,443 81.8% 329,896 136.2% 12/31/2014 2,167,210 2,510,253 343,043 86.3% 324,418 105.7% 12/31/2015 2,289,057 2,694,979 405,922 84.9% 339,518 119.6%

SECTION 2: Valuation Results for the Sonoma County Employees’ Retirement Association
22
Retirement plans are subject to volatility in the level of required contributions. This volatility tends to increase as retirement plans become more mature.
The Asset Volatility Ratio (AVR), which is equal to the market value of assets divided by total payroll, provides an indication of the potential contribution volatility for any given level of investment volatility. A higher AVR indicates that the plan is subject to a greater level of contribution volatility. This is a current measure since it is based on the current level of assets.
For SCERA, the current AVR is about 6.7. This means that a 1% asset gain/(loss) (relative to the assumed investment return) translates to about 6.7% of one-year’s payroll. Since SCERA amortizes actuarial gains and losses over a 20-year period, there would be a 0.5% of payroll decrease/(increase) in the required contribution for each 1% asset gain/(loss). As the plan approaches full funding, we expect the AVR to increase.
The Liability Volatility Ratio (LVR), which is equal to the Actuarial Accrued Liability divided by payroll, provides an indication of the longer-term potential for contribution volatility for any given level of investment volatility. This is because, over an extended period of time, the plan’s assets should track the plan’s liabilities. For example, if a plan is 50% funded on a market value basis, the liability volatility ratio would be double the asset volatility ratio and the plan sponsor should expect contribution volatility to increase over time as the plan becomes better funded.
The LVR also indicates how volatile contributions will be in response to changes in the Actuarial Accrued Liability due to actual experience or to changes in actuarial assumptions.
For SCERA, the current LVR is about 7.9. This is about 18% higher than the AVR. Therefore, we would expect that contribution volatility will increase over the long-term.
F. VOLATILITY RATIOS
CHART 18 Volatility Ratios for Years Ended December 31, 2009 – 2015
Asset Volatility Ratio Liability Volatility Ratio Year Ended December 31 General Safety Total General Safety Total
2009 3.8 4.4 3.9 5.9 6.8 6.1 2010 5.2 6.1 5.4 6.4 7.5 6.6 2011 5.3 6.3 5.5 6.9 8.2 7.2 2012 6.0 7.2 6.3 7.6 8.8 7.9 2013 6.4 7.8 6.7 7.2 8.6 7.5 2014 6.7 8.5 7.1 7.4 9.2 7.7 2015 6.3 8.5 6.7 7.4 10.1 7.9
This chart shows how the asset and liability volatility ratios have varied over time.

SECTION 3: Supplemental Information for the Sonoma County Employees’ Retirement Association
23
EXHIBIT A Table of Plan Coverage i. General Plan A Year Ended December 31
Category 2015 2014 Change From
Prior Year Active members in valuation
Number 2,455 2,626 -6.5% Average age 48.8 48.2 N/A Average service 12.0 11.3 N/A Projected total compensation $208,704,198 $216,555,408 -3.6% Projected average compensation $85,012 $82,466 3.1% Account balances $334,329,250 $318,940,926 4.8% Total active vested members 2,017 2,084 -3.2%
Vested terminated members(1) 735 735 0.0% Retired members
Number in pay status 3,085 3,001 2.8% Average age 69.1 68.8 N/A Average monthly benefit $2,753 $2,708 1.7%
Disabled members Number in pay status 341 350 -2.6% Average age 65.7 65.0 N/A Average monthly benefit $1,745 $1,741 0.2%
Beneficiaries Number in pay status 440 409 7.6% Average age 72.8 72.9 N/A Average monthly benefit $1,184 $1,121 5.6%
(1) Includes members who choose to leave their contributions on deposit even though they have less than five years of service.

SECTION 3: Supplemental Information for the Sonoma County Employees’ Retirement Association
24
EXHIBIT A Table of Plan Coverage ii. General Plan B Year Ended December 31
Category 2015 2014 Change From
Prior Year Active members in valuation
Number 911 585 55.7% Average age 40.0 40.5 N/A Average service 1.4 1.1 N/A Projected total compensation $62,199,997 $39,021,956 59.4% Projected average compensation $68,277 $66,704 2.4% Account balances $8,764,574 $4,001,051 119.1% Total active vested members 10 4 150.0%
Vested terminated members(1) 129 60 115.0% Retired members
Number in pay status 0 0 N/A Average age N/A N/A N/A Average monthly benefit N/A N/A N/A
Disabled members Number in pay status 0 0 N/A Average age N/A N/A N/A Average monthly benefit N/A N/A N/A
Beneficiaries Number in pay status 0 0 N/A Average age N/A N/A N/A Average monthly benefit N/A N/A N/A
(1) Includes members who choose to leave their contributions on deposit even though they have less than five years of service.

SECTION 3: Supplemental Information for the Sonoma County Employees’ Retirement Association
25
EXHIBIT A Table of Plan Coverage iii. Safety Plan A Year Ended December 31
Category 2015 2014 Change From
Prior Year Active members in valuation
Number 615 653 -5.8% Average age 43.7 43.0 N/A Average service 13.1 12.5 N/A Projected total compensation $61,738,252 $64,473,981 -4.2% Projected average compensation $100,387 $98,735 1.7% Account balances $114,902,073 $110,449,194 4.0% Total active vested members 537 563 -4.6%
Vested terminated members(1) 177 174 1.7% Retired members
Number in pay status 428 408 4.9% Average age 64.1 63.6 N/A Average monthly benefit $4,505 $4,446 1.3%
Disabled members Number in pay status 269 256 5.1% Average age 58.4 58.7 N/A Average monthly benefit $3,015 $2,954 2.1%
Beneficiaries Number in pay status 90 82 9.8% Average age 64.3 63.6 N/A Average monthly benefit $1,896 $1,864 1.7%
(1) Includes members who choose to leave their contributions on deposit even though they have less than five years of service.

SECTION 3: Supplemental Information for the Sonoma County Employees’ Retirement Association
26
EXHIBIT A Table of Plan Coverage iv. Safety Plan B Year Ended December 31
Category 2015 2014 Change From
Prior Year Active members in valuation
Number 90 58 55.2% Average age 31.8 33.1 N/A Average service 1.4 0.9 N/A Projected total compensation $6,874,338 $4,367,538 57.4% Projected average compensation $76,382 $75,302 1.4% Account balances $1,298,574 $552,365 135.1% Total active vested members 0 0 0.0%
Vested terminated members(1) 6 6 0.0% Retired members
Number in pay status 0 0 N/A Average age N/A N/A N/A Average monthly benefit N/A N/A N/A
Disabled members Number in pay status 0 0 N/A Average age N/A N/A N/A Average monthly benefit N/A N/A N/A
Beneficiaries Number in pay status 0 0 N/A Average age N/A N/A N/A Average monthly benefit N/A N/A N/A
(1) Includes members who choose to leave their contributions on deposit even though they have less than five years of service.

SECTION 3: Supplemental Information for the Sonoma County Employees’ Retirement Association
27
EXHIBIT B Members in Active Service and Projected Average Compensation as of December 31, 2015 By Age and Years of Service i. General Plan A
Years of Service
Age Total 0-4 5-9 10-14 15-19 20-24 25-29 30-34 35-39 40 & over Under 25 1 1 - - - - - - - - - - - - - - - -
$64,638 $64,638 - - - - - - - - - - - - - - - - 25 - 29 65 54 11 - - - - - - - - - - - - - -
70,938 71,937 $66,033 - - - - - - - - - - - - - - 30 - 34 187 81 88 17 1 - - - - - - - - - -
75,969 78,069 75,798 $68,355 $50,429 - - - - - - - - - - 35 - 39 272 72 115 76 9 - - - - - - - - - -
81,382 84,124 80,715 79,842 80,979 - - - - - - - - - - 40 - 44 319 55 94 107 57 6 - - - - - - - -
85,596 85,211 87,084 85,649 83,404 $85,704 - - - - - - - - 45 - 49 421 67 100 94 105 35 19 1 - - - -
84,442 88,963 81,791 82,167 83,490 91,171 $86,458 $86,598 - - - - 50 - 54 468 54 99 119 93 58 40 5 - - - -
87,786 92,129 84,146 83,758 85,188 99,557 92,136 85,788 - - - - 55 - 59 417 48 74 91 97 43 42 19 3 - -
90,467 96,253 90,137 83,781 89,218 94,562 88,113 108,778 $107,561 - - 60 - 64 228 17 60 59 57 19 13 3 - - - -
85,813 91,239 86,573 83,550 84,180 88,136 93,494 67,423 - - - - 65 - 69 65 7 13 21 19 2 2 - - - - 1
85,135 115,084 69,402 80,784 93,715 64,566 75,670 - - - - $68,436 70 & over 12 1 2 4 3 - - 2 - - - - - -
76,932 97,358 82,832 72,179 68,851 - - 82,447 - - - - - - Total 2,455 457 656 588 441 163 118 28 3 1
$85,012 $85,396 $82,785 $82,694 $85,401 $94,168 $89,496 $99,450 $107,561 $68,436

SECTION 3: Supplemental Information for the Sonoma County Employees’ Retirement Association
28
EXHIBIT B Members in Active Service and Projected Average Compensation as of December 31, 2015 By Age and Years of Service ii. General Plan B
Years of Service
Age Total 0-4 5-9 10-14 15-19 20-24 25-29 30-34 35-39 40 & over Under 25 36 36 - - - - - - - - - - - - - - - -
$54,080 $54,080 - - - - - - - - - - - - - - - - 25 - 29 185 184 1 - - - - - - - - - - - - - -
61,142 61,123 $64,538 - - - - - - - - - - - - - - 30 - 34 154 153 1 - - - - - - - - - - - - - -
65,649 65,873 31,283 - - - - - - - - - - - - - - 35 - 39 147 147 - - - - - - - - - - - - - - - -
71,195 71,195 - - - - - - - - - - - - - - - - 40 - 44 88 87 1 - - - - - - - - - - - - - -
69,949 69,798 83,070 - - - - - - - - - - - - - - 45 - 49 91 91 - - - - - - - - - - - - - - - -
70,843 70,843 - - - - - - - - - - - - - - - - 50 - 54 88 86 2 - - - - - - - - - - - - - -
70,985 71,646 42,581 - - - - - - - - - - - - - - 55 - 59 73 71 2 - - - - - - - - - - - - - -
75,530 76,177 52,565 - - - - - - - - - - - - - - 60 - 64 40 38 1 1 - - - - - - - - - - - -
81,608 82,870 57,395 $57,863 - - - - - - - - - - - - 65 - 69 7 6 1 - - - - - - - - - - - - - -
85,170 90,843 51,137 - - - - - - - - - - - - - - 70 & over 2 2 - - - - - - - - - - - - - - - -
71,574 71,574 - - - - - - - - - - - - - - - - Total 911 901 9 1 - - - - - - - - - - - -
$68,277 $68,440 $53,079 $57,863 - - - - - - - - - - - -

SECTION 3: Supplemental Information for the Sonoma County Employees’ Retirement Association
29
EXHIBIT B Members in Active Service and Projected Average Compensation as of December 31, 2015 By Age and Years of Service iii. Safety Plan A
Years of Service
Age Total 0-4 5-9 10-14 15-19 20-24 25-29 30-34 35 & over Under 25 - - - - - - - - - - - - - - - - - -
- - - - - - - - - - - - - - - - - - 25 - 29 17 15 2 - - - - - - - - - - - -
$87,020 $86,718 $89,285 - - - - - - - - - - - - 30 - 34 89 30 47 11 1 - - - - - - - -
91,114 94,454 88,405 $94,012 $86,389 - - - - - - - - 35 - 39 100 10 43 36 11 - - - - - - - -
93,102 89,503 91,407 93,529 101,600 - - - - - - - - 40 - 44 136 11 25 49 41 10 - - - - - -
101,985 112,175 94,593 105,559 100,305 $98,639 - - - - - - 45 - 49 136 10 12 26 43 35 10 - - - -
105,245 100,885 90,294 100,451 104,398 108,170 $133,410 - - - - 50 - 54 77 3 9 11 27 8 16 3 - -
108,394 92,067 90,036 104,005 102,768 135,010 119,338 $117,168 - - 55 - 59 44 2 14 6 9 5 4 3 1
103,926 123,855 108,937 83,324 105,275 100,613 89,247 124,400 $119,255 60 - 64 14 3 4 2 2 2 1 - - - -
110,093 126,848 116,650 136,947 78,777 89,660 83,394 - - - - 65 - 69 1 - - 1 - - - - - - - - - - - -
109,228 - - 109,228 - - - - - - - - - - - - 70 & over 1 - - 1 - - - - - - - - - - - -
86,689 - - 86,689 - - - - - - - - - - - - Total 615 84 158 141 134 60 31 6 1
$100,387 $97,341 $93,104 $100,023 $102,130 $108,913 $118,835 $120,784 $119,255

SECTION 3: Supplemental Information for the Sonoma County Employees’ Retirement Association
30
EXHIBIT B Members in Active Service and Projected Average Compensation as of December 31, 2015 By Age and Years of Service iv. Safety Plan B
Years of Service
Age Total 0-4 5-9 10-14 15-19 20-24 25-29 30-34 35 & over Under 25 14 14 - - - - - - - - - - - - - -
$70,187 $70,187 - - - - - - - - - - - - - - 25 - 29 39 39 - - - - - - - - - - - - - -
74,227 74,227 - - - - - - - - - - - - - - 30 - 34 22 22 - - - - - - - - - - - - - -
72,496 72,496 - - - - - - - - - - - - - - 35 - 39 2 2 - - - - - - - - - - - - - -
75,193 75,193 - - - - - - - - - - - - - - 40 - 44 1 1 - - - - - - - - - - - - - -
93,195 93,195 - - - - - - - - - - - - - - 45 - 49 2 2 - - - - - - - - - - - - - -
75,437 75,437 - - - - - - - - - - - - - - 50 - 54 6 6 - - - - - - - - - - - - - -
111,995 111,995 - - - - - - - - - - - - - - 55 - 59 3 3 - - - - - - - - - - - - - -
85,096 85,096 - - - - - - - - - - - - - - 60 - 64 1 1 - - - - - - - - - - - - - -
80,221 80,221 - - - - - - - - - - - - - - 65 - 69 - - - - - - - - - - - - - - - - - -
- - - - - - - - - - - - - - - - - - 70 & over - - - - - - - - - - - - - - - - - -
- - - - - - - - - - - - - - - - - - Total 90 90 - - - - - - - - - - - - - -
$76,382 $76,382 - - - - - - - - - - - - - -

SECTION 3: Supplemental Information for the Sonoma County Employees’ Retirement Association
31
EXHIBIT C Reconciliation of Member Data – December 31, 2014 to December 31, 2015
Active
Members
Vested Terminated Members(1)
Disabled Pensioners
Retired Members Beneficiaries Total
Number as of December 31, 2014 3,922 975 606 3,409 491 9,403
New members 467 40(2) N/A N/A N/A 507 Terminations – with vested rights -126 126 N/A N/A N/A 0 Contribution refunds -43 -40 N/A N/A N/A -83 Retirements -142 -38 N/A 180 N/A 0 New disabilities -15 -2 18 -1 N/A 0 Return to work 11 -11 0 0 N/A 0 Died with or without beneficiary -3 -3 -14 -75 39(3) -56 Data adjustments 0 0 0 0 0 0
Number as of December 31, 2015 4,071 1,047 610 3,513 530 9,771
(1) Includes members who choose to leave their contributions on deposit even though they have less than five years of service. (2) Includes members who are included for the first time in this year’s valuation as they were hired and terminated in the 2015 calendar year. (3) This is the net increase in the number of beneficiaries after subtracting the number of beneficiaries who died during the year.

SECTION 3: Supplemental Information for the Sonoma County Employees’ Retirement Association
32
EXHIBIT D Summary Statement of Income and Expenses on an Actuarial Value Basis
Year Ended December 31, 2015 Year Ended December 31, 2014 Contribution income:
Employer contributions $68,239,981 $61,179,319 Employee contributions 38,713,777 37,126,072
Net contribution income $106,953,758 $98,305,391 Investment income:
Interest, dividends and other income $53,531,277 $56,821,792 Recognition of capital appreciation 132,581,481 158,289,584 Less investment fees and administrative expenses -21,855,593 -21,312,110
Net investment income 164,257,165 193,799,266 Total income available for benefits $271,210,923 $292,104,657
Less benefit payments: Service retirement and disability benefits -$147,277,253 -$140,429,773 Member refunds -2,086,976 -1,245,610
Net benefit payments -$149,364,229 -$141,675,383
Change in assets held for future benefits $121,846,694 $150,429,274
Results may be off due to rounding.

SECTION 3: Supplemental Information for the Sonoma County Employees’ Retirement Association
33
EXHIBIT E Summary Statement of Plan Assets
Year Ended December 31, 2015 Year Ended December 31, 2014 Cash equivalents $110,865,919 $160,577,332 Accounts receivable:
Contributions, interest and dividends, and securities sold $21,874,558 $22,284,216 Other receivable 73,448 152,135
Total accounts receivable 21,948,006 22,436,351 Investments:
Domestic and international stocks 1,317,954,822 $1,370,683,219 Domestic bonds 459,049,337 374,923,467 Real estate 400,961,251 382,119,536 Securities lending collateral 83,095,677 113,076,856 Miscellaneous 73,302,486 69,465,441
Total investments at market value 2,334,363,573 2,310,268,519 Total assets $2,467,177,498 $2,493,282,202
Less accounts payable -$185,050,068 -$199,807,507
Net assets at market value $2,282,127,429 $2,293,474,695 Net assets at actuarial value $2,289,056,790 $2,167,210,096 Net assets at valuation value $2,289,056,790 $2,167,210,096
Results may be off due to rounding.

SECTION 3: Supplemental Information for the Sonoma County Employees’ Retirement Association
34
EXHIBIT F Actuarial Balance Sheet
An overview of the Plan’s funding is given by an Actuarial Balance Sheet. In this approach, we first determine the amount and timing of all future payments that are anticipated to be made by the Plan for current participants. We then discount these payments at the valuation interest rate to the date of the valuation, thereby determining their present value. We refer to this present value as the “liability” of the Plan.
Second, we determine how this liability will be met. These actuarial “assets” include the net amount of assets already accumulated by the Plan, the present value of future member contributions, the present value of future employer normal cost contributions, and the present value of future employer amortization payments.
Actuarial Balance Sheet (Dollar Amounts in Thousands)
Assets Basic COLA Total 1 Total valuation assets $2,244,269 $44,788 $2,289,057
2 Present value of future contributions by members(1) $258,904 $0 $258,904
3 Present value of future employer contributions for:
a Entry age normal cost $221,847 $0 $221,847
b Unfunded actuarial accrued liability(1) $405,922 $0 $405,922
4 Total current and future assets $3,130,942 $44,788 $3,175,730
Liabilities
5 Present value of benefits already granted $1,588,859 $44,788 $1,633,647
6 Present value of benefits to be granted $1,542,083 $0 $1,542,083
7 Total liabilities $3,130,942 $44,788 $3,175,730 (1) Before reflecting supplemental contributions payable by certain members for the UAAL.

SECTION 3: Supplemental Information for the Sonoma County Employees’ Retirement Association
35
EXHIBIT G Summary of Reported Reserve Information as of December 31, 2015
Reserves Before True-Up After True-Up Transfer Amount Member reserves (1) General $385,907,674 $385,907,674 $0 Safety 127,535,845 127,535,845 0 Employer reserves (1) General $488,320,286 $443,880,679 $(44,439,607) Safety 210,246,124 189,447,582 (20,798,542) Retired member reserve (1) General $1,148,756,393 $1,193,196,000 $44,439,607 Safety 374,863,458 395,662,000 20,798,542 COLA 43,531,388 44,788,000 1,256,612 Negative contingency reserve (1) (490,104,376) (491,360,990) (1,256,614) Total valuation reserve (1) 2,289,056,792 2,289,056,790 (2) Undistributed reserve (2) 0 0 0 Interest fluctuation reserve (2) 0 0 0 Market stabilization reserve (2) (6,929,363) (6,929,361) 2 Net market value $2,282,127,429 $2,282,127,429 $0
(1) Included in development of valuation value of assets. (2) Not included in development of valuation value of assets.
Results may be off due to rounding.

SECTION 3: Supplemental Information for the Sonoma County Employees’ Retirement Association
36
EXHIBIT H Development of Unfunded Actuarial Accrued Liability for Year Ended December 31, 2015
(Dollar Amounts in Thousands)
1 Unfunded Actuarial Accrued Liability as of December 31, 2014 $343,043 2 Normal Cost 70,337 3 Expected employer and member contributions (100,009) 4 Interest 24,727 5 Expected Unfunded Actuarial Accrued Liability $338,098 6 Actuarial (gains)/losses due to all changes:
Experience (gains)/losses
(a) Investment gain $(3,307)
(b) Greater than expected contributions(1) (3,519)
(c) Lower than expected salary increases (12,829)
(d) Other experience gains (2,546)
(e) Total experience gains and losses (22,201)
7 Assumption changes 93,686
8 County’s additional UAAL payment (3,661)
9 Total changes $67,824
10 Unfunded Actuarial Accrued Liability as of December 31, 2015 $405,922
(1) Includes impact of 18-month delay in rate implementation, phase-in of the impact of the changes in actuarial assumptions on the employer contribution rate and difference between normal cost and UAAL contributions due to actual payroll less than expected during 2015.
Note: Net gain from other experience of $15.4 million (as shown on page 8) is equal to 6(c)+ 6(d).

SECTION 3: Supplemental Information for the Sonoma County Employees’ Retirement Association
37
EXHIBIT I Section 415 Limitations
Section 415 of the Internal Revenue Code (IRC) specifies the maximum benefits that may be paid to an individual from a defined benefit plan and the maximum amounts that may be allocated each year to an individual’s account in a defined contribution plan.
A qualified pension plan may not pay benefits in excess of the Section 415 limits. The ultimate penalty for non-compliance is disqualification: active participants could be taxed on their vested benefits and the IRS may seek to tax the income earned on the plan’s assets.
In particular, Section 415(b) of the IRC limits the maximum annual benefit payable at the Normal Retirement Age to a dollar indexed for inflation. That limit is $210,000 for 2015 and 2016. Normal Retirement Age for these purposes is age 62. These are the limits in simplified terms. They must be adjusted based on each participant’s circumstances, for such things as age at retirement, form of benefits chosen and after tax contributions.
Plan A benefits in excess of the limits may be paid through a qualified governmental excess plan that meets the requirements of Section 415(m).
Legal Counsel’s review and interpretation of the law and regulations should be sought on any questions in this regard.
Plan A contribution rates determined in this valuation have not been reduced for the Section 415 limitations. Actual limitations will result in gains as they occur.

SECTION 3: Supplemental Information for the Sonoma County Employees’ Retirement Association
38
EXHIBIT J Definitions of Pension Terms
The following list defines certain technical terms for the convenience of the reader:
Assumptions or Actuarial Assumptions: The estimates on which the cost of the Plan is calculated including:
(a) Investment return — the rate of investment yield that the Plan will earn over the long-term future;
(b) Mortality rates — the death rates of employees and pensioners; life expectancy is based on these rates;
(c) Retirement rates — the rate or probability of retirement at a given age; and
(d) Turnover rates — the rates at which employees of various ages are expected to leave employment for reasons other than death, disability, or retirement.
Normal Cost: The amount of contributions required to fund the level cost allocated to the current year of service.
Actuarial Accrued Liability For Actives: The equivalent of the accumulated normal costs allocated to the years before the
valuation date.
Actuarial Accrued Liability For Pensioners: The single sum value of lifetime benefits to existing pensioners. This sum takes
account of life expectancies appropriate to the ages of the pensioners and the interest that the sum is expected to earn before it is entirely paid out in benefits.
Unfunded (Overfunded) Actuarial Accrued Liability: The extent to which the actuarial accrued liability of the Plan exceeds (or is exceeded
by) the assets of the Plan. There are many approaches to recognizing the unfunded or overfunded actuarial accrued liability, from meeting the interest accrual only to amortizing it over a specific period of time.

SECTION 3: Supplemental Information for the Sonoma County Employees’ Retirement Association
39
Amortization of the Unfunded (Overfunded) Actuarial Accrued Liability: Payments made over a period of years equal in value to the Plan’s unfunded or
overfunded actuarial accrued liability.
Investment Return: The rate of earnings of the Plan from its investments, including interest, dividends and capital gain and loss adjustments, computed as a percentage of the average value of the fund. For actuarial purposes, the investment return often reflects a smoothing of the market gains and losses to avoid significant swings in the value of assets from one year to the next.

SECTION 4: Reporting Information for the Sonoma County Employees’ Retirement Association
40
EXHIBIT I Summary of Actuarial Valuation Results
The valuation was made with respect to the following data supplied to us: 1. Retired members as of the valuation date (including 530 beneficiaries in pay status) 4,653 2. Members inactive during year ended December 31, 2015 with vested rights(1) 1,047 3. Members active during the year ended December 31, 2015 4,071
The actuarial factors as of the valuation date are as follows (amounts in 000s):
1. Normal cost $72,321 2. Present value of future benefits 3,175,730 3. Present value of future normal costs 480,751 4. Actuarial accrued liability 2,694,979 Retired members and beneficiaries $1,633,647 Inactive members with vested rights 82,020 Active members 979,312 5. Valuation value of assets(2) ($2,282,127 at market value as reported by Retirement Association) 2,289,057 6. Unfunded actuarial accrued liability $405,922 (1) Includes members who choose to leave their contributions on deposit even though they may have less than five years of service. (2) Excludes non-valuation reserves.

SECTION 4: Reporting Information for the Sonoma County Employees’ Retirement Association
41
EXHIBIT I (continued) Summary of Actuarial Valuation Results
The determination of the recommended average employer contribution is as follows (amounts in 000s): Dollar Amount % of Payroll 1. Total normal cost $72,321 21.30% 2. Expected employee normal cost contributions (excluding expected employee supplemental
contributions) 29,214 8.60% 3. Employer normal cost: (1) + (2) $43,107 12.70% 4. Amortization of unfunded actuarial accrued liability (less expected employee supplemental
contributions to reduce the employer’s UAAL) 26,069 7.68% 5. Total recommended average employer contribution: (3) + (4) $69,176 20.38% 6. Projected compensation $339,518

SECTION 4: Reporting Information for the Sonoma County Employees’ Retirement Association
42
EXHIBIT II Schedule of Employer Contributions (Dollar Amounts in Thousands)
Plan Year Ended December 31
Annual Required Contributions
Actual Contributions
Percentage Contributed
2006 $29,391 $29,391 100.0% 2007 34,273 34,273 100.0% 2008 38,553 (1) 38,553 100.0% (1) 2009 47,577 (1) 47,577 100.0% (1) 2010 48,426 (2) 48,426 (3) 100.0% (2) 2011 35,711 (4) 35,711 100.0% (4)
2012 45,079 (2) 45,079 100.0% (2)
2013 51,852 (5) 51,852 100.0% (5)
2014 61,179 (6) 61,179 100.0% (6) 2015 64,687 68,240 105.5%
(1) Determined using an amortization period of about 29 years (an amortization period of up to 30 years was allowed by GASB). (2) Determined using an amortization period of about 26 years (an amortization period of up to 30 years was allowed by GASB). (3) Excludes $289.3 million in proceeds from issuance of Pension Obligation Bonds. (4) Determined using an amortization period of about 23 years (an amortization period of up to 30 years was allowed by GASB). (5) Determined using an amortization period of about 27 years (an amortization period of up to 30 years was allowed by GASB). (6) Determined using an amortization period of about 28 years (an amortization period of up to 30 years was allowed by GASB).
Note: Reference to GASB is under the old Statements 25 and 27.

SECTION 4: Reporting Information for the Sonoma County Employees’ Retirement Association
43
EXHIBIT III Actuarial Assumptions and Actuarial Cost Method
Mortality Rates:
Healthy Retirement: For General Members: Headcount-Weighted RP-2014 Healthy Annuitant Table projected 20 years with the two-dimensional scale MP20142D set back one year for males and set forward one year for females.
For Safety Members: Headcount-Weighted RP-2014 Healthy Annuitant Table projected 20 years with the two-dimensional scale MP20142D set back one year.
Disabled Retirement: Headcount-Weighted RP-2014 Healthy Annuitant Table projected 20 years with the two-dimensional scale MP20142D set forward five years.
For Safety Members: Headcount-Weighted RP-2014 Healthy Annuitant Table projected 20 years with the two-dimensional scale MP20142D set forward four years.
The mortality tables shown above were determined to have a 15% to 20% margin to reflect future mortality improvement, based on a review of the mortality experience in the January 1, 2012 – December 31, 2014 Actuarial Experience Study.
Employee Contribution Rates: For General Members: Headcount-Weighted RP-2014 Healthy Table projected 20 years with the two-dimensional scale MP2014D set back one year for males and set forward one year for females weighted 33.33% male and 66.67% female.
For Safety Members: Headcount-Weighted RP-2014 Healthy Table projected 20 years with the two-dimensional scale MP2014D set back one year weighted 75% male and 25% female.

SECTION 4: Reporting Information for the Sonoma County Employees’ Retirement Association
44
Termination Rates Before Retirement:
Mortality Rates: Rate (%)
General Safety Age Male Female Male Female 30 0.02 0.01 0.02 0.01 35 0.03 0.01 0.03 0.01 40 0.03 0.02 0.03 0.02 45 0.05 0.03 0.05 0.03 50 0.08 0.06 0.08 0.06 55 0.14 0.09 0.14 0.09 60 0.23 0.12 0.23 0.12
All pre-retirement deaths are assumed to be non-service connected deaths.

SECTION 4: Reporting Information for the Sonoma County Employees’ Retirement Association
45
Disability Rates: Rate (%)
Age General(1) Safety(2) 20 0.05 0.06 25 0.05 0.16 30 0.08 0.38 35 0.13 0.65 40 0.18 0.90 45 0.29 1.60 50 0.38 2.30 55 0.43 2.80 60 0.51 0.00
(1) 50% of General disabilities are assumed to be service connected disabilities. The other 50% are assumed to be non-service connected disabilities.
(2) 95% of Safety disabilities are assumed to be service connected disabilities. The other 5% are assumed to be non-service connected disabilities.

SECTION 4: Reporting Information for the Sonoma County Employees’ Retirement Association
46
Withdrawal Rates: Rate (%)
Withdrawal (< 5 Years of Service)
Years of Service General Safety
0 6.0 4.0
1 4.0 2.4
2 3.0 1.6
3 2.5 1.6
4 2.0 1.6
Rate (%)
Withdrawal (5+ Years of Service)
Age General Safety
20 1.50 1.60
25 1.50 1.60
30 1.50 1.26
35 1.05 0.70
40 0.60 0.34
45 0.44 0.14
50 0.34 0.00
55 0.24 0.00
60 0.14 0.00
No withdrawal is assumed after a member is assumed to retire.

SECTION 4: Reporting Information for the Sonoma County Employees’ Retirement Association
47
Vested Termination Rates: Rate (%)
Vested Termination (<5 Years of Service)
Years of Service General Safety
0 6.25 6.00
1 5.50 4.00
2 4.00 4.00
3 3.00 4.00
4 3.00 4.00
Rate (%)
Vested Termination (5+ Years of Service)
Age General Safety
20 3.00 4.00
25 3.00 4.00
30 3.00 3.40
35 3.00 2.10
40 2.40 1.05
45 2.00 0.60
50 2.00 0.00
55 1.70 0.00
60 1.50 0.00
No vested termination is assumed after a member is assumed to retire.

SECTION 4: Reporting Information for the Sonoma County Employees’ Retirement Association
48
Retirement Rates: Rate (%)
General Safety
Age
Plan A Before 30
Years
Plan A 30 or More
Years Plan B
Plan A Before 30
Years
Plan A 30 or More
Years Plan B 50 7.0 10.0 0.0 14.0 10.0 4.0
51 7.0 10.0 0.0 16.0 12.0 5.0
52 7.0 12.0 4.0 16.0 18.0 6.0
53 8.0 16.0 1.5 18.0 25.0 6.0
54 9.0 20.0 2.5 24.0 50.0 8.0
55 10.0 25.0 2.5 30.0 100.0 20.0
56 10.0 30.0 4.5 30.0 100.0 15.0
57 10.0 30.0 5.5 25.0 100.0 15.0
58 15.0 30.0 6.5 25.0 100.0 20.0
59 20.0 40.0 7.5 25.0 100.0 20.0
60 25.0 40.0 8.5 100.0 100.0 100.0
61 25.0 45.0 9.5 100.0 100.0 100.0
62 30.0 45.0 14.5 100.0 100.0 100.0
63 30.0 45.0 16.5 100.0 100.0 100.0
64 30.0 45.0 19.0 100.0 100.0 100.0
65 30.0 45.0 24.0 100.0 100.0 100.0
66 40.0 45.0 20.0 100.0 100.0 100.0
67 40.0 50.0 20.0 100.0 100.0 100.0
68 50.0 50.0 20.0 100.0 100.0 100.0
69 80.0 80.0 20.0 100.0 100.0 100.0
70 100.0 100.0 100.0 100.0 100.0 100.0

SECTION 4: Reporting Information for the Sonoma County Employees’ Retirement Association
49
Retirement Age and Benefit for Deferred Vested Members:
For deferred vested members, we make the following retirement assumption:
General: Age 58
Safety: Age 52
We assumed that 30% of General and 45% of Safety deferred vested members will continue to work for a reciprocal employer. For reciprocals, we assume 4.00% compensation increases per annum.
Future Benefit Accruals: 1.0 year of service per year.
Unknown Data for Members:
Same as those exhibited by members with similar known characteristics. If not specified, members are assumed to be male.
Definition of Active Members:
First day of pay period following employment.
Percent Married: 70% of male members and 55% of female members are assumed to be married at retirement or pre-retirement death.
Age of Spouse: Male retirees are 4 years older than their spouses and Female retirees are 2 years younger than their spouses.
Net Investment Return: 7.25%; net of administration and investment expenses.
Employee Contribution Crediting Rate:
½ of the net investment return credited semi-annually.
Cost-of-Living Adjustment for Retirees:
Not applicable.

SECTION 4: Reporting Information for the Sonoma County Employees’ Retirement Association
50
Salary Scale: Annual Rate of Compensation Increase Inflation: 3.00% per year; plus “Across the Board” salary increases of 0.50% per
year; plus Merit and Promotion increases as follows:
Years of Service General Safety 0 6.00% 8.50% 1 5.00 4.75 2 3.75 3.75 3 2.50 2.75 4 1.50 1.75 5+ 0.50 0.50
Cashouts for General Plan A Court members: The following assumption for a one-time compensation increase at retirement from
vacation, sick leave and holiday cashouts is used:
General members: 4%
Note: For the purposes of calculating member contribution rates, these assumptions are adjusted by a factor of 91% since about 9% of the full costs included above have been determined by SCERA to be from the cashout of sick leave which is excluded from the cashout cost paid by the active members.
Cashouts for Plan A VOM members: The following assumptions for a one-time compensation increase at retirement from
vacation, sick leave and holiday cashouts are used:
General members: 4% Safety members: 6%
Increase in Section 7522.10 Compensation Limit: Increase of 3.00% per year from the valuation date.

SECTION 4: Reporting Information for the Sonoma County Employees’ Retirement Association
51
Actuarial Value of Assets: Market value of assets less unrecognized returns in each of the last five years. Unrecognized return is equal to the difference between the actual market return and the expected return on valuation value and are recognized over a five-year period.
Valuation Value of Assets: The Actuarial Value of Assets reduced by the value of the non-valuation reserves.
Actuarial Cost Method: Entry Age Actuarial Cost Method. Entry Age is the age at the member’s hire date. Actuarial Accrued Liability is calculated on an individual basis and is based on costs allocated as a level percentage of compensation.
Changes in Actuarial Assumptions and Methods: Based on the December 31, 2014 Actuarial Experience Study, the following assumptions
were changed. Previously, these assumtions were as follows:
Mortality Rates:
Healthy Retirement: For General Members – RP-2000 Combined Healthy Mortality Table projected with Scale AA to 2015 set back two years.
For Safety Members – RP-2000 Combined Healthy Mortality Table projected with Scale AA to 2015.
Disabled Retirement: For General Members – RP-2000 Disabled Retiree Mortality Table projected with Scale AA to 2015 set back four years.
For Safety Members – RP-2000 Combined Healthy Mortality Table projected with Scale AA to 2015 set forward six years.
Employee Contribution Rates: For General Members – RP-2000 Combined Healthy Mortality Table projected with Scale AA to 2015 set back two years weighted 30% male and 70% female.
For Safety Members – RP-2000 Combined Healthy Mortality Table projected with Scale AA to 2015 weighted 75% male and 25% female.

SECTION 4: Reporting Information for the Sonoma County Employees’ Retirement Association
52
Changes in Actuarial Assumptions and Methods (continued):
Termination Rates Before Retirement:
Mortality Rates: Rate (%)
General Safety Age Male Female Male Female 30 0.02 0.01 0.02 0.01 35 0.03 0.02 0.04 0.02 40 0.04 0.02 0.05 0.03 45 0.06 0.04 0.06 0.04 50 0.07 0.05 0.08 0.06 55 0.11 0.09 0.14 0.12 60 0.21 0.18 0.26 0.23
All pre-retirement deaths are assumed to be non-service connected deaths.

SECTION 4: Reporting Information for the Sonoma County Employees’ Retirement Association
53
Changes in Actuarial Assumptions and Methods (continued):
Disability Rates: Rate (%)
Age General(1) Safety(2)
20 0.05 0.06
25 0.05 0.16
30 0.06 0.38
35 0.12 0.95
40 0.24 1.40
45 0.33 1.80
50 0.41 2.30
55 0.51 2.80
60 0.70 0.00 (1) 50% of General disabilities are assumed to be service connected disabilities. The other 50%
are assumed to be non-service connected disabilities. (2) 90% of Safety disabilities are assumed to be service connected disabilities. The other 10% are
assumed to be non-service connected disabilities.

SECTION 4: Reporting Information for the Sonoma County Employees’ Retirement Association
54
Changes in Actuarial Assumptions and Methods (continued):
Withdrawal Rates: Rate (%)
Withdrawal (< 5 Years of Service)
Years of Service General Safety
0 7.0 5.0
1 5.0 3.0
2 4.0 2.0
3 3.0 2.0
4 2.5 2.0 Rate (%)
Withdrawal (5+ Years of Service) Age General Safety
20 2.50 2.00
25 2.50 2.00
30 2.20 1.58
35 1.28 0.88
40 0.68 0.42
45 0.48 0.18
50 0.34 0.00
55 0.24 0.00
60 0.14 0.00
No withdrawal is assumed after a member is assumed to retire.

SECTION 4: Reporting Information for the Sonoma County Employees’ Retirement Association
55
Changes in Actuarial Assumptions and Methods (continued):
Vested Termination Rates: Rate (%)
Vested Termination (<5 Years of Service)
Years of Service General Safety
0 6.0 4.0
1 5.0 4.0
2 4.0 4.0
3 3.0 4.0
4 3.0 4.0
Rate (%)
Vested Termination (5+ Years of Service)
Age General Safety
20 3.00 2.00
25 3.00 2.00
30 3.00 2.00
35 3.00 1.40
40 2.40 0.94
45 1.85 0.84
50 1.60 0.00
55 1.05 0.00
60 0.75 0.00
No vested termination is assumed after a member is assumed to retire.

SECTION 4: Reporting Information for the Sonoma County Employees’ Retirement Association
56
Changes in Actuarial Assumptions and Methods (continued):
Retirement Rates: Rate (%)
General Safety
Age Plan A
Before 30 Years Plan A
30 or More Years Plan A
Before 30 Years 50 7.0 10.0 10.0 51 7.0 10.0 12.0 52 7.0 12.0 18.0 53 8.0 14.0 19.0 54 9.0 15.0 20.0 55 9.0 20.0 25.0 56 10.0 22.0 25.0 57 13.0 22.0 25.0 58 15.0 25.0 25.0 59 17.0 35.0 25.0 60 21.0 45.0 100.0 61 25.0 45.0 100.0 62 40.0 45.0 100.0 63 35.0 45.0 100.0 64 35.0 45.0 100.0 65 35.0 45.0 100.0 66 35.0 45.0 100.0 67 40.0 50.0 100.0 68 50.0 50.0 100.0 69 80.0 80.0 100.0 70 100.0 100.0 100.0

SECTION 4: Reporting Information for the Sonoma County Employees’ Retirement Association
57
Changes in Actuarial Assumptions and Methods (continued):
Retirement Age and Benefit for Deferred Vested Members:
For deferred vested members, we make the following retirement assumption:
General: Age 58
Safety: Age 53
We assumed that 30% of General and 45% of Safety deferred vested members will continue to work for a reciprocal employer. For reciprocals, we assume 4.00% compensation increases per annum.
Percent Married: 75% of male members and 55% of female members are assumed to be married at retirement or pre-retirement death.
Age of Spouse: Females (or male) spouses are 3 years younger (older) than their spouses.
Net Investment Return: 7.50%; net of administration and investment expenses.
Salary Scale: Annual Rate of Compensation Increase Inflation: 3.25% per year; plus “Across the Board” salary increases of 0.75% per
year; plus Merit and Promotion increases as follows:
Years of Service General Safety 0 6.00% 8.50% 1 5.00 4.75 2 3.75 3.75 3 2.50 2.75 4 1.50 1.75 5+ 0.50 0.50

SECTION 4: Reporting Information for the Sonoma County Employees’ Retirement Association
58
Changes in Actuarial Assumptions and Methods (continued):
Increase in Section 7522.10 Compensation Limit: Increase of 3.25% per year from the valuation date.

SECTION 4: Reporting Information for the Sonoma County Employees’ Retirement Association
59
EXHIBIT IV Summary of Plan Provisions
This exhibit summarizes the major provisions of the SCERA included in the valuation. It is not intended to be, nor should it be interpreted as, a complete statement of all plan provisions.
Membership Eligibility: All permanent employees of the County of Sonoma or contracting district, scheduled to work at least 50% of a full-time position are eligible to become a member of the Retirement Association.
Plan A All General and Safety members with membership dates before January 1, 2013. Plan B All General and Safety members with membership dates on or after January 1, 2013.
Final Compensation for Benefit Determination:
Plan A Highest consecutive one year of compensation earnable (§31462.1)(FAC1). Plan B Highest consecutive three years of pensionable compensation (§7522.10(c), §7522.32
and §7522.34)(FAC3).
Service: Years of service (Yrs).
Service Retirement Eligibility: General Plan A Age 50 with 10 years of service credit, or age 70 regardless of service credit, or after
30 years of service credit, regardless of age (§31672). Plan B Age 52 with 5 years of service credit (§7522.20(a)). Safety Plan A Age 50 with 10 years of service credit, or age 70 regardless of service credit, or after
30 years of service credit, regardless of age (§31672). Plan B Age 50 with 5 years of service credit (§7522.25(d)).

SECTION 4: Reporting Information for the Sonoma County Employees’ Retirement Association
60
Benefit Formula:
Retirement Age
Benefit Formula General Plan A – County (§31676.17) 50 (2.00%xFAC1 – 1/3x2.00%x$350 x 12)xYrs 55 (2.50%xFAC1 – 1/3x2.50%x$350 x 12)xYrs 60 or later (3.00%xFAC1 – 1/3x3.00%x$350 x 12)xYrs General Plan A – Court (§31676.17) 50 (2.00%xFAC1 – 1/3x2.00%x$350 x 12)xYrs 55 (2.50%xFAC1 – 1/3x2.50%x$350 x 12)xYrs 60 or later (3.00%xFAC1 – 1/3x3.00%x$350 x 12)xYrs General Plan A – Valley of the Moon 50 2.00%xFAC1xYrs (§31676.17) 55 2.50%xFAC1xYrs 60 or later 3.00%xFAC1xYrs General Plan B (§7522.20(a)) 52 1.00%xFAC3xYrs 55 1.30%xFAC3xYrs 60 1.80%xFAC3xYrs 62 2.00%xFAC3xYrs 65 2.30%xFAC3xYrs 67 or later 2.50%xFAC3xYrs

SECTION 4: Reporting Information for the Sonoma County Employees’ Retirement Association
61
Retirement Age Benefit Formula Safety Plan A – County (§31664.1) 50 (3.00%xFAC1 – 1/3x3.00%x$350x12)xYrs 55 (3.00%xFAC1 – 1/3x3.00%x$350x12)xYrs 60 or later (3.00%xFAC1 – 1/3x3.00%x$350x12)xYrs Safety Plan A – Valley of the Moon 50 3.00%xFAC1xYrs (§31664.1) 55 3.00%xFAC1xYrs 60 or later 3.00%xFAC1xYrs Safety Plan B (§7522.25(d)) 50 2.00%xFAC3xYrs 55 2.50%xFAC3xYrs 57 or later 2.70%xFAC3xYrs
Maximum Benefit:
Plan A 100% of Final Average Compensation (§31676.17, §31664.1) Plan B None

SECTION 4: Reporting Information for the Sonoma County Employees’ Retirement Association
62
Non Service Connected Disability: General Plan A Members Eligibility Five years of service (§31720). Benefit Formula 1.8% of FAC per year of service. If the benefit does not exceed one-third of Final
Average Compensation, the service is projected to 62, and the total benefit cannot be more than one-third of Final Average Compensation (§31727.1). The Service Retirement benefit is payable, if greater.
Safety Plan A Members Eligibility Five years of service (§31720). Benefit Formula 1.8% of FAC per year of service. If the benefit does not exceed one-third of Final
Average Compensation, the service is projected to 55, and the total benefit cannot be more than one-third of Final Average Compensation (§31727.2). The Service Retirement benefit is payable, if greater.
All Plan B Members Eligibility Five years of service (§31720). Benefit Formula 1.5% of FAC per year of service. If the benefit does not exceed one-third of Final
Average Compensation, the service is projected to 65, and the total benefit cannot be more than one-third of Final Average Compensation (§31727). The Service Retirement benefit is payable, if greater.
Service Connected Disability: All Members Eligibility No age or service requirements (§31720). Benefit Formula 50% of the Final Average Compensation or 100% of Service Retirement benefit, if
larger (§31727.4).

SECTION 4: Reporting Information for the Sonoma County Employees’ Retirement Association
63
Pre-Retirement Death: All Members Eligibility None. Basic lump sum benefit Refund of employee contributions with interest, plus one month’s compensation for
each year of service, to a maximum of six months’ compensation (§37181). Service Connected Death 50% of Final Compensation or 100% of Service Retirement benefit, if greater,
payable to spouse or registered domestic partner (§31787). OR Vested Members Eligibility Five years of service. Basic benefit 60% of the greater of Service or Non Service Connected Disability Retirement benefit
payable to surviving eligible spouse or registered domestic partner (§31765.1, §31781.1), in lieu of the basic lump sum benefit above.
Service Connected Death 50% of Final Compensation or 100% of Service Retirement benefit, if greater, payable to spouse or registered domestic partner (§31787).
Death After Retirement: All Members Service or Non Service Connected Disability Retirement 60% of member’s unmodified allowance continued to eligible spouse or registered
domestic partner (§31760.1). Service Connected Disability Retirement 100% of member’s unmodified allowance continued to eligible spouse or registered domestic partner (§31786).

SECTION 4: Reporting Information for the Sonoma County Employees’ Retirement Association
64
Withdrawal Benefits:
Less than Five Years of Service Refund of accumulated employee contributions with interest, or earned benefit at age 70 (§31628). A member may also elect to leave contributions on deposit in the retirement fund (§31629.5).
Five or More Years Service If contributions left on deposit, eligible for retirement benefits at any time after meeting eligibility criteria to retire (§31700).
Employer Contributions: The amortization period for the outstanding balance of the December 31, 2007 Unfunded Actuarial Accrued Liability as well as for UAAL established on each subsequent valuation as a result of actuarial gains or losses and changes in actuarial assumptions is amortized over a declining 20-year period. The amortization period for UAAL established as a result of including as pensionable salary a cash allowance is amortized over a declining 20-year period with 12 years remaining as of December 31, 2014.
Member Contributions: Please refer to Appendix A for the specific rates.
General Plan A Provide for an average annuity at age 55 equal to 1/100 of FAC. (§31621.8)
General Plan B 50% of the total Normal Cost rate.
Safety Plan A Provide for an average annuity at age 50 equal to 1/100 of FAC. (§31639.25)
Safety Plan B 50% of the total Normal Cost rate.
Additional Contributions General – County and Courts An additional amount equal to 3.03% of payroll will be paid from July 1, 2004 to
June 30, 2024. Safety – County An additional amount equal to 3.00% of payroll will be paid effective February 1,
2005.

SECTION 4: Reporting Information for the Sonoma County Employees’ Retirement Association
65
Other Information: Safety Plan A members with 30 or more years of service are exempt from paying member contributions. The same applies for General Plan A members hired on or before March 7, 1973.
NOTE: The summary of major plan provisions is designed to outline principle plan benefits as interpreted for purposes of the actuarial valuation. If the Association should find the plan summary not in accordance with the actual provisions, the Association should alert the actuary so they can both be sure the proper provisions are valued.

SECTION 4: Reporting Information for the Sonoma County Employees’ Retirement Association
66
Appendix A Member Contribution Rates
Comparison of Total Member Rate(1) from December 31, 2015 (New) and December 31, 2014 (Current) Valuations General Plan A – County(2) Safety Plan A – County(4)
Entry Age Current New Change Entry Age Current New Change 25 7.49% 7.32% (0.17%) 25 8.32% 8.30% (0.02%) 35 8.81% 8.75% (0.06%) 35 9.80% 9.92% 0.12% 45 10.42% 10.49% 0.07% 45 11.80% 12.11% 0.31%
General Plan A – Court(2) Safety Plan A – VOM Entry Age Current New Change Entry Age Current New Change
25 7.75% 7.58% (0.17%) 25 8.76% 8.78% 0.02% 35 9.12% 9.05% (0.07%) 35 10.31% 10.48% 0.17% 45 10.77% 10.84% 0.07% 45 12.31% 12.68% 0.37%
General Plan A – VOM Safety Plan B – County(4) Entry Age Current New Change Entry Age Current New Change
25 7.75% 7.60% (0.15%) Any(3) 11.98% 11.36% (0.62%) 35 9.12% 9.08% (0.04%) 45 10.77% 10.87% 0.10%
General Plan B(2) Safety Plan B – VOM Entry Age Current New Change Entry Age Current New Change
Any(3) 7.37% 7.40% 0.03% Any(3) 10.36% 10.04% (0.32%) (1) For Plan A integrated members, contributions for the first $350 of monthly payroll are based on 2/3 of the above rates. (2) Rates exclude an additional 3.03% of payroll payable from July 1, 2004 to June 30, 2024 for County and Court members only. (3) Plan B member rates are independent of entry age. (4) Rates exclude an additional 3.00% of payroll payable effective February 1, 2005 for County members only.
Note: The change in member rates for Plan A members is due to the mortality, interest, and wage growth assumptions adopted by the Board for the December 31, 2015 valuation. While the change in mortality and interest assumptions both increase the member rates at all ages, this increase is more than offset at the younger ages and only partially offset at the older ages, by the change in wage growth assumption.

SECTION 4: Reporting Information for the Sonoma County Employees’ Retirement Association
67
Appendix A Member Contribution Rates (continued)
General Members’ Contribution Rates from the December 31, 2015 Actuarial Valuation (As a Percentage of Monthly Payroll)
Plan A – County Plan A – Court Plan A – VOM Entry Age First
$350* Over $350 Entry
Age First $350* Over
$350 Entry
Age First $350* Over
$350 16 4.14% 6.20% 16 4.28% 6.43% 16 4.30% 6.45% 17 4.21% 6.32% 17 4.36% 6.55% 17 4.38% 6.57% 18 4.29% 6.44% 18 4.45% 6.67% 18 4.46% 6.69% 19 4.37% 6.56% 19 4.53% 6.79% 19 4.54% 6.82% 20 4.45% 6.68% 20 4.61% 6.92% 20 4.63% 6.94% 21 4.54% 6.80% 21 4.70% 7.05% 21 4.71% 7.07% 22 4.62% 6.93% 22 4.78% 7.18% 22 4.80% 7.20% 23 4.70% 7.06% 23 4.87% 7.31% 23 4.89% 7.33% 24 4.79% 7.18% 24 4.96% 7.44% 24 4.98% 7.47% 25 4.88% 7.32% 25 5.05% 7.58% 25 5.07% 7.60% 26 4.97% 7.45% 26 5.14% 7.71% 26 5.16% 7.74% 27 5.06% 7.58% 27 5.24% 7.85% 27 5.25% 7.88% 28 5.15% 7.72% 28 5.33% 7.99% 28 5.35% 8.02% 29 5.24% 7.86% 29 5.43% 8.14% 29 5.44% 8.17% 30 5.33% 8.00% 30 5.52% 8.28% 30 5.54% 8.31% 31 5.43% 8.15% 31 5.62% 8.43% 31 5.64% 8.46% 32 5.53% 8.29% 32 5.72% 8.58% 32 5.74% 8.61% 33 5.63% 8.44% 33 5.82% 8.74% 33 5.84% 8.77% 34 5.73% 8.59% 34 5.93% 8.89% 34 5.95% 8.92% 35 5.83% 8.75% 35 6.03% 9.05% 35 6.05% 9.08% 36 5.93% 8.90% 36 6.14% 9.21% 36 6.16% 9.24% 37 6.04% 9.06% 37 6.25% 9.38% 37 6.27% 9.41% 38 6.15% 9.22% 38 6.36% 9.54% 38 6.38% 9.58% 39 6.26% 9.39% 39 6.48% 9.71% 39 6.50% 9.75% 40 6.37% 9.56% 40 6.59% 9.89% 40 6.61% 9.92%

SECTION 4: Reporting Information for the Sonoma County Employees’ Retirement Association
68
Appendix A Member Contribution Rates (continued)
General Members’ Contribution Rates from the December 31, 2015 Actuarial Valuation (As a Percentage of Monthly Payroll)
Plan A – County Plan A – Court Plan A – VOM Entry Age First
$350* Over $350 Entry
Age First $350* Over
$350 Entry
Age First $350* Over
$350 41 6.49% 9.73% 41 6.71% 10.07% 41 6.73% 10.10% 42 6.61% 9.91% 42 6.83% 10.25% 42 6.86% 10.28% 43 6.73% 10.10% 43 6.96% 10.44% 43 6.98% 10.47% 44 6.86% 10.29% 44 7.09% 10.63% 44 7.11% 10.67% 45 6.99% 10.49% 45 7.22% 10.84% 45 7.25% 10.87% 46 7.13% 10.70% 46 7.37% 11.05% 46 7.39% 11.08% 47 7.28% 10.92% 47 7.51% 11.27% 47 7.54% 11.31% 48 7.44% 11.16% 48 7.68% 11.51% 48 7.70% 11.55% 49 7.62% 11.44% 49 7.85% 11.78% 49 7.88% 11.82% 50 7.76% 11.64% 50 7.98% 11.97% 50 8.00% 12.01% 51 7.85% 11.77% 51 8.06% 12.09% 51 8.08% 12.12% 52 7.88% 11.82% 52 8.07% 12.10% 52 8.08% 12.13% 53 7.84% 11.77% 53 7.98% 11.97% 53 8.00% 11.99%
54 & Over 7.76% 11.65% 54 &
Over 7.76% 11.65% 54 &
Over
7.76%
11.65% Interest: 7.25% COLA: 0.00% Mortality: Headcount-Weighted RP-2014 Healthy Table projected 20 years with the two-dimensional scale MP2014D set back
one year for males and set forward one year for females weighted 33.33% male and 66.67% female.
Salary Increase: Inflation (3.00%) + Across the board increase (0.50%) + Merit (see Exhibit III)
Note: The above rates exclude an additional 3.03% of payroll payable from July 1, 2004 to June 30, 2024 for County and Court members only.
* For integrated members only.

SECTION 4: Reporting Information for the Sonoma County Employees’ Retirement Association
69
Appendix A Member Contribution Rates (continued)
General Members’ Contribution Rates from the December 31, 2015 Actuarial Valuation (As a Percentage of Monthly Payroll)
Plan B All Eligible Pay* All Members 7.40%
Interest: 7.25%
COLA: 0.00%
Mortality: Headcount-Weighted RP-2014 Healthy Table projected 20 years with the two-dimensional scale MP2014D set back one year for males and set forward one year for females weighted 33.33% male and 66.67% female.
Salary Increase: Inflation (3.00%) + Across the board increase (0.50%) + Merit (see Exhibit III)
Note: The above rates exclude an additional 3.03% of payroll payable from July 1, 2004 to June 30, 2024 for County and Court members only.
* It is our understanding that in the determination of pension benefits under the CalPEPRA formulas, the maximum compensation that can be taken into account for 2016 is equal to $117,020. (For an employer that is not enrolled in Social Security, the maximum amount is $140,424). (reference: Section 7522.10). These amounts should be adjusted for changes to the Consumer Price Index for All Urban Consumers after 2016. (reference: Section 7522.10(d)).

SECTION 4: Reporting Information for the Sonoma County Employees’ Retirement Association
70
Appendix A Member Contribution Rates (continued)
Safety Members’ Contribution Rates from the December 31, 2015 Actuarial Valuation (As a Percentage of Monthly Payroll)
Plan A – County Plan A – VOM Entry Age First $350* Over $350 Entry Age First $350* Over $350
16 4.70% 7.05% 16 4.98% 7.47% 17 4.79% 7.18% 17 5.07% 7.60% 18 4.87% 7.31% 18 5.16% 7.74% 19 4.96% 7.45% 19 5.26% 7.88% 20 5.05% 7.58% 20 5.35% 8.03% 21 5.15% 7.72% 21 5.45% 8.17% 22 5.24% 7.86% 22 5.55% 8.32% 23 5.34% 8.00% 23 5.65% 8.47% 24 5.43% 8.15% 24 5.75% 8.62% 25 5.53% 8.30% 25 5.85% 8.78% 26 5.63% 8.45% 26 5.96% 8.94% 27 5.73% 8.60% 27 6.06% 9.10% 28 5.83% 8.75% 28 6.17% 9.26% 29 5.94% 8.91% 29 6.28% 9.42% 30 6.05% 9.07% 30 6.39% 9.59% 31 6.16% 9.23% 31 6.51% 9.76% 32 6.27% 9.40% 32 6.63% 9.94% 33 6.38% 9.57% 33 6.74% 10.12% 34 6.50% 9.74% 34 6.86% 10.30% 35 6.61% 9.92% 35 6.99% 10.48% 36 6.74% 10.10% 36 7.11% 10.67% 37 6.86% 10.29% 37 7.24% 10.87% 38 6.99% 10.49% 38 7.38% 11.07% 39 7.12% 10.69% 39 7.52% 11.27% 40 7.26% 10.90% 40 7.66% 11.49%

SECTION 4: Reporting Information for the Sonoma County Employees’ Retirement Association
71
Appendix A Member Contribution Rates (continued)
Safety Members’ Contribution Rates from the December 31, 2015 Actuarial Valuation (As a Percentage of Monthly Payroll)
Plan A – County Plan A – VOM Entry Age First $350* Over $350 Entry Age First $350* Over $350
41 7.41% 11.12% 41 7.81% 11.71% 42 7.57% 11.36% 42 7.97% 11.95% 43 7.74% 11.62% 43 8.14% 12.21% 44 7.94% 11.91% 44 8.33% 12.50% 45 8.07% 12.11% 45 8.45% 12.68% 46 8.16% 12.24% 46 8.52% 12.77% 47 8.20% 12.30% 47 8.52% 12.78% 48 8.21% 12.31% 48 8.44% 12.66%
49 & Over 8.03% 12.05% 49 & Over 8.03% 12.05%
Interest: 7.25%
COLA: 0.00%
Mortality: Headcount-Weighted RP-2014 Healthy Table projected 20 years with the two-dimensional scale MP2014D set back one year weighted 75% male and 25% female.
Salary Increase: Inflation (3.00%) + Across the board increase (0.50%) + Merit (see Exhibit III)
Note: The above rates exclude an additional 3.00% of payroll payable effective February 1, 2005 for County members only.
* For integrated members only.

SECTION 4: Reporting Information for the Sonoma County Employees’ Retirement Association
72
Appendix A Member Contribution Rates (continued)
Safety Members’ Contribution Rates from the December 31, 2015 Actuarial Valuation (As a Percentage of Monthly Payroll)
Plan B – County Plan B – VOM All Eligible Pay* All Eligible Pay*
All Members 11.36% All Members 10.04%
Interest: 7.25%
COLA: 0.00%
Mortality: Headcount-Weighted RP-2014 Healthy Table projected 20 years with the two-dimensional scale MP2014D set back one year weighted 75% male and 25% female.
Salary Increase: Inflation (3.00%) + Across the board increase (0.50%) + Merit (see Exhibit III)
Note: The above rates exclude an additional 3.00% of payroll payable effective February 1, 2005 for County members only.
* It is our understanding that in the determination of pension benefits under the CalPEPRA formulas, the maximum compensation that can be taken into account for 2016 is equal to $117,020. (For an employer that is not enrolled in Social Security, the maximum amount is $140,424). (reference: Section 7522.10). These amounts should be adjusted for changes to the Consumer Price Index for All Urban Consumers after 2016. (reference: Section 7522.10(d)).

SECTION 4: Reporting Information for the Sonoma County Employees’ Retirement Association
73
Appendix B Schedule of Additional (non-SCERA) Employer Contributions
As requested by SCERA, we have provided the following additional employer contributions made by the employer to other outside parties. These rates are provided by the employer and we have not audited them against any other sources.
The County’s total contributions toward retirement benefits include the contributions shown in this report which are paid to SCERA, along with payments to holders of Pension Obligation Bonds issued by the County in 1993, 2003 and 2010. The 1993 Pension Obligation Bond was paid-off in 2012/2013; therefore, the rates for 2013/2014 and later include only the payments for the 2003 and 2010 Pension Obligation Bonds. According to information supplied by the County, these contributions are projected to be made at the following percentage of covered payroll:
Pension Obligation Bonds Fiscal Year Rate as % of Payroll
2007/2008 8.31% 2008/2009 8.11% 2009/2010 8.15% 2010/2011 15.55% 2011/2012 General – 15.43%
Safety – 16.83% 2012/2013 General – 15.95%
Safety – 17.80% 2013/2014 General – 13.69%
Safety – 13.88% 2014/2015 General – 13.83%
Safety – 14.01% 2015/2016 General – 13.28%
Safety – 14.40% 2016/2017 Not Yet Available 2017/2018 Not Yet Available

SECTION 4: Reporting Information for the Sonoma County Employees’ Retirement Association
74
Appendix C Average Employer Contribution Rates
The following chart displays the historical average employer contribution rates, broken down by normal cost and unfunded actuarial accrued liability. These rates have not been adjusted for any contribution rate phase-in (if applicable).
0.00%
5.00%
10.00%
15.00%
20.00%
25.00%
13-14 14-15 15-16 16-17 17-18
Perc
ent-
of-P
ayro
ll C
ontr
ibut
ion
Fiscal Year
Weighted Average Employer Contribution Rate for All Groups
Normal Cost Unfunded Actuarial Accrued Liability

SECTION 4: Reporting Information for the Sonoma County Employees’ Retirement Association
75
Appendix D Reserves
The following chart displays the 5-year historical reserves balance after “true-up”.
-600
-300
0
300
600
900
1,200
1,500
1,800
2,100
2,400
2,700
3,000
2011 2012 2013 2014 2015
(Exp
ress
ed in
mill
ions
)
Year End December 31
Five Year Comparison of Reserves Submitted for the December 31, 2014 Valuation
(in millions)
Member, County and Retired Reserve Undistributed Reserve COLA ReserveMarket Stabilization Reserve Negative Contingency Reserve

SECTION 4: Reporting Information for the Sonoma County Employees’ Retirement Association
76
Appendix E Amortization Schedule for UAAL (Dollar Amounts in Thousands)
Date Established Source Initial
Amount Outstanding
Balance Years
Remaining Annual
Payment(3) General December 31, 2007 Restart amortization - County $123,396 $33,004 (2)(4) 13 $3,236 December 31, 2007 Restart amortization - Court 8,599 8,174 13 801 December 31, 2007(1) Cash Allowance - County 55,982 14,812 (2)(4) 12 1,547 December 31, 2008 Actuarial loss - County 44,591 12,060 (2)(4) 13 1,182 December 31, 2008 Actuarial loss - Court 3,107 2,986 13 293 December 31, 2009(1) Early Retirement Option - County 1,448 398 (2)(4) 14 37 December 31, 2009 Actuarial loss - County 45,691 12,561 (2)(4) 14 1,162 December 31, 2009 Actuarial loss - Court 2,859 2,793 14 258 December 31, 2009 Actuarial loss - VOM 13 13 14 1 December 31, 2009 Assumption changes - County 10,990 3,021 (2)(4) 14 280 December 31, 2009 Assumption changes - Court 688 672 14 62 December 31, 2009 Assumption changes - VOM 3 3 14 0 December 31, 2010 Actuarial loss - County 48,235 47,177 (4) 15 4,142 December 31, 2010 Actuarial loss - Court 3,044 3,008 15 264 December 31, 2010 Actuarial loss - VOM 14 14 15 1 December 31, 2010 Assumption changes - County 37,393 36,572 (4) 15 3,211 December 31, 2010 Assumption changes - Court 2,360 2,332 15 205 December 31, 2010 Assumption changes - VOM 11 11 15 1 December 31, 2011 Actuarial loss - County 74,087 73,028 (4) 16 6,108 December 31, 2011 Actuarial loss - Court 4,760 4,740 16 396 December 31, 2011 Actuarial loss - VOM 23 23 16 2 December 31, 2012 Actuarial loss - County 71,616 70,874 (4) 17 5,670 December 31, 2012 Actuarial loss - Court 4,188 4,188 17 335 December 31, 2012 Actuarial loss - VOM 99 100 17 8 December 31, 2012 Assumption changes - County 64,345 63,678 (4) 17 5,094 December 31, 2012 Assumption changes - Court 3,763 3,762 17 301 December 31, 2012 Assumption changes - VOM 89 90 17 7 December 31, 2012 Compensation earnable change - County (8,157) (8,072)(4) 17 (646) December 31, 2012 Compensation earnable change - Court (477) (477) 17 (38) December 31, 2012 Compensation earnable change - VOM (11) (11) 17 (1) December 31, 2012 Cashout change - County (20,626) (20,413)(4) 17 (1,633) (1) Payment is only made by the County and not by the Court or Valley of the Moon because the programs were only available to County employees. (2) Adjusted to reflect $289.3 million in proceeds from issuance of Pension Obligation Bonds by the County. (3) Before adjustments for supplemental contributions paid by certain employees to reduce the employer’s UAAL. (4) Adjusted to reflect $3.7 million from an additional UAAL payment by the County.
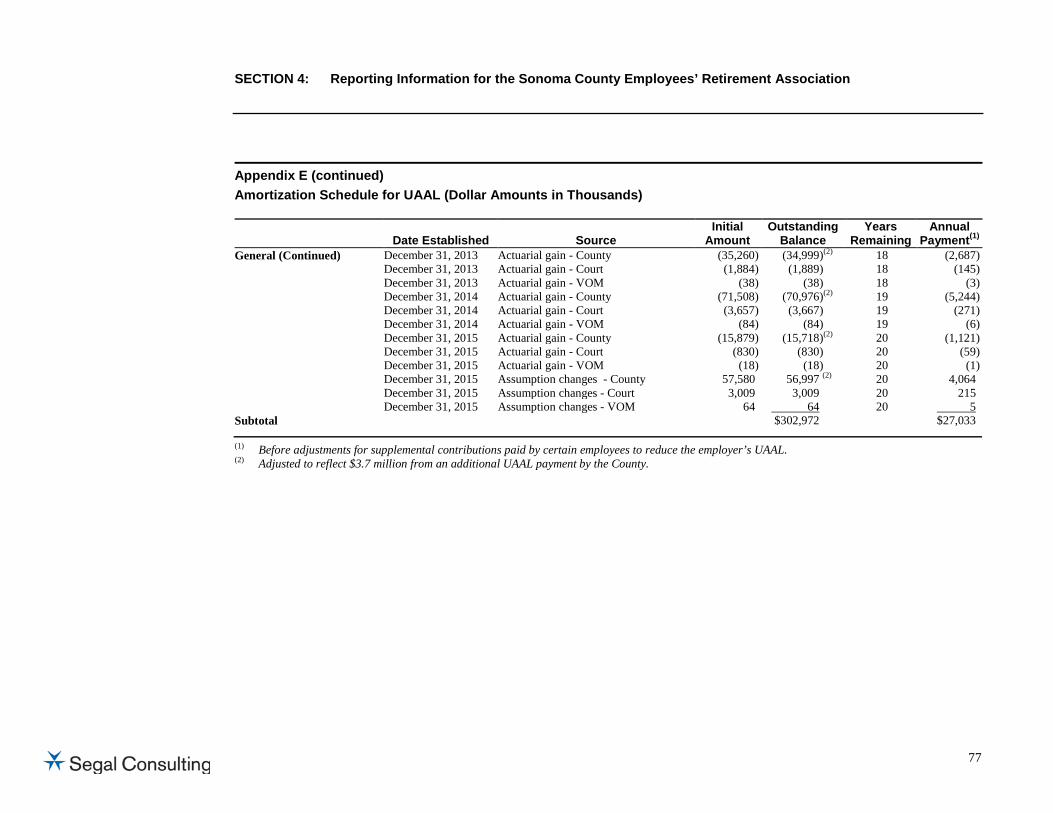
SECTION 4: Reporting Information for the Sonoma County Employees’ Retirement Association
77
Appendix E (continued) Amortization Schedule for UAAL (Dollar Amounts in Thousands)
Date Established Source Initial
Amount Outstanding
Balance Years
Remaining Annual
Payment(1) General (Continued) December 31, 2013 Actuarial gain - County (35,260) (34,999)(2) 18 (2,687) December 31, 2013 Actuarial gain - Court (1,884) (1,889) 18 (145) December 31, 2013 Actuarial gain - VOM (38) (38) 18 (3) December 31, 2014 Actuarial gain - County (71,508) (70,976)(2) 19 (5,244) December 31, 2014 Actuarial gain - Court (3,657) (3,667) 19 (271) December 31, 2014 Actuarial gain - VOM (84) (84) 19 (6) December 31, 2015 Actuarial gain - County (15,879) (15,718)(2) 20 (1,121) December 31, 2015 Actuarial gain - Court (830) (830) 20 (59) December 31, 2015 Actuarial gain - VOM (18) (18) 20 (1) December 31, 2015 Assumption changes - County 57,580 56,997 (2) 20 4,064 December 31, 2015 Assumption changes - Court 3,009 3,009 20 215 December 31, 2015 Assumption changes - VOM 64 64 20 5 Subtotal $302,972 $27,033
(1) Before adjustments for supplemental contributions paid by certain employees to reduce the employer’s UAAL. (2) Adjusted to reflect $3.7 million from an additional UAAL payment by the County.

SECTION 4: Reporting Information for the Sonoma County Employees’ Retirement Association
78
Appendix E (continued) Amortization Schedule for UAAL (Dollar Amounts in Thousands)
Date Established Source Initial
Amount Outstanding
Balance Years
Remaining Annual
Payment(3) Safety – County December 31, 2007 Restart amortization $43,504 $11,652 (2)(4) 13 $1,142 December 31, 2007(1) Cash Allowance 14,693 3,893 (2)(4) 12 407 December 31, 2008 Actuarial loss 7,603 2,059 (2)(4) 13 202 December 31, 2009 Actuarial loss 28,643 7,884 (2)(4) 14 730 December 31, 2009 Assumption changes 7,337 2,021 (2)(4) 14 187 December 31, 2010 Actuarial loss 14,765 14,461 (4) 15 1,269 December 31, 2010 Assumption changes 14,376 14,080 (4) 15 1,236 December 31, 2011 Actuarial loss 24,746 24,426 (4) 16 2,043 December 31, 2012 Actuarial loss 26,012 25,777 (4) 17 2,062 December 31, 2012 Assumption changes 12,268 12,156 (4) 17 972 December 31, 2012 Compensation earnable change (2,613) (2,589)(4) 17 (207) December 31, 2012 Cashout change (11,987) (11,879)(4) 17 (950) December 31, 2013 Actuarial gain (6,051) (6,014)(4) 18 (462) December 31, 2014 Actuarial gain (26,652) (26,490)(4) 19 (1,957) December 31, 2015 Actuarial gain (5,153) (5,108)(4) 20 (364) December 31, 2015 Assumption changes 31,096 30,823 (4) 20 2,198 Subtotal $97,152 $8,508
(1) Payment is only made by the County and not by the Court or Valley of the Moon because the programs were only available to County employees. (2) Adjusted to reflect $289.3 million in proceeds from issuance of Pension Obligation Bonds by the County. (3) Before adjustments for supplemental contributions paid by certain employees to reduce the employer’s UAAL. (4) Adjusted to reflect $3.7 million from an additional UAAL payment by the County.

SECTION 4: Reporting Information for the Sonoma County Employees’ Retirement Association
79
Appendix E (continued) Amortization Schedule for UAAL (Dollar Amounts in Thousands)
Date Established Source Initial
Amount Outstanding
Balance Years
Remaining Annual
Payment(1) Safety – Valley of the Moon December 31, 2007 Restart amortization $1,852 $1,760 13 $173 December 31, 2008 Actuarial loss 169 163 13 16 December 31, 2009 Actuarial loss 678 662 14 61 December 31, 2009 Assumption changes 174 170 14 16 December 31, 2010 Actuarial loss 344 341 15 30 December 31, 2010 Assumption changes 335 332 15 29 December 31, 2011 Actuarial loss 639 636 16 53 December 31, 2012 Actuarial loss 1,444 1,444 17 116 December 31, 2012 Assumption changes 681 681 17 54 December 31, 2012 Compensation earnable change (145) (145) 17 (12) December 31, 2013 Actuarial gain (333) (334) 18 (26) December 31, 2014 Actuarial gain (1,524) (1,528) 19 (113) December 31, 2015 Actuarial gain (321) (321) 20 (23) December 31, 2015 Assumption changes 1,937 1,937 20 138 Subtotal $5,798 $512
(1) Before adjustments for supplemental contributions paid by certain employees to reduce the employer’s UAAL.

SECTION 4: Reporting Information for the Sonoma County Employees’ Retirement Association
80
Appendix E (continued) Amortization Schedule for UAAL (Dollar Amounts in Thousands)
Date Established Source Initial
Amount Outstanding
Balance Years
Remaining Annual
Payment(2) Total December 31, 2007 Restart amortization $177,351 $54,590 (1)(3) 13 $5,352 December 31, 2007 Cash Allowance 70,675 18,705 (1)(3) 12 1,954 December 31, 2008 Actuarial loss 55,470 17,268 (1)(3) 13 1,693 December 31, 2009 Early Retirement Option 1,448 398 (1)(3) 14 37 December 31, 2009 Actuarial loss 77,884 23,913 (1)(3) 14 2,212 December 31, 2009 Assumption changes 19,192 5,887 (3) 14 545 December 31, 2010 Actuarial loss 66,402 65,001 (3) 15 5,706 December 31, 2010 Assumption changes 54,475 53,327 (3) 15 4,682 December 31, 2011 Actuarial loss 104,255 102,853 (3) 16 8,602 December 31, 2012 Actuarial loss 103,359 102,383 (3) 17 8,191 December 31, 2012 Assumption changes 81,146 80,367 (3) 17 6,428 December 31, 2012 Compensation earnable change (11,403) (11,294)(3) 17 (904) December 31, 2012 Cashout change (32,613) (32,292)(3) 17 (2,583) December 31, 2013 Actuarial gain (43,566) (43,274)(3) 18 (3,323) December 31, 2014 Actuarial gain (103,425) (102,745)(3) 19 (7,591) December 31, 2015 Actuarial gain (22,201) (21,995)(3) 20 (1,568) December 31, 2015 Assumption changes 93,686 92,830 (3) 20 6,620 Subtotal $405,922 $36,053
(1) Adjusted to reflect $289.3 million in proceeds from issuance of Pension Obligation Bonds by the County. (2) Before adjustments for supplemental contributions paid by certain employees to reduce the employer’s UAAL. (3) Adjusted to reflect $3.7 million from an additional UAAL payment by the County. 5419320v2/05012.003

lf Segal Consulting
100 Montgomery Street Suíte 500 San Francisco, CA 94104-4308T 41 5.263.8283 wr.,vw.segalco. com
Andy Yeung ASA, MtuAA, FCA, EAVice President & [email protected]
VIA E-MAIL & USPS
}l4ay 4,2016
Ms. Julie WyneRetirement Admini stratorSonoma County Employees' Retirement Association433 Aviation Boulevard, Suite 100Santa Rosa, CA 94503-1069
Re Illustrations of Employer Contribution Rates, UAAL and Funding Percentages -Addendum
Dear Julie:
As mentioned in our Illustrations of Employer Contribution Rates, UAAL and FundingPercentages letter dated Apnl29,2016, we did not reflect the sunsets of the additional 3.03%and3.00o/o member contributions from General County (including the Court) and Safety Countymembers, respectively in developing the projected employer contribution rates. W'e understandthat during recent bargaining, specific sunset dates for these additional member contributionshave been identified and included in the MOUs. Subsequently, we have been asked to provide asecond set of projections for SCERA to reflect the impact of the sunset of these additionalmember contributions on the projected employer contribution rates.
As directed by SCERA, we have used a sunset date of June30,2024 for General County andGeneral Court members and have made the assumption of a sunset date of June30,2023 forSafety County members. We would urge SCERA to seek clarification from the County and DSAon the exact end date especially if it is the intent of the bargaining parties to make suchcontributions through the month of July 2023. (In any event, Segal does not believe that theresults of our projections will be significantly affected due to that difference in end date, if any).
Exhibits lA to lC show our projections of the employer aggregate contribution rates, UnfundedActuarial Accrued Liabilities (UAAL) and funded percentages from December 3T,2014 toDecember 31,2034 with the sunset for the baseline market return under Scenaio #2 (describedbelow) together with the results from our valuation projections that did not reflect the sunset(reference letter dated Apnl29,2016 and attached as Exhibit 3).
Benef¡ts, Compensation and HR Consulting. Member of The Segal Group. Offices throughout the United States and Canada

Ms. Julie WyneMay 4,2016Page 2
The scenarios are as follows:
(Baseline)
In Exhibits 2Ato 2C,we have included the results from the projections described above, underthe three possible sets of market return "scenarios" after December 31,2015. These results havebeen prepared using the same assumptions and methodology as outlined in our Apnl29,2016letter, with the exception of the inclusion of sunset dates for both General and Safety members,as provided by SCERA.
Other Considerations
Projections, by their nature, are not a guarantee of future results. The modeling projections are
intended to serve as estimates of future financial outcomes that are based on the informationavailable to us at the time the modeling is undertaken and completed, and the agreed-uponassumptions and methodologies described herein. Emerging results may differ significantly if theactual experience proves to be different from these assumptions or if alternative methodologiesare used. Actual experience may differ due to such variables as demographic experience, theeconomy, stock market performance, and the regulatory environment.
The projections are based on the actuarial assumptions and census data used in our December 31,2015 valuation report for the Association. Future experience is expected to follow all of theassumptions, except as noted above. This study was prepared under the supervision ofAndy Yeung, ASA, MAAA, FCA, EA.
Please let us know if you have any questions.
Sincerely
AndyYeung
EIVhyEnclosures
(,(
54301 95v1/05012.1 05

Exh
ibit
lA:
Pro
ject
ed E
mpl
oyer
Rat
es(B
efor
e R
efle
ctin
g P
hase
in o
f th
e C
ontr
ibut
ion
R¡t
e Im
pact
of
the
Ass
umpt
ion
Ch¡
ng€s
fro
m t
he D
ecem
ber
31,
2015
val
u¡t¡
on)
25o/
o
2Oo/
o
5o/o
ook
= o 6 À o Ê o o À
50h
00k
2014
20
15
2016
20
17
2018
20
19
2020
20
2'1
2022
2023
20
24
2025
Val
uat¡
on
Dat
e (1
2/31
)20
26
2027
20
28
20?9
20
30
2031
2032
20
33
2034
+20
15 P
roje
ct¡o
n w
¡th
Sun
set
(Sce
nar¡
o #2
): R
etur
n at
1.4
% (
2015
), 7
.25%
the
reaf
ter
+20
15 P
roje
ctio
n w
ithou
t S
unse
t (S
cena
r¡o
*2):
Ret
urn
at 1
.4%
120
751,
7.25
%th
erea
lter
{
Bas
ed o
n '1
2131
1201
5
Va¡
uatio
n D
atel
lz/3
1ìl 2
014
20'1
5 20
16 2
017
2018
201
9 20
20 2
021
2022
202
3 20
24 2
025
2026
202
7 20
28 2
029
2030
203
1 20
32 2
033
203/
2015
Pro
ject
ion
with
Sun
set
(Sce
nar¡
o #2
):l
Ret
urn
at 1
.4%
120
'151
.7 -
25%
the
reaf
terl
19.2
0Â 2
1.4o
/o 1
9.3o
/o 1
8.7o
/o 1
9.0%
19.
20Á
18,
9% 1
9.2o
/o 2
'1.2
o/o
21.O
o/o
2Ù.7
o/o
21.5
o/o
20.2
o/o
19.5
% 1
7.2o
/o 1
6.0%
9.'l
o/o
9.00
/6 8
.80/
6 A
.8o/
o 8.
7o/o
8.7o
/"
2015
Prc
ject
ion
with
out
#21:
5430
1 95
v1/0
5012
.1 0
5S
EG
AL
CO
NS
ULT
ING
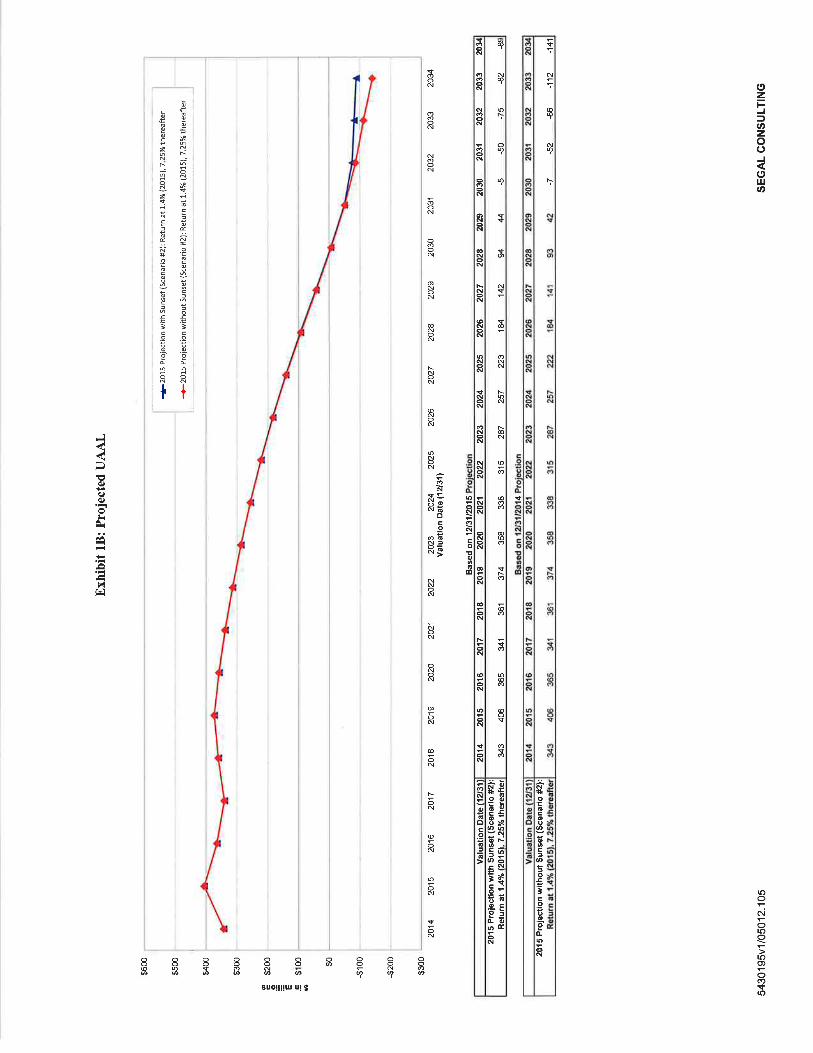
Exh
ibit
1B:
Pro
ject
ed U
AA
L
$600
$500
$400
$300
$200
E 0 = € C00 $0
$ -$1
00
-$20
0
-$30
020
14
2015
20
16
2017
20
't8
2019
20
20
2021
20
2220
23
2024
20
25
2026
20
27
202A
20
29
2030
20
31
2032
20
33
2034
Val
uat¡
on
Dat
e (1
2131
)
+20
15
Prc
ject
ion
w¡t
h S
unse
t {S
cena
r¡o
*2):
Ret
urn
at 1
.4%
(20
15),
7.2
570
ther
eafte
r
+20
15
Prc
ject
¡on
w¡t
hout
Sun
set
(Sce
nario
*2)
: R
etur
n at
1.4
% (
2075
),7.
25%
ther
cafte
t
Bas
ed o
n 12
13'1
1201
5
2014
20
15
2016
, 20
17
2î1A
20
'19
2020
20
21
2022
20
23
2024
20
25
2026
20
27
202A
20
29
2030
20
31
2032
20
33
2øA
343
406
36s
U1
361
374
358
338
315
287
257
223
1U
142
9444
-5
-5
0 -7
5 -8
2 €€
Vâl
uâtio
n D
etê
l'l2r
3lì
2015
Pro
ject
ion
w¡t
h S
unse
t (S
cena
r¡o
ttz):
Ret
urn
at 1
.4%
l¿01
51.7
.25o
/"
ther
eafte
r
-7
-52
€6
-112
-1
4120
15 P
roje
ctio
n w
¡tho
ut S
unse
t (S
cena
rio
#2):
4
5430
1 95
v1 /
0501
2.1
05
SE
GA
L C
ON
SU
LTIN
G

110o
/o
1050
Á
100%
950/
6
90%
85%
800Â
2014
20
15
2016
20
17
2018
20
19
2020
20
2't
2022
Exh
ibit
lC:
Pro
ject
ed F
unde
d P
erce
ntag
e
2023
20
24
2025
Val
uatio
n D
ate
(121
31)
2026
20
27
2028
20
29
2030
20
31
2032
20
33
2034
+20
15
Pro
ject
¡on
with
Sun
set
(Sce
nar¡
o *2
): R
€tur
n at
1.4
% (
2015
), 7
.25%
the
reaf
ter
+20
15
Pro
ject
¡on
wìth
out
Sun
set
(Sce
nar¡
o *2
): R
etur
n at
1.4
% l
2O\5
),7.
25yo
ther
cafte
t
Bas
ed o
n 1?
i31n
015
valu
at¡o
n D
arel
{z31
ìl 20
14
2015
20
16
2017
20
1A
2019
20
20
2021
20
22
2023
2î
24
202s
20
26
2027
20
2A
2029
20
30
20t1
20
32
2033
2î
3Á20
15 P
ro¡e
ct¡o
n w
¡th
Sun
set
(Sce
nar¡
o #2
);l
Ret
urn
at 1
.4o/
o /¿
0151
. 7.
25o/
o th
erea
fterl
2014
201
5 20
16 2
017
2018
201
9 20
20 2
021
2022
202
3 20
24 2
025
2026
202
7 20
28 2
029
2030
203
1 20
32 2
033
203,
4.
86 3
%
Ugo
A
86 9
ol'
g82o
/"
g7 9
o/"
g7 9
o/"
AA
To/
" 89
60t
6 qO
60¿
q1
60Á
92
60A
93
7oA
q¿
9%
q6
101
6 97
Ao/
" q8
8oÁ
1O
O2o
/"
1O1
50Á
1O
2 5o
/" 1
O33
oÀ 1
OÁ
3oÁ
1?J3
1
5430
1 95
vl/0
5012
.105
SE
GA
L C
ON
SU
LTIN
G

1Oo/
o
5o/o
Oo/
o
Exh
ibit
2A:
Pro
ject
ed E
mpl
oyer
Rat
es(B
efor
e R
efle
ctin
g P
hæei
n of
the
Con
trib
utio
n R
¡te
Impa
ct o
fthe
Ass
umpt
ion
Cha
ngm
fr
om t
he D
æem
ber
31,
2015
vâl
uatio
n)
2023
20
24
2025
Val
uat¡
on
Dat
e (1
2/31
)20
14
20't5
20
16
2017
20
'18
2019
20
20
2021
20
2220
26
2027
20
28
2029
20
30
2031
20
32
2033
20
34
30o/
o
250h
2Ûo/
o
15o/
o
o À o t o o o À
+S
cena
rio 1
: R
etu
n at
!4.
5o/o
1'
2076
),7.
25%
the
reaf
ter
+S
cena
r¡o
2: R
etun
at
7.25
% i
'207
6 añ
dthe
reaf
ter)
+
Sce
na
r¡o
3: R
etu
n al
O.O
% (2
076]
,, 7
,25%
t
he r
e af
te r
1_
- __
_.f_
--*{
_
t'
2014
201
5 20
16 2
017
2018
201
5 20
20 2
02',t
202
2 20
23 2
024
2025
202
6 20
27 2
02A
202
9 20
30 2
03',t
203
2 20
33oÂ
10
00/6
97
o/"
11
111o
/o l
OO
oÁ 1
00%
lOO
oÁ 'l
00o/
o 10
0% 1
000/
6 10
00/6
'lO
OoÂ
l11o
/o 1
00%
100
% 1
00%
100
0/6
101o
/oto
Sce
nar¡
o I
Rat
¡o o
f A
VA
to
the
aggr
egat
e ra
te ¡
s 18
.8%
.
5430
1 95
v1 /
0501
2.1
05
SE
GA
L C
ON
SU
LTIN
G

a c Ê Ê .5
$600
$500
$400
$300
-$10
0
-$20
0
-$30
0
$200
$100 $0
Exh
ibit
28:
Pro
ject
ed U
AA
L
2023
20
24
2025
valu
at¡o
n D
ate
(123
1)20
14
2015
20
16
2017
20
18
2019
20
20
2021
20
2220
26
2027
20
28
2029
20
30
2031
20
32
2033
20
34
+S
cena
r¡o
1: R
etun
at7
4.5%
i.2
076]
,,7.2
5% t
here
afte
r
+S
cena
rio 2
: R
etun
at7
.25y
o 12
0!6
and
ther
eafte
r)
+S
cena
rio 3
: R
etun
atO
.O%
120
76],,
7.25
% t
here
afte
r
Bas
ed o
n 12
13'1
1201
5
2025
203
0 20
3',t
2032
203
34
Â1
-88
-96
-lMal
7an
dS
cena
r¡o
3: R
etur
n at
0.0
%7.
250t
1u3
40
6 39
8 41
A
4A2
537
56t
544
520
490
456
417
373
324
269
208
149
9242
6
440
Ã2
-64
scên
ãr¡o
1:
Rèl
urn
àl 1
Á.5
91"
1201
6ì-
7-25
%,
fhêr
êâfte
rl34
34M
;
5430
1 95
v1 /
0501
2.1
05
SE
GA
L C
ON
SU
LTIN
G

1 15
o/o
110o
/o
1050
k
'100
0¿
90%
85%
80%
95o/
o
2014
20
15
2016
20
17
2018
20
19
2020
20
21
2022
Exh
ibit
2C:
Pro
ject
ed F
unde
d P
erce
ntag
e
2023
20
24
2025
Val
uatio
n D
ate
{12/
31}
2026
20
27
2028
20
29
2030
20
31
2032
20
33
2034
+S
cena
r¡o
1: R
etu
rn a
l f4.
5% 1
20].6
l,7.2
5yo
ther
cafte
r
+S
cena
r¡o
2: R
etun
at
7.25
% i
.201
,6 a
nd t
here
afte
r)
-{-S
cena
rio 3
: R
etu
rn a
t O
.O%
(2
0761
,-1.
25%
the
reaf
ter
5430
1 95
v1/0
501
2.1
05S
EG
AL
CO
NS
ULT
ING

100 Montgomery Street Suite 500 San Francisco, CA 94104-4308T 415.263.8283 www.segalco.com
Benefits, Compensation and HR Consulting. Member of The Segal Group. Offices throughout the United States and Canada
VIA E-MAIL AND USPS
April 29, 2016
Ms. Julie WyneRetirement AdministratorSonoma County Employees' Retirement Association433 Aviation Boulevard, Suite 100Santa Rosa, CA 94503-1069
Re: Illustrations of Employer Contribution Rates, UAAL and Funding Percentages
Dear Julie:
Enclosed please find two sets of valuation projections for SCERA. The first set (Exhibits 1A to 1C) show our projections of the employer aggregate contribution rates, Unfunded Actuarial Accrued Liabilities (UAAL) and funded percentages from December 31, 2014 to December 31, 2034 from this year’s projection for the baseline market return under Scenario #2 (described below) together with the results from last year’s projection (reference letter dated May 1, 2015). Please note that the new actuarial assumptions adopted by the Board for the December 31, 2015 valuation are reflected in the 2015 projection only.
Similar to last year, we have expanded the illustrations to include three possible market rate of return scenarios so that the stakeholders may better understand the sensitivity of the above results to a change in the short-term market rate of return. The scenarios are as follows:
Scenario #1: 14.50% for 2016 and 7.25% thereafter
Scenario #2: 7.25% for all years (starting 2016)(Baseline)
Scenario #3: 0.00% for 2016 and 7.25% thereafter
In Exhibits 2A to 2C, we have included the results from this year’s projection under the three possible sets of market return “scenarios” after December 31, 2015. These results have been prepared using the results from the December 31, 2015 valuation.
Results
As of December 31, 2015, there were $6.9 million in net deferred investment losses. In this letter, we have projected the change in the employer’s contribution rate in the next several years
Exhibit 3

Ms. Julie WyneApril 29, 2016Page 2
5424287v1/05012.002
as those net deferred investment losses are recognized as part of the Board’s asset smoothing method, assuming again that the Association earns an annual return of 7.25% on a market value basis beginning with January 1, 2016 as shown in Exhibit 1A (and also Exhibit 2A under Scenario #2).
As we pointed out in our December 31, 2015 funding valuation report, the $6.9 million indeferred investment losses would be recognized in a non-level manner. The Association would recognize two years’ of deferred gains (each of which is greater than the current deferred loss of $6.9 million) followed next by the recognition of two years’ of deferred losses (each of which is less than the current net deferred loss of $6.9 million). We believe it would be appropriate to take the $6.9 million in deferred losses and instead recognize those in four level amounts of about $1.7 million each year. This would reduce the volatility associated with the pattern of deferred loss recognition and result in both more stable projected funded ratios (on a valuation basis) and more level employer contribution rates1. We intend to work with the Association to develop that recommendation for the Board’s consideration well in advance of the next valuation. As we have not yet discussed this topic with the Board, we have not reflected any leveling of the recognition of the net deferred investment losses in preparing these projections.
Due to a reduction in the level of benefits, the employer’s normal costs under the CalPEPRA plans are lower than those under the Legacy plans. The future employer aggregate normal cost rates calculated to include both the Legacy and the CalPEPRA plans are projected to decrease as members in the Legacy plans are gradually replaced by members in the CalPEPRA plans. In addition to the CalPEPRA members reported in the December 31, 2015 valuation, we have estimated the potential employer normal cost savings by assuming that the payroll for the CalPEPRA plans can be modeled as follows: (1) projecting the total $339,518,000 December 31, 2015 combined General and Safety payroll using the 3.5% annual increase used in the valuation to predict annual wage growth for amortizing the UAAL and (2) subtracting the projected closed group payroll for the Legacy plans according to the assumptions used in the December 31, 2015 valuation to anticipate termination, retirement (both service and disability) and other exits from active employment.
Note that the primary purpose for preparing the illustration is to reflect future changes in the employer contribution rates due to: (1) the deferred recognition of investment gains (or losses),(2) the contribution rate impact due to the 18-month delay between the date of the valuation and the date of the rate implementation and (3) the lower normal cost under the CalPEPRA benefit
1 For instance, the contribution rates before and after such leveling on the Scenario #2 results are asfollows:
Projected Employer RatesValuation Date Without Leveling With Leveling
12/31/2015 20.4% 20.4%12/31/2016 19.3% 20.1%12/31/2017 18.7% 19.8%12/31/2018 19.0% 19.5%12/31/2019 19.2% 19.1%12/31/2020 18.9% 18.8%
Exhibit 3 (Continued)

Ms. Julie WyneApril 29, 2016Page 3
5424287v1/05012.002
plans. For that reason, we have not reflected impacts from sunsets of the additional 3.03% and 3.00% member contributions from General County (including the Court) and Safety County members, respectively, which generally would have the impact of increasing the employer contribution rates provided in this letter after the sunset date.2 This is in contrast to our inclusion of the potential cost impact from the CalPEPRA benefits because those savings will be recognized (gradually) starting in 2013 while the impact from the sunsets of the additional contributions will not take place until about the middle of the 20-year period included in our projection.
As a result of CalPEPRA, the employer is required to continue to contribute the normal cost even after the Association is expected to be over 100% funded, at least until the funded percentage exceeds 120%. This is shown in the projections where the contributions are equal to the normal cost once the Association is expected to be over 100% funded. This statutory requirement overrules the Association’s funding policy provision that would amortize surplus over a 30-year period.
Also, there was an increase in the employer rate for the December 31, 2015 valuation3 of 2.29%of payroll as a result of the assumption changes adopted by the Board. According to the Association’s Actuarial Funding Policy that was last reviewed on June 18, 2015, a change greater than 2.00% of payroll due to assumption changes should be phased-in over a period of two years. Since this phase-in adjustment is made by the staff, the rates shown in the projection have notbeen adjusted for the phase-in.
As noted above, a comparison of the changes in the values provided by this year’s projection and last year’s projection can be found in Exhibits 1A to 1C. The employer contribution rates in this year’s projection are higher as a result of the change in actuarial assumptions adopted by the Board effective for the December 31, 2015 valuation, offset by lower than expected individual salary increases and other experience gains.
Other Considerations
Projections, by their nature, are not a guarantee of future results. The modeling projections are intended to serve as estimates of future financial outcomes that are based on the information available to us at the time the modeling is undertaken and completed, and the agreed-uponassumptions and methodologies described herein. Emerging results may differ significantly if the actual experience proves to be different from these assumptions or if alternative methodologies
2 As an example, if we were to reflect the sunset of General County and Court members’ additional 3.03% contributions starting July 1, 2024, we would have increased the aggregate employer’s contribution rate (calculated using both General and Safety payroll) by about 2.38% after adjustment for refundability. Similarly, if we were to reflect the sunset of the Safety County members’ additional 3.00% contributions starting July 1, 2023, we would have increased the aggregate employer’s contribution rate (calculated using both General and Safety payroll) by about 0.56% after adjustment for refundability.
3 The employer rate approved in the December 31, 2015 valuation will be implemented in fiscal year 2017/2018.
Exhibit 3 (Continued)

Ms. Julie WyneApril 29, 2016Page 4
5424287v1/05012.002
are used. Actual experience may differ due to such variables as demographic experience, the economy, stock market performance, and the regulatory environment.
The projections are based on the actuarial assumptions and census data used in our December 31,2015 valuation report for the Association. Future experience is expected to follow all of the assumptions, except as noted above. This study was prepared under the supervision ofAndy Yeung, ASA, MAAA, FCA, EA.
Please let us know if you have any questions.
Sincerely,
Paul Angelo, FSA, MAAA, FCA, EA Andy Yeung, ASA, MAAA, FCA, EASenior Vice President and Actuary Vice President and Actuary
EK/bbfEnclosures
Exhibit 3 (Continued)

5424
287v
1/05
012.
002
SEG
ALC
ON
SULT
ING
Bas
ed o
n 12
/31/
2015
Pro
ject
ion
Valu
atio
n D
ate
(12/
31)
2014
2015
2016
2017
2018
2019
2020
2021
2022
2023
2024
2025
2026
2027
2028
2029
2030
2031
2032
2033
2034
2015
Pro
ject
ion
(Sce
nario
#2)
:R
etur
n at
1.4
% (2
015)
, 7.2
5% th
erea
fter
19.2
%20
.4%
19.3
%18
.7%
19.0
%19
.2%
18.9
%18
.6%
18.3
%18
.0%
17.8
%17
.5%
17.3
%16
.5%
14.2
%13
.1%
9.1%
9.0%
8.8%
8.8%
8.7%
Bas
ed o
n 12
/31/
2014
Pro
ject
ion
Valu
atio
n D
ate
(12/
31)
2014
2015
2016
2017
2018
2019
2020
2021
2022
2023
2024
2025
2026
2027
2028
2029
2030
2031
2032
2033
2034
2014
Pro
ject
ion:
Ret
urn
at 7
.5%
(201
5 an
d th
erea
fter)
19.2
%17
.8%
16.0
%14
.7%
14.3
%13
.9%
13.6
%13
.3%
13.0
%12
.8%
12.5
%9.
9%9.
7%9.
6%9.
4%9.
3%9.
2%9.
1%9.
0%8.
9%8.
8%
Exh
ibit
1A: P
roje
cted
Em
ploy
er R
ates
(Bef
ore
Ref
lect
ing
Suns
et o
f Add
ition
al M
embe
r C
ontr
ibut
ions
and
Pha
se-in
of t
he C
ontr
ibut
ion
Rat
e Im
pact
of t
he A
ssum
ptio
n C
hang
es fr
om th
e D
ecem
ber
31, 2
015
valu
atio
n)
0%5%10%
15%
20%
25%
2014
2015
2016
2017
2018
2019
2020
2021
2022
2023
2024
2025
2026
2027
2028
2029
2030
2031
2032
2033
2034
Percent of Payroll
Valu
atio
n D
ate
(12/
31)
2015
Pro
ject
ion
(Sce
nario
#2)
: Ret
urn
at 1
.4%
(201
5), 7
.25%
ther
eaft
er
2014
Pro
ject
ion:
Ret
urn
at 7
.5%
(201
5 an
d th
erea
fter
)
Exh
ibit
3 (C
ontin
ued)
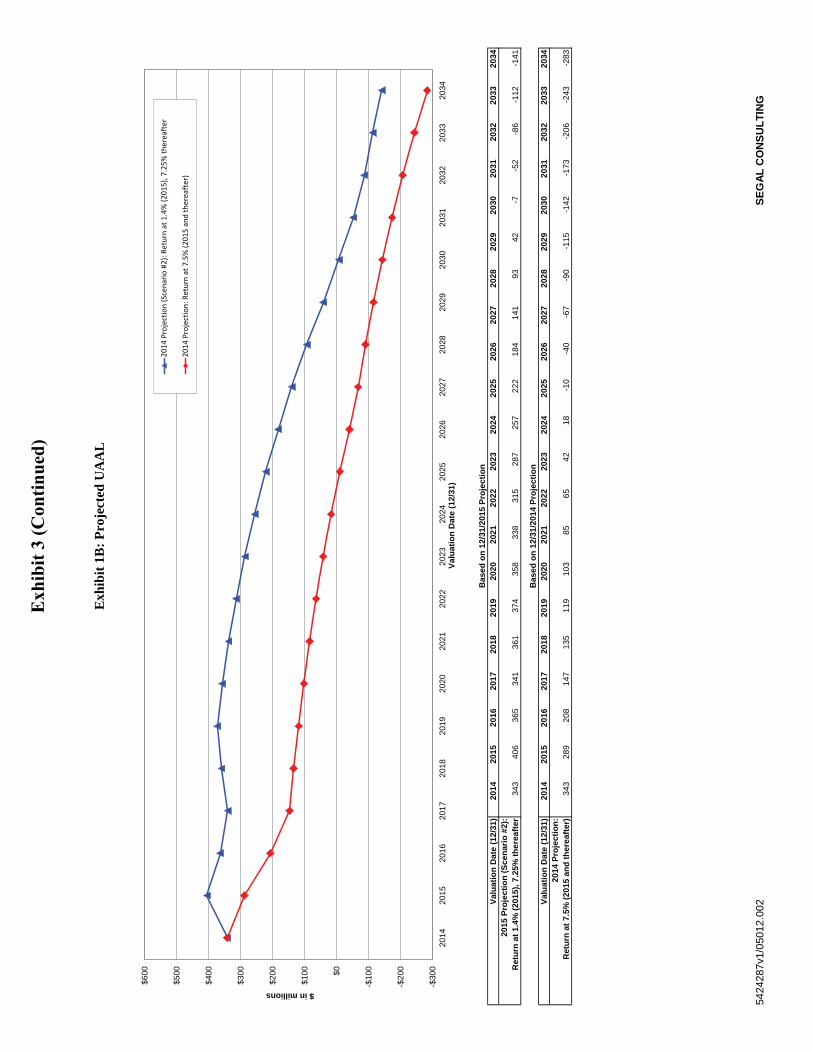
5424
287v
1/05
012.
002
SEG
ALC
ON
SULT
ING
Bas
ed o
n 12
/31/
2015
Pro
ject
ion
Valu
atio
n D
ate
(12/
31)
2014
2015
2016
2017
2018
2019
2020
2021
2022
2023
2024
2025
2026
2027
2028
2029
2030
2031
2032
2033
2034
2015
Pro
ject
ion
(Sce
nario
#2)
:R
etur
n at
1.4
% (2
015)
, 7.2
5% th
erea
fter
343
406
365
341
361
374
358
338
315
287
257
222
184
141
9342
-7-5
2-8
6-1
12-1
41
Bas
ed o
n 12
/31/
2014
Pro
ject
ion
Valu
atio
n D
ate
(12/
31)
2014
2015
2016
2017
2018
2019
2020
2021
2022
2023
2024
2025
2026
2027
2028
2029
2030
2031
2032
2033
2034
2014
Pro
ject
ion:
Ret
urn
at 7
.5%
(201
5 an
d th
erea
fter)
343
289
208
147
135
119
103
8565
4218
-10
-40
-67
-90
-115
-142
-173
-206
-243
-283
Exh
ibit
1B: P
roje
cted
UA
AL
-$30
0
-$20
0
-$10
0$0
$100
$200
$300
$400
$500
$600
2014
2015
2016
2017
2018
2019
2020
2021
2022
2023
2024
2025
2026
2027
2028
2029
2030
2031
2032
2033
2034
$ in millions
Valu
atio
n D
ate
(12/
31)
2014
Pro
ject
ion
(Sce
nario
#2)
: Ret
urn
at 1
.4%
(201
5), 7
.25%
ther
eaft
er
2014
Pro
ject
ion:
Ret
urn
at 7
.5%
(201
5 an
d th
erea
fter
)
Exh
ibit
3 (C
ontin
ued)

5424
287v
1/05
012.
002
SEG
ALC
ON
SULT
ING
Bas
ed o
n 12
/31/
2015
Pro
ject
ion
Valu
atio
n D
ate
(12/
31)
2014
2015
2016
2017
2018
2019
2020
2021
2022
2023
2024
2025
2026
2027
2028
2029
2030
2031
2032
2033
2034
2015
Pro
ject
ion
(Sce
nario
#2)
:R
etur
n at
1.4
% (2
015)
, 7.2
5% th
erea
fter
86.3
%84
.9%
86.9
%88
.2%
87.9
%87
.9%
88.7
%89
.6%
90.6
%91
.6%
92.6
%93
.7%
94.9
%96
.1%
97.4
%98
.8%
100.
2%10
1.5%
102.
5%10
3.3%
104.
3%
Bas
ed o
n 12
/31/
2014
Pro
ject
ion
Valu
atio
n D
ate
(12/
31)
2014
2015
2016
2017
2018
2019
2020
2021
2022
2023
2024
2025
2026
2027
2028
2029
2030
2031
2032
2033
2034
2014
Pro
ject
ion:
Ret
urn
at 7
.5%
(201
5 an
d th
erea
fter)
86.3
%88
.9%
92.3
%94
.8%
95.4
%96
.0%
96.7
%97
.3%
98.0
%98
.7%
99.5
%10
0.3%
101.
1%10
1.9%
102.
5%10
3.2%
104.
0%10
4.9%
105.
9%10
7.2%
108.
6%
Exh
ibit
1C: P
roje
cted
Fun
ded
Perc
enta
ge
80%
85%
90%
95%
100%
105%
110%
2014
2015
2016
2017
2018
2019
2020
2021
2022
2023
2024
2025
2026
2027
2028
2029
2030
2031
2032
2033
2034
Valu
atio
n D
ate
(12/
31)
2015
Pro
ject
ion
(Sce
nario
#2)
: Ret
urn
at 1
.4%
(201
5), 7
.25%
ther
eaft
er
2014
Pro
ject
ion:
Ret
urn
at 7
.5%
(201
5 an
d th
erea
fter
)
Exh
ibit
3 (C
ontin
ued)

5424
287v
1/05
012.
002
SEG
ALC
ON
SULT
ING
Bas
ed o
n 12
/31/
2015
Pro
ject
ion
Valu
atio
n D
ate
(12/
31)
2014
*20
1520
1620
1720
1820
1920
2020
2120
2220
2320
2420
2520
2620
2720
2820
2920
3020
3120
3220
3320
34Sc
enar
io 1
: Ret
urn
at 1
4.5%
(201
6), 7
.25%
ther
eafte
r19
.2%
20.4
%18
.7%
17.2
%16
.6%
16.0
%15
.0%
14.7
%14
.3%
14.1
%13
.8%
13.5
%9.
7%9.
5%9.
3%9.
2%9.
1%9.
0%8.
8%8.
8%8.
7%Sc
enar
io 2
: Ret
urn
at 7
.25%
(201
6 an
d th
erea
fter)
19.2
%20
.4%
19.3
%18
.7%
19.0
%19
.2%
18.9
%18
.6%
18.3
%18
.0%
17.8
%17
.5%
17.3
%16
.5%
14.2
%13
.1%
9.1%
9.0%
8.8%
8.8%
8.7%
Scen
ario
3: R
etur
n at
0.0
% (2
016)
, 7.2
5% th
erea
fter
19.2
%20
.4%
20.0
%20
.2%
21.4
%22
.3%
22.7
%22
.5%
22.3
%22
.0%
21.7
%21
.5%
21.3
%20
.5%
18.2
%17
.0%
13.7
%10
.7%
8.9%
8.8%
8.7%
Valu
atio
n D
ate
(12/
31)
2014
2015
2016
2017
2018
2019
2020
2021
2022
2023
2024
2025
2026
2027
2028
2029
2030
2031
2032
2033
2034
Rat
io o
f AVA
to M
VA, S
cena
rio 1
94%
100%
97%
98%
99%
99%
100%
100%
100%
100%
100%
100%
100%
100%
100%
100%
100%
100%
100%
100%
100%
Rat
io o
f AVA
to M
VA, S
cena
rio 2
94%
100%
102%
102%
101%
100%
100%
100%
100%
100%
100%
100%
100%
100%
100%
100%
100%
100%
100%
100%
100%
Rat
io o
f AVA
to M
VA, S
cena
rio 3
94%
100%
108%
107%
104%
101%
100%
100%
100%
100%
100%
100%
100%
100%
100%
100%
100%
100%
100%
100%
100%
* 19
.2%
is th
e ag
greg
ate
cont
ribut
ion
rate
usi
ng th
e co
mpo
sitio
n of
pay
roll
repo
rted
for G
ener
al/S
afet
y an
d Ti
er A
/B in
the
Dec
embe
r 31,
201
4 va
luat
ion.
If w
e re
com
posi
te th
e ra
te u
sing
pay
rolls
for t
he a
bove
cla
ssifi
catio
ns in
the
Dec
embe
r 31,
201
5 va
luat
ion,
*
the
aggr
egat
e ra
te is
18.
8%.
Exh
ibit
2A: P
roje
cted
Em
ploy
er R
ates
(Bef
ore
Ref
lect
ing
Suns
et o
f Add
ition
al M
embe
r C
ontr
ibut
ions
and
Pha
se-in
of t
he C
ontr
ibut
ion
Rat
e Im
pact
of t
he A
ssum
ptio
n C
hang
es fr
om th
e D
ecem
ber
31, 2
015
valu
atio
n)
0%5%10%
15%
20%
25%
2014
2015
2016
2017
2018
2019
2020
2021
2022
2023
2024
2025
2026
2027
2028
2029
2030
2031
2032
2033
2034
Percent of Payroll
Valu
atio
n D
ate
(12/
31)
Scen
ario
1: R
etur
n at
14.
5% (2
016)
, 7.2
5% th
erea
fter
Scen
ario
2: R
etur
n at
7.2
5% (2
016
and
ther
eaft
er)
Scen
ario
3: R
etur
n at
0.0
% (2
016)
, 7.2
5% th
erea
fter
Exh
ibit
3 (C
ontin
ued)

5424
287v
1/05
012.
002
SEG
ALC
ON
SULT
ING
Bas
ed o
n 12
/31/
2015
Pro
ject
ion
Valu
atio
n D
ate
(12/
31)
2014
2015
2016
2017
2018
2019
2020
2021
2022
2023
2024
2025
2026
2027
2028
2029
2030
2031
2032
2033
2034
Scen
ario
1: R
etur
n at
14.
5% (2
016)
, 7.2
5% th
erea
fter
343
406
332
264
239
210
156
133
109
8558
28-5
-41
-71
-94
-119
-146
-176
-208
-243
Scen
ario
2: R
etur
n at
7.2
5% (2
016
and
ther
eafte
r)34
340
636
534
136
137
435
833
831
528
725
722
218
414
193
42-7
-52
-86
-112
-141
Scen
ario
3: R
etur
n at
0.0
% (2
016)
, 7.2
5% th
erea
fter
343
406
398
418
482
537
561
544
520
490
456
416
372
323
267
207
148
9140
3-2
3
Exh
ibit
2B: P
roje
cted
UA
AL
-$30
0
-$20
0
-$10
0$0
$100
$200
$300
$400
$500
$600
2014
2015
2016
2017
2018
2019
2020
2021
2022
2023
2024
2025
2026
2027
2028
2029
2030
2031
2032
2033
2034
$ in millions
Valu
atio
n D
ate
(12/
31)
Scen
ario
1: R
etur
n at
14.
5% (2
016)
, 7.2
5% th
erea
fter
Scen
ario
2: R
etur
n at
7.2
5% (2
016
and
ther
eaft
er)
Scen
ario
3: R
etur
n at
0.0
% (2
016)
, 7.2
5% th
erea
fter
Exh
ibit
3 (C
ontin
ued)

5424
287v
1/05
012.
002
SEG
ALC
ON
SULT
ING
Bas
ed o
n 12
/31/
2015
Pro
ject
ion
Valu
atio
n D
ate
(12/
31)
2014
2015
2016
2017
2018
2019
2020
2021
2022
2023
2024
2025
2026
2027
2028
2029
2030
2031
2032
2033
2034
Scen
ario
1: R
etur
n at
14.
5% (2
016)
, 7.2
5% th
erea
fter
86.3
%84
.9%
88.1
%90
.9%
92.0
%93
.2%
95.1
%95
.9%
96.7
%97
.5%
98.3
%99
.2%
100.
1%10
1.1%
102.
0%10
2.6%
103.
3%10
4.1%
105.
0%10
6.1%
107.
5%Sc
enar
io 2
: Ret
urn
at 7
.25%
(201
6 an
d th
erea
fter)
86.3
%84
.9%
86.9
%88
.2%
87.9
%87
.9%
88.7
%89
.6%
90.6
%91
.6%
92.6
%93
.7%
94.9
%96
.1%
97.4
%98
.8%
100.
2%10
1.5%
102.
5%10
3.3%
104.
3%Sc
enar
io 3
: Ret
urn
at 0
.0%
(201
6), 7
.25%
ther
eafte
r86
.3%
84.9
%85
.8%
85.5
%83
.9%
82.6
%82
.3%
83.3
%84
.4%
85.6
%86
.9%
88.2
%89
.6%
91.0
%92
.6%
94.3
%95
.9%
97.5
%98
.9%
99.9
%10
0.7%
Exh
ibit
2C: P
roje
cted
Fun
ded
Perc
enta
ge
80%
85%
90%
95%
100%
105%
110%
115%
2014
2015
2016
2017
2018
2019
2020
2021
2022
2023
2024
2025
2026
2027
2028
2029
2030
2031
2032
2033
2034
Valu
atio
n D
ate
(12/
31)
Scen
ario
1: R
etur
n at
14.
5% (2
016)
, 7.2
5% th
erea
fter
Scen
ario
2: R
etur
n at
7.2
5% (2
016
and
ther
eaft
er)
Scen
ario
3: R
etur
n at
0.0
% (2
016)
, 7.2
5% th
erea
fter
Exh
ibit
3 (C
ontin
ued)

8
Other Post-Employent Benefits (OPEB)
Valuation Changes

Page | 1
COUNTY OF SONOMA
OFFICE OF THE COUNTY ADMINISTRATOR 575 ADMINISTRATION DRIVE – ROOM 104A
SANTA ROSA, CALIFORNIA 95403-2888 TELEPHONE (707) 565-2431
FAX (707) 565-3778
VERONICA A. FERGUSON
COUNTY ADMINISTRATOR
CHRISTINA RIVERA DEPUTY COUNTY ADMINISTRATOR
REBECCA WACHSBERG DEPUTY COUNTY ADMINISTRATOR
June 13, 2016 To: Members of the Board of Supervisors
From: Veronica A. Ferguson, County Administrator
Re: Other Post-Employment Benefits (OPEB) – Revised GASB Valuation On March 8, 2016, the Board was informed about new requirements that replace GASB Statements Nos. 43 and 45 with new GASB accounting standards Nos. 74 and 75, effective fiscal year ending June 30, 2017 and Statement No. 75 effective fiscal year ending June 30, 2018. In light of the changes to the GASB accounting and financial reporting requirements, your Board directed staff to conduct a revised 2015 valuation based upon the new GASB accounting standards. Revised Valuation Based upon the revised 2015 valuation, the County’s current Total OPEB Liability is $435,773,000 and the Net OPEB Liability (Unfunded Liability) is $398,515,000, a 30% and 32%, increase over the previous 2015 GASB 43/45 total liability of $307,775,992 and net valuation of the unfunded liability of $270,517,336. Enclosed are the Actuary’s revised valuation for the period ending June 30, 2015, and a summary comparison of the GASB 74/75 valuation to the prior GASB 43/45. New GASB Reporting Requirements The primary objective of these changes is to improve accounting and financial reporting by state and local governments related to recognizing and measuring liabilities for retiree benefits other than pension benefits. These accounting standards require public entities to complete an actuarial valuation at least every two years, to provide public reporting on the cost of post-employment benefits other than pension defined by GASB as medical, prescription drug, dental, vision and life insurance benefits for which an employer provides a contribution. For Sonoma County, OPEB mainly consists of contributions for retiree medical benefits up to $500/month. The following outlines the most significant changes to the valuation standards: 1) Using a discount rate of 4.0% based upon the actual plan’s fiduciary net position and the
investment horizon of those resources, rather than utilizing a long term expected rate of return;
2) Recognition of the OPEB expense over a 7 year amortization period, rather than 30 years;

Page | 2
3) A single method of attributing the actuarial present value of projected benefits (Entry Age Method) rather than the Projected Unit Credit Method previously allowed; and
4) Immediate recognition in the County’s financial statement of the total OPEB liability, rather than the current practice of recognizing only the current year portion of the liability.
Addressing OPEB Obligation In 2008, the County took significant steps towards reducing its OPEB liability by providing employees hired after 2009 with a Retiree Health Reimbursement Arrangement. This Retiree HRA benefit provides employees flexibility in how they want to spend their money for retiree medical benefits, provides portability as the amount contributed to the Retiree HRA remains in their name, even if they leave County employment it becomes available for their use at age 50 (or upon retirement if they continue with the County). This action alone eliminated the County’s OPEB obligation of future employees. There are approximately 1,700 active employees or 42% of our active workforce, hired after January 1, 2009 who are eligible for a Retiree HRA contribution and are not included in the OPEB valuation. Given the significant impact these new GASB reporting requirements place on the County’s budget, it is imperative the County develop a strategic approach to address operational and budgetary changes to further reduce and/or eliminate OPEB liability, as the alternative will result in significant budgetary constrictions, including staffing, program and service reductions, and poor financial reporting results. Based upon direction from your Board in March 2016, and following review of the 2016 OPEB valuation, staff will continue to evaluate further initiatives to reduce and/or eliminate the County’s OPEB liability, and any future OPEB changes that may impact future valuations. Therefore, mitigating the new GASB requirements and proactively managing the County’s OPEB liability should be a high priority. Next Steps: Include New Valuation in Financial Statements The CAO, HR and ACTTC staff will immediately proceed with conducting a complete GASB 74/75 valuation as of June 30, 2016 to be used for financial reporting purposes for the 2016 Comprehensive Annual Financial Report, and will continue valuations on an annual versus biennial basis going forward. Implement Measures to Further Reduce Liability Staff will also continue to evaluate liability reduction options and develop an implementation plan consistent with labor negotiations meet and confer requirements to execute measures previously identified. Including: expansion of the Retiree Health Reimbursement Account (HRA) program, elimination of implicit subsidy and Medicare Part B premium, reduction of employer paid medical contributions for retirees, and evaluation of the County Health Plan. Enclosures: 1. Summary of OPEB Comparative Actuarial Valuations 2007-2015 2. Governmental Accounting Standards 74/75 Actuarial Valuation as of June 30, 2015

Summary of OPEB Comparative Actuarial Valuations 2007-2015
GASB 74/75
$414,418,582 $268,453,913 $316,736,980 $335,364,067 $307,775,992 $435,773,000 Total OPEB Liability
$7,000,000 $9,716,355 $19,045,636 $23,693,872 $37,258,656 $37,258,656
1.69% 3.62% 6.01% 7.07% 12.11% 8.55%
$37,039,322 $38,613,493 $23,582,859 $26,715,197 $21,455,440 $27,529,000
12.92% 7.05% 7.86% 7.51% 7.19% 138.50%
7.5% 7.5% 7.3% 7.5% 8.8% 8.8%
Actuarially determined
GASB 43/45 Terminology
Actuarial Accrued Liability
County OPEB Payroll Rate
Annual Required Contribution
Funded Ratio
Plan Assets
Actuarial Payroll Rate
Unfunded Actuarial Accrued Liability
Plan Fiduciary Net Position
OPEB Valuations Under GASB 43/45
$311,670,195 $270,517,336 Net OPEB Liability
20092007 2011New GASB 74/75
Terminology20152013 2015 Revised
$407,418,582 $258,737,558 $297,691,344 $398,515,000

County of Sonoma Governmental Accounting Standards (GAS) 74/75 Actuarial Valuation as of June 30, 2015
This report has been prepared for the County of Sonoma to assist in administering the Plan. This valuation report may not otherwise be copied or reproduced in any form without the consent of the County of Sonoma and may only be provided to other parties in its entirety. The measurements shown in this actuarial valuation may not be applicable for other purposes.
Copyright © 2016 by The Segal Group, Inc. All rights reserved.

100 Montgomery Street Suite 500 San Francisco, CA 94104-4308 T 415.263.8200 www.segalco.com
May 2, 2016
Ms. Marcia Chadbourne, Risk Manager County of Sonoma Human Resources, Risk Management Division Santa Rosa, CA 95403
Dear Marcia:
We are pleased to submit this Governmental Accounting Standards (GAS) 74/75 Actuarial Valuation as of June 30, 2015. It contains various information that will need to be disclosed in order to comply with GAS 74 and GAS 75.
This report was prepared in accordance with generally accepted actuarial principles and practices at the request of the County of Sonoma to assist in administering the Plan. The census and financial information on which our calculations were based was prepared by the County of Sonoma. That assistance is gratefully acknowledged.
The measurements shown in this actuarial valuation may not be applicable for other purposes. Future actuarial measurements may differ significantly from the current measurements presented in this report due to such factors as the following: plan experience differing from that anticipated by the economic or demographic assumptions; changes in economic or demographic assumptions; and changes in plan provisions or applicable law.
The actuarial calculations were completed under the supervision of Dave Bergerson, ASA, MAAA, FCA, Enrolled Actuary and Thomas Bergman, ASA, MAAA, Enrolled Actuary. We are members of the American Academy of Actuaries and we meet the Qualification Standards of the American Academy of Actuaries to render the actuarial opinion herein. To the best of our knowledge, the information supplied in the actuarial valuation is complete and accurate. Further, in our opinion, the assumptions as approved by the Board are reasonably related to the experience of and expectations for the Association.
We look forward to reviewing this report with you and to answering any questions.
Sincerely,
Segal Consulting, a Member of The Segal Group, Inc. By:
Thomas M. Morrison, Jr. Dave Bergerson, ASA, EA, FCA, MAAA Senior Vice President Vice President & Actuary
Thomas Bergman, ASA, EA, MAAA Associate Actuary
DTB/hy

SECTION 1 SECTION 2 SECTION 3
VALUATION SUMMARY GASB 74 INFORMATION GASB 75 INFORMATION Purpose .......................................... i Significant Issues in Valuation
Year .......................................... i Summary of Key Valuation
Results .................................... iii
EXHIBIT 1 General Information –
“Financial Statements”, Note Disclosures and Required Supplementary Information for a Single-Employer OPEB Plan ............................... 1
EXHIBIT 2 Investments ................................... 2 EXHIBIT 3 Net OPEB Liability ....................... 3 EXHIBIT 4 Schedule of Changes in Net
OPEB Liability – Last Plan Years (in thousands) ................ 5
EXHIBIT 5 Schedule of Contributions –
Last Five Fiscal Years (in thousands) ................................ 6
EXHIBIT 6 Projection of OPEB Plan’s
Fiduciary Net Position for Use in Calculation of Discount Rate as of June 30, 2015 ......................................... 8
APPENDIX A Summary of Significant
Accounting Policies & General Information about the OPEB Plan ............ 10
APPENDIX B Net OPEB Liability .................... 12
APPENDIX C OPEB Expense and Deferred
Outflows of Resources and Deferred Inflows of Resources Related to OPEB .................................... 16
APPENDIX D Schedule of Changes in The
County’s Net OPEB Liability and Related Ratios .................................... 17
APPENDIX E Schedule Of County
Contributions ....................... 18
APPENDIX F Components of County’s
OPEB Expense for the Fiscal Year Ended June 30, 2015 ....................... 19

SECTION 1: Valuation Summary for Sonoma County – June 30, 2015 (GAS) 74/75
i
Purpose
This report has been prepared by Segal Consulting to present certain disclosure information required by Governmental Accounting Standards (GAS) 74 and (GAS) 75 as of June 30, 2015. This valuation is based on:
The benefit provisions of the Plan, as administered by the County of Sonoma;
The characteristics of covered active members, retired members and beneficiaries as of June 30, 2015, provided by the County of Sonoma;
The assets of the Plan as of June 30, 2015, provided by the County of Sonoma;
Economic assumptions regarding future salary increases and investment earnings; and
Other actuarial assumptions, regarding employee terminations, retirement, death, etc.
Significant Issues in Valuation Year
The following key findings were the result of this actuarial valuation:
The Governmental Accounting Standards Board (GASB) approved two new Statements affecting the reporting of OPEB liabilities for accounting purposes. Statement 74 replaces Statement 43 and is for plan reporting. Statement 75 replaces Statement 45 and is for employer reporting. Statement 74 is effective with the calendar year ending June 30, 2017 for Plan reporting and Statement 75 is effective with the fiscal year ending June 30, 2018 for employer reporting. The information contained in this valuation is intended to be used (along with other information) in order to comply with Statement 74 and 75.
It is important to note that the new GASB rules only redefine OPEB liability and expense for financial reporting purposes, and do not apply to contribution amounts for funding purposes. Employers and plans can still develop and adopt funding policies under current practices.
When measuring OPEB liability GASB uses a different actuarial cost method (Entry Age method) and a different discount rate (expected return on assets) than County of Sonoma used in prior GAS 43/45 valuations. This means that the Total OPEB Liability (TOL) measure for financial reporting shown in this report is determined on a different basis from previous reports.
The Net OPEB Liability (NOL) is equal to the difference between the Total OPEB Liability (TOL) and the Plan’s Fiduciary Net Position. The Plan’s Fiduciary Net Position is equal to the market value of assets.

SECTION 1: Valuation Summary for Sonoma County – June 30, 2015 (GAS) 74/75
ii
The NOL decreased from $436 million as of June 30, 2014 to $398 million as of June 30, 2015 primarily as a result of the gain from the combined effect of lower than expected per capita costs and updating the participation assumption and partially offset from lowering the discount rate from 4.4% to 4.0%. Changes in these values during the last year ending June 30, 2015 can be found in Exhibit 4 of Section 2.
The NOLs measured as of June 30, 2015 and 2014 have been determined based on the results of the actuarial valuations as of June 30, 2015 and June 30, 2013, respectively.
The discount rates used to determine the TOL and NOL as June 30, 2015 and 2014 were 4.0% and 4.4%, respectively. The detailed calculations of the discount rate of 4.0% used in calculation of the TOL and NOL as of June 30, 2015 can be found in Exhibit 6 of Section 2. Various other information that is required to be disclosed by GAS 74 can be found throughout Exhibits 1 through 6 in Section 2.
The information that is required to be disclosed by GAS 75 can be found throughout Section 3.
The actuarial assumptions with the exception of discount rate are those used in the June 30, 2015 GAS 43/45 valuation. Updated actuarial assumptions that were adopted after that valuation was released have not been incorporated in this report.

SECTION 1: Valuation Summary for Sonoma County – June 30, 2015 (GAS) 74/75
iii
Summary of Key Valuation Results
2015 2014 Disclosure elements for fiscal year ending June 30: (in thousands)
Service cost 12,043 13,244 Total OPEB liability 435,773 467,803 Plan fiduciary net position 37,259 31,802 Net OPEB liability 398,515 436,001
Schedule of contributions for fiscal year ending June 30: (in thousands) Actuarially determined contributions 27,529 26,500 Actual contributions 25,950 26,060 Contribution deficiency (excess) 1,579 440
Demographic data for plan year ending June 30: Number of retired members and beneficiaries 3,031 3,183(2) Number of active members eligible for OPEB 2,309 3,514(2)
Key assumptions as of June 30: Investment rate of return 4.00% 4.40% Inflation rate 3.25% 3.25% Projected salary increases(1) 4.00% 4.00%
(1) Includes inflation at 3.25% plus real across-the-board salary increase of 0.75% plus merit and longevity increases. (2) As of June 30, 2013.

SECTION 2: Sonoma County – June 30, 2015 (GAS) 74 Information
1
EXHIBIT 1 General Information – “Financial Statements”, Note Disclosures and Required Supplementary Information for a Single-Employer OPEB Plan
Plan Description
Plan administration. The County of Sonoma administers the OPEB Plan - a single employer OPEB plan that is used to provide postemployment benefits other than pensions (OPEB) for permanent full-time general and public safety employees of the County hired before 2009. Management of the OPEB Plan is governed by the County’s Board of Supervisors, which consists of five members.
Plan membership. At June 30, 2015, the County’s membership consisted of the following:
Retired members or beneficiaries currently receiving benefits 3,031
Active members eligible for OPEB 2,309
Total 5,340 Benefits provided. Retirees are eligible for medical and drug benefits provided under two self-insured indemnity plans administered by Anthem Blue Cross (County Health Plan PPO or County Health Plan EPO). In addition, retirees not yet eligible for Medicare can enroll in any of three Kaiser plans, while retirees eligible for Medicare can enroll in a Kaiser HMO or a UHC AARP HMO. Medicare Part B premiums are reimbursed by the County to eligible retired members at a fixed contribution of $96.40 per month, but not to dependents. In addition, retirees are eligible for dental benefits from Delta Dental at full cost to the retiree. Since these benefits are fully paid by the retirees, they have been excluded from this valuation. Duration of Coverage. Lifetime, subject to continuing support by the Board of Supervisors. Dependent Benefits. Same as retirees. Dependent Coverage. Benefits are available for dependents. However, the County does not subsidize coverage for all dependents. As of April 2007, disabled retirees qualify for dependent coverage the same as regular retirees. County Contributions. Retirees may elect to enroll in any County offered medical plan and shall pay for all costs in excess of the County contribution dollar amount. For plans with premiums under $500, the County will pay the full cost of the coverage up to $500 per month. Most retirees are responsible for the full cost of dental coverage. Therefore, no retiree dental costs have been reflected in this valuation. Medicare Integration: Carve-out method in which the plan benefit is first determined without regard to Medicare payments, and is then reduced by the amount of such payments.

SECTION 2: Sonoma County – June 30, 2015 (GAS) 74 Information
2
EXHIBIT 2 Investments
Investment policy. The County of Sonoma’s Investment Policy is detailed in the “Investment Guidelines Document – County of Sonoma Post-Employment Health Care Plan Investment Policy Document – January 2014”. The following is the Board’s adopted asset allocation policy as of June 30, 2015:
Asset Class Target Allocation Long-Term Expected
Nominal Rate of Return Large Cap U.S. Equity 30 9.3 Mid Cap U.S. Equity 4 9.3 Small Cap U.S. Equity 8 9.3 International Equity 8 10.2 Global Equity 6 10.2 U.S. Core Fixed Income 31 4.2 Alternatives 8 6.2 Cash 1 0.0 Real Estate 4 7.1 Total 100%
Rate of return. For the year ended June 30, 2015, the annual money-weighted rate of return on investments, net of investment expense, was 7.5 percent. The money-weighted rate of return expresses investment performance, net of investment expense, adjusted for the changing amounts actually invested.

SECTION 2: Sonoma County – June 30, 2015 (GAS) 74 Information
3
EXHIBIT 3 Net OPEB Liability
The components of the Net OPEB liability for Sonoma County as follows: (in thousands) June 30, 2015 June 30, 2014
Total OPEB liability $435,773 $467,803 Plan fiduciary net position 37,259 31,802 Net OPEB liability $398,515 $436,001 Plan fiduciary net position as a percentage of the total OPEB liability 8.55% 6.80%
The Net OPEB liability was measured as of June 30, 2015 and 2014 and determined based on the total OPEB liability from actuarial valuations as of June 30, 2015 and 2013, respectively.
Actuarial assumptions: The total OPEB liability was determined by an actuarial valuation as of June 30, 2015 using the following actuarial assumptions, applied to all periods included in the measurement:
Inflation 3.25%
Investment rate of return 7.50%, net of OPEB plan investment expense, including inflation
Other assumptions See analysis of actuarial experience during the period January 1, 2009 through December 31, 2011 per formed for the Sonoma County Employees’ Retirement Association (SCERA).
The long-term expected rate of return on OPEB plan investments was determined using a building-block method in which the expected future real rates of return (expected returns, net of inflation) are developed for each major asset class. These returns are combined to produce the long-term expected rate of return by weighting the expected future real rates of return by the target asset allocation percentage, adding expected inflation and subtracting expected investment expenses and a risk margin. The target allocation and projected arithmetic real rates of return for each major asset class, after deducting inflation, but before investment expenses, used in the derivation of the long-term expected investment rate of return assumption are summarized on the previous page.

SECTION 2: Sonoma County – June 30, 2015 (GAS) 74 Information
4
EXHIBIT 3 Net OPEB Liability (continued)
Discount rate: The discount rates used to measure the total OPEB liability were 4.0% and 4.4% as of June 30, 2015 and June 30, 2014, respectively. The projection of cash flows used to determine the discount rate assumed that employer contributions will be made at rates proportional to the actuarially determined contribution rates. For this purpose, employer contributions that are intended to fund benefits of current plan members and their beneficiaries are included. Projected employer contributions that are intended to fund the service costs for future plan members and their beneficiaries are not included. Based on those assumptions, the OPEB plan's fiduciary net position was projected to be available to make all projected future benefit payments for current plan members through the fiscal year ending June 30, 2023.
Sensitivity of the Net OPEB liability to changes in the discount rate The following presents the Net OPEB liability of County of Sonoma’s of June 30, 2015, calculated using the discount rate of 4%, as well as what the County of Sonoma’s Net OPEB liability would be if it were calculated using a discount rate that is 1-percentage-point lower (3%) or 1-percentage-point higher (5%) than the current rate: (in thousands)
1% Decrease (3.0%)
Current Discount (4.0%)
1% Increase (5.0%)
County of Sonoma’s Net OPEB liability as of June 30, 2015 $448,987 $398,515 $355,954 Sensitivity of the Net OPEB liability to changes in the trend rates. The following presents the Net OPEB liability of County of Sonoma’s of June 30, 2015, calculated using the trend rate of +1%, as well as what the County of Sonoma’s Net OPEB liability would be if it were calculated using trend rates that are -1% than the current rates: (in thousands)
1% Decrease Trend -1%
Current Trend Rates
1% Increase Trend +1%
County of Sonoma’s Net OPEB liability as of June 30, 2015 $389,838 $398,515 $407,820

SECTION 2: Sonoma County – June 30, 2015 (GAS) 74 Information
5
EXHIBIT 4 Schedule of Changes in Net OPEB Liability – Last Plan Years (in thousands)
Year Ending June 30, 2015
Total OPEB liability
Service cost $13,244 Interest 21,166 Change of benefit terms 0 Differences between expected and actual experience (43,440) Changes of assumptions 0 Benefit payments, including refunds of employee contributions (23,000) Net change in total OPEB liability (32,030)
Total OPEB liability – beginning 467,803 Total OPEB liability – ending (a) 435,773
Plan fiduciary net position Contributions – employer 27,500 Net investment income 1,083 Benefit payments (23,000) Administrative expense (126) Other 0 Net change in plan fiduciary net position 5,457
Plan fiduciary net position – beginning 31,802 Plan fiduciary net position – ending (b) 37,259 County’s Net OPEB liability – ending (a) – (b) 398,515
Plan fiduciary net position as a percentage of the total OPEB liability 8.55% Covered employee payroll 287,745 Plan Net OPEB liability as percentage of covered employee payroll 138.50%

SECTION 2: Sonoma County – June 30, 2015 (GAS) 74 Information
6
EXHIBIT 5 Schedule of Contributions – Last Five Fiscal Years (in thousands)
Year Ended June 30,
Actuarially Determined
Contributions
Contributions in Relation to the
Actuarially Determined
Contributions Contribution
Deficiency (Excess) Covered-Employee
Payroll
Contributions as a Percentage of
Covered Employee Payroll
2011 $24,465 $23,042 $1,423 $314,045 7.3% 2012 26,313 21,814 4,499 314,045 6.9% 2013 27,692 21,851 5,841 327,651 6.7% 2014 26,500 26,060 440 327,651 8.0% 2015 27,529 25,950 1,579 287,745 9.0%

SECTION 2: Sonoma County – June 30, 2015 (GAS) 74 Information
7
Notes to Exhibit 5
Methods and assumptions used to establish “actuarially determined contribution” rates:
Valuation date Actuarially determined contribution rates are based on the June 30 valuation. Actuarial cost method Projected Unit Credit Cost Method Amortization method Level percent of payroll for total unfunded actuarial accrued liability Remaining amortization period June 30, 2015 valuation 30 years (rolling) for outstanding balance of the June 30, 2015 unfunded OPEB liability. Asset valuation method Market value of assets Actuarial assumptions: June 30, 2015 valuation Investment rate of return 7.5%, net of OPEB plan investment expense, including inflation Other assumptions Same as those used in the June 30, 2015 GASB 43 actuarial valuation dated December 11,
2015.

SECTION 2: Sonoma County – June 30, 2015 (GAS) 74 Information
8
EXHIBIT 6 Projection of OPEB Plan’s Fiduciary Net Position for Use in Calculation of Discount Rate as of June 30, 2015 ($ in thousands)
Year Beginning
Projected Beginning Plan Fiduciary Net
Position
Projected Total
Contributions
Projected Benefit
Payments
Projected Administrative
Expenses
Projected Investment Earnings
Projected Ending Plan Fiduciary Net Position
July 1,
(a)
(b)
(c)
(d)
(e)
(f) = (a) + (b) - (c) - (d) + (e)
2015
$37,259
$20,234
$23,006
$0
$2,690
$37,177
2016
37,177
20,047
24,024
0
2,639
35,839
2017
35,839
19,767
25,210
0
2,484
32,880
2018
32,880
19,495
26,427
0
2,206
28,154
2019
28,154
19,297
27,446
0
1,806
21,811
2020
21,811
19,181
28,516
0
1,286
13,762
2021
13,762
19,100
29,394
0
646
4,114
2022
4,114
19,077
29,974
0
0
0
* Shown until Projected Plan Fiduciary Net Position goes to zero.

SECTION 2: Sonoma County – June 30, 2015 (GAS) 74 Information
9
EXHIBIT 6 Projection of OPEB Plan’s Fiduciary Net Position for Use in Calculation of Discount Rate as of June 30, 2015 ($ in thousands) – continued
Notes:
(1) Amounts may not total exactly due to rounding
(2) Years beyond 2022 have been omitted from this table as the Fiduciary Net Position is zero.
(3) Column (b): Projected total contributions include the normal cost applied to closed group (based on covered active members as of June 30, 2015), plus employer contributions to the unfunded actuarial accrued liability. Contributions are assumed to occur halfway through the year on average.
(4) Column (c): Projected benefit payments have been determined in accordance with paragraphs 43-47 of GASB Statement No. 74 and are based on the closed group of active, retired members, and beneficiaries as of June 30, 2015.
(5) Column (d): Projected administrative expenses have been excluded.
(6) Column (e): Projected investment earnings are based on the assumed investment rate of return of 7.50% per annum and reflect the assumed timing of benefit payments made at the beginning of each month.
(7) As illustrated in this Exhibit, the Plan’s fiduciary net position was projected to be exhausted by June 30, 2023.
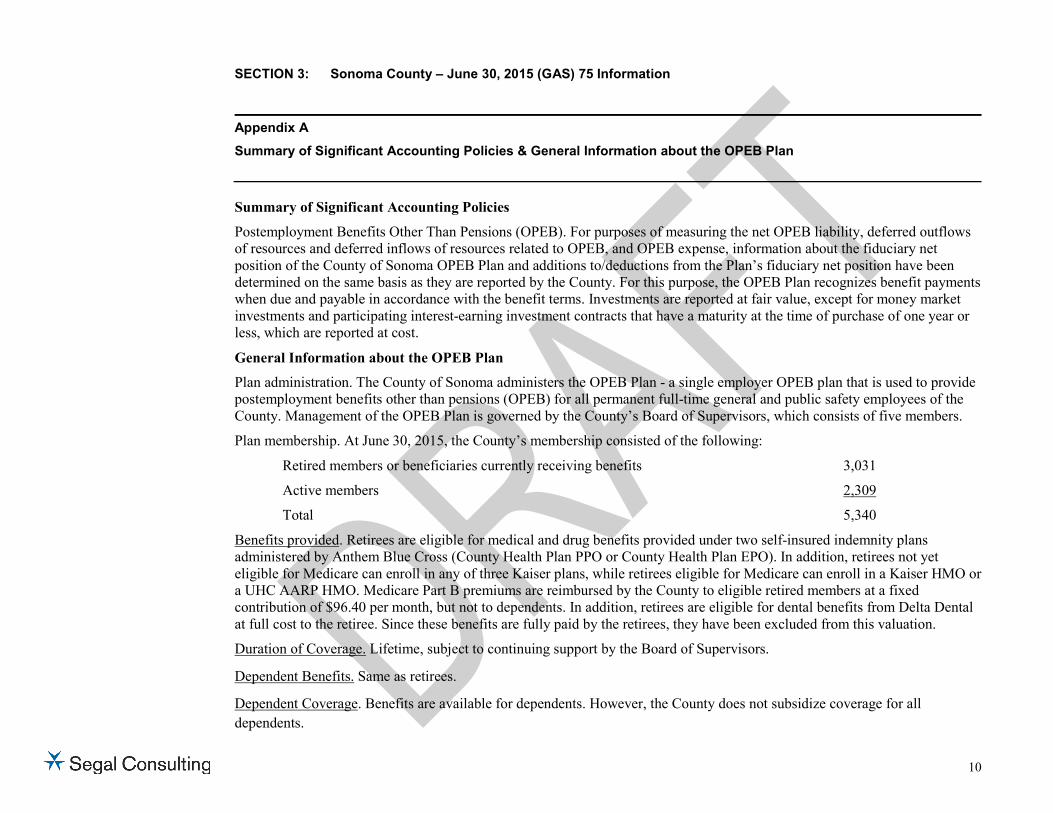
SECTION 3: Sonoma County – June 30, 2015 (GAS) 75 Information
10
Appendix A
Summary of Significant Accounting Policies & General Information about the OPEB Plan
Summary of Significant Accounting Policies
Postemployment Benefits Other Than Pensions (OPEB). For purposes of measuring the net OPEB liability, deferred outflows of resources and deferred inflows of resources related to OPEB, and OPEB expense, information about the fiduciary net position of the County of Sonoma OPEB Plan and additions to/deductions from the Plan’s fiduciary net position have been determined on the same basis as they are reported by the County. For this purpose, the OPEB Plan recognizes benefit payments when due and payable in accordance with the benefit terms. Investments are reported at fair value, except for money market investments and participating interest-earning investment contracts that have a maturity at the time of purchase of one year or less, which are reported at cost.
General Information about the OPEB Plan
Plan administration. The County of Sonoma administers the OPEB Plan - a single employer OPEB plan that is used to provide postemployment benefits other than pensions (OPEB) for all permanent full-time general and public safety employees of the County. Management of the OPEB Plan is governed by the County’s Board of Supervisors, which consists of five members.
Plan membership. At June 30, 2015, the County’s membership consisted of the following:
Retired members or beneficiaries currently receiving benefits 3,031
Active members 2,309
Total 5,340
Benefits provided. Retirees are eligible for medical and drug benefits provided under two self-insured indemnity plans administered by Anthem Blue Cross (County Health Plan PPO or County Health Plan EPO). In addition, retirees not yet eligible for Medicare can enroll in any of three Kaiser plans, while retirees eligible for Medicare can enroll in a Kaiser HMO or a UHC AARP HMO. Medicare Part B premiums are reimbursed by the County to eligible retired members at a fixed contribution of $96.40 per month, but not to dependents. In addition, retirees are eligible for dental benefits from Delta Dental at full cost to the retiree. Since these benefits are fully paid by the retirees, they have been excluded from this valuation.
Duration of Coverage. Lifetime, subject to continuing support by the Board of Supervisors.
Dependent Benefits. Same as retirees.
Dependent Coverage. Benefits are available for dependents. However, the County does not subsidize coverage for all dependents.

SECTION 3: Sonoma County – June 30, 2015 (GAS) 75 Information
11
Appendix A
Summary of Significant Accounting Policies & General Information about the OPEB Plan – (continued)
As of April 2007, disabled retirees qualify for dependent coverage the same as regular retirees.
County Contributions. Retirees may elect to enroll in any County offered medical plan and shall pay for all costs in excess of the County contribution dollar amount. For plans with premiums under $500, the County will pay the full cost of the coverage up to $500 per month. Most retirees are responsible for the full cost of dental coverage. Therefore, no retiree dental costs have been reflected in this valuation. Medicare Integration. Carve-out method in which the plan benefit is first determined without regard to Medicare payments, and is then reduced by the amount of such payments.

SECTION 3: Sonoma County – June 30, 2015 (GAS) 75 Information
12
Appendix B
Net OPEB Liability
Net OPEB Liability
The City’s net OPEB liability was measured as of June 30, 2015 and 2014, and the total OPEB liability used to calculate the net OPEB liability was determined by an actuarial valuation as of June 30, 2015 and 2013, respectively.
Actuarial assumptions. The total OPEB liability in the June 30, 2015 actuarial valuation was determined using the following actuarial assumptions, applied to all periods included in the measurement, unless otherwise specified:
Inflation 3.25%
Investment rate of return 7.50%, net of OPEB plan investment expense, including inflation
Other assumptions See analysis of actuarial experience during the period January 1, 2009 through December 31, 2011 performed for the Sonoma County Employees Retirement Association (SCERA).
Mortality rates were based on the RP-2000 Healthy Annuitant Mortality Table for Males or Females, as appropriate, with adjustments for mortality improvements based on Scale AA.

SECTION 3: Sonoma County – June 30, 2015 (GAS) 75 Information
13
Appendix B
Net OPEB Liability (continued)
The long-term expected rate of return on OPEB plan investments was determined using a building-block method in which best-estimate ranges of expected future real rates of return (expected returns, net of OPEB plan investment expense and inflation) are developed for each major asset class. These ranges are combined to produce the long-term expected rate of return by weighting the expected future real rates of return by the target asset allocation percentage and by adding expected inflation. The target allocation and best estimates of arithmetic nominal rates of return for each major asset class are summarized in the following table:
Asset Class Target Allocation Long-Term Expected
Nominal Rate of Return Large Cap U.S. Equity 30 9.3 Mid Cap U.S. Equity 4 9.3 Small Cap U.S. Equity 8 9.3 International Equity 8 10.2 Global Equity 6 10.2 U.S. Core Fixed Income 31 4.2 Alternatives 8 6.2 Cash 1 4.2 Real Estate 4 7.1 Total 100%
Discount rate. The discount rate used to measure the total OPEB liability was 4.0 percent. The projection of cash flows used to determine the discount rate assumed that County contributions will be made at rates proportional to the actuarially determined contribution rates. Based on those assumptions, the OPEB plan’s fiduciary net position was projected to be available to make all projected future benefit payments for current plan members through the fiscal year ending June 30, 2023. Therefore, the long-term expected rate of return on OPEB plan investments was applied to all periods of projected benefit payments to determine the total OPEB liability.
The discount rate was lowered from 4.4% on June 30, 2014 to 4.0% on June 30, 2015.

SECTION 3: Sonoma County – June 30, 2015 (GAS) 75 Information
14
Appendix B
Net OPEB Liability (continued) (In thousands)
Increase(Decrease)
Total OPEB Liability
Plan Fiduciary
Net Position Net OPEB Liability
(a) (b) (c)
Balance at 6/30/2014 $467,803
31,802
$436,001
Changes for the year:
Service Cost 13,244
13,244
Interest 21,166
21,166
Differences between expected and actual experience (43,440)
(43,440)
Contributions – employer 27,500
(27,500)
Net investment income 1,083
(1,083)
Benefit payments (23,000)
(23,000)
-
Administrative expense (126)
126
Net Changes (32,030)
5,457
(37,487)
Balance at 6/30/2015 $435,773 37,259 $398,514

SECTION 3: Sonoma County – June 30, 2015 (GAS) 75 Information
15
Appendix B
Net OPEB Liability (continued)
Sensitivity of the Net OPEB liability to changes in the discount rate and health-care cost trend rates.
The following presents the Net OPEB liability of County of Sonoma’s of June 30, 2015, calculated using the discount rate of 4%, as well as what the County of Sonoma’s Net OPEB liability would be if it were calculated using a discount rate that is 1-percentage-point lower (3%) or 1-percentage-point higher (5%) than the current rate:
(in thousands)
1% Decrease (3.0%)
Current Discount (4.0%)
1% Increase (5.0%)
County of Sonoma’s Net OPEB liability as of June 30, 2015 $448,987 $398,515 $355,954
The following presents the Net OPEB liability of County of Sonoma’s of June 30, 2015, calculated using the current trend rates, as well as what the County of Sonoma’s Net OPEB liability would be if it were calculated using trend rates that is 1-percentage-point lower or 1-percentage-point higher than the current rate:
(in thousands)
1% Decrease Trend -1%
Current Trend Rates
1% Increase Trend +1%
County of Sonoma’s Net OPEB liability as of June 30, 2015 $389,838 $398,515 $407,820

SECTION 3: Sonoma County – June 30, 2015 (GAS) 75 Information
16
Appendix C
OPEB Expense and Deferred Outflows of Resources and Deferred Inflows of Resources Related to OPEB
OPEB Expense and Deferred Outflows of Resources and Deferred Inflows of Resources Related to OPEB – (In thousands)
For the year ended June 30, 2015, the County recognized OPEB expense of $18,706. At June 30, 2015, the County reported deferred outflows of resources and deferred inflows of resources related to OPEB from the following sources:
Deferred Outflows of Resources
Deferred Inflows of Resources
Difference between expected and actual experience $0 $43,791
Changes of assumptions 13,926 0
Net difference between projected and actual earnings on OPEB plan investments 1,172 0
Total $15,098 $43,791
Amounts reported as deferred outflows of resources and deferred inflows of resources related to OPEB will be recognized in OPEB expense as follows:
Year ended June 30:
2016 (13,282)
2017 (13,282)
2018 (2,422)
2018 293

SECTION 3: Sonoma County – June 30, 2015 (GAS) 75 Information
17
Appendix D
Schedule of Changes in The County’s Net OPEB Liability and Related Ratios
Schedule of Changes in The County’s Net OPEB Liability and Related Ratios (in thousands)
Year Ending June 30, 2015
Total OPEB liability
Service cost $13,244 Interest 21,166 Change of benefit terms 0 Differences between expected and actual experience (43,440) Changes of assumptions 0 Benefit payments (23,000) Net change in total OPEB liability (32,030)
Total OPEB liability – beginning 467,803 Total OPEB liability – ending (a) 435,773
Plan fiduciary net position Contributions – employer 27,500 Net investment income 1,083 Benefit payments (23,000) Administrative expense (126) Other 0 Net change in plan fiduciary net position 5,457
Plan fiduciary net position – beginning 31,802 Plan fiduciary net position – ending (b) 37,259 County’s Net OPEB liability – ending (a) – (b) 398,515
Plan fiduciary net position as a percentage of the total OPEB liability 8.55% Covered employee payroll 287,745 Plan Net OPEB liability as percentage of covered employee payroll 138.50%

SECTION 3: Sonoma County – June 30, 2015 (GAS) 75 Information
18
Appendix E
Schedule Of County Contributions (In thousands)
The schedule of County Contributions are shown in Section 2 – Exhibit 5.

SECTION 3: Sonoma County – June 30, 2015 (GAS) 75 Information
19
Appendix F
Components of County’s OPEB Expense for the Fiscal Year Ended June 30, 2015 (in thousands)
Year Ending June 30, 2015
Service cost $13,244 Interest 21,166 Recognized differences between expected and actual experience (19,905) Recognized changes of assumptions 6,330 Projected earnings on OPEB plan investments (2,549) Recognized differences between projected and actual earnings on plan investments 294 Administrative expense 126 Total OPEB Expense 18,706
5425069v2/10520.041

9
Tribal Update

P a g e | 1
COUNTY OF SONOMA
OFFICE OF THE COUNTY ADMINISTRATOR 575 ADMINISTRATION DRIVE – ROOM 104A
SANTA ROSA, CALIFORNIA 95403-2888 TELEPHONE (707) 565-2431
FAX (707) 565-3778
VERONICA A. FERGUSON
COUNTY ADMINISTRATOR
CHRISTINA RIVERA DEPUTY COUNTY ADMINISTRATOR
REBECCA WACHSBERG DEPUTY COUNTY ADMINISTRATOR
June 13, 2016 To: Members of the Board of Supervisors
From: Veronica A. Ferguson, County Administrator
Re: FY 2016-2017 Tribal Impact Mitigation Funds
The County of Sonoma is home to five federally-recognized tribes, four of which have lands held in trust by the federal government and three of which have intergovernmental agreements with the County. This memo reviews the history and intent of the agreements with the Federated Indians of Graton Rancheria (the Graton Tribe) and the Dry Creek Rancheria Band of Pomo Indians (the Dry Creek Tribe), which provide funding to mitigate casino impacts, an accounting of payments to date and fund balances, and recommendations for further mitigation action with available funding. Overview Tribes are sovereign governments, and trust lands are essentially removed from County jurisdiction and exempt from local land use and taxing authority. As such, the County has prioritized establishing intergovernmental agreements and currently has agreements with the Graton Tribe, the Dry Creek Tribe, and the Lytton Band of Pomo Indians (the Lytton Tribe). The County is currently in negotiations with the Kashia Band of Pomo Indians and Cloverdale Rancheria of Pomo Indians related to areas of mutual interest. The agreements with the tribes cover a number of different issues, but central to all of them is the premise that the impacts of developments on land held in trust for these sovereign governments should be borne by those governments. Some mitigation measures are carried out by the tribes, and some are carried out by neighboring local governments such as the County with funding from the Tribe as governed by the agreements. The Graton Tribe and the Dry Creek Tribe each operate casinos on their trust lands, and the agreements with them focus on mitigating the off-reservation impacts of those and future developments. They are the only two tribes from which the County is currently collecting mitigation payments and has established Mitigation Funds. The agreement with the Lytton Tribe also includes provisions for mitigation payments, however those payments do not begin until the land owned by the tribe outside of Windsor goes into trust.

P a g e | 2
The County has adopted the following financial policy with regards to mitigation funds: “Tribal Development Impact Mitigation Funds shall be accounted for separately, so that when budgeting, only those monies received in the current year shall be relied upon for financing costs in the coming budget. The Board of Supervisors shall make a determination, as new tribal developments occur, on the best uses of these funds to mitigate impacts and maintain the high quality of life in surrounding or affected communities.”
Staff recommendations herein seek to apply these principles to the expenditure of funds associated with the Graton and Dry Creek Tribal Mitigation Funds. Graton Mitigation Fund The Graton Tribe has a 254-acre parcel of land held in trust by the federal government located west of Rohnert Park (the Reservation). On October 23, 2012, the Graton Tribe and the County entered into an Intergovernmental Mitigation Agreement (IMA) primarily to address the anticipated offsite impacts of planned development on the Reservation and to ensure the costs required to mitigate those impacts were borne by the Graton Tribe. Graton Resort & Casino The development of the Graton Resort & Casino is occurring in two phases. Phase I included the construction of a 317,750 sq. ft. casino and entertainment space, with approximately 100,000 sq. ft. dedicated to gaming, including up to 3,000 slot machines. The entertainment space includes numerous restaurants and bars, a nightclub, lounge, and banquet facilities. This phase also included a multi-level parking structure and surface parking for some 5,000 spaces. Phase I was completed and opened to the public in November 2013. Phase II development is currently underway and includes a 200-room hotel, convention center, pool, and spa. Intergovernmental Mitigation Agreement Payments Under the IMA, the Graton Tribe is responsible for covering all costs associated with mitigating the impacts of the casino, including startup costs, one-time infrastructure and project costs, and ongoing expenses. Payments to the County for start-up costs were made directly by the Tribe before the Casino opened. Payments to the County for the remaining costs are made by the state with monies collected from Graton Casino Gaming Revenues as a part of the State Gaming Compact. In any year where insufficient funds are collected by the state to meet all mitigation payments in the State Gaming Compact, the IMA requires the Graton Tribe to directly pay the County for certain minimum guaranteed mitigations. The Tribe is currently permitted a deduction from its payments to the Graton Mitigation Fund for payments to tribal members and predevelopment debt. This will end in 2021, and will thus send more revenue into the Graton Mitigation Fund to be distributed by the state to the City of Rohnert Park and the County. In addition to paying the guaranteed mitigations, this revenue is to be used to address effects on roads, groundwater, and other impacts identified in the agreement. The Graton Mitigation Fund revenue is dependent on revenue increase from Class III gaming machines, and given current data staff estimates that payments beyond the guaranteed amounts will not occur prior to 2019.

P a g e | 3
Start-Up Payments In order for local agencies to sufficiently prepare for the opening of the casino, the Graton Tribe agreed to make non-recurring payments for startup costs that would later be repaid. Those payments include $1.7 million for law enforcement, $1.5 million for fire services, $60,000 for costs associated with negotiating the agreement, and $10,000 to re-time a nearby traffic signal, totaling $3.27 million.
Recurring Payments The agreement provides for guaranteed recurring payments as follows: • Law, Justice, Public Safety, and Tribal Relations: $3.1 million annually to mitigate impacts on law,
justice, and public safety, including payments to the Sheriff’s Office, District Attorney’s Office, Public Defender’s Office, Probation Department, and other County public safety providers. These mitigation payments are also intended to cover dispatch services, tribal relations and administration, and data gathering.
• Health, Human Services, and Socioeconomic Impacts: $600,000 annually to mitigate health, human services, and socioeconomic impacts including substance abuse, domestic violence, and child welfare, and to implement programs that address gambling addiction.
• Fire and Emergency Services: $1 million annually for pass through payments to Rancho Adobe, Central Fire, Rohnert Park, and CSA 40 fire districts for the provision of fire and emergency services.
• Crime Impact Mitigation to Cities: $416,918 annually for pass through payments to Cotati ($12,808), Petaluma ($102,591), Santa Rosa ($286,923), and Sebastopol ($14,596) to mitigate crime impacts caused by the development.
Pursuant to the IMA, these payments are to increase each year based on the Consumer Price Index (CPI) Adjustment, which is to be applied by the Graton Tribe annually.
Other Recurring Payments When there is sufficient revenue going into the Graton Mitigation Fund administered by the state, the IMA instructs that payments to the County first fund the four categories listed above. Once those are fully funded, other County mitigation measures will be funded in the following order: groundwater mitigation, development and mitigation fees, TOT in-lieu fees, local roads maintenance, Highway 101 Sonoma County Transit Authority (SCTA) pass through, and groundwater mitigation/conjunctive use. Additional payments to fund mitigation to parks and open space and other environmental mitigation measures are in a subsequent category. Payments, Expenditures, and Recommendations Below lays out the start-up and recurring payments received from the Graton Tribe and expenditures made by the County to date for each program area as broken out by the IMA. Also included are budgeted revenues and expenditures for FY 2016-2017 based on previously approved mitigation measures, including payments to the Sheriff’s Office and mandated pass throughs to the cities.

P a g e | 4
FY 2015-2016 Estimated Year End Summary
Total
Revenue Total
Expenditures Fund
Balance
Law Justice Public Safety and Tribal Relations $ 6,368,426 $ 4,352,159 $ 2,016,267
Health, Human Services, Socioeconomic Impacts $ 1,229,598 $ 400,000 $ 829,598
Fire Districts Pass Through $ 2,054,330 $ 1,845,660 $ 208,670
City Public Safety Pass Through $ 856,488 $ 833,836 $ 22,652
Interest $ 69,523 $ 16,914 $ 52,609
Total $ 10,578,365 $ 7,448,569 $ 3,129,796
Law, Justice, Public Safety, and Tribal Relations Pre-operating expenses were paid by the Graton Tribe for startup costs related to the Sheriff’s Office ($1,700,000), tribal relations including the cost of negotiating the agreement ($60,000), and traffic mitigation ($10,000). Revenues not expended on operating costs in FY 2013-2014 and 2014-2015 have been reserved for the payback of pre-operating expenses. Currently, the total necessary reserve of $1,770,000 has been set aside, leaving a projected fund balance of $2,016,267 at the end of FY 2015-2016. Expenditures for previously approved mitigation measures are as follows:
• Sheriff: Start-up funds were used to cover the cost of hiring four additional deputies and the ongoing costs of those position to offset the law enforcement impacts. These positions ensure an additional deputy in the service area 24 hours per day.
• Tribal Relations: One-time funds were used to offset the cost of negotiating the IMA, $15,000 to the County Counsel’s Office and $15,000 to the County Administrator’s Office.
• Traffic Mitigation: $16,914 was expended to re-time the traffic signal at Rohnert Park Expressway and Stony Point Road prior to the casino opening. $10,000 was covered by the Graton Tribe and the remaining was paid with interest accrued on the fund balance.
• REDCOM: REDCOM provides dispatch services supporting law enforcement and fire and emergency services. $100,000 was expended for startup costs and $200,000 per year covers the increased demand on those services.
Start-up Payments and Expenditures
Start-up Payment Expenditure
Remainder from Start-up Payment
Sheriff $ 1,700,000 $ 1,247,916 $ 452,084 Tribal Relations $ 60,000 $ 30,000 $ 30,000
Traffic Mitigation $ 10,000 $ 16,914 $ (6,914)
Total $ 1,770,000 $ 1,294,830 $ 475,170
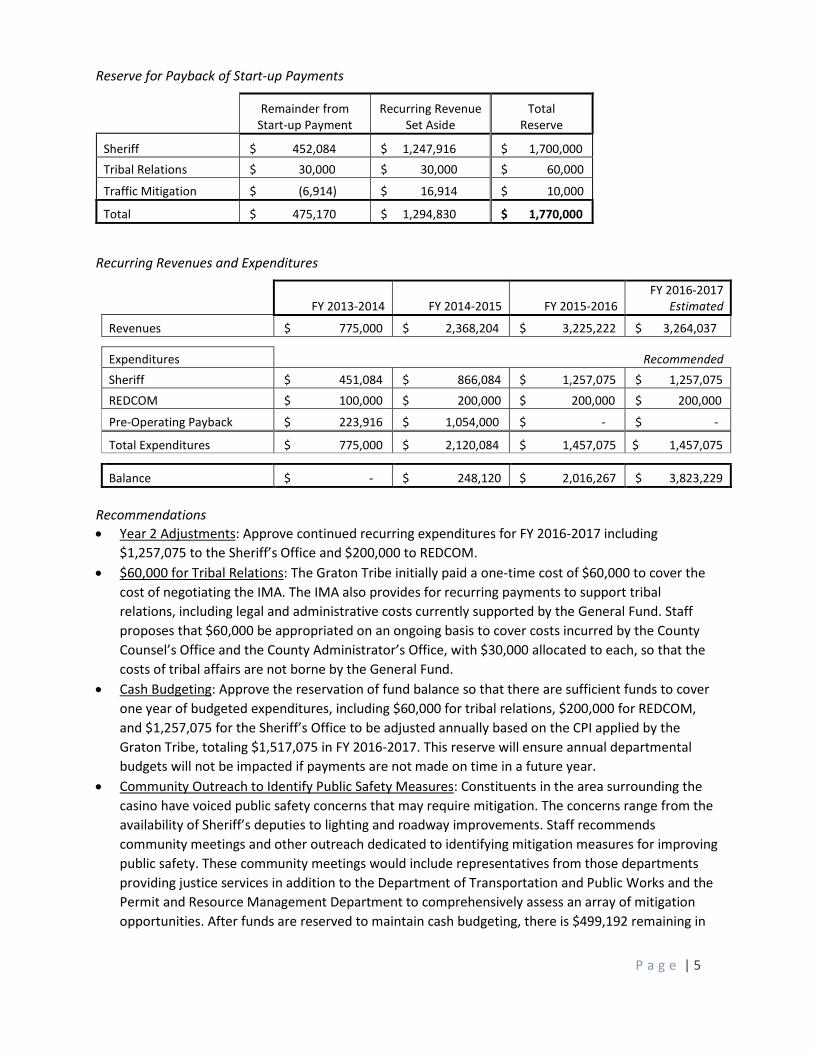
P a g e | 5
Reserve for Payback of Start-up Payments
Remainder from Start-up Payment
Recurring Revenue Set Aside
Total Reserve
Sheriff $ 452,084 $ 1,247,916 $ 1,700,000 Tribal Relations $ 30,000 $ 30,000 $ 60,000
Traffic Mitigation $ (6,914) $ 16,914 $ 10,000
Total $ 475,170 $ 1,294,830 $ 1,770,000
Recurring Revenues and Expenditures
FY 2013-2014 FY 2014-2015 FY 2015-2016 FY 2016-2017
Estimated
Revenues $ 775,000 $ 2,368,204 $ 3,225,222 $ 3,264,037
Expenditures Recommended Sheriff $ 451,084 $ 866,084 $ 1,257,075 $ 1,257,075 REDCOM $ 100,000 $ 200,000 $ 200,000 $ 200,000
Pre-Operating Payback $ 223,916 $ 1,054,000 $ - $ -
Total Expenditures $ 775,000 $ 2,120,084 $ 1,457,075 $ 1,457,075
Balance $ - $ 248,120 $ 2,016,267 $ 3,823,229 Recommendations • Year 2 Adjustments: Approve continued recurring expenditures for FY 2016-2017 including
$1,257,075 to the Sheriff’s Office and $200,000 to REDCOM. • $60,000 for Tribal Relations: The Graton Tribe initially paid a one-time cost of $60,000 to cover the
cost of negotiating the IMA. The IMA also provides for recurring payments to support tribal relations, including legal and administrative costs currently supported by the General Fund. Staff proposes that $60,000 be appropriated on an ongoing basis to cover costs incurred by the County Counsel’s Office and the County Administrator’s Office, with $30,000 allocated to each, so that the costs of tribal affairs are not borne by the General Fund.
• Cash Budgeting: Approve the reservation of fund balance so that there are sufficient funds to cover one year of budgeted expenditures, including $60,000 for tribal relations, $200,000 for REDCOM, and $1,257,075 for the Sheriff’s Office to be adjusted annually based on the CPI applied by the Graton Tribe, totaling $1,517,075 in FY 2016-2017. This reserve will ensure annual departmental budgets will not be impacted if payments are not made on time in a future year.
• Community Outreach to Identify Public Safety Measures: Constituents in the area surrounding the casino have voiced public safety concerns that may require mitigation. The concerns range from the availability of Sheriff’s deputies to lighting and roadway improvements. Staff recommends community meetings and other outreach dedicated to identifying mitigation measures for improving public safety. These community meetings would include representatives from those departments providing justice services in addition to the Department of Transportation and Public Works and the Permit and Resource Management Department to comprehensively assess an array of mitigation opportunities. After funds are reserved to maintain cash budgeting, there is $499,192 remaining in

P a g e | 6
FY 2016-2017 for additional public safety measures. Staff would return at first quarter consolidated budget adjustments with recommended mitigation measures for the Board’s consideration.
Health, Human Services, Socioeconomic Impacts
In FY 2015-2016, $400,000 was paid to the Petaluma Health Center to cover up to 50% of equipment costs for its health center in Rohnert Park to assist with mitigating the impacts of the development on health services. No start-up payments were provided in this category. Recurring Revenues and Expenditures
FY 2013-2014 FY 2014-2015 FY 2015-2016 FY 2016-2017
Estimated
Revenues $ 150,000 $ 455,362 $ 624,236 $ 631,748
Expenditures
Petaluma Health Center $ - $ - $ 400,000 $ -
Total Expenditures $ - $ - $ 400,000 $ -
Balance $ 150,000 $ 605,362 $ 829,598 $ 1,461,346 Recommendation • Community Outreach and Request for Proposal (RFP) Process: As with the public safety measures,
staff recommends community meetings and other outreach be dedicated to identifying specific impacts and opportunities for improving services to mitigate those impacts. First, based on community input, staff will identify existing County programs that could be augmented to provide the needed mitigation services, providing the opportunity to leverage existing resources, also taking into consideration existing programs operated by other entities. Next, staff would produce and disseminate an RFP tailored to the needs identified. The responses would be evaluated and the highest scoring proposals would be brought for Board consideration. Staff would then return at first quarter consolidated budget adjustments with recommended mitigation measures.
Fire District Funding Pass Through
Funding for four fire districts, Rancho Adobe, Central Fire, Rohnert Park, and CSA 40, is designated to cover expenditures associated with additional staffing and other costs necessary to provide services on the Reservation and additional offsite impacts. The Graton Tribe paid $1,500,000 to cover startup costs, of which only $179,957 in actual costs were incurred and paid to the fire districts. The remaining pre-operating balance and additional funds from the FY 2014-2015 operating payment have been set aside to pay back the non-recurring payment. In FY 2014-2015 the Board allocated $297,400 to Rancho Adobe to allow for full station staffing and for station repairs; and $351,710 to Central Fire for station repairs, payment on a new fire apparatus, property tax loss and additional dispatch costs tied to the casino; with an additional $20,000 allocated to CSA 40 for costs associated with administering the funding and for costs incurred with services provided centrally by the County.

P a g e | 7
Start-up Payments and Expenditures
Start-up Payment Expenditure
Remainder from Start-up Payment
Fire & Emergency Services $ 1,500,000 $ 179,957 $ 1,320,043 Reserve for Payback of Start-up Payments
Remainder from Start-up Payment
Recurring Revenue Set Aside
Total Reserve
Fire & Emergency Services $ 1,320,043 $ 179,957 $ 1,500,000 Recurring Revenues and Expenditures
FY 2013-2014 FY 2014-2015 FY 2015-2016 FY 2016-2017
Estimated
Revenues $ 250,000 $ 763,936 $ 1,040,394 $ 1,052,916
Expenditures Recommended To Be Determined Rancho Adobe $ - $ 297,400 $ 300,000 $ - Central Fire $ - $ 351,710 $ 676,036 $ - Rohnert Park $ - $ - $ - $ - CSA 40 $ - $ 20,000 $ 20,557 $ -
Pre-Operating Payback $ 179,957 $ - $ - $ -
Total Expenditures $ 179,957 $ 669,110 $ 996,593 $ -
Balance $ 70,043 $ 164,869 $ 208,670 $ 1,261,586
Recommendations • FY 2015-2016 Pass Through Distribution: The four agencies listed in the IMA meet to make
recommendations about how best to distribute mitigation funds. For FY 2015-2016, staff will return with recommended agreements with the agencies consistent with the following distribution:
o $676,036 for Central Fire Authority of Sonoma County for equipment, dispatch costs, and capital repairs;
o $300,000 for Rancho Adobe Fire Protection District for station staffing and repairs and communications costs; and
o $20,557 for CSA 40 for general operations.
• FY 2016-2017 Pass Through Distribution: The Agencies are currently in the process of meeting and intend to return in FY 2016-2017 with a multi-year agreement including all four members. Staff anticipates returning at first quarter consolidated budget adjustments with the proposed agreement and distribution.
City Public Safety Funding Pass Through
The IMA specifically lays out pass through payments to the surrounding cities to mitigate crime impacts in the following amounts: $12,808 to Cotati, $102,591 to Petaluma, $286,923 to Santa Rosa, and $14,596 Sebastopol. The payments are to be adjusted in accordance with the CPI used by the Graton Tribe to adjust its mitigation payments to the County. In FY 2014-2015 and FY 2015-2016 the CPI

P a g e | 8
Adjustment was not included in the pass through payments to the cities. In FY 2016-2017, the appropriate adjustments will be made in addition to the full FY 2016-2017 pass throughs, leaving the fund balance at $0. No start-up payments were provided in this category. Recurring Revenues and Expenditures
FY 2013-2014 FY 2014-2015 FY 2015-2016 FY 2016-2017
Estimated
Revenues $ 104,230 $ 318,499 $ 433,759 $ 438,979
Expenditures Cotati $ 3,202 $ 9,606 $ 12,808 $ 14,182 Petaluma $ 25,648 $ 76,943 $ 102,591 $ 113,593 Santa Rosa $ 71,731 $ 215,192 $ 286,923 $ 317,694
Sebastopol $ 3,649 $ 10,947 $ 14,596 $ 16,161
Total Expenditures $ 104,230 $ 312,689 $ 416,918 $ 461,631
Balance $ - $ 5,810 $ 22,652 $ - Recommendation • Approve payment of ongoing pass through and CPI Adjustment true ups to the surrounding cities.
Dry Creek Mitigation Fund
The Dry Creek Tribe owns federal trust lands in the Alexander Valley known as the Dry Creek Rancheria, on which the River Rock Casino is located. The County entered into a Memorandum of Agreement (MOA) with the Dry Creek Tribe on March 18, 2008, to address the impacts of the casino and other potential developments on the surrounding area and to ensure the cost of mitigation was borne by the Dry Creek Tribe. To fund mitigation measures, the Tribe agreed to pay the County $75 million over the course of the agreement. Annual payments were set at $3.5 million, with a balloon payment due at the end of 2020 for the remaining balance. The negotiated payments contemplated the development of a hotel resort complex on the Rancheria by 2011, which has not occurred. The MOA contained triggers for “reopening” the agreement and renegotiating various terms, including that the timing of opening the resort and future revenues of the Tribe did not materialize as expected. The Tribe initiated a “reopener” of the MOA in late summer 2013 because it was experiencing a decline in business due to the recession, and anticipating further revenue declines upon the opening of the Graton Resort and Casino in fall 2013. The Tribe failed to pay the County the $3.5 million annual payments that were due on June 30, 2014, and June 30, 2015. On September 22, 2015, the Board adopted an amendment to the MOA that, among other things, renegotiated the mitigation payments due to the County. The amendment provided for a one-time payment of $4.2 million to partially address the $7 million in missed annual payments. It also included a reduced annual payment of $750,000, first due on December 15, 2016, which has the potential to increase based on increases in casino revenue.

P a g e | 9
Payments and Expenditures The County received mitigation payments from the Dry Creek Tribe from the year the casino opened in September of 2002 until the June 30, 2013, payment. These funds, totaling $20.8 million, were paid to the General Fund to cover the loss in property tax revenue and to fund net cost increases for additional costs incurred by several departments responsible for managing or implementing mitigation measures. This included the direct costs of four additional deputies to provide an extra deputy on patrol in the Alexander Valley region 24 hours a day, additional overhead such as training, uniforms, patrol cars expenses, and waste management services provided by Probation’s Supervised Adult Crews through a contract from the Department of Transportation and Public Works (TPW). The initial payments were also used to offset indirect costs associated with the District Attorney’s Office, Public Defender’s Office, and Probation Department for the provision of justice services, as well as costs incurred by the County Counsel’s Office and the County Administrator’s Office in administration, tribal relations, and negotiation of subsequent agreements. Since FY 2014-2015 when mitigation payments from the Dry Creek Tribe ceased, the costs for justice services, administration and the waste management services contract have been paid by the General Fund as the County was committed to continuing these mitigation services for the community despite the lack of reimbursement. In November 2015, the Dry Creek Tribe paid $4.2 million pursuant the amendment to the MOA. The newly negotiated annual payment of $750,000 will not be received until December 2016.
Dry Creek Mitigation Fund
FY 2014-2015 FY 2015-2016
FY 2016-2017 Recommended
FY 2017-2018
Estimated Jul – Dec Jan – Jun
Revenue $ - $ 4,200,000 $ - $ 750,000 $ 750,000
Expenditures Administration $ 60,000 $ 60,000 $ 30,000 $ 30,000 $ 60,000 Sheriff $ 1,015,227 $ 1,043,552 $ 534,508 $ 534,507 $ 1,094,671
TPW $ 147,988 $ 147,988 $ 73,994 $ 73,994 $ 147,988
Geyserville Specific Plan $ 300,000 Follow-up Project Set-aside $ 786,743
Total Expenditures $ 1,223,215 $ 1,251,540 $ 1,725,245 $ 638,501 $ 1,302,659
General Fund Repayment $ 3,113,257
Balance $ (1,223,215) $ 1,725,245 $ - $ 111,499 $ (441,160) Supplemental and Recommended Actions Staff recommends that a portion of the one-time $4.2 million payment be used to reimburse the General Fund for direct costs associated with the Sheriff, TPW, and administration and tribal relations from FY 2014-2015 through second quarter of FY 2016-2017. The annual mitigation payment received in December would be used to offset costs incurred in the third and fourth quarters of FY 2016-2017.

P a g e | 10
The County’s direct expenses will be covered in full through FY 2016-2017. Going forward, mitigation payments received by the Dry Creek Tribe will be insufficient to fully cover mitigation costs. Staff recommends that the County continue to track expenditures and fully fund the existing mitigation measures, and use the $750,000 annual payment to partially offset the impact on the General Fund. In FY 2017-2918, with that offset there will be a shortfall of $441,000. The renegotiated agreement calls for increased annual payments when casino revenue increases, which staff recommends be used for direct expenses to reduce the annual shortfall. After the General Fund is reimbursed, a balance of $1,086,744 remains from the November one-time payment. For these funds staff recommends the following:
• Geyserville Specific Plan: $300,000 to fund an update to the Geyserville Specific Plan, which was first written in 1985. As property values continue to rise and properties change hands, the specific plan will update land uses to reflect current community values, gauge the ability of existing infrastructure to accommodate growth, and estimate costs and financing for public improvements. The updated Specific Plan will take into account the changed circumstances and impacts caused by the casino. The funds will be appropriated once Permit and Resource Management Department (PRMD) develops a timeline associated with the proposed project.
• Infrastructure Follow-up Projects: The remaining funds, $786,743, would be set aside for projects identified by the specific plan or other infrastructure projects in the area designed to mitigate the impacts of casino.
While remaining funds could also be used to support the ongoing shortfall, this recommendation is intended to strike a balance between the need to offset direct impacts of tribal development on the County’s General Fund while also reserving some monies for projects to mitigate for other impacts experienced in the region surrounding the casino. Conclusion In summary, staff recommends that the Board adopt the recommended budget based on previously approved mitigation measures and take the following supplemental actions:
• Graton Mitigation Fund o Staff will create a designation of $1,770,000 to pay back start-up payments made by the
Graton Tribe for law enforcement expenses and $1,500,000 to pay back start-up payments for fire and emergency services.
o Allocate $60,000 ongoing for tribal relations. o Financial policies will be updated to employ cash budgeting and reserve funds sufficient
to cover expenses planned in any subsequent year for tribal relations and law enforcement costs.
o Give staff direction to conduct community outreach for public safety and health, human services, and socioeconomic impacts mitigation with subsequent funding recommendations to come before the Board for approval.
o Direct staff to return with agreements for pass through payments for FY 2015-2016 consistent with the following distribution: $300,000 to Rancho Adobe, $676,036 to Central Fire and $20,557 to CSA 40.

P a g e | 11
• Dry Creek Mitigation Fund o Reimburse $3,113,257 to the General Fund for incurred administration, law
enforcement, and waste management services costs during the period of non-payment by the Dry Creek Tribe.
o Allocate ongoing payments (initially set at $750,000) to the General Fund to partially offset ongoing costs associated with tribal administration, law enforcement, and waste management services. Staff would return to the Board if the annual payments exceed current costs in the future.
o Designate $300,000 for a Geyserville Specific Plan update and $786,743 for one-time and ongoing mitigation measures in the area surrounding the River Rock Casino.

10
Advertising Budget

Page 1
COUNTY OF SONOMA
OFFICE OF THE COUNTY ADMINISTRATOR 575 ADMINISTRATION DRIVE – ROOM 104A
SANTA ROSA, CALIFORNIA 95403-2888 TELEPHONE (707) 565-2431
FAX (707) 565-3778
VERONICA A. FERGUSON
COUNTY ADMINISTRATOR
CHRISTINA RIVERA DEPUTY COUNTY ADMINISTRATOR
REBECCA WACHSBERG DEPUTY COUNTY ADMINISTRATOR
June 13, 2016 To: Members of the Board of Supervisors
From: Veronica A. Ferguson, County Administrator
Re: FY 2016-2017 Supplemental Budget: Advertising Budget
Transient Occupancy Tax (TOT)
Transient Occupancy Tax (TOT) of 9% is charged to rooms in all hotels, motels, bed and breakfasts, inns, and campgrounds in the unincorporated area of the county. Per Board policy, the proceeds of this tax are distributed between the General Fund (25%) and the Advertising Fund (75%). The Advertising Fund finances Chambers of Commerce, Visitor Centers, Economic Development initiatives, Tourism Marketing, Visitor Way Finding and Signage, Workforce Development and Scholarships, a portion of Regional Parks Department operations and maintenance costs, Veteran’s Buildings marketing efforts as Event Facilities, Community Impacts on Public Safety, Agricultural Promotion, Historical Commissions, County Departmental activities that benefit local tourism, Affordable Housing, and staff efforts to administer and operate the funds. Most importantly, the Fund finances local promotions, marketing and advertising efforts of local events, organizations, and documentaries that encourage tourism and economic vitality, per the Advertising and Promotions Program Policy.
Transient Occupancy or Tax History
The chart below summarizes TOT revenues for the past four fiscal years, and includes both quarterly collections and delinquencies. In FY 2015-2016, based on the recent collection report for the past quarter, revenues are 7.6% or $962,136 more than the prior year's total collections. Delinquent collections for FY 2015-2016 total $248,749. It is estimated that $520,000 in outstanding delinquencies, in various stages of collections, are still outstanding.
The existing revenue base (not including outstanding delinquent amounts) is expected to grow 5% from current year estimates.
TOT COLLECTIONS HISTORICAL DATA Percent Fiscal Year General Fund Advertising Fund Total Change FY 12-13 $2,426,258 $7,278,773 $9,705,030 9.8 FY 13-14 $2,761,460 $8,284,381 $11,045,841 12.1 FY 14-15 $3,190,752 $9,572,256 $12,763,008 13.8 FY 15-16 $3,431,536 $10,294,608 $13,725,144 7.6

Page 2
FY 2016-2017 Advertising Program For FY 2016-2017, the Advertising Program Grant applications filing period was open between January 12 and February 19, 2016. An announcement and the application were posted on the County’s Advertising Program website and an email was sent to all current and past grantees. Staff screened and reviewed all applications and provided information and recommendations to the Advertising Committee. The Advertising Committee reviewed applications based on policy guidelines and restrictions, visitor impacts, and the available funding per category. On Tuesday May 3, 2016, the Board approved Advertising and Promotions Program grants for FY 2016-2017. The Board also asked staff to work with the Advertising Committee and return with recommendations on possible ways to spend FY 2016-2017 contingency funds. Specifically, the Board asked for the Advertising Committee to consider the following:
1. Increased funding to 10,000 Degrees 2. Increased base allocation funding for Category E – Local Events, Organizations, and Economic
Development 3. Additional funding for the Sonoma County Landmarks Commission 4. Additional program needs and funding uses
Enclosed is the May 3, 2016, Board approved FY 2016-2017 grant awards. The projected available ending fund balance for FY 2016-2017 based on the recommended budget is $33,010. The economic uncertainty reserve is set at $1,032,201 or 10% of assumed revenues and contingencies at $300,000. The Advertising Committee met on May 25, 2016 to address the Board’s May 3, 2016, direction to explore uses for contingency funds. The Advertising Committee supported the following supplemental changes totaling a $210,324 use of available contingency funds for a new net balance of $89,676 in FY 2016-2017. Of the available remaining contingency funds, the Advertising Committee recommends holding $50,000 of funds to support the 2017 Amgen Tour of California professional cycling race if a bid by the Local Organizing Committee is submitted and approved by Amgen Tour of California. The Board’s Advertising Committee recommends utilizing an additional $50,000 from the economic uncertainty reserve fund if the City of Santa Rosa is selected as the Amgen Tour of California’s overall start city. 1.) Increased funding to 10,000 Degrees
During the May 3, 2016, Board discussion, interest was expressed to provide an additional $50,000 in funding to support the 10,000 Degrees program which includes providing scholarships to skill, trade and apprenticeship programs in addition to college scholarships. On May 25th the Advertising Committee recommended the additional one-time allocation of $50,000.
2.) Increased base allocation funding for Category E – Local Events, Organizations During the May 3, 2016, Board discussion, the Board directed staff to consider an increase to the base allocation funding for Category E – Local Events, Organizations, and Economic Development. Category E funds are dedicated to support advertising and economic development efforts that promote Sonoma County and encourage visitors to frequent the county throughout the year, and are awarded at the discretion of each Supervisorial District. The current Advertising and Promotions Policy provides that of the $160,000 allocated to fund this category, 50% is divided equally across all districts as baseline funding, and the remaining 50% is divided based on percent of collection by district in the previous fiscal year. On May 25th the Advertising Committee recommended funding an

Page 3
additional $2,000 to the base allocation of each Supervisorial District, increasing ongoing appropriations by $10,000 overall.
3.) Additional funding for the Sonoma County Landmarks Commission
On May 3, 2016, the Board discussed additional funding for the Sonoma County Landmarks Commission to fund preservation and restoration of historically significant buildings in the county. On May 25th the Advertising Committee recommended as additional ongoing allocation of $10,000.
4.) Additional program needs and funding uses
On May 3, 2016, the Board directed staff to consider additional options for use of contingencies to fund program and community needs. On May 25th the Advertising Committee reviewed options including one-time funding of $95,940 for night and weekend vacation rental code enforcement to the Permit and Resource Management Department who will manage a contract with a private security firm to provide this service. In addition, the Advertising Committee acknowledged the need to appropriate Advertising Program contingency funds in the amount of $44,384 to fund a position recently reclassified within the Economic Development Department and approved by the Board on May 24, 2016. As recommended by the Advertising Committee on May 25th, the total recommended allocation for additional needs within the Advertising Program is $140,324.
Category E – Local Events/Organizations Allocations The current Advertising and Promotions Policy provides that of the $160,000 allocated to fund this category, 50% is divided equally across all districts as baseline funding, and the remaining 50% is divided based on percent of collection by district in the previous fiscal year. Based on this methodology, the FY 2016-2017 allocation for each district is as follows:
Next Steps: Should the Board approve the proposed actions and adopt the updated Advertising Policy with the Supplemental Budget, staff will incorporate the final grant awards, along with awards approved by the Board on May 3, 2016 into the Advertising Program budget through the FY 2016-2017 supplemental budget process. Enclosures: May 3, 2016 FY 2016-2017 Approved Advertising Program Grant Awards Board Report Draft 6/13/16 Advertising and Promotions Policy (Red Line)
District Base Allocation
% Collected % Allocation
FY 16-17 Allocation
First $16,000 35.59% $28,472 $44,472 Second $16,000 0.27% $216 $16,216 Third $16,000 2.85% $2,280 $18,280 Fourth $16,000 16.88% $13,504 $29,504 Fifth $16,000 44.41% $35,528 $51,528

Revision No. 20140617-1
County of Sonoma Agenda Item
Summary Report
Agenda Item Number: (This Section for use by Clerk of the Board Only.)
Clerk of the Board 575 Administration Drive Santa Rosa, CA 95403
To: Board of Supervisors
Board Agenda Date: May 3, 2016 Vote Requirement: Majority
Department or Agency Name(s): County Administrator’s Office
Staff Name and Phone Number: Supervisorial District(s):
Hannah Euser, 565-3783 All
Title: FY 2016-17 Advertising and Promotions Program Grant Awards
Recommended Actions:
A. Adopt updated Advertising and Promotions Policy B. Approve Fiscal Year 2016-17 Advertising and Promotions Program grant awards and funding
allocation.
Executive Summary:
This item requests Board consideration and approval of Advertising and Promotions Program Policy (Policy) amendments and FY 2016-17 Advertising and Promotions Program (Advertising Program) grant awards and funding allocation. The proposed awards have been reviewed and recommended by Advertising Program Committee liaisons, Supervisors Efren Carrillo and Susan Gorin. Background The Advertising Program utilizes a portion of the Transient Occupancy Tax (TOT) to encourage tourism, economic development and community engagement through a variety of grant award and funding avenues. The Program provides various grants to community non-profits for advertising and promoting events and the county as a visitor destination with the goal of advancing economic growth through tourism. Additionally the program provides grants to promote agricultural promotion as well as address impacts on safety due to tourism. The Program also provides funding to the Regional Parks Department as well as the Economic Development Department and a number of other county department activities, all with the focus of encouraging tourism and awareness of Sonoma County. Monies Now Available Due to a change in County accounting practices for FY 15-16, TOT funds are now collected on an accrual basis. This change resulted in a one-time accrual of $3,000,000 into the Advertising Program’s Fund Balance. The Advertising Committee closely reviewed additional needs throughout the County that could benefit from this one-time funding source. Recommended use of these funds is indicated within each funding category, and clearly designated as “one-time”.

Revision No. 20140617-1
The focus was on mitigating the impacts of tourism; Housing, Workforce Development, Fire Protection, and Infrastructure (Parks, Veterans Hall and Fairgrounds). Proposed Policy Changes Substantial proposed policy changes are summarized below and the proposed Policy is attached (Attachment A – original policy with proposed amendments in track changes, Attachment B – final proposed policy for adoption):
1. Category A6: This new category, Workforce Development and Scholarships, acknowledges that a qualified workforce is essential to the growing needs of the tourism industry as well as the overall health of the community. Funds will be designated to support workforce development and to increase access to educational opportunities through scholarships. Requests may be made for multi-year grants with a maximum of $350,000 per year.
2. Category B1: Updated to include County Event Facilities, including Veterans Halls (managed by General Services Department).
3. Category B2: Updated to allow the Fire Advisory Council to provide recommendations for grant awards, effective for the FY 17-18 grant cycle.
FY 16-17 Grant Recommendations: Grant applications for FY 16-17 funding were accepted from January 12, 2016 to February 19, 2016 following an informational workshop on the various program categories, application process and requirements which was held on January 11, 2016. The application process was conducted for all categories except Category E – Local Events, Organizations and Economic Development, which is funded at the discretion of each supervisor throughout the fiscal year. Staff worked in collaboration with the Advertising Committee, comprised of Supervisors Carrillo and Gorin, in considering all applications, given the available funding. Recommendations are based on a consideration of Policy guidelines and restrictions as well as potential return on investment, including attendance, duration of events and advertisements, and data provided on the success of previous events and usage of prior grant awards. Attachment C details the applications received under each category, a description of the event or program, the grant amount awarded in FY 15-16 if the event/organization previously received an award, the amount requested for FY 16-17, and the amount recommended by the Advertising Committee. The following is a summary of recommendations: Category A1- Chambers of Commerce: Allocates $39,290 to eight entities serving the unincorporated area for membership dues 10% match awards. This amount represents an increase in the maximum funds allowable for this category from $30,000 to $40,000. Category A2 – Visitors Centers: Allocates $342,400 to 10 entities. Nine of the grants in this category are previously approved multi-year grants that will end 6/30/2017. The Committee recommends approving an additional one-year grant for the Geyserville Visitors Center.

Revision No. 20140617-1
Category A3 – Economic Development Initiatives: Includes funding to the Economic Development Department’s Business Assistance Services in the amount of $2,476,215 and $35,000 in funding to the Sonoma County Lodging Association for administrative staffing to provide advocacy and educational resources to the local industry and increase marketing efforts. Category A4 – Tourism Marketing Program: Continues funding to Sonoma County Tourism per the Policy of allocating the first 2% of the 9% tax collected (23% of collections). Category A5 – Visitor Way Finding & Signage: Allocates $97,000 to nine entities. In addition, one-time funding is provided to the Sonoma County Fair & Exposition Center in the amount of $25,000. Category A6 – Workforce Development and Scholarships: This new category focuses on workforce development and allocates $350,000 for six entities. Funding will support the 10,000 Degrees program for direct scholarship awards to underserved high school and undergraduate students from within Sonoma County; the Career Technical Education Foundation for the Regional Advanced Mechanics Program in high schools including program development, grants to high schools and the Santa Rosa Junior College for equipment; Creative Sonoma to support Summer Youth Arts grants and year round arts education programs in underserved schools; the Community Foundation for Career Technical Education (CTE) for new high school sessions in advanced technology and manufacturing as previously approved; and a multi-year grant to fund the Santa Rosa Chamber of Commerce for the Mike Hauser Algebra Academy program geared to strengthen algebra skills and encourage a career in technology for 8th and 9th graders for whom English is a second language. Category B1 – Parks, Recreation and Event Facilities: Provides $2,651,507 in funding to the Regional Parks Department for operations and maintenance of existing and new park facilities, and funding for Veteran’s Buildings online marketing project in the amount of $30,000. One-time funding is provided to the Regional Parks Department to support Sonoma County Integrated Parks Plan (SCIPP) projects and 50th Anniversary Celebration activities, in the amount of $450,000. Additional one-time funding of $400,000 is provided for capital project improvements to Veteran’s Buildings which serve as event facilities for the community. Category B2 – Community Impacts/Public Safety: Allocates $90,000 to nine entities. Additional one-time funds in the amount of $768,000 will be provided to Fire and Emergency Services to fund central dispatch costs for FY 16-17. Category C – Agricultural Promotion: Allocates a total of $185,000 to eight entities. The Advertising Committee recommends that one-time awards be made to Wine Road and Winegrowers of Dry Creek Valley who will be encouraged to fully work with the Sonoma AgGregate/Sonoma County Vintners group (Sonoma County Vintners, Sonoma County Winegrape Commission, Sonoma Valley Vintners and Growers, Sonoma County Farm Trails, Wine Country Weekend, Wine Road, and Sonoma County Harvest Fair) on a joint application for future funding consideration. This amount represents an increase in the maximum funds allowable for this category from $180,000 to $185,000. Category D – Historical Commissions: Allocates $50,000 to two entities. This amount represents an increase in the maximum funds allowable for this category from $30,000 to $50,000.
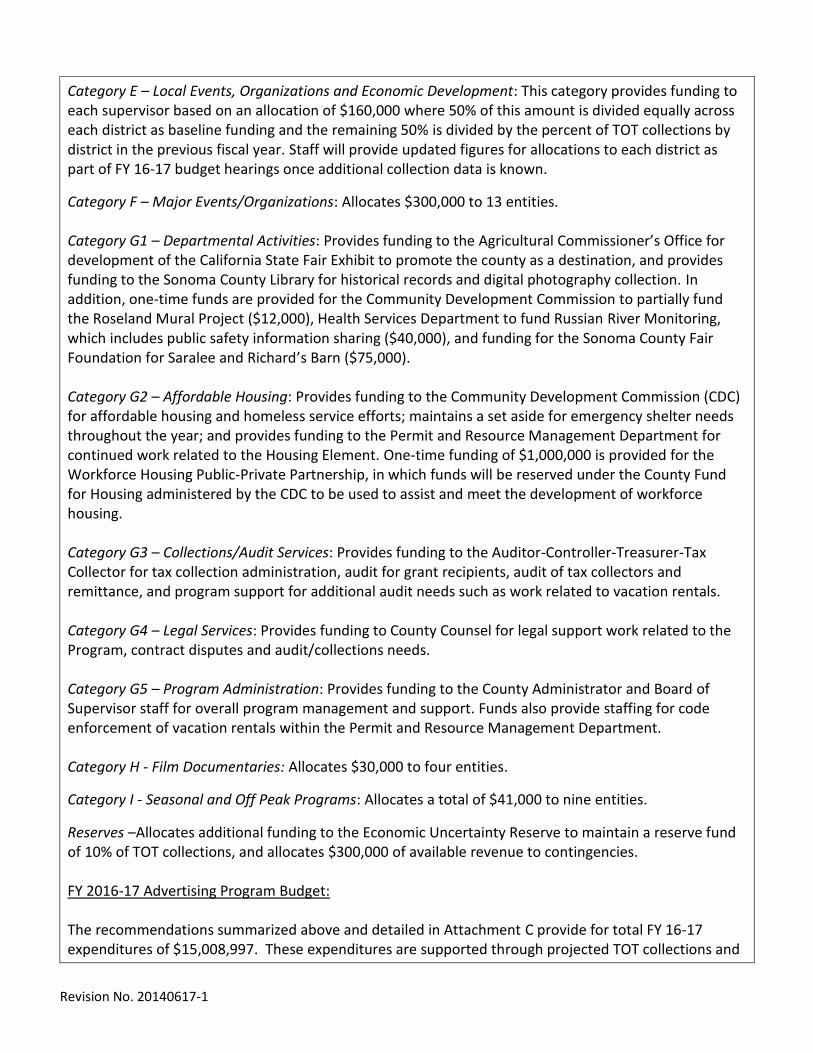
Revision No. 20140617-1
Category E – Local Events, Organizations and Economic Development: This category provides funding to each supervisor based on an allocation of $160,000 where 50% of this amount is divided equally across each district as baseline funding and the remaining 50% is divided by the percent of TOT collections by district in the previous fiscal year. Staff will provide updated figures for allocations to each district as part of FY 16-17 budget hearings once additional collection data is known.
Category F – Major Events/Organizations: Allocates $300,000 to 13 entities. Category G1 – Departmental Activities: Provides funding to the Agricultural Commissioner’s Office for development of the California State Fair Exhibit to promote the county as a destination, and provides funding to the Sonoma County Library for historical records and digital photography collection. In addition, one-time funds are provided for the Community Development Commission to partially fund the Roseland Mural Project ($12,000), Health Services Department to fund Russian River Monitoring, which includes public safety information sharing ($40,000), and funding for the Sonoma County Fair Foundation for Saralee and Richard’s Barn ($75,000). Category G2 – Affordable Housing: Provides funding to the Community Development Commission (CDC) for affordable housing and homeless service efforts; maintains a set aside for emergency shelter needs throughout the year; and provides funding to the Permit and Resource Management Department for continued work related to the Housing Element. One-time funding of $1,000,000 is provided for the Workforce Housing Public-Private Partnership, in which funds will be reserved under the County Fund for Housing administered by the CDC to be used to assist and meet the development of workforce housing. Category G3 – Collections/Audit Services: Provides funding to the Auditor-Controller-Treasurer-Tax Collector for tax collection administration, audit for grant recipients, audit of tax collectors and remittance, and program support for additional audit needs such as work related to vacation rentals. Category G4 – Legal Services: Provides funding to County Counsel for legal support work related to the Program, contract disputes and audit/collections needs. Category G5 – Program Administration: Provides funding to the County Administrator and Board of Supervisor staff for overall program management and support. Funds also provide staffing for code enforcement of vacation rentals within the Permit and Resource Management Department. Category H - Film Documentaries: Allocates $30,000 to four entities.
Category I - Seasonal and Off Peak Programs: Allocates a total of $41,000 to nine entities.
Reserves –Allocates additional funding to the Economic Uncertainty Reserve to maintain a reserve fund of 10% of TOT collections, and allocates $300,000 of available revenue to contingencies. FY 2016-17 Advertising Program Budget: The recommendations summarized above and detailed in Attachment C provide for total FY 16-17 expenditures of $15,008,997. These expenditures are supported through projected TOT collections and

Revision No. 20140617-1
interest of $10,653,100 and use of $4,388,907 in available fund balance. Revenue from collections is budgeted to increase 5% from FY 15-16. This recommended budget maintains an Economic Uncertainty Fund of $1,032,201 and a fund balance of 33,010, and is summarized in Attachment D - Advertising Fund Allocation Summary for FY 2015-16 and 2016-17. Next Steps
Should the Board approve the proposed recommendations, staff will update the Advertising Program Policy as approved and incorporate the final grant awards into the Advertising Program budget through the FY 16-17 budget process.
Prior Board Actions:
2/10/15: Board adopted updated Advertising and Promotions Policy and approved FY 2016-17 Advertising Program grant awards and funding allocation. 6/15/15: Board approved Advertising Program grants for FY 2015-16 as part of the budget hearing process. 12/8/15: FY 2015-16 Supplemental Advertising Program Grant Awards
Strategic Plan Alignment Goal 2: Economic and Environmental Stewardship
Through grants provided to local non-profits to promote the county and encourage tourism, the Advertising Program encourages economic development and job growth.
Fiscal Summary - FY 15-16
Expenditures Funding Source(s)
Budgeted Amount $ County General Fund $
Add Appropriations Reqd. $ State/Federal $
$ Fees/Other $
$ Use of Fund Balance $
$ Contingencies $
$ $
Total Expenditure $ Total Sources $
Narrative Explanation of Fiscal Impacts (If Required):
Grant awards are for FY 16-17, there is no fiscal impact on FY 15-16 as a result of this action. Adjustments will be incorporated into the supplemental FY 16-17 budget based on Board approval of these recommendations.
Staffing Impacts
Position Title (Payroll Classification)
Monthly Salary Range
(A – I Step)
Additions (Number)
Deletions (Number)

Revision No. 20140617-1
Narrative Explanation of Staffing Impacts (If Required):
Attachments:
Attachment A – DRAFT Advertising and Promotions Policy (Red Line) Attachment B – Final DRAFT Advertising and Promotions Policy for adoption Attachment C – FY 16-17 Grant Award Recommendations Attachment D – Advertising Fund Allocation Summary for FY 2015-16 and 2016-17
Related Items “On File” with the Clerk of the Board:

Attachment A
Page 1 of 8
Adopted 07/08/86 Revised 10/02/01; 10/08/02; 09/12/03; 02/03/04; 04/18/06; 04/17/07; 05/10/11; 03/27/12, 6/10/13, 9/16/14, 2/10/15, 5/3/16
ADVERTISING & PROMOTIONS PROGRAM POLICY
I. SOURCE OF FUNDS
The Transient Occupancy Tax (Hotel/Motel Tax or Bed Tax) is authorized under State Revenue and Taxation Code Section 7280 as an additional source of non-property tax revenue to local government. This tax is levied in Sonoma County at a rate of 9%. The code does not require any specific use of the Transient Occupancy Tax (TOT). Funds developed as a result of the TOT may be utilized for General Fund, Advertising Fund, or other purposes. The Sonoma County Board of Supervisors has established a policy that 25% of the TOT funds are designated to the General Fund, and 75% of the funds will be used to finance advertising, promotional and other activities. Activities performed utilizing Advertising Program grants provided to non-profit must also be consistent with Government Code Section 26100, which states that advertising funds may be utilized for the following purposes: A. Advertising, exploiting, and making known the resources of the county;
B. Exhibiting or advertising the agricultural, horticultural, viticultural, mineral, industrial,
commercial, climatic, educational, recreational, artistic, musical, cultural, and other resources or advantages of the county;
C. Making plans and arrangements for a world’s fair, trade fair, or other fair or exposition at which
such resources may be exhibited;
D. Doing any of such work in cooperation with or jointly by contract with other agencies, associations, or corporations.
For purposes of this policy:
a. “Advertising” shall be taken to mean the cost of advertisements in radio, television, newspapers
and magazines, printing of newsletters, direct mail, posters and handbills, internet and other paid advertising, the purpose of which is to draw an increased attendance at an event.
b. “Promotions” shall be taken to mean costs of communication primarily directed outside of the
County for which the purpose is the further recognition of Sonoma County and/or regional areas, events and/or activities in order to achieve favorable media attention and/or large audience exposure. Examples of communication may include attendance at trade shows, public relations activities, in-county familiarization tours and marketing programs.

Attachment A
Page 2 of 8
II. POLICY STATEMENT
The Board of Supervisors wishes to encourage tourism, agriculture, and economic development in the County by supporting a series of promotional, community, and cultural, activities through the use of Advertising funds for: regional and national advertising, support of the community’s spirit and its art/cultural programs, and promotion of other special events as deemed, by the Board, consistent with this Policy. Funding levels will be established annually based on collections.
Except where provided for differently, the Board has established the following general principles which shall govern the allocation of advertising funds:
1. The Board may provide advertising funds to private non-profit organizations whose purpose is to
promote cultural activities, historical preservation activities, promotional activities which enhance tourism and industry, and/or local community events which encourage a sense of community. For purposes of this policy, to qualify as a cultural or artistic organization, the organization must have an annual program consisting of a series of presentations and/or activities. The organization must also have subscriptions, season tickets, and/or non-exclusive memberships, which provides financial support for the organization.
2. Any event promoted by clubs, fraternal organizations, societies, human service organizations, and
other similar type organizations, and for which the proceeds of the event will be used to fund other activities, are not eligible for Advertising funds.
3. Advertising fund grant awards will be based upon an evaluation of all application materials, with
a focus on the return on investment and benefit to be gained, including potential tourism and business revenue, from providing financial support to the event/organization. Events and organizations who demonstrate ability to receive and/or contribute match funding or grants as the result of receipt of Advertising funds will be given priority consideration in the application review process and in consideration of amount of grant award.
4. Costs for staff salaries, overhead, travel expenses (such as transportation, lodging and/or meals)
and fixed assets are not allowable advertising and promotions reimbursable expenses. (Economic Development, Historical Commission, and Departmental activities as indicated in section A.3, B, D, and G and H are exempt from this provision.) Items provided for individual benefit are not allowed, such as t-shirts or wine glasses.
5. Entities will be required to include the County of Sonoma logo and/or statement indicating sponsorship and/or support on all printed and online promotional materials, unless otherwise requested or agreed upon with the County.
6. County funds are not to be used for individual business promotion or advertisement. Any
business name mentioned in county funded materials must be a sponsor or direct participant in the event or promotional effort. Any listing of service or product providers or co-sponsors must be inclusive. Any advertising space or time purchased by an individual business must be clearly and separately identified as paid advertising.
7. Advertisers with multiple events are asked to submit only one (1) application per agency/IRS tax
number. Advertisers may apply for grants for various events and under various categories within the single application. Each separate event or activity for which funds are requested must identify the category(s) under which the event qualifies and is applying for funds.

Attachment A
Page 3 of 8
III. ACTIVITIES ELIGIBLE FOR ADVERTISING AND PROMOTIONS FUNDS
A. Economic Development and Promotional Organizations The Board desires to designate available funds towards projects and initiatives that stimulate and expand the county’s economic vitality.
1. Chambers of Commerce: Funding may be provided to Chambers of Commerce serving unincorporated areas of Sonoma County. Chambers located in the unincorporated area of the county will be given priority in funding consideration. Allocation of funds will be based upon an up to 10% match of membership dues and private cash contributions that are discretionary revenue to the chamber and are not associated with a particular event, function or position. A maximum of $340,000 per year may be made available for Chambers of Commerce.
2. Visitors Centers: Funding for Visitor Centers within the county may be considered at the discretion of the Board of Supervisors. For purposes of funding, Visitors Centers will be distinct from the Tourism Marketing Program. Requests for funding will can be made annually to the Economic Development Board.
3. Economic Development Board:
The Board of Supervisors has designated the Economic Development Board (EDB) to provide business assistance services to enable local businesses to maintain or expand their operations. The EDB will request funds annually through the budget process and will considered at the discretion of the Board of Supervisors.
4. Tourism Marketing Program:
As determined by the Board of Supervisors, the County will provide TOT funds for advertising and promotional efforts as provided by the Sonoma County Tourism Bureau (SCTB). A sum equivalent to the first 2% of the 9% TOT tax collected in the unincorporated Sonoma County will be designated for the SCTB. The county’s TOT contribution to SCTB is disbursed through the EDB budget.
5. Visitor Way Finding and Signage:
Funding may be provided for permanent signage related to visitor way finding and area identification. These funds are intended for the installment and maintenance of permanent identification signs, not temporary or event promotion signs. A maximum of $100,000 per year may be made under this category.
6. Workforce Development and Scholarships: Acknowledging that a qualified workforce is essential to the growing needs of the tourism industry as well as the overall health of the community, the Board of Supervisors has designated funds to support workforce development and to increase access to educational opportunities through scholarships. Requests may be made for multi-year grants. A maximum of $350,000 per year may be made available for Workforce Development and Scholarships.

Attachment A
Page 4 of 8
B. County Tourism Impacts
1. Parks, & Recreation, and Event Facilities: The Board of Supervisors desires to provide TOT funds to County departments for recreational activities that benefit local tourism activities and the tourist industry, including, but not limited to, the Regional Parks Department and the Fairgrounds and Exposition, Inc., and Veterans Halls (under contract or managed by the General Services Department). Funding provided to the Regional Parks Department is allocated for operations and maintenance of existing park facilities only. Requests for TOT funds from County departments will be reviewed annually on a case-by-case basis and will be considered at the discretion of the Board of Supervisors.
2. Community Safety:
The Board of Supervisors desires to address potential impacts on visitors’ and residents’ safety as a result of high-impact tourism within the unincorporated areas of the county. A maximum of $90,000 per year may be made available under this category as Program funding allows. Request for Advertising funds under this category will be reviewed annually on a case-by-case basis. Grants will be awarded as per recommendations from the Fire Advisory Council (effective for FY 17-18 grant cycle).
The following guidelines and specific criteria must be met to be eligible for funding under this category:
a. Only public safety agencies located in the unincorporated area of the county may apply
under this category.
b. Applicants must request funding for a specific purpose (i.e. personnel training, safety equipment, etc.) and include the cost of the activity in relation to the amount of grant funds being applied for.
c. Applicants must demonstrate a clear nexus between the grant request activity and impacts
of tourism resulting in the necessity of the activity.
d. Applicants must demonstrate a clear nexus between the request activity and the benefit to the resident and visitor population within the unincorporated area of the county resulting from the activity.
C. Agricultural Promotion
The Board of Supervisors desires to support advertising campaigns and promotional activities directed by Sonoma County agricultural and viticulture industries.
1. A maximum of $1805,000 per year may be made available for agricultural and viticulture
industries under this category.
2. The following general guidelines shall apply to this category:
a. In order to promote collaborative advertising and promotional efforts within the agricultural sector, only one application will be considered under this category. Such application shall include promotion of the major agricultural related activities within Sonoma County.

Attachment A
Page 5 of 8
i. Application requests that include multiple agency efforts will require submission of agency budgets from all involved agencies.
ii. If county funds are redistributed to other agencies a Memorandum of Understanding
(MOU) between agencies must be submitted with application.
b. Agency applying under this category must be responsive to requests for visitor information on a year-round basis.
c. The request must be part of a larger advertising program. Industry commitment as
demonstrated by matching industry/membership contributions must exceed request for funding from County advertising program.
D. Historical Commissions
The Board of Supervisors desires to support historical preservation of the county’s culture and historical records and architecture.
1. A maximum of $530,000 per year may be made available for this category.
2. The County has designated the Sonoma County Landmarks Commission to advice on the
distribution of funds for preservation and restoration of historically significant buildings. Funding may be provided to this Commission to accept grant applications for the renovation, restoration and/or preservation of historical facilities.
3. The Board has designated a Historical Records Commission to review and make
recommendations regarding the maintenance and destruction and retention of records, which may be of historical significance. Funding under this category may be provided for these activities.
E. Local Events, Organizations and Economic Development
The Board has established this category to assist small cultural, artistic, and countywide events and organizations as well as events occurring during the off peak tourism season (November 15 through April 15) with funding for advertising and economic development efforts that promote Sonoma County and encourage visitors to frequent the county throughout the entire year. Funding for these events and organizations will be at the discretion of each Supervisorial District. Events and organizations will make requests annually to the Supervisorial District in which their event/organization exists.
$160,000 has been allocated for district discretion. 50% of this allocation will be divided equally across each district as baseline funding. The remaining 50% will be divided by the percent of TOT collections by district in the previous fiscal year.
F. Major County Events and Organizations The Board of Supervisors desires to promote major events and cultural and artistic organizations which draw countywide, regional, state and national interest as evidenced by widespread media promotion and which can demonstrate a significant population of participants and visitors from outside the county.
1. A maximum of $300,000 per year may be made available for major events and organizations within this category.

Attachment A
Page 6 of 8
2. The following general guidelines apply to this category:
a. Must demonstrate overall attendance either at a single event or through a series of events in excess of 15,000, with significant (20% or more) demonstrated attendance from out of the county.
b. Must demonstrate extent of out-of-county attendance and demonstrate link to overnight
stays from attendees.
c. Must demonstrate advertising expenses exceeding $25,000, of which the Advertising funds being requested must not exceed 50% of total advertising expenses for the event or organization.
d. Must demonstrate a major advertising campaign plan focused outside of the county.
e. Must demonstrate the extent to which the event, season series, exhibit, or marketing effort
will support the county’s economic development in the form of local job promotion, local education contribution, and/or local business-chambers of commerce-visitors centers partnerships.
3. The maximum advertising fund contribution which can be applied for is $50,000.
3.4. Funds are only to be used for advertising and promotion of the events and not towards the cost
of event production.
4.5. The following will be requested as part of the application process for all events and organizations who apply for advertising funds under this category. This information is not required and failure to provide will not result in disqualification, however, the information will be used to determine grant awards and amounts based on demonstrated ability to most effectively promote tourism, agricultural, and/or economic development.
a. A complete Advertising Fund grant application (form provided by the County);
b. A completed post-program/event report containing results and benefits of prior year
activities and events, if the entity received Advertising Funds in the previous fiscal year (form provided by the County);
c. Detail the advertising/promotional campaign for which advertising funds are being
requested, including the type of advertising and region(s) of promotion;
d. Detail how these activities will promote attendance, including expected attendance, overnight stays, and visitor spending; and
e. Detail how the County of Sonoma organization will be promoted as an organization/event
sponsor in advertising materials, available event/booth attendance, and other such activities. Information should also be provided on available sponsorship packages.
G. County Government Departmental Activities
The Board of Supervisors desires to provide Advertising funds for certain county departmental activities that benefit local tourism activities and the tourist industry, and which preserve and promote Sonoma County history. Advertising funds may be used for salaries of County

Attachment A
Page 7 of 8
employees when participating in activities funded by Advertising funds. Administrative costs (including collection, audit, program coordination, consultant, and legal services), should not exceed 10% of the estimated and/or budgeted TOT revenues.
Request for Advertising funds from departments will be reviewed annually on a case-by-case basis.
1. Miscellaneous Department Activities:
Funding may be provided to County departments to advertise specific activities which promote tourism and awareness of the County, including, but not limited to, the Sonoma County Library, the Sonoma County State Capital Exhibit, and similar endeavors; as well as provide for venue services where tourist and community activities take place.
2. Affordable Housing: Funding may also be identified for an affordable housing program. Funding designated for affordable housing shall be recommended by the County Administrator's Office based on available funding and approved by the Board of Supervisors on an annual basis. As a goal, funds will be recommended based upon 50% of revenues directed toward this fund that are generated from facilities established after 2002, pursuant to the March 2002 Board Policy Workshop, and after categories A-F and H-I have been funded at appropriate levels. The Community Development Commission and the Permit and Resources Management Department shall make requests for these funds annually through the budget process for funding affordable housing programs and related efforts as well as for implementation of the Housing Element. Additionally, $60,000 shall remain in the Affordable Housing Set Aside Fund within the Advertising Program to be available for emergency shelter needs that arise throughout the year that have not been addressed elsewhere.
Should additional funds set aside for affordable housing remain available following these requests and the Set Aside, the funds shall be allocated to the existing County Fund for Housing (CFH), administrated by the Community Development Commission.
3. Collections/Audit Services:
Revenue and tax collection services and program and grantee audit services are provided for this Program. Funding shall be recommended by the County Administrator’s Office annually to fund these activities.
4. Legal Services:
Legal guidance, advice, interpretation and other related services are provided for this Program. Funding shall by recommended be the County Administrator’s Office annually to fund these activities.
5. Program Administration Services:
Administration of this Program, including policy management and review, budget management and review, application review and recommendation, contract management, claims processing, and other related activities are provided by the County Administrator’s Office. Funding shall by recommended be the County Administrator’s Office annually to fund these activities.

Attachment A
Page 8 of 8
H. Documentary Films The Board of Supervisors desires to support Sonoma County based documentary films that document and promote or maintain a historical record of the region, culture, community and arts. 1. A maximum of $30,000 per year may be made available for documentary film production,
with an allocation not to exceed $10,000 per film. 2. The following general guidelines apply in this category:
a. Must demonstrate historical, current social issues, cultural, regional or specific human experiences in Sonoma County that raise awareness and create an impact upon the viewing audience.
b. Must have real, factual situations and circumstances which leave audiences better informed.
c. Must provide detail of advertising/promotional campaign activities, including the type of advertising and region(s) of promotion.
d. Must be able to demonstrate that the film will be exhibited publicly, including but not limited to broadcast and cable television, and Internet transmission.
e. Applicant must provide a production timeline including release date of film and the cost of the activity in relation to the amount of grant funds being applied for.
I. Seasonal and Off Peak Programs The Board of Supervisors desires to promote seasonal programs, events and cultural and artistic organizations as well as events that occur during the off peak tourism season (November 15 through April 15) which draw countywide and regional interest and which can demonstrate participants and visitors from within and/or outside the county. The program will pay for the direct cost of advertising. 1. A maximum of $50,000 per year may be made available under this category. Of that
amount, $30,000 will be designated for off peak programs and $20,000 for seasonal programs.
2. The maximum advertising fund contribution which can be applied for is $5,000.
3. The following general guidelines apply to this category: a. Must detail overall attendance from in and/or outside of the county. b. Must demonstrate local and/or out of county advertising campaign plan. c. Must demonstrate the extent to which the event, seasonal program, exhibit or
marketing effort will support the County’s economic development in the form of local job promotion, local education contribution, and/or overnight stays from attendees.
d. Must provide a budget of total advertising expenses in relation to the amount of grant funds being applied for.

Attachment B
Page 1 of 8
Adopted 07/08/86
Revised 10/02/01; 10/08/02; 09/12/03; 02/03/04; 04/18/06; 04/17/07; 05/10/11; 03/27/12, 6/10/13, 9/16/14,
2/10/15, 5/3/16
ADVERTISING & PROMOTIONS PROGRAM POLICY
I. SOURCE OF FUNDS
The Transient Occupancy Tax (Hotel/Motel Tax or Bed Tax) is authorized under State Revenue and
Taxation Code Section 7280 as an additional source of non-property tax revenue to local
government. This tax is levied in Sonoma County at a rate of 9%. The code does not require any
specific use of the Transient Occupancy Tax (TOT). Funds developed as a result of the TOT may be
utilized for General Fund, Advertising Fund, or other purposes.
The Sonoma County Board of Supervisors has established a policy that 25% of the TOT funds are
designated to the General Fund, and 75% of the funds will be used to finance advertising,
promotional and other activities.
Activities performed utilizing Advertising Program grants provided to non-profit must also be
consistent with Government Code Section 26100, which states that advertising funds may be utilized
for the following purposes:
A. Advertising, exploiting, and making known the resources of the county;
B. Exhibiting or advertising the agricultural, horticultural, viticultural, mineral, industrial,
commercial, climatic, educational, recreational, artistic, musical, cultural, and other resources or
advantages of the county;
C. Making plans and arrangements for a world’s fair, trade fair, or other fair or exposition at which
such resources may be exhibited;
D. Doing any of such work in cooperation with or jointly by contract with other agencies,
associations, or corporations.
For purposes of this policy:
a. “Advertising” shall be taken to mean the cost of advertisements in radio, television, newspapers
and magazines, printing of newsletters, direct mail, posters and handbills, internet and other paid
advertising, the purpose of which is to draw an increased attendance at an event.
b. “Promotions” shall be taken to mean costs of communication primarily directed outside of the
County for which the purpose is the further recognition of Sonoma County and/or regional areas,
events and/or activities in order to achieve favorable media attention and/or large audience
exposure. Examples of communication may include attendance at trade shows, public relations
activities, in-county familiarization tours and marketing programs.

Attachment B
Page 2 of 8
II. POLICY STATEMENT
The Board of Supervisors wishes to encourage tourism, agriculture, and economic development in the
County by supporting a series of promotional, community, and cultural, activities through the use of
Advertising funds for: regional and national advertising, support of the community’s spirit and its
art/cultural programs, and promotion of other special events as deemed, by the Board, consistent with
this Policy. Funding levels will be established annually based on collections.
Except where provided for differently, the Board has established the following general principles
which shall govern the allocation of advertising funds:
1. The Board may provide advertising funds to private non-profit organizations whose purpose is to
promote cultural activities, historical preservation activities, promotional activities which enhance
tourism and industry, and/or local community events which encourage a sense of community.
For purposes of this policy, to qualify as a cultural or artistic organization, the organization must
have an annual program consisting of a series of presentations and/or activities. The organization
must also have subscriptions, season tickets, and/or non-exclusive memberships, which provides
financial support for the organization.
2. Any event promoted by clubs, fraternal organizations, societies, human service organizations, and
other similar type organizations, and for which the proceeds of the event will be used to fund
other activities, are not eligible for Advertising funds.
3. Advertising fund grant awards will be based upon an evaluation of all application materials, with
a focus on the return on investment and benefit to be gained, including potential tourism and
business revenue, from providing financial support to the event/organization. Events and
organizations who demonstrate ability to receive and/or contribute match funding or grants as the
result of receipt of Advertising funds will be given priority consideration in the application
review process and in consideration of amount of grant award.
4. Costs for staff salaries, overhead, travel expenses (such as transportation, lodging and/or meals)
and fixed assets are not allowable advertising and promotions reimbursable expenses. (Economic
Development, Historical Commission, and Departmental activities as indicated in section A.3, B,
D, G and H are exempt from this provision.) Items provided for individual benefit are not
allowed, such as t-shirts or wine glasses.
5. Entities will be required to include the County of Sonoma logo and/or statement indicating
sponsorship and/or support on all printed and online promotional materials, unless otherwise
requested or agreed upon with the County.
6. County funds are not to be used for individual business promotion or advertisement. Any
business name mentioned in county funded materials must be a sponsor or direct participant in
the event or promotional effort. Any listing of service or product providers or co-sponsors must
be inclusive. Any advertising space or time purchased by an individual business must be clearly
and separately identified as paid advertising.
7. Advertisers with multiple events are asked to submit only one (1) application per agency/IRS tax
number. Advertisers may apply for grants for various events and under various categories within
the single application. Each separate event or activity for which funds are requested must identify
the category(s) under which the event qualifies and is applying for funds.

Attachment B
Page 3 of 8
III. ACTIVITIES ELIGIBLE FOR ADVERTISING AND PROMOTIONS FUNDS
A. Economic Development and Promotional Organizations
The Board desires to designate available funds towards projects and initiatives that stimulate and
expand the county’s economic vitality.
1. Chambers of Commerce:
Funding may be provided to Chambers of Commerce serving unincorporated areas of Sonoma
County. Chambers located in the unincorporated area of the county will be given priority in
funding consideration. Allocation of funds will be based upon an up to 10% match of
membership dues and private cash contributions that are discretionary revenue to the chamber
and are not associated with a particular event, function or position. A maximum of $40,000 per
year may be made available for Chambers of Commerce.
2. Visitors Centers:
Funding for Visitor Centers within the county may be considered at the discretion of the Board
of Supervisors. For purposes of funding, Visitors Centers will be distinct from the Tourism
Marketing Program. Requests for funding can be made annually to the Economic
Development Board.
3. Economic Development Board:
The Board of Supervisors has designated the Economic Development Board (EDB) to provide
business assistance services to enable local businesses to maintain or expand their operations.
The EDB will request funds annually through the budget process and will considered at the
discretion of the Board of Supervisors.
4. Tourism Marketing Program:
As determined by the Board of Supervisors, the County will provide TOT funds for
advertising and promotional efforts as provided by the Sonoma County Tourism Bureau
(SCTB). A sum equivalent to the first 2% of the 9% TOT tax collected in the unincorporated
Sonoma County will be designated for the SCTB. The county’s TOT contribution to SCTB is
disbursed through the EDB budget.
5. Visitor Way Finding and Signage:
Funding may be provided for permanent signage related to visitor way finding and area
identification. These funds are intended for the installment and maintenance of permanent
identification signs, not temporary or event promotion signs. A maximum of $100,000 per
year may be made under this category.
6. Workforce Development and Scholarships:
Acknowledging that a qualified workforce is essential to the growing needs of the tourism
industry as well as the overall health of the community, the Board of Supervisors has
designated funds to support workforce development and to increase access to educational
opportunities through scholarships. Requests may be made for multi-year grants. A maximum
of $350,000 per year may be made available for Workforce Development and Scholarships.

Attachment B
Page 4 of 8
B. County Tourism Impacts
1. Parks, Recreation, and Event Facilities:
The Board of Supervisors desires to provide TOT funds to County departments for
recreational activities that benefit local tourism activities and the tourist industry, including,
but not limited to, the Regional Parks Department and the Fairgrounds and Exposition, Inc.,
and Veterans Halls (under contract or managed by the General Services Department). Funding
provided to the Regional Parks Department is allocated for operations and maintenance of
existing park facilities only. Requests for TOT funds from County departments will be
reviewed annually on a case-by-case basis and will be considered at the discretion of the
Board of Supervisors.
2. Community Safety:
The Board of Supervisors desires to address potential impacts on visitors’ and residents’ safety
as a result of high-impact tourism within the unincorporated areas of the county. A maximum
of $90,000 per year may be made available under this category as Program funding allows.
Request for Advertising funds under this category will be reviewed annually on a case-by-case
basis. Grants will be awarded as per recommendations from the Fire Advisory Council
(effective for FY 17-18 grant cycle).
The following guidelines and specific criteria must be met to be eligible for funding under this
category:
a. Only public safety agencies located in the unincorporated area of the county may apply
under this category.
b. Applicants must request funding for a specific purpose (i.e. personnel training, safety
equipment, etc.) and include the cost of the activity in relation to the amount of grant
funds being applied for.
c. Applicants must demonstrate a clear nexus between the grant request activity and impacts
of tourism resulting in the necessity of the activity.
d. Applicants must demonstrate a clear nexus between the request activity and the benefit to
the resident and visitor population within the unincorporated area of the county resulting
from the activity.
C. Agricultural Promotion
The Board of Supervisors desires to support advertising campaigns and promotional activities
directed by Sonoma County agricultural and viticulture industries.
1. A maximum of $185,000 per year may be made available for agricultural and viticulture
industries under this category.
2. The following general guidelines shall apply to this category:
a. In order to promote collaborative advertising and promotional efforts within the
agricultural sector, only one application will be considered under this category. Such
application shall include promotion of the major agricultural related activities within
Sonoma County.

Attachment B
Page 5 of 8
i. Application requests that include multiple agency efforts will require submission of
agency budgets from all involved agencies.
ii. If county funds are redistributed to other agencies a Memorandum of Understanding
(MOU) between agencies must be submitted with application.
b. Agency applying under this category must be responsive to requests for visitor
information on a year-round basis.
c. The request must be part of a larger advertising program. Industry commitment as
demonstrated by matching industry/membership contributions must exceed request for
funding from County advertising program.
D. Historical Commissions
The Board of Supervisors desires to support historical preservation of the county’s culture and
historical records and architecture.
1. A maximum of $50,000 per year may be made available for this category.
2. The County has designated the Sonoma County Landmarks Commission to advice on the
distribution of funds for preservation and restoration of historically significant buildings.
Funding may be provided to this Commission to accept grant applications for the renovation,
restoration and/or preservation of historical facilities.
3. The Board has designated a Historical Records Commission to review and make
recommendations regarding the maintenance and destruction and retention of records, which
may be of historical significance. Funding under this category may be provided for these
activities.
E. Local Events, Organizations and Economic Development
The Board has established this category to assist small cultural, artistic, and countywide events
and organizations as well as events occurring during the off peak tourism season (November 15
through April 15) with funding for advertising and economic development efforts that promote
Sonoma County and encourage visitors to frequent the county throughout the entire year.
Funding for these events and organizations will be at the discretion of each Supervisorial District.
Events and organizations will make requests annually to the Supervisorial District in which their
event/organization exists.
$160,000 has been allocated for district discretion. 50% of this allocation will be divided equally
across each district as baseline funding. The remaining 50% will be divided by the percent of
TOT collections by district in the previous fiscal year.
F. Major County Events and Organizations
The Board of Supervisors desires to promote major events and cultural and artistic organizations
which draw countywide, regional, state and national interest as evidenced by widespread media
promotion and which can demonstrate a significant population of participants and visitors from
outside the county.
1. A maximum of $300,000 per year may be made available for major events and organizations
within this category.

Attachment B
Page 6 of 8
2. The following general guidelines apply to this category:
a. Must demonstrate overall attendance either at a single event or through a series of events
in excess of 15,000, with significant (20% or more) demonstrated attendance from out of
the county.
b. Must demonstrate extent of out-of-county attendance and demonstrate link to overnight
stays from attendees.
c. Must demonstrate advertising expenses exceeding $25,000, of which the Advertising
funds being requested must not exceed 50% of total advertising expenses for the event or
organization.
d. Must demonstrate a major advertising campaign plan focused outside of the county.
e. Must demonstrate the extent to which the event, season series, exhibit, or marketing effort
will support the county’s economic development in the form of local job promotion, local
education contribution, and/or local business-chambers of commerce-visitors centers
partnerships.
3. The maximum advertising fund contribution which can be applied for is $50,000.
4. Funds are only to be used for advertising and promotion of the events and not towards the cost
of event production.
5. The following will be requested as part of the application process for all events and
organizations who apply for advertising funds under this category. This information is not
required and failure to provide will not result in disqualification, however, the information will
be used to determine grant awards and amounts based on demonstrated ability to most
effectively promote tourism, agricultural, and/or economic development.
a. A complete Advertising Fund grant application (form provided by the County);
b. A completed post-program/event report containing results and benefits of prior year
activities and events, if the entity received Advertising Funds in the previous fiscal year
(form provided by the County);
c. Detail the advertising/promotional campaign for which advertising funds are being
requested, including the type of advertising and region(s) of promotion;
d. Detail how these activities will promote attendance, including expected attendance,
overnight stays, and visitor spending; and
e. Detail how the County of Sonoma organization will be promoted as an organization/event
sponsor in advertising materials, available event/booth attendance, and other such
activities. Information should also be provided on available sponsorship packages.
G. County Government Departmental Activities
The Board of Supervisors desires to provide Advertising funds for certain county departmental
activities that benefit local tourism activities and the tourist industry, and which preserve and
promote Sonoma County history. Advertising funds may be used for salaries of County

Attachment B
Page 7 of 8
employees when participating in activities funded by Advertising funds. Administrative costs
(including collection, audit, program coordination, consultant, and legal services), should not
exceed 10% of the estimated and/or budgeted TOT revenues.
Request for Advertising funds from departments will be reviewed annually on a case-by-case
basis.
1. Miscellaneous Department Activities:
Funding may be provided to County departments to advertise specific activities which
promote tourism and awareness of the County, including, but not limited to, the Sonoma
County Library, the Sonoma County State Capital Exhibit, and similar endeavors; as well as
provide for venue services where tourist and community activities take place.
2. Affordable Housing:
Funding may also be identified for an affordable housing program. Funding designated for
affordable housing shall be recommended by the County Administrator's Office based on
available funding and approved by the Board of Supervisors on an annual basis. As a goal,
funds will be recommended based upon 50% of revenues directed toward this fund that are
generated from facilities established after 2002, pursuant to the March 2002 Board Policy
Workshop, and after categories A-F and H-I have been funded at appropriate levels.
The Community Development Commission and the Permit and Resources Management
Department shall make requests for these funds annually through the budget process for
funding affordable housing programs and related efforts as well as for implementation of the
Housing Element. Additionally, $60,000 shall remain in the Affordable Housing Set Aside
Fund within the Advertising Program to be available for emergency shelter needs that arise
throughout the year that have not been addressed elsewhere.
Should additional funds set aside for affordable housing remain available following these
requests and the Set Aside, the funds shall be allocated to the existing County Fund for
Housing (CFH), administrated by the Community Development Commission.
3. Collections/Audit Services:
Revenue and tax collection services and program and grantee audit services are provided for
this Program. Funding shall be recommended by the County Administrator’s Office
annually to fund these activities.
4. Legal Services:
Legal guidance, advice, interpretation and other related services are provided for this
Program. Funding shall by recommended be the County Administrator’s Office annually to
fund these activities.
5. Program Administration Services:
Administration of this Program, including policy management and review, budget
management and review, application review and recommendation, contract management,
claims processing, and other related activities are provided by the County Administrator’s
Office. Funding shall by recommended be the County Administrator’s Office annually to
fund these activities.

Attachment B
Page 8 of 8
H. Documentary Films
The Board of Supervisors desires to support Sonoma County based documentary films that
document and promote or maintain a historical record of the region, culture, community and arts.
1. A maximum of $30,000 per year may be made available for documentary film production,
with an allocation not to exceed $10,000 per film.
2. The following general guidelines apply in this category:
a. Must demonstrate historical, current social issues, cultural, regional or specific human
experiences in Sonoma County that raise awareness and create an impact upon the
viewing audience.
b. Must have real, factual situations and circumstances which leave audiences better
informed.
c. Must provide detail of advertising/promotional campaign activities, including the type
of advertising and region(s) of promotion.
d. Must be able to demonstrate that the film will be exhibited publicly, including but not
limited to broadcast and cable television, and Internet transmission.
e. Applicant must provide a production timeline including release date of film and the
cost of the activity in relation to the amount of grant funds being applied for.
I. Seasonal and Off Peak Programs
The Board of Supervisors desires to promote seasonal programs, events and cultural and artistic
organizations as well as events that occur during the off peak tourism season (November 15
through April 15) which draw countywide and regional interest and which can demonstrate
participants and visitors from within and/or outside the county. The program will pay for the
direct cost of advertising.
1. A maximum of $50,000 per year may be made available under this category. .
2. The maximum advertising fund contribution which can be applied for is $5,000.
3. The following general guidelines apply to this category:
a. Must detail overall attendance from in and/or outside of the county.
b. Must demonstrate local and/or out of county advertising campaign plan.
c. Must demonstrate the extent to which the event, seasonal program, exhibit or
marketing effort will support the County’s economic development in the form of local
job promotion, local education contribution, and/or overnight stays from attendees.
d. Must provide a budget of total advertising expenses in relation to the amount of grant
funds being applied for.

FY 2016/17 Sonoma County Advertising Program Grants (adopted 5/3/16)
Page 1
Entity Event/Purpose 15/16 Advt Grant
Amount Requested Project notes Attend/ Reach
Advrt Budget ROI data Econ impact Match/ Collaborations
County Recognition Adv Cmte Recommendation
Category Max: $40,000Cloverdale Chamber Membership match $2,500 $3,000 Improve local economy by promoting local business.
Organizes Dia de Los Muertos event, Winter Festival, Citrus Fair, Car & Moto Show, maintains website and Welcome Sign, Cycle'Dale program for bike tourism.
$30,000 member dues
Visitors Guide and map, at public events, as applicable.
$3,000
Forestville Chamber Membership match $700 $700 Updating website with business partner information. $7000 member dues
website and FB $700
Geyserville Chamber Membership match $1,700 $2,050 Advertise events in multiple medium targeting Bay Area visitors and beyond. Promote May Day, Fall Colors, Tractor Parade.
10-20 visitors/day
$20,500 member dues
website and materials $2,050
Mark West Chamber Membership match n/a $2,000 Operational costs for organization. $17,050 member dues
acknowledge $2,000
Monte Rio Chamber Membership match $190 $189 Promotion of 4th July Fireworks Program event. 1K-1,500 $1,890 member dues
website and marketing
$190
Russian River Chamber and Visitor Center
Membership match $4,000 $6,500 Targets international and national visitors, California, and San Francisco Bay Area. Funds used for Office Operating costs.
38K $65,000 member dues
$6,000
Sebastopol Chamber and Visitors Center Membership match $6,000 $7,000 Funds used for programming and marketing. $65,000 member dues
directory and website $6,500
Sonoma Valley Chamber Membership match $14,200 $20,000 Forums, promotions, showcase events. $200,000 annual dues and private contrib.
print and online materials
$19,500
$41,439 Total Recommended $39,940
Category A1 - Chambers of Commerce

FY 2016/17 Sonoma County Advertising Program Grants (adopted 5/3/16)
Page 2
Entity Event/Purpose 15/16 Advt Grant
Amount Requested Project notes Attend/ Reach
Advrt Budget ROI data Econ impact Match/ Collaborations
County Recognition Adv Cmte Recommendation
Category Max: None
Cloverdale Visitors Center Existing 2 year contract in place, expires June 2017.
$10,000 $10,000 $10,000
Geyserville Visitors Center Existing. 1 year contract expires June 2016.
$5,000 $19,000 $6,500
Healdsburg Chamber & Visitors Center Existing 3 year contract in place, expires June 2017.
$10,000 $10,000 $10,000
Petaluma Existing 3 year contract in place, expires June 2017.
$10,000 $10,000 $10,000
Redwood Coast Existing 3 year contract in place, expires June 2017.
$6,750 $6,750 $6,750
Russian River Existing 3 year contract in place, expires June 2017.
$78,800 $78,800 $78,800
Santa Rosa Existing 3 year contract in place, expires June 2017.
$31,000 $31,000 $31,000
Sebastopol Existing 3 year contract in place, expires June 2017.
$13,350 $13,350 $13,350
Sonoma Coast (Bodega Bay) Existing 3 year contract in place, expires June 2017.
$82,000 $82,000 $82,000
Sonoma Valley Existing 3 year contract in place, expires June 2017.
$94,000 $94,000 $94,000
$354,900 Total Recommended $342,400
Category Max: None
Economic Development Department Business Assistance Services $1,665,100 $2,476,215 Includes 12.5 FTEs staffing program services in both Business Assistance Services and Research and Program Development areas. The programs are supported by $2,817,115 in funding provided by the Advertising Fund (this includes Visitor Center Program). Additional revenues from external sources in the amount of $66,275 and $469,000 from an MOU with the WIB provide the rest of the funding needed for the department.
$2,476,215
Sonoma County Lodging Association Administrative staffing to provide advocacy and educational resources and increase marketing efforts.
$35,000 $35,000 Target hospitality and lodging. Provides advocacy and educational resources to local industry and increase marketing needs.
$35,000
$2,511,215 Total Recommended $2,511,215
Awarded in FY 14-15 for three consecutive FY. 3nd year of contract
Awarded in FY 14-15 for three consecutive FY. 3nd year of contract
Awarded in FY 14-15 for three consecutive FY. 3nd year of contract
Awarded in FY 14-15 for three consecutive FY. 3nd year of contract
Awarded in FY 14-15 for three consecutive FY. 3nd year of contract
Funded Programs: Business Assistance Hotline: START Your Business; Business Expansion & Outreach Program: EXPAND Your Business; Micro Loan Connect: FINANCE Your Business; Business Development & Marketing: DEVELOP Your Business; Creative Sonoma Arts & Creative Economy Program; Bilingual Business Assistance Program. Partially funded Programs include: Special Events & Economic Briefings; Business Services Program: CONNECT Businesses with Employees; Research Reports and Partnerships; Marketing Industry Sector Special Events, Sonoma County Beer, Cider & Spirits Conference. Permanent Positions Funded: 1.0Executive Director; 1.0 Operations Program Manager; .75 Bus. Develop DPM; 1.0 Bus Assistance DPM; 1.0 Bus Retention DPM; 1.0 Bilingual DPM; 1.0 Creative BDM; 1.0 DPM; 4.75 Admin Aide = 12.5 FTE
Awarded in FY 15-16 for two consecutive FY.
1-year contract expires June 2016.
Awarded in FY 14-15 for three consecutive FY. 2nd year of contract
Awarded in FY 14-15 for three consecutive FY. 2nd year of contract
Awarded in FY 14-15 for three consecutive FY. 3nd year of contract
Category A2 - Visitors Center (rated on # visitors, serve to unincorporated area; cost per visitor ratio and general public levels)
Category A3 - Economic Development
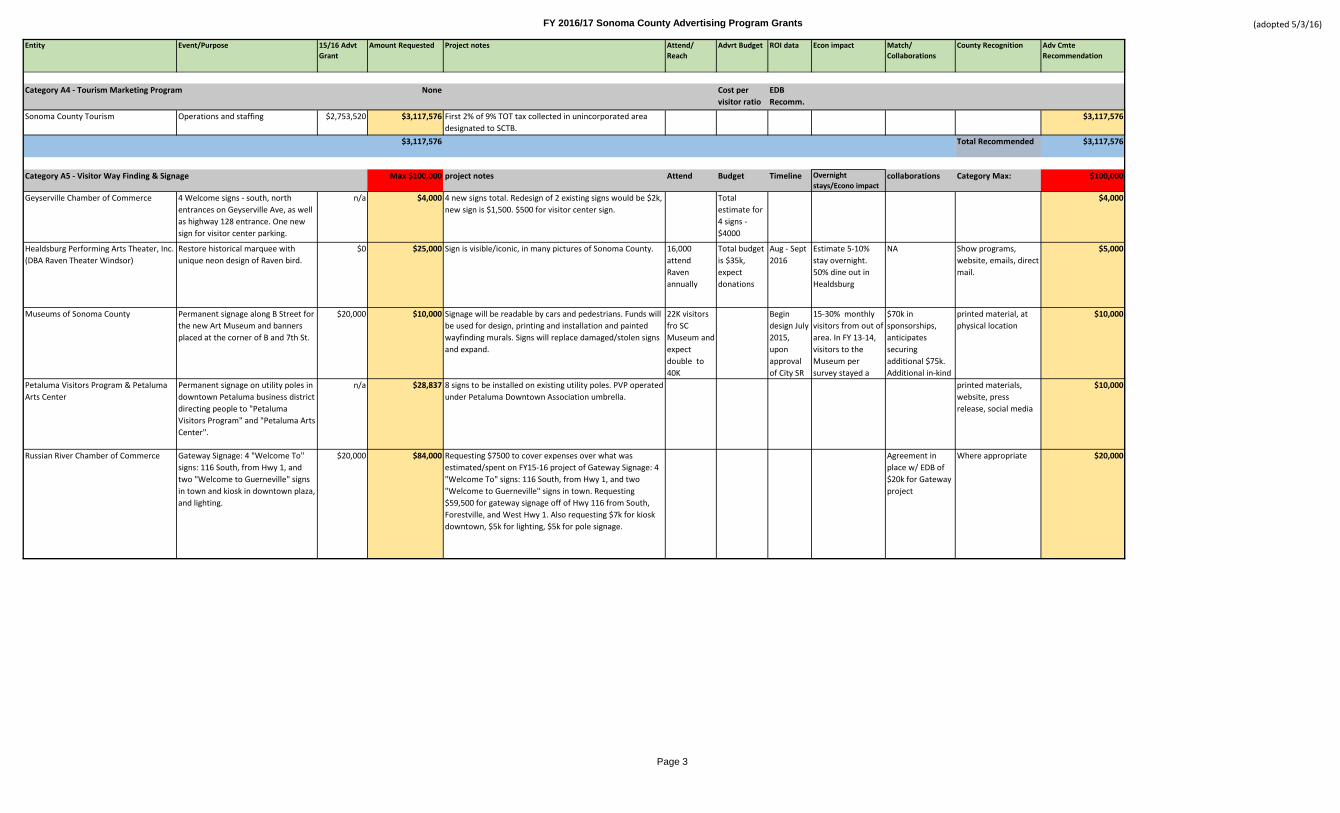
FY 2016/17 Sonoma County Advertising Program Grants (adopted 5/3/16)
Page 3
Entity Event/Purpose 15/16 Advt Grant
Amount Requested Project notes Attend/ Reach
Advrt Budget ROI data Econ impact Match/ Collaborations
County Recognition Adv Cmte Recommendation
None Cost per visitor ratio
EDB Recomm.
Sonoma County Tourism Operations and staffing $2,753,520 $3,117,576 First 2% of 9% TOT tax collected in unincorporated area designated to SCTB.
$3,117,576
$3,117,576 Total Recommended $3,117,576
Max $100,000 project notes Attend Budget Timeline Overnight stays/Econo impact
collaborations Category Max: $100,000
Geyserville Chamber of Commerce 4 Welcome signs - south, north entrances on Geyserville Ave, as well as highway 128 entrance. One new sign for visitor center parking.
n/a $4,000 4 new signs total. Redesign of 2 existing signs would be $2k, new sign is $1,500. $500 for visitor center sign.
Total estimate for 4 signs -$4000
$4,000
Healdsburg Performing Arts Theater, Inc. (DBA Raven Theater Windsor)
Restore historical marquee with unique neon design of Raven bird.
$0 $25,000 Sign is visible/iconic, in many pictures of Sonoma County. 16,000 attend Raven annually
Total budget is $35k, expect donations
Aug - Sept 2016
Estimate 5-10% stay overnight. 50% dine out in Healdsburg
NA Show programs, website, emails, direct mail.
$5,000
Museums of Sonoma County Permanent signage along B Street for the new Art Museum and banners placed at the corner of B and 7th St.
$20,000 $10,000 Signage will be readable by cars and pedestrians. Funds will be used for design, printing and installation and painted wayfinding murals. Signs will replace damaged/stolen signs and expand.
22K visitors fro SC Museum and expect double to 40K
Begin design July 2015, upon approval of City SR
15-30% monthly visitors from out of area. In FY 13-14, visitors to the Museum per survey stayed a
$70k in sponsorships, anticipates securing additional $75k. Additional in-kind
printed material, at physical location
$10,000
Petaluma Visitors Program & Petaluma Arts Center
Permanent signage on utility poles in downtown Petaluma business district directing people to "Petaluma Visitors Program" and "Petaluma Arts Center".
n/a $28,837 8 signs to be installed on existing utility poles. PVP operated under Petaluma Downtown Association umbrella.
printed materials, website, press release, social media
$10,000
Russian River Chamber of Commerce Gateway Signage: 4 "Welcome To" signs: 116 South, from Hwy 1, and two "Welcome to Guerneville" signs in town and kiosk in downtown plaza, and lighting.
$20,000 $84,000 Requesting $7500 to cover expenses over what was estimated/spent on FY15-16 project of Gateway Signage: 4 "Welcome To" signs: 116 South, from Hwy 1, and two "Welcome to Guerneville" signs in town. Requesting $59,500 for gateway signage off of Hwy 116 from South, Forestville, and West Hwy 1. Also requesting $7k for kiosk downtown, $5k for lighting, $5k for pole signage.
Agreement in place w/ EDB of $20k for Gateway project
Where appropriate $20,000
Category A4 - Tourism Marketing Program
Category A5 - Visitor Way Finding & Signage

FY 2016/17 Sonoma County Advertising Program Grants (adopted 5/3/16)
Page 4
Entity Event/Purpose 15/16 Advt Grant
Amount Requested Project notes Attend/ Reach
Advrt Budget ROI data Econ impact Match/ Collaborations
County Recognition Adv Cmte Recommendation
Sebastopol Center for the Arts Permanent signage for Sebastopol Veterans Memorial Bldg to identify Sebastopol Center for the Arts in new location.
n/a $7,500 New venue for Center for the Arts. Signage will also provide information about events/activities within building.
50,000 annually
Total budget is $9500
30% of visitors from out of county
Sebastopol Rotary Club expected to give $1500 grant
On signage frame $7,500
Sonoma Ecology Center Internal way finding and internal signage in park.
$9,550 $11,500 FY 15-16 grant partially funded: Entry "Sonoma Garden Park"; kiosk "Welcome to the Sonoma Garden Park"; “Sonoma Garden Park” sign for pedestrians, bicyclists/ motorists, wayfinding into park. FY 16-17 grant would fund: Way finding signs into park from road and bike route, parking lot gate signs, entrance signs.
200 visitors per week during peak season, 50/wk in winter months
Labor/install/fabric contrib. SEC, volunteers, Berger Concrete, Solarcraft, City of Sonoma, APOSD.
on signage $10,000
Sonoma Valley Visitors Bureau Sonoma Valley billboard program Hwy 37/121, official welcome sign to Sonoma County and Sonoma Valley.
$20,000 $20,700 Billboard at Hwy 37/121 intersection. Funds used for contract costs and artwork/design updates.
43k people view daily during peak months. 100k from Sonoma Raceway.
existing billboards
year round Sonoma Tourism Improvement District & SV marketing Partnership $25K.
visual credit on billboard
$20,500
Windsor Certified Farmers Market, Inc. Permanent directional signs directing traffic to Windsor Farmers Market location with dates and times.
$0 $1,500 Windsor Farmers Market is not a non-profit. 500 attendees each Sun. market, 3-5000 attendees at Thurs. Night Market
Farmers Market spends about $10k/year on advertising of events.
On signs $0
Winegrowers of Dry Creek Valley Replacement of 5 Welcome signs and major entrances to region, Dry Creek Rd, Westside Rd, Canyon Rd, Lytton Springs, and Dutcher.
n/a $15,000 Signs will replace old signs. Will be updated in look, but text will remain the same, "Welcome to Dry Creek Valley, Sonoma County, CA". 5 signs total.
15k visitors per year
WDCV will provide $5k.
On signage and on website
$10,000
$208,037 Total Recommended $97,000
project notes Attend Budget Timeline Overnight stays/Econo impact
collaborations Category Max: 100000
Sonoma County Fair & Exposition Center Replacement of electronic sign at top of Grace Pavillion.
n/a $75,000 Printed materials, on sign, and on website
$25,000
$75,000 Total Recommended $25,000
Category A5 - Visitor Way Finding & Signage (ONE-TIME FUNDS)

FY 2016/17 Sonoma County Advertising Program Grants (adopted 5/3/16)
Page 5
Entity Event/Purpose 15/16 Advt Grant
Amount Requested Project notes Attend/ Reach
Advrt Budget ROI data Econ impact Match/ Collaborations
County Recognition Adv Cmte Recommendation
Category Max:
10,000 Degrees 10,000 Degrees Sonoma County College Prep, Access & Success Expansion Program
$150,000 $300,000 Requesting $300k/year for 5 years. Support for low-income Sonoma County students to attend and graduate from college. Includes funding for scholarships. Recommend funding $100k/year for 5 year term, ending FY 2020-21.
$100,000
Career Technical Education Foundation - Ag and Food Career Exploration and Recruitment
Ag and Food Career Exploration and Recruitment administered by CTE Foundation in conjunction with Food Industry Group, Workforce Development Board, Santa Rosa Junior College, & Sonoma County Office of Education
n/a $25,000 Develop and promote career exploration and job placement opportunities in food and ag industry at high school and JC level. Day long symposium in Spring 2017. Pay for coordinator, promotions, transportation, teacher for survey course. One-time funding.
Many community partners involved.
$0
Career Technical Education Foundation - Regional Advanced Mechanics Program
Regional Advanced Mechanics Program: Regional manufacturing training program to support local manufacturing needs for technicians and mechanics. Funding for program development, grants to high schools and SRJC for equipment, new course implementation, teacher externships and internship opportunities for students. Begins in high schools and finish in one year at SRJC.
$50,000 $50,000 Year 2 of 3 year contract. 2015-16 through 2017-18. “Manufacturing Magnet” program with the goal of preparing globally competitive technicians and engineers.
Recruit students in fall 2015
County invest would attract matching $ needed from local industry that would meet or exceed a 1:1 match.
$50,000
Creative Sonoma Summer Arts Grants Summer Arts Youth Grants n/a $100,000 Creative Sonoma to manage summer grant process and report back to Board by end of year.
$100,000
Creative Sonoma Arts Education Grants Program to support equitable access arts education for underserved Sonoma County schools
n/a n/a Funding previously allocated to Community Foundation. Funds will be used to provide grants to non-profit arts organizations. Committed matching grants from Community Foundation to enhance available funds.
$24,000
Community Foundation: Arts Education Programs
Program to support equitable access arts education for underserved Sonoma County schools
$50,000 $50,000 Through collaboration with Creative Sonoma, funds will now be provided to Creative Sonoma to manage, with collaboration with the Community Foundation.
$0
Community Foundation: Education/Mentorship (CTE)
Career Technical Education: "New" courses at high schools and off campuses to develop local workforce in engineering/design or Advanced Tech & Manufacturing (STEM) county-wide
$51,000 $51,000 Year 4 of 5 year contract. 2013-14 through 2017-18. $51,000
Santa Rosa Chamber of Commerce - Mike Hauser Algebra Academy
Algebra prep program and expansion for 8th & 9th graders in Sonoma County for whom English is a second language. 60% of enrolled students qualify as low income.
$35,000 $35,000 Provides 3 week hands-on learning program in June. In 2015, served 100+ 8th grade English Language Learners county-wide. Goal for 2017 is 180. Recommend funding for $25,000 per year for 3 year term, ending FY 2018-19.
Total Program Cost is $111,000
Private donors, John Jordan Foundation, Healdsburg Education Foundation & SCOE
Press releases, website, printed materials, graduation program
$25,000
$611,000 Total Recommended $350,000
Max: $350,000Category A6 - Workforce Development and Scholarships (NEW) Max: $350,000

FY 2016/17 Sonoma County Advertising Program Grants (adopted 5/3/16)
Page 6
Entity Event/Purpose 15/16 Advt Grant
Amount Requested Project notes Attend/ Reach
Advrt Budget ROI data Econ impact Match/ Collaborations
County Recognition Adv Cmte Recommendation
Category Max: n/a
Regional Parks Department Operations and Maintenance of existing facilities
$2,331,431 $2,751,507 $2,651,507
General Services - Veteran's Buildings Veteran's Building online marketing project
$30,000 $30,000 $30,000
$2,781,507 Total Recommended $2,681,507
Category Max: n/a
Regional Parks Department - One-time Funds
Sonoma County Integrated Parks Plan (SCIPP) projects and 50th Anniversary Celebration
n/a $500,000 $450,000
General Services - Veteran's Buildings - One-time Funds
Capital project improvements for Veteran's Buildings
n/a $684,403 $400,000
$1,184,403 Total Recommended $850,000
Max: $90,000 Category Max: $90,000Bodega Bay Fire Protection District Safety training and education, utility
vehicle for non-emergency and emergency response, AEDs.
$35,000 $90,000 1. Utility vehicle will be used for response and towing of Fire/Rescue Boat and inflatable rescue boat for response ($60k). 2. paramedic training and education for 1-2 people ($20k). 3. 2 new AED's ($10K).
Bodega Bay. FY 14/15 responded to 595 calls (210 non-resident). Total visitors 4M+ visitors annually.
70% calls response and 80% ambulance transport for non-residents
Possibly District or Bodega Bay Fire Assoc. funds
press release, website $15,000
Bodega Volunteer Fire Department Station upgrades. $20,000 $52,000 Facility upgrades for fire station #2/Community Disaster Shelter $52k (Door replacement, $2500; Interior paint, $12k; interior flooring, $15k; New roof, $20k, New Propane Interior Heater, $2500.
Town of Bodega. 50k visitors annually
No current funding dedicated to Fire Station upgrades
website, newsletter, FB
$10,000
Cazadero Community Services District/Cazadero Volunteer Fire District
Exhaust system for Cazadero Fire Hall/Community Hall.
$15,000 $36,452 Hall is currently not OSHA compliant, there is no exhaust system. Cazadero Hall is only large public building in town and is used for many community events, also fire drills/safety training, etc.
Cazadero Area - vacationers, tourists, hikers, and cyclists
None Sign in building $10,000
Monte Rio Fire Protection District Maintain and improve Rescue Boat Program.
$0 $27,500 Will purchase life jackets, radios, modern underwater imaging sonar equipment, inflatable rescue boat, and boat operations training. Rescue Boat responds to water related emergencies. Increase in responses related to water activity tourism.
Monte Rio population is 2500.
MRFPD or Monte rio Firefighters Association will possibly provide funds to fulfill request.
Logo on equipment, materials.
$10,000
Occidental Fire Department Auto Extrication Tool for motor vehicle related emergency response.
$0 $30,000 Increased rise in road traffic has led to increased need for public safety equipment. Tool would be used to extricate victims trapped in a car due to an accident. Current tool is over 25 years old and in disrepair.
Occidental population is 5,000. 263 emergency calls in 2015.
Occidental Fire Dept. will match $30k for extrication tool
Logo on equipment, press release.
$10,000
Increase based on needs and opening of new parks. Additional funds will offset operations and maintenance expenses. Additional allocations will fund existing Planner Tech ($55,915) fund O&M Maintenance ($77,690), O&M Admin ($64,471), and general O&M activities ($122,500).
Category B1 - Parks, Recreation and Event Facilities (ONE-TIME FUNDS)
Project includes a new website and printed promotional materials. Project to be managed by General Services
Category B2 - Community Impacts - Public Safety
Includes $250,000 in funding to support Sonoma County Integrated Parks Plan (SCIPP) projects in each of the five districts. In addition, this will fund the Healdsburg Memorial Beach Master Plan ($50,000) and Bodega Head management ($83,000). Regional Parks 50th Anniversary Celebration activities will receive $67,000 in funds.Projects include: Santa Rosa Vets Hall Reroof (design) - $100,000; Sebastopol Sprinkler - $440,403; Petaluma Kitchen (design) - $32,000; Sonoma Kitchen (design) – $62,000; Guerneville HVAC (design) - $30,000; Guerneville Hazmat Cleanup – $20,000
Category B1 - Parks, Recreation and Event Facilities

FY 2016/17 Sonoma County Advertising Program Grants (adopted 5/3/16)
Page 7
Entity Event/Purpose 15/16 Advt Grant
Amount Requested Project notes Attend/ Reach
Advrt Budget ROI data Econ impact Match/ Collaborations
County Recognition Adv Cmte Recommendation
Russian River Chamber of Commerce & Visitors Center
Extension of contract with security firm to provide security services.
$0 $100,000 FY 15-16 Security firm contract of $35k for seasonal pilot security program funded by Sonoma County. Reports of drug, alcohol, and problematic transient behavior in Russian River area which negatively impacts community and tourism. Total cost to fund one security guard to patrol 24 hours/day, 7 days/wk. = $260k/yr. GENERAL SERVICES is organizing a contract to provide this service in collaboration with the Russian River Chamber.
Website, printed materials, FB, events.
$0
Russian River FPD CERT (Community Emergency Response Team) Program.
$0 $15,000 Includes $9000 for trailer and related equipment and the remaining to cover training materials and staff costs. CERT teams provide emergency response to incidents. Russian River FPD prioritized funding for the "Jaws of Life" need over this program for FY 16-17.
Serves 20 sq. mile are. Population is 10,400, seasonally doubles with tourism. 1700 incident responses/ yr.
Business donations from True Value Hardware ($1000) and Von Renner Construction ($500), $1000 from Mesa Lane Partners.
Website, on equipment
$0
Russian River FPD Hydraulic rescue equipment, "Jaws of Life".
$0 $40,858 Tools used to remove a victim from a mangled car due to traffic collision. Current tools are outdated and unacceptable to save lives.
Serves 20 sq. mile are. Population is 10,400, seasonally doubles with tourism. 1700 incident responses/ yr.
none. On equipment, FB, webpage, at events.
$20,000
Timber Cove FPD Rescue tool, Capstan, cylindrical shaft mounted on tailgate of rescue vehicle. Allows for faster and efficient rescue and increases safety for personnel.
$0 $12,904 Tool is compatible with Bodega Bay Fire rescue and will allow for joint rescue operations.
Timber Cove sees 3500-500 visitors/year. Emergency responses have increased
Timber Voce FPD will pay $1250 for installation costs of capstan.
On equipment $5,000
Valley Moon FPD Live fire structure for mandatory training.
$20,000 $70,000 Live fire structure for mandatory training. Agua Caliente, Boyes Hot Springs, El Verano, Fetters Hot
EMS response area 100 sq. miles. Responds to 4500 calls each year.
Proclamation at FPD Board meeting and letter to Sonoma Index Tribune, plaque on structure.
$10,000
$474,714 Total Recommended $90,000

FY 2016/17 Sonoma County Advertising Program Grants (adopted 5/3/16)
Page 8
Entity Event/Purpose 15/16 Advt Grant
Amount Requested Project notes Attend/ Reach
Advrt Budget ROI data Econ impact Match/ Collaborations
County Recognition Adv Cmte Recommendation
Category Max: n/aFire and Emergency Services Central Dispatch Costs for FY 16-17 -
One Time Fundingn/a $768,000 $768,000
$768,000 Total Recommended $768,000
Max: $185,000 Category Max: $185,000Sonoma AgGregate/Sonoma County Vintners
SC Vintners, SC Winegrowers, SV Vintners & Growers, SC Farm Trails, SC Harvest Fair, Sonoma Wine Country Weekend, Wine Road
$150,000 $180,000 support advertising, public relations programs to build brand awareness for SC’s vineyards, wineries, and farms. $57K Vintners; $51K Winegrape Comm.; $25K SV Vintners; $17K Farm Trails, $10k WC Weekend, $10k Wine Road, $10k Harvest Fair
4.3M visitors annually
websites, printed materials, member communication
$175,000
Wine Road – Northern Sonoma County Barrel
Barrel Tasting Weekends $5,000 $5,000 March 3-5 and 10-12, 2017. 115 wineries participating. Printed materials, posters, postcards, programs, event maps.
14,000-17,000
. 50% from out of County, $800k econ impact plus $1.2M in wine sales
Printed materials, website
$3,000
Wine Road – Northern Sonoma County WINEland
Winter WINEland $5,000 $5,000 Jan. 14-15, 2017 Winter WINEland. Printed material, posters, postcards, programs, event maps.
5000-6000 $30,000 70% from out of County
Printed materials, website
$3,000
Winegrowers of Dry Creek Valley Passport to Dry Creek Valley n/a $5,000 April 29-30, 2017. Advertising campaign. One time funding only - next year will need to apply under Aggregate.
6,000 n/a 2,700 overnight stays, econ impact $2.3M
materials, website, direct mail, event materials
$4,000
$195,000 Total Recommended $185,000
Max: $50,000 Category Max: $50,000Historical Records Commission Peterson Prize an annual writing
competition and general records preservation efforts
$2,000 $10,000 Cataloging and preserving records. Organize Archives Day, a public awareness event to bring attention to importance of historical records. Maintain HRC website.
$10,000
Landmarks Commission Funding for preservation and restoration of historically significant buildings.
$28,000 $60,000 Daniels School Restoration Phase 2 ($15k), Jack London State Park House of Happy Walls Visitor Center interior repairs/restoration and update of museum exhibits and displays ($10k), Luther Burbank Cottage repair/restoration ($10k), Healdsburg Museum exterior re-painting ($11k), Guerneville Bridge/Plaza Signage & Walking Map ($2500), Sonoma Valley Historical Context Report ($10k).
$40,000
Western Sonoma County Historical Society
Replace wood shake roof and gutters of Luther Burbank Experiment Farm Cottage
$0 $23,369 Shake roof ($18k) and wood gutters ($5,309) need replacement to avoid further damage to items within Cottage
$0
Museums of Sonoma County Documentation of original exhibitions on website.
$0 $3,500 Develop and present virtual exhibition records for four Sonoma County history exhibitions.
$0
$96,869 Total Recommended $50,000
15/16 Allocation
16/17 Allocation FY 15/16 % collect
New % x $80k
$80k / 5 Category Max: $160,000
District 1 $43,229 $44,152 35.59% $28,472 16,000 $44,472District 2 $16,096 $16,240 0.27% $216 16,000 $16,216District 3 $18,340 $18,248 2.85% $2,280 16,000 $18,280District 4 $29,603 $29,800 16.88% $13,504 16,000 $29,504District 5 $52,732 $51,560 44.41% $35,528 16,000 $51,528
$160,000 $160,000 100.00% $80,000 $80,000 Total Recommended $160,000
Category C - Agricultural Promotion
Category D - Historical Commissions
Category E - Local Events, Organizations and Economic Development
Amount based on actual costs for FY 15-16.Category B2 - Community Impacts - Public Safety (ONE-TIME FUNDS)

FY 2016/17 Sonoma County Advertising Program Grants (adopted 5/3/16)
Page 9
Entity Event/Purpose 15/16 Advt Grant
Amount Requested Project notes Attend/ Reach
Advrt Budget ROI data Econ impact Match/ Collaborations
County Recognition Adv Cmte Recommendation
Max: $300,000 Category Max: $300,000
American Legion Post 28 Petaluma Veterans Day Parade n/a $11,000 Veterans Day Parade and Fly Over in Petaluma on 11/11/16. Pay for advertising and promote out-of-area visitors. Typically receives tv news coverage.
45,000+ $11,000 n/a n/a website and at parade $4,000
Cruisin the Boulevard Petaluma's Salute to American Graffiti
n/a $10,000 Advertising and promotion of event, radio, newspaper, brochure; 11th annual celebration on May 20, 2017
30,000 $18,000 Hotels report full occupancy rates with out of town visitors
Sponsorships Printed programs $4,000
Luther Burbank Rose Parade & Festival 123 Annual Rose Parade and Festival $6,000 $7,000 Buy print, ad, web, radio and flyers for SF Area, Marin, Napa, Lake. Parade 5/20/17 in Santa Rosa.
15-16,000 attendees
$22,200 Visitors from in and out of County
Print, web, radio advertising and flyers
print materials, website, and broadcast
$5,000
Sonoma County Farm Trails Gravenstein Apple Fair $15,000 $15,000 Promotion of the 43rd annual Gravenstein Apple Fair August 13-14, 2016. Advertise throughout Bay Area with print media, radio, websites, social media, billboards, posters, flyers, rack cards, mailers.
15,000, 30% from outside of SoCo.
$45,000 400,000 in spending
website, printed materials, banners, special stage dedicated at Fair.
$13,000
Sonoma Volunteer Firefighter Association
44th Annual July 4th Fireworks Show in Sonoma
n/a $10,000 Purchase services and materials. Estimates 40,000 people can see fireworks throughout locations
$11,652 Raised $33k through donations
Flyers, notices, website (to be developed)
$3,000
Charles M. Schulz Museum and Research Center
General marketing program for Sept-Dec. 2016
n/a $12,700 84% of visitors from outside Sonoma County, many international.
83,000 visitors/year.
$41,000 $1.2M in spending
3,000 nights, spend $389/day
On-line and email $5,000
Green Music Center at Sonoma State University
2016-17 Winter/Spring Season n/a $50,000 Brand awareness campaign focused outside Sonoma County - SF, Marin, East Bay. Outdoor billboards, MUNI, BART, Taxis, print/online advertisements.
35,000 between 10/1/2016 - May 15, 2017
$472,199 20% from outside county, estimate 50% stay overnight. Econ Impact $500/day
n/a Printed materials, program books, website
$17,500
Jack London Park Partners 2016 Jack London Centennial Celebration
n/a $35,000 Public relations effort to promote events between July 1-Dec 31, 2016. Includes Transcendence Theatre Company summer season Broadway Under the Stars, Jack London Film Festival, Klondike Challenge, Jack London 20th Century Man screening, campaign to re-design the House of Happy Walls.
35,000 over 6 month period
Visitors spend $250/day
Various wineries and non-profit donations and co-promoting match funds, in-kind donations
Press releases, promotional materials, website
$8,500
Category F - Major Events/Organizations
Series (not year round)
Single Event

FY 2016/17 Sonoma County Advertising Program Grants (adopted 5/3/16)
Page 10
Entity Event/Purpose 15/16 Advt Grant
Amount Requested Project notes Attend/ Reach
Advrt Budget ROI data Econ impact Match/ Collaborations
County Recognition Adv Cmte Recommendation
Pacific Coast Air Museum 2 events: 1. Airshow2016 presented by the Pacific Coast Air Museum (formerly Wings Over Wine Country), 2. Pacific Coast Air Museum event series (Climb Aboards and Special Events, Aviation Summer School, 9/11 Commemoration, Veteran's Day, Santa Fly-In)
$20,000 $25,000 $15K for Air Show; $10K for series. Promotion in Bay Area TV stations, Cable, radio and newspaper, expand social media reach.
Air Show: 20K; Museum 16K-18K
Air Show: $36,000; Museum $27,500
33 % air show attendees from out of county
Match by Museum, ABC7, KTVU, Comcast
promotional materials, rack cards
$10,000
Sonoma County Fair 2016 Sonoma County Fair $40,000 $50,000 July 22-August 7, 2016. Radio, tv, newspaper, social media & email in Marin and SC, Bay Area
270,000+ $305,000 $4.1M 4k overnight stays, estimated $4.1M impact
None print, website, social media, jumbotron
$40,000
Summer Repertory Theatre Festival 5 events: Gershwin's Nice Work if You Can Get It; Rock of Ages; Merrily We Roll Along; Boeing Boeing; The Little Dog Laughed
n/a $15,000 National advertising for Summer Repertory Theatre Festival 2016 Season. Mailing list of 22,000 names, adv. In newspaper, websites, visitors guides
28,000 attendees throughout California
$26,642 no specific data - "many stay 2 nights"
n/a website, digital newsletters, program guide
$5,000
6th Street Playhouse 2016-17 6th Street Playhouse season n/a $50,000 Advertising, marketing (inc. marketing initiative to boost outside), broadcasting, signage and printed materials
Project 49,500 attendees for FY 16-17
$145,471 16% from outside County, $1.8M spent in community
In-kind donations of over $30k/year
print, web, social media
$10,000
Healdsburg Jazz Festival, Inc. 2016-17 Healdsburg Jazz year round programming
$12,000 $45,000 print, radio, Internet and social media Bay Area and Sac., digital ads, e-newsletters.
20,000 $81,680 Survey reveals educated/affluent attendees, 39% out of area, 14% stays overnight.
Healdsburg Jazz will match two-thirds. NEA grant some promo costs. In kind = $32,500
Display advertising, direct-mail brochure, programs, newspaper inserts, posters.
$10,000
Luther Burbank Memorial Foundation Wells Fargo Center for the Arts 2016-17 Season
$50,000 $50,000 music, dance, theater. Regional, state & national media: print, radio, tv, web, movie theater, direct mail ads.
100k+/year. 23% outside of SC
$781,215 $9M annual local spending. 55 FTE
25% of visitors stay overnight, spend avg $3350/day.
100% match in-kind print, tv and movie theater
IF $50K+ will list on donor wall, logo eblast, website, campus signage
$45,000
Museums of Sonoma County Art and History Museum year round exhibition programs
$43,000 $50,000 SF Bay, Marin, Sac. Mailings, online, email blast and social media, newspaper, national mag,
40,000+ - 40% from
t id
$230,000 581 stays 100% match by private donors
print materials, web, social media.
$40,000
Petaluma Downtown Association - 4 events: Butter & Egg Days Parade, 2 Antique Fairs, and The Art & Garden Festival
$5,000 $18,000 Print, online, TV, radio and outdoor advertising through greater Bay Area.
Parade: 30,000, Antique Fairs: 8-12k visitors, Art & Garden Festival 12-15k visitors
$2.5M for Parade
Sponsorships being sought.
$5,000
Year Round Series

FY 2016/17 Sonoma County Advertising Program Grants (adopted 5/3/16)
Page 11
Entity Event/Purpose 15/16 Advt Grant
Amount Requested Project notes Attend/ Reach
Advrt Budget ROI data Econ impact Match/ Collaborations
County Recognition Adv Cmte Recommendation
Santa Rosa Symphony 89th Season - year round concerts series, special events and integrated community music education
$50,000 $50,000 95% concerts held at Green Music Hall. Includes free summer/community concerts - Tiempo Libre in 2015 and Mariachi Regna de Los Angeles in 2016. Target SC, North Bay, Bay Area. Ads radio, newspapers, magazine, FB, catalog, web.
46,696+ $205,033 $280k of spending
Using survey estimates 5% stay one night in hotel = 132 overnight stays, spending $100 more per night
in-kind advertising large digital monitors and concert programs
$50,000
Sebastopol Center for the Arts Year round art exhibitions, classes, musical performances, poetry events, special events and film arts.
$40,000 $50,000 Promote in SC, Napa, Marin, SF, Alameda. Newspaper, mag, web, tv, radio, print, newsletter, postcards, banners
50000+ $190,375 $666k Financial In-kind: long list of supermarkets, banks, newspaper, radio, tv, Foundations, local business & others some from SF Bay and local
print materials, newsletters, web, e-announcements
$25,000
$553,700 Total Recommended $300,000
Category Max: NoneSonoma Co Library Digital Image Collection $33,350 $40,000 Costs associated with making reprints preserving,
researching, cataloging & scanning photographs. Website $25,000
Agricultural Commissioner 2017 CA State Fair Exhibit $14,000 $20,000 Exhibit highlights County tourism, ag and recreation. Usually held in July. Draws 700k guests, over 19 days. Funds pay for consultant for services, materials, supplies, design, build, install of exhibit.
700,000 $20,000
$60,000 Total Recommended $45,000
Category Max: None
CDC Department Roseland Mural Project n/a $71,000 Each Mural costs approx. $6,000 to create. Recommendation from the CALLE Taskforce.
$12,000
Health Services Department Russian River Monitoring n/a $80,000 Blue-Green Algae Monitoring in Russian River, includes public information sharing.
$40,000
Sonoma County Fair Foundation Saralee and Richard's Barn $200,000 $75,000 Advertising Program funds in the amount of $300k were provided in FY 14-15 and FY 15-16.
$75,000
$226,000 Total Recommended $127,000
Category Max: n/a
Set Aside Fund for Emergency Shelter Maintain in Advertising Fund $60,000 $60,000 $60,000Community Development Commission Homeless Services $220,000 $285,000 Jones Hall increase from $100k to $165k; Coord. Intake
HUD Mandate Conti of Care $40k; Homeless count $80k. $285,000
Permit and Resource Management Housing Element Implementation $100,000 $150,000 Scope of work is done every two years on the next implementation strategies as part of the Comp Planning Work Plan. Housing Element is on a 7-year update cycle.
$150,000
$495,000 Total Recommended $495,000
Category G1 - Departmental Activities
Category G1 - Departmental Activities (ONE-TIME FUNDS)
Category G2 - Affordable Housing

FY 2016/17 Sonoma County Advertising Program Grants (adopted 5/3/16)
Page 12
Entity Event/Purpose 15/16 Advt Grant
Amount Requested Project notes Attend/ Reach
Advrt Budget ROI data Econ impact Match/ Collaborations
County Recognition Adv Cmte Recommendation
Category Max: n/a
Workforce Housing Public-Private Partnership
Funds reserved under County Fund for Housing, administered through CDC.
$0 $1,000,000 CFH administered through CDC as additional affordable housing funds are available per policy
$1,000,000
$1,000,000 Total Recommended $1,000,000
Category Max: n/a
ACTTC - Collections Tax collection administration activities
$367,819 $367,819 $367,819
ACTTC - Audit Audit services including program grant audits, collection audits and VRBO
$99,850 $99,850 $99,850
$467,669 Total Recommended $467,669
Category Max: n/a
County Counsel Program and collections legal services
$41,810 $51,810 $51,810
$51,810 Total Recommended $51,810
Category Max: n/a
CAO/BOS Program staff support $380,000 $432,093 $432,093
PRMD Code Enforcement Vacation Rental Services
$150,000 $150,000 $150,000
EFS Administration costs $1,787 $1,787 $1,787
$583,880 Total Recommended $583,880
Category H - Documentary Films Max: $30,000 Category Max: $30,000KRCB North Bay Public Media Short documentaries that promote
"rural art" in Sonoma County.$0 $10,000 Three 3-min. documentary shorts that promote "rural art",
featuring local artists, scenic inspiration for their work, and various public venues where their art is located.
Videos to be shown on KRCB and on website
$22,750 Collaborating with Creative Sonoma. KRCB to donate full amount of adv. Budget
$10,000
Museums of Sonoma County Short documentary on Sonoma County artist Ned Kahn, creator of prominent kinetic sculpture titled "erratic fence".
$0 $10,000 Funds will hire 2 filmmakers to produce film. Film will be posted online and shown on KRCB, will be submitted to international film festivals.
Audience is art and independent film followers. Museum expects 32k visitors/yr.
$17,500. Anticipates in-kind donations, partner with Rialto Theater.
500 hotel night stays for those visiting Museum. Anticipates increase in 2016.
Printed materials, exhibition collateral, website, email blasts
$7,500
Category G3 - Collections/Audit Services
Category G4 - Legal Services
Category G5 - Program Administration
Category G2 - Affordable Housing (ONE-TIME FUNDS)

FY 2016/17 Sonoma County Advertising Program Grants (adopted 5/3/16)
Page 13
Entity Event/Purpose 15/16 Advt Grant
Amount Requested Project notes Attend/ Reach
Advrt Budget ROI data Econ impact Match/ Collaborations
County Recognition Adv Cmte Recommendation
Sonoma County Human Rights Commission
NorthBay DREAMers Documentary Film and Social Media Project.
$0 $5,000 Documentaries will promote the County through telling story of youth immigrant, specifically Latino community youth, many of who work in hospitality and travel industries of Sonoma County. Has produced 6 films, plan to produce 10 more.
Will be shown at film festivals, commercial theaters, public TV, KRCB, PBS, in CA and across USA.
$10k grant received for Cat E in FY14-15. Addl. funding from CalHumanities and Human Rights Commission
Working with PBS and KRCB to produce and broadcast.
In documentaries, website, FB
$7,500
Winegrowers of Dry Creek Valley Oral Histories project documenting the history and evolution of the Dry Creek Valley wine region.
$10,000 Five videos will be produced with oral histories from key families in the region who have seen the area evolve since the 1840's.
WDCV represents 60 vintners and over 100 growers in Dry Creek Valley
$100k + annually
15% of visitors staying overnight, $875k rev.
None In documentaries $5,000
$35,000 Total Recommended $30,000
Category I - Seasonal and Off Peak Max: $50,000 Category Max: $50,000SEASONAL Alexander Valley Film Society Alexander Valley Film Festival $5,000 $5,000 2nd Annual 4-day festival - October 20-24, 2016. Buy, print,
distribute local/regional print/digital media ads2,000 $16,600 10-12 overnight
stays - hoping to increase. Est, $20-25k in impact
Printed materials, brochure, trailers
$3,000
Courtney's Pumpkin Patch Courtney's Pumpkin Patch n/a $1,000 Event on 10/1/16. Will advertise in newspapers and radio. Funds raised are donated to non-profits and local cancer patients (donates $15k-$20k).
500-1000 attendees.
$1,000 n/a n/a Banner, radio, newspaper ad
$0
Duncan Mills Association Duncan Mills Merchant Association n/a $5,000 This organization is not a non-profit. 100-1,000 n/a Printed materials and at events.
$0
Geyserville Chamber of Commerce 3 events: May Day, Fall Colors, Tractor Parade
n/a $11,300 Online, local papers, banners, radio 13,500-15,000 total for all 3 events
$11,300 n/a n/a website and materials $5,000
Kings Ridge Foundation (formerly VeloStreet, Inc.)
Levi's GranFondo n/a $50,000 Fundraiser bike ride and festival championed by local pro cyclist Levi Leipheimer. Funds raised are donated to local beneficiaries.
Local, national, international coverage. 6,500 participants, addl 3,000 visitors.
$125,000 Estimated $18M in economic activity. 9000 overnight stays generated.
City of SR, SCTB, SR Convention & Visitor's Bureau
website, outreach materials (utility bill mailers)
$5,000
Kut Ups of Rohnert Park Summer Main Stage Shows $1,400 $2,000 5 Shows: July 9-16. Advertise via post cards, mailers, and info packets throughout Northern CA.
1,357 - Primary target are
$2,400 lobby recognition wall, program and banners
$0
Sebastopol Center for the Arts Sebastopol Center for the Arts presents Sonoma County Art Trails open studio tour
$10,000 $10,000 Art Trails Oct. 8-9, 15-16, 2016. Design, print, distribute 50k copies of catalog, update website and social media, media marketing.
38,371 for Art Trails. 1500 visitors for preview exhibit.
$90k $660k-2.6M in spending
30% out of county, Seeking sponsorship and support from businesses, Community Foundation, City of SR, Sebastopol, donors.
print ad, web advertising
$5,000

FY 2016/17 Sonoma County Advertising Program Grants (adopted 5/3/16)
Page 14
Entity Event/Purpose 15/16 Advt Grant
Amount Requested Project notes Attend/ Reach
Advrt Budget ROI data Econ impact Match/ Collaborations
County Recognition Adv Cmte Recommendation
Sebastopol Chamber (Apple Blossom Festival and Parade)
71st Apple Blossom Festival and Parade
$5,000 $5,000 2 day festival. Promote online, radio to Sonoma; Marin, SF Bay Area and Sacramento. April 22-23, 2017
10,000-15,000
$26,000 n/a Chamber match/exceed advrt dollars. Sponsorships $10k, In-kind $8k
Poster, print ads and website
$5,000
Sonoma International Film Festival Sonoma International Film Festival (5 days)
$12,000 $17,000 Advertising for local, Bay Area, and California digital publications and newspapers. 5-day event is March 30-April 3, 2017 in City of Sonoma.
3,000 attendees
$68,500 500 nights, predicts $247,500 in econ impact
no match e-newsletter (35 to over 20k recipients), Box Office, Programs
$5,000
$106,300 Total Seasonal: $28,000
Performing Arts Coalition for Theater, Inc - DBA Main Stage West
End of 2016 season, first half 2017 season
n/a $5,000 Printing and mailing postcards for off season shows 7,000 each year
$13,825 Est. $175k/yr econ impact, no
i h i f
Posters, postcards, mailings, programs
$4,000
Sonoma County Farm Trails Holidays Along the Farm Trails n/a $5,000 Nov-Dec. 2016, promotion and advertising of event - print, radio, online, mailing
8,000 $10,000 n/a - will conduct survey
website, printed material
$4,000
Sonoma Valley Visitors Bureau 4 events: Holidays in Sonoma Valley, Sonoma Valley Olive Season, Romance in Sonoma Valley, Sonoma Valley Girlfriends and Guys Getaways
$8,000 $50,000 Promote off peak season tourism with marketing, promotion, and advertising program. Print, radio, web video, tv commercial, social media, and contests.
Total: 3,050-5,050 visitors for 4 combined events.
$352,500 Sonoma Tourism District and SV Visitors Bureau will match
materials that list sponsors.
$5,000
$60,000 Total Off Peak: $13,000
$166,300 Total Recommended $41,000
Allocate to Economic Uncertainty Reserve
$300,000
Allocate to Contingencies $300,000
Total to Reserves Total Recommended $600,000
Total Expenditures $15,008,997
TOT Collections $10,628,100
Interest on pooled cash $25,000
Available Fund Balance $4,388,907
Total Revenues $15,042,007
OFF PEAK PROGRAMS
Reserves
Revenues

Attachment D
Page 1
FY 15-16 FY 16-17 FY 16-17Category Description Revised Recommended One-Time Funds
BEGINNING AVAILABLE BALANCE 5,239,250 4,388,907 4,388,907
SOURCESTOT Revenue (75% of total Collection ) 10,122,000 10,628,100 10,628,100 Interest 25,000 25,000 25,000
TOTAL Revenues 10,147,000 10,653,100 10,653,100 USES
A1 Chambers of Commerce 29,290 39,940 A2 Visitor Centers 340,900 342,400 A5 Signage 83,600 97,000 25,000 A6 Workforce Development & Scholarships - 350,000 C Agricultural Promotion 180,000 185,000 E Local Events/Orgs/Econ Develop 160,000 160,000 F Major County Events & Org 306,000 300,000 H Film Documentaries 20,000 30,000 I Seasonal and Off Peak Programs 28,600 41,000
Advertisers Sub-total 1,148,390 1,545,340 25,000
A3 EDB & Econ. Dev. Activities 2,836,100 2,511,215A4 Sonoma County Tourism 2,753,520 3,117,576B1 Parks, Recreation, Event Facilities 2,285,717 2,681,507 450,000B1 Veterans Buildings 400,000B2 Community Safety Impacts 90,000 90,000 768,000D Historical Commissions 30,000 50,000
G1 Departmental Activities 77,350 45,000 127,000G2 PRMD - Housing Element Project 100,000 150,000G2 CDC Homeless Services 220,000 285,000G2 Workforce Housing Partnership 1,000,000G2 Affordable Housing - Emergency Shelter 60,000 60,000
Community Services Sub-total 8,452,687 8,990,298 2,745,000
G3 ACTTC Collection 367,819 367,819 G3 ACTTC Audit 99,850 99,850 G4 Legal Services 41,810 51,810 G5 CAO/BOS & EFS Admin Costs 381,787 433,880 G5 PRMD Code Enforce Vacation Rental 150,000 150,000
Program Admin Sub-total 1,041,266 1,103,359 -
ONE TIME FUNDING FOR TOURISM SUPPORT AND IMPACT MITIGATION (see "One-Time Funds" 2,770,000
Contingencies 55,000 300,000 EUR Contribution 300,000 300,000
TOTAL EXPENSES 10,997,343 15,008,997 2,770,000
Increase/(Decrease) to Fund (850,343) (4,355,897)
ENDING AVAILABLE BALANCE 4,388,907 33,010
Econ. Uncertainty Rve Balance 732,201 1,032,201 1,032,201 % of Revenues 7% 10% 10%
ADVERTISING FUND ALLOCATION SUMMARY

Page 1 of 8
Adopted 07/08/86 Revised 10/02/01; 10/08/02; 09/12/03; 02/03/04; 04/18/06; 04/17/07; 05/10/11; 03/27/12, 6/10/13, 9/16/14, 2/10/15, 5/3/16, 6/13/16
ADVERTISING & PROMOTIONS PROGRAM POLICY
I. SOURCE OF FUNDS
The Transient Occupancy Tax (Hotel/Motel Tax or Bed Tax) is authorized under State Revenue and Taxation Code Section 7280 as an additional source of non-property tax revenue to local government. This tax is levied in Sonoma County at a rate of 9%. The code does not require any specific use of the Transient Occupancy Tax (TOT). Funds developed as a result of the TOT may be utilized for General Fund, Advertising Fund, or other purposes. The Sonoma County Board of Supervisors has established a policy that 25% of the TOT funds are designated to the General Fund, and 75% of the funds will be used to finance advertising, promotional and other activities. Activities performed utilizing Advertising Program grants provided to non-profit must also be consistent with Government Code Section 26100, which states that advertising funds may be utilized for the following purposes: A. Advertising, exploiting, and making known the resources of the county;
B. Exhibiting or advertising the agricultural, horticultural, viticultural, mineral, industrial,
commercial, climatic, educational, recreational, artistic, musical, cultural, and other resources or advantages of the county;
C. Making plans and arrangements for a world’s fair, trade fair, or other fair or exposition at which
such resources may be exhibited;
D. Doing any of such work in cooperation with or jointly by contract with other agencies, associations, or corporations.
For purposes of this policy:
a. “Advertising” shall be taken to mean the cost of advertisements in radio, television, newspapers
and magazines, printing of newsletters, direct mail, posters and handbills, internet and other paid advertising, the purpose of which is to draw an increased attendance at an event.
b. “Promotions” shall be taken to mean costs of communication primarily directed outside of the
County for which the purpose is the further recognition of Sonoma County and/or regional areas, events and/or activities in order to achieve favorable media attention and/or large audience exposure. Examples of communication may include attendance at trade shows, public relations activities, in-county familiarization tours and marketing programs.

Page 2 of 8
II. POLICY STATEMENT
The Board of Supervisors wishes to encourage tourism, agriculture, and economic development in the County by supporting a series of promotional, community, and cultural, activities through the use of Advertising funds for: regional and national advertising, support of the community’s spirit and its art/cultural programs, and promotion of other special events as deemed, by the Board, consistent with this Policy. Funding levels will be established annually based on collections.
Except where provided for differently, the Board has established the following general principles which shall govern the allocation of advertising funds:
1. The Board may provide advertising funds to private non-profit organizations whose purpose is to
promote cultural activities, historical preservation activities, promotional activities which enhance tourism and industry, and/or local community events which encourage a sense of community. For purposes of this policy, to qualify as a cultural or artistic organization, the organization must have an annual program consisting of a series of presentations and/or activities. The organization must also have subscriptions, season tickets, and/or non-exclusive memberships, which provides financial support for the organization.
2. Any event promoted by clubs, fraternal organizations, societies, human service organizations, and
other similar type organizations, and for which the proceeds of the event will be used to fund other activities, are not eligible for Advertising funds.
3. Advertising fund grant awards will be based upon an evaluation of all application materials, with
a focus on the return on investment and benefit to be gained, including potential tourism and business revenue, from providing financial support to the event/organization. Events and organizations who demonstrate ability to receive and/or contribute match funding or grants as the result of receipt of Advertising funds will be given priority consideration in the application review process and in consideration of amount of grant award.
4. Costs for staff salaries, overhead, travel expenses (such as transportation, lodging and/or meals)
and fixed assets are not allowable advertising and promotions reimbursable expenses. (Economic Development, Historical Commission, and Departmental activities as indicated in section A.3, B, D, G and H are exempt from this provision.) Items provided for individual benefit are not allowed, such as t-shirts or wine glasses.
5. Entities will be required to include the County of Sonoma logo and/or statement indicating sponsorship and/or support on all printed and online promotional materials, unless otherwise requested or agreed upon with the County.
6. County funds are not to be used for individual business promotion or advertisement. Any
business name mentioned in county funded materials must be a sponsor or direct participant in the event or promotional effort. Any listing of service or product providers or co-sponsors must be inclusive. Any advertising space or time purchased by an individual business must be clearly and separately identified as paid advertising.
7. Advertisers with multiple events are asked to submit only one (1) application per agency/IRS tax
number. Advertisers may apply for grants for various events and under various categories within the single application. Each separate event or activity for which funds are requested must identify the category(s) under which the event qualifies and is applying for funds.

Page 3 of 8
III. ACTIVITIES ELIGIBLE FOR ADVERTISING AND PROMOTIONS FUNDS
A. Economic Development and Promotional Organizations The Board desires to designate available funds towards projects and initiatives that stimulate and expand the county’s economic vitality.
1. Chambers of Commerce: Funding may be provided to Chambers of Commerce serving unincorporated areas of Sonoma County. Chambers located in the unincorporated area of the county will be given priority in funding consideration. Allocation of funds will be based upon an up to 10% match of membership dues and private cash contributions that are discretionary revenue to the chamber and are not associated with a particular event, function or position. A maximum of $40,000 per year may be made available for Chambers of Commerce.
2. Visitors Centers: Funding for Visitor Centers within the county may be considered at the discretion of the Board of Supervisors. For purposes of funding, Visitors Centers will be distinct from the Tourism Marketing Program. Requests for funding can be made annually to the Economic Development Board.
3. Economic Development Board:
The Board of Supervisors has designated the Economic Development Board (EDB) to provide business assistance services to enable local businesses to maintain or expand their operations. The EDB will request funds annually through the budget process and will considered at the discretion of the Board of Supervisors.
4. Tourism Marketing Program:
As determined by the Board of Supervisors, the County will provide TOT funds for advertising and promotional efforts as provided by the Sonoma County Tourism Bureau (SCTB). A sum equivalent to the first 2% of the 9% TOT tax collected in the unincorporated Sonoma County will be designated for the SCTB. The county’s TOT contribution to SCTB is disbursed through the EDB budget.
5. Visitor Way Finding and Signage:
Funding may be provided for permanent signage related to visitor way finding and area identification. These funds are intended for the installment and maintenance of permanent identification signs, not temporary or event promotion signs. A maximum of $100,000 per year may be made under this category.
6. Workforce Development and Scholarships: Acknowledging that a qualified workforce is essential to the growing needs of the tourism industry as well as the overall health of the community, the Board of Supervisors has designated funds to support workforce development and to increase access to educational opportunities through scholarships. Requests may be made for multi-year grants. A maximum of $400,000 per year may be made available for Workforce Development and Scholarships.
Deleted: $350,000

Page 4 of 8
B. County Tourism Impacts
1. Parks, Recreation, and Event Facilities: The Board of Supervisors desires to provide TOT funds to County departments for recreational activities that benefit local tourism activities and the tourist industry, including, but not limited to, the Regional Parks Department and the Fairgrounds and Exposition, Inc., and Veterans Halls (under contract or managed by the General Services Department). Funding provided to the Regional Parks Department is allocated for operations and maintenance of existing park facilities only. Requests for TOT funds from County departments will be reviewed annually on a case-by-case basis and will be considered at the discretion of the Board of Supervisors.
2. Community Safety:
The Board of Supervisors desires to address potential impacts on visitors’ and residents’ safety as a result of high-impact tourism within the unincorporated areas of the county. A maximum of $90,000 per year may be made available under this category as Program funding allows. Request for Advertising funds under this category will be reviewed annually on a case-by-case basis. Grants will be awarded as per recommendations from the Fire Advisory Council (effective for FY 17-18 grant cycle).
The following guidelines and specific criteria must be met to be eligible for funding under this category:
a. Only public safety agencies located in the unincorporated area of the county may apply
under this category.
b. Applicants must request funding for a specific purpose (i.e. personnel training, safety equipment, etc.) and include the cost of the activity in relation to the amount of grant funds being applied for.
c. Applicants must demonstrate a clear nexus between the grant request activity and impacts
of tourism resulting in the necessity of the activity.
d. Applicants must demonstrate a clear nexus between the request activity and the benefit to the resident and visitor population within the unincorporated area of the county resulting from the activity.
C. Agricultural Promotion
The Board of Supervisors desires to support advertising campaigns and promotional activities directed by Sonoma County agricultural and viticulture industries.
1. A maximum of $185,000 per year may be made available for agricultural and viticulture
industries under this category.
2. The following general guidelines shall apply to this category:
a. In order to promote collaborative advertising and promotional efforts within the agricultural sector, only one application will be considered under this category. Such application shall include promotion of the major agricultural related activities within Sonoma County.

Page 5 of 8
i. Application requests that include multiple agency efforts will require submission of agency budgets from all involved agencies.
ii. If county funds are redistributed to other agencies a Memorandum of Understanding
(MOU) between agencies must be submitted with application.
b. Agency applying under this category must be responsive to requests for visitor information on a year-round basis.
c. The request must be part of a larger advertising program. Industry commitment as
demonstrated by matching industry/membership contributions must exceed request for funding from County advertising program.
D. Historical Commissions
The Board of Supervisors desires to support historical preservation of the county’s culture and historical records and architecture.
1. A maximum of $60,000 per year may be made available for this category.
2. The County has designated the Sonoma County Landmarks Commission to advice on the
distribution of funds for preservation and restoration of historically significant buildings. Funding may be provided to this Commission to accept grant applications for the renovation, restoration and/or preservation of historical facilities.
3. The Board has designated a Historical Records Commission to review and make
recommendations regarding the maintenance and destruction and retention of records, which may be of historical significance. Funding under this category may be provided for these activities.
E. Local Events, Organizations and Economic Development
The Board has established this category to assist small cultural, artistic, and countywide events and organizations as well as events occurring during the off peak tourism season (November 15 through April 15) with funding for advertising and economic development efforts that promote Sonoma County and encourage visitors to frequent the county throughout the entire year. Funding for these events and organizations will be at the discretion of each Supervisorial District. Events and organizations will make requests annually to the Supervisorial District in which their event/organization exists.
$170,000 has been allocated for district discretion. 50% of this allocation will be divided equally across each district as baseline funding. The remaining 50% will be divided by the percent of TOT collections by district in the previous fiscal year.
F. Major County Events and Organizations The Board of Supervisors desires to promote major events and cultural and artistic organizations which draw countywide, regional, state and national interest as evidenced by widespread media promotion and which can demonstrate a significant population of participants and visitors from outside the county.
1. A maximum of $300,000 per year may be made available for major events and organizations within this category.
Deleted: $50,000
Deleted: $160,000

Page 6 of 8
2. The following general guidelines apply to this category:
a. Must demonstrate overall attendance either at a single event or through a series of events in excess of 15,000, with significant (20% or more) demonstrated attendance from out of the county.
b. Must demonstrate extent of out-of-county attendance and demonstrate link to overnight
stays from attendees.
c. Must demonstrate advertising expenses exceeding $25,000, of which the Advertising funds being requested must not exceed 50% of total advertising expenses for the event or organization.
d. Must demonstrate a major advertising campaign plan focused outside of the county.
e. Must demonstrate the extent to which the event, season series, exhibit, or marketing effort
will support the county’s economic development in the form of local job promotion, local education contribution, and/or local business-chambers of commerce-visitors centers partnerships.
3. The maximum advertising fund contribution which can be applied for is $50,000.
4. Funds are only to be used for advertising and promotion of the events and not towards the cost
of event production.
5. The following will be requested as part of the application process for all events and organizations who apply for advertising funds under this category. This information is not required and failure to provide will not result in disqualification, however, the information will be used to determine grant awards and amounts based on demonstrated ability to most effectively promote tourism, agricultural, and/or economic development.
a. A complete Advertising Fund grant application (form provided by the County);
b. A completed post-program/event report containing results and benefits of prior year
activities and events, if the entity received Advertising Funds in the previous fiscal year (form provided by the County);
c. Detail the advertising/promotional campaign for which advertising funds are being
requested, including the type of advertising and region(s) of promotion;
d. Detail how these activities will promote attendance, including expected attendance, overnight stays, and visitor spending; and
e. Detail how the County of Sonoma organization will be promoted as an organization/event
sponsor in advertising materials, available event/booth attendance, and other such activities. Information should also be provided on available sponsorship packages.
G. County Government Departmental Activities
The Board of Supervisors desires to provide Advertising funds for certain county departmental activities that benefit local tourism activities and the tourist industry, and which preserve and promote Sonoma County history. Advertising funds may be used for salaries of County

Page 7 of 8
employees when participating in activities funded by Advertising funds. Administrative costs (including collection, audit, program coordination, consultant, and legal services), should not exceed 10% of the estimated and/or budgeted TOT revenues.
Request for Advertising funds from departments will be reviewed annually on a case-by-case basis.
1. Miscellaneous Department Activities:
Funding may be provided to County departments to advertise specific activities which promote tourism and awareness of the County, including, but not limited to, the Sonoma County Library, the Sonoma County State Capital Exhibit, and similar endeavors; as well as provide for venue services where tourist and community activities take place.
2. Affordable Housing: Funding may also be identified for an affordable housing program. Funding designated for affordable housing shall be recommended by the County Administrator's Office based on available funding and approved by the Board of Supervisors on an annual basis. As a goal, funds will be recommended based upon 50% of revenues directed toward this fund that are generated from facilities established after 2002, pursuant to the March 2002 Board Policy Workshop, and after categories A-F and H-I have been funded at appropriate levels. The Community Development Commission and the Permit and Resources Management Department shall make requests for these funds annually through the budget process for funding affordable housing programs and related efforts as well as for implementation of the Housing Element. Additionally, $60,000 shall remain in the Affordable Housing Set Aside Fund within the Advertising Program to be available for emergency shelter needs that arise throughout the year that have not been addressed elsewhere.
Should additional funds set aside for affordable housing remain available following these requests and the Set Aside, the funds shall be allocated to the existing County Fund for Housing (CFH), administrated by the Community Development Commission.
3. Collections/Audit Services:
Revenue and tax collection services and program and grantee audit services are provided for this Program. Funding shall be recommended by the County Administrator’s Office annually to fund these activities.
4. Legal Services:
Legal guidance, advice, interpretation and other related services are provided for this Program. Funding shall by recommended be the County Administrator’s Office annually to fund these activities.
5. Program Administration Services:
Administration of this Program, including policy management and review, budget management and review, application review and recommendation, contract management, claims processing, and other related activities are provided by the County Administrator’s Office. Funding shall by recommended be the County Administrator’s Office annually to fund these activities.

Page 8 of 8
H. Documentary Films The Board of Supervisors desires to support Sonoma County based documentary films that document and promote or maintain a historical record of the region, culture, community and arts. 1. A maximum of $30,000 per year may be made available for documentary film production,
with an allocation not to exceed $10,000 per film. 2. The following general guidelines apply in this category:
a. Must demonstrate historical, current social issues, cultural, regional or specific human experiences in Sonoma County that raise awareness and create an impact upon the viewing audience.
b. Must have real, factual situations and circumstances which leave audiences better informed.
c. Must provide detail of advertising/promotional campaign activities, including the type of advertising and region(s) of promotion.
d. Must be able to demonstrate that the film will be exhibited publicly, including but not limited to broadcast and cable television, and Internet transmission.
e. Applicant must provide a production timeline including release date of film and the cost of the activity in relation to the amount of grant funds being applied for.
I. Seasonal and Off Peak Programs The Board of Supervisors desires to promote seasonal programs, events and cultural and artistic organizations as well as events that occur during the off peak tourism season (November 15 through April 15) which draw countywide and regional interest and which can demonstrate participants and visitors from within and/or outside the county. The program will pay for the direct cost of advertising. 1. A maximum of $50,000 per year may be made available under this category. .
2. The maximum advertising fund contribution which can be applied for is $5,000.
3. The following general guidelines apply to this category: a. Must detail overall attendance from in and/or outside of the county. b. Must demonstrate local and/or out of county advertising campaign plan. c. Must demonstrate the extent to which the event, seasonal program, exhibit or
marketing effort will support the County’s economic development in the form of local job promotion, local education contribution, and/or overnight stays from attendees.
d. Must provide a budget of total advertising expenses in relation to the amount of grant funds being applied for.

11
Reinvestment & Revitalization Funds

P a g e | 1
COUNTY OF SONOMA
OFFICE OF THE COUNTY ADMINISTRATOR 575 ADMINISTRATION DRIVE – ROOM 104A
SANTA ROSA, CALIFORNIA 95403-2888 TELEPHONE (707) 565-2431
FAX (707) 565-3778
VERONICA A. FERGUSON
COUNTY ADMINISTRATOR
CHRISTINA RIVERA DEPUTY COUNTY ADMINISTRATOR
REBECCA WACHSBERG DEPUTY COUNTY ADMINISTRATOR
June 13, 2016 To: Members of the Board of Supervisors From: Veronica A. Ferguson, County Administrator Re: FY 2016-2017 Budget: Reinvestment and Revitalization Funds The Reinvestment and Revitalization (R&R) fund was created by the Board following the dissolution of Redevelopment in 2012. The fund was established using Redevelopment Property Tax Trust Fund (RPPTF) revenues from the General Fund to support countywide economic, community, and housing development projects. On March 29, 2016, the Board approved the 5-Year R&R Plan, which is reflected in the FY 2016-2017 Recommended Budget. This supplemental report provides updated revenue estimates and recommended expenditures changes to the March 29, 2016 plan, which are outlined in red on the enclosed R&R Fund Summary. Revised Revenue Estimates As a result of an audit recently conducted by the State Controller’s Office for Program Years 2009-2014, the Auditor-Controller-Treasurer-Tax Collector (ACTTC) will be making an adjustment to the tax revenue allocation for FY 2015-16, which will result in a one-time increase in available revenue of $1,074.281. Please see the revisions made to the Revised FY 2015-2016 revenue column of the R&R Fund Summary. Recommended Expenditures Since March, a number of other programs that may be funded with R&R have been identified for the Board’s consideration as a part of the Supplemental Budget. These recommendations, which are outlined in red on R&R Fund Summary Proposed FY 2016-2017 column include:
1) Emergency Solutions Grant Supplemental Funding $847,000 Provide one-time supplemental funding to mitigate the negative impacts of new State Department of Housing and Community Development’s (State HCD) regulations upon Santa Rosa and Petaluma-based homeless service agencies. The new HCD regulation translates to a loss of $1.2 million or almost 80% in funding from annual average awards. The financial support will also give homeless service stakeholders time to develop alternative funding plans. As discussed during the May 3, 2016, meeting that approved R&R funds as one-time supplemental funding, the Community Development Commission (CDC) will be returning to the Board for approval of the recommended grant awards to specific agencies on June 21, 2016.
2) Augment Housing Legal Services $100,000
Augment the existing contract with Sonoma County Legal Aid. Sonoma County Legal Aid currently has a contract with the CDC for $32,000 paid with Low-and-Moderate-Income Housing

P a g e | 2
Assistance Funds to provide legal assistance to tenants facing eviction. The Board has expressed a desire to enhance housing legal services within the County. Sonoma County Legal Aid provided a proposal that would establish a satellite office outside of Santa Rosa in an effort to expand services to other areas of the county. The proposal requested $300,000 to hire two attorneys and two bilingual caseworkers, as well as program expenses to open a satellite office. Staff is recommending the Board authorize one-time support of $100,000 and direct CDC staff to work with Sonoma County Legal Aid to develop an agreeable plan that still meets the Board’s desire to expand housing legal services to other areas of the County.
3) Augment Housing Support for Homeless Youth $100,000 Augment the existing CDC contract with Social Advocates for Youth (SAY) to support the newly opened Dream Center. As noted by the U.S. Department of Housing and Urban Development (HUD) in their 2015 Annual Homeless Assessment Report, Sonoma County has the largest number of unaccompanied youth in their smaller city/county category - 678, representing homeless numbers that are comparable to cities the size of Seattle, Washington and San Diego County. The SAY Dream Center was conceived to address this critical need. The $9.8 million Dream Center was completed in December 2015, using private donations. The program has capacity to provide 40 long-term beds and 12 short-term beds, and is currently using at total of 30 beds to serve 77 unduplicated homeless youth a year. SAY has indicated they have an operational funding gap for a segment of the homeless youth they serve and has requested $150,000 in support from the County. Staff is recommending one-time contribution of $100,000 in R&R for the SAY Dream Center to provide support for this impacted sub-population.
Additionally, due to an E-Coli contamination of drinking wells in the Canon Manor subdivision, CDC staff is recommending that the Housing Rehabilitation Loan Program (HRLP) Design be revised to eliminate the income and asset limits for resident owners of the Canon Manor subdivision to allow them to access R&R funds for water and sewer hook-ups. CDC staff will bring revisions to HRLP Design for consideration in July 2016. The Recommended Budget includes $500,000 for HRLP projects. Enclosures: 1. R&R Funding Recommendations for FY 2016-2017 2. Policy Regarding Use of Reinvestment and Revitalization Funds

Beginning Balance July 1 9,926,561 12,427,064 12,631,794 17,104,920 2,906,828 2,526,191 2,028,866
Actual Actual Revised Projected Projected Projected Projected EstimatedFY 13-14 FY 14-15 FY 15-16 FY 16-17 FY 17-18 FY 18-19 FY 19-20 Total
Successor Agency Reimbursements for Highway 12 - - 3,036,323 - 624,283 507,595 - 4,168,201 Successor Agency Reimbursements for Roseland Village - - 542,022 - 869,600 869,600 602,233 2,883,455 Interest on Cash 57,802 56,483 50,000 25,000 25,000 25,000 25,000 264,285 County Tax Apportionment 2,568,393 3,919,612 2,300,000 2,000,000 2,100,000 2,100,000 2,100,000 17,088,005 County Asset Liquidation Allocation 1,356,247 - 3,504,797 - - - - 4,861,044 State Controller Audit Adjustments 1,074,281 1,074,281 Total Revenue 3,982,442 3,976,095 10,507,423 2,025,000 3,618,883 3,502,195 2,727,233 40,265,832
Actual Actual Revised Proposed Proposed Proposed Proposed TotalFY 13-14 FY 14-15 FY 15-16 FY 16-17 FY 17-18 FY 18-19 FY 19-20 Budgeted
Policy Area 1 - Former RDA Projects Previously ApprovedHighway 12 (TPW) 599,916 1,297,108 1,154,629 1,131,878 - - - 4,183,531 Hwy 12 Parking Mitigation (Funds to complete $2.2M work) - - - 826,847 - - - 826,847 Roseland Village Mixed Use Project - 542,022 - 2,341,433 - - - 2,883,455 Monte Rio Wastewater Feasibility Studies 8,524 85,062 430,000 676,414 - - - 1,200,000 Guerneville Comm. Police (1x set up) - 78,856 - - - - - 78,856 Guerneville Homeless Shelter & Day Service Center 71,136 6,000 942,864 500,000 - - - 1,520,000 Policy Area 2 - Supplement GF Support for Community Services FundCommunity Services Funding - Annual Competitive Grants 200,000 200,000 200,000 200,000 200,000 200,000 200,000 1,400,000 Homeless Safe Parking / Motel Vouchers 140,953 150,000 150,000 150,000 150,000 150,000 150,000 1,040,953 Homeless Outreach Services Team (HOST) Project - 285,000 200,000 200,000 200,000 200,000 200,000 1,285,000 Homeless Gap Funding (1x set up) - 285,000 - - - - - 285,000 Code Blue Expansion - - 29,679 - - - - 29,679 CFSA - Guerneville Homeless Shelter / April 2016 - - 24,160 - - - - 24,160 Sam Jones Hall Winter Beds - - 45,000 - - - - 45,000 Supplement State ESG Funds for Santa Rosa & Petaluma Service Areas - - - 847,000 - - - 847,000 Augment Housing Legal Services - - - 100,000 - - - 100,000 Augment Housing Support for Youth - - - 100,000 - - - 100,000 Policy Area 3 - Former RDA Programs Previously ApprovedCommercial Rehab Loan Program 112,750 409,555 940,445 500,000 500,000 500,000 500,000 3,462,750 Housing Rehab Loan Program - Include Canon Manor 11,281 - 500,000 500,000 500,000 500,000 500,000 2,511,281 Policy Area 4 - Projects & Programs in Unincorporated AreasSprings Hub Plaza & Other Projects TBD - - 50,000 2,000,000 - - - 2,050,000 Roseland Library & Other Potential Parks or Infrastructure Projects in SW SR - - 2,500,000 - - - 2,500,000 Penngrove Pedestrian Safety Improvements (TPW) - - 250,000 2,000,000 - - - 2,250,000 Policy Area 5 - Projects & Programs that Promote Economic DevelopmentDay Labor Centers 30,000 100,000 80,000 - - - - 210,000 Policy Area 6 - Affordable Housing Projects & ProgramsCounty Fund for Housing 250,000 - 250,000 1,200,000 2,000,000 2,000,000 2,000,000 7,700,000 Tiny Home Pilot Project - - 75,000 - - - - 75,000 Housing Toolbox Work Plan - - 213,000 - - - - 213,000 Russell Houses - Repair Reserve Fund - - 50,000 - - - - 50,000 Policy Area - Administrative, Housing Successor, and ROPS Denied CostsR&R Administrative Costs 57,381 182,762 299,520 299,520 299,520 299,520 299,520 1,737,743 Successor Agency Costs Denied on ROPS: Housing Successor Admin Allowance - 150,000 150,000 150,000 150,000 150,000 - 750,000 Total Expenditures 1,481,939 3,771,365 6,034,297 16,223,092 3,999,520 3,999,520 3,849,520 39,359,253
Available Balance 12,427,064 12,631,794 17,104,920 2,906,828 2,526,191 2,028,866 906,579 906,579
Reinvestment and Revitalization Funds SummaryFY 2016-2017 Budget and 5-Year Funding Plan
Estimated Revenue
Projects / Programs

Sonoma County Board of Supervisors Policy Regarding Use of Reinvestment and Revitalization Funds
Revised as of March 29, 2016 Funds available to the Sonoma County Board of Supervisors as a result of the dissolution of Redevelopment Project Areas will be known as “Reinvestment and Revitalization Funds” and will be used to fund projects and programs in the following order:
1. To fund former Sonoma County Redevelopment Agency projects previously approved by the Board of Supervisors acting as the Commissioners of the Redevelopment Agency.
2. To supplement the County General Fund support for the Community Services Fund.
3. To fund former Sonoma County Redevelopment Agency programs previously approved by the Board of Supervisors acting as the Commissioners of the Redevelopment Agency.
4. To fund projects and programs in unincorporated areas of Sonoma County.
5. To fund projects and programs which promote economic development.
6. To fund affordable housing projects and programs.
Funds will primarily be used in the County’s unincorporated areas, except where the funds have historically been used for County-wide purposes (as with the Community Services Fund). They will also be needed to cover administrative costs, operating costs listed on Board-approved Recognized Obligation Payments Schedule (ROPS) if denied by the state, and Housing Successor Agency costs if other funds from the Community Development Commission are not available
This policy is intended to apply through FY 2019-2020. It will be reviewed annually, as well as specific funding recommendations.

12
Community Corrections Partnership (CCP) -
Annual Recommended Budget Materials

Page | 1
COUNTY OF SONOMA
OFFICE OF THE COUNTY ADMINISTRATOR 575 ADMINISTRATION DRIVE – ROOM 104A
SANTA ROSA, CALIFORNIA 95403-2888 TELEPHONE (707) 565-2431
FAX (707) 565-3778
VERONICA A. FERGUSON
COUNTY ADMINISTRATOR
CHRISTINA RIVERA DEPUTY COUNTY ADMINISTRATOR
REBECCA WACHSBERG DEPUTY COUNTY ADMINISTRATOR
June 14, 2016
To: Members of the Board of Supervisors
From: Veronica A. Ferguson, County Administrator
Re: FY 2016 2017 Community Correction Partnership Plan
The California Public Safety Realignment Act (Assembly Bill 109) took effect on October 1, 2011. This legislation shifted responsibility for specific populations of adult offenders from the state to the county where the crime was committed. In November 2012, the voters passed Proposition 30, which provided a guaranteed funding stream for the programs realigned in 2011.
AB 109 also expanded the role of the Community Corrections Partnership (CCP), previously established by Senate Bill 768. The CCP was given the responsibility to adopt an annual AB 109 Implementation Plan, and present the annual plan to the Board of Supervisors for approval. The voting members (Executive Committee) of the CCP include the Chief Probation Officer, the District Attorney, the Sheriff, the Public Defender, the Court Executive Officer, the Director of Behavioral Health, and one Chief of Police (currently Jeff Weaver, Sebastopol). The full membership (non-voting members) includes representatives from the Board of Supervisors, County Administration, Human Services, Victim Services, the Office of Education, and a representative from Community Based Organizations.
Since the beginning, the Sonoma County CCP has aligned the annual Community Corrections Partnership with the recommendations in the 2010 Criminal Justice Master Plan. In developing the 2016-2017 Plan, the CCP aligned with the recommendations of the Criminal Justice System Master Plan, 2015 Update that was adopted by the Board in December 2015. Realignment funding has been used to implement the Day Reporting Center, as recommended, and more recently, a Pre-Trial Services program, in addition to providing on-going support to the Sheriff’s Office and the Probation Department for the services provided to the realigned offenders. There is also specific funding included for the District Attorney and Probation to handle Parole Revocation proceedings for Sonoma County offenders.
While Sonoma County’s share of the statewide funding has decreased, we continue to receive stable revenue with annual growth based on the sales tax growth. The FY 2016-2017 budget is balanced with $10.9 million in new revenue and $2.6 million in fund balance. The fund balance increased during the first 4 years of realignment, and the FY 2015-2016 budget was the first budget that assumed any use of this fund balance.
The total recommended expenditure budget for FY 2016-2017 is $13.5 million, an increase of 1.4 million over FY 2015-2016. The CCP Plan recommends funding for all ongoing programs from previous years and the addition of one Administrative Aide position to support the pre-trial services and other AB 109 funded programs.
The CCP has utilized the tiered approach, similar to that used by Upstream Investments, to classify programs. The CCP is in the process of conducting a solicitation for evaluation services to develop

Page | 2
evaluation data to ensure that the funding remains available for those programs that make the most impact towards reducing recidivism, while reducing future expenditures to align with available revenue.
Enclosures: Staff Report for the 2016-2017 Community Corrections Partnership Plan adoption 2016-2017 Community Corrections Partnership Plan

Revision No. 20151201-1
County of Sonoma Agenda Item
Summary Report
Agenda Item Number: (This Section for use by Clerk of the Board Only.)
Clerk of the Board 575 Administration Drive Santa Rosa, CA 95403
To: Board of Supervisors of Sonoma County
Board Agenda Date: June 14, 2016 Vote Requirement: Majority
Department or Agency Name(s): Probation Department and County Administrator’s Office
Staff Name and Phone Number: Supervisorial District(s):
David Koch, Probation: 565-2168 Mary Booher, CAO: 565-3779
Countywide
Title: Public Safety Realignment Plan for Fiscal Year 2016-17
Recommended Actions:
Approve the Community Corrections Partnership’s recommended Public Safety Realignment Plan for Fiscal Year 2016-17.
Executive Summary:
The purpose of this report is to present for the Board’s approval the Sonoma County Community Corrections Partnership’s (CCP’s) recommended AB 109 Public Safety Realignment Plan (“Plan”) for Fiscal Year 2016-17. The full Plan, which was unanimously approved by the CCP on February 29, 2016, is attached for reference and contains the following supplemental information: an overview of the Public Safety Realignment Act legislation; the CCP’s planning process and objectives; AB 109 population data and reconviction rates; the State’s funding allocation methodology; and descriptions and budgets for all recommended programs and services. The CCP’s Fiscal Year 2016-17 budget includes 63.70 Full-Time Equivalent (FTE) position allocations and $13,471,610 in funding for the following departments: Sheriff’s Office, Probation, Department of Health Services, Human Services Department, District Attorney’s Office, Public Defender’s Office, County Counsel, and Information Systems. The Plan also includes funding for the Sonoma County Office of Education; the Superior Court; and community-based organizations to provide transitional housing, substance use disorder treatment, and restorative justice programs. Consistent with prior years, the FY 2016-17 Plan promotes evidence-based programming and upstream investments by using proven strategies to help offenders successfully complete supervision and reduce future involvement in the justice system. Furthermore, the Plan aligns with the overall strategic goals, guiding principles, and recommendations of Sonoma County’s 2015 Criminal Justice Master Plan Update.

Revision No. 20151201-1
CCP Budgeting Process in FY 2016-17 The CCP Executive Committee held public budget meetings in January and February 2016 to consider input from the public and from the Detention Alternatives Subcommittee, which includes representation from several County departments and community-based organizations. As in previous years, the Executive Committee then ranked existing and proposed programs according to the impacts they were expected to have on the AB 109 realigned offender population, using a tiered approach in which Tier 1 programs are those specifically for realigned offenders; Tier 2 programs assist with the criminal justice system overall, but may not directly or exclusively impact AB 109 offenders; and Tier 3 programs provide ancillary benefits to the criminal justice system. The recommended budget for FY 2016-17 continues all activities funded during FY 2015-16, and adds one position: an Administrative Aide to perform the technical administrative work of the pre-trial and AB 109 programs, perform research for a variety of projects, and coordinate scheduling of pre-trial services with the Sheriff’s Office, Probation Department, and the electronic monitoring vendor. Aside from the Administrative Aide, all line item budgetary changes in FY 2016-17 reflect the estimated costs to continue FY 2015-16 programs in substantially the same formats. Sonoma County FY 2016-17 AB 109 Revenue and Expenses The CCP’s recommended FY 2016-17 budget for Public Safety Realignment assumes Sonoma County will receive state revenues amounting to $18,538,950, which includes $7,627,872 in prior year rollover funds. Of the total anticipated revenues for FY 2016-17, the CCP recommends allocating $13,471,610 to fund all programs and services. The surplus of $5,067,340 will be held as a contingency reserve. The table below shows State funding allocations to Sonoma County since the beginning of Public Safety Realignment.
Overview of State Funding to Sonoma County by Fiscal Year and Revenue Source
FY 11-12 FY 12-13 FY 13-14 FY 14-15 FY 15-16 FY 16-17Main AB 109 Subaccount $3,240,428 $9,027,459 $10,698,219 $9,657,516 $9,732,986 $10,480,592Planning $378,650 $150,000 $150,000 $150,000 $150,000 $150,000DA/PD Subaccount $116,154 $136,028 $159,321 $147,723 $228,129 $280,486Main AB 109 Growth $0 $526,222 $634,193 $4,530,253 $737,368 TBDDA/PD Growth $0 $53,888 $45,618 $67,709 $53,292 TBDPrior Year Rollover $0 $1,317,764 $3,881,593 $5,538,788 $8,845,118 $7,627,872Total Revenue $3,735,232 $11,211,362 $15,568,944 $20,091,988 $19,746,893 $18,538,950Less Expenditures ($2,417,468) ($7,329,769) ($10,030,156) ($11,246,870) ($12,119,021) ($13,471,610)Net Surplus/(Deficit) $1,317,764 $3,881,593 $5,538,788 $8,845,118 $7,627,872 $5,067,340
Recommended CCP Budget $3,361,500 $9,552,756 $12,524,548 $12,609,797 $12,563,527 $13,471,610

Revision No. 20151201-1
Program Highlights Pre-Trial Services Traditionally, courts have based decisions of releasing defendants from incarceration partly on their ability to meet financial burdens of bond or bail, a system that may release dangerous defendants while incarcerating those who pose little risk to their communities. By contrast, under a pre-trial services program, courts base release decisions on defendants’ risk of 1) posing a threat to public safety, and 2) failing to appear in court. The Sonoma County Superior Court and CCP jointly developed this program to mitigate risks and avoid penalizing defendants due to their inability to pay. By using a risk-based model, the program reduces incarceration expenses while protecting the public and allowing many defendants to continue productive, law-abiding activities while awaiting adjudication. The pre-trial services program provides universal front-end screening for all persons booked into jail, supports jail management, and facilitates efficient case processing. The program has two components: assessment, operated within the Sheriff’s Classification Unit in the Main Adult Detention Facility, and supervision, which Probation operates. The Superior Court began using pre-trial services in January 2015. In recent months, the Court has released an average of 82 defendants per month on pre-trial services, and the CCP expects this number to rise as the judges become more comfortable with this developing program. Day Reporting Center Serving as the central point of evidence-based programming and structure for Post-Release Community Supervision, Mandatory Supervision, and felony probationers, the Day Reporting Center (DRC) provides a detention alternative to traditional incarceration for adult offenders who meet the program criteria. The Probation Department collaborates with the Sheriff’s Office, the Department of Health Services, the Human Services Department, and the Sonoma County Office of Education to provide seamless, offender-engaged reentry service coordination that begins in custody, continues through supervision, and transitions the offender to ongoing community-based supports and services when supervision ends. Services include cognitive behavioral intervention programs, life skills, vocational skills, and substance abuse treatment. As of May 2016, the DRC is serving 154 participants, slightly above design capacity of 150 participants. Since Probation assumed operation of the DRC in January 2015, 52 offenders have successfully completed the 54-session Cognitive Behavioral Intervention curriculum, and 11 have completed the 30-sesssion Aggression Replacement Training series. As many offenders are currently enrolled in these programs, Probation expects the numbers of successful completions to accelerate.

Revision No. 20151201-1
Probation’s partners at the DRC have delivered many services as well:
• Since January 2015, the Sonoma County Office of Education has held 111 meetings with offenders to help prepare them for the GED exam.
• Through JobLink, Human Services has held 317 meetings to help offenders secure employment.
• The Department of Health Services has performed 210 substance use disorder and mental health
assessments.
• Contract providers have held 369 meetings with offenders for outpatient substance abuse treatment.
Mental Health Services The CCP funds mental health and substance use disorder services well beyond the DRC. Services begin in the jail, follow inmates as they transition to the DRC, and continue as they enter the community. In the community, offenders will find a suite of wraparound services. For example, a licensed Marriage and Family Therapist conducts mental health assessments for individuals referred by Probation and subsequently refers individuals to appropriate services. An eligibility worker assesses individuals who need mental health services to determine their eligibility for benefits (e.g., Medi-Cal, County Medical Services Program, Social Security Insurance, CalFresh, and related programs). A psychiatrist assesses each individual’s need for medications and develops an initial medication service plan. In all, the CCP’s FY 2016-17 budget invests over $1.9 million into mental health and substance use disorder services, plus additional investments in related services such as the DUI Court, restorative justice, and domestic violence programming. Performance Reporting In FY 2015-16, the CCP commissioned two major initiatives to expand reporting abilities and better understand the outcomes of its programs. The first initiative, a new Offender Outcomes Data Report, is expected to be completed in fall 2016 with regular updates to follow, while a Realignment Evaluation Services project is a longer-term undertaking expected to begin producing data in two to three years. Offender Outcomes Data Report Through its Data and Evaluation Subcommittee, the CCP is constructing the most comprehensive Realignment recidivism report ever in Sonoma County. The report will have a separate section for each of the main offender populations—PRCS, PC 1170(h), and formal probation—with recidivism data for each population as measured by arrests, formal complaints filed, and convictions during supervision and during the first year following supervision or incarceration. The report will also cover formal revocations and types of crimes committed. A final section will review efficacy data for programs such as the Day Reporting Center, transitional housing, electronic monitoring, and services offered through the departments of Health and Human Services.

Revision No. 20151201-1
Realignment Evaluation Services A request for proposals process is underway to identify organizations to support the CCP in addressing the following areas: 1. The effectiveness of criminal justice interventions in accomplishing short-term, intermediate, and long-term outcomes, including the treatment effect related to recidivism for individual criminal justice interventions; 2. The success of the criminal justice system in increasing public safety in Sonoma County, with attention given to specific criminal justice populations, including realigned populations and felony probationers; 3. The effectiveness of system capacity improvements in accomplishing stated goals; 4. The degree to which individual criminal justice interventions are implemented with fidelity to design, and the relationship between fidelity and outcomes for these interventions; 5. The monetized benefit relative to cost for individual criminal justice interventions; 6. The effectiveness of individual criminal justice interventions and the criminal justice system overall compared across demographic groups such as race/ethnicity, sex, neighborhood, mental health status, and gang connection; and 7. The effects of system changes on public safety outcomes (e.g., AB 109 and Proposition 47). These offender outcome data will provide rich sources of information that will guide investments and decision-making in the years to come. The CCP expects to recommend a Realignment evaluation services vendor for Board approval at the July 19, 2016, meeting.
Prior Board Actions:
1) 06/16/2015: The Board approved the CCP’s FY 15-16 Realignment Plan. 2) 06/17/2014: The Board approved the CCP’s FY 14-15 Realignment Plan. 3) 06/04/2013: The Board approved the CCP’s FY 13-14 Realignment Plan. 4) 07/31/2012: The Board approved the CCP’s FY 12-13 Realignment Plan and associated budget. 5) 11/01/2011: The Board approved the CCP’s FY 11-12 Interim Realignment Plan and budget. 6) 08/16/2011: The Board approved initial amendments to both the Sheriff’s and Probation’s
position allocation lists to add staff in anticipation of Realignment.
Strategic Plan Alignment Goal 1: Safe, Healthy, and Caring Community
The CCP’s FY 2016-17 Realignment Plan aligns with the County’s strategic goal of promoting a safe, healthy, and caring community. The Plan includes continued funding for a jail unit to maintain capacity commensurate with need, plus additional resources to monitor offenders effectively in the community. It also includes innovative public safety programs, such as pre-trial services and electronic monitoring, which provide cost-effective detention alternatives, while protecting public safety. Finally, recommended funding will support a variety of programs that invest upstream in health, education, and

Revision No. 20151201-1
human services. These services address offenders’ needs, bolster their skills, improve their employment prospects, and foster integration into the community.
Fiscal Summary - FY 16-17
Expenditures Funding Source(s)
Budgeted Amount $ $13,471,610 $
Add Appropriations Reqd. $ State/Federal $ $10,911,078
Contingency Reserve $ $5,067,340 Fees/Other $
$ Use of Fund Balance $ $7,627,872
$ Contingencies $
$ $
Total Expenditure $ $18,538,950 Total Sources $ $18,538,950
Narrative Explanation of Fiscal Impacts (If Required):
All County departments with AB 109-funded programs incorporated their portion of the Realignment budget into their respective FY 2016-17 departmental budgets. Sonoma County’s FY 2016-17 Main AB 109 Subaccount allocation is $10,480,592. Additionally, Sonoma County expects to receive $280,486 in the District Attorney/Public Defender Subaccount and $150,000 in planning revenue, for a total of $10,911,078 in State funding. Sonoma County expects to receive $737,368 in FY 2015-16 growth allocation funds by November 2016. These funds, combined with prior year rollover funds, contribute to the expected fund balance of $7,627,872.
Staffing Impacts
Position Title (Payroll Classification)
Monthly Salary Range
(A – I Step)
Additions (Number)
Deletions (Number)
Narrative Explanation of Staffing Impacts (If Required):
All County departments with AB 109-funded activities included their requested positions in their respective FY 2016-17 departmental budget submissions. For FY 2016-17, the CCP recommends funding for 63.70 Full-Time Equivalent (FTE) positions, an increase of 1.00 FTE from FY 2015-16 resulting from the addition of 1.00 FTE Probation Administrative Aide.
Attachments:
Attachment A: County of Sonoma Community Corrections Partnership Recommended Public Safety Realignment Plan for Fiscal Year 2016-17.

Revision No. 20151201-1
Related Items “On File” with the Clerk of the Board:
None.

County of Sonoma
Community Corrections Partnership
Recommended Public Safety Realignment
Implementation Plan
Fiscal Year 2016-17
June 14, 2016
Submitted by:
Sonoma County Community Corrections Partnership
Board Budget Memorandum - Attachment “A”

FY 2016-17 County of Sonoma Public Safety Realignment Implementation Plan
Page 2
TABLE OF CONTENTS
1 EXECUTIVE SUMMARY ..................................................................................... 5
2 LEGISLATION OVERVIEW.................................................................................. 6
3 CCP PLANNING PROCESS AND OBJECTIVES ...................................................... 8
4 POPULATION DATA AND RE-OFFENSE RATES OF REALIGNED OFFENDERS ....... 9
4.1 AB 109 Local Population Trends ................................................................................................. 10
4.2 Term Completions, Revocations, and Arrests for PRCS and PC 1170(h) Populations ................ 15
4.3 Reconviction Rates of Realigned Offenders by Calendar Year ................................................... 17
4.4 Crime in California Related to Realignment ................................................................................ 19
4.5 Outcome Reporting—Current Initiatives .................................................................................... 20
5 STATE FUNDING ALLOCATION METHODOLOGY ..............................................22
6 FY 2016-17 REALIGNMENT BUDGET AND PROGRAM OVERVIEW ...................24
6.1 FY 2016-17 Realignment Budget ................................................................................................. 24
6.2 Budget Changes between FY 2014-15 and FY 2015-16 .............................................................. 25
6.3 Program Overview ...................................................................................................................... 27
7 FY 2016-17 REALIGNMENT PROGRAM DESCRIPTIONS AND BUDGETS ............30
7.1 Administration ............................................................................................................................ 31
7.1.1 Department Analyst (Probation) ......................................................................................... 31
7.1.2 Business Systems Analyst .................................................................................................... 31
7.1.3 Department Analyst (Sheriff) .............................................................................................. 32
7.2 Community Supervision .............................................................................................................. 33
7.2.1 AB 109 Supervision Units .................................................................................................... 33
7.2.2 AB 109 Offender Needs Fund ............................................................................................. 33
7.3 Custody ....................................................................................................................................... 35
7.3.1 Jail Unit ................................................................................................................................ 35
7.3.2 Specialized Emergency Response Team Training ............................................................... 35
7.3.3 Senior Legal Processor ........................................................................................................ 36
7.3.4 Inmate Transportation Deputy ........................................................................................... 36
7.4 In-Custody Programming ............................................................................................................ 37
7.4.1 Inmate Program Sergeant ................................................................................................... 37

FY 2016-17 County of Sonoma Public Safety Realignment Implementation Plan
Page 3
7.4.2 Jail Programs ....................................................................................................................... 37
7.4.3 Starting Point Substance Use Disorder Services ................................................................. 38
7.4.4 In-Custody Mental Health Services ..................................................................................... 38
7.4.5 Penal Code 1370 Restoration Services................................................................................ 38
7.5 Out-of-Custody Programming and Detention Alternatives ........................................................ 40
7.5.1 Day Reporting Center .......................................................................................................... 40
7.5.2 Restorative Reentry Program - Circles of Support .............................................................. 41
7.5.3 SCOE GED Preparation and Testing Services ...................................................................... 41
7.5.4 Transitional Housing ........................................................................................................... 41
7.5.5 Domestic Violence 52-Week Course ................................................................................... 42
7.5.6 Supervised Adult Crew ........................................................................................................ 42
7.5.7 Electronic Monitoring Program........................................................................................... 43
7.5.8 Community Mental Health Services ................................................................................... 43
7.5.9 Community Substance Use Disorder Services .................................................................... 44
7.5.10 Substance Use Disorder Contract Services ......................................................................... 44
7.5.11 Employment and Eligibility Services ................................................................................... 45
7.5.12 Business Representative ..................................................................................................... 45
7.5.13 General Assistance .............................................................................................................. 45
7.5.14 DUI Treatment Court........................................................................................................... 46
7.5.15 Young Adult Restorative Justice .......................................................................................... 46
7.6 Parole Revocation Hearings ........................................................................................................ 48
7.6.1 District Attorney - Parole Revocation Hearings Case Prosecution...................................... 48
7.6.2 District Attorney – Legal Processor ..................................................................................... 48
7.6.3 Public Defender - Parole Revocation Hearings Attorney .................................................... 48
7.6.4 Public Defender – Parole Revocation Hearings Investigator .............................................. 49
7.7 Pre-Trial Services ......................................................................................................................... 50
7.7.1 Pre-Trial Services ................................................................................................................. 50
7.7.2 Administrative Aide ............................................................................................................. 51
7.8 Data Management ...................................................................................................................... 52
7.8.1 Programming Support ......................................................................................................... 52
7.8.2 Data Evaluation and Analysis Consultant ............................................................................ 52
7.9 Other Programs ........................................................................................................................... 53

FY 2016-17 County of Sonoma Public Safety Realignment Implementation Plan
Page 4
7.9.1 Legal Support ...................................................................................................................... 53
7.9.2 Penal Code 1368 Mental Competency Assessments .......................................................... 53
Exhibit A: Community Corrections Partnership Roster ..........................................54
Exhibit B: Budget by Major Program .....................................................................55
Exhibit C: Budget by Department ..........................................................................57

FY 2016-17 County of Sonoma Public Safety Realignment Implementation Plan
Chapter 1: EXECUTIVE SUMMARY Page 5
1 EXECUTIVE SUMMARY This document presents the Sonoma County Community Corrections Partnership’s (CCP’s) AB 109 Public Safety Realignment Implementation Plan (Plan) for Fiscal Year 2016-17, covering the 12-month period from July 1, 2016, through June 30, 2017. Chapters 2 through 5 provide broad context for this Plan by describing the legislation, local planning efforts, objectives, data on the AB 109 population, and state methodology for allocating Realignment funds. Chapters 6 and 7 detail Sonoma County’s AB 109 program budget and the specific programs and services recommended by the CCP. Chapter 2 summarizes the October 2011 Public Safety Realignment Act legislation, which consists of Assembly Bill 109 and associated trailer bills. This chapter describes the three primary groups of adult offenders in California affected by AB 109: (1) Post-Release Community Supervision offenders, (2) individuals sentenced to jail and/or mandatory supervision pursuant to Penal Code 1170(h), and (3) state parole violators serving revocation terms in local jail. Following the legislative overview, chapter 3 provides insight into the guiding principles and objectives adhered to by the CCP in developing its annual Plan. Chapter 4 reviews data on realigned offenders—their numbers, composition, and re-conviction rates in Sonoma County, followed by a brief review of a published statewide analysis of crime trends related to Realignment. The CCP’s programmatic and budgetary recommendations must consider the anticipated revenues that Sonoma County will receive from the state to implement AB 109 programs. Chapter 5 explains recent changes in the state’s revenue allocation methodology and how it might affect Sonoma County in 2016 and beyond. The last two chapters of this Plan describe the individual programs and services that comprise the CCP’s recommended FY 2016-17 plan and budget. The individual programs are grouped into the following nine major categories: Administration, Community Supervision, Custody, In-custody Programming, Out-of-Custody Programming and Detention Alternatives, Parole Revocation Hearings Support, Pre-trial Services, Data Management, and Other Programs. Chapter 6 provides a high-level overview of the CCP’s budget by major program and briefly describes programs continued from prior years and scope changes to continuing efforts. Chapter 7 details all programs and services recommended by the CCP. Each program narrative includes an overview, description of any scope changes, and an estimated budget. The CCP’s recommended Plan for FY 2016-17 augments prior year plans, strives to achieve stated objectives, and represents both a synergistic and balanced approach to addressing the challenges of Realignment.

FY 2016-17 County of Sonoma Public Safety Realignment Implementation Plan
Chapter 2: LEGISLATION OVERVIEW Page 6
2 LEGISLATION OVERVIEW In response to a federal court order to reduce prison overcrowding, California’s Public Safety Realignment Act (Assembly Bill 109) took effect October 1, 2011, and mandated sweeping changes to the criminal justice system by shifting the responsibility for managing select adult offenders from the state to each of the 58 counties. Realignment legislation applies to three major groups of offenders. The first group, known as the Post-Release Community Supervision (PRCS) population, consists of offenders incarcerated for offenses classified as non-violent and non-serious and excludes high-risk sex offenders, third-strike offenders, and mentally disordered offenders. No inmates currently in state prison are transferred to county jails, and no state prison inmates are released early. The second group consists of so-called “non-non-non” offenders. The Realignment Act changed the penal code and sentencing laws so that offenders whose current or past offenses are non-violent, non-serious, and non-sex related, will serve their sentences locally pursuant to Penal Code section 1170(h). Local sentences include combinations of county jail detention, Mandatory Supervision (MS) by Probation, and a variety of detention alternatives. The third group consists of state parole and probation violators. Most of these offenders will serve their revocation terms in county jail, although those previously receiving life sentences can still be revoked to state prison. The statutes place a high-value on evidence-based practices to reduce recidivism among offenders. Local courts in Sonoma County function as the designated authorities for determining revocations. However, the Board of Parole Hearings conducts parole consideration hearings for offenders previously receiving life sentences, medical parole hearings, mentally disordered offender case hearings, and sexually violent predator case hearings. In November 2012, California voters passed Proposition 30, which imposed new taxes and added Section 36 to Article XIII of the California Constitution, which guarantees future funding to the counties for Public Safety Realignment. In November 2014, California voters passed Proposition 47, which reduced drug and some other felonies to misdemeanors. The initiative could be expected to cause reductions in prison and jail usage, as well as in the probation population. Data compiled by the CCP do indicate that the initiative has slightly reduced the PRCS population and has more substantially reduced the PC 1170(h) population. Between December 2014 and March 2016, the initiative accounted for termination of 23 PRCS sentences (4% of total PRCS terminations during this period), and 52 MS sentences (12% of total MS terminations during this period) (Figure 2.1). However, terminations resulting from Proposition 47 appear to have mostly run their course, as there have been no new terminations since July 2015 and September 2015 for PRCS and MS offenders, respectively. The CCP will continue to assess effects of Proposition 47.

FY 2016-17 County of Sonoma Public Safety Realignment Implementation Plan
Chapter 2: LEGISLATION OVERVIEW Page 7
Figure 2.1: PRCS and MS Sentences Terminated due to Proposition 47

FY 2016-17 County of Sonoma Public Safety Realignment Implementation Plan
Chapter 3: CCP PLANNING PROCESS AND OBJECTIVES Page 8
3 CCP PLANNING PROCESS AND OBJECTIVES The Public Safety Realignment Act expanded the role and purpose of each county’s local Community Corrections Partnership (CCP) committee, previously established under SB 678, to lead local planning efforts associated with Realignment. AB 117 requires that the CCP Executive Committee prepare a public safety realignment implementation plan to meet the goals of the legislation and that the plan be approved by the Board of Supervisors. The Chief Probation Officer chairs the committee, and the voting membership (Executive Committee) comprises the Sheriff, District Attorney, Public Defender, Director of Behavioral Health, Sonoma Superior Court Executive Officer, and Sebastopol Chief of Police. Exhibit A contains a full membership roster for the CCP as of May 2016. During February 2016, the CCP conducted a series of budget-focused meetings. On February 29, 2016, the CCP voted unanimously in favor of approving the recommended plan and associated budget for FY 2016-17. The CCP’s recommended programs and services fall under the following major categories: community supervision, jail operations, in-custody programming and treatment, detention alternatives, out-of-custody programming and treatment, parole revocation hearings support, pre-trial services, data management, and administration. Consistent with prior year plans, the CCP’s FY 2016-17 plan aims to achieve the following objectives:
Sonoma County CCP Public Safety Realignment Implementation Plan Objectives
1. Reduce recidivism to enhance public safety.
2. Promote evidence-based programming and upstream investments in health, education, and human services to decrease the need for (and costs of) enforcement, prosecution, and incarceration.
3. Fund programs that align with both Sonoma County’s over-arching strategic goals of enhancing public safety and investing in the future and with the tenets of the County’s Criminal Justice Master Plan1.
4. Minimize use of jail beds through utilization of detention alternatives in a manner that is consistent with public safety and that maintains the integrity of the criminal justice system.
5. Provide programming for offenders both in-custody, as well as out-of-custody, and use validated risk assessments to inform programming decisions and ensure continuity.
6. Implement a Day Reporting Center to serve as the central point of evidence-based programming to help offenders reintegrate into the community.
1 An update of the 2010 Master Plan was completed and adopted by the Board of Supervisors in December 2015. The 2015 update informed the CCP’s efforts during development of the FY 2016-17 Realignment Plan.

FY 2016-17 County of Sonoma Public Safety Realignment Implementation Plan
Chapter 4: POPULATION DATA AND RE-OFFENSE RATES OF REALIGNED OFFENDERS Page 9
4 POPULATION DATA AND RE-OFFENSE RATES OF REALIGNED OFFENDERS This chapter focuses on the realigned population, beginning with population trends and followed by various measures of offenders’ involvement with the criminal justice system, such as re-arrests and re-convictions, during their terms of community supervision. Next is a brief review of a published study on Realignment-related crime in California. As treatment programs such as the Day Reporting Center and substance abuse services begin to mature, it becomes increasingly important to evaluate their efficacy. This chapter concludes with a description of two current initiatives that will increase the CCP’s ability to report on the effectiveness of Sonoma County’s criminal justice system.

FY 2016-17 County of Sonoma Public Safety Realignment Implementation Plan
Chapter 4: POPULATION DATA AND RE-OFFENSE RATES OF REALIGNED OFFENDERS Page 10
4.1 AB 109 Local Population Trends The overall population of realigned offenders in Sonoma County steadily rose from October 1, 2011, when AB 109 legislation took effect, until the beginning of 2015, when it began to stabilize at between 327 and 344 individuals (Figure 4.1). As the overall population was increasing during 2013 and 2014, the Post Release Community Supervision (PRCS) population was declining. This pattern was expected as the initial influx of PRCS offenders declined, and newly convicted offenders eligible for PC 1170(h) sentencing were sentenced to county jail rather than being sent to prison, which effectively reduced the pool of individuals who might subsequently be eligible for PRCS at a later date. Since 2014, the PRCS population has held fairly steady at close to 200 individuals.
Figure 4.1: AB 109 Realignment Supervision Population October 2011 through March 2016 Offsetting the earlier decreases in the PRCS population was a steady rise in the Mandatory Supervision (MS) population as the courts increasingly utilized split sentencing (jail time followed by MS) and as the supervision portion of earlier sentences commenced. Since 2014 Q3, the MS population has stabilized at between 135 and 149 individuals.

FY 2016-17 County of Sonoma Public Safety Realignment Implementation Plan
Chapter 4: POPULATION DATA AND RE-OFFENSE RATES OF REALIGNED OFFENDERS Page 11
Figure 4.2 shows the realigned jail inmate population in Sonoma County. Offenders serving sentences under PC 1170(h) have continued to represent by far the largest realigned population in the jail, comprising close to 90% of the realigned population and close to 20% of the total jail population. PRCS violators account for most of the remaining realigned jail population.
Figure 4.2: AB 109 Jail Inmate Population

FY 2016-17 County of Sonoma Public Safety Realignment Implementation Plan
Chapter 4: POPULATION DATA AND RE-OFFENSE RATES OF REALIGNED OFFENDERS Page 12
As shown in Figure 4.3, PRCS quarterly intakes of offenders released from prison to probation peaked immediately after the Realignment Act took effect and then generally declined for the following two years, until beginning to rise again in 2014. It is not clear whether the recent declines in intakes represent a downward trend or only a temporary drop.
Figure 4.3: PRCS Intakes

FY 2016-17 County of Sonoma Public Safety Realignment Implementation Plan
Chapter 4: POPULATION DATA AND RE-OFFENSE RATES OF REALIGNED OFFENDERS Page 13
Inmates serving a sentence under PC 1170(h) and then released to Probation on MS are shown in Figure 4.4. MS releases increased steadily from the beginning of Realignment until the second quarter of 2014, when they peaked at 45. Over the last three quarters, MS releases have been close to 40 per quarter.
Figure 4.4: 1170(h) Inmates Released from Jail to MS
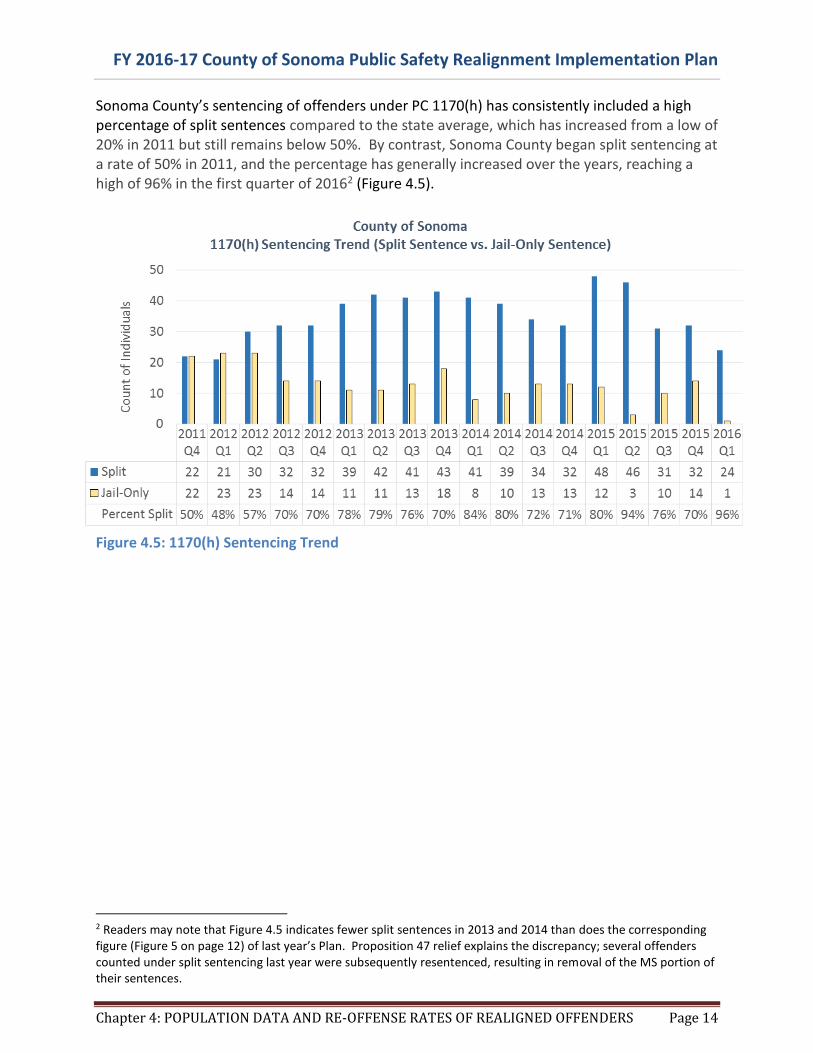
FY 2016-17 County of Sonoma Public Safety Realignment Implementation Plan
Chapter 4: POPULATION DATA AND RE-OFFENSE RATES OF REALIGNED OFFENDERS Page 14
Sonoma County’s sentencing of offenders under PC 1170(h) has consistently included a high percentage of split sentences compared to the state average, which has increased from a low of 20% in 2011 but still remains below 50%. By contrast, Sonoma County began split sentencing at a rate of 50% in 2011, and the percentage has generally increased over the years, reaching a high of 96% in the first quarter of 20162 (Figure 4.5).
Figure 4.5: 1170(h) Sentencing Trend
2 Readers may note that Figure 4.5 indicates fewer split sentences in 2013 and 2014 than does the corresponding figure (Figure 5 on page 12) of last year’s Plan. Proposition 47 relief explains the discrepancy; several offenders counted under split sentencing last year were subsequently resentenced, resulting in removal of the MS portion of their sentences.

FY 2016-17 County of Sonoma Public Safety Realignment Implementation Plan
Chapter 4: POPULATION DATA AND RE-OFFENSE RATES OF REALIGNED OFFENDERS Page 15
4.2 Term Completions, Revocations, and Arrests for PRCS and PC 1170(h) Populations
The CCP produces a regular report on various measures of the realigned populations. This section summarizes data from the March 31, 2016, report. Post-Release Community Supervision Population Since Realignment began, Sonoma County has received 722 PRCS offenders, 205 of whom were still on active PRCS supervision as of March 31, 2016, with the remaining 517 completing their terms. Of the completions, 237 (46%) completed PRCS in the first 12 months without being incarcerated, 41 (8%) who did not complete PRCS in the first 12 months went on to complete their terms by not being incarcerated for 12 consecutive months, 96 (19%) had their PRCS revoked and not reinstated, 91 (18%) transferred to another county or were deceased, 29 (6%) had their PRCS term expire, and 23 (4%) terminated because of a Proposition 47 sentence reduction. A total of 232 individuals had their supervision revoked, although a majority of the revoked terms were later reinstated. Indeed, some offenders experienced multiple formal revocations; the 232 individuals with formal revocations produced 506 formal revocation occurrences. Some 302 PRCS individuals were flash incarcerated for a total of 825 flash incarceration occurrences. At the end of March 2016, 31 jail inmates were serving time for a PRCS violation, which accounted for 3% of the total inmate population. There were 1,021 arrests during the study period, with most being conducted by the Probation Department (35%), the Santa Rosa Police Department (24%), and the Sonoma County Sheriff’s Office (18%). A total of 337 individuals were convicted for new offenses while on PRCS. Of these convictions, 58% were misdemeanors, and 42% were felonies. Penal Code 1170(h) Population Since Realignment began, a total of 872 offenders have been sentenced under PC 1170(h) in Sonoma County, with 633 receiving split sentences and the remaining 239 receiving jail-only sentences. As of March 31, 2016, 592 individuals have been released from custody to MS, 148 of whom were still on active MS supervision as of March 31, 2016, with the remaining 444 completing their terms. Of the completions, 175 (39%) completed their full sentences, 154 (35%) were terminated for probation violations or new crimes, 63 (14%) transferred to another county or were deceased, and 52 (12%) terminated because of a Proposition 47 sentence reduction.

FY 2016-17 County of Sonoma Public Safety Realignment Implementation Plan
Chapter 4: POPULATION DATA AND RE-OFFENSE RATES OF REALIGNED OFFENDERS Page 16
There were 240 arrests, with most being conducted by the Santa Rosa Police Department (32%) and the Sonoma County Sheriff’s Office (27%). At the end of March 2016, 202 individuals from the 1170(h) population were serving jail time, which accounted for 18% of the total inmate population. A total of 190 individuals were convicted for new offenses while on MS. Of these convictions, 56% were misdemeanors, and 44% were felonies.

FY 2016-17 County of Sonoma Public Safety Realignment Implementation Plan
Chapter 4: POPULATION DATA AND RE-OFFENSE RATES OF REALIGNED OFFENDERS Page 17
4.3 Reconviction Rates of Realigned Offenders by Calendar Year The top priority of community supervision is to protect public safety by reducing the chances of offenders reoffending. One method to measure re-offenses is through reconviction rates of realigned offenders during their community supervision, calculated as the number of individuals with reconvictions in a particular year divided by the total number of individuals ending supervision in that year. Figures 4.6 and 4.7 present these calculations for the PRCS and MS populations during calendar years 2012 through 2015.3 Figure 4.6 shows that the PRCS felony new conviction rate has increased gradually since 2013, while the overall new conviction rate has increased sharply during this period, due to a spike in misdemeanor convictions. Total exits from supervision increased steadily from 58 in 2012 to 157 in 2015. Similar to the PRCS data, misdemeanor convictions by the MS population increased sharply in 2015, while total supervision exits rose steadily from 2012 to 2015. Increasing lengths of stay on supervision for individuals ending supervision in later years may have driven the increase. The increasing lengths of stay relate to the recency of Realignment in that individuals ending supervision in 2015 had the opportunity to be on supervision for longer periods than those ending supervision in 2013 and 2014.
3 According to the hierarchy used here, an offender who is on PRCS and MS concurrently is counted only on PRCS.

FY 2016-17 County of Sonoma Public Safety Realignment Implementation Plan
Chapter 4: POPULATION DATA AND RE-OFFENSE RATES OF REALIGNED OFFENDERS Page 18
Figure 4.6: New Conviction Rates for PRCS Population by Calendar Year
Figure 4.7: New Conviction Rates for MS Population by Calendar Year
FY 2016-17 County of Sonoma Public Safety Realignment Implementation Plan
Chapter 4: POPULATION DATA AND RE-OFFENSE RATES OF REALIGNED OFFENDERS Page 19
4.4 Crime in California Related to Realignment
With the advent of Realignment in October 2011 came concerns about increased crime as offenders formerly under state jurisdiction and in state prisons were transferred to the communities and jails of California’s counties. However, the report “Public Safety Realignment: Impacts So Far,” authored by Magnus Lofstrom and Brandon Martin of the Public Policy Institute of California, found no evidence that Realignment statewide has increased violent crime. The study did attribute a modest rise in property crime, resulting from increased auto theft, to Realignment, but overall, concluded that both property and violent crime rates are now below 2011 levels. As discussed in section 4.5 below, coming studies commissioned by the CCP will examine the effects of Realignment in much more detail than is possible today.

FY 2016-17 County of Sonoma Public Safety Realignment Implementation Plan
Chapter 4: POPULATION DATA AND RE-OFFENSE RATES OF REALIGNED OFFENDERS Page 20
4.5 Outcome Reporting—Current Initiatives The above examination of new convictions for crimes committed during supervision is one of many methods to study the impact of Realignment and the effectiveness of Sonoma County’s justice system with the realigned population. At this writing, two major initiatives are underway to expand reporting abilities and better understand the outcomes of our programs. The first initiative, a new offender outcomes data report, will be completed this year, while a Realignment evaluation services project is a longer-term undertaking expected to begin producing data in two to three years. Offender Outcomes Data Report Through its Data and Evaluation Subcommittee, the CCP is constructing the most comprehensive Realignment recidivism report ever in Sonoma County. The report will have a separate section for each of the main offender populations—PRCS, PC 1170(h), and formal probation—with recidivism data for each population as measured by arrests, formal complaints filed, and convictions during supervision and during the first year following supervision or incarceration. The report will also cover formal revocations and types of crimes committed. A final section will review efficacy data for programs such as the Day Reporting Center, transitional housing, electronic monitoring, and services offered through the departments of Health and Human Services. The first release of this report is expected in fall 2016, and it will be updated regularly. Realignment Evaluation Services A request for proposals process is underway to identify an evaluation consultant to support the CCP in addressing the following areas: 1. The effectiveness of criminal justice interventions in accomplishing short-term, intermediate, and long-term outcomes, including the treatment effect related to recidivism for individual criminal justice interventions; 2. The success of the criminal justice system in increasing public safety in Sonoma County, with attention given to specific criminal justice populations, including realigned populations and felony probationers; 3. The effectiveness of system capacity improvements in accomplishing stated goals; 4. The degree to which individual criminal justice interventions are implemented with fidelity to design, and the relationship between fidelity and outcomes for these interventions; 5. The monetized benefit relative to cost for individual criminal justice interventions;

FY 2016-17 County of Sonoma Public Safety Realignment Implementation Plan
Chapter 4: POPULATION DATA AND RE-OFFENSE RATES OF REALIGNED OFFENDERS Page 21
6. The effectiveness of individual criminal justice interventions and the criminal justice system overall compared across demographic groups such as race/ethnicity, sex, neighborhood, mental health status, and gang connection; and 7. The effects of system changes on public safety outcomes (e.g., AB 109 and Proposition 47). These offender outcome data will provide rich sources of information that will guide investments and decision-making in the years to come. Next year’s Plan will include data from the new offender outcomes data report and an update on progress with the Realignment evaluation project.

FY 2016-17 County of Sonoma Public Safety Realignment Implementation Plan
Chapter 5: STATE FUNDING ALLOCATION METHODOLOGY Page 22
5 STATE FUNDING ALLOCATION METHODOLOGY
Each year, Sonoma County receives a base allocation of state funding to implement Realignment programs, and may receive additional funding in the forms of growth funds and planning and other revenue. Historically, both the state budgets for these funding sources and the percentage of these funds that counties receive have varied substantially from year to year. In 2014, California, through its Realignment Allocation Committee (RAC)4, developed new sets of funding allocation formulas in an effort to (1) smooth the level of year-to-year funding that each county receives, and (2) incentivize improvements in certain areas. Base Allocation For FY 2015-16, the RAC developed a new, permanent base allocation formula containing three categories, weighted as follows:
1. Caseload (45%) considers the jail population (share of statewide PC 1170(h) population) and the probation population (share of statewide PRCS and felony probationers).
2. Population and Crime (45%) considers the adult population (share of people statewide
aged 18-64) and crime (share of statewide serious property and violent crimes for 2010, 2011, and 2012, added together).
3. Special Factors (10%) provides funding to counties that have high levels of poverty; that
have small populations; or that house a state prison. Sonoma County does not qualify for any Special Factors funding.
As Table 5.1 indicates, under this new formula, Sonoma County’s share of the statewide budget decreased substantially in FY 2015-16 (0.88%) compared to FY 2014-15 (1.03%). However, this decrease was offset by an increased statewide budget in FY 2015-16. Benefitting from the tailwind of an expected 7.7% increase in the statewide budget in FY 2016-17, Sonoma County anticipates receiving an additional $748,000 in base allocation compared to FY 2015-16. Sonoma County’s base allocation of 0.88% is expected to be permanent. Growth Funds Growth funds are based on sales taxes and vehicle license fees and are usually received in October or November, meaning that growth funds are received in the fiscal year following the year for which they are calculated. For example, the FY 2015-16 growth funds listed in Table 5.1 are expected in November 2016. Beginning in FY 2015-16 (for payments received in FY 2016-17), growth payments are based entirely on incentives. Briefly, this formula weights 80% of growth funding on probation factors
4 The RAC comprises nine county administrative officers, each from a different county. The RAC makes recommendations to the California Department of Finance, which makes final decisions on funding allocation. The Department of Finance has accepted all allocation formulas discussed in this chapter.

FY 2016-17 County of Sonoma Public Safety Realignment Implementation Plan
Chapter 5: STATE FUNDING ALLOCATION METHODOLOGY Page 23
(success and improvement in probation outcomes) and 20% on incarceration factors (success and improvement in reducing prison incarcerations). The RAC considers this formula an interim measure and expects to develop a permanent growth formula within five years. Planning and Other Revenue Sonoma County received $150,000 from the state in each of the past four fiscal years to cover one-time planning costs and expects to receive an additional $150,000 for planning in FY 2016-17. However, these funds are considered one-time in nature and are not assured. To be eligible for these funds, Sonoma County must submit a report to the state describing the status of its local public safety realignment implementation. In addition to the main AB 109 revenue allocations discussed here, Sonoma County also receives annual allotments from the state to fund District Attorney and Public Defender activities related to Realignment (Table 5.1).
Table 5.1: Sonoma County AB 109 Revenue
MAIN AB 109 SUBACCOUNT FY 11-12 FY 12-13 FY 13-14 FY 14-15 FY 15-16 FY 16-17*
Statewide Budget $354,300,000 $842,900,000 $998,900,000 $934,100,000 $1,107,528,945 $1,192,600,000
Sonoma Allocation (%) 0.91% 1.07% 1.07% 1.03% 0.88% 0.88%
Subtotal Revenue $3,240,428 $9,027,459 $10,698,219 $9,657,516 $9,732,986 $10,480,592
DA/PD SUBACCOUNT FY 11-12 FY 12-13 FY 13-14 FY 14-15 FY 15-16 FY 16-17*
Statewide Budget $12,700,000 $14,600,000 $17,100,000 $15,855,211 $24,400,000 $30,000,000
Sonoma Allocation (%) 0.91% 0.93% 0.93% 0.93% 0.93% 0.93%
Subtotal Revenue $116,154 $136,028 $159,321 $147,723 $228,129 $280,486
CCP PLANNING FY 11-12 FY 12-13 FY 13-14 FY 14-15 FY 15-16 FY 16-17**
Subtotal Revenue $378,650 $150,000 $150,000 $150,000 $150,000 $150,000
MAIN AB 109 GROWTH (Performance) FY 11-12 FY 12-13 FY 13-14 FY 14-15 FY 15-16** FY 16-17**
Statewide Budget $0 $86,757,030 $48,446,395 $64,800,000 $85,100,000 $102,000,000
Sonoma Allocation (%) 0.00% 0.61% 0.87% 2.612% 0.87% 0.87%
Subtotal Revenue $0 $526,222 $419,800 $1,692,684 $737,368 $883,801
MAIN AB 109 GROWTH (1x Stabilization) FY 11-12 FY 12-13 FY 13-14 FY 14-15 FY 15-16 FY 16-17
Statewide Budget $0 $0 $24,741,706 $39,052,911 $0 $0
Sonoma Allocation (%) 0.00% 0.00% 0.87% 0.00% 0.00% 0.00%
Subtotal Revenue $0 $0 $214,393 $0 $0 $0
MAIN AB 109 GROWTH (1x Transition) FY 11-12 FY 12-13 FY 13-14 FY 14-15 FY 15-16 FY 16-17
Statewide Budget $0 $0 $0 $108,628,945 $0 $0
Sonoma Allocation (%) 0.00% 0.00% 0.00% 2.61% 0.00% 0.00%
Subtotal Revenue $0 $0 $0 $2,837,569 $0 $0
DA/PD GROWTH FY 11-12 FY 12-13 FY 13-14 FY 14-15 FY 15-16** FY 16-17**
Statewide Budget $0 $5,763,710 $4,879,201 $7,241,930 $5,700,000 $6,800,000
Sonoma Allocation (%) 0.00% 0.93% 0.93% 0.93% 0.93% 0.93%
Subtotal Revenue $0 $53,888 $45,618 $67,709 $53,292 $63,577
Total Revenue $3,735,232 $9,893,597 $11,712,587 $14,553,200 $10,901,775 $11,858,456
* Based on the Governor's May Revised 2016-17 budget
** Planning and Growth figures are projections; there is no assurance that Sonoma County will receive these funds.
AB 109 REVENUE SUMMARY - SONOMA COUNTY

FY 2016-17 County of Sonoma Public Safety Realignment Implementation Plan
Chapter 6: FY 2016-17 REALIGNMENT BUDGET AND PROGRAM OVERVIEW Page 24
6 FY 2016-17 REALIGNMENT BUDGET AND PROGRAM OVERVIEW
6.1 FY 2016-17 Realignment Budget
The CCP’s recommended FY 2016-17 budget for public safety realignment assumes state revenues of $18,538,950 from four sources: (1) projected carry-over of $7,627,872 in unspent prior year Realignment funds; (2) an annual FY 2016-17 subaccount revenue allocation of $10,480,592; (3) an annual District Attorney/Public Defender state subaccount revenue allocation of $280,486; and (4) a planning allocation of $150,000. Of the total anticipated revenues for FY 2016-17, the CCP recommends that $13,471,610 be allocated to fund FY 2016-17 programs and services. The estimated surplus of $5,067,340 will be held as a contingency reserve to cover unanticipated costs and as a buffer against any decreases in state funding that might occur in subsequent years (Table 6.1).
Table 6.1: AB 109 Revenues and Expenditures
The actual surplus carryover amount will not be known until FY 2015-16 concludes; therefore, revenue estimates should be considered preliminary. The FY 2016-17 projected surplus will change based on actual expenditures during the year and the variance between the forecasted and actual FY 2015-16 expenditures and growth fund allocations. The CCP anticipates receiving the FY 2015-16 growth revenues described in Table 6.1 in November 2016. While Sonoma County will likely receive FY 2016-17 growth funds as well, the allocation, if any, is unknown as of May 2016. Any revenues received from these sources would be added to the estimated FY 2016-17 surplus.
FY 11-12 FY 12-13 FY 13-14 FY 14-15 FY 15-16 FY 16-17
Main AB 109 Subaccount $3,240,428 $9,027,459 $10,698,219 $9,657,516 $9,732,986 $10,480,592
Planning $378,650 $150,000 $150,000 $150,000 $150,000 $150,000
DA/PD Subaccount $116,154 $136,028 $159,321 $147,723 $228,129 $280,486
Main AB 109 Growth $0 $526,222 $634,193 $4,530,253 $737,368 TBD
DA/PD Growth $0 $53,888 $45,618 $67,709 $53,292 TBD
Prior Year Rollover $0 $1,317,764 $3,881,593 $5,538,788 $8,845,118 $7,627,872
Total Revenue $3,735,232 $11,211,362 $15,568,944 $20,091,988 $19,746,893 $18,538,950
Less Expenditures ($2,417,468) ($7,329,769) ($10,030,156) ($11,246,870) ($12,119,021) ($13,471,610)
Net Surplus/(Deficit) $1,317,764 $3,881,593 $5,538,788 $8,845,118 $7,627,872 $5,067,340
Recommended CCP Budget $3,361,500 $9,552,756 $12,524,548 $12,609,797 $12,563,527 $13,471,610
Sonoma County AB 109 Revenue vs. Expenditures

FY 2016-17 County of Sonoma Public Safety Realignment Implementation Plan
Chapter 6: FY 2016-17 REALIGNMENT BUDGET AND PROGRAM OVERVIEW Page 25
6.2 Budget Changes between FY 2014-15 and FY 2015-16 Compared to FY 2015-16, the overall FY 2016-17 recommended budget was similar, increasing by 3.9% from $12,563,527 to $13,471,610, due mostly to cost of living-related increases for continuing programs (Table 6.2).
Table 6.2: Summary of Funding Changes between FY 2015-16 and FY 2016-17
Table 6.3 details the line item changes that the CCP made in formulating the FY 2016-17 recommended budget. The only programming cut was a $45,850 reduction for outpatient substance use disorder services at the Day Reporting Center, which was reduced by half because the CCP expects that Drug Medi-Cal will begin subsidizing these services part way through the year. The only programming addition was a $121,557 allocation for a new Administrative Aide, who will perform data collection and reporting processes, mostly to support the pre-trial program. Total salary and benefit costs for existing positions increased by $403,699 or 4.4%. More information about these changes appears in chapter 7.
(a) (b) (c) (d) (e) = (a) + (b) + (c) + (d)
FY 2015-16
CCP Approved,
including mid-year
additions
FY 2016-17
Cut or Eliminated
Programs
FY 2016-17
New or Expanded
Programs
FY 2016-17
Salary and Benefit Net
Changes for Continuing
Programs
FY 2016-17
CCP Approved
$12,963,527 ($45,850) $150,234 $403,699 $13,471,610

FY 2016-17 County of Sonoma Public Safety Realignment Implementation Plan
Chapter 6: FY 2016-17 REALIGNMENT BUDGET AND PROGRAM OVERVIEW Page 26
Table 6.3: Details of Funding Changes between FY 2015-16 and FY 2016-17
FY 2015-16
Dept/Agency Program/Service Description CCP Approved CCP Approved
Addition or (Reduction)
Compared to FY 15-16
FY 2015-16 CCP Approved, including mid-year additions (a)
$12,963,527
FY 2016-17 Cut or Eliminated Programs (b)
Health Outpatient SUD at DRC $91,700 $45,850 ($45,850)
Total ($45,850)
FY 2016-17 New or Expanded Programs (c)
Probation Transitional Housing $291,000 $298,275 $7,275
Probation Program Support (Admin Aide) $121,557 $121,557
Sheriff Jail Programs $138,412 $142,564 $4,152
Superior Court "1368" Competency Assessments $60,000 $77,250 $17,250
Total $150,234
FY 2016-17 Salary and Benefit Net Changes for Continuing Programs (d)
District Attorney Case Prosecution $203,745 $228,769 $25,024
District Attorney Legal Processor $78,319 $99,375 $21,056
Health Services "1370" Restoration Services $491,960 $487,627 ($4,333)
Health Services In-Custody Mental Health $370,595 $455,680 $85,085
Health Services Community Mental Health Services $227,451 $250,022 $22,571
Health Services Starting Point SUD Services $255,238 $242,603 ($12,635)
Health Services AODS SUD Services $131,019 $169,552 $38,533
Human Services Employment/Eligibility Services $231,817 $248,854 $17,037
Probation AB 109 Supervision Unit $2,060,090 $2,087,850 $27,760
Probation Probation-Operated DRC $1,698,987 $1,788,684 $89,697
Probation Pre-Trial Supervision $763,105 $722,382 ($40,723)
Probation DUI Court - PO Support $162,097 $153,469 ($8,628)
Probation Department Analyst (Prob) $140,190 $135,720 ($4,470)
Probation Business Systems Analyst $66,625 $72,369 $5,744
Public Defender Attorney $142,707 $152,297 $9,590
Public Defender Investigator $51,415 $57,354 $5,939
Sheriff Jail Unit 1 $1,633,052 $1,690,373 $57,321
Sheriff Assessment Staff $734,687 $751,500 $16,813
Sheriff Electronic Monitoring - Staff $374,772 $384,538 $9,766
Sheriff Senior Legal Processor $110,715 $105,748 ($4,967)
Sheriff Inmate Transp. Deputy $184,459 $192,624 $8,165
Sheriff Program Sergeant $181,505 $186,499 $4,994
Sheriff Detective $219,955 $245,727 $25,772
Sheriff Department Analyst (SO) $139,504 $148,091 $8,587
Total $403,699
FY 2016-17 CCP Approved (e)
$13,471,610
FY 2016-17

FY 2016-17 County of Sonoma Public Safety Realignment Implementation Plan
Chapter 6: FY 2016-17 REALIGNMENT BUDGET AND PROGRAM OVERVIEW Page 27
6.3 Program Overview
This overview summarizes the FY 2016-17 Realignment Implementation Plan, itemized by the nine major categories that comprise the $13,471,610 recommended program budget (Figure 6.1). Under each major program category, individual program elements are listed and identified as either a continuing effort or new program, and proposed changes to continuing efforts are also noted. Each program element cited in this chapter is described in greater detail in chapter 7.
Figure 6.1: FY 2016-17 CCP Budget by Major Program
1) Administration - $356,180 (3% of total budget)
Description: Administrative, budgetary, and analytical support to the CCP.
Continuing Efforts: Probation Department Analyst, Sheriff Department Analyst, and Probation Business Systems Analyst.
Continuing Effort Scope Changes: None.
New Programs: None.

FY 2016-17 County of Sonoma Public Safety Realignment Implementation Plan
Chapter 6: FY 2016-17 REALIGNMENT BUDGET AND PROGRAM OVERVIEW Page 28
2) Community Supervision - $2,352,577 (17% of total budget)
Description: Supervision of realigned offenders in the local community.
Continuing Efforts: Probation AB 109 Supervision Units, Offender Needs Fund, Family Justice Center rental costs, and Sheriff Detective.
Continuing Effort Scope Changes: None.
New Programs: None.
3) Custody - $2,311,961 (17% of total budget)
Description: Local jail accommodations for realigned inmates.
Continuing Efforts: North County Detention Facility Jail Unit and Specialized Emergency Response Team training.
Continuing Effort Scope Changes: None.
New Programs: None.
4) In-Custody Programming - $1,514,973 (11% of total budget)
Description: Includes all rehabilitative programming for realigned and other jail inmates.
Continuing Efforts: Jail Programs, Inmate Programs Sergeant, Starting Point, In-custody Mental Health Services, and PC 1370 Restoration Services.
Continuing Effort Scope Changes: None.
New Programs: None.
5) Out-of-Custody Programming and Detention Alternatives - $4,280,445 (32% of total budget)
Description: All programs and services that support realigned offenders under community supervision, such as mental health, substance use disorder treatment, evidence-based programming, employment training, and educational assistance. Also includes detention alternatives that allow Sonoma County to minimize use of traditional jail beds.
Continuing Efforts: Day Reporting Center, SCOE GED Preparation and Testing, Transitional Housing, Community Mental Health Services, Domestic Violence Programming, Alcohol and Other Drug Substance Use Disorder Services, Substance Use Disorder Contracts, Employment and Eligibility Services, Human Services Contract Business Representative, and General Assistance subsidy.
Continuing Effort Scope Changes: Budget decreased for substance use disorder services at the DRC.
New Programs: None.
6) Parole Revocation Hearings - $537,795 (4% of total budget)
Description: Staff needed to handle additional workload created by transferring the parole revocation hearings process from the State Board of Parole Hearings to local courts.

FY 2016-17 County of Sonoma Public Safety Realignment Implementation Plan
Chapter 6: FY 2016-17 REALIGNMENT BUDGET AND PROGRAM OVERVIEW Page 29
Continuing Efforts: DA Parole Revocation Hearings Case Prosecution, DA Parole Revocation Legal Processor, Public Defender Parole Revocation Hearings Investigator, and PD Parole Investigations Attorney.
Continuing Effort Scope Changes: None.
New Programs: None.
7) Pre-Trial Services - $1,765,439 (13% of total budget)
Description: Provides universal front-end screening for all persons booked into jail, supports jail management, provides community supervision for defendants awaiting trial, reduces pre-trial failure, and facilitates efficient case processing.
Continuing Efforts: Pre-Trial Services.
Continuing Effort Scope Changes: None.
New Programs: Administrative Aide.
8) Data Management - $224,990 (2% of total budget)
Description: Services to capture, analyze, and report data pertaining to AB 109 offenders.
Continuing Efforts: Programming Support.
Continuing Effort Scope Changes: None.
New Programs: None.
9) Other Programs - $127,250 (1% of total budget)
Description: Services that either support the CCP’s planning efforts or address needs of partner agencies impacted by Realignment.
Continuing Efforts: Legal Support, Data Evaluation and Analysis Consultant, and "1368" Competency Assessments.
Continuing Effort Scope Changes: Budget increased for PC 1368 Competency Assessments.
New Programs: None.

FY 2016-17 County of Sonoma Public Safety Realignment Implementation Plan
Chapter 7: FY 2016-17 REALIGNMENT PROGRAM DESCRIPTIONS AND BUDGETS Page 30
7 FY 2016-17 REALIGNMENT PROGRAM DESCRIPTIONS AND BUDGETS
This chapter reviews the programs and services that comprise the CCP’s recommended FY 2016-17 budget for public safety realignment. The key programs for FY 2016-17 are grouped into the nine major categories described in Table 7.1, which also includes the CCP’s recommended budget and document section references.
Table 7.1: Budget Summary by Major Program
Section Major Program Description County FTEs FY 16-17 Amount
8.1 Administration 2.5 $356,180
8.2 Supervision 14.0 $2,352,577
8.3 Custody 10.0 $2,311,961
8.4 In-Custody Prog 6.1 $1,514,973
8.5 Out-of-Custody Prog & Det Alts 17.6 $4,280,445
8.6 Parole Revocations 3.5 $537,795
8.7 Pre-Trial Services 10.0 $1,765,439
8.8 Data Mgmt & Eval 0.0 $224,990
8.9 Other Programs 0.0 $127,250
Total Major Programs 63.7 $13,471,610
Note: Exhibits B and C to this report provide alternate views (by Major Program and by Department) of the budget summarized below.

FY 2016-17 County of Sonoma Public Safety Realignment Implementation Plan
Chapter 7: FY 2016-17 REALIGNMENT PROGRAM DESCRIPTIONS AND BUDGETS Page 31
7.1 Administration
The Administration major program area includes administrative, budgetary, and analytical support to the CCP for Realignment. Table 7.2 summarizes the CCP’s recommended budget for Administration, and the following sub-sections provide supporting information for each program.
Table 7.2: Administration Budget
7.1.1 Department Analyst (Probation)
7.1.1.1 Program Overview: The Probation Department Analyst provides administrative and
analytical support to the CCP as follows: prepares budget documents and coordinates budget development; drafts and administers requests for proposals, contracts, and memoranda of understanding; and produces this Plan and other data and written reports for internal and external stakeholders.
7.1.1.2 FY 2016-17 Plan: No change from prior year.
7.1.1.3 FY 2016-17 Budget: $135,720 to fund 1.0 FTE Department Analyst. 7.1.2 Business Systems Analyst
7.1.2.1 Program Overview: The Business Systems Analyst identifies and implements
information technology solutions needed to support Probation’s evidence-based practices initiatives, increases efficiency of offender case management practices, and creates data analyses and reports. The position analyzes current and future probation processes, needs, and problems in relation to information technology; works with business users to determine business specifications for information technology solutions; evaluates business processes related to adaptation of technology; works with the Information Systems Department to recommend hardware and software applications; plans, prioritizes, budgets, and reviews resources surrounding technology development and acquisition; and conducts end-user testing of systems.
7.1.2.2 FY 2016-17 Plan: No change from prior year.
7.1.2.3 FY 2016-17 Budget: $72,369 to fund 0.5 FTE Business Systems Analyst. (General Fund contributions fund the other half of this full-time position.)
Section Department Program Description County FTE FY 2016-17 Budget
8.1.1 Probation Department Analyst (Prob) 1.00 $135,720
8.1.2 Probation Business Systems Analyst 0.50 $72,369
8.1.3 Sheriff Department Analyst (SO) 1.00 $148,091
Administration Total 2.50 $356,180

FY 2016-17 County of Sonoma Public Safety Realignment Implementation Plan
Chapter 7: FY 2016-17 REALIGNMENT PROGRAM DESCRIPTIONS AND BUDGETS Page 32
7.1.3 Department Analyst (Sheriff)
7.1.3.1 Program Overview: The Sheriff's Office Department Analyst performs fiscal management, contract management, reporting activities, analysis of the Sheriff's AB 109 programs and services, and compilation of statistical data to analyze the impact of Realignment on detention operations and resources.
7.1.3.2 FY 2016-17 Plan: No change from prior year.
7.1.3.3 FY 2016-17 Budget: $148,091 to fund 1.0 FTE Department Analyst.

FY 2016-17 County of Sonoma Public Safety Realignment Implementation Plan
Chapter 7: FY 2016-17 REALIGNMENT PROGRAM DESCRIPTIONS AND BUDGETS Page 33
7.2 Community Supervision
The Community Supervision major program area includes all programs and services that involve monitoring out-of-custody realigned offenders in the local community. Table 7.3 summarizes the CCP’s recommended budget for the Community Supervision program category, and the following sub-sections provide supporting information for each program.
Table 7.3: Community Supervision Budget
7.2.1 AB 109 Supervision Units
7.2.1.1 Program Overview: In collaboration with the Sheriff’s Office, Probation supervises
the PRCS and MS populations. A Sheriff’s Detective, co-located at the Adult Probation office, provides dedicated support to Probation’s intensive supervision unit. AB 109 funding supports the Sheriff’s Detective and all Probation Officers in this intensive supervision unit.
7.2.1.2 FY 2016-17 Plan: No change from prior year. Based on Probation’s latest AB 109 offender population projections, the department anticipates the current staffing level will be sufficient to maintain a 1:35 officer-to-offender caseload ratio. An additional Probation Officer III position may be necessary (subject to CCP and Board approval) to maintain this caseload ratio, should the actual influx of AB 109 offenders exceed estimates.
7.2.1.3 FY 2016-17 Budget: Probation’s budget of $2,087,850 will fund the following 13.0 FTE positions: 2.0 FTE Probation Officer IV (supervisors), 9.0 FTE Probation Officer III, 1.0 FTE Probation Officer II, and 1.0 FTE Legal Processor. If the AB 109 supervision population exceeds the threshold of 350 active offenders for an extended period of time during FY 2016-17, Probation may request additional funds from the CCP for a 1.0 FTE Probation Officer III. The estimated budget includes training, vehicles, communications, office supplies, and other related administrative expenses. Probation’s budget also includes $17,000 to cover lease costs for Probation’s use of the Family Justice Center facility. The Sheriff’s budget of $245,727 funds 1.0 FTE Deputy Sheriff II Detective, plus overtime, vehicle, and cell phone.
7.2.2 AB 109 Offender Needs Fund
7.2.2.1 Program Overview: Petty cash fund used to help PRCS and MS offenders buy
miscellaneous items, such as identification cards, birth certificates, and medications. There is an ongoing need for smaller amounts of money to pay for items, which are
Section Department Program Description County FTE FY 2016-17 Budget
8.2.1 Probation AB 109 Supervision Unit 13.00 $2,087,850
8.2.1 Probation Family Justice Center Rent 0.00 $17,000
8.2.1 Sheriff Detective 1.00 $245,727
8.2.2 Probation Offender Needs Fund 0.00 $2,000
Community Supervision Total 14.00 $2,352,577

FY 2016-17 County of Sonoma Public Safety Realignment Implementation Plan
Chapter 7: FY 2016-17 REALIGNMENT PROGRAM DESCRIPTIONS AND BUDGETS Page 34
essential stabilizing factors for these offenders. The Offender Needs Fund will be administered by Probation as a petty cash fund under direct control of both the Adult Division Director and Accounting.
7.2.2.2 FY 2016-17 Plan: No change from prior year.
7.2.2.3 FY 2016-17 Budget: $2,000 petty cash fund.

FY 2016-17 County of Sonoma Public Safety Realignment Implementation Plan
Chapter 7: FY 2016-17 REALIGNMENT PROGRAM DESCRIPTIONS AND BUDGETS Page 35
7.3 Custody The Custody major program area includes all programs and services needed to house realigned inmates in the local jail. Table 7.4 summarizes the CCP’s recommended budget for the Custody program category, and the following sub-sections provide supporting information for each program.
Table 7.4: Custody Budget
7.3.1 Jail Unit
7.3.1.1 Program Overview: The Sheriff’s Office re-opened one additional jail unit at the
North County Detention Facility (NCDF) in March 2012 to accommodate the influx of realigned inmates. The unit will remain open through FY 2016-17. In addition to the PC 1170(h) inmate population, state parolees also serve their revocation periods (up to 180 days) in county detention facilities. Prior to Realignment, inmates in local custody on parole violations were sent to state prison within a week to serve any revocation sentence. There were an average of 248 realigned offenders in county detention facilities during the first half of FY 2015-16. The overall cost of housing these 248 inmates at an estimated daily rate of $161.30 per bed is $14,600,876 per year.
7.3.1.2 FY 2016-17 Plan: The original approved FY 2015-16 budget included $300,000 in
contingency funding for a second jail unit to be used if jail capacity were to become strained. Ultimately, this additional unit was needed, and a mid-year adjustment added $300,000 in funding for this purpose. As the CCP expects that this unit will continue to be open during at least part of FY 2016-17, funds to operate it are included in the recommended budget. The unit is staffed by one Correctional Deputy 24 hours a day on overtime.
7.3.1.3 FY 2016-17 Budget: $1,690,373 to fund the following 8.0 FTE positions, plus overtime, meals, inmate clothing, and household supplies necessary to operate one NCDF jail unit: 4.0 FTE Correctional Deputy, 2.0 FTE Legal Processor, 1.0 FTE Detention Assistant, and 1.0 FTE Cook.
7.3.2 Specialized Emergency Response Team Training
7.3.2.1 Program Overview: The Sonoma County Sheriff's Specialized Emergency Response Team
(SERT) is responsible for high-risk emergency response within the jail facilities, which
Section Department Program Description County FTE FY 2016-17 Budget
8.3.1 Sheriff Jail Unit 1 8.00 $1,690,373
8.3.1 Sheriff Jail Unit 2 0.00 $300,000
8.3.2 Sheriff SERT Training 0.00 $23,216
8.3.3 Sheriff Senior Legal Processor 1.00 $105,748
8.3.4 Sheriff Inmate Transportation Deputy 1.00 $192,624
Custody Total 10.00 $2,311,961

FY 2016-17 County of Sonoma Public Safety Realignment Implementation Plan
Chapter 7: FY 2016-17 REALIGNMENT PROGRAM DESCRIPTIONS AND BUDGETS Page 36
includes incidents involving armed inmates, cell extractions, major inmate disturbances, high security searches, escape attempts, riots, and hostage incidents. The team is specifically trained in current emergency response techniques and tactics, including use of specialized equipment, to resolve jail emergencies and maintain the safety and security of the facility, staff, inmates, and the public. The SERT team trains monthly to keep updated on these tactics. All of the high-risk emergency responses conducted by SERT were resolved without injury to staff or inmates during 2015.
7.3.2.2 FY 2016-17 Plan: No change from prior year.
7.3.2.3 FY 2016-17 Budget: $23,216 to fund training, equipment, and premium pay for new
members. 7.3.3 Senior Legal Processor
7.3.3.1 Program Overview: The Senior Legal Processor reviews release paperwork for AB 109
inmates. Calculating release dates takes about four times longer for PC 1170(h) cases than for non-PC 1170(h) cases because of additional factors that need to be considered in the calculations.
7.3.3.2 FY 2016-17 Plan: No change from prior year.
7.3.3.3 FY 2016-17 Budget: $105,748 to fund 1.0 FTE Senior Legal Processor. 7.3.4 Inmate Transportation Deputy
7.3.4.1 Program Overview: The Inmate Transportation Deputy transports inmates to
Alameda County detention facilities to increase capacity at Sonoma County detention facilities; transports inmates from detention facilities to medical care facilities for reasons such as emergency room visits, specialized treatments, and oral and medical surgeries; and performs extraditions resulting from PRCS warrants. The total average additional transportation time because of AB 109 is 41 hours per week.
7.3.4.2 FY 2016-17 Plan: No change from prior year.
7.3.4.3 FY 2016-17 Budget: $192,624 to fund 1.0 FTE Inmate Transportation Deputy.

FY 2016-17 County of Sonoma Public Safety Realignment Implementation Plan
Chapter 7: FY 2016-17 REALIGNMENT PROGRAM DESCRIPTIONS AND BUDGETS Page 37
7.4 In-Custody Programming The In-Custody Programming major program area includes all programs and services that provide rehabilitation for jail inmates. Table 7.5 summarizes the CCP’s recommended budget for this major program category, and the following sub-sections provide supporting information for each program.
Table 7.5: In-Custody Programming Budget
7.4.1 Inmate Program Sergeant
7.4.1.1 Program Overview: The Inmate Program Sergeant is tasked with providing
educational opportunities, rehabilitative programming, job skills training, and the delivery of faith-based support to thousands of inmates on an annual basis. The Program Sergeant collaborates with local non-profit and faith-based organizations to achieve maximum volunteer instruction and support, supplemented by contractual agreements with many of the same organizations to achieve increased access and dosage.
7.4.1.2 FY 2016-17 Plan: No change from the prior year.
7.4.1.3 FY 2016-17 Budget: $186,499 to fund 1.0 FTE Correctional Sergeant. 7.4.2 Jail Programs
7.4.2.1 Program Overview: The Sheriff’s Office is committed to the development and delivery of
evidence-based in-custody programs and services for inmates to reduce recidivism. Contracted services include job and life skills, parenting classes, anger management, adult academic education, and cognitive behavioral skills therapy. During 2015, 1,838 inmates attended inmate programs, 221 of whom were AB 109 inmates. In 2016, milestone incentives under Penal Code 4019 have been implemented to increase AB 109 inmate participation in inmate programs. In an effort to increase AB 109 inmate access to in-custody programs, an electronic tablet-based educational platform with secure connectivity will be implemented in FY 2016-17. The platform will also serve to collect data for evaluation and decision-making purposes.
7.4.2.2 FY 2016-17 Plan: No change from prior year.
7.4.2.3 FY 2016-17 Budget: $142,564 to fund the jail programs contracts.
Section Department Program Description County FTE FY 2016-17 Budget
8.4.1 Sheriff Program Sergeant 1.00 $186,499
8.4.2 Sheriff Jail Programs 0.00 $142,564
8.4.3 Health Starting Point SUD Services 1.45 $242,603
8.4.4 Health In-Custody Mental Health 1.80 $455,680
8.4.5 Health "1370" Restoration Services 1.85 $487,627
In-Custody Programming Total 6.10 $1,514,973

FY 2016-17 County of Sonoma Public Safety Realignment Implementation Plan
Chapter 7: FY 2016-17 REALIGNMENT PROGRAM DESCRIPTIONS AND BUDGETS Page 38
7.4.3 Starting Point Substance Use Disorder Services
7.4.3.1 Program Overview: Starting Point provides a means for incarcerated offenders to initiate drug and alcohol treatment. Behavioral Health counselors provide substance use disorder services in the jail to substance abusing inmates. The program offers relapse prevention, anger management, life skills instruction, as well as a cognitive program designed to reduce criminal thinking, enabling participants to identify their destructive lifestyle, patterns of drug abuse, and criminal behavior. Evidence-based practices and other cognitive behavioral techniques are key components of the curriculum.
7.4.3.2 FY 2016-17 Plan: No change from prior year.
7.4.3.3 FY 2016-17 Budget: $242,603 to fund 1.00 FTE Behavioral Health Clinician and 0.45 FTE AODS Counselor, staff training, and purchase of instructional materials and supplies.
7.4.4 In-Custody Mental Health Services
7.4.4.1 Program Overview: The Department of Health Services provides mental health staff
and services for realigned inmates in the jail. Mental Health staff may assess any PC 1170(h) inmates who appear to need behavioral health services. Assessed PC 1170(h) inmates may subsequently be referred for medication evaluations. Inmates found to have alcohol and other drug services or mental health needs are referred to follow-up services. Upon release from custody, the PC 1170(h) inmates who require follow-up services are referred to the embedded Probation team or appropriate treatment provider referrals.
7.4.4.2 FY 2016-17 Plan: No change from prior year.
7.4.4.3 FY 2016-17 Budget: $455,680 to fund medications, services, supplies, and the following 1.80 FTE positions for 12 months: 0.50 FTE Marriage Family Therapist, 0.30 FTE Psychiatrist, and 1.00 FTE Eligibility Worker.
7.4.5 Penal Code 1370 Restoration Services
7.4.5.1 Program Overview: Penal Code 1370 states that defendants found mentally
incompetent shall have their trial or judgment suspended until they become mentally competent. If the defendant is found mentally competent, the criminal process shall resume, the trial on the offense charged shall proceed, and judgment may be pronounced. The PC 1370 team provides evidence-based interventions designed to restore defendants to competency so that they can participate in the legal process and have their cases adjudicated, thus reducing time spent in custody. Mental health staff assigned to this program report the statuses of the restoration processes to the court, as required by law. The PC 1370 team intensively case manages and engages this high-risk population in treatment services while in custody

FY 2016-17 County of Sonoma Public Safety Realignment Implementation Plan
Chapter 7: FY 2016-17 REALIGNMENT PROGRAM DESCRIPTIONS AND BUDGETS Page 39
and makes referrals to the appropriate out-of-custody mental health services when cases are resolved. Individuals who are not restored typically have their charges dropped with a resulting referral into services.
7.4.5.2 FY 2016-17 Plan: No change from prior year.
7.4.5.3 FY 2016-17 Budget: $487,627 to fund the following 1.85 FTE positions: 1.50 FTE Marriage Family Therapist, 0.10 FTE Psychiatric Registered Nurse, and 0.25 FTE Psychiatrist.

FY 2016-17 County of Sonoma Public Safety Realignment Implementation Plan
Chapter 7: FY 2016-17 REALIGNMENT PROGRAM DESCRIPTIONS AND BUDGETS Page 40
7.5 Out-of-Custody Programming and Detention Alternatives The Out-of-Custody Programming and Detention Alternatives major program area includes evidence-based programs and services that support realigned offenders under community supervision, such as substance use disorder treatment, employment training, and educational assistance. This category also includes detention alternatives that allow Sonoma County to minimize use of traditional jail beds. Table 7.6 summarizes the CCP’s recommended budget for this major program, and the following sub-sections provide supporting information for each program.
Table 7.6: Out-of-Custody Programming and Detention Alternatives Budget
7.5.1 Day Reporting Center
7.5.1.1 Program Overview: Serving as the central point of evidence-based programming and
structure for PRCS, MS, and felony probationers, the Day Reporting Center (DRC) provides a detention alternative to traditional incarceration for adult offenders who meet the program criteria. The Probation Department collaborates with the Sheriff’s Office, the Department of Health Services, the Human Services Department, and the Sonoma County Office of Education to provide seamless, offender-engaged reentry service coordination that begins in custody, continues through supervision, and transitions the offender to ongoing community-based supports and services when supervision ends. Services include cognitive behavioral intervention programs, life skills, vocational skills, and substance abuse treatment. Case coordination within the center is led by each offender’s Probation Officer in collaboration with service partners. The Probation Department staffs the center along with embedded staff from system partners and contractors who provide services such as substance abuse
Section Department Program Description County FTE FY 2016-17 Budget
8.5.1 Probation Probation-Operated DRC 10.00 $1,788,684
8.5.2 Probation DRC Restorative Re-Entry Program 0.00 $35,000
8.5.3 Probation SCOE GED Preparation and Testing 0.00 $49,827
8.5.4 Probation Transitional Housing 0.00 $298,275
8.5.5 Probation Domestic Violence Programming 0.00 $7,000
8.5.6 Probation Supervised Adult Crew 0.00 $200,000
8.5.7 Probation Electronic Monitoring - Contract 0.00 $160,000
8.5.7 Sheriff Electronic Monitoring - Staff 2.00 $384,538
8.5.8 Health Community Mental Health Services 1.60 $250,022
8.5.9 Health AODS SUD Services 1.00 $169,552
8.5.10 Health Outpatient SUD at DRC 0.00 $45,850
8.5.10 Health SUD Contract Services 0.00 $261,442
8.5.11 Human Services Employment and Eligibility Services 2.00 $248,854
8.5.12 Human Services Business Rep (Contract) 0.00 $50,000
8.5.13 Human Services General Assistance Subsidy 0.00 $70,000
8.5.14 Probation DUI Court - PO Support 1.00 $153,469
8.5.14 Superior Court DUI Court - Admin 0.00 $47,932
8.5.15 Probation Young Adult Restorative Justice 0.00 $60,000
Programming & Detention Alternatives Total 17.60 $4,280,445

FY 2016-17 County of Sonoma Public Safety Realignment Implementation Plan
Chapter 7: FY 2016-17 REALIGNMENT PROGRAM DESCRIPTIONS AND BUDGETS Page 41
treatment and restorative justice. As of May 2016, the DRC is operating at full capacity, serving between 150 and 160 participants.
7.5.1.2 FY 2016-17 Plan: No change from prior year.
7.5.1.3 FY 2016-17 Budget: $1,788,684 to fund the following 10.0 FTE positions: 1.0 FTE Probation Officer IV (supervisor), 2.0 FTE Probation Officer III, 4.0 Probation Officer II, 1.0 FTE Administrative Aide, and 2.0 FTE Probation Assistant. This funding also covers facility rent, utilities, maintenance, and all services and supplies.
7.5.2 Restorative Reentry Program - Circles of Support
7.5.2.1 Program Overview: Research shows those returning to the community following
incarceration have a better chance of successful reintegration when they have strong connections with family and positive community members and a solid reentry plan. The restorative reentry program provides an opportunity for accomplishing reunification and reconciliation with family, connection with positive community members, and development of a detailed reentry plan addressing all aspects of the participant’s new life. The program brings together the incarcerated person with his or her family members and trained community support people to participate in a restorative justice dialogue, which focuses on accountability, reconciliation, achieving goals, and community reintegration. The family and community volunteers form a circle of support and accountability to support and hold the participant accountable to the reentry plan.
7.5.2.2 FY 2016-17 Plan: No change from the prior year.
7.5.2.3 FY 2016-17 Budget: $35,000 for Restorative Resources to operate a re-entry pilot program.
7.5.3 SCOE GED Preparation and Testing Services
7.5.3.1 Program Overview: The Sonoma County Office of Education stations an Educational
Coordinator at the DRC to provide tutoring, preparation, and testing for the General Equivalency Diploma.
7.5.3.2 FY 2016-17 Plan: No change from the prior year.
7.5.3.3 FY 2016-17 Budget: $49,827 to fund an Educational Coordinator and administrative costs.
7.5.4 Transitional Housing
7.5.4.1 Program Overview: Probation contracts with Inter-Faith Shelter Network (IFSN) to
provide transitional residential services to homeless offenders who meet the program criteria. AB 109 transitional housing program participants are those who

FY 2016-17 County of Sonoma Public Safety Realignment Implementation Plan
Chapter 7: FY 2016-17 REALIGNMENT PROGRAM DESCRIPTIONS AND BUDGETS Page 42
would otherwise be living marginally in the community with little or no support and who are at increased risk to recidivate without the support of transitional housing. IFSN provides 20 beds dedicated for referrals from Probation and 10 beds that Probation can secure on an as-needed basis. In addition to maintaining a sober living environment, IFSN also coordinates with Probation to provide services such as permanent housing search and placement assistance, assistance with enrollment in health care and CalFresh, employment preparation and job search assistance, referral to credit counseling services, assistance with advancing education or earning a GED, individual counseling, group counseling focused on cognitive-behavioral skill development, referral to substance abuse recovery programs, and drug and alcohol testing. Services are tailored to each offender’s needs. The over-arching goal of the program is to reduce recidivism and enhance public safety by providing a secure, sober living environment for offenders.
7.5.4.2 FY 2016-17 Plan: No change from the prior year.
7.5.4.3 FY 2016-17 Budget: $298,275 to cover contract costs. 7.5.5 Domestic Violence 52-Week Course
7.5.5.1 Program Overview: The Probation Department will contract with certified local
providers of mandated 52-week domestic violence programs to allow indigent offenders who pose a current safety risk to start counseling services. Offenders will be required to make a small co-payment, and funding will cover the first four months of the program.
7.5.5.2 FY 2016-17 Plan: No change from prior year.
7.5.5.3 FY 2016-17 Budget: $7,000 to fund contract costs, which will provide scholarship assistance for up to 12 individuals.
7.5.6 Supervised Adult Crew
7.5.6.1 Program Overview: The Supervised Adult Crew (SAC) program allows Probation Work
Release offenders to satisfy their 90-day or less jail sentences by working on SAC’s crews in lieu of jail, completing community construction projects. Each day on a SAC crew counts as one day of jail time served. Offenders are screened by Probation Work Release staff, and scheduled to work on SAC crews during their days off from employment. In addition to work release offenders, SAC crews include select, low-risk in-custody offenders who have been prescreened for public safety concerns and adult probationers as a non-custody sanction for poor compliance with terms and conditions of probation.
7.5.6.2 FY 2016-17 Plan: No change from prior year.

FY 2016-17 County of Sonoma Public Safety Realignment Implementation Plan
Chapter 7: FY 2016-17 REALIGNMENT PROGRAM DESCRIPTIONS AND BUDGETS Page 43
7.5.6.3 FY 2016-17 Budget: $200,000 to fund approximately 10% of the total annual SAC budget.
7.5.7 Electronic Monitoring Program
7.5.7.1 Program Overview: Electronic monitoring of offenders in the community is a critical
tool for law enforcement to increase public safety, and it provides a cost-effective detention alternative for Sonoma County to manage its jail population. The Electronic Monitoring Program (EMP) is jointly administered by the Sheriff’s Office and Probation Department. It contains both offender-funded and agency-funded program components. Both program components involve electronic monitoring of offenders on radio frequency, alcohol monitoring, and GPS devices. The Sheriff’s offender-funded program serves low-risk offenders and is run by BI Incorporated at no cost to Sonoma County. AB 109 Realignment funds cover Probation’s agency-funded populations, including individuals classified as PRCS, MS, Work Furlough, and Pre-Trial. The Correctional Sergeant and Correctional Deputy assigned to the Sheriff’s EMP perform the following functions: reviewing jail population for EMP candidates; reviewing all out-of-custody defendants sentenced with stay dates for eligibility and contacting them regarding EMP; processing applications for the program; identifying program requirements for each participant, to include type of equipment, restrictions, schedules, and referrals to community-based rehabilitative programming; reviewing and responding to program violations; and serving as liaisons with contracted providers, Probation, and the courts.
During 2015, the Sheriff’s Office placed 315 individuals on the offender-funded EMP,
307 or 97.5% of whom completed their sentence with no new misdemeanor or felony arrests and no failures to appear in court. The program reduced jail bed use by 8,756 days.
7.5.7.2 FY 2016-17 Plan: No change from prior year.
7.5.7.3 FY 2016-17 Budget: A combined budget of $544,538 funds both Probation and Sheriff EMP components. The Sheriff’s budget of $384,538 covers the 2.0 FTEs assigned to administer the Electronic Monitoring Program: 1.0 FTE Correctional Sergeant and 1.0 FTE Correctional Deputy, plus overtime, cell phones, equipment, and supplies. Probation’s budget of $160,000 covers costs for BI Incorporated to operate the agency-funded program.
7.5.8 Community Mental Health Services
7.5.8.1 Program Overview: The following 1.60 FTE Behavioral Health employees are
embedded at Probation’s Adult Division office: 1.00 FTE Licensed Clinical Social Worker or Marriage Family Therapist, 0.50 FTE Eligibility Worker, and 0.10 FTE Psychiatrist. The Marriage Family Therapist conducts mental health assessments for individuals referred by Probation staff and subsequently refers individuals to appropriate services. The Eligibility Worker assesses individuals who need mental

FY 2016-17 County of Sonoma Public Safety Realignment Implementation Plan
Chapter 7: FY 2016-17 REALIGNMENT PROGRAM DESCRIPTIONS AND BUDGETS Page 44
health services to determine their eligibility for benefits (e.g., Medi-Cal, County Medical Services Program, Social Security Insurance, CalFresh, and related programs). The Psychiatrist assesses each individual’s need for medications and develops an initial medication service plan. Embedding these services in Probation creates system efficiencies, improves inter-departmental communication, and enhances offenders’ access to needed services.
7.5.8.2 FY 2016-17 Plan: No change from prior year.
7.5.8.3 FY 2016-17 Budget: $250,022 to fund Behavioral Health staff. 7.5.9 Community Substance Use Disorder Services
7.5.9.1 Program Overview: The Department of Health Services assigns a Substance Use
Disorder (SUD) Specialist to work at the Probation office to assist with the assessment, referral, and case management of substance-abusing realigned offenders.
7.5.9.2 FY 2016-17 Plan: No change from prior year.
7.5.9.3 FY 2016-17 Budget: $169,552 to fund 1.0 FTE SUD Specialist.
7.5.10 Substance Use Disorder Contract Services
7.5.10.1 Program Overview: The Department of Health Services contracts with local providers for residential, outpatient, and narcotic treatment services for substance-abusing AB 109 offenders. The funding provides access to a continuum of care for the AB 109 offenders that includes residential and outpatient services. The program approach is to assess and refer offenders to an existing network of substance use disorder providers. Clients are referred to the appropriate service component based upon clinical assessment. The DRC outpatient program will be modeled after outpatient Drug Medi-Cal (DMC) programs currently run by the Drug Abuse Alternatives Center and California Human Development, two community-based organizations with which Health Services currently holds contracts. Health Services and Probation originally expected to open an RFP for a provider in FY 2015-16; due to delays in determining how the program would be structured, this process will now occur in FY 2016-17. As a requirement of the RFP, the provider will be DMC-certified and will assist in the process of certifying the DRC as a DMC satellite site. Once DMC certification is complete, the CCP expects that Federal Financial Participation will fund a large portion of program costs, with the CCP funding only the local match portion.
7.5.10.2 FY 2016-17 Plan: No change from prior year.

FY 2016-17 County of Sonoma Public Safety Realignment Implementation Plan
Chapter 7: FY 2016-17 REALIGNMENT PROGRAM DESCRIPTIONS AND BUDGETS Page 45
7.5.10.3 FY 2016-17 Budget: $353,142 to cover contract costs, which includes $261,442 for SUD contract services and $45,850 to cover contract costs for outpatient services at the DRC. The recommended outpatient services budget is one-half that of FY 2015-16, which assumes that the DRC will become DMC-certified in FY 2016-17.
7.5.11 Employment and Eligibility Services
7.5.11.1 Program Overview: The Human Services Department staffs an Employment and Training Coordinator to provide a single point of contact for Job Link services to work with AB 109 offenders. This position will work in the DRC for ease of client accessibility, in collaboration with Probation, the Department of Health Services, residential and outpatient services, and other partner agencies. The Coordinator provides vocational plans for clients and coordinates training (paid for by Job Link), as appropriate. An Eligibility Worker II assigned to the program coordinates economic assistance by receiving eligibility applications from the Department of Health Services to ensure fast processing. The Eligibility Worker takes additional applications and determines eligibility for Medi-Cal, County Medical Services Program, CalFresh, and General Assistance, and subsequently makes appropriate referrals.
7.5.11.2 FY 2016-17 Plan: No change from prior year.
7.5.11.3 FY 2016-17 Budget: $248,854 to fund 1.0 FTE Employment and Training Coordinator
and 1.0 FTE Eligibility Worker II. 7.5.12 Business Representative
7.5.12.1 Program Overview: Through an existing contract with Goodwill Industries of the
Redwood Empire, a Business Representative meets with local employers to identify appropriate jobs for the AB 109 population. The Business Representative collaborates with the Employment and Training Coordinator referenced in sub-section 7.5.11.
7.5.12.2 FY 2016-17 Plan: No change from prior year.
7.5.12.3 FY 2016-17 Budget: $50,000 to fund contract costs.
7.5.13 General Assistance
7.5.13.1 Program Overview: The Human Services Department provides General Assistance
(GA) benefits to qualifying individuals. Human Services is reimbursed funding from GA (as GA is otherwise funded primarily through the County General Fund) expended on behalf of AB 109 offenders during their term of active community supervision.
7.5.13.2 FY 2016-17 Plan: No change from prior year.

FY 2016-17 County of Sonoma Public Safety Realignment Implementation Plan
Chapter 7: FY 2016-17 REALIGNMENT PROGRAM DESCRIPTIONS AND BUDGETS Page 46
7.5.13.3 FY 2016-17 Budget: $70,000 to fund program costs.
7.5.14 DUI Treatment Court
7.5.14.1 Program Overview: The Sonoma County Superior Court administers the multi-
agency collaborative DUI Treatment Court program, which includes enhanced alcohol monitoring through continuous alcohol monitoring devices, weekly judicial reviews, intensive supervision by a Probation Officer, and targeted alcohol treatment services from contracted providers. The DUI Treatment Court targets offenders with one or two prior convictions and first-time offenders who exhibit high-risk behaviors. An established interdisciplinary team comprising court staff, local treatment providers, probation professionals, representatives of the District Attorney and Public Defender offices, County treatment experts, and judicial officers administer the program. The DUI Treatment Court provides a closely supervised treatment model, which employs a four-phase, graduated treatment program including counseling, drug testing, incentives, and sanctions. The participants are monitored by a judicial officer and supervised by a Probation Officer and a Behavioral Health Coordinator. A court Management Analyst conducts statistical tracking of the program. Contracted treatment providers provide day-to-day treatment of DUI Court participants. Offenders participating in the program are required to attend regular group and individual counseling sessions, self-help meetings, and the county Drunk Driver Program and are subject to regular random drug and alcohol testing. Participants’ treatment and testing compliance is monitored by a Behavioral Health Coordinator. The program affords the judge control to require specific sanctions and conditions of probation. The Probation Officer links clients to county services, monitors their compliance with conditions of probation, helps them set realistic life goals, and provides structure and guidance to increase the likelihood of success. The Probation Officer also conducts random alcohol testing and can arrest an individual who needs to be remanded to jail.
7.5.14.2 FY 2016-17 Plan: No change from prior year.
7.5.14.3 FY 2016-17 Budget: $201,401 to fund 1.0 FTE Probation Officer III ($153,469) and
Court administration costs ($47,932). The Department of Health Services will oversee all treatment provider contracts. By leveraging federal funding opportunities, the contracts will operate at no cost to the CCP.
7.5.15 Young Adult Restorative Justice
7.5.15.1 Program Overview: This program provides restorative conferencing as an
alternative to incarceration for young adults (usually between 18 and 25 years old). In restorative conferencing, offenders take responsibility for their choices, explore how these choices affected others, and commit to actions that will make amends to

FY 2016-17 County of Sonoma Public Safety Realignment Implementation Plan
Chapter 7: FY 2016-17 REALIGNMENT PROGRAM DESCRIPTIONS AND BUDGETS Page 47
victims and help prevent future offending. As part of the process, offenders develop formal written plans to accomplish these goals. Courts provide incentives for successfully completing the plans, most commonly, offering to drop jail sentences. Referrals will be made through Sonoma Superior Court by an agreement among the Defense Attorney, District Attorney, and Superior Court Judge.
7.5.15.2 FY 2016-17 Plan: No change from prior year.
7.5.15.3 FY 2016-17 Budget: $60,000 will fund case and volunteer management for up to
100 offenders.

FY 2016-17 County of Sonoma Public Safety Realignment Implementation Plan
Chapter 7: FY 2016-17 REALIGNMENT PROGRAM DESCRIPTIONS AND BUDGETS Page 48
7.6 Parole Revocation Hearings
After passage of AB 109, the State Board of Parole Hearings initially retained responsibility for parole revocation hearings; however, that changed on July 1, 2013, at which time the parole revocation process became a local court-based process. The Sonoma County Superior Court is now the designated authority for determining revocations. Under this arrangement, only offenders previously sentenced to a term of life can be revoked to state prison instead of local jail. The Board of Parole Hearings continues to conduct the following types of hearings: parole consideration for lifers, medical parole hearings, mentally disordered offender cases, and sexually violent predator cases. The Parole Revocation Hearings major program area includes all programs and services needed to address the additional workload. Table 7.7 summarizes the CCP’s recommended budget for this major program, and the following sub-sections provide supporting information for each program.
Table 7.7: Parole Revocation Hearings Budget
7.6.1 District Attorney - Parole Revocation Hearings Case Prosecution
7.6.1.1 Program Overview: Funds a Deputy District Attorney to handle the prosecution of
parole and PRCS cases that are referred to the District Attorney’s Office.
7.6.1.2 FY 2016-17 Plan: No change from prior year.
7.6.1.3 FY 2016-17 Budget: $228,769 to fund 1.0 FTE Deputy District Attorney IV. 7.6.2 District Attorney – Legal Processor
7.6.2.1 Program Overview: Funds a Legal Processor to handle the administration of parole
and PRCS cases that are referred to the District Attorney’s Office.
7.6.2.2 FY 2016-17 Plan: No change from prior year.
7.6.2.3 FY 2016-17 Budget: $99,375 to fund 1.0 FTE Legal Processor II. 7.6.3 Public Defender - Parole Revocation Hearings Attorney
7.6.3.1 Program Overview: The Parole Revocation Attorney (PRA) represents individuals
facing parole revocations. The PRA reviews revocation petitions, reports, and criminal histories of parolees upon receipt of the petition and discovery and conducts in-depth interviews with clients in jail. The PRA creates the investigation plan and
Section Department Program Description County FTE FY 2016-17 Budget
8.6.1 District Attorney Case Prosecution 1.00 $228,769
8.6.2 District Attorney Legal Processor 1.00 $99,375
8.6.3 Public Defender Attorney 1.00 $152,297
8.6.4 Public Defender Investigator 0.50 $57,354
Parole Revocation Hearings Total 3.50 $537,795

FY 2016-17 County of Sonoma Public Safety Realignment Implementation Plan
Chapter 7: FY 2016-17 REALIGNMENT PROGRAM DESCRIPTIONS AND BUDGETS Page 49
legal research when appropriate, discusses cases with Parole Officers, seeks counseling alternatives for clients, conducts plea bargain negotiations with the District Attorney’s Office, appears in trial courts when cases are set for motions or hearings, and conducts violation of parole hearings. In addition, the PRA maintains statistics on the cases represented by the Public Defender.
7.6.3.2 FY 2016-17 Plan: No change from prior year.
7.6.3.3 FY 2016-17 Budget: $152,297 to fund 1.0 FTE Public Defender Attorney (Extra Help). 7.6.4 Public Defender – Parole Revocation Hearings Investigator
7.6.4.1 Program Overview: The Parole Revocation Hearings Investigator (PRHI) conducts in-
house and field investigations related to parolees, PRCS clients, and MS clients. The PRHI’s duties include review of records, conducting witness interviews, providing Spanish translation assistance, issuing subpoenas, retrieving medical documents, releasing client information, and retrieving investigative information at the request of an attorney.
7.6.4.2 FY 2016-17 Plan: No change from prior year.
7.6.4.3 FY 2016-17 Budget: $57,354 to fund 0.5 FTE Investigator.

FY 2016-17 County of Sonoma Public Safety Realignment Implementation Plan
Chapter 7: FY 2016-17 REALIGNMENT PROGRAM DESCRIPTIONS AND BUDGETS Page 50
7.7 Pre-Trial Services
Sonoma County’s 2015 Criminal Justice Master Plan Update highlights Pre-Trial Services as a key recommendation. Table 7.8 summarizes the CCP’s recommended budget for Pre-Trial Services, and the following sub-sections provide supporting information for each program.
Table 7.8: Pre-Trial Services Budget
7.7.1 Pre-Trial Services
7.7.1.1 Program Overview: The risk-based pre-trial program allows the Sonoma County
Superior Court to release defendants from custody under the desired level of supervision, which may include electronic monitoring. Pre-trial electronic monitoring is similar in scope to the Probation electronic monitoring program described previously, except that it serves defendants rather than convicted offenders. The Superior Court and CCP jointly developed this program to mitigate defendants’ risk to public safety and the risk of failing to appear in court. By using a risk-based model, the pre-trial program reduces incarceration expenses while protecting the public and allowing defendants to continue productive, law-abiding activities while awaiting adjudication. The Pre-Trial Services program provides universal front-end screening for all persons booked into jail, supports jail management, and facilitates efficient case processing. The program has two components: assessment, operated within the Sheriff’s Classification Unit in the Main Adult Detention Facility, and supervision, which the Probation Department will operate.
7.7.1.2 FY 2016-17 Plan: No change from prior year.
7.7.1.3 FY 2016-17 Budget: A combined budget of $1,643,882 funds both Probation and Sheriff components, as well as contracts. The Sheriff’s budget of $751,500 covers 4.0 FTE Correctional Deputies. Probation’s budget of $722,382 covers 3.0 FTE Probation Officer III, 1.0 FTE Probation Officer II, and 1.0 FTE Senior Legal Processor. Probation’s budget also includes $160,000 to cover electronic monitoring contract costs for the pre-trial population and $10,000 to reimburse the consultant hired to facilitate program design and implementation.
Section Department Program Description County FTE FY 2016-17 Budget
8.7.1 Probation Pre-Trial - Consultant 0.00 $10,000
8.7.1 Probation Pre-Trial - Electronic Monitoring 0.00 $160,000
8.7.1 Probation Pre-Trial Supervision 5.00 $722,382
8.7.1 Sheriff Assessment Staff 4.00 $751,500
8.7.2 Probation Administrative Aide 1.00 $121,557
Pre-Trial Services Total 10.00 $1,765,439

FY 2016-17 County of Sonoma Public Safety Realignment Implementation Plan
Chapter 7: FY 2016-17 REALIGNMENT PROGRAM DESCRIPTIONS AND BUDGETS Page 51
7.7.2 Administrative Aide
7.7.2.1 Program Overview: This new position will perform the technical administrative work of the pre-trial and AB 109 programs, perform research for a variety of projects, and coordinate scheduling of pre-trial services with the Sheriff, Probation, and the electronic monitoring vendor. Specific duties will include the following: initial data entry for those eligible for pre-trial; entry of release information from the Sheriff and Probation; tracking and updating release information and SPRAT report results; compiling and distributing a monthly summary report; performing research to determine information such as charges filed, demographics and release types, and program outcomes such as failures to appear in court and new offenses; researching, entering, and compiling data regarding arrests, warrants, revocations, incarcerations, and completion statuses for the Post-Release Community Supervision (PRCS) and PC 1170(h) populations; and researching the effects of Proposition 47 on PRCS and PC 1170(h) populations.
7.7.2.2 FY 2016-17 Plan: Sonoma County’s pre-trial services program commenced in
February 2015 and has grown rapidly, with 674 defendants being placed into pre-trial supervision during the calendar year. The program promises to reduce the inmate population, allow lower-risk defendants to engage in productive law-abiding activities while awaiting adjudication, and create a more equitable justice system, all while protecting the public from further harm. However, measuring these outcomes and determining any changes needed in the program requires a level of data entry, analysis, and reporting that the current pre-trial staff is unable to fulfill. As a result, some data entry and reporting needs are going unfulfilled entirely while others are being met by sworn staff in the Sheriff’s Office and Probation Department. This position will provide critical reporting functions more consistently and cost-effectively than is currently possible.
7.7.2.3 FY 2016-17 Budget: $121,557 to fund 1.0 FTE Administrative Aide.

FY 2016-17 County of Sonoma Public Safety Realignment Implementation Plan
Chapter 7: FY 2016-17 REALIGNMENT PROGRAM DESCRIPTIONS AND BUDGETS Page 52
7.8 Data Management The Data Management major program area includes programs and services that involve capturing, analyzing, and reporting data pertaining to AB 109 offenders. Table 7.9 summarizes the CCP’s recommended budget for the Data Management program, and the following sub-sections provide supporting information for each program.
Table 7.9: Data Management Budget
7.8.1 Programming Support
7.8.1.1 Program Overview: This funding allocation supports the Information Systems
Department’s (ISD) programming needs for the Integrated Justice System (IJS) that relates to capturing, measuring, and reporting information on AB 109 populations. ISD continues to streamline and implement new functionality in IJS to provide improved management and reporting of Realignment populations.
7.8.1.2 FY 2016-17 Plan: No change from prior year.
7.8.1.3 FY 2016-17 Budget: $124,990 to fund programming time. Changes to ISD’s staffing allocation are not required.
7.8.2 Data Evaluation and Analysis Consultant
7.8.2.1 Program Overview: The CCP will contract with a consultant to establish a plan for
evaluating and collecting appropriate data to determine the impact that Realignment populations have on county resources, as well as the outcomes of programs and services. Specifically, the consultant will evaluate how effective AB 109-funded programs are at achieving their outcomes; how well they are implemented; and how cost-effective the programs are. The consultant will collaborate with the CCP’s Data Management and Evaluation Subcommittee. As of May 2016, an RFP was open to locate an evaluation consultant. The CCP expects that a consultant will be recommended for Board of Supervisors’ approval in July 2016 and that work will commence shortly thereafter to develop a scalable evaluation plan.
7.8.2.2 FY 2016-17 Plan: No change from prior year.
7.8.2.3 FY 2016-17 Budget: $100,000 to contract with a consultant.
Section Department Program Description County FTE FY 2016-17 Budget
8.8.1 ISD Programming Support 0.00 $124,990
8.8.2 Probation AB 109 Evaluation Consultant 0.00 $100,000
Data Management Total 0.00 $224,990

FY 2016-17 County of Sonoma Public Safety Realignment Implementation Plan
Chapter 7: FY 2016-17 REALIGNMENT PROGRAM DESCRIPTIONS AND BUDGETS Page 53
7.9 Other Programs
The Other Programs budget funds legal support for the CCP and mental competency assessments for criminal defendants. Table 7.10 summarizes the CCP’s recommended budget for Other Programs, and the following sub-sections provide supporting information for each program.
Table 7.10: Other Programs Budget
7.9.1 Legal Support
7.9.1.1 Program Overview: County Counsel provides legal services upon request by the CCP
or member agencies on Realignment issues. County Counsel analyzes issues and provides legal opinions on the interpretation and application of various Realignment statutes.
7.9.1.2 FY 2016-17 Plan: No change from prior year.
7.9.1.3 FY 2016-17 Budget: $50,000 to cover ad-hoc legal support. Work will be performed by existing County Counsel staff; therefore, no changes to position allocations are needed.
7.9.2 Penal Code 1368 Mental Competency Assessments
7.9.2.1 Program Overview: The Sonoma County Superior Court’s contract psychologist
provides early assessments of criminal defendants to determine whether a Penal Code 1368 competency process should be ordered, thereby limiting non-competency cases from delaying the process. The psychologist provides pre-screening for PC 1368 referrals from the court and conducts interviews and file reviews to provide reports to the courts. This quick assessment facilitates efficient movement of cases where competency is determined not to be an issue, thereby reducing potential jail bed days. The courts request CCP’s assistance in offsetting these costs, which in turn avoids unnecessary jail time and costs for offenders awaiting full psychiatric review.
7.9.2.2 FY 2016-17 Plan: Budget allocation increased by $17,250 from prior year.
7.9.2.3 FY 2016-17 Budget: $77,250 to reimburse the Superior Court for contract costs. Superior Court will fund any contract costs exceeding the FY 2016-17 budget.
Section Department Program Description County FTE FY 2016-17 Budget
8.9.1 County Counsel Legal Support 0.00 $50,000
8.9.2 Superior Court "1368" Competency Assessments 0.00 $77,250
Other Programs Total 0.00 $127,250

FY 2016-17 County of Sonoma Public Safety Realignment Implementation Plan
Exhibit A: Community Corrections Partnership Roster Page 54
Exhibit A: Community Corrections Partnership Roster (as of May 2016)
Executive Committee (Voting)
Member Name Title
Chief Probation Officer (Chair) David Koch Chief Probation Officer
Chief of Police Jeffrey Weaver Chief, City of Sebastopol Police Department
District Attorney Jill Ravitch District Attorney
Public Defender Kathleen Pozzi Public Defender
Sheriff Steve Freitas Sheriff
Superior Court Jose Guillen Superior Court Executive Officer
Health Services/Mental Health Michael Kennedy Director of Behavioral Health
Full Committee
Member Name Title
Chief Probation Officer (Chair) David Koch Chief Probation Officer
Chief of Police Jeffrey Weaver Chief, City of Sebastopol Police Department
District Attorney Jill Ravitch District Attorney
Public Defender Kathleen Pozzi Public Defender
Sheriff Steve Freitas Sheriff
Superior Court Jose Guillen Superior Court Executive Officer
Health Services/Mental Health Michael Kennedy Director of Behavioral Health
Board of Supervisors Susan Gorin 1st District Supervisor
County Administrator's Office Veronica Ferguson County Administrator
County Administrator's Office Mary Booher Administrative Analyst
Human Services Jerry Dunn Director, Human Services
Employment Services Karen Fies Assistant Director, Human Services
Victim Services Gloria Eurotas Victim Services Director, District Attorney's Office
Office of Education Steven Herrington Superintendent, Sonoma County Schools
Superior Court Raima Ballinger Superior Court Presiding Judge
Community-Based Organization Susan Hertel Director, Drug Abuse Alternatives Center

FY 2016-17 County of Sonoma Public Safety Realignment Implementation Plan
Exhibit B: Budget by Major Program Page 55
Exhibit B: Budget by Major Program
Major Program Department Program Description
County
FTE
FY 2016-17
Budget
Administration Probation Business Systems Analyst 0.50 $72,369
Probation Department Analyst (Prob) 1.00 $135,720
Probation Total 1.50 $208,089
Sheriff Department Analyst (SO) 1.00 $148,091
Sheriff Total 1.00 $148,091
Administration Total 2.50 $356,180
Community Supervision Probation AB 109 Supervision Unit 13.00 $2,087,850
Probation Family Justice Center Rent 0.00 $17,000
Probation Offender Needs Fund 0.00 $2,000
Probation Total 13.00 $2,106,850
Sheriff Detective 1.00 $245,727
Sheriff Total 1.00 $245,727
Community Supervision Total 14.00 $2,352,577
Custody Sheriff Inmate Transportation Deputy 1.00 $192,624
Sheriff Jail Unit 1 8.00 $1,690,373
Sheriff Jail Unit 2 0.00 $300,000
Sheriff Senior Legal Processor 1.00 $105,748
Sheriff SERT Training 0.00 $23,216
Sheriff Total 10.00 $2,311,961
Custody Total 10.00 $2,311,961
Data Management ISD Programming Support 0.00 $124,990
ISD Total 0.00 $124,990
Probation AB 109 Evaluation Consultant 0.00 $100,000
Probation Total 0.00 $100,000
Data Management Total 0.00 $224,990
In-Custody Programming Health "1370" Restoration Services 1.85 $487,627
Health In-Custody Mental Health 1.80 $455,680
Health Starting Point SUD Services 1.45 $242,603
Health Total 5.10 $1,185,910
Sheriff Jail Programs 0.00 $142,564
Sheriff Program Sergeant 1.00 $186,499
Sheriff Total 1.00 $329,063
In-Custody Programming Total 6.10 $1,514,973
Other Programs County Counsel Legal Support 0.00 $50,000
County Counsel Total 0.00 $50,000
Superior Court "1368" Competency Assessments 0.00 $77,250
Superior Court Total 0.00 $77,250
Other Programs Total 0.00 $127,250
Parole Revocation Hearings District Attorney Case Prosecution 1.00 $228,769
District Attorney Legal Processor 1.00 $99,375
District Attorney Total 2.00 $328,144
Public Defender Attorney 1.00 $152,297
Public Defender Investigator 0.50 $57,354
Public Defender Total 1.50 $209,651
Parole Revocation Hearings Total 3.50 $537,795

FY 2016-17 County of Sonoma Public Safety Realignment Implementation Plan
Exhibit B: Budget by Major Program Page 56
Exhibit B: Budget by Major Program (continued)
Major Program Department Program Description
County
FTE
FY 2016-17
Budget
Pre-Trial Services Probation Pre-Trial - Consultant 0.00 $10,000
Probation Pre-Trial - Electronic Monitoring 0.00 $160,000
Probation Pre-Trial Supervision 5.00 $722,382
Probation Administrative Aide 1.00 $121,557
Probation Total 6.00 $1,013,939
Sheriff Assessment Staff 4.00 $751,500
Sheriff Total 4.00 $751,500
Pre-Trial Services Total 10.00 $1,765,439
Programming & Detention Alternatives Health AODS SUD Services 1.00 $169,552
Health Community Mental Health Services 1.60 $250,022
Health Outpatient SUD at DRC 0.00 $45,850
Health SUD Contract Services 0.00 $261,442
Health Total 2.60 $726,866
Human Services Business Rep (Contract) 0.00 $50,000
Human Services Employment and Eligibility Services 2.00 $248,854
Human Services General Assistance Subsidy 0.00 $70,000
Human Services Total 2.00 $368,854
Probation Domestic Violence Programming 0.00 $7,000
Probation DRC Restorative Re-Entry Program 0.00 $35,000
Probation DUI Court - PO Support 1.00 $153,469
Probation Electronic Monitoring - Contract 0.00 $160,000
Probation Probation-Operated DRC 10.00 $1,788,684
Probation SCOE GED Preparation and Testing 0.00 $49,827
Probation Supervised Adult Crew 0.00 $200,000
Probation Transitional Housing 0.00 $298,275
Probation Young Adult Restorative Justice 0.00 $60,000
Probation Total 11.00 $2,752,255
Sheriff Electronic Monitoring - Staff 2.00 $384,538
Sheriff Total 2.00 $384,538
Superior Court DUI Court - Admin 0.00 $47,932
Superior Court Total 0.00 $47,932
Programming & Detention Alternatives Total 17.60 $4,280,445
Grand Total 63.70 $13,471,610

FY 2016-17 County of Sonoma Public Safety Realignment Implementation Plan
Exhibit C: Budget by Department Page 57
Exhibit C: Budget by Department
Department Major Program Program Description County FTE FY 2016-17 Budget
County Counsel Other Programs Legal Support 0.00 $50,000
Other Programs Total 0.00 $50,000
County Counsel Total 0.00 $50,000
District Attorney Parole Revocation Hearings Case Prosecution 1.00 $228,769
Legal Processor 1.00 $99,375
Parole Revocation Hearings Total 2.00 $328,144
District Attorney Total 2.00 $328,144
Health In-Custody Programming "1370" Restoration Services 1.85 $487,627
In-Custody Mental Health 1.80 $455,680
Starting Point SUD Services 1.45 $242,603
In-Custody Programming Total 5.10 $1,185,910
Programming & Detention Alternatives AODS SUD Services 1.00 $169,552
Community Mental Health Services 1.60 $250,022
Outpatient SUD at DRC 0.00 $45,850
SUD Contract Services 0.00 $261,442
Programming & Detention Alternatives Total 2.60 $726,866
Health Total 7.70 $1,912,776
Human Services Programming & Detention Alternatives Business Rep (Contract) 0.00 $50,000
Employment and Eligibility Services 2.00 $248,854
General Assistance Subsidy 0.00 $70,000
Programming & Detention Alternatives Total 2.00 $368,854
Human Services Total 2.00 $368,854
ISD Data Management Programming Support 0.00 $124,990
Data Management Total 0.00 $124,990
ISD Total 0.00 $124,990
Probation Administration Business Systems Analyst 0.50 $72,369
Department Analyst (Prob) 1.00 $135,720
Administration Total 1.50 $208,089
Community Supervision AB 109 Supervision Unit 13.00 $2,087,850
Family Justice Center Rent 0.00 $17,000
Offender Needs Fund 0.00 $2,000
Community Supervision Total 13.00 $2,106,850
Data Management AB 109 Evaluation Consultant 0.00 $100,000
Data Management Total 0.00 $100,000
Pre-Trial Services Pre-Trial - Consultant 0.00 $10,000
Pre-Trial - Electronic Monitoring 0.00 $160,000
Pre-Trial Supervision 5.00 $722,382
Administrative Aide 1.00 $121,557
Pre-Trial Services Total 6.00 $1,013,939
Programming & Detention Alternatives Domestic Violence Programming 0.00 $7,000
DRC Restorative Re-Entry Program 0.00 $35,000
DUI Court - PO Support 1.00 $153,469
Electronic Monitoring - Contract 0.00 $160,000
Probation-Operated DRC 10.00 $1,788,684
SCOE GED Preparation and Testing 0.00 $49,827
Supervised Adult Crew 0.00 $200,000
Transitional Housing 0.00 $298,275
Young Adult Restorative Justice 0.00 $60,000
Programming & Detention Alternatives Total 11.00 $2,752,255
Probation Total 31.50 $6,181,133

FY 2016-17 County of Sonoma Public Safety Realignment Implementation Plan
Exhibit C: Budget by Department Page 58
Exhibit C: Budget by Department (continued)
Department Major Program Program Description County FTE FY 2016-17 Budget
Public Defender Parole Revocation Hearings Attorney 1.00 $152,297
Investigator 0.50 $57,354
Parole Revocation Hearings Total 1.50 $209,651
Public Defender Total 1.50 $209,651
Sheriff Administration Department Analyst (SO) 1.00 $148,091
Administration Total 1.00 $148,091
Community Supervision Detective 1.00 $245,727
Community Supervision Total 1.00 $245,727
Custody Inmate Transportation Deputy 1.00 $192,624
Jail Unit 1 8.00 $1,690,373
Jail Unit 2 0.00 $300,000
Senior Legal Processor 1.00 $105,748
SERT Training 0.00 $23,216
Custody Total 10.00 $2,311,961
In-Custody Programming Jail Programs 0.00 $142,564
Program Sergeant 1.00 $186,499
In-Custody Programming Total 1.00 $329,063
Pre-Trial Services Assessment Staff 4.00 $751,500
Pre-Trial Services Total 4.00 $751,500
Programming & Detention Alternatives Electronic Monitoring - Staff 2.00 $384,538
Programming & Detention Alternatives Total 2.00 $384,538
Sheriff Total 19.00 $4,170,880
Superior Court Other Programs "1368" Competency Assessments 0.00 $77,250
Other Programs Total 0.00 $77,250
Programming & Detention Alternatives DUI Court - Admin 0.00 $47,932
Programming & Detention Alternatives Total 0.00 $47,932
Superior Court Total 0.00 $125,182
Grand Total 63.70 $13,471,610

13
Sheriff Office Helicopter
Replacement

COUNTY OF SONOMA
OFFICE OF THE COUNTY ADMINISTRATOR 575 ADMINISTRATION DRIVE – ROOM 104A
SANTA ROSA, CALIFORNIA 95403-2888 TELEPHONE (707) 565-2431
FAX (707) 565-3778
VERONICA A. FERGUSON
COUNTY ADMINISTRATOR
CHRISTINA RIVERA DEPUTY COUNTY ADMINISTRATOR
REBECCA WACHSBERG DEPUTY COUNTY ADMINISTRATOR
June 14, 2016
To: Members of the Board of Supervisors
From: Veronica A. Ferguson, County Administrator
Re: Replacement of Sheriff’s Helicopter “Henry 1”
Sonoma County has funded a Helicopter Unit within the Sheriff’s office since 1974, utilizing both county-owned and contractor-provided services during this time. Most recently, in 2008, the Board approved the purchase of a 1996 Bell 407 single-engine helicopter, known as Henry 1. Henry 1 is approaching 10,000 hours, a threshold that results in significant maintenance costs as all of the mechanical and electronic components would have to be rebuilt with current technology. This upcoming threshold, along with Federal Aviation Administration requirements for avionic upgrades by 2020, has resulted in staff analyzing the options, including the purchase of a new helicopter. A detailed proposal developed by the Sheriff’s Office is included with this memo.
The Sheriff is asking to purchase a twin engine aircraft, which enhances the safety for the staff and the public, and allows Sonoma County to serve the region with long-line rescues. Henry 1 is the only helicopter in the area that provides long-line rescues, as there are some areas that hoist rescues are not a viable option. California Highway Patrol and the United States Coast Guard use a mechanical hoist system for their helicopter rescues.
The cost to purchase and equip a new helicopter is estimated by Sheriff’s Office staff to be $6.8 to 8.3 million. The variation is due to different options for equipping the new helicopter; market conditions at time of purchase, including the availability of used helicopters; and the trade-in value on the existing helicopter, which will decrease as the total hours approaches 10,000. The Sheriff is requesting approval of the use of approximately $3 million of Asset Forfeiture funds as a down payment, which represents all funds currently available. The Sheriff has also initiated conversations with the Bay Area Urban Areas Security Initiative for regional funding for the inter-operable communications equipment, estimated to be $850,000. This would result in financing $2.9 to $4.4 million. Currently, a seven year loan would be at 2.6% interest. Additional Asset Forfeiture funds may become available for debt service payments in the future, but this is not a reliable or predictable revenue source.
The supplemental budget requests Board approval of expenditure appropriations from the Sheriff’s Asset Forfeiture funds of $2.95 million for the purchase of the helicopter, which is a combination of $1.14 million of anticipated revenue and $1.81 million of fund balance. These funds, along with any trade-in value, will be used as a down payment for the purchase of the new helicopter. If approved by the Board, staff in the Sheriff’s office will issue a Request for Proposals. Once this process is complete, staff will return to the Board with a recommendation to purchase a helicopter, including a life-cycle cost analysis, and request the Board to authorize the purchase documents and any associated financing. Enclosures: Sheriff’s memo Helicopter Replacement Proposal


4/6/2016 7:17 AM Page 1 of 34
To: County Administrator’s Office From: Sheriff Steve Freitas
Prepared by: Jody Like
Sheriff’s Office Helicopter Program
An Analysis of Helicopter Replacement Options

4/6/2016 7:17 AM Page 2 of 34
Special thanks to the many contributors to this analysis including Sgt. Pete Quartarolo, Pilot Paul Bradley,
AJ Trombetta, Stanislaus County Sheriff's Office, Placer County Sheriff's Office, Contra Costa County
Sheriff's Office and Ventura County Sheriff's Office.
TABLE OF CONTENTS
1 Introduction 4
1.1 Subject of this Proposal ..................................................................... 4
1.1.1 Considerations ............................................................................. 4
1.1.2 Objectives ..................................................................................... 4
1.2 Overview ............................................................................................ 4
1.2.1 Historic Overview.......................................................................... 5
1.2.2 Present Operations....................................................................... 6
1.2.2 Operational Overview ................................................................... 6
1.2.3 Rescue Operations ....................................................................... 7
1.2.4 Agency Comparison ..................................................................... 8
2 Replacement Analysis .................................................................................. 10
2.1 Projected Costs Versus Value ......................................................... 10
2.2 Equipment Upgrades ....................................................................... 11
2.2.1 Federal Aviation Administration: ................................................. 11
2.2.2 National Transportation Safety Board......................................... 12
2.2.3 Crew Recommendations ............................................................ 12
3 Requirements Analysis ................................................................................. 13
3.1 Requirements .................................................................................. 14
3.2 Desirable Features .......................................................................... 16
3.3 Product Reliability and Customer Support ....................................... 16
3.4 Sheriff’s Office Recommendation .................................................... 16
3.5 Direct Operating Cost Comparison .................................................. 17
3.6 Mission-Specific Equipment ............................................................. 17
4 Acquisition Options ...................................................................................... 18
4.1 Option 1: Purchase a New Helicopter .............................................. 18
4.1.1 Estimated Cost of Option 1 ......................................................... 19
4.1.2 Pros and Cons of Option 1 ......................................................... 20
4.2 Option 2: Lease a New Helicopter ................................................... 20
4.2.1 Estimated Cost of Option 2 ......................................................... 21
4.2.2 Pros and Cons of Option 2 ......................................................... 21
4.3 Option 3: Purchase a Used Helicopter ............................................. 21
4.3.1 Estimated Cost of Option 3 ......................................................... 22
4.3.2 Pros and Cons of Option 3 ......................................................... 22
4.4 Option 4: Rebuild Existing Bell 407 Craft ......................................... 23
4.5 Comparison of Options .................................................................... 23

4/6/2016 7:17 AM Page 3 of 34
4.5.1 Summary of Pros and Cons ....................................................... 24
4.6 Purchase Financing Options ............................................................ 24
5 Conclusions and Recommendations .......................................................... 26
6 Appendices 27
6.1 News Article ..................................................................................... 27
6.2 Federal Aviation Administration (FAA) Regulations ......................... 29
6.3 NTSB Safety Recommendations ..................................................... 30
6.4 NTSB 2015 Most Wanted List .......................................................... 33

4/6/2016 7:17 AM Page 4 of 34
1 INTRODUCTION
The Sonoma County Sheriff’s Office (SCSO) Helicopter Unit performs a variety of law enforcement
and rescue missions including aerial observation and communication with ground operations
during foot pursuits and perimeters, vehicle pursuit tracking, aerial support for Search and
Rescue (SAR) operations for missing persons, and long-line rescues of individuals in peril.
Annually, the Unit responds to an average of 775 urgent calls for assistance.
The SCSO helicopter, Henry 1, is a 1996 model year single-engine Bell 407 with 8,750 accumulated
flight hours. Maintenance and upgrade costs for Henry 1 will soon exceed the resale value of the
craft. Major maintenance is required at 10,000 accumulated flight hours. Within the next three
years, the Federal Aviation Administration (FAA) will require costly avionics upgrades.
Additionally, the National Transportation Safety Board (NTSB) recommends critical upgrades to
enhance crew and public safety. The Helicopter Unit is a vital component of the Sheriff’s Office
and it is recommended that the aging craft be replaced.
1.1 SUBJECT OF THIS PROPOSAL This analysis presents the helicopter replacement reasons and timing, craft and operational
requirements and crew recommendations to ensure compliance with FAA regulations while
maximizing crew safety and operational flexibility. Research focused on light, twin-engine
helicopters as this class of craft is widely used for rescue operations and meets SCSO operational
requirements. Comparison to single-engine helicopter models is provided.
1.1.1 Considerations
Financial and operational impacts based on historical data and anecdotal inputs are included in
this report. An evaluation of the affordability, availability, and suitability of helicopter models is
presented. Acquisitions options including purchase and operating lease are examined.
1.1.2 Objectives
Replacement of the existing helicopter would meet following objectives:
Increased compliance with FAA regulations.
Maximize safety through implementation of current rotorcraft technology.
Optimize operational capability to allow response to most emergency missions.
1.2 OVERVIEW This section describes the history of the SCSO Helicopter Unit, mission type and frequency, and
operational capability. Rescue methodology is discussed to provide context for helicopter
requirements. A comparison to agencies with similar operations is provided.

4/6/2016 7:17 AM Page 5 of 34
1.2.1 Historic Overview
The Sheriff’s Helicopter Unit program was founded in 1974. From 1974 through 1983, the craft
was a component in a County-owned, County-operated program. Pilots were deputies who had
prior flight experience, and the aircraft was owned and maintained by the County. Unfortunately,
the program suffered two fatal accidents in the first six years. The County purchased a
replacement helicopter in 1981; however, that craft had numerous mechanical issues and was
sold in 1982.
Helicopter Unit Program: 1983-2008
In 1983, the County began contracting for helicopter services. The contract included helicopter
maintenance, staffing, and insurance coverage. However, the program experienced difficulty
recruiting and retaining staff. Additionally, the County lacked control over maintenance repairs
and struggled with lack of craft availability. The County utilized the services of five different
contractors in the span of 24 years.
During this time, the Sheriff’s Office collected payments for medical transports, which was
allowable under a Federal Aviation Administration (FAA) opinion for leased aircraft. In 2006, the
FAA reversed this opinion; as a public agency operating a public use craft, the Sheriff’s Office
could no longer collect payment for medical transports regardless of whether the craft was
leased or owned.
Helicopter Unit Program: 2008 – 2011
On January 15, 2008, the Board of Supervisors approved a County-owned, County-operated
Helicopter Unit. County operations staffing allocations increased from a Sergeant and Tactical
Flight Officer (TFO) deputy to include two pilots and a full-time paramedic. Funding for two
alternate TFO positions was also approved. Under this model, the County continued to contract
for mechanic services. Due to delays with County Human Resources establishing the job class and
difficulty recruiting a full-time paramedic, the position was never filled and was eventually
deleted during FY 11-12.
In the third quarter of FY 10-11, the Field Services Captain temporarily reassigned the deputy TFO
to Patrol to alleviate patrol staffing shortages. Due to budget cuts in FY 11-12, staffing and flight
hours were greatly reduced, but the Helicopter Unit remained in-service for critical search and
rescue, law enforcement and fire suppression needs. The Unit’s flight hours were reduced from
500 to 300 flight hours, and non-essential maintenance was delayed.

4/6/2016 7:17 AM Page 6 of 34
1.2.2 Present Operations
Helicopter Unit Program: 2012 – present
Following FY 11-12 budget cuts, the program staffing plan was reduced to one pilot and one full-
time deputy TFO. Extra-help paramedics filled the paramedic role for the Unit. Alternate TFO
deputies provided relief coverage on overtime for the full-time deputy. Flight hours were
increased from 300 to 350 to provide baseline operation and required training time for alternate
crew members. Unit supervision was divided between the Helicopter and Marine Units, and the
County continued to contract for the services of a mechanic.
In FY 13-14, the Unit determined that a full-time sergeant was necessary to provide Unit
management, and the deputy TFO position was upgraded to a full-time sergeant TFO. Currently,
alternate TFOs continue to train with the Unit and provide coverage when the sergeant TFO is
unavailable.
In FY 14-15, the unit’s flight hours remained at 350 and the unit was able to provide baseline
operational SAR and law enforcement service with the following staff: one full-time sergeant TFO,
one pilot, alternate deputy TFOs on overtime basis, and extra-help paramedics.
The FY 15-16 budget remains at 350 flight hours with no changes to the staffing plan. In August,
the pilot resigned his position and the Unit is out of service until the pilot recruitment is
completed. The helicopter was flown to the contract service center for required maintenance
during this downtime. The Unit expects to return to full service in March/April 2016.
1.2.2 Operational Overview
The SCSO helicopter unit performs a wide variety of missions: law enforcement, fire suppression,
Emergency Medical Service (EMS) transport and Search and Rescue (SAR) missions. The Unit
performs day and night operations utilizing Night Vision Goggle (NVG) technology. Rescue
operations are further described in the following section.
Flight hours by mission type for three years are shown in Figure 1. As shown, 60% of flight hours
were spent on law enforcement calls, 23% of hours were spent on critical search and rescue or
long-line rescue, 10% of hours were spent on training, and the remaining flight hours are
expended on fire suppression, maintenance, public outreach events, or medical transports, if
private air ambulances are unavailable.

4/6/2016 7:17 AM Page 7 of 34
Figure 1: Flight Hours by Mission Type
1.2.3 Rescue Operations
The SCSO Unit performs vertical reference long line rescues, a method that requires the highest
level of skill and training for both the pilot and rescuer. A rescue is performed as follows: the
helicopter is briefly landed while the crew attaches a line to the helicopter belly hook. Figure 2
shows the “belly hook” attachment of the cable to the helicopter. The rescuer is attached to the
line and flown to the rescue site. The pilot holds the helicopter steady (hover) while observing
the rescue and sighting the ground through the open helicopter door. This requires significant
pilot skill. The rescuer provides urgent medical care to the victim then places them on a litter
(stretcher) or attaches a rescue harness. The pilot then flies the victim and rescuer to land where
further medical care is provided.
Other agencies perform rescues using a mechanical hoist: the pilot holds the helicopter stable
while the rescuer is lowered by hoist. A hoist rescue takes longer, extending the most dangerous
Search & Rescue23%
Law Enforcement 59%
Training10%
Demonstrations3%
Mechanical3%
Fire Suppression1%
Medical Service1%
Historical Average of Flight Hours by Mission TypeThree-Yr Average, FY 11-12 to FY 13-14
Search & Rescue
Law Enforcement
Training
Demonstrations
Mechanical
Fire Suppression
Medical Service

4/6/2016 7:17 AM Page 8 of 34
portion of the flight profile, the hover. Hoist rescues require an additional crew member to
operate the hoist, adding weight to the flight and limiting the mission flight time.
Figure 2: Cable Attachment to Helicopter
The Unit excels at water rescues due to frequent calls for assistance along the coastline of
Sonoma, Marin and Mendocino counties. The rescuer is inserted into the water while remaining
attached to the long line for the duration of the rescue. The rescuer immediately secures the
victim to the harness, thereby removing them from cold water exposure as quickly as possible.
Other local agencies, including California Highway Patrol (CHP) and Coast Guard, perform
unassisted rescues in which a rope is dropped near the victim. This method requires the victim
to attach themselves to the rescue harness, extending the rescue time and increasing the risk of
injury and/or hypothermia for the victim. It also assumes that the victim is capable of attaching
the harness themselves when often they cannot due to injury or exhaustion.
The SCSO Unit has perfected its quick, precise technique for long-line rescue and is considered
an expert in the field. First responders rely on assistance from Henry 1, especially when the
rescue creates significant risk to the on-ground responders or when the victim is inaccessible by
land. Refer to the attached News Article for description of a recent complex rescue performed
by the crew of Henry 1.
1.2.4 Agency Comparison
For this analysis, a survey was conducted to compare helicopter operations of similar law
enforcement agencies. Operational ability, mission profile data, helicopter technology and other
relevant parameters were compared. It is impossible to directly compare operations due to vast
differences in budget, helicopter type/quantity, unit staffing, geographic response area, and
mission type. To provide the most accurate comparison, agencies with similar operational ability,

4/6/2016 7:17 AM Page 9 of 34
specifically, the ability to perform long-line rescues, were contacted. The following agencies were
surveyed:
Contra Costa County Sheriff’s Office
Stanislaus County Sheriff’s Office
Ventura County Sheriff’s Office
Placer County Sheriff’s Office
It is important to note that Contra Costa County and Stanislaus County would like to replicate
SCSO’s program within their own county and their personnel have trained with the Sonoma
County unit. The comparison data is summarized in Tables 1 and 2.
Of the comparison agencies, no other unit performs all of the mission types that the SCSO unit
performs utilizing a single helicopter. Stanislaus County Sheriff’s Office does not respond to fire
suppression missions. Ventura County performs all the mission types with access to four
helicopters and dedicated fire personnel. The comparison shows that the range of operations is
large and varies by geographic area.
The SCSO Unit distinguishes itself with the expertise to perform long line rescues utilizing
paramedic trained personnel. While other agencies do perform long line rescues, it is rare to have
a paramedic-trained rescuer. Additionally, the SCSO Unit is the only agency performing vertical
reference long line rescues, as opposed to hoist rescues. SCSO performs more water rescues
than Contra Costa, Stanislaus and Placer counties due to responsibility for the Sonoma coastline
and frequent calls for agency assist to Marin and Mendocino counties coastline.
The smaller surveyed agencies utilize single engine helicopter models in their missions due to
budget restrictions. Ventura County utilizes three twin engine models. Large agencies such as San
Diego Sheriff’s Office (8 helicopters) and Arizona Department of Public Safety (5 helicopters) use
twin engine craft for performing operations with human external cargo. Industry wide, a twin
engine craft is preferred for hover operations during long-line rescue.
The SCSO Helicopter Unit is on the leading edge of operational ability and staff are considered
experts in the field by their peers. The Unit performs the largest variety of specialized missions
for agencies of comparable size in California and is on-par with agencies of much larger size and
resources. For this reason, it is imperative to equip the Unit with current helicopter technology
so that it may continue to respond to critical missions in Sonoma County and provide assistance
to the region.

4/6/2016 7:17 AM Page 10 of 34
Table 1: Agency Comparison Data
Agency Unit Budget ($)
Budgeted Annual Flight Hours
Helo type used for
Long Line Rescue
Helicopter model for Long Line
rescue Model Year(s)
Long Line Rescue method
Placer County SO $949,000 420 Single Engine
EC AS350B3 2008 Hoist
Contra Costa County SO $697,807 624 Single Engine
Bell 407GX 1996/2014 Hoist
Ventura County SO 740 Twin Engine
Bell UH-1H Hoist
Stanislaus County SO $580,000 300 Single Engine Bell 206 1974 Hoist
Sonoma County SO $1,570,763 350 Single Engine Bell 407 1996
Vertical Reference
Table 2: Mission Profile by Agency
Mission Profile
Agency Law
Enforcement Rescue Medical
Evacuation Fire
Suppression
Other (Training/ Maintenance/Demo/
County Business)
Placer County SO 70% 10% n/a 0% 20%
Contra Costa County SO 84% 2% 1% 1% 12%
Ventura County SO 22% 24% 12% 8% 34%
Stanislaus County SO 70% 10% 1% n/a 19%
Sonoma County SO 59% 23% 1% 1% 16%
2 REPLACEMENT ANALYSIS
This section details the reasons and timing for replacement of Henry 1. Applicable Federal
Aviation Administration (FAA) regulations and National Transportation Safety Board (NTSB)
recommendations are explained.
2.1 PROJECTED COSTS VERSUS VALUE Maintenance and upgrade cost for the current helicopter is projected to exceed the resale value
of the craft in FY 17-18. Significant craft maintenance is projected for the next two fiscal years;
major maintenance is required at 10,000 accumulated flight hours, projected to occur in FY 17-
18. Operations staff may be required to reduce flight hours to avoid maintenance costs and the

4/6/2016 7:17 AM Page 11 of 34
loss of resale value. Additionally, the helicopter electronic control and monitoring systems
(avionics) must be upgraded to meet FAA mandates, as described in the following section. The
issue of the current craft’s maintenance costs combined with the FAA safety avionics
requirements necessitates the acquisition of a modern aircraft capable of safely performing
typical SCSO operations. The table below projects maintenance and upgrade cost versus value of
the Bell 407 by fiscal year.
1996, Bell 407 FY 14-15 FY 15-16 FY 16-17 * FY 17-18*
Flight Hours on craft 8,900 9,270 9,640 10,010
Craft Value $900,000 $850,000 $800,000 $750,000
Maintenance costs $390,390 $340,564 $683,670 $858,000
* includes required FAA avionics
2.2 EQUIPMENT UPGRADES This section describes recent changes in Federal Aviation Administration (FAA) regulations and
National Transportation Safety Board (NTSB) recommendations. Unit equipment
recommendations are discussed. The required and recommended equipment upgrades are
summarized in Table 3.
2.2.1 Federal Aviation Administration:
The SCSO Helicopter Unit operates under FAA Part 91 flight rules. Additional rules for air
ambulance operations and external loads are contained in Parts 135 and Part 133, respectively.
As a public safety government agency, the Unit and crew are exempt from FAA rules when
responding to an emergency, under the “public use exemption.” (The FAA considers public
aircraft operations to be those owned or leased by a federal, state, or a local government agency.)
The Unit’s crew members strive to comply with FAA regulations during regular operations as a
matter of crew safety and County liability. However, there may be circumstances where the pilot
must weigh the risk to the crew and make the decision to operate the craft outside FAA
regulations to provide rescue operations and prevent loss of life.
Between 2003 and 2008, the number of air ambulance crashes reached the highest level in
history. In 2008 alone, five air ambulance accidents killed 21 people including pilots, patients,
and medical personnel. These crashes were due to multiple reasons: pilot judgement and actions,
safety management issues, and system component failure, among other reasons. The FAA
responded with significant changes to regulations, developed with industry input, over the
course of a decade. The new regulations include changes in operating methods and require
equipment upgrades, implemented in phases. The compliance deadline for operational changes
was April 22, 2015, with equipment upgrades due by 2018. The Unit has implemented all
applicable procedural safety requirements, including a major revision of the flight manual. Henry
1 is not currently equipped with the technology to operate under the new requirements.
Although the Unit and crew are exempt from the air ambulance and external load regulations,

4/6/2016 7:17 AM Page 12 of 34
civil liability increases for public agencies that operate craft outside FAA rules and public agency
best practices. Refer to Appendix 6.2 for further explanation of the FAA regulations.
2.2.2 National Transportation Safety Board
The NTSB is an independent agency charged with determining the probable cause of
transportation accidents and promoting transportation safety. In 2009, the NTSB issued specific
safety recommendations for the Sonoma County Sheriff’s Office that included installation of new
equipment. In a follow-up letter from the NTSB on March 6, 2015, the NTSB recognized that the
existing helicopter is not outfitted with this equipment and that these safety recommendations
remain “open” pending addition of this technology upon craft replacement. Refer to Appendix
6.3: NTSB Safety Recommendations.
The NTSB has recognized the gap between private and public agency regulations and has
prioritized the need to “Enhance Public Helicopter Safety” in their 2015 Most Wanted List. The
NTSB’s Most Wanted List is designed to “increase awareness of, and support for, the most critical
changes needed to reduce transportation accidents and save lives”. Operational changes and
equipment upgrades are recommended for public helicopter safety. Refer to Appendix 6.4: NTSB
2015 Most Wanted List.
2.2.3 Crew Recommendations
Category A Certified Craft: The Unit recommends acquisition of a Category A (CAT A) certified
twin engine helicopter to increase the safety margin during all operations. In addition to having
two engines, a CAT A helicopter has other redundant systems that greatly improve the margin of
safety in the case of system or component failure.
Vertical long-line rescues performed by the Unit require hover flight with human life on the long-
line (human external cargo). Rescues are performed at height of 100 feet or less above the
ground which does not allow time and distance for a helicopter to land in the event of engine
failure. Malfunction of a single-engine helicopter, especially in the course of a long-line rescue,
would result in significant injury and likely loss of human life. The CAT A craft also increases safety
en-route to calls because Henry 1 operates at night over remote mountainous terrain with limited
availability of landing sites.
The Sheriff’s Office jurisdiction includes five miles off the coastline of Sonoma County. Currently,
the Unit’s response is limited to coastline rescues due to amplified risk during open water
operations with a single engine craft. Acquisition of a CAT A craft would allow response to critical
offshore missions.
Single engine helicopters operate near maximum engine performance while in hover, inducing
strain on the engine over long term use. The CAT A helicopter operates significantly below
maximum engine capability, with one engine “loafing” during normal flight. A Category A craft is
designed to continue hover or forward flight in the event of one engine failure, until a safe landing

4/6/2016 7:17 AM Page 13 of 34
is achieved. Some limitations exist due to altitude or height above ground but in most situations,
the safety margin is vastly improved over operation with a single engine craft.
Instrument Flight Rated (IFR) Craft: Due to limited avionics equipment, such as lack of autopilot,
Henry 1 operates under Visual Flight Rules (VFR). FAA rules require a pilot to maintain a fixed
amount of visibility so that he or she would be less likely to suddenly encounter fog, rain, or other
reduced visibility. Sudden entry of a VFR rated craft into low visibility conditions is a leading cause
of crashes. The Unit recommends acquisition of a helicopter that is Instrument Flight Rules (IFR)
capable to increase the safety margin and expand operations as follows:
1) Improve safety in the case of inadvertent flight into decreased visibility conditions,
allowing the pilot to safely navigate through unexpected changes in visibility.
2) Expand the ability to respond to calls in poor weather. Sonoma County is often blanketed
in fog due to its coastal climate. Currently, if the Sonoma County airport has low visibility
conditions, Henry 1 cannot take off and the Unit must decline the mission.
3) Increase the number of potential receiving hospitals for patients. The helicopter would
be able to land at most hospitals, even in decreased visibility with the use of instrument
technology.
(Note: Single engine models are not configured to be Instrument Flight Rated (IFR) due to
industry/market preference; Category A twin engine craft are also IFR certified.)
Table 3: Summary of Equipment Upgrades
Equipment FAA Required? For Whom? Recommended by? Traffic Awareness ADS-B Yes All Operators Autopilot Recommended All Operators NTSB Radio Altimeter Yes All Operators NTSB Helicopter Terrain Awareness and Warning System (HTAWS)
Yes Air Ambulance NTSB
Flight data recorder Yes Air Ambulance NTSB Category A twin-engine craft Yes External Load
Operators Crew
Instrument Flight Rated (IFR) craft Yes* All Operators Crew *dependent on weather/visibility
3 REQUIREMENTS ANALYSIS
This section details the helicopter and mission-specific equipment specifications required by the
Unit to respond to the varied operational missions. Research focused on light, twin engine
helicopters because this class of craft is widely used for rescue operations and meets SCSO
operational requirements. Comparison to single engine helicopter models is provided. A
comparison of manufacturers and current models against Unit requirements is included.

4/6/2016 7:17 AM Page 14 of 34
Information from the following helicopter manufacturers is presented: Bell Helicopter,
McDonnell-Douglas, Airbus (formerly EuroCopter) and AgustaWestland.
3.1 REQUIREMENTS The Unit has several requirements for a helicopter based on safety and operational requirements
and physical limitations of the hangar facility. Table 4 compares the current Bell 407 (Henry 1)
and selected helicopter models against the requirements explained as follows:
Category A Certified: The selected model should be certified for Category A performance to
increase safety margin during long line rescue operations and comply with FAA Part 133
requirements for private operators.
Instrument Flight Rules (IFR) operation: The Unit responds to calls at night, in variable fog and
other inclement weather conditions that limit visibility requiring helicopter operation outside of
the Visual Flight Rules specified by the FAA. The selected helicopter should be Instrument Flight
Rules (IFR) certified to increase safety margin and compliance with regulations while responding
to all missions.
Length: The existing hangar at the Sonoma County airport will accommodate a maximum
helicopter length of 43 feet, defined as the total helicopter length with “rotors turning” (versus
the fuselage length only).
Hoist system: The helicopter should allow configuration with an external hoist system able to
carry up to 600 pounds of cargo to safely accommodate the combined weight of the rescuer and
victim. (Note: a hoist certified for Human External Cargo with capability to carry 600 pounds is
only available on a twin engine helicopter due to increased hoist weight).
Flat floor: The helicopter interior floor should be flat to accommodate equipment required for
Emergency Medical Services (EMS) missions. A flat floor facilitates the transport of a patient on
a stretcher.
Landing gear: The chosen helicopter must be equipped with skid-type landing gear to
accommodate landing on variable surfaces such as sand, dirt or rock during rescue operations.
There are three models that do not meet the minimum requirements: AgustaWestland 119Kx,
Airbus H125 (formerly EuroCopter AS350B3) and Bell 407GXP. These models have been excluded
from further comparison.
The MD Explorer meets requirements but has been excluded from further consideration due to
model availability/manufacturer delivery issues.
The AW109 Trekker model meets requirements but is not yet available in the United States due
to required FAA certification. The AW109 Trekker has been excluded from further consideration.

4/6/2016 7:17 AM Page 15 of 34
Table 4 Requirements, Comparison by Model
Requirement Henry 1 Bell 407
Bell 429 Airbus H135
(formerly EC135)
Airbus H145
(formerly EC145T2)
MD Explorer
AW109 Trekker
AW 119Kx
Airbus H125
(formerly AS350B3e)
Bell 407GXP
Engine(s) Single Twin Twin Twin Twin Twin Single Single Single
Performance: Category A
no yes yes yes yes yes no no no
Instrument Flight Rules Certified
no yes yes yes yes yes no no no
Length: less than 43 feet
yes yes yes yes yes yes yes no yes
Hoist: 600 Lbs. capacity
no yes yes yes yes yes no no yes
Flat floor no yes yes yes yes yes no yes no
Landing gear: Skid type
yes yes yes yes yes yes yes yes yes

Helicopter Replacement Options
4/6/2016 7:17 AM Page 16 of 34
3.2 DESIRABLE FEATURES A helicopter with the following features and capability will optimize operational performance
for the unique missions of the Unit:
Cruise Speed: The cruise speed of the helicopter affects response time to emergencies. The Unit
recommends acquiring a helicopter with highest cruise speed to minimize response time. (The
maximum cruise speed of a Bell 407 is 133 knots). Cruise speed is reduced with increasing
weight; the Airbus H145 is heavier and thus has lower cruise speed than the Bell 429 and Airbus
H135 models.
Unenclosed tail rotor: The tail rotor on the H135 model is enclosed. This feature is undesirable
for SCSO operations due to the reduced performance with tail winds and reduced ground
clearance. The housing could potentially interfere with landing on variable surfaces and become
cracked during take-off or landing at an elevated angle.
The following table compares desirable features by model to the existing Bell 407:
Requirement Henry 1 Bell 407
Bell 429 Airbus H135
Airbus H145
Max Cruise Speed: 140 KTS or greater
no yes yes no
Unenclosed tail rotor
yes yes no yes
3.3 PRODUCT RELIABILITY AND CUSTOMER SUPPORT Aviation International News conducts a survey, published annually, to rank product
performance and support by aviation manufacturer. Respondents to the survey are actual
product users. The following table gives 2015 survey results for overall product reliability and
customer support for the manufacturers of the helicopter models that are being considered by
the SCSO Helicopter Unit. Bell Helicopter has the highest rating in nine out of ten of the survey
categories, giving it the highest overall average ranking. (Note: McDonnell-Douglas (MD)
helicopter was not included in the survey.)
Manufacturer Bell Airbus AgustaWestland
Parts Availability 7.6 7.0 6.2
Warranty Fulfillment 8.6 7.6 7.6
Overall Reliability 8.0 8.4 7.2
Overall Average 7.9 7.5 6.8
3.4 SHERIFF’S OFFICE RECOMMENDATION The Sheriff’s Office recommends acquisition of a Bell 429 helicopter. The Bell 429 model meets
all requirements and desirable specifications and Bell Helicopter has the highest overall ranking

Helicopter Replacement Options
4/6/2016 7:17 AM Page 17 of 34
in the customer survey performed by Aviation International News. The Unit currently operates
a Bell helicopter, allowing Sonoma County to leverage existing knowledge and training.
Manufacturer Bell Airbus AgustaWestland
Meets Non-negotiable requirements X X X
Meets Desirable specifications X
Best Customer Survey results X
Existing training X
3.5 DIRECT OPERATING COST COMPARISON A Category A twin-engine, IFR certified craft is recommended as the ideal operational craft.
However, there are significant purchase and annual operating cost differences between a single
engine craft and a Category-A twin engine craft.
There is a direct correlation between the number of hours flown and the below operating costs.
Direct Maintenance Costs (DMC) refers to the manufacturer provided cost per flight hour
(excluding fuel). The following table represents the direct operating costs for the current 407
craft in comparison to the operation of a new craft.
Annual Direct Operating Costs based on 350 flight hours
Existing Henry-1, Bell 407
New single engine
New Twin engine, CAT-
A
FY 15-16 FY 16-17 Bell407GX Bell 429
DMC $164,500 $164,500 $123,850 $183,750
Specific maintenance
$45,500 $255,785 $0 $0
Fuel $67,200 $67,200 $81,200 $134,050
Insurance* $40,000 $40,001 $60,000 $75,000
Total $317,200 $527,486 $264,050 $392,800
*estimate – actual insurance costs for these craft will be verified through Risk Management
3.6 MISSION-SPECIFIC EQUIPMENT The acquired helicopter must be outfitted with mission-specific equipment to conduct the law
enforcement, fire suppression, and rescue operations performed by the Unit. These systems
include a night vision/infrared camera (FLIR), computerized mapping for navigation, a
customized 7-band radio for simultaneous communication with multiple agencies (SCSO
dispatch, REDCOM, California Highway Patrol, Cal-Fire, etc.), a moving map overlay system for
relaying incident location to ground patrol units, and attachment system for external cargo. If
the helicopter is being purchased directly from the Original Equipment Manufacturer (OEM),
this equipment may be purchased through them. If a base model helicopter is purchased, this
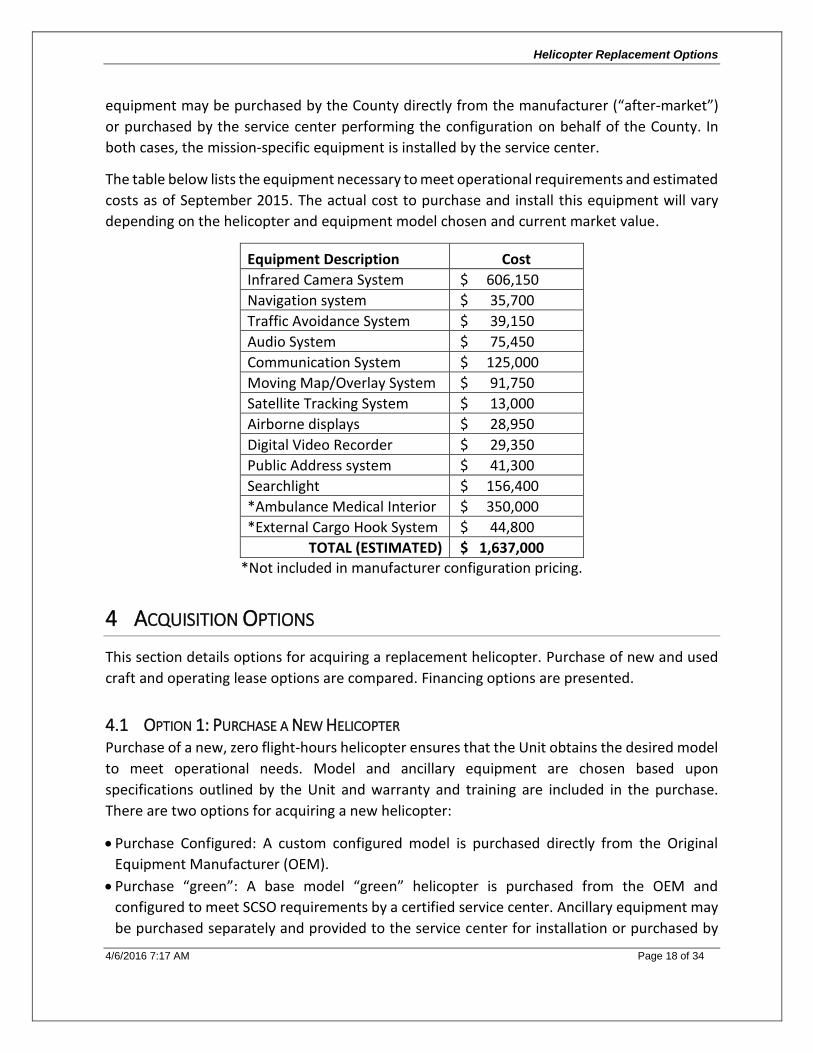
Helicopter Replacement Options
4/6/2016 7:17 AM Page 18 of 34
equipment may be purchased by the County directly from the manufacturer (“after-market”)
or purchased by the service center performing the configuration on behalf of the County. In
both cases, the mission-specific equipment is installed by the service center.
The table below lists the equipment necessary to meet operational requirements and estimated
costs as of September 2015. The actual cost to purchase and install this equipment will vary
depending on the helicopter and equipment model chosen and current market value.
Equipment Description Cost
Infrared Camera System $ 606,150
Navigation system $ 35,700
Traffic Avoidance System $ 39,150
Audio System $ 75,450
Communication System $ 125,000
Moving Map/Overlay System $ 91,750
Satellite Tracking System $ 13,000
Airborne displays $ 28,950
Digital Video Recorder $ 29,350
Public Address system $ 41,300
Searchlight $ 156,400
*Ambulance Medical Interior $ 350,000
*External Cargo Hook System $ 44,800
TOTAL (ESTIMATED) $ 1,637,000
*Not included in manufacturer configuration pricing.
4 ACQUISITION OPTIONS
This section details options for acquiring a replacement helicopter. Purchase of new and used
craft and operating lease options are compared. Financing options are presented.
4.1 OPTION 1: PURCHASE A NEW HELICOPTER Purchase of a new, zero flight-hours helicopter ensures that the Unit obtains the desired model
to meet operational needs. Model and ancillary equipment are chosen based upon
specifications outlined by the Unit and warranty and training are included in the purchase.
There are two options for acquiring a new helicopter:
Purchase Configured: A custom configured model is purchased directly from the Original
Equipment Manufacturer (OEM).
Purchase “green”: A base model “green” helicopter is purchased from the OEM and
configured to meet SCSO requirements by a certified service center. Ancillary equipment may
be purchased separately and provided to the service center for installation or purchased by

Helicopter Replacement Options
4/6/2016 7:17 AM Page 19 of 34
the service center on behalf of SCSO. In the case of Bell helicopters, the custom configuration
would be completed by Rotorcraft Support Incorporated (RSI), the current contract
maintenance provider for Henry 1. Total cost may be slightly lower versus direct purchase
from the OEM. Lead time may be longer than direct purchase from the OEM, depending upon
the service center’s workload.
4.1.1 Estimated Cost of Option 1
Helicopter manufacturers provided quotes in April 2015 for purchase of fully configured
models. The quotes are not included in the appendix of this analysis because they are
proprietary. The following table summarizes the quotes for various models with ancillary
equipment installed (excluding EMS medical interior and cargo hook system) as quoted by the
OEM:
Configured Purchase Price
Bell 407GXP
Airbus H125 (formerly
AS350B3)*
Bell 429
Airbus H135
Airbus H145
Single Engine Single Engine Category A Category A Category A
$4,411,600 $4,857,654 $7,794,550 $7,349,000 $8,358,165
*Note: The State of California has a master agreement with Airbus for purchase of AS350B3
helicopters for use by the California Highway Patrol. This contract is available for use by all
California government agencies provided an administrative fee (1.06% percent of order total)
is paid to the State department of General Services. Use of this contract results in additional
administrative fees of approximately $62,000 for Sonoma County, not included in the cost
shown in the table, above.

Helicopter Replacement Options
4/6/2016 7:17 AM Page 20 of 34
4.1.2 Pros and Cons of Option 1
Pros Cons
Option 1
County obtains long-term asset
Longest asset useful life, 15-20
years
Model of choice
Custom configuration
County fully controls use of craft
Equipment warranty included
Training included
Significant up-front cost
4.2 OPTION 2: LEASE A NEW HELICOPTER Under option 2, the County enters into an agreement with a helicopter leasing agency, such as
Milestone Aviation, Macquarie Rotorcraft Leasing, Inc., or Waypoint Leasing. This option
became more popular as a result of the worldwide financial crisis that began in 2009. The
leasing agency purchases a zero flight-hours craft configured specifically for SCSO and leases
the craft back to the County for an agreed price and term. At the end of the term, the craft is
returned to the leasing company. The term is significantly shorter than the useful life of the
craft to ensure a residual value for the leasing agency. A shorter term means an increased
administrative burden, as the acquisition process would be repeated within five to seven years’
time.
The advantage of this option is minimal up-front cost to the County by avoiding a costly capital
down payment to the helicopter manufacturer and service center performing the custom
configuration. The County does not incur debt and does not retain the asset “on the books” but
instead pays an annual payment to the leasing agency. The lease may be terminated, and the
craft returned to the leasing agency, in the case of non-appropriation of funds.
An operating lease involves additional costs not required in a purchase option. Examples of
additional operating lease requirements are:
Enrollment in a “Power by the Hour” (PBH) maintenance program with a certified service
center. This maintenance program ensures the residual value of the craft upon return
to the leasing agency. Annual costs for PBH programs are higher than maintaining the
craft outside of this program.
Submission of monthly utilization reports to the leasing agency.
Additional liability insurance cost.

Helicopter Replacement Options
4/6/2016 7:17 AM Page 21 of 34
4.2.1 Estimated Cost of Option 2
The below table provides an estimate of operating lease prices based upon April 2015 pricing
and available models from Macquarie Rotorcraft Leasing, Inc. A single engine model is not
available for lease due to limited return on investment for the leasing agency.
Current Cost Annual Operating Lease Cost
FY 15-16 Bell407GXP AW109 Bell 429 H145
$258,313 N/A $757,560 $895,320 $952,824
Note: Actual configured models will vary over time due to manufacturer and lease options.
4.2.2 Pros and Cons of Option 2
Pros Cons
Option 2
Minimal up-front cost
Model of choice
Custom configuration
Lease may be terminated in case of
non-appropriation of funds
Ability to operate with current
technology (craft will be replaced
earlier than owned craft)
Predictable cost
County does not retain asset
Shorter asset useful life (increased
administrative burden)
Higher maintenance costs due to
Power by Hour subscription
Increased insurance cost for
liability coverage
4.3 OPTION 3: PURCHASE A USED HELICOPTER Under this option, the County would purchase a previously-owned helicopter with accumulated
flight hours. The selection is limited by market availability, thus, the County may not be able to
acquire the desired model or equipment options. The Helicopter Unit would need to make
significant equipment compromises and incur cost to have the craft reconfigured for specific
operational requirements. Reconfiguration is not possible in all scenarios due to
model/equipment compatibility limitations. Helicopter manufacturers have limited inventory
of used craft; the County would likely purchase from a private broker, incurring broker fees in
the process. Training would be obtained through the Original Equipment Manufacturer at
additional cost to the County. There is no provision for replacement equipment in the case of
out-of-service events due to equipment malfunction, as the helicopter will likely be outside the
warranty period when acquired.

Helicopter Replacement Options
4/6/2016 7:17 AM Page 22 of 34
4.3.1 Estimated Cost of Option 3
The cost implications of Option 3 are dependent upon the number of flight hours accumulated
on the craft and the initial purchase price. In general, the cost of a used helicopter is calculated
as follows:
Initial purchase price – (# of flight hours x hourly Direct Operating Cost)
The money saved in purchase of a used craft is often expended in the additional maintenance
cost if the craft was not maintained in excellent condition. In addition, the cost to reconfigure
a used helicopter may be higher than custom configuration of a new craft due to additional
labor costs. The following table gives examples of used helicopters available in September 2015.
Option Type Manufacturer/Model
(year)
Flight
Hours
Purchase
Price
Estimate
Notes
1 Category
A
Bell 429 (2013) 244 $5,600,000 Configured for
corporate seating
2 Category
A
Eurocopter 135P2+
(2013)
0 $5,250,000 Needs full
configuration (green)
3 Single Bell 407GX (2011) 130 $3,275,000 Configured for EMS
missions
4 Single Eurocopter
AS350B3E (2014)
8 $2,650,000 New, under warranty
4.3.2 Pros and Cons of Option 3
Pros Cons
Option 3
County obtains long-term asset
County fully controls use of craft
Reduced cost as compared to
purchase of new craft
Unit must compromise on model
and equipment due to limited
market selection
Additional cost to reconfigure
helicopter for SCSO operations
Additional fees for broker services
Additional cost for Training
Reduced asset useful life
No equipment warranty

Helicopter Replacement Options
4/6/2016 7:17 AM Page 23 of 34
4.4 OPTION 4: REBUILD EXISTING BELL 407 CRAFT Under this option, the existing Bell 407 craft would be flown to the contract service center,
stripped of all existing mechanical and avionics equipment and rebuilt with new technology
equipment. This option, although possible, is rarely attempted in the helicopter industry. The
cost is prohibitive due to the significant labor hours required. The Unit would be out of service
for approximately one year total while the craft was rebuilt, unless a replacement craft was
leased during the downtime. Any existing problems with the airframe would be carried over
resulting in unknown future maintenance and downtime impacts. This option is not
recommended due to significant cost and Unit downtime.
4.5 COMPARISON OF OPTIONS The following table provides a comparison of acquisition options:
Purchase New Operating Lease Purchase Used
Relative “up-front” cost to County High Low High
County incurs debt on books Yes No Yes
County fully controls asset operational
use
Yes No Yes
Flexibility for non-appropriation Yes Yes Yes
Useful life of helicopter 15-20 years 9 to 12 years 12-15 years
Requires enrollment in “Power by the
Hour” maintenance program
No Yes No
Asset owned at end of Term Yes No Yes
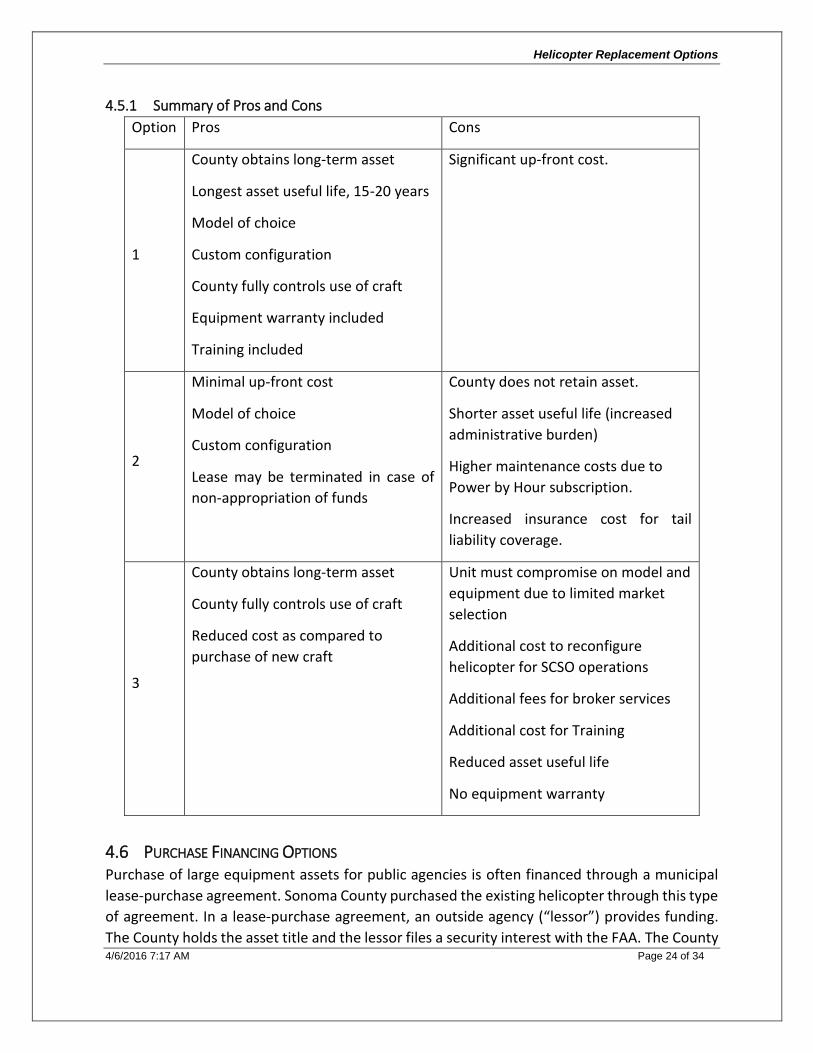
Helicopter Replacement Options
4/6/2016 7:17 AM Page 24 of 34
4.5.1 Summary of Pros and Cons
Option Pros Cons
1
County obtains long-term asset
Longest asset useful life, 15-20 years
Model of choice
Custom configuration
County fully controls use of craft
Equipment warranty included
Training included
Significant up-front cost.
2
Minimal up-front cost
Model of choice
Custom configuration
Lease may be terminated in case of
non-appropriation of funds
County does not retain asset.
Shorter asset useful life (increased
administrative burden)
Higher maintenance costs due to
Power by Hour subscription.
Increased insurance cost for tail
liability coverage.
3
County obtains long-term asset
County fully controls use of craft
Reduced cost as compared to
purchase of new craft
Unit must compromise on model and
equipment due to limited market
selection
Additional cost to reconfigure
helicopter for SCSO operations
Additional fees for broker services
Additional cost for Training
Reduced asset useful life
No equipment warranty
4.6 PURCHASE FINANCING OPTIONS Purchase of large equipment assets for public agencies is often financed through a municipal
lease-purchase agreement. Sonoma County purchased the existing helicopter through this type
of agreement. In a lease-purchase agreement, an outside agency (“lessor”) provides funding.
The County holds the asset title and the lessor files a security interest with the FAA. The County

Helicopter Replacement Options
4/6/2016 7:17 AM Page 25 of 34
makes annual payments on the lease, including principal and interest, and may choose to pay
the lease in full and own the asset outright at any point in the agreement. At the end of the
lease term, the County has the option to purchase the asset from the financing agency, usually
for the amount of $1. A municipal lease-purchase agreement includes a non-appropriation
clause in which the asset would return to the finance agency in the case of non-payment due
to non-appropriation of funds.
This agreement type is available through the helicopter manufacturer or from private agencies.
The County may be required to pay a down payment and configuration costs outside of the
lease-purchase agreement. Additional fees may be required for legal counsel representation for
filing of the security interest with the FAA. Final terms are dependent upon current market.
For this analysis, four agencies were contacted to provide comparison of terms. The following
table provides a comparison of municipal lease-purchase agreements for a loan amount of
$7,500,000:
Agency Term
(years)
Annual
Payment
Nominal
Annual Rate
Total Cost
of Loan
Textron Financial (owner of
Bell Helicopter)
12 $714,871 2.130% $8,578,455
Bank of America 12 $738,035 2.75% $8,856,423
Umpqua Equipment
Financing
*15 year amortization with
10 year balloon payment
10* $609,891 2.76% $8,855,429
($2,756,519
Balloon
Payment)
Umpqua Equipment
Financing
10 $850,680 2.59% $8,506,850

Helicopter Replacement Options
4/6/2016 7:17 AM Page 26 of 34
5 CONCLUSIONS AND RECOMMENDATIONS
The Helicopter Unit provides critical support for Sheriff’s Office deputies and the citizens of
Sonoma County. Maintenance and upgrade costs for the current helicopter, Henry 1, are
projected to exceed the resale value of the craft in FY 17-18. The Sheriff’s Office recommends
acquisition of a modern helicopter to optimize operational capability, maximize safety and
ensure compliance with FAA regulations and NTSB safety recommendations. Delaying
replacement of the existing craft will result in escalating maintenance and upgrade costs and
increased downtime for the Unit.
The Sheriff’s Office recommends purchase of a zero flight-hours helicopter, specifically a
Category A certified craft. The Bell 429 model meets all non-negotiable and desirable
specifications and Bell Helicopter has the highest overall ranking in the customer survey
performed by Aviation International News.
The Sheriff’s Office has applied for grant funding through the Urban Area Security Initiative
(UASI). County Emergency Managers in or Hub Area have expressed support to fund ancillary
equipment for this project. The UASI Approval Authority will finalize awards in April 2016.
Friends of Henry 1, a local non-profit organization, has indicated its intent to aggressively raise
funds to help offset purchase costs, although funding amount is uncertain at this time.

Helicopter Replacement Options
4/6/2016 7:17 AM Page 27 of 34
6 APPENDICES
6.1 NEWS ARTICLE
Vertical Magazine
2013-05-26 20:52:02
Sonoma County Sheriff helicopter rescues nine first responders in Del Norte County
On the night of May 24, the Sonoma County Sheriff’s Bell 407 helicopter “Henry One” came to
the rescue again, this time long-lining nine first responders off a rocky ledge in Del Norte
County, Calif.
The Sonoma County Sheriff’s Office received a request for help from the Del Norte County
Sheriff’s Office at approximately 8:30 p.m. on Friday. The rescue incident for Del Norte County
first responders had begun two hours earlier, when a 27-year-old female fell approximately 20
feet onto a jagged, rocky surface while visiting the Del Norte coast south of Crescent City.
The patient appeared to have suffered major traumatic injuries, which brought numerous first
responders to her location. Prior to Henry One arriving on scene, a United States Coast Guard
helicopter rescued the patient and her male companion. The patient's injuries were severe, and
she was ultimately transported by air ambulance to the UC Davis Medical Center.
While the first responders were providing treatment to the patient and tending to her
companion, high tide rolled in and the waves increased in size, trapping nine first responders
on a steep rocky ledge after the patient and her companion were rescued. Several of the first
responders, including law enforcement, emergency medical and fire personnel, were wearing
normal duty attire, and unprotected from the cold, wet conditions.
The Henry One flight crew, consisting of a pilot, deputy sheriff/tactical flight officer and
paramedic — all of whom are all trained to perform night long-line rescues — reported to the
Sonoma County Sheriff's hangar, located at the Charles M. Schulz Airport in Santa Rosa, Calif.
The crew began making plans for the two-hour flight to Del Norte County, which included a
refueling stop in Arcata, Calif.
The Henry One flight crew departed the airport at approximately 9:30 p.m. and arrived at the
scene of the rescue at approximately 11:45 p.m. The crew located the first responders and
configured the aircraft for a night long-line rescue using a 100-foot rope attached to the belly
of the aircraft. Within minutes, pilot Paul Bradley was flying Deputy Sheriff Chris Mahoney and
paramedic Don Ricci to the first responders.

Helicopter Replacement Options
4/6/2016 7:17 AM Page 28 of 34
Pilot Bradley lowered the rescuers to the rock where the first responders were waiting.
Paramedic Ricci stayed with the first responders on the rock while Bradley made four trips, long-
lining Deputy Mahoney with two victims at a time back to the landing zone a mile away. Bradley
then made one final flight, long-lining the last first responders and Ricci back to the landing
zone.
All of the first responders were met at the landing zone by awaiting medical personnel. The first
responders were wet, cold and several were showing signs of hypothermia.
From the time Henry One arrived on scene, the rescue took approximately 30 minutes. The
Henry One flight crew returned to the Sheriff's hangar at approximately 2:30 a.m. Saturday
morning.
Bradley told Vertical that “lots of practice” is the key to conducting night long-line rescues
safely. Henry One crews conduct such rescues with the aid of a Nightsun searchlight, but
without using night vision goggles. “It’s a constant mental fight against vertigo because you
can’t see the movement very well; that’s why practice makes safe for the crew and pilot,”
Bradley said. “I like to say, ‘We rescue like we train, we train like we rescue.’”

Helicopter Replacement Options
4/6/2016 7:17 AM Page 29 of 34
6.2 FEDERAL AVIATION ADMINISTRATION (FAA) REGULATIONS
FAA Part 91: Due to limited avionics equipment, such as lack of autopilot, Henry 1 operates
under Visual Flight Rules (VFR). Part 91 FAA rules require a pilot to maintain a fixed amount of
visibility so that he or she would be less likely to suddenly encounter fog, rain, or other reduced
visibility known as Instrument Meteorological Conditions. Craft operating under VFR, less than
1,200 feet above ground level (AGL), are required to operate under speed and conditions that
give the pilot adequate opportunity to avoid collision with air traffic, obstruction, or terrain.
The Unit performs long-line rescues over water or other hazardous terrain at altitude less than
1,200 feet AGL.
In 2020 the FAA will require all aircraft to have Automatic Dependent Surveillance-Broadcast
(ADS-B) traffic awareness systems installed. This equipment is the next generation of air traffic
control and allows the pilot to view a display of all other air traffic using satellite rather than
radar equipment on the ground.
FAA Part 133: The regulations for rotorcraft external load operations are specified in part 133.
During the performance of long line rescues, the Unit operates under the public use exemption
in section 133.1. Following the regulation for private operators, the Unit would be subject to all
part 133 regulations, requiring the use of a Category A certified helicopter during operations
with human external cargo (rotorcraft-load combination Class D).
FAA Part 135: Part 135 specifies the operating requirements for commuter and on-demand
operations. The regulations for Helicopter Air Ambulance Operators are contained within Part
135. When the Unit performs a rescue that involves subsequent patient transport to a medical
facility, the operation is conducted under the public use exemption because the existing
helicopter does not meet FAA Part 135 regulations. Compliance with Part 135 would
significantly improve safety for both the crew and the patient, while maintaining a commitment
to comply with regulations to the degree possible.
Required equipment upgrades to comply with Part 135 are as follows:
Radio altimeter, required in 2017 (for all rotorcraft operators)
Helicopter Terrain Awareness and Warning Systems (HTAWS), required in 2017
Flight data monitoring systems, required in 2018
Autopilot (recommended)

Helicopter Replacement Options
4/6/2016 7:17 AM Page 30 of 34
6.3 NTSB SAFETY RECOMMENDATIONS

Helicopter Replacement Options
4/6/2016 7:17 AM Page 31 of 34

Helicopter Replacement Options
4/6/2016 7:17 AM Page 32 of 34

Helicopter Replacement Options
4/6/2016 7:17 AM Page 33 of 34
6.4 NTSB 2015 MOST WANTED LIST
ENHANCE PUBLIC HELICOPTER SAFETY What is the issue? The safety of public helicopter operations is often overlooked.
Every day, hundreds of federal, state, and local helicopter pilots fly emergency medical service, law enforcement support, and search and rescue missions, as well as a host of other public operations. The public trusts these operators and relies on them to conduct the mission safely; the public often needs this transportation to survive. And each of these helicopter operations requires planning, training, and support. Unfortunately, not all of the pilots complete their missions.
On September 27, 2008, a Maryland State Police (MSP) helicopter, Trooper 2, received a medevac flight request to pick up two patients involved in an automobile accident. Trooper 2 reached the accident site, loaded the patients, but never reached the hospital.
On June 9, 2009, a New Mexico State Police (NMSP) helicopter pilot received a request for an aerial search for a lost hiker. The NMSP pilot landed the helicopter, located the hiker, departed from the mountain, but did not make it back to base.
A very similar situation occurred on March 30, 2013. The Alaska Department of Public Safety (ADPS) helicopter pilot received a request to rescue a stranded snowmobiler. The pilot landed the helicopter, located the snowmobiler, departed from the frozen lake, but did not reach the designated landing zone.
Prior to accepting their missions, both the MSP and NMSP pilots expressed concern about weather conditions. Although the pilot of the ADPS helicopter did not discuss the weather with anyone, he should have been aware of the deteriorating conditions. However, all three pilots accepted and attempted to complete the missions even when faced with poor weather at night. And tragically, the helicopters crashed before reaching their destinations, killing a total of nine people.
Crashes involving public helicopters are not just limited to those used by law enforcement agencies. On January 5, 2010, a California Department of Fish and Game helicopter sustained substantial damage when it collided with power lines during a deer-surveying mission. The NTSB determined that the pilot’s failure to maintain positive control of the helicopter caused the crash.
Since 2004, the NTSB has investigated more than 130 accidents involving federal, state,
and local public helicopter operations, including the 4 mentioned above. Fifty people lost
their lives and nearly 40 were seriously injured in these accidents. The lessons learned as
a result of these investigations have the potential to make federal, state, and local public
helicopter operations safer.
What can be done? Because public operator safety is not generally governed by Federal Aviation Administration regulations, a safety net does not necessarily exist; the safety decisions and programs are solely the responsibility of the public operators. Yet these operators often carry passengers, and they owe it to the public, who they serve, to operate in the safest manner possible. The

Helicopter Replacement Options
4/6/2016 7:17 AM Page 34 of 34
NTSB is concerned that, absent a concerted effort to enhance helicopter safety in public operations, accidents involving public helicopters will continue. These could lead to more injuries and loss of life in search and rescue operations and emergency medical service flights, as well as other operations by federal, state, and local entities.
Based on our accident investigations, the NTSB has identified a number of actions that public operators can take to address operational, pilot, and helicopter factors.
Operational factors hold great promise because they impact the overall safety of the operation. Operational improvements include developing and implementing safety management systems that include sound risk management practices, particularly flight risk evaluation programs and formalized dispatch and flight-following procedures. Operators can also implement best practices for flight crews that include scenario-based training and fatigue management. In particular, given the heightened risk associated with flight in bad weather, helicopter operators should employ training scenarios that expose pilots to inadvertent flight into instrument meteorological conditions.
Helicopter technology also plays a significant role in mitigating risk to thousands of pilots and passengers each year. The NTSB has recommended that helicopter operators install radio altimeters, night vision imaging systems, and terrain awareness warning systems.
Finally, the NTSB advocates for crash-resistant flight recorder systems for all aircraft. These
recorders can be used to enhance the safety culture within the public agency by allowing
the operators to identify and address safety issues before a crash occurs. Further, if an
accident does occur, crash-resistant flight recorder systems can assist investigators,
regulatory agencies, and operators to quickly identify what went wrong and how to prevent
it from happening again.
For more information visit: www.ntsb.gov/mostwanted

14
Draft Resolutions Adopting the Budget at the
Conclusion of the Public Hearings

County of Sonoma State of California
Date: June 13, 2016 Item Number:
Resolution Number:
4/5 Vote Required
Resolution Of The Board Of Supervisors Of The County Of Sonoma, State Of California, and all Public Entities for which the Board Of Supervisors Acts as the Board Of Directors or
Commissioners, Adopting the Fiscal Year 2016-17 Budget for all Governmental Entities within its Jurisdiction, and Addressing ADA Requirements, and use of Water Agency Funds for costs
associated with the Russian River Project
Whereas, the Board of Supervisors of the County of Sonoma (“Board”), as the governing body of the County and as the Directors and Commissioners of its Internal Service and Enterprise Funds, Special Districts, and Community Development Commission, has made available for public review the recommended budget for Fiscal Year 2016-17 for the governmental entities within its jurisdiction (“Fiscal Year 2015-2017 Year 2 Recommended Budget”), in accordance with Section 29080 of the Government Code, State of California, and
Whereas, the Board has completed Budget Hearings, as required by Sections 29080 and 29081 of the Government Code, State of California, and
Whereas, at this time, it is the desire of the Board to adopt a Fiscal Year 2016-17 Budget by reference for all governmental entities within its jurisdiction, and
Whereas, the Federal Americans with Disabilities Act of 1990 (ADA) is wide-ranging legislation intended to make American Society more accessible to people with disabilities, and Whereas, the County has an updated ADA Transition Plan with a multi-year schedule for additional ADA barrier removal that is addressed in the Fiscal Year 2016-17 Recommended Budget reviewed in the Budget Hearings.
Now, Therefore, Be It Resolved and Ordered that the Fiscal Year 2016-17 Recommended Budget, adjusted for the attached increases/decreases listed in Exhibit A and in the Budget Hearings Attachment 2, be adopted by reference as the Fiscal Year 2016-17 Adopted Budget for the governmental entities listed in Exhibit B, in accordance with Sections 29088 through 29092 of the Government Code, State of California.

Resolution # Date: June 13, 2016 Page 2
Be It Further Resolved that the County Auditor-Controller-Treasurer-Tax Collector and the County Administrator are authorized to complete any necessary budgetary and accounting transfers and adjustments to implement the adopted FY 2016-17 budget and to re-establish valid prior year encumbrances in FY 2016-17. Such adjustments shall include but not be limited to decreasing appropriations in any and all funds associated with projects initiated prior to the 2016-17 fiscal year-end to meet actual available resources. Authority includes budgetary and accounting adjustments necessary to assign year-end actual fund balances, and increasing or decreasing appropriations for Community Development Commission, Sonoma County Agricultural Preservation and Open Space District, Northern Sonoma County Air Pollution Control District, and Sonoma County Public Finance Authority, to close out the fiscal year for previously approved projects, operations and maintenance expenses and budgetary and accounting adjustments necessary to assign actual fund balances. In addition, the County Auditor-Controller-Treasurer-Tax Collector and the County Administrator are authorized to transfer available year-end County General Fund Balance beyond the amount required in the Adopted Budget in the following ways. First, to meet the Board’s Long Term Fiscal Sustainability priority towards having a Reserve equal to 15% of General Fund Revenues, transfer up to $4 million, or 12%, of Adopted General Fund revenues to incrementally increase reserves towards the 15% goal. Second, to meet the county’s facility obligation associated with the new state courthouse, assign up to $8 million to the Courthouse Inmate Transfer Connector capital project. And third, transfer any remaining General Fund year-end balance to the Sonoma County Employees Retirement Association (SCERA) to pay down pension liability. Conversely, amounts short of the FY 2015-16 year-end General Fund available balance required to finance the Adopted FY 2016-17 Budget would be balanced by reducing FY 2016-17 appropriated General Fund Contingencies. Be It Further Resolved that the County Auditor-Controller-Treasurer-Tax Collector and the County Administrator are authorized to establish new funds and complete any necessary budgetary and accounting transfers and adjustments to comply with Generally Accepted Accounting principles (GAAP). Be It Further Resolved that the County Auditor-Controller-Treasurer-Tax Collector and the County Administrator are authorized to temporarily transfer cash between certain County funds during the last thirty days of the current fiscal year subject to all applicable laws and government accounting standards and principles as necessary in order to maintain appropriate levels of working capital to ensure service delivery continuation for mandated services pending receipt of State reimbursements. This authorization covers permissible temporary cash transfers

Resolution # Date: June 13, 2016 Page 3
within the governmental fund types of the general fund, enterprise funds, internal service funds and special revenue funds as well as from any of the first three of these fund types to any of the other specified fund types, to the extent allowable under law. Be It Further Resolved that the Human Resources Director, with the concurrence of the County Administrator, is authorized to make technical changes to departmental position allocation lists to conform to the position allocation changes included in Exhibit C, as updated by Board direction in the Budget Hearings, and all previous Board actions. Such changes shall also include the adjustment of the term of any time limited positions necessary to complete projects continued into the 2016-17 fiscal year per the adopted budget and authorized adjustments thereto. Be It Further Resolved that the Board declares its intent to continue allocating funds in future years to identify and remove physical and programmatic barriers to County services, and Be It Further Resolved that the Board directs all department and agency heads of the County to examine all possible programmatic and operational means to ensure accessibility of their programs and services to avoid more costly and time-consuming construction or remodeling projects to remove barriers. Be It Further Resolved that the Board authorizes County Administrator and the Auditor-Controller-Treasurer-Tax Collector to transfer to the Sonoma County Employee Retirement Association (SCERA) up to the maximum annual amount allowed per the SCERA policy beyond the current and future year prepaid normal cost to be retained on deposit. Be it Further Resolved that with respect to the Sonoma County Water Agency (“Water Agency”) this Board hereby finds, determines, declares and orders as follows: 1. The Warm Springs Dam/Russian River Project (“the Project”) was approved by the United States Congress (Public Law 516, 81st Congress, 2nd Session), by the California Legislature (Water Code sections 12699 and 12700) and the Water Agency’s indebtedness arising from the Project (“the indebtedness”) was approved by the Water Agency’s voters in elections held in 1955, 1974 and 1979. The Water Agency levies a tax at a rate necessary to pay the indebtedness so as to ensure a continuation of the benefits of the Project. 2. Costs associated with the Project include the contractual obligations owed to the federal government and other public agencies as identified and discussed in the August 2001 “Report to the Board of Directors of the Sonoma County Water Agency on Financing the Costs of the Russian River Project” (“the Report”).

Resolution # Date: June 13, 2016 Page 4
Additional obligations include the obligations relating to the operation of Warm Springs Dam and the Russian River Project that will be imposed on the Water Agency during Fiscal Year 2016-17 under the Biological Opinion issued by the National Marine Fisheries Service in September 2008. Other Water Agency revenues are not reasonably available to fund these increased costs due to the need to fund other obligations identified in the Recommended Budget, including but not limited to funding other Water Agency non-Project obligations and programs. 3. The rate of the tax levied for the indebtedness for fiscal year 2016-17 is a rate reasonable, necessary and appropriate to discharge the Water Agency’s voter-approved indebtedness, including an amount appropriate for necessary reserves, after taking into account funds available from the Water Agency’s General Fund and other Water Agency funds. Accordingly, this Board concludes that the Water Agency’s taxes for the Project have been and are levied in full compliance with the requirements of Article 13 A, section 1(b)(1), Revenue & Taxation Code section 96.31 and Government Code section 29100. 4. The County Counsel is directed to advise this Board and the General Manager as to lawful appropriations that can be made from taxes levied for the Project to pay the indebtedness.
Supervisors:
Gorin: Rabbitt: Zane: Gore: Carrillo:
Ayes: Noes: Absent: Abstain:
So Ordered.

Date: June 13, 2016 Item Number:
Resolution Number:
4/5 Vote Required
Resolution of the Board of Directors of the Sonoma Valley County Sanitation District Adopting the Fiscal Year 2016-17 Budget
Whereas, the Board of Directors has completed Budget Hearings as required by Sections 29080 and 29081 of the Government Code, State of California, and Whereas, it is the desire of the Board of Directors to approve the Fiscal Year 2016-17 Budget by reference for the Sonoma Valley County Sanitation District, Now, Therefore, Be It Resolved and ordered that the Fiscal Year 2016-17 Recommended Budget, adjusted for any attached increases/decreases listed in Exhibit “A” be adopted by reference as the Fiscal Year 2016-17 Budget, for the Sonoma Valley County Sanitation District in accordance with Sections 29088 through 29091 of the Government Code, State of California. Be It Further Resolved that after the adoption of the budget and the end of the 2016-17 fiscal year, the County Auditor-Controller-Treasurer-Tax Collector and the County Administrator are authorized to complete any necessary budgetary and accounting transfers and adjustments necessary to close the FY 2016-17 transactions budget and to re-establish valid prior year encumbrances in FY 2016-17. Such adjustments shall include, but not be limited to, adjusting appropriations for any and all funds associated with projects, budgetary, and accounting adjustments necessary to assign year end actual fund balances.
Directors:
Gorin: Carrillo: Gallian:
Ayes: Noes: Absent: Abstain:
So Ordered.

Budget Adoption Resolution Exhibit ABudget Hearings Actions
Gen. Fund Contingency
Advertising Contingency
Reinvestment & Revitalization
TOTAL
ID Description 5,000,000 39,676 906,579 5,946,255 ON-GOING ONE-TIME ONE-TIME
-
Directions to Staff:
FY 2016-17 2nd Year Budget Hearings

EXHIBIT B
Page | 1 S:\STAFF\Budget\Budget Hearings\FY 16-17\16 Resolution Concurrent Exhibit B.docx
GOVERMENTAL AGENCIES INCLUDED WITHIN THE FY 2016-2017 BUDGET 1. Under the Board of Supervisors Jurisdiction:
A. County of Sonoma - (Including individual budgets and information in the following functional areas)
Administration & Fiscal Services Justice Services Health & Human Services Development Services Other County Services Capital Projects Reserves / Designations
B. Internal Service/Enterprise Funds
Airport Enterprise Fund ERP System Administration - ISF Heavy Equipment Internal Service Fund Mason Marina Enterprise Fund Refuse Disposal Enterprise Fund Self-Funded Insurance - ISF Sonoma County Energy Independence Program Sport Fishing Center Enterprise Fund Spud Point Marina Enterprise Fund Transit Enterprise Fund Unemployment Insurance - ISF
C. Special Districts
1. County Service Areas
a. #40 County Fire Services b. #41 Multi-Services
2. South Santa Rosa Lighting/Landscaping District
3. Community Facilities Districts
a. #4 Wilmar b. #5 Dry Creek c. #7 Mayacamas
4. Lighting Districts a. CSA #41 County-Wide b. Airport/Larkfield/Wikiup
c. Airport Business Center d. Roseland e. CSA #41 Meadowlark
5. Permanent Roads
a. Bittner Lane b. Mill Creek Lane c. Mirabel Heights d. Monte Rosa e. Peaks Pike f. Canon Manor

EXHIBIT B
Page | 2 S:\STAFF\Budget\Budget Hearings\FY 16-17\16 Resolution Concurrent Exhibit B.docx
2. Under the Board of Directors Jurisdiction:
A. Special Districts
1. Sonoma County Water Agency and Zones
2. Sanitation Districts a. Occidental b. Russian River c. Sonoma Valley d. South Park
3. Northern Sonoma County Air Pollution Control District*
4. Sonoma County Agricultural Preservation/Open Space District
5. IHSS Public Authority 6. Rio Nido Geologic Hazard Abatement District
3. Under the Board of Commissioners Jurisdiction:
A. Community Development Commission
B. Successor Agency
1. CASA – Roseland
2. CASA – Sonoma Valley
3. CASA – Russian River
*Subject to a separate public hearing conducted by the Board of Directors scheduled June 14, 2016.

17
Permanent Position Allocation by Department and Job Class

Permanent Position Allocationby Department and Job Class
Exhibit C
Page | 1
Department Defined Title
FY 16/17 Recomm
Total
FY 16/17 Supp
16/17 Totals with
Supp
16/17 Hearing Actions
Final AdoptedFY 16/17 Notes
AGRICULTURAL COMMISSIONERAGRICULTURAL COMMISSIONER OFFICE ASSISTANT II 0.80 0.80 0.80AGRICULTURAL COMMISSIONER SENIOR OFFICE ASSISTANT 1.00 1.00 1.00AGRICULTURAL COMMISSIONER EXECUTIVE SECRETARY 0.00 0.00 0.00AGRICULTURAL COMMISSIONER RECEPTIONIST 1.00 1.00 1.00AGRICULTURAL COMMISSIONER ACCOUNT CLERK II 0.75 0.75 0.75AGRICULTURAL COMMISSIONER SENIOR ACCOUNT CLERK 1.00 1.00 1.00AGRICULTURAL COMMISSIONER ADMINISTRATIVE AIDE 1.00 1.00 1.00AGRICULTURAL COMMISSIONER DEPARTMENT ANALYST 1.00 1.00 1.00AGRICULTURAL COMMISSIONER ADMINISTRATIVE SERVICES OFFICER I 1.00 1.00 1.00AGRICULTURAL COMMISSIONER ENVIRONMENTAL SPECIALIST 1.00 1.00 1.00AGRICULTURAL COMMISSIONER ENGINEERING TECHNICIAN IV 1.00 1.00 1.00AGRICULTURAL COMMISSIONER SENIOR ENGINEER 1.00 1.00 1.00
AGRICULTURAL COMMISSIONERAGRICULTURAL BIOLOGIST-STANDARD SPECIALIST III 6.75 6.75 6.75
AGRICULTURAL COMMISSIONERSENIOR AGRICULTURAL BIOLOGIST-STANDARD SPECIALIST 3.00 3.00 3.00
AGRICULTURAL COMMISSIONER DEPUTY AGRICULTURAL COMMISSION 3.00 3.00 3.00
AGRICULTURAL COMMISSIONERCHIEF DEPUTY AGRICULTURAL COMMISSIONER 1.00 1.00 1.00
AGRICULTURAL COMMISSIONERASSISTANT AGRICULTURAL COMMISSIONER 1.00 1.00 1.00
AGRICULTURAL COMMISSIONER AGRICULTURAL COMMISSIONER-SEALER 1.00 1.00 1.00AGRICULTURAL COMMISSIONER WILDLIFE SPECIALIST 1.00 1.00 1.00
SEALER OF WEIGHTS & MEASURES CHIEF DEPUTY SEALER 1.00 1.00 1.00
SEALER OF WEIGHTS & MEASURESAGRICULTURAL BIOLOGIST-STANDARD SPECIALIST III 4.00 -0.05 3.95 3.95 .05 Deleted 12+ vacant
SEALER OF WEIGHTS & MEASURESSENIOR AGRICULTURAL BIOLOGIST-STANDARD SPECIALIST 1.00 1.00 1.00
10-AGC Total 33.30 -0.05 33.25 0.00 33.25
AUDITOR-CONTROLLER
AUDITOR-CONTROLLERDEPARTMENT INFORMATION SYSTEMS MANAGER 1.00 1.00 1.00
AUDITOR-CONTROLLER ACCOUNT CLERK II 1.00 1.00 1.00AUDITOR-CONTROLLER SENIOR ACCOUNT CLERK 4.00 4.00 4.00AUDITOR-CONTROLLER ACCOUNTING ASSISTANT 5.00 5.00 5.00AUDITOR-CONTROLLER ACCOUNTANT II 2.00 2.00 2.00AUDITOR-CONTROLLER ACCOUNTANT III 2.00 2.00 2.00
AUDITOR-CONTROLLER SUPERVISING ACCOUNTANT 3.00 3.00 3.00Time Limited Ends 6/30/17 (06)
AUDITOR-CONTROLLER ACCOUNTANT-AUDITOR II 5.00 5.00 5.00Time Limited Ends 6/30/17 (17)
AUDITOR-CONTROLLERACCOUNTING MANAGER AUDITOR CONTROLLER'S OFFICE 2.00 2.00 2.00
Time Limited Ends 6/30/17 (03)
AUDITOR-CONTROLLER ASSISTANT AUDITOR-CONTROLLER 1.00 1.00 2.00 2.00

Permanent Position Allocationby Department and Job Class
Exhibit C
Page | 2
AUDITOR-CONTROLLER DEPARTMENT ANALYST 1.00 1.00 1.00Time Limited Ends 6/30/17 (04)
AUDITOR-CONTROLLER SENIOR ACCOUNT CLERK 1.00 1.00 1.00AUDITOR-CONTROLLER ACCOUNTING TECHNICIAN 1.00 1.00 1.00AUDITOR-CONTROLLER ACCOUNTING ASSISTANT 2.00 2.00 2.00AUDITOR-CONTROLLER ACCOUNTANT II 6.00 6.00 6.00AUDITOR-CONTROLLER SUPERVISING ACCOUNTANT 2.00 2.00 2.00AUDITOR-CONTROLLER ACCOUNTANT-AUDITOR II 1.00 1.00 1.00
AUDITOR-CONTROLLERACCOUNTING MANAGER AUDITOR CONTROLLER'S OFFICE 1.00 1.00 1.00
ACTTC-TAX COLLECTOR ACCOUNTING TECHNICIAN 1.00 1.00 1.00ACTTC-TAX COLLECTOR ACCOUNTING ASSISTANT 1.00 1.00 1.00ACTTC-TAX COLLECTOR ACCOUNTANT II 2.00 2.00 2.00ACTTC-TAX COLLECTOR ACCOUNTANT-AUDITOR II 1.00 1.00 1.00
ACTTC-TAX COLLECTORACCOUNTING MANAGER AUDITOR CONTROLLER'S OFFICE 1.00 1.00 1.00
AUDITOR-CONTROLLERDEPARTMENT INFORMATION SYSTEMS COORDINATOR 1.00 1.00 1.00
AUDITOR-CONTROLLERPAYROLL MANAGER AUDITOR CONTROLLER'S OFFICE 0.00 0.00 0.00
AUDITOR-CONTROLLER ACCOUNTANT-AUDITOR II 1.00 1.00 1.00
AUDITOR-CONTROLLERACCOUNTING MANAGER AUDITOR CONTROLLER'S OFFICE 1.00 1.00 1.00
AUDITOR-CONTROLLERDEPT INFO SYSTEMS SPECIALIST II CONFIDENTIAL 2.00 2.00 2.00
AUDITOR-CONTROLLERAUDITORS PAYROLL TECHNICIAN CONFIDENTIAL 6.00 6.00 6.00
AUDITOR-CONTROLLER ACCOUNTANT II CONFIDENTIAL 0.00 0.00 0.00ACTTC-TREASURY ACCOUNTING TECHNICIAN 1.00 1.00 1.00ACTTC-TREASURY ACCOUNTANT-AUDITOR II 1.00 1.00 1.00ACTTC-TREASURY TREASURY MANAGER 1.00 1.00 1.00
ACTTC-TREASURY ASSISTANT TREASURER-TAX COLLECTOR 1.00 -1.00 0.00 0.00ACTTC-TAX COLLECTOR ACCOUNT CLERK II 3.00 3.00 3.00ACTTC-TAX COLLECTOR SENIOR ACCOUNT CLERK 5.00 5.00 5.00ACTTC-TAX COLLECTOR ACCOUNTING TECHNICIAN 1.00 1.00 1.00ACTTC-TAX COLLECTOR ACCOUNTING ASSISTANT 1.00 1.00 1.00ACTTC-TAX COLLECTOR ACCOUNTANT-AUDITOR II 1.00 1.00 1.00ACTTC-TAX COLLECTOR TAX COLLECTION MANAGER 1.00 1.00 1.00ACTTC-TREASURY SENIOR ACCOUNT CLERK 2.00 2.00 2.00ACTTC-TREASURY ACCOUNTANT-AUDITOR II 1.00 1.00 1.00ACTTC-TREASURY INVESTMENT AND DEBT OFFICER 1.00 1.00 1.00ACTTC-TREASURY ADMINISTRATIVE AIDE 1.00 1.00 1.00ACTTC-TREASURY ADMINISTRATIVE AIDE CONFIDENTIAL 1.00 1.00 1.00ACTTC-TREASURY DEPARTMENT ANALYST 1.00 1.00 1.00AUDITOR-CONTROLLER SUPERVISING ACCOUNTANT 1.00 1.00 1.00AUDITOR-CONTROLLER ACCOUNTANT-AUDITOR II 5.00 5.00 5.00AUDITOR-CONTROLLER AUDIT MANAGER 1.00 1.00 1.00ACTTC-ADMINISTRATION ADMINISTRATIVE AIDE CONFIDENTIAL 1.00 1.00 1.00ACTTC-ADMINISTRATION DEPARTMENT ANALYST 2.00 2.00 2.00ACTTC-ADMINISTRATION ADMINISTRATIVE SERVICES OFFICER I 1.00 1.00 1.00
ACTTC-ADMINISTRATIONAUDITOR CONTROLLER-TREASURER-TAX COLLECTOR 1.00 1.00 1.00

Permanent Position Allocationby Department and Job Class
Exhibit C
Page | 3
11-AUD Total 93.00 0.00 93.00 0.00 93.00
DEPT CHILD SUPPORT SERVICESDCSS-CHILD SUPPORT LEGAL SECRETARY II 1.00 1.00 1.00DCSS-CHILD SUPPORT LEGAL PROCESSOR II 10.00 10.00 10.00DCSS-CHILD SUPPORT SENIOR LEGAL PROCESSOR 10.00 10.00 10.00
DCSS-CHILD SUPPORTDEPARTMENT INFORMATION SYSTEMS SPECIALIST II 2.00 2.00 2.00
DCSS-CHILD SUPPORT PAYROLL CLERK 1.00 1.00 1.00DCSS-CHILD SUPPORT ACCOUNT CLERK II 1.00 1.00 1.00DCSS-CHILD SUPPORT CHILD SUPPORT FINANCIAL WORKER II 5.00 5.00 5.00
DCSS-CHILD SUPPORTSENIOR CHILD SUPPORT FINANCIAL WORKER 1.00 1.00 1.00
DCSS-CHILD SUPPORT CHILD SUPPORT OFFICER II 32.00 32.00 32.00DCSS-CHILD SUPPORT CHILD SUPPORT OFFICER III 13.50 13.50 13.50DCSS-CHILD SUPPORT CHILD SUPPORT SERVICES SUPERVISOR 9.00 9.00 9.00DCSS-CHILD SUPPORT ADMINISTRATIVE SERVICES OFFICER II 1.00 1.00 1.00
DCSS-CHILD SUPPORTASSISTANT DIRECTOR CHILD SUPPORT SERVICES 1.00 1.00 1.00
DCSS-CHILD SUPPORT DIRECTOR OF CHILD SUPPORT SERVICES 1.00 1.00 1.00
DCSS-CHILD SUPPORTPROGRAM PLANNING AND EVALUATION ANALYST 1.00 1.00 1.00
DCSS-CHILD SUPPORT HUMAN SERVICES SECTION MANAGER 2.00 2.00 2.00DCSS-CHILD SUPPORT CHILD SUPPORT ATTORNEY IV 4.00 4.00 4.00
DCSS-CHILD SUPPORTEXECUTIVE LEGAL SECRETARY CONFIDENTIAL 1.00 1.00 1.00
12-DCS Total 96.50 0.00 96.50 0.00 96.50
CLERK-RECORDER-ASSESSORRECORDER OPERATIONS FUND RECEPTIONIST 1.00 1.00 1.00RECORDER OPERATIONS FUND MICROGRAPHIC TECHNICIAN II 4.00 -1.00 3.00 3.00 1.0 Deleted vacant 12+
RECORDER OPERATIONS FUND SUPERVISING MICROGRAPHIC TECHNICIAN 1.00 1.00 1.00RECORDER OPERATIONS FUND DOCUMENT RECORDER II 7.00 7.00 7.00RECORDER OPERATIONS FUND DOCUMENT RECORDER III 1.00 1.00 1.00
RECORDER OPERATIONS FUNDCHIEF DEPUTY COUNTY CLERK-RECORDER 1.00 1.00 1.00
CRA-CLERK OP FND LEGAL PROCESSOR II 3.00 3.00 3.00CRA-CLERK OP FND SENIOR LEGAL PROCESSOR 1.00 1.00 1.00CRA-CLERK OP FND LEGAL STAFF SUPERVISOR 1.00 1.00 1.00
ASSESSORDEPARTMENT INFORMATION SYSTEMS SPECIALIST II 2.75 2.75 2.75
ASSESSOR ASSESSMENT CLERK 10.00 10.00 10.00ASSESSOR ASSESSMENT PROCESS SPECIALIST 9.00 9.00 9.00ASSESSOR ASSESSMENT PROCESS SUPERVISOR 2.00 2.00 2.00
ASSESSORASSESSORS CHANGE OF OWNERSHIP SUPERVISOR 1.00 1.00 1.00
ASSESSOR ASSESSMENT PROCESS MANAGER 1.00 1.00 1.00ASSESSOR AUDITOR-APPRAISER II 6.00 6.00 6.00ASSESSOR SUPERVISING AUDITOR-APPRAISER 1.00 1.00 1.00ASSESSOR APPRAISER AIDE 4.00 4.00 4.00ASSESSOR APPRAISER III 19.00 19.00 19.00

Permanent Position Allocationby Department and Job Class
Exhibit C
Page | 4
ASSESSOR APPRAISER IV 4.00 4.00 4.00ASSESSOR CHIEF APPRAISER 1.00 1.00 1.00ASSESSOR CHIEF OF ASSESSMENT STANDARDS 1.00 1.00 1.00ASSESSOR CHIEF DEPUTY ASSESSOR 1.00 1.00 1.00ASSESSOR CADASTRAL MAPPING TECHNICIAN II 3.00 3.00 3.00ASSESSOR CADASTRAL MAPPING SUPERVISOR 1.00 1.00 1.00
ADMINISTRATIVE SERVICESDEPARTMENT INFORMATION SYSTEMS MANAGER 1.00 1.00 1.00
ADMINISTRATIVE SERVICES ACCOUNT CLERK II 1.00 1.00 1.00ADMINISTRATIVE SERVICES ACCOUNTANT II 1.00 1.00 1.00ADMINISTRATIVE SERVICES DEPARTMENT ACCOUNTING MANAGER 0.00 0.00 0.00ADMINISTRATIVE SERVICES DEPARTMENT ANALYST 0.00 0.00 0.00ADMINISTRATIVE SERVICES ADMINISTRATIVE SERVICES OFFICER I 2.00 2.00 2.00ADMINISTRATIVE SERVICES EXECUTIVE SECRETARY CONFIDENTIAL 1.00 1.00 1.00ADMINISTRATIVE SERVICES ACCOUNTANT II CONFIDENTIAL 1.00 1.00 1.00ADMINISTRATIVE SERVICES COUNTY CLERK-RECORDER-ASSESSOR 1.00 1.00 1.00
REGISTRAR OF VOTERS-ELECTIONS CHIEF DEPUTY REGISTRAR OF VOTERS 1.00 1.00 1.00
REGISTRAR OF VOTERS-ELECTIONSDEPARTMENT INFORMATION SYSTEMS SPECIALIST II 1.00 1.00 1.00
REGISTRAR OF VOTERS-ELECTIONSDEPARTMENT INFORMATION SYSTEMS COORDINATOR 1.00 1.00 1.00
REGISTRAR OF VOTERS-ELECTIONS ELECTION SPECIALIST II 5.00 5.00 5.00
REGISTRAR OF VOTERS-ELECTIONS SENIOR ELECTION SPECIALIST 3.00 3.00 3.00
REGISTRAR OF VOTERS-ELECTIONS ELECTION SERVICES SUPERVISOR 0.00 0.00 0.00
REGISTRAR OF VOTERS-ELECTIONS STOREKEEPER 1.00 1.00 1.00
REGISTRAR OF VOTERS-ELECTIONS ADMINISTRATIVE AIDE 1.00 1.00 1.00
REGISTRAR OF VOTERS-ELECTIONS PROGRAM DEVELOPMENT MANAGER 1.00 1.00 1.0013-CRA Total 108.75 -1.00 107.75 0.00 107.75
COMMUNITY DEVELOPMENTCOMMUNITY DEVELOPMENT OFFICE ASSISTANT II 4.00 4.00 4.00COMMUNITY DEVELOPMENT SENIOR OFFICE ASSISTANT 1.00 1.00 1.00COMMUNITY DEVELOPMENT SENIOR OFFICE SUPPORT SUPERVISOR 1.00 1.00 1.00
COMMUNITY DEVELOPMENT ACCOUNT CLERK II 2.00 2.00 2.00
Extend 1.0 Time Limited end date to 6/30/2018 (03)
COMMUNITY DEVELOPMENT ACCOUNTING TECHNICIAN 2.00 2.00 2.00COMMUNITY DEVELOPMENT ACCOUNTANT II 1.00 1.00 1.00COMMUNITY DEVELOPMENT SUPERVISING ACCOUNTANT 1.00 1.00 1.00COMMUNITY DEVELOPMENT ADMINISTRATIVE SERVICES OFFICER I 1.00 1.00 1.00
COMMUNITY DEVELOPMENT SPECIAL PROJECTS DIRECTOR PROJECT 1.00 1.00 1.00Project ends 4/27/2020 (01)
COMMUNITY DEVELOPMENT EXECUTIVE SECRETARY CONFIDENTIAL 1.00 1.00 1.00
COMMUNITY DEVELOPMENTEXECUTIVE DIRECTOR SONOMA COUNTY CDC 1.00 1.00 1.00
COMMUNITY DEVELOPMENT HOUSING REHABILITATION SPECIAL 3.00 3.00 3.00

Permanent Position Allocationby Department and Job Class
Exhibit C
Page | 5
COMMUNITY DEVELOPMENTAFFORDABLE HOUSING ASSISTANT MANAGER 1.00 1.00 1.00
COMMUNITY DEVELOPMENTCOMMUNITY DEVELOPMENT ASSISTANT MANAGER 1.00 1.00 1.00
COMMUNITY DEVELOPMENT ASSISTANT EXECUTIVE DIRECTOR CDC 2.00 2.00 2.00COMMUNITY DEVELOPMENT EMPLOYMENT HOUSING COUNSELOR 1.00 1.00 1.00
COMMUNITY DEVELOPMENT COMMUNITY DEVELOPMENT ASSOCIATE 7.00 7.00 7.00
Extend 1.0 Time Limited end date to 6/30/2018 (05, 06)
COMMUNITY DEVELOPMENTSUPERVISING COMMUNITY DEVELOPMENT SPECIALIST 1.00 1.00 1.00
COMMUNITY DEVELOPMENTSENIOR COMMUNITY DEVELOPMENT SPECIALIST 4.00 4.00 4.00
COMMUNITY DEVELOPMENT COMMUNITY DEVELOPMENT SPEC II 7.00 7.00 7.0014-CDC Total 43.00 0.00 43.00 0.00 43.00
BOARD OF SUPERVISORSBOARD OF SUPERVISORS DISTRICT ONE BOARD OF SUPERVISORS AIDE 1.00 1.00 1.00BOARD OF SUPERVISORS DISTRICT ONE
BOARD OF SUPERVISORS STAFF ASSISTANT 1.00 1.00 1.00
BOARD OF SUPERVISORS DISTRICT ONE SUPERVISOR 1.00 1.00 1.00BOARD OF SUPERVISORS DISTRICT TWO BOARD OF SUPERVISORS AIDE 1.00 1.00 1.00BOARD OF SUPERVISORS DISTRICT TWO
BOARD OF SUPERVISORS STAFF ASSISTANT 1.00 1.00 1.00
BOARD OF SUPERVISORS DISTRICT TWO SUPERVISOR 1.00 1.00 1.00BOARD OF SUPERVISORS DISTRICT THREE BOARD OF SUPERVISORS AIDE 1.00 1.00 1.00BOARD OF SUPERVISORS DISTRICT THREE
BOARD OF SUPERVISORS STAFF ASSISTANT 1.00 1.00 1.00
BOARD OF SUPERVISORS DISTRICT THREE SUPERVISOR 1.00 1.00 1.00BOARD OF SUPERVISORS DISTRICT FOUR BOARD OF SUPERVISORS AIDE 1.00 1.00 1.00BOARD OF SUPERVISORS DISTRICT FOUR
BOARD OF SUPERVISORS STAFF ASSISTANT 1.00 1.00 1.00
BOARD OF SUPERVISORS DISTRICT FOUR SUPERVISOR 1.00 1.00 1.00BOARD OF SUPERVISORS DISTRICT FIVE BOARD OF SUPERVISORS AIDE 1.00 1.00 1.00BOARD OF SUPERVISORS DISTRICT FIVE
BOARD OF SUPERVISORS STAFF ASSISTANT 1.00 1.00 1.00
BOARD OF SUPERVISORS DISTRICT FIVE SUPERVISOR 1.00 1.00 1.00BOARD OF SUPERVISORS CHIEF DEPUTY CLERK OF THE BOARD 1.00 1.00 1.00BOARD OF SUPERVISORS ADMINISTRATIVE AIDE 2.00 2.00 2.00
BOARD OF SUPERVISORS SENIOR OFFICE ASSISTANT CONFIDENTIAL 1.00 1.00 1.00BOARD OF SUPERVISORS SECRETARY CONFIDENTIAL 2.00 2.00 2.0015-BOS Total 21.00 0.00 21.00 0.00 21.00
COUNTY ADMINISTRATOR

Permanent Position Allocationby Department and Job Class
Exhibit C
Page | 6
COUNTY ADMINISTRATOR ASSISTTO THE COUNTY ADMINISTRATOR 1.00 1.00 1.00COUNTY ADMINISTRATOR ADMINISTRATIVE AIDE 0.00 0.00 0.00COUNTY ADMINISTRATOR ADMINISTRATIVE AIDE CONFIDENTIAL 3.00 3.00 3.00COUNTY ADMINISTRATOR DEPUTY COUNTY ADMINISTRATOR 3.00 3.00 3.00COUNTY ADMINISTRATOR ADMINISTRATIVE ANALYST III 7.00 7.00 7.00COUNTY ADMINISTRATOR PRINCIPAL ADMINISTRATIVE ANALYST 3.00 3.00 3.00COUNTY ADMINISTRATOR ASSISTANT COUNTY ADMINISTRATOR 1.00 1.00 1.00COUNTY ADMINISTRATOR COUNTY ADMINISTRATOR 1.00 1.00 1.00LAFCO ADMINISTRATIVE AIDE 0.75 0.75 0.75LAFCO ADMINISTRATIVE ANALYST III 0.80 0.80 0.80LAFCO LAFCO EXECUTIVE OFFICER 1.00 1.00 1.0015-CAO Total 21.55 0.00 21.55 0.00 21.55
COUNTY COUNSEL
COUNTY COUNSEL ADMINISTRATIVE AIDE CONFIDENTIAL 1.00 1.00 1.00Time Limited Ends 6/30/17 (01)
COUNTY COUNSEL ADMINISTRATIVE SERVICES OFFICER I 1.00 1.00 1.00COUNTY COUNSEL CHIEF DEPUTY COUNTY COUNSEL 4.00 4.00 4.00COUNTY COUNSEL ASSISTANT COUNTY COUNSEL 1.00 1.00 1.00COUNTY COUNSEL DEPUTY COUNTY COUNSEL IV 23.25 23.25 23.25COUNTY COUNSEL COUNTY COUNSEL 1.00 1.00 1.00COUNTY COUNSEL LEGAL ASSISTANT CONFIDENTIAL 7.00 7.00 7.00
COUNTY COUNSEL LEGAL SECRETARY II CONFIDENTIAL 2.00 2.00 2.00Time Limited Ends 6/30/17 (01)
COUNTY COUNSEL RECEPTIONIST CONFIDENTIAL 1.00 1.00 1.00
COUNTY COUNSEL ACCOUNTING TECHNICIAN CONFIDENTIAL 1.00 1.00 1.0017-CNS Total 42.25 0.00 42.25 0.00 42.25
DISTRICT ATTORNEY
DISTRICT ATTORNEYDEPARTMENT INFORMATION SYSTEMS SPECIALIST II 1.00 1.00 1.00
DISTRICT ATTORNEY DEPARTMENT ANALYST 1.00 1.00 1.00DISTRICT ATTORNEY ADMINISTRATIVE SERVICES OFFICER II 1.00 1.00 1.00DISTRICT ATTORNEY CHIEF DEPUTY DISTRICT ATTORNEY 5.00 5.00 5.00
DISTRICT ATTORNEYASSISTANT DISTRICT ATTORNEY LIMITED TERM 1.00 1.00 1.00
DISTRICT ATTORNEYEXECUTIVE LEGAL SECRETARY CONFIDENTIAL 1.00 1.00 1.00
DISTRICT ATTORNEY SENIOR ACCOUNT CLERK CONFIDENTIAL 1.00 1.00 1.00
DISTRICT ATTORNEY ACCOUNTING TECHNICIAN CONFIDENTIAL 1.00 1.00 1.00DISTRICT ATTORNEY DISTRICT ATTORNEY 1.00 1.00 1.00DISTRICT ATTORNEY DEPUTY DISTRICT ATTORNEY IV 41.00 41.00 41.00DISTRICT ATTORNEY DEPUTY DISTRICT ATTORNEY IV 4.00 4.00 4.00DISTRICT ATTORNEY LEGAL ASSISTANT 1.00 1.00 1.00DISTRICT ATTORNEY LEGAL SECRETARY II 1.00 1.00 1.00DISTRICT ATTORNEY LEGAL ASSISTANT 1.00 1.00 1.00DISTRICT ATTORNEY SECRETARY 0.75 0.75 0.75DISTRICT ATTORNEY DISTRICT ATTORNEY INVESTIGATOR II 12.00 12.00 12.00
DISTRICT ATTORNEYSENIOR DISTRICT ATTORNEY INVESTIGATOR 1.00 1.00 1.00

Permanent Position Allocationby Department and Job Class
Exhibit C
Page | 7
DISTRICT ATTORNEY CHIEF CRIMINAL INVESTIGATOR 1.00 1.00 1.00DISTRICT ATTORNEY DEPUTY DISTRICT ATTORNEY IV 0.00 0.00 0.00DISTRICT ATTORNEY LEGAL SECRETARY II 1.00 1.00 1.00DISTRICT ATTORNEY LEGAL ASSISTANT 1.00 1.00 1.00DISTRICT ATTORNEY LEGAL SECRETARY II 4.00 4.00 4.00DISTRICT ATTORNEY SECRETARY 1.00 1.00 1.00DISTRICT ATTORNEY LEGAL PROCESSOR II 17.00 17.00 17.00DISTRICT ATTORNEY SENIOR LEGAL PROCESSOR 2.00 2.00 2.00DISTRICT ATTORNEY ADMINISTRATIVE AIDE 1.00 1.00 1.00DISTRICT ATTORNEY LEGAL STAFF SUPERVISOR 2.00 2.00 2.00DISTRICT ATTORNEY DEPARTMENT ANALYST 2.00 2.00 2.00DA-VICTIM WITNESS LEGAL ASSISTANT 1.00 1.00 1.00DA-VICTIM WITNESS LEGAL PROCESSOR II 2.00 2.00 2.00DA-VICTIM WITNESS VICTIM CLAIMS SPECIALIST II 2.00 2.00 2.00DA-VICTIM WITNESS VICTIM CLAIMS SUPERVISOR 1.00 1.00 1.00DA-VICTIM WITNESS DEPARTMENT PROGRAM MANAGER 1.00 1.00 1.00DA-VICTIM WITNESS SENIOR VICTIM WITNESS ADVOCATE 1.00 1.00 1.00DA-VICTIM WITNESS VICTIM WITNESS ADVOCATE II 8.00 8.00 8.00DISTRICT ATTORNEY ADMINISTRATIVE AIDE 1.00 1.00 1.00DISTRICT ATTORNEY BUSINESS DEVELOPMENT MANAGER 1.00 1.00 1.0018-DAO Total 124.75 0.00 124.75 0.00 124.75
ECONOMIC DEVELOPMENT
ECONOMIC DEVELOPMENT BOARDEXECUTIVE DIRECTOR ECONOMIC DEVELOPMENT BOARD 1.00 1.00 1.00
ECONOMIC DEVELOPMENT BOARD ADMINISTRATIVE AIDE 3.75 3.75 3.75
Extend 1.0 Time Limited end date to 6/30/2017 (06)
ECONOMIC DEVELOPMENT BOARD BUSINESS DEVELOPMENT MANAGER 1.00 1.00 1.00
ECONOMIC DEVELOPMENT BOARD DEPARTMENT PROGRAM MANAGER 5.75 5.75 5.75
Extend 1.0 Time Limited end date to 6/30/2017 (06)
19-EDB Total 11.50 0.00 11.50 0.00 11.50
EMERGENCY PLANNING & FIRE
EMERGENCY PLANNINGDEPUTY EMERGENCY SERVICES COORDINATOR 2.00 2.00 2.00
EMERGENCY PLANNING EMERGENCY SERVICES COORDINATOR 1.00 1.00 1.00
EMERGENCY PLANNING SPECIAL PROJECTS DIRECTOR PROJECT 1.00 1.00 1.00 Project ends 2/11/18EMERGENCY PLANNING DEPARTMENT PROGRAM MANAGER 1.00 1.00 1.00EMERGENCY PLANNING MAINTENANCE WORKER II 1.50 1.50 1.50F S HAZARDOUS MATERIALS SENIOR OFFICE ASSISTANT 0.50 0.50 0.50F S HAZARDOUS MATERIALS FIRE SERVICES OFFICER 1.00 1.00 1.00F S HAZARDOUS MATERIALS FIRE INSPECTOR II 4.00 4.00 4.00FIRE ADMINISTRATION SENIOR OFFICE ASSISTANT 1.00 1.00 1.00FIRE ADMINISTRATION SENIOR ACCOUNT CLERK 1.00 1.00 1.00FIRE ADMINISTRATION ADMINISTRATIVE AIDE 1.75 1.75 1.75FIRE ADMINISTRATION ADMINISTRATIVE SERVICES OFFICER I 1.00 1.00 1.00FIRE OPERATIONS MATERIALS HANDLER 1.00 1.00 1.00FIRE OPERATIONS SENIOR FIRE INSPECTOR 1.00 1.00 1.00FIRE OPERATIONS ASSISTANT FIRE CHIEF 1.00 1.00 1.00

Permanent Position Allocationby Department and Job Class
Exhibit C
Page | 8
FIRE MANAGEMENTDIRECTOR OF FIRE AND EMERGENCY SERVICES 1.00 1.00 1.00
FIRE PREVENTION DIVISION SENIOR FIRE INSPECTOR 1.00 1.00 1.00FIRE PREVENTION DIVISION ASSISTANT FIRE CHIEF 1.00 1.00 1.00FIRE PREVENTION DIVISION FIRE INSPECTOR II 2.00 2.00 2.0020-ESO Total 24.75 0.00 24.75 0.00 24.75
GENERAL SERVICESGENERAL SERVICES-ADMINISTRATIO SECRETARY 0.50 0.50 0.50GENERAL SERVICES-ADMINISTRATIO ADMINISTRATIVE SERVICES OFFICER II 1.00 1.00 1.00GENERAL SERVICES-ADMINISTRATIO GENERAL SERVICES DEPUTY DIRECTOR 1.00 1.00 1.00GENERAL SERVICES-ADMINISTRATIO GENERAL SERVICES DIRECTOR 1.00 1.00 1.00GENERAL SERVICES-ADMINISTRATIO EXECUTIVE SECRETARY CONFIDENTIAL 1.00 1.00 1.00GENERAL SERVICES-ACCOUNTING ACCOUNT CLERK II 2.00 2.00 2.00GENERAL SERVICES-ACCOUNTING SENIOR ACCOUNT CLERK 1.00 1.00 1.00GENERAL SERVICES-ACCOUNTING ACCOUNTING TECHNICIAN 1.00 1.00 1.00GENERAL SERVICES-ACCOUNTING SUPERVISING ACCOUNTANT 1.00 1.00 1.00GENERAL SERVICES-ACCOUNTING PAYROLL CLERK CONFIDENTIAL 1.00 1.00 1.00ARCHITECT SENIOR OFFICE ASSISTANT 3.00 3.00 3.00ARCHITECT BUSINESS SYSTEMS ANALYST 1.00 1.00 1.00ARCHITECT ADMINISTRATIVE AIDE 2.00 2.00 2.00ARCHITECT GENERAL SERVICES DEPUTY DIRECTOR 1.00 1.00 1.00ARCHITECT ASSISTANT PROJECT SPECIALIST 1.00 1.00 1.00 Project ends 4/30/20ARCHITECT PROJECT SPECIALIST 4.00 4.00 4.00ARCHITECT SENIOR PROJECT SPECIALIST 3.00 3.00 3.00ARCHITECT CAPITAL PROJECT MANAGER 2.00 2.00 2.00ARCHITECT SENIOR CAPITAL PROJECT MANAGER 2.00 2.00 2.00REAL PROPERTY MANAGEMENT SECRETARY 0.50 0.50 0.50REAL PROPERTY MANAGEMENT REAL ESTATE MANAGER 1.00 1.00 1.00REAL PROPERTY MANAGEMENT DEPARTMENT ANALYST 2.00 2.00 2.00FACILITIES OPERATIONS OFFICE ASSISTANT II 1.00 1.00 1.00FACILITIES OPERATIONS ADMINISTRATIVE AIDE 2.00 2.00 2.00FACILITIES OPERATIONS DEPARTMENT ANALYST 1.00 1.00 1.00FACILITIES OPERATIONS PROJECT SPECIALIST 2.00 2.00 2.00FACILITIES OPERATIONS JANITORIAL SERVICES SUPERVISOR 1.00 1.00 1.00FACILITIES OPERATIONS BUILDING MECHANIC II 28.00 28.00 28.00FACILITIES OPERATIONS ASSISTANT BUILDING SUPERINTENDENT 3.00 3.00 3.00FACILITIES OPERATIONS ASSISTANT FACILITY MANAGER 1.00 1.00 1.00PURCHASING AGENT SENIOR OFFICE ASSISTANT 1.00 1.00 1.00
PURCHASING AGENT BUYER 5.00 5.00 5.00Time Limited Ends 6/30/17 (04, 05)
PURCHASING AGENT ASSISTANT PURCHASING AGENT 2.00 2.00 2.00Time Limited Ends 6/30/17 (03)
PURCHASING AGENT PURCHASING AGENT 1.00 1.00 1.00PURCHASING AGENT DEPARTMENT ANALYST 1.00 1.00 1.00
VETERANS/COMMUNITY BUILDINGS EVENT SERVICES WORKER 0.50 0.50 0.50

Permanent Position Allocationby Department and Job Class
Exhibit C
Page | 9
VETERANS/COMMUNITY BUILDINGS EVENTS SERVICES SUPERVISOR 1.00 1.00 1.00GENERAL SERVICE ENERGY DIV SENIOR OFFICE ASSISTANT 3.00 3.00 3.00GENERAL SERVICE ENERGY DIV ADMINISTRATIVE AIDE 4.00 4.00 4.00GENERAL SERVICE ENERGY DIV DEPARTMENT ANALYST 4.00 4.00 4.00GENERAL SERVICE ENERGY DIV DEPARTMENT PROGRAM MANAGER 2.00 2.00 2.00
GENERAL SERVICE ENERGY DIVENERGY & SUSTAINABILITY PROGRAM MANAGER 1.00 1.00 1.00
FLEET OPERATIONS SENIOR OFFICE ASSISTANT 3.00 3.00 3.00FLEET OPERATIONS DEPARTMENT ANALYST 1.00 1.00 1.00FLEET OPERATIONS ASSISTANT FLEET MANAGER 1.00 1.00 1.00FLEET OPERATIONS FLEET MANAGER 1.00 1.00 1.00FLEET OPERATIONS MOTOR POOL ATTENDANT 1.00 1.00 1.00FLEET OPERATIONS AUTOMOTIVE TECHNICIAN 6.00 6.00 6.00
FLEET OPERATIONS AUTO FLEET MAINTENANCE SUPERVISOR 1.00 1.00 1.00FLEET OPERATIONS WELDER 1.00 1.00 1.00FLEET OPERATIONS HEAVY EQUIPMENT MECHANIC II 7.00 7.00 7.00
FLEET OPERATIONSHEAVY EQUIPMENT FLEET MAINTENANCE SUPERVISOR 1.00 1.00 1.00
21-GSO Total 120.50 0.00 120.50 0.00 120.50
HEALTH SERVICES DEPTHEALTH SVCS ADMINISTRATION SENIOR OFFICE ASSISTANT 3.00 3.00 3.00HEALTH SVCS ADMINISTRATION SECRETARY 1.00 1.00 1.00HEALTH SVCS ADMINISTRATION RECEPTIONIST 1.00 1.00 1.00HEALTH SVCS ADMINISTRATION SYSTEMS SOFTWARE ANALYST 1.00 1.00 1.00
HEALTH SVCS ADMINISTRATIONDEPARTMENT INFORMATION SYSTEMS SPECIALIST II 7.00 1.00 8.00 8.00
Extend Time Limited to 6/30/18 (09)
HEALTH SVCS ADMINISTRATIONDEPARTMENT INFORMATION SYSTEMS MANAGER 1.00 1.00 1.00
HEALTH SVCS ADMINISTRATION STOREKEEPER 2.00 2.00 2.00HEALTH SVCS ADMINISTRATION PAYROLL CLERK 3.00 3.00 3.00HEALTH SVCS ADMINISTRATION ACCOUNT CLERK II 3.00 3.00 3.00HEALTH SVCS ADMINISTRATION SENIOR ACCOUNT CLERK 4.50 4.50 4.50HEALTH SVCS ADMINISTRATION ACCOUNTING TECHNICIAN 4.00 4.00 4.00HEALTH SVCS ADMINISTRATION ACCOUNTANT II 10.00 10.00 10.00HEALTH SVCS ADMINISTRATION ACCOUNTANT III 2.00 2.00 2.00HEALTH SVCS ADMINISTRATION SUPERVISING ACCOUNTANT 2.00 2.00 2.00HEALTH SVCS ADMINISTRATION DEPARTMENT ACCOUNTING MANAGER 1.00 1.00 1.00HEALTH SVCS ADMINISTRATION ADMINISTRATIVE AIDE 5.00 5.00 5.00HEALTH SVCS ADMINISTRATION DEPARTMENT ANALYST 7.00 7.00 7.00HEALTH SVCS ADMINISTRATION ADMINISTRATIVE SERVICES OFFICER I 2.00 2.00 2.00HEALTH SVCS ADMINISTRATION ADMINISTRATIVE SERVICES OFFICER II 2.00 2.00 2.00
HEALTH SVCS ADMINISTRATIONDEPARTMENT ADMINISTRATIVE SERVICES DIRECTOR 1.00 1.00 1.00
HEALTH SVCS ADMINISTRATIONCOMPLIANCE AND DEPARTMENT RISK MANAGER 1.00 1.00 1.00
HEALTH SVCS ADMINISTRATION SPECIAL PROJECTS DIRECTOR PROJECT 1.00 1.00 1.00Project ends 4/27/2020 (01)
HEALTH SVCS ADMINISTRATION BUSINESS DEVELOPMENT MANAGER 1.00 1.00 1.00
HEALTH SVCS ADMINISTRATIONPROGRAM PLANNING AND EVALUATION ANALYST 1.00 1.00 1.00

Permanent Position Allocationby Department and Job Class
Exhibit C
Page | 10
HEALTH SVCS ADMINISTRATION PATIENT CARE ANALYST 1.00 1.00 1.00HEALTH SVCS ADMINISTRATION HEALTH OFFICER 1.00 1.00 1.00
HEALTH SVCS ADMINISTRATIONASSISTANT DIRECTOR OF HEALTH SERVICES 1.00 1.00 1.00
HEALTH SVCS ADMINISTRATION DIRECTOR OF HEALTH SERVICES 1.00 1.00 1.00HEALTH SVCS ADMINISTRATION SECRETARY CONFIDENTIAL 1.00 1.00 1.00HEALTH SVCS ADMINISTRATION EXECUTIVE SECRETARY CONFIDENTIAL 1.00 1.00 1.00PH PROGRAM SUPPORT SENIOR OFFICE ASSISTANT 1.00 1.00 1.00PH PROGRAM SUPPORT VITAL STATISTICS TECHNICIAN 3.00 3.00 3.00PH PROGRAM SUPPORT ADMINISTRATIVE AIDE 1.00 1.00 1.00PH PROGRAM SUPPORT DEPARTMENT ANALYST 1.00 1.00 1.00PH PROGRAM SUPPORT ADMINISTRATIVE SERVICES OFFICER I 1.00 1.00 1.00PH PROGRAM SUPPORT ADMINISTRATIVE SERVICES OFFICER II 1.00 1.00 1.00
PH PROGRAM SUPPORTPROGRAM PLANNING AND EVALUATION ANALYST 1.00 1.00 1.00
PH PROGRAM SUPPORT HEALTH SERVICES DIVISION DIRECTOR 1.00 1.00 1.00PH PROGRAM SUPPORT HEALTH PROGRAM MANAGER 0.80 0.80 0.80PH ENVIRONMENTAL HEALTH OFFICE ASSISTANT II 1.00 1.00 1.00PH ENVIRONMENTAL HEALTH SENIOR OFFICE ASSISTANT 2.00 2.00 2.00PH ENVIRONMENTAL HEALTH SECRETARY 1.00 1.00 1.00PH ENVIRONMENTAL HEALTH ACCOUNT CLERK II 0.50 0.50 0.50PH ENVIRONMENTAL HEALTH SENIOR ACCOUNT CLERK 1.00 1.00 1.00PH ENVIRONMENTAL HEALTH ADMINISTRATIVE AIDE 1.00 1.00 1.00PH ENVIRONMENTAL HEALTH DEPARTMENT ANALYST 0.00 0.00 0.00PH ENVIRONMENTAL HEALTH ENVIRONMENTAL HEALTH TECHNICIAN 1.00 1.00 1.00PH ENVIRONMENTAL HEALTH ENVIRONMENTAL HEALTH SPECIALIST II 0.72 0.72 0.72
PH ENVIRONMENTAL HEALTHSENIOR ENVIRONMENTAL HEALTH SPECIALIST 1.26 1.26 1.26
PH ENVIRONMENTAL HEALTHSUPERVISING ENVIRONMENTAL HEALTH SPECIALIST 0.69 0.69 0.69
PH ENVIRONMENTAL HEALTHENVIRONMENTAL HEALTH PROGRAM MANAGER 1.00 1.00 1.00
PH ENVIRONMENTAL HEALTHENVIRONMENTAL HEALTH AND SAFETY SECTION MANAGER 1.00 1.00 1.00
PH MCH SENIOR OFFICE ASSISTANT 3.00 3.00 3.00PH MCH ADMINISTRATIVE AIDE 1.00 1.00 1.00
PH MCHPROGRAM PLANNING AND EVALUATION ANALYST 1.00 1.00 1.00
PH MCH PUBLIC HEALTH NURSE II 19.35 19.35 19.35PH MCH SENIOR PUBLIC HEALTH NURSE 8.00 8.00 8.00PH MCH SUPERVISING PUBLIC HEALTH NURSE 5.00 5.00 5.00PH MCH FAMILY HEALTH SECTION MANAGER 0.90 0.90 0.90PH MCH HEALTH INFORMATION SPECIALIST II 1.00 1.00 1.00PH MCH HEALTH PROGRAM MANAGER 2.00 2.00 2.00PH MCH SOCIAL SERVICE WORKER III 5.00 5.00 5.00PH MCH SOCIAL SERVICE SUPERVISOR I 1.00 1.00 1.00PH MCH PUBLIC HEALTH ASSISTANT 1.80 1.80 1.80PH WIC SENIOR OFFICE ASSISTANT 1.00 1.00 1.00PH WIC NUTRITIONIST 3.50 3.50 3.50PH WIC SUPERVISING NUTRITIONIST 1.00 1.00 1.00PH WIC FAMILY HEALTH SECTION MANAGER 0.10 0.10 0.10PH WIC SENIOR LACTATION CONSULTANT 0.90 0.90 0.90PH WIC HEALTH PROGRAM MANAGER 1.00 1.00 1.00

Permanent Position Allocationby Department and Job Class
Exhibit C
Page | 11
PH WIC PUBLIC HEALTH AIDE II 5.60 5.60 5.60PH WIC PUBLIC HEALTH ASSISTANT 4.00 4.00 4.00PH-CHILDRENS MEDICAL SVC OFFICE ASSISTANT II 1.00 1.00 1.00PH-CHILDRENS MEDICAL SVC SENIOR OFFICE ASSISTANT 3.80 3.80 3.80PH-CHILDRENS MEDICAL SVC SECRETARY 1.00 1.00 1.00PH-CHILDRENS MEDICAL SVC SENIOR ACCOUNT CLERK 1.50 1.50 1.50PH-CHILDRENS MEDICAL SVC MEDICAL SECRETARY 0.75 0.75 0.75PH-CHILDRENS MEDICAL SVC MEDICAL RECORD CLERK III 1.00 1.00 1.00
PH-CHILDRENS MEDICAL SVCOCCUP THERAPIST II CHILD THERAPY PROGRAM 5.00 5.00 5.00
PH-CHILDRENS MEDICAL SVCPHYS THERAPIST II CHILD THERAPY PROGRAM 5.35 5.35 5.35
PH-CHILDRENS MEDICAL SVCCHIEF THERAPIST CHILDREN'S THERAPY PROGRAM 1.00 1.00 1.00
PH-CHILDRENS MEDICAL SVC PUBLIC HEALTH PHYSICIAN 0.70 0.70 0.70PH-CHILDRENS MEDICAL SVC PUBLIC HEALTH NURSE II 6.75 6.75 6.75PH-CHILDRENS MEDICAL SVC SENIOR PUBLIC HEALTH NURSE 3.00 3.00 3.00PH-CHILDRENS MEDICAL SVC SUPERVISING PUBLIC HEALTH NURSE 2.00 2.00 2.00PH-CHILDRENS MEDICAL SVC FAMILY HEALTH SECTION MANAGER 0.00 0.00 0.00PH-CHILDRENS MEDICAL SVC HEALTH PROGRAM MANAGER 1.00 1.00 1.00PH-CHILDRENS MEDICAL SVC HEALTH SERVICES SECTION MANAGER 1.00 1.00 1.00PH-CHILDRENS MEDICAL SVC SOCIAL SERVICE WORKER II 2.00 2.00 2.00PH-CHILDRENS MEDICAL SVC SOCIAL SERVICE WORKER IV 1.00 1.00 1.00PH-CHILDRENS MEDICAL SVC SOCIAL SERVICE SUPERVISOR I 1.00 1.00 1.00PH-CHILDRENS MEDICAL SVC PUBLIC HEALTH AIDE II 1.50 1.50 1.50PH-CHILDRENS MEDICAL SVC PUBLIC HEALTH ASSISTANT 3.00 3.00 3.00ANIMAL CARE & CONTROL ACCOUNT CLERK II 5.50 5.50 5.50ANIMAL CARE & CONTROL ADMINISTRATIVE AIDE 1.00 1.00 1.00ANIMAL CARE & CONTROL ADMINISTRATIVE SERVICES OFFICER I 0.00 0.00 0.00
ANIMAL CARE & CONTROLPROGRAM PLANNING AND EVALUATION ANALYST 1.00 1.00 1.00
ANIMAL CARE & CONTROL HEALTH PROGRAM MANAGER 1.00 1.00 1.00ANIMAL CARE & CONTROL ANIMAL CONTROL OFFICER II 13.00 13.00 13.00ANIMAL CARE & CONTROL ANIMAL HEALTH TECHNICIAN 5.50 5.50 5.50ANIMAL CARE & CONTROL ANIMAL CARE ASSISTANT 6.00 6.00 6.00
ANIMAL CARE & CONTROL SUPERVISING ANIMAL CONTROL OFFICER 3.00 3.00 3.00ANIMAL CARE & CONTROL LEAD ANIMAL CARE ASSISTANT 1.00 1.00 1.00ANIMAL CARE & CONTROL ANIMAL CARE AND CONTROL DIRECTOR 1.00 1.00 1.00PH DISEASE CONTROL & SURV SENIOR OFFICE ASSISTANT 0.87 0.87 0.87PH DISEASE CONTROL & SURV ADMINISTRATIVE AIDE 1.50 1.50 1.50
PH DISEASE CONTROL & SURVPROGRAM PLANNING AND EVALUATION ANALYST 1.00 1.00 1.00
PH DISEASE CONTROL & SURV PUBLIC HEALTH NURSE II 4.90 4.90 4.90PH DISEASE CONTROL & SURV SENIOR PUBLIC HEALTH NURSE 1.00 1.00 1.00PH DISEASE CONTROL & SURV SUPERVISING PUBLIC HEALTH NURSE 1.00 1.00 1.00PH DISEASE CONTROL & SURV PUBLIC HEALTH INVESTIGATOR 1.00 1.00 1.00PH DISEASE CONTROL & SURV DEPUTY PUBLIC HEALTH OFFICER 1.00 1.00 1.00PH SPECIAL CLINICAL SERVICES ACCOUNT CLERK II 0.00 0.00 0.00PH SPECIAL CLINICAL SERVICES CLINIC CLERK 1.00 1.00 1.00
PH SPECIAL CLINICAL SERVICESNURSE PRACTITIONER-PHYSICIAN'S ASSISTANT 1.25 1.25 1.25
PH SPECIAL CLINICAL SERVICES STAFF NURSE II 4.20 4.20 4.20

Permanent Position Allocationby Department and Job Class
Exhibit C
Page | 12
PH SPECIAL CLINICAL SERVICES BEHAVIORAL HEALTH CLINICIAN 2.50 2.50 2.50PH SPECIAL CLINICAL SERVICES FORENSIC PSYCHIATRIST 0.50 0.50 0.50PH SPECIAL CLINICAL SERVICES HEALTH PROGRAM MANAGER 1.00 1.00 1.00PH EMS ADMINISTRATIVE AIDE 0.50 0.50 0.50PH EMS PSYCHIATRIC NURSE 0.50 -0.50 0.00 0.00PH EMS HEALTH PROGRAM MANAGER 0.20 0.20 0.20
PH EMSEMERGENCY MEDICAL SERVICES COORDINATOR 3.00 3.00 3.00
PH EMS ADVANCED LIFE SUPPORT COORDINATOR 0.00 1.00 1.00 1.00
PH EMSREGIONAL EMERGENCY MEDICAL SERVICES MANAGER 1.00 1.00 1.00
PH CLINICAL LAB SENIOR OFFICE ASSISTANT 1.00 1.00 1.00PH CLINICAL LAB SENIOR ACCOUNT CLERK 0.00 0.00 0.00
PH CLINICAL LABPUBLIC HEALTH LABORATORY TECHNICIAN II 3.00 3.00 3.00
PH CLINICAL LAB PUBLIC HEALTH MICROBIOLOGIST II 2.50 2.50 2.50
PH CLINICAL LAB PUBLIC HEALTH LABORATORY DIRECTOR 1.00 1.00 1.00PH PREPAREDNESS ADMINISTRATIVE AIDE 1.00 1.00 1.00PH PREPAREDNESS DEPARTMENT ANALYST 1.00 1.00 1.00
PH PREPAREDNESSPROGRAM PLANNING AND EVALUATION ANALYST 1.00 1.00 1.00
PH PREPAREDNESS PUBLIC HEALTH MICROBIOLOGIST II 1.50 1.50 1.50CHILDREN & FAMILIES FIRST SENIOR OFFICE ASSISTANT 1.00 1.00 1.00CHILDREN & FAMILIES FIRST ADMINISTRATIVE AIDE 1.00 1.00 1.00
CHILDREN & FAMILIES FIRSTPROGRAM PLANNING AND EVALUATION ANALYST 1.00 1.00 1.00
CHILDREN & FAMILIES FIRST HEALTH INFORMATION SPECIALIST II 3.00 3.00 3.00CHILDREN & FAMILIES FIRST HEALTH PROGRAM MANAGER 1.00 1.00 1.00CHILDREN & FAMILIES FIRST FIRST 5 SECTION MANAGER 1.00 1.00 1.00PH-FEE STABILIZATION FUND ADMINISTRATIVE AIDE 0.00 0.00 0.00PH-FEE STABILIZATION FUND ENVIRONMENTAL HEALTH SPECIALIST II 8.78 8.78 8.78
PH-FEE STABILIZATION FUNDSENIOR ENVIRONMENTAL HEALTH SPECIALIST 5.74 5.74 5.74
PH-FEE STABILIZATION FUNDSUPERVISING ENVIRONMENTAL HEALTH SPECIALIST 2.31 2.31 2.31
PH-FEE STABILIZATION FUND DAIRY INSPECTOR 2.00 2.00 2.00MH PROGRAM SUPPORT SENIOR OFFICE ASSISTANT 1.00 1.00 1.00MH PROGRAM SUPPORT SECRETARY 1.00 1.00 1.00MH PROGRAM SUPPORT ACCOUNT CLERK II 3.00 3.00 3.00MH PROGRAM SUPPORT SENIOR ACCOUNT CLERK 2.50 2.50 2.50MH PROGRAM SUPPORT ACCOUNTING TECHNICIAN 2.00 2.00 2.00MH PROGRAM SUPPORT ADMINISTRATIVE AIDE 1.00 1.00 1.00MH PROGRAM SUPPORT DEPARTMENT ANALYST 1.75 1.75 1.75MH PROGRAM SUPPORT ADMINISTRATIVE SERVICES OFFICER I 1.00 1.00 1.00MH PROGRAM SUPPORT ADMINISTRATIVE SERVICES OFFICER II 0.50 0.50 0.50MH PROGRAM SUPPORT MEDICAL RECORD CLERK III 1.00 1.00 1.00MH PROGRAM SUPPORT PATIENT CARE ANALYST 5.00 5.00 5.00
MH PROGRAM SUPPORTBEHAVIORAL HEALTH CLINICAL SPECIALIST 1.00 1.00 1.00
MH PROGRAM SUPPORT BEHAVIORAL HEALTH MEDICAL DIRECTOR 0.55 0.55 0.55MH PROGRAM SUPPORT HEALTH SERVICES SECTION MANAGER 0.50 0.50 0.50

Permanent Position Allocationby Department and Job Class
Exhibit C
Page | 13
MH PSYCH EMERGENCY SVCS SENIOR OFFICE ASSISTANT 4.00 2.00 6.00 6.00MH PSYCH EMERGENCY SVCS ELIGIBILITY WORKER II 1.00 1.00 1.00MH PSYCH EMERGENCY SVCS MEDICAL UNIT CLERK 1.00 1.00 1.00
MH PSYCH EMERGENCY SVCSNURSE PRACTITIONER-PHYSICIAN'S ASSISTANT 1.60 2.50 4.10 4.10
MH PSYCH EMERGENCY SVCS LICENSED VOCATIONAL NURSE II 1.00 7.50 8.50 8.50MH PSYCH EMERGENCY SVCS CLIENT CARE MANAGER 2.00 1.00 3.00 3.00MH PSYCH EMERGENCY SVCS PSYCHIATRIC TECHNICIAN 1.50 4.50 6.00 6.00MH PSYCH EMERGENCY SVCS PSYCHIATRIC NURSE 5.40 1.00 6.40 6.40MH PSYCH EMERGENCY SVCS SENIOR CLIENT SUPPORT SPECIALIST 2.00 2.00 2.00MH PSYCH EMERGENCY SVCS BEHAVIORAL HEALTH CLINICIAN 19.78 14.50 34.28 34.28
MH PSYCH EMERGENCY SVCSBEHAVIORAL HEALTH CLINICAL SPECIALIST 1.00 1.00 2.00 2.00
MH PSYCH EMERGENCY SVCS ACUTE FORENSICS SECTION MANAGER 1.00 1.00 1.00MH PSYCH EMERGENCY SVCS STAFF PSYCHIATRIST 1.35 0.25 1.60 1.60MH PSYCH EMERGENCY SVCS FORENSIC PSYCHIATRIST 1.35 1.35 1.35MH YOUTH & FAMILY SERVICES SENIOR OFFICE ASSISTANT 2.00 2.00 2.00MH YOUTH & FAMILY SERVICES RECEPTIONIST 1.00 1.00 1.00
MH YOUTH & FAMILY SERVICESNURSE PRACTITIONER-PHYSICIAN'S ASSISTANT 0.00 0.00 0.00
MH YOUTH & FAMILY SERVICES SENIOR CLIENT SUPPORT SPECIALIST 0.00 0.00 0.00MH YOUTH & FAMILY SERVICES BEHAVIORAL HEALTH CLINICIAN 22.15 22.15 22.15MH YOUTH & FAMILY SERVICES CLINICAL PSYCHOLOGIST 0.00 1.00 1.00 1.00
MH YOUTH & FAMILY SERVICESADULT YOUTH AND FAMILY SERVICES SECTION MANAGER 1.00 1.00 1.00
MH YOUTH & FAMILY SERVICES STAFF PSYCHIATRIST 1.90 1.90 1.90MH YOUTH & FAMILY SERVICES FORENSIC PSYCHIATRIST 0.58 0.58 0.58MH YOUTH & FAMILY SERVICES HEALTH PROGRAM MANAGER 3.00 3.00 3.00MH YOUTH & FAMILY SERVICES AODS COUNSELOR II 1.75 1.75 1.75MENTAL HEALTH SERVICES ACT SENIOR OFFICE ASSISTANT 11.00 11.00 11.00MENTAL HEALTH SERVICES ACT SECRETARY 2.00 2.00 2.00MENTAL HEALTH SERVICES ACT RECEPTIONIST 1.00 1.00 1.00MENTAL HEALTH SERVICES ACT ELIGIBILITY WORKER II 2.00 2.00 2.00MENTAL HEALTH SERVICES ACT ELIGIBILITY WORKER III 1.00 1.00 1.00MENTAL HEALTH SERVICES ACT ADMINISTRATIVE AIDE 1.00 1.00 1.00MENTAL HEALTH SERVICES ACT DEPARTMENT ANALYST 1.25 1.25 1.25MENTAL HEALTH SERVICES ACT ADMINISTRATIVE SERVICES OFFICER II 0.50 0.50 0.50
MENTAL HEALTH SERVICES ACTPROGRAM PLANNING AND EVALUATION ANALYST 1.00 1.00 1.00
MENTAL HEALTH SERVICES ACTNURSE PRACTITIONER-PHYSICIAN'S ASSISTANT 0.00 0.00 0.00
MENTAL HEALTH SERVICES ACT SUPERVISING STAFF NURSE 1.00 1.00 1.00MENTAL HEALTH SERVICES ACT CLIENT CARE MANAGER 1.00 1.00 1.00MENTAL HEALTH SERVICES ACT PSYCHIATRIC NURSE 9.60 9.60 9.60MENTAL HEALTH SERVICES ACT PATIENT CARE ANALYST 1.00 1.00 1.00MENTAL HEALTH SERVICES ACT CLIENT SUPPORT SPECIALIST 1.50 1.50 1.50MENTAL HEALTH SERVICES ACT SENIOR CLIENT SUPPORT SPECIALIST 18.00 18.00 18.00MENTAL HEALTH SERVICES ACT BEHAVIORAL HEALTH CLINICIAN 40.40 40.40 40.40
MENTAL HEALTH SERVICES ACTBEHAVIORAL HEALTH CLINICAL SPECIALIST 7.00 7.00 7.00
MENTAL HEALTH SERVICES ACTCOMMUNITY MENTAL HEALTH SECTION MANAGER 1.00 1.00 1.00
MENTAL HEALTH SERVICES ACT STAFF PSYCHIATRIST 4.70 4.70 4.70

Permanent Position Allocationby Department and Job Class
Exhibit C
Page | 14
MENTAL HEALTH SERVICES ACT FORENSIC PSYCHIATRIST 0.00 0.00 0.00
MENTAL HEALTH SERVICES ACT BEHAVIORAL HEALTH MEDICAL DIRECTOR 0.45 0.45 0.45MENTAL HEALTH SERVICES ACT HEALTH SERVICES DIVISION DIRECTOR 1.00 1.00 1.00MENTAL HEALTH SERVICES ACT HEALTH PROGRAM MANAGER 7.00 7.00 7.00MENTAL HEALTH SERVICES ACT HEALTH SERVICES SECTION MANAGER 0.50 0.50 0.50MENTAL HEALTH SERVICES ACT AODS COUNSELOR II 2.00 2.00 2.00MENTAL HEALTH SERVICES ACT AODS SPECIALIST 1.00 1.00 1.00SUBSTANCE USE DISORDERS SENIOR OFFICE ASSISTANT 2.00 2.00 2.00SUBSTANCE USE DISORDERS SENIOR ACCOUNT CLERK 0.00 0.00 0.00SUBSTANCE USE DISORDERS ADMINISTRATIVE AIDE 1.00 1.00 1.00SUBSTANCE USE DISORDERS BEHAVIORAL HEALTH CLINICIAN 1.50 1.50 1.50SUBSTANCE USE DISORDERS HEALTH PROGRAM MANAGER 0.30 0.30 0.30SUBSTANCE USE DISORDERS AODS ASSISTANT II 1.00 1.00 1.00SUBSTANCE USE DISORDERS AODS ASSISTANT III 1.00 1.00 1.00SUBSTANCE USE DISORDERS AODS COUNSELOR II 8.29 8.29 8.29SUBSTANCE USE DISORDERS AODS SPECIALIST 5.00 5.00 5.00
SUBSTANCE USE DISORDERSSubstance Use Disorder & Comm Recvry Svcs Sect Mgr 1.00 1.00 1.00
AODS-DUI PROGRAM OFFICE ASSISTANT II 2.00 2.00 2.00AODS-DUI PROGRAM SENIOR OFFICE ASSISTANT 1.00 1.00 1.00AODS-DUI PROGRAM ACCOUNT CLERK II 1.00 1.00 1.00AODS-DUI PROGRAM AODS INTAKE INTERVIEWER 2.00 2.00 2.00AODS-DUI PROGRAM HEALTH PROGRAM MANAGER 0.70 0.70 0.70AODS-DUI PROGRAM AODS COUNSELOR II 6.13 6.13 6.13AODS-DUI PROGRAM AODS SPECIALIST 1.00 1.00 1.00HEALTH POLICY, PLANNING & EVALUATION PROG SUPPORT OFFICE ASSISTANT II 1.00 1.00 1.00HEALTH POLICY, PLANNING & EVALUATION PROG SUPPORT SENIOR OFFICE ASSISTANT 1.00 1.00 1.00HEALTH POLICY, PLANNING & EVALUATION PROG SUPPORT ADMINISTRATIVE AIDE 1.50 1.50 1.50HEALTH POLICY, PLANNING & EVALUATION PROG SUPPORT DEPARTMENT ANALYST 1.00 1.00 1.00HEALTH POLICY, PLANNING & EVALUATION PROG SUPPORT ADMINISTRATIVE SERVICES OFFICER I 1.00 1.00 1.00HEALTH POLICY, PLANNING & EVALUATION PROG SUPPORT
PROGRAM PLANNING AND EVALUATION ANALYST 5.00 5.00 5.00
HEALTH POLICY, PLANNING & EVALUATION PROG SUPPORT BIOSTATISTICIAN 2.00 2.00 2.00HEALTH POLICY, PLANNING & EVALUATION PROG SUPPORT HEALTH INFORMATION SPECIALIST II 0.00 0.00 0.00HEALTH POLICY, PLANNING & EVALUATION PROG SUPPORT HEALTH PROGRAM MANAGER 1.00 1.00 1.00HEALTH POLICY, PLANNING & EVALUATION PROG SUPPORT HEALTH SERVICES SECTION MANAGER 0.00 0.00 0.00HEALTH POLICY, PLANNING & EVALUATION PROG SUPPORT
DIRECTOR OF HEALTH PROGRAM PLANNING AND EVALUATION 1.00 1.00 1.00
HEALTH SERVICES - HEALTHY COMMUNITIES SENIOR OFFICE ASSISTANT 1.00 1.00 1.00HEALTH SERVICES - HEALTHY COMMUNITIES
PROGRAM PLANNING AND EVALUATION ANALYST 2.00 2.00 2.00
HEALTH SERVICES - HEALTHY COMMUNITIES HEALTH INFORMATION SPECIALIST II 9.00 9.00 9.00

Permanent Position Allocationby Department and Job Class
Exhibit C
Page | 15
HEALTH SERVICES - HEALTHY COMMUNITIES HEALTH PROGRAM MANAGER 2.00 2.00 2.00HEALTH SERVICES - HEALTHY COMMUNITIES SENIOR HEALTH INFORMATION SPECIALIST 1.00 1.00 1.00HEALTH SERVICES - HEALTHY COMMUNITIES
HEALTHY COMMUNITIES SECTION MANAGER 1.00 1.00 1.00
POLICY, STRATEGY & EVALUATION SENIOR OFFICE ASSISTANT 1.00 1.00 1.00POLICY, STRATEGY & EVALUATION ADMINISTRATIVE AIDE 0.50 0.50 0.50
POLICY, STRATEGY & EVALUATIONPROGRAM PLANNING AND EVALUATION ANALYST 1.00 1.00 1.00
POLICY, STRATEGY & EVALUATION BIOSTATISTICIAN 2.00 2.00 2.00
POLICY, STRATEGY & EVALUATION HEALTH INFORMATION SPECIALIST II 0.00 0.00 0.00 0.00Time Limited Expires 6/30/18 (01)
POLICY, STRATEGY & EVALUATION HEALTH PROGRAM MANAGER 3.00 3.00 3.00
POLICY, STRATEGY & EVALUATION SENIOR HEALTH INFORMATION SPECIALIST 1.00 1.00 1.0022-DHS Total 600.70 36.75 637.45 0.00 637.45
HUMAN RESOURCES
ADMINISTRATIONASSISTANT HUMAN RESOURCES DIRECTOR 1.00 1.00 1.00
ADMINISTRATION DIRECTOR HUMAN RESOURCES 1.00 1.00 1.00ADMINISTRATION ADMINISTRATIVE SERVICES OFFICER I 1.00 1.00 1.00
ADMINISTRATION SENIOR OFFICE ASSISTANT CONFIDENTIAL 1.00 1.00 1.00ADMINISTRATION SECRETARY CONFIDENTIAL 1.00 1.00 1.00ADMINISTRATION EXECUTIVE SECRETARY CONFIDENTIAL 1.00 1.00 1.00
ADMINISTRATIONHUMAN RESOURCES TECHNICIAN CONFIDENTIAL 2.00 2.00 2.00
RECRUITMENT HUMAN RESOURCES ANALYST III PROJECT 0.50 0.50 0.50 Project Ends 4/30/20RECRUITMENT HUMAN RESOURCES ANALYST III 6.00 6.00 6.00
RECRUITMENTSUPERVISING HUMAN RESOURCES ANALYST 2.00 2.00 2.00
RECRUITMENTRECRUITMENT & CLASSIFICATION MANAGER 1.00 1.00 1.00
RECRUITMENT DEPARTMENT ANALYST 1.00 1.00 1.00
RECRUITMENTHUMAN RESOURCES TECHNICIAN CONFIDENTIAL 3.00 3.00 3.00
TRAINING HUMAN RESOURCES ANALYST III 1.00 1.00 1.00TRAINING TRAINING MANAGER 1.00 1.00 1.00
TRAINING SENIOR OFFICE ASSISTANT CONFIDENTIAL 1.00 1.00 1.00
HRMSDEPARTMENT INFORMATION SYSTEMS MANAGER 1.00 1.00 1.00
HRMSDEPT INFO SYSTEMS SPECIALIST II CONFIDENTIAL 2.00 2.00 2.00
LABOR RELATIONS HUMAN RESOURCES ANALYST III 3.00 3.00 3.00LABOR RELATIONS EMPLOYEE RELATIONS MANAGER 1.00 1.00 1.00
LABOR RELATIONSHUMAN RESOURCES TECHNICIAN CONFIDENTIAL 1.00 1.00 1.00
HUMAN RESOURCES - ADA COMPLIANCE HUMAN RESOURCES ANALYST III 1.00 1.00 1.00SELF FUNDED INS PROG ADMIN ACCOUNTANT III 1.00 1.00 1.00SELF FUNDED INS PROG ADMIN RISK MANAGER 1.00 1.00 1.00

Permanent Position Allocationby Department and Job Class
Exhibit C
Page | 16
SELF FUNDED INS PROG ADMIN RISK MANAGEMENT ANALYST II 10.00 10.00 10.00SELF FUNDED INS PROG ADMIN RISK MANAGEMENT ANALYST III 5.00 5.00 5.00
SELF FUNDED INS PROG ADMINEQUAL EMPLOYMENT OPPORTUNITY MANAGER 1.00 1.00 1.00
SELF FUNDED INS PROG ADMIN ADMINISTRATIVE AIDE CONFIDENTIAL 1.00 1.00 1.00SELF FUNDED INS PROG ADMIN DEPARTMENT ANALYST 1.00 1.00 1.00
SELF FUNDED INS PROG ADMIN SENIOR OFFICE ASSISTANT CONFIDENTIAL 3.50 3.50 3.50
SELF FUNDED INS PROG ADMIN SENIOR ACCOUNT CLERK CONFIDENTIAL 1.00 1.00 1.00
SELF FUNDED INS PROG ADMINHUMAN RESOURCES TECHNICIAN CONFIDENTIAL 3.00 3.00 3.00
23-HRD Total 61.00 0.00 61.00 0.00 61.00
HUMAN SERVICES OFFICE OF DIRECTOR ASSISTANT DIRECTOR HUMAN SERVICES 1.00 1.00 1.00OFFICE OF DIRECTOR DIRECTOR OF HUMAN SERVICES 1.00 1.00 1.00OFFICE OF DIRECTOR EXECUTIVE SECRETARY CONFIDENTIAL 1.00 1.00 1.00HR/ORG DEVE ADMINISTRATIVE SERVICES OFFICER I 2.00 2.00 2.00HR/ORG DEVE SENIOR OFFICE ASSISTANT 1.00 1.00 1.00HR/ORG DEVE PAYROLL CLERK 2.00 2.00 2.00HR/ORG DEVE ADMINISTRATIVE AIDE 2.00 2.00 2.00HR/ORG DEVE ADMINISTRATIVE AIDE CONFIDENTIAL 1.00 1.00 1.00HR/ORG DEVE ADMINISTRATIVE SERVICES OFFICER I 1.00 1.00 1.00HR/ORG DEVE ADMINISTRATIVE SERVICES OFFICER II 1.00 1.00 1.00HR/ORG DEVE PROGRAM DEVELOPMENT MANAGER 1.00 1.00 1.00HR/ORG DEVE PAYROLL CLERK CONFIDENTIAL 2.00 2.00 2.00HR/ORG DEVE ELIGIBILITY WORKER III 0.00 0.00 0.00HR/ORG DEVE PROGRAM SPECIALIST 3.00 3.00 3.00HR/ORG DEVE SENIOR OFFICE ASSISTANT 2.00 2.00 2.00HR/ORG DEVE SENIOR OFFICE ASSISTANT 1.00 1.00 1.00
HR/ORG DEVEPROGRAM PLANNING AND EVALUATION ANALYST 5.00 5.00 5.00
INFORM TECH OFFICE SUPPORT SUPERVISOR 1.00 1.00 1.00
INFORM TECHSUPERVISING PUBLIC ASSISTANCE SYSTEMS TECHNICIAN 1.00 1.00 1.00
INFORM TECHPUBLIC ASSISTANCE SYSTEMS TECHNICIAN 4.00 4.00 4.00
INFORM TECH OFFICE SUPPORT SUPERVISOR 1.00 1.00 1.00INFORM TECH MICROGRAPHIC TECHNICIAN I 6.00 6.00 6.00INFORM TECH MICROGRAPHIC TECHNICIAN II 4.00 4.00 4.00
INFORM TECHDEPARTMENT INFORMATION SYSTEMS TECHNICIAN II 1.00 1.00 1.00
INFORM TECHDEPARTMENT INFORMATION SYSTEMS SPECIALIST II 6.00 6.00 6.00
INFORM TECHDEPARTMENT INFORMATION SYSTEMS MANAGER 3.00 3.00 3.00
INFORM TECHSENIOR DEPARTMENT INFORMATION SYSTEMS MANAGER 1.00 1.00 1.00
INFORM TECH HUMAN SERVICES NETWORK ANALYST 3.00 3.00 3.00
INFORM TECHHUMAN SERVICES SYSTEMS & PROGRAMMING ANALYST 7.00 7.00 7.00
INFORM TECH COMPUTER LAB SUPPORT SPECIALST 0.00 0.00 0.00
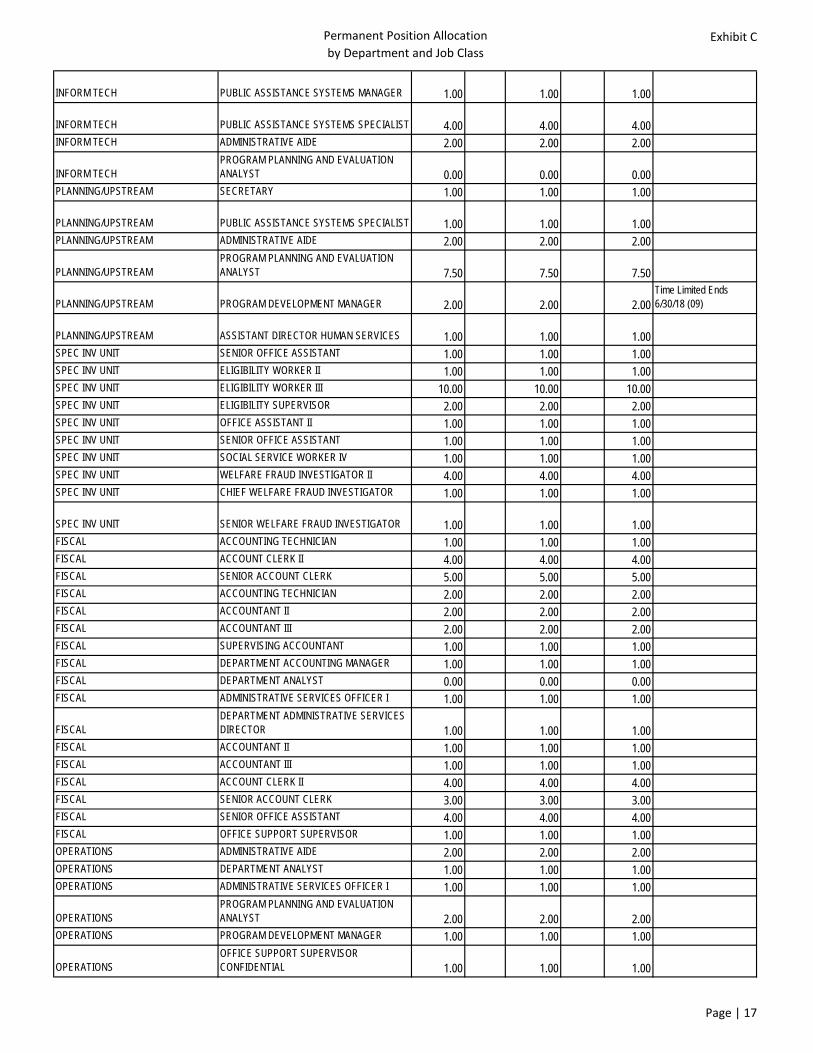
Permanent Position Allocationby Department and Job Class
Exhibit C
Page | 17
INFORM TECH PUBLIC ASSISTANCE SYSTEMS MANAGER 1.00 1.00 1.00
INFORM TECH PUBLIC ASSISTANCE SYSTEMS SPECIALIST 4.00 4.00 4.00INFORM TECH ADMINISTRATIVE AIDE 2.00 2.00 2.00
INFORM TECHPROGRAM PLANNING AND EVALUATION ANALYST 0.00 0.00 0.00
PLANNING/UPSTREAM SECRETARY 1.00 1.00 1.00
PLANNING/UPSTREAM PUBLIC ASSISTANCE SYSTEMS SPECIALIST 1.00 1.00 1.00PLANNING/UPSTREAM ADMINISTRATIVE AIDE 2.00 2.00 2.00
PLANNING/UPSTREAMPROGRAM PLANNING AND EVALUATION ANALYST 7.50 7.50 7.50
PLANNING/UPSTREAM PROGRAM DEVELOPMENT MANAGER 2.00 2.00 2.00Time Limited Ends 6/30/18 (09)
PLANNING/UPSTREAM ASSISTANT DIRECTOR HUMAN SERVICES 1.00 1.00 1.00SPEC INV UNIT SENIOR OFFICE ASSISTANT 1.00 1.00 1.00SPEC INV UNIT ELIGIBILITY WORKER II 1.00 1.00 1.00SPEC INV UNIT ELIGIBILITY WORKER III 10.00 10.00 10.00SPEC INV UNIT ELIGIBILITY SUPERVISOR 2.00 2.00 2.00SPEC INV UNIT OFFICE ASSISTANT II 1.00 1.00 1.00SPEC INV UNIT SENIOR OFFICE ASSISTANT 1.00 1.00 1.00SPEC INV UNIT SOCIAL SERVICE WORKER IV 1.00 1.00 1.00SPEC INV UNIT WELFARE FRAUD INVESTIGATOR II 4.00 4.00 4.00SPEC INV UNIT CHIEF WELFARE FRAUD INVESTIGATOR 1.00 1.00 1.00
SPEC INV UNIT SENIOR WELFARE FRAUD INVESTIGATOR 1.00 1.00 1.00FISCAL ACCOUNTING TECHNICIAN 1.00 1.00 1.00FISCAL ACCOUNT CLERK II 4.00 4.00 4.00FISCAL SENIOR ACCOUNT CLERK 5.00 5.00 5.00FISCAL ACCOUNTING TECHNICIAN 2.00 2.00 2.00FISCAL ACCOUNTANT II 2.00 2.00 2.00FISCAL ACCOUNTANT III 2.00 2.00 2.00FISCAL SUPERVISING ACCOUNTANT 1.00 1.00 1.00FISCAL DEPARTMENT ACCOUNTING MANAGER 1.00 1.00 1.00FISCAL DEPARTMENT ANALYST 0.00 0.00 0.00FISCAL ADMINISTRATIVE SERVICES OFFICER I 1.00 1.00 1.00
FISCALDEPARTMENT ADMINISTRATIVE SERVICES DIRECTOR 1.00 1.00 1.00
FISCAL ACCOUNTANT II 1.00 1.00 1.00FISCAL ACCOUNTANT III 1.00 1.00 1.00FISCAL ACCOUNT CLERK II 4.00 4.00 4.00FISCAL SENIOR ACCOUNT CLERK 3.00 3.00 3.00FISCAL SENIOR OFFICE ASSISTANT 4.00 4.00 4.00FISCAL OFFICE SUPPORT SUPERVISOR 1.00 1.00 1.00OPERATIONS ADMINISTRATIVE AIDE 2.00 2.00 2.00OPERATIONS DEPARTMENT ANALYST 1.00 1.00 1.00OPERATIONS ADMINISTRATIVE SERVICES OFFICER I 1.00 1.00 1.00
OPERATIONSPROGRAM PLANNING AND EVALUATION ANALYST 2.00 2.00 2.00
OPERATIONS PROGRAM DEVELOPMENT MANAGER 1.00 1.00 1.00
OPERATIONSOFFICE SUPPORT SUPERVISOR CONFIDENTIAL 1.00 1.00 1.00

Permanent Position Allocationby Department and Job Class
Exhibit C
Page | 18
OPERATIONS SENIOR OFFICE ASSISTANT 3.00 3.00 3.00OPERATIONS STOREKEEPER 1.00 1.00 1.00OPERATIONS SENIOR STOREKEEPER 1.00 1.00 1.00ECONOMIC ASSISTANCE SECRETARY 1.00 1.00 1.00ECONOMIC ASSISTANCE ADMINISTRATIVE AIDE 3.00 3.00 3.00ECONOMIC ASSISTANCE ADMINISTRATIVE SERVICES OFFICER I 1.00 1.00 1.00
ECONOMIC ASSISTANCEPROGRAM PLANNING AND EVALUATION ANALYST 5.00 5.00 5.00
ECONOMIC ASSISTANCE PROGRAM DEVELOPMENT MANAGER 1.00 1.00 1.00ECONOMIC ASSISTANCE HUMAN SERVICES SECTION MANAGER 3.00 3.00 3.00ECONOMIC ASSISTANCE HUMAN SERVICES DIVISION DIRECTOR 1.00 1.00 1.00
ECONOMIC ASSISTANCE ELIGIBILITY WORKER II 152.50 152.50 152.501.0 Time Limited coverted to perm
ECONOMIC ASSISTANCE ELIGIBILITY WORKER III 35.00 35.00 35.00ECONOMIC ASSISTANCE ELIGIBILITY SUPERVISOR 25.00 25.00 25.00ECONOMIC ASSISTANCE SOCIAL SERVICE WORKER II 1.00 1.00 1.00ECONOMIC ASSISTANCE SOCIAL SERVICE WORKER III 1.00 1.00 1.00ECONOMIC ASSISTANCE SOCIAL SERVICE SUPERVISOR II 1.00 1.00 1.00
ECONOMIC ASSISTANCESUPERVISING EMPLOYMENT & TRAINING SPECIALIST 0.00 0.00 0.00
ECONOMIC ASSISTANCE OFFICE ASSISTANT II 19.50 19.50 19.50ECONOMIC ASSISTANCE SENIOR OFFICE ASSISTANT 11.00 11.00 11.00ECONOMIC ASSISTANCE OFFICE SUPPORT SUPERVISOR 7.00 7.00 7.00ECONOMIC ASSISTANCE TELEPHONE OPERATOR 0.00 0.00 0.00ECONOMIC ASSISTANCE MATERIALS HANDLER 3.00 3.00 3.00ECONOMIC ASSISTANCE STOREKEEPER 1.00 1.00 1.00ECONOMIC ASSISTANCE HUMAN SERVICES AIDE II 14.00 14.00 14.00EMPLOYMENT AND TRAINING ELIGIBILITY WORKER II 7.00 7.00 7.00EMPLOYMENT AND TRAINING SECRETARY 1.00 1.00 1.00EMPLOYMENT AND TRAINING ADMINISTRATIVE AIDE 0.00 0.00 0.00
EMPLOYMENT AND TRAININGPROGRAM PLANNING AND EVALUATION ANALYST 6.00 6.00 6.00
EMPLOYMENT AND TRAINING PROGRAM DEVELOPMENT MANAGER 1.00 1.00 1.00EMPLOYMENT AND TRAINING HUMAN SERVICES SECTION MANAGER 2.00 2.00 2.00EMPLOYMENT AND TRAINING HUMAN SERVICES DIVISION DIRECTOR 1.00 1.00 1.00EMPLOYMENT AND TRAINING OFFICE ASSISTANT II 4.00 4.00 4.00EMPLOYMENT AND TRAINING SENIOR OFFICE ASSISTANT 6.00 6.00 6.00EMPLOYMENT AND TRAINING OFFICE SUPPORT SUPERVISOR 2.00 2.00 2.00EMPLOYMENT AND TRAINING ACCOUNT CLERK II 0.00 0.00 0.00EMPLOYMENT AND TRAINING HUMAN SERVICES AIDE II 4.00 4.00 4.00EMPLOYMENT AND TRAINING SENIOR OFFICE ASSISTANT 1.00 1.00 1.00EMPLOYMENT AND TRAINING COMPUTER LAB SUPPORT SPECIALST 1.00 1.00 1.00
EMPLOYMENT AND TRAINING PUBLIC ASSISTANCE SYSTEMS SPECIALIST 1.00 1.00 1.00EMPLOYMENT AND TRAINING ADMINISTRATIVE AIDE 1.00 1.00 1.00EMPLOYMENT AND TRAINING EMPLOYMENT & TRAINING SPECIALIST 31.50 31.50 31.50
EMPLOYMENT AND TRAININGSENIOR EMPLOYMENT & TRAINING SPECIALIST 5.00 5.00 5.00
EMPLOYMENT AND TRAININGSUPERVISING EMPLOYMENT & TRAINING SPECIALIST 5.00 5.00 5.00
EMPLOYMENT AND TRAINING EMPLOYMENT & TRAINING COUNSELOR II 26.00 26.00 26.00

Permanent Position Allocationby Department and Job Class
Exhibit C
Page | 19
EMPLOYMENT AND TRAINING EMPLOYMENT & TRAINING COORDINATOR 10.00 10.00 10.00
Time Limited Expires 12/31/17 (13) 1.0 Time Limited converted to Perm
EMPLOYMENT AND TRAININGSUPERVISING EMPLOYMENT & TRAINING COUNSELOR 5.00 5.00 5.00
FAMILY YOUTH AND CHILDREN PROGRAM DEVELOPMENT MANAGER 2.00 2.00 2.00FAMILY YOUTH AND CHILDREN ELIGIBILITY WORKER II 3.75 3.75 3.75FAMILY YOUTH AND CHILDREN ELIGIBILITY SUPERVISOR 1.00 1.00 1.00FAMILY YOUTH AND CHILDREN SOCIAL SERVICE WORKER II 1.00 1.00 1.00FAMILY YOUTH AND CHILDREN SOCIAL SERVICE WORKER III 2.00 2.00 2.00FAMILY YOUTH AND CHILDREN SOCIAL SERVICE WORKER IV 97.25 97.25 97.25FAMILY YOUTH AND CHILDREN SOCIAL SERVICE SUPERVISOR I 1.00 1.00 1.00FAMILY YOUTH AND CHILDREN SOCIAL SERVICE SUPERVISOR II 15.00 15.00 15.00FAMILY YOUTH AND CHILDREN SECRETARY 1.00 1.00 1.00FAMILY YOUTH AND CHILDREN ADMINISTRATIVE AIDE 2.00 2.00 2.00
FAMILY YOUTH AND CHILDRENPROGRAM PLANNING AND EVALUATION ANALYST 4.00 4.00 4.00
FAMILY YOUTH AND CHILDREN HUMAN SERVICES SECTION MANAGER 4.00 4.00 4.00FAMILY YOUTH AND CHILDREN HUMAN SERVICES DIVISION DIRECTOR 1.00 1.00 1.00FAMILY YOUTH AND CHILDREN OFFICE ASSISTANT II 0.00 0.00 0.00FAMILY YOUTH AND CHILDREN SENIOR OFFICE ASSISTANT 28.00 28.00 28.00FAMILY YOUTH AND CHILDREN OFFICE SUPPORT SUPERVISOR 3.00 3.00 3.00FAMILY YOUTH AND CHILDREN RECEPTIONIST 0.00 0.00 0.00FAMILY YOUTH AND CHILDREN ADMINISTRATIVE AIDE 1.00 1.00 1.00FAMILY YOUTH AND CHILDREN SOCIAL WORK ASSISTANT 8.00 8.00 8.00
VOM CHILDRENS HOMEPROGRAM PLANNING AND EVALUATION ANALYST 0.00 0.00 0.00
VOM CHILDRENS HOMECHILDREN'S RESIDENTIAL CARE COUNSELOR II 23.00 23.00 23.00
VOM CHILDRENS HOMESUPERV CHILD RESIDENTIAL CARE COUNSELOR 4.00 4.00 4.00
VOM CHILDRENS HOMEVALLEY OF THE MOON CHILDREN'S HOME MANAGER 1.00 1.00 1.00
VOM CHILDRENS HOME JUVENILE CORRECTIONAL COUNSELOR II 4.00 4.00 4.00
VOM CHILDRENS HOME JUVENILE CORRECTIONAL COUNSELOR IV 2.00 2.00 2.00VOM CHILDRENS HOME RESIDENTIAL SERVICE WORKER 3.00 3.00 3.00VOM CHILDRENS HOME COOK 2.00 2.00 2.00VOM CHILDRENS HOME CHEF 0.75 0.75 0.75
ADULT AND AGING ADMIN PUBLIC ASSISTANCE SYSTEMS SPECIALIST 1.00 1.00 1.00ADULT AND AGING ADMIN SENIOR ACCOUNT CLERK 1.00 1.00 1.00
ADULT AND AGING ADMINPROGRAM PLANNING AND EVALUATION ANALYST 2.00 2.00 2.00
ADULT AND AGING ADMIN PROGRAM DEVELOPMENT MANAGER 1.00 1.00 1.00ADULT AND AGING ADMIN HUMAN SERVICES SECTION MANAGER 1.00 1.00 1.00ADULT AND AGING ADMIN HUMAN SERVICES DIVISION DIRECTOR 1.00 1.00 1.00ADULT AND AGING ADMIN SECRETARY CONFIDENTIAL 1.00 1.00 1.00
HUMAN SERVICES ADMINISTRATION SENIOR OFFICE ASSISTANT 2.00 2.00 2.00
HUMAN SERVICES ADMINISTRATION OFFICE SUPPORT SUPERVISOR 1.00 1.00 1.00

Permanent Position Allocationby Department and Job Class
Exhibit C
Page | 20
HUMAN SERVICES ADMINISTRATION RECEPTIONIST 0.00 0.00 0.00IHSS NP AUTHORITY SOCIAL SERVICE WORKER II 1.00 1.00 1.00IHSS NP AUTHORITY SOCIAL SERVICE WORKER III 39.50 39.50 39.50IHSS NP AUTHORITY SOCIAL SERVICE WORKER IV 4.00 4.00 4.00IHSS NP AUTHORITY SOCIAL SERVICE SUPERVISOR I 6.00 6.00 6.00IHSS NP AUTHORITY SOCIAL SERVICE SUPERVISOR II 1.00 1.00 1.00IHSS NP AUTHORITY HOME CARE SUPPORT SPECIALIST 4.00 4.00 4.00IHSS NP AUTHORITY PUBLIC HEALTH AIDE II 2.00 2.00 2.00IHSS NON PUBLIC AUTHORITY SENIOR OFFICE ASSISTANT 7.00 7.00 7.00IHSS NON PUBLIC AUTHORITY OFFICE SUPPORT SUPERVISOR 1.00 1.00 1.00IHSS NON PUBLIC AUTHORITY ACCOUNT CLERK II 7.00 7.00 7.00IHSS NON PUBLIC AUTHORITY ADMINISTRATIVE AIDE 1.00 1.00 1.00IHSS NON PUBLIC AUTHORITY HOME CARE SUPPORT SPECIALIST 1.00 1.00 1.00IHSS NON PUBLIC AUTHORITY SOCIAL WORK ASSISTANT 1.00 1.00 1.00ADULT PROTECTIVE SERVICES SENIOR OFFICE ASSISTANT 2.00 2.00 2.00ADULT PROTECTIVE SERVICES SOCIAL SERVICE WORKER IV 27.00 27.00 27.00ADULT PROTECTIVE SERVICES SOCIAL SERVICE SUPERVISOR II 4.00 4.00 4.00ADULT PROTECTIVE SERVICES HUMAN SERVICES SECTION MANAGER 1.00 1.00 1.00
AREA AGENCY ON AGINGPROGRAM PLANNING AND EVALUATION ANALYST 1.00 1.00 1.00
AREA AGENCY ON AGING PROGRAM DEVELOPMENT MANAGER 1.00 1.00 1.00AREA AGENCY ON AGING ACCOUNTANT III 1.00 1.00 1.00
AREA AGENCY ON AGINGPROGRAM PLANNING AND EVALUATION ANALYST 1.00 1.00 1.00
MSSP SENIOR SERVICES SOCIAL SERVICE WORKER IV 7.00 7.00 7.00MSSP SENIOR SERVICES SOCIAL SERVICE SUPERVISOR II 1.00 1.00 1.00MSSP SENIOR SERVICES SENIOR OFFICE ASSISTANT 0.50 0.50 0.50MSSP SENIOR SERVICES SENIOR ACCOUNT CLERK 1.00 1.00 1.00VETERANS SERVICES SENIOR OFFICE ASSISTANT 1.00 1.00 1.00VETERANS SERVICES VETERANS CLAIMS WORKER II 4.00 4.00 4.00VETERANS SERVICES SENIOR VETERANS CLAIMS WORKER 1.00 1.00 1.00VETERANS SERVICES VETERANS SERVICE OFFICER 1.00 1.00 1.00PA/PG/PC SENIOR OFFICE ASSISTANT 2.00 2.00 2.00PA/PG/PC SENIOR ACCOUNT CLERK 0.80 0.80 0.80
PA/PG/PCDEPUTY PUBLIC ADMINISTRATOR-GUARDIAN-CONSERVATOR 5.00 5.00 5.00
PA/PG/PCSUPERVISING PUBLIC ADMIN-GUARDIAN-CONSERVATOR 1.00 1.00 1.00
PA/PG/PCCHIEF DEPUTY PUBLIC ADMIN-GUARDIAN-CONSERVATOR 1.00 1.00 1.00
IHSS PUBLIC AUTHORITY IHSS PUBLIC AUTHORITY MANAGER 1.00 1.00 1.0024-HSD Total 929.55 0.00 929.55 0.00 929.55
INFORMATION SYSTEMSISD ADMINISTRATION SENIOR OFFICE ASSISTANT 1.00 1.00 1.00
ISD ADMINISTRATIONINFORMATION SYSTEM DIVISION DIRECTOR 0.00 0.00 0.00
ISD ADMINISTRATION INFORMATION SYSTEM DIRECTOR 1.00 1.00 1.00ISD ADMINISTRATION INFORMATION TECHNOLOGY ANALYST II 1.00 1.00 1.00
ISD ADMINISTRATION INFORMATION TECHNOLOGY ANALYST III 1.00 1.00 1.00ISD ADMINISTRATION ADMINISTRATIVE AIDE 5.00 5.00 5.00

Permanent Position Allocationby Department and Job Class
Exhibit C
Page | 21
ISD ADMINISTRATION DEPARTMENT ANALYST 3.00 3.00 3.00ISD ADMINISTRATION ADMINISTRATIVE SERVICES OFFICER I 2.00 2.00 2.00ISD ADMINISTRATION ADMINISTRATIVE SERVICES OFFICER II 1.00 1.00 1.00ISD SYSTEMS & PROGRAMMING SENIOR PROGRAMMER ANALYST 9.00 9.00 9.00ISD SYSTEMS & PROGRAMMING PROGRAMMER ANALYST 1.00 1.00 1.00
ISD SYSTEMS & PROGRAMMINGINFORMATION SYSTEMS PROJECT MANAGER 2.00 2.00 2.00
ISD SYSTEMS & PROGRAMMINGINFORMATION SYSTEM DIVISION DIRECTOR 1.00 1.00 1.00
ISD SYSTEMS & PROGRAMMING SENIOR BUSINESS SYSTEMS ANALYST 1.00 1.00 1.00ISD INFORMATION MANAGEMENT SENIOR PROGRAMMER ANALYST 1.00 1.00 1.00
ISD INFORMATION MANAGEMENTINFORMATION SYSTEMS PROJECT MANAGER 1.00 1.00 1.00
ISD INFORMATION MANAGEMENT GEOGRAPHIC INFORMATION TECHNICIAN II 3.00 3.00 3.00ISD SYSTEMS & PROGRAMMING SYSTEMS SOFTWARE ANALYST 2.50 2.50 2.50ISD SYSTEMS & PROGRAMMING SENIOR PROGRAMMER ANALYST 5.50 5.50 5.50ISD SYSTEMS & PROGRAMMING PROGRAMMER ANALYST 2.00 2.00 2.00
ISD SYSTEMS & PROGRAMMINGINFORMATION SYSTEMS PROJECT MANAGER 2.00 2.00 2.00
ISD INFORMATION MANAGEMENT SENIOR PROGRAMMER ANALYST 1.00 1.00 1.00ISD INFORMATION MANAGEMENT PROGRAMMER ANALYST 2.00 2.00 2.00
ISD INFORMATION MANAGEMENTINFORMATION SYSTEMS PROJECT MANAGER 1.00 1.00 1.00
ISD INFORMATION MANAGEMENTINFORMATION SYSTEM DIVISION DIRECTOR 1.00 1.00 1.00
ISD INFORMATION MANAGEMENT INFORMATION TECHNOLOGY ANALYST II 1.00 1.00 1.00ISD INFORMATION MANAGEMENT SENIOR BUSINESS SYSTEMS ANALYST 1.00 1.00 1.00ISD INFORMATION MANAGEMENT GRAPHICS DESIGNER PHOTOGRAPHER 1.00 1.00 1.00ISD TECHNICIAL SUPPORT SERVICES SYSTEMS SOFTWARE ANALYST 9.50 9.50 9.50ISD TECHNICIAL SUPPORT SERVICES SENIOR NETWORK ANALYST 1.00 1.00 1.00ISD TECHNICIAL SUPPORT SERVICES NETWORK ANALYST 2.00 2.00 2.00ISD TECHNICIAL SUPPORT SERVICES
INFORMATION SYSTEMS PROJECT MANAGER 1.00 1.00 1.00
ISD TECHNICIAL SUPPORT SERVICES
INFORMATION SYSTEM DIVISION DIRECTOR 1.00 1.00 1.00
ISD TECHNICIAL SUPPORT SERVICES INFORMATION TECHNOLOGY ANALYST II 1.00 1.00 1.00ISD TECHNICIAL SUPPORT SERVICES INFORMATION TECHNOLOGY ANALYST III 1.00 1.00 1.00ISD TECHNICIAL SUPPORT SERVICES SENIOR BUSINESS SYSTEMS ANALYST 1.00 1.00 1.00ISD TECHNICIAL SUPPORT SERVICES COMMUNICATIONS MANAGER 0.00 0.00 0.00ISD TECHNICIAL SUPPORT SERVICES SYSTEMS SOFTWARE ANALYST 0.00 0.00 0.00ISD TECHNICIAL SUPPORT SERVICES SENIOR NETWORK ANALYST 2.00 2.00 2.00ISD TECHNICIAL SUPPORT SERVICES NETWORK ANALYST 3.00 3.00 3.00ISD TECHNICIAL SUPPORT SERVICES
INFORMATION SYSTEMS PROJECT MANAGER 1.00 1.00 1.00

Permanent Position Allocationby Department and Job Class
Exhibit C
Page | 22
ISD TECHNICIAL SUPPORT SERVICES INFORMATION TECHNOLOGY ANALYST II 0.00 0.00 0.00
ISD TECHNICAL SUPPORT SERVICESINFORMATION SYSTEMS PROJECT MANAGER 1.00 1.00 1.00
ISD TECHNICAL SUPPORT SERVICES INFORMATION TECHNOLOGY ANALYST II 12.00 12.00 12.00
ISD TECHNICAL SUPPORT SERVICES INFORMATION TECHNOLOGY ANALYST III 3.00 3.00 3.00
ISD TECHNICAL SUPPORT SERVICES STOREKEEPER 0.00 0.00 0.00
ISD TECHNICAL SUPPORT SERVICES SENIOR STOREKEEPER 1.00 1.00 1.00
ISD TECHNICAL SUPPORT SERVICESINFORMATION SYSTEMS PROJECT MANAGER 1.00 1.00 1.00
ISD TECHNICIAL SUPPORT SERVICES SYSTEMS SOFTWARE ANALYST 2.00 2.00 2.00ISD TECHNICIAL SUPPORT SERVICES SENIOR PROGRAMMER ANALYST 1.00 1.00 1.00ISD TECHNICIAL SUPPORT SERVICES
INFORMATION SYSTEMS PROJECT MANAGER 1.00 1.00 1.00
ISD TECHNICIAL SUPPORT SERVICES SENIOR BUSINESS SYSTEMS ANALYST 0.00 0.00 0.00ISD TECHNICIAL SUPPORT SERVICES GEOGRAPHIC INFORMATION TECHNICIAN II 1.00 1.00 1.00
ISD INFORMATION MANAGEMENTINFORMATION SYSTEMS PROJECT MANAGER 1.00 1.00 1.00
ISD INFORMATION MANAGEMENT SENIOR OFFICE ASSISTANT 1.00 1.00 1.00ISD INFORMATION MANAGEMENT RECORDS AND INFORMATION MANAGER 0.50 0.50 0.50
ISD INFORMATION MANAGEMENTMAIL MATERIALS AND RECORDS HANDLER II 8.00 8.00 8.00
ISD INFORMATION MANAGEMENTMAIL MATERIALS AND RECORDS SUPERVISOR 1.00 1.00 1.00
ISD INFORMATION MANAGEMENT MATERIALS EQUIPMENT SPECIALIST 1.00 1.00 1.00ISD INFORMATION MANAGEMENT RECORDS AND INFORMATION MANAGER 0.50 0.50 0.50ISD INFORMATION MANAGEMENT REPROGRAPHICS TECHNICIAN II 0.00 0.00 0.00ISD INFORMATION MANAGEMENT REPROGRAPHICS TECHNICIAN III 0.00 0.00 0.00ISD INFORMATION MANAGEMENT REPROGRAPHICS SUPERVISOR 0.00 0.00 0.00ISD INFORMATION MANAGEMENT GRAPHICS DESIGNER PHOTOGRAPHER 1.00 1.00 1.00ISD INFORMATION MANAGEMENT ADMINISTRATIVE AIDE 1.00 1.00 1.00ISD TECHNICIAL SUPPORT SERVICES SENIOR COMMUNICATIONS TECHNICIAN 1.00 1.00 1.0025-ISD Total 116.50 0.00 116.50 0.00 116.50
PERMIT & RESOURCE MANAGEMENT DEPTCUSTOMER SERVICE SENIOR OFFICE ASSISTANT 1.00 1.00 1.00CUSTOMER SERVICE PERMIT TECHNICIAN II 6.00 6.00 6.00CUSTOMER SERVICE CUSTOMER SERVICE SUPERVISOR 1.00 1.00 1.00ACCOUNTING ADMIN SVC ADMINSTRATION DIS OFFICE ASSISTANT II 1.00 1.00 1.00ACCOUNTING ADMIN SVC ADMINSTRATION DIS SENIOR OFFICE ASSISTANT 1.00 1.00 1.00ACCOUNTING ADMIN SVC ADMINSTRATION DIS TELEPHONE OPERATOR 1.00 1.00 1.00
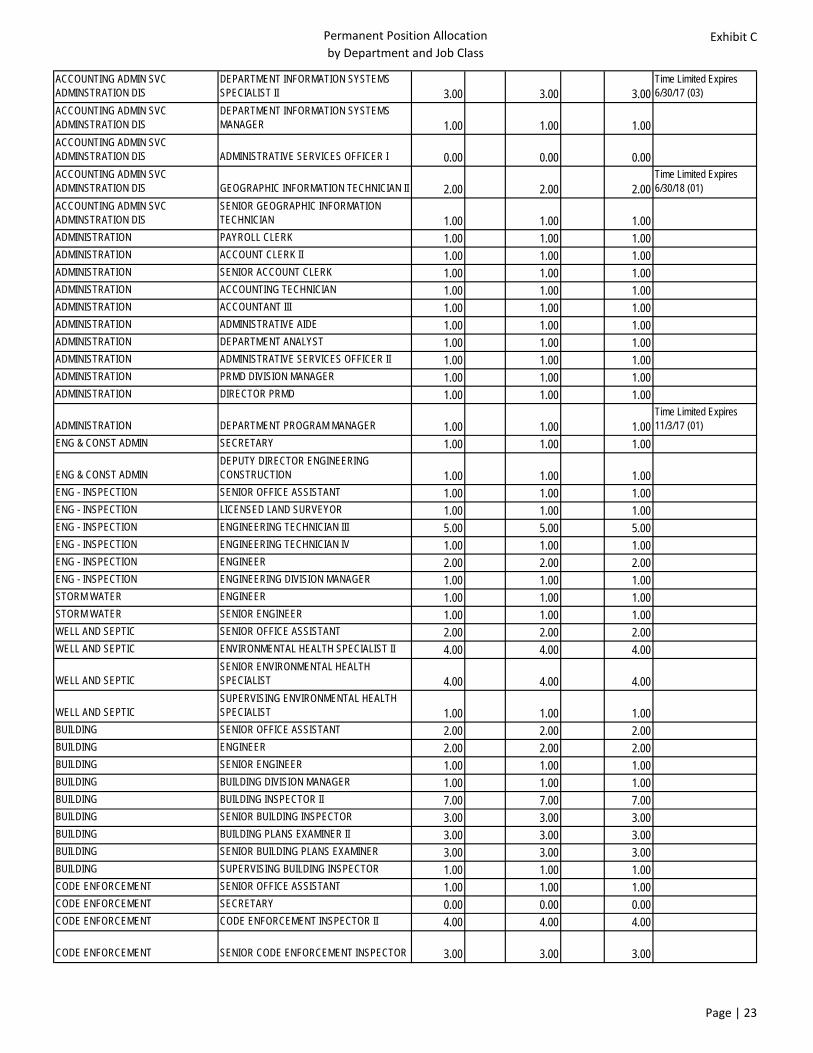
Permanent Position Allocationby Department and Job Class
Exhibit C
Page | 23
ACCOUNTING ADMIN SVC ADMINSTRATION DIS
DEPARTMENT INFORMATION SYSTEMS SPECIALIST II 3.00 3.00 3.00
Time Limited Expires 6/30/17 (03)
ACCOUNTING ADMIN SVC ADMINSTRATION DIS
DEPARTMENT INFORMATION SYSTEMS MANAGER 1.00 1.00 1.00
ACCOUNTING ADMIN SVC ADMINSTRATION DIS ADMINISTRATIVE SERVICES OFFICER I 0.00 0.00 0.00ACCOUNTING ADMIN SVC ADMINSTRATION DIS GEOGRAPHIC INFORMATION TECHNICIAN II 2.00 2.00 2.00
Time Limited Expires 6/30/18 (01)
ACCOUNTING ADMIN SVC ADMINSTRATION DIS
SENIOR GEOGRAPHIC INFORMATION TECHNICIAN 1.00 1.00 1.00
ADMINISTRATION PAYROLL CLERK 1.00 1.00 1.00ADMINISTRATION ACCOUNT CLERK II 1.00 1.00 1.00ADMINISTRATION SENIOR ACCOUNT CLERK 1.00 1.00 1.00ADMINISTRATION ACCOUNTING TECHNICIAN 1.00 1.00 1.00ADMINISTRATION ACCOUNTANT III 1.00 1.00 1.00ADMINISTRATION ADMINISTRATIVE AIDE 1.00 1.00 1.00ADMINISTRATION DEPARTMENT ANALYST 1.00 1.00 1.00ADMINISTRATION ADMINISTRATIVE SERVICES OFFICER II 1.00 1.00 1.00ADMINISTRATION PRMD DIVISION MANAGER 1.00 1.00 1.00ADMINISTRATION DIRECTOR PRMD 1.00 1.00 1.00
ADMINISTRATION DEPARTMENT PROGRAM MANAGER 1.00 1.00 1.00Time Limited Expires 11/3/17 (01)
ENG & CONST ADMIN SECRETARY 1.00 1.00 1.00
ENG & CONST ADMINDEPUTY DIRECTOR ENGINEERING CONSTRUCTION 1.00 1.00 1.00
ENG - INSPECTION SENIOR OFFICE ASSISTANT 1.00 1.00 1.00ENG - INSPECTION LICENSED LAND SURVEYOR 1.00 1.00 1.00ENG - INSPECTION ENGINEERING TECHNICIAN III 5.00 5.00 5.00ENG - INSPECTION ENGINEERING TECHNICIAN IV 1.00 1.00 1.00ENG - INSPECTION ENGINEER 2.00 2.00 2.00ENG - INSPECTION ENGINEERING DIVISION MANAGER 1.00 1.00 1.00STORM WATER ENGINEER 1.00 1.00 1.00STORM WATER SENIOR ENGINEER 1.00 1.00 1.00WELL AND SEPTIC SENIOR OFFICE ASSISTANT 2.00 2.00 2.00WELL AND SEPTIC ENVIRONMENTAL HEALTH SPECIALIST II 4.00 4.00 4.00
WELL AND SEPTICSENIOR ENVIRONMENTAL HEALTH SPECIALIST 4.00 4.00 4.00
WELL AND SEPTICSUPERVISING ENVIRONMENTAL HEALTH SPECIALIST 1.00 1.00 1.00
BUILDING SENIOR OFFICE ASSISTANT 2.00 2.00 2.00BUILDING ENGINEER 2.00 2.00 2.00BUILDING SENIOR ENGINEER 1.00 1.00 1.00BUILDING BUILDING DIVISION MANAGER 1.00 1.00 1.00BUILDING BUILDING INSPECTOR II 7.00 7.00 7.00BUILDING SENIOR BUILDING INSPECTOR 3.00 3.00 3.00BUILDING BUILDING PLANS EXAMINER II 3.00 3.00 3.00BUILDING SENIOR BUILDING PLANS EXAMINER 3.00 3.00 3.00BUILDING SUPERVISING BUILDING INSPECTOR 1.00 1.00 1.00CODE ENFORCEMENT SENIOR OFFICE ASSISTANT 1.00 1.00 1.00CODE ENFORCEMENT SECRETARY 0.00 0.00 0.00CODE ENFORCEMENT CODE ENFORCEMENT INSPECTOR II 4.00 4.00 4.00
CODE ENFORCEMENT SENIOR CODE ENFORCEMENT INSPECTOR 3.00 3.00 3.00

Permanent Position Allocationby Department and Job Class
Exhibit C
Page | 24
CODE ENFORCEMENT CODE ENFORCEMENT SUPERVISOR 1.00 1.00 1.00PLANNING - ADMIN SECRETARY 1.00 1.00 1.00PLANNING - ADMIN DEPUTY DIRECTOR-PLANNING 1.00 1.00 1.00PROJECT REVIEW SENIOR OFFICE ASSISTANT 1.00 1.00 1.00PROJECT REVIEW SECRETARY 1.00 1.00 1.00PROJECT REVIEW PLANNING TECHNICIAN 1.00 1.00 1.00PROJECT REVIEW PLANNER III 8.00 8.00 8.00PROJECT REVIEW PRMD DIVISION MANAGER 1.00 1.00 1.00PROJECT REVIEW SUPERVISING PLANNER 3.00 3.00 3.00
PROJECT REVIEWSENIOR ENVIRONMENTAL HEALTH SPECIALIST 1.00 1.00 1.00
Time Limited Expires 6/30/18 (01)
ENVIRONMENTAL REVIEW SENIOR ENVIRONMENTAL SPECIALIST 5.00 5.00 5.00ENVIRONMENTAL REVIEW PROFESSIONAL GEOLOGIST 1.00 1.00 1.00ENVIRONMENTAL REVIEW PRMD DIVISION MANAGER 1.00 1.00 1.00
COMPREHENSIVE PLANNING PLANNER III 7.00 7.00 7.00Time Limited Expires 8/18/18 (18)
26-PRD Total 119.00 0.00 119.00 0.00 119.00
PROBATIONPROBATION ADMINISTRATION - ADMINISTRATION EXECUTIVE SECRETARY 1.00 -1.00 0.00 0.00PROBATION ADMINISTRATION - ADMINISTRATION DEPARTMENT ANALYST 1.00 1.00 1.00PROBATION ADMINISTRATION - ADMINISTRATION ADMINISTRATIVE SERVICES OFFICER II 1.00 1.00 1.00PROBATION ADMINISTRATION - ADMINISTRATION DEPARTMENT PROGRAM MANAGER 1.00 1.00 1.00PROBATION ADMINISTRATION - ADMINISTRATION PROBATION OFFICER III 1.00 1.00 1.00PROBATION ADMINISTRATION - ADMINISTRATION PROBATION DIVISION DIRECTOR II 1.00 1.00 1.00PROBATION ADMINISTRATION - ADMINISTRATION DEPUTY CHIEF PROBATION OFFICER 2.00 2.00 2.00PROBATION ADMINISTRATION - ADMINISTRATION CHIEF PROBATION OFFICER 1.00 1.00 1.00PROBATION ADMINISTRATION - ADMINISTRATION
EXECUTIVE LEGAL SECRETARY CONFIDENTIAL 0.00 1.00 1.00 1.00
PROBATION ADMINISTRATION - FINANCE ACCOUNT CLERK II 4.60 4.60 4.60PROBATION ADMINISTRATION - FINANCE SENIOR ACCOUNT CLERK 2.00 2.00 2.00PROBATION ADMINISTRATION - FINANCE ACCOUNTING TECHNICIAN 1.00 1.00 1.00PROBATION ADMINISTRATION - FINANCE ACCOUNTANT II 1.00 1.00 1.00PROBATION ADMINISTRATION - FINANCE SUPERVISING ACCOUNTANT 1.00 1.00 1.00PROBATION ADMINISTRATION - HR/SAFETY SENIOR OFFICE ASSISTANT 1.00 1.00 1.00PROBATION ADMINISTRATION - HR/SAFETY ADMINISTRATIVE AIDE 1.00 1.00 1.00PROBATION ADMINISTRATION - HR/SAFETY ADMINISTRATIVE SERVICES OFFICER I 1.00 1.00 1.00PROBATION ADMINISTRATION - INFORMATION SERVICES BUSINESS SYSTEMS ANALYST 1.00 1.00 1.00

Permanent Position Allocationby Department and Job Class
Exhibit C
Page | 25
PROBATION ADMINISTRATION - INFORMATION SERVICES
DEPARTMENT INFORMATION SYSTEMS SPECIALIST II 1.00 1.00 1.00
PROBATION ADMINISTRATION - INFORMATION SERVICES
DEPARTMENT INFORMATION SYSTEMS MANAGER 1.00 1.00 1.00
ADULT INVESTIGATIONS - INVESTIGATIONS LEGAL PROCESSOR II 0.00 0.00 0.00ADULT INVESTIGATIONS - INVESTIGATIONS PROBATION OFFICER II 3.00 3.00 3.00ADULT INVESTIGATIONS - INVESTIGATIONS PROBATION OFFICER III 4.00 4.00 4.00ADULT INVESTIGATIONS - INVESTIGATIONS PROBATION OFFICER IV 2.00 2.00 2.00ADULT INVESTIGATIONS COURT PROBATION OFFICER III 6.00 6.00 6.00ADULT SUPERVISION ADMINISTRATION SECRETARY 1.00 1.00 1.00ADULT SUPERVISION ADMINISTRATION LEGAL PROCESSOR II 4.00 4.00 4.00ADULT SUPERVISION ADMINISTRATION SENIOR LEGAL PROCESSOR 4.00 4.00 4.00ADULT SUPERVISION ADMINISTRATION LEGAL STAFF SUPERVISOR 1.00 1.00 1.00ADULT SUPERVISION ADMINISTRATION PROBATION DIVISION DIRECTOR II 2.00 2.00 2.00ADULT SUPERVISION FIELD SUPERVISION SENIOR LEGAL PROCESSOR 1.00 1.00 1.00ADULT SUPERVISION FIELD SUPERVISION PROBATION ASSISTANT 1.00 1.00 1.00ADULT SUPERVISION FIELD SUPERVISION PROBATION OFFICER II 8.00 8.00 8.00ADULT SUPERVISION FIELD SUPERVISION PROBATION OFFICER III 15.00 15.00 15.00ADULT SUPERVISION FIELD SUPERVISION PROBATION OFFICER IV 3.00 3.00 3.00ADULT SUPERVISION GANG PROBATION OFFICER III 2.00 2.00 2.00ADULT SUPERVISION DOMESTIC VIOLENCE PROBATION OFFICER II 3.00 3.00 3.00ADULT SUPERVISION DOMESTIC VIOLENCE PROBATION OFFICER III 4.00 4.00 4.00ADULT SUPERVISION DOMESTIC VIOLENCE PROBATION OFFICER IV 1.00 1.00 1.00ADULT REALIGNMENT DEPARTMENT ANALYST 1.00 1.00 1.00PROBATION ADULT REALIGNMENT FIELD SUPERVISION SENIOR LEGAL PROCESSOR 1.00 1.00 1.00PROBATION ADULT REALIGNMENT FIELD SUPERVISION PROBATION OFFICER II 1.00 1.00 1.00PROBATION ADULT REALIGNMENT FIELD SUPERVISION PROBATION OFFICER III 9.00 9.00 9.00PROBATION ADULT REALIGNMENT FIELD SUPERVISION PROBATION OFFICER IV 2.00 2.00 2.00PROBATION ADULT REALIGNMENT PRETRIAL SENIOR LEGAL PROCESSOR 1.00 1.00 1.00PROBATION ADULT REALIGNMENT PRETRIAL ADMINISTRATIVE AIDE 0.00 1.00 1.00 1.00PROBATION ADULT REALIGNMENT PRETRIAL PROBATION OFFICER II 0.00 0.00 0.00

Permanent Position Allocationby Department and Job Class
Exhibit C
Page | 26
PROBATION ADULT REALIGNMENT PRETRIAL PROBATION OFFICER III 4.00 4.00 4.00PROBATION ADULT REALIGNMENT DUI PROBATION OFFICER III 1.00 1.00 1.00PROBATION ADULT REALIGNMENT PROGRAMMING ADMINISTRATIVE AIDE 1.00 1.00 1.00PROBATION ADULT REALIGNMENT PROGRAMMING PROBATION ASSISTANT 2.00 2.00 2.00PROBATION ADULT REALIGNMENT PROGRAMMING PROBATION OFFICER II 4.00 4.00 4.00PROBATION ADULT REALIGNMENT PROGRAMMING PROBATION OFFICER III 2.00 2.00 2.00PROBATION ADULT REALIGNMENT PROGRAMMING PROBATION OFFICER IV 1.00 1.00 1.00JUVENILE INVESTIGATIONS ADMINISTRATION LEGAL PROCESSOR II 0.00 0.00 0.00JUVENILE INVESTIGATIONS ADMINISTRATION SENIOR LEGAL PROCESSOR 2.00 2.00 2.00JUVENILE INVESTIGATIONS ADMINISTRATION LEGAL STAFF SUPERVISOR 1.00 1.00 1.00JUVENILE INVESTIGATIONS INTAKE/DIVERSION PROBATION OFFICER III 2.00 2.00 2.00JUVENILE INVESTIGATIONS - INVESTIGATIONS PROBATION OFFICER II 2.00 2.00 2.00JUVENILE INVESTIGATIONS - INVESTIGATIONS PROBATION OFFICER III 5.00 5.00 5.00JUVENILE INVESTIGATIONS - INVESTIGATIONS PROBATION OFFICER IV 1.00 1.00 1.00JUVENILE INVESTIGATIONS COURT PROBATION OFFICER III 1.00 1.00 1.00JUVENILE SUPERVISION ADMINISTRATION SECRETARY 1.00 1.00 1.00JUVENILE SUPERVISION ADMINISTRATION LEGAL PROCESSOR II 1.00 1.00 1.00JUVENILE SUPERVISION ADMINISTRATION SENIOR LEGAL PROCESSOR 3.00 3.00 3.00JUVENILE SUPERVISION ADMINISTRATION DEPARTMENT ANALYST 1.00 1.00 1.00JUVENILE SUPERVISION ADMINISTRATION DEPARTMENT PROGRAM MANAGER 0.00 0.00 0.00JUVENILE SUPERVISION ADMINISTRATION PROBATION DIVISION DIRECTOR II 1.00 1.00 1.00JUVENILE SUPERVISION FIELD SUPERVISION PROBATION ASSISTANT 2.00 2.00 2.00JUVENILE SUPERVISION FIELD SUPERVISION PROBATION OFFICER II 1.00 1.00 1.00JUVENILE SUPERVISION FIELD SUPERVISION PROBATION OFFICER III 7.00 7.00 7.00JUVENILE SUPERVISION FIELD SUPERVISION PROBATION OFFICER IV 3.00 3.00 3.00JUVENILE SUPERVISION PLACEMENT PROBATION OFFICER III 4.00 4.00 4.00JUVENILE SUPERVISION PLACEMENT PROBATION OFFICER IV 1.00 1.00 1.00PROBATION GRANT FUNDS JABG and JJCPA ADMINISTRATIO ADMINISTRATIVE AIDE 1.00 1.00 1.00

Permanent Position Allocationby Department and Job Class
Exhibit C
Page | 27
PROBATION GRANT FUNDS JABG and JJCPA FIELD SUP PROBATION OFFICER II 4.00 4.00 4.00PROBATION GRANT FUNDS JABG and JJCPA FIELD SUP PROBATION OFFICER III 1.00 1.00 1.00PROBATION GRANT FUNDS JABG and JJCPA GANG PROBATION OFFICER III 3.00 3.00 3.00KEEP KIDS IN SCHOOL GRANT DEPARTMENT PROGRAM MANAGER 1.00 1.00 1.00
SUPERVISED ADULT CREWSPROBATION INDUSTRIES CREW SUPERVISOR 7.00 7.00 7.00
SUPERVISED ADULT CREWSPROBATION INDUSTRIES FIELD SUPERVISOR 1.00 1.00 1.00
SUPERVISED ADULT CREWS PROBATION DIVISION DIRECTOR I 1.00 1.00 1.00JUVENILE HALL ADMINISTRATION SECRETARY 1.00 1.00 1.00JUVENILE HALL ADMINISTRATION PROBATION DIVISION DIRECTOR I 2.00 2.00 2.00JUVENILE HALL ADMINISTRATION PROBATION DIVISION DIRECTOR II 1.00 1.00 1.00JUVENILE HALL FIELD SUPERVISION/CD JUVENILE CORRECTIONAL COUNSELOR III 0.00 0.00 0.00JUVENILE HALL FIELD SUPERVISION/CD PROBATION ASSISTANT 0.00 0.00 0.00JUVENILE HALL FIELD SUPERVISION/CD PROBATION OFFICER III 0.00 0.00 0.00
JUVENILE HALL PROGRAMMING JUVENILE CORRECTIONAL COUNSELOR II 3.00 3.00 3.00
JUVENILE HALL PROGRAMMING JUVENILE CORRECTIONAL COUNSELOR III 11.00 11.00 11.00
JUVENILE HALL PROGRAMMING JUVENILE CORRECTIONAL COUNSELOR IV 1.00 1.00 1.00JUVENILE HALL INSTITUTION SUPERVISION UNITS JUVENILE CORRECTIONAL COUNSELOR II 40.00 40.00 40.00JUVENILE HALL INSTITUTION SUPERVISION UNITS JUVENILE CORRECTIONAL COUNSELOR IV 7.00 7.00 7.00JUVENILE HALL INTAKE/SECURITY/CENTRAL CONTROL JUVENILE CORRECTIONAL COUNSELOR II 21.00 21.00 21.00JUVENILE HALL KITCHEN RESIDENTIAL SERVICE WORKER 1.00 1.00 1.00JUVENILE HALL KITCHEN COOK 4.00 4.00 4.00JUVENILE HALL KITCHEN CHEF 1.00 1.00 1.00
PROBATION CAMP ADMINISTRATION SECRETARY 1.00 1.00 1.00
PROBATION CAMP ADMINISTRATION PROBATION DIVISION DIRECTOR I 1.00 1.00 1.00PROBATION CAMP FIELD SUPERVISION/AFTER CARE JUVENILE CORRECTIONAL COUNSELOR III 1.00 1.00 1.00PROBATION CAMP FIELD SUPERVISION/AFTER CARE PROBATION OFFICER III 1.00 1.00 1.00
PROBATION CAMP PROGRAMMING JUVENILE CORRECTIONAL COUNSELOR III 5.00 5.00 5.00
PROBATION CAMP PROGRAMMING JUVENILE CORRECTIONAL COUNSELOR IV 1.00 1.00 1.00
PROBATION CAMP VOCATIONALPROBATION INDUSTRIES CREW SUPERVISOR 2.00 2.00 2.00
PROBATION CAMP VOCATIONAL JUVENILE CORRECTIONAL COUNSELOR III 1.00 1.00 1.00

Permanent Position Allocationby Department and Job Class
Exhibit C
Page | 28
PROBATION CAMP INSTITUTION SUPERVISION (UNITS) JUVENILE CORRECTIONAL COUNSELOR II 4.00 4.00 4.00PROBATION CAMP KITCHEN CHEF 1.00 1.00 1.0027-PRB Total 288.60 1.00 289.60 0.00 289.60
PUBLIC DEFENDERPUBLIC DEFENDER LEGAL SECRETARY II 6.00 6.00 6.00PUBLIC DEFENDER LEGAL PROCESSOR II 3.00 3.00 3.00PUBLIC DEFENDER LEGAL STAFF SUPERVISOR 1.00 1.00 1.00PUBLIC DEFENDER ACCOUNT CLERK II 1.00 1.00 1.00PUBLIC DEFENDER ADMINISTRATIVE SERVICES OFFICER I 1.00 1.00 1.00PUBLIC DEFENDER CHIEF DEPUTY PUBLIC DEFENDER 1.00 1.00 1.00PUBLIC DEFENDER ASSISTANT PUBLIC DEFENDER 1.00 1.00 1.00PUBLIC DEFENDER PUBLIC DEFENDER 1.00 1.00 1.00PUBLIC DEFENDER DEPUTY PUBLIC DEFENDER IV 27.00 27.00 27.00
PUBLIC DEFENDER SENIOR PUBLIC DEFENDER INVESTIGATOR 1.00 1.00 1.00PUBLIC DEFENDER PUBLIC DEFENDER INVESTIGATOR II 7.00 7.00 7.0028-PDO Total 50.00 0.00 50.00 0.00 50.00
REGIONAL PARKSO and M OPERATIONS ADMINISTRATIVE AIDE 1.00 1.00 1.00O and M OPERATIONS ADMINISTRATIVE AIDE CONFIDENTIAL 1.00 1.00 1.00O and M OPERATIONS DEPARTMENT ANALYST 1.00 1.00 1.00O and M OPERATIONS PLANNING TECHNICIAN 1.00 1.00 1.00
O and M OPERATIONSRECREATION AND EDUCATION SERVICES MANAGER 1.00 1.00 1.00
O and M OPERATIONS PARK MANAGER 1.00 1.00 1.00
O and M OPERATIONS PARK RANGER I 10.00 10.00 10.00Time Limited Expires 6/30/17 (14)
O and M OPERATIONS PARK RANGER II 4.00 4.00 4.00O and M OPERATIONS PARK RANGER III 3.00 3.00 3.00
O and M MAINTENANCEPARKS GROUNDS MAINTENANCE WORKER II 18.00 18.00 18.00
Time Limited Expires 6/30/17 (21)
O and M MAINTENANCEPARKS GROUNDS MAINTENANCE SUPERVISOR 2.00 2.00 2.00
PLANNING SENIOR OFFICE ASSISTANT 1.00 1.00 1.00PLANNING PLANNING TECHNICIAN 1.00 1.00 1.00
PLANNING PARK PLANNER II 4.00 4.00 4.00Time Limited Expires 6/30/17 (05)
PLANNING SENIOR PARK PLANNER 1.00 1.00 1.00PLANNING PARK PLANNING MANAGER 1.00 1.00 1.00PLANNING DEPARTMENT PROGRAM MANAGER 1.00 1.00 1.00
CE MARKETING and PARTNERSHIPS MARKETING SPECIALIST 1.00 1.00 1.00
CE MARKETING and PARTNERSHIPSRECREATION AND EDUCATION SERVICES MANAGER 1.00 1.00 1.00
CE PROGRAMS ADMINISTRATIVE AIDE 1.00 1.00 1.00CE PROGRAMS PARK PROGRAM ASSISTANT 1.00 1.00 1.00CE PROGRAMS AQUATIC SPECIALIST 1.00 1.00 1.00ADMINISTRATION OFFICE ASSISTANT II 2.00 2.00 2.00ADMINISTRATION SENIOR OFFICE ASSISTANT 2.00 2.00 2.00ADMINISTRATION SECRETARY 1.00 1.00 1.00

Permanent Position Allocationby Department and Job Class
Exhibit C
Page | 29
ADMINISTRATION PAYROLL CLERK 1.00 1.00 1.00ADMINISTRATION ACCOUNT CLERK II 3.00 3.00 3.00ADMINISTRATION DEPARTMENT ANALYST 2.00 2.00 2.00ADMINISTRATION ADMINISTRATIVE SERVICES OFFICER II 1.00 1.00 1.00ADMINISTRATION DEPUTY DIRECTOR REGIONAL PARKS 1.00 1.00 1.00ADMINISTRATION DIRECTOR OF REGIONAL PARKS 1.00 1.00 1.00
ADMINISTRATION BOOKING & RESERVATION COORDINATOR 1.00 1.00 1.00ADMINISTRATION EXECUTIVE SECRETARY CONFIDENTIAL 1.00 1.00 1.00SLP OPERATIONS PARK RANGER I 3.00 3.00 3.00SLP OPERATIONS PARK RANGER II 1.00 1.00 1.00SLP OPERATIONS PARK RANGER III 1.00 1.00 1.00
SLP MAINTENANCEPARKS GROUNDS MAINTENANCE WORKER II 2.00 2.00 2.00
SLP MAINTENANCEPARKS GROUNDS MAINTENANCE SUPERVISOR 1.00 1.00 1.00
SLP PROGRAMS ADMINISTRATIVE AIDE 1.00 1.00 1.00
SLP PROGRAMSENVIRONMENTAL DISCOVERY CENTER COORDINATOR 1.00 1.00 1.00
SPUD POINT MARINA SECRETARY 1.00 1.00 1.00SPUD POINT MARINA BUILDING MECHANIC I 0.00 0.00 0.00SPUD POINT MARINA BUILDING MECHANIC II 1.00 1.00 1.00SPUD POINT MARINA MARINA ATTENDANT 1.00 1.00 1.00SPUD POINT MARINA SENIOR MARINA ATTENDANT 1.00 1.00 1.00SPUD POINT MARINA MARINA SUPERVISOR 1.00 1.00 1.0029-PRK Total 88.00 0.00 88.00 0.00 88.00
SHERIFFSHERIFF ADMINISTRATION SENIOR OFFICE ASSISTANT 1.00 1.00 1.00SHERIFF ADMINISTRATION EXECUTIVE ASST TO SHERIFF 1.00 1.00 1.00SHERIFF ADMINISTRATION LEGAL PROCESSOR II 1.00 1.00 1.00
SHERIFF ADMINISTRATIONDEPARTMENT INFORMATION SYSTEMS SPECIALIST II 5.00 5.00 5.00
SHERIFF ADMINISTRATIONDEPARTMENT INFORMATION SYSTEMS MANAGER 0.00 0.00 0.00
SHERIFF ADMINISTRATIONSENIOR DEPARTMENT INFORMATION SYSTEMS MANAGER 1.00 1.00 1.00
SHERIFF ADMINISTRATION STOREKEEPER 1.00 1.00 1.00SHERIFF ADMINISTRATION ACCOUNT CLERK II 1.00 1.00 1.00SHERIFF ADMINISTRATION SENIOR ACCOUNT CLERK 5.00 5.00 5.00SHERIFF ADMINISTRATION ACCOUNTANT II 1.00 1.00 1.00SHERIFF ADMINISTRATION SUPERVISING ACCOUNTANT 1.00 1.00 1.00SHERIFF ADMINISTRATION ADMINISTRATIVE AIDE 3.00 3.00 3.00SHERIFF ADMINISTRATION DEPARTMENT ANALYST 6.00 6.00 6.00SHERIFF ADMINISTRATION ADMINISTRATIVE SERVICES OFFICER I 1.00 1.00 1.00SHERIFF ADMINISTRATION ADMINISTRATIVE SERVICES OFFICER II 2.00 2.00 2.00
SHERIFF ADMINISTRATIONDEPARTMENT ADMINISTRATIVE SERVICES DIRECTOR 1.00 1.00 1.00
SHERIFF ADMINISTRATIONWATER AGENCY PUBLIC INFORMATION OFFICER 1.00 1.00 1.00
SHERIFF ADMINISTRATION DEPUTY SHERIFF II 2.00 2.00 2.00SHERIFF ADMINISTRATION SHERIFFS SERGEANT 4.00 4.00 4.00SHERIFF ADMINISTRATION SHERIFFS LIEUTENANT 2.00 2.00 2.00

Permanent Position Allocationby Department and Job Class
Exhibit C
Page | 30
SHERIFF ADMINISTRATION SHERIFFS CAPTAIN 1.00 1.00 1.00SHERIFF ADMINISTRATION CORRECTIONAL DEPUTY II 1.00 1.00 1.00SHERIFF ADMINISTRATION CORRECTIONAL SERGEANT 1.00 1.00 1.00SHERIFF ADMINISTRATION SECRETARY CONFIDENTIAL 1.00 1.00 1.00SHERIFF ADMINISTRATION PAYROLL CLERK CONFIDENTIAL 1.00 1.00 1.00SHERIFF ADMINISTRATION SENIOR ACCOUNT CLERK CONFIDENTIAL 0.00 0.00 0.00SHERIFF ADMINISTRATION SHERIFF-CORONER 1.00 1.00 1.00SHERIFF LAW ENFORCEMENT ADMIN DEPARTMENT ANALYST 1.00 1.00 1.00SHERIFF LAW ENFORCEMENT ADMIN COMMUNITY SERVICES OFFICER II 2.00 2.00 2.00SHERIFF LAW ENFORCEMENT ADMIN ASSISTANT SHERIFF 1.00 1.00 1.00SHERIFF-DISPATCH COMMUNICATIONS DISPATCHER II 19.50 19.50 19.50SHERIFF-DISPATCH SENIOR COMMUNICATIONS DISPATCHER 4.00 4.00 4.00
SHERIFF-DISPATCHSUPERVISING COMMUNICATIONS DISPATCHER 5.00 5.00 5.00
SHERIFF-DISPATCH COMMUNICATIONS DISPATCH MANAGER 1.00 1.00 1.00SHERIFF-CIVIL CIVIL BUREAU SPECIALIST 1.00 1.00 1.00SHERIFF-CIVIL LEGAL PROCESSOR II 2.00 2.00 2.00SHERIFF-CIVIL DEPARTMENT PROGRAM MANAGER 1.00 1.00 1.00SHERIFF-CIVIL COMMUNITY SERVICES OFFICER II 1.00 1.00 1.00SHERIFF-SRVCS-RECORDS LEGAL PROCESSOR II 6.00 6.00 6.00SHERIFF-SRVCS-RECORDS SENIOR LEGAL PROCESSOR 4.00 4.00 4.00SHERIFF-SRVCS-RECORDS LEGAL STAFF SUPERVISOR 3.00 3.00 3.00
SHERIFF-SRVCS-RECORDSSHERIFFS INFORMATION BUREAU MANAGER 1.00 1.00 1.00
SHERIFF-SRVCS-RECORDS COMMUNITY SERVICES OFFICER II 7.00 7.00 7.00SHERIFF-RADIO COMMUNICATIONS TECHNICIAN II 3.00 3.00 3.00SHERIFF-RADIO SENIOR COMMUNICATIONS TECHNICIAN 1.00 1.00 1.00SHERIFF-PATROL COMMUNITY SERVICES OFFICER II 4.00 4.00 4.00SHERIFF-PATROL DEPUTY SHERIFF II 105.00 105.00 105.00SHERIFF-PATROL SHERIFFS SERGEANT 12.00 12.00 12.00SHERIFF-PATROL SHERIFFS LIEUTENANT 4.00 4.00 4.00SHERIFF-PATROL SHERIFFS CAPTAIN 1.00 1.00 1.00SHERIFF-WINDSOR LEGAL PROCESSOR II 1.00 1.00 1.00SHERIFF-WINDSOR ADMINISTRATIVE AIDE 1.00 1.00 1.00SHERIFF-WINDSOR COMMUNITY SERVICES OFFICER II 1.00 1.00 1.00SHERIFF-WINDSOR DEPUTY SHERIFF II 18.00 18.00 18.00SHERIFF-WINDSOR SHERIFFS SERGEANT 2.00 2.00 2.00SHERIFF-WINDSOR SHERIFFS LIEUTENANT 1.00 1.00 1.00SONOMA-SHERIFF ADMINISTRATIVE AIDE 1.00 1.00 1.00SONOMA-SHERIFF COMMUNITY SERVICES OFFICER II 2.00 2.00 2.00SONOMA-SHERIFF DEPUTY SHERIFF II 10.00 10.00 10.00SONOMA-SHERIFF SHERIFFS SERGEANT 2.00 2.00 2.00SONOMA-SHERIFF SHERIFFS LIEUTENANT 1.00 1.00 1.00SHERIFF-HELICOPTER HELICOPTER PILOT 2.00 2.00 2.00SHERIFF-HELICOPTER SHERIFFS SERGEANT 1.00 1.00 1.00SHERIFF MARINE UNIT DEPUTY SHERIFF II 3.00 3.00 3.00SHERIFF MARINE UNIT SHERIFFS SERGEANT 1.00 1.00 1.00SHERIFF-INVESTIGATION SENIOR OFFICE ASSISTANT 1.00 1.00 1.00SHERIFF-INVESTIGATION SECRETARY 2.00 2.00 2.00SHERIFF-INVESTIGATION DEPUTY SHERIFF II 25.00 25.00 25.00

Permanent Position Allocationby Department and Job Class
Exhibit C
Page | 31
SHERIFF-INVESTIGATION SHERIFFS SERGEANT 6.00 6.00 6.00SHERIFF-INVESTIGATION SHERIFFS LIEUTENANT 1.00 1.00 1.00SHERIFF-CORONER FORENSIC ASSISTANT 2.00 2.00 2.00SHERIFF-CORONER DEPUTY SHERIFF II 4.00 4.00 4.00SHERIFF-CORONER SHERIFFS SERGEANT 1.00 1.00 1.00SHERIFF COURT SECURITY DEPUTY SHERIFF II 29.00 29.00 29.00SHERIFF COURT SECURITY SHERIFFS SERGEANT 2.00 2.00 2.00SHERIFF COURT SECURITY SHERIFFS LIEUTENANT 1.00 1.00 1.00SHERIFF COURT SECURITY CORRECTIONAL DEPUTY II 6.00 6.00 6.00SHERIFF TRANSPORTATION DEPUTY SHERIFF II 5.00 5.00 5.00SHERIFF TRANSPORTATION SHERIFFS SERGEANT 1.00 1.00 1.00DETENTION ADMINISTRATION SECRETARY 1.00 1.00 1.00DETENTION ADMINISTRATION LEGAL PROCESSOR II 3.00 3.00 3.00
DETENTION ADMINISTRATIONSHERIFFS INFORMATION BUREAU MANAGER 1.00 1.00 1.00
DETENTION ADMINISTRATION DETENTION ASSISTANT 16.00 16.00 16.00DETENTION ADMINISTRATION SUPERVISING DETENTION ASSISTANT 2.00 2.00 2.00DETENTION ADMINISTRATION ASSISTANT SHERIFF 1.00 1.00 1.00DETENTION ADMINISTRATION SHERIFFS CAPTAIN CORRECTIONS 1.00 1.00 1.00DETENTION ADMINISTRATION CORRECTIONAL DEPUTY II 17.00 17.00 17.00DETENTION ADMINISTRATION CORRECTIONAL SERGEANT 3.00 3.00 3.00DETENTION ADMINISTRATION CORRECTIONAL LIEUTENANT 3.00 3.00 3.00DETENTION ADMINISTRATION JANITOR 6.00 6.00 6.00DETENTION ADMINISTRATION ASSISTANT COOK 0.00 0.00 0.00DETENTION ADMINISTRATION COOK 13.00 13.00 13.00DETENTION ADMINISTRATION CHEF 2.00 2.00 2.00DETENTION-MAIN JAIL SECRETARY 1.00 1.00 1.00DETENTION-MAIN JAIL LEGAL PROCESSOR II 22.60 22.60 22.60DETENTION-MAIN JAIL SENIOR LEGAL PROCESSOR 3.00 3.00 3.00DETENTION-MAIN JAIL LEGAL STAFF SUPERVISOR 4.00 4.00 4.00DETENTION-MAIN JAIL SHERIFFS CAPTAIN CORRECTIONS 1.00 1.00 1.00DETENTION-MAIN JAIL CORRECTIONAL DEPUTY II 135.00 135.00 135.00DETENTION-MAIN JAIL CORRECTIONAL SERGEANT 14.00 14.00 14.00DETENTION-MAIN JAIL CORRECTIONAL LIEUTENANT 4.00 4.00 4.00DETENTION-HONOR FARM LEGAL PROCESSOR II 4.40 4.40 4.40DETENTION-HONOR FARM CORRECTIONAL DEPUTY II 22.00 22.00 22.00DETENTION-HONOR FARM CORRECTIONAL SERGEANT 4.00 4.00 4.0030-SHF Total 652.50 0.00 652.50 0.00 652.50
AG PRESERVATION/OPEN SPACESC AG PRES OPEN SPACE ACCOUNTING TECHNICIAN 1.00 1.00 1.00SC AG PRES OPEN SPACE ADMINISTRATIVE AIDE 2.00 2.00 2.00SC AG PRES OPEN SPACE OSD RECEPTIONIST 1.00 1.00 1.00SC AG PRES OPEN SPACE OSD EXECUTIVE SECRETARY 1.00 1.00 1.00SC AG PRES OPEN SPACE OSD TECHNICIAN 0.00 0.00 0.00SC AG PRES OPEN SPACE OSD LAND ACQUISITION SPECIALIST 0.00 0.00 0.00SC AG PRES OPEN SPACE OSD GENERAL MANAGER 1.00 1.00 1.00SC AG PRES OPEN SPACE OSD ADMINISTRATIVE-FISCAL MANAGER 1.00 1.00 1.00PLANNING OSD ASSOCIATE PLANNER 2.00 2.00 2.00PLANNING OSD CONSERVATION GIS ANALYST 1.00 1.00 1.00PLANNING OSD COMMUNITY RELATIONS MANAGER 1.00 1.00 1.00PLANNING OSD PROGRAM MANAGER 1.00 1.00 1.00

Permanent Position Allocationby Department and Job Class
Exhibit C
Page | 32
ACQUISITION OSD ASSISTANT PLANNER 1.00 1.00 1.00ACQUISITION OSD ASSOCIATE PLANNER 1.00 1.00 1.00ACQUISITION OSD LAND ACQUISITION SPECIALIST 2.00 2.00 2.00ACQUISITION OSD ACQUISITION ASSISTANT 1.00 1.00 1.00ACQUISITION OSD PROGRAM MANAGER 1.00 1.00 1.00STEWARDSHIP OSD PUBLIC INFORMATION SPECIALIST 1.00 1.00 1.00STEWARDSHIP OSD TECHNICIAN 4.00 4.00 4.00STEWARDSHIP OSD ASSOCIATE PLANNER 2.50 2.50 2.50STEWARDSHIP OSD STEWARD COORDINATOR 1.00 1.00 1.00STEWARDSHIP OSD PROGRAM MANAGER 1.00 1.00 1.0031-OSD Total 27.50 0.00 27.50 0.00 27.50
IND OFFICE OF LAW ENF REVIEW & OUTREACH (IOLERO)
IND OFFICE OF LAW ENFORCEMENT REVIEW AND OUTREACH ADMINISTRATIVE AIDE 1.00 1.00 1.00
IND OFFICE OF LAW ENFORCEMENT REVIEW AND OUTREACH
DIRECTOR INDEPENDENT OFF OF LAW ENF REV & OUTREA 1.00 1.00 1.00
32-LRO Total 2.00 0.00 2.00 0.00 2.00
WATER AGENCYWATER AGENCY ACCOUNT CLERK II 2.00 2.00 2.00WATER AGENCY SENIOR ACCOUNT CLERK 2.00 2.00 2.00WATER AGENCY ACCOUNTANT I 1.00 1.00 1.00WATER AGENCY ACCOUNTANT II 1.00 1.00 1.00WATER AGENCY ACCOUNTING TECHNICIAN 1.00 1.00 1.00WATER AGENCY ACCOUNTANT III 1.00 1.00 1.00WATER AGENCY ADMINISTRATIVE SERVICES OFFICER II 1.00 1.00 1.00WATER AGENCY ENGINEERING TECHNICIAN III 1.00 1.00 1.00WATER AGENCY ADMINISTRATIVE AIDE 1.00 1.00 1.00WATER AGENCY DEPARTMENT ANALYST 1.00 1.00 1.00WATER AGENCY ADMINISTRATIVE SERVICES OFFICER I 2.00 2.00 2.00WATER AGENCY TECHNICAL WRITING SPECIALIST 3.00 3.00 3.00WATER AGENCY PAYROLL CLERK 0.00 0.00 0.00WATER AGENCY ADMINISTRATIVE AIDE 1.00 1.00 1.00WATER AGENCY ADMINISTRATIVE SERVICES OFFICER II 1.00 1.00 1.00WATER AGENCY PAYROLL CLERK CONFIDENTIAL 1.00 1.00 1.00WATER AGENCY OFFICE ASSISTANT II 4.00 4.00 4.00WATER AGENCY SENIOR OFFICE ASSISTANT 2.00 2.00 2.00WATER AGENCY ADMINISTRATIVE AIDE 1.00 1.00 1.00WATER AGENCY DEPARTMENT ANALYST 1.00 1.00 1.00WATER AGENCY RISK MANAGEMENT ANALYST II 1.00 1.00 1.00WATER AGENCY RISK MANAGEMENT ANALYST III 1.00 1.00 1.00
WATER AGENCYWATER AGENCY RESOURCE PROGRAMS TECHNICIAN II 3.00 3.00 3.00
WATER AGENCYWATER AGENCY ENVIRONMENTAL SPECIALIST II 4.00 4.00 4.00
WATER AGENCYWATER AGENCY SENIOR ENVIRONMENTAL SPECIALIST 7.00 7.00 7.00
WATER AGENCYWATER AGENCY PRINCIPAL ENVIRONMENTAL SPECIALIST 4.00 4.00 4.00

Permanent Position Allocationby Department and Job Class
Exhibit C
Page | 33
WATER AGENCYWATER AGENCY ENVIRONMENTAL RESOURCES MANAGER 2.00 2.00 2.00
WATER AGENCYWATER AGENCY GOVERNMENTAL AFFAIRS MANAGER 1.00 1.00 1.00
WATER AGENCY WATER AGENCY PROGRAMS SPECIALIST II 2.00 2.00 2.00
WATER AGENCYWATER AGENCY PRINCIPAL PROGRAM SPECIALIST 1.00 1.00 1.00
WATER AGENCY WATER AGENCY PROGRAMS SPECIALIST II 1.00 1.00 1.00
WATER AGENCYWATER AGENCY PRINCIPAL PROGRAM SPECIALIST 1.00 1.00 1.00
WATER AGENCYWATER AGENCY SENIOR PROGRAMS SPECIALIST 1.00 1.00 1.00
WATER AGENCY WATER AGENCY PROGRAMS SPECIALIST II 1.00 1.00 1.00
WATER AGENCYWATER AGENCY PRINCIPAL PROGRAM SPECIALIST 1.00 1.00 1.00
WATER AGENCY WATER AGENCY PROGRAMS SPECIALIST II 1.00 1.00 1.00
WATER AGENCYWATER AGENCY PRINCIPAL PROGRAM SPECIALIST 1.00 1.00 1.00
WATER AGENCYWATER AGENCY SENIOR PROGRAMS SPECIALIST 3.00 3.00 3.00
WATER AGENCY TECHNICAL WRITING SPECIALIST 2.00 2.00 2.00WATER AGENCY ENGINEERING TECHNICIAN III 2.00 2.00 2.00WATER AGENCY WATER AGENCY ENGINEER IV 2.00 2.00 2.00WATER AGENCY WATER AGENCY PRINCIPAL ENGINEER 1.00 1.00 1.00WATER AGENCY WATER AGENCY PRINCIPAL ENGINEER 1.00 1.00 1.00WATER AGENCY WATER AGENCY ENGINEER IV 5.00 5.00 5.00WATER AGENCY PROJECT SPECIALIST 1.00 1.00 1.00
WATER AGENCYDEPARTMENT INFORMATION SYSTEMS SPECIALIST II 1.00 1.00 1.00
WATER AGENCY ENGINEERING TECHNICIAN III 1.00 1.00 1.00WATER AGENCY ENGINEERING TECHNICIAN IV 1.00 1.00 1.00WATER AGENCY WATER AGENCY CAD-GIS COORDINATOR 1.00 1.00 1.00
WATER AGENCYSENIOR GEOGRAPHIC INFORMATION TECHNICIAN 1.00 1.00 1.00
WATER AGENCY DEPUTY CHIEF ENGINEER 1.00 1.00 1.00WATER AGENCY WATER AGENCY PRINCIPAL ENGINEER 1.00 1.00 1.00WATER AGENCY DEPARTMENT ANALYST 1.00 1.00 1.00WATER AGENCY WATER AGENCY PRINCIPAL ENGINEER 1.00 1.00 1.00WATER AGENCY WATER AGENCY ENGINEER IV 5.00 5.00 5.00WATER AGENCY WATER AGENCY HYDROGEOLOGIST IV 2.00 2.00 2.00WATER AGENCY WATER AGENCY LAND SURVEYOR 1.00 1.00 1.00WATER AGENCY ENGINEERING TECHNICIAN III 3.00 3.00 3.00WATER AGENCY RIGHT OF WAY AGENT II 1.00 1.00 1.00WATER AGENCY SUPERVISING RIGHT OF WAY AGENT 1.00 1.00 1.00WATER AGENCY TECHNICAL WRITING SPECIALIST 3.75 3.75 3.75WATER AGENCY TECHNICAL WRITING MANAGER 1.00 1.00 1.00WATER AGENCY SECRETARY 1.00 1.00 1.00
WATER AGENCYWATER AGENCY DIVISION MGR ADMINISTRATIVE SERVICES 1.00 1.00 1.00
WATER AGENCYWATER AGENCY CHIEF ENGINEER-DIR OF GRNDWATER MGT 1.00 1.00 1.00

Permanent Position Allocationby Department and Job Class
Exhibit C
Page | 34
WATER AGENCY WATER AGENCY GENERAL MANAGER 1.00 1.00 1.00WATER AGENCY EXECUTIVE SECRETARY CONFIDENTIAL 1.00 1.00 1.00
WATER AGENCYWATER AGENCY ASSISTANT GENERAL MANAGER 1.00 1.00 1.00
WATER AGENCYWATER AGENCY ASSISTANT GENERAL MANAGER 1.00 1.00 1.00
WATER AGENCY WATER AGENCY COORDINATOR 1.00 1.00 1.00
WATER AGENCY WATER AGENCY MAINTENANCE WORKER II 2.00 2.00 2.00
WATER AGENCYWATER AGENCY MAINTENANCE WORKER III 2.00 2.00 2.00
WATER AGENCYWATER AGENCY LEAD MAINTENANCE WORKER 1.00 1.00 1.00
WATER AGENCYWATER AGENCY ENVIRONMENTAL COMPLIANCE INSPECTOR 2.00 2.00 2.00
WATER AGENCY WATER AGENCY MAINTENANCE WORKER II 2.00 2.00 2.00WATER AGENCY ACCOUNT CLERK II 1.00 1.00 1.00WATER AGENCY ENGINEERING TECHNICIAN III 1.00 1.00 1.00WATER AGENCY VEGETATION CONTROL ADVISOR 1.00 1.00 1.00WATER AGENCY WATER AGENCY COORDINATOR 1.00 1.00 1.00
WATER AGENCY WATER AGENCY MAINTENANCE WORKER II 5.00 5.00 5.00
WATER AGENCYWATER AGENCY MAINTENANCE WORKER III 6.00 6.00 6.00
WATER AGENCYWATER AGENCY LEAD MAINTENANCE WORKER 1.00 1.00 1.00
WATER AGENCY WATER AGENCY MECHANIC 1.00 1.00 1.00WATER AGENCY MATERIALS EQUIPMENT SPECIALIST 1.00 1.00 1.00WATER AGENCY WATER AGENCY COORDINATOR 3.00 3.00 3.00
WATER AGENCYWATER AGENCY LEAD MAINTENANCE WORKER 1.00 1.00 1.00
WATER AGENCY WATER AGENCY MECHANIC 17.00 17.00 17.00WATER AGENCY WATER AGENCY LEAD MECHANIC 6.00 6.00 6.00WATER AGENCY AUTOMOTIVE MECHANIC 1.00 1.00 1.00WATER AGENCY HEAVY EQUIPMENT MECHANIC II 2.00 2.00 2.00WATER AGENCY SENIOR OFFICE ASSISTANT 0.00 0.00 0.00WATER AGENCY SENIOR NETWORK ANALYST 1.00 1.00 1.00
WATER AGENCYWATER AGENCY RESOURCE PROGRAMS TECHNICIAN II 1.00 1.00 1.00
WATER AGENCYWATER AGENCY ENVIRONMENTAL SPECIALIST II 1.00 1.00 1.00
WATER AGENCY WATER AGENCY PROGRAMS SPECIALIST II 0.00 0.00 0.00
WATER AGENCYWATER AGENCY SENIOR PROGRAMS SPECIALIST 1.00 1.00 1.00
WATER AGENCY TECHNICAL WRITING SPECIALIST 1.00 1.00 1.00
WATER AGENCYWATER AGENCY DIV MGR - ENVIR RES & PUBLIC AFFAIRS 1.00 1.00 1.00
WATER AGENCY WATER AGENCY ENGINEER IV 1.00 1.00 1.00
WATER AGENCYWATER AGENCY PRINCIPAL HYDROGEOLOGIST 1.00 1.00 1.00
WATER AGENCYWATER AGENCY LEAD MAINTENANCE WORKER 1.00 1.00 1.00
WATER AGENCY SENIOR PROGRAMMER ANALYST 1.00 1.00 1.00

Permanent Position Allocationby Department and Job Class
Exhibit C
Page | 35
WATER AGENCY PROGRAMMER ANALYST 3.00 3.00 3.00
WATER AGENCY ENGINEERING PROGRAMMING MANAGER 1.00 1.00 1.00
WATER AGENCYWATER AGENCY SENIOR NETWORK ANALYST 2.00 2.00 2.00
WATER AGENCY WATER AGENCY PRINCIPAL ENGINEER 1.00 1.00 1.00
WATER AGENCYELECTRICIAN-INSTRUMENTATION TECHNICIAN 7.00 7.00 7.00
WATER AGENCY WATER AGENCY COORDINATOR 1.00 1.00 1.00WATER AGENCY WATER AGENCY CHEMIST 4.00 4.00 4.00WATER AGENCY ENGINEERING TECHNICIAN III 3.00 3.00 3.00WATER AGENCY WATER AGENCY PRINCIPAL ENGINEER 1.00 1.00 1.00WATER AGENCY WATER AGENCY ENGINEER IV 5.00 5.00 5.00WATER AGENCY WATER AGENCY COORDINATOR 3.00 3.00 3.00
WATER AGENCYWATER AGENCY SENIOR PLANT OPERATOR 16.00 16.00 16.00
33-WTR Total 226.75 0.00 226.75 0.00 226.75
TRANSPORTATION & PUBLIC WORKS
TRANSPORTATION/PUB WRKS ROAD MAINTENANCE WORKER II 2.00 2.00 2.00
TRANSPORTATION/PUB WRKS ROAD BRIDGE WORKER 4.00 4.00 4.00
TRANSPORTATION/PUB WRKS ROAD SENIOR BRIDGE WORKER 3.00 3.00 3.00
TRANSPORTATION/PUB WRKS ROAD BRIDGE SUPERVISOR 1.00 1.00 1.00
TRANSPORTATION/PUB WRKS ROAD MAINTENANCE WORKER II 9.00 9.00 9.00
TRANSPORTATION/PUB WRKS ROAD MAINTENANCE WORKER III 5.00 5.00 5.00
TRANSPORTATION/PUB WRKS ROAD MAINTENANCE SUPERVISOR 1.00 1.00 1.00
TRANSPORTATION/PUB WRKS ROAD OFFICE SUPPORT SUPERVISOR 1.00 1.00 1.00
TRANSPORTATION/PUB WRKS ROAD YARD CLERK 1.00 1.00 1.00
TRANSPORTATION/PUB WRKS ROAD MAINTENANCE WORKER II 1.00 1.00 1.00
TRANSPORTATION/PUB WRKS ROAD MAINTENANCE WORKER III 2.00 2.00 2.00
TRANSPORTATION/PUB WRKS ROAD MAINTENANCE WORKER II 3.00 3.00 3.00
TRANSPORTATION/PUB WRKS ROAD MAINTENANCE WORKER III 1.00 1.00 1.00
TRANSPORTATION/PUB WRKS ROAD MAINTENANCE SUPERVISOR 1.00 1.00 1.00
TRANSPORTATION/PUB WRKS ROAD MAINTENANCE WORKER II 4.00 4.00 4.00
TRANSPORTATION/PUB WRKS ROAD MAINTENANCE WORKER III 3.00 3.00 3.00
TRANSPORTATION/PUB WRKS ROAD MAINTENANCE SUPERVISOR 1.00 1.00 1.00
TRANSPORTATION/PUB WRKS ROAD MAINTENANCE WORKER II 5.00 5.00 5.00

Permanent Position Allocationby Department and Job Class
Exhibit C
Page | 36
TRANSPORTATION/PUB WRKS ROAD MAINTENANCE WORKER III 4.50 4.50 4.50
TRANSPORTATION/PUB WRKS ROAD VEGETATION SPECIALIST 1.00 1.00 1.00
TRANSPORTATION/PUB WRKS ROAD MAINTENANCE SUPERVISOR 1.50 1.50 1.50
TRANSPORTATION/PUB WRKS ROAD MAINTENANCE WORKER II 4.00 4.00 4.00
TRANSPORTATION/PUB WRKS ROAD MAINTENANCE WORKER III 3.00 3.00 3.00
TRANSPORTATION/PUB WRKS ROAD MAINTENANCE SUPERVISOR 1.00 1.00 1.00
TRANSPORTATION/PUB WRKS ROAD SENIOR OFFICE ASSISTANT 3.00 3.00 3.00
TRANSPORTATION/PUB WRKS ROAD SECRETARY 0.00 0.00 0.00
TRANSPORTATION/PUB WRKS ROADDEPARTMENT INFORMATION SYSTEMS MANAGER 1.00 1.00 1.00
TRANSPORTATION/PUB WRKS ROAD MATERIALS EQUIPMENT SPECIALIST 1.00 1.00 1.00
TRANSPORTATION/PUB WRKS ROAD PAYROLL CLERK 1.00 1.00 1.00
TRANSPORTATION/PUB WRKS ROAD SENIOR ACCOUNT CLERK 4.00 4.00 4.00
TRANSPORTATION/PUB WRKS ROAD DEPARTMENT ANALYST 4.00 4.00 4.00
TRANSPORTATION/PUB WRKS ROAD ADMINISTRATIVE SERVICES OFFICER I 1.00 1.00 1.00
TRANSPORTATION/PUB WRKS ROAD ADMINISTRATIVE SERVICES OFFICER II 1.00 1.00 1.00
TRANSPORTATION/PUB WRKS ROAD TECHNICAL WRITING SPECIALIST 1.00 1.00 1.00
TRANSPORTATION/PUB WRKS ROAD LICENSED LAND SURVEYOR 1.00 1.00 1.00
TRANSPORTATION/PUB WRKS ROAD ENGINEERING TECHNICIAN III 10.00 10.00 10.00
TRANSPORTATION/PUB WRKS ROAD ENGINEERING TECHNICIAN IV 5.00 5.00 5.00
TRANSPORTATION/PUB WRKS ROAD TRAFFIC SIGNAL TECHNICIAN 1.00 1.00 1.00
TRANSPORTATION/PUB WRKS ROAD ENGINEER 8.00 8.00 8.00
TRANSPORTATION/PUB WRKS ROAD SENIOR ENGINEER 4.00 4.00 4.00
TRANSPORTATION/PUB WRKS ROAD ENGINEERING DIVISION MANAGER 1.00 1.00 1.00
TRANSPORTATION/PUB WRKS ROADDEPUTY DIRECTOR TRANSPORTATION & OPERATIONS 1.00 1.00 1.00
TRANSPORTATION/PUB WRKS ROADDEPUTY DIRECTOR ENGINEERING & MAINTENANCE 1.00 1.00 1.00
TRANSPORTATION/PUB WRKS ROADDIRECTOR OF TRANSPORTATION & PUBLIC WORKS 1.00 1.00 1.00
TRANSPORTATION/PUB WRKS ROAD RIGHT OF WAY MANAGER 1.00 1.00 1.00
TRANSPORTATION/PUB WRKS ROAD GEOGRAPHIC INFORMATION TECHNICIAN II 1.00 1.00 1.00
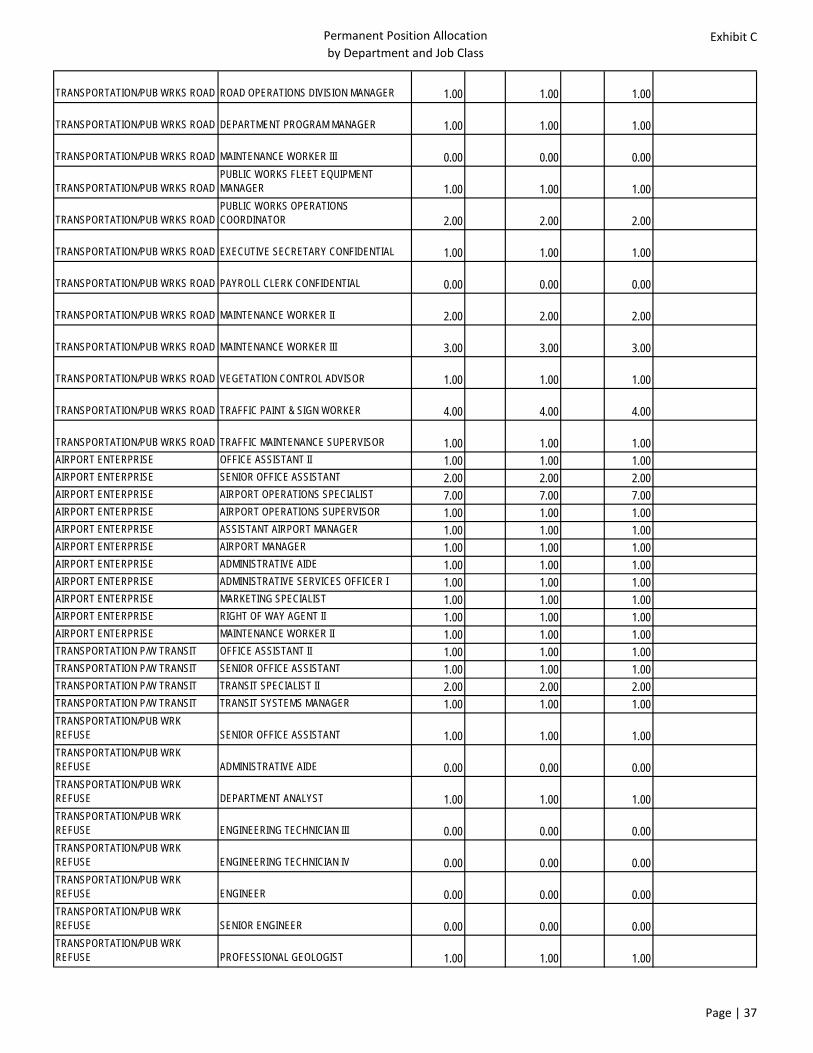
Permanent Position Allocationby Department and Job Class
Exhibit C
Page | 37
TRANSPORTATION/PUB WRKS ROAD ROAD OPERATIONS DIVISION MANAGER 1.00 1.00 1.00
TRANSPORTATION/PUB WRKS ROAD DEPARTMENT PROGRAM MANAGER 1.00 1.00 1.00
TRANSPORTATION/PUB WRKS ROAD MAINTENANCE WORKER III 0.00 0.00 0.00
TRANSPORTATION/PUB WRKS ROADPUBLIC WORKS FLEET EQUIPMENT MANAGER 1.00 1.00 1.00
TRANSPORTATION/PUB WRKS ROADPUBLIC WORKS OPERATIONS COORDINATOR 2.00 2.00 2.00
TRANSPORTATION/PUB WRKS ROAD EXECUTIVE SECRETARY CONFIDENTIAL 1.00 1.00 1.00
TRANSPORTATION/PUB WRKS ROAD PAYROLL CLERK CONFIDENTIAL 0.00 0.00 0.00
TRANSPORTATION/PUB WRKS ROAD MAINTENANCE WORKER II 2.00 2.00 2.00
TRANSPORTATION/PUB WRKS ROAD MAINTENANCE WORKER III 3.00 3.00 3.00
TRANSPORTATION/PUB WRKS ROAD VEGETATION CONTROL ADVISOR 1.00 1.00 1.00
TRANSPORTATION/PUB WRKS ROAD TRAFFIC PAINT & SIGN WORKER 4.00 4.00 4.00
TRANSPORTATION/PUB WRKS ROAD TRAFFIC MAINTENANCE SUPERVISOR 1.00 1.00 1.00AIRPORT ENTERPRISE OFFICE ASSISTANT II 1.00 1.00 1.00AIRPORT ENTERPRISE SENIOR OFFICE ASSISTANT 2.00 2.00 2.00AIRPORT ENTERPRISE AIRPORT OPERATIONS SPECIALIST 7.00 7.00 7.00AIRPORT ENTERPRISE AIRPORT OPERATIONS SUPERVISOR 1.00 1.00 1.00AIRPORT ENTERPRISE ASSISTANT AIRPORT MANAGER 1.00 1.00 1.00AIRPORT ENTERPRISE AIRPORT MANAGER 1.00 1.00 1.00AIRPORT ENTERPRISE ADMINISTRATIVE AIDE 1.00 1.00 1.00AIRPORT ENTERPRISE ADMINISTRATIVE SERVICES OFFICER I 1.00 1.00 1.00AIRPORT ENTERPRISE MARKETING SPECIALIST 1.00 1.00 1.00AIRPORT ENTERPRISE RIGHT OF WAY AGENT II 1.00 1.00 1.00AIRPORT ENTERPRISE MAINTENANCE WORKER II 1.00 1.00 1.00TRANSPORTATION P/W TRANSIT OFFICE ASSISTANT II 1.00 1.00 1.00TRANSPORTATION P/W TRANSIT SENIOR OFFICE ASSISTANT 1.00 1.00 1.00TRANSPORTATION P/W TRANSIT TRANSIT SPECIALIST II 2.00 2.00 2.00TRANSPORTATION P/W TRANSIT TRANSIT SYSTEMS MANAGER 1.00 1.00 1.00TRANSPORTATION/PUB WRK REFUSE SENIOR OFFICE ASSISTANT 1.00 1.00 1.00TRANSPORTATION/PUB WRK REFUSE ADMINISTRATIVE AIDE 0.00 0.00 0.00TRANSPORTATION/PUB WRK REFUSE DEPARTMENT ANALYST 1.00 1.00 1.00TRANSPORTATION/PUB WRK REFUSE ENGINEERING TECHNICIAN III 0.00 0.00 0.00TRANSPORTATION/PUB WRK REFUSE ENGINEERING TECHNICIAN IV 0.00 0.00 0.00TRANSPORTATION/PUB WRK REFUSE ENGINEER 0.00 0.00 0.00TRANSPORTATION/PUB WRK REFUSE SENIOR ENGINEER 0.00 0.00 0.00TRANSPORTATION/PUB WRK REFUSE PROFESSIONAL GEOLOGIST 1.00 1.00 1.00

Permanent Position Allocationby Department and Job Class
Exhibit C
Page | 38
TRANSPORTATION/PUB WRK REFUSE CODE ENFORCEMENT INSPECTOR II 0.00 0.00 0.00TRANSPORTATION/PUB WRK REFUSE DISPOSAL WORKER I 0.00 0.00 0.00TRANSPORTATION/PUB WRK REFUSE DISPOSAL WORKER II 0.00 0.00 0.00TRANSPORTATION/PUB WRK REFUSE DISPOSAL SUPERVISOR 0.00 0.00 0.00TRANSPORTATION/PUB WRK REFUSE
INTEGRATED WASTE OPERATIONS DIVISION MANAGER 1.00 1.00 1.00
TRANSPORTATION/PUB WRK REFUSE WASTE MANAGEMENT SPECIALIST II 3.00 3.00 3.00TRANSPORTATION/PUB WRK REFUSE REFUSE ENFORCEMENT SPECIALIST 1.00 1.00 1.00TRANSPORTATION/PUB WRK REFUSE
WASTE MANAGEMENT AGENCY EXECUTIVE DIRECTOR 1.00 1.00 1.00
TRANSPORTATION/PUB WRK REFUSE BUILDING MECHANIC II 0.00 0.00 0.00TRANSPORTATION/PUB WRK REFUSE LANDFILL FACILITIES SPECIALIST 1.00 1.00 1.00NORTHERN AIR POLLUTION CONTROL SENIOR OFFICE ASSISTANT 1.00 1.00 1.00NORTHERN AIR POLLUTION CONTROL AIR QUALITY SPECIALIST III 3.00 3.00 3.00NORTHERN AIR POLLUTION CONTROL AIR QUALITY ENGINEER 1.00 1.00 1.00NORTHERN AIR POLLUTION CONTROL AIR QUALITY MANAGER 1.00 1.00 1.0034-PWT Total 171.00 0.00 171.00 0.00 171.00
UC COOPERATIVE EXTENSIONUNIV OF CA COOP EXT ADMINISTRATIVE AIDE 1.00 1.00 1.00UNIV OF CA COOP EXT DEPARTMENT ANALYST 2.00 2.00 2.00
UNIV OF CA COOP EXTSENIOR AGRICULTURAL PROGRAM ASSISTANT 2.00 -1.00 1.00 1.00 1.0 Deleted vacant 12+
UNIV OF CA COOP EXT DEPARTMENT PROGRAM MANAGER 2.00 2.00 2.0035-UCC Total 7.00 -1.00 6.00 0.00 6.00
SONOMA COUNTY FAIRGROUNDSSONOMA COUNTY FAIRGROUNDS STOREKEEPER 1.00 1.00 1.00SONOMA COUNTY FAIRGROUNDS FAIRGROUNDS MAINTENANCE WORKER 2.00 2.00 2.00
SONOMA COUNTY FAIRGROUNDSSENIOR FAIRGROUNDS MAINTENANCE WORKER 3.00 3.00 3.00
SONOMA COUNTY FAIRGROUNDS AUTOMOTIVE MECHANIC 0.00 0.00 0.00SONOMA COUNTY FAIRGROUNDS HEAVY EQUIPMENT MECHANIC II 1.00 1.00 1.00SONOMA COUNTY FAIRGROUNDS BUILDING MECHANIC II 3.00 3.00 3.00
SONOMA COUNTY FAIRGROUNDSFAIR GROUNDS BUILDING SUPERINTENDENT 1.00 1.00 1.00
SONOMA COUNTY FAIRGROUNDS SECRETARY 1.00 1.00 1.00SONOMA COUNTY FAIRGROUNDS ACCOUNTING TECHNICIAN 2.00 2.00 2.00SONOMA COUNTY FAIRGROUNDS FAIR MANAGER 1.00 1.00 1.00
SONOMA COUNTY FAIRGROUNDSMARKETING AND PROMOTIONS COORDINATOR 1.00 1.00 1.00
SONOMA COUNTY FAIRGROUNDS FAIR FINANCIAL SERVICES OFFICER 1.00 1.00 1.00SONOMA COUNTY FAIRGROUNDS SIMULCAST ATTENDANT 0.75 0.75 0.75

Permanent Position Allocationby Department and Job Class
Exhibit C
Page | 39
SONOMA COUNTY FAIRGROUNDS SENIOR SIMULCAST ATTENDANT 1.00 1.00 1.00SONOMA COUNTY FAIRGROUNDS JANITOR 0.00 0.00 0.00SONOMA COUNTY FAIRGROUNDS SENIOR OFFICE ASSISTANT 1.00 1.00 1.00SONOMA COUNTY FAIRGROUNDS SECRETARY 1.00 1.00 1.00SONOMA COUNTY FAIRGROUNDS FAIRGROUNDS MAINTENANCE WORKER 2.00 2.00 2.00
SONOMA COUNTY FAIRGROUNDSSENIOR FAIRGROUNDS MAINTENANCE WORKER 3.00 3.00 3.00
SONOMA COUNTY FAIRGROUNDS DEPUTY FAIR MANAGER 1.00 1.00 1.00SONOMA COUNTY FAIRGROUNDS INTERIM EVENTS COORDINATOR 1.00 1.00 1.00SONOMA COUNTY FAIRGROUNDS BUILDING MECHANIC II 1.00 1.00 1.00
SONOMA COUNTY FAIRGROUNDSFAIRGROUND PREMIUM EXHIBIT ASSISTANT 1.00 1.00 1.00
SONOMA COUNTY FAIRGROUNDS PREMIUM AND EXHIBIT COORDINATOR 1.00 1.00 1.0080-FGS Total 30.75 0.00 30.75 0.00 30.75
4,111.70 35.70 4,147.40 0.00 4,147.40