A case study in Cottonlands, eThe - ResearchSpace@UKZN
187
i An Assessment of the Viability and Sustainability of the use of Humanure for Household Agricultural Purposes: A case study in Cottonlands, eThekwini Municipality By Vyasha Harilal (207504882) Submitted in fulfilment of the academic requirements for the: Master of Social Science Degree Geography and Environmental Management, School of Agriculture, Earth and Environmental Sciences, College of Agriculture, Engineering and Science University of KwaZulu-Natal (Howard College) King George V Avenue Durban South Africa
-
Upload
khangminh22 -
Category
Documents
-
view
0 -
download
0
Transcript of A case study in Cottonlands, eThe - ResearchSpace@UKZN
i
An Assessment of the Viability and Sustainability of the use of
Humanure for Household Agricultural Purposes: A case study in
Cottonlands, eThekwini Municipality
By
Vyasha Harilal (207504882)
Submitted in fulfilment of the academic requirements for the:
Master of Social Science Degree
Geography and Environmental Management,
School of Agriculture, Earth and Environmental Sciences,
College of Agriculture, Engineering and Science
University of KwaZulu-Natal (Howard College)
King George V Avenue
Durban
South Africa
ii
Declaration
I, Vyasha Harilal hereby declare that this dissertation, entitled: “An Assessment of the
Viability and Sustainability of the use of Humanure for Household Agricultural Purposes:
A case study in Cottonlands, eThekwini Municipality” is as a result of my own work and
has not been submitted in part or in full for any other degree, university or institution.
Vyasha Harilal Date
iii
Acknowledgements
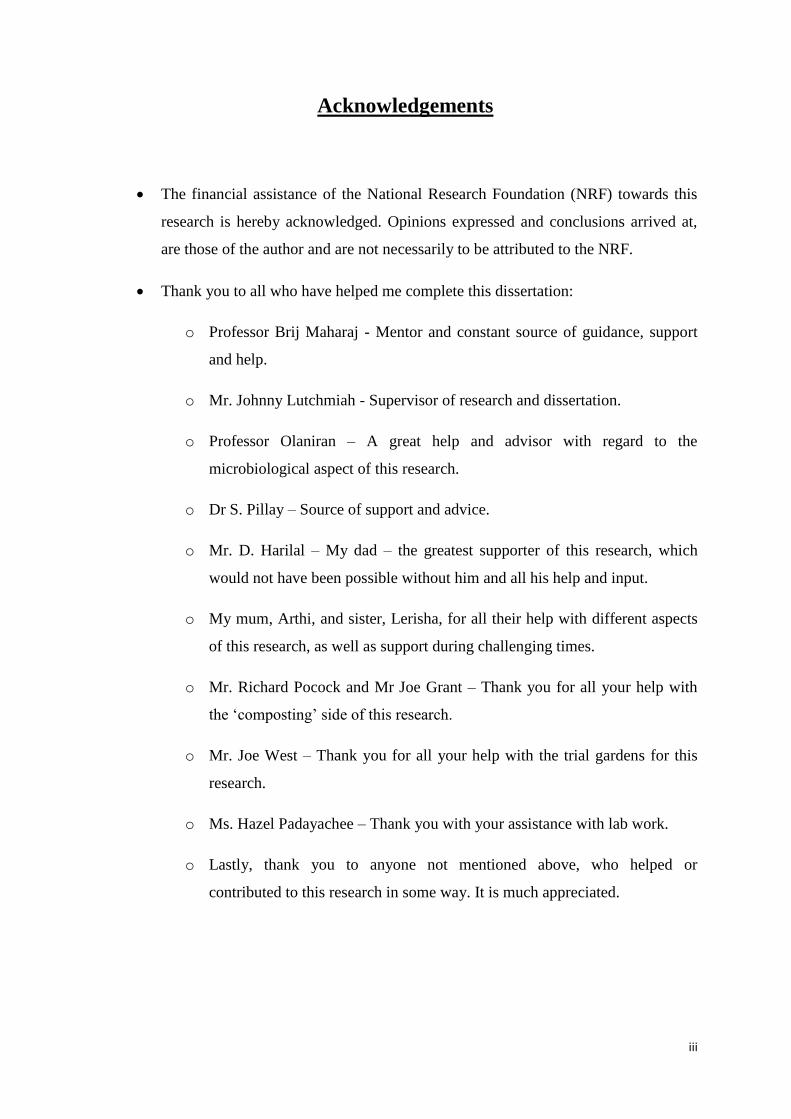
The financial assistance of the National Research Foundation (NRF) towards this
research is hereby acknowledged. Opinions expressed and conclusions arrived at,
are those of the author and are not necessarily to be attributed to the NRF.
Thank you to all who have helped me complete this dissertation:
o Professor Brij Maharaj - Mentor and constant source of guidance, support
and help.
o Mr. Johnny Lutchmiah - Supervisor of research and dissertation.
o Professor Olaniran – A great help and advisor with regard to the
microbiological aspect of this research.
o Dr S. Pillay – Source of support and advice.
o Mr. D. Harilal – My dad – the greatest supporter of this research, which
would not have been possible without him and all his help and input.
o My mum, Arthi, and sister, Lerisha, for all their help with different aspects
of this research, as well as support during challenging times.
o Mr. Richard Pocock and Mr Joe Grant – Thank you for all your help with
the ‘composting’ side of this research.
o Mr. Joe West – Thank you for all your help with the trial gardens for this
research.
o Ms. Hazel Padayachee – Thank you with your assistance with lab work.
o Lastly, thank you to anyone not mentioned above, who helped or
contributed to this research in some way. It is much appreciated.
iv
Abstract
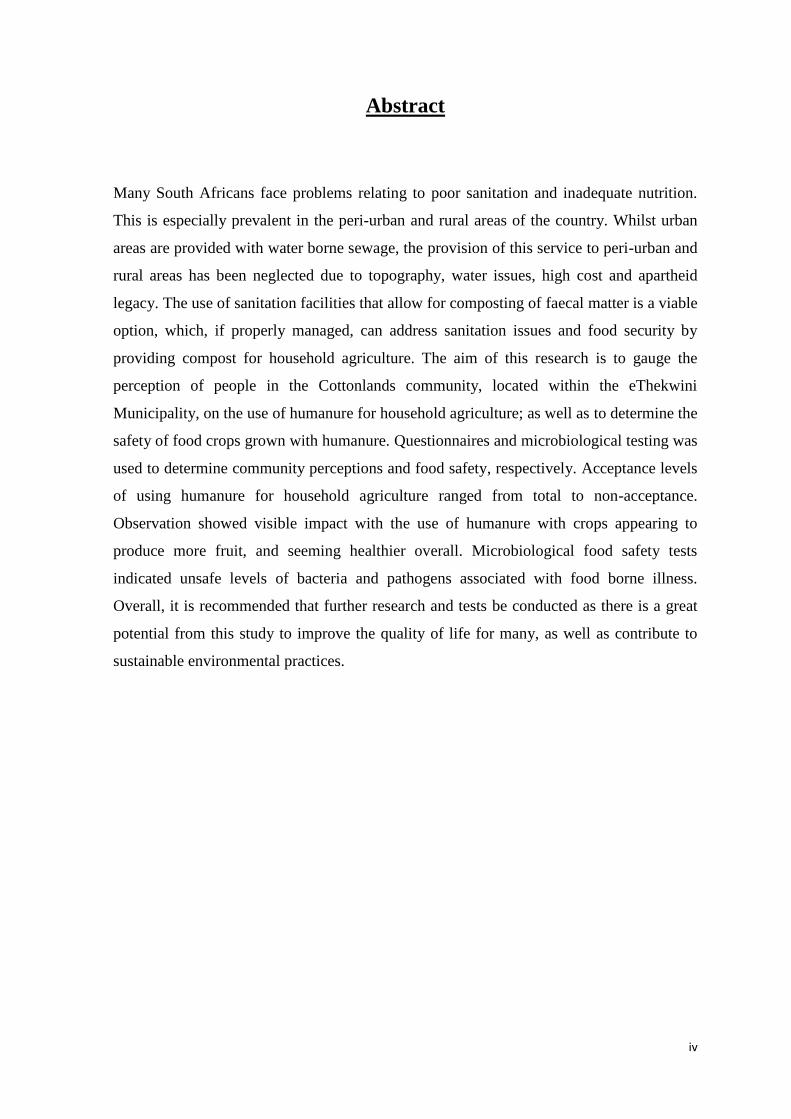
Many South Africans face problems relating to poor sanitation and inadequate nutrition.
This is especially prevalent in the peri-urban and rural areas of the country. Whilst urban
areas are provided with water borne sewage, the provision of this service to peri-urban and
rural areas has been neglected due to topography, water issues, high cost and apartheid
legacy. The use of sanitation facilities that allow for composting of faecal matter is a viable
option, which, if properly managed, can address sanitation issues and food security by
providing compost for household agriculture. The aim of this research is to gauge the
perception of people in the Cottonlands community, located within the eThekwini
Municipality, on the use of humanure for household agriculture; as well as to determine the
safety of food crops grown with humanure. Questionnaires and microbiological testing was
used to determine community perceptions and food safety, respectively. Acceptance levels
of using humanure for household agriculture ranged from total to non-acceptance.
Observation showed visible impact with the use of humanure with crops appearing to
produce more fruit, and seeming healthier overall. Microbiological food safety tests
indicated unsafe levels of bacteria and pathogens associated with food borne illness.
Overall, it is recommended that further research and tests be conducted as there is a great
potential from this study to improve the quality of life for many, as well as contribute to
sustainable environmental practices.
v
Abbreviations
- National Research Foundation (NRF)
- Urine Diversion Toilets (UDT)
- Ventilated Improved Pit latrines (VIP)
- Sustainable Livelihood Framework (SLF)
- Genetically modified organisms (GMO’S)
- Heterotrophic or Standard Plate Count (HPC)
- Escherichia coli (E. coli)
- Klebsiella pneumonia (K. pneumoniae)
- Enterobacteramnigenus (E. amnigenus)
- Citrobacterfreundii (C. freundii)
- European Union (EU)
- Haemolytic Uraemic Syndrome (HUS)
- Statistical Package for Social Science (SPSS)
- African National Congress (ANC)
- NPK (nitrogen, phosphorus and potassium)
- Too numerous to count (TNTC)
- The South African Department of Health (DoH)
- Colony Forming Units (CFU)
vi
Table of Contents
Chapter One ............................................................................................................................... 1
Introduction and Problem Contextualization ............................................................................. 1
1.1. Preamble ............................................................................................................................. 1
1.2. Contextualization of Problem ............................................................................................. 3
1.2.1. The Problem ................................................................................................................. 3
1.2.2. Rationale for Study ...................................................................................................... 5
1.3. Aims and Objectives ........................................................................................................... 6
1.3.1. Aim of Study ................................................................................................................ 6
1.3.2. Objectives .................................................................................................................... 7
1.4. Chapter Sequence and Summation ..................................................................................... 7
1.5. Conclusion .......................................................................................................................... 8
Chapter Two ............................................................................................................................ 10
Theoretical Framework and Literature review ........................................................................ 10
2.1. Introduction ...................................................................................................................... 10
2.2. Theoretical Framework..................................................................................................... 10
2.2.1. The theory of waste management - Zero-waste management ................................... 10
2.2.2. The Sustainable Livelihoods Framework .................................................................. 15
2.2.2.1. Livelihood Assets .................................................................................................... 17
2.2.2.2. Vulnerability Context .............................................................................................. 18
2.2.2.3. Principles of the SLF .............................................................................................. 19
2.3. Literature Review ............................................................................................................. 21
2.3.1. Agriculture ................................................................................................................. 21
2.3.3. Compost and Humanure ............................................................................................ 26
2.3.4. Pathogens ................................................................................................................... 28
vii
2.3.4.1. Indicator Pathogens ................................................................................................ 29
2.3.5.1. Surface and Internal Contamination of produce .................................................... 40
2.3.6. Case study: E.coli contamination of fresh vegetable produce in Germany - 2011 .... 40
2.4. Conclusion ........................................................................................................................ 43
Chapter Three .......................................................................................................................... 44
Study Area and Methodology .................................................................................................. 44
3.1. Introduction ...................................................................................................................... 44
3.2. Background of Study Area ............................................................................................... 44
3.3. Methodology ..................................................................................................................... 49
3.3.1. Methods and Techniques ........................................................................................... 49
3.3.2. Non-probability Sampling ......................................................................................... 49
3.3.2.1 Purposive Sampling or Judgment Sampling ............................................................ 50
3.3.2.2 Convenience or Accidental sampling....................................................................... 50
3.3.3. Sample Size ................................................................................................................ 51
3.3.4. Surveys ....................................................................................................................... 51
3.3.5. Secondary data ........................................................................................................... 52
3.4. Methodology Chosen for this research ............................................................................. 53
3.4.1. Qualitative Methods ................................................................................................... 53
3.4.2. Quantitative Methods ................................................................................................. 53
3.4.3. Humanure ................................................................................................................... 54
3.4.4. Trial Gardens ............................................................................................................. 56
3.4.5. Produce Testing ......................................................................................................... 58
3.4.5.1. Food Safety Tests – Method .................................................................................... 58
3.4.6. Plate Count and Colony Forming Units (CFU) ......................................................... 61
3.5. Limitations and Challenges .............................................................................................. 62
3.6. Conclusion ........................................................................................................................ 63
Chapter Four ............................................................................................................................ 64
viii
Analysis and Discussion of Results ......................................... Error! Bookmark not defined.
4.1. Introduction ...................................................................................................................... 64
4.2. Demographics ................................................................................................................... 64
4.3. Water Access and Storage ................................................................................................ 69
4.4. Sanitation .......................................................................................................................... 72
4.5. Compost, Humanure and Household Agriculture ............................................................ 78
4.6. Humanure analysis ........................................................................................................... 94
4.6.1. Minimal Infective Doses ............................................................................................ 95
4.6.2. Humanure Sample Analysis and Discussion ............................................................. 95
4.7. Food Safety tests ............................................................................................................... 99
4.7.1. Food Safety - Results ................................................................................................. 99
4.6.2. Food safety – Discussion ......................................................................................... 116
4.7. Plant Health .................................................................................................................... 123
4.7.1. Visible Analysis - Results ........................................................................................ 123
4.7.2. Visual Analysis - Discussion ................................................................................... 143
4.8. Conclusion ...................................................................................................................... 144
Chapter Five .......................................................................................................................... 145
Summary of Key Findings, Recommendations and Conclusion ........................................... 145
5.1. Introduction .................................................................................................................... 145
5.2. Summary of Key Findings .............................................................................................. 145
5.2.1. Social Acceptability ................................................................................................. 145
5.2.2. Humanure Preparation ............................................................................................. 147
5.2.3. Food Safety .............................................................................................................. 148
5.3. Recommendations .......................................................................................................... 149
5.4. Conclusion ...................................................................................................................... 151
References ............................................................................................................................. 154
Appendix ............................................................................................................................... 166
ix
COMMUNITY PERCEPTION OF COMPOSTING HUMAN WASTE FOR
AGRICULTURAL PURPOSES SURVEY .......................................................................... 167
Ethical Clearance Letter ........................................................................................................ 172
x
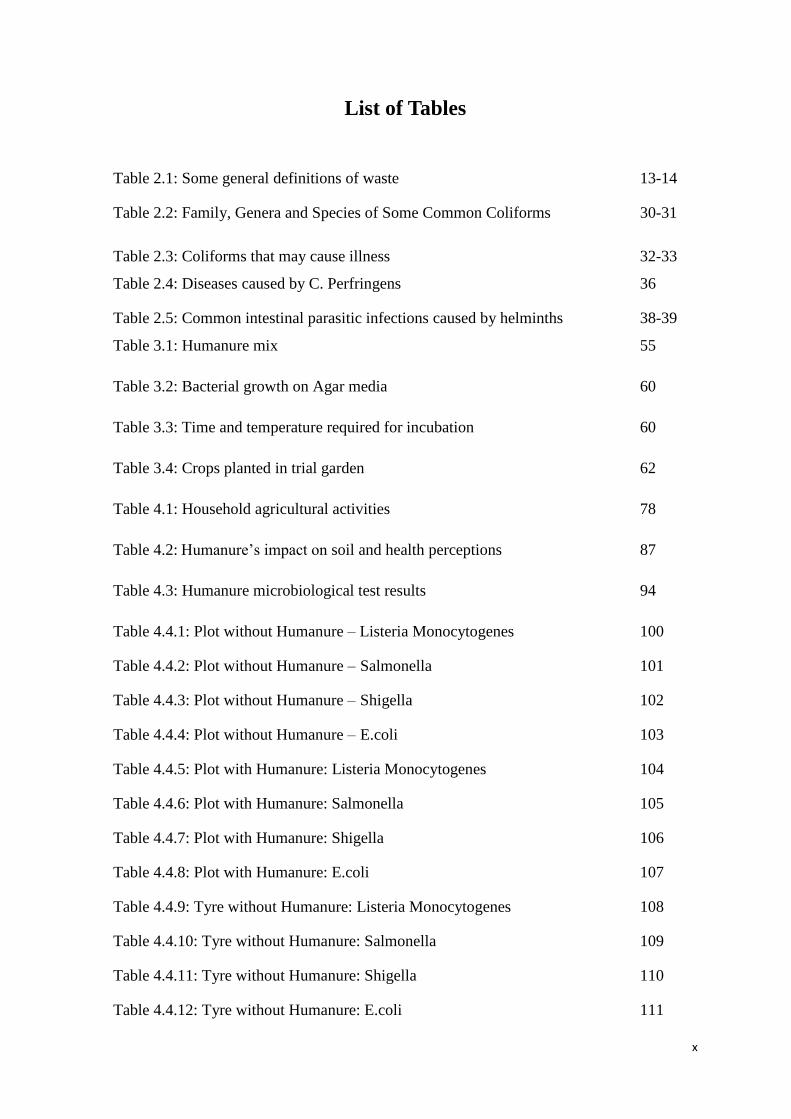
List of Tables
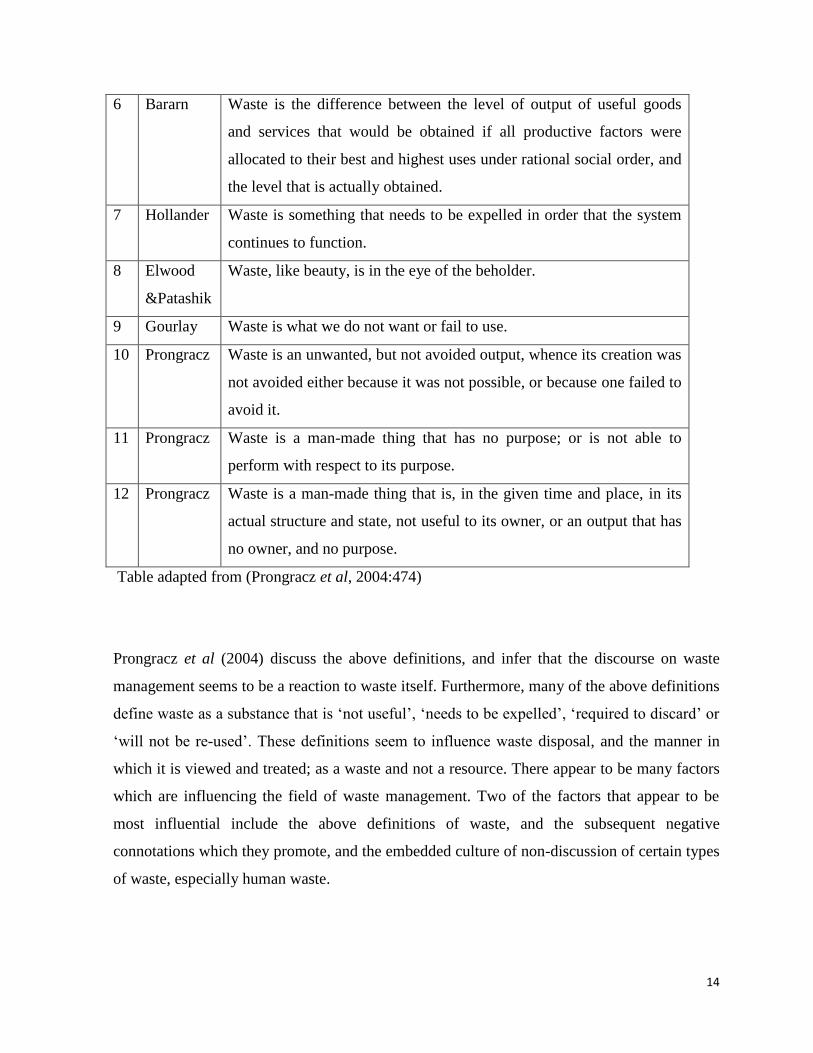
Table 2.1: Some general definitions of waste 13-14
Table 2.2: Family, Genera and Species of Some Common Coliforms 30-31
Table 2.3: Coliforms that may cause illness 32-33
Table 2.4: Diseases caused by C. Perfringens 36
Table 2.5: Common intestinal parasitic infections caused by helminths 38-39
Table 3.1: Humanure mix 55
Table 3.2: Bacterial growth on Agar media 60
Table 3.3: Time and temperature required for incubation 60
Table 3.4: Crops planted in trial garden 62
Table 4.1: Household agricultural activities 78
Table 4.2: Humanure’s impact on soil and health perceptions 87
Table 4.3: Humanure microbiological test results 94
Table 4.4.1: Plot without Humanure – Listeria Monocytogenes 100
Table 4.4.2: Plot without Humanure – Salmonella 101
Table 4.4.3: Plot without Humanure – Shigella 102
Table 4.4.4: Plot without Humanure – E.coli 103
Table 4.4.5: Plot with Humanure: Listeria Monocytogenes 104
Table 4.4.6: Plot with Humanure: Salmonella 105
Table 4.4.7: Plot with Humanure: Shigella 106
Table 4.4.8: Plot with Humanure: E.coli 107
Table 4.4.9: Tyre without Humanure: Listeria Monocytogenes 108
Table 4.4.10: Tyre without Humanure: Salmonella 109
Table 4.4.11: Tyre without Humanure: Shigella 110
Table 4.4.12: Tyre without Humanure: E.coli 111
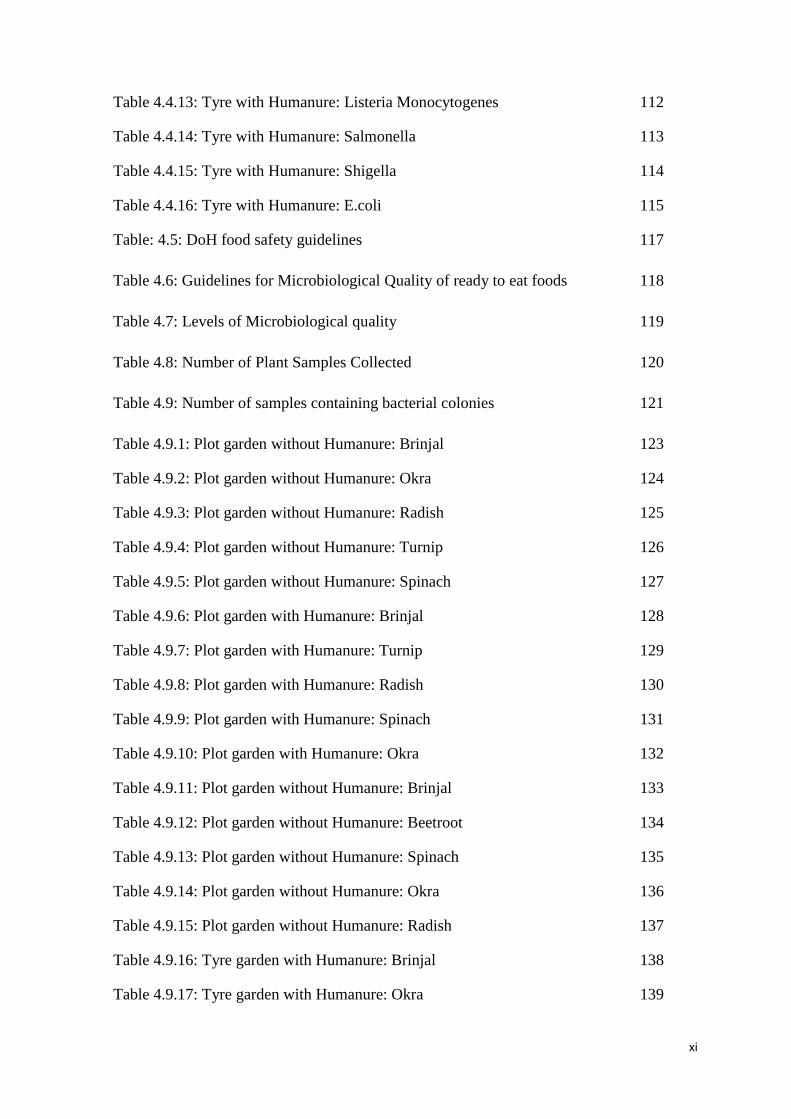
xi
Table 4.4.13: Tyre with Humanure: Listeria Monocytogenes 112
Table 4.4.14: Tyre with Humanure: Salmonella 113
Table 4.4.15: Tyre with Humanure: Shigella 114
Table 4.4.16: Tyre with Humanure: E.coli 115
Table: 4.5: DoH food safety guidelines 117
Table 4.6: Guidelines for Microbiological Quality of ready to eat foods 118
Table 4.7: Levels of Microbiological quality 119
Table 4.8: Number of Plant Samples Collected 120
Table 4.9: Number of samples containing bacterial colonies 121
Table 4.9.1: Plot garden without Humanure: Brinjal 123
Table 4.9.2: Plot garden without Humanure: Okra 124
Table 4.9.3: Plot garden without Humanure: Radish 125
Table 4.9.4: Plot garden without Humanure: Turnip 126
Table 4.9.5: Plot garden without Humanure: Spinach 127
Table 4.9.6: Plot garden with Humanure: Brinjal 128
Table 4.9.7: Plot garden with Humanure: Turnip 129
Table 4.9.8: Plot garden with Humanure: Radish 130
Table 4.9.9: Plot garden with Humanure: Spinach 131
Table 4.9.10: Plot garden with Humanure: Okra 132
Table 4.9.11: Plot garden without Humanure: Brinjal 133
Table 4.9.12: Plot garden without Humanure: Beetroot 134
Table 4.9.13: Plot garden without Humanure: Spinach 135
Table 4.9.14: Plot garden without Humanure: Okra 136
Table 4.9.15: Plot garden without Humanure: Radish 137
Table 4.9.16: Tyre garden with Humanure: Brinjal 138
Table 4.9.17: Tyre garden with Humanure: Okra 139

xii
Table 4.9.18: Tyre garden with Humanure: Radish 140
Table 4.9.19: Tyre garden with Humanure: Spinach 141
Table 4.9.20: Tyre garden with Humanure: Beetroot 142
xiii
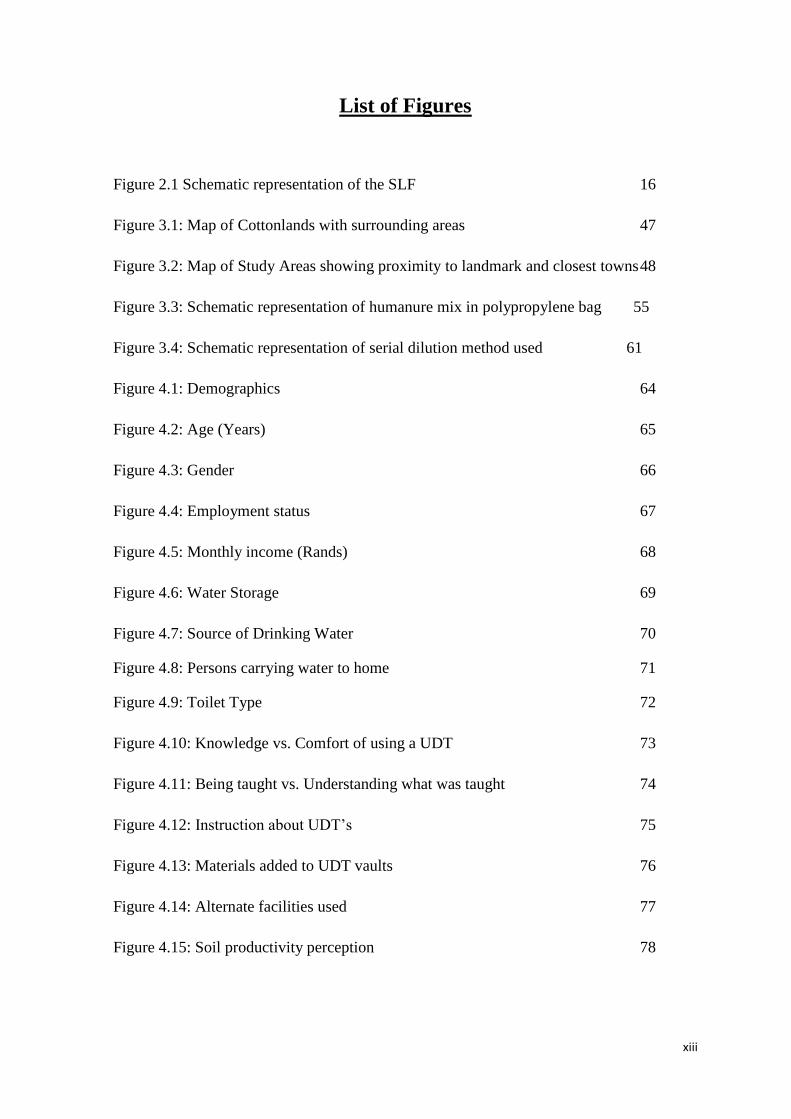
List of Figures
Figure 2.1 Schematic representation of the SLF 16
Figure 3.1: Map of Cottonlands with surrounding areas 47
Figure 3.2: Map of Study Areas showing proximity to landmark and closest towns 48
Figure 3.3: Schematic representation of humanure mix in polypropylene bag 55
Figure 3.4: Schematic representation of serial dilution method used 61
Figure 4.1: Demographics 64
Figure 4.2: Age (Years) 65
Figure 4.3: Gender 66
Figure 4.4: Employment status 67
Figure 4.5: Monthly income (Rands) 68
Figure 4.6: Water Storage 69
Figure 4.7: Source of Drinking Water 70
Figure 4.8: Persons carrying water to home 71
Figure 4.9: Toilet Type 72
Figure 4.10: Knowledge vs. Comfort of using a UDT 73
Figure 4.11: Being taught vs. Understanding what was taught 74
Figure 4.12: Instruction about UDT’s 75
Figure 4.13: Materials added to UDT vaults 76
Figure 4.14: Alternate facilities used 77
Figure 4.15: Soil productivity perception 78
xiv
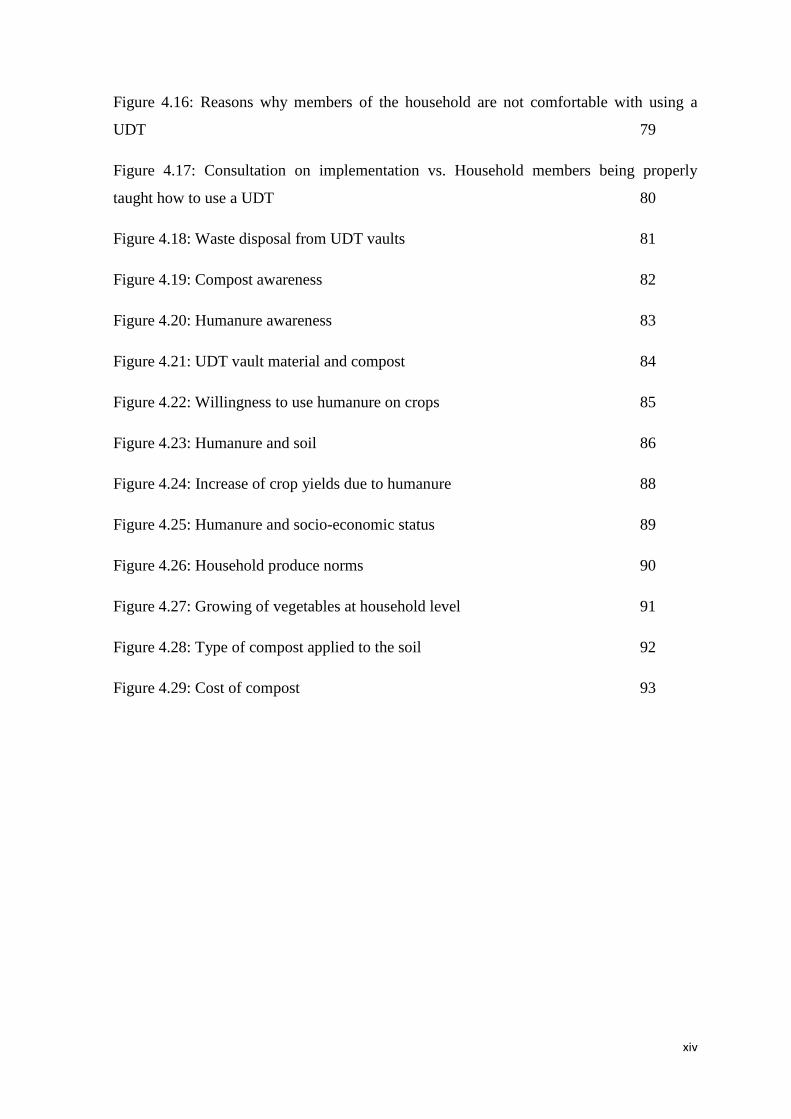
Figure 4.16: Reasons why members of the household are not comfortable with using a
UDT 79
Figure 4.17: Consultation on implementation vs. Household members being properly
taught how to use a UDT 80
Figure 4.18: Waste disposal from UDT vaults 81
Figure 4.19: Compost awareness 82
Figure 4.20: Humanure awareness 83
Figure 4.21: UDT vault material and compost 84
Figure 4.22: Willingness to use humanure on crops 85
Figure 4.23: Humanure and soil 86
Figure 4.24: Increase of crop yields due to humanure 88
Figure 4.25: Humanure and socio-economic status 89
Figure 4.26: Household produce norms 90
Figure 4.27: Growing of vegetables at household level 91
Figure 4.28: Type of compost applied to the soil 92
Figure 4.29: Cost of compost 93

xv
List of Plates
Plate 1: Applied and Non-Applied plots 56
Plate 2: Prepared tyres lined with plastic and planted tyres 57
Plate 3: Nearly complete tyre garden 58
1
Chapter One
Introduction and Problem Contextualization
1.1. Preamble
South Africa faces many problems that stem from its torrid apartheid legacy, which inter alia
include poor sanitation, wide spread poverty and health conditions, food insecurity, and land
and soil degradation. Many of these issues have had severe negative effects on the quality of
life of rural black communities; and are perpetuated by high levels of poverty in the
democratic era. Some of the factors which exacerbate poverty levels include the lack of
education, healthcare, and basic provisions such as food, potable water and housing.
Consequently, the poor are trapped in a vicious cycle. Without proper healthcare, education
and having his/her basic needs being met, an individual may be classed as poverty stricken.
Similarly, as a result of being poverty stricken, access to education, healthcare and basic
amenities to meet basic needs (food, shelter and sanitation) is severely limited.
A potential solution that may alleviate some of the problems that are currently faced by the
rural poor is a system of aerobic thermophilic composting, which reconstitutes human excreta
as well as other organic waste into a natural and enriched compost and soil conditioner, known
as humanure. The resultant compost derived from this system, commonly known as humanure,
may be used for agricultural purposes and home gardens, which may increase food security for
many people, as well as contribute to land and soil rehabilitation. Additionally, the conversion
of human excreta for agricultural purposes eliminates the problem of human waste disposal, as
well as the associated health, safety and hygiene effects of incorrect disposal and management.
Land degradation is a major issue in South Africa, as it impacts significantly on agriculture
and food security (Gibson et al., 2005; Scherr, 1999). Soil erosion, desertification and
vegetation loss are all forms of land degradation. Desertification and land degradation are two
2
of the most critical global environmental issues which are intricately linked with issues of food
security, poverty and urbanization. As 91% of South Africa comprises land that is susceptible
to desertification and a large proportion of the population is dependent on livelihoods derived
from the natural resource base, it is clearly a critical issue for the country (Gibson et al.,
2005). Soil degradation or erosion is most severe and generally perceived to be occurring at
an increasing rate in most communal croplands, grazing lands and settlements in South Africa
(Gibson et al., 2005). This is due to overcrowding, poor farming techniques and overgrazing
due to high stocking rates. Soil degradation in the form of fluvial affects about 70% of the
land in South Africa (Gibson et al., 2005).
Land productivity is intricately linked to social, political and environmental issues. Land
degradation is perceived to be particularly severe in communal areas and is a serious threat to
the sustained supply of ecosystem services, household food security, biodiversity and
livelihoods. Although 80% of the land surface area in South Africa is used for agriculture and
subsistence livelihoods, only about 11% has arable potential (Gibson et al., 2005). The amount
of arable land in South Africa is minimal due to climatic (water scarcity, drought),
environmental (soil composition) and socio-economic and political factors (apartheid land
policies). It is thus vital that this small percentage of arable land is managed and used in a
sustainable manner in order to maintain food security and minimise the levels of land
degradation.
Measures to preserve, conserve and rehabilitate soil need to be taken, as food security is
directly linked to the productivity of the land. The use of humanure as a soil conditioner may
be a cost effective method of contributing to the rehabilitation of degraded land, and of
maintaining the good health of productive soil. This may be attributed to the increase of
organic matter and essential nutrients from the soil conditioner or compost added to the soil
(Polprasert, 1996). If the good health of soil is maintained, it is likely that food security may
be achieved through agricultural practises. Soil productivity may be maintained through the
3
use of humanure, which imparts essential nutrients into the soil, ensuring that agricultural
practises are able to transpire.
1.2. Contextualization of Problem
1.2.1. The Problem
The lack of access to and provision of proper sanitation facilities has resulted in the poor state
of sanitation, both nationally and locally. In an attempt to combat this problem of inadequate
sanitation facilities, eThekwini municipality has installed more than eighty-five thousand
Urine Diversion Toilets (UDT) throughout the peri-urban and rural areas of the city (Buckley,
2010). The UDT’s that were installed in the eThekwini Municipality were in response to the
many problems that are associated with the Ventilated Improved Pit latrines (VIP) that were
being used by those who did not have access to water-borne sewage systems. UDT’s may be
classified as part of the dry sanitation movement (CSIR, 2000). Within the context of the
eminent shortage of usable and potable water, there are many to provide water-borne sewage
facilities to all citizens of the country. Furthermore, terrain and monetary constraints results in
citizens located in peri-urban and rural areas are not connected to a system of water-borne
sewage (Buckley et al .n.d.).
Through the provision of UDT’s, the city of Durban’s eThekwini Municipality has managed to
provide sanitation facilities for more than eighty-five thousand people within the municipality
(Buckley, 2010; Bell et al, 2010). However, the issue of what is to be done with the output
from the UDT’s is yet to be determined (Bell et al, 2010). Furthermore, through recent
investigation of UDT’s in the Municipality, it would seem that the system is not functioning in
the manner that was anticipated. This problem may stem from a lack of proper education and
effective monitoring of the utilization of UDT’s. Moreover, the stigma attached to the use of
UDT’s may also be partially responsible for the failure of the system (Wilkinson et al, n.d.).
4
The health impacts of poor sanitation are severe, as water contaminated by waste can lead to
outbreaks of diseases such as cholera and other water-borne diseases. For examples, there was
a cholera outbreak in parts of Kwa-Zulu Natal in the year of 2000 (Bell et al, 2010). Since
many people do not have access to proper sanitation, pits dug in the ground or on the banks of
rivers are used as lavatories. This has a serious impact in terms of the resultant pollution and
contamination of rivers, as well as ground water, due to the presence of pathogenic bacteria
and micro-organisms (Emmanuel, 2009).
The composting process, however, ensures that pathogens from faecal matter are destroyed,
thus rendering compost from human waste to be non-toxic and useful for soil enrichment. The
process involves faecal matter and other organic material being subjected to high temperatures
over a certain period of time in aerobic conditions (Golueke, 1972).
Apart from potential health impacts that may result from poor sanitation and an inefficient
composting system, it is essential to consider the presence of pathogens in soil. Pathogens
present in soil may become resident in edible plants grown in said soil during their growth
phase. If consumed, such produce may have serious negative impacts on the health and well-
being of those who consume the produce. As a result, food security may not necessarily be
enhanced if produce grown is unsafe for consumption. This highlights an important link
between microbial levels in produce, food safety and food security; a connection that will be
explored through this investigation.
Hence, through the use of this system of composting human waste, fertiliser of the highest
quality is produced, and the risks associated with human waste in terms of health concerns are
eliminated (Were, 2007). Composting is a fairly common concept. However, the idea of
composting human waste, in addition to other organic waste is not one that is widely accepted.
It is difficult to get rid of human waste (Jenkins, 2005). However, it is one of the most
important types of waste material that needs to be dealt with as every single person on the
5
planet produces this type of waste (Jenkins, 2005). Therefore, finding a sustainable manner in
which to deal with this type of waste is imperative.
It has already been established that disposing of untreated waste in the ground or in water
systems is dangerous and can be hazardous to the environment and human health. Diverting
all sewage to waste water treatment plants is not possible either. As previously mentioned, this
is due to financial constraints, as well as the unsustainable nature of providing water-borne
sewage to the entire population of the country, within the context of the imminent shortage of
potable water. Furthermore, terrain in certain areas does not allow for infrastructure to be put
in place, as areas may be excessively hilly and uneven (Buckley et al, n.d.).
Due to the direct benefit of improved sanitation that this system promotes, health and
nutritional levels of the community will also improve due to the enhanced quality and physical
condition of the land (Were, 2007).
1.2.2. Rationale for Study
Against the above background, the problem that this research hopes to address relates to waste
management, or more specifically, human waste management, and food security. It is a fact
that each and every person on this planet produces waste. Although the amount of waste that
each person produces may vary, depending on diet, it is not something that can or should be
avoided (Polprasert, 1996). Waste may have several damaging impacts on the physical
environment, if not tended to in the appropriate manner (Polprasert, 1996; Sharma et al, 1997).
Therefore, a solution needs to be found with regard to what is to be done with human waste
that is not taken care of by water-borne sewage technology. It is of increasing concern that the
amount of arable land in our country is rapidly decreasing, a fact which may be largely
attributed to the incorrect use of the land (Gibson et al., 2005).
6
Hence, the motivation of this study is based primarily within the field of human waste disposal
and household agriculture. The researcher assumes that if human waste, which is available in
abundant quantities at no cost, can be reconstituted into a soil conditioner, this will aid in
rehabilitating the land and enable households to produce sufficient yields, with subsequent
achievement of food security. In short, the problem identification is firstly, that not everybody
has access to modern sanitation technology, namely, water borne sewage. Therefore, a
solution needs to be found for those who do not have access to this technology, as current
solutions are not functioning as anticipated. Secondly, an increasing percentage of the
population lack food security, as the land that is being cultivated does not have the capacity to
produce yields, and that the price of chemical fertilizers is higher than many can afford.
Water-borne sewage facilities are costly and somewhat unsustainable, due to the use and
quantity of water that these systems require (Buckley, 2010). Water is a precious resource that
is fast becoming scarce. Consequently, waterless methods, or methods that require a smaller
amount of water when dealing with this type of waste will be invaluable. One such community
that lacks water-borne sewage facilities, and has to rely on UDT’s as the main form of
sanitation system is Cottonlands, situated north of Durban, within the boundaries of the
eThekwini Municipality. This community, apart from lacking water borne sewage systems, is
also, to a large extent, dependent on household agriculture for food security. Hence, it is a
suitable case study for the research that is being undertaken.
1.3. Aims and Objectives
1.3.1. Aim of Study
- To assess the viability and sustainability of the use of humanure for household
agricultural purposes with specific reference to Cottonlands in the eThekwini
Municipality.
7
1.3.2. Objectives
- To ascertain the Cottonlands community’s perception of the use of humanure for
small-scale agriculture.
- To investigate the process of producing humanure.
- To evaluate the health and safety risks associated with the use of humanure.
- To determine the effectiveness of using humanure for agricultural purposes.
1.4. Chapter Sequence and Summation
The introductory chapter of this dissertation comprises of an introduction to the research topic
being undertaken, as well as a background to the research problem. The study will be
contextualized through an explanation of the origin of the problem, and the rationale for the
study. Furthermore, this introductory chapter details the aims and objectives of this
dissertation, which are critical components of the study that will aid in ensuring that the
research remains focused and defined.
This will be followed by a comprehensive review of principle theories, frameworks,
approaches and literature upon which this dissertation will be based. Principle theories
relevant to this dissertation are related to zero waste management and the theory on waste
management. The sustainable livelihoods framework is also a fundamental element of what
will be the theoretical review. Furthermore, the theoretical review will include detailed
discussions on pertinent issues related to the research topic, citing relevant scholarly articles,
books and other appropriate academic material. Issues such as the potential health impacts of
the incorrect use of human waste; organic agriculture; food security; waste disposal and land
degradation and restoration will be discussed in detail in this chapter. Case studies of countries
that have embraced the concept of using humanure will also feature in this part of the study.
8
A description of the study area and the methodology for this investigation will be highlighted
in the third chapter of this dissertation. This study will employ a mixed method approach, in
terms of using both qualitative and quantitative methods. Surveys will be carried out with
households from the study area in an attempt to gain the communities’ perception towards the
use of humanure. The method of composting human waste, the analysis of the resultant
humanure, and a microbiological analysis of the produce grown in the trial gardens will be
discussed to achieve the objectives of this research.
The emphasis on the fourth and penultimate chapter of this dissertation will be on a
presentation of the results obtained from the implementation of the methodology described in
the previous chapter; as well as an analysis and discussion of such results. Graphical and
tabular representations will feature prominently in this chapter.
The fifth and final chapter will include an evaluation of the research. As a final point,
recommendations and an overall conclusion will be presented in this chapter.
1.5. Conclusion
This chapter has served to introduce the topic of this study – ‘An assessment of the viability
and sustainability of the use of humanure for household agricultural purposes’. Agriculture
forms an integral aspect of the livelihoods of many people who reside in peri-urban and rural
areas. In many cases, agricultural activities are the source of food security. Waste management
is a critical issue that needs to be addressed urgently, as the improper disposal and
management of waste has the potential to seriously and negatively affect agricultural
production, as well as cause severe health disorders in communities. The management of
waste, specifically human waste, can be directly linked to agricultural production, as human
waste can be reconstituted into a compost or soil conditioner, commonly known as humanure.
This study aims to assess the viability and sustainability of the use of humanure at a household

9
agricultural level. Scientific testing of the resultant compost and produce grown using
humanure, together with surveys conducted with households from the study area will enable
the researcher to achieve the aims and objectives of the study. The surveys that are to be
conducted are a critical aspect of this study as the perception of the community with regard to
the use of humanure will be ascertained.
10
Chapter Two
Theoretical Framework and Literature review
2.1. Introduction
The theory of zero-waste management and the sustainable livelihood framework are central to
the theme of this research. This chapter will assess these two theories, and their relevance to
this research, while the second part of this chapter will focus on the literature review. This will
comprise a discussion of literature pertinent to this study, which inter alia include the
following themes: agriculture, land degradation, humanure, microbiology and food safety.
Relevant case studies will also be cited to add scholarly depth to this research.
2.2. Theoretical Framework
2.2.1. The theory of waste management - Zero-waste management
The theory of zero-waste management is based on a holistic framework that advocates the
elimination of waste, as opposed to the management of it (Curran andWilliams, 2010). Zero-
waste management operates on the notion that waste is non-existent. All ‘waste’ material
should be viewed as a resource, thereby reducing the volume of disposable materials that have
to be disposed of in landfill sites or by other means (Curran and Williams, 2010).
Conventionally, the generation of waste in the production line is common practice, with the
waste products being diverted to landfill and incineration sites, which is termed the ‘disposal
culture’ (Curran and Williams, 2010: 1).
It seems that the ‘disposal culture’ is a global phenomenon, evidenced by the popularity of
goods packaged in ‘disposable’ material; such as plastic water bottles, polystyrene take-out
11
containers and the vast array of electronic disposable or one-use items. As Joseph Jenkins
(2005:6) stated, “for waste is not found in nature — except in human nature.” There have been
efforts by the food industry in Seattle, USA to break the cycle of the ‘disposal culture’. All
single-use packaging for food is required to be recyclable or compostable (Ferry, 2011).The
theory of zero-waste management rejects the ‘disposal culture’ (Curran and Williams, 2010:1)
in favor of the closed loop system, in which all material has a use or application. In an article
written for The Wall Street Journal, David Ferry state “the prime benefits in adopting zero-
waste are environmental; many cities that have enacted zero-waste plans say they have taken
up the task in the name of sustainability” (2011:1).
The theory of zero-waste management may be applied to the management of human waste.
There is an urgent need for human waste management to be seriously remedied in South
Africa, as well as globally. Thus, zero-waste management plans can be adopted with regard to
human waste management. Human waste is generally managed through a system of water
borne sewage in urban areas, where the appropriate infrastructure and technology have been
provided. However, there are many peri-urban and rural areas in the South Africa that lack
proper human waste technology. Efforts to manage human waste thus far have not been
successful. Zero-waste management, as applied to the specific field of human waste
management, would entail viewing human waste as a resource, and not as waste material that
has to be disposed of. This has been emphasized by Jenkins (2005:7-8):
“Feces and urine are examples of natural, beneficial, organic materials excreted by the
bodies of animals after completing their digestive processes. They are only “waste”
when we discard them. When recycled, they are resources, and are often referred to as
manures, but never as waste, by the people who do the recycling. We do not recycle
waste. It’s a common semantic error to say that waste is, can be, or should be recycled.
Resource materials are recycled, but waste is never recycled. That’s why it’s called
“waste.” Waste is any material that is discarded and has no further use. We humans
12
have been so wasteful for so long that the concept of waste elimination is foreign to us.
Yet, it is an important concept.”
The concept of “disposable culture” (Curran and Williams, 2010:1) seems to have intricately
wound itself into all facets of our lives, to the extent of preventing us from realizing the
benefit of resources that we are mindlessly ‘flushing’ away; without thought of the
consequences.
Human waste management can serve to improve agricultural practices and increase food
security. This is because human waste, through proper management, may be converted into a
rich, organic soil conditioner and compost, at a very low cost. This is the principle of the
theory of zero-waste management: material that is commonly termed as waste will more often
than not have other uses (Winter, 2007). Hence, through the application of the theory of zero-
waste management, human waste is a resource which may aid in bridging the gap between
waste management, agriculture and food security. However, the issue of human waste is not
one that is easily and openly dealt with. This is an issue that has been concealed in society –
‘society’s dirty secret’ – and is not discussed. Yet, it is this negative attitude toward human
waste management that is the root of the problem. This is echoed by Jenkins (2005:6):
“Perhaps one reason we have taken such a head-in-the-sand approach to the recycling
of human excrement is because we can’t even talk about it. If there is one thing that the
human consumer culture refuses to deal with maturely and constructively, it’s bodily
excretions. This is the taboo topic, the unthinkable issue. It’s also the one we are about
to dive headlong into.”
The theory of waste management has been criticised, as it is unclear as to why we need a
theory on how to manage waste. As Prongracz (2002:114) states:
13
“Waste management is a practical discipline, seeking solutions to specific waste
problems. Given that the everyday problems of waste management are so important to
solve, it may even appear that theorising, instead of acting, is a waste of time or
effort.”
Although this may stand to reason, Prongracz (2002:114) further states:
“There is no such thing as absolute waste: a thing that would be waste under every
condition, at every time, and for everyone or everything. Precisely due to the fact that
waste is a concept, calls for it to be analysed conceptually.”
Hence, the emergence of the theory of waste management, and especially the focus zero-waste
management. These theoretical approaches underpin this study, especially in terms of the way
in which human waste, among all other types of waste is managed, as opposed to being
disposed of in landfill sites or in water bodies, and ultimately becoming pollutants.
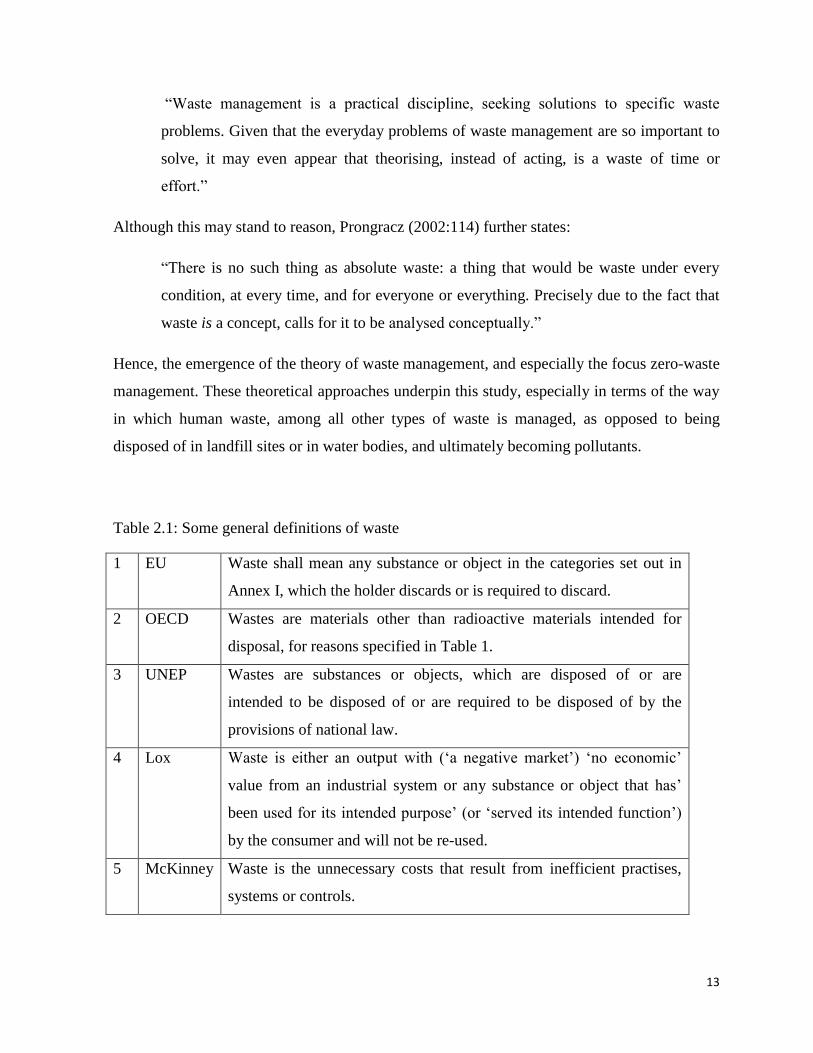
Table 2.1: Some general definitions of waste
1 EU Waste shall mean any substance or object in the categories set out in
Annex I, which the holder discards or is required to discard.
2 OECD Wastes are materials other than radioactive materials intended for
disposal, for reasons specified in Table 1.
3 UNEP Wastes are substances or objects, which are disposed of or are
intended to be disposed of or are required to be disposed of by the
provisions of national law.
4 Lox Waste is either an output with (‘a negative market’) ‘no economic’
value from an industrial system or any substance or object that has’
been used for its intended purpose’ (or ‘served its intended function’)
by the consumer and will not be re-used.
5 McKinney Waste is the unnecessary costs that result from inefficient practises,
systems or controls.
14
6 Bararn Waste is the difference between the level of output of useful goods
and services that would be obtained if all productive factors were
allocated to their best and highest uses under rational social order, and
the level that is actually obtained.
7 Hollander Waste is something that needs to be expelled in order that the system
continues to function.
8 Elwood
&Patashik
Waste, like beauty, is in the eye of the beholder.
9 Gourlay Waste is what we do not want or fail to use.
10 Prongracz Waste is an unwanted, but not avoided output, whence its creation was
not avoided either because it was not possible, or because one failed to
avoid it.
11 Prongracz Waste is a man-made thing that has no purpose; or is not able to
perform with respect to its purpose.
12 Prongracz Waste is a man-made thing that is, in the given time and place, in its
actual structure and state, not useful to its owner, or an output that has
no owner, and no purpose.
Table adapted from (Prongracz et al, 2004:474)
Prongracz et al (2004) discuss the above definitions, and infer that the discourse on waste
management seems to be a reaction to waste itself. Furthermore, many of the above definitions
define waste as a substance that is ‘not useful’, ‘needs to be expelled’, ‘required to discard’ or
‘will not be re-used’. These definitions seem to influence waste disposal, and the manner in
which it is viewed and treated; as a waste and not a resource. There appear to be many factors
which are influencing the field of waste management. Two of the factors that appear to be
most influential include the above definitions of waste, and the subsequent negative
connotations which they promote, and the embedded culture of non-discussion of certain types
of waste, especially human waste.
15
There are arguments against the zero-waste management approach, as it is purported by some
that incineration of all waste is a preferable option. Contrary to this belief, incineration is not a
preferred option, due to the resultant emission of greenhouse gases, and the fact that this
approach is a ‘clean’ one (Mataki, 2011). Supporters of the zero-waste management approach
maintain that “incineration destroys, rather than conserves, resources” (Ferry, 2011:1). The
advantage of the zero-waste approach is that it is a sustainable cycle with no harmful effects
on our natural systems. According to Larry Chalfan, executive director of the non-profit Zero-
waste Alliance in Portland Ore:
“Zero-waste looks at what nature has given us as a model, everything at the end of its
life, whether it's a flower or a dead body, is recycled; there are no toxic substances or
'waste' built up anywhere to cause harm to future generations. Everything is a resource
to be used again." (Winter, 2007:1).
The zero-waste management approach can be applied to the field of waste management, and
more specifically, human waste management. The benefits of adopting this approach would be
many-fold, as not only would the physical environment be enriched, but the quality of lives of
people would be enhanced. This approach may be adopted as part of the Sustainable
Livelihood Framework (SLF).
2.2.2. The Sustainable Livelihoods Framework
The sustainable livelihoods framework (SLF) is an approach that provides an understanding of
livelihoods of the poor. It does this by examining the main factors that affect the lives of these
people. The framework is centered on assets of poor people, and how this can increase the
ability of people to withstand shocks such as natural disasters, violence or family deaths
(Allison and Ellis, 2001). Allison and Ellis (2001: 379) state:
16
“The concept of a ‘livelihood’ seeks to bring together critical factors that affect the
vulnerability or strength of individual or family survival strategies. They are thought to
compromise, chiefly, the assets possessed by people, the activities in which they
engage in order to generate an adequate standard of living and to satisfy other goals
such as risk reduction, and the factors that facilitate or inhibit different people from
gaining access to assets and activities.”
Against this background, “A livelihood comprises the assets (natural, physical, human,
financial and social capital), the activities, and the access to these (mediated by institutions
and social relations) that together determine the living gained by the individual or household”
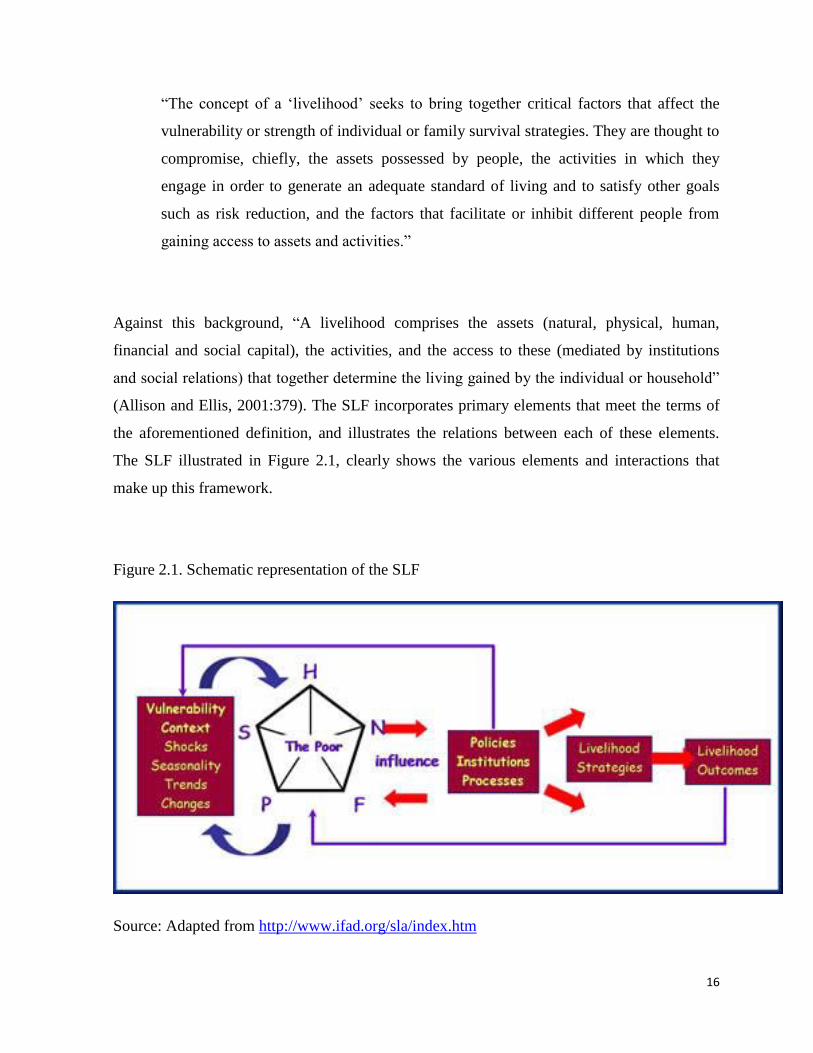
(Allison and Ellis, 2001:379). The SLF incorporates primary elements that meet the terms of
the aforementioned definition, and illustrates the relations between each of these elements.
The SLF illustrated in Figure 2.1, clearly shows the various elements and interactions that
make up this framework.
Figure 2.1. Schematic representation of the SLF
Source: Adapted from http://www.ifad.org/sla/index.htm
17
2.2.2.1. Livelihood Assets
As can be seen from Figure 2.1, the SLF is a people centered framework. People are at the
center of the web of livelihood assets. The Human Capital (H) is based on the characteristics
of the people, such as knowledge and skills (for example, indigenous knowledge); ability to
work, learn and acclimatize to new situations; education levels; and the health and nutrition of
people. The health and nutrition of people is of great importance as a person who is not in
good health or is malnourished may not have the capacity to work or adapt to new situations
that may arise. Therefore, health and nutrition is a critical aspect of the SLF. Additionally,
people who are not in good health generally require assistance, which further reduces human
capital (NRI, n.d). All assets in the SLF are interrelated. Impacts on any one variable can have
repercussions on the other ones. This may be illustrated by the above mentioned link between
human capital and other assets (NRI, n.d).
Natural Capital (N) is based on the natural resources that are used by people, such as air, land,
water, plant and animal reserves, forests and other environmental resources such as wetlands.
Social Capital (S) is based on the networks and connections that are formed between people,
based on familial ties or patronage. Social capital is made up of both formal and informal
groups of people who follow common rules. Leadership is an important aspect of social
capital, as under the proper guidance of a leader, people are able to follow the common
societal rules (NRI, n.d). Physical Capital (P) refers to the infrastructure, tools and technology
required by people for day to day activities. Infrastructures such as roads, buildings, water and
sanitation, energy and communication facilities are all vital aspects of people’s livelihood.
Without Physical Capital, people would not be in a position to access the other types of
capital.
The tools and technology of Physical capital encompass the apparatus required for production.
It also includes agricultural gear needed for the growth of crops. Traditional technology also
forms a part of tools and technology, much like indigenous knowledge (NRI, n.d).Financial
18
capital (F) is based on the monetary resources that are available to people, which include any
savings that a person may have, subsidies such as pension, earned income and services that
offer credit facilities such as loans. Financial Capital is often thought of as the most important
type of capital, as other types of capital may be purchased with financial capital (NRI, n.d).
The SLF is based on these assets. However, these are not the only assets to which people or
households have access. The access to these and other similar assets directly affect the
livelihoods of people.
As mentioned above, the framework is centered on the assets of poor people. More
specifically, the focus is on how the management of these assets can influence the nature of
response to shocks (Allison and Ellis, 2001). The various assets, apart from increasing the
ability of people to withstand shocks, also enables them to withstand changes in population
patterns, the environment, technology and the changes that globalisation brings about.
Collectively, these shocks and changes are known as the vulnerability context of the SLF.
2.2.2.2. Vulnerability Context
The vulnerability context of the SLF gives rise to policies, institutions and processes which are
introduced to aid people with regard to access to assets. The policies, institutions and
processes are influenced and modelled by people and the assets become available, as can be
seen in Figure 2.1. Livelihood strategies take account of the assets that people have access to,
in view of their vulnerability context. These strategies also take into consideration the policies,
institutions and processes that either sustain the livelihoods of people or impede them. The
result of various livelihood strategies that may be instituted is the livelihood outcome. The
livelihood outcome is directly related to people and their various assets. (Morton and
Meadows, 2000)
19
The SLF is a holistic framework which does not single out a particular cause of poverty, but
rather recognises that deprivation and destitution can be attributed to many factors, which are
most likely to be interconnected with each other. This is validated by Majale (2002:3) who
states:
“The sustainable livelihoods approach is a holistic approach that tries to capture, and
provide a means of understanding, the fundamental causes and dimensions of poverty
without collapsing the focus onto just a few factors (e.g. economic issues, food
security, etc.). In addition, it tries to sketch out the relationships between the different
aspects (causes, manifestations) of poverty, allowing for more effective prioritisation
of action at an operational level”
It may be argued that poverty is characterized by a ‘cause and effect’ type condition. Hence, it
may not be possible to identify a single cause of poverty, but rather many interrelated causes.
Poverty is a cycle that perpetuates itself. This is evident by the millions of people globally
who seems to be stuck in this vicious cycle. Once entrenched in poverty, without external aid,
it is extremely difficult and challenging for people to break free of the cycle. (Morton and
Meadows, 2000)
2.2.2.3. Principles of the SLF
The SLF is grounded in the knowledge that poverty is a diverse issue, with many faces. As
Solesbury (2003:14) states “conceptually it drew on changing views of poverty, recognising
the diversity of aspirations, the importance of assets and communities, and the constraints and
opportunities provided by institutional structures and processes”. Furthermore, he goes on to
state that “in practical terms it placed people – rather than resources, facilities or organisations
– as the focus of concern and action; and emphasised that development must be participatory
and improvements must be sustainable” (Solesbury, 2003:14).
20
This is the basis of the SLF, as it is a people centered framework. It recognises that people
themselves need to be involved in poverty alleviation strategies if these are to be sustainable in
the long term. Furthermore, as indicated by Majale (2002), this framework is overarching and
considers all factors that are at the root of poverty, exploring the relationship that exists
between them in an attempt to determine solutions. Some of the factors that the framework
considers are adverse trends or shocks, basic lack of assets, and poorly functioning policies
and institutions.
According to Dorward (2001), these principles of the framework are: people centered,
responsive and participatory, dynamic, sustainable, multi-leveled, holistic and conducted in
partnerships. A people centered approach indicates that the goal of poverty alleviation can
only be truely achieved if the lives and existing strategies of people are taken into
consideration. The imposition of a foreign solution on people already caught in a cycle of
poverty may only serve as a means of further entrenchment. Therefore, the social
environments of people, as well as their ability to adjust must be taken into consideration, if
the framework is to be successful.
With regard to demand led, livelihoods should be generated by providing goods that are in
market demand, at prices which will ensure a profit. Dynamic implies that people have various
means through which they hope to achieve their livelihood, and these means should be
supported by those in a position to help. People should not be limited to one livelihood
strategy; they should be allowed to diversify. All practises within the SLF need to be
sustainable in the long term, in order to achieve the ultimate goal of poverty alleviation
(Krantz, 2001).
Furthermore, a one-level direct approach to poverty reduction, where solutions are formulated
without consultation at ground level, is not what the SLF promotes. The SLF indicates that
poverty alleviation will only be achieved in a sustainable and long term setting if a multi-level
21
approach is adopted, whereby activity at the ground level is the basis of policy development.
This alludes to the next principle of the SLF, namely, a ‘holistic framework’, which attempts
to consider all factors (human capital, natural capital, social capital, physical capital, and
financial capital) which impact on poverty and people. The last principle of this framework,
conducted in partnership, indicates that strategies for poverty alleviation and livelihood
improvement need to be conducted in association with stakeholders that include government,
private parties and the public in order to achieve sustainable results (Dorward, 2001).
2.3. Literature Review
2.3.1. Agriculture
Agriculture is an integral part of society; globally, nationally and locally. In every part of the
world agricultural practices date back hundreds of years, each of which has contributed to
development in the field. There have been iconic eras in agriculture, such as the green
revolution and the red revolution, each of which have had a role in shaping rural development.
Agriculture is not only concerned with the production of crops; it is an all-encompassing field
that deals with the rearing of livestock, plants and crops, as well as aqua based practices
(McIntyre et al, 2009). Furthermore, agriculture influences many other fields. Ecosystem
services and the social sector are perhaps two of the most important fields that agriculture
influences. Communities and lifestyles are modelled by agriculture, providing employment
and livelihood for many. Ecosystem services such as water supply and carbon sequestration or
release are also influenced by agriculture (McIntyre et al, 2009).
Due to climate change and its knock-on effects, such as land degradation, temperature
increases and reduced access to natural resources, agriculture has reached a critical point.
Scientific developments in the field such as the introduction of genetically modified organisms
(GMO’S) have also placed caused concern in the social sector; which agriculture plays an
22
important role in, as the safety of using GMO’S has been questioned by many, despite the lack
of reports of negative health effects from GMO’s (Schauzu, 2000). Globally, increasing
temperatures have led to different weather patterns and land use change, each of which
severely affects agriculture; as current changes in weather patterns are impacting on
agricultural yields (Olesen and Bindi, 2002; Schimidhuber and Tubiello, 2007).
Along with impacts on agriculture, land use and soil changes occur as knock-on effects of
climate change, which in turn impacts on agriculture. This is explained by Montgomery who
notes:
“Although soil fertility generally declines with accelerated erosion, soil fertility is itself
a function of agricultural methods and site conditions such as soil type, nutrient, and
organic matter content.” (2007a:13268).
Agricultural practices may become unsuitable due to change in the characteristics of the land
and soil. Land degradation, exacerbated by incorrect agricultural practices and climate change,
impacts on the quality of soil. Soil is an essential factor of agriculture, as Twyman et al (2004;
81) states:
“Soils are an integral part of natural capital, and their management is vital for sustained
and productive use. Soil fertility management practices have evolved in the two cross-
border areas, based on the use of both organic and inorganic fertilisers, and practices
that directly or indirectly address wind- and water erosion problems.”
Land and consequently soil degradation is a serious issue that needs to be addressed. Soil
degradation, “although less dramatic than climate change or a comet impact, can prove
catastrophic nonetheless, given time” (Montgomery, 2007b:5). Communities that depend on
agriculture for their livelihood will become vulnerable.
Agriculture has served as a means for many to achieve food and financial security, with many
urban, peri-urban and rural communities reliant on agriculture for food security. However, this
23
is becoming increasingly difficult due to the issues relating to accessibility of land and the
condition of the land itself. This is confirmed by Bryceson (2000 cited in Baiphethi and
Jacobs, 2009:472):
“based on a case study of seven countries (Nigeria, Ethiopia, Tanzania, Congo-
Brazzaville, Malawi, Zimbabwe and South Africa), the countries were all undergoing
“de-agrarianisation” and “depeasantisation”. This was driven mostly by, restrictions on
access to land (South Africa). While the country is self-sufficient in food production,
this has been accompanied by considerable levels of household food insecurity.”
It is evident from the above that in South Africa, as well as other developing countries,
agriculture is a critical livelihood strategy. Agricultural practises at the household level have
ensured for decades that families are food secure through their own production of food, as the
market price of food was, and still is, unaffordable to many. This is reiterated by Ruel et al
(1998), who discusses critical components affecting household food security, and cites the
ability to earn an income and the price of food as two factors.
This highlights an important link: food security- income-agriculture, as highlighted by
Schmidhuber and Tubiello (2001). As stated above, many families attain food security through
practicing household agriculture (Ruel et al, 1999). Others attain food security through
purchasing power, enabled through employment (Ruel et al, 1999). However, employment is
not available to all, with many people falling into the category of being unemployed or being
causally employed, with no guarantee of a fixed income for purchasing power. The reliance on
the market for the attainment of food security, through purchasing power can also be
problematic. As Ruel et al (1999:1918) state:
“With urban-dwellers’ dependence on purchases in the market for food, the level of
food prices can seriously affect an urban household’s food security. Food prices
depend on a number of factors, including the efficiency of the food marketing system,
the household’s access to food subsidies or other food programs, and other
macroeconomic policies.”
24
Similarly, food security achieved through household agriculture is placed at risk due to land
degradation, improper farming practices and lack of access to agricultural land (White Paper
on Agriculture, 1995).
2.3.2. Food Security
The issue of food security is a complex and multifaceted one. Food security, as defined by the
Food and Agriculture Organization (FAO), cited in Schmidhuber and Tubiello (2007:19703)
is:
“a situation that exists when all people, at all times, have physical , social and
economic access to sufficient, safe and nutritious food that meets their dietary needs
and food preferences for an active and healthy life.”
According to the Agriculture at Crossroads Global Report,
“food security exists when all people of a given spatial unit, at all times, have physical
and economic access to safe and nutritious food that is sufficient to meet their dietary
needs and food preferences for an active and healthy life, and is obtained in a socially
acceptable and ecologically sustainable manner” (WFS, 1996 as cited in McIntyre et
al, 2009:10).
Thus, it is evident that the matter of food security deals with people not only having access to
food, but to a variety of food, which aids in achieving a balanced diet and also with people
having the ability to purchase food, as discussed above. Those people who do not produce
their own food rely on purchasing power to achieve food security or on social welfare grants
from the government (Ruel et al, 1999). This may lead to the issue of social differentiation
among people. Food security among the working class is usually achieved through the ability
to purchase food. Food security among those who are unemployed is usually achieved through
the production of food through cultivation or through purchase with money made available
through grants (Ruel et al, 1998).
25
There are two different levels of food security, namely: chronic food security and transient
food security (Saad, 1999). Chronic food insecurity may be described as persistent periods of
not having access to food. These periods are not however permanent. Transient food insecurity
is brief, short lived periods of food insecurity that people experience. There are many triggers
of chronic and acute food insecurity. Some of these triggers include poverty, poor governance,
economic mismanagement and a high unemployment rate (Saad, 1999). Food insecurity that is
induced by poverty is triggered by deprivation, which in turn is linked to poverty. High
unemployment rates result in a large number of people not having the purchasing power to
achieve food security. As Klasen and Woolard (2000:1) state “This country is South Africa
which is currently experiencing one of the highest reported unemployment rates in the world.”
There are various methods through which one may attain food security, namely: the
production of one’s own food; through purchasing power; the reliance on welfare grants and
through having social and cultural claims which ensures food security. Social and cultural
claims refer to systems that ensure that all members of a community are food secure as a result
of familial ties. Baipethi and Jacobs (2009:460) as cited in Ruel et al (1998) state:
“there is a general consensus that households access food mainly through three
sources. These are the markets, subsistence production and transfers from public
programmes or other households.”
One’s purchasing power is reliant on an income that one receives. Therefore, if one’s
purchasing power is taken away, so too is one’s food security. The same may be said for a
reliance on welfare grants. The production of one’s own food seems like a guaranteed method
of attaining food security, insulating households from external factors that may compromise
their food security. This is further explained by Baipethi and Jacobs (2009:462), who state:
“Subsistence production and/or smallholder production can increase food supplies and
this cushions households from food price shocks, thereby improving household food
security.”
26
However, there are many factors that need to be taken into consideration. These include
climatic factors that may affect food production, land and soil types that influence the type of
food that may be grown and the amount of land that is available for the production of food.
Additionally, a lack of agricultural knowledge may also prove to be a barrier to people seeking
the attainment of food security through the production of their own food (Baipethi et al, 2010).
In areas where there is poverty and where soil and fertility problems are prevalent, compost
and humanure can be used to improve and increase agricultural output.
2.3.3. Compost and Humanure
Compost is a material that resembles soil, and is often added to soil for optimal health and
growth of plants. Compost is derived from the process of composting various materials, and
may be defined as “enhancing the consumption of crude organic matter by a complex ecology
of biological decomposition organisms” (Solomon, 1993:1). There are different methods of
composting, such as aerobic or anaerobic composting processes. Aerobic composting occurs
within the presence of oxygen; whilst anaerobic composting occurs with an absence of
oxygen, resulting in the production and release of methane gas. Thus, it may be said that
aerobic composting is a cleaner method of composting, as no green-house gas such as methane
is produced. As Hoyos et al state:
“The composting process is a biological exothermic oxidation of organic matter,
followed by a maturing phase, carried out by a dynamic and rapid succession of
microbial populations. The organic matter is transformed into a final stable humus type
product (compost) through its mineralization and humification. This product is a
hygienic material, free of unpleasant characteristics.” (Hoyos et al, 2002:162).
Aerobic composting, performed under the correct conditions, activates thermophilic bacteria
which produce heat spikes in the range of 50 to 70 degrees Celsius (Hoyos et al, 2002), within
the compost pile. Reaching the correct temperatures, heat has the potential to render
27
potentially harmful bacteria, pathogens and helminths ineffective and safe for agricultural
purposes (Rihani et al, 2010).
Humanure is compost that is made with the addition of human excrement. It is a substance
rich in potassium, phosphorus and nitrogen, which are essential elements for plant growth and
key additives to chemical fertilisers (Wilkinson et al, n.d.). These elements are found
abundantly in human excrement (Were, 2007). From a ‘humanure’ point of view, “human
excrement, including faecal material and urine, are not considered waste materials that need to
be disposed of. They are resource materials that should be recycled and reclaimed for use”
(Jenkins, n.d:1).
This is not the outlook of the majority, as human excrement is associated with many stigmas
and taboos. Kelly (2010), introduced the concepts of ‘faecophobic’ and ‘faecaphilic’ as a form
of differentiation. ‘Faecophobic’ refers to “strong taboos against handling and talking about
human faeces” and ‘faecaphilic’ is having “no taboos … to use faeces and urine to build the
fertility of soils: (Kelly, 2010:13). There are many people who adopt a ‘faecophobic’ view,
possibly due to cultural influence. Many cultures are ‘faecophobic’ due to the belief that
human excrement is taboo and dirty and should not in any way be handled. However, once the
stigmas and taboos are overcome, the value of human excrement as compost, humanure, may
be recognised.
The composting process involves the biological decomposition of organic matter.
Thermophilic composting is “the aerobic decomposition of organic matter that includes a hot
stage dominated by heat producing bacteria” (Jenkins, n.d:8). These bacteria are essential for
thermophilic composting, as the hot stage is a necessary stage in which harmful bacteria and
pathogens are destroyed due to the high temperatures (Jenkins, n.d.). As Jenkins (n.d.:8) notes,
“research has shown that human pathogens find the thermophilic environment hostile and that
they will rapidly die off in such an environment.” Rendering humanure free of harmful
28
bacteria and pathogens is essential, as humanure that remains unsanitised may pollute soil and
groundwater. This is reiterated by the Guidelines for Human Settlement and Planning (n.d.),
which notes that soil and groundwater contamination may result from unsanitary human
excrement.
Jenkins (n.d.:10) explains the thermophilic process that a humanure compost pile undergoes:
“Humanure compost piles will undergo several stages of decomposition in addition to
the initial thermophilic stage. After the hot phase has ended, the organic material will
continue the process of biological degradation and transformation into humus aided by
non-thermophilic microorganisms, macroorganisms such as earthworms and other
insects, and fungi. These additional stages allow for further decomposition of the
organic material to produce a plant-friendly and agriculturally beneficial final product.
The composting process therefore incorporates both the element of temperature and the
element of time. Combined, they produce an end product that is safe, sanitary, pleasant
smelling, stable, can be stored indefinitely and can be used for growing human food.”
It is through the abovementioned process that harmful bacteria and pathogens that may be
present in human excrement are destroyed. The typical pathogens that are present in
excrement are discussed in the next section.
2.3.4. Pathogens
Excrement from various organisms and species contain numerous types and strains of bacteria
and pathogens, many having the ability to be harmful to human health if ingested, or if mere
contact is made (Jenkins, 2005). Humanure, which contains a percentage of human excrement,
will inevitably contain certain pathogens and bacteria that are harmful, and need to be
eradicated. Taking into consideration the reluctance to use human excrement for agricultural
use, especially for food production, it is necessary to examine the bacteria and pathogens
likely to be found in the growing medium. However, since the number and types of bacteria
29
and pathogens are too large of a population to identify, it is necessary to identify certain
indicator pathogen and bacteria which will indicate the safety of using human excrement in
agriculture for food production (Tortorello, 2003).
2.3.4.1. Indicator Pathogens
Indicator pathogen and bacteria are those strains that are used as “a sign of quality or hygienic
status in food, water, or environment” (Tortorello, 2003:1208) and are able to survive in
hostile conditions with relative ease. Judging excrement by the survival rate of these
pathogens is a useful method of testing the hygiene of humanure. Indicator pathogens and
bacteria of human excrement include Heterotrophic or Standard Plate Count (HPC), Coliform
bacteria, Escherichia coli (E. coli), faecal Streptococci, Pseudomonas Aeruginosa, Clostridium
Perfringens, Legionella Pneumophilia, and Helminth ova. These pathogens will be discussed
in greater detail below.
I. Heterotrophic or Standard Plate Count (HPC)
The HPC consists of a diverse group of bacteria that “have a wide range of metabolic
capabilities and culture requirements and constitute a wide range of risks to public health”
(LeChevallier and McFeters, 1985: 1338). HPC is intended to reveal the number of bacterial
colonies in the substance tested, but “the test itself does not specify the organisms that are
detected” (Koch, 2003:2).Not all of these colonies fall into the category of harmful bacteria,
however, it is still a good indicator of bacterial activity. As the Guidelines for Canadian
Drinking Water Quality (2006:3) state, “HPC results are not an indicator of water safety and,
as such, should not be used as an indicator of potential adverse human health effects.”
Health impacts: As Gandham (2012) suggested, HPC bacteria should not be viewed as a
health concern. However, certain bacteria that may be present in the HPC could be
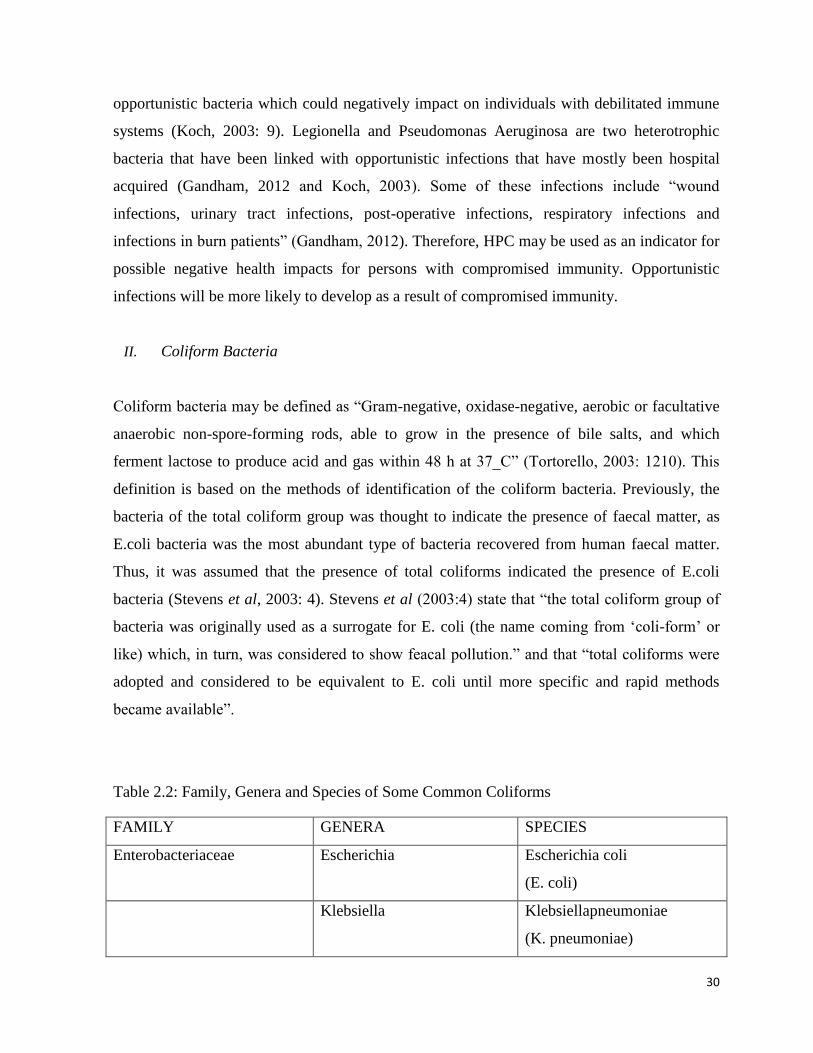
30
opportunistic bacteria which could negatively impact on individuals with debilitated immune
systems (Koch, 2003: 9). Legionella and Pseudomonas Aeruginosa are two heterotrophic
bacteria that have been linked with opportunistic infections that have mostly been hospital
acquired (Gandham, 2012 and Koch, 2003). Some of these infections include “wound
infections, urinary tract infections, post-operative infections, respiratory infections and
infections in burn patients” (Gandham, 2012). Therefore, HPC may be used as an indicator for
possible negative health impacts for persons with compromised immunity. Opportunistic
infections will be more likely to develop as a result of compromised immunity.
II. Coliform Bacteria
Coliform bacteria may be defined as “Gram-negative, oxidase-negative, aerobic or facultative
anaerobic non-spore-forming rods, able to grow in the presence of bile salts, and which
ferment lactose to produce acid and gas within 48 h at 37_C” (Tortorello, 2003: 1210). This
definition is based on the methods of identification of the coliform bacteria. Previously, the
bacteria of the total coliform group was thought to indicate the presence of faecal matter, as
E.coli bacteria was the most abundant type of bacteria recovered from human faecal matter.
Thus, it was assumed that the presence of total coliforms indicated the presence of E.coli
bacteria (Stevens et al, 2003: 4). Stevens et al (2003:4) state that “the total coliform group of
bacteria was originally used as a surrogate for E. coli (the name coming from ‘coli-form’ or
like) which, in turn, was considered to show feacal pollution.” and that “total coliforms were
adopted and considered to be equivalent to E. coli until more specific and rapid methods
became available”.
Table 2.2: Family, Genera and Species of Some Common Coliforms
FAMILY GENERA SPECIES
Enterobacteriaceae Escherichia Escherichia coli
(E. coli)
Klebsiella Klebsiellapneumoniae
(K. pneumoniae)
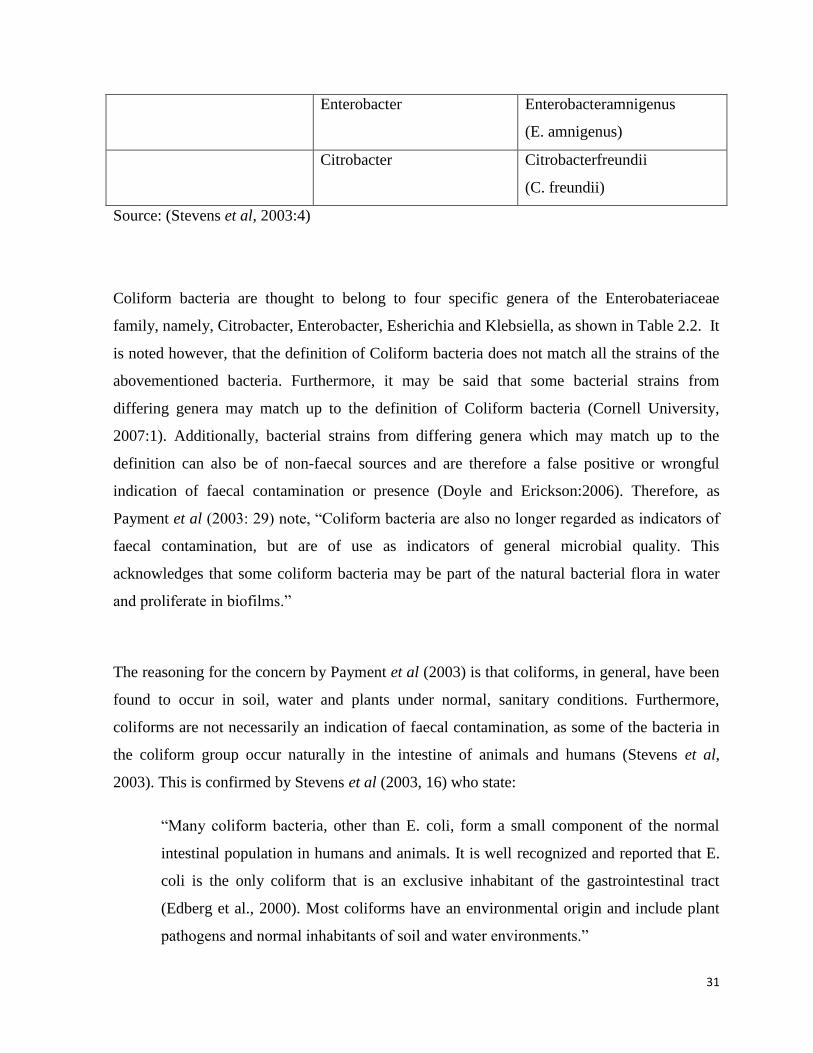
31
Enterobacter Enterobacteramnigenus
(E. amnigenus)
Citrobacter Citrobacterfreundii
(C. freundii)
Source: (Stevens et al, 2003:4)
Coliform bacteria are thought to belong to four specific genera of the Enterobateriaceae
family, namely, Citrobacter, Enterobacter, Esherichia and Klebsiella, as shown in Table 2.2. It
is noted however, that the definition of Coliform bacteria does not match all the strains of the
abovementioned bacteria. Furthermore, it may be said that some bacterial strains from
differing genera may match up to the definition of Coliform bacteria (Cornell University,
2007:1). Additionally, bacterial strains from differing genera which may match up to the
definition can also be of non-faecal sources and are therefore a false positive or wrongful
indication of faecal contamination or presence (Doyle and Erickson:2006). Therefore, as
Payment et al (2003: 29) note, “Coliform bacteria are also no longer regarded as indicators of
faecal contamination, but are of use as indicators of general microbial quality. This
acknowledges that some coliform bacteria may be part of the natural bacterial flora in water
and proliferate in biofilms.”
The reasoning for the concern by Payment et al (2003) is that coliforms, in general, have been
found to occur in soil, water and plants under normal, sanitary conditions. Furthermore,
coliforms are not necessarily an indication of faecal contamination, as some of the bacteria in
the coliform group occur naturally in the intestine of animals and humans (Stevens et al,
2003). This is confirmed by Stevens et al (2003, 16) who state:
“Many coliform bacteria, other than E. coli, form a small component of the normal
intestinal population in humans and animals. It is well recognized and reported that E.
coli is the only coliform that is an exclusive inhabitant of the gastrointestinal tract
(Edberg et al., 2000). Most coliforms have an environmental origin and include plant
pathogens and normal inhabitants of soil and water environments.”
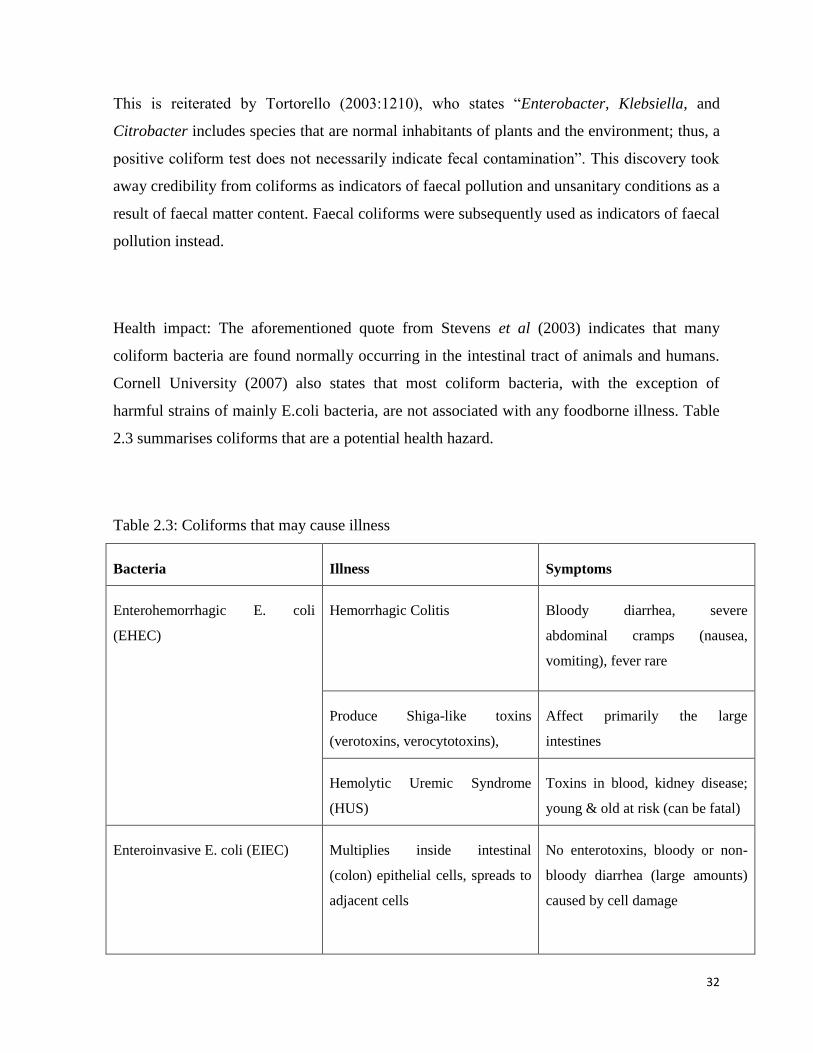
32
This is reiterated by Tortorello (2003:1210), who states “Enterobacter, Klebsiella, and
Citrobacter includes species that are normal inhabitants of plants and the environment; thus, a
positive coliform test does not necessarily indicate fecal contamination”. This discovery took
away credibility from coliforms as indicators of faecal pollution and unsanitary conditions as a
result of faecal matter content. Faecal coliforms were subsequently used as indicators of faecal
pollution instead.
Health impact: The aforementioned quote from Stevens et al (2003) indicates that many
coliform bacteria are found normally occurring in the intestinal tract of animals and humans.
Cornell University (2007) also states that most coliform bacteria, with the exception of
harmful strains of mainly E.coli bacteria, are not associated with any foodborne illness. Table
2.3 summarises coliforms that are a potential health hazard.
Table 2.3: Coliforms that may cause illness
Bacteria Illness Symptoms
Enterohemorrhagic E. coli
(EHEC)
Hemorrhagic Colitis Bloody diarrhea, severe
abdominal cramps (nausea,
vomiting), fever rare
Produce Shiga-like toxins
(verotoxins, verocytotoxins),
Affect primarily the large
intestines
Hemolytic Uremic Syndrome
(HUS)
Toxins in blood, kidney disease;
young & old at risk (can be fatal)
Enteroinvasive E. coli (EIEC) Multiplies inside intestinal
(colon) epithelial cells, spreads to
adjacent cells
No enterotoxins, bloody or non-
bloody diarrhea (large amounts)
caused by cell damage
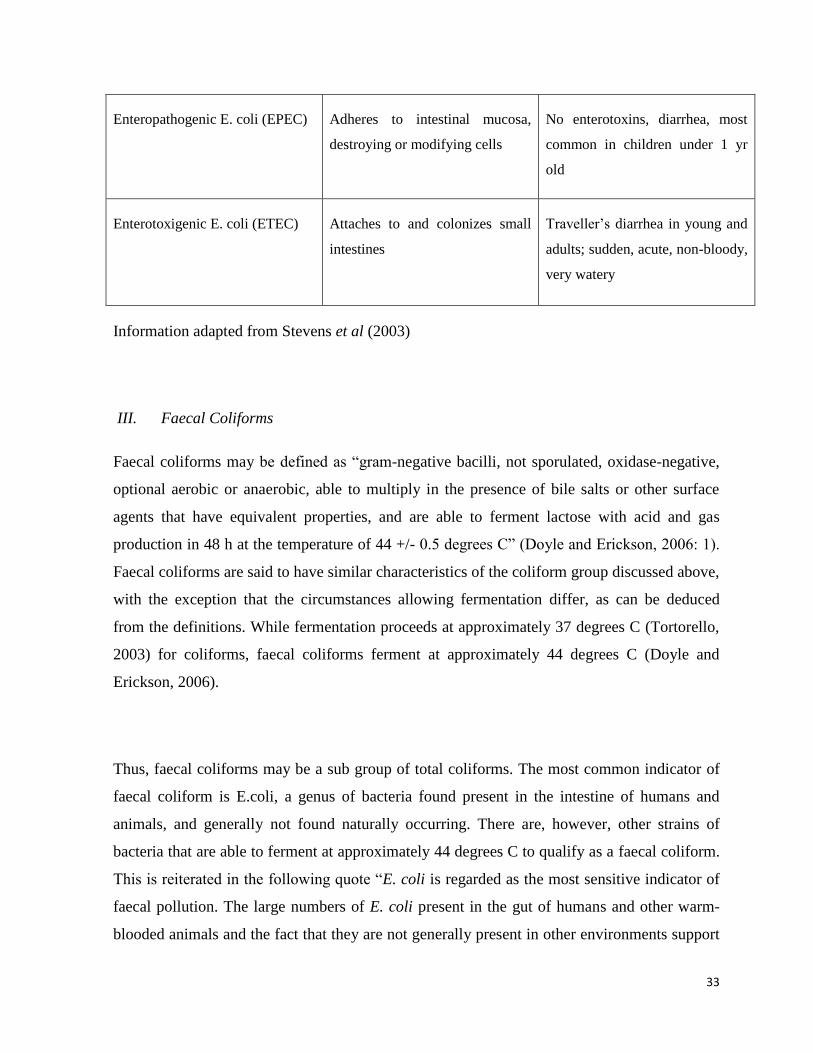
33
Enteropathogenic E. coli (EPEC) Adheres to intestinal mucosa,
destroying or modifying cells
No enterotoxins, diarrhea, most
common in children under 1 yr
old
Enterotoxigenic E. coli (ETEC) Attaches to and colonizes small
intestines
Traveller’s diarrhea in young and
adults; sudden, acute, non-bloody,
very watery
Information adapted from Stevens et al (2003)
III. Faecal Coliforms
Faecal coliforms may be defined as “gram-negative bacilli, not sporulated, oxidase-negative,
optional aerobic or anaerobic, able to multiply in the presence of bile salts or other surface
agents that have equivalent properties, and are able to ferment lactose with acid and gas
production in 48 h at the temperature of 44 +/- 0.5 degrees C” (Doyle and Erickson, 2006: 1).
Faecal coliforms are said to have similar characteristics of the coliform group discussed above,
with the exception that the circumstances allowing fermentation differ, as can be deduced
from the definitions. While fermentation proceeds at approximately 37 degrees C (Tortorello,
2003) for coliforms, faecal coliforms ferment at approximately 44 degrees C (Doyle and
Erickson, 2006).
Thus, faecal coliforms may be a sub group of total coliforms. The most common indicator of
faecal coliform is E.coli, a genus of bacteria found present in the intestine of humans and
animals, and generally not found naturally occurring. There are, however, other strains of
bacteria that are able to ferment at approximately 44 degrees C to qualify as a faecal coliform.
This is reiterated in the following quote “E. coli is regarded as the most sensitive indicator of
faecal pollution. The large numbers of E. coli present in the gut of humans and other warm-
blooded animals and the fact that they are not generally present in other environments support
34
their continued use as the most sensitive indicator of faecal pollution available” (Edberg et al.,
2000 as cited in Stevens et al, 2003: 23). Although used as an indicator of faecal pollution,
faecal coliforms are said to be not the most effective indicator. Tortorello (2003: 1210)
indicated that “species that have this capacity also are known to be present naturally in the
environment; thus the fecal coliforms are not specific indicators of fecal pollution of water,
either.”
This is substantiated by Fujioka and Shizumura (1985: 986) who states:
“pathogens such as human enteric viruses have been recovered from natural waters that
were determined to be safe based on low densities of fecal coliforms, fecal coliforms
have been reported to be capable of multiplying in environmental waters under some
conditions, some fecal coliforms such as Klebsiella pneumoniae do not have a fecal
source, and laboratory results show that fecal coliforms are less resistant than some
pathogens (such as human enteric viruses) to chlorination or less stable in natural
waters.”
It is due to these reasons that faecal coliforms as an indicator of faecal pollution is questioned.
Fujioka and Shizumura (1985) further state that Streptococci and Clostridium Perfringens
bacteria appear to be more reliable alternative indicators.
The health impacts of faecal coliforms are much the same as that of total coliforms, due to
faecal coliforms being a sub group of total coliforms. Table 2.3 lists illnesses and symptoms
typically caused by coliform bacteria.
35
IV. Streptococcus/Streptococci
Streptococcus bacteria are “gram-positive and a member of the lactic acid bacteria” (Hoskins
et al, 2001: 5709). This group of bacteria includes a collection of human pathogens, which are
known to cause opportunistic infections (Hoskins et al, 2001:5709). This indicates that
although this type of bacteria has the potential to cause illness and disease, it will do so when
the immunity of a person is compromised, hence, opportunistic infections.
V. Pseudomonas Aeruginosa
Pseudomonas Aeruginosa, a gram negative bacterium, is one of the major pathogens from
nonfermentative bacteria; causing infections in many due to its resistance to antibiotics
(Hancock, 1998).
VI. Clostridium Perfringens (C. perfringens)
Clostridium perfringens are “sulfite-reducing, spore-forming, clostridia, which are hardy rod-
shaped anaerobic bacteria” (Stevens et al, 2003:24), known to be the “most widely distributed
in nature” (Shimizu et al, 2001: 996). Although these bacteria are directly associated with
faecal matter, as they have been isolated from the intestine of many animals and humans as
normal flora; this type of bacteria is also commonly found in the environment in soil (Steven
et al, 2003 and Shimizu et al, 2001). Fujioka and Shizumura (1985: 991) note that this
bacterium is one of the reliable and more telling indicators of faecal contamination due to “its
resistance to chlorination and environmental factors closely resembles that of enteric virusus.”
Health Impacts: C. perfringens bacteria are classified into five groups based on their
production of the four major toxins, namely, alpha-, beta-, epsilon-, and iota-. Each of the five
groups is associated with certain illnesses as summarised in Table 2.4.
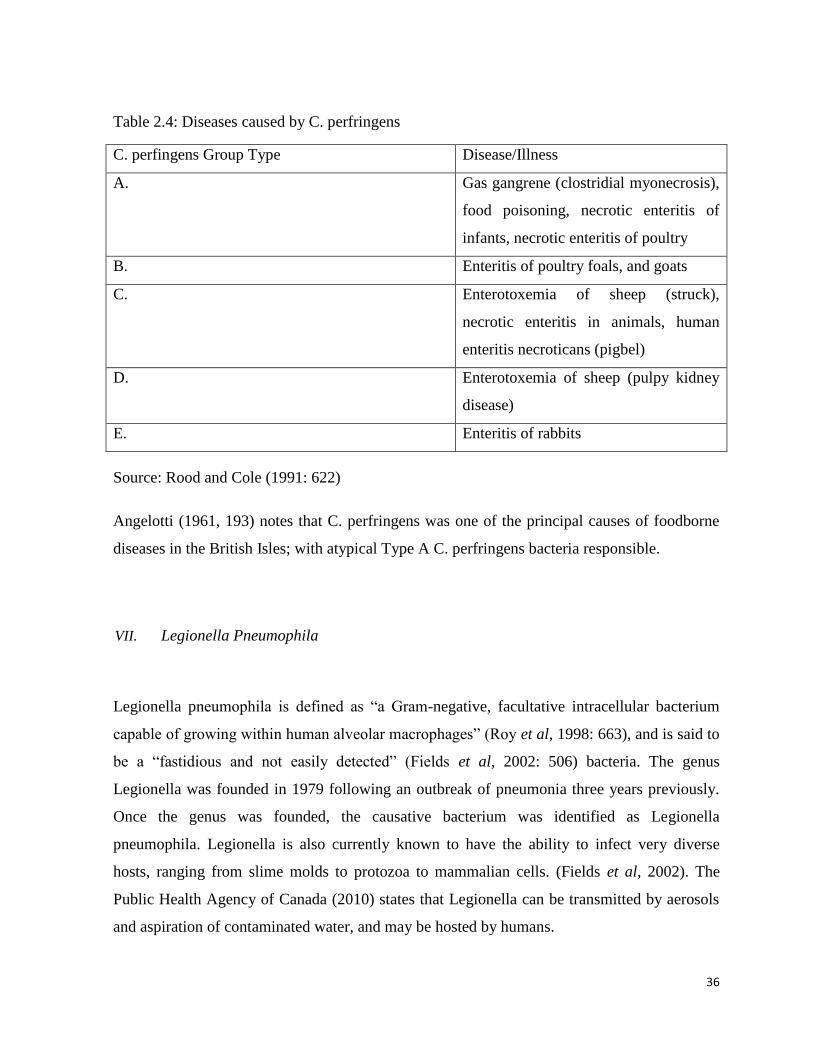
36
Table 2.4: Diseases caused by C. perfringens
C. perfingens Group Type Disease/Illness
A. Gas gangrene (clostridial myonecrosis),
food poisoning, necrotic enteritis of
infants, necrotic enteritis of poultry
B. Enteritis of poultry foals, and goats
C. Enterotoxemia of sheep (struck),
necrotic enteritis in animals, human
enteritis necroticans (pigbel)
D. Enterotoxemia of sheep (pulpy kidney
disease)
E. Enteritis of rabbits
Source: Rood and Cole (1991: 622)
Angelotti (1961, 193) notes that C. perfringens was one of the principal causes of foodborne
diseases in the British Isles; with atypical Type A C. perfringens bacteria responsible.
VII. Legionella Pneumophila
Legionella pneumophila is defined as “a Gram-negative, facultative intracellular bacterium
capable of growing within human alveolar macrophages” (Roy et al, 1998: 663), and is said to
be a “fastidious and not easily detected” (Fields et al, 2002: 506) bacteria. The genus
Legionella was founded in 1979 following an outbreak of pneumonia three years previously.
Once the genus was founded, the causative bacterium was identified as Legionella
pneumophila. Legionella is also currently known to have the ability to infect very diverse
hosts, ranging from slime molds to protozoa to mammalian cells. (Fields et al, 2002). The
Public Health Agency of Canada (2010) states that Legionella can be transmitted by aerosols
and aspiration of contaminated water, and may be hosted by humans.
37
Health impacts: As (Roy et al, 1998: 663) notes, “infections by this organism can result in an
acute pneumonia known as Legionnaires’ disease.” This disease is often thought of as an
unusual illness, but is really a severe form of pneumonia, which is frequently misdiagnosed
due to the ignorance and lack of common knowledge about the bacteria and disease.
Symptoms caused by Legionnaires’ disease include confusion, headache, diarrhea, abdominal
pain, fever, chills, and myalgia as well as a non-productive cough. The mortality rate of this
disease is reported to be 15-25%. Legionella is also responsible for the cause of Pontiac fever,
a non-pneumonic form of L. pneumophila infection. Symptoms of Pontiac fever are flu-like,
including fever, tiredness, myalgia, headache, sore throat, nausea, and a cough that may or
may not be present. Unlike Legionnaires’ disease, persons with Pontiac fever do not require
hospitalization or medication such as anti-biotics. Furthermore, no reported deaths associated
with Pontiac fever have been reported (Public Health Agency of Canada, 2010).
VIII. Helminth ova
Helminth ova are worm eggs that pose serious health threats to humans and animals. These
ova are known to be extremely resilient to hostile conditions, and are able to survive outside of
the host for long periods of time. One of the hardiest, Ascaris ova is known to have many
layers of protective material as its outer shell, thus ensuring that the egg survives in most
conditions. Ascaris ova belong to the nematode group, and are used as an indicator of all
helminth eggs. Temperature and pH do affect the survival of the helminth ova, with high
temperatures and low pH values rendering the ova inactive (Maya, 2012: 4771). Helminths are
parasitic and are the cause of intestinal disease and illness for many.
Health impacts: Health impacts caused by helminth ova are very serious. Those with
inadequate and unhygienic sanitation and a lack of basic services are most vulnerable to
infection. As Crompton and Savioli (1993: 1) state:
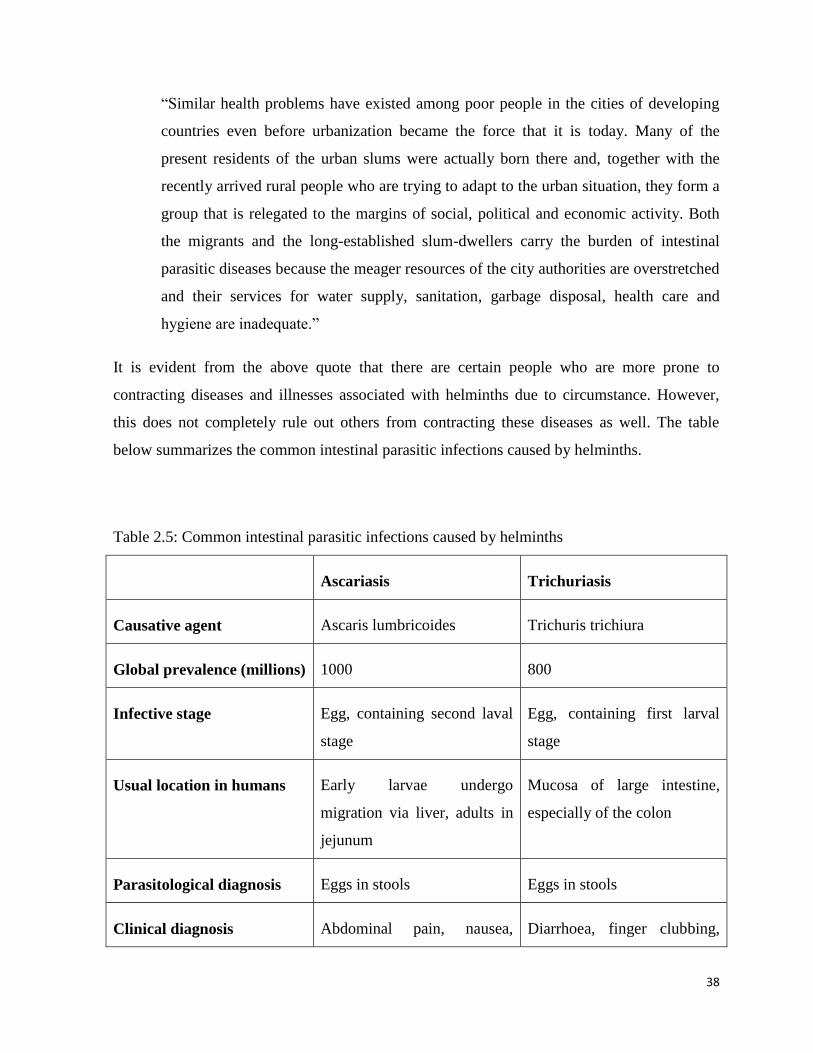
38
“Similar health problems have existed among poor people in the cities of developing
countries even before urbanization became the force that it is today. Many of the
present residents of the urban slums were actually born there and, together with the
recently arrived rural people who are trying to adapt to the urban situation, they form a
group that is relegated to the margins of social, political and economic activity. Both
the migrants and the long-established slum-dwellers carry the burden of intestinal
parasitic diseases because the meager resources of the city authorities are overstretched
and their services for water supply, sanitation, garbage disposal, health care and
hygiene are inadequate.”
It is evident from the above quote that there are certain people who are more prone to
contracting diseases and illnesses associated with helminths due to circumstance. However,
this does not completely rule out others from contracting these diseases as well. The table
below summarizes the common intestinal parasitic infections caused by helminths.
Table 2.5: Common intestinal parasitic infections caused by helminths
Ascariasis Trichuriasis
Causative agent Ascaris lumbricoides Trichuris trichiura
Global prevalence (millions) 1000 800
Infective stage Egg, containing second laval
stage
Egg, containing first larval
stage
Usual location in humans Early larvae undergo
migration via liver, adults in
jejunum
Mucosa of large intestine,
especially of the colon
Parasitological diagnosis Eggs in stools Eggs in stools
Clinical diagnosis Abdominal pain, nausea, Diarrhoea, finger clubbing,
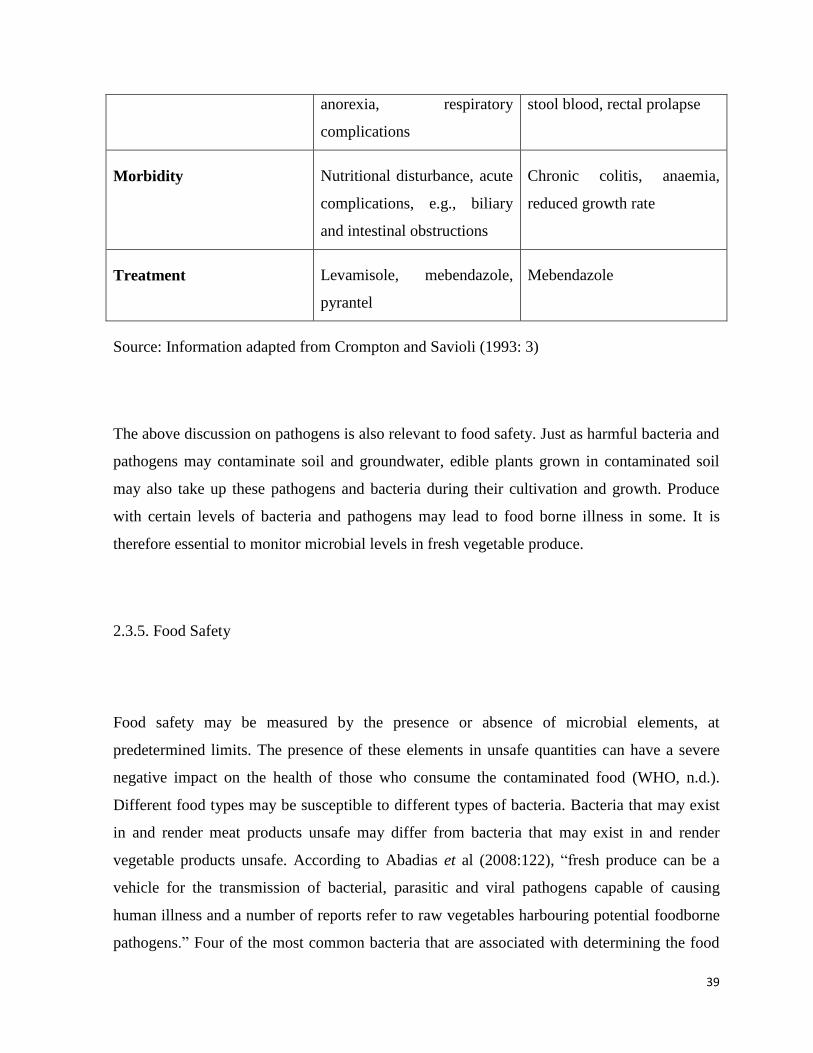
39
anorexia, respiratory
complications
stool blood, rectal prolapse
Morbidity Nutritional disturbance, acute
complications, e.g., biliary
and intestinal obstructions
Chronic colitis, anaemia,
reduced growth rate
Treatment Levamisole, mebendazole,
pyrantel
Mebendazole
Source: Information adapted from Crompton and Savioli (1993: 3)
The above discussion on pathogens is also relevant to food safety. Just as harmful bacteria and
pathogens may contaminate soil and groundwater, edible plants grown in contaminated soil
may also take up these pathogens and bacteria during their cultivation and growth. Produce
with certain levels of bacteria and pathogens may lead to food borne illness in some. It is
therefore essential to monitor microbial levels in fresh vegetable produce.
2.3.5. Food Safety
Food safety may be measured by the presence or absence of microbial elements, at
predetermined limits. The presence of these elements in unsafe quantities can have a severe
negative impact on the health of those who consume the contaminated food (WHO, n.d.).
Different food types may be susceptible to different types of bacteria. Bacteria that may exist
in and render meat products unsafe may differ from bacteria that may exist in and render
vegetable products unsafe. According to Abadias et al (2008:122), “fresh produce can be a
vehicle for the transmission of bacterial, parasitic and viral pathogens capable of causing
human illness and a number of reports refer to raw vegetables harbouring potential foodborne
pathogens.” Four of the most common bacteria that are associated with determining the food
40
safety of fresh vegetable produce are Listeria, Salmonella, Shigella and E.coli; which can taint
fresh vegetable produce at any stage of growth, harvest or post-harvest (Abadias et al, 2008;
Gilbert et al, 2000). This is reiterated by the European Commission’s Scientific Committee on
Food (2002:7), who state “during growth, harvest, transportation and further processing and
handling the produce can, however, be contaminated with pathogens from human or animal
sources.”
2.3.5.1. Surface and Internal Contamination of produce
Many bacteria that are associated with causing food borne illnesses may be present in soil, the
growing environment and in the water used to irrigate crops. Consequently, surface
contamination of produce may occur. Surface contamination may be quashed if the skin or
peel of the produce is removed (WHO, n.d.). However, there is a chance of cross
contamination from the peel of the produce to the inner portion. Internal contamination, unlike
surface contamination, is unable to be cleansed by removal of the outer portion of the produce
(WHO, n.d). Bacteria become resident within the produce, under the outer layers, resulting in
internal contamination. Internal contamination of produce may be removed through
processing. Minimally processed goods, such as fresh vegetable and fruit produce, are
susceptible to both internal and surface contamination (Lynch, Tauxe and Hedberg, 2009).
There are cases of fresh vegetable produce becoming contaminated, either internally or on the
surface. Some of these incidents have resulted in serious illness and death. It is for this reason
that food safety measures are important.
2.3.6. Case study: E.coli contamination of fresh vegetable produce in Germany - 2011
It is of utmost importance that the microbiological safety of foods is maintained to prevent
contamination, and consequent severe health hazards for consumers of the fresh vegetable
produce (Lynch, Tauxe and Hedberg, 2009). Food safety is especially important when using
41
humanure for the growth of food, as there are many potential disease causing pathogens and
bacteria that are present in the gut of humans, and hence in faecal matter (Fooks and Gibson,
2002). There have been cases where harmful and disease causing bacteria have contaminated
fresh vegetable produce, consequently infecting many consumers of the produce. One such
case study was the contamination of fresh produce in the European Union (EU) region in
2011.
In Germany, an unidentified bacterial disease had claimed the lives of 16 people, as at 01 June
2011. It was suspected that the outbreak originated from fresh vegetable produce sourced from
European farmers. Due to this, many countries in the region were forced to place restrictions
on vegetable imports, while retailers across the region withdrew all produce from their stores.
This had a severe negative impact on farmers, costing them millions of Euros. At this time,
authorities were unsure of the cause of the outbreak, but were able to identify a strain of E.coli
as the responsible bacteria (the Guardian, 2011, Sample). This strain of the bacteria resulted in
Haemolytic Uraemic Syndrome (HUS), a disease which is commonly linked to kidney failure
and bloody diarrhea. Sample (the Guardian, 2011:20, Sample) notes that:
“the new strain of E coli causes’ disease by colonising the gut and producing a toxin
called Shiga. Many patients experienced bloody diarrhea and in the most serious cases
the infection caused a life-threatening condition called haemolytic uraemic syndrome
(HUS).”
The number of infected people increased to 470, reported on 01 June 2011 (Mail and Guardian
online, 2011a, Curta).
Authorities and health officials were unsure of the source, but cautioned citizens against
consuming raw vegetable produce such as raw cucumbers, tomatoes, or lettuce, which were
presumed to be the most probable source of the bacterial contamination. Through
investigation, all cases of food poisoning across Europe were linked to Germany; more
specifically, to people who had recently travelled to northern Germany, where the outbreak
42
had started in mid-May of 2011 (Mail and Guardian online, 2011b, Curta). By 03 June 2011,
the number of lives claimed by the outbreak of the disease had risen to at least 18 and the
number of reported infections of HUS increased to 499 people (Mail and Guardian online,
2011, Bronst). Approximately 2000 cases of food poisoning were reported by the Regional
German health authority, with symptoms including diarrhea, fever, vomiting and stomach
cramps (Mail and Guardian online, 2011, Bronst). As reported by the European Center for
Disease Prevention and Control, the number of lives claimed had risen to 22 by 06 June 2011.
The World Health Organisation identified the cause as a rare strain of E.coli bacteria that was
not commonly associated with strains related to food poisoning. Furthermore, cases of food
poisoning had been spread to many other countries, including Britain, France, Spain, Sweden,
and the United States of America. Each of these reported cases were related to travel with
Germany (Mail and Guardian online, 2011b, Curta).
By 10 June 2011, it was reported that the death toll due to the E.coli contamination outbreak
was 29, with 2900 people affected by food poisoning related symptoms. Bean sprouts were
also added to the list of suspected carriers of the disease causing bacteria. Due to the uproar
surrounding the outbreak, countries such as Russia and Saudi Arabia had issued a ‘blanket
ban’ on all imports of vegetables from the EU region (Sunday Times, 2011, Sapa-AP). Ian
Sample, reporting for The Guardian reported that bean sprouts were officially linked to the
outbreak of disease associated with vegetable produce from Germany. According to Sample
(2011:20) “Bean sprouts from an organic farm in northern Germany caused the E coli
outbreak that has killed 31 people and infected thousands more, German officials said on
Friday.” Due to this finding, warnings against the consumption of fresh vegetable produce
such as cucumbers, tomatoes and lettuce were lifted, as well as ‘blanket import bans’ imposed
by Russia. The head of Germany’s risk assessment agency stated “Lettuce, tomatoes and
cucumbers should be eaten again – it is all healthy produce." (Sample, 2011:20)
43
2.4. Conclusion
The theory of zero waste management, where ‘waste’ is viewed as a resource, is fitting for this
research. Human excrement has long since been viewed as a toxic waste, which has a stigma
attached to it. Through the application of this theory, human excrement may be viewed as a
freely available resource which may be used to make humanure, contributing to ensuring food
security at household level; as well as the non-hazardous disposal of human excrement. This
chapter has comprised of a compilation of literature relevant to this study, including
agriculture; food security; food safety and indicator organisms. Food security is an important
aspect of the literature, as it is linked to agriculture and food safety. Agricultural practices may
contribute to food security at household level, but this may be negated by unsafe,
contaminated produce. A case study of fresh vegetable produce contamination in Germany has
been used as an example to illustrate the importance of food safety standards. The
consumption of contaminated food can have dire consequences. The background of the study
area, as well as a discussion of the methods employed in this study will be discussed in the
following chapter.
44
Chapter Three
Study Area and Methodology
3.1. Introduction
This chapter will focus on the study area in which this research is based, as well as the
methods employed to achieve the objectives of this study. It is divided into two sections,
namely, ‘background to study area’ and ‘methodology’. It should be noted that information
with regard to the study area is largely absent, possibly due to its peripheral location. The
researcher has attempted to describe the area through observation and information gained
through interaction with community members.1
3.2. Background of Study Area
The study area for this investigation is Cottonlands, located within the borders of the
eThekwini Municipality, some 50 kilometers north of the Durban CBD. Cottonlands was
originally sugarcane farming land. However, the area underwent a change, and transformed
into a rural/residential area, through rezoning. The area is once again undergoing change, from
a rural to a peri-urban area, as services such as water and electricity being are made available
to the community.
1 It should be noted that information with regard to the study area is largely absent, possibly
due to its peripheral location. The researcher has attempted to describe the area through
observation and information gained through interaction with community members.
45
Cottonlands is located in close proximity to the town of Verulam, which is north of the city of
Durban. Although the town is a multi-racial one, the population of the Cottonlands community
is comprised predominantly of isiZulu speaking people. The community, which comprises of
approximately 2500 households, displays characteristics of both rural and urban areas, due to
its proximity to Verulam, thus making it a peri-urban area. Services such as sanitation remain
an issue in Cottonlands, as there is a lack of or limited infrastructure available in the area. The
area acts as a transition zone, as it is geographically close to the towns of Verulam and
Tongaat, and close to landmarks in the Municipality such as the King Shaka International
Airport, as illustrated in Figure 3.2. Despite the physical closeness of the airport to the
community; the area and services offered in the community have not seen much improvement
in recent years.
The community still lacks facilities such as clinics and hospitals, transportation modes such as
railway stations or formal, roads. This is illustrated in Figure 3.1, where it is evident that the
area of Cottonlands is free of any hospitals, railway stations, sewer pipes or roads.
Furthermore, residents of Cottonlands in need of medical services have to travel to the next
town, Tongaat, where the nearest hospital is located. The neighboring towns of Verulam and
Tongaat service the community of Cottonlands, as these towns are equipped with the
amenities and facilities that the residents require. Efforts to uplift the area have been made by
the municipality, in the form of a community based mushroom farm, where locals are
employed and are involved in the day-to-day running and upkeep of the farm. Currently, there
is an eco-village that is being built in the area. It is apparent that development is occurring in
the area, albeit at a slow pace. Recreational facilities such as sporting centers and shopping
malls are not present in the immediate area2. These facilities can, however be found in towns
located in close proximity to the study area. These include the towns of Verulam and Tongaat.
2 It should be noted that information with regard to the study area is largely absent, possibly
due to its peripheral location. The researcher has attempted to describe the area through
observation and information gained through interaction with community members.
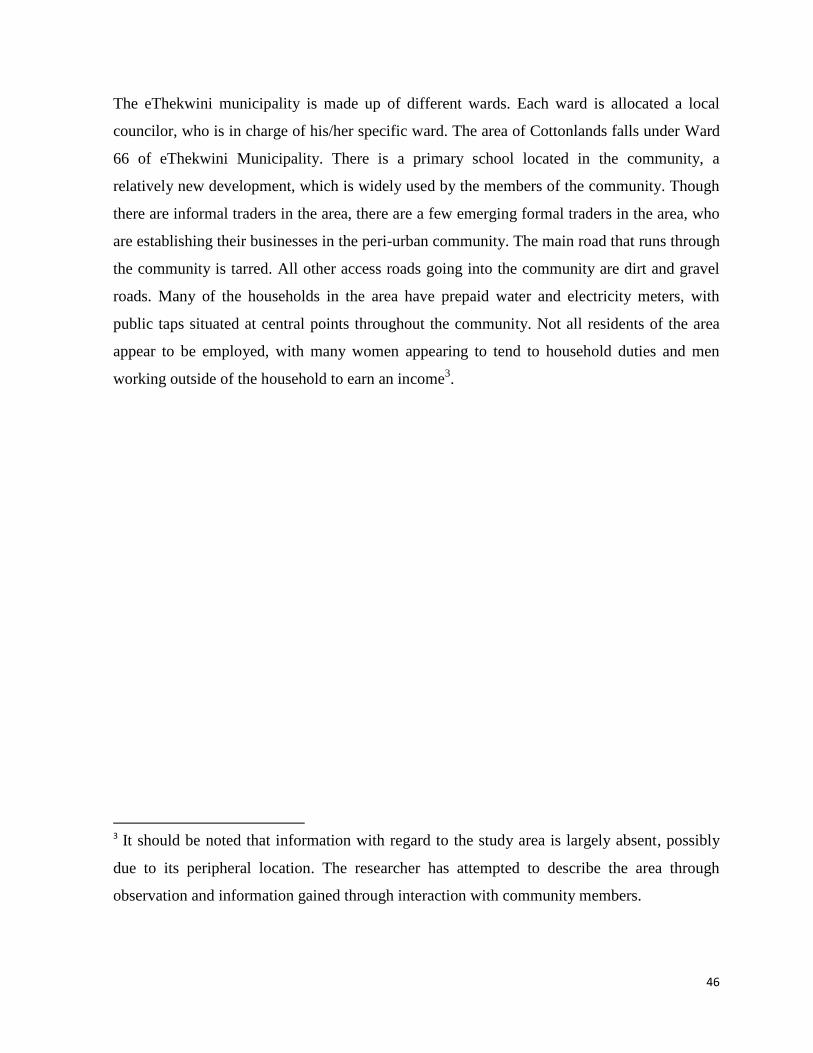
46
The eThekwini municipality is made up of different wards. Each ward is allocated a local
councilor, who is in charge of his/her specific ward. The area of Cottonlands falls under Ward
66 of eThekwini Municipality. There is a primary school located in the community, a
relatively new development, which is widely used by the members of the community. Though
there are informal traders in the area, there are a few emerging formal traders in the area, who
are establishing their businesses in the peri-urban community. The main road that runs through
the community is tarred. All other access roads going into the community are dirt and gravel
roads. Many of the households in the area have prepaid water and electricity meters, with
public taps situated at central points throughout the community. Not all residents of the area
appear to be employed, with many women appearing to tend to household duties and men
working outside of the household to earn an income3.
3 It should be noted that information with regard to the study area is largely absent, possibly
due to its peripheral location. The researcher has attempted to describe the area through
observation and information gained through interaction with community members.
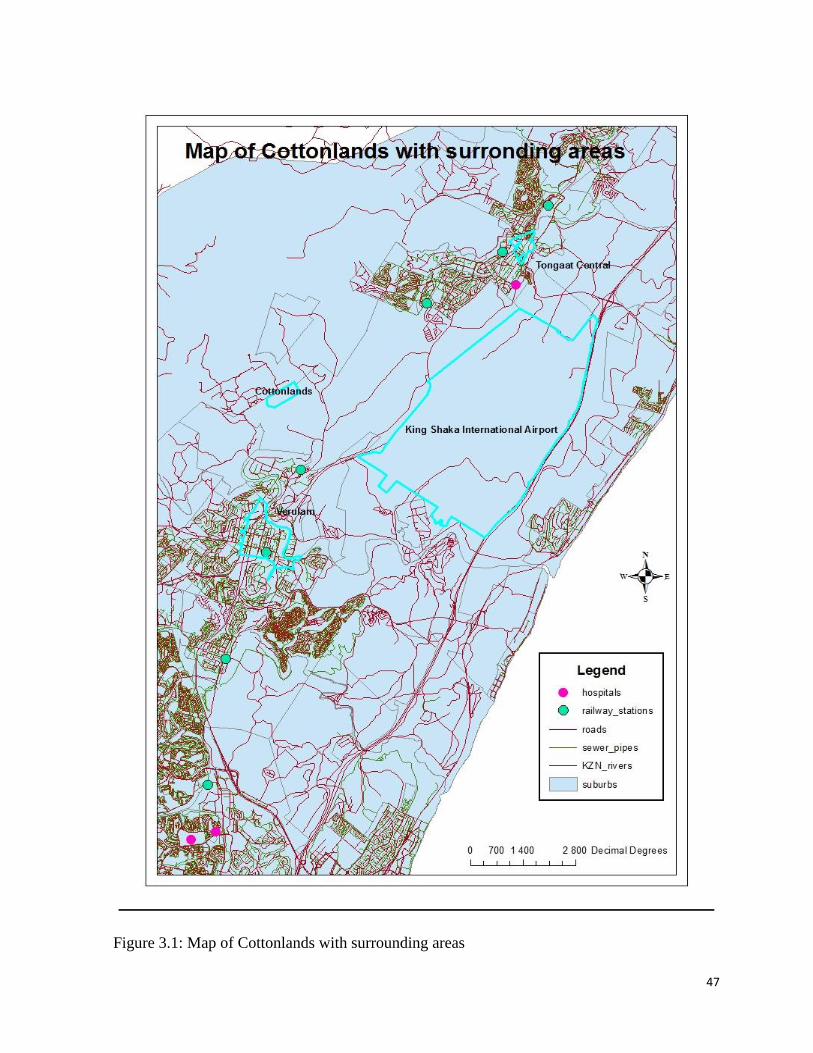
47
Figure 3.1: Map of Cottonlands with surrounding areas
48
Figure 3.2: Map of Study Areas showing proximity to landmark and closest towns
49
3.3. Methodology
3.3.1. Methods and Techniques
This study employed a mixed method approach, through the use of both qualitative and
quantitative methods. Using a combination of these methods may achieve a more in-depth and
holistic result. Qualitative methods deal with observations and perceptions, whereas
quantitative methods focus on numbers and facts. According to Babbie (2011:11) “the
distinction between qualitative and quantitative data in social research is essentially the
distinction between numerical and non-numerical data.”
Quantitative research methods are defined as “one in which the investigator primarily uses
postpositivist claims for developing knowledge (i.e., cause and effect thinking, reduction to
specific variables and hypotheses and questions, use of measurement and observation, and the
test of theories), employs strategies of inquiry such as experiments and surveys, and collects
data on predetermined instruments that yield statistical data” (Creswell, 2013:18).
Furthermore, qualitative research methods may be defined as “research using methods such as
participant observation or case studies which result in a narrative, descriptive account of a
setting or practice” (Guest et al, 2013:2).
3.3.2. Non-probability Sampling
When using non-probability sampling, it is impossible to know if all the representative
elements of the study population have been included in the sample. It is possible that some of
the elements of the study population may not be included in the sample. Due to this, the
degree to which the sample truly represents the study population is difficult to ascertain,
making any generalization that may be drawn from the sample questionable. Non-probability
sampling is another type of sampling method that is commonly used. Non-probability
50
sampling may be used when it is not possible to execute probable sampling methods due to
factors like a complete sampling frame being unavailable or time and financial constraints
(Judd and Kidder, 1986).
3.3.2.1 Purposive Sampling or Judgment Sampling
In purposive sampling, the researcher subjectively selects the sample. While selecting the
sample, the researcher aims to get a sample that is, or appears to be representative of the
population that is being researched. Furthermore, the researcher will try to make certain that
the sample is representative of the population including a wide range of elements from one
extreme to the other. Purposive sampling is a type of sampling that is often used in situations
such as political polling. This may be attributed to the fact that previous polling results in the
area create a pattern which may serve as an indicator of what electorate results may be. (Judd
and Kidder, 1986).
A drawback with this type of sampling is that different researchers will have different views
on which elements of a population to choose to be a part of the sample. As is the case with any
non-probability sample, there is a risk of bias of an unknown extent. The risk of a bias to a
certain extent does not decrease with an increase in the size of the sample. (Dixon et al, 1989).
3.3.2.2 Convenience or Accidental sampling
A convenience sample is made up of elements of a population who are available in a
convenient way to the researcher. The researcher does not have specific elements from the
population that are required to be in the sample. Rather, elements from the population are
added to the sample until the desired size for the sample is reached. Thus, this method of
sampling is void of the concept of randomness; therefore, the likelihood of bias in the sample
is high. Over-representation of elements in the population may occur. As a result, any
51
generalization that may be drawn from a sample formed through convenience sampling is very
risky. The only way to evaluate the bias of such samples is to conduct a parallel study with a
probability sample. However, this is very monotonous, time consuming and costly. This
method of sampling is often used by researchers who have restricted access to resources and
experience time constraints. When this method of sampling is employed, the limitation of the
method must be clearly understood. (Judd and Kidder, 1986). An advantage of this method of
sampling is that it is confined to a part of the population that is reasonably accessible to the
researcher. (Dixon et al, 1989).
3.3.3. Sample Size
The sample size that was used in this study was a sample of 50 households from the
Cottonlands community, which was the area in which this research was based.
3.3.4. Surveys
Surveys may be classified as either interviews or questionnaires. A questionnaire may be
described as a document consisting of a series of questions which is answered by the
respondent; whilst an interview may be described as a process which is documented and
completed by the interviewer or researcher, based upon the answers provided by the
respondent (Trochim, 2006). Interviews are an important process used in order to gather
information required. It is important to note that within human geography and the social
sciences, there is a significant emphasis on human interaction in order to understand
underlying reasons that changes occur or why specific situations take place. An interview
according to Key (1997) is explained as “direct face-to-face attempt to obtain reliable and
valid measures in the form of verbal responses from one or more respondents. It is a
conversation in which the roles of the interviewer and the respondent change continually”.
52
The various forms of interviews are: panel interviews, group interviews, telephonic interviews
and face-to-face interviews. Structured interviews can be advantageous as this type of
interview ensures a relatively easy and quick interview, where the interviewer is well
prepared. This type of interview also prevents respondents from digressing from the topic, as
there is a set of standardized questions that need to be answered. The surveys that were
conducted for the purposes of this study comprised of many different types of questions,
namely, open ended questions, closed ended questions and multiple-response questions. All
the data derived from the surveys was input into Statistical Package for Social Science (SPSS)
for analysis. Through analysis of the data, the critical questions of this study were answered.
SPSS is a computerized program which was used in the analysis of the questionnaires used in
this study. This program is a very powerful statistical analysis and data management system.
The program has many functions that allows for the use different methods in data analysis, and
also allows for visual output of data in the form of graphs and figures.
3.3.5. Secondary data
Secondary data sources such as journal articles and academic publications were used in this
research project. Secondary data may be described as data which has previously been collected
by a researcher and published. Secondary data from reliable sources such as academic journals
and book publications undergo stringent review processes to ensure that the data contained
within the articles is worthy.
53
3.4. Methodology Chosen for this research
3.4.1. Qualitative Methods
Questionnaires were administered to the community, at a sample size of 50, using a purposive
sampling method. Non-probability sampling was employed, using purposive and snow-ball
sampling techniques, discussed in section 3.3.2, as the questionnaires were aimed at heads of
households in the area. A few heads of households in the community were contacted, and
asked to refer the researcher to other heads of households in the area. The local school hall in
the community was used as a central meeting point for all the respondents, where the
questionnaires were individually administered. Individual administration of the questionnaires
was essential, due to language barriers. Translators were employed to help overcome these
language barriers. Although the use of questionnaires is generally classified as a quantitative
data method, they may also be used for descriptive purposes, as is the case in this study, thus
qualifying them as a dual quantitative/qualitative research tool.
Another research tool, visual analysis, was employed in this study. Produce from the applied
and control plots were compared, according to a set of predetermined characteristics, to
determine the effectiveness of using humanure. The produce that was sampled for
microbiological levels was also subjected to a visual study, which examined the appearance of
the vegetable. Signs of visible disease and blemished areas were regarded as undesirable. All
produce samples, from both applied and non-applied trial plot and tyre gardens were subjected
to visual analysis. This type of analysis is loosely based on the type of criteria that consumers
use to deem fresh vegetable produce suitable for consumption or not.
3.4.2. Quantitative Methods
In addition to the use of questionnaires, other methods were employed in this study to achieve
the objectives of the research. Humanure was produced through an aerobic, thermophillic
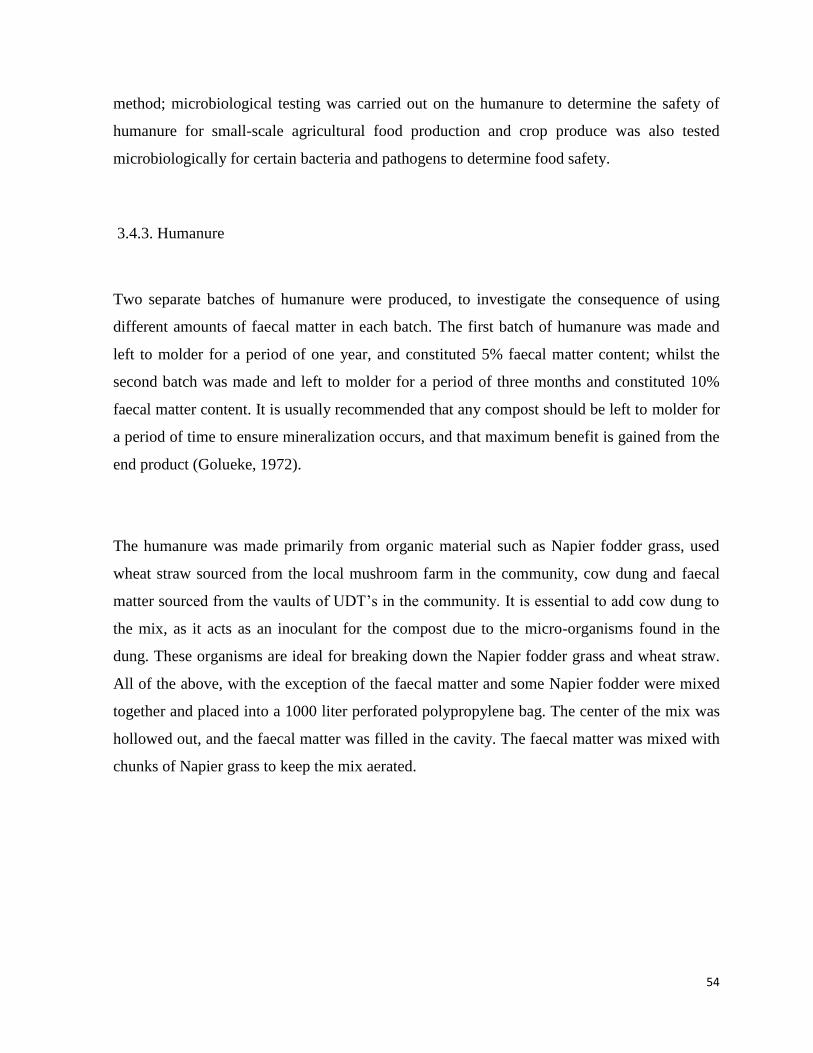
54
method; microbiological testing was carried out on the humanure to determine the safety of
humanure for small-scale agricultural food production and crop produce was also tested
microbiologically for certain bacteria and pathogens to determine food safety.
3.4.3. Humanure
Two separate batches of humanure were produced, to investigate the consequence of using
different amounts of faecal matter in each batch. The first batch of humanure was made and
left to molder for a period of one year, and constituted 5% faecal matter content; whilst the
second batch was made and left to molder for a period of three months and constituted 10%
faecal matter content. It is usually recommended that any compost should be left to molder for
a period of time to ensure mineralization occurs, and that maximum benefit is gained from the
end product (Golueke, 1972).
The humanure was made primarily from organic material such as Napier fodder grass, used
wheat straw sourced from the local mushroom farm in the community, cow dung and faecal
matter sourced from the vaults of UDT’s in the community. It is essential to add cow dung to
the mix, as it acts as an inoculant for the compost due to the micro-organisms found in the
dung. These organisms are ideal for breaking down the Napier fodder grass and wheat straw.
All of the above, with the exception of the faecal matter and some Napier fodder were mixed
together and placed into a 1000 liter perforated polypropylene bag. The center of the mix was
hollowed out, and the faecal matter was filled in the cavity. The faecal matter was mixed with
chunks of Napier grass to keep the mix aerated.
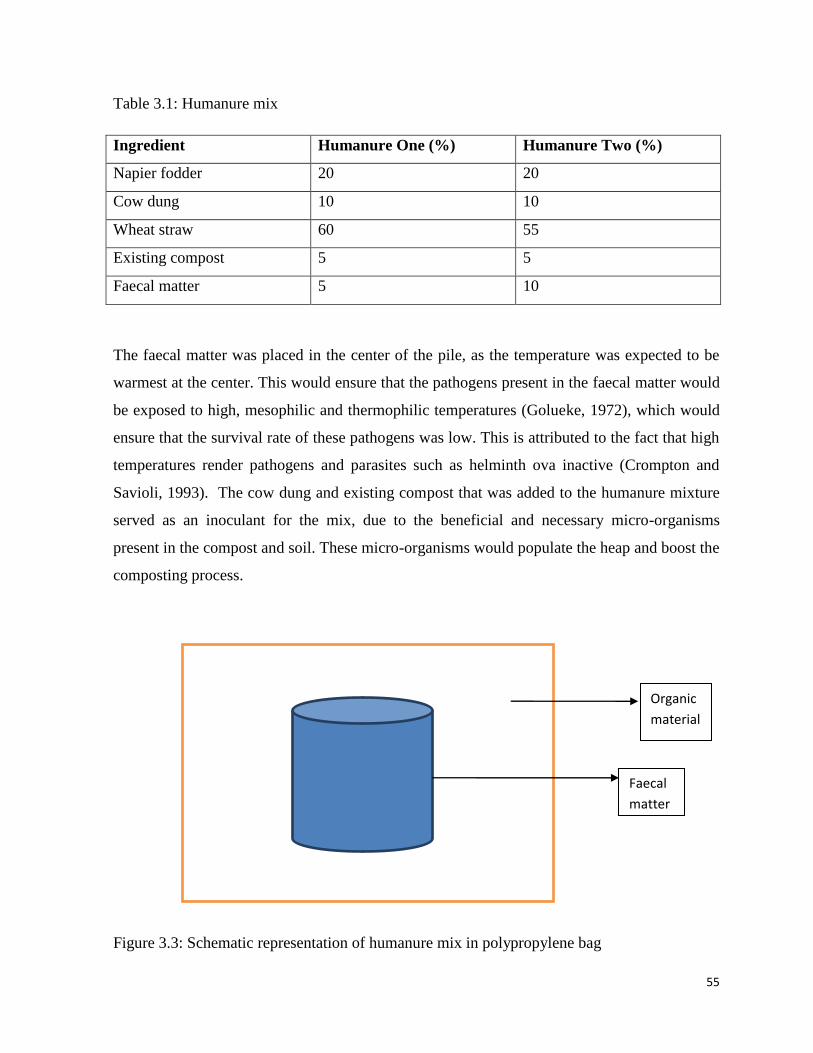
55
Table 3.1: Humanure mix
Ingredient Humanure One (%) Humanure Two (%)
Napier fodder 20 20
Cow dung 10 10
Wheat straw 60 55
Existing compost 5 5
Faecal matter 5 10
The faecal matter was placed in the center of the pile, as the temperature was expected to be
warmest at the center. This would ensure that the pathogens present in the faecal matter would
be exposed to high, mesophilic and thermophilic temperatures (Golueke, 1972), which would
ensure that the survival rate of these pathogens was low. This is attributed to the fact that high
temperatures render pathogens and parasites such as helminth ova inactive (Crompton and
Savioli, 1993). The cow dung and existing compost that was added to the humanure mixture
served as an inoculant for the mix, due to the beneficial and necessary micro-organisms
present in the compost and soil. These micro-organisms would populate the heap and boost the
composting process.
Figure 3.3: Schematic representation of humanure mix in polypropylene bag
Organic
material
Faecal
matter
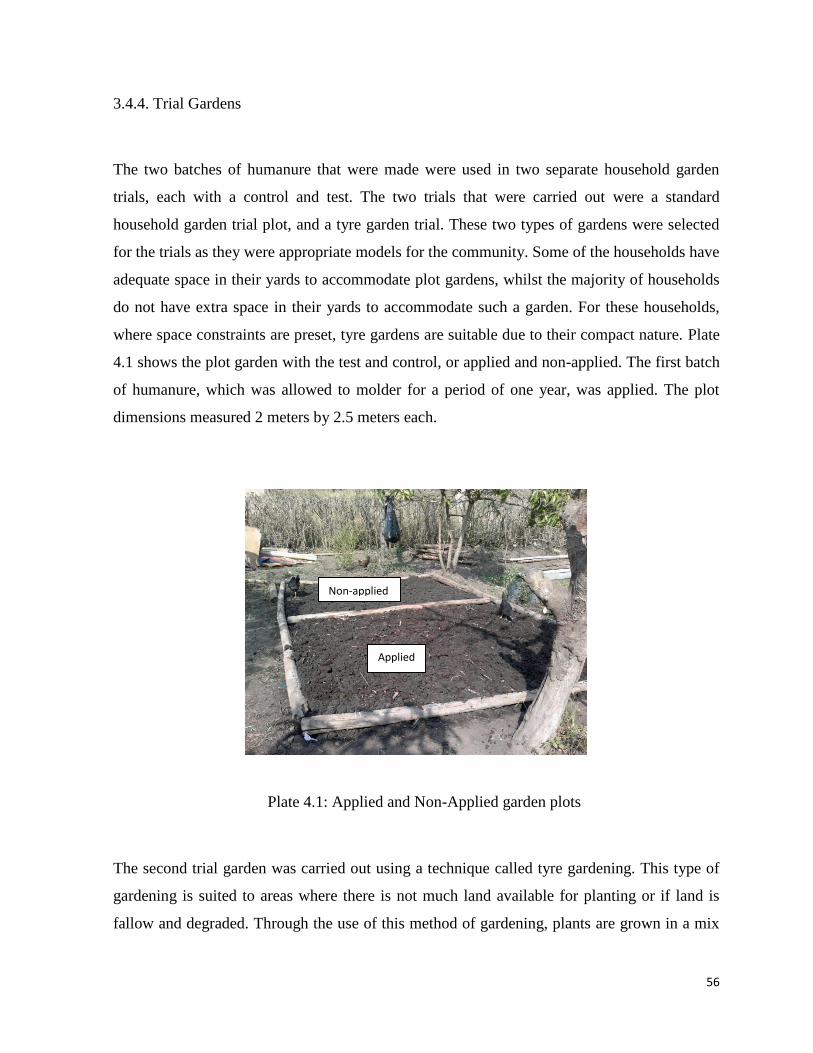
56
3.4.4. Trial Gardens
The two batches of humanure that were made were used in two separate household garden
trials, each with a control and test. The two trials that were carried out were a standard
household garden trial plot, and a tyre garden trial. These two types of gardens were selected
for the trials as they were appropriate models for the community. Some of the households have
adequate space in their yards to accommodate plot gardens, whilst the majority of households
do not have extra space in their yards to accommodate such a garden. For these households,
where space constraints are preset, tyre gardens are suitable due to their compact nature. Plate
4.1 shows the plot garden with the test and control, or applied and non-applied. The first batch
of humanure, which was allowed to molder for a period of one year, was applied. The plot
dimensions measured 2 meters by 2.5 meters each.
The second trial garden was carried out using a technique called tyre gardening. This type of
gardening is suited to areas where there is not much land available for planting or if land is
fallow and degraded. Through the use of this method of gardening, plants are grown in a mix
Non-applied
Plate 4.1: Applied and Non-Applied garden plots
Non-applied
Applied
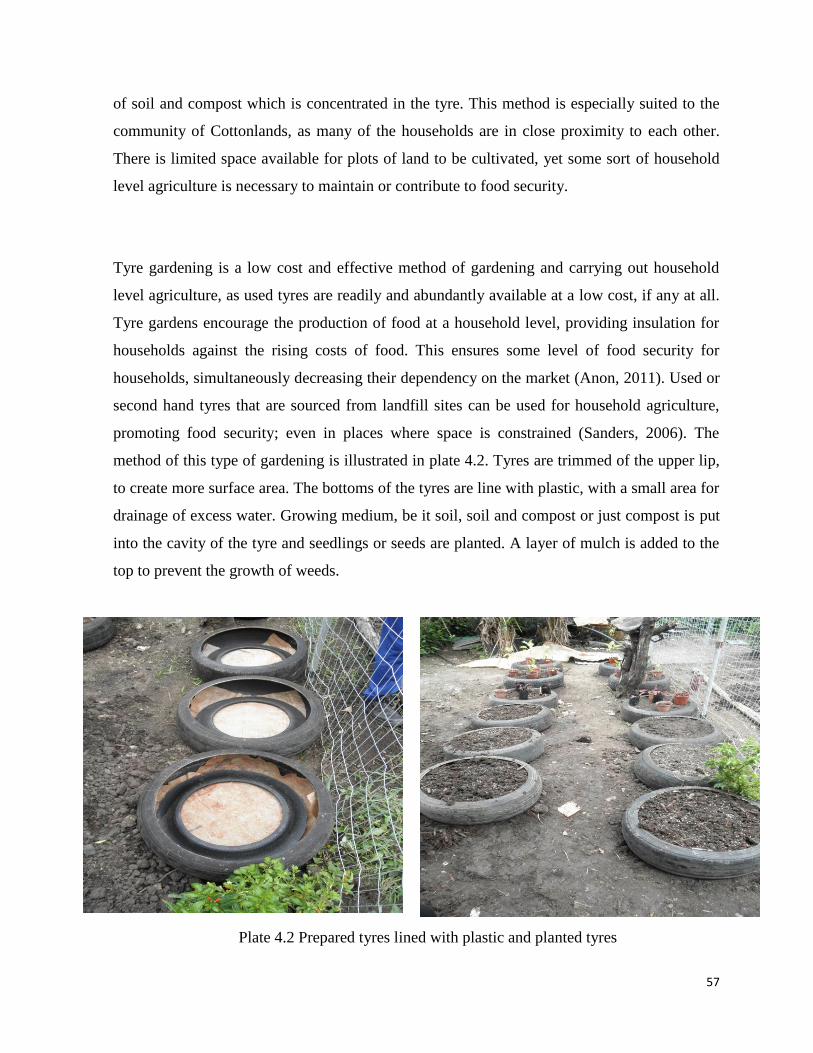
57
of soil and compost which is concentrated in the tyre. This method is especially suited to the
community of Cottonlands, as many of the households are in close proximity to each other.
There is limited space available for plots of land to be cultivated, yet some sort of household
level agriculture is necessary to maintain or contribute to food security.
Tyre gardening is a low cost and effective method of gardening and carrying out household
level agriculture, as used tyres are readily and abundantly available at a low cost, if any at all.
Tyre gardens encourage the production of food at a household level, providing insulation for
households against the rising costs of food. This ensures some level of food security for
households, simultaneously decreasing their dependency on the market (Anon, 2011). Used or
second hand tyres that are sourced from landfill sites can be used for household agriculture,
promoting food security; even in places where space is constrained (Sanders, 2006). The
method of this type of gardening is illustrated in plate 4.2. Tyres are trimmed of the upper lip,
to create more surface area. The bottoms of the tyres are line with plastic, with a small area for
drainage of excess water. Growing medium, be it soil, soil and compost or just compost is put
into the cavity of the tyre and seedlings or seeds are planted. A layer of mulch is added to the
top to prevent the growth of weeds.
Plate 4.2 Prepared tyres lined with plastic and planted tyres
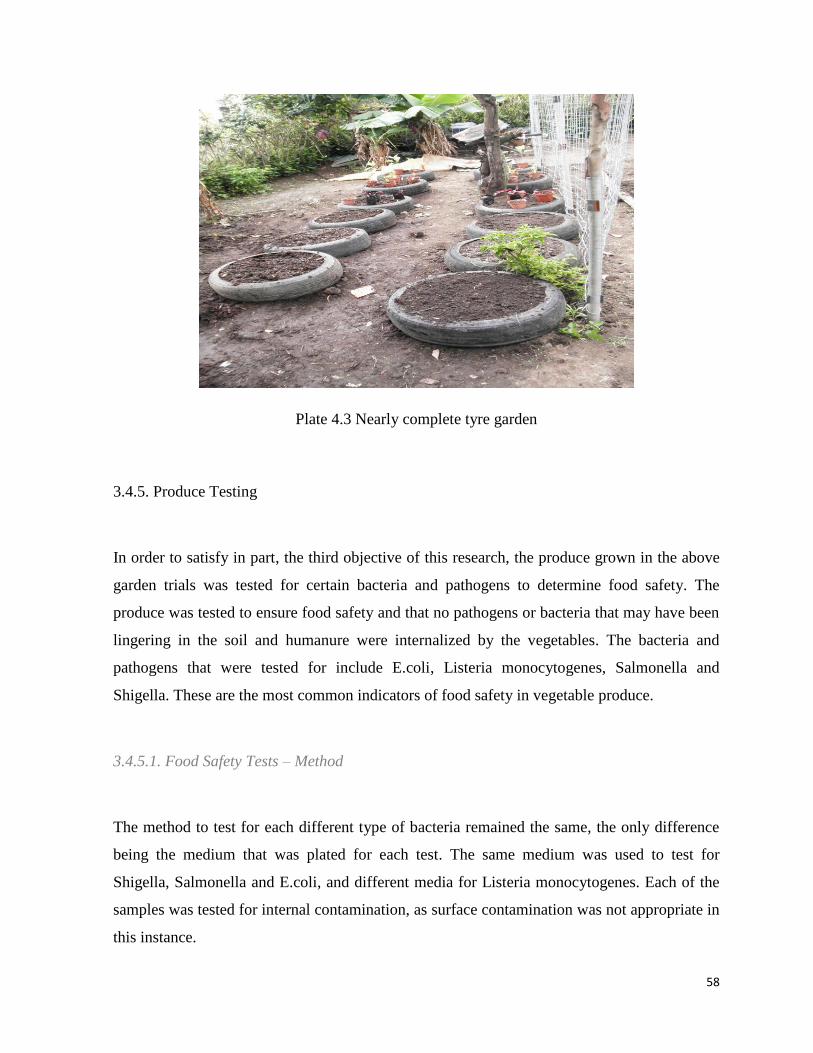
58
Plate 4.3 Nearly complete tyre garden
3.4.5. Produce Testing
In order to satisfy in part, the third objective of this research, the produce grown in the above
garden trials was tested for certain bacteria and pathogens to determine food safety. The
produce was tested to ensure food safety and that no pathogens or bacteria that may have been
lingering in the soil and humanure were internalized by the vegetables. The bacteria and
pathogens that were tested for include E.coli, Listeria monocytogenes, Salmonella and
Shigella. These are the most common indicators of food safety in vegetable produce.
3.4.5.1. Food Safety Tests – Method
The method to test for each different type of bacteria remained the same, the only difference
being the medium that was plated for each test. The same medium was used to test for
Shigella, Salmonella and E.coli, and different media for Listeria monocytogenes. Each of the
samples was tested for internal contamination, as surface contamination was not appropriate in
this instance.
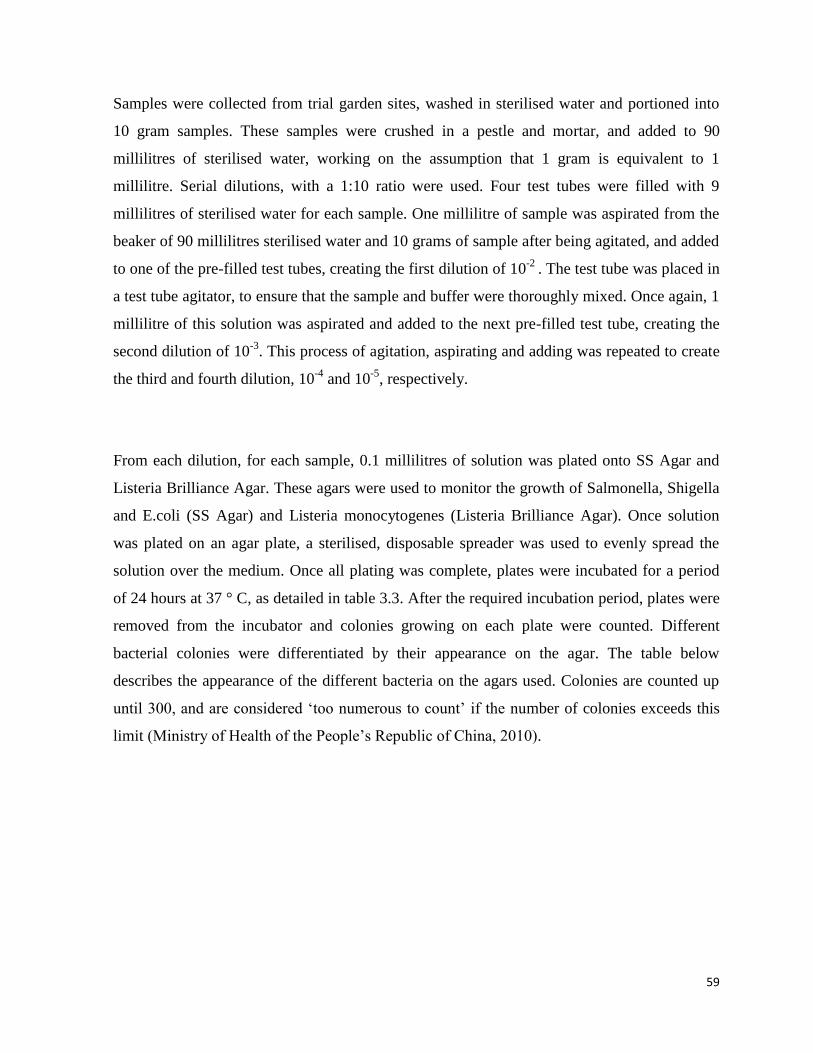
59
Samples were collected from trial garden sites, washed in sterilised water and portioned into
10 gram samples. These samples were crushed in a pestle and mortar, and added to 90
millilitres of sterilised water, working on the assumption that 1 gram is equivalent to 1
millilitre. Serial dilutions, with a 1:10 ratio were used. Four test tubes were filled with 9
millilitres of sterilised water for each sample. One millilitre of sample was aspirated from the
beaker of 90 millilitres sterilised water and 10 grams of sample after being agitated, and added
to one of the pre-filled test tubes, creating the first dilution of 10-2
. The test tube was placed in
a test tube agitator, to ensure that the sample and buffer were thoroughly mixed. Once again, 1
millilitre of this solution was aspirated and added to the next pre-filled test tube, creating the
second dilution of 10-3
. This process of agitation, aspirating and adding was repeated to create
the third and fourth dilution, 10-4
and 10-5
, respectively.
From each dilution, for each sample, 0.1 millilitres of solution was plated onto SS Agar and
Listeria Brilliance Agar. These agars were used to monitor the growth of Salmonella, Shigella
and E.coli (SS Agar) and Listeria monocytogenes (Listeria Brilliance Agar). Once solution
was plated on an agar plate, a sterilised, disposable spreader was used to evenly spread the
solution over the medium. Once all plating was complete, plates were incubated for a period
of 24 hours at 37 ° C, as detailed in table 3.3. After the required incubation period, plates were
removed from the incubator and colonies growing on each plate were counted. Different
bacterial colonies were differentiated by their appearance on the agar. The table below
describes the appearance of the different bacteria on the agars used. Colonies are counted up
until 300, and are considered ‘too numerous to count’ if the number of colonies exceeds this
limit (Ministry of Health of the People’s Republic of China, 2010).
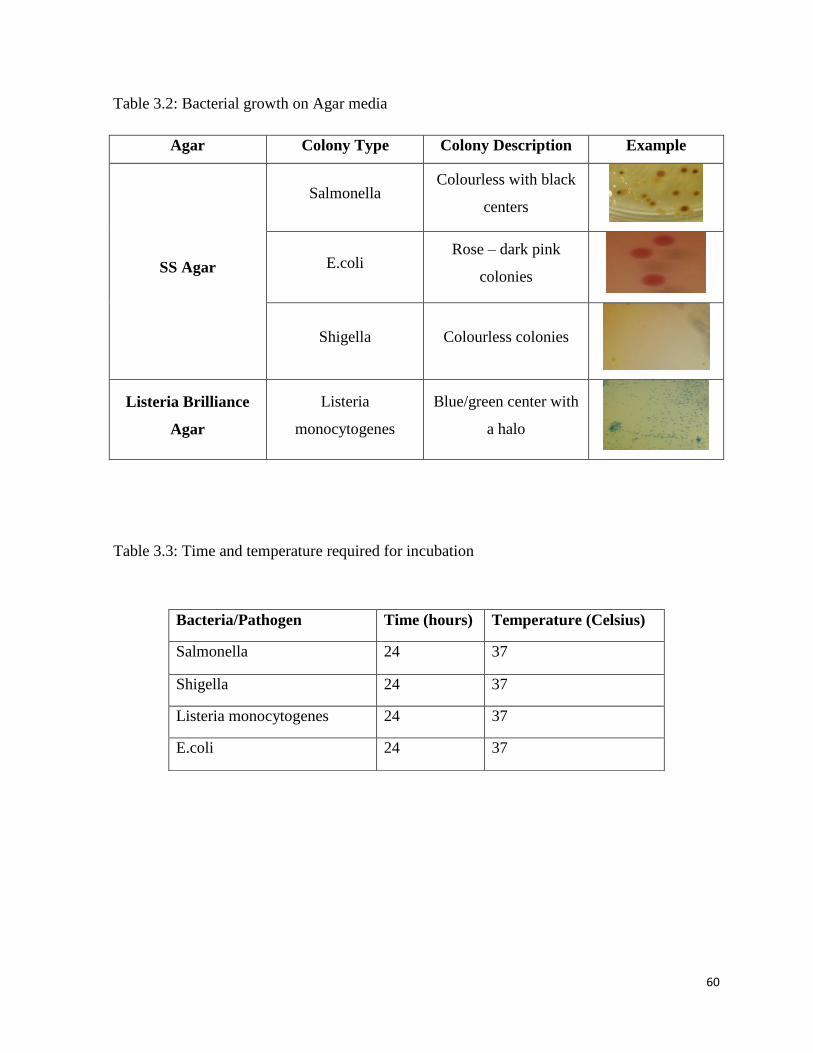
60
Table 3.2: Bacterial growth on Agar media
Agar Colony Type Colony Description Example
SS Agar
Salmonella Colourless with black
centers
E.coli Rose – dark pink
colonies
Shigella Colourless colonies
Listeria Brilliance
Agar
Listeria
monocytogenes
Blue/green center with
a halo
Table 3.3: Time and temperature required for incubation
Bacteria/Pathogen Time (hours) Temperature (Celsius)
Salmonella 24 37
Shigella 24 37
Listeria monocytogenes 24 37
E.coli 24 37
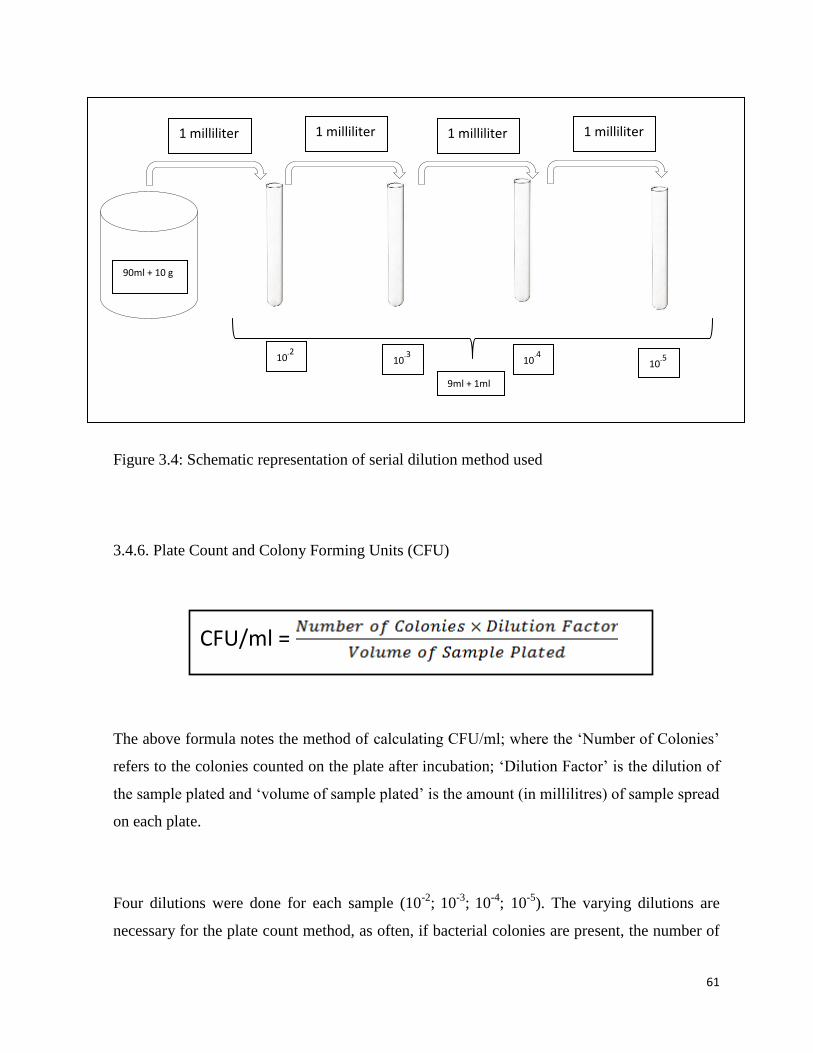
61
Figure 3.4: Schematic representation of serial dilution method used
3.4.6. Plate Count and Colony Forming Units (CFU)
The above formula notes the method of calculating CFU/ml; where the ‘Number of Colonies’
refers to the colonies counted on the plate after incubation; ‘Dilution Factor’ is the dilution of
the sample plated and ‘volume of sample plated’ is the amount (in millilitres) of sample spread
on each plate.
Four dilutions were done for each sample (10-2
; 10
-3; 10
-4; 10
-5). The varying dilutions are
necessary for the plate count method, as often, if bacterial colonies are present, the number of
CFU/ml =
1 milliliter 1 milliliter 1 milliliter 1 milliliter
9ml + 1ml
90ml + 10 g
10-2 10-3
10-4 10-5
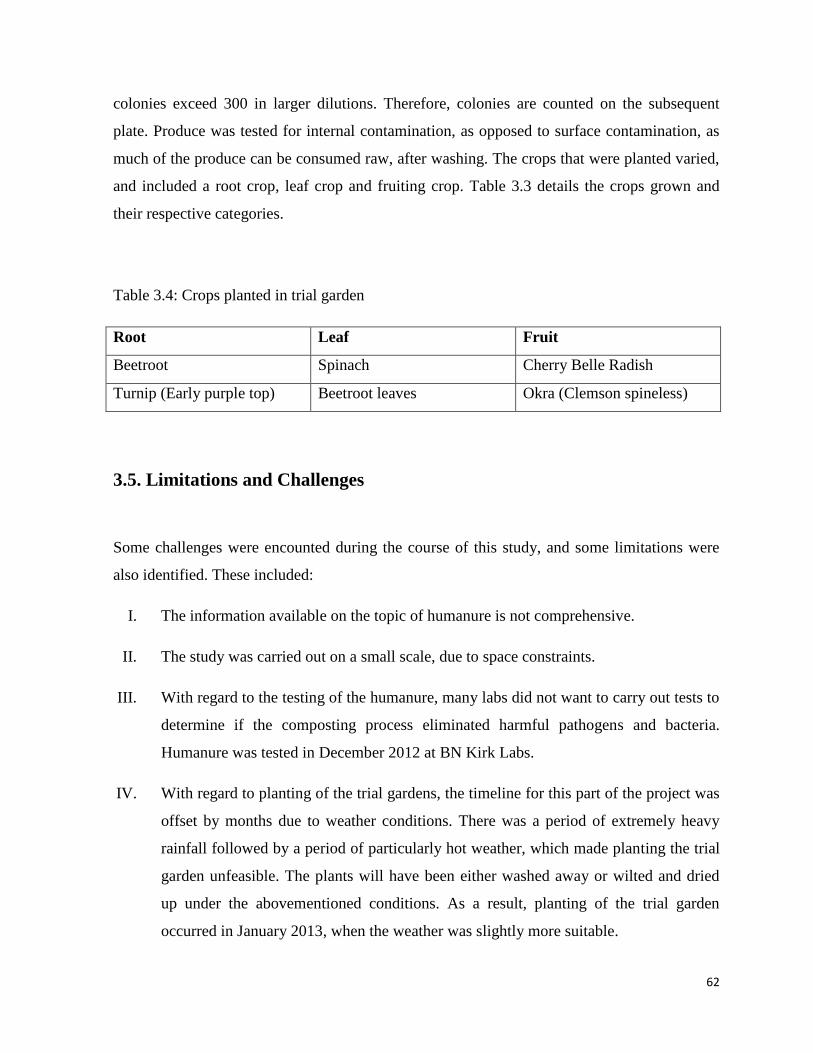
62
colonies exceed 300 in larger dilutions. Therefore, colonies are counted on the subsequent
plate. Produce was tested for internal contamination, as opposed to surface contamination, as
much of the produce can be consumed raw, after washing. The crops that were planted varied,
and included a root crop, leaf crop and fruiting crop. Table 3.3 details the crops grown and
their respective categories.
Table 3.4: Crops planted in trial garden
Root Leaf Fruit
Beetroot Spinach Cherry Belle Radish
Turnip (Early purple top) Beetroot leaves Okra (Clemson spineless)
3.5. Limitations and Challenges
Some challenges were encounted during the course of this study, and some limitations were
also identified. These included:
I. The information available on the topic of humanure is not comprehensive.
II. The study was carried out on a small scale, due to space constraints.
III. With regard to the testing of the humanure, many labs did not want to carry out tests to
determine if the composting process eliminated harmful pathogens and bacteria.
Humanure was tested in December 2012 at BN Kirk Labs.
IV. With regard to planting of the trial gardens, the timeline for this part of the project was
offset by months due to weather conditions. There was a period of extremely heavy
rainfall followed by a period of particularly hot weather, which made planting the trial
garden unfeasible. The plants will have been either washed away or wilted and dried
up under the abovementioned conditions. As a result, planting of the trial garden
occurred in January 2013, when the weather was slightly more suitable.
63
V. Testing the resultant produce for food safety was the crux of this research, as if the
produce grown with humanure is contaminated, it is unsuitable for use in food gardens.
Many labs in the country were consulted, each providing exorbitantly priced quotes,
not inclusive of all the necessary tests. As an alternative, a Professor from the School
of Microbiology and Genetics agreed to teach me the method of testing for the bacteria
and pathogens, as I have no experience in microbiological laboratory work. Ultimately,
this worked out for the best, as I have gained some experience and knowledge in this
field of work, as well as had hands on approach with this aspect of my research.
3.6. Conclusion
This chapter has provided a description of the study area of this research, an account of
methodologies in general and specific methods employed in this study. Both qualitative and
quantitative methods were employed, adding depth to the research. Through a combination the
two methods, a social acceptability survey as well as a scientific study was conducted.
Laboratory analysis facilitated the scientific aspect of this study, which was used in the testing
of humanure for pathogens, as well as microbiological testing of produce from the trial
gardens for food safety. The next chapter will provide an analysis and discussion of the results
of this research.
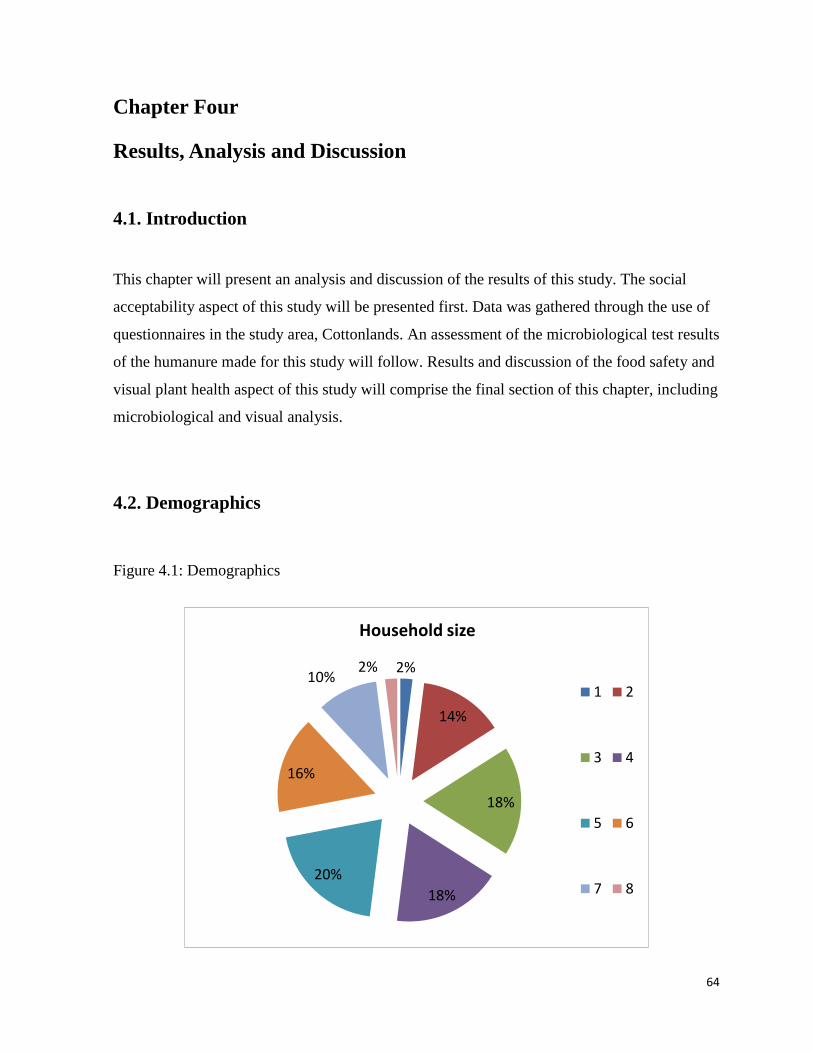
64
Chapter Four
Results, Analysis and Discussion
4.1. Introduction
This chapter will present an analysis and discussion of the results of this study. The social
acceptability aspect of this study will be presented first. Data was gathered through the use of
questionnaires in the study area, Cottonlands. An assessment of the microbiological test results
of the humanure made for this study will follow. Results and discussion of the food safety and
visual plant health aspect of this study will comprise the final section of this chapter, including
microbiological and visual analysis.
4.2. Demographics
Figure 4.1: Demographics
2%
14%
18%
18%
20%
16%
10%2%
Household size
1 2
3 4
5 6
7 8
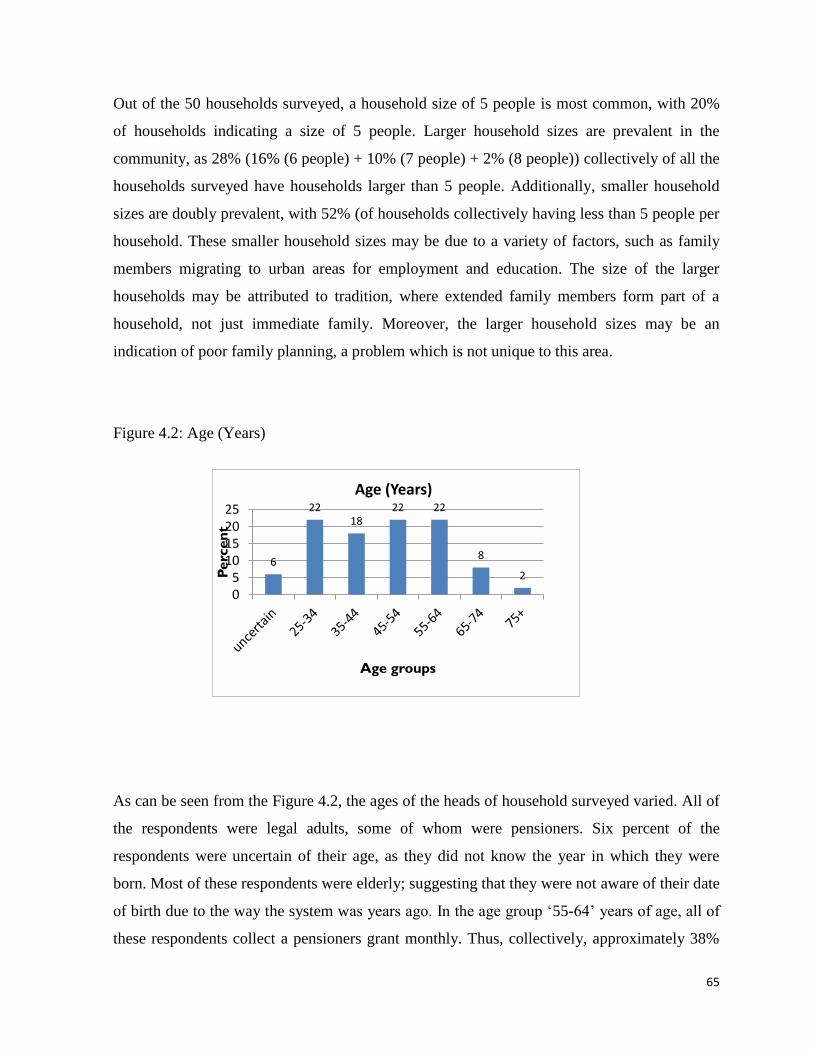
65
Out of the 50 households surveyed, a household size of 5 people is most common, with 20%
of households indicating a size of 5 people. Larger household sizes are prevalent in the
community, as 28% (16% (6 people) + 10% (7 people) + 2% (8 people)) collectively of all the
households surveyed have households larger than 5 people. Additionally, smaller household
sizes are doubly prevalent, with 52% (of households collectively having less than 5 people per
household. These smaller household sizes may be due to a variety of factors, such as family
members migrating to urban areas for employment and education. The size of the larger
households may be attributed to tradition, where extended family members form part of a
household, not just immediate family. Moreover, the larger household sizes may be an
indication of poor family planning, a problem which is not unique to this area.
Figure 4.2: Age (Years)
6
2218
22 22
8
2
05
10152025
Perc
en
t
Age groups
Age (Years)
As can be seen from the Figure 4.2, the ages of the heads of household surveyed varied. All of
the respondents were legal adults, some of whom were pensioners. Six percent of the
respondents were uncertain of their age, as they did not know the year in which they were
born. Most of these respondents were elderly; suggesting that they were not aware of their date
of birth due to the way the system was years ago. In the age group ‘55-64’ years of age, all of
these respondents collect a pensioners grant monthly. Thus, collectively, approximately 38%
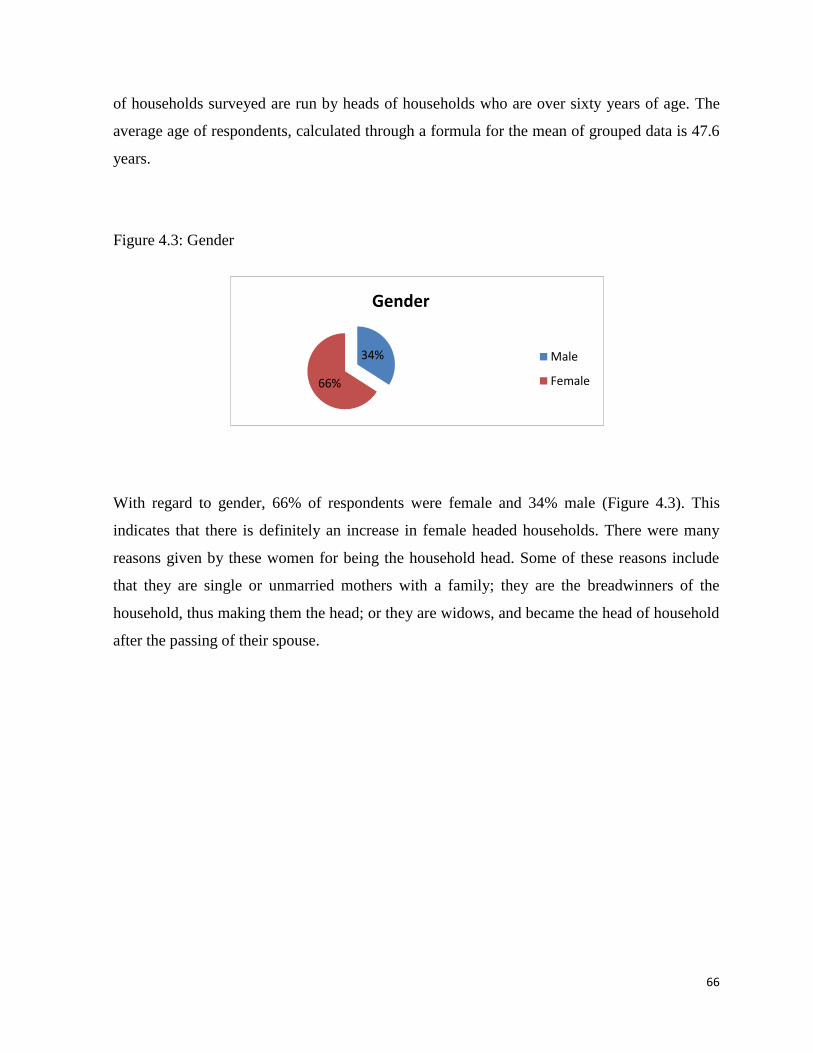
66
of households surveyed are run by heads of households who are over sixty years of age. The
average age of respondents, calculated through a formula for the mean of grouped data is 47.6
years.
Figure 4.3: Gender
34%
66%
Gender
Male
Female
With regard to gender, 66% of respondents were female and 34% male (Figure 4.3). This
indicates that there is definitely an increase in female headed households. There were many
reasons given by these women for being the household head. Some of these reasons include
that they are single or unmarried mothers with a family; they are the breadwinners of the
household, thus making them the head; or they are widows, and became the head of household
after the passing of their spouse.
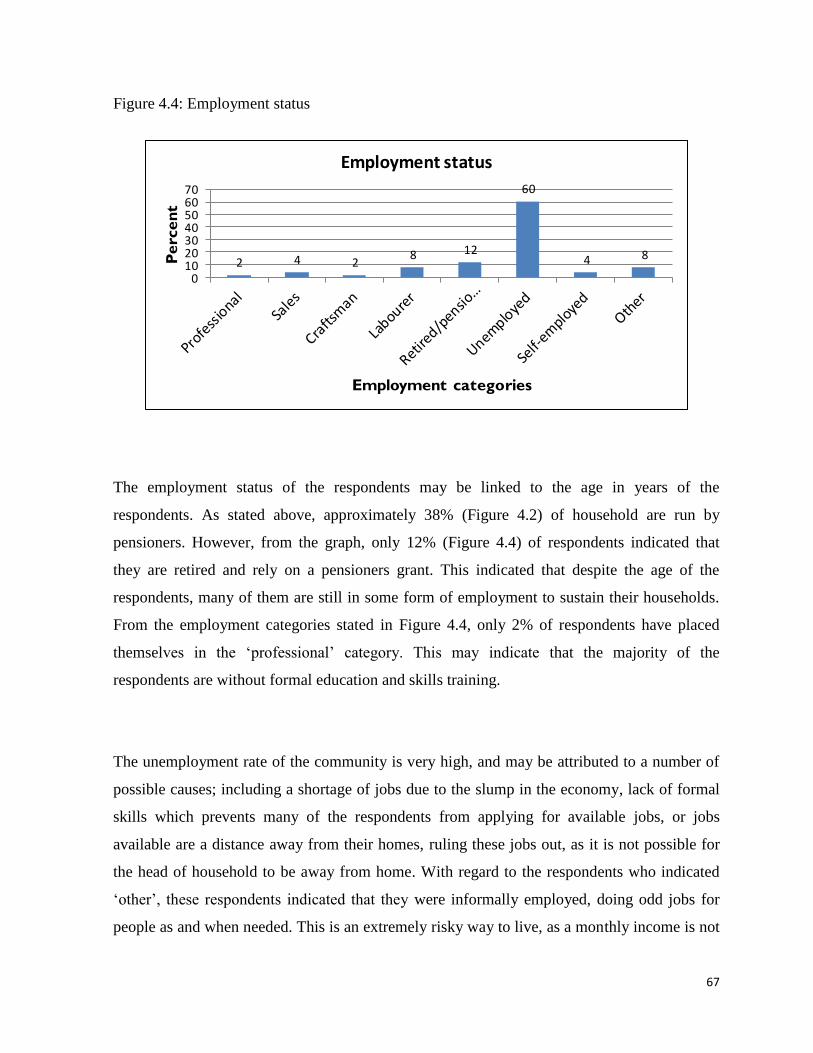
67
Figure 4.4: Employment status
2 4 28 12
60
4 8
010203040506070
Pe
rce
nt
Employment categories
Employment status
The employment status of the respondents may be linked to the age in years of the
respondents. As stated above, approximately 38% (Figure 4.2) of household are run by
pensioners. However, from the graph, only 12% (Figure 4.4) of respondents indicated that
they are retired and rely on a pensioners grant. This indicated that despite the age of the
respondents, many of them are still in some form of employment to sustain their households.
From the employment categories stated in Figure 4.4, only 2% of respondents have placed
themselves in the ‘professional’ category. This may indicate that the majority of the
respondents are without formal education and skills training.
The unemployment rate of the community is very high, and may be attributed to a number of
possible causes; including a shortage of jobs due to the slump in the economy, lack of formal
skills which prevents many of the respondents from applying for available jobs, or jobs
available are a distance away from their homes, ruling these jobs out, as it is not possible for
the head of household to be away from home. With regard to the respondents who indicated
‘other’, these respondents indicated that they were informally employed, doing odd jobs for
people as and when needed. This is an extremely risky way to live, as a monthly income is not
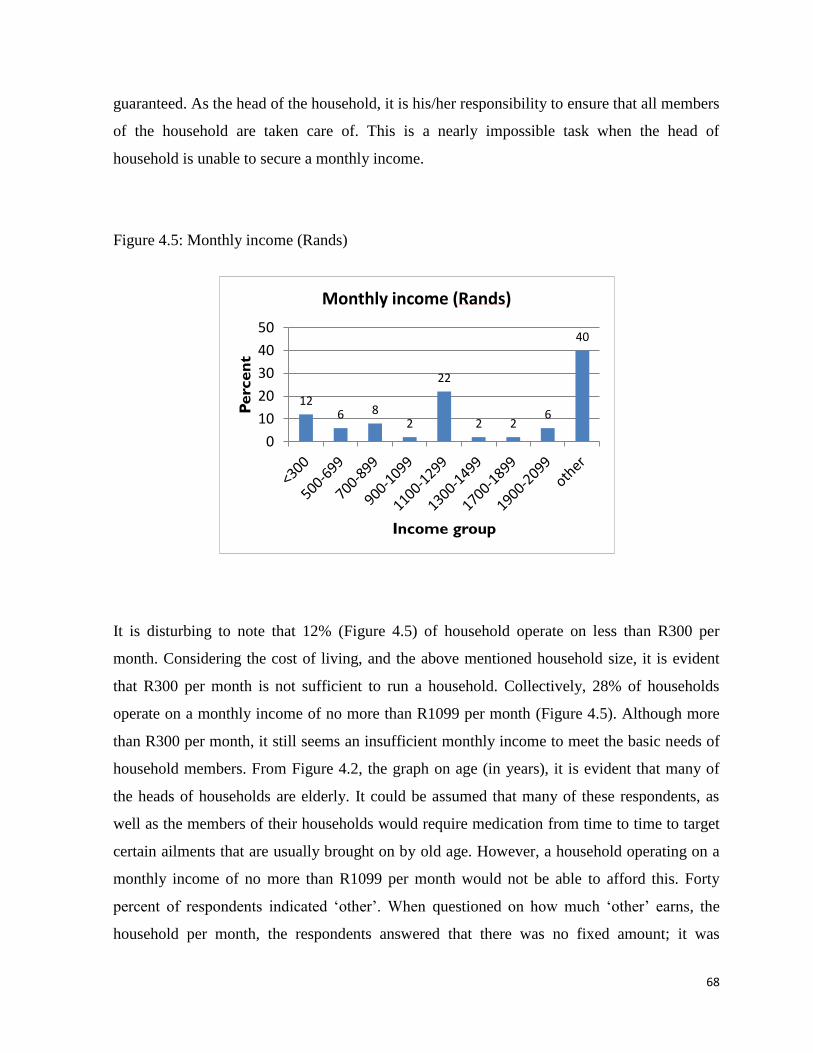
68
guaranteed. As the head of the household, it is his/her responsibility to ensure that all members
of the household are taken care of. This is a nearly impossible task when the head of
household is unable to secure a monthly income.
Figure 4.5: Monthly income (Rands)
126 8
2
22
2 26
40
0
10
20
30
40
50
Perc
en
t
Income group
Monthly income (Rands)
It is disturbing to note that 12% (Figure 4.5) of household operate on less than R300 per
month. Considering the cost of living, and the above mentioned household size, it is evident
that R300 per month is not sufficient to run a household. Collectively, 28% of households
operate on a monthly income of no more than R1099 per month (Figure 4.5). Although more
than R300 per month, it still seems an insufficient monthly income to meet the basic needs of
household members. From Figure 4.2, the graph on age (in years), it is evident that many of
the heads of households are elderly. It could be assumed that many of these respondents, as
well as the members of their households would require medication from time to time to target
certain ailments that are usually brought on by old age. However, a household operating on a
monthly income of no more than R1099 per month would not be able to afford this. Forty
percent of respondents indicated ‘other’. When questioned on how much ‘other’ earns, the
household per month, the respondents answered that there was no fixed amount; it was
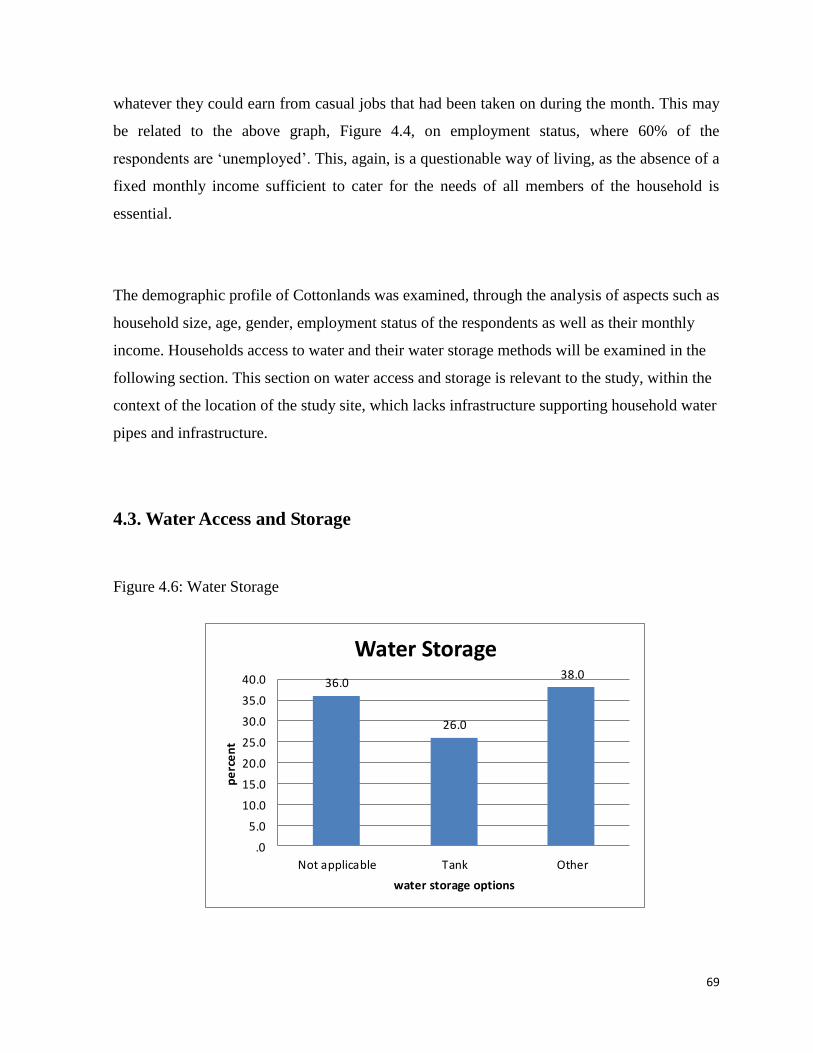
69
36.0
26.0
38.0
.0
5.0
10.0
15.0
20.0
25.0
30.0
35.0
40.0
Not applicable Tank Other
pe
rce
nt
water storage options
Water Storage
whatever they could earn from casual jobs that had been taken on during the month. This may
be related to the above graph, Figure 4.4, on employment status, where 60% of the
respondents are ‘unemployed’. This, again, is a questionable way of living, as the absence of a
fixed monthly income sufficient to cater for the needs of all members of the household is
essential.
The demographic profile of Cottonlands was examined, through the analysis of aspects such as
household size, age, gender, employment status of the respondents as well as their monthly
income. Households access to water and their water storage methods will be examined in the
following section. This section on water access and storage is relevant to the study, within the
context of the location of the study site, which lacks infrastructure supporting household water
pipes and infrastructure.
4.3. Water Access and Storage
Figure 4.6: Water Storage
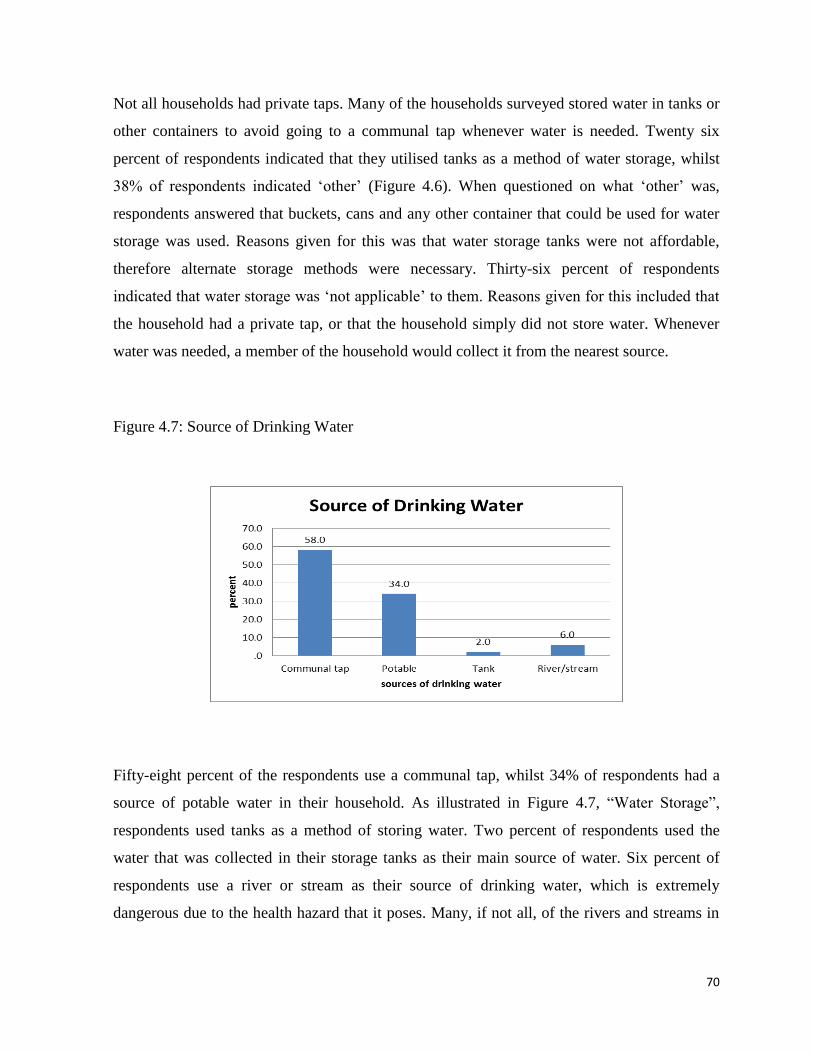
70
Not all households had private taps. Many of the households surveyed stored water in tanks or
other containers to avoid going to a communal tap whenever water is needed. Twenty six
percent of respondents indicated that they utilised tanks as a method of water storage, whilst
38% of respondents indicated ‘other’ (Figure 4.6). When questioned on what ‘other’ was,
respondents answered that buckets, cans and any other container that could be used for water
storage was used. Reasons given for this was that water storage tanks were not affordable,
therefore alternate storage methods were necessary. Thirty-six percent of respondents
indicated that water storage was ‘not applicable’ to them. Reasons given for this included that
the household had a private tap, or that the household simply did not store water. Whenever
water was needed, a member of the household would collect it from the nearest source.
Figure 4.7: Source of Drinking Water
Fifty-eight percent of the respondents use a communal tap, whilst 34% of respondents had a
source of potable water in their household. As illustrated in Figure 4.7, “Water Storage”,
respondents used tanks as a method of storing water. Two percent of respondents used the
water that was collected in their storage tanks as their main source of water. Six percent of
respondents use a river or stream as their source of drinking water, which is extremely
dangerous due to the health hazard that it poses. Many, if not all, of the rivers and streams in
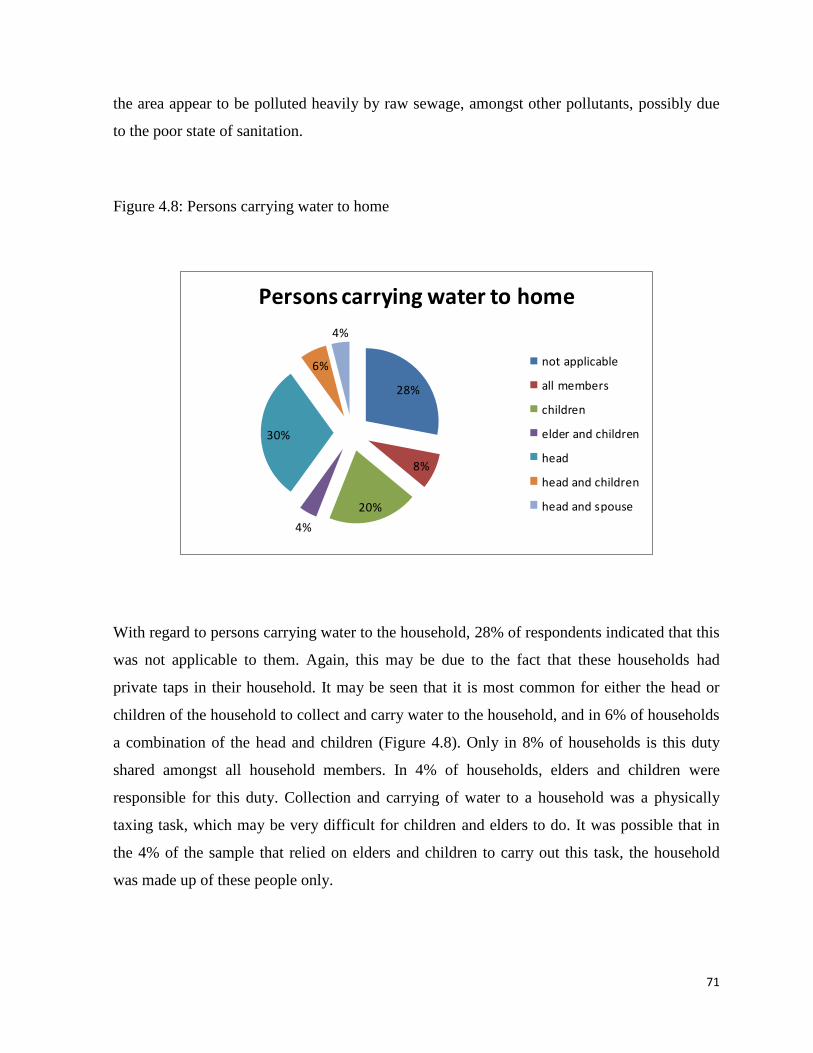
71
the area appear to be polluted heavily by raw sewage, amongst other pollutants, possibly due
to the poor state of sanitation.
Figure 4.8: Persons carrying water to home
28%
8%
20%
4%
30%
6%
4%
Persons carrying water to home
not applicable
all members
children
elder and children
head
head and children
head and spouse
With regard to persons carrying water to the household, 28% of respondents indicated that this
was not applicable to them. Again, this may be due to the fact that these households had
private taps in their household. It may be seen that it is most common for either the head or
children of the household to collect and carry water to the household, and in 6% of households
a combination of the head and children (Figure 4.8). Only in 8% of households is this duty
shared amongst all household members. In 4% of households, elders and children were
responsible for this duty. Collection and carrying of water to a household was a physically
taxing task, which may be very difficult for children and elders to do. It was possible that in
the 4% of the sample that relied on elders and children to carry out this task, the household
was made up of these people only.
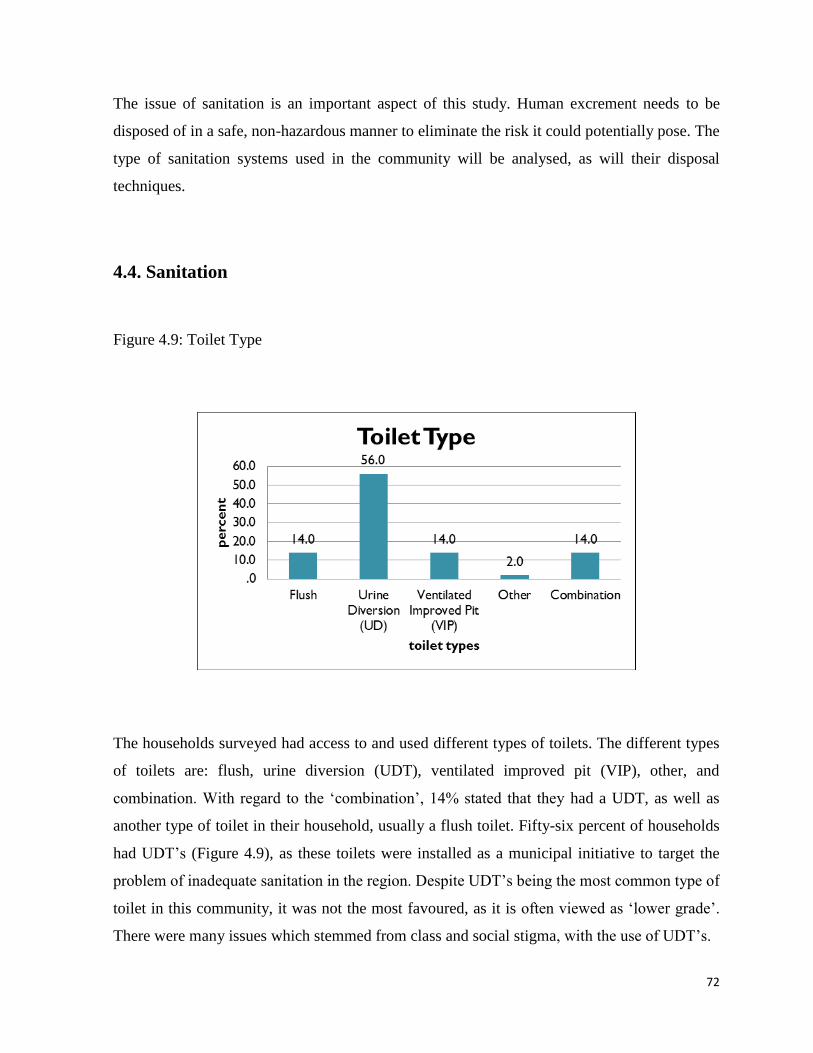
72
The issue of sanitation is an important aspect of this study. Human excrement needs to be
disposed of in a safe, non-hazardous manner to eliminate the risk it could potentially pose. The
type of sanitation systems used in the community will be analysed, as will their disposal
techniques.
4.4. Sanitation
Figure 4.9: Toilet Type
The households surveyed had access to and used different types of toilets. The different types
of toilets are: flush, urine diversion (UDT), ventilated improved pit (VIP), other, and
combination. With regard to the ‘combination’, 14% stated that they had a UDT, as well as
another type of toilet in their household, usually a flush toilet. Fifty-six percent of households
had UDT’s (Figure 4.9), as these toilets were installed as a municipal initiative to target the
problem of inadequate sanitation in the region. Despite UDT’s being the most common type of
toilet in this community, it was not the most favoured, as it is often viewed as ‘lower grade’.
There were many issues which stemmed from class and social stigma, with the use of UDT’s.
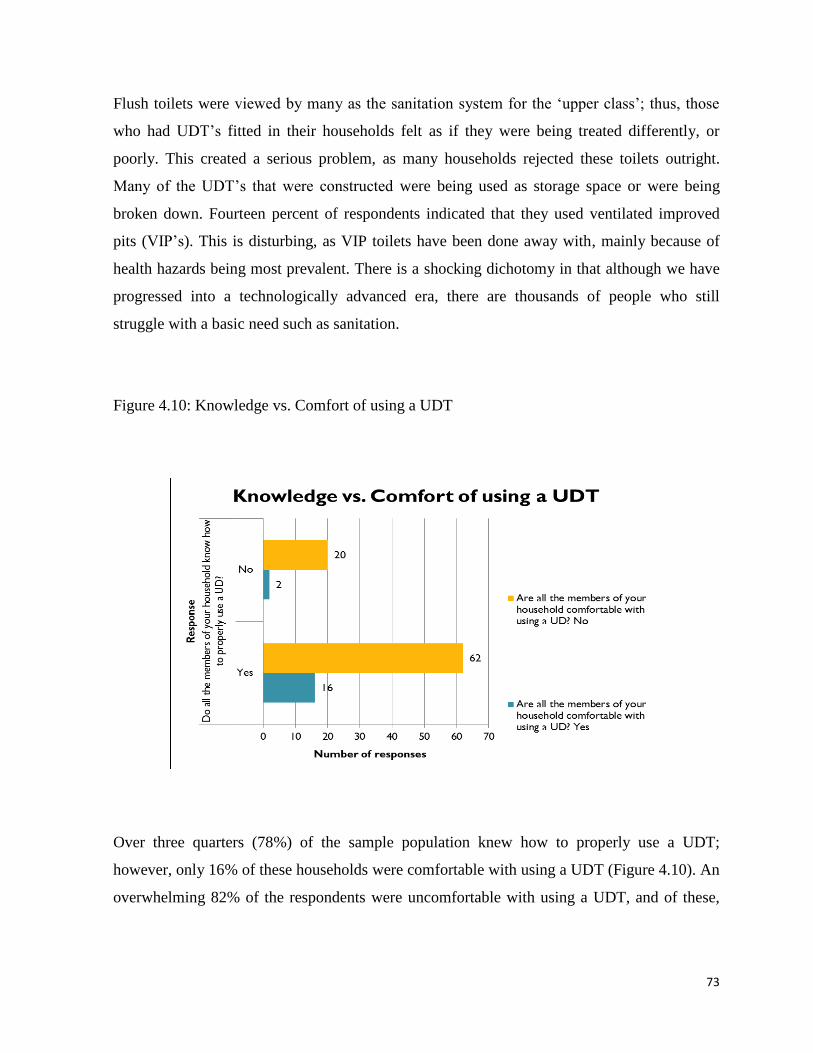
73
Flush toilets were viewed by many as the sanitation system for the ‘upper class’; thus, those
who had UDT’s fitted in their households felt as if they were being treated differently, or
poorly. This created a serious problem, as many households rejected these toilets outright.
Many of the UDT’s that were constructed were being used as storage space or were being
broken down. Fourteen percent of respondents indicated that they used ventilated improved
pits (VIP’s). This is disturbing, as VIP toilets have been done away with, mainly because of
health hazards being most prevalent. There is a shocking dichotomy in that although we have
progressed into a technologically advanced era, there are thousands of people who still
struggle with a basic need such as sanitation.
Figure 4.10: Knowledge vs. Comfort of using a UDT
Over three quarters (78%) of the sample population knew how to properly use a UDT;
however, only 16% of these households were comfortable with using a UDT (Figure 4.10). An
overwhelming 82% of the respondents were uncomfortable with using a UDT, and of these,
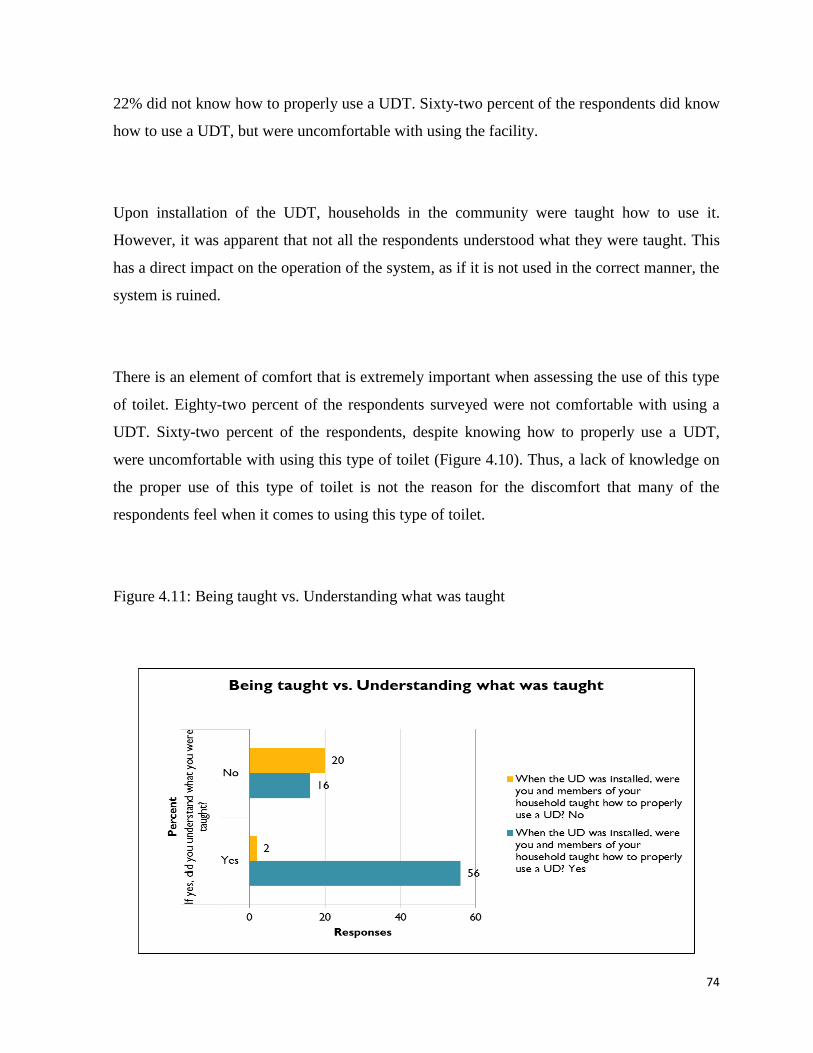
74
22% did not know how to properly use a UDT. Sixty-two percent of the respondents did know
how to use a UDT, but were uncomfortable with using the facility.
Upon installation of the UDT, households in the community were taught how to use it.
However, it was apparent that not all the respondents understood what they were taught. This
has a direct impact on the operation of the system, as if it is not used in the correct manner, the
system is ruined.
There is an element of comfort that is extremely important when assessing the use of this type
of toilet. Eighty-two percent of the respondents surveyed were not comfortable with using a
UDT. Sixty-two percent of the respondents, despite knowing how to properly use a UDT,
were uncomfortable with using this type of toilet (Figure 4.10). Thus, a lack of knowledge on
the proper use of this type of toilet is not the reason for the discomfort that many of the
respondents feel when it comes to using this type of toilet.
Figure 4.11: Being taught vs. Understanding what was taught
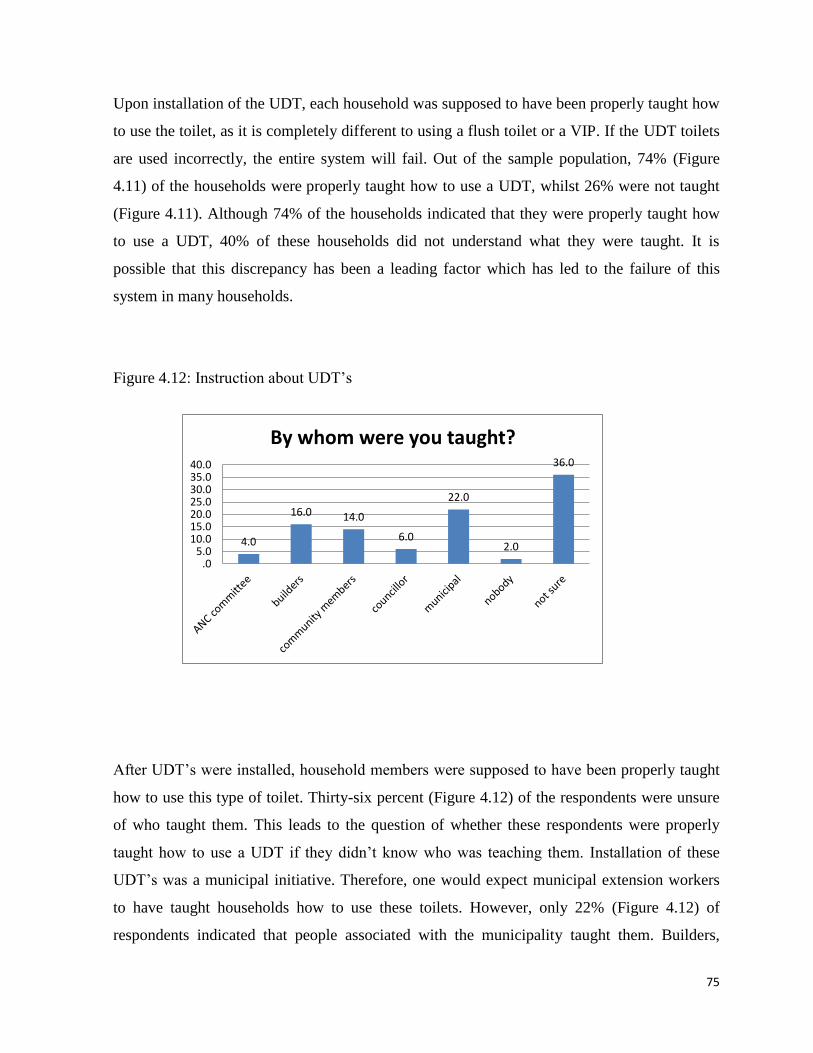
75
Upon installation of the UDT, each household was supposed to have been properly taught how
to use the toilet, as it is completely different to using a flush toilet or a VIP. If the UDT toilets
are used incorrectly, the entire system will fail. Out of the sample population, 74% (Figure
4.11) of the households were properly taught how to use a UDT, whilst 26% were not taught
(Figure 4.11). Although 74% of the households indicated that they were properly taught how
to use a UDT, 40% of these households did not understand what they were taught. It is
possible that this discrepancy has been a leading factor which has led to the failure of this
system in many households.
Figure 4.12: Instruction about UDT’s
4.0
16.0 14.0
6.0
22.0
2.0
36.0
.05.0
10.015.020.025.030.035.040.0
By whom were you taught?
After UDT’s were installed, household members were supposed to have been properly taught
how to use this type of toilet. Thirty-six percent (Figure 4.12) of the respondents were unsure
of who taught them. This leads to the question of whether these respondents were properly
taught how to use a UDT if they didn’t know who was teaching them. Installation of these
UDT’s was a municipal initiative. Therefore, one would expect municipal extension workers
to have taught households how to use these toilets. However, only 22% (Figure 4.12) of
respondents indicated that people associated with the municipality taught them. Builders,
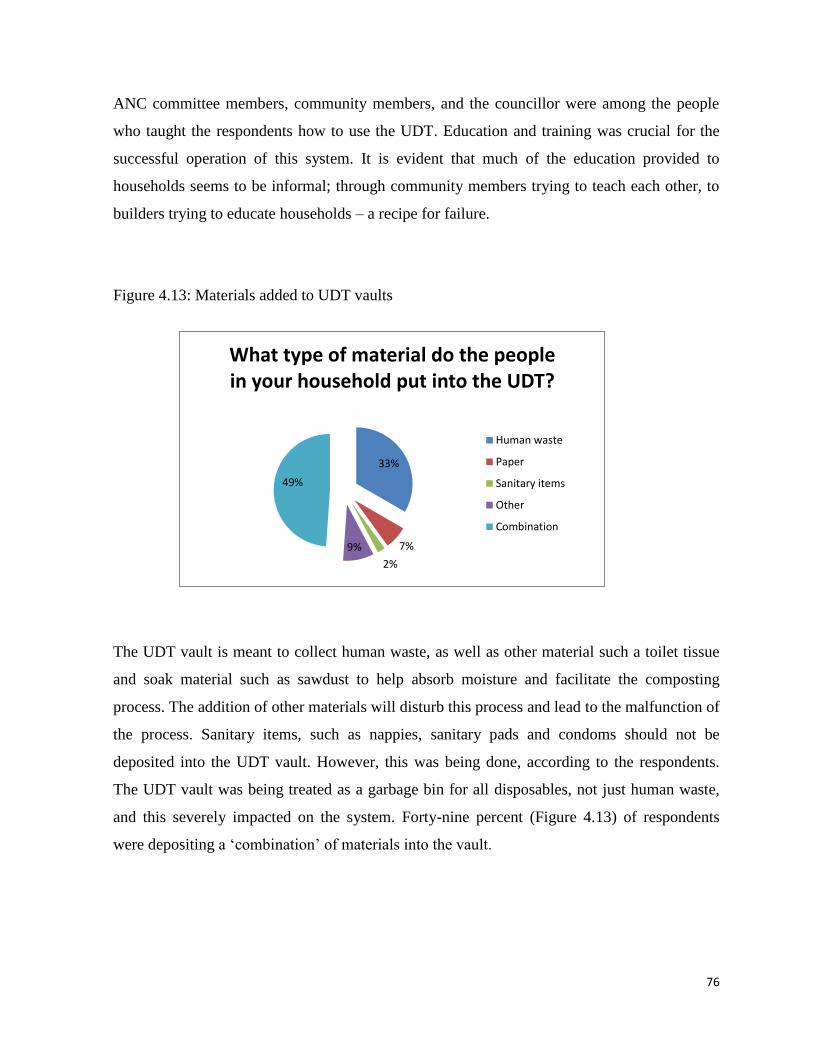
76
ANC committee members, community members, and the councillor were among the people
who taught the respondents how to use the UDT. Education and training was crucial for the
successful operation of this system. It is evident that much of the education provided to
households seems to be informal; through community members trying to teach each other, to
builders trying to educate households – a recipe for failure.
Figure 4.13: Materials added to UDT vaults
33%
7%
2%
9%
49%
What type of material do the people in your household put into the UDT?
Human waste
Paper
Sanitary items
Other
Combination
The UDT vault is meant to collect human waste, as well as other material such a toilet tissue
and soak material such as sawdust to help absorb moisture and facilitate the composting
process. The addition of other materials will disturb this process and lead to the malfunction of
the process. Sanitary items, such as nappies, sanitary pads and condoms should not be
deposited into the UDT vault. However, this was being done, according to the respondents.
The UDT vault was being treated as a garbage bin for all disposables, not just human waste,
and this severely impacted on the system. Forty-nine percent (Figure 4.13) of respondents
were depositing a ‘combination’ of materials into the vault.
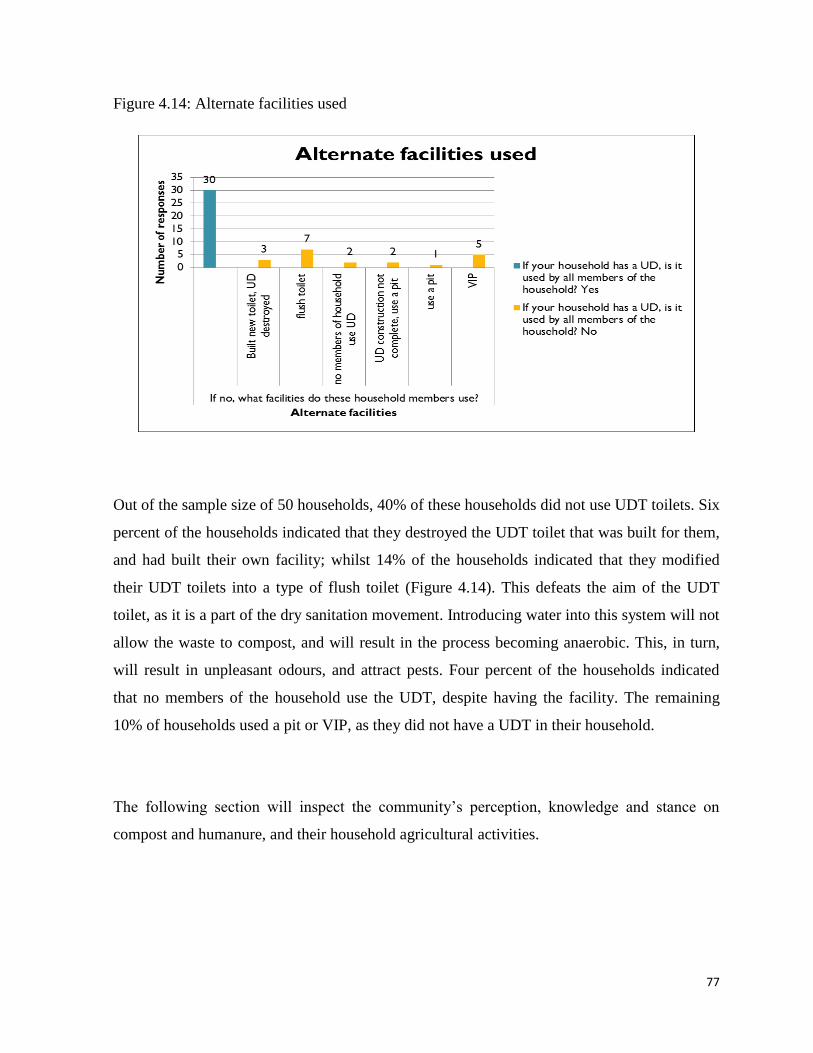
77
Figure 4.14: Alternate facilities used
Out of the sample size of 50 households, 40% of these households did not use UDT toilets. Six
percent of the households indicated that they destroyed the UDT toilet that was built for them,
and had built their own facility; whilst 14% of the households indicated that they modified
their UDT toilets into a type of flush toilet (Figure 4.14). This defeats the aim of the UDT
toilet, as it is a part of the dry sanitation movement. Introducing water into this system will not
allow the waste to compost, and will result in the process becoming anaerobic. This, in turn,
will result in unpleasant odours, and attract pests. Four percent of the households indicated
that no members of the household use the UDT, despite having the facility. The remaining
10% of households used a pit or VIP, as they did not have a UDT in their household.
The following section will inspect the community’s perception, knowledge and stance on
compost and humanure, and their household agricultural activities.
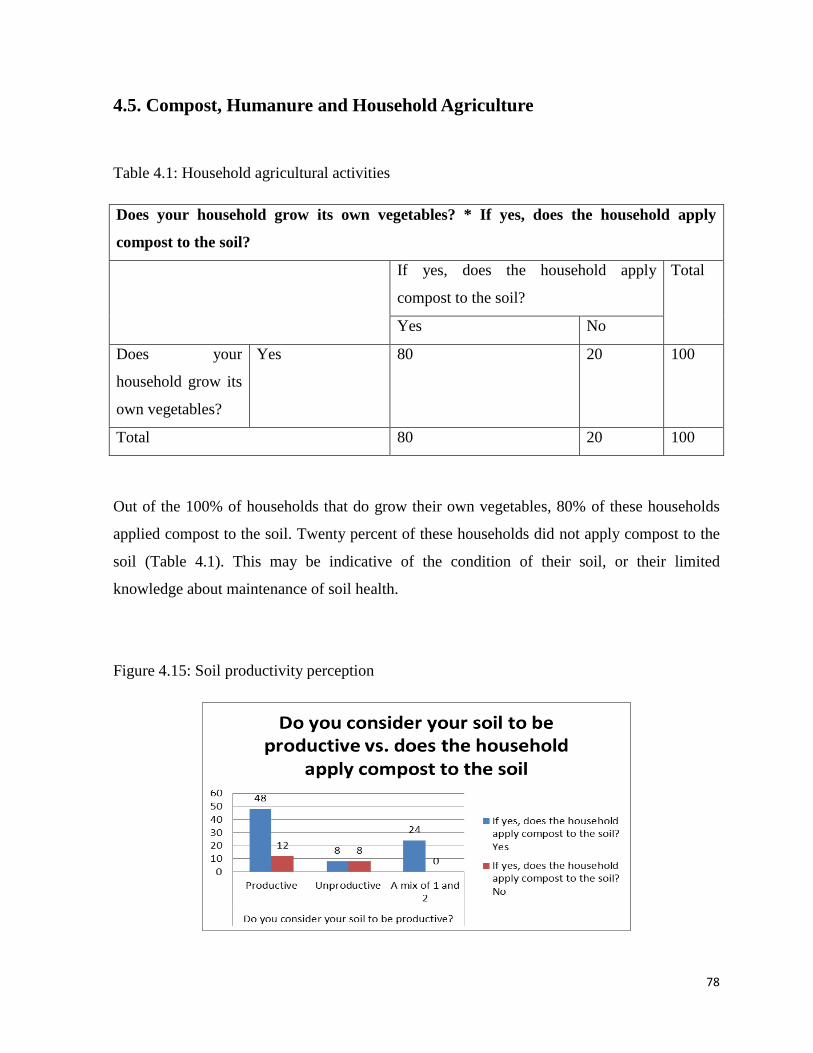
78
4.5. Compost, Humanure and Household Agriculture
Table 4.1: Household agricultural activities
Does your household grow its own vegetables? * If yes, does the household apply
compost to the soil?
If yes, does the household apply
compost to the soil?
Total
Yes No
Does your
household grow its
own vegetables?
Yes 80 20 100
Total 80 20 100
Out of the 100% of households that do grow their own vegetables, 80% of these households
applied compost to the soil. Twenty percent of these households did not apply compost to the
soil (Table 4.1). This may be indicative of the condition of their soil, or their limited
knowledge about maintenance of soil health.
Figure 4.15: Soil productivity perception
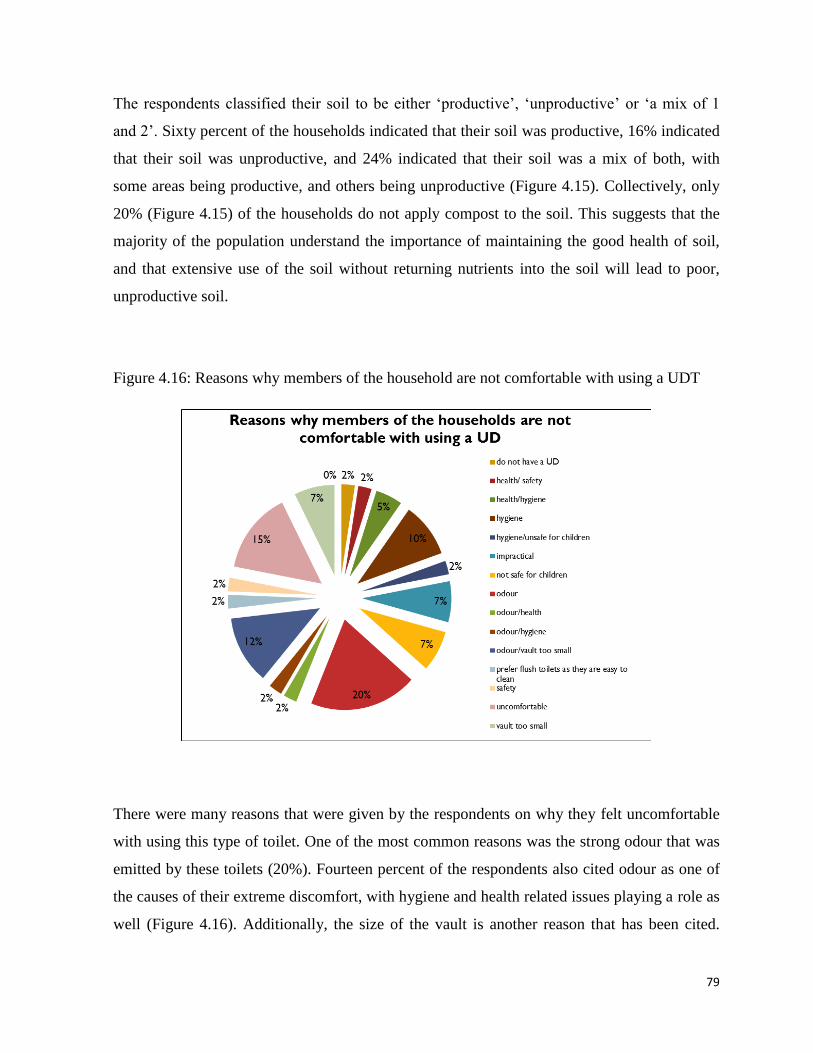
79
The respondents classified their soil to be either ‘productive’, ‘unproductive’ or ‘a mix of 1
and 2’. Sixty percent of the households indicated that their soil was productive, 16% indicated
that their soil was unproductive, and 24% indicated that their soil was a mix of both, with
some areas being productive, and others being unproductive (Figure 4.15). Collectively, only
20% (Figure 4.15) of the households do not apply compost to the soil. This suggests that the
majority of the population understand the importance of maintaining the good health of soil,
and that extensive use of the soil without returning nutrients into the soil will lead to poor,
unproductive soil.
Figure 4.16: Reasons why members of the household are not comfortable with using a UDT
There were many reasons that were given by the respondents on why they felt uncomfortable
with using this type of toilet. One of the most common reasons was the strong odour that was
emitted by these toilets (20%). Fourteen percent of the respondents also cited odour as one of
the causes of their extreme discomfort, with hygiene and health related issues playing a role as
well (Figure 4.16). Additionally, the size of the vault is another reason that has been cited.
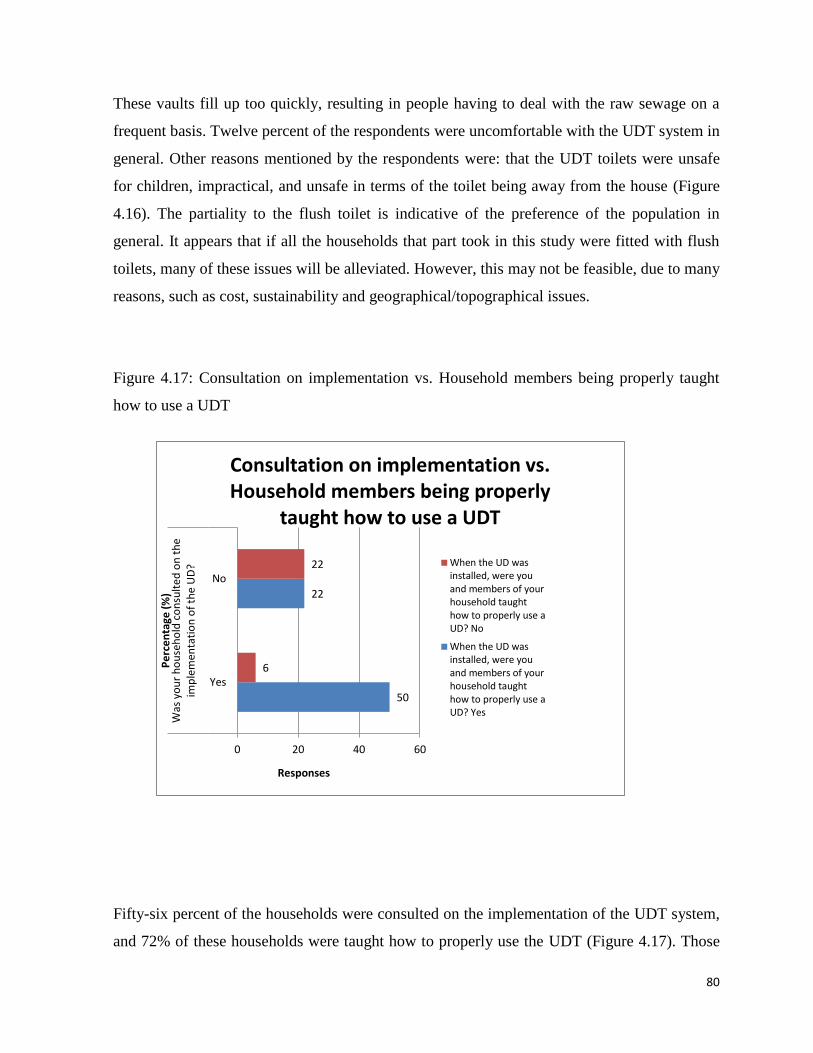
80
These vaults fill up too quickly, resulting in people having to deal with the raw sewage on a
frequent basis. Twelve percent of the respondents were uncomfortable with the UDT system in
general. Other reasons mentioned by the respondents were: that the UDT toilets were unsafe
for children, impractical, and unsafe in terms of the toilet being away from the house (Figure
4.16). The partiality to the flush toilet is indicative of the preference of the population in
general. It appears that if all the households that part took in this study were fitted with flush
toilets, many of these issues will be alleviated. However, this may not be feasible, due to many
reasons, such as cost, sustainability and geographical/topographical issues.
Figure 4.17: Consultation on implementation vs. Household members being properly taught
how to use a UDT
50
22
6
22
0 20 40 60
Yes
No
Was
yo
ur
ho
use
ho
ld c
on
sult
ed
on
th
eim
ple
men
tati
on
of
the
UD
?
Responses
Pe
rce
nta
ge (
%)
Consultation on implementation vs. Household members being properly
taught how to use a UDT
When the UD wasinstalled, were youand members of yourhousehold taughthow to properly use aUD? No
When the UD wasinstalled, were youand members of yourhousehold taughthow to properly use aUD? Yes
Fifty-six percent of the households were consulted on the implementation of the UDT system,
and 72% of these households were taught how to properly use the UDT (Figure 4.17). Those
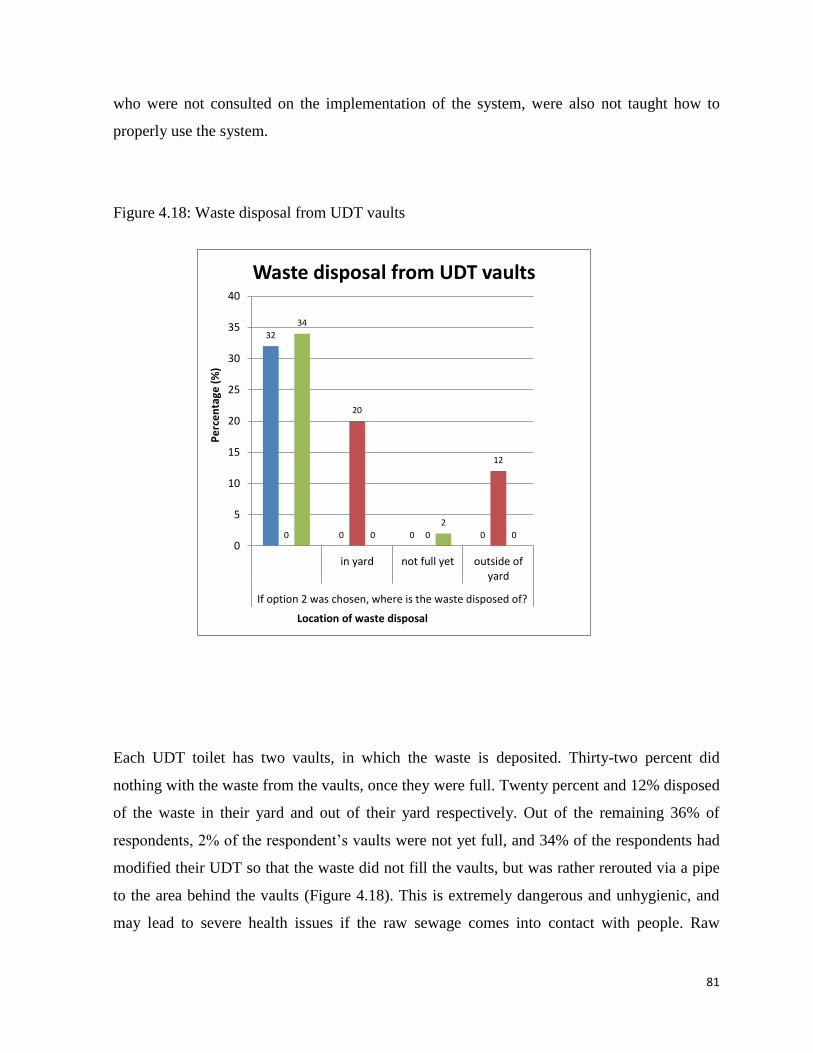
81
who were not consulted on the implementation of the system, were also not taught how to
properly use the system.
Figure 4.18: Waste disposal from UDT vaults
32
0 0 00
20
0
12
34
0
2
00
5
10
15
20
25
30
35
40
in yard not full yet outside ofyard
If option 2 was chosen, where is the waste disposed of?
Pe
rce
nta
ge (
%)
Location of waste disposal
Waste disposal from UDT vaults
Each UDT toilet has two vaults, in which the waste is deposited. Thirty-two percent did
nothing with the waste from the vaults, once they were full. Twenty percent and 12% disposed
of the waste in their yard and out of their yard respectively. Out of the remaining 36% of
respondents, 2% of the respondent’s vaults were not yet full, and 34% of the respondents had
modified their UDT so that the waste did not fill the vaults, but was rather rerouted via a pipe
to the area behind the vaults (Figure 4.18). This is extremely dangerous and unhygienic, and
may lead to severe health issues if the raw sewage comes into contact with people. Raw
82
sewage contains many harmful pathogens that can be lethal to humans. Furthermore, if raw
sewage is left untreated in soil, it could soak through and pollute ground water.
Agricultural activities such as rearing livestock and planting food gardens are an important
part of the daily activities of households in the community. Compost is usually combined with
soil to ensure that good health of soil is maintained and that maximum yield of crops is gained.
The respondents were questioned on their agricultural activities, regarding their knowledge of
compost and humanure and, their use of it.
Figure 4.19: Compost awareness
The majority (94%) of the respondents surveyed were aware of compost and its value. They
knew that compost is a substance that supports plant growth, by making soil fertile (Figure
4.19). This illustrated that the majority of the sample population possessed some knowledge
83
on soil health and upkeep and agricultural practices. It is interesting to note that 20% (Figure
4.19) of the respondents defined compost as a substance that made their soil dark and fertile,
thus judging the fertility of the soil by colour. Only 2% (Figure 4.19) of the respondents
indicated that compost was a chemical; which suggests that majority of households in this area
do not rely on chemical additives in their agricultural activities.
Figure 4.20: Humanure awareness
Humanure is a compost or soil conditioner that is made up of organic matter and human waste.
This compost is nutrient rich, and contains the essential elements for vegetation growth,
namely NPK (nitrogen, phosphorus and potassium) (Wilkonson et al, n.d.). There is a stigma
attached to this type of compost, as the key ingredient is human waste. Many people are wary
of this type of compost, and are unwilling to use it in their agricultural practices. Humanure
has been used for many years, and can be dated back to the application of ‘night soil’.
84
However, unlike night soil, humanure is treated human waste, which undergoes a process to
eliminate all harmful pathogens and bacteria rendering it safe for use. Forty percent of the
respondents surveyed had an inkling about what humanure was. The respondents referred to
humanure being almost the same as compost/performing the same function, cow or chicken
dung, a substance that makes soil fertile and using waste from the UDT vault as a substitute
for compost (Figure 4.20). This suggests some awareness of the concept of using human waste
to make compost, and that there was possibly room for acceptance of this idea.
Figure 4.21: UDT vault material and compost
70
1218
0
10
20
30
40
50
60
Feacal matter Urine Combination
If yes, what type of waste from the UDT is used?
60%
40%
Are you aware that compost may be produced from waste in the UDT vault?
Yes
No
85
Sixty percent of the respondents were aware that humanure may be produced from waste in a
UDT vault. Seventy percent in this category indicated that the faecal matter from the vaults
was used in the process of making humanure. Eighteen percent of respondents indicated that a
combination of all waste present in the UDT vaults was used in the production of humanure
(Figure 4.21).
Figure 4.22: Willingness to use humanure on crops
As mentioned previously, there was a stigma attached to the use of humanure, as it is produced
from human waste. Forty-eight percent of the households were willing to use humanure on
their crops. The remaining 52% were severely opposed to the use of humanure. Some of the
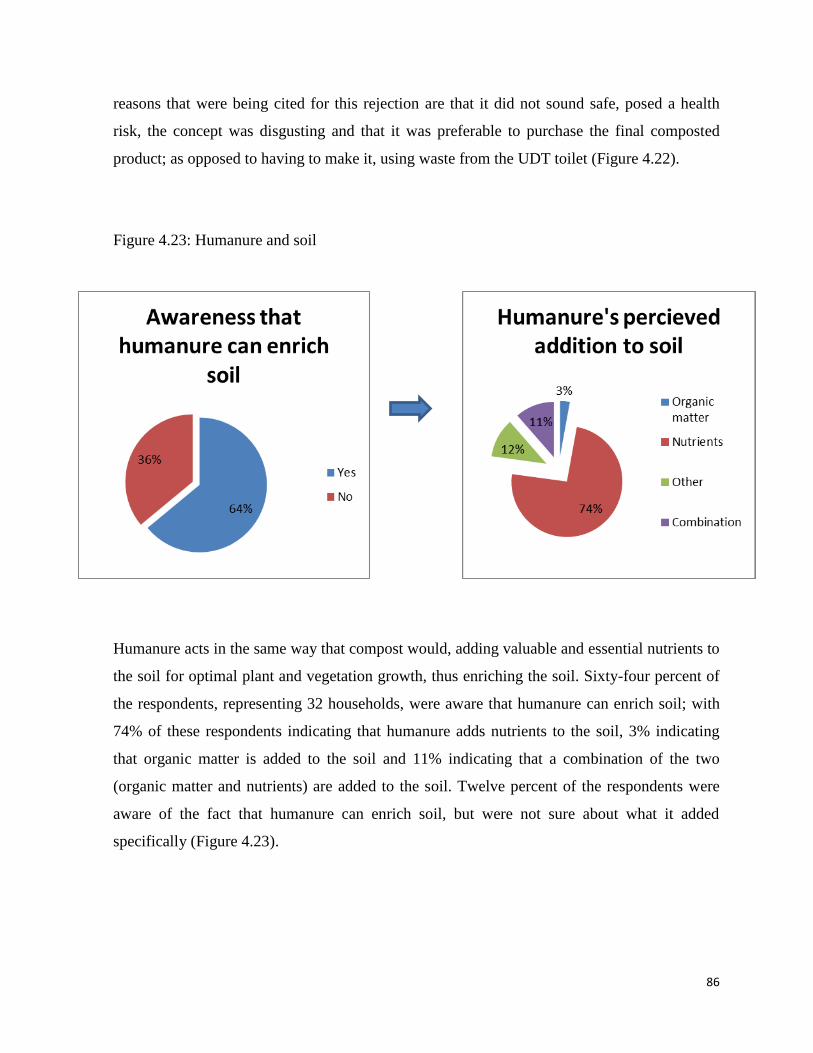
86
reasons that were being cited for this rejection are that it did not sound safe, posed a health
risk, the concept was disgusting and that it was preferable to purchase the final composted
product; as opposed to having to make it, using waste from the UDT toilet (Figure 4.22).
Figure 4.23: Humanure and soil
Humanure acts in the same way that compost would, adding valuable and essential nutrients to
the soil for optimal plant and vegetation growth, thus enriching the soil. Sixty-four percent of
the respondents, representing 32 households, were aware that humanure can enrich soil; with
74% of these respondents indicating that humanure adds nutrients to the soil, 3% indicating
that organic matter is added to the soil and 11% indicating that a combination of the two
(organic matter and nutrients) are added to the soil. Twelve percent of the respondents were
aware of the fact that humanure can enrich soil, but were not sure about what it added
specifically (Figure 4.23).
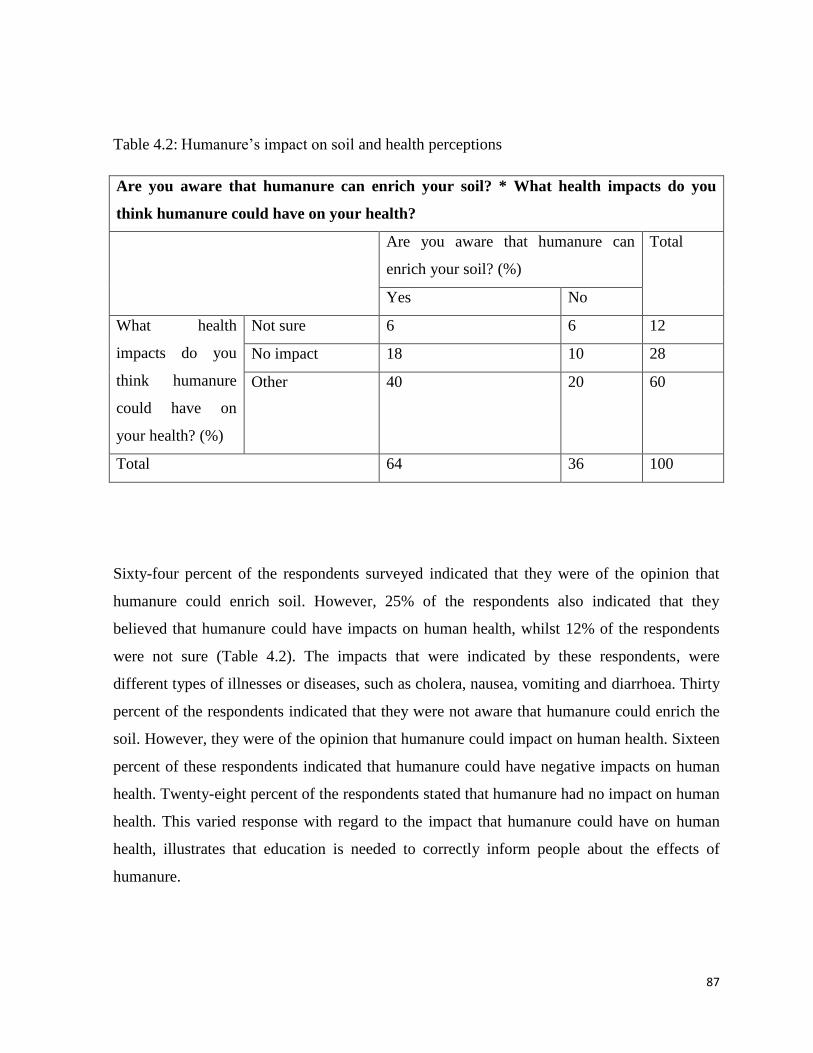
87
Table 4.2: Humanure’s impact on soil and health perceptions
Are you aware that humanure can enrich your soil? * What health impacts do you
think humanure could have on your health?
Are you aware that humanure can
enrich your soil? (%)
Total
Yes No
What health
impacts do you
think humanure
could have on
your health? (%)
Not sure 6 6 12
No impact 18 10 28
Other 40 20 60
Total 64 36 100
Sixty-four percent of the respondents surveyed indicated that they were of the opinion that
humanure could enrich soil. However, 25% of the respondents also indicated that they
believed that humanure could have impacts on human health, whilst 12% of the respondents
were not sure (Table 4.2). The impacts that were indicated by these respondents, were
different types of illnesses or diseases, such as cholera, nausea, vomiting and diarrhoea. Thirty
percent of the respondents indicated that they were not aware that humanure could enrich the
soil. However, they were of the opinion that humanure could impact on human health. Sixteen
percent of these respondents indicated that humanure could have negative impacts on human
health. Twenty-eight percent of the respondents stated that humanure had no impact on human
health. This varied response with regard to the impact that humanure could have on human
health, illustrates that education is needed to correctly inform people about the effects of
humanure.
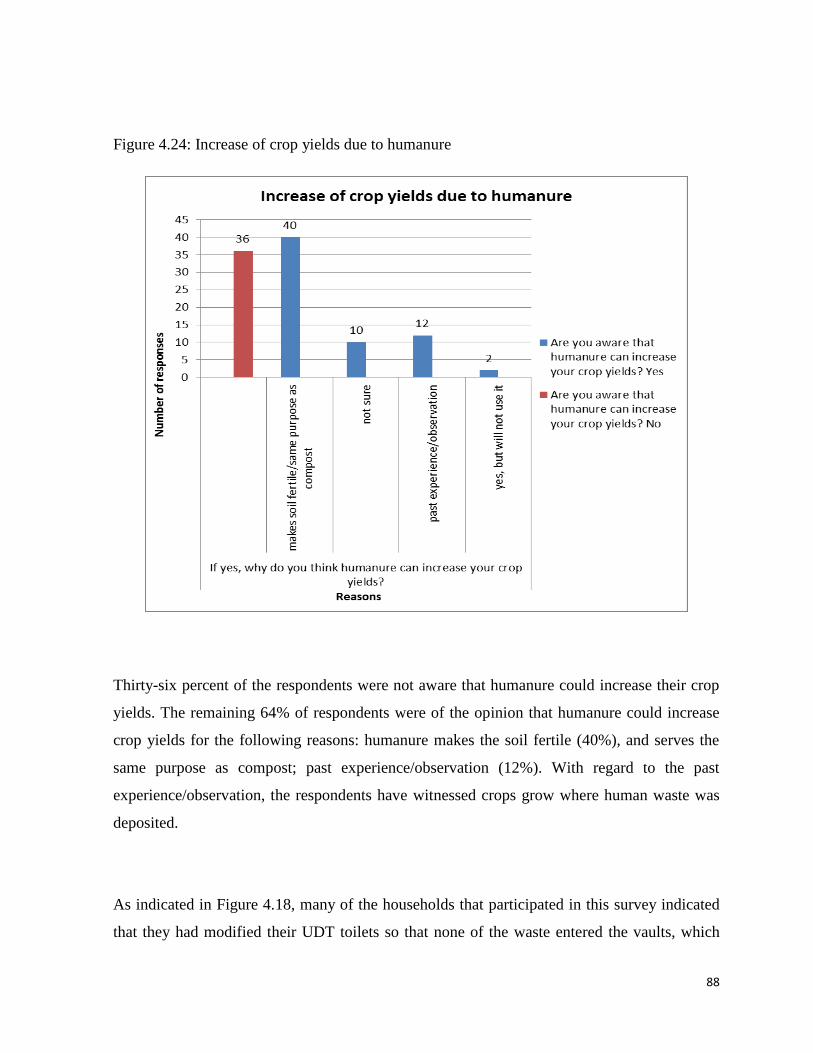
88
Figure 4.24: Increase of crop yields due to humanure
Thirty-six percent of the respondents were not aware that humanure could increase their crop
yields. The remaining 64% of respondents were of the opinion that humanure could increase
crop yields for the following reasons: humanure makes the soil fertile (40%), and serves the
same purpose as compost; past experience/observation (12%). With regard to the past
experience/observation, the respondents have witnessed crops grow where human waste was
deposited.
As indicated in Figure 4.18, many of the households that participated in this survey indicated
that they had modified their UDT toilets so that none of the waste entered the vaults, which
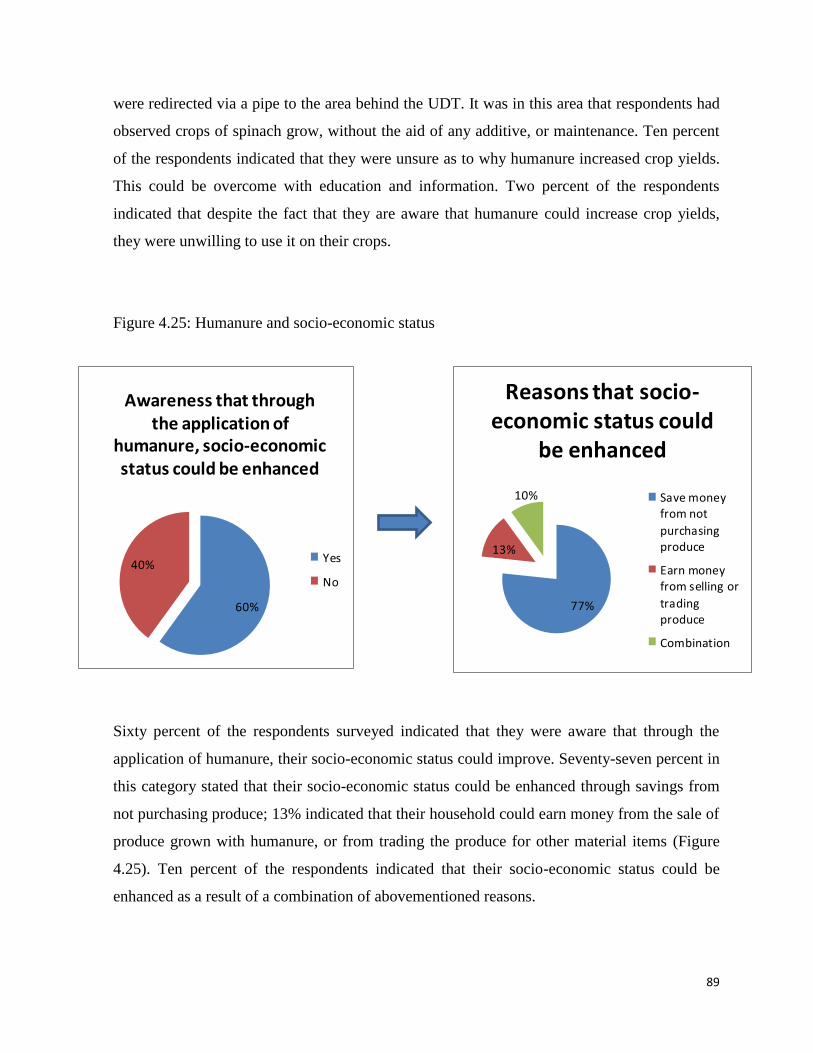
89
were redirected via a pipe to the area behind the UDT. It was in this area that respondents had
observed crops of spinach grow, without the aid of any additive, or maintenance. Ten percent
of the respondents indicated that they were unsure as to why humanure increased crop yields.
This could be overcome with education and information. Two percent of the respondents
indicated that despite the fact that they are aware that humanure could increase crop yields,
they were unwilling to use it on their crops.
Figure 4.25: Humanure and socio-economic status
Sixty percent of the respondents surveyed indicated that they were aware that through the
application of humanure, their socio-economic status could improve. Seventy-seven percent in
this category stated that their socio-economic status could be enhanced through savings from
not purchasing produce; 13% indicated that their household could earn money from the sale of
produce grown with humanure, or from trading the produce for other material items (Figure
4.25). Ten percent of the respondents indicated that their socio-economic status could be
enhanced as a result of a combination of abovementioned reasons.
77%
13%
10%
Reasons that socio-economic status could
be enhanced
Save moneyfrom not
purchasingproduce
Earn moneyfrom selling or
tradingproduce
Combination
60%
40%
Awareness that through the application of
humanure, socio-economic status could be enhanced
Yes
No
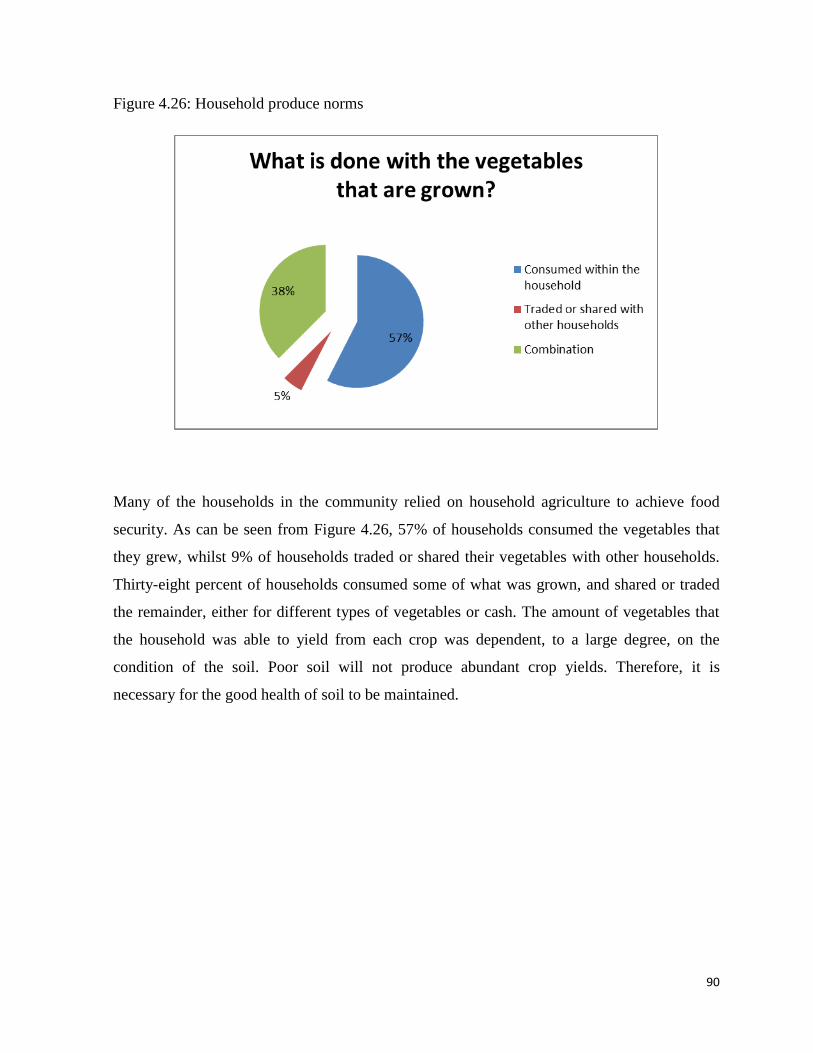
90
Figure 4.26: Household produce norms
Many of the households in the community relied on household agriculture to achieve food
security. As can be seen from Figure 4.26, 57% of households consumed the vegetables that
they grew, whilst 9% of households traded or shared their vegetables with other households.
Thirty-eight percent of households consumed some of what was grown, and shared or traded
the remainder, either for different types of vegetables or cash. The amount of vegetables that
the household was able to yield from each crop was dependent, to a large degree, on the
condition of the soil. Poor soil will not produce abundant crop yields. Therefore, it is
necessary for the good health of soil to be maintained.
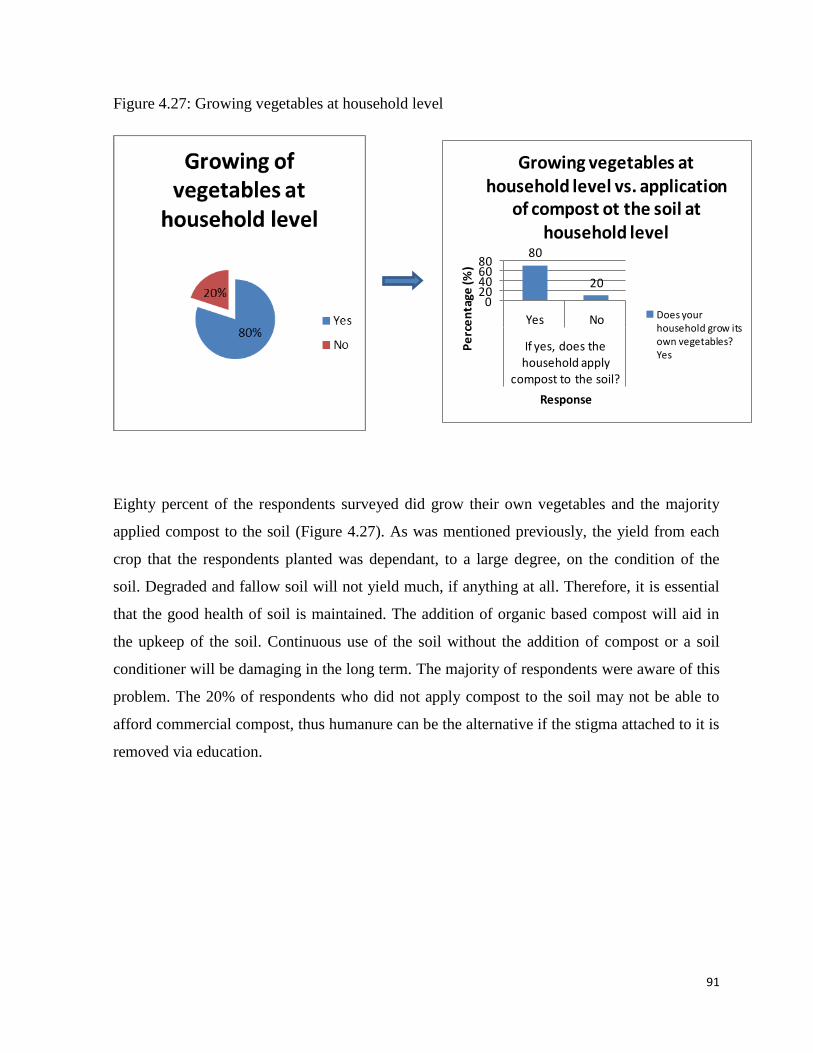
91
Figure 4.27: Growing vegetables at household level
Eighty percent of the respondents surveyed did grow their own vegetables and the majority
applied compost to the soil (Figure 4.27). As was mentioned previously, the yield from each
crop that the respondents planted was dependant, to a large degree, on the condition of the
soil. Degraded and fallow soil will not yield much, if anything at all. Therefore, it is essential
that the good health of soil is maintained. The addition of organic based compost will aid in
the upkeep of the soil. Continuous use of the soil without the addition of compost or a soil
conditioner will be damaging in the long term. The majority of respondents were aware of this
problem. The 20% of respondents who did not apply compost to the soil may not be able to
afford commercial compost, thus humanure can be the alternative if the stigma attached to it is
removed via education.
80
20
020406080
Yes No
If yes, does the household apply
compost to the soil?
Pe
rce
nta
ge (%
)
Response
Growing vegetables at household level vs. application
of compost ot the soil at household level
Does your household grow its own vegetables? Yes
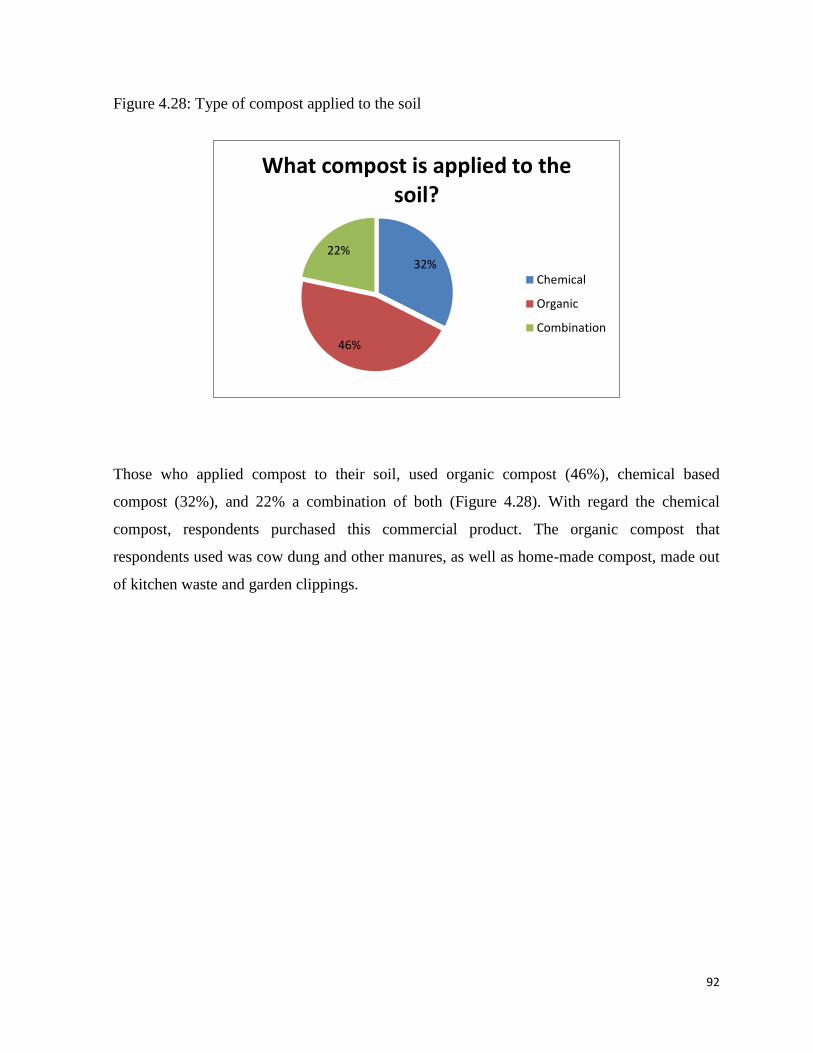
92
Figure 4.28: Type of compost applied to the soil
32%
46%
22%
What compost is applied to the soil?
Chemical
Organic
Combination
Those who applied compost to their soil, used organic compost (46%), chemical based
compost (32%), and 22% a combination of both (Figure 4.28). With regard the chemical
compost, respondents purchased this commercial product. The organic compost that
respondents used was cow dung and other manures, as well as home-made compost, made out
of kitchen waste and garden clippings.
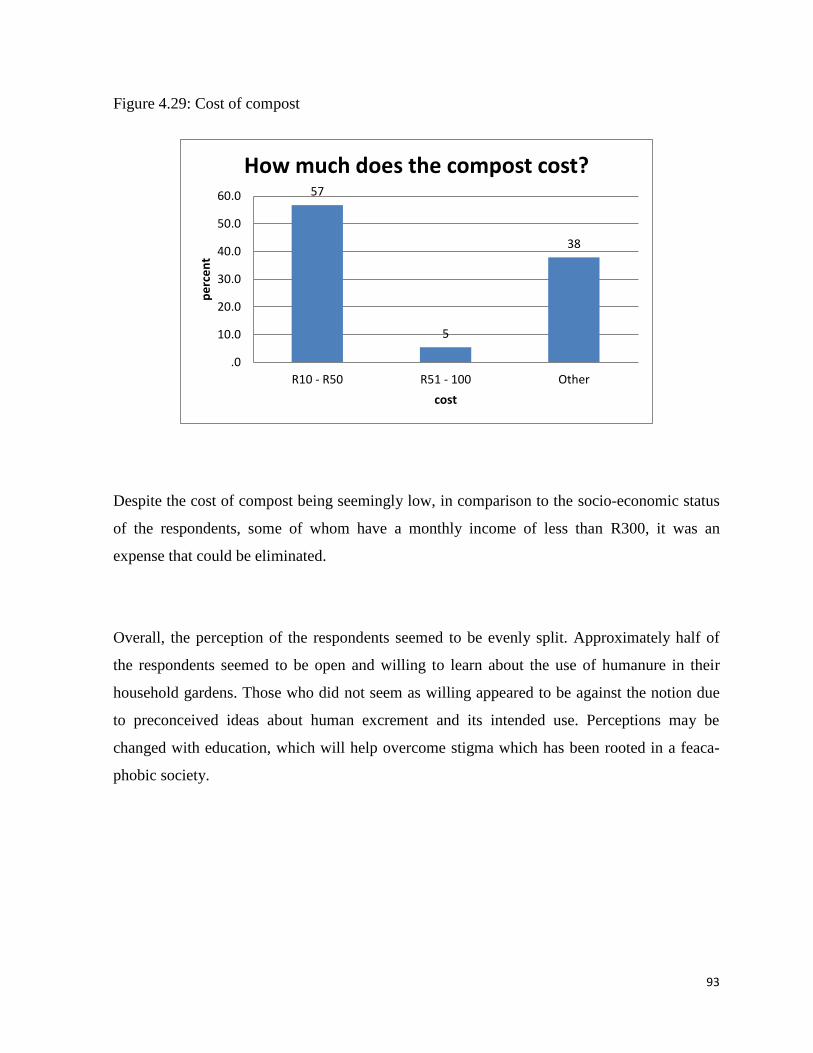
93
Figure 4.29: Cost of compost
57
5
38
.0
10.0
20.0
30.0
40.0
50.0
60.0
R10 - R50 R51 - 100 Other
pe
rce
nt
cost
How much does the compost cost?
Despite the cost of compost being seemingly low, in comparison to the socio-economic status
of the respondents, some of whom have a monthly income of less than R300, it was an
expense that could be eliminated.
Overall, the perception of the respondents seemed to be evenly split. Approximately half of
the respondents seemed to be open and willing to learn about the use of humanure in their
household gardens. Those who did not seem as willing appeared to be against the notion due
to preconceived ideas about human excrement and its intended use. Perceptions may be
changed with education, which will help overcome stigma which has been rooted in a feaca-
phobic society.
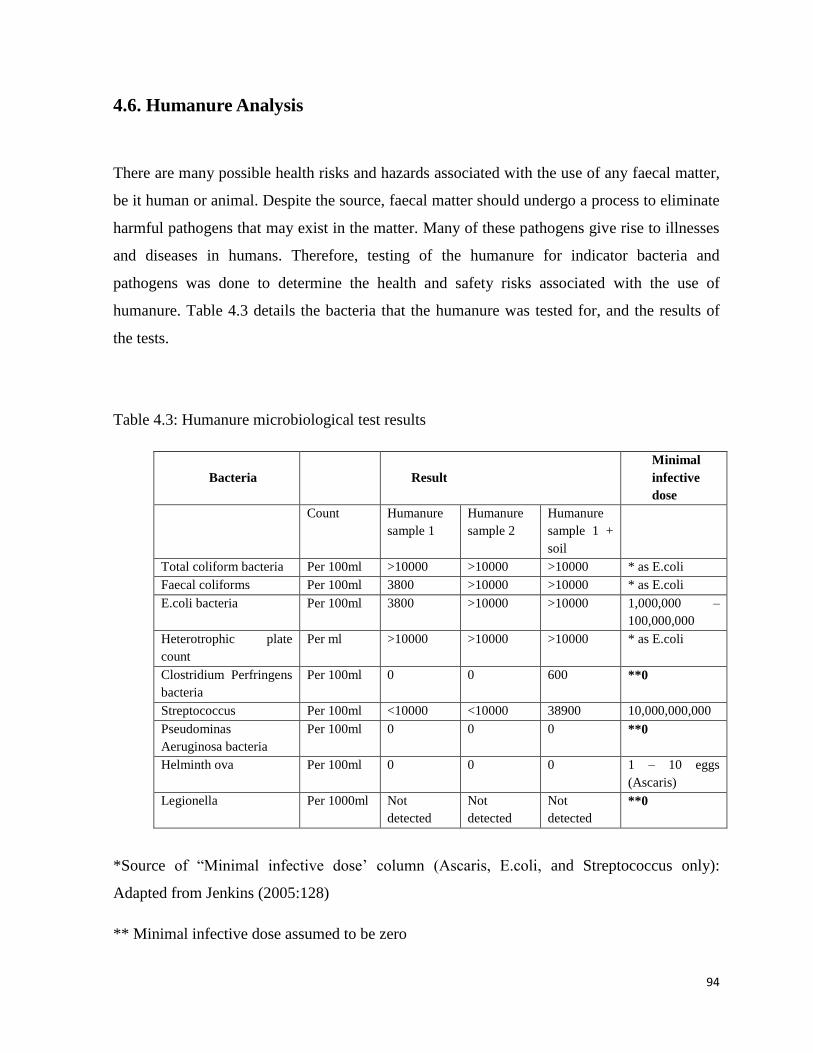
94
4.6. Humanure Analysis
There are many possible health risks and hazards associated with the use of any faecal matter,
be it human or animal. Despite the source, faecal matter should undergo a process to eliminate
harmful pathogens that may exist in the matter. Many of these pathogens give rise to illnesses
and diseases in humans. Therefore, testing of the humanure for indicator bacteria and
pathogens was done to determine the health and safety risks associated with the use of
humanure. Table 4.3 details the bacteria that the humanure was tested for, and the results of
the tests.
Table 4.3: Humanure microbiological test results
Bacteria Result
Minimal
infective
dose
Count Humanure
sample 1
Humanure
sample 2
Humanure
sample 1 +
soil
Total coliform bacteria Per 100ml >10000 >10000 >10000 * as E.coli
Faecal coliforms Per 100ml 3800 >10000 >10000 * as E.coli
E.coli bacteria Per 100ml 3800 >10000 >10000 1,000,000 –
100,000,000
Heterotrophic plate
count
Per ml >10000 >10000 >10000 * as E.coli
Clostridium Perfringens
bacteria
Per 100ml 0 0 600 **0
Streptococcus Per 100ml <10000 <10000 38900 10,000,000,000
Pseudominas
Aeruginosa bacteria
Per 100ml 0 0 0 **0
Helminth ova Per 100ml 0 0 0 1 – 10 eggs
(Ascaris)
Legionella Per 1000ml Not
detected
Not
detected
Not
detected
**0
*Source of “Minimal infective dose’ column (Ascaris, E.coli, and Streptococcus only):
Adapted from Jenkins (2005:128)
** Minimal infective dose assumed to be zero
95
4.6.1. Minimal Infective Doses
Minimal ineffective doses do not exist for most of the bacteria with respect to humanure.
Consequently the researcher had to make assumptions in order to reach conclusions. The
minimal infective doses of E.coli was applied to Total coliforms, Faecal coliforms and
Heterotrophic Plate count, as E.coli is considered in each of these plate counts. In the case of
Legionella, Clostridium Perfringens and Pseudomonas Aeruginosa, the minimal infective dose
was assumed to be zero, erring on the side of caution.
Additional notes from the testing laboratory state:
- Faecal coliforms: Indicator of unacceptable microbial water quality. Could be tested
instead of E.coli but is not the preferred indicator of faecal pollution. Also provides
information on treatment efficiency and after growth in distribution networks.
- E.coli: Definitive, preferred indicator of faecal pollution.
- Heterotrophic plate count: Process indicator that provides information on treatment
efficiency and after growth in distribution networks
4.6.2. Humanure Sample Analysis and Discussion
Sample one is the first batch of humanure made, Sample two is the second batch of humanure
made, and Sample three is from the first batch of humanure and soil, taken from the trial
garden plot three months after the application of the humanure. With regard to the results of
the tests carried out on the humanure, the outcome is varied for the different indicators.
Minimal infective dose values for each bacterium vary. The results have been separated on the
basis of the level of risk posed (by the indicator tested).
All indicators can be classified as high risk, due to their disease causing ability. However, the
levels of indicators present in the samples tested do eliminate some of the indicators from the
high risk profile, due to their respective minimal infective doses. Therefore, the results of the
96
humanure microbiological test results will be organised on a level of risk posed, based on the
indicator’s minimal infective dose and the presence in the sample tested. The levels of risk
posed are ‘High’, ‘Medium’ and ‘Low’. Indicators classified as ‘High’ are present in the
sample tested and exceed the minimal infective dose; whilst indicators that are classified as
‘Medium’ are present in the sample and do not exceed the minimal infective dose. ‘Low’ risk
indicators are those that tested negative or absent in the sample.
I. LEVEL OF RISK POSED: HIGH
- Clostridium Perfringens bacteria in sample three, with a level of 600 counts per 100
ml of sample. The minimal infective dose for this indicator is assumed to be zero, as
discussed 4.4.1.
II. LEVEL OF RISK POSED: MEDIUM
- The test for Total Coliforms presented similar results, with more than 10 000
organisms per 100ml of sample. While total coliforms were initially thought to be an
indicator of faecal contamination, other methods have emerged to test solely for E.coli
bacteria, which is a more accurate indicator of faecal contamination. Furthermore,
types of coliforms have been found to be naturally occurring in soils, water and plants
(Payment et al, 2003). Therefore, despite the high total coliform count, it is uncertain
whether this will impact negatively on crops grown with humanure. This will be
confirmed by results from pathogen tests on produce from the garden trial.
- Faecal coliforms are a sub group of the total coliform group, with the most common
indicator faecal coliform being E.coli. This is due to the fact that this type of bacteria is
97
present in the intestine of humans and animals and is not found naturally occurring in
the environment. Results for the faecal coliform and E.coli tests confirm a link
between these coliforms, as the results for each sample correspond for the two tests.
Sample one has a faecal coliform and E.coli count of 3800 organisms per 100ml of
sample; while sample two and three have a count of more than 10 000 organisms per
100ml of sample. The difference in these results may be attributed to the time allowed
for the humanure to moulder. The humanure used in sample one was allowed to
moulder for a period of one year, the recommended time according to Jenkins (2005).
Humanure used in sample two was allowed to moulder for a shortened period of three
months, which could be the reason for the elevated E.coli count. With regard to sample
three, a mix of sample one and soil from the garden trial plot, it should be noted that
the faecal coliform and E.coli count could have been elevated due to the excrement of
domestic animals.
- With regard to the Heterotrophic Plate Count test carried out, the results for all three
samples indicate more than 10 000 organisms per ml of sample. Although this is a high
count, the heterotrophic plate count is a count of all bacterial colonies present, not only
harmful and pathogenic bacteria (Koch, 2003:2).
- Tests carried out for the presence of Streptococcus were positive, with less than 10
000 counts per 100ml detected in sample one and two, and 38 900 counts per 100ml
detected in sample three. Although pathogens cause disease and illness, they each have
varying degrees of virulence, which is “their potential for causing disease in humans”
(Jenkins, 2005: 128). The minimal infective dose, which refers to the number of
pathogens required to establish infection, is not the same for all pathogens.
The minimal infective dose of Streptococcus as 10,000,000,000; which is considerably
more than the amounts detected in the samples. It may be assumed from the above that
while the presence of Streptococcus can pose a health risk, the danger is relatively low.
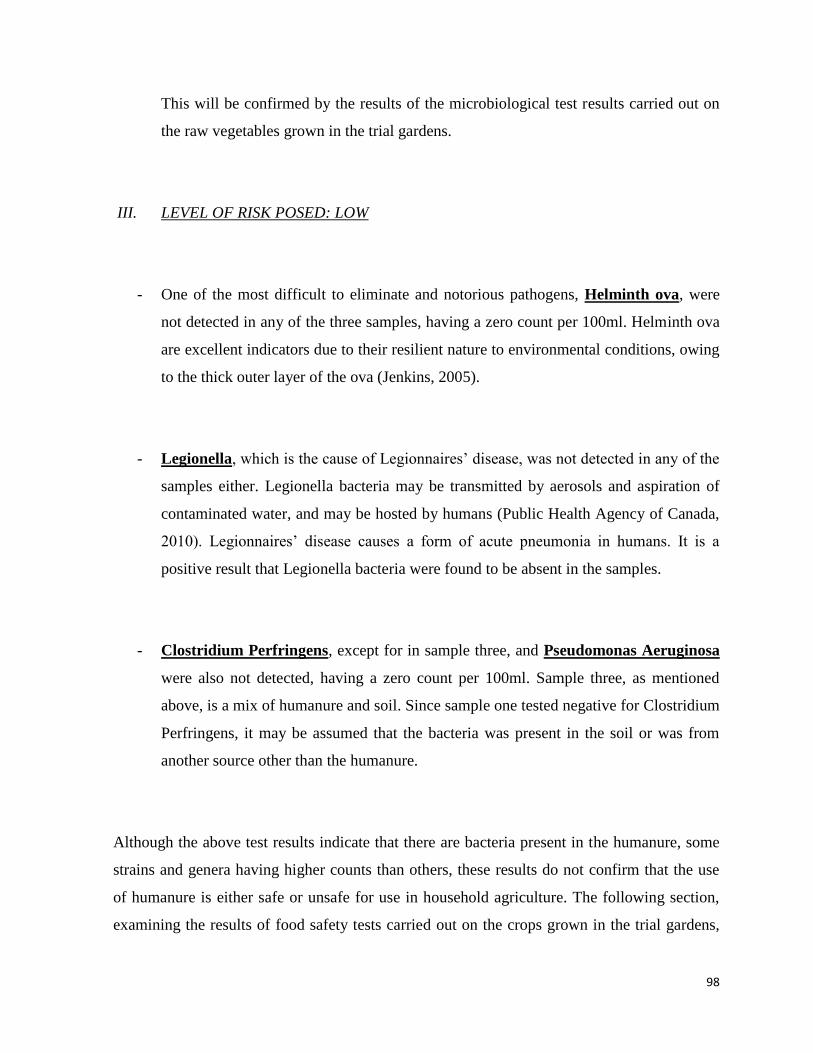
98
This will be confirmed by the results of the microbiological test results carried out on
the raw vegetables grown in the trial gardens.
III. LEVEL OF RISK POSED: LOW
- One of the most difficult to eliminate and notorious pathogens, Helminth ova, were
not detected in any of the three samples, having a zero count per 100ml. Helminth ova
are excellent indicators due to their resilient nature to environmental conditions, owing
to the thick outer layer of the ova (Jenkins, 2005).
- Legionella, which is the cause of Legionnaires’ disease, was not detected in any of the
samples either. Legionella bacteria may be transmitted by aerosols and aspiration of
contaminated water, and may be hosted by humans (Public Health Agency of Canada,
2010). Legionnaires’ disease causes a form of acute pneumonia in humans. It is a
positive result that Legionella bacteria were found to be absent in the samples.
- Clostridium Perfringens, except for in sample three, and Pseudomonas Aeruginosa
were also not detected, having a zero count per 100ml. Sample three, as mentioned
above, is a mix of humanure and soil. Since sample one tested negative for Clostridium
Perfringens, it may be assumed that the bacteria was present in the soil or was from
another source other than the humanure.
Although the above test results indicate that there are bacteria present in the humanure, some
strains and genera having higher counts than others, these results do not confirm that the use
of humanure is either safe or unsafe for use in household agriculture. The following section,
examining the results of food safety tests carried out on the crops grown in the trial gardens,
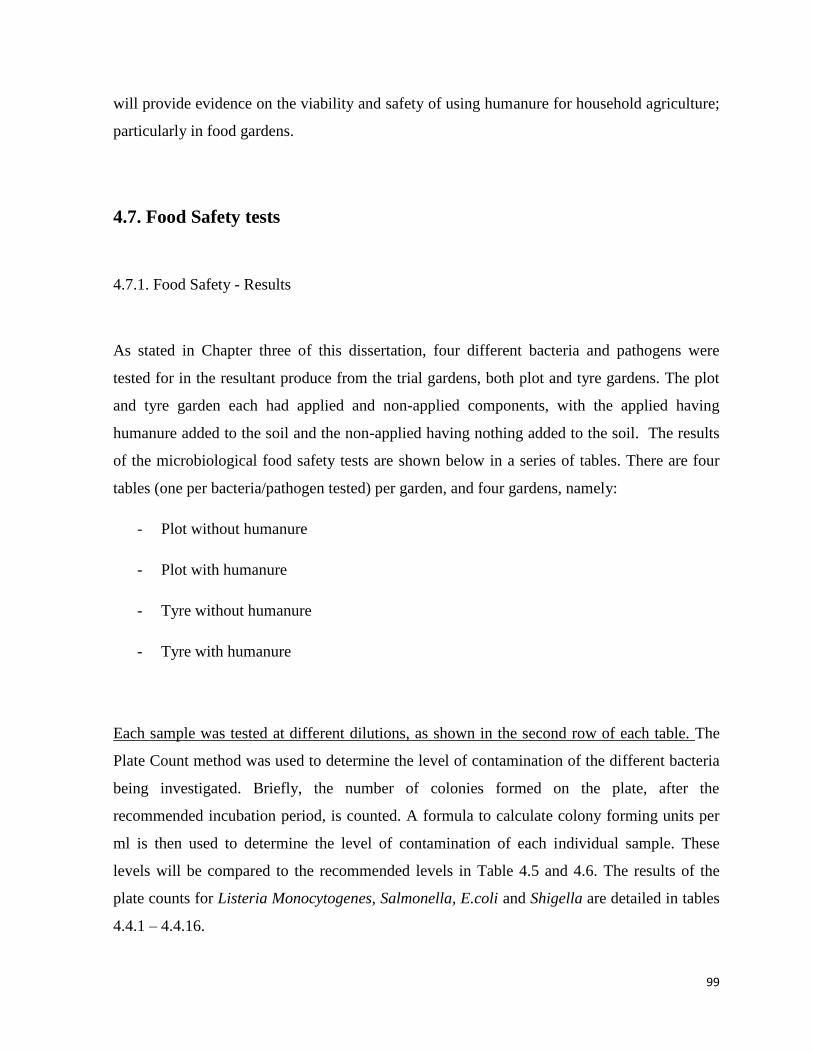
99
will provide evidence on the viability and safety of using humanure for household agriculture;
particularly in food gardens.
4.7. Food Safety tests
4.7.1. Food Safety - Results
As stated in Chapter three of this dissertation, four different bacteria and pathogens were
tested for in the resultant produce from the trial gardens, both plot and tyre gardens. The plot
and tyre garden each had applied and non-applied components, with the applied having
humanure added to the soil and the non-applied having nothing added to the soil. The results
of the microbiological food safety tests are shown below in a series of tables. There are four
tables (one per bacteria/pathogen tested) per garden, and four gardens, namely:
- Plot without humanure
- Plot with humanure
- Tyre without humanure
- Tyre with humanure
Each sample was tested at different dilutions, as shown in the second row of each table. The
Plate Count method was used to determine the level of contamination of the different bacteria
being investigated. Briefly, the number of colonies formed on the plate, after the
recommended incubation period, is counted. A formula to calculate colony forming units per
ml is then used to determine the level of contamination of each individual sample. These
levels will be compared to the recommended levels in Table 4.5 and 4.6. The results of the
plate counts for Listeria Monocytogenes, Salmonella, E.coli and Shigella are detailed in tables
4.4.1 – 4.4.16.
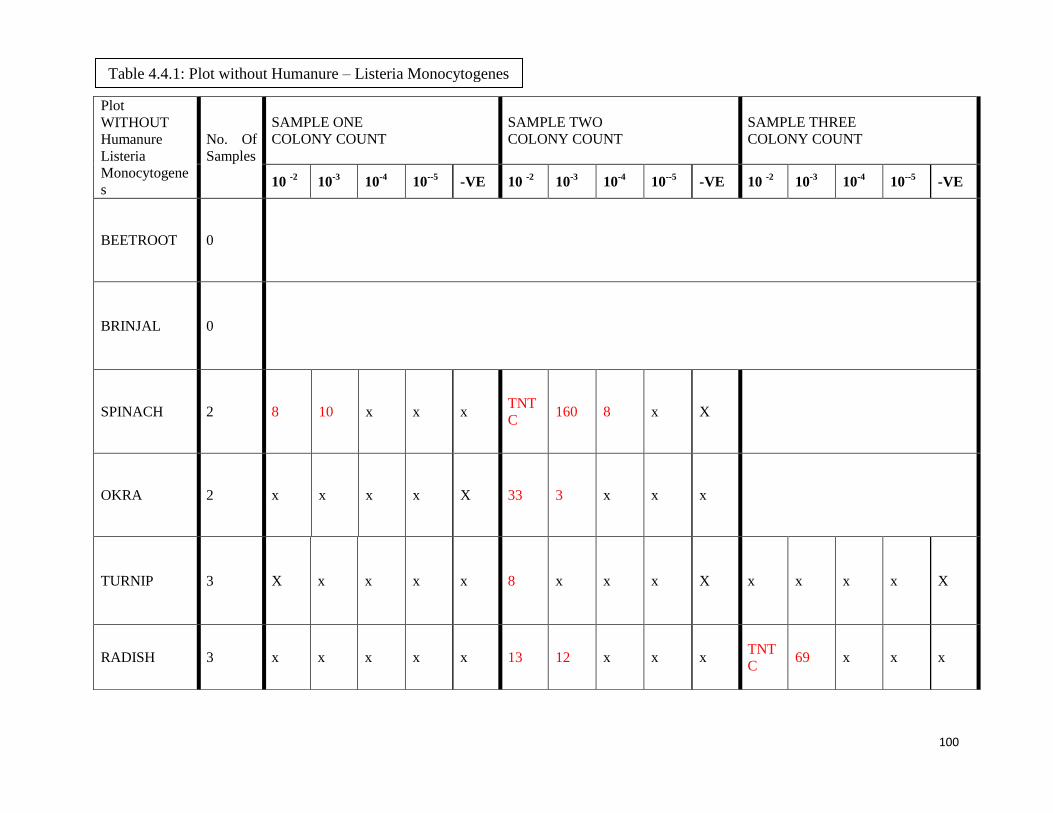
100
Plot
WITHOUT
Humanure
Listeria
Monocytogene
s
No. Of
Samples
SAMPLE ONE
COLONY COUNT
SAMPLE TWO
COLONY COUNT
SAMPLE THREE
COLONY COUNT
10 -2
10-3
10-4
10--5
-VE 10 -2
10-3
10-4
10--5
-VE 10 -2
10-3
10-4
10--5
-VE
BEETROOT 0
BRINJAL 0
SPINACH 2 8 10 x x x TNT
C 160 8 x X
OKRA 2 x x x x X 33 3 x x x
TURNIP 3 X x x x x 8 x x x X x x x x X
RADISH 3 x x x x x 13 12 x x x TNT
C 69 x x x
Table 4.4.1: Plot without Humanure – Listeria Monocytogenes
101
Plot
WITHOUT
Humanure
Salmonella
No. Of
Samples
SAMPLE ONE
COLONY COUNT
SAMPLE TWO
COLONY COUNT
SAMPLE THREE
COLONY COUNT
10 -2
10-3
10-4
10--5
-VE 10 -2
10-3
10-4
10--5
-VE 10 -2
10-3
10-4
10--5
-VE
BEETROOT 0
BRINJAL 0
SPINACH 2 x x x x x x x x x x
OKRA 2 x x x x x x x x x x
TURNIP 3 x x x x x TNT
C x x x x x x x x x
RADISH 3 x 7 x x x x x x x x x 4 x x x
Table 4.4.2: Plot without Humanure – Salmonella
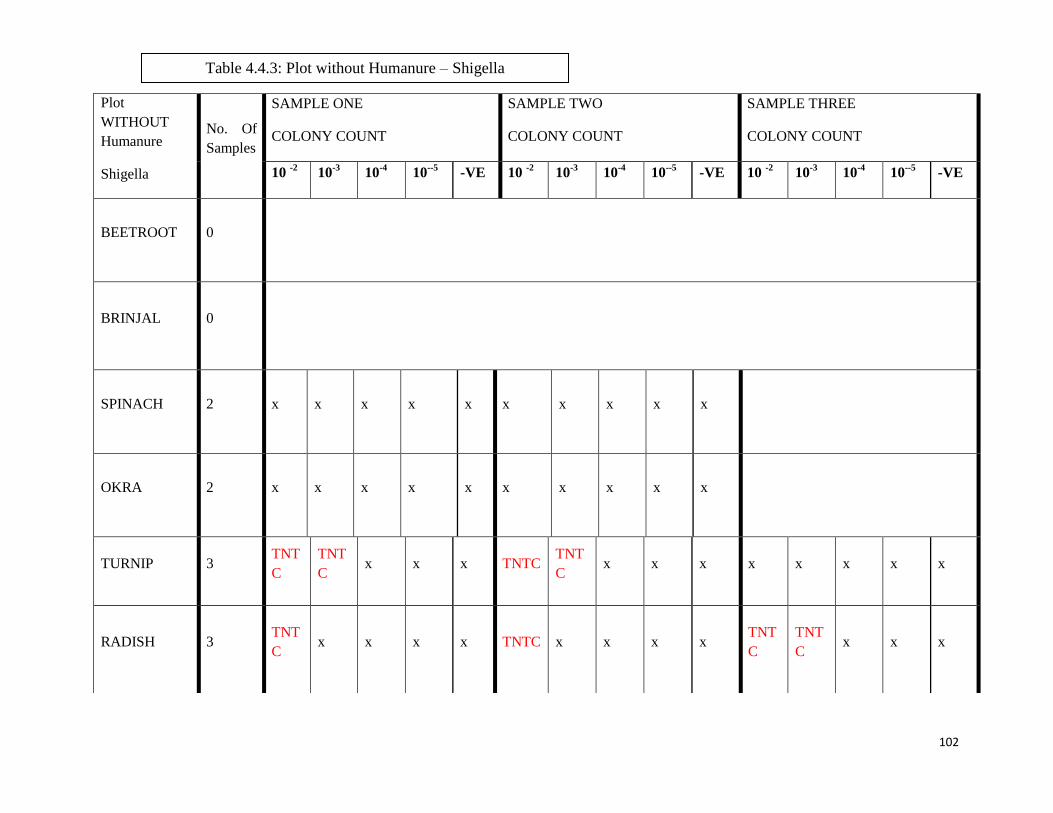
102
Plot
WITHOUT
Humanure
Shigella
No. Of
Samples
SAMPLE ONE
COLONY COUNT
SAMPLE TWO
COLONY COUNT
SAMPLE THREE
COLONY COUNT
10 -2
10-3
10-4
10--5
-VE 10 -2
10-3
10-4
10--5
-VE 10 -2
10-3
10-4
10--5
-VE
BEETROOT 0
BRINJAL 0
SPINACH 2 x x x x x x x x x x
OKRA 2 x x x x x x x x x x
TURNIP 3 TNT
C
TNT
C x x x TNTC
TNT
C x x x x x x x x
RADISH 3 TNT
C x x x x TNTC x x x x
TNT
C
TNT
C x x x
Table 4.4.3: Plot without Humanure – Shigella
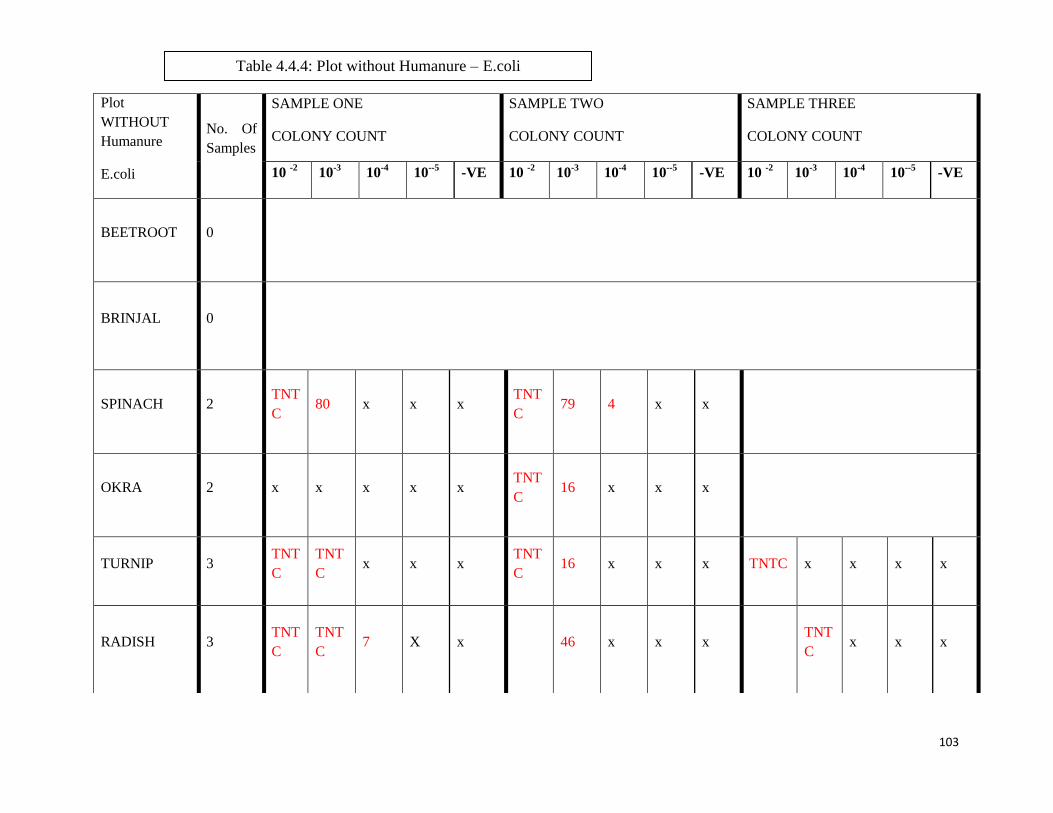
103
Plot
WITHOUT
Humanure
E.coli
No. Of
Samples
SAMPLE ONE
COLONY COUNT
SAMPLE TWO
COLONY COUNT
SAMPLE THREE
COLONY COUNT
10 -2
10-3
10-4
10--5
-VE 10 -2
10-3
10-4
10--5
-VE 10 -2
10-3
10-4
10--5
-VE
BEETROOT 0
BRINJAL 0
SPINACH 2 TNT
C 80 x x x
TNT
C 79 4 x x
OKRA 2 x x x x x TNT
C 16 x x x
TURNIP 3 TNT
C
TNT
C x x x
TNT
C 16 x x x TNTC x x x x
RADISH 3 TNT
C
TNT
C 7 X x 46 x x x
TNT
C x x x
Table 4.4.4: Plot without Humanure – E.coli
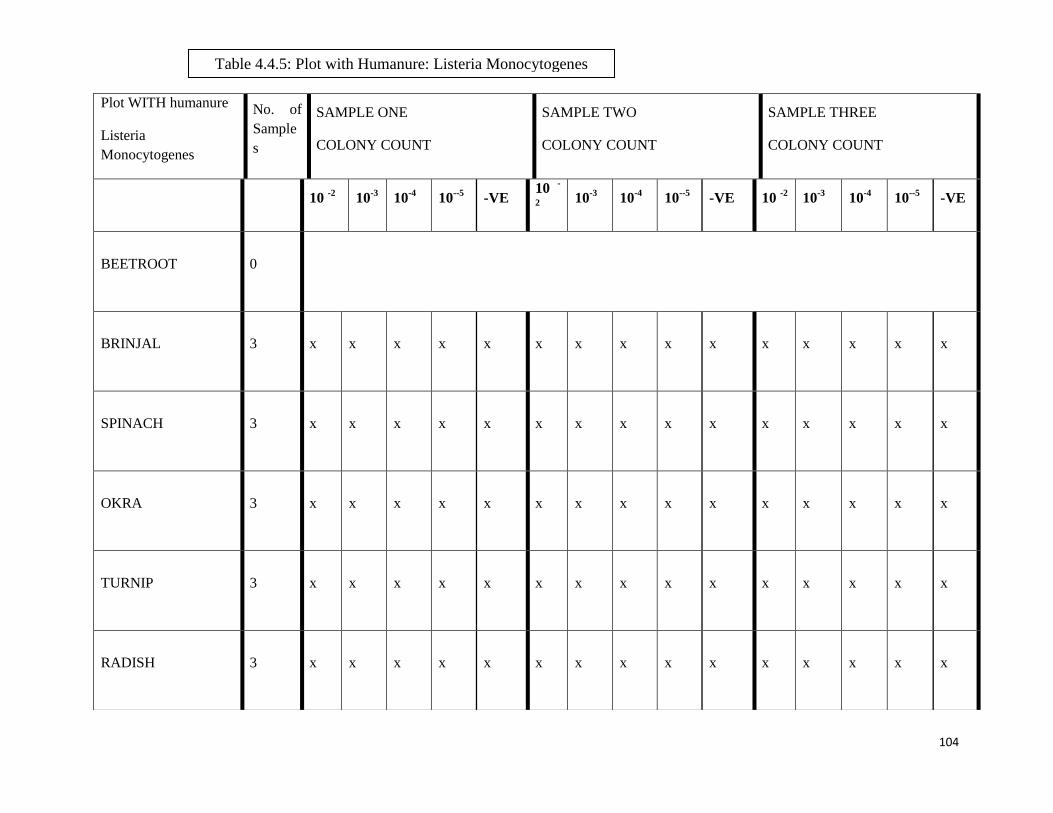
104
Plot WITH humanure
Listeria
Monocytogenes
No. of
Sample
s
SAMPLE ONE
COLONY COUNT
SAMPLE TWO
COLONY COUNT
SAMPLE THREE
COLONY COUNT
10 -2
10-3
10-4
10--5
-VE 10
-
2
10-3
10-4
10--5
-VE 10 -2
10-3
10-4
10--5
-VE
BEETROOT 0
BRINJAL 3 x x x x x x x x x x x x x x x
SPINACH 3 x x x x x x x x x x x x x x x
OKRA 3 x x x x x x x x x x x x x x x
TURNIP 3 x x x x x x x x x x x x x x x
RADISH 3 x x x x x x x x x x x x x x x
Table 4.4.5: Plot with Humanure: Listeria Monocytogenes
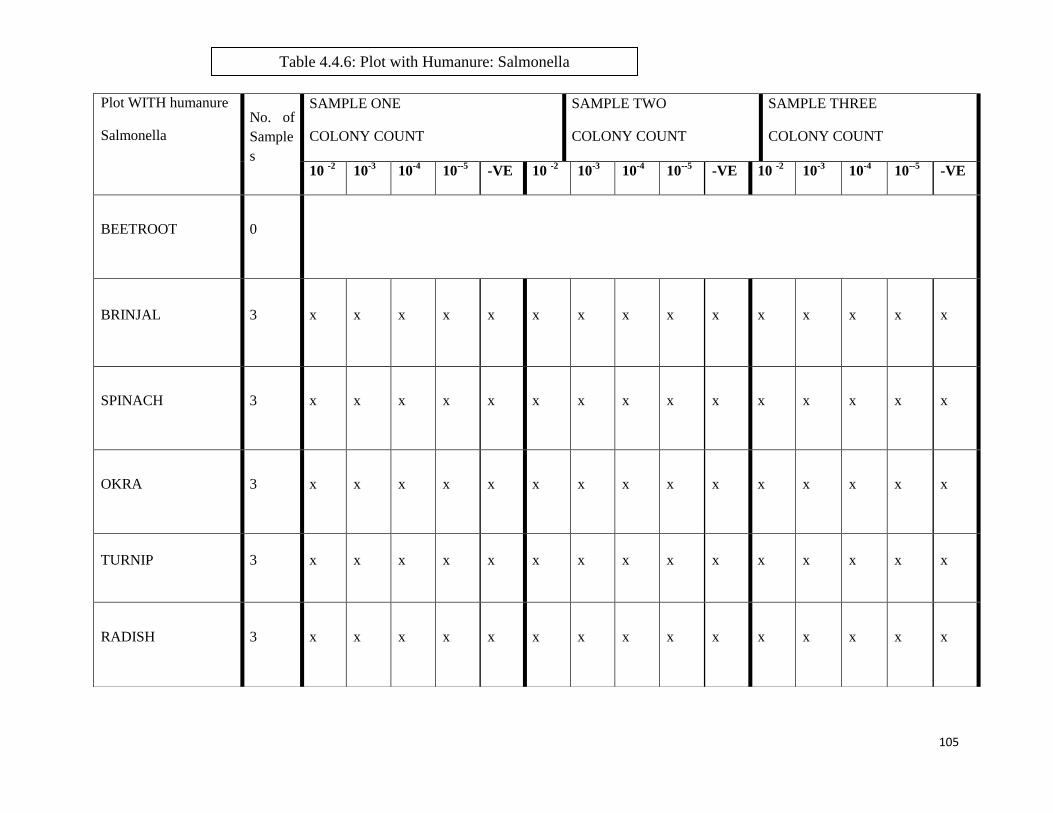
105
Plot WITH humanure
Salmonella
No. of
Sample
s
SAMPLE ONE
COLONY COUNT
SAMPLE TWO
COLONY COUNT
SAMPLE THREE
COLONY COUNT
10 -2
10-3
10-4
10--5
-VE 10 -2
10-3
10-4
10--5
-VE 10 -2
10-3
10-4
10--5
-VE
BEETROOT 0
BRINJAL 3 x x x x x x x x x x x x x x x
SPINACH 3 x x x x x x x x x x x x x x x
OKRA 3 x x x x x x x x x x x x x x x
TURNIP 3 x x x x x x x x x x x x x x x
RADISH 3 x x x x x x x x x x x x x x x
Table 4.4.6: Plot with Humanure: Salmonella
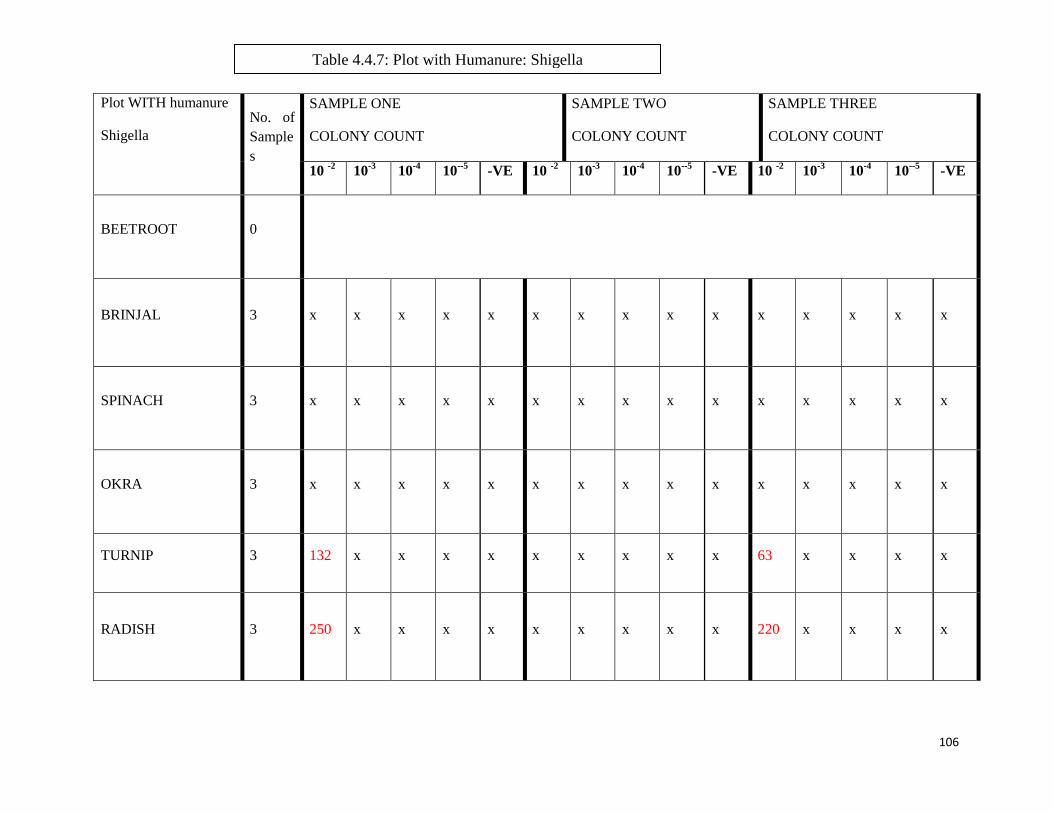
106
Plot WITH humanure
Shigella
No. of
Sample
s
SAMPLE ONE
COLONY COUNT
SAMPLE TWO
COLONY COUNT
SAMPLE THREE
COLONY COUNT
10 -2
10-3
10-4
10--5
-VE 10 -2
10-3
10-4
10--5
-VE 10 -2
10-3
10-4
10--5
-VE
BEETROOT 0
BRINJAL 3 x x x x x x x x x x x x x x x
SPINACH 3 x x x x x x x x x x x x x x x
OKRA 3 x x x x x x x x x x x x x x x
TURNIP 3 132 x x x x x x x x x 63 x x x x
RADISH 3 250 x x x x x x x x x 220 x x x x
Table 4.4.7: Plot with Humanure: Shigella
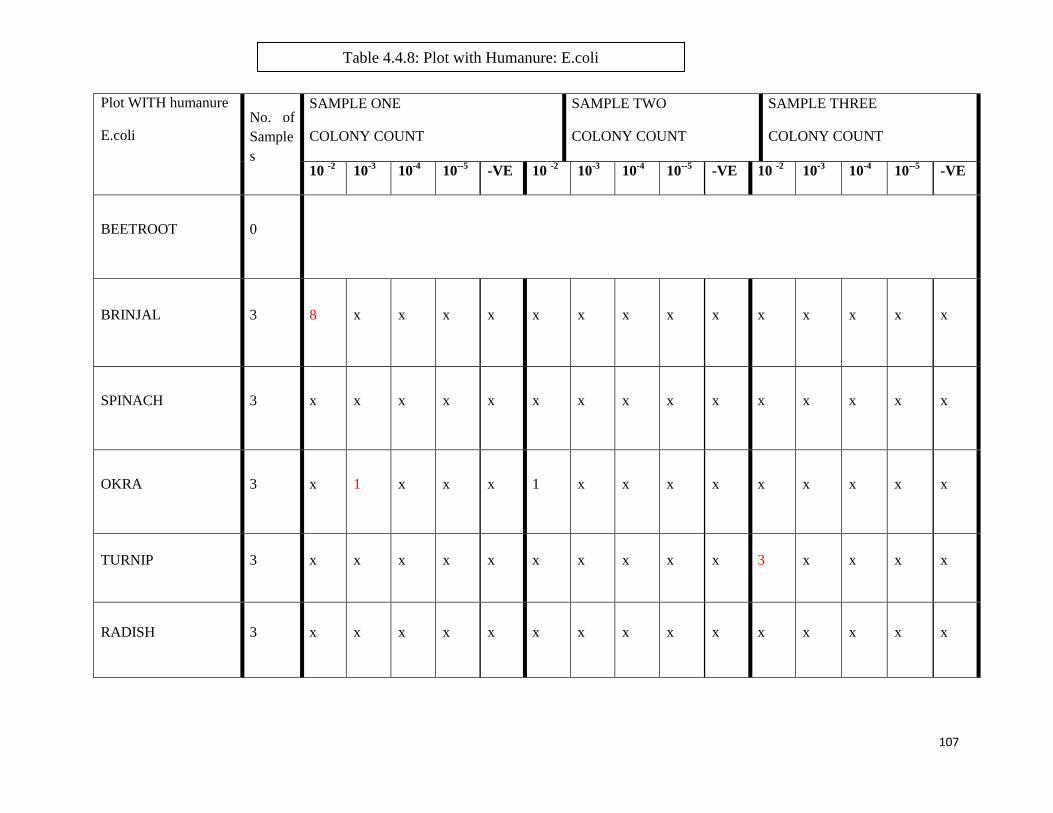
107
Plot WITH humanure
E.coli
No. of
Sample
s
SAMPLE ONE
COLONY COUNT
SAMPLE TWO
COLONY COUNT
SAMPLE THREE
COLONY COUNT
10 -2
10-3
10-4
10--5
-VE 10 -2
10-3
10-4
10--5
-VE 10 -2
10-3
10-4
10--5
-VE
BEETROOT 0
BRINJAL 3 8 x x x x x x x x x x x x x x
SPINACH 3 x x x x x x x x x x x x x x x
OKRA 3 x 1 x x x 1 x x x x x x x x x
TURNIP 3 x x x x x x x x x x 3 x x x x
RADISH 3 x x x x x x x x x x x x x x x
Table 4.4.8: Plot with Humanure: E.coli
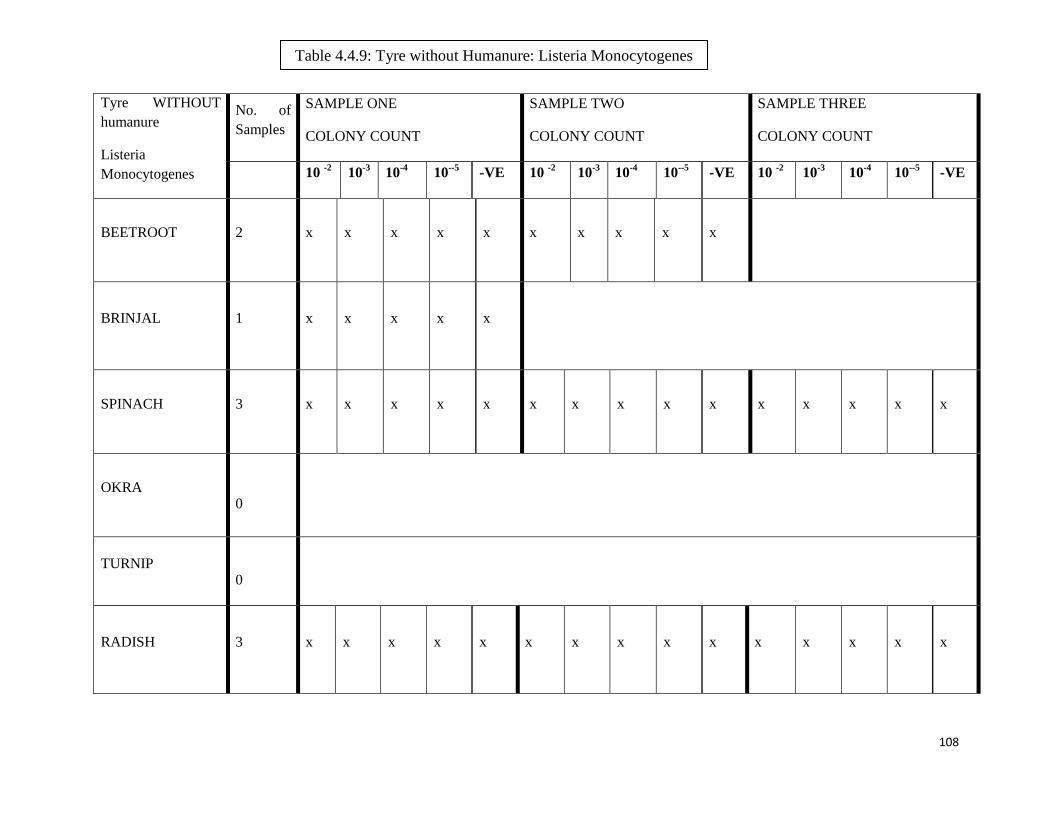
108
Tyre WITHOUT
humanure
Listeria
Monocytogenes
No. of
Samples
SAMPLE ONE
COLONY COUNT
SAMPLE TWO
COLONY COUNT
SAMPLE THREE
COLONY COUNT
10 -2
10-3
10-4
10--5
-VE 10 -2
10-3
10-4
10--5
-VE 10 -2
10-3
10-4
10--5
-VE
BEETROOT 2 x x x x x x x x x x
BRINJAL 1 x x x x x
SPINACH 3 x x x x x x x x x x x x x x x
OKRA
0
TURNIP
0
RADISH 3 x x x x x x x x x x x x x x x
Table 4.4.9: Tyre without Humanure: Listeria Monocytogenes
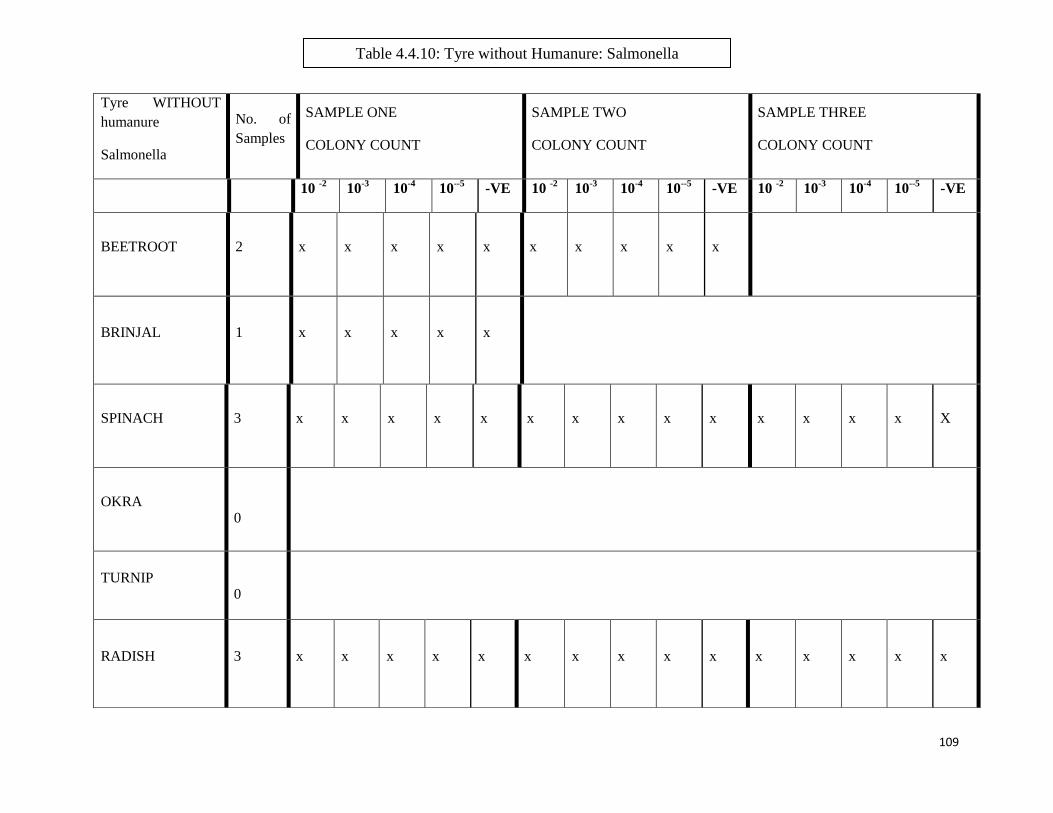
109
Tyre WITHOUT
humanure
Salmonella
No. of
Samples
SAMPLE ONE
COLONY COUNT
SAMPLE TWO
COLONY COUNT
SAMPLE THREE
COLONY COUNT
10 -2
10-3
10-4
10--5
-VE 10 -2
10-3
10-4
10--5
-VE 10 -2
10-3
10-4
10--5
-VE
BEETROOT 2 x x x x x x x x x x
BRINJAL 1 x x x x x
SPINACH 3 x x x x x x x x x x x x x x X
OKRA
0
TURNIP
0
RADISH 3 x x x x x x x x x x x x x x x
Table 4.4.10: Tyre without Humanure: Salmonella
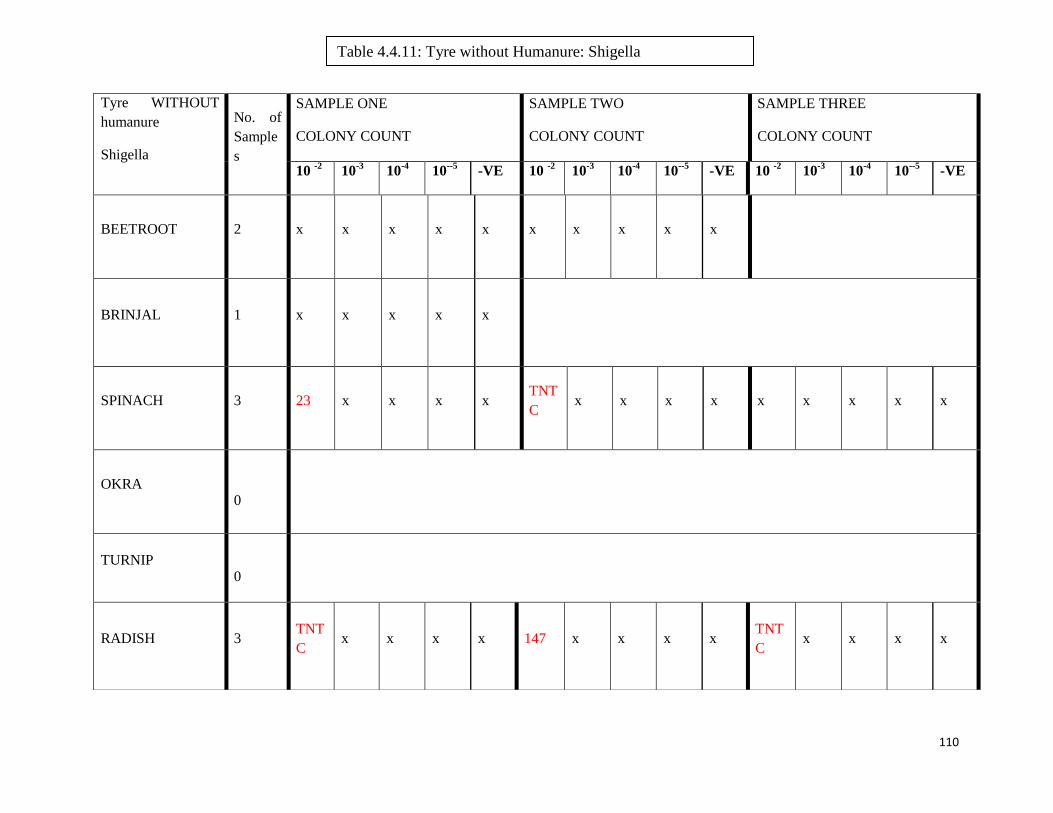
110
Tyre WITHOUT
humanure
Shigella
No. of
Sample
s
SAMPLE ONE
COLONY COUNT
SAMPLE TWO
COLONY COUNT
SAMPLE THREE
COLONY COUNT
10 -2
10-3
10-4
10--5
-VE 10 -2
10-3
10-4
10--5
-VE 10 -2
10-3
10-4
10--5
-VE
BEETROOT 2 x x x x x x x x x x
BRINJAL 1 x x x x x
SPINACH 3 23 x x x x TNT
C x x x x x x x x x
OKRA
0
TURNIP
0
RADISH 3 TNT
C x x x x 147 x x x x
TNT
C x x x x
Table 4.4.11: Tyre without Humanure: Shigella
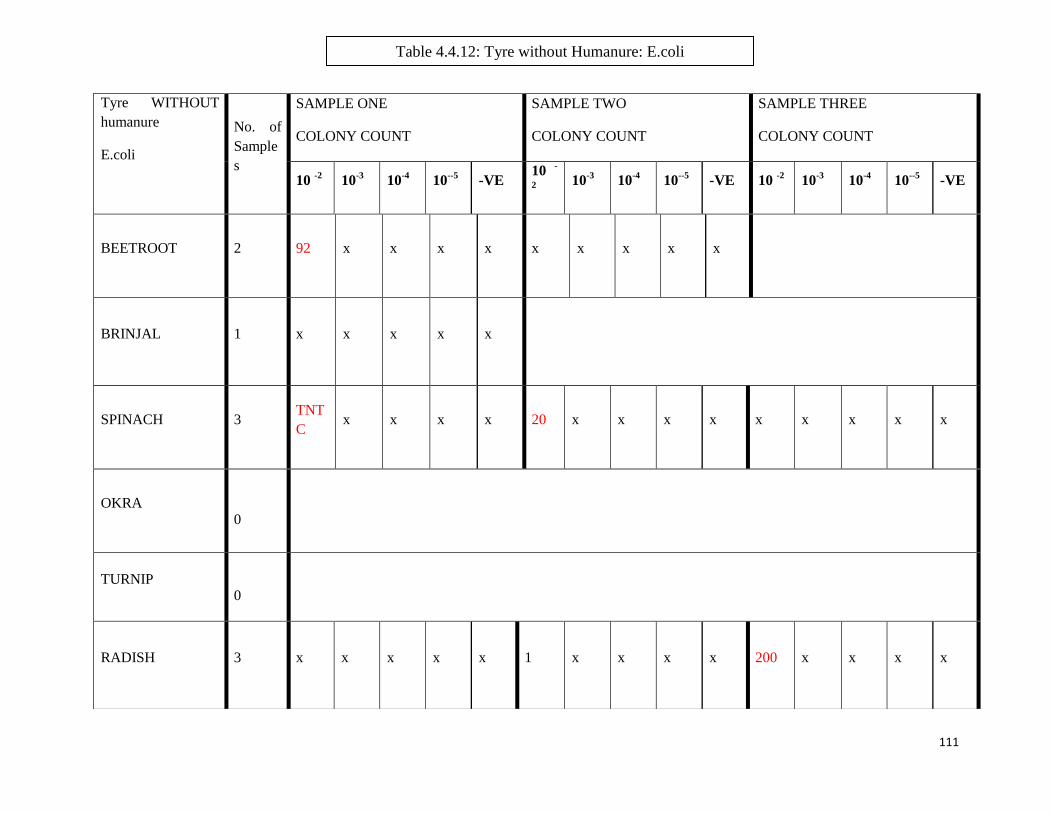
111
Tyre WITHOUT
humanure
E.coli
No. of
Sample
s
SAMPLE ONE
COLONY COUNT
SAMPLE TWO
COLONY COUNT
SAMPLE THREE
COLONY COUNT
10 -2
10-3
10-4
10--5
-VE 10
-
2
10-3
10-4
10--5
-VE 10 -2
10-3
10-4
10--5
-VE
BEETROOT 2 92 x x x x x x x x x
BRINJAL 1 x x x x x
SPINACH 3 TNT
C x x x x 20 x x x x x x x x x
OKRA
0
TURNIP
0
RADISH 3 x x x x x 1 x x x x 200 x x x x
Table 4.4.12: Tyre without Humanure: E.coli
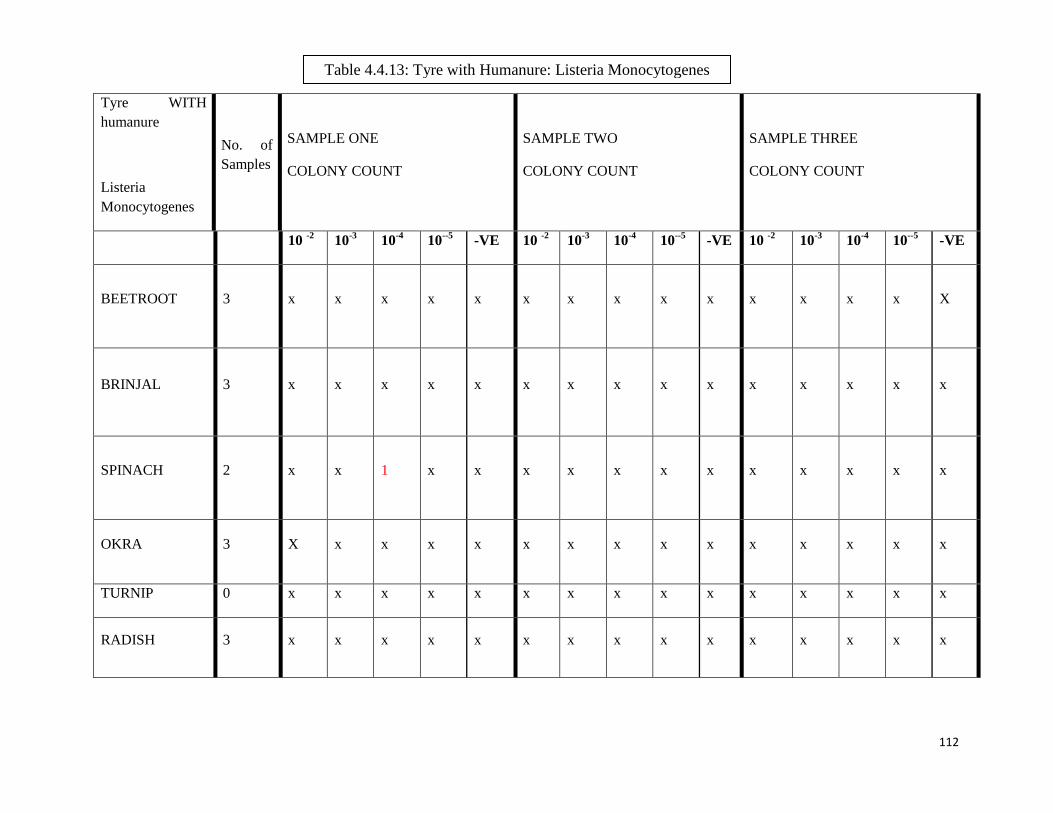
112
Tyre WITH
humanure
Listeria
Monocytogenes
No. of
Samples
SAMPLE ONE
COLONY COUNT
SAMPLE TWO
COLONY COUNT
SAMPLE THREE
COLONY COUNT
10 -2
10-3
10-4
10--5
-VE 10 -2
10-3
10-4
10--5
-VE 10 -2
10-3
10-4
10--5
-VE
BEETROOT 3 x x x x x x x x x x x x x x X
BRINJAL 3 x x x x x x x x x x x x x x x
SPINACH 2 x x 1 x x x x x x x x x x x x
OKRA 3 X x x x x x x x x x x x x x x
TURNIP 0 x x x x x x x x x x x x x x x
RADISH 3 x x x x x x x x x x x x x x x
Table 4.4.13: Tyre with Humanure: Listeria Monocytogenes
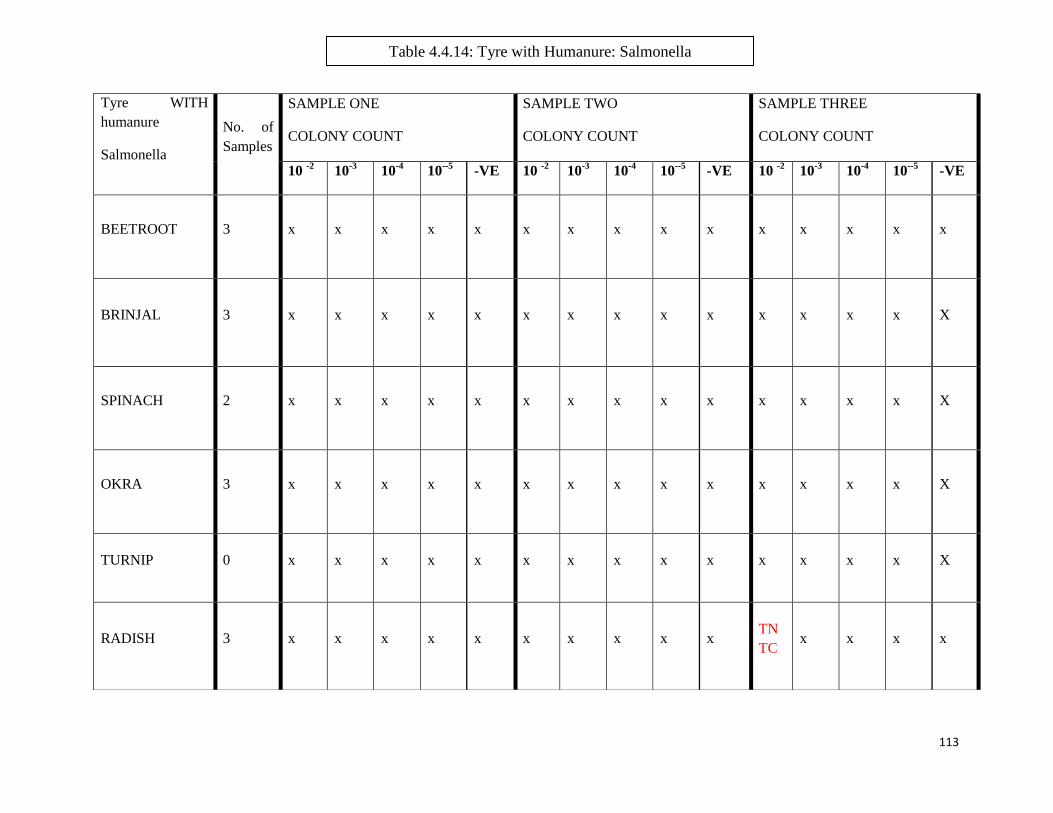
113
Tyre WITH
humanure
Salmonella
No. of
Samples
SAMPLE ONE
COLONY COUNT
SAMPLE TWO
COLONY COUNT
SAMPLE THREE
COLONY COUNT
10 -2
10-3
10-4
10--5
-VE 10 -2
10-3
10-4
10--5
-VE 10 -2
10-3
10-4
10--5
-VE
BEETROOT 3 x x x x x x x x x x x x x x x
BRINJAL 3 x x x x x x x x x x x x x x X
SPINACH 2 x x x x x x x x x x x x x x X
OKRA 3 x x x x x x x x x x x x x x X
TURNIP 0 x x x x x x x x x x x x x x X
RADISH 3 x x x x x x x x x x TN
TC x x x x
Table 4.4.14: Tyre with Humanure: Salmonella
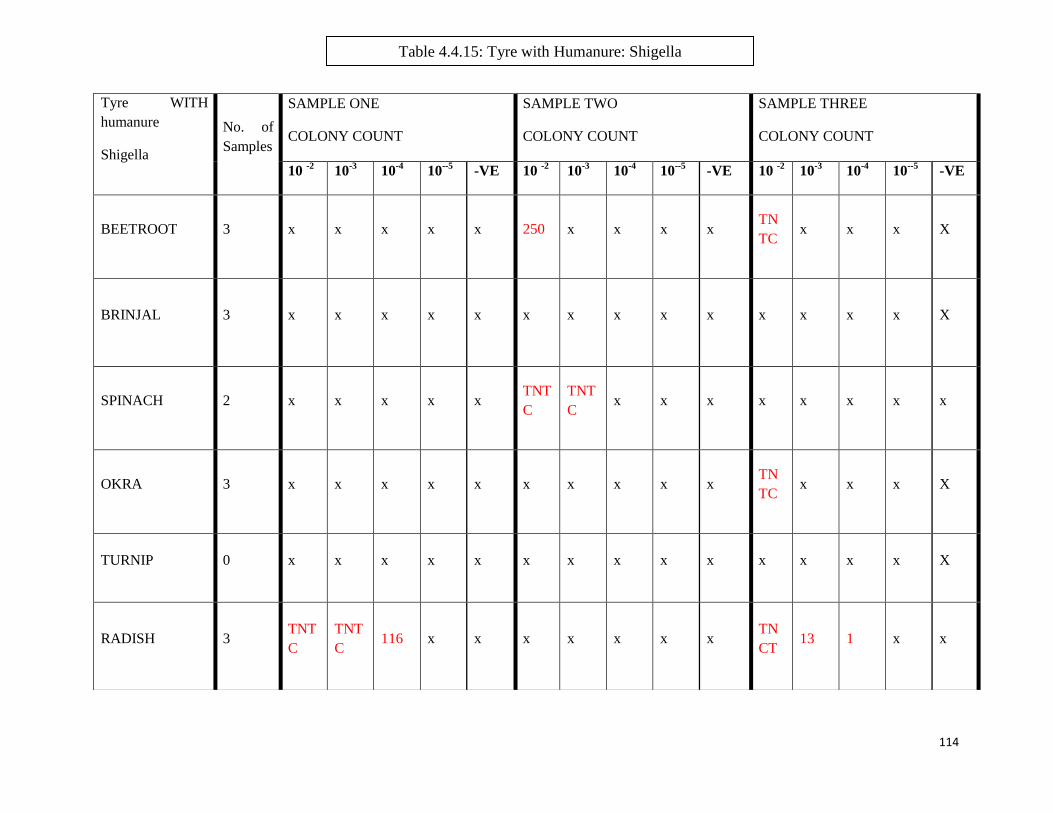
114
Tyre WITH
humanure
Shigella
No. of
Samples
SAMPLE ONE
COLONY COUNT
SAMPLE TWO
COLONY COUNT
SAMPLE THREE
COLONY COUNT
10 -2
10-3
10-4
10--5
-VE 10 -2
10-3
10-4
10--5
-VE 10 -2
10-3
10-4
10--5
-VE
BEETROOT 3 x x x x x 250 x x x x TN
TC x x x X
BRINJAL 3 x x x x x x x x x x x x x x X
SPINACH 2 x x x x x TNT
C
TNT
C x x x x x x x x
OKRA 3 x x x x x x x x x x TN
TC x x x X
TURNIP 0 x x x x x x x x x x x x x x X
RADISH 3 TNT
C
TNT
C 116 x x x x x x x
TN
CT 13 1 x x
Table 4.4.15: Tyre with Humanure: Shigella
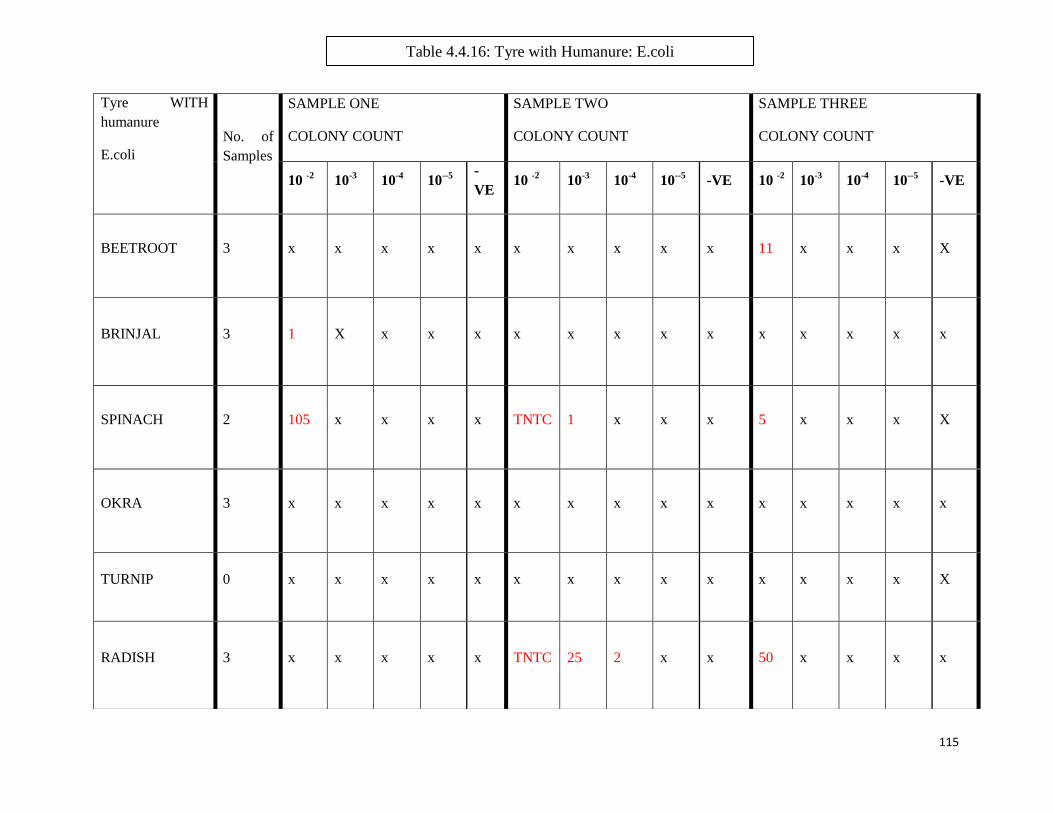
115
Tyre WITH
humanure
E.coli
No. of
Samples
SAMPLE ONE
COLONY COUNT
SAMPLE TWO
COLONY COUNT
SAMPLE THREE
COLONY COUNT
10 -2
10-3
10-4
10--5 -
VE 10
-2 10
-3 10
-4 10
--5 -VE 10
-2 10
-3 10
-4 10
--5 -VE
BEETROOT 3 x x x x x x x x x x 11 x x x X
BRINJAL 3 1 X x x x x x x x x x x x x x
SPINACH 2 105 x x x x TNTC 1 x x x 5 x x x X
OKRA 3 x x x x x x x x x x x x x x x
TURNIP 0 x x x x x x x x x x x x x x X
RADISH 3 x x x x x TNTC 25 2 x x 50 x x x x
Table 4.4.16: Tyre with Humanure: E.coli
116
4.6.2. Food safety – Discussion
Food safety of minimally processed and ready to eat foods need to be carefully monitored, as
many incidences of food-borne illness outbreaks have occurred in recent times. Minimally
processed foods are food items that are mostly ready to consume and do not need to undergo
many preparations in order to be ‘ready to eat’. Raw fruits and vegetables, including fresh cut
fruit or vegetable salads are included in the category of ‘minimally processed’ and ‘ready to
eat’ foods. However, these food items need to be monitored to ensure microbial populations
that may be present on the surface or within the item, are in accordance with recognised food
safety standards and guidelines. Indicator bacteria and pathogens are usually tested for to
ensure food safety. For the purpose of this study, Listeria monocytogenes, Salmonella,
Shigella and E.coli were the indicator bacteria tested for in food samples from the trial
gardens.
As a result of the garden trials carried out in this study using humanure, it was necessary to
ensure that resultant produce was safe to eat – that it did not take up any pathogens that may
have been lingering in the soil or were not destroyed during the composting process. The
South African Department of Health (DoH) issued ‘Guidelines for Environmental Health
Officers on the Interpretation of Microbiological Analysis Data of Food’. These Guidelines
detail proposed microbiological specification to be used as guidelines for foods. As detailed
Table 4.5, the DoH guidelines specify proposed limits for two of the indicator bacteria tested
for in this study, E.coli and Salmonella.
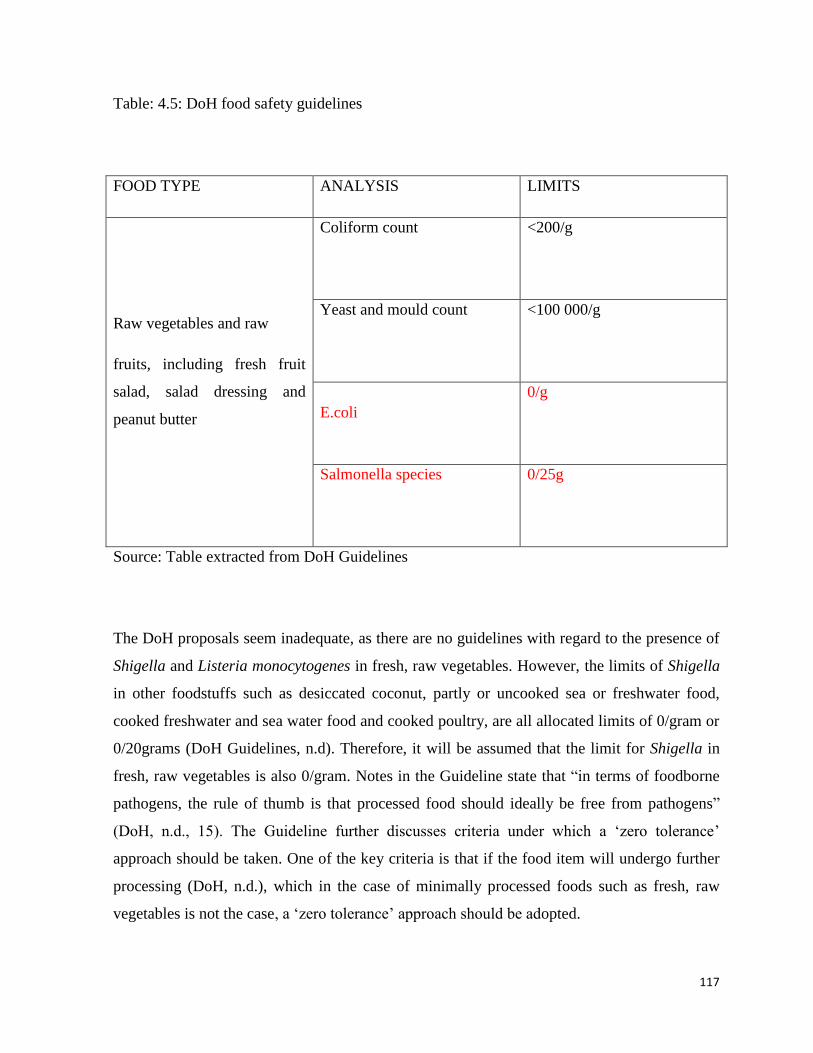
117
Table: 4.5: DoH food safety guidelines
FOOD TYPE ANALYSIS LIMITS
Raw vegetables and raw
fruits, including fresh fruit
salad, salad dressing and
peanut butter
Coliform count
<200/g
Yeast and mould count
<100 000/g
E.coli
0/g
Salmonella species
0/25g
Source: Table extracted from DoH Guidelines
The DoH proposals seem inadequate, as there are no guidelines with regard to the presence of
Shigella and Listeria monocytogenes in fresh, raw vegetables. However, the limits of Shigella
in other foodstuffs such as desiccated coconut, partly or uncooked sea or freshwater food,
cooked freshwater and sea water food and cooked poultry, are all allocated limits of 0/gram or
0/20grams (DoH Guidelines, n.d). Therefore, it will be assumed that the limit for Shigella in
fresh, raw vegetables is also 0/gram. Notes in the Guideline state that “in terms of foodborne
pathogens, the rule of thumb is that processed food should ideally be free from pathogens”
(DoH, n.d., 15). The Guideline further discusses criteria under which a ‘zero tolerance’
approach should be taken. One of the key criteria is that if the food item will undergo further
processing (DoH, n.d.), which in the case of minimally processed foods such as fresh, raw
vegetables is not the case, a ‘zero tolerance’ approach should be adopted.
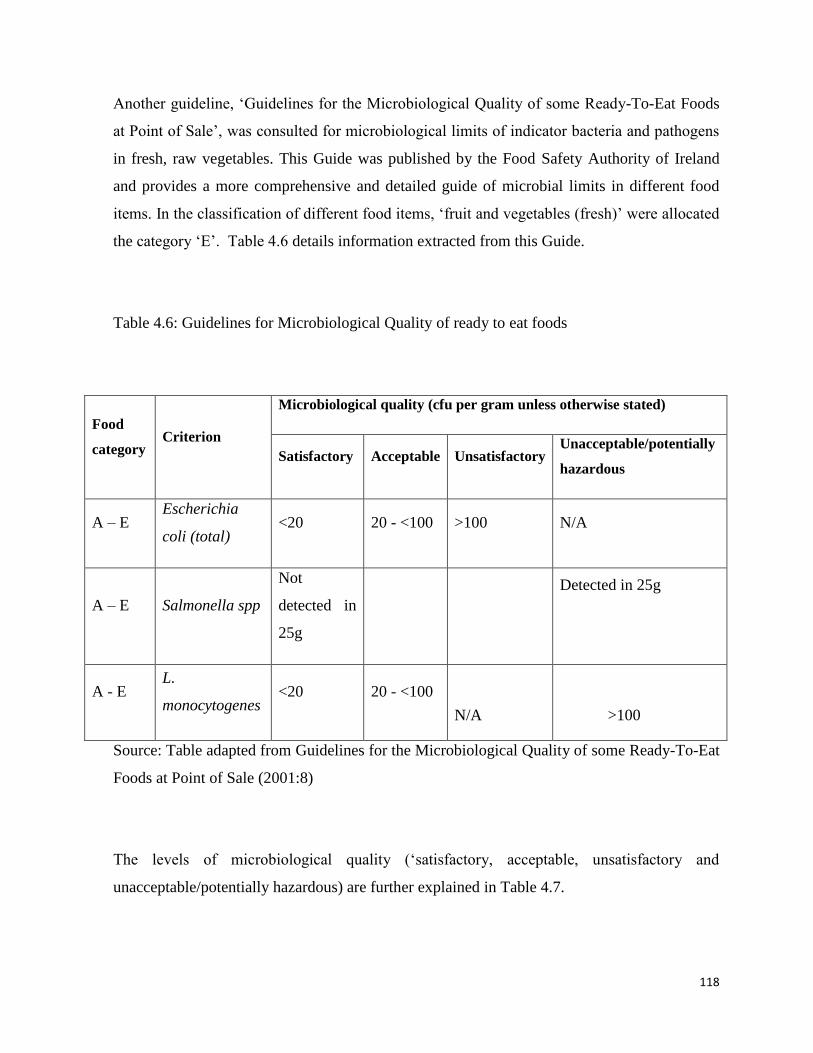
118
Another guideline, ‘Guidelines for the Microbiological Quality of some Ready-To-Eat Foods
at Point of Sale’, was consulted for microbiological limits of indicator bacteria and pathogens
in fresh, raw vegetables. This Guide was published by the Food Safety Authority of Ireland
and provides a more comprehensive and detailed guide of microbial limits in different food
items. In the classification of different food items, ‘fruit and vegetables (fresh)’ were allocated
the category ‘E’. Table 4.6 details information extracted from this Guide.
Table 4.6: Guidelines for Microbiological Quality of ready to eat foods
Food
category Criterion
Microbiological quality (cfu per gram unless otherwise stated)
Satisfactory Acceptable Unsatisfactory Unacceptable/potentially
hazardous
A – E Escherichia
coli (total) <20 20 - <100 >100 N/A
A – E Salmonella spp
Not
detected in
25g
Detected in 25g
A - E L.
monocytogenes <20 20 - <100
N/A
>100
Source: Table adapted from Guidelines for the Microbiological Quality of some Ready-To-Eat
Foods at Point of Sale (2001:8)
The levels of microbiological quality (‘satisfactory, acceptable, unsatisfactory and
unacceptable/potentially hazardous) are further explained in Table 4.7.
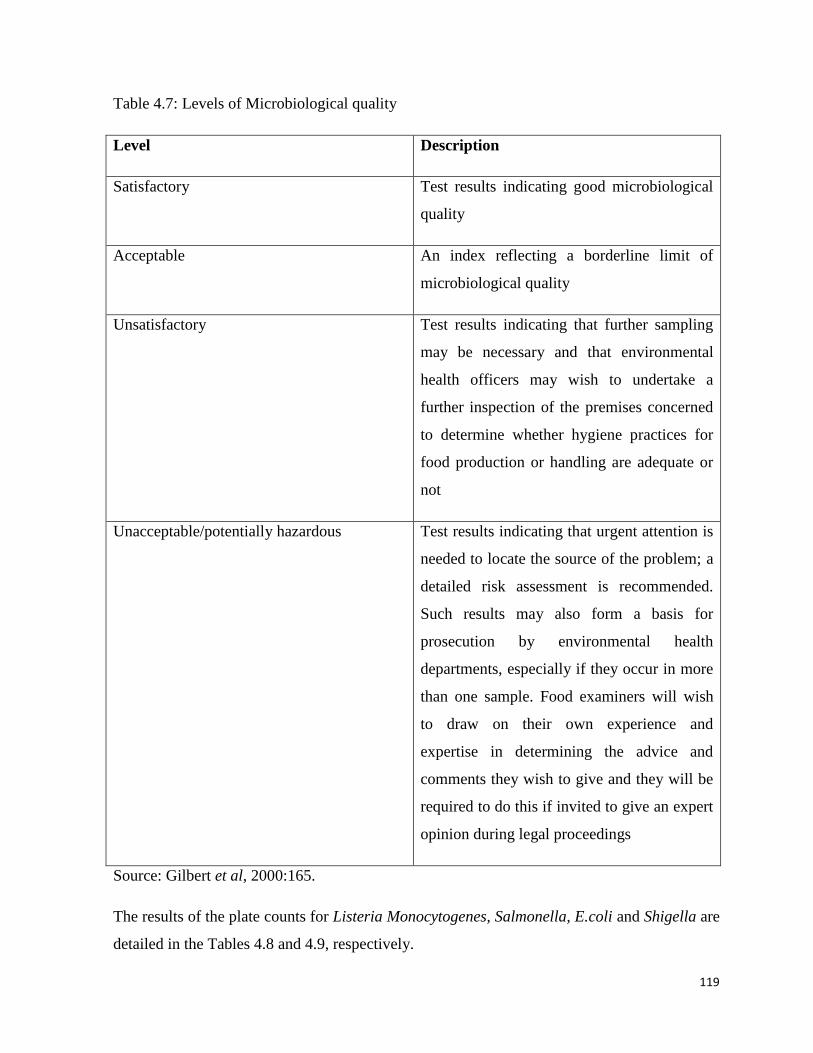
119
Table 4.7: Levels of Microbiological quality
Level Description
Satisfactory Test results indicating good microbiological
quality
Acceptable An index reflecting a borderline limit of
microbiological quality
Unsatisfactory Test results indicating that further sampling
may be necessary and that environmental
health officers may wish to undertake a
further inspection of the premises concerned
to determine whether hygiene practices for
food production or handling are adequate or
not
Unacceptable/potentially hazardous Test results indicating that urgent attention is
needed to locate the source of the problem; a
detailed risk assessment is recommended.
Such results may also form a basis for
prosecution by environmental health
departments, especially if they occur in more
than one sample. Food examiners will wish
to draw on their own experience and
expertise in determining the advice and
comments they wish to give and they will be
required to do this if invited to give an expert
opinion during legal proceedings
Source: Gilbert et al, 2000:165.
The results of the plate counts for Listeria Monocytogenes, Salmonella, E.coli and Shigella are
detailed in the Tables 4.8 and 4.9, respectively.
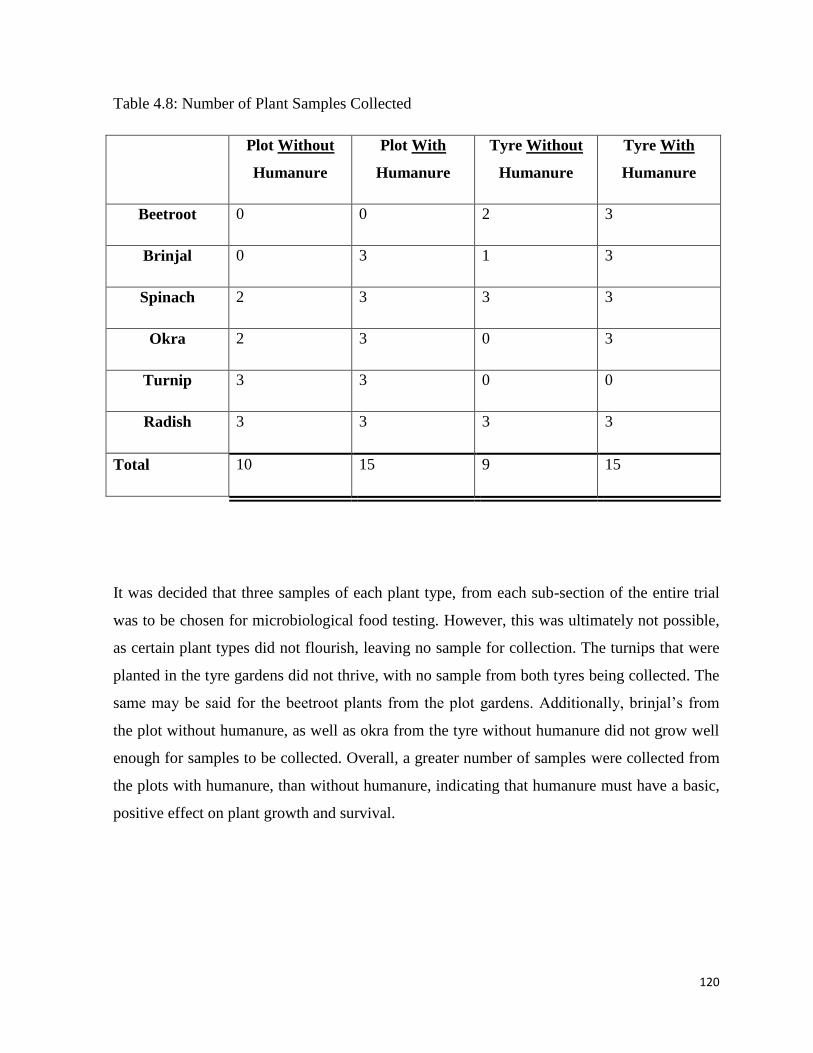
120
Table 4.8: Number of Plant Samples Collected
Plot Without
Humanure
Plot With
Humanure
Tyre Without
Humanure
Tyre With
Humanure
Beetroot 0 0 2 3
Brinjal 0 3 1 3
Spinach 2 3 3 3
Okra 2 3 0 3
Turnip 3 3 0 0
Radish 3 3 3 3
Total 10 15 9 15
It was decided that three samples of each plant type, from each sub-section of the entire trial
was to be chosen for microbiological food testing. However, this was ultimately not possible,
as certain plant types did not flourish, leaving no sample for collection. The turnips that were
planted in the tyre gardens did not thrive, with no sample from both tyres being collected. The
same may be said for the beetroot plants from the plot gardens. Additionally, brinjal’s from
the plot without humanure, as well as okra from the tyre without humanure did not grow well
enough for samples to be collected. Overall, a greater number of samples were collected from
the plots with humanure, than without humanure, indicating that humanure must have a basic,
positive effect on plant growth and survival.
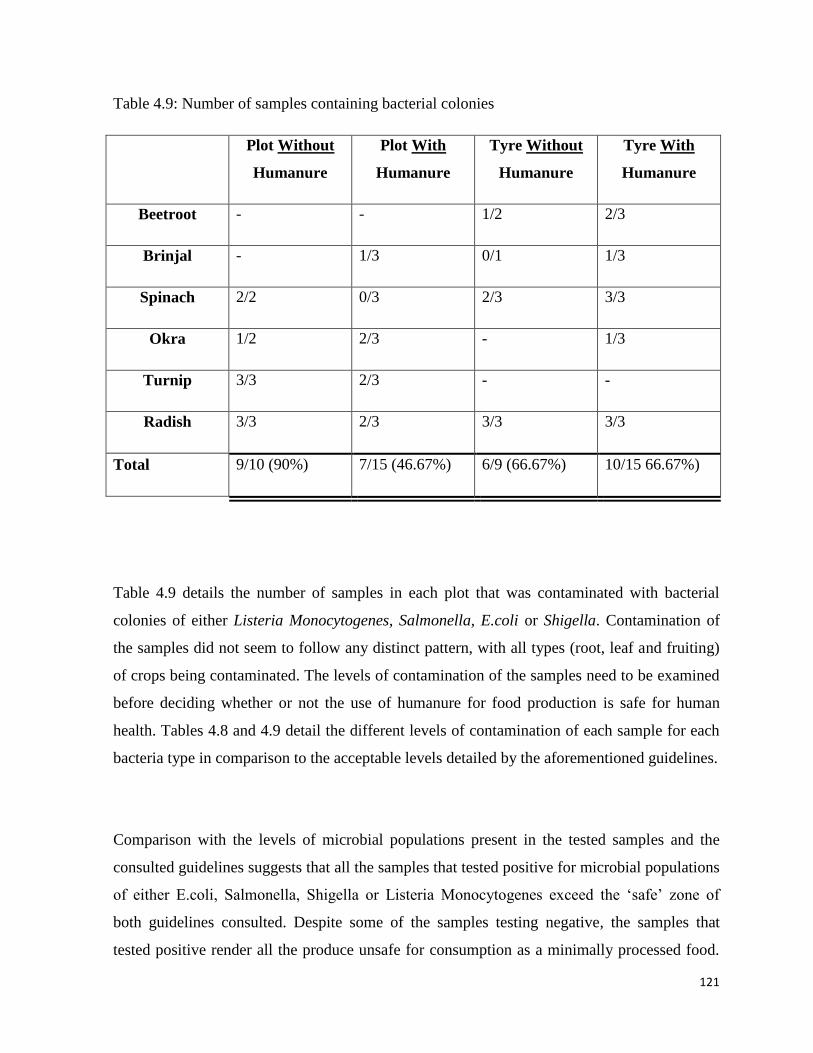
121
Table 4.9: Number of samples containing bacterial colonies
Plot Without
Humanure
Plot With
Humanure
Tyre Without
Humanure
Tyre With
Humanure
Beetroot - - 1/2 2/3
Brinjal - 1/3 0/1 1/3
Spinach 2/2 0/3 2/3 3/3
Okra 1/2 2/3 - 1/3
Turnip 3/3 2/3 - -
Radish 3/3 2/3 3/3 3/3
Total 9/10 (90%) 7/15 (46.67%) 6/9 (66.67%) 10/15 66.67%)
Table 4.9 details the number of samples in each plot that was contaminated with bacterial
colonies of either Listeria Monocytogenes, Salmonella, E.coli or Shigella. Contamination of
the samples did not seem to follow any distinct pattern, with all types (root, leaf and fruiting)
of crops being contaminated. The levels of contamination of the samples need to be examined
before deciding whether or not the use of humanure for food production is safe for human
health. Tables 4.8 and 4.9 detail the different levels of contamination of each sample for each
bacteria type in comparison to the acceptable levels detailed by the aforementioned guidelines.
Comparison with the levels of microbial populations present in the tested samples and the
consulted guidelines suggests that all the samples that tested positive for microbial populations
of either E.coli, Salmonella, Shigella or Listeria Monocytogenes exceed the ‘safe’ zone of
both guidelines consulted. Despite some of the samples testing negative, the samples that
tested positive render all the produce unsafe for consumption as a minimally processed food.
122
If this produce is consumed as a minimally processed food, there is a definite risk of food
borne illness. The safety of consumption of the produce after further processing, such as
cooking using heat, is unknown. Although there is a possibility that further processing may
render the produce safe to consume, further investigation is required to establish whether this
is the case.
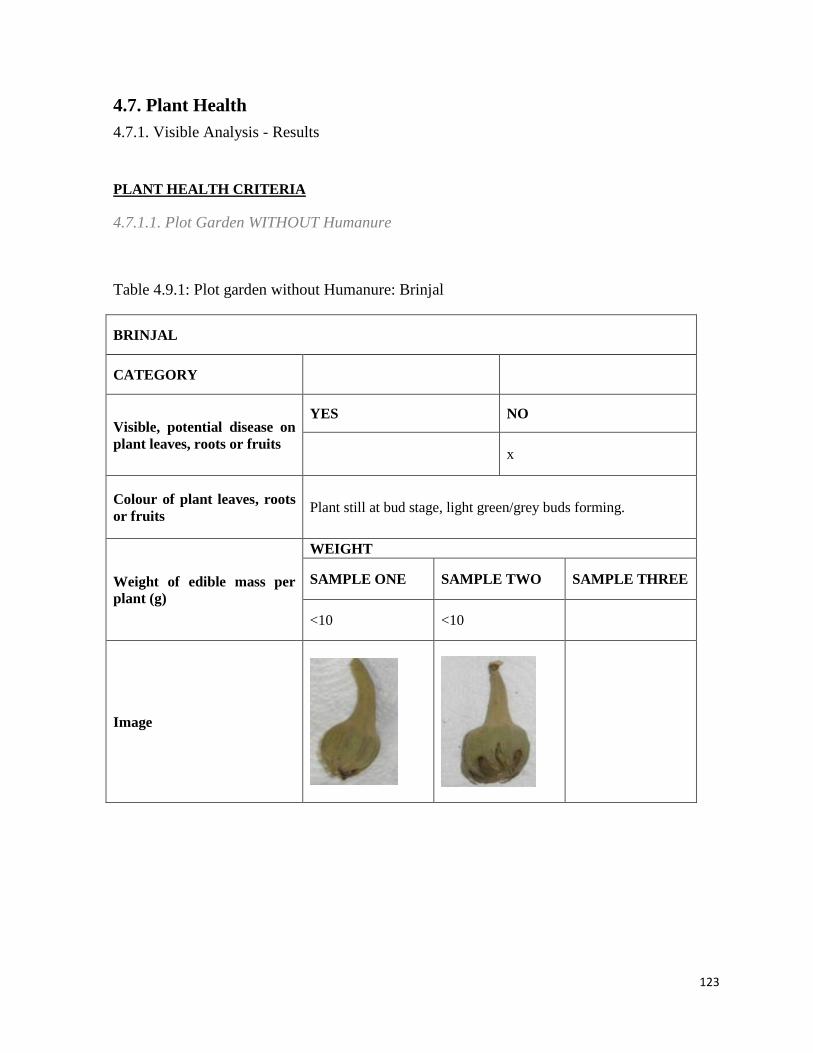
123
4.7. Plant Health
4.7.1. Visible Analysis - Results
PLANT HEALTH CRITERIA
4.7.1.1. Plot Garden WITHOUT Humanure
Table 4.9.1: Plot garden without Humanure: Brinjal
BRINJAL
CATEGORY
Visible, potential disease on
plant leaves, roots or fruits
YES NO
x
Colour of plant leaves, roots
or fruits Plant still at bud stage, light green/grey buds forming.
Weight of edible mass per
plant (g)
WEIGHT
SAMPLE ONE SAMPLE TWO SAMPLE THREE
<10 <10
Image
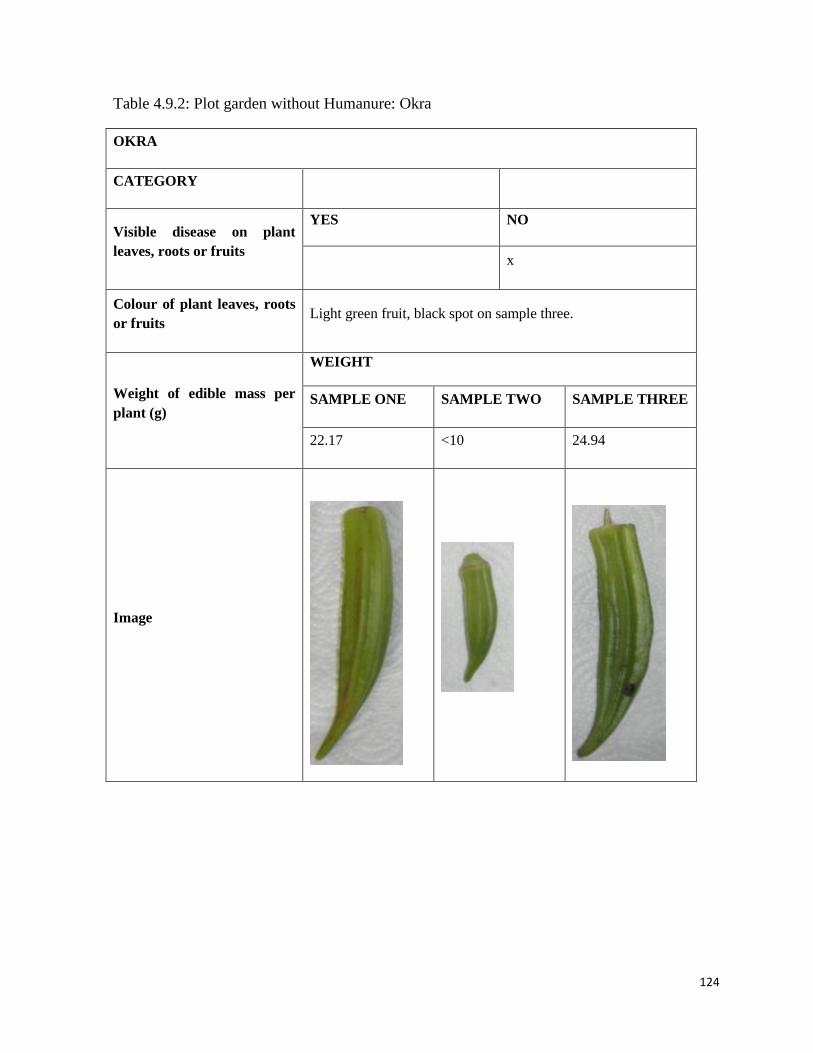
124
Table 4.9.2: Plot garden without Humanure: Okra
OKRA
CATEGORY
Visible disease on plant
leaves, roots or fruits
YES NO
x
Colour of plant leaves, roots
or fruits Light green fruit, black spot on sample three.
Weight of edible mass per
plant (g)
WEIGHT
SAMPLE ONE SAMPLE TWO SAMPLE THREE
22.17 <10 24.94
Image
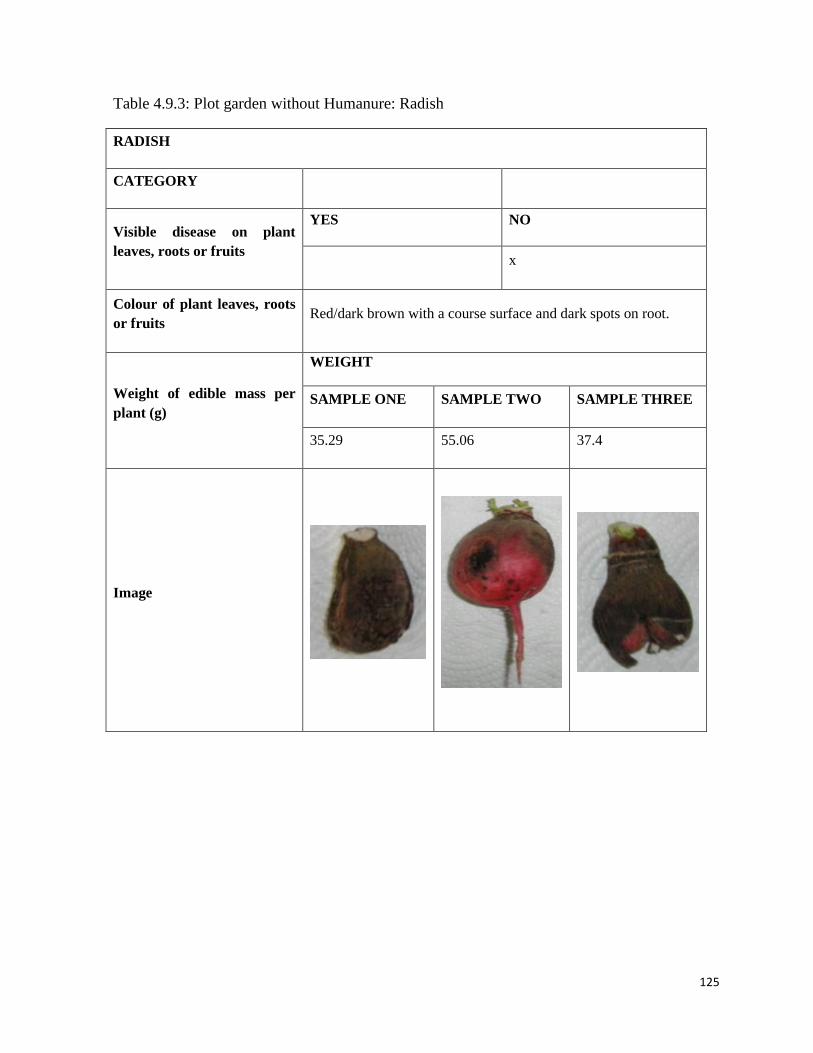
125
Table 4.9.3: Plot garden without Humanure: Radish
RADISH
CATEGORY
Visible disease on plant
leaves, roots or fruits
YES NO
x
Colour of plant leaves, roots
or fruits Red/dark brown with a course surface and dark spots on root.
Weight of edible mass per
plant (g)
WEIGHT
SAMPLE ONE SAMPLE TWO SAMPLE THREE
35.29 55.06 37.4
Image
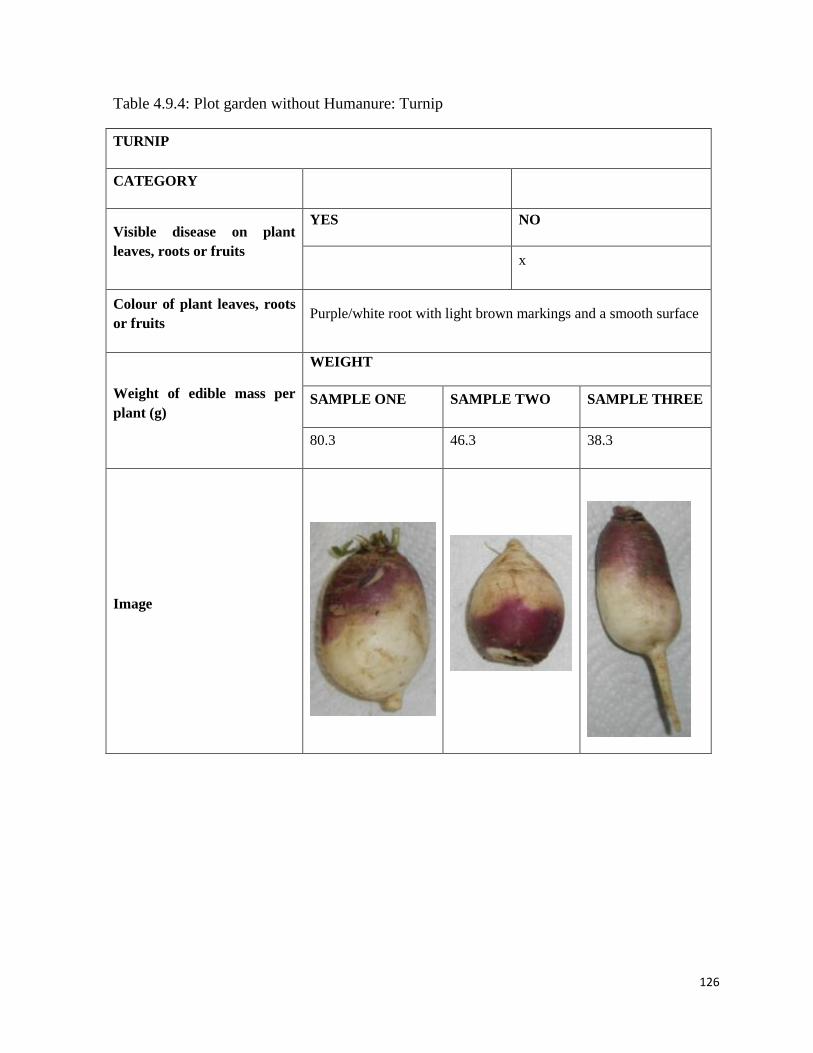
126
Table 4.9.4: Plot garden without Humanure: Turnip
TURNIP
CATEGORY
Visible disease on plant
leaves, roots or fruits
YES NO
x
Colour of plant leaves, roots
or fruits Purple/white root with light brown markings and a smooth surface
Weight of edible mass per
plant (g)
WEIGHT
SAMPLE ONE SAMPLE TWO SAMPLE THREE
80.3 46.3 38.3
Image
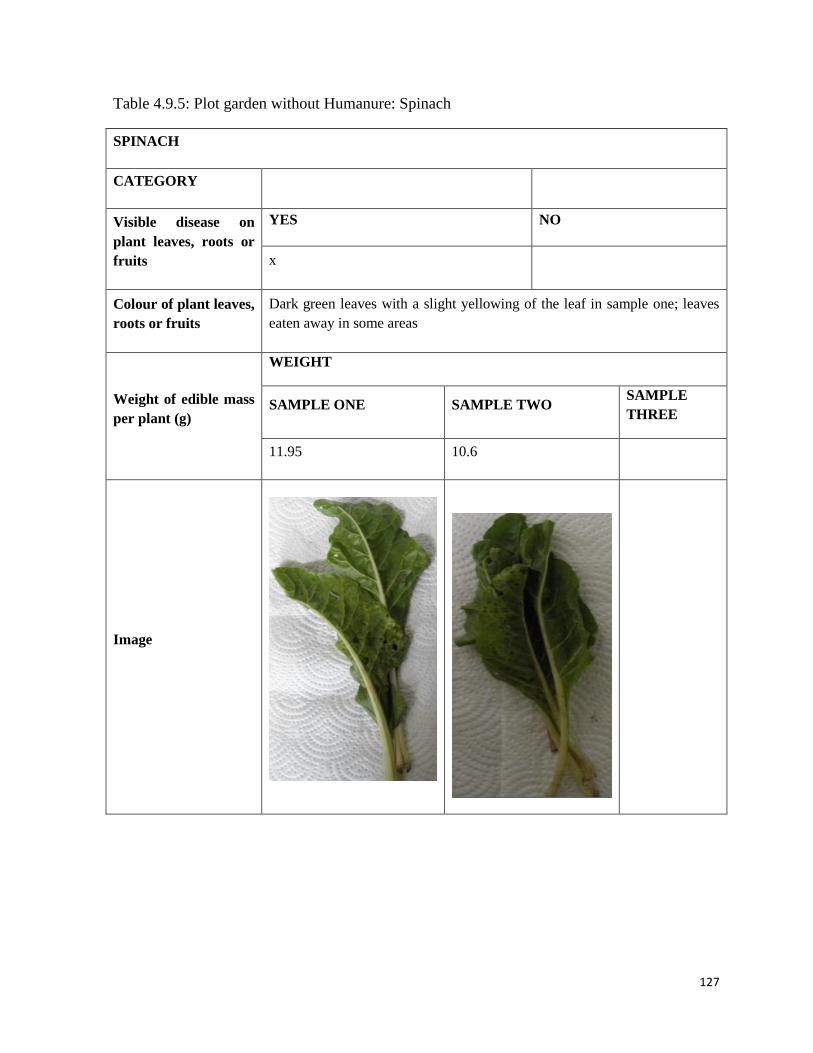
127
Table 4.9.5: Plot garden without Humanure: Spinach
SPINACH
CATEGORY
Visible disease on
plant leaves, roots or
fruits
YES NO
x
Colour of plant leaves,
roots or fruits
Dark green leaves with a slight yellowing of the leaf in sample one; leaves
eaten away in some areas
Weight of edible mass
per plant (g)
WEIGHT
SAMPLE ONE SAMPLE TWO SAMPLE
THREE
11.95 10.6
Image
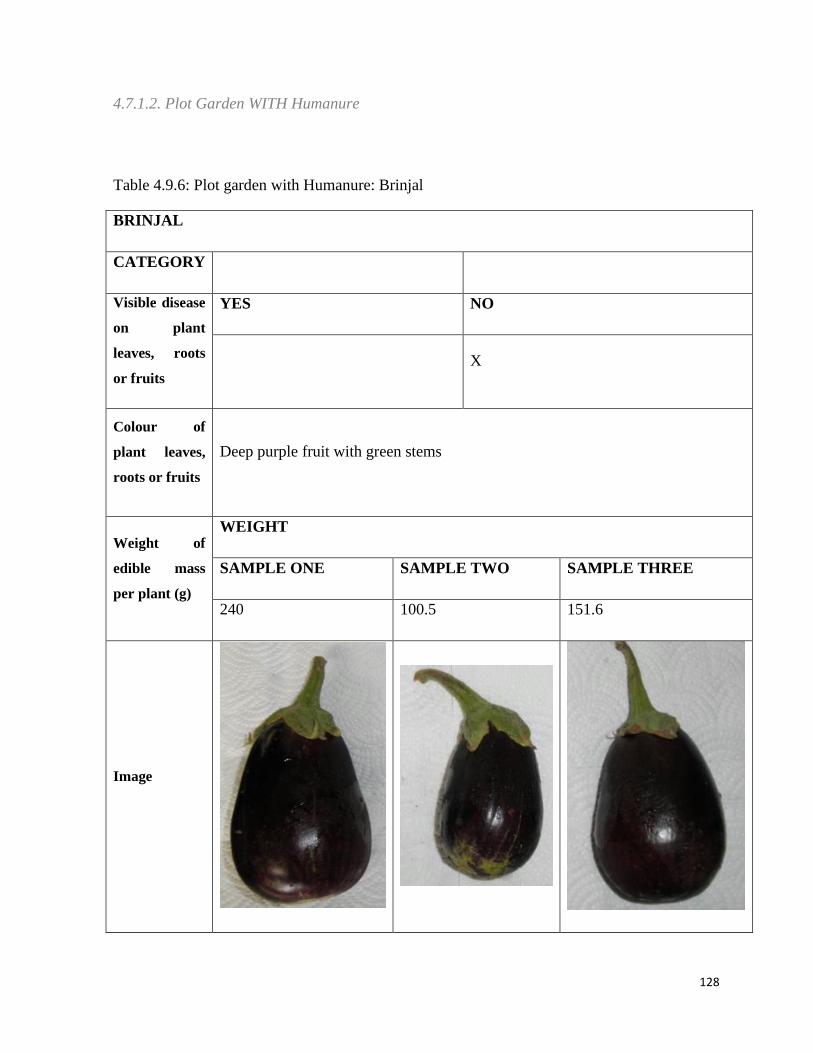
128
4.7.1.2. Plot Garden WITH Humanure
Table 4.9.6: Plot garden with Humanure: Brinjal
BRINJAL
CATEGORY
Visible disease
on plant
leaves, roots
or fruits
YES NO
X
Colour of
plant leaves,
roots or fruits
Deep purple fruit with green stems
Weight of
edible mass
per plant (g)
WEIGHT
SAMPLE ONE SAMPLE TWO SAMPLE THREE
240 100.5 151.6
Image
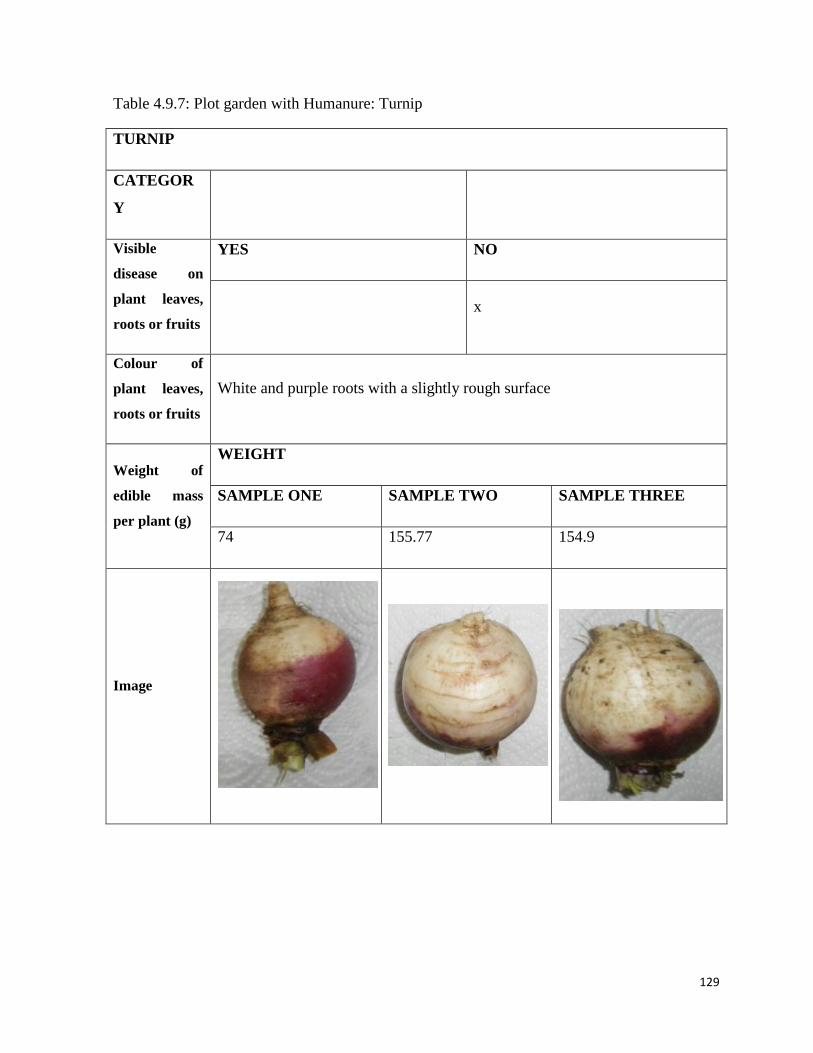
129
Table 4.9.7: Plot garden with Humanure: Turnip
TURNIP
CATEGOR
Y
Visible
disease on
plant leaves,
roots or fruits
YES NO
x
Colour of
plant leaves,
roots or fruits
White and purple roots with a slightly rough surface
Weight of
edible mass
per plant (g)
WEIGHT
SAMPLE ONE SAMPLE TWO SAMPLE THREE
74 155.77 154.9
Image
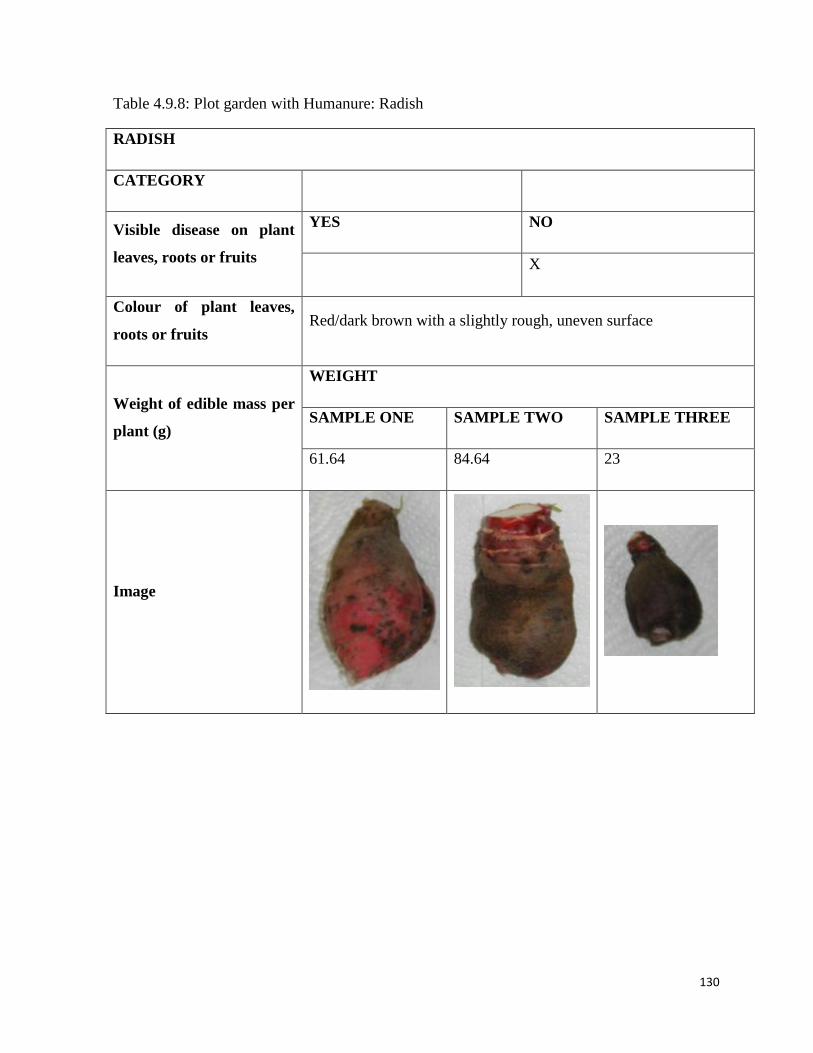
130
Table 4.9.8: Plot garden with Humanure: Radish
RADISH
CATEGORY
Visible disease on plant
leaves, roots or fruits
YES NO
X
Colour of plant leaves,
roots or fruits Red/dark brown with a slightly rough, uneven surface
Weight of edible mass per
plant (g)
WEIGHT
SAMPLE ONE SAMPLE TWO SAMPLE THREE
61.64 84.64 23
Image
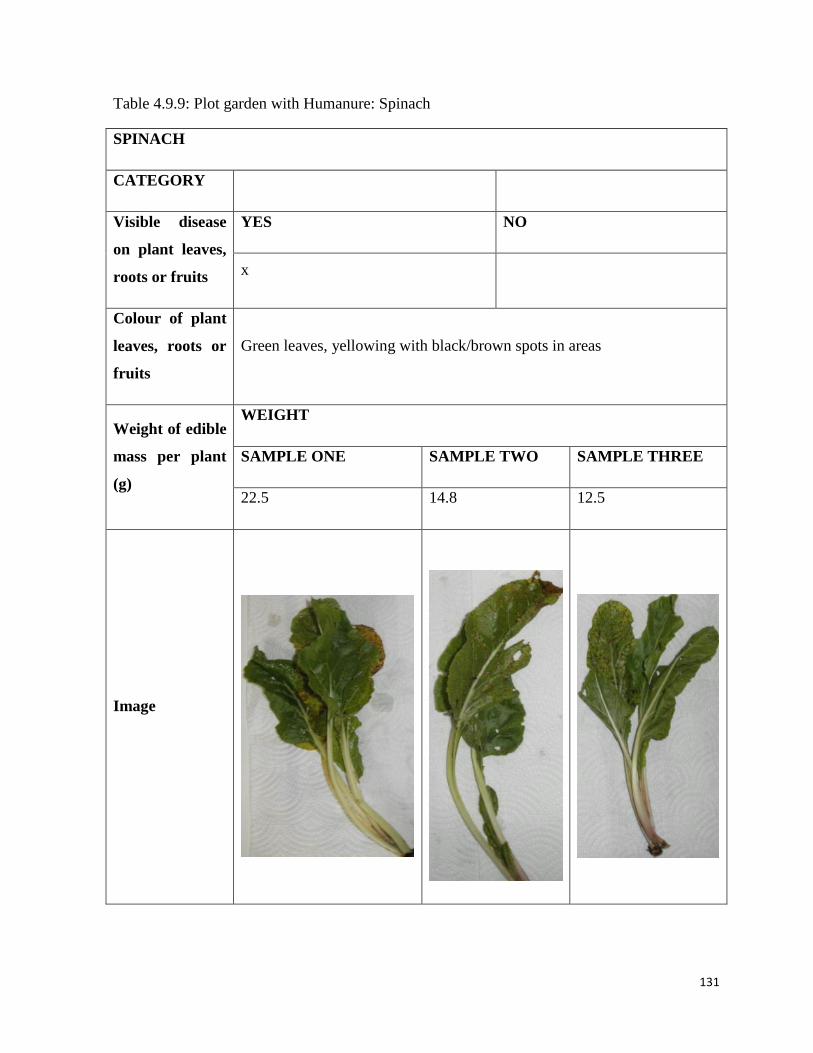
131
Table 4.9.9: Plot garden with Humanure: Spinach
SPINACH
CATEGORY
Visible disease
on plant leaves,
roots or fruits
YES NO
x
Colour of plant
leaves, roots or
fruits
Green leaves, yellowing with black/brown spots in areas
Weight of edible
mass per plant
(g)
WEIGHT
SAMPLE ONE SAMPLE TWO SAMPLE THREE
22.5 14.8 12.5
Image
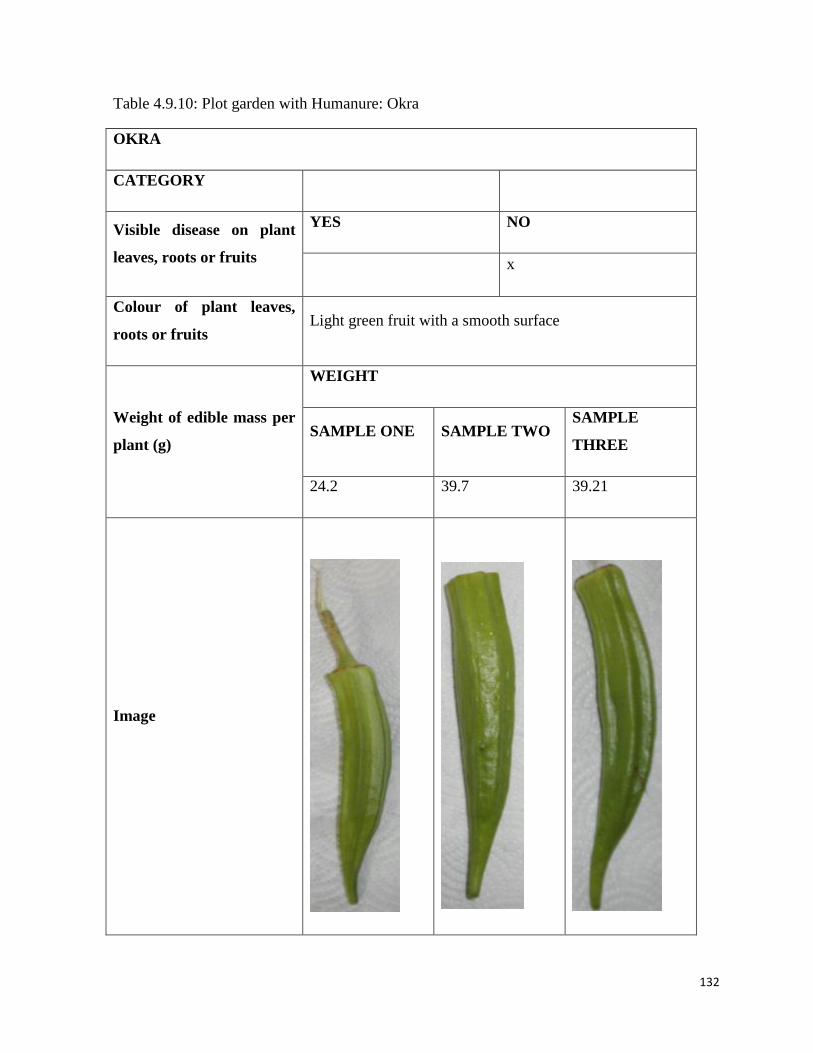
132
Table 4.9.10: Plot garden with Humanure: Okra
OKRA
CATEGORY
Visible disease on plant
leaves, roots or fruits
YES NO
x
Colour of plant leaves,
roots or fruits Light green fruit with a smooth surface
Weight of edible mass per
plant (g)
WEIGHT
SAMPLE ONE SAMPLE TWO SAMPLE
THREE
24.2 39.7 39.21
Image
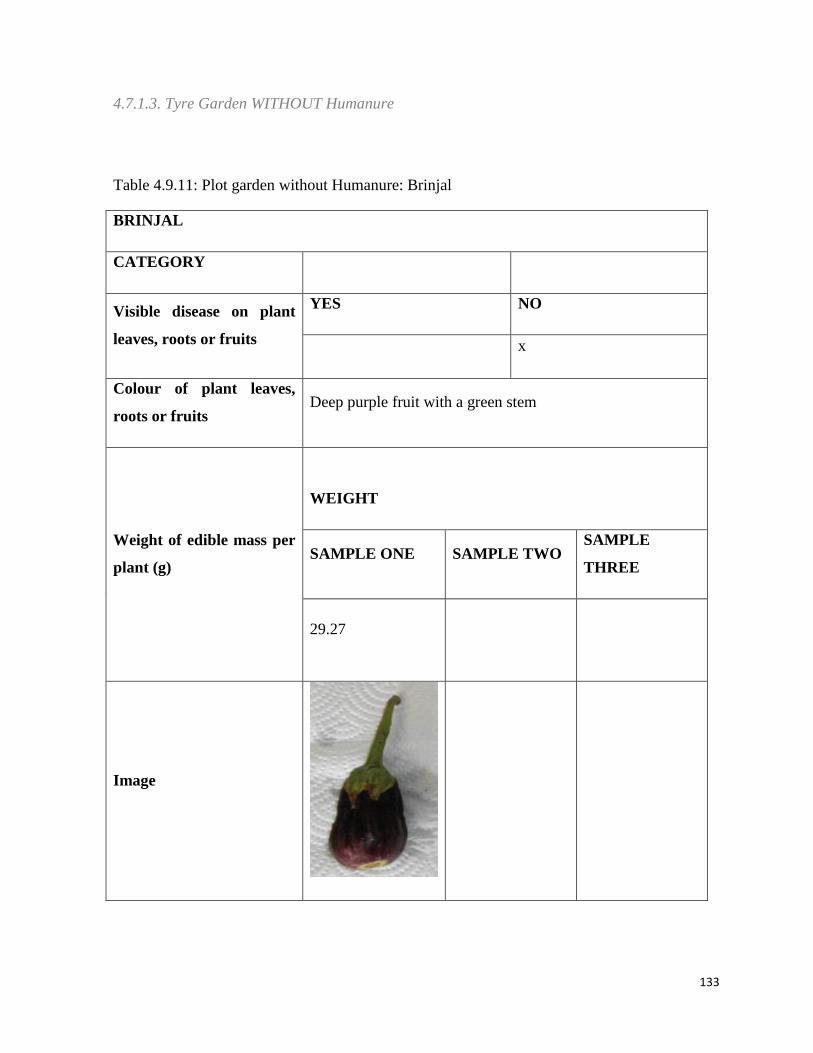
133
4.7.1.3. Tyre Garden WITHOUT Humanure
Table 4.9.11: Plot garden without Humanure: Brinjal
BRINJAL
CATEGORY
Visible disease on plant
leaves, roots or fruits
YES NO
x
Colour of plant leaves,
roots or fruits Deep purple fruit with a green stem
Weight of edible mass per
plant (g)
WEIGHT
SAMPLE ONE SAMPLE TWO SAMPLE
THREE
29.27
Image
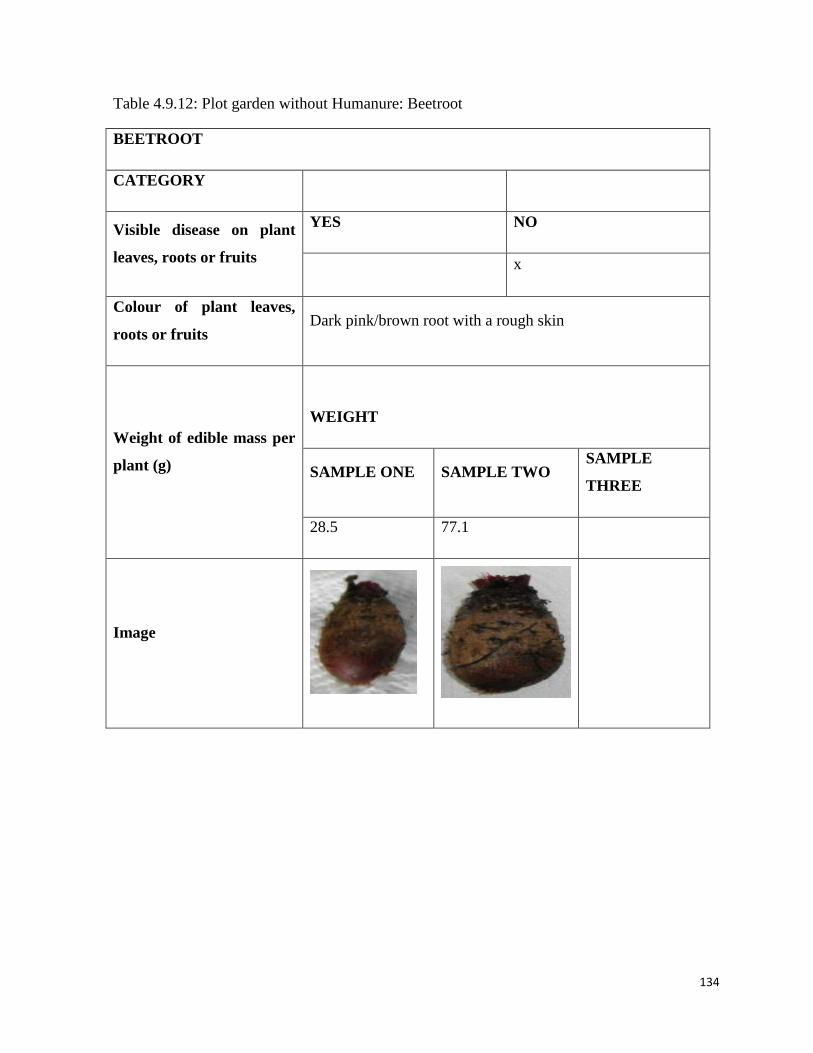
134
Table 4.9.12: Plot garden without Humanure: Beetroot
BEETROOT
CATEGORY
Visible disease on plant
leaves, roots or fruits
YES NO
x
Colour of plant leaves,
roots or fruits Dark pink/brown root with a rough skin
Weight of edible mass per
plant (g)
WEIGHT
SAMPLE ONE SAMPLE TWO SAMPLE
THREE
28.5 77.1
Image
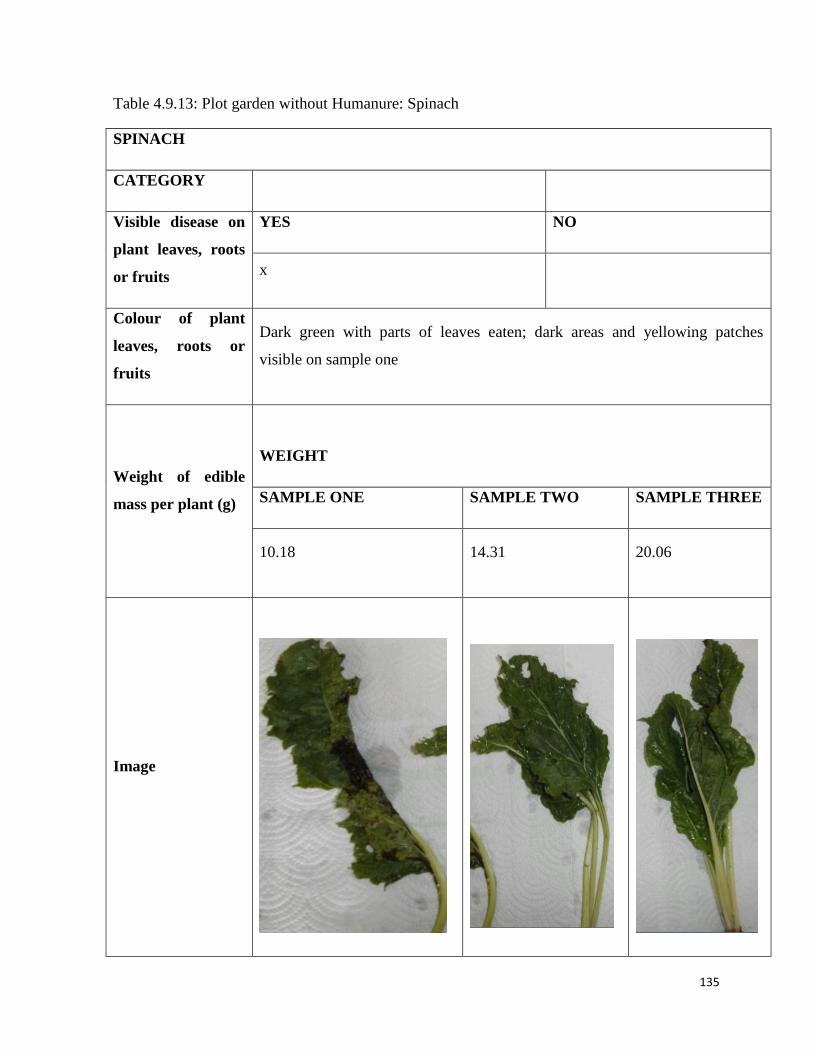
135
Table 4.9.13: Plot garden without Humanure: Spinach
SPINACH
CATEGORY
Visible disease on
plant leaves, roots
or fruits
YES NO
x
Colour of plant
leaves, roots or
fruits
Dark green with parts of leaves eaten; dark areas and yellowing patches
visible on sample one
Weight of edible
mass per plant (g)
WEIGHT
SAMPLE ONE SAMPLE TWO SAMPLE THREE
10.18 14.31 20.06
Image
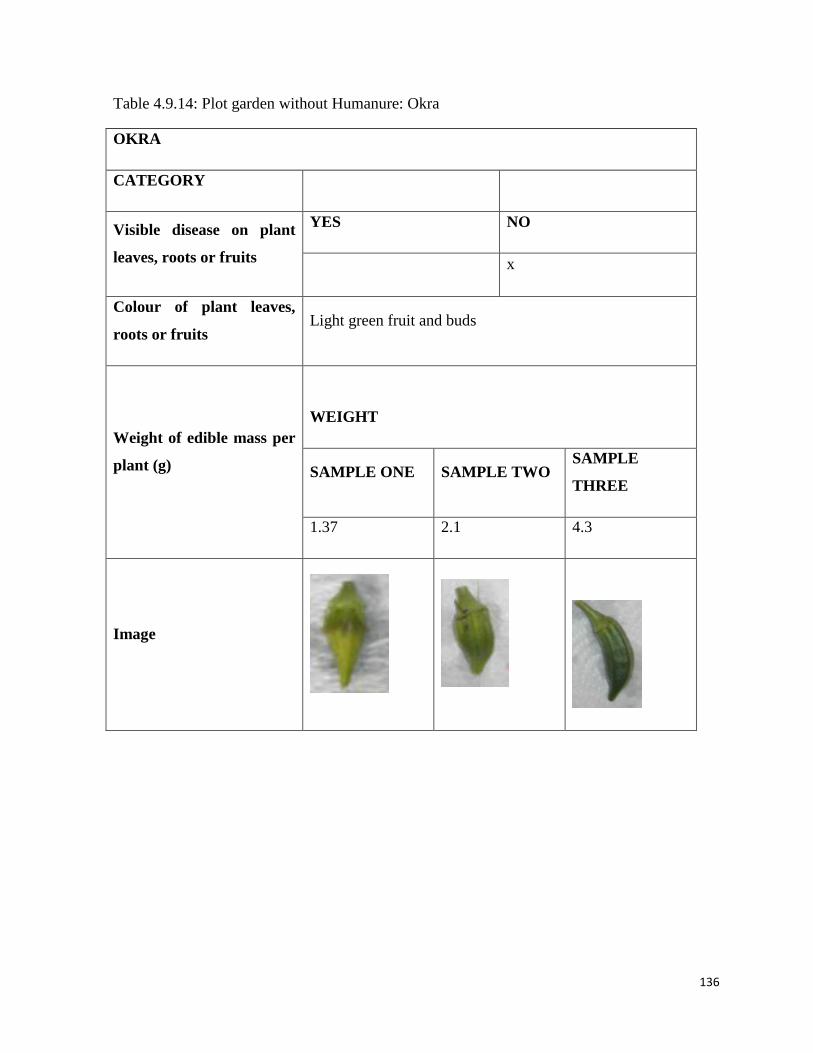
136
Table 4.9.14: Plot garden without Humanure: Okra
OKRA
CATEGORY
Visible disease on plant
leaves, roots or fruits
YES NO
x
Colour of plant leaves,
roots or fruits Light green fruit and buds
Weight of edible mass per
plant (g)
WEIGHT
SAMPLE ONE SAMPLE TWO SAMPLE
THREE
1.37 2.1 4.3
Image
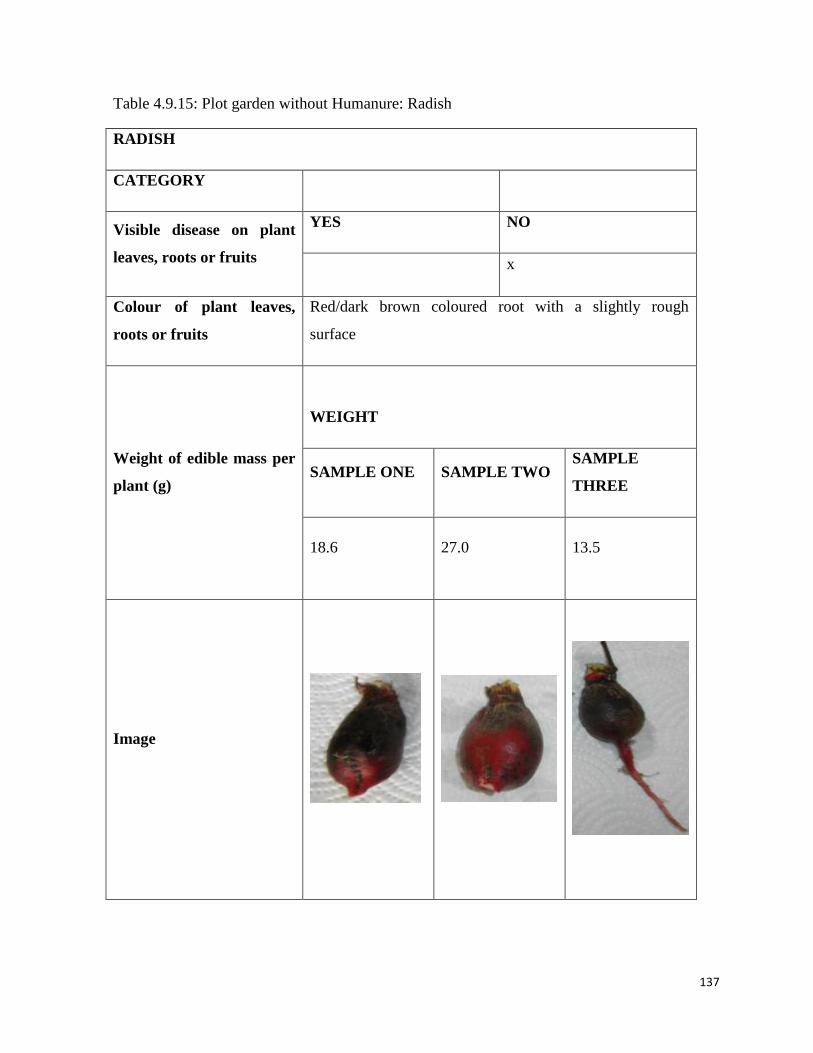
137
Table 4.9.15: Plot garden without Humanure: Radish
RADISH
CATEGORY
Visible disease on plant
leaves, roots or fruits
YES NO
x
Colour of plant leaves,
roots or fruits
Red/dark brown coloured root with a slightly rough
surface
Weight of edible mass per
plant (g)
WEIGHT
SAMPLE ONE SAMPLE TWO SAMPLE
THREE
18.6 27.0 13.5
Image
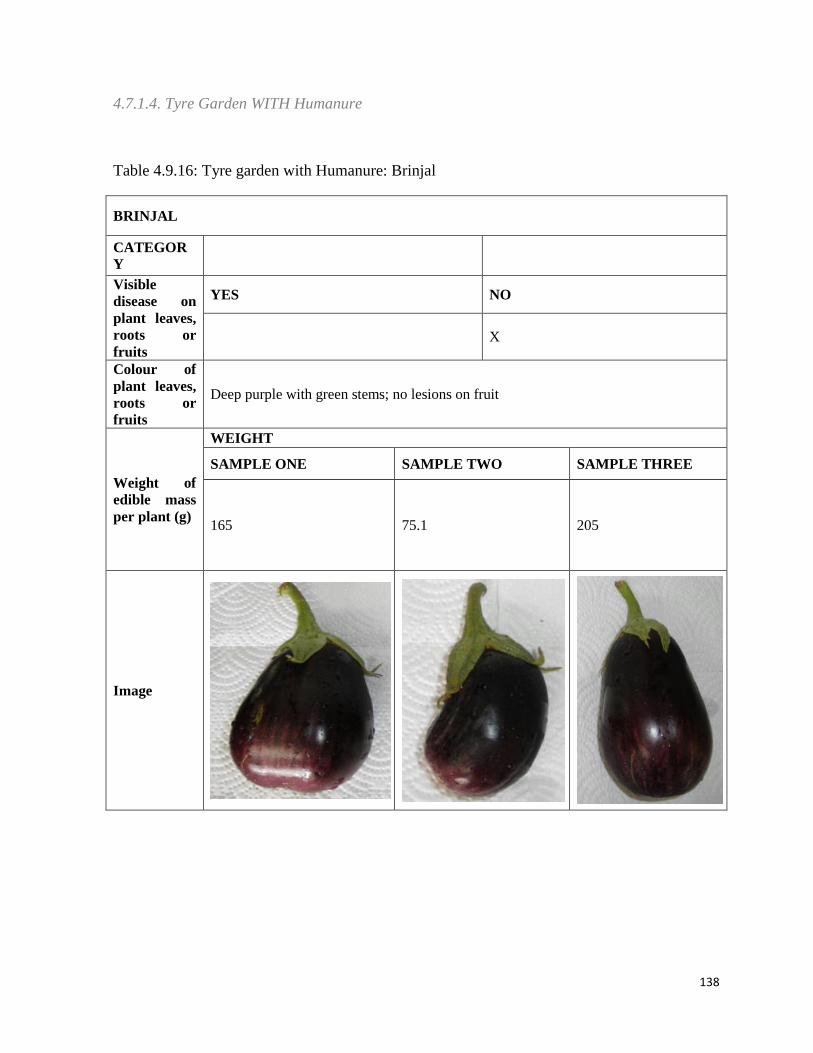
138
4.7.1.4. Tyre Garden WITH Humanure
Table 4.9.16: Tyre garden with Humanure: Brinjal
BRINJAL
CATEGOR
Y
Visible
disease on
plant leaves,
roots or
fruits
YES NO
X
Colour of
plant leaves,
roots or
fruits
Deep purple with green stems; no lesions on fruit
Weight of
edible mass
per plant (g)
WEIGHT
SAMPLE ONE SAMPLE TWO SAMPLE THREE
165 75.1 205
Image
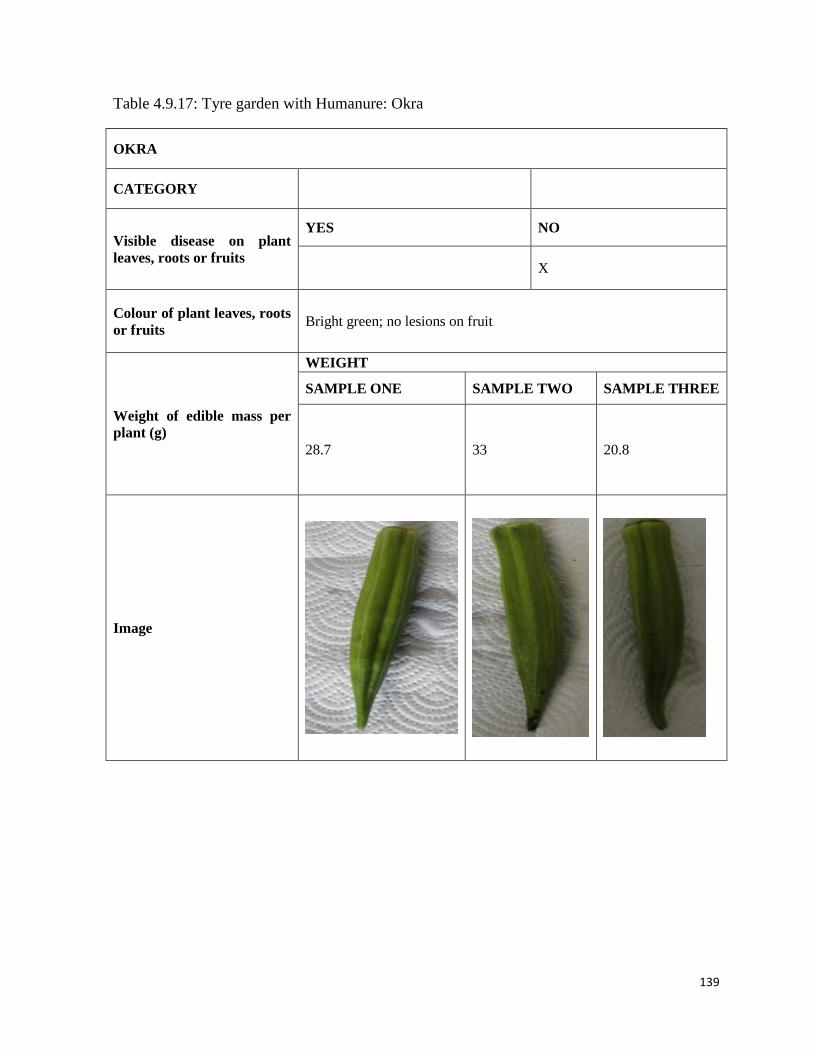
139
Table 4.9.17: Tyre garden with Humanure: Okra
OKRA
CATEGORY
Visible disease on plant
leaves, roots or fruits
YES NO
X
Colour of plant leaves, roots
or fruits Bright green; no lesions on fruit
Weight of edible mass per
plant (g)
WEIGHT
SAMPLE ONE SAMPLE TWO SAMPLE THREE
28.7 33 20.8
Image
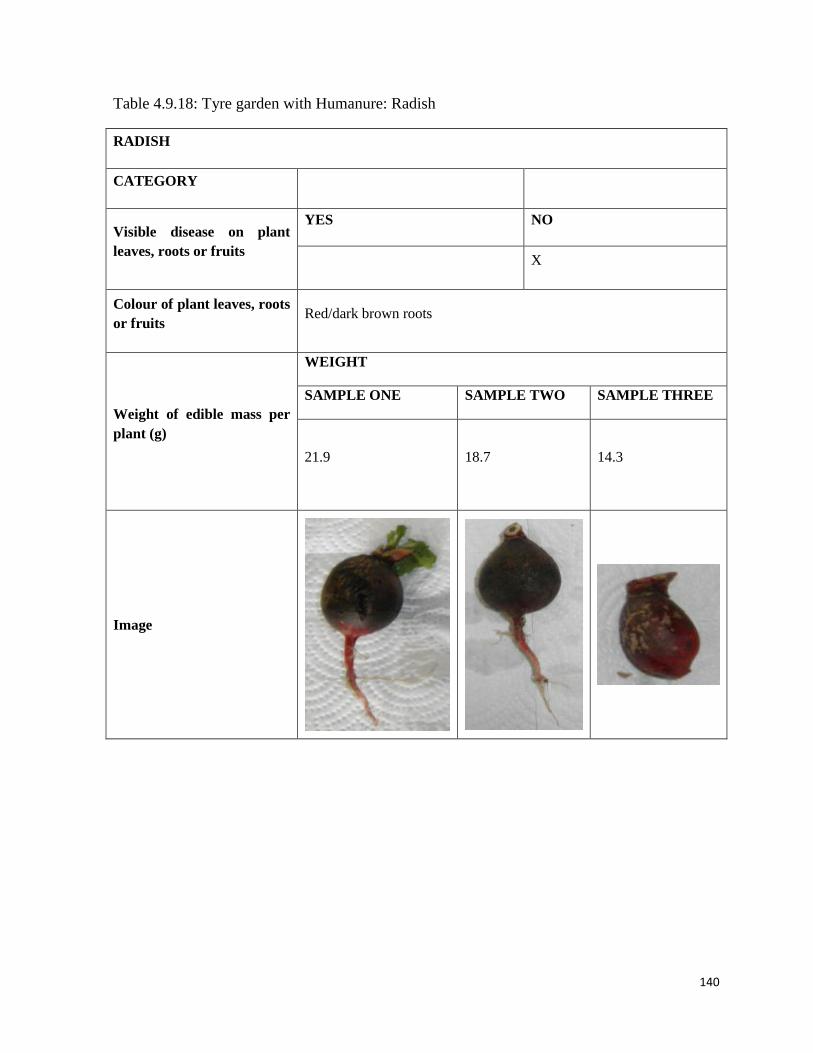
140
Table 4.9.18: Tyre garden with Humanure: Radish
RADISH
CATEGORY
Visible disease on plant
leaves, roots or fruits
YES NO
X
Colour of plant leaves, roots
or fruits Red/dark brown roots
Weight of edible mass per
plant (g)
WEIGHT
SAMPLE ONE SAMPLE TWO SAMPLE THREE
21.9 18.7 14.3
Image
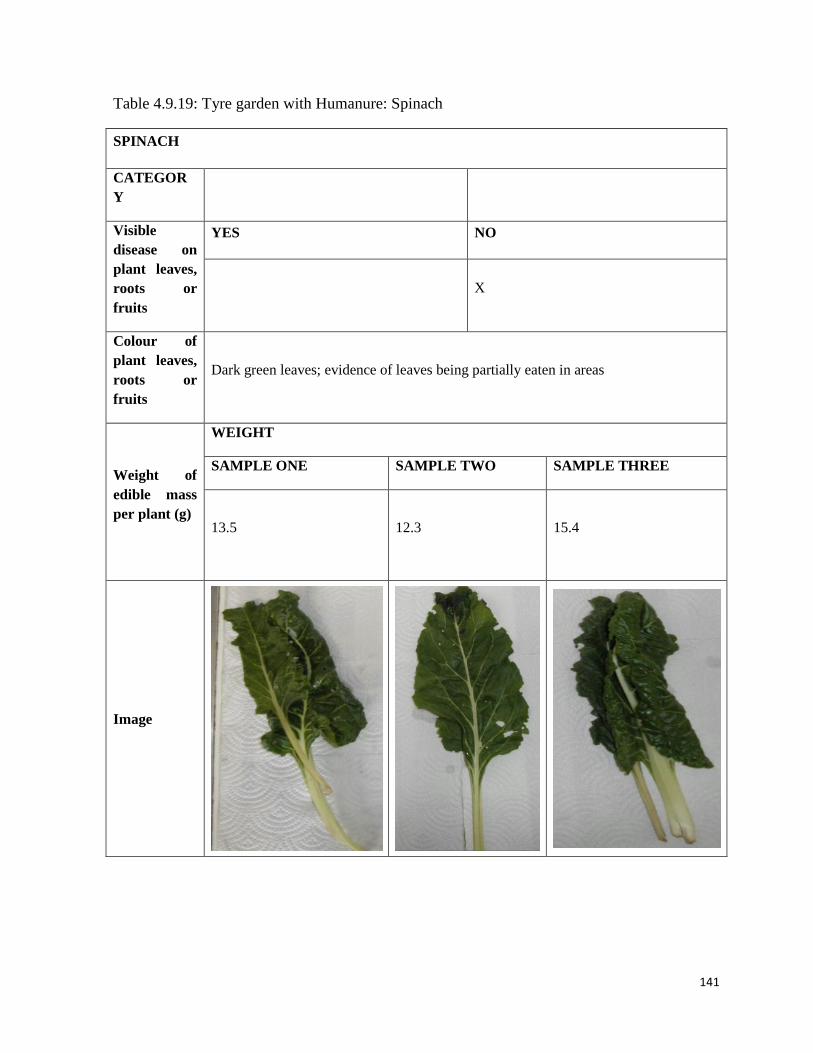
141
Table 4.9.19: Tyre garden with Humanure: Spinach
SPINACH
CATEGOR
Y
Visible
disease on
plant leaves,
roots or
fruits
YES NO
X
Colour of
plant leaves,
roots or
fruits
Dark green leaves; evidence of leaves being partially eaten in areas
Weight of
edible mass
per plant (g)
WEIGHT
SAMPLE ONE SAMPLE TWO SAMPLE THREE
13.5 12.3 15.4
Image
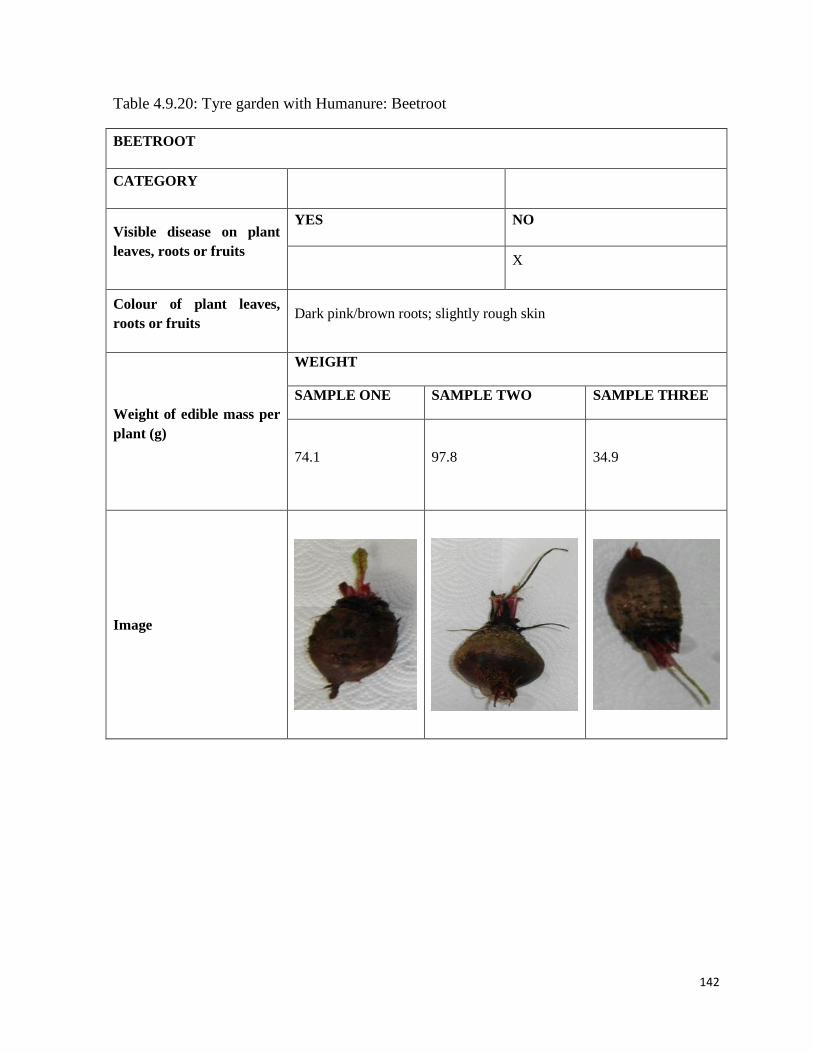
142
Table 4.9.20: Tyre garden with Humanure: Beetroot
BEETROOT
CATEGORY
Visible disease on plant
leaves, roots or fruits
YES NO
X
Colour of plant leaves,
roots or fruits Dark pink/brown roots; slightly rough skin
Weight of edible mass per
plant (g)
WEIGHT
SAMPLE ONE SAMPLE TWO SAMPLE THREE
74.1 97.8 34.9
Image
143
4.7.2. Visual Analysis - Discussion
Tables 4.9.1 – 4.9.20 each detail and illustrate the appearance of various samples of vegetables
that were grown in the trial gardens, and tested for microbiological food safety. Based on the
visuals, there is a marked difference between the crops grown with and without humanure.
The crops grown without humanure appear to be smaller and more prone to disease and pests,
as evidenced by the spinach leaves grown without humanure. Crops grown with humanure
appear to have grown larger in size within the same amount of time. Furthermore, some of the
crops grown without humanure did not produce the quality of vegetables compared to the
crops grown with humanure. This is evidenced by the above visuals (Tables 4.9.1 – 4.9.20),
with some of the leaf crops grown without humanure appearing diseased and sickly, whilst
those grown with humanure appearing healthy and disease free.
Another point in favour of the use of humanure is that, although this research has not
investigated ‘yield’ of each crop, it is shown that the trial crops grown with humanure appear
to have produced a greater amount of fruits, roots and leaves as compared to those grown
without humanure. Brinjal and okra grown in the plot trial garden without the addition of
humanure did not reach a weight greater than 10 grams in the time frame, which is the amount
of sample that was required for microbiological food safety tests. Comparatively, brinjal
grown in the plot trial garden with humanure reached weights of greater than 100 grams each.
The same may be said for okra grown in these trial plot gardens. Additionally, as mentioned
above, the quality of the produce from the trial crops with humanure appear to be of a higher
quality.
With regard to the presence of visible disease on the plants, all samples, with the exception of
the spinach leaves seemed unaffected by any pest or disease. Three of the four spinach
samples were visibly affected, excluding the spinach grown in the trial tyre garden with
humanure. This may be indicative of a higher resistance to pests and diseases, without the
144
application of pesticides, of plants grown with humanure, as opposed to those grown without
humanure.
Visible analysis was carried out to determine the presence of diseases. Assistance in this
regard was obtained from a professional horticulturist. Considering the community where the
study was undertaken, it was important to inform them of this potential. Overall, there is a
definite and noticeable difference in the plants grown with and without humanure. This
difference favours humanure, with a greater amount and quality of produce being harvested.
4.8. Conclusion
This chapter has presented an analysis and discussion of the results of this study. Part one
illustrated and discussed the social acceptability aspect of this study; whilst part two of this
chapter dealt with results of humanure testing and food safety of the crops grown in the trial
gardens. The food safety aspect of this research was further dealt with in two parts, namely,
microbiological test results and a visual analysis. The following and final chapter of this
research will outline overall conclusions drawn from this research, as well as
recommendations and limitations of this study.
145
Chapter Five
Summary of Key Findings, Recommendations and Conclusion
5.1. Introduction
This study has explored the possibility of using human excrement to make humanure, to be
used for household agriculture; eliminating the problem of safe disposal of the excrement.
Research for this study was undertaken within the community of Cottonlands, whose
perception on the use of humanure was determined. Humanure was produced with excrement
sourced from UDT vaults, from households located within the community. The resultant
humanure was used in garden trials to grow vegetable crops, including a root, leaf and fruiting
crop. Samples from these plants were tested for certain indicator pathogens and bacteria to
determine the food safety of crops grown with the addition of humanure. The key findings of
this research will be presented in this chapter, with reference to relevant literature being made.
Recommendations and an overall, final conclusion will follow.
5.2. Summary of Key Findings
The analysis and results of this research were organised in accordance of the research
objectives of this study. Key findings may be divided into three sections, namely, ‘social
acceptability’; ‘humanure’ and ‘food safety’.
5.2.1. Social Acceptability
I. On the use of UDT’s:
People are uncomfortable with using this type of toilet, preferring ventilated improved pits
(VIP’s) or pit latrines to UDT’s. This gives an indication of the level of dissatisfaction with
UDT’s, as VIP’s and pit latrines are unpleasant types of sanitation systems. The most
146
preferred and sought after type of toilet is the flush toilet, as people are most comfortable with
this type of system. Many UDT’s have been modified by people to create a flush toilet system,
defeating the aim of the installation of the UDT’s. UDT’s form part of the dry sanitation
movement (CSIR, 2000); where a waterless approach to sanitation management is adopted,
within the context of the unsustainability of using potable water for sanitation disposal. There
is a shortage of potable water; using this water is a wasteful and careless practice,
contaminating what little of the resource remains (Binns et al, 2001; Friedrich et al, 2008).
Furthermore, the issue of purifying this waste water arises.
There is a negative perception and stigma attached to the use of UDT’s. People who have been
given UDT’s view this as a ‘second class’ treatment. This is especially prominent in the study
area, as the landmark of the King Shaka International Airport is situated in close proximity to
the study area, as well as the fully established towns of Verulam and Tongaat. This distinct
difference in services offered to people within close proximity to one another is what gives
rise to the sentiment of ‘second class’ treatment. Furthermore, many of the people who were
allocated UDT’s are unsure of how to properly use a UDT, resulting in incorrect usage.
A system such as this will only function optimally if used in the precise manner, with the
correct materials being added to the vault. The addition of incorrect soak materials being
added to the vault will result in the composting process being negatively affected, as well as
result in material in the vault turning rancid, as opposed to desiccating. As Jenkins (2005:159)
states, “The cover material acts as an organic lid or biofilter … Therefore, the choice of
organic cover material is very important … .” He goes on to state that “cover materials prevent
odour, absorb excess moisture, and balance the C/N ratio” (Jenkins, 2005:170). This was
observed in many of the vaults in the study area.
147
II. On the use of Humanure:
There was almost a 50/50 split with regard to the willingness to use humanure in food gardens.
The reluctance of those who disagree with its use in food gardens stem from societal
perceptions on human excrement. There is an extremely negative connotation attached to
human excrement, often referred to as human ‘waste’. These perceptions may be altered with
education, from a faecophobic to a faecaphilic view (Kelly, 2010), thus creating a new
perception and attitude toward human excrement, and especially its potential value. This may
be achieved through the adoption of the zero-waste management policy; changing the view of
human excrement from a waste to a resource. As David Ferry noted, the benefits of adopting
of a zero-waste framework are mainly environmental (Ferry, 2011).
5.2.2. Humanure Preparation
Drawing from the levels of contamination of vegetables grown in humanure left to moulder
for different time periods, it may be noted that the period of mouldering has a definite and
noticeable impact the microbiological state of humanure. Vegetables grown in humanure left
to moulder for a period of 1 year had a distinctly lower level of bacterial contamination than
those vegetables grown in humanure left to moulder for a period of 3 months. This is in line
with the literature, which suggests that “a long curing period, such as a year after the
thermophilic stage, adds a safety net for pathogen destruction” (Jenkins, 2005:43); and
Golueke (1972) who notes that compost should be left for a period of time for mineralisation
of the compost to occur and maximum benefit to be gained from the compost.
It is imperative that the method and technique of making and producing humanure is
perfected, as incorrect methods could have negative impacts on the vegetable produce grown
using the resultant humanure.
148
UDT waste has a huge impact on the process of making humanure. Waste that has been
treated incorrectly and the addition of wrong cover materials have a negative impact on the
process, not allowing optimal temperatures to be reached. This problem may be linked to the
social acceptability study; which indicated that people are uncomfortable with or do not know
how to properly use a UDT. If humanure is to be made within a community, it should be at a
central point, after the method and technique have been perfected, and carried out by trained
personnel. There is not much room for error, as incorrect methods may have negative knock-
on effects on human health and lead to the outbreak of food-borne illness and disease, as
evidenced by the case study of the German E.coli outbreak, discussed in Chapter two.
5.2.3. Food Safety
Vegetables were grown in trial gardens to gauge the difference between plants grown with and
without humanure. The resultant produce was tested to certain bacteria and pathogens in order
to assess the safety of the vegetables as minimally processed food. It is of extreme importance
to test fresh vegetable produce for the presence indicator bacteria (WHO, n.d.). Many of the
vegetables, from both the applied and control trials, tested positive for certain bacteria, all of
which were more than the recommended microbiological limit for food safety, for minimally
processed foods. According Abadias et al (2008:122), “fresh produce can be a vehicle for the
transmission of bacterial, parasitic and viral pathogens capable of causing human illness and a
number of reports refer to raw vegetables harbouring potential foodborne pathogens.”
The implication of this is that humanure should not be used to grow minimally processed
foods for human consumption, as food borne illnesses are a great risk. Food borne illnesses
can potentially be devastating, and lead to death, as illustrated by the case study on E.coli
contamination of fresh vegetable produce in Germany (Sample, 2011; Curta, 2011; Bronst,
2011, Sapa-AP, 2011), discussed in Chapter two of this study. Further research may be
conducted to investigate the levels of indicator bacteria and pathogens in cooked or processed
food.
149
Growing vegetables with humanure resulted in a definite and visible improvement in yield,
plant health and appearance. Some of the plants grown without humanure wilted before
bearing any fruit or growing any roots or leaves; whilst the same plants grown with humanure
thrived in comparison. Humanure, if not made or prepared in accordance with recommended
techniques can be dangerous for food production. It definitely has the ability to improve food
security; however, much improvement in methods and techniques is needed. Alternatively,
whilst these are being modified, humanure may be used to grow ornamentals, manure crops
and cover crop, as there is definite proof that humanure improves plant growth.
5.3. Recommendations
This study has illustrated the potential of humanure to improve food security at a household
level, dispose of human excrement in a non-hazardous manner, as well as conserve water.
Further research needs to be done to perfect the method and technique of making humanure, in
order to ensure that it is safe to grow food crops on it, and so that it will not lead to food-borne
disease outbreaks. However, until such time, humanure may be used to grow ornamental
plants and trees, for which there is a large demand; as well as manure or cover crops. Cover
crops reduced the rate of soil erosion, and as a result, land degradation, adding another
positive to the use of humanure.
The negative attitude towards any type of sanitation system other than flush toilets needs to be
addressed. Flush toilets are viewed as a preferential amenity, thus reflecting treatment as either
a ‘first’ or ‘second’ class citizen. This is problematic, especially when viewed within the
context of South Africa’s past. People have been made to feel inferior based on their race
group. It seems that people continue to feel this way, only now due to their socio-economic
standing. This issue needs to be addressed as it is not a case of one system being reserved for a
certain group of people. Topography, infrastructure, water availability and cost are deciding
factors.
150
Gauging from the social acceptability study, UDT’s do not seem to be the preferred sanitation
system. This may be attributed to the lack of understanding on how to properly use these
toilets, associated negative perceptions and general dislike of the system. Incorrect use of the
UDT will result in unpleasant odours emanating from the vault. Ensuring that people are
taught how to properly use and manage a UDT system should alleviate many of the problems
that are associated with the system.
The taboo that society has attached to human excrement is a definite limiting factor to the
UDT system, as well as the use of humanure. People do not want to deal with their excrement,
it is viewed as dirty and of no value; a highly sensitive issue that should not be handled.
Unfortunately, this approach is not realistic. As Jenkins (2005) states:
“It is ironic that humans have ignored one waste issue that all of us contribute to each
and every day — an environmental problem that has stalked our species from our
genesis, and which will accompany us to our extinction. Perhaps one reason we have
taken such a head-in-the-sand approach to the recycling of human excrement is
because we can’t even talk about it.”
Efforts should be made to change the status of human excrement from ‘taboo’ to acceptable,
especially since it is an issue that every single person contributes to on this earth.
The period of time that humanure is allowed to moulder for is an important factor which
influences the quality and safety of the end product. This was evident in the two batches of
humanure that were produced, and the resultant levels of bacteria and pathogen present in
vegetable samples grown in each batch. It is strongly recommended that humanure be allowed
to moulder for a minimum period of 1 year. The longer, the better.
This study tested the safety of minimally processed foods only. Further research should be
conducted on the effect of processing the vegetable samples, through cooking, in order to
151
determine food safety as not all vegetables grown with humanure are consumed as minimally
processed or raw food.
The perceptions and attitudes of people may only be altered once they have been properly
made aware of the benefits of alternate sanitation systems. If people are schooled on the
proper method of operating and maintaining a UDT system, many problems and negative
views associated with the system may be alleviated. Furthermore, the process of making
humanure could drastically improve, as human excrement will be treated in the correct
manner, with appropriate materials only being added to the vault.
5.4. Conclusion
This dissertation has assessed the sustainability and viability of the use of humanure for
household agriculture. The focus of the study was to determine community perception about
the use of humanure; the process of making humanure; food safety status of crops grown with
humanure and an overall assessment of whether growing crops with humanure resulted in a
marked difference in plant health and growth.
Through investigation of the above objectives, it was determined that the community
perception of the use of humanure was not collectively negative, with a significant percentage
of the community displaying either acceptance or willingness to accept humanure as compost
for their home gardens. This was a definite positive in favour of this research, as negative
perceptions may be altered through education.
The process of making humanure was explored, with two separate batches of humanure being
made, using the aerobic, thermophilic method. This method of composting allowed heat cycles
to occur within the compost pile, with temperatures reaching thermophilic levels, which are
152
ideal conditions for the activation of essential microbes and the elimination of most harmful
bacteria and pathogens. Furthermore, with the use of aerobic composting as opposed to
anaerobic composting systems, the emission of green-house gases such as methane was
eliminated. Each batch of humanure was left to moulder and mineralise for different time
periods, to investigate the value and necessity of a mouldering period. Results indicate that the
longer humanure is left to moulder, the safer the humanure is for use in food gardens. A
minimum mouldering time period of more than 12 months must be observed for a superior end
product. Results indicate a higher level of produce contamination in produce grown with the
addition of humanure with a reduced mouldering period. This is indicative of a need for a
significant mouldering period.
The determined safety levels of food crops grown with the addition of humanure were the crux
of this research. Food crops need to be grown in clean and safe conditions, to ensure that
human health is not compromised in any way. Food borne illnesses and diseases are easily
contracted through the ingestion of contaminated food, and can prove to be fatal, as has been
the case previously. It is a matter that cannot be taken lightly, with a zero risk attitude being
adopted. It is for this reason, despite there being evidence of the beneficial use of humanure,
that the recommendation of this study is that humanure should not be used for food crops until
its safety is confirmed beyond doubt.
Although there is great potential for humanure to increase food security in peri-urban and rural
areas whilst targeting the problem of sanitation and waste disposal, the system needs to be
researched and refined. The garden trial that was conducted as part of this research
demonstrated two ways of having and maintaining food gardens in a limited space. This
targeted one of the main issues regarding food security, as people and households do not have
ample place to develop gardens. Through the use of tyres, space is maximised and gardens
may be grown.

153
This research has the potential to target many of the key issues society faces, but further and
more intensive investigation needs to be conducted to refine processes and help educate
people on alternative practices that will aid in improving their quality of life and lead to socio-
economic improvement.
154
References
Abadias, M. et al., 2008. Microbiological quality of fresh, minimally-processed fruit and
vegetables, and sprouts from retail establishments. International Journal of Food
Microbiology, 123, pp 121-129.
Allison, E.H. and Ellis, F., 2001. The livelihoods approach and management of small-scale
fisheries. Marine Policy, 25, pp 377-388.
Angelotti, R., Hall, H.E., Foter, M.J., and Lewis. K.H., 1962. Quantitation of Clostridium
Perfringens in Foods. Applied Microbiology, 10, pp 193-199.
Anonymous., 2011. Learners grow green fingers. The City of Johannesburg, [online] 27 May.
Available at:
http://www.joburg.org.za/index.php?option=com_content&view=article&id=6657:learners-
grow-green-fingers&catid=118:education&Itemid=199#ixzz2Ja3WMkUS
[Accessed 30 May 2012]
Babbie, E., 2011. The Practice of Social Research. 13th
ed. USA: Wadsworth Publishing
Company.
Baipethi, M.N. and Jacobs, P.T., 2009. The contribution of subsistence farming to food
security in South Africa. Agrekon, 48 (4), pp 459-482.
Baipethi, M.N. et al., 2010. Enhancing food and livelihood security in the context of the food
and financial crisis: challenges and opportunities for small scale rainwater harvesting and
conservation. In: African Association of Agricultural Economists (AAAE), Joint 3rd African
Association of Agricultural Economists (AAAE) and 48th Agricultural Economists Association
of South Africa (AEASA) Conference, Cape Town, South Africa, September 19-23, 2010.
155
Bell, S., Galvin, M and Penner, B., 2010.Essential Diversions: Toilets in Durban, South
Africa.UCL Institute for Global Health.
Binns, J.A., Illgner, P.M and Nel,E.L., 2001. Water Shortage, Deforestation and Development:
South Africa’s Working For Water Programme. Land Degradation and Development, 12, pp
341-355.
Bronst, S., 2011. Germany: E.coli outbreak ‘stabalising’. ABS-CBNnews.com, [online] 03
June.
Available at: http://www.abs-cbnnews.com/global-filipino/world/06/03/11/german-e-coli-
outbreak-stabilizing-doctor
[Accessed 30 May 2012]
Buckley,C., 2010. Water and Sanitation Showcase: Experiences from the South. [Power-point
presentation] Science against Poverty. April 2010. South Africa: University of KwaZulu
Natal.
Buckley, C., Gounden, T., Pfaff.B., and Rodda, N., n.d. Health Risk Assessment of the
operation and maintenance of a urine diversion toilet. South Africa: Pollution Research Group
– University of KwaZulu Natal.
Cornell University, 2007. Coliform Bacteria – Indicators in Food and Water. [pdf]. Ithaca:
Department of Food Sciences.
Available at: http://www.foodscience.cornell.edu/cals/foodsci/extension/upload/CU-
DFScience-Notes-Bacteria-Coliform-Indicators-09-07.pdf
[Accessed 02 June 2012]
Council for Scientific and Industrial Research, (CSIR), 2000.Guidelines for human settlement
planning and design: The red book. South Africa: CSIR Building and Construction
Technology. Pp 1-36.
156
Creswell, J.W., 2013. Research design: Qualitative, quantitative and mixed methods
approaches. Sage Publications, Incorporated.
Crompton, D.W.T. and Savioli, L., 1997. Intestinal parasitic infections and urbanization.
Bulletin of the World Health Organization, 71 (1), pp 1-1.
Curta, F., 2011a. Source of bacteria in Germany remains unidentified. Mail and Guardian
Online, [online] 01 June.
Available at: http://mg.co.za/article/2011-06-01-source-of-killer-bacteria-in-germany-remains-
unidentified
[Accessed 30 May 2012]
Curta, F., 2011b. Germany probes sprouts as possible E.coli source. Mail and Guardian
Online, [online] 06 June.
Available at: http://mg.co.za/article/2011-06-06-germany-probes-sprouts-as-possible-e-coli-
source
[Accessed 30 May 2012]
Department of Health Directorate: Food Control (DoH)., n.d. Guidelines for Environmental
Health Officers on the Interpretation of Microbiological Analysis Data of Food. South Africa:
Department of Health.
Dixon et al., 1989. Survey Methods and Practice. South Africa: Human Science Research
Center.
Doward, A., 2001. Pro-Poor Livelihoods: Addressing the Market/Private Sector Gap. Paper
presented at: The Sustainable Livelihoods Seminar on ‘Private Sector and Enterprise
Development’. Crown Plaza Hotel, Manchester, 19 November 2001.
157
Doyle, M. P. & Erickson, M. C., 2006. The faecal coliform assay, the results of which have
led to numerous misinterpretations over the years, may have outlived its usefulness. Microbe,
4, pp 162-163.
Emmanuel, B. A., 2009. Co-Composting of dewatered sewage sludge (BIOSOLIDS) and
sawdust for agricultural use as an organic fertilizer: A case study of the KNUST Sewage
Treatment Plant. MSc. Kwane Nkrumah: Kwame Nkrumah University of Science and
Technology.
European Commission: Scientific Committee on Food., 2002. Risk Profile on the
Microbiological Contamination of Fruits and Vegetables Eaten Raw. Europe: Belgium.
Ferry. D., 2011. The Urban Quest for ‘Zero’ Waste. The Wall Street Journal, [online] 11
September.
Available at:
http://online.wsj.com/article/SB10001424053111904583204576542233226922972.html
[Accessed 01 April 2012]
Fields, B.S., Benson R.F. and Besser, R.E., 2002. Legionella and Legionnaires’ Disease: 25
Years of Investigation. Clinical Microbiology Reviews, 15 (3), pp 506-526.
Fooks, L.J. and Gibson, G.R., 2002. Probiotics as modulators of the gut flora. British Journal
of Nutrition, 88 (1), pp 39-49.
Friedrich, E., Pillay, S. and Buckley, C.A., 2009. Carbon footprint analysis for increasing
water supply and sanitation in South Africa: a case study. Journal of Cleaner Production, 17,
pp1-12.
Fujioka, R.S. and Shizumura, L.K., 1985. Perfringens, a Reliable Indicator of Stream Quality.
Water Pollution Control Federation, 57 (10), pp986-992.
158
Gandham, L., 2012. Heterotrophic Plate Count: What is HPC and when is the right time to
use it?. [online]
Available at: http://www.moldbacteriaconsulting.com/laboratory/heterotrophic-plate-count-
what-is-hpc-and-when-is-the-right-time-to-use-it.html
[Accessed 02 June 2012]
Gibson, D., Paterson, G., Newby, T., 2005.“National State of the Environment Project”.South
Africa Environment Outlook. Background Research Paper: Land.
Gilbert, R.J. et al., 2000. Guidelines for the microbiological quality of some ready-to-eat foods
sampled at the point of sale. Communicable Disease and Public Health, 3 (3), pp 163-167.
Golueke, C. G., 1972. Composting: A study of the process and its principles. Pennsylvania:
Litton Aducational Publishing, Inc.
Guest, G., Namey, E.E. and Mitchell, M.L., 2013. Collecting Qualitative Data: A Field
Manual for Applied Research. SAGE Publications, Inc.
Hancock, R.E.W., 1998. Resistance Mechanisms in Pseudomonas Aeruginosa and Other
Nonfermentative Gram-Negative Bacteria. Clinical Infectious Diseases Society of America,
27(1), pp 93-99.
Health Canada. 2006. Guidelines for Canadian Drinking Water Quality. Canada: Health
Canada.
Hoskins, J. et al., 2001. Genome of the Bacterium Streptococcus pneumoniae Strain R6.
Journal of Bacteriology, 183 (19), pp 5709-5717.
Hoyos, S.E.G. et al., 2002. Aerobic thermophillic composting of waste sludge from gelatin-
grenetine industry. Resources, Conservation and Recycling, 34 (3), pp 161-173.
159
International Fund for Agricultural Development (IFAD), n.d. The Sustainable Livelihoods
Approach. [online]
Available at: http://www.ifad.org/sla/index.htm
[Accessed 25 June 2012]
Jenkins, J., 2005. The Humanure Handbook: A Guide to Composting Human Manure. 3rd
Ed.
Grove City, PA: Joseph Jenkins, Inc.
Jenkins, J., n.d. Humanure Sanitation: The ‘no waste, no pollution, nothing to dispose of’
toilet system. Pp 1-18.
Judd, C. M. and Kidder, L. H., 1986. Research Methods in Social Science. 5th
ed. Japan: CBS
Publishing.
Klasen, S. and Woolard, I., 2000. Surviving Unemployment without State Support:
Unemployment and Household Formation in South Africa. IZA Discussion paper series, No.
237.
Kelly, R.L., 2010. World Congress of Soil Science, Soil Solutions for a Changing World.
Soils are Dirt. Australia, Brisbane, 1-6 August 2010.
Key, P.J., 1997. Research Design in Occupational Education: Questionnaire and Interview as
Data-Gathering Tools, Oklahoma State University.
Available at: www.okstate.edu/ag/agedcm4h/academic/.../newpage16.htm
Koch, R., 2003. Expert Consensus: Expert Meeting Group Report In: Bartram, J., Cotruvo,
M., Exner, M., Fricker, A. and Glasmacher, A. ed. 2003. Heterotrophic Plate Counts and
Drinking Water Safety: The Significance of HPCs for Water Quality and Human Health.
London: IWA Publishing.
160
Krantz, L., 2001. The sustainable livelihood approach to poverty reduction: An introduction.
[pdf]. Sweden: Swedish International Development Cooperation Agency.
Available at:
http://www.forestry.umn.edu/prod/groups/cfans/@pub/@cfans/@forestry/documents/asset/cfa
ns_asset_202603.pdf
[Accessed 01 April 2012]
LeChevallier, M.W. and McFeters, G.A., 1985. Interractions between Heterotrophic Plate
Count Bacteria and Coliform Organisms. American Society for Microbiology, 49 (5), pp 1338-
1341.
Lynch, M.F., Tauxe, R.V. and Hedberg, C.W., 2009. The growing burden of foodborne
outbreaks due to contaminated fresh produce: risks and opportunities. Epidemiology and
infection, 137 (3), pp 307-315.
Majale, M., 2002. Towards Pro-poor Regulatory Guidelines for Urban Upgrading. In:
Intermediate Technology Development Group (ITDG), Practical Answers to Poverty.
Bourton-On-Dunsmore, 17-18 May 2001. Warwickshire, United Kingdom.
Mataki, M., 2011. A critical assessment of the paradigms for solid waste management in
Pacific Island Countries. Phd. Australia: Murdoch University.
Maya, C., et al., 2012. Viability of six species of larval and non-larval helminth eggs for
different conditions of temperature, pH and dryness. Water Research, 46, pp 4770-4782.
McIntyre, B.D., Herren, H.R., Wakhungu, J. and Wastson, R. eds., 2009. International
Assessment of Agricultural Knowledge, Science and Technology for Development: Global
Report (IAASTD). Washington: Island Press.
Ministry of Health of the People’s Republic of China., 2010. National Food Safety Standard:
Food microbiological examination: Aerobic plate count. (GB4789.2-2010), China: Ministry of
Health.
161
Morton, J. and Meadows, N., 2000. Pastoralism and Sustainable Livelihoods: an Emerging
Agenda. Policy Series 11. Chatham, UK: Natural Resources Institute.
Montgomery, D.R., 2007a. Soil erosion and agricultural sustainability. Proceedings of the
National Academy of Sciences of the United Stated of America, 104 (33), pp 13268-13272.
Montgomery, D.R., 2007b. Is agriculture eroding civilization’s foundation?. GSA Today, 17
(10), pp 4-9.
Natural Resources Institute (NRI), n.d. Pastoralism and Sustainable Livelihoods. NRI
Discussion Paper.
Olesen, J.E. and Bindi, M., 2002. Consequences of climate change for European agricultural
productivity, land use and policy. European Journal of Agronomy, 16 (4), pp 239-262.
Olsen J., Sabroe S., Sarensen H. T., 1996. A framework for evaluation of secondary data
sources for epidemiological research. International Journal of Epidemiology. 25, pp 435-442.
Payment, P., Sartory, D.P. and Reasoner 2003. The history and use of HPC in drinking-water
quality management. In: Bartram, J. (Ed.). Heterotrophic plate counts and drinking-water
safety: the significance of HPCs for water quality and human health. IWA Publishing. Ch. 3.
Pp 20-48.
Polprasert, C., 1996. Organic Waste Recycling: Technology and Management.2nd
Ed. New
York: John Wiley and Sons, Inc.
Prongracz, E., 2002. Re-defining the concepts of waste and waste management. Evolving the
Theory of Waste Management. PhD. Finland: University of Oulu
162
Prongracz, E., Phillips, P.S. and Keiski, R.L., 2004. Evolving the Theory of Waste
Management: defining key concepts. Waste Management and the Environment II, 471-480.
Public Health Agency of Canada, 2010. Legionella Pneumophila: Pathogen Safety Data Sheet
– Infectious Substances. [online]. Canada: Public Health Agency of Canada.
Available at: http://www.phac-aspc.gc.ca/lab-bio/res/psds-ftss/legionella-eng.php#cont
[Accessed 05 June 2012]
Rihani, M. et al., 2010. In-vessel treatment of urban primary sludge by aerobic composting.
Bioresource Technology, 101, pp 5988-5995.
Rood, J.I. and Cole, S.T., 1991. Molecular Genetics and Pathogenesis of Clostridium
perfringens. Microbiological Reviews. 55 (4), pp 621-648.
Roy, C.R., Berger, K.H. and Isberg, R.R., 1998. Legionella pneumophila DotA protein is
required for early phagosome trafficking decisions that occur within minutes of bacterial
uptake. Molecular Microbiology, 28 (3), pp 663-674.
Ruel, M.T. et al., 1998. Urban Challenges to Food Security and Nutrition Security: A review
of Food Security, Health and Caregiving in the Cities. International Food Policy Research
Institute: Food Consumption and Nutrition Division. FCND Discussion Paper No. 51.
Ruel, M.T., Haddad, L. and Garrett, J.L., 1999. Some Urban Facts of Life: Implications for
Research and Policy. Pergamon, 27 (11), pp1917-1938.
Saad, M.B., 1999. Food Security for the Food-Insecure: new challenges and renewed
commitments. CSD NGO Women’s Caucus Position Paper for CSD-8, 2000, pp 1-11.
163
Sample, I., 2011. E.coli outbreak: German organic farm officially identified. The Guardian,
[online] 10 June.
Available at: http://www.theguardian.com/world/2011/jun/10/e-coli-bean-sprouts-blamed
[Accessed 30 May 2012]
Sanders, C., 2006. A new use for old tires: A garden using tires. Backwoods Home Magazine,
98.
Available at: http://www.backwoodshome.com/articles2/sanders98.html
[Accessed 06 June 2012]
Sapa-AP., 2010. Dutch find different E.coli, pull beet sprouts. Times Live, [online] 10 June.
Available at: http://www.timeslive.co.za/world/2011/06/10/dutch-find-different-e.coli-pull-
beet-sprouts
[Accessed 30 May 2012]
Schauzu, M., 2000. The concept of substantial equivalence in safety assessment of foods
derived from genetically modified organisms. AgBiotechNet, 2, pp 1-4.
Scherr, S.J., 1999. Soil degradation: A threat to developing-country food security by 2020?.
Vol 58. Washington: International Food Policy Research Institute (IFPRI).
Schmidhuber, J. and Tubiello, F.N., 2007. Global food security under climate change.
Proceedings of the National Academy of Sciences, 104 (50), pp 19703-19708.
Sharma, V.K., Canditelli, M., Fortuna, F. and Cornacchia, G., 1997. Processing of Urban and
Agro-industrial Residues by Aerobic Composting: Review. Pergamon, 38 (5), pp 452-478.
Shimizu, T. et al., 2001. Complete genome sequence of Clostridium Perfringens, an anaerobic
flesh-eater. Proceedings of the National Academy of Sciences of the United States of America,
99 (2), pp996-1001.
164
Solesbury, W., 2003. Sustainable Livelihoods: A Case Study of the Evolution of DFID Policy,
Working Paper,No. 217.
Solomon, S., 1993. Organic Gardener’s Composting. Portland: Van Patten Publishing.
South Africa. White Paper on Agriculture. Government of South Africa: Department of
Agriculture. 1995.
Stevens, M. et al., 2003. Microbial Indicators of Drinking Water: Recommendations to
change the use of coliforms as microbial indicators of drinking water quality. Australia:
National Health and Medical Research Council.
Tortorello, M.L., 2003. Indicator Organisms for Safety and Quality – Uses and Methods for
Detection: Minireview. Journal of AOAC International, 86 (6), pp 1208-1217.
Trochim, W.M.K., 2006. Research Methods Knowledge Base. [online] (Updated October
2006)
Available at: http://www.socialresearchmethods.net/
[Accessed 22 September 2011]
Twyman, C., Sporton, D. and Thomas, D.S.G., 2004. ‘Where is the life in farming?’: The
viability of smallholder farming on the margins of the Kalahari, Southern Africa. Geoforum,
35, pp 69-85.
Were, E., 2007.Recycling human waste for food security. Entwicklung and Landlicher Raum.,
1, pp24-26.
Wilkinson, M.J., Crafford, J.G., Jonsson, H. and Duncker, L., n.d. Cost-benefit analysis of the
use of humanure from urine diversion toilets to improve subsistence crops in the rural areas of
South Africa.
165
Williams, I.D. and Curran, T., 2010. Aiming for zero waste. Waste Management World,
[online] 1 August.
Available at:
http://www.waste-management-world.com/_search?q=aiming+for+zero+waste&x=0&y=0
[Accessed 30 May 2012]
Winter, J., 2007. A world without waste. The Boston Globe, [online] 11 March.
Available at:
http://www.boston.com/news/education/higher/articles/2007/03/11/a_world_without_waste/?p
age=full
[Accessed 30 May 2012]
World Health Organisation, n.d. Surface decontamination of fruits and vegetables eaten raw
[pdf]. USA: Center for Food Safety and Quality Enhancement.
Available at: http://www.who.int/foodsafety/publications/fs_management/surfac_decon/en/
[Accessed 06 August 2012]

166
Appendix
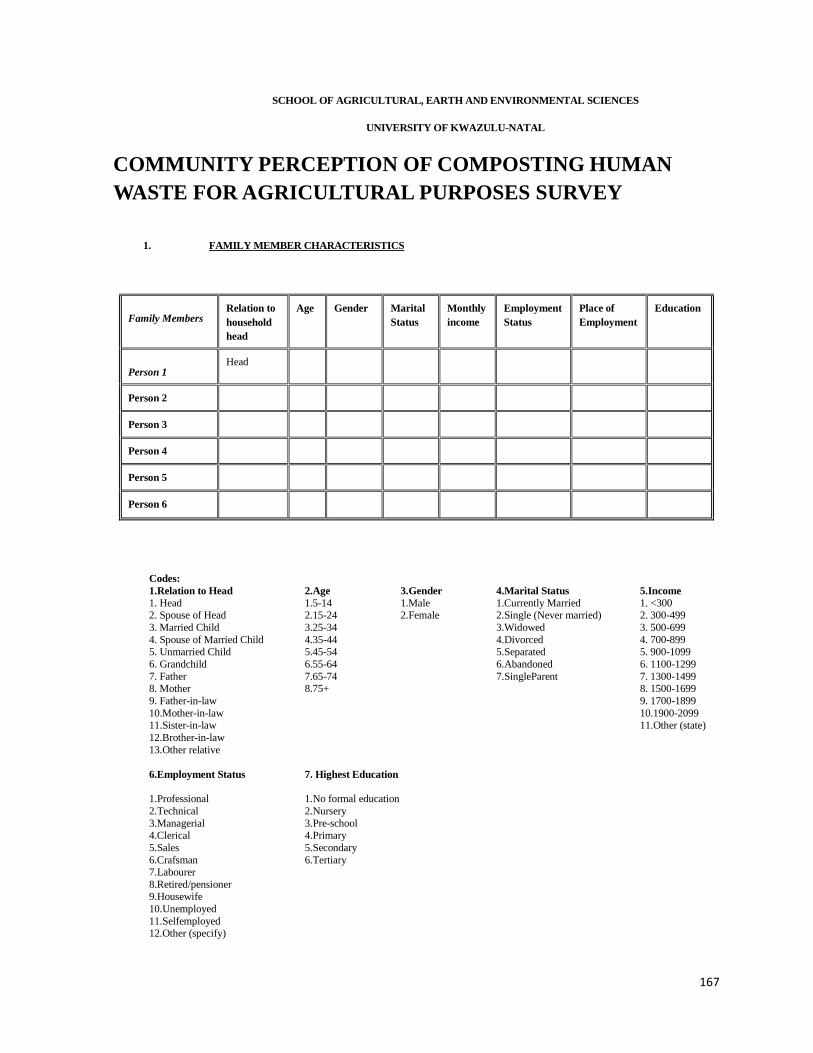
167
SCHOOL OF AGRICULTURAL, EARTH AND ENVIRONMENTAL SCIENCES
UNIVERSITY OF KWAZULU-NATAL
COMMUNITY PERCEPTION OF COMPOSTING HUMAN
WASTE FOR AGRICULTURAL PURPOSES SURVEY
1. FAMILY MEMBER CHARACTERISTICS
Family Members Relation to
household
head
Age Gender Marital
Status
Monthly
income
Employment
Status
Place of
Employment
Education
Person 1 Head
Person 2
Person 3
Person 4
Person 5
Person 6
Codes:
1.Relation to Head 2.Age 3.Gender 4.Marital Status 5.Income 1. Head 1.5-14 1.Male 1.Currently Married 1. <300 2. Spouse of Head 2.15-24 2.Female 2.Single (Never married) 2. 300-499
3. Married Child 3.25-34 3.Widowed 3. 500-699
4. Spouse of Married Child 4.35-44 4.Divorced 4. 700-899 5. Unmarried Child 5.45-54 5.Separated 5. 900-1099
6. Grandchild 6.55-64 6.Abandoned 6. 1100-1299
7. Father 7.65-74 7.SingleParent 7. 1300-1499 8. Mother 8.75+ 8. 1500-1699
9. Father-in-law 9. 1700-1899
10.Mother-in-law 10.1900-2099 11.Sister-in-law 11.Other (state)
12.Brother-in-law
13.Other relative
6.Employment Status 7. Highest Education 1.Professional 1.No formal education
2.Technical 2.Nursery
3.Managerial 3.Pre-school 4.Clerical 4.Primary
5.Sales 5.Secondary
6.Crafsman 6.Tertiary 7.Labourer
8.Retired/pensioner 9.Housewife
10.Unemployed
11.Selfemployed 12.Other (specify)
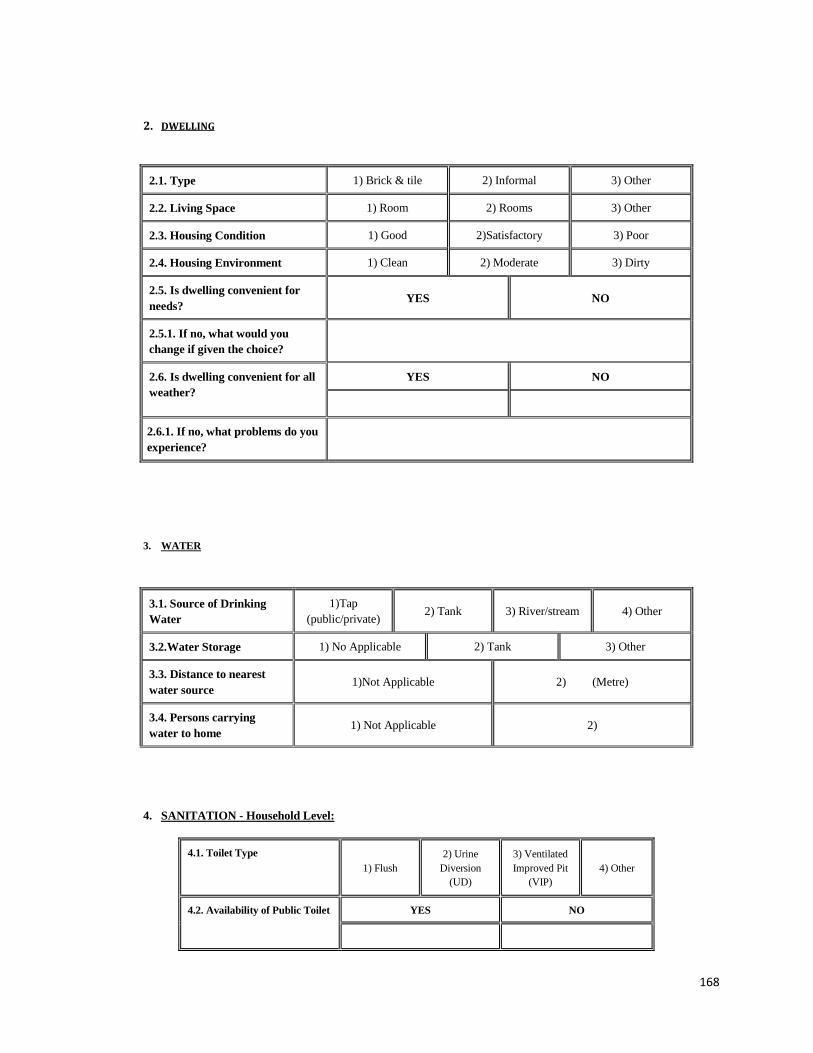
168
2. DWELLING
2.1. Type 1) Brick & tile 2) Informal 3) Other
2.2. Living Space 1) Room 2) Rooms 3) Other
2.3. Housing Condition 1) Good 2)Satisfactory 3) Poor
2.4. Housing Environment 1) Clean 2) Moderate 3) Dirty
2.5. Is dwelling convenient for
needs? YES NO
2.5.1. If no, what would you
change if given the choice?
2.6. Is dwelling convenient for all
weather?
YES NO
2.6.1. If no, what problems do you
experience?
3. WATER
3.1. Source of Drinking
Water
1)Tap
(public/private) 2) Tank 3) River/stream 4) Other
3.2.Water Storage 1) No Applicable 2) Tank 3) Other
3.3. Distance to nearest
water source 1)Not Applicable 2) (Metre)
3.4. Persons carrying
water to home 1) Not Applicable 2)
4. SANITATION - Household Level:
4.1. Toilet Type
1) Flush
2) Urine
Diversion
(UD)
3) Ventilated
Improved Pit
(VIP)
4) Other
4.2. Availability of Public Toilet YES NO
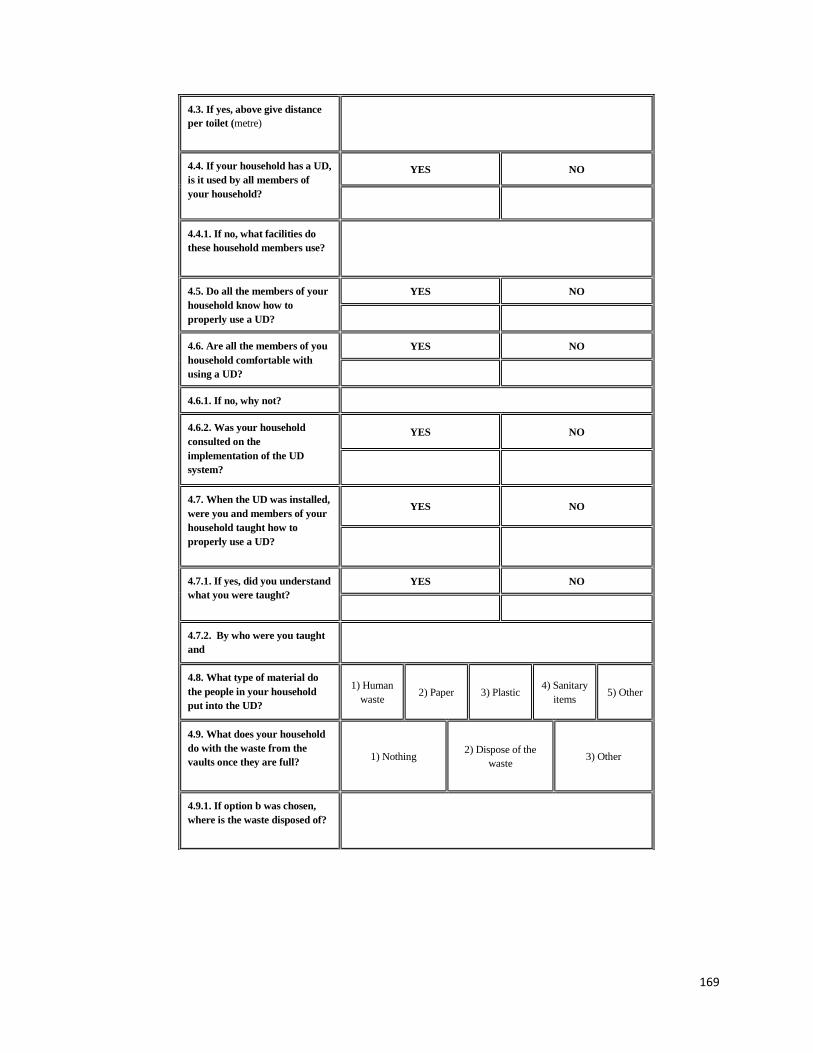
169
4.3. If yes, above give distance
per toilet (metre)
4.4. If your household has a UD,
is it used by all members of
your household?
YES NO
4.4.1. If no, what facilities do
these household members use?
4.5. Do all the members of your
household know how to
properly use a UD?
YES NO
4.6. Are all the members of you
household comfortable with
using a UD?
YES NO
4.6.1. If no, why not?
4.6.2. Was your household
consulted on the
implementation of the UD
system?
YES NO
4.7. When the UD was installed,
were you and members of your
household taught how to
properly use a UD?
YES NO
4.7.1. If yes, did you understand
what you were taught?
YES NO
4.7.2. By who were you taught
and
4.8. What type of material do
the people in your household
put into the UD?
1) Human
waste 2) Paper 3) Plastic
4) Sanitary
items 5) Other
4.9. What does your household
do with the waste from the
vaults once they are full? 1) Nothing
2) Dispose of the
waste 3) Other
4.9.1. If option b was chosen,
where is the waste disposed of?
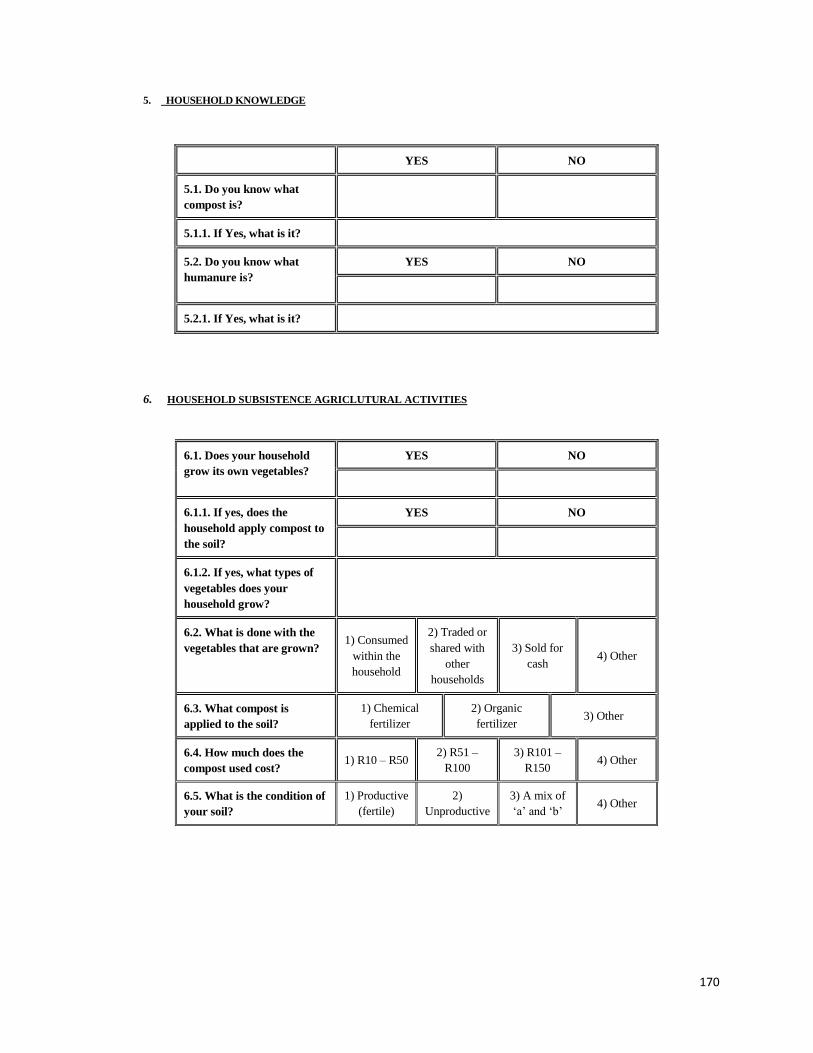
170
5. HOUSEHOLD KNOWLEDGE
YES NO
5.1. Do you know what
compost is?
5.1.1. If Yes, what is it?
5.2. Do you know what
humanure is?
YES NO
5.2.1. If Yes, what is it?
6. HOUSEHOLD SUBSISTENCE AGRICLUTURAL ACTIVITIES
6.1. Does your household
grow its own vegetables?
YES NO
6.1.1. If yes, does the
household apply compost to
the soil?
YES NO
6.1.2. If yes, what types of
vegetables does your
household grow?
6.2. What is done with the
vegetables that are grown? 1) Consumed
within the
household
2) Traded or
shared with
other
households
3) Sold for
cash 4) Other
6.3. What compost is
applied to the soil?
1) Chemical
fertilizer
2) Organic
fertilizer 3) Other
6.4. How much does the
compost used cost? 1) R10 – R50
2) R51 –
R100
3) R101 –
R150 4) Other
6.5. What is the condition of
your soil?
1) Productive
(fertile)
2)
Unproductive
3) A mix of
‘a’ and ‘b’ 4) Other
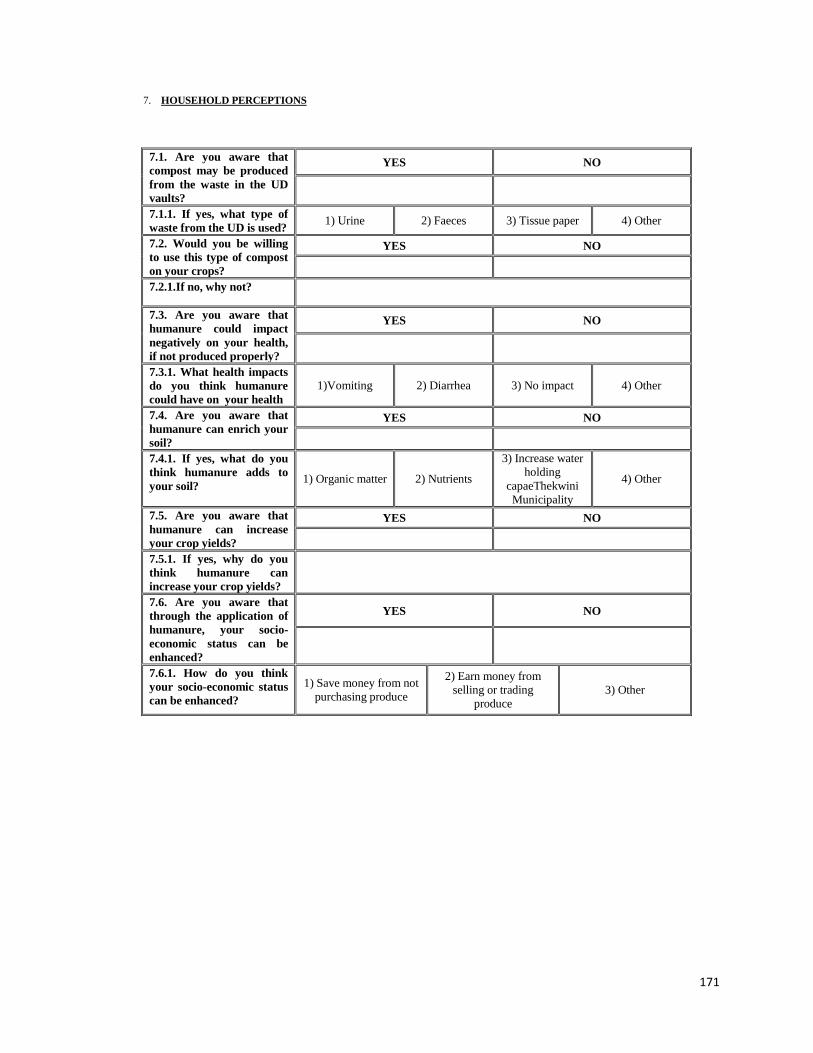
171
7. HOUSEHOLD PERCEPTIONS
7.1. Are you aware that
compost may be produced
from the waste in the UD
vaults?
YES NO
7.1.1. If yes, what type of
waste from the UD is used? 1) Urine 2) Faeces 3) Tissue paper 4) Other
7.2. Would you be willing
to use this type of compost
on your crops?
YES NO
7.2.1.If no, why not?
7.3. Are you aware that
humanure could impact
negatively on your health,
if not produced properly?
YES NO
7.3.1. What health impacts
do you think humanure
could have on your health
1)Vomiting 2) Diarrhea 3) No impact 4) Other
7.4. Are you aware that
humanure can enrich your
soil?
YES NO
7.4.1. If yes, what do you
think humanure adds to
your soil? 1) Organic matter 2) Nutrients
3) Increase water
holding
capaeThekwini
Municipality
4) Other
7.5. Are you aware that
humanure can increase
your crop yields?
YES NO
7.5.1. If yes, why do you
think humanure can
increase your crop yields?
7.6. Are you aware that
through the application of
humanure, your socio-
economic status can be
enhanced?
YES NO
7.6.1. How do you think
your socio-economic status
can be enhanced?
1) Save money from not
purchasing produce
2) Earn money from
selling or trading
produce
3) Other
172
Ethical Clearance Letter