Eugene_Katapazi_2017.pdf - UKZN ResearchSpace
153
Recombinant expression and bioinformatic analysis of Plasmodium falciparum lactate dehydrogenase and heat shock protein 70-1 by Katapazi Eugene Specialised degree in Biochemistry Submitted in fulfilment of the academic requirements for the degree of Master of Science in Biochemistry School of Life Sciences College of Agriculture, Engineering and Science University of KwaZulu-Natal Pietermaritzburg South Africa 4-05-2017
-
Upload
khangminh22 -
Category
Documents
-
view
1 -
download
0
Transcript of Eugene_Katapazi_2017.pdf - UKZN ResearchSpace
Recombinant expression and bioinformatic analysis of Plasmodium
falciparum lactate dehydrogenase and heat shock protein 70-1
by
Katapazi Eugene
Specialised degree in Biochemistry
Submitted in fulfilment of the academic requirements for the
degree of Master of Science in Biochemistry
School of Life Sciences
College of Agriculture, Engineering and Science
University of KwaZulu-Natal
Pietermaritzburg
South Africa
4-05-2017

ii
PREFACE
The research contained in this dissertation was completed by the candidate while based in
the Discipline of Biochemistry, School of Life Sciences of the College of Agriculture,
Engineering and Science, University of KwaZulu-Natal, Pietermaritzburg Campus, South
Africa from January 2014 to November 2016, under the supervision of Professor J. P. D.
Goldring. The research was financially supported by NRF.
The contents of this work have not been submitted in any form to another university and,
except where the work of others is acknowledged in the text, the results reported are due to
investigations by the candidate.
_________________________
Signed: Mr Katapazi Eugene
Date: 04/05/2017
As the candidate’s supervisor I agree to the submission of this dissertation.
_________________________
Signed: Prof J. P. D. Goldring
Date: 04/05/2017

iii
DECLARATION OF PLAGIARISM
I, Katapazi Eugene, declare that:
(i) the research reported in this dissertation, except where otherwise indicated or
acknowledged, is my original work;
(ii) this dissertation has not been submitted in full or in part for any degree or
examination to any other university;
(iii) this dissertation does not contain other persons’ data, pictures, graphs or
other information, unless specifically acknowledged as being sourced from other persons;
(iv) this dissertation does not contain other persons’ writing, unless specifically
acknowledged as being sourced from other researchers. Where other written sources have
been quoted, then:
a) their words have been re-written but the general information attributed
to them has been referenced;
b) where their exact words have been used, their writing has been
placed inside quotation marks, and referenced;
(v) where I have used material for which publications followed, I have indicated in
detail my role in the work;
(vi) this dissertation is primarily a collection of material, prepared by myself,
published as journal articles or presented as a poster and oral presentations at conferences.
In some cases, additional material has been included;
(vii) this dissertation does not contain text, graphics or tables copied and pasted
from the Internet, unless specifically acknowledged, and the source being detailed in the
dissertation and in the References sections.
_______________________
Signed: Mr Katapazi Eugene
Date: 04/05/2017

iv
Abstract
Malaria remains a serious human health problem and the disease is particularly
prevalent in developing countries. Malaria is caused by a parasite of the genus Plasmodium.
Diagnosis of malaria is required before any treatment or intervention. The gold standard for
malaria diagnosis is microscopy. Rapid diagnostic tests (RDT) have been used at point-of-
care because of their relative ease of use. Correct and accurate diagnosis of malaria is a
prerequisite as a point-of-care intervention aimed at eradication, detection of an
asymptomatic reservoir, quantification of parasite load and tracking of drug resistance to
malaria. Therefore, RDTs that have high sensitivity and specificity are required.
Plasmodium LDH (PLDH) is one of the three proteins in current use as antibody
targets in RDTs to detect human malaria. The other two proteins are Plasmodium falciparum
histidine rich protein II (PfHRPII) and aldolase. Of the three proteins, HRPII is the most
widely used protein in RDTs in sub-Saharan Africa. One of the requirements in improving the
current RDTs is to improve specificity and sensitivity. Plasmodium falciparum heat shock
protein 70-1 (PfHSP70-1) has been found to be immunogenic in infected humans,
abundantly expressed in the asexual stages and thought to be a potential diagnostic target
for malaria. Conditions were optimized for the recombinant expression of PfLDH and
PfHSP70-1 in different growth media, temperatures, concentrations of IPTG, times of
induction, stages at which IPTG is introduced, use of a single colony as starting material or a
dilution of an overnight culture to inoculate fresh media. Terrific Broth was found to be a
better growth medium than Lysogeny Broth and does not require induction with IPTG. Use of
a single starting colony was found to be better than dilution of an overnight culture as it
saves time. Inducing at the stationary phase of bacterial growth yields more soluble protein
than at mid-log phase. Expressing at lower temperatures lower than 37°C produces more
soluble protein than growth at 37°C.
Methods of lysing the host bacterial cells expressing PfLDH and PfHSP70-1 by
freezing and thawing, sonication, lysozyme digestion and a combination of these methods
were compared and optimized. The combination of freeze and thaw followed by repeated
sonication was found to be optimal for lysing the E. coli host cells.
Both proteins were affinity purified using an affinity Talon® resin and proteins were
eluted with 150 mM imidazole. The purification protocol was monitored by separating the
proteins on a 12.5% sodium dodecyl sulphate polyacrylamide electrophoresis gel. Purifying
recombinant protein at 4°C produced higher yields of recombinant protein. The identity of the
recombinant protein was confirmed by probing a western blot with anti-His-tag antibodies
against each protein. The anti-His-tag antibodies detected both PfLDH and PfHSP70-1.

v
Preliminary experiments on PfLDH enzyme found that the recombinant enzyme was
active. In silico studies were done on PfLDH and PfHSP70-1 to identify potential
immunogenic peptides to be used in the production of antibodies in chickens using a
prediction program Predict7™. Potential post-translational modifications that may affect the
activity of the native protein were evaluated. There is evidence that some post-translational
modifications may affect the activity of proteins such as PfLDH and PfHSP70-1. Potential
lysine acetylation, phosphorylation, glycosylation and proteolytic sites were identified on both
PfLDH and PfHSP70-1.
This research generated soluble PfLDH which can be used to produce antibodies in
chickens and can be evaluated to detect malaria in blood.

vi
ACKNOWLEDGMENTS
I would like to thank my supervisor Professor J. P. D. Goldring for offering me the
opportunity to do my Msc. For the relentless number of hours of supervision, guidance,
criticism and correction of my work. Thank you for imparting so many skills in me.
I would like to extend my gratitude to Professor T. H. T. Coetzer, Professor C. Niesler, Dr M.
Simelane, Dr R. Hewer, Dr Che Pillay and Mr E. Dzomba for the advice, encouragement and
assistance throughout my entire period of studies. You were always available when I needed
help.
My colleague Dr R. Krausse for being such a pillar in our research group – giving
advice every time I needed it. Kelvin Addicott, Faiaz Shaik, Mark Hutton, Mlondi Shezi,
Abdulmalik Salmane , Kajal Fowdar, Sinothile Khuzwayo, Sheldon Sookai and Zainab Baig
for being great inspiration and a wonderful group to work with. The funny games we enjoyed
together as a group are memorable, especially bowling!
To colleagues in the other research groups Murtala Issa, Laurees Eissen, Alex
Delport, Amukalani Murivate, Mphindile and Faith for the laughter and assistance you gave
me.
To Jesse and Yegan for the technical assistance you offered me. The support staff
Charmaine, Natalie, Tanya and the cleaners for making my work run smooth and for your
friendliness.
To my Mum and Dad for believing in me and allowing me to follow my heart. You
taught me the importance of hard work and value of being honest. My brothers and sisters,
especially Paul for the laughter, friendship and brotherliness we share.
I dedicate this dissertation to my late grandmother for having sacrificed everything in
her life to give me a decent education, notwithstanding her humble background, and my wife
Nachilima Namwala Katapazi for being such a pillar of faith, strength, belief encouragement
and guidance. You are a very strong woman. Thank you for the prayers you prayed for me.
I would like to thank the South African National Research Foundation, Medical
Research Council and the University of KwaZulu-Natal for their financial support throughout
this program.
Finally I thank the Almighty God for many gifts that He has endowed me with,
especially the gift of Jesus Christ, time and health, without which it would have been
impossible to complete this task.

vii
TABLE OF CONTENTS
PREFACE .............................................................................................................................. ii
DECLARATION PLAGIARISM .............................................................................................. iii
ABSTRACT ........................................................................................................................... iv
ACKNOWLEDGEMENTS ..................................................................................................... vi
TABLE OF CONTENTS ....................................................................................................... vii
LIST OF TABLES .................................................................................................................. xi
LIST OF FIGURES .............................................................................................................. xii
LIST OF ABBREVIATIONS AND SYMBOLS……………………………………………………..xv
CHAPTER 1: INTRODUCTION AND LITERATURE REVIEW ............................................ ...1
1.1 History of malaria ............................................................................................................. 1
1.2 Overview of malaria ........................................................................................................ 1
1.3 The life cycle of malaria parasite ...................................................................................... 2
1.4 Species of malaria that infect humans .............................................................................. 5
1.5 Malaria endemic regions .................................................................................................. 5
1.6 Vector control of malaria .................................................................................................. 5
1.7 Treatment of malaria and the development of drug resistance ......................................... 8
1.8 Diagnosis of malaria in the human host .......................................................................... 12
1.9 How to measure the performance of diagnostic tests ..................................................... 12
1.10 Methods of malaria diagnosis ...................................................................................... 13
1.10.1 Clinical diagnosis ................................................................................................. 13
1.10.2 Diagnosis of malaria with microscopy .................................................................. 13
1.10.3 Detecting malaria with fluorescence microscopy ................................................. 14
1.10.4 Colorimetric detection of malaria in patients using immunomagnetic or nano-
particle capture ..................................................................................................... 15
1.10.5 Detecting malaria with the polymerase chain reaction (PCR) .............................. 16
1.10.6 Diagnosis of malaria with loop-mediated isothermal amplification (LAMP) ......... 16
1.10.7 DNA aptamers used to diagnose malaria ............................................................ 17
1.10.8 Antibody based diagnosis of malaria ................................................................... 17
1.10.9 Flow cytometry .................................................................................................... 18
1.11 Rapid diagnostic tests ................................................................................................. 18
1.11.1 How RDTs work .................................................................................................. 19
1.11.2 Why RDTs need to be improved .......................................................................... 19
1.11.3 False negative or invalid results caused by high temperature and humidity ......... 20

viii
1.11.4 False positive test due to the device .................................................................... 20
1.11.5 Antigen based diagnostic problems ..................................................................... 20
1.11.6 False negative results.......................................................................................... 20
1.11.7 False positive results ........................................................................................... 20
1.11.8 Rheumatoid factor ............................................................................................... 21
1.12 Quality assurance of RDTs .......................................................................................... 21
1.13 Why improve malaria RDT? ......................................................................................... 21
1.13.1 PfLDH as target antigen in malaria RDTs ............................................................ 22
1.13.2 PfHSP70-1 as target antigen in Malaria RDTs .................................................... 22
1.14 Aims and objectives of current study ............................................................................ 23
CHAPTER 2 MATERIALS AND METHODS ......................................................................... 25
2.1 Materials ........................................................................................................................ 25
2.1.1 Equipment ............................................................................................................. 25
2.1.2 Reagents ............................................................................................................... 25
2.2 Molecular biology techniques ......................................................................................... 26
2.2.1 Expression plasmids and plasmid evaluation ........................................................ 26
2.2.1.1 The pKK233-3 plasmid ................................................................................ 26
2.2.1.2 The pQE30 plasmid ..................................................................................... 26
2.2.1.3 Agarose gel electophoresis ......................................................................... 28
2.2.1.4 Plasmid isolation ......................................................................................... 28
2.2.1.5 Restriction digestion .................................................................................... 29
2.2.2 Expression of recombinant proteins in various growth media ............................... 29
2.2.3 Lysis of bacteria cells ............................................................................................ 29
2.2.4 Affinity purification of PfLDH and PfHSP70-1 on Talon® (Co2+) resin ..................... 30
2.2.5 Concentrating proteins by dialysis against polyethylene glycol 20 000 (PEG20000) . 30
2.2.6 Concentrating protein using SDS/KCI precipitation ................................................ 31
2.3 Biochemical methods ..................................................................................................... 31
2.3.1 Bradford method to measure protein concentration ............................................... 31
2.3.2 A280 determination of protein concentration .......................................................... 32
2.3.3 Measuring A280/A260 and A260/A230 using a Nano-drop spectrophotometer .............. 32
2.3.4 Sodium dodecyl sulphate polyacrylamide gel electrophoresis ............................... 32
2.3.5 Western blotting .................................................................................................... 33
2.4 Bioinformatics ................................................................................................................ 34
2.4.1 Predict7TM .............................................................................................................. 34
2.4.2 Sequence alignments ............................................................................................ 34
2.4.3 The 3D crystal structure of PfLDH ......................................................................... 34
ix
2.4.4 Prediction of acetylation, phosphorylation, glycosylation and proteolytic sites ....... 34
CHAPTER 3: Recombinant expression of PfLDH and PfHSP70-1 ................. 36 Introduction 36
3.2 Results …………………………………………………………………………………………..38
3.2.1 Comparision of media used to express PfLDH ...................................................... 38
3.2.2 Growth of E. coli host cells in Terrific and Lysogeny Broth media .......................... 39
3.2.3 Comparison of methods for lysing PfLDH E. coli cells ........................................... 41
3.2.4 Comparison of phase of induction ....................................................................... 43
3.2.5 Comparision of 25°C and 37°C growth temperatures on the expression of PfLDH
induced at stationary phase .................................................................................... 43
3.2.6 Affinity purification of PfLDH on Talon® (Co2+) resin ............................................. 44
3.2.7 Western blot of recombinant PfLDH………………………………………………….. 46
3.2.8 Enzyme activity of recombinant PfLDH………………………………………………. 46
3.2.9 Comparision of induced and uninduced cultures in the expression of recombinant
PfHSP70-1………………………………………………………………………………...47
3.2.10 Comparision of growth media on the exression of recombinant PfHSP70-1 ........ 50
3.2.11 Comparision of methods for lysing PfHSP70-1 E. coli cells ................................. 51
3.2.12 Affinity purification of recombinant PfHSP70-1 on Talon® (Co2+) resin and
detection of the protein in a western blot ................................................................ 53
3.2.13 Isolation of pQE30/His6PfHSP70-1 plasmid and restriction digestion .................. 54
3.3 Discussion ..................................................................................................................... 55
3.3.1 Media used to express recombinant PfLDH and PfHSP70-1 ................................. 55
3.3.2 Growth of E. coli host cells in TB and LB media .................................................... 56
3.3.3 Initiating bacterial growth from a single colony or an overnight bacteria
culture.….56
3.3.4 Time of induction of protein expression ................................................................. 56
3.3.5 Two temperatures (25°C and 37°C) on the expression of PfLDH induced at
stationary phase………………………………………………………………………………………57
3.3.6 Optimising the method of lysis of E. coli cells ........................................................ 57
3.3.7 Affinity purification of recombinant PfLDH and PfHSP70-1 .................................... 58
3.3.8 Western blots detecting PfLDH and PfHSP70-1 .................................................... 58
3.3.9 Determination of the cause of poor expression of PfHSP70-1 .............................. 59
CHAPTER 4: Bioinformatics................................................................................................. 60
4.1 Introduction .................................................................................................................... 60
4.2 Selection of immunogenic peptides ................................................................................ 60

x
4.3 Prediction of post-translational modification ................................................................... 66
4.3.1 Acetylation ............................................................................................................ 67
4.3.2 Phosphorylation .................................................................................................... 74
4..3 Glycosylation ......................................................................................................... 80
4.3.4 Proteolytic cleavage .............................................................................................. 89
CHAPTER 5: Brief overview................................................................................................. 91
5.1 Brief overview………………………………………………………………………………… 91
5.2 Aims and objectives of current study .............................................................................. 92
5.3 Main findings .................................................................................................................. 92
5.4 Conclusion ..................................................................................................................... 94
REFERENCES .................................................................................................................... 96
xi
LIST OF TABLES
Table 1.1 The approximate number of parasites per stage that are used to infect or are
ingested by the host, and vector, respectively .......................................................... 4
Table 1.2 The data of the life cycle of the 5 human infecting species .................................... 6
Table 1.3 Antimalarial drugs used and their targeted stages, mutation positions in
corresponding resistant allele’s and the regions where resistance in the drugs has
been reported ........................................................................................................... 9
Table 2.1 The ingredients to make different percentage acrylamide electrophoresis gels ... 33

xii
LIST OF FIGURES
Figure 1.1 The life cycle of a malaria parasite in the mosquito and human host ..................... 3
Figure 1.2 Regional distribution of Anopheles mosquito vector .............................................. 7
Figure 1.3 A time course of merozoite invasion of the erythrocyte........................................ 11
Figure 1.4 Erythrocytic stages of malaria parasite development ........................................... 13
Figure 1.5 Trophozoites of P. falciparum stained with AO in the QBC fluorescence method 14
Figure 1.6 Trophozoite of P. falciparum stained with benzothiocarboxypurine (BCP) in the
fluorescence method ................................................................................................ 15
Figure 1.7 Sample test line configurations on commercial RDTs that detect malaria and their
result interpretation ................................................................................................... 19
Figure 2.1 pKK233-3 vector map expressing PfLDH ............................................................ 27
Figure 2.2 Map of the pQE30/PfHSP70-1 plasmid ............................................................... 28
Figure 2.3 Bradford standard curve to measure protein concentration ................................. 31
Figure 3.1 Expression of PfLDH in Lysogeny broth and Terrific broth media at (A) 30°C and
(B) 37°C ................................................................................................................... 38
Figure 3.2 Growth curves of E. coli host cells grown in Terrific broth and Lysogeny broth
media inoculated from overnight cultures at 1:100 dilution ........................................ 39
Figure 3.3 Growth of E. coli host cells grown in Terrific and Lysogeny broth media from a
single starting colony ................................................................................................ 40
Figure 3.4 Expression of PfLDH comparing inoculating with a single starting colony and from
an overnight culture .................................................................................................. 40
Figure 3.5 Comparing methods of lysing E. coli cells ........................................................... 41
Figure 3.6 Evaluating the amount of recombinant PfLDH in the soluble fraction after lysing
using a combination of freeze and thaw followed by sonication ................................ 42

xiii
Figure 3.7 Evaluating the amount of recombinant PfLDH which remains in the insoluble
fraction after two rounds of lysing using a combination of freeze and thawing followed
by sonication ............................................................................................................ 42
Figure 3.8 Expression of PfLDH in LB broth after induction at mid-log and stationary phases43
Figure 3.9 Comparing the expression of PfLDH in LB media induced at stationary phase
grown at 25°C or 37°C .............................................................................................. 44
Figure 3.10 Comparison of affinity purification of PfLDH at room temperature and 4°C........ 45
Figure 3.11 Affinity purification of PfLDH at
4°C………………………………………………….45
Figure 3.12 Expression, purification and detection of PfLDH using anti-His-tag primary
antibodies ................................................................................................................. 46
Figure 3.13 Enzyme activity at amounts concentrations of PfLDH are shown ...................... 47
Figure 3.14 Expression of recombinant PfHSP70-1 in LB media at 37°C ............................. 48
Figure 3.15 Comparison of PfHSP70-1 expression after induction at OD600 of 0.2 with that of
OD600 of 0.5 in LB media at 37°C .............................................................................. 49
Figure 3.16 E. coli host cell growth in cultures induced at OD600 0.2 and 0.5 ........................ 49
Figure 3.17 Expression of recombinant PfHSP70-1 E. coli cell culture in TB and LB media 50
Figure 3.18 Comparing different dilutions of overnight cultures on the growh of E. coli host
cells .......................................................................................................................... 51
Figure 3.19 Expression of recombinant PfHSP70-1 from different starting colonies in TB
media ....................................................................................................................... 51
Figure 3.20 Methods used to lyse bacterial cells .................................................................. 52
Figure 3.21 A 1% (w/v) agarose gel of E. coli host cells containing PfHSP70-1 insert .......... 52
Figure 3.22 Affinity purification of recombinant PfHSP70-1 on Talon® (Co2+)
resin………....53
Figure 3.23 Samples of PfHSP70-1 E. coli host cells from two different glycerol stocks ...... .54
Figure 3.24 Restriction digestion of pQE30/His6PfHSP70-1 and pET/hHSP70 by BamHI .... 55

xiv
Figure 4.1 Predict7™ analysis of three PfHSP70-1 peptides................................................ 62
Figure 4.2 Alignment of amino acid sequences from P. falciparum, chicken and human
HSP70-1 showing the positions of the immunogenic peptides identified by the
predicition program ................................................................................................... 64
Figure 4.3 An image of the crystal structure of PfHSP70-1 showing the location of the three
selected peptides ..................................................................................................... 65
Figure 4.4 The predicted lysine acetylation sites on PfLDH and PfHSP70-1 using two
programs .................................................................................................................. 69
Figure 4.5 Prediction of acetylation sites in the sequence of PfLDH aligned with chicken
(Gallus gallus) cKLDH and human (Homo sapien) hLDH using PAIL ....................... 70
Figure 4.6 Prediction of acetylation sites in the sequence of PfHSP70-1 aligned with chicken
(Gallus gallus) cKHSP70-1 and human (Homo sapien) hHSP70-1 using PAIL ......... 72
Figure 4.7 Predicted phosphorylation sites on the PfLDH and PfHSP70-1 amino acid
sequences using Kinasephos ................................................................................... 76
Figure 4.8 Predicted phosphorylation sites on the PfLDH sequence with the key catalytic
amino acids in the active site of PfLDH aligned with chicken (Gallus gallus) cKLDH
and human (Homo sapien) mLDH using Kinasephos ............................................... 77
Figure 4.9 The positions of the predicted phosphorylation sites on the PfHSP70-1 sequence
aligned with chicken (Gallus gallus) cKHSP70-1 and human (Homo sapien) hHSP70-
1 using Kinasephos. ................................................................................................. 79
Figure 4.10 The predicted O-glycosylation sites on the PfLDH and PfHSP70-1 amino acid
sequences using DictOGlyc ...................................................................................... 85
Figure 4.11 Predicted N-glycosylation sites on PfLDH and PfHSP70-1 amino acid sequences
using NetNGlyc ........................................................................................................ 87
Figure 4.12 Predicted N-glycoslation sites on the PfHSP70-1 sequence aligned with chicken
(Gallus gallus) PfHSP70-1 and human (Homo sapien) PfHSP70-1 using
NetNGlyc....................................................................................................................89

xv
LIST OF ABBREVIATIONS AND SYMBOLS
18S rRNA Small eukaryotic ribosomal subunit component
ACT Artemisinin-based combination therapy
Anti-His-tag Anti histidine tagged
APAD+ Acetylpyridine adenine dinucleotide
APADH Acetylpyridine adenine dinucleotide hydrogenate
AuNP Gold nano-particles
AV Autophagic vesicles
BamHI Bacillus amyloliquefaciens type II restriction endonuclease
BC Before Christ
BCP Benzothiocarboxypurine
BLAST Basic local alignment search tool
BSA Bovine serum albumin
CDC Centre for Disease Control
CoxIII Cytochrome oxidase 3
CRT Chloroquine resistant transporter
DAPI 4’, 6-Diamidino-2-phenylindole
DDT Dichloro-diphenyl-trichloroethane
DHFR Dihydrofolate reductase
DHFR-TS Dihydrofolate reductase-thymidylate synthase
DHPS Dihydopteroate synthase
DMSO Dimethyl sulfoxide
DTT Dithiothreitol
ELISA Enzyme linked immunosorbent assay
EtBr Ethidium bromide

xvi
FAD Flavin adenine dinucleotide
FCA Freud’s complete adjuvant
FIA Freud’s incomplete adjuvant
FIND Foundation for Innovative New Diagnostics
GFP Green fluorescent protein
His6 6 Histidine residues
HNB Hydroxyl naphthol blue
HRPO Horse radish peroxidase
HSA Human serum albumin
HSP Heat shock protein family
IFA Indirect immunofluorescent antibody assay
IPTG Isopropyl-β-D-1-thiogalactopyranoside
IRS Indoor residual spraying
KAP1 Kruppel associated box (KRAB)-associated protein 1
kKDa Kilo Dalton
LAMP Loop mediated isothermal amplification
LB Lysogenyauria Brothertani media
LOD Limit of detection
MAPS Multiple antigenic peptides
MDR Multidrug resistance p-glycoprotein pump
MSP-1 Merozoite surface protein
NCBI National Centre for Biotechnology Information
OmpT Outer membrane protease
PAIL Prediction of Acetylation on Internal Lysine
PBS Phosphate buffered saline
PEG Polyethylene glycol

xvii
PfEMPI Plasmodium falciparum erythrocyte membrane protein 1
PfHRPII Plasmodium falciparum histidine rich protein 2
PfHSP70-1 Plasmodium falciparum heat shock protein 70-1
PfLDH Plasmodium falciparum lactate dehydrogenase
PfRH5 Plasmodium falciparum reticulocyte binding protein homologue 1
PLDH Plasmodium lactate dehydrogenase
PMT Phosphoethanolamine N-transferase
QBC Quantitative buffy coat
RBC Red blood cell
RDT Rapid diagnostic test
RIG Arginine, Iisoleucine and Glycine
RTS, S/AS02 Pre-erythrocytic malaria vaccine based on circumsporozoite surface protein
of Plasmodium falciparum fused to HBsAg, incorporating a new adjuvant AS02
ScFv Single-chain variable fragement
SE-HPLC Size exclusion high performance liquid chromatography
SELEX Systematic evolution of ligands by exponential enrichment
Ss rRNA Small subunit ribosomal RNA
STET Salt (NaCl), Tris-HCl, EDTA and Triton Xx-100
SYBR Cyanine dye used to stain nucleic acids
TAE Tris, acetic acid and EDTA buffer
TB Terrific broth media
TBST Tris buffered saline with Tween 20

xviii
TEMED N,N,N’,N’- tetramethylethylenediamine
ULK1 unc-51-like kinase 1
WHO World Health Organization

1
Chapter 1
Introduction and literature review
1.1 History of malaria
Malaria is an ancient disease infecting mankind. Symptoms of malaria have been described
in an Egyptian papyri from 1570 BC, a Chinese document from 2700 BC and clay tablets
from Mesopotamia from 200 BC (Cox, 2010). For over 2500 years the idea that malaria
fevers were caused by unpleasant vapour rising from swamps persisted, and thus probably
led to the naming of the disease as malaria, which in Italian translates as bad air (mal - bad,
aria - air). Intensive studies into malaria were observed in the 19th century (Cox, 2010).
Marchiafava and Bignami using eosin-based staining and an oil immersion microscope,
observed amoeboid movement of blood in patients suspected of malaria, as these
organisms invaded red blood cells, grew within the cells and produced daughter cells
(Marchiafava and Bignami, 1894). Camillo Golgi between 1885-56, observed erythrocytic
stages of the malaria parasite, and differentiated between the tertian (48 hrs periodicity) and
quartan (72 hr periodicity) malaria (Golgi, 1886). Marchiafava and Golgi further described
mild spring malaria (benign tertian) and severe summer-autumn (malignant tertian) malaria.
The French scientist, Charles Louis Alphonse Laveran, observed that the symptoms
characteristic of malaria coincided with the presence of infected red blood cells (Laveran,
1893).
In 1897, Ronald Ross discovered that avian malaria parasite Plasmodium relictum was
transmitted by Culicine mosquitoes and suggested that human malaria parasites may also
be transmitted by mosquitoes. In 1889 while in Sierra Leone, he demonstrated that human
malaria parasites were indeed transmitted by anopheline mosquitoes (Bynum and Ovary,
1998). Ross later discovered spores in the salivary glands of the anopheline mosquito and
found the developmental stages of human malaria parasites in anopheline mosquitoes
(Ross, 1923; Bynum and Ovary, 1998). After working with avian malaria, Ross concluded
that mosquitoes fed on infected birds and took up male and female gametocytes which
fertilized in the mosquito’s gut. In the mosquito gut rod-like structures were produced that
invaded the mosquito’s salivary glands and these rod like structures were then injected into
the new host, as the infected mosquito is feeding (Ross, 1898; Manson, 1898). Bignami and
Grassi produced evidence that female anopheles mosquitoes would transmit malaria and
described the whole-blood mosquito life cycle of P. vivax, P. falciparum and P. malariae
(Grassi, 1899).

2
1.2 Overview of malaria
Malaria is a disease caused by a eukaryotic parasite of the genus Plasmodium (Cox, 2010;
Miller et al., 1994; Bannister et al., 2000). Malaria transmission occurs globally and an
estimated 3.3 billion people are at risk of being infected with malaria and 1.2 billion are at
high risk (WHO, 2014). An estimated 198 million cases of malaria occurred globally in 2013
and 584 000 deaths were recorded. About 90% of the deaths occurred in the African region
and mostly in children under the age of five years (WHO, 2014; Black et al., 2003). The
number of malaria cases seems to be on the increase due to increased transmission risks in
areas where malaria control has declined, increases in the prevalence of drug resistant
strains of parasites, and in a few cases, international travel to endemic regions and migration
of people from endemic regions (Tangpukdee et al., 2009; Pasvol et al., 2005; Cui et al.,
2015; Sinha et al., 2014). Adults in endemic regions develop natural immunity against
malaria. Though they may be prone to infection, they do not show symptoms of malaria but
they are reservoirs of malaria (Miller et al., 1994; Hafalla et al., 2011).
Though slow, the development of a vaccine against malaria has reached an advanced stage
(Schwartz et al., 2012; Mordmüller et al., 2017). The strategies in vaccine development
include multi-peptide vaccines such as RTS,S/AS02 ( Bojang et al., 2001; Snounou et al.,
2005; Alonso et al., 2005; Aponte et al., 2007), multi-stage vaccines using chimeric proteins
(Thiesen et al., 2014), erythrocyte stage vaccine that uses Merozoite surface protein-1
(Moss et al., 2012; Cavangh et al., 2014; Fong et al., 2015; De Silva et al., 2016) and
another that uses Plasmodium falciparum Recticulocyte Binding Protein homologue 5
(PfRH5) (Wright et al., 2014). Other vaccines being developed include subunit protein and
sporozoite vaccines (Nuussenzweig et al., 1967; Nussenzweig et al., 1989; Friesen et al.,
2010; Calvo-Calle et al., 2005), anti cyto-adhesion vaccines (Magowan et al., 1988; Bull et
al., 1998) and placental malaria vaccines (Salanti et al., 2003; Salanti et al., 2004; Viebig et
al., 2005). Even when a vaccine for malaria has been discovered, the accurate diagnosis
and treatment with anti-malarials still remain an important part of malaria treatment and
eradication of the disease (Moody 2002; Mouatcho and Goldring, 2013).
1.3 The life cycle of malaria parasite
The life cycle of malaria in the human host begins when the infected female anopheles
mosquito injects sporozoites in the skin of the host during a blood meal (Baldacci and
Menard, 2004) and during feeding the female anopheles mosquitoes releases the
sporozoites along with their saliva anti-coagulants as part of their feeding process (Miller et

3
al., 1994). Only a fraction of the sporozoites released in the host survive the hostile
environment in the blood, skin and lymphatic system (Kebaier et al., 2009), and successfully
invade the hepatocytes. The sporozoites possess an apical complex machinery involved in
host cell invasion (Florens et al., 2002). Approximately 10-100 sporozoites are injected per
mosquito bite (Kappe et al., 2010; Baldacci and Menard, 2004) in the exoerythrocytic or liver
stage. The sporozoites in the lymphatic system move by gliding motion and finally invade the
hepatocyte within 60 minutes (Frischknecht et al., 2004; Amino et al., 2007; Kebaier et al.,
2009). However, in P. vivax and P. ovale the sporozoites can be transformed into a dormant
form known as hypnozoite for up to six months (Krotoski et al., 1985; Fujioka and Aikiwa,
2002). The schizonts, with time, divide to occupy the entire cytoplasm of hepatocytes
causing them to rapture and release the thousands of merozoites in the blood stream of the
host (Miller et al., 1994; Fujioka and Aikawa, 2002) as shown in Figure 1.1 step 1-4.
Figure 1. 1 The life cycle of a malaria parasite in the mosquito and human host. The liver stage or
exoerythrocytic, erythrocytic or blood stage and the mosquito stages are shown here. The stage at which the

4
diagnostic targets (d triangles) are found and the infective stage (I triangles) are shown. Taken from CDC 2016
(https://www.cdc.gov/malaria/about/biology/).
The erythrocytic or blood stage begins when the released merozoites invade uninfected red
blood cells. Within a few minutes of their release from the hepatocytes or host RBCs the
merozoites recognise new target RBCs and parasite entry begins which lasts about 27.6 s
after primary contact (Gilson and Crabb, 2008). The entry phase can be divided into two
distinct phases. After invasion, an echinocytosis phases commences where a dramatic
dehydration-type morphology is adopted by the infected RBC every 36 seconds. The
infected RBC recover after a 5-11 minute period. At this time, the merozoites would have
assumed the amoeboid-like state and is apparently free in the cytoplasm (Gilson and Crabb,
2008). The infected RBCs, now in the ring stage, then develop into the trophozoite stage at
which point haemozoin begins to appear and finally they develop into the schizont stage
after which the infected RBCs rapture and reinfection of new target RBCs occurs as shown
in Figure 1.1, section B6 and 5. The erythrocytic stage has a cycle that ranges from 28-72
hrs depending on the infecting species of the malaria parasite (Cowman and Crabb, 2006;
Aikawa et al., 1978; Lee et al., 2013; Murray et al., 2008). This stage is responsible for the
symptoms associated with malaria and is targeted for diagnosis as shown in Figure 1.1 blue
triangle with the letter ”d” (Antia et al., 2008; Murray et al., 2008; Fong et al., 2015; Stansic et
al., 2015; Piper et al.,1999; Lee et al., 2014; Sessions et al., 1997). The period of time from
infection to appearance of symptoms is known as the incubation period and ranges from 12-
40 days for other species and 6-12 months in P. vivax. The erythrocytic cycle repeats
several times, after 3-10 cycles of red blood cycle reinfection, male and female gametocytes
are formed at which point female anopheles mosquitoes can ingest the gametocytes.
Table 1.1 The approximate number of parasites per stage that are used to infect or are
ingested by the host and vector, respectively.
Infection stage Approximate number of parasites
Per stage
Infected mosquito bite
10 - 100
Schizont liver stage
rupture
10 000 - 30 000
Merozoite formed per infecting
merozoite
14 - 32
Gametocyte ingested per blood

5
meal of mosiquito 10 - 1000
The data was taken from Antia et al., 2008; Smith and Craig, 2005; Fujioka and Aikowa, 2002; Baldacci and
Menard, 2004; Kappe et al., 2010; Miller et al., 1994.
The gametocytes mature into gametes in the gut of mosquitoes (Fujioka and Aikowa,
2002).The parasite densities associated with each stage are shown Table 1.1.
During a blood meal, female anopheles mosquitoes ingest the gametocytes (MacCallum,
1898) into the mid-gut lumen of mosquitoes where the male gamete, which is flagellated
(Microgamete), fuses with the female gamete which is non-motile (Macrogamete) to form a
zygote (Kappe et al., 2010). The zygote develops into an Ookinete that traverses the mid-gut
epithelial cells. The Ookinete then becomes sessile and transforms into Oocysts. The
Oocysts are the only parasitic developmental stage that grows extracellulary and the
Ookinete nucleus inside the Oocyst divides (sporogony) resulting in the formation of
sporozoites. The sporozoites are then released into the mosquito body cavity and invades
the salivary glands (Hillyer et al., 2007).
1.4 Species of malaria that infect humans
There are five species of malaria parasites that infect humans: Plasmodium falciparum,
Plasmodium vivax, Plasmodium ovale, Plasmodium malariae and the recently discovered
and formerly thought to only infect macaques Plasmodium knowlesi (Moutaucho and
Goldring, 2013; Van den Eede et al., 2009; Van den Eede et al., 2010; Lee et al., 2009;
Singh & Daneshvar, 2010; Suh et al., 2004; Tangpukdee et al., 2009). A summary of the
life cycles in the exoerythrocytic (liver) and erythrocytic (blood) stages are shown in Table
1.2.
1.5 Malaria endemic regions
All forms of human malaria are transmitted by female anopheles mosquitoes (Ross, 1923;
Bynum, 1998; Baldacci and Menard, 2004; Kiszewski et al., 2004), and malaria endemic
region encompass all the areas in which these species of mosquitoes are prevalent.
The areas most affected are the tropical regions that include sub-Saharan Africa, East Asia
and part of South America. Most of the developed North American and European countries
have managed to eradicate the infectious species of mosquitoes and are thus regarded as
non-transmitting regions. Figure 1.2 shows the regional distribution of anopheles mosquitoes
and the prevalent species.
1.6 Vector control of malaria

6
In the mid-20th century, North America and most of Europe eliminated the malaria vector by
spraying agricultural crops with an insecticide dichloro-diphenyl-trichloroethane (DDT) (Shiff,
2002). DDT was initially developed as a public insecticide prior to its widespread agricultural
use and recognition as an environmental pollutant (Curtis & Lines, 2000)

7
Table 1.2 The data of the life cycle of the five human infecting species
Plasmodium species
P. falciparum
P. vivax P. ovale P. malariae P. knowlesi
Exo-erythrocytic
phase (days)
5-7
6-8
9
14-16
No data
Erythrocytic
cycle (hours)
48
48
50
72
24
Incubation
period (days)
9-14
12-17;
sometimes
6-12
months
16-18;
sometimes
more
18 – 40; or
more
No data
Sporogony
(days)
9-10
8-10
12-14
14-16
10-12
Hypnozoites
(Dormant stage)
No
Yes
Yes
No
No
Maximum
number of
merozoites
/RBC
32
24
20
14
16
Merozoites
released/infected
hepatocyte
30 000
10 000
15 000
10 000
No data
Type of RBC they
infect
RBCs of
all
ages
Prefer
young
RBCs
Prefers
young
RBCs
Aging
RBCs
No data
available
Blood stream
parasitaemias/µl
250 000
About
50 000
about
50 000
10 000
No data
available

8
The table is summary of the life cycles in the exo-erythrocytic stage (liver) and erythrocytic stage (blood) of the
five human infecting species. The data of the life cycle of the five human infecting species was collected from:
Lee et al, 2009; Murray et al., 2008; Aly et al., 2008; Fujioka and Aikawa, 2002; Cox, 2010; D’Alessandro et al.,
2013.
Figure 1. 2 Regional distribution of anopheles mosquito vector. The information was taken from the
following sources: White, 1974; Fanello et al., 2002; Choi et al., 2013; Soleimani-Ahmadi et al., 2015; Hay et al.,
2010, Daneshvar et al., 2010; Abdoon & Alshahran, 2003; Kiszewski et al., 2004; Sinka et al., 2012. The key to
the colours of regions is shown in the left bottom panel.
Insecticide classes include organochloride (DDT, hexachlorocyclohexane (HCH), dieldrin)
(Goodman et al., 1999, Goodman et al., 2001), organophosphates (malathion, temephose),
carbamites (proposur, carbaryl), pyrethroids (synthetic compounds that resemble active
constituents of flowers), insect regulator (diflubenzuron, methoprene, pyripoxyfen). Most of
these classes have a serious impact on the environment (Arrow et al., 2003). Around 1966
the emergence of resistance by anopheles mosquitoes to DDT became evident as 15
species were found to be resistant (WHO expert committee on insecticide, 1974). Also the
environmental pollution of DDT was known, and as such, activists forced most governments
in developed countries to discontinue its use (Shiff, 2002). Other methods included draining
of the marshes, so that mosquitoes would have less breeding places.
Indoor residual spraying (IRS) was introduced to destroy the mosquito vectors that entered
homes and it reduced mortality rates (Pluess et al., 2010). Insect-treated mosquito nets were
An darling, An albitarsis s.i, An
albimanus, An aquasalis, An
pseudopunctipennis
An gambiae, An arabiensis, An
melas, An funestus, An coluzzii
An stephensi, An culicifacies, An fluviatilis
An sergenti, An Arabianses, An dthali,
An labranchise, An superpictus
An koliensis, An lesteri, An sinensis, An
farauti s.i, An balabacensis s.i, An
punctulatus s.i
An flavirostris, An punctulatus
s.i, An lesteri, An sundaicus
High malaria transmission region
Moderate malaria transmission region
Low malaria transmission region
No transmission in the region
9
also introduced and reduced the malaria mortality rate by about 55% in children under five
years of age in sub-Saharan Africa, and reduced childhood death from other causes that are
exacerbated by malaria (Lengeler et al., 2004). In Gambia, Alonso et al, (1991) reported an
overall childhood mortality reduction by 60% when the use of insecticide-treated mosquito
nets was combined with malaria chemoprophylaxis. But, to be effective, insecticide-treated
mosquito nets need to be used properly and must contain insecticides that are effective
against killing mosquitoes. With the prevalence of insecticide-resistant mosquitoes, this
method may become ineffective and thereby increase the re-emergence of malaria.
Other vector control measures introduced include House Siting and construction, by building
houses far from mosquito breeding sites was demonstrated. There was a reduction of
malaria cases (Trape et al., 1992). Zooprophylaxis was used, where animals were used to
divert mosquitoes from biting humans, however in some cases the opposite happened
(Hewitt et al., 1994; Booma and Rowland, 1995; Mouche, 1998). The introduction of
repellants, aerosols and fumigation reduced mosquito bites (Snow et al., 1987; Lindsay et
al., 1998). Environmental and biological management of breeding areas, such as the use of
petroleum oil for larvicide, draining of pools, salinating of coastal marshes reduced breeding
of mosquitoes (Romi et al., 1993; Karch et al., 1993).
1.7 Treatment of malaria and the development of drug resistance
The earliest recorded treatment of malaria came from the use of the Cinchona tree by Native
Americans around 1934, which contains quinine. In China, the Chinese herb Quinghaosu
(Artemisinin) was used to reduce fevers associated with malaria as early as 340 AD as
recorded in the Zhou Hou Bei-ji Fang handbook (Klayman, 1985). In 1934, a German, Hans
Andersag discovered Resochin, which later was named chloroquine. Because of World War
II, chloroquine was not recognised until 1946. During the 1960s and 1970s chloroquine
began losing its effectiveness against P. falciparum malaria in Asia, and later in Africa
around the 1980s. This was caused by genetically-mediated chloroquine resistance
appearing in the parasite. Because of poor diagnostic techniques that existed in that era,
symptoms similar to malaria were treated as malaria, until proven otherwise (Perkins and
Bell, 2008; Okiro and Snow, 2010), which lead to the overuse of chloroquine by many
clinicians. Pyrimethamine, doxycycline, quinine and primaquine have been used to treat
malaria.
Malaria treatment is dependent on the geographical location of the infection and the type of
infecting species. Species of importance such as P. vivax and P. ovale have hypnozoites
that are reservoirs of patient infections as shown in Table 1.2 and Table 1.3.

10
Table 1.3 Antimalarial drugs used and their targeted stages, mutation positions in
corresponding resistant allele’s and the regions where resistance in the drugs has
been reported.
Drug name Organism
targeted
Mutations in
corresponding
resistant alleles
Malaria stage
targeted
Region
showing
resistance
Chloroquine P.
falciparum,
P. vivax,
P. ovale,
P. marlariae
CRT, MDR Gametocyte in blood
stage
Aisia, Africa,
central and
South
America
Mefloquine P.
falciparum,
P. ovivax,
P. ovale
DHFR,
Cytochrome b
Schizont in blood
stage
Halofantrine P. falciparum DHFR,
Cytochrome b
Blood stage
Lumefantrine P. falciparum DHFR,
Cytochrome b
Blood stage
Pyrimethamine P.
falciparum,
P. vivax
DHFR,
Cytochrome b
Blood stage by
stopping DNA
synthesis in
parasites
Cycloguanil P. falciparum DHFR,
Cytochrome b
Schizonts in blood
stage in children
Chlorocycloguanil P. falciparum DHFR,
Cytochrome b
Schizonts in blood
stage in children
Atovaquone P. falciparum DHFR,
Cytochrome b
Asexual and sexual
blood stage. Used
for prophylaxis
Sulfonamide
(Fancidar)
P. falciparum DHPS Schizonts and
asexual blood
stages. Also used for

11
chemoprophylaxis
Quinine Drug
resistant P.
falciparum
DHFR Blood stage Thai border,
Myanmar
Artemisinin
(Qinghaosu)
P.
falciparum,
P. vivax,
P. ovale,
P. marlariae,
P. knowlesi
Asexual and
gametocytes in
blood stage.
Asia, Africa
Amodiaquine P. falciparum Blood stage
Clindamycin P. falciparum Schizonts in blood
stage, especially in
pregnant women
Tetracycline P. falciparum Blood stage
Doxycycline Drug
resistant P.
falciparum
Blood stage
Primaquone P. vivax,
P. Ovale,
P. falciparum
gametocytes
Liver hypnozoites,
schizont and
gametocytes in
blood stage
Sulfones P. falciparum DHPS Schizont and
asexual blood stage,
chemoprophilaxis
Rifampicin P.
falciparum,
P. vivax,
P. ovale,
P. marlariae
Liver and blood
stage
Fosmidomycin P.
falciparum,
P. vivax,
P. ovale,
P. marlariae
Liver and blood
stage

12
A summary of antimalarial drugs used and their targeted species, the targeted stage, mutation positions in
corresponding resistant allele’s and the regions where resistance in the drugs has been reported. Chloroquine
resistance transporter, Multidrug resistance p-glycoprotein pump, Dihydrofolate reductase, Dihydropteroate
synthase. Data was adapted from Bruce-Chwatt, 1981; Kappe et al., 2010; Lallo et al., 2007; Suh et al., 2004;
Peterson et al., 1998; Kublin et al., 2003; D’Alessandro et al., 2013.
Drug resistance in malaria has been associated with protein transporters such as the
Chloroquine resistance transporter (CDR), Multidrug resistance p-glycoprotein pump (MDR),
dihydrofolate reductase (DHFR), dihydropteroate synthase (DHPS), cytochrome b of
different species against different antimalarials as shown in Table 1.3 (Bruce-Chwatt, 1981;
Kappe et al., 2010; Lallo et al., 2007; Suh et al., 2004; Peterson et al., 1998; Kublin et al.,
2003; D’Alessandro et al., 2013). Table 1.3 shows the different types of drugs used to treat
malaria, the type of Plasmodium species they target, the stage targeted and resistance that
has been reported on the drug with its corresponding mutation in the resistant allele.
Figure 1.3 A time course of merozoite invasion of the erythrocyte. A cellular overview is given with
associated timing of organelle secretion and key mechanistic or signalling steps listed below. After apical
reorientation, the merozoite establishes a tight junction that is marked by RON4 and AMA1. The tight junction is
ultimately connected to the actomyosin motor, although the exact nature of this has yet to be established. As the
tight junction moves across the merozoite surface, proteins are shed into the supernatant through the activity of
proteases such as ROM4, ROM1, SUB1, and SUB2. The parasitophorous vacuole and membrane are formed
primarily from the rhoptries, although some red blood cell membrane components are included, which expel their
contents, forming the space into which the parasite can move under the action of the actomyosin motor. Once the
tight junction reaches the posterior end of the parasite, the membranes seal by an as yet unknown mechanism.
Adapted from Cowman et al, 2012.
To combat widespread resistance against malaria drugs, the WHO recommended the use of
Artemisinin-based combination treatment (ACT). ACT has reduced the incidence of P.
falciparum (Nosten et al., 2000).

13
As a result of high prevalence of malaria drug resistance to antimalarial treatment, there is a
great need for diagnostic testing that is fast, accurate, reliable and that can be used to
monitor treatment (Gupta et al., 2015).
1.8 Diagnosis of malaria in the human host
Malaria diagnosis mostly targets the erythrocytic (blood) stage of parasite growth (Bannister
el al., 2000; Parra et al., 1991; Calderwood et al., 2007; Beere & Green, 2001; Desakorn et
al., 2005; Howard et al., 1986). The erythrocytic stage begins with the merozoites either from
the exoerythrocytic stage or from another erythrocytic stage infecting fresh red blood cells as
shown in Figure 1. 3.
This stage has high levels of parasitaemia (Table 1.2) and is associated with the symptoms
of malaria (Miller et al., 2002; Antia et al., 2008; Miller et al., 1994). The parasite changes its
morphology as it changes from one stage to another as depicted in Figure 1.4. These
stages can be identified using a microscope and appropriate stain (Moody, 2002). As the
ring stage develops and grow asexually, haemozoin begins to appear. The gametocytes of
the parasite are found in the peripheral blood for several days after their release (Fujioka
and Aikowa, 2002). Other methods of diagnosis make use of the presence of specific
proteins released during the erythrocytic stage, associated with the parasite as described
later.
1.9 How to measure the performance of diagnostic tests
Most malaria endemic countries are poor. In these countries the choice of the diagnostic
method used is often based on the available skilled labour, presence or absence of
electricity, easy use and interpretation of results (Wongsrhrichanalai et al., 2007). A criterion
was developed to compare the performance of different tests. The Gold standard being
microscopy (WHO, 1999; Mouatcho and Goldring, 2013, Murray et al., 2008). The criteria
use specificity, sensitivity and limit of detection (Bharti et al., 2008, Murray et al., 2008).
Specificity is how accurate a method is in identifying the infecting specie of Plasmodium.
Sensitivity refers to the ability by the test method to detect infection out of a total number of
positive and negative samples. Limit of detection (LOD) refers to minimum number of
parasites per microliter that can be detected by the test (Bharti et al., 2008, Murray et al.,
2008).
1.10 Methods of malaria diagnosis
Diagnosis of malaria in the blood of patients involves identification of Plasmodial DNA,
proteins and/or antigens and antigen products in the blood (Conroy et al., 2009). Some

14
methods were developed in which malaria infections were identified in the urine and saliva of
patients (Buppan et al., 2010; Nwakanama et al., 2009; Sutherland and Hallet, 2009).
Figure 1.4 Erythrocytic stages of malaria parasite development. The data was described by Cowman et al.,
2012; Bannister et al., 2003; Bannister et al., 2000.The ring stage lasts about 0-5 hr, early trophozoite 10-20 hr,
late trophozoite 10-20 hr, schizont > 40 hr. After several cycles of erythrocytic development male and female
gametocytes are formed. The rupture of schizonts releases new merozoites and haemozoin.
1.10.1 Clinical diagnosis
During the erythrocytic stage of malaria, patients develop clinical symptoms of
malaria such as fever, headaches, chills and sweating that are associated with the rupture of
the schizonts (Miller et al., 1994; Antia et al., 2008). The parasitaemia, erythrocytic cycle and
the incubation time of each infecting species has been detailed in Table 1.2. Other
symptoms manifested during malaria include acute respiratory distress, jaundice, renal
failure, coma and vomiting (Das, 2008; Wilairatana et al., 2013). Most tropical diseases,
especially the mosquito vector borne diseases such as dengue share common symptoms
like fever (Kallander et al., 2004) which leads to mis-diagnosis of malaria (Perkins and Bell,
2008; Gwer et al., 2007). Presumptive diagnosis is reported to have reduced mortality
(Kidane and Morrow, 2000), but can also lead to development of drug resistant strains of
parasite due to overuse of antimalarials (Murray et al., 2008).
1.10.2 Diagnosis of malaria with microscopy
Male gametocyte
Female gametocyte

15
In 1880, Charles Laveran visualised the protozoan parasite that causes malaria in a blood
smear under a microscope (Sutherland and Hallet, 2009; Cox, 2010; Laveran, 1881). In
1891, Dimitri Romanowsky accidentally discovered that methylene blue eosin stains the
parasite nucleus red and cytoplasm blue (Garnham, 1966) which became the basis of
staining blood of infected patients in thin and thick films of patient blood (Sutherland and
Hallet, 2009). Microscopy makes use of the fact that the mature RBCs do not contain a
nucleus (Moody, 2002; Suh et al., 2004). The eosin dye, therefore, stains the parasite DNA
making the parasite visible. Thin blood films of parasitised blood are fixed by methanol and
stained with diluted Giemsa or Wright’s stain (Moody, 2002). Because the parasite is fixed in
a monolayer of peripheral blood cells, identification of parasite morphology is possible, and
parasites can be enumerated and the species of malaria identified. Thick blood films have
many layers of RBC on a small surface stained with Field’s or Wrights stain without fixation.
This method has greater sensitivity than a thin film, and can detect 50 parasites/µl of blood.
It is used for detecting low numbers of parasites and the reappearance of circulating
parasites during recrudescence or relapse as observed in P. vivax and P. ovale infections
(Moody et al., 2002).
1.10.3 Detecting malaria with fluorescence microscopy
Fluorescence microscopy uses fluorescent dyes that have an affinity for nucleic acid
molecules in the parasite nucleus. Commonly used dyes include acridine orange (AO) (Gaye
et al., 1999; Kawamoto et al., 1991a, Kawamoto et al., 1991b; Lowe et al., 1996) and AO in
the quantitative buffy coat system (QBC) (Baird et al., 1992; Clendeman et al., 1995, Craig
and Sharp, 1997), Benzothiocarboxypurine (BCP) (Makler et al., 1991; Cooke et al., 1992)
and Rhodamine-123 (Srinavasan et al., 2000). When stained with dyes, the nucleus
fluoresces strongly under UV light at an appropriate wavelength.
Figure1.5 Trophozoites of P. falciparum stained with AO in the QBC fluorescence method. The figure was
taken from Moody, 2002.

16
Rodamine123 is used to access the viability state of parasites, because it is taken up only by
membranes of living cells (Srinavasan et al., 2000; Makler et al., 1991). Another fluorescent
method is the QBC which uses acridine orange after white blood cells (WBC) and platelets
have been separated (Baird et al., 1992), leaving the parasite to settle below the layer of
cells as shown in Figure 1.5. Alternatively BCP is applied directly to lysed blood suspension
or to unfixed dry blood film and stains the nucleic acid of living P. falciparum parasite as
shown in Figure 1.6. A gold nanoparticle-based fluorescence immunoassay for malaria
antigen detection has been developed (Guirgis et al., 2011) and a method based on
fluorescence spectra of a set of blood plasma biomolecules such as tyrosine, tryptophan,
nicotinamide adenine dinucleotide (NAD), flavin adenine dinucleotide (FAD) and red blood
cells-associated porphyrin is under development (Masilamani et al., 2014).
Figure 1.6 Trophozoites of P. falciparum stained with benzothiocarboxypurine (BCP) in the fluorescence
method. The figure was taken from Moody, 2002.
1.10.4 Colorimetric detection of malaria in patients using immunomagnetic or nano-
particle capture
Antibodies against a biomarker for malaria such as parasite LDH have been couple to
magnetic beads and used to measure enzyme activity, (Markwalter et al., 2015) or HRPII
interacton with gold nan-particles (Gulka et al., 2015). In the reaction, PLDH in the infected
lysed blood sample oxidises lactate to pyruvate, while reducing the cofactor acetylpyridine
adenine dinucleotide (APAD+) to acetylpyridine adenine dinucleotide hydrogenate (APADH).
The APADH in turn reduces a yellow tetrazolium dye nitro-blue tetrazolium (NBT), to a blue
compound (diformazan) with the assistance of phenazine ethosulfate (PES). The reaction is
measured at 650 nm (Makler et al., 2004; Makler and Hinrichs, 1993; Makler et al., 1998).
Limit of detection (LOD) is as low as 21 parasites/µl. Advantages of PLDH is that PLDH is
conserved across all five species of Plasmodium known to infect humans (Makler et al.,

17
2004), PLDH activity is lost within 24 hrs post treatment and, therefore, can be used in the
management of malaria and measuring drug susceptibility (Markwalter et al., 2015). Another
magneto-colorimetric method uses the detection of malaria pigment hemozoin in the
intraerythrocytic stage (Orban et al., 2016). Malaria parasites break down haemoglobin in
the food vacuole as a source of amino acids. This releases free haematin a toxic substance
which inhibits parasite enzyme activity and releases free radicals (Bannister et al., 2000;
Olszewsk et al., 2011). The parasite, therefore, polymerises haematin to haemozoin, which
begins to appear in the late ring stage as a brown pigment (Dossert et al., 2009). The LOD
of 50 parasites/µl was obtained which exceeded that of RDTs and competes with the
threshold achievable by light microscopic observation of blood smears. Another potential
colorimetric method uses Cu2+ peroxidase-catalytic activity, which can catalyse H2O2-
mediated oxidation of peroxidase substrate and obtain the oxidation product colour change
(Zheng et al., 2016; Xianyu et al., 2013). This method has the potential to detect many
malarial proteins that interact with Cu2+, such as HRPII proteins.
1.10.5 Detecting malaria with the polymerase chain reaction (PCR)
The polymerase chain reaction (PCR) amplifies and detects specific sequences of malaria
parasite nucleic acid (DNA or RNA) in whole blood lysates. A number of PCR assays have
been developed. Some methods use sequences coding for small subunit ribosomal RNA
(ssrRNA) (Snounou et al., 1993), 18S rRNA (Echeverry et al., 2016; Kawamoto et al., 1996;
Gunderson et al., 1987; Water, 1994), sequences coding for specific genes such as
dihydrofolate reductase-thymidylate synthase (DHFR-TS) (Wataya et al., 1993; Wataya et
al., 1991), direct PCR combined with a rapid readout system, nucleic acid lateral flow
immunoassay (Mens et al., 2012), amplified Plasmodium DNA probed with a specific DNA
probe (Barket et al., 1992). A single-step direct-PCR uses the cytochrome oxidase III gene
(COX-III) to detect microscopic and submicroscopic malaria infections in humans (Echeverry
et al., 2016). Some methods use species-specific fluorescein such as 4',6-diamidino-2-
phenylindole (DAPI) or radio labelled probes for detection of P. vivax DNA on a microscope
that uses a rechargeable battery (Sethabutr et al., 1992). PCR has high sensitivity with a
LOD of < 5 parasites/µl of blood and is species specific (Snounou et al., 1993). However,
PCR requires highly skilled labour, electricity, very expensive equipment and reagents.
Investigations showed that disappearance of parasite P. falciparum using PCR was
achieved for a median 144 hrs compared to 66 hrs for microscopy (Kain et al., 1994) and
that the DNA of non-viable parasites may be detected from circulating blood (Srinavasan et
al., 2000).
18
1.10.6 Diagnosis of malaria with loop-mediated isothermal amplification (LAMP)
Loop-mediated isothermal amplification (LAMP) was described as a novel DNA amplification
method by Notomi et al, 2000.LAMP is an isothermic nucleic acid amplification using four
different primers and a polymerase to identify six distinct regions on the target gene.
Intensive amplification leads to accumulation of magnesium pyrophosphate, which turns the
solution turbid, and this turbidity is visible to the naked eye or can be measured using a
turbidity meter (Notomi et al., 2000). Poon et al, (2006) first reported the use of LAMP for the
diagnosis of clinical malaria caused by P. falciparum.Han et al., (2007) designed primers that
target 18S rRNA gene in a genus- and species-specific LAMP method that detected four
Plasmodium species. Goto et al, 2009 introduced the concept of pre-addition of
hydroxylnaphthol blue (HNB) as a cheap and easily visible dye in the reaction mixture that
does not inhibit the amplification of target nucleic acid. The use of 18S rRNA as a target of
P. falciparum in whole blood samples for the diagnosis of clinical malaria has been used
recently (Mohon et al., 2014; Gupta et al., 2016). This method has also been used to detect
other parasitic diseases such as visceral leishmaniasis (Khan et al., 2012). LAMP has been
reported to have detected low-density malaria parasites in Zanzibar (Cooke et al., 2015).
Two LAMP assays have been developed for use in detecting P. knowlesi which is difficult to
identify with a microscope and RDTs (Jeremiah et al., 2014). One of the problems
associated with LAMP is DNA contamination (Cooke et al., 2015).
1.10.7 DNA aptamers used to diagnose malaria
DNA aptamers are specific oligonucleotides, peptides or chemical molecules that bind
specifically to target DNA. DNA aptamers specific for a malaria biomarker can be used to
diagnose malaria (Godonoga et al., 2016). Some DNA aptamers can be tethered with a
capture enzyme where the product can be measured colorimetrically (Dirkzwager et al.,
2015). . Jain et al., (2016a) used a novel ssDNA developed through systematic evolution of
ligands by exponential enrichment (SELEX) to detect PfLDH. Aptamers have several
advantages over antibodies such as, ease of chemical synthesis, thermal stability and
reduced cost (Cho et al., 2009). Jain et al., (2016b) developed a 90 mer ssDNA aptamer
against PfLDH.
1.10.8 Antibody based diagnosis of malaria
Enzyme-linked immunosorbent assay (ELISA) is based on the use of specific antibodies to
capture target antigens in solution that is accompanied by a colour change. Antigens specific
for malaria parasites have been used in ELISA (Wongsrhrichanalai et al., 2007; Spencer et
al., 1979; Inoue et al., 2013; D’Allessandro et al., 2013; Sousa et al., 2014; Piper et al.,

19
1999). ELISA can also be used to detect gametocytes in the asexual blood stage
(D’Allessandro et al., 2013). Antibodies can be used to detect malaria antigens using an
indirect immunofluorescence antibody assay (IFA) (Sulzer et al., 1969; Wongsrhrichanali et
al., 2007). Another test, the Latex agglutination assay is based on specific agglutination of
sensitive polystyrene particles that contain carboxylic acid with antigen or antibody
molecules in the presence of corresponding antibody or antigen, respectively, in human
plasma (Polpanich et al., 2007).
Malaria antigens can be detected in the serum of infected blood using ELISA or IFA based
on the presence of antibodies against malaria proteins like MSP-1 (She et al., 2007; Doderer
et al., 2007). These antibodies in serum may persist in blood for longer periods (Makler et
al., 1998) and as such may not detect a current infection.
1.10.9 Flow cytometry
Flow cytometry uses fluorescent dyes such as Hoechst 33258 to detect malaria parasites
and monitor antimalarial drug sensitivity (Woodrow et al., 2015; Van-Vianen et al, 1993;
Hanscheid, 1999). A laser flow cytometry system may detect the malaria pigment hemozoin
in monocytes (Grobusch et al., 2003; Wongchotigul et al., 2004; Shapiro & Mandy, 2007) or
detect stained P. falciparum DNA at different stages using SYBR Green I (Izumiyama et
al., 2009). Hemozoin within the phagocytes can be detected by depolarisation of laser light
as cells pass through a flow cytometer (Padial et al., 2005). Though flow cytometry offers
automated counts of parasitaemias, this is offset by low sensitivity due to background noise
(Janse & Van-Vianen, 1994).
1.11 Rapid diagnostic tests
The WHO recognised the urgent need for a new, simple, quick, accurate and cost effective
diagnostic test for the detection of malaria parasites to overcome the deficiencies of using
microscopy (WHO, 2000). This led to the increase in the use of RDTs for malaria detection,
as affected regions lack electricity and skilled manpower required to do microscopic
examinations (Bell et al., 2006; Tangpukdee et al., 2009). The use of RDT is quick, requires
basic skills and does not require electricity. Although most RDTs target P. falciparum specific
proteins such as histidine rich protein II (HRPII) (Leow et al., 2014; Verma et al., 2014;
Laurent et al., 2010; Ho et al., 2014), other RDTs target lactate dehydrogenase (LDH) (Shin
et al., 2013; Otsuki et al., 2015; Miao et al., 2013; Brown et al., 2004) or both HRPII and LDH
(Bharti et al., 2008). Other proteins targeted as antigens include aldolase
(Wongsrhrichanalai et al., 2007), phosphoethanolamine N-methyltransferase (PMT) (Pessi
et al., 2004) and heat shock protein 70-1. Recently a new RDT for detecting P. knowlesi has

20
been developed (McCutchan et al., 2008). Many RDTs on the market are used to diagnose
P. falciparum only (Lee et al., 2008; Park et al., 2006; Kim et al., 2008).
1.11.1 How RDTs work
RDTs use a chromatographic nitrocellulose membrane strip as a solid phase upon which a
lysed infected blood sample moves by capillary action. This strip is fixed with antibodies at a
capture point coupled to colloidal gold-nanoparticles against a Plasmodium antigen epitope.
To capture the antigen in the infected blood, the antibodies on strip bind to the antigen and
produce a colour change as shown in Figure 1.7.
A second capture point with non-specific antibodies conjugated with colloidal gold nan-
particles against a protein such as human serum albumin (HSA) are fixed at a point further
than the capture point to act as a control that shows the test works (Makler et al., 1998;
Murray et al., 2008) as shown in Figure 1.7.
Figure 1.7 Sample test line configurations on commercial RDTs that detect malaria and their result
interpretation. Taken from Wongsrhrichanalai et al., 2007.
There are more than 86 commercially available RDTs for malaria (Tangpukdee et al., 2009).
Figure 1.7 also shows how blood with mixed infection samples are electrophoresed and
interpreted on an HRPII/aldolase RDT (Wongsrhrichanalai et al., 2007).
1.11.2 Why RDTs need to be improved

21
Rapid diagnostic tests have shown problems that relate to the device itself and problems
associated with the antigen/antibody targeted for detection. In order to improve performance
of RDTs, problems associated with transport, storage and durability of antibodies used in
RDT have to be understood.
1.11.3 False negative or invalid results caused by high temperature and humidity
RDTs can be damaged by extreme temperatures of over 40°C and humidity (Jorgenesen et
al., 2006; Chiodini et al., 2007). Most RDTs are used in tropical regions where temperatures
are over 40°C (Jorgensen et al., 2006). LDH based RDT were found to be more thermal
stable than HRPII based RDTs (Chiodini et al., 2007). This may lead to the test showing a
positive result without a confirmatory test line, making the result a false negative or invalid
test (Wongsrhrichanalai et al., 2007). The need to transport RDTs to field clinics using
refrigerated transport was recommended (Wongsrhrichanalai et al., 2007).
1.11.4 False positive test due to device
Approved buffers sometimes runout or are lost in the field. Therefore, use of distilled water
or tap water as a substitute of approved buffers has shown to yield false positive results
(Gillet et al., 2010). Now RDTs supply buffers in each box containing RDTs.
1.11.5 Antigen based diagnostic problems
A RDT may give false results if there are factors that interfere with antibodies to detect
corresponding epitopes in the antigen.
1.11.6 False negative results
Gene deletion and single nucleotide polymorphism (SNP) in the DNA of P. falciparum HRPII
has been reported in Peru and caused false negative results in HRPII-based RDT tests
(Gamboa et al., 2010; Baker et al., 2010; Lee et al., 2006a, Solano et al., 2015; Okoth et al.,
2015). LDH has also shown to have SNPs in some isolates of P. vivax (Shin et al., 2013;
Cicek et al., 2013), though no false negative has been reported as a result. Low parasite
densities can also cause a false negative result (Palmer et al., 1998; Lee et al., 2007).
The prozone effect caused by excessive HRPII antigen concentration has resulted in false
negative tests in P. falciparum infected blood samples (Gillet et al., 2009; Ho et al., 2014; Ho
et al., 2015). LDH RDTs were not affected by the prozone effect.
1.11.7 False positive results

22
HRPII persists in blood for upto 28 days after parasite clearance. Therefore HRPII-based
RDTs may test positive in the absence of viable parasites (Iqbal et al., 2004; Tjitra et al.,
2001; Vakharia 1997; Kodisinghe et al., 1997; Humar et al., 1997). LDH and aldolase
antigens persist less than 2-7days (Iqbal et al., 2004; Ashley et al., 2009; Murray et al.,
2008; Markwalter et al., 2015) and can, therefore, be used to monitor the treatment of
malaria. LDH and aldolase are produced during gametocyte stages of the asexual
erythrocytic stage and, as such, low levels of these antigens may be present if the
gametocytes are not cleared in the blood of infected humans (Vakharia et al., 1997; Farcas
et al., 2003; Tjitra et al., 2001; Murray et al., 2008).
1.11.8 Rheumatoid factor
Rheumatoid factor can react with the antibodies employed in RDTs and give false positive
results for RDT (Mishra et al., 1999; Jelinek et al., 2001; Karbwang et al., 1996, Sing et al.,
2000, Iqbal et al., 2000; WHO, 2000). Rheumatoid factors are autoantibodies against the Fc
region of IgG and were found to react with the mouse IgG isotype monoclonal antibodies
often used in RDTs (Iqbal et al., 2000). The Fc portion of lgG molecules is made of a heavy
chain at the carboxyl termini involved in the activation of complement by binding effector
molecules or immune Fc receptors (Delves et al., 2006). Producing antibodies in chicken
can circumvent this problem as chicken antibodies are in form of lgY.
Other cross reaction were observed in LDH and aldolase based-RDTs in which P. vivax-
specific LDH based RDT cross reacted with and detected P. knowlesi (Kawai et al., 2009;
McCutchan et al., 2008).
1.12 Quality assurance of RDTs
In 2008, the WHO recommended a series of tests for RDTs to improve the quality of RDTs
and delivery of quality product (Wongsrhrichanalai et al., 2007). Among the initiatives
outlined were guidelines for testing RDTs, standardising manufacturing process and
distribution (Wongsrhrichanalai et al., 2007) and evidence of good manufacturing practise
(Bell et al., 2006). The WHO, working together with Foundation for Innovated New
Diagnostics (FIND), has established and offers a testing program to evaluate performance of
RDTs (WHO, 2009, 2010, 2011b; Mouatcho & Goldring, 2013). Positive controls have been
developed (Murray et al., 2008; Lon et al., 2005) to ensure RDT sensitivity is maintained
after delivery to the field (Lon et al., 2005; McMorrow et al., 2008).
1.13 Why improve malaria RDT?

23
The limit of detection (LOD) of current RDTs is about 50-100 parasites/µl (Tangpedkee et
al., 2009). Therefore, there is a possible need to look at alternative proteins so that detection
of malaria can be improved. This requires RDTs to detect <100 parasites/µl that act as
reservoirs (Hans et al., 2010; Miller et al., 1994; Hafalla et al., 2011). Identifying other
parasite antigens can be an added advantage. If these alternative antigen can be used to
detect viable parasite, clear in peripheral blood within a short period and are present in
higher concentration in the intraerythrocytic stage they, therefore, can be potential diagnostic
targets.
1.13.1 PfLDH as target antigen in malaria RDTs
Plasmodium LDH (PLDH) is a metabolic protein and is associated with a viable parasite
(Lang-Unnasch and Murphy, 1998; Vaidya and Mather, 2009; Brown et al., 2004). PLDH-
based RDTs reverted back to negative within 2-7 days after clearance of infection (Iqbal et
al., 2004; Murray et al., 2008; Markwalter et al., 2015). The presence of PLDH can be used
to measure a current infection. PLDH was found not to produce the prozone (Gillet et al.,
2009; Martin et al., 2009). Aldolashas little antigenic variation and single nucleotide
polymorphism, and has been found to show no false negative results (Lee et al., 2006b).
PLDH has a conserved catalytic residue involved in enzyme activity and shares > 90%
amino acid identity among Plasmodia species (Brown et al., 2004; Turgut-Balik et al., 2004).
Because PLDH is a conserved enzyme across all species and all malarial PLDH sequences
share common epitopes (Hurdayal et al., 2010) it can, therefore, be used to detect pan-
specific malaria (Makler and Hinrichin, 1993; Piper et al., 1999; Brown et al., 2004).
Differences in the P. falciparum, P. knwolesi and P. vivax LDH amino acid sequences are
present that can allowto differentiate between the among thesespecies (Hurdayal et al.,
2010; McCutchan et al., 2008; Piper et al., 2011). PLDH-based RDTs does not detect low
parasitaemias (Ashley et al., 2009, Abba et al., 2011, Kattenburg et al., 2011, Hendrisken et
al., 2011; Hopkins et al., 2008; Heutmekers et al., 2012).
1.13.2 PfHSP70-1 as target antigen in malaria RDTs
PfHSP70-1, a member of the heat shock protein family (HSPs), is induced in cells exposed
to sublethal heat shock. In 1984 Hugh Pelham suggested that the ability of HSP70 to
enhance the recovery of stressed cells was mediated by its ability to catalyse the assembly
of damaged ribosomal proteins (Pelham et al., 1984). Subsequently, research revealed that
such chaperoning function was characteristic of HSP70 proteins and that it was essential for
HSP70 mediated protection against stress (Sharma, 1992; Josh et al., 1992) that cause
protein denaturation as well as many of the newly discovered house-keeping roles of

24
constitutively expressed HSP70 in non-stressed cells. Heat shock is not the only stimulus
that can induce and alter the synthesis of HSPs. Exposure of cells to amino acid analogues
(Kelly and Schlesinger, 1978; Li and Laszlo, 1985), glucose analogues (Pouyssegur et al.,
1977), heavy metals (Levison et al., 1980), protein kinase C stimulator (Ding et al., 1996),
Ca2+ increasing agents (Ding et al., 1986), ischemia, sodium arsenate (Johnson et al., 1980),
microbial infections, nitric oxide, hormones and antibiotics induce the expression of HSPs.
HSPs in malaria parasites play important roles in parasite growth, development and survival
and are, therefore, important targets for diagnosis, anti-malarial vaccines and drug targets
(Archaya et al., 2007; Guirgis et al., 2012; Dat et al., 2000; Shonai et al., 2007; Calderwood
et al., 2007; Kumar et al., 1990). PfHsp70-1 was found to be abundantly expressed in the
asexual stages at 37oC and is also induced and translocated to the nucleus upon heat shock
at 41oC (Beere and Green, 2001; Calderwood et al., 2007; Bindu et al., 1992; Singh, 2004).
Studies have shown the effect of various body temperatures (close to malaria fever) on the
P. falciparum viability, growth and expression of the PfHSP70-1 gene (Bindu et al., 1992).
PfHSP70-1 is abundantly available as soluble cytosolic proteins during the intra-erythrocytic
stage of parasite development after fever (Bindu et al., 1992; Bottger et al., 2012; Beere
and Green, 2001, Ardeshir et al., 1987; Calderwood et al., 2007; Pavithra et al., 2004) and,
therefore, can be used as an alternative to HRPII, PLDH and aldolase in RDTs. Previously,
PfHSP70-1 was detected by antibodies in infected blood during the intra-erythrocytic stage
(Ardeshir et al., 1987; Zhang et al., 2001). Other studies have shown that PfHSP70-1 is a
good target for detection in blood samples during the intra-erythrocytic stage (Kumar et al.,
1990; Tatu et al., 2007; Dat et al., 2000; Haldar et al., 2007). The P. falciparum heat shock
protein is well conserved across all plasmodia species and was found to be immunogenic in
infected humans (Mattei et al., 1989) and experimentally infected monkeys (Gysin et al.,
1982). Patients’ sera and T-cells collected from malaria endemic areas showed increased
activity to PfHSP70-1 in individuals already exposed to malaria (Duboi et al., 1987). PfHSP
70-1 is produced by sporozoite (Tsuji et al., 1994), hepatic (Renia et al., 1990) and
gametocyte stages.
1.14 Aims and objectives of the current study
RDTs currently in use have shortcomings. These shortcomings include the lack of thermal
stability, lower sensitivity caused by high limit of detection and cross reactivity with
rheumatoid factor (Mishra et al., 1999; Jelinek et al., 2001; Karbwang et al., 1996; Sing et
al., 2000; Iqbal et al., 2000; WHO, 2000).
The first aim of this study was to optimise the expression and purification of PfLDH and
PfHSP70-1 to produce soluble proteins for use in producing polyclonal and peptide-specific

25
antibodies in chicken and test the antibodies in detecting the expressed protein and the
native protein in ELISA, western blots and dip stick format. The antibodies produced in
chicken do not cross react with rheumatoid factors as they lack the Fc portion to which
rheumatoid factors bind.
PfHSP70-1 was reported in literature as being expressed in higher amounts during the
intraerythrocytic stage. The second aim was, therefore, to assess whether the use of
PfHSP70-1 would improve the LOD below 50 parasites/µl and compare it with that of PfLDH.
The objectives were:
1) To optimise the recombinant expression and purification of PfLDH and PfHSP70-1.
2) To identify immunogenic peptides with higher surface probability in order to produce
anti-peptide antibodies in chicken.
3) To identify possible post-translation modifications that may affect the activity of
PfLDH and PfHSP70-1 in the native protein.

26
Chapter 2
Materials and Methods
This chapter describes the techniques used in this study. The techniques include
biological, biochemical, bioinformatical and immunochemical methods. The chapter also lists
the reagents used in the experiments and the source of the reagents.
2.1 Materials
2.1.1 Equipment
Beckman CoulterTM AllegraTM X-22R centrifuge, Beckman CoulterTM AvantiTM J-26XPI
centrifuge were purchased from Beckman Coulter (California, USA). Labnet SpectrafugeTM
16M Brushless Laboratory Microcentrifuge was purchased from Labnet International Inc
(New Jersey, USA). Shimadzu UV-1800 UV spectrophometer, Shimadzu CPS- Controller
were purchased from (Japan). MRC Benchtop shaker incubator 300 x 400 mm, 250 rpm,
70°C and MRC Refrigerated shaker incubator 960 x 600 mm, 250 rpm, 0-60°C were
purchased from MRC (London, UK). Another orbital shaking incubator was purchased from
New Brunswick Scientific (New Jersey, USA). Small volume shaker LabnetTM Pro 30
Laboratory reciprocal shaker was purchased from Labnet (New Jersey, USA). A VirosonicTM
cell disruptor using a rod was purchased from VirTis (New York, USA) and a Shalom
Laboratory Supplies c.c Utrasonic cell disruptor that uses water was purchased from
advanced Labs (Durban, South Africa). Mini Protean IITM vertical SDS-PAGE unit, Poly
Prep® system for electrophoresing polyacrylamide gels. DNR Bio-imaging system MiniBis
Pro was purchased from Bio-Imaging Systems (USA) for gel imaging and the Vacutec G-
BOX Syngene system was purchased from Syngene (Maryland, USA) for western and
chemiluminescence imaging. The pH meter microprocessor was purchased from Hanna

27
Instruments (Durban, South Africa). Magnetic stirrer Veep was purchased from Fisher
Scientific (USA) and the Corning hot plate stirrer PC-351 was purchased from Sigma-Aldrich
(Steinheim, Germany). An Edward 5A.C. pump was purchased from GEC Machines Ltd.
(Newcastle, UK) and Micro tube peristaltic pump MP-3 was purchased from Rikakikai Co.
Ltd (Tokyo, Japan), NanoDrop 2000 spectrophotometer (Thermo Scientific, USA).
2.1.2 Reagents
Unstained molecular weight marker with sizes ranging from: 116-14.4 kDa,
dithiothreitol (DTT) molecular biology grade, restriction enzymes, 10 mM dNTP mix, DNA
MassRulerTM were all purchased from Fermentas (Vilinius, Lithuania). Tween-20, yeast
extract, Rabbit albumin, kanamycin, penicillin, Ponceau S, Coomassie Brilliant Blue R-250,
Coomassie Brilliant Blue G-250, bisacrylamide, acrylamide, N,N,N’,N’-
tetramethylethylenediamine (TEMED), bromophenol blue, 4-chloro-naphthol, ethidium
bromide (EtBr), triton X-100, β-mercaptoethanol, isopropyl β-D-1- thiogalactopyranoside
(IPTG), tryptone, Freud’s complete adjuvant (FCA), Freud’s incomplete adjuvant (FIA),
sodium azide, ammonium persulphate, kanamycin sulphate analytical grade, ampicillin
analytical grade, were all purchased from Sigma- Aldrich Fluka (Steinheim, Germany).
Sodium chloride, potassium dihydrogen orthophosphate, dipotassium hydrogen
orthophosphate, potassium chloride, agar bacteriological, D+ glucose, sodium dihydrogen
orthophosphate, hydrogen peroxide, sucrose, all types of polyethylene glycol, glycine, were
all purchased from Merck (Germany). Agarose for DNA gel electrophoresis, agarose for
protein gel electrophoresis were purchased from Whiteman Scientific (Rockland, USA).
Dimethyl sulfoxide (DMSO) was purchased from Capital Laboratory supplies (New Germany,
RSA). Ninety-six well culture plates and immunotubes were from NUNC (Roskilde,
Denmark). The anti-M13 monoclonal antibody was from Thermo Scientific (Waltham, MA,
USA) and the goat anti-mouse-HRPO secondary antibody was from Jackson
Immunochemicals (Pennsylvania, USA).
2.2 Molecular biology techniques
These are the methods that were used to clone, transform, express and isolate the
recombinant proteins used in this study. The expression vector expressing recombinant
Plasmodium falciparum lactate dehydrogenase (rPfLDH) was a kind gift from Professor R.L.
Brady, University of Bristol, UK. Recombinant Plasmodium falciparum heat shock protein 70-
1 (rPfHsp70-1) was kindly provided by Professor A. Shonhai, University of Venda, SA.
2. 2. 1 Expression plasmids and plasmid evaluation

28
2.2.1.1 The pKK233-3 plasmid
The vector map shows the cleavage sites for inserting the desired coding gene
sequences and the ampicillin resistance marker in Figure 2.1. PfLDH sequence was inserted
between the PstI and EcoRI restriction sites. The size of the vector without an insert is 4.6
kb.
2.2.1.2 The pQE30 plasmid
The plasmid used for the expression of His6 recombinant Plasmodium falciparum Heat
shock protein 70-1 (His6-rPfHsp70-1) was pQE30 which was used to transform the
Escherichia coli BL21 (DE3) expression host. The pQE30 plasmid was co-transformed with
the RIG plasmid. The RIG plasmid codes tRNA for rare codons during protein synthesis in E.
coli namely: Arg, Ile and Gly and thus the name RIG (Baca and Hol, 2000). The plasmid
vector map is shown in Figure 2.2.

29
Figure 2.1 pKK233-3 vector map expressing PfLDH.
The pKK233-3 plasmid used for the expression of His6 recombinant Plasmodium falciparum lactate
dehydrogenase (His6-rPfLDH) which was transformed into an Escherichia coli BL21 (DE3) expression host.
Restriction and endonuclease sites and position of the ampicillin resistance gene are shown.

30
Figure 2.2 Map of the pQE30/PfHSP70-1 plasmid. Restriction maps of pQE30/PfHSP70-1 indicating
the BamHI and HindIII restriction sites and the PfHSP70-1 gene insert.
PfHSP70-1 was inserted between BamHI and HindIII sites in pQE30 plasmid as shown in
Figure 2.2.The size of the plasmid vector without insert is 5459 base pairs.
2.2.1.3 Agarose gel electrophoresis
A 1% (w/v) agarose gel (0.3 g agarose was dissolved in 30 ml TAE buffer (2 M Tris,
0.95 M glacial acetic acid, 50 mM EDTA, pH 8.0)) was prepared and heated in a microwave
until the agarose was melted. 2 μl of ethidium bromide (1% (w/v)) was added. The solution
was poured into a casting tray with a dimension of (7 x 6.5 cm) and left to solidify at RT. A
volume of 5 μl sample was mixed with 1 μl of loading dye (0.25% (w/v) bromophenol blue
and 40% (w/v) sucrose in TAE buffer). A volume of 3 μl of DNA ladder and 12 μl of sample
were used to load the lanes. The gels were electrophoresed at 70V for about 45 min in TAE
buffer containing ethidium bromide. Gels were visualised under UV light and images of gels
were taken using VersaDocTM imaging system. Sizes of the unknown bands were calculated
from the log of relative distance travelled from start point to the band of DNA and compared
to the molecular mass standards.
2.2.1.4 Plasmid isolation
A volume of 5 ml of an overnight culture (16 hrs) grown in LB media supplemented
with 10 μl of 100 μg/ml ampicillin with 200 rpm shaking at 37°C was centrifuged at 6800xg,
4°C, 5 min and the supernatant was discarded. The plasmid was isolated from the pellet
following the instructions in the GeneJET miniprep kit.

31
2.2.1.5 Restriction digestion
Restriction digestion was performed on plasmid DNA. A single restriction and double
restriction digestion was done. The A280/A230 ratio was determined to establish the purity of
DNA.
A single restriction digest of plasmid DNA was used. The reaction mixture of 0.5μl of
restriction endonuclease, 2 μl of 10 x digestion buffer and milliQ water to a final volume of
50 μl. For double digestion using BamHI and HindIII, the following reaction mixture was
used; 1 μg of plasmid DNA, the amount of restriction enzyme was chosen according to the
selected buffer chosen using the Fermentas restriction endonuclease buffers and the
mixture was made up to 50 μl using milliQ water. The reaction was done at 37°C for 2 hrs.
2.2.2 Expression of recombinant proteins in various growth media
From a glycerol stock a 3-way streak on an LB agar plate [1% (w/v) tryptone, 0.5%
(w/v) yeast extract, 0.5% NaCl, 0.2% (w/v) glucose, and 1.5% (w/v) bacto-agar] was done
and incubated overnight at 37°C. A single colony was picked and inoculated into 5 ml of
either fresh LB [1% (w/v) tryptone, 0.5% (w/v) yeast extract, 0.5% (w/v) NaCl, and 0.2%
(w/v) glucose] or TB [1.2% (w/v) tryptone, 2.4% (w/v) yeast extract, 0.4% (v/v) glycerol,
0.23% (w/v) KH2PO4, 1.25% (w/v) K2HPO4] broth supplemented with 50 μg/ml ampicillin for
PfLDH and 100 μg/ml ampicillin for PfHSP70-1 or 34 μg/ml kanamycin for PfHSP70-1 and
left to incubate overnight at 37°C, with shaking at 200 rpm. These cultures were used to
inoculate large volumes of either LB or TB growth media at 1:10 or 1:100 dilutions of
overnight cultures or using a single starting colony supplemented with the appropriate
antibiotic. Cultures were left to incubate at 37°C or 25°C, with shaking at 200 rpm until OD600
of 0.5-0.6 for mid-log phase induction or 0.7 for induction after stationary phase. A
concentration of 0.3 mM IPTG was used for PfLDH and 1 mM for PfHSP70-1. IPTG Induced
expression was allowed to continue for 4 hrs after addition of IPTG. TB media was not
induced because it is self-inducing. Cultures grown in TB were left to incubate for 8 hrs. The
cultures were then centrifuged at 4000xg, 4°C, 10 min and the pellet was resuspended in 4%
original volume with appropriate buffer PBS pH 8.0 [0.8% (w/v) NaCl, 0.02% (w/v) KCl,
1.02% (w/v) Na2HPO4, 0.02% (w/v) KH2PO4] or 10 mM imidazole lysing buffer [0.6% (w/v)
NaH2PO4, 1.753% (w/v) NaCl, 0.068% (w/v) imidazole, and 0.02% NaN3] as required.
2.2.3 Lysis of bacterial cells
Lysis of the bacterial cells was accomplished through freeze and thaw, lysozyme
digestion, sonication or a combination of these methods. For freezing and thawing, liquid

32
nitrogen was used to freeze the bacterial pellet and cells were thawed at 37°C. The steps
were repeated three times. Lysozyme samples were prepared by addition of STET buffer [10
mM Tris-HCl, pH 8.0, 100 mM NaCl, 1 mM EDTA, 5% (v/v) Triton X-100] to the freshly
prepared lysozyme solution (10 mg of lysozyme dissolved in 1 ml in dH2O). The mixture was
vortexed and put in a water bath at 37°C for 30 min. Samples for small volumes were lysed 4
x 30 s with resting on ice using a box sonicator. Large sample volumes were lysed 4 x 30 s
on ice at 80 watts, 6 rms using a rod sonicator.
2.2.4 Affinity purification of PfLDH and PfHSP70-1 on Talon® (Co2+) resin
The insert in pKK233-3/PfLDH and pQE30/PfHSP70-1 plasmids are expressed
as proteins with an N-terminal poly-histidine (His6) tag. Poly-histidine has a high affinity for
Co2+ immobilised on resin. The polyhistidine-tagged recombinant proteins selectively bind to
the column during purification and are eluted with a high concentration of imidazole in the
elution buffer in a step wise method. Low concentrations of imidazole were incorporated in
the wash buffer to reduce the binding of contaminating proteins with low affinity for the Talon
resin.
A 10 ml of the clarified sample (from section 2. 2. 3) was added to the Talon® resin.
The resin was rocked gently at RT (25°C) or at 4°C overnight to allow the protein to bind to
the resin. The resin was centrifuge at 700xg for 5 min and the supernatant was carefully
removed. The resin was washed with 10 bed volumes of 10 mM imidazole wash buffer [10
mM imidazole, 50 mM NaH2PO4, 300 mM NaCl, 0.02% NaN3], centrifuged at 700xg for 5 min
and the supernatant discarded. The resin was resupended in one column volume of 10 mM
imidazole wash buffer and added to a column. The column was washed with 10 mM
imidazole until A280 of <0.02 was reached. The polyhistidine-tagged proteins were eluted by
adding 5 ml of 150 mM imidazole buffer (150 mM imidazole, 50 mM NaH2PO4, and 300 mM
NaCl, 0.02% NaN3), 250 mM imidazole buffer (250 mM imidazole, 50 mM NaH2PO4, 300 mM
NaCl, 0.02% NaN3) or gradient of 10 mM to 250 mM imidazole. Eluents were analysed by
absorbance at A280 nm. Samples from each step of the purification protocol were evaluated
by a 12.5% SDS-PAGE gel and a western blot. The Talon® resin was regenerated according
to manufacturer’s instruction.
2.2.5 Concentrating proteins by dialysis against polyethylene glycol 20 000 (PEG20000)
A dialysis bag (snake skin) with a molecular weight cut-off of 3, 500 Da was briefly
soaked in distilled water. Excess water and bubbles were squeezed out, and one end was
clamped. The protein sample solution was poured into the bag and the other end clamped.
The sample was surrounded by PEG20000 (Mr 20 000) at 4°C. Wet PEG20000 was changed
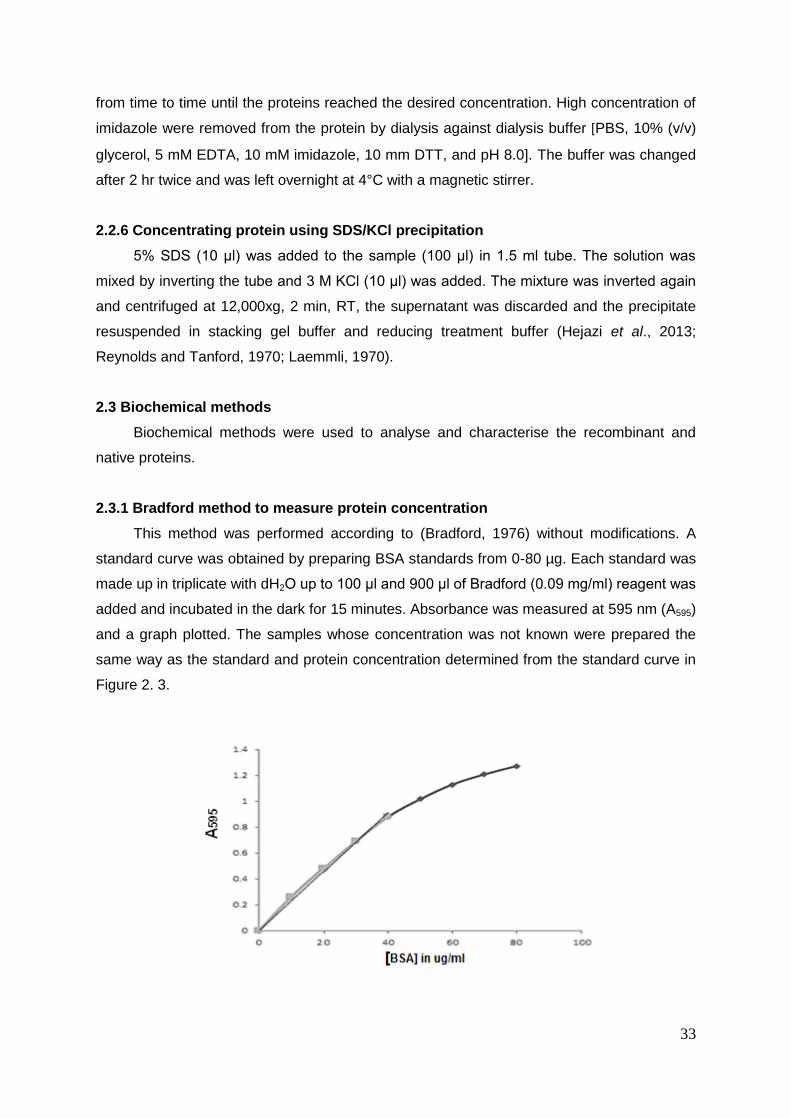
33
from time to time until the proteins reached the desired concentration. High concentration of
imidazole were removed from the protein by dialysis against dialysis buffer [PBS, 10% (v/v)
glycerol, 5 mM EDTA, 10 mM imidazole, 10 mm DTT, and pH 8.0]. The buffer was changed
after 2 hr twice and was left overnight at 4°C with a magnetic stirrer.
2.2.6 Concentrating protein using SDS/KCl precipitation
5% SDS (10 μl) was added to the sample (100 μl) in 1.5 ml tube. The solution was
mixed by inverting the tube and 3 M KCl (10 μl) was added. The mixture was inverted again
and centrifuged at 12,000xg, 2 min, RT, the supernatant was discarded and the precipitate
resuspended in stacking gel buffer and reducing treatment buffer (Hejazi et al., 2013;
Reynolds and Tanford, 1970; Laemmli, 1970).
2.3 Biochemical methods
Biochemical methods were used to analyse and characterise the recombinant and
native proteins.
2.3.1 Bradford method to measure protein concentration
This method was performed according to (Bradford, 1976) without modifications. A
standard curve was obtained by preparing BSA standards from 0-80 µg. Each standard was
made up in triplicate with dH2O up to 100 µl and 900 μl of Bradford (0.09 mg/ml) reagent was
added and incubated in the dark for 15 minutes. Absorbance was measured at 595 nm (A595)
and a graph plotted. The samples whose concentration was not known were prepared the
same way as the standard and protein concentration determined from the standard curve in
Figure 2. 3.

34
Figure 2. 3 Bradford standard curve to measure protein concentration. All values are the average of
triplicate readings. The area of the graph where there is a straight line was used to measure protein
concentration.
2.3.2 A280 determination of protein concentration
Samples were prepared to appropriate dilutions before measuring absorbance at
280 nm using a quartz cuvette in a Shimadzu UV-1800 spectrophotometer.
2.3.3 Measuring A280/A260 and A260/A230 using a Nano-drop spectrophotometer
Samples were measured according to the manufacturer’s instructions of the NanoDrop
2000 spectrophotometer. The measurements were done at 280, 260 and 230 nm to
determine the purity of proteins and the amount of contaminating nucleic acids.
2.3.4 Sodium dodecyl sulphate polyacrylamide gel electrophoresis
Sodium dodecyl sulphate polyacrylamide gel (SDS-PAGE) was used as described by
(Laemmli, 1970). The gel consists of a lattice made by cross linking of acrylamide with N, N’-
methylenebisacrylamide (bisacrylamide). The cross linking creates a sieve that separates
proteins according to size as smaller proteins are less impeded through the lattice.
According to Chart (1994) the size of the sieve can be altered by changing the ratio of
acrylamide to biscacrylamide to make different percentage gels. The proteins that contain
disulphide bonds are reduced by β-mercaptoethanol in the reducing buffer (Walker and
Rapley, 2002). Sodium dodecyl sulphate (SDS), an anionic detergent, is used to further
denature the proteins and covers the protein in an overall negative charge so that in an
electric field proteins are separated only based on size and not charge as they migrate
towards a positive electrode. The samples are also boiled for 5 minutes to denature the
proteins.
The appropriate separating and stacking gels were prepared according to Table 2.1.
Solution A [30% (w/v) acrylamide, 2.7% (w/v) bis-acrylamide]; Solution B [1.5 M Tris-HCl, pH
8.8]; Solution C [500 mM Tris-HCl, pH 6.8]; Solution D [10% (w/v) SDS); Solution E [10%
(m/v) ammonium persulfate]. Gels were set in a Bio-Rad Mini PROTEAN II® vertical slab
apparatus. Samples were prepared in 2 x reducing treatment buffer [125 mM Tris-HCl, 4%
(m/v) SDS, 20% (v/v) glycerol, 10% (v/v) 2-mercaptoethanol, 0.1% bromophenol blue, pH
6.8] in a ratio of 1:1, boiled for 5 min and loaded in the lanes. The gel was then placed in an
electrophoresis tank filled with tank buffer [250 mM Tris-HCl, 192 mM glycine, 0.1% (m/v)
SDS, pH 8.3] and electrophoresed at 20 mA per gel until the bromophenol blue was 0.5 cm

35
from the bottom of the gel. The gel was stained in coomassie brilliant blue R-250 [125%
(m/v) Coomassie Brilliant Blue R-250, 50% (v/v) methanol, 10% (v/v) acetic acid] for at least
4 hr and destained in destain solution I [50% (v/v) methanol, 10% (v/v) acetic acid] until
bands were clearly seen. The gels were left in destain solution II [7% (v/v) acetic acid, 5%
(v/v) methanol] to swell back to the original size. The size of the protein bands were
determined by extrapolation from a graph of log molecular weight of the molecular weight
standards electrophoresed on the same gel against relative distance travelled by the protein
(Rf values).
Table 2. 1 The ingredients to make different percentage acrylamide electrophoresis
gels.
Running gel % Stacking gel %
15* 12.5* 10* 7.5* 5** 4* 3**
A 0.5 0.42 0.33 0.25 0.17 0.13 0.1
B 0.25 0.25 0.25 0.25 0.25 0 0
C 0 0 0 0 0 0.25 0.25
D 0.01 0.01 0.01 0.01 0.01 0.01 0.01
E 0.005 0.005 0.005 0.005 0.005 0.005 0.005
dH2O 0.23 0.32 0.4 0.48 0.57 0.6 0.64
TEMED 0.0005 0.0005 0.0005 0.0005 0.0005 0.002 0.002
*refers to % gel to be prepared
% Acrylamide Separation range (kDa)
6 60 - 300
8 40 - 100
10 20 - 70
12 20 - 60
14 10 - 40
2.3.5 Western blot
Western blot is done after completion of SDS-PAGE technique described in section 2.
3. 4. The SDS-PAGE gel was soaked in blotting buffer [0.6% (w/v) Tris, 1.44% (w/v) glycine,
20% (v/v) methanol]. Electrophoretic transfer to nitrocellulose was carried out overnight at
40 mA. The nitrocellulose membrane was stained with Ponceau S [0.1% (m/v) Ponceau S,
1% (v/v) glacial acetic acid] to mark the molecular weight markers and removed with distilled

36
water containing a little NaOH. The gel was stained with Coomassie Brilliant Blue R-250 to
determine the efficiency of the blotting. The nitrocellulose membrane was rinsed with TBST
[0.24% (w/v) Tris, 1.17% (w/v) NaCl, and 0.05% (v/v) Tween-20] for 5 minutes. The
membrane was blocked with 5% (m/v) Elite low fat milk in TBST for 1 hr. The membrane
was washed in TBST 3 x 5 minutes and incubated with primary antibody 1:2000 in 0.5%
BSA-TBST for 2 hrs. The membrane was washed in TBST 3 x 5 minutes. Secondary
antibodies were prepared in 0.5% BSA-TBST at a dilution of 1:6000 and was incubated for 1
hr followed by 3 x 5 min washes in TBST. The nitrocellulose membrane was then immersed
in substrate solution (4-chloro-1-naphthol (2 ml), TBS (8 ml) and 30% H2O2 (4 μl)) and the
colour was allowed to develop in the dark for 10 - 30 minutes. The membrane was allowed
to dry before the picture was taken using a Vacutec G-Box Syngene system.
2.4 Bioinformatics
Algorithms were used in silico to predict the peptide epitopes for recombinant
PfHSP70-1 and the effect of certain post-translational modifications on the activity of the
native proteins as described in the section below.
2.4.1 Predict7TM
Predict7TM was used to predict immunogenic and soluble peptides in the primary
structure of proteins in order to raise antibodies against these peptides in chickens
(Carmenes et al., 1989). Graphs were generated based on four parameters; antigenicity
(Kolaskar and Tongaona, 1990), surface probability (Emini et al., 1985), flexibility (Karplus
and Shulz, 1985) and hydrophilicity (Parker et al., 1986). Peptides with potential
immunogenicity should be soluble and situated on the surface of proteins for easy interaction
with antibodies. However, not all predicted peptides are necessarily immunogenic.
The National Centre for Biotechnology Information (NCBI) (www.ncbi.org/) or plasmoDB
(www.plasmodb.org/) were used to obtain protein sequences.
2.4.2 Sequence alignments
The alignment of the primary structure of proteins and coding DNA were done using
ClustalW2 (www.ebi.ac.uk/Tools/msa/clustalW/). The protein sequences were either
obtained from PlasmoDB (www.plasmodb.org/) or the national centre for biotechnology
information (NCBI) (www.ncbi.org/).
2.4.3 The 3D crystal structure of PfLDH

37
The 3D structure of PfLDH was viewed using SwisPDB viewer software at spdv.vital-
it.ch/disclaim.html#.
2.4.4 Prediction of acetylation, phosphorylation, glycosylation and proteolytic sites
The prediction of potential acetylation of PfLDH and PfHSP70-1 were done using PAIL
(bdmpail.biocuckoo.org/predicitions.php/) and NetAcet (www.cbs.dtu.dk/services/NetAcet/).
The prediction of potential phosphorylation sites on PfLDH and PfHSP70-1 was done using
Kinasephos (www.kinasephos.mbc.nctu.edu.tw/predict.php/).
The prediction of potential ‘O’ glycosylation sites on PfLDH and PfHSP70-1 was done using
DictyOGlyc (www.cbs.dtu.dk/services/DictyOGlyc/) and ‘N’ glycosylation sites were done
using (www.cbs.dtu.dk/services/NetNGlyc/).
The prediction of potential proteolytic sites on PfLDH and PfHSP70-1 was done using
NetChop (www.cbs.dtu.dk/services/NetChop/).

38
Chapter 3
Recombinant expression of PfLDH and PfHSP70-1
3.1 Introduction
In order to study and characterise a protein of interest, the protein has to be available
in sufficient quantities. Proteins can be recombinantly expressed in different expression
systems including prokaryotic Escherichia coli (Baneyx, 1999) and the Bacillus genus,
eukaryotic (Saccharomyces cerevisiae, Pichia pastoris), human (HeLa) and insect cell
(Luciferase vectors) systems and cell free systems (Yin et al., 2007). The most commonly
used expression system is gram negative E. coli bacteria (Baneyx, 1999). Malaria rapid
diagnostic tests (RDTs) in current use are based on three soluble malaria parasite proteins.
The Plasmodium falciparum histidine rich protein II (PfHRP-II), and the metabolic parasite
proteins Plasmodium lactate dehydrogenase (PLDH), and aldolase (Murray et al., 2008).
Malaria infecting humans is caused by five malaria species namely: P. malariae, P.
ovale, P. vivax, P. falciparum and a monkey parasite P. knowlesi has emerged causing
zoonotic malaria in humans in South East Asia (Anderios, 2009; Daneshvar et al., 2009; Lee
et al., 2009; Sabbatani et al., 2010; Van den Eede et al., 2010; Van Hellemond et al., 2009;
Collin, 2012). Most RDTs currently use PfHRPII as the antigen but this protein is only
expressed by P. falciparum and can only be used to detect Plasmodium falciparum malaria.
Problems that stem from the use of PfHRPII as the antigen include patients testing positive
for malaria even after parasite clearance. This is because the protein persists in blood after
parasite clearance (Murray et al., 2008; Iqbal et al., 2004; Tjitra et al., 2001; Kodisinghe et
al., 1997; Bell et al., 2005). False positive RDTs for malaria may be due to the presence of
rheumatoid factor in patients (Iqbal et al., 2000). Another problem is false negatives which
can be due to deletion of the PfHRPII gene as reported by Gamboa et al., in 2010 in Peru
and other parts of the world (Koita et al., 2012). Single nucleotide polymorphisms (SNPs) in
parasite DNA have been reported to affect the detection of P. falciparum malaria infections
(Baker et al., 2010; Lee et al., 2006a).
Because of possible co-infection of P. falciparum with other species of malaria, there
is a need for RDTs that can detect other forms of malaria, so that drugs can be prescribed

39
that target each infecting species to avoid relapses (Murray et al., 2008; Chuangchaiya et
al., 2009) and the development of drug resistant strains (Price et al., 2001; Price et al., 2006;
Van Vugt et al., 1998; Van Vugt et al., 1999; Van Vugt et al., 2000). Plasmodium LDH and
Plasmodium aldolase enzymes are found in all Plasmodium species (Murray et al., 2008).
PLDH and aldolase are involved in metabolism, and are, therefore, associated with living
parasites (Murray et al., 2008; Iqba et al., 2004). The proteins have a short half-life and can
be used to detect current infection and monitor the progress of treatment. Ashley et al, 2009
reported that some PLDH-based RDTs revert back to negative within 2-7 days post drug
clearance thus confirming the rapid clearance of PfLDH from blood. All the RDTs developed
to date have limited specificity, sensitivity and limits of detection (Moody, 2002; Moutacho
and Goldring, 2007).
Malaria has similar symptoms to other tropical diseases such as Dengue and,
therefore, incorrect treatment can be administered (Gwer et al., 2007; Kallander et al., 2004).
The most vulnerable to malaria are children (Black et al., 2003; WHO 2014). Often children
with malaria-like symptoms who end up testing negative for malaria still get treated for
malaria. This led the CDC to outline a requirement for diagnosis before treatment (Lallo et
al., 2007). Confidence in malaria RDTs is still low among clinicians who still prescribe
presumptive treatment of malaria when the RDT test is negative (Bisoffi et al., 2009). The
WHO, together with the Foundation for Innovated New Diagnostics (FIND), has established
and offers a testing programme to evaluate the performance of RDTs in order to improve
confidence in their use among clinicians (WHO, 2008; WHO, 2009; WHO, 2010; WHO,
2010b). Other measures taken include the buying of RDTs from manufacturers with
evidence of good manufacturing practice as well as “in field testing” of RDTs. As a method of
testing RDTs in the field a positive control was included. This would entail the use of
recombinant antigens or peptides reconstituted in uninfected blood (Murray et al., 2008; Lon
et al., 2005) or dried blood spots (Versteeg and Men, 2009). This format was found to work
better for PfHRPII-based tests than PLDH-based and aldolase-based tests and this was
thought to be due to the stability of the PfHRPII antigen.
PfHSP70-1, a member of the heat shock protein family (HSPs), is induced in malaria
parasite exposed to sublethal heat shock. In 1984 Hugh Pelham suggested that the ability of
HSP70 to enhance the recovery of stressed cells was mediated by its ability to catalyse the
assembly of damaged ribosomal proteins (Pelham et al., 1984). Subsequently, research
revealed that chaperoning was characteristic of HSP70 proteins and that it was essential for
the HSP70-mediated protection against stresses that cause protein denaturation and other
newly discovered house-keeping roles of constitutively expressed HSP70 in non-stressed
cells. Heat shock is not the only stimulus that can induce and change the synthesis of HSPs.

40
Exposure of cells to amino acid analogues (Kelly and Schlesinger, 1978; Li and Laszlo,
1985), glucose analogues (Pouyssengur et al., 1977), heavy metals (Levison et al., 1980),
protein kinase C stimulator (Ding et al., 1986), Ca2+ increasing agents (Ding et al., 1986),
Ischemia, sodium arsenate (Johnston et al., 1980), microbial infections, nitric oxide,
hormones and antibiotics induce the expression of HSPs. HSPs in malarial parasites play
important roles in growth, development and survival and HSPs are, therefore, potential
targets for anti-malarial vaccines and drugs. PfHsp70-1 has been found to be abundantly
expressed in the asexual stages and is induced and translocated to the nucleus upon heat
shock at 41°C. Studies have shown the effect of various body temperatures (close to malaria
fever) on the P. falciparum viability, growth and expression of PfHSP70-1 proteins (Bindu et
al., 1994). PfHSP70-1 is abundantly available as a soluble cytosolic protein during the intra-
erythrocytic stage of parasite development that is induced by heat shock in the form of
febrile episodes and has potential as a malaria diagnostic target.
For this study, two parasite proteins were selected for study. The first protein
Plasmodium falciparum lactate dehydrogenase (PfLDH) is in use as a RDT target and the
second protein is Plasmodium falciparum heat shock protein 70-1 (PfHSP70-1). PfLDH is a
conserved glycolytic metabolic enzyme, making it a good target to detect and measure
current infection (Lee et al., 2006b; Murray, 2008). PfHSP70-1 is also highly conserved
across all Plasmodial species and was found to be immunogenic in infected humans (Mattei
et al., 1989) and experimentally infected monkeys (Gysin et al., 1982). PfHS70-1 is
abundantly expressed during fever and has diagnostic potential. These proteins were
recombinantly expressed in E. coli BL21 (DE3) host cells and were characterised using
SDS-PAGE and western blotting.
3.2 Results
Figure 3.1 Expression of PfLDH in Lysogeny Broth and Terrific Broth media at (A) 30°C and (B) 37°C.
Recombinant PfLDH was expressed at 30°C and 37°C in LB (panel A) and TB (panel B). The samples were

41
analysed on 12.5% reducing SDS-PAGE gels, stained with Coomassie Brilliant Blue R-250. Panel A lane 1:
molecular weight marker, non-induced PfLDH lane 2 and 3 at 30°C, lane 4 and 5 , at 37°C; induced PfLDH lane 6
and 7 at 30°C, lane 8 and 9 at 37°C. Panel B lane 1: molecular weight markers, lane 2, 3 and 4: samples of
PfLDH incubated at 30°C, lane 5, 6 and 7: samples of PfLDH incubated at 37°C. The experiment was repeated
three times, an example experiment is shown. The arrow shows the expected size of PfLDH.
3.2.1 Comparison of media used to express PfLDH
Recombinant protein expression was evaluated in different growth media to
determine which media promoted high amounts of soluble recombinant protein.
The media compared were Terrific Broth (TB) and Lysogeny Broth (LB). Terrific broth
contains glycerol and phosphates and is said to be self-inducing (Li et al., 2011).
The expression of PfLDH appeared to be higher in TB than LB media. The expression was
marginally better at 37°C compared to 30°C in TB as shown by the intensity of a 36 kDa
band on the gels above shown by the arrow (figure 3.1). Lower expression was observed in
LB media.
3.2.2 Growth of E. coli host cells in Terrific and Lysogeny Broth media
Figure 3. 2 shows that E. coli host cells initially grow faster in TB media than in LB
media. All cells reach stationary phase at approximately 4 hrs after inoculation. The growth
of E .coli host cells was also observed after inoculation with a single colony. Figure 3.3
shows similar growth patterns for cells from a single starting colony grown in TB and LB
media. All cells reach stationary phase at approximately 4 hrs after inoculation at an OD600 of
0.6. It is suggested that a single colony can be used to inoculate media for expression of
PfLDH as this can save time.

42
Figure 3.2 Growth of E. coli host cells grown in Terrifc Broth and Lysogeny Broth inoculated from
overnight cultures at 1: 100 dilution. E. coli host cells growing in TB and LB media at 37°C. LB media and
protein expression was induced with 0.3 mM IPTG at OD600 of 0.5-0.6.Triplicate cultures are shown.
Figure 3.3 Growth of E. coli host cells grown in Terrifc and Lysogeny Broth media from a single starting
colony. E. coli host cells growing in TB and LB media at 37°C. Triplicate cultures are shown.
Figure 3.4 Expression of PfLDH comparing inoculating with a single starting colony and from an
overnight culture. Expression of recombinant PfLDH in TB media was monitored on a reducing 12.5% SDS-
PAGE gel stained with Coomassie Brilliant Blue R-250. Panel A are individual colonies taken from the same LB
agar plate, lane 1: Molecular weight marker, Lane 2, 3, 4, 5, 6, 7, 8 and 9: are different colonies containing
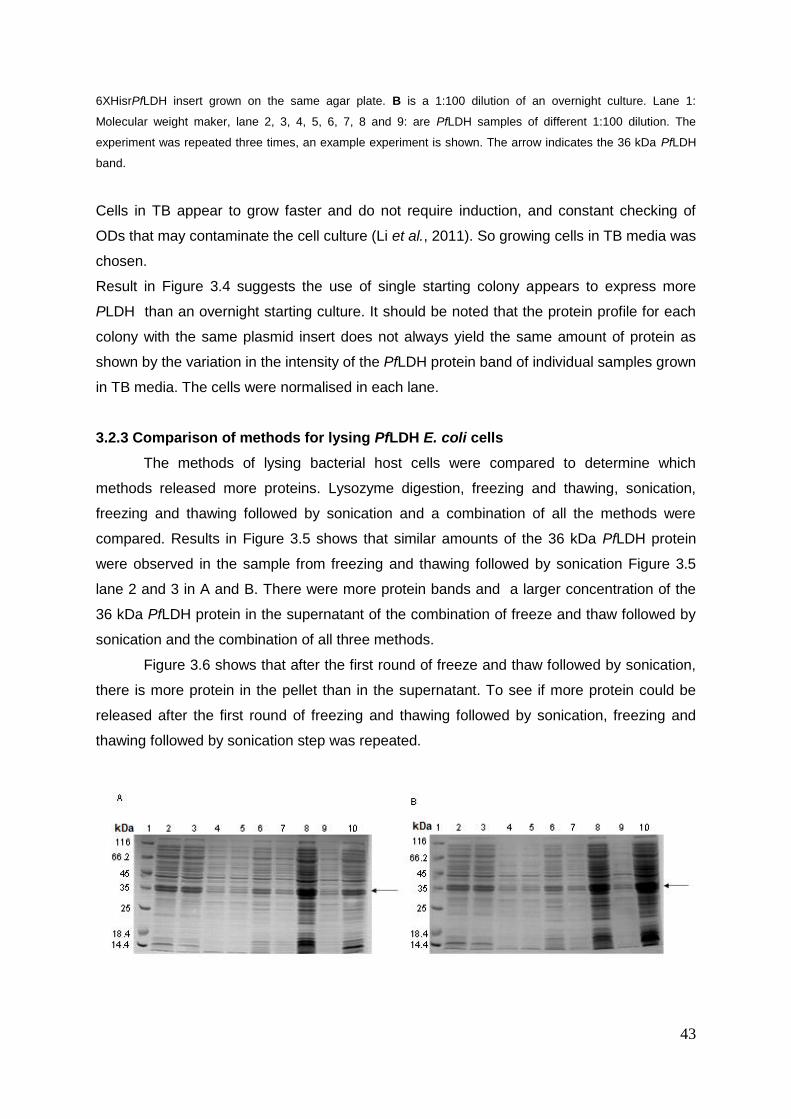
43
6XHisrPfLDH insert grown on the same agar plate. B is a 1:100 dilution of an overnight culture. Lane 1:
Molecular weight maker, lane 2, 3, 4, 5, 6, 7, 8 and 9: are PfLDH samples of different 1:100 dilution. The
experiment was repeated three times, an example experiment is shown. The arrow indicates the 36 kDa PfLDH
band.
Cells in TB appear to grow faster and do not require induction, and constant checking of
ODs that may contaminate the cell culture (Li et al., 2011). So growing cells in TB media was
chosen.
Result in Figure 3.4 suggests the use of single starting colony appears to express more
PLDH than an overnight starting culture. It should be noted that the protein profile for each
colony with the same plasmid insert does not always yield the same amount of protein as
shown by the variation in the intensity of the PfLDH protein band of individual samples grown
in TB media. The cells were normalised in each lane.
3.2.3 Comparison of methods for lysing PfLDH E. coli cells
The methods of lysing bacterial host cells were compared to determine which
methods released more proteins. Lysozyme digestion, freezing and thawing, sonication,
freezing and thawing followed by sonication and a combination of all the methods were
compared. Results in Figure 3.5 shows that similar amounts of the 36 kDa PfLDH protein
were observed in the sample from freezing and thawing followed by sonication Figure 3.5
lane 2 and 3 in A and B. There were more protein bands and a larger concentration of the
36 kDa PfLDH protein in the supernatant of the combination of freeze and thaw followed by
sonication and the combination of all three methods.
Figure 3.6 shows that after the first round of freeze and thaw followed by sonication,
there is more protein in the pellet than in the supernatant. To see if more protein could be
released after the first round of freezing and thawing followed by sonication, freezing and
thawing followed by sonication step was repeated.

44
Figure 3.5 Comparing methods of lysing E. coli cells. The effectiveness of the lysing methods was evaluated
on a reducing 12.5% SDS-PAGE gel stained with Coomassie Brilliant Blue R-250. Panel A is the supernatant
and B is the pellet: lane 1: molecular weight maker, lane 2 and 3: samples from lysozyme digestion, lane 4 and 5:
samples from freezing and thawing, lane 6 and 7: samples from sonication, lane 8 and 9: samples from freeze
and thaw followed by sonication, lane 10: samples from all methods combined. The experiment was repeated
three times, a sample experiment is shown. The arrow indicates the 36 kDa band of PfLDH.
Figure 3.6 Evaluating the amount of recombinant PfLDH in the soluble fraction after lysing using a
combination of freeze and thaw followed by sonication. The recombinant PfLDH was frozen and thawed four
times and sonicated four times. The amount of protein in the supernatant and pellet was evaluated using a
reducing 12.5% SDS-PAGE gel stained with Coomassie Brilliant Blue R-250. Lane 1: Molecular weight marker,
lane 2, 3, 4 and 5: supernatants (soluble fraction) after lysis, lane 6, 7, 8 and 9: pellets that remained after
removing each supernatant respectively. The experiment was repeated three times, a sample experiment is
shown. The arrow indicates the 36 kDa band of PfLDH.
Figure 3.7 Evaluating the amount of recombinant PfLDH which remains in the insoluble fraction after two
rounds of lysis using a combination of freeze and thawing followed by sonication. The recombinant PfLDH
was frozen and thawed X4 followed by sonication, the first supernatant was collected. The processes was
repeated and the second supernatant collected. The amount of supernatant and pellet that was obtained was
evaluated using a reducing 12.5% SDS-PAGE gel, stained with Coomassie Brilliant Blue R-250. Lane 1:
Molecular weight marker, lane 2, 3 and 4: supernatant obtained after the first round of freeze and thaw followed
by sonication, lane 5, 6 and 7: the supernatant obtained after the second round of freeze and thaw followed by
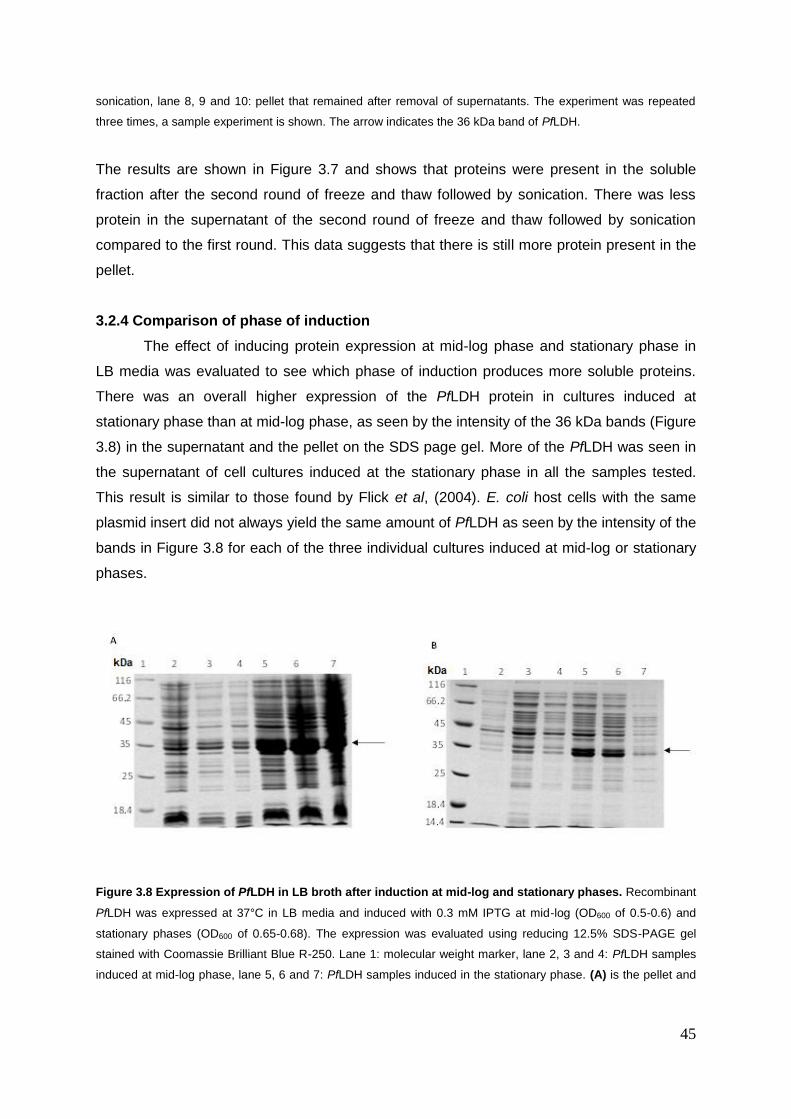
45
sonication, lane 8, 9 and 10: pellet that remained after removal of supernatants. The experiment was repeated
three times, a sample experiment is shown. The arrow indicates the 36 kDa band of PfLDH.
The results are shown in Figure 3.7 and shows that proteins were present in the soluble
fraction after the second round of freeze and thaw followed by sonication. There was less
protein in the supernatant of the second round of freeze and thaw followed by sonication
compared to the first round. This data suggests that there is still more protein present in the
pellet.
3.2.4 Comparison of phase of induction
The effect of inducing protein expression at mid-log phase and stationary phase in
LB media was evaluated to see which phase of induction produces more soluble proteins.
There was an overall higher expression of the PfLDH protein in cultures induced at
stationary phase than at mid-log phase, as seen by the intensity of the 36 kDa bands (Figure
3.8) in the supernatant and the pellet on the SDS page gel. More of the PfLDH was seen in
the supernatant of cell cultures induced at the stationary phase in all the samples tested.
This result is similar to those found by Flick et al, (2004). E. coli host cells with the same
plasmid insert did not always yield the same amount of PfLDH as seen by the intensity of the
bands in Figure 3.8 for each of the three individual cultures induced at mid-log or stationary
phases.
Figure 3.8 Expression of PfLDH in LB broth after induction at mid-log and stationary phases. Recombinant
PfLDH was expressed at 37°C in LB media and induced with 0.3 mM IPTG at mid-log (OD600 of 0.5-0.6) and
stationary phases (OD600 of 0.65-0.68). The expression was evaluated using reducing 12.5% SDS-PAGE gel
stained with Coomassie Brilliant Blue R-250. Lane 1: molecular weight marker, lane 2, 3 and 4: PfLDH samples
induced at mid-log phase, lane 5, 6 and 7: PfLDH samples induced in the stationary phase. (A) is the pellet and

46
(B) is the supernatant from the pellet in A. The experiment was repeated three times, an example experiment is
shown. The arrows indicate the 36 kDa PfLDH band.
3.2.5 Comparison of 25°C and 37°C growth temperatures on the expression of PfLDH
induced at stationary phase.
One of methods to improve the expression of soluble proteins is to change the
growth temperature of cultures. At lower temperatures, bacteria grow slowly and, typically
exhibit a low rate of protein synthesis. When bacteria grow slowly there is a low probability of
misfolding and aggregation of proteins to form inclusion bodies, favouring a relatively high
yield of expressed protein (Vasina and Baneyx, 1997). Results in Figure 3.9 shows higher
amounts of PfLDH at 37°C and 25°C in the pellet sample. There were higher amounts of
PfLDH in the soluble fraction (supernatant) at 25°C than at 37°C. The amounts of PfLDH in
the supernatant at 25°C are high compared to other protein bands in each lane, whereas at
37°C all the protein bands are more intense. This suggests that relatively the expression of
PfLDH compared to other proteins is higher at 25°C than at 37°C. This result is similar to
what Tsai et al., 2016 found.
Figure 3.9 Comparing the expression of PfLDH in LB media induced at stationary phase grown at 25°C or
37°C. Bacteria were grown at 25°C and 37°C.The expression was evaluated using 12.5% reducing DSD-PAGE

47
gel stained with Coomassie Brilliant Blue R-250. Panels A and B E. coli host cells incubated at 25°C, panels C
and D E. coli host cells incubated at 37°C. Lane 1: molecular weight marker, lane 2, 3, 4, 5 and 6: PfLDH pellet
samples induced in the stationary phase in panel A and C. Panels B and D are supernatants from the same
pellets. The experiment was repeated three times, a sample experiment is shown. The arrow indicates the 36
kDa PfLDH.
3.2.6 Affinity purification of PfLDH on Talon® (Co2+) resin
After cell lysis, as described above, the clarified soluble protein fraction was passed
over a Talon® (Co2+) resin and incubated overnight at either 4°C, or room temperature on a
platform shaker. When purifying at 4°C, more recombinant PfLDH compared to room
temperature was obtained (Figure 3.10). A doublet was observed with one band at about 36
kDa and a second band at 33 kDa (Figure 3.10 A. lanes 6, 7, 8 and figure 3.10 B. lanes 11,
12, 13).
Figure 3.10 Comparison of affinity purification of PfLDH at room temperature and at 4°C. Expression and
purification of PfLDH sample passed over a Talon® (Co
2+) resin at RT (A) and 4°C (B) monitored on a reducing
12.5% SDS-PAGE stained with Coomassie Brilliant Blue R-250. Panel A: Lane 1: Molecular weight marker, lane
2: supernatant whole cell lysate, lane 3: unbound protein to the column, lane 4: wash samples from the column,
lane 5-8: elutions of PfLDH. Panel B: Lane 1: Molecular weight marker, lane 2: supernatant from the mid-log
phase, lane 3: supernatant from the stationary phase, lane 4: supernatant from the stationary phase induced with
IPTG, lane 5: pellet after removal of supernatant at mid-log phase, lane 6: pellet after removal of supernatant at
stationary phase, lane 7: pellet after removal of supernatant at stationary phase induced with IPTG, lane 8: wash
samples from of the column, lane 9: wash one, lane 10-14: elutions of PfLDH. The experiment was repeated
three time, a sample experiment is shown.

48
Figure 3.11 Affinity purification of PfLDH at 4°C. Panel A is a 12.5% reducing SDS-PAGE gel stained with
Coomassie Brilliant Blue R-250. Lane 1: Molecular weight marker, lane 2: supernatant of cell lysate, lane 3:
unbound protein to the column, lane 4: wash sample from the column, lane 5-8: elutions of PfLDH. Panel B is an
elution profile of PfLDH taken by measuring absorbance at 280 nm of elution 1 to elution 10. Arrows shows the
monomer (36 kDa) and dimer (75 kDa) of PfLDH. The experiment was repeated three times, a sample
experiment is shown.
The bands in Figure 3.10 B lanes 11, 12 and 13 are sharper compared to Figure 3.10 A
lanes 6, 7, and 8. A faint band was seen in Figure 3.10 A at about 75 kDa and was thought
to be a dimer of PfLDH similar to the observation by Zocher et al., (2012) with P. falciparum
glutamate dehydrogenase. The 33 kDa band was suggested to be a truncated form of
PfLDH (Turgut-Balik et al., 2004; Berwal et al., 2008; Hurdayal et al., 2010) due to an
internal Shine Dalgarno sequence (GGAGGA) between base 45 and 51 in the coding
sequence of recombinant PfLDH (Cicek et al., 2012).
A 50 ml bacterial culture was grown and used for the purification PfLDH in Figure 3.11. An
elution profile of the purification shows a high yield of recombinant protein was obtained.
3.2.7 Western blot of recombinant PfLDH
Western blot of each of the steps in the purification protocol of PfLDH showed high
yields of recombinant protein as shown by the intensity of bands in Figure 3.12. The total
protein obtained as determined by the Bradford method section 2.3.1 from a 200 ml culture
yielded 144.77 mg of recombinant PfLDH. The proteins in different fractions were pooled
together and concentrated using PEG20000 (section 2.2.5). The yield obtained was higher
than obtained by others (Berwal et al., 2008; Hurdayal et al., 2010).
Figure 3.12 Expression, purification and detection of PfLDH using anti-His-tag primary antibodies. Panel
A is a 12.5% SDS-PAGE reducing gel of recombinant PfLDH stained with Coomassie Brilliant Blue R-250 and
panel B is a western blot of an identical gel as in A of recombinant PfLDH probed with anti- His-tag monoclonal
antibodies at dilution 1 : 1000 and goat anti-mouse HRPO conjugated secondary antibodies at 1: 6000 dilution.

49
Lane 1: Molecular weight marker, lane 2: supernatant whole cell lysate, lane 3: unbound protein to the column,
lane 4: wash sample from the column, lane 5-9: elution of PfLDH. Arrows show the monomer (36kDa) and dimer
(75 kDa) of PfLDH. The experiment was repeated three times. A sample experiment is shown.
3.2.8 Enzyme activity of recombinant PfLDH
Preliminary studies of the activity of the recombinant protein were done to see if an
active enzyme was expressed. An assay in which the amount of cofactor NAD+ and
substrate L-lactate were kept constant. An increase in the concentration of PfLDH resulted in
an increase in activity as indicated by an increase in the absorbance at 345 nm (Figure
3.13). The noise seen at 50 s was when the spectrophotometer was opened to add the
substrate to the reaction.
LDH
Lactate + NAD+ Pyruvate + NADH + H+
Figure 3.13 Enzyme activity at various amounts of PfLDH are shown. The substrate, lactic acid, and cofactor
NAD+
was kept constant and the enzyme concentration was increased. The experiment was repeated three
times. A sample experiment is shown.
-0.4
-0.2
0
0.2
0.4
0.6
0.8
1
0 50 100 150 200 250 300 350
Time (s)
A345 nm
1 ug LDH 0.5 ug LDH 0.3 ug LDH 5 ug LDH 10 ug LDH 20 ug LDH

50
3.2.9 Comparison of induced and uninduced cultures in the expression of
recombinant PfHSP70-1
Induced E. coli cell cultures produced high amounts of recombinant PfHSP70-1 and
basal expression of PfHSP70-1 was observed in uninduced E. coli cells. Even in the
absence of IPTG, basal expression levels of target protein known as ‘leaky’ expression can
occur, as shown in Figure 3.14 lanes 2, 3 and 4. Expression of PfHSP70-1 protein increased
after induction with 1 mM IPTG as seen in lanes 5, 6 and 7 (Figure 3.14). The experiment
shows that there can be different amounts of protein expressed by each sample of three
cultures diluted from a single initial culture.
Figure 3.14 Expression of recombinant PfHSP70-1 in LB media at 37°C. Expression of recombinant
PfHSP70-1 E. coli cell culture induced at mid-log phase (OD600 of 0.5-0.6) with 1 mM IPTG in LB media
monitored on a 12.5% reducing SDS-PAGE gel stained with Coomassie Brilliant Blue R-250. Lane 1: Molecular
weight marker, lane 2, 3 and 4: uninduced E. coli culture, lane 5, 6 and 7 induced E. coli culture. Arrow shows the
72 kDa band of PfHSP70-1.
Induction of E. coli cultures in LB media at 37°C, at OD600 of 0.5 (mid-log phase) showed a
minor difference compared to induction at OD600 of 0.2 as shown in Figure 3.15 panel A and
B, respectively. There was overall poor growth of E. coli cells.
The growth of E. coli host cells showed earlier increase in cell number after 1 hr and
subsequently reached stationary phase earlier when induced at OD600 of 0.5 compared at
0.2 (at 2 hr) as seen in Figure 3.16. The difference is not very significant, suggesting poor
growth of E. coli host cells as observed in Figure 3.15. The E. coli host cells reached

51
stationary phase after approximately 5 hrs and the optical density at stationary phase was
about 1.8.
Figure 3.15 Comparison of PfHSP70-1 expression after induction at OD600 of 0.2 with that of OD600 of 0.5
in LB media at 37°C. The induction of the recombinant protein with 1 mM IPTG at OD600 of 0.2 in panel A and
0.5 in panel B was monitored using a 12.5% SDS-PAGE reducing gel stained with Coomassie Brilliant Blue R-
250. Lane 1: Molecular weight marker, lane 2 and 3: uninduced E. coli culture 1, lane 4 and 5: induced E. coli
cultures. The arrow shows the 72 kDa PfHSP70-1 band.

52
Figure 3.16 E. coli host cell growth in cultures induced at OD600 0.2 and 0.5. The E. coli host cell were grown
in LB media and monitored at OD 600 nm over a 6 hrs period. The experiment was done in triplicate.
3.2.10 Comparison of growth media on the expression of recombinant PfHSP70-1
The effect of TB and LB media on the expression of PfHSP70-1 was evaluated. TB is
a self-inducing medium and, therefore, the addition of IPTG is not required. The cultures
grown in LB media were induced with 1 mM IPTG at mid-log phase at an OD600 of 0.5-0.6.
The results in Figure 3.17 shows a difference in the expression of recombinant PfHSP70-1 in
TB compared to LB media. Expression of recombinant PfHSP70-1 was higher in TB than LB
media. The expression of PfHSP70-1 protein in the E. coli lysate was higher relative to other
proteins in the TB media.
The effect of inoculating fresh LB broth with overnight cultures at different dilutions was
evaluated. A dilution of 1:10 was compared with that of 1:100. The cultures were induced at
OD600 of 0.5-0.6 with 1 mM IPTG. The results in Figure 3.18 suggest that a dilution of 1:100
is marginally better than that of 1:10.
The expression of PfHSP70-1 using different individual starting colonies of host E.
coli cells was evaluated and Figure 3.19 shows that the protein profiles in all lanes were
different. Lanes 3, 6, 7 and 9 had similar amounts of recombinant PfHSP70-1, lane 11 had
the highest amount of recombinant PfHSP70-1 and lane 2 had the least amount of
recombinant PfHSP70-1. Inoculating fresh broth with a single colony to express
recombinant protein has an advantage over overnight culture dilutions. It involves less steps
and can save time.
Figure 3.17 Expression of recombinant PfHSP70-1 E. coli cell culture in TB and LB media. The expression
of PfHSP70-1 E. coli cell culture in TB and LB was monitored using a reducing 12.5% SDS-PAGE gel stained
with Coomassie Brilliant Blue R-250. Panel A is recombinant PfHSP70-1 E. coli cell culture grown in TB media.
Lane 1: molecular weight marker, lane 2, 3 and 4: lysate of E. coli cells. Panel B is recombinant PfHSP70-1 E.

53
coli cells grown in LB media. Lane 1: Molecular weight marker, lane 2 and 3: un-induced PfHSP70-1 E. coli cells,
lane 4 and 5: induced PfHSP70-1 E. coli cells. The arrow show the 72 kDa PfHSP70-1 bands.
Figure 3.18 Comparing different dilutions of overnight cultures on the growth of E. coli host cells. The
effect of diluting an overnight culture into fresh LB broth induced at OD600 of 0.5-0.6 was tested and monitored
using a reducing 12.5% SDS-PAGE gel stained with Coomassie Brilliant Blue R-250. Lane 1: Molecular weight
marker, lane 2, 3 and 4: induced E. coli culture diluted at 1:10 from an overnight culture, lane 5, 6 and 7: induced
E. coli culture diluted at 1:100 from an overnight culture. The arrow shows the 72 kDa band of PfHS70-1 band.
Figure 3.19 Expression of recombinant PfHSP70-1 from different starting colonies in TB media. The
expression profile of 10 different E. coli colonies containing a 6XHis PfHSP70-1 was analysed on a 12.5% SDS-
PAGE reducing gel stained with Coomassie Brilliant Blue R-250. Lane 1: molecular weight marker, lanes 2-11:
contain lysate prepared from different individual colonies on the same petri dish. The arrow shows the 72 kDa
PfHSP70-1 band.
The data above suggests that TB is a better choice of media to use for expressing
recombinant PfHSP70-1 as TB does not require use of IPTG for induction recombinant
protein and frequent checking of the optical density during expression. The use of a single
colony can be easier. The data indicated that triplicate samples are necessary when looking
to optimise bacterial growth and recombinant protein expression.
3.2.11 Comparison of methods for lysing PfHSP70-1 E. coli cells

54
Methods of lysing bacterial cells includes lysozyme digestion, freezing and thawing,
sonication, and a combination of all three methods. Combining all three methods yielded the
most proteins as seen by intensity of the bands in Figure 3.20. The sample obtained after
lysing of E. coli host cells containing PfHSP70-1 were always viscous. The samples were
prepared and lysed as in section 2.2.4 above were run on 1% agarose gel to determine if
these samples contained high amounts of nucleic acids. The agarose gels showed high
amount of nucleic acid (Figure 3.21).
Figure 3.20 Methods used to lyse bacterial cells. The bacterial cells were lysed using lysozyme, freezing and
thawing, sonication and a combination of all the methods. The amount of protein released by each method was
evaluated on a reducing 12.5% SDS-PAGE stained with Coomassie Brilliant Blue R-250. Lane 1: molecular
weight marker, lane 2 and 3: supernatant of lysozyme digested samples, lane 4 and 5: supernatant of freeze and
thaw samples, lane 6 and 7: supernatant of sonication samples, lane 8 and 9: supernatant of freeze and thaw
then sonication samples, lane 10 and 11: supernatant of all three methods combined. The experiment was
repeated three times, a sample experiment is shown. The arrow shows the 72 kDa PfHSP70-1 band.
Figure 3.21 A 1% (w/v) agarose gel of E. coli host cells containing a PfHSP70-1 insert. The E. coli cells
were frozen and thawed, then sonicated. A 1% (w/v) agarose gel of expressed PfHSP70-1. Panel A: Lane 1:

55
DNA ladder, lane 2: supernatant of un-induced culture, lane 3 and 4: supernatant of induced culture. The
experiment was repeated three times, a sample experiment is shown.
The use of freeze and thaw, followed by sonication was chosen as it was a less viscous
solution and contained less contaminants.
3.2.12 Affinity purification of recombinant PfHSP70-1 on Talon® (Co2+) resin and
detection of the protein on a western blot
After cell lysis, the clarified soluble protein fraction was poured over a Talon® (Co2+)
resin. The expressed and affinity purified recombinant PfHSP70-1 protein were run on an
SDS-PAGE gel and transferred to a nitrocellulose membrane and probed with anti-His-tag
monoclonal antibodies.
Figure 3.22 Affinity purification of recombinant PfHSP70-1 on Talon® (Co
2+) resin. The expression and
affinity purification of PfHSP70-1 on Talon® (Co
2+) resin was evaluated using a reducing 12.5% SDS-PAGE gel
stained with Comassie Brilliant Blue R-250 in panel A and western blot probed with anti- His-tag primary
antibodies at a dilution of 1:2000 as shown in panel B. Lane 1: molecular weight marker, lane 2. proteins that did
not bind to resin, lane 3 and 4: 2 washes of the resin, lane 5-12: elution of PfHSP70-1 from resin. The arrows
show the 72 kDa PfHSP70-1 bands.
There was a low yield of purified protein as shown by low intensity of the bands in
panel A and the western blot in panel B of Figure 3.22. The expression and purification steps
were repeated to establish the cause of the low yields of the purified protein. Bacteria from
different stocks were compared to see if source of material may make a difference. Low
yields were obtained from all sample (Figure 3.23). Each expression round of PfHSP70-1
yielded less and less protein until no protein was detected on western blots. The lower
protein band of 34 kDa may be a truncated form of PfHSP70-1 as shown in Figure 3.24 D.
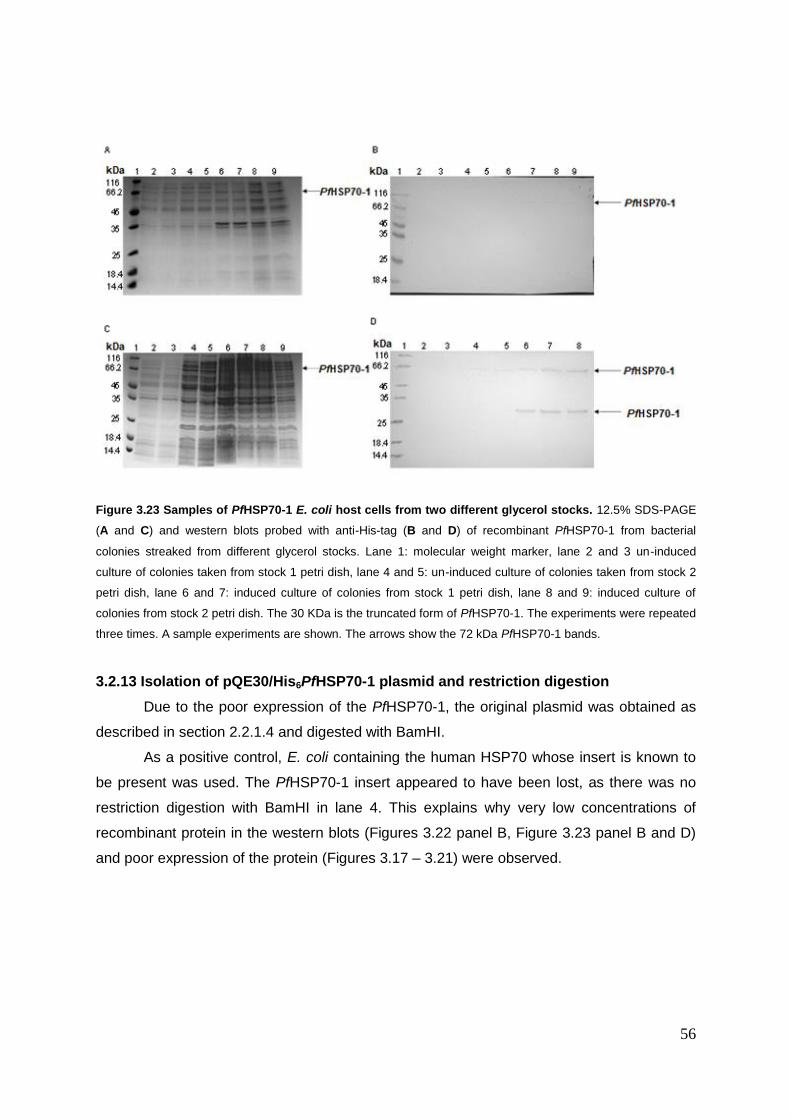
56
Figure 3.23 Samples of PfHSP70-1 E. coli host cells from two different glycerol stocks. 12.5% SDS-PAGE
(A and C) and western blots probed with anti-His-tag (B and D) of recombinant PfHSP70-1 from bacterial
colonies streaked from different glycerol stocks. Lane 1: molecular weight marker, lane 2 and 3 un-induced
culture of colonies taken from stock 1 petri dish, lane 4 and 5: un-induced culture of colonies taken from stock 2
petri dish, lane 6 and 7: induced culture of colonies from stock 1 petri dish, lane 8 and 9: induced culture of
colonies from stock 2 petri dish. The 30 KDa is the truncated form of PfHSP70-1. The experiments were repeated
three times. A sample experiments are shown. The arrows show the 72 kDa PfHSP70-1 bands.
3.2.13 Isolation of pQE30/His6PfHSP70-1 plasmid and restriction digestion
Due to the poor expression of the PfHSP70-1, the original plasmid was obtained as
described in section 2.2.1.4 and digested with BamHI.
As a positive control, E. coli containing the human HSP70 whose insert is known to
be present was used. The PfHSP70-1 insert appeared to have been lost, as there was no
restriction digestion with BamHI in lane 4. This explains why very low concentrations of
recombinant protein in the western blots (Figures 3.22 panel B, Figure 3.23 panel B and D)
and poor expression of the protein (Figures 3.17 – 3.21) were observed.

57
Figure 3.24 Restriction digestion of pQE30/His6PfHSP70-1 and pET/hHSP70 by BamHI. A 1% (w/v) agarose
gel showing plasmid DNA of PfHSP70-1 and human HSP70-1 (hHSP70-1). Lane 1: DNA ladder, lane 2:
pQE30/PfHSP70-1 plasmid, lane 3: a 1:10 dilution of pQE30/PfHSP70-1 plasmid, lane 4: pQE30/PfHSP70-1
plasmid digested with BamHI, lane 5: pET/hHSP70 plasmid digested with BamHI.
3. 3 Discussion
The conditions that were evaluated for the expression of two recombinant proteins
included comparisons of the type of media used, the growth of E. coli host cells in TB and LB
media, starting bacterial growth from a single colony or an overnight culture, the time during
growth when protein expression is induced, two temperatures on the expression of
recombinant protein induced at stationary or mid-log phase of growth, methods for lysing E.
coli cells and conditions for affinity purification of the recombinant proteins.
3.3.1 Media used to express recombinant PfLDH and PfHSP70-1
PfLDH showed better expression in TB than LB media. TB media contains tryptone,
yeast extract, glycerol and dibasic phosphates. Tryptone, a pancreatic digest of casein
provides source of amino acids. Yeast extract provides a source of amino acids and trace
elements to the medium. The extra addition of tryptone and yeast extract in TB medium
allows bacteria to produce higher plasmid yield per volume. Glycerol is both a source of
carbon and carbohydrates in the medium and unlike glucose, glycerol is not fermented to
acetic acid, as such, it prevents the drop of pH during the growth of E. coli cell culture.
Dibasic potassium phosphates are added to provide potassium for cellular systems and to
maintain the pH during growth of the E. coli cell culture. TB media is self-induced and does

58
not require measuring ODs, and as such does not require to be monitored for the correct
time of induction (Li et al., 2011). In Figure 3.3.2 the OD600 was measured to compare
growth in TB and LB medium. Expression of PfHSP70-1 in TB was better than in LB
medium. Previously, the amount of IPTG in the expression of PfLDH was determined to 0.3
mM and 1 mM for PfHSP70-1 when expressed in LB media.
3.3.2 Growth of E. coli host cells in TB and LB media
The E.coli host cells grow faster in TB media than LB media. This may be due to the
presence of extra tryptone, yeast extract and glycerol in TB media. The use of a single
colony to inoculate media also showed faster growth of E. coli host cells in TB media than in
LB media. The time it takes to reach stationary phase for PfLDH and PfHSP70-1 was
approximately 4 hrs at an optical density measured at 600 nm of about 0.68 and 5 hrs at
optical density measured at 600 nm of about 1.8 respectively to monitor the growth of E. coli
host cells.
3.3.3 Initiating bacterial growth from a single colony or an overnight bacterial culture
Starting with an overnight culture to evaluate recombinant protein expression was
compared to starting with a single starting colony. There appeared to be more intense bands
of recombinant proteins seen for both PfLDH and PfHSP70-1 from E. coli cell cultures
grown using a single colony than a dilution of 1:100 as shown in Figure 3.4 (section 3.2.2)
and Figure 3.18-19 (section 3.2.10), respectively. Use of a single colony to inoculate fresh
media would save a lot of time as there is no requirement to grow an overnight culture for 16
hrs prior to protein expression. Each individual colony and dilution of an overnight culture did
not produce the same amount of protein in the lanes examined.
3.3.4 Time of induction of protein expression
The induction of the expression of protein in the culture after the stationary phase
OD600 of 0.68 for PfLDH yielded higher amounts of PfLDH compared to induction at mid-log
phase OD600 of 0.5-0.6 with 0.3 mM ITPG, which was similar to results obtained by
Flick et al, (2004). Among the reasons suggested for this observation are that proteins
expressed at post-log phase tend to be less truncated (Flick et al., 2004). Induction of E. coli
host cells containing PfHSP70-1 at mid-log phase and early log phase did not show a
significant difference as expression was poor.

59
3.3.5 Two temperatures (25°C and 37°C) on the expression of PfLDH induced at
stationary phase
Expression of PfLDH at 25°C produced more PfLDH protein than at 37°C. The result
is similar to what Flick et al, (2004) and Tsai et al, (2016) found when expressing
Plasmodium falciparum erythrocyte membrane protein I (PfEMP I) at temperatures as low as
16°C. Schein and Noteborn (1988) also found that expression at 30°C produced more
recombinant interferon α2 (IFN-α2) and interferon ɣ (IFN-ɣ) proteins than at 37°C. Berwal et
al., (2008) also noted the same observation with recombinant Plasmodium falciparum LDH
at 15°C compared to 37°C.
Expression in E. coli BL21 (DE3) has some advantages. The strain is deficient in the
outer membrane protease (OmpT) and Lon protease which can digest recombinant proteins
as they are expressed (Lee, 2009). BL21 DE3 E. coli cells require the T7 RNA polymerase
gene to be lysogenised into the host E. coli BL21 genome (Sorensen and Mortensen, 2005).
The T7 RNA polymerase, which is under control of the lacUV5 promoter, remains
suppressed by LacI until IPTG is added to media to induce transcription of the target protein
(Divan and Royds, 2013).
3.3.6 Optimising the method of lysis of E. coli cells
Bacterial cells are often lysed using three methods: lysozyme digestion, freezing and
thawing and sonication. Lysozyme digestion released most proteins in the supernatant after
lysing of E. coli cells as an individual method compared to sonication and, freezing and
thawing. The only drawback in using lysozyme digestion was that the resulting supernatant
was viscous and was contaminated with nucleic acids (Figure 3.7 & Figure 3.20). Freezing
and thawing released more protein in the supernatant than sonication as an individual
method after lysing of E. coli cells and contained less contaminants (Figure 3.7 & Figure
3.20). Sonication released the least amount of proteins in the supernatant after lysing E. coli
cells as an individual method and contained the least contaminants (Figure 3.7 & Figure
3.20).The combination of freezing and thawing followed by sonication and then the two
methods repeated yielded high amounts of recombinant PfLDH and PfHSP70-1 compared to
lysozyme digestion alone, freeze and thaw alone and sonication alone. The problems of
using all three methods is that it produces high contamination of nucleic acids in the samples
and the samples were viscous (Figure 3.21). The combination of freeze and thaw followed
by sonication repeated was, therefore, considered optimal for the lysing of E.coli cells in this
study.

60
3.3.7 Affinity purification of recombinant PfLDH and PfHSP70-1
His-tagged proteins contain a histidine whose imidazole side chain has a pKa of 6.04
(Voet and Voet, 2004). The solubility of a protein is dependent on the overall charge which is
negative if the pH is above the protein’s pI and positive if the pH is below the protein’s pI
(Bondansky and Latner, 1975, Voet and Voet, 2004). The pI of PfLDH is around 8.5
(Nirmalan et al., 2004). The buffers used for the purification of PfLDH was 8.0 suggesting
that PfLDH will have an overall positive charge and is likely to be soluble. Imidazole binds to
cobalt ion (Co2+) in the Talon® (Co2+) resin. At pH 8.0, the recombinant protein will bind with
high affinity to the Co2+ ions on the Talon® (Co2+) resin. Nguyen et al., (2014) showed that
His-tag provides good yields of tagged proteins from inexpensive, high capacity resins.
Purification of PfLDH at room temperature was compared to purification at 4°C. Improved
purification was observed at 4°C compared to RT (Tsai et al., 2016 and Goto et al., 2016). A
doublet was clearly observed at around 33 kDa and 36 kDa and a single band was observed
at around 75 kDa when purified at 4°C and a blurred doublet and 75 kDa were observed
when purified at 37°C. Hurdayal et al., (2010) expressed a 2X His6-PfLDH with His tags at
both the N- and C- terminal ends of PfLDH and found the size to be approximately 39 kDa
and Berwal et al., (2008) expressed a His6-PfLDH and found the size to be around 36.3 kDa.
Purification of PfHSP 70-1 yielded low amounts compared to what was observed by
Matambo et al., (2004). The size observed was about 72 kDa.
3.3.8 Western blots detecting PfLDH and PfHSP70-1
Anti-His-tagged antibodies were used to detect PfLDH band on a western blot. A
36kDa band and another band at about 75 kDa were detected. The 75 kDa may be due to
dimer formation a result similar to Zocher et al., (2012) with recombinant Plasmodium
falciparum glutamate dehydrogenase 1 on reducing SDS-PAGE gel which was detected by
western blots, and was determined to be a dimer of PfLDH. This could be confirmed by
molecular exclusion chromatography. Another small band just below the 36 kDa of about 33
kDa was observed in the western blot which is similar to results found by others (Berwal et
al., 2008; Hurdayal et al., 2010 and Turgurt-Balik et al., 2004). This was due to the presence
of an internal Shine-Dalgarno like sequence (GGAGGA) between bases 46 to 61 in the
coding sequence for recombinant PfLDH (Cicek et al., 2013). Berwal et al., (2008) with His6-
rPfLDH and Goto et al., (2016) with swine LDH found both the recombinant proteins form
tetramers and had enzyme activity. Probing western blots of PfHSP70-1 with anti-His-tag
antibodies showed low concentration of PfHSP70-1. The size of the recombinant protein was
approximately 72 kDa, similar to what was observed by Matambo et al., (2004) who found a
monomer of 73.5 kDa and a dimer of 199.5 kDa using SE-HPLC analysis. The 199.5 kDa

61
was too large to be a dimer and too small to be a trimer. Therefore the dimer may have been
formed as an intermediated complex between a dimer and trimer. It was also noted that
PfHSP70-1 exists mainly in the monomer form.
3.3.9 Determination of the cause of poor expression of PfHSP70-1
To determine the cause of poor expression of PfHSP70-1, the plasmid was isolated
according to manufacturer’s instructions in section 2.2.1.4. The plasmid was then subjected
to restriction digestion by BamHI to determine if the insert was still present. As a positive
control, the plasmid containing human HSP70 whose insert was known to be present in
plasmid was isolated and digested with BamHI and electrophoresed on the same 1%
agarose gel. The DNA samples were resolved on 1% agarose gel and viewed under UV
radiation. The results showed PfHSP70-1 the insert appeared to have been lost. More
sensitive methods such as PCR may be used to confirm the loss of the plasmid containing
His6-PfHSP70-1 insert.
Summary
These results suggest that for the recombinant expression of PfLDH in TB media at
low temperature and purifying the protein at 4°C ensures production of more soluble
recombinant proteins. The use of a single colony as starting material yields a larger amount
of recombinant protein compared to dilution of an overnight culture. Therefore, use of a
single colony was preferred as it was time saving. Freezing and thawing followed by
sonication twice appeared to release more protein in the supernatant and was sufficient for
lysing E. coli cells. The evidence as shown by poor expression and purification of PfHSP70-
1 coupled with results of plasmid digestion of pQE30/PfHSP70-1 as shown on agarose gel
electrophoresis (Figure 3.24) suggests loss of plasmid containing His6-PfHSP70-1 insert.

62
Chapter 4
Bionformatics
4.1 Introduction
Most of the antibodies used in current malarial RDTs are monoclonal antibodies. These
monoclonal antibodies are selected against one of three peptides as opposed to identifying them
from a unique epitope. Epitope mapping can be done to determine an epitope target (Saravanan
and Kumar, 2009). Identifying a target epitope is important because antigenic variations
sometimes affects the detection of certain antigens as in the case of a commonly used RDT
target HRPII in malaria (Lee et al., 2006; Baker et al., 2010). HRPII undergoes antigenic variation
leading to false negative results with antibodies in particular test kits (Gamboa et al., 2010). In
this study, polyclonal and anti-peptide specific antibodies against the target epitopes are
intended to be raised as an alternative to monoclonal antibodies. The peptides used to raise anti-
peptide antibodies are usually 12-15 amino acid residues in length and cannot elicit an immune
response by themselves. They are, therefore, coupled to a carrier protein usually rabbit albumin.
The use of polyclonal antibodies raised against the peptides of target proteins for malaria
diagnosis has been validated (Tomar et al., 2006). The use of anti-peptide antibodies raised
against specific epitopes for diagnosis of malaria and differentiation between the malaria lactate
dehydrogenase from different species has been demonstrated by Hurdayal et al., 2010.
Many human proteins undergo post translational modifications which may reduce the
interactions between antibodies raised against a recombinant protein or a peptide and its
detection in the native protein (Glozak et al., 2005; Huang et al., 2007; Gupta et al., 1999;
Nielsen et al., 2005). This chapter describes the ‘in silico’ work done to identify potential
immunogenic peptides to be used in the production of antibodies in chicken using a prediction
program Predict7™. The chapter describes the prediction of potential post translational
modifications such as lysine acetylation, phosphorylation, glycosylation and protease digestion to
see if these modifications have the potential to reduce antibody recognition. There is evidence
that certain post translational modifications of each protein can affect the activity of native
proteins (Zhao et al., 2013; Fan et al., 2011).
4.2 Selection of immunogenic peptides
The entire amino acid sequence of PfHSP70-1 was analysed using Predict7™ to identify
which regions in the sequence had potential as immunogenic peptides as described by
Carmenes et al., 1989. The structural features analysed were antigenicity (Welling et al., 1985),
flexibility (Karplus and Schulz, 1985), hydrophilicity (Hoop and Woods, 1981) and surface
probability (Janin et al., 1978; Emini, 1985). Other features of the program include hydropathy

63
(Kyte and Doolittle, 1982) and secondary structure (Garnier et al., 1978). The selected peptides
need to be on the surface of the protein to increase the probability of recognition and binding by
antibodies in solution (Saravanan and Kumar, 2009). Three peptides with high surface probability
and hydrophilicity values were selected from the amino acid sequence of PfHSP70-1 and are
shown in Figure 4.1. All the three amino acid sequences chosen are located in the α-helical-
subdomain (lid and hinge region) of PfHSP70-1, which closes in the ADP state and is open in the
ATP state to allow substrate binding. Analysis of PfLDH sequences with Predict7™ to identify
immunogenic epitopes was previously done in our laboratory. Within the sequence of PfHSP70-1
three peptides chosen had hydrophilicity and surface probability values above zero, and were,
therefore, considered to be potential immunogenic peptides.
RNSLENYCYGVKSSLED
PAEIETCMKTIT

64
AGKDEYEAKQKEAESVC
Figure 4.1 Predict7™ analysis of three PfHSP70-1 peptides. Data from the Predict7™ program analysing the
three chosen PfHSP70-1 epitopes based on antigenicity, hydrophilicity, surface probability and flexibility. Panel
A; RNSLENYCYGVKSSLED, panel B; PAEIETCMKTIT and panel C; AGKDEYYAKQLEAESVC were the
epitopes chosen. Surface probability and hydrophilicity were plotted on the primary axis while flexibility and
antigenicity were plotted on the secondary axis.
PfHSP70-1 1 MASAKGSKPNLPESNIAIGIDLGTTYSCVGVWRNENVDIIANDQGNRTTPSYVAFTDTER
cKHSP70-1 1 ----------MSGKGPAIGIDLGTTYSCVGVFQHGKVEIIANDQGNRTTPSYVAFTDTER
hHSP70-1 1 -----------MAKAAAIGIDLGTTYSCVGVFQHGKVEIIANDQGNRTTPSYVAFTDTER
. ***************::: :*:**********************
PfHSP70-1 61 LIGDAAKNQVARNPENTVFDAKRLIGRKFTESSVQSDMKHWPFTVKSGVDEKPMIEVTYQ
cKHSP70-1 51 LIGDAAKNQVAMNPTNTIFDAKRLIGRKYDDPTVQSDMKHWPFRVVNE-GGKPKVQVEYK
hHSP70-1 50 LIGDAAKNQVALNPQNTVFDAKRLIGRKFGDPVVQSDMKHWPFQVIND-GDKPKVQVSYK
*********** ** **:**********: : ********** * . . ** ::* *:
PO4-1 Binding

65
PfHSP70-1 121 GEKKLFHPEEISSMVLQKMKENAEAFLGKSIKNAVITVPAYFNDSQRQATKDAGTIAGLN
cKHSP70-1 110 GEMKTFFPEEISSMVLTKMKEIAEAYLGKKVQNAVITVPAYFNDSQRQATKDAGTITGLN
hHSP70-1 109 GDTKAFYPEEISSMVLTKMKEIAEAYLGYPVTNAVITVPAYFNDSQRQATKDAGVIAGLN
*: * *.********* **** ***:** : **********************.*:***
PfHSP70-1 181 VMRIINEPTAAAIAYGLHKKG--KGEKNILIFDLGGGTFDVSLLTIEDGIFEVKATAGDT
cKHSP70-1 170 VMRIINEPTAAAIAYGLDKKGTRAGEKNVLIFDLGGGTFDVSILTIEDGIFEVKSTAGDT
hHSP70-1 169 VLRIINEPTAAAIAYGLDRTG--KGERNVLIFDLGGGTFDVSILTIDDGIFEVKATAGDT
*:***************.:.* **:*:*************:***:*******:*****
PfHSP70-1 239 HLGGEDFDNRLVNFCVEDFKRKNRGKDLSKNSRALRRLRTQCERAKRTLSSSTQATIEID
cKHSP70-1 230 HLGGEDFDNRMVNHFVEEFKRKHK-RDIAGNKRAVRRLRTACERAKRTLSSSTQASIEID
hHSP70-1 227 HLGGEDFDNRLVNHFVEEFKRKHK-KDISQNKRAVRRLRTACERAKRTLSSSTQASLEID
**********:**. **:****:: :*:: *.**:***** **************::***
PfHSP70-1 299 SLFEGIDYSVTVSRARFEELCIDYFRDTLIPVEKVLKDAMMDKKSVHEVVLVGGSTRIPK
cKHSP70-1 289 SLFEGIDFYTSITRARFEELNADLFRGTLEPVEKALRDAKLDKGQIQEIVLVGGSTRIPK
hHSP70-1 286 SLFEGIDFYTSITRARFEELCSDLFRSTLEPVEKALRDAKLDKAQIHDLVLVGGSTRIPK
*******: .:::******* * **.** ****.*:** :** .::::***********
PfHSP70-1 359 IQTLIKEFFNGKEACRSINPDEAVAYGAAVQAAILSGDQSNAVQDLLLLDVCSLSLGLET
cKHSP70-1 349 IQKLLQDFFNGKELNKSINPDEAVAYGAAVQAAILMGDKSENVQDLLLLDVTPLSLGIET
hHSP70-1 346 VQKLLQDFFNGRDLNKSINPDEAVAYGAAVQAAILMGDKSENVQDLLLLDVAPLSLGLET
:*.*:::****:: :******************* **:*: ********* ****:**
PfHSP70-1 419 AGGVMTKLIERNTTIPAKKSQIFTTYADNQPGVLIQVYEGERALTKDNNLLGKFHLDGIP
cKHSP70-1 409 AGGVMTALIKRNTTIPTKQTQTFTTYSDNQSSVLVQVYEGERAMTKDNNLLGKFDLTGIP
hHSP70-1 406 AGGVMTALIKRNSTIPTKQTQIFTTYSDNQPGVLIQVYEGERAMTKDNNLLGRFELSGIP
****** **:**:***:*::* ****:*** .**:********:********:*.* ***
PfHSP70-1 479 PAPRKVPQIEVTFDIDANGILNVTAVEKSTGKQNHITITNDKGRLSQDEIDRMVNDAEKY
cKHSP70-1 469 PAPRGVPQIEVTFDIDANGILNVSAVDKSTGKENKITITNDKGRLSKDDIDRMVQEAEKY
hHSP70-1 466 PAPRGVPQIEVTFDIDANGILNVTATDKSTGKANKITITNDKGRLSKEEIERMVQEAEKY
**** ******************:*.:***** *:***********:::*:***::***
Connect 1 region PO4
-2 Binding domain
Adenosine
Binding region
β-Subdomain (Peptide substrate binding)
Connect 2 region
α-Helical subdomain (Lid and hinge region)

66
PfHSP70-1 539 KAEDEENRKRIEARNSLENYCYGVKSSLEDQKIKEKLQPAEIETCMKTITTILEWLEKNQ
cKHSP70-1 529 KAEDEANRDRVGAKNSLESYTYNMKQTVEDEKLKGKISDQDKQKVLDKCQEVISWLDRNQ
hHSP70-1 526 KAEDEVQRERVSAKNALESYAFNMKSAVEDEGLKGKISEADKKKVLDKCQEVISWLDANT
***** :*.*: *:*:**.* :.:*.::**: :* *:. : :. :.. ::.**: *
PfHSP70-1 599 LAGKDEYEAKQKEAESVCAPIMSKIYQDAAGAAGGMPGGMPGGMPGGMPSGMPGGMNFPG
cKHSP70-1 589 MAEKEEYEHKQKELEKLCNPIVTKLYQGAGGAGAGGSG----------------------
hHSP70-1 586 LAEKDEFEHKRKELEQVCNPIISGLYQGAGGPGPGGFGAQ--------------------
:* *:*:* *:** *.:* **:: :**.*.* . * *
PfHSP70-1 659 GMPGAGMPGNAPAGSGPTVEEVD
cKHSP70-1 626 ---------------GPTIEEVD
hHSP70-1 625 -----G--PKGGSGSGPTIEEVD
***:****
Figure 4.2 Alignment of amino acid sequences from P. falciparum, chicken and human HSP70-1
showing the positions of the immunogenic peptides identified by the prediction program. A multiple
sequence alignment of P. falciparum HSP70-1 (PlasmoDB ID: PF3D7_0818900), Gallus gallus HSP70
(NCBI accession ID: NP_001006686 XP-421406) and Homosapien HSP70 (NCBI accession ID: PODMV8)
amino acids. The annotation ‘*’ refers to identical amino acid residues, “:” refers to conserved amino acid
residues, “.” refers to semi-conserved amino acid residues and a blank space represented no identity in
amino acid residues in the sequences. The blue, green and pink colour show the positions of chosen
peptides in the sequence of PfHSP70-1. The blue, green and red colour in the α-helical subdomain (lid and
hinge region) in grey colour show RNSLENYCYGVKSSLED, PAEIETCMKTIT and AGKDEYEAKQKEAESVC
immunogenic peptide sequences respectively chosen using Predict7™. The underlined regions are:
phosphate 1 binding region (dark green), phosphate 2 binding region (red), connect 1 region (yellow),
connect 2 region (light green), Adenosine binding region (light blue), β-subdomain for peptide substrate
binding (purple), α-helical subdomain for hinge and lid region (grey) and the EEVD motif (greenish ).
Multiple alignment (Figure 4.2) of the amino-acid sequence of PfHSP70-1 (PlasmoDB ID:
PF3D7_0818900), chicken HSP70 (Gallus gallus) (NCBI accession ID: NP_001006686 XP-
421406) and human (Homosapien) HSP70 (PODMV8) using clustal W
(www.ebi.ac.uk/Tools/msa/clustalo/) was done to ensure that the peptides chosen were
unique to P. falciparum malaria, so that the antibodies produced in chicken will not cross
react with the chicken and human HSP70-1 proteins. The positions of important domains in
the sequence of the PfHSP70-1, ckHSP70-1 and hHSP70-1 proteins are also shown. The
peptides selected by Predict7™ analysis are shown on the sequence as

67
RNSLENYCYGVKSSLED (blue), PAEIETCMKTIT (green) and AGKDEYYAKQLEAESVC
(red). The alignment shows that RNSLENYCYGVKSSLED has six identical, six conserved
and four semi-conserved amino acid residues. PAEIETCMKTIT has three conserved and
three semi-conserved amino acid residues. AGKDEYYAKQLEAESVC has nine identical,
four conserved and one semi-conserved amino acid residues. The three peptide sequences
were aligned to predict if the anti-peptide raised against these peptides would cross react
with the chicken and human HSP70-1 protein sequences. The data suggests that there
would be no cross reactivity with chicken and human HSP70-1.
Figure 4.3 An image of the crystal structure of PfHSP70-1 showing the location of the three selected
peptides. All the selected peptides (blue, green and pink) were located on the surface of PfHSP70-1. The
structure was developed using SwissPDB 4.1.0 (http://www.expasy.org.spdv/). The sequence was obtained from
the SWISS-MODEL repository (www.spdv.vital-it.ch/disclaim.html#).
A blast search (data not shown) in http://blast.ncbi.nlm.nih.gov/Blast.cgi showed that
RNSLENYCYGVKSSLED and PAEIETCMKTIT are unique to the Plasmodium falciparum
genome and AGKDEYEAKQKEAESVC was 100% identical in P. ovale and P. vivax genome and
was, therefore, a common peptide. There was 63.58% (433 amino acid residues) identical,
13.8% (94 amino acid residues) conserved, 4.26% (29 amino acid residues) semi-conserved and
18.36% (125 amino acid residues) non-identical amino acid residues in the sequence of
PfHSP70-1 that was compared with ckHSP70-1 and hHSP70-1. The phosphate, adenosine and
β-subdomain are highly conserved. The α-helical subdomain is semi conserved. All the three

68
immunogenic peptides for PfHSP70-1 identified above were located on the surface of the 3D
crystal structure model of PfHSP70-1 (spdbv.vital-it.ch/disclaim.html#) as shown in Figure 4.3.
The chosen peptides ranged from 15 – 17 amino acid residues in length. The peptide
AGKDEYEAKQKEAESVC has cysteine at the C-terminal end and the other two peptides
required the addition of a cysteine at the C-terminus during synthesis of the peptides for coupling
to carrier proteins. A common carrier is rabbit albumin, and coupling is done with
maleimidobenzoyl-N-hydroxysuccinimide ester (MBS). MBS links with SH-group of a cysteine
side chain to the ε-amino group of lysine on the carrier protein (Peeters et al., 1989). All selected
peptides had predicted surface probability and hydrophilicity values. This prediction suggests the
surface location of the peptides which ensures the interaction with and binding to antibodies
raised against the epitopes on the native protein in solution (Saravanan et al., 2009). All the three
immunogenic peptides for PfHSP70-1 identified above were located on the surface of the 3D
crystal structure model of PfHSP70-1. This confirmed the data obtained using Predict7™
analysis of the amino-acid sequence of the PfHSP70-1. The peptides will be synthesized and
used to produce antibodies in chickens. Peptides selected in the same manner for PfLDH were
found to be on the surface of the 3D structure based on the published crystal model by Hurdayal
et al., 2010 (Dunn et al., 1996). The antibodies will be tested in ELISA and dip-stick format to
detect both recombinant and native PfHSP70-1.
4.3 Prediction of post-translational modification
Post translational modification of proteins in cells play an important role in biological
functions such as cell signalling (Kiemer et al., 2005), transcription regulation (Faiola et al.,
2005), apoptosis (Subramanian et al, 2005), cytokine signalling (Yuan et al., 2005) and many
other functions. The prediction of possible post translational modification was done to access if
the potential post translational sites are close to or on the site of important catalytic amino acids.
There is evidence that certain post translational modifications affect the activity of enzymes
(Zhao et al., 2013; Fan et al., 2011). Antibodies produced against a recombinant protein may not
interact with the native protein if the native protein is acetylated, phosphorylated, glycosylated or
cleaved on its surface.
4.3.1 Acetylation
Acetylation is a widespread post translational modification of eukaryote proteins, in which
an acetyl group from acetyl coenzyme A is transferred to either the α-amino group of the amino-
terminal residue or to the ε-amino group of internal lysines at specific sites (Glozak et al., 2005;
Kouzarids, 2000; Polevoda et al., 2000; Yang, 2004). Acetylation alters the electrostatic
properties of proteins as the positive charge of the lysine residue is neutralised. Also formation of
hydrogen bonds on lysine side-chains are disrupted (Yang et al., 2004). This leads to loss of

69
function of the protein. In addition, lysine acetylation also creates a new interface for protein
binding, this may results in a gain of function, such as in protein-protein interaction, enzymatic
activity, stability and subcellular localization (Glozak et al., 2005; Polevoda et al., 2002; Yang
2004; Faiola et al., 2005).
The recombinant proteins used in this study are produced in E. coli cells and, therefore,
they are not acetylated. This may result in recombinant proteins having less activity as a result of
non-acetylation. Native PfLDH and PfHSP70-1 can be acetylated (Miao et al., 2013; Zhao et al.,
2010). The antibodies produced from recombinant proteins may not recognise the epitopes in
the native protein if the epitopes contain lysine residues that are acetylated. Two prediction
algorithms were used to screen the two protein sequences for potential acetylation sites.
A
>PfLDH
Peptide Position Score Threshold
***MAPKAKIVLV 4 11.04 0.20
*MAPKAKIVLVGS 6 3.01 0.20
ATLIVQKNLGDVV 26 0.23 0.20
KNMPHGKALDTSH 44 0.57 0.20
MAYSNCKVSGSNT 60 1.03 0.20
VTAGFTKAPGKSD 84 1.27 0.20
FTKAPGKSDKEWN 88 1.92 0.20
APGKSDKEWNRDD 91 1.84 0.20
EIGGHIKKNCPNA 114 0.96 0.20
QHSGVPKNKIIGL 144 0.22 0.20
SGVPKNKIIGLGG 146 0.51 0.20
VGAHGNKMVLLKR 185 1.30 0.20
MAESYLKDLKKVL 252 1.03 0.20
SYLKDLKKVLICS 255 1.10 0.20
QLNSEEKAKFDEA 299 0.48 0.20
EAIAETKRMKALA 310 1.69 0.20
AETKRMKALA*** 313 3.06 0.20
B
PfHsp70-1
Peptide Position Score Threshold
**MASAKGSKPNL 5 8.42 0.20
ASAKGSKPNLPES 8 2.77 0.20
LIGDAAKNQVARN 67 0.73 0.20
KRLIGRKFTESSV 88 1.50 0.20
VTYQGEKKLFHPE 123 0.91 0.20
TYQGEKKLFHPEE 124 0.78 0.20
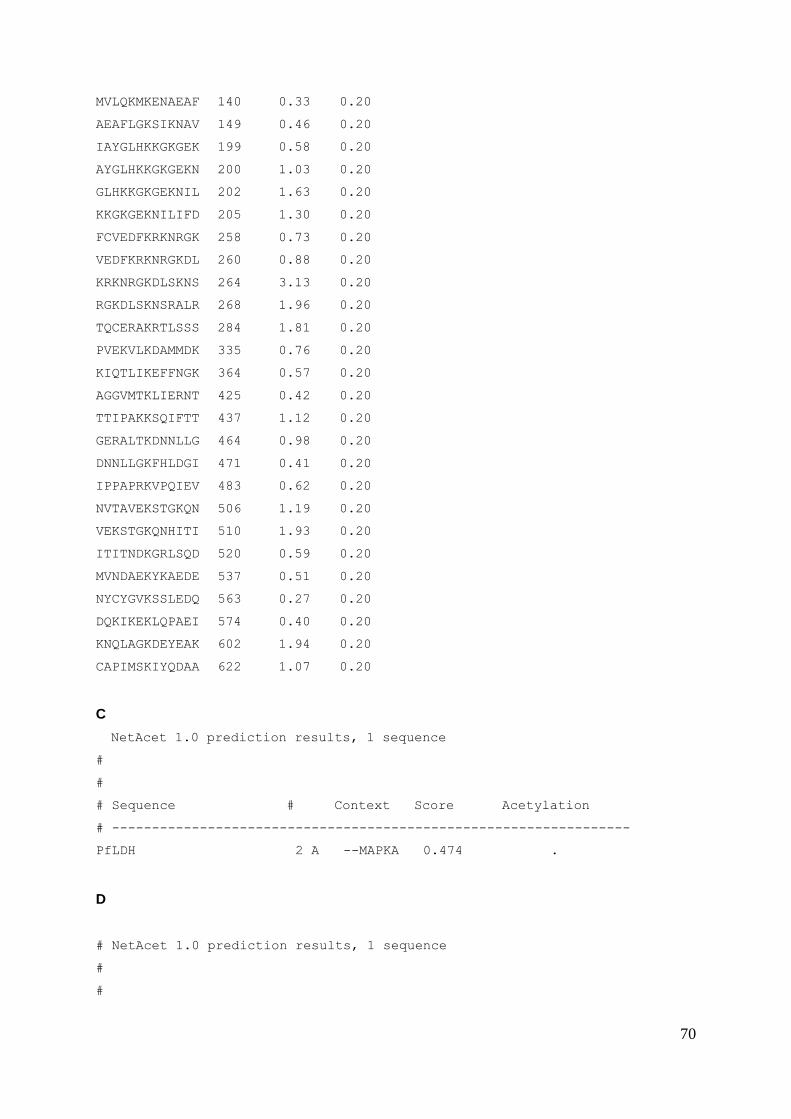
70
MVLQKMKENAEAF 140 0.33 0.20
AEAFLGKSIKNAV 149 0.46 0.20
IAYGLHKKGKGEK 199 0.58 0.20
AYGLHKKGKGEKN 200 1.03 0.20
GLHKKGKGEKNIL 202 1.63 0.20
KKGKGEKNILIFD 205 1.30 0.20
FCVEDFKRKNRGK 258 0.73 0.20
VEDFKRKNRGKDL 260 0.88 0.20
KRKNRGKDLSKNS 264 3.13 0.20
RGKDLSKNSRALR 268 1.96 0.20
TQCERAKRTLSSS 284 1.81 0.20
PVEKVLKDAMMDK 335 0.76 0.20
KIQTLIKEFFNGK 364 0.57 0.20
AGGVMTKLIERNT 425 0.42 0.20
TTIPAKKSQIFTT 437 1.12 0.20
GERALTKDNNLLG 464 0.98 0.20
DNNLLGKFHLDGI 471 0.41 0.20
IPPAPRKVPQIEV 483 0.62 0.20
NVTAVEKSTGKQN 506 1.19 0.20
VEKSTGKQNHITI 510 1.93 0.20
ITITNDKGRLSQD 520 0.59 0.20
MVNDAEKYKAEDE 537 0.51 0.20
NYCYGVKSSLEDQ 563 0.27 0.20
DQKIKEKLQPAEI 574 0.40 0.20
KNQLAGKDEYEAK 602 1.94 0.20
CAPIMSKIYQDAA 622 1.07 0.20
C
NetAcet 1.0 prediction results, 1 sequence
#
#
# Sequence # Context Score Acetylation
# -----------------------------------------------------------------
PfLDH 2 A --MAPKA 0.474 .
D
# NetAcet 1.0 prediction results, 1 sequence
#
#

71
# Sequence # Context Score Acetylation
# -----------------------------------------------------------------
PfHSP70-1 2 A --MASAK 0.471 .
PfHSP70-1 3 S -MASAKG 0.506 YES
E
Protein Predicted lysine acetylation
sites
PfLDH
17
PfHSP70-1
32
F
Protein
Predicted lysine acetylation
sites
PfLDH
0
PfHSP70-1
1
Figure 4.4 The predicted lysine acetylation sites on PfLDH and PfHSP70-1 using two programs. A and B
show the lysine acetylation site using a program PAIL and C and D using a program NetAcet that uses N-
acetyltransferase A as a substrate. E and F shows the tables the numbers of sites for PAIL and NetAcet,
respectively.
PfLDH alignments showing position of acetylation acetylation
PfLDH 1 -----------------MAPKAKIVLVGSGMIGGVMATLIVQKNLGD-VVLFDIVKNMPH
mLDH 1 -ATLKDQLIYNLLK-EEQTPQNKITVVGVGAVGMACAISILMKDLADELALVDVIEDKLK
ckLDH 1 MATLKEKLITPVAA-GSTVPSNKITVVGVGQVGMACAISILGKGLCDELALVDVLEDKLK
htLDH 1 -ATLKEKLIAPVAEEEATVPNNKITVVGVGQVGMACAISILGKSLADELALVDVLEDKLK
.*. **.:** * :* . * *: *.* * :.*.*:::: :
PfLDH 43 GKALDTSHTNVMAYSNCKVSGSNTYDDLAGADVVIVTAGFTKAPGKSDKEWNRDDLLPLN
mLDH 59 GEMMDLQHGSLFLR-TPKIVSGKDYNVTANSKLVIITAGARQQEGESRLN-----LVQRN
ckLDH 60 GEMMDLQHGSLFLQ-THKIVADKDYAVTANSKIVVVTAGVRQQEGESRLN-----LVQRN
htLDH 60 GEMMDLQHGSLFLQ-TPKIVADKDYSVTANSKIVVVTAGVRQQEGESRLN-----LVQRN

72
*: :* .* .:: . *: ..: * *.:.:*::*** : *:* : *: *
PfLDH 103 NKIMIEIGGHIKKNCPNAFIIVVTNPVDVMVQLLHQHSGVPKNKIIGLGGVLDTSRLKYY
mLDH 113 VNIFKFIIPNVVKYSPNCKLLIVSNPVDILTYVAWKISGFPKNRVIGSGCNLDSARFRYL
ckLDH 114 VNVFKFIIPQIVKYSPNCTILVVSNPVDILTYVTWKLSGLPKHRVIGSGCNLDTARFRYL
htLDH 114 VNVFKFIIPQIVKYSPDCIIIVVSNPVDILTYVTWKLSGLPKHRVIGSGCNLDSARFRYL
::: * :: * .*:. :::*:****::. : : **.**:::** * **::*::*
PfLDH 163 ISQKLNVCPRDVNAHIVGAHGNKMVLLKRYITVGGIPLQEFINNKLIS--DAELEAIFDR
mLDH 173 MGERLGVHPLSCHGWVLGEHGDSSVPVWSGMNVAGVSLKTLHPDLGTDKDKEQWKEVHKQ
ckLDH 174 MAERLGIHPTSCHGWILGEHGDSSVAVWSGVNVAGVSLQELNPAMGTDKDSENWKEVHKQ
htLDH 174 MAEKLGIHPSSCHGWILGEHGDSSVAVWSGVNVAGVSLQELNPEMGTDNDSENWKEVHKM
:.::*.: * . :. ::* **:. * : :.*.*: *: : . . : : :..
PfLDH 221 TVNTALEIVNLHASPYVAPAAAIIEMAESYLKDLKKVLICSTLLEGQYGH-SDIFGGTPV
mLDH 233 VVESAYEVIKLKGYTSWAIGLSVADLAESIMKNLRRVHPVSTMIKGLYGIKDDVFLSVPC
ckLDH 234 VVESAYEVIRLKGYTNWAIGLSVAELCETMLKNLYRVHSVSTLVKGTYGIENDVFLSLPC
htLDH 234 VVESAYEVIKLKGYTNWAIGLSVADLIESMLKNLSRIHPVSTMVKGMYGIENEVFLSLPC
.*::* *::.*:. * . :: :: *: :*:* :: **:::* ** .::* . *
PfLDH 280 VLGANGVEQVIELQLNSEEKAKFDEAIAET----KRMKALA
mLDH 293 ILGQNGISDLVKVTLTSEEEARLKKSADTLWGIQKELQF--
ckLDH 294 VLSASGLTSVINQKLKDDEVAQLKKSADTLWSIQKDLKDL-
htLDH 294 ILNARGLTSVINQKLKDDEVAQLKKSADTLWDIQKDLKDL-
:*. *: .::: *..:* *::.:: * ::
Figure 4.5 Predication of acetylation sites in the sequence of PfLDH aligned with chicken (Gallus gallus)
cKLDH and human (Homo sapien) hLDH using PAIL. The dark red colour (with letter K) show the positions of
predicted potential lysine acetylation sites by PAIL in the PfLDH sequence. Light blue conserved arginine 109
and 171, Dark green conserved aspartic acid 168, Yellow conserved histidine 195 all conserved in the catalytic
site of LDH sequence. The numbering of these conserved amino acids is based on the standard N numbering
system (Evenlhoff et al., 1977). Dark blue threonine 246 and grey isoleucine 250 are residues in the cofactor
binding site of LDH substituted by proline residues in PfLDH.
PfHSP70-1 acetylation
PfHSP70-1 1 MASAKGSKPNLPESNIAIGIDLGTTYSCVGVWRNENVDIIANDQGNRTTPSYVAFTDTER
cKHSP70-1 1 ----------MSGKGPAIGIDLGTTYSCVGVFQHGKVEIIANDQGNRTTPSYVAFTDTER
PO4-1 Binding domain

73
hHSP70-1 1 -----------MAKAAAIGIDLGTTYSCVGVFQHGKVEIIANDQGNRTTPSYVAFTDTER
. ***************::: :*:**********************
PfHSP70-1 61 LIGDAAKNQVARNPENTVFDAKRLIGRKFTESSVQSDMKHWPFTVKSGVDEKPMIEVTYQ
cKHSP70-1 51 LIGDAAKNQVAMNPTNTIFDAKRLIGRKYDDPTVQSDMKHWPFRVVNE-GGKPKVQVEYK
hHSP70-1 50 LIGDAAKNQVALNPQNTVFDAKRLIGRKFGDPVVQSDMKHWPFQVIND-GDKPKVQVSYK
*********** ** **:**********: : ********** * . . ** ::* *:
PfHSP70-1 121 GEKKLFHPEEISSMVLQKMKENAEAFLGKSIKNAVITVPAYFNDSQRQATKDAGTIAGLN
cKHSP70-1 110 GEMKTFFPEEISSMVLTKMKEIAEAYLGKKVQNAVITVPAYFNDSQRQATKDAGTITGLN
hHSP70-1 109 GDTKAFYPEEISSMVLTKMKEIAEAYLGYPVTNAVITVPAYFNDSQRQATKDAGVIAGLN
*: * *.********* **** ***:** : **********************.*:***
PfHSP70-1 181 VMRIINEPTAAAIAYGLHKKG--KGEKNILIFDLGGGTFDVSLLTIEDGIFEVKATAGDT
cKHSP70-1 170 VMRIINEPTAAAIAYGLDKKGTRAGEKNVLIFDLGGGTFDVSILTIEDGIFEVKSTAGDT
hHSP70-1 169 VLRIINEPTAAAIAYGLDRTG--KGERNVLIFDLGGGTFDVSILTIDDGIFEVKATAGDT
*:***************.:.* **:*:*************:***:*******:*****
PfHSP70-1 239 HLGGEDFDNRLVNFCVEDFKRKNRGKDLSKNSRALRRLRTQCERAKRTLSSSTQATIEID
cKHSP70-1 230 HLGGEDFDNRMVNHFVEEFKRKHK-RDIAGNKRAVRRLRTACERAKRTLSSSTQASIEID
hHSP70-1 227 HLGGEDFDNRLVNHFVEEFKRKHK-KDISQNKRAVRRLRTACERAKRTLSSSTQASLEID
**********:**. **:****:: :*:: *.**:***** **************::***
PfHSP70-1 299 SLFEGIDYSVTVSRARFEELCIDYFRDTLIPVEKVLKDAMMDKKSVHEVVLVGGSTRIPK
cKHSP70-1 289 SLFEGIDFYTSITRARFEELNADLFRGTLEPVEKALRDAKLDKGQIQEIVLVGGSTRIPK
hHSP70-1 286 SLFEGIDFYTSITRARFEELCSDLFRSTLEPVEKALRDAKLDKAQIHDLVLVGGSTRIPK
*******: .:::******* * **.** ****.*:** :** .::::***********
PfHSP70-1 359 IQTLIKEFFNGKEACRSINPDEAVAYGAAVQAAILSGDQSNAVQDLLLLDVCSLSLGLET
cKHSP70-1 349 IQKLLQDFFNGKELNKSINPDEAVAYGAAVQAAILMGDKSENVQDLLLLDVTPLSLGIET
hHSP70-1 346 VQKLLQDFFNGRDLNKSINPDEAVAYGAAVQAAILMGDKSENVQDLLLLDVAPLSLGLET
:*.*:::****:: :******************* **:*: ********* ****:**
PfHSP70-1 419 AGGVMTKLIERNTTIPAKKSQIFTTYADNQPGVLIQVYEGERALTKDNNLLGKFHLDGIP
cKHSP70-1 409 AGGVMTALIKRNTTIPTKQTQTFTTYSDNQSSVLVQVYEGERAMTKDNNLLGKFDLTGIP
Connect 1 region PO4-2 Binding domain
Adenosine
Binding region
β-Subdomain (Peptide substrate binding)
Connect 2 region

74
hHSP70-1 406 AGGVMTALIKRNSTIPTKQTQIFTTYSDNQPGVLIQVYEGERAMTKDNNLLGRFELSGIP
****** **:**:***:*::* ****:*** .**:********:********:*.* ***
PfHSP70-1 479 PAPRKVPQIEVTFDIDANGILNVTAVEKSTGKQNHITITNDKGRLSQDEIDRMVNDAEKY
cKHSP70-1 469 PAPRGVPQIEVTFDIDANGILNVSAVDKSTGKENKITITNDKGRLSKDDIDRMVQEAEKY
hHSP70-1 466 PAPRGVPQIEVTFDIDANGILNVTATDKSTGKANKITITNDKGRLSKEEIERMVQEAEKY
**** ******************:*.:***** *:***********:::*:***::****
PfHSP70-1 539 KAEDEENRKRIEARNSLENYCYGVKSSLEDQKIKEKLQPAEIETCMKTITTILEWLEKNQ
cKHSP70-1 529 KAEDEANRDRVGAKNSLESYTYNMKQTVEDEKLKGKISDQDKQKVLDKCQEVISWLDRNQ
hHSP70-1 526 KAEDEVQRERVSAKNALESYAFNMKSAVEDEGLKGKISEADKKKVLDKCQEVISWLDANT
***** :*.*: *:*:**.* :.:*.::**: :* *:. : :. :.. ::.**: *
PfHSP70-1 599 LAGKDEYEAKQKEAESVCAPIMSKIYQDAAGAAGGMPGGMPGGMPGGMPSGMPGGMNFPG
cKHSP70-1 589 MAEKEEYEHKQKELEKLCNPIVTKLYQGAGGAGAGGSG----------------------
hHSP70-1 586 LAEKDEFEHKRKELEQVCNPIISGLYQGAGGPGPGGFGAQ--------------------
:* *:*:* *:** *.:* **:: :**.*.* . * *
PfHSP70-1 661 GMPGAGMPGNAPAGSGPTVEEVD
cKHSP70-1 626 ---------------GPTIEEVD
hHSP70-1 625 -----G--PKGGSGSGPTIEEVD
***:****
Figure 4.6 Predication of acetylation sites in the sequence of PfHSP70-1 aligned with chicken (Gallus
gallus) cKHSP70-1 and human (Homo sapien) hHSP70-1 using PAIL. Dark red colour (with letter K) potential
lysine acetylation sites by PAIL in the PfHSP70-1 sequence. Dark green phosphate 1 binding region, red
phosphate 2 binding region, yellow connect 1 region, light green connect 2 region, light blue the adenosine
binding region, purple β-subdomain for peptide substrate binding, grey α-helical subdomain for hinge and lid
region, greenish is the EEVD mortif. Within the α-subdomain the blue, green and pink colours shows the position
of the 3 immunogenic peptide sequences predicted by Predict7™.
The program, “prediction of acetylation on internal lysine” (PAIL)
(bdmpail.biocuckoo.org/predictions.php/) which was used to generate the data in Figure 4.4 (A, B
and E), predicted 17 possible lysine acetylation sites for native PfLDH and 32 for native
PfHSP70-1. The position of the predicted acetylation sites are shown in Figure 4.5 and Figure
4.6 on the aligned sequences of PfLDH and PfHSP70-1, respectively with chicken and human
sequences for each protein. The position of the predicted potential lysine acetylation sites
relative to the important amino acid residues in the active sites of each protein can be seen on
Figure 4.5 and 4.6. Should lysine acetylation occur near or close to essential catalytic residues in
the active site and this lysine acetylation is conserved in the species, this may alter activity of the
native protein. Another program NetAcet (www.cbs.dtu.dk/services/NetAcet/) predicts substrates
of N-acetyltransferase A (NatA) in acetylation (Kiemer et al., 2004). NetAcet predicted no
α-Helical subdomain (Lid and hinge region)

75
acetylation site for PfLDH and one acetylation site for PfHSP70-1 as shown in Figure 4.4 (C, D
and F). Another important factor is the surface probability of the acetylated lysine residue,
because only the acetylated sites on the surface would interfere with the activity of the protein.
Only acetylated lysine residues on the surface of the native protein can interact with antibodies.
Crystal structure analysis is required to determine which lysines are on the surface. Miao et al.,
2013 and Zhao et al., 2010 showed that Plasmodium proteins like many parasitic proteins are
acetylated.
Zhao et al., (2013) demonstrated that human LDH-A in tumour cells is acetylated at
lysine 5 (K5) and that acetylation inhibits LDH-A activity. Furthermore, the K5 acetylated LDH-A
is recognised by the HSC70 chaperone and delivered to lysosomes for degradation (Zhao et al.,
2013). Neumann et al., (2008) showed that a genetically modified Nε-acetyllysine recombinant
protein produced in E. coli that produces 100% acetylated LDH-A at K5 had less enzyme activity
compared to un-acetylated LDH-A activity. In addition, K5 acetylation lead to a time-dependent
reduction of LDH-A protein levels. The K5 of PfLDH is a conserved lysine in chicken, muscle and
heart LDH, and may, therefore, be acetylated. If that is the case, then the activity of native PfLDH
has the potential to alter enzyme activity. Because human LDH and PfLDH are conserved
proteins, it would, therefore, be interesting to observe if K5 on PfLDH is acetylated in vivo and
does this influence PfLDH activity in the parasite. Then it may be responsible for reduced
sensitivity in the detection of parasitemia and drug sensitivity assay using PfLDH (Makler and
Hinrichs, 1993; Makler et al., 1993). The numbering of amino acid residues in LDH is based on
the standard N numbering system (Evenhoff et al., 1977; Gomez et al., 1997).
Yang et al., 2013 demonstrated that cellular stresses could influence increase in
intracellular levels of acetylated HSP70s (HSP72, HSP70-1, HSPAIA, GRP78), which bind to
Beclin-I-Vps 34 complex and promote KAPI-dependent SUMOylation and activity of Vps34.
These findings add to accumulating evidence that supports the role of HSP70 and HSP90 in
stabilising and promoting the activity of the molecular effectors upstream in the AV formation,
such as ULKI and downstream in the AV expansion and fusion with lysosome (Yang et al.,
2013). Most of the predicted potential lysine acetylation sites were far from key catalytic domain
of PfHSP70-1.The interesting acetylation sites were K563, K574 and K602 which are found in the
α-helical subdomain of PfHSP70-1 and conserved in chicken and humans HSP70 proteins. The
K563, K574 and K602 acetylations may affect the activity of the native protein if they are
acetylated as they have a higher possibility of being on the surface in P. falciparum, Chicken and
Human HSP70-1. If poly-clonal antibodies against of the whole PfHSP70-1 were produced in
chicken and tested on the native protein, there may be a possibility of reduced recognition due to
acetylation of K563, K574 and K602. HSP70 proteins are highly conserved proteins and
investigation will show if PfHSP70-1 acetylation has an effect on the interaction with antibodies
raised against the recombinant proteins.

76
The results showed potential acetylation sites in both PfLDH and PfHSP70-1 and that similar
proteins in humans are acetylated. Human LDH and HSP70 acetylation alter the activities of
these proteins. It would be interesting to study the effect of acetylation of Plasmodial LDH and
PfHSP70-1 in human blood with malaria.
4.3.2 Phosphorylation
Phosphorylation is a post-translational modification of proteins in which amino acid
residues threonine, serine or tyrosine undergo the addition of a phosphate group covalently
bonded by a protein kinase. Protein phosphorylation is the most fundamental molecular
mechanism through which protein function is regulated in response to extracellular stimuli.
Virtually all types of extracellular signals, including neurotransmitters, light, hormones, cytokines,
neurotropic factors, energy management and cell regulation, produce their diverse physiological
effects by regulating the phosphorylation of specific phosphoproteins in their target cells.
Potential phosphorylation sites on PfLDH and PfHSP70-1 were predicted using a
phosphorylation predicting algorithm Kinasephos (Huang et al., 2005a; Huang et al., 2005b;
Hong et al., 2007) at www.kinasephos.mbc.nctu.edu.tw/predict.php/. Phosphorylation plays an
important role in protein function modification by either activating or deactivating many enzyme,
thereby regulating their function (Nestler et al., 1984). Peace et al., (2013) identified 2767
proteins, 1337 phosphoproteins, and 6293 phosphrylation sites in P. falciparum. Post
translational regulatory mechanisms have dominant roles in regulation of intraerythrocytic gene
expression. Lasonder et al., (2015) identified merozoite proteasome revealing 1765 unique
phosphorylation sites, including 785 phosphorylation sites previously identified in schizonts.
These merozoite phosphorylation interaction network, a subnet of 119 proteins with potential
roles in cellular movement and invasion. Wu et al., 2009 also showed that P. falciparum
infections greatly increased phosphorylation of a set of proteins in parasitized RBC.
A
Protein Name
Predicted phosphorylated site
Serine (S) Threonine (T) Tyrosine (Y)
PfLDH 3 0 1
PfHSP70-1 7 6 2
B
PfLDH
MAPKAKIVLV GSGMIGGVMA TLIVQKNLGD VVLFDIVKNM PHGKALDTSH TNVMAYSNCK 60
VSGSNTYDDL AGADVVIVTA GFTKAPGKSD KEWNRDDLLP LNNKIMIEIG GHIKKNCPNA 120
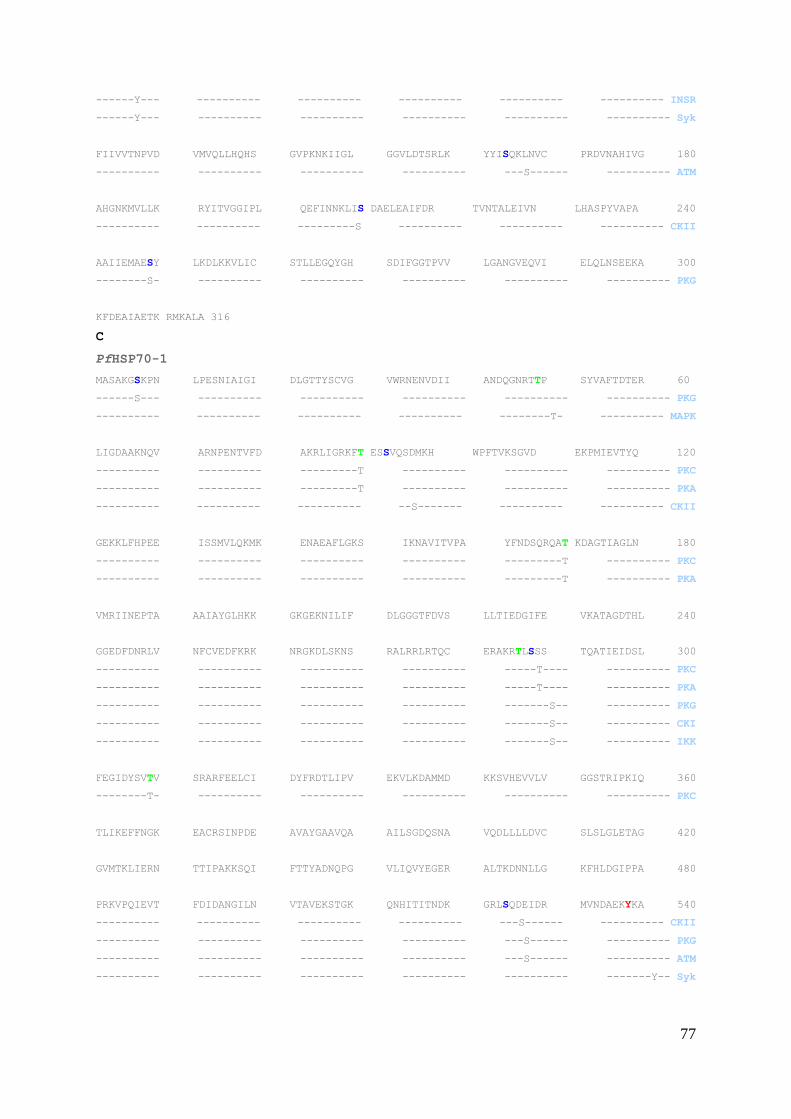
77
------Y--- ---------- ---------- ---------- ---------- ---------- INSR
------Y--- ---------- ---------- ---------- ---------- ---------- Syk
FIIVVTNPVD VMVQLLHQHS GVPKNKIIGL GGVLDTSRLK YYISQKLNVC PRDVNAHIVG 180
---------- ---------- ---------- ---------- ---S------ ---------- ATM
AHGNKMVLLK RYITVGGIPL QEFINNKLIS DAELEAIFDR TVNTALEIVN LHASPYVAPA 240
---------- ---------- ---------S ---------- ---------- ---------- CKII
AAIIEMAESY LKDLKKVLIC STLLEGQYGH SDIFGGTPVV LGANGVEQVI ELQLNSEEKA 300
--------S- ---------- ---------- ---------- ---------- ---------- PKG
KFDEAIAETK RMKALA 316
C
PfHSP70-1
MASAKGSKPN LPESNIAIGI DLGTTYSCVG VWRNENVDII ANDQGNRTTP SYVAFTDTER 60
------S--- ---------- ---------- ---------- ---------- ---------- PKG
---------- ---------- ---------- ---------- --------T- ---------- MAPK
LIGDAAKNQV ARNPENTVFD AKRLIGRKFT ESSVQSDMKH WPFTVKSGVD EKPMIEVTYQ 120
---------- ---------- ---------T ---------- ---------- ---------- PKC
---------- ---------- ---------T ---------- ---------- ---------- PKA
---------- ---------- ---------- --S------- ---------- ---------- CKII
GEKKLFHPEE ISSMVLQKMK ENAEAFLGKS IKNAVITVPA YFNDSQRQAT KDAGTIAGLN 180
---------- ---------- ---------- ---------- ---------T ---------- PKC
---------- ---------- ---------- ---------- ---------T ---------- PKA
VMRIINEPTA AAIAYGLHKK GKGEKNILIF DLGGGTFDVS LLTIEDGIFE VKATAGDTHL 240
GGEDFDNRLV NFCVEDFKRK NRGKDLSKNS RALRRLRTQC ERAKRTLSSS TQATIEIDSL 300
---------- ---------- ---------- ---------- -----T---- ---------- PKC
---------- ---------- ---------- ---------- -----T---- ---------- PKA
---------- ---------- ---------- ---------- -------S-- ---------- PKG
---------- ---------- ---------- ---------- -------S-- ---------- CKI
---------- ---------- ---------- ---------- -------S-- ---------- IKK
FEGIDYSVTV SRARFEELCI DYFRDTLIPV EKVLKDAMMD KKSVHEVVLV GGSTRIPKIQ 360
--------T- ---------- ---------- ---------- ---------- ---------- PKC
TLIKEFFNGK EACRSINPDE AVAYGAAVQA AILSGDQSNA VQDLLLLDVC SLSLGLETAG 420
GVMTKLIERN TTIPAKKSQI FTTYADNQPG VLIQVYEGER ALTKDNNLLG KFHLDGIPPA 480
PRKVPQIEVT FDIDANGILN VTAVEKSTGK QNHITITNDK GRLSQDEIDR MVNDAEKYKA 540
---------- ---------- ---------- ---------- ---S------ ---------- CKII
---------- ---------- ---------- ---------- ---S------ ---------- PKG
---------- ---------- ---------- ---------- ---S------ ---------- ATM
---------- ---------- ---------- ---------- ---------- -------Y-- Syk

78
EDEENRKRIE ARNSLENYCY GVKSSLEDQK IKEKLQPAEI ETCMKTITTI LEWLEKNQLA 600
---------- ---S------ ---------- ---------- ---------- ---------- PKG
---------- ---------- ----S----- ---------- ---------- ---------- PKG
GKDEYEAKQK EAESVCAPIM SKIYQDAAGA AGGMPGGMPG GMPGGMPGGM NFPGGMPGAG 660
----Y----- ---------- ---------- ---------- ---------- ---------- EGFR
----Y----- ---------- ---------- ---------- ---------- ---------- INSR
----Y----- ---------- ---------- ---------- ---------- ---------- Syk
---------- ---S------ ---------- ---------- ---------- ---------- PKC
---------- ---S------ ---------- ---------- ---------- ---------- CKII
---------- ---S------ ---------- ---------- ---------- ---------- IKK
MPGNAPAGSG PTVEEVD 677
---------- -T----- PKC
Figure 4.7 Predicted phosphorylation sites on the PfLDH and PfHSP70-1 amino acid sequences using
Kinasephos. A is the table showing the number of predicted sites, and B and C the position of the predicted
residues in sequence.
PfLDH phosphorylation
PfLDH 1 -----------------MAPKAKIVLVGSGMIGGVMATLIVQKNLGD-VVLFDIVKNMPH
mLDH 1 -ATLKDQLIYNLLK-EEQTPQNKITVVGVGAVGMACAISILMKDLADELALVDVIEDKLK
ckLDH 1 MATLKEKLITPVAA-GSTVPSNKITVVGVGQVGMACAISILGKGLCDELALVDVLEDKLK
htLDH 1 -ATLKEKLIAPVAEEEATVPNNKITVVGVGQVGMACAISILGKSLADELALVDVLEDKLK
.*. **.:** * :* . * *: *.* * :.*.*:::: :
PfLDH 43 GKALDTSHTNVMAYSNCKVSGSNTYDDLAGADVVIVTAGFTKAPGKSDKEWNRDDLLPLN
mLDH 59 GEMMDLQHGSLFLR-TPKIVSGKDYNVTANSKLVIITAGARQQEGESRLN-----LVQRN
ckLDH 60 GEMMDLQHGSLFLQ-THKIVADKDYAVTANSKIVVVTAGVRQQEGESRLN-----LVQRN
htLDH 60 GEMMDLQHGSLFLQ-TPKIVADKDYSVTANSKIVVVTAGVRQQEGESRLN-----LVQRN
*: :* .* .:: . *: ..: * *.:.:*::*** : *:* : *: *
PfLDH 103 NKIMIEIGGHIKKNCPNAFIIVVTNPVDVMVQLLHQHSGVPKNKIIGLGGVLDTSRLKYY
mLDH 113 VNIFKFIIPNVVKYSPNCKLLIVSNPVDILTYVAWKISGFPKNRVIGSGCNLDSARFRYL
ckLDH 114 VNVFKFIIPQIVKYSPNCTILVVSNPVDILTYVTWKLSGLPKHRVIGSGCNLDTARFRYL
htLDH 114 VNVFKFIIPQIVKYSPDCIIIVVSNPVDILTYVTWKLSGLPKHRVIGSGCNLDSARFRYL
::: * :: * .*:. :::*:****::. : : **.**:::** * **::*::*
PfLDH 163 ISQKLNVCPRDVNAHIVGAHGNKMVLLKRYITVGGIPLQEFINNKLIS--DAELEAIFDR
mLDH 173 MGERLGVHPLSCHGWVLGEHGDSSVPVWSGMNVAGVSLKTLHPDLGTDKDKEQWKEVHKQ
ckLDH 174 MAERLGIHPTSCHGWILGEHGDSSVAVWSGVNVAGVSLQELNPAMGTDKDSENWKEVHKQ
htLDH 174 MAEKLGIHPSSCHGWILGEHGDSSVAVWSGVNVAGVSLQELNPEMGTDNDSENWKEVHKM
:.::*.: * . :. ::* **:. * : :.*.*: *: : . . : : :..

79
PfLDH 221 TVNTALEIVNLHASPYVAPAAAIIEMAESYLKDLKKVLICSTLLEGQYGH-SDIFGGTPV
mLDH 233 VVESAYEVIKLKGYTSWAIGLSVADLAESIMKNLRRVHPVSTMIKGLYGIKDDVFLSVPC
ckLDH 234 VVESAYEVIRLKGYTNWAIGLSVAELCETMLKNLYRVHSVSTLVKGTYGIENDVFLSLPC
htLDH 234 VVESAYEVIKLKGYTNWAIGLSVADLIESMLKNLSRIHPVSTMVKGMYGIENEVFLSLPC
.*::* *::.*:. * . :: :: *: :*:* :: **:::* ** .::* . *
PfLDH 280 VLGANGVEQVIELQLNSEEKAKFDEAIAET----KRMKALA
mLDH 293 ILGQNGISDLVKVTLTSEEEARLKKSADTLWGIQKELQF--
ckLDH 294 VLSASGLTSVINQKLKDDEVAQLKKSADTLWSIQKDLKDL-
htLDH 294 ILNARGLTSVINQKLKDDEVAQLKKSADTLWDIQKDLKDL-
:*. *: .::: *..:* *::.:: * ::
Figure 4.8 Predicted phosphorylation sites on the PfLDH sequence with the key catalytic amino acids in
the active site of PfLDH aligned with chicken (Gallus Gallus ) cKLDH and human (Homo sapien) mLDH
using Kinasephos. The light green colour (with letter Y) show the positions of predicted potential tyrosine
phosphorylation sites by Kinasephos in the PfLDH sequence. Light blue (with letter S) potential serine
phosphorylation sites. Light red conserved arginine 109 and 171, purple conserved aspartic acid 168, yellow
conserved histidine 195 are conserved amino-acid residues in the active site of LDH sequence. Dark blue
threonine 246 and the greenish isoleucine 250 are residues in the cofactor binding site of LDH are substituted by
proline residues in PfLDH. The numbering of these conserved essential catalytic amino acids is based on the
standard N numbering system (Evenlhoff et al., 1977).
PfHSP70-1 phosphorylation
PfHSP70-1 1 MASAKGSKPNLPESNIAIGIDLGTTYSCVGVWRNENVDIIANDQGNRTTPSYVAFTDTER
cKHSP70-1 1 ----------MSGKGPAIGIDLGTTYSCVGVFQHGKVEIIANDQGNRTTPSYVAFTDTER
hHSP70-1 1 -----------MAKAAAIGIDLGTTYSCVGVFQHGKVEIIANDQGNRTTPSYVAFTDTER
. ***************::: :*:**********************
PfHSP70-1 61 LIGDAAKNQVARNPENTVFDAKRLIGRKFTESSVQSDMKHWPFTVKSGVDEKPMIEVTYQ
cKHSP70-1 51 LIGDAAKNQVAMNPTNTIFDAKRLIGRKYDDPTVQSDMKHWPFRVVNE-GGKPKVQVEYK
hHSP70-1 50 LIGDAAKNQVALNPQNTVFDAKRLIGRKFGDPVVQSDMKHWPFQVIND-GDKPKVQVSYK
*********** ** **:**********: : ********** * . . ** ::* *:
PfHSP70-1 121 GEKKLFHPEEISSMVLQKMKENAEAFLGKSIKNAVITVPAYFNDSQRQATKDAGTIAGLN
cKHSP70-1 110 GEMKTFFPEEISSMVLTKMKEIAEAYLGKKVQNAVITVPAYFNDSQRQATKDAGTITGLN
hHSP70-1 109 GDTKAFYPEEISSMVLTKMKEIAEAYLGYPVTNAVITVPAYFNDSQRQATKDAGVIAGLN
*: * *.********* **** ***:** : **********************.*:***
PO4-1 Binding domain
Connect 1 region PO4
-2 Binding domain

80
PfHSP70-1 181 VMRIINEPTAAAIAYGLHKKG--KGEKNILIFDLGGGTFDVSLLTIEDGIFEVKATAGDT
cKHSP70-1 170 VMRIINEPTAAAIAYGLDKKGTRAGEKNVLIFDLGGGTFDVSILTIEDGIFEVKSTAGDT
hHSP70-1 169 VLRIINEPTAAAIAYGLDRTG--KGERNVLIFDLGGGTFDVSILTIDDGIFEVKATAGDT
*:***************.:.* **:*:*************:***:*******:*****
PfHSP70-1 239 HLGGEDFDNRLVNFCVEDFKRKNRGKDLSKNSRALRRLRTQCERAKRTLSSSTQATIEID
cKHSP70-1 230 HLGGEDFDNRMVNHFVEEFKRKHK-RDIAGNKRAVRRLRTACERAKRTLSSSTQASIEID
hHSP70-1 227 HLGGEDFDNRLVNHFVEEFKRKHK-KDISQNKRAVRRLRTACERAKRTLSSSTQASLEID
**********:**. **:****:: :*:: *.**:***** **************::***
PfHSP70-1 299 SLFEGIDYSVTVSRARFEELCIDYFRDTLIPVEKVLKDAMMDKKSVHEVVLVGGSTRIPK
cKHSP70-1 289 SLFEGIDFYTSITRARFEELNADLFRGTLEPVEKALRDAKLDKGQIQEIVLVGGSTRIPK
hHSP70-1 286 SLFEGIDFYTSITRARFEELCSDLFRSTLEPVEKALRDAKLDKAQIHDLVLVGGSTRIPK
*******: .:::******* * **.** ****.*:** :** .::::***********
PfHSP70-1 359 IQTLIKEFFNGKEACRSINPDEAVAYGAAVQAAILSGDQSNAVQDLLLLDVCSLSLGLET
cKHSP70-1 349 IQKLLQDFFNGKELNKSINPDEAVAYGAAVQAAILMGDKSENVQDLLLLDVTPLSLGIET
hHSP70-1 346 VQKLLQDFFNGRDLNKSINPDEAVAYGAAVQAAILMGDKSENVQDLLLLDVAPLSLGLET
:*.*:::****:: :******************* **:*: ********* ****:**
PfHSP70-1 419 AGGVMTKLIERNTTIPAKKSQIFTTYADNQPGVLIQVYEGERALTKDNNLLGKFHLDGIP
cKHSP70-1 409 AGGVMTALIKRNTTIPTKQTQTFTTYSDNQSSVLVQVYEGERAMTKDNNLLGKFDLTGIP
hHSP70-1 406 AGGVMTALIKRNSTIPTKQTQIFTTYSDNQPGVLIQVYEGERAMTKDNNLLGRFELSGIP
****** **:**:***:*::* ****:*** .**:********:********:*.* ***
PfHSP70-1 479 PAPRKVPQIEVTFDIDANGILNVTAVEKSTGKQNHITITNDKGRLSQDEIDRMVNDAEKY
cKHSP70-1 469 PAPRGVPQIEVTFDIDANGILNVSAVDKSTGKENKITITNDKGRLSKDDIDRMVQEAEKY
hHSP70-1 466 PAPRGVPQIEVTFDIDANGILNVTATDKSTGKANKITITNDKGRLSKEEIERMVQEAEKY
**** ******************:*.:***** *:***********:::*:***::****
PfHSP70-1 539 KAEDEENRKRIEARNSLENYCYGVKSSLEDQKIKEKLQPAEIETCMKTITTILEWLEKNQ
cKHSP70-1 529 KAEDEANRDRVGAKNSLESYTYNMKQTVEDEKLKGKISDQDKQKVLDKCQEVISWLDRNQ
hHSP70-1 526 KAEDEVQRERVSAKNALESYAFNMKSAVEDEGLKGKISEADKKKVLDKCQEVISWLDANT
***** :*.*: *:*:**.* :.:*.::**: :* *:. : :. :.. ::.**: *
Adenosine
Binding region
β-Subdomain (Peptide substrate binding)
Connect 2 region
α-Helicalsubdomain (Lid and hinge region)

81
PfHSP70-1 599 LAGKDEYEAKQKEAESVCAPIMSKIYQDAAGAAGGMPGGMPGGMPGGMPSGMPGGMNFPG
cKHSP70-1 589 MAEKEEYEHKQKELEKLCNPIVTKLYQGAGGAGAGGSG----------------------
hHSP70-1 586 LAEKDEFEHKRKELEQVCNPIISGLYQGAGGPGPGGFGAQ--------------------
:* *:*:* *:** *.:* **:: :**.*.* . * *
PfHSP70-1 661 GMPGAGMPGNAPAGSGPTVEEVD
cKHSP70-1 626 ---------------GPTIEEVD
hHSP70-1 625 -----G--PKGGSGSGPTIEEVD
***:****
Figure 4.9 The positions of the predicted phosphorylation sites on the PfHSP70-1 sequence aligned with
chicken (Gallus Gallus) cKHSP70-1 and human (Homosapien) hHSP70-1 using Kinasephos. The light blue
colour (with letter S, Y, T) show the positions of predicted potential serine, tyrosine and threonine phosphorylation
sites by Kinasephos in the PfHSP70-1 sequence. Dark green phosphate 1 binding region, red phosphate 2
binding region, yellow connect 1 region, light green connect 2 region, light blue the adenosine binding region,
purple β-subdomain for peptide substrate binding, grey α-helical subdomain for hinge and lid region, greenish is
the EEVD mortif. Within the α-subdomain the blue, green and pink show the position of the three immunogenic
peptide sequences predicted by Predict7™.
Figure 4.7 shows that PfLDH has three possible phosphorylation sites on serine residues and
one on a tyrosine residue and PfHSP70-1 has seven possible phosphorylation sites on serine
residues, six on threonine and two on tyrosine residues. The position of the predicted
phosphorylation sites are shown in Figure 4.8 and Figure 4.9 on the aligned sequences of PfLDH
and PfHSP 70-1 respectively. The position of the predicted potential serine, tyrosine and
threonine phosphorylation sites relative to the important amino acid residues in the active sites of
each protein can be seen on Figure 4.8 and 4.9.
Human LDH-A was found to be directly phosphorylated by the oncogenic receptor tyrosine
kinase FGFR1. Phosphorylation at tyrosine 10 (Y10) and tyrosine 83 (Y83) enhances LDH-A
activity by enhancing the formation of active, tetrameric LDH-A and the binding of LDH-A
substrate NADH, respectively (Fan et al., 2011). The Y10 in PfLDH is not present, but the Y83
amino acid is present. If Y83 in PfLDH is phosphorylated, it may increase the activity of PfLDH
like in human LDH-A. Most of the predicted potential phosphorylation sites are located far away
from the essential catalytic amino acid residues. The numbering of amino acid residues in LDH is
based on the standard N numbering system (Evenhoff et al., 1977; Gomez et al., 1997). The Y10
and Y 83 are conserved in the LDH sequence analysed except PfLDH.
Muller et al., 2011 identified a C-terminal phosphorylation of human HSP70 and HSP90
as a switch for regulating co-chaperone binding and indicated that cancer cells possess an
elevated protein folding environment by the concerted action of co-chaperone expression and
chaperone modification. S574 in the β-subdomain (peptide substrate binding domain) is a
predicted phosphorylation site that is conserve in P. falciparum, chicken and human LDH, but

82
may not be phosphorylated because of its location. The remaining phosphorylation sites are
located far from the essential catalytic amino acids.
Both LDH and HSP70 are conserved proteins in humans and malaria parasites, and it would be
important to see if native PfLDH and PfHSP70-1 phosphorylation has an effect on the activity of
these proteins in malaria parasites. It would be interesting also to find out if native PfLDH and
PfHSP70-1 phosphorylation has an effect on the interaction with antibodies raised against the
recombinant proteins.
4.3.3 Glycosylation
Glycosylation is post-translational modification by the conjugation of a sugar moiety to
proteins. Glycosylation is important in a wide range of biological processes, including cell
attachment to the extracellular matrix, protein-ligand interactions in the cell, monitoring the status
of protein folding, quality control mechanisms to ensure that only properly folded proteins are
trafficked to the Golgi, used in export of proteins to proper destination and can alter the solubility
of a protein because sugars are soluble. N-Glycosylation in P. falciparum may have a role in
protein targeting and both N- and O- glycosylation occur in P. falciparum (De Macedo et al.,
2010). Parasite proteins were found to bind concanavalin A (Con A) which suggested the
presence of mannosylated glycans (Kilejian and Olson, 1979). Later, Kilejian and Olson, (1980)
demonstrated the presence of glycoproteins in the late trophozoite stage by radioactive labelling
with glucosamine. Gowda and Davidson, (1999) also discussed, in their review, that N- and O-
glycosylation were present in P. falciparum and glycosylation may influence activation of a signal
pathway in host cells, and thereby induce expression of cytokines, adhesion molecules and
induced nitric oxide synthase (Gowda et al., 1997). Cova et al., (2015) suggests that P.
falciparum protein glycosylation is important for parasite survival. Types of glycosylation include
N-, O-, C-, glypiation and phosphoglycoslation.
O-Glycosylation of PfLDH and PfHSP70-1 predictions were done according to Gupta et al., 1999
using a predicting program known as DictyOGlyc (www.cbs.dtu.dk/services/DictyOGlyc/).
A
Name: PfLDH Length: 316
MAPKAKIVLVGSGMIGGVMATLIVQKNLGDVVLFDIVKNMPHGKALDTSHTNVMAYSNCKVSGSNTYDDLAGADVVIVTA 80
GFTKAPGKSDKEWNRDDLLPLNNKIMIEIGGHIKKNCPNAFIIVVTNPVDVMVQLLHQHSGVPKNKIIGLGGVLDTSRLK 160
YYISQKLNVCPRDVNAHIVGAHGNKMVLLKRYITVGGIPLQEFINNKLISDAELEAIFDRTVNTALEIVNLHASPYVAPA 240
AAIIEMAESYLKDLKKVLICSTLLEGQYGHSDIFGGTPVVLGANGVEQVIELQLNSEEKAKFDEAIAETKRMKALA
................................................................................ 80
........G....................................................................... 160
................................................................................ 240
............................................................................
B

83
Name Residue Number Potential Threshold Assignment
PfLDH Ser 0012 0.0683 0.7863 .
PfLDH Thr 0021 0.0140 0.8543 .
PfLDH Thr 0048 0.0191 0.5915 .
PfLDH Ser 0049 0.0193 0.5845 .
PfLDH Thr 0051 0.0139 0.6325 .
PfLDH Ser 0057 0.0160 0.6764 .
PfLDH Ser 0062 0.0133 0.5496 .
PfLDH Ser 0064 0.0314 0.5636 .
PfLDH Thr 0066 0.0173 0.5366 .
PfLDH Thr 0079 0.0152 0.7823 .
PfLDH Thr 0083 0.2749 0.5795 .
PfLDH Ser 0089 0.4551 0.3807 G
PfLDH Thr 0126 0.0419 0.7733 .
PfLDH Ser 0140 0.1257 0.5745 .
PfLDH Thr 0156 0.0109 0.6744 .
PfLDH Ser 0157 0.0309 0.6175 .
PfLDH Ser 0164 0.0749 0.6714 .
PfLDH Thr 0194 0.0214 0.7084 .
PfLDH Ser 0210 0.0211 0.6055 .
PfLDH Thr 0221 0.0660 0.6185 .
PfLDH Thr 0224 0.0118 0.6684 .
PfLDH Ser 0234 0.1610 0.6585 .
PfLDH Ser 0249 0.0515 0.6555 .
PfLDH Ser 0261 0.1525 0.7843 .
PfLDH Thr 0262 0.0130 0.7314 .
PfLDH Ser 0271 0.3547 0.6575 .
PfLDH Thr 0277 0.6417 0.6754 .
PfLDH Ser 0296 0.0256 0.4796 .
PfLDH Thr 0309 0.0166 0.5705 .
C

84
D
Name: PfHsp70-1 Length: 677
MASAKGSKPNLPESNIAIGIDLGTTYSCVGVWRNENVDIIANDQGNRTTPSYVAFTDTERLIGDAAKNQVARNPENTVFD 80
AKRLIGRKFTESSVQSDMKHWPFTVKSGVDEKPMIEVTYQGEKKLFHPEEISSMVLQKMKENAEAFLGKSIKNAVITVPA 160
YFNDSQRQATKDAGTIAGLNVMRIINEPTAAAIAYGLHKKGKGEKNILIFDLGGGTFDVSLLTIEDGIFEVKATAGDTHL 240
GGEDFDNRLVNFCVEDFKRKNRGKDLSKNSRALRRLRTQCERAKRTLSSSTQATIEIDSLFEGIDYSVTVSRARFEELCI 320
DYFRDTLIPVEKVLKDAMMDKKSVHEVVLVGGSTRIPKIQTLIKEFFNGKEACRSINPDEAVAYGAAVQAAILSGDQSNA 400
VQDLLLLDVCSLSLGLETAGGVMTKLIERNTTIPAKKSQIFTTYADNQPGVLIQVYEGERALTKDNNLLGKFHLDGIPPA 480
PRKVPQIEVTFDIDANGILNVTAVEKSTGKQNHITITNDKGRLSQDEIDRMVNDAEKYKAEDEENRKRIEARNSLENYCY 560
GVKSSLEDQKIKEKLQPAEIETCMKTITTILEWLEKNQLAGKDEYEAKQKEAESVCAPIMSKIYQDAAGAAGGMPGGMPG 640
GMPGGMPGGMNFPGGMPGAGMPGNAPAGSGPTVEEVD
................................................................................ 80
................................................................................ 160
................................................................................ 240
................................................................................ 320
................................................................................ 400
................................................................................ 480
................................................................................ 560
................................................................................ 640
...............................G.....
E
Name Residue Number Potential Threshold Assignment
PfHsp70-1 Ser 0003 0.0427 0.5406 .
PfHsp70-1 Ser 0007 0.0516 0.4966 .
PfHsp70-1 Ser 0014 0.0212 0.6984 .
PfHsp70-1 Thr 0024 0.0120 0.7424 .
PfHsp70-1 Thr 0025 0.0604 0.7833 .
PfHsp70-1 Ser 0027 0.1140 0.7823 .
PfHsp70-1 Thr 0048 0.0214 0.5785 .

85
PfHsp70-1 Thr 0049 0.0273 0.6155 .
PfHsp70-1 Ser 0051 0.4669 0.7024 .
PfHsp70-1 Thr 0056 0.0174 0.7474 .
PfHsp70-1 Thr 0058 0.0293 0.7114 .
PfHsp70-1 Thr 0077 0.0265 0.6645 .
PfHsp70-1 Thr 0090 0.0146 0.6525 .
PfHsp70-1 Ser 0092 0.1980 0.6964 .
PfHsp70-1 Ser 0093 0.0347 0.6635 .
PfHsp70-1 Ser 0096 0.0297 0.6595 .
PfHsp70-1 Thr 0104 0.0156 0.7164 .
PfHsp70-1 Ser 0107 0.0425 0.6575 .
PfHsp70-1 Thr 0118 0.0356 0.7394 .
PfHsp70-1 Ser 0132 0.0407 0.7713 .
PfHsp70-1 Ser 0133 0.4580 0.8183 .
PfHsp70-1 Ser 0150 0.1532 0.6535 .
PfHsp70-1 Thr 0157 0.0809 0.8233 .
PfHsp70-1 Ser 0165 0.0175 0.6085 .
PfHsp70-1 Thr 0170 0.0101 0.5426 .
PfHsp70-1 Thr 0175 0.0154 0.6984 .
PfHsp70-1 Thr 0189 0.0210 0.6894 .
PfHsp70-1 Thr 0216 0.0748 0.7304 .
PfHsp70-1 Ser 0220 0.0149 0.8283 .
PfHsp70-1 Thr 0223 0.0155 0.7853 .
PfHsp70-1 Thr 0234 0.0105 0.6784 .
PfHsp70-1 Thr 0238 0.0235 0.6625 .
PfHsp70-1 Ser 0267 0.0161 0.5646 .
PfHsp70-1 Ser 0270 0.0179 0.6305 .
PfHsp70-1 Thr 0278 0.0344 0.6575 .
PfHsp70-1 Thr 0286 0.0151 0.6005 .
PfHsp70-1 Ser 0288 0.0434 0.6335 .
PfHsp70-1 Ser 0289 0.0485 0.6445 .
PfHsp70-1 Ser 0290 0.0223 0.6645 .
PfHsp70-1 Thr 0291 0.0119 0.6555 .
PfHsp70-1 Thr 0294 0.0109 0.7264 .
PfHsp70-1 Ser 0299 0.1401 0.7484 .
PfHsp70-1 Ser 0307 0.2203 0.7853 .
PfHsp70-1 Thr 0309 0.0449 0.7683 .
PfHsp70-1 Ser 0311 0.1890 0.7444 .
PfHsp70-1 Thr 0326 0.0876 0.7384 .
PfHsp70-1 Ser 0343 0.0423 0.6355 .
PfHsp70-1 Ser 0353 0.0897 0.7264 .

86
PfHsp70-1 Thr 0354 0.2519 0.6974 .
PfHsp70-1 Thr 0361 0.0344 0.7244 .
PfHsp70-1 Ser 0375 0.2277 0.6575 .
PfHsp70-1 Ser 0394 0.1559 0.7064 .
PfHsp70-1 Ser 0398 0.0143 0.6425 .
PfHsp70-1 Ser 0411 0.0179 0.8013 .
PfHsp70-1 Ser 0413 0.0117 0.7923 .
PfHsp70-1 Thr 0418 0.0116 0.7044 .
PfHsp70-1 Thr 0424 0.0160 0.7813 .
PfHsp70-1 Thr 0431 0.1538 0.6305 .
PfHsp70-1 Thr 0432 0.0155 0.6395 .
PfHsp70-1 Ser 0438 0.0332 0.6435 .
PfHsp70-1 Thr 0442 0.0245 0.7494 .
PfHsp70-1 Thr 0443 0.0304 0.7454 .
PfHsp70-1 Thr 0463 0.0128 0.6085 .
PfHsp70-1 Thr 0490 0.0570 0.7923 .
PfHsp70-1 Thr 0502 0.0139 0.7713 .
PfHsp70-1 Ser 0507 0.0123 0.5755 .
PfHsp70-1 Thr 0508 0.0179 0.5396 .
PfHsp70-1 Thr 0515 0.0162 0.7284 .
PfHsp70-1 Thr 0517 0.0219 0.6804 .
PfHsp70-1 Ser 0524 0.0137 0.6265 .
PfHsp70-1 Ser 0554 0.0130 0.6704 .
PfHsp70-1 Ser 0564 0.0246 0.6665 .
PfHsp70-1 Ser 0565 0.0187 0.6505 .
PfHsp70-1 Thr 0582 0.1213 0.7104 .
PfHsp70-1 Thr 0586 0.0291 0.7364 .
PfHsp70-1 Thr 0588 0.0558 0.7574 .
PfHsp70-1 Thr 0589 0.1031 0.7753 .
PfHsp70-1 Ser 0614 0.0259 0.7014 .
PfHsp70-1 Ser 0621 0.2921 0.7494 .
PfHsp70-1 Ser 0669 0.1299 0.5636 .
PfHsp70-1 Thr 0672 0.5753 0.5656 G
F

87
Figure 4.10 The predicted O-glycoslation sites on the PfLDH and PfHSP70-1 amino acid sequences using
DictyOGlyc. A and D are sequences of PfLDH and PfHSP70-1, respectively with the possible gycosylation sites.
B and E shows the threshold and the predicted values. C and F is a graphical representation of B and E.
The program predicted 1 glycosylation site for PfLDH and 1 for PfHSP70-1 as shown in figure
4.10 A where a G (where the green arrow is pointing), in B where a G is written on serine 0089
and in C (where the green arrow is pointing) and figure 4.10 D where a G (where the green arrow
is poiting), threonine 0672 in E and F (where the green arrow is pointing).
N-Glycosylation of PfLDH and PfHSP70-1 was done according to Gupta et al., 2002
using a predicting program known as NetNGlyc 1.0 (www.cbs.dtu.dk/services/NetNGlyc/).
A
Name: PfLDH Length: 316
MAPKAKIVLVGSGMIGGVMATLIVQKNLGDVVLFDIVKNMPHGKALDTSHTNVMAYSNCKVSGSNTYDDLAGADV 80
VIVTAGFTKAPGKSDKEWNRDDLLPLNNKIMIEIGGHIKKNCPNAFIIVVTNPVDVMVQLLHQHSGVPKNKIIGLGGVLD 160
TSRLKYYISQKLNVCPRDVNAHIVGAHGNKMVLLKRYITVGGIPLQEFINNKLISDAELEAIFDRTVNTALEIVNLHASP 240
YVAPAAAIIEMAESYLKDLKKVLICSTLLEGQYGHSDIFGGTPVVLGANGVEQVIELQLNSEEKAKFDEAIAETKRMKAL 320
A
................................................................................ 80
................................................................................ 160
................................................................................ 240
................................................................................ 320
. 400
(Threshold=0.5)
B
No sites predicted in this sequence.
C

88
D
Name: PfHSP70-1 Length: 677
MASAKGSKPNLPESNIAIGIDLGTTYSCVGVWRNENVDIIANDQGNRTTPSYVAFTDTERLIGDAAKNQVARNPENT 80
VFDAKRLIGRKFTESSVQSDMKHWPFTVKSGVDEKPMIEVTYQGEKKLFHPEEISSMVLQKMKENAEAFLGKSIKNAVIT 160
VPAYFNDSQRQATKDAGTIAGLNVMRIINEPTAAAIAYGLHKKGKGEKNILIFDLGGGTFDVSLLTIEDGIFEVKATAGD 240
THLGGEDFDNRLVNFCVEDFKRKNRGKDLSKNSRALRRLRTQCERAKRTLSSSTQATIEIDSLFEGIDYSVTVSRARFEE 320
LCIDYFRDTLIPVEKVLKDAMMDKKSVHEVVLVGGSTRIPKIQTLIKEFFNGKEACRSINPDEAVAYGAAVQAAILSGDQ 400
SNVQDLLLLDVCSLSLGLETAGGVMTKLIERNTTIPAKKSQIFTTYADNQPGVLIQVYEGERALTKDNNLLGKFHLDGIP 480
PAPRKVPQIEVTFDIDANGILNVTAVEKSTGKQNHITITNDKGRLSQDEIDRMVNDAEKYKAEDEENRKRIEARNSLENY 560
CYGVKSSLEDQKIKEKLQPAEIETCMKTITTILEWLEKNQLAGKDEYEAKQKEAESVCAPIMSKIYQDAAGAAGGMPGGM 640
PGGMPGGMPGGMNFPGGMPGAGMPGNAPAGSGPTVEEVD
................................................N............................... 80
................................................................................ 160
.....N.......................................................................... 240
................................................................................ 320
................................................................................ 400
...............................N................................................ 480
.....................N.......................................................... 560
................................................................................ 640
....................................... 720
(Threshold=0.5)
----------------------------------------------------------------------
SeqName Position Potential Jury N-Glyc
agreement result
----------------------------------------------------------------------
Sequence 49 NRTT 0.6357 (8/9) +
Sequence 166 NDSQ 0.5906 (8/9) +
Sequence 432 NTTI 0.5696 (7/9) +
Sequence 502 NVTA 0.7803 (9/9) +++
----------------------------------------------------------------------

89
E
Figure 4.11 Predicted N-glycosylation sites on PfLDH and PfHSP70-1 amino acid sequences using
NetNGlyc. A and D are sequences of PfLDH and PfHSP70-1, respectively with the possible gycosylation sites. B
and E shows the threshold and the predicted values. C and F is a graphical representation of B and E.
PfHSP70-1 1 MASAKGSKPNLPESNIAIGIDLGTTYSCVGVWRNENVDIIANDQGNRTTPSYVAFTDTER
cKHSP70-1 1 ----------MSGKGPAIGIDLGTTYSCVGVFQHGKVEIIANDQGNRTTPSYVAFTDTER
hHSP70-1 1 -----------MAKAAAIGIDLGTTYSCVGVFQHGKVEIIANDQGNRTTPSYVAFTDTER
. ***************::: :*:**********************
PfHSP70-1 61 LIGDAAKNQVARNPENTVFDAKRLIGRKFTESSVQSDMKHWPFTVKSGVDEKPMIEVTYQ
cKHSP70-1 51 LIGDAAKNQVAMNPTNTIFDAKRLIGRKYDDPTVQSDMKHWPFRVVNE-GGKPKVQVEYK
hHSP70-1 50 LIGDAAKNQVALNPQNTVFDAKRLIGRKFGDPVVQSDMKHWPFQVIND-GDKPKVQVSYK
*********** ** **:**********: : ********** * . . ** ::* *:
PfHSP70-1 121 GEKKLFHPEEISSMVLQKMKENAEAFLGKSIKNAVITVPAYFNDSQRQATKDAGTIAGLN
cKHSP70-1 110 GEMKTFFPEEISSMVLTKMKEIAEAYLGKKVQNAVITVPAYFNDSQRQATKDAGTITGLN
hHSP70-1 109 GDTKAFYPEEISSMVLTKMKEIAEAYLGYPVTNAVITVPAYFNDSQRQATKDAGVIAGLN
*: * *.********* **** ***:** : **********************.*:***
PfHSP70-1 181 VMRIINEPTAAAIAYGLHKKG--KGEKNILIFDLGGGTFDVSLLTIEDGIFEVKATAGDT
cKHSP70-1 170 VMRIINEPTAAAIAYGLDKKGTRAGEKNVLIFDLGGGTFDVSILTIEDGIFEVKSTAGDT
PO4-1 Binding domain
Connect 1 region PO4-2 Binding domain

90
hHSP70-1 169 VLRIINEPTAAAIAYGLDRTG--KGERNVLIFDLGGGTFDVSILTIDDGIFEVKATAGDT
*:***************.:.* **:*:*************:***:*******:*****
PfHSP70-1 239 HLGGEDFDNRLVNFCVEDFKRKNRGKDLSKNSRALRRLRTQCERAKRTLSSSTQATIEID
cKHSP70-1 230 HLGGEDFDNRMVNHFVEEFKRKHK-RDIAGNKRAVRRLRTACERAKRTLSSSTQASIEID
hHSP70-1 227 HLGGEDFDNRLVNHFVEEFKRKHK-KDISQNKRAVRRLRTACERAKRTLSSSTQASLEID
**********:**. **:****:: :*:: *.**:***** **************::***
PfHSP70-1 299 SLFEGIDYSVTVSRARFEELCIDYFRDTLIPVEKVLKDAMMDKKSVHEVVLVGGSTRIPK
cKHSP70-1 289 SLFEGIDFYTSITRARFEELNADLFRGTLEPVEKALRDAKLDKGQIQEIVLVGGSTRIPK
hHSP70-1 286 SLFEGIDFYTSITRARFEELCSDLFRSTLEPVEKALRDAKLDKAQIHDLVLVGGSTRIPK
*******: .:::******* * **.** ****.*:** :** .::::***********
PfHSP70-1 359 IQTLIKEFFNGKEACRSINPDEAVAYGAAVQAAILSGDQSNAVQDLLLLDVCSLSLGLET
cKHSP70-1 349 IQKLLQDFFNGKELNKSINPDEAVAYGAAVQAAILMGDKSENVQDLLLLDVTPLSLGIET
hHSP70-1 346 VQKLLQDFFNGRDLNKSINPDEAVAYGAAVQAAILMGDKSENVQDLLLLDVAPLSLGLET
:*.*:::****:: :******************* **:*: ********* ****:**
PfHSP70-1 419 AGGVMTKLIERNTTIPAKKSQIFTTYADNQPGVLIQVYEGERALTKDNNLLGKFHLDGIP
cKHSP70-1 409 AGGVMTALIKRNTTIPTKQTQTFTTYSDNQSSVLVQVYEGERAMTKDNNLLGKFDLTGIP
hHSP70-1 406 AGGVMTALIKRNSTIPTKQTQIFTTYSDNQPGVLIQVYEGERAMTKDNNLLGRFELSGIP
****** **:**:***:*::* ****:*** .**:********:********:*.* ***
PfHSP70-1 479 PAPRKVPQIEVTFDIDANGILNVTAVEKSTGKQNHITITNDKGRLSQDEIDRMVNDAEKY
cKHSP70-1 469 PAPRGVPQIEVTFDIDANGILNVSAVDKSTGKENKITITNDKGRLSKDDIDRMVQEAEKY
hHSP70-1 466 PAPRGVPQIEVTFDIDANGILNVTATDKSTGKANKITITNDKGRLSKEEIERMVQEAEKY
**** ******************:*.:***** *:***********:::*:***::****
PfHSP70-1 539 KAEDEENRKRIEARNSLENYCYGVKSSLEDQKIKEKLQPAEIETCMKTITTILEWLEKNQ
cKHSP70-1 529 KAEDEANRDRVGAKNSLESYTYNMKQTVEDEKLKGKISDQDKQKVLDKCQEVISWLDRNQ
hHSP70-1 526 KAEDEVQRERVSAKNALESYAFNMKSAVEDEGLKGKISEADKKKVLDKCQEVISWLDANT
***** :*.*: *:*:**.* :.:*.::**: :* *:. : :. :.. ::.**: *
PfHSP70-1 599 LAGKDEYEAKQKEAESVCAPIMSKIYQDAAGAAGGMPGGMPGGMPGGMPSGMPGGMNFPG
cKHSP70-1 589 MAEKEEYEHKQKELEKLCNPIVTKLYQGAGGAGAGGSG----------------------
Adenosine
Binding region
β-Subdomain (Peptide substrate binding)
Connect 2 region
α-Helicalsubdomain (Lid and hinge region)

91
hHSP70-1 586 LAEKDEFEHKRKELEQVCNPIISGLYQGAGGPGPGGFGAQ--------------------
:* *:*:* *:** *.:* **:: :**.*.* . * *
PfHSP70-1 661 GMPGAGMPGNAPAGSGPTVEEVD
cKHSP70-1 626 ---------------GPTIEEVD
hHSP70-1 625 -----G--PKGGSGSGPTIEEVD
***:****
Figure 4.12 Predicted N-glycosylation sites on the PfHSP70-1 sequence aligned with chicken (Gallus
Gallus) cKHSP70-1) and human (Homo sapien) hHSP70-1) using NetNGlyc. The light blue colour (with letter
N) show the positions of predicted potential asparagine glycosylation sites by NetNGlyc in the PfHSP70-1
sequence. Dark colour phosphate 1 binding region, red phosphate 2 binding region, yellow connect 1 region, light
green connect 2 region, light blue the adenosine binding region, purple β-subdomain for peptide substrate
binding, grey α-helical subdomain for hinge and lid region, greenish is the EEVD mortif. Within the α-subdomain
the blue, green and pink show the position of the 3 immunogenic peptide sequences predicted by Predict7™.
The program predicted no glycosylation sites for PfLDH and four potential glycosylation
sites for PfHSP70-1 (Figure 4.11 A-D and E where the blue arrows point). The position of the
predicted N-glycosylation sites in the sequence are shown in Figure 4.12 on the aligned
sequences of PfHSP 70-1 with chicken and human PfHSP70-1 sequences. The position of the
predicted potential N-glycosylation sites relative to the important amino acid residues in the
active site of PfHSP70-1 can be seen in Figure 4.12. The predicted potential glycosylation sites
N432 and N502 are located in the β-subdomain (the peptide substrate domain) and may not be
phosphorylated. The other two, N46 and N166 are located far away from the essential catalytic
residues. The recombinant PfLDH and PfHSP70-1 produced in E. coli are non-glycosylated, but
the native proteins may be glycosylated leading to differences in their activity compared to the
recombinant proteins. Glycosylation can be examined in the native protein by digesting with
neuraminidase, then running an SDS-PAGE gel of the digested and undigested native protein
and compare the size of the bands. Alternatively, a zymogram of these proteins can be done
using neuraminidase to cleave off the glucose moiety (Mensah-Brown et al., 2014).
4.3.4 Proteolytic cleavage
Although recombinant proteins produced in E.coli are not subject to proteolytic digest
because the host cells lack proteases, native proteins may be cleaved by various proteases. The
recombinant protein can be subject to protease digestion and probed with antibodies against the
protein to determine which portion of the protein the antibody binds to. Netcchop
www.cbs.dtu.dk/services/NetChop/ (Kesmir et al., 2002; Nielsen et al., 2003; Nielsen et al., 2005)
was used to predict the cleavage sites of PfLDH and PfHSP70-1. The program predicted 92
cleavage sites for PfLDH and 204 for PfHSP70-1. There are so many predicted sites that the
data is not shown. Recombinant protein lysate can be immunoprecipitated and an in-gel
protease digestion can be done ((Dinglasan et al., 2007; Ghosh et al., 2009; Chaerkady et

92
al., 2011), after which immunoprecipitated digested peptides can be analysed on a high
resolution mass spectrometer (Cha et al., 2016).
Three peptides were identified in the structure of PfHSP70-1 as potential
immunogenic peptides by Predict7™ and were found to be located on the α-helical
subdomain close to the C-terminus of the protein. All the 3 peptides were found to be located
on the surface of the 3D crystal structure model of PfHSP70-1.
Potential lysine acetylation sites were identified on both PfLDH and PfHSP70-1. K5
lysine acetylation on PfLDH is implicated in enzyme activity. The amino acid has been
shown to be important in human LDH-A as it reduced the activity of human LDH-A. K563,
K574 and K602 lysine acetylation of PfHSP70-1 may affect activity of the native protein as it
was found to affect activity of human HSP70-1. Only amino acid residues on the surface of
the proteins can affect activity of the native proteins because they can interact with
antibodies.
Potential phosphorylation sites were identified on both PfLDH and PfHSP70-1. Y83
of PfLDH may enhance activity of the enzyme as Y83 of human LDH-A was found to
enhance activity of human LDH-A. The predicted S574 of PfHSP70-1 is found on the β-
subdomain which is less likely to be located on the surface and is far from essential catalytic
amino acids, and may not affect the activity of PfHSP70-1.
Potential O-glycosylation sites for both PfLDH and PfHSP70-1 were found. No
potential N-glycosylation site was found for PfLDH. Four N-glycosylation sites were found on
PfHSP70-1. N432 and N502 are located in the β-subdomain which is not likely to be on the
surface and may not be phosphorylated. N46 and N166 are located far away from essential
catalytic residues, therefore will not affect the activity of the native protein. 92 potential
cleavage sites for PfLDH and 204 for PfHSP70-1 were identified. Recombinant proteins can
be digested by proteases to see which fragment of the protein antibodies bind to.

93
Chapter 5
5.1 Brief overview
Malaria is a global heath burden and an estimated 3.3 billion people are at risk of
being infected with malaria and 1.2 billion are at high risk (WHO 2014). An estimated 198
million cases of malaria occurred globally in 2013 and 584 000 deaths were recorded (WHO
2014). Although malaria control programs in many countries include vector control, treatment
with artemisinin combination therapy, diagnosis in most remote settings is still problematic
(Moody, 2002; Kappe et al., 2010; Shiff, 2002). RTS, S/AS01 Vaccine development is in the
advanced stages of clinical trials (Schwartz et al., 2012). Malaria affects mostly developing
countries in the tropics, especially sub-Saharan Africa, where there is a lack of infrastructure
and funding to control the disease (Hay et al., 2009).
Microscopy is the gold standard for the diagnosis of malaria, but most field clinics
lack infrastructure, electricity and the experienced manpower needed to use a microscope
(Moody, 2002; Suh et al., 2004). Field clinics, therefore, require diagnostic methods that are
fast, easy to perform and interpret and do not need electricity (Perkins & Bell., 2008; Moody,
2002; Makler et al., 1998). Various methods have been developed in an attempt to improve
diagnosis including PCR, flow cytometry, LAMP, DNA aptamers (Gupta et al., 2015;
Echeverry et al., 2016; Godonoga et al., 2016; Woodrow et al., 2015). Most of the methods
mentioned require expensive equipment, reagents and skills (Mouatcho & Goldring, 2013).
Malaria immunochromatographic or rapid diagnostic tests (RDTs) were developed to
simplify malaria diagnosis as they are fast, easy to use, easy to interpret and do not require
the use of electricity. RDTs in current use detect Plasmodium falciparum histidine rich
protein II (PfHRPII), Plasmodium lactate dehydrogenase (LDH) and Plasmodium aldolase
(Murray et al., 2008; Ashley et al., 2009; Khairnar et al., 2009; Wongrichanalai et al., 2007;
Leow et al., 2014; Verma et al., 2014; Ho et al., 2014; Shin et al., 2013; Otsuki et al., 2013;
Miao et al., 2013). The limit of detection is about 200 parasites/µl and takes an average of 5-
20 min to perform (Makler et al., 1998; Murray et al., 2008; Perkins & Bell, 2008; Ashley et
al., 2009). To detect asymptomatic malaria RDTs require to have a limit of detection of less
than 100 parasites/µl (Suh et al., 2011). Other short comings among RDTs in current use
include cross reaction with rheumatoid factor, loss of reactivity due to exposure to high
temperatures when stored, single nucleotide polymorphism in DNA of parasite genes leading
to changes in the proteins and failure of the test to differentiate co-infections with different
species of malaria (Mishra et al., 1999; Baker et al., 2010; Gwer et al., 2007).

94
5.2 Aims and objectives of the current study
The main aim of the study was to optimise the expression and purification of
recombinant PfLDH and PfHSP70-1 to produce recombinant protein for use in raising
polyclonal antibodies in chickens, antibody-antigen interaction studies and screening of
ScFvs in Nkuku® library for scFvs. The second aim was to identify immunogenic peptides
using an epitope prediction algorithm Predict7™. The peptide could be used to raise anti-
peptide antibodies in chickens for comparison with polyclonal antibodies in the detection of
each protein. The last aim was to identify possible post-translational modifications that may
interfere with detection of PfLDH and PfHSP70-1 by antibodies.
5.3 Main findings
PfLDH showed better expression in TB media (Li et al., 2011) (Figure 3.1 and Figure
3.2) and the expression of PfHSP70-1 was better in TB than LB media (Figure 3.17). TB
media was found to be a good choice of media by Li et al., (2011) using GFP, gluatathione-
S-transferase tagged GFP and human basic fibroblast growth factor recombinant proteins,
as cells grow faster in this media and do not require induction. Growing cells in TB media
were chosen. Induction in LB media was done using IPTG (a very expensive reagent)
although IPTG can be substituted by cheaper substances such as lactose and glucose. The
growth, following bacterial cells, showed that the E. coli host cells grew faster in TB media
reaching the stationary phase at about 4 hrs and 5 hrs for PfLDH and PfHSP70-1,
respectively (Figure 3.3 and Figure 3.16). The use of a single colony as starting material for
expression of recombinant proteins yielded better results than dilution of an overnight culture
1:100 in fresh growth medium. Induction of cultures at stationary phase was compared with
induction at mid-log phase or exponential phase. The results showed that inducing the
culture at stationary phase yields higher amounts of recombinant protein than inducing at
mid-log phase. This result was similar to that obtained by Flick et al., (2004) with
recombinant GST-PfEMP1. Expression speed and folding processes appear to influence
protein folding, and these appear to be slowed when induction is done at stationary phase.
At stationary phase, there is a low bacterial growth rate, which implicates a slow
biosynthesis process that results in a low speed of synthesising recombinant proteins. This
slow process allows the protein processing machinery to efficiently assemble the freshly
synthesised proteins into correctly folded structures. Correctly folded proteins are more likely
to remain in the soluble form provided the molecules do not have large numbers of
hydrophobic amino acid residues (Flick et al., 2004). Expression of recombinant PfLDH
protein at 25°C was compared to expression at 37°C. Expression at 25°C produced more
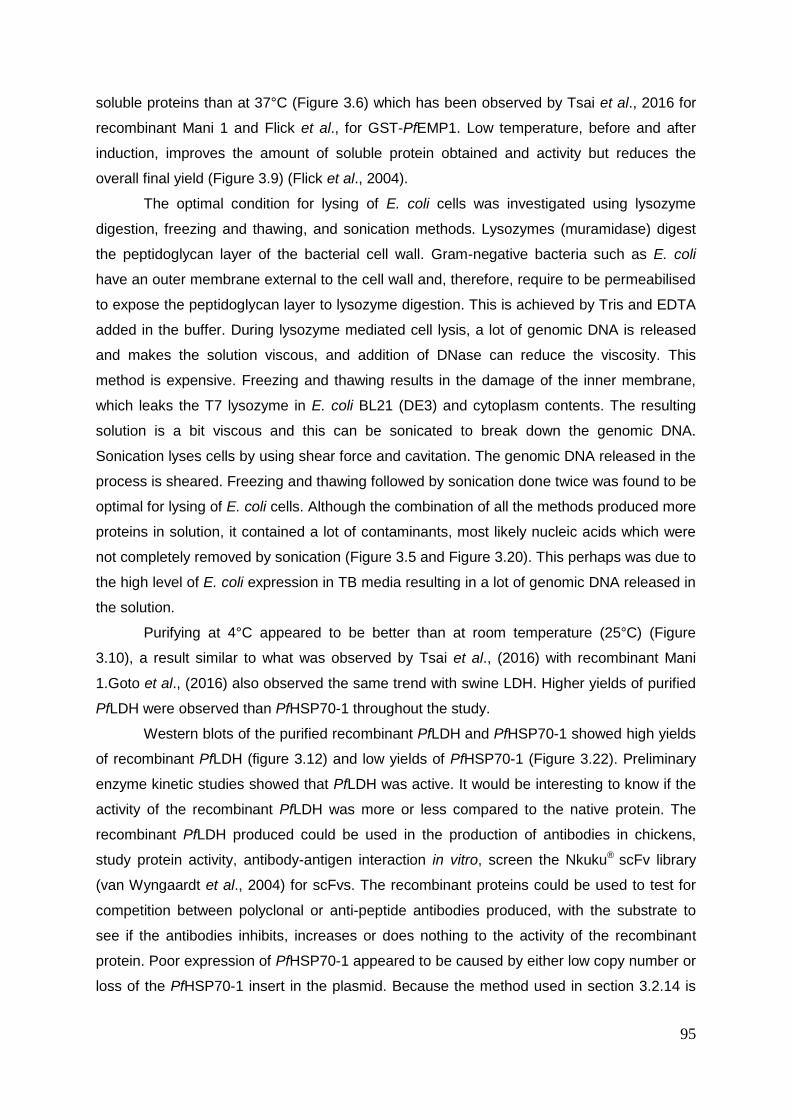
95
soluble proteins than at 37°C (Figure 3.6) which has been observed by Tsai et al., 2016 for
recombinant Mani 1 and Flick et al., for GST-PfEMP1. Low temperature, before and after
induction, improves the amount of soluble protein obtained and activity but reduces the
overall final yield (Figure 3.9) (Flick et al., 2004).
The optimal condition for lysing of E. coli cells was investigated using lysozyme
digestion, freezing and thawing, and sonication methods. Lysozymes (muramidase) digest
the peptidoglycan layer of the bacterial cell wall. Gram-negative bacteria such as E. coli
have an outer membrane external to the cell wall and, therefore, require to be permeabilised
to expose the peptidoglycan layer to lysozyme digestion. This is achieved by Tris and EDTA
added in the buffer. During lysozyme mediated cell lysis, a lot of genomic DNA is released
and makes the solution viscous, and addition of DNase can reduce the viscosity. This
method is expensive. Freezing and thawing results in the damage of the inner membrane,
which leaks the T7 lysozyme in E. coli BL21 (DE3) and cytoplasm contents. The resulting
solution is a bit viscous and this can be sonicated to break down the genomic DNA.
Sonication lyses cells by using shear force and cavitation. The genomic DNA released in the
process is sheared. Freezing and thawing followed by sonication done twice was found to be
optimal for lysing of E. coli cells. Although the combination of all the methods produced more
proteins in solution, it contained a lot of contaminants, most likely nucleic acids which were
not completely removed by sonication (Figure 3.5 and Figure 3.20). This perhaps was due to
the high level of E. coli expression in TB media resulting in a lot of genomic DNA released in
the solution.
Purifying at 4°C appeared to be better than at room temperature (25°C) (Figure
3.10), a result similar to what was observed by Tsai et al., (2016) with recombinant Mani
1.Goto et al., (2016) also observed the same trend with swine LDH. Higher yields of purified
PfLDH were observed than PfHSP70-1 throughout the study.
Western blots of the purified recombinant PfLDH and PfHSP70-1 showed high yields
of recombinant PfLDH (figure 3.12) and low yields of PfHSP70-1 (Figure 3.22). Preliminary
enzyme kinetic studies showed that PfLDH was active. It would be interesting to know if the
activity of the recombinant PfLDH was more or less compared to the native protein. The
recombinant PfLDH produced could be used in the production of antibodies in chickens,
study protein activity, antibody-antigen interaction in vitro, screen the Nkuku® scFv library
(van Wyngaardt et al., 2004) for scFvs. The recombinant proteins could be used to test for
competition between polyclonal or anti-peptide antibodies produced, with the substrate to
see if the antibodies inhibits, increases or does nothing to the activity of the recombinant
protein. Poor expression of PfHSP70-1 appeared to be caused by either low copy number or
loss of the PfHSP70-1 insert in the plasmid. Because the method used in section 3.2.14 is
96
less sensitive, primers of the PfHSP70-1 gene can be designed and the gene amplified by
PCR to conclusively know if low copy number or loss of insert is the cause of poor
expression. The PCR product can be cloned and transformed into E. coli for the expression
of PfHSP70-1. Alternatively, using specific primers, PfHSP70-1 gene can amplified by PCR
from genomic DNA, then transcribed into mRNA of PfHSP70-1. The mRNA can be reverse
transcribed into cDNA and then cloned and transformed as mentioned earlier.
Three peptides with high surface probability and hydrophilicity values were identified
from the amino acid sequence of PfHSP70-1 using the Predict 7™ program. These peptides
were found to be on the surface of PfLDH crystal structure. Production of polyclonal and
anti-peptide antibodies against PfHSP70-1 in chicken and isolating lgY from the egg yolk.
Testing of these antibodies with the recombinant and native protein would be required. This
information would be used to assess the effectiveness in predicting immunogenic epitopes
by the algorithm Predict7™ used in the current study to predict the epitopes for PfHSP70-1.
There would be need to study the activity of ATPase and substrate binding domains of
recombinant PfHSP70-1 and compare this to previous data as proof that the expressed
recombinant protein in PfHSP70-1. This study may include studying the ATPase activity of
PfHSP70-1 and determine the ATP hydrolysis of PfHSP70-1 in the presence or absence of
co-chaperones such as Plasmodium falciparum Dnaj 1-4 and Plasmodium falciparum
HSP90. Potential acetylation, phosphorylation, glycosylation and proteolytic cleavage sites
were found in both PfLDH and PfHSP70-1. Polyclonal and anti-peptide antibodies raised
from these recombinant proteins would be characterized by comparing their affinity for
acetylated, phosphorylated or glycosylated and non-acetylated, non-phosphorylated and
non-glycosylated peptides using ELISA formats.
5.4 Conclusion
Recombinant expression and purification of PfLDH and PfHSP70-1 was achieved.
PfLDH was expressed and purified in high amounts of 144.77 mg of recombinant protein
from 200 ml culture volume compared to 18 mg of recombinant PfLDH per liter of culture
volume obtained by Berwal et al., 2008. Preliminary studies showed activity of PfLDH.
PfHSP70-1 was poorly expressed and purified. The data observed suggests possible low
plasmid copy number or loss of PfHSP70-1 insert in the plasmid, and hence poor yields.
Purification of recombinant proteins at 4°C is better than at room temperature (25°C). The
purified proteins were identified by anti-His-tag antibodies. Potential acetylation,
phosphorylation, glycosylation and proteolytic cleavage sites were identified.
The PfLDH plasmid was sequenced, and the sequence was confirmed to be of
PfLDH. Probing the recombinant PfLDH protein with anti-peptide antibodies against epitopes

97
of PfLDH or anti-PfLDH antibodies would further confirm the identity of recombinant PfLDH.
The recombinant PfLDH protein amino acid residues can also be sequenced.
A basal ATPase and steady state ATPase activity of recombinant PfHSP70-1 can be
done to confirm the identity of recombinant PfHSP70-1. Probing the recombinant PfHSP70-1
with anti-PfHSP70-1 antibodies can confirm the identity of PfHSP70-1. Furthermore,
recombinant PfHSP70-1 plasmid can be isolated and sequenced or amino acid residues of
recombinant PfHSP70-1 can be sequenced to confirm the identity of PfHSP70-1.
Future work will involve cloning of the PfHSP70-1 gene with a His6-tag at the N-
terminal into a pQE30 or another appropriate plasmid vector. Express the recombinant
PfHSP70-1 protein, purify and use the purified recombinant protein to raise anti-peptide and
whole protein poly clonal antibodies against PfHSP70-1 in chickens. Screening of scFv
against PfLDH and PfHSP70-1 recombinant proteins in the Nkuku® library will be done. The
antibodies will be tested in ELISA, western blots, enhanced chemiluminescence and dip
stick format.

98
References
Abba, K., Deeks, J. J., Olliaro, P. L., Naing, C. M., Jackson, S. M., Takwoingi, Y.,
Donegan, S. and Garner, P. (2011). Rapid diagnostic tests for diagnosing uncomplicated P.
falciparum malaria in endemic countries. Cochrane Database of Systematic Reviews, 7,
CD008122.
Abdoon, A. M. M. O. and Alshahrani, A. M. (2003). Prevalence and distribution of
Anopheline mosquitoes in malaria endemic areas of Asia Region, Saudi Arabia. Eastern
Mediterranean Health Journal, 9 (3), 240– 247.
Acharya, P., Kumar, R. and Tatu, U. (2006). Chaperoning a cellular upheaval in malaria:
Heat shock proteins in Plasmodium falciparum. Molecular Biochemical Parasitology, 153,
85–94.
Aikawa, M., Miller, L. H., Johnson, J. and Rabbege, J. (1978). Erythrocyte entry by
malarial parasites: a moving junction between erythrocyte and parasite. Journal of Cell
Biology, 77, 72-82.
Alonso, P. L., Lindsay, S. W., Armstrong, J. R., Conteh, M., Hill, A. G., David, P. H.,
Fegan, G., de Francisco, A., Hall, A. J. and Shenton, F. C. (1991). The effect of
insecticide-treated bed nets on mortality of Gambian children. Lancet, 337, 1499-1502.
Alonso, P. L., Sacarlal, J., Aponte, J. J., Leach, A., Macete, E., Sigauque, B., Milman,
J., Mandomando, I., Bassat, Q., Guinovart, C., Espasa, M., Corachan, S., Lievens, M.,
Navia, M. M., Dubois, M., Menendez, C., Dubovsky, F., Cohen, I. and Thompson, R.
(2005). Duration of protection with RTS,S/AS02A malaria vaccine in prevention of
Plasmodium falciparum disease in Mozambican children: single-blind extended follow-up of
a randomised controlled trial. Lancet, 366, 2012–18.
Aly, A. S. I., Mikolajczak, S. A., Rivera, H. S., Camargo, N., Jacobs-Lorena, V., Labaied,
M., Coppens, I. and Kappe, S.H. I. (2008). Targeted deletion of SAP1 abolishes the
expression of infectivity factors necessary for successful malaria parasite liver infection.
Molecular Microbiology, 69, 152- 163.
Amino, R., Thiberge, S., Blazquez, S., Baldacci, P., Renaud, O., Shorte, S. and
Me´nard, S. (2007). Imaging malaria sporozoites in the dermis of the mammalian host.
Nature Protocols, Vol.2 No.7, 1705-1712.
Anderios, F., NoorRain, A. and Vythilingam, L. (2009). In vivo study of human
Plasmodium knowlesi in Macaca fascicularis. Experimental Parasitology, 124, 181-189.
99
Antia R., Yates A. and de Roode J.C. (2008). The dynamics of acute malaria infections. I.
Effect of the parasite's red blood cell preference. Proceedings of the Royal Society, 275,
1449-1458.
Aponte, J. J., Aide, P., Renom, M., Mandomando, i., Bassat, Q., Sacarlal, J., Manaca,
M. N., Lafuente, S., Barbosa, A., Leach, A., Lievens, M., Vekemans, J., Sigauque, B.,
Dubois, M., Demoitié, M., Sillman, M., Savarese, B., McNeil, J. G., Macete, E., Ballou, R.
W., Cohen, J. and Alonso, P. L. (2007). Safety of the RTS,S/AS02D candidate malaria
vaccine in infants living in a highly endemic area of Mozambique: a double blind randomised
controlled phase I/IIb trial. Lancet, 370, 1543-51.
Ardeshir, F., Flint, J. E., Richman, S. J. and Reese, R. T. (1987). A 75-kDa merozoite
surface protein of Plasmodium falciparum which is related to the 70 kDa heat shock proteins.
European Molecular Biology Organization Journal, 6, 493–9.
Arrow, K. J., Panosian, C. and Gelband, H. (2003). Saving Lives, Buying Time: Economics
of malaria drugs in an age of resistance. Institute of Medicine, Board on Global Health,
Committee on the Economics of Antimalarial Drugs.
Ashley, E. A., Touabi, M., Ahrer, M., Hutagalung, R., Htun, K., Luchavez, J., Dureza, C.,
Proux, S., Leimanis, M., Min Lwin, M., Koscalova, A., Comte, E., Hamade, P., Page, A-
L., Nosten, F. and Guerin, P. J. (2009). Evaluation of three parasite lactate
dehydrogenase-based rapid diagnostic tests for the diagnosis of falciparum and vivax
malaria. Malaria Journal, 8, 241.
Bachmann, J., Burte´, F., Pramana, S., Conte, I., Brown, B. J., Orimadegun, A. E.,
Ajetunmobi, W. A., Afolabi, N. K., Akinkunmi, F., Omokhodion, S., Akinbami, F. O.,
Shokunbi, W. A., Kampf, C., Pawitan, Y., Uhle´n, M., Sodeinde, O., Schwenk, J. M.,
Wahlgren, M., Fernandez-Reyes, D. and Nilsson, P. (2014). Affinity proteomics reveals
elevated Muscle proteins in plasma of children with cerebral malaria. PLoS Pathogens, 10
(4).
Baird, J. K., Purnomo, and Jones, T. R. (1992). Diagnosis of malaria in the field by
fluorescence microscopy of QBC capillary tubes. Transactions of the Royal Society of
Tropical Medicine and Hygiene, 86, 3–5.
Baker, J., Ho, M-F., Pelecanos, A., Gatton, M., Chen, N., Abdullah, S., Albertini, A.,
Ariey, F., Barnwell, J., Bell, D., Cunningham, J., Djalle, D., Echeverry, D. F., Gamboa,
D., Hii, J., Kyaw, M. P., Luchavez, J., Membi, C., Menard, D., Murillo, C., Nhem, S.,
Ogutu, B., Onyor, P., Oyibo, W., Wang, S. Q., McCarthy, J. and Cheng, Q. (2010). Global
sequence variation in the histidine-rich proteins 2 and 3 of Plasmodium falciparum:
implications for the performance of malaria rapid diagnostic tests. Malaria Journal, 9 (129).

100
Baldacci, P. and Ménard, R. (2004). The elusive malaria sporozoite in the mammalian host.
Molecular Microbiology, 54 (2), 298-306.
Baneyx, F. (1999). Recombinant protein expression in Escherichia coli. Current Opinion in
Biotechnology, 10, 411-421.
Bannister, A. J., Miska, E. A., Gorlich, D. and Kouzarides, T. (2000). Acetylation of
importin-a nuclear import factor by CBP/p300. Current Biology, 10, 467-470.
Bannister, L. and Mitchell, G. (2003). The ins, outs and roundabouts of malaria. Trends in
Parasitology, 19, 209-213.
Bannister, L. H., Hopkin, J. M., Fowler, R. E., Krishna, S. and Mitchell, G. H. (2000). A
brief illustrated guide to the ultrastructure of Plasmodium falciparum asexual blood stages.
Molecular Approaches to Malaria, 16 (10), 427-433.
Barker, R. H., Banchongaksorm, N. T., Courval, M, M., Suwonkerd, W.,
Rimwungtragoon, K. and Wirth, D. R. (1992). A simple method to detect Plasmodium
falciparum infection in human patients: a comparison of the DNA probe method to
microscopic diagnosis. American Journal of Tropical Medicine and Hygiene, 41, 266–272.
Bdmpail.biocuckoo.org/predictions.php/. Accessed on 10-10-2016.
Beere, H. M., and Green, D. R. (2001). Stress management - heat shock protein-70 and the
regulation of apoptosis. Trends in Cell Biology, 11, 6–10.
Bell, D. R., Wilson, D. W. and Martin, L. B. (2005). False-positive results of a Plasmodium
falciparum histidine-rich protein 2-detecting malaria rapid diagnostic test due to high
sensitivity in a community with fluctuating low parasite density. American Journal of Tropical
Medicine and Hygiene, 73, 199–203.
Bell, D., Wongsrichanalai, C. and Barnwell, J. W. (2006). Ensuring quality and access for
malaria diagnosis: how can it be achieved? Nature Reviews Microbiology, 4, S7–20.
Bertin, G. I., Sabbagh, A., Argy, A., Salnot, V., Ezinmegnon, S., Agbota, G., Ladipo, Y.,
Alao, J. A., Sagbo, G., Guillonneau, F. and Deloron, P. (2016). Proteomic analysis of
Plasmodium falciparum parasites from patients with cerebral and uncomplicated malaria.
Scientific Reports, 6, 26773.
Berwal, R., Gopalan, N., Chandel, K., Prasad, G. and Prakash, S. (2008). Plasmodium
falciparum: Enhanced soluble expression, purification and biochemical characterization of
lactate dehydrogenase. Experimental Parasitology, 120 (2), 135-141.
Betson, M., Jawara, M. and Awolola, T. S. (2009). Status of insecticide susceptibility in
Anopheles gambiae s.I. from malaria surveillance sites in The Gambia. Malaria Journal, 8,
187.
Bharti, P. K., Silawat, N., Singh, P. P., Singh, M. P., Shukla, M., Chand, G., Dash, A. P.
and Singh, N. (2008). The usefulness of a new rapid diagnostic test, the First Response

101
Malaria Combo (pLDH/HRP2) card test, for malaria diagnosis in the forested belt of central
India. Malaria Journal, 7, 126.
Bindu, J., Biswas, S. and Sharma, Y. D. (1994). Enhanced expression of P. falciparum
heat shock protein Pfhsp70-1 at higher temperatures and parasites survival. Federation of
European Microbiological Societies Microbiology Letters, 124, 425–429.
Bisoffi, Z., Gobbi, F., Angheben, A. and Van den Ende, J. (2009). The role of rapid
diagnostic tests in managing malaria. PLoS Medicine, 6, (4).
Black, R. E., Morris, S. S. and Bryce, J. (2003). Where and why are 10 million children
dying every year? Lancet, 361, 2226-2234.
Böttger, E., Multhoff, G., Kun, J. F. J. and Esen, M. (2012). Plasmodium falciparum-
infected erythrocytes induce granzyme B by NK cells through expression of hostHsp70.
PLoS ONE, 7(3).
Bodansky, O. and Latner, A. L. (1975). Advances in clinical chemistry: Elsevier Science,
volume 13. pp 193-194. Academic Press INC. (London).
Bojang, K. A., Milligan, P.J., Pinder, M., Vigneron, L., Alloueche, A., Kester, K. E.,
Ballou, W. R., Conway, J. D., Reece, H. H., Gothard, P., Yamuach, L., Delchambre, M.,
Voss, G., Greenwood, M. B., Hill, A., McAdam P. W. J. K., Tornieporth, N., Cohen, D. J.
and Doherty, T. (2001). Efficacy of RTS,S/AS02 malaria vaccine against Plasmodium
falciparum infection in semi-immune adult men in The Gambia: a randomised trial. Lancet,
358, 1927- 34.
Bouma, M. and Rowland, M. (1995). Failure of passive zooprophylaxis: Cattle ownership in
Pakistan is associated with a higher prevalence of malaria. Transactions of the Royal
Society of Tropical Medicine and Hygiene, 89 (4), 351-353.
Bradford, M. M. (1976). A rapid and sensitive method for the quantitation of microgram
quantities of protein utilizing the principle of protein-dye binding. Analytical Biochemistry, 72,
248-254.
Bray, R. S. (1960). Studies on malaria in chimpanzees. VIII. The experimental transmission
and pre-erythrocytic phase of Plasmodium malariae with a note on the host range of the
parasite. American Journal of Tropical Medicine and Hygiene, 9, 455-65.
Breman, J. L. (2001). The ears of the Hippopotamus: manifestations, determinants, and
estimates of the malaria burden. American Journal of Tropical Medicine and Hygiene, 64, 1–
11.
Brown, W. M., Yowell, C. A., Hoard, A., Vander Jagt, T. A., Hunsaker, L. A., Deck, L. M.,
Royer, R. E., Piper, R. C., Dame, J. B., Makler, M. T. and Vander Jagt, D. L. (2004).
Comparative structural analysis and kinetic properties of lactate dehydrogenases from the
four species of human malarial parasites. Biochemistry, 43, 6219–6229.

102
Bruce-Chwatt, L. J. (1985). Essential Malariology. 2nd edition New York: John Wiley and
Sons.
Bruna-Romero, O., Hafalla, J. C. R., Gonzalez-Aseguinolaza, G., Sano, G., Tsuji, M. and
Zavala, F. (2001). Detection of malaria liver-stages in mice infected through the bite of a
single Anopheles mosquito using a highly sensitive real-time PCR. International Journal of
Parasitology, 31, 1499–1502.
Bull, P. C., Lowe, B. S., Kortok, M., Molyneux, C. S., Newbold, C. I. and Marsh, K.
(1998). Parasite antigens on the infected red cell surface are targets for naturally acquired
immunity to malaria. Nature Medicine, 4, 358-360.
Buppan, P., Putaporntip, P., Pattanawon, U., Seethamchai, S. and Jongwutiwes, S.
(2010). Comparative detection of Plasmodium vivax and Plasmodium falciparum DNA in
saliva and urine samples from symptomatic malaria patients in a low endemic area. Malaria
Journal, 9, 72.
Bynum, W. F. and Ovary, C. (1998). The beast in the mosquito: the correspondence of
Ronald Ross and Patrick Manson. Amsterdam Rodopi, B V.
Calderwood, S. K., Mambula, S. S., Gray, P. J. and Theriault, J. R. (2007). Extracellular
heat shock proteins in cell signalling. Federation of European Microbiological Societies
Microbiology Letters, 581, 3689–3694.
Calvo-Calle, J. M., Oliveira, G. A. and Nardin, E. H. (2005). Human CD4+ T cells induced
by synthetic peptide malaria vaccine are comparable to cells elicited by attenuated
Plasmodium falciparum sporozoites. Journal of Immunology, 175, 7575-7585.
Cármenes, R. S., Freije, J. P., Molina, M. M. and Martín, J. M. (1989). Predict7, a program
for protein structure prediction. Biochemical and Biophysical Research Communications, 159
(2), 687-693.
Cavanagh, D. R., Kocken, C.H. M., White, J. H., Cowan, G. J. M., Samuel, K., Dubbeld,
M. A., Voorberg-van der Wel, A., Thomas, A. W., McBride, J. S. and Arnot, D. E. (2014).
Antibody responses to a novel Plasmodium falciparum merozoite surface protein vaccine
correlate with protection against experimental malaria infection in Aotus monkeys. PLoS
ONE 9 (1).
Centres for Disease Control and Prevention, (2016). http://www.cdc
.gov/malaria/about/history /. Accessed on 2-11-2016.
Cha, S., Kim, M., Pandey, A. and Jacobs-Lorena, M. (2016). Identification of GAPDH on
the surface of Plasmodium sporozoites as a new candidate for targeting malaria liver
invasion. Journal of Experimental Medicine. DOI: 10.1084/jem.20160059.
Chaerkady, R., Kelkar, D. S., Muthusamy, B., Kandasamy, K., Dwivedi, S. B.,
Sahasrabuddhe, N. A., Kim, M. S., Renuse, S., Pinto, S. M., Sharma, R., Pawar, H.,

103
Sekhar, N. R., Mohanty, A. K., Getnet, D., Yang, Y., Zhong, J.,. Dash, A. P., MacCallum,
R. M., Delanghe, B., Mlambo, G., Kumar, A., Prasad, T. S. K., Okulate, M., Kumar. N.,
and Pandey, A. (2011). A proteogenomic analysis of Anopheles gambiae using high-
resolution Fourier transform mass spectrometry. Genome Research, 21, 1872–1881.
Chart, H. (1994). Methods in Practical Laboratory Bacteriology, 1 edition. pp 21. Florida:
CRC press.
Chiodini, P. L., Bowers, K., Jorgensen, P., Barnwell, J. W., Grady, K. K., Luchavez, J.,
Moody, A. H., Cenizal, A. and Bell, D. (2007). The heat stability of Plasmodium lactate
dehydrogenase-based and histidine-rich protein 2-based malaria rapid diagnostic tests.
Transactions of the Royal Society of Tropical Medicine and Hygiene, 101, 331–337.
Cho, E. J., Lee, J. W. and Ellington, A. D. (2009). Applications of aptamers as
sensors. Annual Reviews of Analytical Chemistry, 2, 241–264.
Choi, K. S., Koekemoer, L. L. and Coetzee, M. (2012). Population genetic structure of the
major malaria vector anopheles funestus s.s. and allied species in southern Africa. Parasites
and Vectors, 5, 283.
Chotivanich, K., Udomsangpetch, R., Simpson, J. A., Newton, P., Pukrittayakamee, S.,
Looareesuwan, S. and White, N. J. (2000). Parasite multiplication potential and the
severity of falciparum Malaria. Journal of Infectious Diseases, 181, 1206–1209.
Choudhary, C., Kumar, C., Gnad, F., Nielsen, M.L., Rehman, M., Walther, T.C., Olsen,
J.V. and Mann, M. (2009). Lysine acetylation targets protein complexes and co-regulates
major cellular functions. Science, 325, 834–840.
Chuangchaiya, S., Jangpatarapongsa, K., Chootong, P., Sirichaisinthop, J.,
Sattabongkot, J., Pattanapanyasat, K., Chotivanich, K., Troye-Blomberg, M., Cui, L.
and Udomsangpetch, R. (2009). Immune response to Plasmodium vivax has a potential to
reduce malaria severity. Clinical and Experimental Immunology, 160 (2), 233-239.
Cicek, M., Mutlu, O., Erdemir, A., Ozkan, E., Saricay, Y. and Turgut-Balik, D. (2013).
Single mutation in Shine-Dalgarno-Like sequence present in theamino terminal of lactate
dehydrogenase of Plasmodium affects the production of a eukaryotic protein expressed in a
prokaryotic system. Molecular Biotechnology, 54, 602–608.
Clendeman, T. E., Long, G. W. and Baird, J. K. (1995). QBC® and Giemsa stained thick
blood films: diagnostic performance of laboratory technologists. Transactions of the Royal
Society of Tropical Medicine and Hygiene, 86,378.
Cohen, H. Y., Lavu, S., Bitterman, K. J., Hekking, B., Imahiyerobo, T. A., Miller, C.,
Frye, R., Ploegh, H., Kessler, B. M. and Sinclair, D. A. (2004). Acetylation of the C
terminus of Ku70 by CBP and PCAF controls Bax-mediated apoptosis. Molecular Cell, 13,
627–638.

104
Collins, W. E. (2012). Plasmodium knowlesi: a malaria parasite of monkeys and humans.
Annual Reviews of Entomology, 57,107–121.
Collins, W. E., LivingstoneWernsdorfer, W. H. and McGregor, I. (1988). Major animal
models in malaria research: simian. Malaria: Principles and Practice of Malariology, 2, 1073-
1501.
Collins, W. E. and Jeffery, G. M. (2007). Plasmodium malariae: parasite and disease.
Clinical Microbiology Reviews, 20 (4), 579.
Conroy, L., Lafferty, E. I., Lovegrove, F. E., Krudsood, S., Tangpukdee, N., Liles, C. W.
and Kain, K. C. (2009). Whole blood angiopoietin-1 and -2 levels discriminate cerebral and
severe (non-cerebral) malaria from uncomplicated malaria. Malaria Journal, 8, 295.
Cook, J., Aydin-Schmidt, B., González, I. J., Bell, D., Edlund, E., Nassor, M. H.,
Msellem, M., Ali, A., Abass, A. K., Mårtensson, A. and Björkman, A. (2015). Loop-
mediated isothermal amplification (LAMP) for point-of-care detection of asymptomatic low-
density malaria parasite carriers in Zanzibar. Malaria Journal, 14, 43.
Cooke, A. H., Moody, A. H., Lemon, K., Chiodini, P. L. and Horton, J. (1992). Use of the
fluorochrome benzothiocarboxypurine in malaria diagnosis. Transactions of the Royal
Society of Tropical Medicine and Hygiene, 87, 549.
Cova, M., Rodrigues, J. A., Smith, T. K. and Izquierdo, L. (2015). Sugar activation and
glycosylation in Plasmodium. Malaria Journal, 14, 427.
Cowan, G. J. M., Bockau, U., Eleni-Muus, J., Aldag, I., Samuel, K., Creasey, A. M.,
Hartmann, M. W. W. and Cavanagh, D. R. (2014). A novel malaria vaccine candidate
antigen expressed in Tetrahymena thermophila. PLoS ONE, 9 (1).
Cowman, A. F. and Crabb, B. S. (2006). Invasion of red blood cells by malaria parasites.
Cell, 124, 755-766.
Cowman, A. F., Berry, D. and Baum, J. (2012). The cellular and molecular basis for
malaria parasite invasion of the human red blood cell. Journal of Cell Biology, 198, 961–971.
Cox, E. G. F. (2010). History of the discovery of the malaria parasites and their vectors.
Parasites and Vectors, 3, 5.
Craig, M. and Sharp, B. L. (1997). Comparative evaluation of four techniques for the
diagnosis of Plasmodium infections. Transactions of the Royal Society of Tropical Medicine
and Hygiene, 91, 279–282.
Cui, L., Mharakurwa, S., Ndiaye, D., Rathod, P. K. and Rosenthal, P. J. (2015).
Antimalarial drug resistance: literature review and activities and findings of the ICEMR
Network. American Journal of Tropical Medicine and Hygiene, 93, 57–68.
Curtis, C. F. and Lines, J. D. (2000). Should DDT be banned by international treaty?
Parasitology Today, 16 (3), 119-121.

105
D’Alessandro, S., Silvestrini, F., Dechering, K., Corbett, Y., Parapini, S., Timmerman,
M., Galastri, L., Basilico, N., Sauerwein, R., Alano, P. and Taramelli, D. (2013). A
Plasmodium falciparum screening assay for anti-gametocyte drugs based on parasite lactate
dehydrogenase detection. Journal of Antimicrobial Chemotherapy, 68, 2048–2058.
Daneshvar, C., Davis, T.M.E., Cox-Singh, J., Rafa'ee, M.Z., Zakarai K., Divis, P.C.S. and
Singh, B. (2009). Clinical and laboratory features of human Plasmodium knowlesi infection.
Clinical Infectious Diseases, 49 (6), 852-860.
Das, B. S. (2008). Renal failure in malaria. Journal of Vector Borne Diseases, 45, 83-97.
Dat, M.H., Behr, C., Jouin, H., Baleux, F., Mercereau-Puijalon, O. and Dubois, P. (2000).
Mimicking a conformational B cell epitope of the heat shock protein PfHsp70-1 antigen of
Plasmodium falciparum using a multiple antigenic peptide. Parasite Immunology, 22, 535.
de Macedo, C. S., Schwarz, R. T., Todeschini, A. R., Previato, J. O. and Mendonça-
Previato, L. (2010). Overlooked post-translational modifications of proteins in Plasmodium
falciparum: N- and O-glycosylation – a review. Memórias do Instituto Oswaldo Cruz, Rio de
Janeiro, 105 (8), 949–956.
De Ni, M., Ullrich, A., Heiber, A., Soares, A. B., Pick, C., Lyck, R., Keller, D., Kaiser, G.,
Prado, M., Flemming, S., del Portillo, H., Janse, C. J., Heussler, V. and Spielmann, T.
(2016). The machinery underlying malaria parasite virulence is conserved between rodent
and human malaria parasites. Nature Communications, DOI: 10.1038/ncomms11659.
De Silva, J. R., Lau, Y-L. and Fong, M-Y. (2016). Expression and evaluation of
recombinant Plasmodium knowlesi Merozoite surface protein-3 (MSP-3) for detection of
human malaria. PLoS ONE, 11 (7).
Delves, P. J., Martin, S. J., Burton, D. R. and Roitt, I. M. (2006). Roitt's Essential
Immunology. Blackwell Publishing Ltd., London, 37-38; 57; 112; 221-223.
Desakorn, V., Dondorp, A. M., Silamut, K., Pongtavornpinyo, W., Sahassananda, D.,
Chotivanich, K., Pitisuttithum, P., Smithyman, A. M., Day, N. P. J. and White, N. J.
(2005). Stage dependent production and release of histidine-rich protein 2 by Plasmodium
falciparum. Transactions of the Royal Society of Tropical Medicine and Hygiene, 99, 517–
524.
Ding, X. Z., Smallridge, R. C., Galloway, R. J. and Kiang, J. G. (1996). Increases in HSF1
translocation and synthesis in human epidermoid A-431 cells: role of protein kinase C and
[Ca2+]. Journal of Investigative Medicine, 44, 144–153.
Dinglasan, R. R., Kalume, D. E., Kanzok, S. M., Ghosh, A. K., Muratova, O., Pandey, A.
and Jacobs-Lorena, M. (2007). Disruption of Plasmodium falciparum development by
antibodies against a conserved mosquito midgut antigen. Proceedings of the National
Academy of Science of the United States of America, 104, 13461–13466.

106
Dirkzwager, R. M., Kinghorn, A. B., Richards, J. S. and Tanner, J. A. (2015). APTEC:
aptamertethered enzyme capture as a novel rapid diagnostic test for malaria. Chemical
Communications, 51 (22), 4697-4700.
Divan, A. and Royds, J. (2013). Tools and Techniques in Biomolecular Science. pp 153,
OUP Oxford.
Doderer, C., Heschung, A., Guntz, P., Cazenave, J. P., Hansmann, Y., Senegas, A.,
Pfaff, A. W., Abdelrahman, T. and Candolfi, E. (2007). A new ELISA kit which uses a
combination of Plasmodium falciparum extract and recombinant Plasmodium vivax antigens
as an alternative to IFAT for detection of malaria antibodies. Malaria Journal, 6, 19.
Dostert, C., Guarda, G., Romero, J. F., Menu, P., Gross, O., Tardivel, A., Suva, M.,
Stehle, J., Kopf, M., Stamenkovic, I., Corradin, G. and Tschopp, J. (2009). Malaria
hemozoin is a Nalp3 inflammasome activating danger signal. PLoS One, 4 (8).
Dubois, P., Druilhe, P., Arriat, D., Jendoubi, M. and Jouin, H. (1987). Changes in
recognition of Plasmodium falciparum antigens by human sera depending of previous
malaria exposure, Annales de l'Institut Pasteur / Immunologe, 26, 203-214.
Dunn, C. R., Banfield, M. J., Barker, J. J., Higham, C. W., Moreton, K. M., Turgut-Balik
D., Brady, R. L. and Holbrook, J.J. (1996). The structure of lactate dehydrogenase from
Plasmodium falciparum reveals a new target for anti-malarial design. Nature Structural
Biology, 3 (11), 912-915.
Echeverry, D. F., Deason, N. A., Davidson, J., Makuru, V., Xiao, H., Niedbalski, J., Kern,
M., Russell, T. L., Burkot, T. R., Collins, F. H. and Lobo, N. F. (2016). Human malaria
diagnosis using a single-step direct-PCR based on the Plasmodium cytochrome oxidase III
gene. Malaria Journal, 15, 128.
Emini, E. A., Hughes, J. V., Perlow, D. S. and Boger, J. (1985). Induction of hepatitis A
virus-neutralizing antibody by a virus-specific synthetic peptide. Journal of Virology, 55, 836–
839.
Eventhoff, W., Rossmann, M. G., Taylor, S. S., Torff, H. J., Meyer, H., Keil, W. and Kiltz,
H. H. (1977). Structural adaptations of lactate dehydrogenase isoenzymes. Proceedings of
the National Academy of Sciences of the United States of America, 74, 2677–81.
Faiola, F., Liu, X., Lo, S., Pan, S., Zhang, K., Lymar, E., Farina, A. and Martinez, E.
(2005). Dual regulation of c-Myc by p300 via acetylation-dependent control of Myc protein
turnover and coactivation of Myc-induced transcription. Molecular and Cellular Biology, 25
(23), 10220–34.
Fan, J., Hitosugi, T., Chung, T., Xie, J., Ge, Q., Gu, T., Polakiewicz, R. D., Chen, G. Z.,
Boggon, T. J., Lonial, S., Khuri, F. R., Kang, S. and Chen, J. (2011). Tyrosine

107
phosphorylation of lactate dehydrogenase A is important for NADH/NAD(+) redox
homeostasis in cancer cells. Molecular and Cellular Biology, 31, 4938.
Fanello, C., Santomalazza, F. and della Torre, A. (2002). Simultaneous identification of
species and molecular forms of the Anopheles gambiae complex by PCR-RFLP. Medical
and Veterinary Entomology, 16, 461–464.
Farcas, G. A., Zhong, K. J. Y., Lovergrove, F. E., Graham, C. G. and Kain, K. C. (2003).
Evaluation of the Binax NOW ICT test versus polymerase chain reaction and microscopy for
the detection of malaria in returned travellers. American Journal of Tropical Medicine and
Hygiene, 69, 589–592.
Flick, K., Ahuja, S., Chene, A., Teresa Bejarano, M. and Chen, Q. (2004). Optimized
expression of Plasmodium falciparum erythrocyte membrane protein 1 domains in
Escherichia coli. Malaria Journal, 3, 1-8.
Florens, L., Washburn, M. P., Raine, J. D., Anthony, R. M., Graingerk, M., Haynes, D. J.,
Moch, K. J., Muster, N., Sacci, J. B., Tabb, D. L., Witney, A. A., Wolters, D., Wu, Y.,
Gardner, M. J., Holderk, A. A., Sinden, R. E., Yates, J. R. and Carucci, D. J. (2002). A
proteomic view of the Plasmodium falciparum life cycle. Nature, Vol 419, 520-526.
Fong, K. Y., Sandlin, R. B. and Wright, D. W. (2015). Identification of b-hematin inhibitors
in the MMV malaria box. International Journal for Parasitology: Drugs and Drug Resistance,
5, 84-91.
Franke-Fayard, B., Fonager, J., Braks, A., Khan, S. M. and Janse, C. J. (2010).
Sequestration and tissue accumulation of human malaria parasites: Can We Learn Anything
from Rodent Models of Malaria? PLoS Pathogens, 6 (9).
Friesen, J., Silvie, O., Putrianti, E. D, Hafalla, J. C. Matuschewski, K. and Borrmann, S.
(2010). Natural immunization against malaria: causal prophylaxis with antibiotics. Science
Translational Medicine, 2, 40-49.
Frischknecht, F., Baldacci, P., Martin, B., Zimmer, C., Thiberge, S., Olivo-Marin, J.,
Shorte, S. L. and Ménard, R. (2004). Imaging movement of malaria parasites during
transmission by Anopheles mosquitoes. Cellular Microbiology, 6 (7), 687–694.
Fujioka, H. and Aikawa, M. (2002). Malaria parasites and disease, structure and lifecycle.
Malaria Immunology, 80, 1-26.
Gamboa, D., Ho, M. F., Bendezu, J., Torres, K., Chiodini, P. L., Barnwell, J. W.,
Incardona, S., Perkins, M., Bell, D., McCarthy, J. and Cheng, Q. (2010). A large
proportion of P. falciparum isolates in the amazon region of Peru lack pfhrp2 and pfhrp3:
implications for malaria rapid diagnostic tests. Plos One, 5 (1).

108
Garnham, P. C. C., Bray, R.S., Cooper, W., Lainson, R., Awad, F.I. and Williamson, J.
(1954). Preerythrocytic stages of human malaria: Plasmodium ovale. A preliminary note.
British Medical Journal, 1, 257.
Garnham, P. C. C. (1966). Malaria Parasites and other Haemosporidia Oxford. Blackwell
Scientific Publications.
Garnier, J., Osguthorpe, D. J. and Robson, B. (1978). Analysis and implications of simple
methods for predicting the secondary structure of globular proteins. Journal of Molecular
Biology, 120, 97-120.
Gaye, O., Diouf, M. and Diallo, S. (1999). A comparison of thick films, QBC malaria, PCR
and PATH falciparum malaria test strip in Plasmodium falciparum diagnosis. Parasite, 6,
273–275.
Ghosh, A.K., Devenport, M., Jethwaney, D., Kalume, D. E., Pandey, A., Anderson, V. E.,
Sultan, A. A., Kumar, N. and Jacobs-Lorena, M. (2009). Malaria parasite invasion of the
mosquito salivary gland requires interaction between the Plasmodium TRAP and the
Anopheles saglin proteins. PLoS Pathogens, 5.
Gillet, P., Mori, M., Van Esbroeck, M., Van den Ende, J. and Jacobs, J. (2009).
Assessment of the prozone effect in malaria rapid diagnostic tests. Malaria Journal, 8 (271).
Gillet, P., Mori, M., Van den Ende, J. and Jacobs, J. (2010). Buffer substitution in malaria
rapid diagnostic tests causes false-positive results. Malaria Journal, 9 (215).
Gilson, P. R. and Crabb, B. S. (2009). Morphology and kinetics of the three distinct phases
of red blood cell invasion by Plasmodium falciparum merozoites. International Journal for
Parasitology, 39, 91-96.
Glozak, M. A., Sengupta, N., Zhang, X. and Seto, E. (2005). Acetylation and deacetylation
of non-histone proteins. Gene, 363, 15–23.
Godonoga, M., Lin, T. Y., Oshima, A., Sumitomo, K., Tang, M. S. L., Cheung, Y. W.,
Kinghorn, A. B., Dirkzwager, R. M., Zhou, C., Kuzuya, A., Tanner, J. A. and Heddle, J.
G. (2016). A DNA aptamer recognising a malaria protein biomarker can function as part of a
DNA origami assembly. Scientific Reports, vol. 6, p. 21266.
Golenser, J., Waknine, J. H., Krugliak, M., Hunt, N. H. and Grau, G. E. (2006). Current
perspectives on the mechanism of action of artemisinins. International Journal for
Parasitology, 36, 1427-1441.
Golgi, C. (1886). Sul’ infezione malarica. Archivio per le Scienze Mediche, Torino, 10,109-
135.
Golgi, C. (1889). Sul ciclo evolutivo dei parassiti malarici nella febbre terzana: diagnosi
differenziale tra i parassiti endoglobulari malarici della terzana e quelli della quartana.
Archivio per le Scienze Mediche, Torino, 13,173-196.

109
Gomez, M. S., Piper, R. C., Hunsaker L. A., Royer, R. E., Deck, L. M., Makler, M. T. and
Vander Jagt, D. L. (1997). Substrate and cofactor specificity and selective inhibition of
lactate dehydrogenase from the malarial parasite P. falciparum. Molecular and Biochemical
Parasitology, 90, 235-246.
Goodman, C. A., Coleman, P. G. and Mills, A. J. (1999). Cost-effectiveness of malaria
control in subSaharan Africa. Lancet, 354 (9176), 378-385.
Goodman, C. A., Mnzava, A. E., Dlamini, S. S., Sharp, B. L., Mthembu, D. J. and
Gumede, J. K. (2001). Comparison of the cost and cost-effectiveness of insecticide-treated
bed-nets and residual house-spraying in Kwazulu-Natal, South Africa. Tropical Medicine and
International Health, 6 (4), 280-295.
Goto, M., Honda, E., Ogura, A., Nomoto, A. and Hanaki, K. I. (2009). Colorimetric
detection of loopmediated isothermal amplification reaction by using hydroxy naphthol blue.
Biotechniques, 46, 167–172.
Goto, T., Sugawara, K., Nakamura, S., Kidokoro, S., Wakui, H. and Nunomura, W.
(2016). Enzymatic and thermodynamic profiles of a heterotetramer lactate dehydrogenase
lysozyme in swine. Biochemical and Biophysical Research Communications, 479, 860-867.
Gowda, D. C., Gupta, P. and Davidson, E. A. (1997). Glycosylphosphatidylinositol anchors
represent the major carbohydrate modification in proteins of intraerythrocytic stage
Plasmodium falciparum. Journal of Biological Chemistry, 272, 6428-6439.
Gowda, D. C. and Davidson, E. A. (1999). Protein glycosylation in the malaria parasite.
Parasitology Today, 15 (4), 147–152.
Grassi, B., Bignami, A. and Bastianelli, G. (1899). Ulteriore ricerche sul ciclo dei parassiti
malarici umani sul corpo del zanzarone. Atti D ella Reale Accademia Dei Lincei, 8, 21-28.
Grobusch, M. P., Hanscheid, T., Kramer, B., Neukammer, J., May, J., Seybold, J., Kun,
J. F. and Suttorp, N. (2003). Sensitivity of hemozoin detection by automated flow cytometry
in non- and semi-immune malaria patients. Cytometry Part B Clinical Cytometry, 55, 46-51.
Guerin, P. J., Olliaro, P., Nosten, F., Druilhe, P., Laxminarayan, R., Binka, F., Kilama,
W. L., Ford, N. and White, N. J. (2002). Malaria: current status of control, diagnosis,
treatment, and a proposed agenda for research and development. Lancet Infectious
Diseases, 2, 564-573.
Guirgis, B. S., Cunha, C. S., Gomes, I., Cavadas, M., Silva, I., Doria, G., Blatch, G. L.,
Baptista, P. V., Pereira, E., Azzazy, H. M., Mota, M. M., Prudêncio, M. and Franco, R.
(2011). Gold nanoparticle-based fluorescence immunoassay for malaria antigen
detection. Analytical and Bioanalytical Chemistry, 402, 1019-1027.

110
Gulka, C. P., Swartz, J. D. and Wright, D. W. (2015). Ni(II)NTA AuNPs as a low-resource
malarial diagnostic platform for the rapid colorimetric detection of Plasmodium falciparum
histidine-rich protein-2. Talanta, 135, 94-101.
Gunderson, J. H., Sogin, M. L., Wollett, G., Hollindale, M., De La Cruz, V. F., Waters, A.
P. and McCutchan, T. F. (1987). Structurally distinct, stage-specific ribosomes occur in
Plasmodium. Science, 238, 933–937.
Gupta, H., Jain, A., Saadi, A. V., Vasudevan, T. G., Hande, M. H., D’Souza, S. C., Ghosh,
S. K., Umakanth, S. and Satyamoorthy, K. (2015). Categorical complexities of
Plasmodium falciparum malaria in individuals is associated with genetic variations in
ADORA2A and GRK5 genes. Infection, Genetics and Evolution, 34, 188–199.
Gupta, H., Srivastava, S., Chaudhari, S., Vasudevan, T. G., Hande, M. H., D’souza, S.
C., Umakanthd, S. and Satyamoorthy, K. (2016). New molecular detection methods of
malaria parasites with multiple genes from genomes. Acta Tropica, 160, 15–22.
Gupta, R., Jung, E., Gooley, A. A., Williams, K. L., Brunak, S. and Hansen, J. (1999).
Scanning the available Dictyostelium discoideum proteome for O-linked GlcNAc
glycosylation sites using neural networks. Glycobiology, 9, 1009–1022.
Gupta, R., Jung, E. and Brunak, S. (2002). Prediction of N-glycosylation sites in human
proteins, http://www.cbs.dtu.dk/services/NetNGlyc/.
Gwer, S., Newton, C. R. J. C. and Berkley J. A. (2007). Over-diagnosis and co-morbidity of
severe malaria in African children: A guide for clinicians. American Journal of Tropical
Medicine and Hygiene, 77, 6-13.
Gysin, J., Dubois, P. and Pereira da Silva, L. (1982). Protective antibodies against stages
of Plasmodium falciparum in experimental infection of the squirrel monkey Saimiri sciureus.
Parasite Immunology, 4, 421-430.
Hafalla, J. C., Silvie, O. and Matuschewski, K. (2011). Cell biology and immunology of
malaria. Immunological Reviews, 240, 297-316.
Hakim, S. L., Furuta, T., Rain A. N., Normaznah, Y., Zamri, M. R., Kojima, S. and Mak, J.
W. (1993). Diagnosis of malaria using a light microscope fitted with an interference filter for
the diagnosis of malaria. Transactions of the Royal Society of Tropical Medicine and
Hygiene, 56, 44–48.
Haldar, K., Murphy, S. C., Milner, D. A and Taylor, T. E. (2007). Malaria: mechanisms of
erythrocytic infection and pathological correlates of severe disease. Annual Review of
Pathology, 2, 217–249.
Han, E. T., Watanabe, R., Sattabongkot, J., Khuntirat, B., Sirichaisinthop, J., Iriko, H.,
Jin, L., Takeo, S. and Tsuboi, T. (2007). Detection of four Plasmodium species by genus

111
and species-specific loop-mediated isothermal amplification for clinical diagnosis. Journal of
Clinical Microbiology, 45, 2521–2528.
Hanscheid, T. (1999). Diagnosis of malaria: a review of alternatives to conventional
microscopy. Clinical and Laboratory Haematology, 21, 235–245.
Hay, S. I., Sinka, M. E., Okara, R. M., Kabaria, C. W., Mbithi, P. M., Tago, C. C., Benz, D.,
Gething, P. W., Howes, R. E., Patil, A. P., Temperley, W. H., Bangs, M. J.,
Chareonviriyaphap, T., Elyazar, I. R., Harbach, R. E., Hemingway, J., Manguin, S.,
Mbogo, C. M., Rubio-Palis, Y. and Godfray, H. C. (2010). Developing global maps of the
dominant Anopheles vectors of human malaria. PLoS Medicine, 7, 1-6
Hendriksen, I. C. E., Mtove, G., Pedro, A. J., Gomes, E., Silamut, K., Lee, S. J.,
Mwambuli, A., Gesase, S., Reyburn, H., Day, N. P. J., White, N. J., von Seidlein, L. and
Dondorp, A. M. (2011). Evaluation of a PfHRP2 and a pLDH-based rapid diagnostic test for
the diagnosis of severe malaria in 2 populations of African children. Clinical Infectious
Diseases, 52, 1100–1107.
Heutmekers, M., Gillet, P., Maltha, J., Scheirlinck, A., Cnops, L., Bottieau, E., Van
Esbroeck, M. and Jacobs, J. (2012). Evaluation of the rapid diagnostic test CareStart
pLDH malaria (Pf-pLDH/panpLDH) for the diagnosis of malaria in a reference setting.
Malaria Journal, 11, 204.
Hewitt, S., Kamal, M., Muhammad, N. and Rowland, M. (1994). An entomological
investigation of the likely impact of cattle ownership on malaria in an Afghan refugee camp in
the North West frontier province of Pakistan. Medical and Veterinary Entomology, 8 (2), 160-
164.
Hillyer, J. F., Barreau, C. and Vernick, K. D. (2007). Efficiency of salivary gland invasion
by malaria sporozoites is controlled by rapid sporozoite destruction in the mosquito
haemocoel. International Journal of Parasitolology, 37,673– 81.
Hind, M., Agabani, M., El Hag, I. A., El Toum, I. A., Satti, M. and El Hassan, A. M. (1994).
Fluorescence microscopy using a light microscope fitted with an interference filter for the
diagnosis of malaria. Transactions of the Royal Society of Tropical Medicine and Hygiene,
88, 61.
Ho, M. F., Baker, J., Lee, N., Luchavez, J., Ariey, F., Nhem, S., Oyibo, W., Bell, D.,
González, I., Chiodini, P., Gatton, M. L., Cheng, Q and McCarthy, J. S. (2014).
Circulating antibodies against Plasmodium falciparum histidine-rich proteins 2 interfere with
antigen detection by rapid diagnostic tests. Malaria Journal, 13, 480.
Holder, A. A. (1996). Malaria vaccine development: a multi-immune response approach.
Preventing merozoite invasion of erythrocytes. American Society of Microbiology Press, 77–
104.

112
Hopkins, H., Bebell, L., Kambale, W., Dokomajilar, C., Rosenthal, P. J. and Dorsey, G.
(2008). Rapid diagnostic tests for malaria at sites of varying transmission intensity in
Uganda. Journal of Infectious Diseases, 197, 510–518.
Hopp, T. P. and Woods, K. R. (1981). Prediction of protein antigenic determinants from
amino acid sequences. Proceedings of the National Academy of Sciences, 78, 3824-3828.
Howard, R. J., Uni, S., Aikawa, M., Aley, S. B., Leech, J. H., Lew, A. M., Wellems, T. E.,
Rener, J. and Taylor, D.W. (1986). Secretion of a malarial histidine-rich protein (Pf HRP II)
from Plasmodium falciparum-infected erythrocytes. Journal of Cell Biology, 103, 1269-1277.
http://blast.ncbi.nlm.nih.gov/Blast.cgi. Accessed on 2-10-2016.
Huang, H. D., Lee, T. Y., Tseng, S. W., Wu, L. C., Horng, J. T., Tsou, A. P. and Huang, K.
T. (2005a) Incorporating hidden Markov models for identifying protein kinase-specific
phosphorylation sites. Journal of Computational Chemistry, 26, 1032–1041.
Huang, H., Lee, T., Tseng, S. and Horng, J. (2005b). KinasePhos: a web tool for identifying
protein kinase-specific phosphorylation sites. Nucleic Acids Research, 33 (Web server
issue), W226–229.
Hulden, L. and Hulden, L. (2011). Activation of the hypnozoite: a part of Plasmodium vivax
life cycle and survival. Malaria Journal, 10, 90.
Humar, A., Ohrt, C., Harrington, M. A., Pillai, D. and Kain, K. C. (1997). ParaSight® F test
compared with the polymerase chain reaction and microscopy for the diagnosis of
Plasmodium falciparum malaria in travellers. American Journal of Tropical Medicine and
Hygiene, 56, 44–48.
Hurdayal, R., Achilonu, I., Choveaux, D., Coetzer T. H. T. and Goldring J. P. D. (2010).
Anti-peptide antibodies differentiate between plasmodial lactate dehydrogenases. Peptides,
31, 525-532.
Inoue, S., Niikura, M., Mineo, S and Kobayashi, F. (2013). Roles of IFN-gamma and
gammadelta T cells in protective immunity against blood-stage malaria. Frontiers in
Immunology, 4, 258.
Iqbal, J., Sher, A. and Rab, A. (2000). Plasmodium falciparum Histidine-Rich Protein 2-
Based Immunocapture Diagnostic assay for malaria: cross-reactivity with rheumatoid factors.
Journal of Clinical Microbiology, 38 (3), 1184-1186.
Iqbal, J., Siddique, A., Jameel, M. and Hira, P. R. (2004). Persistent histidine-rich protein
2, parasite lactate dehydrogenase, and pan-malarial antigen reactivity after clearance of
Plasmodium falciparum mono-infection. Journal of Clinical Microbiology, 42 (9), 4237.
Izumiyama, S., Omura, M., Takasaki, T., Ohmae, H. and Asahi, H. (2009). Plasmodium
falciparum: development and validation of a measure of intraerythrocytic growth using SYBR
Green I in a flow cytometer. Experimental Parasitology, 121, 144-150.

113
Jain, P., Chakma, B., Singh, N., Patra, S. and Goswami, P. (2016a). Aromatic surfactant
as aggregating agent for aptamer-gold nanoparticle based detection of Plasmodium lactate
dehydrogenase. Molecular Biotechnology, 58 (7), 497-508.
Jain, P., Das, S., Chakma, B. and Goswami, P. (2016b). Aptamer-graphene oxide for
highly sensitive dual electrochemical detection of Plasmodium lactate dehydrogenase.
Analytical Biochemistry, 514, 32-37.
Janin, J., Wodak, S., Levitt, M. and Maigret, B. (1978). Conformation of amino acid side-
chains in proteins. Journal of Molecular Biology, 125, 357-386.
Janse, C. J. and van Vianen, P. H. (1994). Flow cytometry in malaria detection. Methods in
Cell Biology, 42 (Pt B), 295–318.
Jelinek, T., Grobusch, M. P. and Harms, G. (2001). Evaluation of a dipstick test for the
rapid diagnosis of imported malaria among patients presenting within the network
TropNetEurop. Scandinavian Journal of Infectious Diseases, 33, 752–754.
Jeremiah, S. S., Janagond, A. B. and Parija, S. C. (2014). Challenges in diagnosis of
Plasmodium knowlesi infections. Tropical Parasitology, 4 (1), 25–30.
Johnston, D., Oppermann, H., Jackson, J. and Levinson, W. (1980) Induction of four
proteins in chick embryo cells by sodium arsenite. Journal of Biological Chemistry, 255,
6975–6980.
Jorgensen, P., Chanthap, L., Rebueno, A., Tsuyuoka, R. and Bell, D. (2006). Malaria
rapid diagnostic tests in tropical climates: the need for a cool chain. American Journal of
Tropical Medicine and Hygiene, 74 (5), 750-754.
Joshi, B., Biswas, S. and Sharma, Y. D. (1992). Effect of heat-shock on Plasmodium
falciparum viability, growth and expression of the heat-shock protein ‘PFHSP70-I’ gene.
Federation of European Biochemical Societies, 312, 91–94.
Kain, K. C., Kyle, D. E., Wongrichanalai, C. and Brown, A. E. (1994). Qualitative and
semi-quantitative polymerase chain reaction to predict Plasmodium falciparum treatment
failure. Journal of Infectious Diseases, 170, 1626–1630.
Källander K., Nsungwa-Sabiiti J. and Peterson S. (2004). Symptom overlap for malaria
and pneumonia – policy implications for home management strategies. Acta Tropica, 90,
211-214.
Kappe, S. H. I., Vaughan, A. M., Boddey, J. A. and Cowman, A. F. (2010). That was then
but this is now: malaria research in the time of an eradication agenda. Science, 328, 862-
866.
Karbwang, J., Tasanor, O., Kanda, T., Watanagoon, Y., Ibrahim, M., Nabanchang, K.,
Thanavibil, A. and Roonty, W. (1996). ParaSight® F test for the detection of treatment
114
failure in multidrug resistant Plasmodium falciparum malaria. Transactions of the Royal
Society of Tropical Medicine and Hygiene, 90, 513–515.
Karch, S., Garin, B., Asidi, N., Manzambi, Z., Salaun, J. J. and Mouchet, J.
(1993). Mosquito nets impregnated against malaria in Zaire. Annales de la Societe Belge de
Medecine Tropicale, 73 (1), 37-53.
Karplus, P. A. and Schulz, G. E. (1985). Prediction of chain flexibility in proteins.
Naturwissenschaften, 72, 212-213.
Kattenberg, J. H., Ochodo, E. A., Boer, K. R., Schallig, H. D. F. H., Mens, P. F. and
Leeflang, M. M. G. (2011). Systematic review and meta-analysis: rapid diagnostic tests
versus placental histology, microscopy and PCR for malaria in pregnant women. Malaria
Journal, 10, 321.
Kawai, S., Hirai, M., Haruki, K., Tanabe, K. and Chigusa, Y. (2009). Cross-reactivity in
rapid diagnostic tests between human malaria and zoonotic simian malaria parasite
Plasmodium knowlesi infections. Parasitology International, 58 (3), 300-302.
Kawamoto, F. (1991). Rapid diagnosis of malaria by fluorescence microscopy with light
microscopy and interference filters. Lancet, 200–202.
Kawamoto, F., Miyake, H., Kaneko, O., Kimura, M., Nguyen, T. D., Lui, Q., Zhou, M., Le,
D. D., Kawai, S., Isomura, S. and Wataya, Y. (1996). Sequence variation in the 18S rRNA
gene, a target for PCR-based malaria diagnosis, in Plasmodium ovale from southern
Vietnam. Journal of Clinical Microbiology, 34, 2287–2289.
Kebaier, C., Voza, T. and Vanderberg, J. (2009). Kinetics of mosquito-injected
Plasmodium sporozoites in mice: Fewer Sporozoites Are Injected into Sporozoite-Immunized
Mice. PLoS Pathogens, 5 (4).
Kelley, P. M., and M. J. Schlesiner. (1978).The effect of amino acid analogues and heat
shock on gene expression in chicken embryo fibroblasts. Cell, 15, 1277-1286.
Kesmir, C., Nussbaum, A. K., Schild, H., Detours, V. and Brunak, S. (2002). Prediction of
proteasome cleavage motifs by neural networks. Protein Engineering, Design and Selection,
15, 287– 296
Khan, M. G. M., Bhaskar, K. R. H., Salam, A. M., Akther, T., Pluschke, G. and Mondal,
D. (2012). Diagnostic accuracy of loop-mediated isothermal amplification (LAMP) for
detection of Leishmania DNA in buffy coat from visceral leishmaniasis patients. Parasites
and Vectors, 5, 280.
Kidane, G. and Morrow, R. H. (2000). Teaching mothers to provide home treatment of
malaria in Tigray, Ethiopia: a randomized trial. Lancet, 356, 550-555.
Kiemer, L., Bendtsen, J. D. and Blom, N. (2005). NetAcet: prediction of N-terminal
acetylation sites. Bioinformatics, 21 (7), 1269– 1270.

115
Kilejian, A. and Olson, J. (1979). Proteins and glycoproteins from human erythrocytes
infected with Plasmodium falciparum. Bulletin World Health Organization Journal, 57 (Suppl
1), 101-107.
Kim, S. C., Sprung, R., Chen, Y., Xu, Y., Ball, H., Pei, J., Cheng, T., Kho, Y., Xiao, H.,
Xiao, L., Grishin, N. V., White, M., Yang, X. and Zhao, Y. (2006). Substrate and functional
diversity of lysine acetylation revealed by a proteomics survey. Molecular Cell, 23, 607–618.
Kim, S. H., Nam, M. H., Roh, K. H., Park, H. C., Nam, D. H., Park, G. H., Han, E. T., Klein,
T. A. and Lim, C. S. (2008). Evaluation of a rapid diagnostic test specific for Plasmodium
vivax. Tropical Medicine International Health, 13, 1495-1500.
Kiszewski, A., Mellinger, A., Spielman, A., Malaney, P., Sachs, S. E. and Sachs, J.
(2004). A global index representing the stability of malaria transmission. American Journal of
Tropical Medicine and Hygiene, 70 (5), 486-498.
Klayman, D. L. (1985). Qinghaosu (Artemisinin): An antimalarial drug from china. Science
228, 1049-1055.
Kodisinghe, H. M., Perera, K. L. R. L., Premawansa, S., de S. Naotunne, T.,
Wickramasinghe, A. R. and Mendis, K. N. (1997). The ParaSight™-F dipstick test as a
routine diagnostic tool for malaria in Sri Lanka. Transactions of the Royal Society of Tropical
Medicine and Hygiene, 91 (4), 398-402.
Koita, O. A., Doumbo, O. K., Ouattara, A., Tall, L.K. and Konare, A. (2012).
Falsenegative rapid diagnostic tests for malaria and deletion of the histidine-rich repeat
region of the hrp2 gene. American Journal of Tropical Medicine and Hygiene, 86, 194–198.
Kolaskar, A. and Tongaonkar, P. C. (1990). A semi-empirical method for prediction of
antigenic determinants on protein antigens. Federation of European Biochemical Societies
Letters Journal, 276, 172–174.
Kouzarides, T. (2000). Acetylation: a regulatory modification to rival phosphorylation?
European Molecular Biology Organization Journal, 19, 1176-1179.
Krotoski, W. A., Collins, W. E., Bray, R. S., Garnham, P. C. C., Cogswell, F. B., Gwadz,
R., Killick-Kendrick, R., Wolf, R. H., Sinden, R. L., Koontz, C. and Stanfill, P. S. (1982).
Demonstration of hypnozoites in sporozoite-transmitted Plasmodium vivax infection.
American Journal of Tropical Medicine and Hygiene, 31, 1291-1293.
Krotoski, W. A. (1985). Discovery of the hypnozoite and a new theory of malarial relapse.
Transactions of the Royal Society of Tropical Medicine and Hygiene, 79, 1–11.
Kublin, J. G., Cortese, J. F., Njunju, E. M., Mukadam, R. A., Wirima, J. J., Kazembe, P.
N., Djimde, A. A., Kouriba, B., Taylor, T. E. and Plowe, C. V. (2003). Re-emergence of
chloroquine-sensitive Plasmodium falciparum malaria after cessation of chloroquine use in
Malawi. Journal of Infectious Diseases, 187 (12), 1870-1875.

116
Kumar, N., Zhao, Y., Graves, P., Perez Folgar, J., Maloy, L. and Zheng, H. (1990).
Human immune response directed against Plasmodium falciparum heat shock-related
proteins. Infection and Immunity, 58, 1408–1414.
Kyte, J., and Doolittle, R. F. (1982). A simple method for displaying the hydropathic
character of a protein. Journal of Molecular Biology, 157, 105–132.
Laemmli, U. K. (1970). Cleavage of structural proteins during the assembly of the head of
bacteriophage T. Nature, 277, 680-685.
Lalloo, D. G., Shingadia, D., Pasvol, G., Chiodini, P. L., Whitty, C. J., Beeching, N. J.,
Hill, D. R., Warrell, D. A. and Bannister, B. A. (2007). UK malaria treatment guidelines.
Journal of Infection, 54 (2), 111-121.
Lang-Unnasch, N. and Murphy, A. D. (1998). Metabolic changes of the malaria parasite
during the transition from the human to the mosquito host. Annual Review of Microbiology,
52, 561–590.
Lasonder, E., Green, J. L., Grainger, M., Langsley, G., and Holder, A. A. (2015).
Extensive differential protein phosphorylation as intraerythrocytic Plasmodium falciparum
schizonts develop into extracellular invasive merozoites. Proteomics, 15, 2716–2729.
Laurent, A., Schellenberg, J., Shirima, K., Ketende, S. C., Alonso, P. L., Mshinda, H.,
Tanner, M. and Schellenberg, D. (2010). Performance of HRP-2 based rapid diagnostic
test for malaria and its variation with age in an area of intense malaria transmission in
southern Tanzania. Malaria Journal, 9, 294.
Laveran, A. (1881). Un nouveau parasite trouvé dans le sang de malades atteints de fièvre
palustre. Origine parasitaire des accidents de l’impaludisme., Bulletins et Mémoires de la
Société Médicale des Hôpitaux de Paris 17, 158-164.
Laveran, A. (1893). Paludism London. New Sydenham Society.
Le Roch, K. G., Zhou, Y., Blair, P. L., Grainger, M., Moch, J. K., Haynes, J. K., De la
Vega, P., Holder, A. A., Batalov, S., Carucci, D. J. and Winzeler, E. A. (2003). Discovery
of gene function by expression profiling of the malaria parasite life cycle. Science, 301,
1503-1508.
Lee, K. S., Cox-Singh, J. and Singh, B. (2009). Morphological features and differential
counts of Plasmodium knowlesi parasites in naturally acquired human infections. Malaria
Journal, 8, 73.
Lee, N., Baker, J., Andrews, K. T., Gatton, M. L., Bell, D., Cheng, Q. and McCarthy, J.
(2006). Effect of sequence variation in Plasmodium falciparum histidine-rich protein 2 on
117
binding of specific monoclonal antibodies: implications for rapid diagnostic tests for malaria.
Journal of Clinical Microbiology, 44 (8), 2773-2778.
Lee, N., Baker, J., Bell, D., McCarthy, J. and Cheng, Q. (2006). Assessing the genetic
diversity of the aldolase genes of Plasmodium falciparum and Plasmodium vivax and its
potential effect on performance of aldolase-detecting rapid diagnostic tests. Journal of
Clinical Microbiology, 44 (12), 4547-4549.
Lee, S. W., Jeon, K., Jeon, B. R. and Park. I. (2008). Rapid diagnosis of vivax malaria by
the SD Bioline malaria antigen test when thrombocytopenia is present. Journal of Clinical
Microbiology, 46, 939-942.
Lengeler, C. (2004). Insecticide-treated bed nets and curtains for preventing malaria.
Cochrane Database of Systematic Reviews, CD000363.
Leow, C. H., Jones, M., Cheng, Q., Mahler, S. and McCarthy, J. (2014). Production and
characterization of specific monoclonal antibodies binding the Plasmodium falciparum
diagnostic biomarker, histidine-rich protein 2. Malaria Journal, 13, 277, 1–12.
Levinson, W., Oppermann, H. and Jackson, W. (1980). Transition series metals and
sulfhydryl reagents induce the synthesis of four proteins in eukaryotic cells. Biochimica et
Biophysica Acta, 606, 170- 180.
Li, G.C. and Laszlo, A. (1985). Amino acid analogs while inducing heat shock proteins
sensitize CHO cells to thermal damage. Journal of Cellular Physiology, 122, 91 -97.
Li, H., Child, M.A. and Bogyo, M. (2012). Proteases as regulators of pathogenesis:
examples from the Apicomplexa. Biochimica et Biophysica Acta, 1824, 177–185.
Li, Z., Kessler, W., van den Heuvel, J. and Rinas, U. (2011). Simple defined autoinduction
medium for high-level recombinant protein production using T7-based Escherichia coli
expression systems. Applied Microbiology and Biotechnology, 91, 1203-1213.
Lilburn, T. G, Cai, H., Zhou, Z. and Wang, Y. (2011) Protease-associated Cellular
Networks in Malaria Parasite Plasmodium falciparum. BioMed Central Genomics, 12(Suppl
5), 59.
Lindsay, S. W. and Gibson, M. E. (1988). Bednets revisited-old idea, new
angle. Parasitology Today, 4 (10), 270-272.
Lon, C. T., Alcantara, S., Luchavez, J., Tsuyuoka, R. and Bell, D. (2005). Positive control
wells: a potential answer to remote-area quality assurance of malaria rapid diagnostic tests.
Transactions of the Royal Society of Tropical Medicine and Hygiene, 99, 493-498.
Lowe, B. S., Jeffa, N. F., New, L., Pederson, C., Engback, K. and Marsh, K. (1996).
Acridine orange fluorescence techniques as alternatives to traditional Giemsa staining for
the diagnosis of malaria in developing countries. Transactions of the Royal Society of
Tropical Medicine and Hygiene, 90, 34–36.

118
MacCallum, W. G. (1897). On the flagellated form of the malarial parasite. Lancet, ii, 1240-
1241.
MacCallum, W. G. (1898). On the haematozoan infections of birds. Journal of Experimental
Medicine, 3,117-136.
Magowan, C., Wollish, W., Anderson, L. and Leech, J. (1988). Cytoadherence by
Plasmodium falciparum-infected erythrocytes is correlated with the expression of a family of
variable proteins on infected erythrocytes. Journal of Experimental Medicine, 168, 1307-
1320.
Makler, M. T., Ries, L. K., Ries, J., Horton, R. J. and Hinrichs, D. J. (1991). Detection of
Plasmodium falciparum infection with the fluorescent dye Benzothiocarboxypurine. American
Journal of Tropical Medicine and Hygiene, 44, 11–16.
Makler, M. T., Ries, J. M., Williams, J. A., Bancroft, J. E., Piper, R. C., Gibbins, B. L. and
Hinrichs, D. J. (1993a). Parasite lactate dehydrogenase as an assay for Plasmodium
falciparum drug sensitivity. American Journal of Tropical Medicine Hygiene, 48, 739-741.
Makler, M. T. and Hinrichs, D. J. (1993b). Measurement of the lactate-dehydrogenase
activity of Plasmodium falciparum as an assessment of parasitemia. American Journal of
Tropical Medicine Hygiene, 48, 205-210
Makler, M. T., Palmer, C. J. and Ager, A. L. (1998a). A review of practical techniques for
the diagnosis of malaria. Annals of Tropical Medicine and Parasitology, 92 (4), 419-433.
Makler, M. T., Piper, R. C. and Milhous, W. K. (1998b). Lactate dehydrogenase and the
diagnosis of malaria. Parasitology Today, vol. 14, no. 9.
Maltha, J., Gillet, P., Cnops, L., van den Ende, J., van Esbroeck, M. and Jacobs, J.
(2010). Malaria rapid diagnostic tests: Plasmodium falciparum infections with high parasite
densities may generate false positive Plasmodium vivax pLDH lines. Malaria Journal, 9, 198.
Manson, P. (1898). Surgeon-Major Ronald Ross’s recent investigations on the mosquito-
malaria theory. British Medical Journal, I, 1575-1577.
Marchiafava, E. and Bignami, A. (1894). On summer-autumn malarial fevers London. New
Sydenham Society.
Markwalter, C. F., Davis, K. M. and Wright, D. W. (2015). Immunomagnetic capture and
colorimetric detection of malarial biomarker Plasmodium falciparum lactate dehydrogenase.
Analytical Biochemistry, 493, 30-34.
Martin, S. K., Rajasekariah, H. G., Awinda, G., Waitumbi, J. N. and Kifude, C. (2009).
Unified parasite lactate dehydrogenase and histidine-rich protein ELISA for quantification of
Plasmodium falciparum. American Journal of Tropical Medicine and Hygiene, 80 (4), 516-
522.

119
Masilamani, V., Devanesan, S., Ravikuma, M., Perinbam, K., AlSalhi, M. S., Prasad, S.,
Palled, S., Ganesh, K.M. and Alsaeed, A. H. (2014). Fluorescence spectral diagnosis of
malaria – a preliminary study. Diagnostic Pathology, 19, 182.
Matambo, T. S., Odunuga, O. O., Boshoff, A. and Blatch, G. L. (2004). Overproduction,
purification, and characterization of the Plasmodium falciparum heat shock protein 70.
Protein Expression and Purification, 33, 214–222.
Mattei, D., Scherf, A., Bensaude, O. and Pereira da Silva, L. (1989). A heat shock-like
protein from the human malaria parasite Plasmodium falciparum induces autoantibodies.
European Journal of Immunology, 19, 1823-1828.
Mbengue, B., Niang, B., Niang, M. S., Varela, M. L., Fall, B., Fall, M. M., Diallo, R. N.,
Diatta, B., Gowda, D. C., Dieye, A. and Perraut, R. (2015). Inflammatory cytokine and
humoral responses to Plasmodium falciparum glycosylphosphatidylinositols correlates with
malaria immunity and pathogenesis. Immunity, Inflammation and Disease, vol. 4, no. 1, pp.
24–34.
McCutchan, T. F., Piper, R. C. and Makler, M. T. (2008). Use of malaria rapid diagnostic
test to identify Plasmodium knowlesi infection. Emerging Infectious Diseases, 14 (11), 1750-
1752.
McMorrow, M. L., Masanja, M. I., Abdulla, S. M. K., Kahigwa, E. and Kachur, S. P.
(2008). Challenges in routine implementation and quality control of rapid diagnostic tests for
malaria- Rufiji district, Tanzania. American Journal of Tropical Medicine and Hygiene, 79 (3),
385-390.
Mens, P. F., de Bes, H. M., Sondo, P., Laochan, N., Keereecharoen, L., van Amerongen,
A., Flint, J., Sak, J. R., Proux, S., Tinto, H. and Schalling, H. D. (2012). Direct blood PCR
in combination with nucleic acid lateral flow immunoassay for detection of Plasmodium
species in settings where malaria is endemic. Journal of Clinical Microbiology, 50, 3520–
3525.
Miao, J., Lawrence, M., Jeffers, V., Zhao, F. Q., Parker, D., Ge, Y., Sullivan, W. J., and
Cui, L. W. (2013) Extensive lysine acetylation occurs in evolutionarily conserved metabolic
pathways and parasite-specific functions during Plasmodium falciparum intraerythrocytic
development. Molecular Microbiology, 89, 660-675.
Miao, P., Sheng, S., Sun, X., Liu, J. and Huang, G. (2013). Lactate dehydrogenase A in
cancer: A promising target for diagnosis and therapy. International Union of Biochemistry
and Molecular Biology Life Journal, 65, 904–910.
Miller, L. H., Good, M. F. and Milon, G. (1994). Malaria Pathogenesis. Science, 264,
1878-1883.

120
Miller, L. H., Baruch, D. I., Marsh, K. and Doumbo, O. K. (2002). The pathogenic basis of
malaria. Nature, 415, 673–679.
Mishra, B., Samantaray, J. C., Kumar, A. and Mirdha, B. R. (1999). Study of false
positivity of two rapid antigen detection tests for diagnosis of Plasmodium falciparum
malaria. Journal of Clinical Microbiology, 37, 1233.
Mohon, A. N., Elahi, R., Khan, W. A., Haque, R., Sullivan, D. J. Jr. and Alam, M. S.
(2014) A new visually improved and sensitive loop mediated isothermal amplification (LAMP)
for diagnosis of symptomatic falciparum malaria. Acta Tropica, 134 C, 52–57.
Moody, A. (2002). Rapid Diagnostic Tests for Malaria Parasites. Clinical Microbiology
Reviews, 15 (1), 66-78.
Mordmüller, B., Surat, G., Lagler, H., Chakravarty, S., Ishizuka, A. S., Lalremruata, A.,
Gmeiner, M., Campo, J. J., Esen, M., Ruben, A. J., Held, J., Lamsfus Calle, C., Mengue,
J. B., Gebru, T., Ibáñez, J., Sulyok, M., James, E. R., Billingsley, P. F., Natasha, K. C.,
Manoj, A., Murshedkar, T., Gunasekera, A., Eappen, A. G., Li, T., Stafford, R. E., Li, M.,
Felgner, P. L., Seder, R. A., Richie, T. L., Kim Lee Sim, B., Hoffman, S. L. and
Kremsner, P. G. (2017). Sterile protection against human malaria by chemoattenuated
PfSPZ vaccine. Nature, 21060, 1-7.
Moss, D. K., Remarque, E. J., Faber, B. W., Cavanagh, D. R., Arnot, D. E., Thomas, A.
W. and Holdera, A. A. (2012). Plasmodium falciparum 19-kilodalton merozoite surface
protein 1 (MSP1)-specific antibodies that interfere with parasite growth in vitro can inhibit
MSP1 processing, merozoite invasion, and intracellular parasite development. Infection and
Immunity, 80, 1280–1287.
Mouatcho, J. C and Goldring, J. P. D. (2013). Malaria rapid diagnostic tests: challenges
and Prospects. Journal of Medical Microbiology, 62, 1491–1505.
Mouchet, J. (1998). Origin of malaria epidemics on the plateaus of Madagascar and the
mountains of east and South Africa. Bulletin de la Societe de Pathologie Exotique, 91 (1),
64-66.
Mouchet, J., Carnevale, P., Coosemans, M., Julvez, J., Manguin, S., RichardLenoble,
D. and Sircoulon, J. (2004). Biodiversité du paludisme dans le monde Montrouge, France:
John Libbey Eurotext.
Muller, P., Ruckova, E., Halada, P., Coates, P. J., Hrstka, R., Lane, D. P. and Vojtesek,
B. (2012). C-terminal phosphorylation of Hsp70 and Hsp90 regulates alternate binding to
co-chaperones CHIP and HOP to determine cellular protein folding/degradation balances.
Oncogene, 1-10.

121
Murr, R., Loizou, J. I., Yang, Y., Cuenin, C., Li, H., Wang, Z. and Herceg, Z. (2006).
Histone acetylation by Trrap–Tip60 modulates loading of repair proteins and repair of DNA
double-strand breaks. Nature Cell Biology, 8, 91 – 99.
Murray, C. K., Gasser, R. A. Jr., Magill, A. J. and Miller, R. S. (2008). Update on rapid
diagnostic testing for malaria. Clinical Microbiology Reviews, 21 (1), 97-110.
Nestler, E. J., Walaas, S. I. and Greengard, P. (1984). Neuronal phosphoproteins:
physiological and clinical implications. Science, 225, 1357-1364.
Neumann, H., Peak-Chew, S. Y. and Chin, J. W. (2008). Genetically encoding N(epsilon)-
acetyllysine in recombinant proteins. Brief Communications Nature Chemical Biology, 4,
232–234.
Nguyen, M. T., Koo, B., Vu, T. T. T., Song, A., Chong, S., Jeong, B., Ryu, H., Moh, S.
and Choe, H. (2014). Prokaryotic soluble overexpression and purification of bioactive
human growth hormone by fusion to thioredoxin, maltose binding protein, and protein
disulfide isomerase. Plos One, 9, e89038.
Nielsen, M., Lundegaard, C., Worning, P., Lauemoller, S. L., Lamberth, K., Buus, S.,
Brunak, S. and Lund, O. (2003). Reliable prediction of T-cell epitopes using neural
networks with novel sequence representations. Protein Science, 12, 1007–1017.
Nielsen, M., Lundegaard, C., Lund, O. and Kesmir, C. (2005). The role of the proteasome
in generating cytotoxic T-cell epitopes: insights obtained from improved predictions of
proteasomal cleavage. Immunogenetics, 57, 33–41.
Nirmalan, N., Sims, P. F. G. and Hyde, J. E. (2004). Quantitative proteomics of the human
malaria parasite Plasmodium falciparum and its application to studies of development and
inhibition. Molecular Microbiology, 52 (4), 1187-1199.
Nosten, F., van Vugt, M., Price, R., Luxemburger, C., Thway, K. L., Brockman, A.,
McGready, R., ter Kuile, F., Looareesuwan, S. and White, N. J. (2000). Effects of
artesunate-mefloquine combination on incidence of Plasmodium falciparum malaria and
mefloquine resistance in western Thailand: a prospective study. Lancet, 356, 297-302.
Notomi, T., Okayama, H., Masubuchi, H., Yonekawa, T., Watanabe,K., Amino, N. and
Hase, T. (2000). Loop-mediated isothermal amplification of DNA. Nucleic Acids Research,
28, E63.
Nussenzweig, R. S., Vanderberg J., Most H. and Orton C. (1967). Protective Immunity
produced by the Injection of X-irradiated Sporozoites of Plasmodium berghei. Nature, 216,
160-162.
Nussenzweig, R. S. and Nussenzweig, V. (1989). Antisporozoite vaccine for malaria:
experimental basis and current status. Revisions of Infectious Diseases, 11 (Suppl 3), 579-
585.

122
Nwakanma, D. C., Gomez-Escobar, N., Walther, M., Crozier, S., Dubovsky, F., Malkin,
E., Locke, E. and Conway, C. J. (2009). Quantitative detection of Plasmodium falciparum
DNA in saliva, blood, and urine. Journal of Infectious Diseases, 199, 1567-1578.
Okiro, E. A. and Snow, R. W. (2010). The relationship between reported fever and
Plasmodium falciparum infection in African children. Malaria Journal, 9 (1), 99.
Okoth, A. S., Abdallah, J. F., Ceron, N., Adhin, M. R., Chandrabose, J., Krishnalall, K.,
Huber, C. S., Goldman, I. F., de Oliveira, A. M., Barnwell, J. W., Udhayakumaret, V.
(2015). Variation in Plasmodium falciparum histidine-rich protein 2 (Pfhrp2) and Plasmodium
falciparum histidine-rich protein 3 (Pfhrp3) gene deletions in Guyana and Suriname. PLoS
One, 10, e0126805.
Olszewski, K. L. and Llinas, M. (2011). Central carbon metabolism of Plasmodium
parasites. Molecular and Biochemical Parasitology, 175, 95-103.
Orbán, A., Rebelo, M., Molnár, P., Albuquerque, I, S., Butykai, A. and Kézsmárki, I.
(2016). Efficient monitoring of the blood-stage infection in a malaria rodent model by the
rotating-crystal magneto-optical method. Scientific Reports, 6, 23218.
Otsuki, H., Yokouchi, Y., Iyoku, N., Tachibana, M., Tsuboi, T. and Torii, M. (2015). The
rodent malaria lactate dehydrogenase assay provides a high throughput solution for in vivo
vaccine studies. Parasitology International, 64, 60–3.
Padial, M. M., Subirats, M., Puente, S., Lago, M., Crespo, S., Palacios, G. and Baquero,
M. (2005). Sensitivity of laser light depolarization analysis for detection of malaria in blood
samples. Journal of Medical Microbiology, 54, 449-452.
Palmer, C. J., Lindo, J. F., Klaskala, W. I., Quesada, J. A., Kaminsky, R., Baum, M. K.
and Ager, A. L. (1998). Evaluation of the OptiMAL test for rapid diagnosis of Plasmodium
vivax and Plasmodium falciparum malaria. Journal of Clinical Microbiology, 36, 203–206.
Park, T. S., Kim, J. H., Kang, C. I., Lee, B. H., Jeon, B. R., Lee, S. M., Chang, C. L., Lee,
E. Y., Son, H. C. and Kim , H. H. (2006) Diagnostic usefulness of SD malaria antigen and
antibody kits for differential diagnosis of vivax malaria in patients with fever of unknown
origin. Korean Journal of Laboratory Medicine, 26, 241-245.
Parker, J., Guo, D. and Hodges, R. (1986). New hydrophilicity scale derived from high-
performance liquid chromatography peptide retention data: correlation of predicted surface
residues with antigenicity and X-ray-derived accessible sites. Biochemistry, 25, 5425-5432.
Parra, M. E., Evans, C. B. and Taylor, D. W. (1991). Identification of Plasmodium
falciparum histidine-rich protein 2 in the plasma of humans with malaria. Journal Clinical
Microbiology, 29, 1629—1634.
Pasvol, G. (2005). Management of severe malaria: interventions and controversies.
Infectious Disease Clinic of North America, 19, 211-240.

123
Pavithra, S. R., Banumathy, G., Joy, O., Singh, V. and Tatu, U. (2004). Recurrent fever
promotes Plasmodium falciparum development in human erythrocytes. Journal of Biological
Chemistry, 279, 46692–46699.
Pease, B. N., Huttlin, E. L., Jedrychowski, M. P., Talevich, E., Harmon, J., Dillman, T.,
Kannan, N., Doerig, C., Chakrabarti, R., Gygi, S. P., and Chakrabarti, D. (2013). Global
analysis of protein expression and phosphorylation of three stages of Plasmodium
falciparum intraerythrocytic development. Journal of Proteome Research, 12, 4028–4045.
Peeters, J. M., Hazendonk, T. G., Beuvery, E. C. and Tesser, G. I. (1989). Comparison of
four bifunctional reagents for coupling peptides to proteins and the effect of the three
moieties on the immunogenicity of the conjugates. Journal of Immunological Methods, 120,
133-143.
Pelham, H. R. B. (1984). Hsp70 accelerates the recovery of nucleolar morphology after heat
shock. European Molecular Biology Organization Journal, 3, 3095-3100.
Perkins, M. D. and Bell, D. R. (2008). Working without a blindfold: the critical role of
diagnostics in malaria control. Malaria Journal, 7 (Suppl 1): S5.
Pessi, G., Kociubinski, G. and Mamoun, C. B. (2004). A pathway for phosphatidylcholine
biosynthesis in Plasmodium falciparum involving phosphoethanolamine methylation.
Proceedings of the National Academy of Sciences of the United States of America, 101,
6206–6211.
Peterson D. S., Walliker D. and Wellems T. E. (1998). Evidence that a point mutation in
dihydrofolate reductase-thymidylate synthase confers resistance to pyrimethamine in
falciparum malaria. Proceedings of the National Academy of Science United States of
America, 85, 9114-9118.
Phillips, R. S. (2001). Current status of malaria and potential for control. Clinical
Microbiology Reviews, 14, 208.
Piper R., Lebras J., Wentworth L., Hunt-Cooke A., Houze S., Chiodini P. and Makler M.
(1999). Immunocapture diagnostic assays for malaria using Plasmodium Lactate
Dehydrogenase (pLDH. American Journal of Tropical Medicine and Hygiene, 60 (1), 109-
118.
Piper, R. C., Buchanan, I., Choi, Y. H. and Makler, M. T. (2011). Opportunities for
improving pLDH-based malaria diagnostic tests. Malaria Journal, 10, 213.
Piper, R., Lebras, J., Wentworth, L., Hunt-Cooke, A., Houze, S., Chiodini, P. and
Makler, M. (1999). Immunocapture diagnostic assays for malaria using Plasmodium Lactate
Dehydrogenase (pLDH). American Journal of Tropical Medicine and Hygiene, 60 (1), 109-
118.

124
Pluess, B., Tanser, F. C., Lengeler, C. and Sharp, B. L. (2010). Indoor residual spraying
for preventing malaria. Cochrane Database of Systematic Reviews, CD006657.
Polevoda, B. and Sherman, F. (2000). Na-terminal acetylation of eukaryotic proteins.
Journal of Biological Chemistry, 275, 36479-36482.
Polevoda, B. and Sherman, F. (2002). The diversity of acetylated proteins. Genome
Biology, 3, 1-6.
Polpanich, D., Tangboriboonrat, P., Elaissari, A. and Udomsangpetch, R. (2007).
Detection of malaria infection via latex agglutination assay. Analytical Chemistry, 79, 4690–
4695.
Poon, L. L. M., Wong, B. W. Y., Ma, E. H. T., Chan, K. H., Chow, L. M. C.,
Abeyewickreme, W., Tangpukdee, N., Yuen, K. Y., Guan, Y. and Looareesuwan, S.
(2006). Sensitive and inexpensive molecular test for falciparum malaria: detecting
Plasmodium falciparum DNA directly from heat-treated blood by loop-mediated isothermal
amplification. Clinical Chemistry, 52, 303–306.
Pouyssegur, J. R., Shiu, P. C. and Pastan, I. (1977). Induction of two transformation
sensitive membrane polypeptides in normal fibroblasts by a block in glycoprotein synthesis
or glucose deprivation. Cell, 11, 941 -947.
Price, R., van Vugt, M., Phaipun, L., Luxemburger, C., Simpson, J., McGready, R.,
Kuile, F., Kham, A., Chongsuphajaisiddhi, T., White, N. J. and Nosten, F. (1999).
Adverse effects in patients with acute falciparum malaria treated with artemisinin derivatives.
American Journal Tropical Medicine and Hygiene, 60, 547 – 555.
Price, R. N. and Nosten, F. (2001). Drug resistant falciparum malaria: clinical
consequences and strategies for prevention. Drug Resistance Updates, 4, 187–96.
Price, R. N., Uhlemann, A., van Vugt, M., Brockman, A., Hutagalung, R., Nair, D. N.,
Singhasivanon, P., Anderson, T. J. C., Krishna, S., White, N. J. and Nosten, F. (2006).
Molecular and pharmacological determinants of the therapeutic response to artemether-
lumefantrine in multidrug-resistant Plasmodium falciparum malaria. Clinical Infectious
Diseases, 42, 1570–1577.
Renia, L., Mattei, D., Goma, J., Pied, S., Dubois, P., Miltgen, F., Nüssler, A., Matile, H.,
Menégaux, F. and Gentilini, M. (1990). A malaria heat-shock like protein epitope expressed
on the infected hepatocyte surface is the target of antibody dependent cell-mediated
cytotoxic mechanism by non-parenchymal liver cells. European Journal of Immunology, 20,
1445.

125
Richardson, D. C., Ciach, M., Zhong, K. J., Crandall, I. and Kain, K. C. (2002). Evaluation
of the Makromed dipstick assay versus PCR for diagnosis of Plasmodium falciparum malaria
in returned travellers. Journal of Clinical Microbiology, 40, 4528–4530.
Romi, R., Ravoniharimelina, B., Ramiakajato, M. and Majori, G. (1993). Field trials
of Bacillus thuringiensis H-14 and Bacillus sphaericus (Strain 2362) formulations
against Anopheles arabiensis in the central highlands of Madagascar. Journal of the
American Mosquito Control Association, 9 (3), 325-329.
Ross, R. (1898). The role of the mosquito in the evolution of the malaria parasite. Yale
Journal of Biology and Medicine, 75, 103-05.
Ross, R. (1923). Memoirs with a full account of the great malaria problem and its solution
London: John Murray.
Sabbatani, S., Fiorino, S. and Manfredi, R. (2010). The emerging of the fifth malaria
parasite (Plasmodium knowlesi). A public health concern? Brazilian Journal of Infectious
Diseases, 14 (3), 299-309.
Salanti, A., Staalsoe, T., Lavstsen, T., Jensen, A. T., Sowa, M. P., Arnot, D. E., Hviid, L.
and Theander, T.G. (2003). Selective upregulation of a single distinctly structured var gene
in chondroitin sulphate A-adhering Plasmodium falciparum involved in pregnancy associated
malaria. Molecular Microbiology, 49, 179-191.
Salanti, A., Dahlback, M., Turner, L., Nielsen, M. A., Barford, L., Magistrado, P., Jensen,
A. T. R., Lavstsen, T., Ofori, M. F., Marsh, K., Hviid, L. and Theander, T. G. (2004).
Evidence for the involvement of VAR2CSA in pregnancy associated malaria. Journal of
Experimental Medicine, 200, 1197-1203.
Saravanan, P. and Kumar, S. (2009). Diagnostic and immunoprophylactic applications of
synthetic peptides in veterinary microbiology. Microbiology Research, 1 (1).
Schein, C. H. and Noteborn, M. H. M. (1988). Formation of soluble recombinant proteins in
Escherichia coli is favoured by lower growth temperature. Nature Biotechnology, 6, 291–294.
Schultz, L. J., Steketee, R. W., Macheso, A., Kazembe, P., Chitsulo, L. and Wirima, J. J.
(1994). The efficacy of antimalarial regimens containing sulfadoxine-pyrimethamine and/or
chloroquine in preventing peripheral and placental Plasmodium falciparum infection among
pregnant women in Malawi. American Journal of Tropical Medicine and Hygiene, 51 (5),
515-522.
Schwartz, L., Brown, G. V., Genton, B. and Moorthy, V. S. (2012) A review of malaria
vaccine clinical projects based on the WHO rainbow table. Malaria Journal, 11, 10.1186.
Seesod, N., Lundeberg, J., Hedrum, A., Asland, L., Holder, A., Thaithong, S. and Uhlen,
M. (1993). Immunomagnetic purification to facilitate DNA diagnosis of Plasmodium
falciparum. Journal of Clinical Microbiology, 31, 2715–2719.

126
Service, M. W. (1993a). Appendix II. Characteristics of some major Anopheles vectors of
human malaria. In: Gilles HM, Warrell DA, eds. BruceChwatt’s Essential Malariology. Third
edition London: Edward Arnold. 305–310.
Service, M. W. (1993b). The Anopheles vector. In: Gilles HM, Warrell DA, eds. Bruce-
Chwatt’s Essential Malariology. Third edition London: Edward Arnold. 96–123.
Sessions, R. B., Dewar, V., Clarke, A. R. and Holbrook, J. J. (1997). A model of
Plasmodium falciparum lactate dehydrogenase and its implications for the design of
improved antimalarials and the enhanced detection of parasitaemia. Protein Engineering,
vol. 10, no. 4, 301–306.
Sethabutr, O., Brown, A. E., Panyim, S., Kain, K. C., Webster, K. and Echeverria, P.
(1992). Detection of Plasmodium falciparum by polymerase chain reaction in a field study.
Journal of Infectious Diseases, 166,145–148.
Shapiro, H. M. and Mandy, F. (2007). Cytometry in malaria: moving beyond Giemsa.
Cytometry Part A, 71, 643-645.
Sharma, Y. D. (1992). Structure and possible function of heat-shock proteins in Plasmodium
falciparum Malaria. Comparative Biochemistry and Physiology, 102, 437–444.
She, R. C., Rawlins, M. L., Mohl, R., Perkins, S. L., Hill, H. R. and Litwin C.M. (2007).
Comparison of immunofluorescence antibody testing and two enzyme immunoassays in the
serological diagnosis of malaria. Journal of Travel Medicine, 14 (2), 105-111.
Shiff, C. (2002). Integrated approach to malaria control. Clinical Microbiology Reviews, 15
(2), 278-293.
Shin, H. I., Kim, J. Y., Lee, W. J., Sohn, Y., Lee, S. W., Kang, Y. J. and Lee, H.W. (2013).
Polymorphism of the parasite lactate dehydrogenase gene from Plasmodium vivax Korean
isolates. Malaria Journal, 12, 166.
Shonhai, A., Boshoff, A. and Blatch, G. L. (2007). The structural and functional diversity of
Hsp70 proteins from Plasmodium falciparum. Protein Science, 16, 1803-1818.
Shortt, H. E. and Garnham, P. C. C. (1948a). The preerythrocytic-development of P.
cynomolgi and P. vivax. Transactions of the Royal Society of Tropical Medicine and
Hygiene, 41, 785-795.
Shortt, H. E. and Garnham, P. C. C. (1948b). Pre-erythrocytic stages in mammalian
malaria parasites. Nature, 161, 126.
Shortt, H. E., Fairley, N. H., Covell, G., Shute, P. G. and Garnham, P. C. C. (1949). A
preliminary note on the pre-erythrocytic stage of Plasmodium falciparum. British Medical
Journal, 2, 1006-8.

127
Shortt, H. E., Garnham, P. C. C., Covell, G. and Shute, P.G. (1948). The pre-erythrocytic
stage of human malaria Plasmodiun vivax. British Medical Journal, 1, 547.
Simpson, J., Silamut, K., Chotivanich, K., Pukrittayakamee, S. and White, N. J. (1999).
Red cell selectivity in malaria: a study of multiple-infected erythrocytes. Transactions of the
Royal Society of Tropical Medicine and Hygiene, 93,165–8.
Singh, B., Lee, K. S., Matusop, A., Radhakrishnan, A., Shamsul, S. S. G., Cox-Singh, J.,
Thomas, A. and Conway, D. J. (2004). A large focus of naturally acquired Plasmodium
knowlesi infections in human beings. Lancet, 363, 1017–1024.
Singh, B. and Daneshvar, C. (2010). Plasmodium knowlesi malaria in Malaysia. Medical
Journal of Malaysia, 65, 166–172.
Singh, N., Saxena, A. and Valecha, N. (2000). Field evaluation of the ICT malaria P.f/P.v
immunochromatographic test for diagnosis of Plasmodium falciparum and Plasmodium vivax
infection in forest villages of Chhindwara, central India. Tropical Medicine and International
Health, 5, 765-770.
Singh, V. (2004). Heat shock protein 70 of Plasmodium falciparum: proteomic analysis of its
complexes and cellular functions. A thesis. Bangalore, India: Department of Biochemistry,
Indian Institute of Science.
Sinha, S., Medhi, B. and Sehgal, R. (2014). Challenges of drug resistant malaria. Parasite,
21, 61.
Sinka, M. E., Bangs, M. J., Manguin, S., Rubio-Palis, Y., Chareonviriyaphap, T.,
Coetzee, M., Mbogo, C. M., Hemingway, J., Patil, A. P., Temperley, W. H., Gething, P.
W., Kabaria, C. W., Burkot, T. R., Harbach, R. E. and Hay, S.I. (2012). A global map of
dominant malaria vectors. Parasites and Vectors 5, 69.
Sleebs, B. E., Lopaticki, S., Marapana, D. S., O’Neill, M. T., Rajasekaran, P., Gazdik, M.,
Gunther, S., Whtehead, L.W., Lowes, N. K., Bradford, L., Hviid, L., Shaw, P. J., Hodder,
N. A., Smith, B. J., Cowman, F. A. and Boddey, J. A. (2014) Inhibition of plasmepsin V
activity demonstrates its essential role in protein export, PfEMP1 display, and survival of
malaria parasites. PLoS Biology, 12 (7).
Smith, J. D. and Craig, A. D. (2005). The surface of the Plasmodium falciparum-infected
erythrocyte. Current Issues in Molecular Biology, 7, 81-94.
Snounou, G., Viriyakosol, S., Jarra, W., Thaithong, S. and Brown, K. N. (1993).
Identification of the four human malarial species in field samples by the polymerase chain
reaction and detection of a high prevalence of mixed infections. Molecular and Biochemical
Parasitology, 58, 283–292.
Snounou, G., Gruner, A. C., Muller-Graf, C. D., Mazier, D. and Renia, L. (2005). The
Plasmodium sporozoite survives RTS,S vaccination. Trends in Parasitology, 21, 456–461.

128
Snow, R. W., Bradley, A. K., Hayes, R., Byass, P. and Greenwood, B. M. (1987). Does
woodsmoke protect against malaria? Annals of Tropical Medicine and Parasitology, 81 (4),
449-451.
Snow, R. W., Guerra, C. A., Noor, A. M., Myint, H. Y. and Hay, S. I. (2005). The global
distribution of clinical episodes of Plasmodium falciparum malaria. Nature, 434, 214–217.
Solano, M. C., Okoth, A. S., Abdallah, J. F., Pava, Z., Dorado, E., Incardona, S., Huber,
C. S., de Oliveira, A. M., Bell, D., Udhayakumar, V. and Barnwell, J. W. (2015). Deletion
of Plasmodium falciparum histidine-rich protein 2 (pfhrp2) and histidine-rich protein 3
(pfhrp3) genes in Colombian parasites. PLoS One, 10.
Soleimani-Ahmadi, M., Vatandoost, H., Zare, M., Turki, H. and Alizadeh, A. (2015).
Topographical distribution of anopheline mosquitoes in an area under elimination
programme in the south of Iran. Malaria Journal, 14, 262.
Sonaimuthu, P., Cheong, F. W., Chin, L. C., Mahmud, R., Fong, M. Y and Lau, Y. L.
(2015). Detection of human malaria using recombinant Plasmodium knowlesi merozoite
surface protein-1 (MSP-1(1)(9)) expressed in Escherichia coli. Experimental Parasitology,
153, 118–22.
Sorensen, H. P. and Mortensen, K. K. (2005). Advanced genetic strategies for
recombinant protein expression in Escherichia coli. Journal of Biotechnology, 115, 113-128.
Sousa, L. P., Mariuba, L. A., Holanda, R. J., Pimentel, J. P., Almeida, M. E., Chaves, Y.
O., Borges, D., Lima, E., Crainey, J. L., Orlandi, P. P., Lacerda, M.V. and Nogueira, P. A.
(2014). A novel polyclonal antibody-based sandwich ELISA for detection of Plasmodium
vivax developed from two lactate dehydrogenase protein segments. BioMed Central
Infectious Diseases, 14, 49.
Spencer, H. C., Collins, W. E., Chin, W. and Skinner, J. C. (1979). The enzyme-linked
immunosorbent assay (ELISA) for malaria. I. The use of in vitro-cultured Plasmodium
falciparum as antigen. American Journal of Tropical Medicine and Hygiene, 28, 927–932.
Srinavasan, S., Moody, A. H. and Chiodini, P. L. (2000). Comparison of blood-film
microscopy, the OptiMAL® dipstick, Rhodamine 123 and PCR for monitoring anti-malarial
treatment. Annals Tropical Medicine and Parasitology, 94, 227–232.
Stanisic, D. I., Liu, X. Q., De, S. L., Batzloff, M. R., Forbes, T., Davis, C. B., Sekuloski,
S., Chavchich, M., Chung, W., Trenholme, K., McCarthy, J. S., Li, T., Sim, L. K. B.,
Hoffman, S. L. and Good, M. L. (2015). Development of cultured Plasmodium falciparum
blood-stage malaria cell banks for early phase in vivo clinical trial assessment of anti-malaria
drugs and vaccines. Malaria Journal, 14, 143.
Stephens, J. W. W. (1922). A new malaria parasite of man. Annals of Tropical Medicine and
Parasitology, 16, 383-388.

129
Studier, F. W. (2005). Protein production by auto-induction in high-density shaking cultures.
Protein Expression and Purification, 41, 207-234.
Subramanian, C., Opipari, A. W. Jr., Bian, X., Castle, V. P. and Kwok, R. P. (2005). Ku70
acetylation mediates neuroblastoma cell death induced by histone deacetylase inhibitors.
Proceedings of the National Academy of Science of United States of America, 102 (13),
4842–4847.
Suh, K. N., Kain, K. C. and Keystone, J. S. (2004). Malaria. Canadian Medical Association
Journal, 170 (11), 1693-1702.
Sulzer, A. J., Wilson, M. and Hall, E. C. (1969). Indirect fluorescent-antibody tests for
parasitic diseases. V. An evaluation of a thick-smear antigen in the IFA test for malaria
antibodies. American Journal of Tropical Medicine and Hygiene, 18, 199–205.
Sutherland, C. J. and Hallett, R. (2009). Detecting malaria parasites outside the blood.
Journal of Infectious Diseases, 199, 1561-1563.
Tangpukdee, N., Duangdee, C., Wilairatana, P. and Krudsood, S. (2009). Malaria
diagnosis. Korean Journal of Parasitology, Vol 47, 2, 93-102.
Theisen, M., Roeffen, W., Singh, S. K., Andersen, G., Amoah, L., Van der Vegte-
Bolmer, M., Arens, T., Tiendrebeogo, R. W., Jones, S., Bousema, T., Adu, B., Dziegiel,
H. M., Christiansen, M. and Sauerwein, R. (2014). A multistage malaria vaccine candidate
targeting both transmission and asexual parasite life-cycle stages. Vaccine, 32, 2623–2630.
Tjitra, E., Suprianto, S., McBroom, J., Currie, B. J. and Anstey, N. M. (2001). Persistent
ICT malaria P.f/P.v panmalarial and HRP2 antigen aeactivity after treatment of Plasmodium
falciparum malaria is associated with gametocytemia and results in false-positive diagnoses
of Plasmodium vivax in convalescence. Journal of Clinical Microbiology, 39 (3), 1025-1031.
Tomar, D., Biswas, S., Tripathi, V. and Rao, D. N. (2006). Development of diagnostic
reagents: raising antibodies against synthetic peptides of PfHRP-2 and LDH using
microsphere delivery. Immunobiology, 211, 797-805.
Trape, J. F., Lefebvre-Zante, E., Legros, F., Ndiaye, G., Bouganali, H., Druilhe, P. and
Salem, G. (1992). Vector density gradients and the epidemiology of urban malaria in Dakar,
Senegal. American Journal of Tropical Medicine and Hygiene, 47 (2), 181-189.
Tsai, W., Wu, T., Chang, B. and Wen, H. (2016). Cloning, expression, and purification of
recombinant major mango allergen Man i 1 in Escherichia coli. Protein Expression and
Purification, 130, 35-43.
Tsuji, M., Mattei, D., Nussenzweig, R. S., Eichinger, D. and Zavala F. (1994).
Demonstration of heat-shock protein 70 in the sporozoite stage of malaria parasites.
Parasitology Research, 80, 16-21.

130
Turgut-Balik, D., Akbulut, E., Shoemark, D. K., Celik, V., Moreton, K. M., Sessions, R.
B., Holbrook, J. J. and Brady, R. L. (2004). Cloning, sequence and expression of the
lactate dehydrogenase gene from the human malaria parasite, Plasmodium vivax.
Biotechnology Letters, 26, 1051-1055.
Vaidya, A. B. and Mather, M. W. (2009). Mitochondrial evolution and functions in malaria
parasites. Annual Review of Microbiology, 63, 249–267.
Vakharia, S., Gopinathan, N. and Kshirsagar, N. A. (1997). The ParaSight-F test for
detecting treatment failure. Transactions of the Royal Society of Tropical Medicine and
Hygiene, 91, 490– 491.
Van den Eede, P., Van, H. N., Van Overmeir, C., Vythilingam, I., Duc,T. N., Hung le, X.,
Manh, H. N., Anne´, J., D’Alessandro, U. and Erhart, A. (2009). Human Plasmodium
knowlesi infections in young children in central Vietnam. Malaria Journal, 8, 249.
Van den Eede, P., Vythilingam, I., Ngo Duc, T., Van, T. N., Hung, L. H., D'Alessandro, U.
and Erhart, A. (2010). Plasmodium knowlesi malaria in Vietnam: some clarifications.
Malaria Journal, 9 (20).
Van Hellemond, J. J., Rutten, M., Koelewijn, R., Zeeman, A. M., Verweij, J. J., Wismans,
P. J., Kocken, C. H. and van Genderen, P. J. (2009). Human Plasmodium knowlesi
infection detected by rapid diagnostic tests for malaria. Emerging Infectious Disease, 15,
1478–1480.
Van Vianen, P. H., van Engen, A., Thaithong, S., van der Keur, M., Tanke, H. J., van der
Kaay, H. J., Mons, B. and Janse, C. J. (1993). Flow cytometric screening of blood samples
for malaria parasites. Cytometry Part A, 14, 276–280.
Van Vugt, M., Brockman, A., Gemperli, B., Luxemburger, C., Gathman, I., Royce, C.,
Slight, T., Looareesuwan, S., White, N. J. and Nosten, F. (1998). Randomized
comparison of artemether-benflumetol and artesunate- mefloquine in treatment of multidrug-
resistant falciparum malaria. Antimicrobial Agents and Chemotherapy, 42,135–9.
Van Vugt, M., Wilairatana, P., Gemperli, B., Gathmann, I., Phaipun, L., Brockman, A.,
Luxemburger, C., White, N. J., Nosten, F. and Iooareesuwan, S. (1999a). Efficacy of six
doses of artemether-lumefantrine (benflumentol) iti the treatment of multidrug-resistant
Plasmodium falciparum malaria. American Journal of Tropical Medicine and Hygiene, 60,
936-942.
Van Vugt, M., Ezzet, F., Nosten, F., Gathmarm, P., Wilairatana, P., Looareesuwan, S.
and White, N. J. (1999b). No evidence of cardiotoxicity during antimalarial treatment with
artemether-lumefantrine. American Journal of Tropical Medicine and Hygiene, 61, 964-967.
Van Vugt, M., Looareesuwan, S., Wilairatana, P., McGreadty, R., Villegas, L., Mull, R.,
Brockman, A., White, N. J. and Nosten, F. (2000). Artemether-lumefantrine for the

131
treatment of multidrug-resistant falciparum malaria. Transactions of the Royal Society
Tropical Medicine and Hygiene, 94, 545–8.
Vasina, J. A. and Baneyx, F. (1997) Expression of aggregation prone recombinant proteins
at low temperatures: a comparative study of the Escherichia coli cspA and tac promoter
systems. Protein Expression and Purification, 9, 211–218.
Verma, R., Jayaprakash, N. S., Vijayalakshmi, M. A. and Venkataraman, K. (2015).
Novel monoclonal antibody against truncated C terminal region of Histidine Rich Protein2
(PfHRP2) and its utility for the specific diagnosis of malaria caused by Plasmodium
falciparum. Experimental Parasitology. doi.org/10.1016/j.exppara.2015.01.001.
Versteeg, I. and Mens, P. F. (2009). Development of a stable positive control to be used for
quality assurance of rapid diagnostic tests for malaria. Diagnostic Microbiology and
Infectious Disease, 64, 256-260.
Viebig, N. K., Gamain, B., Scheidig, C., Le´ polard, C., Przyborski, J., Lanzer, M., Gysin,
J. and Scherf, A. (2005). A single member of the Plasmodium falciparum var multigene
family determines cytoadhesion to the placental receptor chondroitin sulphate A. European
Molecular Biology Organization Reports, 6, 775-781.
Voet, D. and Voet, J. G. (2004). Biochemistry. John Wiley and Sons, Incorporation, 4th
Edition, 70, 131; 503; 604-607.
Vugt, M. V., Wilairatana, P., Gemperli, B., Gathmann, I., Phaipun, L., Brockman, A.,
Luxemburger, C., White, N. J., Nosten, F. and Looareesuwan, S. (1999). Efficacy of six
doses of artemether-lumefantrine (benflumetol) in multidrug-resistant Plasmodium
falciparum malaria. American Journal of Tropical Medicine and Hygiene, 60, 936 –42.
Walker, J. M. and Rapley, R. (2008) Molecular Biomethods Handbook, 2nd edition. Totowa:
Humana Press.
Walsh, J. A. (1989). Disease problems in the Third World. Annals of the New York Academy
of Science, 569, 1-16.
Wang, Q., Zhang, Y., Yang, C., Xiong, H., Lin, Y., Yao, J., Li, H., Xie, L., Zhao, W., Yao,
Y., Ning, Z., Zeng, R., Xiong, Y., Guan, K., Zhao, S. and Zhao, G. (2010). Acetylation of
metabolic enzymes coordinates carbon source utilization and metabolic flux. Science, 327,
1004–1007.
Wataya, Y., Arai, M., Kubochi, F., Mizuloshi, C., Kakutani, T., Ohta, N. and Ishii, A.
(1993). DNA diagnosis of falciparum malaria using a double PCR technique: a field trial in
the Solomon Island. Molecular and Biochemical Parasitology, 58, 65–168.
Waters, A. P. (1994). The ribosomal RNA genes of Plasmodium. Advances in Parasitology,
34, 33–79.

132
Wataya, Y., Kubochi, F., Mizukoshi, C., Ohya, Y., Watanabe, K., Arai, M., Ishii, A. and
Nakagam, A. (1991). DNA diagnosis of falciparum malaria. Nucleic Acids Symposium
Series, 25,155–156.
Welling, G. W., Weijer, W. J., van der Zee, R. and Welling-Wester, S. (1985). Prediction
of sequential antigenic regions in proteins. Federation of European Biochemical Societies
Letters, 188, 215-218.
White, G. B. (1974). Anopheles gambiae complex and disease transmission in Africa.
Transactions of the Royal Society of Tropical Medicine Hygiene, 68, 278-301.
White, G. B. (1989). Malaria. Geographical distribution of arthropod-borne diseases and
their principal vectors. Geneva: World Health Organization, Division of Vector Biology and
Control. WHO/VBC/89967, 7-22.
Wilairatana, P., Tangpukdee, N. and Krudsood, S. (2013). Definition of hyperparasitemia
in severe falciparum malaria should be updated. Asian Pacific Journal of Tropical
Biomedicine, 3 (7), 586.
Wong, P. S. J., Tan, C. H., Lee, V., Li, M. Z. I., Lee, K. S., Lee, P. J., Balbir, S. and Ng L.
C. (2011). Molecular epidemiological investigation of Plasmodium knowlesi in humans and
macaques in Singapore. Vector-borne and Zoonotic Diseases, Vol 11 (2), 131-135.
Wong, Y., Lee, T., Liang, H., Huang, C., Wang, T., Yang, Y, Chu, C., Huang, H., Ko, M.
and Hwang, J. (2007). KinasePhos 2.0: a web server for identifying protein kinase-specific
phosphorylation sites based on sequences and coupling patterns. Nucleic Acids Research,
Vol. 35.
Wongchotigul, V., Suwanna, N., Krudsood, S., Chindanond, D., Kano, S., Hanaoka, N.,
Akai, Y., Maekawa, Y., Nakayama, S., Kojima, S. and Looareesuwan, S. (2004). The use
of flow cytometry as a diagnostic test for malaria parasites. Southeast Asian Journal of
Tropical Medicine and Public Health, 35, 552-559.
Wongsrichanalai, C., Barcus, M. J., Muth, S., Sutamihardja, A. and Wernsdorfer, W. A.
(2007). A review of malaria diagnostic tools: microscopy and rapid diagnostic test (RDT).
American Society of Tropical Medicine and Hygiene, 77 (6), 119–127.
Woodrow, C. J., Wangsing, C., Sriprawat, K., Christensen, P. R., Nosten, F., Rénia, L.,
Russell, B. and Malleret, B. (2015). Comparison between flow cytometry, microscopy, and
lactate dehydrogenase-based enzyme-linked immunosorbent assay for Plasmodium
falciparum drug susceptibility testing under field conditions. Journal of Clinical Microbiology,
53, 3296 –3303.
World Health Organization. (1974). WHO expert committee on malaria: 16th report. World
Health Organization, Geneva, Switzerland.

133
World Health Organization. (1999). New Perspectives: malaria diagnosis. Report of joint
WHO/USAID informal consultation 25–27 October 1999. Report No.
WHO/CDS/RBM/2000.14, WHO/MAL/2000.1091. Geneva: World Health Organization.
http://wholibdoc.who.int/hq/2000/WHO_ CDS_RBM_2000.14.pdf.
World Health Organization. (2000). WHO/MAL/2000.1091. New perspectives in malaria
diagnosis. World Health Organization, Geneva, Switzerland.
World Health Organization. (2003). Malaria rapid diagnosis: making it work. Meeting report
20–23 January 2003. Manila: World Health Organization.
http://www.who.int/malaria/publications/atoz/rdt2/en/index.html
World Health Organization. (2005). Establishing QA systems for malaria rapid diagnostic
tests. World Health Organization Western Pacific Regional Challenges in RDT
Implementation 389 RDT website. Geneva: World Health Organization.
http://www.wpro.who.intmalariainternetresources.
ashxRDTdocsProductTestingOutline_160308.pdf.
World Health Organization. (2008). RDT instructions and training 2008. Geneva, World
Health Organization. http://www.wpro.who.int/malaria/sites/rdt/.
World Health Organization. (2008). The global burden of disease: 2004 update. World
health organization: geneva.
World Health Organization. (2008). Update on WHO procedures for Ppocurement and
quality assurance of malaria rapid diagnostic tests. Available at
http://www.wpro.who.int/NR/rdonlyres/3659F207-C0B3-4D59-83BD-
446CD9847ED1/0/WHOmalariaQAupdate_052008.pdf.
World Health Organization. (2009) Malaria fact sheet number 94, 2006, World Health
Organization, Geneva, Available at http://www. who. int/inf-fs/en/fact094. html.
World Health Organization. (2009). Malaria rapid diagnostic test performance: results of
WHO product testing of malaria RDTs: Round 1 (2008). Geneva: World Health Organization.
http://www.who.int/tdr/news/documents/ executive-summary-malaria-RDTs.pdf.
World Health Organization. (2010). Malaria rapid diagnostic test performance: results of
WHO product testing of malaria RDTs: Round 2 (2009). Geneva: World Health Organization.
http://www.who.int/malaria/publications/atoz/9789241599467/en/index.html.
World Health Organization. (2011a). World malaria report. Geneva: World Health
Organization. http://www.who.int/malaria/world_malaria_report_2011/en/.
World Health Organization. (2011b). Malaria rapid diagnostic test performance: Summary
results of WHO malaria RDT product testing: rounds 1–3 (2008–2011). Geneva: World
Health Organization. http://www2.wpro.who.int/NR/rdonlyres/005E574B-FFCD-484C-BEDE-
C580324AC2CF/0/RDTMalariaRd3_Summary_FINAL11Oct.pdf.

134
World Health Organization. (2014). World malaria report 2014. Available at
http://www.who.int/malaria/publications/world_malaria_report_2014/wmr-2014-no-
profiles.pdf?ua=1. Date obtained 2-11-2016.
Wright, K. E., Hjerrild, K. A., Bartlett, J., Douglas, A. D., Jin, J., Brown, R. E.,
Illingworth, J. J., Ashfield, R., Clemmensen, S. B., de Jongh, W. A., Draper, S. J. and
Higgins, M. K. (2014). Structure of malaria invasion protein RH5 with erythrocyte basigin
and blocking antibodies. Nature, 515, 427- 430.
www.cbs.dtu.dk/services/DictyOGlyc/. Accessed on 18-10-2016.
www.cbs.dtu.dk/services/NetAcet?. Accessed on 14-10-2016.
www.cbs.dtu.dk/services/NetChop/. Accessed on 23-10-2016.
www.cbs.dtu.dk/services/NetNGlyc/. Accessed on 19-10-2016.
www.ebi.ac.uk/Tools/msa/clustalo/. Accessed on 2-10-2016.
www.kinasephos.mbc.nctu.edu.tw/predict.php/. Accessed on 16-10-2016.
www.plasmodb.org/. Accessed on 3-10-2016.
www.spdv.vital-it.ch/disclaim.html#/ Accessed on 5-11-16.
Xianyu, Y., Zhu, K., Chen, W., Wang, X., Zhao, H., Sun, J., Wang, Z. and Jiang, X.
(2013). Enzymatic assay for Cu (II) with horseradish peroxidase and its application
incolorimetric logic gate. Analytical Chemistry, 85, 7029–7032.
Yang, X. (2004). The diverse superfamily of lysine acetyltransferases and their roles in
leukemia and other diseases. Nucleic Acids Research, Vol. 32, No. 3, 959-976.
Yang, Y., Fiskus, W., Yong, B., Atadja, P., Takahashi, Y., Pandita, T. K., Wang, H. G.
and Bhalla, K. N. (2013). Acetylated hsp70 and KAP1-mediated Vps34 SUMOylation is
required for autophagosome creation in autophagy. Proceedings of the National Academy of
Science of the United States of America, 110, 6841–6846.
Yin, J., Li, G., Ren, X. and Herrler, G. (2007). Select what you need: A comparative
evaluation of the advantages and limitations of frequently used expression systems for
foreign genes. Journal of Biotechnology, 127, 335-347.
Yuan, Z. L., Guan, Y. J., Chatterjee, D. and Chin, Y. E. (2005). Stat3 dimerization
regulated by reversible acetylation of a single lysine residue. Science, 307 (5707), 269–273.
Zhang, M., Hisaeda, H., Kano, S., Matsumoto, Y., Hao, Y. P., Looaresuwan, S., Aikawa,
M. and Himeno, K. (2001). Antibodies specific for heat shock proteins in human and murine
malaria. Microbes and Infection, 3, 363-367.
Zhao, D., Zou, S. W., Liu, Y., Zhou, X., Mo, Y., Wang, P., Xu, Y. H., Dong, B., Xiong, Y.,
Lei, Q. Y. and Guan, K. L. (2013). Lysine-5 acetylation negatively regulates lactate
dehydrogenase A and is decreased in pancreatic cancer. Cancer Cell, 23, 464–476.

135
Zhao, S., Xu, W., Jiang, W., Yu, W., Lin, Y., Zhang, T., Yao, J., Zhou, L., Zeng, Y., Li, H.,
Li, Y., Shi, J., An, W., Hancock, S. M., He, F., Qin, L., Chin, J., Yang, P., Chen, X., Lei,
Q., Xiong, Y. and Guan, K. (2010). Regulation of cellular metabolism by protein lysine
acetylation. Science, 327, 1000–1004.
Zheng, A., Zhang, X., Gao, J., Liu, X. and Liu, J. (2016). Peroxidase-like catalytic activity
of copper ions and its application for highly sensitive detection of glypican-3. Analytica
Chimica Acta, 941, 87-93.
Zocher, K., Fritz-Wolf, K., Kehr, S., Fischer, M., Rahlfs, S. and Becker K. (2012).
Biochemical and structural characterisation of Plasmodium falciparum glutamate
dehydrogenase 2. Molecular and Biochemical Parasitology, 183, 52-62.