A case study in Allah Valley Landscape in - J. Bio. & Env. Sci.
11
J. Bio. & Env. Sci. 2018 98 | Janiola and Puno RESEARCH PAPER OPEN ACCESS Land use and land cover (LULC) change detection using multi- temporal landsat imagery: A case study in Allah Valley Landscape in Southern, Philippines Mark Daryl C. Janiola * , George R. Puno CMU-GeoSAFER Mindanao Project, College of Forestry and Environmental Science, Central Mindanao University, Musuan, Bukidnon, Philippines Article published on February 28, 2018 Key words: Landsat, Multi-temporal, Change detection, Feature extraction, Land cover change, Image classification Abstract The widely used application on remote sensing using Landsat imagery is on monitoring changes. With the progressive dynamics of land cover change in the different parts of the world and especially in the Philippines at a fast rate, satellite remote sensing is playing an important role in mapping the spatial distribution and the temporal dynamics of land cover change. Feature extraction and change detection using Landsat imagery are an effective means of collecting information on temporal changes. Monitoring the extent of changes is critical for understanding environmental and socioeconomic impacts. The primary objectives of this study are to detect the temporal dynamics of LULC change in Allah valley landscape through integrating remote sensing and GIS in extracting and analyzing the spatial distribution of land cover changes from the year 1989 to 2002 and 2002 to 2015. Allah valley is more or less 261,000ha of valley landscape located specifically in the Provinces of South Cotabato and Sultan Kudarat in Mindanao and considered as watershed forest reserve under Proclamation No. 2455 by President Ferdinand Marcos. The valley landscape supports the existence of two watersheds namely Allah and Kapingkong Watershed. The detected land cover change in Allah valley using multi-temporal Landsat imagery posed a serious trend, by which forest resources are decreasing that is driven by the continuously increasing need for agricultural land, built-up areas, and industrial plantation expansion. * Corresponding Author: Mark Daryl C. Janiola [email protected] Journal of Biodiversity and Environmental Sciences (JBES) ISSN: 2220-6663 (Print) 2222-3045 (Online) Vol. 12, No. 2, p. 98-108, 2018 http://www.innspub.net
-
Upload
khangminh22 -
Category
Documents
-
view
6 -
download
0
Transcript of A case study in Allah Valley Landscape in - J. Bio. & Env. Sci.
J. Bio. & Env. Sci. 2018
98 | Janiola and Puno
RESEARCH PAPER OPEN ACCESS
Land use and land cover (LULC) change detection using multi-
temporal landsat imagery: A case study in Allah Valley
Landscape in Southern, Philippines
Mark Daryl C. Janiola*, George R. Puno
CMU-GeoSAFER Mindanao Project, College of Forestry and Environmental Science,
Central Mindanao University, Musuan, Bukidnon, Philippines
Article published on February 28, 2018
Key words: Landsat, Multi-temporal, Change detection, Feature extraction, Land cover change, Image classification
Abstract
The widely used application on remote sensing using Landsat imagery is on monitoring changes. With the
progressive dynamics of land cover change in the different parts of the world and especially in the Philippines at
a fast rate, satellite remote sensing is playing an important role in mapping the spatial distribution and the
temporal dynamics of land cover change. Feature extraction and change detection using Landsat imagery are an
effective means of collecting information on temporal changes. Monitoring the extent of changes is critical for
understanding environmental and socioeconomic impacts. The primary objectives of this study are to detect the
temporal dynamics of LULC change in Allah valley landscape through integrating remote sensing and GIS in
extracting and analyzing the spatial distribution of land cover changes from the year 1989 to 2002 and 2002 to
2015. Allah valley is more or less 261,000ha of valley landscape located specifically in the Provinces of South
Cotabato and Sultan Kudarat in Mindanao and considered as watershed forest reserve under Proclamation No.
2455 by President Ferdinand Marcos. The valley landscape supports the existence of two watersheds namely
Allah and Kapingkong Watershed. The detected land cover change in Allah valley using multi-temporal Landsat
imagery posed a serious trend, by which forest resources are decreasing that is driven by the continuously
increasing need for agricultural land, built-up areas, and industrial plantation expansion.
*Corresponding Author: Mark Daryl C. Janiola [email protected]
Journal of Biodiversity and Environmental Sciences (JBES) ISSN: 2220-6663 (Print) 2222-3045 (Online)
Vol. 12, No. 2, p. 98-108, 2018
http://www.innspub.net
J. Bio. & Env. Sci. 2018
99 | Janiola and Puno
Introduction
The availability of different satellite imagery data
boosted the application of remote sensing
technology. One of the most common and freely
available satellite image data for remote sensing is
Landsat imagery. The widely used application on
remote sensing using Landsat imagery is on
monitoring different environmental changes. The
basic premise in using remote sensing data for
change detection is that the process can identify a
change between two or more dates that is
uncharacteristic of normal variation (Shalaby and
Gad, 2010; Hegazy and Kaloop, 2015). Further,
change detection is the process of identifying
differences in the state of an object or phenomenon
by observing it at different times, most satellite
images often exhibit a strong contrast between a
two or more time scene images (Song et al., 2014;
Hegazy and Kaloop, 2015). Landsat provides one of
the longest and most consistent satellite records of
the land surface with a spatial resolution suitable
for monitoring many types of anthropogenic land
cover change (Townshend and Justice, 1988).
In recent times the availability of Landsat satellites
since 1972 has made available a lot more
information such as large volumes of multi-
temporal data which can be used for land cover
change investigation (Shodimu, 2016). Remote
sensing has increasingly been recognized and used
effectively as a powerful tool and source of
information for characterizing land use and land
cover change at local, regional, and global scales
(Jing, 201; Doung, 2004; Sader et al., 2001; Pol
and Marvine, 1996). Monitoring the extent of
changes is critical for understanding
environmental and socioeconomic impacts. With
the progressive sprawling of different land use and
land cover changes in the different parts of the
world and especially in the Philippines at a fast
rate. Remote sensing using satellite imagery is
playing an important role in mapping the spatial
distribution and temporal dynamics of such
environmental changes happening everywhere
(Shodimu, 2016; Torbick et al., 2016).
For the past two decades, the international community
became aware of changes happening in the environ-
ment. Allah valley landscape in Southern Mindanao,
Philippines is one of the key examples of watershed
areas around the country having boundless changes in
land cover. Allah valley is more or less 261,000 ha of
valley landscape located specifically in the Province of
South Cotabato and Sultan Kudarat in Mindanao and
considered as watershed forest reserve under
Proclamation No. 2455 by President Ferdinand Marcos
(Proclamation No.2455). Despite the procla-mation for
forest reserve in the mountain range of the watershed
area, the area did not have complete protection against
environmental changes. Weak enforcement of the policy
and forestry laws lead to massive deforestation in the area
that resulted to land cover changes. Most of these changes
were the conversion of forest to grassland that later on
leads to the proliferation and expansion of agricultural
lands and development settlement areas. Also with the
continued increasing success and demand on the global
market of highly valued industrial plantation products,
added other pressures for land cover change (Pohl,
2012). According to Jing (2014), human activities in
many years have become recognized as a major force
shaping the biosphere. Further, the land transformation
did not abate, but rather accelerated and diversified with
the onset of the industrial revolution, the globalization of
the world economy, and the expansion of the population
and technological capacity.
Therefore, understanding the actions and forces
that drive the land cover change is a crucial
importance for understanding such changes. A
major objective of land use land cover change
detection is to better understand the relationships and
interactions between humans and its environment in
order to manage and use resources in a better way for
sustainable development (Lu et al., 2004). This study
focuses on the 13 year land cover changes of Allah valley
landscape in Southern Mindanao using multi-temporal
Landsat imagery of 1989, 2002 and 2015 in order (i)
assess the trends of land cover change in whole Allah
valley landscape; (ii) identify, quantify and classify the
nature, magnitude and direction of land cover changes
within the period of the study.
J. Bio. & Env. Sci. 2018
100 | Janiola and Puno
Materials and method
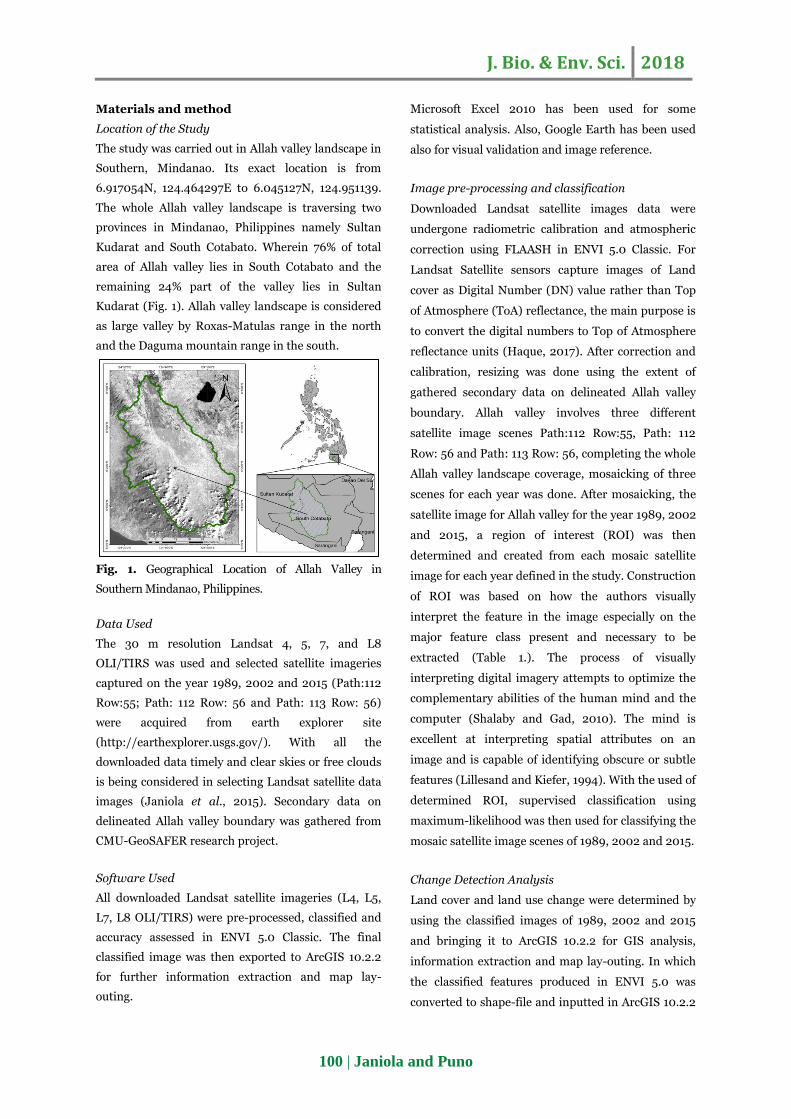
Location of the Study
The study was carried out in Allah valley landscape in
Southern, Mindanao. Its exact location is from
6.917054N, 124.464297E to 6.045127N, 124.951139.
The whole Allah valley landscape is traversing two
provinces in Mindanao, Philippines namely Sultan
Kudarat and South Cotabato. Wherein 76% of total
area of Allah valley lies in South Cotabato and the
remaining 24% part of the valley lies in Sultan
Kudarat (Fig. 1). Allah valley landscape is considered
as large valley by Roxas-Matulas range in the north
and the Daguma mountain range in the south.
Fig. 1. Geographical Location of Allah Valley in
Southern Mindanao, Philippines.
Data Used
The 30 m resolution Landsat 4, 5, 7, and L8
OLI/TIRS was used and selected satellite imageries
captured on the year 1989, 2002 and 2015 (Path:112
Row:55; Path: 112 Row: 56 and Path: 113 Row: 56)
were acquired from earth explorer site
(http://earthexplorer.usgs.gov/). With all the
downloaded data timely and clear skies or free clouds
is being considered in selecting Landsat satellite data
images (Janiola et al., 2015). Secondary data on
delineated Allah valley boundary was gathered from
CMU-GeoSAFER research project.
Software Used
All downloaded Landsat satellite imageries (L4, L5,
L7, L8 OLI/TIRS) were pre-processed, classified and
accuracy assessed in ENVI 5.0 Classic. The final
classified image was then exported to ArcGIS 10.2.2
for further information extraction and map lay-
outing.
Microsoft Excel 2010 has been used for some
statistical analysis. Also, Google Earth has been used
also for visual validation and image reference.
Image pre-processing and classification
Downloaded Landsat satellite images data were
undergone radiometric calibration and atmospheric
correction using FLAASH in ENVI 5.0 Classic. For
Landsat Satellite sensors capture images of Land
cover as Digital Number (DN) value rather than Top
of Atmosphere (ToA) reflectance, the main purpose is
to convert the digital numbers to Top of Atmosphere
reflectance units (Haque, 2017). After correction and
calibration, resizing was done using the extent of
gathered secondary data on delineated Allah valley
boundary. Allah valley involves three different
satellite image scenes Path:112 Row:55, Path: 112
Row: 56 and Path: 113 Row: 56, completing the whole
Allah valley landscape coverage, mosaicking of three
scenes for each year was done. After mosaicking, the
satellite image for Allah valley for the year 1989, 2002
and 2015, a region of interest (ROI) was then
determined and created from each mosaic satellite
image for each year defined in the study. Construction
of ROI was based on how the authors visually
interpret the feature in the image especially on the
major feature class present and necessary to be
extracted (Table 1.). The process of visually
interpreting digital imagery attempts to optimize the
complementary abilities of the human mind and the
computer (Shalaby and Gad, 2010). The mind is
excellent at interpreting spatial attributes on an
image and is capable of identifying obscure or subtle
features (Lillesand and Kiefer, 1994). With the used of
determined ROI, supervised classification using
maximum-likelihood was then used for classifying the
mosaic satellite image scenes of 1989, 2002 and 2015.
Change Detection Analysis
Land cover and land use change were determined by
using the classified images of 1989, 2002 and 2015
and bringing it to ArcGIS 10.2.2 for GIS analysis,
information extraction and map lay-outing. In which
the classified features produced in ENVI 5.0 was
converted to shape-file and inputted in ArcGIS 10.2.2
J. Bio. & Env. Sci. 2018
101 | Janiola and Puno
in which the method of analysis was to determine the
extent of alteration from a particular land cover in
1989 and to other land cover category of 2002 and
respectively for 2002 and 2015 LULC change.
Statistical Analysis
Accuracy assessment using confusion matrix in ENVI
5.0 software was done in the classified image of Allah
valley in order to determine the accuracy of
classification done. And graphically showing the
extracted information on detected change of LULC on
Allah Watershed, Microsoft Excel 2010 was used in
graphing the extracted LULC changes from the year
1989 to 2002 and 2002 to 2015.
Results and discussion
Allah Watershed Land Cover Change Detection and
Mapping
Supervise maximum-likelihood classification used in
this study is the most common method in remote
sensing on satellite data image analysis. The maximum-
likelihood algorithm is a method based on the
probability that a pixel belongs to a particular class
(Rawat and Kumar, 2015). In order to effectively
understand the 13 years changes of Allah valley from
1989 to 2002 and 2002 to 2015, using the aid of satellite
imagery from Landsat and the use of remote sensing
technology and with the assistance of GIS, the land cover
change was monitored and mapped in Allah valley
landscape. The map produce can be a baseline map that
can be used by local government and stakeholders on
the overall management of Allah valley landscape in
Southern Mindanao, Philippines. The produce land
cover trend map could be benchmark information on the
historical event on land cover change happen in the
whole valley landscape area.
Mapping change detection using satellite remote like
Landsat proves to be an effective way of understanding
spatial and temporal activities happen in the past.
Comparing images taken at two different time periods
for change detection is classical but provide a useful
way of determining land cover/use change (Lillesand
and Kiefer, 2008; Chemura, 2012). The maps produced
in this study shows the trend of land cover change of
1989, 2002 and 2015. Based on the map produce
visually there was a decreased trend in the forest of
Allah watershed and increase in grassland, built-up
areas, and perennial plantation.
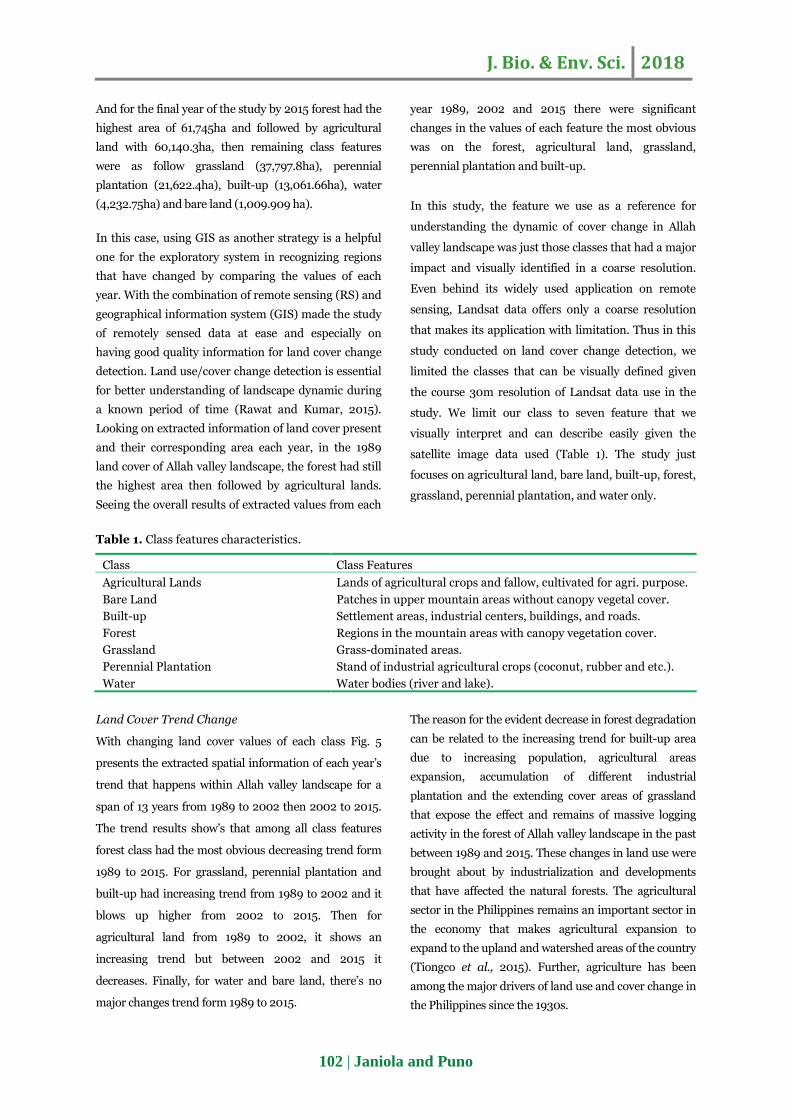
Classification Accuracy Assessment
Running the confusion matrix analysis on each
classified image on ENVI it showed that for the year
1989 it had confusion matrix of 81.8338%. For the
year 2002 and 2015, it had confusion matrix analysis
of 78.0740% and 83.5970% respectively. Among all
accuracy assessment results showed that year 2002
had the lowest accuracy analysis and year 2015 had
the highest overall accuracy assessment. Base in our
classification and as we observe among the class types
built-up areas had the most misclassified features.
Objects such as buildings and roads were difficult to
identify in low and medium spatial resolution
(Bouzekri et al., 2015). With the misclassification of
built-up, it drags the overall accuracy to decrease,
that’s why we had just an average accuracy for our
classification and low accuracy for the classified
image of the year 2002.
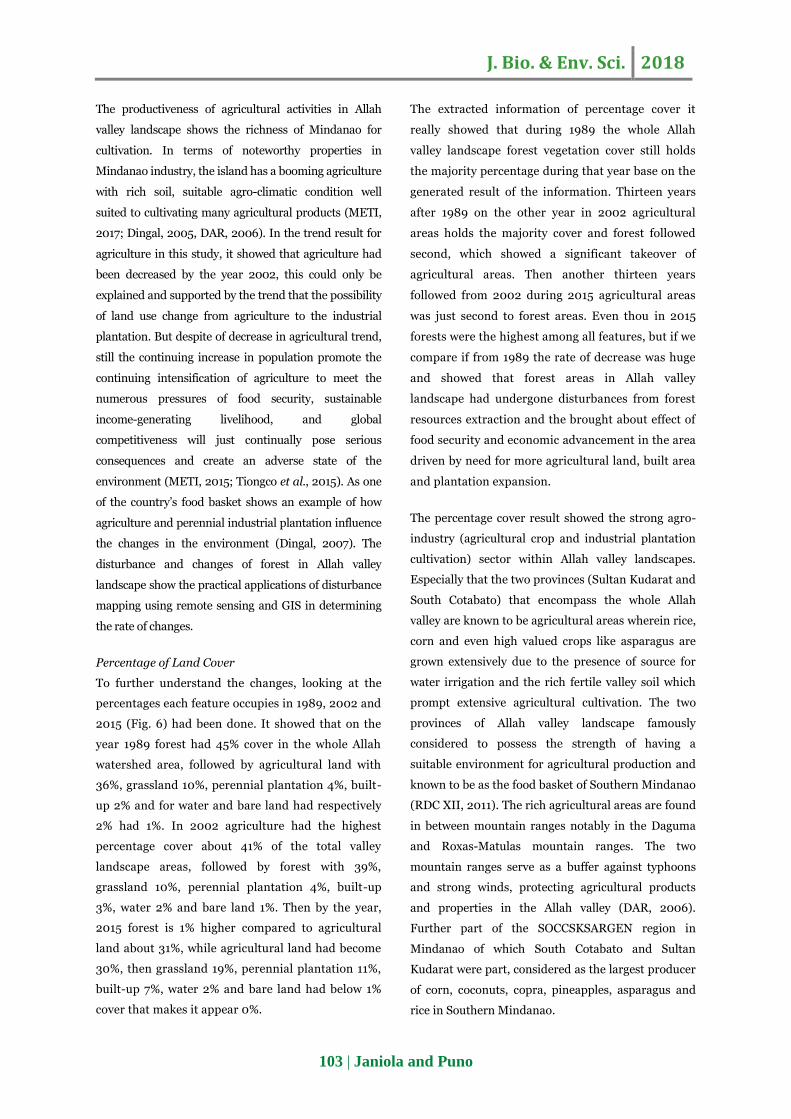
Quantifying Land Cover Present
By quantifying the land cover present in each year (1989,
2002 and 2015) the classified feature were converted
from raster to shapefile and brought to ArcMap 10.2.2
for spatial analysis through GIS techniques by extracting
the area for each classified feature and computing the
area in a hectare. Fig. 4 shows the extracted features
from each year together with their corresponding area
present on a specific year (1989, 2002, 2015). For the
year 1989 of Allah valley landscapes forest had still the
highest area of about 90,594.1 ha then followed by
agriculture with 71,129.1 ha and the remaining class
features were grassland (19,633.4ha), perennial
plantation (7,523.25ha), built-up (5,064.9 ha), water
(4,241.8 ha) and lastly bare land (1,423.2ha). Then after
thirteen years by year 2002 agricultural lands dominates
the area of Allah valley landscapes of about 81,751.1ha
then followed by forest of 77,704.1ha while other feature
still in the same order with grassland (20,584ha),
perennial plantation (7,169.32ha), built-up (7,017.18ha),
water (4,222.88ha) and lastly bare land (1,161.14ha).
J. Bio. & Env. Sci. 2018
102 | Janiola and Puno
And for the final year of the study by 2015 forest had the
highest area of 61,745ha and followed by agricultural
land with 60,140.3ha, then remaining class features
were as follow grassland (37,797.8ha), perennial
plantation (21,622.4ha), built-up (13,061.66ha), water
(4,232.75ha) and bare land (1,009.909 ha).
In this case, using GIS as another strategy is a helpful
one for the exploratory system in recognizing regions
that have changed by comparing the values of each
year. With the combination of remote sensing (RS) and
geographical information system (GIS) made the study
of remotely sensed data at ease and especially on
having good quality information for land cover change
detection. Land use/cover change detection is essential
for better understanding of landscape dynamic during
a known period of time (Rawat and Kumar, 2015).
Looking on extracted information of land cover present
and their corresponding area each year, in the 1989
land cover of Allah valley landscape, the forest had still
the highest area then followed by agricultural lands.
Seeing the overall results of extracted values from each
year 1989, 2002 and 2015 there were significant
changes in the values of each feature the most obvious
was on the forest, agricultural land, grassland,
perennial plantation and built-up.
In this study, the feature we use as a reference for
understanding the dynamic of cover change in Allah
valley landscape was just those classes that had a major
impact and visually identified in a coarse resolution.
Even behind its widely used application on remote
sensing, Landsat data offers only a coarse resolution
that makes its application with limitation. Thus in this
study conducted on land cover change detection, we
limited the classes that can be visually defined given
the course 30m resolution of Landsat data use in the
study. We limit our class to seven feature that we
visually interpret and can describe easily given the
satellite image data used (Table 1). The study just
focuses on agricultural land, bare land, built-up, forest,
grassland, perennial plantation, and water only.
Table 1. Class features characteristics.
Class Class Features
Agricultural Lands Lands of agricultural crops and fallow, cultivated for agri. purpose.
Bare Land Patches in upper mountain areas without canopy vegetal cover.
Built-up Settlement areas, industrial centers, buildings, and roads.
Forest Regions in the mountain areas with canopy vegetation cover.
Grassland Grass-dominated areas.
Perennial Plantation Stand of industrial agricultural crops (coconut, rubber and etc.).
Water Water bodies (river and lake).
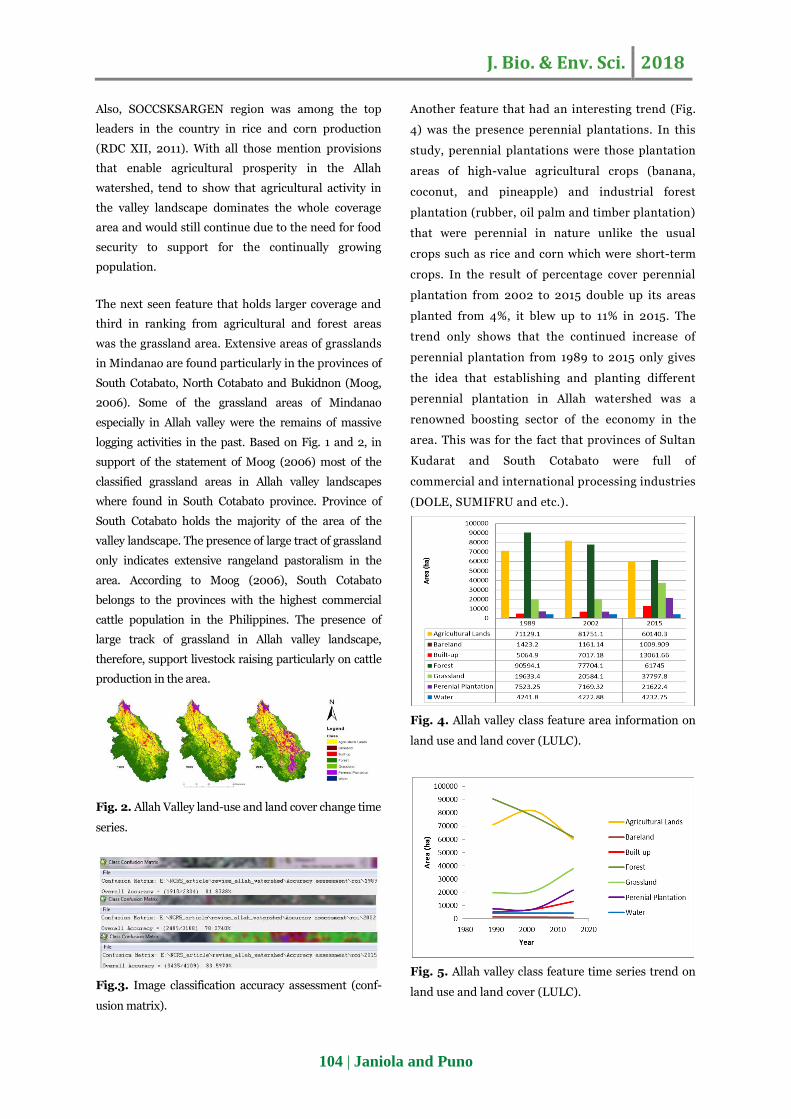
Land Cover Trend Change
With changing land cover values of each class Fig. 5
presents the extracted spatial information of each year’s
trend that happens within Allah valley landscape for a
span of 13 years from 1989 to 2002 then 2002 to 2015.
The trend results show’s that among all class features
forest class had the most obvious decreasing trend form
1989 to 2015. For grassland, perennial plantation and
built-up had increasing trend from 1989 to 2002 and it
blows up higher from 2002 to 2015. Then for
agricultural land from 1989 to 2002, it shows an
increasing trend but between 2002 and 2015 it
decreases. Finally, for water and bare land, there’s no
major changes trend form 1989 to 2015.
The reason for the evident decrease in forest degradation
can be related to the increasing trend for built-up area
due to increasing population, agricultural areas
expansion, accumulation of different industrial
plantation and the extending cover areas of grassland
that expose the effect and remains of massive logging
activity in the forest of Allah valley landscape in the past
between 1989 and 2015. These changes in land use were
brought about by industrialization and developments
that have affected the natural forests. The agricultural
sector in the Philippines remains an important sector in
the economy that makes agricultural expansion to
expand to the upland and watershed areas of the country
(Tiongco et al., 2015). Further, agriculture has been
among the major drivers of land use and cover change in
the Philippines since the 1930s.
J. Bio. & Env. Sci. 2018
103 | Janiola and Puno
The productiveness of agricultural activities in Allah
valley landscape shows the richness of Mindanao for
cultivation. In terms of noteworthy properties in
Mindanao industry, the island has a booming agriculture
with rich soil, suitable agro-climatic condition well
suited to cultivating many agricultural products (METI,
2017; Dingal, 2005, DAR, 2006). In the trend result for
agriculture in this study, it showed that agriculture had
been decreased by the year 2002, this could only be
explained and supported by the trend that the possibility
of land use change from agriculture to the industrial
plantation. But despite of decrease in agricultural trend,
still the continuing increase in population promote the
continuing intensification of agriculture to meet the
numerous pressures of food security, sustainable
income-generating livelihood, and global
competitiveness will just continually pose serious
consequences and create an adverse state of the
environment (METI, 2015; Tiongco et al., 2015). As one
of the country’s food basket shows an example of how
agriculture and perennial industrial plantation influence
the changes in the environment (Dingal, 2007). The
disturbance and changes of forest in Allah valley
landscape show the practical applications of disturbance
mapping using remote sensing and GIS in determining
the rate of changes.
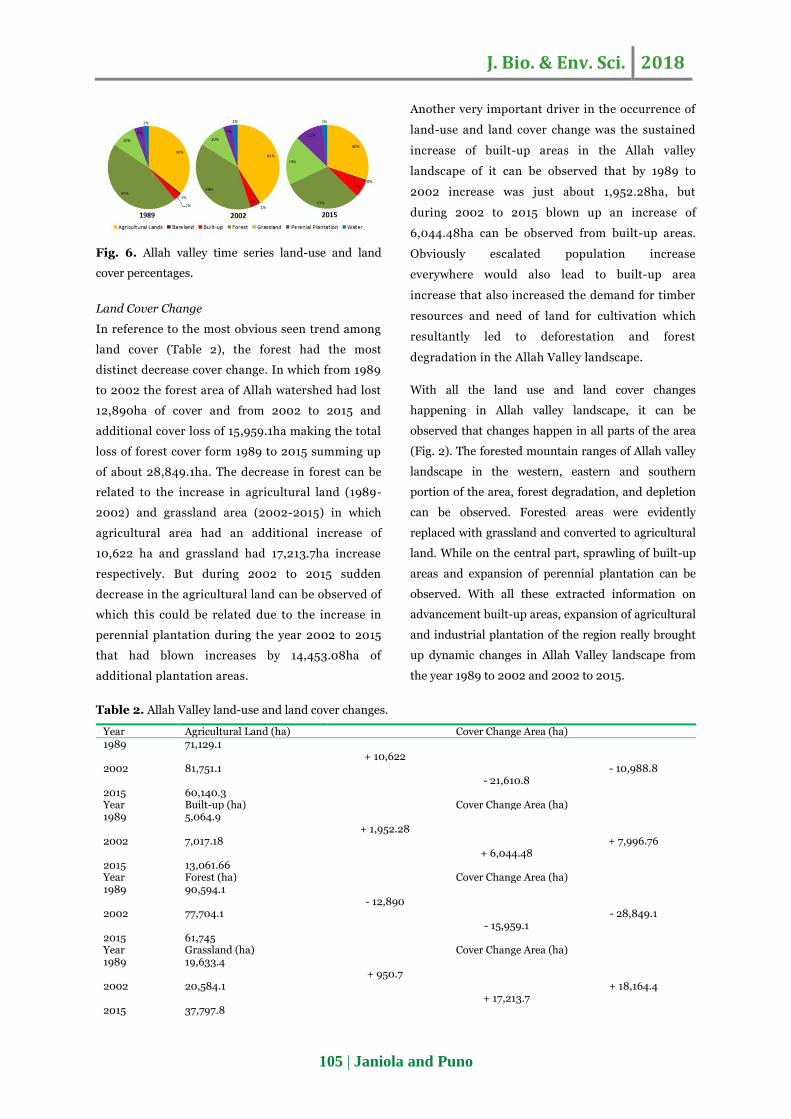
Percentage of Land Cover
To further understand the changes, looking at the
percentages each feature occupies in 1989, 2002 and
2015 (Fig. 6) had been done. It showed that on the
year 1989 forest had 45% cover in the whole Allah
watershed area, followed by agricultural land with
36%, grassland 10%, perennial plantation 4%, built-
up 2% and for water and bare land had respectively
2% had 1%. In 2002 agriculture had the highest
percentage cover about 41% of the total valley
landscape areas, followed by forest with 39%,
grassland 10%, perennial plantation 4%, built-up
3%, water 2% and bare land 1%. Then by the year,
2015 forest is 1% higher compared to agricultural
land about 31%, while agricultural land had become
30%, then grassland 19%, perennial plantation 11%,
built-up 7%, water 2% and bare land had below 1%
cover that makes it appear 0%.
The extracted information of percentage cover it
really showed that during 1989 the whole Allah
valley landscape forest vegetation cover still holds
the majority percentage during that year base on the
generated result of the information. Thirteen years
after 1989 on the other year in 2002 agricultural
areas holds the majority cover and forest followed
second, which showed a significant takeover of
agricultural areas. Then another thirteen years
followed from 2002 during 2015 agricultural areas
was just second to forest areas. Even thou in 2015
forests were the highest among all features, but if we
compare if from 1989 the rate of decrease was huge
and showed that forest areas in Allah valley
landscape had undergone disturbances from forest
resources extraction and the brought about effect of
food security and economic advancement in the area
driven by need for more agricultural land, built area
and plantation expansion.
The percentage cover result showed the strong agro-
industry (agricultural crop and industrial plantation
cultivation) sector within Allah valley landscapes.
Especially that the two provinces (Sultan Kudarat and
South Cotabato) that encompass the whole Allah
valley are known to be agricultural areas wherein rice,
corn and even high valued crops like asparagus are
grown extensively due to the presence of source for
water irrigation and the rich fertile valley soil which
prompt extensive agricultural cultivation. The two
provinces of Allah valley landscape famously
considered to possess the strength of having a
suitable environment for agricultural production and
known to be as the food basket of Southern Mindanao
(RDC XII, 2011). The rich agricultural areas are found
in between mountain ranges notably in the Daguma
and Roxas-Matulas mountain ranges. The two
mountain ranges serve as a buffer against typhoons
and strong winds, protecting agricultural products
and properties in the Allah valley (DAR, 2006).
Further part of the SOCCSKSARGEN region in
Mindanao of which South Cotabato and Sultan
Kudarat were part, considered as the largest producer
of corn, coconuts, copra, pineapples, asparagus and
rice in Southern Mindanao.
J. Bio. & Env. Sci. 2018
104 | Janiola and Puno
Also, SOCCSKSARGEN region was among the top
leaders in the country in rice and corn production
(RDC XII, 2011). With all those mention provisions
that enable agricultural prosperity in the Allah
watershed, tend to show that agricultural activity in
the valley landscape dominates the whole coverage
area and would still continue due to the need for food
security to support for the continually growing
population.
The next seen feature that holds larger coverage and
third in ranking from agricultural and forest areas
was the grassland area. Extensive areas of grasslands
in Mindanao are found particularly in the provinces of
South Cotabato, North Cotabato and Bukidnon (Moog,
2006). Some of the grassland areas of Mindanao
especially in Allah valley were the remains of massive
logging activities in the past. Based on Fig. 1 and 2, in
support of the statement of Moog (2006) most of the
classified grassland areas in Allah valley landscapes
where found in South Cotabato province. Province of
South Cotabato holds the majority of the area of the
valley landscape. The presence of large tract of grassland
only indicates extensive rangeland pastoralism in the
area. According to Moog (2006), South Cotabato
belongs to the provinces with the highest commercial
cattle population in the Philippines. The presence of
large track of grassland in Allah valley landscape,
therefore, support livestock raising particularly on cattle
production in the area.
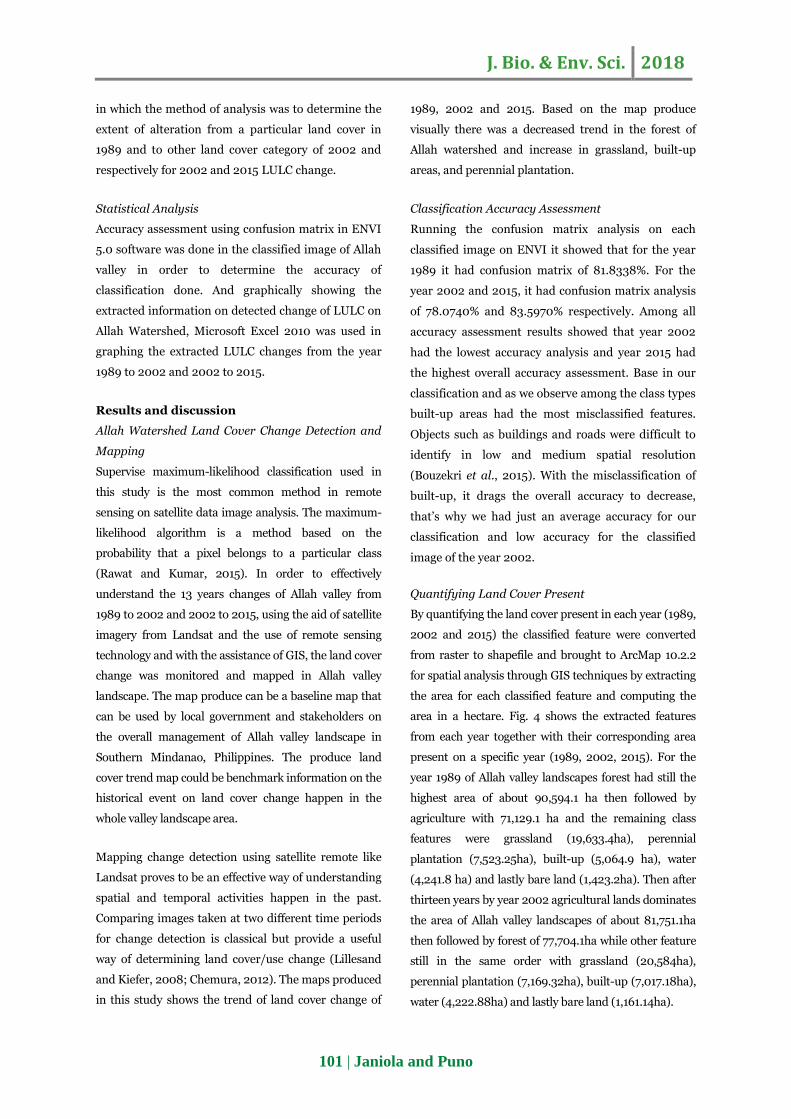
Fig. 2. Allah Valley land-use and land cover change time
series.
Fig.3. Image classification accuracy assessment (conf-
usion matrix).
Another feature that had an interesting trend (Fig.
4) was the presence perennial plantations. In this
study, perennial plantations were those plantation
areas of high-value agricultural crops (banana,
coconut, and pineapple) and industrial forest
plantation (rubber, oil palm and timber plantation)
that were perennial in nature unlike the usual
crops such as rice and corn which were short-term
crops. In the result of percentage cover perennial
plantation from 2002 to 2015 double up its areas
planted from 4%, it blew up to 11% in 2015. The
trend only shows that the continued increase of
perennial plantation from 1989 to 2015 only gives
the idea that establishing and planting different
perennial plantation in Allah watershed was a
renowned boosting sector of the economy in the
area. This was for the fact that provinces of Sultan
Kudarat and South Cotabato were full of
commercial and international processing industries
(DOLE, SUMIFRU and etc.).
Fig. 4. Allah valley class feature area information on
land use and land cover (LULC).
Fig. 5. Allah valley class feature time series trend on
land use and land cover (LULC).
J. Bio. & Env. Sci. 2018
105 | Janiola and Puno
Fig. 6. Allah valley time series land-use and land
cover percentages.
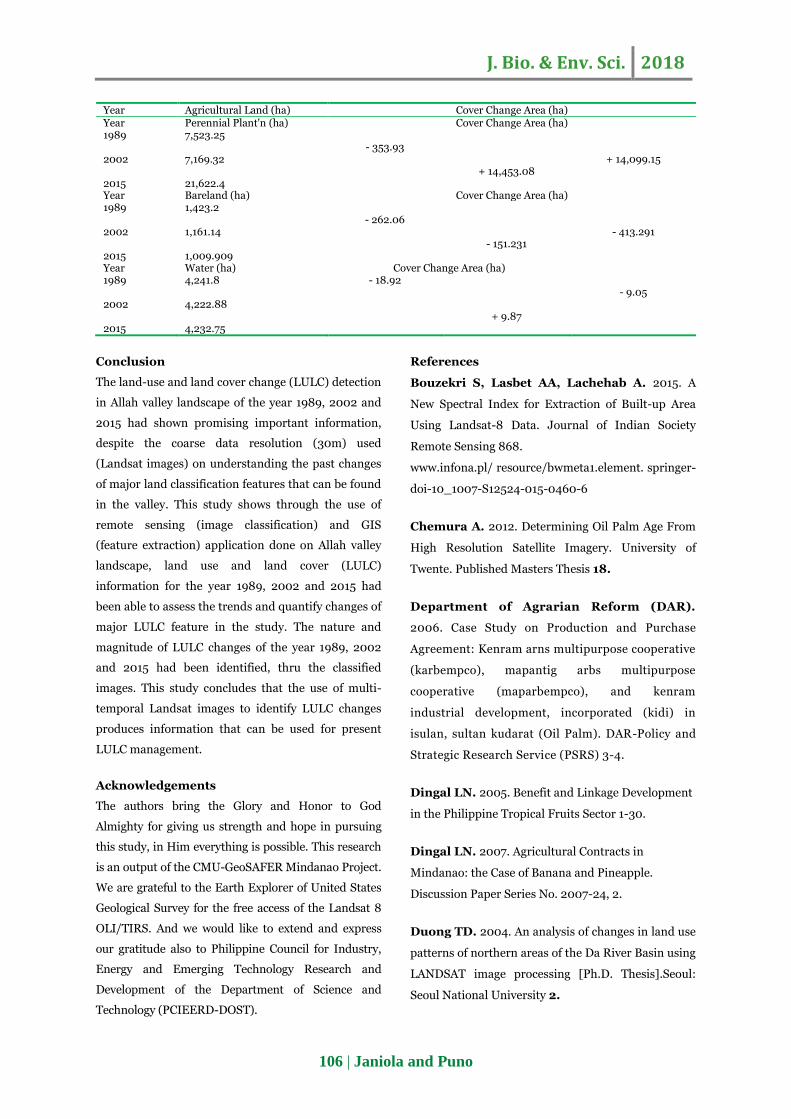
Land Cover Change
In reference to the most obvious seen trend among
land cover (Table 2), the forest had the most
distinct decrease cover change. In which from 1989
to 2002 the forest area of Allah watershed had lost
12,890ha of cover and from 2002 to 2015 and
additional cover loss of 15,959.1ha making the total
loss of forest cover form 1989 to 2015 summing up
of about 28,849.1ha. The decrease in forest can be
related to the increase in agricultural land (1989-
2002) and grassland area (2002-2015) in which
agricultural area had an additional increase of
10,622 ha and grassland had 17,213.7ha increase
respectively. But during 2002 to 2015 sudden
decrease in the agricultural land can be observed of
which this could be related due to the increase in
perennial plantation during the year 2002 to 2015
that had blown increases by 14,453.08ha of
additional plantation areas.
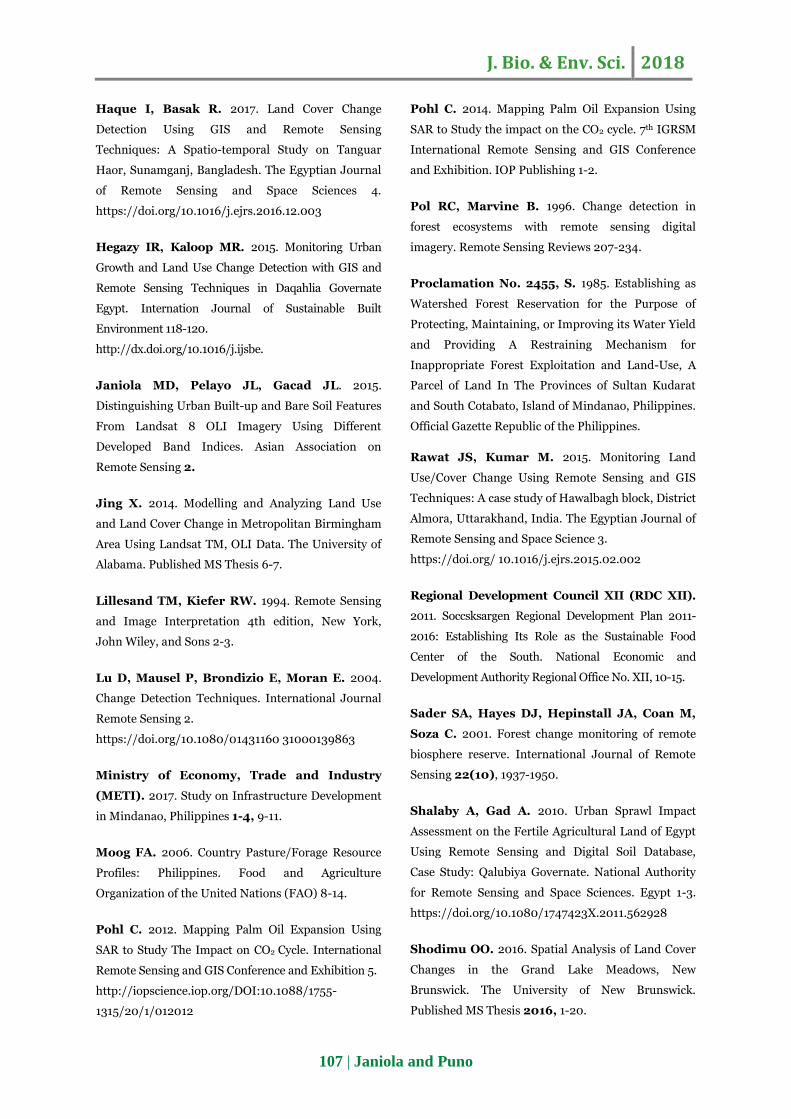
Another very important driver in the occurrence of
land-use and land cover change was the sustained
increase of built-up areas in the Allah valley
landscape of it can be observed that by 1989 to
2002 increase was just about 1,952.28ha, but
during 2002 to 2015 blown up an increase of
6,044.48ha can be observed from built-up areas.
Obviously escalated population increase
everywhere would also lead to built-up area
increase that also increased the demand for timber
resources and need of land for cultivation which
resultantly led to deforestation and forest
degradation in the Allah Valley landscape.
With all the land use and land cover changes
happening in Allah valley landscape, it can be
observed that changes happen in all parts of the area
(Fig. 2). The forested mountain ranges of Allah valley
landscape in the western, eastern and southern
portion of the area, forest degradation, and depletion
can be observed. Forested areas were evidently
replaced with grassland and converted to agricultural
land. While on the central part, sprawling of built-up
areas and expansion of perennial plantation can be
observed. With all these extracted information on
advancement built-up areas, expansion of agricultural
and industrial plantation of the region really brought
up dynamic changes in Allah Valley landscape from
the year 1989 to 2002 and 2002 to 2015.
Table 2. Allah Valley land-use and land cover changes.
Year Agricultural Land (ha) Cover Change Area (ha) 1989 71,129.1 + 10,622 2002 81,751.1 - 10,988.8 - 21,610.8 2015 60,140.3 Year Built-up (ha) Cover Change Area (ha) 1989 5,064.9 + 1,952.28 2002 7,017.18 + 7,996.76 + 6,044.48 2015 13,061.66 Year Forest (ha) Cover Change Area (ha) 1989 90,594.1 - 12,890 2002 77,704.1 - 28,849.1 - 15,959.1 2015 61,745 Year Grassland (ha) Cover Change Area (ha) 1989 19,633.4 + 950.7 2002 20,584.1 + 18,164.4 + 17,213.7 2015 37,797.8
J. Bio. & Env. Sci. 2018
106 | Janiola and Puno
Year Agricultural Land (ha) Cover Change Area (ha) Year Perennial Plant'n (ha) Cover Change Area (ha) 1989 7,523.25 - 353.93 2002 7,169.32 + 14,099.15 + 14,453.08 2015 21,622.4 Year Bareland (ha) Cover Change Area (ha) 1989 1,423.2 - 262.06 2002 1,161.14 - 413.291 - 151.231 2015 1,009.909 Year Water (ha) Cover Change Area (ha) 1989 4,241.8 - 18.92 - 9.05 2002 4,222.88 + 9.87 2015 4,232.75
Conclusion
The land-use and land cover change (LULC) detection
in Allah valley landscape of the year 1989, 2002 and
2015 had shown promising important information,
despite the coarse data resolution (30m) used
(Landsat images) on understanding the past changes
of major land classification features that can be found
in the valley. This study shows through the use of
remote sensing (image classification) and GIS
(feature extraction) application done on Allah valley
landscape, land use and land cover (LULC)
information for the year 1989, 2002 and 2015 had
been able to assess the trends and quantify changes of
major LULC feature in the study. The nature and
magnitude of LULC changes of the year 1989, 2002
and 2015 had been identified, thru the classified
images. This study concludes that the use of multi-
temporal Landsat images to identify LULC changes
produces information that can be used for present
LULC management.
Acknowledgements
The authors bring the Glory and Honor to God
Almighty for giving us strength and hope in pursuing
this study, in Him everything is possible. This research
is an output of the CMU-GeoSAFER Mindanao Project.
We are grateful to the Earth Explorer of United States
Geological Survey for the free access of the Landsat 8
OLI/TIRS. And we would like to extend and express
our gratitude also to Philippine Council for Industry,
Energy and Emerging Technology Research and
Development of the Department of Science and
Technology (PCIEERD-DOST).
References
Bouzekri S, Lasbet AA, Lachehab A. 2015. A
New Spectral Index for Extraction of Built-up Area
Using Landsat-8 Data. Journal of Indian Society
Remote Sensing 868.
www.infona.pl/ resource/bwmeta1.element. springer-
doi-10_1007-S12524-015-0460-6
Chemura A. 2012. Determining Oil Palm Age From
High Resolution Satellite Imagery. University of
Twente. Published Masters Thesis 18.
Department of Agrarian Reform (DAR).
2006. Case Study on Production and Purchase
Agreement: Kenram arns multipurpose cooperative
(karbempco), mapantig arbs multipurpose
cooperative (maparbempco), and kenram
industrial development, incorporated (kidi) in
isulan, sultan kudarat (Oil Palm). DAR-Policy and
Strategic Research Service (PSRS) 3-4.
Dingal LN. 2005. Benefit and Linkage Development
in the Philippine Tropical Fruits Sector 1-30.
Dingal LN. 2007. Agricultural Contracts in
Mindanao: the Case of Banana and Pineapple.
Discussion Paper Series No. 2007-24, 2.
Duong TD. 2004. An analysis of changes in land use
patterns of northern areas of the Da River Basin using
LANDSAT image processing [Ph.D. Thesis].Seoul:
Seoul National University 2.
J. Bio. & Env. Sci. 2018
107 | Janiola and Puno
Haque I, Basak R. 2017. Land Cover Change
Detection Using GIS and Remote Sensing
Techniques: A Spatio-temporal Study on Tanguar
Haor, Sunamganj, Bangladesh. The Egyptian Journal
of Remote Sensing and Space Sciences 4.
https://doi.org/10.1016/j.ejrs.2016.12.003
Hegazy IR, Kaloop MR. 2015. Monitoring Urban
Growth and Land Use Change Detection with GIS and
Remote Sensing Techniques in Daqahlia Governate
Egypt. Internation Journal of Sustainable Built
Environment 118-120.
http://dx.doi.org/10.1016/j.ijsbe.
Janiola MD, Pelayo JL, Gacad JL. 2015.
Distinguishing Urban Built-up and Bare Soil Features
From Landsat 8 OLI Imagery Using Different
Developed Band Indices. Asian Association on
Remote Sensing 2.
Jing X. 2014. Modelling and Analyzing Land Use
and Land Cover Change in Metropolitan Birmingham
Area Using Landsat TM, OLI Data. The University of
Alabama. Published MS Thesis 6-7.
Lillesand TM, Kiefer RW. 1994. Remote Sensing
and Image Interpretation 4th edition, New York,
John Wiley, and Sons 2-3.
Lu D, Mausel P, Brondizio E, Moran E. 2004.
Change Detection Techniques. International Journal
Remote Sensing 2.
https://doi.org/10.1080/01431160 31000139863
Ministry of Economy, Trade and Industry
(METI). 2017. Study on Infrastructure Development
in Mindanao, Philippines 1-4, 9-11.
Moog FA. 2006. Country Pasture/Forage Resource
Profiles: Philippines. Food and Agriculture
Organization of the United Nations (FAO) 8-14.
Pohl C. 2012. Mapping Palm Oil Expansion Using
SAR to Study The Impact on CO2 Cycle. International
Remote Sensing and GIS Conference and Exhibition 5.
http://iopscience.iop.org/DOI:10.1088/1755-
1315/20/1/012012
Pohl C. 2014. Mapping Palm Oil Expansion Using
SAR to Study the impact on the CO2 cycle. 7th IGRSM
International Remote Sensing and GIS Conference
and Exhibition. IOP Publishing 1-2.
Pol RC, Marvine B. 1996. Change detection in
forest ecosystems with remote sensing digital
imagery. Remote Sensing Reviews 207-234.
Proclamation No. 2455, S. 1985. Establishing as
Watershed Forest Reservation for the Purpose of
Protecting, Maintaining, or Improving its Water Yield
and Providing A Restraining Mechanism for
Inappropriate Forest Exploitation and Land-Use, A
Parcel of Land In The Provinces of Sultan Kudarat
and South Cotabato, Island of Mindanao, Philippines.
Official Gazette Republic of the Philippines.
Rawat JS, Kumar M. 2015. Monitoring Land
Use/Cover Change Using Remote Sensing and GIS
Techniques: A case study of Hawalbagh block, District
Almora, Uttarakhand, India. The Egyptian Journal of
Remote Sensing and Space Science 3.
https://doi.org/ 10.1016/j.ejrs.2015.02.002
Regional Development Council XII (RDC XII).
2011. Soccsksargen Regional Development Plan 2011-
2016: Establishing Its Role as the Sustainable Food
Center of the South. National Economic and
Development Authority Regional Office No. XII, 10-15.
Sader SA, Hayes DJ, Hepinstall JA, Coan M,
Soza C. 2001. Forest change monitoring of remote
biosphere reserve. International Journal of Remote
Sensing 22(10), 1937-1950.
Shalaby A, Gad A. 2010. Urban Sprawl Impact
Assessment on the Fertile Agricultural Land of Egypt
Using Remote Sensing and Digital Soil Database,
Case Study: Qalubiya Governate. National Authority
for Remote Sensing and Space Sciences. Egypt 1-3.
https://doi.org/10.1080/1747423X.2011.562928
Shodimu OO. 2016. Spatial Analysis of Land Cover
Changes in the Grand Lake Meadows, New
Brunswick. The University of New Brunswick.
Published MS Thesis 2016, 1-20.
J. Bio. & Env. Sci. 2018
108 | Janiola and Puno
Song XP, Huang C, Sexton JO, Channan S,
Townshend JR. 2014. Annual Detection of Forest
Cover Loss Using Time Series Satellite Measurement
of Percent Tree Cover. Remote Sensing 5.
https://doi.org/10.3390/rs6098878
Tiongco MM, Espaldon MVO, Guzman LEde,
Ancog RC, Quiray AE, Jaffee S, Frias J. 2015.
Green Agriculture in the Philippines: An Old Wine in
a New Bottle 6-11.
Torbick N, Ledoux L, Salas W, Zhao M. 2016.
Regional Mapping of Plantation Extent Using
Multisensor Imagery. Journal of Remote Sensing 1-2.
https://doi.org/10.3390/rs8030236
Townshend JR, Justice CO. 1988. Selecting the
Spatial Resolution of satellite Sensors Required for
Global Monitoring of Land Transformations.
International Journal of Remote Sensing 187-236.