A Box-Behnken Design and Response Surface Approach for the Simultaneous Determination of Chromium...
14
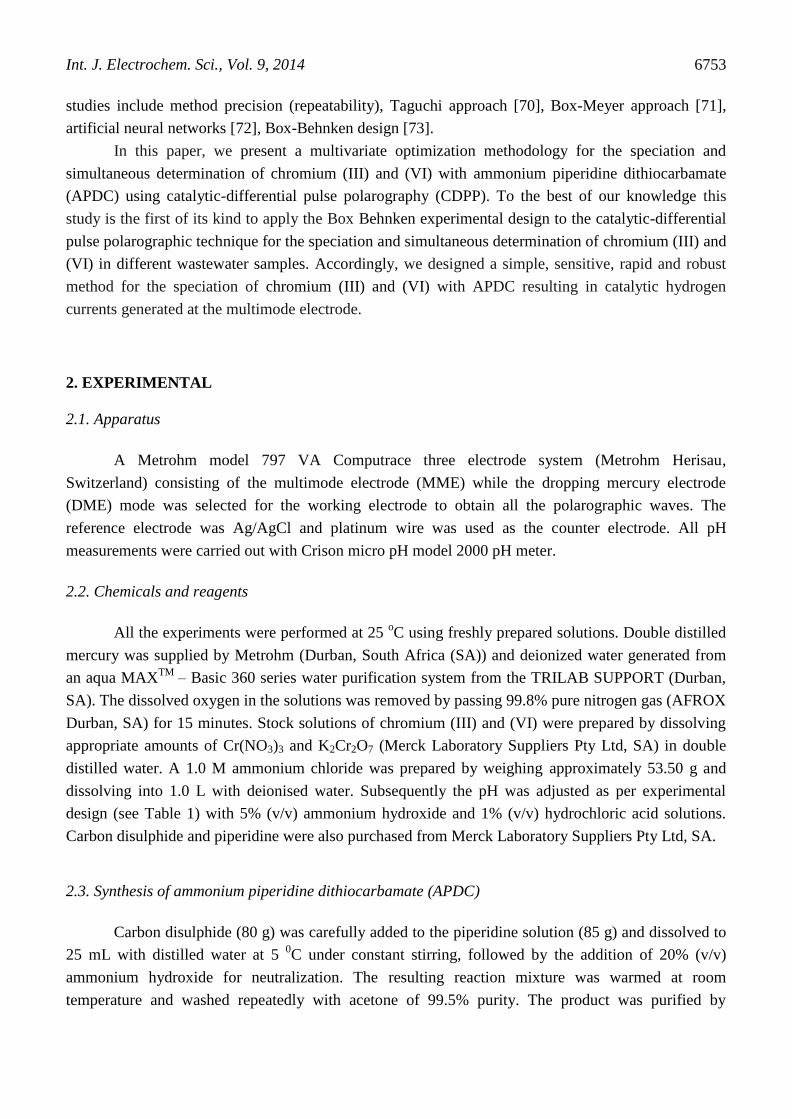
Int. J. Electrochem. Sci., 9 (2014) 6751 - 6764 International Journal of ELECTROCHEMICAL SCIENCE www.electrochemsci.org A Box-Behnken Design and Response Surface Approach for the Simultaneous Determination of Chromium (III) and (VI) Using Catalytic Differential Pulse Polarography Myalowenkosi I. Sabela, Suvardhan Kanchi * , Bathinapatla Ayyappa, Krishna Bisetty * Department of Chemistry, Durban University of Technology, P.O Box 1334, Durban 4000, South Africa * E-mail: [email protected] , [email protected] Received: 5 August 2014 / Accepted: 12 September 2014 / Published: 29 September 2014 The present paper describes an optimized Box-Behnken design using a catalytic-differential pulse polarograhic technique for the simultaneous determination of chromium (III) and (VI) in wastewater samples using ammonium piperidine dithiocarbamate as a complexing agent. The optimization strategy was carried out using a two level full factorial design. The results of the experimental design were based on an analysis of variance and demonstrated that only the pH, concentrations of the buffer and the complexing agent were statistically significant throughout the experiment. The optimal values for the three variables were 8.0, 0.2 mM and 5.0 mM for pH, concentrations of the buffer and the complexing agent respectively. Under optimum experimental conditions the detection limit of the proposed method was found to be 0.0841 µg L -1 while the linear range was 1.0-10.0 and 0.5-25.0 µg L - 1 for chromium (III) and (VI) respectively. The present method was also applied for the simultaneous determination of chromium in the presence of some foreign ions with satisfactory analytical responses. Keywords: Box-Bahnken design, Catalytic-differential pulse polarography, Speciation, Chromium (III) and chromium (VI), Ammonium piperidine dithiocarbamte (APDC), Wastewater samples 1. INTRODUCTION Due to the adverse effects of chromium compounds, speciation plays a significant role in toxicological studies. However, chromium in its trivalent form does not occur freely in nature, yet it is a dietary requirement for a number of organisms. On the other hand the hexavalent chromium is very toxic to flora and fauna, but does not pose a threat to the environment. The discharging of the untreated chromium polluted wastewater into rivers has caused environmental disasters in the past.
Transcript of A Box-Behnken Design and Response Surface Approach for the Simultaneous Determination of Chromium...

Int. J. Electrochem. Sci., 9 (2014) 6751 - 6764
International Journal of
ELECTROCHEMICAL SCIENCE
www.electrochemsci.org
A Box-Behnken Design and Response Surface Approach for the
Simultaneous Determination of Chromium (III) and (VI) Using
Catalytic Differential Pulse Polarography
Myalowenkosi I. Sabela, Suvardhan Kanchi*, Bathinapatla Ayyappa, Krishna Bisetty
*
Department of Chemistry, Durban University of Technology, P.O Box 1334, Durban 4000, South
Africa *E-mail: [email protected], [email protected]
Received: 5 August 2014 / Accepted: 12 September 2014 / Published: 29 September 2014
The present paper describes an optimized Box-Behnken design using a catalytic-differential pulse
polarograhic technique for the simultaneous determination of chromium (III) and (VI) in wastewater
samples using ammonium piperidine dithiocarbamate as a complexing agent. The optimization
strategy was carried out using a two level full factorial design. The results of the experimental design
were based on an analysis of variance and demonstrated that only the pH, concentrations of the buffer
and the complexing agent were statistically significant throughout the experiment. The optimal values
for the three variables were 8.0, 0.2 mM and 5.0 mM for pH, concentrations of the buffer and the
complexing agent respectively. Under optimum experimental conditions the detection limit of the
proposed method was found to be 0.0841 µg L-1
while the linear range was 1.0-10.0 and 0.5-25.0 µg L-
1 for chromium (III) and (VI) respectively. The present method was also applied for the simultaneous
determination of chromium in the presence of some foreign ions with satisfactory analytical
responses.
Keywords: Box-Bahnken design, Catalytic-differential pulse polarography, Speciation, Chromium
(III) and chromium (VI), Ammonium piperidine dithiocarbamte (APDC), Wastewater samples
1. INTRODUCTION
Due to the adverse effects of chromium compounds, speciation plays a significant role in
toxicological studies. However, chromium in its trivalent form does not occur freely in nature, yet it is
a dietary requirement for a number of organisms. On the other hand the hexavalent chromium is very
toxic to flora and fauna, but does not pose a threat to the environment. The discharging of the
untreated chromium polluted wastewater into rivers has caused environmental disasters in the past.
Int. J. Electrochem. Sci., Vol. 9, 2014
6752
Several compounds of chromium are relatively water insoluble, but chromium (III) compounds such as
the oxides and hydroxides are soluble. These compounds are largely bound to the floating particles in
water. The trivalent chromium is mainly discharged by the metal industry while the hexavalent
chromium in industrial wastewater mainly originates from tanning and paint industries. Chromium
compounds are applied as pigments and 90% of the leather is tanned by means of chromium
compounds. Particularly in wastewater samples, chromium (VI) is generally present in relatively small
amounts compared with chromium (III) [1]. Furthermore, the toxicity level of chromium (III) in the
living cells is about 1000 times less than that of chromium (VI) [2]. Spectrophotometric techniques
have been reported since the 19th
century for the speciation and determination of chromium. Generally,
these methods are conducted sequentially where the total chromium content is firstly determined
followed by the compound being determined after extraction, complexation or enrichment. It’s well
understood that direct determination of total chromium concentration cannot always provide the right
answer, hence the speciation analysis is required instead.
Different separation methods include Liquid–liquid extraction [3], Solid phase extraction [4-6],
Co-precipitation [7], Cloud point extraction [8-11], Ion-exchange [12] and Membrane filtration [13]
have been reported in the literature for the speciation and determination of chromium in various
environmental matrices. Additionally other widely used techniques for the speciation of chromium
includes Adsorptive stripping voltammetry [14-20], Differential pulse polarography [21], DC
polarography [22], Capillary electrophoresis [23], High performance liquid chromatography [11,24-
26], Flame atomic absorption spectrometry [7, 8, 27-38], Graphite furnace atomic absorption
spectrometry [39, 40], Electrochemical atomic absorption spectrometry [41-44], Inductively coupled
plasma atomic emission spectrometry [45], Inductively coupled plasma mass spectrometry [46-48],
Spectrophotometry [49-55], Spectrofluorimetry [56, 57], X-ray absorption spectrometry [58] and X-
ray fluorescence spectrometry [59]. Nevertheless, chromium (VI) detection limits are frequently
substandard using chromatographic and spectroscopic methods. In addition, some of these procedures
do not meet the minimum requirements of routine analysis, principally because of their complicated
design and cost. Electrochemical techniques, especially catalytic-differential pulse polarography
appears to be a suitable alternative for the speciation analysis of chromium due to its low cost, low
detection limit and in-situ determination of chromium species with a simple cleaning procedure [60-
62].
A good experiment is achieved more effectively with the help of statistical design to monitor
the traceability, validation and optimization process in all stages of the experiment [63]. Experimental
design plays a pivotal role in the improvement of the analytical data process for method development
and validation [64, 65]. In particular, during method optimization some performance parameters
should also be investigated in order to avoid serious problems during the validation step. These
performance parameters include accuracy, precision and robustness which are evaluated during the
pre-validation stage [66-68]. Moreover, experimental design helps to verify changes in factor values in
relation to the observed response by a well-defined mathematical model. Hence, experimental design is
considered to be a valuable tool for the validation and optimization of variable parameters in the
multivariate experimental design systems [69]. Strategies used for the experimental optimization
Int. J. Electrochem. Sci., Vol. 9, 2014
6753
studies include method precision (repeatability), Taguchi approach [70], Box-Meyer approach [71],
artificial neural networks [72], Box-Behnken design [73].
In this paper, we present a multivariate optimization methodology for the speciation and
simultaneous determination of chromium (III) and (VI) with ammonium piperidine dithiocarbamate
(APDC) using catalytic-differential pulse polarography (CDPP). To the best of our knowledge this
study is the first of its kind to apply the Box Behnken experimental design to the catalytic-differential
pulse polarographic technique for the speciation and simultaneous determination of chromium (III) and
(VI) in different wastewater samples. Accordingly, we designed a simple, sensitive, rapid and robust
method for the speciation of chromium (III) and (VI) with APDC resulting in catalytic hydrogen
currents generated at the multimode electrode.
2. EXPERIMENTAL
2.1. Apparatus
A Metrohm model 797 VA Computrace three electrode system (Metrohm Herisau,
Switzerland) consisting of the multimode electrode (MME) while the dropping mercury electrode
(DME) mode was selected for the working electrode to obtain all the polarographic waves. The
reference electrode was Ag/AgCl and platinum wire was used as the counter electrode. All pH
measurements were carried out with Crison micro pH model 2000 pH meter.
2.2. Chemicals and reagents
All the experiments were performed at 25 oC using freshly prepared solutions. Double distilled
mercury was supplied by Metrohm (Durban, South Africa (SA)) and deionized water generated from
an aqua MAXTM
– Basic 360 series water purification system from the TRILAB SUPPORT (Durban,
SA). The dissolved oxygen in the solutions was removed by passing 99.8% pure nitrogen gas (AFROX
Durban, SA) for 15 minutes. Stock solutions of chromium (III) and (VI) were prepared by dissolving
appropriate amounts of Cr(NO3)3 and K2Cr2O7 (Merck Laboratory Suppliers Pty Ltd, SA) in double
distilled water. A 1.0 M ammonium chloride was prepared by weighing approximately 53.50 g and
dissolving into 1.0 L with deionised water. Subsequently the pH was adjusted as per experimental
design (see Table 1) with 5% (v/v) ammonium hydroxide and 1% (v/v) hydrochloric acid solutions.
Carbon disulphide and piperidine were also purchased from Merck Laboratory Suppliers Pty Ltd, SA.
2.3. Synthesis of ammonium piperidine dithiocarbamate (APDC)
Carbon disulphide (80 g) was carefully added to the piperidine solution (85 g) and dissolved to
25 mL with distilled water at 5 0C under constant stirring, followed by the addition of 20% (v/v)
ammonium hydroxide for neutralization. The resulting reaction mixture was warmed at room
temperature and washed repeatedly with acetone of 99.5% purity. The product was purified by

Int. J. Electrochem. Sci., Vol. 9, 2014
6754
NH
CS2 N
C
S S NH4
Piperidine Carbon disulphide
5 0C
NH4OH
Ammonium piperidine dithiocarbamate
recrystallization in acetone with melting points ranging from 196-199 oC at 740 mm pressure [74-77]
as shown in Scheme 1.
Scheme 1. Preparation method of ammonium piperidine dithiocarbamate
2.4. Polarographic measurements
The developed procedure was examined by using standard solutions. At optimum pH, 5 mL of
3.0 µg of chromium (VI) and 3.0 mm APDC was added into the electrochemical cell followed by 5 mL
of 0.1 M ammonium chloride-ammonium hydroxide buffer. The dissolved oxygen was expelled by
bubbling pure nitrogen through the measuring solution for 15 min. At selected pH chromium (VI)
undergoes the reduction process and results in formation of chromium (III) -APDC complex.
Polarogram of the solution were recorded using DPP against SCE in ammonium chloride-ammonium
hydroxide medium. APDC or simple metal ions in the medium do not give any current signal at the
potential mentioned. According to the reported method in the literature [78], total chromium was
determined after oxidizing Chromium (III) to (VI) by the addition of K2S2O8 in an acidic medium as
follows: 1.0 mL of K2S2O8 (1%, w/v), one drop of AgNO3 (0.01%, w/v) and 1.0 mL concentrated
H2SO4 were added into a 50 mL beaker containing 25 mL of the standard solution of 3.0 µg mL−1
Cr(III). The beaker was kept in a sonicator for 5 min for proper dissolution and the mixture was heated
on a hot plate at 60 oC for 30 min to facilitate oxidation and then boiled to reduce excess of K2S2O8.
Then the mixture was cooled to room temperature and transferred into the polarographic cell for
electrochemical investigation. The concentration of chromium (III) was calculated by subtracting the
concentration of chromium (VI) from total chromium concentration.
2.5. Preparation of water samples
Wastewater samples collected from different industrial areas around Durban, South Africa
were filtered through a 0.45 µm cellulose nitrate filter. In case of chromium (VI) determination; 10 mL
of wastewater was diluted 10-fold with double distilled water, then acidified with 5.0 mL of
concentrated H2SO4 then allowed to cool to room temperature in 30 min. The speciation procedure was
followed as mentioned in the section.

Int. J. Electrochem. Sci., Vol. 9, 2014
6755
2.6. Experimental design
A Box-Behnken design with fifteen runs, three independent variables (pH, concentration of
NH4Cl-NH4OH and APDC) and three replicates at a centre point was used in this study. The
experiment was randomized to reduce confounding variables by equalizing the three independent
variables that have not been accounted for in the experimental design. Table 1 shows the experimental
design of the three factors; pH, concentration of NH4Cl-NH4OH and APDC. The maximum current
signals and their respective potentials due to chromium species were taken as the response of the
designed experiments per APDC for the three replicates. The statistical and correlation analysis of the
response of the model was performed with analysis of variance (ANOVA), pareto charts, interaction
plots and surface responses. Interestingly, the design enabled us to evaluate the responses with respect
to the simultaneous factor variations in all the experimental regions studied and to optimize the
experimental conditions for the speciation and simultaneous determination of chromium (III) and (VI),
taking into account randomization for even distribution (Figure 1). The concentrations of APDC and
buffer were varied from 2.6 to 5.0 and 0.2 to 1.0 Mol/L, respectively while the pH was varied from 6
to 8.
Table 1. Box-Behnken experimental design of 15 runs and 3 parameters.
Run
No.
pH [NH4Cl-NH4OH]
mol/L
[APDC]
mol/L
*Potential
V
*Current
nA
1 7 0.2 5.0 1.38 46.37
2 7 0.6 2.6 1.37 10.68
3 7 0.6 2.6 1.38 12.06
4 8 1.0 2.6 1.39 51.71
5 7 1.0 5.0 1.28 1.20
6 8 0.2 2.6 1.39 48.40
7 6 0.6 0.3 1.52 63.79
8 7 0.6 2.6 1.41 11.90
9 6 0.6 5.0 1.36 8.24
10 8 0.6 0.3 1.37 10.41
11 7 0.2 0.3 1.40 11.78
12 7 1.0 0.3 1.40 6.41
13 8 0.6 5.0 1.38 6.43
14 6 1.0 2.6 1.38 11.28
15 6 0.2 2.6 1.39 1.34 *Average current response and potential of three replicates
2.7. Data analysis
STATGRAPHICS Plus version 5.1 and Microsoft excel® 2013 were used for data evaluation
and preparation of the experimental design. Peak evaluation was performed with 797 PC Software
1.3.1® 2008.
Int. J. Electrochem. Sci., Vol. 9, 2014
6756
3. RESULTS AND DISCUSSION
3.1. Analysis of variance on analyte response
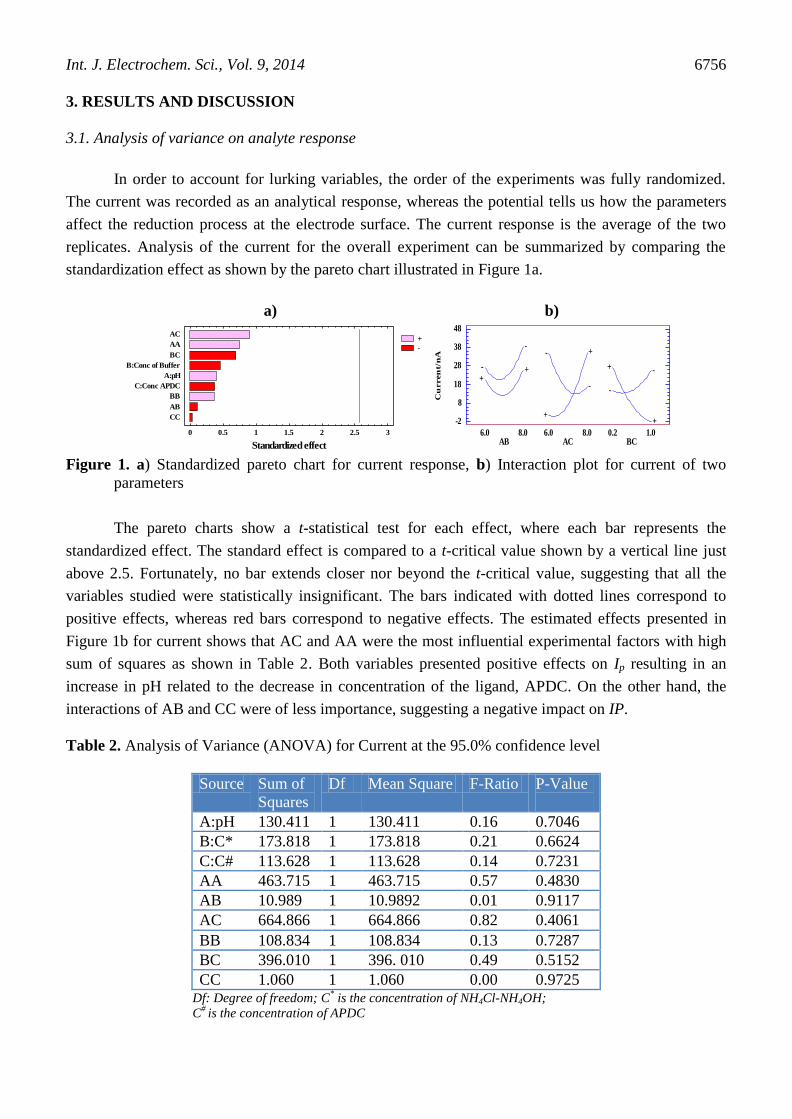
In order to account for lurking variables, the order of the experiments was fully randomized.
The current was recorded as an analytical response, whereas the potential tells us how the parameters
affect the reduction process at the electrode surface. The current response is the average of the two
replicates. Analysis of the current for the overall experiment can be summarized by comparing the
standardization effect as shown by the pareto chart illustrated in Figure 1a.
a) Standardized Pareto Chart for Current
Standardized effect
+
-
0 0.5 1 1.5 2 2.5 3
CC
AB
BB
C:Conc APDC
A:pH
B:Conc of Buffer
BC
AA
AC
b) Interaction Plot for Current
Cu
rren
t/n
AAB
6.0 8.0
-
-
++
AC6.0 8.0
-
-
+
+
BC0.2 1.0
-
-+
+-2
8
18
28
38
48
Figure 1. a) Standardized pareto chart for current response, b) Interaction plot for current of two
parameters
The pareto charts show a t-statistical test for each effect, where each bar represents the
standardized effect. The standard effect is compared to a t-critical value shown by a vertical line just
above 2.5. Fortunately, no bar extends closer nor beyond the t-critical value, suggesting that all the
variables studied were statistically insignificant. The bars indicated with dotted lines correspond to
positive effects, whereas red bars correspond to negative effects. The estimated effects presented in
Figure 1b for current shows that AC and AA were the most influential experimental factors with high
sum of squares as shown in Table 2. Both variables presented positive effects on Ip resulting in an
increase in pH related to the decrease in concentration of the ligand, APDC. On the other hand, the
interactions of AB and CC were of less importance, suggesting a negative impact on IP.
Table 2. Analysis of Variance (ANOVA) for Current at the 95.0% confidence level
Source Sum of
Squares
Df Mean Square F-Ratio P-Value
A:pH 130.411 1 130.411 0.16 0.7046
B:C* 173.818 1 173.818 0.21 0.6624
C:C# 113.628 1 113.628 0.14 0.7231
AA 463.715 1 463.715 0.57 0.4830
AB 10.989 1 10.9892 0.01 0.9117
AC 664.866 1 664.866 0.82 0.4061
BB 108.834 1 108.834 0.13 0.7287
BC 396.010 1 396. 010 0.49 0.5152
CC 1.060 1 1.060 0.00 0.9725 Df: Degree of freedom; C
* is the concentration of NH4Cl-NH4OH;
C# is the concentration of APDC
Int. J. Electrochem. Sci., Vol. 9, 2014
6757
The statistical significance shown in Table 2 of each effect predicted by comparing the mean
square against an estimate of the experimental error shows that none of the effects have P-values less
than 0.05, indicating that they are significantly different from zero at the 95.0% confidence level. This
also indicates that there is a possible serial correlation based on the order in which they occur in our
data. Therefore, the Durbin-Watson (DW) statistic testing of the residuals was performed to determine
if there were any significant correlations resulting to the matrix shown in Table 3.
Table 3. Correlation matrix showing the extent of the confounding amongst the effects included.
1 2 3 4 5 6 7 8 9 10
Ave 1.00 0.00 0.00 0.00 -0.56 0.00 0.00 -0.56 0.00 -0.56
A:pH 0.00 1.00 0.00 0.00 0.00 0.00 0.00 0.00 0.00 0.00
B:C* 0.00 0.00 1.00 0.00 0.00 0.00 0.00 0.00 0.00 0.00
C:C# 0.00 0.00 0.00 1.00 0.00 0.00 0.00 0.00 0.00 0.00
AA -0.56 0.00 0.00 0.00 1.00 0.00 0.00 0.08 0.00 0.08
AB 0.00 0.00 0.00 0.00 0.00 1.00 0.00 0.00 0.00 0.00
AC 0.00 0.00 0.00 0.00 0.00 0.00 1.00 0.00 0.00 0.00
BB -0.56 0.00 0.00 0.00 0.08 0.00 0.00 1.00 0.00 0.08
BC 0.00 0.00 0.00 0.00 0.00 0.00 0.00 0.00 1.00 0.00
CC -0.56 0.00 0.00 0.00 0.08 0.00 0.00 0.08 0.00 1.00
C* is the concentration of NH4Cl-NH4OH, C
# is the concentration of APDC
The R-squared statistic indicated that the model is fitted explains 33.56% of the variability in
the current response. In addition, the correlation matrix in Table 3 shows the extent of the confounding
amongst the effects. This is a perfectly orthogonal design showing a diagonal matrix with 1's on the
diagonal and 0's off on the diagonal. All the non-zero terms of the diagonal imply that the estimates of
the effects corresponding to rows and columns were correlated. Herein there are three pairs of effects
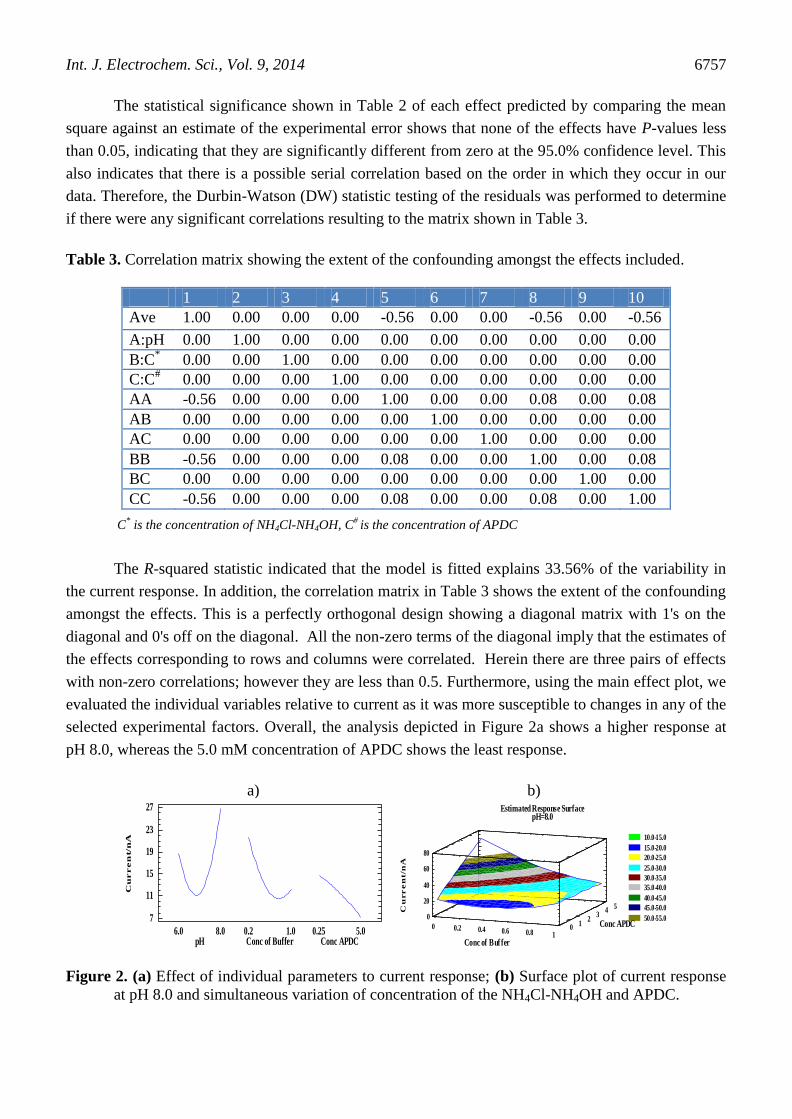
with non-zero correlations; however they are less than 0.5. Furthermore, using the main effect plot, we
evaluated the individual variables relative to current as it was more susceptible to changes in any of the
selected experimental factors. Overall, the analysis depicted in Figure 2a shows a higher response at
pH 8.0, whereas the 5.0 mM concentration of APDC shows the least response.
a) Main Effects Plot for Current
Cu
rren
t/n
A
pH6.0 8.0
Conc of Buffer0.2 1.0
Conc APDC0.25 5.0
7
11
15
19
23
27
b) Estimated Response Surface
pH=8.0
Conc of Buf fer
Conc APDC
Cu
rr
en
t/n
A
10.0-15.0
15.0-20.0
20.0-25.0
25.0-30.0
30.0-35.0
35.0-40.0
40.0-45.0
45.0-50.0
50.0-55.00 0.2 0.4 0.6 0.8 1
01
23
45
0
20
40
60
80
Figure 2. (a) Effect of individual parameters to current response; (b) Surface plot of current response
at pH 8.0 and simultaneous variation of concentration of the NH4Cl-NH4OH and APDC.

Int. J. Electrochem. Sci., Vol. 9, 2014
6758
On the other hand, the current response of the surface plot, shown in Figure 2b, is significantly
affected by the concentration of the NH4Cl-NH4OH and APDC. Therefore, current response due to
chromium changed between 23 to 70 nA as a result of varying the concentration of APDC.
Interestingly, the highest response was obtained at minimal concentration of the NH4Cl-NH4OH and
the highest concentration of the APDC for the selected range. For this purpose, the optimum values
obtained over the selected range were found to be; pH 8.0, 0.2 mM NH4Cl-NH4OH and 5.0 mM
APDC.
3.2. Foreign ion effect
To test the selectivity of the proposed method, a possible effect of the presence of other ions in
the sample solution was investigated. Therefore, in order to discriminate the interferences from other
foreign species under optimized experimental conditions, chromium (III) and (VI) concentrations were
fixed at 0.5 and 0.05 µM respectively by changing the amount of different foreign ions. A closer
inspection of Table 4 suggests that a large number of ions have no considerable effect on the speciation
and simultaneous determination of the chromium (III) and (VI) ions in the wastewater samples.
Table 4. Tolerance levels of foreign ions for the speciation and determination of chromium (III) and
(VI) under optimized experimental conditions
Index Foreign
Ions
Tolerance
limits
( nmol L-1
)
Index Foreign Ions Tolerance
limits
( nmol L-1
)
1 Pb(NO3)2 1×10⁶ 13 Mg
2+ 15×10
4
2 MnSO4 1×10⁶ 14 Ni
2+ 10×10
4
3 FeCl3 9×10⁵ 15 Cu
2+ 30×10
4
4 CuCl2 7×10⁵ 16 K
+ 25×10
5
5 CaCl2 1×10⁵ 17 Na
+ 15×10
5
6 Co(NO3)2 1×10⁶ 18 Pb
2+ 20×10
5
7 KCl 5×10⁶ 19 Ni
2+ 25×10
5
8 Ni(NO)3 7×10⁵ 20 Ca
2+ 5×10
4
9 NaCl 1×10⁶ 21 Ba
2+ 25×10
5
10 NH4VO3 1×10⁵ 22 Al
3+ 10×10
5
11 Zn2+
25×104 23 Ag
+ 15×10
4
12 Fe3+
25×104
3.3. Figures of merit
Chromium (III) and (VI) were speciated and simultaneously determined under the optimized
experimental conditions presented in Table 5. The regression equations and the correlation coefficients
were y = 0.8818x-0.695, y = 1.1081x-0.43 and 0.9997, 0.9997 for chromium (III) and (VI)
respectively. The LOD and LOQ were found to be 0.0841 and 0.0276 µg L-1
respectively.

Int. J. Electrochem. Sci., Vol. 9, 2014
6759
To obtain good reproducibility of the developed method in terms of signals, five successive runs
with APDC/NH4Cl-NH4OH buffer of pH 8.0 were carried out with the same solutions. The
repeatability was evaluated by performing five determinations with the same solution resulting in the
percentage relative standard deviations (%RSD n = 5) of ±1.24.
Table 5. Optimum parameters obtained from the Box-Behnken experimental design over the indicated
region
Factor Low High Optimum
pH 6.0 8.0 7.94
C* 0.2 1.0 0.20
C# 0.25 5.0 5.0 0
C* is the concentration of NH4Cl-NH4OH;
C# is the concentration of APDC
3.4. Method validation
The developed method was validated using synthetic samples prepared by spiking 20 mL of
laboratory tap water with solutions of chromium (III) and (VI) solution (1.0 and 4.0 μg L-1
). From the
prepared water sample, 5.0 mL was then transferred into the polarographic cell containing 10.0 mL of
deionised water, 3.0 mL of NH4Cl-NH4OH buffer (0.2 mM, pH 8.0) and 2.0 μL of mM APDC, and the
determination of chromium (VI) was carried out using catalytic differential pulse polarography. The
concentrations of chromium (III) and (VI) were determined as per the procedure described in section
2.4. Figure 3 shows the differential pulse polarograms for the speciation and determination of
chromium (VI).
Figure 3. Voltammogram for the speciation and determination of chromium (III) and (VI)
(Conditions= pH: 8.0, NH4Cl-NH4OH: 5 mM, APDC: 0.2 mM)
3.5. Analytical applications
Accuracy studies were performed using the proposed procedure, by collecting wastewater
samples from different industrial areas around Durban, South Africa. Recovery studies of chromium

Int. J. Electrochem. Sci., Vol. 9, 2014
6760
(III) and (VI) were investigated using standard addition method, due to low concentration (below
detection limits of the instrument) of analyte in the wastewater samples.
Table 6. Analytical data for the simultaneous determination of chromium (III) and (VI) in wastewater
samples spiked with chromium (III) and (VI)
Sample
Added
(µg L-1
)
Chromium(III) Chromium(VI)
Found
(µg L-1
)
Recovery±RSD* Found
(µg L-1
)
Recovery±RSD*
Site-1 5.0 4.84 96.80±1.85 4.95 99.0±1.33
Site-2 10.0 9.45 94.50±1.47 9.79 97.90±1.24
Site-3 15.0 14.59 97.26±1.65 14.90 99.30±1.50
*Relative standard deviation for five individual determinations
In the case of chromium (VI) analysis, the standard addition method was based on the
measurements obtained from the same solution before and after addition of chromium (VI). Where as
in the case of chromium (III) determination, it was added to the new portion of analyzing samples and
voltammogram was recorded as depicted in Table 6. As can be seen, the percentage recoveries and
reproducibility of chromium (III) and (VI) reveal the acceptable accuracy and precision. This method
was also found to be sensitive, selective, specific, reliable and rapid and may be successfully applied
for the speciation and simultaneous determination of chromium (III) and (VI) APDC as complexing
agent using Box-Behnken design coupled with catalytic-differential pulse polarographic technique in
various water samples of environmental importance as compared to the other techniques reported in
the literature (see Table 7).
It is interesting to highlight the fact that reference materials for chromium speciation obtainable
up to now have considered very simple matrix and the procedure validated using such material does
not include chemomatrics approach. It is also clear that most of the work done doesn’t focus
particularly on speciation with electrochemical measurements.
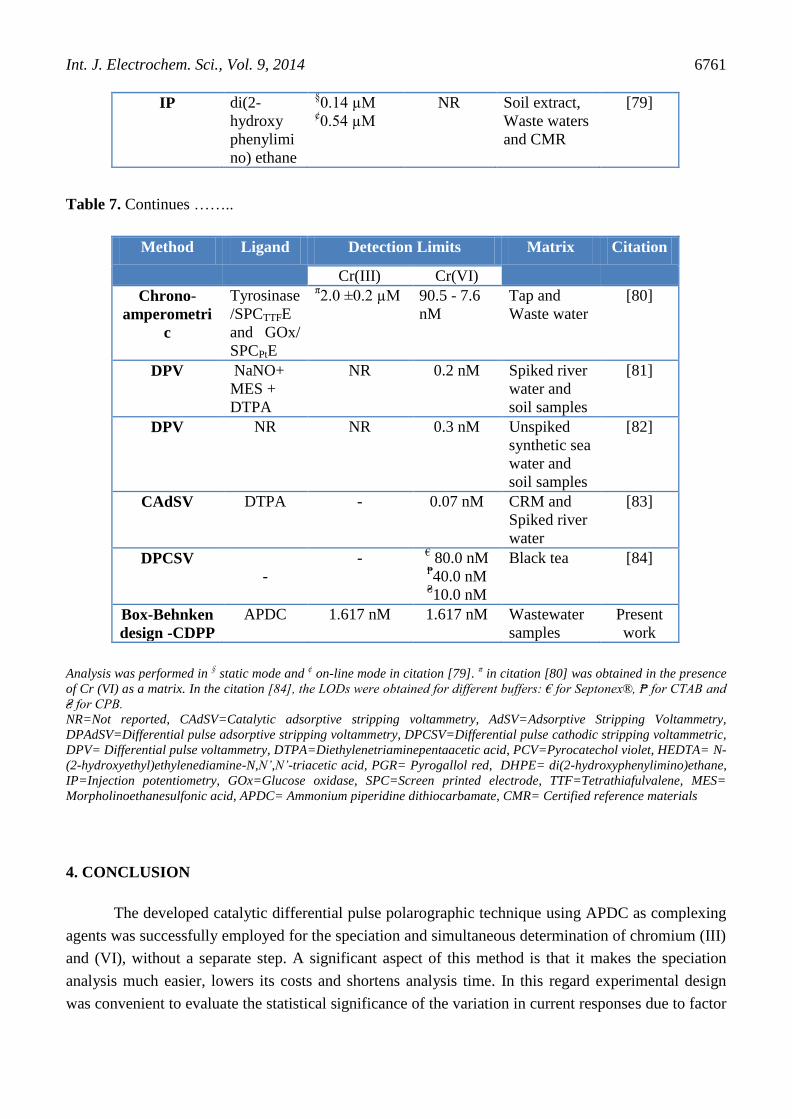
Table 7. Brief review of electrochemical methods reported on the simultaneous determination of
chromium (III) and chromium (VI)
Method Ligand Detection Limits Matrix Citation
Cr(III) Cr(VI)
DPAdSV PCV and
HEDTA
NR NR Mineral, Tap
and
tannery
wastewater
[14]
CAdSV DTPA
NR 80.0 µM Tannery
wastewater
[15]
AdSV PGR 0.00096 µM 0.00096 µM Sea water [17]
DPP - 0.3 µM 1.0 µM River water [21]
Int. J. Electrochem. Sci., Vol. 9, 2014
6761
IP di(2-
hydroxy
phenylimi
no) ethane
§0.14 µM
¢0.54 µM
NR Soil extract,
Waste waters
and CMR
[79]
Table 7. Continues ……..
Method Ligand Detection Limits Matrix Citation
Cr(III) Cr(VI)
Chrono-
amperometri
c
Tyrosinase
/SPCTTFE
and GOx/
SPCPtE
π2.0 ±0.2 µM 90.5 - 7.6
nM
Tap and
Waste water
[80]
DPV NaNO+
MES +
DTPA
NR 0.2 nM Spiked river
water and
soil samples
[81]
DPV NR NR 0.3 nM Unspiked
synthetic sea
water and
soil samples
[82]
CAdSV DTPA - 0.07 nM CRM and
Spiked river
water
[83]
DPCSV
-
- € 80.0 nM
₱40.0 nM
₴10.0 nM
Black tea [84]
Box-Behnken
design -CDPP
APDC 1.617 nM 1.617 nM Wastewater
samples
Present
work
Analysis was performed in
§ static mode and
¢ on-line mode in citation [79].
π in citation [80] was obtained in the presence
of Cr (VI) as a matrix. In the citation [84], the LODs were obtained for different buffers: € for Septonex®, ₱ for CTAB and
₴ for CPB.
NR=Not reported, CAdSV=Catalytic adsorptive stripping voltammetry, AdSV=Adsorptive Stripping Voltammetry,
DPAdSV=Differential pulse adsorptive stripping voltammetry, DPCSV=Differential pulse cathodic stripping voltammetric,
DPV= Differential pulse voltammetry, DTPA=Diethylenetriaminepentaacetic acid, PCV=Pyrocatechol violet, HEDTA= N-
(2-hydroxyethyl)ethylenediamine-N,N’,N’-triacetic acid, PGR= Pyrogallol red, DHPE= di(2-hydroxyphenylimino)ethane,
IP=Injection potentiometry, GOx=Glucose oxidase, SPC=Screen printed electrode, TTF=Tetrathiafulvalene, MES=
Morpholinoethanesulfonic acid, APDC= Ammonium piperidine dithiocarbamate, CMR= Certified reference materials
4. CONCLUSION
The developed catalytic differential pulse polarographic technique using APDC as complexing
agents was successfully employed for the speciation and simultaneous determination of chromium (III)
and (VI), without a separate step. A significant aspect of this method is that it makes the speciation
analysis much easier, lowers its costs and shortens analysis time. In this regard experimental design
was convenient to evaluate the statistical significance of the variation in current responses due to factor

Int. J. Electrochem. Sci., Vol. 9, 2014
6762
variations and optimization of the related parameters. In contrast to chromium (III), lower detection
limits for chromium (VI) along with the wide linear range offers greater opportunity for real and
routine speciation applications.
ACKNOWLEDGEMENT
The authors extend their appreciation to the National Research Foundation of South Africa and Durban
University of Technology (DUT) for their financial support of this project.
References
1. K. L. Mandiwana, N. Panichev, M. Kataeva, S. Siebert, J. Hazard. Mater. 147 (2007) 540.
2. M. Costa, Toxicol. Appl. Pharm. 188 (2003) 1.
3. Á. Béni, R. Karosi, J. Posta, Microchem. J. 85 (2007) 103.
4. K.O. Saygi, M. Tuzen, M. Soylak, L. Elci, J. Hazard. Mater. 153 (2008) 1009.
5. Y.W. Wu, J. Zhang, J. F. Liu, L. Chen, Z. L. Deng, M. X. Han, X.S. Wei, A.M. Yu, H.L. Zhang,
Appl. Surf. Sci. 258 (2012) 6772.
6. G. Hu, R.L. Deming, Anal. Chim. Acta 535 (2005) 237.
7. A. Karatepe, E. Korkmaz, M. Soylak, L. Elci, J. Hazard. Mater. 173 (2010) 433.
8. K. Kiran, K.S. Kumar, B. Prasad, K. Suvardhan, L.R. Babu, K. Janardhanam, J. Hazard. Mater.
150 (2008) 582.
9. M. Ezoddin, F. Shemirani, R. Khani, Desalination 262 (2010) 183.
10. M. Hashemi, S. M. Daryanavard, Spectrochim Acta Part A: Mol. Biomol. Spec. 92 (2012) 189.
11. L.L. Wang, J.Q. Wang, Z.X. Zheng, P. Xiao, J. Hazard. Mater. 177 (2010) 114.
12. J. Wang, K. Ashley, D. Marlow, E. C. England, G. Carlton, Anal. Chem. 71(1999) 1027.
13. A.S. Stasinakis, S. N. Thomaidis, T. D. Lekkas, Anal. Chim. Acta 478 (2003) 119.
14. O. Domínguez, M.J. Arcos, Anal. Chim. Acta 470 (2002) 241.
15. A. Bobrowski, B. Bas, J. Dominik, E. Niewiara E. Szalinska, D. Vignati, J. Zarebski, Talanta 63
16. (2004) 1003.
17. E.O. Jorge, M.M. Rocha, I.T.E. Fonseca, M.M.M. Neto, Talanta 81 (2010) 556.
18. V. Arancibia, E. Nagles, M. Gómez, C. Rojas, Int. J. Electrochem. Sci., 7 (2012) 11444.
19. M. Grabarczyk, Electroanal. 20 (20) (2008) 2217.
20. E.P. Achterberg, C. Braungardt, Anal. Chim. Acta 400 (1999) 381.
21. J.K. Kiptoo, J.C. Ngila, G.M. Sawula, Talanta 64 (2004) 54.
22. O. Sendil, N. Mohammed, G. Somer, Turk. J. Chem. 36 (2012), 335.
23. S. Kanchi, M. Sulochana, K.B. Naidu, K. Saraswathi, N.V. Naidu, Food. Anal.
24. Methods 4 (2011) 4 453.
25. F.P. Capote, M.D. Luque de Castro, J. Chromatogr. A 1113 (2006) 244.
26. M. Safari, S. Nojavan, S.S.H. Davarani, A.M. Najarian, Anal. Chim. Acta 789 (2013) 58.
27. I. Ali, H.Y. Aboul-Enein, Chemosphere 48 (2002) 275.
28. L.Y. Ying, H.L. Jiang, S. Zhou, Y. Zhou, Microchem. J. 98 (2011) 200.
29. X. Zhu, B. Hu, Z. Jiang, M. Li, Water Res. 39 (2005) 589.
30. I. Narin, A. Kars, M. Soylak, J. Hazard. Mater. 150 (2008) 453.
31. C. Duran, D. Ozdes, A. Gundogdu, M. Imamoglu, H.B. Senturk, Anal. Chim. Acta 688 (2011) 75.
32. H. Gitet, P.A. Subramanian, D. Minilu, T. Kiros, M. Hilawie, G. Gebremariam, K. Taye, Talanta
116 (2013)626.
33. S. Sahan, S. Sacmaci, S. Kartal, M. Sacmaci, U. Sahin, A. Ulgen, Talanta 120 (2014) 391.
34. H.A. Zadeh, G.H. Sadeghi, Talanta 94 (2012) 201.
35. M. Tuzen, M. Soylak, J. Hazard. Mater. B129 (2006) 266.
Int. J. Electrochem. Sci., Vol. 9, 2014
6763
36. G.D. Matos, E.B. dos Reis, A.C.S. Costa, S.L.C. Ferreira, Microchem. J. 92 (2009) 135.
37. S. Sacmaci, S. Kartal, Y. Yılmaz, M. Sacmaci, C. Soykan, Chem. Eng. J. 181-182 (2012) 746.
38. F.A. Aydin, M. Soylak, J. Hazard. Mater. 162 (2009) 1228.
39. O.D. Uluozlu, M. Tuzen, D. Mendil, B. Kahveci, M. Soylak, J. Hazard. Mater. 172 (2009) 395.
40. M.E. Mahmoud, M.K. Obada, T.S. Kassem, Chem. Eng. J. 230 (2013) 210.
41. P. Liang, H. Sang, J. Hazard. Mater. 154 (2008) 1115.
42. M.R. Moghadam, S. Dadfarnia, A.M.H. Shabani, J. Hazard. Mater. 186 (2011) 169.
43. S. Sadeghi, A.Z. Moghaddam, Talanta 99 (2012) 758.
44. I. López-García, M. Briceño, Y. Vicente-Martínez, M. Hernández-Córdoba, Talanta 115 (2013)
166.
45. A.S. Stasinakis, N.S. Thomaidis, T.D. Lekkas, Anal. Chim. Acta 478 (2003) 119.
46. A.M. Zou, X.Y. Tang, M.L. Chen, J.H. Wang, Spectrochimica Acta Part B: Mol. Biomol. Spec 63
(2008) 607.
47. X. Zhu, B. Hu, Z. Jiang, Y. Wu, S. Xiong, Anal. Chim. Acta 471 (2002) 121.
48. Z.L. Chen, M. Megharaj, R. Naidu, Talanta 72 (2007) 394.
49. S. Chen, S. Zhu, Y. He, D. Lu, Food Chem. 150 (2014) 254.
50. S. Saputro, K. Yoshimura, S. Matsuoka, K.Takehara, Narsito, J. Aizawa, Y. Tennichi, Chem. Geol.
364 (2014) 33.
51. M. Hashemi, S.M. Daryanavard, Spectrochimica Acta Part A: Mol. Biomol. Spec. 92 (2012) 189.
52. H. Cui, R. He, J. Wang, Talanta 70 (2006) 139.
53. A.S. Amin, M.A. Kassem, Spectrochimica Acta Part A: Mol. and Biomol. Spec. 96 (2012) 541.
54. V. Gómez, M.S. Larrechi, M.P. Callao, Anal. Chim. Acta 571 (2006) 129.
55. S. Pramanik, S. Dey, P. Chattopadhyay, Anal. Chim. Acta 584 (2007) 469.
56. M.E. Mahmoud, A.A. Yakout, S.B. Ahmed, M.M. Osman, J. Hazard. Mater.158 (2008) 541.
57. M.H. Sorouraddin, M. Saadati, H.K. Baneshat, Sensors and Actuators B 188 (2013) 73.
58. M.S. Hosseini, F. Belador, J. Hazard. Mater. 165 (2009) 1062.
59. M.S. El-Shahawi, H.M. Al-Saidi, A.S. Bashammakh, A.A. Al-Sibaai, M.A. Abdelfadeel, Talanta 84
(2011) 175.
60. R.E. Shaffer, J.O. Cross, S.L. Rose-Pehrsson, W.T. Elam, Anal. Chim. Acta 442 (2001) 295.
61. J. Malherbe, F. Claverie, Anal. Chim. Acta 773 (2013) 37.
62. L. Lin, N. S. Lawrence, S. Thongngamdee, J. Wang, Y. Lin, Talanta 65 (2005) 144.
63. E. Niewiara, B. Baś, W.W. Kubiak, Electroanal. 19 (2007) 2185.
64. L. Husša´kova, A. Bobrowski, J. Šramkova, A. Królicka, K. Vytřas, Talanta 66 (2005) 999.
65. M.E. Swartz, I. Krull, Analytical method development and validation. 1997, Dekker, New York.
66. J.M. Green, Anal. Chem. 68 (1996) 305.
67. M. Thomposon, S. Ellison, R. Wood, Pure Appl. Chem. 74 (2002) 835.
68. R. Carlson, Design and optimization in organic synthesis, 1992, Elsevier, Amsterdam.
69. H.J. Pieniaszek, Short course on bioanalytical method development, validation and transfer. 10th
International Symposium on Pharmaceutical and Biomedical Analysis, 1999, Washington, D.C.,
USA.
70. G.A. Lewis, D. Mathieu, R. Phan Tan Luu, Pharmaceutical experimental Design, 1999, Dekker,
New York.
71. 69. D.C. Montgomery, Design and analysis of experiments, 1997, Wiley New York
72. D. Mathieu, R. Phan-Tan-Luu, M. Sergent, Methodes modernes d’elaboration de matrices
d’experiences optimales et qualite. 1998, LPRAI, Marseille.
73. G. Box, D. Meyer, Dispersion effects from factorial designs, Technometrics. 28 (1986) 11.
74. P. Polaskova, G. Bocaz, H. Li, J. Havel, J. Chromatogr. A 979 (2002) 59.
75. N. Aslan, and Y. Cebeci, Fuel 86 (2007) 90
76. S. Kanchi, P. Singh, K. Bisetty, Arabian J. Chem. 7 (2014) 11.
77. S. Kanchi, P. Singh, M.I. Sabela, K. Bisetty, N. Venkatasubba Naidu, Int. J. Electrochem. Sci. 8
Int. J. Electrochem. Sci., Vol. 9, 2014
6764
(2013) 4260.
78. S. Kanchi, K. Saraswathi, N. Venkatasubba Naidu, Environ. Monit. Assess. 183(1) (2011) 531.
79. S. Kanchi, K. Saraswathi, N. Venkatasubba Naidu, Food Anal. Methods 5(1) (2012) 69.
80. D.A. Skoog, D.M. West, F.J. Holler, Fundamentals of Analytical Chemistry, seventh ed., USA,
1996, p. 362.
81. R.A. Sánchez-Moreno, M.J. Gismera, M.T. Sevilla, J.R. Procopio, Anal. Chim. Acta 634 (2009)
68.
82. A. Calvo-Pérez, O. Domínguez-Renedo, M. Alonso-Lomillo, M. Arcos-Martínez, Anal. Chim. Acta
833 (2014) 15.
83. M. Korolczuk, M. Grabarczyk, Microchem. J. 72 (2002) 103.
84. M. Korolczuk, Anal. Chim. Acta 414 (2000) 165.
85. M. Grabarczyk, Electrochim. Acta 51 (2006) 2333.
86. I. Svancara, P. Foret, K. Vytras, Talanta 64 (2004) 844.
© 2014 The Authors. Published by ESG (www.electrochemsci.org). This article is an open access
article distributed under the terms and conditions of the Creative Commons Attribution license
(http://creativecommons.org/licenses/by/4.0/).