
A blood plasma inhibitor is responsible for circadian changes in rat renal Na,K-ATPase activity
12
The International Journal of Biochemistry & Cell Biology 36 (2004) 2054–2065 A blood plasma inhibitor is responsible for circadian changes in rat renal Na,K-ATPase activity Dar´ ıo Segura a , Antonio Eblen-Zajjur b,1 , Fulgencio Proverbio a , Teresa Proverbio a , Francisco Carrera a , Celso Caruso-Neves c , Reinaldo Mar´ ın a,∗ a Laboratorio de Bioenergética Celular, Centro de Biof´ ısica y Bioqu´ ımica, Instituto Venezolano de Investigaciones Cient´ ıficas (IVIC), A.P. 21827, Caracas 1020A, Venezuela b Laboratorio de Neurofisiolog´ ıa, Centro de Biof´ ısica y Bioqu´ ımica, Instituto Venezolano de Investigaciones Cient´ ıficas (IVIC), A.P. 21827, Caracas 1020A, Venezuela c Instituto de Biof´ ısica Carlos Chagas Filho, UFRJ, CCS, Bloco G, 21949-900 Rio de Janeiro, RJ, Brazil Received 4 September 2003; received in revised form 15 March 2004; accepted 19 March 2004 Abstract Rhythmic changes in activity following a circadian schedule have been described for several enzymes. The possibility of circadian changes in Na,K-ATPase activity was studied in homogenates of rat kidney cortex cells. Male Sprague–Dawley rats were kept on a schedule of 12 h light (06:00–18:00 h) and 12 h darkness (18:00–06:00 h) for 2 weeks. At the end of the conditioning period, one rat was killed every 2 h, until completion of a 24 h cycle. Outermost kidney cortex slices were prepared, homogenized and assayed for Na,K-ATPase activity. The whole procedure was repeated six times. Na,K-ATPase activity shows an important oscillation (2 cycles/24 h). Peak activities were detected at 09:00 and 21:00 h, whereas the lowest activities were detected at 15:00 and 01:00–03:00 h. The highest activity was 79 ± 3 nmoles P i mg protein −1 min −1 (09:00 h), and the lowest was 40 ± 3 nmoles P i mg protein −1 min −1 (15:00 h). The amount of the Na + -stimulated phosphorylated intermediate is the same for the 09:00 h and 15:00 h homogenates. Preincubation of 09:00 h kidney cortex homogenates with blood plasma drawn from rats at either 03:00h or 15:00h, significantly inhibited their Na,K-ATPase activity. This inhibition was not seen when the preincubation was carried out with either 09:00 h or 21:00 h blood plasma. The striking oscillation (2 cycles/24 h) of the Na,K-ATPase activity of rat kidney cortex cells is ascribed to the presence of an endogenous inhibitor in blood plasma. © 2004 Elsevier Ltd. All rights reserved. Keywords: Na,K-ATPase; Kidney; Circadian rhythm; Blood plasma inhibitor Abbreviations: DTT, dithiothreitol; PMSF, phenylmethylsul- fonyl fluoride ∗ Corresponding author. Tel.: +58-212-504-1395; fax: +58-212-504-1093. E-mail address: [email protected] (R. Mar´ ın). 1 Current address: Laboratorio de Neurofisiolog´ ıa, Dpto. Cien- cias Fisiol´ ogicas, Facultad de Ciencias de la Salud, A.P. 3798, El Trigal, Valencia, Venezuela. 1. Introduction Rhythmicity is a feature of living matter, being widely present in uni- (Kondo et al., 1994) and mul- ticellular (Vitaterna et al., 1994) organisms, as an adaptation to cyclic changes in environmental vari- ables e.g., light, temperature, and food availability (Bünning, 1993; Edmunds, 1988). In mammals, light is the major factor in the synchronization between 1357-2725/$ – see front matter © 2004 Elsevier Ltd. All rights reserved. doi:10.1016/j.biocel.2004.03.005
-
Upload
independent -
Category
Documents
-
view
1 -
download
0
Transcript of A blood plasma inhibitor is responsible for circadian changes in rat renal Na,K-ATPase activity

The International Journal of Biochemistry & Cell Biology 36 (2004) 2054–2065
A blood plasma inhibitor is responsible for circadianchanges in rat renal Na,K-ATPase activity
Darıo Seguraa, Antonio Eblen-Zajjurb,1, Fulgencio Proverbioa, Teresa Proverbioa,Francisco Carreraa, Celso Caruso-Nevesc, Reinaldo Marına,∗
a Laboratorio de Bioenergética Celular, Centro de Biof´ısica y Bioqu´ımica, Instituto Venezolano deInvestigaciones Cient´ıficas (IVIC), A.P. 21827, Caracas 1020A, Venezuela
b Laboratorio de Neurofisiolog´ıa, Centro de Biof´ısica y Bioqu´ımica, Instituto Venezolano deInvestigaciones Cient´ıficas (IVIC), A.P. 21827, Caracas 1020A, Venezuela
c Instituto de Biof´ısica Carlos Chagas Filho, UFRJ, CCS, Bloco G, 21949-900 Rio de Janeiro, RJ, Brazil
Received 4 September 2003; received in revised form 15 March 2004; accepted 19 March 2004
Abstract
Rhythmic changes in activity following a circadian schedule have been described for several enzymes. The possibility ofcircadian changes in Na,K-ATPase activity was studied in homogenates of rat kidney cortex cells. Male Sprague–Dawleyrats were kept on a schedule of 12 h light (06:00–18:00 h) and 12 h darkness (18:00–06:00 h) for 2 weeks. At the end of theconditioning period, one rat was killed every 2 h, until completion of a 24 h cycle. Outermost kidney cortex slices were prepared,homogenized and assayed for Na,K-ATPase activity. The whole procedure was repeated six times. Na,K-ATPase activity showsan important oscillation (2 cycles/24 h). Peak activities were detected at 09:00 and 21:00 h, whereas the lowest activities weredetected at 15:00 and 01:00–03:00 h. The highest activity was 79±3 nmolesPi mg protein−1 min−1 (09:00 h), and the lowestwas 40± 3 nmolesPi mg protein−1 min−1 (15:00 h). The amount of the Na+-stimulated phosphorylated intermediate is thesame for the 09:00 h and 15:00 h homogenates. Preincubation of 09:00 h kidney cortex homogenates with blood plasma drawnfrom rats at either 03:00 h or 15:00 h, significantly inhibited their Na,K-ATPase activity. This inhibition was not seen whenthe preincubation was carried out with either 09:00 h or 21:00 h blood plasma. The striking oscillation (2 cycles/24 h) of theNa,K-ATPase activity of rat kidney cortex cells is ascribed to the presence of an endogenous inhibitor in blood plasma.© 2004 Elsevier Ltd. All rights reserved.
Keywords:Na,K-ATPase; Kidney; Circadian rhythm; Blood plasma inhibitor
Abbreviations: DTT, dithiothreitol; PMSF, phenylmethylsul-fonyl fluoride
∗ Corresponding author. Tel.:+58-212-504-1395;fax: +58-212-504-1093.
E-mail address:[email protected] (R. Marın).1 Current address: Laboratorio de Neurofisiologıa, Dpto. Cien-
cias Fisiologicas, Facultad de Ciencias de la Salud, A.P. 3798, ElTrigal, Valencia, Venezuela.
1. Introduction
Rhythmicity is a feature of living matter, beingwidely present in uni- (Kondo et al., 1994) and mul-ticellular (Vitaterna et al., 1994) organisms, as anadaptation to cyclic changes in environmental vari-ables e.g., light, temperature, and food availability(Bünning, 1993; Edmunds, 1988). In mammals, lightis the major factor in the synchronization between
1357-2725/$ – see front matter © 2004 Elsevier Ltd. All rights reserved.doi:10.1016/j.biocel.2004.03.005
D. Segura et al. / The International Journal of Biochemistry & Cell Biology 36 (2004) 2054–2065 2055
many body functions and environment. At the cel-lular level, rhythmic changes in activity following acircadian schedule have been described for severalenzymes, i.e. glycogensynthase (Harley & Rusak,1993; Uchiyama, 1990), glucose-6-phosphate dehy-drogenase, glyceraldehyde-3-phosphate dehydroge-nase (Peleg, Dotan, Luzato, & Ashkenazi, 1990),cardiac Ca-ATPase (Chen et al., 1993). In the ani-mal kingdom, one of the most important mechanismsfor active cellular Na+ extrusion occurs in exchangefor extracellular K+, in a function catalyzed by theNa,K-ATPase. This process regulates the cellularNa+/K+ concentrations and hence their gradientsacross the plasma membrane, which are required forvital functions such as membrane cotransports, cellvolume regulation and membrane excitability (Doucet,1988; Jørgensen, 1986; Katz, 1982). Changes inNa,K-ATPase activity might modulate these cell func-tions, with important physiological implications. Onthis regard, renal excretion of water and electrolytesshows a marked circadian rhythm, which is indepen-dent of the time of daily food ingestion (Mann, Stiller,& Korz, 1976; Min, Jones, & Flink, 1966; Rabinowitz,Wydner, Smith, & Yamauchi, 1986). Since the renalNa,K-ATPase activity plays, doubtlessly, an importantrole in the renal excretion of electrolytes, it is of phys-iological and biochemical interest to explore whetherthe Na,K-ATPase activity of kidney cell membranesshows a circadian rhythm. In the present work wefound that the renal Na,K-ATPase activity changesaccording to a circadian pattern. These oscillationsin ATPase activity are ascribed to the presence of anendogenous inhibitor in blood plasma.
2. Materials and methods
2.1. Homogenates of rat kidney cortex slices
Twelve healthy male rats of the Sprague–Dawleystrain (body weight 200–300 g, 3 months old) werehoused, four animals per cage, for 2 weeks, with con-stant room temperature (23± 1◦C, mean± S.D.),low noise and the following light–darkness sched-ule: 12 h of light (06:00–18:00 h, 80 lux) and 12 h ofdarkness (18:00–06:00 h). All the rats received wa-ter and food ad libitum. At the end of the condition-ing periods, one rat of the group was anesthetized
with diethylether and immediately decapitated. Theremaining rats were maintained under the same light-ing schedule. Thereafter, one rat was killed every 2 h,until completion of a 24 h cycle. The kidneys were re-moved, decapsulated and collected in a medium con-taining 250 mM sucrose, 20 mM Tris–HCl (pH 7.2),0.5 mM dithiothreitol and 0.2 mM phenylmethylsul-fonyl fluoride (sucrose/Tris/DTT/PMSF medium), at4◦C. Then, slices of the outermost part of the kidneycortex (rich in proximal tubules), were homogenizedat 4◦C by eight strokes with a tight-fitting teflon pestlein an Eberbach homogenizer, in three volumes of su-crose/Tris/DTT/PMSF medium (DTT and PMSF wereused in order to protect the thiol groups of the ATPaseand to inhibit protease activity, respectively). The pro-tein concentration of the homogenates was adjustedto approximately 10 mg ml−1. The K+ concentrationof the homogenates prepared in this way was about20 mM. The whole procedure was repeated six timeswith different animals.
2.2. SDS pretreatment of the homogenates
In order to avoid the presence of membrane vesi-cles, before any assay all the homogenates werepretreated with SDS/BSA/Imidazole as previouslydescribed (Marın, Proverbio, & Proverbio, 1986).Two hundred and fifty microliter of the homogenates(10 mg protein ml−1, approximately, and a K+ con-centration around 20 mM) were mixed with 20�l ofa solution containing 20% SDS, 1% BSA, 25 mMImidazole pH 7.2 at 37◦C. The optimal SDS/proteinratio was around 1.6�g SDS/�g protein. The ho-mogenates were incubated for 20 min at 37◦C, im-mediately diluted with a solution of 250 mM sucrose,20 mM Tris–HCl (pH 7.2, 4◦C) to a protein con-centration of 0.1–0.2 mg ml−1, then used for bloodplasma incubations and/or ATPase assays. Proteinwas determined by the Bio-Rad micromethod basedon Bradford’s reaction (Bradford, 1976).
2.3. Na,K-ATPase assays
The Na,K-ATPase activity was determined as de-scribed elsewhere (Marın, Proverbio, & Proverbio,1986; Proverbio, Proverbio, & Marın, 1986). A180�l aliquot of the incubation medium containing(final concentrations): 50 mM Tris–HCl (pH 7.0),
2056 D. Segura et al. / The International Journal of Biochemistry & Cell Biology 36 (2004) 2054–2065
5 mM MgCl2, 100 mM NaCl, 20 mM KCl and 2 mMTris-ATP, with or without 5 mM ouabain, was prein-cubated at 37◦C for 5 min. The reaction was startedby addition of 20�l of the homogenates (0.1–0.2 mgprotein ml−1) previously treated with SDS. After a10 min incubation, 300�l of a stop solution contain-ing (final concentrations) 2.8% SDS, 0.48% molybdicacid, 2.8% ascorbic acid and 0.48N hydrochloric acid,were added to the tubes, which were placed on icefor 10 min, and then supplemented with 500�l of asolution containing (final concentrations), 2% sodiumarsenite, 2% sodium citrate and 2% acetic acid. Thetubes were rewarmed at 37◦C for 10 min, and thedeveloped color was measured in a Milton Roy 1201spectrophotometer at 705 nm. The Na,K-ATPase ac-tivity was calculated as the difference between thequantity of phosphate liberated in the tubes withoutouabain, minus that liberated in the tubes containingouabain. All samples were run in triplicate. Activitywas expressed as nmoles ofPi liberated per mg ofprotein per min, after subtraction of a blank run inparallel without the membrane suspension, which wasadded after the reaction was stopped. For the usedincubation time (10 min), the ATPase activity wastime-linear for all the samples assayed.
2.4. Na,K-ATPase activity during 1 week of storageof the homogenates at−70◦C
Homogenates of kidney cortex slices were preparedfrom rats maintained on the 12 h light/darkness sched-ule, and killed either at 09:00 h or at 15:00 h. Aliquotsof the homogenates were immediately assayed forNa,K-ATPase activity. The remaining portion of thehomogenates was diluted to a protein concentration of0.1–0.2 mg ml−1, divided into 1 ml aliquots and storedat −70◦C (the K+ concentration of the diluted ho-mogenates was 0.2–0.4 mM). Every day, for a week,one aliquot was thawed, assayed for ATPase activityand then discarded.
2.5. Phosphorylated intermediate
The phosphorylated intermediate of the Na,K-ATPase was assayed following a modification of themethod of Knauf, Proverbio, and Hoffman (1974).Forty microliter aliquot of the homogenates (0.1–0.2 mg protein ml−1) were added to 60�l of the
incubation medium at 0◦C, in 1.5 ml microcentrifugetubes. The final concentrations in the reaction mediumwere 12�M MgCl2, 50 mM Tris–HCl (pH 7.2),10�M ATP with traces of [32P]-�-ATP (10�Ci ml−1
specific activity), and according to the experimentaldesign, either 100 mM NaCl or 100 mM Tris–HCl(pH 7.2). After 15 s at 0◦C, the reaction was stoppedby adding 400�l of a solution (0◦C) containing 5%trichloroacetic acid, 0.1 mM ATP and 1 mM inor-ganic phosphate. The tubes were then centrifuged at16,000×g for 2 min. The supernatants were carefullydiscarded by aspiration and the pellets were washedtwice with the same trichloroacetic acid solution, thendissolved in 500�l of 0.2% TritonX 100, and trans-ferred to scintillation vials containing 4 ml of Instagel.The phosphorylated intermediate of the Na,K-ATPasewas calculated as the difference in phosphorylationin a medium containing Mg2+ + Na+, minus thatobtained in a medium containing Mg2+ alone. Theresults were expressed as pmoles P mg protein−1.
2.6. Chemicals
ATP, ouabain (strophanthin-G), PMSF and dithio-threitol were purchased from the Sigma ChemicalCompany, Coomassie blue dye binding assay fromBio-Rad Laboratories, Hercules, CA, [32P]-�-ATPfrom Amersham, and Instagel from New EnglandNuclear.
2.7. Statistical analysis
In order to identify the underlying cyclical compo-nents within the ATPase activity data, a Fast Fouriertransformation of raw enzyme activity values usingfive term Hamming data window was performed.Spectral analysis of enzyme activity was performedon 2 h intervals of data, over a 24 h period. Briefly,the purpose of this analysis was to decompose thetime series with cyclical components into a few un-derlying sinusoidal (sine and cosine) functions ofparticular wavelengths to identify specific frequenciesand their contribution to the overall periodic behaviorof the series (Box & Jenkins, 1976; Brillinger, 1975;Monro, 1975; Monro & Branch, 1976). Results ofthis analysis are presented as spectral density versusfrequency graphs. Frequencies ranging from 0 to 6cycles per day were tested. For statistical analysis of

D. Segura et al. / The International Journal of Biochemistry & Cell Biology 36 (2004) 2054–2065 2057
periodogram values against white noise, the Fisherκ-test was used.P < 0.05 was considered the level ofstatistical significance. The Wilcoxon test was usedto compare activity values between groups.
3. Results
The Na,K-ATPase activity of kidney cortex ho-mogenates from rats maintained on a 2 weeks sched-ule of 12 h light–12 h darkness was studied. Ratswere killed every 2 h, until completion of a 24 h cycleand kidney cortex homogenates were prepared. Be-fore assay, the homogenates were treated with SDSin order to avoid the presence of membrane vesicles(Marın et al., 1986). The results of this experimentare shown inFig. 1. It can be seen that the ATPaseactivity exhibits a rhythmicity with the highest value,79± 3 nmolesPi mg protein−1 min−1 (mean± S.E.),seen at 09:00 h, i.e. 3 h after light onset. The ac-tivity decreased during the light period until the
7 9 11 13 15 17 19 21 23 1 3 5
25
50
75
100
Na,K
-AT
Pase
acti
vit
y
(nm
ole
s P
i •
mg
pro
t-1 •
min
-1)
time (h)
Fig. 1. Enzyme activity over time of Na,K-ATPase in homogenatesof kidney cortex slices from rats maintained for 2 weeks under thefollowing light–darkness schedule: 12 h light (between 06:00 and18:00 h, 80 lux) and 12 h darkness (between 18:00 and 06:00 h).The horizontal black bar represents the darkness period. Beforeassay, the homogenates were pretreated with SDS (Marın et al.,1986), at a protein concentration of approximately 10 mg ml−1,with 20 mM K+. After treatment, the homogenates were dilutedwith a 250 mM sucrose, 20 mM Tris–HCl (pH 7.2, 4◦C) solution,to a protein concentration of 0.1–0.2 mg ml−1 and then assayed forNa,K-ATPase activity, as described underSection 2. The valuesrepresent means± S.E., for six different animals.
lowest activity value was observed at 15:00 h, with40± 3 nmolesPi mg protein−1 min−1 (mean± S.E.).Enzyme activity then began to increase up till 21:00 h,i.e. 3 h after the onset of darkness, time at which asecond activity peak was detected with 66± 3 nmolesPi mg protein−1 min−1 (mean± S.E.). Thereafter, theactivity decreased, reaching a low at 01:00–03:00 h.The 09:00 h activity peak was significantly higherthan the 21:00 h peak, but the low values at 15:00 hand 01:00–03:00 h were not statistically different.The arithmetic mean of all activity values during the24 h period was 53.5 ± 11.5 (mean± S.E.), witha coefficient of variation of 21.4%. This coefficientgives an insight about the amplitude of the oscillation.Complete oscillation analysis of the ATPase activitywas carried out by spectral analysis, and as shown inFig. 2, a statistically significant 2 peak per day cycle(κ = 10.2, P < 0.05) was revealed.
The circadian changes shown for the Na,K-ATPaseactivity may be ascribed to several factors. Amongthem, we can consider the existence of an agent able tobind to the membranes, stimulating or inhibiting in thisway their ATPase activity. To study this possibility, thefollowing experiment was performed: Homogenatesof kidney cortex slices were prepared from rats main-tained on the 12 h light/darkness schedule, killedeither at 09:00 h or at 15:00 h and stored at−70◦C.Every day, for a week, one aliquot of the homogenates
0 1 2 3 4 5 6
0
200
400
600
800
1000
Peri
odogra
m v
alu
es
(arb
itra
ry u
nit
s)
Frequency (cycles/24 h)
Fig. 2. Spectral analysis (periodogram) of Na,K-ATPase activity ofhomogenates of rat kidney cortex slices. Analysis was conductedon two hours intervals of the data presented inFig. 1, over a 24 hperiod. A pattern of 2 cycles per 24 h is statistically different frombackground noise (Fisherκ-test,κ = 10.2, P < 0.05).

2058 D. Segura et al. / The International Journal of Biochemistry & Cell Biology 36 (2004) 2054–2065
1 2 3 4 5 6 7
50
60
70
80
90
0900 h
1500 h
Na,K
-AT
Pase
acti
vit
y
(nm
ole
s P
i •
mg p
rot-1
• m
in-1
)
Storage time (days)
Fig. 3. Effect of storage time on the Na,K-ATPase activity ofhomogenates of kidney cortex slices, prepared at either 09:00 h or15:00 h, from rats maintained for 2 weeks on a 12 h light/12 h darkcycle. Before assaying, the freshly prepared homogenates werepretreated with SDS (Marın et al., 1986) at a protein concentrationof approximately 10 mg ml−1, with 20 mM K+. After treatment,the homogenates were diluted with a 250 mM sucrose, 20 mMTris–HCl (pH 7.2, 4◦C) solution, to a protein concentration of0.1–0.2 mg ml−1 (final K+ concentration approximately 0.2 mM)and divided into 1 ml aliquots. An aliquot of the freshly preparedhomogenates was immediately assayed for Na,K-ATPase activity.The rest of the aliquots were stored at−70◦C. Every day fora week, single aliquots were thawed, immediately assayed forNa,K-ATPase activity and then discarded. The values representmeans± S.E., for six different animals.
was thawed, assayed for ATPase activity and then dis-carded. The results of this experiment are presented inFig. 3. It may be seen that the Na,K-ATPase activity ofthe 15:00 h homogenates, which was lower than that ofthe 09:00 h homogenates when assayed immediatelyafter preparation of the samples, gradually increasedin activity during the week, reaching values similar tothose of the 09:00 h homogenates at the seventh dayof preparation. On the other hand, the activity of the09:00 h homogenates remained constant. These resultsmay be explained considering the existence of an in-hibitor of the Na,K-ATPase bound to the membranesin the 15:00 h samples. This inhibitor becomes inactiveor is released from the membranes over time. There-fore, one could expect the oscillations of Na,K-ATPaseactivity (Fig. 1) to disappear if all the homogenatesfrom a 24 h period are stored at−70◦C for a weekor longer. This experiment was performed and all
7 9 11 13 15 17 19 21 23 1 3 5
25
50
75
100
Na,K
-AT
Pase
acti
vit
y
(nm
ole
s P
i •
mg
pro
t-1 •
min
-1)
time (h)
Fig. 4. Enzyme activity/time plot of Na,K-ATPase of homogenatesof kidney cortex slices from rats maintained for 2 weeks on a 12 hlight/12 h dark cycle. The homogenates were prepared as describedin Fig. 1, but the ATPase assay was carried out after 15 daysof storage at−70◦C. The freshly prepared homogenates werepretreated with SDS (Marın et al., 1986) at a protein concentrationof approximately 10 mg ml−1, with 20 mM K+. After treatment,the homogenates were diluted with a 250 mM sucrose, 20 mMTris–HCl (pH 7.2, 4◦C) solution to a protein concentration of0.1–0.2 mg ml−1, and then stored at−70◦C for 2 weeks. At theend of the storage period, the homogenates were thawed andimmediately assayed for Na,K-ATPase activity. The horizontalblack bar represents the darkness period. The values representmeans± S.E., for six different animals.
the homogenates (diluted to 0.1–0.2 mg protein ml−1)were assayed for Na,K-ATPase activity immediatelyafter preparation, and again after 15 days of storageat −70◦C. The results are shown inFig. 4. All thesamples, independently of their Na,K-ATPase activityimmediately after preparation, showed similar highvalues 15 days after their preparation. The arithmeticmean of all the activity values over the 24 h period, af-ter 15 days of storage at−70◦C, was 76.5±1.0 nmolesPi mg protein−1 min−1 (mean± S.E.). This value issimilar (P > 0.05) to the maximal ATPase activityvalue shown for the freshly prepared 09:00 h ho-mogenates (79± 3 nmolesPi mg protein−1 min−1).The coefficient of variation was 1.3%, indicating avery low amplitude of oscillation. Spectral analysisdid not reveal any significant frequency pattern.
In general, inhibitors require specific conditionsand cofactors to bind membranes. These require-ments were studied for the inhibitor responsible of the
D. Segura et al. / The International Journal of Biochemistry & Cell Biology 36 (2004) 2054–2065 2059
0
20
40
60
80
100
***
Preincubation
30 min, 37˚C
Plasma 1500 h
Preincubation
30 min, 37˚C
Plasma 0900 h
0
MgCl2
5 mM
MgCl2
0.5 mM
MgCl2
5 mM
MgCl2
0.5 mM
MgCl2
0
MgCl2
Plasma
1500 h
Plasma
0900 h
Control
Na,K
-AT
Pase
acti
vit
y
(nm
ole
s P
i •
mg
pro
t-1 •
min
-1)
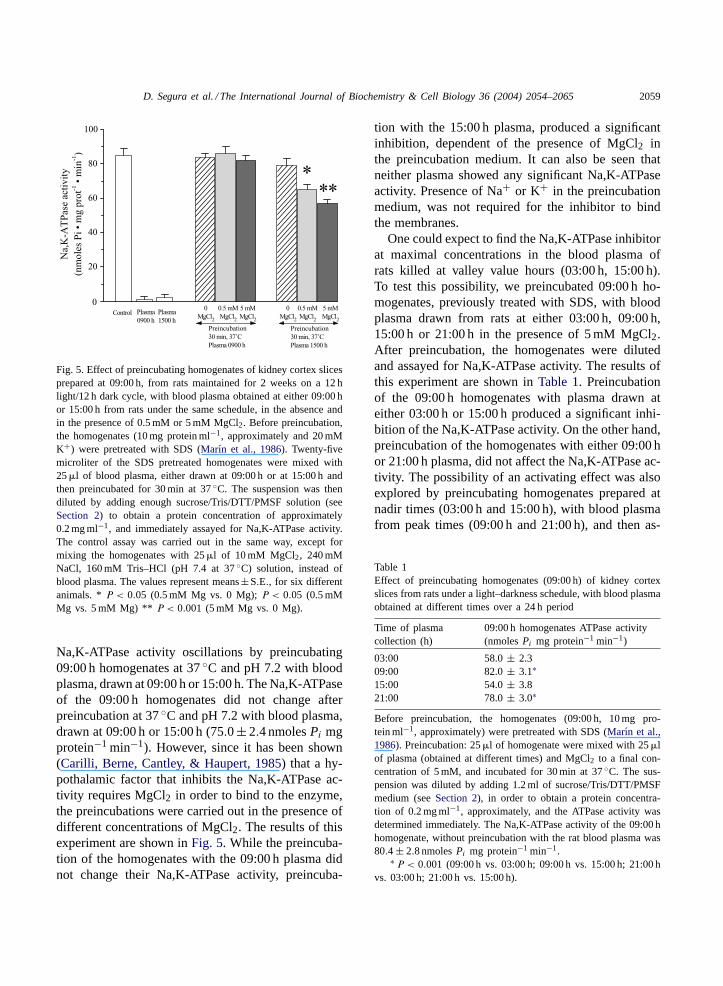
Fig. 5. Effect of preincubating homogenates of kidney cortex slicesprepared at 09:00 h, from rats maintained for 2 weeks on a 12 hlight/12 h dark cycle, with blood plasma obtained at either 09:00 hor 15:00 h from rats under the same schedule, in the absence andin the presence of 0.5 mM or 5 mM MgCl2. Before preincubation,the homogenates (10 mg protein ml−1, approximately and 20 mMK+) were pretreated with SDS (Marın et al., 1986). Twenty-fivemicroliter of the SDS pretreated homogenates were mixed with25�l of blood plasma, either drawn at 09:00 h or at 15:00 h andthen preincubated for 30 min at 37◦C. The suspension was thendiluted by adding enough sucrose/Tris/DTT/PMSF solution (seeSection 2) to obtain a protein concentration of approximately0.2 mg ml−1, and immediately assayed for Na,K-ATPase activity.The control assay was carried out in the same way, except formixing the homogenates with 25�l of 10 mM MgCl2, 240 mMNaCl, 160 mM Tris–HCl (pH 7.4 at 37◦C) solution, instead ofblood plasma. The values represent means±S.E., for six differentanimals. *P < 0.05 (0.5 mM Mg vs. 0 Mg);P < 0.05 (0.5 mMMg vs. 5 mM Mg) ** P < 0.001 (5 mM Mg vs. 0 Mg).
Na,K-ATPase activity oscillations by preincubating09:00 h homogenates at 37◦C and pH 7.2 with bloodplasma, drawn at 09:00 h or 15:00 h. The Na,K-ATPaseof the 09:00 h homogenates did not change afterpreincubation at 37◦C and pH 7.2 with blood plasma,drawn at 09:00 h or 15:00 h (75.0± 2.4 nmolesPi mgprotein−1 min−1). However, since it has been shown(Carilli, Berne, Cantley, & Haupert, 1985) that a hy-pothalamic factor that inhibits the Na,K-ATPase ac-tivity requires MgCl2 in order to bind to the enzyme,the preincubations were carried out in the presence ofdifferent concentrations of MgCl2. The results of thisexperiment are shown inFig. 5. While the preincuba-tion of the homogenates with the 09:00 h plasma didnot change their Na,K-ATPase activity, preincuba-
tion with the 15:00 h plasma, produced a significantinhibition, dependent of the presence of MgCl2 inthe preincubation medium. It can also be seen thatneither plasma showed any significant Na,K-ATPaseactivity. Presence of Na+ or K+ in the preincubationmedium, was not required for the inhibitor to bindthe membranes.
One could expect to find the Na,K-ATPase inhibitorat maximal concentrations in the blood plasma ofrats killed at valley value hours (03:00 h, 15:00 h).To test this possibility, we preincubated 09:00 h ho-mogenates, previously treated with SDS, with bloodplasma drawn from rats at either 03:00 h, 09:00 h,15:00 h or 21:00 h in the presence of 5 mM MgCl2.After preincubation, the homogenates were dilutedand assayed for Na,K-ATPase activity. The results ofthis experiment are shown inTable 1. Preincubationof the 09:00 h homogenates with plasma drawn ateither 03:00 h or 15:00 h produced a significant inhi-bition of the Na,K-ATPase activity. On the other hand,preincubation of the homogenates with either 09:00 hor 21:00 h plasma, did not affect the Na,K-ATPase ac-tivity. The possibility of an activating effect was alsoexplored by preincubating homogenates prepared atnadir times (03:00 h and 15:00 h), with blood plasmafrom peak times (09:00 h and 21:00 h), and then as-
Table 1Effect of preincubating homogenates (09:00 h) of kidney cortexslices from rats under a light–darkness schedule, with blood plasmaobtained at different times over a 24 h period
Time of plasmacollection (h)
09:00 h homogenates ATPase activity(nmolesPi mg protein−1 min−1)
03:00 58.0± 2.309:00 82.0± 3.1∗15:00 54.0± 3.821:00 78.0± 3.0∗
Before preincubation, the homogenates (09:00 h, 10 mg pro-tein ml−1, approximately) were pretreated with SDS (Marın et al.,1986). Preincubation: 25�l of homogenate were mixed with 25�lof plasma (obtained at different times) and MgCl2 to a final con-centration of 5 mM, and incubated for 30 min at 37◦C. The sus-pension was diluted by adding 1.2 ml of sucrose/Tris/DTT/PMSFmedium (seeSection 2), in order to obtain a protein concentra-tion of 0.2 mg ml−1, approximately, and the ATPase activity wasdetermined immediately. The Na,K-ATPase activity of the 09:00 hhomogenate, without preincubation with the rat blood plasma was80.4 ± 2.8 nmolesPi mg protein−1 min−1.
∗ P < 0.001 (09:00 h vs. 03:00 h; 09:00 h vs. 15:00 h; 21:00 hvs. 03:00 h; 21:00 h vs. 15:00 h).
2060 D. Segura et al. / The International Journal of Biochemistry & Cell Biology 36 (2004) 2054–2065
saying their Na,K-ATPase activity. The experimentwas carried out under the same conditions indicatedin Table 1. The preincubation of both homogenates,03:00 h and 15:00 h, with the blood plasma from peaktimes, did not change their original Na,K-ATPaseactivity (45.0 ± 3.2 nmolesPi mg protein−1 min−1
and 48.0 ± 2.9 nmolesPi mg protein−1 min−1, re-spectively). These results give a clear indication thatan Na,K-ATPase inhibiting factor may be found inthe blood of the rats, whose concentration (or po-tency) shows oscillations over a 24 h period, givingthe Na,K-ATPase activity pattern showed inFig. 1.
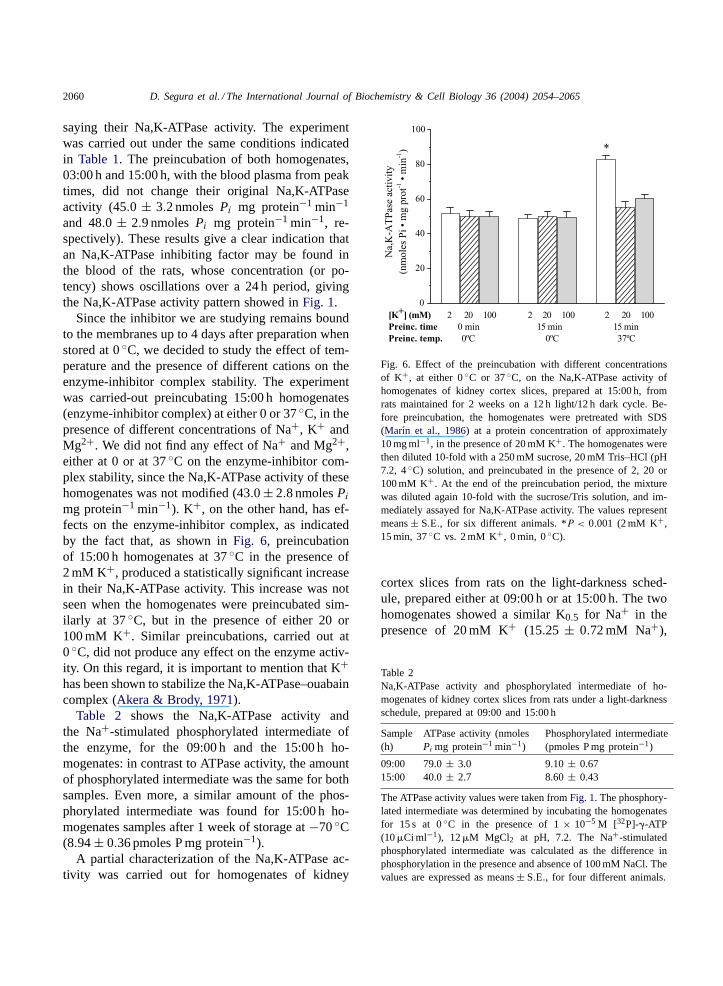
Since the inhibitor we are studying remains boundto the membranes up to 4 days after preparation whenstored at 0◦C, we decided to study the effect of tem-perature and the presence of different cations on theenzyme-inhibitor complex stability. The experimentwas carried-out preincubating 15:00 h homogenates(enzyme-inhibitor complex) at either 0 or 37◦C, in thepresence of different concentrations of Na+, K+ andMg2+. We did not find any effect of Na+ and Mg2+,either at 0 or at 37◦C on the enzyme-inhibitor com-plex stability, since the Na,K-ATPase activity of thesehomogenates was not modified (43.0± 2.8 nmolesPi
mg protein−1 min−1). K+, on the other hand, has ef-fects on the enzyme-inhibitor complex, as indicatedby the fact that, as shown inFig. 6, preincubationof 15:00 h homogenates at 37◦C in the presence of2 mM K+, produced a statistically significant increasein their Na,K-ATPase activity. This increase was notseen when the homogenates were preincubated sim-ilarly at 37◦C, but in the presence of either 20 or100 mM K+. Similar preincubations, carried out at0◦C, did not produce any effect on the enzyme activ-ity. On this regard, it is important to mention that K+has been shown to stabilize the Na,K-ATPase–ouabaincomplex (Akera & Brody, 1971).
Table 2 shows the Na,K-ATPase activity andthe Na+-stimulated phosphorylated intermediate ofthe enzyme, for the 09:00 h and the 15:00 h ho-mogenates: in contrast to ATPase activity, the amountof phosphorylated intermediate was the same for bothsamples. Even more, a similar amount of the phos-phorylated intermediate was found for 15:00 h ho-mogenates samples after 1 week of storage at−70◦C(8.94± 0.36 pmoles P mg protein−1).
A partial characterization of the Na,K-ATPase ac-tivity was carried out for homogenates of kidney
0
20
40
60
80
100
[K+] (mM) 2 20 100 2 20 100 2 20 100
Preinc. time 0 min 15 min 15 min
Preinc. temp. 0ºC0ºC 37ºC
Na,K
-AT
Pase
acti
vit
y
(nm
ole
s P
i •
mg
pro
t-1 •
min
-1) *
Fig. 6. Effect of the preincubation with different concentrationsof K+, at either 0◦C or 37◦C, on the Na,K-ATPase activity ofhomogenates of kidney cortex slices, prepared at 15:00 h, fromrats maintained for 2 weeks on a 12 h light/12 h dark cycle. Be-fore preincubation, the homogenates were pretreated with SDS(Marın et al., 1986) at a protein concentration of approximately10 mg ml−1, in the presence of 20 mM K+. The homogenates werethen diluted 10-fold with a 250 mM sucrose, 20 mM Tris–HCl (pH7.2, 4◦C) solution, and preincubated in the presence of 2, 20 or100 mM K+. At the end of the preincubation period, the mixturewas diluted again 10-fold with the sucrose/Tris solution, and im-mediately assayed for Na,K-ATPase activity. The values representmeans± S.E., for six different animals. *P < 0.001 (2 mM K+,15 min, 37◦C vs. 2 mM K+, 0 min, 0◦C).
cortex slices from rats on the light-darkness sched-ule, prepared either at 09:00 h or at 15:00 h. The twohomogenates showed a similar K0.5 for Na+ in thepresence of 20 mM K+ (15.25 ± 0.72 mM Na+),
Table 2Na,K-ATPase activity and phosphorylated intermediate of ho-mogenates of kidney cortex slices from rats under a light-darknessschedule, prepared at 09:00 and 15:00 h
Sample(h)
ATPase activity (nmolesPi mg protein−1 min−1)
Phosphorylated intermediate(pmoles P mg protein−1)
09:00 79.0± 3.0 9.10± 0.6715:00 40.0± 2.7 8.60± 0.43
The ATPase activity values were taken fromFig. 1. The phosphory-lated intermediate was determined by incubating the homogenatesfor 15 s at 0◦C in the presence of 1× 10⁻⁵ M [32P]-�-ATP(10�Ci ml−1), 12�M MgCl2 at pH, 7.2. The Na+-stimulatedphosphorylated intermediate was calculated as the difference inphosphorylation in the presence and absence of 100 mM NaCl. Thevalues are expressed as means± S.E., for four different animals.

D. Segura et al. / The International Journal of Biochemistry & Cell Biology 36 (2004) 2054–2065 2061
0 5 10 15 20
0
10
20
30
40
50
60
70
80
90
0900hN
a,K
-AT
Pase
acti
voty
(nm
ole
s P
i •
mg
pro
t-1 •
min
-1)
[K+
] (mM)
1500h
Fig. 7. Effect of different concentrations of K+, in the incubation medium, on the Na,K-ATPase activity of homogenates of kidney cortexslices, prepared at either 09:00 h or 15:00 h, from rats maintained for 2 weeks on a 12 h light/12 h dark cycle. Before assays, the homogenateswere pretreated with SDS (Marın et al., 1986) at a protein concentration of approximately 10 mg ml−1, in the presence of 20 mM K+. Thehomogenates were then diluted 100-fold with a 250 mM sucrose, 20 mM Tris–HCl (pH 7.2, 4◦C) solution, and immediately assayed forATPase activity in the presence of 100 mM Na+, 5 mM Mg2+ and 2 mM Tris-ATP. The values represent means± S.E., for six differentanimals.
and a similar K0.5 for ATP, with a 5:2 Mg:ATP ratio(0.59 ± 0.03 mM ATP). For both homogenates, theoptimal pH for Na,K-ATPase activity was 7.5, andthe optimal temperature 50◦C. In both cases, 5 mMouabain produced 100% inhibition of the ATPaseactivity. The effect of different K+ concentrations inthe assay medium in the presence of 100 mM Na+on the Na,K-ATPase activity, was also evaluated forthe 09:00 h and 15:00 h homogenates. The results ofthis study are shown inFig. 7, it can be seen thatthe 15:00 h homogenates showed a different behaviorthan that of the 09:00 h homogenates. K+ concentra-tions under 2 mM stimulated the ATPase activity in asimilar way for both homogenates. On the contrary,K+ concentrations above 2 mM, led the 15:00 h ho-mogenates to ATPase activity values lower than thoseof the 09:00 h homogenates. Therefore, only the K05for K+ for the 09:00 h homogenates was estimatedand it resulted to be 0.67± 0.03 mM K+.
4. Discussion
The results of this study indicate for the first time,to the best of our knowledge, that the activity of the
Na,K-ATPase of rat kidney cortex cells displays dailyoscillations (Fig. 1). These oscillations could be theresult of several processes, such as (1) differential for-mation of membrane vesicles during preparation andstorage; (2) changes along the day in the number ofATPase molecules; and (3) variation in the number ofactive ATPase molecules and/or in the turnover rateof the enzyme. The first possibility was eliminated bytreating the rat kidney cortex homogenates with SDSbefore the ATPase activity assays. Neither did changesalong the day in the number of ATPase molecules ap-pear to be the cause, since the level of the phospho-rylated intermediate was similar for the two samples:09:00 h (peak activity value) and 15:00 h (valley activ-ity value) (Table 2). In addition, after 1 week of storageat−70◦C, the Na,K-ATPase activity of the 15:00 h ho-mogenates rose to values similar to those of the 09:00 hhomogenates (Fig. 3), without showing any variationin the maximal amount of phosphorylated intermedi-ate when compared with that of the freshly preparedhomogenates (8.75±0.55 pmoles P mg protein−1 and9.03± 0.44 pmoles P mg protein−1, freshly preparedand after 1 week of storage at−70◦C, respectively).Consequently, the third possibility, i.e., variation inthe number of active ATPase molecules and/or in the
2062 D. Segura et al. / The International Journal of Biochemistry & Cell Biology 36 (2004) 2054–2065
turnover rate of the enzyme, appears to explain thedaily oscillations.
The fact that the ATPase activity of all the 24 hsamples showed uniformly high values after a storageperiod at−70◦C (Fig. 4), and that the homogenateswith high ATPase activity showed some degree ofinhibition after preincubation with blood plasma fromanimals with low ATPase activity (Table 1), suggeststhat the oscillations of the Na,K-ATPase activity areprobably produced by an endogenous inhibitor of thisenzyme. Release (or degradation) of this inhibitor dur-ing storage at−70◦C would allow higher enzymaticactivity. On the other hand, binding of the inhibitorto the enzyme by preincubating 09 h homogenateswith either the 03:00 h or 15:00 h plasma would pro-duce the observed inhibition of Na,K-ATPase activity.In this respect, it has been shown that numeroushormones and autacoids may cause rapid changesin Na,K-ATPase activity (Aizman, Rabinowitz, &Mayer-Harnisch, 1994), either acting directly on theATPase, or through specific intracellular messengers(Bertorello & Aperia, 1990).
The binding of the Na,K-ATPase inhibitor to thecell membranes is stabilized by K+ (Fig. 6), a char-acteristic that has also been reported to stabilize theouabain–enzyme complex (Akera & Brody, 1971).This fact can be taken as an indication that wecould be in the presence of some of the endogenousouabain analogues already detected in blood plasma,brain, heart and kidney (Blaustein, 1993). However,if this were the case, the phosphorylated intermedi-ate measured in our experiments for the 09:00 h andthe 15:00 h homogenates (Table 2), would not repre-sent the maximal enzyme concentration, because theouabain–enzyme complex would be in a conforma-tion with very low affinity for binding of ATP andhence for being phosphorylated (Sen & Tobin, 1969).Consequently, the phosphorylated intermediate deter-mined for the 15:00 h samples, should be lower thanthat determined for the 09:00 h samples, which wasnot the case (Table 2). Additionally, the amount ofphosphorylated intermediate, determined before andafter 1 week storage of the 1500 h homogenates at−70◦C was the same, while there was an importantincrease in Na,K-ATPase activity (Fig. 3). Since theamount of the Na-stimulated phosphorylated inter-mediate may be taken as an indicator of the numberof total Na,K-ATPase molecules, we can conclude
that (1) the total number of ATPase molecules inthe 0900 h and 1500 h homogenates is the same, and(2) the inhibitor is not a ouabain analogue. This lat-ter conclusion is further reinforced by the fact thatthe inhibitor present in the 0300 h and in the 1500 hplasma samples, was able to bind to the enzyme in thepresence of 20 mM K+ (Table 1), which is known tointerfere with the formation of the ouabain–enzymecomplex. In addition, in the preincubation medium ofthe homogenates with plasma, there were very lowconcentrations of Na+ and ATP, which are essentialsfor type I ouabain binding, and very low concen-trations of Pi which is essential for type II ouabainbinding (Sen & Tobin, 1969).
The behavior of the enzyme under different K+concentrations (Figs. 6 and 7), can be explained con-sidering that at low K+ concentrations the inhibitoris released and hence, the ATPase shows full activ-ity; at higher K+ concentrations, the inhibitor remainsbound to the membranes, and hence the enzyme is in-hibited.Fig. 6shows also that even when the inhibitoris tightly bound to the membranes, it can be easily re-leased from them, if the right conditions are given, i.e.37◦C and low K+ concentrations. These results con-stitute an evidence to be in the presence of a reversibleinhibition. Even more, since: (a) there are no changesin the number of ATPase molecules for the 0900 and1500 h homogenates (Table 2); and (b) theKm, ei-ther for Mg:ATP or for Na+ is the same for both ho-mogenates, it becomes clear that the inhibitor changesthe turnover rate of the enzyme, possibly through areversible noncompetitive inhibition, since there areno changes in theKm, either for Mg:ATP or for Na+,with an important change in theVmax of the enzyme.
There are several endogenous proteins or pep-tides of different molecular masses that produce animportant and specific inhibition of Na,K-ATPase(Araki, Kuroki, Ito, Kuwada, & Tachibana, 1989;Bhattacharyya & Sen, 1997; Chao, Chiou, Jeng, &Chang, 1996; Chiou and Vesely, 1995; Ishizuka,Fukushima, Urayama, & Akera, 1991). Some ofthese have been shown to bind to a site differentfrom that of ouabain (Bhattacharyya & Sen, 1997;Chiou & Vesely, 1995), with accordingly differentbehavior. An inhibitor of the Na,K-ATPase boundto the plasma membranes of platelets and peripheralblood mononuclear cells has been identified in sub-jects with allergic rhinitis (Van Deusen, Gentile, &

D. Segura et al. / The International Journal of Biochemistry & Cell Biology 36 (2004) 2054–2065 2063
Skoner, 1997). Similarly to what we found in ourexperiments, the Na,K-ATPase inhibitor was alsodisplaced from the plasma membranes by 1 weekof storage at−70◦C. In addition, the same grouphas shown that blood plasma of the same subjectscontains a dilutable Na,K-ATPase inhibitor, which isable to down-regulate the Na,K-ATPase activity ofcanine kidney and isolated platelet membranes of nonallergic subjects (Gentile & Skoner, 1993; Skoner,Gentile, & Evans, 1990; Skoner, Gentile, & Evans,1991). These authors proposed that the displacementof the Na,K-ATPase inhibitor could result from afreezing-associated molecular rearrangement of thelipid bilayer.
The inhibitor responsible for the oscillations ofthe Na,K-ATPase activity could, like oligomycin, beblocking the E1–E2 conformational change, inhibit-ing in this way the Na,K-ATPase activity, withoutinhibiting the phosphorylation of the enzyme (Hobbs,Albers, & Froehlich, 1983). If this were the case, theinhibitor would be changing the number of activeATPase molecules. On the other hand, if the inhibitordiminishes either the phosphorylation or the dephos-phorylation rate of Na,K-ATPase, then it would beaffecting the turnover rate of the enzyme. It is there-fore, necessary to carry out additional experiments, inorder to determine the precise mechanism of actionof the inhibitor.
Preliminary experiments were carried out in ourlaboratory in order to partially characterized this en-dogenous Na,K-ATPase inhibitor. It was found thatthe activity of the inhibitor is resistant to a previoustreatment with a weak acid, such as the sulfosalicylicacid; it has a molecular weight under 3 kDa; and it iswater-soluble. In other words, the inhibitor is neithera protein nor a lipid. More work is under way in or-der to explore the chemical nature of this endogenousNa,K-ATPase inhibitor.
Since our experiments were not done on fastedanimals, it is interesting to consider the possibilitythat the circadian appearance of the inhibitor of theNa,K-ATPase in the blood plasma of the rat, couldbe due secondarily to something the rat eats in acircadian manner. On this regard, it has been previ-ously reported (Rabinowitz et al., 1986) that fastingdecreases both sodium and potassium excretion dras-tically, eliminates the sodium diurnal rhythm anddiminishes the amplitude of the potassium rhythm. If
there is something the rat eats that is associated withthe inhibition of the Na,K-ATPase activity in a cir-cadian manner, then this compound should be takenat least twice a day since there are two valley valuesof the ATPase activity per day cycle. This possibilityshould be studied by running the experiments withfasted animals.
The Na,K-ATPase plays an important role in thereabsorption of Na+ through the kidney tubular cells,hence, the rhythmicity of this enzyme’s activity couldplay an important role in the circadian rhythms ofurinary sodium excretion and urine flow rates (Mannet al., 1976; Min et al., 1966; Rabinowitz et al.,1986). Specifically, peak values of this ATPase activ-ity (0900 h and 2100 h) should be correlated to valleyvalues of sodium excretion, and on the contrary, val-ley values of the Na,K-ATPase activity (0300 h and1500 h) should be correlated to peak values of sodiumexcretion. On this regard, it is important to mentionthat the diurnal course of renal sodium excretion inhealthy male subjects have been reported to have peakvalues at 16:00 h and 24:00 h, and valley values at08:00 h and 20:00 h (Mann et al., 1976). Even whenthere is some level of negative correlation betweenthe two parameters, it must be considered that (1)we are comparing the results of human subjects withthose of rats; (2) the sodium excretion is not solelyunder control of the Na,K-ATPase activity and; (3)the sodium excretion can be altered by food intake(Rabinowitz et al., 1986).
The physiological and pathophysiological impor-tance of the present results, should be understoodin terms of the impact of the modulation of theNa,K-ATPase activity on the Na+ gradient-dependentprocesses present in many cells. It is also impor-tant to mention that the reported oscillations of theNa,K-ATPase activity should be kept in mind in anystudy of membrane transport processes related, pri-marily or secondarily, to the activity of this enzyme.
Acknowledgements
Partially supported by grants from Consejo Na-cional de Investigaciones Cientıficas y Tecnológicas(CONICIT), Venezuela, No. S1-2292 and DeutschesAkademisches Austauchdienst, DAAD, Germany.The authors are grateful to Dr. Peter Taylor for read-

2064 D. Segura et al. / The International Journal of Biochemistry & Cell Biology 36 (2004) 2054–2065
ing and commenting on the manuscript. We alsothank Drs. Y. Casart and J.R. Elvir for their help dur-ing enzyme activity assays and Mr. J. Coello for histechnical assistance with the animals.
References
Aizman, R. I., Rabinowitz, L., & Mayer-Harnisch, C. (1994).Circadian rhythms and time course of adaptive sodium andpotassium excretion in rats after uninephrectomy.AmericanJournal of Physiology, 266, R1454–R1462.
Akera, T., & Brody, T. M. (1971). Membrane adenosinetriphosphatase. The effect of potassium on the formation anddissociation of the ouabain–enzyme complex.The Journal ofPharmacology and Experimental Therapeutics, 176, 545–557.
Araki, K., Kuroki, J., Ito, O., Kuwada, M., & Tachibana, S.(1989). Novel peptide inhibitor (SPAI) of Na+, K+-ATPasefrom porcine intestine.Biochemistry and Biophysics ResearchCommunication, 164, 496–502.
Bertorello, A., & Aperia, A. (1990). Short-term regulation ofNa+,K+-ATPase activity by dopamine.American Journal ofHypertension, 3(Suppl), 51S–54S.
Bhattacharyya, D., & Sen, P. C. (1997). Purification and functionalcharacterization of a low-molecular-mass Na+,K+-ATPaseinhibitor protein from rat brain cytosol.European Journal ofBiochemistry, 244, 829–834.
Blaustein, M. P. (1993). Physiological effects of endogenousouabain: control of intracellular Ca2+ stores and cellresponsiveness.American Journal of Physiology, 264, C1367–C1387.
Box, G. E. P., & Jenkins, G. M. (1976).Time series analysis:Forecasting and control. San Francisco: Holden-Day.
Bradford, M. M. (1976). A rapid and sensitive method for thequantitation of microgram quantities of protein utilizing theprinciple of protein-dye binding.Analytical Biochemistry, 72,248–254.
Brillinger, D. R. (1975).Time series: Data analysis and theory.New York: Holt, Rinehart & Winston.
Bünning, E. (1993).The physiological clock. New York: Springer.Carilli, C. T., Berne, M., Cantley, L. C., & Haupert Jr., G. T.
(1985). Hypothalamic factor inhibits the (Na,K)ATPase fromthe extracellular surface. Mechanism of inhibition.Journal ofBiological Chemistry, 260, 1027–1031.
Chao, C. F., Chiou, S. T., Jeng, H., & Chang, W. C. (1996).The porcine sperm motility inhibitor is identical to beta-microseminoprotein and is a competitive inhibitor of Na+, K+-ATPase. Biochemical Biophysical Research Communication,218, 623–628.
Chen, L. D., Tan, D. X., Reiter, R. J., Yaga, K., Poeggeler, B., &Kumar, P. et al., (1993). In vivo and in vitro effects of the pinealgland and melatonin on [Ca2+ + Mg2+]-dependent ATPase incardiac sarcolemma.Journal of Pineal Research, 14, 178–183.
Chiou, S., & Vesely, D. L. (1995). Kaliuretic peptide: The mostpotent inhibitor of Na+-K+ ATPase of the atrial natriureticpeptides.Endocrinology, 136, 2033–2039.
Doucet, A. (1988). Function and control of Na-K-ATPase insingle nephron segments of the mammalian kidney.KidneyInternational, 34, 749–760.
Edmunds, J. (1988).Cellular and molecular basis of biologicalclocks. New York: Springer.
Gentile, D. A., & Skoner, D. P. (1993). A circulating inhibitor of theplatelet Na+,K+ adenosine triphosphatase enzyme in patientswith allergic diseases.Pediatric Asthma Allergy Immunology,7, 217–226.
Harley, C., & Rusak, B. (1993). Daily variation in active glycogenphosphorylase patches in the molecular layer of rat dentategyrus.Brain Research, 626, 310–317.
Hobbs, A. S., Albers, R. W., & Froehlich, J. P. (1983).Effects of oligomycin on the partial reactions of the sodiumplus potassium-stimulated adenosine triphosphatase.Journal ofBiological Chemistry, 258, 8163–8168.
Ishizuka, N., Fukushima, Y., Urayama, O., & Akera, T. (1991).Na+, K+-ATPase inhibition by an endogenous peptide, SPAI-1,isolated from porcine duodenum.Biochimica Biophysica Acta,1069, 259–266.
Jørgensen, P. L. (1986). Structure, function and regulation of Na,K-ATPase in the kidney.Kidney International, 29, 10–20.
Katz, A. I. (1982). Renal Na-K-ATPase: Its role in tubular sodiumand potassium transport.American Journal of Physiology, 242,F207–F219.
Knauf, P. A., Proverbio, F., & Hoffman, J. F. (1974). Chemicalcharacterization and pronase susceptibility of the Na:K pump-associated phosphoprotein of human red blood cells.Journalof General Physiology, 63, 305–323.
Kondo, T., Tsinoremas, N. F., Golden, S. S., Johnson, C. H.,Kutsuna, S., & Ishiura, M. (1994). Circadian clock mutants ofcyanobacteria.Science, 266, 1233–1236.
Mann, H., Stiller, S., & Korz, R. (1976). Biological balanceof sodium and potassium: A control system with oscillatingcorrecting variable.Pflügers Archives, 362, 135–139.
Marın, R., Proverbio, T., & Proverbio, F. (1986). Inside-outbasolateral plasma membrane vesicles from rat kidney proximaltubular cells.Biochimica Biophysica Acta, 858, 195–201.
Min, H. K., Jones, J. E., & Flink, E. B. (1966). Circadian variationsin renal excretion of magnesium, calcium, phosphorus, sodium,and potassium during frequent feeding and fasting.FederalProceedings, 25, 917–921.
Monro, D. M., & Branch, J. L. (1976). The chirp discrete Fouriertransform of general length.Applied Statistics, 26, 351–361.
Monro, D. M. (1975). Complex discrete fast Fourier transform.Applied Statistics, 24, 153–160.
Peleg, L., Dotan, A., Luzato, P., & Ashkenazi, I. E. (1990).Long ultradian rhythms in red blood cells and ghostsuspensions: possible involvement of cell membrane.In VitroCell Developmental Biology, 26, 978–982.
Proverbio, F., Proverbio, T., & Marın, R. (1986). Na+-ATPase isa different entity from the (Na+ + K+)-ATPase in rat kidneybasolateral plasma membranes.Biochimica Biophysica Acta,858, 202–205.
Rabinowitz, L., Wydner, C. J., Smith, K. M., & Yamauchi, H.(1986). Diurnal potassium excretory cycles in the rat.AmericanJournal of Physiology, 250, F930–F941.

D. Segura et al. / The International Journal of Biochemistry & Cell Biology 36 (2004) 2054–2065 2065
Sen, A. K., & Tobin, T. (1969). A cycle for ouabaininhibition of sodium- and potassium-dependent adenosinetriphosphatase.Journal of Biological Chemistry, 244, 6596–6604.
Skoner, D. P., Gentile, D., & Evans, R. (1990). Decreased activityof the platelet Na+,K+-adenosine triphosphatase enzyme inallergic subjects.Journal of Laboratory Clinical Medicine, 115,535–540.
Skoner, D. P., Gentile, D., & Evans, R. W. (1991). A circulatinginhibitor of the platelet Na+,K+ adenosine triphosphatase(ATPase) enzyme in allergy.Journal of Allergy ClinicalImmunology, 87, 476–482.
Uchiyama, Y. (1990). Rhythms in morphology and function ofhepatocytes.Journal of Gastroenterology Hepatology, 5, 321–333.
Van Deusen, M. A., Gentile, D. A., & Skoner, D. P. (1997).Inhibition of the sodium, potassium adenosine triphosphataseenzyme in peripheral blood mononuclear cells of subjects withallergic rhinitis.Annual Allergy Asthma Immunology, 78, 259–264.
Vitaterna, M. H., King, D. P., Chang, A. M., Kornhauser, J. M.,Lowrey, P. L., & McDonald, J. D. et al., (1994). Mutagenesisand mapping of a mouse gene, Clock, essential for circadianbehavior.Science, 264, 719–725.