A 3D Simulation of Single-Channel High-Temperature ... - MDPI
17
applied sciences Article A 3D Simulation of Single-Channel High-Temperature Polymer Exchange Membrane Fuel Cell Performances Mohammad Yaghoub Abdollahzadeh Jamalabadi 1,2, * , Milad Ghasemi 3 , Rezvan Alamian 4 , Ebrahim Afshari 5 , Somchai Wongwises 6,7 , Mohammad Mehdi Rashidi 8 and Mostafa Safdari Shadloo 9 1 Department for Management of Science and Technology Development, Ton Duc Thang University, Ho Chi Minh City 700000, Vietnam 2 Faculty of Civil Engineering, Ton Duc Thang University, Ho Chi Minh City 700000, Vietnam 3 Faculty of Mechanical Engineering, Babol Noshirvani University of Technology, Babol 47148-71167, Iran 4 Sea-Based Energy Research Group, Babol Noshirvani University of Technology, Babol 47148-71167, Iran 5 Department of Mechanical Engineering, Faculty of Engineering, University of Isfahan, Hezar-Jerib Ave., Isfahan 81746-73441, Iran 6 Fluid Mechanics, Thermal Engineering and Multiphase Flow Research Lab. (FUTURE), Department of Mechanical Engineering, Faculty of Engineering, King Mongkut’s University of Technology Thonburi, Bangmod, Bangkok 10140, Thailand 7 The Academy of Science, The Royal Society of Thailand, Sanam Suea Pa, Dusit, Bangkok 10300, Thailand 8 Shanghai Automotive Wind Tunnel Center, Tongji University, Shanghai 201804, China 9 CORIA Lab./CNRS, University and INSA of Rouen, Normandie University, 76000 Rouen, France * Correspondence: [email protected] Received: 4 August 2019; Accepted: 30 August 2019; Published: 3 September 2019 Abstract: The fuel cell is an electrochemical energy converter that directly converts the chemical energy of the fuel into electrical current and heat. The fuel cell has been able to identify itself as a source of clean energy over the past few decades. In order to achieve the durability and stability of fuel cells, many parameters should be considered and evaluated Therefore, in this study, a single-channel high-temperature polymer exchange membrane fuel cell (HT-PEMFC) has been numerically simulated in three-dimensional, isothermal and single-phase approach. The distribution of the hydrogen and oxygen concentrations, as well as water in the anode and cathode, are shown; then the effect of different parameters of the operating pressure, the gas diffusion layer porosity, the electrical conductivity of the gas diffusion layer, the ionic conductivity of the membrane and the membrane thickness are investigated and evaluated on the fuel cell performance. The results showed that the pressure drop in the cathode channel was higher than the anode channel, so that the pressure drop in the cathode channel was higher than 9 bars but, in the anode channel was equal to 2 bars. By examining the species concentration, it was observed that their concentration at the entrance was higher and at the output was reduced due to participation in the reaction and consumption. Also, with increasing the operating pressure, the electrical conductivity of the gas diffusion layer and ionic conduction of the membrane, the performance of the fuel cell is improved. Keywords: high-temperature PEM fuel cell; operating pressure; porosity coefficient; ionic conduction; electrical conductivity; fuel cell performance 1. Introduction Due to the environmental issues posed by fossil energy sources, reducing the effects of these sources is one of the main priorities in energy planning today. In this context, in addition to striving Appl. Sci. 2019, 9, 3633; doi:10.3390/app9173633 www.mdpi.com/journal/applsci
-
Upload
khangminh22 -
Category
Documents
-
view
4 -
download
0
Transcript of A 3D Simulation of Single-Channel High-Temperature ... - MDPI

applied sciences
Article
A 3D Simulation of Single-ChannelHigh-Temperature Polymer Exchange MembraneFuel Cell Performances
Mohammad Yaghoub Abdollahzadeh Jamalabadi 1,2,* , Milad Ghasemi 3, Rezvan Alamian 4 ,Ebrahim Afshari 5, Somchai Wongwises 6,7, Mohammad Mehdi Rashidi 8
and Mostafa Safdari Shadloo 9
1 Department for Management of Science and Technology Development, Ton Duc Thang University,Ho Chi Minh City 700000, Vietnam
2 Faculty of Civil Engineering, Ton Duc Thang University, Ho Chi Minh City 700000, Vietnam3 Faculty of Mechanical Engineering, Babol Noshirvani University of Technology, Babol 47148-71167, Iran4 Sea-Based Energy Research Group, Babol Noshirvani University of Technology, Babol 47148-71167, Iran5 Department of Mechanical Engineering, Faculty of Engineering, University of Isfahan, Hezar-Jerib Ave.,
Isfahan 81746-73441, Iran6 Fluid Mechanics, Thermal Engineering and Multiphase Flow Research Lab. (FUTURE), Department of
Mechanical Engineering, Faculty of Engineering, King Mongkut’s University of Technology Thonburi,Bangmod, Bangkok 10140, Thailand
7 The Academy of Science, The Royal Society of Thailand, Sanam Suea Pa, Dusit, Bangkok 10300, Thailand8 Shanghai Automotive Wind Tunnel Center, Tongji University, Shanghai 201804, China9 CORIA Lab./CNRS, University and INSA of Rouen, Normandie University, 76000 Rouen, France* Correspondence: [email protected]
Received: 4 August 2019; Accepted: 30 August 2019; Published: 3 September 2019�����������������
Abstract: The fuel cell is an electrochemical energy converter that directly converts the chemicalenergy of the fuel into electrical current and heat. The fuel cell has been able to identify itselfas a source of clean energy over the past few decades. In order to achieve the durability andstability of fuel cells, many parameters should be considered and evaluated Therefore, in this study,a single-channel high-temperature polymer exchange membrane fuel cell (HT-PEMFC) has beennumerically simulated in three-dimensional, isothermal and single-phase approach. The distributionof the hydrogen and oxygen concentrations, as well as water in the anode and cathode, are shown;then the effect of different parameters of the operating pressure, the gas diffusion layer porosity,the electrical conductivity of the gas diffusion layer, the ionic conductivity of the membrane and themembrane thickness are investigated and evaluated on the fuel cell performance. The results showedthat the pressure drop in the cathode channel was higher than the anode channel, so that the pressuredrop in the cathode channel was higher than 9 bars but, in the anode channel was equal to 2 bars.By examining the species concentration, it was observed that their concentration at the entrance washigher and at the output was reduced due to participation in the reaction and consumption. Also,with increasing the operating pressure, the electrical conductivity of the gas diffusion layer and ionicconduction of the membrane, the performance of the fuel cell is improved.
Keywords: high-temperature PEM fuel cell; operating pressure; porosity coefficient; ionic conduction;electrical conductivity; fuel cell performance
1. Introduction
Due to the environmental issues posed by fossil energy sources, reducing the effects of thesesources is one of the main priorities in energy planning today. In this context, in addition to striving
Appl. Sci. 2019, 9, 3633; doi:10.3390/app9173633 www.mdpi.com/journal/applsci

Appl. Sci. 2019, 9, 3633 2 of 17
for maximum energy savings, the most important concern is to replace these energy sources withrenewable energies [1]. Consequently, the use of these resources such as fuel cell, wave [2,3], wind [4],solar, and hydrothermal energies attained substantial attention [5–7]. Fuel cells, especially PEM fuelcells with high power density, high efficiency, and short startup time are recognized as one of the mostencouraging technologies for achieving these goals that can be employed in various applications [8–10].
Numerous research has been done recently for optimization of the PEM fuel cells performanceconsidering various parameters that can be effective on its proficiency [11–15]. The operatingtemperature in determining the type of PEM fuel cells is an important parameter. In addition tooperating temperature, the main difference between normal PEM fuel cell and high temperature isthe membrane of the fuel cell. The normal polymer membrane is a Nafion® type that is made fromperfluoro-carbon-sulfonic acid ionomer. The fuel entering the cell should be saturated with steam sothat the membrane does not dry because the transfer mechanism uses the water as a proton carrierfrom the membrane. The function of the fuel cell at the desired temperature can lead to a blockageproblem, which causes the membrane to flood and reduce the ionization of the membrane. Therefore,research was directed into the development of a new membrane so that it can function well above100 ◦C and have a high conductivity in low moisture [16].
Improved membranes should have low material costs and high durability. Acid-based polymermembranes have been developed to achieve high proton conductivity, and one of the most favoriteacid-base polymer membranes is polybenzimidazole (PBI) doped with phosphoric acid to increasethe protonic conductivity. Phosphoric acid has more stability than other acids. In the context of thedevelopment of HT-PEMFCs, Authayanun et al. performed extensive studies and evaluated the resultsof one, two, and three-dimensional simulations in this area [16]. Studies have shown that most researchhas been done to examine the materials and processes for improving fuel cell performance, includingoptimizing and simplifying fuel cell components and simulation of fuel cell systems to diminish theircost and enhance the efficiency, stability and durability compared to combustion engines; these shouldbe considered in the studies.
Rosly et al. [17] reviewed the research on various HT-PEMFCs and parameters affecting theirperformance. Based on their investigations, it is possible to find suitable solutions for increasing thestability and durability of the fuel cell and create proper conditions for better fuel cell performance. Forthis purpose, firstly, the components and performance of low-temperature fuel cell have been explored,and the need to go towards the design and development of high-temperature fuel cell components hasbeen expressed in order to be able to achieve key factors in optimum fuel cell performance. Also, theeffect of various parameters on the performance of PEMFC such as different working temperatures,working pressures, and combinations of these parameters was evaluated experimentally by Wang etal. [18]. Voltage-current diagrams obtained from experimental results have shown the effect of thesevariables on fuel cell performance. Graphs have revealed that fuel cell performance has improved withincreasing fuel cell pressure and temperature due to increased fuel reaction rate. Furthermore, thesimulation of a three-dimensional fuel cell model was implemented, and the results were comparedwith experimental work, which showed an acceptable match between experimental and numerical data.Subsequently, Cheddie and Munroe presented a one-dimensional mathematical model for predictingthe performance of HT-PEMFC with PBI membrane [19]. Their attention was on MEA and evaluatedthe energy and mass transfer in the gas diffusion layer (GDL) and the electrochemical model. Themost significant loss in the PBI fuel cell is the activation over-potential. The second-largest was Ohmicover-potential. The performance of this type of fuel cell has also been improved by increasing themembrane conductivity and enhancing catalyst performance.
Scott et al. [20] improved a high-temperature fuel cell with PBI membrane condensed by phosphoricacid in a one-dimensional and steady-state. In this research, the effect of operating pressure and celltemperature on the open circuit potential, and the effect of diffusion coefficients, exchange currentdensity, and water transport across the membrane on the conductivity of the PBI membrane wereexamined. Their results are consistent with experimental data. Olapade et al. [21] studied the

Appl. Sci. 2019, 9, 3633 3 of 17
morphological properties of HT-PEMFC components by one-dimensional modeling, in steady-stateand non-isothermal conditions, so that by achieving an optimal state, the catalyst layer can hold thesteam generated from electrochemical reactions brought on by the feed gases. Their simulation wascarried out at the temperature of 190 ◦C and operating pressure of 2 bars. The results showed that theporosity reduction of the GDL leads to retaining more water in the catalyst layer. Also, they stated thatthe use of micro-porous layer also helps to keep water generated in the catalyst layer by reducing thepore size and porosity of the layer. It should be noted, however, that the pore size and porosity of thefuel cell components should not be too small to prevent the increasing of over-potential of oxygenconcentration. Besides, the porosity reduction of the GDL causes the steam to rise in the catalyst layer.The optimal values of the GDL porosity and the micro- porous layer depend on factors such as cellvoltage, operating pressure and relative humidity, which have been investigated and calculated inthis paper.
Shamardina et al. [22] simulated two-dimensional HT-PEMFC and investigated the role oftransport in the cathode catalyst layer. Their calculations showed that close to the oxygen channelinlet, the cathode catalyst layer works in the regime limited by poor proton transport, while close tothe outlet, the cathode catalyst layer operation is specified by poor oxygen transport. Sue et al. [23]examined numerically and experimentally the performance of high-temperature fuel cell. In theirnumerical simulation, they used a two-dimensional model and observed the effect of PBI loading onthe fuel cell. In their research, PBI value in the catalyst layer is considered between 5 to 30 wt%, and celltemperature is considered in the range of 160–200 ◦C. Sun et al. [24] numerically surveyed the effect oftemperature and mass transfer in an HT-PEMFC. Their models were simulated in two-dimensionaland single-phase models, and the effect of the porosity of the GDL and its thickness on the fuel cellperformance were evaluated. The results show that increasing the cell temperature and the porosity ofthe GDL and reducing the thickness of the GDL will improve the performance of high-temperaturefuel cells.
Using the PEM fuel cell simulation, Al-Baghdadi and Al-Janabi [25] studied and optimized theparameters affecting the performance of the fuel cell. Their models have a direct gas flow channeland are simulated three-dimensional, single-phase, and non-isothermal. They studied the effectof temperature, pressure, flow stoichiometry, gas channel width, thickness of the GDL, membranethickness, porosity of the GDL and thermal conductivity of the GDL on the fuel cell performance.Zhang et al. [26] investigated the effect of relative humidity on the performance of single-cell PEM fuelcell at temperature of 120 ◦C and pressure of 1 atmosphere. Their experimental results showed that withrelative humidity decreasing from 100 to 25 percent, the voltage reached from 0.675 V to 0.358 V andthe performance and production capacity of the fuel cell decreased, since, with decreasing of humidity,the electrode reaction and mass penetration rate were slower and membrane resistance increases. Theyindicated that by enhancing the relative humidity from 25 to 100 percent, the pressure drop in theanode and the cathode increases, and the partial pressure of oxygen and hydrogen decreases, whichare a function of the input relative humidity at temperature of 120 ◦C and pressure of 1 atmosphere.Ubong et al. [27] experimentally and numerically studied the performance of HT-PEMFCs. Theirmodel is a single cell with a serpentine channel, and their simulation were implemented in steady-state,three-dimensional, and isothermal.
Su et al. [28] addressed the three-dimensional and isothermal simulation of an HT-PEMFC withPTFE membrane. They examined the parameters such as the distribution of saturated water, membraneconductivity, temperature, flow density, etc. on the performance of the fuel cell. Wang et al. [29]investigated the start-up process modeling of an HT-PEMFC using Comsol software. Starting HT-PEMfuel cells from room temperature to a proper operating temperature is a challenge. In this study,the preheated air was used to increase the temperature of the cooling channel or gas channel, andthe optimum state was selected by checking the start-up time and temperature behavior of the fuelcell. Liu and Chang [30] experimentally investigated the effects of the micro-porous layer on theperformance of an HT-PEMFC based on PBI. Using PBI electrolyte, they expressed the effect of MPL

Appl. Sci. 2019, 9, 3633 4 of 17
compounds, including PTFE and carbon and extracted an optimal state. The results showed thatthe micro-porous layer with a content of 40 wt% of PTEF and loading of 1 mg/cm2 carbon yieldedthe optimum performance of the cell. Lonescu [31] performed a three-dimensional simulation ofa single-channel HT-PEMFC in a steady state. In this research, the Comsol software was used forsimulation, and the concentration of species, namely, hydrogen and oxygen, and water concentrationin the cathode and anode gas channels were investigated.
Liu et al. [32] examined the effect of gas flow channel dimensions and operating conditions suchas pressure and temperature on the efficiency of HT-PEMFCs. They used a developed mathematicalmodel in their research. They also calculated the concentration of gas species in the electrodes throughmass transfer analysis. Since their model required less computer computing, it has been used toanalyze many samples with different gas flow channels and different operating conditions, and itsoptimal mode has been selected. Caglayan et al. [33] investigated developed a three-dimensionaland isothermal modeling for an HT-PEMFC. Triple mixed serpentine flow channel single-cell withPBI membrane was applied for the model. The model was defined in steady-state, isothermal andsingle-phase, and simulated for different operating temperatures in the range of 100 to 180 ◦C. Theresults show that the increase in temperature has improved the performance of the fuel cell. Also, thedistribution of current density at different voltages was investigated, and it was deduced that at higheroperating voltages, local flow density is more uniform. Pressure drop contours and distribution ofoxygen concentration along the gas flow channel were also evaluated.
Moreover, in another study [34], they improved a mathematical non-isothermal and 3D modelof HT-PEMFC. The distribution of temperature and pressure along the channels and the membranecurrent density distribution over the entire membrane electrode active area were shown. Results wereobtained for two operating voltages of 0.45, and 0.6 volts and the results of this model were comparedwith the results of the isothermal model in the previous study.
In the present study, a single-channel high-temperature PEM fuel cell, condensed with PBI, issimulated in 3D. This simulation has been carried out in steady-state, isothermal and single phase.
In the current paper, the IV curve of the simulation was validated according to an experimentalwork. Also, a comprehensive study of the effects of essential parameters on the PEMFC performancesuch as operating pressure, species concentration, ionic conductivity, electrical conductivity and currentdensity were performed, some of which such as ionic conductivity and electrical conductivity arerarely investigated in other researches. This study was generated by an interest in obtaining a generalunderstanding of the effect of material properties on the fuel cell efficiency. The results presented areused to define the most effective material properties that should be considered in the improvement ofPEMFC degradation models.
2. Model Details and Validation
In this study, a single-channel HT-PEMFC with a PBI membrane is modeled in three dimensionsand isothermal. The schematic of the computational region, including the PBI membrane, the catalystlayers, the gas diffusion layers (GDL) and the gas flow channel, is shown in Figure 1. In this figure, theupper part of the geometry is the cathode and the lower part is the anode.
Also, the geometric and physical properties of the fuel cell for modeling and validation aresummarized in Table 1. This specification is derived from the experimental study by Ubong et al. [27].

Appl. Sci. 2019, 9, 3633 5 of 17
Appl. Sci. 2019, 9, x FOR PEER REVIEW 5 of 17
Figure 1. Schematic of 3D single-channel HT-PEMFC.
Table 1. Geometry and main physical parameters.
Symbol Value Unit h , h , h ,h (1, 0.38, 0.05, 0.1) 10−3 m 𝑤 , 𝑤 (0.7874, 0.90932) 10−3 m L 0.02 m V 0.93 V 𝜀 , 𝜀 0.4 - 𝜀 0.3 - ɑ𝑗 , 1.0× 910 Am 3 ɑ𝑗 , 33 10× Am 3 C , 40.88 mol m 3 C , 40.88 mol m 3 𝛼 , 1 - 𝜎 9.825 Sm 1 𝜎 222 Sm 1 𝐷 , , 𝐷 , , 𝐷 , (9.15, 2.82, 2.56)510−× m2s 1 ζ , 100% - 𝑘 1.18× 1110− m2
F 96,487 Cmol 1 R 8.314 J mol 1K 1
To test the results’ independency of the mesh, nine different meshes of a structured type have been produced and the results are compared with each other. Table 2 shows the results from different meshes. To check the precision of different meshes, polarization curve is obtained for each mesh; the relative error shown in Table 2 presents the average difference of voltages achieved from numerical simulation of a sample mesh and voltages from an experimental study by Ubong et al. [27].
Figure 1. Schematic of 3D single-channel HT-PEMFC.
Table 1. Geometry and main physical parameters.
Symbol Value Unit
hch, hgdl, hcl,hmem (1, 0.38, 0.05, 0.1) ×10−3 mwch, wrib (0.7874, 0.90932) ×10−3 m
L 0.02 mVOc 0.93 V
εe f fgdl , εe f f
cl 0.4 -εmc 0.3 -ajre f
0,a 1, 0× 109 Am−3
ajre f0,c 3× 10³ Am−3
CH2,ref 40.88 mol m−3
CO2,ref 40.88 mol m−3
αa,c 1 -σm 9.825 Sm−1
σs 222 Sm−1
D0,H2 , D0,O2 , D0,H2O (9.15, 2.82, 2.56) ×10−5 m2s−1
ζina,c 100% -kp 1.18 ×10⁻¹¹ m2
F 96,487 Cmol−1
R 8.314 J mol−1K−1
To test the results’ independency of the mesh, nine different meshes of a structured type havebeen produced and the results are compared with each other. Table 2 shows the results from differentmeshes. To check the precision of different meshes, polarization curve is obtained for each mesh; therelative error shown in Table 2 presents the average difference of voltages achieved from numericalsimulation of a sample mesh and voltages from an experimental study by Ubong et al. [27].

Appl. Sci. 2019, 9, 3633 6 of 17
Table 2. Relative difference with benchmark solution for nine different numbers of meshes.
Number of Elements Relative Difference with Benchmark Solution (%)
104,034 1.06549397992631120,087 1.04886832015082167,684 1.0158217386034253,476 0.983903959745763583,421 0.940992880083474733,403 0.932825833514081
1,064,601 0.9219221058081831,288,763 0.917297753972291
31,624,896 0.88729051065396
As shown in Table 2, the results are close to each other for the 1,288,763 and 31,624,896 meshes, andfinally, to reduce the computational time, the mesh number has been selected 1,288,763. It is importantto note that in order to get the best response, it is crucial to consider the number of meshes suitable forthe GDL, the catalyst layer, and the membrane along Y. To increase the accuracy of simulation, giventhat the reaction occurs in the catalyst layers, the mesh of this section is finer, and a multi-grid methodis used for meshing (Figure 2). The number of meshes in percent used for gas channels, GDL, catalystlayer, and the membrane are 15, 35, 45, and 5, respectively. For validation, a numerical study has beenused from the experimental work of Ubong et al. [27], which is shown in Figure 3. As can be seen,there is an acceptable agreement between empirical work and numerical simulation.
Appl. Sci. 2019, 9, x FOR PEER REVIEW 6 of 17
Table 2. Relative difference with benchmark solution for nine different numbers of meshes.
Number of Elements Relative Difference with Benchmark Solution (%) 104,034 1.06549397992631 120,087 1.04886832015082 167,684 1.0158217386034 253,476 0.983903959745763 583,421 0.940992880083474 733,403 0.932825833514081
1,064,601 0.921922105808183 1,288,763 0.917297753972291 31,624,896 0.88729051065396
As shown in Table 2, the results are close to each other for the 1,288,763 and 31,624,896 meshes, and finally, to reduce the computational time, the mesh number has been selected 1,288,763. It is important to note that in order to get the best response, it is crucial to consider the number of meshes suitable for the GDL, the catalyst layer, and the membrane along Y. To increase the accuracy of simulation, given that the reaction occurs in the catalyst layers, the mesh of this section is finer, and a multi-grid method is used for meshing (Figure 2). The number of meshes in percent used for gas channels, GDL, catalyst layer, and the membrane are 15, 35, 45, and 5, respectively. For validation, a numerical study has been used from the experimental work of Ubong et al. [27], which is shown in Figure 3. As can be seen, there is an acceptable agreement between empirical work and numerical simulation.
(a) (b)
(c)
Figure 2. Multi-grid mesh for HT-PEMFC (a) isometric view, (b) right view, (c) front view. Figure 2. Multi-grid mesh for HT-PEMFC (a) isometric view, (b) right view, (c) front view.

Appl. Sci. 2019, 9, 3633 7 of 17Appl. Sci. 2019, 9, x FOR PEER REVIEW 7 of 17
Figure 3. Comparison between the isothermal simulation at 180 °C and experimental results.
The flow in the gas channels is laminar, and because the fuel cell works at a temperature above 100 °C, water will only exist in the steam state. Also, due to the properties of PBI membrane, the water drag coefficient from anode to cathode is considered to be zero, in contrast to low-temperature PEM fuel cell with a Nafion® membrane [27]. The operating temperature of the fuel cell is 180 °C and pressure 1 bar, and stoichiometry 1.2 and 2 are considered for the anode and cathode, respectively, with a saturated inlet gas (100% humidity). The governing equations are solved in a steady-state, and the Simple Algorithm is used to adjust the partial derivative equations. Also, the second-order upwind has been used to discrete momentum, species, and energy equations, and the first-order upwind for the discretization of charge, liquid water, and membrane water content equations.
3. Governing Equations
Fluid flow, heat and mass transfer, electrochemical reactions and charge transfer processes in a PEM fuel cell are described by solving the conservation equations of mass, momentum, energy, chemical species, and charge as follows.
3.1. Mass and Momentum Conservation
The equations of mass and momentum conservation for the PEM fuel cell are defined as follows: ∇. 𝜌( )𝑢( ) = 𝑆 (1) ∇. 𝜌( )𝑢( ) = 𝑆 (2)
Source term of mass conservation equation, Smass, is only non-zero for the catalyst layers of anode and cathode in which the mass production and consumption and the transfer of chemical species are occurred, and in the rest of the areas, it is zero. In the channels, the second term and in the porous regions where viscous forces overcome the displacement forces, the first term will be applied to the right-hand side of the momentum conservation equation. In the porous regions, the momentum equation of the Navier-Stokes equation is corrected to the Brinkman equation. In Equation (2), μ (pa·s) is dynamic viscosity and, k (m2) is permeability; 𝜏̿ is total stress tensor that is determined as follows: 𝜏̿ = −𝑃(𝑔)𝐼 + 𝜇(𝑔) ∇𝑢(𝑔) + ∇𝑢(𝑔) 𝑇 − 23 𝜇(𝑔) ∇𝑢(𝑔) 𝐼 (3)
Figure 3. Comparison between the isothermal simulation at 180 ◦C and experimental results.
The flow in the gas channels is laminar, and because the fuel cell works at a temperature above100 ◦C, water will only exist in the steam state. Also, due to the properties of PBI membrane, thewater drag coefficient from anode to cathode is considered to be zero, in contrast to low-temperaturePEM fuel cell with a Nafion® membrane [27]. The operating temperature of the fuel cell is 180 ◦C andpressure 1 bar, and stoichiometry 1.2 and 2 are considered for the anode and cathode, respectively, witha saturated inlet gas (100% humidity). The governing equations are solved in a steady-state, and theSimple Algorithm is used to adjust the partial derivative equations. Also, the second-order upwindhas been used to discrete momentum, species, and energy equations, and the first-order upwind forthe discretization of charge, liquid water, and membrane water content equations.
3. Governing Equations
Fluid flow, heat and mass transfer, electrochemical reactions and charge transfer processes ina PEM fuel cell are described by solving the conservation equations of mass, momentum, energy,chemical species, and charge as follows.
3.1. Mass and Momentum Conservation
The equations of mass and momentum conservation for the PEM fuel cell are defined as follows:
∇.(ρ(g)u(g)
)= Smass (1)
∇.(ρ(g)u(g)
)= Smass (2)
Source term of mass conservation equation, Smass, is only non-zero for the catalyst layers of anodeand cathode in which the mass production and consumption and the transfer of chemical species areoccurred, and in the rest of the areas, it is zero. In the channels, the second term and in the porousregions where viscous forces overcome the displacement forces, the first term will be applied to theright-hand side of the momentum conservation equation. In the porous regions, the momentum

Appl. Sci. 2019, 9, 3633 8 of 17
equation of the Navier-Stokes equation is corrected to the Brinkman equation. In Equation (2), µ (pa·s)is dynamic viscosity and, k (m2) is permeability;
=τ is total stress tensor that is determined as follows:
=τ = −P(g)I + µ(g)
[∇u(g) +
(∇u(g)
)T]−
23µ(g)
(∇u(g)
)I (3)
3.2. Energy Equation
The Energy equation reads as
∇.((ρCP)e f f u(g)T
)= ∇.
(ke f f∇T
)+ Stemp (4)
where CP is the specific heat capacity of the mixture of gases, keff is effective thermal conductivity, andT is temperature in Kelvin. To determine the value of the parameters in porous media, the effectivecharacteristics are determined as follow:
(ρcP)e f f = ερ f cPf + (1− ε)ρscP
s (5)
ke f f = εk f + (1− ε)ks (6)
In all equations, ε is the porosity coefficient, which is equal to one in the gas flow channels and inthe porous regions, its value ranges from zero to one. Stemp is the source term, which includes the heatgenerated by the electrochemical reactions (that only exists in the catalyst layers), the Ohmic heat dueto the thermal resistance of the solid areas and the heat generated by the phase change process if any.
3.3. Equations of Species
In chemical species equations, the consumed reactants and the products produced from thereactions are considered as gas mixtures, so they are all in the gas phase.
∇.n(g)i = Si (7)
The source term in the transfer equation of chemical species, Si, is zero, except for the catalystlayers where species are produced or consumed in electrochemical reactions. The source term usedfor the cathode and anode catalyst layers is different and depends on the exchange current density
produced by the electrochemical reactions. n(g)i is the mass flux of the type i defined as follow:
n(g)i = ρ(g)u(g)ω
(g)i − ρ
(g)D(g)i,e f f∇ω
(g)i (i = H2, O2, H2O, N2) (8)
3.4. Potential Equation of Membrane and Solid
Transmission of electrons through the solid phase and the transport of protons through themembrane phase are expressed in terms of charge conservation equations. The transfer of protonsthrough the membrane causes ionic flow, and transfer of electrons from the solid parts of the electrodesleads to electrical current. These equations are obtained by Ohm’s law:
Membrane potential : ∇.(σm∇φm) = Spot (9)
Solid potential : ∇.(σs∇φs) = −Spot (10)

Appl. Sci. 2019, 9, 3633 9 of 17
where σs and σm, respectively, are the electrical conductivity coefficient in the solid phase and the ionicconductivity coefficient in the polymer membrane. ϕs and ϕm also indicate the potential of the solidphase and the potential of the polymer membrane phase. The source term Spot is defined as:
Spot =
−Jc (cathode cl)
Ja (anode cl)0 (elsewhere)
(11)
In theory, the activation losses, η, which are the difference between the potentials of the solidphase and membrane, are the driving force of the volumetric exchange current density. The sourceterms for the solid phase and membrane phase represent the production of electrons and protons,which are calculated by the Butler-Volmer equations.
ja = jre fa
CH2
Cre fH2
γan(
exp(αaFηa
RT
)− exp
(−αcFηa
RT
))(12)
jc = jre fc
CO2
Cre fO2
γcat(
exp(−αcFηc
RT
)− exp
(αaFηc
RT
))(13)
The source terms of the conservation of electrical load are named as the transitional electrical currentdensity. jre f
a and jre fc , respectively, are the exchange current density in in the anode and cathode at
reference conditions. F is Faraday’s constant, and Ci and Cre fi , are the concentration of chemical species
and the concentration of chemical species at reference conditions, respectively. γ is a factor dependenton the concentration and α is the transfer coefficient.
The activation losses, η, in the anode and cathode are calculated as follows:
ηa = φs −φm (14)
ηc = φs −φm −Voc (15)
Voc is open circuit voltage on the cathode side. Based on the charge conservation, the totalelectrons flowing out of the anode catalyst layer should be equivalent to the total current entered intothe cathode catalyst layer, and also for the protons.
3.5. Boundary Conditions
The input velocities, temperature, and mass fraction of chemical species are determined as fuelcell performance parameters. Before solving the governing equations, the average electric currentdensity, stoichiometric ratio, temperature, pressure and other parameters, the mass flow rate of theflow channels and the mass fraction of the chemical species are calculated.
For the anode and cathode gas channel, the output boundary condition is as follows.
P = Pre f ,∂→
V∂n
= 0 ,∂T∂n
= 0 ,∂Yi∂n
= 0 ,∂s∂n
= 0 (16)
All outer plates of the PEM fuel cell, except terminals, are defined as the outer boundaries of thefuel cell. The terminals are the upper and lower plates of the fuel cell that the electric current entersand exits. The flow conditions of zero flow are considered for external boundaries.
∂φs
∂n= 0 ,
∂φm
∂n= 0 (17)
If the voltage is considered constant for calculating the electrical current, the following applies:

Appl. Sci. 2019, 9, 3633 10 of 17
Boundary conditions for anode terminal:
φs = 0 ,∂φm
∂n= 0 (18)
And boundary conditions for the cathode terminal:
φs = Vcell ,∂φm
∂n= 0 (19)
4. Results and Discussion
In Figure 4, the pressure variation in the anode and cathode sides of the fuel cell is displayed. Thepressure drop across the anode channel is 2 bars, and throughout the cathode channel is higher than 9bars. Although the pressure has decreased both in the cathode and anode, the pressure drop in thecathode is larger than the anode. Since the oxygen velocity in the inlet of the cathode channel is 2.5times the speed of the hydrogen velocity in the input of the anode channel, a higher pressure drop inthe cathode is obtained.Appl. Sci. 2019, 9, x FOR PEER REVIEW 10 of 17
Figure 4. Pressure distribution at the cathode and anode channels at T = 180 °C, P = 1 atm, st = 1.2 , st = 2 and V = 0.4 V.
Figure 5 shows the effect of pressure changes on the performance of the fuel cell. In this graph, 5 different operating pressures were investigated. According to the figure, with increasing pressure, the performance of the fuel cell is improved and the fuel cell generated power is increased; at different pressures and at a constant voltage, an increase in the fuel cell generated current can be detected, as the pressure increases, penetration of the reactive gases in the catalyst layer is augmented, which leads to an increment in the flow density.
Figure 5. Pressure effect on the current density at T = 180 °C, st = 1.2, st = 2.
The concentration of reactive species, namely, hydrogen (Figure 6a) and oxygen (Figure 6b), are shown in Figure 6 at 180 °C and at a voltage of 0.4 V. As can be seen, the highest concentration is at the channel entrance, and the concentration of species decreases towards the channel outlet, as the species entering the anode and cathode channel, the reaction is started and species are consumed to generate current density According to figure, the oxygen concentration along the cathode channel
Figure 4. Pressure distribution at the cathode and anode channels at T = 180 ◦C, P = 1 atm, sta = 1.2,stc = 2 and V = 0.4 V.
Figure 5 shows the effect of pressure changes on the performance of the fuel cell. In this graph,5 different operating pressures were investigated. According to the figure, with increasing pressure,the performance of the fuel cell is improved and the fuel cell generated power is increased; at differentpressures and at a constant voltage, an increase in the fuel cell generated current can be detected, asthe pressure increases, penetration of the reactive gases in the catalyst layer is augmented, which leadsto an increment in the flow density.

Appl. Sci. 2019, 9, 3633 11 of 17
Appl. Sci. 2019, 9, x FOR PEER REVIEW 10 of 17
Figure 4. Pressure distribution at the cathode and anode channels at T = 180 °C, P = 1 atm, st = 1.2 , st = 2 and V = 0.4 V.
Figure 5 shows the effect of pressure changes on the performance of the fuel cell. In this graph, 5 different operating pressures were investigated. According to the figure, with increasing pressure, the performance of the fuel cell is improved and the fuel cell generated power is increased; at different pressures and at a constant voltage, an increase in the fuel cell generated current can be detected, as the pressure increases, penetration of the reactive gases in the catalyst layer is augmented, which leads to an increment in the flow density.
Figure 5. Pressure effect on the current density at T = 180 °C, st = 1.2, st = 2.
The concentration of reactive species, namely, hydrogen (Figure 6a) and oxygen (Figure 6b), are shown in Figure 6 at 180 °C and at a voltage of 0.4 V. As can be seen, the highest concentration is at the channel entrance, and the concentration of species decreases towards the channel outlet, as the species entering the anode and cathode channel, the reaction is started and species are consumed to generate current density According to figure, the oxygen concentration along the cathode channel
Figure 5. Pressure effect on the current density at T = 180 ◦C, sta = 1.2, stc = 2.
The concentration of reactive species, namely, hydrogen (Figure 6a) and oxygen (Figure 6b),are shown in Figure 6 at 180 ◦C and at a voltage of 0.4 V. As can be seen, the highest concentration is atthe channel entrance, and the concentration of species decreases towards the channel outlet, as thespecies entering the anode and cathode channel, the reaction is started and species are consumed togenerate current density According to figure, the oxygen concentration along the cathode channelreached from 1.26 to 5.43 mol/m3 and the hydrogen concentration along the anode channel reachedfrom 25.8 to 25.2 mol/m3 that indicating a higher concentration of oxygen comparing to hydrogen.
Appl. Sci. 2019, 9, x FOR PEER REVIEW 68 of 120
The concentration of reactive species, namely, hydrogen (Figure 6a) and oxygen (Figure 6b), are shown in Figure 6 at 180 °C and at a voltage of 0.4 V. As can be seen, the highest concentration is at the channel entrance, and the concentration of species decreases towards the channel outlet, as the species entering the anode and cathode channel, the reaction is started and species are consumed to generate current density According to figure, the oxygen concentration along the cathode channel reached from 1.26 to 5.43 mol/m3 and the hydrogen concentration along the anode channel reached from 25.8 to 25.2 mol/m3 that indicating a higher concentration of oxygen comparing to hydrogen.
(b) (a)
Figure 6. Concentration of (a) the hydrogen along the anode flow channel and (b) the oxygen along the cathode flow channel operating at 180 °C and 0.4 V (mol/m3).
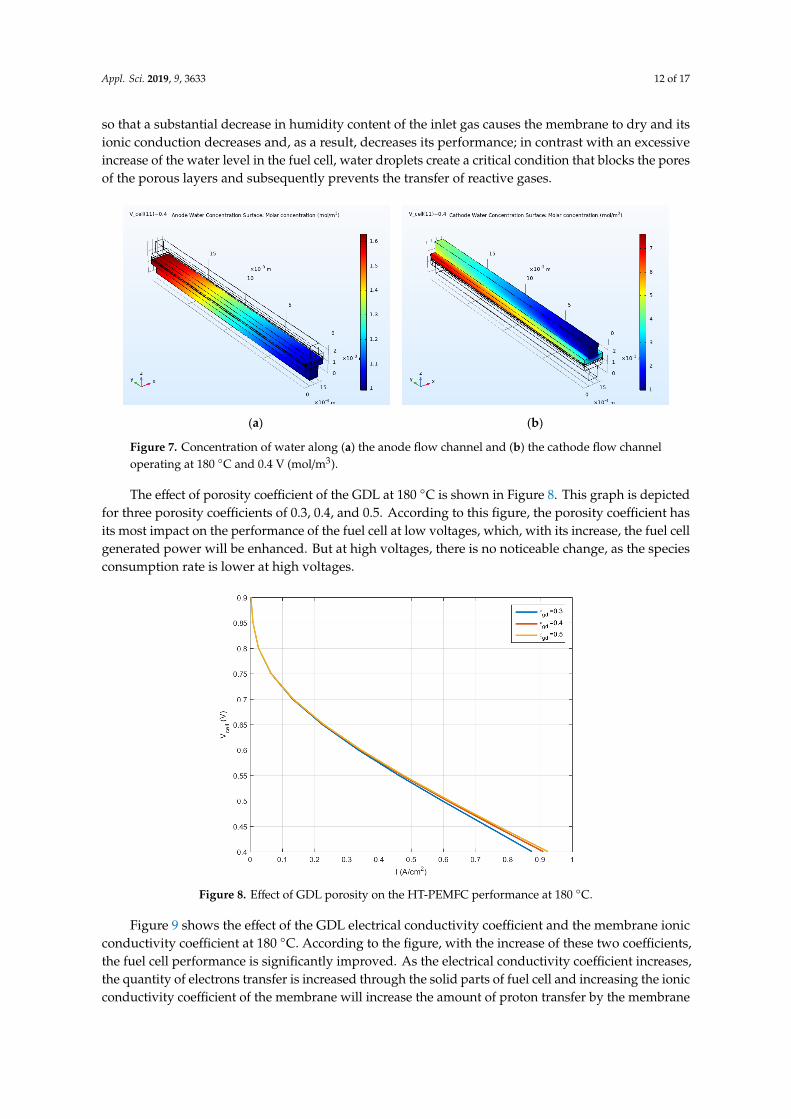
In Figure 7, the distribution of water concentration in the anode (Figure 7a) and cathode (Figure 7b) is shown at 180 °C and at a voltage of 0.4 V. Regarding the figure, it can be seen that the behavior of water dispersion in the cathode and anode channels is different from the dispersion behavior of the species concentration according to Figure 6. In contrast to species concentration, the lowest concentration of water is observed at the entrance of the channels, and the highest concentration of water is observed in the channel outputs. Because with moving of reactants from the entrance to the outlet, the species is consumed and more water will be generated by the reactions. Water management in fuel cell is critical, so that a substantial decrease in humidity content of the inlet gas causes the membrane to dry and its ionic conduction decreases and, as a result, decreases its performance; in contrast with an excessive increase of the water level in the fuel cell, water droplets create a critical condition that blocks the pores of the porous layers and subsequently prevents the transfer of reactive gases.
Figure 6. Concentration of (a) the hydrogen along the anode flow channel and (b) the oxygen along thecathode flow channel operating at 180 ◦C and 0.4 V (mol/m3).
In Figure 7, the distribution of water concentration in the anode (Figure 7a) and cathode (Figure 7b)is shown at 180 ◦C and at a voltage of 0.4 V. Regarding the figure, it can be seen that the behavior of waterdispersion in the cathode and anode channels is different from the dispersion behavior of the speciesconcentration according to Figure 6. In contrast to species concentration, the lowest concentration ofwater is observed at the entrance of the channels, and the highest concentration of water is observed inthe channel outputs. Because with moving of reactants from the entrance to the outlet, the species isconsumed and more water will be generated by the reactions. Water management in fuel cell is critical,
Appl. Sci. 2019, 9, 3633 12 of 17
so that a substantial decrease in humidity content of the inlet gas causes the membrane to dry and itsionic conduction decreases and, as a result, decreases its performance; in contrast with an excessiveincrease of the water level in the fuel cell, water droplets create a critical condition that blocks the poresof the porous layers and subsequently prevents the transfer of reactive gases.
Appl. Sci. 2019, 9, x FOR PEER REVIEW 11 of 17
reached from 1.26 to 5.43 mol/m3 and the hydrogen concentration along the anode channel reached from 25.8 to 25.2 mol/m3 that indicating a higher concentration of oxygen comparing to hydrogen.
(b)
(a)
Figure 6. Concentration of (a) the hydrogen along the anode flow channel and (b) the oxygen along the cathode flow channel operating at 180 °C and 0.4 V (mol/m3).
In Figure 7, the distribution of water concentration in the anode (Figure 7a) and cathode (Figure 7b) is shown at 180 °C and at a voltage of 0.4 V. Regarding the figure, it can be seen that the behavior of water dispersion in the cathode and anode channels is different from the dispersion behavior of the species concentration according to Figure 6. In contrast to species concentration, the lowest concentration of water is observed at the entrance of the channels, and the highest concentration of water is observed in the channel outputs. Because with moving of reactants from the entrance to the outlet, the species is consumed and more water will be generated by the reactions. Water management in fuel cell is critical, so that a substantial decrease in humidity content of the inlet gas causes the membrane to dry and its ionic conduction decreases and, as a result, decreases its performance; in contrast with an excessive increase of the water level in the fuel cell, water droplets create a critical condition that blocks the pores of the porous layers and subsequently prevents the transfer of reactive gases.
(b)
(a)
Figure 7. Concentration of water along (a) the anode flow channel and (b) the cathode flow channel operating at 180 °C and 0.4 V (mol/m3).
The effect of porosity coefficient of the GDL at 180 °C is shown in Figure 8. This graph is depicted for three porosity coefficients of 0.3, 0.4, and 0.5. According to this figure, the porosity coefficient has its most impact on the performance of the fuel cell at low voltages, which, with its increase, the fuel
Figure 7. Concentration of water along (a) the anode flow channel and (b) the cathode flow channeloperating at 180 ◦C and 0.4 V (mol/m3).
The effect of porosity coefficient of the GDL at 180 ◦C is shown in Figure 8. This graph is depictedfor three porosity coefficients of 0.3, 0.4, and 0.5. According to this figure, the porosity coefficient hasits most impact on the performance of the fuel cell at low voltages, which, with its increase, the fuel cellgenerated power will be enhanced. But at high voltages, there is no noticeable change, as the speciesconsumption rate is lower at high voltages.
Appl. Sci. 2019, 9, x FOR PEER REVIEW 69 of 120
(b) (a)
Figure 7. Concentration of water along (a) the anode flow channel and (b) the cathode flow channel operating at 180 °C and 0.4 V (mol/m3).
The effect of porosity coefficient of the GDL at 180 °C is shown in Figure 8. This graph is depicted for three porosity coefficients of 0.3, 0.4, and 0.5. According to this figure, the porosity coefficient has its most impact on the performance of the fuel cell at low voltages, which, with its increase, the fuel cell generated power will be enhanced. But at high voltages, there is no noticeable change, as the species consumption rate is lower at high voltages.
Figure 8. Effect of GDL porosity on the HT-PEMFC performance at 180 °C.
Figure 9 shows the effect of the GDL electrical conductivity coefficient and the membrane ionic conductivity coefficient at 180 °C. According to the figure, with the increase of these two coefficients, the fuel cell performance is significantly improved. As the electrical conductivity coefficient increases, the quantity of electrons transfer is increased through the solid parts of fuel cell and increasing the ionic conductivity coefficient of the membrane will increase the amount of proton transfer by the membrane from the anode side to the cathode side. As can be seen in the figure, the more significant effect of ionic conductivity coefficient is evident compared to the electrical conductivity coefficient.
(b)
(a)
Figure 9. Effect of (a) ionic and (b) electric conductivity on the HT-PEMFC performance at 180 °C.
Figure 8. Effect of GDL porosity on the HT-PEMFC performance at 180 ◦C.
Figure 9 shows the effect of the GDL electrical conductivity coefficient and the membrane ionicconductivity coefficient at 180 ◦C. According to the figure, with the increase of these two coefficients,the fuel cell performance is significantly improved. As the electrical conductivity coefficient increases,the quantity of electrons transfer is increased through the solid parts of fuel cell and increasing the ionicconductivity coefficient of the membrane will increase the amount of proton transfer by the membrane

Appl. Sci. 2019, 9, 3633 13 of 17
from the anode side to the cathode side. As can be seen in the figure, the more significant effect of ionicconductivity coefficient is evident compared to the electrical conductivity coefficient.
Appl. Sci. 2019, 9, x FOR PEER REVIEW 69 of 120
(b) (a)
Figure 7. Concentration of water along (a) the anode flow channel and (b) the cathode flow channel operating at 180 °C and 0.4 V (mol/m3).
The effect of porosity coefficient of the GDL at 180 °C is shown in Figure 8. This graph is depicted for three porosity coefficients of 0.3, 0.4, and 0.5. According to this figure, the porosity coefficient has its most impact on the performance of the fuel cell at low voltages, which, with its increase, the fuel cell generated power will be enhanced. But at high voltages, there is no noticeable change, as the species consumption rate is lower at high voltages.
Figure 8. Effect of GDL porosity on the HT-PEMFC performance at 180 °C.
Figure 9 shows the effect of the GDL electrical conductivity coefficient and the membrane ionic conductivity coefficient at 180 °C. According to the figure, with the increase of these two coefficients, the fuel cell performance is significantly improved. As the electrical conductivity coefficient increases, the quantity of electrons transfer is increased through the solid parts of fuel cell and increasing the ionic conductivity coefficient of the membrane will increase the amount of proton transfer by the membrane from the anode side to the cathode side. As can be seen in the figure, the more significant effect of ionic conductivity coefficient is evident compared to the electrical conductivity coefficient.
(b)
(a)
Figure 9. Effect of (a) ionic and (b) electric conductivity on the HT-PEMFC performance at 180 °C. Figure 9. Effect of (a) ionic and (b) electric conductivity on the HT-PEMFC performance at 180 ◦C.
In Figure 10, the effect of channel width increment on fuel cell performance is shown. Based onthis figure, with increasing channel width, the fuel cell generated power is reduced; as the channelwidth increases, the inlet velocity of the species decreases, and as a result, the diffusion rate of specieswill also decrease. The result will be a lower current density generation in the fuel cell.
Appl. Sci. 2019, 9, x FOR PEER REVIEW 70 of 120
In Figure 10, the effect of channel width increment on fuel cell performance is shown. Based on this figure, with increasing channel width, the fuel cell generated power is reduced; as the channel width increases, the inlet velocity of the species decreases, and as a result, the diffusion rate of species will also decrease. The result will be a lower current density generation in the fuel cell.
Figure 10. Effect of channel width on the HT-PEMFC performance.
Figure 11 shows the dispersion of the current density generated by the fuel cell at 180 °C and 0.3, 0.6, and 0.9 V at the membrane surface. As can be seen, at low voltages of 0.3 and 0.6 V, due to the higher input inflow of the species, they penetrate into the reaction spot more and also more species participate in the reaction so that according to the figure, the difference in the amount of current density produced at high and low voltages is quite evident. Therefore, at the channel inlet, the produced current density is lower and this value increases towards the channel output as more and more reactants are consumed (Figure 11a,b). On the contrary, as the voltage increased to 0.9 V, the produced current density decreased, because at higher voltages, due to the lower input flow rate, the species flowed with less velocity and penetration and almost uniformly along the channel and followed by less reaction, the current density is reduced and the distribution of the current density is almost uniform from the inlet to the outlet (Figure 11c).
Figure 10. Effect of channel width on the HT-PEMFC performance.
Figure 11 shows the dispersion of the current density generated by the fuel cell at 180 ◦C and0.3, 0.6, and 0.9 V at the membrane surface. As can be seen, at low voltages of 0.3 and 0.6 V, dueto the higher input inflow of the species, they penetrate into the reaction spot more and also morespecies participate in the reaction so that according to the figure, the difference in the amount ofcurrent density produced at high and low voltages is quite evident. Therefore, at the channel inlet,the produced current density is lower and this value increases towards the channel output as moreand more reactants are consumed (Figure 11a,b). On the contrary, as the voltage increased to 0.9 V,the produced current density decreased, because at higher voltages, due to the lower input flow rate,the species flowed with less velocity and penetration and almost uniformly along the channel and

Appl. Sci. 2019, 9, 3633 14 of 17
followed by less reaction, the current density is reduced and the distribution of the current density isalmost uniform from the inlet to the outlet (Figure 11c).
Appl. Sci. 2019, 9, x FOR PEER REVIEW 13 of 17
Figure 10. Effect of channel width on the HT-PEMFC performance.
Figure 11 shows the dispersion of the current density generated by the fuel cell at 180 °C and 0.3, 0.6, and 0.9 V at the membrane surface. As can be seen, at low voltages of 0.3 and 0.6 V, due to the higher input inflow of the species, they penetrate into the reaction spot more and also more species participate in the reaction so that according to the figure, the difference in the amount of current density produced at high and low voltages is quite evident. Therefore, at the channel inlet, the produced current density is lower and this value increases towards the channel output as more and more reactants are consumed (Figure 11a,b). On the contrary, as the voltage increased to 0.9 V, the produced current density decreased, because at higher voltages, due to the lower input flow rate, the species flowed with less velocity and penetration and almost uniformly along the channel and followed by less reaction, the current density is reduced and the distribution of the current density is almost uniform from the inlet to the outlet (Figure 11c).
(a) (b) (c)
Figure 11. Current density distribution on membrane surface at 180 °C and (a) 0.3 V, (b) 0.6 V, (c) 0.9 V.
Figure 11. Current density distribution on membrane surface at 180 ◦C and (a) 0.3 V, (b) 0.6 V, (c) 0.9 V.
5. Conclusions
In this research, a single-channel high-temperature PEM fuel cell was simulated in a threedimensional, isothermal and steady-state, and the effect of different parameters on its performancewas investigated. Initially, the distribution of pressure was shown in the cathode and anode channels,and it was observed that the pressure drop in the cathode channel is higher than the anode channel, sothat the pressure drop in the cathode channel was 9 bars but in the anode channel was 2 bars. In thenext step, the distribution of hydrogen concentration in the anode channel and oxygen concentrationin the cathode channel was illustrated. The concentration of these species at the channel entrance wasat its highest level and decreased with moving toward the outlet and consumption of the species. Bychecking the concentration of water in the channels, it was observed that the concentration of waterwas increased from the entrance to the outlet due to the use of species. Also, the results showed thatby increasing the operating pressure, the electrical conductivity of the GDL and the membrane ionicconductivity were improved. This improvement has also been observed with increasing the GDLporosity but only at low voltages. By studying the thickness variation in the gas channel, it was alsoobserved that its increase would reduce the performance of the fuel cell, as the increase in the inlet gascross-section reduced the rate of the species and produced less current.
Author Contributions: Data curation, Investigation, Visualization, M.Y.A.J.; Formal analysis, Investigation, M.G.;Formal analysis, Writing—original draft, R.A.; Methodology, review & editing, E.A.; review & editing, S.W.;review & editing, M.M.R.; Supervision, M.S.S.
Funding: This research received no external funding.
Conflicts of Interest: The authors declare no conflict of interest!

Appl. Sci. 2019, 9, 3633 15 of 17
Nomenclature
αSpecific Surface Area on theAnode, m−1
=τ Total Stress Tensor, Nm−2
C(g)P
specific heat capacity of the gasmixture, kJKg−1K−1 σs electric conductivity, sm−1
Ci,refreference molar concentration ofspecies i, mol m−3 σm ionic conductivity, sm−1
D(g)i
diffusivity of species diffusivity ofspecies i, m2s−1 φm ionic phase potential, V
D(m)H2O
diffusivity of water in themembrane, m2s−1 φs solid-phase potential, V
F Faraday’s constant, C mol−1 Superscriptsh Height, m eff effectivej Exchange current density, Am−2 (g) gas phasek thermal conductivity, Wm−1K−1 (m) membranekp GDL permeability ref referenceL Length, m (s) solidmem membrane Subscripts
n(g)i
mass flux of species i, kg m−2s−1 a anodeP(g) Absolute gas pressure, Pa c cathodeR Universal gas constant, J mol−1K−1 ch Channels liquid saturation cl catalyst layerS source term GDL gas diffusion layerSt stoichiometry H2 hydrogenT temperature, K H2O wateru, v, w, U Velocities, ms−1 i species ix, y, z coordinates, m m membrane
ω(g)i
mass fraction of species i mass massα transfer coefficients O2 oxygenζ relative humidity, % OC Open cirquteGreek pot potentialε porosity ref reference
εmcVolume fraction of ionomer inanode/cathode catalyst layers
rib rib
µ dynamic viscosity, kg m2s−1 temp temperatureρ density, kgm−3
References
1. Alamian, R.; Shafaghat, R.; Safaei, M.R. Multi-objective optimization of a pitch point absorber wave energyconverter. Water 2019, 11, 969. [CrossRef]
2. Alamian, R.; Shafaghat, R.; Shadloo, M.S.; Bayani, R.; Amouei, A.H. An empirical evaluation of the sea deptheffects for various wave characteristics on the performance of a point absorber wave energy converter. OceanEng. 2017, 137, 13–21. [CrossRef]
3. Zanous, S.P.; Shafaghat, R.; Alamian, R.; Shadloo, M.S.; Khosravi, M. Feasibility study of wave energyharvesting along the southern coast and islands of Iran. Renew. Energy 2019, 135, 502–514. [CrossRef]
4. Ebrahimpour, M.; Shafaghat, R.; Alamian, R.; Safdari Shadloo, M. Numerical Investigation of the SavoniusVertical Axis Wind Turbine and Evaluation of the Effect of the Overlap Parameter in Both Horizontal andVertical Directions on Its Performance. Symmetry 2019, 11, 821. [CrossRef]
5. Wang, A.; Hu, K.; Liu, Y.; Li, R.; Ye, C.; Yi, Z.; Yan, K. Flower-like MoS2 with stepped edge structure efficientfor electrocatalysis of hydrogen and oxygen evolution. Int. J. Hydrog. Energy 2019, 44, 6573–6581. [CrossRef]
6. Wang, Y.; Deng, H.; Ye, C.; Hu, K.; Yan, K. Facile synthesis of mesoporous TiC-C nanocomposite microsphereefficient for hydrogen evolution. J. Alloy. Compd. 2019, 775, 348–352. [CrossRef]

Appl. Sci. 2019, 9, 3633 16 of 17
7. Hu, K.; Zhou, J.; Yi, Z.; Ye, C.; Dong, H.; Yan, K. Facile synthesis of mesoporous WS2 for water oxidation.Appl. Surf. Sci. 2019, 465, 351–356. [CrossRef]
8. Barbir, F. Pem Fuel Cells: Theory and Practice; Academic Press: Cambridge, MA, USA, 2012.9. Manoharan, Y.; Hosseini, S.E.; Butler, B.; Alzhahrani, H.; Senior, B.T.F.; Ashuri, T.; Krohn, J. Hydrogen Fuel
Cell Vehicles; Current Status and Future Prospect. Appl. Sci. 2019, 9, 2296. [CrossRef]10. Rafique, M.K.; Khan, S.U.; Saeed Uz Zaman, M.; Mehmood, K.K.; Haider, Z.M.; Bukhari, S.B.A.; Kim, C.-H.
An Intelligent Hybrid Energy Management System for a Smart House Considering Bidirectional Power Flowand Various EV Charging Techniques. Appl. Sci. 2019, 9, 1658. [CrossRef]
11. Atyabi, S.A.; Afshari, E.; Wongwises, S.; Yan, W.-M.; Hadjadj, A.; Shadloo, M.S. Effects of assembly pressureon PEM fuel cell performance by taking into accounts electrical and thermal contact resistances. Energy 2019,179, 490–501. [CrossRef]
12. Latorrata, S.; Gallo Stampino, P.; Cristiani, C.; Dotelli, G. Development of an optimal gas diffusion mediumfor polymer electrolyte membrane fuel cells and assessment of its degradation mechanisms. Int. J. Hydrog.Energy 2015, 40, 14596–14608. [CrossRef]
13. Latorrata, S.; Stampino, P.G.; Cristiani, C.; Dotelli, G. Preparation, ex situ and in situ Characterization of GasDiffusion Media Containing and Non-Containing Carboxymethylcellulose for PEM Fuel Cells. Fuel Cells2015, 15, 463–471. [CrossRef]
14. Toghyani, S.; Afshari, E.; Baniasadi, E.; Shadloo, M. Energy and exergy analyses of a nanofluid based solarcooling and hydrogen production combined system. Renew. Energy 2019, 141, 1013–1025. [CrossRef]
15. Toghyani, S.; Fakhradini, S.; Afshari, E.; Baniasadi, E.; Jamalabadi, M.Y.A.; Shadloo, M.S. Optimizationof operating parameters of a polymer exchange membrane electrolyzer. Int. J. Hydrog. Energy 2019, 44,6403–6414. [CrossRef]
16. Authayanun, S.; Im-Orb, K.; Arpornwichanop, A. A review of the development of high temperature protonexchange membrane fuel cells. Chin. J. Catal. 2015, 36, 473–483. [CrossRef]
17. Rosli, R.; Sulong, A.B.; Daud, W.R.W.; Zulkifley, M.A.; Husaini, T.; Rosli, M.I.; Majlan, E.; Haque, M. A reviewof high-temperature proton exchange membrane fuel cell (HT-PEMFC) system. Int. J. Hydrog. Energy 2017,42, 9293–9314. [CrossRef]
18. Wang, L.; Husar, A.; Zhou, T.; Liu, H. A parametric study of PEM fuel cell performances. Int. J. Hydrog.Energy 2003, 28, 1263–1272. [CrossRef]
19. Cheddie, D.; Munroe, N. Mathematical model of a PEMFC using a PBI membrane. Energy Convers. Manag.2006, 47, 1490–1504. [CrossRef]
20. Scott, K.; Pilditch, S.; Mamlouk, M. Modelling and experimental validation of a high temperature polymerelectrolyte fuel cell. J. Appl. Electrochem. 2007, 37, 1245–1259. [CrossRef]
21. Olapade, P.O.; Meyers, J.P.; Borup, R.L.; Mukundan, R. Parametric study of the morphological proprietiesof HT-PEMFC components for effective membrane hydration. J. Electrochem. Soc. 2011, 158, B639–B649.[CrossRef]
22. Shamardina, O.; Kulikovsky, A.; Chertovich, A.; Khokhlov, A. A Model for High-Temperature PEM FuelCell: The Role of Transport in the Cathode Catalyst Layer. Fuel Cells 2012, 12, 577–582. [CrossRef]
23. Su, A.; Ferng, Y.; Hou, J.; Yu, T. Experimental and numerical investigations of the effects of PBI loading andoperating temperature on a high-temperature PEMFC. Int. J. Hydrog. Energy 2012, 37, 7710–7718. [CrossRef]
24. Sun, H.; Xie, C.; Chen, H.; Almheiri, S. A numerical study on the effects of temperature and mass transfer inhigh temperature PEM fuel cells with ab-PBI membrane. Appl. Energy 2015, 160, 937–944. [CrossRef]
25. Al-Baghdadi, M.A.S.; Al-Janabi, H.A.S. Parametric and optimization study of a PEM fuel cell performanceusing three-dimensional computational fluid dynamics model. Renew. Energy 2007, 32, 1077–1101. [CrossRef]
26. Zhang, J.; Tang, Y.; Song, C.; Xia, Z.; Li, H.; Wang, H.; Zhang, J. PEM fuel cell relative humidity (RH) and itseffect on performance at high temperatures. Electrochim. Acta 2008, 53, 5315–5321. [CrossRef]
27. Ubong, E.; Shi, Z.; Wang, X. Three-dimensional modeling and experimental study of a high temperaturePBI-based PEM fuel cell. J. Electrochem. Soc. 2009, 156, B1276–B1282. [CrossRef]
28. Su, A.; Ferng, Y.M.; Shih, J.C. Experimentally and numerically investigating cell performance and localizedcharacteristics for a high-temperature proton exchange membrane fuel cell. Appl. Therm. Eng. 2009, 29,3409–3417. [CrossRef]
29. Wang, Y.; Kowal, J.; Sauer, D.U. Modeling of HTPEM Fuel Cell Start-Up Process by Using Comsol Multiphysics.In Proceedings of the 2012 Comsol Conference in Milan, Milan, Italy, 10–12 October.

Appl. Sci. 2019, 9, 3633 17 of 17
30. Liu, C.-T.; Chang, M.-H. Effects of Microporous Layer on PBI-based Proton Exchange Membrane Fuel CellPerformance. Int. J. Electrochem. Sci 2013, 8, 3687–3695.
31. Ionescu, V. High temperature PEM fuel cell steady-state transport modeling. An. Univ. “Ovidius”Constanta-Ser. Chim. 2013, 24, 55–60. [CrossRef]
32. Liu, H.; Li, P.; Hartz, A.; Wang, K. Effects of geometry/dimensions of gas flow channels and operatingconditions on high-temperature PEM fuel cells. Int. J. Energy Environ. Eng. 2015, 6, 75–89. [CrossRef]
33. Caglayan, D.G.; Sezgin, B.; Devrim, Y.; Eroglu, I. Three-dimensional modeling of a high temperaturepolymer electrolyte membrane fuel cell at different operation temperatures. Int. J. Hydrog. Energy 2016, 41,10060–10070. [CrossRef]
34. Caglayan, D.G.; Sezgin, B.; Devrim, Y.; Eroglu, I. Three-dimensional non-isothermal model development ofhigh temperature PEM Fuel Cells. Int. J. Hydrog. Energy 2018, 43, 10834–10841. [CrossRef]
© 2019 by the authors. Licensee MDPI, Basel, Switzerland. This article is an open accessarticle distributed under the terms and conditions of the Creative Commons Attribution(CC BY) license (http://creativecommons.org/licenses/by/4.0/).