9789290234531-eng.pdf - WHO | World Health Organization
88
STATUS UPDATE ON THE INSTITUTIONALIZATION OF NATIONAL HEALTH ACCOUNTS IN THE WHO AFRICAN REGION July 2021
-
Upload
khangminh22 -
Category
Documents
-
view
2 -
download
0
Transcript of 9789290234531-eng.pdf - WHO | World Health Organization

1
STATUS UPDATE ON THE INSTITUTIONALIZATION OF NATIONAL HEALTH ACCOUNTS
IN THE WHO AFRICAN REGION
July 2021

Status update on the institutionalization of national health accounts in the WHO African Region
ISBN: 978-929023453-1 © WHO Regional Office for Africa 2021
Some rights reserved. This work is available under the Creative Commons Attribution-NonCommercial-ShareAlike 3.0 IGO licence (CC BY-NC-SA 3.0 IGO; https://creativecommons.org/licenses/by-nc-sa/3.0/igo).
Under the terms of this licence, you may copy, redistribute and adapt the work for non-commercial purposes, provided the work is appropriately cited, as indicated below. In any use of this work, there should be no suggestion that WHO endorses any specific organization, products or services. The use of the WHO logo is not permitted. If you adapt the work, then you must license your work under the same or equivalent Creative Commons licence. If you create a translation of this work, you should add the following disclaimer along with the suggested citation: “This translation was not created by the World Health Organization (WHO). WHO is not responsible for the content or accuracy of this translation. The original English edition shall be the binding and authentic edition”.
Any mediation relating to disputes arising under the licence shall be conducted in accordance with the mediation rules of the World Intellectual Property Organization.
Suggested citation. Status update on the institutionalization of national health accounts in the WHO African Region. Brazzaville: WHO Regional Office for Africa; 2021. Licence: CC BY-NC-SA 3.0 IGO.
Cataloguing-in-Publication (CIP) data. CIP data are available at http://apps.who.int/iris.
Sales, rights and licensing. To purchase WHO publications, see http://apps.who.int/bookorders. To submit requests for commercial use and queries on rights and licensing, see http://www.who.int/about/licensing.
Third-party materials. If you wish to reuse material from this work that is attributed to a third party, such as tables, figures or images, it is your responsibility to determine whether permission is needed for that reuse and to obtain permission from the copyright holder. The risk of claims resulting from infringement of any third-party-owned component in the work rests solely with the user.
General disclaimers. The designations employed and the presentation of the material in this publication do not imply the expression of any opinion whatsoever on the part of WHO concerning the legal status of any country, territory, city or area or of its authorities, or concerning the delimitation of its frontiers or boundaries. Dotted and dashed lines on maps represent approximate border lines for which there may not yet be full agreement.
The mention of specific companies or of certain manufacturers’ products does not imply that they are endorsed or recommended by WHO in preference to others of a similar nature that are not mentioned. Errors and omissions excepted, the names of proprietary products are distinguished by initial capital letters.
All reasonable precautions have been taken by WHO to verify the information contained in this publication. However, the published material is being distributed without warranty of any kind, either expressed or implied. The responsibility for the interpretation and use of the material lies with the reader. In no event shall WHO be liable for damages arising from its use.
Designed and printed in the WHO Regional Office for Africa, Brazzaville, Congo

2
3
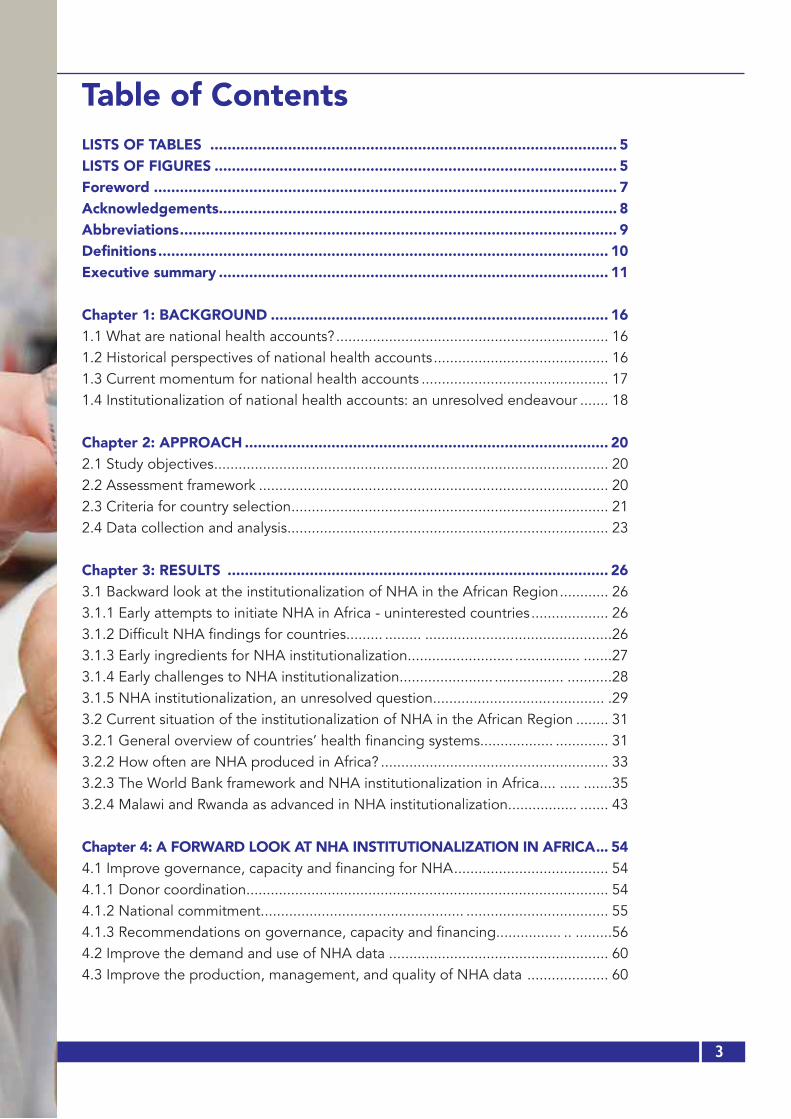
Table of ContentsLISTS OF TABLES .............................................................................................. 5LISTS OF FIGURES ............................................................................................. 5Foreword ........................................................................................................... 7Acknowledgements............................................................................................ 8Abbreviations ..................................................................................................... 9Definitions ........................................................................................................ 10Executive summary .......................................................................................... 11
Chapter 1: BACKGROUND .............................................................................. 161.1 What are national health accounts? ................................................................... 161.2 Historical perspectives of national health accounts ........................................... 161.3 Current momentum for national health accounts .............................................. 171.4 Institutionalization of national health accounts: an unresolved endeavour ....... 18
Chapter 2: APPROACH .................................................................................... 202.1 Study objectives ................................................................................................. 202.2 Assessment framework ...................................................................................... 202.3 Criteria for country selection .............................................................................. 212.4 Data collection and analysis ............................................................................... 23
Chapter 3: RESULTS ........................................................................................ 263.1 Backward look at the institutionalization of NHA in the African Region ............ 26
3.1.1 Early attempts to initiate NHA in Africa - uninterested countries ................... 26 3.1.2 Difficult NHA findings for countries......... ......... ..............................................26 3.1.3 Early ingredients for NHA institutionalization.......................... ................ .......27 3.1.4 Early challenges to NHA institutionalization....................... ................. ...........28 3.1.5 NHA institutionalization, an unresolved question............................. ............. .29
3.2 Current situation of the institutionalization of NHA in the African Region ........ 313.2.1 General overview of countries’ health financing systems.................. ............. 313.2.2 How often are NHA produced in Africa? ........................................................ 333.2.3 The World Bank framework and NHA institutionalization in Africa.... ..... .......353.2.4 Malawi and Rwanda as advanced in NHA institutionalization................. ....... 43
Chapter 4: A FORWARD LOOK AT NHA INSTITUTIONALIZATION IN AFRICA ... 544.1 Improve governance, capacity and financing for NHA ...................................... 54
4.1.1 Donor coordination................................................................................. ........ 54 4.1.2 National commitment.................................................. ................................... 55 4.1.3 Recommendations on governance, capacity and financing................ .. .........56
4.2 Improve the demand and use of NHA data ...................................................... 604.3 Improve the production, management, and quality of NHA data .................... 60

4
4.3.1 Identify relevant national institutions and legal frameworks in support of NHA.... ................................................................................................. ..60 4.3.2 Invest in IT infrastructure and integrate NHA variables in existing routine data and information systems ........ ..........................................................................61 4.3.3 Integrate NHA data into national financing indicator dashboards............ .....61 4.3.4 Summarized recommendations on the production, management, quality assurance and translation of specific analyses into policies................. .. ......62
Improve the translation of data into specific analysis .............................................. 62Revisit the World Bank framework to fit the reality on the ground .......................... 63Country reports ........................................................................................................ 64
Chapter 5: ANNEXES ....................................................................................... 65Annex 1: Reviewed documents ........................................................................ 65Annex 2: Interview guides ............................................................................... 74Annex 3: List of respondents ........................................................................... 80
5
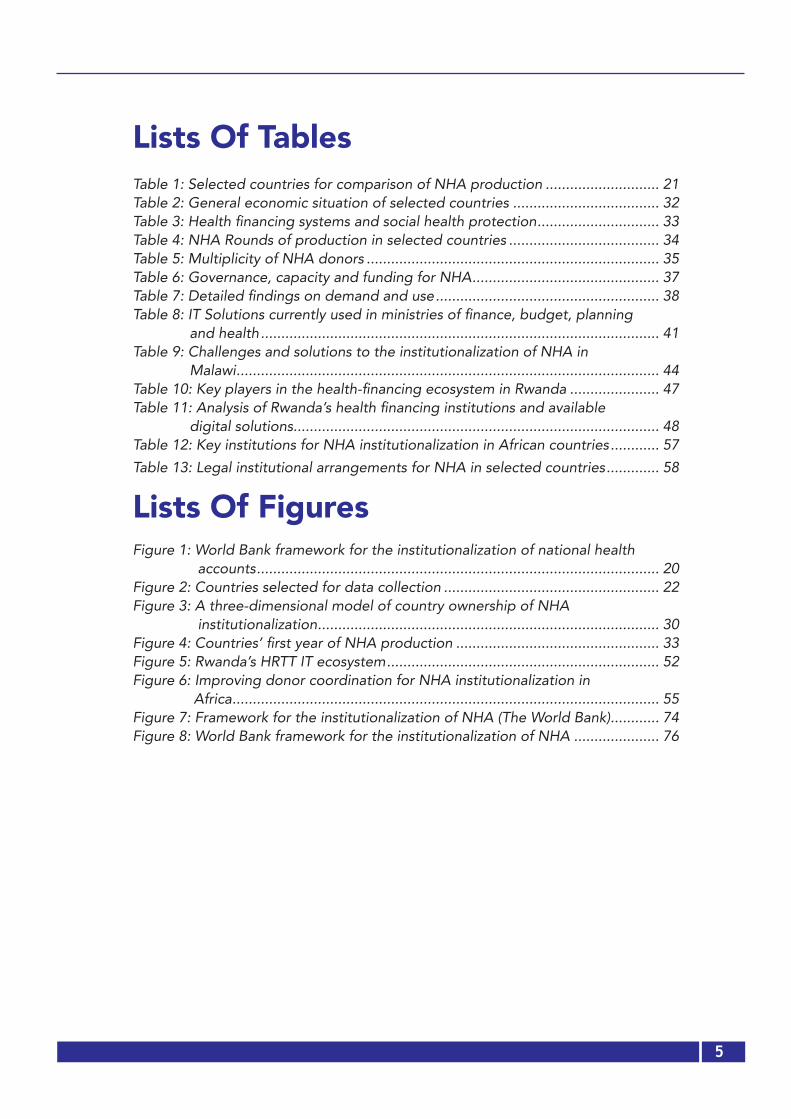
Lists Of TablesTable 1: Selected countries for comparison of NHA production ............................ 21Table 2: General economic situation of selected countries .................................... 32Table 3: Health financing systems and social health protection .............................. 33Table 4: NHA Rounds of production in selected countries ..................................... 34Table 5: Multiplicity of NHA donors ........................................................................ 35Table 6: Governance, capacity and funding for NHA .............................................. 37Table 7: Detailed findings on demand and use ....................................................... 38Table 8: IT Solutions currently used in ministries of finance, budget, planning and health .................................................................................................. 41Table 9: Challenges and solutions to the institutionalization of NHA in Malawi ........................................................................................................ 44Table 10: Key players in the health-financing ecosystem in Rwanda ...................... 47Table 11: Analysis of Rwanda’s health financing institutions and available digital solutions .......................................................................................... 48Table 12: Key institutions for NHA institutionalization in African countries ............ 57
Table 13: Legal institutional arrangements for NHA in selected countries ............. 58
Lists Of FiguresFigure 1: World Bank framework for the institutionalization of national health accounts ................................................................................................... 20Figure 2: Countries selected for data collection ..................................................... 22Figure 3: A three-dimensional model of country ownership of NHA institutionalization .................................................................................... 30Figure 4: Countries’ first year of NHA production .................................................. 33Figure 5: Rwanda’s HRTT IT ecosystem ................................................................... 52Figure 6: Improving donor coordination for NHA institutionalization in Africa ......................................................................................................... 55Figure 7: Framework for the institutionalization of NHA (The World Bank) ............ 74Figure 8: World Bank framework for the institutionalization of NHA ..................... 76

6

7
The World Health Organization (WHO) has supported the production and use of nation-al health accounts (NHA) in Member States to inform advocacy for increased funding, monitor global and regional commitments and to make comparisons across countries. However, after two decades and despite the attendant benefits, very few countries have produced NHA annually. The institutionalization of NHA thus remains an unresolved issue.
Several developments provide impetus for renewed efforts in this endeavour, including the commitment to universal health coverage (UHC), which calls for more investments. Prioritized and aligned investments and efficient spending are highlighted as major con-siderations that require timely and good quality health expenditure data. Furthermore, at the 27th African Union (AU) Summit of 2016 in Kigali, African Heads of State and Govern-ment adopted the Africa Scorecard on Domestic Financing for Health. It is an important milestone aimed at promoting financial planning, performance monitoring and account-ability by players at various levels. The quality of data for the Scorecard depends on updat-ed NHA. In this context, African leaders requested that the Commission collaborate with WHO and other partners to support countries in strengthening NHA and submit the Africa Scorecard on Domestic Financing for Health annually to the Assembly.This report on the institutionalization of national health accounts is a timely effort in these difficult times of the COVID-19 pandemic when, more than ever before, countries need to be efficient with the available resources and use evidence in decision-making.
This assessment was undertaken by WHO AFRO, in collaboration with WHO country offic-es and governments in seven countries, namely Burkina Faso, Cameroon, Democratic Re-public of the Congo, Guinea, Malawi, Rwanda and Uganda. It is the result of an extensive literature review and interviews with global and national health experts.
The lessons learnt from this assessment have led to some recommendations and informed the development of a guide to institutionalize NHA in countries. I urge all of you to sup-port countries in implementing these recommendations and use the guide to institution-alize NHA.
Dr Kasonde MwingaDirector UHC Life courseWHO Regional Director for Africa
Foreword

8
Acknowledgements
This report has been produced by the UHC Life Course Cluster at WHO AFRO: Geoffrey Bisoborwa, Juliet Nabyonga-Orem, Diane Karenzi Muhongerwa, Benjamin Nganda, Seydou Coulibaly and Farba Sall. Dr Angelique Rwiyereka, who coordinated country-level case studies and led the drafting of the regional report is specially ac-knowledged.
WHO in the African Region acknowledges the exceptional effort of country consul-tants who supported the country case studies. Seven country reports were produced and synthesized into this regional report. WHO AFRO wishes to acknowledge the contributions of all participants and facilitators from African government ministries, universities, private consultants, and civil society organizations that contributed to the present assessment.
Additionally, WHO in the African Region recognizes the participation of development partner organizations. Key respondents were drawn from the World Bank, the Bill & Melinda Gates Foundation (BMGF), the Clinton Health Access Initiative, universities and research institutions in the USA, Management Sciences for Health, private con-sultants with international experience, and finally the WHO country offices, AFRO and headquarters.

9
AbbreviationsBMGF Bill & Melinda Gates FoundationDHS Demographic health surveyEMR Electronic Medical RecordsGFF Global Financing FacilityHMIS Health management information systemHRTT Health resource tracking toolIC Investment caseIFMIS Integrated Financial Management Information SystemMINECOFIN Ministry of Finance and Economic PlanningMoF Ministry of FinanceMoH Ministry of HealthNHA National health accountsNHO National health observatoriesOOP Out-of-pocketRMET Resource mapping and expenditure trackingSDGs Sustainable Development GoalsSHA System of Health AccountsUHC Universal health coverageWB World BankWHO World Health OrganizationWHO AFR WHO African RegionWHO AFRO World Health Organization Regional Office for Africa
10
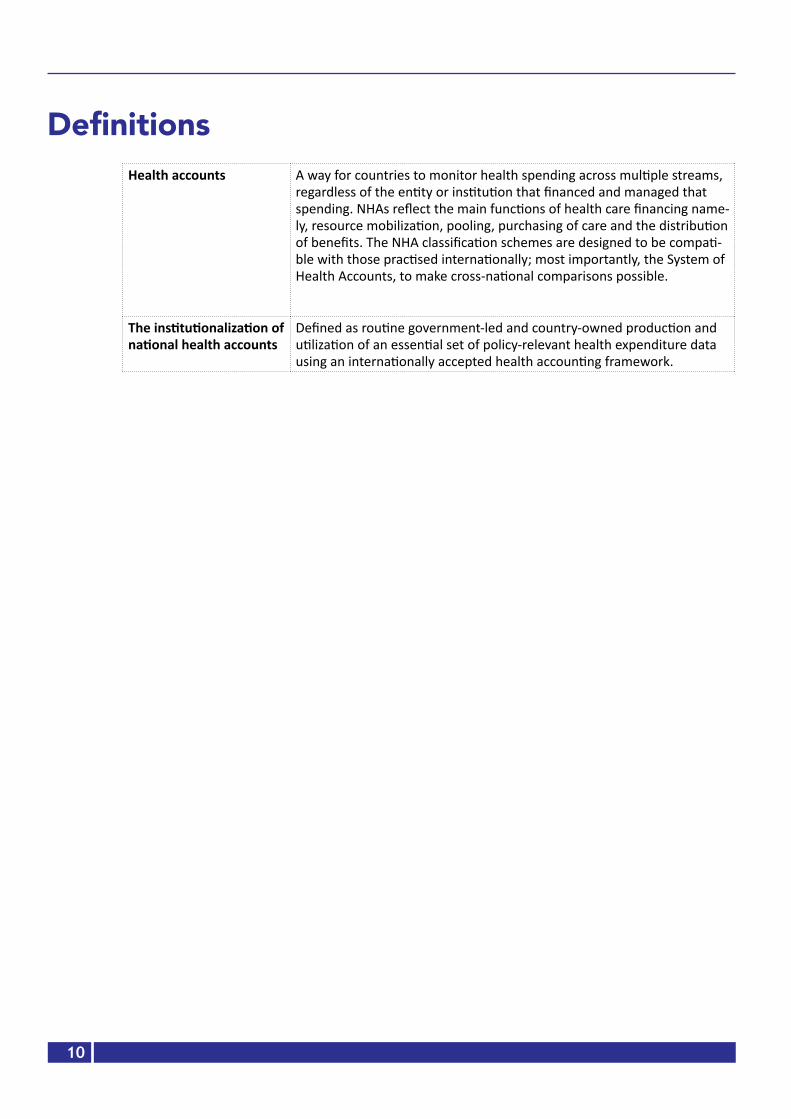
DefinitionsHealth accounts A way for countries to monitor health spending across multiple streams,
regardless of the entity or institution that financed and managed that spending. NHAs reflect the main functions of health care financing name-ly, resource mobilization, pooling, purchasing of care and the distribution of benefits. The NHA classification schemes are designed to be compati-ble with those practised internationally; most importantly, the System of Health Accounts, to make cross-national comparisons possible.
The institutionalization of national health accounts
Defined as routine government-led and country-owned production and utilization of an essential set of policy-relevant health expenditure data using an internationally accepted health accounting framework.

11
Executive summaryAfrican countries are committed to and have made huge investments aimed at moving to-wards universal health coverage (UHC). Reliable information on health financing and trends is crucial in that it underpins monitoring, decision-making and efficient use of funds. It is even more important in the context of the shifts generated by the COVID-19 pandemic, the project-ed reduction in economic growth and the need to ensure transparency. For the last two de-cades, WHO has supported countries to undertake health expenditure tracking and produce national health accounts (NHA) reports. Despite considerable efforts made to institutionalize production, the process, which mainly uses specifically designed surveys to collect data, is still costly. Country ownership, use of domestic resources to fund NHA production and use of NHA data to inform policy decisions are still suboptimal. There is need to address bottlenecks for effective institutionalization of NHA in many countries of the WHO African Region.
ObjectiveThe objective of this study was to provide a status update on the institutionalization of NHA, highlighting good practices and challenges in the World Health Organization African Region (WHO AFR):l Seven countries were selected with varying experiences and representing the three WHO African subregions.l The World Bank framework on institutionalization of NHA was used to understand the level of country ownership of the demand and use of NHA data; the production, management and quality assurance of data; and the dissemination and translation of NHA data into specific analyses of policy interest.
ApproachThe assignment involved work at country and regional levels using the World Bank framework which looks at governance, capacity and finance, demand and use, production, dissemination and translation of data into policies, to provide insights into the institutionalization of NHA in Africa. At country level, building case studies involved literature review of documents related to policy and health expenditure data in each of the countries, and semi-structured interviews with policy-makers, universities and teaching institutions, civil society and donors. At regional level, assessment involved analysing country case studies, undertaking literature review and conducting in-depth interviews with global experts.
FindingsThe assessment provided a backward look, the current situation and a forward look at the potential progress of NHA institutionalization in Africa. No difference was observed in terms of country language (anglophones and francophone countries) or geographic location on the continent. It was generally observed that African countries have not yet fully institutionalized NHA. Despite efforts made in the last 20 years, NHA is still perceived as an external control tool and a donor-driven initiative for country comparison, rather than for informing policy pro-cesses in-country.

12
To shed light on where improvements need to be made, the assessment of the current situ-ation showed that the institutionalization of NHA in Africa was incomplete because all com-ponents of the institutionalization process have not yet been “transferred to national govern-ments”. Indeed, NHA governance, capacity and finance are still in the hands of donors and depend on ad hoc commitments and a changing environment. There have been some efforts towards institutionalization through written commitment in some countries. However, the level of “written” commitment has not translated into “practical” commitment with resources ear-marked for NHA. Countries with written commitment showed the same level of dependency on external leadership and resources as those with none.
The assessment found that NHA production was not rooted in the idea of sustainability from the beginning because unlike other routinely shared data systems, the current digital revolu-tion benefited all routine data collection except NHA, which still depends on expensive and irregular surveys. The assessment revealed that all the countries studied produced at least two rounds of NHA and all rounds depended on ad hoc commitments and changing teams with high staff turnover. Whereas countries with more NHA rounds would be expected to have greater commitment to NHA institutionalization, the study showed that it was not the case. Donors have been leading production even in countries where the ministry of health has a written mandate to produce NHA.
Similar to the demand and production of NHA, results dissemination and the translation of data into policies have been dependent on external resources and limited to workshops. NHA reports have been mainly technical and difficult to read for non-technical persons. Addition-ally, the focus has not been to produce friendly products to the targeted audience of poli-cy-makers and the institutions that provided data. The quality and accuracy of NHA reports have been questioned in many countries, which led to lack of use of NHA data in policy-mak-ing. In most countries, key institutions have been left out of the dissemination and translation of data, including the ministries of finance, budget and planning, and institutes of statistics.
Overall, there has been a lack of leadership and prioritization of NHA in Africa given that past effort did not achieve its core mission which is to shed light on resource allocation and advocate for expanded coverage. There is, however, a general consensus that the availability of NHA is important for policy-making, especially in the current era of the Sustainable De-velopment Goals and the COVID-19 pandemic. There is renewed momentum towards more investments in health with demands for more funding and accountability in the use of both national government and donor money. Going forward, more transparency and reporting on health expenditure and outcomes will be required.
13
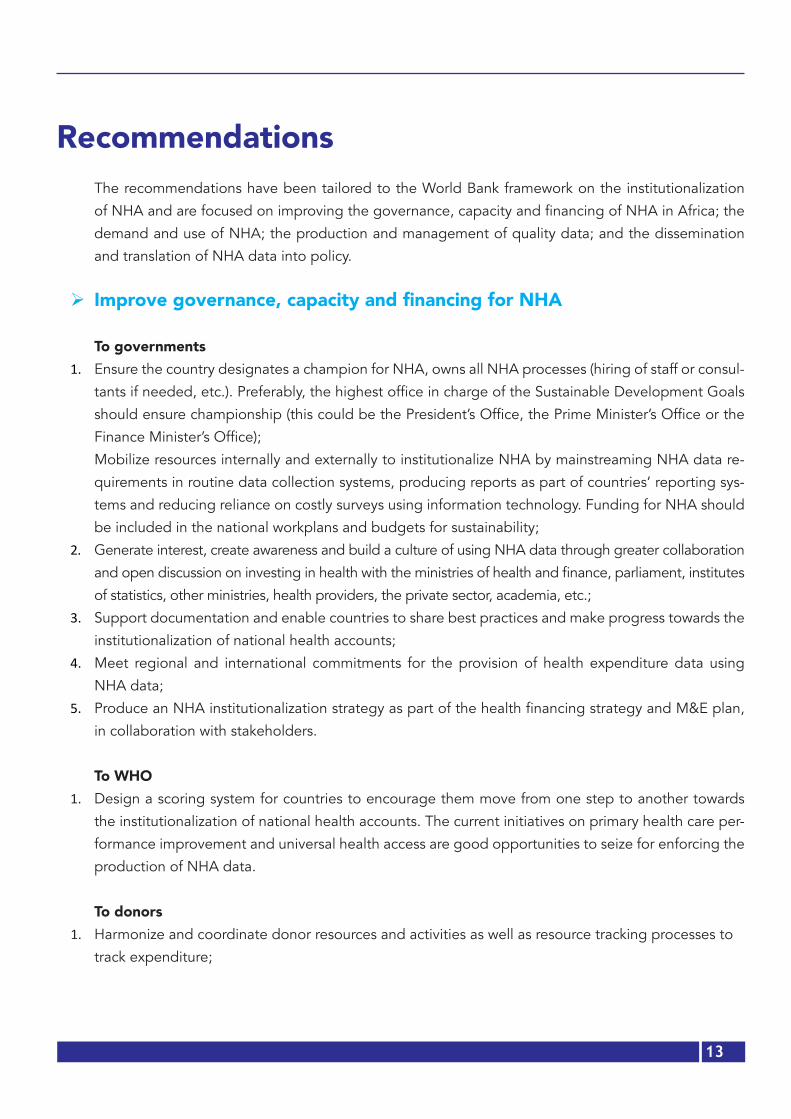
RecommendationsThe recommendations have been tailored to the World Bank framework on the institutionalization
of NHA and are focused on improving the governance, capacity and financing of NHA in Africa; the
demand and use of NHA; the production and management of quality data; and the dissemination
and translation of NHA data into policy.
Improve governance, capacity and financing for NHA
To governments1. Ensure the country designates a champion for NHA, owns all NHA processes (hiring of staff or consul-
tants if needed, etc.). Preferably, the highest office in charge of the Sustainable Development Goals
should ensure championship (this could be the President’s Office, the Prime Minister’s Office or the
Finance Minister’s Office);
Mobilize resources internally and externally to institutionalize NHA by mainstreaming NHA data re-
quirements in routine data collection systems, producing reports as part of countries’ reporting sys-
tems and reducing reliance on costly surveys using information technology. Funding for NHA should
be included in the national workplans and budgets for sustainability;
2. Generate interest, create awareness and build a culture of using NHA data through greater collaboration
and open discussion on investing in health with the ministries of health and finance, parliament, institutes
of statistics, other ministries, health providers, the private sector, academia, etc.;
3. Support documentation and enable countries to share best practices and make progress towards the
institutionalization of national health accounts;
4. Meet regional and international commitments for the provision of health expenditure data using
NHA data;
5. Produce an NHA institutionalization strategy as part of the health financing strategy and M&E plan,
in collaboration with stakeholders.
To WHO1. Design a scoring system for countries to encourage them move from one step to another towards
the institutionalization of national health accounts. The current initiatives on primary health care per-
formance improvement and universal health access are good opportunities to seize for enforcing the
production of NHA data.
To donors1. Harmonize and coordinate donor resources and activities as well as resource tracking processes to
track expenditure;

14
2. Create incentives for countries by tying funding to timely production of good quality NHA data. This
will require strong coordination among development partners (WHO, World Bank, International Mon-
etary Fund, the BMGF, multilateral and bilateral donors, etc.).
Improve the demand and use of NHA
1. Map the policy needs and potential use of NHA data for the different stakeholders through a partici-
patory process of developing policy questions to be addressed by NHA. The process should include
policy-makers at presidential and prime ministerial level, parliament, relevant line ministries, provid-
ers in the public and private sectors, health providers, civil society, etc.;
2. Continued sensitization of high-level decision-makers and training of technicians on NHA value, in-
cluding in government ministries, the private sector, members of parliament, academia, etc.;
3. Build a common understanding among stakeholders regarding the utility of NHA;
4. Develop shorter, user-friendly, relevant reports, written in easy-to-understand language (templates
can be proposed), customize reports for different audiences (policy briefs for decision-makers, for
hospitals, etc.);
5. Enforce the demand and use of NHA: for example, every request for funds needs to have a set of
selected health financing indicators generated from country expenditure data.
Production and translation of specific analyses into policies
1. Make a national needs assessment to strengthen NHA production in individual countries by:
a. Identifying relevant national institutions and legal frameworks in support of NHA;
b. Assessing gaps in institutional and legal arrangements for NHA;
c. Developing strategies and plans of action for immediate action and short-term and long-term plans
in all concerned institutions including the ministries of finance, budget and planning, and national
institutes of statistics.
2. Invest in IT infrastructure and integrate NHA variables in existing routine data collection and analysis
information systems (create solutions, training, scale and evaluate solutions);
3. Integrate NHA data into national financing indicator dashboards;
4. Combine NHA with other data sources for richer analyses;
5. Collaborate with universities and research institutes to conduct further analysis. Conduct subregional anal-
yses and provide critical analyses on key issues: equity, allocative and technical efficiency;
6. Sustain human resources for NHA: give mandate to any of the following technical data-oriented in-
stitutions (different from the ministry of health) to build necessary capacity: school of public health,
department of economics, institute of statistics;
7. In partnership with schools of public health and research institutes, mainstream NHA training in
pre-service curriculum and in routine activities of research institutes;

15
8. Ensure formal and informal sector compliance with timely submission of data, for example, by bind-
ing renewal of licences to the submission of NHA data.
Improve the dissemination of NHA
1. Map evidence needs of the different stakeholders and develop tailored dissemination packages.
Customize reports for different audiences (policy briefs for decision-makers, summaries targeting
hospital interests, the private sector, key cost-effective analyses for the ministry of finance, etc.);
2. Explore innovative methods of disseminating NHA data using modern marketing methodology and
easy-to-understand language; produce scientific publications in collaboration with academia (tem-
plates can be proposed). Target the institutions contributing to NHA data collection and those that
can implement the recommendations and support advocacy efforts;
3. Create a multisectoral group to follow up on the recommendations for NHA to inform next iterations
of data analyses;
4. Design a scoring system to motivate countries to learn from best performers; map best practices; de-
sign rewards for best performers in terms of additional grants in support of improvements.
To WHO1. Provide financial support and undertake regional studies, innovation and sharing of best practices.

16
CHAPTER 1
Background1.1 What are national health accounts?Health accounts are a way for countries to monitor health spending across multiple streams, regard-less of the entity or institution that finances and manages that spending. They allow health adminis-trators to learn from past expenditure and improve planning and allocation of resources throughout the system, thereby increasing efficiency and accountability.1 National health accounts (NHA) consti-tute a systematic, comprehensive and consistent framework for monitoring and measuring resource flows (public, private, and donor) in a country’s health system for a given period of time. It is a tool de-signed to assist policy-makers’ efforts to understand their health systems and improve performance. NHA reflect the main functions of health-care financing namely, resource mobilization and allocation, pooling, purchasing of health services and the distribution of benefits2, measured through answering questions like:- Who in the country is financing health services? - How much do they spend and on what types of services? - Who provides health services? - Who benefits from these health expenditures?3
The NHA classification schemes are designed to be compatible with those practised internationally (most importantly, the System of Health Accounts) to make cross-national comparisons possible. The International Classification for Health Accounts (ICHA) is a comprehensive system which classifies NHA into four dimensions:4
- Financing sources (FS) for contributions by different actors; - Financing agents (HF) refers to entities that manage health expenditures; - Providers (HP) refers to entities that provide health care services and goods; and - Functions (HC) refers to types of health care activities.
1.2 Historical perspectives of national health accounts5 Between 1920 and 1940, economists in the United States of America started making different sets of measurements to assess spending. They started developing simple measurements to assess national income, namely gross national product (GNP) and gross domestic product (GDP). Different experts drew from these broad measurements to focus on their specific fields of interest. The first efforts to understand health expenditure came from the American private sector in 1926 when 15 delegates
1 WHO – Health Accounts https://www.who.int/health-topics/health-accounts/#tab=tab_1 2 WHO - What are National Health Accounts? http://apps.who.int/nha/what/en/index.html3 USAID, National Health Accounts – Global Policy Brief: http://pdf.usaid.gov/pdf_docs/Pnacs960.pdf4 PHRplus Project, NHA regional policy brief - Eastern, Central, and Southern Africa: Using NHA to Inform the Policy Process5 This subchapter was inspired by the following article: Fetter B. (2006). Origins and elaboration of the national health accounts, 1926-2006. Health care financing review, 28(1), 53–67. https://www.ncbi.nlm.nih.gov/pmc/articles/PMC4194972/
17
from the medical profession, academia, and government public health agencies met to see how to expand the availability of health services and lower the cost of health care. A year later, the Commit-tee on the Costs of Medical Care was created and five years later 26 studies laid the groundwork for the first NHA, helped with understanding of the “money income for the country” and further detailed payer groups, namely patients, governments, philanthropy and industry. In 1932, a comparative study showed that Americans were spending twice as much on toiletries, tobacco and recreation and three times more on automobiles and travel than on health care. The discussion that aimed at covering all population groups started then and proposed a prepayment mechanism through taxation and insur-ance to cover the entire population.
Between the 1930s and 1960s, social welfare expanded to cover a finer breakdown in costs defined by the NHA. These efforts inspired a worldwide effort to monitor health spending and provided rec-ommendations for improvements within each country’s specific design and needs. In 2000, the Or-ganisation for Economic Co-operation and Development (OECD) recognized that health was becom-ing the most important industry for which there was need to provide a core set of financial data to meet the needs of analysts and policy-makers. Building on more than 15 years of work in the area of health accounts, the OCED produced the System of Health Accounts (SHA 2000), the first version of a manual to help standardize a set of comprehensive, consistent and flexible accounts6. In 2003, the World Health Organization (WHO) in collaboration with the World Bank (WB) and USAID produced a guide for middle- and low-income countries to further improve the use of NHA measurements.
With the growing need to understand health care provision worldwide, NHA became more and more a global standard and a newer version of SHA was produced by the OECD, Eurostat and WHO to adapt to international comparison. SHA2011 was produced for a global reach with the required flexibility to meet health accounts’ international needs. 7 Since 2011, SHA2011 has been improved with different tools for production (Health Accounts Production Tool) and analysis (Health Accounts Analysis Tool). Today, more than 190 countries use NHA as part of a global WHO database.8
1.3 Current momentum for national health accounts It is vital for effective policy-making that decision-makers have access to essential information on health expenditure in their countries, such as the share of health expenditure, the financial burden of health spending on households, the magnitude of external financing in health expenditure, and the share of spending on primary care among other key indicators. NHA represents a cost-effective, “smart” investment for policy-makers in countries, given that it enables them to mobilize resources, match their country’s health budget based on political commitments, understand how these metrics shift over time in their countries, and make accurate comparisons with health expenditure in other countries.9 NHA data can be used by all levels of policy-makers, nongovernmental stakeholders and
6 A system of health accounts. Version of 2011. https://www.oecd.org/health/health-systems/21160591.pdf7 A system of health accounts. Version of 2011. https://www.who.int/health-accounts/methodology/sha2011.pdf?ua=18 Global Health Expenditure Database (GHED) 9 OrganizationforEconomicCo-operationandDevelopment(OECD),Creatinganevidencebaseforbetterhealthfinancingandgreater
accountability - A Strategic Guide for the Institutionalization of National Health Accounts

18
managers to make better decisions in the health policy process, including policy design and imple-mentation.
NHA can be used to provide evidence in policy dialogues, to guide monitoring and evalua-tion of health care interventions and to improve health system performance. It has the potentialto inform the development of national strategies for effective health financing and to raise additional funds for health. Information provided by NHA can also be used to make financialprojections of a country’s health system requirements.10 Disaggregated comparative spending estimates available for all diseases can be used at both country and global levels to foster best practices. Likewise, NHA can highlight equity imbalances in the distribution of health expenditures.11 However, to answer all health policy questions, NHA information must be combined with non-financial data from sources such as epidemiological studies, population surveys, etc. The accounts themselves do not assess the effec-tiveness of expenditures and require linkages to non-financial data such as health outcomes.12 Finally, NHA can also provide evidence for accountability of donor, public and private investments on health by highlighting the level and proportions of spending in a given health system.
In response to this, at the 27th African Union (AU) Summit of 2016 in Kigali, African Heads of State and Government adopted the Africa Scorecard on Domestic Financing for Health. This is an import-ant milestone in promoting financial planning, performance monitoring and accountability by players at various levels. The Scorecard measures progress towards meeting domestic and external health financing commitments. The quality of the data for the Scorecard depends on updated NHA. It is in this context that the African leaders requested the Commission to collaborate with WHO and other partners to support countries in strengthening NHA and submit the Africa Scorecard on Domestic Financing for Health annually to the Assembly.13 To this end, WHO AFRO is assessing the extent of institutionalization of NHA and providing guidelines for improvement in Member States.
1.4 Institutionalization of national health accounts: an unresolved endeavour The institutionalization of NHA has been defined as a “routine government-led and country-owned production and utilization of an essential set of policy-relevant health expenditure data using an in-ternationally accepted health accounting framework”. WHO has supported the production and use of NHA in Member States to inform advocacy for increased funding, monitor global and regional commitments and to make cross-country comparisons. However, after two decades, very few coun-tries have produced NHA annually. Moreover, NHA institutionalization remains an unresolved issue despite all the benefits that they provide. This means that critical decisions are being made without the needed evidence on how much the country is spending on health, who is spending money on health care and where, what are they buying and the quality of health care services bought. There is
10 WHO, National Health Accounts: http://apps.who.int/nha/en/11 USAID, National Health Accounts – Global Policy Brief: http://pdf.usaid.gov/pdf_docs/Pnacs960.pdf12 WHO, National health accounts in policy formulation: http://apps.who.int/nha/use/en/13 AfricanUnion(AU),AfricanHeadsofStateandGovernmentdefinethefuturedirectionforAIDS,TBandmalariaresponses, http://www.au.int

19
no regular evidence to show whether resources are spent at the intended level of care and whether interventions are cost effective.
Uninformed decisions end up being ineffective and perpetuating resource allocation inefficiencies. African health system failures keep the populations in a poverty trap because health is one of the key ingredients for economic development.14 It is therefore of utmost significance for countries to invest smartly in their health systems through smarter and informed investments.
National health accounts are some of the most important vital statistics for health and therefore need to be available for governments and all health-sector stakeholders.
With the current international commitments made by African countries, the new momentum is to strengthen health systems in Africa, which provides an opportunity, among other priorities, to insti-tutionalize NHA as part of routine key demographic and health statistics. There have been several international commitments that did not result in significant change. However, the current Sustainable Development Goals can achieve the goal of NHA institutionalization if the moment is seized strate-gically and the question: What will it take for Africa to promptly and routinely produce and use NHA? is answered. When can African states start working on the institutionalization of NHA once we define what it takes? This report seeks to contribute to the former question by learning from the past and the present situation of NHA in the WHO African Region (WHO AFR) and making recommenda-tions for improvement.
14 Jennifer, Prah Ruger, Health and Development, 2014, https://www.ncbi.nlm.nih.gov/pmc/articles/PMC4006200/

20
Chapter 2
Approach1. Study objectives The first objective of this assignment was to provide a status update on the institutionalization of
national health accounts (NHA) in the WHO African Region, highlighting challenges and good prac-
tices.
l Seven countries with varying experiences were selected, representing the three WHO AFR sub-
regions.
l Using the World Bank’s framework for the institutionalization of NHA, the study aimed at under-
standing the level of country ownership with regard to the demand and use of NHA data, in terms of
production, management and quality assurance, and the dissemination and translation of NHA data
into specific analyses of policy interest.
The second objective involved developing a regional guide for the institutionalization of NHA in the
WHO African Region, learning from country best practices and challenges, and including global ex-
periences. The regional guide to institutionalizing NHA is a separate document.
2. Assessment frameworkThe World Bank’s framework for the institutionalization of NHA has been used in undertaking this assessment. It outlines the following key compo-nents for the effective institutionaliza-tion of NHA: ensuring country own-ership of the governance, capacity and financing for NHA leading to a complete ownership of the demand and use of NHA data; producing, managing and ensuring quality data; disseminating results to an active and interested audience at country level; and translation of the data into relevant policy decisions. See Figure 1. A number of countries have put in place various NHA institutionalization initiatives and this framework pro-vides a holistic approach to assessing NHA institutionalization.
Source: World Bank, 2011, Where is the money and what are we doing with it? (page 29)
Figure 1: World Bank framework for the institutionalization of national health accounts

21
3. Criteria for country selectionSelection of countries was informed by the need to ensure geographic representation of the
three WHO African subregions and variation of experiences between countries along key vari-
ables drawn from the World Bank framework, and performance regarding institutionalization
of NHA. The following countries were selected: West Africa (Burkina Faso and Guinea), Central
Africa (Cameroon and the Democratic Republic of Congo), and Eastern and Southern Africa
(Malawi and Uganda) – See Table 1 and Figure 2.
This is a well-intended method used in qualitative studies to understand implementation pat-
terns including successes and challenges and to identify solutions.15
Rwanda stands as a unique case study. It has not produced NHA since 2010 but has tried to
produce health expenditure data using a home-grown solution, the health resource tracking
tool (HRTT), with relevant albeit incomplete data. The HRTT collects yearly data on health
spending, combining government and donor spending. Table 1 shows the countries selected
and variables considered.
15 Robert Yin, Case Studies Design and Methods, 2013
Table 1: Selected countries for comparison of NHA production
African subregions
Status of NHA production
Advanced Not advanced Unique experience
West Burkina Faso Guinea
RwandaCentral Dem Rep Congo Cameroon
East and Southern Uganda Malawi

22
Figure 2: Countries selected for data collection
23
4. Data collection and analysis
Data collectionData were collected through a review of published and grey literature and interviews with key infor-
mants at global and country level. The key sources of data collected are illustrated below.
Literature reviewThe review of literature mapped the past and current situation of NHA institutionalization in Africa
and used available evidence to make recommendations on needed interventions for the future. The
documents reviewed included health sector policies and strategic plans, health financing policies and
strategies, relevant guidelines, etc. to assess evidence of use of NHA data. Reviewed documents are
shown in Annex 1.
Interviews Interviews were conducted at global and national levels using a snowballing sampling method, with
one expert providing referral to another. Global interviews focused on capturing expert opinion on
the history of NHA in Africa; whether the institutionalization of NHA was possible and if yes, cur-
rent opportunities to make it a reality; and the challenges faced during the process of getting NHA
reports, from demand for data to the use of NHA data. Global experts also gave their opinions on
the World Bank framework used to assess the level of institutionalization and requirements for the
institutionalization of NHA in Africa. Finally, they discussed the changes that should happen to ensure
successful institutionalization of NHA in Africa. Annex 2 shows the interview guides.
Twenty global experts participated in the interviews by telephone and video conference. They were
drawn from government, academia, WHO, the World Bank, charities, and nongovernmental organi-
zations; some were independent consultants. Out of 25 recommended respondents, 20 responded
to e-mails inviting them to participate in the interviews. The global interviews were unstructured con-
versations that were guided by key questions to allow for flexibility in capturing the varied and deep
experiences of international experts. Annex 3 shows the list of respondents.
Global interviews were set on a day and at a time that was convenient for the interviewee and the
researcher.16 They always started with the introduction of the researcher and the participant and fo-
cused on the area of expertise related to NHA in the African Region. The interviews lasted on average
one and a half hours but could vary from an hour to an hour and 45 minutes. National-level interviews
were the main source of data in drafting national reports and were country-focused as described in
the next paragraphs.
16 Annex 4. Global interviews guide

24
National reportsIn trying to understand countries’ experiences, rigour in data collection was applied as follows: na-
tional consultants triangulated qualitative and quantitative data from literature reviews and inter-
views. Whereas the qualitative data were obtained through interviews, the quantitative data were
drawn from documents and included among other indicators in countries’ financial data such as the
gross domestic product, health expenditure and key national health indicators such as poverty rates,
life expectancy, etc.
Contrary to global experts, national participants were purposively selected based on: the institutions
they served; their past experience in undertaking, supporting and use of NHA data and the position
held; from government (specific policy-makers), universities and teaching institutions, civil society
and development partners. The list of potential participants was adapted to the context of individual
countries. The interviews were semi-structured and used the World Bank framework key components
as themes in understanding the level of institutionalization of NHA.17 To ensure consistency in report-
ing, a template was provided as a basis for reporting and each country had the liberty to provide
more and not less information based on its own context.18
Precisely, country participants discussed the processes, challenges and opportunities of NHA institu-
tionalization in line with the World Bank framework. The following key themes were assessed:
1. The feasibility of institutionalization of NHA in countries;
2. The opportunities countries can capitalize on to advance NHA institutionalization;
3. The challenges in institutionalizing NHA in the country;
4. The review of the proposed WB framework on the institutionalization of NHA in Africa. Partici-
pants provided their opinions on whether the WB framework portrayed a comprehensive picture
of the NHA;
5. Finally, participants made recommendations for countries to fully institutionalize NHA.
For both global and national interviews, no personal data was shared. Rather, opinions were given
about the institutionalization of NHA. However, to keep respondents’ answers anonymous, partici-
pants’ quotes in the report did not include names. At the end of the interview, respondents were
urged to share documents or papers related to the study questions and all interviewees agreed to
comply should questions or clarification be needed. Extensive notes were taken during interviews
and served as the basis for creating chapters and subchapters.
17 Annex 5. National interview guide 18 Annex 6: Country Report Template
25
Data analysisThe analytical process followed the work of Vaismoradi et al19; the review of notes was followed by
the definition codes and deriving themes. Codes are ideas that “have a common point of reference
with a high degree of generality that unifies those ideas regarding the subject of inquiry. Coding
reduces the amount of raw data to that which is relevant to the research question”. Similarities and
differences between codes led to the selection of themes. A theme is a broader concept that organiz-
es a group of repeating ideas or codes and enables one to respond to the study objective. Themes
created the basis for different subtitles included in the results section.
The interviews at global and national levels inspired a look at the data in different time periods. The
results section provides both a backward look and a presentation of the current situation on NHA
institutionalization. A forward look is presented as a separate chapter, while the last chapter is made
up of recommendations. The backward-look section provides past experiences including challenges
and lessons learnt from early efforts at the institutionalization of NHA in Africa. This section benefited
mainly from input by global experts.
The current status of NHA in selected countries benefited essentially from national reports whereas
the forward-looking section focused on the recommendations for moving forward and was inspired
by both the global interviews and country reports. To achieve these objectives, data were triangulat-
ed at two levels: first, with quantitative and qualitative data collected through literature review, and
second with the interviews at global and national levels that also included national reports.
19 Vaismoradi et al., 2016: Theme development in qualitative content analysis and thematic analysis. Journal of Nursing Education and Practice. https://core.ac.uk/download/pdf/52132811.pdf
26
Chapter 3
ResultsThe data analysis shows “time” as the main element in both the interviews and country reports. Every respondent and report talked about the time frame as follows: when NHA was first introduced, what happened next, what is going on at the present time and what should ideally happen. The results are presented in two main sections: a backward look into the past, an assessment of the current situation and a forward look that constitutes the recommendations component.3.1 Backward look at the institutionalization of NHA in the African RegionThe backward-looking section was mainly inspired by global experts who pioneered the initiatives of NHA in African countries from the early 2000s to 2015. Data from countries was complementary to the global interviews. The next paragraphs present the early efforts at introducing NHA in Africa, and the surprising findings that led to either interest in or rejection of NHA.
3.1.1 Early attempts to initiate NHA in Africa - uninterested countriesThe NHA producer guide of the early 2000s was meant for OECD countries. Global experts thought some work could be done to adapt it for low- and middle-income countries (LMICs) as they attempt-ed to produce NHA in Africa. That is how a producer guide was developed for LMICs. At that time, several tracking tools were in use in countries, with every donor tracking their own resources using their own tools. A respondent shared their knowledge about the early stage of introducing NHA in Africa: “In the early 2000s, we were trying to see if countries could capture some of the needed in-formation on NHA but they were not interested at all in it… There was a big fight also on the meth-odology amongst global experts, we finally managed to have some countries see health accounts like vital statistics of health financing. HIV funding was an important trigger for convincing countries that health financing is key in understanding spending for HIV and tracking donor resources. Coun-tries needed donor resources and had to comply with the production of NHA.” Eventually, surprising findings had positive and negative effects as the next paragraph reveals.
3.1.2 Difficult NHA findings for countriesBefore 2000, there was no requirement for understanding health financing indicators and the goal of the new NHA team was to start a conversation at country level about financing. Early countries to produce NHA also provided surprising evidence that would promote but also stifle NHA. For exam-ple, NHA showed that in a Middle Eastern country, a huge chunk of money went missing from one level of care to another and revealed a lot of corruption issues. In another country in Africa the HIV sub-accounts showed that people living with HIV were spending less out-of-pocket (OOP) than the general population, which was surely counter-intuitive and raised many questions on resource alloca-tion. The finding triggered many unanswered questions including on the accuracy of the number of
HIV patients and on where donor funding went missing.

27
Finally, in another country, early NHA data showed a lot of money missing at the lowest level of ser-
vice delivery and the government refused to buy into the findings. A much more robust household
survey was then conducted and when the same results were returned, the head of policy and plan-
ning was brave enough to say “we need better estimates to inform our funding request to the Min-
istry of Finance”. The key respondent remembered moments of difficult discussions and in her own
words narrated the process: “Both the early evidence and the household survey were corroborating,
and the survey was believable because it was led by the government. It was not possible for the gov-
ernment to keep shying away from the results; they showed that over 50% of health expenditure was
financed by households out of pocket. That was significantly too much for a very poor population.
The good part of the story is that the findings also led to the biggest budget increase (30%) for the
Ministry of Health since independence. It was a huge win for the understanding of NHA and that is
when we started looking at ingredients for NHA institutionalization”.
3.1.3 Early ingredients for NHA institutionalizationGlobal experts provided insights into what we called early ingredients for NHA success. The early
challenges are discussed in subsequent chapters. As said before, the first ingredient of NHA insti-
tutionalization was enforcement by donors because countries needed donor funding. One of the
key respondents said: “You need to get an incentive for countries to do NHA because it was not a
culture to produce health financing indicators. Something needed to be requested and an important
consequence for not doing that had to be felt. That is why when it was no more a requirement from
donors, many countries did not keep up with NHA”. By the time the very donors who brought NHA
to Africa stopped supporting it, African countries had not yet valued NHA enough to keep investing
in it. Each country had to deal with the difficult findings. It was important to emphasize that NHA was
not a control or audit tool but a tool that can serve the interests of ministries of health.
There was also another kind of soft incentive: experts kept giving positive experiences of the im-
pact of NHA, given that they appeared (such as increases in government budget for health) to mo-
tivate countries into submitting their NHA data. One of them recalls that the second ingredient for
successful NHA production was government leadership. For countries with greater leadership and
support for NHA, institutionalization followed much more smoothly: “The key ingredients of NHA
institutionalization appeared to be government leadership; technical support needs to be backing
a very willing ministry.” The third ingredient was the inclusion of a course on NHA in the academ-ic programme in some countries: “… that is how schools of public health started to be involved
in teaching NHA in Africa. With this, however, there were mixed results, because schools needed
resources to sustain those classes; it was necessary for funders to keep this support for some time;
unfortunately, they chose to withdraw their support to NHA”.
Finally, the fourth and last ingredient was mandating stakeholders to submit NHA data and decen-tralization of NHA institutionalization. For countries with great government leadership, all donors
were not always compliant. The foremost donor supporting NHA, the United States of America, was

28
also part of donors with difficult data to tabulate because the financial management of US systems is
totally different. For example, the US Centers for Disease Control (CDC), USAID, and all US organi-
zations have different systems. When you add all players including European countries and others, it
becomes even more difficult to use their management information systems and translate them into
health accounts as one respondent recalls: “I had to develop a syntax to try to align all stakeholders;
starting with the US organizations themselves; therefore, for each stakeholder, a certain effort of
institutionalization needs to happen. We need to look at their internal financial information systems
and improve them…”
3.1.4 Early challenges to NHA institutionalizationJust like with the early ingredients of success, this section was informed by global interviews with actors
who were part of early processes, and enriched with national data. For most respondents, the idea of
institutionalizing NHA was not new and some of them were involved in early NHA institutionalization
efforts that eventually failed to be completed. The most important challenge was the lack of a vision for institutionalizing NHA from the beginning. Experts came to African countries, explained the value of
NHA, conducted surveys and expected to have regular surveys done. It was not envisioned then that
they could build slowly on emerging information systems to support their efforts.
Secondly, NHA faced issues of lack of sufficient resources in terms of time and funding. Indeed,
the international funding and attention it received did not last long enough to result in a sustainable
programme as one of the participants reported: “A few years of implementation were enough for
early donors to make pressure and ask for when it would be time to stop funding NHA. ‘When are
we going to exit these health accounts?’ was a frequent question; ‘this has to stop’. To some extent,
this was not fair because we had not yet looked at institutionalization deeply…” Donor fatigue was
premature for NHA. Compared to the demographic health surveys that kept building on evidence to
make every iteration easier and institutionalize the method, NHA pretty much maintained its broad
surveying methodology for 20 years.
The lack of vision and resources did not support exploring information systems as a solution. A re-
spondent remembered: “One important mistake we all made was not to look at information tech-nology as a solution, including the growing government financial management systems in coun-
tries. The most important thing now is how to readily improve and integrate government financial
management systems to ease NHA work … sometimes in some very large countries, the work is
simply impossible. In those countries, we never looked at financial systems, which is unfortunate...”
NHA continued to be perceived as an outsider tool because countries could have stepped in and
improved the original NHA but this did not happen. A key informant described one of the negative
perceptions of NHA as an externally driven instrument for international comparisons not necessarily
meant to serve ministries of health: “The idea that data was resulting in country comparisons where
a few countries felt they were not positively represented frustrated some government officials and

29
that led to loss of momentum for national ownership. Consultants were mostly hired by donors, local
leadership was not in control of contracts, had no expertise to assess the quality of NHA reports and
did not therefore feel the motivation and or obligation of leading the next iteration of NHA”. More
efforts are needed to ensure NHA is not perceived as a tool for auditing governments.
3.1.5 NHA institutionalization, an unresolved questionThe story of the institutionalization of NHA in Africa keeps coming back over and over according to
respondents and no entity is taking responsibility for the whole initiative once and for all. Some key
respondents reported that in 2010, the Bill & Melinda Gates Foundation provided US$ 5 million to
support the institutionalization of NHA, an initiative that the World Bank used to lead in collaboration
with WHO. As a result, in 2012, a book was produced to provide guidance on the institutionalization
of NHA. It was entitled: Creating Evidence for Better Health Financing Decisions: A Strategic Guide
for the Institutionalization of National Health Accounts.20 The book by Maeda et al. does not need to
be reproduced and has great value in discussing the constraints to institutionalization and suggesting
the way forward.
In Maeda’s book, the institutionalization of NHA is presented as a business case. It shows how NHA
could shed light on sound policies by providing evidence on resource gaps, value for money invested
in the health system (by linking NHA data to non-financial and health outcome data) and the bur-
den of health spending on households. It presents a framework for the institutionalization of NHA
and its core objective as a long-term strategy to ensure NHA transitions from a donor-driven tool
to a country-owned tool. It is a very detailed book that provides significant information on making
progress related to the institutionalization of NHA. However, 10 years later, respondents expressed
disappointment that the issue of NHA institutionalization is still unresolved.
Nevertheless, said a respondent: “although this makes me feel like we missed key opportunities to
institutionalize NHA, the renewed debate shows that it is an important but unfinished endeavour.
Hopefully, we can take best practices and scale them up, learning from the current explosion of
information technology that was not available two decades ago.” Another respondent said: “I was
involved in providing evidence for NHA institutionalization and the renewed interest on this subject
shows the loss of institutional memory in global health institutions. To sustain this current effort,
there is need to bind the institutionalization of NHA with key funding requirements in health such as
grants and or loans provided by the World Bank, or data should be routinely required by the Inter-
national Monetary Fund just like other key economic indicators”.
20 Maeda et al, 2012: Creating Evidence for Better Health Financing Decisions: A Strategic Guide for the Institutionalization of National Health Accounts. http://documents1.worldbank.org/curated/ar/410301468323088938/pdf/689660PUB0publ07926B009780821394694.pdf

30
Figure 3: A three-di-mensional model of country ownership of NHA institutionalization
Maeda’s book suggests as the way forward the development of a long-term strategy to address three
key elements of the World Bank framework cycle: governance, capacity and financing. – See Figure 3.
- The NHA governance structure will ensure that countries use one of the four proposed gov-
ernance models for NHA: (a) leadership by the ministry of health; (b) an MoH-led endeavour with
multisectoral collaboration; (c) government-mandated coordination by a multisectoral team; and (d)
an undertaking led by an entity outside of government. Each model has its strengths and limitations.
The optimal institutional “home” for NHA will depend on a country’s institutional capacity, financial
resources and political context.
- Capacity building to strengthen the NHA cycle: demand generation, production, translation of
data into policy and dissemination. However, it has been documented that only production has been
the main focus of capacity building. When that happens, the rest of the NHA institutionalization steps
are weakened, which eventually halts or slows NHA production.
- Financing: experience has shown that the cost of producing NHA decreases with subsequent
rounds. The book advises that embedding NHA production in the country’s budget ensures sus-
tained financing and economies of scale as countries try to reduce cost and improve the process by
merging NHA data collection with other data collection systems such as the demographic and health
survey (DHS), the integrated households living conditions survey, etc
International and regional organizations were invited to be part of value addition to NHA by stimulat-
ing peer learning. However, regional agencies often lack adequate financing and strong governance
structures to support their work.
Source: Maeda et al, 2012: Creating Evidence for Better Health Financing Decisions: A Strategic Guide for the Institutionaliza-tion of National Health Accounts

31
One of the difficulties in institutionalizing NHA highlighted in the book is the lack of capacity of
NHA experts to actually respond to policy-makers’ top financing concerns. To provide insight into
how this could be achieved, the authors provide case studies with the aim of bringing policy-makers
and producers of NHA closer together: (a) by introducing the common language and the type of
answers NHA can provide; and (b) by learning how other countries have used NHA as input to evi-
dence-based policy-making.
3.2 Current situation of the institutionalization of NHA in the African RegionHealth systems, including their financing and ultimately their health accounts will depend on the
overall economic situation of countries. Sub-Saharan African countries have a significant proportion
of their population living in extreme poverty. Their economic growth has not necessarily impacted
social sectors, including health. Among the seven countries selected to assess NHA institutionaliza-
tion, Cameroon stands as the richest with three to four times the average GDP of some of its peers.
DRC stands as the country with the highest proportion of poor population although it is renowned
for natural resources. – See Table 2.
A significant proportion of the GDP of these countries goes to loan repayment, with Rwanda having
the highest debt-to-GDP loan repayment rate. In situations of extreme resource constraints, countries
become reluctant to increase their investment in health, resulting in government displacement of
funding from health to other needs perceived to be more urgent and reliance on donor funding for
health. It is therefore important for these countries to take smart cost-effective decisions using every
dollar for the greatest value. This means the issue of corruption raised by some of our respondents is
tackled and resources flow to intended beneficiaries.
3.2.1 General overview of countries’ health financing systemsThere is a very disturbing pattern of underinvestment in health in Africa that led to a high-level meet-
ing in Abuja in April 2001, where African countries pledged under the auspices of the African Union
to allocate at least 15% of their annual budgets to health. However, 20 years down the road, WHO
reports: “… only one African country reached this target. Twenty-six countries had increased the pro-
portion of government expenditures allocated to health and 11 had reduced it. In the remaining nine
countries there was no obvious trend up or down. Current donor spending varies dramatically.21”
Rwanda is reported to have attained the Abuja target.
21 https://www.who.int/healthsystems/publications/abuja_declaration/en/

32
On a positive note, all African countries have the required basics for a strong health-financing system,
with key institutions in charge of public financial management such as the ministries of finance, plan-
ning and budget, revenue authorities, etc. In all countries there are ministries of health with a unit in
charge of health financing housed in the department in charge of policy and planning. However, the
unit is reportedly understaffed and not sufficiently funded to fully undertake assigned health financ-
ing functions. All countries have statistics institutes to store key vital statistics, which represent a great
opportunity for NHA.
There is strong collaboration between the ministries of health, universities and schools of public
health that could provide the necessary technical expertise to complement the insufficient human
resource capabilities often observed in public institutions, as reported by respondents and in Mae-
da’s book. In addition, African countries have set their vision, developed their strategic documents
and laws in relation to financial management (public and private reporting). Finally, countries have
adhered to the African Union’s vision and have set goals and signed up to the United Nations’ SDGs.
The necessary international, regional and national legal and institutional frameworks are available to
achieve great success in health financing systems. – See Table 3.
Table 2: General economic situation of selected countries
31
Table 2: General economic situation of selected countries
Burkina Faso
Guinea Cameroon DRC Rwanda Uganda Malawi
Population (millions, rounded)*
21 13 26 85 12 43 18
Life expectancy (years)** 56.7 56 59,4 58 66.4 62.5 64 GDP per capita ($US)* 731 965 1 529 470 837 643 517 Most recent GDP growth (%)
5.7
4 5.8 9 (2019) 6.5 4.4
COVID-19 GDP decline expected
3.6-12 3-4
Government loan, share of GDP (%)
38 63 44 49
Population living under poverty line (%)***
40 55 29 77 38 21 52
All numbers are rounded
* Latest is 2018-9 ** Latest is 2015-
2019 *** Latest is 2014-2019
On a positive note, African countries all have the required basics for a strong health-financing system, with key institutions in charge of public financial management such as the ministries of finance, planning and budget, revenue authorities, etc. In all countries there are ministries of health with a unit in charge of health financing housed in the department in charge of policy and planning. However, the unit is reportedly understaffed and not sufficiently funded to fully undertake assigned health financing functions. All countries have statistics institutes to store key vital statistics, which represent a great opportunity for NHA. There is strong collaboration between the ministries of health, universities and schools of public health that could provide the necessary technical expertise to complement the insufficient human resource capabilities often observed in public institutions, as reported by respondents and in Maeda’s book. In addition, African countries have set their vision, developed their strategic documents and laws in relation to financial management (public and private reporting). Finally, countries have adhered to the African Union’s vision and have set goals and signed up to the United Nations’ SDGs. The necessary international, regional and national legal and institutional frameworks are available to achieve great success in health financing systems. – See Table 3.

33
X* : Not estimated.
** : WHO recommends a minimum of US$ 84 per capita per year for sub-Saharan African countries.
3.2.2 How often are NHA produced in Africa?Today, all countries have made at least two years of NHA rounds. Figure 4 shows the year the country
first produced NHA and depicts a significant achievement because it shows that the NHA journey has
started in Africa. Its benefits are known and improvement would be much easier if implementation
this time focuses on sustainability.
* These years correspond to the start of NHA work, not necessarily the production year
Table 3: Health financing systems and social health protection
32
Table 3: Health financing systems and social health protection
Burkina Faso Guinea Cameroon DRC Rwanda Uganda Malawi Government budget on health (% total government budget)
15 (2014) 15 (2015) 19 (2016)
8 (2019) 6 (2011-2020) 5 (2016)
16 (2017) 8 (2019/20)
5 (2020/21) 9.7 (2020/21)
Total health expenditure (%)
Government 39 (2018) 9 (2010) 15 (2016)
15(2012) 34 (2020)
15 (2018) 26 (2017) 11 (2019)
18 (2013/14) 15 (2014/15) 16 (2015/16)
25 (2016) 23 (2017) 24 (2018)
Donors 15 (2018) 27 (2010) 36 (2016)
7 (2012) 36 (2018) 49 (2017) 41 (2013/14) 41 (2014/15) 43 (2015/16)
58 (2016) 60 (2017) 58 (2018)
Households 40 (2018) 62 (2010) 50 (2016)
71 (2012) 45 (2018) X* 41 (2013/14) 43 (2014/15) 42 (2015/16)
12.5 (2016) 12.7 (2017) 12.6 (2018)
Estimated health spending needs ($/inhabitant/year)* 112
122 32 60 X* 48
Current spending on health ($US/inhabitant) 44 44 (2016) 61 23 37 (2017) 51 (2016) 40
Social health protection coverage (% total population) 7 < 10 6.5 2 (CBHI) 94 (2017) 1 (2014) x
X* : Not estimated. ** : WHO recommends a minimum of US$ 84 per capita per year for sub-Saharan African countries. 3.2.2 How often are NHA produced in Africa?
Today, all countries have made at least two years of NHA rounds. Figure 4 shows the year the country first produced NHA and depicts a significant achievement because it shows that the NHA journey has started in Africa. Its benefits are known and improvement would be much easier if implementation this time focuses on sustainability.
Figure 4: Countries’ first year of NHA production
* These years correspond to the start of NHA work, not necessarily the production year
2000 2001 2002
2005 2006 2007
2012
199820002002200420062008201020122014
Uganda Malawi Rwanda Burkina Faso DRC Guinea Cameroon
Figure 4: Countries’ first year of NHA production

34
Table 4: NHA Rounds of production in selected countries
Each country has its own NHA journey that depends mainly on the ministry of health leaders that
pushed the NHA agenda and the availability of donors willing to support NHA production. Table
4 shows different performance levels in producing NHA. It was observed that the official language
(English or French) does not play a big role in the process of NHA institutionalization in Africa. For
example, Burkina Faso, a French-speaking country shows consistency in yearly production of NHA,
followed by Malawi, an English-speaking country. DRC and Uganda seem to have lost the momen-
tum they had acquired, and Rwanda exited the production of NHA 10 years ago and moved on to the
next level with its own HRTT after the 2010 NHA was not validated. Guinea follows nicely in produc-
ing NHA even though it lacks ingredients of sustainability. The NHA production rounds for the seven
selected countries in West, Central, East and Southern Africa are presented below.
Burkina Guinea Cameroon DRC Rwanda Uganda Malawi2005 2014 2007 2012 2006 2002 2000 20012006 2015 2010 2014 2008 2005 2013 20072007 2016 2013 2009 2010 (Draft) 2014 20082008 2017 2015 2010 2016 20122009 2018 2018 2011 2017 20142010 2019 2012 20162013
As has been mentioned before, the lack of sustained interest in producing NHA has made it a fragile
tool without proper ownership. It was originally funded by USAID, which quickly withdrew before
proper institutionalization, leading to the introduction of several health resource tracking tools that
have been imposed by individual countries without proper coordination, further decreasing the NHA
momentum. Leadership and funding are based on ad hoc commitments in which technical teams are
continually being hired and changed yearly, based on available funding. Given these recurrent pro-
cesses, there is loss of competence and institutional memory. Twenty years down the road, the NHA
agenda and funding are still driven by donors in a very fragmented and unpredictable environment.
The funding for NHA production shows that many players (see Table 5) have been working inde-
pendently and inefficiently without any sustainability plans. Governments have not always been able
to perform their coordinating role of planning ahead and providing a long-term solution for NHA.
WHO as a moral global health leader has worked to keep countries engaged and informed on re-
quired health finances for achieving key global health goals. Due to insufficient funding, WHO sup-
port has not been holistic and as such, the coordination of willing development partners and country
leadership will be crucial.

35
Country DonorsBurkina Faso France, WHO, Japan, Global Fund, UEMOAGuinea WHO, World BankCameroon WHO, World BankDRC USAID, WHO, Belgian Cooperation, World Bank, Global Fund, SANRU, EU, GAVIRwanda USAID, EUUganda USAID, UNICEF, WHO, World Bank, ECSA-HC, UNFPAMalawi EU, SIDA, USAID, WHO, Action Aid International, Institute for Democracy in South Africa, UNDP,
UNAIDS, Malawi Economic Justice Network, CHAI, UKAID, The Global Fund
3.2.3 The World Bank framework and NHA institutionalization in AfricaThis assessment used the World Bank framework to provide an understanding of the institutional-
ization of NHA in Africa. It revealed considerable challenges that need to be addressed for further
progress. We shall look at the demand and use of NHA data, the production of NHA data and quality
assurance, the dissemination of results and translation of NHA data into policy formulation.
Governance, capacity and financing for NHA As said earlier, all countries reported that the NHA agenda was driven mainly by donors. Governance
considers the presence of clear mandates, roles and responsibilities and the provision of necessary
capacities and funding. However, for most countries, although existing documents state that the
ministry of health is mandated to provide data, the mandate is not enforced (see Table 6). There are
a few countries without written mandates on NHA production (Guinea), thus making the production
of NHA a deliverable for which ministries are not accountable. Despite written mandates for most of
the countries, government funding has not been consistent for NHA. That is the case in Cameroon.
Where there are funding commitments, such as in DRC, there is no budget and when there is a bud-
get, it gets diverted and does not serve the primary purpose of producing NHA. There is a typical
lack of NHA prioritization overall.
Indeed, NHA does not serve the purpose for which it was created, which is to shed light on resource
allocation and advocate for expanded coverage. members of parliament do not use NHA due to lack
of regular and timely information, and even when there is data, the reports are long and too technical
to be understood by the majority of members of parliament. The situation can change if regional and
global commitments for NHA production are enforced.
In Rwanda, the Integrated Financial Management Information System (IFMIS) team at the Ministry of
Finance was not aware of the existence of NHA. Once they understood the importance of NHA, they
Table 5: Multiplicity of NHA donors
36
reported that the lack of NHA data is due to lack of advocacy: “We do generate indicators required
by the IMF, the World Bank, UNDP, NASA, etc. Why would it be impossible to generate NHA data?
The Ministry of Health did not advocate sufficiently for NHA, but yes we can produce SHA2011 data
given some programming work and scaling up the new tools. We will need time and resources to do
this”. The IFMIS team in Rwanda is made of a group of close to 40 young IT experts and economists.
With the challenges enumerated above, the following important opportunities can be re-emphasized:
• All countries have a ministry of health, and a department with a mission to produce health spend-
ing-related data (planning department); for some countries that mission lies with the statistics
institute.
• Some countries have clear laws mandating the MoH to produce accounts (such as Burkina Faso,
DRC), a few countries have funding for NHA (DRC) even though the funding is often diverted.
• NHA competence is currently available in Africa.
• There is renewed country commitment to universal health coverage and the SDGs.
• WHO has the opportunity to significantly improve the production of NHA using African human
resources on the ground.
• At the 27th AU Summit of 2016 in Kigali, African Heads of State and Government adopted the
Africa Scorecard on Domestic Financing for Health. The quality of the data for the Scorecard de-
pends on updated NHA.

37
A clear discussion on the possible avenue of progress lies with enforcing the production of NHA by:
• Selecting a champion, ideally the prime minister or president, and rewarding best performers
on national leadership and NHA-driven decision-making;
• Giving mandate to countries’ institutions to lead on NHA, ideally national institutes of statistics,
and mainstreaming NHA within a broad national database. Research institutes, schools or insti-
tutes of public health are an alternative to statistics institutes;
• Requesting NHA indicators as part of regular reporting by the ministry of finance as a prerequi-
site for IMF, World Bank or WHO loans or grants;
• Continuing advocacy through regional bodies, the AU and WHO.
Demand and use of NHA dataGovernance and demand challenges and opportunities for NHA are closely related because strong
governance for NHA means there is demand for it. Details on demand and use for NHA are shown in
Table 7. As said earlier, overall, in Africa, the demand for NHA has been weak because of lack of use
of NHA data by the MoH, ministry of finance, parliament, presidents’ and prime ministers’ offices, etc.
Countries that produce NHA regularly are not doing so because data is internally needed but rather
because of external demand. Donors mostly use NHA for country comparison (WHO) rather than for
internally stimulating the use of NHA indicators by relevant institutions. The new momentum to move
Burkina Faso Guinea Cameroon DRC Rwanda Uganda MalawiSome level of institutionaliza-tion (clear man-date of MoH for NHA produc-tion, permanent team with a focal person). However, no government budget for NHA production. WHO leads the process. Local competence is available, high staff turnover.
WHO and other develop-ment partners drive the NHA agenda. The capacity for production and finance com-pletely relies on them. Local competence is available.
Presidential de-cree mandates NHA produc-tion at MoH. However, lack of prioritization, no resources allocated to NHA. Local competence is available.
Ministerial de-cree mandates production of NHA. Howev-er, budgeting for NHA is a big problem. When there is a budget, it is diverted. Local competence, high staff turn-over.
Early govern-ment lead, donor-funded. MoH included NHA budget but the country took another IT-based solution for tracking health spend-ing. High staff turnover.
Leadership at MoH at the beginning. A decline noted in its function-ality. Local competence is available, high staff turnover.
Periodic NHA but on demand from WHO. Capacity is available but un-planned and ad hoc. Confusion of roles and high staff turnover. Lo-cal competence is available.
Table 6: Governance, capacity and funding for NHA
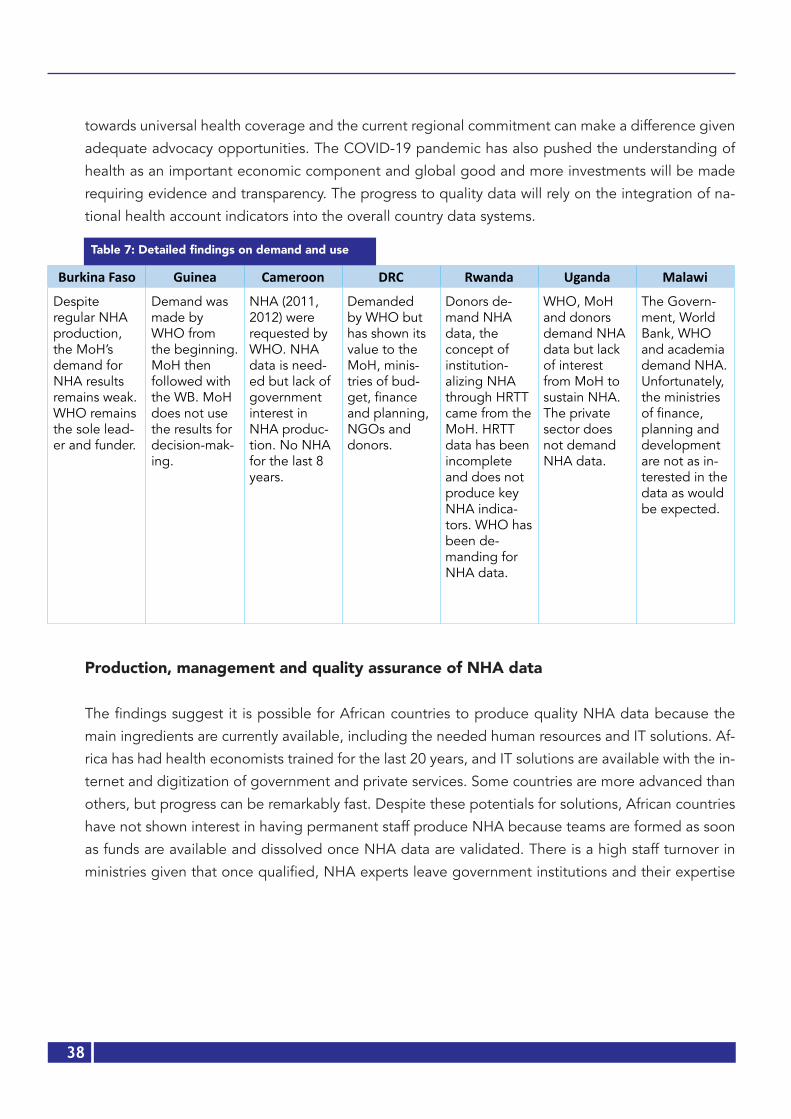
38
towards universal health coverage and the current regional commitment can make a difference given
adequate advocacy opportunities. The COVID-19 pandemic has also pushed the understanding of
health as an important economic component and global good and more investments will be made
requiring evidence and transparency. The progress to quality data will rely on the integration of na-
tional health account indicators into the overall country data systems.
Production, management and quality assurance of NHA data
The findings suggest it is possible for African countries to produce quality NHA data because the
main ingredients are currently available, including the needed human resources and IT solutions. Af-
rica has had health economists trained for the last 20 years, and IT solutions are available with the in-
ternet and digitization of government and private services. Some countries are more advanced than
others, but progress can be remarkably fast. Despite these potentials for solutions, African countries
have not shown interest in having permanent staff produce NHA because teams are formed as soon
as funds are available and dissolved once NHA data are validated. There is a high staff turnover in
ministries given that once qualified, NHA experts leave government institutions and their expertise
Burkina Faso Guinea Cameroon DRC Rwanda Uganda Malawi
Despite regular NHA production, the MoH’s demand for NHA results remains weak. WHO remains the sole lead-er and funder.
Demand was made by WHO from the beginning. MoH then followed with the WB. MoH does not use the results for decision-mak-ing.
NHA (2011, 2012) were requested by WHO. NHA data is need-ed but lack of government interest in NHA produc-tion. No NHA for the last 8 years.
Demanded by WHO but has shown its value to the MoH, minis-tries of bud-get, finance and planning, NGOs and donors.
Donors de-mand NHA data, the concept of institution-alizing NHA through HRTT came from the MoH. HRTT data has been incomplete and does not produce key NHA indica-tors. WHO has been de-manding for NHA data.
WHO, MoH and donors demand NHA data but lack of interest from MoH to sustain NHA. The private sector does not demand NHA data.
The Govern-ment, World Bank, WHO and academia demand NHA. Unfortunately, the ministries of finance, planning and development are not as in-terested in the data as would be expected.
Table 7: Detailed findings on demand and use
39
is lost because in the majority of cases, they do not continue their career in the production of NHA. In addition to staff, the ministries of health in African countries do not have appropriate infrastruc-ture to produce NHA. In all the countries, there are no sufficient computers, software and offices to support regular and permanent production of NHA. The data collection system is still predominant-ly paper based, using printed questionnaires. Data are collected using printed questionnaires and managed using Excel without relevant automation to detect human errors. Meanwhile, IT tools have evolved considerably and have been applied in other surveys such as the demographic and health survey at the institutes of statistics that use iPads, internet, etc. Another important challenge is the lack of synchronization of other data systems. NHA has not benefited from investments made in other data production systems, which could be obtained by including critical variables in surveys and link-ing IT systems to provide the information needed for NHA. Getting data from the private sector is still very challenging but efforts could be made to work with revenue authorities. Overall, respondents have criticized the accuracy of data coming from NHA production. Often but not always, the results are felt not to be reliable and are questioned by decision-makers, thereby affecting the demand and use of NHA results.
The present assessment mapped (Table 8) all IT tools used in selected countries and it is clear that there are untapped solutions not yet used to their full potential to serve the NHA agenda in Africa. In terms of the needed IT solutions to produce NHA, Africa is ready and already has health infor-mation systems and databases (DHS, household living conditions surveys, etc.) that can be adjusted to provide most of the data required to produce NHA. There are more IT experts that coupled with health economists, have the potential to create solutions customized to each country’s context. The best example is Rwanda, where health financing experts worked with IT programmers to create the NHA technological infrastructure.22 Malawi has also been exploring digitization and synchronization of different systems to produce NHA data. It produced a concept paper in 2018. Such an initiative needs to be supported.23
DisseminationThe present assessment shows that in all countries where NHA data and analyses are produced, they are used to some extent, given that they inform health sector reviews, health sector strategic plans, health sector budgeting, etc. In all countries, NHA dissemination has mainly been internal to MoH and a few donors through “dissemination workshops”. The main channels for dissemination have been: validation workshops, e-mails, leaflets, flash discs, etc. Sometimes the media is invited and the news relayed on TV. In some countries, academia uses the reports for studies. Critical and targeted analyses do not exist and when they do, they make no sense to a regular citizen, member of par-liament, and even staff at the ministry of health, because the data are very technical. Only in a few countries is academia interested, and today’s media are not yet used to their full potential to serve NHA dissemination and stimulate necessary discussions (social media: Twitter, Fakebook, interactive
YouTube sessions, etc.). Basically, the population has been left out.
22 Improvement of Rwanda’s Health Financing Information Systems, 2009 led by Angelique Rwiyereka, with BMGF funding.23 Institutionalization of the National Health Accounts (NHA) Production in Malawi
40
The push by donors for every round of NHA and the lack of involvement of key institutions for which the data should actually make sense is unfortunate and needs to be addressed. One key respondent said: “…summary reports used to be developed in the past, but recently, summary reports are not printed or circulated widely… this should be encouraged because it is what many policy-makers should be looking for…” Another participant responded: “…dissemination is not well funded and yet this stage is very important and should be given the attention that it deserves…” It is classic that the reports are left on the shelves and get forgotten. There has been underuse of the results compared to other statistical products due to: (1) the highly technical nature of reports, (2) difficulty in understanding for lay people, (3) lack of specific summary reports with insights that inform specific areas of interest (hospitals, private sector, etc.).

41
Burkina Faso Guinea Cameroon DRC Rwanda Uganda Malawi
Excel DHIS2 (MoH) since 2016
Excel USQUEL (Minifin) Smart IFMIS (MI-NECOFIN; 2007) IFMIS unit could be the brain behind. A team of > 30 IT experts
IFMIS (public finance manage-ment)
Excel
DHIS2 (MoH, 2013)
IFMIS (Min Fin) CSPRO for data entry
SIDONIA (Central Bank)
HRTT (MoH) 2010. Intended to harmonize differ-ent tools (NHA, NASA, JAWP) but today obsolete
HMIS (MoH) IFMIS-Central version
IFMIS-District version
PAMS (MoH, 2008)
DHIS2 (MoH, 2016,)
CAMCIS (cus-toms)
TOMPRO (MoH) DHIS2- Public health
EMR (several ver-sion in hospitals)
DHIS2 Aid manage-ment platform in treasury
CID (Minecofin, 2008)
iHRIS (MoH, 2018) MESURE (taxes) DHIS (MoH) EMR (OpenClinic, OpenMRS) in all referral and district hospitals. Private facilities use different EMRs
OBTB: output based tool for budgeting
Several EMR in different health facilities.
REDES (CNLS, Presidency, 2010)
eSIGL (MoH, 2019)
DHIS2 (MoH,) EMR (in some hospitals)
ISHYIGA - private pharmacies (rural and traditional healers excluded)
The Kuunika Project achieved interoperability of some digital systems
EMR (MoH, 2019) eLMIS (eSIGL in French)
PROMISE (bud-get)
PGAI (Ministry of Planning)
Rwanda plans to improve the HRTT platform to get real time NHA data. Funding under discussion with BMGF.
Ongoing discus-sion to improve lack of routiniza-tion using IFMIS
CADRE (govern-ment expenses)
EMR
Others: to be specified
Plans to create a national data warehouse, based on the DHIS2 platform, interop-erable with IFMIS
Table 8: IT Solutions currently used in ministries of finance, budget, planning and health24
24 Some countries have one ministry in charge of finance, economic development, budget and planning. For some other countries, these functions are performed by different ministries.
Table 8: IT Solutions currently used in ministries of finance, budget, planning and health24

42
This table illustrates IT solutions used in all seven countries, which means that it is relatively easy to use digital solutions to institutionalize NHA since the countries have adopted a digital process in some of their work. In Rwanda for example, although the health management information system (HMIS) was not intended for use to submit expenditure data, it was modified to capture health-centre level expenditure. Electronic Medical Records (EMR) in Rwanda have been customized to include expenditure data and the new proposal is to scale EMR in all facilities and stop using HMIS in expen-diture collection.

43
Translating data and dissemination of specific analysesThis step was not well documented because as countries reported, it is seemingly part of the pro-
duction process. According to them, there is no such additional step as translating data and dissem-
ination of specific analyses. After dissemination of NHA results, national consultants reported: “Data
are not translated into analyses that inform policies or any action” and “there is no plan to improve
analysis and interpretation of NHA data and there are no best practices to share”. NHA seems not
to attract interesting translation of data and dissemination of specific analyses because, according
to one respondent: (1) “There is no evidence that NHA data analysed have any impact on resource
allocation and its efficiency, equity distribution and ultimately improved health outcomes”; and (2)
“In general, policy-makers are not very engaged in these processes to determine what key questions
to which they exactly want answers from the NHA exercise, largely due to lack of understanding of
the NHA process and impact”.
3.2.4 Malawi and Rwanda as advanced in NHA institutionalization Malawi and Rwanda are the only countries that had started discussions on institutionalizing NHA; the
five other countries welcomed the initiative as a first opportunity to discuss moving the NHA agenda
forward.
MALAWI: NHA institutionalization concept paper, 2018
In 2018, Malawi developed a concept paper. A consultant working on a concept note on the institu-
tionalization of NHA used the World Bank framework to identify challenges and presented solutions
on the demand and use of NHA, the production, management and quality of data, dissemination of
results and translation and dissemination of specific policies. The challenges and potential solutions
are summarized in Table 9.
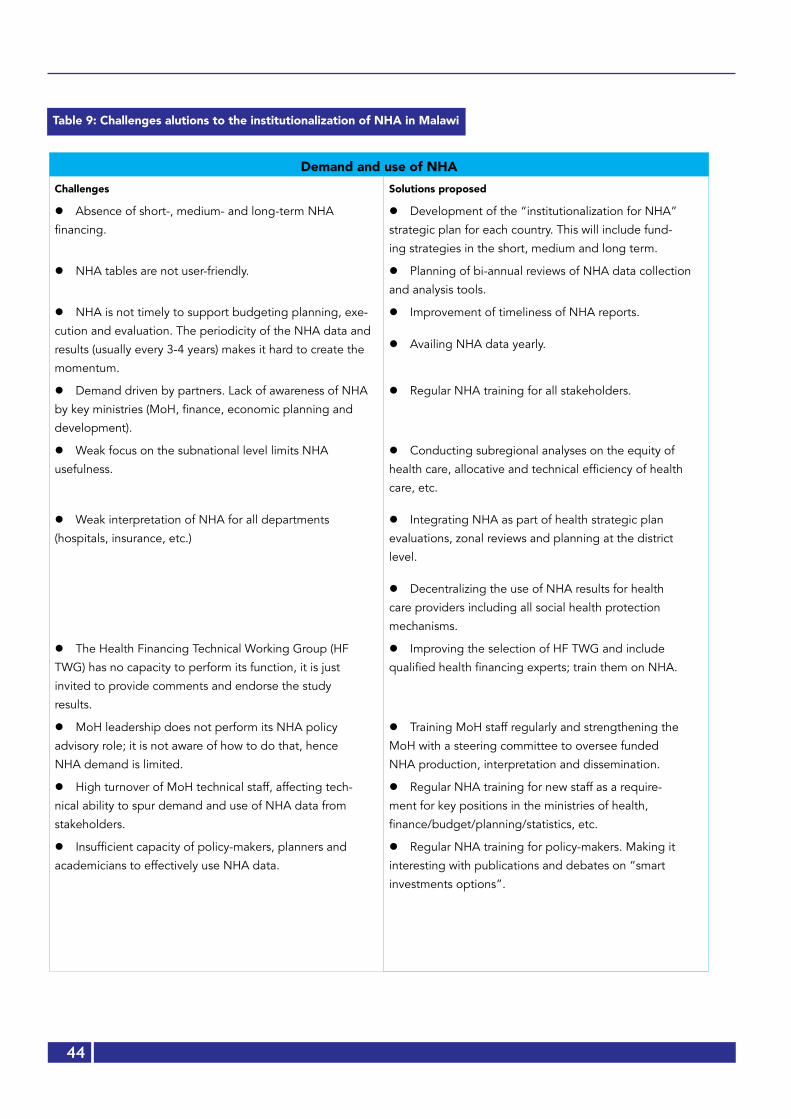
44
Table 9: Challenges alutions to the institutionalization of NHA in Malawi
Demand and use of NHAChallenges Solutions proposed
l Absence of short-, medium- and long-term NHA
financing.
l Development of the “institutionalization for NHA”
strategic plan for each country. This will include fund-
ing strategies in the short, medium and long term.
l NHA tables are not user-friendly. l Planning of bi-annual reviews of NHA data collection
and analysis tools.
l NHA is not timely to support budgeting planning, exe-
cution and evaluation. The periodicity of the NHA data and
results (usually every 3-4 years) makes it hard to create the
momentum.
l Improvement of timeliness of NHA reports.
l Availing NHA data yearly.
l Demand driven by partners. Lack of awareness of NHA
by key ministries (MoH, finance, economic planning and
development).
l Regular NHA training for all stakeholders.
l Weak focus on the subnational level limits NHA
usefulness.
l Weak interpretation of NHA for all departments
(hospitals, insurance, etc.)
l Conducting subregional analyses on the equity of
health care, allocative and technical efficiency of health
care, etc.
l Integrating NHA as part of health strategic plan
evaluations, zonal reviews and planning at the district
level.
l Decentralizing the use of NHA results for health
care providers including all social health protection
mechanisms.
l The Health Financing Technical Working Group (HF
TWG) has no capacity to perform its function, it is just
invited to provide comments and endorse the study
results.
l Improving the selection of HF TWG and include
qualified health financing experts; train them on NHA.
l MoH leadership does not perform its NHA policy
advisory role; it is not aware of how to do that, hence
NHA demand is limited.
l Training MoH staff regularly and strengthening the
MoH with a steering committee to oversee funded
NHA production, interpretation and dissemination.
l High turnover of MoH technical staff, affecting tech-
nical ability to spur demand and use of NHA data from
stakeholders.
l Regular NHA training for new staff as a require-
ment for key positions in the ministries of health,
finance/budget/planning/statistics, etc.
l Insufficient capacity of policy-makers, planners and
academicians to effectively use NHA data.
l Regular NHA training for policy-makers. Making it
interesting with publications and debates on “smart
investments options”.

45
Production, management, and data quality Challenges identified Solutions proposed
l The Integrated Household Living Conditions Surveys (IHLCS) and DHS do not capture useful data for NHA.
l The DHIS2 current format cannot capture NHA data from both public and private health facilities.
l Donor aid management platforms do not have disag-gregated data.
l Data collection tools are used unintuitively, inefficient-ly.
l Identifying all legal, policy and technical issues pertinent to NHA.
C l ustomizing and synchronizing the following data systems to meet NHA needs: EMR, DHIS2, IFMIS, DHS, EICV, donor funding reporting tools, private sector and logistics data systems, etc.
l NHA data unavailable routinely compared to DHIS2 and IFMIS.
l Linking NHA reporting cycles to other IFMIS and DHIS2 reporting time frames to ease discussions and use of NHA in policy-making.
l Donor irregularity and/or lack of submission of data. l MoH will enforce donor and NGO reporting through a system that should be linked to NHA, for example, before renewing licences or before approving their plans of actions.
l No central storage system for NHA. l Procuring central data storage for NHA or using existing national data storage systems. This will depend on each country.
l Lack of synergies between institutions for NHA. l Strengthening collaboration among ministries, aca-demia, private sector, etc.
DisseminationChallenges identified Solutions proposed
l High staff turnover at MoH. l Regular NHA training for all new staff, making it a requirement.
l Absence of a dissemination strategy, diversification of communication channels.
l Including a dissemination strategy in the “NHA institu-tionalization” strategic plan.
l Publishing results in formal and informal formats, including using social media.
l Over-reliance on donor financing. l Generating resources internally for the dissemination of NHA (ministries, academia, etc.).
l Limited demand for NHA products. l Reaching out to all contributing stakeholders or poten-tial users of NHA results, particularly:
- ministries (health, finance, planning, budget, etc.) and parliament;
- district and CSO forums to disseminate NHA report;
- public and private sectors to present results.
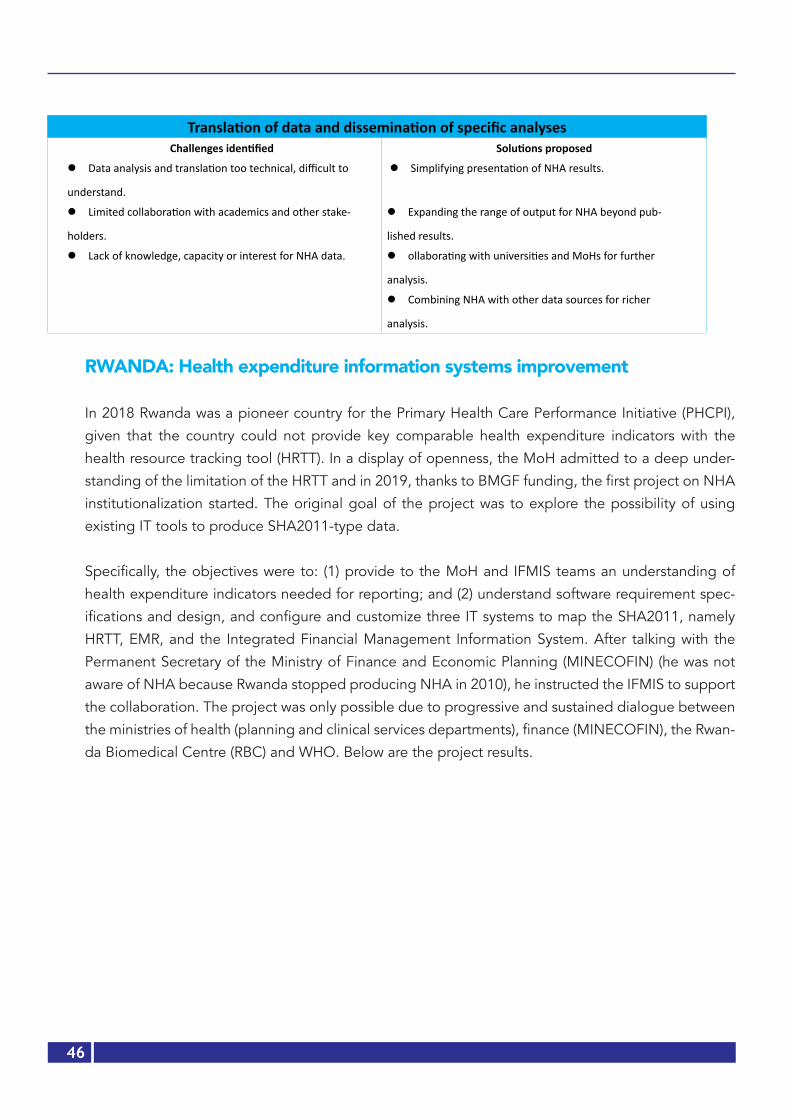
46
Translation of data and dissemination of specific analysesChallenges identified Solutions proposed
l Data analysis and translation too technical, difficult to
understand.
l Simplifying presentation of NHA results.
l Limited collaboration with academics and other stake-
holders.
l Expanding the range of output for NHA beyond pub-
lished results.
l Lack of knowledge, capacity or interest for NHA data. l ollaborating with universities and MoHs for further
analysis.
l Combining NHA with other data sources for richer
analysis.
RWANDA: Health expenditure information systems improvement
In 2018 Rwanda was a pioneer country for the Primary Health Care Performance Initiative (PHCPI),
given that the country could not provide key comparable health expenditure indicators with the
health resource tracking tool (HRTT). In a display of openness, the MoH admitted to a deep under-
standing of the limitation of the HRTT and in 2019, thanks to BMGF funding, the first project on NHA
institutionalization started. The original goal of the project was to explore the possibility of using
existing IT tools to produce SHA2011-type data.
Specifically, the objectives were to: (1) provide to the MoH and IFMIS teams an understanding of
health expenditure indicators needed for reporting; and (2) understand software requirement spec-
ifications and design, and configure and customize three IT systems to map the SHA2011, namely
HRTT, EMR, and the Integrated Financial Management Information System. After talking with the
Permanent Secretary of the Ministry of Finance and Economic Planning (MINECOFIN) (he was not
aware of NHA because Rwanda stopped producing NHA in 2010), he instructed the IFMIS to support
the collaboration. The project was only possible due to progressive and sustained dialogue between
the ministries of health (planning and clinical services departments), finance (MINECOFIN), the Rwan-
da Biomedical Centre (RBC) and WHO. Below are the project results.

47
l Objective 1: Understanding of health expenditure indicators needed for reporting: a week-
long consultative workshop was conducted with the MoH and IT experts from the IFMIS at MINECO-
FIN. The IFMIS experts were comprised of economists and IT experts. Both groups were trained on
the general questions that NHA wants to respond to: Who finances health activities in Rwanda? How
does the country raise funds? Who manages the funds? Who provides health services? What types of
services are provided? At what cost? Who pays the cost at the point of care and how much?
The IFMIS team was fascinated by NHA and argued that because they produce reports for the IMF,
NASA and UNAIDS, as well as several other reports for different bilateral and multilateral partners,
NHA was possible to produce. An effort was made to map key players in the health system (Table 10)
and health financing institutions, including the digital tools that were used (Table 11).
Table 10: Key players in the health-financing ecosystem in Rwanda
HS stakeholders Data sourcesFinancing sources and agents Expenditure Revenue
Government IFMIS IFMIS
Donors HRTT HRTT
NGOs HRTT HRTT
Insurance (public, private) HRTT (hospitals, pharmacies and claims) HRTT (premiums and subsidies)
Health providers Expenditure Revenue
Teaching hospitals/Referrals HRTT Own electronic system
Hospitals and pharmacies IFMIS IFMIS & EMR/Open clinics
Health centres HMIS HMIS
Health posts None None
Private hospitals HMIS HMIS
Private pharmacies HMIS /ISHYIGA25 HMIS /through ISHYIGA)
Household out-of-pocket Indirectly collected through insurance com-panies and providers’ financial reports
Table 11: An
25 ISHYIGA is a software used by all private pharmacies to report their taxes.
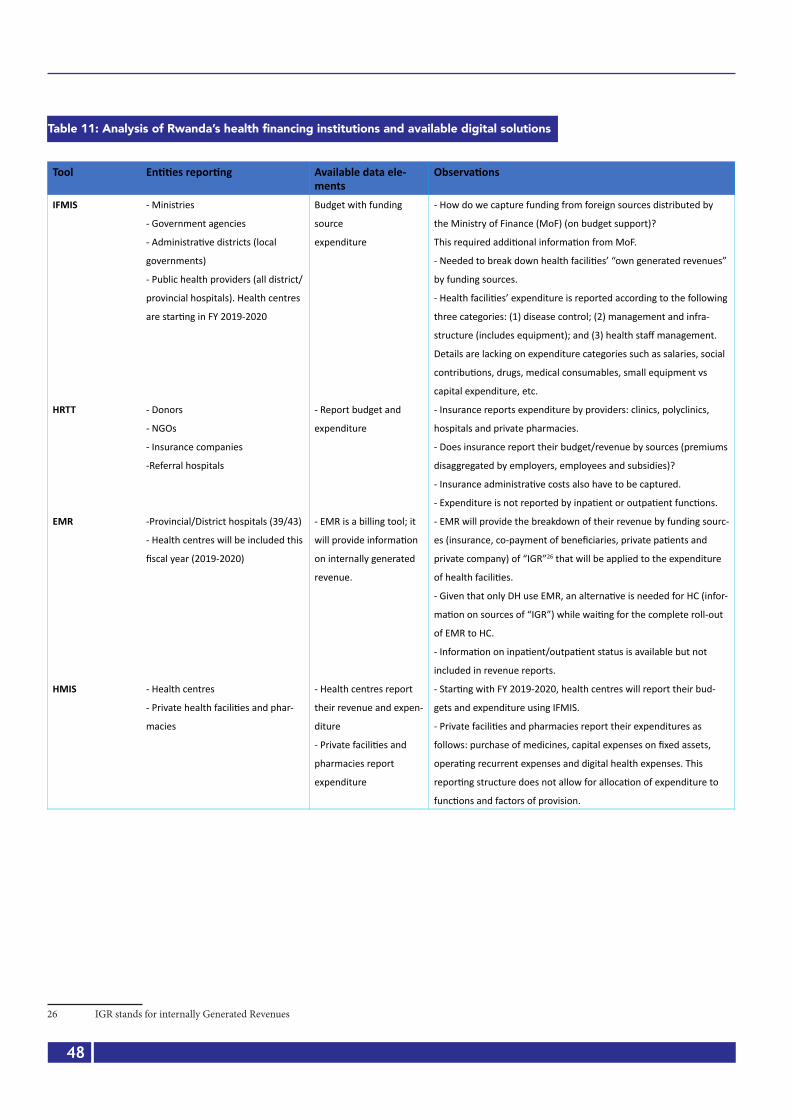
48
Tool Entities reporting Available data ele-ments
Observations
IFMIS - Ministries
- Government agencies
- Administrative districts (local
governments)
- Public health providers (all district/
provincial hospitals). Health centres
are starting in FY 2019-2020
Budget with funding
source
expenditure
- How do we capture funding from foreign sources distributed by
the Ministry of Finance (MoF) (on budget support)?
This required additional information from MoF.
- Needed to break down health facilities’ “own generated revenues”
by funding sources.
- Health facilities’ expenditure is reported according to the following
three categories: (1) disease control; (2) management and infra-
structure (includes equipment); and (3) health staff management.
Details are lacking on expenditure categories such as salaries, social
contributions, drugs, medical consumables, small equipment vs
capital expenditure, etc.
HRTT - Donors
- NGOs
- Insurance companies
-Referral hospitals
- Report budget and
expenditure
- Insurance reports expenditure by providers: clinics, polyclinics,
hospitals and private pharmacies.
- Does insurance report their budget/revenue by sources (premiums
disaggregated by employers, employees and subsidies)?
- Insurance administrative costs also have to be captured.
- Expenditure is not reported by inpatient or outpatient functions.
EMR -Provincial/District hospitals (39/43)
- Health centres will be included this
fiscal year (2019-2020)
- EMR is a billing tool; it
will provide information
on internally generated
revenue.
- EMR will provide the breakdown of their revenue by funding sourc-
es (insurance, co-payment of beneficiaries, private patients and
private company) of “IGR”26 that will be applied to the expenditure
of health facilities.
- Given that only DH use EMR, an alternative is needed for HC (infor-
mation on sources of “IGR”) while waiting for the complete roll-out
of EMR to HC.
- Information on inpatient/outpatient status is available but not
included in revenue reports.
HMIS - Health centres
- Private health facilities and phar-
macies
- Health centres report
their revenue and expen-
diture
- Private facilities and
pharmacies report
expenditure
- Starting with FY 2019-2020, health centres will report their bud-
gets and expenditure using IFMIS.
- Private facilities and pharmacies report their expenditures as
follows: purchase of medicines, capital expenses on fixed assets,
operating recurrent expenses and digital health expenses. This
reporting structure does not allow for allocation of expenditure to
functions and factors of provision.
26 IGR stands for internally Generated Revenues
Table 11: Analysis of Rwanda’s health financing institutions and available digital solutions
49
l Objective 2: Software enhancements to produce SHA2011 indicators
Presented below are enhancements made to each software to allow for real-time production of NHA:
EMR Enhancements: Rwanda had a total of 39 public hospitals using the EMR billing system and eight public hospitals that used different billing systems. Each private health facility used its own billing system. All the systems were meant to be enhanced to produce required data for SHA2011 indicators. For public hospitals that were not using EMR, this information was submitted manually through IFMIS for accountability of public funds and the same information was also used to charge insurance companies for services rendered to their clients. Two major improvements were suggested to the public hospitals’ EMR: inclusion of outpatients and inpatients and several subcategories linked to both inpatient and outpatient categories were enhanced, namely internal medicine, surgery, pae-diatrics, gynaecology, obstetrics, consultation, laboratory, radiology, dental services, ophthalmology, dermatology, physiotherapy, etc. As part of the improvement process, the EMR team developed the following new features:
Activity 1: Creating new admission types: “preventive care” and “day curative”
In order to track patients’ health expenditure in a given health facility, selecting a patient as (1) in-patient or (2) outpatient has become mandatory during admission. Two other admission types have been created to fit SHA2011 requirements: (3) “day curative care” and (4) “preventive care”. A pa-tient will always have one admission type at a time, which will have to be closed before readmission.
Activity 2: Inclusion of foreigners in the socioeconomic categories
In addition to the four existing socioeconomic categories (Ubudehe) applicable to only Rwandans, a new category named “not applicable” or “N/A” was added to include all foreigners using health services and living in Rwanda.
Activity 3: Linking “diagnosis” to revenue
On the patient’s discharge form, the “diagnosis” feature was added to enable the system to track health facilities’ revenue per diagnostic category. When a patient is discharged, EMR will link the pro-vider’s clinical diagnosis to the total bill corresponding to the services provided. In case the diagnosis was not captured, the system gives the provider another chance to fill in the diagnosis information before discharge. An additional enhancement provides flexibility for the provider to fill the diagnostic information manually whenever the specific disease is not part of the clinical forms’ available options.
The diagnosis will be aligned to the International Classification of Diseases (ICD).

50
Activity 4: Redefining health insurance classification
Prior to this project, all insurance was listed in one category called “insurance” regardless of owner-
ship. A new feature redefined insurance into four subcategories: (1) public health insurance (RSSB/
RAMA, CBHI, MMI, MIS/UR); (2) private health insurance (UAP, Radiant, etc.); (3) public/parastatal
(BNR); and (4) private companies (Bralirwa, Bank of Kigali, etc.). Additionally, the system was upgrad-
ed to accommodate different payment plans. For example, if an insurance provider has more than
one payment policy, each one will be featured (copayments of 0%, 10%, 15% etc. will be reported).
Activity 5: Reporting
Initially, EMR used to generate financial reports based on service (such as internal medicine, surgery,
etc.) and insurance categories. Current enhancements involve additional reports including:
l Funding source by admission type (outpatient, inpatient, day curative and preventive) and service
category (internal medicine, etc.) to feed IFMIS;
l Funding source by diagnosis to feed HRTT.
IFMIS enhancements:
The IFMIS system was upgraded to consume data from EMR, generate public health financing data
and push the consolidated data to HRTT. The activities performed were:
1. Analyse and compare SHA2011 classification with IFMIS classification (Chart of Accounts of the
Government of Rwanda);
2. A deep walk-through of existing health systems (HRTT, EMR) to be integrated with IFMIS;
3. Identify enhancements to be made in IFMIS by module (core module, IFMIS budget module,
IFMIS payment module, IFMIS receipt module and IFMIS accounting module);
4. Harmonize IFMIS terminology with HRTT and EMR terminologies;
5. Elaborate requirements to be implemented by software developers;
6. Set up the development environment for integration with HRTT and EMR;
7. Develop a domain of intervention management, a sub-domain and an activity purpose;
8. Improve the system so that it should be possible to map the health subprogramme to activity
purposes;
9. Create the linkage of IFMIS planned activity with activity purpose;
10. Develop input category management;
11. Create the input category and economic item mapping;
12. Develop insurance category management;

51
13. Create the insurance and funder categories;
14. Develop the functionality to group detailed records sent from EMR mapping;
15. Create an option of uploading a shared file to respond to the issue of offline systems;
16. Create the option of posting the grouped records to IFMIS accounting;
17. Create a template to share IFMIS and EMR data to HRTT.
HRTT Enhancements: Compared to other systems, the HRTT faced the most challenges in upgrad-
ing its systems, the major challenge of which was the inability to set up a reliable testing environment
for both software and hardware. Its software comprised an outdated windows server 2008, SQL serv-
er 2008, visual studio 2010 and SharePoint server 2010. Additionally, there was lack of physical space
or hardware to host the testing environment (server). To address these limitations, the team used
available licensed software, trial versions and a laptop as a server. Finally, the Core HRTT was found
to have obsolete source codes and that impeded improvements. An external tool was developed to
receive and send data to the HRTT report space which was functional. With a lot of effort, the IT team
managed to get testing space on a laptop with all the attendant limitations (can crash or be stolen).
In future, HRTT will need to be completely redesigned.
Activity 5: Ensuring interoperability of HRTT with IFMIS and EMR
This part of the work was done with all teams together. Before the actual interoperability was imple-
mented, each team of experts developed their individual software technical user manual to guide
system end users. To ensure that the overall ecosystem was functioning well, each team did two types
of testing: internal and external testing for HRTT, EMR and IFMIS. Internal testing involved software
developers working on making fake data and assessing whether the system was pushing and pulling
data to and from where data is supposed to be taken and sent. External testing involved end users
entering fake patients’ data, and the EMR team created dummy patient records to generate finan-
cial reports. IFMIS testing involved internal testing by IFMIS IT staff and integration with the other
systems. IFMIS uploaded data from EMR. HRTT testing involved receiving data from IFMIS and EMR
through the external tool created and pushing it to the report space that was functional and mapped
to produce SHA2011 indicators at central level.
Figure 5: Rwanda’s HRTT IT ecosystem

52
Note: “Push” and “Pull” are IT words used to show the origin and destination of data.
It is worth sharing with other countries the challenges faced and lessons learnt in Rwanda during im-plementation of the project to improve the three main health financing software. The project was an exploration with the aim of improving Rwanda’s health expenditure information systems and produce future national health accounts using information technology, while avoiding expensive periodic sur-veys. The challenges encountered that were progressively addressed related to time and finances. The team worked under a tight deadline and with very limited resources put in place. It necessitated more of their goodwill to achieve beyond what was needed and present good work.
Further recommendations for NHA routinization in Rwanda1. In IFMIS, the health facilities’ “own-generated revenue” was broken down into funding sources.
To address this limitation, the proposal was made to extract this data from EMR. Indeed, EMR has broken down public health facilities in terms of funding sources or internally generated revenue and these proportions are then used as spending categories to feed the HRTT.
2. In EMR, it was suggested that mandatory use be made of the inpatient/outpatient fields by not allowing the user to move to the next screen without first checking that option. This will allow the production of an expenditure report by function (inpatient/outpatient). These proportions will then be used as allocation keys to allocate expenditure to key functions.
3. Likewise, it was proposed that EMR be used to obtain expenditure by diseases. In EMR, diagnos-tics are grouped according to the International Classification of Diseases 10 (ICD 10), thus it is possible to produce allocations of revenue by disease category.
4. Some household expenditure would be captured through insurance reporting, public providers’ revenue and private providers’ revenue (health facilities, pharmacies, etc.). Given that not all pharmacies report to ISHYIGA (mainly in rural areas) and households do spend on health through
Figure 5: Rwanda’s HRTT IT ecosystem
53
traditional healers, the team may need to still rely on a few household surveys for these compo-
nents. A precaution will be to figure out how to avoid double counting.
Lessons from Rwanda’s experience in digitizing NHA1. The availability of the HRTT was an important starting point to reflect on real-time submission
of health financing data. It is possible to completely digitize the production of NHA and get re-
al-time data using the current IT infrastructure in African countries. However, this will require the
following: An understanding of the resources needed (to first study and scale both infrastructure
and human resources) at national level to improve systems.
2. Timely and adequate resources to move such a project forward; independence from government
bureaucracy is necessary to study what is required at country level.
3. A very willing ministry of health and a passionate project team is important to kick off strong col-
laboration between the ministries of health and finance (budget, planning in countries where it is
applicable).
4. A dedicated team of consultants is critical to move around challenges because: (1) the challenges
in IT could not always be foreseen; (2) work can demand longer hours than planned. The project
needs health economists, health financing, health policy, data analysts and IT experts to digitize
the production of NHA.
5. Design an implementation plan:
a) Phase 1 is a country needs assessment. It is a complete understanding of data systems
available in the country, the level of use of information technology in data collection and
analysis and the level of synchronization of data systems. Once mapping of all data
systems is done, including their advantages and limitations in accommodating NHA,
propose the needed NHA infrastructure.
b) Phase 2 is the upgrading of systems. This requires the multidisciplinary team to work
together for some time. They need to be released from their regular functions.
c) Phase 3 is scaling up of upgraded systems. This is expected to be the most expensive
part of the process; it involves procuring all IT infrastructure and training users.
d) Phase 4: Once the electronic platforms have been set, real success will depend on a
monitoring and evaluation plan. This will require strong and long-term commitment from
the government and donors. Expert collaboration and more investments in hardware and
software infrastructure will be needed.

54
Chapter 4:
A forward look at NHA institutionalization in Africa
Based on the previous summary of the past and current situation, it is important to look forward and
set a path towards the institutionalization of NHA in Africa because all respondents unanimously think
that it is possible to work towards a sustainable production of NHA in the Region. Using the World
Bank framework on the institutionalization of NHA, a few recommendations are made.
4.1 Improve governance, capacity and financing for NHA4.1.1 Donor coordinationAny sustainable solution to institutionalize NHA will depend on high-level donor commitment to
work together and harmonize their efforts. It is fair to say that NHA failed in Africa because donors
introduced it and failed to sustain their efforts in preparing for a smooth transition to capacitated
national institutions. If the different players currently working on resource tracking were to pool their
funding and expertise towards the institutionalization of NHA, then it would be possible, with WHO
advocacy, to institutionalize NHA. The image with a question mark in Figure 6 represents all donors
that are unaccounted for.
The Global Financing Facility (GFF) in 2017 developed a paper entitled “Strengthening Alignment at
Country Level”, outlining how resource mapping and expenditure tracking (RMET) of the investment
case (IC) is a key component of the GFF approach, resulting in aligning donor and government fund-
ing to the priorities of the IC. The RMET tools were initiated with the objectives to:
l Assess sources of funding of the investment case (domestic/external);
l he funding gap = cost of IC resources available;
l Identify what specific priorities and sub-priorities are currently being funded and where;
l Investigate whether donors and governments have kept their initial commitment towards IC
priorities by monitoring the implementation of the IC.
Resource mapping is mainly an exercise to capture budget data from government and external part-
ners. In the GFF context, it is the mapping of government and external forward-looking budgets
linked to IC priorities, which are the national health strategy. Expenditure tracking routinely captures
expenditure data in the health and other sectors. In the GFF context, it tracks government and ex-
ternal expenditure linked to IC priorities to monitor implementation of IC. There is a strong rationale
for coordination, harmonization and collaboration between WHO, WB, and GFF in data collection for
resource mapping and expenditure tracking.

55
Figure 6: Improving donor coordination for NHA institutionalization in Africa
4.1.2 National commitmentThe second element will be national commitment and leadership to bring together technical and
policy teams towards the digitization of data collection, the enhancement of existing IT solutions
in each country and the synchronization or interoperability of all systems to produce real-time NHA
indicators. Past experiences of NHA routinization in Africa show lack of countries’ commitment and
leadership in taking policy decisions based on evidence from previous expenditure and impacts.
NHA has suffered from a general lack of prioritization. It is critical that leaders depoliticize NHA data
and adopt a more scientific attitude as suggested by a global expert: “Data is political; there is fear
that data will be used against people and countries when comparisons are done… Data needs to be
seen as a scientific contribution for impact assessments…”
With the current SDG commitment, countries have made clear commitments for UHC. It is vital that
WHO and other partners capitalize on this renewed momentum to institutionalize NHA and make
it part of national priorities. “Development partners need to make NHA a ‘country tool’, not an ex-
ternal demand”. NHA should be at the forefront and centre stage of every investment decision in
terms of prioritization, cost effective interventions and resource mobilization. At the 27th AU Summit
of 2016 in Kigali, African Heads of State and Government adopted the Africa Scorecard on Domestic
=Figure 6: Improving donor coordination for NHA institutionalization in Africa
56
Financing for Health. A more interconnected world has turned out to be fragile, requiring critical in-
vestment for prevention and emergency preparedness as seen with the current COVID-19 epidemic.
It is an opportunity to put NHA at the centre stage of decision-making. National commitment will
involve engaging all key government institutions that contribute to or use NHA (see Table 12) and
working on all legal arrangements between and within institutions for NHA to thrive (Table 13).
4.1.3 Recommendations on governance, capacity and financingFor donors:1. Harmonize and coordinate donor resources and activities as well as resource-tracking processes
related to expenditure tracking.
2. Create incentives for countries that tie funding to timely production of good quality NHA data.
This will require strong coordination among development partners (WHO, WB, IMF, BMGF, mul-
tilateral and bilateral donors, etc.).
For WHO1. Design a scoring system for countries to encourage them move from one step to another to-
wards the institutionalization of national health accounts. The current initiative on primary health
care performance improvement and universal health access are good opportunities to seize for
enforcing the production of NHA data.
For governments1. Ensure that the country designates a champion for NHA, and owns all NHA processes (hiring
of staff, consultants if needed, etc.). Preferably, the highest office in charge of the Sustainable
Development Goals could ensure championship. This could be the President’s Office, the Prime
Minister’s Office or the Finance Minister’s Office.
2. Mobilize resources internally and externally to institutionalize NHA by mainstreaming NHA data
requirements in routine data collection systems, producing reports as part of countries’ report-
ing systems and reducing reliance on costly surveys by using information technology. Funding
for NHA should be included in the national workplans and budgets for sustainability.
3. Generate interest in and create awareness and a culture of using NHA through greater collabo-
ration and open discussion on investing in health with the ministries of health and finance, par-
liament, the institute of statistics, and other ministries, providers, the private sector, academia,
etc.
4. Support documentation, facilitate countries’ sharing of best practices and make progress to-
wards institutionalization of national health accounts.
5. Meet regional and international commitments for the provision of health expenditure data using
NHA data.
6. Produce an NHA institutionalization strategy as part of the health financing strategy and moni-
toring and evaluation plan, in collaboration with stakeholders.
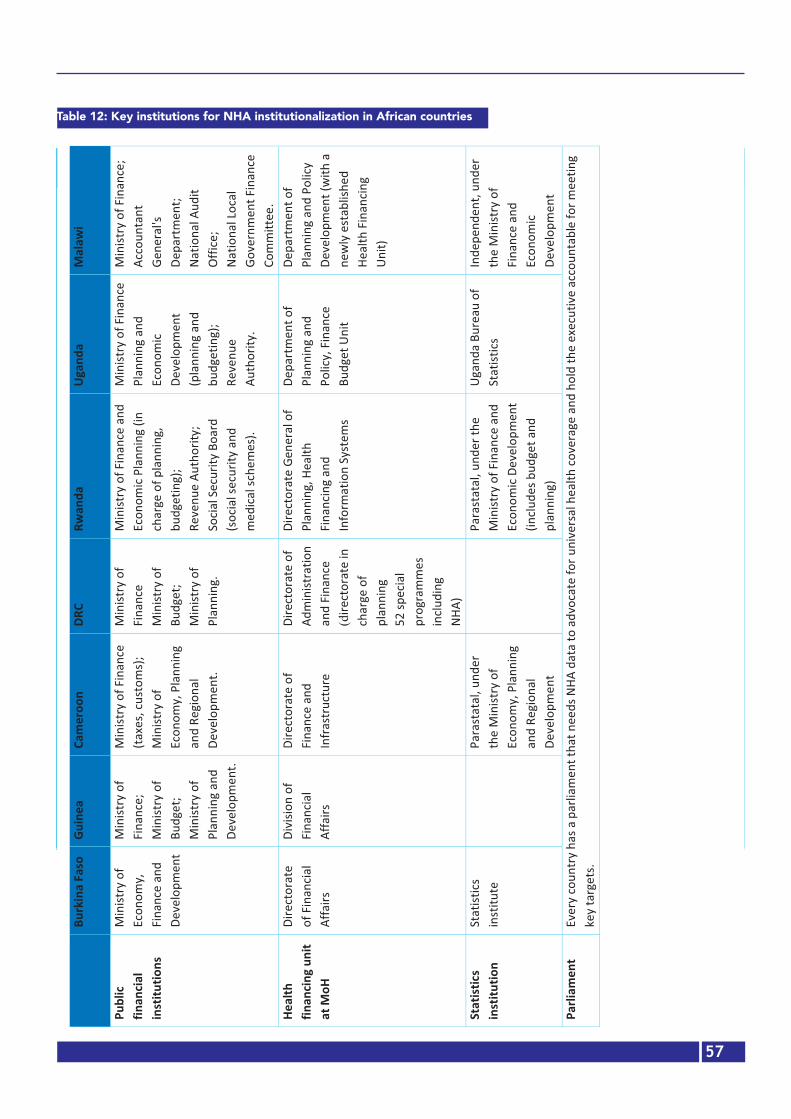
57
Table 12: Key institutions for NHA institutionalization in African countries
Burkina Faso
Guinea Cameroon DRC Rwanda Uganda Malawi
Public financial institutions
Ministry of Economy, Finance and Develop-ment
Ministry of Finance; Ministry of Budget; Ministry of Planning and Development.
Ministry of Finance (taxes, customs); Ministry of Economy, Planning and Regional Devel-opment.
Ministry of Finance Ministry of Budget; Ministry of Planning.
Ministry of Finance and Economic Plan-ning (in charge of planning, budgeting); Revenue Au-thority; Social Security Board (social se-curity and medi-cal schemes).
Ministry of Finance Planning and Economic Development (planning and budgeting); Revenue Authority.
Ministry of Fi-nance; Accountant Gener-al’s Department; National Audit Office; National Local Government Fi-nance Committee.
Health financing unit at MoH
Directorate of Financial Affairs
Division of Fi-nancial Affairs
Directorate of Finance and Infrastructure
Directorate of Adminis-tration and Finance (directorate in charge of planning 52 special programmes including NHA)
Directorate Gen-eral of Planning, Health Financing and Information Systems
Department of Planning and Policy, Fi-nance Budget Unit
Department of Planning and Policy Develop-ment (with a newly established Health Financing Unit)
Statistics insti-tution
Statistics institute
Parastatal, un-der the Ministry of Economy, Planning and Regional Devel-opment
Parastatal, under the Ministry of Finance and Economic Development (includes budget and planning)
Uganda Bureau of Statistics
Independent, under the Ministry of Finance and Economic Devel-opment
Parliament Every country has a parliament that needs NHA data to advocate for universal health cover-age and hold the executive accountable for meeting key targets.
Every country has a parlia-ment that needs NHA data to advocate for universal health cover-age and hold the executive accountable for meeting key targets.
Every country has a par-liament that needs NHA data to advo-cate for univer-sal health cov-erage and hold the executive accountable for meeting key targets.
Every country has a parliament that needs NHA data to advocate for univer-sal health coverage and hold the executive accountable for meeting key targets.
Every country has a parliament that needs NHA data to advocate for universal health cover-age and hold the executive accountable for meeting key targets.
Every country has a parliament that needs NHA data to advocate for universal health cover-age and hold the executive accountable for meeting key targets.
Every country has a parliament that needs NHA data to advocate for universal health coverage and hold the execu-tive accountable for meeting key targets.
Tabl
e 12
: Key
inst
itutio
ns fo
r NHA
inst
itutio
naliz
atio
n in
Afri
can
coun
trie
s
Bu
rkin
a Fa
so
Guin
ea
Cam
eroo
n DR
C Rw
anda
Ug
anda
M
alaw
i
Publ
ic fin
ancia
l in
stitu
tions
Min
istry
of
Econ
omy,
Fi
nanc
e an
d De
velo
pmen
t
Min
istry
of
Fina
nce;
M
inist
ry o
f Bu
dget
; M
inist
ry o
f Pl
anni
ng a
nd
Deve
lopm
ent.
Min
istry
of F
inan
ce
(taxe
s, cu
stom
s);
Min
istry
of
Econ
omy,
Pla
nnin
g an
d Re
gion
al
Deve
lopm
ent.
Min
istry
of
Fina
nce
M
inist
ry o
f Bu
dget
; M
inist
ry o
f Pl
anni
ng.
Min
istry
of F
inan
ce a
nd
Econ
omic
Plan
ning
(in
char
ge o
f pla
nnin
g,
budg
etin
g);
Reve
nue
Auth
ority
; So
cial S
ecur
ity B
oard
(s
ocia
l sec
urity
and
m
edica
l sch
emes
).
Min
istry
of F
inan
ce
Plan
ning
and
Ec
onom
ic De
velo
pmen
t (p
lann
ing
and
budg
etin
g);
Reve
nue
Auth
ority
.
Min
istry
of F
inan
ce;
Acco
unta
nt
Gene
ral's
De
part
men
t;
Natio
nal A
udit
Offic
e;
Natio
nal L
ocal
Go
vern
men
t Fin
ance
Co
mm
ittee
. He
alth
fin
ancin
g un
it at
MoH
Dire
ctor
ate
of F
inan
cial
Affa
irs
Divi
sion
of
Fina
ncia
l Af
fairs
Dire
ctor
ate
of
Fina
nce
and
Infra
stru
ctur
e
Dire
ctor
ate
of
Adm
inist
ratio
n an
d Fi
nanc
e (d
irect
orat
e in
ch
arge
of
plan
ning
52
spec
ial
prog
ram
mes
in
cludi
ng
NHA)
Dire
ctor
ate
Gene
ral o
f Pl
anni
ng, H
ealth
Fi
nanc
ing
and
Info
rmat
ion
Syst
ems
Depa
rtm
ent o
f Pl
anni
ng a
nd
Polic
y, F
inan
ce
Budg
et U
nit
Depa
rtm
ent o
f Pl
anni
ng a
nd P
olicy
De
velo
pmen
t (w
ith a
ne
wly
est
ablis
hed
Heal
th F
inan
cing
Unit)
Stat
istics
in
stitu
tion
Stat
istics
in
stitu
te
Para
stat
al, u
nder
th
e M
inist
ry o
f Ec
onom
y, P
lann
ing
and
Regi
onal
De
velo
pmen
t
Para
stat
al, u
nder
the
Min
istry
of F
inan
ce a
nd
Econ
omic
Deve
lopm
ent
(inclu
des b
udge
t and
pl
anni
ng)
Ugan
da B
urea
u of
St
atist
ics
Inde
pend
ent,
unde
r th
e M
inist
ry o
f Fi
nanc
e an
d Ec
onom
ic De
velo
pmen
t Pa
rliam
ent
Ever
y co
untr
y ha
s a p
arlia
men
t tha
t nee
ds N
HA d
ata
to a
dvoc
ate
for u
nive
rsal
hea
lth co
vera
ge a
nd h
old
the
exec
utiv
e ac
coun
tabl
e fo
r mee
ting
key
targ
ets.

58
Table 13: Legal institutional arrangements for NHA in selected countries
Burkina Faso Guinea Cameroon Rwanda Malawi
Vision National pro-spective study (ENP) BURKINA 2025
Guinea, vision 2030
Vision 2035 for a democratic, unified and richer Cameroon
Vision 2050 provides an overview of the develop-ment goals for Rwanda
Vision 2020. It will be succeed-ed by Vision 2063 being finalized now
National development strategy
National economic and social devel-opment plan (PNDES) 2015-2020
National economic and social devel-opment plan 2016-2020
National Devel-opment Strategy 2030
The National Strategy for Transformation (NST1)
Malawi Growth and Develop-ment Strategy (2017-2022)
Health sector strategy
National health development plan (PNDS) 2016 -2020
National Health Deve-lopment Plan 2015-2024
Health Sector Strategy 2016-2030
Health Sector Strategic plan 2018-2024 (HSSP IV)
National Health Policy National Com-munity Health Strategy HSSP Ⅱ (2017-2022)
Health financing strategy
PNDS costing 2021-2015Health Financing Strategy Towards Universal Health CoverageHealth Financing Strategy 2020-2030Health Funding Strategy for Universal Health Coverage (2018)First Health Financing Strategic Plan (HFSP 2018-2014)Health financing strategy 2015/16 - 2024/25None. Currently in draft
Laws related to health spending
Law and regu-lation mandate MoH to pro-duce NHA. Ministerial de-cree providing legal basis for MoH to collect national health information including national health accounts.
No law, no regulation mandating MoH or any institution to produce NHA
Law No. 2019/023 of 24 Decembe 2019. Circular No. 00008349 /C/MIN-FI on instructions to execute the Finance Law.
Rwandan Constitution Organic Law No. 12/2013/OL on State Finances and Property. Un-der Article 13 of this law, MI-NECOFIN has the responsibil-ity to promote and enforce transparency and account-ability; Ministerial Order No. 001/16/10/TC dictates the structure and functioning of PFM, and the PFM legal framework
Public Financial Management Act (2003)
57
Tabl
e 13
: Leg
al in
stitu
tiona
l arr
ange
men
ts fo
r NHA
in se
lect
ed co
untr
ies
Bu
rkin
a Fa
so
Guin
ea
Cam
eroo
n DR
C Rw
anda
Ug
anda
M
alaw
i Vi
sion
Natio
nal
pros
pect
ive
stud
y (E
NP) B
URKI
NA
2025
Guin
ea, v
ision
203
0 Vi
sion
2035
for
a de
moc
ratic
, un
ified
and
ric
her
Cam
eroo
n
Proj
ecte
d gr
owth
in
the
next
25
year
s, w
ith a
di
vers
ified
and
in
clusiv
e ec
onom
y an
d po
vert
y al
levi
atio
n
Visio
n 20
50 p
rovi
des a
n ov
ervi
ew o
f the
dev
elop
men
t go
als f
or R
wan
da
Ugan
da's
Visio
n 20
40
aim
s at
achi
evin
g m
iddl
e in
com
e st
atus
by
2030
Visio
n 20
20. I
t w
ill b
e su
ccee
ded
by V
ision
206
3 be
ing
final
ized
now
Natio
nal
deve
lopm
ent
stra
tegy
Natio
nal e
cono
mic
and
socia
l de
velo
pmen
t pla
n (P
NDES
) 201
5-20
20
Natio
nal e
cono
mic
and
socia
l de
velo
pmen
t pla
n 20
16-2
020
Natio
nal
Deve
lopm
ent
Stra
tegy
203
0
Grow
th a
nd
Pove
rty
Redu
ctio
n St
rate
gy p
aper
The
Natio
nal S
trat
egy
for
Tran
sfor
mat
ion
(NST
1)
M
alaw
i Gro
wth
an
d De
velo
pmen
t St
rate
gy (2
017-
2022
) He
alth
se
ctor
st
rate
gy
Natio
nal h
ealth
de
velo
pmen
t pla
n (P
NDS)
201
6 -2
020
Natio
nal H
ealth
De
velo
pmen
t Pla
n 20
15-2
024
Heal
th S
ecto
r St
rate
gy 2
016-
2030
Natio
nal S
trat
egy
for S
tren
gthe
ning
DR
C He
alth
Sy
stem
(rev
ised
in 2
010)
Heal
th S
ecto
r Str
ateg
ic pl
an
2018
-202
4 (H
SSP
IV)
Heal
th
Sect
or
Deve
lopm
ent
Plan
(HSD
P II)
Natio
nal H
ealth
Po
licy
Na
tiona
l Co
mm
unity
He
alth
Str
ateg
y
HSSP
(2
017-
2022
) He
alth
fin
ancin
g st
rate
gy
PNDS
cost
ing
2021
-20
15
Heal
th F
inan
cing
Stra
tegy
Tow
ards
Un
iver
sal H
ealth
Co
vera
ge
Heal
th
Fina
ncin
g St
rate
gy 2
020-
2030
Heal
th F
undi
ng
Stra
tegy
for
Univ
ersa
l Hea
lth
Cove
rage
(201
8)
Firs
t Hea
lth F
inan
cing
Stra
tegi
c Pla
n (H
FSP
2018
-20
14)
Heal
th
finan
cing
stra
tegy
20
15/1
6 -
2024
/25
None
. Cur
rent
ly
in d
raft
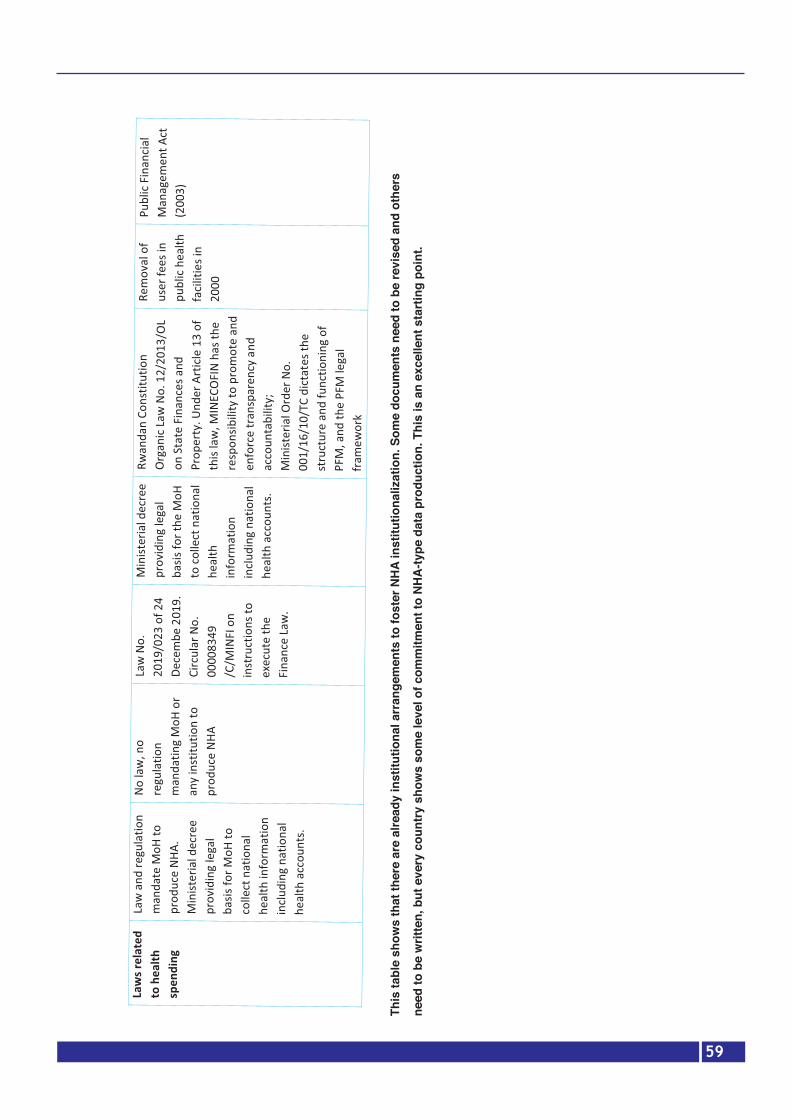
59
This
tabl
e sh
ows
that
ther
e ar
e al
read
y in
stitu
tiona
l arr
ange
men
ts to
fost
er N
HA
inst
itutio
naliz
atio
n. S
ome
docu
men
ts n
eed
to b
e re
vise
d an
d ot
hers
need
to b
e w
ritte
n, b
ut e
very
cou
ntry
sho
ws
som
e le
vel o
f com
mitm
ent t
o N
HA
-type
dat
a pr
oduc
tion.
Thi
s is
an
exce
llent
sta
rtin
g po
int.
58
This
tabl
e sh
ows t
hat t
here
are
alre
ady
inst
itutio
nal a
rran
gem
ents
to fo
ster
NHA
inst
itutio
naliz
atio
n. S
ome
docu
men
ts n
eed
to b
e re
vise
d an
d ot
hers
nee
d to
be
writ
ten,
but
eve
ry co
untr
y sh
ows s
ome
leve
l of c
omm
itmen
t to
NHA-
type
dat
a pr
oduc
tion.
Thi
s is a
n ex
celle
nt
star
ting
poin
t.
Law
s rel
ated
to
hea
lth
spen
ding
Law
and
regu
latio
n m
anda
te M
oH to
pr
oduc
e NH
A.
Min
ister
ial d
ecre
e pr
ovid
ing
lega
l ba
sis fo
r MoH
to
colle
ct n
atio
nal
heal
th in
form
atio
n in
cludi
ng n
atio
nal
heal
th a
ccou
nts.
No la
w, n
o re
gula
tion
man
datin
g M
oH o
r an
y in
stitu
tion
to
prod
uce
NHA
Law
No.
20
19/0
23 o
f 24
Dece
mbe
201
9.
Circ
ular
No.
00
0083
49
/C/M
INFI
on
inst
ruct
ions
to
exec
ute
the
Fina
nce
Law
.
Min
ister
ial d
ecre
e pr
ovid
ing
lega
l ba
sis fo
r the
MoH
to
colle
ct n
atio
nal
heal
th
info
rmat
ion
inclu
ding
nat
iona
l he
alth
acc
ount
s.
Rwan
dan
Cons
titut
ion
Orga
nic L
aw N
o. 1
2/20
13/O
L on
Sta
te F
inan
ces a
nd
Prop
erty
. Und
er A
rticl
e 13
of
this
law
, MIN
ECOF
IN h
as th
e re
spon
sibili
ty to
pro
mot
e an
d en
forc
e tr
ansp
aren
cy a
nd
acco
unta
bilit
y;
Min
ister
ial O
rder
No.
00
1/16
/10/
TC d
ictat
es th
e st
ruct
ure
and
func
tioni
ng o
f PF
M, a
nd th
e PF
M le
gal
fram
ewor
k
Rem
oval
of
user
fees
in
publ
ic he
alth
fa
ciliti
es in
20
00
Publ
ic Fi
nanc
ial
Man
agem
ent A
ct
(200
3)

60
4.2 Improve the demand and use of NHA dataTo improve the demand for, and use of NHA data, it is critical to go through the steps below, which
can be customized based on each country’s context:
1. Map policy needs and potential use of NHA data for the different stakeholders through a par-
ticipatory process of developing policy questions to be addressed by NHA. The process should
include policy-makers at presidential and prime ministerial level, parliament, relevant line minis-
tries, public and private sector providers, civil society, etc.;
2. Continued sensitization of high-level decision-makers and training of technicians on NHA value,
including government ministries, the private sector, members of parliament, academia, etc.;
3. Build a common understanding among stakeholders regarding the utility of NHA;
4. Develop shorter, user-friendly, relevant reports, written in easy-to-understand language. Templates
can be proposed to customize reports for different audiences (policy briefs for decision-makers,
hospitals, etc.);
5. Enforce the demand and use of NHA, for example, every request for funds needs to have a set of
selected health financing indicators generated by country expenditure data.
4.3 Improve the production, management, and quality of NHA dataIt is possible with the current technologies and human resource capacity in Africa to synchronize
health information systems with the current human resources available in the Region. Rwanda has
already customized its health information system architecture to produce timely NHA indicators while
Malawi has developed a concept note awaiting funding to move forward with its implementation.
Processes need to be customized to the country’s context to avoid complete disruption. However, in
countries where very little has been done, learning from the best systems integration is necessary for
implementation of the best model.
4.3.1 Identify relevant national institutions and legal frameworks in support of NHA Every country has its own institutional arrangement to build upon for NHA institutionalization. These
institutions are either regulators, NHA data producers or consumers and are presented in Table 12.
Legal arrangements are also unique for every individual country, even though key documents rein-
force the need for transparency, accountability, universal health coverage, etc. Table 13 illustrates
the legal ground on which to initiate dialogue and implement a successful routinization of NHA. It
is evident that countries are at different levels of commitment towards NHA production (but all un-
derstand) and with coordinated support and a mid-term strategy, all countries can move together
towards the same goal. It is important to house NHA in an institution that can dialogue with the MoH
to avoid conflict of interest, sustain human resources and stimulate independent discussion outside
of politics. The institute of statistics has been used as the NHA house in some countries, while in
others it has been the schools of (health) economics and public health, etc. A regional approach can,
however, be suggested to ensure that institutions with the same mandate dialogue for regional dis-
semination and/or publication.

61
4.3.2 Invest in IT infrastructure and integrate NHA variables in existing routine data and in-formation systemsAs discussed earlier, current NHA production comprises expensive, outdated, ad hoc data collection
processes that rely mainly on donor willingness to demand and finance the production of health ex-
penditure data. Estimating household OOP expenditure is the most complex and expensive survey.
Several avenues to integrate NHA variables into routine information systems have been discussed
and progress has been in two countries: Malawi has developed a concept note while Rwanda is sev-
eral steps ahead and has already upgraded its health expenditure information systems architecture,
while waiting for more funding to scale up the new features developed by local IT experts and train-
ing institutions. The integration of facility-level data collection for the NHA would involve: the HMIS,
IFMIS, EMR, logistics management information systems, pharmaceutical management systems, etc.
Table 8 shows current financial and logistical management information systems that can be used to
reduce the burden of NHA production. An example is Rwanda that for the past decade included
financing indicators in the HMIS. However, the inclusion was done as a limited short-term strategy
because the HMIS data managers do not think that the software was conceived to provide financial
data. As Rwanda’s Ministry of Finance was scaling IFMIS to the lowest levels in its administration and
health centres, IFMIS became more appropriate for reporting on health financing indicators although
it is limited to public health facilities. In addition to scaling IFMIS, the Rwanda MoH scaled EMR in
all district hospitals, which left out the core layer of the health system, the health centres. Although
private health facilities were also left out, every step is a positive step towards reducing the data
collection burden.
Rwanda’s EMR platform was upgraded with key indicators needed for NHA and was ready to scale
to the district hospitals, health centres and health posts, while still leaving out the private sector. The
lack of inclusion of private hospitals, polyclinics, clinics, and dispensaries was due only to the lack of
time and funds to support a team of consultants dedicated to that endeavour. It was then suggested
that private facilities willing to use government-owned software would be provided access free of
charge while those not willing to adopt government systems would fund the improvement of their
individual EMR and logistics information systems to meet the NHA requirements. This would be en-
forced when health facilities renew their licences every year.
4.3.3 Integrate NHA data into national financing indicator dashboardsThe ministries of health have national health observatories (NHO) and the ministries of finance have a
set of reporting indicators that would benefit from timely health accounts production. Every country
has a repository of data that can be used to inform decision-making. The repository has a capacity to
store disaggregated, input, output, outcome and impact (morbidity and mortality) data. The NHO,
and by extension, the Integrated African Health Observatory, therefore provide an opportunity for
improving the utilization of generated data through triangulation of different data to inform policy.

62
Integration of health expenditure data from the NHA offers an opportunity to enrich the data in this
repository and facilitate decision-making.
4.3.4 Summarized recommendations on the production, management, quality assurance and translation of specific analyses into policies1. Undertake a national needs assessment to strengthen NHA production in individual countries by:
a. Identifying relevant national institutions and legal frameworks in support of NHA;
b. Assessing gaps in terms of institutional and legal arrangements for NHA;
c. Developing plans of action based on immediate action, short-term and long-terms plans.
2. Invest in IT infrastructure and integrate NHA variables in existing routine data collection and anal-
ysis of information systems (create solutions, training, scale and evaluate solutions).
3. Integrate NHA data into national financing indicator dashboards.
4. Combine NHA with other data sources for richer analyses.
5. Collaborate with universities and research institutes to conduct further analyses. Conduct subre-
gional analyses and provide critical analyses on key issues: equity of health care, allocative and
technical efficiency of health care.
6. Sustain human resources for NHA: give mandate to a technical data-oriented institution, different
from the ministry of health, to build necessary capacity and a career based on NHA skills from
schools of public health, departments of economics and institutes of statistics, given that techno-
crats can vary based on political appointments.
7. In partnership with schools of public health and research institutes, mainstream NHA training in
preservice curricula and in routine activities of research institutes.
8. Ensure formal and informal sector compliance for timely submission of data by binding renewal
of licences to the submission of NHA data.
Improve the translation of data into specific analysis Some of the recommendations to improve the translation and dissemination of NHA data were in-
cluded in the previous chapters. Participants suggested that to improve the analysis and dissemina-
tion of NHA data, there is need to create a platform for relevant debate. The important players on
this platform should not only be economists and IT experts; the team needs to be larger and include
policy-makers, members of parliament and academics. The private sector must play a role. As a re-
minder of the first steps towards NHA, the private sector led the process in the USA. It is important
to empower the private health sector in Africa. It is recommended to:

63
1. Expand the range of output from NHA beyond published results;
2. Collaborate with universities and MoH for further analyses;
3. Combine NHA with other data sources for richer analyses;
4. Conduct subregional analyses and provide evidence on key issues: equity of health care, alloca-
tive and technical efficiency of health care;
5. Sustain human resources for NHA: give mandate to a technical data-oriented institution, different
from the ministry of health, to build necessary capacity and a career with NHA skills from schools
of public health, departments of economics and institutes of statistics, given that technocrats at
MoH are very few, have a broad scope of work and are more inclined to leave.
4.5. Improve the dissemination of NHA1. Map the evidence needs of different stakeholders and develop tailored dissemination pack-
ages. Customize reports for different audiences (policy briefs for decision-makers, summaries
targeting hospital interests, the private sector, key cost-effective analyses for the ministry of
finance, etc.).
2. Explore innovative methods for disseminating NHA data, using modern marketing method-
ology and easy-to-understand language; produce scientific publications in collaboration with
academia; propose templates as needed. Target the institutions contributing to NHA data col-
lection and those that can implement the recommendations; support advocacy efforts.
3. Create a multisectoral group to follow up on the recommendations for NHA to inform next iter-
ations of data analyses.
4. Work with academia to publish results and reach out to the public and private sectors to present
results.
5. Design relevant, shorter, user-friendly reports, easy to understand for every stakeholder; pro-
pose templates as needed. Target institutions contributing to NHA data collection.
WHO1. Provide financial support and undertake regional studies, innovation and sharing of best practic-
es.
2. Design a scoring system to motivate countries to learn from best performers; map best practic-
es. Design rewards for best performers, in terms of additional grant to support improvements.
Revisit the World Bank framework to fit the reality on the groundThe overall NHA framework provides a good overview of any basic data production cycle because
it is simple enough to be understood by all technicians. However, a respondent suggests that the
“translation of data and dissemination of specific analyses is not a realistic step”. NHA production
goes together with the “translation of data into specific analysis as an iterative process, going back
and forth from data to translation and back again”. Dissemination comes last and is not redundant:
64
“it is an iterative process that when we produce NHA reports, the steering committee discusses the
findings as we refine our analyses and the dissemination is done later when these processes have
been finalized…”
Country reportsThe country reports are a 246-page document including detailed reports of every participating country’s sta-
tus with regard to NHA institutionalization. The country reports are submitted separately with the summary of
the status update of NHA institutionalization in the African Region. The document includes seven individual
country reports, formatted but not translated or modified; three reports are in English and four are in French.
Although all consultants received the same report template, each report has been customized based on the
context of individual countries and the consultant’s creativity.
65
Chapter 5: Annexes
Annex 1: Reviewed documents
Global literature review1. WHO – Health Accounts https://www.who.int/health-topics/health-accounts/#tab=tab_1
2. WHO - What are National Health Accounts? http://apps.who.int/nha/what/en/index.html
3. USAID, National Health Accounts – Global Policy Brief: http://pdf.usaid.gov/pdf_docs/
Pnacs960.pdf
4. PHRplus Project, NHA regional policy brief - Eastern, Central, and Southern Africa: Using
NHA to Inform the Policy Process
5. Fetter B. (2006). Origins and elaboration of the national health accounts, 1926-2006. Health
care financing review, 28(1), 53–67.
6. https://www.ncbi.nlm.nih.gov/pmc/articles/PMC4194972/
7. A system of health accounts. Version of 2011. https://www.oecd.org/health/health-sys-
tems/21160591.pdf
8. A system of health accounts. Version of 2011. https://www.who.int/health-accounts/method-
ology/sha2011.pdf?ua=1
9. Global Health Expenditure Database (GHED)
10. Organization for Economic Co-operation and Development (OECD), Creating an evidence
base for better health financing and greater accountability - A Strategic Guide for the Institu-
tionalization of National Health Accounts
11. WHO, National Health Accounts: http://apps.who.int/nha/en/
12. USAID, National Health Accounts – Global Policy Brief: http://pdf.usaid.gov/pdf_docs/
Pnacs960.pdf
13. WHO, National health accounts in policy formulation: http://apps.who.int/nha/use/en/
14. African Union (AU), African Heads of State and Government define the future direction for
AIDS, TB and malaria responses, http://www.au.int
15. Xu Ke, Soucat A & Kutzin J et al. Public Spending on Health: A Closer Look at Global Trends.
Geneva: World Health Organization; 2018
16. USAID, National Health Accounts – Global Policy Brief: http://pdf.usaid.gov/pdf_docs/
Pnacs960.pdf
17. Robert Yin, Case Studies Design and Methods, 2013
18. Vaismoradi et al., 2016: Theme development in qualitative content analysis and the-
matic analysis. Journal of Nursing Education and Practice. https://core.ac.uk/download/
pdf/52132811.pdf
19. Maeda et al, 2012: Creating Evidence for Better Health Financing Decisions: A Strategic
Guide for the Institutionalization of National Health Accounts. http://documents1.worldbank.

66
org/curated/ar/410301468323088938/pdf/689660PUB0publ07926B009780821394694.pdf
20. https://www.who.int/healthsystems/publications/abuja_declaration/en/
21. Institutionalization of the National Health Accounts (NHA) Production in Malawi
22. Angelique K. Rwiyereka, Improvement of Rwanda’s health expenditure information systems,
Report to PHCPI & WHO, 2019
23. World Bank, https://www.worldbank.org/en/topic/governance/brief/financial-management-in-
formation-systems-fmis
Burkina Faso24. MS-BF_Plan de transformation_Ministère Santé BF_Meda N_09 Août 2017
25. Ministère de la santé, Rapports des Comptes de la Santé de 2011 à 2017
26. Nomenclature des activités du plan national de développement sanitaire 2016-2020, Mai
2017
27. OMS, Système des Comptes de la Santé (SHA), 2011, version abrégée, juin 2012
28. NOTE DE POLITIQUE: Stratégies d’amélioration des allocations budgétaires pour la santé au
Burkina Faso, Novembre 2011
29. Stratégie nationale du financement de la santé (SNFS), MS, 2017
30. Ministère de la santé, Politique nationale de santé (PNS), 2011-2020
31. Ministère de la santé, Plan national de développement sanitaire (PNDS), 2016-2020
32. Ministère de la santé, Bilan des plans d’action 2018 du Ministère de la santé
33. Ministère de la santé, Annuaires statistiques du Ministère de la Santé 2013 à 2018
34. Rapport annuel d’activités 2017 du programme d’appui au développement sanitaire
35. Plan national multisectoriel de lutte contre le VIH, le Sida et les IST (PNM) 2016, Juin 2017
36. INSD, Rapport sur l’Enquête intégrale sur les conditions de vie des ménages, EICVM 2009-
2010
37. Enquête nationale sur les dépenses individuelles de santé au Burkina Faso, ENDIS 2009
38. INSD, Enquête multisectorielle continue (EMC) 2014; Profil de pauvreté et d’inégalités au
Burkina Faso, Nov 2015
39. INSD, Enquête module démographique et santé (EMDS), 2015
40. ONUSIDA, Country factsheets, BURKINA FASO, 2018
41. Ministère de la santé, plan national de relance de la planification familiale 2013 – 2015
42. Ministère de la santé, Plan stratégique de sécurisation des produits de la sante de la repro-
duction 2009-2015
43. Yoann BAZIN, 2012, L’institutionnalisation des pratiques organisationnelles : le cas du dia-
gnostic en psychiatrie
44. Linda ROUSSEAU, 2007, Théorie des organisations, Approches classiques, contemporaines et
de l’avant-garde ; université de Québec
45. Yvon PESQUEUX - cf. C. 15 Livre Théorie des Organisations, P. de ROZARIO & Y. PESQUEUX,
Pearson, Paris, 2018
46. OMS (2007) L’affaire de tous – Renforcer les systèmes de santé pour de meilleurs résultats

67
sanitaires. Genève, OMS.
47. OMS (2008) Framework and standards for country health information systems (Cadre et
normes pour les systèmes d’information sanitaire des pays). Genève: OMS.
48. OMS (2010a) Rapport sur la santé dans le monde. Le financement des systèmes de santé- Le
chemin vers une couverture universelle. Genève, OMS.
49. OMS (2010b) Monitoring the building blocks of the health system. Genève: OMS.
50. OMS (2012) Country health information system assessments. Genève: OMS.
51. E. Akotionga et all, 2018, Evaluer les effets du financement sur les interventions de réduction
de la morbidité et de la mortalité palustre au Burkina: Etude rétrospective 2006-2015
52. http://apps.who.int/nha/database
53. https://www.banquemondiale.org
54. https://www.populationdata.net
Guinea55. Ministère du Plan et de la Coopération internationale, Institut national de la statistique, Bu-
reau central de recensement, troisième recensement général de la population et de l’habita-
tion (RGPH3).
56. Ministère du Plan et du Développement, Cadrage macro-économique, 2020
57. Ministère du Plan, ’Enquête Légère pour l’Évaluation de la Pauvreté (ELEP), 2012
58. PNUD, Rapport sur le développement humain, 2010
59. PNUD, Rapport sur le développement humain, 2011
60. PNUD, Rapport sur le développement humain, 2012
61. PNUD, Rapport sur le développement humain, 2013
62. PNUD, Rapport sur le développement humain, 2014
63. PNUD, Rapport sur le développement humain, 2015
64. PNUD, Rapport sur le développement humain, 2016
65. PNUD, Rapport sur le développement humain, 2017
66. PNUD, Rapport sur le développement humain, 2018
67. PNUD, Rapport sur le développement humain, 2019
68. Ministère de la Santé, Bureau de Stratégie et de Développement, Annuaire des statistiques
sanitaires, 2017
69. Ministère de la Santé, Politique nationale de santé, novembre 2014
70. Ministère de la Santé, Plan national de développement sanitaire (PNDS) 2015-2024
71. Ministère de la Santé, Bureau de Stratégie et de développement, Comptes nationaux de la

68
Santé, Exercice 2010
72. Ministère de la Santé, Bureau de Stratégie et de développement, Rapport Comptes natio-
naux de la Santé, Années 2011-2012-2013
73. Ministère de la Santé, Bureau de Stratégie et de développement, Comptes nationaux de la
Santé, Années 2014-2015-2016
74. Loi Fondamentale de la République de Guinée, Margareta Harrit, Shunsuke Mabuchi,
75. A. Maeda, M. Harrit, S. Mabuchi, B. Siadat, and S. Nagpal. Creating Evidence for Better
Health Financing Decisions A Strategic Guide for the Institutionalization of National Health
Accounts. The World Bank
76. J. H. Lee, N. Röbbel, C. Dora. Analyse transnationale sur l’institutionnalisation de l’évaluation
d’impact sur la santé. Organisation mondiale de la santé. 2014
77. C. GUILLEUX. L’institutionnalisation de la santé environnementale en France. D’une approche
globale homme / environnement à la sectorisation d’actions de santé publique, 2015
78. M. Wismar et col. La mise en œuvre et l’institutionnalisation des évaluations d’impact sur la
santé en Europe.
79. R. P. Rannan-Eliya, L. Lorenzoni. Guidelines for improving the comparability and availability
of private Health expenditures under the system of health accounts framework à http://www.
oecd.org/els/health/workingpapers
Cameroon80. DECRET N° 2013/093 du 03 avril 2013 portant organisation du Ministère de la Santé Pu-
blique.
81. DECRET N° 2013/066 du 28 février 2013 portant organisation du ministère des finances.
82. DECRET N0 2008/220 du 04 juillet 2008 portant organigramme du MINEPAT (Ministère
de l´Economie, de la Planification et de l’Aménagement du Territoire).
83. Décision MINSANTE portant création d’une Cellule Opérationnelle chargée de l’élaboration
des CNS 2010
84. Décision MINSANTE création, composition et fonctionnement d’un Comité Technique char-
gé de l’élaboration des CNS 2014
85. Loi n°2019/023 du 24 décembre 2019 portant loi de finances de la République du Cameroun
pour l’exercice 2020
86. la Circulaire N° 00008349 /C/MINFI portant Instructions relatives à l’Exécution des Lois de
Finances, au Suivi et au Contrôle de l’Exécution du Budget de l’État et des Autres Entités
Publiques pour l’Exercice 2020.
69
87. Stratégie sectorielle de santé 2016-2027
88. Cadres budgétaires à moyen terme 2019-2021
89. Cadre des dépenses à moyens terme 2018-2020
90. Comptes Nationaux de la Santé 2012
91. Stratégie de Financement de la Santé 2020-2030
92. Banque Mondiale CAMEROUN Revue des dépenses publiques Aligner les dépenses pu-
bliques aux objectifs de la vision 2035
93. RAPPORT ANNUEL 2018 Direction Générale des Impôts https://www.impots.cm/sites/de-
fault/files/documents/RA_DGI_2018_light%20fr.pdf
94. Guide pour l’élaboration des comptes nationaux de la santé https://www.who.int/health-ac-
counts/documentation/FrenchPG-Final.pdf?ua=1
95. Manuel sur les comptes nationaux des personnels de santé https://apps.who.int/iris/
bitstream/handle/10665/275750/9789242513110-fre.pdf?ua=1
96. Cameroun: le Taux d’endettement inquiètehttps://ecomatin.net/cameroun-le-taux-dendet-
tementinquiete/#:~:text=Un%20chiffre%20qui%20situe%20le,dette%20avalis%C3%A9e%20
par%20l%27Etat.
97. Rapport annuel de performance 2018 https://www.minepat.gov.cm/index.php?option=com_
docman&view=download&alias=112-rapport-de-performance-annuel-2018-du-mine-
pat-au-28-novembre-2019&category_slug=rapport-d-execution-du-bip&Itemid=279&lang=en
98. La Banque mondiale au Cameroun: La stratégie de partenariat de la Banque mondiale pour le
Cameroun porte principalement sur le renforcement de la compétitivité du pays et l’améliora-
tion de la prestation des services.
99. Banque africaine de développement (BAD) sur les perspectives économiques de l’Afrique en
2020,https://www.afdb.org/sites/default/files/documents/publications/aeo_2020_fr-_perspec-
tives_economiques_en_afrique.pdf
100. Direction Générale du Budget 2020: Document de stratégie d’endettement public et de ges-
tion de la dette publique 2020 document de stratégie d’endettement public et de gestion de
la dette publique 2020 stratégie d’endettement à moyen terme 2020-2022
101. MINSANTE 2018 Instauration de la couverture sante universelle au Cameroun https://www.
minsante.cm/site/sites/default/files/Point%20CSU%20Conf%C3%A9rence%20Services%20
Centraux%202018%20OK.pdf
DRC102. FMI Rapport du FMI N°19/285
103. Présentation au séminaire d’orientation Budgétaire 2020 sur le cadrage macroéconomique
2021-2023, Direction Générale de Planification et de Programmation Budgétaire, Ministère

70
du Budget
104. Harmonization for Health in Africa, OMS, 2009
105. Rapports des Comptes de la santé, 2017, 2018, 2019, RDC PNCNS/Ministère de la santé
106. Loi n°11/011 du 13 juillet 2011 relative aux Finances publiques, Ministère des Finances, Jour-
nal Officiel de la RDC, 2011
107. Programme d’Appui au Niveau Central (PANC), ENABEL, Coopération Belge2020, Ministère
de la santé. Document de travail
108. Description du projet ASSP, IMA/ Sanru, IMA Health World, 2013. Document de travail
109. Cadre d’investissement pour la Santé de la Mère, du Nouveau-Né, de l’Enfant et de l’Adoles-
cent, Ministère de la santé, 2017
110. Evaluation des Mesures de base pour la Couverture Sanitaire Universelle en RDC, OMS, 2016
111. Revue de dépenses publiques de santé, Banque Mondiale, Groupe banque Mondiale, 2014
112. Revue à mi-parcours du PDSS, Banque Mondiale, 2019. Document de travail
113. Lettre n°CAB/PM/SOC/ DK/ 2015/5998, Primature et Banque Mondiale, 2015
114. Plan de renforcement du SNIS 2018-2020, DSSP/MSP, 2013
115. Liste des indicateurs de routine du système national d’information sanitaire RDC, MSP
116. Plan National de Développement Sanitaire 2010-2018, Ministère de la Santé
117. Stratégie de Renforcement du Système de santé 2006-2010, Ministère de la santé
118. Document de Stratégie de Réduction de la Pauvreté, Ministère du Plan, 2011
119. République Démocratique du Congo (RDC): Justification du Soutien aux Programmes 2019
(Période stratégique -2020- 2024), Ministère de la Santé, Aout 2019
120. Rapport du deuxième dialogue pour l’adoption de la Justification du Soutien au Programme
de GAVI pour la période 2020-2024, Ministère de la Santé, Avril 2019
121. Rapport de la mission d’appui à la Couverture Sanitaire Universelle en République Démocra-
tique du Congo, Bureau Régional de l’OMS, Novembre 2019
122. Stratégie de coopération de l’OMS avec le pays: République Démocratique du Congo 2017-
2021, OMS
123. Etude sur l’allocation des ressources pour la mise en œuvre des priorités du Plan National de
Développement Sanitaire 2011-2015, Projet Health Finance and Gouvernance, USAID, Juin
2018
124. Renforcement des systèmes de santé pour la CSU et les ODD en Afrique : un cadre d’actions,
OMS, Bureau régional de l’Afrique
125. Loi n°18/035 du 13 Décembre 2018 fixant les principes fondamentaux relatifs à l’organisation
de la santé publique, Ministère de la Santé, Journal officiel de la RDC, Déc 2018
126. Loi N° 11/011 Du 13 Juillet 2011 relative aux Finances Publiques, Ministère des Finances,

71
Journal officiel de la RDC, Juillet 2011
Rwanda127. National Institute of Statistics of Rwanda (NISR), Ministry of Finance and Economic Planning
(MINECOFIN) [Rwanda], 2012. Fourth Population and Housing Census. Thematic Report:
Population Projections.
128. National Institute of Statistics of Rwanda (NISR), Rwanda Statistical YearBook 2019. December
2019.
129. National Institute of Statistics of Rwanda (NISR), Gross Domestic Product-2019.
130. National Institute of Statistics of Rwanda (NISR), Ministry of Health, and ICF International
2015. Rwanda Demographic Health Survey, 2014-2015. Rockville, Maryland, USA.
131. Republic of Rwanda. Seven years Government Programme: National Strategy for Transforma-
tion (NST1) 2017 -2024.
132. National Institute of Statistics of Rwanda (NISR), EICV5 Main Indicators Report, November 2018.
133. African Development Bank. East Africa Economic Outlook 2019: Macroeconomic develop-
ments and prospects. 2019.
134. Official Gazette Special of 24/12/2015: The Constitution of The Republic of Rwanda, 2003,
revised 2015.
135. Official Gazette no Special of 05/11/2013: Organic Law on State finances and property.
136. Republic of Rwanda, Ministry of Health. Health Financing Strategic Plan 2018-2024. May 2019
137. Republic of Rwanda, Ministry of Health: Health Resources Tracking Output Report: Expendi-
ture for FY 2015/16 and FY 2016/17.
138. Official Gazette no Special of 26/07/2019: Prime Minister’s Order related to the CBHI scheme
subsidies.
139. PHCPI, Ministry of Health, Ministry of Finance, WHO. Improvement of Rwanda’s Health Ex-
penditure Information Systems. October 2019.
Uganda140. The World Bank. Uganda Country Overview.
141. The World Bank. Uganda Economic Update Recommends Expanding Social Protection Pro-
grams to Boost Inclusive Growth
142. Economic impacts of and policy responses to the coronavirus pandemic: early evidence from
Uganda
143. African Development Bank. Uganda Economic Outlook
144. Uganda Bureau of Statistics. 2019. The extent and nature of multi-dimensional child poverty
and deprivation. Volume 1.

72
145. Health Financing Strategy 2015/16 – 2024/25
146. MoH. Health Financing Review, 2010.
147. Stierman E, Ssengooba F, Bennett S.2013. Aid alignment: a longer-term lens on trends in
development assistance for health in Uganda. Globalization and Health
148. Oliveira Cruz V, McPake B. 2011. Global Health Initiatives and aid effectiveness: insights from
a Ugandan case study. Globalization and Health; 7(1): 20.
149. Orem and Zikusooka et al. How Equitable is Proposed NHI. 2011
150. Okwero et al. Fiscal Space for Health. 2010
Malawi151. Ministry of Health and Population: Malawi national health accounts: A broader perspective of
the Malawian health Sector. Lilongwe. 2000
152. Ministry of Health: Malawi National health Accounts 2002-2004: With sub-accounts for HIV
and AIDS, reproductive and child health. Lilongwe. 2007
153. Ministry of Health: Multi-country impact evaluation of the scale up to fight AIDS, tuberculosis
and malaria: Malawi national health accounts - with sub-accounts for HIV and AIDS, tuberculo-
sis and malaria. Lilongwe. 2008
154. Ministry of Health, Malawi National Heath Accounts with subaccounts for HIV/AIDS, Malaria,
Reproductive Health, and Child Health for Financial Years 2006/07, 2007/08, and 2008/09,
Department of Health Planning and Policy Development, Lilongwe, Malawi, 2012
155. Ministry of Health (MoH) [Malawi] (2014). Malawi National Heath Accounts with subaccounts
for HIV/AIDS, Malaria, Reproductive Health, and Child Health for Financial Years 2009/10,
2010/11, and 2011/12. Lilongwe: MoH
156. Ministry of Health, 2016. Malawi National Heath Accounts Report for fiscal years 2012/13,
2013/14 and 2014/15. Ministry of Health, Department of Planning and Policy Development,
Malawi
157. Ministry of Health (MoH). 2020. Malawi National Heath Accounts Report for Fiscal Years
2015/16–2017/18. Lilongwe, Malawi: Ministry of Health, Department of Planning and Policy
Development.
158. NSO (2019) Malawi Population and Housing Census Main Report available on http://pop-
ulationmalawi.org/wp1/wp-content/uploads/2019/10/2018-Malawi-Population-and-Hous-
ing-Census-Main-Report-1.pdf
159. The World Bank (2019) Malawi Economic Monitor. Available on https://www.worldbank.org/
en/news/feature/2019/06/25/malawi-economic-monitor-charting-a-new-economic-course
160. Ministry of Finance, Economic Planning and Development (2020) Annual Economic Report..
161. Ministry of Health (2015) Malawi National Health Information System Policy. Available online

73
on https://www.healthdatacollaborative.org/fileadmin/uploads/hdc/Documents/Country_
documents/September_2015_Malawi_National_Health_Information_System_Policy.pdf
162. Ministry of Health (2020). National Health Accounts 2015/16 – 2017/18. Department of Plan-
ning and Policy Development, Lilongwe 3
163. Ministry of Health (2020). Resource Mapping Round 6. Department of Planning and Policy
Development, Lilongwe
164. Ministry of Health and Population (2017) Community Health Strategy. Department of Preven-
tive Health Services, Lilongwe
165. Ministry of Health and Population (2017) Health Sector Strategic Plan II. Department of Plan-
ning and Policy Development, Lilongwe
166. Ministry of Health and Population (2018) National Health Policy. Department of Planning and
Policy Development, Lilongwe
167. Ministry of Local Government and Rural Development (1998) National Decentralization Policy.
Department of Planning and Policy Development, Lilongwe
168. The World Bank (2020) World Development Indicators. https://datacatalog.worldbank.org/
dataset/world-development-indicators.
169. USAID/PHRplus Project. 2004. National Health Accounts: Trainer Manual. Available online at
https://www.hfgproject.org/national-health-accounts-trainer-manual/
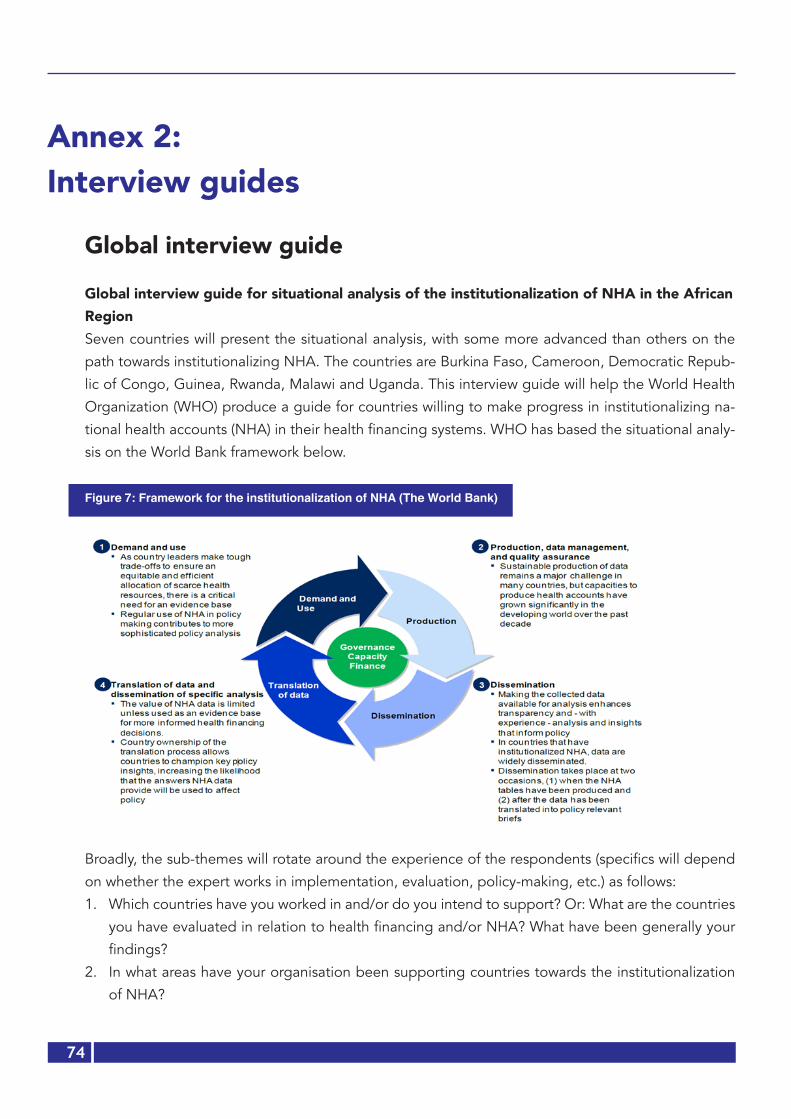
74
Annex 2: Interview guides
Global interview guide
Global interview guide for situational analysis of the institutionalization of NHA in the African RegionSeven countries will present the situational analysis, with some more advanced than others on the
path towards institutionalizing NHA. The countries are Burkina Faso, Cameroon, Democratic Repub-
lic of Congo, Guinea, Rwanda, Malawi and Uganda. This interview guide will help the World Health
Organization (WHO) produce a guide for countries willing to make progress in institutionalizing na-
tional health accounts (NHA) in their health financing systems. WHO has based the situational analy-
sis on the World Bank framework below.
Figure 7: Framework for the institutionalization of NHA (The World Bank)
Broadly, the sub-themes will rotate around the experience of the respondents (specifics will depend
on whether the expert works in implementation, evaluation, policy-making, etc.) as follows:
1. Which countries have you worked in and/or do you intend to support? Or: What are the countries
you have evaluated in relation to health financing and/or NHA? What have been generally your
findings?
2. In what areas have your organisation been supporting countries towards the institutionalization
of NHA?
75
3. Based on your experience, do you think that institutionalization is possible in the African Region?
If yes or no, could you elaborate on your response?
4. In your view, what are the opportunities countries can capitalize on to achieve full institutionaliza-
tion of NHA in their own systems?
5. What are the challenges in institutionalizing NHA that African countries will need to address?
6. What do you think of the current WB framework proposed? Do you think it paints a comprehen-
sive picture of the NHA institutionalization? What is missing? What needs to be taken out? Does
it need to be completely revised? Please elaborate on your thoughts.
7. How can African countries get to the institutionalization of NHA in the African Region? Could you
please elaborate on requirements to consider and steps for every requirement?
8. Could you please share documents (papers, reports, manuscripts) around the study or work you
did?
9. Who else do you think can provide valuable contributions? Could we call you back for further
clarification or new questions?
Thank you very much, we greatly appreciate your contributions.
National interview guide
Interview of guide for the situational analysis of national institutionalization of NHA in the African Region: Guide for national consultantsSeven countries are involved in the current assessment, namely Burkina Faso, Cameroon, Democratic
Republic of Congo, Guinea, Malawi, Rwanda and Uganda. Some countries are more advanced than
others on the path towards institutionalizing NHA. This interview guide is framed to feed information
into the World Bank framework for the institutionalization of NHA (Fig. 1). The detailed questions will
be customized to fit a specific country’s context. As you do so, please keep the changes tracked to
help inform the reporting.

76
Figure 8: World Bank framework for the institutionalization of NHA
Specifically, the consultant will help answer the following questions:
1. The demand and use of NHA data and clarify the following: a. Is there an established governance structure for undertaking and coordinating NHA work? Where
is it housed?
b. Who predominantly finances NHA work-related activities? Is there a long-term financing strategy
for the production of NHA?
c. Who demands for NHA data in the country? When was this demand expressed? What triggered
the demand? Who had direct interest in its demand and use? Please present the context related
to the expression of the need for NHA data from government (was it from the Ministry of Health
or Finance?), private sector and donor perspective.
d. Who are all the stakeholders interested in documenting and using NHA data? This would enrich
understanding of the willingness and readiness to use NHA data.
e. What is the extent to which reference is made to NHA data in policy dialogue (joint annual reviews
and health sector assessments), in which decision-makers discuss the need for the availability of
health expenditure data for planning and implementation?
f. Is there any reference to NHA data in making resource allocations, negotiations with the Ministry
of Finance, monitoring implementation, equity or efficiency?

77
g. Are there plans to further improve the demand and use of NHA data? Documentation will be
made of challenges and suggestions for the improvement of the demand and use of NHA data,
including best practices that have pushed the country forward in demanding and using NHA data.
h. Is there any additional information we may have forgotten on the demand and use of NHA data?
Please add as much information as needed to clarify this topic within your country’s context.
2. Production, management and quality assurance of NHA dataa. Are policy priorities to be addressed by NHA determined before the exercise? Who decides
these?
b. Is there a team/institution with knowledge and skills charged with undertaking and coordinating
NHA in the country?
c. Who funds the production, management and quality assurance of NHA data? Is there any sustain-
able financing of these activities?
d. To what extent are NHA data requirements incorporated into routine information systems? Is
there routinization of NHA indicators in the national financial and health information systems
through adequate adjustments of the systems to provide the data required to produce NHA?
e. Is the undertaking of NHA included in the monitoring and evaluation plans with planned and/or
existing data collection tools? Please provide details.
f. What are the existing tools and national data systems to sustainably produce NHA data? This will
include all information technology (IT) tools such as the health management information systems
(HMIS) and integrated financial management information system (IFMIS).
g. What are the challenges in NHA reporting, the degree of annualization of the NHA and the de-
gree of institutionalization in terms of scope of NHA dimensions, including existing road maps in
countries for effective NHA institutionalization? An identification of gaps and limitations, in view
of identifying existing opportunities for integration of NHA indicators into existing data collection
systems will be provided.
h. What are the areas for potential upgrade and customization of existing tools to align with SHA2011
requirements and achieve NHA institutionalization? Quality assurance processes for meeting the
criteria of reliable NHA data at country level should be clearly outlined.
i. Are there plans to further improve the production, management and quality assurance of NHA
data?
j. What are the best practices, in the context of synchronizing data tools and systems, that provide
great contributions to the production and management of NHA data?
k. Is there any additional information we may need to know in relation to the production, manage-
ment and quality assurance of NHA data? Please add as much information as needed to clarify
this topic.

78
1. Dissemination
A detailed description of the different methods of dissemination of NHA data will be made in
answering the questions below.
a. What are the different fora/meetings in which NHA data is presented in the country? What are
the institutions involved? How often are NHA data dissemination fora/meetings organized?
b. Are NHA results disseminated using soft and hard copies? Do national websites publish NHA
data? Are there printed summary reports of NHA data and their interpretation into policies and
decisions?
c. Who funds the dissemination activities of NHA results? Is there any sustainable financing of the
dissemination of NHA results?
d. Are there plans to further improve the dissemination of NHA data?
e. What are the challenges and possible solutions to improve the dissemination of NHA results?
This applies to national, sub-national and local levels, in addition to regional and international
levels.
f. What are the best practices that significantly improved NHA data dissemination in your country
that can be used by other countries?
g. Is there any additional information we may have forgotten on the dissemination of NHA data?
Please add as much information as needed to clarify this topic.
2. Translation of data and dissemination of specific analyses: a. Ownership of data production and analysis:
i. Who are the stakeholders involved in the translation of data and specific analyses? They
may be the ministries of health, finance, etc., members of parliament, civil society or donor
community.
ii. Who are the funding organizations taking part in activities related to the translation of data
and specific analyses?
b. Ownership of the processes of translating data into concrete decisions and actions is presented
as follows:
i. Is the health sector leadership aware of and taking action based on the NHA analysis results?
ii. Who leads the translation of data into concrete decisions and the implementation of those
decisions? Who is involved? Government ministries, donor organization or civil society?
iii. How is the translation of data and specific analyses done? Describe the processes step by
step.
c. Do analysed NHA data affect policy decisions in terms of recalibrating resource allocations for
efficiency, equity in distribution and improved health outcomes?
d. Are there plans to further improve the translation of data and dissemination of specific analyses
of NHA data?

79
e. What are the challenges and suggestions in translating NHA data into specific policy interpre-
tation and country ownership of its processes?
f. What are the best practices that the country has used in improving data, translating NHA data
into specific policy decisions and enhancing its ownership of overall processes?
g. Is there any additional information we may have forgotten on the translation of NHA data and
dissemination of specific analyses? Please add as much information as needed to clarify this
topic.

80
Annex 3: List of respondentsGlobal respondents
# Organization Names Email
1 BMGF Jean Kagubare [email protected]
2 BMGF Logan Brenzel [email protected]
3 BMGF David Wilson [email protected]
4 BMGF Susna De [email protected]
5 World Bank Marion Jane Cros [email protected]
6 World Bank Pia Schneider [email protected]
7 USAID Lisa Fleisher [email protected]
8 Clinton Health Access Initiative Samantha Dia-
mond
9 Clinton Health Access Initiative Aparna Kamath [email protected]
10 MSH Wilson Randy [email protected]
11 MSH Jeff Sine [email protected]
12 Brandeis University Donald Shepard [email protected]
13 Brandeis University, Former Abt,
BMGF
Nandakumar
Allyala
14 University of North Carolina Inde-
pendent Consultant/ Twubakane
Laura Hoemeke [email protected]
15 WHO Staff Bataringaya Juliet [email protected]
16 WHO Staff Musango Laurent [email protected]
17 WHO Staff Xu Ke [email protected]
18 WHO Consultant, Uganda Ezra Rwakinanga
19 WHO Consultant, Kenya David Njuguna [email protected]
20 Government, Dem Rep Congo Gerard Eloko [email protected]

81
National respondents Name Organization Contacts
Burkina Faso1 Dr OUANGARE Assane Directeur des Statistiques Sectorielles/
Ministère de la Santé[email protected] (+226) 70256347/78628245
2 Dr YAMEOGO S. Pierre Secrétaire Technique/Assurance Mala-die Universelle (ST/AMU). Ministère de la santé
[email protected] +226 70266739
3 Mr DRABO Mamadou Conseiller technique/Ministère de la santé Ministère de la santé
[email protected] 22670283616
4 Dr Tegawendé Pierre ILBOUDO
Health Specialist UNICEF/Burkina Faso
[email protected] +226) 70235374 / 76235374
5 Mr Ali KONE National Programme Officer P&D United Nations Population Fund
[email protected] +226 75 87 03 38 / +22670493373
6 Dr Bakary Siriki KONE Chef de la Division de la Protection Sociale et de la mutualité Union Economique Monétaire Ouest Africaine
[email protected] +226 25 32 87 27
7 Dr Annick SIDIBE Responsable communication, plai-doyer, relation extérieures Direction de la prévention par les vaccinations
[email protected] 22665601265
8 Mr Paul BAMBARA En charge du REDES Secrétariat Permanent du Conseil na-tional de lutte contre le SIDA et les IST (SP/CNLS-IST)
[email protected] 22670114113
9 Mr Edouard AKOTIONGA Gestionnaire, suivi évaluation, spécia-liste en planification, en économie et épidémiologie Direction générale des Etudes et des statistiques sectorielle/ Direction de la Formulation des politiques (DGESS/DFP)
[email protected] +(226)70262369 ou +(226) 73040704
10 Mrs OUEDRAOGO LAE-TICIA
Attachée de santé en épidémiologie Gestionnaire de données au service Suivi/ Evaluation Programme national de lutte contre la tuberculose
[email protected] +226 70244923
11 Mr Noufou SAVADOGO Démographe, Service de la Population et des Etudes Démographiques Institut National de la Statistique et de la Démographie (INSD)
[email protected] (00226) 76 95 47 49/ 70 58 06 22/ 78 06 47 56
12 M. KABRE Sana Issaka Service de la Comptabilité Direction de l’Administration et des Finances, Minisanté
[email protected] +226 70 28 08 53

82
13 Mrs Céline Zoubga Attachée de santé en épidémiologie Direction de la nutrition
[email protected] 22670740089
14 Mr Ouattara Baly Policy Adviser Effective Development Banque mondiale BF
[email protected] 22670741624
15 Mrs DIASSO Rose Chargé du SNIS OMS BFA
[email protected] 22670500737
16 Mr Serge RAMDE Secrétaire Général Association Professionnelle des Socié-tés d’Assurances du Burkina (APSAB)
[email protected] (00226) 61 86 68 36 / 69 24 94 86
17 Mr KAMBOU Sié Julien Direction générale du Budget (DGB) Ministère de l’Economie des Finances et du Développement (MINEFID)
[email protected] 22571837475
18 Mr SAMA Ouambi Paul Secrétariat permanent en charge des SPONG Faitière des ONG
[email protected] 22670414651
Guinea1 Dr Sékou CONDE Secrétaire général/MS [email protected] 664 587 065
2 Dr M Lmaine YANSANE Conseiller Principal MS [email protected] 622 931 389
3 Dr Souleymane Diakité Bureau de Stratégie et de Développe-ment: chef division Etudes et Planifi-cation
[email protected] 622 719 028
4 Ousmane Diakité Bureau de Stratégie et de Développe-ment: responsable financier
[email protected] 622 555 672
5 Dr Aly Fancinadouno Bureau de Stratégie et de Développe-ment: chef section Etude
[email protected] 628 697 416
8 Dr Aboubacar Conté Direction nationale des Etablissements Hospitaliers et Hygiène Sanitaire
[email protected] 621 297 472
9 Dr Djeney Fadima Kaba Direction nationale de la Santé Fa-miliale et de la Nutrition: Directrice nationale
[email protected] 622 014 723
10 Dr Madina Rachid Direction nationale de la Santé Fa-miliale et de la Nutrition: Directrice nationale adjointe
[email protected] 664 256 470
11 Abdoulaye Soumah Direction nationale de la Santé Fami-liale et de la Nutrition: comptable
12 Pr Falaye TRAORE Direction nationale de la Pharmacie et du Laboratoire: Directeur national
[email protected] 628 532 880
13 Dr Mohamed Awada Höpital national Ignace Deen: Direc-teur général
622 40 12 37
14 Dr Hamidou Kaba Pharmacie privée (Soleil) [email protected] 628 39 16 62
15 Mr FOFANA Abdoulaye Directeur National adjoint du Plan 620 632 165
18 Mr CAMARA Mohamed Chef de division Politiques Publiques , Direction E Economiques et Prévision
[email protected]. 625 393 939
19 Mr DIALLO Abdoulaye Ibrahima
Directeur National Adjoint , Direction E Economiques et Prévision
abdoulayeib@[email protected] 628 404 292

83
21 Mr SYLLA N’Fansou Responsable Suivi & Evaluation /Anafic 628532701
22 Mr DIALLO Chaikou Yaya Conseiller Principal [email protected] 628 365 035
23 Dr Karifa MARA Syst SANTE
OMS: Responsable renforcement du système de santé
[email protected] 622 597 023
24 Mr Gué Gorges Doré Dga Lanala Assurances: directeur général adjoint
[email protected] 620 30 30 87
Cameroon1 Mr EYENGA NDJOMO Point focal CNS, Directeur des
Ressources Humaines, ex Sous-di-recteur du Budget et Finance Ministère de la Santé Publique
699285436 [email protected]
2 Mr PAZIMI Barthez chef de service du Budget Ministère de la Santé Publique
696221666 [email protected]
3 Mr EKANI chargé d’étude assistant à la CIS Ministère de la Santé Publique
699629050
4 Mr TALA Salvador cadre à la CIS Ministère de la Santé Publique
5 Mr WANDJI Hans Ferry, Ing stat,
Cadre à la cis Ministère de la Santé Publique
696134665 [email protected]
6 Mr MANFOUO Daniel Ing Chef CPP Ministère de la Santé Publique
675605298 [email protected]
7 Mrs ANKUONG FANG Lucie chef cellule à la DPB (Division de la préparation du Budget, sectoriel MINSANTE Ministère des Finances
677631798
8 Mr YOUSSOUFA IYA chef service à DPB (division de la préparation du Budget) Ministère des Finances
675354800
9 Mrs NGO NSOA PAULINE Chef de service, (Division des Analyses démographiques et Migrations) Minis-tère de l’Economie, de Planification et de l’Aménagement du Territoire
[email protected] 650003530
10 Mr NDONGO Daniel Sous-directeur, SECTORIEL SANTE Mi-nistère de l’Economie, de Planification et de l’Aménagement du Territoire
671600439 [email protected]
11 Mr YENE ENYEGUE Michel sectoriel Santé MINTSS Ministère du Travail et de la Sécurité Sociale
69910948 [email protected]
12 Col Dr ABENG MBOZO’O Ferdi-nand
Directeur de la santé milliaire Ministère de la Défense: DSM
698805972 [email protected]
13 Mr DEFFO Achille Responsable des Comptes Nationaux Institut National de la Statistique
677338720 [email protected]
14 KONLACK LONLACK Giscard Chargé d’études assistant (Division des Statistiques Démographiques)
[email protected] 675793111
15 Mr YEH SIMON Chef de Centre de santé intégré Centre de santé (rural CSI de SOMIE)
671142880/661601858

84
16 Mr DOCTEUR Gabriel chef de centre Centre de santé Urbain SABONGARI
17 Dr ADAMOU YACOUBOU CMA Rural Nkontcha 69738648318 Dr MOHAMADOU NGUEMSE Directeur
Hôpital de district (urbain) HD EFOU-LAN,
677186388
19 Dr EKANI BOUKAR Directeur, HD rural de SOA 67756979720 Centre de urgences de Yaoundé Le Directeur des affaires administra-
tives et financières Hôpitaux nationaux de référence Hôpital Central de Yaoun-dé, HGOPY, CURY
21 MEDCAMER (Médecins du Cameroun)
SYMEC (Syndicat des Médecins du Cameroun)Syndicats Nationaux
22 Dr TANKOUA Chantal Présidente de l’ordre national des Chirurgiens dentist. Association des prestataires privés (médecins, infir-mières)
699951114
23 POWO DONGSON Julius Ferry Administrateur Général PROSAT (Promotion de la santé pour tous). Fédération Nationale des régimes d’assurance communautaires
678951516/6582215
24 Dr Ruth NGONGANG Directeur Médical la clinique le Jour-dain Association des Hôpitaux Privés
679766897 [email protected]
22 Dr BISSOUA-LEDJOU Tania HPA WHO Cameroun Office OMS
23 Dr BELYSE NGUM HALMATA Health Specialist UNICEF
698493724 [email protected]
24 Dr Marquise KOUO NGAMBY Programme Specialist Reproductive Health UNFPA
696298163 [email protected]
25 Alexandra RINALDI Conseillère technique responsable SE GIZ
670323162 [email protected]
DRC1 Abel KUZONZA Chef de Division Nutrition et Santé,
Direction des Secteurs Sociaux, Minis-tère du Plan
2 Alain LEMBA Expert en Finances Publiques, Direc-tion Générale de Programmation et de Préparation Budgétaire, Ministère du Budget
3 Albert NTAMBWE Chef de Bureau Fonctionnement des Ministères, Direction Générale de Programmation et de Préparation Budgétaire, Ministère du Budget
4 Arona DIALLO Expert Economiste, Projet de Renfor-cement de l’Offre et Demande des Services, Union Européenne
5 Christian LUYELA Expert à la Direction d’Etudes et Cadrage Macroéconomique, Ministère du Plan

85
6 Dr Adrien NSIALA Expert en Approche Communautaire, Projet Santé en Milieu Rural, USAID
7 Dr Alain IYETI Ancien Directeur à la Direction d’Etudes et Planification, Ministère de la Santé
8 Dr Anatole MANGALA Expert au Cabinet Couverture Maladie Universelle, Présidence de la Répu-blique
9 Dr Brigitte KINI Bureau OMS, Kinshasa
10 Dr Didier RAMANANA Coordonnateur Adjoint du Projet de Développement du Système de Santé, Ministère de la Santé et Banque Mon-diale
11 Dr Ghislain BISIMWA Professeur à l’Ecole de Santé Publique de Bukavu/Sud Kivu
12 Dr Godefroid MAYALA CMTP, USAID
13 Dr Nestor MUKINAY Point Focal national, GAVI, Ministère de la Santé
14 Eddy MONGANI Expert analyste au Programme Natio-nal des Comptes Nationaux de la Santé
15 Fidèle MUKUTE Coordonnateur Adjoint de la Plate-forme Gestion de l’Aide et Investisse-ments, Ministère du Plan
16 Isidore KIBAYA Expert en Finances Publiques, Comité Technique des Réformes, Ministère des Finances
17 Marie Jeanne OFFOSSE Economiste de la santé, Team Leader RBF Crown Agents, Zimbabwe (An-cienne consultante technique Health System 20-20 auprès du PNCNS-RDC)
18 Me Henry KAMUUNZE Conseiller Juridique au Plateforme des Organisations Mutualistes au Congo
19 Prof Faustin CHENGE Ecole de Santé Publique/Lubumbashi, Directeur du Centre des Connaissances en Santé
20 Prof NGO BEBE Professeur à l’Ecole de Santé Publique de Kinshasa, ancien haut fonctionnaire de l’OMS Afro
21 Prof Gérard ELOKO Directeur du Programme National des Comptes Nationaux de la Santé-RDC
Rwanda1 Dr Parfait Uwaliraye Ministry of Health Director General
Planning, Health Financing, and Infor-mation Systems
2 Ismael Niringiyimana Ministry of Health, Health Financing Specialist
3 Lazare Ndazaro Ministry of Health, Health Cooperation Officer
4 Pascal Kayobotsi Ministry of Health, Health Finance Specialist
pascal. [email protected]
86
5 Damascene Butera Independent consultant, previously at Partnership for Health Reform (PHR)
6 Dr Claude Sekabaraga Independent Consultant. Former Director for Policy, Planning, and Capacity Building in the Ministry of Health of Rwanda
7 Pierrot Karemera Cyubahiro Ministry of Finance and Economic Planning IFMIS Business Analyst
Uganda1 Dr Sarah Byakika MoH [email protected]
2 Susan Najjuka MoH [email protected] 3 Richard Kabagambe MoH [email protected]
4 John Kauta USAID [email protected] 5 Tom Aliti MoH [email protected] 6 Ezrah Trevor Rwakinanga NHA Consultant [email protected]
7 Nimrod Agasha MOFPED [email protected] 8 Juliet Kyokuheire MOFPED [email protected] 9 Darinka Perisic WHO [email protected]
10 Godfrey Ssemugooma UBOS [email protected]
11 Federica Margini MoH (ODI Fellow) [email protected] 12 Mark Tumwine CDC [email protected] Jotham Mubangizi UNAIDS [email protected] Dr Charlotte Muheki Health Financing Expert / Civil Society [email protected]
Malawi1 Dr Gerald Manthalu Deputy Director for Planning and Bud-
geting-Ministry of [email protected]
2 Mark Malema Health Financing Advisor-Options Con-sultancy Services Limited (WISH2Ac-tion)
3 Ian Yoon Senior Associate (Health Financ-ing)-Clinton Health Access Initiative
4 Nikhil Mandalia Health Economist, Overseas Develop-ment Initiative fellowship, Ministry of Health
5 Collins Chansa Senior Health Specialist, World Bank [email protected] Pius Nakoma Global Financing Facility [email protected] Atamandike Chingwanda Health Economist, Health Policy Plus
Project (USAID funded)[email protected]
8 Dr Paul Dielemans Deputy Team Leader, GIZ Malawi [email protected]
9 Dr Juliana Kanyengambeta Director of Health and Social Ser-vices-Mchinji District Council

87
10 Noel Dakamau Director of Planning and Develop-ment-Mchinji District Council
11 Darwin Mngoli Director of Administration-Dedza District Council
12 Stalin Zinkanda Director of Health and Social Services - Chikhwawa District Council
13 Jeremiah Mbite Health Centre in Charge-Golomoti- Dedza District Council
14 Dumisani Chiwala Planning Coordinator-Lilongwe District Health Office, Lilongwe District Council
15 Tyler Smith Cooper/Smith, Kuunika [email protected] Penjani Kayira Principal Economist, Central Monitor-
ing and Evaluation Division, Ministry of Health
17 Ms Pakwanja Twea Economist, Department of Planning and Policy Development, Ministry of Health
18 Frank Mangwaya IFMIS Manager, Accountant General [email protected]
19 Rabson Chomba Chief Accountant, Ministry of Health [email protected] Dr Marlene Chawani Research Fellow, Health Economics
and Policy [email protected]