9
11
International Journal of Business, Humanities and Technology Vol.3 No.5; May 2013 75 The Impact of Inventory Management Practices on Financial Performance of Sugar Manufacturing Firms in Kenya Timothy Lwiki Lecturer in Accounting & Finance Sigalagala National Polytechnic P.O Box 2966-50100, Kakamega Kenya Patrick Boniface Ojera, Phd School of Business & Economics Maseno University P.O Box Private BagMaseno Kenya Nebat Galo Mugenda Lecturer in Accounting & Finance Chuka University P.O. Box 109-60400 Chuka-Kenya Virginia Kirigo Wachira Department of Accounting and Finance Meru University of Science & Technology P.O Box 972-60200 Meru-Kenya Abstract Manufacturing firms apply various techniques in the management of their inventories. The practices adopted have a significant impact on returns, profitability and volume of sales. Manufacturing firms that efficiently apply these practices have an excellent financial performance. This paper examines the impact of inventory management practices on the financial performance of sugar manufacturing firms in Kenya, by analyzing the extent to which lean inventory system, strategic supplier partnership and technology are being applied in these firms. The research survey was conducted in all the eight operating sugar manufacturing firms from the period 2002- 2007. The primary data was collected using structured and semi- structured questionnaires administered to key informants in the organizations. Secondary data was obtained from annual financial performance statements available in the year Book sugar statistics. Descriptive statistics was used to test the impact of inventory management practices and Correlation analysis was used to determine the nature and magnitude of the relationship among inventory management variables. The results indicate that there exists a positive correlation between inventory management and Return on Sales (r=0.740) and also with Return on Equity (r=0.653) which were found to be statistically significant at 5% level. Key Words: Inventory Management, Financial Performance, Return on Sales, Return on Equity, Sugar Manufacturing Introduction Managing assets of all kinds can be viewed as an inventory problem, for the same principles apply to cash and fixed assets (Koumanakos, 2008). The tradeoff between ordering costs and holding costs characterizes the transactions approach to inventory management represented by the EOQ models of inventory developed many decades ago (Koumanakos,2008). In the recent years, as the field of operations management has developed, many new concepts have been added to the list of relevant inventory control topics.
Transcript of 9
International Journal of Business, Humanities and Technology Vol.3 No.5; May 2013
75
The Impact of Inventory Management Practices on Financial Performance of Sugar Manufacturing Firms in Kenya
Timothy Lwiki Lecturer in Accounting & Finance Sigalagala National Polytechnic P.O Box 2966-50100, Kakamega
Kenya
Patrick Boniface Ojera, Phd School of Business & Economics
Maseno University P.O Box Private BagMaseno
Kenya
Nebat Galo Mugenda Lecturer in Accounting & Finance
Chuka University P.O. Box 109-60400
Chuka-Kenya
Virginia Kirigo Wachira Department of Accounting and Finance
Meru University of Science & Technology P.O Box 972-60200
Meru-Kenya
Abstract
Manufacturing firms apply various techniques in the management of their inventories. The practices adopted have a significant impact on returns, profitability and volume of sales. Manufacturing firms that efficiently apply these practices have an excellent financial performance. This paper examines the impact of inventory management practices on the financial performance of sugar manufacturing firms in Kenya, by analyzing the extent to which lean inventory system, strategic supplier partnership and technology are being applied in these firms. The research survey was conducted in all the eight operating sugar manufacturing firms from the period 2002- 2007. The primary data was collected using structured and semi- structured questionnaires administered to key informants in the organizations. Secondary data was obtained from annual financial performance statements available in the year Book sugar statistics. Descriptive statistics was used to test the impact of inventory management practices and Correlation analysis was used to determine the nature and magnitude of the relationship among inventory management variables. The results indicate that there exists a positive correlation between inventory management and Return on Sales (r=0.740) and also with Return on Equity (r=0.653) which were found to be statistically significant at 5% level.
Key Words: Inventory Management, Financial Performance, Return on Sales, Return on Equity, Sugar Manufacturing Introduction
Managing assets of all kinds can be viewed as an inventory problem, for the same principles apply to cash and fixed assets (Koumanakos, 2008). The tradeoff between ordering costs and holding costs characterizes the transactions approach to inventory management represented by the EOQ models of inventory developed many decades ago (Koumanakos,2008). In the recent years, as the field of operations management has developed, many new concepts have been added to the list of relevant inventory control topics.
© Center for Promoting Ideas, USA www.ijbhtnet.com
76
These more management oriented concepts include the materials requirements planning systems (MRP) Just-In- Time (JIT) and ERP methods while another emerging stream of studies postulate that the characteristics of a firm’s demand and marketing environments also play an important role.
In determination of optimal corporate inventories, notwithstanding the theoretical and practical short comings inherent in these concepts and techniques, their application in real business life should have an effect on firm’s performance (Koh, Demirbag, Tatoglu and Zaim, 2007). Building on this situation, the purpose of this study is to investigate the relationship, if any, between inventory management practices and financial performance of sugar manufacturing firms in Kenya. Inventory Management is viewed as a significant blend of the key performance determinant variables in sugar industry.
Inventory management and control are crucial to a firm because mismanagement of inventory threatens a firm’s viability (Sprague and Wacker, 1996). Too much inventory consumes physical space, creates financial burden, and increases possibility of damage, spoilage and loss. In this context the lean production principle pioneered by Womack et al (1990) has been linked to reduced inventories on the other hand, too little inventory often disrupts manufacturing operations and increase the likelihood of poor customer service.
The Concept of Inventory Management
Inventory refers to the value or quantity of raw materials, supplies, work in progress (WIP) and finished stock that are kept or stored for use as need arises (Lyons and Gillingham, 1981). Raw materials are commodities such as steel and lumber that go into the final product. Supplies include items such as Maintenance, Repair and Operating (MRO) inventory that do not go into the final product. Work in progress is materials that have been partly fabricated but are not yet completed. Finished goods are completed items ready for shipment (Kothari, 1992).
Inventory management is the art and science of maintaining stock levels of a given group of items incurring the least cost consistent with other relevant targets and objectives set by management (Jessop, 1999). It is important that managers organizations that deals with inventory, to have in mind, the objective of satisfying customer needs and keeping inventory costs at a minimum level. Drury (2004) asserts that inventory costs include holding costs, ordering costs and shortage costs. Holding costs relate to costs of having physical items in stock. These include insurance, obsolescence and opportunity costs associated with having funds which could be elsewhere but are tied up in inventory.
Ordering costs are costs of placing an order and receiving inventory. These include determining how much is needed, preparing invoices, transport costs and the cost of inspecting goods. Shortage costs result when demand exceeds the supply of inventory on hand. The costs include opportunity costs of making a sale, loss of customer goodwill, late charges and similar costs.
Theory of Economic Order Quantity (Wilson EOQ Model)
Mathematical models have been developed within the scope of operations management to determine the optimal inventory level. The most widely used model is the EOQ model. This model was developed by F.W.Haris in 1913. But still R.H. Wilson is given credit for his early in- depth analysis of the model (Arsham, 2006). The model is also known as the Wilson EOQ model. According to this model, some costs (ordering costs) decline with inventory holdings, while others (holding costs) rise and that the total inventory-associated cost curve has a minimum point. This is the point where total inventory costs are minimized.
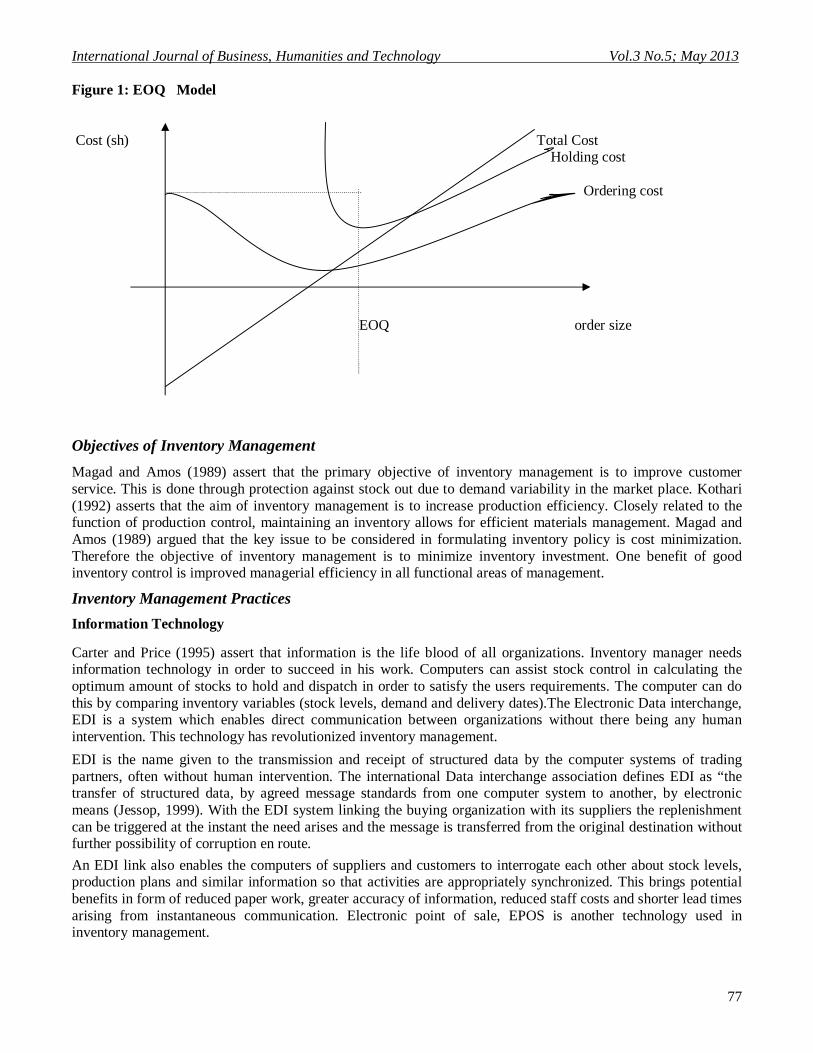
The economic order quantity is the level of inventory that minimizes the total of the inventory holding cost and ordering cost. The graphical representation of EOQ model is shown in figure 1 below:
International Journal of Business, Humanities and Technology Vol.3 No.5; May 2013
77
Figure 1: EOQ Model Cost (sh) Total Cost Holding cost Ordering cost EOQ order size Objectives of Inventory Management
Magad and Amos (1989) assert that the primary objective of inventory management is to improve customer service. This is done through protection against stock out due to demand variability in the market place. Kothari (1992) asserts that the aim of inventory management is to increase production efficiency. Closely related to the function of production control, maintaining an inventory allows for efficient materials management. Magad and Amos (1989) argued that the key issue to be considered in formulating inventory policy is cost minimization. Therefore the objective of inventory management is to minimize inventory investment. One benefit of good inventory control is improved managerial efficiency in all functional areas of management.
Inventory Management Practices
Information Technology Carter and Price (1995) assert that information is the life blood of all organizations. Inventory manager needs information technology in order to succeed in his work. Computers can assist stock control in calculating the optimum amount of stocks to hold and dispatch in order to satisfy the users requirements. The computer can do this by comparing inventory variables (stock levels, demand and delivery dates).The Electronic Data interchange, EDI is a system which enables direct communication between organizations without there being any human intervention. This technology has revolutionized inventory management.
EDI is the name given to the transmission and receipt of structured data by the computer systems of trading partners, often without human intervention. The international Data interchange association defines EDI as “the transfer of structured data, by agreed message standards from one computer system to another, by electronic means (Jessop, 1999). With the EDI system linking the buying organization with its suppliers the replenishment can be triggered at the instant the need arises and the message is transferred from the original destination without further possibility of corruption en route.
An EDI link also enables the computers of suppliers and customers to interrogate each other about stock levels, production plans and similar information so that activities are appropriately synchronized. This brings potential benefits in form of reduced paper work, greater accuracy of information, reduced staff costs and shorter lead times arising from instantaneous communication. Electronic point of sale, EPOS is another technology used in inventory management.

© Center for Promoting Ideas, USA www.ijbhtnet.com
78
The purpose of EPOS is to scan and capture information relating to goods sold. An EPOS system verifies checks and provides instant sales reports, charges transactions and sends out intra- and inter- stores messages. The EPOS technology allows substantial cost savings and gives “real time” information on sale of goods patterns of stores traffic, and popularity and profitability of every line carried. It enables stock to be limited to demand, reduces the risk of obsolescence and deterioration of stocks, reduced chances of theft and provides information to buyers. This leads to improved customer service and hence improved financial performance (Lysons, 1984)
Bar coding is a technology that is employed in counting raw materials and finished goods inventory. It gives the level of inventories, facilities faster data entry with greater accuracy. Its benefits include reduced labour costs through time saving and productivity. It also enables greater responsiveness to customers and supplies
Lean Inventory System
Lean production principle was pioneered by Womack et al (1990). This principle was linked with reduced inventories. The argument is that as inventory is reduced there will be profit improvement due to interest savings as well as a reduction in storage fees, handling and waste. These savings have been estimated by literature to be in the range of 20 -30 percent (Brigham & Gapenski, 1993). Lean Management is getting more and more attention in today’s highly competitive environment. The proponents of Lean Inventory system argue that excess inventory will adversely affect the net cash flows of a firm.
On the cost side, most obvious are the costs of holding inventory, which include the capital costs (interest or opportunity) and the physical cost (storage, insurance and spoilage). In recent years, a number of systems have been developed in the field of operations management to deal with excess inventory problem. Management–oriented systems include the Just-In-Time (JIT), the materials Requirements Planning systems (MRP) and Enterprise resource planning, ERP. Just-In-Time refers to a collection of practices that eliminate waste. These organization wide practices encompass the entire supply chain.
The elements of JIT include shared product design with suppliers and customers, movement towards single sourcing proximate suppliers, reduced machine set- up times and total preventive maintenance. It is an inventory strategy that is implemented to improve the return on investment of a business by reducing inventory and its associated carrying costs. In order to achieve JIT, the process must have signals of what is going on everywhere within the processJIT can lead to dramatic improvements in a manufacturing organization’s return on investments, quality and efficiency. It emphasizes that production should create items that arrive when needed, neither earlier nor later.
Quick communication of the consumption of old stock, which triggers new stock to be ordered, is key to JIT and inventory reduction. This saves warehouse space and costs. The basic philosophy of JIT is that inventory is defined as waste. The technique was first used by Ford motor company. It was subsequently adopted and publicized by Toyota Motor Corporation of Japan in the 1950s. MRP system is defined as product- oriented computerized technology aimed at minimizing inventory and maintaining delivery schedules. It relates the dependent requirements for materials and components comprising an end product to time periods over planned horizon on the basis of forecasts provided by marketing and sales and other input information (Lysons and Gillingham, 2003).
This system is based on the recognition that demand for an item may be dependent on the demand for other inventory items. The emphasis is one the end product into which related parts are incorporated. The inventory quantities required are specified on the basis of future demand. The demand for inventory items is precisely determined from the master production schedule for the end products. The operation of a lean inventory system such as JIT and MRP result in relatively low inventory levels. The warehousing costs and material handling costs are significantly reduced. This increases return on assets through decreased conversion costs.
Strategic Supplier Partnership
Lysons and Gillingham (2003) defines partnering as a commitment by both customers and suppliers, regardless of size, to a long term relationship based on clear, mutually agreed objectives to strive for world class capability. The emphasis is on good working relations between customers and suppliers. The concept of supplier partners developed strongly in the 1980s as a result of the movement towards just- in–time (JIT) manufacturing. JIT emphasis reduction in waste, shortening of lead times, improvement and simplicity. These are also the goals of supplier partnership (Bicheno, 1996). The philosophy is that through co-operation rather than confrontation both parties benefit.
International Journal of Business, Humanities and Technology Vol.3 No.5; May 2013
79
In the partnership, long terms table relationships are sought rather than short term and adversarial relations. The contracts are longer term in order to give the supplier confidence and the motivation to invest and improve. For partnership to work, proper communication is an important factor. The suppliers and customers who communicate clearly and directly are judged to be more effective. Personal connections with supplier’s representatives remain important despite the increasing use of electronic communication of all kinds. There is also need to embrace the principle of early supplier involvement in design.
This reduces the chances to defective items and the risk of obsolesce because the supplier is involved in the design process (Brownell, 2005) Vendor Managed Inventory (VMI) is a new feature of supplier partnerships. In a VMI relationship, the supplier holds inventory on site or near the customer, allowing the customer instant access to the inventory. This immediate access allows the customer to pull inventory as needed and only pay for that which is consumed, thus reducing inventory investment and increasing inventory turns. In VMI arrangements the supplier has a responsibility for replenishing stock, which would include ordering, managing the logistics to ship the material and counting inventory.
By passing these costs normally managed by the customer on the supplier, the customer is able to reduce the overall cost of their product and increase their margins. The supplier benefits from a higher share of the purchaser’s total purchase requirements (Loughrin, 2008)
Inventory Management and Financial Performance
There have been numerous attempts to explain financial performance of companies in the fields of strategic management, accounting, finance, marketing and management science. Naturally each of these areas concentrates on different explanatory variables and therefore this study limits the survey to papers that are perceived as immediately relevant. In the US, Sanghal (2005) studied the effect of excess inventory on long term stock price performance. The study estimated the long-run price effects of excess inventory using 900 excess inventory announcements made by publicly traded firms during 1990-2002. These announcements are clear and unambiguous acknowledgement by affirm that it is suffering from excess inventory.
Examples include instances of production curtailment, temporary shutdowns, price mark downs, promotion to liquidate inventory and inventory write- offs to deal with excess inventories. He found evidence suggesting that stock market partially anticipates excess inventory situations and that firms do not recover quickly from negative effects of excess inventory. He further noted that the negative effect of excess inventory is economically and statistically significant. In Malaysia, Agus and Noor (2006) examined the relationship between inventory management practices and financial performance. The study measured he manager’s perceptions of inventory and supply chain management practices and the level of performance in the industry.
The practices include lean inventory systems, Technology and strategic supplier partnerships. They employed a structured questionnaire, which was designed to assess the companies in terms of the described dimensions. The sample companies were randomly chosen from manufacturing companies (non- food based manufacturing companies with medium to high technology) in Klang valley, Malaysia. The findings suggest that inventory management practices have significant correlations with profitability and return on sales (ROS).
Roumiantsev and Netessine (2005) investigated the association between inventory management policies and the financial performance of affirm. The purpose of the study was to assess the impact of inventory management practices on financial performance across the period 1992-2002.They used conventional firm specific variables (inventory levels, margins, and lead times) as explanatory variables. They found no evidence that smaller relative levels are associated with financial performance as measured by return on assets. Eckert (2007) examined inventory management and role it plays in improving customer satisfaction. He found a positive relationship between customer satisfaction and supplier partnerships, education and training of employees, and technology.
In Greece, Koumanakos (2008) studied the effect of inventory management on firm performance 1358 manufacturing firms operating in three industrial sectors in Greece, food textiles and chemicals were used in the study covering 2000 – 2002 period. The hypothesis that lean inventory management leads to an improvement in a firm’s financial performance was tested. The findings suggest that the higher the level of inventories preserved (departing from lean operations) by a firm, the lower the rate of return. In conclusion, most of the studies reviewed concentrated on conventional firm level variables such as inventory levels, demand and lead time.
© Center for Promoting Ideas, USA www.ijbhtnet.com
80
Little attempt was made to capture the perceptions of managers about the impact of inventory management practices on firm financial performance. Agus and Noor (2006) did measure the perception of managers about the impact of inventory management practices on financial performance of manufacturing firms in Malaysia. However, circumstances in Malaysia could be different from those in Kenya. This study seeks to investigate the impact of inventory management practices on financial performance of sugar manufacturing firms in Kenya.
Methodology
This study adopted a descriptive research design. A survey was conducted on all the eight (8) sugar manufacturing firms in Kenya to determine the impact of the effective inventory management practices on financial performance of sugar manufacturing firms. The sugar industry in Kenya currently has total annual production of about 530,000 tonnes. The factories are West Kenya, Soin, Kibos, Mumias, Chemilil, Nzoia, Muhoroni and Sony. The first three (3) are entirely private owned. Mumias sugar was privatized in 2001 though the government holds majority shares. The rest are wholly government owned. In Kenya, sugar cane is grown in Nyanza, Western and Coast provinces. The Ministry of Agriculture has the overall responsibility for the sugar industry development. The industry is regulated by the Kenya Sugar Board, KSB
Research design and Sampling Technique
The population of the study constituted all the eight (8) operating sugar manufacturing firms in Kenya. Since the number of firms is small, a census survey was conducted in all the eight (8) sugar firms. The period covered was between 2002 -2007.
Data Collection and Analysis
Both Primary and secondary data were used. The primary data was collected using structured and semi - structured questionnaires. The secondary data was obtained from the publications of the Kenya sugar Board and from the annual performance statements available in the Year Book of Sugar Statistics. Descriptive statistics such as frequencies, proportions, percentages, mean scores and standard deviation were used to analyze data. The coefficient of correlation (r) was used to determine the nature and magnitude of the relationship among inventory management variables and financial performance. The relevant computer packages were also used to analyze data. Cronbach’s alpha was calculated to determine the internal consistency reliability. Data was presented through tables and charts. This study employed Return on Sales and Return on Equity to proxy for financial performance. These measures were used by Roumantsev and Netessine (2005) and Agus and Noor (2006).
Data Analysis
The following findings have been presented in order of inventory management practices, financial performance and correction analysis. Presentation and analysis of data on Inventory management practices has been based on the likert scale in the range 1-4; where:1 = The practice is not used at all, 2 = the practice is used to a small extent, 3 = The practice is used to some extent, 4= the practice is used to a great extent. Descriptive statistics
Table 1; Lean Inventory System X1
Parameters N Min Max Freq % Mean SD X1.1 Operation of JIT purchasing system – where no
safety stocks are kept 8 2.0000 3.000 6 75 2.750000 .4629100
X1.2 Agreements with supplier for short cycle deliveries
8 2.0000 4.0000 7 87.5 3.125000 .6408699
X1.3 Accurate prediction of vendor delivery dates 8 2.0000 4.0000 7 87.5 3.250000 .7071068 X1.4 Operation of materials Requirements planning
system (MRP) – where bills of materials are 100% accurate
8 2.0000 4.0000 6 75 3.375000 .9161254
X1.5 Little or no expediting 8 4.0000 5 62.5 2.875000 .8345230 X=3.075 0.7123
Source: Survey Data (2009)
International Journal of Business, Humanities and Technology Vol.3 No.5; May 2013
81
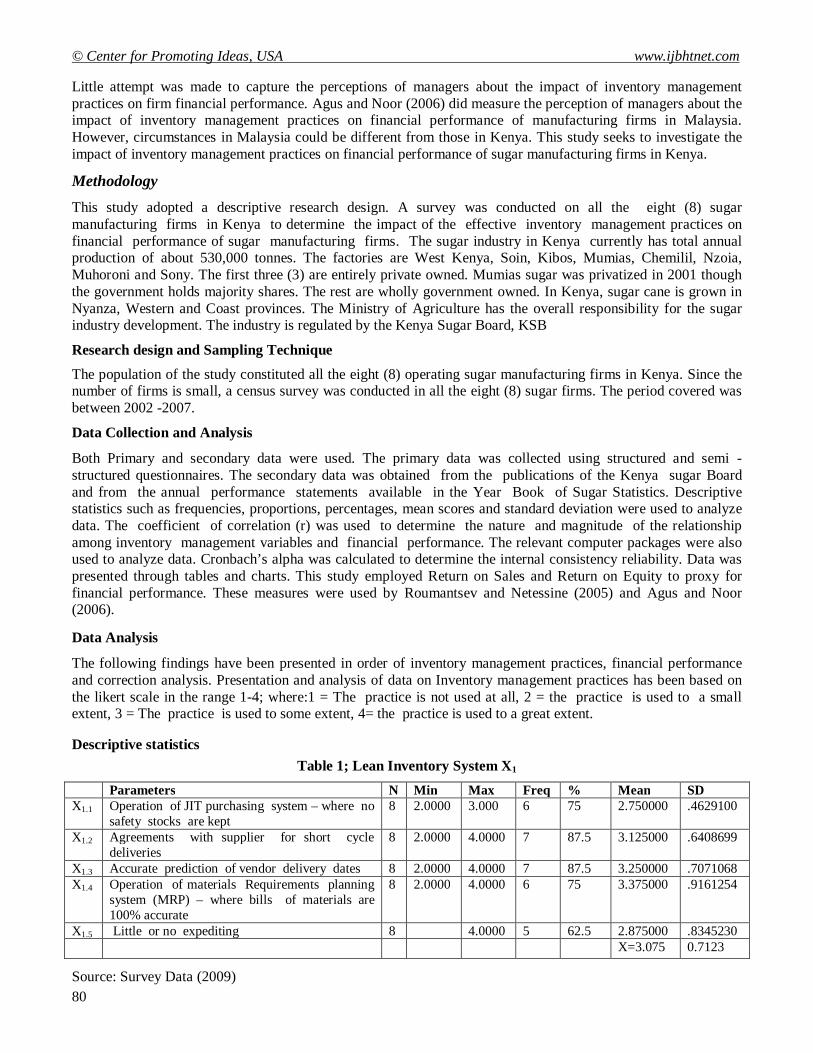
Table 1 presents managerial opinion on the extent of use of the practice of lean inventory system in their firms. The major determinants in Lean Inventory System are Materials Requirement Planning , with a mean of 3.375 at 75 accurate prediction of vendor delivery dates, with a mean of 3.25 at 87.5% and agreements with suppliers for short cycle deliveries with a mean of 3.125 at 87.5%. MRP is the most widely used system because all manufacturing firms have to prepare master production schedules, with accurate bills of materials which are key element in MRP system. Other parameters considered to be important determinants of Leans Inventory system include little or no expediting with a mean of 2.875 at 62.5% and operation of JIT purchasing system with a mean of 2.75 at 75%. In general based on the results, Lean inventory system takes a mean of 3.075 showing that sugar firms have employed Lean Inventory systems to some extent.
Table 2 Strategic Supplier Partnerships X2
Parameters N Min Max Freq %Ages Mean SD X 2.1
Involving suppliers early in product design process
8 3.000 4.000 8 100 3.375000 .5175492
X 2.2
Use of suppliers to manage inventory on behalf of the firm (Vendor managed Inventory)
8 1.0000 2.0000 0 0 1.625000 .5175492
X
2.3 Use of fewer suppliers as opposed to many suppliers
8 1.0000 4.0000 6 75 2.750000 .8864053
X 2.4
Frequent meetings between firm’s inventory staff and the suppliers
8 2.0000 3.0000 6 75 2.750000 .4629100
X 2.6
Complete information sharing between the firm and its suppliers
8 1.0000 4.0000 5 62.5 2.625000 1.0606602
X 2.6
Proper communication between the firm and suppliers
8 2.0000 4.0000 6 75 3.125000 .8345230
X 2.7
Long – term agreements between the firm and its suppliers
8 1.0000 4.0000 6 75 3.000000 1.0690450
Source: Survey data (2009)
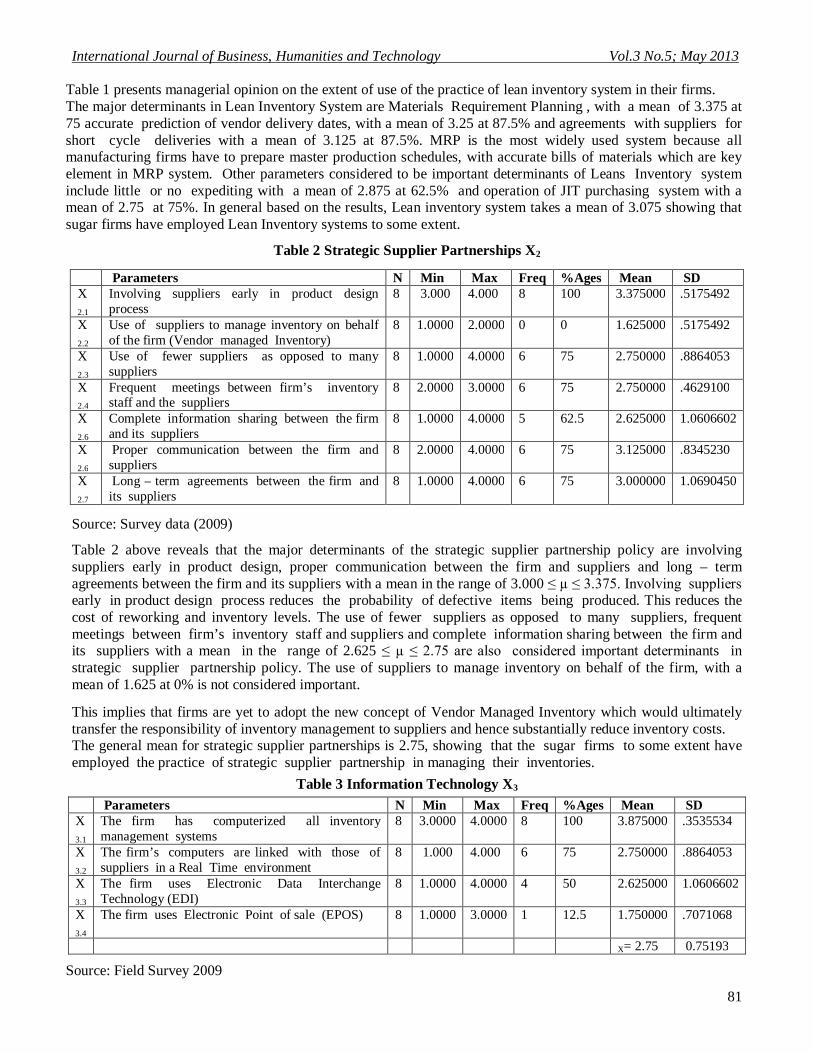
Table 2 above reveals that the major determinants of the strategic supplier partnership policy are involving suppliers early in product design, proper communication between the firm and suppliers and long – term agreements between the firm and its suppliers with a mean in the range of 3.000 ≤ µ ≤ 3.375. Involving suppliers early in product design process reduces the probability of defective items being produced. This reduces the cost of reworking and inventory levels. The use of fewer suppliers as opposed to many suppliers, frequent meetings between firm’s inventory staff and suppliers and complete information sharing between the firm and its suppliers with a mean in the range of 2.625 ≤ µ ≤ 2.75 are also considered important determinants in strategic supplier partnership policy. The use of suppliers to manage inventory on behalf of the firm, with a mean of 1.625 at 0% is not considered important.
This implies that firms are yet to adopt the new concept of Vendor Managed Inventory which would ultimately transfer the responsibility of inventory management to suppliers and hence substantially reduce inventory costs. The general mean for strategic supplier partnerships is 2.75, showing that the sugar firms to some extent have employed the practice of strategic supplier partnership in managing their inventories.
Table 3 Information Technology X3
Parameters N Min Max Freq %Ages Mean SD X 3.1
The firm has computerized all inventory management systems
8 3.0000 4.0000 8 100 3.875000 .3535534
X 3.2
The firm’s computers are linked with those of suppliers in a Real Time environment
8 1.000 4.000 6 75 2.750000 .8864053
X
3.3 The firm uses Electronic Data Interchange Technology (EDI)
8 1.0000 4.0000 4 50 2.625000 1.0606602
X 3.4
The firm uses Electronic Point of sale (EPOS) 8 1.0000 3.0000 1 12.5 1.750000 .7071068
X= 2.75 0.75193
Source: Field Survey 2009
© Center for Promoting Ideas, USA www.ijbhtnet.com
82
Table 3 above shows the degree to which sugar manufacturing firms apply information technology in inventory management. It is clear that all the firms have computerized their systems, with mean of 3.875 at 100%. Computers can aid in stock control by setting stock control levels and calculating the amount of stocks to hold and dispatch. Linking firms computers with those of suppliers in a Real Time environment with a mean of 2.75 at 75% and use of EDI technology with a mean of 2.625 at 50% are also considered important in information technology. The remaining parameter mean for technology is 2.75, showing that sugar manufacturing firms have to some extent adopted information technology in their inventory management activities.
Financial Performance
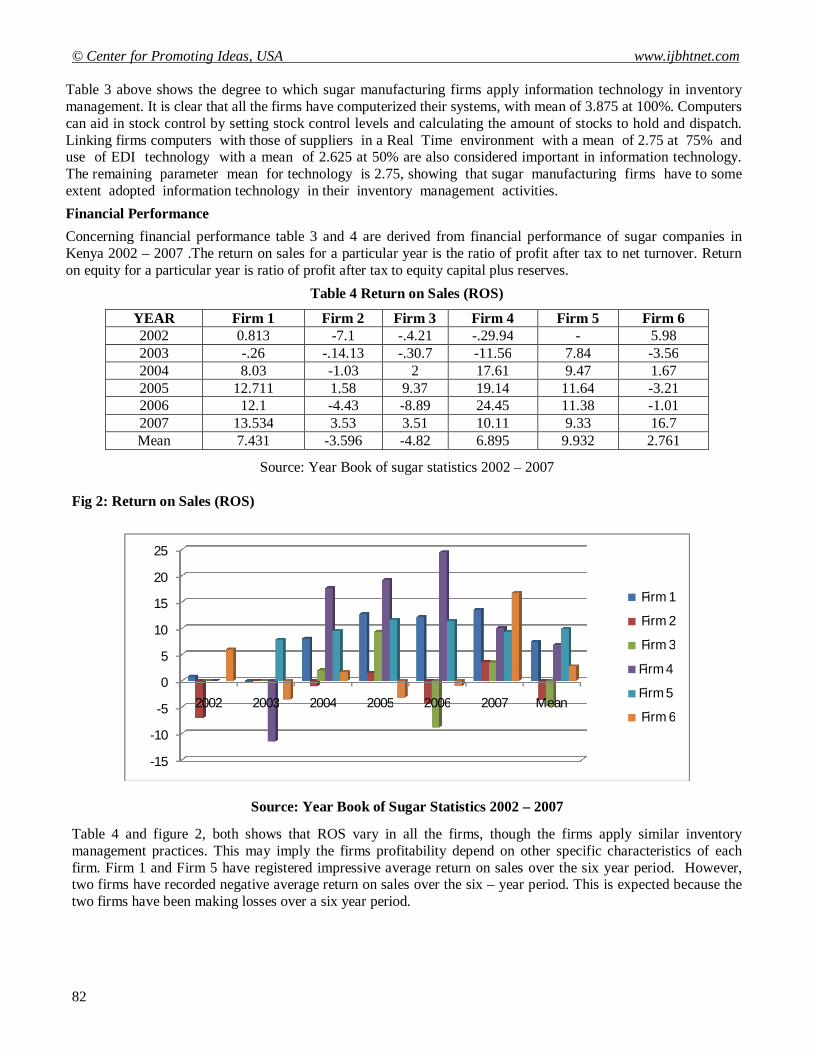
Concerning financial performance table 3 and 4 are derived from financial performance of sugar companies in Kenya 2002 – 2007 .The return on sales for a particular year is the ratio of profit after tax to net turnover. Return on equity for a particular year is ratio of profit after tax to equity capital plus reserves.
Table 4 Return on Sales (ROS)
YEAR Firm 1 Firm 2 Firm 3 Firm 4 Firm 5 Firm 6 2002 0.813 -7.1 -.4.21 -.29.94 - 5.98 2003 -.26 -.14.13 -.30.7 -11.56 7.84 -3.56 2004 8.03 -1.03 2 17.61 9.47 1.67 2005 12.711 1.58 9.37 19.14 11.64 -3.21 2006 12.1 -4.43 -8.89 24.45 11.38 -1.01 2007 13.534 3.53 3.51 10.11 9.33 16.7 Mean 7.431 -3.596 -4.82 6.895 9.932 2.761
Source: Year Book of sugar statistics 2002 – 2007 Fig 2: Return on Sales (ROS)
Source: Year Book of Sugar Statistics 2002 – 2007
Table 4 and figure 2, both shows that ROS vary in all the firms, though the firms apply similar inventory management practices. This may imply the firms profitability depend on other specific characteristics of each firm. Firm 1 and Firm 5 have registered impressive average return on sales over the six year period. However, two firms have recorded negative average return on sales over the six – year period. This is expected because the two firms have been making losses over a six year period.
-15
-10
-5
0
5
10
15
20
25
2002 2003 2004 2005 2006 2007 Mean
Firm 1
Firm 2
Firm 3
Firm 4
Firm 5
Firm 6
International Journal of Business, Humanities and Technology Vol.3 No.5; May 2013
83
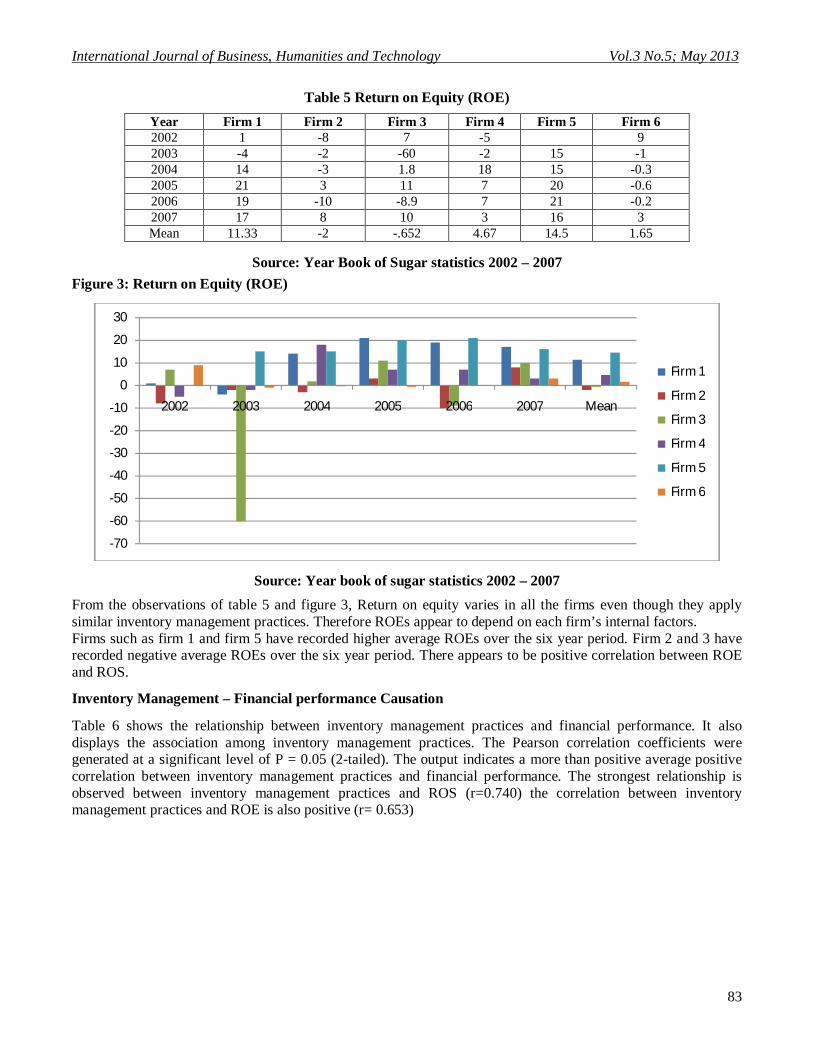
Table 5 Return on Equity (ROE)
Year Firm 1 Firm 2 Firm 3 Firm 4 Firm 5 Firm 6 2002 1 -8 7 -5 9 2003 -4 -2 -60 -2 15 -1 2004 14 -3 1.8 18 15 -0.3 2005 21 3 11 7 20 -0.6 2006 19 -10 -8.9 7 21 -0.2 2007 17 8 10 3 16 3 Mean 11.33 -2 -.652 4.67 14.5 1.65
Source: Year Book of Sugar statistics 2002 – 2007
Figure 3: Return on Equity (ROE)
Source: Year book of sugar statistics 2002 – 2007
From the observations of table 5 and figure 3, Return on equity varies in all the firms even though they apply similar inventory management practices. Therefore ROEs appear to depend on each firm’s internal factors. Firms such as firm 1 and firm 5 have recorded higher average ROEs over the six year period. Firm 2 and 3 have recorded negative average ROEs over the six year period. There appears to be positive correlation between ROE and ROS.
Inventory Management – Financial performance Causation
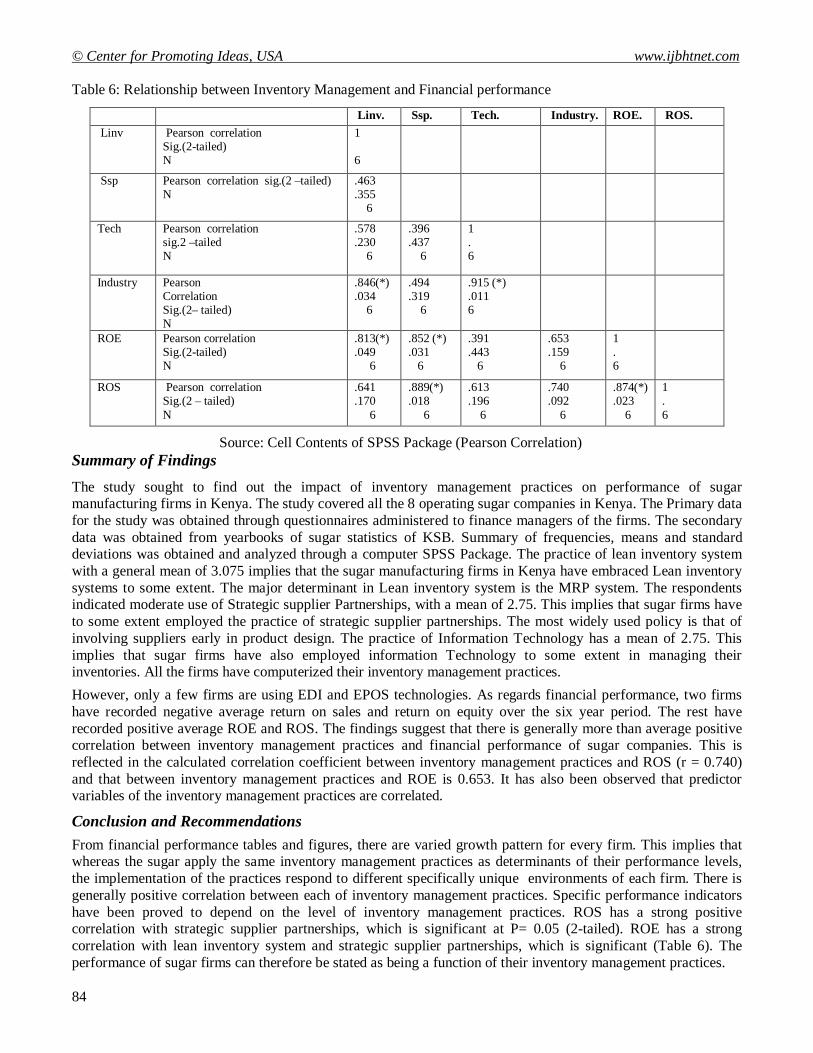
Table 6 shows the relationship between inventory management practices and financial performance. It also displays the association among inventory management practices. The Pearson correlation coefficients were generated at a significant level of P = 0.05 (2-tailed). The output indicates a more than positive average positive correlation between inventory management practices and financial performance. The strongest relationship is observed between inventory management practices and ROS (r=0.740) the correlation between inventory management practices and ROE is also positive (r= 0.653)
-70
-60
-50
-40
-30
-20
-10
0
10
20
30
2002 2003 2004 2005 2006 2007 Mean
Firm 1
Firm 2
Firm 3
Firm 4
Firm 5
Firm 6
© Center for Promoting Ideas, USA www.ijbhtnet.com
84
Table 6: Relationship between Inventory Management and Financial performance
Linv. Ssp. Tech. Industry. ROE. ROS. Linv Pearson correlation
Sig.(2-tailed) N
1 6
Ssp Pearson correlation sig.(2 –tailed) N
.463
.355 6
Tech Pearson correlation sig.2 –tailed N
.578
.230 6
.396
.437 6
1 . 6
Industry Pearson Correlation Sig.(2– tailed) N
.846(*)
.034 6
.494
.319 6
.915 (*)
.011 6
ROE Pearson correlation Sig.(2-tailed) N
.813(*)
.049 6
.852 (*)
.031 6
.391
.443 6
.653
.159 6
1 . 6
ROS Pearson correlation Sig.(2 – tailed) N
.641
.170 6
.889(*)
.018 6
.613
.196 6
.740
.092 6
.874(*)
.023 6
1 . 6
Source: Cell Contents of SPSS Package (Pearson Correlation) Summary of Findings
The study sought to find out the impact of inventory management practices on performance of sugar manufacturing firms in Kenya. The study covered all the 8 operating sugar companies in Kenya. The Primary data for the study was obtained through questionnaires administered to finance managers of the firms. The secondary data was obtained from yearbooks of sugar statistics of KSB. Summary of frequencies, means and standard deviations was obtained and analyzed through a computer SPSS Package. The practice of lean inventory system with a general mean of 3.075 implies that the sugar manufacturing firms in Kenya have embraced Lean inventory systems to some extent. The major determinant in Lean inventory system is the MRP system. The respondents indicated moderate use of Strategic supplier Partnerships, with a mean of 2.75. This implies that sugar firms have to some extent employed the practice of strategic supplier partnerships. The most widely used policy is that of involving suppliers early in product design. The practice of Information Technology has a mean of 2.75. This implies that sugar firms have also employed information Technology to some extent in managing their inventories. All the firms have computerized their inventory management practices.
However, only a few firms are using EDI and EPOS technologies. As regards financial performance, two firms have recorded negative average return on sales and return on equity over the six year period. The rest have recorded positive average ROE and ROS. The findings suggest that there is generally more than average positive correlation between inventory management practices and financial performance of sugar companies. This is reflected in the calculated correlation coefficient between inventory management practices and ROS (r = 0.740) and that between inventory management practices and ROE is 0.653. It has also been observed that predictor variables of the inventory management practices are correlated.
Conclusion and Recommendations
From financial performance tables and figures, there are varied growth pattern for every firm. This implies that whereas the sugar apply the same inventory management practices as determinants of their performance levels, the implementation of the practices respond to different specifically unique environments of each firm. There is generally positive correlation between each of inventory management practices. Specific performance indicators have been proved to depend on the level of inventory management practices. ROS has a strong positive correlation with strategic supplier partnerships, which is significant at P= 0.05 (2-tailed). ROE has a strong correlation with lean inventory system and strategic supplier partnerships, which is significant (Table 6). The performance of sugar firms can therefore be stated as being a function of their inventory management practices.

International Journal of Business, Humanities and Technology Vol.3 No.5; May 2013
85
The predictor variables of inventory management practices are correlated such that each influences the strength of the other.
Recommendations
1. It is recommended that sugar manufacturing firms develop a policy framework to facilitate faster implementation of the best inventory management practices such as JIT and MRP.
2. It is also recommended that sugar firms consider investing in modern technology and implement EDI. This will reduce inventory costs and improve returns.
3. The firms should also strengthen the supplier relation to the level of partnerships. This will facilitate implementation of programmes such as Vendor Managed Inventory (VMI)
References
Agus, A & Noor, Z.M (2006). Supply chain management and performance. An Empirical Study. A working paper university of Malaysia.
Bicheno, J. (1996). Supplier partnerships. National institute for manufacturing management, London Brigham, E.F & Gapenski L.C (1993). Intermediate Financial Management. New York:Dryden Press. Brownell, J. (2005), Strengthening the Purchase Supplier Partnership. A working paper Cornell University. Drurry, C. (2004), Management and Cost accounting. London: Prentice Hall Eckert, S.G (2007) Inventory Management and its effects on customer satisfaction Journal of Public policy Vol 1
no.3 Koh, C., Demirbag, M., Tatoglou ,E, & Zaim, S. (2007) The impact of supply chain practices on Performance on
SMES Industrial Management & Data systems Vol 107 No 1 (pp 103 -240) Kothari, C.R (1992) An introduction to operational Research. New Delhi: Vikas publishing Koumanakos, D.P
(2008).The effect of inventory management on firm performance International Journal of productivity and performance Management, Vol 57 (pp 355-369) Emerald Group Publication
Loughrim, M. (2008). Lean Thinking and Vendor Managed Inventory. A working Paper University of Liverpool. Lysons, K and Gillingham, M. (2003). Purchasing and supply chain management. London:Prentice Hall Magad, E.and Amos, J. (1989)Total materials management.NewYork: Van Nostrand ReinholdSinghal ,V.R.
(2002). Excess Inventory and Long- term stock price performance A working. paper, Georgia Institute of Technology. Roumianstev, S, and Netessine, S (2005), Should inventory policy be lean or responsive?: An Emperical Analysis working paper university of Pennsylvania.
Womack J.P. Jones , D.T and Roos ,D. (1990), The Machine changed the world RawsonAssociated. Newyork.