79 JOURNAL OF GLOBAL BUSINESS AND ECONOMICS JULY 2012. VOLUME 5. NUMBER 1 DETERMINANTS OF FINANCIAL...
21
79 JOURNAL OF GLOBAL BUSINESS AND ECONOMICS JULY 2012. VOLUME 5. NUMBER 1 DETERMINANTS OF FINANCIAL PERFORMANCE IN BRAZILIAN COMPANIES: A MULTI-RATIO MODEL USING MULTIVARIATE STATISTICAL METHOD Prof. Dr. Hong Yuh Ching Head of Business department, Centro Universitário da FEI, SBC, Brazil [email protected] Prof. Dr. Fábio Gerab Head of Mathematic department, Centro Universitário da FEI, SBC, Brazil [email protected] ABSTRACT The objectives of this research are twofold: a) identify the factors and correlated indicators that impact corporate financial performance; b) determine the indicators that most affect profitability of Brazilian cyclical consumer goods industry. Two motivations for this study were the lack of academic research in this industry and its importance in the economy. Sixteen companies with current asset greater than 50% of total asset, for the period 2005-2009, were selected. Principal Component Analysis PCA was used to extract, from 20 variables and ratios, five factors that impact financial performance. The variable with the biggest component loading in each one of the five factors was selected to be its representative in the multiple regression analysis MRA. Finally, MRA is used to assert which indicators affect corporate profitability the most as measured by ROS return on sales, ROA return on assets and ROE return on equity. The results show that five factors impact corporate financial performance with 18 correlated variables and ratios. The firm size factor is the most predominant and accounts for 26,9% of total variance, while the financial debt is the least important, accounting for 9,1%. Percentage of gross margin and the amount of equity are the indicators that impact the profitability, while financial leverage impacts only ROE. The first two indicators account for 50,7% and 73,4% of ROS and ROA variances respectively, while they, together with financial leverage, account for 72,7% of ROE variance. Working capital indicators account for 20,8% of financial performance variance but none of them affects profitability. The findings can provide experience sharing for other industries and also for cyclical consumer goods industry in other countries, which can be of interest to international audience of academics and business managers. The originality of this study was to combine both techniques: the use of PCA to identify the most relevant indicator in each factor followed by a MRA to assert which indicators affect the corporate profitability the most. Keywords: Financial performance, financial indicators, principal component factors, multiple regression analysis. ----------------------------------------------------------------------------------------------------------------------------------
Transcript of 79 JOURNAL OF GLOBAL BUSINESS AND ECONOMICS JULY 2012. VOLUME 5. NUMBER 1 DETERMINANTS OF FINANCIAL...

79 JOURNAL OF GLOBAL BUSINESS AND ECONOMICS
JULY 2012. VOLUME 5. NUMBER 1
DETERMINANTS OF FINANCIAL PERFORMANCE IN BRAZILIAN COMPANIES: A MULTI-RATIO MODEL USING MULTIVARIATE STATISTICAL METHOD
Prof. Dr. Hong Yuh Ching Head of Business department,
Centro Universitário da FEI, SBC, Brazil [email protected]
Prof. Dr. Fábio Gerab Head of Mathematic department,
Centro Universitário da FEI, SBC, Brazil [email protected]
ABSTRACT
The objectives of this research are twofold: a) identify the factors and correlated indicators that impact corporate financial performance; b) determine the indicators that most affect profitability of Brazilian cyclical consumer goods industry. Two motivations for this study were the lack of academic research in this industry and its importance in the economy. Sixteen companies with current asset greater than 50% of total asset, for the period 2005-2009, were selected. Principal Component Analysis PCA was used to extract, from 20 variables and ratios, five factors that impact financial performance. The variable with the biggest component loading in each one of the five factors was selected to be its representative in the multiple regression analysis MRA. Finally, MRA is used to assert which indicators affect corporate profitability the most as measured by ROS return on sales, ROA return on assets and ROE return on equity. The results show that five factors impact corporate financial performance with 18 correlated variables and ratios. The firm size factor is the most predominant and accounts for 26,9% of total variance, while the financial debt is the least important, accounting for 9,1%. Percentage of gross margin and the amount of equity are the indicators that impact the profitability, while financial leverage impacts only ROE. The first two indicators account for 50,7% and 73,4% of ROS and ROA variances respectively, while they, together with financial leverage, account for 72,7% of ROE variance. Working capital indicators account for 20,8% of financial performance variance but none of them affects profitability. The findings can provide experience sharing for other industries and also for cyclical consumer goods industry in other countries, which can be of interest to international audience of academics and business managers. The originality of this study was to combine both techniques: the use of PCA to identify the most relevant indicator in each factor followed by a MRA to assert which indicators affect the corporate profitability the most.
Keywords: Financial performance, financial indicators, principal component factors, multiple regression analysis.
----------------------------------------------------------------------------------------------------------------------------------
80 JOURNAL OF GLOBAL BUSINESS AND ECONOMICS
JULY 2012. VOLUME 5. NUMBER 1 1. INTRODUCTION
The complex economic and business environment landscape is no longer a place for noncompetitive companies. The consolidation of economic sectors, the fierce competition and the sophistication of management models are some of the factors that companies have to consider when devising their strategies (Deloitte, 2007). Results from Deloitte survey First Quarter 2011 (2011) indicate that many companies are nearing or already beyond a major shift from recovery to growth. Chief Financial Officers CFOs say their companies’ strategic focus has shifted toward revenue growth and away from cost reduction and that revenue growth is now their dominant company challenge. Despite their growth agendas, CFOs cite continuing concerns about the economy and consumer demand, concerns about industry regulation, and a shortage of attractive investment opportunities as the main reasons for constrained spending.
This seems to be the case of Brazil. Since the sustained growth of the Brazilian economy in the last seven years, the cyclical consumer goods industry has become very important and played a major role in this growth. Data extracted from IBGE Brazilian Institute of Geography and Statistics show that the revenue of Brazilian commerce sector, for instance, has increased at a compound annual rate of around 14% from 2007 to 2010. This sector represented 7,78% of national Gross Domestic Product in 2005 and went up to 8,6% in 2008. Commerce sector, together with footwear, clothing and textile, form the cyclical consumer goods industry, for the purpose of this study. (note: there are no specific data for cyclical consumer goods industry at IBGE). However, Brazilian economy is facing now a global financial crisis and investment opportunities are becoming scarce.
Within this business context, it is imperative that companies be able to analyze their overall performance and assess the current financial standing. This is even more true for the managers of cyclical consumer goods enterprises to evaluate their financial performance in order to continue with sustainable competitive advantage. Financial ratios have played an important role in evaluating the performance and financial competitiveness of an enterprise. These two topics have been analysed from various scale perspectives. Das (2009) used 23 ratios related to profitability, liquidity, capital structure, activity and others to understand the important dimensions of the financial performance of non-profit hospitals. Feng and Wang (2000) used 63 financial and operational performance indicators in their study concerning airline performance evaluation, divided into production, marketing and management departments. Koyuncugil and Ozgulbas (2006), on the other hand, used 17 indicators to study the financial performance of small and medium sized enterprises in Turkey.
Two classic articles try to bridge the gap between traditional ratio analysis and the most rigorous statistical techniques. Using empiric analysis, Beaver (1966) aimed to identify which financial indicators were the most significant to predict financial difficulties and the likelihood of a company to fail through these indicators. Altman (1968) showed that the financial ratios and statements could be used to predict corporate bankruptcy. He applied the statistical method of discriminant analysis on his model. In Brazil, Kanitz (1976) developed a model of insolvency prediction and also utilized the discriminant analysis. His thermometer of insolvency, using financial ratios, ranked the companies´ insolvency likelihood from -7 to +7.
81 JOURNAL OF GLOBAL BUSINESS AND ECONOMICS
JULY 2012. VOLUME 5. NUMBER 1 The financial statements and ratios are no substitute for a crystal ball, but they help the management to monitor the company´s performance and devise financial strategies to improve its value. Most corporate financial theories are built up on the premise that the objective in corporate finance is the maximization of firm value (Damodaran, 1996). He advocates that the relationship between financial decisions, corporate strategy and firm value has to be delineated. However there is a danger of the management being overwhelmed by the sheer volume of data available. In Chen and Shimerda article (1981), they summarized 26 studies by different authors and the ratios they employed. These studies analyzed more than 100 financial items, from which 65 are financial ratios. Forty one of these were considered useful and/or are used in the final analysis by one or more researchers. They concluded saying that given such a heterogeneous set of useful financial ratios, the decision makers are at a loss in selecting which ratios to use.
The challenge is which financial indicators and ratios, among the hundreds that can be computed from the available financial data, should be analyzed to evaluate corporate overall performance? In this paper, a multi-ratio model is developed to evaluate corporate financial performance and profitability of cyclical consumer goods enterprises in Brazil using 23 indicators related to liquidity, efficiency, leverage, size and profitability. By using principal component analysis PCA, this paper identifies initially the factors and their correlated indicators that impact financial performance. Then, the analysis is followed by multiple regression analysis MRA to assert which indicators affect the corporate profitability the most. The objectives of this research are twofold:
a) identify factors and related indicators that impact corporate financial performance
b) determine the indicators that most affect profitability.
Although the cyclical consumer goods industry has made achievements in recent years in Brazil, there are still shortcomings of its own. This study can provide a empyrical basis and effective assistance for the enterprises in this industry to evaluate and enhance their financial performance and profitability. An additional motivation is the lack of academic research of this industry. Some studies discussed in the next section use factor analysis to identify the factors that explain most of the variation in the financial performance or for evaluating the financial competitiveness of the enterprises within a given industry. Other studies use multiple regression to establish a relationship between financial ratios and corporate profitability. The originality of this study is to combine both techniques: the use of the multivariate statistical technique of PCA to identify the most relevant indicator in each component followed by a MRA to assert which indicators and ratios affect the corporate profitability the most.
The rest of this paper is organized as follows. Section 2 reviews the literature for some relevant theoretical and empirical work on financial variables (indicators and ratios) and their impact on financial performance and corporate profitability. Section 3 covers the research methodology, the sample and the variables used in this study. The data analysis and statistical results are discussed in Section 4. Finally Section 5 presents the conclusions.
82 JOURNAL OF GLOBAL BUSINESS AND ECONOMICS
JULY 2012. VOLUME 5. NUMBER 1 2. LITERATURE REVIEW
This section discusses studies applying multivariate statistical techniques in industries other than cyclical consumer goods. Unfortunately, the authors were not able to find studies related to cyclical consumer goods industry. It is divided in two parts: the first shows studies related to evaluation of financial performance and financial competitiveness of a given industry using multivariate statistical techniques. The second part shows studies related to determination of corporate profitability using multiple regression analysis.
2.1 Financial performance and financial competitiveness and the use of multivariate statistical techniques
The first four studies have the objective of identifying the most significant financial indicators in the evaluation of corporate financial performance and financial competitiveness while allowing a simultaneous analysis of various indicators behavior. These studies have in common the use of principal component analysis and factor analysis to create the financial indicators selection criteria. The indicators that form one specific factor must be highly correlated amongst themselves and weakly correlated with those indicators that form another factor. These techniques have as objective the identification of factors to help interpretation of the data.
Das (2009) aimed to understand the dimensions of the financial and operational performance of non-profit hospitals in United States. Using a initial set of 23 indicators, 5 of them were excluded in the final sample and he extracted five factors that explain most of the variations in the performance. These factors are: profitability (with ROA, ROE, cash flow to total debt, operating and total margin indicators), liquidity (with current and quick ratios), capital structure (with long term debt to capitalization, total liability to total asset, fixed asset financing and equity financing indicators), activity (with asset turnover, fixed asset turnover, current asset turnover and markup indicators) and operational (with non financial indicators). The most important factor, which explains approximately two fifths of the variation in the performance measures is capital structure. This is followed by profitability, which explains one-fifth of the variation. The next two factors – activity and liquidity – have basically the same variation with operational as the least important. He concluded that capital structure is more important than profitability in determining the performance of these hospitals.
Chun, Xinocheng and Kai (2011) analyzed the significance of enterprise competitiveness evaluation in Chinese automobile industry. They used factor analysis method to construct a composite score rank of 13 enterprises based on financial statements and relevant financial indicators. They extracted three factors that explain 84,7% of the variance which are: enterprise scale (composed of total assets, total profit and main business income indicators); profit (earnings per share, inventory turnover and total assets turnover) and operational development (ROE and accounts receivable turnover). The first factor can explain 51,62% of the variance, the second explains 18,48% and the third factor explains 14,59%. One main conclusion of the study is that due to the increasing fierceness of market competition, the enterprises should expand resources to enhance scale capacity. When these enterprises expand their scale, they must improve the asset management capabilities and enhance profitability.
83 JOURNAL OF GLOBAL BUSINESS AND ECONOMICS
JULY 2012. VOLUME 5. NUMBER 1 There are also a lot of studies about the financial competitiveness of business enterprises. Ran and Zheng (2011) investigated the sporting goods enterprise in China. Using principal component analysis, they extracted 3 component factors and named them as solvency (with current and quick ratios, total asset and current asset turnover indicators); sustainable profit making (with earnings per share, gross profit and equity per share indicators) and capital management (with gross profit margin and asset liability ratio).
Zeting and Liping (2011) conducted an analysis on the fertilizer manufacturing companies using the factor analysis method and 3 factors were extracted accounting for 91,74% of the variance. These factors were named as short term debt paying ability (with cash to current liabilities, quick and current ratios), growth and circulating asset management (with net asset growth, circulation asset growth, total asset growth and net profit growth indicators) and profitability (with ROA and ROE indicators).
Lixin and Shuxia (2010) built a financial competitiveness model for 27 companies from electrical equipment section based on the method of analytical hierarchy process. They included 15 indicators grouped in four areas: solvency (current and quick ratios and asset liability ratio), operational capacity (inventory, receivables, current and total asset turnover), profitability (net profit ratio, earnings per share, ROE and ROA) and development capacity (operating income growth, net profit growth, total asset growth and net asset growth).
By using CHAID Decision Tree Algorithms method, Koyuncugil and Ozgulbas (2006) managed to categorize small and medium-sized enterprises into 4 different profiles in terms of level of financial performance. This is explained by means of all 17 financial indicators of a firm. In each profile group, the authors suggest minimum values for each indicator and concluded that on return on equity ROE can be used as the performance measure. The criticism that may be made to this study is that it does not lead to which indicators that impact ROE the most.
We can notice that there is not a common pattern neither to the factors name nor to the indicators loaded in each factor. For instance, while for Das (2009) profitability factor is loaded with ROA, ROE, cash flow to total debt, operating and total margin indicators, for Chun, Xinocheng and Kai (2011) ROE is loaded in the operational development factor and not in the profit factor. For Ran and Zheng (2011), they loaded with different indicators in the sustainable profit making factor but for Zeting and Liping (2011) they considered only ROA and ROE in their profitability factor.
2.2 Indicators, corporate profitability and use of multiple linear regression
In the following articles, most of the authors use models linking various hypothesized variables to some performance measures, mostly profitability measures (ROA, ROI and ROS). They typically estimate the impact of different variables on performance, using statistical techniques (mostly multiple linear regression).
84 JOURNAL OF GLOBAL BUSINESS AND ECONOMICS
JULY 2012. VOLUME 5. NUMBER 1 Shin and Soenen (1998) investigated the relationship between several financial indicators and profitability in north american companies during the period between 1975 and 1994. The variables used for profitability were return on assets (ROA) and return on sales (ROS). Their research found strong evidence of a negative relation between profitability and cash conversion cycle, which means that the shorter the days of working capital, the higher the profitability. Profitability is also negatively related to current ratio and total debt/total asset variables while sales growth is positively related to profitability. Their findings also indicate a positive impact in the shareholder´s value.
Lazaridis and Tryfonidis (2006) investigated the relationship that is statistically significant between corporate profitability and several financial indicators. They used a sample of 131 companies listed in the Athnes Stock Exchange for the period of 2001-2004. The independent variables used were fixed financial assets, the natural logarithm of sales, financial debt ratio, cash conversion cycle and its components – days inventory, days receivable and days payable. The dependent variable is profitability measured by gross operating profit. The research findings show negative relation between cash conversion cycle and financial debt with profitability, while fixed financial assets have a positive coefficient. When the authors replaced cash conversion cycle with accounts receivable and inventory, they found negative relation with these two variables; the opposite occurred with accounts payable.
Karaduman et al (2011) used a sample of 127 listed firms in Istanbul from several sectors for the period of 2005-2009. They found out that firm size (represented by logarithm of assets) and sales growth have positive relation with return on asset while days receivable, days inventory, days payable, cash conversion cycle and debt ratio (as being total debt/total asset) are negatively related. Two other studies presented similar results. In Palombini dissertation (2010) with 357 Brazilian listed companies for the period of 1994-2008, the firm size (represented by logarithm of sales), sales growth and days receivable have also shown positive relation with profitability measures (being gross margin and operational margin) while cash conversion cycle and days inventory were negatively related. Deloof (2003) found negative relation between gross operating profit and accounts receivable, inventory and accounts payable. Gross operating profit is positively related to sales growth, firm size and negatively related to financial debt measured by financial debt/total assets ratio. He studied 1009 Belgian companies from 1992 to 1996.
Mohamad and Saad (2010) worked with 172 Malaysian companies chosen in a random basis for the period of 2003-2007. Regression analysis shows that profitability variables (represented by return on assets and return on investment) are negatively correlated with cash conversion efficiency, current ratio, current liabilities to total asset ratio and total debt to total asset ratio (although this latter only with ROA). Profitability variables are positively correlated with current asset to total asset ratio.
Ganesan (2007) used a sample of 349 telecommunication equipment companies covering the period 2001-2007. The independent variables used were current ratio, days receivable, days inventory, days payable, days working capital and cash conversion efficiency. The dependent variable profitability is measured in terms of ROA and ROS. Working capital management efficiency is negatively associated to ROS and there is no association to ROA. Overall there is evidence that the management of days receivable, days in inventory and days payable in this industry is poor and they do not have much impact on both ROA and ROS.
85 JOURNAL OF GLOBAL BUSINESS AND ECONOMICS
JULY 2012. VOLUME 5. NUMBER 1 Ching et al (2010) in their study of Brazilian listed companies indicated that a better cash conversion efficiency improves ROS return on sales while days inventory has negative association with ROS and ROA return on assets. Debt ratio is also negative related to ROA only. However it displays no statistical evidence in ROE improvement with any of the indicators.
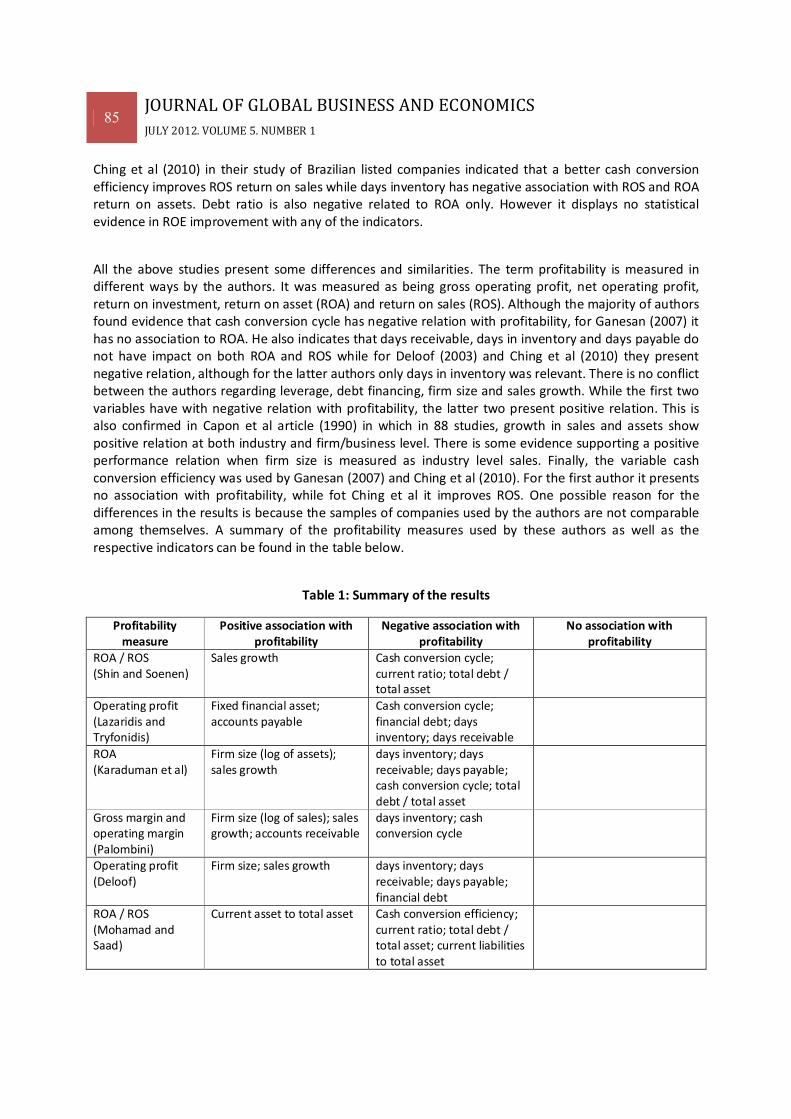
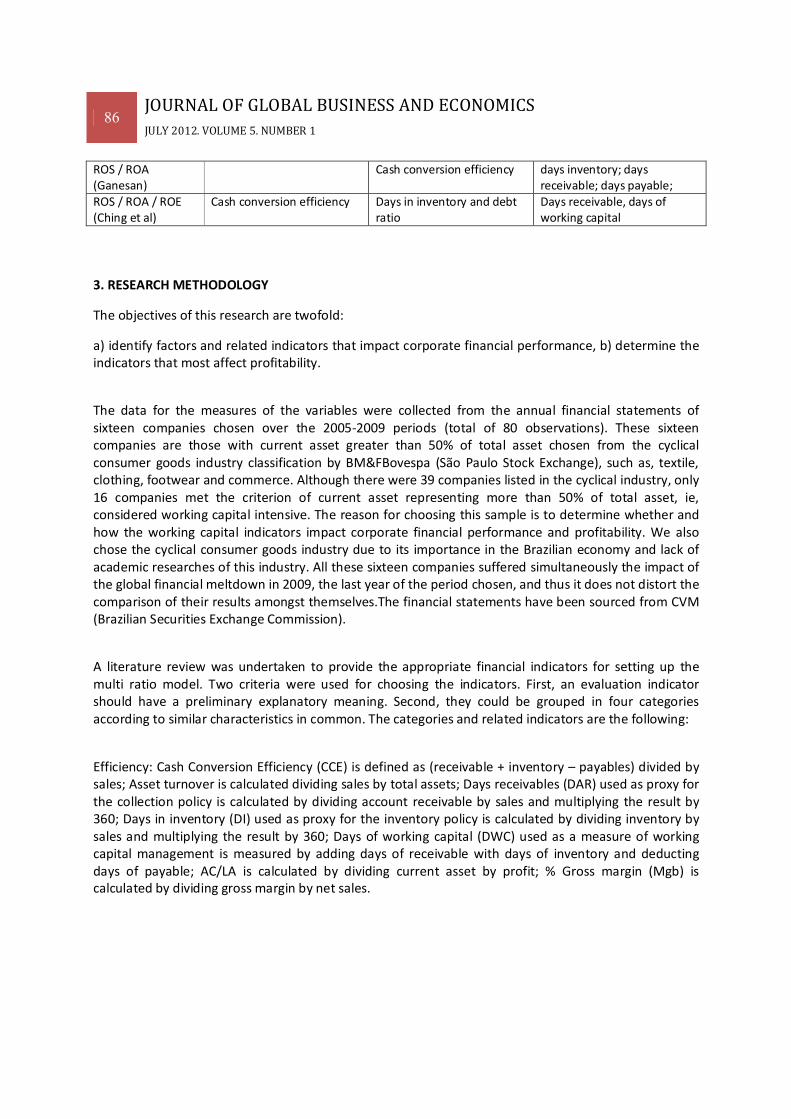
All the above studies present some differences and similarities. The term profitability is measured in different ways by the authors. It was measured as being gross operating profit, net operating profit, return on investment, return on asset (ROA) and return on sales (ROS). Although the majority of authors found evidence that cash conversion cycle has negative relation with profitability, for Ganesan (2007) it has no association to ROA. He also indicates that days receivable, days in inventory and days payable do not have impact on both ROA and ROS while for Deloof (2003) and Ching et al (2010) they present negative relation, although for the latter authors only days in inventory was relevant. There is no conflict between the authors regarding leverage, debt financing, firm size and sales growth. While the first two variables have with negative relation with profitability, the latter two present positive relation. This is also confirmed in Capon et al article (1990) in which in 88 studies, growth in sales and assets show positive relation at both industry and firm/business level. There is some evidence supporting a positive performance relation when firm size is measured as industry level sales. Finally, the variable cash conversion efficiency was used by Ganesan (2007) and Ching et al (2010). For the first author it presents no association with profitability, while fot Ching et al it improves ROS. One possible reason for the differences in the results is because the samples of companies used by the authors are not comparable among themselves. A summary of the profitability measures used by these authors as well as the respective indicators can be found in the table below.
Table 1: Summary of the results
Profitability measure
Positive association with profitability
Negative association with profitability
No association with profitability
ROA / ROS (Shin and Soenen)
Sales growth Cash conversion cycle; current ratio; total debt / total asset
Operating profit (Lazaridis and Tryfonidis)
Fixed financial asset; accounts payable
Cash conversion cycle; financial debt; days inventory; days receivable
ROA (Karaduman et al)
Firm size (log of assets); sales growth
days inventory; days receivable; days payable; cash conversion cycle; total debt / total asset
Gross margin and operating margin (Palombini)
Firm size (log of sales); sales growth; accounts receivable
days inventory; cash conversion cycle
Operating profit (Deloof)
Firm size; sales growth days inventory; days receivable; days payable; financial debt
ROA / ROS (Mohamad and Saad)
Current asset to total asset Cash conversion efficiency; current ratio; total debt / total asset; current liabilities to total asset
86 JOURNAL OF GLOBAL BUSINESS AND ECONOMICS
JULY 2012. VOLUME 5. NUMBER 1 ROS / ROA (Ganesan)
Cash conversion efficiency days inventory; days receivable; days payable;
ROS / ROA / ROE (Ching et al)
Cash conversion efficiency Days in inventory and debt ratio
Days receivable, days of working capital
3. RESEARCH METHODOLOGY
The objectives of this research are twofold:
a) identify factors and related indicators that impact corporate financial performance, b) determine the indicators that most affect profitability.
The data for the measures of the variables were collected from the annual financial statements of sixteen companies chosen over the 2005-2009 periods (total of 80 observations). These sixteen companies are those with current asset greater than 50% of total asset chosen from the cyclical consumer goods industry classification by BM&FBovespa (São Paulo Stock Exchange), such as, textile, clothing, footwear and commerce. Although there were 39 companies listed in the cyclical industry, only 16 companies met the criterion of current asset representing more than 50% of total asset, ie, considered working capital intensive. The reason for choosing this sample is to determine whether and how the working capital indicators impact corporate financial performance and profitability. We also chose the cyclical consumer goods industry due to its importance in the Brazilian economy and lack of academic researches of this industry. All these sixteen companies suffered simultaneously the impact of the global financial meltdown in 2009, the last year of the period chosen, and thus it does not distort the comparison of their results amongst themselves.The financial statements have been sourced from CVM (Brazilian Securities Exchange Commission).
A literature review was undertaken to provide the appropriate financial indicators for setting up the multi ratio model. Two criteria were used for choosing the indicators. First, an evaluation indicator should have a preliminary explanatory meaning. Second, they could be grouped in four categories according to similar characteristics in common. The categories and related indicators are the following:
Efficiency: Cash Conversion Efficiency (CCE) is defined as (receivable + inventory – payables) divided by sales; Asset turnover is calculated dividing sales by total assets; Days receivables (DAR) used as proxy for the collection policy is calculated by dividing account receivable by sales and multiplying the result by 360; Days in inventory (DI) used as proxy for the inventory policy is calculated by dividing inventory by sales and multiplying the result by 360; Days of working capital (DWC) used as a measure of working capital management is measured by adding days of receivable with days of inventory and deducting days of payable; AC/LA is calculated by dividing current asset by profit; % Gross margin (Mgb) is calculated by dividing gross margin by net sales.
87 JOURNAL OF GLOBAL BUSINESS AND ECONOMICS
JULY 2012. VOLUME 5. NUMBER 1 Liquidity: Current ratio (LC) is calculated by dividing current asset by current liability; Quick ratio (LS) is defined as (current asset – inventory) divided by current liability; General ratio (LG) is calculated by dividing current asset and long term receivable by current and non-current liability.
Leverage: Liability ratio (ET/AT) is calculated by dividing the sum of current and non-current liability by total assets; Financial leverage (AF) is defined as (short + long term debt) divided by equity; Leverage ratio (AF/PL) is calculated by dividing fixed asset by equity;
Size: Inventory, accounts receivable, fixed asset, suppliers, long term debt, equity (PL) and gross sales, expressed in local currency;
The dependent variables are measured in three distinct terms of profitability:
- Return on Sales (ROS) is defined as net profit plus depreciation and equity method result divided by net sales;
- Return on Asset (ROA) is calculated by dividing profit by total assets;
- Return on Equity (ROE) is calculated by dividing profit by total equity.
We have applied the Principal Component Analysis (PCA) to identify the data set dimension. After identifying the number of retained components, the variable with the biggest correlation with each component is chosen to represent its correspondent dimension. These selected variables are used as independent variables in Multiple Regression Analysis to explain the behavior of ROS, ROA and ROE. To represent each identified principal component in the Multiple Regression Analysis (MRA), we selected the variable with the biggest component loading in each principal component. This approach has some advantages: it avoids multicollinearity problems in MRA; selected representative variables are pure variables, with no influence from variables related with the other remaining principal components; makes the MRA results much easier to understand given that the variable scale and unit are preserved; and all identified factors present in the full data set were taken into account, since we selected one representative variable for each extracted principal component.
From the linear regression equations we can observe the dependence of ROS, ROA and ROE on some representative variables, chosen to describe the behavior of different components. The standardized regression coefficients (Beta) are used to compare the explanation power of each regression coefficient concerning the dependent variable behavior.
4. EMPIRICAL ANALYSIS
Two types of analysis – descriptive and quantitative - were performed and divided in three different sections. In Section A, descriptive statistics are shown. Quantitative analysis is divided in Sections B and C. In Section B Principal Component Analysis is used to extract the components. In Section C, having the
88 JOURNAL OF GLOBAL BUSINESS AND ECONOMICS
JULY 2012. VOLUME 5. NUMBER 1 representative variables selected, multiple regression analysis is used to assert which variables affect the company profitability the most as measured by ROS, ROA and ROE.
Section A – Descriptive Statistics
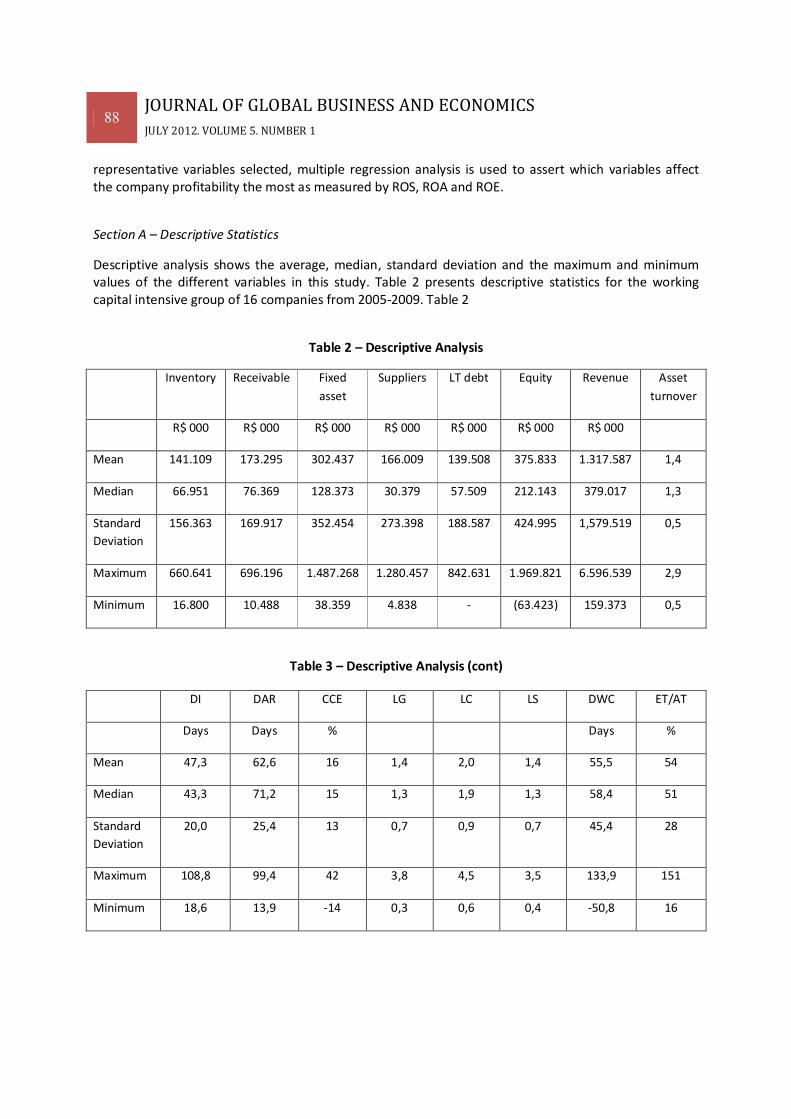
Descriptive analysis shows the average, median, standard deviation and the maximum and minimum values of the different variables in this study. Table 2 presents descriptive statistics for the working capital intensive group of 16 companies from 2005-2009. Table 2
Table 2 – Descriptive Analysis
Inventory Receivable Fixed
asset
Suppliers LT debt Equity Revenue Asset
turnover
R$ 000 R$ 000 R$ 000 R$ 000 R$ 000 R$ 000 R$ 000
Mean 141.109 173.295 302.437 166.009 139.508 375.833 1.317.587 1,4
Median 66.951 76.369 128.373 30.379 57.509 212.143 379.017 1,3
Standard
Deviation
156.363 169.917 352.454 273.398 188.587 424.995 1,579.519 0,5
Maximum 660.641 696.196 1.487.268 1.280.457 842.631 1.969.821 6.596.539 2,9
Minimum 16.800 10.488 38.359 4.838 - (63.423) 159.373 0,5
Table 3 – Descriptive Analysis (cont)
DI DAR CCE LG LC LS DWC ET/AT
Days Days % Days %
Mean 47,3 62,6 16 1,4 2,0 1,4 55,5 54
Median 43,3 71,2 15 1,3 1,9 1,3 58,4 51
Standard
Deviation
20,0 25,4 13 0,7 0,9 0,7 45,4 28
Maximum 108,8 99,4 42 3,8 4,5 3,5 133,9 151
Minimum 18,6 13,9 -14 0,3 0,6 0,4 -50,8 16
89 JOURNAL OF GLOBAL BUSINESS AND ECONOMICS
JULY 2012. VOLUME 5. NUMBER 1
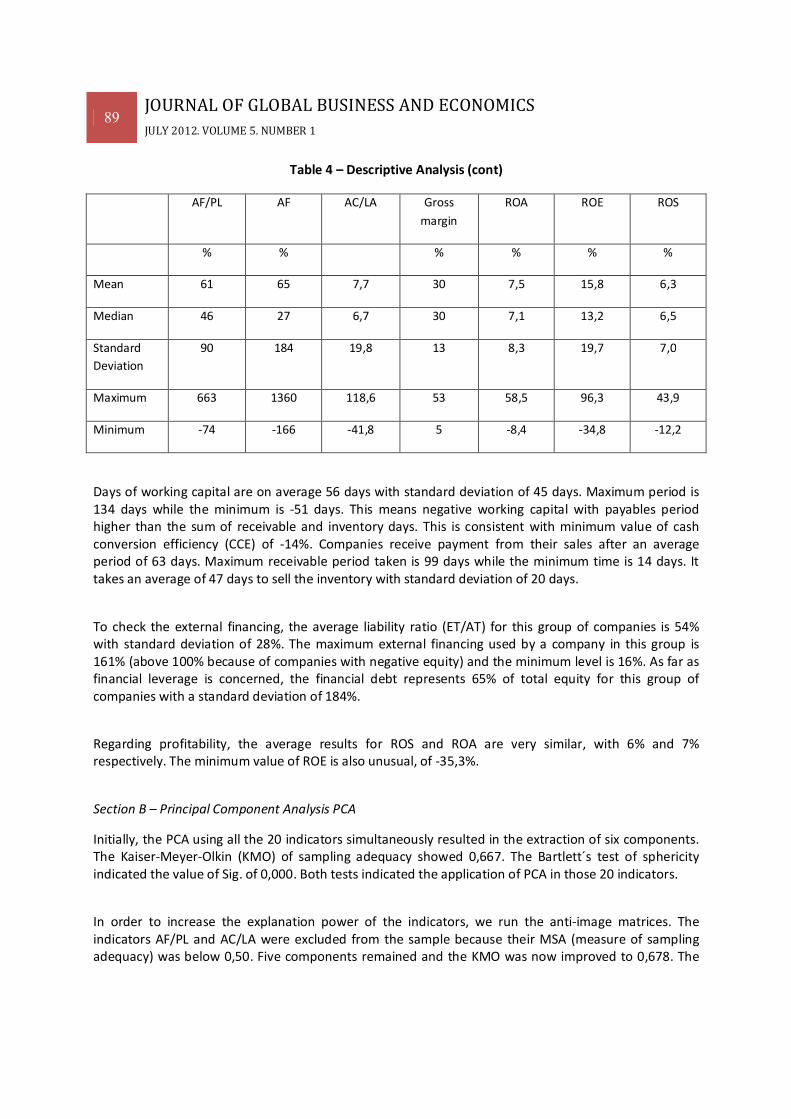
Table 4 – Descriptive Analysis (cont)
AF/PL AF AC/LA Gross
margin
ROA ROE ROS
% % % % % %
Mean 61 65 7,7 30 7,5 15,8 6,3
Median 46 27 6,7 30 7,1 13,2 6,5
Standard
Deviation
90 184 19,8 13 8,3 19,7 7,0
Maximum 663 1360 118,6 53 58,5 96,3 43,9
Minimum -74 -166 -41,8 5 -8,4 -34,8 -12,2
Days of working capital are on average 56 days with standard deviation of 45 days. Maximum period is 134 days while the minimum is -51 days. This means negative working capital with payables period higher than the sum of receivable and inventory days. This is consistent with minimum value of cash conversion efficiency (CCE) of -14%. Companies receive payment from their sales after an average period of 63 days. Maximum receivable period taken is 99 days while the minimum time is 14 days. It takes an average of 47 days to sell the inventory with standard deviation of 20 days.
To check the external financing, the average liability ratio (ET/AT) for this group of companies is 54% with standard deviation of 28%. The maximum external financing used by a company in this group is 161% (above 100% because of companies with negative equity) and the minimum level is 16%. As far as financial leverage is concerned, the financial debt represents 65% of total equity for this group of companies with a standard deviation of 184%.
Regarding profitability, the average results for ROS and ROA are very similar, with 6% and 7% respectively. The minimum value of ROE is also unusual, of -35,3%.
Section B – Principal Component Analysis PCA
Initially, the PCA using all the 20 indicators simultaneously resulted in the extraction of six components. The Kaiser-Meyer-Olkin (KMO) of sampling adequacy showed 0,667. The Bartlett´s test of sphericity indicated the value of Sig. of 0,000. Both tests indicated the application of PCA in those 20 indicators.
In order to increase the explanation power of the indicators, we run the anti-image matrices. The indicators AF/PL and AC/LA were excluded from the sample because their MSA (measure of sampling adequacy) was below 0,50. Five components remained and the KMO was now improved to 0,678. The
90 JOURNAL OF GLOBAL BUSINESS AND ECONOMICS
JULY 2012. VOLUME 5. NUMBER 1 matrix of communalities, which calculates the percentage of explained variability of each variable by PCA model, presented high percentage for all the indicators, being the lowest the indicator AF with 75,3%.
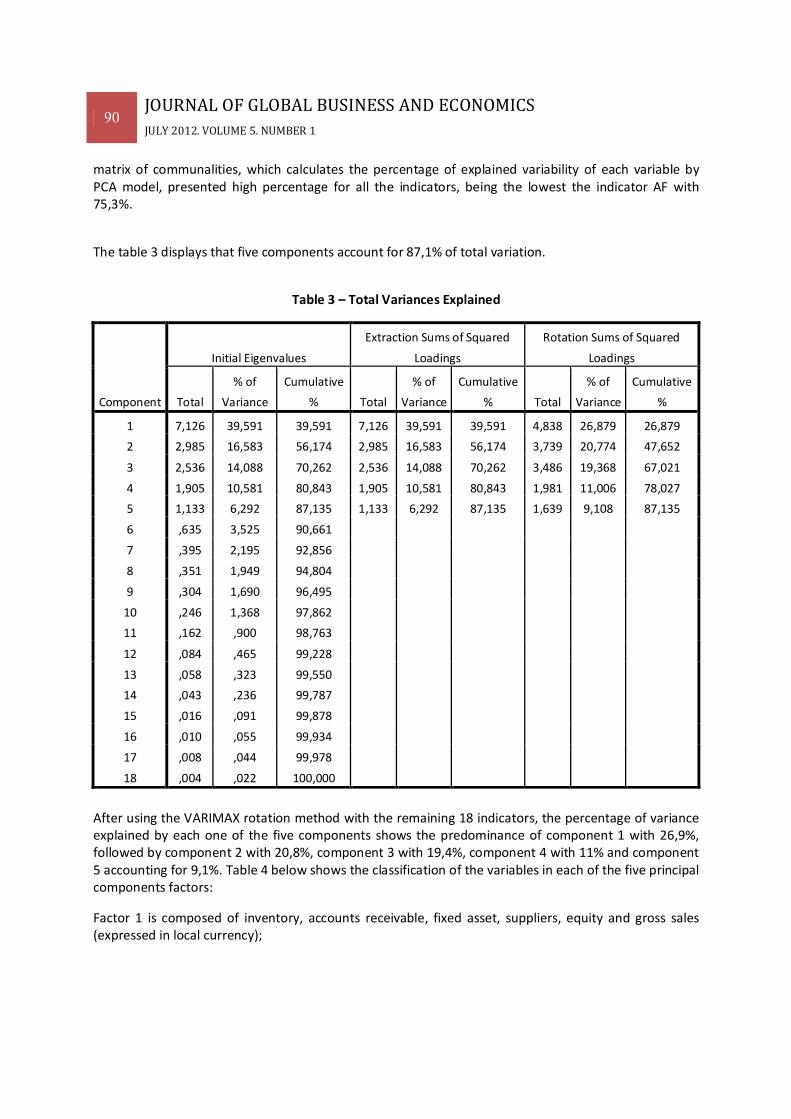
The table 3 displays that five components account for 87,1% of total variation.
Table 3 – Total Variances Explained
Component
Initial Eigenvalues
Extraction Sums of Squared
Loadings
Rotation Sums of Squared
Loadings
Total
% of
Variance
Cumulative
% Total
% of
Variance
Cumulative
% Total
% of
Variance
Cumulative
%
1 7,126 39,591 39,591 7,126 39,591 39,591 4,838 26,879 26,879
2 2,985 16,583 56,174 2,985 16,583 56,174 3,739 20,774 47,652
3 2,536 14,088 70,262 2,536 14,088 70,262 3,486 19,368 67,021
4 1,905 10,581 80,843 1,905 10,581 80,843 1,981 11,006 78,027
5 1,133 6,292 87,135 1,133 6,292 87,135 1,639 9,108 87,135
6 ,635 3,525 90,661
7 ,395 2,195 92,856
8 ,351 1,949 94,804
9 ,304 1,690 96,495
10 ,246 1,368 97,862
11 ,162 ,900 98,763
12 ,084 ,465 99,228
13 ,058 ,323 99,550
14 ,043 ,236 99,787
15 ,016 ,091 99,878
16 ,010 ,055 99,934
17 ,008 ,044 99,978
18 ,004 ,022 100,000
After using the VARIMAX rotation method with the remaining 18 indicators, the percentage of variance explained by each one of the five components shows the predominance of component 1 with 26,9%, followed by component 2 with 20,8%, component 3 with 19,4%, component 4 with 11% and component 5 accounting for 9,1%. Table 4 below shows the classification of the variables in each of the five principal components factors:
Factor 1 is composed of inventory, accounts receivable, fixed asset, suppliers, equity and gross sales (expressed in local currency);
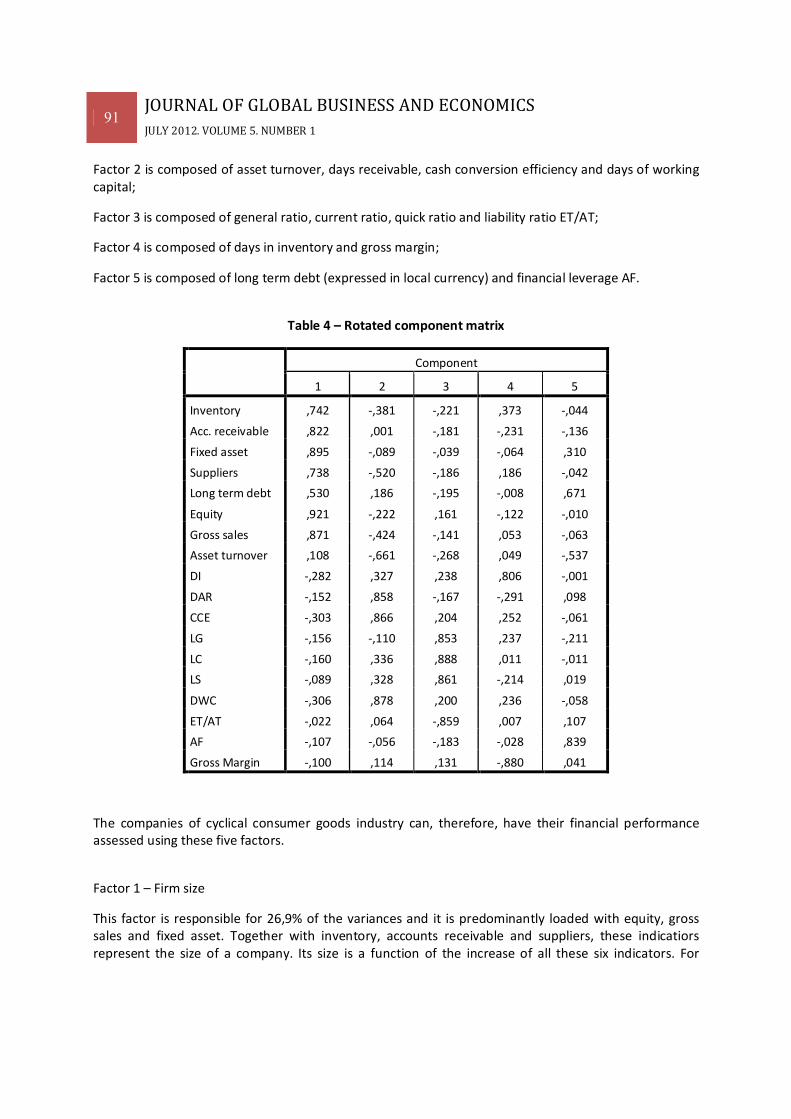
91 JOURNAL OF GLOBAL BUSINESS AND ECONOMICS
JULY 2012. VOLUME 5. NUMBER 1 Factor 2 is composed of asset turnover, days receivable, cash conversion efficiency and days of working capital;
Factor 3 is composed of general ratio, current ratio, quick ratio and liability ratio ET/AT;
Factor 4 is composed of days in inventory and gross margin;
Factor 5 is composed of long term debt (expressed in local currency) and financial leverage AF.
Table 4 – Rotated component matrix
Component
1 2 3 4 5
Inventory ,742 -,381 -,221 ,373 -,044
Acc. receivable ,822 ,001 -,181 -,231 -,136
Fixed asset ,895 -,089 -,039 -,064 ,310
Suppliers ,738 -,520 -,186 ,186 -,042
Long term debt ,530 ,186 -,195 -,008 ,671
Equity ,921 -,222 ,161 -,122 -,010
Gross sales ,871 -,424 -,141 ,053 -,063
Asset turnover ,108 -,661 -,268 ,049 -,537
DI -,282 ,327 ,238 ,806 -,001
DAR -,152 ,858 -,167 -,291 ,098
CCE -,303 ,866 ,204 ,252 -,061
LG -,156 -,110 ,853 ,237 -,211
LC -,160 ,336 ,888 ,011 -,011
LS -,089 ,328 ,861 -,214 ,019
DWC -,306 ,878 ,200 ,236 -,058
ET/AT -,022 ,064 -,859 ,007 ,107
AF -,107 -,056 -,183 -,028 ,839
Gross Margin -,100 ,114 ,131 -,880 ,041
The companies of cyclical consumer goods industry can, therefore, have their financial performance assessed using these five factors.
Factor 1 – Firm size
This factor is responsible for 26,9% of the variances and it is predominantly loaded with equity, gross sales and fixed asset. Together with inventory, accounts receivable and suppliers, these indicatiors represent the size of a company. Its size is a function of the increase of all these six indicators. For
92 JOURNAL OF GLOBAL BUSINESS AND ECONOMICS
JULY 2012. VOLUME 5. NUMBER 1 instance, to increase gross sales, the company needs to invest in fixed assets to process more inventory, grants more credit to clients, be granted with more credit from the suppliers and raises equity capital in order to buy new machinery. This finding is echoed somehow with Chun, Xinohen and Kai (2011) and Lixin and Shuxia (2010) as they called this factor as enterprise scale and operational capacity respectively. Chun, Xinohen and Kai advogate that when the enterprises expand their scale, they must improve the asset management capabilities and enhance profitability. Ozgulbas, Kayuncugil and Yilmaz (2006) concluded in their study that firm size can be an important determinant for firm performance and having larger size affects positively financial performance.
Factor 2 – Working capital management
The second factor is related to the working capital management and represents 20,8% of the variances. It gives high positive weightings to days of working capital, cash conversion efficiency and days receivable and negative weighting to asset turnover. This factor reflects the ability of a company to create income by making use of assets. The financial performance of a company can deteriorate due to the credit/collection policy and cash cycle (ie, days of working capital). The higher the days receivable, the higher the cash cycle and the cash conversion efficiency. On the other hand, asset turnover gets worse (negative value in the rotated component matrix) because the amount of the asset increases more proportionally than sales. Total asset turnover was found to be significant in three studies, in spite of being loaded in different factors. Ran and Zhang (2011) loaded it in the solvency factor, Das (2009) loaded it in activity while Chun, Xinohen and Kai (2011) in profit. Lixin and Shuxia (2010) found receivables to be significantly related to operational capacity factor. The remaining two indicators were not part of the set of indicators in earlier studies.
Factor 3 – Solvency
The third factor has principal loadings with current ratio, quick ratio, general ratio and liability ratio. It is denominated solvency because the indicators demonstrate the financial situation of the company and its ability to pay the current liabilities. This is in line with earlier studies of Ran and Zhang (2011), Lixin and Shuxia (2010) and Zeting and Liping (2011). These three indicators were found to be significant for all of them. Through the liability ratio ET/AT we can identify the proportion of total asset financed by liability. Since this variable has negative value, the better the levels of liquidity, the lower the liabilities proportion financing the assets. This factor explains 19,4% of total variance.
Factor 4 – Margin
The indicators showing strong correlation to this factor are gross margin percentage (negative) and days in inventory (positive) and explain 11% of total variance. Gross margin appears with negative value in the rotated component matrix and it suggests a reduction in the margin when the company increases the days in inventory. The days in inventory increase when the company produces more than sells, thus, accumulating fixed cost in the inventory and increasing cost of goods sold when the inventory is sold. Two of the earlier studies considered gross margin percentage to be significantly important; Das (2009) loaded it under profitability factor and Ran and Zhang (2011) loaded it under capital management factor. For them, the gross margin can indicate how, and to what extent, the capital can be controlled
93 JOURNAL OF GLOBAL BUSINESS AND ECONOMICS
JULY 2012. VOLUME 5. NUMBER 1 and well managed. Inventory turnover was found to be significant in only one study (Chun, Xinohen and Kai, 2011) and it was loaded under profit factor.
Factor 5 – Financial debt
The indicator with highest correlation with this factor is financial leverage. This factor represents the ability of a company to grow using external debt. It accounts for 9,1% of total variance and indicates the level of dependence of the company in relation to financial debt. The bigger the long term debt, the higher the financial leverage. Only one study (Das, 2009) considered financial leverage to be significant and correlated to capital structure. Other authors did not consider financial debt indicators as part of the set of indicators in their studies. Some authors used asset liability ratio but this is quite different because it considers the whole third capital amount (suppliers and payables included) and not only financial debt.
The results at this stage can help the enterprises to better evaluate their financial performance. They address the first objective of this study, ie, to identify factors and related indicators that impact corporate financial performance. However there is one critical issue not yet addressed. How do the factors chosen affect the corporate profitability?
The other earlier studies discussed in the literature review section were concerned on understanding the determinants of financial performance and/or evaluating the financial competitiveness of a given industry. Our study goes one stage further. We can now move to address our second objective, ie, to determine the indicators that most affect profitability.
Section C – Multiple Regression Analysis MRA
We have now selected the indicator in table 4 with the highest loading in each of the five component factors to represent them, in a multiple regression analysis, and explain their relationship with profitability. This was the reason why the profitability indicators were not included in the PCA so as to avoid interference with the independent variables selection.
These indicators are:
Factor 1 – Equity (PL)
Factor 2 – Days of working capital (DWC)
Factor 3 – Current liquidity (LC)
Factor 5 – Gross margin (Mgb)
Factor 5 – Financial leverage (AF)
94 JOURNAL OF GLOBAL BUSINESS AND ECONOMICS
JULY 2012. VOLUME 5. NUMBER 1 We have utilized as proxy of profitability the indicators ROS, ROA and ROE as mentioned in section 3. A backward stepwise approach for regression, together with Anova, was applied. Using this methodology, we have excluded those indicators that do not affect ROS, ROA or ROE. This analysis is used to determine which variables have significant effect on corporate profitability.
Part A: MRA for ROS
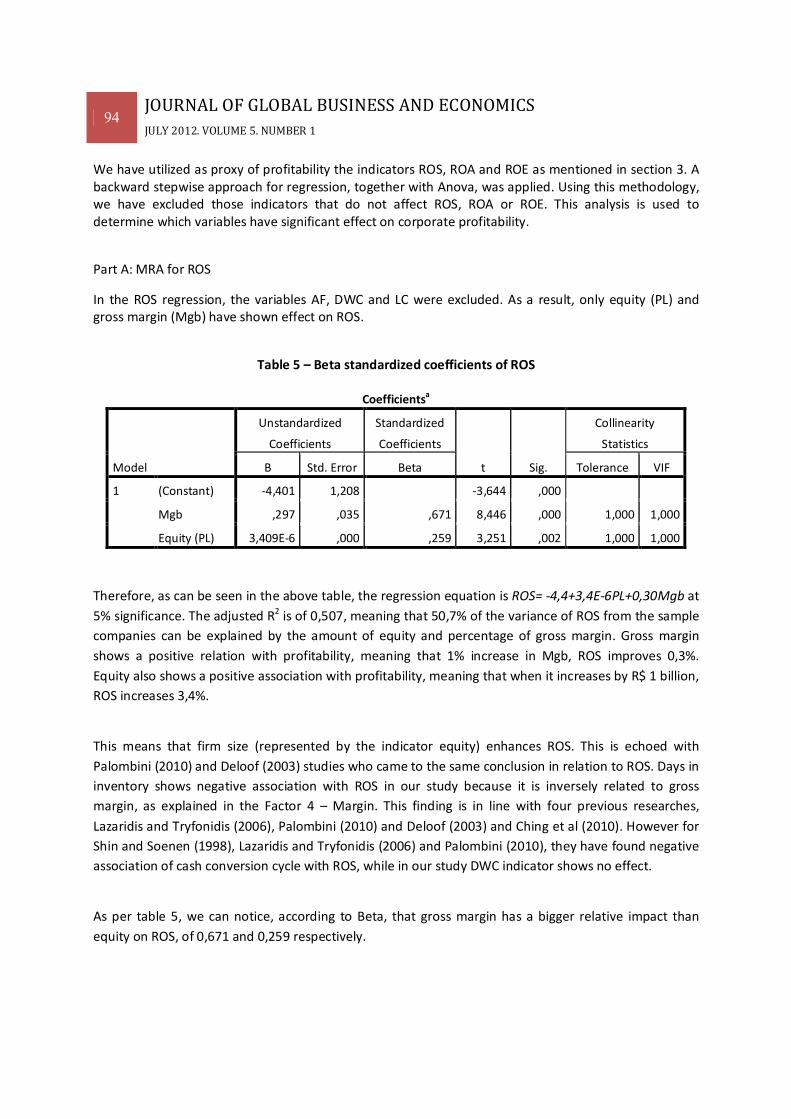
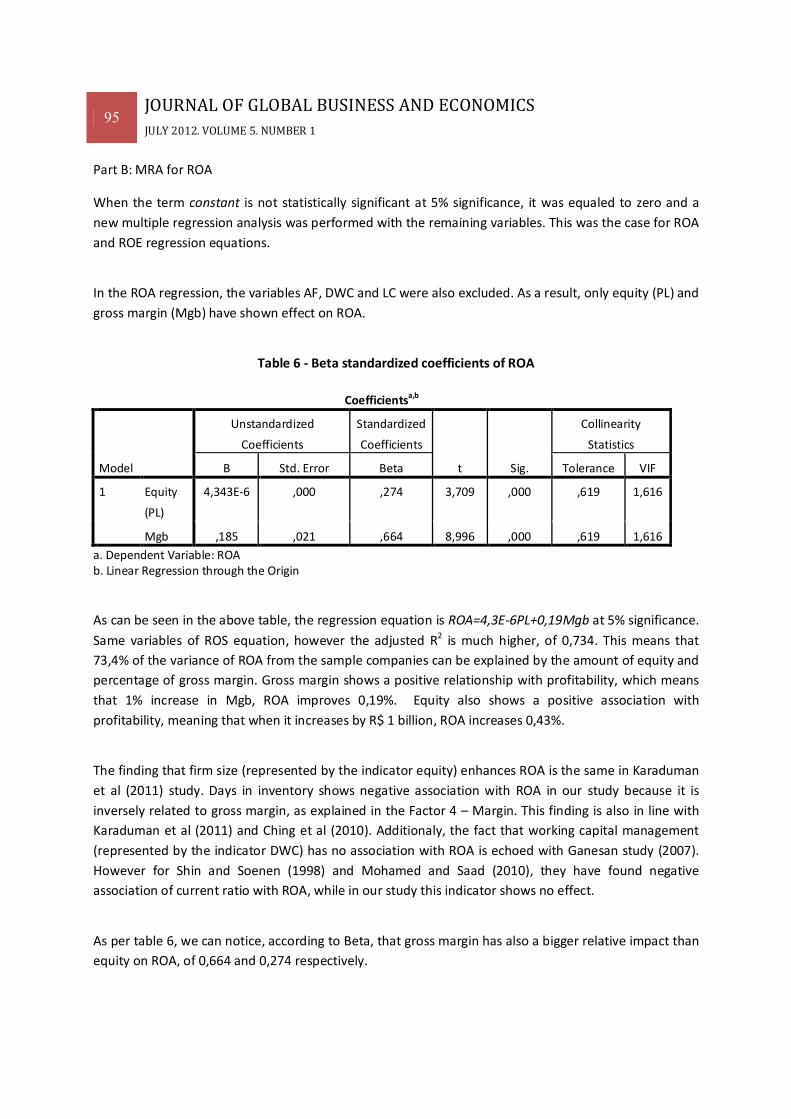
In the ROS regression, the variables AF, DWC and LC were excluded. As a result, only equity (PL) and gross margin (Mgb) have shown effect on ROS.
Table 5 – Beta standardized coefficients of ROS
Coefficientsa
Model
Unstandardized
Coefficients
Standardized
Coefficients
t Sig.
Collinearity
Statistics
B Std. Error Beta Tolerance VIF
1 (Constant) -4,401 1,208 -3,644 ,000
Mgb ,297 ,035 ,671 8,446 ,000 1,000 1,000
Equity (PL) 3,409E-6 ,000 ,259 3,251 ,002 1,000 1,000
Therefore, as can be seen in the above table, the regression equation is ROS= -4,4+3,4E-6PL+0,30Mgb at
5% significance. The adjusted R2 is of 0,507, meaning that 50,7% of the variance of ROS from the sample
companies can be explained by the amount of equity and percentage of gross margin. Gross margin
shows a positive relation with profitability, meaning that 1% increase in Mgb, ROS improves 0,3%.
Equity also shows a positive association with profitability, meaning that when it increases by R$ 1 billion,
ROS increases 3,4%.
This means that firm size (represented by the indicator equity) enhances ROS. This is echoed with
Palombini (2010) and Deloof (2003) studies who came to the same conclusion in relation to ROS. Days in
inventory shows negative association with ROS in our study because it is inversely related to gross
margin, as explained in the Factor 4 – Margin. This finding is in line with four previous researches,
Lazaridis and Tryfonidis (2006), Palombini (2010) and Deloof (2003) and Ching et al (2010). However for
Shin and Soenen (1998), Lazaridis and Tryfonidis (2006) and Palombini (2010), they have found negative
association of cash conversion cycle with ROS, while in our study DWC indicator shows no effect.
As per table 5, we can notice, according to Beta, that gross margin has a bigger relative impact than
equity on ROS, of 0,671 and 0,259 respectively.
95 JOURNAL OF GLOBAL BUSINESS AND ECONOMICS
JULY 2012. VOLUME 5. NUMBER 1 Part B: MRA for ROA
When the term constant is not statistically significant at 5% significance, it was equaled to zero and a
new multiple regression analysis was performed with the remaining variables. This was the case for ROA
and ROE regression equations.
In the ROA regression, the variables AF, DWC and LC were also excluded. As a result, only equity (PL) and
gross margin (Mgb) have shown effect on ROA.
Table 6 - Beta standardized coefficients of ROA
Coefficientsa,b
Model
Unstandardized
Coefficients
Standardized
Coefficients
t Sig.
Collinearity
Statistics
B Std. Error Beta Tolerance VIF
1 Equity
(PL)
4,343E-6 ,000 ,274 3,709 ,000 ,619 1,616
Mgb ,185 ,021 ,664 8,996 ,000 ,619 1,616
a. Dependent Variable: ROA b. Linear Regression through the Origin
As can be seen in the above table, the regression equation is ROA=4,3E-6PL+0,19Mgb at 5% significance.
Same variables of ROS equation, however the adjusted R2 is much higher, of 0,734. This means that
73,4% of the variance of ROA from the sample companies can be explained by the amount of equity and
percentage of gross margin. Gross margin shows a positive relationship with profitability, which means
that 1% increase in Mgb, ROA improves 0,19%. Equity also shows a positive association with
profitability, meaning that when it increases by R$ 1 billion, ROA increases 0,43%.
The finding that firm size (represented by the indicator equity) enhances ROA is the same in Karaduman
et al (2011) study. Days in inventory shows negative association with ROA in our study because it is
inversely related to gross margin, as explained in the Factor 4 – Margin. This finding is also in line with
Karaduman et al (2011) and Ching et al (2010). Additionaly, the fact that working capital management
(represented by the indicator DWC) has no association with ROA is echoed with Ganesan study (2007).
However for Shin and Soenen (1998) and Mohamed and Saad (2010), they have found negative
association of current ratio with ROA, while in our study this indicator shows no effect.
As per table 6, we can notice, according to Beta, that gross margin has also a bigger relative impact than
equity on ROA, of 0,664 and 0,274 respectively.
96 JOURNAL OF GLOBAL BUSINESS AND ECONOMICS
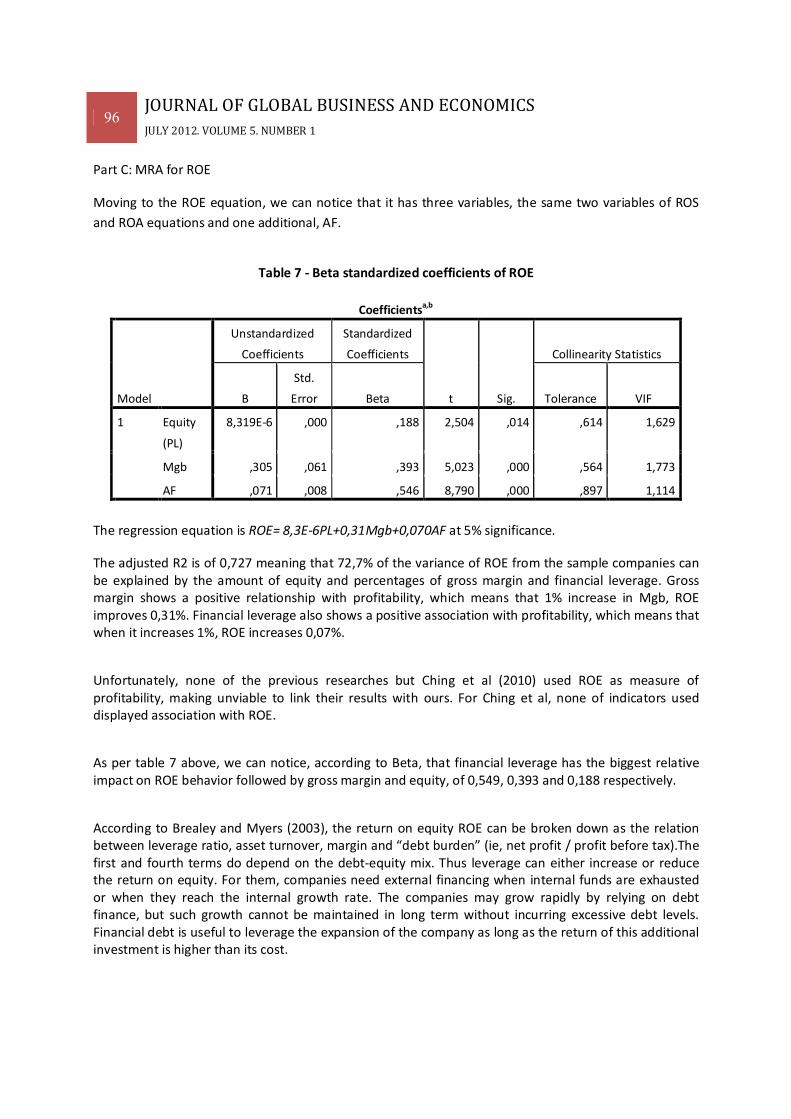
JULY 2012. VOLUME 5. NUMBER 1 Part C: MRA for ROE
Moving to the ROE equation, we can notice that it has three variables, the same two variables of ROS
and ROA equations and one additional, AF.
Table 7 - Beta standardized coefficients of ROE
Coefficientsa,b
Model
Unstandardized
Coefficients
Standardized
Coefficients
t Sig.
Collinearity Statistics
B
Std.
Error Beta Tolerance VIF
1 Equity
(PL)
8,319E-6 ,000 ,188 2,504 ,014 ,614 1,629
Mgb ,305 ,061 ,393 5,023 ,000 ,564 1,773
AF ,071 ,008 ,546 8,790 ,000 ,897 1,114
The regression equation is ROE= 8,3E-6PL+0,31Mgb+0,070AF at 5% significance.
The adjusted R2 is of 0,727 meaning that 72,7% of the variance of ROE from the sample companies can be explained by the amount of equity and percentages of gross margin and financial leverage. Gross margin shows a positive relationship with profitability, which means that 1% increase in Mgb, ROE improves 0,31%. Financial leverage also shows a positive association with profitability, which means that when it increases 1%, ROE increases 0,07%.
Unfortunately, none of the previous researches but Ching et al (2010) used ROE as measure of profitability, making unviable to link their results with ours. For Ching et al, none of indicators used displayed association with ROE.
As per table 7 above, we can notice, according to Beta, that financial leverage has the biggest relative impact on ROE behavior followed by gross margin and equity, of 0,549, 0,393 and 0,188 respectively.
According to Brealey and Myers (2003), the return on equity ROE can be broken down as the relation between leverage ratio, asset turnover, margin and “debt burden” (ie, net profit / profit before tax).The first and fourth terms do depend on the debt-equity mix. Thus leverage can either increase or reduce the return on equity. For them, companies need external financing when internal funds are exhausted or when they reach the internal growth rate. The companies may grow rapidly by relying on debt finance, but such growth cannot be maintained in long term without incurring excessive debt levels. Financial debt is useful to leverage the expansion of the company as long as the return of this additional investment is higher than its cost.
97 JOURNAL OF GLOBAL BUSINESS AND ECONOMICS
JULY 2012. VOLUME 5. NUMBER 1 5. CONCLUSIONS
The objectives of this study are twofold: a) identify the factors and correlated indicators that impact corporate financial performance; b) determine the indicators that most affect profitability. The analysis of the 16 Brazilian listed companies for the period 2005-2009 allowed identifying the existence of five factors that impact their financial performance. These factors were firm size, working capital management, liquidity, margin and financial debt. The firm size factor is the most predominant accounting for 26,9% of total variance, while the financial debt is the least important one, which accounts for 9,1%.
Through the Principal Component Analysis, the indicators that form one specific factor must be highly correlated amongst themselves and weakly correlated with those indicators that form another component. This makes us perceive the influence of one indicator over the other and the impact as consequence of such factors on the company´s performance. The correlation amongst the indicators in each factor was explained in Principal Component Analysis in the empirical analysis section. The indicator with the biggest component loading in each factor was then chosen to be its representative in the Multiple Regression Analysis.
Percentage of gross margin and the amount of equity (firm size) account for 50,7% of the variances of ROS. These same indicators account for 73,4% of ROA variance. As far as ROE variance is concerned, these same indicators together with financial leverage account for 72,7%. These findings contrast with those presented in the literature review section. Days of working capital presents negative relationship with ROS and ROA while our study proves no association with any of the three measures of profitability. The same occurred with current ratio. This indicator has negative relationship with ROA and ROS for some of the authors. However, in our study it proves no association whatsoever. As far as leverage is concerned, our finding shows positive relationship with profitability, contrary to some of the authors. Firm size proves to be very significant in our study for performance evaluation as well as impacting positively on profitability and is echoed with other studies (represented by sales, total asset or fixed asset) Finally, two different aspects in our study when compared with earlier studies: gross margin percentage was not used as a variable and it shows a large positive impact on ROS, ROA and ROE and ROE indicator was not used also as measure of profitability.
Regarding our objectives, we can confirm the existence of five factors and their correlated indicators that impact corporate financial performance. Percentage of gross margin and the amount of equity are the indicators that affect positively profitability, while financial leverage affects positively only ROE.
This study used only financial data as determinants of financial performance and did not consider nonfinancial or operational explanatory factors. It is restricted to the companies from the cyclical consumer goods industry whose current asset is greater than 50% of total asset. However, the findings can provide experience sharing for other industries and also for cyclical consumer goods industry in other countries, which can be of interest to international audience of academics and business managers. Suggestion for future research is to apply the same research for the companies with non-current asset greater than 50% of total asset and check whether the conclusions are different. The originality of this study was to combine both techniques: the use of PCA to identify the most relevant indicator in each
98 JOURNAL OF GLOBAL BUSINESS AND ECONOMICS
JULY 2012. VOLUME 5. NUMBER 1 factor followed by a MRA, using selected variables as factors representatives, to assert which indicators affect the corporate profitability the most.
REFERENCES
Abraham, R. (1999). Emotional dissonance in organizations: conceptualizing the roles of self-esteem and job-induced tension, Leadership & Organization Development Journal, 20(1), 18-25.
ALTMAN, E.I. (1968). Financial ratios, Discriminant Analysis and the prediction of corporate bankruptcy.
Journal of Finance, Vol. 23, No. 4, September, pp. 589-609. BEAVER, W. (1966). Financial ratios as predictors of failure: empirical search in accounting: selected
studies. Journal of Accounting Research, No.4, January, pp.71-111. BREALEY, R. A.; MYERS, S. C. (2003). Principles of corporate finance.7th ed. Boston: McGraw-Hill. CAPON, N.; FARLEY, J.U.; HOENING, S. (1990). Determinants of financial performance: a meta-analysis.
Management Science. Vol.36, No. 10, pp. 1143-1159. CHEN, K.H.; SHIMERDA, T.A. (1981). An empirical analysis of useful and financial ratios. Financial
Management. Vol.10, No. 1, Spring, pp. 51-60 CHING, H.Y.; NOVAZZI, A.; FERAB, F. (2010). Relationship between working capital management and
profitability in Brazilian listed companies. Journal of Global Business and Economics. Vol.3, No. 1, pp.74-86.
CHUN, C.; XINOHENG, L.; KAI, W. A (2011). Research on Chinese automobile enterprise competitiveness
based on factor analysis. 6th International Conference on Product Innovation Management (ICPIM) 2011. Available on http://ieeexplore.ieee.org/stamp/stamp.jsp?tp=&arnumber=5983729. Access on October 15, 2011.
DAMODARAN, A. (1996). Investment valuation: tools and techniques for determining the value of any
asset. New York: John Wiley. DAS, D. (2009). Factor analysis of financial and operational performance measures of non-profit
hospitals. Journal Health Care Finance. Vol. 36 No 2, pp. 13-23. DELOOF, M. (2003). Does Working Capital Management affect profitability of Belgian Firms? Journal of
Business Finance & Accounting, Vol.3 No 3-4, pp 573-587. DELOITTE TOUCHE TOHMATSU. (2007). “As pequenas e médias empresas que mais crescem no Brasil”,
Brazil. DELOITTE. (2011). “CFO Signals Q1 2011”. Deloitte Development LLC. United Sates.
99 JOURNAL OF GLOBAL BUSINESS AND ECONOMICS
JULY 2012. VOLUME 5. NUMBER 1 FENG, C-M.; WANG, R-T. (2000). Performance evaluation for airlines including the consideration of
financial ratios. Journal of Air Transport Management. Vol. 6, pp.133-142. GANESAN, V (2007). An Analysis of working capital management efficiency in telecommunication
equipment industry. River Academic Journal, Vol. 3 No 2. HAIR, J.F.; TATHAM, R.L.; ANDERSON, R.E.; BLACK, W. (1998). Multivariate Data Analysis. 5th ed. Prentice
Hall. KANITZ, S.C. (1976). “Indicadores contábeis e financeiros de previsão de insolvência: a experiência da
pequena e média empresa brasileira”. Tese de Livre Docência. Faculdade de Economia, Administração e Contabilidade, São Paulo University, S Paulo.
KARADUMAN, H.A.; AKBAS, H.E.; CALISKAN, A.O.; DURER, S. (2011). The relationship between working
capital management and profitability: Evidence from an emerging market. International Research Journal of Finance and Economics, Issue 62, February, pp. 61-67.
KOYUNCUGIL, A.S. ; OZGULBAS, N.; (2006). The Business Review, Cambridge.. Vol 5. No 2. Summer. LAZARIDIS, J.; TRYFONIDIS, D (2006). Relationship between working capital management and
profitability of listed companies in the Athens Stock Exchange. Journal of Financial Management and Analysis. Vol. 19 (1), pp. 26-35.
LIXIN, D.; SHUXIA, W. (2010). Financial competitiveness evaluation of Chinese listed companies of
electrical equipment section. Logistics Engineering and Intelligent Transportation Systems (LEITS), 2010 International Conference.
MOHAMAD, N.E.A.B.; SAAD, N.B.M. (2010). Working Capital Management: the effect of market
valuation and profitability in Malaysia. International Journal of Business and Management. Toronto: Vol..5, No. 11, Nov, pp.140-148.
OZGULBAS, N.; KOYUNCUGIL, A.S. (2006). The Business Review, Cambridge.. Vol 6. No 1. Dec. PALOMBINI, N. (2010). “Gestão do capital de giro: impacto sobre a rentabilidade da empresa e seus
determinantes”. Master of Science Dissertation in Business.UniversidadePresbiteriana Mackenzie. São Paulo.
RAN, F.; ZHANG. X. (2011). Financial competitiveness evaluation on sporting goods listed enterprises.
African Journal of Business Management. Vol.5 (17), pp.7404-7409. SHIN, H. H.; SOENEN, L (1998). Efficiency of working capital management and corporate profitability.
Financial Practice and Education. Vol.8 No 2, pp 37-45. ZETING, L.; LIPING, L. (2011). Comparative Studies on financial competitiveness in fertilizer
manufacturing listed companies of China. International Conference on Management and Service Science, MASS 2011.