Culture media - serum, serum free media, cell cytototoxicity & viability
Upload
khangminh22Category
view
1download
0
he
ma
to
lo
gy
re
po
rt
s —
vo
lu
me
2,
20
10
—
su
pp
le
me
nt
26th International Symposium on
Clinical Applications ofSerum Free Light Chain Analysis (plus Hevylite)
Bath, UK, 23-24 September 2010
Guest Editor: A.R. Bradwell
MKG585

HEMATOLOGY REPORTS
ISSN 2038-8322 - eISSN 2038-8330
Editor-in-ChiefGiovanni Martinelli, Italy
Deputy EditorFrancesca Palandri, Italy
Editorial BoardGiuliana Alimena, ItalyLuca Arcaini, ItalyDavid Dingli, USAMuller Fabbri, USAMario Federico, USAFrancesca Gualandi, ItalyJean-Luc Harousseau, FranceKarl-Anton Kreuzer, GermanyDelong Liu, USAHans E. Johnsen, DenmarkTaira Maekawa, JapanLuca Malcovati, ItalyAnne F. McGettrick, IrelandRuben Mesa, USAMarkus Raderer, AustriaManuela Schmidinger, AustriaEvangelos Terpos, GreeceElisabeth Walsby, UK
Editorial StaffNicole Pezzolo, Managing EditorCristiana Poggi, Production EditorAnne Freckleton, Copy EditorJeanette Mitchell, Copy EditorFilippo Lossani, Technical Support
HEMATOLOGY REPORTSis published by PAGEPress Publications.
The journal is completely free online at www.pagepress.org/hrPublishing costs are offset by a publication fee charged to authors.
For more information and manuscript submission:
www.pagepress.org/hr
Copyright InformationAll works published in PAGEPress journals are subject to the terms
of the Creative Commons Attribution License (http:⁄⁄creativecommons.org/licenses/by-nc/3.0) unless otherwise noted.
Copyright is retained by the authors.Any non-commercial reuse is permitted if the original author and source are credited.
CorrespondenceOur publishing offices are located
in via Giuseppe Belli 4, 27100 Pavia, Italy. Our telephone number is +39.0382.1751762 and our fax number is +39.0382.1750481.
E-mail: [email protected]
All PAGEPress journals are Open Access.PAGEPress articles are freely available online and deposited
in a public archive immediately upon publication.
6th International Symposium on Clinical Applications of Serum
Free Light Chain Analysis (plus Hevylite)
Bath, United Kingdom, 23-24 September 2010
Guest EditorsA.R. Bradwell
Oral Communications
Review Lectures...........................................................................................................................1
Free Light Chains (FLCs) and the kidney .....................................................................................4
Diseases associated with monoclonal free light chains ...............................................................7
Diseases associated with elevated polyclonal free light chains – I ............................................11
Diseases associated with elevated polyclonal free light chains – II ...........................................14
Hevylite......................................................................................................................................16
Posters
Free light chain assay evaluations and analytical issues ...........................................................22
Free light chains in diagnosis and prognosis .............................................................................28
Free light chains and disease monitoring ..................................................................................33
Free light chains in renal and other diseases ............................................................................40
Free light chains and non-plasma cell disorders .......................................................................44
Heavy chain/light chain analysis at diagnosis and comparison with electrophoresis ................50
Heavy chain/light chain analysis for patient monitoring and prognosis.....................................56
Index of authors...........................................................................................................................a

REVIEW LECTURES
THE MONOCLONAL PROTEINS: A BRIEF HISTORYR.A. Kyle
Mayo Clinic, Rochester, MN, USA
Less than a decade after the introduction of the term “pro-tein,” Thomas Alexander McBean, 44 years of age and ahighly respectable grocer of temperate habits and exem-plary conduct, developed easy fatigue. He took a vacationin the country in September, 1844 to regain his strength,but while vaulting out of an underground cavern, he deve-loped sudden pain in his chest. He was treated with astrengthening plaster to the chest because movement pro-duced pain. He was subsequently treated by the removalof a pound of blood and the application of leeches. Mr.McBean was seen in consultation on October 30, 1845,by Dr. William Macintyre, a 53-year-old Harley Streetconsultant, and, because of mild edema Macintyre perso-nally examined the urine. The specimen was acidic andhad a specific gravity of 1.035. When heated it becameopaque and cleared with boiling, but the precipitate reap-peared when it cooled. He sent a sample of the urine toHenry Bence Jones, a 31-year-old physician at St.George’s Hospital, who had already established a reputa-tion as a chemical pathologist. Jones calculated that thepatient excreted more than 60 g/day and concluded thatthe protein was “hydrated deuteroxide of albumen.”Although Macintyre described the heat properties of theurine, Jones emphasized its place in the diagnosis of mye-loma, for he said “I need hardly remark on the importan-ce of seeking for this oxide of albumen in other cases ofmollities ossium (softening of the bone).” In 1846,Johann F. Heller, an Austrian chemist, described a proteinin the urine that precipitated when warmed a little above50˚ C and then disappeared on further heating, but did notrecognize the precipitation of the protein when the urinecooled. The term Bence Jones protein was first used in1880 by Fleischer. It was recognized in Dr. Loos, thefamous patient of Otto Kahler. Bradshaw, in 1898, repor-ted that meals had little or no effect on the amount ofBence Jones proteinuria and that there was no nocturnalvariation. Bence Jones proteinuria was found in the bloodin 1917 by Jacobson who postulated that the Bence Jonesprotein was “dammed back” in the bloodstream becauseof renal failure. Five years after the discovery of BenceJones protein in the blood, Stanhope Bayne-Jones andD.W. Wilson immunized rabbits by intravenous injectionof Bence Jones protein. Two distinct groups of antibodieswere recognized and designated, group I and group II.Korngold and Lipari in 1956 rediscovered the two classesof Bence Jones protein and noted that they also reactedwith myeloma proteins. As a tribute to Korngold andLipari, the two classes of Bence Jones protein were desi-gnated as kappa and lambda. Putnam and Hardy found
that Bence Jones protein was rapidly excreted and theythought that it came from the nitrogen pool rather thanfrom a plasma or tissue protein precursor. One hundredseventeen years after the description of the unique heatproperties by Macintyre, Edelman and Gally showed thatthe light chains prepared from an IgG monoclonal proteinand the Bence Jones protein from the same patient’s urinewere virtually identical. Hilschmann and Craig showedthat each light chain was divided into a variable or Vregion and a constant or C region. Hyperproteinemia wasnot recognized until 1928 when Perlzweig et al. describeda patient with multiple myeloma who had 9-11 g/dL ofglobulin in the serum. Arne Tiselius became TheodorSvedberg’s research assistant in 1925 and began his elec-trophoretic studies of proteins. Svedberg had realized thatcolloids could be studied not only with ultracentrifuga-tion but through migration in an electric field, i.e., elec-trophoresis. Svedberg had noted that light rays were bentwhen they passed through a concentration gradient. Thisrefractive index was used to identify the protein bounda-ries in a U-tube. Tiselius received his doctorate degree bydescribing the moving boundary method for investigationof electrophoresis of proteins in 1930. His manuscriptdescribing the apparatus for electrophoresis was rejectedby the Biochemical Journal and was subsequently publi-shed in the Transactions of the Faraday Society in 1937.That same year, he described the separation of serum glo-bulins into three components which he designated asalpha, beta, and gamma. Tiselius and Kabat then localizedantibody activity to the gamma globulin fraction of pla-sma proteins. Longsworth applied electrophoresis to thestudy of multiple myeloma and demonstrated the tall, nar-row-based peak. However, the Tiselius U-tube apparatuswas cumbersome and difficult to use. The original com-mercial models were 20 feet long and 5 feet high. A sin-gle electrophoretic run required a full day and the effortsof an experienced operator. Immunoelectrophoresis wasreported in 1953 and immunofixation 11 years later. Theconcept of monoclonal and polyclonal gammopathieswas presented in the Harvey Lecture series by JanWaldenström in 1961. Monoclonal proteins were charac-terized by the presence of a tall, narrow based spike.Although many of these patients had multiple myelomaor macroglobulinemia, others had no evidence of mali-gnancy and were considered as having ‘essential hyper-gammaglobinemia” or “benign monoclonal gammopa-thy”. The term monoclonal gammopathy of undeterminedsignificance (MGUS) was introduced in 1978 because insome of these patients multiple myeloma, macroglobuli-nemia, AL amyloidosis or a related disorder developedduring long-term follow-up. Waldenström regarded thebroad band in hypergammaglobulinemia as a polyclonalincrease in proteins. This simple distinction is extremelyimportant because patients with a monoclonal gammopa-thy either have a malignant process (multiple myeloma,etc.,) or may develop a neoplastic process whereaspatients with a polyclonal gammopathy have an inflam-
ORAL COMMUNICATIONS
6th International Symposium on Clinical Applications of Serum Free Light Chain Analysis (plus Hevylite)Bath, United Kingdom, 23-24 September 2010
Hematology Reports 2010; 2 (s2) | 1 |
matory or reactive cause of their hypergammaglobuline-mia. Free light chains (FLC) were separated from theserum in 1975 using column chromatography, but wasimpractical for routine use. In 2001, immunoassays,based on polyclonal antibodies, were developed thatcould measure kappa and lambda FLCs in normal serum.The FLC assay is most useful when following a patientwith no measurable M-protein in serum and urine. It alsoplays a role in screening for an M-protein and for risk ofprogression of MGUS, smoldering multiple myeloma orsolitary plasmacytoma of bone. It is of prognostic impor-tance in multiple myeloma and AL amyloidosis.
SERUM FREE LIGHT CHAIN (SFLC) GUIDELINESFOR MONOCLONAL GAMMOPATHIESB.G.M. Durie
MD Cedars-Sinai Cancer Center, Los Angeles, CA, USA
The widespread availability of sFLC testing has allowedassessment of sFLC results in a broad range of diseasesettings. The sFLC results are part of the risk stratifica-tion for both MGUS and smoldering myeloma.Identification of high risk smoldering myeloma has beco-me especially important because of new intervention stra-tegies with, for example, Lenalidomide therapy. It is par-ticularly important to identify patients at risk of progres-sion within the first 18-24 months. For patients withnewly diagnosed active myeloma, sFLC can be used as abaseline stratification factor. For the subset of patientswith non-secretory or hyposecretory disease, the availabi-lity of sFLC testing has allowed entry into frontline ran-domized trials as well as into new drug trials forrelapse/refractory disease. Patients with light chain mye-loma, systemic amyloidosis and light chain depositiondiseases are particularly amenable to assessment usingsFLC. Several studies now address the comparisons bet-ween sFLC measurements and urine M-component quan-titation. The occurrence and significance of elevatedsFLC at relapse is also being assessed in part because ofthe apparent more frequent development of “light-chainescape” in patients previously treated with the novelagents, Thalidomide, Bortezomib, and Lenalidomide.Potential cross correlations between light-chain escape,new bone events, PET/CT and MRI findings and othermarker changes are under investigation. Evaluation ofsFLC changes during the monitoring process is a particu-lar focus of attention both in terms of early response andrelapse. Several studies have already addressed the prosand cons of using the sFLC ratio as an indicator of strictcomplete response (sCR). Ongoing comparisons helpvalidate the role of sFLC ratio as a correlate of PFS andOS outcomes. The additional availability of “Hevylite”testing will provide an extra tool for both monitoring andvery sensitive determination of the completeness ofresponse. Accurate, routine documentation of minimalresidual disease (MRD) remains a challenge post-tran-splantation and consolidation as well as a part of mainte-nance monitoring. It has become important to know therelative benefit of 1-2 years of maintenance versus, forexample, indefinite maintenance until progression.Careful MRD monitoring becomes especially relevant in
such comparisons which also incorporate immunopheno-typing and PCR. It can be anticipated that many new usesfor sFLC testing and Hevylite will emerge and contribu-te to more accurate disease assessment.
SERUM FLC ASSAY: TECHNICAL CONSIDERATIONSH.D. Carr-Smith
The Binding Site Group Ltd, Birmingham, UK
The clinical utility of the serum free light chain (FLC)assays in the diagnosis, monitoring and prognosis of B-cell dyscrasias has been extensively researched and thisin turn has lead to a wide adoption of the assay within cli-nical laboratories. It is therefore quite correct that thetechnical performance of such a widely used assay shouldbe scrutinised and in this study I want to examine some ofthe technical considerations that have been discussed inthe literature and describe some recent work explainingand addressing the issues highlighted. Antigen excess(AgXS) is always an issue when measuring a monoclonalprotein with a greater than 10,000-fold range. There hasbeen one study investigating the frequency of AgXS anda number of case reports detailing examples. AgXS is nota frequent occurrence, in the one study investigating it’sfrequency on the BNII FLC assays, of 7538 consecutivesamples, 9 (0.12%) kappa and 0 lambda results were sub-ject to AgXS. However, because it is impossible to pre-dict which samples may exhibit AgXS it is advisable forlaboratories to have strategies for dealing with it and theproduct inserts suggest a strategy. The most satisfactorysolution is to use automated antigen excess detection(AAED). AAED is available on the The Binding Site(TBS) SPAPLUS and the Roche Integra and recently TBShave implemented AAED protocols for FLC on the BNII(see other abstracts). Sometimes the apparent FLC mea-surement is higher than the total protein measurement orseem unfeasibly high compared to the band visualised byserum or urine protein electrophoresis. This has lead toquestions regarding the accuracy of the FLC measure-ment in these situations. Investigations at TBS laborato-ries have shown that this is due to polymerisation of FLCthat leads to an over estimation of FLC levels by theassays, perhaps due to the availability of multiple epito-pes on the large polymeric molecules (see otherabstracts). This analytical issue cannot be rectified usingdirect homogeneous latex enhanced assays. Alternativeassay formats have been investigated and patent protec-tion has been applied for on two novel FLC assay for-mats. Firstly, we have developed a novel nephelo -metric/turbidimetric assay format for the FLC assays uti-lising the inhibition of immunocomplex formation. Thisassay format is unsusceptible to AgXS and does not overestimate polymerised FLC. Secondly, a monoclonal gam-mopathy screening assay has been developed utilising theenzyme immunoassay format and allows the simultane-ous measurement of FLC and Hevylite. This assay is notsusceptible to AgXS or over estimation of polymericFLC.
| 2 | Hematology Reports 2010; 2 (s2)
Oral Communications
ROLE OF SFLC ASSAYS IN THE LABORATORYJ.A. Katzmann
Mayo Clinic, Rochester, MN, USA
The use of quantitative immuno-nephelometric assays forserum free light chain (FLC) has changed the approachesto identifying and managing monoclonal gammopathies.The FLC assay has been incorporated into screeningpanels, prognostic testing, and disease monitoring. Theimpact on clinical practice has been significant becauseof the increased sensitivity of quantitative serum freelight chains for significant plasma cell proliferative disea-ses, better discrimination between aggressive and morebenign premalignant disorders, a better assessment ofhematologic response in monoclonal light chain diseases,and simplified sample requirements for patient testing.The changes for the laboratory have been significantbecause the introduction of this test procedure adds a newassay that must be integrated into the electrophoretic andnephelometric processes used for evaluating plasma celldyscrasias, reduces the need for highly concentratedurine, and increases the need for consistent laboratory testprotocols for monitoring FLC. Diagnosis. The sensitivity of serum FLC k/λ ratio fordetecting imbalances in kappa and lambda FLC hasincreased the diagnostic sensitivity of serum assays fordetecting monoclonal free light chains. This has decrea-sed the need for urine as part of the diagnostic screeningpanel for monoclonal gammopathies. The recommendedscreening panel for detection of monoclonal gammopa-thies is serum protein electrophoresis, serum immunofi-xation electrophoresis (IFE), and serum FLC with urinestudies only suggested if primary amyloidosis is suspec-ted. In order to further simplify the screening panel,we’ve investigated the effect of also removing serum IFEfrom the screening panel, and retrospective data showsthat serum PEL and FLC provide a simplified screeningpanel with little loss of diagnostic sensitivity. A screeningpanel of serum PEL and FLC is sufficient for detectingmultiple myeloma and Waldenström’s macroglobuline-mia with only a slight decrease (1%) in sensitivity for pri-
mary amyloidosis. The use of serum PEL and FLC withthe selective use of serum and urine IFE is therefore anefficient approach to identifying monoclonal gammopa-thies, but requires that clinical judgment be integral toordering screening panels for detection of monoclonalgammopathies. For the laboratory, this means that urineprotein electrophoresis will be predominantly performedfor assessment of renal function and quantitation of urineM-spikes but that the need for highly concentrated urinefor sensitive diagnostic testing is greatly reduced.Prognosis. The serum FLC k/λ ratio is also a useful pro-gnostic marker for progression of MGUS to MM. MGUSis a common premalignant disorder with a progressionrate of 1%/yr. Patients with a normal FLC k/λ ratio (0.25-1.65), an M-spike<15g/L, and a gamma heavy chainrepresent approximately half of all MGUS patients. Thisgroup of patients has a 0.1%/yr risk of progression (2%lifetime risk), and these low-risk patients don’t have to bemonitored with laboratory assessments unless there areclinical signs of progression. Identification of low-riskpatients will decrease medical costs as well as patientanxiety, and conversely, identification of high-riskpatients will focus approaches to interfere with malignanttransformation. For the laboratory, the identification oflow-risk MGUS patients means that we need to changeour recommendations for long-term follow-up. Monitoring. The concentration of monoclonal FLC(involved FLC) has a role in disease monitoring. To date,that role has been restricted to patients with no measura-ble serum or urine M-spike, and to confirm a stringentcomplete response in MM. The long-term variability ofserum FLC and urine M-spike measurements, however,indicate that the urine M-spike and serum FLC may pro-vide comparable assessments and allow monitoringwithout the need for a urine sample. This may require achange in the guidelines for disease monitoring andresponse criteria. For the laboratory, this means additio-nal requirements to perform “delta” checks on serial sam-ples for FLC quantitation, reduce inter-assay variability,and eliminate variability due to dilution artifacts and anti-gen excess.
Hematology Reports 2010; 2 (s2) | 3 |
6th International Symposium on Clinical Applications of Serum Free Light Chain Analysis (plus Hevylite)Bath, United Kingdom, 23-24 September 2010

Oral Communications
| 4 | Hematology Reports 2010; 2 (s2)
FREE LIGHT CHAINS AND THE KIDNEY
USE OF HIGH CUT-OFF HAEMODIALYSIS FORTREATMENT OF MYELOMA KIDNEY: WORLDWIDE EXPERIENCE TO DATEC.A. Hutchison
Clinical lecturer, Renal Institute of Birmingham,University of Birmingham, Birmingham, UK
Irreversible severe renal failure greatly increases the mor-bidity and mortality of patients with multiple myeloma.1,2
Once confounding factors, such as hypercalcaemia andnon-steroidal anti-inflammatory drugs, have been exclu-ded the principal renal pathology is myeloma kidney (castnephropathy). This tubulointerstitial lesion occurs as adirect consequence of the high concentrations of circula-ting monoclonal immunoglobulin free light chains(FLCs). Recent work has demonstrated that an earlyreduction in serum FLC concentrations predicts the clini-cal outcomes of patients with myeloma kidney.3,4
Achieving this early reduction has therefore become akey focus in the management of these patients. Growingevidence suggests that novel chemotherapeutic agents,such as thalidomide and bortezomib, have a role for rapi-dly reducing FLC production in this setting and in uncon-trolled studies have been associated with favorable clini-cal outcomes.5,6 The impact of effective chemotherapyalone on the serum concentrations of FLCs can howeverbe limited by the prolonged serum half-lives of FLCs inthe context of established renal failure.7 Therefore, strate-gies to directly remove FLCs from the serum have beendeveloped to be used in combination with chemotherapy.Principally plasma exchange has been used, however,results have been disappointing.8 A mathematical modelof FLC kinetics suggests this failure of plasma exchangerelates to the inefficiency of the procedure to removelarge quantities of FLCs.9 More recently haemodialysisusing a dialysis membrane with a uniquely high molecu-lar weight cut-off has been described as an alternativestrategy.10 The capacity of high cut-off haemodialysis(HCO-HD), for FLC removal, is approximately 5 foldgreater than plasma exchange. This new treatment is cur-rently being evaluated by the European Trial of FreeLight Chain Removal by Extended Haemodialysis in CastNephropathy (EuLITE),11 a multi-centre randomised con-trolled trial based in the United Kingdom and Germany.
Study purpose. The current study was undertaken todescribe how FLC removal by HCO-HD has been adop-ted into clinical practice internationally and report the cli-nical outcomes associated with its use.Web-based electronic case report forms were used fordata collection. Clinicians from centers across 13 coun-tries were approached in an unselected manner. Data col-lection included basic demographic details, the patients’haematological and renal presentations, treatments recei-ved and clinical outcomes. Results. In total 16 centres, across 9 countries enrolled 67patients, between November 10, 2008 and September 24,2009. The population was predominately male (62.7%)
and had a median age of 65.1 years (SD=10.01). Themajority had new presentation of multiple myeloma(n=50, 74.6%). Nearly a third of the population had alight chain only myeloma (lambda 13.4%, kappa 16.4%),but the most frequent myeloma type was an intact IgG,with associated kappa or lambda FLCs (total 55.3%). TheFLC type was closely distributed with 46% of patientshaving a kappa FLC and 54% a lambda FLC. Sixty per-cent of the patients had immunoparesis at presentation.Only 11 patients (16%) were known to have pre-existingchronic kidney disease. The majority of patients wereassessed with a renal biopsy (56.7%), of these myelomakidney was the predominant diagnosis (86.7%). Themajority of the population received a chemotherapy regi-me including ‘novel’ chemotherapeutic agents, with57.6% receiving a bortezomib based regime. On averagepatients received 12.5 (SD=8) HCO-HD sessions.Ninety-seven percent of the population received an exten-ded dialysis schedule (greater than 4 hours) per session,predominately this was on one HCO dialyser not two.Dialysis related side-effects were reported in 6% of thepatients. Sustained reductions in serum FLCs. Forty one patients(61.2%) were reported to have a sustained reduction inserum FLC concentrations by day 12, and 42 patients(62.7%) by day 21. Of these 71% and 69% subsequentlybecame independent of dialysis, respectively. Amongpatients who achieved a sustained reduction in serumFLC concentrations, 68.3% had a decline of greater than50% on day 12 and 83.3% had a decline of greater than50% on day 21.
Figure 1. Percentage of the population who became independentof dialysis and the reduction in serum FLCs at day 12.
Predictors of dialysis independenceThe achievement of a sustained reduction in serum FLCconcentrations by days 12 and 21 significantly increasedthe probability of becoming dialysis independent OR=29(p=0.002) and OR=22.3 (p=0.005), respectively.Moreover, the probability of achieving dialysis indepen-dence increased linearly with increasing levels of reduc-tion in FLC concentrations on day 12 (Figure 1). Using anunadjusted logistic regression model only the delay in ini-tiating HCO-HD and the degree of FLC reduction at days12 and 21 significantly predicted dialysis independence.Bortezomib chemotherapy, number of dialysis sessions,

duration of dialysis, number of dialysers, time from renalfailure to chemotherapy, time from chemotherapy toHCO initiation, new or relapsing multiple myeloma, andknown chronic kidney disease were not statistically signi-ficantly predictors.In summary, FLC removal by HCO-HD was well tolera-ted and resulted in sustained reductions in serum FLCconcentrations in the majority of patients. The degree ofearly reduction in serum FLC concentrations achievedand the time to initiating HCO-HD were the only factorswhich independently predicted dialysis independence.
References
1. Bladé J, Fernández-Llama P, Bosch F, et al: Renal failure inmultiple myeloma: presenting features and predictors of out-come in 94 patients from a single institution. Arch InternMed 1998;158:1889-93.
2. Haynes RJ, Read S, Collins GP, et al: Presentation and sur-vival of patients with severe acute kidney injury and multiplemyeloma: 20-year experience from a single centre. NephrolDial Transplant, 2009.
3. Leung N, Gertz MA, Zeldenrust SR, et al: Improvement ofcast nephropathy with plasma exchange depends on the diag-nosis and on reduction of serum free light chains. Kidney Int2008;73:1282-8.
4. Hutchison CA, Bradwell AR, Cook M, et al: Treatment ofacute renal failure secondary to multiple myeloma withchemotherapy and extended high cut-off hemodialysis. ClinJ Am Soc Nephrol 2009;4:745-54.
5. Ludwig H, Drach J, Graf H, et al: Reversal of acute renal fail-ure by bortezomib-based chemotherapy in patients with mul-tiple myeloma. Haematologica 2007;92:1411-4.
6. Kastritis E, Anagnostopoulos A, Roussou M, et al:Reversibility of renal failure in newly diagnosed multiplemyeloma patients treated with high dose dexamethasone-containing regimens and the impact of novel agents.Haematologica 2007;92:546-9.
7. Hutchison CA, Harding S, Hewins P, et al: Quantitativeassessment of serum and urinary polyclonal free light chainsin patients with chronic kidney disease. Clin J Am SocNephrol 2008;3:1684-90.
8. Clark WF, Stewart AK, Rock GA, et al: Plasma exchangewhen myeloma presents as acute renal failure: a randomized,controlled trial. Ann Intern Med 2005;143:777-84.
9. Hutchison CA, Cockwell P, Reid S, et al: Efficient removalof immunoglobulin free light chains by hemodialysis formultiple myeloma: in vitro and in vivo studies. J Am SocNephrol 2007;18:886-95.
10. Hutchison CA, Harding S, Mead G, et al: Serum free-lightchain removal by high cutoff hemodialysis: optimizingremoval and supportive care. Artif Organs 32:910-7, 2008.
11. Hutchison CA, Cook M, Heyne N, et al: European trial of freelight chain removal by extended haemodialysis in castnephropathy (EuLITE): A randomised control trial. Trials2008;9:55.
EuLITE TRIAL: RESULTS TO DATEM. Cook
University Hospital Birmingham NHS Foundation TrustBirmingham, UK
Myeloma is an incurable malignancy of plasma cells.Renal complications are common, either as a direct con-sequence of the disease (cast nephropathy) or due to otherfeatures such as infection, hypercalcaemia and dehydra-tion. Indeed, it is estimated that up to 50% of myelomapatients will have some degree of renal impairment atleast once in their disease pathway. Up to 10% of patientswill present with acute renal failure requiring dialysis atdiagnosis. The commonest renal lesion in this circum-stance is cast nephropathy, which occurs when clonal freelight chains, circulating in excess, are filtered and retai-ned within the renal tubules. The end product is the depo-sition of an insoluble waxy cast resulting in renal failure.Acute renal failure has significant negative prognosticimplications in this patient group. Survival for patientspresenting needing dialysis is significantly reduced com-pared to a non-dialysis cohort with death due to infectiona significant problem. For those who survive initial treat-ment and are young enough to undergo autologous tran-splantation, the morbidity and mortality of the procedureis significantly increased. Continued requirement of hae-modialysis also has a marked negative impact on qualityof life. There is therefore a compelling argument to tryand reverse the renal failure of myeloma. If successful, itis hoped that subsequent treatment with conventionalanti-myeloma therapy can be delivered in a safer fashionwith a positive impact on response and survival. Theambition therefore is to return the patient to a ‘standard’pathway of care with expectations of survival similar topatients who did not present needing dialysis and a con-sequent positive impact on quality of life.In a previous pilot study, we examined the role of a highcutoff dialysis membrane (HCO1100, Gambro) as an aidto prompt reduction in circulating light chain levels(Hutchison et al. Clin J Am Soc Nephrol 2009 4(4) 745-754). In combination with anti-myeloma chemotherapy, asignificant reduction (median 85%) in light chain levelswas seen and as a clinical consequence, reversal of dialy-sis dependency in over 70% of patients. Renal responsewas linked to the ability to receive anti-myeloma treat-ment in a sustained fashion- there was only one renalresponse seen in the cohort of patients unable to receiveregular anti-myeloma therapy. Of note was that most ofthese patients had relapsed myeloma and had had at leastone prior line of therapy. More recently, there has beenevidence that in patients with various degrees of renalimpairment, renal response is linked to the response ofmyeloma to anti-myeloma therapy (Ludwig et al Blood2009 114 Abs#3862).The European trial of free LIght chain removal byexTEnded haemodialysis in cast nephropathy (EuLITE)study is a randomised phase II study designed to evalua-te the impact of extended high cut off dialysis in newlydiagnosed myeloma patients presenting with acute renalfailure requiring dialysis. Entry criteria include biopsyproven symptomatic myeloma and confirmation of cast
6th International Symposium on Clinical Applications of Serum Free Light Chain Analysis (plus Hevylite)Bath, United Kingdom, 23-24 September 2010
Hematology Reports 2010; 2 (s2) | 5 |

Oral Communications
| 6 | Hematology Reports 2010; 2 (s2)
nephropathy on renal biopsy. All patients receive modi-fied PAD chemotherapy (bortezomib, doxorubicin, dexa-methasone given in a 3 week cycle) as anti-myeloma the-rapy. Patients can receive up to 8 cycles of chemotherapy.Randomisation is between extended dialysis with theHCO1100 and conventional dialysis. Patients also recei-ve appropriate anti-infective prophylaxis. The primaryendpoint is independence of dialysis at 3 months aftertrial entry. Secondary endpoints are duration of dialysis,reduction in serum free light chains, myeloma responseand survival.After slow initial recruitment (including an initial safetycohort of 6 patients), at the time of writing, 19 patientshave been recruited. There are now over 10 participatingcentres in the UK and recently, German partner centrescompleted the regulatory work required for the study toopen in Germany. We now expect recruitment to increasesignificantly. The target number of patients for treatmentwithin the study is 90. Interim analyses are planned after25 and 50 patients.Treatment has been well-tolerated in the majority ofpatients. An update on patient recruitment, adverse eventsand projected timeline for key landmarks in the study willbe given at the meeting.Note. The EuLITE study is registered ISRCTN45967602.The study is sponsored by UHB NHS Foundation Trust.Gambro (Hechingen, Germany) have kindly providedequipment and financial support and Ortho-Biotech(High Wycombe, UK) have kindly provided bortezomib.
POLYCLONAL FLC AND CHRONIC KIDNEY DISEASES. Stringer
Renal Institute of Birmingham, University ofBirmingham, Birmingham, UK
Chronic kidney disease (CKD) is a significant cause ofmorbidity and mortality in the UK with around 10% ofthe population having some form of CKD. There aremany causes of CKD but for most there is no disease spe-cific treatment and the mainstay of management is toreduce the risk of further decline in renal function and toreduce cardiovascular (CV) risk. Patients with CKD areat enhanced CV risk by virtue of several factors; the riskfactors for CV disease are the same as those for CKD(hypertension, diabetes and smoking to name but three)and the likely presence of a low grade inflammatory statemediated by CKD resulting in endothelial dysfunctionand atherogenic plaque formation; the role of free lightchains (FLC) in this process is considered below.As kidney function declines (the glomerular filtration rate(GFR) is reduced) levels of serum FLC rise. Decliningkidney function is associated with a pro-inflammatorystate; a consequence of this is increased polyclonal FLCproduction. While the clearance of polyclonal FLC is nor-mally via the kidneys, when there is impaired kidney fun-ction the mode of clearance becomes predominantly reti-culo-endothelial, unlike the renal route this method ofclearance is not related to molecular size so the serumhalf lives of kappa (k) and lambda (λ) converge as renalfunction worsens. FLC are filtered at the glomerulus andabsorbed at the proximal tubule, when the capacity for
reabsorption at the proximal tubule is overwhelmed theFLC appear in the urine. The renal toxicity of monoclo-nal FLC is well understood (the formation of casts of FLCand Tamm-Horsfall protein in myeloma kidney being anexample of this). However a role for direct renal pathoge-nicity of polyclonal FLC has not been shown to date.To address this we have (i) analysed a large cohort ofpatients with CKD to assess the relationship betweenserum polyclonal FLC and clinical outcomes (ii) studiedthe pathogenic potential of polyclonal FLC in human kid-ney disease.A large cohort of patients (n=1328) with varying stages ofCKD were recruited in Birmingham; the cohort compri-sed patients recruited from secondary care clinics andincluded all stages of kidney disease. The cohort was fol-lowed prospectively for a median of 43 months. The out-comes examined were death, cardiovascular events andprogression of renal disease where appropriate. Eighteenpatients had an abnormal k/λ ratio and were excludedfrom analysis (n=18). The total free light chains weresignificantly higher in dialysis patients (median 237 ver-sus 57 for CKD and 50 in the transplant cohort, p<0.001).The survival analysis showed that the factors that weresignificantly associated with patient survival were thetotal FLC (p<0.001), the serum k (p<0.001) and serum λ(p<0.001), for all three of these variables higher levelswere associated with an increased chance of death at anytime and thus worse survival, on a log scale a one-unitincrease in total FLC caused the hazard of death to increa-se three-fold. The multi-variable analysis demonstratedthat total FLCs, age, pre-existing CV disease, highly sen-sitive CRP and classification (CKD, dialysis or tran-splant) were all significantly associated with patient sur-vival, after adjustment for these none of the other varia-bles were significant, in particular GFR was not a predic-tor of death.Renal progression was analysed in those patients whowere not dialysis dependent at recruitment. The measureof renal progression was the delta eGFR (the change ofeGFR divided by the length of follow up). In the multiva-riable analysis both age and total FLC had a significanteffect upon delta GFR (p<0.001 and p=0.02 respectively).Other factors including ACR were not significant (thoughthis tended towards significance).To address the possible mechanisms of rate of deteriora-tion of kidney function, ex vivo and in vitro studies wereperformed. These showed that polyclonal FLC, unlikemonoclonal FLC, do not activate proximal tubular epithe-lial cells. However there is a relationship between distaltubular casts containing FLC and in situ surrogates forprogressive CKD. Furthermore polyclonal FLC co-preci-pitates with Tamm-Horsfall Protein, the major protein ofthe renal tract, confirming the potential for polyclonalFLC to act as a co-factor for cast formation in CKD.These data indicate that total FLC may be a risk markerfor (i) death and (ii) progression of renal disease. Whilstthe biological basis for these relationships requires fur-ther investigation, the association with mortality mayreflect both systemic inflammation and reticulo-endothe-lial dysfunction. For renal function, further studies arerequired to assess the interplay between polyclonal FLCand known co-factors for the progression of kidney disea-

se including proteinuria and ischaemiaThe clinical outcome results are the first from a series oflarge cohorts of patients with CKD, which should accura-tely define the utility of polyclonal FLC as an aid to riskfactor assessment and directed clinical management inpatients with CKD.
References
De Lusignan S, Chan T, Stevens P, O’Donoghue D, Hague N,Dzregah B, et al. Identifying patients with chronic kidneydisease from general practice computer records. Fam Pract.2005 Jun;22(3):234-41.
Stevens PE, O’Donoghue DJ, de Lusignan S, Van Vlymen J,Klebe B, Middleton R, et al. Chronic kidney disease manage-ment in the United Kingdom: NEOERICA projectresults.[see comment]. Kidney International. 2007;72:92-9.
Solomon A. Light chains of human immunoglobulins. MethEnzymol 1985;116:101-21.
Landray M et al. Inflammation, endothelial dysfucntion andplatelet activation in patients with chronic kidney disease: thechronic renal impariment in Birmingham (CRIB) study. AmJ Kid Dis 2004;43:244-53.
Hutchison CA, et al. Quantitave assessment of serum and urinarypolyclonal free light chains in patients with type 2 diabetes:an early marker of diabetic kidney disease? Expert Opin TherTargets 2008;12:667-76.
Hutchison CA et al. Quantitative assessment of serum and urinarypolyclonal free light chains in patients with chronic kidneydisease. CJASN 2008;3:1684-90.
Van Der Hiijen M, et al. Free immunogolbulin light chains as tar-gets in the treatment of chronic inflammatory disease. Eu JPharmacol 2006;533:319-26.
Sanders PW et al. Spectrum of glomerular and tubulo-interstitialrenal lesions associated with mono-typical immunoglobulinlight chain deposition. Lab Invest 1991;64:527-31.
Waldmann TA et al. The renal handling of Low Molecular WeightProteins II. Disorders of serum protein catabolism in patientswith tubular proteinuria, the nephrotic syndrome or uraemia.J Clin Invest 1972;51:2162-74.
Cohen G. Immunoglobulin light chains in uraemia. Kidney IntSuppl 2003;s15-18.
Sanders PW. Monoclonal Free Light chains and renal damage.Haematological meeting reports 2008;2:13-4.
DISEASES ASSOCIATED WITH MONOCLONAL FREE LIGHT CHAINS
AL AMYLOIDOSIS - ROLE OF FLC ASSAY IN RISKESTIMATIONS. Kumar
Mayo Clinic, Rochester, MN, USA
Light chain amyloidosis (AL amyloidosis), where mono-clonal immunoglobulin free light chains form the substra-te for amyloid fibril formation, represents the most com-mon form of systemic amyloidosis. The ability to directlymeasure the amount of free kappa and lambda lightchains in the serum has had a profound impact on themanagement of AL amyloidosis. Studies have shown thatlevels of serum free light chains at diagnosis directly cor-relate with the degree of organ involvement and havebeen shown to predict the outcome in patients with ALamyloidosis. Serum free light chain measurements can beintegrated with the current staging parameters such ascardiac biomarkers such as cardiac troponin T (cTnT) andN terminal pro Brain natriuretic peptide (NT-ProBNP) inorder to develop improved risk stratification systems.Among patients undergoing stem cell transplantation forAL amyloidosis, the baseline FLC levels as well as themagnitude of FLC change following therapy can be usedto predict outcome. In addition, the type of light chain(kappa or lambda) also predicts the spectrum of organinvolvement in the disease. Presence of free light chainunaccompanied by a detectable heavy chain also appearsto predict poorer outcome among these patients. In addi-tion to its role in risk stratifying patients with AL amyloi-dosis, FLC estimates offer a better marker for assessmentof disease response compared to the intact monoclonalprotein. Studies have shown that response assessmentusing FLC reduction allows better estimate of outcomebased on response and moreover the majority of patientsdo not have measurable levels of intact monoclonal pro-tein in order to apply conventional definitions of hemato-logical response.
FLCS IN THE AMYLOIDOSIS CLINICP. Hawkins
National Amyloidosis Centre, UCL Medical School,London, UK
AL amyloidosis is the cause of death of about 1 in 1000individuals in the UK, and it is associated with a widespectrum of clonal B-cell dyscrasias. Although all ALamyloid fibrils are derived from monoclonal immunoglo-bulin light chains and the deposits can be very extensive,the underlying B-cell dyscrasias are often extremely sub-tle, and conventional serum and urine immunofixation areeach negative in about 20% of cases. A whole serum para-protein greater than 10 g/L, i.e. a serially quantifiablelevel, is present in only about 10% of patients. Quantitative measurements of serum free light chains(FLC) using the robust, sensitive, Freelite immunoassayhas had a major impact on the clinical management of AL
6th International Symposium on Clinical Applications of Serum Free Light Chain Analysis (plus Hevylite)Bath, United Kingdom, 23-24 September 2010
Hematology Reports 2010; 2 (s2) | 7 |
amyloidosis during the past 10 years. The combination ofserum and urine immunofixation and serum FLC measu-rements are recommended in UK and US guidelines forevaluation of patients with possible AL amyloidosis, withdiagnostic performance approaching 100%. Althoughdemonstration of a monoclonal immunoglobulin productplainly supports the diagnosis of AL in patient with pro-ven or suspected amyloidosis, it remains vital to confirmthe AL nature of the deposits through immunohistochemi-cal staining, or proteomic approaches when the latter doesnot yield a definitive result. Subtle monoclonal gammo-pathies are not infrequent in the general population, illu-strated by their misleading incidental presence in manyolder patients with hereditary and senile cardiac amyloi-dosis. Serial FLC measurements are usually the most effectivemeans for evaluating the early effects of chemotherapyand the need for ongoing treatment, supporting the appro-ach of cyclic combination chemotherapy which is nowpursued in the majority of AL patients. Evidence ofresponse to cyclophosphamide, thalidomide and dexame-thasone can be determined within 2-3 cycles of treatment,enabling an early change of therapy if unsuccessful,whilst response to bortezomib usually becomes evidentduring the first cycle. The degree of reduction of the involved FLC followingchemotherapy is the single most important modifier ofoutcome in AL amyloidosis, and correlates strongly withthe likelihood of gradual regression of existing amyloiddeposits. However, SAP scintigraphy has revealed thatthe rate of turnover of amyloid varies substantially betwe-en patients, and between different organs within indivi-dual patients, governing the potential within a givenpatient for regression of amyloid to occur in a clinicallybeneficial timescale. A favorable outcome in cardiacamyloidosis is unlikely to occur unless the involved FLChas be suppressed by more than 90%, and the greatestlikelihood of a renal response also occurs among patientswho achieve >90% FLC response. Various challenges in the utility of FLC assays remain,including difficulties in their interpretation in renal failu-re due to retention of healthy polyclonal light chains, andin up to 20% of patients in whom FLC results are only sli-ghtly abnormal or not abnormal at all. Explanations forthe latter include anti-light chain antibodies not bindingcertain monoclonal FLCs or very efficient sequestrationof highly amyloidogenic FLCs into amyloid deposits.Use of the dFLC method, a simple formula in which theconcentration of the uninvolved class of light chain issubtracted from that of the aberrant amyloidogenic lightchain, is often more informative in renal failure, and inmany of the one-third of AL patients without renal failu-re in whom the involved FLC values is <100mg/L at pre-sentation.
SERUM FREE LIGHT CHAINS IN CHRONIC LYMPHOCYTIC LEUKAEMIAG. Pratt
University of Birmingham, Birmingham, UK
Background. Serum free light chain (sFLC) assays haveimproved screening and monitoring and provided pro-gnostic information, for a range of plasma cell disorders.Data has also emerged indicating a prognostic significan-ce for an abnormal serum FLC ratio in some non-plasmacell lymphoid malignancies. Whereas an abnormal ratio,reflecting clonal production, has prognostic relevance inplasma cell disorders it may be that elevated polyclonalsFLC may be more relevant as a prognostic marker innon-plasma cell disorders, reflecting generalised B cellactivation.Aims. The aim of the current study was to determinewhether both monoclonal and polyclonal sFLC elevationshave prognostic significance in patients with chroniclymphocytic leukaemia (CLL).Methods. We retrospectively analysed sFLC in 181untreated/pre-treatment and 78 treated CLL patients fromthree UK centres.Results. An abnormal serum FLC ratio was found in 39%(100/259) of the CLL cohort. Using multivariate analysis(n=194), four independent prognostic variables for ove-rall survival were identified namely Zap-70 (p=0.0001),β2M (p=0.01), IgVH gene mutation status (p=0.017) andan abnormal sFLC ratio (p=0.024). For patients withmutated Vh genes, reduced k/λ ratios were adversely pro-gnostic and associated with the poor prognostic Vh 3.21,Vh 3.48 and Vh 3.53 subgroups, suggesting an abnormalsFLC ratio may reflect biological subgroups within CLL.Patients with abnormal sFLC ratios were significantlymore likely to have unmutated IgVH status (p=0.001),Zap-70 positivity (p=0.034), lymphocyte doubling time(LDT) less than 12 months (p=0.004) and have a highβ2M (p=0.001) than CLL patients with a normal FLCratio. Where available surface expression of light chain inthe majority of CLL cases correlated with an abnormalFLC ratio of the same type except for 8 patients. Analysisof a subpopulation of 167 untreated stage A patients, withnormal kappa / lambda sFLC ratios identified summatedpolyclonal sFLC >50mg/L as being significantly associa-ted with progressive disease and poorer outcome. 35/120patients had serum FLC>50mg/L and had the followingcharacteristics Median age 79 (range 62-98), Mutated vUnmutated 22 v 7; 6 unknown), Zap 70 pos v neg (9 vs23, 3 unknown), CD38 pos v neg (11 vs 23, 1 unknown),18/35 patients have progressed to treatment and 10/35patients died. Median time to first treatment was 88months compared to 170 months for patients with a nor-mal FLC, (p=0.023). Median survival points were notreached, 75%ile survival was significantly shorted inpatients with sFLC >50mg/L compared to those with anormal sFLC concentration (98 vs 201 months p=0.006).Summary/Conclusion. This study shows that in an unse-lected population of CLL patients an abnormal serum FLCratio has independent prognostic significance and that aserum FLC >50mg/L can independently identify a group ofCLL patients with progressive disease and a poorer outlo-
| 8 | Hematology Reports 2010; 2 (s2)
Oral Communications

ok. Here we present our data and review other relevant stu-dies of sFLC in CLL.
SERUM FREE LIGHT CHAINS IN NON-HODGKINLYMPHOMAM.J. Maurer, J.A. Katzmann, B.K. Link, J.R. Cerhan, T.E. Witzig
Mayo Clinic, Rochester, MN, USA
Serum FLC abnormalities in NHL. The first report ofserum free light chain (FLC) abnormalities assessed via theFreelite assay in NHL were by Martin and colleagues at theMayo Clinic (Martin et al). Using frozen sera from theMayo Clinic/ Lymphoma SPORE serum bank, they evalua-ted 208 NHL samples. Twenty seven samples (13%) had anabnormal FLC ratio. Prevalence of abnormal FLC ratio wasvaried across NHL subtype, ranging from 36% of mantlecell samples (9/25) to 4% of follicular lymphoma samples(3/75). To further characterize the prevalence of FLC abnor-malities in NHL, we recently assessed serum FLC in acohort of over 1400 lymphoma patients from the MayoClinic and University of Iowa SPORE MolecularEpidemiology Resources (MER). The MER offers enrol-lment to any newly diagnosed lymphoma patient seen atMayo Clinic and the University of Iowa. Similar to theMartin analysis, we saw a range of abnormal FLC ratio pre-valence across subtypes, with the highest prevalence in highgrade B-cell lymphoma (50%), CLL/SLL (33.7%), andmantle cell lymphoma (26%) (see table). We also assessedthe percentage of patients with elevated FLC, as defined bya kappa or lambda concentration above the established refe-rence ranges (Katzmann et al). Elevated FLC was mostcommon in mantle cell lymphoma (63%) and was general-ly present in 25-35% of patient across subtypes. Notably,elevated FLC was not restricted to B-cell NHL, as 25% ofHodgkin lymphomas and 37% of T-cell lymphomas had anelevated kappa or lambda.FLC and outcome in DLBCL. We recently reported atASH on serum FLC in untreated DLBCL patients fromNCCTG N0489, a phase II study of epratuzumab + R-CHOP (Maurer et al). Serum was collected both prior totreatment as well as at restaging after 2 and 6 cycles of tre-atment. We found a similar prevalence of FLC abnormali-ties to the Martin publication with 12% of patients haveabnormal FLC ratio and 34% of patients having elevatedFLC. Elevated FLC was highly associated with poor out-come on the clinical trial. Patients with elevated FLC hada significantly worse event-free survival (EFS HR=3.06,p=0.01) and overall survival (OS HR=3.16, p=0.02) thanpatients with kappa and lambda in the normal range.Abnormal FLC ratio was positively associated with survi-val, though not statistically significant (EFS, HR=1.87,p=0.26, OS HR=2.58, p=0.10). Serum FLC was reducedsignificantly during treatment in all patients, with a medianreduction in total FLC of 42% and 57% after 2 and 6 cyclesof treatment, respectively. In summary, FLC abnormalitiesare quite prevalent in lymphoma. Elevated FLC concen-trations are associated with poor outcome in patients withDLBCL. Additional studies of FLC in lymphoma arewarranted to better understand the mechanisms of eleva-ted FLC and reasons for poor outcome in these patients.
References
Martin W, Abraham R, Shanafelt T, et al: Serum-free light chain-a new biomarker for patients with B-cell non-Hodgkin lym-phoma and chronic lymphocytic leukemia. Transl Res2007;149:231-5.
Katzmann JA, Clark RJ, Abraham RS, et al: Serum referenceintervals and diagnostic ranges for free kappa and free lamb-da immunoglobulin light chains: relative sensitivity fordetection of monoclonal light chains. Clin Chem 2002;48:1437-44.
Maurer MJ, Micallef INM, Katzmann JA, Nikcevich D, WitzigTE. Elevated Pre-Treatment Serum Immunoglobulin FreeLight Chains (FLC) Are Associated with Poor Event-Freeand Overall Survival in Diffuse Large B-Cell Lymphoma(DLBCL) Blood (ASH Annual Meeting Abstracts), Nov2009;114:136.
Table 1. Prevalence of FLC Abnormalities in Lymphoma in MayoClinic/University of Iowa SPORE Molecular EpidemiologyRegistry.
Lymphoma N Elevated Abnormal Both ElevatedSubtype FLC FLC Ratio FLC and
Abnormal FLC Ratio
DLBCL 318 27.4% 17.0% 8.5%Mediastinal 16 6.3% 6.7% 0%Large B-cell PCNSL 25 8.0% 29.2% 4.0%PTLD 11 27.3% 9.1% 0%
Follicular 283 13.1% 11.8% 3.9%FL I 150 13.3% 10.7% 4.0%FL II 85 11.8% 10.8% 3.5%FL III 47 12.8% 17.0% 4.3%
Mantle Cell 72 62.5% 26.4% 25.0%
T-Cell 71 36.6% 8.8% 2.8%
Post Follicular 106 40.6% 28.9% 19.8%Splenic / Nodal 19 42.1% 38.9% 21.1%Marginal ZoneMALT 70 30.0% 17.4% 10.0%LPL 17 82.4% 64.7% 58.8%
Hodgkin Lymphoma 144 24.8% 6.3% 0.7%
Burkitt / High Grade 15 26.7% 50.0% 20.0%
CLL/SLL 380 32.6% 33.7% 18.4%
Hematology Reports 2010; 2 (s2) | 9 |
6th International Symposium on Clinical Applications of Serum Free Light Chain Analysis (plus Hevylite)Bath, United Kingdom, 23-24 September 2010

PROGRESSING SERUM IMMUNE ABNORMALI-TIES IN MYELOMAGENESIS O. Landgren
National Cancer Institute, National Institutes of Health,Center for Cancer Research, Medical Oncology Branch,Bethesda, MD, USA
Monoclonal gammopathy of undetermined significance(MGUS) is a pre-malignant plasma-cell proliferativedisorder associated with a life-long risk of progression tomultiple myeloma (MM). In fact, long-term follow-up stu-dies of MGUS cases have shown that the excess averageannual MM risk does not diminish even after 25 to 35years. Consequently, most individuals diagnosed withMGUS are typically followed for life by their responsibleprimary-care provider. Until recently, it has been impossi-ble to determine if a protracted premalignant phase(MGUS) precedes MM in all patients. Taking advantage ofthe large nationwide U.S. PLCO (Prostate, Lung,Colorectal, and Ovarian) Cancer Screening Trial, weemployed a unique study design to conduct the first pro-spective study to address this question (Blood2009;113:5412-7). Among 77,469 persons in the screenedarm who were cancer-free at baseline, we identified 71individuals who developed MM during the course of thestudy in whom serially-collected pre-diagnostic serumsamples obtained at least 2 years (up to 9.8 years) prior toMM diagnosis were available. Using multiple pre-diagno-stic blood samples (up to 6 samples) obtained annually inthe same individual; we applied serum protein electropho-resis, immunofixation, and kappa-lambda free light chain(FLC) assays to define the prevalence of MGUS prior tothe diagnosis of MM, and characterized longitudinally pat-terns of M-protein abnormalities prior to MM diagnosis.MGUS was present in 100.0% (87.2-100.0%), 98.3%(90.8-100.0%), 97.9% (88.9-100.0%), 94.6% (81.8-99.3%), 100.0% (86.3-100.0%), 93.3% (68.1-99.8%), and82.4% (56.6-96.2%) at 2, 3, 4, 5, 6, 7, and 8+ years priorto MM diagnosis, respectively. The median for M-proteinconcentration exhibited a year-by-year (ptrend=0.025)increase; at 8+ and 2 years prior to MM diagnosis, themedian (range) concentration was 0.9 (0.5-1.8) and 1.6(0.4-3.7) grams per deciliter, respectively. Simultaneously,
we found that the proportion of study subjects with anabnormal kappa-lambda FLC-ratio at 8+ to 2 years prior toMM varied between 47% and 85%. This pattern adds sub-stantially to our previous investigation where we foundthat about 30% of all MGUS cases had an abnormalkappa-lambda FLC-ratio, and if the ratio was abnormal,there was a 2.6-fold increase for progression. In the presentstudy, when we assessed FLC variations on a group level,year-by-year in a 10-year interval prior to MM diagnosis,there was no statistical association over time. Interestingly,in accord with recent observations, when we evaluated M-protein and involved-FLC ratios over time in individualpatients, about half the study population showed a year-by-year increase prior to MM diagnosis, while the other halfmaintained largely stable abnormal serum protein level upto the diagnosis of MM. Although it remains to be confir-med, others have speculated that “evolving MGUS” poten-tially could be a marker for an early myeloma with a slowrate of progression. In summary, we found MM to be con-sistently preceded by MGUS. The median M-protein con-centration exhibited a year-by-year increase over time.Two years prior to MM diagnosis, the proportion ofMGUS cases with an abnormal FLC-ratio was 85%, sup-porting a role for FLC assays in routine MGUS follow-up.In about half the study population, the M-protein concen-tration and involved FLC-ratio levels showed a year-by-year increase prior to MM diagnosis, while the other halfmaintained largely stable abnormal serum protein level upto the diagnosis of MM. Thus, stable M-protein or FLClevels do not exclude the development of MM develop-ment. Until better molecular markers for progression toMM are available, clinicians have to use clinical measuresin combination with routine blood test (including renalfunction, hemoglobin, and serum calcium) and serum andurine M-protein markers in their monitoring of MGUScases. Future studies are needed to provide insights to thepathogenesis of MGUS and predictors for MM progres-sion. A better understanding of mechanisms mediatingmonoclonal plasma-cell proliferation, survival, and migra-tion in the bone marrow microenvironment will improveour insights on myelomagenesis and help us to identifynovel molecular targets. Larger prospective samples willbe required to further refine these patterns.
Oral Communications
| 10 | Hematology Reports 2010; 2 (s2)

DISEASES ASSOCIATED WITH ELEVATEDPOLYCLONAL FREE LIGHT CHAINS – I
DISEASES ASSOCIATED WITH POLYCLONALFREE LIGHT CHAINS - CONCEPTSG. Mead
University of Birmingham, Birmingham, UK and TheBinding Site Group Ltd, Birmingham, UK
To date, the main interest in the use of serum free lightchain FLC measurement has been as an aid in the diagno-sis and monitoring of patients with monoclonal plasmacell disorders, particularly multiple myeloma and ALamyloidosis. Diagnostically, the guidance has alwaysbeen that it is the presence of an abnormal FLC ratiowhich is indicative of monoclonal FLC production.However, any laboratory that has been using FLC as partof a screening protocol for lymphoproliferative disorderswill see a number of results with a normal FLC ratio butFLC concentrations above the reference range. Suchresults indicate a polyclonal FLC increase and the poten-tial causes of such elevations are manifold. As with anyserum protein, an increased concentration may resultfrom increased production or from reduced clearance.The predominant clearance mechanism for FLC is via thekidneys and this determines the serum half-life of only 2-6 hours.1 There is also a second mechanism for clearanceof FLC and that is via pinocytosis by metabolically acti-ve cells, a route that operates for all other serum proteinsas well. In the absence of any renal clearance, this mecha-nism would remove FLC with a half-life of 2-3 days.8
The main source of FLC production is thought to be pla-sma cells and studies following the clearance of radio-labelled FLC and IgG indicated that, in addition to thelight chains that were paired with heavy chains to formintact immunoglobulin, there was an excess synthesis ofapproximately 40%, which was released as FLC.1 Even ifFLC production is solely a “by-product” of immunoglo-bulin synthesis, the measurement of serum FLC concen-trations will provide different information than overallimmunoglobulin levels. Immunoglobulins have serumhalf-lives of several days (IgA ~5 days, IgG ~20 days.13
So serum FLC concentrations, with a serum half-life of afew hours, will reflect current production rates moreaccurately. Furthermore, the range of IgG concentrationsis limited because of its concentration-dependent catabo-lism: at 5g/L the serum half-life of IgG is close to 30 dayswhereas it is approximately 10 days when the concentra-tion is 30g/L. This is because the Fc receptor which recy-cles IgG, (avoiding catabolism in endosomal vesicles)saturates at higher IgG levels.13,14,15 However, plasma cellsare not the only B-lymphocytes capable of FLC produc-tion. Cells earlier in the process of B-cell maturation arealso able to express FLC and this is reflected in the num-ber of non-Hodgkin lymphoma patients who have abnor-mal FLC ratios.11,12 FLC production in lymphomas is,however, considerably less than that seen with most pla-sma cell disorders. Therefore, in consideration of theabove, a polyclonal FLC elevation may be caused by anydisorder that adversely affects either of the FLC clearan-ce mechanisms or that increases FLC production by pla-
sma cells or B-lymphocytes.The most common diseaseassociated with reduced FLC clearance is chronic kidneydisease, and this, in turn, is associated with other co-mor-bidities, notably cardiovascular disorders.6 At ~24kDa(monomeric kappa) and ~50kDa (dimeric lambda) FLCsare more sensitive markers of glomerular filtration rate(GFR) than serum creatinine.5 It is generally recognisedthat serum creatinine is insensitive to minor changes inGFR.7 Disorders associated with increased FLC produc-tion include, autoimmune disease, infections and inflam-matory disorders. It is worth noting that FLC is not anacute phase protein and it correlates poorly with C-reac-tive protein (CRP). An observational study of serum mar-kers in 14 patients during treatment in an intensive careunit2 revealed that CRP, FLC and immunoglobulins fre-quently showed very different concentrations and chan-ges in concentration. Correcting FLC values using cysta-tin C, to account for any changes in renal function, did notsignificantly improve the correlations. Furthermore,significantly raised concentrations of FLC are seen withviral infections9,10 whereas CRP is known to be poorlyresponsive and an unreliable indicator of viral infections.In addition to the diseases already discussed, preliminarystudies, measuring serum FLC concentrations in patientswith liver disease, showed levels that were significantlyelevated in some patients. Surprisingly, the elevationsseen with alcoholic liver disease were higher than thosewith other disorders such as autoimmune hepatitis.3 Thesedifferences persisted, after correction for renal functionand it was speculated that reduced pinocytotic clearanceof FLC, due to liver fibrosis, might have contributed tothe raised concentrations observed. Although pinocytoticclearance of FLC is much slower than renal clearance, amathematical model of the processes indicated thatreductions in pinocytosis could have a significant effecton FLC concentrations, particularly if there was somedegree of concurrent renal impairment.4 In conclusion, apolyclonal serum FLC increase may be the result of anumber of diverse disorders; it is not a specific marker ofany particular disease process. FLC measurement could,however, form part of an initial examination and, if indi-cating that something is amiss, prompt further, more spe-cific, investigations. There are a number of studies nowexploring these possibilities in more detail.
References
1. Waldmann TA, Strober W, Mogielnicki RP. The renal han-dling of low molecular weight proteins: II. Disorders ofserum protein catabolism in patients with tubular proteinuria,the nephrotic syndrome, or uremia. J Clin Invest 1972;51:2162–74.
2. Pratt G. Unpublished Observations 2010.3. Assi LK, Hughes RG, Gunson B et al. Abnormally ElevatedSerum Free Light Chains in Patients with Liver Disease.Presented at 45th Annual Meeting of the EuropeanAssociation for the Study of the Liver 2010; [Abstract #1139].
4. Evans ND, Chappel MJ. Unpublished Observations 2010.5. Hutchison CA, Harding S, Hewins P et al. Quantitativeassessment of serum and urinary polyclonal free light chainsin patients with chronic kidney disease. Clin J Am SocNephrol 2008;3:1684-90.
6th International Symposium on Clinical Applications of Serum Free Light Chain Analysis (plus Hevylite)Bath, United Kingdom, 23-24 September 2010
Hematology Reports 2010; 2 (s2) | 11 |

6. Go S, Chertow G, Fan D, McCulloch CE, Hsu C-Y. Chronickidney disease and the risks of death, cardiovascular events,and hospitalization. N Engl J Med 2004; 351: 1296-1305.
7. Froissart M, Rossert J, Jacquot C, et al Predictive perform-ance of the modification of diet in renal disease andCockcroft-Gault equations for estimating renal function. JAm Soc Nephrol 2005;16:763-73.
8. Abraham GN, Waterhouse C. Evidence for defectiveimmunoglobulin metabolism in severe renal insufficiency.Am J Med Sci 1974;268:227-33.
9. Terrier B, Sène D, Saadoun D, et al Serum free light chainassessment in hepatitis C virus related lymphoproliferativedisorders. Ann Rheum Dis 2009;68:89-93.
10. Landgren O, Goedert JJ, Rabkin CS et al. Circulating SerumFree Light Chains As Predictive Markers of AIDS-RelatedLymphoma. J Clin Oncol 2010;28:773-9.
11. Martin W, Abraham R, Shanafelt T et al. Serum-free lightchain--a new biomarker for patients with B-cell non-Hodgkin lymphoma and chronic lymphocytic leukemia.Translational Research 2007;149:231-5.
12. Pratt G, Harding S, Holder S et al. Abnormal serum free lightchain ratios are associated with poor survival and may reflectbiological subgroups in patients with chronic lymphocyticleukaemia. Br J Haematol 2009;144:217-22.
13. Waldmann TA, Strober W. Metabolism of Immunoglobulins.Progr. Allergy 1969;13:1-110.
14. Junghans RP, Anderson CL. The protection receptor for IgGcatabolism is the �2-microglobulin-containing neonatal intes-tinal transport receptor. Proc Natl Acad Sci USA1996;93:5512-6.
15. Kim J, Hayton WL, Robinson J M, Anderson CL. Kinetics ofFcRn-mediated recycling of IgG and albumin in human:Pathophysiology and therapeutic implications using a simpli-fied mechanism-based model. Clin Immunol 2007;122:146-55.
NON-CLONAL SERUM IMMUNOGLOBULIN FREELIGHT CHAINS (FLC) AS MARKERS OF OVERALLSURVIVALA. Dispenzieri, J.A. Katzmann, R.A. Kyle, D. Larson,S.V. Rajkumar
Mayo Clinic, Rochester, MN, USA
Background. When screening for clonal disease, the kappa(k) to lambda (λ) FLC ratio (FLC-R) is employed to correctfor both impaired catabolism (renal function) and non-spe-cific production (generalized immune overstimulation).This adjustment makes it possible to identify patients withrelative imbalances between k and λ levels, which typical-ly qualifies for clonal excess and has been of value in scree-ning for and prognosticating in patients with most clonalplasma cell disorders. We previously performed a popula-tion-based study among Olmsted County residents to ascer-tain the prevalence of monoclonal gammopathy of undeter-mined significance (MGUS) and light chain MGUS. Wehypothesized that by using this cohort, we could identifywhether the FLC assay provides information that would beprognostic in a general population of people 50-years andolder. Methods. The Olmsted MGUS prevalence cohort wascomprised of 21,463 of the 28,038 enumerated indivi-duals over the age of 50 who were living Olmsted betwe-en 1/1/95 and 11/21/2003. The final sample size of indi-viduals for the present study was 15839 due to patient los-
ses secondary to blinding, inadequate sample to performthe FLC assay, and known MGUS or LC-MGUS. For themultivariate analyses, another 772 were excluded duelack of coincident creatinine measurement. The FLCmeasurements were performed using the FLC assay(Binding Site, Birmingham, UK). The respective referen-ce ranges for k FLC and λ FLC are 0.33-1.94 mg/dL and0.57-2.63; therefore, the reference range for the sum of kand λ FLC (Σ FLC) is 0.90-4.57 mg/dL. Survival timewas calculated from the time of sample ascertainment. Results. Nearly 45% of the cohort was male. The medianage was 63 years (range 50, 109). On univariate analysis,the hazard ratio for death for those patients with thehighest decile of Σ FLC relative to the other 90% ofpatients in the cohort was 4.3 (95%CI 4.01, 4.62), Figure1. Because serum immunoglobulin FLC rise with age andwith renal insufficiency, a multivariate analysis was per-formed to exclude the possibility that Σ FLC was merelya surrogate for these other parameters. With these othervariables included, the hazard ratio for death with highestΣ FLC dropped 2.0 (95%1.88, 2.2). Conclusions. The finding that Σ FLC above the normalrange (i.e. highest decile) among individuals above the ageof 50, excluding patients with known MGUS or LC-MGUS, is intriguing. Although there is an association bet-ween Σ FLC, renal function, gender, and age, excess risk ofdeath still exists. The mechanism by which Σ FLC predictsfor outcomes is uncertain, but one could postulate that con-ditions resulting in overactivation of the immune systemcontributes to excess risk of death. Whether the Σ FLCadds above and beyond other conventional inflammatorymarkers like ESR or CRP cannot be determined by the pre-sent study, but is certainly worthy of further investigation.
Figure 1.
| 12 | Hematology Reports 2010; 2 (s2)
Oral Communications
Deciles Σ FLC
123-4
567
8
9
10
(lowest)
(highest)
1.0
0.9
0.8
0.7
0.6
0.5
0.4
0.3
0.2
0.1
0
0 2 4 6 8 10 12 14 16
Years FU
Surv
ivin
g
POLYCLONAL FREE LIGHT CHAIN ELEVATIONAND MORTALITY IN THE GERMAN HEINZ NIX-DORF RECALL STUDYJ. Dürig,1 L. Eisele,1 A Hüttmann,1 U. Dührsen,1 A.Führer,1 S. Kieruzel,1 B. Bokhof,3 R. Erbel,3 K. Mann,3 K.-H. Jöckel,3 S. Moebus3 on behalf of the Heinz NixdorfRecall study Investigative Group1Department of Hematology, University Hospital Essen,Germany; 2Department of Endocrinology and Divisionof Laboratory Research, University Hospital Essen,Germany; 3Heinz Nixdorf Recall study InvestigativeGroup
Abnormalities of the �λ� free light chain (FLC) ratio candetect monoclonal FLC elevations and are a valuable toolin the diagnosis and follow-up of plasma cell dyscrasias.However, due to their generation in active cells of theimmune system and their renal metabolism, polyclonalFLC elevations might also provide valuable hints to otherpathologic conditions. Recent reports suggest e.g. a rolein predicting outcome in chronic viral infectious diseases.In a previous study, we screened the cohort of the GermanHeinz Nixdorf Recall study for monoclonal gammopa-thies by combined serum protein electrophoresis andscreening immunofixation1 and also measured FLC con-centration by nephelometric immunoassays (The BindingSite Group Ltd, UK) in all available samples. We herereport our first preliminary results of the analysis of poly-clonal FLC elevation with regard to all-cause mortality inthe Heinz Nixdorf Recall cohort. After exclusion of sam-ples with monoclonal FLC elevation, laboratory resultstogether with clinical information from 4350 study subjects(2180 male, 2170 female) were available for analysis. Weused summated FLC (total FLC, tFLC) as a measure forpolyclonal elevation. tFLC ranged from 2.7 to 275 mg/lwith a median of 30.2 mg/l. High levels of tFLC were asso-ciated with high-sensitive CRP (hsCRP) and chronic kidneydisease (CKD). Both quintiles of tFLC and CKD stage wereassociated with shorter survival in univariate analysis.Using the median as cutoff, tFLC still separated groups withdifferent survival within CKD stages 0 and 1. tFLC remai-ned an independent predictor of survival in multivariablecox regression analysis adjusted for sex, age, hsCRP andCKD stage (HR 1.13 (95%CI 1.03 – 1.24 per quintile,p=0.0068). For the 274 deaths that occurred during amedian observational time of 5 years we had informationavailable from death certificates. Causes of death were cate-gorized into cardiopulmonary, infectious, cancer, and other.The number of deaths increased from the lowest to thehighest tFLC quintile (34 vs. 98), however we found noassociations of tFLC with categorized causes of death.Polyclonal FLC measurements are affected by a varietyof health conditions and may thus be subject to fluctua-tions over time. We are currently measuring FLC in the 5-year follow-up samples of the Heinz Nixdorf Recallstudy. This will provide us with a more precise estimateof polyclonal FLC elevation and will help us to furtherdefine their role in predicting mortality. These results willbe reported at the conference.
References
1. Lewin Eisele, Jan Dürig, Andreas Hüttmann, UlrichDührsen, Anja Führer, Sabrina Kieruzel, Roland Assert,Beate Bokhof, Raimund Erbel, Klaus Mann, Karl-HeinzJöckel, Susanne Moebus. Prevalence of monoclonal gam-mopathy of undetermined significance in a densely populat-ed, highly industrialized area in Germany. EuropeanHematology Association 2010, Abstract book, No. 0949.
CIRCULATING SERUM FREE LIGHT CHAINS ASPREDICTORS OF AIDS LYMPHOMA AND BEYONDO. Landgren
National Cancer Institute, National Institutes of Health,Center for Cancer Research, Medical Oncology Branch,Bethesda, MD, USA
Chronic HIV infection leads to progressive immunosup-pression (i.e., AIDS). As a result, HIV-infected indivi-duals have a markedly increased risk for certain cancers,including non-Hodgkin’s lymphoma (NHL); this riskremains increased in the era of effective HIV therapy.Although the hallmark of HIV infection is progressiveloss of CD4 lymphocytes, HIV-infected individuals at allstages of progression also manifest abnormalities in B-cell function. B-cell dysfunction is characterized byabnormally low levels of antibodies to specific pathogensand poor immune responses to vaccines. Paradoxically,total serum levels of immunoglobulin (Ig; mostly of Igisotype G) are elevated, reflecting nonspecific polyclonalB-cell activation. In some, but not other, studies, highlevels of serum globulins (mostly Ig) have been reportedto be predictive of the development of NHL. Also, basedon small numbers, it has been suggested that monoclonalgammopathy of undetermined significance (MGUS) maybe elevated among HIV-infected people and it is thus pos-sible that MGUS could predict AIDS NHL among HIV-infected people. Recently (J Clin Oncol 2010;28:773-9),we took advantage of three established cohorts of HIV-infected people, and evaluated the role of B-cell dysfun-ction in the etiology of AIDS-related NHL by directlymeasuring serum-based markers of B-cell stimulation.Among approximately 5,000 HIV-infected people, weidentified 66 individuals who developed AIDS NHL andfor whom serially collected blood samples collected befo-re NHL diagnosis were available. We applied proteinelectrophoresis, immunofixation, and assays for and freelight chains (FLCs) to define patterns of serum proteinabnormalities before NHL diagnosis. For comparison, wealso evaluated 225 HIV-infected matched controls whowere free from NHL. Our study tested the hypothesis thatthe risk of lymphomagenesis is related to an alteredimmunoregulatory state, reflected in circulating polyclo-nal or monoclonal Ig levels. Serum/plasma samples obtai-ned 0 to 2 years and 2 to 5 years before diagnosis/selec-tion were assayed for IgG, IgM, and IgA levels; monoclo-nal (M) Igs; and kappa and lambda FLC levels. Patientsand matched controls were compared by using conditio-nal logistic regression. The kappa and lambda FLCs wereboth significantly higher in patients (e.g., in 2- to 5-yearwindow: median kappa, 4.24 v 3.43 mg/dL; median lam-bda, 4.04 v 3.09 mg/dL) and strongly predicted NHL in a
Hematology Reports 2010; 2 (s2) | 13 |
6th International Symposium on Clinical Applications of Serum Free Light Chain Analysis (plus Hevylite)Bath, United Kingdom, 23-24 September 2010

dose-response manner up to 2 to 5 years before diagno-sis/selection (e.g., NHL risk 3.76-fold higher with kappaconcentration >2 times the upper limit of normal (ULN),and 8.13-fold higher with lambda concentration >2 timesULN compared with normal levels). In contrast, IgG,IgM, and IgA levels were similar in patients and controls.M proteins were detected in only two patients with NHL(3%) and in nine controls (4%), and they were not signi-ficantly associated with NHL risk. In summary, we foundthat the presence of elevated FLC levels, a marker ofpolyclonal B-cell activation, is a strong risk factor forAIDS-related NHL among HIV-infected individuals. Ona clinical note, we speculate that FLC measurement mayhave utility in assessing risk for NHL and perhaps otherAIDS-related outcomes. At present, decisions regardinginitiation of HAART are guided mainly by the CD4 countand, to a secondary degree, the HIV viral load.Commonly, a threshold CD4 count of 350 cells/mm3 isused, but recent evidence suggests that earlier initiation ofHAART may be beneficial to prevent HIV-related com-plications. One possibility is that clinicians could utilizeFLC levels to help determine which patients might bene-fit most in starting HAART. Although this is a prelimina-ry suggestion, this approach would find support from ourobservations that FLCs were especially predictive ofNHL risk among patients not on HAART who had a rela-tively high CD4 count ( 100 cells/mm3) and that this pre-dictive relationship was obtained over a prolonged periodof 2 to 5 years after FLC measurement.Although NHLrisk has declined substantially in the HAART era, lym-phoma still remains a considerably important morbidityin the setting of HIV infection. On the basis of our fin-dings, additional elucidation of the pathogenetic mecha-nisms of AIDS-related NHL should continue to be a prio-rity in epidemiologic studies and clinical trials, and thiselucidation may help in the development of improvedprevention strategies and the identification of novel the-rapeutic targets.
DISEASES ASSOCIATED WITH ELEVATEDPOLYCLONAL FREE LIGHT CHAINS – II
HEPATITIS C VIRUS AND LYMPHOMA DEVELOPMENT B. Terrier, P. Cacoub
Department of Internal Medicine, Groupe HospitalierPitié-Salpétrière, Université Paris 6, Paris, France
Besides hepatic manifestations, chronic hepatitis C virus(HCV) infection is associated with B-cell disorders,mainly mixed cryoglobulinemia (MC) which can evolvein some cases into overt B-cell non Hodgkin lymphoma(B-NHL). The estimated risk for B-NHL in patients withHCV-related MC is 35-fold higher compared with thegeneral population. Epidemiological studies have demon-strated the association between HCV infection and B-NHL, mainly low-grade marginal zone lymphomas, andmore rarely lymphoplasmacytic lymphomas and large Bcell lymphomas. The finding that HCV-associated spleniclymphoma with villous lymphocytes responds to antiviraltherapy with a strong correlation between viral load andtumor burden supports the existence of a causal relation-ship between HCV chronic antigenic stimulation and themarginal zone lymphomatous process. However, a directtransformation of B-cells may be at play in some cases. Inpatients infected with HCV, the diagnosis of B-NHL isoften difficult, and early biomarkers are lacking. Freelight chain (FLC) assessment could be used as a surroga-te marker of B-cell lymphoproliferative disorders. Anabnormal serum FLC ratio is consistently associated withthe presence of MC vasculitis and/or B-NHL. Moreover,after antiviral therapy, the serum FLC ratio could be usedas marker of the control of the HCV-related lymphoproli-feration.
FREE LIGHT CHAINS OF IMMUNOGLOBULINS ASDISEASE ACTIVITY MARKERS IN AUTOIMMUNEDISEASES J. Gottenberg
National Reference Center for Autoimmune Diseases,Strasbourg University Hospital, France
Objectives. B lymphocytes play a pathogenic role inautoimmune diseases. Serum levels of free light chains ofimmunoglobulins might represent markers of B-cell acti-vation and disease activity markers in rheumatoid arthri-tis (RA) and primary Sjögren’s syndrome (pSS).Methods. Serum FLCs were assessed using nephelome-try, as well as other markers of B-cell activation, such astotal levels of Igs, beta2-microglobulin, B-cell-activatingfactor of the TNF family (BAFF), in prospective cohortsof patients with RA and patients with pSS.Results. Increased levels of FLCs and other markers ofB-cell activation were observed in patients with RA andpSS compared with controls. Kappa to lambda ratio wasnot altered. Serum FLC levels were associated withhigher disease activity in both RA and pSS. In early RA,increased kappa levels were associated with a higher fre-
| 14 | Hematology Reports 2010; 2 (s2)
Oral Communications

Hematology Reports 2010; 2 (s2) | 15 |
6th International Symposium on Clinical Applications of Serum Free Light Chain Analysis (plus Hevylite)Bath, United Kingdom, 23-24 September 2010
quency of radiographic lesions.Conclusions. Serum markers of B-cell activation, inclu-ding FLCs, are increased in autoimmune diseases andcorrelate with disease activity. An extended follow-up isnecessary to determine whether the increase of FLCsmight help identify patients at risk to develop lympho-mas, which are more frequent in autoimmune diseases.
CLINICAL AND BIOLOGICAL RELEVANCE OFSERUM FREE LIGHT CHAINS (sFLC) ASSESSMENTIN PATIENTS WITH HODGKIN’S LYMPHOMAA. Pinto,1 G. Iaccarino,1 F. Russo,1 B. Amoroso,2
E. Morelli,1 C. Riemma,1 R. De Filippi1,3
1Hematology-Oncology and Stem Cell TransplantationUnit, Istituto Nazionale Tumori, Fondazione‘G.Pascale’, IRCSS, Naples, Italy; 2The Binding SiteGroup Ltd, Rome, Italy; 3Faculty of BiotechnologicalSciences, Federico II University, Naples, Italy
The role of cellular microenvironment in the evolutionand progression of tumours has recently emerged also asan important determinant of prognosis and response to tre-atments. A suitable and well studied model of tumour-microenvironment interactions is represented by classicalHodgkin’s lymphoma (cHL). The tumor cells of HL, theHodgkin and Reed-Sternberg (H-RS) cells, derive fromgerminal center B-cells with a deranged B-cell transcrip-tion program due to epigenetic silencing and acquiredgenetic lesions. Tissue H-RS cells are surrounded by apreponderant infiltrate of mixed non-malignant reactivecells which are recruited and/or induced to proliferate bytumour cells and in turn produce soluble or membrane-bound molecules essential for tumour cell growth and sur-vival. Microenvironmental cell types of cHL include non-neoplastic B and T small lymphocytes, plasma cells, eosi-nophils, mast cells and histiocytes/macrophages in addi-tion to a great number of fibroblast-like cells and interdi-gitating reticulum cells which often associate with HRScells within the collagen bands of nodular sclerosis cHL.While tumor H-RS mostly lost the typical B cell surfaceand functional phenotype and display an abnormal reper-toire of membrane markers and transcriptional regulatorof multiple lympho-haemopoietic lineages, normal fun-ctionally mature B-lymphocytes may account for 20% to50% of infiltrating reactive cells in HL lesions. These non-malignant B cells are able to deliver survival and prolife-ration signals to H-HRS cells through the secretion ofmultiple cytokines and the presentation of TNF-superfa-mily ligands such as CD30L, CD40L and OX40L. Morerecently, it has been shown that small percentages (0.2%;range 0–2.4% of CD19+) of clonotypic B cells, i.e. clonal-ly related to HRS cells, circulate in the peripheral blood ofHL patients, probably representing HL-initiating cells.The role of reactive B-cells in HL is still poorly understo-od. While some data indicate that high intratumoral B-cellcounts may predict for a better outcome, the activity ofrituximab in cHL, regardless of CD20 expression on H-RScells, was suggested to result by depletion from the HLmicroenvironment of normal B lymphocytes required fortumor cell growth. Since the serum free light chain (sFLC)assay detects and quantifies monoclonal and polyclonal B-
cell populations expanding in lymphohemopoietic tissues,we exploited the sFLC testing to further explore the biolo-gic significance of B-lymphocytes in HL. Since tumorcells of HL do not produce immunoglobulins, we assumedthat results would directly reflect changes in the reactiveB-cells pool. To this end frozen (-80°C) serum samplesfrom 119 newly diagnosed cHL patients and two separategroups of 26 relapses and 30 patients in complete remis-sion from at least two years, were assayed by immunone-phelometry (Freelite, The Binding Site Group Ltd., UK).After quantization of free k and λ concentrations (normalranges, k: 3.3-19.4 mg/L; λ: 5.71-26.3 mg/L), the sFLCk/λ ratio was calculated (reference range 0.26-1.65) andresults were correlated to clinico-pathologic findings atdiagnosis and clinical outcome. Patients were required tohave a normal renal function and normal serum immuno-chemistry at study entry. This because serum levels ofpolyclonal and monoclonal sFLC are known to increase asa function of the progressive renal impairment. Themedian age was 31 years, with 22% of patients aged ≥45years. Histology was nodular sclerosis in 85 pts (71.4%)and 72 (60.5%) were in stage I–II. According to GHSGcriteria, 16% had early favorable, 29% early unfavorableand 55% advanced disease. The International PrognosticScore (IPS) was of 0-2 and ≥3 in 66.4% and 33.6% of pts,respectively. The EBV status was available for 111patients as assessed by LMP-1 immunostaining. Resultsshowed that 48% and 29% of newly diagnosed patientsdisplayed abnormally elevated serum levels of k and λsFLC respectively, consistent with the presence of anexpanded polyclonal B-cell population. Interestingly,about one fourth of patients displayed the simultaneouselevation of both k and λ levels. In contrast, sFLC testingwas consistent with the presence of monoclonal B-cells inonly 7% of patients, who appeared to bear a B-cell popu-lation clonally restricted for k chains in about 90% of thecases. Similar results were obtained when comparing themedian absolute levels of k and λ sFLC among the diffe-rent patients subsets. A statistically significant differencewas evident between newly diagnosed or relapsed patientsas compared to those in complete remission for the abso-lute levels of both k and λ sFLC, suggesting that an abnor-mal Freelite test may correlate with the presence of anactive disease. The presence of concurrently elevatedlevels of both k and λ sFLC statistically correlated withsome clinical features at presentation including older age,leukocytosis, abnormal erythrocyte sedimentation rate anda low albumin. The presence of elevated levels of sFLCwas also statistically correlated to an unfavourable IPSscore, ≥3. This was not, however, unexpected given thatIPS includes most of the above features. Similar resultswere obtained by analyzing separately patients with eleva-ted kappa or lambda levels. Conversely, no correlationswith other prognostic parameters, including the EBV sta-tus were found. To assess the effects of the abnormal k andλ sFLC values on the clinical outcome we performed anevent free survival (EFS) analysis. Patients were dividedinto tertiles for k and λ values and no statistically signifi-cant differences emerged when the whole patient popula-tion was analyzed, according sFLC levels. In contrast,while we found no significant association with responserate, baseline elevation in sFLC predicted for event free
survival in 51 evaluable pts with early stage disease trea-ted with 4 to 6 ABVD cycles with or without radiothera-py. The best break point value for predicting EFS coinci-ded with the upper limit of the highest tertile for both k(>24.43 mg/L) or λ (> than 23.33mg/L) sFLC. Patients inthe top tertile had the worst outcome compared with the 2lower tertiles. Outcomes for the 2 lower tertiles were com-parable. The worst outcome, in terms of EFS, was recor-ded in a small group of 13 early stage patients who displa-yed, at diagnosis, the concurrent elevation of both k and λsFLC with values in the the respective 3° tertiles. The pre-dictive effect of k and λ tertiles was maintained within thelow and high risk IPS groups IPS. In contrast, baselinesFLC levels, kappa or lambda, were not predictive forEFS in pts with advanced disease. The presence of anexpanded polyclonal B-cell population in about 50% ofpatients, as witnessed by our Freelite testing data may berelevant to the pathophysiology of HL under severalaspects. First, polyclonal B-cells may directly deliver sur-vival and stimulatory signals to H-RS cells and/or theirprogenitors promoting tumor cell growth. Second, anexcess of FLCs in HL tissues may promote and sustaininflammatory processes typical for this disease by activa-ting several reactive cells which in turn stimulate H-RScells and maintain the tumour microenvironment. Underthis light different groups have shown that FLCs stimula-te tissue sclerosis through fibroblast activation, and pro-mote survival and activation of both neutrophils and mastcells. These latter cell types are able in turn to stimulatetumor cells through a wide array of soluble and membra-ne-bound molecules. Our study support that elevated FLClevels may reflect an increased polyclonal B cell activityin HL microenvironment which appears to negativelyinfluence the outcome of pts in early stage disease. Thiseffect is lost in advanced disease, suggesting that rituxi-mab might result more active for pts in early than advan-ced stages. Finally, whether such polyclonal B-cell expan-sion, present from the early phases of disease develop-ment, and at relapse, may facilitate the emergence and/ormaintainment of the recently described putative HL-initia-ting small B-cells, remains an intriguing possibility to befurther assessed.
HEVYLITE
HEVYLITE: CONCEPTSA.R. Bradwell
Department of Immunity and Infection, University ofBirmingham and The Binding Site Group Ltd,Birmingham, UK
Introduction. Intact immunoglobulin - heavy chain/lightchain (HLC) ratios (Hevylite)1,2 The important clinicalapplications of serum FLC k/λ ratios have stimulated theanalysis of k/λ ratios for the M-spike based upon specificimmunoassays for IgGk, IgGλ, IgAk and IgAλ. Of parti-cular interest is the ability of the HLC assays, as Igk/Igλratios, to compensate for changes in FcRn turnover, bloodvolume and haematocrit variations. Furthermore theyallow measurement of the suppression of the un-involved,polyclonal Igs of the same isotype as that produced by thetumor. This has not previously been possible. Intactimmunoglobulin molecules contain unique junctionalepitopes between the heavy chain (CH1) and light chain(CL) constant regions. These are the target of Hevyliteantibodies. Hence, they can separately identify the diffe-rent light chain types of each immunoglobulin class, i.e.,IgGk, IgGλ, IgAk, IgAλ and IgMk, IgMλ.FcRn Receptors.3,4,5 Under normal circumstances, serumproteins that are too large for renal filtration (>65kDa)have a half-life of 2-3 days. The removal mechanism isby pinocytosis which occurs in nucleated cells as theyobtain their essential nutrients from plasma. However, forIgG the half-life is prolonged to 20-25 days by FcRnreceptors. These heterodimeric FcRn molecules protectinternalised IgG and albumin from acid digestion andrecycle them back to the cell surfaces to be released in theslightly alkaline environment of the blood. The processoccurs many times under normal circumstances so thatthe half-lives of both IgG and albumin extend from 3 to21 days. Interestingly, IgG and albumin molecules do notcompete for the same receptor sites, but the exact mecha-nism and sites of binding are unknown. FcRn proteinshave a structure similar to Class I MHC molecules with aheavy chain of 3 domains and a single domain light chaincomprising β2-microglobulin. They are the same recep-tors that transport IgG from the mother to the developingfoetus in the last trimester of pregnancy. When there areno functioning FcRn receptors such as in familial hyper-catabolic hypoproteinaemia (a disease associated with agenetic deficiency of β2-microglobulin) the half-lives ofIgG and albumin are only 2-3 days. Such patients havehypogammaglobulinaemia, not from failure of produc-tion, but simply from excess catabolism. An additionalfeature of the FcRn recycling system is that it saturates,presumably because of limited supplies of FcRn molecu-les. This results in a continuous relationship between IgGconcentrations and its serum half-life. IgG half-life is 21days at normal concentrations but at high IgG concentra-tions this falls towards 3 days as there are insufficientFcRn receptors to protect all IgG molecules. Hence, apatient presenting with, for example, a monoclonal IgGof 90g/L is producing far more than 3 times the amountof IgG than a patient presenting with 30g/L of IgG. In
| 16 | Hematology Reports 2010; 2 (s2)
Oral Communications
contrast, at low IgG concentrations, when FcRn receptorprotection is maximal, IgG half-life extends for manyweeks. For IgA and IgM, clearance rates are not concen-tration dependent, although there is presumably somemechanism that prolongs their half-lives beyond 2-3 days(5 days for IgM and 6 days for IgA compared with only 3days for IgD). This variation in catabolic rate has severalconsequences for serum measurements of IgG in patientswith intact immunoglobulin multiple myeloma:1) Concentrations do not accurately relate to tumour pro-duction rates (in addition to any variations in the efficien-cy of Ig production by myeloma cells).2) Incremental increases in concentrations under-estima-te tumour growth.3) Incremental falls in concentrations under-estimatereductions in tumour size.4) At high concentrations, the rate of IgG fall after suc-cessful tumour killing is much faster than 21 days, whilefor low concentrations it is slower.5) Background IgG is low when monoclonal IgG is highbecause of FcRn saturation. This is manifest as suppres-sion of polyclonal IgG.6 In additional, there is bone mar-row suppression of IgG producing plasma cells in manypatients. Hence, the apparent speed of tumour response is muchgreater when monoclonal IgG concentrations are veryhigh compared with when they are low. Since high con-centrations are associated with larger tumour masses, andnormally a worse outcome, these patients may have a fastinitial fall in IgG concentrations but then may relapsequickly. Therefore, landmark studies of patients at 6 or 12months, where patients have responded fast initially mayidentify patients with worse prognosis. These processesmean that measurements of, and changes in, monoclonalIgG concentrations bear less relationship to tumour pro-duction rates than might be hoped. Early guidelines forMM included measurements of monoclonal immunoglo-bulin concentrations for tumour staging but it was laterrealised that such measurements were unhelpful. Thiswas probably because of these mechanisms. FcRn recep-tors are functional in many different cells including thepodocytes of the glomerular filtration apparatus. Proteinsdiffusing through the glomerular basement membranepass through the slit membrane of the podocytes into theurinary space of the Bowman’s capsule. Proteins of<60kDa are readily filtered but larger proteins cannotpass so they remain in the basement membrane wherethey could block fluid flow. FcRn molecules activelytransport albumin (65kDa) and immunoglobulins(150kDa) from the basement membrane, through thepodocyte cells into the urinary space, thus, by-passingpodocyte slit fenestrations. This provides a mechanismwhereby monoclonal IgG molecules could enter the urinein the absence of glomerular damage. IgG molecules cansubsequently be taken up by cells of the proximal tubules,partially degraded into monoclonal FLCs and re-enter theurine. This may explain why some patients with mono-clonal serum IgG but no monoclonal serum FLCs mayhave monoclonal IgG and monoclonal FLCs in urine.7,8
Blood volume changes in monoclonal gammopathies.9
Changes in red cell volume (haematocrit) affect measure-ments of serum immunoglobulins in a direct manner. If,
for example, haematocrit rises from 20 to 40% during tre-atment there is less blood volume available for immuno-globulin molecules so their concentrations increase (assu-ming no changes in immunoglobulin mass). Moreover,changes in haematocrit do not affect the serum concentra-tions of IgG, A and M to the same extent. Because of theirdiffering molecular sizes, 90% of the IgM, 50% of IgGand only 20% of free light chains (FLCs) are located inthe vascular compartment. Hence, serum FLCs are leastaffected because of their large extra-vascular distribution.Furthermore, using serum FLC ratios compensates forany errors in the individual FLCs or immunoglobulinconcentrations, making them inherently more reliable forjudging changes in tumour mass. Blood volume changesalso occur in monoclonal gammopathies. Immuno -globulin molecules are osmotically active so that highserum concentrations lead to increases in plasma volume.This relates to the relative amounts in serum comparedwith the extra-vascular compartment, so again, molecularsize is relevant. As the mass of monoclonal immunoglo-bulins fall during treatment, there is a reduction in theplasma volume and vice-versa. Thus, changes in serummeasurements under-represent changes in tumour pro-duction. Again, serum FLC ratios are little affected bychanges in plasma volume. All these various factors: longhalf-life of serum IgG, saturable receptors and changes inhaematocrit and blood volume, may explain why intact Igmeasurements at diagnosis are not helpful prognosticallywhile serum FLCs and serum FLC ratios are prognostic. Antibody specificity. Inevitably, one of the most deman-ding aspects of HLC assay production is ensuring goodspecificity. As for FLC immunoassays, the reagents arepolyclonal antibodies produced in sheep. Immunisationand adsorption techniques are designed to ensure nocross-reactivity. For example, IgGk reagents do not reactwith free k or IgGλ, and any other immunoglobulin.There are 4 HLC epitope regions per immunoglobulinmolecule - one on each side of the heavy chain/light chaincontact regions and the same on the other arm of themolecule. Because there are 4 per molecule, immunecomplexes readily form to produce good homogeneousimmunoassays that are suitable for nephelometry and tur-bidimetry.
References
1. Bradwell AR, Harding SJ, Fourrier NJ, et al. Assessment ofMonoclonal Gammopathies by Nephelometric Measurementof Individual Immunoglobulin k/λ ratios. Clin Chem 2009;55:1646-55.
2. Keren DF. Heavy/Light-Chain Analysis of MonoclonalGammopathies. Editorial Clin Chem 2009;55:1606-8.
3. Kim J, Hayton W, Robinson J, et al. Kinetics of FcRn-mediat-ed recycling of IgG and albumin in humans: Pathophysiologyand therapeutic implications using a simplified mechanism-based model. Clin Immunol 2007;122:146-55.
4. Roopenian DC, Akilesh S. RcRn:the neonatal Fc receptorcomes of age. Nature Reviews: Immunology 2007;7:715-25.
5. Anderson CL, Chaudhury C, Kim J, Bronson CL, Wani MA,Mohanty S. Perspective – FcRn transports albumin: rele-vance to immunology and medicine. TRENDS inImmunology 2006;27:343-8.
6. Wang L, Young DC. Suppression of polyclonal Ig productionby M-proteins shows isotype specificity. Ann Clin Lab Sci
Hematology Reports 2010; 2 (s2) | 17 |
6th International Symposium on Clinical Applications of Serum Free Light Chain Analysis (plus Hevylite)Bath, United Kingdom, 23-24 September 2010

2001;31:274-8. 7. Katzmann JA, Dispenzieri A, Kyle RA et al. Elimination ofthe need for urine studies in the screening algorithm for mon-oclonal gammopathies by using serum immunofixation andfree ligh chain assays. Mayo Clin Proc 2006;81:1575-8.
8. Beetham R, Wasse J, Whiteway AJ et al. Can serum free lighchains replace urine electrophoresis in the detection of mon-oclonal gammopathies? Ann Clin Biochem 2007;44:516-22.
9. Alexanian R. Blood Volume in Monoclonal Gammopathy.Blood 1977;49:301-7.
DIAGNOSTIC ROLE OF HEAVY/LIGHT CHAINANALYSISS. Harding
The Binding Site Group Ltd, Birmingham, UK
Background
International guidelines recommend serum protein elec-trophoresis (SPE) and immunofixation (IFE) for thedetection, quantification and typing of monoclonalimmunoglobulins. This approach is adequate for themajority of intact immunoglobulins but inadequate inidentifying and monitoring monoclonal serum free lightchains (FLC). Nephelometric tests are currently used tomeasure FLC and their use has been recommended inscreening algorithms. However, FLC testing is not routi-nely used in screening and many laboratories utilise SPEalone as the primary screen, reflexing to IFE if an abnor-mality is seen. SPE is relatively insensitive and quantifi-cation of monoclonal proteins below 1g/L may not beaccurate due to the presence of a normal polyclonalimmunoglobulin background. Furthermore, identificationand quantification of IgA, and to a lesser extent IgM,monoclonal proteins by SPE can be difficult due to theirco-migration with other serum proteins such as transfer-rin and beta-2 microglobulin. IFE can detect such pro-teins but it is qualitative and subjective; guidelinesrecommend the use of total immunoglobulin measure-ments for monitoring these patients. Total immunoglobu-lin measurements are analytically sensitive but inherentlyinclude both monoclonal and polyclonal proteins, whichmake them clinically insensitive when immunoglobulinconcentrations are close to normal. Monospecific antisera have now been produced whichrecognise junctional, conformational epitopes betweenthe bound kappa or lambda light chain and their heavychain partners. These antisera have been used to generatenephelometric tests for the measurement of serum IgGk /IgGλ, IgAk / IgAλ and IgMk / IgMλ which allow thedetermination of heavy/light chain ratios (HLC). Normalreference ranges were established for IgG, IgA and IgMHLC ratios from healthy blood donors. Sensitivity limits for the detection of monoclonal immu-noglobulins were determined experimentally by dilutinga known concentration of monoclonal protein into normalsera. For 3 IgG monoclonal proteins SPE had a greatersensitivity than the IgGk / IgGλ ratio. For IgA and IgMmonoclonal proteins sensitivities for SPE and HLC ratioswere similar. Arithmetically it is easy to understand whythe IgG HLC ratio may not be as sensitive as IgA or IgMin this system. 1g/L of monoclonal protein in a normal(16g/L) IgG polyclonal background represents less than
10% of the total IgG, by contrast 1g/L monoclonal proteinin normal (2g/L) IgA or IgM represents 33% of the totalIg. This concentration of monoclonal protein would bewithin the detection limits of SPE, although perhaps atthe limit of accurate quantification. Furthermore, greatersensitivity for HLC ratios would be expected in clinicalsamples because of the suppression of the non-tumourimmunoglobulin production. Retrospectively, 530 IgG (374 IgGk and 156 IgGλ) pre-sentation sera from patients with multiple myeloma(MM) have been analysed. Abnormal ratios were reportedin 526/530 patients. All 4 patients with normal IgGk /IgGλ ratios had monoclonal protein levels below thedetection limit of SPE and had total IgG concentrations ofless than 10g/L but within the normal range. Of thesepatients 2/4 had high levels of kFLC and abnormal FLCratios. A third patient was reclassified as a nonsecretorymultiple myeloma patient and was negative by IFE andFLC. The final patient’s sample had degraded and accu-rate evaluation was not possible. In addition, 210 IgA (145 IgAk and 65 IgAλ) MM pre-sentation sera were analysed; abnormal HLC ratios werefound in all 210 sera. 83/210 sera had monoclonal pro-teins migrating anodally and accurate quantification wasnot possible by SPE. Finally, of 92 IgM (71 IgMk and 21IgMλ) Waldenström’s Macroglobulinemia (WM) patientstested, 91/92 sera had an abnormal IgMk / IgMλ ratio.For the 1 WM patient with a normal ratio, there was noobvious paraprotein by SPE densitometry and the totalIgM concentration was less than 2g/L.Similar diagnostic sensitivities have been seen in mono-clonal gammopathy of undetermined significance(MGUS) and smouldering MM (SMM). In presentationsera from 23 IgA MGUS (13 IgAk and 10 IgAλ) and 4SMM (2IgAk and 2 IgAλ), 22/23 and 4/4 patients respec-tively had abnormal IgA HLC ratios. The 1 IgA MGUSpatient with a normal ratio had no obvious paraprotein bySPE and a barely detectable band by IFE; total IgA wasless than 2g/L. In presentation sera from 7 IgG MGUS (6IgGk and 1IgGλ) and 30 SMM (20 IgGk and 10 IgGλ),5/7 MGUS and 28/30 SMM patients had abnormal ratios.All those patients with normal IgG HLC ratios had mono-clonal proteins below 1g/L and had normal levels of poly-clonal IgG. In the majority of patients immunosuppres-sion of polyclonal Ig means that HLC ratios are as sensi-tive, or more sensitive than SPE. A few IgG patients withlow level monoclonal production and normal polyclonalIgG serum concentrations have normal IgG HLC ratios. Preliminary data is now available from a study comparingIFE to HLC ratio sensitivities. Approximately 1500 serawere screened with SPE and FLC, 41 patients were iden-tified as having abnormal SPE (24 of which were alsoabnormal by FLC) and an additional 42 patients had FLCabnormalities alone. IgA HLC ratio matched IFE in thedetection of monoclonal proteins. IgG HLC ratios detec-ted the clinically diagnosed MM and plasmacytomapatients. There were discordant IgG HLC and IFE resultsin 7 patients, 2 of whom had MGUS with monoclonalprotein production less than 1g/L. The remaining 5patients had diseases not normally associated with mono-clonal protein production. Similar results were returnedwith the IgM HLC assay. In the patients with a normal
| 18 | Hematology Reports 2010; 2 (s2)
Oral Communications
SPE and who were only identified by abnormal FLCratio, HLC ratios detected 1 small lymphocytic lympho-ma patient, 3 chronic lymphocytic leukaemia patients, 1WM patient and 1 patient with progressing MGUS. Therewere other malignancies identified not normally associa-ted with monoclonal protein production and final clinicaloutcome for all the patients has yet to be established. Analysis of HLC ratios is a sensitive tool for the diagno-sis of monoclonal gammopathies. Low concentrations ofIgG monoclonal proteins may be missed by the assay, butthese are unlikely to be symptomatic. In addition theassay is more sensitive than SPE at detecting B-cell non-Hodgkin lymphoma and may aid in early detection.
MONITORING MULTIPLE MYELOMA PATIENTSWITH HEAVY/LIGHT CHAIN ANTIBODIES FOR IgAAND IgGH. Ludwig, L. Mirbahai, N. Zojer, A.R. Bradwell, S.HardingCenter for Oncology and Haematology,Wilhelminenspital, Vienna, Austria
Background. Serum protein electrophoresis (SPE) densi-tometry is the most commonly used method for the quan-tification of monoclonal proteins (M-proteins). In multiplemyeloma (MM) changes in M-protein concentrations areroutinely used to monitor the course of the disease.However, quantification of the M-protein by SPE can beinaccurate. In approximately 30% of IgA MM patients theM-protein co-migrates with other serum proteins andsmall IgG monoclonal proteins can be difficult to quanti-fy. Nephelometric measurements of total immunoglobu-lins would avoid such problems. However, inherently themeasurements will include monoclonal and polyclonalimmunoglobulins making response evaluation and moni-toring difficult particularly at normal serum concentra-tions. Nephelometric assays have been produced whichcan quantify the different light chain types of each of theIgA and IgG immunoglobulin classes. Here we reportresults obtained using these assays with 102 MM patients(53 IgA and 49 IgG) followed through the course of theirdisease. In addition, we compared results obtained withthe novel assays with those obtained using SPE, IFE andfree light chain (FLC) measurements.Materials and Methods. SPE and immunofixation (IFE)were performed using a SEBIA Hydrasys system, accor-ding to the manufacturer’s instructions. FLC andheavy/light chain (HLC) analysis was performed on aSiemens Dade Behring BNII analyzer. Longitudinal sam-ples from 53 IgA (29 IgAk / 24IgAλ) and 49 IgG (31IgGk / 18 IgGλ) MM patients were analysed (mediannumber of samples = 4, range 1-12). 68 (29 IgA and 39IgG) patients had baseline samples available.Results. IgA HLC ratios correctly identified monoclonalprotein in 29/29 baseline samples and matched IFE. In 14of the 53 IgA patients the monoclonal protein was obscu-red by other proteins and accurate quantification withSPE densitometry was not possible. In these cases theHLC ratio could be used to monitor the patients throughthe course of their disease. IgG HLC ratios correctly iden-tified monoclonal protein in 39/39 baseline samples and
matched IFE. In 41 IgG MM patients, measurement ofHLC ratios allowed response evaluation and monitoringof the disease. In 6/41 patient sera at presentation totalIgG immunoglobulin levels were within the normal range(6-16 g/L) with monoclonal protein measurements betwe-en 2-10g/L. In 3/6 instances patients monoclonal proteinlevels fell below 2 g/L and accurate monitoring was notpossible with conventional SPE. HLC measurementswere able to accurately monitor the patients in all cases.In an additional 3/41 cases HLC ratios remained abnor-mal when there was no M-protein identifiable by SPE. Atrelapse in 5/49 IgG patients HLC ratios became abnormalbefore any other test, in 3/5 cases the abnormal ratio cor-rectly identified clinical disease progression (75-282days) before other tests. In 2/5 patients disease progres-sion occurred >1000 days after the ratio had becomeabnormal. Conclusions. The HLC IgG and IgA assays correctlyidentified monoclonal proteins at presentation. Further -more, HLC measurements allowed monitoring of IgAmonoclonal proteins, even when they were obscured byother proteins on SPE and were able to monitor IgGpatients where accurate SPE densitometry was not possi-ble. HLC assays improve the detection and measurementof paraproteins enabling the accurate response evaluationand monitoring of patients with IgG or IgA paraproteins.
PROGNOSTIC ROLE OF HEVYLITE IN MYELOMAH. Avet-Loiseau
Laboratoire d’Hématologie, Institut de Biologie, Nantes,France
Serum concentrations of the immunoglobulin (Ig) heavychain/light chain (HLC) subsets; IgGk, IgGλ, IgAk andIgAλ, were evaluated in relation to outcome in patientswith multiple myeloma, alongside IgG, IgA, IgM andother measurements. 339 patients were studied from theFrench IFM 2005-01 trial that compared Velcade (V) anddexamethasone (D) with vincristine-adriamycin plus D.Results showed that the HLC ratio of the tumor Ig isoty-pe correlated with progression free survival (PFS) (Coxregression analysis hazard ratio [HR] 1.9; p=0.00018)that was largely due to suppression of the polyclonalcomponent (HR 1.8; p=0.002). Furthermore, greater HLCratios were associated with shorter PFS (p<0.001). Therewas no association between PFS and concentrations oftumor produced IgG or IgA, serum free light chain �/�ratios or suppression of non-tumor Igs, implying the pre-sence of Ig specific, myeloma niches in the bone marrow.In multivariate Cox regression analysis, only β2-micro-globulin (β2-M) (p=0.045) and HLC ratios (p=0.001)were of prognostic significance, even including cytoge-netic abnormalities. Using the International StagingSystem, comprising β2-M plus albumin, correlation withPFS was less significant (HR 1.3: p=0.017) than ß2-Mplus HLC ratios (HR 1.7: p=0.00002). Thus, HLC measu-rements were prognostic and may have a role in stagingpatients with multiple myeloma.
Hematology Reports 2010; 2 (s2) | 19 |
6th International Symposium on Clinical Applications of Serum Free Light Chain Analysis (plus Hevylite)Bath, United Kingdom, 23-24 September 2010
PROGNOSTIC ROLE OF HEVYLITE IN MGUSJ.A. Katzmann,1 R. Clark,1 A. Dispenzieri,1 R.A. Kyle,1 O.Landgren,2 A.R. Bradwell,3 S.V. Rajkumar1
1Mayo Clinic, Rochester, MN, USA; 2National CancerInstitute, Bethesda, MD, USA; 3The Binding Site GroupLtd, Birmingham, UK
Background. Prognostic factors for progression ofMGUS include the size of the M-spike, heavy chain iso-type, and free light chain (FLC) k/λ ratio. The combineduse of these variables provides approximately a 10-folddifference in risk for progression. Suppression of unin-volved immunoglobulins has been an inconsistent predic-tor of progression. The Hevylite assay measures concen-trations of each isotype-specific heavy and light chain(HLC) pair enabling us to determine if isotype-specificsuppression of the uninvolved HLC pair is occurring [e.g.GL concentration in a patient with a monoclonal GK] andif it is predictive of progression of MGUS to MM. Methods. Total immunoglobulins were quantitated byimmunonephelometry, and suppression was defined asconcentrations less than the lower limit of the referencerange. HLC concentrations were quantitated withHevylite reagents. Reference ranges were derived from276 serum donors aged 22-90 years. We compared theproportion of patients who had isotype specific suppres-sion of the opposite HLC pair in 40 MGUS patients (30IgG, 10 IgA) who eventually progressed to MM versus 40long-term stable (36 IgG, 4 IgA). To confirm the relation-ship of isotype specific HLC pair suppression comparedto suppression of uninvolved immunoglobulins of otherheavy chain classes, we tested a second cohort of 39 IgGand 14 IgA MGUS patient samples that were obtainedjust prior to the development of MM. Results. The adult 95% reference ranges were Gk = 407-1130 mg/dL, Gλ = 188-583 mg/dL, Ak = 55-292 mg/dL,and Aλ = 39-249 mg/dL. Using quantile regression, noage or gender effects existed for any of the assays. TheGk/Gλ ratio (median = 1.9) was different than the Ak/Aλratio (median = 1.4). In the diagnostic samples from 36IgG MGUS patients who had stable MGUS, 64% had anabnormal Gk/Gλ ratio and 22% had isotype specific sup-pression of the opposite HLC pair. Only 6% had suppres-sion of uninvolved intact immunoglobulins of IgA and/orIgM. In baseline samples from 30 IgG MGUS patientswho eventually progressed to myeloma or related mali-gnancy, 83% had an abnormal Gk/Gλ ratio. Compared tothe stable MGUS patients the same percentage (7%) hadsuppression of IgA and/or IgM, but 53% had isotype spe-cific suppression of the opposite IgG HLC pair. In these2 groups of MGUS patients, HLC pair suppression was 4-8-fold more frequent than isotype suppression of immu-noglobulin heavy chain classes. In addition, MGUSpatients who eventually progressed had a 2 to 3-foldhigher rate of isotype specific HLC pair suppression thanstable MGUS patients. These same studies were perfor-med using the diagnostic samples from IgA MGUSpatients who remained stable or who eventually progres-sed. These results were not the same as for IgG MGUSpatients. The IgA MGUS patients all had abnormalAk/Aλ ratios. In addition, whether the IgA patients werestable or eventually progressed, heavy chain isotype sup-
pression (IgG or IgM) was approximately equal to theopposite HLC pair suppression. Stable IgA MGUSpatients had 25% heavy chain isotype suppression and25% HLC pair suppression. Non-stable IgA MGUSpatients had 50% and 40% suppression. Thus the HLCpair suppression was similar to the IgG MGUS patients,but the heavy chain isotype suppression was greater thanthe IgG patients. We tested these findings on a secondcohort of MGUS patients who progressed to myeloma. Inthe initial samples from 39 IgG MGUS patients, 44% hadsuppression of other heavy chain classes (IgA or IgM),while 87% had suppression of the isotype specific HLCby the Hevylite assay. In the last samples prior to pro-gression, the isotype suppression of heavy chain classesincreased to 54%, while isotype specific HLC suppres-sion rose to 95%. Interestingly, the 14 IgA patients hadequivalent suppression of gamma or mu heavy chain clas-ses as compared to the HLC pair suppression, with 43%and 50% of the patients having heavy chain isotype andHLC pair suppression in the initial sample and 79% forboth in the last sample prior to MM. Discussion. We have studied the prognostic value of iso-type specific HLC suppression of uninvolved immuno-globins as a predictor of progression in MGUS. Previousattempts to study isotype suppression had inconsistentconclusions. The availability of reagents to separatelyquantitate the kappa and lambda containing proteins ofeach immunoglobulin isotype provides a different tool tostudy polyclonal immunoglobulin suppression in mono-clonal gammopathy patients. The HLC data in the IgGMGUS patients indicate: 1) IgA and/or IgM isotype sup-pression is rare early in the disease process but increasesprior to diagnosis of MM, 2) HLC pair suppression ismore common than IgA or IgM suppression in each groupof MGUS patients (3-4-fold early in stable MGUS, 7-8-fold early in eventual progressive MGUS, 2-fold justprior to progression), and 3) HLC pair isotype suppres-sion is more frequent in MGUS patients that eventuallyprogress to MM. The HLC data in the IgA MGUSpatients indicate: 1) IgG and/or IgM isotype suppressionin early disease is more common than in IgG MGUS andincreases prior to diagnosis of MM, 2) HLC pair suppres-sion is equal to IgG or IgM suppression in each group ofMGUS patients, and 3) HLC pair isotype suppression ismore frequent in MGUS patients that eventually progressto MM. Our findings suggest that clonal IgG plasma cellsare able to suppress other IgG producing non-clonal pla-sma cells far more effectively than they can suppress IgAor IgM secreting cells, and this occurs more frequentlywith cells that will eventually undergo malignant tran-sformation. Conclusions. 1. Suppression of the opposite IgG HLCpair is a predictor of MGUS patients destined for progres-sion. 2. Isotype specific HLC pair suppression is morefrequent in IgG MGUS patients than isotype suppressionof other heavy chain classes. 3. We were not able todemonstrate a similar differential effect of heavy chainisotype suppression compared to HLC pair suppression inIgA MGUS. Larger studies are underway to determine ifHLC pair suppression is independent of M-spike quanti-tation, heavy chain isotype, and FLC ratio for predictionof risk for MGUS progression.
| 20 | Hematology Reports 2010; 2 (s2)
Oral Communications

CASE STUDIESG. Mead, E. Koulieres, M-C Kyrtsonis, M. Drayson, H.Lachmann, D. Riebe, D. Bruegel, D. Schauseil, S.Harding
University of Birmingham, Birmingham, UK and TheBinding Site Group Ltd, Birmingham, UK
Introduction. Heavy/light chain (HLC) assays appear tohave a utility in the diagnosis of monoclonal gammopa-thies; as a reflex test after abnormal serum protein elec-trophoresis results. They may also facilitate monitoring insome patients, particularly those where the monoclonalimmunoglobulins are hidden on the serum protein elec-trophoresis (SPE) gel. Here we present some case studies,which illustrate the use of HLC assays in diagnostic andmonitoring settings.Diagnostic Case studies. While measuring HLC ratios isfrequently more sensitive than SPE at identifying mono-clonal immunoglobulin production, the relative sensitivi-ty of immunofixation electrophoresis (IFE) and HLCratios is more closely aligned. There are, however, instan-ces where HLC measurements can help resolve equivocalIFE results.Case study 1. A serum sample from a patient under inve-stigation for a possible plasma cell disorder. At > 16g/L,the IgA was abnormally high. Immunofixation did notshow any monoclonal bands but there was concern aboutthe result because the density of polyclonal staining couldhave hidden a monoclonal band. HLC analysis indicatedapproximately 9g/L of both IgAk and IgAλ, confirmingthat there was a polyclonal elevation.Case study 2. A presentation serum from a patient withsuspected heavy chain disease because of immunofixa-tion results showing a clear monoclonal band in the anti-α chain track but no corresponding band in either of thelight chain tracks. The IgAk/IgAλ ratio was 0.39 (normalrange: 0.8-2.0) indicating that there was monoclonalIgAλ production but the λ light chain was not recognisedby the immunofixation antiserum. A FLC ratio of 0.12supported this interpretation.Case study 3.A patient with AL amyloidosis and a small,IgGk monoclonal protein which disappeared after treat-
ment. During a subsequent relapse a truncated, isolatedheavy chain was visible (ie. Heavy chain disease), but noIgGk by IFE. Retrospective HLC analysis of stored serarevealed an abnormal IgGk/IgGλ ratio, indicating thereturn of monoclonal IgGk production below the sensiti-vity of IFE detection.Monitoring Case studies. In addition to those patientswho can never be monitored quantitatively because theirmonoclonal immunoglobulin (usually IgA) co-migrateswith other proteins, there are instances where HLC ratiosappear to be indicating different clinical interpretationsthan SPE measurements of the monoclonal immunoglo-bulins. Case study 4. An IgAk multiple myeloma (MM) patientwho achieved a stringent complete response (sCR) afterinduction chemotherapy, which was also reflected by nor-malisation of their IgAk/IgAλ HLC ratio. After 7 months,there was a clinical relapse which was corroborated bySPE and a worsening HLC ratio. Salvage chemotherapywith velcade resulted in a fall in the SPE densitometrymeasurement but the HLC ratio continued to deteriorate.This was associated with continued clinical decline andextensive bone marrow plasma cell infiltration. Case study 5. An IgGλ MM patient, enrolled on a MRCmyeloma trial, whose frozen serum samples were retro-spectively analysed with HLC assays. Response to theinitial therapy resulted in a CR and temporary normalisa-tion of the HLC ratio. There was a relapse after ~400 daysaccompanied by the return of the monoclonal band onSPE and a worsening HLC ratio. Salvage chemotherapyproduced a temporary fall in the SPE results but no chan-ge in the HLC ratio. This was then followed by steadydecline in both parameters.Case study 6.An IgAλ MM patient given VAD inductiontherapy. SPE measurements indicated a partial responseat 111 days but the HLC ratio was progressively beco-ming more abnormal. There was continued clinical dete-rioration and the patient re-presented with spontaneousfractures 6 months later and was found to have 100%bone marrow plasma cell infiltration with severe anae-mia. Treatment with velcade and high-dose melphalan(with stem cell rescue) resulted in a sCR and normalisa-tion of the HLC ratio.
Hematology Reports 2010; 2 (s2) | 21 |
6th International Symposium on Clinical Applications of Serum Free Light Chain Analysis (plus Hevylite)Bath, United Kingdom, 23-24 September 2010
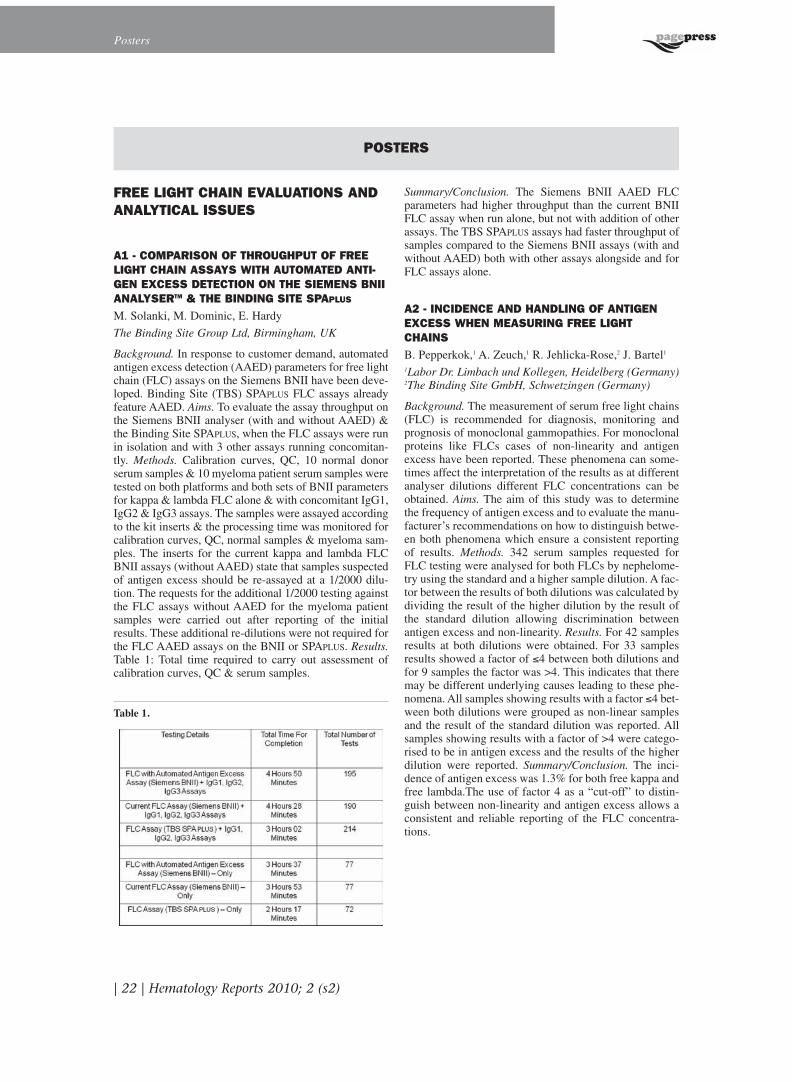
FREE LIGHT CHAIN EVALUATIONS ANDANALYTICAL ISSUES
A1 - COMPARISON OF THROUGHPUT OF FREELIGHT CHAIN ASSAYS WITH AUTOMATED ANTI-GEN EXCESS DETECTION ON THE SIEMENS BNIIANALYSERTM & THE BINDING SITE SPAPLUS
M. Solanki, M. Dominic, E. Hardy
The Binding Site Group Ltd, Birmingham, UK
Background. In response to customer demand, automatedantigen excess detection (AAED) parameters for free lightchain (FLC) assays on the Siemens BNII have been deve-loped. Binding Site (TBS) SPAPLUS FLC assays alreadyfeature AAED. Aims. To evaluate the assay throughput onthe Siemens BNII analyser (with and without AAED) &the Binding Site SPAPLUS, when the FLC assays were runin isolation and with 3 other assays running concomitan-tly. Methods. Calibration curves, QC, 10 normal donorserum samples & 10 myeloma patient serum samples weretested on both platforms and both sets of BNII parametersfor kappa & lambda FLC alone & with concomitant IgG1,IgG2 & IgG3 assays. The samples were assayed accordingto the kit inserts & the processing time was monitored forcalibration curves, QC, normal samples & myeloma sam-ples. The inserts for the current kappa and lambda FLCBNII assays (without AAED) state that samples suspectedof antigen excess should be re-assayed at a 1/2000 dilu-tion. The requests for the additional 1/2000 testing againstthe FLC assays without AAED for the myeloma patientsamples were carried out after reporting of the initialresults. These additional re-dilutions were not required forthe FLC AAED assays on the BNII or SPAPLUS. Results.Table 1: Total time required to carry out assessment ofcalibration curves, QC & serum samples.
Table 1.
Summary/Conclusion. The Siemens BNII AAED FLCparameters had higher throughput than the current BNIIFLC assay when run alone, but not with addition of otherassays. The TBS SPAPLUS assays had faster throughput ofsamples compared to the Siemens BNII assays (with andwithout AAED) both with other assays alongside and forFLC assays alone.
A2 - INCIDENCE AND HANDLING OF ANTIGENEXCESS WHEN MEASURING FREE LIGHTCHAINS B. Pepperkok,1 A. Zeuch,1 R. Jehlicka-Rose,2 J. Bartel1
1Labor Dr. Limbach und Kollegen, Heidelberg (Germany)2The Binding Site GmbH, Schwetzingen (Germany)
Background. The measurement of serum free light chains(FLC) is recommended for diagnosis, monitoring andprognosis of monoclonal gammopathies. For monoclonalproteins like FLCs cases of non-linearity and antigenexcess have been reported. These phenomena can some-times affect the interpretation of the results as at differentanalyser dilutions different FLC concentrations can beobtained. Aims. The aim of this study was to determinethe frequency of antigen excess and to evaluate the manu-facturer’s recommendations on how to distinguish betwe-en both phenomena which ensure a consistent reportingof results. Methods. 342 serum samples requested forFLC testing were analysed for both FLCs by nephelome-try using the standard and a higher sample dilution. A fac-tor between the results of both dilutions was calculated bydividing the result of the higher dilution by the result ofthe standard dilution allowing discrimination betweenantigen excess and non-linearity. Results. For 42 samplesresults at both dilutions were obtained. For 33 samplesresults showed a factor of ≤4 between both dilutions andfor 9 samples the factor was >4. This indicates that theremay be different underlying causes leading to these phe-nomena. All samples showing results with a factor ≤4 bet-ween both dilutions were grouped as non-linear samplesand the result of the standard dilution was reported. Allsamples showing results with a factor of >4 were catego-rised to be in antigen excess and the results of the higherdilution were reported. Summary/Conclusion. The inci-dence of antigen excess was 1.3% for both free kappa andfree lambda.The use of factor 4 as a “cut-off” to distin-guish between non-linearity and antigen excess allows aconsistent and reliable reporting of the FLC concentra-tions.
POSTERS
Posters
| 22 | Hematology Reports 2010; 2 (s2)

6th International Symposium on Clinical Applications of Serum Free Light Chain Analysis (plus Hevylite)Bath, United Kingdom, 23-24 September 2010
Hematology Reports 2010; 2 (s2) | 23 |
A3 - MONOCLONAL IgM PROTEINS CAN CAUSEABERRANT NEPHELOMETRIC FREE LIGHT CHAINRESULTS MAKING DATA INTERPRETATION DIFFI-CULTD. White,1 N. Gardner,1 S. Harding,1 H. Stang,2 H.Gisslinger,3 T. Perkmann,3 S.J. Naides4
1The Binding Site Group Ltd, Birmingham, UK2Evergreen Haematology Oncology, Spokane, WA3AKH Wien - Universitätsklinken 4Quest Diagnostics Nichols Institute, USA
Background. Serum free light chain (FLC) testing is routi-nely performed on nephelometers and turbidimeters wor-ldwide. The assay is useful in AL Amyloidosis, Multiplemyeloma (MM), Waldenström’s macroglobulinemia andmonoclonal gammopathy of undetermined significance(MGUS). Increasingly, clinicians are requesting the testfor diseases including chronic lymphocytic leukaemia,non-Hodgkin’s lymphoma and chronic kidney disease.Occasionally samples behave unexpectedly on the assayand require further testing, most commonly from antigenexcess. Cross reaction with intact immunoglobulins orother serum proteins has not been reported. MonoclonalIgM is an inherently unstable and difficult protein to quan-tify in the laboratory and has been identified as potential-ly interfering in a number of nephelometric assays. In afew cases these proteins have been identified as possiblycausing aberrant results in the nephelometric quantifica-tion of FLC. Aims. To investigate the role of IgM mono-clonal proteins in two samples with atypical serum FLCresults. Methods. The Siemens Dade Behring BNII nephe-lometer was used to measure serum FLC and to evaluate‘blank’ latex reagents. Patient sera were fractionated bysize exclusion chromatography under native conditions.Fractions were analysed by FLC assay, SDS-PAGE gelsand characterised by Western blotting using isotype speci-fic antisera. Where appropriate, additional gel techniquesincluding Ouchterlony plates, and immuno-fixation elec-trophoresis (IFE) were employed. Results. Sample A hadan IgM kappa monoclonal protein with FLC results initial-ly being reported in antigen excess. The final results repor-ted were 7,490mg/L kappa and 2,710mg/L lambda.Neither IFE nor Ouchterlony identified free kappa or lam-bda light chains in the sample. Size exclusion chromato-graphy demonstrated protein peaks of 60kDa, 150kDa and>600kDa. Analysis of the fractions using the FLC assayshowed the majority of the activity was present in the peakwhich corresponded to >600kDa. Replacing the FLC latexwith blank reagents showed that the sample precipitatedunder reaction conditions in the absence of specific antise-ra. Ouchterlony analysis showed there was no specificreaction between the anti-FLC antibodies, BSA (which isused to coat latex) or sheep IgG in these fractions. Asecond sample from a patient with an IgM kappa mono-clonal protein and trace IgG lambda monoclonal protein,with FLC values of 5,290mg/L kappa and 1,500mg/L lam-bda was similarly separated and analysed. After sizeexclusion chromatography kappa and lambda activity wasonly found in the largest (>600kDa) peak. Non-specificprecipitation was shown using a blank latex assay andOuchterlony plates as before. Summary/Conclusion. Highelevations of free kappa and lambda light chain in the
same sample have been reported but are rare. Two sampleswith both k and λ FLC levels >1000mg/L and no otherindication of monoclonal protein apart from IgM kappaprotein by IFE aroused suspicion. On investigation, theapparent elevations of FLC were due to non-specific reac-tions of the IgM protein with the latex particles. No simi-lar response has been identified in other monoclonal IgMsamples.
A4 - EVALUATION OF PARAMETERS FOR MEASU-RING FREE IMMUNOGLOBULIN LIGHT-CHAINSWITH AUTOMATED ANTIGEN EXCESS DETECTIONON THE SIEMENS BNII ANALYSERM. Solanki, D. Matters
The Binding Site Group Ltd, Birmingham, UK
Background. Assays specific for serum immunoglobulinfree light chains (FLC) on automated analysers are avai-lable. Although a rare occurrence, one aspect of theseassays that has been criticised is their susceptibility toantigen excess. Automated antigen excess detection(AAED) is available on The Binding Site Group Ltd(TBS) SPAPLUS and Roche Integra 400 & 800 analysers.Aims. To evaluate newly developed serum FLC assayswith AAED for use on the Siemens BNII analyser.Methods. Total precision was assessed at three antigenlevels for both assays. The assay linearity was calculatedover an antigen concentration range of 2.6 -124.2mg/Lfor kappa FLC and 2.7 -146.0mg/L for lambda FLC.Results from serially diluted polyclonal serum sampleswere compared with calculated expected results for thesesamples. Possible interference from co-existing substan-ces was tested by adding haemoglobin, bilirubin, and tri-glyceride to serum samples and comparing to an equiva-lent sample blank at the minimum sample dilution (1/5).Comparison was made with the current TBS FLC assaysfor the Siemens BNII analyser by measuring samplesfrom normal subjects and subjects with a prior diagnosisof multiple myeloma and carrying out Passing-Bablokregression analysis. Efficacy of the AAED parameterswas challenged using samples which had previously exhi-bited antigen excess on the Siemens BNII FLC assays(Table).
Table.

Results. One lambda and 64 kappa FLC samples whichdisplayed antigen excess on the current BNII FLC assays,auto-repeated correctly on the AAED FLC parameters.Summary/Conclusion. The FLC assays with AAED forthe Siemens BNII provide a precise method of measuringFLC in serum and show good agreement with existingassays. Both assays correctly detected antigen excess inall samples tested, although, due to rarity of antigenexcess in lambda samples only one was tested.
A5 - A STUDY OF THE USE OF FREE LIGHTCHAINS TO IMPROVE THE INTERPRETATION OFCAPILLARY ELECTROPHORESISA. Boyle
Department of Biochemistry, Royal Lancaster Infirmary,Ashton Road Lancaster, UK
Background. Since April 2007 the laboratory has offereda diagnostic and monitoring service for patients withMyeloma and related diseases. The tests available whenthe service began were serum Capillary Zone Electro -phoresis (CZE), Immunotyping (IFE) and urine gel elec-trophoresis (UPE). In response to clinical demand serumfree light chain (FLC) assays were added in 2008. Aims.To identify situations where further tests are required tointerpret Capillary Zone Electrophoresis. Methods. Allrequests received from 1st April 2009 to 31st May 2010were assessed and results obtained for each of the threetests were compared. Results. In total, 6,648 CZE, 1,347UPE and 951 FLCs were assayed. Of the CZEs, 18% hada paraprotein, with 28% of these (334 patients) having noprevious history of Myeloma. The FLCs were analysedand the results tabulated against the CZE results (Table1). 6% of all CZE requests were reported as abnormal butwith no band identified. This group included sampleswith Beta/Gamma bridging, small peaks in the gammaand irregular patterns in the Beta region which cannot beconclusively identified by a combination of CZE and IFE.Of the UPEs, 50 abnormal bands were detected (4%).Three patients had an abnormal band in the urine and noabnormalities detected by CZE or FLCs. One patient hadan 8.5 g/L paraprotein nine months later but neitherremaining patient had a subsequent sample analysed.
Table.
Summary/Conclusion. CZE combined with IFE allowsidentification of paraprotein bands down to 2 g/L whenthey migrate in the gamma region. FLCs are essential forthe identification of patients with paraproteins which runin the beta region and for patients with hypogammaglo-bulinaemia.
A6 - SERUM FREE LIGHT CHAIN ANALYSIS COR-RELATION WITH SERUM PROTEIN ELECTROPHO-RESIS IN MULTIPLE MYELOMA - AN INDIANSTUDYM. Noorgahan, M. Goyal, S. Murthy, D. Palanki, S. Nirni
Indo-American Cancer Institute & Research Centre,Hyderabad, India
Background. Quantitative measurement of serum free lightchains (serum FLC) has now been adopted into screeningalgorithms for multiple myeloma. The assays indicatemonoclonal FLC production by the presence of abnormalkappa or lambda free light chain ratios (reference range0.26-1.65). Aim.We report our experience with serum FLCassays in the diagnosis of multiple myeloma in an Indianpopulation in comparison with serum protein electrophore-sis (SPE). Methods. Review of 42 cases of multiple myelo-ma was undertaken. Multiple myeloma was diagnosed inthese cases according to the CRAB criteria. Serum FLCswere measured by a turbidimetric method using Freelite(Binding Site). SPE was done on cellulose acetate stripaccording to procedure provided by GenioLilac medicare.Result. All 42 cases of multiple myeloma patients showedabnormal ratio of serum FLCs while SPE could detectmonoclonal protein in 36 (85.7%) out of 42 cases. By SPE,the detection limit for monoclonal protein is 1-2 g/L whereas for the serum FLCs it is 1mg/L. Conclusion. These fin-dings indicate that serum FLC assay enables us to detectmultiple myeloma patients with very low monoclonal pro-teins. The incorporation of quantitative measurement ofserum FLCs with serum kappa/lambda FLC ratio is usefulin the detection of monoclonal proteins particularly when itis not detected by SPE but there is strong clinical suspicion.
A7 - A SINGLE, LATEX-ENHANCED TURBIDIME-TRIC ASSAY FOR TOTAL KAPPA AND LAMBDAFREE LIGHT CHAINS IN SERUMP.J. Showell, C.J. Buckley, G.P. Mead
The Binding Site Ltd, Warstock Road, Kings Heath,Birmingham, UK
Background. A number of recent studies have indicatedthat the measurement of polyclonal free light chains (FLC)may be useful for monitoring a variety of inflammatorydiseases. This utility appears to derive from the dual role ofFLCs as markers of B-Cell activation and of renal function.As both kappa and lambda FLC change in parallel in theseinstances, and there is a normal FLC ratio, there would bea practical advantage in having a single assay which mea-sures the combined concentration of free kappa and freelambda (tFLC). Aims. Here we describe a single, latex-enhanced, turbidimetric assay for combined measurementof both kappa and lambda free light chains. Methods.
| 24 | Hematology Reports 2010; 2 (s2)
Posters

Hematology Reports 2010; 2 (s2) | 25 |
6th International Symposium on Clinical Applications of Serum Free Light Chain Analysis (plus Hevylite)Bath, United Kingdom, 23-24 September 2010
Monospecific, polyclonal antibodies directed to both kappaand lambda FLC were bound to latex microparticles. Assayparameters were generated for the resultant reagent on theBinding Site SPAPLUS turbidimetric analyser. The analyserwas programmed to construct a calibration curve from a 6point calibration set. Curves were validated by assay ofcontrol fluids. Samples were initially measured at a 1/10dilution and, if out of range, the instrument automaticallyre-measured the samples at a 1/20 dilution. All dilutionswere made with the instrument’s on-board pipettingsystem. The measuring range was from 6.25-200 mg/L at a1/10 sample dilution, with a reflex range of 12.5-400 mg/Lat 1/20, and sensitivity of 0.625 mg/L at neat. The assaytook 10 minutes and was read at end-point. To assess ana-lytical sensitivity, ten replicates of two samples with con-centrations equivalent to 140% and 200% of the curve bot-tom point were run and assessed by paired t-test. Intra-assay precision was assessed at three antigen levels (n=20).Inter-assay precision was assessed in duplicate at threelevels over ten days. Linearity was assessed by mixing ahigh polyclonal sample pool with a normal sample poolaccording to NCCLS EP6-A over a range of 30-160 mg/L.The assay was tested for possible interference from co-exi-sting substances by adding haemoglobin (5g/L), bilirubin(200 mg/L) and Chyle (1500 FTU’s) to serum samples andcomparing to an equivalent sample blank. Comparison wasmade with summated values from the Binding Site kappa& lambda FLC kits for the SPAPLUS by measuring samplesfrom normal (n=52), myeloma (n=30) and chronic kidneydisease patients (n=21), and performing Passing andBablock regression analysis. Result. The analytical sensiti-vity of the assay was confirmed through measurement oflow level samples – 8.3 mg/L (CV 5.5%), 12.6 mg/L (CV4.7%), p<0.0001. Intra-assay precision generated CVs of2.0% (188 mg/L), 3.1% (56 mg/L), and 5.5% (23 mg/L).Inter-assay precision generated CVs of 2.9% (188 mg/L),3.8% (56 mg/L), and 5.6% (23 mg/L). Assay linearity wasconfirmed by linear regression – y=1.009x-3.6, R2=0.999.Interference was within ±6% when haemoglobin, bilirubinor chyle were added to serum samples of known total freelight chain concentrations. Good agreement was observedwhen the assay was compared with summated FLC values:y=1.03x-1.24. Summary/Conclusion.We conclude that thiscombined FLC assay provides a more rapid, cost-effectivemeans of measuring tFLCs than separate FLC tests andshows good agreement with summated values from exi-sting assays.
A8 - MONOCLONAL GAMMOPATHY DIAGNOSISUSING AN ANTIBODY COATED BEAD ARRAYIMMUNOASSAY, FOR FREE KAPPA AND LAMBDALIGHT CHAIN AND IgG, IgA AND IgM KAPPA AND LAMBDAR. Budd,1 D. Taylor,1 A. Bunce,2 S. Harding,1
A.R. Bradwell,3 G. Mead11The Binding Site Group Ltd, Birmingham, UK; 2DynexTechnologies Inc, Chantilly, USA; 3Division of Immunityand Infection, The Medical School, University ofBirmingham, Birmingham, UK
Background. Laboratory screening guidelines written by
the International Myeloma Working Group, recommendserum protein electrophoresis (SPE) plus immunofixationelectrophoresis (IFE), for identifying monoclonal intactimmunoglobulins, and determining serum free light chain(FLC) ratios for identifying monoclonal free light chainproduction. This protocol thus entails a combination ofboth nephelometry/turbidimetry and gel electrophoresis,which can require a degree of expert interpretation.Recent studies utilising assays specific for heavychain/light chain (HLC) pairs have indicated that HLCratios (IgGk/IgGλ, IgAk/IgAλ, IgMk/IgMλ) provide asensitive indication of monoclonal intact immunoglobu-lin production. This raises the possibility of developingmonoclonal gammopathy screening protocols based uponthe use of both HLC and FLC ratios. Combining these inone multiplex assay would have obvious time and costbenefits. Aims. To develop a single assay to screen formonoclonal intact immunoglobulin and monoclonal FLCproduction based on a prototype bead array assay conceptdeveloped by Dynex Technologies using the Binding Sitepolyclonal antibodies. Methods. Ninety six sera frompatients previously identified as having a monoclonalgammopathy (16 IgGk, 13 IgAk, 17 IgMk, 1 IgDk, onefree k; 18 IgGλ, 6 IgAλ, 15 IgMλ, 9 free λ) and 48 nor-mal blood donor sera (NBDS) were screened. The assaywas automated using a modified Dynex DS2 instrument.Diluted samples were added to wells containing specific,sheep antibody-coated beads to the following targets:kFLC, λ FLC, IgGk, IgGλ, IgAk, IgAλ, IgMk and IgMλand incubating for 30 minutes, followed by a wash step.Due to individual dilution constraints, three wells wererequired per sample. Bound FLC or HLC was detectedusing horseradish peroxidase conjugated antibodies tototal k and λLC, and incubated for 30 minutes. Followinga final wash, luminol substrate was added for two minu-tes. Luminescence was captured using a Photometricscamera; images were interpreted using Array-Pro softwa-re. Result. 144 samples were tested; this generated 8results for each sample, 1,152 in total. The assay correc-tly picked out abnormal FLCk/λ ratios in 10/10 (100%)of the sera from patients with FLC myeloma and normalratios in all NBDS samples. All 13 IgAk samples had araised k/λρatio, the 6 IgAλ k/λratios were low, and inaddition the appropriate k or λHLC was raised, with anabnormal HLC ratio, in all sera. With one exception, allthe IgG gammopathies also gave appropriately abnormalresults. The exception, a sample classified as an IgG3λmonoclonal protein, was later found to be from a patientwith primary biliary cirrhosis and polyclonal hypergam-maglobulinemia, but no clear indication of monoclonali-ty by IFE. The IgM samples were also 100% correctlydetected, 17/17 IgMk and 15/15 IgMλ, with correspon-ding abnormal k/λ FLC ratios. The IgDk sample had ahigh k/λ FLC ratio. Summary/Conclusion. This studydemonstrates that it is possible to quantify 8 immunoglo-bulin analytes in one assay and identify the FLC type andHLC class. This development could significantly simpli-fy the monoclonal protein screening process into oneassay format, thereby eliminating the need for gel electro-phoresis. The inclusion of related markers e.g. cystatin C(for renal function) and beta 2-microglobulin (tumourmass) would further enhance the utility of this protocol.

A9 - NORMAL RANGES AND REFERENCE INTER-VALS OF SERUM FREE LIGHT CHAINS CONCEN-TRATIONS IN A SPANISH URBAN POPULATION J.M. Hernandez,1 M.J. Jimenez-Cobaleda,2 H. Muñoz,2
R. Caro,2 J.A. Qiueizan,1 M. Latorre, L. Gonzalvez,3
B. de la Hoz,4 B. Perez-Moneo5
1Dpt. Hematology-Hospital General de Segovia; 2Dpt.Clinical Analysis-Hospital General de Segovia; 3C.SaludSegovia-3; 4C.Salud Segovia-1; 5C.Salud Segovia-2, Spain
Background. The diagnostic and prognostic importance ofmeasuring serum free light chains in several monoclonalgammopathies is growing. Reference ranges in normalpopulations has been studied by some authors. However,we do not known the normal values in Spanish populations.The Spanish city of Segovia is conducting a study of popu-lation screening for monoclonal gammopathy of undetermi-ned significance (MGUS). Aims. We undertook a study todetermine the concentration ranges of serum free lightchains kappa (SFK) and lambda (SFL) in our population.Methods. We analyzed 444 consecutive serum samplesobtained between April 1 and May 16, 2010. The method ofrecruitment of participants in the study was offered by fami-ly doctors or by letter. Inclusion criteria: 1) to have lived 50years on October 1 2008; 2) to live in Segovia. The deter-mination of SFK and SFL and k/λ ratios was carried out byturbidimetry. We studied the possible presence of serummonoclonal component by capillary electrophoresis andserum immunofixation (IFE). Furthermore, IFE was perfor-med in doubtful cases.
Table. Parameters by gender and age groups with cutoff at 70years.
Sex n Media± Median Age n Media± MedianSD (Range) SD (Range)
Free k Men 149 10.24± 8.73 <70 253 8.87± 8.3 chain /mg/L) 5.32 (2.9-35.2) 3.92 (2.9-31.7)
Women 282 9.52± 8.68 ≥70 178 11.05± 9.66 4.12 (3.36-31.7) 5.12 (3.6-35.2)
Free λ Men 149 17.45± 15.5 <70 253 16.51± 14.5chain /mg/L) 7.92 (6.89-50) 7.26 6.11-48.9)
Women 282 17.79± 15 ≥70 178 18.38± 16.377.73 (6.11-61.9 8.39 (8.29-61.9)
Ratio k/λ Men 149 0.59± 0.57 <70 253 0.57± 0.530.23 (0.21-1.6) 0.24 (0.21-2.46)
Women 282 0.62± 0.55 ≥70 178 0.64± 0.60.25 (0.22-2.46) 0.23 (0.22-1.6)
Media±SD Median (Range)
Free k chain /mg/L) 9.77±4.58 8.71 (2.9-35.2)Free λ chain /mg/L) 17.28±7.79 15.1 (6.11-61.9)Ratio k/λ 0.6±0.23 0.56 (0.21-2.46)
The test proved the non-Gaussian distribution of the series.There were no significant differences between the values by gender. By contrast, theconcentrations of SFk (p<0.001), SFλ (p<0.05) and Rk/λ (p<0.01) were significantlyhiger in patients older than 70 years. The reference intyervals calculated were: sFk →
3.94-20.29 mg/λ; sFλ → 7.17-35.52 mg/λ; Rk/λ → 0.28-1.31.
Statistical Methods. Descriptive statistics of central tenden-cy and distribution. We evaluated the normality of the seriesby asymmetry, kurtosis and Kolmogorov-Smirnov tests. Topresent the reference ranges we performed logarithmic tran-sformation of the values in order to achieve Gaussian distri-butions; concentrations were calculated with limits of 95%of the determinations. Non-parametric test (Mann-Whitney
U) was used for the comparison of independent samples.Results. 13 MGUS were detected among 444 participants,so that the analysis was restricted to 431 samples who hadno serum MC. The table shows the descriptive parametersof the series. Conclusion.The reference values and intervalsobtained in our population are similar to those reported inother countries. Higher values in the elderly group could bedue to impaired renal function but data was not available.
A10 - ESTABLISHMENT OF SERUM FREE LIGHTCHAINS REFERENCE INTERVALS, SELECTIONAND EVALUATION OF CUT-OFF VALUE FOR k/λRATIO Y. Liang,1 W.-m. Chen,2 Q.-t. Wang,2 Y.-h. Zhai2
1GongTi, BeiJing, China; 2Beijing Chaoyang Hospitalaffiliate of Capital Medical University, Beijing, China
Background. Suitable reference intervals are important forlaboratory tests. As yet, serum FLCs reference intervalsand k/λ ratios have not been established for Chinese peo-ple and may differ from other populations such as thosereported by Katzmann et al. Aims. To establish the referen-ce intervals of serum free light chains, to select and evalua-te the cut-off value for the ratio of free k to free λ. Methods.Serum samples from 326 healthy donors were measured byfree light chain immunoassays and the k/λ ratios were cal-culated. The reference intervals were established by nonpa-rametric methods suggested by CLSI document C28-A2.Serum free light chains were measured for samples from117 plasma cell dyscrasia disease and related disorders andthe cut-off value for k/λ ratio were selected by means ofROC curve. Then the accuracy of the cut-off values wasevaluated using another 178 serum samples of plasma celldyscrasia disease and related disorders. Results. For sexsubgroups, Z< Z* and SDlarger <1.5×SDsmaller. The totalmean square is homogenous for all age groups, but therewas a statistically significant difference among them(p<0.001) by one way ANOVA test. According to CLSIdocument C28-A2, the sample size should be expanded ifdifferent age groups’ reference intervals need to be asses-sed. In this study, the reference intervals for 20 to 86 yearsof old were 8.9 to 25.5 mg/L for free k and 12.5 to 33.6mg/L for free λ. The cut-off values for k/λ ratio were 0.36and 1.36. The diagnostic accuracy, sensitivity and specifi-city of the cut-off values were 93.3%, 95.2% and 88.5%respectively. Summary/Conclusion. There was no need toset up serum free light chains reference intervals for diffe-rent sexes, the reference intervals for age 20 to 86 were dif-ferent from the manufacturer’s, the cut-off values 0.36 and1.36 for k/λ ratios were accurate in clinical test.
A11 - BONE MARROW CELL POPULATIONS ANDSERUM FREE LIGHT CHAIN LEVELS IN MONOCLONAL GAMMOPATHY PATIENTS M. Ayliffe, N. Sumar, J. Behrens
Immunology and Haematology Departments, Epsom andSt Helier Hospital NHS Trust, Carshalton, Surrey, UK
Introduction.We have previously reported dual populationsof plasma cells, some making intact monoclonal immuno-
Posters
| 26 | Hematology Reports 2010; 2 (s2)

6th International Symposium on Clinical Applications of Serum Free Light Chain Analysis (plus Hevylite)Bath, United Kingdom, 23-24 September 2010
Hematology Reports 2010; 2 (s2) | 27 |
globulin; others restricted to free light chain (FLC) produc-tion only, are found in the bone marrow of a minority ofindividuals with monoclonal gammopathies. We also sho-wed changes in these cell populations within individualpatients during the course of their disease and treatment.The presence of FLC-only cells was associated with shorte-ned survival and we suggested that this might be a cellularmechanism underlying so-called light chain escape.Separate studies have observed sharp rises in FLC concen-trations in the serum co-incident with light chain escape andurinary light chain rises. Aims. Here we aimed to formallytest the connection between marrow plasma cell popula-tions and the level of FLCs in serum taken at the same time,from individual patients. Methods. Bone marrow aspirates,collected from patients with paraproteins were examinedusing an established double immunofluorescence methodthat counts marrow plasma cells of each heavy and lightchain isotype independently to establish the cellular popula-tions present. These results were then compared to the con-centration of FLC in serum, collected within 24hrs of theaspirates and assayed by the standard latex-enhancednephelometric immunoassay. Result. We report here theresults of the first 30 patients tested. The presence of a sub-population of cells restricted to FLC production only, didappear to be generally associated with higher serum FLClevels. This observation was consistent for both kappa andlambda-restricted tumours. There were, however, someexceptional patients where serum FLC levels were highwithout a separate FLC-only cellular population.Conclusion. We need to continue to recruit more patients,especially those with high levels of serum FLC, to clarifythese observations.
Figure 1.
A12 - IMPACT OF SERUM FREE LIGHT CHAINSON THE ANION GAP IN MONOCLONAL GAMMO-PATHIES K. van Hoeven,1 L. McBride,2 E. Bilotti,2 A. McNeill,2
L. Schmidt,2 D. Schillen,2 D. Siegel2
1The Binding Site, Inc., San Diego, CA,USA; 2HackensackUniversity Medical Center, Hackensack, NJ, USA
Background. A decreased anion gap is associated with
IgG monoclonal gammopathies, and an increased aniongap is associated with IgA monoclonal gammopathies.The effect of free light chains on the anion gap isunknown. Aim.To study the impact of serum free lightchains on the anion gap in light chain (LC), IgG and IgAmonoclonal gammopathies. Methods. The anion gap,Na+– (Cl– + HCO3–), was calculated in patients with noevidence of monoclonal gammopathy by serum proteinelectrophoresis (SPEP), serum immunofixation andserum free light chains to establish a normal range. Then,the anion gap was calculated in patients with monoclonalgammopathies (mostly with myeloma) at presentation orat relapse. Following initial data analysis, patients withmonoclonal gammopathies were excluded if serum albu-min was <2.5 g/dL, serum Ca++ was >11.0 mg/dL, orserum creatinine was >2 mg/dL. Results. In 40 patients without monoclonal gammopathy,the anion gap range was 9–15. In 37 of these 40 patients,the anion gap range was 9–14, and thus this was establi-shed as the normal range. A decreased anion gap wasfound in 35% of 102 IgG monoclonal gammopathies. Anincreased anion gap was identified in 36% of 50 IgAmonoclonal gammopathies. The anion gap was increasedin 25% and decreased in 3% of 60 LC monoclonal gam-mopathies. With exclusion criteria applied, the anion gapwas decreased in 34% of 89 IgG, and increased in 31% of42 IgA monoclonal gammopathies. In 40 LC monoclonalgammopathies, 17% had an increased and 3% had adecreased anion gap. A poor correlation (strongest r was0.58) was found between the anion gap and the parapro-tein spike on SPEP, as well as between the anion gap andthe mean concentration of the involved Ig (IgG 4.64g/dL±0.18 (SEM), IgA 3.27 g/dL±0.26, free kappa 0.5g/dL±0.08 [or 4956 mg/L±769; n=20], free lambda 0.36g/dL±0.08 [or 3607 mg/L±809; n=20]). Importantly,measurable paraprotein spikes were identified in only 23of 40 (58%) LC monoclonal gammopathies, but free lightchains were diagnostic in all: free kappa ranged from478–14,400 mg/L in 20 kappa light chain processes, andfree lambda ranged from 440–17,300 mg/L in 20 lambdalight chain processes. In IgG monoclonal gammopathieswith a decreased anion gap, the mean clonal serum freelight chain concentration was 620 mg/L±198 versus 967mg/L±508 in other IgG monoclonal gammopathies(P=NS). In IgA monoclonal gammopathies with anincreased anion gap, the mean clonal serum free lightchain concentration was 821 mg/L±420 versus 431mg/L±177 in other IgA monoclonal gammopathies(P=NS). Conclusions. The association of IgG monoclonalgammopathies with a decreased anion gap was confir-med, as was the association of IgA monoclonal gammo-pathies with an increased anion gap. There was a weakassociation between LC monoclonal gammopathies andan increased anion gap. No significant impact of free lightchains on the anion gap in IgG and IgA monoclonal gam-mopathies was identified, likely due in part to relativelylow serum concentrations of clonal free light chains ver-sus IgG or IgA.
| 27 | Hematology Reports 2010; 2 (s2)

FREE LIGHT CHAINS IN DIAGNOSISAND PROGNOSIS
B13 - SERUM FREE LIGHT CHAIN MEASURE-MENTS IN SCREENING FOR LYMPHOPROLIFERA-TIVE DISEASES - COMPARISON RECOMMENDEDAND RENAL REFERENCE INTERVAL FOR FREELIGHT CHAIN RATIOS IN PATIENTS WITH RENALFAILUREZ. Cermakova,1,2 M. Dastych,1,2 J. Gottwaldova1
1Department of Clinical Biochemistry UniversityHospital Brno; 2Department of Laboratory MethodFaculty of Medicine Masaryk University, CzechRepublic
Background. The assay of serum free light chains(sFLCs) is carried out in patients with symptoms ofmonoclonal gammapathies (MG). Suggestion of mono-clonal sFLC production is when the ratio of kappa to lam-bda is outside the reference interval (0,26-1,65). Forpatients with renal impairment the recommended renalreference interval is (0,37-3,1). Aims. Comparison of thediagnostic sensitivity of using the recommended referen-ce range with using the renal reference range for sFLCratios in patients with renal failure. Methods. We haveretrospectively evaluated samples from 334 patients whowere newly diagnosed with MG in the time period of2008-2009 at the University Hospital in Brno. For thesesamples we carried out: serum electroforesis (sEPG),urine electroforesis (uEPG), serum imunofixation (sIFE),urine imunofixation (uIFE), sFLC k/λ ratio, serum crea-tinine concentration and calculated glomerular filtrationrate (GFR) according to MDRD (Modification of Diet inRenal Disease). The group of tested patients included 216diagnosed with multiple myeloma (MM) and 118 peoplediagnosed with MG of undetermined significance(MGUS). Results. 39.4% patients were found with redu-ced GFR in the group of patients with MM. Also, 11.9%of patients showed lowered GFR in the group of patientswith MGUS. The highest sensitivity of the conductedtests was reached by a combination of the three tests:sIFE, uIFE, and sFLC k/λ ratio. 97.2% of patients withMM and 96.6% patients with MGUS were found positivewith this method and with the recommended referenceinterval for sFLC ratio. We used the same combination oftests for the patients with renal failure but using the renalreference interval for sFLC ratio. Although the number ofpositive results was lower in both groups of patients, thesensitivity of the combination of the three tests was thesame. Summary/Conclusion. We have proved that thehighest sensitivity was reached by the combining all threetests: sIFE, uIFE and sFLC k/λ ratio. Using the renal refe-rence range in patients with renal failure did not reducesensitivity for this combination in both groups of patientswith MM or MGUS.
B14 - SERUM FREE LIGHT CHAINS IN THESCREENING OF MONOCLONAL GAMMOPATHIESA. Miralles, C. Martinez, C. Sempere, G. Galar, B. Alegre
Hospital de Sagunto, Puerto de Sagunto, Valencia, Spain
Background. Plasma cells proliferative disorders may bepresented in a variety of ways, and the diagnostic key isoften finding a monoclonal gammopathy (MG) in bloodand urine. Electrophoresis (SPE) and immunofixation(IFE) in serum (s) and urine (u) are the most frequentlyused methods. However, with the recent addition ofserum free light chains (sFLC) quantification, someauthors proposed a new screening panel using onlyserum. Aims. To evaluate in a prospective study the bene-fits of sFLC quantification in the screening/diagnosticprotocol for monoclonal gammopathies (MG). Methods.All samples requested for a MG study from December2008 to May 2010 were included. Samples coming fromlaboratory findings by SPE (monoclonal band or hypo-globulinemia <0.6 g/dL) that were not previously studiedwere also included. All controls from the follow-up of apreviously known MG were excluded. Serum and recenturine (2nd of the morning) were requested. The study pro-tocol included SPE, sIFE and uIFE in agarose gel, urineproteins, quantification of IgG, A and M, total kappa andlambda, and sFLC by turbidimetry. Results. We perfor-med 312 MG screening studies from 293 patients. Theserequests represent 10% of the total SPE requests in thesame period. 53 new MG were identified (7 multiplemyeloma (MM), 1 light chain (LC) MM, 4 smolderingMM, 3 AL amyloidosis, 34 MGUS, 4 plasmacytoma.From the 53 MG diagnosed, SPE was able to identify84.9% of the cases (1AL, 7MM, 4SMM, 33MGUS). Theuse of SPE + sFLC detected 94.3% (1 AL; 7 MM; 4SMM; 33 MGUS + 2 AL, 1 LCMM, 5 MGUS). 5.7% (3cases) were only detected by uIFE. During the follow-upof these patients uIFE became negative for what we con-sidered as transitory MP. From the remaining 259 studiesin which a MP was not detected, 42 presented with analtered sFLC ratio of between 1.66–3.27. It was observedthat at least 43% of these patients had an altered renalfunction (creatinine (Cr) >1,3 mg/dL). When the recom-mended sFLC ratio renal range was applied (0.37–3.1)for patients with renal impairment, the number of patientswith abnormal ratios was <7.7%. Discussion. The use ofSPE + sFLC in the screening of a MG identified allpatients with a significant abnormality. SPE + sFLC is asimple diagnostic algorithm for MG with high diagnosticsensitivity with the benefit of working only with serum.sIFE and uIFE are laborious techniques not recommenda-ble for initial screening. However, they are necessary tocomplete the study for the detected MG.
Posters
| 28 | Hematology Reports 2010; 2 (s2)

6th International Symposium on Clinical Applications of Serum Free Light Chain Analysis (plus Hevylite)Bath, United Kingdom, 23-24 September 2010
Hematology Reports 2010; 2 (s2) | 29 |
B15 - PREVALENCE OF MONOCLONAL COMPO-NENTS IN PLASMA DONORS IN CATALONIAE. Ruiz Ortiz de Arrizabaleta,1 A. Teniente Serra,1 A.Marín Sánchez,1 I. Salvador Corres,1 M. Sáez Bruguera,2
A. Ester Codins,2 R. Pujol-Borrell,1 E. Martínez-Cáceres1
1Laboratorio de Inmunología (LIRAD)-BST, Badalona,Spain; 2Banc de Sang i Teixits (BST), Barcelona, Spain
Background. Prevalence of monoclonal gammopathy ofundetermined significance (MGUS) is 3% in people >50years, and the risk of progression to multiple myeloma(MM), Waldenström’s macroglobulinemia, AL amyloido-sis or lymphoproliferative disorders, 1%/year according toa recent review (Kyle, Leukemia; 2010). Plasma donors ofthe Banc de Sang i Teixits of Catalonia (BST), are screenedfor total serum proteins, immunoglobulin (Ig) levels andserum protein electrophoresis (SPE) at the inclusion andevery six donations in order to rule out the existence of pla-sma abnormalities such as the presence of a monoclonalcomponent. This data provides us excellent information toassess the prevalence of MGUS in our population. Aims.To analyze the prevalence of monoclonal components inplasma donors in Catalonia (Spain). Methods. A total of8,262 plasma donors were analyzed between January 2006and December 2009, corresponding to 31,064 donations.Of these, 4,981 (60.3%) were men and 3,281 (39.7%)women. Average age was 43.7 years (28% >50 years and72% <50 years). Ig levels were measured by nephelometryand SPE by capillary electrophoresis. When suspiciouspeaks were detected in the SPE the sample were analyzedby immunofixation electrophoresis. Samples with confir-med monoclonal protein (M-protein) and abnormal total Iglevels were analyzed for free light chains (FLC). Results.Monoclonal components were suspected in 104 plasmadonors, and an M-protein was confirmed in 49 cases(47%), corresponding to 0.59% of all donors. From them,34 (69.4%) were men and 15 (30.6%) women. 25 (51%) ofthe 49 donors with a monoclonal component were <50years old. Monoclonal components were: a) IgG isotype:IgG kappa 22 (44.9%); IgG lambda 13 (26.5%); b) non-IgG isotype: IgM kappa 3 (6.1%); IgM lambda 1 (2%); IgAkappa 4 (8.2%); IgA lambda 3 (6.1%). In 3 donors (6.1%)a biclonal component was found. In 4 (8.2%) of 10 donorsan abnormal FLC ratio was detected. Discussion. The ana-lysis of monoclonal components in healthy plasma donorsof Catalonia shows an incidence of 0.59% (1.04% indonors <50 years and 0.42% in donors >50 years). Most ofthe monoclonal components were IgG. When monoclonalcomponents are suspected in plasma donors it is advisableto fully characterize them in order to exclude the productsfrom the plasma pool used for Ig production and to referdonors to hematological consultation.
B16 - SERUM FREE LIGHT CHAIN ASSAYS(sFLC) IN PATIENTS WITH MGUS ATTENDING THEHAEMATOLOGY DEPARTMENT AT ST. MARY’SHOSPITAL IN LONDONS. Adballa
Imperial College Healthcare Trust, London, UK
Introduction.MGUS is defined as a monoclonal gammo-
pathy without any end organ damage with a paraprotein(PP) level of less than 30g/L and clonal bone marrow pla-sma cells (CPC) of less than 10% (International myelomaworking group consensus, Leukaemia 2010). Patientswith levels of PP of over 30g/L and those with CPC ofover 10% without end organ damage are classified asSmoldering Multiple Myeloma. A third of patients withMGUS have abnormal sFLC ratios. A recent publicationfrom the Mayo clinic has further risk stratified patientswith MGUS according to the sFLC abnormalities, type ofimmunoglobulin (Ig) and levels of Ig into three riskgroups (Rajkumar et al. Blood, 2005). The highest risk ofprogression was found in patients with three risk factorsand the risk of progression was increased with an increa-se of sFLC imbalance. Aim of study. To prospectively testthe Mayo clinic risk stratification in our patient popula-tion with MGUS in a practical clinical setting. Patientsand Methods. The patients were a cohort of 174 patientswith MGUS who were being followed up in the parapro-teinaemia clinic at St Mary’s Hospital. Patients under-went the usual investigations at diagnosis, but not all thepatients had sFLCs measured initially. Bone marrow andskeletal surveys were only carried out routinely onpatients with paraproteins of above 10 g/L until 2009 and15g/L after that date unless there were additional clinicalfeatures. Similarly, skeletal surveys were carried out onlyon selected cases using similar criteria. Results. Of the174 patients, 85 had abnormal sFLC ratios (48.6%). Ofthese, 59 had overproduction of kappa chains (ratiorange: 1.77 to 1066) and 26 had overproduction of lam-bda chains (ratio range: 0.11 to .25). 4 patients progressedto symptomatic MM after 2, 8, 12 and 13 years of follow-up. All 4 had abnormal sFLC ratios. Conclusion. Wefound a higher rate of sFLC imbalance in our patientpopulation with MGUS than in the Mayo clinic and otherstudies. Several factors may contribute to this includingthe assessment of sFLCs not always being at the point ofdiagnosis. Following the Mayo clinic risk stratificationmodel, patients with low risk disease did not have bonemarrow and skeletal survey studies at diagnosis and theperiod of follow up for low risk patients has also beenincreased leading to more efficient use of clinician andpatient time.
B17 - NORMAL SERUM FREE LIGHT CHAINRATIO AT PRESENTATION IS MORE COMMON INIgA-k MULTIPLE MYELOMA: A SINGLE CENTREOBSERVATIONAL STUDYH. Ahmed, S. Simpson, A. Roy
Basingstoke and North Hampshire NHS FoundationTrust, Basingstoke, Hampshire, UK
Background. Several studies have shown that baselineserum free light chain ratio (sFLCr) is an independentprognostic factor in patients with multiple myeloma andother plasma cell disorders. Baseline sFLC correlatedwith serum creatinine, lactate dehydrogenase, marrowinfiltration by plasma cells and light chain type multiplemyeloma in some studies. The relationship between base-line sFLCr at diagnosis and the different subtypes of mul-tiple myeloma has not been reported to date. Aims. To

analyse the baseline sFLCr in relation to the different sub-types of multiple myeloma and to assess the relationshipbetween the baseline sFLCR and parameters of diseaseactivity. Methods.All newly diagnosed multiple myelomapatients in our centre between June 2005 and January2010 were included. The sFLC measurements were per-formed by immunonephelometry (Freelite assay; TheBinding Site Group Ltd, Birmingham, UK). sFLCr wascalculated as k/λ (normal range 0.26-1.65). Clinical andlaboratory parameters at the time of diagnosis were recor-ded. Statistical tests were performed with SPSS software.Categorical variables were contrasted by the Fisher exacttest and median differences by the Mann-Whitney U test.Results. 48 patients were included in this study. The maleto female ratio was 1.4:1 with a median age of 73 years(range 45- 94 years). The majority of the patients (56%)had IgG multiple myeloma, 31% had IgA multiple mye-loma and 13% were light chain only subtype. 44 patientshad their sFLCr measured at diagnosis. All patients withIgG and FLC multiple myeloma had an abnormal sFLCrat presentation. Interestingly 33% of IgA multiple myelo-ma patients in our study showed an absolutely normalsFLCr with a further 20% of patients showing only mildelevation of monoclonal FLCs. Normal baseline sFLCrwas associated with IgA-k subtype of multiple myeloma(p=0.008). Normal sFLCr correlated with negative BenceJones proteinuria, heavy bone marrow infiltration (>45%plasma cell infiltration), and the ISS stage II – III.However, there was no observed relation of the baselinesFLCr with serum creatinine, calcium level or serumalbumin. The median baseline sFLCr in IgA-k group was2.59 (range 0.5–310.6) in comparison with 32.84 (range1.74-1791.75) in IgG-k group (p=0.009). In contrast,IgA-λ and IgG-λ groups showed no difference in themedian baseline sFLCr. Summary/Conclusion. Our studyhas shown, for the first time, that IgA-k multiple myelo-ma patients commonly present with normal sFLCr. Ourdata suggests that sFLCr at presentation may be of lessprognostic value in IgA-k multiple myeloma subtype.This might also have an implication in the assessment ofstringent complete response in this group of patients.Further analysis is required to assess the clinical course inthis group of patients.
B18 - SERUM FREE LIGHT CHAINS RATIO: ANINDEPENDENT PROGNOSTIC FACTOR FOR OVE-RALL SURVIVAL AND PROGRESSION FREE SUR-VIVAL IN MULTIPLE MYELOMAM. Sobh, S. Morisset, T. Guilli, S. Ducastelle, F. Barraco,Y. Chelghoum, X. Thomas, A. Praire, F. Nicolini, C.Chapuis-Cellier, M. Michallet
Edouard Herriot Hospital, Haematology, Lyon, France
Background. Some studies have evaluated the prognosticvalue of the serum free light chain (sFLC) levels expressedas k/λ ratio (sFLCR), but this factor has not been introdu-ced yet into the international staging system (ISS). Aims.To evaluate the impact of sFLCR, measured at diagnosis inmultiple myeloma (MM) patients, on the progression freesurvival (PFS) and overall survival (OS). Methods.A totalof 118 consecutive patients diagnosed between years 2002
and 2008, and for which we have assessed the sFLCR atdiagnosis, were included in this study. There were 73(62%)males and 45(38%) females, median age: 57 years [34-72],63 IgG, 35 IgA, 2IgD and 18 light chains; 11(9%) in stageI, 13(11%) in stage II and 94(80%) in stage III. Among55(47%) having FISH analysis done, 28(24%) detected achromosome 13 deletion. Measurements of sFLC weremade using the Freelite test from the Binding Site on aBNII, Dade Behring. According to the distribution of thedifferent ratios, we have defined three groups: group1(n=25): patients with 0.13<sFLCR<3.3 which representsdouble the normal range(0.26-1.65); group2 (n=63):patients with sFLCR>3.3 and group3 (n=30): patients withsFLCR<0.13. Kaplan Meier and Cox regression analysiswere performed to study the PFS and OS in differentgroups. Results. After a median follow-up of 38 months[3.3-93.7], the probability of OS at 5 years for groups 1, 2and 3 was 75% [56-100], 60% [47-76] and 40% [23-69]respectively; and the probability of PFS at 5 years was 69%[49-96], 43% [31-60] and 29% [15-54] respectively(Figure).The multivariate analysis showed that both OSand PFS are significantly worse with a more abnormalsFLCR. Summary/Conclusion. Our study has showed thatabnormal sFLCR at diagnosis predicts OS and PFS inde-pendently of any other concomitant variables. We suggestthat this factor deserves more focus for its validation as aprognostic factor in MM.
Figure.
Posters
| 30 | Hematology Reports 2010; 2 (s2)

6th International Symposium on Clinical Applications of Serum Free Light Chain Analysis (plus Hevylite)Bath, United Kingdom, 23-24 September 2010
Hematology Reports 2010; 2 (s2) | 31 |
B19 - THE CLINICAL VALUE OF THE SERUM FREELIGHT CHAIN ASSAY IN NEWLY DIAGNOSED UNIFORMLY TREATED ELDERLY PATIENTSM.E. Fernández Redondo,1 B. Paiva,2 J. Martínez-López,1
J.J. Lahuerta,1 M.V. Mateos,2 J.F. San Miguel,2 J. Bladé,3
M.B. Vidriales,4 L. Rosiñol,4 J. Besalduch,4 J. Bargay,4 M.Canales,4 A. Alegre,4 J. García-Laraña,4 R. Martínez,4 J.F.Tomás4
1Hospital 12 de Octubre de Madrid, Servicio deHematología, Laboratorio de Biología Molecular,Madrid; 2Hospital Universitario de Salamanca;3Hospital Clinic de Barcelona, Spain; 4Spanish MyelomaGroup
Background. The measurement of serum free kappa andlambda light chain (sFLC) concentrations provides ahighly sensitive tool for the diagnosis of monoclonalgammopathies. In multiple myeloma (MM), it has beensuggested that the sFLC ratio at initial diagnosis is animportant predictor of prognosis. However, the majorityof these results were obtained retrospectively from non-uniformly treated, younger MM patients (transplant can-didates). Aims. To evaluate the clinical value of the sFLCassay in newly diagnosed, uniformly treated elderly MMpatients. Material and methods.A total of 230 symptoma-tic MM patients were included in this study, all of themuniformly treated according to the Spanish GEM05>65yprotocol (two arms of 6 cycles of bortezomib/melpha-lan/prednisone (n=118) or bortezomib/thalidomide/pred-nisone (n=112) supplemented with maintenance therapy).Median follow-up was 32 months and the EBMT criteriawere used for response evaluation. sFLC levels weremeasured at diagnosis using standard techniques(Freelite, The Binding Site Group Ltd., Birmingham,UK) performed on a Dade-Behring Nephelometer BNII(Deerfield,IL). sFLC ratios between 0.26-1.65 were con-sidered normal. On the basis of the distribution of sFLCvalues for �and � patients, sFLC ratios <0.02 and >10 wereclassified as highly abnormal. Results. Abnormal sFLCratios were detected at diagnosis in 204 (89%) out of 230MM patients. In order to gain further insight into thegroup of newly diagnosed myeloma patients with normalsFLC ratios (n=26; 11%), we have compared the baselinecharacteristics of abnormal vs. normal sFLC cases. Nosignificant differences were found for patients’ age, lightchain myeloma subtype, biochemical markers, ISS andthe pattern of cytogenetic abnormalities, including thehigh-risk t(4;14), t(14;16) and/or del(17p). However, wehave found that abnormal vs. normal baseline sFLCpatients showed significantly different distribution ofheavy chain myeloma subtypes (IgG, IgA and B-J: 56%,31% and 13% vs. 81%, 19% and 0%; respectively,p=.03), bone marrow plasma cell (BMPC) infiltration(12% vs. 3.1%; respectively, p=.01) and normal PCdetected by flow cytometry (patients with >5% normal-PC/total-BMPC: 8% vs. 32%; respectively, p<.001). Nodifferences were found between abnormal vs. normalbaseline sFLC patients for overall response (87% vs.88%; respectively) and complete remission (25% vs.28%, respectively) rates after induction therapy, nor forprogression-free survival (PFS; median of 28 months vs.not reached -NR-; p=.2) and overall survival (OS; p=.2).
In turn, patients with highly abnormal baseline sFLCratios - <0.02 or >10 - (n=145; 63%) when compared tothe rest of cases (n=85; 37%) did showed a significantlydecreased PFS (median of 27 vs. 35 months, p=.03) andalso a trend for decreased OS (p=.09). Conclusions. Insummary, this study confirms the prognostic value of thesFLC assay in elderly MM patients (non-transplant can-didates) treated with novel agents. The presence of base-line normal sFLC ratios should be taken in considerationparticularly in cases with lower BMPC infiltration andresidual normal PC.
B20 - FREE LIGHT CHAINS RATIO AS A MARKEROF THE COURSE AND SURVIVAL IN PLASMA-PROLIFERATIVE DISEASESZ. Mijuskovic,1 V. Radović,2 J. Pejovic,1 L. Tukić,3
S. Marjanović3
1Institute of Medical Biochemistry, Military MedicalAcademy, Belgrade; 2Institute for research and develo-pement, STADA Hemofarm, AD Belgrad; 3Clinc ofHematology, Military Medical Academy, Belgrade;Serbia
Background. The quantification of monoclonal immuno-globulins (Ig) and its fragments are used for the monito-ring of plasmaproliferative disease course and effects oftherapy. Relatively new laboratory tests in serum for thequantification of kappa (k) and lambda (λ) free lightchains (FLC) and the calculation of the FLC ratio repre-sents additional parameters for monitoring of malignantplasmocytic production. Aims. The aim of FLC examina-tion was to evaluate significance of k/λ ratio as a progno-stic factor for progression, remission and survival in dif-ferent disease groups.
Table. Percentage of FLC ratio in plasmaproliferative diseasesgroups. From 2004 to 2010 yrs.
Disease Gruops k/λ ratio k/λ ratio k/λ ratio k/λ ratio (n-number of patients) cut point cut point cut point abn. value
<0.26 or >1.65 <0.26 or >1.65 <0.03-0.001 >32abn. value abn. value abn. value high<0.26-0.03 >1.65-4 >4-32 RRλ isotype – k isotype – intermediatelow RR low RR RR
MGUS (n=31) 5/31 (16%) 16/31 (52%) 10/31 (32%) 0LCD (BJM) (n=28) 4/28 (14%) 7/28 (25%) 0 17/28 (60%)LCDD (n=3) 1/3 (33%) 0 1/3 (33%) 1/3 (33%)AL (n=3) 0 0 1/3 (33%) 2/3 (66%)NSMM (n=3) 1/33 (33%) 1/33 (33%) 1/33 (33%) 0MM (n=15) 3/15 (20%) 4/15 (2%) 3/15 (20%) 5/15 (%)
Methods. The concentrations of Ig and FLC were measu-red by immunonephelometric method on a Siemens BN IIanalyser, combined with serum protein electrophoresis onSebia (Capillarys) and immunofixation (Hidrasys)methods. In this examination, 83 patients from 6 differentdisease groups were investigate during the period of 7years: 1. Monoclonal gammopathy of undeterminedsignificance - MGUS (n=31); 2. Light chain multiplemyeloma-LCMM or Bence Jones myeloma (n=28); 3.Light chains deposit disease-LCDD (n=3); 4. Primary AL

amyloidosis (n=3); 5. Nonsecretory multiple myeloma -NSMM (n=3) and 6. Multiple myeloma - MM (n=15).Cut point intervals for k/λ ratios was (0.26-1.65). Results.According to the ISS model of stratification risk of diseaseprogression, values <0.26 to 0.03 for λ and >1.65 to 4.0 fork-isotype represents low relative risk (RR) of disease pro-gression. Values inside intervals <0.03 to 0.001 as well as>4.0 to 32 indicate intermediate and >32 are connectedwith high RR of disease progression. Results showed thatin MGUS group 10/31 (32%) patients had elevated k/λratios of intermediate RR for progression. Patients withworse prognosis were from LCMM group in which 17/28(61%) had high RR (table). Among the LCMM group 5/28(18%) patients died during the period of 24-36 months. InLCDD and AL, rare disease groups, 2/3 patients died insi-de 12-28 months. Summary/Conclusion. Results comfir-med concordance with ISS model of stratification risk ofdisease progression in MM. sFLC ratio didn’t show addi-tional diagnostics aid in MM group, compared with theintact immunoglobulin concentrations.
B21 - VALUE OF SERUM FREE LIGHT CHAINANALYSIS IN IgD AND IgE MULTIPLE MYELOMA K. van Hoeven,1 A. McNeill,2 E. Bilotti,2 L. McBride,2
L. Schmidt,2 D. Schillen,2 D. Siegel2
1The Binding Site, Inc., San Diego, CA, USA;2Hackensack University Medical Center, Hackensack,NJ, USA
Background. IgD and IgE are the rarest myeloma subty-pes. IgD myeloma has been associated with hypogamma-globulinemia and renal impairment at presentation and anaggressive course. Aim. To explore the value of serumfree light chain (sFLC) analysis in conjunction with otherlaboratory tests in diagnosis and monitoring of IgD andIgE myeloma. Methods. Data were analyzed from elec-tronic laboratory reports of patients with IgD and IgEmyeloma treated between 2003 and 2007. Results.Among 7 IgD myeloma patients (5 men, 2 women),median age was 62 yr (range 41-72). Baseline characteri-stics are shown (table). Serum protein electrophoresis(SPEP) demonstrated an M-protein (1.1 g/dL) in only 1patient; in the other 6 patients, SPEP was non-diagnostic(3 normal, 2 hypogammaglobulinemia, and 1 faint non-quantifiable band). Initial serum and urine immunofixa-tion in two patients yielded light chains only, but subse-quent studies demonstrated IgD myeloma. Six patientshad increased IgD levels; the other patient demonstratedan IgD M-protein by immunofixation only. BaselinesFLC ratios were abnormal in the 6 patients for whomdata were available. Only 2/6 patients had baseline serumcreatinine >2.0 mg/dL. These 2 patients had the highestclonal sFLC concentrations (kappa 81,200 mg/L, lambda3,600 mg/L). IgD has a short half-life (2-days), thus IgDand sFLC tended to show similar changes while monito-ring treatment response. In the two patients with signifi-cant renal impairment, sFLC decreased during treatmentand mirrored improved renal function. In one patient withIgE kappa myeloma (SPEP M-protein 0.81 g/dL; IgE>50,000 mg/dL [normal ≤114 mg/dL], free kappa 42.8mg/L, free lambda 10 mg/L), sFLC concentrations were
below the measurable disease threshold of ≥100 mg/L atpresentation and during follow-up. Conclusion. sFLCanalysis was a valuable clinical tool in IgD myeloma. IgDmyeloma may be under-diagnosed given that it may beconfused with light chain myeloma.
Table.
Baseline (serum) Median (range) Normal range
IgD, mg/dL (n=5) 123 (12.93-842) 0.13-15.27Creatinine, mg/dL (n=6) 1.45 (0.8-7.50) 0.5-1.3β2-microglobulin, mg/dL (n=7) 3.94 (2.37-27.8) ≤2.51Uncorrected Ca++, mg/dL (n=6) 9.1 (6.8-9.7) 8.6-10.2Albumin (sPEP), g/dL (n=7) 3.80 (2.60-4.50) 3.5-4.7Globulin, g/dL (n=5) 2.9 (1.9-4.1) 2.2-4-2Free light chain clone- k, mg/L (n=3) 1310 (143-81,200) 3.3-19.4- k, mg/L (n=3) 987 (163-3600) 5.7-26.3
Intyernational stage (n=7) stage 1=2; stage 2=2; Not applicablestage 3=3
B22 - SMOLDERING MULTIPLE MYELOMA WITHIgE λ PLUS λ FREE LIGHT CHAINS. A DIAGNO-STIC CLINICAL CASE B. Cabanas López de Vergara, M.A. Rodríguez López, R.Ocampo Martínez, J.P. Plaza Villa
Complexo Hospitalario Universitario de Vigo, Calle dePizarro, Vigo, Spain
Background. Most multiple myeloma (MM) patients arecharacterized by the secretion of a monoclonal protein(MP) of the IgG or IgA type, and less frequently by thelight chain type (Bence Jones). IgD, IgM, and IgE areuncommon MP found in patients sera (1%, 0.2%, and0.02%, respectively). Methods/Clinical presentation. An82-year old male was admitted with respiratory problemsand congestive cardiac failure. Although the protein ana-lysis results did not show any clear MP, a suspicious peakin the gamma fraction was observed and, consequently, a24h urine immunofixation (uIFE) was performed. TheuIFE results were negative but the concentration of the λfree light chain in the serum (sFLC) was >289 mg/dL.Further laboratory investigations for the diagnosis of aMP were performed. Serum immunofixation (sIFE) con-firmed the increased levels of λ sFLC. While the concen-trations of immunoglobulins IgG, IgA, and IgM were of600, 172, and 27mg/dL, respectively, the IgE concentra-tion was of 328,500 kU/L. sIFE against IgE antiserumconfirmed the MP result. Therefore, the patient presenteda λ type IgE MP and a free λ sFLC. No numerical orstructural chromosomal alterations were found at the timeof diagnosis and the FISH assay for the genes Rb, p53,and IgH did not show any alteration. There was 16% bonemarrow infiltration by plasma cells and PCR detectedmonoclonal IgH. Subsequent follow-up of the uIFE con-tinued to be negative, while the sIFE continued to bepositive for IgE, and the sFLC ratios continued to be alte-red (0.196; 0.204; 0.183). Conclusions. IgE MM is belie-ved to have a greater clinical malign course than otherforms of monoclonal gammopathy. There is a need forsensitive techniques that detect monoclonality andprompts the clinical tests towards a definitive diagnostic.
Posters
| 32 | Hematology Reports 2010; 2 (s2)

6th International Symposium on Clinical Applications of Serum Free Light Chain Analysis (plus Hevylite)Bath, United Kingdom, 23-24 September 2010
Hematology Reports 2010; 2 (s2) | 33 |
In this case, the altered concentration of sFLC and theabnormal k/λ ratio led to the diagnosis of smolderingMM with IgEλ plus FLC λ. Furthermore, the sFLCs werefound to be most useful simple test for patient follow-upbecause of the scarcity of monoclonal IgE tests.
B23 - ROLE OF KAPPA FREE INDEX IN PREDIC-TING CONVERSION OF CLINICALLY ISOLATEDSYNDROMES TO MULTIPLE SCLEROSISL.M. Villar, M. Espiño, J.C. Álvarez-Cermeño
Hospital Ramon y Cajal, Madrid, Spain
Background. It is has been recently described that localproduction of free kappa chains within the CentralNervous System calculated by kappa free index may be auseful tool in the diagnosis of multiple sclerosis (MS).Most MS patients initiate with a clinically isolated syn-drome (CIS). However some CIS are auto-limited and donot develop MS. The finding of reliable markers that pre-dict the conversion of CIS to MS is of great importancesince it has been widely shown the importance of earlytreatment in MS. Aims. To investigate the role of thekappa index in predicting the conversion of CIS to MS.Comparison with quantitative and qualitative measures ofintra-thecal immunoglobulin synthesis. Methods.Patients: 96 with CIS consecutively recruited at the MSunit from Hospital Ramon y Cajal (Madrid, Spain) from2001 to 2009. Control group: 20 patients with other neu-rological diseases. Baseline studies. We studied IgG,IgM, albumin, free kappa lambda chains and lgG andIgM oligoclonal bands in serum and CSF of all patients.A magnetic resonance imaging study was also performedin every CIS patients within 3 months from disease onsetFollow-up study: Patients were examined every 6 monthsand at the time of relapse. Statistival differences were stu-dies by an Anova test, with a Dunns Post Hoc analysis.Results. 36 patients converted to clinically definite MSduring follow-up (Group 1) and 60 did not. We dividedpatients that did not converted to MS as follows: Group 2included 35 patients with IgG oligoclonal bands and atleast two T2 MRI lesions, which show a high probabilityof conversion to MS. Group 3 included twenty five CISthat did not show oligoclonal IgG bands and did not ful-fil Barkhof-Tintore MRI criteria and have a very low pro-bability of conversion to MS. Group 1 and 2 patients sho-wed similar increase of kappa free index (p<0.0001)when compared with group 3 patients. A moderate increa-se of kappa free index could also be observed in somepatients with other neurological inflammatory diseases,although this group did not show statistical differences inthe kappa index with respect to group 3 values.Discussion. Kappa free index may be a useful biomarkerto predict conversion to MS in patients with clinicallyisolated syndromes.
FREE LIGHT CHAINS AND DISEASEMONITORING
C24 - SERUM FREE LIGHT CHAINS ADD TO M-PROTEIN BY IMMUNOFIXATION IN RESPONSEASSESSMENT IN NEWLY DIAGNOSED PATIENTSWITH MYELOMA RECEIVING NOVEL THERAPIESAND MAY HOLD UNIQUE, A PRIORI PROGNOSTICPOWER PRIOR TO HDC/SCTS. Mori, B. Crawford, J. Roddy, G. Phillips, P. Elder, C.Hofmeister, Y. Efebera, C. Greenfield, K. Rose, D.M.Benson Jr
The Ohio State University Comprehensive CancerCenter Columbus, OH, USA
Background. The care of patients with multiple myeloma(MM) has evolved rapidly with the advent of novel treat-ments, including bortezomib and the immunomodulatoryagents, thalidomide and lenalidomide. In addition, thewide-spread availability of technology to measure freelight chains (sFLC) in serum has provided an additionalbiomarker for screening, prognosis, and monitoring ofpatients (pts) with oligo/non-secretory MM. Whethernovel agents will obviate the need for high dose chemo-therapy (HDC) and autologous stem cell transplantation(SCT) remains controversial, and most newly-diagnosed,transplant eligible patients with MM now receive aninduction regimen incorporating a novel agent prior toHDC/SCT. Moreover, specific roles for sFLC in responseassessment and prognosis following HDC/SCT remain tobe defined. Aims. 1.To determine if sFLC contributes toresponse assessment in newly diagnosed MM undergoinginduction therapy 2.To determine if sFLC holds progno-stic value for pts with MM undergoing HDC/SCT.Methods. Under an IRB-approved protocol, data werecollected on n=73 pts with MM who received novelagent-based induction therapy prior to stem cell mobiliza-tion and HDC/SCT. Pt demographics and disease charac-teristics at diagnosis and following induction were collec-ted specifically; M-protein measured by immunofixation(IFE), serum FLC, kappa/lambda ratio, as well as bonemarrow plasmacytosis at diagnosis and post-inductiontherapy. Linear regression models were created witheither one or two primary predictor variables using resi-dual disease burden (as defined by bone marrow plasma-cytosis) post-induction as the outcome variable. Kaplan-Meier analyses of PFS and OS post-HDC/SCT were per-formed. Results.M-protein IFE correlated with bone mar-row plasmacytosis and diagnosis (p=0.001) and post-induction therapy (p<0.001). Involved sFLC also correla-ted with bone marrow plasmacytosis at diagnosis(p=0.02) and post-induction (p=0.03). 16 individual, mul-tivariable-regression models were created to determineresidual marrow plasmacytosis with M-protein IFE orinvolved sFLC serving as the primary predictor.Statistical significance was observed in 6 of the 8 modelsregarding M-protein as the primary predictor, whereasstatistical significance was observed in only 2 of the 8models regarding involved sFLC as the primary predictor.8 additional linear regression models were created using
M-protein IFE and involved sFLC as co-primary predic-tors. In these models, the change from diagnosis to post-induction of both M-protein and involved sFLC perfor-med best at predicting marrow plasmacytosis. A clear OSsurvival advantage was observed post-HDC/SCT inpatients in whom involved sFLC fell by more than 50%during induction (p=0.009). Also, in pts in whom invol-ved sFLC normalized during induction, significantly bet-ter PFS (p=0.009) following HDC/SCT was also obser-ved. Similar findings were not seen with M-protein byIFE change or pre-HDC/SCT marrow plasmacytosis.Summary/Conclusion. As independent predictors ofdisease burden post-induction, M-protein by IFE appearsto outperform involved sFLC; however, the addition ofinvolved sFLC to M-protein by IFE significantly impro-ves test performance at estimating residual marrow pla-smacytosis post-induction therapy. In addition, involvedsFLC may carry a unique, a priori prognostic significan-ce for estimating PFS and OS following consolidativeHDC/SCT. These findings suggest potential novel appli-cations for sFLC in the management of pts with MM.
C25 - SERUM FREE LIGHT CHAINS ANALYSISCAN DETECT EARLY RELAPSE/PROGRESSION ININTACT IMMUNOGLOBULIN MULTIPLE MYELOMAM. Sobh, S. Morisset, T. Guilli, S. Ducastelle, F. Barraco,Y. Chelghoum, X. Thomas, A. Praire, F. Nicolini, C. Chapuis-Cellier, M. Michallet
Edouard Herriot Hospital, Haematology, Lyon, France
Background. Serum free light chains (sFLC) analysis hasproved its usefulness in disease diagnosis and early treat-ment responses in multiple myeloma (MM). The sFLCratio (sFLCr) has been included as one of the necessary cri-teria for achieving a “stringent complete response” in theproposed international response criteria. In contrast, per-forming this analysis during patients’ follow up and afterdifferent treatments, in a daily practice setting, is still notvery well defined yet. Aims. The main objective of thisstudy was to assess the importance of sFLC analysis duringMM patients’ follow-up especially for relapse/progressiondetection alongside traditional serum protein electrophore-sis (SPE). Methods. We have analysed 174 MM patientsdiagnosed at the Edouard Herriot University Hospital bet-ween years 2002 and 2008, for which a concomitant mea-surement of sFLC and SPE was done during follow-up.The sFLC analysis was performed using the Freelite testfrom the Binding Site on a BNII, Dade Behring, and forSPE, analysis was done using a Paragon CZE 2000,Beckman Coulter. There were 92 (53%) males and 82(47%) females, median age at diagnosis 57 years (34-72).One hundred and twenty patients (69%) had IgG(87k&33λ), 52 (30%) IgA (41k&11λ) and 2 (1%) IgD(1k&1λ) monoclonal proteins. Twenty six (15%) patientshad renal insufficiency. We were interested to monitor thebehaviour of sFLC and SPE in a way to detect early relap-se or progression independently of treatment type. Slopesof the increase period corresponding to each measurementwere compared using the student t-bilateral test with R sta-tistical software (version 2.9.2). Results. After monitoringall patients, we observed 117 (67%) patients with relapse
or disease progression and 57 (33%) patients were still inresponse to treatment. As our main objective was to detectrelapse or progression, the 57 patients in response wereexcluded from the analysis. Among the 117 patients, in 77(66%) cases, relapse or progression was detected by con-comitant increase of both sFLC and the intact immunoglo-bulin level (Ig) with a significant earlier increase for sFLC.In 17 (15%) patients, the relapse or progression was cha-racterised by the increase only of sFLC without any increa-se of the Ig. Contrarily, in 5 (4%) patients there was onlyan increase of the Ig without increasing the sFLC. Finally,in 18 (15%) patients, the relapse or progression was revea-led by the increase of Ig faster than the concerned sFLC.When comparing slopes of increasing sFLC comparing toincreasing Ig, we found a very high significant difference(p<0.001), thus showing that sFLC have a faster detectionof relapse or progression. (Figures of different profiles willbe communicated). Summary/conclusion. We have obser-ved that in 81% (66%+15%) of patients, sFLC analysisenabled an earlier detection of relapse or progression com-pared to SPE, that could be very important for early treat-ment intervention especially for high risk patients. Sincethere are no uniform recommendations for the use of thisanalysis during follow-up, we recommend its concomitantuse with SPE, while waiting for guidelines.
C26 - SERUM & URINE FREE LIGHT CHAIN MONI-TORING COMPARED TO CONVENTIONAL SPE: ANUPDATE ON USEFULNESS AND PITFALLS IN“REAL LIFE HAEMATOLOGY”W. Willenbacher,1 G. Gastl,1 W. Prokop,2 E. Willenbacher,1
1Innsbruck University Hospital, Internal Medicine VHaematology & Oncology, Innsbruck, Austria
Introduction. Serum free light chain analysis (sFLCA) is atool to monitor myeloma disease activity and treatmentresponse, as well as to stratify myeloma patients (pts) and todefine risk groups and has been incorporated into recentdiagnostic guidelines.1 Either, the ratio of the freekappa/lambda light chains (FLCQ), the absolute value of theinvolved light chain (FLCi) or the difference of involvedand uninvolved light chain (FLCD) may be used. WhilesFLCA is recommended in guidelines, urine free light chainanalysis (uFLCA) at the moment is not. To analyze whetherresults from sFLCA and uFLCA would potentially havetranslated into altered clinical decision making and timingof treatments, compared with classical paraprotein measu-rements (PPM) in a cohort of myeloma pts, we analyzed allmeasurements routinely performed at Innsbruck UniversityHospital between MAR 03 and OKT 08 and correlatedthem with individual patients clinical courses. Patients,assays and treatment lines. 187 pts. (109 m, 78 f) out of 235pts. identified were deemed eligible. Myeloma subtypeswere IgG (57.2%), IgA (21,9%), FLC only (13.9%), IgM(3.2%), oligo and nonsecretory (2.6 %, incl. 2 pts. comple-tely asecretory), and IgD (1,0%). 4 pts. were completeimmunoglobulin only secretors. According to mSMART15% were high risk, 61% standard risk and 23,5% ofunknown category. In this cohort 3,202 sFLCA, 1,136uFLCA and 2,583 PPM were performed (range 2-89,median 12). The measurements were correlated with 167
Posters
| 34 | Hematology Reports 2010; 2 (s2)

6th International Symposium on Clinical Applications of Serum Free Light Chain Analysis (plus Hevylite)Bath, United Kingdom, 23-24 September 2010
Hematology Reports 2010; 2 (s2) | 35 |
treatment times applied in this pts. (49 auto-transplants, 3allo-transplants, 7 auto/allo procedures, 68 regimes contai-ning novel agents and 40 conventional chemotherapeuticapproaches. Results. sFLCA showed a significant advanta-ge in detecting any of the predefined clinical endpoints(Table 1). By using PPM only , ~ 40% of events would havebeen missed during the observation period. A median of13% of the applied therapies proven to be ineffective couldhave been stopped and altered earlier using the results ofsFLCA. While the use of sFLCi and sFLCD resulted in com-parable rates of false positive and negative results (Table 2),in comparison to PPM, sFLCQ is more sensitive to effects ofimmunoparesis, changes of the uninvolved FLC concentra-tion and renal function resulting in both more false positiveas well as false negative results. sFLCA detected relapseswith a median of 3 months prior to PPM, therapeutic effec-tiveness with a median of 2 therapy cycles earlier than PPMand therapeutic failure with a median of 1 antecedent cycleof therapy. Discussion. This analysis proves sFLCA is auseful tool in monitoring myeloma pts, clinical courses andthe therapeutic effectiveness of myeloma treatment approa-ches, even in the setting of “real life medicine”. For moni-toring purposes sFLCi and sFLCD should be used preferablydue the higher false positive/negative potential of sFLCQ.By using sFLCA in a structured diagnostic pathway, treat-ment effectiveness could be judged earlier and altered ifnecessary. Thus this analysis shows a potential clinicallysignificant benefit to myeloma pts. An update on this dataand an analysis of the techniques pitfalls from high dosehook effects to immunoparesis, light chain escapes, and tre-atment effects will be given.
Table 1. sFLCA vs. PPM.
Clinical events SFLCi SFLCQ SFLCD SPPM p (vs PPM)
Antecedent 51 53 54 36 0.1relapseAntecedent 43 46 48 40 0.1remissionAntecedent therapy 31 33 34 11 0.1effectivenessAntecedent 18 15 16 4 0.1therapy failureCombined clinical 143 147 152 91 0.01endpoints (total number 154)% detected 92.9 95.4 98.7 59.1 0.01
Table 2. sFLCA vs. PPM. Frequency of false negative.
Result FLCi FLCQ FLCD SPPM
False pos. (relapse/effectiveness) 1 8 1False neg. (relapse/effectiveness) 1 5 1 2False pos. remission 1False neg. remission 1 1 3
3 14 3 5
References
1. Dispenzieri et al. Leukemia advance online publication 20November 2008; doi:10.1038/leu.2008.307.
C27 - MONITORING PATIENTS WITH MONOCLO-NAL PLASMA CELL DISORDERS (PCDS) AFTERAUTOLOGOUS STEM CELL TRANSPLANTATIONBY USING SERUM FREE LIGHT CHAINS ANDSERUM PROTEIN ELECTROPHORESISM. Dogaru,1 D. Coriu,1,2 S. Badelita,2 M. Crisan1
1Fundeni Clinical Institute, Bucharest, Romania;2University of Medicine and Pharmacy "Carol Davila",Bucharest, Romania
Serum free light chains are important markers for moni-toring patients with monoclonal plasma cell disorders(PCDs). Automated immunoassays that measures serumfree light chains (FLCs) have been recently introduced inour lab and this report presents our experience. Aims. toanalyse the efficiency of serum FLC in comparison withserum protein electrophoresis (SPE) in monitoringpatients after autologous peripheral blood stem cell tran-splantation (PBSCT). Methods. We analyzed serial sam-ples from 10 patients with monoclonal plasma cell disor-ders (PCDs) undergoing autologous stem cell transplanta-tion. All samples had been analyzed by scanning densito-metry of electrophoresis gels and FLCs. The FLC assay(Freelite; Binding Site) was performed on a DadeBehring, BN ProSpec automated nephelometer. Datawere analysed based on previously established normalranges. A k/λ ratio less than 0.26 (positive for λ FLC) orgreater than 1.65 (positive for k FLC) were consideredabnormal. SPE was performed on a SEBIA electrophore-sis automated analyzer. Results. In this study we presen-ted in dynamics the evolution of 7 patients with intactimmunoglobulin multiple myeloma (IIMM) (2 IgG,k; 3IgG,λ; 1 IgA,k; 1 IgA,λ) and 2 patients with light chainmultiple myeloma before and after autologous PBSCT.All patients had previously been given cytotoxic chemo-therapy (VAD or velcade). In two of the patients withIIMM both FLC and protein electrophoresis fell towardsnormal range after autologous PBSCT and both reporteda relapse after 23 month and 9 months respectively. Inone patient FLC fell in the normal range after inductionchemotherapy but SPE continued to be abnormal. Thepatient has undergone autologous PBSCT and will beunder our observation. In one patient FLC became normalafter transplantation but the SPE stayed abnormal. In onepatient SPE became normal before FLC but FLC were thefirst to signal the relapse after 20 months from transplan-tation. In one patient (IgGλ) the outcome was poor. SPEdid not normalize and although the k/λ ratio fell in thenormal range, the concentrations of free λ were above thenormal range. In one patient SPE and FLC fell in the nor-mal range at the same time but FLC was the first to signalthe relapse after 16 month from transplantation. Forpatients with light chain multiple myeloma, classical SPEfailed to demonstrate monoclonal protein and FLC assayhelped us to identify the monoclonal light chain in thesecases. After autologous PBSCT the serum free lightchains concentrations fell but they continued to be out ofthe normal range even after 3 month. These patients con-tinue to be under our observation in the future.Conclusions. With regard to the choice of method formonitoring patients with PCDs that undergone autolo-gous stem cell transplantation, FLC assay has proven to
be more efficient than SPE in indicating whether autolo-gous PBSCT is effective or not.
C28 - NORMALIZATION AND MAINTENANCE OFNORMAL LEVELS AND RATIOS OF SERUM FREELIGHT CHAIN (sFLC) OVER 1 YEAR POST-TRAN-SPLANT ARE ASSOCIATED WITH LONGER SURVI-VAL OF PATIENTS WITH MULTIPLE MYELOMA(MM)C.K. Lee,1 M. Berg,2 J. Ryder,2 H. Myint,2 J. Gutman,2 W.Robinson2
1UCHSC Cancer Center, Colorado, US; 2University ofColorado, Aurora, CO, USA
Background. The role of sFLC assay for predicting survi-val has been uncertain for patients with MM followingautotransplant-based therapy. Aims. We sought to seewhether survival improves by achieving and maintainingnormal level/ratios of sFLC for at least a year after auto-transplant. Methods. We followed a cohort of MMpatients with serial sFLC assays before and after tran-splant at least once month for a minimum of one year.Between September 2006 and July 2009, patients (n=59;median age 60, range 37-77) were treated with inductionchemotherapy, autotransplant following high-dose mel-phalan-based ablative therapy and post-transplant mainte-nance. Polyclonal antisera-based FLC test of the BindingSite was used for sFLC assay. Results. Twenty sixpatients had IgG, 14 IgA, 15 FLC only and 4 nonsecreto-ry MM. At diagnosis, six patients (10%) had a normalsFLC level/ratio. During the first year follow-up aftertransplant, 16 of the 53 patients (30%) showed abnormalsFLC related to new mono- or oligoclonal immunoglobu-lin (Ig) in serum, with a median time of onset of 44 daysfrom the 1st autotransplant, and 7 of 23 (30%) in 64 daysfollowing the 2nd autotransplant. These new clonal Ig(s)disappeared spontaneously in a median of 51 and 48 days,following the 1st and 2nd autotransplant, respectively.Changes in sFLC level/ratio in the presence of new clo-nal Ig were not taken as indicator of relapse for the cur-rent study. Of the 53 patients, 40 achieved a normal leveland ratio of sFLC in a median of 143 days (range 31-949), with a 3-year cumulative incidence of 67%. Thirtyfive of the 40 patients (88%) remained normal on thesFLC assay through the end of the study. Forty four of the53 patients are currently alive, with an estimated 3-yearoverall survival of 78%. Thirteen patients relapsed, withan estimated 3-year event free survival (EFS) of 64%.Patients (n=35) who became and remained normal on thesFLC assay for at least one year post-transplant had a 3-year overall survival of 68% whereas those (n=18) whoremained or converted to abnormal had 50%, Logrankp<0.01. An estimated 3-year EFS was 59% for the 35 and50% for the 18 patients, respectively, Logrank p=0.09.Summary/Conclusion. The current study suggests thatsurvival of MM patients may improve by normalizationand maintenance of normal level/ratio of sFLC at leastover a year following autotransplant based therapy.Further study is necessary to confirm the findings.
C29 - FREE LIGHT CHAIN RECOVERY AFTERREDUCED INTENSITY ALLOGENIC TRANSPLANT(RIC) FOR MULTIPLE MYELOMA (MM) - EFFECTOF CHRONIC GRAFT VERSUS HOST DISEASE(CGVHD) & PROGRESSION V. Singh, R. Cornell, M. Sala, S. Paruchuri, A. Saad, J. Palmer, P. Hari
Department of Neoplastic diseases, Medical College ofWisconsin, Milwaukee, WI, USA
Introduction. RIC allogeneic transplantation depends ondonor derived allo-immunity to prevent progression orrelapse of MM. Donor T cell mediated graft vs. MMeffect is central to this. Also after RIC, recipient B cellfunction is donor derived. We hypothesized that recoveryof B cell function in this setting is influenced by the com-peting effects of recurrence of myeloma clone vs. theimpact of graft vs. MM. The recovery of donor B cell fun-ction could be delayed by graft vs. host effect (GVHD)which also is associated with the graft vs. MM effect. Westudied alternate (uninvolved) free light chain recovery asa marker for donor derived immune function after RICfor MM. The outcomes of 47 recipients (matched siblingsdonors =45) of RIC for multiple myeloma were analyzed.Conditioning regimen did not involve anti-myeloma che-motherapy and was primarily immunosuppressive.Median follow up was 2 years.
Table 1.
FLC response Median TRM DFS Relapse Relapse an alivegroup N=47 PFS 7 23 death 10 No Rx vs Rx
1 6
Never (12) 4.6 mo 6 0 6 0 0Early recovery 11.8 mo 1 4 3 0 2(10)Late recovery NR @ 5 yrs 0 19 1 1 4
P=0.0001
Methods & Results. Serum free light chain assay was per-formed pre-transplant and at 3-monthly intervals aftertransplant. Progression free survival, treatment relatedmortality, overall survival and myeloma progression wereanalyzed. The light chain associated with MM clone wasdesignated as involved (IFLC) and the complementarylight chain designated as the uninvolved (UFLC). Allpatients, except those with progressive MM, had suppres-sion of both light chains immediately after RIC. Based onpattern of recovery of uninvolved free light chains weidentified 3 clear patterns. First group – those who did nothave any UFLC recovery, secondly those whose UFLCreturned to normal levels within 6 months of RIC (earlyrecovery) and a third group were the UFLC recovery wasdelayed beyond 6 months (late recovery). OS and PFS ofwhole group at 4.5 years was 54% (CI 36-72%) and 38%(CI 15- 61%) respectively. TRM was 14.5%. Median PFSwas significantly superior in the late recovery group(p=0.0001). A landmark analysis of 6 month survivorsafter RIC confirmed these findings (Figure 1).Conclusion. Recovery of uninvolved light chain serves as
Posters
| 36 | Hematology Reports 2010; 2 (s2)
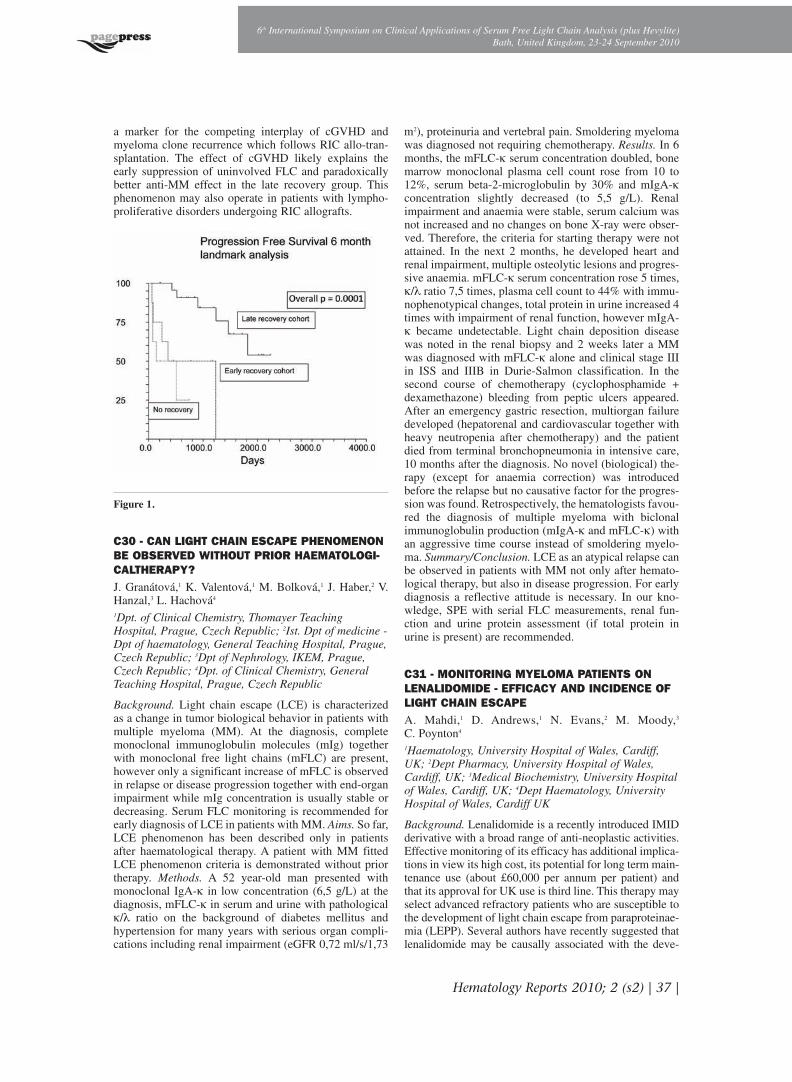
6th International Symposium on Clinical Applications of Serum Free Light Chain Analysis (plus Hevylite)Bath, United Kingdom, 23-24 September 2010
Hematology Reports 2010; 2 (s2) | 37 |
a marker for the competing interplay of cGVHD andmyeloma clone recurrence which follows RIC allo-tran-splantation. The effect of cGVHD likely explains theearly suppression of uninvolved FLC and paradoxicallybetter anti-MM effect in the late recovery group. Thisphenomenon may also operate in patients with lympho-proliferative disorders undergoing RIC allografts.
Figure 1.
C30 - CAN LIGHT CHAIN ESCAPE PHENOMENONBE OBSERVED WITHOUT PRIOR HAEMATOLOGI-CALTHERAPY?J. Granátová,1 K. Valentová,1 M. Bolková,1 J. Haber,2 V.Hanzal,3 L. Hachová4
1Dpt. of Clinical Chemistry, Thomayer TeachingHospital, Prague, Czech Republic; 2Ist. Dpt of medicine -Dpt of haematology, General Teaching Hospital, Prague,Czech Republic; 3Dpt of Nephrology, IKEM, Prague,Czech Republic; 4Dpt. of Clinical Chemistry, GeneralTeaching Hospital, Prague, Czech Republic
Background. Light chain escape (LCE) is characterizedas a change in tumor biological behavior in patients withmultiple myeloma (MM). At the diagnosis, completemonoclonal immunoglobulin molecules (mIg) togetherwith monoclonal free light chains (mFLC) are present,however only a significant increase of mFLC is observedin relapse or disease progression together with end-organimpairment while mIg concentration is usually stable ordecreasing. Serum FLC monitoring is recommended forearly diagnosis of LCE in patients with MM. Aims. So far,LCE phenomenon has been described only in patientsafter haematological therapy. A patient with MM fittedLCE phenomenon criteria is demonstrated without priortherapy. Methods. A 52 year-old man presented withmonoclonal IgA-k in low concentration (6,5 g/L) at thediagnosis, mFLC-k in serum and urine with pathologicalk/λ ratio on the background of diabetes mellitus andhypertension for many years with serious organ compli-cations including renal impairment (eGFR 0,72 ml/s/1,73
m2), proteinuria and vertebral pain. Smoldering myelomawas diagnosed not requiring chemotherapy. Results. In 6months, the mFLC-k serum concentration doubled, bonemarrow monoclonal plasma cell count rose from 10 to12%, serum beta-2-microglobulin by 30% and mIgA-kconcentration slightly decreased (to 5,5 g/L). Renalimpairment and anaemia were stable, serum calcium wasnot increased and no changes on bone X-ray were obser-ved. Therefore, the criteria for starting therapy were notattained. In the next 2 months, he developed heart andrenal impairment, multiple osteolytic lesions and progres-sive anaemia. mFLC-k serum concentration rose 5 times,k/λ ratio 7,5 times, plasma cell count to 44% with immu-nophenotypical changes, total protein in urine increased 4times with impairment of renal function, however mIgA-k became undetectable. Light chain deposition diseasewas noted in the renal biopsy and 2 weeks later a MMwas diagnosed with mFLC-k alone and clinical stage IIIin ISS and IIIB in Durie-Salmon classification. In thesecond course of chemotherapy (cyclophosphamide +dexamethazone) bleeding from peptic ulcers appeared.After an emergency gastric resection, multiorgan failuredeveloped (hepatorenal and cardiovascular together withheavy neutropenia after chemotherapy) and the patientdied from terminal bronchopneumonia in intensive care,10 months after the diagnosis. No novel (biological) the-rapy (except for anaemia correction) was introducedbefore the relapse but no causative factor for the progres-sion was found. Retrospectively, the hematologists favou-red the diagnosis of multiple myeloma with biclonalimmunoglobulin production (mIgA-k and mFLC-k) withan aggressive time course instead of smoldering myelo-ma. Summary/Conclusion. LCE as an atypical relapse canbe observed in patients with MM not only after hemato-logical therapy, but also in disease progression. For earlydiagnosis a reflective attitude is necessary. In our kno-wledge, SPE with serial FLC measurements, renal fun-ction and urine protein assessment (if total protein inurine is present) are recommended.
C31 - MONITORING MYELOMA PATIENTS ONLENALIDOMIDE - EFFICACY AND INCIDENCE OFLIGHT CHAIN ESCAPEA. Mahdi,1 D. Andrews,1 N. Evans,2 M. Moody,3
C. Poynton4
1Haematology, University Hospital of Wales, Cardiff,UK; 2Dept Pharmacy, University Hospital of Wales,Cardiff, UK; 3Medical Biochemistry, University Hospitalof Wales, Cardiff, UK; 4Dept Haematology, UniversityHospital of Wales, Cardiff UK
Background. Lenalidomide is a recently introduced IMIDderivative with a broad range of anti-neoplastic activities.Effective monitoring of its efficacy has additional implica-tions in view its high cost, its potential for long term main-tenance use (about £60,000 per annum per patient) andthat its approval for UK use is third line. This therapy mayselect advanced refractory patients who are susceptible tothe development of light chain escape from paraproteinae-mia (LEPP). Several authors have recently suggested thatlenalidomide may be causally associated with the deve-
lopment of LEPP. Aims. We aimed to review the patientsin our institution who have received lenalidomide formyeloma since its approval in Wales in 2008, in order todetermine the efficacy, method of monitoring, incidenceof LEPP and outcomes. Methods. Retrospective analysisof laboratory paraprotein and LEPP measurements, phar-macy records of prescriptions for lenalidomide and indivi-dual patient medical records were assessed. Results. 15patients received lenalidomide for progressive myelomafrom 2008-2010. All patients had previously been treatedwith thalidomide. There were 10 males and 5 females.Median age was 59 (38-79). Median number of prior tre-atments for the myeloma was 3 (2-6). 8 patients had recei-ved high dose melphalan with autologous stem cell rescuepreviously (one had a double autograft). A total of 117cycles (3 weeks on and one week off) of lenalidomidewere prescribed (range 2-13) and a total of 143 serum freelight chain (sFLC) measurements were made (on average,1.2 tests per cycle). Only 2 patients had light chain onlymyeloma when first diagnosed but 8 patients developedLEPP prior to starting lenalidomide and 1 patient revertedto whole paraprotein secretion from LEPP while on lena-lidomide. The presence of LEPP in this patient group cor-related highly with the number of prior treatments. Nopatient developed LEPP since starting Lenalidomide.sFLC measurements appeared highly concordant with theclinical outcome and an effective means of monitoring theclinical course. 4 patients had the lenalidomide stoppeddue to lack of response or toxicity. There were 2 patientswho progressed and died, 3 partial responses and 10patients are now in plateau phase again. One of thesepatients has reverted from LEPP to monoclonal immuno-globulin production during lenalidomide treatment.Summary/Conclusion. Lenalidomide appears highly effec-tive in patients with advanced myeloma and the majorityof patients receiving the drug will inevitably have beenheavily pre-treated. These patients have a high incidenceof (LEPP) so that sFLC measurements are crucial both formonitoring their progress and for early cessation if thedrug is not effective. A preliminary guideline on the opti-mal timing and frequency of monitoring would be useful.There is no evidence from this group of patients that lena-lidomide enhances the development of LEPP.
C32 - A SINGLE CENTRE EXPERIENCE OF CLO-NAL EVOLUTION IN RELAPSED MYELOMA MANI-FESTED BY LIGHT CHAIN ESCAPEH. McCarthy, M. Lasebai, R. Hall
Royal Bournemouth Hospital, Bournemouth, UK
Background. The majority of myeloma patients secrete anintact immunoglobulin (Ig) molecule accompanied byvariable isotypic light chain secretion. Following prolon-ged therapy clonal evolution can occur with acquiredgenetic changes such as secondary Ig translocations, Mycdysregulation and p53 inactivation. Light chain escape(LCE), characterised by a shift from intact Ig secretion tofree light chain only, is another manifestation of clonalevolution recognised by haematologists but rarely repor-ted. Such biological change often manifests by the deve-lopment of significant organ dysfunction including renal
impairment or new bony lesions. Aims. The aim of thisstudy was to investigate the prevalence and clinical featu-res of LCE myeloma. Methods. We retrospectively stu-died a patient cohort treated in our institution from 2005to 2010. For identified cases, patient characteristics, num-ber of lines of treatment, response to treatment and modeand speed of disease progression were recorded. Serumfree light chains (FLC) were measured using the Freeliteassay and correlated with other laboratory results such asparaprotein level (intact Ig) and serum creatinine.Results. We identified 7 cases of LCE myeloma in ourcohort of 155 patients. The prevalence of LCE within ourpatient’s cohort was 4.5%. The median time from diagno-sis to LCE was 14.5 months. In all cases the LCE wasmanifested by renal deterioration. The median number oftherapies received prior to the onset of LCE was 2, ran-ging from 0 to 5. Interestingly, one case demonstratedLCE prior to receiving any therapy. Conclusion. Ourstudy demonstrates that LCE myeloma is more commonthan previously reported, and frequently characterised byrenal deterioration. Early detection facilitated by serialserum FLC measurements could allow early interventionto prevent unwanted complications. Furthermore, ourdata demonstrates that LCE can present early in the disea-se course prior to initiating anti-myeloma therapy. Furtherlarge studies on the prevalence and molecular mecha-nisms underlying this phenomenon are warranted.
C33 - PROGRESSIVE CLONAL SERUM FREE LIGHTCHAIN ABNORMALITIES PRIOR TO RELAPSE OFOLIGOSECRETORY MULTIPLE MYELOMA (MM) K. van Hoeven,1 E. Bilotti,2 L. McBride,2 A. McNeill,2
L. Schmidt,2 D. Schillen,2 D. Siegel2
1The Binding Site, Inc., San Diego, CA, USA;2Hackensack University Medical Center, Hackensack,NJ, USA
Background. Serum free light chain (sFLC) analysis is asensitive technique for detection of clonal light chaindisorders. An increased clonal FLC with an abnormalsFLC ratio in the absence of intact immunoglobulin M-protein or other abnormality is a phenomenon known asFLC monoclonal gammopathy of undetermined signifi-cance (MGUS). Progression of FLC MGUS to light chainor oligosecretory MM has been described in stored serumsamples (Dispenzieri et al. Lancet 2010; Weiss et al.Blood 2009). Progressive clonal sFLC abnormalities inthe setting of relapsed oligosecretory MM represent asimilar phenomenon in which sFLC abnormalities maybe the first measurable disease manifestation. Aim. Toassess temporal changes in laboratory results prior torelapse of oligosecretory MM. Methods. Clinical andlaboratory records were analyzed in a patient with oligo-secretory MM. Results. A 59-year old woman receivedpulsed dexamethasone followed by tandem melphalan200 mg/m2 autologous stem cell transplantation (ASCT)for newly diagnosed MM in 1999. Sustained remissionwas achieved through 2005, with no M-protein evident byserum protein electrophoresis (sPEP), serum and urineimmunofixation (IFE), or urine protein electrophoresis(uPEP), and a normal sFLC ratio. In 2006 (at months 74
Posters
| 38 | Hematology Reports 2010; 2 (s2)
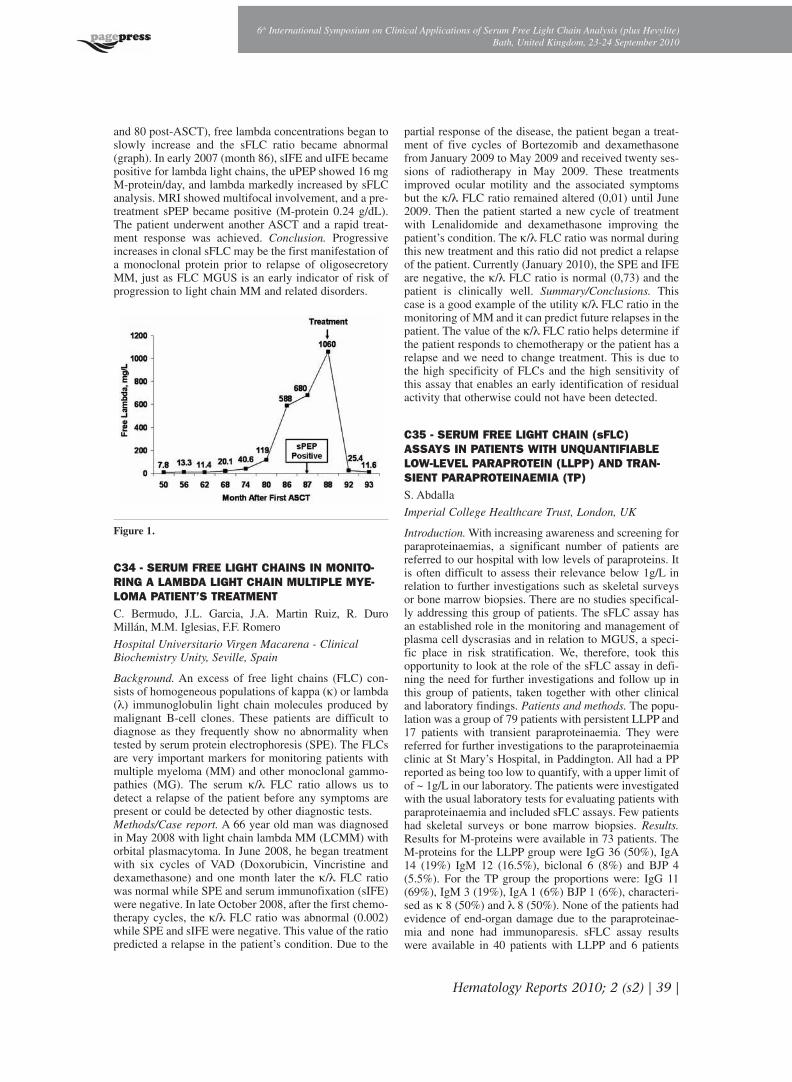
Hematology Reports 2010; 2 (s2) | 39 |
6th International Symposium on Clinical Applications of Serum Free Light Chain Analysis (plus Hevylite)Bath, United Kingdom, 23-24 September 2010
and 80 post-ASCT), free lambda concentrations began toslowly increase and the sFLC ratio became abnormal(graph). In early 2007 (month 86), sIFE and uIFE becamepositive for lambda light chains, the uPEP showed 16 mgM-protein/day, and lambda markedly increased by sFLCanalysis. MRI showed multifocal involvement, and a pre-treatment sPEP became positive (M-protein 0.24 g/dL).The patient underwent another ASCT and a rapid treat-ment response was achieved. Conclusion. Progressiveincreases in clonal sFLC may be the first manifestation ofa monoclonal protein prior to relapse of oligosecretoryMM, just as FLC MGUS is an early indicator of risk ofprogression to light chain MM and related disorders.
Figure 1.
C34 - SERUM FREE LIGHT CHAINS IN MONITO-RING A LAMBDA LIGHT CHAIN MULTIPLE MYE-LOMA PATIENT’S TREATMENTC. Bermudo, J.L. Garcia, J.A. Martin Ruiz, R. DuroMillán, M.M. Iglesias, F.F. Romero
Hospital Universitario Virgen Macarena - ClinicalBiochemistry Unity, Seville, Spain
Background. An excess of free light chains (FLC) con-sists of homogeneous populations of kappa (k) or lambda(λ) immunoglobulin light chain molecules produced bymalignant B-cell clones. These patients are difficult todiagnose as they frequently show no abnormality whentested by serum protein electrophoresis (SPE). The FLCsare very important markers for monitoring patients withmultiple myeloma (MM) and other monoclonal gammo-pathies (MG). The serum k/λ FLC ratio allows us todetect a relapse of the patient before any symptoms arepresent or could be detected by other diagnostic tests. Methods/Case report. A 66 year old man was diagnosedin May 2008 with light chain lambda MM (LCMM) withorbital plasmacytoma. In June 2008, he began treatmentwith six cycles of VAD (Doxorubicin, Vincristine anddexamethasone) and one month later the k/λ FLC ratiowas normal while SPE and serum immunofixation (sIFE)were negative. In late October 2008, after the first chemo-therapy cycles, the k/λ FLC ratio was abnormal (0.002)while SPE and sIFE were negative. This value of the ratiopredicted a relapse in the patient’s condition. Due to the
partial response of the disease, the patient began a treat-ment of five cycles of Bortezomib and dexamethasonefrom January 2009 to May 2009 and received twenty ses-sions of radiotherapy in May 2009. These treatmentsimproved ocular motility and the associated symptomsbut the k/λ FLC ratio remained altered (0,01) until June2009. Then the patient started a new cycle of treatmentwith Lenalidomide and dexamethasone improving thepatient’s condition. The k/λ FLC ratio was normal duringthis new treatment and this ratio did not predict a relapseof the patient. Currently (January 2010), the SPE and IFEare negative, the k/λ FLC ratio is normal (0,73) and thepatient is clinically well. Summary/Conclusions. Thiscase is a good example of the utility k/λ FLC ratio in themonitoring of MM and it can predict future relapses in thepatient. The value of the k/λ FLC ratio helps determine ifthe patient responds to chemotherapy or the patient has arelapse and we need to change treatment. This is due tothe high specificity of FLCs and the high sensitivity ofthis assay that enables an early identification of residualactivity that otherwise could not have been detected.
C35 - SERUM FREE LIGHT CHAIN (sFLC)ASSAYS IN PATIENTS WITH UNQUANTIFIABLELOW-LEVEL PARAPROTEIN (LLPP) AND TRAN-SIENT PARAPROTEINAEMIA (TP) S. Abdalla
Imperial College Healthcare Trust, London, UK
Introduction.With increasing awareness and screening forparaproteinaemias, a significant number of patients arereferred to our hospital with low levels of paraproteins. Itis often difficult to assess their relevance below 1g/L inrelation to further investigations such as skeletal surveysor bone marrow biopsies. There are no studies specifical-ly addressing this group of patients. The sFLC assay hasan established role in the monitoring and management ofplasma cell dyscrasias and in relation to MGUS, a speci-fic place in risk stratification. We, therefore, took thisopportunity to look at the role of the sFLC assay in defi-ning the need for further investigations and follow up inthis group of patients, taken together with other clinicaland laboratory findings. Patients and methods. The popu-lation was a group of 79 patients with persistent LLPP and17 patients with transient paraproteinaemia. They werereferred for further investigations to the paraproteinaemiaclinic at St Mary’s Hospital, in Paddington. All had a PPreported as being too low to quantify, with a upper limit ofof ~ 1g/L in our laboratory. The patients were investigatedwith the usual laboratory tests for evaluating patients withparaproteinaemia and included sFLC assays. Few patientshad skeletal surveys or bone marrow biopsies. Results.Results for M-proteins were available in 73 patients. TheM-proteins for the LLPP group were IgG 36 (50%), IgA14 (19%) IgM 12 (16.5%), biclonal 6 (8%) and BJP 4(5.5%). For the TP group the proportions were: IgG 11(69%), IgM 3 (19%), IgA 1 (6%) BJP 1 (6%), characteri-sed as k 8 (50%) and λ 8 (50%). None of the patients hadevidence of end-organ damage due to the paraproteinae-mia and none had immunoparesis. sFLC assay resultswere available in 40 patients with LLPP and 6 patients

with TPP. The sFLC ratio was abnormal in 12 out of 40LLPP (ratio range: 0.87 to 4.46), increased k in 10 (range20.1-157 mg/L and k/λ ratio range: 1.67-4.46) and increa-sed λ in 2 (237 and 321 mg/L: k/λ ratios 0.087 and 0.25).None of the TP group was abnormal. Ten of the original73 patients with LLPP developed higher levels of quanti-fiable PP from 2-10g/L between 2 and 5 years after the ini-tial detection of the paraproteins. 3 of these patients hadabnormal sFLC ratios. Conclusion. Many of the LLPPpatients had abnormal sFLCs but, interestingly, none ofthe TP patients. Over the limited period of the study sFLCabnormalities did not relate to clinical outcome. Furtherstudies with longer follow up periods are needed to drawfirm conclusions.
FREE LIGHT CHAINS IN RENAL ANDOTHER DISEASES
D36 - MONITORING OF SERUM FREE LIGHTCHAINS IN THE TREATMENT OF LIGHT CHAINDEPOSITION DISEASE WITH HIGH CUT-OFF HAE-MODIALYSISC. Bermudo, J.L. Garcia, J.A. Martin Ruiz, R. DuroMillán, M. Merchan Iglesias, F.F. Romero
Hospital Universitario Virgen Macarena - ClinicalBiochemistry Unity, Seville, Spain
Background. Light chain deposition disease (LCDD) is arare entity where serum free light chains (sFLCs) are preci-pitated on the basement membranes of cells in the kidneyand other organs. Severe renal failure is the common pre-senting feature. This disease does not have a clearly definedtreatment and patients have an adverse prognosis. We pre-sent the case of a patient with LCDD and severe renal fai-lure, treated by chemotherapy and sFLC haemodialysiswith Theralite High Cut-Off technology. This enables anefficient and direct removal of sFLCs. Case report. A 57year old man was admitted to the hospital due to very inten-se bone pain. He was diagnosed with LCDD. The k/λ FLCratio was abnormal at 43. The serum kappa FLC was 289mg/l and the serum lambda FLC was 6.74 mg/l. While onanalgesics, the intense bone pain improved but acute renalfailure was detected (creatinine was 9,70 mg/dl) in the con-text of LCDD. The patient began treatment withBortezomib and haemodialysis (daily six-hour periods oversix days) with high cut-off membrane in order to removeFLCs in serum. We measured pre- and post-haemodialysissFLC, the k/λ ratio and the creatinine in serum. The percen-tage of serum kappa FLC removed was 61% and the levelsof kappa sFLC decreased from 90mg/dL to 59mg/dl duringthe treatment. The percentage of k/λ FLCs ratio reductionwas 57% (from 11.1 to 6.3 during treatment). This produ-ced an improvement in the patient’s renal function with adecrease of 88% in the creatinine serum levels (from 5.9mg/dL to 0.7 mg/dlL). Discussion. A combination of theefficient and direct removal of the toxic excess of serumFLCs using high cut-off membranes with Bortezomid allo-wed us to reduce the serum FLCs levels. The determinationof the rate of reduction with sFLC was a useful tool thatallowed us an accurate and rapid monitoring of serum FLCslevels to guarantee an optimum treatment of the patient.
D37 - FREE LIGHT CHAIN REMOVAL WITH HIGHCUT-OFF HAEMODIALYSIS IN PATIENTS WITHCAST NEPHROPATHYG. Martin Reyes,1 N.M. Barbosa de Carvalho,2 A. Torres deRueda,1 R. Toledo Rojas,1 M. Martín Velásquez,1 C.Gironda Gallegos,1 E. Sola Moyano,1 M. González Molina1
1Hospital Universitario Carlos Haya, Avenida de HayaCarlos, Malaga, Spain; 2The Binding Site, Barcelona,Spain
Background. Renal failure is a major cause of morbidityand mortality in patients with multiple myeloma (MM)
Posters
| 40 | Hematology Reports 2010; 2 (s2)

and is caused by monoclonal free light chains (FLC). Atinitial presentation, up to 50% of patients have renalimpairment and 12 to 20% have acute renal failure(ARF). A new generation of dialysers with large pores isnow available and allow large amounts of FLC removal.We present 4 clinical cases which were treated with che-motherapy and FLC haemodialysis (HD) with high Cut-Off (HCO) technology (HDHCO). Aims. To study theeffectiveness of HCO membranes for dialysis of FLC inpatients with cast nephropathy. Methods. HCOHD wasused together with MM chemotherapy in 4 patients inorder to improve renal function and patients’ haematolo-gical condition. Serum FLC kappa (k) and lambda (λ)were measured pre- and post-haemodialysis in the fol-low-up of the therapy together with renal function para-meters. Case 1: A 54 year old man was admitted withARF, presenting at the time of diagnosis with a creatinine(cr) of 8.9 mg/dL. The patient was diagnosed with a klight chain MM. Case 2: A 52 year old woman with a klight chain MM presented with cr levels of 6 mg/L. Case3: A man of 79 years, diagnosed with IgAk MM, presen-ted with osteolytic bone lesions and renal function dete-rioration (cr=3.4 mg/L). Case 4: A 70 year old womanwith ARF. The patient was diagnosed with IgG k MMwith 80% plasma cells in the bone marrow and k FLC of11,600 mg/L. Follow up data is shown in the Table.Discussion. The use of HCO membranes for the dialysisof FLC allowed a very efficient elimination of FLC. Withthe demonstrated survival data we estimate that HCOHDis a suitable treatment for cast nephropathy. Nowadays,we will use HCOHD in patients presenting with renal fai-lure and sFLC levels higher than 1000 mg/L.
Table1. Pre-dialysis value of: calcium, magnesium, albumin andcreatinine and Pre and post-dialysis value of kappa serum freelight chain. Numbers (1, 2, 3...) refers to successive dialysis ses-sions (days). In patient 4, betweeen dialysis session n° 8 and n°9 passed a 5 days period.
Patient 1 1 2 3 4 5 6 7 8 9 10 11Calcium 9,3 9,3 9 9,1 8,9 8,9 9,4 9,3Magnesium 8,2 7 7 6,2 5,4 5,5 5,7 5,8Albumin 2,9 2,7 2,7 2,8 2,8 3 3,2 3Creatinine 1,9 1,7 1,9 1,9 1,8 2,1 2 1,8k sFLC pre 12600 12100 11400 10600 6460 6680 6140k sFLC post 9910 6900 5250 4420 3840 3430 4680 3920
Patient 2 1 2 3 4 5 6 7 8 9 10 11Calcium 8,7 8,4 7,9 7,7 9,7 8,3Magnesium 2,3 1,7 2,2 1,9Albumin 3,2 3,8 3,4 3,5 4,3 4,4Creatinine 5,9 4,4 4,4 2,7 2,7 3,5k sFLC pre1 146 115 99,1 97,6 109k sFLC post1 57,5 56 51,3 54,3 23,7
Patient 3 1 2 3 4 5 6 7 8 9 10 11Calcium 8,1 8,7 9,4 7,8 10 9,7Magnesium 1,8 2,1 1,8 2,8 2,1Albumin 2,6 3 3,1 4 4,5 4Creatinine 1,6 2,6 2,1 1,8 1,1 1,1k sFLC pre 1080 725 638 577 571 393 528 717 779k sFLC post 184 130 135 146 127 131 121
Patient 4 1 2 3 4 5 6 7 8 9 10 11Calcium 6,9 7 7,1 6,5 6,3 6,6 6,8 6,4 7,1 7,5 7Magnesium 2,3 2,1 2,1 2 2,2 2,3 2Albumin 1,9 2,2 2,2 2,4 2,4 2,3 2,7 30 3,3 3Creatinine 6,5 4 3,9 2,7 3,2 1,7 2 2,5 2,2 2,1 4,7k sFLC pre 13000 12900 8140 3890 2190 1730 2300 714 4428 1390 2010k sFLC post 8240 5280 3300 1220 708 770 400 993 666
D38 - FAILURE TO REMOVE POLYMERISEDIMMUNOGLOBULIN FREE LIGHT CHAINS BYHIGH CUT-OFF HAEMODIALYSISD. White,1 N. Gardner,1 S. Harding,1 F. Provot,2
J.B. Beuscart,2 M. Cook,3 S. Stringer,4 P. Cockwell,5
C. Hutchison5
1The Binding Site Group Ltd, Birmingham, UK;2University Hospital of Lille, Lille France; 3Departmentof Haematology, Queen Elizabeth Hospital, Birmingham,UK; 4Department of Immunity and Infection , Universityof Birmingham, UK; 5Department of Nephrology, QueenElizabeth Hospital, Birmingham, UK
Background. Serum free light chains (FLC) are responsi-ble for the renal injury in cast nephropathy in patients withmultiple myeloma (MM). Recently the removal of FLC byhigh cut-off haemodialysis (HCO-HD) has been describedas an adjuvant therapy to complement effective chemothe-rapy in the management of cast nephropathy. Togetherthese treatments allow a rapid reduction in serum FLCconcentrations, which in turn enables renal recovery tooccur. The effective removal of FLCs by HCO-HD isdependent on the molecular weight of the FLCs in rela-tionship to the molecular weight cut-off of the dialysismembrane. Here we describe two patients in whom HCO-HD was unable to effectively remove FLCs. Aims. Theaim of this investigation was to determine why HCO-HDcould not remove FLCs in two patients. Methods. Patientsera were fractionated by size exclusion chromatographyon a Superdex S200 (1.6¥70cm) column under native con-ditions. Free light chain concentrations in sample fractionswere determined on a Siemens BN II nephelometer.Fractions were also analysed by SDS-PAGE gels and werefurther characterised by Western blotting using isotypespecific antisera. Results. Patient one, a 61 year old man,demonstrated failure to clear λ FLC from serum followingsix sessions of HCO-HD (median 7% reduction per ses-sion between pre- and post-dialysis samples). Size exclu-sion chromatography of the patient’s serum and subse-quent analysis demonstrated that the majority of λ FLCswere high molecular weight polymers (>150kDa) andonly the minority were present in the serum as dimers(50kDa). Patient two, a 51 year old lady, received 5 ses-sions of HCO-HD and also failed to demonstrate a signi-ficant reduction in serum k FLC concentration as assessedpre- and post-dialysis (median reduction 10.5%).Evaluation of the patient’s serum demonstrated k FLCs atthree molecular weights: ~25kDa (monomer), ~50kDa(dimer) and the majority at >100 kDa (polymer). Analysisof dialysate fluid, from HCO-HD sessions, demonstratedthat only k monomers (25kDa) were present.Summary/Conclusion. The presence of a high proportionof FLC as polymers, prevents efficient removal of FLCsby HCO-HD.
6th International Symposium on Clinical Applications of Serum Free Light Chain Analysis (plus Hevylite)Bath, United Kingdom, 23-24 September 2010
Hematology Reports 2010; 2 (s2) | 41 |

D39 - BETA 2-MICROGLOBULIN, KAPPA ANDLAMBDA LIGHT CHAINS REDUCTION BY HAEMO-DIALYSISL. Bârsan,1 S. Stancu,2 M. Lipan,1 V. Decu,1
C. Talangescu,1 C. Sântimbrean,3 M. Săndulescu,3
G. Mircescu1,2
1“Dr Carol Davila” Teaching Hospital of Nephrology,Bucharest, Romania; 2“Carol Davila” University ofMedicine and Pharmacy, Bucharest, Romania; 3“DrCarol Davila” Fresenius Nephrocare Dialysis Center,Bucharest, Romania
Background. Beta 2 microglobulin (β2M) is a recognizedsurrogate marker of middle-molecule uraemic toxins and akey component in dialysis-associated amyloidosis.Recently, it was associated with the clinical outcome indialysed patients. Free imunoglobulin light chains (FLC) kand λ are also markers of middle molecule uremic toxins.They have been less investigated than β2M, but seem tointerfere with essential neutrophil functions and to partici-pate in the disturbed immune function of CKD patients.Aim. To compare β2M, k and λ light chains reduction byhaemodialysis. Methods. 87 haemodialysis (HD) patientswere studied: 1% diabetics, 59% male; median age 61years (range 53-72); median HD period 7 years (range 4-10); 23% haemo-diafiltration; 77% high flux HD; medianCRP 6mg/L. Investigated parameters (pre- and post dialy-sis) were: urea, β2M, FLC k and λ, serum albumin; bodyweight, total body water (TBW), extracellular body water(ECW - measured with BCM, Fresenius Medical Care) andultrafiltration volume. Solute concentrations were normali-zed to pre- and post-dialysis albumin levels. Solute deple-tion was quantified either by reduction ratio or quantitati-vely (no rebound; mono-compartment model as total bodywater for urea; and extracellular water for β2M and FLCs).Results. Dialysis reduced all investigated parameter levelsbut the slope was different in case of λ light chains from kand β2M. Estimated by reduction ratio, β2M depletion(68.2%) was not different from urea (70.9%) but signifi-cantly different from k and λ light chains (49.2% and25.5%). When examined quantitatively, k and λ FLCs areexcreted in significantly larger amounts than β2M (1100and 803, vs. 212mg/session; p<0.05). β2M and urea hadsimilar percentage reduction (68.2% vs. 70.9%), while kand λ FLCs were less (49.2% and 25.5%; p<0.05).Albumin normalized pre- and post-dialysis; β2M and klevels were closely correlated (r2 0.91 and 0.23; p<0.05),but not λ FLCs (r2 0.00 and 0.08; p>0.5), suggesting ana-logous distibution volumes and similar equilibration con-stants for β2M and k, but not for λ. A model including thepercentage reduction in body weight and pre-dialysis β2Mconcentration predicted the reduction ratio in 17% of cases.A significant component was the percentage reduction inbody weight, suggesting a dominant role for ultrafiltrationas the mechanism of β2M reduction ratio. Conclusion.β2M, k and λ light chains are effectively depleted by dialy-sis. While β2M seems to have a similar distribution volumeand excretion by dialysis as urea, k and λ light chains per-form differently. A mono-compartment model is more fit-ted to β2M than to k and λ FLC dialysis excretion. Morestudies are necessary to validate k and λ light chains as sur-rogate markers of middle molecule removal.
D40 - INTERNALIZATION PATHWAY OF AMYLOI-DOGENIC SERUM FREE LIGHT CHAINSD. Ricotta,1 G. Di Noto,1 A. Dossi,1 L. Paolini,1
A. Radeghieri,1 B. Amoroso,2 L. Caimi1
1Biomedical Science and Biotechnology Dept., Brescia,Italy; 2Clinical Research Direction, The Binding SiteRome, Italy
Background. Primary (AL) Amyloidosis is a disease ofprotein misfolding. During plasma cell dyscrasia, such asmicromolecular myeloma, plasma cells produce a greatamount of monoclonal immunoglobulin free light chains(kappa or lambda FLCs) that may accumulate in differentperipheral districts and determine tissue damage. It hasbeen shown that FLCs induce oxidative stress and FLCsinternalization in cardiac fibroblasts enhances sulfatationof secreted glycosaminoglycans (GAGs) suggesting thatthe intracellular trafficking pathway of FLCs could becorrelated with the amyloidogenic potential of monoclo-nal immunoglobulins. Aims. The mechanism of internali-zation and trafficking of FLCs is not well understood, sowe aimed to characterize this pathway. Methods. In orderto identify a correlation between the FLC phenotype andtheir pathogenicity, we have investigated the internaliza-tion rate of different lambda and kappa FLCs (belongingto hospitalized patients) in different cellular lines. Themechanisms of internalization in different cellular subty-pes might be an important key in the study of differentpathological conditions strictly correlated to FLCs meta-bolism (systemic and not only kidney related). ResultsSummary/Conclusion. Our results highlight that themonoclonal FLCs of every patient behaves in a differentway in different cellular lines and we could also show thatnot only epithelial cells are able to process paraproteins.Considering these data we could hypothesize that theinteraction of FLCs with peripheral districts depends onhigh specificity receptors expressed on certain cellularlines and/or that each patient has an individual clinicalpattern due to the paraprotein molecular structure.
D41 - MEASUREMENT OF SERUM FREE LIGHTCHAINS IN RENAL TRANSPLANTATIONM. Sánchez-Castañón, M. Gago, G. Fernandez-Fresnedo,C. Gómez, J. Ruiz-Criado, M. Lopez-Hoyos, M. Arias
Hospital Universitario Marqués de Valdecilla -Immunology Services, Santander, Spain
Background. Plasma cell dyscrasias can cause renaldisease. Very sensitive methods have been introducedrecently to quantify serum free light chains (sFLC). Renalfunction may influence the variability of these methods asshown in chronic kidney disease patients, but it has notbeen addressed in renal transplant patients. Aims. To eva-luate the association between polyclonal sFLC concentra-tions and renal function in a population of renal tran-splanted patients. Methods. 102 kidney allograft reci-pients and 53 CKD patients classified according toKDOQI stages were studied. None of the patients hadmonoclonal gammopathies. The levels of polyclonalsFLC were quantified by nephelometry. Results. Bothserum k and λ FLC concentrations rose progressively
Posters
| 42 | Hematology Reports 2010; 2 (s2)

Hematology Reports 2010; 2 (s2) | 43 |
6th International Symposium on Clinical Applications of Serum Free Light Chain Analysis (plus Hevylite)Bath, United Kingdom, 23-24 September 2010
through each stage of KDOQI in transplant and non-tran-splant patients (p<0.0001). In transplanted patients sFLCconcentrations correlated (Spearman coefficient) signifi-cantly with serum creatinine, serum cystatin and estima-ted glomerular filtration rate: 0.723, 0.797 and -0.711 forskFLC and 0.705, 0.759 and -0.694 for sλFLC (p<0.0001in all cases). Spearman correlation coefficients in non-transplant patients were: 0.559, 0.848 and -0.766 forskFLC and 0.702, 0.875 and -0.855 for sλFLC (p<0.0001in all cases). Discusion. sFLC must be interpreted cau-tiously due to their clear association with renal function.Renal transplantation does not induce changes differentfrom those dependent on renal function.The role of sFLCin the progression of the renal impairment should beinterpreted in prospective studies.
D42 - CONVENTIONAL HIGH EFFICIENCY HAEMO-DIAFILTRATION AS AN ADJUNCTIVE TREATMENTOF KAPPA LIGHT CHAIN NEPHROPATHY: A CLINI-CAL CASE REPORT L. Chenine-Khoualef, A. Rodriguez, H. Leray-Moragues,A. Gontiers, M. Morena, C. Cognot-Pons, G. Cartron, B.Canaud
Nephrology, Dialysis and Intensive Care - Hemato-oncology - Immunology - Lapeyronie and Saint EloiUniversity Hospital - CHU Montpellier, France
Introduction. The incidence of multiple myeloma is 3-4%;approximately 10% of all haematological malignancies.Renal disease is a common manifestation of multiple mye-loma (up to 50% of patients) with a poor prognosis. One-year survival was 80% in patients with creatinine (Cr)<130 compared with 50% in patients with a Cr>200.Prognosis is worse in patients who require dialysis with amedian survival of 4 months. We report here a clinical
case showing that conventional high efficient on-line hae-modiafiltration with high flux polysulfone membrane wasable to remove significant amount of kappa light chainsand contributed to kidney recovery in a multiple myelomapatient. Patient and results.A 40 year old male was admit-ted to our intensive care unit with acute renal failure. Overthe last 4 months, he presented with rapid deterioration.The results showed elevated serum Cr of 500 mM/L andurea 24.6 mM/L, with a mild anemia and haemoglobin of11 g/dl. Protein electrophoresis showed an abnormal IgGpeak. Routine imaging found bilateral enlarged kidneyswith interstitial oedema on echography and interstitial pul-monary oedema on chest X-ray. Serum free light chainswere kappa 78,000 mg/L, lambda 12.5 mg/L. A kidneybiopsy was showed typical cast cell nephropathy withtubulopathy and protein cylinders staining for light chains(kappa+++, lambda+). Multiple myeloma with lightchains kappa and focal AL amyloidosis was diagnosed.Multiple myeloma treatment consisted of a short inductiontherapy with dexamethazone and Bortezomib, completedby melphalan, Bortezomib and dexamethazone. Renalreplacement therapy consisted of high efficiency post-dilutional haemodiafiltration (HDF) daily for 3 months.We noticed after this period partial recovery of kidneyfunction allowing interruption of dialysis. After almost 18months the patient is considered in remission from its mul-tiple myeloma and kidney function is stable with a GFR45mL/min/1.73m2. In our treatment schedule, daily HDFreduced circulating light chain immunoglobulins kappa by45% and lambda by 20%. Conclusion. HDF combinedwith standard chemotherapy represents an appealingadjunctive treatment to reduce kidney damage in multiplemyeloma free light chains. Prospective studies assessingthe role of HDF as adjunctive therapy are required to defi-ne the exact place of this method in care of multiple mye-loma patients with renal involvement.
Posters
| 44 | Hematology Reports 2010; 2 (s2)
FREE LIGHT CHAINS AND NON-PLASMACELL DISORDERS
E43 - SERUM FREE LIGHT CHAIN LEVELS AS AMARKER OF DISEASE ACTIVITY FOLLOWINGTREATMENT WITH B-CELL DEPLETION IN SYSTE-MIC LUPUS ERYTHEMATOSUS (SLE) T. Guillemette, N. Bardin, J.-M. Cournac, J. Mancini, R.Jean, N. Schleinitz, G. Kaplanski, J.-M. Durand, J.-R.Harlé, L. Chiche, J. Boucraut
Hôpital la Conception, Marseille, France
Background. Increased free light chain (FLC) levels havebeen reported as useful in various autoimmune conditions.B-cell depletion therapy with rituximab is commonly usedalthough there is no agreement on how to monitor theresponse to this biotherapy. Aims. We investigated howFLC concentrations correlate with disease activity upon Bcell targeted therapy in SLE patients. Methods. Patientswith active SLE treated with rituximab, without signifi-cant renal failure, were retrospectively identified.Quantitative determination of IgG, IgA, IgM and serumFLCs was performed in serum samples by immunonephe-lometry, before (T1) and after (T2) rituximab (mediandelay 104 days). Results. Eleven Caucasian patients withSLE were identified with a median age of 36 years (20-59). In SLE patients with active disease at baseline, 7/10had abnormal serum FLC levels, with 7 patients havingboth increased kappa levels (mean 32.8±24.2 mg/l; maxi-mum 91.2 mg/l) and increased lambda levels (mean39.3±31.6 mg/l, maximum 116 mg/l). Conversely, thekappa/lambda ratio was normal for all patients (mean0.897±0.257). Kappa FLC levels were correlated withserum level of IgG (r=0.73, p=0.025). FLCs were not cor-related with anti-DNA levels. A significant negative corre-lation was observed between SLE disease activity asses-sed by complement C3 fraction and kappa levels (r=-0.929, p<0.001) or lambda levels (r=-0.854, p=0.003) andby lymphopenia and lambda levels (r=-0.733, p=0.025). Acorrelation was also observed with complement C4 frac-tion (r=-0.7, p=0.036) and with total complement activity(r=-0.703, p=0.035) for kappa. No correlation was obser-ved between IgG, A or M levels and neither complementC3 fraction consumption, complement C4 fraction, nortotal complement activity. Analysis of all samples pooledfrom 11 patients (n=36), before and after rituximab-indu-ced B cell depletion was also performed. Over time, kappaand lambda FLC concentrations decreased significantlyafter rituximab treatment: 32.8±24.2 mg/l for kappa at T1vs 16.4±4.6 mg/l at T2 (p=0.017), and 39.3±31.6 mg/mLfor lambda at T1 vs 20.8±6.6 mg/l at T2 (p=0.015). Totalconcentrations of IgG, A and M decreased after admini-stration of rituximab, but remained within the normalrange, except for IgM in 3 patients. There was a good cor-relation between kappa and lambda FLC levels and serumlevel of IgG (r=0.65, p<0.001 and r=0.771, p<0.001,respectively) but still no correlation between serum levelof IgG and SLE disease activity assessed by complementC3 fraction consumption. Conversely, there was still astrong negative correlation between kappa FLC levels and
complement C3 fraction consumption (r=-0.543,p=0.003). Again, no correlation was observed betweenneither FLC levels nor IgG level, and anti-DNA antibodieslevels. Summary/Conclusion. In the absence of renal failu-re, increased FLC levels without abnormal kappa/lambdaratio is a common feature of SLE patients with activedisease and correlates well with disease activity.
E44 - FREE LIGHT CHAINS: A PREDICTOR OFEMERGENT MEDICAL CARE UTILIZATION INLUPUSM. Jolly, A.R. Mikolaitis, J.A. Block, W. Sequeira
Rush University, Chicago, USA
Background. Systemic Lupus Erythematosus (SLE) isassociated with disease flares, organ damage and poorquality of life. In addition frequent physician visits andinvestigative work up for disease surveillance and moni-toring of treatment side effects is required. Patients mayalso need emergent care and hospitalization resulting insignificant health care resources utilization and economicburden. Potential biomarkers that predicts emergent useof medical care (Emergency room {ED} visits or hospita-lizations) may serve as a screening tool to identify SLEpatients at risk and allow for timely intervention toimprove patient health. Aims. To determine the relation-ship between serum total free light chains (FLC) and sub-sequent (a) ED visits (any cause vs. SLE related), (b)Hospitalization (any cause vs. SLE related), and (c)Combined Outcome-ED visit and/or hospitalization (SLErelated), (d) Deaths, among SLE patients. Methods. FLCkappa and lambda was measured on a Siemens DadeBehring BN II nephelometer in 211 patients sera. Datafrom 57 SLE subjects was retrospectively compared forsubsequent ED visit/s, hospitalization/s and death.Correlation analysis (Spearman’s), Mann Whitney testand Odds ratio estimates were utilized. A p value ≤0.05was considered significant. Results. Twenty one percentof patients were Caucasian, 58% African-American,Hispanic 14%, Asian 2%, and Other 5%. Ninety one per-cent were women. Mean age was 43.8±12.7 yrs. 33% ofsubjects had visited ED, while 34% had been hospitalizedFLC kappa and FLC lambda were summated (total FLC,TFLC). Total FLC correlated with SLE related and anycause ED visits (r=0.5, p=0.001 and r=0.39, p=0.02respectively). There was also a significant correlationwith SLE related hospitalisation (r=0.40, p=0.01). TotalFLC values correlated with “any cause” ED visit (r=0.39,p=0.02) but not with “any cause” hospitalization or death.Total FLC values correlated with “SLE related” ED visit(r=0.50, p=0.001) and “SLE related hospitalization”(r=0.40, p=0.01). Total FLC (Median, IQR mg/L) valuesamong those with “SLE related” ED visit (70.6, 21.5mg/L) or “SLE related” hospitalization (70.6, 29.1 mg/L)were significantly greater as compared to those withoutED visit (42.3, 29.1 mg/L) or hospitalization (44.6, 29.1mg/L). There were no significant differences in TFLClevels among those with “non-SLE related” ED visit or“non-SLE related” hospitalization from those without EDvisit and hospitalization respectively. Total FLC correlated with the combined outcome measu-

6th International Symposium on Clinical Applications of Serum Free Light Chain Analysis (plus Hevylite)Bath, United Kingdom, 23-24 September 2010
Hematology Reports 2010; 2 (s2) | 45 |
re (SLE related ED visit or/and SLE related hospitaliza-tion) (r 0.55, p=0.001). Total FLC (Median, IQR) amongthose with this combined outcome (67.9, 27 mg/L) wassignificantly greater than those without an ED visit andhospitalization (42.6, 24.8 mg/L). The calculated odds forexperiencing the combined outcome were 7.8 timeshigher if Total FLC levels exceeded 65 mg/L.Summary/Conclusion. Total FLC may predict subsequentneed for emergent medical care in SLE, and may be use-ful in identifying those at risk. Timely intervention inthose identified at risk has the potential to improve healthoutcomes and reduce health care utilization.
E45 - SYSTEMIC LUPUS ERYTHEMATOSUS ANDFREE LIGHT CHAINSJ. Jiménez Jiménez, N.M. Barbosa de Carvalho, M.Crespo Echeverría, R. Jañez Carrera, C. Hernando deLarramendi1Hospital Severo Ochoa, Clinical analysis service,Leganes, Spain; 2The Binding Site, Barcelona, Spain
Background. Systemic lupus erythematosus (SLE) is adisease of unknown etiology and is the prototype autoim-mune disease. It is characterized by B cell polyclonalhyperactivity with a wide spectrum of antibodies. Themajority of patients present with disease flares punctua-ted by periods of inactivity. Aims. To evaluate serum freelight chains (sFLC) as a disease activity marker. Methods.40 patients with SLE were studied (33 females and 7males). The average disease period was 8 years (1 to 24years). Patients had at least 4 of the 11 disease criteriadevised by the American Rheumatologic College.Patients’ ages were 28 to 54 years; 35 had inactive disea-se and 5 were in flare. 15 serum samples from patientsthat were not affected by any rheumatological diseasewere used as a control group. Anti-nuclear and anti-dsDNA antibodies, CRP, β2-microglobulin, C3, C4, immu-noglobulins, kappa (ksFLC) and lambda (λsFLC), hae-moglobin and erythrocyte sedimentation rate (ESR) wereassessed in all samples. Results. The mean results obtai-ned in the control group for ksFLC and λsFLC were:12.18 (±2.11) and 14.08 (±4.85) respectively and for SLEpatients; 17.40 (±10.66) and 23.47 (±617); significantlydifferent for both ksFLC (p<0.02) and λsFLC(p<0.0004). For inactive patients, the results for ksFLCwere 16.04 (±6.67) and λsFLC 21.0 (±5.48) and corre-spondingly for the flare group were 20.84 (±16.49) and29.97 (±2.55), presenting a significant difference forλsFLC (p<0.0008). ROC curves for the usual SLE fol-low-up parameters gave higher area under the curve forksFLC+λsFLC: 0.842 (0.105), λsFLC: 0.833 (0.130) andESR: 0.750 (0.153). Sensitivity (Se) and specificity (Sp)obtained for ksFLC+λsFLC Se - 100%, Sp - 71.4%; ESRSe - 100%, Sp - 25%; ksFLC Se - 66,7%, Sp - 62,5% andλsFLC Se - 100%, Sp - 63,5%. When cut-off points weremarked at 9.9 mg/L for ksFLC and 16.2 mg/L for λsFLC,values of Se and Sp respectively were: 100% and 87.5%for ksFLC and 100% and 75% for λsFLC. In a patientwith serial determinations of sFLC we observed a 50%decrease in sFLC concentrations when she was in aperiod of inactivity compared with a flare period.
Conclusion. We believe that sFLCs could be included asan SLE follow-up parameter, presenting a clear advanta-ge over other parameters. It has a short half-life thatreflects quicker changes produced by the disease so apatient’s base-line sFLC is useful. However, this issueshould be studied in larger prospective studies.
E46 - SERUM FREE LIGHT CHAINS AND DISEASEACTIVITY IN SYSTEMIC LUPUS ERYTHEMATOSUSM. Jolly,1 R. Aggarwal,2 S. Francis,1 A.R. Mikolaitis,1 T.Niewold,3 S. Chubinskaya,1 J.A. Block,1 W. Sequeira1
1Rush University, Chicago, ILL, USA; 2University ofPittsburg Medical Center, Pittsburg, Penn, USA
Background. Systemic Lupus Erythematosus (SLE) isassociated with significant morbidity and mortality. Wepreviously reported greater total FLC (tFLC) elevationand stronger association with disease activity in SLE thanin rheumatoid arthritis. Furthermore, we reported thesuperiority of using tFLC over dsDNA antibody andimmunoglobulin G levels as a biomarker of disease acti-vity in 75 SLE patients. Aims. To measure tFLC in SLEpatients and compare its utility with interleukin 6 (IL 6),interleukin10 (IL10) and interferon α (IFN α) as a bio-marker for disease activity. Methods. 211 SLE patients ata University Hospital were enrolled. Disease activity wasassessed using physician global assessments (PGA) andSelena-SLEDAI. Adjusted SLEDAI (adjSLEDAI= SLE-DAI – [C3C4 and ds-DNA antibody abnormality]) wasobtained. serum FLC (kappa (k), lambda (λ) and totalFLC [k+λ]) was measured using nephelometry.Additionally, serum dsDNA (antibody positivity andtiters), complement (C3 & C4 abnormality and titers), IL6, IL10 and IFN α levels were available. Spearman cor-relation was used to correlate tFLC and other biomarkerswith PGA, SLEDAI and adjSLEDAI.
Table 1. Correlation of markers with disease activity.
TFLC DsDNA DsDNA Complement C3 titer C4 Titer IL6 IL10 IFN αabnormality titer abnormality
N 211 182 171 171 109 109 121 117 120
PGA 0.39 0.39 0.34 -0.14 -0.24 -0.14 0.02 0.18 0.13
(p=0.0001) (p=0.0001) (p=0.0001) (p=0.07) (p=0.01) (p=0.16) (p=0.88) (p=0.20) (p=0.40)
SLEDAI 0.44 0.49 0.47 -0.13 -0.41 -0.23 0.23 0.21 0.20
(p=0.0001) (p=0.0001) (p=0.0001) (p=0.16) (p=0.0001) (p=0.03) (p=0.04) (p=0.05) (p=0.09)
Adj. 0.39 0.23 0.211 -0.08 -0.15 0.12 0.16 0.32 0.03
SLEDAI (p=0.0001) (p=0.03) (p=0.05) (p=0.45) (p=0.22) (p=0.31) (p=0.24) (p=0.02) (p=0.83)
Results. The mean age was 42±13 yrs. African American45%, Caucasian 30%, Hispanic 12%, Asian 10% andOthers 4%. PGA and SLEDAI (mean± SD, median) were0.7±0.8, 0.5 and 4.2±4.3, 2, respectively. The values(mean± SD, median) were: tFLC (62.5±69.8, 44.3), IL 6(6±7, 4), IL10 (16±20, 13) and IFN α (21 ± 39, 4). tFLCcorrelated with IFN α (r=0.37, p=0.0001) and IL 6 (r=0.25,p=0.009). Table 1 depicts the association of various bio-markers with disease activity. Summary/Conclusion. tFLCis correlated with disease activity. Its correlation with PGAand adjSLEDAI is stronger than other biomarkers tested.These data suggest that tFLC may serve as a potential bio-marker for SLE activity.
Posters
| 46 | Hematology Reports 2010; 2 (s2)
E47 - SJÖGREN’S SYNDROME AND SERUM FREELIGHT CHAIN ANALYSIS IN NEWLY DIAGNOSEDPATIENTS M. Maignan,1 A. Driad,1 C. Jacob,2 N. Jay,3 B. Dousset,2
J.-M. Vignaud,4 J.-D. De Korwin1
1Service de Médecine Interne H- HOPITAL CENTRAL,Nancy France; 2Laboratoire de Biochimie, CHU, NancyFrance; 3Departement d’information Médicale, CHU,Nancy France; 4Laboratoire d’anatomo-pathologie,CHU, Nancy, France
Background. Sjögren’s syndrome (SS) is a chronicautoimmune epitheliitis characterised by lymphocyticinfiltration of the lachrymal and salivary glands. B cellsactivation has been well demonstrated in SS. Fatigue andsicca syndrome are the main complaints. Outcome ofsystemic extraglandular manifestations and a long termrisk for lymphoma development justify a regular follow-up. Aims. We examined the presence of the serum freelight chain (sFLC) in all patients with SS newly diagno-stic in an internal medicine department. We compared thesFLC with clinical and biological markers of disease acti-vity. Methods. Diagnosis of SS was made on the criteriaof the American-European Consensus group in 2002. Wecompared value of sFLC (k, λ and the k/λ ratio) withlevels of β2-microglobulin (β2M), blood lymphocytecount, gammaglobulin, Immunoglobulin G, complementfactors and presence of cryoglobulinaemia. Disease acti-vity at presentation was also compared with the value ofsFLC. Spearman correlation coefficients were testedagainst zero. Results. In 2009/2010, we identified 22patients with a new diagnosis of SS (21 females and 1male). The mean age was 55.7 years (range: 27-78).Twelve patients had primary SS and 10 secondary SS.Secondary SS was associated with; autoimmune thyroidi-tis (5 patients), limited scleroderma (3 patients), primarybiliary cirrhosis (3 patients) and 1 dermatopolymyositis.Eight patients had an enlarged parotid gland at presenta-tion. Main systemic manifestations were arthralgia and/orRaynaud’s phenomenon. All patients had a Cockroft-Gault clearance of creatinine above 50 ml/min. None hadHIV, hepatitis C infection, sarcoidosis, myeloma, amyloi-dosis, lymphoma or monoclonal gammapathy of undeter-mined significance. 19/20 patients had a positive labialsalivary gland biopsy. 13/22 patients had significant anti-SSA or anti-SSB antibodies. 12/21 had an increased β2Mabove 1.5 mg/l. Hypergammaglobulinemia was observedin 11/22 patients. 8/18 patients had a highImmunoglobulin G. Eleven patients had a high k freelight chain or λ free light chain or abnormal k/λ ratio.1/15 patients had a cryoglobulinemia. k sFLC levels werecorrelated with serum level of gammaglobulin (rho=0.76,p<10–4), of IgG (rho=0.85, p<10–5), and with β2M(rho=0.75, p<10–4). There was a significant negative cor-relation between blood lymphocyte and k sFLC levels(rho= -0.66, p<10–3). λ sFLC levels were correlated withserum level of gammaglobulin (rho= 0.56, p<6.10–3), ofIgG (rho=0.67, p=0.002) and with β2M (rho=0.66,p<10–3). Correlation between blood lymphocyte countand lambda sFLC levels was not significant (rho=-0.41,p=0.056). Median value of k sFLC in patients with enlar-ged parotid glands was 25.05 mg/L, and 12.85 mg/L in
patients without enlarged parotid gland (p=0.07). We didnot observe any correlation between k/λ ratio and serumgammaglobulin, IgG nor β2M levels. Conclusion. Innewly diagnosed SS patients, serum free light chain wassignificantly associated with lymphopenia, β2M and gam-maglobulin. We continue the study and follow-up thepatients in order to specify the role of sFLC measurementfor diagnosis and/or prognosis of Sjögren’s syndrome.
E48 - SERUM FREE LIGHT CHAINS ANDIgAk/IgAλ RATIOS IN PATIENTS WITH SYSTEMICINFLAMMATORY RHEUMATIC DISEASESWITHOUT MONOCLONAL GAMMOPATHYB. Schlüter, G. Bonsmann, H. Becker, P. Willeke
University Hospital Münster, Centre for LaboratoryMedicine, Münster, Germany
Background. Novel nephelometric assays allow for thespecific and sensitive quantification of serum k and λ freelight chains (FLC) as well as intact IgAk and IgAλ immu-noglobulins in the routine clinical laboratory setting. Thedetermination of k/λ FLC and IgAk/IgAλ ratios as deri-ved parameters is helpful for the sensitive detection andmonitoring of monoclonal gammopathies since valuesoutside the normal range are indicative of monoclonalproliferation of immunoglobulin producing cells. A cha-racteristic feature of some systemic inflammatory rheu-matic diseases is polyclonal B cell activation which mayaffect the production of serum FLC, IgAk and IgAλimmunoglobulins and potentially the respective ratios.This may be of particular importance since inflammatoryrheumatic diseases lead to an increased risk for the deve-lopment of myeloma and monoclonal gammopathies ofundetermined significance (MGUS). Aims. We studiedthe serum FLC and IgAk/IgAλ ratios in patients withsystemic rheumatic diseases without monoclonal gammo-pathy. Methods. In a cross-sectional retrospective studysera obtained from 120 patients (92 female, 28 male,mean age 46.9±15.4 years) with an established diagnosisof either a collagenosis (group CD: 51 SLE, 7 systemicsclerosis, 6 CREST, 3 dermatomyositis, 11 Sjögren’s syn-drome, 3 MCTD, 2 overlap syndrome), rheumatoidarthritis (group RA: 17) or Wegener’s granulomatosis(group WG: 20). There was no evidence of monoclonalgammopathy in these samples as demonstrated by serumelectrophoresis, quantification of serum IgG, IgA andIgM levels, and in individual cases by serum immunofi-xation. All sera were tested by immunonephelometricassays (Binding Site, UK) on a BN II analyser (Siemens,Germany) for serum FLC and intact IgAk and IgAλ con-centrations. Results. Polyclonal gammopathy (PG) defi-ned as serum levels of IgG, IgA and/or IgM above therespective upper reference limit was present in 52 % ofCD, 41 % of RA, and 10 % of WG samples (p=0.0032).The serum concentrations of FLC and intact IgAk andIgAλ were significantly increased in PG-positive versusPG-negative sera (median values in mg/l for k: 25.7 vs.16.5; for λ: 25.6 vs. 16.5; for IgAk: 2075 vs. 1110; forIgAλ 1595 vs. 933; p<0.0001 for each comparison). Incontrast, the FLC and IgAk/IgAλ ratios did not differsignificantly between PG-positive and negative sera

6th International Symposium on Clinical Applications of Serum Free Light Chain Analysis (plus Hevylite)Bath, United Kingdom, 23-24 September 2010
Hematology Reports 2010; 2 (s2) | 47 |
(median k/λ FLC ratio 0.92 vs. 1.01; median IgAk/IgAλratio 1.32 vs. 1.33). Ratios ranged from 0.47 to 2.19 fork/λ and from 0.68 to 2.40 for IgAk/IgAλ (2.5 to 97.5 per-centiles). The glomerular filtration rate (GFR) was redu-ced in 10 % of patients. The concentration of k FLC, butneither of λ FLC nor of intact IgAk and IgAλ was signi-ficantly increased in patients with a reduced GFR (p =0.0079). In addition, the FLC and IgAk/IgAλ ratios didnot differ according to GFR status. Summary/Conclusion.Our data demonstrate that patients with systemic inflam-matory rheumatic diseases have increased serum levels ofFLC, intact IgAk and IgAλ due to polyclonal B cell acti-vation. FLC and IgAk/IgAλ ratios were comparable topreviously reported values for healthy subjects.
E49 - POLYCLONALLY RAISED SERUM FREELIGHT CHAINS IN LIVER DISEASE COMPAREDTO MARKERS OF LIVER DAMAGEL.K. Assi,1 R.G. Hughes,1 B. Gunson,2 G. Webb,1 D.H.Adams2
1The Binding Site Group Ltd, Birmingham, UK; 2LiverResearch Laboratories, University of Birmingham,Birmingham, UK
Background. Monoclonal immunoglobulin serum freelight chains (sFLCs) are elevated in many B-cell dyscra-sias, including multiple myeloma, typically producing anabnormal k/λ FLC ratio. Increased concentrations of kand λ sFLCs can result from reduced clearance by thekidneys or increased polyclonal production. Abnormal B-cell activation is also observed in autoimmune liverdiseases (LD), shown by the emergence of autoantibodiesand high levels of immunoglobulins detected in manychronic patients. sFLCs have recently been shown to beparticularly elevated in alcohol-related LD (ALD), possi-bly due to reduced clearance or increased production.Aims. To determine whether there is any association bet-ween sFLCs and other biological markers of liver dysfun-ction in LD. Methods. Serum samples from 80 LDpatients, including 22 ALD patients, were obtained (withethical approval) from the University Hospital,Birmingham. Immunoglobulins, sFLCs and cystatin Cwere measured turbidimetrically. Free k and λ valueswere summated to give total sFLC values and k/λ ratioswere calculated. Values were compared against establi-shed normal ranges (k: 3.3-19.4mg/L, λ: 5.71-26.3mg/L,ratio: 0.26-1.65). sFLCs were also corrected for renal fun-ction using cystatin C. Platelet cell counts (normal range:150-400¥109/L) and serum transaminase levels, to assessliver damage (alanine aminotransferase (ALT) and aspar-tate aminotransferase (AST)), were collated and analysedin relation to sFLC results. The model for end stage liverdisease (MELD) score (ranges between 6-40 indicatingincreasing disease severity) was compared with the sFLCresults. Results. Individuals in several LD groups had par-ticularly high sFLC concentrations. Highest levels weredetected in the ALD group (median concentration:59.9mg/L, range: 20.4-256.4mg/L), with one particularlyelevated total sFLC result of 754mg/L in a patient withcryptogenic cirrhosis. ALT values were generally withinnormal ranges (5-41U/L), with a slight elevation for AST.
No correlation was observed between corrected sFLCsand ALT in ALD or the whole LD population.Furthermore, although no association was determinedbetween corrected sFLCs and AST in the ALD group, acorrelation was observed when analysing the whole LDpopulation (r=0.244, p=0.03). Both the ALD and crypto-genic cirrhosis populations had reduced median plateletcell counts (median: 125¥109/L and 92¥109/L respective-ly). There was no correlation with corrected sFLCs in theALD group (r=0.12, p=0.63), although a significant cor-relation was determined in all LD patients (r=-0.307,p=0.006). 11/22 ALD patients had a MELD score <20,but conversely had abnormally elevated corrected sFLCs.Summary/Conclusion. sFLCs are polyclonally elevated inLD particularly ALD (N=22) and no association wasobserved between sFLCs and other markers of liverdysfunction in this group. ALD and cryptogenic cirrhosisdisease groups had reduced platelet cell counts, indicati-ve of portal hypertension and advanced LD. In ALD,there was no correlation between sFLCs and plateletcounts or AST, although a positive correlation was deter-mined when analysing the whole LD population. Mostinterestingly, 50% ALD patients with a relatively lowMELD score had elevated sFLCs. Therefore, elevatedsFLC levels may be an additional useful biological mar-ker for the diagnosis and monitoring of ALD, but furtherstudies are required to verify these preliminary results.
E50 - DIFFERENCES BETWEEN C-REACTIVE PRO-TEIN AND FREE LIGHT CHAIN PRODUCTIONAFTER TRAUMA P. Lukacik,1 R.G. Hughes,1 G. Pratt,2 C.A. Hutchison,3,4
G.P. Mead1,4
1The Binding Site Group Ltd, Birmingham, UK;2Heartlands Hospital, Heart of England NHS Trust,Birmingham, UK; 3Renal Unit, University HospitalBirmingham, Birmingham, UK; 4Division of Immunity &Infection, The Medical School, University ofBirmingham, Birmingham, UK
Background. The measurement of serum free light chains(FLCs) is now widely used as an aid in the diagnosis andmonitoring of a range of monoclonal gammopathies inclu-ding multiple myeloma, AL amyloidosis and plasmacyto-ma. However, potential applications for the measurementof polyclonal FLC elevations have recently been reported(e.g. in renal disease or autoimmune conditions). Aims.Theaim of this study was to therefore determine whether FLClevels correlate with those of acute phase proteins.Methods. The relationship between the production of freelight chains (FLCs) and the acute phase protein CRP wasexamined in 11 patients in the intensive therapy unit (ITU).Clinical problems included surgery, sepsis and respiratoryfailure. Plasma samples were collected as clinically indica-ted during ITU admission (range 3 to 32 days), residualvolumes of which were used for this study. Plasma concen-trations of kFLC, λFLC, IgG, IgA, IgM, cystatin C andCRP were measured by established nephelometric immu-noassays. FLC levels were corrected for variations in kid-ney function by using cystatin C values, since it is a sensi-tive indicator of renal clearance. The corrected values,

which should be a reflection of FLC production, were the-refore calculated as [kFLC+λFLC]/[cystatin C]. Totalimmunoglobulin concentration was estimated by summa-ting immunoglobulins IgG, IgA and IgM. Results. 10 out of11 patients showed a substantial elevation of CRP (range57-367 mg/L). In 7 of these 10 patients, the peak in CRPwas followed by a delayed gradual rise in FLC production.In general, the increase in FLC concentration was approxi-mately 4-fold but did not exceed the upper normal rangevalue ([k+λ] ≤50 mg/L in 9 out of 11 patients).Furthermore, in 4 out of 11 patients the changes in correc-ted FLC levels were not correlated with changes in totalimmunoglobulin concentration. This latter observation is atodds with the current understanding that polyclonal FLCproduction is a “by-product” of immunoglobulin synthesisand calls for further study. Summary/Conclusion. Thesepreliminary results clearly show that FLCs do not behaveas acute phase proteins. Additional studies in patients froma well defined clinical background (e.g. elective surgery)and with a longer follow up may help to dissect theseobservations more fully.
E51 - ABNORMAL SERUM FREE LIGHT CHAIN(sFLC) RATIO IS A PREDICTOR OF AGGRESSIVEFORM OF CLL AND IS RELATED TO RESPONSETO TREATMENTF. Durrieu, J. Dubois, H. Eghbali, P. Correia, F. Demarthe, G. Etienne
Institut Bergonie, Bordeaux, France
Background. Although chronic lymphocytic leukaemia(CLL) seldom has a detectable serum monoclonal immu-noglobulin peak, previously published data have empha-sized the utility of serum free light chain (sFLC) asses-sment in newly diagnosed chronic lymphocytic leukae-mia.1,2 Aims. The aim of our study was to confirm the uti-lity of sFLC assessment at CLL diagnosis, but also eva-luate the use of the test in patients’ follow-up, particular-ly in relation to the response to treatment. Methods. Weinvestigated the sFLC ratio in 58 patients newly diagno-sed with CLL in our centre between August 2007 andMay 2010. Prognostic factors such as Binet stage, CD38and ZAP-70 expression, FISH analysis for P53, ATM, orRB deletion and chromosome 12 number, serum thymidi-ne kinase and serum soluble CD23 were systematicallyevaluated. In addition, the sFLC ratio was assessedduring patients’ follow-up over a 36-month period, allo-wing 116 control measurements (one to six per patient),and was compared to minimal residual disease (MRD)measured by 5-colour flow cytometry, according to inter-national recommendations.3 Results. Twenty-one patients(36%) had an abnormal sFLC ratio at diagnosis. The ratioof kappa/lambda was increased in 19 cases (90%). Weconfirmed that an abnormal sFCL ratio was associatedwith adverse prognostic factors such as advanced Binetstage (B and C, p=0.0004), CD38 positivity (p=0.0003),ZAP-70 positivity (p<0.0001), adverse cytogenetics (P53deletion, ATM deletion or trisomy 12, p=0.06) and increa-sed serum thymidine kinase (p=0.0001). Surprisingly, norelation was found with the presence of a serum monoclo-nal immunoglobulin peak, which was detected in 3
patients only. However a decrease in normal immunoglo-bulin serum level was evidenced in 20 of the 21 patientswith abnormal sFLC ratio (95%), with a significant cor-relation (p=0.002). Analysis of treatment-free survival(TFS) duration between diagnosis and first line treatmentshowed a relation of the sFLC ratio. Patients with abnor-mal sFLC ratios had shorter TFS (HR=2.19, 95%CI=0.84-7.38). Abnormal sFLC ratios distinguished agroup with shorter TFS even in low risk CLL patients(less than 2 adverse prognostic factors), confirming thatthe disease was more aggressive in this group (HR=3.95,95% CI=0.93-58.15). When analysed during patients’ fol-low-up after treatment, an abnormal sFLC ratio was asso-ciated with positive MRD (p<0.0001), with a specificityof 86% and a positive predictive value of 96%.Conclusion. sFLC ratio assessment could be a simple andcost-effective test to appreciate the aggressiveness ofCLL at diagnosis, and could be implemented as a first-intention test to estimate the response to treatment, savingflow cytometry for when the ratio is, or becomes normal.
References:
1. Martin W et al. Translational Research 2007;149:231-5. 2. Pratt G et al. British Journal of Haematology 2008;144:217-22.
3. Rawstron AC et al. Leukemia 2007; 21:956-64.
E52 - ABNORMAL SERUM IMMUNOGLOBULINFREE LIGHT CHAIN (SFLC) RATIO PREDICTS THE-RAPY REQUIREMENTS AND ALLOWS DEFINI-TION OF A NOVEL PROGNOSTIC SCORE SYSTEMFOR PATIENTS WITH CHRONIC LYMPHOCYTICLEUKEMIA (CLL)F. Morabito,1 R. De Filippi,2 S. Cavalcanti,3 G. Iaccarino,2
M. Gentile,3 I. Attolico,4 G. Cutrona,5 A. Neri,6 M.Ferrarini,5 S. Molica,7 V. Gigliotti,3 A. Recchia3 E.Morelli,2 B. Amoroso,8 L. Laurenti,9 G. Del Poeta,10 A.Pinto2
1U:O.C. Ematologia Azienda Ospedaliera viale dellaRepubblica, Cosenza, Italy; 2Hematology-Oncology andTransplantation Unit, Fondazione G. Pascale, Napoli,Italy; 3Hematology Unit, Cosenza, Italy; 4HematologyUnit Ospedale San Carlo, Potenza, Italy; 5Divisione diOncologia Medica C, Istituto Nazionale per la Ricercasul Cancro, Genova, Italy; 6Centro di Ricerca per loStudio delle Leucemie, Fondazione IRCS, Milano, Italy;7Dipartimento di Oncologia/Ematologia, AziendaOspedaliera Pugliese-Ciaccio, Catanzaro, Italy; 8ClinicalResearch Direction, The Binding Site, Rome, Italy;9Istituto di Ematologia, Università Cattolica del SacroCuore, Rome, Italy; 10Division of Haematology, OspedaleS. Eugenio, University Tor Vergata, Roma, Italy
Background. The most common CLL biological progno-stic factors include expression of CD38, ZAP-70, whosedetection techniques are associated with significantinter-laboratory variations, and IGHV mutation statuswhich requires DNA sequencing. Since the serum freelight chain (sFLC) assay is a sensitive, simple and highlyreproducible serum test, it is particularly attractive as a
| 48 | Hematology Reports 2010; 2 (s2)
Posters
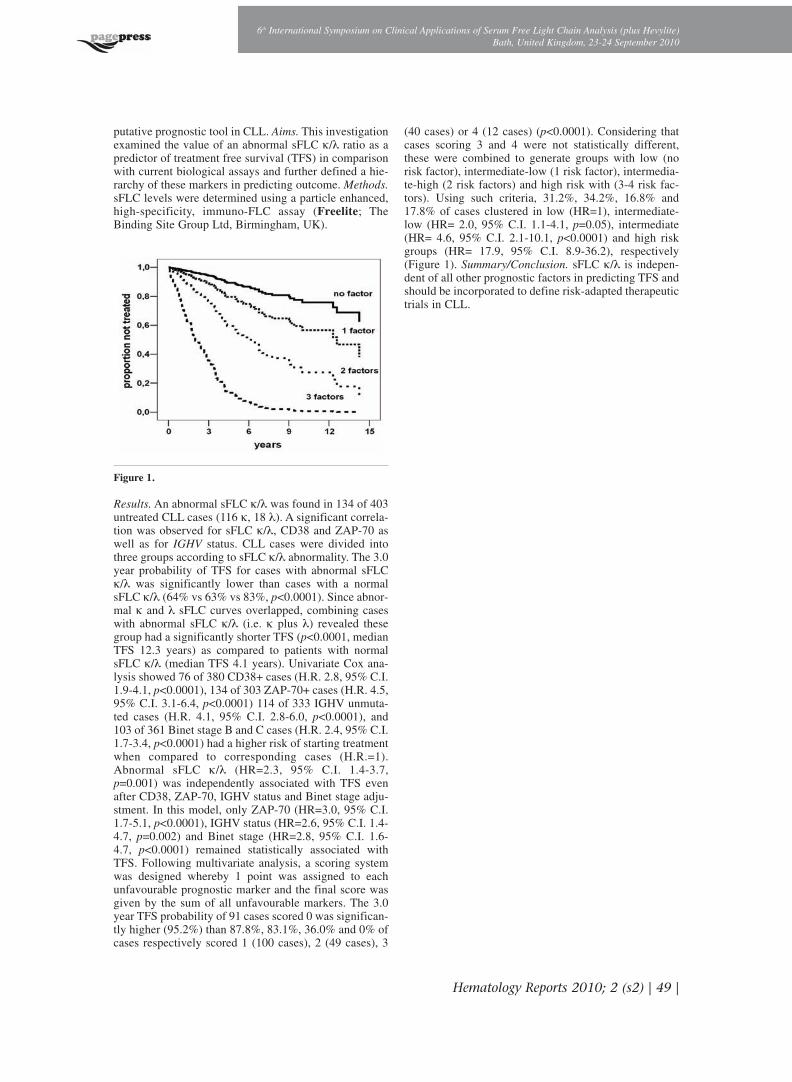
putative prognostic tool in CLL. Aims. This investigationexamined the value of an abnormal sFLC k/λ ratio as apredictor of treatment free survival (TFS) in comparisonwith current biological assays and further defined a hie-rarchy of these markers in predicting outcome. Methods.sFLC levels were determined using a particle enhanced,high-specificity, immuno-FLC assay (Freelite; TheBinding Site Group Ltd, Birmingham, UK).
Figure 1.
Results.An abnormal sFLC k/λ was found in 134 of 403untreated CLL cases (116 k, 18 λ). A significant correla-tion was observed for sFLC k/λ, CD38 and ZAP-70 aswell as for IGHV status. CLL cases were divided intothree groups according to sFLC k/λ abnormality. The 3.0year probability of TFS for cases with abnormal sFLCk/λ was significantly lower than cases with a normalsFLC k/λ (64% vs 63% vs 83%, p<0.0001). Since abnor-mal k and λ sFLC curves overlapped, combining caseswith abnormal sFLC k/λ (i.e. k plus λ) revealed thesegroup had a significantly shorter TFS (p<0.0001, medianTFS 12.3 years) as compared to patients with normalsFLC k/λ (median TFS 4.1 years). Univariate Cox ana-lysis showed 76 of 380 CD38+ cases (H.R. 2.8, 95% C.I.1.9-4.1, p<0.0001), 134 of 303 ZAP-70+ cases (H.R. 4.5,95% C.I. 3.1-6.4, p<0.0001) 114 of 333 IGHV unmuta-ted cases (H.R. 4.1, 95% C.I. 2.8-6.0, p<0.0001), and103 of 361 Binet stage B and C cases (H.R. 2.4, 95% C.I.1.7-3.4, p<0.0001) had a higher risk of starting treatmentwhen compared to corresponding cases (H.R.=1).Abnormal sFLC k/λ (HR=2.3, 95% C.I. 1.4-3.7,p=0.001) was independently associated with TFS evenafter CD38, ZAP-70, IGHV status and Binet stage adju-stment. In this model, only ZAP-70 (HR=3.0, 95% C.I.1.7-5.1, p<0.0001), IGHV status (HR=2.6, 95% C.I. 1.4-4.7, p=0.002) and Binet stage (HR=2.8, 95% C.I. 1.6-4.7, p<0.0001) remained statistically associated withTFS. Following multivariate analysis, a scoring systemwas designed whereby 1 point was assigned to eachunfavourable prognostic marker and the final score wasgiven by the sum of all unfavourable markers. The 3.0year TFS probability of 91 cases scored 0 was significan-tly higher (95.2%) than 87.8%, 83.1%, 36.0% and 0% ofcases respectively scored 1 (100 cases), 2 (49 cases), 3
(40 cases) or 4 (12 cases) (p<0.0001). Considering thatcases scoring 3 and 4 were not statistically different,these were combined to generate groups with low (norisk factor), intermediate-low (1 risk factor), intermedia-te-high (2 risk factors) and high risk with (3-4 risk fac-tors). Using such criteria, 31.2%, 34.2%, 16.8% and17.8% of cases clustered in low (HR=1), intermediate-low (HR= 2.0, 95% C.I. 1.1-4.1, p=0.05), intermediate(HR= 4.6, 95% C.I. 2.1-10.1, p<0.0001) and high riskgroups (HR= 17.9, 95% C.I. 8.9-36.2), respectively(Figure 1). Summary/Conclusion. sFLC k/λ is indepen-dent of all other prognostic factors in predicting TFS andshould be incorporated to define risk-adapted therapeutictrials in CLL.
Hematology Reports 2010; 2 (s2) | 49 |
6th International Symposium on Clinical Applications of Serum Free Light Chain Analysis (plus Hevylite)Bath, United Kingdom, 23-24 September 2010

HEAVY CHAIN/LIGHT CHAIN ANALYSISAT DIAGNOSIS AND COMPARISON WITHELECTROPHORESIS
F53 - ABNORMAL HEAVY/LIGHT CHAIN RATIOSIN PATIENTS WITH SYSTEMIC AL AMYLOIDOSISA. Wechalekar,1 S. Harding,2 H. Lachmann,1 J. Gillmore,1
N. Wassef,1 M. Thomas,1 S.D.J. Gibbs,1 P. Sattianayagam,1
C.J. Whelan,1 A.R. Bradwell,3 P. Hawkins1
1National Amyloidosis Centre, Centre for Amyloidosis &Acute Phase Proteins, Department of Medicine RoyalFree and University College Medical School, London,UK; 2The Binding Site Group Ltd, Birmingham, UK;3Division of Immunity and Infection, Medical School,University of Birmingham, UK
Background. Primary systemic amyloidosis is a diseasecharacterised by the accumulation of misfolded monoclonalfree light chains. The monoclonal disease is subtle and in 5-20% of patients undetectable in the serum by serum proteinelectrophoresis (SPE) and 6% have no detectable clonalmarker by any standard method including serum free lightchains (FLC). FLC measurements are fundamental in thediagnosis of these patients. The sensitivity of the assayrelies on the specificity of the antisera and the production ofa FLC kappa/lambda ratio. The FLC ratio means that it ispossible to detect clonality even when there are low levelsof monoclonal protein produced. In a similar manner, anti-bodies which recognise kappa or lambda bound to theirheavy chain partner allow accurate and specific quantifica-tion of serum IgGk and IgGλ, IgAk and IgAλ, and IgMkand IgMλ proteins and the calculation of their ratios [heavy-light chain or (HLCr) ratios]. Here we report on the utilityof these antibodies in nephelometric assays for detectionand quantification of monoclonal proteins in patients withsystemic AL amyloidosis. Materials and Methods. In retro-spective analysis of 155 patients attending the UK NationalAmyloidosis Centre (NAC), IgGk and IgGλ, IgAk andIgAλ, and IgMk and IgMλ were measured on a SiemensDade Behring BN II Nephelometer. HLCr were comparedwith previously produced SPE and immunofixation (IFE)results. Results. IgA HLCr correctly identified all IgA (10IgAλ and 4 IgAk) IFE positive patients, 7/14 of thesepatients had monoclonal proteins which were not quantifia-ble by SPE because of their co-migration with other pro-teins or because they were below the sensitivity of SPE.Similarly, IgM HLC identified all of the IgM (2 IgM� and 6IgM�) IFE positive patients, all of whom were also positiveby SPE. There was concordance between IFE and HLC in55/58 IgG (48 IgG� and 6 IgG�) patients. 3 patients hadabnormal IFE results with normal HLC ratios while mono-clonal protein concentrations were below the limits of SPEsensitivity in all cases. In 46 patient sera that were negativeby traditional serum and urine analysis HLC ratios identi-fied clonality in 9 cases (2 IgAk, 3 IgAλ and 4 IgGk).Conclusions.Analysis of serum Igk and Igλ and the produc-tion of Igk/Igλ ratios identified low levels of paraproteins inpatients with systemic AL amyloidosis. This was particular-ly useful in the case of IgA patients where the monoclonalprotein co-migrated with other proteins. In an addition Igk
/Igλ ratios identified clonality in patients that were normalby all other standard serum and urine tests.
F54 - EXPERIMENTAL AND PRACTICAL SENSITI-VITES OF Ig’k/Ig’λ NEPHELOMETRIC IMMUNO-ASSAYSJ. Harper,1 N. Fourrier,1 K. Sharp,1 L. Mirbahai,1
J. Harris,1 J. Bradwell,2 S. Harding1
1The Binding Site Group Ltd, Birmingham, UK;2Division of Immunity and Infection, Medical School,University of Birmingham, UK
Introduction. The sensitivity of the serum free light chaintests (FLC) for clones which are producing low concentra-tions of monoclonal proteins relies upon the use of numeri-cal k/λ ratios to define clonality. Separate measurement ofk and λ light chains bound to their heavy chain partnersmay also offer similar advantages. The production ofIg’k/Ig’λ ratios may be particularly useful when monoclo-nal proteins are difficult to measure, for example when theyco-migrate with other proteins on serum protein electropho-resis gels (SPE). Novel polyclonal antibodies have beenproduced which recognise junctional, conformational epito-pes between the k or λ light chains and their heavy chainpartners (HLC). Here we report on the use of these antibo-dies in nephelometric assays for the detection and quantifi-cation of IgA and IgG monoclonal proteins. Methods. SPEand immunofixation (IFE) were performed using a SEBIAHydrasys II electrophoresis system in accordance withmanufacturer’s instruction. Total IgG and IgA concentra-tions were measured using a Siemens BN II nephelometer.In addition IgGk, IgGλ, IgAk and IgAλ were also measu-red nepehlometrically and the results used to produceIgGk/IgGλ and IgAk/IgAλ ratios. Experimental sensitivi-ties were tested by spiking known concentrations of mono-clonal proteins into well characterised, pooled normalhuman sera and comparison between SPE and HLC ratioswas made. Presentation sera from 530 IgG (374 IgGk and156 IgGλ) and 210 IgA (145 IgAk and 65 IgAλ) multiplemyeloma (MM) patients were retrospectively analysed andresults compared with normal ranges. Results. The limits ofSPE sensitivity for detection of 3 monoclonal IgG proteinswere 0.48, 0.85 and 0.43 g/L compared with IgG HLC ratiosensitivities of 0.95, 1.7 and 1.7 g/L. For 3 IgA monoclonalproteins the limits were comparable between SPE and IgAHLC. There was good agreement between IgG HLC andIFE in 526/530 samples (99.3%). In 4 samples (0.7%), IgGHLC was normal when IFE was positive, however in allcases the concentrations of monoclonal proteins were belowthe detection limit of SPE. There was concordance betweenIFE and IgA HLC for all samples measured. In 83/210(40%) samples, accurate quantification by SPE densitome-try was not possible due to the co-migration of the mono-clonal protein with other serum proteins. Conclusions. Theexperimental sensitivity of IgG HLC is lower than SPE,although this is likely to be an experimental anomaly whichwas not reflected in patient sera due to the role of immuno-paresis. Overall there was good agreement between IFE andHLC measurement at presentation. In conclusion Igk/Igλratios provided a sensitive method for the identification andquantification of monoclonal proteins.
| 50 | Hematology Reports 2010; 2 (s2)
Posters

F55 - SERUM Ig’k/Ig’λ (HEVYLITE) RATIOS CANCONFIRM MONOCLONALITY IN SERA THAT AREAMBIGUOUS BY IMMUNOFIXATIONS. Harding,1 E. Lachmann,2 A. Legg,1 J. Reibe,3 M.Bruegel,4 S. Schauseil,5 A.R. Bradwell,6 G. Mead1
1The Binding Site Group Ltd, Birmingham, UK; 2NationalAmyloidosis Centre, Centre for Amyloidosis & AcutePhase Proteins, Department of Medicine Royal Free andUniversity College Medical School, London, UK; 3MVZCornely, Reibe and Berndt, Aachen; 4Institute ofLaboratory Medicine, Clinical Chemistry and MolecularDiagnostics, University Hospital Leipzig; 5MedizinischeLaboratorien, Düsseldorf; 6Division of Immunity andInfection, Medical School, University of Birmingham
Introduction. Immunofixation electrophoresis (IFE) isused to identify monoclonal immunoglobulins (Ig) alon-gside abnormal serum protein electrophoresis (SPE)and/or serum free light chains (FLC). Whilst the majorityof intact monoclonal Igs can be satisfactorily classifiedby IFE, it is frequently inadequate for the detection ofclonality in nonsecretory multiple myeloma, light chainonly myeloma and AL Amyloidosis. In addition, patientswith low concentrations of monoclonal Igs can be diffi-cult to characterise in the presence of normal or high con-centrations of polyclonal Igs. Here we describe the use ofserum Hevylite (HLC) measurements for identifying andquantifying difficult to characterise monoclonal Igs.Materials and Methods. SPE and IFE were performedusing a SEBIA Hydrasys 2 in accordance with the manu-facturer’s instructions. FLCs, IgGk, IgGλ, IgAk andIgAλ concentrations were measured on a SiemensHealthcare Diagnostics BN II nephelometer and resultscompared with published normal ranges. Results. Apatient with a low level IgGk monoclonal protein relap-sed with heavy chain disease confirmed by the presenceof a monoclonal gamma band with no associated lightchain. Retrospective analysis of the patient’s IgGk andIgGλ concentrations and calculation of IgGk/IgGλ ratioof 4.9 (normal range 0.98-2.75) indicated a persistentIgGk monoclonal protein which was below the sensitivi-ty of IFE. Serum IgAk and IgAλ levels were measured in3 patients with ambiguous IFE results. The first samplehad a monoclonal alpha band with no associated lightchain by IFE. Serum HLC measurements indicated aclear IgAλ monoclonal protein (IgAk=1.06, IgAλ=2.69,IgAk/IgAλ=0.394: normal range; 0.8-2.04) and FLCmeasurements confirmed a lambda clone (kFLC=12.1,λFLC=103 kFLC/λFLC=0.12). In a second sample witha low total serum IgA concentration (0.95g/L) an IgAkband was suggested by SPE but not clearly visible byIFE. The IgAk/IgAλ ratio value of 10 clearly identifiedan IgAk monoclonal protein. Third, a patient with increa-sed levels of IgA was investigated for possible monoclo-nal gammopathy. Identification of a monoclonal band byIFE was difficult due to high levels of polyclonal Ig stai-ning. Both IgAk and IgAλ values were high but theIgAk/IgAλ ratio indicated no monoclonal Ig (IgAk=9.1,IgAλ=9.5, IgAk/IgAλ=0.96). Conclusion. Analysis ofimmunoglobulin ratios can identify monoclonal Igs andmay be particularly useful for assessing subtle clonesbelow the sensitivity limit of IFE.
F56 - NEW QUANTITATIVE SERUM HEAVYCHAIN/LIGHT CHAIN ASSAY CONSISTENTLYIDENTIFIED IFE POSITIVE MYELOMA PATIENTSEVALUATED IN STUDY AT THE MYELOMA INSTITU-TEJ. Bornhorst,1 T. Kuus,2 L. Traylor2
1University of Arkansas for Medical Sciences, LittleRock, AR; 2The Binding Site, San Diego, CA, USA
Background. The current most sensitive method fordetecting intact immunoglobulins in the serum is the non-quantitative immunofixation electrophoresis (IFE). Thenew serum heavy chain/light chain (HLC) immunoassayis a quantitative analysis of intact immunoglobulin heavychain (IgH) and light chain kappa or lambda. The assayprovides absolute concentrations of IgH kappa (k) andIgH lambda (λ) as well as the clinically useful IgHk/IgHλratio. Aims. The primary aim of this study was to evalua-te the IgA HLC Assay on the Siemens BNII instrumentusing IgA myeloma patient and normal subject samples.Methods. The IgA k/λ HLC reagent kits, provided by TheBinding Site, Inc, were evaluated on 25 normal and 25myeloma patient (20 IFE positive and 5 IFE negative)samples with known serum free light chain results usingthe Siemens BNII instrument. Results. The HLC assayidentified all known myeloma patients and showed strongcorrelation with total IgA assay (see Figure 1). The IFEnegative IgA myeloma patients also had normalIgAk/IgAλ ratios. The serum free light chain ratios wereabnormal in 18/20 (90%) IFE positive samples, consistentwith previously reported percentages for intact Ig MM.Summary/Conclusion. In this study, quantitative HLCassay appears to offer similar analytical advantages as thatof the serum free light chain assay including high sensiti-vity and quantitative assessment of clonality. Additionalways that HLC assays can be potentially utilized in themonitoring of myeloma patients are by providing numeri-cal results for patients that are IFE positive but not readi-ly followed by serum protein electrophoresis, and throughcalculation of the clinically beneficial IgAk/IgAλ ratio.Biological variations that may impact electrophoretic eva-luation of the immunoglobulin protein should not affectthis ratio, for example changes in blood volume, hemato-crit and metabolism. Further clinical studies are requiredto fully assess the clinical benefit of this assay in practice.
Figure1.
Hematology Reports 2010; 2 (s2) | 51 |
6th International Symposium on Clinical Applications of Serum Free Light Chain Analysis (plus Hevylite)Bath, United Kingdom, 23-24 September 2010

F57 - ANALYTICAL VALIDATION OF HEVYLITE IgAASSAY FOR THE DIAGNOSIS OF MONOCLONALGAMMOPATHIESJ. Eckold,1 W. Poenisch,2 J. Kratzsch,1 J. Thiery,1
M. Bruegel1
1Institute of Laboratory Medicine, Clinical Chemistryand Molecular Diagnostics, University Hospital Leipzig,Leipzig, Germany; 2Department of Internal Medicine,Haematology/Oncology, University Hospital Leipzig,Germany
Background. The analysis of monoclonal proteins inserum is an integral part of the diagnosis of monoclonalgammopathies. Currently used detection methods aremainly based on electrophoretic techniques, characteri-zed by limited sensitivity and lack of quantification.Aims. The aim of our study was to analytically validatethe Binding Site Hevylite IgA (HLC) assay, a newlydeveloped immunoassay for the detection of monoclonalheavy chains type IgA k and λ. Methods. Intra- and inter-assay precision were determined using patient sera (n=4)containing IgA monoclonal protein in a range between0.5-31.0 g/L. Accuracy was estimated by testing linearityafter dilution of patient sera with high monoclonal proteinlevels (n=2) and by spiking of assay calibrators into seraof healthy subjects (n=3). A potential interference withrheumatoid factors (RF) was investigated by dilution ofsera containing monoclonal protein (n=2) with sera con-taining low or high amounts of RF IgM (34 and 974U/ml). Sera containing monoclonal proteins in immuno-fixation electrophoresis (IFE) (n=22, 20 MM, 2 MGUS)were analyzed by the HLC assay. Results. Intra- and inter-assay precision ranged between 1.5 to 20.0% for the coef-ficient of variation. Testing accuracy of the analyticalmethod resulted in a linear recovery from 0.9 to 13.0 g/L.RFs did not affect test results until a concentration of 974U/ml. All 22 IFE positive samples could be confirmed bythe HLC assay. Summary/Conclusion. Our test validationrevealed high precision and accuracy of the analyticalmethod and a high concordance between test results ofIFE and the HLC assay. We are currently investigating thediagnostic value of the Hevylite-IgA assay in estimationof prognosis and disease activity.
F58 - SYSTEM HEVYLITE AND IgA MONOCLONALGAMMOPATHY – FIRST EXPERIENCET. Pika,1 Z. Hermanova,2 P. Lochman,3 J. Zapletalova,4
J. Minarik,1 V. Scudla1
The Third Clinic of Internal Medicine, Medical Facultyof Palacky University and University Hospital,Olomouc, Czech Republic; 2Department of Immunology,Medical Faculty of Palacky University and UniversityHospital, Olomouc, Czech Republic; 3Department ofClinical Biochemistry and Immunogenetics, UniversityHospital, Olomouc, Czech Republic; 4Institute ofMedical Biophysics, Medical Faculty of PalackyUniversity, Olomouc, Czech Republic
Background. Typical features of monoclonal gammopathy(MG) include the presence of monoclonal immunoglobulin(MIG) molecules or their fragments in the serum and/or
urine. The latest test which extends the range of MIG exa-mination possibilities is the Hevylite system, using princi-pally specific antibodies against junctional epitopes betwe-en the domains of heavy and light immunoglobulin chainsin the constant regions. Aims. The study aimed at imple-menting the Hevylite system and performing a pilot analy-sis in the group of IgA-type MG patients. Methods. Thestudied group consisted of 24 patients with multiple mye-loma (MM) (4 patients in the stage of disease diagnosis, 6patients in disease remission, and 14 in disease progres-sion) and, in addition, 7 individuals with monoclonal gam-mopathy of undetermined significance (MGUS) (1¥ low-risk, 6¥ high-risk). The Hevylite system (The Binding SiteGroup Ltd, UK) was used to determine the serum levels ofIgAk, IgAλ on the BN II analyser (Siemens HealthcareDiagnostics). The ratio of IgAk/IgAλ was determined bycalculation. Results. The patients in the active disease stagerevealed highly pathological levels of the dominant MIG,with suppressed levels of the alternative IgA immunoglo-bulin, and significant influence on the IgAk/IgAλ ratio. 5out of the patients who had achieved a complete remission(IFE negativity) showed a normal IgAk/IgAλ ratio, 1patient had suppression of both IgA pairs, evidently due tothe short interval from their previous chemotherapy, with amodified IgAk/IgAλ ratio. All individuals with MGUSrevealed abnormal Hevylite levels as well as ratios ofIgAk/IgAλ, one patient with a low-risk disease type hadthe IgAk/IgAλ ratio value slightly above the threshold.When comparing the results of M-protein determination bythe method of Hevylite and membrane electrophoresis,Spearman’s correlation analysis confirmed a very closecorrelation of M-protein levels regarding IgAk (r=0.946,p=0.0001) as well as IgAλ (r=0.872, p= 0.0001). The sum-mations of the dominant as well as alternative IgA immu-noglobulin levels substantially correlated with the generallevel of IgA immunoglobulin determined nephelometrical-ly (r=0.994, p=0.0001). Summary/Conclusion. Preliminaryobservations confirm that the Hevylite system promisinglycomplements the set of examinations used routinely byMG monitoring, in particular for very low concentrationsof MIG, or the mere positivity of the IFE. Further experien-ce needs to be gained in order to fully assess the benefits ofthis examination for clinical practice. Supported by Internal grant agency of Palacky Universitygrant No.: LF 2010013
F59 - FIRST EXPERIENCES WITH MEASUREMENTOF IgA HEAVY/LIGHT CHAINS IN IgA MONOCLO-NAL GAMMOPATHIESR. Assert, L. Eisele, V. Chapot, J. Dürig, A. Fleer, L. Volbracht, H. Nückel
Department of Haematology, Essen, Germany
Background. Light chain restricted over-expression ofcomplete or incomplete monoclonal proteins are a hal-lmark of most gammopathies which results in typicallydiscordant serum heavy/light chain concentrations.Therefore, the separate monitoring of kappa and lambdabound heavy chains may be of value in the diagnosis andclinical assessment of gammopathies. Aims. We presentour first experiences with a recently developed automated
| 52 | Hematology Reports 2010; 2 (s2)
Posters
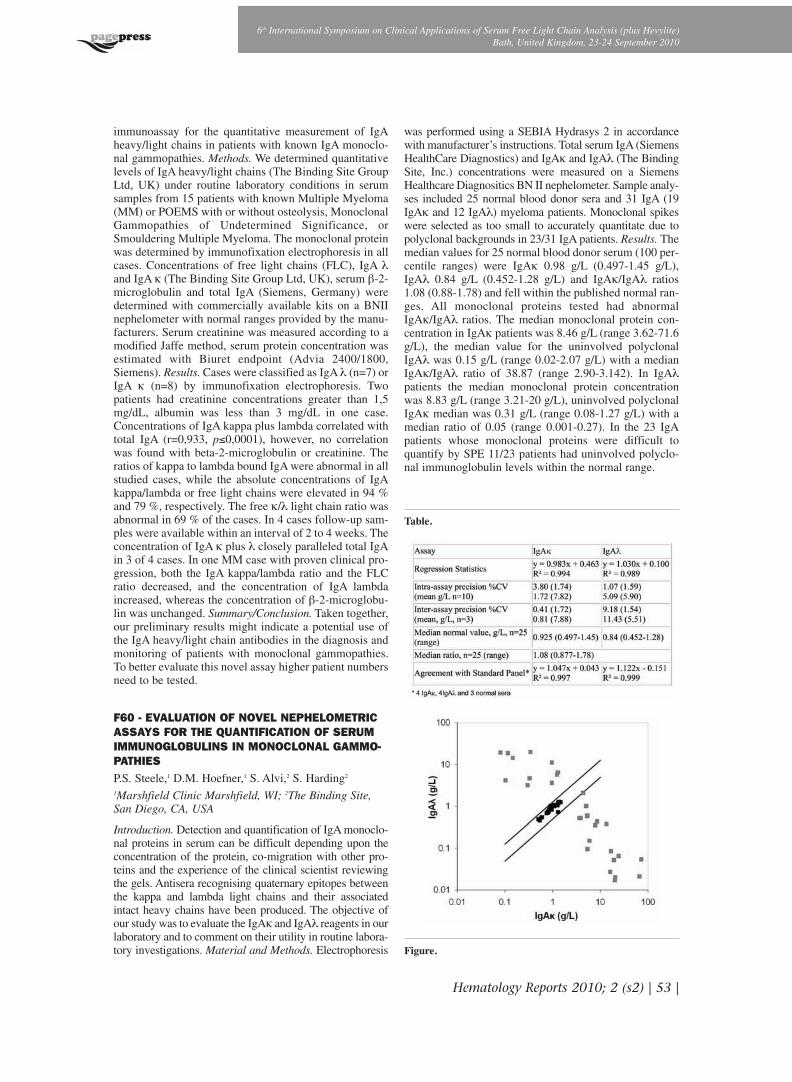
immunoassay for the quantitative measurement of IgAheavy/light chains in patients with known IgA monoclo-nal gammopathies. Methods. We determined quantitativelevels of IgA heavy/light chains (The Binding Site GroupLtd, UK) under routine laboratory conditions in serumsamples from 15 patients with known Multiple Myeloma(MM) or POEMS with or without osteolysis, MonoclonalGammopathies of Undetermined Significance, orSmouldering Multiple Myeloma. The monoclonal proteinwas determined by immunofixation electrophoresis in allcases. Concentrations of free light chains (FLC), IgA λand IgA k (The Binding Site Group Ltd, UK), serum β-2-microglobulin and total IgA (Siemens, Germany) weredetermined with commercially available kits on a BNIInephelometer with normal ranges provided by the manu-facturers. Serum creatinine was measured according to amodified Jaffe method, serum protein concentration wasestimated with Biuret endpoint (Advia 2400/1800,Siemens). Results. Cases were classified as IgA λ (n=7) orIgA k (n=8) by immunofixation electrophoresis. Twopatients had creatinine concentrations greater than 1,5mg/dL, albumin was less than 3 mg/dL in one case.Concentrations of IgA kappa plus lambda correlated withtotal IgA (r=0,933, p≤0,0001), however, no correlationwas found with beta-2-microglobulin or creatinine. Theratios of kappa to lambda bound IgA were abnormal in allstudied cases, while the absolute concentrations of IgAkappa/lambda or free light chains were elevated in 94 %and 79 %, respectively. The free k/λ light chain ratio wasabnormal in 69 % of the cases. In 4 cases follow-up sam-ples were available within an interval of 2 to 4 weeks. Theconcentration of IgA k plus λ closely paralleled total IgAin 3 of 4 cases. In one MM case with proven clinical pro-gression, both the IgA kappa/lambda ratio and the FLCratio decreased, and the concentration of IgA lambdaincreased, whereas the concentration of β-2-microglobu-lin was unchanged. Summary/Conclusion. Taken together,our preliminary results might indicate a potential use ofthe IgA heavy/light chain antibodies in the diagnosis andmonitoring of patients with monoclonal gammopathies.To better evaluate this novel assay higher patient numbersneed to be tested.
F60 - EVALUATION OF NOVEL NEPHELOMETRICASSAYS FOR THE QUANTIFICATION OF SERUMIMMUNOGLOBULINS IN MONOCLONAL GAMMO-PATHIES P.S. Steele,1 D.M. Hoefner,1 S. Alvi,2 S. Harding2
1Marshfield Clinic Marshfield, WI; 2The Binding Site,San Diego, CA, USA
Introduction. Detection and quantification of IgA monoclo-nal proteins in serum can be difficult depending upon theconcentration of the protein, co-migration with other pro-teins and the experience of the clinical scientist reviewingthe gels. Antisera recognising quaternary epitopes betweenthe kappa and lambda light chains and their associatedintact heavy chains have been produced. The objective ofour study was to evaluate the IgAk and IgAλ reagents in ourlaboratory and to comment on their utility in routine labora-tory investigations. Material and Methods. Electrophoresis
was performed using a SEBIA Hydrasys 2 in accordancewith manufacturer’s instructions. Total serum IgA (SiemensHealthCare Diagnostics) and IgAk and IgAλ (The BindingSite, Inc.) concentrations were measured on a SiemensHealthcare Diagnositics BN II nephelometer. Sample analy-ses included 25 normal blood donor sera and 31 IgA (19IgAk and 12 IgAλ) myeloma patients. Monoclonal spikeswere selected as too small to accurately quantitate due topolyclonal backgrounds in 23/31 IgA patients. Results. Themedian values for 25 normal blood donor serum (100 per-centile ranges) were IgAk 0.98 g/L (0.497-1.45 g/L),IgAλ 0.84 g/L (0.452-1.28 g/L) and IgAk/IgAλ ratios1.08 (0.88-1.78) and fell within the published normal ran-ges. All monoclonal proteins tested had abnormalIgAk/IgAλ ratios. The median monoclonal protein con-centration in IgAk patients was 8.46 g/L (range 3.62-71.6g/L), the median value for the uninvolved polyclonalIgAλ was 0.15 g/L (range 0.02-2.07 g/L) with a medianIgAk/IgAλ ratio of 38.87 (range 2.90-3.142). In IgAλpatients the median monoclonal protein concentrationwas 8.83 g/L (range 3.21-20 g/L), uninvolved polyclonalIgAk median was 0.31 g/L (range 0.08-1.27 g/L) with amedian ratio of 0.05 (range 0.001-0.27). In the 23 IgApatients whose monoclonal proteins were difficult toquantify by SPE 11/23 patients had uninvolved polyclo-nal immunoglobulin levels within the normal range.
Table.
Figure.
Hematology Reports 2010; 2 (s2) | 53 |
6th International Symposium on Clinical Applications of Serum Free Light Chain Analysis (plus Hevylite)Bath, United Kingdom, 23-24 September 2010

Conclusions. IgA monoclonal protein may be difficult toassess due to the co-migration with other serum proteins.Measurement of IgAk/IgAλ ratios provided a sensitivemethod for identifying monoclonal proteins and quantifi-cation was simple compared with SPE measurements insome anodal migrating samples.
F61 - NEPHELOMETRIC IMMUNOASSAYS IgAkAND IgAλ FOR ASSESSMENT AND MONITORINGOF MULTIPLE MYELOMA PATIENTSL. Mirbahai,1 H. Avet Loiseau,2 C. Mathiot,3 M. Attal,4
P. Moreau,5 J.L. Harousseau,2 J. Bradwell,6 S. Harding1
1The Binding Site Group Ltd, Birmingham, UK;2Laboratory of Hematology, Clinical HematologyDepartment, University Hospital, Nantes, France;3Department of Hematology, Institut Curie, Paris,France; 4Centre Hospitalier Universitaire Toulouse,Toulouse, France; 5Centre Hospitalier UniveritaireNantes, France; 6Division of Immunity and Infection,Medical School, University of Birmingham, UK
Introduction. International guidelines recommend serumprotein electrophoresis (SPE) and immunofixation (IFE)for the identification, quantification and characterisationof monoclonal proteins. Accurate quantification of IgAmonoclonal proteins can be difficult particularly whenthey co-migrate with other serum proteins. IFE can iden-tify these patients but it is a qualitative rather than quan-titative test. Antibodies have been developed which reco-gnise junctional, conformational epitopes between kappaor lambda light chains and the bound heavy chain partner(heavy/light chain - HLC). These antibodies have beenused in nephelometric assays to quantify serum IgAk andIgAλ proteins. Aims. Comparison of IgAk/IgAλ ratioswith SPE and IFE to identify and monitor IgA multiplemyeloma (MM) patients. Methods. Serum of 46 IgApatients (28 IgAk and 18 IgAλ) from the IFM 2007 02trial (comparing Velcade and Dexamathasone versus vel-cade, thalidomide and dexamethasone) were analysed atpresentation, cycle 2, cycle 4 and after autologous stemcell transplant (ASCT) (mean=3, range 1-5 samples).IgAk and IgAλ were measured using a Siemens Dade-Behring BN II nephelometer. Results were comparedwith the 95 percentile normal ranges generated from 138normal blood donor sera. Comparison with historic SPE,IFE and clinical assessments were made. All statisticswere performed using SPSS version 18. Results.Abnormal IgAk/IgAλ ratios correctly identified allpatients at presentation. By SPE, in 10/42 patients it wasnot possible to quantify the monoclonal protein accurate-ly and in 2/42 patients there was no monoclonal proteinvisible. After 2 cycles of therapy there was monoclonalprotein detectable in all patients by IFE and HLC, howe-ver in 8 patients the concentration of the protein wasbelow SPE sensitivity. After 4 cycles of therapy therewere concordant IFE and HLC results in 29 patient seraof which 21 had monoclonal protein levels which weremeasurable by SPE, in 3 patients IFE was positive whenHLC ratio was normal and in 2 cases HLC was positivewhen IFE was normal. In the patients with an abnormalIFE and normal HLC ratio there had been significant
increases in the level of polyclonal IgA and in all instan-ces the monoclonal proteins were below the sensitivity ofSPE. After ASCT, 14/39 patients had abnormal IFE andHLC ratios while IFE was positive in 3 patients that hada normal HLC ratio. It is possible that the IFE bands wereoligoclonal which occurs frequently after ASCT and isnot indicative of the tumour clone. In these cases IgAlevels were normal and the level of monoclonal proteinproduction was below the sensitivity of SPE. Discussion.IgAk and IgAλ immunoassays provide a quantitativemethod for identifying and monitoring monoclonal pro-teins in MM patients. The IgAk/IgAλ ratio was frequen-tly more sensitive than SPE and provided a quantitativemeasure of the protein concentration when SPE wasnegative. In a few instances there were disparate resultsbetween IFE and HLC that could be due to the presenceof oligoclonal bands after therapy and ASCT.
F62 - QUANTIFICATION OF IgA-k AND IgA-λ IMMU-NOGLOBULINS IN 54 SERUM SAMPLES WITHDETECTABLE IgA MONOCLONAL COMPONENTJ.J. Rodríguez-Molina, J. Navarro, E. Fernández-Cruz
Hospital General Universitario Gregorio Marañón,Madrid, Spain
Background. Quantitation of serum monoclonal compo-nent (MC) has been used as a criterion for the diagnosis,staging, risk stratification and response to therapy in mul-tiple myeloma (MM) and other monoclonal gammopa-thies. The International Myeloma Working Group has sta-ted that serum MC level should be quantified using den-sitometry on serum protein electrophoresis (SPE) exceptin cases where the SPE is felt to be unreliable (e.g., insome cases of IgA MC migrating in SPE beta region).The procedure for the quantification of IgAk and IgAλimmunoglobulin concentration in human serum samplesis a new tool for monitoring monoclonal gammopathies.Aims. To evaluate the quantification of IgAk and IgAλimmunoglobulin concentrations in comparison withquantification of MC using high resolution capillary elec-trophoresis. Methods. 1.- Samples: 54 serum samplesfrom patients with measurable IgA MC using a standardprocedure: Capillary electrophoresis and densitometricevaluation of MC referred to albumin and subtraction ofoverlaping transferrin or C3 complement component. 2.-Typing MC by automated capillary electrophoresis andimmune-displacement. 3.- Quantification of IgAk/IgAλimmunoglobulin concentration by an automated turbidi-metric procedure. 4.- Comparison of the turbidimetricquantification of the involved IgAk or IgAλ immunoglo-bulin concentration versus standard quantification ofserum MC. Results. a) Abnormal levels of IgAk or IgAλin 45/54 IgA-MC serum samples. b) Abnormal levels ofIgAk and IgAλ in 4/54 IgA-MC serum samples. c)Normal levels of IgAk and IgAλ in 5/54 IgA-MC serumsamples. The figure shows correlation between quantifi-cation of MC and involved IgAk or IgAλ immunoglobu-lin. Summary/Conclusion. Quantification of IgAk/IgAλimmunoglobulin concentration is a useful tool for evalua-ting MC. Discrepancies between quantification of MCand the involved IgAk/IgAλ may be related to high reso-
| 54 | Hematology Reports 2010; 2 (s2)
Posters

lution procedure used for quantification of MC and/or tothe overlap of monoclonal and polyclonal components inthe involved IgAk/IgAλ immunoglobulin quantification.
Figure.
F63 - QUANTIFICATION OF SERUM IgM k ANDIgM λ IN PATIENTS WITH WALDENSTRÖM’SMACROGLOBULINAEMIA (WM): CLINICAL COR-RELATIONSE. Koulieres,1 M.-C. Kyrtsonis,1 D. Maltezas,1 T. Tzenou,1
L. Mirbahai,2 G. Mead,2,3 M. Dimou,1 V. Bartzis,1
P. Panayiotidis,1 A.R. Bradwell,3 S. Harding2
1First Dpt of Internal Medicine and Dpt of Hematology,Laikon University Hospital, Athens, Greece; 2TheBinding Site Group Ltd, Birmingham, UK; 3Departmentof immunity and Infection, University of Birmingham,Medical School, Birmingham, UK
Introduction. Poor resolution of IgM monoclonal proteins(M-proteins) on serum protein electrophoresis (SPE) canmake accurate quantification difficult. Specific polyclonalantibodies which recognise epitopes spanning the junctionof the heavy and light chains (HLC) of the individualimmunoglobulin isotypes have been produced. These havebeen used successfully in the identification and monitoringof IgA and IgG M-proteins in myeloma patients. Here wedescribe the use of the automated nephelometric assays toquantify serum concentrations of IgMk and IgMλ and theuse of IgMk/IgMλ ratios to identify IgM M-proteins andassess patient outcome. Patients and Methods.Retrospective sera from 39 patients with IgM M-proteins(25 IgMk, 13 IgMλ and 1 patient with IgM restriction butno identifiable light chain) diagnosed and followed duringthe last two decades were included in this study (31 WM,4 IgM monoclonal gammopathy of undetermined signifi-cance (MGUS), 2 symptomatic MGUS (neuropathy) and 2mantle cell lymphoma). Patients’ median follow-up was 59months. Analysis of IgMk and IgMλ was performed on aSiemens Dade-Behring BN™II nephelometer and resultswere compared with disease parameters (such as bloodcounts, beta-2-microglobulin (β2M), serum albumin, lacta-te dehydrogenase (LDH), lymphoplasmacytic bone mar-
row infiltration) and International Prognostic ScoringSystem (IPSS). Results.Abnormal IgMk/IgMλ ratios werereported in 30/31 WM, 5/6 MGUS and 1/2 mantle celllymphoma patient sera. There was a good correlation bet-ween summated IgMk + IgMλ and total IgM (r=0.832p<0.0001), although in 12 patients there was considerabledisagreement between total IgM (range 12.9-80.4) andsummated IgMk + IgMλ (range 22.2-150.8, p>0.01).These 12 patients had polyclonal hypogammaglobulinemiawith regard to their IgG and IgA levels. Median levels ofthe IgMk/IgMλ ratios (expressed as IgMk/IgMλ orIgMλ/IgMk) were 90.9 (range 1.91-1000) in WM v 17.7(range 1.08-34.57) in IgM MGUS (p=0.06). MedianIgMk/IgMλ ratio was higher in WM patients requiring tre-atment (n=24) at presentation than in patients not (n=7)requiring treatment (185.7 v 13.45 p=0.023). IgMk/IgMλratios correlated with bone marrow infiltration (p=0.029),time to treatment (p=0.003) and IPSS (p=0.001). A simplemodel built on the presence of 0 or 1, 2 and 3 of the follo-wing: IgMk/IgMλ ratio > median, β2M>5 and abnormalLDH, identified 3 prognostic arms with respect to survival(p<0.0001) (Figure). Conclusions. Analysis of HLC IgMseems useful in clinical evaluation of WM patients.IgMk/IgMλ correlated with bone marrow infiltration, timeto treatment need and outcome.
Figure.
F64 - SENSITIVITIES AND SPECIFICITIES FORIMMUNOGLOBULIN HEAVY/LIGHT CHAIN (HEVY-LITE) ASSAYSJ. Harris,1 A. Alvi,1 N. Fourrier,1 H. Carr-Smith,1
G. Mead,1,2 A.R. Bradwell,2 S. Harding,1
1The Binding Site Group Ltd, Birmingham, UK;2Division of Immunity and Infection, Medical School,University of Birmingham, UK
Introduction. Specific polyclonal antibodies have beendeveloped which recognise quaternary conformational epi-topes spanning the junction between immunoglobulin lightchains (kappa and lambda) and their heavy chain partners(IgG, IgA and IgM). Here we describe the development of
Hematology Reports 2010; 2 (s2) | 55 |
6th International Symposium on Clinical Applications of Serum Free Light Chain Analysis (plus Hevylite)Bath, United Kingdom, 23-24 September 2010

automated, nephelometric immunoassays on the SiemensBN II nephelometer; the main assay characteristic are sum-marised below. Methods and Results. Normal ranges wereestablished by testing blood donor sera and comparisonsmade to the appropriate total immunoglobulin results aresummarised in the table above. Interference was within±10% for all antisera when either bilirubin (200mg/L),haemoglobin (4.56g/L) or Chyle (1000 FTU) were addedto a characterized pool of normal serum. Susceptibility tointerference and specificity was assessed using a panel ofmonoclonal serums: 22 IgGk median 27.4g/L (range 7.8-70.8), 16 IgGλ median 24.6g/L (range 2.0-36.0), 14 IgAkmedian 30.6g/L (range 6.3-43.0), 9 IgAλ median 22.2g/L(range 8.5-35.9), 15 IgMk median 29.8g/L (range 3.6-39.1), 10 IgMλ median 45.8g/L (range 1.2-99.9), 2 FLCkmedian 5460mg/L (range 4440-6480) and 6 FLCλ median1797mg/L (range 605-8424). The data was expressedeither as summated Ig’k +Ig’λ or as ratios (i.e. Ig’k / Ig’λ)and compared to total immunoglobulin and immunofixa-tion results. For all assays median summated values werewithin 10% of the total immunoglobulin. Additionallyabnormal ratio results correctly identified all monoclonalproteins in agreement with IFE. Conclusion.We concludethat serum assays provide a rapid and precise method forquantifying the isotype specific Ig’k /Ig’λ in serum.
Table.
Assay IgGk IgGλ IgAk IgAλ IgMk IgMλ
Range (g/L) 1.72-27.50 0.88-14.00 0.35-11.20 0.33-10.40 0.20-6.40 0.18-5.60
Sample dilution 1/100 1/100 1/100 1/100 1/100 1/100
Min sample 1/5 1/5 1/5 1/5 1/5 1/5dilution
Sensitivity (g/L) 0.086 0.044 0.018 0.016 0.010 0.009
Assay time (min) 12 12 12 12 12 12
Assay format Antisera Antisera Antisera Antisera Latex Latex
Total precisionCV 5.6% 4.7% 5.1% 6.4% 5.7% 10.6%(g/L) (24.05) (10.83) (9.14) (8.45) (4.85) (4.24)CV 7.4% 4.6% 5.5% 3.3% 6.5% 8.7%(g/L) (11.25) (5.90) (2.48) (1.93) (1.16) (0.77)CV 6.5% 8.5% 3.6% 4.0% 7.7% 6.9%(g/L) (2.92) (1.38) (0.56) (0.50) (0.35) (0.30)
Median normal 6.85 3.81 1.19 0.98 0.61 0.42(95%ile) g/L (4.03-9.78) (1.97-5.71) (0.48-2.82) (0.36-1.98) (0.17-1.98) (0.18-1.20)
Ig’k/Ig’λ median 1.87 1.27 1.57normal (95%ile) (0.98-2.75) (0.80-2.04) (0.79-2.28)
Ig’k/Ig’λ median y=0.94x +0.43 y=1.09x +0.05 y=1.00x -0.03Summation vTotal Ig’ (g/L)
F65 - NEPHELOMETRIC IMMUNOASSAY MEASU-REMENTS OF IGMk AND IGMλ FOR THE ASSES-SMENT OF IGM MONOCLONAL GAMMOPATHYPATIENTSN. Fourrier,1 L. Mirbahai,2 G.P. Mead,1 A.R. Bradwell,1 S.Harding1
1The Binding Site Group, Ltd. Birmingham, UK;2Division of Immunity and Infection, The MedicalSchool, University of Birmingham, Birmingham, UK
Background. Serum protein electrophoresis (SPE) andimmunofixation (IFE) are used to detect, quantify andtype monoclonal immunoglobulins. Problems in thedetection and measurement of the IgM monoclonal pro-teins using gel techniques can occur, particularly whenthe IgM monoclonal proteins aggregate thereby preven-ting migration into the gels. Specific polyclonal antibo-dies have been produced that target epitopes in the regionspanning the junction of the heavy and light chain of theIgM molecule. Using these antisera, nephelometric IgMkand IgMλ assays have been developed and optimised onthe Dade Behring BNTMII nephelometer. Here we reportthe use of the IgM� and IgM� immunoassays for the detec-tion and the quantification of IgM monoclonal protein inpatients with Waldenstrom’s Macroglobulinemia (WM)and monoclonal gammopathy of undetermined signifi-cance (MGUS). Methods. IgMk and IgMλ assay charac-teristics are summarized in the table below. Normal ran-ges for IgMk and IgMλ were derived from 89 normal(blood donor) sera and summated values compared withtotal IgM (Siemens Dade Behring BNII). IgMk and IgMλconcentrations were measured in 19 IgM WM (14 IgMkand 5 IgMλ) and 4 MGUS (4 IgMk) patients. Results.Normal range results were; median IgMk 0.611g/L (range0.126-2.020g/L), median IgMλ 0.423g/L (range 0.168-1.290g/L), median IgMk/IgMλ ratio of 1.566 (range0.750-2.314). IgMk+IgMλ summation correlated wellwith total IgM (Passing Bablok, Y=-0.03+1.01X). In 14IgMk WM and 4 IgMk MGUS patients the median con-centration of IgMk was 17.9g/L (range 3.57-53.1g/L) themedian ratio was 179.48 (range 1.08-695.12). In 5 IgMλWM patients the median concentration of IgM� was20g/L (range 15.7-40.40g/L) the median ratio was 0.013(range 0.003-0.037). In all WM and 3/4 MGUS patientsamples the IgM isotype was identified correctly andmatched the IFE results. One MGUS patient had highpolyclonal levels of IgM and a normal IgMk/IgMλ wasreported. Summary/Conclusion. Normal ranges for IgMkand IgMλ in patient serum were established and wedemonstrated that IgMk/IgMλ ratios can be a relevantindicator of IgM monoclonal protein production.
Table.
Assay IgMk IgMλ
Range (mg/L) 200-6400 175-5600Sample dilution 1/100 1/100Min. sample dilution 1/5 1/5Sensivity (mg/L) 10 8.8Assay time (mins) 12 12
| 56 | Hematology Reports 2010; 2 (s2)
Posters

HEAVY CHAIN/LIGHT CHAIN ANALYSISFOR PATIENT MONITORING AND PROGNOSIS
G65 - HEVYLITE Ig’k/Ig’λ RATIOS IN MULTIPLEMYELOMA CORRELATE WITH CLINICAL STATUSS. Harding,1 E. Koulieres,2 M.C. Kyrtsonis,3 A. Levoguer,1
L. Mirbahai,1 M. Drayson,4 A.R. Bradwell,4 G. Mead,1
1The Binding Site Group Ltd, Birmingham, UK; 2FirstDpt of Internal Medicine and Dpt of Hematology,Laikon University Hospital, Athens, Greece; 3LaikonUniversity Hospital, Athens, Greece; 4Division ofImmunity and Infection, University of Birmingham, UK
Introduction. Serum protein electrophoresis (SPE) andimmunofixation (IFE) are the most commonly used labo-ratory tests for monitoring monoclonal immunoglobulin(Ig) production in multiple myeloma (MM). Levels of Igin individual patients are commonly assumed to assesstumour burden and reductions relate to therapeuticresponses. However, SPE measurements can be inaccura-te if there is significant polyclonal immunoglobulin pro-duction and/or when large changes occur in haematocritand plasma volume. Assays measuring the heavy/lightchain (HLC) subsets, IgGk, IgGλ, IgAk and IgAλ, havebeen developed that quantify the concentrations of themonoclonal Ig as well as the uninvolved Ig’s of the sameisotype. Here we report three case studies where HLCIg’k/Ig’λ ratios closely matched clinical assessments butwere at variance with SPE & IFE measurements.Materials and Methods. Sequential serum samples(median n=10, range 5-14) from 3 MM patients (1¥IgGλ,1¥IgAk and 1¥IgAλ) were retrospectively analysed. TheIgGk, IgGλ, IgAk and IgAλ concentrations were measu-red on a Siemens BN II nephelometer. Results were com-pared with clinical assessments, total Igs and monoclonalIgs by SPE and IFE. Results. The IgGλ MM patientresponded well to cyclophosphamide therapy and achie-ved a complete response (CR) after 264 days (SPE andIFE negative). The CR lasted until 732 days when thepatient relapsed with a low level IgGλ. Salvage therapywith cyclophosphamide, vincristine, adriamycin, melpha-lan and prednisone resulted in a monoclonal Ig reductionbut a terminal relapse occurred by day 1,160. The patien-t’s IgGλ/IgGk ratio showed a similar response to the ini-tial treatment but showed no change during the salvagetherapy supporting the clinical response. The IgAk MMpatient responded well to the initial treatment of vincristi-ne, adriamycin and dexamethasone (VAD) achieving astringent Cr (sCR) by 342 days. The response lasted 220days when the patient relapsed and was treated with vel-cade. A second response by SPE was recorded after 8days but the patient continued to clinically decline andbone marrow aspirations showed considerable plasmacell infiltration. The IgAk/IgAλ ratio normalised at sCR,became abnormal during relapse and increasingly abnor-mal during the second clinical relapse in contrast to theSPE results. The IgAλ patient showed a partial responseto VAD therapy after 111 days by SPE. However, thepatient deteriorated clinically and presented with sponta-
neous fractures at 351 days. Subsequent treatment withvelcade and high dose melphalan (with stem cell rescue)achieved sCr. The IgAk/IgAλ ratio became increasinglyabnormal after presentation and did not show any respon-ses to VAD treatment. The ratio normalised when thepatient achieved sCr. Conclusion. Serum Ig’k/Ig’λ ratioscan be used to monitor MM patients through the course oftheir disease. In the 3 patients described, HLC ratios cor-responded better with the clinical status than SPE and IFEand suggested alternative management strategies.
G66 - HEAVY/LIGHT CHAIN ANALYSIS AS ANAID IN MONITORING IgA AND IgG MULTIPLEMYELOMA PATIENTSE. Koulieres,1 L. Mirbahai,2 D. Maltezas,3 M.C.Kyrtsonis,3 N. Kafasi,3 M. Dimou,3 V. Bartzis,3 A.Efthymiou,3 G. Georgiou,3 P. Panayiotidis,3 G. Mead,2,4
A.R. Bradwell,4 S. Harding2
1First Dpt of Internal Medicine and Dpt of Hematology,Laikon University Hospital, Athens, Greece; 2TheBinding Site Group Ltd, Birmingham, UK; 3LaikonUniversity Hospital, Athens, Greece; 4Division ofImmunity and Infection, University of Birmingham, UK
Background.Monoclonal protein quantification by serumprotein electrophoresis (SPE) and scanning densitometryis perhaps the most commonly performed laboratory testfor assessing the response to therapy in multiple myelo-ma (MM) patients. The accuracy of the test depends uponthe amount of protein, the position of the protein on theSPE gel (particularly in IgA MM) and may require skil-led interpretation. Operator error can account for unex-pected results, particularly at low concentrations. Assaysfor measuring specific heavy chain/light chain pairs (eg.IgGk or IgAλ) have recently been developed and initialevaluations have reported prognostic value in MMpatients at presentation. Here we report the use of theseassays for monitoring IgA and IgG multiple myelomapatients. Materials and Methods. SPE and immunofixa-tion (IFE) were performed on a SEBIA Hydrasys inaccordance to manufacturers’ instruction. A SiemensDade Behring BNII nephelometer was used for all serumprotein measurements (Total IgG, total IgA, IgGk/IgGλand IgAk/IgAλ). Multiple serum samples from 53patients were analysed retrospectively (median number ofsamples 4; range 1-15). The patients comprised: 1 ALamyloidosis, 2 free light chain MM, 5 IgAk, 5 IgAλ, 27IgGk, 11 IgGλ, 1 plasmacytoma relapsing with MM and1 smouldering IgGk MM. All statistics were performedusing SPSS version 18 and results were compared to theclinical assessments. Results. In the presentation sera,abnormal IgAk/IgAλ ratios were identified for all 10 IgAMM patients; there was sufficient sample to analyseIgGk/IgGλ ratios in 6/10 patients all of whom had a nor-mal ratio. Similarly, abnormal IgGk/IgGλ ratios wereidentified in all 38 IgG MM patients, there was sufficientsample to analyse IgAk/IgAλ ratios in 20/38 patients allof whom had normal ratios. Normal IgGk/IgGλ andIgAk/IgAλ ratios were identified in the FLC MM patientsera, and in the presentation sera of the patient with pla-smacytoma. An abnormal IgGλ result was reported for
Hematology Reports 2010; 2 (s2) | 57 |
6th International Symposium on Clinical Applications of Serum Free Light Chain Analysis (plus Hevylite)Bath, United Kingdom, 23-24 September 2010

the amyloidosis patient, identifying a previously uniden-tified monoclonal protein. In the 10 IgA patients followedthrough the course of their disease IgAk/IgAλ ratios mat-ched clinical assessment; IgAk/IgAλ ratios normalisedonly in patients achieving a complete response (Cr) orstringent complete response (sCr). In one IgAλ patient,where SPE quantification was not possible and totalimmunoglobulin measurements were used, IgAk/IgAλratios were able to monitor the course of the patient’sdisease, even during periods of response when the serumconcentration levels where within the normal range. Inthe 38 IgG patients followed through the course of theirdisease IgGk/IgGλ ratios matched clinical assessment inthe majority of cases. In all patients achieving a sCrIgGk/IgGλ ratios were normal, in 4/8 patients achievinga near Cr (nCr) IgGk/IgGλ ratios remained abnormal. Inone patient presenting with a plasmacytoma, theIgGk/IgGλ ratio was initially normal, however, when thepatient relapsed with MM, abnormal ratios indicated thedisease progression. Conclusion. Monitoring patientresponses to treatment is important in ensuring effectivetherapy. Traditional methods can be inaccurate anddependent upon skilled personnel. Intact immunoglobulinratios matched clinical assessments in these patients andmay add additional information.
G67 - SERIAL SAMPLE ANALYSIS OF 5 MULTI-PLE MYELOMA PATIENTS USING HEAVY/LIGHTCHAIN SPECIFIC IMMUNOGLOBULIN RATIOSO. Decaux,1 M.P. Beaumont,2 S. Besnard,3 N. Collet,2
M. Sebillot,3 B. Grosbois,3 L. Guenet2
1Hôpital Sud, Rennes, France; 2Laboratory ofBiochemistry, University Hospital, Rennes, France;3Internal Medicine Department, University Hospital,Rennes, France
Background. The standard for measuring paraproteins inpatients with multiple myeloma (MM) to assess tumourburden is the quantification of protein bands by serumprotein electrophoresis (SPE). There are several limita-tions with this method. The development of antibodieswhich bind to conformational epitopes spanning the jun-ctional regions between bound k or λ light chains andtheir respective heavy chain partners has allowed deve-lopment of nephelometric immunoassays for specificmeasurement of serum IgGk, IgGλ, IgAk and IgAλ con-centrations. These assays have enabled the calculation ofIgGk/IgGλ and IgAk/IgAλ ratios (heavy/light chain orHLC ratios) for individual patients. Measurement of theinvolved and uninvolved heavy/light chains in serum mayprovide an accurate and quantifiable measurement oftumor burden. Aims. The aim of this study was to performretrospective analysis of tumour burden in 5 multiplemyeloma patients using this novel nephelometric assay.Methods. We analysed 41 samples from 5 multiple mye-loma patients (2 IgGλ and 3 IgAk). Informed consents ofpatients were obtained. We collected presentation seraand monthly serial samples through the course of thedisease. IgGk, IgGλ, IgAk and IgAλ concentrations weredetermined and HLC ratios calculated. Results. In all pre-sentation sera, the involved immunoglobulin concentra-
tion and HLC ratio were abnormal, including one patientwhere the SPE did not allow quantification of monoclo-nal IgAλ. The sum of the IgGk + IgGλ or IgAk + IgAλmeasurements correlated well with total IgG or IgA in all41 sera samples (R²=0,95). Moreover, the changes obser-ved in HLC ratios during serial follow up reflected theclinical assessments and were correlated with changes inSPE or free light chain evaluation. All patients initiallyachieved at least a partial response. In one patient, relap-se from partial response was indicated by an increase inHLC ratio 2 months before SPE. No patients achievedcomplete response and HLC ratio remained abnormalthroughout, except in one patient who achieved very goodpartial response. Serial samples analysis of this patientshowed normalisation of IgGλ concentration and HLCratio after respectively 3 and 6 months of treatment, whe-reas a quantifiable protein band was still present in SPEand persist after 9 months of treatment. When immunopa-resis was present with very low concentration of uninvol-ved immunoglobulin (2 patients), the use of HLC ratiowas difficult because very small variations of uninvolvedimmunoglobulin concentration induced high modifica-tion of HLC ratio for which interpretation was ambi-guous. Summary/Conclusion. These preliminary resultsindicate that it is possible to monitor response to treat-ment using HLC ratio. Analysis of HLC ratio in multiplemyeloma seems to be very a sensitive marker of tumourburden which could result in a significantly earlier detec-tion of relapse when compared with traditional methods.However, further studies are necessary to define moreprecisely the interest of this new assay among traditionalmethods.
G68 - USEFULNESS OF A HEVYLITE IMMUNOAS-SAY IN SERUM FOR THE DIAGNOSIS AND THEFOLLOW UP OF IgA MONOCLONAL GAMMOPA-THYD. Bengoufa,1 B. Arnulf,2 L. Bugnot,1 D. Charron,1
J.P. Fermand2
1Laboratoire d’immunologie et histocompatibilité, hôpi-tal Saint Louis, Paris, France; 2Service d’immuno-héma-tologie, Hôpital Saint Louis, Paris, France
Background. Protein electrophoresis (SPE) and immuno-fixation electrophoresis constitute the two conventionalassays for the evaluation of monoclonal immunoglobu-lins as markers for monoclonal gammopathies and anindicator of the tumor mass. However, these assays do notalways provide satisfactory results in terms of sensitivityand objectivity. This is particularly relevant for IgAbecause of its electrophoretic migration positions over-lapping with other bands such as transferrin. Recently, anew automated immunoassay has been developed byBinding Site (Hevylite) for diagnosis and monitoring ofmonoclonal gammopathies. Aims. The aim of this studywas to evaluate the usefulness of the Hevylite assay fordiagnosis and monitoring of IgA gammopathies.Methods-Patients. In a retrospective study, we analysedsera from 81 patients with monoclonal gammopathies (50myeloma and 31 MGUS). Sera from 38 healthy donorswere included as control. Serum was taken at the time of
| 58 | Hematology Reports 2010; 2 (s2)
Posters

diagnosis for all patients. For 10 of the myeloma patientsthe disease was further monitored and serum taken atvarious time points during the course of the disease.Methods. All samples were subjected to SPE for the eva-luation of the monoclonal spike, when the peak was mea-surable, and identification by immunofixation usingHydrasys Sebia. The determination of Hevylite levelswas performed using a Siemens Dade Behring (BNII)nephelometer. Normal ranges: IgAk: 0.48-2.82 g/l, IgAλ:0.36-1.98 g/l, Ratio IgAk/IgAλ:0.80-2.04. Results.Results for healthy donors were in the normal range. ForMGUS and myeloma patients, all the monoclonal Ig wereconfirmed by the ratio (>2.82 for IgAk and <0.80 forIgAλ). 45% of MGUS and 46% of myeloma did not havea measurable peak. A correlation was found between thelevels of Hevylite and the monoclonal Ig peak when thiswas measurable. For the myeloma monitoring cohort,there was a correlation between the Hevylite levels andthe therapeutic response. The ratio was an early indicatorof the disease evolution as an out of range ratio could bedetected prior the reappearance of the spike and relapse.Summary/Conclusion. The determination of Hevylite bynephelometry allowed a more precise and sensitive mea-surement of the monoclonal Ig. This method is of particu-lar relevance in the follow up of monoclonal gammopa-thies when the monoclonal component is not measurableusing the conventional methods. Moreover, the sensitivi-ty of the method allowing a more accurate quantificationof the serum Hevylitemakes it suitable for diagnosis, fol-low up and treatment monitoring of IgA myeloma.
G69 - IgA HEAVY/LIGHT CHAIN ASSAY FOR DIA-GNOSIS AND MONITORING OF MYELOMAPATIENTSD. Lakomy,1 T. Dejoie,2 I. Lafon,3 S. Lemaire-Ewing,1
B. Jean-Noel,3 B. Bonnotte,4 D. Caillot3
1Hopital du Bocage-Biochemistry, Laboratory, Dijon,France; 2Universitary Hospital-BiochemistryLaboratory, Nantes, France; 3Hopital du Bocage-Hematology Department, Dijon, France; 4Hopital duBocage, Immunology and Internal MedicineDepartment, Dijon, France
Background. Multiple myeloma diagnosis and follow upare based on monoclonal protein measurements. The esti-mation of monoclonal immunoglobulin production requi-res serum protein electrophoresis (SPE), serum immuno-fixation (IFE) and serum free light chain assays.Recently, a new nephelometric assay has been developedallowing the measurement of IgA heavy/light chain ratio:IgAk/IgAλ (IgAk/IgAλ). Aims. The aim of this study wasto determine the performance of the IgAk/IgAλ ratiomeasurement for the diagnosis and follow-up of myelomapatients. Methods. Forty four sera from 26 patients wereassayed (10 non myeloma patients and 16 myelomapatients). Total IgA, IgAk, IgAλ concentrations, SPE andIFE were performed for all patients. For the myelomapatients, two evaluations were performed: at diagnosisand during follow-up. Results. The IgAk/IgAλ ratio wasnormal in the non-myeloma group with the exception of2 patients (one patient hospitalized for renal transplanta-
tion follow-up and the second for urinary infection andcolitis). In the myeloma group, all the patients had anabnormal IgAk/IgAλ ratio at diagnosis and monoclonalisotype values were often more elevated than the standardIgA measurements. During follow-up, 5 myelomapatients had normal SPE and IFE. Three of them had anormal IgAk/IgAλ ratio. The 2 remaining patients had anabnormal IgAk/IgAλ ratio due to the decreased nonmonoclonal isotype but with normalized monoclonal iso-type. This could indicate a residual disease. Four myelo-ma patients had negative SPE but positive IFE during fol-low-up. Despite normal values of monoclonal isotype, allthe IgAk/IgAλ ratios were abnormal, in accordance withIFE. Finally, 7 patients had still positive SPE and IFEduring follow-up, with an abnormal IgAk/ IgAλ ratio inall cases. When compared with standard IgA concentra-tions, the addition of IgAk and IgAλ showed a very goodcorrelation for the concentrations below 10 g/l, but a wea-ker correlation for the values beyond 10 g/l. For the caseswhere the monoclonal immunoglobulin migrates in thegamma-globulin region on electrophoresis, we comparedthe values of monoclonal isotype IgAk or IgAλ with thedensitometric estimation of the monoclonal spike. TheIgAk or IgAλ values were greater than the monoclonalspike but they followed the spike evolution over the time.During disease monitoring, the correlation between thepercentage of decrease of monoclonal component givenby the M-spike and the IgAk or IgAλ concentration was0.97. Summary/Conclusion. IgA heavy/light chain assayappears to be an interesting test, especially when themonoclonal immunoglobulin has an anodal migration onelectrophoresis and co-migrates with other normal pro-tein, making a reliable estimation impossible. In ourstudy, the IgA heavy/light chain assay can be as sensitiveas IFE. Further investigations are needed to assess its rolein the determination of residual disease. Finally, ourresults suggest that for high monoclonal IgA concentra-tions, the values of IgAk or IgAλ can be used for moni-toring. At the stage of complete or near complete remis-sion, the IgAk/IgAλ ratio seems to be more sensitive.
G70 - IMMUNOGLOBULIN HEAVY/LIGHT CHAINRATIOS CAN BE USED TO EFFECTIVELY MONI-TOR IgA MULTIPLE MYELOMA PATIENTS L. Ludwig,1 L. Mirbahai,2 N. Fourrier,2 N. Zojer,3
A.R. Bradwell,4 S. Harding2
1Department of Medicine I, Wilhelminenspital Vienna,Austria; 2The Binding Site Group Ltd, Birmingham, UK;3Department of Medicine I, Wilhelminenspital Vienna,Vienna, Austria; 4Division of Immunity and Infection,Medical School, University of Birmingham, UK
Background. Accurate monitoring of monoclonal proteinlevels in multiple myeloma patients is important in deter-mining treatment times and for prognostication. Guidelinesrecommend the use of serum protein electrophoresis (SPE)and immunofixation (IFE) in the identification, quantifica-tion and typing of monoclonal proteins. However, SPEmay be inaccurate especially when the monoclonal proteinco-migrates with other serum protein or at low concentra-tions. Total immunoglobulin assays may be used in this
Hematology Reports 2010; 2 (s2) | 59 |
6th International Symposium on Clinical Applications of Serum Free Light Chain Analysis (plus Hevylite)Bath, United Kingdom, 23-24 September 2010

instance however they may be clinically insensitive. Novelnephelometric assays have been produced which quantifythe serum IgAk and IgAλ. Quantification of these proteinsenables the calculation of an IgAk/IgAλ (HLC) ratio whichhas been suggested as having a greater sensitivity than IFE.Here, we report the evaluation of these reagents in monito-ring a cohort of IgA patients through the course of theirdisease and comment on its usefulness compared to SPE,IFE and free light chain (FLC) measurements. Methods.SPE and IFE were performed using the SEBIA Hydrasysaccording to manufacturer’s instructions. FLC andheavy/light chain analysis was performed on a SiemensDade Behring BN II analyser. Longitudinal samples from53 IgA (29 IgAk/24IgAλ) multiple myeloma patients wereanalysed (mean =4, range 1-12). Results. IgA HLC ratioscorrectly identified monoclonal protein in 29/29 baselinesamples and matched IFE. In 14 of the 53 IgA patients themonoclonal protein was obscured by other proteins andaccurate quantification with SPE densitrometry was notpossible. In these cases the HLC ratio could be used tomonitor the patients through the course of their disease.One patient presented with 60g/L IgAk which co-migratedwith other serum proteins making accurate quantificationimpossible. The patient responded well to VAD and beca-me IFE and HLC negative after 58 days. The patient relap-sed after 86 days which was identifiable by SPE and HLCratios. The patient underwent autologous stem cell tran-splant after 235 days. SPE normalised and remained nor-mal through the course of the patient’s disease whilst HLCratio became increasingly abnormal reflecting a biochemi-cal unidentified relapse. In 5/53 patients HLC ratios beca-me abnormal before any other test, in 3/5 cases the abnor-mal ratio correctly identified early disease progression (75-282d) before other tests. In 2/5 patients disease progressionoccurred >1000d after the ratio had become abnormal.Conclusions. Abnormal HLC ratios correctly identifiedmonoclonal proteins at presentation. Furthermore, HLCratios quantified monoclonal proteins, even when theywere obscured by other proteins on SPE. HLC ratios pre-dicted a patient’s relapse which was missed by standardlaboratory tests.
G71 - IgA HEVYLITE PILOT STUDY IN CLINICALPRACTICE K. Arrowsmith,1 M. Knapp,1 S. Simpson,2
1Biochemistry BNHFT, Basingstoke, Hants, UK;2Haematology BNHFT, Basingstoke, Hants, UK
Background. Biochemical identification of monoclonalgammopathies is currently performed at Basingstoke andNorth Hampshire NHS Foundation Trust (BNHFT) byserum protein electrophoresis (SPE) followed by scan-ning densitometry, immunofixation, serum free lightchain (FLT) and total immunoglobulin analysis. SPE cou-pled with densitometry is known to be insensitive forquantitation at low paraprotein concentrations and canlead to overestimation due to co-migration with otherserum proteins. Hevylite utilises high avidity, specificantibodies to unique junctional epitopes between theheavy and light chain constant regions of intact immuno-globulin molecules enabling the nephelometric quantita-
tion of different light chain types of each immunoglobu-lin class. Measurement of serum Hevylite pairs (e.g. IgAk/IgA λ) produces ratios of monoclonal immunoglobulinto background analogous to the serum FLC ratios andcould provide a much more sensitive, specific and lesslabour intensive method of identifying and quantifyingmonoclonal immunoglobulins than current techniques. Inthis study three cases were followed over a one yearperiod (2009-2010). Aims. 1) To evaluate the Hevylitequantification against SPE and scanning densitometryusing co-migrating and non-co-migrating paraproteins 2)To investigate the use of the Hevylite assay in the follo-wing clinical settings: i) Response to therapy, ii) Diseaserelapse, iii) Light chain escape. Methods. Hevylite andFLC automated immunoassay using the SPAPLUS analy-ser. SPE, immunofixation and densitometry using theSebia Phoresis system. Total immunoglobulin turbidime-try assays on the Siemens Advia 2400 multianalyser.Results. Patient A was followed from disease presentationthrough induction treatment prior to autologous stem celltransplant (SCT). The paraprotein co-migrated in the β-region on SPE. Patient B was post autologous SCT andstarted with an undetectable band on SPE. This patientwas followed through relapse and the paraprotein co-migrated within the β-region. Patient C demonstrated thefeatures of MGUS with a stable non-co-migrating para-protein but demonstrated the light chain escape phenome-non. The Hevylite analysis demonstrated the following:In patient A, Hevylite analysis showed a greater reduc-tion in paraprotein concentration than SPE densitometrydue to masking of the paraprotein reduction by the pre-sence of normal serum proteins that co-migrated withinthe same area on SPE. In this patient the IgA kappa con-centration normalised when the SPE densitometry was4g/L. In patient B, throughout disease progression increa-sed IgA k, Hevylite ratio and SPE densitometry concen-trations were observed. The concordance between theIgA kappa and SPE densitometry concentrations decrea-sed as the paraprotein level increased. This may be due toa loss of SPE densitometry linearity at very high parapro-tein concentrations. In patient C, Hevylite results were inkeeping with the diagnosis of MGUS and offered no addi-tional information in relation to the patients light chainescape. Conclusions. 1) Hevylite analysis showed impro-ved sensitivity at low serum concentrations when compa-red to SPE densitometry due to SPE interference with co-migrating proteins. 2) Hevylite gave higher results athigh serum paraprotein concentrations when compared toSPE densitometry due to the possible loss of linearity ofdensitometry at high concentrations. 3) Further study iswarranted on the clinical applications of Hevylite.
G72 - A NEW STAGING SYSTEM FOR MULTIPLE MYELOMA H. Avet-Loiseau,1 L. Mirbahai,2 G. Mead,2,3 A.R. Bradwell,3
S. Harding,4
1Centre Hospitalier Universitaire Nantes, France; 2TheBinding Site Group Ltd, Birmingham, UK; 3Departmentof Immunity and Infection, Medical School, Universityof Birmingham, UK
| 60 | Hematology Reports 2010; 2 (s2)
Posters

Background. The current international staging system(ISS) for multiple myeloma (MM) relies upon the measu-rement of Beta 2 microglobulin (β2M) and albumin. β2Mis thought to be a measure of tumour bulk in patients andcorrelates well with the Durie and Salmon staging system.The role of albumin is less well understood; hypoalbumi-nemia is a common occurrence in MM The level of albu-min is not influenced by the degree of proteinuria althoughit has been correlated to the concentration of monoclonalimmunoglobulin. Somewhat counter-intuitively measure-ment of immunoglobulin production is not prognostic, butis the most commonly used laboratory method for monito-ring patients’ responses to therapy. Newly developednephelometric assays enable the accurate quantification ofserum heavy/light chain (IgAk/IgAλ and IgGk/IgGλ) pro-teins; the measurement of which gives a closer estimate oftumour-derived immunoglobulin than total immunoglobu-lin assays and indicates the level of isotype-specificimmunoglobulin suppression. Aims. To determine the pro-gnostic utility of serum immunoglobulin heavy/light chain(HLC) ratios and to compare their use with the current ISSin predicting outcome in MM patients. Methods.Presentation sera from 339 patients enrolled on the IFM2005-01 trial were assayed retrospectively. Free lightchains (FLC), β2M and albumin were measured in all sera.IgGk & IgGλ concentrations were measured in sera fromthe 245 IgG MM patients (166 IgGk, 79 IgGλ). IgAk andIgAλ concentrations were measured in the sera from the94 IgA MM patients (60 IgAk, 34 IgAλ). Association withprogression free survival (PFS) was determined using uni-variate and multivariate analysis (SPSS Version 18).Results. Abnormal HLC ratios were recorded for all 339patients tested, matching IFE sensitivity. 33% (31/94) ofIgA patients had monoclonal immunoglobulins whichcould not be accurately quantified by SPE because of lowconcentrations or their co-migration with other serum pro-teins and all had abnormal HLC ratios. There was a weak,negative correlation between the HLC ratios and albuminconcentrations (r=0.195 p<0.0001), but there was no cor-relation with other serum markers including β2M andFLC. Cox regression analysis identified abnormal theHLC ratio as being associated with reduced progressionfree survival (PFS, p>0.001). Separation of the HLC ratiointo production and suppression clearly showed that poly-clonal suppression had a greater influence on outcomethan the level of production (p=0.002), but was not assignificant as the ratio (p=0.0002). The degree of suppres-sion varied greatly between individual patients althoughsuppression was generally greater with IgA-producingtumours compared with IgG tumours However, the corre-lation between suppression and production was greater inIgG patients (IgGk r=-0.456; p=8.7¥10–10, IgGλ patientsr=-0.310; p=0.005) than in IgA patients (IgAk r=-0.28;p=0.031, IgAλ r=-0.33; p=0.05). It is possible that the cor-relation was greater for IgG patients than IgA patients dueto saturation of FcRn receptors. Thus, greater concentra-tions of monoclonal IgG directly result in more rapid cata-bolism of any polyclonal IgG. Combining β2M and theHLC ratio in a risk stratification model separated thepopulation with 0, 1 or 2 risk factors and had greater sta-tistical strength than the current ISS (p=0.00000013 vp=0.023). Conclusion. Levels of monoclonal protein have
only been weakly associated with outcome in MM and arenot used in the current ISS. Heavy/light chain ratios aresignificantly associated with outcome and can be used toreplace albumin in a risk stratification model. Heavy/lightchain ratios correct for variations in plasma volume andhaematocrit and in the case of IgG (the most frequentmonoclonal protein) corrects for variable catabolism dueto FcRn receptor saturation.
G73 - STABILITY OF FREE LIGHT CHAINS ANDHEAVY/LIGHT CHAINS IN SERUM SAMPLESAFTER AN INITIAL SHIPPING PERIOD AT 22°CD. Matters
The Binding Site Group Ltd, Birmingham, UK
Background. Serum stabilities of three weeks at 4°C forserum free light chains (FLC) and heavy/light chains(HLC) (IgAk&λ and IgGk&λ) are referenced in the assaymanufacturer’s instructions. Studies conducted to verifythis stability data did not take into account time spent atambient temperature during the shipping of the samplesprior to storage. Aims. To determine the stability of FLCand HLC at 4°C and -20°C following storage at 22°C for48h to mimic the effect of a two day shipping period.Methods. Venous blood samples (n=10) were collectedfrom healthy donors and the serum separated by centrifu-gation. The serum FLC & HLC values were measuredand the samples incubated at 22°C for two days, the ana-lyte levels were re-measured and aliquots transferred tostorage at 4°C and -22°C. The FLC & HLC levels werere-measured either weekly (4°C) or after 1 month (-20°C). Results. Following storage of sera at 22°C for 2days the average levels of all analytes investigated werewithin ±10% of day 0 values. Following subsequent sto-rage at 4°C for 4 weeks, average analyte levels werewithin ±20% for FLC and ±15% for HLC. The tableshows the percentage difference of FLC and HLC levelsin 10 normal serum samples following storage for 2 daysat 22°C and subsequent storage at +4°C and -20°C.Summary/Conclusion. Storage of samples for FLC orHLC analysis at 22°C for 2 days does not have a detri-mental effect on subsequent storage at 4°C or -20°C.
Table.
Hematology Reports 2010; 2 (s2) | 61 |
6th International Symposium on Clinical Applications of Serum Free Light Chain Analysis (plus Hevylite)Bath, United Kingdom, 23-24 September 2010

INDEX OF AUTHORS
Adams D.H., 47Adballa S., 29,39Aggarwal R., 45Ahmed H., 29Alegre A., 31Alegre B., 28Álvarez-Cermeño J.C., 33Alvi A., 55Alvi S., 53Amoroso B., 15,42,48Andrews D., 37Arias M., 42Arnulf B., 58Arrowsmith K., 60Assert R., 52Assi L.K., 47Attal M., 54Attolico I., 48Avet-Loiseau H., 19,54,60Ayliffe M., 26
Badelita S., 35Barbosa de Carvalho N.M., 40,45Bardin N., 44Bargay J., 31Barraco F., 30,34Bârsan L., 42Bartel J., 22Bartzis V., 55,57Beaumont M.P., 58Becker H., 46Behrens J., 26Bengoufa D., 58Benson Jr D.M., 33Berg M., 36Bermudo C., 39,40Besalduch J., 31Besnard S., 58Beuscart J.B., 41Bilotti E., 27,32,38Bladé J., 31Block J.A., 44,45Bokhof B., 13Bolková M., 37Bonnotte B., 59Bonsmann G., 46Bornhorst J., 51Boucraut J., 44Boyle A., 24Bradwell A.R., 16,19,20,25,50,51,55,56,57,59,60Bradwell J., 50,54Bruegel D., 21Bruegel M., 51,52Buckley C.J., 24Budd R., 25Bugnot L., 58Bunce A., 25
Cabanas López de Vergara B., 32Cacoub P., 14
Caillot D., 59Caimi L., 42Canales M., 31Canaud B., 43Caro R., 26Carr-Smith H., 2, 55Cartron G., 43Cavalcanti S., 48Cerhan J.R., 9Cermakova Z., 28Chapot V., 52Chapuis-Cellier C., 30,34Charron D., 58Chelghoum Y., 30,34Chen W.-m., 26Chenine-Khoualef L., 43Chiche L., 44Chubinskaya S., 45Clark R., 20Cockwell P., 41Cognot-Pons C., 43Collet N., 58Cook M., 5,41Coriu D., 35Cornell R., 36Correia P., 48Cournac J.-M., 44Crawford B., 33Crespo Echeverría M., 45Crisan M., 35Cutrona G., 48
Dastych M., 28De Filippi R., 15,48De Korwin J.-D., 46de la Hoz B., 26Decaux O., 58Decu V., 42Dejoie T., 59Del Poeta G., 48Demarthe F., 48Di Noto G., 42Dimou M., 55,57Dispenzieri A., 12,20Dogaru M., 35Dominic M., 22Dossi A., 42Dousset B., 46Drayson M., 21,57Driad A., 46Dubois J., 48Ducastelle S., 30,34Dührsen U., 13Durand J.-M., 44Durie B.G.M., 2Dürig J., 13,52Duro Millán R., 39,40Durrieu F., 48
Eckold J., 52Efebera Y., 33Efthymiou A., 57
Hematology Reports 2010; 2 (s2) | a |
6th International Symposium on Clinical Applications of Serum Free Light Chain Analysis (plus Hevylite)Bath, United Kingdom, 23-24 September 2010

Eghbali H., 48Eisele L., 13,52Elder P., 33Erbel R., 13Espiño M., 33Esther Codins A., 29Etienne G., 48Evans N., 37
Fermand J.P., 58Fernández Redondo M.E., 31Fernández-Cruz E., 54Fernandez-Fresnedo G., 42Ferrarini M., 48Fleer A., 52Fourrier N., 50,55,56,59Francis S., 45Führer A., 13
Gago M., 42Galar G., 28Garcia J.L., 39,40García-Laraña J., 31Gardner N., 23,41Gastl G., 34Gentile M., 48Georgiou G., 57Gibbs S.D.J., 50Gigliotti V., 48Gillmore J., 50Gironda Gallegos C., 40Gisslinger H., 23Gómez C., 42Gontiers A., 43González Molina M., 40Gonzalvez L., 26Gottenberg J., 14Gottwaldova J., 28Goyal M., 24Granátová J., 37Greenfield C., 33Grosbois B., 58Guenet L., 58Guillemette T., 44Guilli T., 30,34Gunson B., 47Gutman J., 36
Haber J., 37Hachová L., 37Hall R., 38Hanzal V., 37Harding S., 8,19,21,23,25,41,50,51,53,54,55,56,57,59,60Hardy E., 22Hari P., 36Harlé J.-R., 44Harousseau J.L., 54Harper J., 50Harris J., 50,55Hawkins P., 7, 50Hermanova Z., 52Hernandez J.M., 26
Hernando de Larramendi C., 45Hoefner D.M., 53Hofmeister C., 33Hughes R.G., 47Hutchison C.A., 4,41,47Hüttmann A., 13
Iaccarino G., 15,48Iglesias M.M., 39
Jacob C., 46Jañez Carrera R., 45Jay N., 46Jean R., 44Jean-Noel B., 59Jehlicka-Rose R., 22Jiménez Jiménez J., 45Jimenez-Cobaleda M.J., 26Jöckel K.-H., 13Jolly M., 44,45
Kafasi N., 57Kaplanski G., 44Katzmann J.A., 3,9,12,20Kieruzel S., 13Knapp M., 60Koulieres E., 21,55,57Kratzsch J., 52Kumar S., 7Kuus T., 51Kyle R.A., 1,12,20Kyrtsonis M.C., 21,55,57
Lachmann E., 51Lachmann H., 21,50Lafon I., 59Lahuerta J.J., 31Lakomy D., 59Landgren O., 10,13,20Larson D., 12Lasebai M., 38Latorre M., 26Laurenti L., 48Lee C.K., 36Legg A., 51Lemaire-Ewing S., 59Leray-Moragues H., 43Levoguer A., 57Liang Y., 26Link B.K., 9Lipan M., 42Lochman P., 52Lopez-Hoyos M., 42Ludwig H., 19Ludwig L., 59Lukacik P., 47
Mahdi A., 37Maignan M., 46Maltezas D., 55,57Mancini J., 44Mann K., 13
| b | Hematology Reports 2010; 2 (s2)
Index of authors

Marín Sánchez A., 29Marjanovi� S., 31Martin Reyes G., 40Martin Ruiz J.A., 39,40Martín Velásquez M., 40Martinez C., 28Martínez R., 31Martínez-Cáceres E., 29Martínez-López J., 31Mateos M.V., 31Mathiot C., 54Matters D., 23,61Maurer M.J., 9McBride L., 27,32,38McCarthy H., 38McNeill A., 27,32,38Mead G., 11,21,24,25,47,51,55,56,57,60Merchan Iglesias M., 40Michallet M., 30,34Mijuskovic Z., 31Mikolaitis A.R., 44,45Minarik J., 52Miralles A., 28Mirbahai L., 19,50,54,55,56,57,59,60Mircescu G., 42Moebus S., 13Molica S., 48Moody M., 37Morabito F., 48Moreau P., 54Morelli E., 15,48Morena M., 43Mori S., 33Morisset S., 30,34Muñoz H., 26Murthy S., 24Myint H., 36
Naides S.J., 23Navarro J., 54Neri A., 48Nicolini F., 30,34Niewold T., 45Nirni S., 24Noorgahan M., 24Nückel H., 52
Ocampo Martínez R., 32
Paiva B., 31Palanki D., 24Palmer J., 36Panayiotidis P., 55,57Paolini L., 42Paruchuri S., 36Pejovic J., 31Pepperkok B., 22Perez-Moneo B., 26Perkmann T., 23Phillips G., 33Pika T., 52Pinto A., 15,48
Plaza Villa J.P., 32Poenisch W., 52Poynton C., 37Praire A., 30,34Pratt G., 8,47Prokop W., 34Provot F., 41Pujol-Borrell R., 29
Qiueizan J.A., 26
Radeghieri A., 42Radovi� V., 31Rajkumar S.V., 12,20Recchia A., 48Reibe J., 51Ricotta D., 42Riebe D., 21Riemma C., 15Robinson W., 36Roddy J., 33Rodriguez A., 43Rodríguez López M.A., 32Rodríguez-Molina J.J., 54Romero F.F., 39,40Rose K., 33Rosiñol L., 31Roy A., 29Ruiz Ortiz de Arrizabaleta E., 29Ruiz-Criado J., 42Russo F., 15Ryder J., 36
Saad A., 36Sáez Bruguera M., 29Sala M., 36Salvador Corres I., 29San Miguel J.F., 31Sánchez-Castañón M., 42S�ndulescu M., 42Sântimbrean C., 42Sattianayagam P., 50Schauseil D., 21Schauseil S., 51Schillen D., 27,32,38Schleinitz N., 44Schlüter B., 46Schmidt L., 27,32,38Scudla V., 52Sebillot M., 58Sempere C., 28Sequeira W., 44,45Sharp K., 50Showell P.J., 24Siegel D., 27,32,38Simpson S., 29,60Singh V., 36Sobh M., 30,34Sola Moyano E., 40Solanki M., 22,23Stancu S., 42Stang H., 23
Hematology Reports 2010; 2 (s2) | c |
6th International Symposium on Clinical Applications of Serum Free Light Chain Analysis (plus Hevylite)Bath, United Kingdom, 23-24 September 2010

Steele P.S., 53Stringer S., 6,41Sumar N., 26
Talangescu C., 42Taylor D., 25Teniente Serra A., 29Terrier B., 14Thiery J., 52Thomas M., 50Thomas X., 30,34Toledo Rojas R., 40Tomás J.F., 31Torres de Rueda A., 40Traylor L., 51Tuki� L., 31Tzenou T., 55
Valentová K., 37van Hoeven K., 27,32,38Vidriales M.B., 31Vignaud J.-M., 46Villar L.M., 33Volbracht L., 52
Wang Q.-t., 26Wassef N., 50Webb G., 47Wechalekar A., 50Whelan C.J., 50White D., 23,41Willeke P., 46Willenbacher E., 34Willenbacher W., 34Witzig T.E., 9
Zapletalova J., 52Zeuch A., 22Zhai Y.-h., 26Zojer N., 19,59
| d | Hematology Reports 2010; 2 (s2)
Index of authors
Copyright © 2022 FDOKUMEN


![Dictionary of Chemistry [6th Ed.]](https://static.fdokumen.com/doc/165x107/6316ba01f68b807f88035f31/dictionary-of-chemistry-6th-ed.jpg)