6:30 pm 6:3 - City of Ashland, Oregon
43
Page 1 of 1 AGENDA FOR REGULAR BUSINESS MEETING ASHLAND PARKS & RECREATION COMMISSION June 10, 2020 Electronic Meeting – 6:30 p.m. This meeting will be held electronically. The public can view on Channel 9 or Channels 180 and 181 (for Charter Communications customers) or live stream via rvtv.sou.edu select RVTV Prime. Written testimony is encouraged and will be accepted via email sent to [email protected]. Please include “Public Testimony for June 10 Regular Meeting” in the subject line. Written testimony submitted before Tuesday, June 9, 2020, 1:00 pm will be made available to the Parks Commissioners before the meeting. All testimony will be included in the meetings minutes. 6:30 p.m. I. CALL TO ORDER II. PUBLIC FORUM III. ADDITIONS OR DELETIONS TO THE AGENDA IV. UNFINISHED BUSINESS V. NEW BUSINESS 1. Pathways Contract Approval (Action) 2. Q3 Budget Update (Action) 3. COVID-19 Response Update (Information) 4. COVID-19 Related Budget Reductions (Action) 5. CIP Prioritization Discussion (Possible Action) VI. ITEMS FROM COMMISSIONERS/STAFF VII. UPCOMING MEETING DATES 1. APRC Study Session—July 1, 2020 • Location TBD—6:30 p.m. 2. APRC Regular Business Meeting—July 8, 2020 • Location TBD —6:30 p.m. 3. All APRC Subcommittee Meetings—TBD VIII. ADJOURNMENT In compliance with the Americans with Disabilities Act, if you need special assistance to participate in this meeting, please contact the City Admin istrator’s office at (541) 488-6002 (TTY phone number (800) 735-2900). Notification 72 hours prior to the meeting will enable the City to make reasonable arrangements to ensure accessibility to the meeting (28 CFR 35.102-35.104 ADA Title I). Parks Commission meetings are broadcast live on Channel 9, or on CHARTER CABLE CHANNEL 180. Visit the City of Ashland’s website at www.ashland.or .us.
-
Upload
khangminh22 -
Category
Documents
-
view
2 -
download
0
Transcript of 6:30 pm 6:3 - City of Ashland, Oregon
Page 1 of 1
AGENDA FOR REGULAR BUSINESS MEETING
ASHLAND PARKS & RECREATION COMMISSION
June 10, 2020 Electronic Meeting – 6:30 p.m.
This meeting will be held electronically. The public can view on Channel 9 or Channels 180 and 181 (for Charter Communications customers) or live stream
via rvtv.sou.edu select RVTV Prime. Written testimony is encouraged and will be accepted via email sent to [email protected]. Please include “Public Testimony for June 10 Regular Meeting” in the subject line. Written testimony submitted before Tuesday, June 9, 2020, 1:00 pm will be made available
to the Parks Commissioners before the meeting. All testimony will be included in the meetings minutes.
6:30 p.m.
I. CALL TO ORDER
II. PUBLIC FORUM
III. ADDITIONS OR DELETIONS TO THE AGENDA
IV. UNFINISHED BUSINESS
V. NEW BUSINESS 1. Pathways Contract Approval (Action) 2. Q3 Budget Update (Action)3. COVID-19 Response Update (Information) 4. COVID-19 Related Budget Reductions (Action) 5. CIP Prioritization Discussion (Possible Action)
VI. ITEMS FROM COMMISSIONERS/STAFF
VII. UPCOMING MEETING DATES 1. APRC Study Session—July 1, 2020
• Location TBD—6:30 p.m. 2. APRC Regular Business Meeting—July 8, 2020
• Location TBD —6:30 p.m. 3. All APRC Subcommittee Meetings—TBD
VIII. ADJOURNMENT
In compliance with the Americans with Disabilities Act, if you need special assistance to participate in this meeting, please contact the City Admin istrator’s office at (541) 488-6002 (TTY phone number (800) 735-2900). Notification 72 hours prior to the meeting will enable the City to make reasonable arrangements to ensure accessibility to the meeting (28 CFR 35.102-35.104 ADA Title I). Parks Commission meetings are broadcast live on Channel 9, or on CHARTER CABLE CHANNEL 180. Visit the City of Ashland’s website at www.ashland.or .us.
ASHLAND PARKS & RECREATION COMMISSION 340 S PIONEER STREET • ASHLAND, OREGON 97520
COMMISSIONERS: Michael A. Black, AICP
Mike Gardiner Director Joel Heller Rick Landt
Jim Lewis
Julian Bell
541.488.5340 AshlandParksandRec.org [email protected]
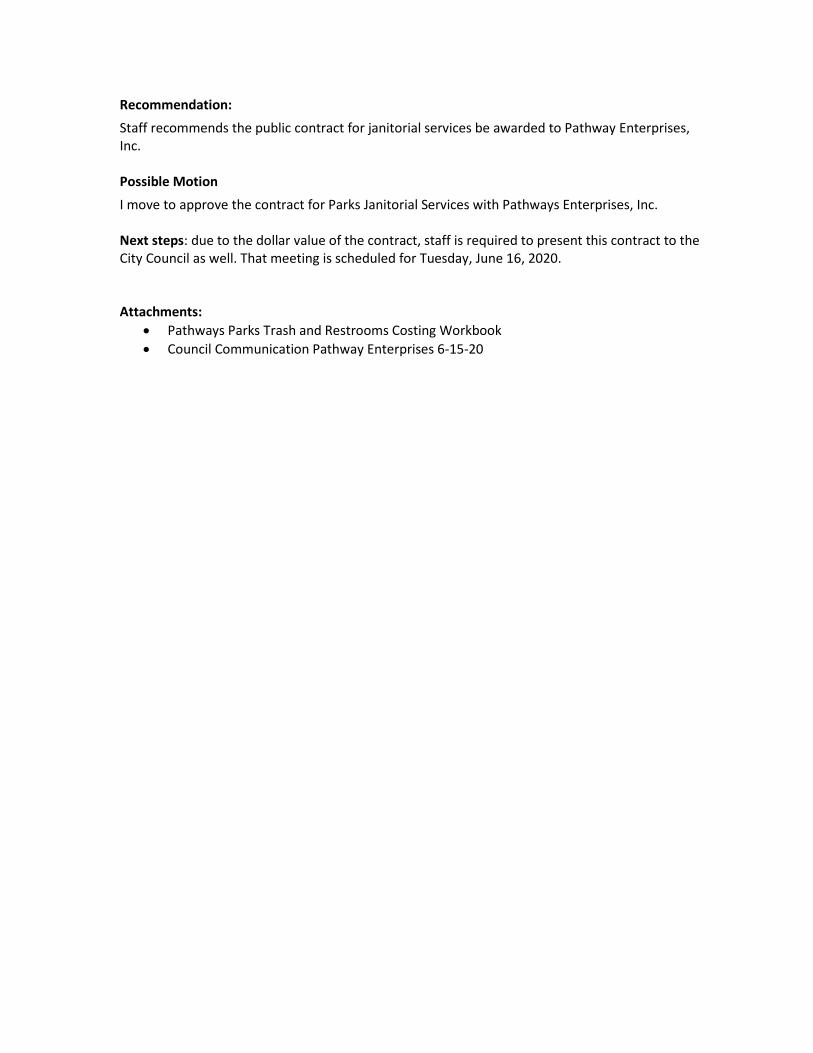
PARKS COMMISSIONER STAFF REPORT TO: Ashland Parks and Recreation Commissioners FROM: Michael Black, APRC Director Tara Kiewel, Administrative Analyst DATE: June 4, 2020 SUBJECT: Pathways Contract Approval (Action) Situation: This request is for approval to award a public contract to Pathway Enterprises, Inc. to provide janitorial services for Parks restrooms and trash removal. Pathway Enterprises, Inc. is a local Qualified Rehabilitation Facility (QRF) that provides janitorial services. The term for the janitorial service contract will begin on July 1, 2020 and end on June 30, 2021. Background: For several years Parks has contracted with Pathways Enterprises to provide janitorial services for recreation facilities. Staff is seeking approval to enter into an additional contract with Pathways Enterprises for janitorial services for Park restrooms and trash removal. Pathways Enterprises is a Qualified Rehabilitation Facility (QRF) approved by the state of Oregon. In accordance with ORS 279.850, public agencies are required by law to contract with a QRF, if the QRF can provide the product or service as specified and required by the public agency. City Council will be reviewing all Pathways Enterprises contracts for the City and APRC at the June 16, 2020 Council Business Meeting. Per City Ordinance, the City Council must provide final approval for all contracts that exceed $100,000. Assessment: Janitorial services for Parks restrooms and trash removal was quoted at $167,503.54 for the FY21 fiscal year. Trash pickup and restrooms cleaning will be done every day. High use areas may be serviced more frequently. This is an unbudgeted expense that will be offset through staff reduction. Contracting for janitorial services allows APRC the ability to have flexibility in the frequency of cleaning and to reduces services if needed to save on expenses.
Recommendation: Staff recommends the public contract for janitorial services be awarded to Pathway Enterprises, Inc. Possible Motion I move to approve the contract for Parks Janitorial Services with Pathways Enterprises, Inc. Next steps: due to the dollar value of the contract, staff is required to present this contract to the City Council as well. That meeting is scheduled for Tuesday, June 16, 2020. Attachments:
• Pathways Parks Trash and Restrooms Costing Workbook • Council Communication Pathway Enterprises 6-15-20

Costing Workbook For Janitorial & Grounds Maintenance
Contracts Under the Qualified Rehabilitation Facilities Program
Oregon State Department of Administrative Services Procurement, Fleet, and Surplus Services
1225 Ferry Street SE, U140 Salem, Oregon 97301
(503) 378-4642
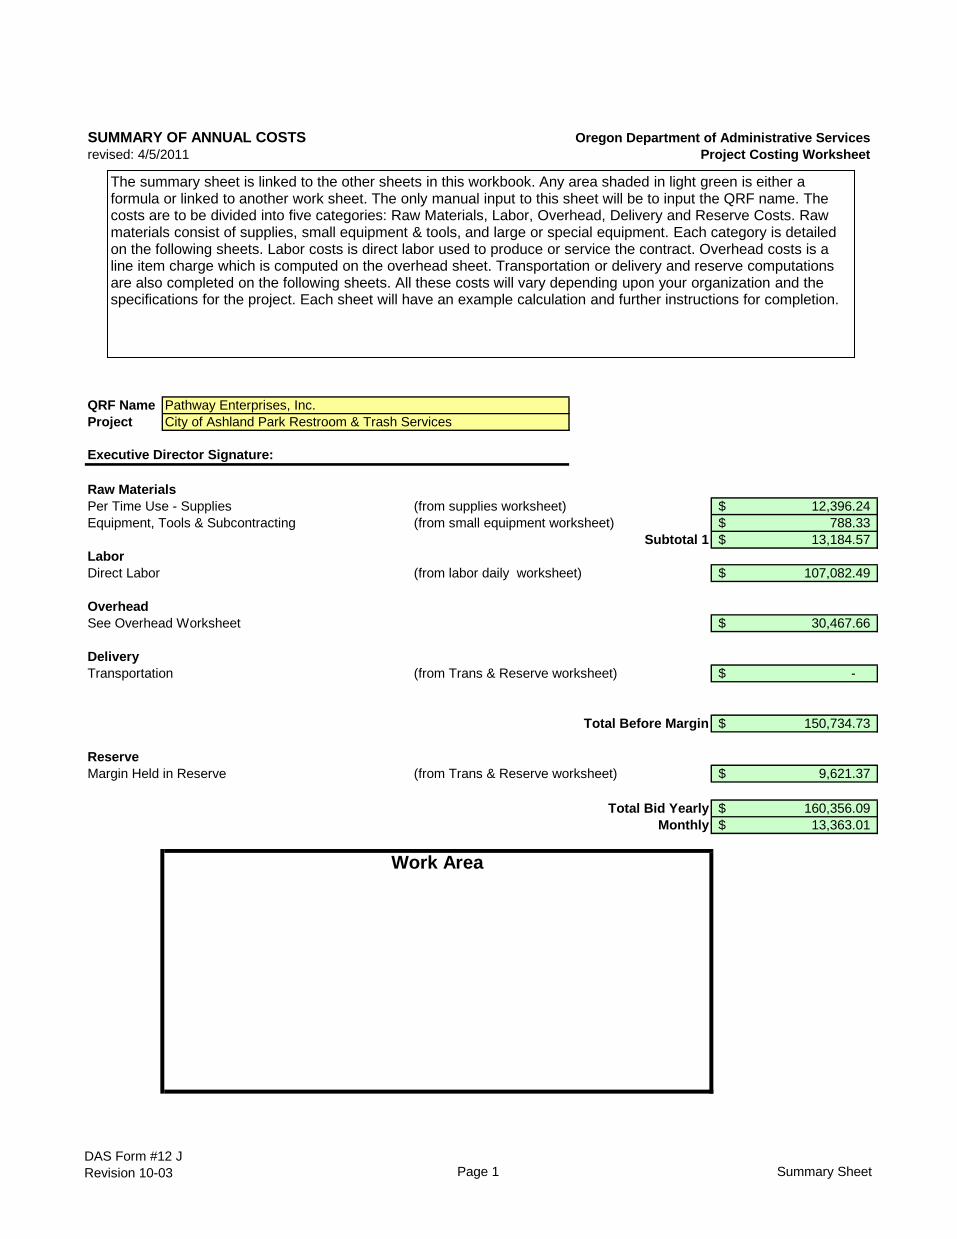
SUMMARY OF ANNUAL COSTS Oregon Department of Administrative Servicesrevised: 4/5/2011 Project Costing Worksheet
QRF Name Pathway Enterprises, Inc.Project City of Ashland Park Restroom & Trash Services
Executive Director Signature:
Raw MaterialsPer Time Use - Supplies (from supplies worksheet) 12,396.24$ Equipment, Tools & Subcontracting (from small equipment worksheet) 788.33$
Subtotal 1 13,184.57$ LaborDirect Labor (from labor daily worksheet) 107,082.49$
OverheadSee Overhead Worksheet 30,467.66$
DeliveryTransportation (from Trans & Reserve worksheet) -$
Total Before Margin 150,734.73$
ReserveMargin Held in Reserve (from Trans & Reserve worksheet) 9,621.37$
Total Bid Yearly 160,356.09$ Monthly 13,363.01$
Work Area
The summary sheet is linked to the other sheets in this workbook. Any area shaded in light green is either a formula or linked to another work sheet. The only manual input to this sheet will be to input the QRF name. The costs are to be divided into five categories: Raw Materials, Labor, Overhead, Delivery and Reserve Costs. Raw materials consist of supplies, small equipment & tools, and large or special equipment. Each category is detailed on the following sheets. Labor costs is direct labor used to produce or service the contract. Overhead costs is a line item charge which is computed on the overhead sheet. Transportation or delivery and reserve computations are also completed on the following sheets. All these costs will vary depending upon your organization and the specifications for the project. Each sheet will have an example calculation and further instructions for completion.
DAS Form #12 JRevision 10-03 Page 1 Summary Sheet
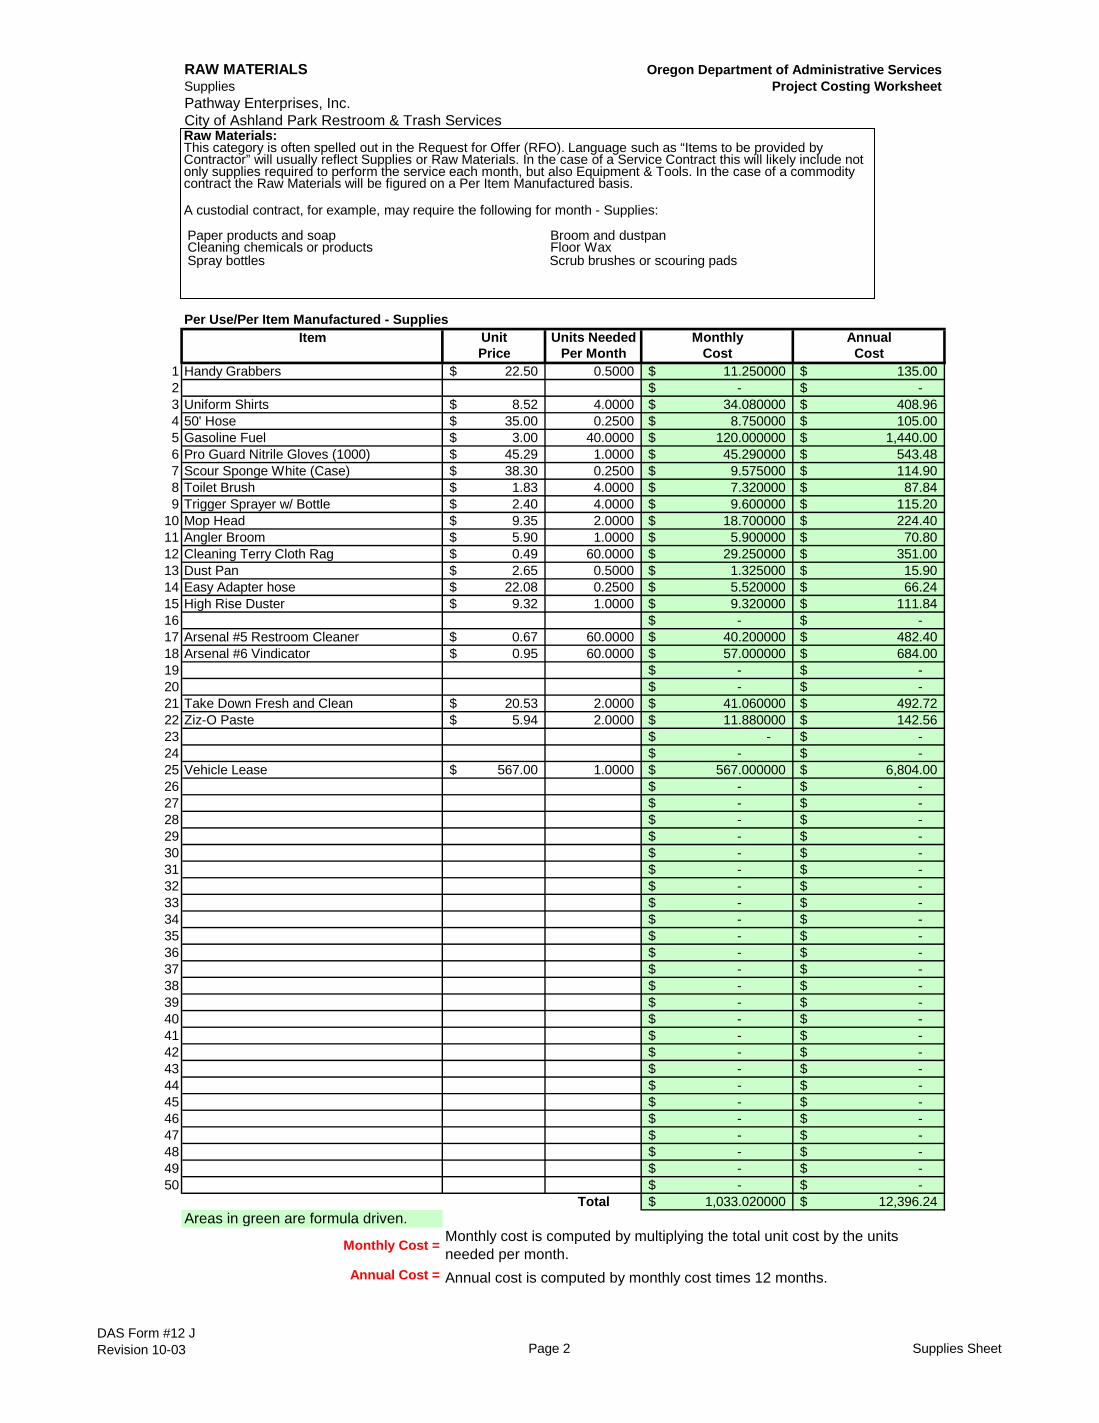
RAW MATERIALS Oregon Department of Administrative ServicesSupplies Project Costing WorksheetPathway Enterprises, Inc.City of Ashland Park Restroom & Trash Services
Per Use/Per Item Manufactured - SuppliesItem Unit Units Needed Monthly Annual
Price Per Month Cost Cost1 Handy Grabbers 22.50$ 0.5000 11.250000$ 135.00$ 2 -$ -$ 3 Uniform Shirts 8.52$ 4.0000 34.080000$ 408.96$ 4 50' Hose 35.00$ 0.2500 8.750000$ 105.00$ 5 Gasoline Fuel 3.00$ 40.0000 120.000000$ 1,440.00$ 6 Pro Guard Nitrile Gloves (1000) 45.29$ 1.0000 45.290000$ 543.48$ 7 Scour Sponge White (Case) 38.30$ 0.2500 9.575000$ 114.90$ 8 Toilet Brush 1.83$ 4.0000 7.320000$ 87.84$ 9 Trigger Sprayer w/ Bottle 2.40$ 4.0000 9.600000$ 115.20$
10 Mop Head 9.35$ 2.0000 18.700000$ 224.40$ 11 Angler Broom 5.90$ 1.0000 5.900000$ 70.80$ 12 Cleaning Terry Cloth Rag 0.49$ 60.0000 29.250000$ 351.00$ 13 Dust Pan 2.65$ 0.5000 1.325000$ 15.90$ 14 Easy Adapter hose 22.08$ 0.2500 5.520000$ 66.24$ 15 High Rise Duster 9.32$ 1.0000 9.320000$ 111.84$ 16 -$ -$ 17 Arsenal #5 Restroom Cleaner 0.67$ 60.0000 40.200000$ 482.40$ 18 Arsenal #6 Vindicator 0.95$ 60.0000 57.000000$ 684.00$ 19 -$ -$ 20 -$ -$ 21 Take Down Fresh and Clean 20.53$ 2.0000 41.060000$ 492.72$ 22 Ziz-O Paste 5.94$ 2.0000 11.880000$ 142.56$ 23 -$ -$ 24 -$ -$ 25 Vehicle Lease 567.00$ 1.0000 567.000000$ 6,804.00$ 26 -$ -$ 27 -$ -$ 28 -$ -$ 29 -$ -$ 30 -$ -$ 31 -$ -$ 32 -$ -$ 33 -$ -$ 34 -$ -$ 35 -$ -$ 36 -$ -$ 37 -$ -$ 38 -$ -$ 39 -$ -$ 40 -$ -$ 41 -$ -$ 42 -$ -$ 43 -$ -$ 44 -$ -$ 45 -$ -$ 46 -$ -$ 47 -$ -$ 48 -$ -$ 49 -$ -$ 50 -$ -$
Total 1,033.020000$ 12,396.24$ Areas in green are formula driven.
Monthly Cost =
Annual Cost = Annual cost is computed by monthly cost times 12 months.
Monthly cost is computed by multiplying the total unit cost by the units needed per month.
Raw Materials:This category is often spelled out in the Request for Offer (RFO). Language such as “Items to be provided by Contractor” will usually reflect Supplies or Raw Materials. In the case of a Service Contract this will likely include not only supplies required to perform the service each month, but also Equipment & Tools. In the case of a commodity contract the Raw Materials will be figured on a Per Item Manufactured basis.
A custodial contract, for example, may require the following for month - Supplies:
Paper products and soap Broom and dustpanCleaning chemicals or products Floor WaxSpray bottles Scrub brushes or scouring pads
DAS Form #12 JRevision 10-03 Page 2 Supplies Sheet

RAW MATERIALS Oregon Department of Administrative ServicesEquipment, Tools & Subcontractors Project Costing WorksheetPathway Enterprises, Inc.City of Ashland Park Restroom & Trash Services
Cost per Time Times per Year
-$ -$ -$ -$ -$ -$ -$ -$ -$ -$ -$ -$
Equipment Unit Useful life Contract Depreciation Units Cost Project Project # of AnnualDescription Price of Asset life Percentage Per Year % Use Unit Cost Units Cost
1 Cordless Backpack 1,215.00$ 36 12 33% 405.00$ 100% 405.00$ 1 405.00$ 2 Pressure Washer 1,150.00$ 36 12 33% 383.33$ 100% 383.33$ 1 383.33$ 3 12 4 12 5 12 6 12 7 12 8 12 9 12
10 12 11 12 12 12 13 12 14 12 15 12 16 12 17 12 18 12 19 12 20 12 21 12 22 12 23 12 24 12 25 12
Total 788.33$ Areas in green are formula driven.
Useful Life of Assets = What is the estimated useful life of the equipment in monthsDepreciation Percentage = Depreciation is calculated by dividing the contract life by the useful life.
Unit Cost Per Year = Computed by multiplying the total unit cost by the depreciation.Projected % Use = Enter project use percentage. If any of the equipment is used on more than one project, be sure to include only that portion of the costs
associated with this project. (note: 100% would be an item used only for this contract.)Projected Unit Cost = Calculated by multiplying the unit cost per year times the project use.
# of Units = Multiply by units needed to complete the contract/service.Annual Cost = Computed by project unit cost times the number of units.
Description
Work Area
SUBCONTRACTORSThe following Equipment & Tools are examples which may be required to do the job:
Burnishing/Floor machines Carpet extractors Blind cleaning machines Auto scrubbers Sweepers Mop buckets and presses
If any of this equipment is used on more than one project, be sure to include only that portion of the cost associated with this project.
Note: Any asset purchased with grant money is not eligible for depreciation, however, the cost to maintain the asset is an allowable expense and should be listed.
DAS Form #12 JRevision 10-03 Page 3 Equipment Tools

LABOR Oregon Department of Administrative ServicesDirect Labor Project Costing WorksheetPathway Enterprises, Inc.City of Ashland Park Restroom & Trash Services
Worker Work Hourly % Pro- Sub- FICA Sub- Workers Sub- Unemploy- Sub- Other Other Benefits Other Benefits Daily/Per Times Annual/Total Annual HoursDescription Hours Rate ductivity Total 1 Total 2 comp% Total 3 ment % Total 4 Benefits % Monthly $ SubTotal 5 Item Labor Per Yr. Labor Labor
1 Janitor Summer 14.00 14.87$ 100% 208.18$ 0.0765 15.93$ 2.60% 5.41$ 1.42% 2.96$ 29.44% 61.29$ 293.76$ 214 62,865.24$ 2,996.02 Supervisor 6.00 21.27$ 100% 127.62$ 0.0765 9.76$ 2.60% 3.32$ 1.42% 1.81$ 29.44% 37.57$ 180.08$ 52 9,364.40$ 312.03 -$ -$ -$ -$ -$ -$ -$ 0.04 Janitor Winter 11.00 14.87$ 100% 163.57$ 0.0765 12.51$ 2.60% 4.25$ 1.42% 2.32$ 29.44% 48.16$ 230.81$ 151 34,852.86$ 1,661.05 -$ -$ -$ -$ -$ -$ -$ 0.06 -$ -$ -$ -$ -$ -$ -$ 0.07 -$ -$ -$ -$ -$ -$ -$ 0.08 -$ -$ -$ -$ -$ -$ -$ 0.09 -$ -$ -$ -$ -$ -$ -$ 0.0
10 -$ -$ -$ -$ -$ -$ -$ 0.011 -$ -$ -$ -$ -$ -$ -$ 0.012 -$ -$ -$ -$ -$ -$ -$ 0.013 -$ -$ -$ -$ -$ -$ -$ 0.014 -$ -$ -$ -$ -$ -$ -$ 0.015 -$ -$ -$ -$ -$ -$ -$ 0.016 -$ -$ -$ -$ -$ -$ -$ 0.017 -$ -$ -$ -$ -$ -$ -$ 0.018 -$ -$ -$ -$ -$ -$ -$ 0.019 -$ -$ -$ -$ -$ -$ -$ 0.020 -$ -$ -$ -$ -$ -$ -$ 0.021 -$ -$ -$ -$ -$ -$ -$ 0.022 -$ -$ -$ -$ -$ -$ -$ 0.023 -$ -$ -$ -$ -$ -$ -$ 0.024 -$ -$ -$ -$ -$ -$ -$ 0.025 -$ -$ -$ -$ -$ -$ -$ 0.026 -$ -$ -$ -$ -$ -$ -$ 0.027 -$ -$ -$ -$ -$ -$ -$ 0.028 -$ -$ -$ -$ -$ -$ -$ 0.029 -$ -$ -$ -$ -$ -$ -$ 0.030 -$ -$ -$ -$ -$ -$ -$ 0.0
Total 704.66$ Total 107,082.49$ 4,969.0
Areas in green are formula driven. Work Hours = Breakdown total “work hours” (see Overview) into hours or partial hours required per time or per item.
Subtotal 1 = Computed by multiplying hours in work hours by hourly rate (prevailing wage if required) and then multiply by % productivity.
Subtotal 2 = Computed by multiplying subtotal 1 by FICA % (as of July 2002 7.65%).
Subtotal 3 = Computed by multiplying subtotal 1 by your organization's Workers Comp %.
Subtotal 4 = Computed by multiplying subtotal 1 by your organization's Unemployment Insurance %.
Other Benefits % = Input in this column if you calculate Other Benefits by a percentage.
Subtotal 5 = This column may be a combination of both Other Benefits % and Other Benefits Monthly $.
Daily Per Item Labor = The sum of subtotals 1,2,3, 4, and 5
Times Per Year = This is the days or shifts worked per year
Annual Total Labor = Times per year multiplied by daily/per item labor
Annual Labor Hours = Work hours multiplied by times per year
Other Benefits Mo. $ =Input in this column if you calculate Other Benefits as a flat dollar amount per month. Adjust amount to reflect this employees' allocated time to this contract. (e.g, Employee works 50% of their time on this contract, and 50% of their time on a different contract. If their monthly benefit is $100, then only $50 would be allocated to this column.
PTO
Holiday
401 K
Health Ins.
List "Other Benefits" Provided
18.2
1.64
3.84
5.76
For purposes of costing a project, it’s important to distinguish between direct and indirect labor. Indirect labor (supervision, administration, inspection etc.) may be captured as Overhead, and will be discussed later. Direct labor is that which is specifically identifiable as a part of the contract requirements. It should be noted that working supervisors could spend a percentage of their time in direct labor functions. The percentage may vary depending on the project or organization. For example, a supervisor may spend 50% of his/her time in direct labor functions and the other 50% supervising. In that case you would include 50% of that person’s time as direct labor and capture the other 50%, as well as any other supervisory costs, in the indirect labor portion of Overhead.
Direct labor is best expressed as “work hours”. That is, the total number of hours that will be required to complete a task or project. The first and perhaps most critical step is to identify the work and break it down into its component tasks. The description of work or specifications in the contract is the place to start. Once the component tasks are identified, the next step is to estimate the time that will be required to accomplish each task. Since this estimated time may be in minutes or even seconds, the times must be compiled into a Per-Time or Per-Item direct labor cost estimate. For example, in a custodial contract, first breakdown the work requirements into component tasks such as, loading and unloading equipment, emptying trash and recycle containers, vacuuming, sweeping, cleaning sinks, waxing floors, etc. (be sure to account for time between jobs also). Next, estimate the time required for each component task. Then, compile those estimates into a figure that represents the total number of hours per service. That figure is the required “work hours.” This number will stay the same regardless of how many people are working. For example, 8 “work hours” can be accomplished by I person working at 100% productivity for 8 hrs. (1x8=8), or 2 people working at 100% productivity for 4 hrs. each (2x4=8). It could also be done by 8 people working at 50% productivity for 2 hrs. each. (8x.50=4, 4x2=8)
Once you know the total work hours per service or per item, it’s simply a matter of assigning the appropriate wage to the hours. Some contracts, including those on which you pay workers sub-minimum wages based on productivity, require you to pay a “prevailing wage.” Check the contract! Also, be sure to add the appropriate “Other Payroll Expense” (OPE) for your organization onto the wage.
Matching FICAWorkers’ Comp at your costCost of other benefits paid by your organization (e.g. medical, dental, retirement, etc.)
After you’ve established the direct labor cost per time or per item, you can extend the time frame to come up with the annual requirement. On a service contract multiply the daily cost by the number of days per year that you will provide the service. For example, a service with direct labor cost of $80.00 per time, required 5 days per week and 52 weeks per year, would give you an annual direct labor cost of $20,800.00 per year. (80 x 5 = 400, 400 x 52 = 20,800). For monthly cost divide the annual cost by 12 (in this case you get $1733.33/month).
DAS Form #12 JRevision 10-03 Page 4 Direct Labor Sheet
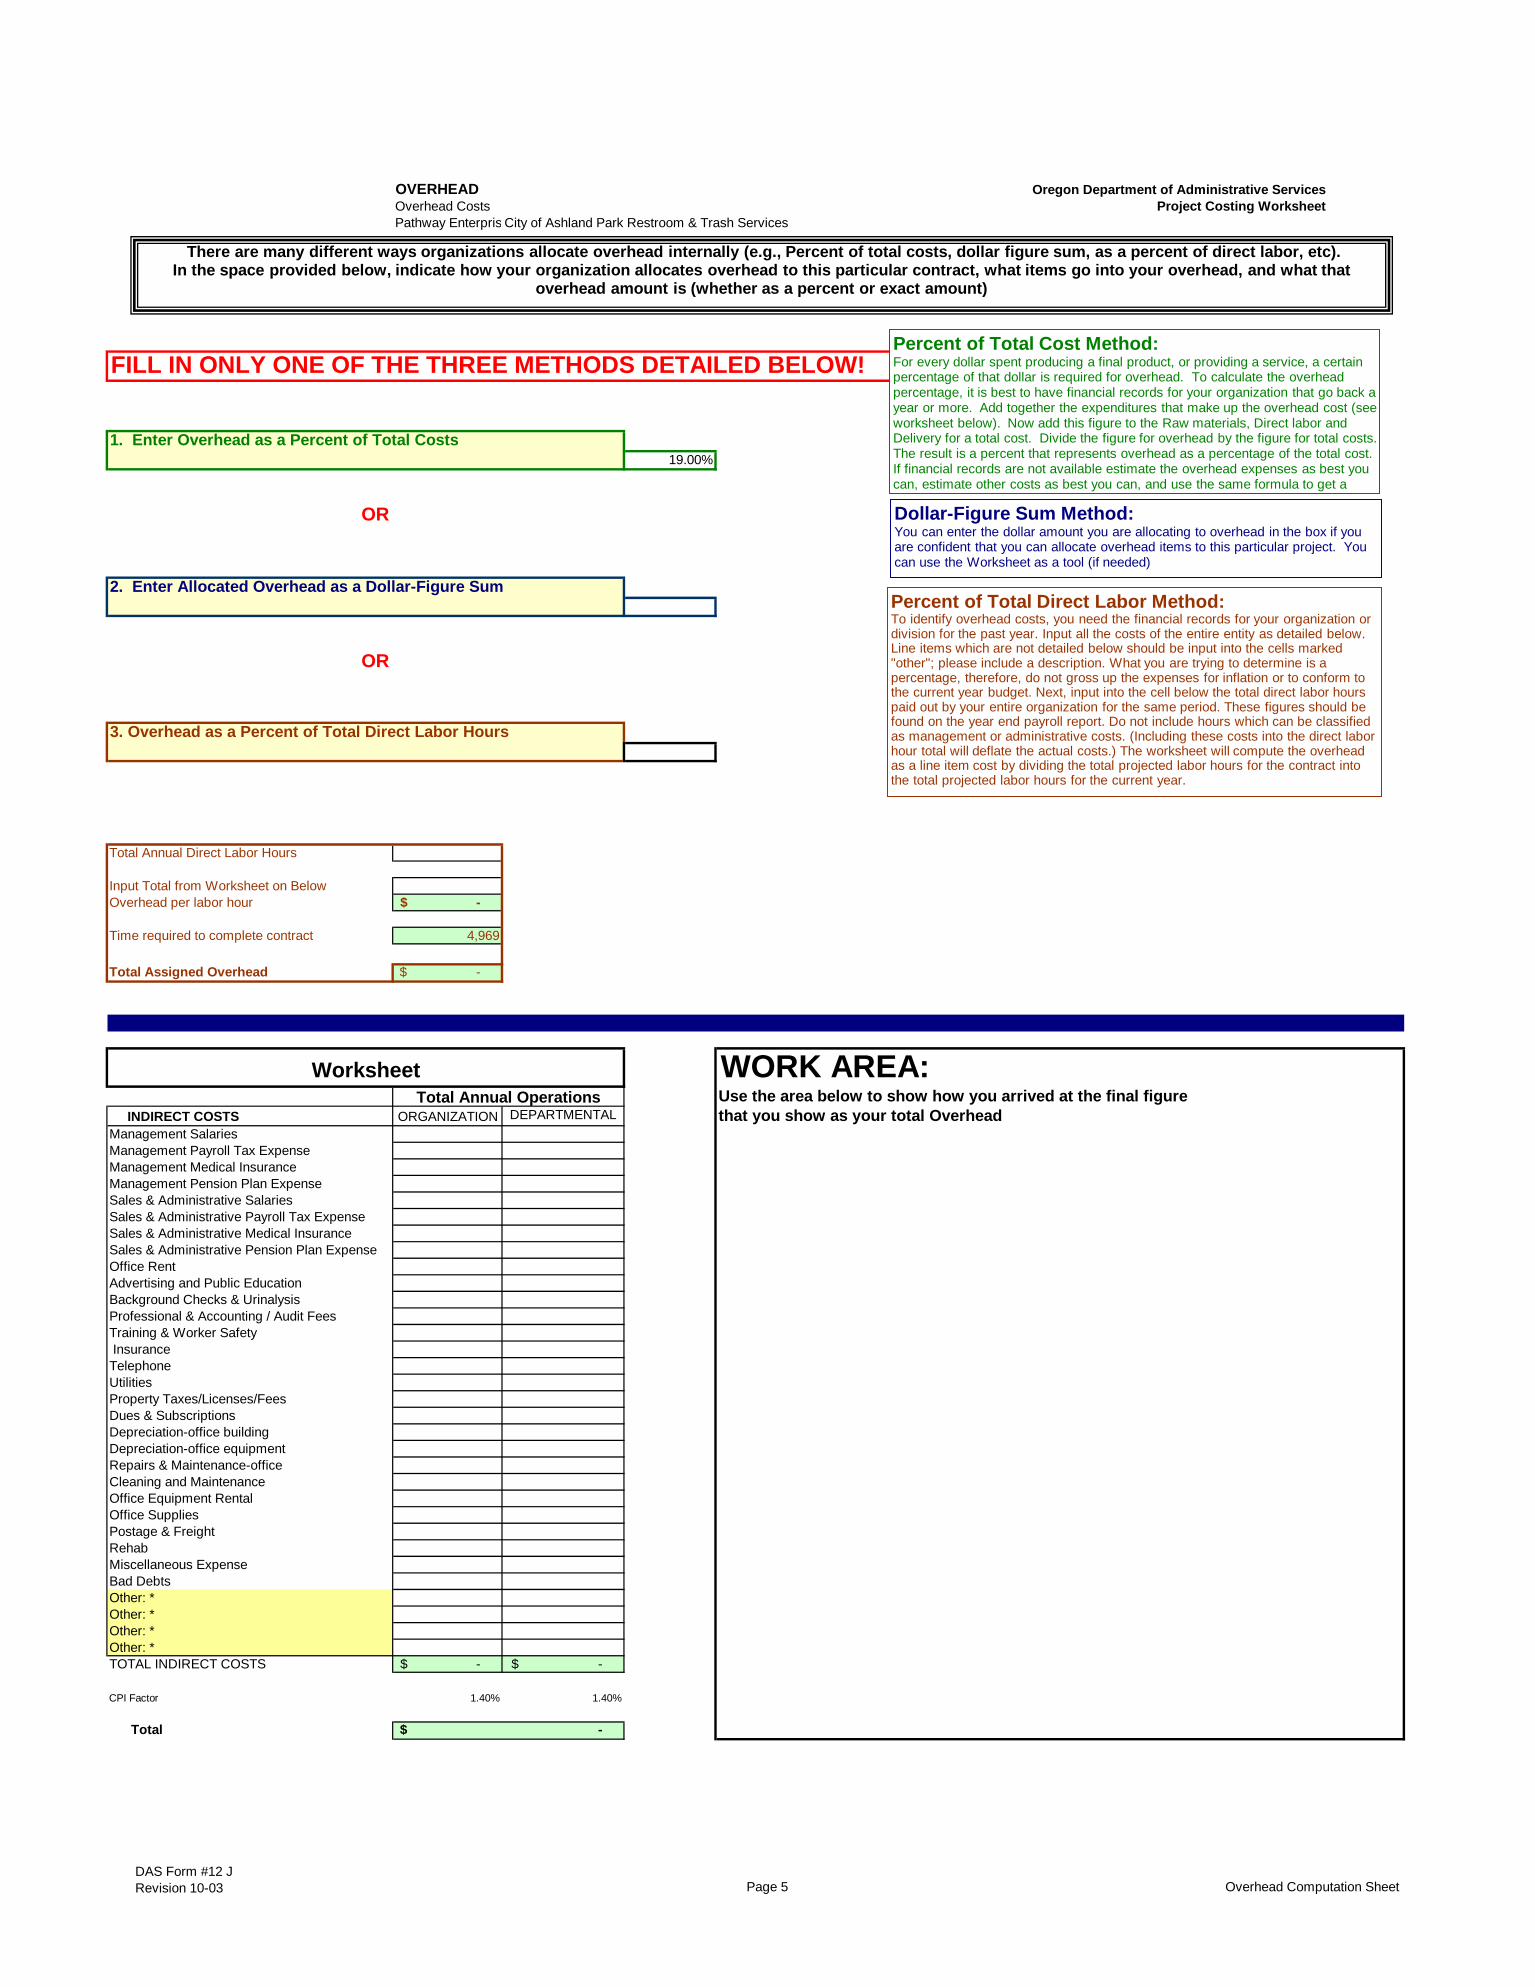
OVERHEAD Oregon Department of Administrative ServicesOverhead Costs Project Costing WorksheetPathway Enterpris City of Ashland Park Restroom & Trash Services
FILL IN ONLY ONE OF THE THREE METHODS DETAILED BELOW!
1. Enter Overhead as a Percent of Total Costs 19.00%
OR
2. Enter Allocated Overhead as a Dollar-Figure Sum
OR
3. Overhead as a Percent of Total Direct Labor Hours
Total Annual Direct Labor Hours
Input Total from Worksheet on BelowOverhead per labor hour -$
Time required to complete contract 4,969
Total Assigned Overhead -$
WORK AREA:Use the area below to show how you arrived at the final figure
INDIRECT COSTS ORGANIZATION DEPARTMENTAL that you show as your total OverheadManagement SalariesManagement Payroll Tax ExpenseManagement Medical InsuranceManagement Pension Plan ExpenseSales & Administrative SalariesSales & Administrative Payroll Tax ExpenseSales & Administrative Medical InsuranceSales & Administrative Pension Plan ExpenseOffice RentAdvertising and Public EducationBackground Checks & UrinalysisProfessional & Accounting / Audit FeesTraining & Worker Safety InsuranceTelephoneUtilitiesProperty Taxes/Licenses/FeesDues & SubscriptionsDepreciation-office buildingDepreciation-office equipmentRepairs & Maintenance-officeCleaning and MaintenanceOffice Equipment RentalOffice SuppliesPostage & FreightRehabMiscellaneous ExpenseBad DebtsOther: *Other: *Other: *Other: *TOTAL INDIRECT COSTS -$ -$
CPI Factor 1.40% 1.40%
Total
WorksheetTotal Annual Operations
-$
Percent of Total Direct Labor Method:To identify overhead costs, you need the financial records for your organization or division for the past year. Input all the costs of the entire entity as detailed below. Line items which are not detailed below should be input into the cells marked "other"; please include a description. What you are trying to determine is a percentage, therefore, do not gross up the expenses for inflation or to conform to the current year budget. Next, input into the cell below the total direct labor hours paid out by your entire organization for the same period. These figures should be found on the year end payroll report. Do not include hours which can be classified as management or administrative costs. (Including these costs into the direct labor hour total will deflate the actual costs.) The worksheet will compute the overhead as a line item cost by dividing the total projected labor hours for the contract into the total projected labor hours for the current year.
Dollar-Figure Sum Method:You can enter the dollar amount you are allocating to overhead in the box if you are confident that you can allocate overhead items to this particular project. You can use the Worksheet as a tool (if needed)
Percent of Total Cost Method:For every dollar spent producing a final product, or providing a service, a certain percentage of that dollar is required for overhead. To calculate the overhead percentage, it is best to have financial records for your organization that go back a year or more. Add together the expenditures that make up the overhead cost (see worksheet below). Now add this figure to the Raw materials, Direct labor and Delivery for a total cost. Divide the figure for overhead by the figure for total costs. The result is a percent that represents overhead as a percentage of the total cost. If financial records are not available estimate the overhead expenses as best you can, estimate other costs as best you can, and use the same formula to get a
There are many different ways organizations allocate overhead internally (e.g., Percent of total costs, dollar figure sum, as a percent of direct labor, etc).In the space provided below, indicate how your organization allocates overhead to this particular contract, what items go into your overhead, and what that
overhead amount is (whether as a percent or exact amount)
DAS Form #12 JRevision 10-03 Page 5 Overhead Computation Sheet
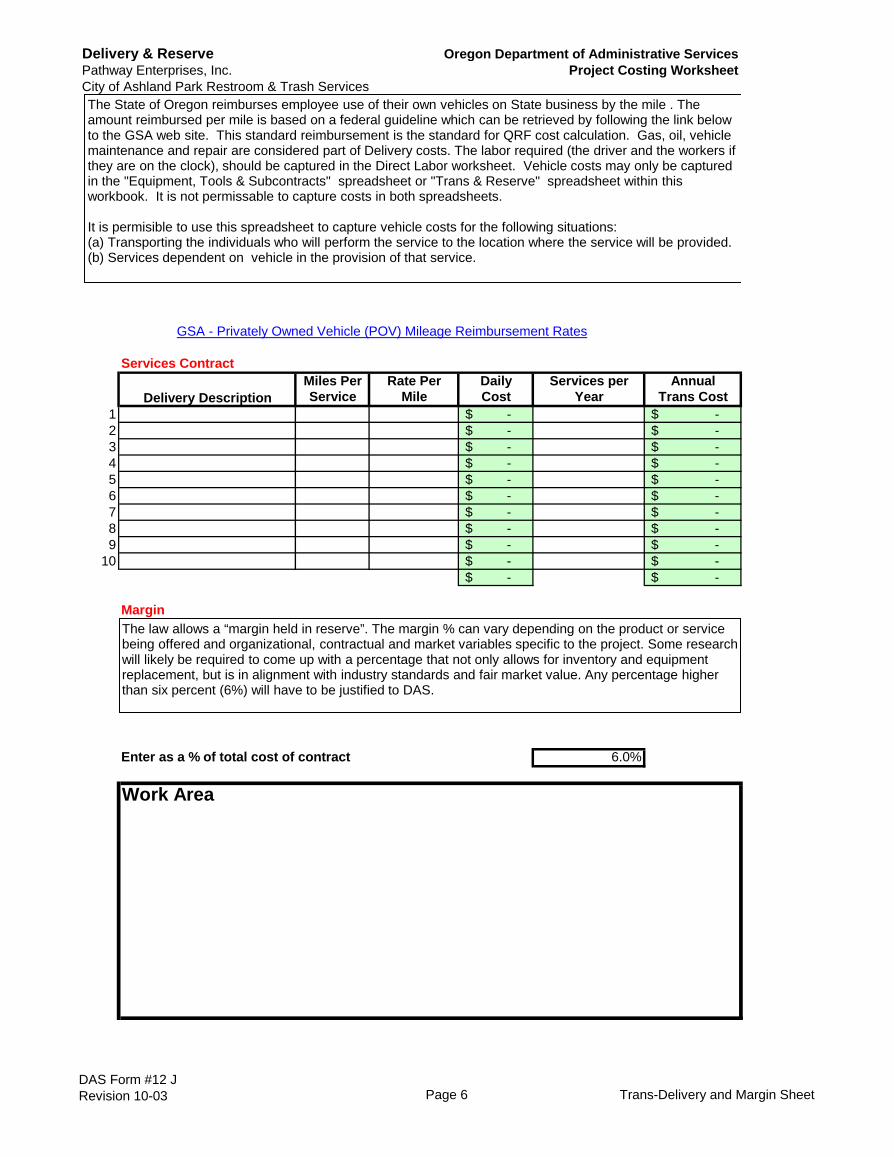
Delivery & Reserve Oregon Department of Administrative ServicesPathway Enterprises, Inc. Project Costing WorksheetCity of Ashland Park Restroom & Trash Services
Services Contract Miles Per Rate Per Daily Services per Annual
Delivery Description Service Mile Cost Year Trans Cost1 -$ -$ 2 -$ -$ 3 -$ -$ 4 -$ -$ 5 -$ -$ 6 -$ -$ 7 -$ -$ 8 -$ -$ 9 -$ -$
10 -$ -$ -$ -$
Margin
6.0%Enter as a % of total cost of contract
GSA - Privately Owned Vehicle (POV) Mileage Reimbursement Rates
Work Area
The State of Oregon reimburses employee use of their own vehicles on State business by the mile . The amount reimbursed per mile is based on a federal guideline which can be retrieved by following the link below to the GSA web site. This standard reimbursement is the standard for QRF cost calculation. Gas, oil, vehicle maintenance and repair are considered part of Delivery costs. The labor required (the driver and the workers if they are on the clock), should be captured in the Direct Labor worksheet. Vehicle costs may only be captured in the "Equipment, Tools & Subcontracts" spreadsheet or "Trans & Reserve" spreadsheet within this workbook. It is not permissable to capture costs in both spreadsheets.
It is permisible to use this spreadsheet to capture vehicle costs for the following situations:(a) Transporting the individuals who will perform the service to the location where the service will be provided.(b) Services dependent on vehicle in the provision of that service.
The law allows a “margin held in reserve”. The margin % can vary depending on the product or service being offered and organizational, contractual and market variables specific to the project. Some research will likely be required to come up with a percentage that not only allows for inventory and equipment replacement, but is in alignment with industry standards and fair market value. Any percentage higher than six percent (6%) will have to be justified to DAS.
DAS Form #12 JRevision 10-03 Page 6 Trans-Delivery and Margin Sheet

Page 1 of 2
Council Business Meeting June16, 2020
Agenda Item Contract award to Pathway Enterprises Inc. (QRF) for janitorial services
From Michael Morrison Michael Black Rachel Dials David Shepherd
Public Works Superintendent Parks Director Recreation Superintendent Fire Chief
Contact [email protected] (541) 552-2325 [email protected] (541) 552-2251 [email protected] (541) 552-2260 [email protected] (541) 552-2219
SUMMARY This request is for approval to award a public contract to Pathway Enterprises, Inc. to provide janitorial services for the City, Parks and Fire facilities. Pathway Enterprises, Inc. is a local Qualified Rehabilitation Facility (QRF) that provides janitorial services. The term for the janitorial service contract will begin on July 1, 2020 and end on June 30, 2021. POLICIES, PLANS & GOALS SUPPORTED City Council Goals C. Utilize City resources as leverage to develop and/or enhance prioritized Value Services. D. Develop current and long-term budgetary resiliency. E. During the 2019-2021 Biennium analyze various departments/programs with the goal efficiencies,
reducing costs, and improving City services. PREVIOUS COUNCIL ACTION The public contracts previously awarded to Pathway Enterprises, Inc. were approved by the City Council on July 16, 2019 for a term beginning on July 1, 2019 and ending on June 30, 2020. BACKGROUND AND ADDITIONAL INFORMATION In accordance with ORS 279.850, public agencies are required by law to contract with a QRF, if the QRF can provide the product or service as specified and required by the public agency. Additional information:
How to do business with a QRF: https://www.oregon.gov/das/Procurement/Pages/QRFhow.aspx
Costing workbooks are prepared by Pathway Enterprises, Inc. after the COA Living Wage is reviewed and updated in June every year.
Request for Price Approval forms have been submitted with costing workbooks to State of Oregon, Department of Administrative Services (DAS) for pricing approval.
Page 2 of 2
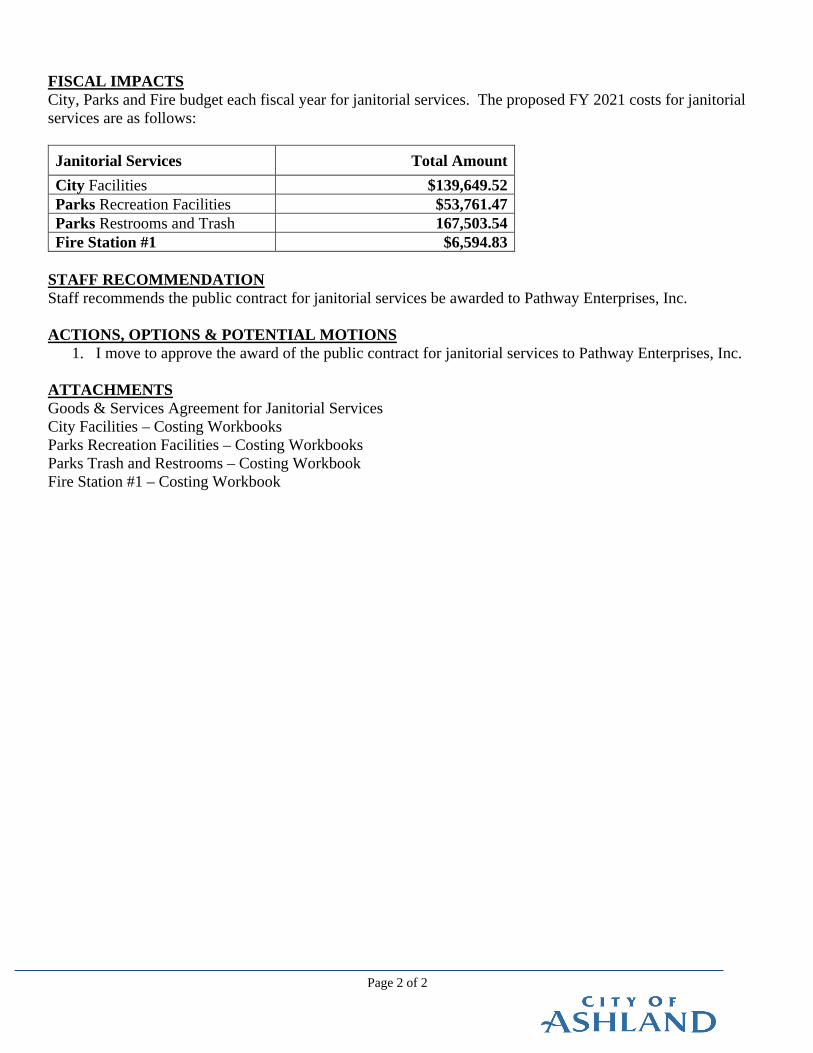
FISCAL IMPACTS City, Parks and Fire budget each fiscal year for janitorial services. The proposed FY 2021 costs for janitorial services are as follows:
Janitorial Services Total Amount City Facilities $139,649.52 Parks Recreation Facilities $53,761.47 Parks Restrooms and Trash 167,503.54 Fire Station #1 $6,594.83
STAFF RECOMMENDATION Staff recommends the public contract for janitorial services be awarded to Pathway Enterprises, Inc. ACTIONS, OPTIONS & POTENTIAL MOTIONS
1. I move to approve the award of the public contract for janitorial services to Pathway Enterprises, Inc.
ATTACHMENTS Goods & Services Agreement for Janitorial Services City Facilities – Costing Workbooks Parks Recreation Facilities – Costing Workbooks Parks Trash and Restrooms – Costing Workbook Fire Station #1 – Costing Workbook

ASHLAND PARKS & RECREATION COMMISSION 340 S PIONEER STREET • ASHLAND, OREGON 97520
COMMISSIONERS: Michael A. Black, AICP
Mike Gardiner Director Joel Heller Rick Landt
Jim Lewis
Julian Bell
541.488.5340 AshlandParksandRec.org [email protected]
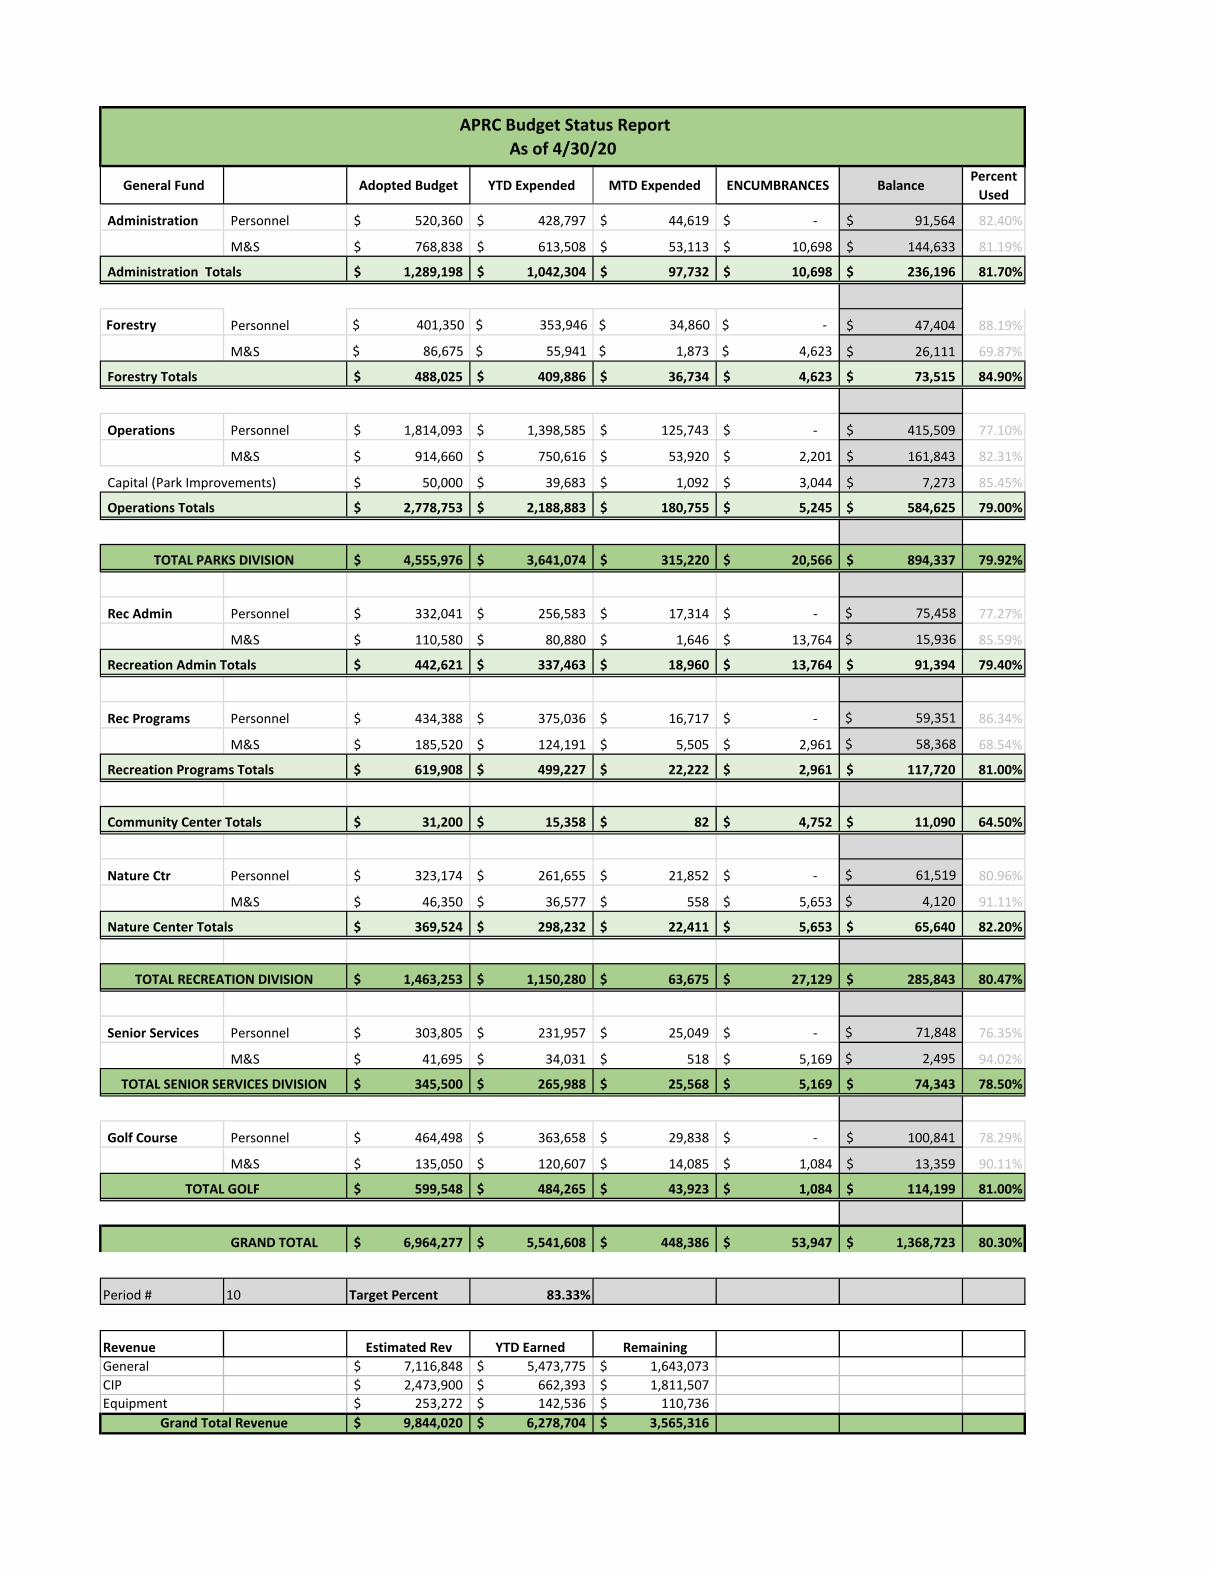
PARKS COMMISSIONER STAFF REPORT TO: Ashland Parks and Recreation Commissioners FROM: Tara Kiewel, Admin Analyst DATE: June 4, 2020 SUBJECT: April FY20 YDT APRC Budget Summary Report Third Quarter FY20 COA Financial Report (Information) Situation: Staff prepares budget summary reports for the Commission to review each quarter and at the end of each fiscal year. The report being presented at this time is the budget summary report for April 2020. The City financial reports for the third quarter (January 1 to March 31, 2020) are also included for review. Background: The budget summary reports detail expenditures broken down by division and department and the targeted expenditure percent. APRC administrative staff reviews this information on a monthly basis. Assessment: Attached to this report you will find the current year-to-date (YDT) report as of April 30, 2020. Expenses Our target for April expenditures is 83.33%. Due to cost cutting measures implemented in April we are currently trending under budget for expenses at 80.30% ($261,957). Cost cutting measures included layoffs of 6 APRC full time staff, not hiring any seasonal workers, laying off all temporary employees, eliminating Park Patrol and canceling Park improvement projects. In FY20 APRC has received a total of $54,709 in grants which includes Ashland Parks Foundation (APF) grants and corporate sponsorships for programs. On June 2, 2020 City Council approved APRC’s request for a supplemental budget request. These grants off set expenditures not previously budgeted. Grants include a $25,000 APF (Avista) grant used for fuels reduction on the Lithia hillside and $17,500 used for park beautification projects including planting bulbs and restoring wood benches and tables.
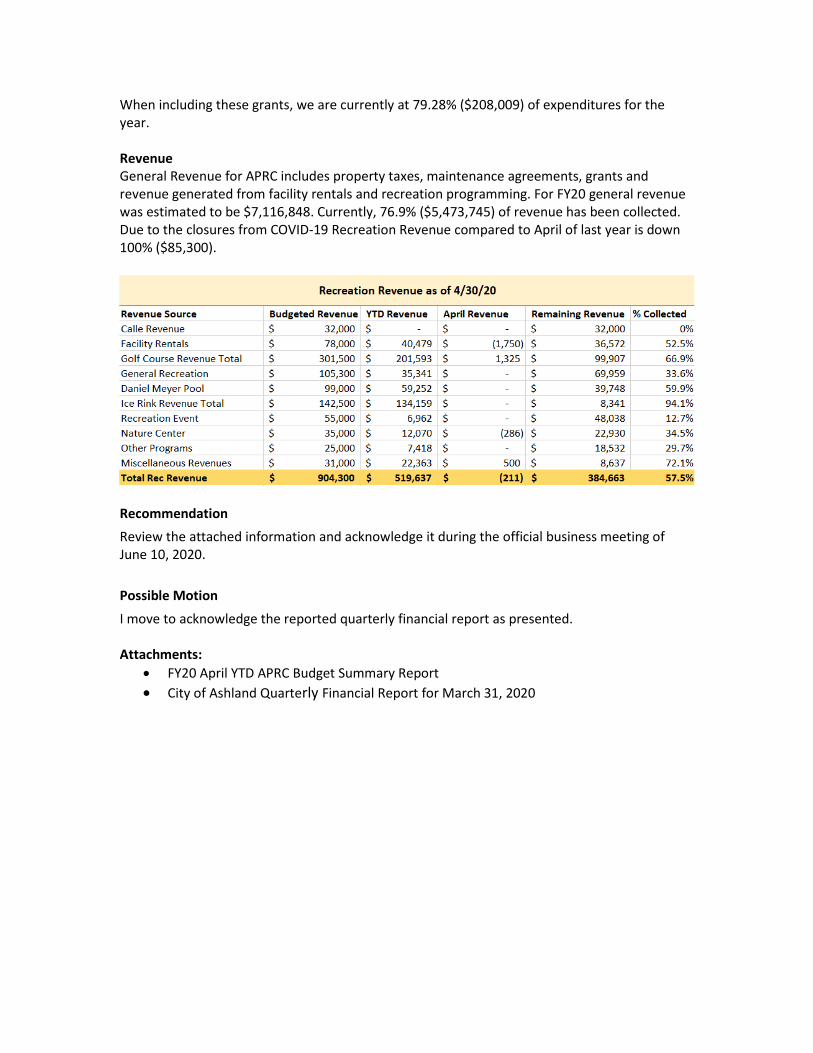
When including these grants, we are currently at 79.28% ($208,009) of expenditures for the year.
Revenue General Revenue for APRC includes property taxes, maintenance agreements, grants and revenue generated from facility rentals and recreation programming. For FY20 general revenue was estimated to be $7,116,848. Currently, 76.9% ($5,473,745) of revenue has been collected. Due to the closures from COVID-19 Recreation Revenue compared to April of last year is down 100% ($85,300).
Recommendation Review the attached information and acknowledge it during the official business meeting of June 10, 2020. Possible Motion
I move to acknowledge the reported quarterly financial report as presented. Attachments:
• FY20 April YTD APRC Budget Summary Report • City of Ashland Quarterly Financial Report for March 31, 2020
General Fund Adopted Budget YTD Expended MTD Expended ENCUMBRANCES BalancePercent
Used
Administration Personnel 520,360$ 428,797$ 44,619$ -$ 91,564$ 82.40%
M&S 768,838$ 613,508$ 53,113$ 10,698$ 144,633$ 81.19%
1,289,198$ 1,042,304$ 97,732$ 10,698$ 236,196$ 81.70%
Forestry Personnel $ 401,350 $ 353,946 $ 34,860 $ - 47,404$ 88.19%
M&S $ 86,675 $ 55,941 $ 1,873 $ 4,623 26,111$ 69.87%
488,025$ 409,886$ 36,734$ 4,623$ 73,515$ 84.90%
Operations Personnel 1,814,093$ 1,398,585$ 125,743$ -$ 415,509$ 77.10%
M&S 914,660$ 750,616$ 53,920$ 2,201$ 161,843$ 82.31%
50,000$ 39,683$ 1,092$ 3,044$ 7,273$ 85.45%
2,778,753$ 2,188,883$ 180,755$ 5,245$ 584,625$ 79.00%
4,555,976$ 3,641,074$ 315,220$ 20,566$ 894,337$ 79.92%
Rec Admin Personnel 332,041$ 256,583$ 17,314$ -$ $ 75,458 77.27%
M&S 110,580$ 80,880$ 1,646$ 13,764$ $ 15,936 85.59%
442,621$ 337,463$ 18,960$ 13,764$ 91,394$ 79.40%
Rec Programs Personnel 434,388$ 375,036$ 16,717$ -$ $ 59,351 86.34%
M&S 185,520$ 124,191$ 5,505$ 2,961$ $ 58,368 68.54%
619,908$ 499,227$ 22,222$ 2,961$ 117,720$ 81.00%
31,200$ 15,358$ 82$ 4,752$ 11,090$ 64.50%
Nature Ctr Personnel 323,174$ 261,655$ 21,852$ -$ $ 61,519 80.96%
M&S 46,350$ 36,577$ 558$ 5,653$ $ 4,120 91.11%
369,524$ 298,232$ 22,411$ 5,653$ 65,640$ 82.20%
1,463,253$ 1,150,280$ 63,675$ 27,129$ 285,843$ 80.47%
Senior Services Personnel 303,805$ 231,957$ 25,049$ -$ $ 71,848 76.35%
M&S 41,695$ 34,031$ 518$ 5,169$ $ 2,495 94.02%
345,500$ 265,988$ 25,568$ 5,169$ 74,343$ 78.50%
Golf Course Personnel 464,498$ 363,658$ 29,838$ -$ 100,841$ 78.29%
M&S 135,050$ 120,607$ 14,085$ 1,084$ 13,359$ 90.11%
599,548$ 484,265$ 43,923$ 1,084$ 114,199$ 81.00%
GRAND TOTAL 6,964,277$ 5,541,608$ 448,386$ 53,947$ 1,368,723$ 80.30%
Period # 10 Target Percent 83.33%
Revenue Estimated Rev YTD Earned RemainingGeneral 7,116,848$ 5,473,775$ 1,643,073$ CIP 2,473,900$ 662,393$ 1,811,507$ Equipment 253,272$ 142,536$ 110,736$
9,844,020$ 6,278,704$ 3,565,316$
TOTAL PARKS DIVISION
APRC Budget Status Report As of 4/30/20
Administration Totals
Forestry Totals
Capital (Park Improvements)
Operations Totals
TOTAL GOLF
Grand Total Revenue
Recreation Admin Totals
Recreation Programs Totals
Community Center Totals
Nature Center Totals
TOTAL RECREATION DIVISION
TOTAL SENIOR SERVICES DIVISION
Page 1 of 1
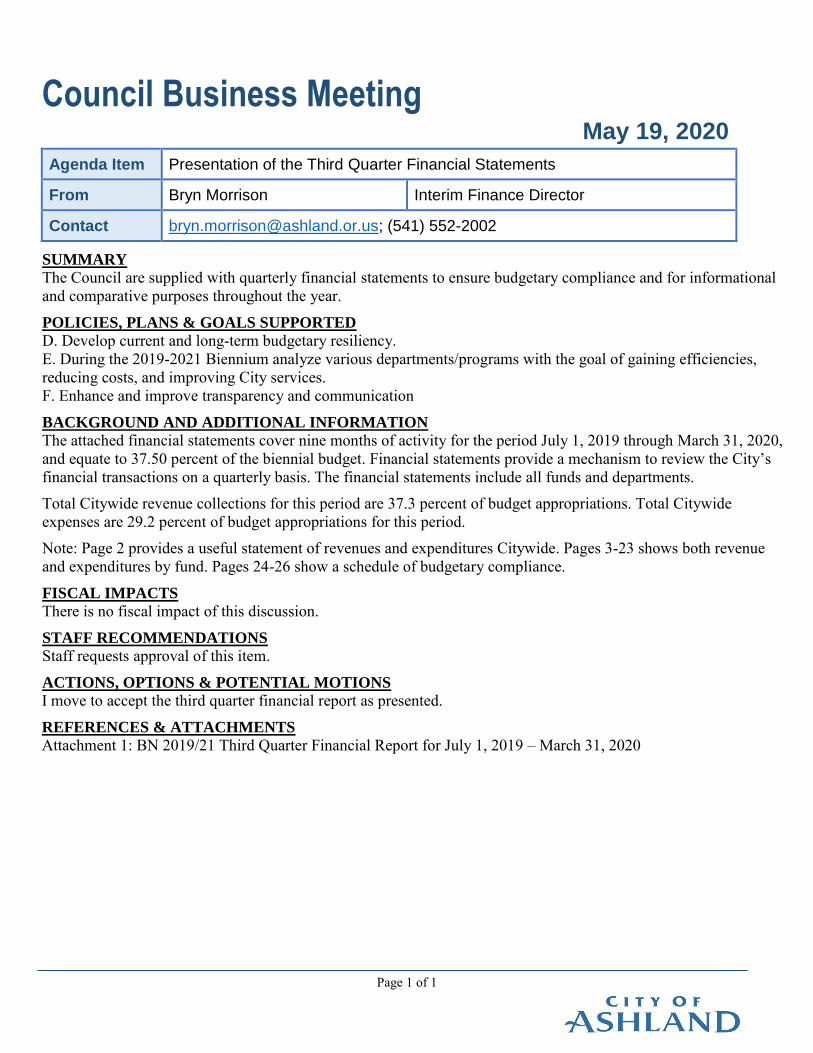
Council Business Meeting May 19, 2020
Agenda Item Presentation of the Third Quarter Financial Statements
From Bryn Morrison Interim Finance Director
Contact [email protected]; (541) 552-2002
SUMMARY
The Council are supplied with quarterly financial statements to ensure budgetary compliance and for informational and comparative purposes throughout the year.
POLICIES, PLANS & GOALS SUPPORTED
D. Develop current and long-term budgetary resiliency. E. During the 2019-2021 Biennium analyze various departments/programs with the goal of gaining efficiencies, reducing costs, and improving City services. F. Enhance and improve transparency and communication
BACKGROUND AND ADDITIONAL INFORMATION
The attached financial statements cover nine months of activity for the period July 1, 2019 through March 31, 2020, and equate to 37.50 percent of the biennial budget. Financial statements provide a mechanism to review the City’s financial transactions on a quarterly basis. The financial statements include all funds and departments. Total Citywide revenue collections for this period are 37.3 percent of budget appropriations. Total Citywide expenses are 29.2 percent of budget appropriations for this period. Note: Page 2 provides a useful statement of revenues and expenditures Citywide. Pages 3-23 shows both revenue and expenditures by fund. Pages 24-26 show a schedule of budgetary compliance.
FISCAL IMPACTS
There is no fiscal impact of this discussion.
STAFF RECOMMENDATIONS
Staff requests approval of this item.
ACTIONS, OPTIONS & POTENTIAL MOTIONS
I move to accept the third quarter financial report as presented.
REFERENCES & ATTACHMENTS
Attachment 1: BN 2019/21 Third Quarter Financial Report for July 1, 2019 – March 31, 2020

City of AshlandSummary of Fund Balances
as of March 31, 2020
Balance Balance Change From
Fund March 31, 2020 March 31, 2019 FY 2019
General Fund 7,668,262$ 6,421,506$ 1,246,756$ Parks General Fund 772,468 779,626 (7,157) Housing Fund 106,180 52,309 53,871 Community Block Grant Fund 3,628 31,988 (28,360) Reserve Fund 39,091 38,211 880 Street Fund 2,213,980 5,090,713 (2,876,733) Airport Fund 293,335 241,341 51,994 Capital Improvements Fund 869,308 1,090,762 (221,454) Parks Capital Improvements Fund 1,312,677 999,326 313,351 Debt Service Fund 1,368,524 1,357,384 11,140 Water Fund 11,762,880 10,033,768 1,729,112 Wastewater Fund 10,616,183 9,581,042 1,035,142 Storm Drain Fund 1,789,291 1,847,057 (57,767) Electric Fund 2,640,308 3,079,473 (439,164) Telecommunications Fund 1,521,209 1,037,751 483,459 Central Services Fund 1,713,924 831,529 882,395 Insurance Services Fund (327,382) 191,792 (519,174) Health Benefits Reserve Fund 1,149,358 651,461 497,897 Equipment Fund 4,189,130 3,097,721 1,091,409 Parks Equipment Fund 247,844 256,242 (8,397) Cemetery Trust Fund 949,378 983,601 (34,223)
50,899,579$ 47,694,603$ 3,204,976$
Total Fund Balances 50,899,579$ 47,694,603$ 3,204,976$
Restricted and Committed FundsRestricted 10,741,136$ 10,617,640$ 123,496$ Committied 14,193,570 13,336,525 857,045 Unassigned 25,964,873 23,740,438 2,224,435
Total Fund Balances 50,899,579$ 47,694,603$ 3,204,976$
9. Mar20 FY20 Financial Report wih Live Cubes Links new format w y1 links.xlsx5/5/2020 1

City of Ashland Statement of Revenues and Expenditures - City Wide
as of March 31, 2020 (75.00% of Fiscal Year)
Fiscal Year 2019 Year-To-Date
Actuals
Fiscal Year 2019 End -of-Year
Actuals
Percent Collected / Expended
Fiscal Year 2020 Year-To-Date
Actuals 1st Year of
Biennial Budget
Percent Collected / Expended
Year-over-Year Change
RevenuesTaxes 20,645,248$ 25,940,766$ 79.6% 21,707,545$ 27,350,130$ 79.4% 105.1%Licenses and Permits 581,984 859,045 67.7% 798,661 949,150 84.1% 137.2%Intergovernmental Revenues 2,854,006 4,132,531 69.1% 2,624,307 6,382,437 41.1% 92.0%Charges for Services - Rate & Internal 45,584,541 61,075,437 74.6% 47,790,046 62,661,349 76.3% 104.8%Charges for Services - Misc. Service fees 1,380,776 1,945,241 71.0% 1,672,054 1,798,673 93.0% 121.1%System Development Charges 515,210 898,309 57.4% 651,987 386,500 168.7% 126.5%Fines and Forfeitures 421,563 588,070 71.7% 359,498 602,900 59.6% 85.3%Assessment Payments 2,778 8,924 31.1% 707 30,000 2.4% 25.5%Interest on Investments 766,892 1,035,443 74.1% 750,621 777,110 96.6% 97.9%Miscellaneous Revenues 1,766,474 2,369,877 74.5% 456,911 685,025 66.7% 25.9%
Total Revenues 74,519,473 98,853,643 75.4% 76,812,337 101,623,273 75.6% 103.1%
Budgetary Resources:Other Financing Sources 1,905,135 3,065,628 62.1% 1,139,432 25,202,562 4.5% 59.8%Transfers In 1,016,003 1,201,143 84.6% 776,146 1,085,156 71.5% 76.4% Total Budgetary Resources 2,921,138 4,266,771 68.5% 1,915,578 26,287,718 7.3% 65.6%
Total Resources 77,440,611 103,120,414 75.1% 78,727,915 127,910,991 61.5% 101.7%
Personnel Services 25,304,675 33,828,865 74.8% 26,114,220 36,293,908 72.0% 103.2%Materials and Services 36,580,919 50,064,300 73.1% 36,923,087 53,193,943 69.4% 100.9%Debt Service 2,312,885 4,624,140 50.0% 2,380,400 4,617,690 51.5% 102.9%
Total Operating Expenditures 64,198,479 88,517,306 72.5% 65,417,707 94,105,541 69.5% 101.9%
Capital ConstructionCapital Outlay 7,008,450 10,583,306 66.2% 6,930,071 21,281,918 32.6% 98.9%
Transfers Out 1,016,003 1,201,143 84.6% 776,146 1,085,156 71.5% 76.4%Contingencies (Original Budget $3,085,000) - - 59.8% - 1,417,059 0.0% 102.9% Total Budgetary Requirements 1,016,003 1,201,143 84.6% 776,146 2,502,215 31.0% 76.4%
Total Requirements 72,222,932 100,301,755 72.0% 73,123,924 117,889,674 62.0% 101.2%Excess (Deficiency) of Resources over Requirements 5,217,679 2,818,659 185.1% 5,603,991 10,021,317 44.1% 107.4%Working Capital Carryover 42,476,929 42,476,929 100.0% 45,295,588 24,403,661 185.6% 106.6%
Unappropriated Ending Fund Balance 47,694,603$ 45,295,588$ 105.3% 50,899,579$ 34,424,978$ 147.9% 106.7%
9. Mar20 FY20 Financial Report wih Live Cubes Links new format w y1 links.xlsx5/5/2020 2
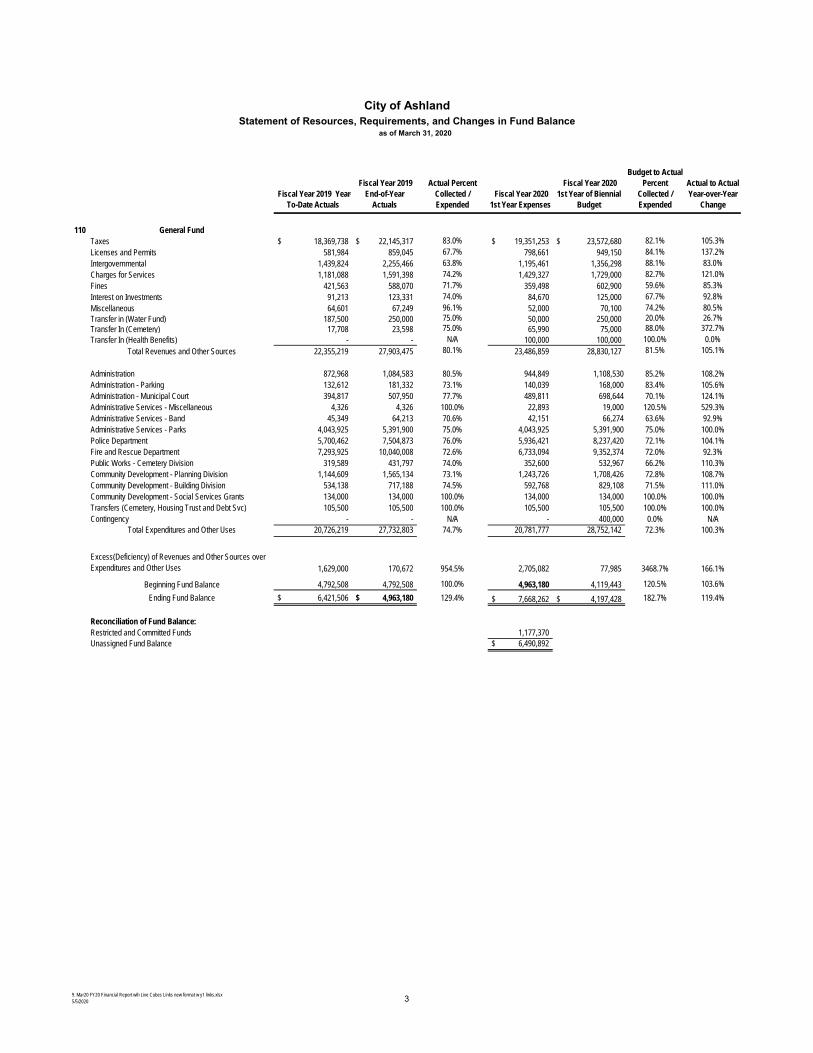
City of AshlandStatement of Resources, Requirements, and Changes in Fund Balance
as of March 31, 2020
Fiscal Year 2019 Year-To-Date Actuals
Fiscal Year 2019 End-of-Year
Actuals
Actual Percent Collected / Expended
Fiscal Year 2020 1st Year Expenses
Fiscal Year 2020 1st Year of Biennial
Budget
Budget to Actual Percent
Collected / Expended
Actual to Actual Year-over-Year
Change
110 General Fund Taxes 18,369,738$ 22,145,317$ 83.0% 19,351,253$ 23,572,680$ 82.1% 105.3% Licenses and Permits 581,984 859,045 67.7% 798,661 949,150 84.1% 137.2% Intergovernmental 1,439,824 2,255,466 63.8% 1,195,461 1,356,298 88.1% 83.0% Charges for Services 1,181,088 1,591,398 74.2% 1,429,327 1,729,000 82.7% 121.0% Fines 421,563 588,070 71.7% 359,498 602,900 59.6% 85.3% Interest on Investments 91,213 123,331 74.0% 84,670 125,000 67.7% 92.8% Miscellaneous 64,601 67,249 96.1% 52,000 70,100 74.2% 80.5%
Transfer in (Water Fund) 187,500 250,000 75.0% 50,000 250,000 20.0% 26.7%Transfer In (Cemetery) 17,708 23,598 75.0% 65,990 75,000 88.0% 372.7%
Transfer In (Health Benefits) - - N/A 100,000 100,000 100.0% 0.0% Total Revenues and Other Sources 22,355,219 27,903,475 80.1% 23,486,859 28,830,127 81.5% 105.1%
Administration 872,968 1,084,583 80.5% 944,849 1,108,530 85.2% 108.2%Administration - Parking 132,612 181,332 73.1% 140,039 168,000 83.4% 105.6%Administration - Municipal Court 394,817 507,950 77.7% 489,811 698,644 70.1% 124.1%Administrative Services - Miscellaneous 4,326 4,326 100.0% 22,893 19,000 120.5% 529.3%Administrative Services - Band 45,349 64,213 70.6% 42,151 66,274 63.6% 92.9%Administrative Services - Parks 4,043,925 5,391,900 75.0% 4,043,925 5,391,900 75.0% 100.0%Police Department 5,700,462 7,504,873 76.0% 5,936,421 8,237,420 72.1% 104.1%Fire and Rescue Department 7,293,925 10,040,008 72.6% 6,733,094 9,352,374 72.0% 92.3%Public Works - Cemetery Division 319,589 431,797 74.0% 352,600 532,967 66.2% 110.3%Community Development - Planning Division 1,144,609 1,565,134 73.1% 1,243,726 1,708,426 72.8% 108.7%Community Development - Building Division 534,138 717,188 74.5% 592,768 829,108 71.5% 111.0%Community Development - Social Services Grants 134,000 134,000 100.0% 134,000 134,000 100.0% 100.0%Transfers (Cemetery, Housing Trust and Debt Svc) 105,500 105,500 100.0% 105,500 105,500 100.0% 100.0%Contingency - - N/A - 400,000 0.0% N/A
Total Expenditures and Other Uses 20,726,219 27,732,803 74.7% 20,781,777 28,752,142 72.3% 100.3%
Excess(Deficiency) of Revenues and Other Sources over Expenditures and Other Uses 1,629,000 170,672 954.5% 2,705,082 77,985 3468.7% 166.1%
Beginning Fund Balance 4,792,508 4,792,508 100.0% 4,963,180 4,119,443 120.5% 103.6%Ending Fund Balance 6,421,506$ 4,963,180$ 129.4% 7,668,262$ 4,197,428$ 182.7% 119.4%
Reconciliation of Fund Balance:Restricted and Committed Funds 1,177,370 Unassigned Fund Balance 6,490,892$
9. Mar20 FY20 Financial Report wih Live Cubes Links new format w y1 links.xlsx5/5/2020 3

City of AshlandStatement of Resources, Requirements, and Changes in Fund Balance
as of March 31, 2020
Fiscal Year 2019 Year-To-Date Actuals
Fiscal Year 2019 End-of-Year
Actuals
Actual Percent Collected / Expended
Fiscal Year 2020 1st Year Expenses
Fiscal Year 2020 1st Year of Biennial
Budget
Budget to Actual Percent
Collected / Expended
Actual to Actual Year-over-Year
Change
211 Parks and Recreation General FundIntergovernmental 500.00$ 500.00$ 100.0% 68,902$ 15,000$ 459.3% N/A
Charges for Services - Internal 4,043,925 5,391,900 75.0% 4,043,925 5,391,900 75.0% 100.0% Charges for Services - Misc. Service Fees 629,813 916,636 68.7% 687,955 1,165,100 59.0% 109.2% Interest on Investments 14,838 20,599 72.0% 15,147 23,310 65.0% 102.1% Miscellaneous 13,891 25,700 54.1% 21,883 31,000 70.6% 157.5% Transfer In 85,000 85,000 100.0% 185,000 185,000 100.0% 217.6% Total Revenues and Other Sources 4,787,968 6,440,335 74.3% 5,022,812 6,811,310 73.7% 104.9%
Parks Division 3,131,129 4,151,758 75.4% 2,952,701 4,067,952 72.6% 94.3%Recreation Division 1,124,401 1,552,403 72.4% 1,086,605 1,463,252 74.3% 96.6%Golf Division 414,264 554,750 74.7% 440,342 599,548 73.4% 106.3%Senior Services Division - - N/A 240,420 345,500 69.6% N/AParks Forestry Division - - N/A 373,153 488,025 76.5% N/AContingency - - N/A - 75,000 0.0% N/A
Total Expenditures and Other Uses 4,669,795 6,258,911 74.6% 5,093,221 7,039,277 72.4% 109.1%
Excess(Deficiency) of Revenues and Other Sources over Expenditures and Other Uses 118,173 181,424 65.1% (70,409) (227,967) 69.1% -59.6%
Beginning Fund Balance 661,453 661,453 100.0% 842,877 305,538 275.9% 127.4%Ending Fund Balance 779,626$ 842,877$ 92.5% 772,468$ 77,571$ 995.8% 99.1%
Reconciliation of Fund Balance:Restricted and Committed Funds - Unassigned Fund Balance 772,468$
9. Mar20 FY20 Financial Report wih Live Cubes Links new format w y1 links.xlsx5/5/2020 4
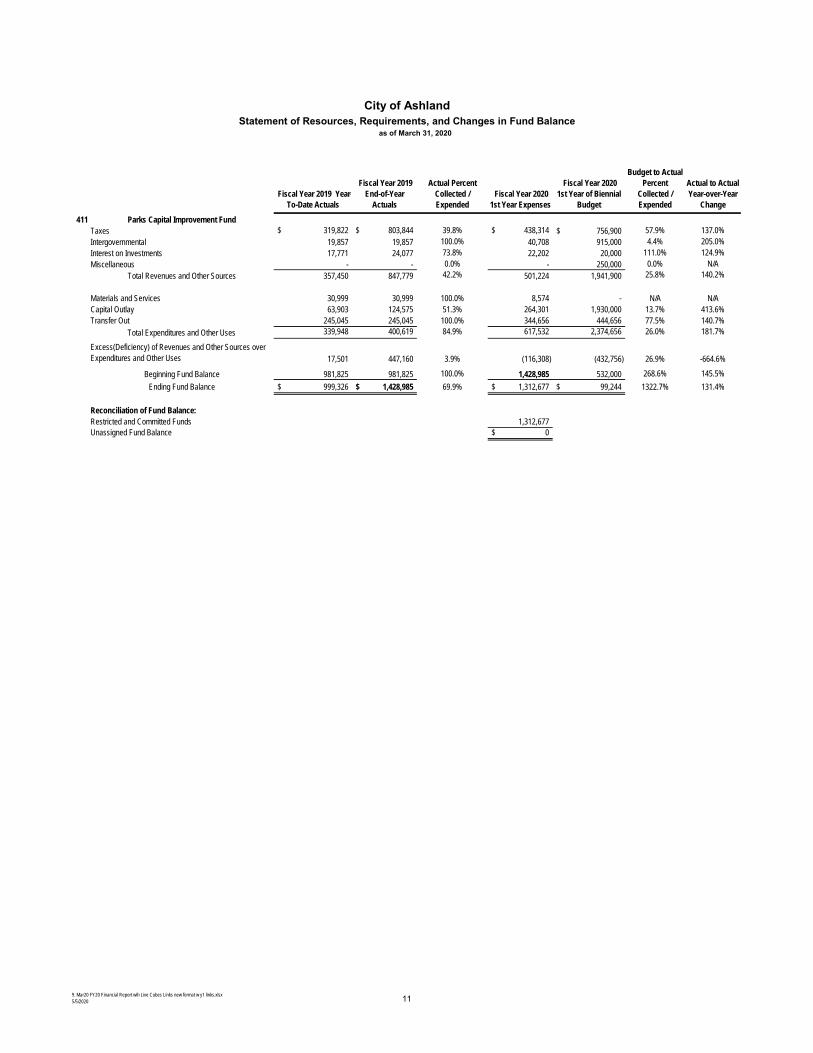
City of AshlandStatement of Resources, Requirements, and Changes in Fund Balance
as of March 31, 2020
Fiscal Year 2019 Year-To-Date Actuals
Fiscal Year 2019 End-of-Year
Actuals
Actual Percent Collected / Expended
Fiscal Year 2020 1st Year Expenses
Fiscal Year 2020 1st Year of Biennial
Budget
Budget to Actual Percent
Collected / Expended
Actual to Actual Year-over-Year
Change
411 Parks Capital Improvement FundTaxes 319,822$ 803,844$ 39.8% 438,314$ 756,900$ 57.9% 137.0%Intergovernmental 19,857 19,857 100.0% 40,708 915,000 4.4% 205.0%Interest on Investments 17,771 24,077 73.8% 22,202 20,000 111.0% 124.9%Miscellaneous - - 0.0% - 250,000 0.0% N/A
Total Revenues and Other Sources 357,450 847,779 42.2% 501,224 1,941,900 25.8% 140.2%
Materials and Services 30,999 30,999 100.0% 8,574 - N/A N/ACapital Outlay 63,903 124,575 51.3% 264,301 1,930,000 13.7% 413.6%Transfer Out 245,045 245,045 100.0% 344,656 444,656 77.5% 140.7%
Total Expenditures and Other Uses 339,948 400,619 84.9% 617,532 2,374,656 26.0% 181.7%
Excess(Deficiency) of Revenues and Other Sources over Expenditures and Other Uses 17,501 447,160 3.9% (116,308) (432,756) 26.9% -664.6%
Beginning Fund Balance 981,825 981,825 100.0% 1,428,985 532,000 268.6% 145.5%Ending Fund Balance 999,326$ 1,428,985$ 69.9% 1,312,677$ 99,244$ 1322.7% 131.4%
Reconciliation of Fund Balance:Restricted and Committed Funds 1,312,677 Unassigned Fund Balance 0$
9. Mar20 FY20 Financial Report wih Live Cubes Links new format w y1 links.xlsx5/5/2020 11

City of AshlandStatement of Resources, Requirements, and Changes in Fund Balance
as of March 31, 2020
Fiscal Year 2019 Year-To-Date Actuals
Fiscal Year 2019 End-of-Year
Actuals
Actual Percent Collected / Expended
Fiscal Year 2020 1st Year Expenses
Fiscal Year 2020 1st Year of Biennial
Budget
Budget to Actual Percent
Collected / Expended
Actual to Actual Year-over-Year
Change
731 Parks Equipment Fund Charges for Services - Internal 170,625$ 227,500$ 75.0% 110,625$ 147,500$ 75.0% 64.8%
Interest on Investments 3,239 4,898 66.1% 4,463 725 615.6% 137.8%Miscellaneous 31,006 46,331 66.9% 11,942 - N/A 38.5%
Total Revenues and Other Sources 204,870 278,729 73.5% 127,030 148,225 85.7% 62.0%
Materials and Services - - N/A 1,086 - N/A N/ACapital Outlay 75,482 141,092 53.5% 142,591 150,000 95.1% 188.9%
Total Expenditures and Other Uses 75,482 141,092 53.5% 143,677 150,000 95.8% 190.3%Excess(Deficiency) of Revenues and Other Sources over Expenditures and Other Uses 129,388 137,637 94.0% (16,647) (1,775) 937.8% -12.9%
Beginning Fund Balance 126,854 126,854 100.0% 264,491 105,047 251.8% 208.5%Ending Fund Balance 256,242$ 264,491$ 96.9% 247,844$ 103,272$ 240.0% 96.7%
Reconciliation of Fund Balance:Restricted and Committed Funds 247,844 Unassigned Fund Balance -$
9. Mar20 FY20 Financial Report wih Live Cubes Links new format w y1 links.xlsx5/5/2020 22
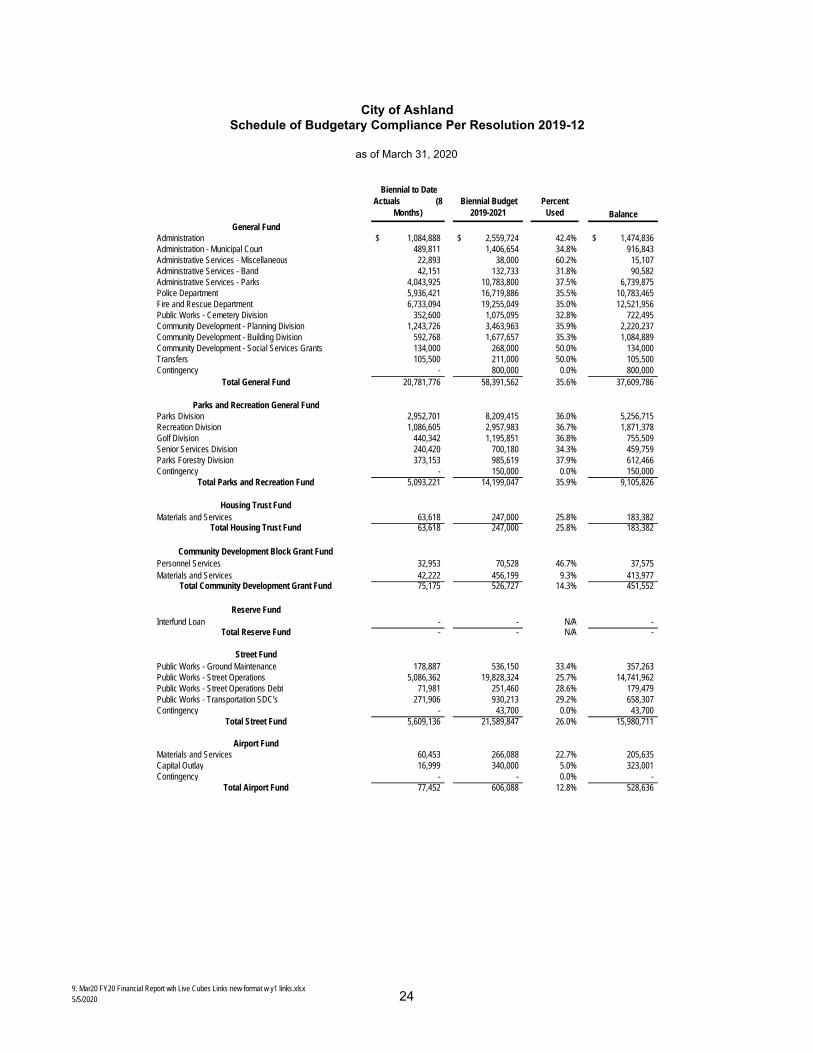
City of AshlandSchedule of Budgetary Compliance Per Resolution 2019-12
Biennial to Date Actuals (8
Months) Biennial Budget
2019-2021 Percent
Used Balance
Administration 1,084,888$ 2,559,724$ 42.4% 1,474,836$ Administration - Municipal Court 489,811 1,406,654 34.8% 916,843 Administrative Services - Miscellaneous 22,893 38,000 60.2% 15,107 Administrative Services - Band 42,151 132,733 31.8% 90,582 Administrative Services - Parks 4,043,925 10,783,800 37.5% 6,739,875 Police Department 5,936,421 16,719,886 35.5% 10,783,465 Fire and Rescue Department 6,733,094 19,255,049 35.0% 12,521,956 Public Works - Cemetery Division 352,600 1,075,095 32.8% 722,495 Community Development - Planning Division 1,243,726 3,463,963 35.9% 2,220,237 Community Development - Building Division 592,768 1,677,657 35.3% 1,084,889 Community Development - Social Services Grants 134,000 268,000 50.0% 134,000 Transfers 105,500 211,000 50.0% 105,500 Contingency - 800,000 0.0% 800,000
20,781,776 58,391,562 35.6% 37,609,786
Parks Division 2,952,701 8,209,415 36.0% 5,256,715 Recreation Division 1,086,605 2,957,983 36.7% 1,871,378 Golf Division 440,342 1,195,851 36.8% 755,509 Senior Services Division 240,420 700,180 34.3% 459,759 Parks Forestry Division 373,153 985,619 37.9% 612,466 Contingency - 150,000 0.0% 150,000
5,093,221 14,199,047 35.9% 9,105,826
Materials and Services 63,618 247,000 25.8% 183,382 63,618 247,000 25.8% 183,382
Personnel Services 32,953 70,528 46.7% 37,575 Materials and Services 42,222 456,199 9.3% 413,977
75,175 526,727 14.3% 451,552
Interfund Loan - - N/A - - - N/A -
Public Works - Ground Maintenance 178,887 536,150 33.4% 357,263 Public Works - Street Operations 5,086,362 19,828,324 25.7% 14,741,962 Public Works - Street Operations Debt 71,981 251,460 28.6% 179,479 Public Works - Transportation SDC's 271,906 930,213 29.2% 658,307 Contingency - 43,700 0.0% 43,700
5,609,136 21,589,847 26.0% 15,980,711
Materials and Services 60,453 266,088 22.7% 205,635 Capital Outlay 16,999 340,000 5.0% 323,001 Contingency - - 0.0% -
77,452 606,088 12.8% 528,636
Total Parks and Recreation Fund
Parks and Recreation General Fund
Reserve Fund
Total Reserve Fund
as of March 31, 2020
General Fund
Total General Fund
Community Development Block Grant Fund
Total Community Development Grant Fund
Housing Trust Fund
Total Housing Trust Fund
Street Fund
Total Street Fund
Airport Fund
Total Airport Fund
9. Mar20 FY20 Financial Report wih Live Cubes Links new format w y1 links.xlsx5/5/2020 24
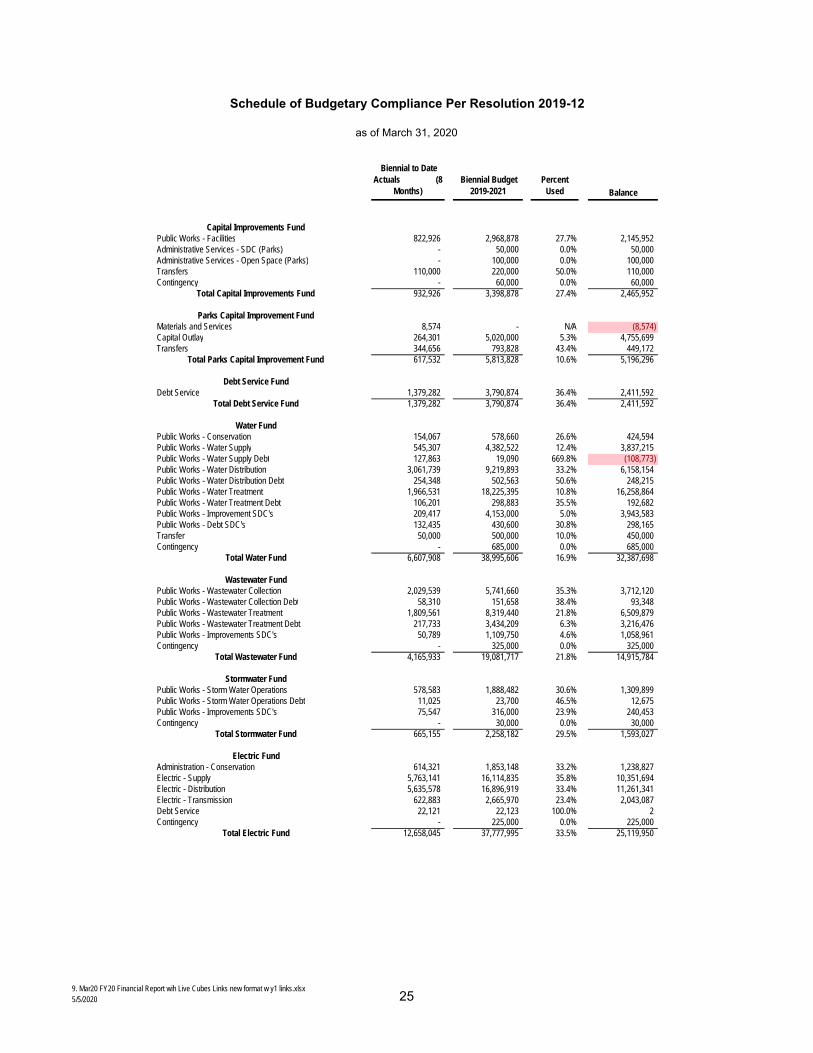
Schedule of Budgetary Compliance Per Resolution 2019-12
Biennial to Date Actuals (8
Months) Biennial Budget
2019-2021 Percent
Used Balance
as of March 31, 2020
Public Works - Facilities 822,926 2,968,878 27.7% 2,145,952 Administrative Services - SDC (Parks) - 50,000 0.0% 50,000 Administrative Services - Open Space (Parks) - 100,000 0.0% 100,000 Transfers 110,000 220,000 50.0% 110,000 Contingency - 60,000 0.0% 60,000
932,926 3,398,878 27.4% 2,465,952
Materials and Services 8,574 - N/A (8,574) Capital Outlay 264,301 5,020,000 5.3% 4,755,699 Transfers 344,656 793,828 43.4% 449,172
617,532 5,813,828 10.6% 5,196,296
Debt Service 1,379,282 3,790,874 36.4% 2,411,592 1,379,282 3,790,874 36.4% 2,411,592
Public Works - Conservation 154,067 578,660 26.6% 424,594 Public Works - Water Supply 545,307 4,382,522 12.4% 3,837,215 Public Works - Water Supply Debt 127,863 19,090 669.8% (108,773) Public Works - Water Distribution 3,061,739 9,219,893 33.2% 6,158,154 Public Works - Water Distribution Debt 254,348 502,563 50.6% 248,215 Public Works - Water Treatment 1,966,531 18,225,395 10.8% 16,258,864 Public Works - Water Treatment Debt 106,201 298,883 35.5% 192,682 Public Works - Improvement SDC's 209,417 4,153,000 5.0% 3,943,583 Public Works - Debt SDC's 132,435 430,600 30.8% 298,165 Transfer 50,000 500,000 10.0% 450,000 Contingency - 685,000 0.0% 685,000
6,607,908 38,995,606 16.9% 32,387,698
Public Works - Wastewater Collection 2,029,539 5,741,660 35.3% 3,712,120 Public Works - Wastewater Collection Debt 58,310 151,658 38.4% 93,348 Public Works - Wastewater Treatment 1,809,561 8,319,440 21.8% 6,509,879 Public Works - Wastewater Treatment Debt 217,733 3,434,209 6.3% 3,216,476 Public Works - Improvements SDC's 50,789 1,109,750 4.6% 1,058,961 Contingency - 325,000 0.0% 325,000
4,165,933 19,081,717 21.8% 14,915,784
Public Works - Storm Water Operations 578,583 1,888,482 30.6% 1,309,899 Public Works - Storm Water Operations Debt 11,025 23,700 46.5% 12,675 Public Works - Improvements SDC's 75,547 316,000 23.9% 240,453 Contingency - 30,000 0.0% 30,000
665,155 2,258,182 29.5% 1,593,027
Administration - Conservation 614,321 1,853,148 33.2% 1,238,827 Electric - Supply 5,763,141 16,114,835 35.8% 10,351,694 Electric - Distribution 5,635,578 16,896,919 33.4% 11,261,341 Electric - Transmission 622,883 2,665,970 23.4% 2,043,087 Debt Service 22,121 22,123 100.0% 2 Contingency - 225,000 0.0% 225,000
12,658,045 37,777,995 33.5% 25,119,950
Wastewater Fund
Stormwater Fund
Total Stormwater Fund
Parks Capital Improvement Fund
Total Parks Capital Improvement Fund
Total Electric Fund
Electric Fund
Total Wastewater Fund
Total Debt Service Fund
Water Fund
Total Water Fund
Total Capital Improvements Fund
Debt Service Fund
Capital Improvements Fund
9. Mar20 FY20 Financial Report wih Live Cubes Links new format w y1 links.xlsx5/5/2020 25

City of AshlandRevenue Summary as of March 31, 2020
Current Year Prior Year Current /2019 - 2020 2018 - 2019 Prior
Revenue ItemReceiving Fund \
Share Month YTD 1st Year Budget
Amounts % YTD YTD EOFY YTD % Change
Food & Beverage Tax Street 18% 9,272$ 315,586$ 698,000$ 45% 230,272$ 645,685$ 137.0%Parks Cap. Impr. 25% 12,878 438,314 756,900 58% 319,822 803,844 137.0%Wastewater 55% 28,331 964,291 1,600,000 60% 1,102,905 1,600,600 87.4%Central Svs 2% 1,030 35,065 60,550 58% 25,586 64,308 137.0%
Total F&B Tax 51,512 1,753,256 3,115,450 56% 1,678,585 3,114,437 104.4%
Transient Occupancy Tax General 100% 8,548 2,047,176 3,276,369 62% 1,853,345 3,134,108 110.5% Late & Interest Fees General 100% 23 1,539 2,500 62% 2,753 7,731 55.9%
Electric User Tax General 100% 305,184 2,692,183 3,659,353 74% 2,611,301 3,378,833 103.1%
Ambulance General 100% 103,626 1,131,052 1,321,000 86% 913,995 1,206,554 123.7%
Court Fees & Fines General 100% 30,212 249,200 338,400 74% 251,175 365,326 99.2%
Parking Fees General Fund 20,242 238,008 460,000 52% 299,743 413,801 79.4%Capital Fund 5,000 40,000 60,000 67% 44,577 59,577 89.7%
Total Parking Fees 25,242 278,008 520,000 53% 344,320 473,378 80.7%
Franchises General 278,456 2,612,015 3,699,870 71% 2,553,260 3,588,310 102.3%Streets-AHN/Charter - 28,778 55,000 52% 29,460 58,913 97.7%
Total Franchises 278,456 2,640,794 3,754,870 70% 2,582,720 3,647,223 102.2%
SDC's Streets 21,404 219,142 100,000 219% 84,712 176,885 258.7%Capital Impr. 3,742 54,511 51,500 106% 43,534 75,359 125.2%Water 13,824 189,800 100,000 190% 201,407 346,254 94.2%Wastewater 11,023 174,972 100,000 175% 164,672 269,372 106.3%Storm Drain 3,812 13,563 35,000 39% 20,884 30,439 64.9%
Total SDC's 53,804 651,987 386,500 169% 515,210 898,309 126.5%
Planning Permits and Fees General 100% 42,238 455,834 576,500 79% 337,865 497,696 134.9% Charges for Services General 100% 2,832 34,888 40,000 87% 28,355 49,147 123.0%
Total Planning 45,070 490,722 616,500 80% 366,220 546,844 134.0%
Building Permits and Fees General 100% 55,553 342,827 372,650 92% 244,119 361,349 140.4% Charges for Services General 100% 398 5,078 13,500 38% 5,222 9,907 97.3%
Total Building 55,951 347,905 386,150 90% 249,341 371,256 139.5%
Charges for Services (Sales) (Excludes SDC's) Electric 1,415,123 12,642,661 16,766,395 75% 12,237,824 15,983,036 103.3%
Water 472,339 6,300,352 8,300,600 76% 6,286,010 8,135,815 100.2%Wastewater 497,183 4,606,031 5,560,000 83% 4,411,079 5,873,506 104.4%Stormwater 60,618 544,456 770,000 71% 530,583 708,474 102.6%Telecommunication 213,491 1,866,533 2,342,646 80% 1,752,241 2,361,300 106.5%
Total Sales 2,658,753 25,960,033 33,739,641 77% 25,217,737 33,062,131 102.9%
Interest All Funds 75,300 750,621 777,110 97% 766,892 1,035,443 97.9%
Property Tax (Current Taxes) General 254,722 11,018,116 11,596,235 95% 10,508,477 10,986,655 104.8%
Debt Svcs 10,434 451,308 475,000 95% 457,965 478,622 98.5% Total Taxes 265,156 11,469,424 12,071,235 95% 10,966,442 11,465,276 104.6%
Totals 3,956,840$ 50,463,902$ 63,962,578$ 79% 48,320,037$ 62,706,848$ 104.4%
9. Mar20 FY20 Financial Report wih Live Cubes Links new format w y1 links.xlsx5/5/2020 27

City of AshlandSummary of Cash and Investments
as of March 31, 2020
Balance Balance Change From
Fund March 31, 2020 March 31, 2019 FY 2019
General Fund 6,826,555$ 5,844,109$ 982,446$ Parks General Fund 906,491 933,935 (27,444) Housing Fund 109,305 52,099 57,206 Community Block Grant Fund 5,885 33,791 (27,906) Reserve Fund 39,089 38,209 880 Street Fund 2,135,105 5,010,077 (2,874,971) Airport Fund 273,606 216,747 56,858 Capital Improvements Fund 907,789 1,104,958 (197,169) Parks Capital Improvements Fund 1,332,485 1,005,669 326,816 Debt Service Fund 1,204,525 1,192,026 12,498 Water Fund 9,881,538 9,096,978 784,560 Wastewater Fund 10,050,469 9,152,423 898,046 Storm Drain Fund 1,740,659 1,792,331 (51,672) Electric Fund 2,320,071 3,007,050 (686,979) Telecommunications Fund 1,258,154 757,071 501,083 Central Services Fund 1,970,754 995,859 974,894 Insurance Services Fund (109,201) 393,859 (503,060) Health Benefits Reserve Fund 1,070,874 617,112 453,761 Equipment Fund 4,202,923 3,096,004 1,106,919 Parks Equipment Fund 247,844 256,242 (8,397) Cemetery Trust Fund 946,960 982,984 (36,023)
47,321,879$ 45,579,534$ 1,742,345$
Total Cash Distribution 47,321,879$ 45,579,534$ 1,742,345$
Manner of InvestmentGeneral Banking Accounts 3,815,719$ 1,875,630$ 1,940,089$ Local Government Inv. Pool 40,510,723 43,703,903 (3,193,180) City Investments 2,995,437 - 2,995,437
Total Cash and Investments 47,321,879$ 45,579,534$ 1,742,346$
9. Mar20 FY20 Financial Report wih Live Cubes Links new format w y1 links.xlsx5/5/2020 28
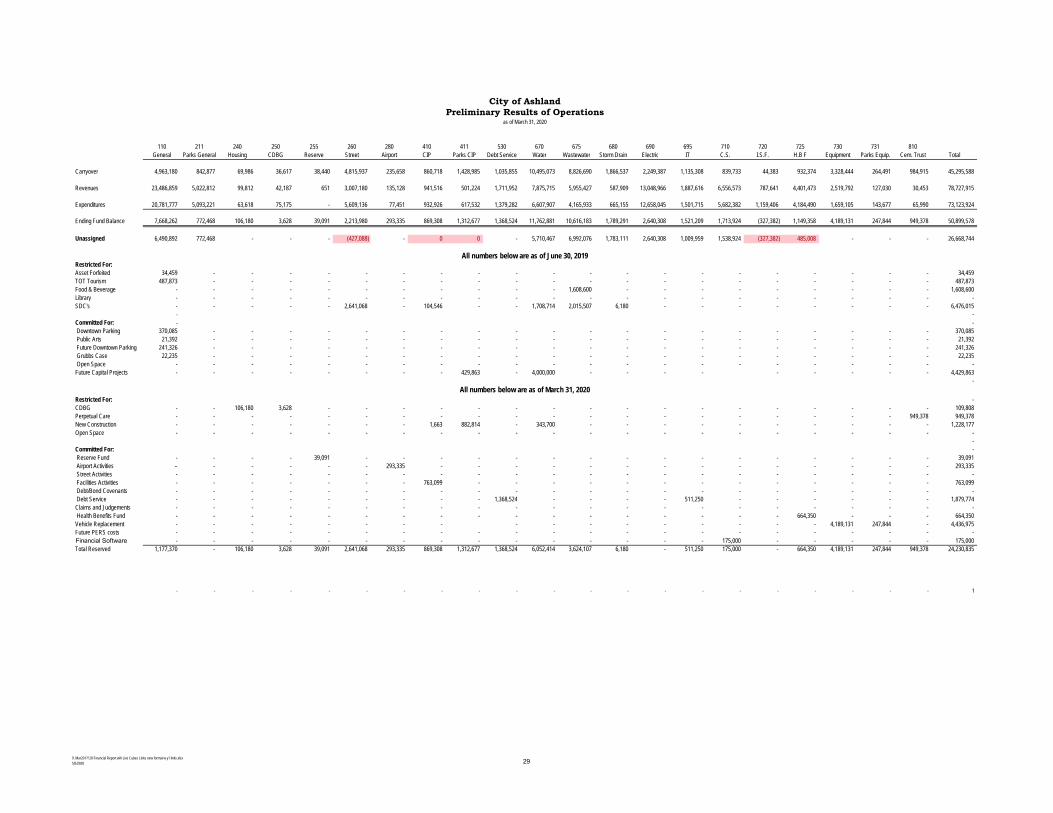
City of AshlandPreliminary Results of Operations
110 211 240 250 255 260 280 410 411 530 670 675 680 690 695 710 720 725 730 731 810General Parks General Housing CDBG Reserve Street Airport CIP Parks CIP Debt Service Water Wastewater Storm Drain Electric IT C.S. I.S.F. H.B F Equipment Parks Equip. Cem. Trust Total
Carryover 4,963,180 842,877 69,986 36,617 38,440 4,815,937 235,658 860,718 1,428,985 1,035,855 10,495,073 8,826,690 1,866,537 2,249,387 1,135,308 839,733 44,383 932,374 3,328,444 264,491 984,915 45,295,588
Revenues 23,486,859 5,022,812 99,812 42,187 651 3,007,180 135,128 941,516 501,224 1,711,952 7,875,715 5,955,427 587,909 13,048,966 1,887,616 6,556,573 787,641 4,401,473 2,519,792 127,030 30,453 78,727,915
Expenditures 20,781,777 5,093,221 63,618 75,175 - 5,609,136 77,451 932,926 617,532 1,379,282 6,607,907 4,165,933 665,155 12,658,045 1,501,715 5,682,382 1,159,406 4,184,490 1,659,105 143,677 65,990 73,123,924
Ending Fund Balance 7,668,262 772,468 106,180 3,628 39,091 2,213,980 293,335 869,308 1,312,677 1,368,524 11,762,881 10,616,183 1,789,291 2,640,308 1,521,209 1,713,924 (327,382) 1,149,358 4,189,131 247,844 949,378 50,899,578
Unassigned 6,490,892 772,468 - - - (427,088) - 0 0 - 5,710,467 6,992,076 1,783,111 2,640,308 1,009,959 1,538,924 (327,382) 485,008 - - - 26,668,744
All numbers below are as of June 30, 2019Restricted For:Asset Forfeited 34,459 - - - - - - - - - - - - - - - - - - - - 34,459 TOT Tourism 487,873 - - - - - - - - - - - - - - - - - - - - 487,873 Food & Beverage - - - - - - - - - - - 1,608,600 - - - - - - - - - 1,608,600 Library - - - - - - - - - - - - - - - - - - - - - - SDC's - - - - - 2,641,068 - 104,546 - - 1,708,714 2,015,507 6,180 - - - - - - - - 6,476,015
- - Committed For: - - Downtown Parking 370,085 - - - - - - - - - - - - - - - - - - - - 370,085 Public Arts 21,392 - - - - - - - - - - - - - - - - - - - - 21,392 Future Downtown Parking 241,326 - - - - - - - - - - - - - - - - - - - - 241,326 Grubbs Case 22,235 - - - - - - - - - - - - - - - - - - - - 22,235 Open Space - - - - - - - - - - - - - - - - - - - - - - Future Capital Projects - - - - - - - - 429,863 - 4,000,000 - - - - - - - - - 4,429,863
- All numbers below are as of March 31, 2020
Restricted For: - CDBG - - 106,180 3,628 - - - - - - - - - - - - - - - - - 109,808 Perpetual Care - - - - - - - - - - - - - - - - - - - - 949,378 949,378 New Construction - - - - - - - 1,663 882,814 - 343,700 - - - - - - - - - - 1,228,177 Open Space - - - - - - - - - - - - - - - - - - - - - -
- Committed For: - Reserve Fund - - - - 39,091 - - - - - - - - - - - - - - - - 39,091 Airport Activities - - - - - - 293,335 - - - - - - - - - - - - - - 293,335 Street Activities - - - - - - - - - - - - - - - - - - - - - - Facilities Activities - - - - - - - 763,099 - - - - - - - - - - - - - 763,099 Debt/Bond Covenants - - - - - - - - - - - - - - - - - - - - - - Debt Service - - - - - - - - - 1,368,524 - - - - 511,250 - - - - - - 1,879,774 Claims and Judgements - - - - - - - - - - - - - - - - - - - - - - Health Benefits Fund - - - - - - - - - - - - - - - - - 664,350 - - - 664,350 Vehicle Replacement - - - - - - - - - - - - - - - - - 4,189,131 247,844 - 4,436,975 Future PERS costs - - - - - - - - - - - - - - - - - - - - - - Financial Software - - - - - - - - - - - - - - - 175,000 - - - - - 175,000 Total Reserved 1,177,370 - 106,180 3,628 39,091 2,641,068 293,335 869,308 1,312,677 1,368,524 6,052,414 3,624,107 6,180 - 511,250 175,000 - 664,350 4,189,131 247,844 949,378 24,230,835
- - - - - - - - - - - - - - - - - - - - - 1
as of March 31, 2020
9. Mar20 FY20 Financial Report wih Live Cubes Links new format w y1 links.xlsx5/5/2020 29

City of AshlandDepartmental Expense Report
as of March 31, 2020 (37.50% of Biennium)
Year-To-Date Year 1 Percent Biennium Biennium Percent Biennium Biennium Biennium Percent of BienniumExpenditures Budget Expended Expenditures Budget Expended Balance Encumbered Available Budget Used
Parks Department
0211 120900 Parks Division0211 121200 Personnel Services 1,657,020$ 2,334,454$ 71.0% 1,657,020$ 4,717,195$ 35.1% 3,060,175$ -$ 3,060,175$ 35.1%
Materials and Services 1,257,091 1,683,498 74.7% 1,257,091 3,392,221 37.1% 2,135,130 13,081 2,122,049 37.4%Capital Outlay 38,591 50,000 77.2% 38,591 100,000 38.6% 61,409 3,044 58,365 41.6%
2,952,701 4,067,952 72.6% 2,952,701 8,209,415 36.0% 5,256,715 16,125 5,240,589 36.2%0211 125300 Recreation Division
Personnel Services 837,390 1,089,602 76.9% 837,390 2,208,601 37.9% 1,371,211 - 1,371,211 37.9%Materials and Services 249,215 373,650 66.7% 249,215 749,382 33.3% 500,167 27,217 472,950 36.9%
1,086,605 1,463,252 74.3% 1,086,605 2,957,983 36.7% 1,871,378 27,217 1,844,161 37.7%0211 125500 Golf Division
Personnel Services 333,819 464,498 71.9% 333,819 938,951 35.6% 605,132 - 605,132 35.6%Materials and Services 106,523 135,050 78.9% 106,523 256,900 41.5% 150,377 1,326 149,052 42.0%Capital Outlay - - N/A - - N/A - - - N/A
440,342 599,548 73.4% 440,342 1,195,851 36.8% 755,509 1,326 754,183 36.9%
0211 126900 Senior Services DivisionPersonnel Services 206,908 303,805 68.1% 206,908 616,120 33.6% 409,212 - 409,212 33.6%Materials and Services 33,513 41,695 80.4% 33,513 84,060 39.9% 50,547 5,169 45,379 46.0%Capital Outlay - - N/A - - N/A - - - N/A
240,420 345,500 69.6% 240,420 700,180 34.3% 459,759 5,169 454,591 35.1%
0211 127000 Parks Forestry DivisionPersonnel Services 319,085 401,350 79.5% 319,085 812,269 39.3% 493,183 - 493,183 39.3%Materials and Services 45,301 86,675 52.3% 45,301 173,350 26.1% 128,049 4,623 123,427 28.8%Capital Outlay 8,767 - N/A 8,767 - N/A (8,767) - (8,767) N/A
373,153 488,025 76.5% 373,153 985,619 37.9% 612,466 4,623 607,843 38.3%
0411 123000 CIPPersonnel Services - - N/A - - N/A - - - N/AMaterials and Services 8,574 - N/A 8,574 - N/A (8,574) 12,626 (21,200) N/ACapital Outlay 264,301 1,930,000 13.7% 264,301 5,020,000 5.3% 4,755,699 254,453 4,501,246 10.3%
272,876 1,930,000 14.1% 272,876 5,020,000 5.4% 4,747,124 267,078 4,480,046 10.8%0731 121000 Equipment
Materials and Services 1,086 - N/A 1,086 - N/A (1,086) - (1,086) N/ACapital Outlay 142,591 150,000 95.1% 142,591 300,000 47.5% 157,409 - 157,409 47.5%
143,677 150,000 95.8% 143,677 300,000 47.9% 156,323 - 156,323 47.9%Totals
Personnel Services 3,354,222 4,593,709 73.0% 3,354,222 9,293,135 36.1% 5,938,913 - 5,036,517 36.1%Materials and Services 1,701,302 2,320,568 73.3% 1,701,302 4,655,913 36.5% 2,954,611 64,041 2,721,765 37.9%Capital Outlay 454,250 2,130,000 21.3% 454,250 5,420,000 8.4% 4,965,750 257,497 4,717,021 13.1%
Total Parks Department 5,509,774$ 9,044,277$ 60.9% 5,509,774$ 19,369,047$ 28.4% 13,859,274$ 321,538$ 12,475,302$ 30.1%
9. Mar20 FY20 Financial Report wih Live Cubes Links new format w y1 links.xlsx5/5/2020 40

ASHLAND PARKS & RECREATION COMMISSION
340 S PIONEER STREET • ASHLAND, OREGON 97520 COMMISSIONERS: Michael A. Black, AICP
Mike Gardiner Director Joel Heller Rick Landt
Jim Lewis
Julian Bell
541.488.5340 AshlandParksandRec.org [email protected]
PARKS COMMISSIONER STAFF REPORT TO: Ashland Parks and Recreation Commissioners FROM: Rachel Dials, Recreation Superintendent DATE: June 4, 2020 SUBJECT: COVID-19 Response Update Situation After 21 days in Phase 1, counties continuing to meet the prerequisites may be able to enter Phase 2. Jackson County has applied for Phase 2 and the application is still under review by the Governor. Phase 2 guidelines have been posted on the Governors website and at the time of this memo staff is still interpreting them. The guidelines are available here govstatus.egov.com/or-covid-19 Staff will have an update on APRC’s current response at the meeting on Wednesday.

1
ASHLAND PARKS & RECREATION COMMISSION
340 S PIONEER STREET • ASHLAND, OREGON 97520 COMMISSIONERS: Michael A. Black, AICP
Mike Gardiner Director Joel Heller Rick Landt
Jim Lewis
Julian Bell
541.488.5340 AshlandParksandRec.org [email protected]
STAFF REPORT To: Ashland Parks and Recreation Commissioners From: Michael Black, Parks and Recreation Director Date: June 4, 2020 Subject: June 10, 2020 COVID-19 Related Budget Reductions
SITUATION
Since the first announcements of virus-related social and physical restrictions, by the Governor on March 12, 2020, APRC has been ordered to stop the events, activities and programs that bring most of the revenue that supports our recreation division. We have previously reported the loss in revenue in the current biennium to be approximately $375,000. Several immediate steps were taken to respond to this revenue loss, including lay-offs and program changes.
Currently, we have more information about the projected losses in revenue for the coming fiscal year, including recreation revenue and general fund revenue reductions. This memo is intended to inform you of the new information and make recommendations on how to respond proportionally to those revenue reductions.
BACKGROUND
The yearly operating budget for APRC is $ 6,964,277. APRC employs 38.75 FTEs, and, depending on the season, dozens more part-time temporary employees. The organization is split into four distinct divisions: a) Administration; b) Parks Operations; c) Recreation; and, d) Senior Services. The Budget and FTE count for each of the divisions is as follows:
a) Administration: $ 1,289,198; 4 FTEs (includes Central Service Fees paid to the City) b) Parks Operations: $ 3,266,788; 20.5 FTEs c) Recreation: $2,062,791; 11.25 FTEs d) Senior Services: $ 345,500; 3 FTEs
Home of Famous Lithia Park

2
APRC receives the bulk of its revenue from property taxes, which are collected by the City of Ashland and distributed to APRC, consistent with City Charter. APRC operates a biennial budget, and the historical contribution to APRC from the City tax revenue is $2.09 per $1,000 of assessed property value in the City of Ashland.
With growing budget concerns that predate COVID-19, APRC has placed more emphasis on creating alternative revenue streams through the recreation program. In practice, we have increased our revenue earnings over the years through enhancements to our recreation program – which has also increased our dependence on these projected revenues.
Biennium 2019/21 General Budget Reductions
Although the historic amount needed to maintain the current park and recreation system is $2.09/$1,000 of assessed value, APRC received less revenue - $1.89 per $1,000 of assessed property value – in the current biennium. The result of the reduced budget was a significant decrease in operating revenues, which had a significant effect on operations for the biennium starting on July 1, 2019. At the time of the reduction in general fund (tax) revenue, APRC agreed to the reduction in revenue for the current biennium. It was clear at the time, that the entire City was experiencing perpetually increasing expenses with not enough revenue to go around, and we accepted our proportionate share of the impact.
Recreation revenue for services performed, such as classes, events, programs and food and beverage sales represent 12.3 % ($876,100) of the total APRC budgeted revenue and 42.5% of the recreation division’s total budget.
ASSESSMENT
Current Budget Situation Post-COVID-19 (projected to impact revenues through June)
APRC is very supportive of the Governor’s actions and we understand the necessity of those actions; however, the resulting impacts to recreation revenue are significant and inescapable.
The recreation division of APRC was projected to collect $877,000 in revenue in FY 19/20. This revenue was intended to offset expenses in the FY 19/20 biennium. The projected loss of revenue from the last week of March to the end of June is $372,000 – 45% of the total projected revenue of FY 19/20.
ACTIONS ALREADY TAKEN
To address the loss in revenue due to COVID-19, the following actions have been taken already to address the loss of revenue, as reported:
1. Staff who can be assigned to direct COVID-19 response efforts have been redeployed whenever possible. APRC is responsible for care and shelter in the City EOC, and our staff is engaged in those response efforts. Most of the staff involved with response efforts are in the recreation division, which will potentially allow for some reimbursements from federal disaster relief funding. Unfortunately, we do not know how much or when we will see this relief, if at all.

3
2. All line items in the current biennial budget have been re-evaluated, and the following line-item reductions have been made:
a. Park Patrol – ($29,000) b. Park Improvements – ($40,000)
3. No realistic alternative revenue sources during the COVID-19 restrictions have been identified. 4. All part-time temporary staff have been laid-off due to lack of work associated with the recreation
and park shutdown. a. A total of eight part-time temporary employees were laid off, for a potential savings of
$17,500 through FY 19/20. 5. The following full-time positions/staff were also laid-off through FY 19/20, at least. Decisions will be
made on the dispositions of these positions as a fuller picture of the COVID-19 impacts are clearer – as time passes:
a. Recreation Office Assistants – 2.75 FTEs – these positions are usually tasked with answering phones, setting up reservations, signing people up for classes and acting as reception for the Grove Recreation Center and the Nature Center.
b. Parks Custodial Workers – 2.0 FTEs – these positions are usually tasked with cleaning park restrooms in 18 parks and several facilities.
c. Parks Superintendent – 1.0 FTEs – The duties of the Parks Superintendent are largely administrative. This position is usually responsible for the administration of the parks maintenance division, budget management, and employee oversight of parks supervisors.
OUTLOOK BEYOND JUNE 2019
APRC staff is prepared to offer a scenario of projected revenue reductions and commensurate expense reductions that are necessary to manage the APRC budget without going over budget.
New Information on Revenue Reductions
In addition to the losses that we anticipate for the current fiscal year (about $372,000), we now project that Recreation revenue will be reduced a total of 25% (about $255,000) for the entire 20/21 fiscal year and the general fund revenue reductions – those funds we receive from the City of Ashland – will be reduced by $300,000.1
REVENUE IMPACTS
1. Fiscal Year 19/20: $372,000 2. Fiscal Year 20/21
a. Facility Rentals: $36,000 b. Golf Events: $5,000 c. General Rec.: $67,251 d. Pool: $54,000
1 This is a projection based on the best information that is available today. The City has reported that they expect a maximum of a $2.5 million reduction in their general fund. Since the majority of APRC’s funding comes from the City’s general fund, we will be impacted proportionally by the reduction in the City’s revenue.

4
e. Ice Rink: $15,013 f. Events: $6,700 g. Nature Center: $22,155 h. Senior Programs: $5,300 i. TOTAL: $211,419
3. General Fund Revenue Reduction: $300,000
TOTAL REVENUE LOSS FOR THE BIENNIUM 19/21: $883,419
EXPENSE REDUCTIONS
1. Expense Reductions Fiscal Year 19/20 a. Lay-Offs: $181,541 b. Reduction in Temporary Employees: $17,400 c. Park Improvements: $40,000 d. TOTAL: $239,041
2. Expense Reductions Fiscal Year 20/21 a. OPS Layoffs: $408,000 b. Rec. Layoffs: $84,768 c. COLA Reduction: $48,000 d. Furloughs (to be addressed below): $93,000 e. Pool Expenses: $7,000 f. 4th of July Run: $9,000 g. Summer Guide: $6,000 h. Park Patrol: $26,000 i. Pool Employee Expense: $78,000 j. Ice Rink Tent: $20,892 k. TOTAL: $780,732
TOTAL EXPENSE REDUCTION FOR THE 19/21 BIENNIUM: $1,019,773
ADDITIONAL EXPENSES
Staff is proposing to replace two full-time employees with a new custodial contract – this will be presented in a separate memo.
TOTAL EXPENSE INCREASE RESULTING FROM OUTSOURCING TO PATHWAYS: $167,504
Considering all the information above, the following should be true of the 19/21 Biennium:
1. Total Projected Revenue Loss: $883,419 2. Total Net Expense Reduction: $852,269, which is:
a. Total Expense Reduction $1,019,773; minus,
5
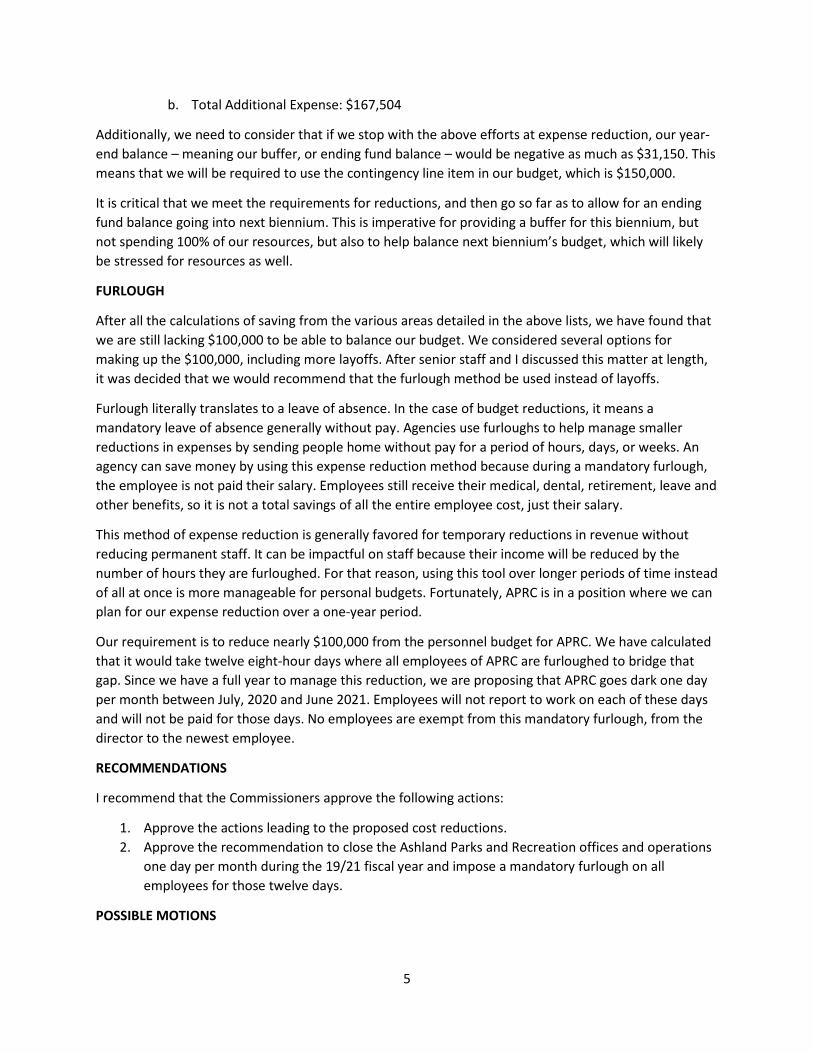
b. Total Additional Expense: $167,504
Additionally, we need to consider that if we stop with the above efforts at expense reduction, our year-end balance – meaning our buffer, or ending fund balance – would be negative as much as $31,150. This means that we will be required to use the contingency line item in our budget, which is $150,000.
It is critical that we meet the requirements for reductions, and then go so far as to allow for an ending fund balance going into next biennium. This is imperative for providing a buffer for this biennium, but not spending 100% of our resources, but also to help balance next biennium’s budget, which will likely be stressed for resources as well.
FURLOUGH
After all the calculations of saving from the various areas detailed in the above lists, we have found that we are still lacking $100,000 to be able to balance our budget. We considered several options for making up the $100,000, including more layoffs. After senior staff and I discussed this matter at length, it was decided that we would recommend that the furlough method be used instead of layoffs.
Furlough literally translates to a leave of absence. In the case of budget reductions, it means a mandatory leave of absence generally without pay. Agencies use furloughs to help manage smaller reductions in expenses by sending people home without pay for a period of hours, days, or weeks. An agency can save money by using this expense reduction method because during a mandatory furlough, the employee is not paid their salary. Employees still receive their medical, dental, retirement, leave and other benefits, so it is not a total savings of all the entire employee cost, just their salary.
This method of expense reduction is generally favored for temporary reductions in revenue without reducing permanent staff. It can be impactful on staff because their income will be reduced by the number of hours they are furloughed. For that reason, using this tool over longer periods of time instead of all at once is more manageable for personal budgets. Fortunately, APRC is in a position where we can plan for our expense reduction over a one-year period.
Our requirement is to reduce nearly $100,000 from the personnel budget for APRC. We have calculated that it would take twelve eight-hour days where all employees of APRC are furloughed to bridge that gap. Since we have a full year to manage this reduction, we are proposing that APRC goes dark one day per month between July, 2020 and June 2021. Employees will not report to work on each of these days and will not be paid for those days. No employees are exempt from this mandatory furlough, from the director to the newest employee.
RECOMMENDATIONS
I recommend that the Commissioners approve the following actions:
1. Approve the actions leading to the proposed cost reductions. 2. Approve the recommendation to close the Ashland Parks and Recreation offices and operations
one day per month during the 19/21 fiscal year and impose a mandatory furlough on all employees for those twelve days.
POSSIBLE MOTIONS

6
A. I move to approve the recommended reductions in expenses contained in the staff report for 2019/2021 Biennium.
B. I move to approve the recommendation to close the Ashland Parks and Recreation offices and operations one day per month during the 19/21 fiscal year and impose a mandatory furlough on all employees for those twelve days.

1
ASHLAND PARKS & RECREATION COMMISSION
340 S PIONEER STREET • ASHLAND, OREGON 97520 COMMISSIONERS: Michael A. Black, AICP
Mike Gardiner Director Joel Heller Rick Landt
Jim Lewis
Julian Bell
541.488.5340 AshlandParksandRec.org [email protected]
STAFF REPORT To: Ashland Parks and Recreation Commissioners From: Michael Black, Parks and Recreation Director Date: June 4, 2020 Subject: Capital Improvement Plan (CIP) Prioritization
SITUATION
Since the announcement of COVID 19 restrictions in Oregon in late March, Ashland Parks and Recreation Commission (“APRC”) has been experiencing losses to projected revenue that are unprecedented. Since the first announcements of virus-related social and physical restrictions, by the Governor on March 12, 2020, restaurants were ordered to close or go to take-out only. This is projected to have a drastic effect on Food and Beverage Tax (F&B) revenue.
BACKGROUND
APRC receives funds for Capital Improvement Projects from several sources. Those sources are: 1. Food and Beverage Tax; 2. SDC Fees; 3. Grants; and, 4. Loans/Bonds. Item 1. has been affected by COVID-19 due to restaurant restrictions and closures, and new projections are listed below. Items 2. and 3. may be affected by COVID-19 due to lower development and fewer SDC fees due to a potential recession and grants may be affected by reductions in funding for granting agencies. Number 4. is directly correlated to our ability to repay those loans, which relies on F&B Tax revenue.
ASSESSMENT
COVID-19 has affected our ability to accomplish our nearly $8.5 mil. Capital Improvement Plan (CIP). Our CIP requires review and reprioritization due to the anticipated reduction in funding. All projects are impacted either directly or indirectly from the current situation.
Pre-COVID Budget Expectations1
The CIP Projections for the current biennium were expected to be as represented below:
1 “Pre-COVID” refers to the time period prior to the first order from the Governor, dated March 12, 2020.

2
NEW BONDS
The total amount of the bond was approved for $2,900,000. Of the total, $2,600,000 was intended for the replacement of the Daniel Meyer Pool. The remaining $300,000 ($150,000 for Pickle Ball and $150,000 for Hunter Park Tennis Courts) was added to the pool needs for a total of $2,900,000.
APRC anticipated receiving a projected Food and Beverage Tax income of $750,000 per year. These funds are generally used for capital projects and purchasing land. APRC has used these funds in the past to secure revenue bonds to complete several large projects through the parks system, including Garfield Park and several Lithia Park projects. We have also used these funds to acquire new properties, like the recent purchase of the Hitt Road Property and the Briscoe School Park.
Due to the drastic decrease in revenue from the Food and Beverage Tax, the above bond scenario is no longer valid.
GRANTS
The grant category includes anticipated income from the Nature Playground at NMP (already received and already complete), a bike skills park at the new East Main Park ($225,000) and the Kestral Park pedestrian bridge ($500,000). This category also includes the Japanese Garden ($1,300,000).
At this point we are still anticipating the Japanese Garden grant coming through – the funds are already in the Ashland Parks Foundation’s accounts and the donor would like to move the project forward. The bike skills park and Kestral Park bridge were being managed by partner agencies – Rogue Valley Mountain Bike Assn. and the Bear Creek Greenway Foundation, respectively. Some impacts to grant availability may become a reality. That prospect is discussed below.
LAND SALES
APRC sold the YMCA Park property to the YMCA for a total of $480,000. We also sold a piece of the property adjacent to the YMCA Park to the City for a total of $120,000. The final piece of the total are

3
the surplus funds ($91,000) from the sale of the remaining property of the piece adjacent to the former YMCA Park to the Housing Authority of Jackson County.
SDCs
These funds come from building permits. Whenever a new building is constructed, the Building Division charges a calculated amount in that permit for Parks System Development Charges (SDCs). These funds are used to expand the parks system through new parks or new improvements to parks. We budgeted to receive $50,000 per year for SDCs.
FOOD & BEVERAGE TAX
This is the bulk of our revenue for the CIP budget. In the current biennium, we rolled forward $981,825 from the previous biennium, which was then added to the following revenue projections:
1. Food and Beverage Tax Revenue: a. FY19/20: Budgeted $756,900; New Projection $462,655 ($294,245 less than budgeted) b. FY20/21: Budgeted $753,844; New Projection $265,447 ($488,397 less than budgeted)
These funds are used for three categories of expenses:
1. Transfer to the Parks General Fund for project management and other project related operations costs: $185,000 per year or $370,000 for the full biennium.
2. Payments to bonds and other loans: about $185,000 per year, or $370,000 for the full biennium. 3. Parks Improvement. The remaining F&B funds – after debt payments and transfers to the
operations budget, which is about $1,750,000 – goes to pay for current projects like the Mace Property Trail, new playgrounds, the All Parks Master Plan, etc. ( a list of all the projects is later in this memo)
APRC has three current revenue bonds in place that are secured by the Food and Beverage Tax, as well as the anticipated addition of a fourth revenue bond for the DMP. Those encumbrances are directly below:

4
Post-COVID Budget Expectations2
Budget expectations have changed drastically due to COVID-19. New F&B income is expected to be half of what was budgeted. Again, here is the breakdown of the pre and post-COVID F&B projections:
1. Food and Beverage Tax Revenue: a. FY19/20: Budgeted $756,900; New Projection $462,655 ($294,245 less than budgeted) b. FY20/21: Budgeted $753,844; New Projection $265,447 ($488,397 less than budgeted)
The chart below shows only the new projections, post-COVID:
NEW BONDS
Due to the drastic decrease in revenue from the Food and Beverage Tax, the bond scenario mentioned above for the DMP is no longer valid. The Parks Commissioners have voted to reconsider the bond, and we are looking forward to hearing your direction regarding future bonds at the meeting.
Some of the scenarios, but not all, that could be considered regarding the former DMP bond are:
1. Do not attempt to issue the Bond, and find another way to fund the projects, such as grants, donations, etc.
2. Attempt to reissue the Bond, and: a. Use whatever remaining F&B funds to attempt to secure the first year of Bond
payments. b. If it is anticipated that the impact from the COVID-19 closure of restaurants is
temporary, we could, potentially, provide security of $325,000 (if you choose to do all of
2 When we use the term ”post-COVID” we are only referring to the time period after the first financial impacts of the pandemic. We do not intend to imply that the impacts of the pandemic are in the past.
F&B, 1,709,927
SDC, 100,000 Land Sales, 691,000
Grants , 1,500,000
NEW Bonds ? -
CIP REVENUE POST-COVID

5
the projects) for the first years Bond payment and continue the remaining payments with future F&B income.3
3. Try to limp the current pool along for another few years, with some major capital improvements to the pool and the operating system.4
Other scenarios certainly exist, and we look forward to hearing the ideas and direction of the Commissioners.
GRANTS
At this point it is hard to speculate whether the granting agencies will be reducing their grant offerings due to their own COVID-19 related budget impacts. The Nature Playground is already finished and paid for but grants for a bike skills park at the new East Main Park ($225,000) and the Kestral Park pedestrian bridge ($500,000) may be affected by COVID-19. The aforementioned grants are being sought by partner groups (RVMBA and BCGF) and I wouldn’t want to stifle their attempt to get these grants, but I do think it is reasonable to think that there will be an affect to some granting agencies that use funds from Lotto and other sources affected by consumer spending.
At this point we are still anticipating the Japanese Garden grant coming through – the funds are already in the Ashland Parks Foundation’s accounts.
LAND SALES
This category is not affected by COVID-19.
APRC sold the YMCA Park property to the YMCA for a total of $480,000. We also sold a piece of the property adjacent to the YMCA to the City for a total of $120,000. The final piece of the total were the funds ($91,000) from the sale of the remaining property of the piece adjacent to the former YMCA Park to the Housing Authority of Jackson County.
SDCs
It does not appear, at this time, that this category will be affected by COVID-19. Building is still taking place, and we generally estimate low on this category because of the volatility of the building market. We budgeted to receive $50,000 per year for SDCs.
FOOD & BEVERAGE TAX
We are currently expecting that the revenue coming in to APRC from F&B will be half of what was budgeted. Again, here are the projections:
1. Food and Beverage Tax Revenue:
a. FY19/20 New Projection $462,655 ($294,245 less than budgeted)
3 This assumes that the banks will be issuing revenue bonds at this time. 4 We do not have a figure on what the improvements would cost at this point.

6
b. FY20/21 New Projection $265,447 ($488,397 less than budgeted) APRC has several financial obligations that are required to be met prior to any additional spending from this category. Those requirements are current bond payments (see chart below) and transfers to the operations budget for project management and other project related operations costs ($185,000 per year or $370,000 for the full biennium).
Together, the requirements for our financial obligations are $740,000 for the biennium. Those two obligations are listed below:
As of June 1, 2020, there are six projects that staff suggests are critical to continue with a total expense of $537,000. These projects are generally those that have already begun and we have some accountability to complete those. Those are listed below:
Garfield Briscoe Calle TOTAL2020 98,239.60$ 50,000.00$ 36,581.26$ 184,820.86$ 2021 98,363.40$ 50,000.00$ 40,931.26$ 189,294.66$ 2022 97,455.40$ 50,000.00$ 40,231.26$ 187,686.66$ 2023 97,515.60$ 50,000.00$ 39,531.26$ 187,046.86$ 2024 97,533.40$ 50,000.00$ 38,831.26$ 186,364.66$ 2025 48,508.80$ 50,000.00$ 38,109.38$ 136,618.18$ 2026 50,000.00$ 37,343.75$ 87,343.75$ 2027 50,000.00$ 41,475.00$ 91,475.00$ 2028 40,500.00$ 40,500.00$ 2029 -$ 2030 -$
Food and Beverage Tax Encumerance until 2030
REQUIRED PROJECTS (BONDS & BUDGET REQ.) BUDGETProject Manager/Operations Transfer 370,000.00$
Debt Payments (Calle, Briscoe, Garfield) 370,000.00$
TOTAL REQUIRED PROJECTS 740,000.00$
CRITICAL PROJECTS (ALREADY UNDERWAY) BUDGETDaniel Meyer Pool - Design Only 161,000.00$
Real Estate Acquisition 109,000.00$
Oak Knoll CIP 000581 32,000.00$
Mace Property Trail 150,000.00$
Kestral Bridge 35,000.00$
TID Improvements 50,000.00$
TOTAL CRITICAL PROJECTS 537,000.00$

7
The remaining funds that could be expended on capital projects from F&B, after the Required and Critical Projects listed above are accounted for, is approximately $450,000. The total of the remaining projects below is over $1.5 million.5
All CIP projects that are funded by the F&B Tax need to be reviewed and a reprioritization needs to take place. The focus of the reprioritization process should be the desirability of the 10 projects immediately above. The Commissioners could reevaluate the critical projects as well, but staff recommends that all those projects go forward as proposed.
APRC is fortunate to still have $450,000 that can be used to fund projects for this biennium. The 10 projects above all have varying levels of necessity. I won’t go into those here, but it should suffice to say that all of the projects above are important to some segment of the Ashland population. The actual CIP plan was developed based on a lot of feedback from the community; however, the premise that was used to create the plan – meaning the projected F&B resources in 2018 when the budget was approved – is no longer the same. It has changed drastically, and we must now change the CIP drastically as a result. We simply cannot do all the projects that we anticipated going into this biennium.
RECEOMENDATION
There are 10 projects that require reprioritization. Those projects are (in no particular order):
• Repair Perozzi Fountain • East Main Park Development • Daniel Meyer Pool Rebuild • Lithia Park Improvements
5 The cost of the pool is included in two ways in the table. The first is the cost it would be to set aside the funds to pay for the total revenue bond as was proposed ($325,000) and the second is the total cost of the pool (2,600,000). Prior to now, it wasn’t anticipated that we would pay for the first year of the bond until next biennium; however, I have included the cost of the bond in this biennium in case the commissioners wish to use F&B funds from this biennium to secure the first payment of the bond.
DESIRABLE PROJECTS (APPROX. $450,000,000 AVAILABLE FOR THESE PROJECTS) BUDGETRepair Perozzi Fountain @ Lithia Park 25,000.00$
East Main Park Development 350,000.00$
Daniel Meyer Pool Rebuild $325,00/YEAR $2,600,000 TOTAL
Lithia Park Improvements 121,185.00$
All Parks Master Plan 300,000.00$
Oak Knoll Playground 113,000.00$
Senior Center Improvements 50,000.00$
Ashland Creek Park Basketball Court 50,000.00$
Build Dedicated Pickle-Ball Courts 175,000.00$
Bike Skills Park 25,000.00$
TOTAL DESIRABLE PROJECTS 1,534,185.00$
8
• All Parks Master Plan • Oak Knoll Playground • Senior Center Improvements • Ashland Creek Park Basketball Court • Dedicated Pickle Ball Courts • Bike Skill Park
I will send each Commissioner a list of these projects in an email. I am recommending that each Commissioner review the projects and the information provided and rank the list of projects 1-10 – with one being the highest priority and 10 being the lowest priority. You can use any method you want to rank these, but I suggest that you do not use the cost of the project as the only factor in your ranking. It is true that we only have a certain amount of funding, but the priority should be based on what you think is the most important, not the most achievable based on funds. Staff will then work out the scenarios for funding the highest priority projects. Or at least we will do our best in identifying options to fund the highest priority projects.