№60/2021 Norwegian Journal of development of the International ...
57
№60/2021 Norwegian Journal of development of the International Science ISSN 3453-9875 VOL.1 It was established in November 2016 with support from the Norwegian Academy of Science. DESCRIPTION The Scientific journal “Norwegian Journal of development of the International Science” is issued 24 times a year and is a scientific publication on topical problems of science. Editor in chief – Karin Kristiansen (University of Oslo, Norway) The assistant of theeditor in chief – Olof Hansen • James Smith (University of Birmingham, UK) • Kristian Nilsen (University Centre in Svalbard, Norway) • Arne Jensen (Norwegian University of Science and Technology, Norway) • Sander Svein (University of Tromsø, Norway) • Lena Meyer (University of Gothenburg, Sweden) • Hans Rasmussen (University of Southern Denmark, Denmark) • Chantal Girard (ESC Rennes School of Business, France) • Ann Claes (University of Groningen, Netherlands) • Ingrid Karlsen (University of Oslo, Norway) • Terje Gruterson (Norwegian Institute of Public Health, Norway) • Sander Langfjord (University Hospital, Norway) • Fredrik Mardosas (Oslo and Akershus University College, Norway) • Emil Berger (Ministry of Agriculture and Food, Norway) • Sofie Olsen (BioFokus, Norway) • Rolf Ulrich Becker (University of Duisburg-Essen, Germany) • Lutz Jäncke (University of Zürich, Switzerland) • Elizabeth Davies (University of Glasgow, UK) • Chan Jiang(Peking University, China) and other independent experts 1000 copies Norwegian Journal of development of the International Science Iduns gate 4A, 0178, Oslo, Norway email: [email protected] site: http://www.njd-iscience.com
-
Upload
khangminh22 -
Category
Documents
-
view
1 -
download
0
Transcript of №60/2021 Norwegian Journal of development of the International ...

№60/2021
Norwegian Journal of development of the International Science
ISSN 3453-9875
VOL.1
It was established in November 2016 with support from the Norwegian Academy of Science.
DESCRIPTION
The Scientific journal “Norwegian Journal of development of the International Science” is issued 24 times a year
and is a scientific publication on topical problems of science.
Editor in chief – Karin Kristiansen (University of Oslo, Norway)
The assistant of theeditor in chief – Olof Hansen
• James Smith (University of Birmingham, UK)
• Kristian Nilsen (University Centre in Svalbard, Norway)
• Arne Jensen (Norwegian University of Science and Technology, Norway)
• Sander Svein (University of Tromsø, Norway)
• Lena Meyer (University of Gothenburg, Sweden)
• Hans Rasmussen (University of Southern Denmark, Denmark)
• Chantal Girard (ESC Rennes School of Business, France)
• Ann Claes (University of Groningen, Netherlands)
• Ingrid Karlsen (University of Oslo, Norway)
• Terje Gruterson (Norwegian Institute of Public Health, Norway)
• Sander Langfjord (University Hospital, Norway)
• Fredrik Mardosas (Oslo and Akershus University College, Norway)
• Emil Berger (Ministry of Agriculture and Food, Norway)
• Sofie Olsen (BioFokus, Norway)
• Rolf Ulrich Becker (University of Duisburg-Essen, Germany)
• Lutz Jäncke (University of Zürich, Switzerland)
• Elizabeth Davies (University of Glasgow, UK)
• Chan Jiang(Peking University, China) and other independent experts
1000 copies
Norwegian Journal of development of the International Science
Iduns gate 4A, 0178, Oslo, Norway
email: [email protected]
site: http://www.njd-iscience.com

CONTENT
AGRICULTURAL SCIENCES Tkachuk O., Vergelis V. INTENSITY OF LEGUMINAL PERENNIAL GRASSES GREEN MASS FORMATION DEPENDING ON WEATHER CONDITIONS OF VEGETATION .................................... 3
ECONOMIC SCIENCES Grigan N. STRATEGIC ANALYSIS OF XIAOMI IN RUSSIA: SWOT AND PEST ANALYSIS .................................................. 10 Fostolovych V., Hurtovyi O. INNOVATIVE DEVELOPMENT OF ENTERPRISES IN THE POST-INDUSTRIAL MANAGEMENT SYSTEM .............. 17
Shogelbaeva G.K. HOTEL INDUSTRY IN KAZAKHSTAN: ANALYTICAL REVIEW ...................................................................... 28
TECHNICAL SCIENCES Nikolaenko V., Kozin G., Prokopovich M. HYDRAULIC CONVERTER OF THE VEHICLE ................ 33 Ovcharuk V., Yushchuk I. USE OF E-LEARNING TECHNOLOGIES IN THE EDUCATIOSNAL PROCESS .......................................... 35 Saptsin V. CARGO PASSING SPECIAL FACILITIES AS PART OF HYDRAULIC STRUCTURES .......................................... 39
Shyshkin A. FORMATION OF CONCRETE PROPERTIES WHEN USING FILLED MICELLES OF SURFACE-ACTIVE SUBSTANCES .............................................................. 49 Shyshkina А. FORMATION OF CONCRETE PROPERTIES WITH STRUCTURED WATER ................................................ 53

Norwegian Journal of development of the International Science No 60/2021 3
AGRICULTURAL SCIENCES
INTENSITY OF LEGUMINAL PERENNIAL GRASSES GREEN MASS FORMATION DEPENDING
ON WEATHER CONDITIONS OF VEGETATION
Tkachuk O.,
Doctor of Agricultural Sciences,
Associate Professor of Ecology and Environmental Protection
Vinnytsia National Agrarian University
Vinnytsia, Ukraine
Vergelis V.
Assistant of the Department of Ecology and Environmental Protection
Vinnytsia National Agrarian University
Vinnytsia, Ukraine
DOI: 10.24412/3453-9875-2021-60-1-3-9
Abstract
In the first year of the growing season, the largest average daily gains of green mass by the first cut are sand
sainfoin (Onobrychis arenaria Kit.) and white clover (Melilotus albus L.), and by the second cut - in addition to
these species - also Lotus corniculatus L. The most efficient use of natural resources for the formation of the
vegetative mass of the second year of vegetation by the first cut is white clover (Melilotus albus L.) and eastern
goatweed (Galega orientalis Lam.), in the second cut - meadow clover (Trifolium pratense L.) and alfalfa (Medi-
cago) sativa L.), by the third cut - bird's-foot trefoil (Lotus corniculatus L.), in the third year of life - respectively
sand sainfoin (Onobrychis arenaria Kit.) and eastern goatweed (Galega orientalis Lam.); alfalfa (Medicago sativa
L.); bird's-foot trefoil (Lotus corniculatus L.), in the fourth year - sand sainfoin (Onobrychis arenaria Kit.); alfalfa
(Medicago sativa L.) and sainfoin (Onobrychis arenaria Kit.).
Keywords: legumes, perennial grasses, vegetative mass, intensity, vegetation, weather conditions.
Formulation of the problem
Perennial legumes are primarily a balanced and
complete feed for the livestock sector of agricultural
production, so when choosing types of perennial leg-
umes for different soil and climatic conditions of culti-
vation, take into account their yield, suitability for a
particular type of feed, sustainability in the agroecosys-
tem, and their ecological role in relation to the complex
impact on the soil and subsequent crops in crop rotation
[1].
Of particular importance are perennial legumes in
field lands and natural forage lands, which are not only
an important source of feed, but also a major factor in
the biologization of agriculture. With limited resource
provision of agriculture, when the balance of soil or-
ganic matter is unfavorable, the importance of biologi-
zation of agriculture increases, as the annual costs of
humus mineralization are very significant [2].
Leguminous perennial grasses are extremely im-
portant in solving the problem of resource conservation
and stabilization of crop yields, because their cultiva-
tion consumes 2-3 times less energy compared to cere-
als and row crops [3].
Optimizing the structure of sown areas of legumi-
nous perennial grasses and increasing the productivity
of forage crops will reduce the humus deficit by 20-
25%, and the supply of biological nitrogen will increase
by 2 times. Forage production is one of the main stabi-
lizing factors, which can ensure not only productivity
but also the sustainability of agricultural landscapes.
However, due to global warming, it is important to op-
timize the species structure of perennial legumes [4].
Analysis of recent research and publications
In the structure of field fodder crops the largest
share should be occupied by leguminous perennial
grasses, the sown areas of which must be restored to the
norms recommended for the Forest-Steppe zone of 45-
50%. Among perennial legumes, a special place is
given to alfalfa – the most productive and least energy-
intensive high-protein crop. In the Forest-Steppe, it
should occupy 50-60% of all crops of leguminous per-
ennial grasses. On acid soils, meadow clover is prefer-
able. For dry lands you need to use sand sainfoin [5-7].
One of the decisive factors in the choice of grasses
in the conditions of climate change is their adaptability
to periodic during the growing season lack of moisture.
This is facilitated by the deep development of the root
system of herbs, which is primarily characteristic of al-
falfa. It is able to quickly restore growth while improv-
ing moisture supply. In addition, the placement of al-
falfa on poor and acidic soils limits root growth and re-
duces drought resistance. Bird's-foot trefoil has less
resistance to drought than alfalfa. Its root system is well
branched and penetrates to a depth of 1.5 m and is well
adapted to acidic and poor soils. Oriental goatweed is
also drought-resistant, but grows well with neutral acid-
ity and fertile soils with high water holding capacity [8-
10].
Alfalfa has been grown in the Forest-Steppe since
ancient times, is better adapted to soil and climatic fac-
tors and changes in growing conditions, is character-
ized by plasticity, durability, polygamy, high fodder
value and provides the highest yield of leaf mass and
nutrient yield with the highest energy efficiency. There-
fore, today it remains the main legume of the Forest-
Steppe. However, the use of sainfoin, bird's-foot trefoil,

4 Norwegian Journal of development of the International Science No 60/2021
white clover and eastern goatweed should be comple-
mentary with the maximum use of their biological char-
acteristics in specific soil and climatic conditions. In
particular, sand sainfoin has a constant seed productiv-
ity, early achievement of mowing maturity in the first
cut and high biological resistance to adverse growing
conditions. White clover has the ability to form high
yields of green mass on sandy, infertile and saline soils,
high drought resistance and winter hardiness. Bird's-
foot trefoil has productive longevity and the ability to
grow on low-yielding and acidic soils. In the eastern
goatweed - it is productive longevity, high biological
plasticity. The benefits of these herbs will allow you to
get a higher yield than alfalfa [11-13].
Selection of previously unsolved parts of the
overall problem
As to the mentioned above, it is necessary to es-
tablish the intensity of growth of green mass of legumi-
nous perennial grasses taking into account weather fac-
tors, which will allow to choose for the production con-
ditions of the Forest-Steppe Right Bank of Ukraine
those types of leguminous perennial grasses that can
form a high yield of green mass in a short period of
time. minimum amount of natural resources, including
moisture and heat.
The purpose of the article
The aim of the research was to establish the inten-
sity of green mass formation by six species of perennial
legumes: alfalfa (Medicago sativa L.), meadow clover
(Trifolium pratense L.), sand sainfoin (Onobrychis are-
naria Kit.), white clover (Melilotus albus L.), bird's-
foot trefoil (Lotus corniculatus L.) and eastern goat-
weed (Galega orientalis Lam.). The intensity of green
mass formation means the amount of harvest formed by
plants in one day per unit area.
Field research was conducted during 2013-2017 at
the Research Farm (SRF) “Agronomichne” of Vinny-
tsia National Agrarian University. The field of the ex-
perimental plot has a wide undulating relief, the flat
lands are dominated by slopes. The surface of water-
shed plateaus is leveled, its slope does not exceed 2-3
°, so the surface runoff of atmospheric and meltwater is
slow and soil erosion is almost absent. The soil is mois-
tened due to precipitation, the groundwater level is at a
depth of 10-15 m.
The soil at the experimental site is gray podzolic
medium loam. The agrochemical composition of the
soil of the experimental site is characterized by the fol-
lowing indicators: humus content – 2.0%, hydrolyzed
nitrogen (according to Cornfield) – 133 mg / kg of soil
– low, mobile forms of phosphorus (according to Chi-
rikov) – 390 mg / kg of soil – very high, mobile forms
of potassium (according to Chirikov) – 64 mg / kg of
soil – medium, calcium – 130 mg / kg of soil – suffi-
cient, hydrolytic acidity – 2.53 mg.-eq./100 g of soil –
increased, the reaction of the soil solution pH. 5.0 – me-
dium acid. Providing the site with trace elements: cop-
per – 5.4 mg / kg of soil, zinc – 6.0 mg / kg of soil,
heavy metal content: lead – 1.4 mg / kg of soil, cad-
mium – not detected.
One of the important factors influencing the inten-
sity of plant formation of vegetative mass is the weather
conditions in the years of study. During the 2013 calen-
dar year, 652 mm of precipitation, which is 18 mm
more than the average long-term value (634 mm), with
an average annual temperature of 9.0 ºC, which is 2.0
ºC higher than the norm (7.0 ºC). The growing season
began in the first decade of April and ended in the sec-
ond decade of November. During the growing season,
429 mm of precipitation fell. The hydrothermal coeffi-
cient (HTC) for the calendar year was 1.38 with a long-
term value of the hydrothermal coefficient of 1.52 (Ta-
ble 1).
Table 1.
Weather conditions in the years of research
(according to the Vinnytsia Regional Hydrometeorological Center)
Indexes Long-term
indicator
Years of research
2013 2014 2015 2016 2017
Average annual temperature, ° C 7,0 9,0 8,6 9,3 9,0 9,1
Average temperature during the growing season, ° С 12,4 16,0 13,6 15,8 16,7 14,6
The amount of precipitation per year, mm 634 652 550 368 469 503
The amount of precipitation during the growing season, mm 451 429 379 263 217 315
HTC for the year 1,52 1,38 1,50 0,69 0,54 0,86
In 2014, the amount of precipitation was 550 mm,
which was 86.8% of the long-term average. The aver-
age annual temperature was 8.6 ºC, which is 1.6 ºC
higher than the long-term average. The growing season
began in the second decade of March and lasted until
the end of the first decade of November. During the
growing season the amount of precipitation was 442
mm. HTC was 1.50.
In 2015, 368 mm of precipitation fell, which was
only 58% of the average long-term data. The average
annual temperature was 9.3 ºC, which is 2.3 ºC higher
than the average long-term temperature. The growing
season for the growth and development of perennial
legumes began in the third decade of March and lasted
until the second decade of November. During the grow-
ing season 235 mm of precipitation fell. HTC was 0.69,
which indicates very unfavorable conditions for vege-
tation and crop formation.
In 2016, the average annual temperature was 9.0
ºС, which is 2 ºС above the norm. The amount of pre-
cipitation during the year was 469 mm, which is 26%
less than normal. The growing season began in early
April and lasted until the end of September. The hydro-
thermal coefficient was 0.54, which corresponds to ex-
tremely arid vegetation conditions of plants. 2017 was characterized by an average annual tem-
perature of 9.1 ºC, which is 2.1 ºC above normal. The amount of precipitation for the year was 503 mm, which corresponds to 80% of the long-term norm. HTC

Norwegian Journal of development of the International Science No 60/2021 5
was 0.86, which corresponds to unfavorable growing conditions.
Thus, based on the analysis, it was found that the most favorable growing conditions, taking into account the temperature and humidity levels, were in 2014, which corresponds to the second year of growing per-ennial legumes. The most unfavorable growing condi-tions were typical for 2016, when the grasses grew for the fourth year.
Sowing of perennial legumes was carried out in 2013 in a coverless manner in the early spring with the introduction of herbicides. To reduce the acidity of the soil was carried out liming of the experimental site. The formed crop of green mass of grasses was mowed in the phase of the beginning of flowering of plants. Perennial legumes have been grown for four years. Annual mow-ing was performed up to three times during the growing season.
Repeated experiments four times. The estimated area of each field experiment is 50 m2, the total area of the area is 70 m2. Variants in the experiment are placed systematically in 6 blocks.
The following records and observations were per-formed: phenological observations - roughly on the ba-sis of visual observations of the onset of phases of plant development with counting the number of days from germination or restoration of plant vegetation to mow-ing [14]; accounting for the yield of green mass of per-ennial legumes - in a continuous way by mowing and weighing all the green mass from the accounting area [14]; foliage of the vegetative mass - by weighing plants and their leaves [15]; clogging of the green mass - a method of analysis and subsequent weighing of sheaf samples [16].
Presenting the main material In the formation of the vegetative mass of legumi-
nous perennial grasses, the rate of its growth is of par-
amount importance. After all, crops can generate sig-nificant yields throughout the growing season, using a significant amount of natural and climatic resources. This requires the establishment of average daily gains in green mass of perennial legumes.
The largest average daily increases in vegetative mass in the first year of vegetation of perennial grasses in the first cut were observed in white clover (Melilotus albus L.) – 483.8 kg / ha per day and in sand sainfoin (Onobrychis arenaria Kit.) – 483.9 kg / ha per day. High average daily growth in sand sainfoin (On-obrychis arenaria Kit.) was observed due to the for-mation of a significant vegetative mass – 30.0 t / ha in a short time – 52 days after germination, and white clo-ver (Melilotus albus L.) – only due to high yield – 38.7 t / ha. 1.3 times lower average daily gains were ob-served in plants of alfalfa (Medicago sativa L.), 1.58 times – in bird's-foot trefoil (Lotus corniculatus L.) and 1.62 times – in meadow clover (Trifolium pratense L.). Due to almost no growth in the year of sowing of east-ern goatweed (Galega orientalis Lam.). Its average daily gain was only 92.9 kg / ha per day (Table 2).
In the second cut of the first year of vegetation, the highest average daily gains of green mass were ob-served in bird’s-foot trefoil (Lotus corniculatus L.), white clover (Melilotus albus L.) and sand sainfoin (Onobrychis arenaria Kit.), which amounted to 293.5-296.9 kg / ha per day. Lotus corniculatus (L.) achieved this indicator due to the short interval of formation of the second cut – 13 days after the beginning of re-growth, white clover (Melilotus albus L.) – due to high yield - 20.7 t / ha, and sand sainfoin ( Onobrychis are-naria Kit.) – due to a combination of yield and early maturity. The average daily gains in alfalfa (Medicago sativa L.) were 1.24 times less than in bird’s-foot trefoil (Lotus corniculatus L.), and in meadow clover (Trifo-lium pratense L.) – 1.62 times less.
Table 2 Average daily growth of green mass of perennial legumes
grasses in the year of sowing (SRF "Agronomichne")
Perennial legumes grasses
Gains, kg / ha per day, depending on the cut
1 2 3
Alfalfa (Medicago sativa L.) 371,4 239,2 -
Meadow clover (Trifolium pratense L.) 298,8 183,8 -
Sand sainfoin (Onobrychis arenaria Kit.) 483,9 293.5 -
White clover (Melilotus albus L.) 483,8 295,7 -
Bird's-foot trefoil (Lotus corniculatus L.) 306,7 296,9 177,6
Eastern goatweed (Galеga orientаlis Lam.) 92,9 - -
The average daily gain of vegetative mass of per-
ennial legumes in the second cut decreased by 35.6-39.0%, compared with the first cut in alfalfa (Medicago sativa L.), clover (Trifolium pratense L.), sand sainfoin (Onobrychis arenaria Kit .) and white clover (Melilotus albus L.), and in the bird’s-foot trefoil (Lotus cornicu-latus L.) remained virtually unchanged. Only in the third cut the average daily increments of Lotus cornic-ulatus L. decreased by 40% compared to the first and second cuts.
Summarizing the results of research to study the intensity of the yield formation of green mass of peren-nial legumes in the year of sowing, it should be noted:
- according to the ratio "yield of green mass – speed of its formation" in the first cut white clover (Melilotus albus L.) and sand sainfoin (Onobrychis are-naria Kit.) prevail;
- еastern goat has the lowest average daily gains (Galega orientalis Lam.);
- in the second cut the largest average daily gains were observed in sand sainfoin (Onobrychis arenaria Kit.), white clover (Melilotus albus L.) and bird’s-foot trefoil (Lotus corniculatus L.);
- high average daily growth of white clover (Mel-ilotus albus L.) is achieved due to the formation of a large vegetative mass, bird’s-foot trefoil (Lotus cornic-ulatus L.) – due to early ripening, and sand sainfoin (Onobrychis arenaria Kit.) – due to a combination of both indicators;
- in most leguminous perennial grasses, the aver-age daily gain in the second cut is reduced by 35–40%, and in the bird’s-foot trefoil (Lotus corniculatus L.) – in the third cut.

6 Norwegian Journal of development of the International Science No 60/2021
In the first cut of the first year of vegetation, the highest foliage is observed in the plants of the eastern goatweed (Galega orientalis Lam.) – 57.9% and white clover (Melilotus albus L.) – 51.3%. This is explained
by the fact that these types of leguminous perennial grasses in the year of sowing form only vegetative shoots, and the phases of budding and flowering do not reach (Table 3).
Table 3
Foliage and littering of green mass of perennial legumes
in the year of sowing (SRF "Agronomichne")
Perennial legumes grasses
%, depending on the cut Average, %
1 2 3
foli
age
litt
erin
g
foli
age
litt
erin
g
foli
age
litt
erin
g
foli
age
litt
erin
g
Alfalfa (Medicago sativa L.) 36,3 11,2 43,4 3,9 - - 39,9 7,6
Meadow clover (Trifolium pratense L.) 36,8 21,0 48,7 2,3 - - 42,8 11,7
Sand sainfoin (Onobrychis arenaria Kit.) 33,0 13,8 32,9 6,1 - - 33,0 10,0
White clover (Melilotus albus L.) 51,3 4,8 53,0 5,7 - - 52,2 5,3
Bird's-foot trefoil (Lotus corniculatus L.) 44,0 8,5 45,5 20,2 50,0 26,7 46,5 18,5
Eastern goatweed (Galеga orientаlis Lam.) 57,9 8,9 - - - - 57,9 8,9
The foliage of the green mass of lotus corniculatus
(Lotus corniculatus L.) was 44.0%, and other types of
perennial legumes – 33.0-36.8%.
In the second cut, the foliage of meadow clover
(Trifolium pratense L.) increases by 11.9% to 48.7%
and alfalfa (Medicago sativa L.) by 7.1% to 43.4%. The
foliage of sainfoin (Onobrychis arenaria Kit.), white
clover (Melilotus albus L.) and bird’s-foot trefoil (Lo-
tus corniculatus L.), almost did not change compared
to the first cut. The highest foliage was observed in
white cranberry (Melilotus albus L.) – 53.0%, which,
compared to other types of leguminous perennial
grasses, does not form peduncles.
The infestation of green mass of perennial leg-
umes with weeds in the first cut is the lowest in white
clover (Melilotus albus L.) – 4.8%, due to the large veg-
etative mass and its intensive growth, which signifi-
cantly suppresses weeds. The largest litter of green
mass of meadow clover (Trifolium pratense L.) –
21.0% – is due to its slow growth.
Contamination of the second cut of leguminous
perennial grasses, except for lovage (Lotus corniculatus
L.) decreased by 2.3-9.1 times, which is facilitated by
faster growth of vegetative mass and dry weather. The
share of weeds in their vegetative mass in the second
cut was 2.3-5.7%. Only in the green mass of Lotus cor-
niculatus L. the litter increases to 20.2% due to low
grass cover in the second and subsequent cuts, which is
not competitive with weeds.
Summarizing the results of studies on the foliage
and litter of green mass of perennial legumes in the year
of sowing, it should be noted:
- perennial grasses that do not form generative
stems have the highest foliage in the first cut
- white clover (Melilotus albus L.) and eastern
goatweed (Galega orientalis Lam.), as well as bird's-
foot trefoil (Lotus corniculatus L.); other types of legu-
minous perennial grasses have a foliage 1.5 times less
than specified;
- in the second cut, due to a significant reduction
of flower shoots, the foliage of alfalfa (Medicago sativa
L.) and meadow clover (Trifolium pratense L.) in-
creases by 7-12%;
- leguminous perennial grasses, which in the sec-
ond cut form the same number of flower shoots with
the first cut – sand sainfoin (Onobrychis arenaria Kit.)
and bird's-foot trefoil (Lotus corniculatus L.) – have the
same foliage in the second cut.
For the second and subsequent years of vegetation
in the first cut, the foliage of perennial legumes in the
early flowering phase was 38.0-45.3% and only sand
sainfoin (Onobrychis arenaria Kit.) – 25.9%. This is
due to the formation of an extremely large yield of sand
sainfoin (Onobrychis arenaria Kit.) and, accordingly,
the coarsening of the green mass. The highest was the
foliage of plants of alfalfa (Medicago sativa L.) and
eastern goatweed (Galega orientalis Lam.) (Table 4).
Table 4.
Foliage and litter of green mass of leguminous perennial grasses in the second or fourth years of the growing
season (SRF "Agronomichne", average 2013-2017)
Perennial legumes grasses
%, depending on the cut Average, %
1 2 3
foli
age
litt
erin
g
foli
age
litt
erin
g
foli
age
litt
erin
g
foli
age
litt
erin
g
Alfalfa (Medicago sativa L.) 45,3 9,2 48,2 2,9 49,0 2,5 47,5 4,9
Meadow clover (Trifolium pratense L.) 38,0 4,5 39,0 25,0 45,5 1,8 40,8 10,4
Sand sainfoin (Onobrychis arenaria Kit.) 25,9 2,7 38,5 31,7 50,0 9,7 38,1 14,7
White clover (Melilotus albus L.) 39,2 0,4 - - - - 39,2 0,4
Bird's-foot trefoil (Lotus corniculatus L.) 38,7 6,1 45,5 4,0 56,3 5,9 46,8 5,3
Eastern goatweed (Galеga orientаlis Lam.) 41,5 1,0 59,0 2,0 - - 46,8 1,5

Norwegian Journal of development of the International Science No 60/2021 7
In the second cut, the foliage of leguminous per-
ennial grasses increased by 1-17% and amounted to
38.5-59.0%. It was the largest in the eastern goatweed
(Galega orientalis Lam.), which in the second cut
reaches the phase of single flowering and thus well
leafy, and the smallest – in meadow clover (Trifolium
pratense L.) and sand sainfoin (Onobrychis arenaria
Kit.). In the third cut, the foliage of perennial legumes
was 45.5-56.3%, which is 1-12% more than in the sec-
ond cut. The highest was the foliage of plants of bird’s-
foot trefoil (Lotus corniculatus L.), and the lowest – in
clover (Trifolium pratense L.).
The largest increase in foliage of the second cut,
compared to the first – 13.4-17.5%, is characteristic of
plants of sainfoin (Onobrychis arenaria Kit.) and east-
ern goatweed (Galega orientalis Lam.), and the small-
est – 1.0-2.9 %, in plants of meadow clover (Trifolium
pratense L.) and alfalfa (Medicago sativa L.), which
form a uniform crop in both the first and second cut.
The largest increase in foliage of the third cut,
compared to the second – 10.8-11.5%, was observed in
plants of sainfoin (Onobrychis arenaria Kit.) and
bird's-foot trefoil (Lotus corniculatus L.), and the
smallest – 0.8% in alfalfa sowing (Medicago sativa L.).
Comparing the foliage of leguminous perennial
grasses in the first cut in the year of sowing and the sec-
ond and subsequent years of vegetation, it was found
that higher foliage in the year of sowing was observed
in plants of sand sainfoin (Onobrychis arenaria Kit.) –
by 7%, white clover (Melilotus albus L.) – by 12.1%,
the bird’s-foot trefoil (Lotus corniculatus L.) – by 5.3%
and the eastern goat (Galega orientalis Lam.) – by
16.4%. This is partly due to the development in the year
of sowing of perennial legumes by winter type and the
absence of the flowering phase (white clover (Melilotus
albus L.), eastern goatweed (Galega orientalis Lam.)),
as well as coarsening of the leaf and stem mass for the
second and subsequent years vegetation due to the for-
mation of a large crop (sand sainfoin (Onobrychis are-
naria Kit.) and bird’s-foot trefoil (Lotus corniculatus
L.)). By alfalfa (Medicago sativa L.) plants, the foliage
increased by 9.0% in the second and subsequent years
of the growing season, and in meadow clover (Trifo-
lium pratense L.) – by 1.2%.
By the second cut, the foliage in the second and
subsequent years of vegetation increases in alfalfa
(Medicago sativa L.) by 4.8%, sainfoin (Onobrychis
arenaria Kit.) – by 5.6% and decreases in meadow clo-
ver (Trifolium pratense L.) by 9.7%, remains the same
as in the year of sowing in plants of the bird’s-foot tre-
foil (Lotus corniculatus L.).
The clogging of the green mass of leguminous per-
ennial grasses in the first cut was 0.4-9.2%. It was the
smallest in the green mass of white clover (Melilotus
albus L.) due to extremely large biomass, and the larg-
est – in alfalfa (Medicago sativa L.) and bird's-foot tre-
foil (Lotus corniculatus L.) – due to slow initial growth
and predominance in their grassland weeds in wet
weather. The most common weeds by Lotus cornicula-
tus L. were Euphorbia virgata and Capsella bursa-pas-
toris.
By the second cut, there was insignificant littering
of alfalfa (Medicago sativa L.) and eastern goatweed
(Galega orientalis Lam.) – 2.0-2.9%, and significantly
increased in sand sainfoin (Onobrychis arenaria Kit.)
to 31.7% due to falling of grass, its depletion and une-
ven and non-uniform regrowth, as well as meadow clo-
ver (Trifolium pratense L.) – up to 25.0% due to re-
growth in the second cut of shoots that were not mown
in the first. The main mass of weeds consisted of grass
clover (Trifolium pratense L.), milkweed (Euphorbia
virgata), nettle (Urtica dioica L.), horse sorrel (Rumex
confertus Willd.); in the green mass of bird’s-foot tre-
foil (Lotus corniculatus L.) and sand sainfoin (On-
obrychis arenaria Kit.) – Galinsoga small-flowered
(Galinsoga parviflora Cav.), milkweed (Euphorbia vir-
gata), dandelion (Taraxacuma wica). retroflexus).
Summarizing the results of studies on the foliage
and litter of green mass of perennial legumes in the sec-
ond and subsequent years of the growing season, it
should be noted:
- the foliage of leguminous perennial grasses with
each subsequent mowing increases and reaches the
highest level in the third (last) mowing;
- plants of alfalfa (Medicago sativa L.) and
meadow clover (Trifolium pratense L.) develop evenly
during the formation of all cuts, so they have almost the
same foliage in the first or third cuts;
- low foliage of green mass of sand sainfoin (On-
obrychis arenaria Kit.) in the first cut is compensated
by its significant growth in the second or third cuts;
- in the year of sowing, most leguminous perennial
grasses have higher foliage than in the second and sub-
sequent years of vegetation, except for alfalfa (Medi-
cago sativa L.) and meadow clover (Trifolium pratense
L.);
- littering of the green mass of leguminous peren-
nial grasses in the first cut determined.
The average daily gain in the third cut was 84.3-
391.7 kg / ha. They were highest in plants of Lotus cor-
niculatus L., which is 37% more than in the second cut
and similar to the level of the first cut. In other species
of leguminous perennial grasses they were significantly
lower than in the second cut: in alfalfa (Medicago sa-
tiva L.) – by 38.2%, but the same as in the first cut; in
meadow clover (Trifolium pratense L.) – by 84.6%,
sand sainfoin (Onobrychis arenaria Kit.) – by 65.2%
lower.
Comparing the average daily yields of green mass
in the first mowing in the year of sowing and in the sec-
ond year of vegetation of perennial legumes, it was
found that similar growth rates had sand sainfoin (On-
obrychis arenaria Kit.), meadow clover (Trifolium
pratense L.), clover (Melilotus albus L.). Larger
growths than in the year of sowing had plants of eastern
goatweed (Galega orientalis Lam.), and less – alfalfa
(Medicago sativa L.).
By the second cut, the average daily growth of
vegetative mass increases by 1.5-3.0 times in the sec-
ond year of vegetation, compared with the first year of
vegetation, and only in plants of Lotus corniculatus L.
almost coincide with the first year.
In the third year of vegetation by the first cut the
average daily growth of green mass of leguminous per-
ennial grasses was 300.0-466.7 kg / ha. They were the

8 Norwegian Journal of development of the International Science No 60/2021
largest in the crops of Eastern goatweed (Galega orien-
talis Lam.), and the smallest – in alfalfa (Medicago sa-
tiva L.). In the third year of the growing season, the av-
erage daily growth decreased by 2.8-10.4%, compared
to the second year of the growing season, except for al-
falfa grass (Medicago sativa L.), where they increased
by 15.9% (Table 5).
Table 5
Average daily growth of vegetative mass of leguminous perennial grasses for the second-fourth years of vegeta-
tion (SRF "Agronomichne", 2013-2017)
Perennial legumes grasses Vegetation years Gains, kg / ha per day, depending on the cut
1 2 3
Alfalfa (Medicago sativa L.)
2 252,2 450,0 278,3
3 300,0 200,0 160,0
4 255,6 225,0 -
Meadow clover (Trifolium pratense L.) 2 255,7 548,4 84,3
Sand sainfoin (Onobrychis arenaria Kit.)
2 462,7 425,0 148,1
3 450,0 130,0 -
4 325,0 200,0 -
White clover (Melilotus albus L.) 2 583,9 - -
Bird's-foot trefoil (Lotus corniculatus L.)
2 400,0 246,7 391,7
3 356,3 100,0 250,0
4 150,0 120,0 -
Eastern goatweed (Galеga orientаlis Lam.)
2 520,7 188,1 -
3 466,7 91,7 -
4 250,0 50,0 -
In the second cut, the average daily gain was 91.7-
200.0 kg / ha. They were the smallest on the herbaceous
eastern goatweed (Galega orientalis Lam.), and the
largest – alfalfa (Medicago sativa L.) compared with
the first cut, the average daily increments decreased by
1.5-3.5 times, and compared to the second year of veg-
etation – by 2.1-3.3 times.
The average daily increments of the third cut were
only Lotus corniculatus L. – 250.0 kg / ha and alfalfa
(Medicago sativa L.) – 160.0 kg / ha. Compared to the
second cut, the bird’s-foot trefoil (Lotus corniculatus
L.) had an average daily gain of 2.5 times larger, and
alfalfa (Medicago sativa L.) – 1.3 times less. Compared
to the second year of the growing season, the average
daily gains of green mass of Lotus corniculatus L. were
1.6 times less, and alfalfa (Medicago sativa L.) – 1.7
times less.
In the fourth year of vegetation, the first cut con-
tinued to decrease the value of the average daily in-
crease in green mass, in particular, it amounted to
150.0-325.0 kg / ha. The largest increments were char-
acteristic of sand sainfoin (Onobrychis arenaria Kit.),
And the smallest – for bird's-foot trefoil (Lotus cornic-
ulatus L.). Compared to the previous year of vegetation
of leguminous perennial grasses, the average daily
gains were 1.2-2.4 times less.
By the second cut, the value of average daily in-
crements was 50.0-225.0 kg / ha. The largest incre-
ments were alfalfa (Medicago sativa L.), and the small-
est – eastern goatweed (Galega orientalis Lam.). Com-
pared to the first mowing, the increments decreased by
1.6-5.0 times, and compared to the third year of vege-
tation – increased by 1.1-1.5 times, except for the east-
ern goatweed (Galega orientalis Lam.), where they de-
creased by 1,8 times.
Summarizing the results of research on the aver-
age daily growth of green mass of perennial legumes in
the second and subsequent years of the growing season,
it should be noted:
- all studied grasses in the first cut provide the
highest average daily gains of green mass of the second
year of vegetation, except for alfalfa (Medicago sativa
L.), which provides the highest average daily gains of
the third year of vegetation;
- the lowest average daily gains of green mass in
the first cut have grasses of the fourth year of vegeta-
tion;
- in the second cut all grasses have the highest av-
erage daily increments of the second year of vegetation,
and the smallest – the fourth;
- the highest average daily gains in the third mow-
ing of grasses are observed in the second year of vege-
tation of leguminous perennial grasses.
Conclusions and suggestions
In the first year of the growing season, the largest
average daily increments of green mass in the first cut
are sand sainfoin (Onobrychis arenaria Kit.) and white
clover (Melilotus albus L.), and in the second cut - in
addition to these species - also Lotus corniculatus L.
The most efficient use of natural resources for the for-
mation of the vegetative mass of the second year of
vegetation in the first cut is white clover (Melilotus al-
bus L.) and eastern goatweed (Galega orientalis Lam.),
in the second cut - meadow clover (Trifolium pratense
L.) and alfalfa (Medicago sativa L.), in the third cut -
bird’s-foot trefoil (Lotus corniculatus L.), in the third
year of life – respectively sand sainfoin (Onobrychis
arenaria Kit.) and eastern goatweed (Galega orientalis
Lam.); alfalfa (Medicago sativa L.); bird’s-foot trefoil
(Lotus corniculatus L.), in the fourth year – sand sain-
foin (Onobrychis arenaria Kit.); alfalfa (Medicago sa-
tiva L.) and sainfoin (Onobrychis arenaria Kit.).

Norwegian Journal of development of the International Science No 60/2021 9
REFERENCES:
1. Antipova L.K. Alfalfa is a universal plant for ag-
rocenoses. Feed and feed production. Vinnytsia, 2008.
Issue. 62. S. 139-143.
2. Novikov M.N., Frolova L.D. Perennial grasses
as environment-forming crops in Non-Black Soil Zone.
Agriculture. Moscow, 2010. № 7. P. 16-17.
3. Shevnikov M.Ya. Legumes – a factor of sustain-
ability and biologization of agriculture in modern con-
ditions. Feed and feed production. Vinnytsia, 2008. Is-
sue 62. P. 84-89.
4. Kosolapov V.M. Prospects for the development
of Russian feed production. Feed production. Moscow,
2008. № 8. P. 2-10.
5. Petrichenko V.F., Korniychuk O.V. Strategy for
the development of feed production in Ukraine. Feed
and feed production. Vinnytsia, 2012. Issue. 73. S. 3-
10.
6. Glazko V.I., Glazko T.T. Modern directions of
"sustainable" intensification of agriculture. TSHA noti-
fications. Moscow, 2010. Issue. 3. S. 101-114.
7. Sobko M.G., Sobko N.A., Sobko O.M. The role
of perennial legumes in increasing soil fertility. Feed
and feed production. Vinnytsia, 2012. Issue. 74. S. 53-
57.
8. Blagoveshchensky G.V. Feed production of the
Non-Black Soil Zone in a changing climate. Feed pro-
duction. Moscow, 2008. № 10. P. 6-8.
9. Hetman N.Ya., Kvitko G.P. Agrobiological sub-
stantiation of resource-saving technologies for growing
phytocenoses of perennial and annual fodder crops in
field fodder production. Bulletin of Agricultural Sci-
ence. Kyiv, 2013. № 9. P. 44-47.
10. Shramko N.V., Meltsaev IG, Vikhoreva GV
Legumes are the basis of fodder production and in-
crease of fertility of sod-podzolic soils of the Non-
Black Soil zone . Feed production. Moscow, 2008. №
3. P. 2-4.
11. Kvitko G.P., Tkachuk O.P., Hetman N.Ya.
Perennial legumes are the basis of natural intensifica-
tion of fodder production and improvement of soil fer-
tility in the Forest-Steppe of Ukraine. Feed and feed
production. Vinnytsia, 2012. Issue. 73. S. 113-117.
12. Kapsamun A.D., Pavlyuchik E.N., Degt-
yarev V.P. The role of perennial agrocenoses in main-
taining soil fertility. Feed production. Moscow, 2009.
№ 10. P. 31-32.
13. The role of legumes in improving field
grassland in Russia. / Ju.K. Novoselov et al. Feed pro-
duction. Moscow, 2010. № 7. P. 19-22.
14. Methods of experiments on feed production
/ Ed. A.O. Babych. Vinnytsia, 1994. 96 p.
15. Moiseychenko V.F., Yeshchenko V.O. Fun-
damentals of scientific research in agronomy. K .:
Higher school, 1994. 334 p.
16. Fundamentals of scientific research in
agronomy / V.O. Yeshchenko and others; for order.
V.O. Yeshchenko. K .: Diya, 2005. 288 p.

10 Norwegian Journal of development of the International Science No 60/2021
ECONOMIC SCIENCES
STRATEGIC ANALYSIS OF XIAOMI IN RUSSIA: SWOT AND PEST ANALYSIS
Grigan N.
Master’s degree student
Shanghai University, SILC Business School DOI: 10.24412/3453-9875-2021-60-1-10-17
Abstract Xiaomi entered the Russian market in 2016 and quickly gained consumer interest with its inexpensive but
high-quality products. The article presents the results of SWOT and PEST analyzes of the company in the Russian market and offers recommendations for improving the company's work.
Keywords: strategic management, strategic analysis, PEST analysis, SWOT analysis
Modern economic conditions, which are charac-
terized by the dynamism and complexity of the market environment, increased competition, rapid and unpre-dictable changes in legislation, have led to the develop-ment of a strategic approach to the management pro-cess. This approach enables enterprises to timely and adequately respond to changes in the environment of their operation and form competitive advantages, which in the long term will ensure the growth of the value of the business unit and the achievement of the strategic goal.
An integral key part of strategic management is strategic analysis. Strategic analysis is a way of explor-ing and transforming a database from the analysis of the environment into an enterprise strategy.
Effective strategic management is impossible without strategic analysis. The explanation for such a categorical statement is the fact that strategic manage-ment requires knowledge about the strategic position of the enterprise in the market and the specifics of imple-menting the strategy. This is due to the fact that changes in circumstances and their combinations both inside the enterprise and outside it demand appropriate strategy adjustments. Strategic analysis helps to choose the di-rection in which the company will develop. Without a strategy, an enterprise has no sound business plan and no single program to achieve the desired results.
Strategic analysis is the initial stage in the devel-opment of an enterprise activity strategy, which is based on research and assessment of the internal and external environment in which the enterprise is located, and makes it possible to find out what position the en-terprise occupies in the industry at the moment and in what direction and how it needs to develop. It is strate-gic analysis that can help an enterprise realize its stra-tegic vision. It is a method that enables the management of an enterprise to formulate a strategy to achieve an intended goal.
Companies invest huge amounts of resources (e.g., time, money, intellectual capital) in the acquisi-tion and implementation of various strategic instru-ments. Research on the use of strategic analysis tools in various organizations has shown that managers prefer to use tools that are flexible, easy to learn and use, well tested and proven [1]. Moreover, modern tools and strategy methods promise to make managers more suc-cessful in the digital age. It is shown in [2] that Chinese managers in their work prefer to use such strategic anal-ysis tools as: PEST - analysis (share of use - 59%), SWOT - analysis (58%), brainstorming (57%) and life
cycle analysis (51%). The study convincingly con-firmed that managers in China prefer to use strategic tools to foster creativity and innovation.
Considering the above, we will conduct a strategic analysis of the Chinese high-tech company Xiaomi in the Russian market, using the two most commonly used strategic tools: SWOT analysis and PEST analysis.
PEST - analysis allows a comprehensive assess-ment of external factors that can significantly affect the business of the company in question.
Political factors The extent to which politicians can intervene in
the commercial environment is critical in PEST analy-sis. Commercial constraints and political stability are also imperative factors that can determine the success or failure of a business. There is a wide range of politi-cal factors that can affect an internet technology com-pany. The political factors affecting Xiaomi's activities in Russia are as follows:
1. Xiaomi is a Chinese brand successfully pro-moted in the Russian market.
Since its appearance in Russia in June 2016, the company has been constantly expanding the range of products offered to Russian consumers. The company manufactures and markets a wide range of products: smartphones, smart home systems, smart vehicles, TVs, drones, robots and other goods. The Xiaomi brand is well known and recognized in Russia. So, in 2019, Xiaomi was recognized as the fastest growing brand and received the “Best consumer brand in Russia 2019” award in the field of consumer electronics. In 2020, the company was ranked 7th in the top 20 foreign compa-nies in Russia.
2. Xiaomi has good support from the Chinese po-litical system.
In China, there is an active state participation in business through various incentives and regulations. Xiaomi has benefited greatly from the political factors in China in general and the protectionist policies of the Chinese government in particular. The Chinese govern-ment is protecting local tech companies like Xiaomi by creating barriers to operating in the country for their in-ternational competitors. The head of Xiaomi, along with the heads of other high-tech companies, advises the government on international business policy. [3] This gives tech companies an enviable opportunity to influence local political factors that affect their busi-ness to some extent. On the other hand, while political factors benefit Xiaomi in its domestic market, the com-

Norwegian Journal of development of the International Science No 60/2021 11
pany is usually negatively influenced by political fac-tors outside of China.
3. Tension between the United States and the Eu-ropean Union, on the one hand, and China, on the other, is only growing.
In January 2021, the administration of former US President Donald Trump expanded the blacklist of Chi-nese companies that, according to the authorities, are associated with the PRC military industry. Among them was Xiaomi. Americans are barred from investing in blacklisted companies because Washington suspects them of links to the Chinese military-industrial com-plex. American investors are required to dispose of the assets of these companies by November 11, 2021. Xia-omi said it did not agree with the decision. The com-pany denies any connection with the Chinese military industry and assures that it will take measures to protect the interests of its shareholders in response to the sanc-tions. The inclusion of Xiaomi in the sanctions list led to a more than 10 percent drop in the company's quotes in January 2021. Moreover, Europe has joined the US sanctions, to the detriment of its economic goals. Therefore, Xiaomi decided to work more actively in the Russian market [4].
Economic factors Economic factors have the most obvious impact
on the profitability and overall attractiveness of a mar-ket or industry.
1. Increasing competition from other international companies operating in the Russian market.
Competition is intensifying due to the develop-ment of industry standards, the rapid adoption of tech-nology and scientific advances in competing products, short product life cycles and consumer price sensitivity. In doing so, companies must compete on factors that include product price, features, relative price and per-formance, quality and reliability of products and ser-vices, design innovation, third-party accessories and software ecosystem, distribution and marketing oppor-tunities, and corporate reputation [5]. In its competi-tion, Xiaomi uses a business model that lowers costs and increases profits. At the same time, costs are re-duced due to the abandonment of retail sales, the use of viral marketing and the attraction of partners for the production of hardware and software. And the profit, in turn, is created from the sale of mobile services pro-vided for smartphone users.
2. Xiaomi offers quality at an affordable price for the price conscious customer.
Currently, the market for electronic devices is very competitive, there is an active struggle among manu-facturers, and the focus is either on innovation or on the optimal ratio of price and quality. Xiaomi has chosen the golden mean - it produces and sells goods of the middle price category, using the most demanded seg-ment of the market. Buyers, in turn, choose the brand's devices for a reasonable ratio between price and qual-ity: often Xiaomi products have a better specification than competitors, and at the same time have a lower cost. The release of new models is not delayed, old models are supported for a long time, due to the release of updates for them. At the same time, the company's employees follow the following principles: be friends with consumers, offer them the best prices for products, prioritize innovation, offer the highest quality devices and adhere to an entrepreneurial spirit.
3. Decreasing purchasing power of Russian con-sumers and rising unemployment in Russia
The purchasing power of the population is often considered as one of the indicators of the well-being of the country as a whole, since it depends on many fac-tors. It is influenced by wages, the development of the economy, and the standard of living of citizens in gen-eral. Given the economic crisis, which is developing due to instability in the oil market, as well as due to the coronavirus pandemic, there cannot be any positive forecast for the time being. And, naturally, this eco-nomic situation has the most negative impact on the purchasing power of the citizens of the country. Also, due to the pandemic, there is a noticeable increase in the number of unemployed in Russia. All this, in the end, can lead to an increase in demand for the compa-ny's products, which are distinguished by relatively low prices and high-quality goods.
Social factors (Social) Social trends dictate work patterns and attitudes,
tastes and preferences of consumers, as well as a spe-cific type, form and volume of demand for a product or a service [6]. For Xiaomi, these social determinants will be:
1. In Russia, there is an increase in the number of consumers purchasing and using smartphones of vari-ous classes for various needs.
Russia in terms of population (146.17 million peo-ple) ranks 9th in the world as of January 1, 2021. It un-doubtedly has a large purchasing power in the world of mobile phones, which are now an affordable commod-ity for the population of the country. And, although there are various obstacles in terms of social develop-ment (for example, lower incomes of the population, unemployment, social inequality), there is an increase in smartphone users in Russia. So, their number in 2020 was 106.23 million people. Experts predict an increase in the number of smartphone users in Russia to 114.61 million people in 2025 [7]. The growth in the number of users is driven by the ease of use of smartphones and their ability to make life much easier for consumers. This increases the size of the smartphone market in Russia and has a positive impact on Xiaomi's opera-tions in Russia.
2. Western buyers find that almost any product la-beled "Made in China" does not meet quality standards and criteria. However, Russian buyers don't think so.
It is possible that someone still has unfounded prejudices about the quality of goods made in China. The current state of affairs justifiably refutes this opin-ion. Xiaomi manufactures its products from high-qual-ity components, choosing as partners the leading man-ufacturers, with whom top Western companies also work - including the leading manufacturer of proces-sors Qualcomm. One of the factories that produces Mi-smartphones is famous for its quality and the minimum defect rate - Foxconn. For this it is appreciated, for ex-ample, by Apple! Xiaomi's own production is built to the most modern standards and guarantees perfect build quality. And one more quality that distinguishes Xia-omi products from other manufacturers: the company has been supporting its devices for a very long time, releasing updates for them. Providing customers with the highest quality products and services to gain the trust and loyalty of customers is the main principle of the company's employees.
Technological factors

12 Norwegian Journal of development of the International Science No 60/2021
Technological changes taking place in a company are driven by innovations, which, in turn, are developed by entrepreneurs who seek to go beyond existing con-straints. Once new frontiers are broken, technologies become obsolete and competitive advantages are lost. From a business perspective, technology can be used to gain a competitive advantage through a variety of fac-tors. Benefits may include cheaper manufacturing, effi-cient customer access, improved branding, product quality, and higher levels of business intelligence [6]. According to the latest report from the Boston Consult-ing Group (BCG), Xiaomi is ranked 24th among the most innovative companies on the planet.
1. Xiaomi company offers gadgets for the devel-opment and use of which the latest technologies are ap-plied.
The rapid development of the Internet has brought a new future to the mobile phone industry, transforming them into miniature pocket computers. The Internet is becoming more and more accessible. Good access to technology and more people actively using social me-dia have contributed to widespread use of smartphones. For Russia, the Internet penetration index is 76%. The number of Internet users reached 118.4 million. [8]. The company's developers have implemented all the advanced technologies in their innovative products to achieve their efficiency and functionality. The line of smartphones, even in budget series, is equipped with a fingerprint sensor, which increases the security of de-vices. In addition, most smartphones are manufactured in an aluminum case, which makes them mechanically
resistant to drops. In the mobile phone market, techno-logical innovation is a key strategy for leading players. New technological features can give leading players an edge over their rivals.
2. Now Xiaomi phones are able to work with mo-bile communications of the fifth generation and partic-ipate in the work of the “Internet of Things”.
Another key technological innovation for the Chi-nese mobile phone market to hit in 2019 is the introduc-tion of 5G technology. Xiaomi Mi 10 and Mi 10 Pro, the company's flagship devices of the year, come with a 5G version. Xiaomi continues to promote the hard-ware & software & internet services model, adheres to the mobile internet phone development trend, and builds the smart terminals & mobile internet ecological chain. The company announced that the company's IoT platform has more than 800 smart appliances and 400 partners. IoT (Internet of Things) is the interaction of various devices, objects and systems with each other using communication technologies for the exchange of information, its processing and analysis. The Internet of Things allows you to: reduce operating costs; improve the level of customer service; receive additional income by expanding the portfolio of services; optimize the lo-gistics supply chain; ensure the safety of production, employees, facilities. The company has recorded 85 million connected devices, making Xiaomi the world's largest smart hardware manufacturer.
The results of the PEST analysis are shown in Fig. 1.
Fig. 1. PEST analysis by Xiaomi
Xiaomi
Economic Political
Xiaomi is a Chinese brand success-
fully promoted in the Russian mar-
ket
Xiaomi has good support from Chi-
na's political system
Tension between the United States
and the European Union, on the one
hand, and China, on the other, is
only growing
Increasing competition from other in-
ternational companies operating in the
Russian market
Xiaomi offers quality at an affordable
price for budget-conscious customers
Declining purchasing power of Rus-
sian consumers and rising unemploy-
ment in Russia
Technological Social
Xiaomi company offers gadgets, for
the development and use of which
the latest technologies are applied
Now Xiaomi phones are able to
work with mobile communication
of the fifth generation and partici-
pate in the work of the "Internet of
Things"
In Russia, there is an increase in the
number of consumers purchasing
and using smartphones of various
classes for various needs.
Western buyers find that virtually
any product labeled "Made in China"
does not meet quality standards and
criteria. However, Russian buyers
don't think so.
P
P
E
T S

Norwegian Journal of development of the International Science No 60/2021 13
After analyzing the external environment of Xia-
omi in the Russian market, it is possible to detail the
results of the PEST analysis and supplement them with
an analysis of the internal environment while conduct-
ing the SWOT analysis. It allows us to assess the inter-
nal environment of the company, its strengths (S) and
weaknesses (W). The SWOT analysis also assesses the
company's external environment, its market opportuni-
ties (O) and threats from the external environment (T).
Let's characterize the main factors studied in the course
of the SWOT analysis.
Company Strengths
1. The presence of a strong leader in the company,
a close-knit leadership team and experienced staff.
According to experts, Xiaomi is the most expen-
sive startup in the world, which was founded in 2010
by an IT specialist Lei Jun and his associates. Given the
company's rapid success in the electronics market, it
has often been compared to Apple, and its founder has
been referred to as "China's Steve Jobs." At the same
time, the effective and forward-looking leadership style
and teamwork of the company's managers have become
one of the main factors in the phenomenal growth of
the Internet technology company. Xiaomi invests a lot
of resources in the training and development of its em-
ployees, resulting in the formation of highly qualified
personnel motivated to achieve high results.
2. A wide range of products produced by the com-
pany.
The main activity of the company is the produc-
tion of smartphones, the models of which cover a wide
range from budget to flagship solutions. The flagship
line is divided into separate groups of basic, modified
and extended smartphones. They can vary significantly
in performance and price, but they have one thing in
common - they are built using the latest technologies
available to Xiaomi. In addition to smartphones, the
company produces tablets, laptops, speakers, TVs and
other electronics, thereby demonstrating a steady
growth trend. Xiaomi produces a wide range of innova-
tive products: smart home systems, gadgets for tracking
human health, smart vehicles, drones and robots.
3. Creation of an effective trading network.
The Chinese company Xiaomi has carried out the
scaling of the retail network in the Russian Federation.
By mid-July 2020, Xiaomi had about 30 own MiS-
tore stores in Moscow, Nizhny Novgorod, Yekaterin-
burg, Novosibirsk and other cities. In addition, the
company has entered into partnership agreements with
major retail players. So, in July 2020, Inventive Retail
Group announced the launch of a network of Xiaomi
stores in agreement with the company. In total, the
company plans to open about 60 Xiaomi stores in Rus-
sia. They will appear in shopping malls with the most
advantageous locations for the brand. These stores will
sell a variety of Xiaomi devices, including
smartphones, tablets, laptops, wearable gadgets such as
watches and bracelets, and various accessories. In the
future, the partner of Xiaomi plans to open mono-brand
stores with a larger area, where products from the
brand's ecosystem will be sold, including products for
the smart home. At the end of February 2021, MTS and
Xiaomi began to open joint stores, which will sell con-
sumer electronics, home appliances, TVs, gadgets and
accessories only from this Chinese manufacturer. In to-
tal, the company plans to open at least 200 branded
stores in Russia.
4. Low price of products with their high quality
due to cost leadership.
The company's products have won users over with
their high performance, reliability and low cost. Even
against the backdrop of a huge number of competitors
in China, Xiaomi clearly wins in terms of cost. If we
compare similar models of the company and other
brands, then the former provides a better and more
powerful product, or it also offers the same option, but
at a lower price.
5. High brand awareness and value.
The Xiaomi brand, which produces inexpensive
high-quality smartphones, is well known in Russia.
Xiaomi is a young, but well-known brand. It is this cus-
tomer focus that allows the company to maintain its
high position in the ranking of global smartphone man-
ufacturers. Most of the users are satisfied with the com-
pany, because it provides an opportunity to get excel-
lent quality for an affordable price. Over the years, Xia-
omi has invested in building a strong portfolio of
brands. One of the solutions aimed at increasing brand
value is the combination of Chinese companies Baidu
and Xiaomi to develop systems based on the Internet of
Things and artificial intelligence. Companies will cre-
ate devices using computer vision, deep learning and
other AI technologies.
Weaknesses
1. Weak competitiveness.
Despite exceptional performance for their prices,
Xiaomi smartphones lag behind their global competi-
tors Apple, Samsung and Huawei in terms of brand per-
ception and customer experience. In Russia, Xiaomi
controls 18% of the smartphone market, while Apple
has 25% of the market and Samsung has 24% of the
market. [9].
2. Lack of an effective marketing strategy.
Marketing of products in the company leaves
much to be desired. Despite the fact that the product is
successful in terms of sales, its positioning and unique
selling proposition are not clearly defined, which can
lead to attacks in this segment from competitors [10].
3. Low level of technical support.
Experts point to poor after-sales service and cus-
tomer support in the Russian market. Xiaomi's services
in Russia, including after-sales support, are currently
provided by third parties and dealers. This is a disad-
vantage in comparison with the global competitors of
the company [8].
4. Weak advertising campaign.
Xiaomi's global advertising strategy is largely
standardized with local specificities based on brand
penetration and country factors. These differences can
be observed in the local implementation of the Xiaomi
advertising complex. The tools that Xiaomi uses in
Russia are digital marketing (social media), sales pro-
motion and direct marketing.
5. Low profitability of the company because of the
pricing adopted in it.

14 Norwegian Journal of development of the International Science No 60/2021
For an internet tech company, low profit margins
expose the brand to certain risks. For Xiaomi, there is a
higher risk that a decline in sales will significantly re-
duce its bottom line, and this could lead to a net loss. In
addition, low margins could limit R&D investment in
an electronics and software company, jeopardizing its
long-term growth prospects.
6. Lack of sufficient experience in the Russian
market
Xiaomi, which is only 10 years old, lacks the nec-
essary experience in the global market and this is a se-
rious weakness for the company. At the same time, its
main competitors, such as Apple and Samsung, have
been operating in the Russian market for decades. This
means that they have solid experience in dealing with
various issues related to working in international mar-
kets, such as intercultural differences, regional charac-
teristics, consumer preferences, access to distribution
channels and international supply chain management.
7. Promotion channels and logistics become bot-
tlenecks with increasing sales.
When planning its work in Russia, Xiaomi has to
take into account the large size of the country, the une-
ven distribution of the retail network, and differences
in consumer priorities. In this case, it is necessary to
take into account the peculiarities of the company's
work in a pandemic. All this creates certain difficulties
for the planning and operation of logistics channels.
Opportunities
1. Formation of strategic cooperation with other
companies in the Russian market
Formation of strategic cooperation with compa-
nies working in the field of e-commerce, information
technology and related industries is a good opportunity
for Xiaomi in the Russian market. This can be cooper-
ation with retail chains present in the market, or com-
panies engaged in R&D. It can also cooperate with lo-
gistics companies that form supply chains. The benefits
that Xiaomi can derive from strategic cooperation re-
main great, and the company needs to take advantage
of such opportunities more actively.
2. Increasing the efficiency of innovation and the
efficiency of implementation of research and develop-
ment results
Xiaomi has the ability to significantly improve the
efficiency of innovation by making effective invest-
ments in research and development. To use this oppor-
tunity, the company needs to attract the best specialists
and motivate them with the complex application of tan-
gible and intangible motivation tools. The effect is also
possible from joining efforts to develop and implement
innovations with other interested companies operating
in the Russian market. Significant efforts are also
needed to improve the efficiency of the introduction of
innovative developments in various areas of the com-
pany's activities.
3. Increase the presence in the cloud segment
This is one of the strategic opportunities for Xia-
omi. The company can focus on products and services
with high growth rates, such as the cloud segment and
artificial intelligence, taking into account the main
trends in the global e-commerce and IT industries [10].
4. Adaptation of the MIUI operating system to the
peculiarities of the Russian market
Most Xiaomi smartphones have a modified An-
droid MIUI Xiaomi user interface that significantly up-
dates Android, includes features to improve battery per-
formance, and is fully customizable. For greater suc-
cess in the Russian market, Xiaomi needs to strengthen
the development of the MIUI system adapted to the
Russian market and accelerate cooperation with related
manufacturers. The advantages of the MIUI system and
the cooperation of manufacturers will create great ben-
efits [11].
5. The ability to bypass competitors OPPO and
Vivo, which have not yet entered the Russian market
Outside of China, few people know about these
two firms, but domestically, they are the fastest grow-
ing companies in the market. The companies are sub-
sidiaries of BBK Electronics and produce not the
cheapest smartphones in China. BBK Electronics plans
to enter the Russian market and expects that Vivo will
occupy about 5-7% of the Russian smartphone market,
while Oppo's share will be 5%.
6. Growth of smartphone penetration
According to the country rating of smartphone
penetration, Russia is among the top ten countries with
the highest penetration rating and is ranked 7th. At the
same time, the distribution of smartphones is 66.3%,
with 95.4 million users [8]. And the numbers character-
izing the penetration of smartphones are only growing.
As the penetration of mobile phones in the country
grows, the leading players are shifting their focus to
selling more expensive high-value goods.
7. Active participation of the company in the de-
velopment and implementation of the Internet of
Things (IoT) and artificial intelligence
Xiaomi, in addition to the usual smartphones, also
sells smart home and lifestyle products in the Russian
market. And although this product is quite new for the
Russian market, more and more consumers are inter-
ested in it. This leads to a steady increase in sales vol-
umes.
8. Implementation of 5G technology in the com-
pany's smartphones
An important technological innovation for the
Chinese mobile phone market, which has gained prom-
inence in 2019, is the introduction of 5G technology.
Xiaomi's flagship devices, the Mi 10 and Mi 10 Pro,
come with the 5G version. At the same time, the de-
mand for 5G phones will grow, which will help to in-
crease their market value. With the arrival of this tech-
nology in Russia, we should expect an increase in sales
of mobile devices using this technology.
9. Increase in the number of specialized stores and
optimization of the retail network.
Xiaomi uses both direct and indirect distribution
channels to effectively reach their customers in the con-
sumer market. In most of its markets, the company sells
its products and resells third-party products directly to
consumers and small and medium-sized businesses
through its retail and online stores, as well as through
direct sales. The company's retail stores are usually lo-
cated in high-traffic locations in shopping malls and ur-
ban shopping areas. Stores are designed to simplify and
improve the presentation and marketing of a company's

Norwegian Journal of development of the International Science No 60/2021 15
products and related solutions. By increasing the num-
ber of specialized stores and optimally placing them in
the sales area, you can influence the volume and effi-
ciency of sales.
Threats
1. Possible saturation of the smartphone market
The saturation of the smartphone market is one of
the biggest threats to Xiaomi. To cope with this threat,
Xiaomi needs to further explore the possibilities of ex-
panding the Russian market. The possibilities for ex-
panding the Russian smartphone market are in good
agreement with the inexpensive prices for Xiaomi
products.
2. Possible increase in the cost of the resources
used
The rise in the cost of the resources used can be
considered a serious threat to Xiaomi. After all, a high-
tech electronics and software company has chosen a
cost-leadership business strategy and operates with a
very low profit margin [12]. Unlike its main competi-
tors, any slight increase in resource costs for Xiaomi
will inevitably affect the cost of products, thereby jeop-
ardizing Xiaomi's competitive advantage.
3. Possibility of scandals related to corporate so-
cial responsibility
For Xiaomi, there is a potential for corporate so-
cial responsibility issues that could jeopardize the long-
term prospects for business growth. Due to the cost
leadership business strategy that Xiaomi is pursuing,
the company is trying to cut costs wherever possible.
Accordingly, there are attempts to reduce costs, includ-
ing the cost of human resources. At the same time, the
company may face ethical problems that can escalate
into scandals.
4. Dangerous competitors OPPO and Vivo may
enter the Russian market
In the event that OPPO and Vivo enter the Russian
market, the existing market equilibrium will be upset
and a possible redistribution of segments between mar-
ket participants will occur. And this may not be in favor
of Xiaomi.
5. Growth of intensity of competition in the indus-
try
Strong profitability in the industry has boosted
player numbers over the past two years, putting down-
ward pressure not only on profitability but also on over-
all sales. New technologies developed by a competitor
or newcomer to the market can pose a serious threat to
the industry in the medium to long term. Competition
is also intensifying due to advancing industry stand-
ards, rapid technology adoption and advances by com-
petitors, shorter product life cycles and consumer price
sensitivity.
6. A high degree of government participation in
the telephone industry
As known, in Russia there is a high degree of state
participation in the telephone industry. In the country,
electronics suppliers are facing this challenge as the
government recently passed a new law requiring Rus-
sian software to be installed on all smartphones from
2021, which is expected to be delayed due to the Covid-
19 crisis.
7. Instability of pricing policy
High quality mobile phone brands have taken over
the domestic mobile phone market thanks to price re-
duction measures. While they cannot sell at low mar-
gins like Xiaomi in the short term, Xiaomi's margins
will continue to weaken in the near future [5]. Since the
company operates in many countries, it is subject to
fluctuations in exchange rates, especially given the un-
stable political climate in a number of markets around
the world, including the Russian one. Xiaomi's pricing
strategy in the Russian market helped Xiaomi to in-
crease its market share, but also led to low margins and
increased foreign exchange risks in the market.
8. Anti-Chinese sentiments in the West and all
kinds of sanctions
The possible growth of anti-Chinese sentiments on
the part of the United States and the European Union,
the introduction of new sanctions may negatively affect
the company's activities. Certain inconveniences will
be created by the ongoing, and even intensifying, coro-
navirus pandemic, which affects consumption, govern-
ment policy and global trade.
Let's summarize the factors discussed above in the
SWOT matrix (Fig. 2).
Based on the results of SWOT and PEST analysis,
the following recommendations can be proposed to im-
prove the efficiency of Xiaomi in the Russian market.
Xiaomi should continue to promote the company's
“hardware and software and Internet services” model,
adhere to the development of mobile Internet phones
and build an ecological chain of “smart terminals and
mobile Internet”.
Continue investing in startups that create smart
home devices in order to create an ecosystem that can
be controlled from a Xiaomi smartphone.
Xiaomi should consider the Russian market geo-
graphically, and not according to general statistics,
which most often characterize only the western part of
Russia. This will create a flexible pricing strategy, tak-
ing into account the specifics of demand and the finan-
cial capabilities of the local population. It will then be
possible to adjust prices for each local market so that it
remains profitable while maintaining price and quality
competitiveness due to the price sensitivity of the mar-
kets studied.
A possible step for Xiaomi could be the moderni-
zation of the operating system, the optimization of
MIUI for applications that are often used by Russian
consumers. Currently, not all owners of Xiaomi
smartphones in Russia are satisfied with the operating
system of the devices.
To ensure brand awareness for Xiaomi, it is advis-
able to develop and effectively implement an advertis-
ing mix that includes: digital marketing, social media,
sales promotion, direct marketing, public relations, per-
sonal selling and traditional advertising. At the same
time, when distributing forces and resources between
various elements of the advertising complex, it is nec-
essary to take into account the peculiarities of the re-
gion where the events are planned. Moreover, if in the
middle and lower segments in Russia there are enough
classic advertising and billboards in places where the
target audience is concentrated, then hidden advertising
is needed for promoting more expensive devices.

16 Norwegian Journal of development of the International Science No 60/2021
Fig. 1. SWOT Matrix for Xiaomi
Xiaomi should focus on offline sales, but at the
same time, it needs to increase its influence on the Rus-
sian Internet, social networks such as VKontakte and
Odnoklassniki, as well as on popular online video chan-
nels. It is advisable to involve popular Instagram blog-
gers for work.
Considering that the majority of Russian consum-
ers are interested in a necessary device with the Internet
connection, but tend to buy a smartphone in offline
stores, it is important for them to personally hold the
device in their hands before paying money. This sug-
gests the need to open offline stores in remote regions
of Russia.
In order to solve the problems that Xiaomi faces
in the Russian market in terms of brand perception and
quality of customer service, differentiated marketing
should be used more widely; as well as to increase the
number of corporate events and giveaways, as well as
expand the number of Mi stores in Russia.
To support the promotion, we can recommend
Xiaomi to create a network of service centers and or-
ganize online technical support in most regional cen-
ters.
The study showed that there is still significant
market potential that can be explored and used by Xia-
omi to improve its performance in the Russian market.
Xiaomi Weaknesses Strengths
The presence of a strong leader in the com-
pany, a close-knit leadership team and ex-
perienced staff
Wide product line of the company
Creation of an effective trading network
Low product price with high quality due to
cost leadership
High brand awareness and value
Weak competitiveness
Lack of an effective marketing strategy
Low level of technical support
Weak advertising campaign
Low profitability of the company due to the
pricing adopted in it
Lack of sufficient experience in the Russian
market
Promotion channels and logistics become
bottlenecks with increasing sales
Threats Opportunities
Possible saturation of the smartphone mar-
ket
Possible increase in the cost of resources
used
The possibility of scandals related to corpo-
rate social responsibility
Dangerous competitors OPPO and Vivo
may enter the Russian market
Growing intensity of competition in the in-
dustry
High degree of government involvement in
the telephone industry
Instability of pricing policy
Anti-Chinese sentiments in the West and all
kinds of sanctions
Formation of strategic cooperation with
other companies in the Russian market
Improving the efficiency of innovation and
the efficiency of implementation of research
and development results
Increased presence in the cloud segment
Adaptation of the MIUI operating system to
the peculiarities of the Russian market
Opportunity to bypass competitors OPPO
and Vivo, which have not yet entered the
Russian market
Smartphone penetration growth
Active participation of the company in the
development and implementation of the In-
ternet of Things (IoT) and artificial intelli-
gence
Implementation of 5G technology in the
company's smartphones
Increase in the number of specialized stores
and optimization of the retail network
S
P
W
T O

Norwegian Journal of development of the International Science No 60/2021 17
REFERENCES:
1. Stenfors S, Tanner L, Syrjanen M, Seppala
T, Haapalinna I. Executive views concerning decision
support tools. Eur. J. Oper. Res., 181(2), 2007. - pp.
929-938.
2. Hui He, Nelson Antonio, Alvaro Rosa. Stra-
tegic tools in China/strategic tools: An investigation
into strategy in practice in China. - African Journal of
Business Management, Vol.6 (26) 2012. - pp. 7823-
7832.
3. Banjo S. China Protectionism Creates Tech
Billionaires Who Protect Xi. - Bloomberg, 2018. Avail-
able at: https://www.bloomberg.com/news/arti-
cles/2018-03-06/how-china-protectionism-creates-
tech-billionaires-whoprotect-xi
4. Lomanov A. China: the destruction of old il-
lusions, March 24, 2021. Available at: https://www.in-
terfax.ru/world/757541
5. Leo Sun, Chung Tin Fah. Xiaomi – trans-
forming the competitive smartphone market to become
a major player. – Eurasian journal of social sciences,
8(3), 2020. - pp. 96 – 110.
6. Sammut-Bonnici T., Galea D. PEST analy-
sis / Wiley Encyclopedia of Management. - Publisher:
John Wiley & Sons, Ltd, Vol. 12, Strategic Manage-
ment, 2015
7. O’Dea, S. Number of smartphone users in
Russia from 2015 to 2025 (in millions),
https://www.statista.com/statistics/467166/forecast-of-
smartphone-users-in-russia/, 16 Jul 2020, Statista.
8. Yan N., Sokolova O., Lyu D., Huang J. Xia-
omi Smartphones Global Marketing - Analysis on fo-
cus markets of China, Russia, the Netherlands and Bra-
zil, 2020. – 30 p.
9. GlobalStats (2020), Mobile Vendor Market
Share Worldwide: https://gs.statcounter.com/vendor-
market-share/mobile/.
10. Xiaomi (2020), Xiaomi Corporation 2019
Annual Report: http://cnbj1.fds.api.xiaomi.com/com-
pany/announcement/en-us/2019_AR_E.pdf.
11. Leavy, B. The next wave of global disrup-
tion and the role of China’s entrepreneurs. Strategy and
Leadership, 44(3), 2016, pp. 27–37.
https://doi.org/10.1108/SL-04-2016-0020
12. Sun, L. How Does Xiaomi Technology
Make Money? The Motley Fool, 2016. Available at:
https://www.fool.com/investing/2016/06/03/how-
does-xiaomi-technology-make-money.aspx
INNOVATIVE DEVELOPMENT OF ENTERPRISES IN THE POST-INDUSTRIAL MANAGEMENT
SYSTEM
Fostolovych V.,
Dr. PhD, Associate Professor of the Department of Accounting and Taxation in the branches of the econ-
omy Faculty of Accounting and Auditing of Vinnytsia National Agrarian University, Ukraine
Hurtovyi O.
4th year student Faculty of Economics
Vasyl’ Stus Donetsk National University, Ukraine
DOI: 10.24412/3453-9875-2021-60-1-17-28
Abstract
The article examines the place of innovative development of enterprises in the post-industrial management
system of enterprise development. The possibility of realization of the innovative direction of development in the
direction of digitalization of technologies and technological processes in business is investigated. The institutional
environment and its ability to implement an innovative direction of society development in Ukraine are studied.
The intellectual potential and human capital that will guide business activity in the direction of business digitali-
zation are analyzed. An assessment of the rating of doing business according to Eurotablo is presented. The dy-
namics of the index of economic globalization of Ukraine is estimated and the indicators of the rating of the global
index of innovations in 2019 of Ukraine and some other countries are studied. A qualitative assessment of
Ukraine's innovation potential in the dynamics over the years. The place of innovations in modern business is
substantiated.
Keywords: Households, innovations, innovative technologies, digitalization, transformation, human capital
Post-industrial development of society is charac-
terized by the transition of elements of activity, life, economic activity of enterprises and organizations, or-ganization and conduct of business, performance of household functions in digital format. The main func-tions of physical action can be implemented using de-vices or elements that work by transforming analog data into digital format, provoking a "digital revolu-tion" in the system of society (at the private level), in the system of organization and implementation of busi-ness (business level) and in the management system of all elements of the system at the regional and state lev-els. It is impossible even today to imagine the activities of the state and structures of all hierarchical levels of
government without the use of digital technologies that determine the available resources and take into account the need for them, allocating the share needed for im-plementation to accumulate capital. That is, digitaliza-tion permeated both the activities of individuals, the functioning of society and the economy as a whole. To-day, it has become quite acceptable not only to do busi-ness through the process of organizing and conducting business in digital format, but also a holistic digital business. Both the financial crisis and the spatial isola-tion caused by the pandemic have prompted the whole world to quickly adapt to integrating elements of digital technologies into absolutely all spheres of life. That is, all over the world, and in Ukraine in particular, a rapid

18 Norwegian Journal of development of the International Science No 60/2021
digital transformation has taken place, which has reori-ented education - into digital education, business be-comes competitive only when it reorients its activities to innovative technologies, system methods with max-imum use of digital elements and digital models of pro-duction technologies. Therefore, digitalization has be-come not a manifestation of the future, but a necessity of the present, ie the only element in the modern way of life, which gives the opportunity to see the future only with an active transition to "digital technology".
The future of any company is determined by its ability to quickly find and select for its activities the most modern technologies and techniques, and an auto-mated business management system. Therefore, the ability of enterprises, society and the state as a whole to rapid digital transformation encourages the transition from industrial development that involved the use of analog technologies to post-industrial - which involves the widespread use of digital knowledge, digital crea-tivity, digital technology, digital business innovation. Our vision is confirmed by research Innolytics.ag MANAGAMENT SYSTEMS SOFTWARE [1], which investigated that «Digitalization is the generic term for the Digital Transformation of society and the economy. It describes the transition from an industrial age char-acterized by analogue technologies to an age of knowledge and creativity characterized by digital tech-nologies and digital»
We believe that the active digitalization of any en-terprise should become its development strategy and lifestyle of the company, because the introduction of innovations in the field of digitalization determine the level of long-term digitalization of the company. In the enterprise management system, it is important to form a management system so that its management staff has all the tools to manage innovation. The introduction of innovations and the orientation of the enterprise to the innovative direction of development with constant im-provement involves constant changes not only in the production process, but also in the organization of the management system.
The process of constant improvement, renewal, constant modernization through the introduction of in-novative tools, instruments, techniques, technologies, methods and models and processes contribute to the formation of new values of the enterprise and reaching a new stage of development.
Continuous improvement involves the analysis of the current process and control over situations that oc-cur directly in the production of goods, works or ser-vices. All this is possible only in the case of having op-erational information about the process. Full dissemi-nation of information, its processing, analysis and decision-making on the basis of the obtained data is a condition for post-industrial development. The primacy of information possession has become especially rele-vant today. Possessing information, its dissemination makes it possible to stay ahead of the competitor in terms of user interest in the information or the buyer, expanding their markets. The formation of an infor-mation database, which is constantly updated when changes are made and has a ranked level of user access to it depending on the level of hierarchy (from user to manager) with the possibility of expert evaluation and automated construction of ready-made decision algo-rithms ensures the transition to post-industrial develop-
ment. In the system of modern business process, infor-mation becomes important not so much as a resource for sale, but in its processing, evaluation, structuring, which contributes to the creation of a new finished quality product based on itUkraine already has such a not quite positive practice - to sell not the finished prod-uct, but raw materials that minimize the economic ef-fect of the operation. The value added that is formed in the production cycle according to the closed cycle scheme is much higher than the cost of the raw material itself. Therefore, selling the final finished product, the manufacturer increases the economic effect by several orders of magnitude higher than when selling the infor-mation itself (analog - the sale of raw materials). In the system of post-industrial production, information should be considered as a raw material that can be sold, but the effect will be minimal. However, the already processed information, grouped, analyzed on the basis of which the algorithm of actions is built and alternative variants of the decision of problems are developed - act as the final knowledge and skills which serve as a fin-ished product. The post-industrial system of develop-ment is characterized by another feature, which is due to the fact that the constant application of new knowledge encourages the company to develop, im-proving its competitive position in the market. After re-ceiving the basic information, the user decides which of the whole array should be chosen for use, and then buys the product that is most informed, which gives the clearest, and the one that is most ready and suitable for use in its conditions. As a result, the dissemination of information about the company, about the finished product it produces creates a platform of potential de-mand and forms a potential consumer.
Quality service, product, work, presented to the user as a gift, serves as the greatest incentive to become a regular consumer or customer. Thus, involving ele-ments of post-industrial development in the technology of production of the finished product and in the enter-prise management system, the maximum economic ef-fect is achieved. However, this can be achieved only on the basis of relevant data, processed, analyzed and formed into a finished product in the form of variants or algorithms of ready-made management decisions. Full possession of relevant information makes it possi-ble to disseminate it at the level of the planned segment of the potential and existing market segment and offer for implementation a processed version of it trans-formed into knowledge. Thus, enterprises of various in-dustries, including agricultural enterprises, will be able to inform all potential consumers about the quality characteristics of their product and its own brand, the quality of which is confirmed by relevant certificates that ensure recognition not only in domestic but also in international markets. The efficiency of modern busi-ness is determined by the primacy of the enterprise in the possession of information, the primacy in its pro-cessing and systematization and the primacy in its im-plementation. Therefore, we believe that economic ac-tivity in the post-industrial era is the result of a «game in advance».
The free dissemination of information does not in-dicate the disclosure of business secrets. Only infor-mation that is of interest to the end user, indicating the characteristics of the finished product and technology, is presented for public review. Information about the

Norwegian Journal of development of the International Science No 60/2021 19
technology itself should also be provided, but its spe-cific elements should be presented in an encrypted for-mat and in a language that is understandable to a limited number of professionals. That is, the encryption of spe-cial data that constitute a trade secret of the business process becomes the basis of the information culture of the post-industrial era of economic development and states in general.
Multilingualism is an important element in the de-velopment of enterprises, the economy and the state as a whole. Knowing the languages of different countries, it is possible to learn the main principles of successful companies, to identify the main tools for success in the development of not only economic prosperity, but also to learn to form technology combining financial results with environmental security and social development. Therefore, documenting business processes in the na-tive language is one of the elements of unique encryp-tion of particularly important information and own de-velopments, and knowledge of other languages reduces the time to develop innovative approaches to solving problems set by the enterprise or the state. Therefore, in the era of post-industrialism, the sphere of infor-mation resources and services is ahead of the sphere of material production in need, which leads to a change in the nature of human activity and directions of its devel-opment. The type of resources for the effective imple-mentation of the development strategy has changed, where the main production resource was information, which led to the modification of the social structure and change its needs. The main productive resource of post-industrial society is information, not the raw materials or energy that underlie pre-industrial and industrial so-ciety. . Production activity began to implement technol-ogies of recycling, recycling or treatment, while in pre-
vious epochs production was based on intensive extrac-tion and mass production. Modern technologies have acquired the characteristics of knowledge-intensive, in-novative and resource-saving, to replace labor-inten-sive and capital-intensive technologies, which pre-vailed in pre-industrial and post-industrial production, respectively.
Thus, the basis of post-industrial development of society is the information society, which is a phase of development in which information and the creation of knowledge based on it are produced in a unified infor-mation space. The speed of formation and dissemina-tion of information and its transformation into knowledge based on the processing, analysis and sys-tematization of available information depends on the level of development of information and communica-tion technologies.
The level of information and communication tech-nologies and the intensity of their spread is evidenced by the intensity of the use of computers and computer networks in enterprises with an estimate of the distribu-tion by the average number of employees. We analyzed these indicators during 2018-2019. The study found that the number of companies that used computers in 2019 increased compared to 2018 data. Thus, if in 2018 44133 enterprises used computers, in 2019 its number increased to 44532 units. This indicates the production need to use information and communication technolo-gies in the process of organizing and conducting busi-ness. In addition, it should be noted that more than half of enterprises used a local computer network (LAN) in the process of their activities (53.5 and 51.9%, respec-tively, in 2018 and 2019), and even more enterprises had an Intranet ( 59.2 and 58.05% respectively in 2018 and 2019).
Table 1 The use of computers and computer networks in enterprises with a distribution by the average number of em-
ployees in 2018-2019
№ Indexes
Period
2018 2019 2018 2019
units in% to the total num-
ber of enterprises
1. Number of enterprises that used computers: of them: 44133 44532 Х Х
1.1 used a local computer network (LAN) 26307 26287 53,5 51,9
1.2 had an intranet 29129 29388 59,2 58,0
1.3 had an Extranet network 4094 4112 8,3 8,1
2. Including with an average number of employees from 10 to 49 people:
2.1 Number of enterprises that used computers. Of them: 33671 33844
2.2 used a local computer network (LAN) 18154 18031 47,6 45,9
2.3 had an intranet 21607 21681 56,7 55,1
2.4 had an Extranet network 2239 2199 5,9 5,6
3. Including with an average number of employees from 50 to 249 people
3.1 Number of enterprises that used computers: of them: 8310 8511 Х Х
3.2 used a local computer network (LAN) 6195 6281 70,2 69,1
3.3 had an intranet 5888 6042 66,7 66,5
3.4 had an Extranet network 1176 1207 13,3 13,3
4. Including with an average number of employees of 250 people or more
4.1 Number of enterprises that used computers: of them: 2152 2177 Х Х
4.2 used a local computer network (LAN) 1958 1975 87,5 86,2
4.3 had an intranet 1634 1665 73,0 72,7
4.4 had an Extranet network 679 706 30,3 30,8
Source: [1]

20 Norwegian Journal of development of the International Science No 60/2021
Percentage of enterprises with an average number
of employees of 250 or more use information and com-
munication technologies to a greater extent than enter-
prises with a smaller number of employees. Thus, if the
percentage of enterprises with an average number of
employees over 250 people using a local computer net-
work (LAN) is 87.5 and 86.2%, respectively, in 2018
and 2019, then only 70.2-69.1% respectively in 2018
and in 2019 the company, with an average number of
employees from 50 to 249 people used this network.
This figure is even lower in enterprises with an average
number of employees from 10 to 49 people.
All this indicates that companies with a strong in-
tellectual base, developed management and marketing
system feel the urgent need to use digital intensification
tools and the use of automated systems of information
base formation and analysis and processing for active
use of automated control systems. Important in the sys-
tem of post-industrial development is the system of
«big data», which was presented by Gartner [2] model
«3V» (Volume, Velocity, Variety). Analytical pro-
cessing of a large array of data should provide eco-
nomic benefits for business structures, because without
the result any processed array of information remains a
technological solution. A similar vision is described by
Gartner «… Big data» warrants innovative processing
solutions for a variety of new and existing data to pro-
vide real business benefits. But processing large vol-
umes or wide varieties of data remains merely a tech-
nological solution unless it is tied to business goals and
objectives.» [2].
That is, Big Data is an information source of a sig-
nificant array of data aimed at assisting the manage-
ment of the enterprise in making effective management
decisions. The resource for the formation of the Big
Data network are: information on transactions, which is
a database of customers from existing electronic sys-
tems (transactions carried out by online stores; infor-
mation based on accounting data); data from reading
sensors; data of digital and electronic meters; data of
automated trading networks and systems; social net-
work data (customer reviews, blogs, sites) and more.
Ukrainian enterprises have also to some extent started
to use the «big data» network intensively. However,
during 2018-2019, the share of enterprises that con-
ducted «big data» analysis is quite small (Table 2). Less
than 6% of Ukrainian enterprises conducted big data
analysis. Therefore, business structures of Ukraine
need to take measures and implement innovations in the
management system of the enterprise, which will allow
to obtain maximum effects from the use of the «big
data» network.
Table 2
Analysis of «big data» with the distribution by average number of employees in 2018-2019
№ Indexes Period
2018 2019 2018 2019
units in% to the total number of enterprises
1 Number of enterprises that conducted "big data" analysis, according to "big data" sources
1.1 data obtained from smart devices or sensors 2917 2896 5,9 5,7
1.2 geolocation data obtained from portable devices 1697 1874 3,4 3,7
1.3 data generated from social media 1600 1658 3,3 3,3
other sources 2974 2852 6,0 5,6
2 Number of enterprises in which the analysis of "big data" was conducted
2.1 on ones own 5256 5146 10,7 10,2
2.2 external service providers 2023 2051 4,1 4,0
Source: [3]
In the process of obtaining information and ana-
lyzing «big data», companies used various sources, in
particular: data obtained from smart devices or sensors;
geolocation data obtained from portable devices; data
generated from social media; other sources.
To a greater extent, enterprises analyzed «big
data» based on information obtained from smart de-
vices or sensors (5.9 and 5.7% of enterprises, respec-
tively, in 2018 and 2019) and their other sources (6.0
and 5, 6% respectively in 2018 and 2019). To a lesser
extent, enterprises used for analysis information re-
sources obtained from geolocation data obtained from
portable devices (3.4 and 3.7% of enterprises, respec-
tively, in 2018 and 2019) and data generated on the ba-
sis of social media. Estimating the number of enterprises where the
analysis of «big data» was conducted, we noted that more than 10% of enterprises carried it out on their own both in 2018 (10.7% of enterprises) and in 2019 (10.2% of enterprises). The analysis of «big data» at the ex-pense of external service providers was conducted by 4.1% of enterprises in 2018 and 4% of enterprises in
2019. The development of information and communi-cation technologies enables domestic business struc-tures and management staff of all institutions to mini-mize risks and build management decision-making al-gorithms based on real data with the ability to forecast future results. Using information resources and per-forming analysis of "Big Data" companies gain scien-tific and technological advantages in the process of im-plementing development strategies and in making man-agement decisions. Access to information is quite important to solve social problems. It should be under-stood that using the old approaches that have not previ-ously given a positive result to solve problems, to ex-pect a positive result each time is a futile expectation. Therefore, information about successful results and op-portunities should be available not only in the spheres of big business, but also at the level of the whole soci-ety. An important element is the exchange of knowledge and presentation of their own experience in solving problems using innovative solutions. This ap-proach will enable the state to solve a significant share of social problems and provide tools for managing so-cial impact. Therefore, the application of the method of

Norwegian Journal of development of the International Science No 60/2021 21
"positive deviance" helps to obtain ready-made solu-tions to problems under certain conditions and in a sim-ilar environment. Finding the most effective innovative solutions to existing problems through the spread and development of information and communication tech-nologies is the engine of sustainable development not only of the individual enterprise, the territorial commu-nity, but also the state as a whole.
We believe that today the level of development of the information society is an indicator of economic de-velopment. The level of technological innovation has a direct impact on the economic efficiency of production and the business structure as a whole. The sustainable development goals adopted by Ukraine envisage Ukraine's growth in the direction of industrial, innova-tion and infrastructure development (Goal 9).
Assessing the place of Ukraine in the ranking of the Global Innovation Index, we noted that its value is at the 47th rating level in 2019. while the target for 2020 was 50th place in the ranking. Such a place (50th
place in the ranking) according to the Global Innova-tion Index Ukraine occupied in 2017, but in 2018 the ranking position was lost by 7 points (43rd place in the ranking). Understanding the importance of innovation in the direction of digitalization of production technol-ogies and control systems encourages the transfor-mation of technologies in the direction of increasing their knowledge intensity.
To implement the planned task, it is necessary to create institutional and financial opportunities for self-realization of the potential of the economically active part of the population and the development of the crea-tive economy. Indicators of achieving positive results are: The number of employees in medium and small en-terprises; Share of value added by production costs of medium and small enterprises, in% of the total amount of value added by production costs ; Ukraine's place in the ranking of ease of doing business Doing Business (Table 3). We investigated that none of the indicators was achieved in 2020.
Table 3 Dynamics of indicators of realization of the goal focused on creation of institutional and financial opportunities in Ukraine for self-realization of potential of economically active part of the population and development of cre-
ative economy
Indexes Years Target set
for 2020 2015 2016 2017 2018 2019
Number of employees in medium and small businesses, million people
6,5 6,5 6,6 7,0 7,4 8,3
Share of value added by production costs of medium and small enterprises, in% of the total amount of value added by production costs
58,1 62,3 62,6 64,3 - 70,0
Ukraine's place in the ranking of ease of doing business Doing Business
81 80 76 71 64 30
Source: [4] Taking into account the dynamics of indicators of
realization of the goal focused on the creation of insti-tutional and financial opportunities in Ukraine for self-realization of the potential of the economically active part of the population and development of the creative economy, a gradual increase in their size. However, the targets set for 2020 are higher than the achieved goals. And the indicators that characterize the ease of doing business during the study period grew and in 2019 Ukraine took 64th place in the ranking, while in 2015 it occupied 81 ranking position. The changes are positive, but much more needs to be done by public authorities to prepare both businesses and the public to operate in a digital economy.
Among the indicators that characterize the ease of doing business is the Index of ease of connection to the grid, where in 2020 Ukraine took 126th place in the ranking list, while Ukraine's closest neighbor - Poland was in 60th place. Among the surveyed countries ac-cording to this indicator, the highest in the ranking was Germany, which took 5th place in the overall world ranking list among 190 countries. Ukraine took a simi-larly low 145th place in terms of resolving the bor-rower's insolvency issues. According to this indicator, among the countries analyzed by us, the United States took 2nd place, and Germany - 4th ranking position (Table 4).
Table 4 Rating of ease of doing business in 2020
Indicator Ukraine USA Germany Poland
Rating of ease of doing business 64 6 22 40
Group rating 64 6 22 40
Starting a business 61 55 125 128
Obtaining building permits 20 24 30 39
Ease of connection to power grids 126 64 5 60
Property registration 61 39 76 92
Getting loans 37 4 48 37
Protection of property rights of minority investors 45 36 61 51
Ease of paying taxes 65 25 45 77
Foreign trade 74 39 46 1
Ensuring the implementation of contracts 63 17 13 55
Resolving issues of insolvency of the borrower 145 2 4 25
Source: Generalized by the author on the axis 1

22 Norwegian Journal of development of the International Science No 60/2021
As the government of Ukraine works in the direc-
tion of economic growth of our state, it is necessary to
form favorable factors of influence on the factors pro-
moting its growth.. Since business is the driving force
of the economy, organized on the basis of advanced
techniques, technologies and methods of organizing
and conducting business - is the key to its effectiveness.
Ease of business organization and simplicity of its man-
agement contribute to the additional inflow of financial
resources in the form of taxes to the state budget and
cause an increase in economic activity of the population
while reducing unemployment. Global trends in eco-
nomic development are the transition to digital technol-
ogies for organizing and conducting business. Ukraine
should focus on the global vector of the direction of
movement, and try to act simultaneously with partners
and competitors.
Raising the level of awareness of business partici-
pants with the work and tools that form a competitive
advantage in the market in the digital economy will
contribute to more intensive acquisition of knowledge
and skills to function through the active introduction of
innovations in all areas of activity.
The level and intensity of globalization processes
in the country determine the intensity of its develop-
ment. Thus, assessing the rate of active globalization of
Ukraine during 1991-2018, we noted its gradual
growth. Thus, if in 1991 this ratio was 30.94, then in
2018 its value more than doubled and amounted to
74.25 (Fig. 1).
Fig. 1. Dynamics of the index of economic globalization of Ukraine (1991-2018)
Source: [5] Our research shows the importance of the devel-
opment of the information society and the policy of the state in the direction of strengthening innovation activ-ity at different levels of the social hierarchy of the state. A country in which the information society is more de-veloped ranks higher in the ranking of the global inno-vation index.
We conducted a comparative assessment of the rating of the global innovation index in 2019 of Ukraine, along with Poland, Germany and the United States. The leader among the studied countries and in
the world as a whole in terms of the Global Innovation Index in 2019 is the United States, where the value of the subindex of innovation growth was 70.85 points out of 100, which gave the 3rd place in the ranking for its value. In the same year (2019), Ukraine ranked 32nd in the ranking of countries according to the Global Inno-vation Index, while the Sub-Index of Innovative Growth took only 82nd place among 129 countries that participated in this assessment. The value of the sub-index of innovative growth of Ukraine in 2019 was 40.73 on a scale of 0-100 points.
Table 4 Indicators of the global innovation index rating in 2019
№ Indexes Ukraine USA Poland Germany 1 Global innovation index, place in the ranking 32 1 26 7
2 Innovative growth subindex: place in the ranking of 129 countries rating (0-100)
82
40,73
3
70,85
37
50,97
12
65,28 Source: Formed by the author on the basis Source: [6]
Ukraine's low rating positions on the level of the global innovation index are caused by the low level of quality of persons who took part in the implementation
of research and development. During the period of stud-ying the structure of the qualitative composition of the innovation potential of Ukraine (2010-2019), we noted a rapid decrease in these indicators by more than 2.3 times.
0
10
20
30
40
50
60
70
80
1991 2009 2011 2012 2018
30,94
66,2864,38
67,52
74,25

Norwegian Journal of development of the International Science No 60/2021 23
Fig. 2. Dynamics of qualitative assessment of innovation potential of Ukraine, (persons) 2010-2019
Source: Generated by the author based on data [7] Thus, if in 2010 research and development was
performed by 182484 people, in 2019 only 79262 peo-
ple, which is 2.3 times less. Similarly negative is the
share of quality specialists (doctors of sciences and can-
didates of sciences) in the total number of specialists
who form the innovation potential of Ukraine (Fig. 2).
Getting any result requires investment of re-
sources, energy, knowledge, effort and desire or need
to obtain the planned. Therefore, if the goal of state de-
velopment is the introduction of innovations in the sys-
tem of economic activity and in the economic and so-
cial spheres, the state must implement opportunities for
their development and implementation. Innovation re-
quires financial investment in the development or ac-
quisition of knowledge and the process of adapting
them to the relevant field. However, the share of re-
search and development expenditures in the structure of
Ukraine's GDP in 2019 decreased significantly com-
pared to its value in 2010. Thus, if in 2010 the share of
expenditures incurred for research and development in
the structure of GDP was 0.75%, in the structure of
GDP in 2019 only 0.43 (Fig. 3).
Fig. 3. Dynamics of the value of expenditures for research and development and the share of expenditures for
research and development in GDP, 2010-2019
Source: Formed by the author on the basis of data from the State Statistics Service of Ukraine [8]
0
20000
40000
60000
80000
100000
120000
140000
160000
180000
200000
2010 2011 2012 2013 2014 2015 2016 2017 2018 2019
182484175330
164340155386
136123
122504
97912 9427488128
79262
Всього виконували дослідження і розробки
доктора наук
доктора філософії (кандидата наук)
8107,1 8513,49419,9
10248,59487,5
11003,6
11530,713379,3
16773,7 17254,60,750,65
0,67 0,70
0,60
0,55
0,48 0,45 0,470,43
0
0,1
0,2
0,3
0,4
0,5
0,6
0,7
0,8
0
2000
4000
6000
8000
10000
12000
14000
16000
18000
20000
2010 2011 2012 2013 2014 2015 2016 2017 2018 2019
Витрати на виконання наукових досліджень і розробок - усього, млн.грн
Частка витрат на виконання наукових досліджень і розробок у ВВП, %
Total, performed research and development
Doctors of science
Doctor of Philosophy (PhD)

24 Norwegian Journal of development of the International Science No 60/2021
The main goal of the development of our state is to ensure socio-economic development on the basis of a highly developed socially oriented economy. Knowledge and innovations are a fundamental tool in the process of implementing the state development strategy. Economic growth can be achieved only by gaining a competitive advantage in the market, and this means today to be in the forefront of countries that im-plement in all areas of economic activity and at all lev-els of government digital transformation. The use of "Big Data" allows you to choose the right management decision and the most optimal technology that should be adapted to specific business conditions. This will re-duce the cost of the high quality end product and max-imize the economic benefits along with gaining a com-petitive advantage. This is the basis of the post-indus-trial development model, to produce not the maximum amount of product, but the amount of product that will allow to obtain the maximum effect with minimal re-source costs and minimal negative impact on the envi-ronment, providing maximum social benefits and satis-faction. That is, the basic indicators of modern technol-ogies were: their resource efficiency; low waste; energy saving and low energy consumption; high energy value and safety; social efficiency; economic feasibility. These are the main directions of modern innovative technologies.
It is possible to analyze the existing technology and evaluate its effectiveness or consider the feasibility of implementing a new technology or innovative devel-opment only with relevant data, which should be com-pared with the probable risks and impacts of various factors on existing technology and potential technology for implementation. That is, each business entity must focus its activities on innovative development, which involves continuous improvement and constant analy-sis along with the constant acquisition of new knowledge, which will be transformed into better tech-nologies that will be subject to the process of adaptation to specific business conditions. That is, we believe that the post-industrial stage of development involves a constant movement towards improvement through re-search, analysis, control, transformation of knowledge
into action, which are again subject to careful analysis. This constant cyclical movement of knowledge in the direction of constant improvement is similar to the Deming cycle (PDCA cycle).
Realizing that the basis of innovative development of countries is the level of activity of the introduction of digital technologies in various spheres of life, we can draw a parallel and trace the level of digital distribution. The reasons for such differentiation of states according to the level of formation of the information society are first of all insufficient level of development within the country of electronic readiness and insignificant level of electronic involvement..
In order to motivate society to increase the level of e-readiness, it is necessary to form an appropriate basis that will facilitate the free transition of all hierarchical levels of society to a new lifestyle, way of organizing life and methods of doing business. The fundamental basis of the readiness of each stratum of society to move to a new level of quality of life or economic ac-tivity is determined by the presence (or absence) of quality tools and means of such intensification with a sufficient level of access to certain resources. The level of society's perception of innovations in the form of digital technologies is determined by the professional-ism of users of innovations and the speed of acquiring skills and abilities to act according to the new scheme. That is, the level of education, professionalism and in-tellectual development of the country's population will determine not only the ability to develop digital tech-nologies, but also to absorb the already acquired knowledge. In order to determine the potential of Ukraine to implement the innovative direction of state development, we conducted an assessment of the Inno-vation Efficiency Index (Fig. 4). Potential opportunities for creating a favorable climate for Ukraine's innova-tion performance over the years of research (2010-2018) are growing. Comparing the innovation output index with the innovation input index determines the rating of innovation efficiency of countries. If in 2010 Ukraine took 54th place, in 2018 - 5th place, which is a positive direction of change.
Fig. 4. Dynamics of the innovation efficiency index, 2010-2018
Source: Formed by the author on the basis of data Reports «The Global Innovation Index» 2010-2018 у. [9]
54
14 14 15 12 11 563 70 57 33 25 21 22
56
1119
139
7 9
8580
76
93
66
48
42
0
10
20
30
40
50
60
70
80
90
100
0
10
20
30
40
50
60
70
80
2010 2012 2014 2015 2016 2017 2018
Index of innovative efficiency Україна США
Німеччина Польща
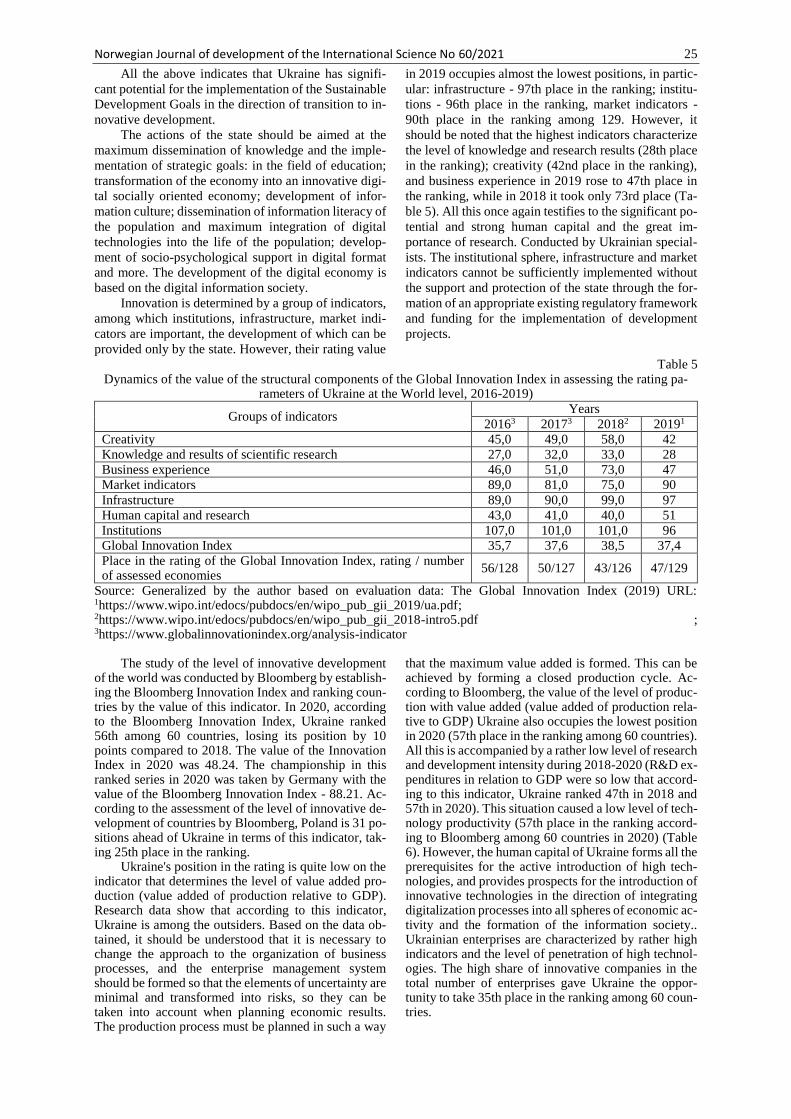
Norwegian Journal of development of the International Science No 60/2021 25
All the above indicates that Ukraine has signifi-
cant potential for the implementation of the Sustainable
Development Goals in the direction of transition to in-
novative development.
The actions of the state should be aimed at the
maximum dissemination of knowledge and the imple-
mentation of strategic goals: in the field of education;
transformation of the economy into an innovative digi-
tal socially oriented economy; development of infor-
mation culture; dissemination of information literacy of
the population and maximum integration of digital
technologies into the life of the population; develop-
ment of socio-psychological support in digital format
and more. The development of the digital economy is
based on the digital information society.
Innovation is determined by a group of indicators,
among which institutions, infrastructure, market indi-
cators are important, the development of which can be
provided only by the state. However, their rating value
in 2019 occupies almost the lowest positions, in partic-
ular: infrastructure - 97th place in the ranking; institu-
tions - 96th place in the ranking, market indicators -
90th place in the ranking among 129. However, it
should be noted that the highest indicators characterize
the level of knowledge and research results (28th place
in the ranking); creativity (42nd place in the ranking),
and business experience in 2019 rose to 47th place in
the ranking, while in 2018 it took only 73rd place (Ta-
ble 5). All this once again testifies to the significant po-
tential and strong human capital and the great im-
portance of research. Conducted by Ukrainian special-
ists. The institutional sphere, infrastructure and market
indicators cannot be sufficiently implemented without
the support and protection of the state through the for-
mation of an appropriate existing regulatory framework
and funding for the implementation of development
projects.
Table 5 Dynamics of the value of the structural components of the Global Innovation Index in assessing the rating pa-
rameters of Ukraine at the World level, 2016-2019)
Groups of indicators Years
20163 20173 20182 20191
Creativity 45,0 49,0 58,0 42
Knowledge and results of scientific research 27,0 32,0 33,0 28
Business experience 46,0 51,0 73,0 47
Market indicators 89,0 81,0 75,0 90
Infrastructure 89,0 90,0 99,0 97
Human capital and research 43,0 41,0 40,0 51
Institutions 107,0 101,0 101,0 96
Global Innovation Index 35,7 37,6 38,5 37,4
Place in the rating of the Global Innovation Index, rating / number of assessed economies
56/128 50/127 43/126 47/129
Source: Generalized by the author based on evaluation data: The Global Innovation Index (2019) URL: 1https://www.wipo.int/edocs/pubdocs/en/wipo_pub_gii_2019/ua.pdf; 2https://www.wipo.int/edocs/pubdocs/en/wipo_pub_gii_2018-intro5.pdf ; 3https://www.globalinnovationindex.org/analysis-indicator
The study of the level of innovative development of the world was conducted by Bloomberg by establish-ing the Bloomberg Innovation Index and ranking coun-tries by the value of this indicator. In 2020, according to the Bloomberg Innovation Index, Ukraine ranked 56th among 60 countries, losing its position by 10 points compared to 2018. The value of the Innovation Index in 2020 was 48.24. The championship in this ranked series in 2020 was taken by Germany with the value of the Bloomberg Innovation Index - 88.21. Ac-cording to the assessment of the level of innovative de-velopment of countries by Bloomberg, Poland is 31 po-sitions ahead of Ukraine in terms of this indicator, tak-ing 25th place in the ranking.
Ukraine's position in the rating is quite low on the indicator that determines the level of value added pro-duction (value added of production relative to GDP). Research data show that according to this indicator, Ukraine is among the outsiders. Based on the data ob-tained, it should be understood that it is necessary to change the approach to the organization of business processes, and the enterprise management system should be formed so that the elements of uncertainty are minimal and transformed into risks, so they can be taken into account when planning economic results. The production process must be planned in such a way
that the maximum value added is formed. This can be achieved by forming a closed production cycle. Ac-cording to Bloomberg, the value of the level of produc-tion with value added (value added of production rela-tive to GDP) Ukraine also occupies the lowest position in 2020 (57th place in the ranking among 60 countries). All this is accompanied by a rather low level of research and development intensity during 2018-2020 (R&D ex-penditures in relation to GDP were so low that accord-ing to this indicator, Ukraine ranked 47th in 2018 and 57th in 2020). This situation caused a low level of tech-nology productivity (57th place in the ranking accord-ing to Bloomberg among 60 countries in 2020) (Table 6). However, the human capital of Ukraine forms all the prerequisites for the active introduction of high tech-nologies, and provides prospects for the introduction of innovative technologies in the direction of integrating digitalization processes into all spheres of economic ac-tivity and the formation of the information society.. Ukrainian enterprises are characterized by rather high indicators and the level of penetration of high technol-ogies. The high share of innovative companies in the total number of enterprises gave Ukraine the oppor-tunity to take 35th place in the ranking among 60 coun-tries.

26 Norwegian Journal of development of the International Science No 60/2021
Table 6
Dynamics of innovation development assessment according to Bloomberg rating
Indexes Germany Poland Ukraine
2019 2020 2019 2020 2018 2019 2020
Place in the ranking 4 1 21 25 46 53 56
Innovation index Bloomberg 87,3 88,21 69,1 69,98 48,05 48,24
Intensity of research and development (R&D expend-
itures in relation to GDP) 7 8 36 35 47 54 57
Value added production (value added of production
in relation to GDP) 3 4 20 17 48 58 57
Penetration of high technologies (share of innovative
companies in the total number of enterprises) 3 3 18 22 32 37 35
Productivity 24 18 40 39 50 60 57
Efficiency of higher education (share of freelance
graduates in the total number of graduates of educa-
tional institutions)
14 26 16 19 21 28 48
Concentration of researchers (number of scientists
per 1 million inhabitants) 11 11 38 38 46 46 49
Patent activity 7 3 37 29 35 35 36
Source: Generalized by the author based on [11, 12]
Therefore, the data of our research suggest that to
implement the strategy of state development towards
the formation of an innovative society and digital econ-
omy is possible only with the active implementation of
digitalization in all spheres of economic activity and in
the social sphere. Electronic involvement of society is
a tool for its direction in the direction of digitalization,
which provides new opportunities and competitive ad-
vantages. institutional framework is ready to imple-
ment them in full. In this segment of economic growth,
the priority in action should be taken by the state, which
should implement scientific support, promote auto-
mated innovative management methods, and initiate in-
novative development of enterprises through easy ac-
cess to investment support for innovative enterprises.
The high level of competition has become an ob-
stacle to the development of the least economically bal-
anced agricultural formations to achieve significant
rates of economic growth is not possible without the in-
troduction of scientific support and innovative manage-
ment methods that ensure balanced economic, socio-
cultural and environmental development..
Digitization and innovative direction of develop-
ment of agricultural enterprises is the main basis for in-
creasing their level of competitiveness and market lead-
ership both through the implementation of differentia-
tion strategies and price competition. The introduction
of innovations focused on energy-saving and resource-
saving high-efficiency technologies make it possible to
achieve market leadership through price competitive-
ness through cost optimization. However, by introduc-
ing innovative technologies that make it possible to
produce a unique product and distinguish the company
on the market among other companies provide a lead-
ing position through the implementation of a strategy
of differentiation. Constant innovative activity of enter-
prises is the main guarantee of development. In the con-
ditions of active digitalization and unrestrained devel-
opment of digital technologies, economic activity takes
the form of constant cyclical innovative development,
forming the so-called innovative culture of the com-
pany. We believe that modern software is a tool for in-
novative development. The factor of development of
modern enterprises is the level of their innovative
adaptability to digital innovations.
In order to develop a culture of innovative devel-
opment both at the state level and at the level of enter-
prises, it is necessary to promote the formation of crea-
tive thinking in all its participants and readiness for
constant changes focused on the development and im-
plementation of innovative projects.. It is important for
the company to encourage employees to find new meth-
ods and ways to achieve the goals, aimed at improving
the conditions for the ultimate goal and result, aimed at
ensuring not only the maximum economic effect, but
also environmental and social efficiency. Changing the
approach to the task always helps to change the ex-
pected result, and, in the first stages - a certain discom-
fort until you gain experience working on a new. How-
ever, new knowledge and experience contribute to the
development of the enterprise and provide an oppor-
tunity to gain competitive advantage through increased
productivity, reduced energy consumption and in-
creased resource efficiency.
An important element of post-industrial develop-
ment of society is not only the introduction of capital
innovation projects. It is important to gradually intro-
duce small innovative developments and innovative
ideas, which are focused on the gradual change of con-
cept and technology in the direction of its improvement
for the implementation of the Deming Cycle - continu-
ous improvement. This approach will make it possible
to overcome existing obstacles and optimize the devel-
opment strategy to the requirements of today. There-
fore, the generation of innovative ideas in the transition
to post-industrial development must take place con-
stantly, in parallel with changes in market require-
ments, the external environment, demand, legal norms
and requirements. The development of digital infra-
structure and digitalization technologies provides new
opportunities and encourages constant updating of
technologies for the production of products, goods,

Norwegian Journal of development of the International Science No 60/2021 27
works and services. The primacy of participation in in-
novative technologies helps to increase the level of
competitive advantages of business in the market. In
addition, it is important not to focus on any one type of
innovation. Different types of innovations should be
implemented in business synchronously. Thus, along
with the improvement of processes through the use of
the principle of continuous improvement, it is im-
portant to develop new ideas. The effect of innovation
is enhanced by the constant development of innovative
products and product characteristics. Development of
new types of services and quality characteristics of their
provision in combination with development of innova-
tive business models and directions of business pro-
mote transition to innovative type of development of
business as a whole. The introduction of destructive or
radical innovations contributes to a complete change in
the approach to doing business in the market.
The company must have an innovative team of
employees who have different areas of knowledge and
thinking in the direction of innovative development and
development and implementation of digital technolo-
gies in business. Such teams must develop new projects
and implement them, adapting them to the company's
business process. The rapid development of digitaliza-
tion encourages digital transformation in the organiza-
tion of business and its implementation. Changing the
standard technology of production of goods, works or
services and digital requires the development of new
approaches to doing business.
Thus, the post-industrial development of society
can be realized through the active introduction of inno-
vations at each stage of economic activity of enter-
prises. The value of man and the definition of human
capital as a major factor in the post-industrial develop-
ment of society put at the forefront the integration of
corporate social responsibility into business. The goals
of sustainable development of Ukraine until 2030 con-
tributed to the separation of environmental security as
a necessary element of the development strategy of
companies and business in general. Therefore, the reor-
ientation of business to the implementation of its strat-
egy through tools that contribute to a positive result in
environmental, economic and social direction with the
widespread use of all elements of digitalization is the
basis of post-industrial development of society.
REFERENCES:
1. Use of information and communication
technologies at enterprises in 2018-2019 (2020)
[Vykorystannia informatsiino-komunikatsiinykh
tekhnolohii na pidpryiemstvakh u 2018-2019 rokakh].
State Statistics Service of Ukraine. Economic statistics.
Economic activity. Information society. URL:
http://www.ukrstat.gov.ua/
2. Beyer M.A., Laney D. The Importance of
"Big Data": A Definition. Gartner Inc. Electronic data.
Stamford: Gartner (2012) URL: https://www.gart-
ner.com/en/documents/2057415 (viewed on
01.06.2019)
3. Analysis of "big data" by type of economic
activity and with a distribution by the average number
of employees in 2018-2019 (2020). [Vykorystannia
informatsiino-komunikatsiinykh tekhnolohii na
pidpryiemstvakh u 2018-2019 rokakh]. State Statistics
Service of Ukraine. Economic statistics. Economic
activity. Information society. URL: http://www.ukr-
stat.gov.ua/
4. Sustainable development goals. Ukraine
2020 (2021) Monitoring report. State Statistics Service
of Ukraine with the support of UNICEF in Ukraine.
URL:
http://www.ukrstat.gov.ua/csr_prezent/ukr/st_rozv/pu
bl/SDGs%20Ukraine%202020%20Monitoring_12.20
20ukr.pdf
5. KOF Index of Globalization - 100 most
globalized countries 2018 (2019). URL:
https://www.statista.com/statistics/268168/globaliza-
tion-index-by-country
6. Soumitra Dutta, Bruno Lanvin, and Sacha
Wunsch-Vincent. GLOBAL INNOVATION INDEX
2019. Creating Healthy Lives - The Future of Medical
Innovation. - file:///C:/Us-
ers/%D0%92%D0%BB%D0%B0%D0%B4%D0%B5
%D0%BB%D0%B5%D1%86/Downloads/gii-full-
report-2019.pdf
7. Number of employees involved in research
and development with a scientific degree, for 2010-
2019 (2021) [Kilkist pratsivnykiv, zadiianykh u vy-
konanni naukovykh doslidzhen i rozrobok, yaki maiut
naukovyi stupin, za 2010-2019 roky] State Statistics
Service of Ukraine. Economic statistics / Science,
technology and innovation. URL: http://www.ukr-
stat.gov.ua/
8. Expenditures for research and development
by type of work for 2010-2019 (2020) [Vytraty na vy-
konannia naukovykh doslidzhen i rozrobok za vydamy
robit za 2010-2019 roky]. Economic statistics. Science,
technology and innovation. State Statistics Service of
Ukraine. URL:
http://www.ukrstat.gov.ua/operativ/menu/menu_u/ni.h
tm
9. Reports «The Global Innovation Index»
2010-2018 y (2020). URL: http://www.globalinnova-
tionindex.org
10. The Global Innovation Index (2019) URL: 1https://www.wipo.int/edocs/pubdocs/en/wipo_pub_gi
i_2019/ua.pdf; 2https://www.wipo.int/edocs/pubdocs/en/wipo_pub_gi
i_2018-intro5.pdf ; 3https://www.globalinnovationindex.org/analysis-
indicator
11. Bloomberg Innovation Index – 2020 (2020)
Bloomberg URL:
https://www.bloomberg.com/news/articles/2020-01-
18/germany-breaks-korea-s-six-year-streak-as-most-
innovative-nation
12. Bloomberg innovation index 2019 report
(2019) Bloomberg URL: https://www.bloom-
bergquint.com/global-economics/germany-nearly-
catches-korea-as-innovation-champ-u-s-rebounds
13. Whot is innowation? (2020) Innolytics.ag
MANAGAMENT SYSTEMS SOFTWARE (2021).
URL: https://innolytics-innovation.com/what-is-digi-
talization/
14. Oksana Mykoliuk, Hanna Kucherova,

28 Norwegian Journal of development of the International Science No 60/2021
Valentyna Fostolovych, Nataliia Prylepa (2020). Re-
cursive Modelling Of Intentions Of Fulfilling Tax Ob-
ligations By Industrial Enterprises In Case Of Imple-
menting A Mechanism For Promoting Their Energy Ef-
ficiency Estudios de economia aplicad. The recent
economic trends and their impact on marketing. VOL
38, NO 3 (1) (2020) DOI:
http://dx.doi.org/10.25115/eea.v38i3%20(1).4044
15. Fostolovych V. Modern business manage-
ment mechanism with hybrid structure. Theoretical and
practical aspects of the development of the European.
Research Area: Monograрh. Riga, Latvia : “Baltija
Publishing”, 2020. 322 p. (Р. 290-317 с. )
DOI: 10.30525/978-9934-588-53-2-13
16. FOSTOLOVYCH Valentyna. Integrated en-
terprise management model in the post-industrial de-
velopment system. Norwegian Journal of development
of the International Science. 2020. №52. Vol 3. Р. 3-13.
DOI: 10.24412/3453-9875-2020-52-3-3-13
HOTEL INDUSTRY IN KAZAKHSTAN: ANALYTICAL REVIEW
Shogelbaeva G.K.
Doctoral student
Almaty Management Univerisity
Almaty, Kazakhstan
ГОСТИНИЧНАЯ ИНДУСТРИЯ КАЗАХСТАНА: АНАЛИТИЧЕСКИЙ ОБЗОР
Шогельбаева Г.К.
докторант
Алматы Менеджмент Университет
Алматы, Казахстан
DOI: 10.24412/3453-9875-2021-60-1-28-32
Abstract The article presents an analytical review of the current state of the hotel business industry in the Republic of
Kazakhstan, taking into account the specifics of the formation of the management strategy. Market analysis allows
you to summarize and interpret data collected to determine patterns, relationships, or trends. According to the
analysis, the hotel business was gaining momentum in Kazakhstan and hotel companies had to fight in a fierce
competition. However, the analysis data serves as a starting point for analyzing the consequences of the pandemic
in the hotel business.
Аннотация В статье представлен аналитический обзор текущего состояния индустрии отельного бизнеса в Рес-
публике Казахстан, учитывая специфика формирования стратегии управления. Анализ рынка позволяет
обобщить и интерпретировать данные, собранные для определения закономерностей, взаимосвязей или
тенденций. Согласно проведенному анализу, отельный бизнес набирал темпы развития в Казахстане и гос-
тиничным предприятиям приходилось бороться в острой конкурентной борьбе. Однако, данные анализа
служат отправной точкой для анализа последствий пандемии в отельном бизнесе.
Keywords: hospitality industry, Republic of Kazakhstan
Ключевые слова: Индустрия гостеприимства, Республика Казахстан
Отельный бизнес сложная социально-эконо-
мическая система, влияющая на развитие и полно-
ценное функционирование общества, который в
настоящее время является развивающимся секто-
ром национальной экономики. Из-за пандемии
Covid-19 мировая экономика, и в особенности, ин-
дустрия гостеприимства столкнулась с беспреце-
дентной задачей, что привело к временному закры-
тию многих предприятий гостиничного бизнеса.
Ограничения передвижения, введенные в государ-
ствах по всему миру привели к резкому сокраще-
нию числа отелей, количества работников в инду-
стрии и доходов. Последствия пандемии только
предстоит изучить предметно, но для этого необхо-
димо провести анализ состояния рынка на момент
наступления всемирного локдауна. В связи с этим
определение тенденций развития отельного биз-
неса в период до пандемии являются задачами дан-
ного исследования.
К особенностям функционирования гостинич-
ных предприятий следует отнести как характерные
для рынка гостиничных продуктов в целом, так и
специфические, а именно:
определение на государственном уровне
гостиничных продуктов как услуг размещения, ко-
торые являются одним из системообразующих эле-
ментов индустрии туризма;
определение въездного туризма как од-
ного из приоритетных направлений государствен-
ной политики в сфере туризма и гостиничного хо-
зяйства;
учет факторов социально-экономической
нестабильности, уровня доходности и занятости

Norwegian Journal of development of the International Science No 60/2021 29
населения стран-партнеров по формированию и ре-
ализации туристических и гостиничных продуктов,
а также факторов международного сотрудничества;
необходимость обеспечения быстрой
адаптивности к изменениям спроса по отношению
к туризму и гостиничному хозяйству.
Также особенностью современных гостиниц и
отельного бизнеса является то, что данные органи-
зации функционируют в условиях жесткой конку-
ренции. Конкуренция гостиничных предприятий
предопределяет стратегию ее поведения на рынке.
На эффективное функционирование и разви-
тие отельного бизнеса оказывает огромное влияние
туристские потоки как внутренние, тки внешние.
По статистическим данным количество посетите-
лей по въездному туризму в 2019 году составило 8
789 314 человек, что на 2456580 человек больше в
сравнении с 2016 годом. Количество туристов из
стран СНГ составляют в среднем за пять лет 91,3%,
из других стран всего 8,7% (рисунок 1). Как видно
из рисунка, количество посетителей в период с 2015
по 2019 постоянно растет, это связано конечно же с
проведением различных форумов и международ-
ных конференций, ЭКСПО-2017, проведением
Саммитов и ряда других крупных мероприятий, что
благоприятно сказывается и на отечественном
отельном бизнесе.
Рисунок 1 - Количество посетителей по въездному туризму и обслуженных в местах размещения в
2016-2019 гг. в Республике Казахстан
Примечание: составлено на основании [2]
Посещение Казахстана туристами сопровож-
даются различными целями, как показал проведен-
ный анализ, 83,98 % туристов приезжают в личных
целях, 16,02 % - с деловыми целями [2]. В структуре
личных поездок основную часть 89,28 % занимают
частные поездки, по туризму – 9,66% и транзитом –
1,06 %.
В структуре туристкой отрасли больший
удельный вес от общего объема произведенной
продукции, выполненных работ и оказанных услуг
приходится на организации, оказывающих услуги
проживания – 54,46 %, на деятельность по органи-
зации отдыха и развлечений, культуры и спорта –
33,87% и от деятельности туроператоров, тураген-
тов - 11,67 %. К местам размещения посетителей
согласно ОКЭД относят гостиницы, мотели, госте-
вые дома, дома отдыха, туристские базы, кемпинги,
пансионаты и другие, используемые для прожива-
ния туристов и их обслуживания.
Услуги проживания в Республике Казахстан
предоставляются различными организациями с раз-
ным организационно-правовым статусом, разме-
ренности. Так на 2019 год зарегистрировано 3 322
организаций, из них: малых – 3154 единицы, сред-
них и крупных 90 и 78 единиц соответственно.
Большинство организаций, занимающихся разме-
щением посетителей, находятся в частной соб-
ственности – 3204 единицы, государственной – 77
единиц. Всего в 2019 году местами размещения
было обслужено 5 526 864 человек, что больше в
сравнении с 2015 на 1 722 417 человек, но в сравне-
нии с 2018 годом данный показатель изменился со-
всем не значительно лишь на 247 458 человек. Ко-
личество номеров в рассматриваемый период уве-
личилось на 22 730 единиц, из них класса-люкс
увеличилось на 2 399 единиц. Объем услуг, оказан-
ный местами размещения в 2019 году составил 103
948 ,3 млн.тенге, что на 31 546 млн.тенге больше в
сравнении 2015 годом, но на 4411,5 млн. тенге
меньше в сравнении с 2018 годом, что можно объ-
яснить ростом цен на стоимость гостиничных
услуг. Средняя стоимость койко-суток в анализиру-
емый период возросла в среднем на 2715, тенге.
Распределение мест размещения по звездности
в среднем за пять лет представлено на рисунке 14.
Как видно из рисунка в основную часть занимают
организации без категории 52,77%, наименьшую 1
– звездочные организации – 0,42% (рисунок 2).
Данные анализа говорят о том, что необходимо
улучшать качество обслуживания стандартизиро-
вать гостиничные услуги в республике.

30 Norwegian Journal of development of the International Science No 60/2021
Рисунок 2 - Распределение мест размещения в Республике Казахстан по звездности
Примечание: составлено на основании [2]
Анализ услуг гостиниц, предоставляющие
услуги проживания с питанием и без показал, что в
период с 2015 по 2019 годы большей популярно-
стью гостиницы с организацией питания (рису-
нок 3).
Рисунок 3 - Распределение мест размещения в Республике Казахстан по звездности
Примечание: составлено на основании [2]
Задачей диссертационного исследования явля-
ются человеческие ресурсы, роль которых в инду-
стрии гостеприимства играет большое значение, в
этой связи были изучены и проанализированы ос-
новные показатели развития человеческих ресур-
сов в данной сфере услуг. На 2019 год численность
работников в организациях, предлагающие услуги
проживания составило 29,2 тыс.человек, что на 3,5
тыс.человек больше в сравнении с 2015 годом (ри-
сунок 4).
Рисунок 4 - Численность работников, занятых в сфере услуг предоставления проживания, тыс. человек
Примечание: составлено на основании [2]
0,69 2,38 3,61 0,720,42
52,77
39,40
5 - звездочные
4 - звездочные
3 - звездочные
2 - звездочные
1 - звездочные
0
20000
40000
60000
80000
100000
120000
2015 2016 2017 2018 2019
35053,1
65243,3
79397,2
94005,1
114735
13490,422799,8
39207,1
59465,2
118267,2
предоставление услуг гостиницами с ресторанами
предоставление услуг гостиницами без ресторанов
22
24
26
28
30
2015 2016 2017 2018 2019
25,7 25,326,5
27,629,2

Norwegian Journal of development of the International Science No 60/2021 31
Рисунок 5 - Численность работников, занятых в сфере услуг предоставления проживания в разрезе ре-
гионов, тыс. человек
Примечание: составлено на основании [2]
Эффективность работы сотрудников организа-
ций отельного бизнеса, производительность их
труда напрямую связано с заработной платы, усло-
виями труда, предоставлением различных льгот,
дотаций, материальным и моральным стимулиро-
ванием. Среднемесячная заработная плата сотруд-
ников, работающих в отельном бизнесе в 2019 году
составила 124 217 тенге, что являлась наибольшим
показателем по всей сфере туризма. Так среднеме-
сячная заработная плата туроператоров, турагентов
в данный период составила 95 341 тенге, среднеме-
сячная заработная плата сотрудников организации
отдыха, развлечений, культуры и спорта 86 510
тенге. В период с 2015 по 2019 годы наблюдается
тенденция роста среднемесячной заработной платы
сотрудников, работающих в отельном бизнесе на
37945 тенге. Интересным является тот факт, что в
анализируемый период времени наблюдается за-
метное сокращение заработной платы сотрудников
государственного сектора на 59 183 тенге, в част-
ном секторе у сотрудников, занятых в данной сфере
наоборот произошло увеличение заработной платы
на 47 651 тенге, незначительное сокращение
наблюдается в организациях других государств
(таблица 1).
Таблица 1
Среднемесячная заработная плата сотрудников, работающих в отельном бизнесе в 2015-2019 гг.
тенге 2015 2016 2017 2018 2019 +\- 2019 к
2015 гг.
Всего 86 272 106 823 112 582 118 606 124 217 37 945
Государственная 119 835 50 219 55 360 56 659 60 652 -59 183
Частная 76 297 108 816 108 559 115 369 123 948 47 651
Собственность других госу-
дарств, их юридических лиц и
граждан
130 589 141 615 140 451 168 779 128 697 - 1 892
Примечание: составлено на основании [2]
Оплата труда в отельном бизнесе представляет
собой сложную систему комплексных и дополни-
тельных льгот. Менеджмент разрабатывает специ-
альные механизмы, целью которых является доне-
сение до служащих всех тонкостей и принципов
оплаты труда. Оплата труда в гостиницах делится
на несколько основных типов. В Америке и Европе
почасовая оплата является обычным типом зара-
ботной платы для служащих низкого уровня. Сама
оплата основана на спросе и предложении рабочей
силы, а так же на навыках и знаниях, которые тре-
буются на определенном месте работы.
Другой тип оплаты труда не зависит от коли-
чества часов работы. Договор между организацией
и служащим фиксирует оплату в течение месяца
или года. Каждую неделю или месяц служащий по-
лучает определенную сумму, которая и составляет
зарплату. Управленческий аппарат получает фик-
сированную зарплату. Менеджеры продажи часто
получают и зарплату и определенный процент от
продаж.
В большинстве организаций существует си-
стема премиальных выплат. Премии могут быть ос-
нованы на результатах как индивидуальной работы,
так и работы отделов организации, а так же на удо-
влетворении клиентов, доле рынка, производитель-
ности труда, количестве несчастных случаев на ра-
боте и завершении специфических проектов.
Наиболее обычная форма премии — ежегодная,
хотя премии могут выплачиваться и каждый квар-
тал, каждые полгода, приурочиваются к какому-
либо празднику.
2,30,9
3,4
1,60,7
0,61,8
0,80,51,4
0,80,50,5
2,2
4,5
5,7
0,9 Акмолинская область
Актубинская область
Алматинская область
Атырауская область
Западно-Казахстанская область Жамбылская область

32 Norwegian Journal of development of the International Science No 60/2021
Рисунок 6 - Среднемесячная заработная плата сотрудников,
работающих в отельном бизнесе в разрезе регионов, тыс. тенге
Примечание: составлено на основании [2]
Как видно из рисунка 6 наибольшая среднеме-
сячная заработная плата характерно для крупных
городов Казахстана, таких как: г.Нур-Султан, г.Ал-
маты, Атырауская область. А наименьшая средне-
месячная заработная плата зафиксирована в Турки-
станской области, Северо-Казахстанской и Коста-
найской областях.
Как показал проведенный анализ, отельный
бизнес набирает темпы развития в Казахстане и
гостиничным предприятиям приходится бороться в
острой конкурентной борьбе. Новые условия функ-
ционирования требуют от организаций отельного
бизнеса совершенствование методов управления, а
от сотрудников владеть не только технологиями
производства продукта, но и технологиями взаимо-
действия с его потребителями. Как следствие, кад-
ровый менеджмент в сфере услуг участвует не
только в процессах производства продукта
(услуги), но и в процессах взаимодействия работни-
ков с потребителями услуги в процессе их произ-
водства. Для работы в современной гостинице пер-
соналу помимо технологической подготовки, зна-
ний в области гостеприимства, требуется специаль-
ная психологическая подготовка и понимание осо-
бенностей межличностного общения.
В то время как пандемия COVID-19 поставила
беспрецедентную задачу перед индустрией госте-
приимства, она также открыла новые исследова-
тельские возможности для ученых в сфере гости-
ничного бизнеса. Масштабы и последствия постко-
видного кризиса предстоит изучить в дальнейшем,
поэтому необходимо провести аналитический об-
зор ситуации на момент начала пандемии.
СПИСОК ЛИТЕРАТУРЫ:
1. Чудновский А.Д. Индустрия гостеприим-
ства: основы организации и управления: учеб. по-
соб. / А.Д.Чудновский, М.А.Жукова [и др.]. - М.:
ИД Форум: ИНФРА-М, 2011. – 400с.
2. Бюро национальной статистики Агентства
по стратегическому планированию и реформам
Республики Казахстан www. https://stat.gov.kz/
108 134
86 357
81 078
129 822
114 425
56 134
67 83951 54174 66892 190
64 788
50 923
43 309
65 751
163 433
137 861
102 906 Акмолинская область
Актубинская область
Алматинская область
Атырауская область
Западно-Казахстанская область Жамбылская область
Карагандинская область

Norwegian Journal of development of the International Science No 60/2021 33
TECHNICAL SCIENCES
HYDRAULIC CONVERTER OF THE VEHICLE
Nikolaenko V.,
Candidate of Technical Sciences, Associate Professor of the Department of Machine Science and Machine
Parts of the Belarusian National Technical University (Minsk, Belarus)
Kozin G.,
2nd year student of the Energy Faculty of the Belarusian National Technical University (Minsk, Belarus)
Prokopovich M.
2nd year student of the Energy Faculty of the Belarusian National Technical University (Minsk, Belarus)
ГИДРОХОДОПРЕОБРАЗОВАТЕЛЬ ТРАНСПОРТНОГО СРЕДСТВА
Николаенко В.Л.,
кандидат технических наук, доцент кафедры машиноведения и детали машин Белорусского Нацио-
нального Технического Университета (Минск, Беларусь)
Козин Г.Д.,
студент 2 курса энергетического факультета Белорусского Национального Технического Универси-
тета (Минск, Беларусь)
Прокопович М.В.
студент 2 курса энергетического факультета Белорусского Национального Технического Универси-
тета (Минск, Беларусь)
DOI: 10.24412/3453-9875-2021-60-1-33-35
Abstract
The invention relates to transport engineering, and more specifically to hydraulic converters used as speed
variators in vehicle transmissions. The purpose of the invention is to simplify the design of the hydroconverter.
Аннотация
Изобретение относится к транспортному машиностроению, а более конкретно к гидроходопреобра-
зователям, используемым в качестве вариаторов скорости в трансмиссиях транспортных средств. Цель
изобретения - упрощение конструкции гидроходопреобразователя.
Keywords: hydraulic converter, shaft, gear, hydraulic machine, hydraulic system, driver.
Ключевые слова: гидроходопреобразователь, вал, шестерня, гидромашина, гидросистема, водило.
Гидроходопреобразователь - это совокупность
объемных гидромашин, гидроаппаратуры и других
устройств, предназначенная для передачи механи-
ческой энергии и преобразования движения по-
средством жидкости. В гидроходопреобразователь
входят один или несколько гидродвигателей, ис-
точники энергии жидкости, аппаратура управления
соединительных линий. Работа данного устройства
основывается на принципе гидравлического ры-
чага. [2, с. 379]
Гидроходопреобразователь транспортного
средства содержит входной вал 1, связанный с дви-
гателем 2, выходной вал 3, связанный с движителем
4, дифференциальный механизм 5 с входным зве-
ном 6, например солнечной шестерней, связанной с
входным валом 1, выходным звеном 7, например
водилом, связанным с выходным валом 3, и проме-
жуточным звеном 8, например коронной шестер-
ней, и гидропередачу 9, первая гидромашина 10 по-
стоянного объема которой связана с промежуточ-
ным звеном 8 дифференциального механизма 5 и
вторая гидромашина 11 постоянного объема кото-
рой связана с входным валом 1. Гидросистема гид-
роходопреобразователя включает в себя распреде-
литель 12 с тремя позициями 13-15 и четырьмя ли-
ниями 16-19.

34 Norwegian Journal of development of the International Science No 60/2021
Рис. 1. Гидравлическая принципиальная схема гидроходопреобразователя
Гидроходопреобразователь транспортного
средства содержит входной вал 1, связанный с дви-
гателем 2, выходной вал 3, связанный с движителем
4, дифференциальный механизм 5 с входным зве-
ном 6, например солнечной шестерней, связанной с
входным валом 1, выходным звеном 7, например
водилом, связанным с выходным валом 3, и проме-
жуточным звеном 8, например коронной шестер-
ней, и гидропередачу 9, первая гидромашина 10 по-
стоянного объема которой связана с промежуточ-
ным звеном 8 дифференциального механизма 5 и
вторая гидромашина 11 постоянного объема кото-
рой связана с входным валом 1. Гидросистема гид-
роходопреобразователя включает в себя распреде-
литель 12 с тремя позициями 13 - 15 и четырьмя ли-
ниями 16 -19, при этом линия 16 связана с
магистралью 20 первой гидромашины 10, маги-
страль 21 которой связана с гидробаком 22, линия
17 связана с гидробаком 22, и линии 18 и 19 связаны
с магистралями 23 и 24 второй гидромашины 11;
регулятор 25 потока и обратный клапан 26, уста-
новленные между линией 16 распределителя 12 и
гидробаком 22. В позиции 13 распределителя 12 ли-
ния 16 связана с линией 18, а линия 17 - с линией
19, в позиции 14 распределителя 12 линия 17 свя-
зана с линиями 18 и 19 и в позиции 15 распредели-
теля 12 линия 16 связана с линией 19, а линия 17- с
линией 18.
Принцип работы гидроходопреобразователя
транспортного средства заключается в наличии
трех диапазонов бесступенчатого регулирования
скорости выходного звена 7 и связанного с ним дви-
жителя 4.
В первом поддиапазоне, что соответствует по-
зиции 13 распределителя 12, гидромашина 10, ра-
ботающая в режиме насоса, подает рабочую жид-
кость в гидромашину 11, работающую в режиме
мотора, и на регулятор 25 расхода. Открытие регу-
лятора 25 расхода соответствует максимально воз-
можной скорости промежуточного звена 8 диффе-
ренциального механизма 5, т.е. минимальной ско-
рости выходного звена 7, и егo закрытие уменьшает
скорость промежуточного звена 8 с соответствую-
щим увеличением скорости выходного звена.
Во втором поддиапазоне, что соответствует
позиции 14 распределителя 12, гидромашина 11 вы-
ключается из работы (холостое вращение), а гидро-
машина 10, работающая в режиме насоса, подает
рабочую жидкость на регулятор 25 расхода. Откры-
тие регулятора расхода 25 соответствует скорости
промежуточного звена 8 и выходного звена 7 соот-
ветственно минимальной и максимальной в первом
поддиапазоне, и его закрытие уменьшает скорость
промежуточного звена 8 до нуля с соответствую-
щим дальнейшим увеличением скорости выход-
ного звена 7.
И в третьем поддиапазоне, что соответствует
позиции 15 распределителя 12, гидромашина 11,
работающая в режиме насоса, подает рабочую жид-
кость в гидромашину 10, работающую в режиме
мотора, и на регулятор 25 расхода. Открытие регу-
лятора 25 расхода соответствует нулевой скорости
промежуточного звена 8 и скорости выходного
звена 7, равной максимальной во втором поддиапа-
зоне, и его закрытие увеличивает скорость проме-
жуточного звена 8 в противоположном относи-
тельно первых двух поддиапазонов направлении с
соответствующим дальнейшим увеличением ско-
рости выходного звена 7.
Обратный клапан 26 необходим для питания
гидромашины 11 в позиции 13 распределителя 12
при остановке транспортного средства посред-
ством, например, выжима муфты 27 сцепления.
Таким образом, гидроходопреобразователь
транспортного средства, содержащий входной и
выходной валы, связанные соответственно с двига-
телем и движителем, трехзвенный дифференциаль-
ный механизм, одно звено которого связано с вход-
ным валом, другое - с выходным, две гидрома-
шины, одна из которых связана с третьим звеном
дифференциального механизма, а другая - с вход-
ным валом, регулятор расхода, трехпозиционный
четырехлинейный гидрораспределитель, первая
линия которого связана с магистралью первой гид-
ромашины, вторая - с гидробаком, а третья и чет-
вертая - с магистралями второй гидромашины, об-
ратный клапан с возможностью проходимости - к
гидрораспределителю, гидробак, отличающийся

Norwegian Journal of development of the International Science No 60/2021 35
тем, что, с целью упрощения конструкции гидрохо-
допреобразователя, регулятор расхода и обратный
клапан установлены между первой линией гидро-
распределителя и гидробаком, причем в первой по-
зиции гидрораспределителя первая линия связана с
третьей, а вторая - с четвертой, во второй позиции
вторая линия связана с третьей и четвертой, а в тре-
тьей позиции первая линия связана с четвертой, а
вторая - с третьей.
СПИСОК ЛИТЕРАТУРЫ:
1. Авторское свидетельство СССР №
1622180, кл. В 60 К 17/10, 1989.
2. Башта Т.М. Гидравлика гидромашины и
гидроприводы. - М: «Издательский дом Альянс»,
2010. – 379 с.
USE OF E-LEARNING TECHNOLOGIES IN THE EDUCATIONAL PROCESS
Ovcharuk V.,
PhD, Docent, Associate Professor of the Department of Informatics,
National University of Food Technologies, Kyiv, Ukraine
Yushchuk I.
Senior Lecturer of the Department of Informatics,
National University of Food Technologies, Kyiv, Ukraine
ВИКОРИСТАННЯ ТЕХНОЛОГІЙ E-LEARNING В ОСВІТНЬОМУ ПРОЦЕСІ
Овчарук В.,
К.т.н., доцент, доцент кафедри інформатики,
Національний університет харчових технологій, Київ, Україна
Ющук І.
Старший викладач кафедри інформатики,
Національний університет харчових технологій, Київ, Україна
DOI: 10.24412/3453-9875-2021-60-1-35-38
Abstract
The paper considers software and web services for digital distance learning in the educational process of
higher education institutions. The main characteristics of the most popular learning management systems, their
functions, features, advantages and disadvantages, as well as the convenience of creating distance learning courses.
The MOODLE learning management system is considered in detail as a platform for creating an information and
educational environment of the educational institution, which provides interactive interaction between the partic-
ipants of the educational process. Also, the work presents BigBlueButton software, created specifically for online
learning platforms for video conferencing.
Анотація
У роботі розглянуто програмні засоби та веб-сервіси для цифрового дистанційного навчання в освіт-
ньому процесі закладів вищої освіти. Наведені основні характеристики найбільш популярних систем уп-
равління навчанням, їх функції, особливості роботи, переваги та недоліки, а також зручність для створення
дистанційних курсів навчання. Детально розглянута система управління навчанням MOODLE, як платфо-
рма для створення інформаційно-освітнього середовища навчального закладу, що забезпечує інтерактивну
взаємодію між учасниками навчального процесу. А також у роботі представлене програмне забезпечення
BigBlueButton, створене спеціально для онлайн-платформ навчання для організації відео конференцій.
Keywords: educational technologies, distance learning
Ключові слова: освітні технології, дистанційне навчання.
Швидка зміна технологічної епохи на епоху ін-
формаційно-технологічну спонукає до усвідом-
лення невідворотних змін, які очікують освітню га-
лузь. Усі технологічні революції в історії людства
характеризувалися всеосяжним впливом, проник-
ненням у всі сфери людської діяльності не лише як
зовнішнє джерело. Інтегральною частиною життє-
вого середовища є освітнє середовище.
Нині немає єдиного визначення віртуального
освітнього простору для закладів вищої освіти. Ро-
зглядаючи освіту в інформаційному суспільстві, не-
обхідно виділити організацію інформаційних про-
цесів, розвиток і застосування інформаційних осві-
тніх технологій, які передбачають такі процеси: пе-
редавання, оброблення, організація, збереження і
накопичення даних, формалізація та автоматизація
знань.
Одним із важливих напрямків розвитку інфор-
матизації вищої освіти є нові комп’ютерні техноло-
гії. Інтерактивність, інтенсифікація процесу нав-
чання, зворотний зв'язок – помітні переваги цих те-
хнологій, котрі зумовили необхідність їх
застосування у різних галузях людської діяльності,
насамперед у тих, які пов'язані з освітою.

36 Norwegian Journal of development of the International Science No 60/2021
Сучасні інформаційні технології відкривають
нові перспективи для підвищення ефективності
освітнього процесу. Змінюється сама парадигма ви-
щої освіти. Велика роль надається методам актив-
ного пізнання, самоосвіті, дистанційним освітнім
програмам [1, c. 23].
Дистанційні технології навчання можна розг-
лядати, на перший погляд, як природний етап ево-
люції традиційної системи освіти від дошки з крей-
дою до електронної дошки й комп'ютерних навча-
льних систем, від книжкової бібліотеки до
електронної, від звичайної аудиторії до віртуальної.
Однак в ситуації нестабільності, хаосу, складності
й невизначеності сучасного світу взагалі та віртуа-
льної реальності зокрема, яка яскраво ілюструє
таку нестабільність, основний акцент має робитися
на розвиток готовності до пошуку власних нетриві-
альних підходів до прийняття рішень, розв’язу-
вання задач, тобто саме на розвиток інтелекту здо-
бувача вищої освіти.
Під час створення та використання систем ди-
станційного навчання застосовуються поняття пла-
тформи дистанційного навчання та засобів ство-
рення дистанційних курсів. Платформа дистанцій-
ного навчання(LMS) – це програмне забезпечення,
що дозволяє не тільки розміщувати навчальні мате-
ріали, а дає можливість реалізовувати спілкування,
контролювати знання здобувачів вищої освіти,
здійснювати управління навчальним процесом.
Тобто засоби розроблення дистанційних курсів є
спеціалізованими програмними середовищами, що
дозволяють інтегрувати та обробляти різні формати
медіа-файлів, підтримують міжнародні стандарти
електронного навчання, мають інструменти підтри-
мки різних платформ дистанційного навчання, на-
дають можливість використовувати шаблони та
отримувати якісний навчальний курс [2, c. 55].
Moodle – найпопулярніша безкоштовна LMS із
відкритим вихідним кодом, орієнтована на органі-
зацію взаємодії між викладачем та здобувачами ви-
щої освіти, підходить для організації дистанційних
курсів та підтримки очного навчання. Moodle –
web-орієнтоване середовище, яке можна масштабу-
вати і налаштовувати, відрізняється високим ступе-
нем безпеки і пропонує великий набір інструментів
для комп'ютеризованого дистанційного навчання.
Moodle підтримується мережею сертифікованих
партнерів, а також має активне співтовариство ко-
ристувачів і розробників по всьому світу (більше,
ніж 129 мільйонів активних користувачів). Основна
навчальна одиниця Moodle – навчальний курс.
Moodle має вбудований конструктор курсів і підт-
римує, серед іншого, асинхронне і змішане нав-
чання, гейміфікацію, мобільне навчання, стандарти
SCORM, синхронне навчання, відеоконференції і
багато іншого. При всіх перевагах відкритого коду,
архітектура системи дуже складна та й інтерфейс
(UI) системи залишає бажати кращого.
Talent LMS – хмарна e-learning платформа для
навчання. Дана LMS відрізняється простотою і чіт-
кістю інтерфейсу, має вбудований конструктор ку-
рсів, інтуїтивно зрозуміла і швидко налаштову-
ється, що дозволяє отримувати доступ до курсів без
необхідності встановлювати програмне забезпе-
чення. Велика перевага даної системи - наявність
простої і зрозумілої аналітики всього, що відбува-
ється в навчальному середовищі. Варто відзначити
потужну підтримку SCORM & TinCan (xAPI), підт-
римку відеоконференцій і гейміфікації, розширю-
ваних профілів користувачів, мобільне навчання і
багато іншого. Використовується в більш, ніж 70
000 організацій по всьому світу [3, c. 12]. З недолі-
ків можна відмітити деякі обмеження кастомізації,
тестування, обмежені налаштування повідомлень.
Платформа доступна в безкоштовній версії з підт-
римкою до 5 користувачів, також надається проб-
ний доступ. У платній версії тарифні плани варію-
ються.
Litmos – популярна, зазна-
чена нагородою G2 як найкраща багатофункціона-
льна платформа 2019 для електронного навчання. Її
називають найзручнішою у використанні LMS у
світі завдяки сучасному дизайну і простоті інтер-
фейсу. Ключовими особливостями системи є наяв-
ність бібліотеки готових курсів, гнучка й автомати-
зована система звітності, управління користува-
чами. Платформа повністю розширюється завдяки
потужному API і готовим з'єднувачів для додатків.
Крім цього, LMS підтримує змішане і асинхронне
навчання, налаштування платного доступу до кур-
сів, гейміфікацію, стандарти SCORM, синхронне
навчання, відеоконференції. Має локалізацію на
більш, ніж 24 мовами. Мінуси – підтримка здійсню-
ється через систему онлайн-тікетів, що збільшує
час очікування, складності з об'єднанням курсів.
Вартість передплати залежатиме від кількості кори-
стувачів та обраного тарифного плану. Максима-
льне число підтримуваних користувачів – до 1 мі-
льйона в розширеній версії. Надається 14-денний
безкоштовний доступ.
Docebo – модульна LMS, особливістю якої є
розширена кастомізація і поєднання формального,
експериментального і соціального навчання з уп-
равлінням навичками на базі використання штуч-
ного інтелекту. Складається з 4 модулів: Learn (ос-
новний модуль, що входить у базову вартість),
Coach & Share, Extended Enterprise і Perform. Плат-
форма підтримує інтеграцію з десятками зовнішніх
сервісів, у тому числі Google Analytics, Slack,
WordPress, Drupal, Salesforce CRM, Shopify та ін., а
також популярними інструментами для проведення
відеоконференцій, наприклад, Adobe Connect, Cisco
Webex або Onsync. Також Docebo має вбудований
конструктор курсів, однак, він менш зручний у ви-
користанні в порівнянні з іншими. Серед безумов-
них переваг даної системи – можливість підклю-
чати та відключати модулі, неформальне соціальне
навчання, локалізація на більш, ніж 40 мовами, уп-
равління навичками, підтримка змішаного і мобіль-
ного навчання, необмежений обсяг сховища даних.
Але не безкоштовна [4, c. 105].
Canvas – багатообіцяюча платформа для елек-
тронного навчання, спочатку розроблена виключно
для навчальних закладів. Ця LMS має наявність су-
часних інструментів для створення курсів, відкри-

Norwegian Journal of development of the International Science No 60/2021 37
тий API і, завдяки йому, підтримка численних сто-
ронніх розширень та інтеграцій, що дозволяє роз-
ширити функціонал. Також до плюсів можна відне-
сти зручність використання вкладок і контекстного
меню в інтерфейсі, посилену безпеку, можливості
для мобільного навчання. Серед недоліків системи
можна відзначити відсутність гейміфікації. Однак
компанія-розробник Instructure також представила
Arc-інклюзивну відео платформу для онлайн-нав-
чання, що легко може використовуватися з Canvas
для завантаження та обміну відео, і дозволяє здобу-
вачам вищої освіти і викладачам коментувати відео,
створюючи бесіди.
Створити акаунт у хмарній версії Canvas мо-
жна безкоштовно. Компанія пропонує 14-денний
пробний доступ до розширених можливостей,
проте вартість тарифних планів у відкритому дос-
тупі не розголошується. Canvas доступна також у
версії з відкритим вихідним кодом, що можна про-
тестувати в режимі live demo.
У Національному університеті харчових тех-
нологій вже не один рік застосовується система уп-
равління навчанням MOODLE (Modular Object-
Oriented Dynamic Learning Environment – модульне
об’єктно-орієнтоване динамічне навчальне середо-
вище). Середовище MOODLE розроблено на PHP з
використанням SQL-бази, має модульну архітек-
туру, що дозволяє легко розгалужувати можливо-
сті.
MOODLE відноситься до автоматизованих ін-
формаційних систем класу LMS (Learning
Management System) – систем управління навчан-
ням. Ця система управління навчанням використо-
вується більш ніж у 30 000 навчальних закладів ба-
гатьох країн світу для організації дистанційного на-
вчання, її перекладено майже на 80 мов, у тому
числі і на українську.
MOODLE надає можливість проектувати,
створювати та керувати інформаційно-навчаль-
ними ресурсами навчального закладу. MOODLE є
достатньо гнучкою системою: викладач може само-
стійно створювати дистанційний курс та управляти
ним, тобто власноруч контролювати доступ до
своїх курсів, використовувати часові обмеження,
створювати власні системи оцінювання знань, кон-
тролювати надсилання на перевірку виконаних здо-
бувачами вищої освіти завдань, фіксувати за-
вдання, надіслані із запізненням, дозволяти або за-
бороняти здобувачами вищої освіти перездавання
контрольних завдань (модульних або підсумкових
– заліків, іспитів) тощо.
Система MOODLE надає зручні засоби управ-
ління контентом і різні форми організації занять.
Дистанційний курс може містити різні елементи:
лекції, практичні завдання, форум, чат тощо. При
цьому можна використовувати текст, презентації,
таблиці, схеми, графіку, відеоматеріали, посилання
в мережі Інтернет, допоміжні файли та інші матері-
али. За результатами виконання здобувачами вищої
освіти завдань викладач може виставляти оцінки та
давати коментарі.
Система управління навчанням MOODLE має
багато функцій, що полегшують процес оціню-
вання знань здобувачів вищої освіти. Контроль
знань здійснюється в системі за допомогою окре-
мого модуля, який пропонує багато видів тестів, на-
дає можливість перетестування з дозволу викла-
дача, можливість захисту від списування шляхом
рандомізації питань в тестових завданнях, організа-
ції бази даних питань для використання їх у тестах.
Система має механізми зберігання поточних оцінок
кожного здобувача вищої освіти за всіма дистанцій-
ними курсами, встановлення шкали оцінок, напіва-
втоматичного перерахунку результатів тестування
тощо.
Оскільки систему MOODLE орієнтовано на за-
стосування у дистанційному навчанні, вона має ве-
ликий набір засобів комунікації. Можливості, які
надає система, дозволяють забезпечити індивідуа-
льну роботу викладача з кожним здобувачем вищої
освіти. Це не лише електронна пошта та обмін вкла-
деними файлами, але й форуми, чати, ведення бло-
гів тощо.
Таким чином, підсумовуючи, MOODLE – це
оптимальна система для створення інформаційно-
освітнього середовища навчального закладу, яка
орієнтована, насамперед, на забезпечення інтерак-
тивної взаємодії між учасниками навчального про-
цесу.
Для організації інтерактивного дистанційного
навчання необхідний сервіс для організації онлайн-
конференцій. Один з таких – BigBlueButton.
BigBlueButton - це програмне забезпечення з
відкритим вихідним кодом, що володіє всіма функ-
ціями для організації відеоконференцій та створене
спеціально для онлайн-платформ навчання. Здобу-
вачам вищої освіти не потрібно встановлювати до-
даток, щоб приєднатися до вебінарів. Організатор
може поділитися своїм екраном в режимі реального
часу, а учасники можуть співпрацювати за допомо-
гою ряду інструментів, таких як віртуальні дошки і
загальні замітки. Програмне забезпечення
BigBlueButton безкоштовне як для особистого ви-
користання, так і може призначене для учбових за-
кладів, які запровадили дистанційне навчання.
Що дуже важливо для навчальних закладів,
BigBlueButton легко інтегрується з основними сис-
темами управління навчанням, такими як Moodle,
Canvas і Jenzabar. BigBlueButton має безліч функ-
цій, які ідеально підходять для онлайн-семінарів з
навчання. Під час сеансів можна обмінюватися ау-
діо, відео, презентаціями та своїм робочим столом,
а також співпрацювати зі здобувачами вищої
освіти, використовуючи дошку, загальні замітки,
опитування і чат.
BigBlueButton йде далі, ніж традиційне програ-
мне забезпечення для відеоконференцій, в своїх фу-
нкціях, корисних для віртуального класу. Напри-
клад, у вас є багато користувачів дошка і ви можете
розмістити здобувачів вищої освіти в “кімнатах”
обговорення груп, щоб разом вирішувати про-
блеми.

38 Norwegian Journal of development of the International Science No 60/2021
BigBlueButton отримав свою назву завдяки
простоті установки, але насправді його важко вста-
новити для тих, хто ще не знайомий з серверами
Linux. Знадобиться 64-бітний сервер Ubuntu 16.04,
виділений для BigBlueButton. Доменне ім'я і дійс-
ний сертифікат SSL також рекомендується. Звідти
установка – це запуск декількох команд в команд-
ній оболонці або запуск сценарію bbb-install.sh, до-
ступного на GitHub, який автоматизує більшу час-
тину процесу.
Позитивним моментом є те, що здобувачами
вищої освіти не потрібно турбуватися про встанов-
лення, так як BigBlueButton запускається в їх веб-
браузері.
Інтерфейс BigBlueButton є простим і професій-
ним, що відповідає своїй основній функції як ін-
струмент навчання. У розпорядженні організатора
є декілька інструментів для викладання предмета
здобувачам вищої освіти в режимі реального часу,
наприклад, можливість малювати фігури і текст по-
верх слайдів. Можна відмітити, як легко перемика-
тися між загальними вкладками Chrome, окремими
додатками або всім вашим робочим столом.
BigBlueButton має декілька механізмів безпеки
для забезпечення безпеки потоків. Якщо
BigBlueButton встановлений на сервері з сертифіка-
том TLS, він шифрує весь контент, що відправля-
ється з сервера в веб-браузер. Для спільного вико-
ристання аудіо, відео і екрану бібліотеки WebRTC
передають пакети протоколу реального часу (RTP)
по протоколу користувача дейтаграм (UDP) через
протокол захисту транспортного рівня дейтаграм
(DTLS), а медіапакети шифруються з використан-
ням безпечного протоколу реального часу. Все це
забезпечує високий рівень вбудованої безпеки ва-
ших потоків.
Також можна встановити код доступу в “кім-
нату” для кожної сесії і вимагати схвалення моде-
ратора приєднання нових здобувачів вищої освіти.
BigBlueButton має якісні навчальні відео, дета-
льну документацію і три списки розсилки підтри-
мки спільноти. Комерційна підтримка доступна
тільки через сторонні компанії, деякі з яких укомп-
лектовані розробниками BigBlueButton.
Якщо встановити BigBlueButton на свій сер-
вер, електронна документація має вирішальне зна-
чення. Документація по установці і налаштуванні
детальна, але необхідно мати досвід роботи з серве-
рами Linux і використанням командного рядка.
Основними конкурентами BigBlueButton для
організації відеоконференцій з функціями, призна-
ченими для онлайн-навчання, є Jitsi і Zoom. Jitsi та-
кож має відкритий вихідний код та може бути вста-
новлений на власному сервері. Jitsi, на відміну від
BigBlueButton, має додатки для iOS і Google Play,
але BigBlueButton має кращі інструменти для спіль-
ної роботи і підвищену безпеку.
Останнім часом Zoom набув великої популяр-
ності, тому що він додав інтеграцію з освітнім про-
грамним забезпеченням, таким як Canvas. Він про-
понує прямі трансляції на YouTube і Facebook Live.
Zoom набагато простіше в налаштуванні і обслуго-
вуванні, ніж BigBlueButton, але він коштує доро-
жче.
BigBlueButton - це, мабуть, краще програмне
забезпечення для відеоконференцій з відкритим ви-
хідним кодом для онлайн-навчання. У порівнянні з
іншими інструментами для організації відеоконфе-
ренцій його складно налаштувати, але він безкош-
товний і має всі функції дорогого комерційного
програмного забезпечення. Продуктивність від-
мінна, і програмне забезпечення прекрасно інтегру-
ється з іншими освітніми програмами, такими як
Moodle і Sakai.
Досвід інноваційної діяльності українських ви-
щих навчальних закладів підтверджує їх здатність
адаптуватися до вимог сучасного світу і випускати
інноваційну продукцію, що має попит, використо-
вуючи результати цього виробництва для вдоскона-
лення своєї освітньої і наукової роботи. Інновацій-
ний підхід в освіті визначається не через викорис-
тання якоїсь однієї моделі, а через здатність
проектувати і моделювати потрібний вищому нав-
чальному закладу навчальний процес з використан-
ням різних освітніх технологій на основі знання їх
потенційних можливостей і переваг «сильних сто-
рін». Саме така здатність і робить процес навчання
у вищому навчальному закладі технологічним,
тобто прогнозованим і максимально наближеним
до запланованих результатів.
СПИСОК ЛІТЕРАТУРИ:
1. Бочков А. Л. Использование LMS-систем
для дистанционного обучения / Андрей Леонидо-
вич Бочков [Електронний ресурс] – Режим доступу:
http://www.mmf.spbstu.ru/mese/2014/105.pdf
2. Іванюк І. В. Формування понятійно-тер-
мінологічного апарату з питань розвитку дистан-
ційної освіти [Електронний ресурс] – Режим дос-
тупу: http://lib.iitta.gov.ua/740/1/Іванюк_стаття.pdf
3. Колос К. Р. Основні компоненти
комп’ютерно-орієнтованого навчального середо-
вища закладу післядипломної педагогічної освіти
[Електронний ресурс] – Режим доступу:
http://lib.iitta.gov.ua/1422/1/ /Колос_21_01_2014.pdf
4. Коротун О.В. Хмарні SaaS – сервіси в
освітньому процесі загальноосвітніх навчальних за-
кладів. //Наукові записки. – Випуск 7. – Серія: Про-
блеми методики фізико-математичної і технологіч-
ної освіти. Частина 2. – Кіровоград: РВВ КДПУ ім.
В.Винниченка, 2015 – С. 300.

Norwegian Journal of development of the International Science No 60/2021 39
УДК 626.52/54
CARGO PASSING SPECIAL FACILITIES AS PART OF HYDRAULIC STRUCTURES
Saptsin V.
Doctor of Engineering,
full professor, Building Structures and Water Supply Department
Institute of Construction and Architecture
Federal State Budgetary Educational Institution of Higher Education, Volga State University of Technology
Yoshkar-Ola
СПЕЦИАЛЬНЫЕ СООРУЖЕНИЯ, ОБЕСПЕЧИВАЮЩИЕ ПРОПУСК ГРУЗОВ В СОСТАВЕ
ГИДРОУЗЛОВ
Сапцин В.П.
доктор технических наук,
профессор кафедры «Строительные конструкции и водоснабжения»
Институт строительства и архитектуры
ФГБОУ ВО «Поволжский государственный технологический университет»
г. Йошкар-Ола
DOI: 10.24412/3453-9875-2021-60-1-39-48
Abstract
The paper discusses the operation features of transport navigation facilities as part of hydraulic structures.
Inclined plane ship lifts with a longitudinal layout (as in Krasnoyarsk) are considered. These structures can also
pass timber cargo, which is carried out both in timber vessels (barges) and in raft sections. The most promising is
a balanced inclined plane ship lift with a transverse layout, allowing the use of steep terrain slopes and downstream
slopes of embankment dams. This type shortens the route and provides a shorter passage time between upstream
and downstream to ensure the transit movement of all purpose cargo (passengers, coal, ores, including timber).
The proposed relations assume safe transportation conditions for timber cargo both in ships (Krasnoyarsk ship lift
with a longitudinal layout) and in raft sections, studied on the model of a transverse ship lift at the Volga State
University of Technology, including emergency operating modes of an inclined plane ship lift in the case of an
electric drive shutdown or if there are other obstacles on the track.
Аннотация
В работе рассмотрены особенности работы транспортных судопропускных сооружений в составе гид-
роузлов. Рассмотрены наклонные судоподъёмники с продольной компоновкой (Красноярск). Одновре-
менно эти сооружения могут пропускать и лесные грузы, которые выполняются как в лесовозных судах
(баржах), так и секциями плотов. Наиболее перспективным является наклонный судоподъемник с попе-
речной компоновкой уравновешенный, позволяющий использовать крутые уклоны местности и низовые
откосы грунтовых плотин. Это сокращает путь и обеспечивает более короткое время пропуска из одного
бьефа в другой для обеспечения транзитного перемещения грузов любого назначения (пассажиров, угля,
руд, в том числе и лесных грузов). Предложенные зависимости предполагают безопасные условия транс-
портировки лесных грузов как в судах (Красноярский судоподъемник с продольной компоновкой), так
секциях плотов при модельных исследованиях для поперечного судоподъемника в Поволжском государ-
ственном технологическом университете (ПГТУ) даже при экстренных режимах работы наклонного судо-
подъемника в случае отключения электропривода или при наличии других препятствий на рельсовых пу-
тях.
Keywords: inclined plane ship lifts with longitudinal and transverse layouts; a speed-time chart in case of
nonuniform camera movement; overall dimensions of vessels; timber barges; assortment rafts.
Ключевые слова: наклонные судоподъемники c продольной и поперечной компоновками; график
изменения скорости при неравномерном движении камеры; габаритные размеры судов; лесовозные баржи;
плоты сортиментные.
Введение. Численность населения Земли рас-
тет, и улучшение условий его существования явля-
ется главной целью развития общества. Человече-
ский организм примерно на 2/3 состоит из пресной
воды. Если человек не восполняет неизбежных по-
терь воды из организма, то наступают расстройства
жизненно важных функций. Без воды человек поги-
бает в течение несколько дней.
В связи со строительством ряда гидроузлов на
Дальнем Востоке, а также в ряде регионов Восточ-
ной Сибири возникает проблема лесосводки в зоне
водохранилищ, переработка и транспортировка
лесных грузов из труднодоступных районов к круп-
ным промышленным центрам и транспортным уз-
лам. Все лесопромышленные комплексы привя-
заны к существующим рекам. Для перевалки лес-
ных грузов через створ гидроузла следует

40 Norwegian Journal of development of the International Science No 60/2021
предусматривать специальные судопропускные со-
оружения, обеспечивающие экономию пресной
воды [4,7,9].
В связи с принятием закона о земле все боль-
шее внимание будет уделяться борьбе с затопле-
нием земельных угодий водохранилищами круп-
ных гидроэлектростанций. Поэтому будет разви-
ваться использование водных ресурсов путем
постройки низконапорных и транспортных гидро-
узлов. Одним из мощнейших побудительных моти-
вов развития транспортного строительства по
трассе Северного морского пути и крупным рекам
Сибири является реализация общей транспортной
схемы освоения арктической зоны России: Транс-
сиб и БАМ с юга, морской транспорт – с севера,
речной транспорт – в меридиональных и широтных
направлениях [9,11].
Область применения продольных наклонных
судоподъемников, которые могут быть односкат-
ные (Ронкьер, Бельгия [9,17]) и двухскатные (Крас-
ноярская ГЭС,[5,9]), от 1:8 до 1:20 естественного
уклона местности; поперечных - могут преодоле-
вать более крутые уклоны (Арзвиль, Франция), – от
1:3 до 1:6 (18о 04 до 9
о 04 ) [4,7,9,18-20]; водо-
клиновые (Монтеш, Фонсеранн, Франция) - от 3%
до 5% [9,16,20]. Кроме того, транспортные наклон-
ные судоподъемники могут быть неуравновешен-
ными и уравновешенными [4,7].
Любые судопропускные сооружения, в том
числе и традиционные – судоходные шлюзы, обла-
дают принципам сезонности, когда река имеет сво-
бодную поверхность ото льда. Эффективность су-
допропускных сооружений связана с рядом пре-
имуществ относительно железнодорожного и
автомобильного транспорта, водный транспорт
требует меньших первоначальных капиталовложе-
ний, а также удельных расходов металла, и топлива
на сопоставимый объем перевозок. Навигационный
период колеблется от 150 до 210 дней и может уве-
личиваться в связи с потеплением климата на всей
планете.
Цель исследования – создание приближен-
ных формул для судоподъёмников, обеспечение
наименьших расходов пресной воды при использо-
вании сооружений для перевозки грузов, в том
числе и лесных в составе гидроузлов.
Традиционные судопропускные сооружения –
судоходные шлюзы расходуют значительные объ-
емы воды [8-9]. Например, шлюз №5 Волго-Бал-
тийского водного пути, длиной 270 м, шириной 18
м, напор которого равен 13,25 м, за месяц расходует
28 млн. м3, а за навигацию – до 175 млн. м
3, что
представляет собой немалую величину. Общие по-
тери воды из верхнего бьефа в нижний при различ-
ных типах судопропускных сооружений состав-
ляют: в шлюзах (лестнице шлюзов) от 1 до 7 м3/с
[8-9]; в водоклиновых бескамерных судоподъемни-
ках до 0,083 м3/с [9,16]; в вертикальных и наклон-
ных судоподъемниках от 0,015 до 0,040 м3/с [9,16-
20]. Это связано с утечками воды через уплотнения
в затворах камеры судоподъемников.
Наклонные судоподъемники обладают эффек-
том энергосберегающих технологий: при спуске ка-
меры из верхнего в нижний бьеф, могут быть уста-
новлены генераторы, позволяющие вырабатывать
электроэнергию и возвращать ее в сеть. По данным
работы Колосова М А. [7], рекуперируется 25–30 %
энергии, затраченной на подъем камеры, что со-
ставляет примерно 25% проектной.
Наклонные судоподъемники позволяют ча-
стично или полностью бороться с утечками нефте-
продуктов, необходимых для успешной работы су-
доподъемника, так в подвижной камере утечки бу-
дут очевидными и легче поддаются устранению.
Результаты исследований и их обсуждение. Автору настоящей статьи удалось участвовать в
экспериментальных и натурных исследованиях
транспортного наклонного Красноярского судо-
подъемника с продольной компоновкой [5,9,12].
Критерием достоверности теоретических зависи-
мостей является проверка их на результатах натур-
ных исследований. Приведены сопоставление
натурных данных (Красноярский судоподъемник,
испытание 8-Б, 8.10.1976 г.) с результатами расчета
по линейной теории. Наполненная водой (глубина
наполнения 2,2 м) камера свободна от судов; осу-
ществляется 3-х ступенчатый разгон до скорости 24
м/мин (рис. 2 а): I ступень разгона – время разгона
камеры 9 с до скорости равномерного движения 11
м/мин, с которой камера затем двигалась в течение
34 с; II ступень разгона – время последующего раз-
гона камеры 11 м/ мин до скорости равномерного
движения 17,5 м/мин, с которой камера двигалась
35 с; III ступень разгона – время последующего раз-
гона камеры 17,5 м/мин до скорости равномерного
движения 24 м/мин и последующее равномерное
движение в течение 419 с.
Результаты расчета колебательных процессов
воды в камере в линейном приближении [1-2] пред-
ставлены на рис. 1, б – колебания воды у затвора (В-
1) и на рис. 1, в – у торцевой стенки пульта управ-
ления (В-3).
В работе [3,9] приведено сопоставление линей-
ной теории колебаний с трехступенчатым разгоном
камеры Красноярского судоподъемника в натур-
ных условиях. Оно показало хорошее совпадение,
как по амплитудам колебаний, так и по частотам.
Транспортировка лесных грузов может осу-
ществляться как в судах, так и в плотах. Наиболь-
шим расчетным судном для Красноярского судо-
подъемника принята лесовозная баржа водоизме-
щением 1785 т, проект № 459-К. Размеры
лесовозного судна: длина габаритная - 78,16 м, ши-
рина - 15,0 м, осадка - 1,86 м.

Norwegian Journal of development of the International Science No 60/2021 41
Рис. 1. Сопоставление колебаний воды у торцевых стенок камеры в натурных условиях: 1 – результаты натурных измерений; 2 – расчет по линейной теории
Особенность расположения судна в камере с
продольной компоновкой при его центральном рас-положении: швартовка его к одной из боковых сте-нок камеры, так чтобы был запас от торцевых сте-нок камеры до оконечностей судна (секции плота). Связанные колебания воды и транспортируемого
судна рассмотрены в работах [1-3,5]. В работе [12] изучены колебания уровня воды в зависимости от режимов неравномерного движения наклонного су-доподъемника (процесс разгона или торможения) в свободной от судов камере, они отражены в работе [3,9].
Рис. 2. Фото поступательного движения модельной установки Красноярского судоподъемника в гидро-
технической лаборатории НИСИ
Стенд поступательного движения камеры был выполнен в виде горизонтального участка пути, так как вертикальные составляющие скорости и ускоре-ния при движении камеры по наклонному пути малы и практически не влияют на гидродинамические про-цессы в камере. Рабочий участок пути имел длину 20 м. Привод модели осуществлялся при помощи двига-теля постоянного тока, соединенного через редуктор с ведущей осью камеры.
На стенде поступательного движения модели-ровались как эксплуатационные нормальные ре-
жимы движения камеры, так и режимы её экстрен-ного торможения. В первом случае заданный трапе-цеидальный график изменения скорости движения камеры осуществлялся с помощью полуавтомати-ческого пульта управления [1]. Экстренное тормо-жение камеры воспроизводилось с помощью спе-циальных устройств на рис.2.
На рис.3 приведены амплитуды колебаний в замкнутых резервуарах при эксплутационных ре-жимах неравномерного движения камеры.
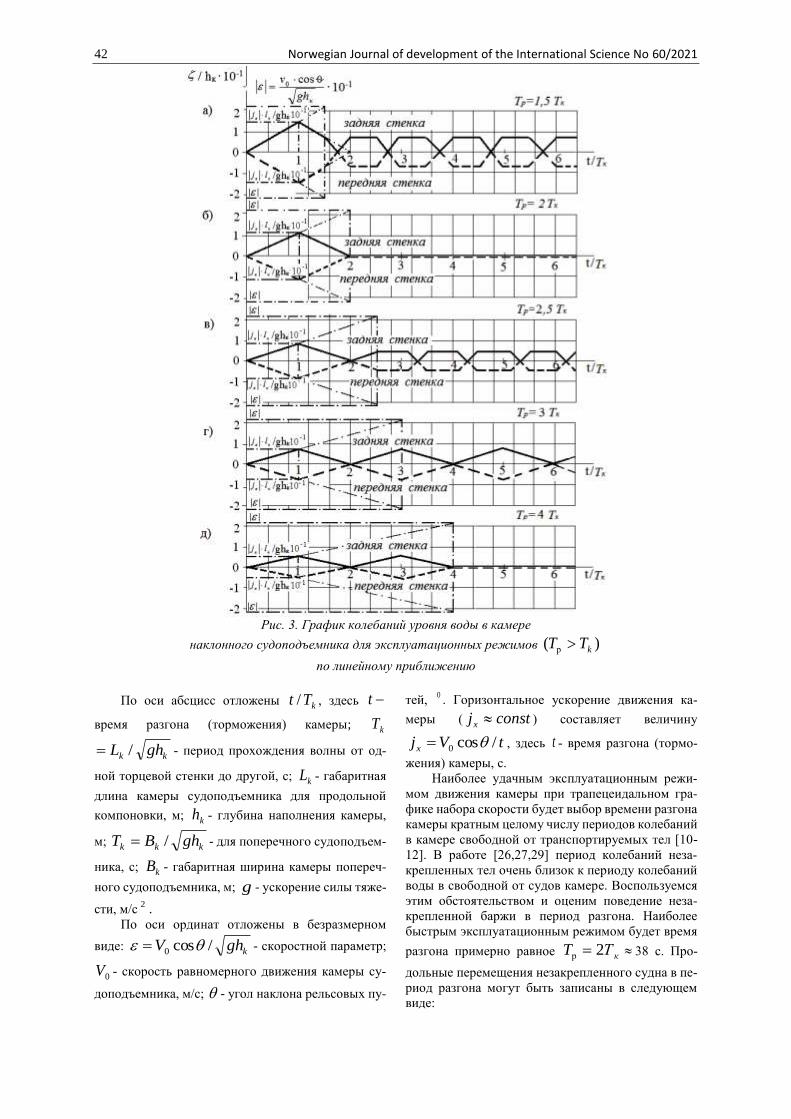
42 Norwegian Journal of development of the International Science No 60/2021
Рис. 3. График колебаний уровня воды в камере
наклонного судоподъемника для эксплуатационных режимов )( р kTT
по линейному приближению
По оси абсцисс отложены kTt / , здесь t
время разгона (торможения) камеры; kT
kk ghL / - период прохождения волны от од-
ной торцевой стенки до другой, с; kL - габаритная
длина камеры судоподъемника для продольной
компоновки, м; kh - глубина наполнения камеры,
м; kkk ghBT / - для поперечного судоподъем-
ника, с; kB - габаритная ширина камеры попереч-
ного судоподъемника, м; g - ускорение силы тяже-
сти, м/с2
.
По оси ординат отложены в безразмерном
виде: kghV /cos0 - скоростной параметр;
0V - скорость равномерного движения камеры су-
доподъемника, м/с; - угол наклона рельсовых пу-
тей, 0. Горизонтальное ускорение движения ка-
меры ( constjx ) составляет величину
tVjx /cos0 , здесь t - время разгона (тормо-
жения) камеры, с.
Наиболее удачным эксплуатационным режи-
мом движения камеры при трапецеидальном гра-
фике набора скорости будет выбор времени разгона
камеры кратным целому числу периодов колебаний
в камере свободной от транспортируемых тел [10-
12]. В работе [26,27,29] период колебаний неза-
крепленных тел очень близок к периоду колебаний
воды в свободной от судов камере. Воспользуемся
этим обстоятельством и оценим поведение неза-
крепленной баржи в период разгона. Наиболее
быстрым эксплуатационным режимом будет время
разгона примерно равное кТT 2р 38 с. Про-
дольные перемещения незакрепленного судна в пе-
риод разгона могут быть записаны в следующем
виде:

Norwegian Journal of development of the International Science No 60/2021 43
)],(),([ 212
2
txtxgjMdt
xdM cxc
cc ,(1)
где cM - масса судна, кН; cx - продольные
перемещения судна, м; xj - горизонтальная состав-
ляющая ускорения неравномерного движения ка-
меры, м/с2
; - плотность воды, кг/м3; с
- пло-
щадь поперечного сечения погруженной части
судна, м2
; ),( tх - амплитуды колебаний воды у
оконечностей судна, м; t – время, с.
Оси координат расположены у задней торце-
вой стенки в состоянии покоя камеры; ось Z – вер-
тикально вверх; ось Х–по направлению движения
камеры.
Начальные условия нулевые:
при 0)(;0)(;0 txtVt cc .
g
kLj ||)(t =
{
0 при kTt 0
kT
t при kk TtT )1(
21 при kk TtT )1()1(
kT
t2 при kk TtT )2()1(
0 при )2( kk TtT 2
(2)
Проинтегрируем скорость движения судна при 2
kT.
)21(821
41
8)421(
)21(4
||)
2(
22
2
n
V
n
VT
T
jTV ook
k
k
c . (3)
Здесь oV - скорость равномерного движения камеры судоподъемника, м/с; n - натуральное число
(1,2,3…).
)41()21(4
||)
2
3( 2
2
k
k
k
c
T
T
jTV )21(
8)21(
)41(
8
2
n
V
n
V cc. (4)
Наибольшие перемещения судна при разгоне будут при kTt :
)2
921(
12)942(
12
||)( 22
2
n
TVTjTx kok
kc . (5)
Рассмотрим поведение воды в камере судоподъемника в линейном приближении, это иллюстрирует
рис.3.
При модельных исследованиях наклонного судоподъемника с поперечной компоновкой примени-
тельно к Богучанскому гидроузлу возникла необходимость использовать своего рода таймер, то есть фор-
мирователь временных сигналов (ФВС), принципиальная схема которого приведена в работе [13].
Таблица 1
Максимальные скорости и перемещения лесовозной баржи при разгоне
Время разгона камеры
kT , с
Максимальная скорость
)2
3();
2
1( kkc TTV ,м/с
Максимальное
перемещение )( kc Tx ,м
kT2 1
8K
Vx 212
KTV kx
kT4 1
16K
Vx 224
KTV kx
kT6 1
24K
Vx 236
KTV kx
kT8 1
32K
Vx 248
KTV kx
kT10 1
40K
Vx 260
KTV kx

44 Norwegian Journal of development of the International Science No 60/2021
Рис. 4. Параметры транспортировки лесных грузов в барже при разгоне камеры
Красноярского судоподъемника[11-12]:
а – амплитуды волн у торцовых стенок камеры; б – скорость и перемещение баржи
Это подтверждает график на рис. 6 для наклонного судоподъемника с поперечной компоновкой на
модели (масштаб 1:25) в лабораторных условиях в Поволжском государственном технологическом уни-
верситете (ПГТУ).
Рис. 5. Модель уравновешенного наклонного судоподъемника с поперечной компоновкой в ПГТУ:
а) - общий вид установки; б) – привод камеры
Условия проведения модельных опытов: уста-
новка выполнена в металле, рельсовые пути из
швеллера №14 длиною 10 м могут менять уклон от
1:3 до 1:8 с помощью специальной ручной лебедки
в конце рельсовых путей и телескопических стоек,
способных поднимать или опускать рельсы на ве-
личину 50 см на начальных участках путей.
Размеры камеры на модели 0,4882,00,25 м.
Привод модели камеры тросовый фуникулерного
типа. Два троса, соединенные с камерой, наматыва-
ются на барабаны диаметром 11 см, ширина бара-
бана между ребордами 8 см. Барабаны жестко наса-
жены на горизонтальную ось червячного редуктора

Norwegian Journal of development of the International Science No 60/2021 45
с передаточным числом 1:20. Входной вал редук-
тора соединен с валом электродвигателя постоян-
ного тока мощностью 760 Вт (МИ 32 ФТ).
Для измерения скорости движения модели ка-
меры использовался встроенный в один корпус с
МИ 32 ФТ электродвигатель постоянного тока СЛ-
221, питаемый напряжением 110 В, с фиксацией его
показаний на шлейф осциллографа НО 41 У.4.2.
Датчик тарировался по времени прохождения каме-
рой при равномерном движении фиксированного
участка пути длиною 102,5 см электрическим се-
кундомером ПВ-53 Щ с ценой деления 0,01 с [10].
Для регистрации амплитуды колебаний вод-
ной поверхности использовались волномеры, рабо-
тающие по принципу жидкостного реостата. Вол-
номер В-1 устанавливался у задней боковой стенки
камеры на расстоянии 3 мм от нее, волномер В-3 –
у передней стенки. Принцип работы волномеров:
питание датчиков осуществлялось переменным то-
ком частотой равной 1 кГц, что полностью исклю-
чает явления электролиза и поляризации электро-
дов [9].
В качестве задающего генератора использова-
лась обычная двухтактная схема преобразователя
постоянного напряжения, выполненная на полу-
проводниковых триодах П-4Б. Измерительная
часть прибора выполнена в виде двух каналов: из-
мерительного (основного) и компенсационного.
Основной канал состоит из датчика и выпрямитель-
ного моста, компенсационный - из эталонного пе-
ременного сопротивления и также выпрямитель-
ного моста. Оба канала включались навстречу друг
другу. Это позволяет устанавливать любое нужное
заглубление датчика, компенсировав начальный
ток с помощью компенсационного канала.
Рис. 6. Проверка колебаний воды на модели поперечного судоподъемника:
В-1 - опытные значения колебаний воды у задней боковой стенки; В-3 – то же у передней боковой
стенки; сплошной и пунктирной линиями – линейное приближение
Тарировка датчиков-волномеров осуществля-
ется путем погружения датчиков под уровень с по-
мощью шпитценмасштаба с параллельной реги-
страцией показаний на осциллографе [9]. Сам дат-
чик состоит из двух трубок нержавеющей стали
(иглы от медицинского шприца), расставленных на
расстоянии 5 мм. Диаметр трубок 1 мм, длина 100
мм.
Моделирование нестационарных процессов
проводилось по критерию Фруда.
Глубина наполнения с грузом может быть
назначена по таблице действующих наклонных су-
доподъемников [9]: для плоскодонных судов (сек-
ций плотов) shk 2,1 , где s – осадка с полным
грузом в равновесном состоянии, м; для килеватых
судов shk 35,1 .
Отличительной особенностью расположения
судна (секции плота) в камере поперечного судо-
подъемника на случай его экстренного торможения
является центральное расположение грузов по ши-
рине камеры, так чтобы был запас от передней бо-
ковой стенки до борта судна (секции плота), и от
другого борта судна (секции плота) до задней боко-
вой стенки камеры.
Скорости и перемещение лесных грузов в ле-
совозной барже опубликованы в работе [10], а сек-
циями плотов [12].
Наилучшими условиями транспортировки лес-
ных грузов по рис. 3 будут kTT 2р , где Тр – время
разгона (или торможения) камеры. В работе [10]
приведена таблица максимальных скоростей и пе-
ремещений лесовозных судов при эксплуатацион-
ных режимах неравномерного движения камеры.
Для судоподъемника с продольной компоновкой
величина
k
ck
L
LL
2
, (обычно )1 . Пере-
ложим это на камеру с поперечной компоновкой,
тогда
k
k
B
BB
2
пл . Величина 211 K - для

46 Norwegian Journal of development of the International Science No 60/2021
максимальных скоростей перемещения баржи (сек-
ции плота), 2
2 2/921 K - соответ-
ственно для линейных перемещений.
При исследованиях эксплуатационных режи-
мов поперечного судоподъемника на модели воз-
никла необходимость варьировать временем нерав-
номерного движения камеры (разгоном, торможе-
нием). Был разработан формирователь временных
сигналов (ФВС), своего рода таймер. Структурная
схема приведена [8,12]. ФВС включает в себя квар-
цевый генератор на 32768 Гц, делитель частоты на
1638, формирователь сигналов ускорения и форми-
рователь сигналов торможения с дискретностью
0,05 с. ФВС выдает сигналы на разгон с заданной
длительностью от 0,05 с до 12,8 с. Запуск формиро-
вателей производится при нажатии кнопок «уско-
рение» или «торможение». Для надежной работы
временем разгона (или торможения) модели ка-
меры автоматическое регулирование дублируется
ручным переключением кнопок.
Рис. 7. Компоновка судоподъемника с поперечным движением камеры [15]:
1 – грунтовая плотина; 2 – дамбы обвалования с верхнего бьефа; 3 – отсыпка с нижнего бьефа;
4 – наклонные рельсовые пути камеры и противовесов; 5 – камера судоподъемника; 6 – затворы ка-
меры; 7 – затворы каналов; 8 – причальные сооружения; 9 – машинный зал; 10 – камера судоподъемника
в нижнем бьефе
Основные результаты исследований по пропуску
лесных грузов опубликованы [13-15].
Поперечный наклонный судоподъемник явля-
ется единственным видом судопропускных соору-
жений, когда в камере возможно расположение за-
творов по торцам, вывод (ввод) судов, лесовозных
барж (секций плотов) за время совмещения будет
сокращаться на (10…15)% на эти операции. Это об-
стоятельство приведет к увеличению грузооборота
сооружения.
Кроме того, камера поперечного судоподъем-
ника может служить для пропуска рыбы в качестве
циклического и принудительного действия как
подъемное устройство. Достаточно оснастить ка-
меру насосами для подачи привлекающих скоро-
стей, оборудовать ее побудительным устройством
(сеткой), создать условия, привлекающие рыбу
(например, жмых или другие средства).

Norwegian Journal of development of the International Science No 60/2021 47
Рис.5. Поперечный судоподъемник Арзвиль (Франция, 1969 г)
Кроме этого, рассчитаны габаритные размеры
действующего наклонного судоподъемника с попе-
речной компоновкой Арзвиль (Франция), расчеты
подтвердили существующие.
Для оценки габаритных размеров уравнове-
шенного наклонного судоподъёмника с поперечной
компоновкой приемлемы те же соотношения,
только длина и ширина камеры меняются местами,
а именно: для габаритной ширины камеры рекомен-
дуется значение
cск bВВ 5,0 , (6)
где cb - приведенная эквивалентная ширина
судна ( cc Bb , - коэффициент полноты ми-
дельшпангоута), а для габаритной длины камеры
поперечного судоподъёмника можно рекомендо-
вать значение
LLL ck , (7)
где L - запас по длине камеры поперечного
судоподъемника, который можно принять равным
м0,2 .
Сопоставим габаритные размеры камеры
наклонного уравновешенного судоподъёмника Ар-
звиль (Франция) с поперечной компоновкой
)6,25,50,43( ммм . Скорость равномер-
ного движения камеры вверх по наклонным рельсо-
вым путям равна см /6,0 , угол наклона путей
02220 , 925,0cos . Грузоподъёмность
транспортируемого судна т350 , размеры судна:
ммм 2,20,55,38 . (баржа Европа 2). Ши-
рина судна с бортовыми накладками составляет ве-
личину мBc 2,5 )75,4;95,0( ' мbc .
В настоящее время глубина наполнения камеры 3,0
м, тогда скоростной параметр будет 0,102.
Наибольшие перемещения судна лагом будут 0,136
м, при свободном пространстве 0,15 м.
Рекомендуемая глубина наполнения камеры
составляет м64,2 , что весьма близко к реаль-
ному значению мhk 6,2 . Горизонтальная со-
ставляющая скорости cos0VVx
см /555,0925,06,0 ,
смghСk
/05,5 , 11,0 . Тогда реко-
мендуемая ширина камеры по (9) составляет
мВк 46,5 , округленно мВк 5,5 . Длина
камеры формула (7) рекомендует величину
м5,40 . Реальная камера имеет небольшой запас.
Таким образом, в настоящей работе даны реко-
мендации по выбору габаритных размеров подвиж-
ных камер наклонных судоподъемников как с про-
дольной, так и с поперечной их компоновкой, не-
плохо согласующиеся с имеющимся опытом
проектирования и строительства таких сооруже-
ний. Эти соотношения позволяют рекомендовать
габариты подвижных камер транспортных наклон-
ных судоподъемников, если известны габариты
расчетного судна и транзитная скорость движения
камеры, либо назначать максимально допустимую
скорость движения камеры, если уже приняты ее
габаритные размеры.
Выводы
1. Для сокращения расходов питьевой воды
необходимо при строительстве судопропускных
сооружений, особенно на Дальнем Востоке и Се-
вере нашей страны, использовать транспортные
наклонные судоподъемники.
2. Наиболее перспективным сооружением сле-
дует считать уравновешенный транспортный судо-

48 Norwegian Journal of development of the International Science No 60/2021
подъемник с поперечной компоновкой, обещаю-
щий значительный грузооборот в составе гидро-
узла с учетом климатических условий.
3. Для надежной эксплуатации наклонных су-
доподъемников необходимо предусмотреть тай-
мер, формирователь временных сигналов (ФВС) в
схеме привода работы судоподъемника.
СПИСОК ЛИТЕРАТУРЫ:
1. Атавин А.А., Васильев О.Ф., Сапцин В.П.
Исследование гидродинамических процессов, воз-
никающих при работе наклонного судоподъёмника
Красноярского гидроузла // Тр. Гидропроекта, №62.
– М.: 1978. – С. 100 - 132.
2. Атавин А.А., Васильев О.Ф., Яненко А.П.
Гидродинамические процессы в судопропускных
сооружениях // ВО «Наука». Сибирская
издательская фирма. Новосибирск: 1993. – 101 с.
3. Атавин А.А., Сапцин В.П. Обоснование
габаритных размеров камеры наклонных судоподъ-
емников из условия их безаварийной эксплуата-
ции» // Безопасность речных судоходных гидротех-
нических сооружений: Мат. международной
научно-практической конференции. Книга II. -
СПб.: СПГУВК, 2008. – С. 57-72.
4. Баланин В.В., Колосов М.А. Транспорт-
ные судоподъемники // Итоги науки и техники,
ВИНИТИ. Сер. Водный транспорт.–М.:1989.-Том
15.-156 с.
5. Васильев О.Ф. Вопросы гидродинамики
судоходных сооружений: Автореф. дис. на соиск.
учен. степ. д-ра техн. наук / О.Ф. Васильев // АН
СССР. Сиб. отд-ние. – Новосибирск, 1960. – 43 с.
6. Васильев О.Ф., Атавин А.А., Боярский
В.М., Екимов Ю.Ф. Судоподъёмник Красноярского
гидроузла // Гидр-ское строительство, №12, 2002.–
С. 27 – 29.
7. Лохматиков Г.П., Колосов М.А., Селез-
нев С.В. Судоподъемники – СПб.: Энергоатомиз-
дат. Санкт-Петербургское отд-ние, 1998. – 344 с.
8. Патент, RU № 2 588 479 С. Модель транс-
портного наклонного лесо-судоподъемника с попе-
речной компоновкой. / Поволжский государствен-
ный технологический университет //Авторы: Сап-
цин В.П., Лаврентьев Б.Ф., Турецких С.О.
Опубликовано 27.06.2016. Бюлл. № 18.
9. Сапцин В.П. Природоохранные меропри-
ятия при проектировании лесо-судопропускных со-
оружений / В.П. Сапцин // Тез. доклада, материалы
международного симпозиума: Гидрологические и
экологические процессы в водоемах и их водосбор-
ных бассейнах. Новосибирск, 1995.-С.45.
10. Сапцин В.П. Обоснование габаритных
размеров камеры лесо-судопропускных сооруже-
ний из условия их безаварийной эксплуатации. Дис.
д-ра техн. наук, по специальности 05.23.07-Гидро-
техническое и мелиоративное строительство.
Новосибирск, НГАСУ, 1999. – 276 с.
11. Сапцин В.П. Условия перевозки лесных
грузов в камере транспортного наклонного судо-
подъёмника //Вестник Марийского государствен-
ного технического университета: Серия: Лес.
Экология. Природопользование №1, 2009. - С. 59-
70.
12. Сапцин В.П. Гидротехнические сооруже-
ния комплексного и отраслевого назначения. Часть
II. Водосливные плотины и специальные сооруже-
ния: конспект лекций. Йошкар-Ола: Марийский
государственный технический университет, 2010.-
232 с.
13. Сапцин В.П., Лаврентьев Б.Ф. Режимы
движения камеры транспортного судоподъёмника
для перевозки лесных грузов // Вестник МарГТУ.
Серия Лес. Экология. Природопользование. №1,
2012. – С. 65 – 74.
14. Сапцин, В.П., Турецких С.О. Повышение
безопасности пропуска лесных грузов в камере
лесо-судопропускного сооружения. Наука и мир,
международный научный журнал, Волгоград. №4
(20), 2015, Том 1, С. 76–82.
15. Сапцин В.П., Турецких С.О. Пути повы-
шения грузооборота лесо-судопропускных соору-
жений // Труды Поволжского государственного
технологического университета. Серия
технологическая, Йошкар-Ола: 2014.–С. 316–321.
16. Aubert J. Der Ersatz von Scheusen durch das
“Wasserkeil-Abstiegsbauwerk” // “Z. Binnen-Schiffart
und Wassertr.” – 1973. – S.511-512,
17. De Ries J. Adute sur le movement de et les
forces d’ammarrage des bateaux dans un sas mobile //
Annales des travaux publics de Belgigue, 1962. №4. –
P. 379-408; P. 451-508.
18. Dietrichs E. Neue Erkenntnisse fur den Bau
von Schiffshebewerken / Wiss. Z. Hochsch.
Verkehrsw. Dresden. – 1969. 16. №3. – S. 637-645.
19. Le plan incline transversal d’Arzviller-
Saint-Louis remplace 17 ecluses // Editions de la Navi-
gation du Rhin. Strasbourg. 1970. – 67 s.
20. Partenscky H.W. Hydraulics of navigation
structures and limits of thein transport capacity // Bull.
Assoc. int perman. Congr. Navig. 1989. Vol. 63. №64.
– P. 138-153.

Norwegian Journal of development of the International Science No 60/2021 49
FORMATION OF CONCRETE PROPERTIES WHEN USING FILLED MICELLES OF SURFACE-
ACTIVE SUBSTANCES
Shyshkin A.
Doctor of technical sciences, Professor, Department of Technology of Building Products,
Materials and Structures, National University, Kryvyi Rih, Ukraine
DOI: 10.24412/3453-9875-2021-60-1-49-52
Abstract
Intensive methods of construction of buildings require the introduction of modern technologies that would
ensure the dismantling of monolithic structures in a short time, increase the turnover of formwork, increase the
efficiency of construction work in different temperature conditions of hardening, reduce the production cycle.
Keywords: powder, concrete, surface-active substances, strength
Introduction
Given the peculiarities of monolithic construction,
when hardening of concrete occurs without use or with
limited thermal exposure, it is mandatory for high-
speed technology to introduce fast-setting binders to
obtain high strength concrete in one or two days, to in-
crease concrete strength at design age.
In addition, modern construction requires a num-
ber of engineering problems to maintain the efficiency
and functionality of existing buildings, structures, road
infrastructure, which is associated with increasing rates
of physical depreciation of fixed assets [1, 2]. There-
fore, there is a need to develop high-performance fast-
setting building composites to ensure the commission-
ing of facilities in a short period of time and their relia-
ble operation throughout the life cycle. Repair, restora-
tion and reconstruction of existing construction sites,
the restoration of operational functions of which is pos-
sible only in certain short periods of time (underpasses,
pavements, facilities at airports and railways, hydraulic
structures), requires the use of effective fast-setting ma-
terials.
The main directions of obtaining ultra-fast port-
land cements are based on providing the necessary
chemical and mineralogical composition and structural
features of clinker, cement dispersion, introduction of
special crystallization seeds, mechano-chemical activa-
tion of cements with the introduction of superplasticiz-
ers in the grinding process.
Therefore, the definition of the general principles
of the mechanism of influence of micelles of surfac-
tants (surfactants), including filled, on the structure and
properties of concrete based on portland cement is rel-
evant and has some scientific novelty.
Based on the above, the aim is to establish the
mechanisms of influence of surfactant micelles on the
structure and properties of concrete based on Portland
cement in order to obtain fine-grained concrete.
Materials and research methods
Theoretical studies were performed by analyzing
the conformity of previously defined processes of
structure formation and properties of compositions
based on Portland cement and water, structured using
filled micelles of surfactants, according to the known
laws of colloid chemistry and physicochemical me-
chanics of dispersed systems. As a theoretical basis for
the development of these ideas used fundamental pro-
visions: the theory of micellar catalysis [3,4], colloid
chemistry and physicochemical mechanics of dispersed
systems [5], the effect of ultra-low doses [6], the theory
of electroheterogeneous interactions in the hardening of
cement binders [7].
Colloidal surfactants were used as modifiers of
water structure. Determination of hydrogen, pH, elec-
trical conductivity and strength of concrete was per-
formed by standard methods.
The results of our own research and their dis-
cussion It is known that effective water-reducing additives
in Portland cement systems are polycarboxylate esters,
the molecule of which consists of a main chain with
carboxylate groups, negatively charged, and side
chains, which are responsible for spatial repulsion.
When the polycarboxylate interacts with the cement
component, the surfactant density of the surfactant on
the surface of the cement grain decreases, so part of the
active centers of the polymer-free overlapping films re-
mains, which provides water access to clinker minerals.
It should be noted that the micelles of surfactants have
the same properties [3], both conventional and filled
[4], which also do not cover the entire surface of the
cement grain and provide water access to clinker min-
erals.
If micelles formed on the basis of alkali metal are
used in the manufacture of concrete, then calcium ions,
which pass into the liquid phase in the primary acts of
hydration of cement, promote the exchange reaction,
which produces molecules of hydrophobic surfactants
based on calcium and partially disappears micelles ob-
tained on based on alkali metal. From now on, there
will be two types of hydrophobic surfactant molecules
in the system: alkali metal-based and calcium-based, ie
two types of micelles (forward and reverse).
The results of determining the effect of the speci-
fied mixture of molecules (micelles), which are given
in table. 1 show the positive effect of its application.

50 Norwegian Journal of development of the International Science No 60/2021
Table 1
The effect of surfactant mixture on the compressive strength of fine-grained concrete,
which was obtained using a surfactant mixture at the age of 28 days
Concentration
of calcium oleate solution
Relative strength of concrete,%, depending on the concentration of so-
dium oleate solution
0 10-3М 10-4М 10-5М
0 100 125 126 120
10-3М 109 140 145 146
10-4М 113 149 153 168
10-5М 118 148 148 156
Table 2 compares the strength of concrete obtained using a surfactant mixture with the strength of concrete ob-
tained using only sodium oleate.
Table 2
The effect of surfactant mixture on the compressive strength of fine-grained concrete, which was obtained using
a surfactant mixture at the age of 28 days
Concentration of calcium
oleate solution
Relative strength of concrete,%,
depending on the concentration of sodium oleate solution
0 10-3М 10-4М 10-5М
0 100 125(100) 126(100) 120(100)
10-3М 109 112 115 122
10-4М 113 119 121 140
10-5М 118 118 117 130
Note. The value of the strength of concrete obtained without calcium oleate for each concentration of sodium
oleate is taken as 100%
Table 3 compares the strength of concrete ob-
tained using a surfactant mixture with the strength of
concrete obtained using only calcium oleate.
Experiments show that the use of a mixture of hy-
drophobic surfactants for the manufacture of fine-
grained concrete, one of which is based on an alkaline
ion and the other on a multivalent metal ion or the for-
mation in the hydration of cement hydrophobic surfac-
tants based on polyvalent metal due to the rotation of
the metal , leads to a significant increase in the strength
of concrete.
Table 3
The effect of surfactant mixture on the compressive strength of fine-grained concrete, which was obtained using
a surfactant mixture at the age of 28 days
Concentration of calcium oleate
solution
Relative strength of concrete,%,
depending on the concentration of sodium oleate solution
0 10-3М 10-4М 10-5М
10-3М 109 (100) 128 133 134
10-4М 113(100) 132 135 145
10-5М 118(100) 125 125 132
Note. The value of the strength of concrete obtained without calcium oleate for each concentration of sodium
oleate is taken as 100%
The presence of anionic surfactants in the system
leads to an increase in the reaction rate primarily due to
the electrostatic attraction of nucleophiles to the posi-
tively charged surface of the cement grain.
It is known that improving the quality of cement
stone and concrete is possible through the use of ul-
trafine additives (removal ash, microsilica, metakaolin,
carbon nanotubes and others) [8-16]. However, one of
the disadvantages of ultrafine additives is considered to
be the increased water consumption and ability to ag-
gregate, as a result of which Portland cement systems
lose mobility, which leads to the use of increased
amounts of superplasticizers to provide a plasticizing
effect. The positive effect of the complex organo-min-
eral additive is to reduce the duration of the plastic state
of cement paste, respectively, intensify hydration and
strength of cement stone to create a high-density, mi-
croporous, fine structure due to the formation of na-
nosized hydrosilicate phases.
At the same time, such complex organo-mineral
additives in accordance with the provisions of colloid
chemistry and physicochemical mechanics of dispersed
systems [5] are classified as filled micelles of surfac-
tants (Fig. 1)..
Рис. 1. Scheme of filled micelles

Norwegian Journal of development of the International Science No 60/2021 51
The mechanism of micelle formation is in princi-
ple similar to the mechanism of surfactant adsorption at
the water-air phase separation: the forces of interaction
between strongly polar water molecules are much more
intense than between water molecules and hydrocarbon
radicals. Surfactant molecules seem to be dissolved in
a "foreign" environment. For this reason, at low con-
centrations, molecules or surfactant ions are mainly
pushed by water molecules to the surface, where they
are adsorbed and oriented (according to their diphilic
nature), and an adsorption equilibrium is established
between the water phase and the surface. With a further
increase in concentration, the surface layer becomes
saturated, and the hydrophobic hydrocarbon radicals of
the surfactant are pushed by water molecules into the
micelles, ie into the liquid "pseudophase". The latter is
separated from water by a hydrophilic shell of the polar
groups of surfactants. Any process associated with the
transition of hydrocarbon chains from the water phase
to a phase close in polarity is energetically advanta-
geous: the transfer of one group -CH2- from water to
the micelle is accompanied by an energy gain of 1.08
kJ/mol, which is only slightly less work adsorption of
the link -CH2- on the surface "liquid - gas". It should be
noted that the formation of micelles occurs at much
lower concentrations than the saturation of surfactant
molecules of the surface layer "water - air". Therefore,
the amount of adsorption is limited not by the degree of
surface filling, but by the value of the critical concen-
tration of micelle formation (CCM).
At the same time, in the presence of a fine compo-
nent in the system, surfactant molecules at a concentra-
tion of much lower CCM are adsorbed on the surface
of this component, forming an artificial filled micelle.
The actions of filled micelles, which were formed
by anionic surfactants, were thoroughly studied in [17–
19], and the mechanism of their action when filled with
carbon nanotubes was described in [8].
When used as a filler micelles of microsilica and
other substances based on silica, the mechanism of ac-
tion of such micelles is somewhat different. First of all,
the micelle of anionic surfactant (for example, based on
sodium ions) is adsorbed on the microsilica powder
particles - micelle fillers. Sodium ions introduced into
the dispersed system by colloidal surfactants have a de-
structive effect on silica, activating its surface. As a re-
sult of breaking the O – Si – O bonds, the surface of the
silica is covered with active centers containing sodium
ions.
Calcium ions - products of hydration of Portland
cement minerals lead to the rotation of the micelle,
which covers the particle of microsilica, and gain ac-
cess to the surface of its particles. At the active centers
formed and containing sodium ions, calcium ions are
condensed by chemisorption - products of hydration of
Portland cement minerals, ie they are fused with the re-
action powder.
This is the exchange reaction of sodium ions from
the active centers on the surface of the reaction powder
and calcium. As a result of this process, calcium hydro-
silicates are formed on the surface of the reaction pow-
der particles, and colloidal surfactant micelles are re-
turned to the system, which have fulfilled their role of
catalyst. And this process is repeated (Fig. 2).
Рис. 2. Scheme of micellar catalysis
Cationic surfactants stabilize nanoparticles during
their synthesis and interfere with agglomeration pro-
cesses, which allows to obtain systems with a highly
developed surface area. The growing interest in carbon
nanotubes and the problem of their dispersion in solu-
tions have led to the use of cationic surfactants for these
purposes.
Among the most important practically significant
properties of supramolecular systems based on cationic
surfactants should be noted their ability to act as nano-
reactors, allowing to regulate the speed and mechanism
of chemical processes, as well as their anticorrosive
properties.
The presence of cationic surfactants in the system
leads to an increase in the reaction rate primarily due to
the electrostatic attraction of nucleophiles to the posi-
tively charged surface of the cement grain.
Conclusions 1. The so-called "mineral-organic additives",
which are now widely offered for use in concrete tech-
nology, are filled micelles of colloidal surfactants and
their action is subject to known mechanisms of micellar
catalysis, which increases the rate of formation and
strength at compression, frost resistance and water re-
sistance of concrete.
2. Application of theories of electroheterogeneous
interactions in hardening of cement binders, theories of
ultralow concentrations and micellar catalysis allows to

52 Norwegian Journal of development of the International Science No 60/2021
present a theoretical model of the initial phase of inter-
action of cement with water, which contains micelles of
colloidal surfactants.
3. The basis of the processes occurring in the sys-
tem "cement - water - micro (nano) component - mi-
celles of colloidal surfactants" are adsorption and ther-
modynamic processes at the interface between the com-
ponents of the phases that are introduced into the
system of cement that hardens.
4. Simultaneous use of micelles of different types
(forward and reverse) leads to an increase in concrete
strength by 40-68%, frost resistance by 40 cycles of
freezing and thawing, water resistance by 2 marks.
REFERENCES:
1. Dvorkin LY, Dvorkin OL, Dorofeev VS,
Mishutin. AV 2012. Hydraulic and road concrete.
Odessa (ZHC). 216 р. (in Russian)
2. Mishutin AV, Smolyanets VV, Krovyakov
SA 2014. The prospect of using hard pavements for city
streets and the highway "North - South" in Odessa.
Problems of urban development.. 1. pp. 104–111. (in
Russian)
3. Bukanova EF Colloid chemistry of surfac-
tants. 2006. Part 1. Micelle formation in surfactant so-
lutions. Moscow (МIТХТ). 80 р. (in Russian)
4. Berezin IV Martinek K., Yatsimirsky AK
1973 Physicochemical bases of micellar catalysis. Suc-
cesses in chemistry. XLII, 10. рр. 1729–1756. (in Rus-
sian)
5. Friedrichsberg DA 1984 Colloid chemistry
course. L. (Chemistry). 368 р.
6. Burlakova Е.B. 1994 The effect of ultra-
small doses. Bulletin of the Russian Academy of Sci-
ences, 64, 5, р. 425 – 431
7. Plugin AN 1985 Electroheterogeneous
mechanism of structure formation of cement-water sys-
tems. Thesis. report VI Respubl. conference. on physi-
cochemistry and technology of production and applica-
tion of washing liquids, dispersed systems and grouting
solutions. Kiev (IКХХВ) АS UССР. I. р. 127. (in Rus-
sian)
8. Plugin A. et al 2020 Nanomodified cement
composites for thin walled architectural structures To
cite this article: IOP Conf. Ser.: Mater. Sci. Eng. 907
012030
9. Pukharenko Yu.V., Aubakirova IU,
Staroverov VD 2009 Efficiency of activation of mixing
water by carbon nanoparticles. Engineering and con-
struction magazine.1.рр. 40-45. (in Russian)
10. Dvorkin LY, Lushnikova NV, Runova RF,
Troyan VV 2007 Metakaolin in mortars and concretes.
Kyiv (KNUBA). 216 р. (in Russian)
11. Kirakevich II, Marushchak UD, Sanitsky
MA, Stechyshyn MS 2012 Self-compacting concretes
with a rapid increase in strength. Bulletin of Lviv Pol-
ytechnic National University.737. рр. 153–158. (in
Russian)
12. Sanitsky MA, Sobol HS, Markiv TE 2010
Modified composite cements. Lviv (ВLP). 132 р. (in
Russian)
13. Lagier F., Kurtis K. E. 2007 Influence of
Portland cement composition on early age reactions
with metakaolin. Cement and Concrete Research. 37.
рр. 1411–1417.
14. Diamond S., Sahu S. 2006 Densified silica
fume : particle size and dispersion in concrete. Materi-
als and Structures. 39. 9. рр. 849–859.
15. Korpa A., Kowald T., Trettin R. 2008 Hy-
dration behavior, structure and morphology of hydra-
tion phases in advanced cement-based systems contain-
ing micro and nanoscale pozzolanic additives. Cement
and Concrete Research. 38. 7. рр. 955–962. (in Rus-
sian)
16. Zdeb T. 2007 Aktywność pucolanowa
mączek kwarcowych jako składnika betonów z
proszkami reaktywnymi. Cement Wapno Beton. 1. рр.
34-39
17. Shishkina, A., Shishkin, A. 2020Application
of the easy concentration effect in concrete technology
IOP Conference Series: Materials Science and Engi-
neering, 907(1), 012038.
18. Shishkina, A., Nastich, O., Romanenko, K.,
Oliinyk, S. 2019 The aerated concrete based on an in-
tegrated foam concentrate containing iron compounds
EЕJET, 4(6-100), pр. 48–53
19. Shishkin, A., Shishkina, A. 2018 Study of
the effect of micellar catalysis on the strength of alka-
line reactive powder concrete EEJET, 3(6-93), pр. 46–
51

Norwegian Journal of development of the International Science No 60/2021 53
FORMATION OF CONCRETE PROPERTIES WITH STRUCTURED WATER
Shyshkina А.
Candidate of technical sciences, Associate Professor, Department of Technology of Building Products, Ma-
terials and Structures, National University, Kryvyi Rih, Ukraine
DOI: 10.24412/3453-9875-2021-60-1-53-56
Abstract
The strength of fine-grained concrete was studied, for the production of which water was used, which was
structured by adding non-electrolytes. It is determined that due to the structuring of water in its composition in-
creased the content of protons, which accelerate the hydration reaction of cement minerals, as well as destroy the
flocs of cement particles. The optimal amount of these substances, which are not electrolytes, allows you to control
the rheological properties of concrete mixtures and modify the structure of cement stone so as to ensure the prop-
erties of concrete, which provide high operational reliability of structures. The aim of the study is to determine the
effect of reaction powders used simultaneously with non-electrolytes on the strength of fine-grained concrete and
the rate of its formation
Keywords: powder, concrete, surface-active substances, strength
Introduction
AS A result of development in the construction of
tall and requirements for the construction and technical
properties of new types of concrete production technol-
ogies of building products and structures that will de-
termine is the current problem of building materials
science.
In recent years, high-strength concretes have been
intensively replicated, the method of obtaining them
(reduction of water consumption, use of hyperplasticiz-
ers) causes fair fear and caution [1,2]. At the same time,
concretes were invented that have a high rate of for-
mation and strength without reducing the amount of
water and the use of hyperplasticizers [3,4].
But to date, many problems of the mechanism of
hydration and hardening of cement are debatable and
there are no clear answers to the questions that arise
from these problems. The nature and physical essence
of the induction period, the causes and mechanism of
hydrolysis of calcium silicates, the "driving force" of
the structure and formation of microbeton, its morpho-
logical structure, adaptability, etc. are not clear. Tech-
nological improvement, for example, is the complete
conversion of cement grains into hydrated compounds
that openly contradicts the experiment as second indi-
cates the immutability of their size at any temperature
and humidity conditions and terms of curing. (Moreo-
ver, the volume of grains even increases due to extru-
sion into the pore space of the surface highly porous
amorphous hydrate). There is still a debatable way to
transform plastic cement mass into stone (thoroughly
soluble, topochemical or their symbol and lake). Alt-
hough preference is given crystal and civilizational first
"theory hardening", however, it has repeatedly been
criticized and questioned an adequate reflection of the
process that actually takes place [5,6]. Therefore, deter-
mining the mechanism of influence of water structured
by organic non-electrolytes on the structure and prop-
erties of concrete based on Portland cement is relevant
and has some scientific novelty.
Accordingly, the purpose of the work is to estab-
lish mechanisms to water, structured organic electro-
lyte on the structure and properties of concrete based on
Portland cement to obtain fine concrete.
Materials and research methods
Theoretical studies conducted by analyzing com-
pliance processes previously determined the structure
and properties of compositions on the basis of Portland
cement and water, structured organic electrolyte, the
known laws of colloid chemistry and physicochemical
first mechanic and disperse systems. As a theoretical
basis for the development of these ideas used the fun-
damental provisions: the formation of the surface of ce-
ment particles during grinding [7], the theory of micel-
lar catalysis [8], colloid chemistry and physicochemical
mechanics of disperse systems [9] effect of very small
doses [10], theories of electroheterogeneous interac-
tions in the hardening of cement binders [11,12].
Polyalcohol and hydrocarbons were used as mod-
ifiers of water structure. Index pH, electrical conductiv-
ity and strength of concrete were performed by standard
methods.
The results of our own research and their dis-
cussion According to [7], the grain of the solid after grind-
ing consists of three parts (Fig.1): the outer hyperamor-
phized layer, 2-5 molecular diameters thick with a con-
tinuous decrease in density, the amorphous layer 5-15
μm thick and the inner part, which remained intact.

54 Norwegian Journal of development of the International Science No 60/2021
Figure 1. The composition of cement grains after grinding
X-ray studies of the surface layers showed that
their crystal lattice is strongly distorted, almost to the
complete disappearance of the distant order in the ar-
rangement of atoms. Such activated (amorphous) lay-
ers, according to [7], are characterized by abnormally
high chemical activity and sorption capacity, as well as
abnormally low diffusion resistance. Mechanically de-
stroyed surface layers of cement particles interact in-
tensively with molecules of the environment - water
molecules that chemically bind to the activated sub-
stance of the surface layers of particles and penetrates
deep into them. The diffusion rate in the plastic defor-
mation-activated destructured layers of cement parti-
cles is several orders of magnitude higher than the dif-
fusion rate in ordinary crystals and glass. This kind of
absorption and interaction, both in intensity and by a
mechanism not identical second physical second ad-
sorption and classic second chemisorptions [7].
According to O Paschenko [13], the maximum
thickness of the cement particles as ground undergoes
hydration, is 15 micron meters, that practically corre-
sponds to the thickness of amorphous and zovanoho
layer and cement particles less than 30 microns com-
pletely amorphous and hydrated. In the fine fraction (0-
20 μm) - usually more C3S and C3A, and larger frac-
tions are enriched with C3S and C4AF. As shown by
numerous studies, the greatest influence on the strength
of cement has a fraction of 5 to 30 microns. The fraction
of 5-10 microns affects the strength at three and seven
days of age, and the fraction of 10-30 microns - at one
month of age and more. Cement fractions larger than
60 μm are practically a ballast [15]. Research L Spi-
nova and others. [15] it was also shown that cement par-
ticles up to 10 μm in size when interacting with mixing
water are completely hydrated, and larger particles are
hydrated only on the surface.
The results of the research showed that when or-
ganic non-electrolytes are added to water (in experi-
ments of polyalcohol and hydrocarbons) it changes its
properties: the temperature decreases, the electrical
conductivity increases and the pH decreases. This indi-
cates that the water is structured and acquires acidic
properties, ie a negative charge. It should be noted that
the sum of the volumes of water and organic non-elec-
trolyte does not coincide with the volume of the solu-
tion of non-electrolyte in water. This means that or-
ganic non-electrolytes are located in the cavities of wa-
ter clathrates, which leads, at a certain concentration, to
stabilization of the volume, and a decrease in tempera-
ture indicates a decrease in the amplitude of oscillations
of water molecules, ie to its stabilization. At a certain
concentration of organic non-electrolytes in water, a
continuous fractal network is formed, which provides
free movement of protons.
Based on the above, the theoretical model of the
initial phase of the interaction of cement with structured
water can be represented as follows.
As is known [11], on the surface of Portland ce-
ment particles in an aqueous medium, regions with a
negative surface charge (regions containing C3S, C2S)
and regions with a positive surface charge (regions con-
taining C3A, C4AF) are formed. According to [11,12],
after mixing with water, between it and the oppositely
charged areas of the cement particles there are forces of
electrostatic attraction. Therefore, water molecules,
which due to structuring under the influence of non-
electrolytes are negatively charged, are grouped near
the active centers C3A, C4AF, positively charged, and
seek to compensate for the thickness of the solvate shell
potential of their surface. There is a similarity to the
classical electric layer with the nucleus of the micelle -
cement grain (floccule) and water solvate shell. The lat-
ter is a layer of liquid, part of which in the zone of con-
tact with the active centers of the cement surface is ori-
ented in its force field, forming a "cluster" of tightly
spaced polarized water molecules. In this case, the dif-
ference between the system "cement core - solvate shell
water" is that groups of water molecules are formed not
only at active centers on the surface of the solid phase
of cement particles [11,12], but also in the depth of their

Norwegian Journal of development of the International Science No 60/2021 55
hyperamorphized layer. Over time, these water mole-
cules create forces that exceed the binding energy
within the volume of the solid phase. Thus, by defini-
tion, D Mendeleev, provides the necessary and suffi-
cient condition for the dissolution of the latter.
The difference between the system "cement parti-
cle - non-electrolyte-structured water", which is stud-
ied, is that when its components collide, water mole-
cules (respectively, protons) are actively absorbed by
the hyperamorphized layer of cement particles.
Hydrogen ions (ie protons) penetrating the hyper-
amorphized layer and the amorphized layer of the ce-
ment particle have an abnormally high mobility -
3.26·10-5 m/s at an electric field strength of 1 V/cm and
high penetrating power, as their size several orders of
magnitude smaller than the size of the crystal lattice of
cement clinker minerals and bind strongly to electro-
negative oxygen atoms and form hydroxylions. In ad-
dition, protons enter into ion exchange reactions with
cations (Ca2+↔2H+, etc.). As a result, aquacomplexes
[Ca (H2O)6]2+ and primary molecules of Ca(OH)2 are
formed along with hydroxyls, the size of which can be
compared with the size of the crystal lattice of basic
minerals. Due to this, the destruction of the surface
layer of cement particles with the formation of nanodis-
persed hydrated particles with a size of 5-10 nm.
On the surface of cement grains, an electric layer
of not flattened (with evenly spaced Helmholtz layer of
charges) configuration is formed, but in the form of lo-
cally dispersed polymolecular water clusters. Explo-
sion-like destruction of Ca–O bonds in the structure of
calcium silicates, hydrogen and chemical bonds of ad-
sorbed clusters, the appearance of active particles
(Ca2+, (SiO4)4-, H3O+, OH-, etc.), their transient interac-
tion and is the cause of the appearance on the surface
of cement grains amorphous hydrate product.
Hydration of cement minerals is accompanied by
hydrolysis, first of all, of the aluminate and then of the
silicate component of clinker, with a predominant re-
lease of calcium ions into the liquid medium. Hydroly-
sis "residues" (SiO4)4- remain in the solid phase, bind to
highly reactive decay products of water molecules.
Since protons from water molecules on the surface
migrate into the original crystal, fixing on the acceptor
with the formation of stable OH- particles, in the oppo-
site direction is the movement of calcium atoms and, to
a lesser extent, silicon out into the solution through the
hydration products. When C3S is hydrated, the topo-
chemical reaction of protonation of unsaturated oxygen
atoms in the C3S structure is first carried out.
In the process of hardening of cement stone, its
pores are penetrated by needle crystals of etringite,
which acts as a center of crystallization for other hy-
drate compounds formed, as well as crystals of port-
landite (application of 0.0002% hydrocarbon solution).
the introduction of hydrocarbons or alcohol in small
concentrations (0.0002 – 0.0004%) leads to the for-
mation of evenly distributed pores in the cement stone,
which migrate the formed portlandite and etringite. as
a result, the structure of cement stone with a high con-
tent of high-strength low-base calcium hydrosilicates is
formed, which leads to an increase in the strength of
cement stone almost 2 times after a year of hardening
in air and humid conditions..
Acceleration of the hydration process and subse-
quent curing process leads to a more uniform crystalli-
zation of tumors, their subsequent collective recrystal-
lization, which provides a more homogeneous matrix,
which has increased density and strength.
At the same time there is an involuntary disaggre-
gation of cement flocs, which under the influence of
structured water develops due to the repulsive (wedg-
ing effect) of thin films of liquid when wetting the sur-
face of the contacting cement particles. As a result, in
the mouth of such "cracks" films of liquid are formed,
which pass into monolayers of oriented water mole-
cules, there is an effort of mutual repulsion of the same
charged surfaces and the destruction of flocs.
Hydrated parts of cement have a negative surface
charge, so the presence of structured water, which has
a negative charge, prevents their coagulation. Subse-
quently, protons are adsorbed on the surface of the ox-
ygen nodes of the crystal lattices of hydrated C3A by
the formation of hydrogen sorption bond with the oxy-
gen atom:
It is also possible the interaction of the acidic pro-
ton with the oxygen atom of the oxygen node hydrated
C4AF:
and this atom with a hydrogen atom of water:
and the hydrogen bonds between oxygen atoms
and hydrogen atoms of water molecules with hydrogen
hydroxyl node hydrateds C2S and C3S:
If the spatial second orientation of the molecules
near the oxygen the crystal lattice silicate, aluminate or
ferrite acidic protons appear at a distance to be adsorbed
and centers oxygen units or happen their migration (dif-
fusion) in the surface layer for oxygen units and subse-
quent adsorption, they vacancies can be occupied by
hydrogen atoms of water molecules with the formation
of a "new" structure close to the polymer.
Thus, increasing to a certain limit the concentra-
tion of protons in the system "cement - water" increases
the strength of cement stone. The increase in the con-
centration of protons in the structuring of water by or-
ganic non-electrolytes, which are introduced in ultra-
low concentrations (up to 0.0005%), leads to an in-
crease in concrete strength at an early age (2 days) by

56 Norwegian Journal of development of the International Science No 60/2021
an average of 60-83%, and later more) - 35-40%. Frost
resistance of concrete is 200-300 cycles of freezing and
thawing, water resistance corresponds to brand W6.
Conclusions: - the use of organic non-electrolytes for water
structuring leads to increased compressive strength,
frost resistance and water resistance of fine-grained
concrete
- the application of theories of electroheterogene-
ous interactions in the hardening of cement binders, the
formation of the surface of cement particles during
grinding, theories of ultra-low concentrations and mi-
cellar catalysis allows us to present a theoretical model
of the initial phase of interaction of cement with struc-
tured water.
- the basis of the processes that occur in the system
"cement - non-electrolyte-structured water" are acidic
protons, which are introduced into the system when
structuring water with organic non-electrolytes.
- a certain concentration of non-electrolytes in wa-
ter (0.0002-0.0005% by weight of cement) provides the
optimal number of protons in it, which leads to an in-
crease in the strength of concrete at an early age (2
days) by an average of 60-83%, and in later (28 days or
more) - 35-40%, frost resistance for 50 cycles of freez-
ing and thawing, water resistance for 2-4 brands.
REFERENCES:
1. Usherov-Marshak AV, Zlatkovsky OA, Per-
shina LA, Tsiak M. 2003. On the evaluation of compat-
ibility of chemical additives with cements in concrete
technology. Construction materials. 4. p. 11-15 (in Rus-
sian)
2. Babkov VV, Polak AF, Komokhov PG 1988
Aspects of durability of cement stone. Cement, 3, pp.
14-16 (in Russian)
3. Shishkina A. Shishkin A., Application of the
easy concentration effect in concrete technology. IOP
Conference Series: Materials Science and Engineering,
2020, 907(1), 012038
4. Shishkin, A., Shishkina, A 2018 Study of the
effect of micellar catalysis on the strength of alkaline
reactive powder concrete. Eastern-European Journal of
Enterprise Technologies, 3 (6/93), pp. 46–51
5. Gladkikh Yu.P., Zavrazhina VI 2005 On
condensation in nature in the hardening of inorganic
binders. Bulletin of BSTU.V.G. Shukhova, 10, pp. 59-
61. (in Russian)
6. Usherov-Marshak O.V. 2008 On the levels
of development of concrete management and concrete
technology. Proceedings of the International Congress
Science and Innovation in Construction SIB-2008, vol.
1, book.2. Voronezh: VGASU, pp. 569-573.
7. Khodakov GS 1972 Fine grinding of build-
ing materials. (Moscow: ASV) р 198. (in Russian)
8. Berezin IV, Martinek K., Yatsimirsky AK
1973 Physicochemical bases of micellar catalysis. Suc-
cesses in chemistry. Issue 10.. Volume XLU. pp.1729-
1756. (in Russian)
9. Friedrichsberg DA 1984 Colloid chemistry
course. L.: Khimiya,. p. 368. (in Russian)
10. Burlakova EB 1994 The effect of ultra-small
doses. Bulletin of the Russian Academy of Sciences,
Volume 64, 5, pp. 425-431(in Russian)
11. Plugin AN 1985 Electroheterogeneous
mechanism of structure formation of cement-water sys-
tems. Abstracts. report VI Republic. confer. on physical
chemistry and technology for the production and use of
flushing fluids, dispersed systems and grouting solu-
tions. Kiev: IKHHV AN USSR. Part IC 127. (in Rus-
sian)
12. Andrii Plugin et al 2020 Nanomodified ce-
ment composites for thin walled architectural struc-
tures. To cite this article: IOP Conf. Ser.: Mater. Sci.
Eng. 907 012030
13. Pashchenko AA, Serbia VP, Starchevskaya
EA 1975 Binding materials. (K.: Higher school), p.
444. (in Russian)
14. Shpynova LG, Chikh VI, Sanitsky MA.
1981 Physico-chemical bases of formation of structure
of a cement stone. (Leo: Higher school). p. 160. (in
Russian)

№60/2021
Norwegian Journal of development of the International Science
ISSN 3453-9875
VOL.1
It was established in November 2016 with support from the Norwegian Academy of Science.
DESCRIPTION
The Scientific journal “Norwegian Journal of development of the International Science” is issued 24 times a year
and is a scientific publication on topical problems of science.
Editor in chief – Karin Kristiansen (University of Oslo, Norway)
The assistant of theeditor in chief – Olof Hansen
• James Smith (University of Birmingham, UK)
• Kristian Nilsen (University Centre in Svalbard, Norway)
• Arne Jensen (Norwegian University of Science and Technology, Norway)
• Sander Svein (University of Tromsø, Norway)
• Lena Meyer (University of Gothenburg, Sweden)
• Hans Rasmussen (University of Southern Denmark, Denmark)
• Chantal Girard (ESC Rennes School of Business, France)
• Ann Claes (University of Groningen, Netherlands)
• Ingrid Karlsen (University of Oslo, Norway)
• Terje Gruterson (Norwegian Institute of Public Health, Norway)
• Sander Langfjord (University Hospital, Norway)
• Fredrik Mardosas (Oslo and Akershus University College, Norway)
• Emil Berger (Ministry of Agriculture and Food, Norway)
• Sofie Olsen (BioFokus, Norway)
• Rolf Ulrich Becker (University of Duisburg-Essen, Germany)
• Lutz Jäncke (University of Zürich, Switzerland)
• Elizabeth Davies (University of Glasgow, UK)
• Chan Jiang(Peking University, China) and other independent experts
1000 copies
Norwegian Journal of development of the International Science
Iduns gate 4A, 0178, Oslo, Norway
email: [email protected]
site: http://www.njd-iscience.com