Natural Hazard Mitigation Plan - Previously Recorded Taney ...

Palaeogeography, Palaeoclimatology, Palaeoecology 297 (2010) 223–237
Contents lists available at ScienceDirect
Palaeogeography, Palaeoclimatology, Palaeoecology
j ourna l homepage: www.e lsev ie r.com/ locate /pa laeo
6000 years of environmental changes recorded in Blue Lake, South Australia, basedon ostracod ecology and valve chemistry
Chris Gouramanis ⁎, Daniel Wilkins 1, Patrick De DeckkerResearch School of Earth Sciences, The Australian National University, Canberra ACT, 0200, Australia
⁎ Corresponding author.E-mail addresses: [email protected] (C. Gour
[email protected] (D. Wilkins), Patrick.dedeck(P. De Deckker).
1 Present address: Australian Antarctic Division, DepWater, Heritage and the Arts, Kingston, Tasmania 7050,
0031-0182/$ – see front matter © 2010 Elsevier B.V. Aldoi:10.1016/j.palaeo.2010.08.005
a b s t r a c t
a r t i c l e i n f oArticle history:Received 24 December 2009Received in revised form 11 August 2010Accepted 12 August 2010Available online 19 August 2010
Keywords:AquifersAMS 14C datingReservoir effectStable isotopes of biogenic carbonateTrace elementsMg/CaSr/CaNa/CaHolocene
A 4 m long core taken from the freshwater Blue Lake crater near the township ofMount Gambier in southeasternSouth Australia provided a high-resolution palaeoclimatic record for the last six millennia. Accelerator MassSpectrometry (AMS) radiocarbon (14C) dates were obtained from organic plant fibres and biogenic carbonatesfrom the laminated sequence of the core and from a modern water sample. Large discrepancies between theradiocarbon ages determined from plant fibres and biogenic carbonates indicate the presence of a time-variablelacustrine reservoir, which is consistent with what is known of the lake's hydrology.Ostracod assemblages, associatedwith stable isotope (δ13C, δ18O) analyses and, in combinationwithMg/Ca, Sr/CaandNa/Ca analyses done onostracod valves, infer salinity, temperature andwater level changes in Blue Lake overthe last 6 millenia. The influence of local aquifers through time has also been determined from the Na/Ca ofostracod valves. Approximately 900 year cycles are evident in the δ13C record from 5.4 ka to 1.8 ka.The history of Blue Lake records an initial period of high hydrological variability around 6 ka, becomingincreasingly deeper as groundwaterflowed into the basin. By 4 ka, the lakehad reached steady statewith the lakelevel fluctuating by as much as 9 m, although significant geochemical variations represent temperaturefluctuations until European settlement near the lake in 1839.
amanis),[email protected]
artment of the Environment,Australia.
l rights reserved.
© 2010 Elsevier B.V. All rights reserved.
1. Introduction
Hydrologically closedvolcanic crater lakes fromsoutheasternAustraliaact as giant rain gauges with lake levels responding to variations in theregional climate (Currey, 1970; Bowler, 1981;DeDeckker, 1982a; Jones etal., 1998; 2001). Changes in climate affect crater-lakewater levels throughvariations of E/P (evaporation/precipitation). Increasing (decreasing) E/Presults in shallowing (deepening) of the lakes' water level (Bowler, 1981;Jones et al., 1998, 2001). The absence of river inflow or outflow, a welldefined rim and the steep-sided nature of these craters mean the non-water surface area of the catchment is relatively small compared to thewater surface area (De Deckker, 1982a; Jones et al., 1998, 2001). As such,surface flow into these lakes is negligible and the predominant watersource is from precipitation. When water levels are below the crater rim,water loss is mostly through evaporation. Some leakage may also occurthrough theporous lithologies (e.g. scoria) of the craters. Thus, variation inlake level also engenders either concentration or dilution of dissolved ionsin the water and, thus, changes salinity (Currey, 1970; De Deckker andForester, 1988).
Unlike many of the volcanic crater lakes in southeastern Australia,Blue Lake intersects the regional groundwater table and, at present, thelake level is predominantly controlled by groundwater flow, E/P andpumping for human consumption (Holmes and Waterhouse, 1983;Ramamurthy et al., 1985; B.L.M.C., 2001). Groundwater inflowing intoBlue Lake is chemically distinct from rainwater having chemicallyreacted with the surrounding basalt and limestone (Blackburn andMcLeod, 1983; Love et al., 1993, 1994). The significant groundwaterinfluence in Blue Lake complicates interpretations of lake level variationthrough E/P variations, and to solve this effect, evidence is examinedfrom several proxy records preserved in the lake's sediment.
This paper describes the high-resolution palaeoenvironmental andpalaeoclimatic changes recorded in the Holocene sediments andassociated fossil microbiota and hydrochemistry of Blue Lake. In con-junctionwithacompanionpaper focussingon thecrater LakesKeilambeteand Gnotuk located in western Victoria, some 200 km east of Blue Lake(Wilkins et al., in preparation), this paper seeks to provide geochrono-logically-constrained, high-resolution lacustrine Holocene paleoenviron-mental and paleoclimatic histories from southeastern Australia.
2. Regional setting
2.1. Site description
Blue Lake (37° 50.713′S, 140° 46.486′E) is the largest and deepest offour lakes (Valley, Leg of Mutton and Brownes Lakes) in the maar

224 C. Gouramanis et al. / Palaeogeography, Palaeoclimatology, Palaeoecology 297 (2010) 223–237
complex near the township of Mount Gambier in South Australia(Fig. 1). The water from Blue Lake has been used as Mount Gambier'swater supply since 1883 and is pumped from the northern crater rimjust below the water's edge.
Tamuly (1970) described Blue Lake's surface area, volume andmean and maximum depths as 0.6 km2, 36.8 million m3, 61 m and77 m, respectively. The catchment area of Blue Lake is a mere 10%greater than the lake's surface area. The very steep crater walls andsmall surface area to volume ratio of the lake indicate that the primarymechanisms for water to enter the lake system are via precipitationand groundwater flow (Fig. 1) (see Herczeg et al., 2003).
Tamuly (1970) showed that Blue Lake is oligotrophic and mono-mictic, becoming thermally stratified in October (austral spring). Peakstratification occurs in January to February (summer) with surfacewaters recording temperatures greater than 22 °C,while bottomwatersremain relatively constant at about 13 °C all year round (Tamuly, 1970;Vanderzalm et al., 2009). Complete thermal mixing occurs during thewintermonths from June to September (Telfer, 2000; Vanderzalm et al.,2009). This time coincides with the colour change from grey to blue bythe precipitation of tiny calcite crystals in the water column andconcentrating humic substances during the degassing of CO2 duringstratification (Telfer, 2000). Turner et al. (1984) found that Blue Lake isalways supersaturated with respect to calcium carbonate.
2.2. Modern climatology
The local climate is characterised by cool, wet winters and hot, drysummers. The lowest mean minimum/maximum temperatures atMount Gambier occur in July (5.3 °C/13.8 °C) and the highest in
Fig. 1. a) Figure showing the lake's edge (solid line), bathymetry (dashed lines) and coring loto the Australian coastline. Site 6 shows the location of the hydrological sampling site used insatellite image courtesy of GoogleEarth™ version 4.2.0205.5730 (2007), b) line marked A–A′the Blue Lake volcanic complex showing the main stratigraphical units, and the main aquifer(1995) and Sheard (1978), and c) is the historical (1882 to 1993) lake level curve for Blue
February (11.9 °C/24.8 °C). Regional precipitation decreases northeastof the southern coast (Blackburn and McLeod, 1983); however, BlueLake is within 25 km of the coast. Mean minimum precipitation(29 mm) occurs in February, and mean maximum precipitation(107.1 mm) occurs in July (Fig. 2) (Data courtesy of the Bureau ofMeteorology, http://www.bom.gov.au/climate/averages/tables, 2008).
2.3. Regional geology
Blue Lake occurs in a complex maar crater located in the basalticand tuffaceous Newer Volcanics in southeastern South Australia thatforms part of the western portion of the Otway Basin. The Blue Lakevolcanic structure intersects the upper part of the Late Palaeocene toMiddle Eocene Dilwyn Formation and the conformably overlyingMiddle to Late Miocene Gambier Limestone (Fig. 1). The DilwynFormation represents a transition from a sandy fluvial environment toa deltaic/interdistributary bay environment, opening to the fossilif-erous carbonate open-marine shelf Gambier Limestone (Waterhouse,1977; Love et al., 1993). Li et al. (2000) identified seven diachronousmembers of the Gambier Limestone including the fractured dolomiticCamelback Member.
2.4. Geochronology
Numerous studies have been conducted to determine the age of thevolcanism of the Blue Lake complex (Gill, 1955; Blackburn, 1966;Kigoshi and Kobayashi, 1966; Blackburn et al., 1982) and the lacustrinesediments within the Blue Lake catchment (Ayliffe, 1983; Leaney et al.,1995).Ages for volcanism in theBlue Lake complexhave ranged from38
cations within the Blue Lake basin, and the location of the Blue Lake complex in relationthe hydrochemical modelling. Bathymetric contours are fromWaterhouse (1977), andthrough a) is the approximate location of the north–south vertical cross section throughs feeding the lake and the current water level. Cross section modified from Leaney et al.Lake (from D.W.L.B.C., 2010).

Fig. 2. Boxplots of the monthly precipitation at Mount Gambier from 1861 to 2004(http://www.bom.gov.au/climate/averages/tables, 2008). The thin outlined boxesshow the span between 25 and 75 percentiles, the thick solid lines show the medianvalue, lines extending from the boxes show the minimum and maximum values andoutliers are represented as open circles.
225C. Gouramanis et al. / Palaeogeography, Palaeoclimatology, Palaeoecology 297 (2010) 223–237
400 yr BP (Barton and McElhinny, 1980) to 1410 yr BP (Blackburn,1966; Kigoshi and Kobayashi, 1966). Leaney et al. (1995) calculated amaximum age of 28000 yr BP from basal bulk sediment samples.
Table 1Water samples collected and analysed by Love et al. (1993, 1994) from the Dilwyn(DIL) and Gambier (GAM) aquifers in the Blue Lake region.
Sites Distance fromSouth Coast(km)
TDS(g/L)
Mg/Ca Na/Ca δ18O δ13C
DIL052 24 0.816 0.43 2.26 −3.5 −10.6DIL016 20 0.795 0.6 2.55 −4.4 −11.9GAM011 22 0.575 0.42 1.42 −4.9GAM014 36 −9.3
2.5. Water chemistry and regional hydrology
TheBlue Lake crater intersects twoaquifers, theunconfinedGambieraquifer in theGambier Limestone and the confinedDilwynaquifer in theDilwyn Formation (Fig. 1). Holmes and Waterhouse (1983) producedpotentiometric maps that describe a high gradient of groundwater flowfrom 5 km northeast of Mount Gambier, which decreases to almost ahorizontal flow into the Blue Lake area through the Gambier Limestone.The groundwater flow through the Dilwyn Formation is almosthorizontal and also from the northeast.
The Camelback Member of the Gambier Limestone is approxi-mately 50 m below the current lake level on the northern face of thelake (B.L.M.C., 2006; Vanderzalm et al., 2009; Lawson pers. comm.) andcontributes 85% of the groundwater inflow to the lake from the Gambieraquifer (Ramamurthy et al., 1985). The Dilwyn aquifer contributes theremaining 15% (Ramamurthy et al., 1985). The drop in Blue Lake waterlevel from22mto13 maboveAHD(AustralianHeightDatum) from1911to 1993 (Fig. 1) is strongly correlatedwith the decline in regional precipi-tation variation in the Mount Gambier area during this period (B.L.M.C.,2006). However, pumping of Blue Lake forMountGambier'swater supplyhas steadily increased between 1960 and 2001 (4×10⁶ m3/yr deter-mined by Turner et al. (1984)) but has not caused variation in the lakelevel (B.L.M.C., 2006). This increased pumping has resulted in greaterinflow rates of the groundwater to between 5×10⁶ and 6.5×10⁶ m3/yr(Turner et al., 1984). Thewater residence time has also been calculated tobe 6 to 10 years (Turner et al., 1984; Herczeg et al., 2003). It is currentlyunknown howmuch groundwater flows from Blue Lake.
In two extensive studies of the regional hydrology, Love et al. (1993,1994) showed that recharge of the Gambier aquifer was via downwardpercolation of local precipitation. The predominant region of rechargefor the Dilwyn aquifer, on the other hand, outcrops in a small zone nearNangwarry, some 30 km north of Mount Gambier. The Gambier andDilwyn aquifers' dominant flow is southward, towards the coast in theMount Gambier region and, just north of Mount Gambier, the hydraulic
potential shifts from downward leakage from the Gambier aquifer tosignificant upward leakage from the Dilwyn aquifer (Love et al., 1993).
The groundwater that reaches Blue Lake is predominantly fromhorizontal transmission from recharge areas north of the Blue Lakevolcanic crater (Waterhouse, 1977; Love et al., 1993, 1994). North ofBlue Lake, the flow rates of both aquifers is slow (Waterhouse, 1977)and the top of the water table resides well below the basaltic scoria(Fig. 1). This means that chemically altered precipitation that haspercolated through the basaltic scoria contributes negligible volumes tothe overall hydrologic budget of the aquifers or Blue Lake. There is alsono direct spring seepage from the scoria cone into the lake.
Love et al. (1994) measured low radiocarbon concentrations inconfined and unconfined aquifers from a transect passing close to MtGambier. Modeled groundwater ages from the confined aquifers werebetween 2500 and 35000 years (61.2 and 1.3 percent modern carbon(pmc)), whereas the unconfined aquifers contained between 62.5 and78.2 pmc (equating to modeled groundwater ages of between 950 and2500 years) (Love et al., 1994). In the unconfined aquifers, the ages areconsistent with mixing of older water with modern and younger soilradiocarbon. The radiocarbon ages from the Gambierwells tended to beyounger, but were still in the order of 2000 to 3000 years (Love et al.,1994). We note, however, that the water percolating through alimestone terrain would provide “old” bicarbonate to the groundwater.
Love et al. (1993, 1994) alsoprovided somewater chemistry data fortwo Dilwyn aquifer and the unconfined Gambier aquifer that arerelevant to our study, and these are presented in Table 1. Modern andmodelled hydrological data for Blue Lake is presented in the Supple-mentary information.
3. Ostracods
Ostracods are microcrustaceans found in most Australian inlandwaters from freshwater to salinities close to 200 g/L (De Deckker, 1981,1983). Ostracods secrete low-Mg calcite valves, which theymoult up tonine times before reaching adulthood. Following the moulting of thevalves as the ostracod grows, the chemical elements of the ostracodvalves comedirectly from the ambientwater (Turpen andAngell, 1971),and, as such, can be used as hydrochemical indicators. Chivas et al.(1983, 1985, 1986) and De Deckker et al. (1999) determined thegeochemical relationships between the uptake of trace metal (Mg, Sr)substitution of Ca in the CaCO3 by ostracods and the ambient water.
Chivas et al. (1983, 1985, 1986) were the first to show that for Mgthere is a strong temperature effect onMg incorporation in the ostracodcalcite, but that this relationship also dependedon theMg/Ca of the hostwater. Chivas et al. (1983, 1985, 1986) also showed that Sr uptake iscontrolled by the Sr/Ca of the hostwater. Nevertheless, DeDeckker et al.(1999) suggested that there may be a weak temperature influence onSr/Cavalve in the euryhaline Cyprideis australiensis, and Gouramanis andDe Deckker (2010) have recently argued, using Australian examples,that the Sr/Ca in ostracod valves is affected by the αHCO3
− with adecrease in the Sr/Ca that is correlated with alkalinity increase.However, Ito and Forester (2009) suggested that utilising ostracodvalve chemistry as proxies for environmental parameters may over-simplify the true nature and causes of variation in any lake.

226 C. Gouramanis et al. / Palaeogeography, Palaeoclimatology, Palaeoecology 297 (2010) 223–237
The incorporation of the stable isotopes (δ18O and δ13C) intoostracod valves is due in part to the isotopic signature of the hostwaters, and temperature for δ18O, and the isotopic composition ofdissolved inorganic carbon for δ13C (von Grafenstein et al., 1999b;Holmes and Chivas, 2002; Ito et al., 2003).
The oxygen isotopic signature of the host water is derived from acomplex interplay between ambient air temperature and evaporation,water temperature, groundwater inflow and outflow, precipitation andprecipitation sources, and water depth (von Grafenstein et al., 1999b).The carbon isotopic signature is also a complex interaction betweenatmospheric CO2 and dissolved CO2, plant and algal photosynthesis,oxidation and reduction reactions in the sediments within andsurrounding the lake, overland water flow, groundwater inflow andoutflow and methanogenesis (Curry et al., 1997), as well as possiblesulphate reduction (Ito and Forester, 2009).
Both trace metal and stable isotope analysis of ostracod valveshave been utilised as excellent proxies for hydrochemical conditionsat the time of ostracod valve calcification, and, as such, have been usedfor lacustrine palaeoenvironmental and palaeoclimatic reconstruc-tions (Chivas et al., 1985; Engstrom and Nelson, 1991; Chivas et al.,1993; Holmes, 1996; Holmes et al., 1997; De Deckker et al., 1999; vonGrafenstein et al., 1999a; Ricketts et al., 2001; Ito, 2002; Schwalb,2003; Anadon et al., 2006; Mischke and Wunnemann, 2006).
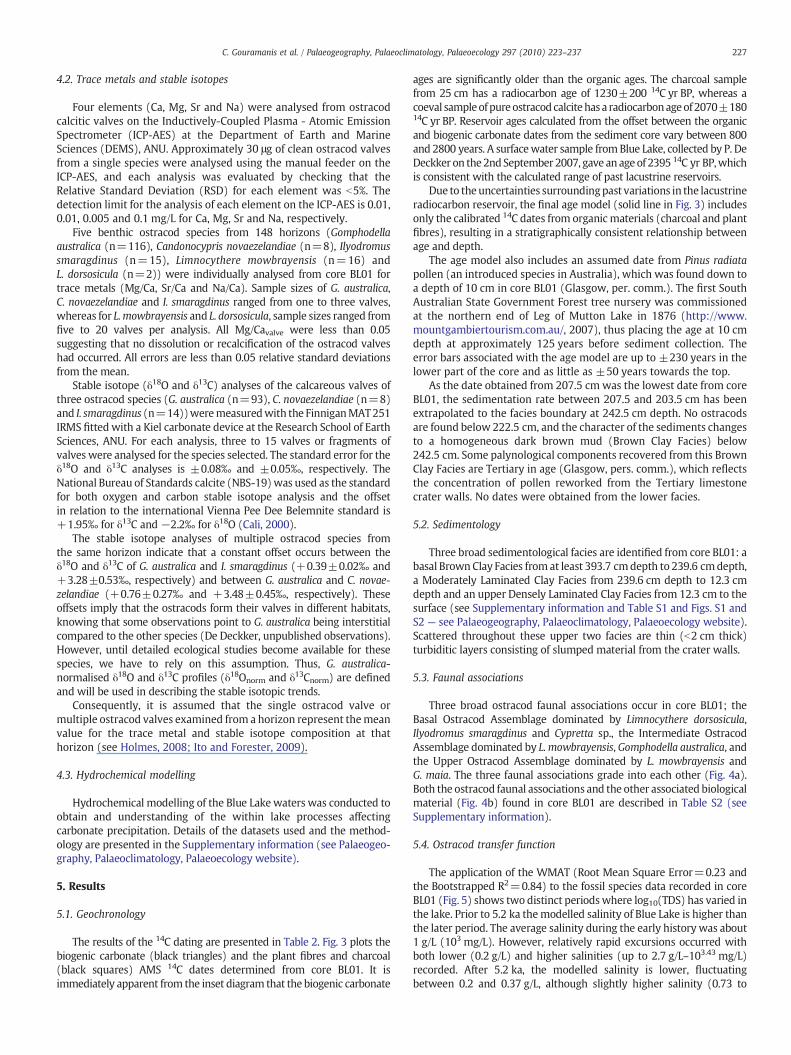
Table 2Geochronology of samples from Blue Lake Core BL01.
Sample Code Depth(cm)
Material δ13C 14C ageb
(14C yr BP±1σ)Calibrated agec
(cal.yr BP±1σ)
ANUSSA2309 0 Water −11 2395±30ANUA36707 13 Mixed
carbonatea−7 3070±180
OZJ950 16 Plant fibres −24 800±60 700±35ANUA36714 25 Charcoal −24 1230±200 1100±185ANUA36708 25 Ostracod calcite −7 2070±180ANUA36028 53 Mixed
carbonatea−7 4260±180
ANUA36709 66 Mixedcarbonatea
−7 5350±170
ANUA36029 69 Ostracod calcite −7 4780±185OZJ951 81 Plant fibres −25 3010±60 3120±105OZJ952 102 Plant fibres −25 3390±60 3560±80ANUA36710 130 Charophyte
oogonia−7 6390±185
OZJ953 141 Plant fibres −20 4360±70 4900±80ANUA36711 147 Mixed
carbonatea−7 7170±210
OZJ954 185 Plant fibres −27 4650±50 5260±185OZJ955 203 Plant fibres −25 4770±70 5450±130ANUA36030 208 Ostracod calcite −1 6890±190
a Mixed carbonate samples consisting of ostracods, juvenile lacustrine gastropods and/or lacustrine bivalves. Inorganic carbonate and foraminifera were avoided (as numerousreworked marine foraminifera of Tertiary age were identified in the samples).
b Radiocarbon ages are presented at 1σ, ANUAages incorporate a further 2%error addedin quadrature with the statistical error to incorporate accelerator system reproducibility.
c Only organic ages (charcoal and plant fibres) have been calibrated. Calibrated datesare reported at 1σ.
4. Methods
Three, approximately 4 m long,Mackereth coreswere obtained fromBlue Lake (Fig. 1) in November 2002. The three cores were cut into 1 mlengths, opened and photographed using a Nikon D70 digital camerawith a Nikon 18–70 mm f/3.5–4.5 DX lens. Comparison of the threecores (not shown) resulted in core BL01 being used for geochronology,faunal andgeochemical aswell as sedimentological analysis as itwas thelongest. Photographs of the core and sedimentological interpretationsare available as Supplementary Fig. S2 and Table S1 (see Palaeogeo-graphy, Palaeoclimatology, Palaeoecology website).
Sediment and faunal samples of the upper laminated part of the core(above 239.6 cm)were taken of individual laminae or groups of very thinlaminaeandranged in thickness from4to15mm. In theunlaminatedpartof the core (below 239.6 cm), a sample of one centimetre thickness wastakenevery4 cm. In all, 200horizonswere sampled fromcoreBL01. Thesesamples had the outer few millimetres cut away to remove potentialcontamination during the coring procedure.
The sediment samples were weighed, oven dried at 50 °C andreweighed to obtain the normalised water loss. A 3% H2O2 solution wasadded to the dry sample placed in clean 125 mL jars to disaggregateclays and clean the carbonate fraction. The samples were filteredthrough 120 μm aluminium sieves using tap water, oven dried at 50 °C,and visually checked to ensure the ostracod valves were clean. Whereostracod valves were unclean, the process was repeated.
Where present, ostracodswere identified to species level, picked andcounted for standardised quantitative faunal variation, and trace metaland stable isotope analysis of selected valves could be undertaken.
Eight carbonate and one charcoal sample for radiocarbon analysis(prefixed by ANUA) were hand-picked from the sediment samples,purified and graphitised at the Department of Nuclear Physics,Research School of Physical Sciences and Engineering (RSPhysSE)at the Australian National University (ANU) (Wilkins, 2009). Thegraphite targets were measured on the 14UV tandem accelerator(Fifield et al., 1994). Six additional fibrous samples of terrestrial origin(prefixed by OZJ) were processed and measured at the AustralianNuclear Science and Technology Organisation (ANSTO) (Fink et al.,2004). Carbonate was precipitated from a modern water sample(prefixed by ANUSSA) and analysed with the Single Stage AMS(SSAMS) facility at the ANU (Fallon, pers. comm.). These ages arepresented in Table 2.
Raw radiocarbon ages were corrected for δ13C fractionation usingvalues measured from the graphite target (in the case of the OZJ andANUSSA samples) or from coeval samples (in the case of the ANUAcarbonate samples). For samples where δ13C was not measured (theANUA charcoal sample), a generic value was substituted from the tableof Stuiver and Polach (1977) as standard practice. All of the organicradiocarbon ages were calibrated using Calib 5.0.1 (Stuiver and Reimer,1993)with the southern hemisphere dataset ofMcCormac et al. (2004).These samples have been calibrated assuming a sedimentary age spancalculated from first-order accumulation rates (10 to 40 years) ratherthan an instantaneous age. The carbonate ages have not been calibrated,due to the presence of variable reservoir ages and the complexity of thegroundwater hydrology.
4.1. Ostracod transfer function
The salinity (log10(TDS)) of Blue Lake is reconstructed from thefossil ostracod fauna preserved in core BL01 using the C2 program(Juggins, 2003). The transfer function employed utilised the weightedaverage of 10 modern analogues technique (WMAT) using the Bray-Curtis percent dissimilarity coefficient and Bootstrapping cross-validation with 4999 iterations (Gouramanis, 2009).
Themodern analogue data include 496 samples from southeasternAustralia, 30 from southwestern Western Australia, 10 samples fromnorthwestern Western Australia and one sample from centralAustralia. The Western Australian and central Australian data areincluded since these sites include hydrochemical data for sitescontaining Candonopsis tenuis. This species is found in southeasternAustralia, but no hydrochemical data is reported. Thus, it is assumedthat the salinity tolerance of this species is the same across thecontinent (Gouramanis, 2009). There is no ecological data available forIlyodromus smaragdinus, and this species was not included in themodelling of log10(TDS). All other species have been included. Furtherdetails regarding the ostracod salinity transfer function are available inGouramanis (2009).
227C. Gouramanis et al. / Palaeogeography, Palaeoclimatology, Palaeoecology 297 (2010) 223–237
4.2. Trace metals and stable isotopes
Four elements (Ca, Mg, Sr and Na) were analysed from ostracodcalcitic valves on the Inductively-Coupled Plasma - Atomic EmissionSpectrometer (ICP-AES) at the Department of Earth and MarineSciences (DEMS), ANU. Approximately 30 μg of clean ostracod valvesfrom a single species were analysed using the manual feeder on theICP-AES, and each analysis was evaluated by checking that theRelative Standard Deviation (RSD) for each element was b5%. Thedetection limit for the analysis of each element on the ICP-AES is 0.01,0.01, 0.005 and 0.1 mg/L for Ca, Mg, Sr and Na, respectively.
Five benthic ostracod species from 148 horizons (Gomphodellaaustralica (n=116), Candonocypris novaezelandiae (n=8), Ilyodromussmaragdinus (n=15), Limnocythere mowbrayensis (n=16) andL. dorsosicula (n=2)) were individually analysed from core BL01 fortrace metals (Mg/Ca, Sr/Ca and Na/Ca). Sample sizes of G. australica,C. novaezelandiae and I. smaragdinus ranged from one to three valves,whereas for L.mowbrayensis and L. dorsosicula, sample sizes ranged fromfive to 20 valves per analysis. All Mg/Cavalve were less than 0.05suggesting that no dissolution or recalcification of the ostracod valveshad occurred. All errors are less than 0.05 relative standard deviationsfrom the mean.
Stable isotope (δ18O and δ13C) analyses of the calcareous valves ofthree ostracod species (G. australica (n=93), C. novaezelandiae (n=8)and I. smaragdinus (n=14))weremeasuredwith the FinniganMAT251IRMS fitted with a Kiel carbonate device at the Research School of EarthSciences, ANU. For each analysis, three to 15 valves or fragments ofvalves were analysed for the species selected. The standard error for theδ18O and δ13C analyses is ±0.08‰ and ±0.05‰, respectively. TheNational Bureau of Standards calcite (NBS-19)was used as the standardfor both oxygen and carbon stable isotope analysis and the offsetin relation to the international Vienna Pee Dee Belemnite standard is+1.95‰ for δ13C and −2.2‰ for δ18O (Cali, 2000).
The stable isotope analyses of multiple ostracod species fromthe same horizon indicate that a constant offset occurs between theδ18O and δ13C of G. australica and I. smaragdinus (+0.39±0.02‰ and+3.28±0.53‰, respectively) and between G. australica and C. novae-zelandiae (+0.76±0.27‰ and +3.48±0.45‰, respectively). Theseoffsets imply that the ostracods form their valves in different habitats,knowing that some observations point to G. australica being interstitialcompared to the other species (De Deckker, unpublished observations).However, until detailed ecological studies become available for thesespecies, we have to rely on this assumption. Thus, G. australica-normalised δ18O and δ13C profiles (δ18Onorm and δ13Cnorm) are definedand will be used in describing the stable isotopic trends.
Consequently, it is assumed that the single ostracod valve ormultiple ostracod valves examined from a horizon represent themeanvalue for the trace metal and stable isotope composition at thathorizon (see Holmes, 2008; Ito and Forester, 2009).
4.3. Hydrochemical modelling
Hydrochemical modelling of the Blue Lake waters was conducted toobtain and understanding of the within lake processes affectingcarbonate precipitation. Details of the datasets used and the method-ology are presented in the Supplementary information (see Palaeogeo-graphy, Palaeoclimatology, Palaeoecology website).
5. Results
5.1. Geochronology
The results of the 14C dating are presented in Table 2. Fig. 3 plots thebiogenic carbonate (black triangles) and the plant fibres and charcoal(black squares) AMS 14C dates determined from core BL01. It isimmediately apparent from the inset diagram that the biogenic carbonate
ages are significantly older than the organic ages. The charcoal samplefrom 25 cm has a radiocarbon age of 1230±200 14C yr BP, whereas acoeval sampleofpureostracodcalcitehasa radiocarbonageof2070±18014C yr BP. Reservoir ages calculated from the offset between the organicand biogenic carbonate dates from the sediment core vary between 800and 2800 years. A surfacewater sample fromBlue Lake, collected by P. DeDeckker on the2ndSeptember 2007, gave an ageof 2395 14C yr BP,whichis consistent with the calculated range of past lacustrine reservoirs.
Due to theuncertainties surroundingpast variations in the lacustrineradiocarbon reservoir, the final age model (solid line in Fig. 3) includesonly the calibrated 14C dates from organic materials (charcoal and plantfibres), resulting in a stratigraphically consistent relationship betweenage and depth.
The age model also includes an assumed date from Pinus radiatapollen (an introduced species in Australia), which was found down toa depth of 10 cm in core BL01 (Glasgow, per. comm.). The first SouthAustralian State Government Forest tree nursery was commissionedat the northern end of Leg of Mutton Lake in 1876 (http://www.mountgambiertourism.com.au/, 2007), thus placing the age at 10 cmdepth at approximately 125 years before sediment collection. Theerror bars associated with the age model are up to ±230 years in thelower part of the core and as little as ±50 years towards the top.
As the date obtained from 207.5 cm was the lowest date from coreBL01, the sedimentation rate between 207.5 and 203.5 cm has beenextrapolated to the facies boundary at 242.5 cm depth. No ostracodsare found below 222.5 cm, and the character of the sediments changesto a homogeneous dark brown mud (Brown Clay Facies) below242.5 cm. Some palynological components recovered from this BrownClay Facies are Tertiary in age (Glasgow, pers. comm.), which reflectsthe concentration of pollen reworked from the Tertiary limestonecrater walls. No dates were obtained from the lower facies.
5.2. Sedimentology
Three broad sedimentological facies are identified from core BL01: abasal Brown Clay Facies from at least 393.7 cmdepth to 239.6 cmdepth,a Moderately Laminated Clay Facies from 239.6 cm depth to 12.3 cmdepth and an upper Densely Laminated Clay Facies from 12.3 cm to thesurface (see Supplementary information and Table S1 and Figs. S1 andS2 — see Palaeogeography, Palaeoclimatology, Palaeoecology website).Scattered throughout these upper two facies are thin (b2 cm thick)turbiditic layers consisting of slumped material from the crater walls.
5.3. Faunal associations
Three broad ostracod faunal associations occur in core BL01; theBasal Ostracod Assemblage dominated by Limnocythere dorsosicula,Ilyodromus smaragdinus and Cypretta sp., the Intermediate OstracodAssemblage dominated by L. mowbrayensis, Gomphodella australica, andthe Upper Ostracod Assemblage dominated by L. mowbrayensis andG. maia. The three faunal associations grade into each other (Fig. 4a).Both the ostracod faunal associations and the other associated biologicalmaterial (Fig. 4b) found in core BL01 are described in Table S2 (seeSupplementary information).
5.4. Ostracod transfer function
The application of the WMAT (Root Mean Square Error=0.23 andthe Bootstrapped R2=0.84) to the fossil species data recorded in coreBL01 (Fig. 5) shows two distinct periodswhere log10(TDS) has varied inthe lake. Prior to 5.2 ka themodelled salinity of Blue Lake is higher thanthe later period. The average salinity during the early history was about1 g/L (103 mg/L). However, relatively rapid excursions occurred withboth lower (0.2 g/L) and higher salinities (up to 2.7 g/L–103.43 mg/L)recorded. After 5.2 ka, the modelled salinity is lower, fluctuatingbetween 0.2 and 0.37 g/L, although slightly higher salinity (0.73 to

Fig. 3. Final age model determined for BL01, black filled squares are calibrated AMS 14C plant fibre dates, black filled circle (at 25 cm) is an AMS 14C charcoal date and the blackdiamond (at 10 cm) is the first appearance of Pinus radiata pollen (c. 1880 AD). Inset plots the uncalibrated biogenic carbonate (black triangles) and plant fibre (black squares) dates,showing the variability in the lacustrine 14C reservoir over time.
228 C. Gouramanis et al. / Palaeogeography, Palaeoclimatology, Palaeoecology 297 (2010) 223–237
1.16 g/L) is recorded for short periods. During the period of Europeansettlement and extraction of water from Blue Lake, the salinity has risento the present salinity value of 0.37 g/L. This period records rapid, small-scale fluctuations in salinity, and may reflect variations in the rate ofpumping from the lake.
5.5. Geochemistry
5.5.1. Mg/CaThe Mg/Cavalve data for G. australica ranged from 1.12×10⁻³ to
1.18×10⁻² with an average of 6.79×10⁻³ (with one outlier at 135.6 cm(4.8 ka) removed); for C. novaezelandiae Mg/Cavalve ranged from6.1×10−4 to 1.12×10⁻², averaging 7.8×10⁻³; I. smaragdinus rangedfrom 6.1×10⁻³ to 1.15×10⁻³ averaging 8.66×10⁻³; L. mowbrayensisranged from 2.43×10⁻³ to 1.03×10⁻³ averaging 6.2×10⁻³; and thereare two analyses of L. dorsosicula, 5.98 and 6.58×10⁻³ and (Fig. 5).
5.5.2. Sr/CaThe Sr/Cavalve for G. australica ranges from 1.0×10⁻⁵ to 8.2×10⁻⁴
(mean=5.6×10⁻⁴±2.0×10⁻⁴, n=37) before 4.0 ka, and after 4.0 kaG. australica Sr/Cavalve range from 7.7×10⁻⁴ to 1.12×10⁻³
(mean=9.1×10⁻⁴±7×10⁻⁵, n=76 with one outlier removed). Thesmall number of analyses of C. novaezelandiae before (n=5) and after(n=3) 4.0 ka have mean Sr/Cavalve of 6.8×10⁻⁴±1.0×10⁻⁴ and1.1×10−3±2.5×10⁻⁴, respectively (Fig. 5). The Sr/Cavalve of analysedI. smaragdinus between 5.3 and 5.7 ka of core BL01 had a meanof 9.4×10⁻⁴±2.4×10⁻⁴ (n=15) and ranged from 5.1×10⁻⁴ to1.27×10−3. The Sr/Cavalve for I. smaragdinus linearly decreases up thecore.
Only two analyses of L. dorsosicula were performed (approximateage of 5.7 ka), and nine L. mowbrayensis analyses from sediments olderthan 4.0 ka with Sr/Cavalve ranging from 4.63 to 6.46×10⁻³
(mean=5.6×10⁻³±5.4×10⁻⁴). Seven analyses of Sr/Cavalve forL. mowbrayensis between 0.27 ka and the present ranged from 1.8 to2.3×10−3 (mean=2.1×10⁻³±1.7×10⁻⁴).
5.5.3. Na/CaThe Na/Cavalve analysis performed on fossil ostracod valves in core
BL01 show high variability prior to 4.0 ka and low variability after4.0 ka. From 5.4 ka to 4.0 ka, G. australica was analysed for Na/Cavalvewith a mean and standard deviation of 5.5×10⁻³±5.4×10⁻³
(n=36) reflecting the high intra-species variability in this section.Large inter-species Na/Cavalve variation occurs within the same
horizon, for example, at 5.7 ka, the Na/Cavalve of I. smaragdinus was1.02×10−2. The mean Na/Cavalve of 64 G. australica analyses between4.0 and 0.53 ka is significantly lower than the previous period(mean=1.8×10⁻⁴±1.5×10⁻⁴, using the Smith–SatterthwaiteTest, where t=5.91, df=35, α=0.05, pb0.001) to the earlier period.Similarly, after 0.53 ka the Na/Cavalve of the G. australica analysesincreases significantly (mean=1.46×10⁻³±3.0×10⁻⁴, using theSmith–Satterthwaite Test, where t=14.4, df=14.3, α=0.05,pb0.001). These trends are clearly evident in Fig. 5.
5.5.4. δ18OIn total 115 stable isotope analyses were performed on ostracod
valves recovered from the BL01 core. Seven horizons from core BL01were analysed for G. australica and C. novaezelandiae, and a relativelyconstant δ18O offset of +0.76±0.27‰ for the latter. Two horizonswere analysed for δ18O of G. australica and I. smaragdinus resulting inan offset of +0.39±0.02‰ for I. smaragdinus compared to G.australica. This results in a G. australica-calibrated δ18O profile(δ18Onorm), where 0.76‰ was subtracted from C. novaezelandiaeδ18O values and 0.39‰ subtracted from I. smaragdinus δ18O values, butnote that this only applies to two samples. Unfortunately, too fewsamples were available. In addition, Blue Lake does not have anyequivalent in the Australian landscape today as most crater lakes insouthern Australia are saline and do not share a similar history of lakelevel changes.
Using the δ18Onorm data, the period from 5.7 to 5.0 ka is a period ofsteep increase in δ18Onorm from −2.47‰ to +0.62‰. The followingperiod from 5.0 to 0.44 ka represents a gradual increase in δ18Onorm
rising from +0.9‰ to +2.9‰. From 0.44 ka to the present, there hasbeen a precipitous decrease in δ18Onorm from +2.9‰ to +1.85‰(Fig. 5).
5.5.5. δ13CComparing the δ13C of G. australica with C. novaezelandiae and I.
smaragdinus from the same horizons recorded higher δ13C in the latterspecies with an average offset of 3.48±0.45‰ and 3.28±0.53‰,respectively. This results in a G. australica-calibrated δ13C profile(δ13Cnorm) following the similar subtraction of these δ13C values fromthe ostracods similar to the δ18O measurements. Similarly to ourcomments on the disparity of δ18O values for the three species, theδ13C comparison has to be treated with caution, but it only concernsthe lower part of the core. Even if the adjustment towards a commonδ13C signal is inadequate, the observed trend is still prevalent.

Fig. 4. a) Ostracod species distributions in core BL01 as percentages of the total ostracod fauna versus age, and b) renormalised counts of the non-ostracod biological componentsversus age in each horizon of core BL01. Faunal assemblages are UOA = upper ostracod assemblage, IUOA = intermediate to upper ostracod assemblage transition, IOA =intermediate ostracod assemblage, BIOA = basal to intermediate ostracod assemblage transition, BOA = basal ostracod assemblage and NO = no ostracods.
229C. Gouramanis et al. / Palaeogeography, Palaeoclimatology, Palaeoecology 297 (2010) 223–237

Fig. 5. Figure showing the salinity transfer function derived from the BL01 fossil ostracod assemblages, and the combined species valve chemistry data for each trace metal and stableisotope. Sr/Cavalve is plotted twice; firstly, showing all of the species data; and secondly with the Limnocythere species removed. Stable isotopes (relative to PDB) are renormalised(δ18Onorm and δ13Cnorm) to G. australica values since both C. novaezelandiae and I. smaragdinus are positively offset from G. australica for both δ18O and δ13C (see text). Gomphodellaaustralica (circles), Ilyodromus viridulus (diamonds), Candonocypris novaezelandiae (squares), Limnocythere dorsosicula (crosses) and Limnocythere mowbrayensis (triangles).
230 C. Gouramanis et al. / Palaeogeography, Palaeoclimatology, Palaeoecology 297 (2010) 223–237
From 5.7 to about 5.4 ka, there is a dramatic decrease in δ13Cnormfrom −1.84‰ to −8.16‰. From 5.4 to 1.8 ka, there is a gradual linearincrease in δ13Cnorm from about−8‰ to−6.5‰. Superimposed on thislinear increase is an approximate 900 year cycle with increases anddecreases of δ13Cnorm of 1.5‰. After 1.8 ka, the cycle is not apparent(Fig. 5).
5.6. Hydrochemical and lake level modelling
As shown in the hydrochemical modelling of modern BlueLake waters and comparison with the sedimentary profile recoveredfrom core BL01 and the historical measured lake level (seeSupplementary Information — see Palaeogeography, Palaeoclimatol-ogy, Palaeoecology website), the saturation state of calcite and theprofiles of Mg/Cawater in Blue Lake are intimately related.
Extrapolation of these relationships to the longer term recordpreserved in Blue Lake implies that significant lowering of lake levelwillresult in a deepening of the saturation index of calcite chemocline andthe summer Mg/Cawater chemocline. This means that calcite will have ahigher state of saturation, i.e. higher likelihoodof precipitatingat greaterwater depth, because of warmer water temperatures and higheractivities of Ca2+ and HCO3
- in the water column. Decreasing thedepth of the lake will also result in longer periods of holomixis allowingoverturn of the water column and prolonged periods of elevated calcitesaturation. This subsequently will raise theMg/Cawater, and with longerperiods of overturning, increase the Mg/Cawater available to benthicostracods during their valve formation.
Assuming that the Mg/Cavalve of G. australica is representative of thehorizon sampled and that the mean age attributed to those horizons iscorrect, then conversion of these ages to calendar years allowscomparison of the Mg/Cavalve of those horizons to the mean measuredlake level (metres Australian Height Datum — mAHD) at that time
(Fig. 6). Fig. 7 shows a significant (r=−0.8, pb0.05) negative linearrelationship betweenmean lake level (mAHD) and theMg/Cavalve of thebenthic G. australica.
Consequently, this Mg/Cavalve versus lake water depth relationshipcan be extrapolated to model the pre-1880 water depth of Blue Lake, atleast for theperiodwhenBlue Lakehad attained a steadyhydrochemicalstate (i.e. post-4 ka). The resulting palaeo-lake level curve is shown inFig. 8.
6. Discussion
6.1. Sedimentology and geochronology
Examination of Fig. 3 shows that the early section of the record,prior to about 5.0 ka registered very rapid sedimentation rate and,after 5.0 ka, the sedimentation rate slowed. The sedimentation ratewas slowest between 0.75 and 0.13 ka, but rapidly increased duringthe period of European settlement of the area.
The Brown Clay Facies (see Supplementary information) lacksprimary biogenic carbonate or organic plant fibres, so no 14C datescould be obtained from this section of core BL01. Glasgow (pers.comm.) identified Tertiary pollen in this section, which originatedfrom the Miocene limestone bedrock. Optical Stimulated Lumines-cence dating of the commonly occurring quartz grains is one means ofresolving the dating ambiguities in the lower facies.
Leaney et al. (1995) described threeMackereth cores fromBlue Lakeand identified twobroad sedimentolgical facies, a laminated facies and auniform dark coloured facies, and identified the boundary betweenthese two facies at 200, 288 and 263 cm, respectively. This boundarycorresponds to the boundary at 242.5 cm separating the Brown ClayFacies and Sub-Facies 1A of the Moderately Laminated Facies (Table S1,

Fig. 6. Blue Lake water depth (mAHD - D.W.L.B.C., 2010) (solid line) and the Mg/Cavalve(black squares)with respect to date of sampling. This assumes that themeanage of theagemodel converted to calendar age, and using this as an exact date for comparison with thewater depthmeasured at the pontoon shows a significant negative correlation (see Fig. 7).
Fig. 8. Comparison of the modelled lake water depth (mAHD — dashed line) versusbenthic Mg/Cavalve (solid line) for the last 4 ka.
231C. Gouramanis et al. / Palaeogeography, Palaeoclimatology, Palaeoecology 297 (2010) 223–237
see Supplementary information — see Palaeogeography, Palaeoclima-tology, Palaeoecology website).
TheModerately LaminatedFacies (242.5 to12.3 cmdepth) spans theentire middle to late Holocene record recovered from core BL01. Thelowest calibrated AMS 14C date was obtained from 203 cm (5.5 ka) andthe age model has been extrapolated down to the Brown Clay Faciesboundary. The seven calibratedAMS 14Cdates recovered from theupperfacies provide a well defined chronologic history for this record.
The Densely Laminated Facies begins at 12.3 cm (c. 0.35 ka) in coreBL01 with the latter part being deposited after European settlement ofthe Mount Gambier district in 1839 (http://www.mountgambiertour-ism.com.au/, 2007). No AMS 14C dates were obtained from this section,however, the presence of P. radiata at 10 cmdepth constrains the age atapproximately 125 years before coring (http://www.mountgambier-tourism.com.au/, 2007). The top of the core is assumed to be the presentday sediment-water interface.
The discrepancy between the organic 14C ages and biogeniccarbonate ages in theBlueLake sediment is consistentwith observationsof the regional groundwater (Love et al., 1994), and supports the notionof a variable lacustrine radiocarbon reservoir in Blue Lake. Reservoirages calculated from modelled ages (using linear interpolation andsquared errors between dates) vary between 800 to 2800 14C years.There is no significant difference between the reservoir ages obtainedfrom comparisons of organic dates with pure ostracod calcite or withmixed biogenic carbonate (i.e. ostracods and juvenile gastropods). Nodateswere obtained from inorganic calcite, and relict foraminiferawerealso avoided, of which both sources could provide erroneously old ages.The age of the modern water sample (2385±30 14C yr BP) is also
Fig. 7. Plot of Mg/Cavalve of G. australica versus Lake Level (mAHD), showing thesignificant negative correlation between the two variables.
consistent with the range, so we can be confident that our calculatedrange is a reflection of reservoir ages in Blue Lake during themid to lateHolocene.
Leaney et al. (1995) obtained bulk carbonate14C ages from their
cores. However, due to the fact that their samples contain a mixture ofbiogenic and inorganic carbonates and they do not adequately accountfor the significant (and variable) lacustrine reservoir effect, it is difficultto reconcile their ages with the age model presented here. We alsobelieve that by the use of bulk samples, Leaney et al. (1995) wouldhave been dating the reworked Tertiary foraminifera that abound inthe lake sediments, having been weathered out of the Mount GambierLimestone. The incorporation of radiocarbon-dead Tertiary foraminiferawould result in erroneously old ages for thedate of sediment deposition.As such, we propose that our age model (based only on AMS 14C datesof organic macrofossils and the Pinus horizon) is a more accuratereflection of the age of the laminated portion of the Blue Lake sedimentprofile.
6.2. Ostracod valve chemistry
6.2.1. Mg/Cavalve and lake level modellingComparison of the modelled lake level curve (m AHD) to the
measured Mg/Cavalve and the measured water level fluctuations at BlueLake shows that the calculatedwater depth underestimates the highestmeasured water level by approximately 2.5 m, but corresponds wellwith the lower end of the measured water levels (Fig. 9). This suggeststhat the variation in the water level in the relatively hydrologicallystable post-4 ka period may be as high as 8 to 9 m rather than the 6metres predicted here.
Interestingly, this period shows little variability in Sr/Ca and Na/Caratios. There is no significant relationship between measured lake leveland the other chemical elements or transfer function modelled salinity.
Prior to 4 ka, the lake had not reached the stable hydrological state asit had after 4 ka, evidenced by the highly variable Sr/Cavalve andNa/Cavalve, and as such the modelling of the lake level could not beapplied to this earlier lacustrine phase.
6.2.2. Sr/CavalveThe discrepancy between the Sr/Cavalve of the Limnocythere species
and the other species examined in this core is the result of theLimnocythere species living in very different hydrological environments.The two alternatives, that there was detrital carbonate materialcontaminating the analysed Limnocythere specimens, or that analysisof multiple Limnocythere valves introduced errors into the results aredisregarded as only pristine specimens were used for analysis, and that

Fig. 9. Plot of the Mg/Cavalve (black crosses), the historically measured water depth(mAHD — solid black line) and the modelled water depth (mAHD — grey triangles) forthe historical period of Blue Lake.
232 C. Gouramanis et al. / Palaeogeography, Palaeoclimatology, Palaeoecology 297 (2010) 223–237
other chemical analyses recorded no such variation. For this reason, theL. mowbrayensis and L. dorsosicula analyses are not used in thereconstructions discussed below.
The Sr/Cavalve profile derived from benthic G. australica valves isa reflection of the bottom water Sr/Cawater conditions in Blue Lake.Prior to 4 ka, the water was shallow and eutrophic (see δ13CnormSection 6.2.5), but buffered against pH due to the contribution of Ca2+
and HCO3− -rich groundwater sources from both the Dilwyn and
Gambier aquifers. The elevated HCO3− concentration hindered the
uptake of Sr into the ostracod valve calcite (Gouramanis and DeDeckker, 2010).
After 4 ka, when the lake had filled substantially and had reached ahydrological steady state with relatively constant contribution of Ca2+
and HCO3− from both aquifers, the Sr/Cavalve became relatively
invariant. The hydrochemical modelling of the modern Blue Lakewater (see Supplementary information Fig. S8) records relativelyinvariant Ca2+/HCO3
− throughout thewater column in 1993 and 1994.Subtle variations record a slight decline in Ca2+/HCO3
− in the upperwater column and a slight increase in Ca2+/HCO3
− in the lower watercolumn reflecting the HCO3
− buffered nature of the water column.
6.2.3. Na/CavalveThe salinity (TDSDIL) andNa/Cawater (Na/CaDIL) of theDilwynaquifer,
are larger than the salinity (TDSGAM) and Na/Cawater (Na/CaGAM) of theGambier aquifer (Love et al., 1993). As such, variation in Na/Cavalvereflects variation in the contribution of the unconfined Gambier aquifer(lower Na/Cavalve) and the confined Dilwyn aquifer (higher Na/Cavalve)to Blue Lake water through time. Because of this, Na/Cavalve closelyfollows salinity, however, this does not suggest that Na/Cavalve is asalinity indicator in Blue Lake, but that it is an aquifer tracer through theBlue Lake core sequence.
The very similar values obtained from analyses of G. australica,I. smaragdinus and C. novaezelandiae from the same levels in thecore suggests that these species take up Na in the same way from thewater column. As L. mowbrayensis and L. dorsosicula have verydifferent Na/Cavalve values to those of the other species from the samehorizons, this indicates that these species live in a different habitatand, as such, will be ignored until better understanding of the Na/Caincorporation mechanism is gained.
6.2.4. δ18Onorm
The δ18Onorm record of ostracod valves preserved in Blue Lakereflects a history of evaporative enrichment and fluctuating groundwa-ter recharge. Love et al. (1993; 1994) showed that the moderngroundwater around Blue Lake is significantly depleted in 18O withthe δ18Owater ranging from −3.5 to −4.9‰. However, the general
increase in the δ18Onorm record in the core indicates that 18O enrichmentwas the trend in the δ18Onorm evolution.
The factors influencing 18O fractionation between the δ18Owater
and the δ18OG.australica, δ18OI.smaragdinus and δ18OC.novaezelandiae areunknown, as are the vital effects that each species imposes on theδ18O utilised during valve formation. Although we do not know theeffect of each of these factors on the δ18O incorporation in valves forthese species, the trend towards enrichment is not compromised asboth fractionation differences between ostracod low-Mg calcite andinorganic precipitated low-Mg calcite results in δ18O enrichment inostracod valves (Ito et al., 2003), and that, thus far, all vital offsetsdetermined for the ostracods suggest that each species preferentiallyincorporates 18O (Holmes and Chivas, 2002). Similarly, the thickerand larger valves that G. australica, I. smaragdinus and C. novaeze-landiae calcify, and the calcification temperature, which has beenmeasured to be 13.1 °C (Vanderzalm et al., 2009) in the hypolimnionwhere these species lived, would also act to enrich the valve calcite inδ18O (Ito et al., 2003). With all of these factors additively contributingto ostracod valve δ18O enrichment, this overall trend towards theδ18Onorm enrichment for the most part of the Blue Lake record is a truereflection of the δ18Owater. The combined total of these δ18Oenrichment factors in ostracod valve calcite may be as high as severalper mille (vital effects can be as high as 2.5±0.2‰ as recorded inCandona candida and Pseudocandona rostrata from the U.K. (Keatingset al., 2002), and the vital effects for the species examined from thiscore are unknown). However, until these vital effects are known fromin vitro experimentation or detailed and careful field collection (e.g.von Grafenstein et al., 1999b), accurate δ18Owater reconstructions fromBlue Lake fossil ostracods cannot be produced.
The initial low δ18Onorm in Blue Lake is the result of a shallow, possiblyephemeralwaterbody, and, as the lakefills, there is a broad trend towardsδ18Onorm increase with an initial rapid 18O enrichment during the middleHolocene (5.7 to 5.4 ka). This rate of enrichment gradually slows as thelake isfilled by inflowing 18O-depletedgroundwater until about 200 yearsago. Subtle variations in the δ18Onorm throughout this period reflectperiods of increased groundwater recharge causing either subtledepletion or slowing of the enrichment rate. After 5.4 ka, periods ofδ18O increase suggest periods of reduced groundwater inflow andprecipitation, and increased drought with elevated temperatures causingevaporation to preferentially remove 16O from the lakewater (Gat, 1996).
Since European establishment of the Mount Gambier area, therehas been a significant depletion in the δ18Onorm. This coincides withlake water extraction by pumping for the town's supply. This has leadto an increase in the rate of recharge of groundwater sources (Leaneyet al., 1995; Herczeg et al., 2003).
6.2.5. δ13Cnorm and chemical cyclicityThe record of δ13Cnorm from core BL01 is unlike any of the other
parameters analysed from the ostracod valves andwill be treated hereseparately.
In the period from 5.7 to 5.4 ka, the ostracod valves show a sig-nificant trend towards decreased δ13Cnorm (from −1.84 to −8.16‰).This suggests that in this early phase of Blue Lake establishment, algalphotosynthesis in the shallow lake would have initially maintained arelatively enriched δ13Cnorm. However, with increased contribution ofgroundwater from both aquifers as the lake filled, δ13Cnorm decreasesto−8.3‰ approaching themodern day δ13Cnorm values of both aquifers(−9.3‰) (Love et al., 1993; 1994). Thus, the δ13Cnorm suggests a periodof lake filling from groundwater sources.
Replotting the δ13Cnorm data of Fig. 5 from 5.4 ka to the Present inFig. 10, andapplying afive-pointmoving-average curve to thedata showaseries of cyclesprior to1.8 ka. Theabsoluteδ13Cnormminimaoccur at c. 5.3,4.2, 3.5, 2.5 and 1.8 ka and record a periodic pacing of 895±190 years. Atthe present, it is unknownwhether this periodicity is a real phenomenonor an artefact of this particular dataset. It is also unclear why this cyclicalpattern ends at 1.8 ka.

Fig. 10. Plot of the δ13Cnorm data determined from Blue Lake (core BL01) ostracods(I. smaragdinus and C. novaezelandiae renormalised to G. australica — see text) from5.4 ka to the present, fitted with a five-point moving-average curve. Arrows indicatethe absolute minima in the δ13Cnorm used in determining the periodicity in the record(895±187 years), and ages between arrows indicate period between absolute minima.The difference between successive absolute minima was used to determine thisperiodicity.
Fig. 11. Plot of δ18Onorm versus δ13Cnorm with regressions plotted for periods from 5.7 to5.35 ka (thin dashed line) and from 5.35 ka to present (thick dashed line). Filledtriangles are analyses of G. australica, (X) represent analyses of I. smaragdinus, and (+)for C. novaezelandiae. Circled analysis is an apparent outlier and not included in thepost-5.35 ka regression.
233C. Gouramanis et al. / Palaeogeography, Palaeoclimatology, Palaeoecology 297 (2010) 223–237
Moros et al. (2009) identified a 1567 year periodicity in δ18O frombenthicmarine foraminifera recovered fromHolocenesediments fromtheoffshore Murray Canyons on the southeastern Australian continentalmargin. This cyclicity is interpreted as cold water pulses comparable toAntarctic and Northern Hemisphere records (see references in Moroset al., 2009). These authors identified these cold events as occurring at 5.8,4.3, 2.7 and 1.4 ka for themid- to late Holocene in this region. The 4.3 and2.7 ka events also occur in the δ13Cnorm record of Blue Lake (within 2σdating errors),whichmaybe the result of lower productivity in the lake atthese times caused by the lower ambient temperatures. As such, untilmore high-resolution palaeoclimate records from many regions areexamined, local and global teleconnections of Holocene climate cyclicitywill remain poorly understood.
7. Blue Lake palaeohydrological history
The palaeohydrological history of Blue Lake recorded in core BL01has four distinct chronological periods distinguishable in thesedimentological, faunal and geochemical record.
7.1. Before 5.9 ka
Prior to 5.9 ka, other nearby records of palaeoenvironmentalchange from southeastern Australia (Dodson, 1974a,b; Bowler, 1981;De Deckker, 1982b; De Deckker et al., 1982; Edney et al., 1990;Colhoun et al., 1999; Stanley and De Deckker, 2002) show that theearly to middle Holocene was a period of elevated lake levels insoutheastern Australia due to increased regional precipitation.However, this period in Blue Lake (Brown Clay Facies), characterisedby a uniform brown mud and a lack of fauna and plant fibres suggeststhat the full lacustrine phase had yet to be established.
Two possible hypotheses could account for this apparent discrep-ancy. Firstly, that the undated sediments could have formed prior to themid-Holocene wet period. Glasgow (pers. comm.) identified Tertiarypollen eroded from the Miocene marine limestones of the crater walland concentrated in themud, however, due to the comparatively youngages of the volcanic crater, a much younger age for sediment depositionis envisaged. The sedimentary column fromcore BL01does not preservean unconformity, suggesting the alternative may have occurred.
The onset of deglaciation and early Holocene sea level rise ofapproximately 120 m(Lambeck andChappell, 2001),flooded the 20 kmwide continental shelf south of Blue Lake (Calvo et al., 2007;Moros et al.,2009). This sea level rise caused progradation of the intrusive oceanicwedge that restricted outflow from the Dilwyn and Gambier aquifers as
the coastline receded. This contracted the aquifers landward of thecoastline and causing vertical migration of the water table. The mid-Holocene wet phase across southeastern Australia was recharging theDilwyn andGambier aquifers and contributed to raising thewater table.By 5.9 ka, the water table intersected with the Blue Lake volcanic craterand groundwater began to flow into the lake.
7.2. 5.9 to 4 ka
The initial conditions of Blue Lake suggest a shallow lake that wassignificantly eutrophic, thus preventing the occurrence or preserva-tion of ostracods prior to 5.7 ka. The presence of turbidites throughoutthis period indicates significant gravity flows down the crater slope.The cause of these turbidites may reflect tectonic activity ordestabilisation of the crater walls as the water table rose.
As the water table is raised, the dominant contributor of groundwa-ter initially is the Dilwyn aquifer, but this contribution wanes asincreasingGambier aquiferwater flows into the lake. Fluctuations in thecontribution of the Dilwyn and Gambier aquifers results in variable butdecreasing modelled salinity, Na/Cavalve and δ13Cnorm of the benthicostracods (Fig. 5). The decline in the δ13Cnorm indicates a trend fromeutrophic conditions to oligotrophy and signifies a shift to the δ13Cwater
of the aquifers (Love et al., 1993).Talbot (1990) reported that over long periods of time (N5000 years)
lakes that have a strong positive δ18O and δ13C correlation arehydrologically closed systems. However, over shorter periods of time,this interpretation can be oversimplified due to subtle fluctuations inhydrology (Li and Ku, 1997). Fig. 11 shows a strong negative correlationbetween δ18Onorm and δ13Cnorm in this early period in Blue Lakeindicating an uncoupling of the evolution of the δ18Owater and δ13Cwater.
Today, the two aquifers have δ18Owater of−3.5 to−4.9‰ (Love et al.,1993; 1994).However, the significantenrichment in δ18Owater (reflectedin the δ18Onorm) must indicate a significant evaporative enrichment ofthe inflowing groundwater (Fig. 5). This δ18Owater enrichment initiallyproceeded rapidly, but the rate of enrichment slowed later in the recordindicating that, as the lake deepened, the increased water volumebuffered the temperature effect on the δ18Owater.
This enrichment in δ18Owater can only be attributed to increasedEvaporation/Precipitation (E/P) caused by an extensive arid periodresulting in high evaporation as witnessed in other southeasternAustralian lakes (Dodson, 1974a,b; Bowler, 1981; De Deckker, 1982b;

234 C. Gouramanis et al. / Palaeogeography, Palaeoclimatology, Palaeoecology 297 (2010) 223–237
D'Costa et al., 1989; Edney et al., 1990; Colhoun et al., 1999; Stanleyand De Deckker, 2002; Gouramanis, 2009).
The early to middle Holocene stalagmite record from Lynds Cave inTasmania suggested that the period from 6.6 to 5.1 ka had the lowestprecipitation and temperature (Xia et al., 2001). Lower sea surfacetemperatures (SST) (Calvo et al., 2007) and lower discharge from thenearbyMurrayRiver (Gingele et al., 2004; 2007)were also recorded in amarine core taken from offshore the Murray mouth, approximately200 km west of Blue Lake, both reflecting increased aridity acrosssoutheastern Australia at this time.
Moros et al. (2009 and references therein) argue that a southwardshift of the South Australian Frontal system that brought higher levelsof precipitation through the early to mid-Holocene had retractedfurther south causing this reduction in rainfall.
In their reviewof global rapid climate change events,Mayewski et al.(2004) recognised the period from 4.2 to 3.8 ka from several of the 50records they examined as a period of tropical aridity and cooling.However, these authorsonly includedone record fromNewZealandandnone from Australia. McKenzie and Kershaw (1997) presented a pollenrecord from Chapple Vale, approximately 200 km east of Blue Lake,which showed a vegetation pattern shift from cool temperate rainforestto tall eucalypt forests from 5.2 to 4.1 ka (calibrated using Stuiver andReimer (1993)with the southernhemispheredataset ofMcCormac et al.(2004)), caused by a decrease in precipitation and an increase intemperature. After 4.1 ka, the Chapple Vale record shows an increase inprecipitation, similar to the Blue Lake data presented here.
7.3. 4 to 0.5 ka
By 4 ka, the hydrological balance of Blue Lake had established arelatively stable system, dominated by groundwater recharge withlake levels responding to variations in E/P. This remained unchangedfor nearly 3800 years.
The steady hydrological state is evident from the invariantSr/Cavalve, Na/Cavalve and modelled salinity reconstructions (Fig. 12).
Fig. 12. Selected trace metal and stable isotope analyses of G. au
For much of this period (prior to 0.5 ka) the groundwater recharge wasalmost exclusively from the Gambier aquifer. However, after 0.5 ka, theDilwyn aquifer contributed up to 15% of the groundwater inflow to BlueLake (Ramamurthy et al., 1985). The poor correlation between δ18Onorm
and δ13Cnorm (Fig. 11), reflects a hydrologically open deep lake with lowsurface area (Talbot, 1990).
In this period, the permanently fresh, oligotrophic and deep(N60 m deep) Blue Lake records variations of up to 8 or 9 m in waterdepth (Figs. 8 and 9). These lake level changes occur rapidly andindicate that during this period the climate of southeastern Australiaimposed a highly variable E/P on the regional hydrology.
Many other authors have suggested that this period acrosssoutheastern Australia was climatically highly variable, but, thesestudies lack the temporal sampling resolution to identify the subtleclimate variability (Bowler and Hamada, 1971; Dodson, 1974a,b; DeDeckker, 1982b; D'Costa et al., 1989; Edney et al., 1990; Leaney et al.,1995; Colhoun et al., 1999; Stanley and De Deckker, 2002).
7.4. 0.5 ka to present
From 0.5 ka to present, the δ18Onorm record shows a general trendtowards decreased values, although, after approximately 1880 ADminor fluctuations do occur. This decline in δ18Onorm is due toincreased pumping and shortening of the residence time of the waterin the lake (Ramamurthy et al., 1985; Herczeg et al., 2003). Herczeget al. (2003) calculated the residence time of Blue Lake to have been23±2 years before 1850, which has decreased to 8±2 years today.Maintenance of the lake at relatively high levels when 10 to 15% of thevolume is extracted for human use (Turner et al., 1984) is compen-sated for by elevated recharge from the two aquifers, including ahigher proportion from the underlying Dilwyn aquifer. This is shownby an increase in the Na/Cavalve during this period. Relatively minorvariations (b9 m between 1880 and 1993) are due to variations in E/P,but the overall hydrological balance is controlled by groundwaterrecharge.
stralica valves from 4 ka to the present from the core BL01.

235C. Gouramanis et al. / Palaeogeography, Palaeoclimatology, Palaeoecology 297 (2010) 223–237
Herczeg et al. (2003) recorded a 3‰ decline in δ18Ccarb and δ13Corg,which they interpret to reflect a decrease in residence time ofdissolved inorganic carbon in the lake. No apparent decline in δ13Cnormis observed from the benthic G. australica suggesting that the shift inδ13C recorded by Herczeg et al. (2003) is restricted to epilimneticorganic matter. Leaney et al. (1995) also showed a depletion in δ13Cand δ18O caused by pumping of the lake. A future examination of thevalve chemistry of the nektic ostracod N. fenestrata, may explain thisdiscrepancy between G. australica δ13Cnorm and the stable isotope dataof Leaney et al. (1995) and Herczeg et al. (2003).
The subtle variations in hydrology recorded in this section of BlueLake and the subsequent reactions to increased pumping show thatthe hydrological balance in Blue Lake is closely linked to climate andanthropogenic use of the lake and surrounding catchment.
8. Conclusion
The ostracod valve chemistry record recovered from core BL01from Blue Lake preserves a high-resolution sequence of environmen-tal and hydrological change throughout the middle to late Holocenethat can be related to climatic variation affecting the southeasternAustralian region. The palaeoenvironmental and palaeoclimatichistory of Blue Lake reflects a higher degree of variability in theclimate system affecting southeastern Australia than had previouslybeen documented from the area.
Prior to 5.9 ka, there was little water in the Blue Lake crater. Thisperiod coincides with the mid-Holocene wet phase recorded fromcores examined from nearby lakes, indicating that the precipitationthat fell on the Blue Lake catchment rapidly percolated through thecrater floor and directly contributed to the underlying water table.Blue Lake, at this time, was little more than a very shallow, eutrophiclake, like the adjacent Brownes Lake today.
After 5.9 ka, the regional water table had risen sufficiently tointersect the crater and it began to fill with carbonate-saturatedwater. Ostracods became preserved in the sediment column by 5.7 ka.AMS 14C dating of organic plant fibres and biogenic carbonate shows“old” water flowing into the lake. From 5.7 to 4 ka, the lake levelrapidly rose, mirroring the rise in the water table, and a replacementof the waning Dilwyn aquifer's contribution to an increased Gambieraquifer contribution. This deepening of the lake resulted in a shiftfrom eutrophic to oligotrophic conditions. However, as the lake levelrose, the recharging groundwater was subjected to an arid climate(high E/P) resulting in the evaporative enrichment of the δ18O asshown by the ostracod valves composition.
By 4 ka, the lake had attained a sufficient depth so that thehydrological processes influencing the lake had reached a steadystate.
In addition, soon after 4 ka the hydrological processes operating atBlue Lake would have been very similar to the processes influencingthe lake since monitoring of Blue Lake began (from approximately1880). These processes include thermal stratification and lake levellowering due to evaporation from the lake surface during the warmermonths, and holomixis and lake level rise during the cooler months ofJuly to September.
The Mg/Cavalve of Gomphodella australica preserved a record ofcalcite saturation of the upper water column that is comparable tolake level variation; this resulted in rapid water level fluctuations ofup to 9 m during this period. Based on the modern knowledge of thehydrology of Blue Lake, this variation in water level is a reflection ofvariations of E/P, with low lake levels occurring in response to aridconditions and high lake levels responding to wetter conditions. Thegroundwater recharge rate, as reflected in the δ18Ovalve varied, but didnot influence the water level of the lake.
The most recent period, since European settlement of the area(approximately 1840), has resulted in increased volumes of water
being removed for human consumption and has significantlyincreased the recharge rate.
This study also documents the first use of Na/Cavalve determinedfrom ostracods in a lacustrine setting and shows that, at least for BlueLake, it can be used as a proxy for groundwater contribution as twodistinct aquifers have different salinities. For the last 4 ka, the δ18Ovalve
is a proxy for groundwater recharge and the Mg/Cavalve records ahistory of the lake level fluctuations in Blue Lake. This paper presentsthe first quantified high-resolution lake level curve from southeasternAustralia.
Supplementarymaterials related to this article can be found onlineat doi:10.1016/j.palaeo.2010.08.005.
Acknowledgments
This work was funded as part of an ARC Discovery grant(DP0344932) awarded to De Deckker and others, and some of thedates were performed at ANSTO as part of an AINSE grant (AIN-GRA07037) awarded to PDD. We are grateful to Andy McPharlin foraccess to Blue Lake and supplying a boat necessary for coring and ColinMagilton of Deakin University facilitated access with a second boat. Wewould also like to thank Jim Neale for coring the lake, Sharron Glasgowfor preliminary pollenwork and Judith Shelley and Dr Jessica Reeves forpicking samples for geochronology. C.G. thanks Dr Stuart Halse, JimCocking, JaneMcRae and Adrian Pinder (CALM) for data and discussionsof the transfer function, Jeff Lawson (DWLBC) for modern hydrologicaldata and unpublished reports, Linda McMorrow (DEMS) for use of theICP-AES, Joe Cali (RSES) for use of the Finnigan MAT 251, and Prof.Jonathon Holmes, Dr Paco Mezquita and Prof. Antje Schwalb forcomments on an earlier draft. DW thanks Keith Fifield and Steve Timsfor running the graphite targets on the 14UV accelerator and StewartFallon (RSES) for 14C dating the modern water sample. The manuscriptwas greatly improved by the helpful and constructive comments of theeditor, Prof. Thierry Corrège and two anonymous reviewers.
References
Anadon, P., Moscariello, A., Rodrıguez-Lazaro, J., Filippi, M.L., 2006. Holoceneenvironmental changes of Lake Geneva (Lac Leman) from stable isotopes (δ13C,δ18O) and trace element records of ostracod and gastropod carbonates. Journal ofPaleolimnology 35, 593–616.
Ayliffe, L.K., 1983. An isotopic and sedimentological study of the sediments from BlueLake and Valley Lake, Mount Gambier, South Australia. Unpublished HonoursThesis, Flinders University, p. 104.
B.L.M.C., 2001. Our Blue Lake: managing for 2005 and beyond. In: Board, S.E.C.W.M.(Ed.). Blue Lake Management Committee, p. 16.
B.L.M.C., 2006. Blue Lake management plan. In: Board, S.E.N.R.M. (Ed.), Mount Gambier,p. 90.
Barton, C.E., McElhinny, M.W., 1980. Ages and ashes in lake floor sediment cores fromValley Lake, Mount Gambier, South Australia. Transactions of the Royal Society ofSouth Australia 104, 161–165.
Blackburn, G., 1966. Radiocarbon dates relating to soil development, coast-line changes,and volcanic ash deposition in south-east South Australia. Australian Journal ofScience 29, 50–52.
Blackburn, G., Allison, G.B., Leaney, F.W.J., 1982. Further evidence on the age of tuff atMt Gambier, South Australia. Transactions of the Royal Society of South Australia106, 163–167.
Blackburn, G., McLeod, S., 1983. Salinity of atmospheric precipitation in the Murray-Darling Drainage Division, Australia. Australian Journal of Soil Research 21,411–434.
Bowler, J.M., 1981. Australian salt lakes. Hydrobiologia 82, 431–444.Bowler, J.M., Hamada, T., 1971. Late Quaternary stratigraphy and radiocarbon
chronology of water level fluctuations in Lake Keilambete, Victoria. Nature 232,330–332.
Cali, J.A., 2000. Explanatory notes for data from the Finnigan MAT 251 and Kiel device.http://rses.anu.edu.au/enproc/EP/oz_ms/kiel_expl_notes.html.
Calvo, E., Pelejero, C., De Deckker, P., Logan, G.A., 2007. Antarctic deglacial pattern in a30 kyr record of sea surface temperature offshore South Australia. GeophysicalResearch Letters 34, L13707.
Chivas, A.R., De Deckker, P., Cali, J.A., Chapman, A., Kiss, E., Shelley, J.M.G., 1993. Coupledstable-isotope and trace element measurements of lacustrine carbonates aspaleoclimatic indicators. In: Swart, P.K. (Ed.), Climate Change in ContinentalIsotopic Records. American Geophysical Union, pp. 113–121.
Chivas, A.R., De Deckker, P., Shelley, J.M.G., 1983. Magnesium, strontium and bariumpartitioning in nonmarine ostracode shells and their use in paleoenvironmental

236 C. Gouramanis et al. / Palaeogeography, Palaeoclimatology, Palaeoecology 297 (2010) 223–237
reconstructions — a preliminary study. In: Maddocks, R.F. (Ed.), Applications ofOstracoda. University Houston Geosciences, Houston, pp. 238–249.
Chivas, A.R., De Deckker, P., Shelley, J.M.G., 1985. Strontium content of ostracodsindicates lacustrine palaeosalinity. Nature 316, 250–253.
Chivas, A.R., De Deckker, P., Shelley, J.M.G., 1986. Magnesium content of non-marineostracod shells: a new palaeosalinometer and palaeothermometer. Palaeogeogra-phy, Palaeoclimatology, Palaeoecology 54, 43–61.
Colhoun, E.A., Pola, J.S., Barton, C.E., Heijnis, H., 1999. Late Pleistocene vegetation andclimate history of Lake Selina, western Tasmania. Quaternary International 57 (58),5–23.
Currey, D.T., 1970. Lake systems, western Victoria. Bulletin of the AustralianLimnological Society 3, 1–13.
Curry, B.B., Anderson, T.F., Lohmann, K.C., 1997. Unusual carbon and oxygen isotopicratios of ostracodal calcite from last interglacial (Sangamon episode) lacustrinesediment in Raymond Basin, Illinois, USA. Journal of Paleolimnology 17, 421–435.
D'Costa, D.M., Edney, P., Kershaw, A.P., De Deckker, P., 1989. Late Quaternarypalaeoecology of Tower Hill, Victoria, Australia. Journal of Biogeography 16,461–482.
De Deckker, P., 1981. Ostracoda from Australian inland waters — notes on taxonomyand ecology. Proceedings of the Royal Society of Victoria 93, 43–85.
De Deckker, P., 1982a. Australian aquatic habitats and biota: their suitability forpalaeolimnological investigations. Transactions of the Royal Society of SouthAustralia 106, 145–153.
De Deckker, P., 1982b. Holocene ostracods, other invertebrates and fish remains fromcores of four maar lakes in southeastern Australia. Proceedings of the Royal Societyof Victoria 94, 183–220.
De Deckker, P., 1983. Notes on the ecology and distribution of non-marine ostracods inAustralia. Hydrobiologia 106, 223–234.
De Deckker, P., Bauld, J., Burne, R.V., 1982. Pillie Lake, Eyre Peninsula, South Australia:modern environment and biota, dolomite sedimentation and Holocene history.Transactions of the Royal Society of South Australia 106, 169–181.
De Deckker, P., Chivas, A.R., Shelley, J.M.G., 1999. Uptake of Mg and Sr in the euryhalineostracod Cyprideis determined from in vitro experiments. Palaeogeography,Palaeoclimatology, Palaeoecology 148, 105–116.
De Deckker, P., Forester, R.M., 1988. The use of ostracods to reconstruct continentalpalaeoenvironmental records. In: De Deckker, P., Colin, J., Peypouquette, J. (Eds.),Ostraocda in the Earth Sciences. Elsevier, Amsterdam, pp. 175–199.
Dodson, J.R., 1974a. Vegetation and climate history near Lake Keilambete, westernVictoria. Australian Journal of Botany 22, 709–717.
Dodson, J.R., 1974b. Vegetation history and water fluctuations at Lake Leake, south-eastern South Australia. I. 10,000 B.P. to present. Australian Journal of Botany 22,719–741.
D.W.L.B.C., 2010. http://e-nrims.dwlbc.sa.gov.au/SiteInfo/ 2010.Edney, P., Kershaw, A.P., De Deckker, P., 1990. A Late Pleistocene and Holocene vegetation
and environmental record from LakeWangoom,Western Plains of Victoria, Australia.Palaeogeography, Palaeoclimatology, Palaeoecology 80, 325–343.
Engstrom, D.R., Nelson, S.R., 1991. Paleosalinity from trace metals in fossil ostracodescompared with observational records at Devils Lake, North Dakota, USA.Palaeogeography, Palaeoclimatology, Palaeoecology 83, 295–312.
Fallon, S., 2008. Personal Communication 11/04/2008 to D. Wilkins.Fifield, L.K., Allan, G.L., Stone, J.O.H., Ophel, T.R., 1994. The ANU AMS system and
research program. Nuclear Instruments andMethods in Physics Research Section B:Beam Interactions with Materials and Atoms 92, 85–88.
Fink, D., Hotchkis, M., Hua, Q., Jacobsen, G., Smith, A.M., Zoppi, U., Child, D., Mifsud, C.,van der Gaast, H., Williams, A., Williams, M., 2004. The ANTARES AMS facility atANSTO. Nuclear Instruments andMethods in Physics Research B: Beam Interactionswith Materials and Atoms 223–224, 109–115.
Gat, J.R., 1996. Oxygen and hydrogen isotopes in the hydrologic cycle. Annual Review ofEarth and Planetary Science 24, 225–262.
Gill, E.D., 1955. Radiocarbon dates for Australian archaeological and geological samples.Australian Journal of Science 18, 49–52.
Gingele, F., De Deckker, P., Hillenbrand, C.D., 2004. Late Quaternary terrigenoussediments from the Murray Canyons area, offshore South Australia and theirimplications for sea level change, palaeoclimate and palaeodrainage of the Murray-Darling Basin. Marine Geology 212, 183–197.
Gingele, F., De Deckker, P., Norman, M., 2007. Late Pleistocene and Holocene climate ofSE Australia reconstructed from dust and river loads deposited offshore the RiverMurray Mouth. Earth and Planetary Science Letters 255, 257–272.
Gouramanis, C., 2009. High-resolution Holocene palaeoenvironmental and palaeocli-matic changes recorded in southern Australian lakes based on ostracods and theirchemical composition. Unpublished PhD Thesis, Research School of Earth Sciences.The Australian National University, Canberra, p. 308.
Gouramanis, C., De Deckker, P., 2010. Alkalinity control on partition coefficients inlacustrine ostracodes from Australia. Geology 38, 359–362.
Herczeg, A.L., Leaney, F.W., Dighton, J.C., Lamontagne, S., Schiff, S.L., Telfer, A.L., English,M.C., 2003. A modern isotope record of changes in water and carbon budgets in agroundwater-fed lake: Blue Lake South Australia. Limnology and Oceanography 48,2093–2105.
Holmes, J.A., 1996. Trace-element and stable-isotope geochemistry of non-marineostracod shells in Quaternary palaeoenvironmental reconstruction. Journal ofPaleolimnology 15, 223–235.
Holmes, J.A., 2008. Sample-size implications of the trace-element variability of ostracodshells. Geochimica et Cosmochimica Acta 72, 2934–2945.
Holmes, J.A., Chivas, A.R., 2002. Ostracod shell chemistry — overview. In: Holmes, J.A.,Chivas, A.R. (Eds.), The Ostracoda: Applications in Quaternary Research: AmericanGeophysical Union, Washington D.C. , pp. 185–204.
Holmes, J.A., Street-Perrott, F.A., Allen, M.J., Fothergill, P.A., Harkness, D.D., Kroon, D.,Perrott, R.A., 1997. Holocene palaeolimnology of Kajemarum Oasis, NorthernNigeria: an isotopic study of ostracodes, bulk carbonate and organic carbon. Journalof the Geological Society, London 154, 311–319.
Holmes, J.W.,Waterhouse, J.D., 1983. 6: Hydrology. In: Tyler, M.J., Twidale, C.R., Ling, J.K.,Holmes, J.W. (Eds.), Natural history of the South East. Royal Society of SouthAustralia Inc., pp. 49–59.
http://www.bom.gov.au/climate/averages/tables, 2008. Mount Gambier.http://www.mountgambiertourism.com.au/, 2007. Mount Gambier Tourism.Ito, E., 2002. Mg/Ca, Sr/Ca, δ18O and δ13C chemistry of Quaternary lacustrine ostracode
shells from the North American continental interior. In: Holmes, J.A., Chivas, A.R.(Eds.), The Ostracoda: Applications in Quaternary Research. Washington D.C.,American Geophysical Union.
Ito, E., De Deckker, P., Eggins, S.M., 2003. Ostracodes and their shell chemistry:implications for paleohydrologic and paleoclimatologic applications. The Palaeon-tological Society Papers 9, 119–152.
Ito, E., Forester, R.M., 2009. Changes in continental ostracode shell chemistry;uncertainty of cause. Hydrobiologia 620, 1–15.
Jones, R.N., Bowler, J.M., McMahon, T.A., 1998. A high resolution Holocene record of P/Eratio from closed lakes, western Victoria. Palaeoclimates 3, 51–82.
Jones, R.N., McMahon, T.A., Bowler, J.M., 2001. Modelling historical lake levels andrecent climate at three closed lakes, Western Victoria, Australia (c. 1840–1990).Journal of Hydrology 246, 159–180.
Juggins, S., 2003. C2 User guide. Software for ecological and palaeoecological dataanalysis and visualisation. University of Newcastle, Newcastle upon Tyne, 69 pp.
Keatings, K.W., Heaton, T.H.E., Holmes, J.A., 2002. Carbon and oxygen isotopefractionation in non-marine ostracods: results from ‘natural culture’ environment.Geochimica et Cosmochimica Acta 66, 1701–1711.
Kigoshi, K., Kobayashi, H., 1966. Gakushuin natural radiocarbon measurements V.Radiocarbon 8, 54–73.
Lambeck, K., Chappell, J.C., 2001. Sea level changes through the last glacial cycle. Science292, 679–686.
Leaney, F.W.J., Allison, G.B., Dighton, J.C., Trumbore, S., 1995. The age and hydrologicalhistory of Blue Lake, South Australia. Palaeogeography, Palaeoclimatology,Palaeoecology 118, 111–130.
Li, H.-C., Ku, T.-L., 1997. δ13C- δ18O covariance as a paleohydrological indicatorfor closed-basin lakes. Palaeogeography, Palaeoclimatology, Palaeoecology 133,69–80.
Li, Q., McGowran, B., White, M.R., 2000. Sequences and biofacies packages in the mid-Cenozoic Gambier Limestone, South Australia: reappraisal of foraminiferalevidence. Australian Journal of Earth Sciences 47, 955–970.
Love, A.J., Herczeg, A.L., Armstrong, D., Stadter, F., Mazor, E., 1993. Groundwater flowregime within the Gambier Embayment of the Otway Basin, Australia: evidencefrom hydraulics and hydrochemistry. Journal of Hydrology 143, 297–338.
Love, A.J., Herczeg, A.L., Leaney, F.W., Stadter, F., Dighton, J.C., Armstrong, D., 1994.Groundwater residence time and palaeohydrology in the Otway Basin, SouthAustralia: 2H, 18O and 14C data. Journal of Hydrology 153, 157–187.
Mayewski, P., Rohling, E.E., Stager, J.C., Karlén, W., Maasch, K.A., Meeker, L.D., Meyerson,E.A., Gasse, F., van Kreveld, S., Holmgren, K., Lee-Thorp, J., Rosqvist, G., Rack, F.,Staubwasser, M., Schneider, R.R., Steig, E.J., 2004. Holocene climate variability.Quaternary Research 62, 243–255.
McCormac, F.G., Hogg, A.G., Blackwell, P.G., Buck, C.E., Higham, T.F.G., Reimer, P.J., 2004.SHCal04 Southern Hemisphere Calibration 0–11.0 cal kyr BP. Radiocarbon 46,1087–1092.
McKenzie, G.M., Kershaw, A.P., 1997. A vegetation history and quantitative estimate ofHolocene climate from Chapple Vale, in the Otway Region of Victoria, Australia.Australian Journal of Botany 45, 565–581.
Mischke, S., Wunnemann, B., 2006. The Holocene salinity history of Bosten Lake(Xinjiang, China) inferred from ostracod species assemblages and shell chemistry:possible palaeoclimatic implications. Quaternary International 154–155, 100–112.
Moros, M., De Deckker, P., Jansen, E., Perner, K., Telford, R.J., 2009. Holocene climatevariability in the Southern Ocean recorded in a deep-sea sediment core off SouthAustralia. Quaternary Science Reviews 28, 1932–1940.
Ramamurthy, L.M., Veeh, H.H., Holmes, J.W., 1985. Geochemical mass balance of avolcanic crater lake in Australia. Journal of Hydrology 79, 127–139.
Ricketts, R.D., Johnson, T.C., Brown, E.T., Rasmussen, K.A., Romanovsky, V.V., 2001. TheHolocene paleolimnology of Lake Issyk-Kul, Kyrgyzstan: trace element and stableisotope composition of ostracodes. Palaeogeography, Palaeoclimatology, Palaeoe-cology 176, 207–227.
Schwalb, A., 2003. Lacustrine ostracodes as stable isotope recorders of late-glacial andHolocene environmental dynamics and climate. Journal of Paleolimnology 29,267–351.
Sheard, M.J., 1978. Geological history of the Mount Gambier volcanic complex,southeast South Australia. Transactions of the Royal Society of South Australia102, 125–139.
Stanley, S., De Deckker, P., 2002. A Holocene record of allochthonous, aeolian mineralgrains in an Australian alpine lake; implications for the history of climate change insoutheastern Australia. Journal of Paleolimnology 27, 207–219.
Stuiver, M., Polach, H.A., 1977. Discussion and reporting of 14C data. Radiocarbon 19,355–363.
Stuiver, M., Reimer, P.J., 1993. Extended 14C database and revised CALIB 3.0 14C agecalibration program. Radiocarbon 35, 215–230.
Talbot, M.R., 1990. A review of the palaeohydrological interpretation of carbon andoxygen ratios in primary lacustrine carbonates. Chemical Geology 80, 26l–279l.
Tamuly, A., 1970. Physical and chemical limnology of the Blue Lake of Mount Gambier,South Australia. Transactions of the Royal Society of South Australia 94, 71–86.

237C. Gouramanis et al. / Palaeogeography, Palaeoclimatology, Palaeoecology 297 (2010) 223–237
Telfer, A.L., 2000. Identification of processes regulating the colour and colour change inan oligotrophic, hardwater, groundwater-fed lake, Blue Lake, Mount Gambier,South Australia. Lakes and Reservoirs: Research and Management 5, 161–176.
Turner, J.V., Allison, G.B., Holmes, J.W., 1984. The water balance of a small lake usingstable isotopes and tritium. Journal of Hydrology 70, 199–220.
Turpen, J.B., Angell, R.W., 1971. Aspects of moulting and calcification in the ostracodHeterocypris. Biological Bulletin 140, 331–338.
Vanderzalm, J., Dillon, P.P., D., Marvanek, S., Lamontagne, S., Cook, P., King, H., Dighton, J.C.,Sherman, B., Adams, L., 2009. Protecting Blue Lake from land use impacts. In: CSIRO(Ed.). Water for a Healthy Country National Research Flagship, 94 pp.
von Grafenstein, U., Erlenkeuser, H., Brauer, A., Jouzel, J., Johnsen, S., 1999a. A mid-European decadal isotope-climate record from 15,500 to 5000 years BP. Science 284,1654–1657.
von Grafenstein, U., Erlenkeuser, H., Trimborn, P., 1999b. Oxygen and carbon isotopes inmodern fresh-water ostracod valves: assessing vital offsets and autecological
effects of interest for paleoclimate studies. Palaeogeography, Palaeoclimatology,Palaeoecology 148, 133–152.
Waterhouse, J.D., 1977. The hydrogeology of the Mount Gambier area. GeologicalSurvey of South Australia, Report of Investigations No 48, 61 pp.
Wilkins, D., 2009. Comparative Optical Stimulated Luminescence and Radiocarbondating of Holocene lacustrine and marine deposits in south-east and south-westAustralia., Unpublished PhD Thesis, Research School of Earth Sciences. TheAustralian National University, Canberra, p. 460.
Wilkins, D., Gouramanis, C., De Deckker, P., Fifield, K.L., Olley, J., in preparation. NewHolocene lake level curves from Lake Keilambete and Lake Gnotuk, south-westernVictoria, Australia: comparative OSL and radiocarbon dating of two sedimentarysequences.
Xia, Q., Zhao, J., Collerson, K.D., 2001. Early-Mid Holocene climatic variations inTasmania, Australia: multi-proxy records in a stalagmite from Lynds Cave. Earthand Planetary Science Letters 194, 177–187.
Copyright © 2022 FDOKUMEN