59_Statistical Methods.pdf - Sultan Chand & Sons
26
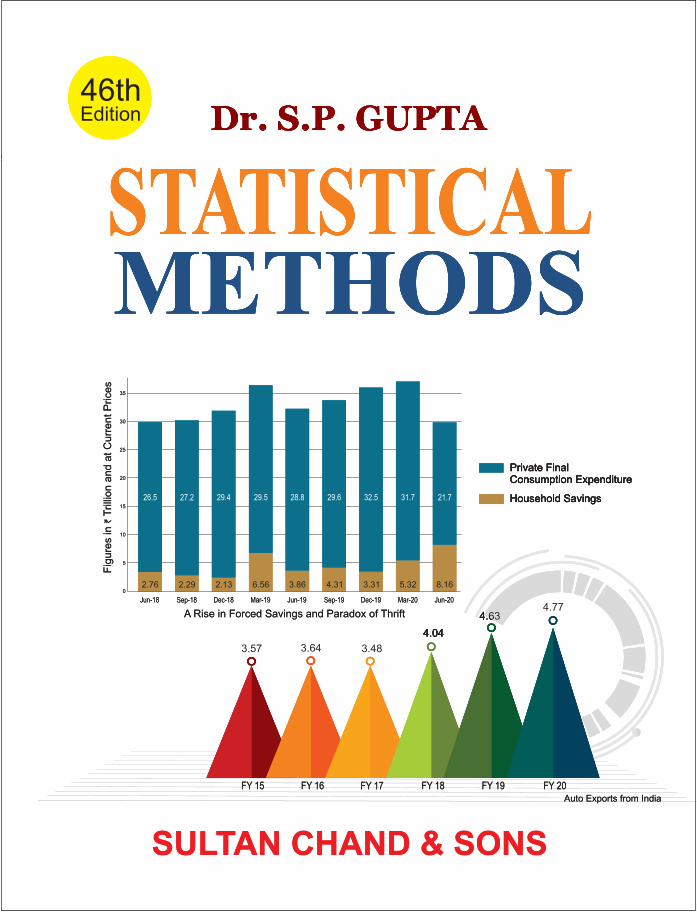
46th Edition 46th Edition Dr. S.P. GUPTA Dr. S.P. GUPTA STATISTICAL METHODS STATISTICAL METHODS SULTAN CHAND & SONS 3.57 3.48 4.04 4.63 FY 15 FY 16 FY 17 FY 18 FY 19 FY 20 3.64 4.04 4.63 Auto Exports from India Household Savings Private Final Consumption Expenditure Household Savings Private Final Consumption Expenditure A Rise in Forced Savings and Paradox of Thrift Jun-18 Sep-18 Dec-18 Mar-19 Jun-19 Sep-19 Dec-19 Mar-20 Jun-20 0 5 10 15 20 25 30 35 Figures in Trillion and at Current Prices ` 46th Edition 46th Edition Dr. S.P. GUPTA Dr. S.P. GUPTA STATISTICAL METHODS STATISTICAL METHODS SULTAN CHAND & SONS 4.04 4.63 FY 15 FY 16 FY 17 FY 18 FY 19 FY 20 4.04 4.63 Auto Exports from India 4.77 Household Savings Private Final Consumption Expenditure Household Savings Private Final Consumption Expenditure A Rise in Forced Savings and Paradox of Thrift Jun-18 Sep-18 Dec-18 Mar-19 Jun-19 Sep-19 Dec-19 Mar-20 Jun-20 0 5 10 15 20 25 30 35 Figures in Trillion and at Current Prices ` 2.76 2.29 2.13 6.56 3.86 4.31 3.31 5.32 8.16 26.5 27.2 29.5 28.8 29.6 32.5 31.7 21.7 29.4
-
Upload
khangminh22 -
Category
Documents
-
view
1 -
download
0
Transcript of 59_Statistical Methods.pdf - Sultan Chand & Sons
46thEdition46thEdition Dr. S.P. GUPTA Dr. S.P. GUPTA
STATISTICAL METHODSSTATISTICAL METHODS
SULTAN CHAND & SONS
3.57 3.48
4.04
4.63
FY 15 FY 16 FY 17 FY 18 FY 19 FY 20
3.64
4.04
4.63
Auto Exports from India
Household Savings
Private FinalConsumption Expenditure
Household Savings
Private FinalConsumption Expenditure
A Rise in Forced Savings and Paradox of Thrift
Jun-18 Sep-18 Dec-18 Mar-19 Jun-19 Sep-19 Dec-19 Mar-20 Jun-200
5
10
15
20
25
30
35
Fig
ure
s in
T
rilli
on a
nd a
t C
urr
ent P
rice
s`
2.76 2.29 2.13 6.56 3.86 4.31 3.31 5.32 8.16
26.5 27.2 29.5 28.8 29.6 32.5 31.7 21.729.4
46thEdition46thEdition Dr. S.P. GUPTA Dr. S.P. GUPTA
STATISTICAL METHODSSTATISTICAL METHODS
SULTAN CHAND & SONS
4.04
4.63
FY 15 FY 16 FY 17 FY 18 FY 19 FY 20
4.04
4.63
Auto Exports from India
4.77
Household Savings
Private FinalConsumption Expenditure
Household Savings
Private FinalConsumption Expenditure
A Rise in Forced Savings and Paradox of Thrift
Jun-18 Sep-18 Dec-18 Mar-19 Jun-19 Sep-19 Dec-19 Mar-20 Jun-200
5
10
15
20
25
30
35
Fig
ure
s in
T
rilli
on a
nd a
t C
urr
ent P
rice
s`
2.76 2.29 2.13 6.56 3.86 4.31 3.31 5.32 8.16
26.5 27.2 29.5 28.8 29.6 32.5 31.7 21.729.4
Contents i
STATISTICAL METHODS

ii Contents
O’ God make me a better person in the society.
Give me courage to face the world Make me
simple and truthful fill in me happiness and
contentment Make me tough and tolerant.
Let me serve the society with honesty and
dignity. Keeping in mind the highest
standards of quality and service of values
and ethics of moral and humanity of beauty
and duty. Let me face the challengers of today
and tomorrow. With utmost efficiency and
effectiveness without harming and spoiling the
environment.
Dr. S.P. Gupta
Contents iii
STATISTICAL METHODSContains, besides theory, more than 1500 fully solved illustrations
and about 2000 problems with answers.
[For B. Com., B. Com. (Hons.), B.A. Hons. (Econ.), M.A. (Econ.), M.Com., BBA, MBA, C.A., I.C.W.A., I.A.S. and other equivalent examinations]
Dr. S. P. GuptaFormerly Head & Dean
Faculty of Management Studies University of Delhi, Delhi
SULTAN CHAND & SONSEducational Publishers
New Delhi
iv Contents
SULTAN CHAND & SONS23, Daryaganj, New Delhi-110002Tel.: 23266105, 23277843, 23247051, 23243183, 23281876E-mail: [email protected]; [email protected]: www.sultanchandandsons.com
First Edition: 1969Forty Fifth Revised Edition, 2017Forty Sixth Revised Edition, 2021
ISBN: 978-93-5161-176-9 & (TC506)
Price: ` 695.00
EVERY GENUINE COPY OF THIS BOOK HAS A HOLOGRAMIn our endeavour to protect you against counterfeit/fake books, we have pasted a copper hologram over the cover of this book. The hologram displays the full visual image, unique 3D multi-level, multi-colour effects of our logo from different angles when tilted or properly illuminated under a single light source, such as 3D depth effect, kinetic effect, pearl effect, gradient effect, trailing effect, emboss effect, glitter effect, randomly sparking tiny dots, micro text, laser numbering, etc.A fake hologram does not display all these effects.Always ask the bookseller to put his stamp on the first page of this book.
All Rights Reserved: No part of this book, including its style and presentation, can be reproduced, stored in a retrieval system, or transmitted in any form or by any means—electronic, mechanical, photocopying, recording or otherwise without the prior written consent of the publishers. Exclusive publication, promotion and distribution rights reserved with the Publishers.Warning: An unauthorised act done in relation to a copyright work may result in both civil claim for damages and criminal prosecution.Special Note: Photocopy or Xeroxing of educational books without the written permission of publishers is illegal and against Copyright Act. Buying and Selling of pirated books is a criminal offence. Publication of a key to this book is strictly prohibited.General: While every effort has been made to present authentic information and avoid errors, the author and the publishers are not responsible for the consequences of any action taken on the basis of this book.Limits of Liability/Disclaimer of Warranty: The publisher and the author make no representation or warranties with respect to the accuracy or completeness of the contents of this work and specifically disclaim all warranties, including without limitation warranties of fitness for a particular purpose. No warranty may be created or extended by sales or promotional materials. The advice and strategies contained therein may not be suitable for every situation. This work is sold with the understanding that the publisher is not engaged in rendering legal, accounting, or other professional services. If professional assistance is required, the services of a competent professional person should be sought. Neither the publishers nor the author shall be liable for damages arising herefrom.Disclaimer: The publishers have taken all care to ensure highest standard of quality as regards typesetting, proofreading, accuracy of textual material, printing and binding. However, they accept no responsibility for any loss occasioned as a result of any misprint or mistake found in this publication.Author’s Acknowledgement : The writing of a Textbook always involves creation of a hug debt towards innumerable author’s and publications. We owe our gratitude to all of them. We acknowledge our indebtedness in extensive footnotes throughout the book. If, for any reason, any acknowledgement has been left out we beg to be excused. We assure to carry out correction in the subsequent edition, as and when it is known.
Printed at: Sanjay Printers, Shahibabad, U.P.
Contents v
PrefaceTo the Forty Sixth EditionThis is a thoroughly revised and enlarged edition of the book. Approprate changes practically in all the chapters have been made wherever found necessary.
I take this opportunity to thank all the readers in India & Abroad who have spared their valuable time in making suggestions for improving the quality of the book.
I an specially thankful to Prof. Abad Ahmad, Prof. B.S. Sharma, Dr. Sarika & Rajeev Gulhar and Sameer who have been a source of great inspiration.
My very special thanks to M/S Sultan Chand & Sons 23, Darya Ganj New Delh – 2 for their efforts and co-operation in publishing the book in an elegant from.
I firmly believe that the road to improvement is never ending. I shall look forward and gratefully acknowledge all suggestions received.
Last but not the least, I am indebted to the Almighty, the supreme Architect of the Universe, for infusing in me life and blood for the work I have been doing.
Dr. S.P. Gupta
To the First EditionStatistical Methods are plying an ever-increasing role in framing suitable policies in a large number of diversified fields covering natural, physical and social sciences. Statistics today has become indispensable in all phases of human endeavour.
This book is primarily meant for undergraduate students of Commerce and Economics. I have gone through the syllabi and examination papers of almost all universities where the subject is taught so as to make it as comprehensive as possible. A large number of properly graded questions and problems, mainly from examination question papers of various universities, are given at the end of each chapter. Answers to the problems, along with the hints, where necessary, have also been provided.
The lucidity of style and simplicity of expression have been my twin objects to remove the awe which is usually associated with most mathematical and statistical textbooks. The only mathematical background needed for understanding the entire book is a little arithmetic and elementary algebra. In order that the students may not feel any difficulty in following the text, steps in calculation along with every formula have also been given.
I am deeply indebted to my distinguished teacher, Dr. C.B. Gupta, Head of the Deptt. of Commerce, Shri Ram Collage of Commerce, who has always been a source of help, guidance and inspiration to me. I also owe a great deal to my teachers: Dr. R.L. Gulati of the Faculty of Mathematics, University of Delhi; Mr. K.R. Rao (Statistics), Delhi Cloth Mills; Sri J.K. Gautam, Head of Deptt. of Commerce, Rajdhani College, and Ss Vidya Rattan and R.L Lele of S.R. College who have taught me thet subject. I acknowledge with thanks the valuable suggestions of my friends, Mr. R.N. Goel of S.R. College and Mr. Y.P. Sabharwal, Dr. N.K. Kakkar and Dr. D.B. Gupta of Ramjas Collage and Mr. Davendira Gupta of Rajdhani College.
Any suggestions for the improvement of the book shall be highly welcome and gratefully acknowledged.Ist Jan., 1969 S.P. GUPTAS.R. College of Commerce,Delhi University, Delhi.
vi Contents
AcknowledgmentsThe author gratefully acknowledges the inspiration, encouragement, guidance, help and valuable suggestions received from the following well-wishers :
1. Late Shri Jai Narayan Vaish, S.R. college of Commerce, University of Delhi. 2. Prof. Abad Ahmad, Formerly PVC, University of Delhi. 3. Prof. Mustaffa, Jamia Millia University, New Delhi. 4. Late Prof. A. Das Gupta, Founder FMS, University of Delhi. 5. Late Prof. D.N. Elhance, Formerly Vice-Chancellor, University of Jodhpur, Jodhpur. 6. Prof. B.S. Sharma, Formerly Vice-Chancellor, Kota Open University, Kota. 7. Prof. K.K. Aggarwal, Formerly Vice-Chancellor, Guru Gobind Singh Indraprastha University,
Delhi. 8. Prof. Vishnu Bhagwan, Formerly Vice Chancellor, Guru Jambheshwar University, Hissar. 9. Prof. C.L. Chandan, Director, Institute of Management, HPU, Shimla. 11. Prof. R.S. Dwivedi,
Former Head, Deptt. of Management, Kurukshetra University, Kurukshetra. 12. Prof. M.P. Gupta, Former Dean, FMS, University of Delhi. 13. Prof. M.Y. Khan, Former Head, Deptt. of Financial Studies, South Delhi Campus, University
of Delhi. 14. Prof. Y.K. Bhushan, Director General, NMIMS, Mumbai. 15. Prof. S.N. Maheshwari, Delhi Institute of Advanced Studies, Delhi. 16. Dr. Rekha Dayal, Jesus & Mary College, New Delhi. 17. Prof. C.P. Gupta, Dean, Deptt. of Financial Studies, South Delhi Campus, University of Delhi. 18. Dr. S.K. Grover, Deptt. of Commerce, Satyawati College, University of Delhi. 19. Dr. A.B. Ghosh, FRCS, North End Medicare Centre, Delhi. 20. Prof. B.P. Singh, Former Dean, Faculty of Commerce & Business, University of Delhi. 21. Prof. Thomas Gladwin, New York University, Graduate School of Business Administration,
USA. 22. Mrs. & Prof. H.B. Singh, New Delhi. 23. Prof. S.K. Khatik, Dean, Faculty of Management Studies, Barkatullah University, Bhopal. 24. Prof. P.K. Yadav, Dean, Faculty of Management, Rohilkhand University, Bareilly. 25. Prof. Rajashekar, Deptt. of Commerce, University of Mysore, Mysore. 26. Mr. Rajeev Gulhar, Sr. Manager, IT, CISOU, California, USA. 27. Ms. Sarika Gulhar, HR Director, Stone Ridge Creek, California, USA. 28. Prof. Jagdish Naraian, Dean, Deptt. of Commerce, University of Allahabad. 29. Prof. D.R. Adhikari, Dean Faculty of Management, Tribuvan University, Kathmandu. 30. Ms. Sangeeta & Prajesh, Harsh Vihar, Delhi. 31. Mr. Sameer Gupta, Global Manager, Wipro, California, USA. 32. Prof. L.C. Gupta, Director, Society for Capital Market Research & Development, New Delhi. 33. Prof. J.D. Aggarwal, Executive Director, Indian Institute of Finance, Noida. 34. Prof. O.P. Gupta, Formerly Head, Deptt. of Commerce, University of Delhi. 35. Prof. S.K. Gupta, Florida International University, Miami, USA. 36. Ms. Sapna Gupta, Acmas India Ltd., Delhi. 37. Dr. Shailender Gupta, Ranchi. 38. Dr. P.C. Jain, Ex-Principal, S.R. College of Commerce, University of Delhi.
Contents vii
39. Prof. B.D. Kavidayal, Dean, Commerce & Management, Kumaun University, Nainital. 40. Prof. Rakesh Joshi, Indian Institute of Foreign Trade, New Delhi. 41. Prof. Abdul Aziz, Deptt. of Commerce & Business Studies, Jamia Millai University, New
Delhi. 42. Prof. N.S. Bisht, Formerly Head, Deptt. of Management, Kumaun University, Nainital. 43. Prof. Vijay Shrimali, Head, Deptt. of Business Administration, Sukhadia University, Udaipur. 44. Prof. Gaurav Lodha, Faculty of Management, Jodhpur National University, Jodhpur 45. Dr. Manjula Chaudhary, Dean, Faculty of Commerce & Management, Kurukshetra University,
Kurukshetra. 46. Prof. A.K. Saha, Deptt of Commerce & Business Administration, Bhagalpur University, Bihar. 47. B.K. Rani, Brahmakumaris, Delhi. 48. Late Prof. N.R. Chatterjee, Formerly Dean, FMS, University of Delhi. 49. Prof. K.L. Krishna, Former Head, Deptt. of Economics, Delhi School of Economics, University
of Delhi. 50. Shri R.P. Maheshwari, Formerly S.R. College of Commerce, Delhi. 51. Prof. T.C. Majupuria, Tribhuvan University, Kathmandu, Nepal. 52. Prof. John Moirice, Guru Nanak College, Chennai. 53. Prof. A.L. Nagar, Formerly PVC, University of Delhi. 54. Prof. B.N. Nagnur, Deptt. of Statistics, Karnataka University, Dharwad. 55. Prof. Laxmi Narain, Formerly Dean, Deptt. of Commerce & Management, Osmania University. 56. Prof. P. Parmeshwar, L.B.P.G. College, Warangal. 57. Late Prof. Vidya Ratan, Shri Ram College of Commerce, University of Delhi. 58. Prof. Surendra Pradhan, California State University, California. 59. Late Mr. Prakash Chand, Sultan Chand & Sons, New Delhi. 60. Prof. A.K. Singh, Faculty of Commerce & Business, University of Delhi, Delhi. 61. Prof. Nageshwar Rao, Director, Pt. Jawaharlal Nehru Institute of Management, Ujjain. 62. Prof. Sudarsana Rao, Deptt. of Commerce & Management Studies, Andhra University, A.P. 63. Prof. Y.V. Reddy, Dean, Faculty of Commerce, Goa University, Panaji. 64. Prof. Mohsin Khan, Deptt. of Commerce, Aligarh Muslim University, Aligarh. 65. Prof. Y.P. Sabharwal, Deptt. of Mathematical Statistics, Ramjas College, University of Delhi. 66. Shri G.R. Sawhney, Hans Raj College, University of Delhi. 67. Prof. Kanwar Sen, Deptt. of Statistics, University of Delhi. 68. Mr. Ashok Mittal, HIL, New Delhi. 69. Mr. N.M. Shah, S.R. College of Commerce, University of Delhi. 70. Prof. K.C. Singhal, Head & Dean, Deptt. of Management, Punjabi University, Patiala. 71. Dr. Mark Easterby-Smith, Centre for the Study of Management Learning, University of
Lancaster (U.K.). 72. Prof. M.S. Turan, Dept. of Management, Guru Jambheshwar University, Hissar. 73. Prof. Khursheed Ahmad, Dean, Faculty of Commerce & Management, University of Kashmir. 74. Prof. K.P.M. Sundaram, Formerly S.R. College of Commerce, University of Delhi. 75. Prof. R.D. Sharma, Vice Chancellor, Jammu University, Jammu. 76. Dr. N.D. Vohra, Deptt. of Commerce, Ramjas College, University of Delhi. 77. Dr. Renu Jain, Deptt. of Commerce, Satyawati College, University of Delhi. 78. Mrs. & Dr. Vijay Kansal, Pitampura, Delhi. 79. Miss. Alka Goyale, Deptt. of Commerce, Shri Ram College of Commerce, University of Delhi. 80. Prof. Akbar Ali Khan, Head, Deptt. of Commerce, Osmania University, Hyderabad. 81. Dr. N.C. Goel, Formerly, Ministry of Chemicals & Fertilizers, Govt. of India, New Delhi
Acknowledgments vii
viii Contents
Brief ContentsPart I
1. Statistics – What and Why 1.1 – 1.20 2. Organising a Statistical Survey 2.1 – 2.11 3. Collection of Data 3.1 – 3.19 4. Sampling and Sample Designs 4.1 – 4.22 5. Classification and Tabulation of Data 5.1 – 5.30 6. Diagrammatic and Graphic Presentation 6.1 – 6.46 7. Measures of Central Value 7.1 – 7.78 8. Measures of Dispersion 8.1 – 8.62 9. Skewness, Moments and Kurtosis 9.1 – 9.47 10. Correlation Analysis 10.1 – 10.56 11. Regression Analysis 11.1 – 11.46 12. Association of Attributes 12.1 – 12.37 13. Index Numbers 13.1 – 13.72 14. Analysis of Time Series 14.1 – 14.83 15. Interpolation and Extrapolation 15.1 – 15.35 16. Vital Statistics 16.1 – 16.31 17. Statistical Fallacies 17.1 – 17.6
Part II 1. Probability and Expected Value 1.1 – 1.50 2. Theoretical Distributions 2.1 – 2.72 3. Statistical Inference – Tests of Hypotheses 3.1 – 3.67 4. C2 Test and Goodness of Fit 4.1 – 4.46 5. F-Test and Analysis of Variance 5.1 – 5.37 6. Experimental Designs 6.1 – 6.10 7. Statistical Quality Control 7.1 – 7.42 8. Business Forecasting 8.1 – 8.14 9. Partial and Multiple Correlation 9.1 – 9.27 10. Statistical Decision Theory 10.1 – 10.21 11. Non-Parametric Tests 11.1 – 11.12
Revisionary Exercise (R.1 – R.147)
Appendices
1. Logarithms, Reciprocals and Square Root A.3 – A.8 2. Permutations and Combinations A.9 – A.10 3. Select References A.11 – A.13 4. Symbols, Abbreviations and Formulae A.15 – A.25 5. Statistical Tables A.27 – A.43
Contents ix
ContentsPart I
1 STATISTICS – WHAT AND WHY 1.1 – 1.20Introduction 1.2Origin of Statistics 1.3
Government Records 1.4Mathematics 1.4
Growth of Statistics 1.4Increased Demand for Statistics 1.5Decreasing Cost of Statistics 1.5
Statistics Defined 1.5Statistical Data 1.5Statistical Methods 1.7
Statistics: Science or Art 1.9Functions of Statistics 1.9
Definiteness 1.10Condensation 1.10Comparison 1.10Formulating and Testing 1.10Prediction 1.10Formulation of Suitable Policies 1.11
Applications of Statistics 1.11Statistics and the State 1.11Statistics and Business 1.12Statistics and Economics 1.13Statistics and Physical Sciences 1.14Statistics and Natural Sciences 1.14Statistics and Research 1.15Statistics and Other Uses 1.15
Limitations of Statistics 1.15Statistics Does not Deal With Individual Measurements 1.16Statistics Deals Only With Quantitative Characteristics 1.16Statistical Results are True Only on an Average 1.16Statistics is Only One of the Methods of Studying a Problem 1.16Statistics Can be Misused 1.16
Distrust of Statistics 1.17Statistical Methods vs Experimental Methods 1.17Statistics and Computers 11.18At a Glance 1.19Key Terms 1.20
2. ORGANISING A STATISTICAL SURVEY 2.1 – 2.11Statistical Survey—An Introduction 2.2Planning the Survey 2.3
Specification of the Purpose 2.3Scope of the Survey 2.3
x Contents
The Unit of Data Collection 2.4Sources of Data 2.5Technique of Data Collection 2.5The Choice of a Frame 2.6Degree of Accuracy Desired 2.6Miscellaneous Considerations 2.6
Executing the Survey 2.7Setting Up an Administrative Organisation 2.7Design of Forms 2.7Selection, Training and Supervision of the Field Investigators 2.7Control Over the Quality of the Field Work and the Field Edit 2.8Follow-Up of Non-Response 2.9Processing of Data 2.9Preparation of Report 2.9
Key Terms 2.11 3. COLLECTION OF DATA 3.1 – 3.19
Introduction 3.2Primary and Secondary Data 3.2
Choice Between Primary and Secondary Data 3.3Methods of Collecting Primary Data 3.3
Direct Personal Interviews 3.4Indirect Oral Interviews 3.5Information from Correspondents 3.6Mailed Questionnaire Method 3.6
Drafting the Questionnaire 3.8Covering Letter 3.8Number of Questions Should be Small 3.8Questions Should be Arranged Logically 3.9Questions Should be Short and Simple to Understand 3.9Ambiguous Questions Ought to be Avoided 3.9Personal Questions Should be Avoided 3.9Instructions to the Informants 3.9Questions Should be Capable of Objective Answer 3.10‘‘Yes’’ or ‘‘No’’ Question 3.10Specific Information Questions and Open-End Questions 3.10Questionnaire Should Look Attractive 3.11Questions Requiring Calculations Should be Avoided 3.11Pre-Testing the Questionnaire 3.11Cross-Checks 3.11Method of Tabulation 3.11
Pre-Testing the Questionnaire (Or Pilot Survey) 3.11Specimen Questionnaires 3.12
Questionnaire No.1 3.12Questionnaire No.2 3.14Delhi Metro Rail Survey 3.15Sources of Secondary Data 3.16Published Sources 3.16Unpublished Sources 3.17
Editing Primary and Secondary Data 3.17Editing for Completeness 3.17Editing for Consistency 3.18Editing for Accuracy 3.18Editing for Homogeneity 3.18
Contents xi
Precautions in the Use of Secondary Data 3.18Whether the Data are Suitable for the Purpose of Investigation in View 3.18Whether the Data are Adequate for the Investigation 3.19Whether the Data are Reliable 3.19
Key Terms 3.19 4. SAMPLING AND SAMPLE DESIGNS 4.1 – 4.22
Introduction 4.2Census and Sample Method 4.2Theoretical Basis of Sampling 4.3
Law of Statistical Regularity 4.3Law of Inertia of Large Numbers 4.4
Essentials of Sampling 4.4Representativeness 4.4Adequacy 4.4Independence 4.4Homogeneity 4.5
Methods of Sampling 4.5Non-Probability Sampling Methods 4.5
Judgement Sampling 4.5Quota Sampling 4.6Convenience Sampling 4.7
Probability Sampling Methods 4.7Advantages of Probability Sampling 4.7Limitations of Probability Sampling 4.7Simple or Unrestricted Random Sampling 4.8Restricted Random Sampling 4.10Selection of Appropriate Method of Sampling 4.15
Size of Sample 4.15Determination of Sample Size 4.16
Merits and Limitations of Sampling 4.17Sampling and Non-Sampling Errors 4.18
Sampling Errors 4.19Method of Reducing Sampling Errors 4.20Non-Sampling Errors 4.21
Key Terms 4.22 5. CLASSIFICATION AND TABULATION OF DATA 5.1 – 5.30
Introduction 5.2Meaning and Objectives of Classification 5.2
Objectives of Classification 5.2Types of Classification 5.3
Geographical Classification 5.3Chronological Classification 5.3Qualitative Classification 5.4Quantitative Classification 5.4
Formation of a Discrete Frequency Distribution 5.5Formation of Continuous Frequency Distribution 5.7
Class Limits 5.7Class Intervals 5.7Class Frequency 5.8Class Mid-Point or Class Mark 5.8Considerations in the Construction of Frequency Distributions 5.10Relative Frequency Distribution 5.14Bivariate or Two-Way Frequency Distribution 5.14

xii Contents
Tabulation of Data 5.15Difference Between Classification and Tabulation 5.16Role of Tabulation 5.16
Parts of a Table 5.16General Rules of Tabulation 5.18
Review of the Table 5.19Types of Tables 5.20
Simple and Complex Tables 5.20General and Special Purpose Tables 5.21
Miscellaneous Illustrations 5.23Machine Tabulation 5.29
6. DIAGRAMMATIC AND GRAPHIC PRESENTATION 6.1 – 6.46Introduction 6.2Significance of Diagrams and Graphs 6.2Comparison of Tabular and Diagrammatic Presentation 6.2
Difference Between Diagrams and Graphs 6.3General Rules for Constructing Diagrams 6.3
Title 6.3Proportion Between Width and Height 6.3Selection of Scale 6.3Footnotes 6.3Index 6.3Neatness and Cleanliness 6.4Simplicity 6.4
Types of Diagrams 6.4One-Dimensional or Bar Diagrams 6.4Two-Dimensional Diagrams 6.12Squares 6.14Circles 6.15Pictograms and Cartograms 6.20Choice of a Suitable Diagram 6.23
Graphs 6.23Technique of Constructing Graphs 6.24Graphs of Time Series or Line Graphs 6.24Rules for Constructing the Line Graphs on Natural Scale 6.25False Baseline 6.25Graphs of One Variable 6.26Graph of Two or More Variables 6.27Graphs Having Two Scales 6.28Range Chart 6.29Band Graph 6.30Semi-Logarithmic Line Graphs or Ratio Charts 6.31Interpretation of Logarithmic Curves 6.36
Graphs of Frequency Distributions 6.36Histogram 6.36Frequency Polygon 6.39Smoothed Frequency Curve 6.40Cumulative Frequency Curves or Ogives 6.41
7. MEASURES OF CENTRAL VALUE 7.1 – 7.78Introduction 7.2Average Defined 7.2Objectives of Averaging 7.2
Contents xiii
Requisites of a Good Average 7.3Types of Averages 7.4
Arithmetic Mean 7.4Calculation of Arithmetic Mean—Continuous Series 7.7Median 7.16Calculation of Median—Continuous Series 7.19Computation of Quartiles, Decides, Percentiles, Etc. 7.25
Geometric Mean 7.39Properties of Geometric Mean 7.39Calculation of Geometric Mean—Individual Observations 7.39Calculation of Geometric Mean—Discrete Series 7.40Calculation of Geometric Mean—Continuous Series 7.41Uses of Geometric Mean 7.42Compound Interest Formula 7.43Weighted Geometric Mean 7.45Harmonic Mean 7.47Calculation of Harmonic Mean—Individual Observations 7.47Calculation of Harmonic Mean—Discrete Series 7.48Calculation of Harmonic Mean—Continuous Series 7.49Uses of Harmonic Mean 7.49Weighted Harmonic Mean 7.51Merits and Limitations of Harmonic Mean 7.52
Relationship Among the Averages 7.52Miscellaneous Illustrations 7.52Which Average to Use 7.76
Harmonic Mean 7.77General Limitations of Average 7.77List of Formulae 7.78
8. MEASURES OF DISPERSION 8.1 – 8.62Introduction 8.2Significance of Measuring Variation 8.3
Range 8.4The Interquartile Range or the Quartile Deviation 8.6Merits and Limitations 8.9The Mean Deviation 8.10Calculation of Mean Deviation—Continuous Series 8.12Merits and Limitations 8.14The Standard Deviation 8.15Difference Between Mean Deviation and Standard Deviation 8.15Calculation of Standard Deviation 8.15Relation Between Measures of Dispersion 8.23Coefficient of Variation 8.25Variance and Standard Deviation Compared 8.30Correcting Incorrect Values of Mean and Standard Deviation 8.31Lorenz Curve 8.34
Which Measure of Dispersion to Use 8.62List of Formulae 8.62
9. SKEWNESS, MOMENTS AND KURTOSIS 9.1 – 9.47Introduction 9.2Difference Between Dispersion and Skewness 9.3Tests of Skewness 9.3Measures of Skewness 9.4
Absolute Measures of Skewness 9.4
xiv Contents
Relative Measures of Skewness 9.4Bowley’s Coefficient of Skewness 9.5Kelly’s Coefficient of Skewness 9.6Measure of Skewness Based on the Third Moment 9.6
Moments 9.12Moments About Arbitrary Origin 9.14Conversion of Moments About an Arbitrary Origin
Into Moments About Mean or Central Moments 9.14Moments About Zero 9.15Sheppard’s Correction for Grouping Errors 9.16Conditions for Applying Sheppard’s Corrections 9.16Measure of Skewness Based on Moments 9.19
Kurtosis 9.20Measures of Kurtosis 9.20
List of Formulae 9.47Skewness 9.47
10. CORRELATION ANALYSIS 10.1 – 10.56Introduction 10.2Significance of the Study of Correlation 10.3Correlation and Causation 10.3Typesof Correlation 10.4
Positive and Negative Correlation 10.4Simple, Partial and Multiple Correlation 10.5Linear and No-Linear (Curvilinear) Correlation 10.5
Methodsof Studying Correlation 10.6Scatter Diagram Method 10.6Merits and Limitations of the Method 10.7
Graphic Method 10.7Karl Pearson’sCoefficient of Correlation 10.8
Direct Method of Finding Out Correlation Coefficient 10.11Calculation of Correlation Coefficient When Change of Scale and
Origin is Made 10.12When Deviations are Taken from an Assumed Mean 10.13Calculation of Correlation in Grouped Data 10.16Assumption of the Pearsonian Coefficient 10.20Merits and Limitations of the Pearsonian Coefficient 10.20Interpreting Coefficient of Correlation 10.20
Coefficient of Correlation and Probable Error 10.21Conditions for the Use of Probable Error 10.21
Coefficient of Determination 10.22Properties of the Coefficient of Correlation 10.23Rank Correlation Coefficient 10.25
Features of Spearman’s Correlation Coefficient 10.27Where Ranks are Not Given 10.29Merits and Limitations of the Rank Method 10.32When to Use Rank Correlation Coefficient? 10.32
Concurrent Deviation Method 10.32Calculation of Correlation in Time Series 10.35Correlation of Long-Term Changes 10.35Calculation of Correlation in Short-Term Changes or Oscillation 10.35
Lag and Lead in Correlation 10.37Caution While Using Correlation Analysis 10.55List of Formulae 10.55
Contents xv
11. REGRESSION ANALYSIS 11.1 – 11.46Introduction 11.2Uses of Regression Analysis 11.3Difference Between Correlation and Regression Analysis 11.3Regression Lines 11.4Regression Equations 11.6
Regression Equation of Y on X 11.6Regression Equation of X on Y 11.7Deviations Taken from Arithmetic Means of X and Y 11.8Deviations Taken from Assumed Means 11.10Graphing Regression Lines 11.12
Regression Equations in Case of Correlation Table 11.17Standard Error of Estimate 11.19Miscellaneous Illustrations 11.20Limitations of Regression Analysis 11.45
List of Formulae 11.45 12. ASSOCIATION OF ATTRIBUTES 12.1 – 12.37
Introduction 12.2Difference Between Correlation and Association 12.2Notation and Terminology 12.2
Class Frequencies 12.3Order of Classes and Class Frequencies 12.3Number of Frequencies 12.3Ultimate Class Frequencies 12.3Consistency of Data 12.5
Association and Disassociation 12.5Methods of Studying Association 12.6
Comparison of Observed and Expected Frequencies Methods 12.6Proportion Method 12.8Criteria of Independence 12.11Coefficient of Colligation 12.11Coefficient of Contingency 12.11Miscellaneous Illustrations 12.14Association of Three Attributes 12.23
Partial Association 12.28First Method 12.29Second Method 12.29Third Method (Yule’s Coefficient) 12.29
Illusory Association 12.36List of Formulae 12.37
13. INDEX NUMBERS 13.1 – 13.72Introduction 13.2Uses of Index Numbers 13.3Classification of Index Numbers 13.4Problems in the Construction of Index Numbers 13.4
The Purpose of the Index 13.4Selection of a Base Period 13.5Selection of Number of Items 13.5Price Quotations 13.6Choice of an Average 13.6Selection of Appropriate Weights 13.6Selection of an Appropriate Formula 13.7
Methods of Constructing Index Numbers 13.8
xvi Contents
Unweighted Index Numbers 13.8Weighted Index Numbers 13.13
Quantity or Volume Index Numbers 13.22Value Index Numbers 13.23Tests of Adequacy of Index Number Formulae 13.24
Unit Test 13.24Time Reversal Test 13.24Factor Reversal Test 13.25Circular Test 13.26
The Chain Index Numbers 13.29Steps in Constructing a Chain Index 13.29Conversion of Chain Index to Fixed Index 13.31
Base Shifting, Splicing and Deflating the Index Numbers 13.32Base Shifting 13.32Splicing 13.34Use of Index Numbers in Deflating 13.36Consumer Price Index Numbers 13.37Meaning and Need 13.37Utility of the Consumer Price Indices 13.38Construction of a Consumer Price Index: 13.38Method of Constructing the Index 13.40Aggregate Expenditure Method 13.40Family Budget Method 13.40
Index Number of Industrial Production 13.44Miscellaneous Illustrations 13.45Limitations of Index Numbers 13.70List of Formulae 13.71
14. ANALYSIS OF TIME SERIES 14.1 – 14.83Introduction 14.2Time Series Defined 14.2Utility of Time Series Analysis 14.3Components of Time Series 14.4
Secular Trend 14.5Seasonal Variations 14.7Irregular Variations 14.9
Preliminary Adjustments Before Analysing Time Series 14.10Calendar Variations 14.10Population Changes 14.11Price Changes 14.11Comparability 14.11
Measurement of Trend 14.11Freehand or Graphic Method 14.12Merits and Limitations 14.13Semi-Average Method 14.13Merits and Limitations 14.16Moving Average Method 14.16Merits and Limitations 14.22Method of the Least Squares 14.22Merits and Limitations 14.29Second Degree Parabola 14.29
Measuring Trends By Logarithms 14.32Exponential Trends 14.33Second Degree Curves Fitted to Logarithms 14.34
Contents xvii
Growth Curves 14.34Selecting the Type of Trend 14.35Choice of the Trend Period 14.36
Shifting the Trend Origin 14.36Conversion of Annual Trend Values to Monthly Values 14.37Measurement of Seasonal Variations 14.38
Method of Simple Averages 14.39Ratio-To-Trend Method 14.41Ratio-To-Moving Average Method 14.43Link Relative Method 14.49Which Method to Use? 14.51Uses and Limitations of Seasonal Index 14.52Deseasonalized Data 14.53
Measurement of Cyclical Variations 14.53Residual Method 14.53Reference Cycle Analysis or the National Bureau Method 14.54
Measurement of Irregular Variations 14.55Calculation of Correlation in Time Series 14.55
Miscellaneous Illustrations 14.59List of Formulae 14.83
15. INTERPOLATION AND EXTRAPOLATION 15.1 – 15.35Introduction 15.2Interpolation and Extrapolation Defined 15.2Significance of Interpolation and Extrapolation 15.2Assumptions of Interpolation and Extrapolation 15.3Methods of Interpolation 15.3
Graphic Method 15.4Algebraic Methods 15.5Newton’s Method 15.8Lagrange’s Method 15.16Parabolic Curve Method 15.18
Inverse Interpolation 15.20Extrapolation 15.21Miscellaneous Illustrations 15.22List of Formulae 15.35
16. VITAL STATISTICS 16.1 – 16.31Introduction 16.2Vital Statistics 16.2Uses of Vital Statistics 16.2
Use to Individuals 16.2Use to Operating Agencies 16.3Use in Research 16.3Use in Public Administration 16.3International Use of Vital Statistics 16.3
Methods of Obtaining Vital Statistics 16.3Registration Method 16.3Census Enumeration 16.4Analytical Method—Estimation of Vital Rates Using Census Data 16.4
Measurement of Fertility 16.5Crude Birth Rate 16.5Specific Fertility Rate 16.5General Fertility Rate 16.6Total Fertility Rate (TFR) 16.6
xviii Contents
Reproduction Rates 16.7Net Reproduction Rate 16.8
Measurement of Mortality 16.14Crude Death Rate 16.15Specific Death Rates 16.15Standardised Death Rates 16.16Infant Mortality Rate 16.18Neo-Natal Mortality Rate 16.19Maternal Mortality Rate 16.19Natural Increase Rate 16.20Net Migration Rate 16.20Vital Index 16.20
Life Tables 16.21Uses of Life Tables 16.21
Miscellaneous Illustrations 16.25 17. STATISTICAL FALLACIES 17.1 – 17.6
Introduction 17.2Bias 17.2Inconsistency in Definitions 17.2Faulty Generalizations 17.3Faulty Deductions 17.3Inappropriate Comparisons 17.3Misuse of Various Tools of Analysis Like Mean, Median, Mode, Dispersion, Correlation, etc. 17.4Faulty Interpretation of Trend, Seasonal and Cyclical Variations, etc. 17.4Technical Errors 17.4Failure to Comprehend the Total Background of the Data 17.5
Part II
1. PROBABILITY AND EXPECTED VALUE 1.1 – 1.50Introduction 1.2Probability Defined 1.3
Classical or a Priori Probability 1.3Shortcomings of the Classical Approach 1.5Relative Frequency Theory of Probability 1.5Subjective Approach to Probability 1.6Axiomatic Approach to Probability 1.7
Importance of the Concept of Probability 1.7Calculation of Probability 1.8Theorems of Probability 1.10
Addition Theorem 1.10Multiplication Theorem 1.12
Conditional Probability 1.13Bayes’ Theorem 1.14Mathematical Expectation 1.19
Random Variable and Probability Distribution 1.20Miscellaneous Illustrations 1.22
Appendix I 1.46Elementary Set Theory 1.46Operation on Sets 1.47
Appendix II 1.49Counting Rules 1.49
Contents xix
2. THEORETICAL DISTRIBUTIONS 2.1 – 2.72Introduction 2.2Binomial Distribution 2.4Obtaining Coefficients of the Binomial 2.7
Understanding Pascal’s Triangle 2.8Properties of the Binomial Distribution 2.8Constants of the Binomial Distribution 2.8Importance of the Binomial Distribution 2.11Fitting a Binomial Distribution 2.13The Multinomial Distribution 2.18Negative Binomial Distribution 2.19Poisson Distribution 2.20Constants of the Poisson Distribution 2.21Role of the Poisson Distribution 2.24Fitting a Poisson Distribution 2.25Poisson Distribution As an Approximation of the Binomial Distribution 2.28
Hypergeometric Distribution 2.29Normal Distribution 2.30
Graph of Normal Distribution 2.31Relation Between Binomial, Poisson and Normal Distributions 2.31Importance of the Normal Distribution 2.31Properties of the Normal Distribution 2.33Conditions for Normality 2.34Area Under the Normal Curve 2.34Significance of the Normal Distribution 2.38Fitting a Normal Curve 2.46
A Word of Caution 2.50Miscellaneous Illustrations 2.51
3. STATISTICAL INFERENCE – TESTS OF HYPOTHESES 3.1 – 3.67Introduction 3.2Hypothesis Testing 3.2
Procedure of Testing Hypothesis 3.2Measuring the Power of a Hypothesis Test 3.8
Standard Error and Sampling Distribution 3.8Universe Distribution 3.9
Estimation 3.10Point Estimates 3.11Interval Estimates 3.11Tests for Number of Successes 3.13Test for Proportion of Successes 3.14Test for Difference Between Proportions 3.15
Tests of Significance for Large Samples 3.19Difference Between Small and Large Samples 3.19Two-Tailed Test for Difference Between the Means of Two Samples 3.24Standard Error of the Difference Between Two Standard Deviations 3.27
Tests of Significance for Small Samples 3.27The Assumption of Normality 3.28Student’s T-Distribution 3.28Application of the T-Distribution 3.30
Miscellaneous Illustrations 3.46Limitations of Tests of Significance 3.65
List of Formulae 3.66
xx Contents
4. C2 TEST AND GOODNESS OF FIT 4.1 – 4.46Introduction 4.2X2 Defined 4.2
Degrees of Freedom 4.3The Chi-Square Distribution 4.4Constants of C2 Distribution 4.5The X2 Test When the Degrees of Freedom Exceed 30 4.5Alternative Method of Obtaining the Value of X2 4.6
Conditions for Applying X2 Test 4.6Yates’ Corrections 4.6
Grouping When Individual Frequencies are Small 4.7Uses of X2 Test 4.7Additive Property of X2 4.15Chi-Square Test for Specified Value of Population Variance 4.16Miscellaneous Illustrations 4.17
Using the Computer for Chi-Square Test 4.45Misuse of Chi-Square Test 4.45Limitations on the Use of X2 Test 4.45
5. F-TEST AND ANALYSIS OF VARIANCE 5.1 – 5.37The F-Test or the Variance Ratio Test 5.2Applications of F-Test 5.2Analysis of Variance 5.5
Assumptions in Analysis of Variance 5.6Technique of Analysis of Variance 5.7One-Way Classification 5.7Coding of Data 5.12
Analysis of Variance in Two-Way Classification Model 5.14Word of Caution 5.37
6. EXPERIMENTAL DESIGNS 6.1 – 6.10Introduction 6.2Randomized Block Design 6.2
Advantages of a Completely Randomized Experimental Design 6.3Latin Squares 6.6
Significance of Latin Square 6.7Assumption in the Analysis of Latin Square 6.7
Randomized Blocks vs Latin Square 6.10Latin Cubes 6.10
Factorial Experiment 6.10 7. STATISTICAL QUALITY CONTROL 7.1 – 7.42
Introduction 7.2Control Charts 7.4
How to Set Up the Control Limits 7.6Types of Control Charts 7.6Setting Up a Control Procedure 7.7
X -Chart 7.7R-Chart 7.10
Control Chart for the Standard Deviation or Σ-Chart 7.13R-Chart vs Σ-Chart 7.14
Control Chart for C (Number of Defects Per Unit) 7.14Use of C-Chart 7.15
Control Chart for P (Fraction Defective) 7.17Advantages and Limitations of Statistical Quality Control 7.22
Contents xxi
Advantages 7.22Limitations 7.23
Total Quality Management 7.23 Acceptance Sampling 7.24
Role of Acceptance Sampling 7.24Types of Acceptance Sampling Plans 7.25Advantages of Double Sampling Plan 7.26Selection of a Sampling Plan 7.26Construction of an OC Curve 7.27The Operating Characteristic (OC) Curve 7.27AQL and LTPD 7.27Shape of an Ideal OC Curve 7.28Shape of a Typical OC Curve 7.28
8. BUSINESS FORECASTING 8.1 – 8.14Introduction 8.2Role of Forecasting in Business 8.2Steps in Forecasting 8.2Methods of Forecasting 8.3
Business Barometers 8.4Extrapolation 8.5Regression Analysis 8.5Econometric Models 8.6Forecasting By the Use of Time Series Analysis 8.7Opinion Polling 8.8Causal Models 8.8Exponential Smoothing 8.8Survey Method 8.11
Theories of Business Forecasting 8.11Sequence or Time-Lag Theory 8.12Action and Reaction Theory 8.12Economic Rhythm Theory 8.12Specific Historical Analogy 8.12Cross-Section Analysis 8.13
Cautions While Using Forecasting Techniques 8.13 9. PARTIAL AND MULTIPLE CORRELATION 9.1 – 9.27
Introduction 9.2Partial Correlation 9.2
Partial Correlation Coefficient 9.2Zero Order, First Order and Second Order Coefficients 9.3Partial Correlation Coefficients in Case of Four Variables 9.4Second-Order Partial Correlation Coefficients 9.5The Significance of a Partial Correlation Coefficient 9.6
Multiple Correlation 9.7Coefficient of Multiple Correlation 9.7Advantages of Multiple Correlation Analysis 9.8Limitations of Multiple Correlation Analysis 9.9
Multiple Regression Analysis 9.9Multiple Regression and Correlation Analysis 9.9Normal Equations for the Least Square Regression Plane 9.10Assumptions of Linear Multiple Regression Analysis 9.10Other Equations of Multiple Linear Regression 9.11Generalizations for More than Three Variables 9.12Use of Computers in Multiple Regression and Correlation Analysis 9.12
xxii Contents
Reliability of Estimates 9.14Coefficient of Multiple Determination 9.15
Miscellaneous Illustrations 9.15List of Formulae 9.27
10. STATISTICAL DECISION THEORY 10.1 – 10.21Introduction 10.2Ingredients of Decision Problem 10.2
1.Alternative Courses of Action 10.32.Uncertainty 10.33.Payoff Table 10.34.Decision Criteria 10.4
Optimal Decisions 10.71.the Maximin Principle 10.72.the Minimax Principle 10.73.the Bayes’ Principle 10.8
Miscellaneous Illustrations 10.12Decision Tree Analysis 10.20Steps in Decision Tree Analysis 10.20Advantages of Decision Tree Approach 10.21
11. NON-PARAMETRIC TESTS 11.1 – 11.12Introduction 11.2Advantages of Non-Parametric Tests 11.2Sign Test 11.3
The Paired-Sample Sign Test 11.3A Rank Sum Test : the Mann-Whitney U Test 11.6The One Sample Runs Test 11.8The Kruskal-Wallis or H-Test 11.10Spearman’s Rank Correlation 11.11Limitations of Non-Parametric Tests 11.12
Comments 11.12
Revisionary Exercise (R.1 – R.148)
Appendices
1. LOGARITHMS, RECIPROCALS AND SQUARE ROOT A.3 – A.8Logarithms A.3Reciprocals A.7Extracting Square Root A.7Rules of Signs A.8
2. PERMUTATIONS AND COMBINATIONS A.9 – A.10Permutations A.9Combinations A.10
3. SELECT REFERENCES A.11 – A.13 4. SYMBOLS, ABBREVIATIONS AND FORMULAE A.15 – A.25
Symbols and Abbreviations A.15(Formulae) A.16
5. STATISTICAL TABLES A.27 – A.43
Contents xxiii...
......
......
......
......
......
......
......
......
......
......
......
.PLE
ASE
CU
T A
LON
G T
HIS
LIN
E A
ND
MA
IL T
O U
S ..
......
......
......
......
......
......
......
......
......
......
......
..
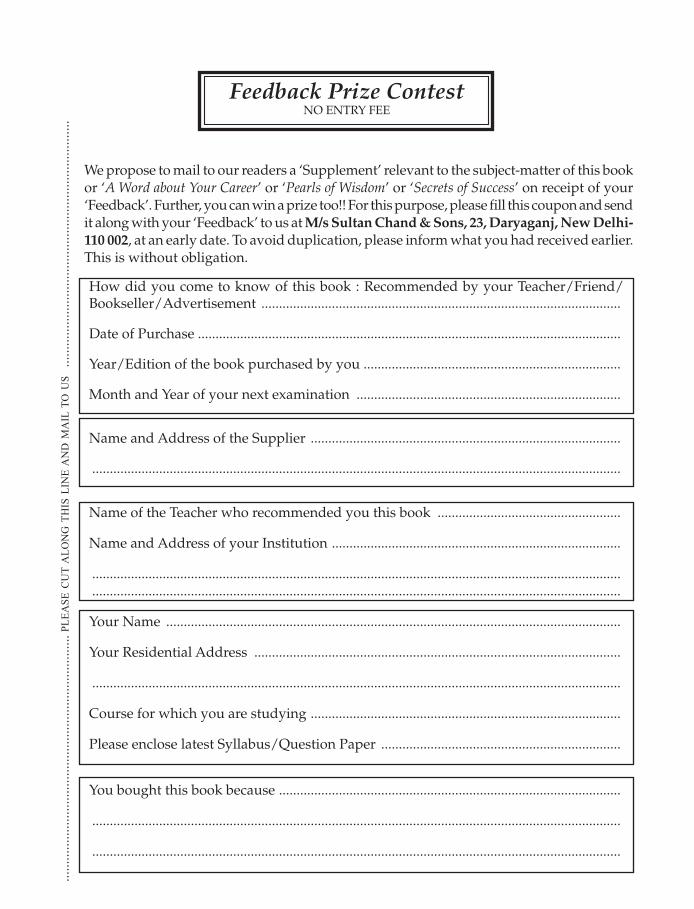
Feedback Prize ContestNO ENTRY FEE
We propose to mail to our readers a ‘Supplement’ relevant to the subject-matter of this book or ‘A Word about Your Career’ or ‘Pearls of Wisdom’ or ‘Secrets of Success’ on receipt of your ‘Feedback’. Further, you can win a prize too!! For this purpose, please fill this coupon and send it along with your ‘Feedback’ to us at M/s Sultan Chand & Sons, 23, Daryaganj, New Delhi- 110 002, at an early date. To avoid duplication, please inform what you had received earlier. This is without obligation.
How did you come to know of this book : Recommended by your Teacher/Friend/Bookseller/Advertisement ......................................................................................................
Date of Purchase ........................................................................................................................
Year/Edition of the book purchased by you .........................................................................
Month and Year of your next examination ...........................................................................
Name and Address of the Supplier ........................................................................................
......................................................................................................................................................
Name of the Teacher who recommended you this book ....................................................
Name and Address of your Institution ..................................................................................
...................................................................................................................................................... ......................................................................................................................................................
Your Name .................................................................................................................................
Your Residential Address ........................................................................................................
......................................................................................................................................................
Course for which you are studying ........................................................................................
Please enclose latest Syllabus/Question Paper ....................................................................
You bought this book because .................................................................................................
......................................................................................................................................................
......................................................................................................................................................
xxiv Contents
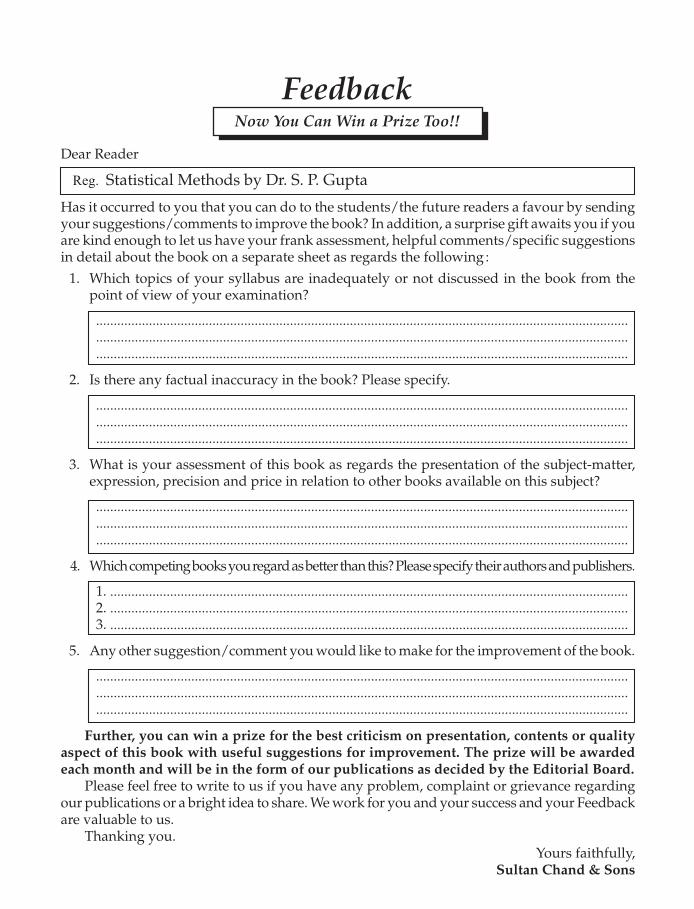
Dear Reader
Reg. Statistical Methods by Dr. S. P. Gupta
Has it occurred to you that you can do to the students/the future readers a favour by sending your suggestions/comments to improve the book? In addition, a surprise gift awaits you if you are kind enough to let us have your frank assessment, helpful comments/specific suggestions in detail about the book on a separate sheet as regards the following :
1. Which topics of your syllabus are inadequately or not discussed in the book from the point of view of your examination?
....................................................................................................................................................... ....................................................................................................................................................... .......................................................................................................................................................
2. Is there any factual inaccuracy in the book? Please specify.
....................................................................................................................................................... ....................................................................................................................................................... .......................................................................................................................................................
3. What is your assessment of this book as regards the presentation of the subject-matter, expression, precision and price in relation to other books available on this subject?
....................................................................................................................................................... ....................................................................................................................................................... .......................................................................................................................................................
4. Which competing books you regard as better than this? Please specify their authors and publishers.
1. ................................................................................................................................................... 2. ................................................................................................................................................... 3. ...................................................................................................................................................
5. Any other suggestion/comment you would like to make for the improvement of the book.
....................................................................................................................................................... ....................................................................................................................................................... .......................................................................................................................................................
Further, you can win a prize for the best criticism on presentation, contents or quality aspect of this book with useful suggestions for improvement. The prize will be awarded each month and will be in the form of our publications as decided by the Editorial Board.
Please feel free to write to us if you have any problem, complaint or grievance regarding our publications or a bright idea to share. We work for you and your success and your Feedback are valuable to us.
Thanking you.Yours faithfully,
Sultan Chand & Sons
FeedbackNow You Can Win a Prize Too!!
About the AuthorDr. S.P. Gupta (born 1942) has a brilliant academic record of teaching more than 4 decades in Indian and foreign Universities. He was a student of Shri Ram College of Commerce, University of Delhi. He obtained B.Com. (H) and M. Com. Degree with “Advanced Statistics” as specialization and taught for more than a decade in SRCC.
He was invited by the Tribhuvan University, Kathmandu, Nepal as visiting professor for a period of 2 years. He was also appointed visiting Professor in Karl Marx University, Milano for a period of 1 year. He attended prestigious International Teachers Program in Stockholm (Sweden) and also Budapest Hungary.
Mr. Gupta joined Faculty of Management Studies (FMS), University of Delhi from where he obtained Ph.D degree in Management and taught for about 3 decades. He has authored more than a dozen books in the field of Statistics for B.Com., M.Com., MBA, CA, ICWA courses etc. He was also Head & Dean, Faculty of Management Studies, University of Delhi for a period of 3 years.
About the BookThis book entitled “Statistical Methods” was first published in 1969. The 46th edition of the book has many new features:
The book is written in a very simple and lucid style.For the first time the book is being published in the broader form on the initiative of the publisher, Sultan Chand & Sons.It caters to the requirements of under-graduate as well as post-graduate students of Commerce, Economics and Management.The Engineering, Medical and Research students can also refer to the book to meet their specific requirements.The book is non-mathematical in character.Besides good theory it contains more than 1,500 Illustrations and about more than two thousand exercise questions for a better understanding of the subject.A large number of questions have been picked up from the examination papers of most leading Universities.Hints to ticklish problems have been given wherever necessary.Every effort has been made to minimise the printing errors and other mistakes.
Ÿ
Ÿ
Ÿ
Ÿ
Ÿ
Ÿ
Ÿ
Ÿ
Ÿ
Publishers of Standard Educational Textbooks
Sultan Chand & Sons
23 Daryaganj, New Delhi-110002
Phones: 23243183, 23247051, 23277843, 23281876, 23266105email: [email protected], [email protected]: 011-23266357; Website: www.sultanchandandsons.com
ISBN 81-5161-176-0
TC
-506
9 789351 611769