
4. ON-SITE MEASUREMENTS - US Environmental Protection ...
242
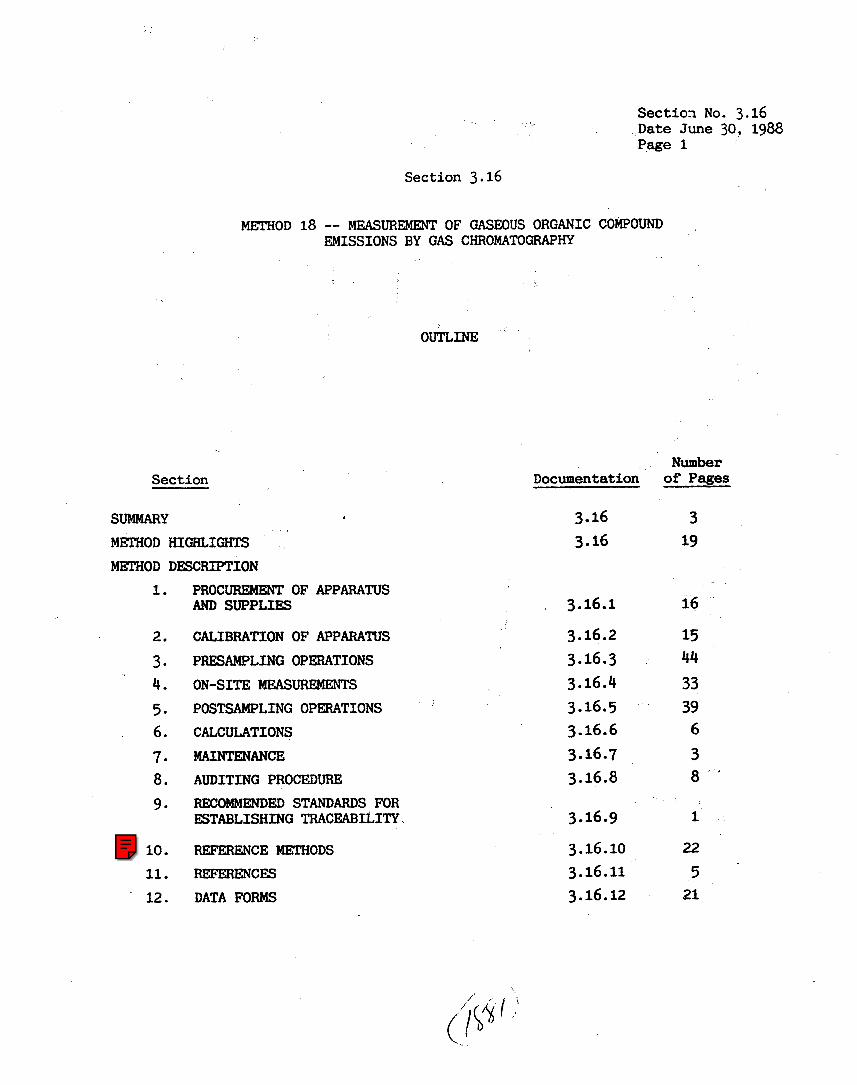
Section No. 3.16 Date June 30, 1988 Page 1 \I Section 3-16 METHOD 18 -- MEASUREMENT OF GASEOUS ORGANIC COMPOUND EMISSIONS BY GAS CHROMATOGRAPHY Section SUMMARY MEXHOD H I M L I m METHOD DESCRIPTION 1. PROCUREMENT OF APPARAWS 2. CALIBRATION OF APPARAmS 3. PRESAMPLmG OPERATIONS 4. ON-SITE MEASUREMENTS 5. POSTSAMPLING OPERATIONS 6. CALCULATIONS 8. AUDITING PROCEDm AND SUPPLIES 7. MAINTENANCE 9. RECOMMENDED STANDARDS FOR FSTABLISHING TRACEABILITY 10. REFERENCE MEI'HODS 11. ReFERENcEs ' 12. DATA FORMS Number Documentation of Pages 3 3.16 3.16 19 3.16.1 3.16.2 3.16.3 3.16.4 3.16.5 3.16.6 3.16.7 3.16.8 3.16.9 16 15 44 33 39 6 3 8 1 22 3.16.10 5 3.16.11 21 3.16.12
-
Upload
khangminh22 -
Category
Documents
-
view
0 -
download
0
Transcript of 4. ON-SITE MEASUREMENTS - US Environmental Protection ...
Section No. 3.16 D a t e June 30, 1988 Page 1
\ I
Section 3-16
METHOD 18 -- MEASUREMENT OF GASEOUS ORGANIC COMPOUND EMISSIONS BY G A S CHROMATOGRAPHY
Section
SUMMARY MEXHOD H I M L I m
METHOD DESCRIPTION 1. PROCUREMENT OF APPARAWS
2. CALIBRATION OF APPARAmS
3. PRESAMPLmG OPERATIONS
4. ON-SITE MEASUREMENTS 5. POSTSAMPLING OPERATIONS 6. CALCULATIONS
8 . AUDITING P R O C E D m
AND SUPPLIES
7. MAINTENANCE
9 . RECOMMENDED STANDARDS FOR FSTABLISHING TRACEABILITY
10. REFERENCE MEI'HODS 11. ReFERENcEs
' 12. DATA FORMS
Number D o c u m e n t a t i o n of Pages
3 3.16 3.16 19
3.16.1
3.16.2 3.16.3 3.16.4 3.16.5 3.16.6 3.16.7 3.16.8
3.16.9
16
15 44 33 39 6 3 8
1
22 3.16.10 5 3.16.11
21 3.16.12
US EPA EMC
The Federal Register Version Presented was published with this Report but has been supeceded. Users should use the most recent version of EPA Method 18 rather than the method presented.
Section N o . 3.16 Date June 30, 1988 Page 2
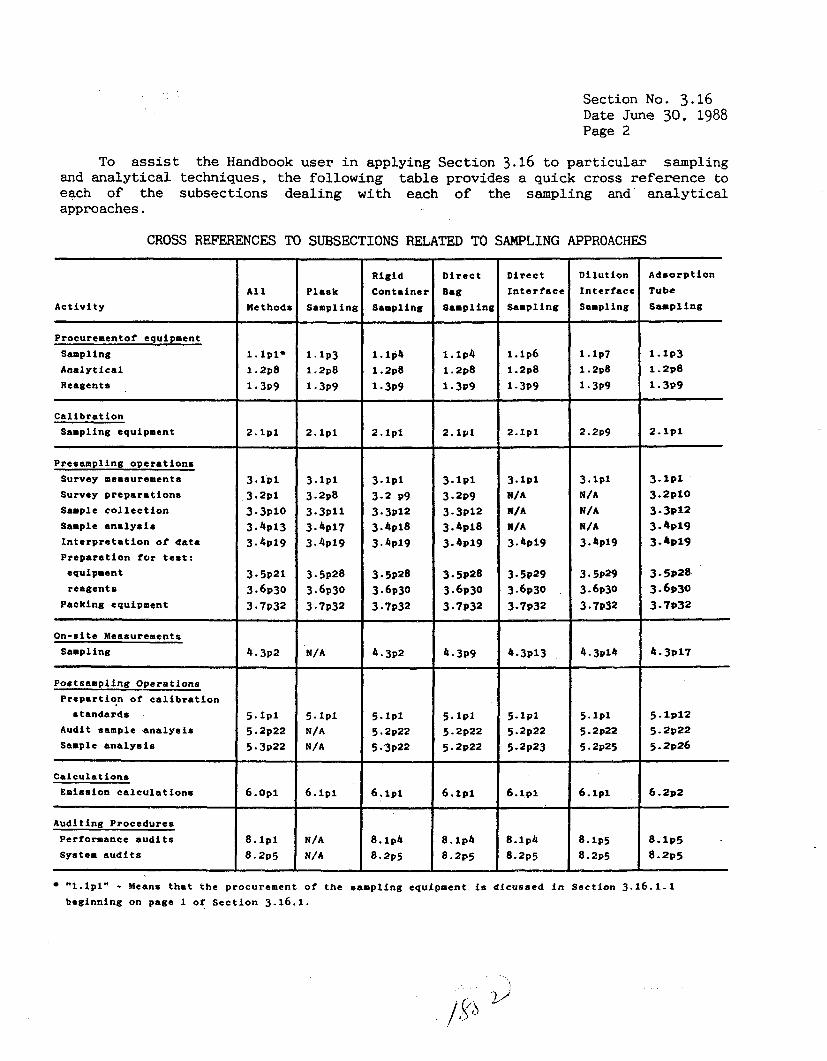
To assist the Handbook u s e r i n applying Sec t ion 3.16 to p a r t i c u l a r sampling and a n a l y t i c a l techniques, t h e fol lowing t a b l e provides a quick cross reference to each of t he subsec t ions dea l ing wi th each of the sampling and a n a l y t i c a l approaches.
CROSS REFERENCES TO SUBSECTIONS RELATED TO SAMPLING APPROACHES
Adsorption
Sampling Tube
Rigid Con taine I
Sampling
Direct
Bag Sampl ins
Direct Interface Sampling
Dilution Interface Sampling
A1 1 Methods
Flask Sampling Activity
Procurementof equipment Sampling Analytical Reagents ,
1.116 1.2~8
1 - 3P9
l.lP7 1.2~8
1 3P9
1 - lP3 1 . 2 ~ 8 1 - 3P9
l.lpl* 1 . 2 ~ 8
1 * 3P9
Calibration Sampling equipment 2.lPl 2.lp1 2.lpl 2. lpl 2.lyl 2.lpl
Presampling operation6 Survey meaeurementa Survey preparations Sample coll cc tion
Interpretation of data
Preparation for t e ~ t :
Sample analy6i6
equipment reagent ti
Packing equipment
3-lPl 3.2~10
3.4~19 3.4~19
3.5~28 3.6~30
3-3P12
3 - 7P32 On-6fte Measurements Sampling 4.3P9 4.3~13 4.3~17
Postsampling Operations Prepartiqn of calibration
Audit sample analysis Sample analy~is
6tandard6 5 - lpl2 5.2p22 5.2~26
5.1Pl 5.2p22 5.2~22
~
6.1~1 Calculations Emi6sion calculations 6.2~2 6 . 0 ~ 1 6 . 1 ~ 1 6 . 1 ~ 1 6.1~1
8.1~4
8 - 2 ~ 5
Auditing Procedures Performance audits System audits
8 . 1 ~ 4
8 * 2P5
"l.lpl" - Means that the procurement of the sampling equipment is dicussed in Section 3.16.1-1 beginning on page 1 of Section 3.16.1.
Section No. 3.16 Date June 30, 1988 Page 3
SUMMARY Method 18 is a generic method for measuring gaseous organic compounds. The
method is based on separating the major gaseous organic components of a gas mixture with a gas chromatograph (GC) and measuring the separated components with a su i tab le detector. The gas samples are analyzed immediately as taken from the stack or within a set period of t i m e a f t e r being collected i n a Tedlar bag or on an adsorption tube.
To identify and quantify the major components, the retention t i m e s of each separated component are compared.' with those of known compounds under identical conditions. Therefore, the analyst must ident i fy approximate concentrations of t h e organic emission components beforehand. With t h i s information, the analyst can then prepare or purchase commercially available standard mixtures t o calibrate the GC under physical conditions ident ical t o those tha t w i l l be used f o r the samples. The analyst must a l so have some presurvey information concerning interferences a r i s ing from other compounds present and indicating the need for sample dilution to avoid detector saturat ion, gas stream f i l t r a t i o n t o eliminate par t icu la te matter. and prevention of sample loss i n moisture condensation i n the sampling apparatus.
This method is structured t o analyze approximately 90 percent of the t o t a l gaseous organics emitted from an indus t r ia l source. It does not include techniques t o ident i fy and m e a s u r e trace amounts of organic compounds, such as those found in building air and fugi t ive emission sources.
This method w i l l not determine cdmpounds tha t 1) are polymeric (high molecular weight), 2) polymerize before analysis, or 3) have very low vapor pressures at stack or instrument conditions.
method is from about 1 part per million (ppm)" t o the upper , l i m i t governed by GC detector saturation or column overloading. The upper l i m i t can be extended by d i lu t ing the stack gases with an i n e r t gas or by using smaller gas sampling loops. The sens i t iv i ty l i m i t for a compound is defined as the minimum detectable concentration of t ha t compound, or the concentration t h a t produces a signal-to-noise r a t i o of three t o one. The minimum detectable concentration and l i m i t of quantitation are determined during the presurvey cal ibrat ion for each compound.
The method descriptions given herein are based on the method' *2 promulgated October 8, 1983, and on corrections and additions published on May 30. 1984 (Section 3.16.10). t o the method were promulgated February 19, 1987 and these are also described. ' Blank foms for recording data are p'rovided i n the Method Highlights and i n Section 3.3.12 f o r the convenience of Handbook users.
The range of t h i s
Revis'ons
I , *Note: Selective detectors m a y allow detection and quantitation of f a r smaller concentrations of c e r t d types of gaseous organic compounds.
Section No. 3.16 Date June 30. I988 Page 4
METHOD HIGHLIGHTS Section 3.16 describes procedures and specifications for determining gaseous
organic compounds from stationary sources. A gas sample is extracted from the stack a t a rate proportional t o the stack velocity using one of four techniques: (1) integrated bag sampling, (2) d i rec t interface sampling, (3) dilution interface sampling, and (4) adsorption tube sampling. For the first three techniques, the sample or diluted sample is introduced direct ly in to the sample loop of the gas chromatograph (a). The measured sample is then carried in to the GC column with a carrier gas where the organic compounds are separated. The organic compounds then are each measured quant i ta t ively by the GC detector. The qual i ta t ive analysis is made by comparing the retention times ( f r o m injection t o detection) of known standards t o the retention t i m e s of the sample compounds. Once sample cospounds are ident i f ied, quant i ta t ive analysis is made by comparing the detector response f o r the sample compound to a known quantity of corresponding standard. Gas samples collected on adsorption tubes are desorbed f r o m the adsorption m e d i a using a solvent. A measured volume of the desorption solution is injected into a heated injection port where the mixture vaporizes and is carried in to the GC column with a carrier gas. The sample is separated in to the individual components. then quali tatively and quant i ta t ively analyzed i n the same manner as a gas sample.
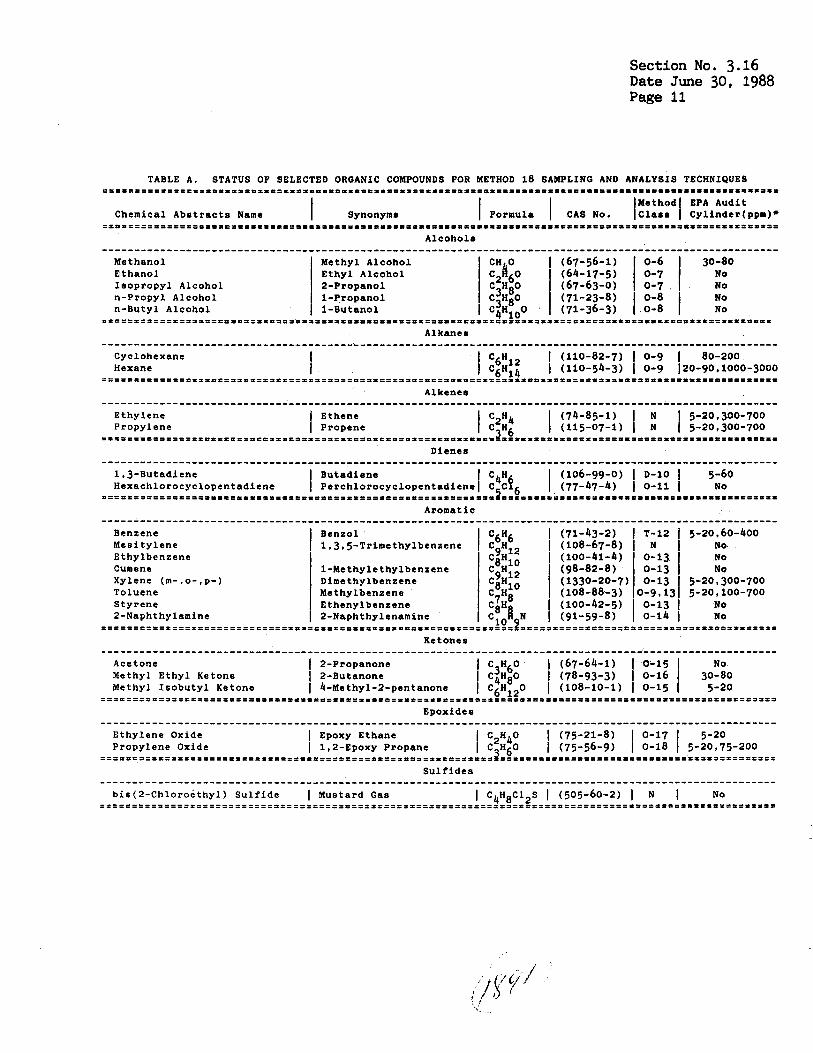
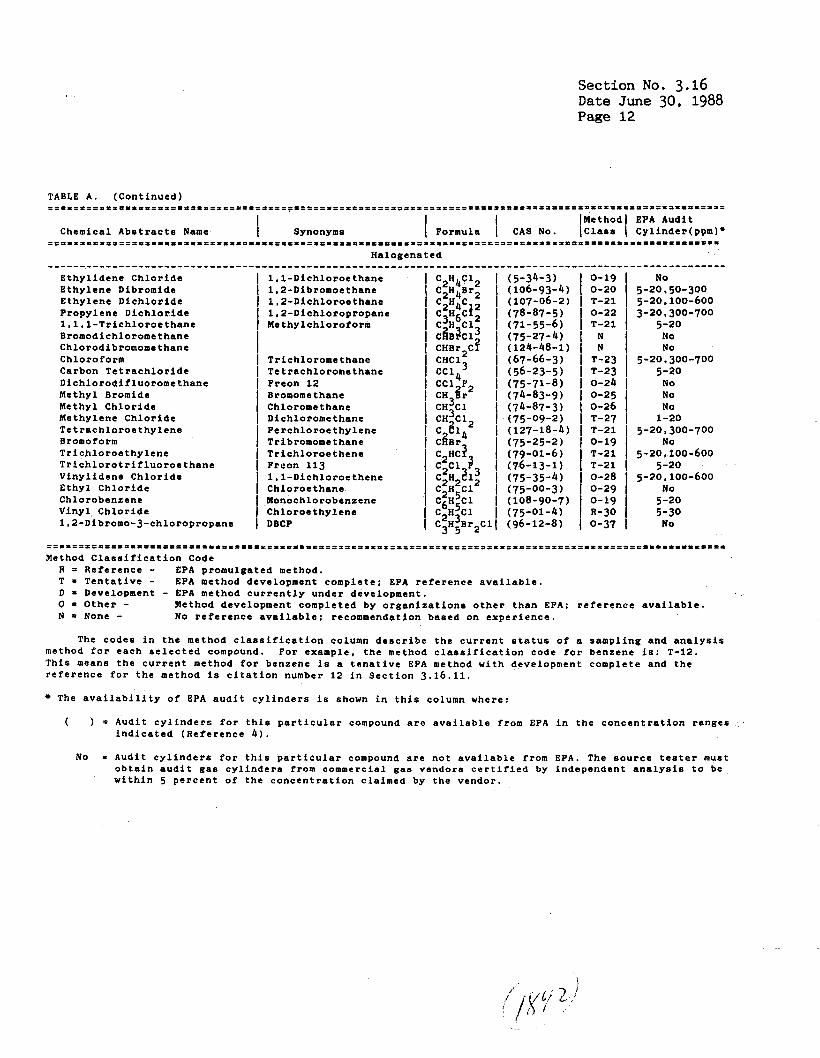
Because of the number of d i f fe ren t combinations of sampling, sample prepar- ation, cal ibrat ion procedures* GC column materials and operating procedures. and GC detectors covered under this m e t h o d , a set of tables (appearing at the end of the Method Highlights section) has been developed t o assist the tester in selecting and the test observer in approving an acceptable sampling and analytical technique. The compounds listed i n these tables w e r e selected based on their current status as either presently regulated or being evaluated f o r future regulations by €PA and state and loca l agencies. Table A l i a t s selected organic compound8 f o r Method 18 and provides the user with: (1) the Chemical Abstracts (CA) name. any synonyrs. the chemical formula, the Chemical Absteacts Service (CAS) number: (2) method classif icat ion and corresponding references for more4information: and (3) whether EPA currently has an audi t cylinder f o r th i s compound.
For a given compound, the sampling and analytical techniques described i n Tables B, C, D and E &re classified in Table A (Status of Selected Organic Compounds for Method 18 Sampling and Analysis Techniques) i n t o one of f i v e classes as follows:
1. Reference (R). This is a method promulgated by EPA as the compliance test method for one or more EPA emission regulations.
2. Tentative (TI. This is a method where EPA m e t h o d development is completed and documented, but the method has not been promulgated.
3. Development ( D ) . This is a method currently under development by EPA. 4. Other (0). This is a method developed and documented by an organization
other than EPA. 5. None (N) . This is a method tha t has not been developed or val ida ted but
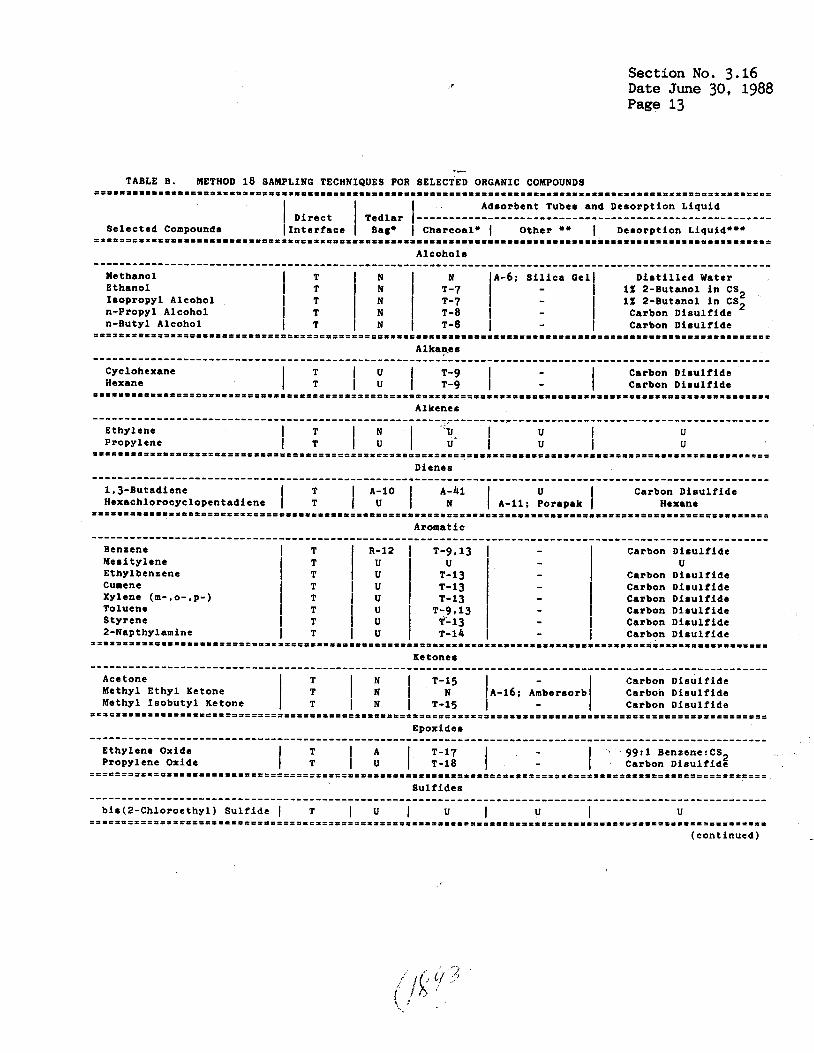
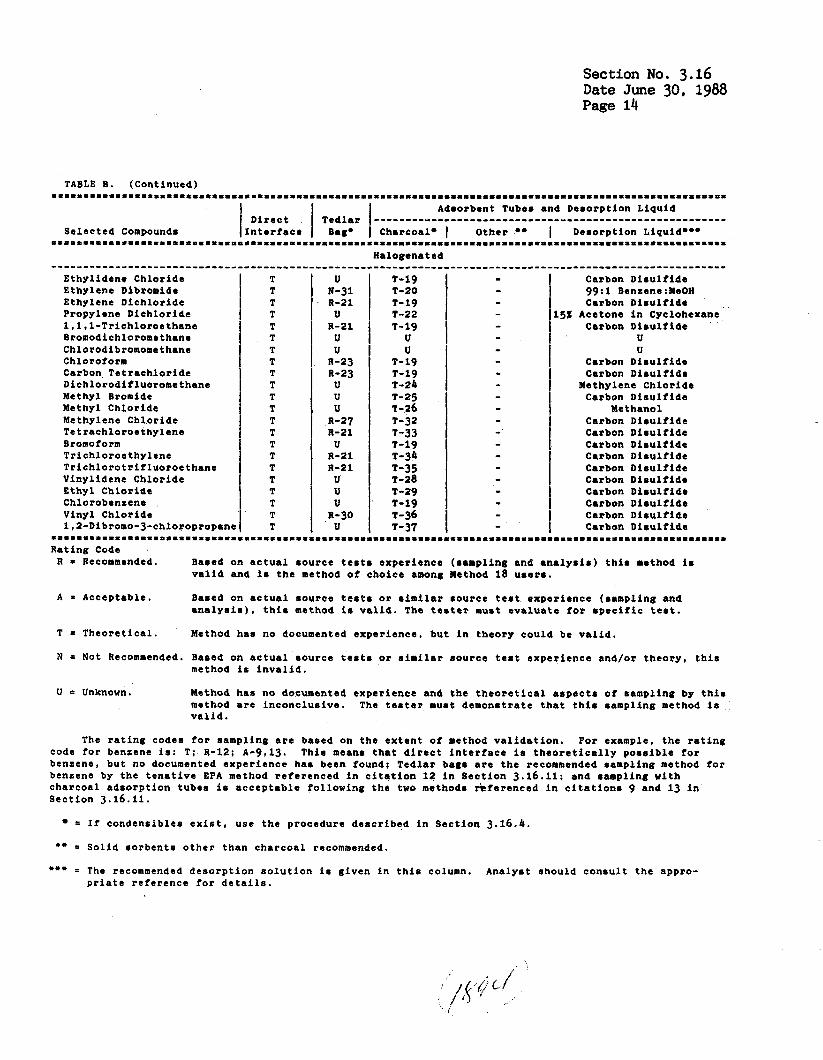
should work based on experience with s i m i l a r s i tuat ions. Table B shows a l l the sampling techniques described in Method 18. For each
compound, each of the allowed sampling techniques is rated either: (1) reammend- ed, (2) acceptable, (3) theoret ical , (4) not recommended, or (5) unknown. The ra t ing codes for sampling are based on the extent of method validation. A p a r t i c u - l a r Where EPA meth- odology does not ex i s t , methodology provided by organizations other than the EPA is used fo r rating. A s an example on how to use Table B, the r a t i n g for benzene is N T I t fo r direct interface, "R-12" for Tedlar bags, and "A-9,13" w i t h carbon disul-
sampling technique is rated based on current EPA methodology.
Section No. 3.16 Date June 30, 1988 Page 5
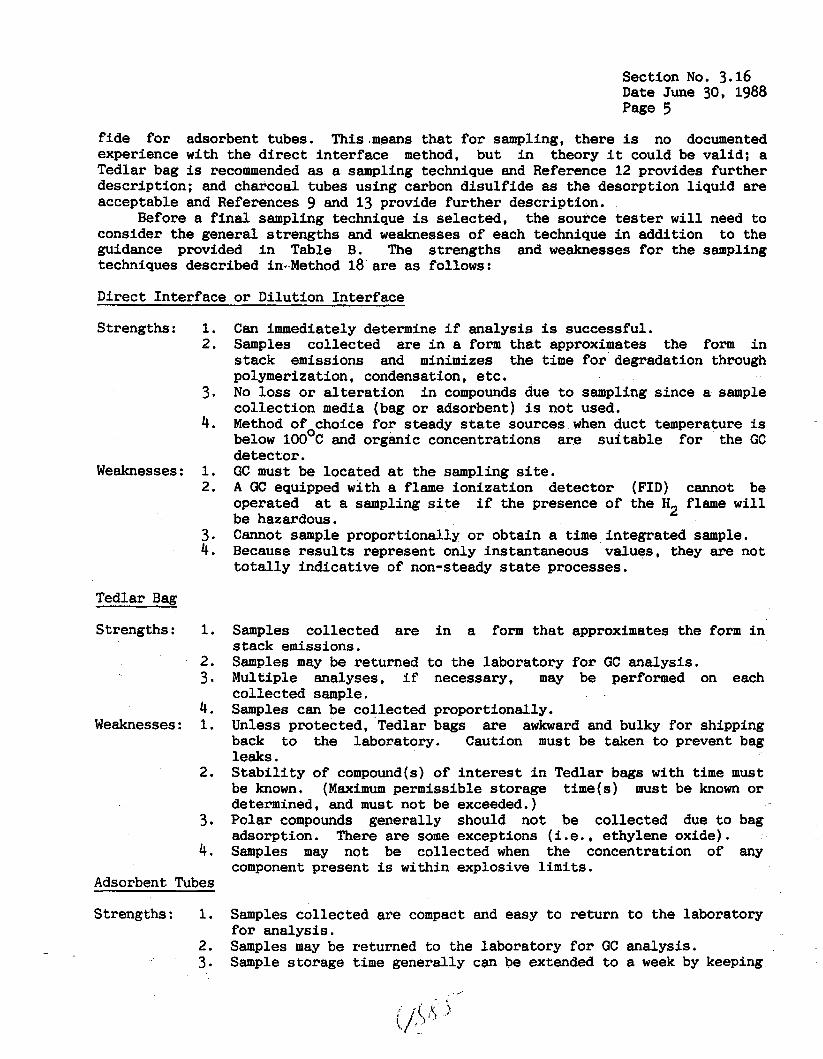
f ide for adsorbent tubes. This,means that for sampling, there is no documented experience with the direct in t e r f ace method, but i n theory i t could be val id; a Tedlar bag is recommended as a sampling technique and Reference 12 provides f u r t h e r description; and charcoal tubes using carbon d i su l f ide as the desorption l iqu id are acceptable and References 9 and 13 provide fu r the r description.
the source tester w i l l need t o consider the general s t rengths and weaknesses of each technique i n addition t o the guidance provided i n Table B. The strengths and weaknesses f o r the sampling techniques described in-.Method 18 are as follows:
Before a f i n a l sampling technique is selected,
Direct In te r face o r Dilution In te r face
Strengths: 1. 2.
3.
4.
Weaknesses: 1. 2.
3. 4 .
Tedlar Bag
Strengths: 1.
2. 3 .
4. Weaknesses: 1.
2.
3.
4.
Adsorbent Tubes
Strengths : 1.
2. 3 .
C a n immediately determine i f analysis is successful. Samples col lected are i n a form that approximates the form i n stack emissions and minimizes the time f o r degradation through polymerization, condensation, etc. No loss or a l t e r a t i o n i n compounds due to sampling s ince a sample col lec t ion media (bag or adsorbent) is not used. Method ofochoice for steady state sources when duct temperature is below 100 C and organic concentrations are su i t ab le f o r the GC detector . GC must be located a t the sampling site. A GC equipped with a flame ionizat ion detector (FID) cannot be operated a t a sampling site i f the presence of the H2 flame w i l l be hazardous. Cannot sample proportionally or obtain a time integrated sample. Because r e s u l t s represent only instantaneous values, they are not t o t a l l y ind ica t ive of non-steady state processes.
Samples collected are i n a form t h a t approximates the form i n stack emissions. Samples may be returned to the laboratory for GC analysis. Multiple analyses, i f necessary, may be performed on each col lected sample. Samples can be col lected proportionally. Unless protected, Tedlar bags are awkward and bulky f o r shipping back to the laboratory. Caution must be taken t o prevent bag leaks. S t a b i l i t y of compound(s) of i n t e r e s t i n Tedlar bags with time must be known. ( M a x i m u m permissible storage time(s) must be known o r determined, and must not be exceeded.) Polar compounds generally should not be collected due t o bag adsorption. There are some exceptions (i.e., ethylene oxide). Samples may not be col lected when the concentration of any component present is within explosive l i m i t s .
Samples col lected are compact and easy t o re turn for analysis. Samples may be returned t o the laboratory f o r GC Sample s torage t i m e generally can be extended to
t o the laboratory
analysis. a week by keeping
,

Weaknesses: 1.
2.
3.
4.
5.
Section No. 3.16 Date June 30, 1988 Page 6
samples a t O°C. However, the migration of the col lected com- pound(s) through the charcoal t o the backup portion may be a problem. Quant i ta t ive recovery percentage of each organic compound from the adsorbent material must be known. Breakthrough sample gas volume f o r organic compounds as present i n the source matrix must be known f o r the adsorbent material. Any e f f e c t of moisture ( i n the s tack gas) on the adsorbent material co l lec t ion capacity must be known. Moisture i n the sample above 2 t o 3 percent may severely reduce the adsorptive capacity . Qenerally, samples can be collected conveniently only a t a constant rate. Samples must be returned t o the l ab f o r analysis.
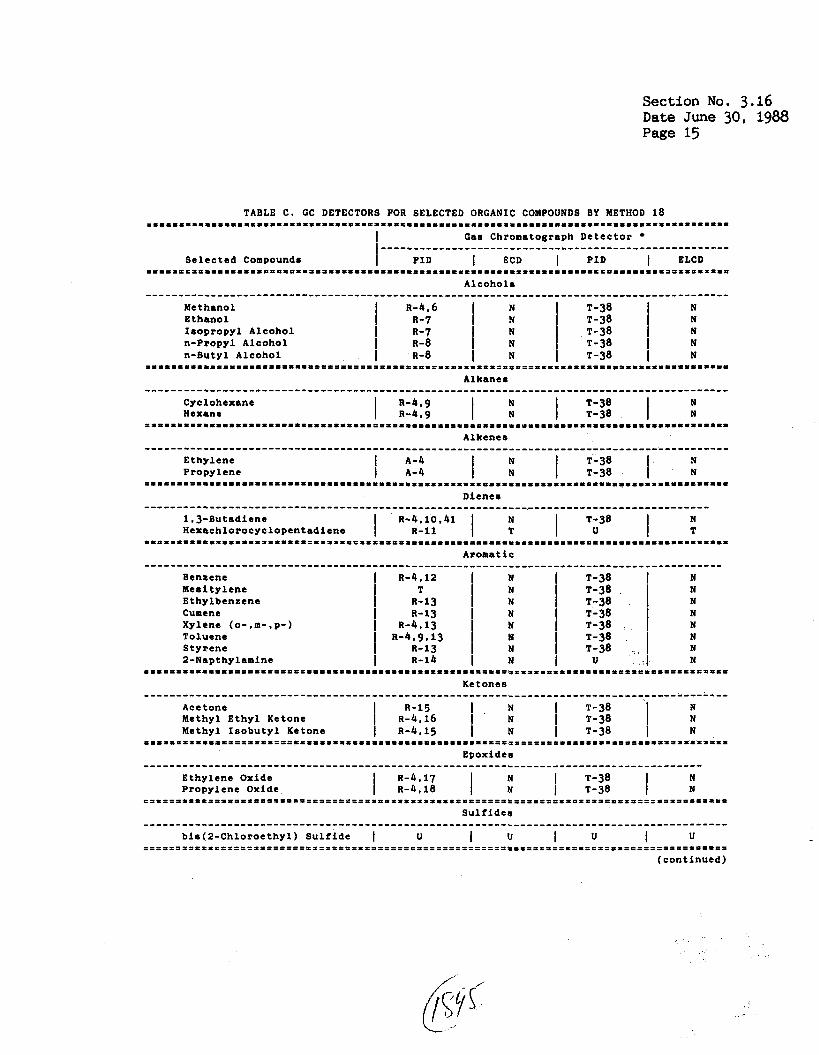
Table C lists the recommended GC detectors commonly used with Method 18. For each compound, each GC detector is rated e i ther : R - recommended, A - acceptable, T - theoret ical , N - not recommended, or U - unknown. A par t i cu la r GC detector is rated based on current EPA methodology. Where EPA methodology does not e x i s t , methodology provided by organizations other than the EPA is used f o r ra t ing. A s an example on how t o use Table C, the r a t ing f o r benzene is "R-4,12" f o r a flame ionization detector (FID), "N" for an electron capture detector (ECD), "T-38" fo r a photoionization detector (PID), and "N" f o r an e l e c t r o l y t i c conductivity detector (ELCD) . This means an FID is recommended as the GC detector and References 4 and 12 provide fur ther description, an ECD and an ELCD are not recommended, and there is no documented experience with a PID f o r benzene, but i ts use is theoret ical ly possible based on the ionizat ion potent ia l found i n Reference 38.
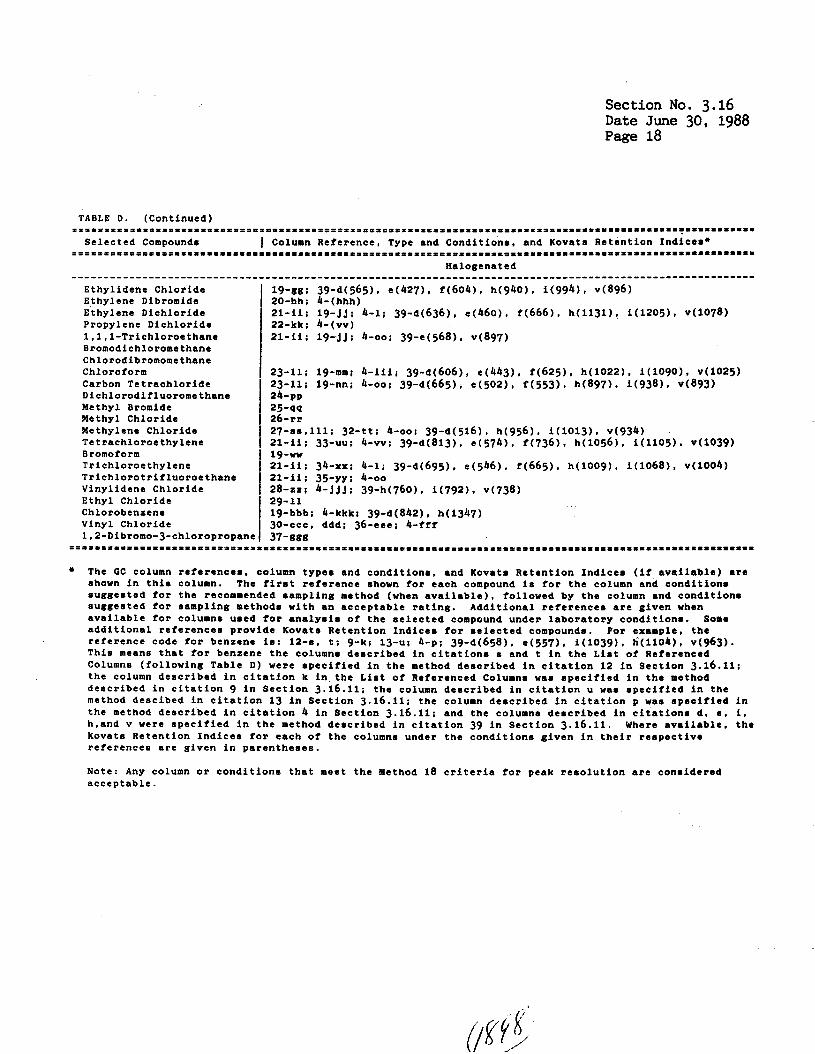
Table D presents information on packed columns su i t ab le f o r GC analysis of the selected compounds. Items covered include column type and conditions, Kovats Retention Indices (KRI's), i f avai lable , and associated l i t e r a t u r e references. The recommended column appears first, the others are acceptable. Specif ical ly , any column or condition tha t meets the Method 18 criteria f o r peak resolution is considered acceptable. A par t icu lar GC column is recommended based on current EPA methodology: where EPA methodology does not e x i s t , methodology provided by organizations o ther than the P A is used for ra t ing. Kovats Retention Indices were previously used to ident i fy unknown compounds by comparison of the measured KRI(s) f o r a compound t o catalogued KRI's f o r the various columns. I n performing Method 18, KRI's can be useful i n se lec t ing a GC column which w i l l e f fec t ive ly separate two (or more) target compounds and/or in te r fe ren ts i n an air sample. I n Table D , the first number shown f o r each compound r e fe r s to the l i t e r a t u r e reference f o r the column and column conditions suggested fo r the recommended sampling method (when ava i lab le) ; the letter(s) associated with t h i s number cross-references the L i s t of Referenced Columns following Table D. Listed next f o r each compound are the columns and conditions suggested f o r sampling methods with an acceptable rating: additional references are provided f o r columns used f o r analysis of t h e selected compounds under laboratory conditions. Supplementary references provide KRI's ( i n parentheses) f o r ce r t a in compounds. As an example of how to use Table D , the entry for benzene is "12-9, t; 9-k; 13-11: 4-p; 39-d(658), e(557). i(1039). h(1104). v(963)." This means t h a t the column described in c i t a t ions s and t i n the Table D L i s t of Referenced Columns was specif ied i n the method described i n Reference 12: the column described i n c i t a t i o n k i n the L i s t of Referenced Columns was specified i n the method described i n Reference 9; the column described i n c i t a t ion u i n the L i s t was specif ied i n the method described i n Reference 13; the column described i n c i t a t i o n p i n the L i s t was specified i n the method described i n Reference 4: and
~~
Section No. 3.16 Date June 30, 1988 Page 7
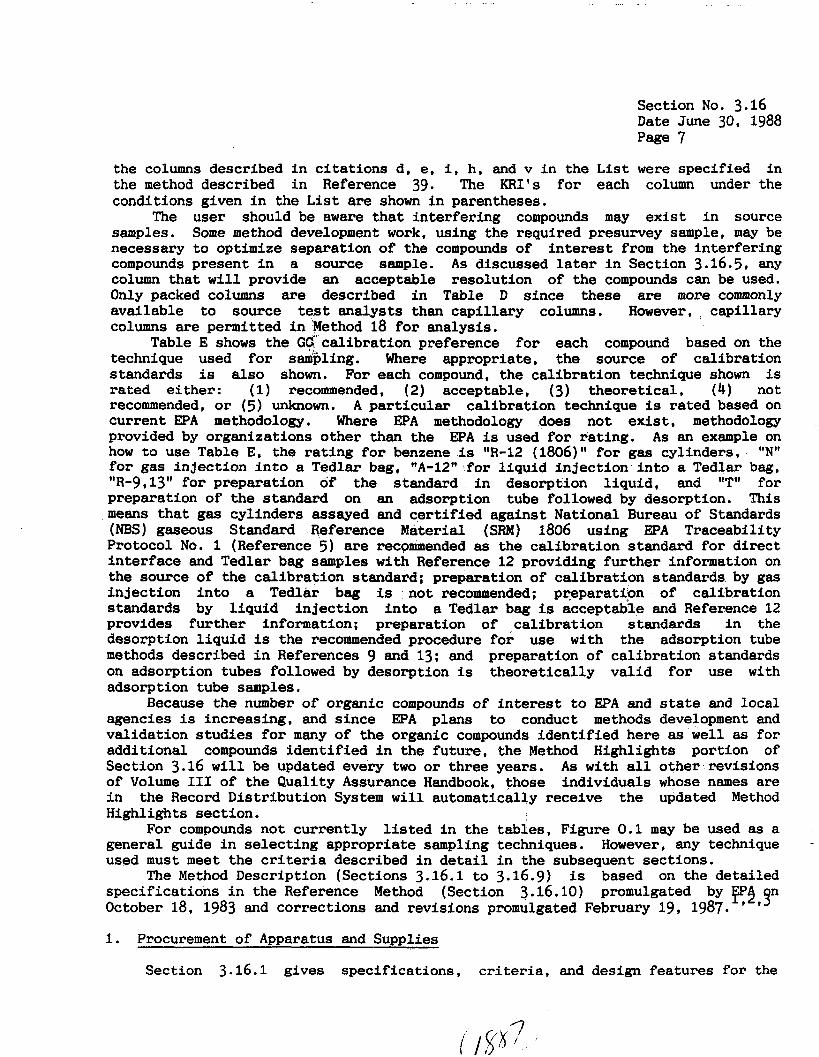
the columns described i n c i ta t ions d, e, i, h, and v i n the L i s t the method described i n Reference 39. The KRI's fo r each conditions given i n the L i s t are shown i n parentheses.
The user should be aware tha t interfering compounds may
were specified i n column under the
ex is t i n source samples. Some method development work, using the required presurvey sample, may be necessary t o optimize separation of the compounds of i n t e re s t from the interfering compounds present i n a source sample. A s discussed later i n Section 3.16.5, any column that w i l l provide an acceptable resolution of the compounds can be used. Only packed columns are described i n Table D since these are more commonly available t o source test analysts than capi l lary columns. However, . capillary columns are permitted i n Method 18 fo r analysis.
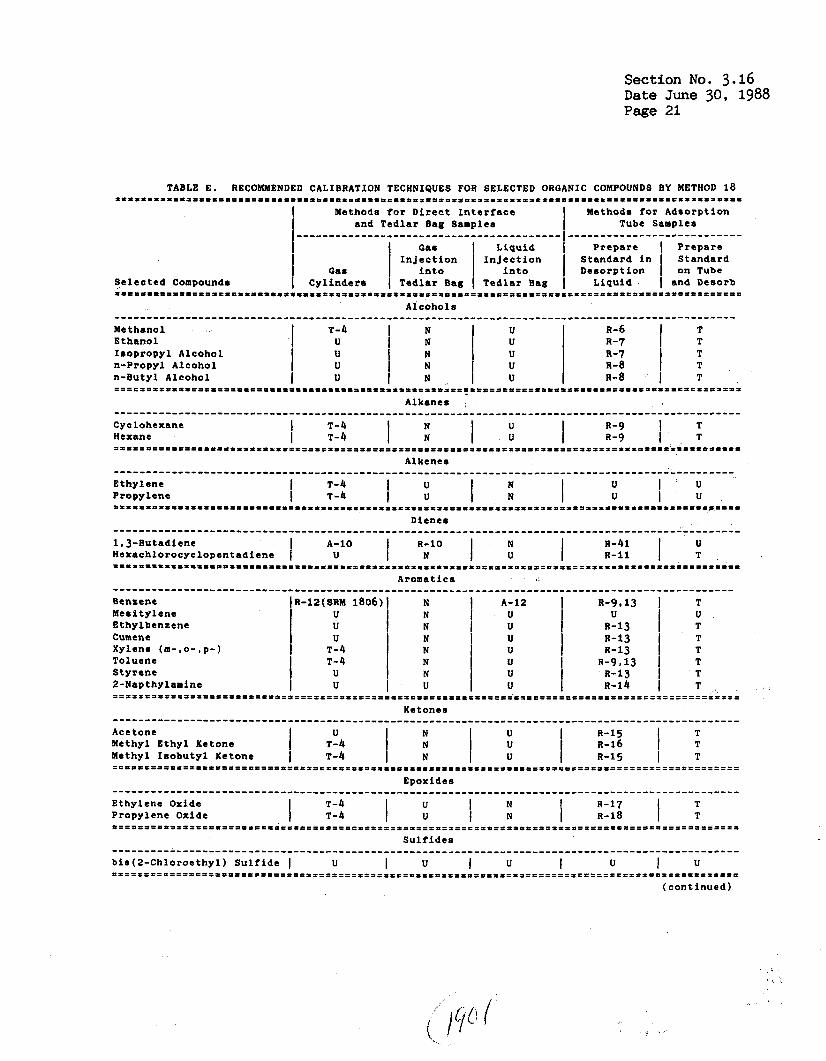
Table E shows the Gd cal ibrat ion preference fo r each compound based on the technique used f o r sampling. Where appropriate, the source of calibration standards is also shown. For each compound, the cal ibrat ion technique shown is rated either: (1) recommended, (2) acceptable, (3) theoret ical , (4) not recommended, or (5) unknown. A par t icular calibration technique is rated based on current EPA methodology. Where EPA methodology does not ex i s t , methodology provided by organizations other than the As an example on how t o use Table E, the ra t ing f o r benzene is "R-12 (1806)" for gas cylinders, "N" for gas injection i n t o a Ted la r bag, "A-12" for l iquid inject ion in to a Tedlar bag, "R-9,13" for preparation of the standard i n desorption l iqu id , and "T" for Preparation of the standard on an adsorption tube followed by desorption. This means t h a t gas cylinders assayed and ce r t i f i ed against National Bureau of Standards (NBS) gaseous Standard Reference Material (SRM) 1806 using EPA Traceability Protocol No. 1 (Reference 5) are recommended as the cal ibrat ion standard for direct interface and Tedlar bag samples with Reference 12 providing fur ther information on the source of the cal ibrat ion standard: preparation of cal ibrat ion standards by gas inject ion i n t o a Tedlar bag is not recommended; pFparati,on of calibration standards by l iquid inject ion i n t o a Tedlar bag is acceptable and Reference 12 provides fur ther information; preparation of cal ibrat ion standards i n the desorption l iqu id is the recommended procedure for use with the adsorption tube methods described i n References 9 and 13; and preparation of cal ibrat ion standards on adsorption tubes followed by desorption is theoretically val id for use with adsorption tube samples.
Because the number of organic compounds of i n t e re s t to FPA and state and local agencies is increasing, and since EPA plans t o conduct methods development and validation s tudies f o r many of the organic compounds ident i f ied here as w e l l as for additional compounds ident i f ied i n the f u t u r e , the Method Highlights portion of Section 3.16 w i l l be updated every two or three years. As with a l l other revisions of Volume I11 of the Quality Assurance Handbook, those individuals whose names are i n the Record Distribution System w i l l automatically receive the updated Method Highlights section.
listed i n the tables, Figure 0.1 may be used as a general guide i n select ing appropriate sampling techniques. However, any technique used must meet the cri teria described i n de t a i l i n the subsequent sections.
The Method Description (Sections 3.16.1 t o 3.16.9) is based on the detailed specifications i n the Reference Method (Section 3.16.10) promulgated by F9 '3" October 18, 1983 and corrections and revisions promulgated February 19, 1987. ' '
EPA is used fo r rating.
For compounds not currently
1. Procurement of Apparatus and Supplies
Section 3.16.1 gives specifications, criteria, and design features for the
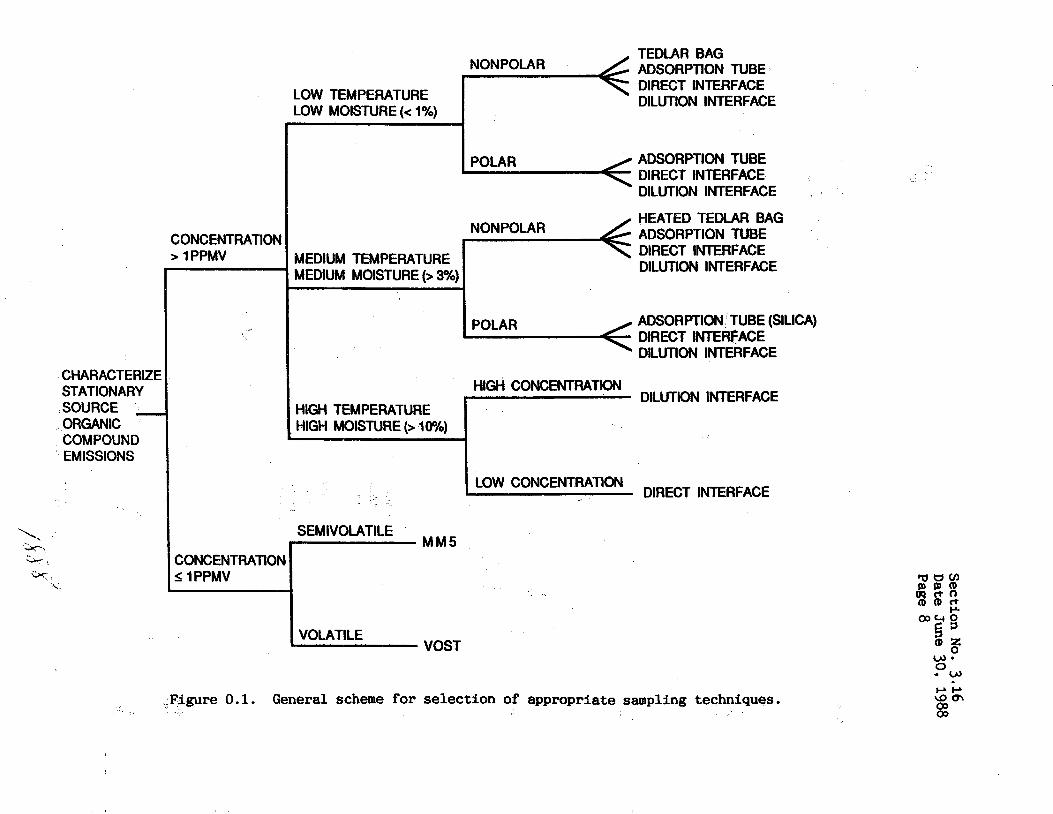
CHARACTERIZE STATIONARY SOURCE - ORGANIC COMPOUND EMISSIONS
CONCENTRATION > 1PPMV
TEDLAR BAG ADSORPTION TUBE DIRECT INTERFACE
LOW TEMPERATURE DILUTION INTERFACE LOW MOISTURE (< 1Yo)
MEDIUM TEMPERATURE MEDIUM MOISTURE (> 3?!0)
ADSORPTION TUBE DIRECT INTERFACE DILUTION INTERFACE , NONPOLAR
6 HEATED TEDLAR BAG ADSORPTION TUBE DIRECT INTERFACE - DILUTION INTERFACE I
I ADSORPTION TUBE (SILICA) DIRECT INTERFACE DILUTION INTE~FACE
HlGH CONCENTRATloN DILUTION INTERFACE HIGH TEMPERATURE 7 HIGH MOETURE (> loo/)
____I I Low CoNCENTRATION DIRECT INTERFACE
SEMIVOLATILE IM
CONCENTRATION S 1PPMV
VOLATILE VOST
W ’
PW P P \Dm 03 03
Figure 0.1. General scheme for selection of appropriate sampling techniques.
Section No. 3.16 Date June 30, 1988 Page 9
required equipment and materials. is divided according to the different sampling approaches. This section can be used as a guide for procurement and initial checks of equipment and supplies. The activity matrix (Table 1.1) at the end of the section is a summary of the details given in the text and can be used as a quick reference.
The sampling apparatus for Method 18
2. Presampling Preparations
Section 3.16.2 describes the required calibration procedures for the Method 18 sampling equipment. Section 3.16.3 describes the presampling operations and the acquisition of supplies and equipment Preliminary survey sampling is discussed, including a description of,classes of organic compounds and the presurvey sampling techniques that are generally used to obtain a sample for evaluation purposes. The presurvey sampling and analytical methods are then described. Finally, how to select the proper sampling and analytical equipment based on the presurvey data is discussed. The preliminary survey and presampling preparation forms (Figures 3.2 and 3.5 of Section 3.16.3) can be used as equipment checklists. Suggestions for packing the equipment and supplies for shipping are given to help minimize breakage and reduce contamination.
Activity matrices for the calibratfon of equipment and the presampling operations (Tables 2.1 and 3.1) summarize the activities detailed in the text.
needed for the sampling.
3. On-Site Measurements
Section 3.16.4 describes several sampling techniques. The use of the presur- vey sample analyses and the sampling matrix tables (Tables A through E) provides the user with the required information to select the proper sampling technique. A checklist (Figure 4.8) is an easy reference for field personnel to use in all sampling activities. Sampling and analyses using the direct interface and the dilution interface methods are both conducted on-site; however, to provide for greater consistency of presentation, the analytical procedures are presented in the Posttest Operations Section with those for the other sampling techniques.
4. Posttest Operations
Section 3.16.5 describes the analytical procedures and the posttest activities for checking the equipment. The initial dalytical procedure of sample preparation is shown based on the sampling technique used and includes the procedures for preparation of the calibration standards. The second procedure discussed is the method of introducing a known volume of sample into the GC and this is followed by a discussion of GC operations. The detailed analytical procedures can be removed for use as an easy reference in the laboratory. An activity matrix (Table 5.1) summarizes the postsampling Operations.
Section 3.16.6 describes calculations, nomenclature, and significant digits for the data reduction. A programmed calculator is recommended to reduce calculation errors.
Section 3.16.7 recommends routine and preventive maintenance programs. The programs are not required, but their use should reduce equipment downtime.
5 . Auditing Procedures
Section 3.16.8 describes performance and system audits. Performance audits for both the analytical phase and the dagp processing are described. A checklist
Section No. 3.16 Date June 30, 1988 Page 10
(Figure 8.2) outlines a system audit .
calibration standards should be traceable.
6. References
Section 3.16.9 lists t h e primary standards t o which the working standards or
Section 3.16.10 contains the promulgated Method; Section 3.16.11 contains the references used throughout t h i s text ; and Section 3.16.12 lists a l l the data forms i n Section 3.16 and contains copies of blank data forms f o r those shown completed i n the text. These may be removed from the Handbook, copied, and used i n performing the method. Each form has a sub t i t l e [e.g., M18-2.5 (Figure 2.5)] to assist the user i n locating the same completed form in the text. Several checklists t h i s section.
are not completed i n the text and and therefore not reproduced i n
. .
Section No. 3.16 Date June 30, 1988 Page 11
Benzene Mesitylene Ethylbenzene Cunene Xylene (m-,o-,p-) Toluene Styrene 2-Naphthylamine
I = t l a = = = l = ~ = = = = E D I I = = = L l f P I
Benzol I (71-43-2) T-12 5-20.60-400 1,3,5-Trimethylbenzene I C C6H6 H I (108-67-8) I N I No
C9H12 I (100-41-4) No 1-Methylethylbenzene I C8H10 1 (98-82-8) 1 ~~~~ 1 No Dimethylbenzene CtH:; (1330-20-7) 0-13 5-20,300-700
(100-42-5) 0-13 1 No Methylbenzene Ethenylbentene 2-Naphthylenamine I E8HW N I (91-59-8) I 0-14 I NO
(108-88-3) 0-9,iSl 5-20,100-700 I ‘TH8 E t I = 5 D = I3 = = tl I == = I= P 5 3 5 = i 5 e =%?a I I = = === I = f ===== t 3 31 ==a === I E a i u a f a = = = I i a
Ketones
Section No. 3.16
Page 12 Date J U ~ S 30, 1988
Ethylidene Chloride I 1.1-Dichloroethane Ethylene Dibromide I 1.2-Dibromoethane Ethylene Dichloride I 1,2-Dichloroethane Propylene Dichloride I 1,2-Dichloropropane 1,l.l-Trichloroethane , Methylchloroform Bromodichloromethane Chlorodibromomethane Chloroform I Trichloromethane Carbon Tetrachloride I Tetrachloromethane Dichlorodifluoromethane I Freon 12 Methyl Bromide I Bromomethane Methyl Chloride [ Chloromethane Methylene Chloride 1 Dichloromethane Tetrachloroethylene Perchloroethylene Bromoform , Tribromomethane Trichloroethylene Trichloroethene Trichlorotrifluoroethane Freon 113 Vinylidene Chloride I 1.1-Dichloroethene Ethyl Chloride Chloroethane Chlorobenzene Monochlorobenzene Vinyl Chloride Chloroethylene 1.2-Dibromo-3-chloropropane I DBCP
CHBr2Cf
3 CHCl
cc1 P CH38r2 CH-C1
CC14
CH3C12
C6Br C HC?
CzH2&: C H C1 C2H5Cl C6H5Cl
c Z14
c2c1 a
C2H3Br C1 3 5 2
(5-34-3) I 0-19 1 No (106-93-4) I 0-20 5-20,50-300 (107-06-2) I T-21 5-2O.100-600 (78-87-5) 0-22 I 3-20.300-700 (71-55-6) I T-21 I 5-20 (75-27-4) I N I No (124-48-1) I N I No
(56-23-5) I T-23 I 5-20 (75-71-8) I 0-24 I No (74-83-9) I 0-25 1 No
(67-66-3) I T-23 5-20.300-700
(74-87-3) 0-26 I NO f75-09-2) 1 T-27 I 1-20 (127-18-4) I T-21 I 5-20,300-700 (75-25-2) I 0-19 I No (79-01-6) T-21 I 5-20,100-600 (76-13-1) I T-21 [ 5-20 (75-35-4) I 0-28 1 5-20,100-600 (75-00-3) I 0-29 I No (108-90-7) 0-19 5-20 (75-01-4) 1 R-30 I 5-30 (96-12-8) I 0-37 ( NO
= I . I E I I S D I I ~ P I I I I I I I = = ~ ~ ~ ~ ~ = = ~ ~ ~ ~ ~ = = ~ ~ ~ ~ ~ ~ = = = = ~ ~ ~ = ~ = ~ = ~ = ~ = = ~ = ~ = = = = ~ = ~ ~ ~ = = ~ = ~ ~ ~ ~ = = = = = - = I = = = = ~ ~ = ~ = = - E P ~ = = = ~
Method Classification Code R = Reference - EPA promulgated method. T = Tentative - EPA method development complete; EPA reference available. D Development - EPA method currently under development. 0 = Other - Method development completed by organizations other than EPA; reference available. N = None - No reference available; recommendation based on experience.
The codes in the method classification column describe the current status of a sampling and analysis method f o r each selected compound. For example, the method classification code for benzene is: T-12. This means the current method for benzene is a tcnative EPA method with development complete and the reference f o r the method is citation number 12 in Section 3.16.11,
The availability of EPA audit cylinders is shown in this column where:
( ) = Audit cylinders for this particular compound are available from EPA in the concentration ranges indicated (Reference 4).
No = Audit cylinders for this particular compound are not available from EPA. The source tester must obtain audit gam cylinders from commercial gas vendors certified by independent analysis to be within 5 percent of the concentration claimed by the vendor.
Section No. 3.16 Date June 30, 1988 Page 13
A1 Coho16 ............................................................................. N A-6; Silica Gel I : 1 : :
I T I : Methanol Ethanol Ieopropyl Alcohol T n-Propyl Alcohol - n-Butyl Alcohol - 1 ::i 1 - -
........................... Diatflled Water
1% 2-Butanol in CS2 1% 2-Butanol in CS2 Carbon Disulfide Carbon Dirulfide
Section No. 3.16 Date June 30, 1988 Page 14
- - - - - - - - - - - - -
Carbon Diaulfide 15% Acetone in Cyclohexane
Carbon Diaulride U U
Carbon Dirulfide Carbon Diaulfide
Methylene Chloride Carbon Disulfide
Yet hanol Carbon Dioulfidc Carbon Diaulfide Carbon Diaulfide
T-19 T-20
T-22 T-19
U U
T-19
T-24
T-19
T-19
T-25 T-26 T-32
T-19 T-33
T-34 T-35 T-28
T-19 T-29
T-36 T-37
,=====*.===a
1,l.l-Trichloroethane Broaodichloromethane Chlorodibromomethane Chloroform Carbon Tetrachloride Dichlorodifluoromethane Methyl Bromide Methyl Chloride
f I R;21 T U T I R-23 T T T T I T3
R =
A =
T =
m .
u s
code
Bromof orm
Trichlorotrifluoroethane Trichloroethylene
Vinylidene Chloride Ethyl ChLorida Chlorobentene
Recommended. Baaed on actual source teata experience (rampling and analyaia) thia method is valid and ia the method of choice among Method 18 uaer6.
Acceptable. Baaed on actual aource teata or 8imllar source teat experience (sampling and analy8ia). this aethod io valid. The taatar must evaluate for apecific te8t.
Theoretical. Method haa no documented experience, but in theory could be valid.
Not Recommended. Baaed on actual source teat. or aimilar source te8t experience and/or theory, this method is invalid.
Unknown. Method has no documented experience and the theoretical napact6 of sampling by thia method are inconclusive. The teater muat demonatrate that thi8 aampling method is valid.
T U
T T 1 y: T T U T
The rating codes for sampling are based on the extent of method validation. For example, the rating for benzene is: T; R-12; A-9,13. This meana that direct interface is theoretically possible for
benzene, but no documented experience has been found: Tedlar bag. are the recommended sampling method for benzene by the tenative EPA method referenced in citation 12 in Section 3.16.11: and rampling with charcoal adsorption tubes i r acceptable following the two method. rbferenced in citation. 9 and 13 in Section 3.16.11.
= If condansibles exist, use the procedure deacribed in Section 3.16.4.
*. = Solid sorbenta other than charcoal recommended.
++, = The recommended desorption solution is given in this column. Analyst should consult the appro- priate reference for details.
Section No. 3.16 Date June 30, 1988 Page 15

Section No. 3.16 Date June 30, 1988 Page 16
I I I I
I I I
Ethylidene Chloride Ethylene Dibromide Ethylene Dichloride Propylene Dichloride l.l,l-Trichloroethane Bromodichloromethane Chlorodibromomethane I Chloroform I
I Methyl Chloride I Methylene Chloride I Tetrachloroethylene I
Carbon Tetrachloride Dichlorodifluoromethane Methyl Bromide
0 romo f orm Trichloroethylene Trichlorotrifluoroethane Vinylidene Chloride Ethyl Chloride Chlorobenzene Vinyl Chloride 1.2-Dibromo-3-chloropropane
R-19 A-4
R-4,21 A-4
R-4.21 0 U
R-4.23 R-4,23 R-24
R-26 R-4,27 I 32 R-4.21
R-4,21 R-1.21 R-4,28 R-29
R-4,19 R-4,30
U
R-25
R-19
T R-20 T T T T T T T T T T T T T T T T T T T R-37
U U
T-38 T-38 U U U "-38 T-38 N-38 T-38 T-38 T-38 "-38 "-38 T-38 N-38 T-38 T-38 T-38 T-38 U
T T T
R-22 T T T
A-23 A-23
T T T T T T T T T T T T T
Rating Code R = Recommended.
A = Acceptable.
T = Theoretical.
N = Not Recommended.
U = Unknown.
Baaed on actual source tests experience (sampling and analysis) this method is valid an is the method of choice among Method 1 8 uaers.
Based on actual source teats or similar source test experience (sampling and analyais). this method is valid. The tester must evaluate for specific test.
Method has no documented experience, but in theory could be valid.
Baaed on actual source tests or similar source test experience and/or theory, this method is invalid.
Method has no documented experience and the heoretical aspects are not conclusive. The tester must demonstrate that this detection method is valid.
The rating codes for GC detectors are based on the detector specified in the method that is referenced. For example, the rating code f o r benzene is: R-4,12; N; T-38: N. This means that the PID is recommended for detection of benzene by both references 4 and 12 cited i n Section 3.16.11: the ECD and the ELCD are not recommended for benzene: and detection of benzene with a PID is theoretically possible based on the ionization potential found in reference 38.
* The following abreviationa are used f o r the gas chromatography detectors:
FID Flame Ionization Detector ELCD = Electroconductivity Detector
(Hall Detector)
ECD = Electron Capture Detector PID = Photoionization Detector (with lamps up to 11.7 electron volts)

Section No. 3.16 Date June 30, 1988 Page 17
Section No. 3.16 Date June 30, 1988 Page 18
Ethylidene Chloride Ethylene Dibromide Ethylene Dichloride Propylene Dichloride l.l,l-Trichloroethane Bromodichloromethane Chlorodibromomethane Chloroform Carbon Tetrachloride Dichlorodifluoromethane Methyl Bromide Methyl Chloride Methylene Chloride Tetrachloroethylene B romoform Trichloroethylene Trichlorotrifluoroethane Vinylidene Chloride Ethyl Chloride Chlorobenaene Vinyl Chloride 1,2-Dibromo-~-chloropropane
20-hh; 4-(hhh)
22-kk; ~-(vv) 21-11; 19-jj; 4-1; 39-d(636), e(460),
21-ii; 19-Jj; 4-00; 39-e(568), ~(897)
= = 1 1 a 1 ~ i ~ r ~ ~ i ~ i ~ i a ~ ~ ~ a ~ ~ a ~ ~ ~ ~ ~ ~ ~ x ~ ~ ~ ~ ~ ~ ~ ~ ~ ~ ~ ~ ~ ~ ~ ~ x ~ ~ ~ e ~ ~ ~ ~ ~ ~ ~ ~ ~ ~ ~ x 8 ~ ~ ~ ~ u ~ a ~ ~ ~ ~ ~ ~ ~ ~ m ~ ~ ~ ~ ~ ~ ~ ~ ~ ~ ~ ~ ~ ~ ~ ~ ~ ~ ~ ~ ~ ~ ~
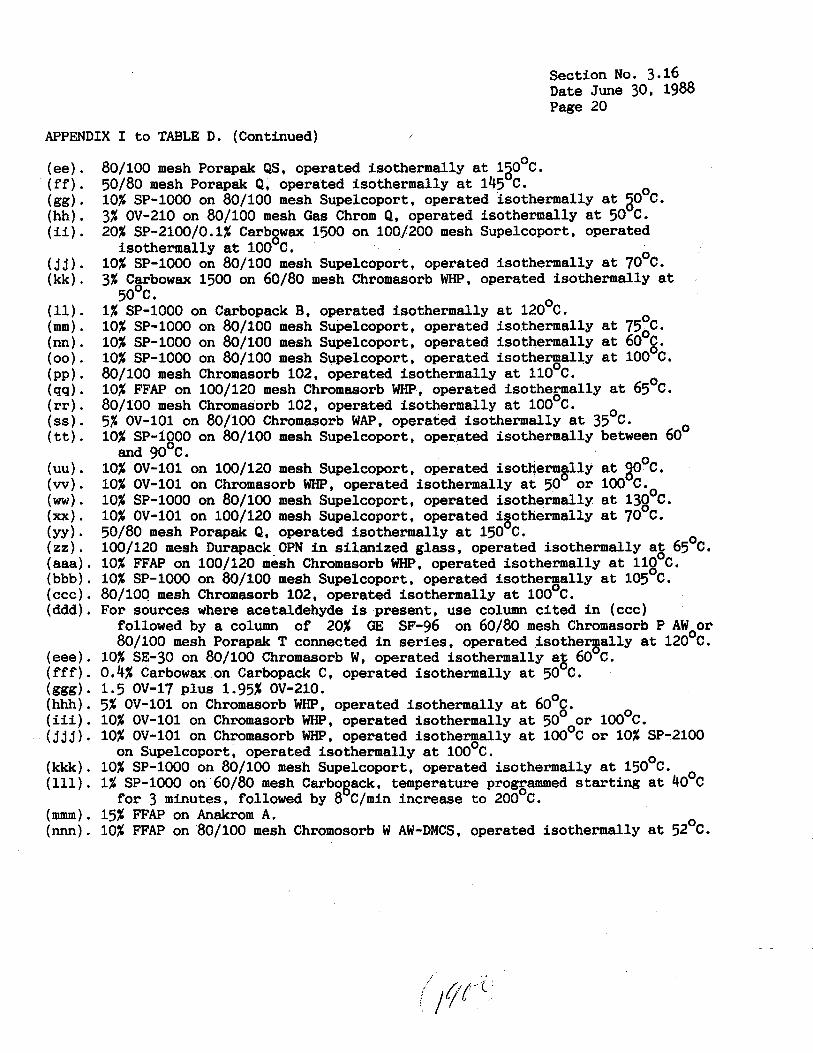
The GC column references. column type. and conditions. and Kovats Retention Indices (if available) are shown in this column. The first reference shown for each compound is for the column and conditions suggested for the recommended sampling method (when available), followed by the column and condition. suggested for aanpling methods with an acceptable rating. Additional references are given when available for columns used for analysis of the selected compound under laboratory conditions. Some additional reference8 provide Kovats Retention Indicer for selected compoundr. For example. the reference code for benzene ia: 12-0. t; 9-k; 13-ur 4-p: 39-d(658), e(557). i(l039), h(1104), ~(963). This mean6 that for benzene the columnr deacribed in citations s and t in the List of Referenced Column8 (following Table D) were specified in the method described in citation 12 in Section 3.16.11; the column described in citation k in the List of Referenced Columns was specified in the method described in citation 9 in Section 3.16.11; the column described in citation u was specified in the method descibed in citation 13 in Section 3.16.11; the column described in citation p was specified in the method described in citation 4 in Section 3.16.11; and the columns described in citations d, e, i, h,and v were specified in the method described in citation 39 in Section 3.16.11. Where available. the Kovats Retention Indices for each of the columns under the conditions given in their reapective references are given in parentheses.
Note: Any column or conditions that meet the Method 18 criteria for peak renolution are considered acceptable.
Section No. 3.16 Date June 30, 1988 Page 19
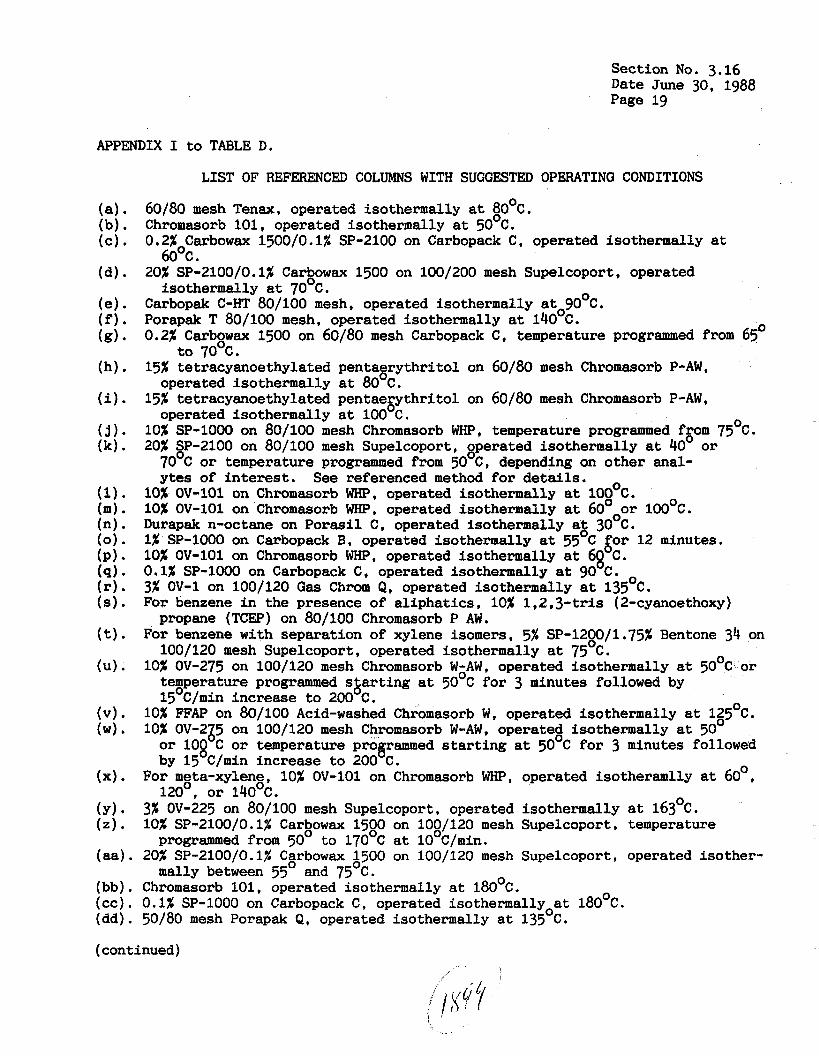
APPENDIX I to TABLE D.
LIST OF REFERENCED COLUMNS WITH SUGGESTED OPERATING CONDITIONS
60/80 mesh Tenax, operated isothermally a t 80°C. Chromasorb 101, operated isothermally at 50 C. 0.2% Carbowax l 5 O O / O . l % SP-2100 on Carbopack C, operated isothermally a t
60OC. 20% SP-2100/0.1% Carbowax 1500 on 100/200 mesh Supelcoport, operated
Carbopak C-HT 80/100 mesh , operated isothermally ato900C. Porapak T 80/100 mesh, operated isothermally at 140 C. 0.2% Carbgwax 1500 on 60/80 mesh Carbopack C, temperature programmed from 65"
15% tetracyanoethylated pentasrythritol on 60/80 mesh Chromasorb P-AW ,
15% tetracyanoethylated pentaegythritol on 60/80 mesh Chromasorb P-AW ,
10% SP-1000 on 80/100 mesh Chromasorb WHP, temperature programmed fgom 75OC. 20% SOP-2100 on 80/100 mesh Supelcoport, gperated isothermally at 40
See referenced method fo r detai ls . 10% OV-101 on Chromasorb WHP, operated isothermally at 10g°C. 10% OV-101 on Chromasorb WHP, operated isothermally at 60 Durapak n-octane on Porasil C, operated isothermally a& 30 C. 1% SP-1000 on Carbopack B, operated isothermally at 55 C $or 12 minutes. 10% OV-101 on Chromasorb WHP, operated isothermally at 68 C. 0.1% SP-1000 on Carbopack C, operated isothermally a t 90 C. 3% OV-1 on 100/120 Gas Chrom Q, operated isothermally a t 135OC. For benzene i n the presence of aliphatics, 10% 1,2,3- t r is (2-cyanoethoxy)
For benzene with separation of xylene isomers, 5% SP-1280/1.75% Bentone 34 on
10% OV-275 on 100/120 mesh Chromasorb W;AW, operated isothermally a t 50°C or
10% FFAP on 80/100 Acid-washed Chromasorb W , operated isothermally a t 1Z5OC. 10% OV-2Z5 on 100/120 mesh Chromasorb W-AW, operate$ isothermally a t 50 or 108 C o r temperature programmed s t a r t i ng a t 50 C for 3 minutes followed by 15 C/min increase t o 200 C.
For meta-xylene, 10% OV-101 on Chromasorb WHP, operated isotheramlly a t 60°, 120°, or 14OoC.
3% OV-225 on 80/100 mesh Supelcoport, operated isothermally a t 163OC. 10% SP-2100/0.1% Cargowax 1580 on lOg/l20 mesh Supelcoport, temperature
20% SP-2100/0.1% Cgrbowax &5OO on 100/120 mesh Supelcoport, operated isother-
Chromasorb 101 , operated isothermally a t 180Oc. 0.1% SP-1000 on Carbopack C , operated isothermallyoat 180Oc. 50/80 mesh Porapak 8 , operated isothermally a t 135 C.
isothermally a t 70 C.
t o 70 C.
operated isothermally a t 80 C.
operated isothermally a t 100 C.
70 C o r temperature programmed from 50 C, depending on other anal- ytes of in te res t .
100°C.
or
propane (TCEP) on 80/100 Chromasorb P AW.
100/120 mesh Supelcoport, operated isothermally at 75 C.
temperature programmed sgarting a t 50 C for 3 minutes followed by 15O~/min increase t o 200 C.
programmed from 50
mally between 55
t o 170 C a t 10 C/min.
and 75 C.
(continued)
Section No. 3.16 Date June 30, 1988 Page 20
APPENDIX I to TABLE D. (Continued)
80/100 mesh Porapak QS, operated isothermally a t lzO°C. 50/80 mesh Porapak Q, operated isothermally a t 145 C. 10% SP-1000 on 80/100 mesh Supelcoport , operated isothermally a t 20°C. 3% OV-210 on 80/100 mesh Gas Chrom Q, operated isothermally a t 50 C. 20% SP-2100/0.1$ Carbgwax 1500 on 100/200 mesh Supelcoport, operated
10% SP-1000 on 80/100 mesh Supelcoport , operated isothermally a t 7OoC. 3% Cgrbowax 1500 on 60/80 mesh Chromasorb WHP, operated isothermally at
1% SP-1000 on Carbopack B, operated isothermally a t 12OoC. 10% SP-1000 on 80/100 mesh Supelcoport , operated isothermally a t 7 5 3 . 10% SP-1000 on 80/100 mesh Supelcoport, operated isothermally a t 60 g. 10% SP-1000 on 80/100 mesh Supelcoport, operated isothergally at 100 C. 80/100 mesh Chromasorb 102, operated isothermally a t 110 C. 10% FFAP on 100/120 mesh Chromasorb WHP, operated isothegmally at 65OC. 80/100 mesh Chromasorb 102, operated isothermally a t 100 C. 5% OV-101 on 80/100 Chromasorb WAP, operated isothermally a t 35OC. 10% SP-1800 on 80/100 mesh Supelcoport , operated isothermally between 60'
10% OV-101 on 100/120 mesh Supelcoport , operated isotqermglly at 80°C. 10% OV-101 on Chromasorb WHP, operated isothermally aQ 50 10% SP-1000 on 80/100 mesh Supelcoport, operated isothermally a t 1351 C.
isothermally a t 100 C ,
50 c.
and 90 C.
or 100 C.o
10% OV-101 on 100/120 mesh Supelcoport, operated igotdermally at 70°C. 50/80 mesh Porapak Q, operated isothermally a t 150 C. 100/120 mesh Durapack OPN i n silanized glass, operated isothermally a$ 65'C.
(aaa) . 10% FFAP on 100/120 mesh Chromasorb WHP, operated isothermally a t 118 C. (bbb) . 10% SP-1000 on 80/100 mesh Supelcoport, operated i s o t h e q a l l y a t 105 C. (ccc). 80/lOO mesh Chromasorb 102, operated isothermally a t 100 C. (dad). For sources where acetaldehyde is present, use column ci ted i n (ccc)
followed by a column of 20% GE SF-96 on 60180 mesh Chromasorb P AWoor 80/100 mesh Porapak T connected i n series, operated i s o t h e q a l l y a t 120 C.
(eee) . 10% SE-30 on 80/100 Chromasorb W, operated isothermally ag 60 C. ( f f f ) . 0.4% Carbowax on Carbopack C, operated isothermally a t 50 C. (ggg). 1.5 OV-17 plus 1.95% OV-210. (hhh) . 5% QV-101 on Chromasorb WHP, operated isothermally a t 6Oog. (iii). 10% OV-101 on Chromasorb WHP, operated isothermally a t 50 ( j j j ) . 10% OV-101 on Chromasorb WHP, operated isothergally a t 100 C or 10% SP-2100
(kkk) . 10% SP-1000 on 80/100 mesh Supelcoport, operated isothermally at 15OoC. (111). 1% SP-1000 on 60/80 mesh Carbogack, temperature proggammed s t a r t i ng a t 4OoC
( m m m ) . 15% FFAP on Anakrom A. (nnn). 10% FFAP on 80/100 mesh Chromosorb W AW-DMCS, operated isothermally a t 52OC.
100°C.
on Supelcoport, operated isothermally at 100 C.
for 3 minutes, followed by 8 C/min increase t o 200 C.
Section No. 3.16 Date June 30, 1988 Page 21
Section No. 3.16 Date June 30, 1988 Page 22
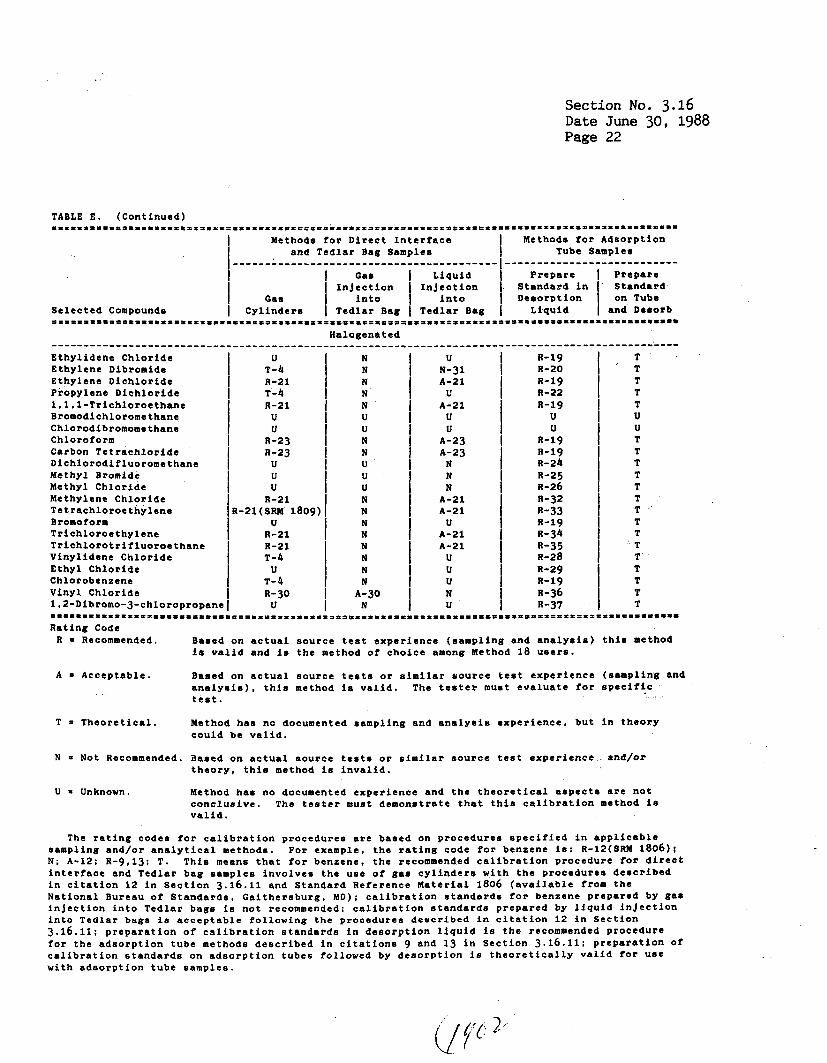
TABLE E. (Continued) = = a = a a = = = = ~ = n = = = . = = ~ ~ ~ ~ a a ~ ~ = ~ - = ~ ~ ~ = a ~ = ~ ~ = n ~ ~ ~ = = ~ x ~ ~ ~ a = ~ = = - = ~ = ~ ~ = ~ ~ ~ ~ = = ~ a n = = = = = = = a ~ ~ = a a = = = = = = = - = = ~
Methods for Direct Interface I Methods for Adsorption and Tedlar Bag Samples I Tube Samples
I I
I Gaa I Liquid I Prepare I Prepare I Injection Injection Standard in Standard I Gas I into I into 1 Deoorption I on Tube
Selected COmpOUnds I Cylinders I Tedlar Bag I Tedlar Bag I Liquid I and Deaorb S I I D l l l ¶ l ~ t D I I = I R 3 1 1 ~ = = ~ 8 ~ = = 8 = ~ 6 a ~ ~ 6 a E ~ = * ¶ ~ ~ = ~ ~ = = ~ n ~ ~ - ~ = ~ - ~ ~ = = ~ - = ¶ ~ X = ~ X ¶ ~ X X ~ 9 8 ~ a ~ = = - = = ~ = = E ¶ = ~ ~ = ~ =
Halogenated . . . . . . . . . . . . . . . . . . . . . . . . . . . . . . . . . . . . . . . . . . . . . . . . . . . . . . . . . . . . . . . . . . . . . . . . . . . . . . . . . . . . . . . . . . . . . . . . . T
T
R-19 I T
U U 13-19 R-19 T I R-24 I T R-25 I T
R-32 T
Ethylidene Chloride U N U Ethylene Dibromide I T-& I N 1 N-31 Ethylene Dichloride R-21 I N A-21 R-19 I R-22 Propylene Dichloride I T-4 I N I .
U I u I
I R-26 I T
I R-28 T
N A-21
U I I
I u I
1.1.1-Trichloroethane Bromodichloromethane
U R-23 I N I A-23
I A-23
Chlorodibromomethane I Chloroform I Carbon Tetrachloride I R-23 I N
U I u I N N
Dichlorodifluoromethane I Methyl Bromide U
Methylene Chloride R-21 N A-21 Methyl Chloride
Tetrachloroethylene 1R-21(SRM 18091I N I A-21 I R-33
I R-34 R-35
N I A-21 Bromo f orm
N A-21
I R-29 I T
R-37 I T
u I N u Trichloroethylene I R-21 I Trichlorotrifluoroethane I R-21 I Vinylidene Chloride I T-4 Ethyl Chloride U Chlorobenzene I T-4 53-19 I T
N I R-36 T I
0 I N I
I u u I : : I R-30 I A-30 Vinyl Chloride I
1,2-Dibromo-3-chloropropane~ X = = = R I I X R = t L Z ~ P 1 E 1 3 = . . . . . I I D . D I . I Y . I I . I I ~ = = a a ~ ~ = = = = n a ~ ~ ~ = ~ = a = ~ ~ = ~ = = = ~ = a = ~ ~ ~ 6 ¶ ~ E * ~ = ~ = ~ X ~ 8 = = = = ~ 8 S = S
Rating Code R = Recommended. Based on actual source test experience (sampling and analysis) this method
ia valid and is the method of choice among Method 18 uaers.
A = Acceptable. Based on actual source tests or similar source test experience (sampling and analysis), this method is valid. test.
The tester must evaluate for specific
T = Theoretical. Method has no documented sampling and analysis experience, but in theory could be valid.
N = Not Recommended. Based on actual source teats or similar source test experience and/or theory, this method is invalid.
U = Unknown Method has no documented experience and the theoretical aspects are not COnClU8iVe. The tester must demonstrate that this calibration method is valid.
The rating code6 for calibration procedures are based on procedure6 specified in applicable 8amPlin.g and/or analytical methods. For example, the rating code for benzene is: R-lS(SRH 1806); N: A-12: R-9,13; T. This means that for benzene, the recommended calibration procedure for direct interface and Tedlar bag samples involves the use of gas cylinders with the procedures described in citation 12 in Section 3.16.11 and Standard Reference Material 1806 (available from the National Bureau of Standards. Gaithersburg, MD); calibration standards for benzene prepared by gas injection into Tedlar bags is not recommended; calibration standards prepared by liquid injection into Tedlar bags is acceptable following the procedures described in citation 12 in Section 3.16.11; preparation of calibration standards in desorption liquid is the recommended procedure for the adsorption tube methods described in citations 9 and 13 in Section 3.16.11; preparation Of calibration standards on adsorption tubes followed by desorptlon is theoretically valid for use with adsorption tube samples.
Section No. 3.16.1 Date June 30, 1988 Page 1
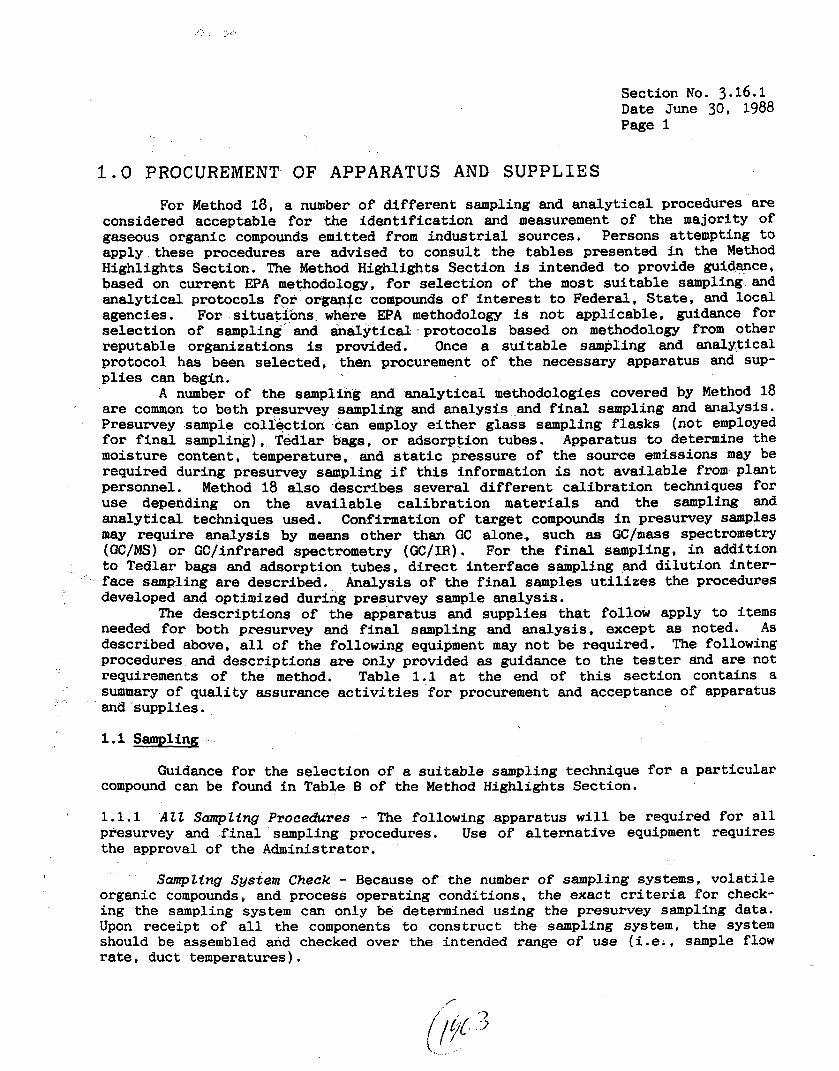
1 . 0 PROCUREMENT OF A P P A R A T U S AND S U P P L I E S
For Method 18, a number of d i f fe ren t sampling and ana ly t ica l procedures are considered acceptable for the ident i f ica t ion and measurement of the majority of gaseous organic compounds emitted from indus t r ia l sources. Persons attempting t o apply these procedures are advised to consult the tables presented i n the Method Highlights Section. The Method Highlights Section is intended t o provide guidance, based on current EPA methodology, f o r select ion of the most su i tab le sampling and analyt ical protocols for orgapic compounds of i n t e r e s t t o Federal, S ta te , and local agencies. For s i tua t ions where EPA methodology is not applicable, guidance for se lec t ion of sampling and ana ly t ica l protocols based on methodology from other reputable organizations is provided, Once a su i tab le sampling and analyt ical protocol has been selected, then procurement of the necessary apparatus and SUP- plies can begin.
A number of the sampling and analyt ical methodologies covered by Method 18 are common t o both presurvey sampling and analysis and f i n a l sampling and analysis. Presurvey sample col lect ion can employ either g lass sampling f lasks (not employed fo r f i n a l sampling), Tedlar bags, or adsorption tubes. Apparatus t o determine the moisture content, temperature, and static pressure of the source emissions m a y be required during presurvey sampling i f t h i s information is not avai lable from plant Personnel. Method 18 a lso describes several d i f fe ren t ca l ibra t ion techniques for use depending on t h e ava i l ab le c a l i b r a t i o n materials and the sampling and analyt ical techniques used. Confirmation of ta rge t compounds i n presurvey samples may require analysis by means other than GC alone, such as GC/mass spectrometry (GC/MS) or GClinfrared spectrometry (GC/IR). For the f i n a l sampling, i n addition to Tedlar bags and adsorption tubes, d i r ec t in te r face sampling and d i lu t ion inter- face sampling a re described. Analysis of the f i n a l samples u t i l i z e s the procedures developed an4 optimized during presurvey sample analysis.
The descriptions of the apparatus and supplies t ha t follow apply t o items needed fo r both presurvey and f i n a l sampling and analysis, except as noted. As described above, a l l of the following equipment may not be required. The following procedures and descriptions are only provided as guidance t o the tester &d are not requirements of the method. Table 1.1 a t the end of t h i s sect ion contains a summary of qua l i ty assurance a c t i v i t i e s f o r procurement and acceptance of apparatus and supplies.
1.1 Sampling
Guidance for the select ion of a su i tab le sampling technique f o r a par t icular compound can be found i n Table B of the Method Highlights Section.
A 1.1.1 A l l Sampling Procedures - The following apparatus w i l l be required for a l l presurvey and f i n a l sampling procedures. Use of a l te rna t ive equipment requires the approval of the Administrator.
Sampling System Check - Because of the number of sampling systems, vo la t i le organic compounds, and process operating conditions, the exact c r i t e r i a fo r check- ing the sampling system can only be determined using t h e presurvey sampling data. Upon receipt of a l l the components t o construct t he sampling system, the system should be assembled and checked over the intended range of u s e (i.e., sample flow rate, duct temperatures).
Section No. 3.16.1 Date June 30, 1988 Page 2
Sampling Probe - The sampling probe should (1) be constructed of s t a in l e s s s t e e l , Pyrex g l a s s , or Teflon tubing, (2) exhib i t an outside diameter (OD) of 6.4 mm, (3) be enlarged a t the duct end to contain a g lass wool plug, and (4 ) possess a heating system capable of maintaining the sample temperature a t Oo t o 3 O C above duct temperature. The expanded sect ion of the probe must be packed with g lass wool p r i o r t o sampling, The probe o u t l e t must have a f i t t i n g su i t ab le f o r attachment to the sample l i n e . A probe approximately 1.1 m ( 4 f t ) long is usual ly su f f i c i en t ; the exact length can be determined during the preliminary survey.. The selected -" probe material should be nonreactive toward with the sample gas const i tuents so .'' t h a t i t w i l l not b i a s t h e analysis, as w e l l as appropriate t o withstand the duct temperature.
Upon r e c e i v i n g a new probe, v i s u a l l y check i t for adherence t o ' spec i f ica t ions ( i .e .* the length and composition ordered). Check f o r breaks, ' - cracks, and leaks. Leak check the probe and check the probe heating system during the sampling system check described above. The probe should be able t o maintain the required temperature at the desired flow rate and remain leak free.
' -,
,.
,'
Sample Line and Connecting Tubing - The sample l i n e is generally 6.4-mm OD Teflon tubing. Sample l i n e s w i l l require heat-tracing t o prevent condensation of sample const i tuents during sampling a t some sources. The sample temperature must be maintained a t O°C to 3OC above the source temperature. The capacity of the heating system should be s u f f i c i e n t for its intended use. Upon rece ip t or during the system check, the sample l i n e should be checked to ensure t h a t i t is leak fre and w i l l maintain the desired temperature a t the desired flow rate. It should be, noted tha t heat-traced sample l i n e s require a s ign i f i can t amount of e l e c t r i c a l current t o maintain the higher temperature leve ls . The electrical requirements and the weight of the heat-traced l i n e should be taken i n t o account when designing t h e sample t r a i n .
Qufck Connects - For connections on the sample l i n e s , gas sampling valve., the pump un i t , cyl inders , sample bags, and ca l ibra t ion gas bags, quick connects or the equivalent are needed. When the connects come i n t o contact w i t h the sample gas, they should be constructed of s t a i n l e s s steel. It is also useful to haye se l f - sea l ing quick connects on the sampling bags. The quick connects can be leak checked during the system check.
Barometer - A mercury, aneroid, or other barometer capable of measuring atmospheric pressure to within 2.5 mm (0.1 i n . ) H g may be used; however, i n many cases the absolute barometric pressure can be obtained from a nearby weather se rv ice s t a t ion . If the elevat ion of the sampling point is higher than t h a t of the weather s t a t i o n , the reported barometric pressure is reduced a t a rate of 2.5 mm Hg/30 m (0.1 i n . Hg/100 f t ) of elevat ion difference; if the sampling point is lower than the weather s t a t i o n , the pressure is increased a t the same rate. Note: The barometric pressure from the weather se rv ice s t a t i o n should not be corrected t o sea leve l .
Check the f i e l d barometer against a mercury-in-glass barometer (or i ts equival'ent). I f the f i e l d barometer cannot be adjusted t o agree with t h e mercury- in-glass barometer, i t is not acceptable and should be repaired or replaced.
Moisture Determination - A moisture determination may be required. Two techniques can gene ra l ly be used: (1) Method 4 o r (2) w e t bulb/dry bulb thermometers. If Method 4 is used, the tester should refer t o Section 3.3 of t h i s Handbook. I f the w e t bulb/dry bulb thermometers are used, both thermometers should
Section No. 3.16.1 Date June 30, 1988 Page 3
be accurate t o within 1 O C . vpon rece ip t , the thermometers shiuld be checked against a mercury-in-glass thermometer t o ensure t h a t they are’ reading properly.
Flow Rate Determination - The flow rate i n the duct m a y have t o be deter- mined f o r some emission standards. I f the flow rate is t o be determined, the tester should refer t o Section 3.1 of t h i s Handbook and meet the requirements and follow the procedures of t h i s method.
1.1.2 Glass Sampling Flask Sampling Technique - The following apparatus and rea- gents w i l l be required f o r the col lect ion of samples (presurvey only) using g lass sampling f lasks . U s e of a l te rna t ive equipment requires the approval of the Administrator.
Purged or Evacuated Glass Sampling Flasks - Presurvey samples can be col lected i n precleaned double ended glass sampling f l a sks possessing minimum capacities of 250 m l . Teflon stopcocks, without grease, are preferred. Upon receipt, f l a sks should be checked t o ensure t h a t they are not broken. Flasks must be cleaned p r i o r t o use. The cleaning procedures are described later i n Subsection 3.2. I f the f l a sks do not meet these requirements, replace or reclean.
1.1.3 Tedlar Bag/Evacuated Container and Adsorption Tube Sampling - The following apparatus will be required f o r the co l lec t ion of presurvey o r f i n a l samples using adsorption tubes o r Tedlar bags housed i n evacuable containers. I f the apparatus are purchased separa te ly , each item should be checked individual ly as described below. Following t h i s , a l l components should be assembled, as they w i l l be used in the f i e l d and then checked using the following procedures:
1. 2. 3. Attach a primary gas test meter t o the i n l e t of the sample t r a i n and
Assemble the sample t r a i n as described i n Subsection 4.3.1. Leak check the t r a i n as described i n Subsection 4.3.1.
p u l l the desired flow rate through the sample t r a i n f o r the t y p i c a l sample run t i m e . The measured volume should be within 10% of the calculated volume or rate. requirements, replace or repair and then recalibrate.
If the system does not meet these
I - < -
Tedtar Bags (For Sampling and to Prepare Gaseous Calibration Standards Bags used t o c o l l e c t f i e l d samples and prepare gaseous ca l ibra t ion standards mu be constructed of a su i t ab le material, be leak f r e e , and have the proper f i t t i n g s . Typically, se l f - sea l ing quick disconnects are used on the sample bags. Tedlar is the material of choice f o r the sample bags, how-ever other materials may be used successfully. If the sample bags are constructed by the tester, they are generally double-sealed. The exact bags t o be used in the f i e l d test or f o r making calibra- t ion standards must pass three c r i t e r i a as follows:
1. Bags must pass the leak check as described i n Subsection 4.3.1. 2. The organic components t h a t are t o be col lected i n the bags should be
placed i n a bag a t about the same concentration f o r which i t w i l l be used, and the organic concentration i n the bag determined as soon as possible after th i s . The organics should then remain i n the bag f o r a per iod equal t o the t i m e ant ic ipated between f i e l d sampling and analysis . The concentration, upon reanalysis, must be within 10% o the o r ig ina l concentration. Next, the bag should be emptied and r e f i l l e d with zero air or nitrogen. It should be allowed t o sit for , a t least 2 hours and then be reanalyzed: the concentration of the organic(s) i n the bag must be
3.
Section No. 3.16.1 Date June 30, 1988 Page 4
less than 10% of the or ig ina l concentration. I f the bags do not pass the leak check, they must be reconstructed. I f they do not pass the second and t h i r d cr i ter ia , a d i f f e ren t material of construction o r a d i f f e ren t sampling technique must be used. I f the bags do not meet these require- ments, replace, u s e an a l t e rna t ive technique o r use a d i f f e r e n t sampling technique.
Rigid Leak-Proof Container - Rigid leak-proof containers must be of the proper s i z e t o f i t the bags and are generally made of r i g i d p l a s t i c . However, the material of construction is typica l ly not important s ince the container does not come i n t o contact with the sample gas. Containers usual ly have a clear top or window i n them to check t h a t the bag does not o v e r f i l l during tes t ing . The top of the container must have connectiond'to a t tach the sample probe t o the outside and the sample bag to the inside. A connection f o r the sample pump must a l so be avai lable on the container. Upon rece ip t o r construction of the container, assemble the system as i t w i l l be used i n the f i e l d and then leak check it a t the m a x i m u m vacuum ant ic ipated. I n f l a t e a bag t o the degree i t w i l l be f i l l e d i n the f i e l d and check t h a t the bag can be removed a f t e r it has been f i l l e d t o allow external heating. I f the bag system is designed t o keep the bag a t a specif ied temperature, then the heating system must b e - checked as' described below i n Subsection 1.1.6. If the container does not meet these requirements, modify, r epa i r , o r replace it.
Pump - For the i n d i r e c t sampling technique (pump a f t e r the bag or charcoal tube) , any pump of proper capacity can be used. If the pump is t o be used fo r a d i r e c t sampling technique (pmp i n the sample l i n e } , th,e pump in t e rna l s must be leakless and made of s t a i n l e s s steel o r , preferably, Teflon. Upon rece ip t , check f o r proper spec i f ica t ions . If the pump does not meet the spec i f ica t ions , repa i r or replace it.
Ftometer - The flowmeter must be of the proper fiow rate range. Upon rece ip t , check the spec i f ica t ions and then ca l ib ra t e as described i n Subsection 2.1.3. If the flowmeter does not meet the requirements, replace o r reca l ibra te i t .
Adsorption Tube - An absorption tube must (1) be of adequate capacity, (2) contain the proper adsorption material, and (3 ) cons is t of a primary and secondary sect ion. The se l ec t ion of the proper type and s i z e of adsorption tube should be based on previous experience (including the l i t e r a t u r e and tab les i n the Method Highlights) o r laboratory evaluation. The se lec t ion and/or evaluation of the proper adsorption tube is described i n d e t a i l i n Subsection 3 . 4 . The cri teria shown i n Subsection 3 .4 must be m e t or the tubes must be replaced o r modified.
Personnel Sampling Pump -. :;A personnel sampling pump can be used for co l lec t ing adsorbent tube samples. It must sample a t o r be adjustable t o the proper flow rate range. Upon receipt, check the spec i f ica t ions and ca l ib ra t e as described i n Subsection 2.1.4. ca l ib ra t e i t .
1.1.4 Direct Pump Sampling Procedure - The d i r e c t pump sampling procedure w i l l require the same apparatus described i n Section 1.1.3 f o r bag and adsorption tube sampling. The only difference is t h a t the pump i n t e r n a l s must be constructed of materials t h a t w i l l not i n t e r f e r e i n the analysis (i.e., Teflon o r s t a i n l e s s steel) and the r i g i d container does not have t o be leak free. The system should be assembled, leak checked and then the flow rate checked as described above. If t h e
If i t does not meet the s p e c i f i c a t i o
- \
i t ' / G [ L -
Section No. 3.16.1 Date June 30, 1988 Page 5
system does not meet the c r i t e r i a , then i t must be replaced o r repaired and then leak checked and recal ibrated.
1.1.5 Explosion Risk Bag Sampling Procedure - The following apparatus, i n addition to the apparatus described i n Subsection 1 . 1 . 3 , w i l l be required f o r co l lec t ion of bag samples i n areas where there is any poss ib i l i t y of explosion. These procedures assume t h a t t he sample gas col lected is not above the lower explosive l i m i t . If it is, a complete sa fe ty plan should be developed and reviewed by the p lan t and tester. This Handbook w i l l not attempt to describe the procedures used to collect explosive gases.
The major concern i n most areas having an explosion po ten t i a l is t h a t no open flames o r non-intr insical ly safe electzical equipment be used. The first approach to sampling i n these areas is t o remove the electrial systems (i.e., pumps) t0 an area t h a t is not explosive. This can be accomplished by running the vacuum l i n e from an area t h a t is not explosive t o the sample bag or charcoal tube i n the explosive area. The vacuum l i n e can be run up t o 200 t o 300 feet with no problems. Sampling is then conducted i n the normal manner.
Another approach described i n Method 18 uses a steel canister t o provide the vacuum source. This approach is d i f f i c u l t and can still be hazardous because i t involves handling a steel container, and possibly a s t a i n l e s s steel probe, i n an explosive area. Another a l t e rna t ive is the use of an i n t r i n s i c a l l y safe pump, such as a personnel sampling pump, with adsorption tubes o r Tedlar bags housed i n evacuable containers. Any system t h a t is purchased o r constructed must be leak less , be ab le t o control the flow rate properly, and meet a l l p lan t safety requirements.
1.1.6 Heated Bag Sampling Procedure - This procedure must be used i n the event t h a t condensation is observed i n the bag and/or sample l i n e during t e s t i n g o r if the sample bag r e t a i n s more than 10% of the sample concentration based on the post- test sample bag re ten t ion check. The apparatus described below w i l l be required, i n addi t ion t o the apparatus described i n Subsection 1.1.3. Both the sample l i n e and container must be heated t o maintain the bag a t a spec i f ied temperature ( i . e . , O°C t o 3OC above source temperature). The sampling system is checked i n the manner described above, except t h a t the heating system must a l s o be considered: check procedures should consider use of t he system a t ambient temperatures less than the laboratory temperature ( including wind c h i l l f a c t o r s ) . The e n t i r e surface of the sample probe and the sample bag must be maintained a t the spec i f ied temperature. A possible a l t e r n a t i v e to maintaining the bag a t the spec i f ied temperature is the addi t ion of ex terna l heat ing with heat lamps prior to analysis . The exact system t h a t w i l l be s u i t a b l e for any given source should be determined p r i o r t o tes t ing , if possible. The operation and checks of heated sampling systems are described i n Subsection 4 . 3 . If the system does not meet a l l the criteria, use a d i f fe ren t approach o r repair the system and reca l ibra te .
Heated Bag Sample Container - The heated bag sample container must be capable of maintaining the e n t i r e bag a t the spec i f ied temperature. If an electrical source is used t o heat the container, the tester must be aware of the addi t ional explosion po ten t i a l t h a t is created. One check on the system can be made with a thermocouple i n the sample cavity: t h i s check of the system w i l l not , however, demonstrate t h a t a l l t h e sur faces are maintained a t the required temperature. A l l ex te rna l surfaces of the container should be w e l l insulated. A visua l check of the system should reveal i f the system appears to be su f f i c i en t ly insulated. I f t he system allows the bag t o have cooler surfaces , the pos t t e s t
I .
re tent ion check on the bag w i
Section No. 3.16.1 Date June 30, 1988 Page 6
1 probably f a i l .
Heated Sample Lines and Probe - The sample probe and sample l i n e must also be capable of maintaining the specif ied temperature. They should a l so not have any cooler surfaces. These can be checked by pul l ing the desired flow rate through them and then checking the temperature i n the l i n e and/or probe with a thermocouple. Proper in su la t ion is necessary t o maintain the temperature throughout the e n t i r e length. I f the temperature cannot be maintained, replace or repa i r the l i n e and/or probe and then recheck.
1.1.7 . Prefilted Tedlar Bag Sampling Procedure - This procedure is an a l te rna t ive t o the heated bag sampling procedure. The following apparatus and reagents are required f o r t h i s procedure, i n addition t o the apparatus described i n Subsections- , = 1.1.3 and 1.1.4. The ppefi l led bag sampling system is used t o d i l u t e the- concentration of the condensibles below saturat ion. This system can also be used t o d i l u t e the gases t o below the lower explosive l i m i t . The major difference between the p r e f i l l e d bag sampling system and the other bag sampling systems is t h a t the volume of di luent gas added t o the sample bag and the volume sf. gas sampled must be accurately measured. The d i lu t ion must be accounted f o r i n the '
calculat ion of the measured gas concentration. Therefore, the d i h e n t gas must be added with a cal ibrated dry gas meter or a cal ibrated flowmeter; then, during sample col lect ion, the gas col lected must be accurately measured using a flowmeter OF a metered pump. To obtain the required accuracy, the flowmeter and pump are placed i n the sample l i n e p r i o r t o the sample bag. Since condensation may occur, the flowmeter and pump must be housed i n a heated box. This system is checked i n the same manner as a d i lu t ipn system (see Subsection 1.1.9). The check f o r the p re f i l l ed system is described i n Subsection 4.3.4.
;
Heated Flowmeter - A cal ibrated heated flowmeter is required t o accurately determine the volume of gas sampled. The flowmeter should be housed i n a heated box t h a t w i l l maintain the specif ied temperature. The flowmeter should be cal ibrated as described above i n Subsection 2.1.3. I f the criteria are not met, replace o r r epa i r and then recal ibrate . A metering type pump may be used t o replace the flow rate meter and the pump.
Positive Displacement Teflon-Lined Pump - A pos i t ive displacement pump l ined with Teflon o r constructed of s t a in l e s s steel, of proper capacity and contained i n a heated box is required. A Teflon-coated diaphram-type pump tha t can withstand 120OC and de l ivers 1.5 l i ters /minute is typical ly used. Upon rece ip t , check the pump f o r capacity and then conduct a leak check on the pump. The pump must be leak f r e e a t a l l vacuum se t t ings . The heating system w i l l be checked during t h e sampling system check. I f the pump is not of the correct capacity and not leak free, then replace o r repa i r it.
Heated Box for Flowmeter and Pump - The flowmeter and pump must be contained i n a heated box t o maintain the proper temperature. Construct the box such tha t the temperature can be controlled and monitored. After construction, check the system t o ensure tha t i t w i l l maintain the desired temperature(s). If i t w i l l not maintain the temperature(s), repa i r the uni t .
1.1.8 Direct Interface Sampling Procedure - A heated probe, heated sample l i ne , heated gas sampling valve, needle valve, and charcoal adsorber are required f o r d i r e c t in te r face sampling. The required apparatus and reagents per ta ining t o the
Section No. 3.16.1 Date June 30, 1988 Page 7
gas chromatograph are described below i n Subsection 1.2. After the individual components are checked as shown below, the sampling system should be assembed as shown i n Subsection 4.3.6 and checked using the following procedures:
1. Turn on the heating system and adjust t o the m a x i m u m temperature a t
2. Connect the i n l e t t o the sampling probe. After the heating system has ~
which it is t o be used.
s t ab i l i zed a t the temperature se t t i ng , turn on the pump and evacuate t o about 10 in . of H,O. The system must be leak f r ee ; no flow should be observed from the charcoal adsorber system. If the system is not leak f r e e , r epa i r the system.
3. After the system has 'been shown t o be leak f ree , ad jus t the needle valve u n t i l the flow rate tha t w i l l be used i n the f i e l d is obtained. The temperature a t the discharge of the heated sample valve should be a t the set temperature. In se r t a thermocouple i n t o the i n l e t of the probe t o insure tha t the f i r s t several feet of the probe and l i n e are properly heated. If the set temperature is not obtained, r epa i r the system or use the temperature obtained for a recal ibrat ion of the temperature se t t ing . I.,
Heated Probe and Sample Lines - The sample probe and sample l i n e must be equipped with a heating system and insulat ion. All of the i n t e r i o r surfaces must be maintained a t the temperature se t t ing . Although a l l the i n t e r i o r surfaces can not be e a s i l y checked, i n s t a l l i n g proper insulat ion and following the system check shown above should be s u f f i c i e n t t o determine the adequacy of the probe and sample l i n e heating system.
Heated Gas Sampling Valve - A heated sampling valve (which includes the '' sample loops) is required t o maintain the sample injected i n t o the GC at the desired temperature. The sample valve and loop are generally enclosed i n an oven i n which the temperature can be controlled and monitored. Upon rece ip t , check the temperature cont ro l le r .
CharcoaZ Adsorber - The charcoal adsorber is required t o remove the organics from the excess flow through the system. Since the charcoal adsorber is used only f o r tester safe ty , there are no requirements on the adsorber. However, since the charcoal w i l l be spent with t i m e , the tester should change i t periodically. Alternatively, t he flow can be vented a t a safe dis tance away from any personnel.
1.1.9 Dilution Interface Sampling Procedure - I n addition t o the apparatus des- cribed i n Subsection 1.1.8, d i lu t ion pumps, flowmeters and valves which are con- tained i n a heated box, and di luent gases are required f o r the d i lu t ion in te r face system. The ca l ibra t ion of the d i lu t ion system is described i n Subsection 2.2. ' The individual components should be checked as shown below and then the system should be cal ibrated as described i n Subsection 2.2. If the system does not meet the ca l ibra t ion requirements, i t should be replaced, o r repaired and recal ibrated.
Ditution Pumps - Two Model A-150 Komhyr Teflon pos i t ive displacement-type pumps, or equivalent models capable of del iver ing 150 cc/minute, are required. Alternatively, ca l ibra ted flowmeters can be used i n conjunction with Teflon-coated ' , diaphram pumps. Upon receipt ca l ib ra t e the pumps o r flowmeter and pump as ~;
descl'ibed i n Subsection 2.1.. I f t h e 'pumps do not meet the c a l i b r a t i o n requAr'ements, replace or repa i r and then reca l ibra te .
Section No. 3.16.1 Date June 30, 1988 Page 8
Flowmeters - Two flowmeters are required t o measure the d i luent gas, a t a rate of about 1350 cc/minute. Upon receipt, the flowmeters should be cal ibrated as described i n Subsection 2.1. If the flowmeters do not meet the ca l ibra t ion c r i t e r a , replace or repair and then reca l ibra te .
Dituent Gas - Diluent gas i n cylinders f i t t e d with regulators are required f o r sample d i lu t ion . Nitrogen or hydrocarbon-free air can be used depending on the nature of the source gases. Alternatively, ambient a i r can be cleaned and dr ied with charcoal and s i l i ca ge l . The organics i n the d i l u t e n t gas must be below the detection l i m i t .
Heated Box f o r Sample Dilution Sgstem - The pumps and control valves must be housed i n a heated box t o control and monitor the temperature. After construction o r receipt, check the temperature control system. If the box cannot maintain the desired temperature, replace or r epa i r and recheck.
1.2 Sample Analysis
The analysis of Method 18 samples requires the use of a gas chromatograph (GC) regardless of the technique used for e i t h e r presurvey or f i n a l sampling. Guidance for the se l ec t ion of su i t ab le GC detectors is provided i n Table C i n the Method Highlights Section. A s a s t a r t i n g point for the analysis of the presurvey sample, Table D i n the Method Highlights Section provides guidance f o r the se lec t ion of a s u i t a b l e packed GC column. Any in te r fe rences with the GC analysis may be source-specific, so t he most su i t ab le analytical system must be establ ished using the presurvey samples. The following apparatus w i l l be required for the GC analysis.
1.2.1 Gas Chromatograph - A GC equipped with a s u i t a b l e detector as specif ied i n Table C i n the Method Highlights Section. The GC s h a l l be equipped with a temperature-controlled sample loop and valve assembly f o r analysis of gas samples or a temperature-controlled in j ec t ion por t for analys is of l i qu id samples from adsorption tubes. Use of a l t e rna t ive techniques f o r introducing samples i n t o the GC requires the approval of the Administrator. The GC should be equipped with a temperature-controlled oven, while a temperature-programmable oven may also be required fo r some analyzers. Method 18 may be used to quant i fy gaseous organic compounds a t concentrations ranging from about 1 part-per-million (ppm) to the upper range governed by de tec tor sa tura t ion or column overloading. For the combination of GC options chosen, the lower l i m i t of quant i ta t ion , as defined by
fo r the target organic compounds should be less than the emission l i m i t f o r the pa r t i cu la r source being tes ted.
1.2.2 GC Cotumn - Guidance fo r the se lec t ion of the appropriate GC column is provided i n Table D i n the Method Highlights Section. The columns listed i n Appendix I t o Table D have been found t o work for ana lys i s of the corresponding organic compounds under c e r t a i n conditions. Since i n t e r f e r i n g compounds may be source-specific, Method 18 permits the use of any GC column, provided the following precision and accuracy are achieved:
Precision: Duplicate analyses within 5 percent of t h e i r mean value. Accuracy: Analysis r e s u l t s of an audi t sample within 10 percent of the
prepared value.
Section No. 3.16.1 Date June 30, 1988 page 9
In addition, resolution of interfering compounds from target compounds should be achieved. For determining whether acceptable resolution has been achieved, follow the procedures described in Appendix C "Quality Assurance Procedures", Procedure 1 "Determination of Adequate Chromatographic Peak Resolution. '14
1.2.3 Recorder - A linear strip chart recorder is required, as a minimum, to record the GC detector output. Alternatively, an electronic integrator may be used and is generally recommended.
1.2.4 Recorder or Electronic Integrator Puper - Consult operator's manual or manufacturer for correct type.
1.2.5 Regutators - Gas cylinder regulators will be required for use of the' gas cylinders described in Subsections 1.3.1, 1.3.2, and 1.3.3. Consult with suppliers of gas cylinders to determine the proper type of regulator required.
1.2.6 Tubfng and Ffttfngs - Tubing and fittings will be required to connect the gas cylinder regulators to the GC.
1.3 Rewents and Glassware
The exact reagents and glassware required depend on the sampling procedure chosen, the calibration techniques to be used, and the particular requirements of the GC system.
1.3.1 GC Carrier Gas - The carrier gas selected must be hydrocarbon-free. The type of carrier gas depends on the type of GC detector and GC column being used. Consult the GC operator's manual, the GC manufacturer, and/or the column manufacturer for recommendations on the optimum carrier gas for a particular appli- cation.
1.3.2 Azaittary GC Gases - Certain GC detectors will require auxillary gases for proper operation. Consult the GC operator's manual or the GC manufacturer for recommendations on a particular application.
1.3.3 Catfbration Gases - These include cylinder gases containing known concentrations of target organic compounds for preparation of GC calibration standards, direct use as GC calibration standards, or calibration of a dilution interface system. If gases are not available in the required concentrations for GC calibration, procure the reagents and glassware described in Subsections 1.3.4 through 1.3.7.
1.3.4 Zero Gas - Hydrocarbon-free air or nitrogen, for preparing gaseous cali- bration standards from calibration gas cylinders or liquid organic compounds.
1.3.5 samples of all the organics for which calibration standards will be prepared.
Liqufd Organic Compounds - Pure or high purity liquid (occasionally gaseous)
1.3.6 Syringes - Calibrated, gas tight 5OO-, lo-, and 1.0-microliter sizes with maximum accuracy, for preparing gaseous calibration standards, for preparing adsorption tube standards, and for injection of liquid standards and samples into the GC. Other size gas tight syringes may be appropriate.

Section No. 3.16.1 Date June 30, 1988 Page 10
,19397 bags f septum
Midget Impinger/Hot Plate Assembty - To prepare gaseous standards i n Tedlar 'rom l iqu id organic compounds requires a midget impinger wuipped with a and a tee on the i n l e t stem and a boiling water bath on a hot plate. A dry
ScraJ Top Septum Vtats - For preparation of adsorption tube standards and
gas meter, previously described i n Subsection 1.1.1, is also required.
1.3.8 samples, 7-ml amber screw top septum vials w i t h Teflon-lined septa are required.
1.3.9 Desorptton Liquid - For preparation of adsorption tube standards and samples, desorption l iquid is required. For the correct desorption l iquid, refer t o the appropriate NIOSH method for the target compound(s) referenced i n Table B i n the Method Highlights Section. -7
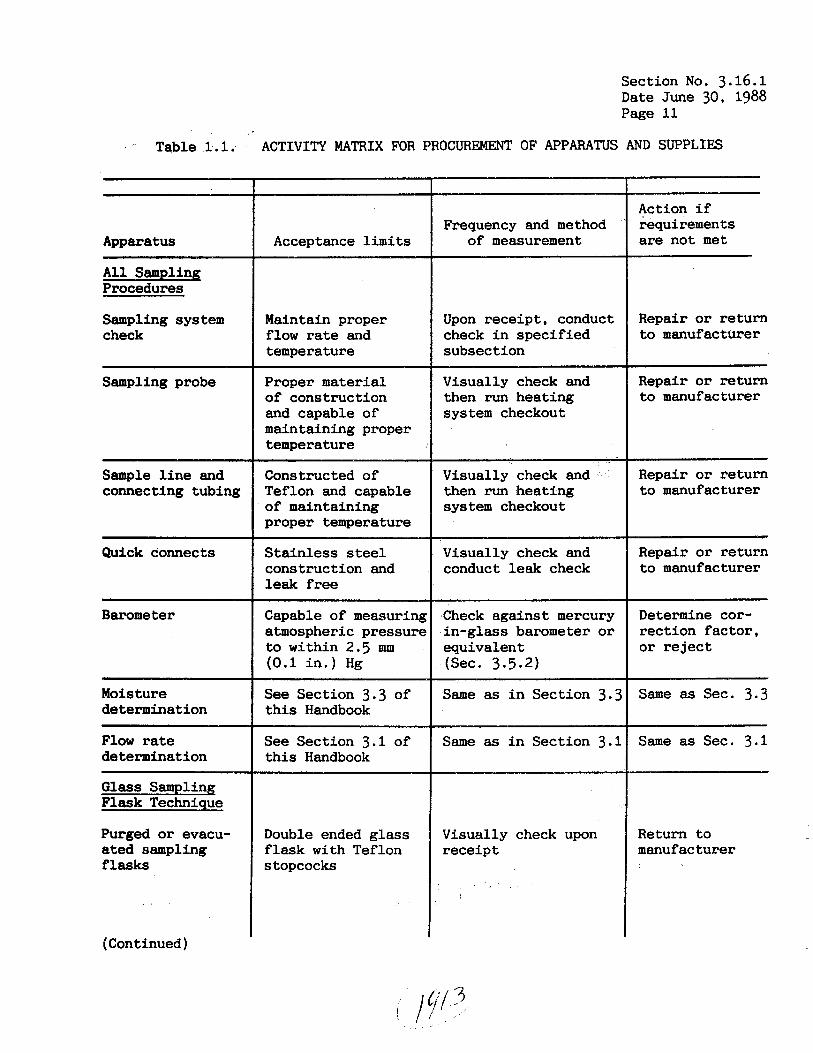
Section No. 3.16.1 Date June 30, 1988 Page 11
Table 1.1. ACTIVITY MATRIX FOR PROCUREMENT OF APPARATUS AND SUPPLIES
~
Acceptance l i m i t s
Action i f requirements are not m e t
Frequency and method of measurement Apparatus
A l l Sampling Procedures
Sampling system check
Maintain proper flow rate and temperature
Upon receipt, conduct check i n specif ied subsection
Repair or return t o manufacturer
Sampling probe Proper material of construction and capable of maintaining proper temperature
Visually check and then run heating system checkout
Repair or return to manufacturer
Repair or return t o manufacturer
Sample l i n e and connecting tubing
Constructed of Teflon and capable of maintaining proper temperature
Visually check and then run heating system checkout
Quick connects Stainless steel construction and leak f r ee
Visually check and conduct leak check
Repair or return t o manufacturer
Barometer Capable of measuring atmospheric pressure t o within 2.5 mm (0.1 i n . ) H g
Determine cor- rection fac tor , o r reject
Check against mercury in-glass barometer or equivalent (Sec. 3.5.2)
Moisture determination
See Section 3.3 of t h i s Handbook
Same as i n Section 3.3 Same as Sec. 3.3
Same as Sec. 3.1 See Section 3.1 of t h i s Handbook
Same as i n Section 3.1 Flow rate determination
Glass Sampling Flask Technique
Purged or evacu- ated sampling f lasks
Double ended glass f lask with Teflon stopcocks
Visually check upon receipt
Return t o manufacturer
(Continued)
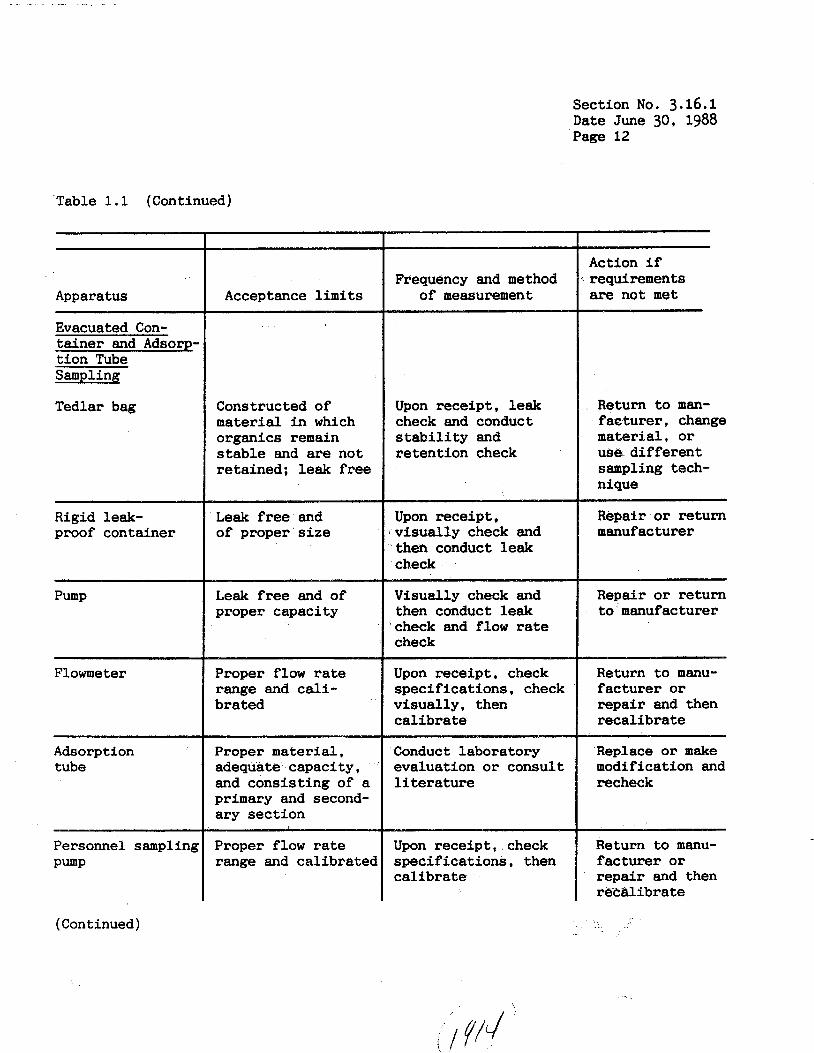
Section No. 3.16.1 Date June 30, 1988 Page 12
.Table 1.1 (Continued)
Apparatus
Evacuated Con- ta iner and Adsorp- t ion Tube Samplinq
Tedlar bag
Rigid leak- proof container
Flowme ter
Adsorption tube
Personnel sampling P U P
(Continued)
Acceptance l i m i t s
Constructed of material i n which organics remain s t ab le and are not retained: leak f r e e
Leak f r e e and of proper ' s ize
Leak free and of proper capacity
Proper flow rate range and C a l i - brated
Proper material, adequate. capacity , and consisting of a primary and second- ary sect ion
Proper flow rate range and calibrated
Frequency and method of measurement
Upon receipt, leak check and conduct s t a b i l i t y and retention check
Upon receipt , v isual ly check and then conduct leak check
Visually check and then conduct leak check and flow rate check
Upon receipt, check specif icat ions, check visual ly , then calibrate
Conduct laboratory evaluation or consult l i t e r a t u r e
Upon receipt, check specif icat ions, then calibrate
Action i f requirements are not met
Return t o man- f ae turer , change material, or us&. d i f fe ren t sampling tech- nique
Repair or return manufacturer
Repair or return t o manufacturer
Return t o manu- facturer or repair and then recal ibrate
Replace or m a k e modification and recheck
Return t o manu- facturer or repair and then ree815brate
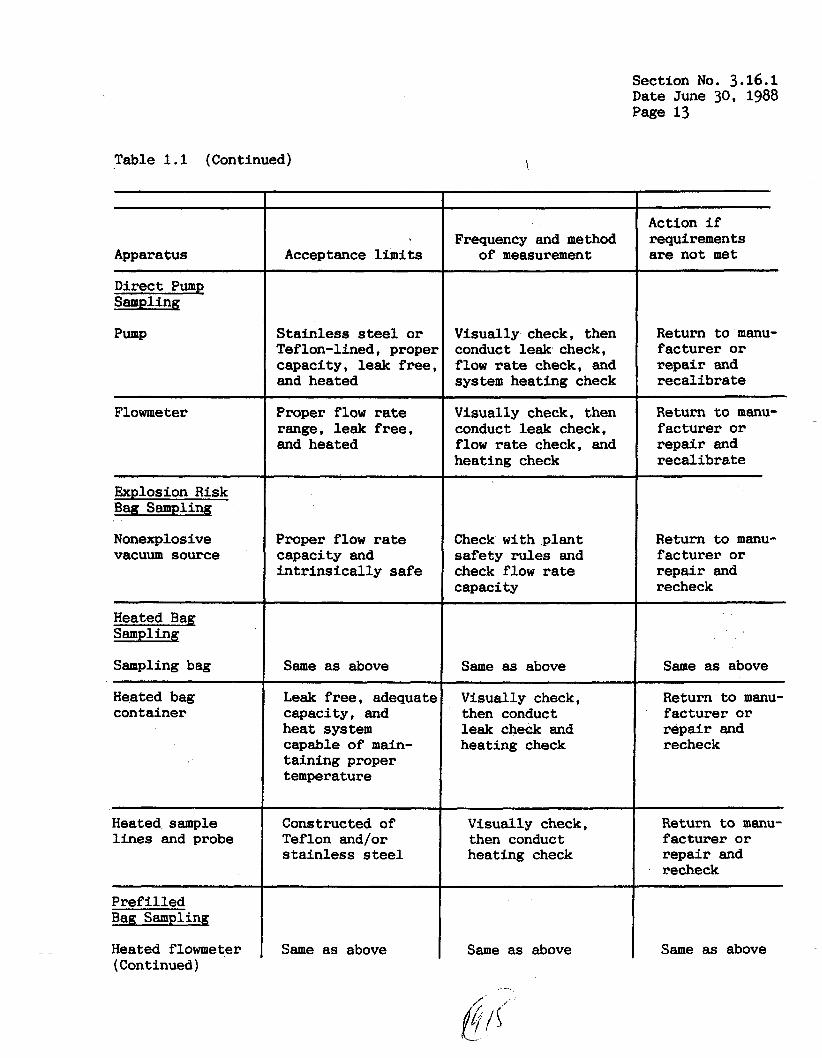
Section No. 3.16.1 Date June 30, 1988 Page 13
Table 1.1 (Continued) \
~~
Action i f requirements are not m e t
Frequency and method of measurement Acceptance l i m i t s Apparatus
Direct Pump Sampling
Stainless steel or Teflon-lined, proper capacity, leak free, and heated
Return t o manu- facturer or repa i r and reca l ibra te
Visually check, then conduct leak check, flow rate check, and system heating check
Visually check, then conduct leak check, flow r a t e check, and heating check
Flowme ter Proper flow rate range, leak free, and heated
Return t o manu- facturer or repa i r and recal ibrate
Explosion Risk Bax Sampling
Nonexplosive vacuum source
Proper flow rate capacity and in t r in s i ca l ly safe
Check with plant safety rules and check flow r a t e capacity
Return t o manu- facturer or repa i r and recheck
Heated Bag Sampling
Same as above Same as above Same as above Sampling bag
Heated bag container
Leak free, adequate capacity, and heat system capable of main- ta ining proper temperature
~ ~~ ~~
Visually check, then conduct leak check and heating check
Return t o manu- facturer or repa i r and recheck
~~ ~~
Return to manu- facturer o r repair and recheck
Heated sample l i nes and probe
Constructed of Teflon and/or s t a in l e s s steel
Visually check, then conduct heating check
~~
Same as above
Pre f i l l e d Bag Sampling
Heated flowmeter (Continued)
Same as above Same as above
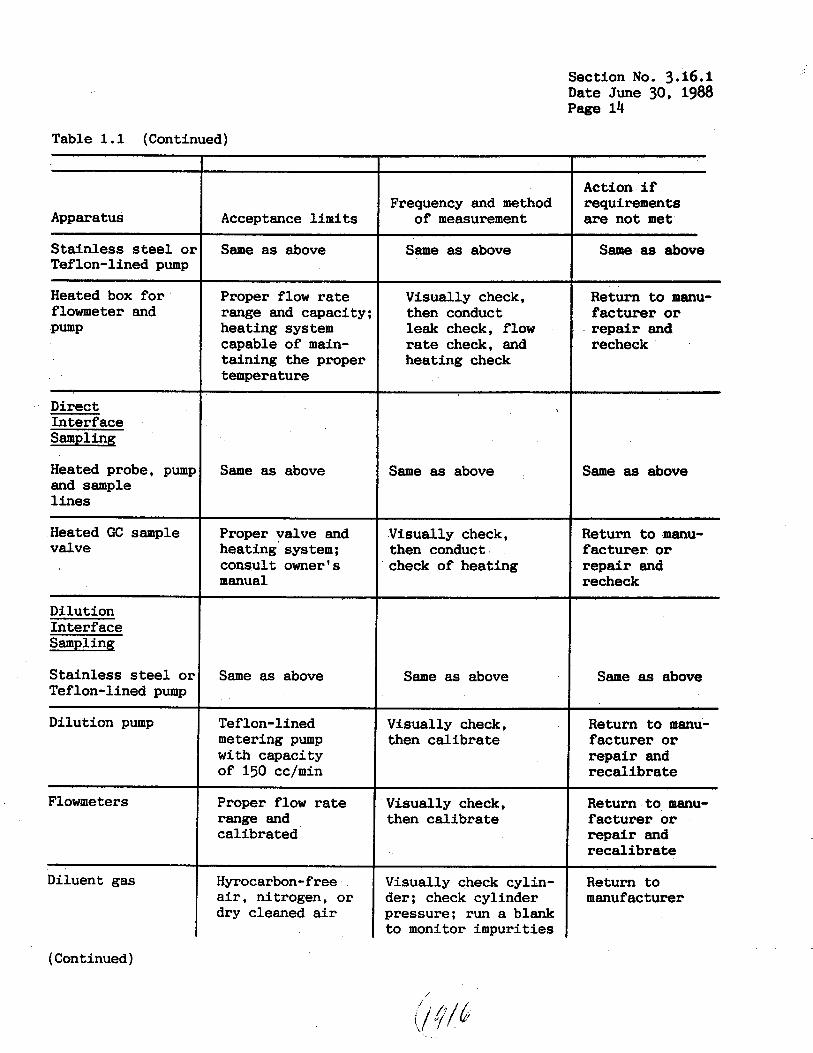
Section No. 3.16.1 Date June 30, 1988 Page 14
Proper valve and heating' system; consult owner's manual
Table 1.1 (Continued)
Visually check, then conduct check of heating
c
Teflon-lined metering pump with capacity of 150 cc/min
Proper flow rate range and calibrated
Hyrocarbon-free a i r , nitrogen, or dry cleaned a i r
Apparatus
Visually check, then ca l ibra te
Visually check, then ca l ibra te
Visually check cylin- der; check cylinder pressure: run a blank t o monitor impurities
Stainless steel 01 Teflon-lined pump
Heated box f o r flowmeter and PUP
Direct Interface Sampling
Heated probe, pumr and sample l i n e s
Heated GC sample valve
Dilution Interface Sampling
Stainless steel 01 Teflon-lined pump
Dilution pump
Flowme ters
Diluent gas
Frequency and method Acceptance l i m i t s of measurement
Same as above Same as above
~ ~~~~
Proper flow rate range and capacity; heating system capable of main- taining the proper temperature
I ,
Same as above
Visually check, then conduct leak check, flow rate check, and heating check
Same as above Same as above
Action if requirements are not met
Same as above
Return t o manu- fac turer or repair and recheck
Same as above
Return to manu- fac turer or repa i r and recheck
Same as above
Return to manu- facturer or repa i r and reca l ibra te
Return to manu- fac turer or repair and reca l ibra te
Return t o manufacturer
(Continued)
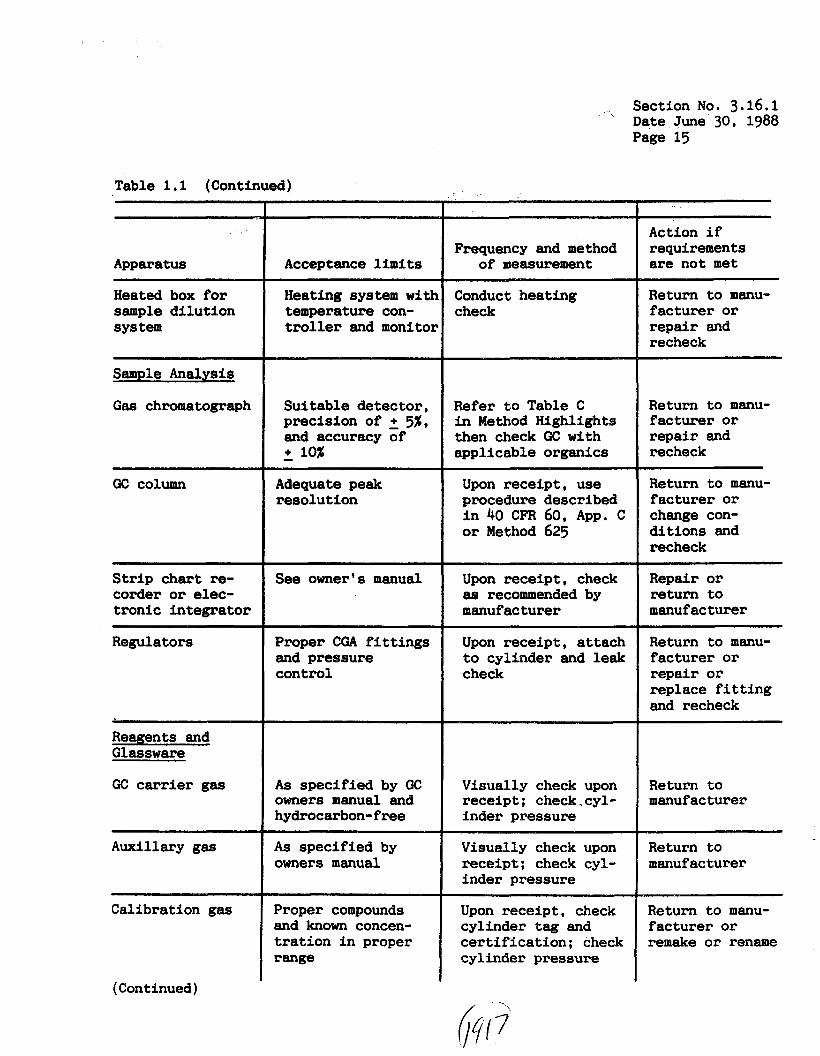
Section No. 3.16.1 D a t e June 30, 1988 Page 15
Table 1.1 (Continued)
Action if requirements are not m e t
Frequency and method of measurement Apparatus Acceptance l i m i t s
Heated box for sample d i lu t ion sys tem
Heating system w i t € temperature con- troller and monitoi
Conduct heating check
Return t o manu- facturer or repair and recheck
Sample Analysis
Gas chromatograph Sui table detector , precision of 2 5%. and accuracy of - + 10%
Refer t o Table C i n Method Highlights then check GC with applicable organics
Return t o manu- facturer or repair and recheck
Return t o manu- fac turer or change con- d i t ions and recheck
Gc column Adequate peak resolution
Upon receipt, use procedure described i n 40 CFR 60, App. C or Method 625
S t r i p chart re- corder or elec- t ronic in tegra tor
See owner's manual Upon receipt, check as recommended by manufacturer
Repair or return t o manufacturer
Regulators Proper CGA f i t t i n g s and pressure control
Return t o manu- facturer or repair or replace f i t t i n g and recheck
Upon receipt, attach t o cylinder and leak check
Rewents and G l a s s w a r e
GC carrier gas A s specif ied by GC owners manual and hydrocarbon-free
Visually check upon receipt: check-cyl- inder pressure
Return t o manufacturer
Auxillary gas A s specified by owners manual
Visually check upon receipt; check cyl- inder pressure
Return t o manufacturer
Calibration gas Proper compounds and known concen- t r a t i o n i n proper range
Upon receipt, check cylinder tag and ce r t i f i ca t ion ; check cylinder pressure
Return to manu- facturer or remake or rename
(Continued)
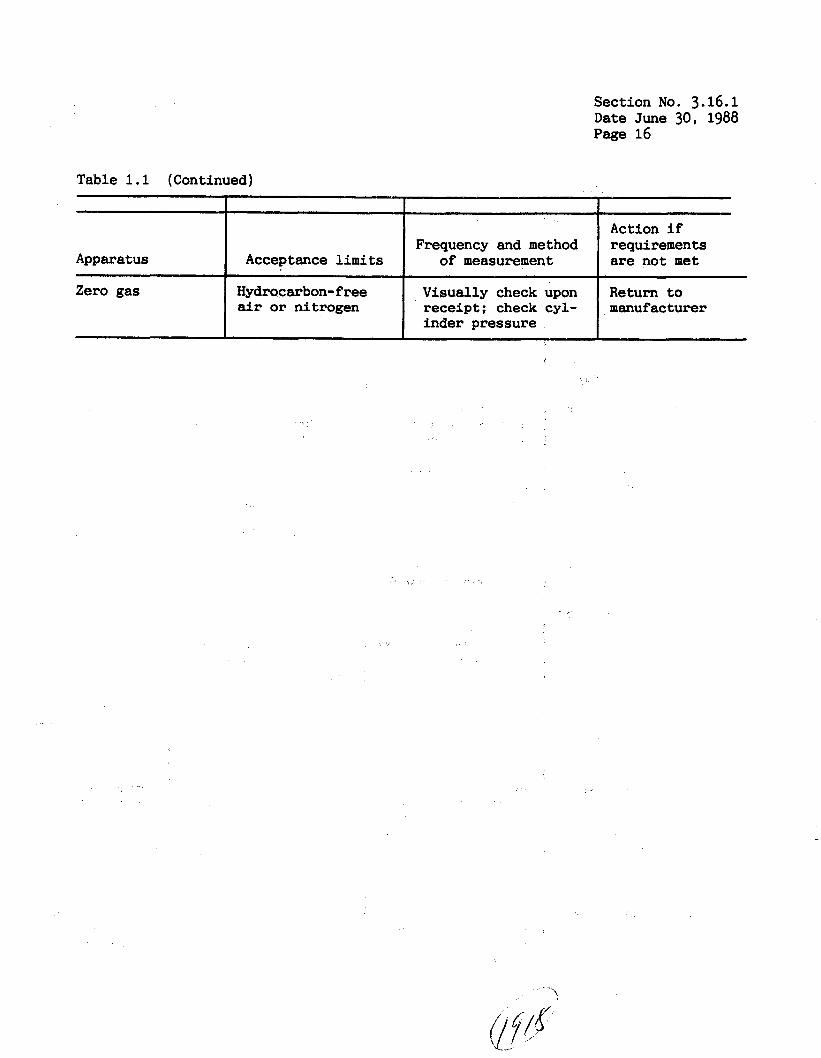
Section No. 3.16.1 Date June 30, 1988 Page 16
Table 1.1 (Continued)
Zero gas Hydrocarbon-f air or nitrog
er pressure
Section No. 3.16.2 Date June 30, 1988 Page 1
2.0 CALIBRATION OF APPARATUS Calibration of the apparatus is one of the most important functions i n
maintaining da ta qua l i ty . The de ta i led ca l ibra t ion procedures included i n t h i s sect ion were designed for the sampling equipment spec i f ied i n Method 18 and de- scribed i n the previous sect ion. The ca l ibra t ion of the ana ly t ica l equipment is described i n the sec t ion d e t a i l i n g the ana ly t ica l procedures, Section 3.16.5. Table 2.1 a t the end of t h i s sec t ion summarizes the qua l i t y assurance fuqctions for the ca l ibra t ions addressed i n t h i s section. A l l ca l ibra t ions including the analyt- ical equipment should be recorded on standardized forms and retained i n a ca l ibra t - ion log book.
2.1 MeterinR Systems
2.1.1 Wet Test Meter - The w e t test meter must be calibrated and have the proper capacity. For Method 18, the wet test meter should have a capacity of about 1 L/min. No upper l i m i t is placed on the capacity; however, the w e t test meter d i a l should make at least one complete revolution a t the spec i f ied flow rate for each of the three independent ca l ibra t ions .
Wet test meters are ca l ibra ted by the manufacturers to an accuracy of 2 2%. Calibration of the w e t test meter must be checked upon rece ip t and yearly there- after. A l i qu id pos i t i ve displacement technique can be used to ve r i fy and adjus t , i f necessary, the accuracy of the w e t test meter to 2 2%. This technique is de- scribed i n Sections 3.5.2, 3.8.2, and 3.15.2 of the Handbook.
2.1.2 D q j Gas Meter - A dry gas meter is required f o r gas and l iqu id in jec t ion ca l ibra t ions , to p re f i l l bags prior t o sampling using the pref i l led bag d i lu t ion technique, and/or to c a l i b r a t e the flow rate meters. For Method 18, the dry gas meter is the same s i z e or smaller than the dry gas meter typica l ly used for Method 6. The meter must have an accuracy of + 3% f o r the flow rate and sample volume used. Calibration of the dry gas meter must be conducted i n i t i a l l y upon rece ip t , quar ter ly when u t i l i z e d t o make laboratory ca l ibra t ion standards, and following each f i e l d test series for f i e l d use. The ca l ibra t ion procedures are described i n Section 3.5.2 of t h i s Handbook,
2.1.3 FZow Rate Meter(s) - Flow rate meters are needed f o r (1) sampling and (2) making ca l ibra t ion standards. Since they are used t o determine flow rate and for total volume determinations, the flow rate meter(s) se lec ted must have an accuracy of 2 3% for the flow rate and t o t a l sample volume f o r which they are used. Acceptable flow rate meters inc lude ro t ame te r s , c r i t i c a l o r i f i c e s , mass flowmeters, and dry gas meters. If data from the flow rate meter is used only as an indicator of the flow rate and is not used i n any of t he emission calculat ions, then the accuracy of 2 3% does not apply. While it is des i rab le t o calibrate the gas flowmeter with the cyl inder gas to be measured, the quant i ty avai lable and cost may preclude it . The e r r o r introduced by using the d i luent gas for ca l ibra t ion i n place of the ac tua l gas t o be measured is ins igni f icant for gas mixtures of up t o 1,000 t o 2,000 ppm.
Initial Calibration - The flow metering system should be calibrated when first purchased and a t any time the pos t tes t ca l ib ra t ion y ie lds a ca l ibra t ion fac tor t ha t does not agree within 5% of the pretest ca l ib ra t ion factor. A
Section No. 3.16.2 Date June 30, 1988 Page 2
ca l ibra ted w e t test meter, ca l ibra ted dry gas meter, or a properly s ized bubble meter should be used to ca l ib ra t e the metering system.
The flow rate meter should be cal ibrated i n the following manner before its i n i t i a l use i n the f i e l d .
1. Leak check the flow rate meter and pump as follows: a. Temporarily a t tach a su i t ab le rotameter (e.g., 0-40 cm3/min) to
the o u t l e t of flow rate system. before or after the flow rate meter based on where it w i l l be used. Place a vacuum ,gauge at the i n l e t t o t he drying tube.
b. Plug the flow rate system i n l e t . Evacuate to a pressure a t least equal to the lowest pressure t h a t w i l l be encountered during use. If the system usually operates a t or near atmospheric conditions, then p u l l a vacuum of 25 mm (1 i n . ) Hg. Note the flow rate as indicated by the rotameter. A leak of (0.02 L/min must be recorded or leaks > 0.02 L/min must be eliminated.
2. Attach the w e t test meter, bubble meter, or ca l ibra ted dry gas meter to the i n l e t of t he flow rate metering system.
3. Run the pump for 15 minutes with the flow rate set a t the midrange flow to allow the pump to w a r m up and to permit the i n t e r i o r surface of the w e t test meter to become w e t .
4. Collect the information required i n the forms provided {Figure 2.1A (English un i t s ) or 2.1B (metric un i t s ) when ca l ib ra t ing a dry gas meter , rotameter, or mass flow meter, and Figure 2.2A (English u n i t s ) or 2.2B (metric units) when ca l ib ra t ing a cri t ical o r i f i ce} using sample volumes equivalent t o a t least f i v e revolutions of the dry test meter. Three independent runs must be made. a. For crit ical orifices, runs w i l l be conducted at the s i n g l e flow rate
of the orifice meter. The runs should be a t three d i f f e r e n t vacuums t h a t are greater than one half an atmosphere ( i .e. , 18, 19 and 20 in. Hg.). This is to demonstrate t h a t the orifice y ie lds the same flowrate a t a l l cri t ical vacuums.
conducted at three d i f f e ren t flow rates over the range to be used ( top , middle, and bottom of range).
The pump should be placed e i t h e r
c. d.
b. For rotameters, mass flow meters, and dry gas meters, runs w i l l be
5 . Calculate the Y, f o r each run f o r the dry gas meter, rotameter and mass flowmeter o r ca lcu la te the K’ for the cri t ical o r i f i c e as ,shown on the d a t a forms. Adjust and reca l ibra te or reject the dry gas meter, rotameter, o r mass flow meter i f one or more values of Y, f a l l outs ide the in t e rva l Y 2 O.O3Y, where Y is the average for three runs. Otherwise, the Y (ca l ibra t ion factor) is acceptable and is to be used for fu tu re checks and subsequent test runs. The K’ should be within 3% of the average f o r a l l three runs. If t h i s is not t r u e , reject the orifice or repeat the ca l ibra t ion un t i l acceptable r e s u l t s are obtained. The completed form should be forwarded to the supervisor f o r approval, and then f i l e d i n the ca l ibra t ion log book.
Posttest Catibration Check - After each f i e l d test series, conduct a cal ibra- t ion check as described above i n Subsection 2.1 concerning the i n i t i a l ca l ibra t ion with the following exceptions:
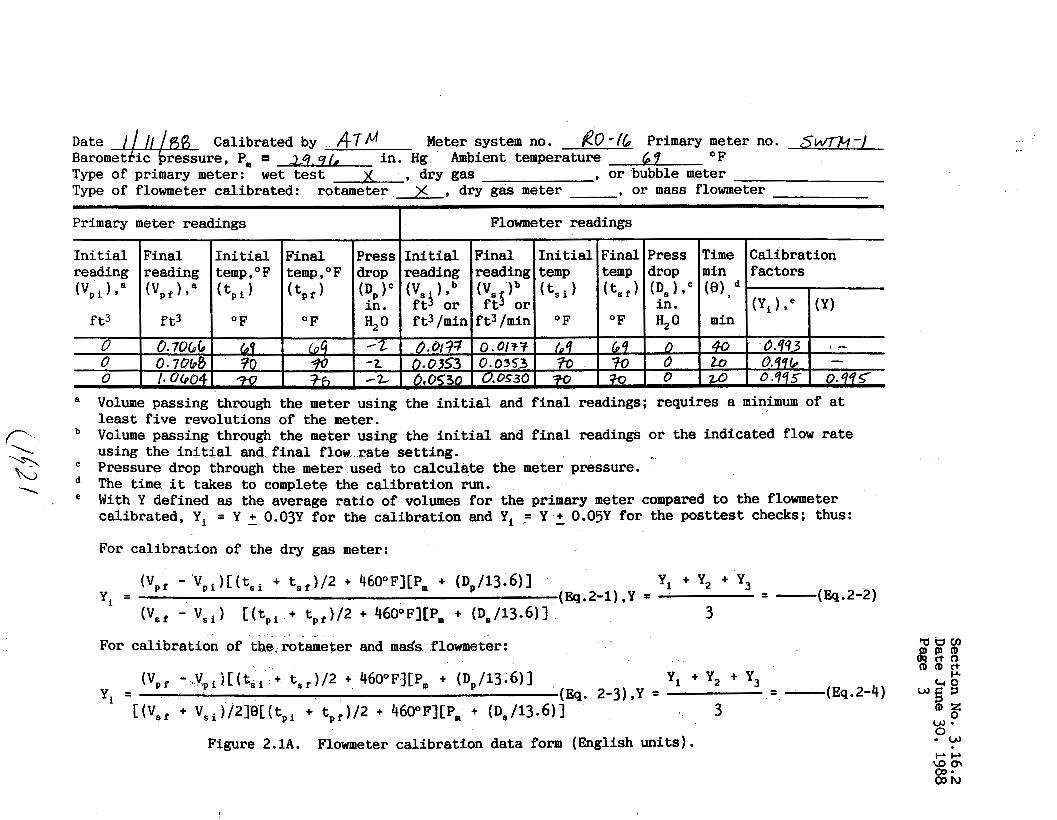
Date // / I df36 Calibrated by 14-7M Meter system no. Po -16 Primary meter no. 5- - 1 Baromet i c ressure, P, 39,9(, i n . H g Ambient temperature 69 OF Type of primary meter: wet test X , dry gas , or bubble meter Type of flowmeter calibrated: rotameter )r , dry gas meter , or mass flowmeter
Primary meter readings
I n i t i a l Final I n i t i a l Final Press reading reading temp,OF temp,OF drop ( V P i ) , * ( V p f I P a ( tp i ) ( tp f ) (D,)'
in . f t 3 f t 3 OF OF H,O 0 0.706 b b?! IP? -2 0 0.701P8 70 ..70 -2 0 1.0604 '30 36 --Z
Flowmeter readings
I n i t i a l Final I n i t i a l Final Press Time Calibration reading reading temp temp drop min factors (V, (V, lb ( tSr ) ( t s f ) (D,),' f t j or f t3 or in . (Y, ) t e ( Y ) ft3/min ft3/min OF OF H,O min
0 .013 0.0177 I0 4 b4 0 6.493 I -
0.0353 0.0353 ?O 30 0 to 0.4Tb - 6.0530 0 .OS30 30 0 zo 0.q4.s 0.445
For cal ibrat ion of the dry gas meter:
I -
,
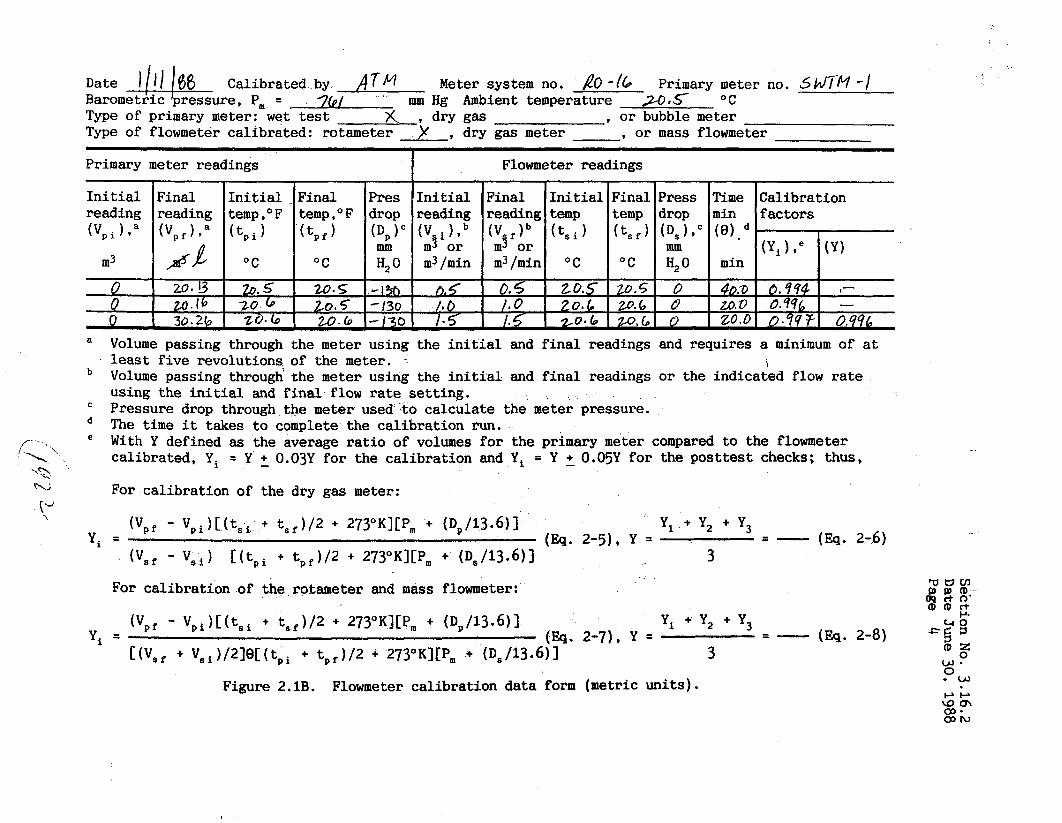
Date ) / j / 1 6 Calibrated.by A T M Meter system no. /0-/6 Primary meter no. S f l N -1 Barometric ressure, P, = 7b/ mm H g Ambient temperature 2-0,s O C
Type of primary meter: w e t test x dry gas , o r bubble meter Type of flowmeter ca l ibra ted : rotameter ) , dry gas meter , o r mass flowmeter
Primary meter readings
I n i t i a l Final I n i t i a l F ina l Pres reading reading temp,OF temp,OF drop
m3 / a d O C O C H,O
( V p f ) v a ( t p i ) ( t p f ) ( D p I C
0 20. !3 20.5 20.2 - 1 % 0 20.16 20 b 20.5 -130 0 30.242 Z0.b i 20.6 -13 0
mm
~~
Flowmeter readings
I n i t i a l Final I n i t i a l Final Press Time Cal ibra t ion reading reading temp temp drop min f a c t o r s ( v g i ) , b ( V f I b ( t s i ) ( t s f ) ( D s ) * C
m o r m 3 or mm ( y i L e (Y) m3/min m3/min O C O C H,O min
13.5 0.5 20.5 zo .5 0 46.2, 0.494 1-
1.0 20.6 20.6 a ZO. 2) 0.996 - I. 5 z O * b ZO .b 0 20.0 0.947 0.99i3
0
For ca l ib ra t ion of t he rotameter and mass flowmeter:
Figure 2.1B. Flowmeter ca l ib ra t ion da ta form (metric u n i t s ) . - w w c 1
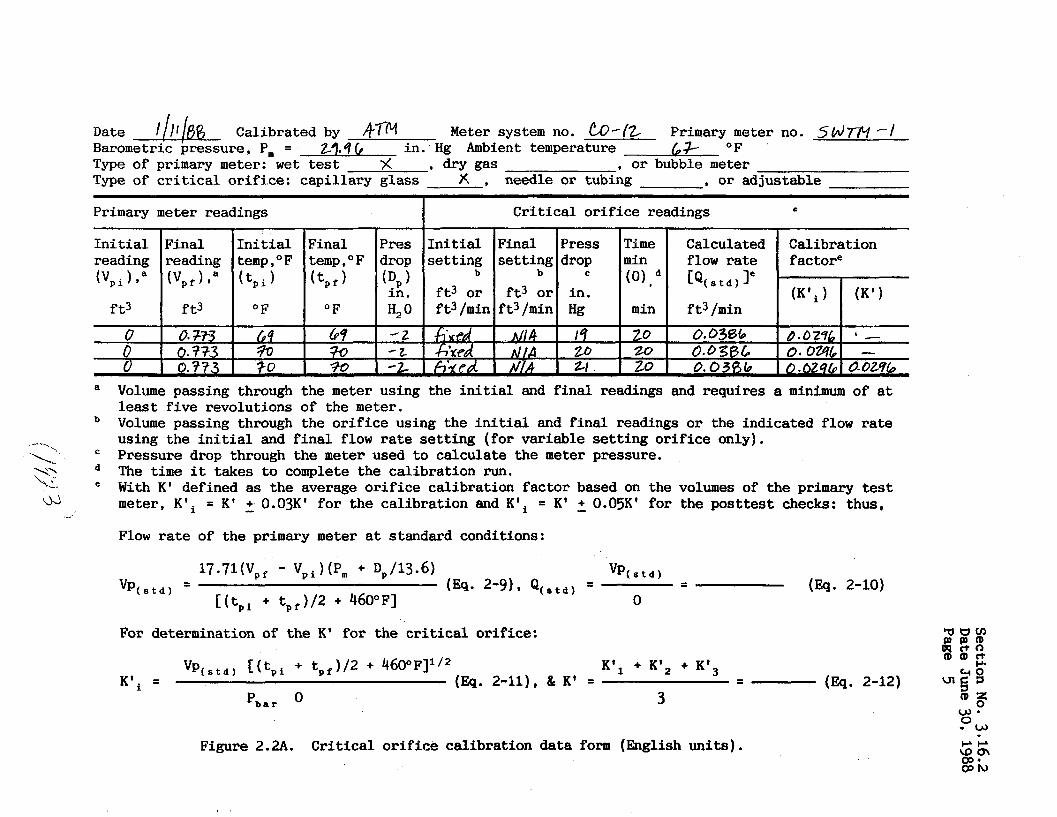
Date I/I l / f l$ Calibrated by kTfl Meter system no. b - / Z Primary meter no. 5NTM - 1
Type of primary meter: w e t test 'r( 9 dry gas , o r bubble meter Type of c r i t i c a l o r i f i ce : capillary glass X , needle or tubing , or adjustable
Barometric pressure, P, = 27,9 b in . Hg Ambient temperature L+- OF
Primary meter readings Critical o r i f i c e readings D
a Volume passing through the meter using the i n i t i a l and f i n a l readings and requires a minimum of a t least f ive revolutions of the meter. Volume passing through the o r i f i c e using the i n i t i a l and f i n a l readings o r the indicated flow rate
Pressure drop through the meter used t o calculate the meter pressure. The t i m e it takes t o complete the calibration run. With K' defined as the average o r i f i c e calibration factor based on the volumes of the primary test meter, K', = K' 2 O.O3K' for the cal ibrat ion and K', = K' - + 0.05K' for the posttest checks: thus,
Flow rate of the primary meter a t standard conditions:
- using the i n i t i a l and f i n a l flow rate se t t i ng ( for variable se t t i ng o r i f i c e only). .\ Y> k:, '&a
- - (FQ. 2-10) 17.71(Vp, - Vp,)(P, + Dp/13.6) - v p ( s t d )
(Eq* 2-91, Q ( s t d ) - - VP(Std) -
[(tpi + t p , ) /2 + 460°F] 0
For determination of the K' for the critical or i f ice: V W l A & fx o o g
@ 3
K', + K', + K', K', = (FQ. 2-11), & K' = - - (Eq. 2-12) u p 'P(std) [ ( t p i + t p f ) / 2 + 4600Fi1'2
W ' Pbar 0 3
Figure 2.2A. Critical o r i f i c e cal ibrat ion data form (English uni t s ) .
,

Date ja//kf$ Calibrated by km Baromet c ressure, P, = 7G/ mm H g Ambient temperature 2.5 O C
* or bubble meter Type of primary meter: wet test K * dry gas Type of cri t ical orifice: capillary glass , needle or tubing
Meter system no. O-/L Primary meter no. W J - F I - 1
, or adjustable
Primary meter readings ~~ -~
C r i t i c a l o r i f ice readings
a
b
C
d
e
Calculated Calibration flow rate factore
Volwne passing through the meter using the i n i t i a l and f ina l readings and requires a minimum of at leas t f ive revolutions of the meter. Volume passing through the o r i f i ce using the i n i t i a l and f ina l readings or the indicated flow rate using the i n i t i a l and final flow rate s e t t i n g (for variable se t t ing or i f ice only). Pressure drop through the meter used t o calculate the meter pressure. The time i t takes t o complete the calibration run. With K' defined as the average or i f ice calibration factor based on the volumes of the primary test meter, K', = K' - + 0.03K' for the calibration and K t i = K' - + O.O5K' for the posttest checks; thus,
Flow rate of the primary meter at standard conditions:
W . 0 ' W
Figure 2 . B . Critical or i f ice calibration data form (metric units) .
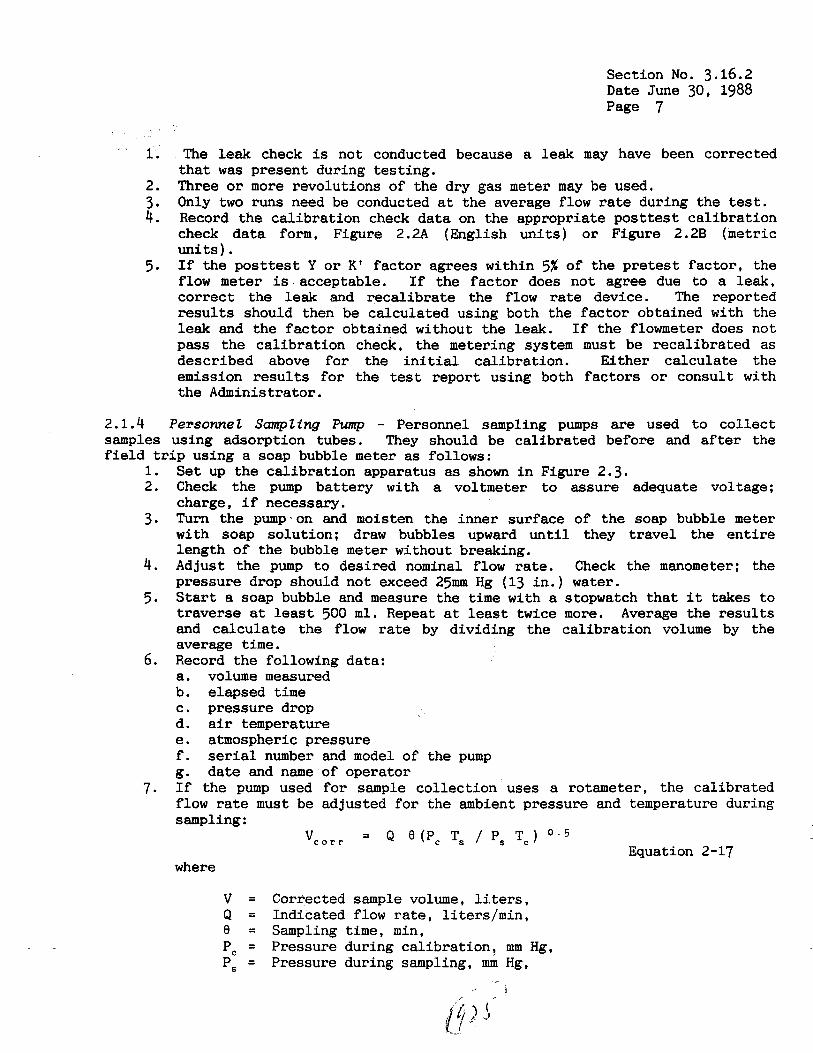
Section No. 3.16.2 Date June 30, 1988 Page 7
1. The leak check is not conducted because a leak may have been corrected
2. 3. 4.
t h a t was present during tes t ing . Three o r more revolutions of the dry gas meter may be used. Only two runs need be conducted a t the average flow rate during the test. Record the ca l ib ra t ion check da ta on the appropriate pos t t e s t ca l ibra t ion check da ta form, Figure 2.2A (English un i t s ) o r Figure 2.2B (metric
I f the p o s t t e s t Y or K' factor agrees within 5% of the pretest fac tor , the flow meter is acceptable. If the factor does not agree due to a leak, cor rec t the leak and reca l ibra te the flow rate device. The reported r e s u l t s should then be calculated using both the factor obtained with the leak and the f ac to r obtained without the leak. If the flowmeter does not pass the ca l ib ra t ion check, the metering system must be reca l ibra ted as descr ibed above f o r the i n i t i a l cal ibrat ion. Ei ther ca lcu la te the emission r e s u l t s f o r t he test report using both f ac to r s o r consult with the Administrator.
u n i t s ) . 5.
2.1.4 Personnet Sampling Pump - Personnel sampling pumps are used t o collect samples using adsorption tubes. They should be ca l ibra ted before and after the f i e l d t r i p using a soap bubble meter as follows:
1. Se t up the ca l ibra t ion apparatus as shown i n Figure 2.3. 2. Check the pump ba t te ry with a voltmeter to assure adequate voltage;
charge, i f necessary. 3. Turn the pump.on and moisten the inner surface of the soap bubble meter
with soap solut ion; draw bubbles upward u n t i l they t r ave l the e n t i r e length of the bubble meter without breaking.
4. Adjust the pump t o desired nominal flow rate. Check the manometer: the pressure drop should not exceed 25mm H g (13 i n . ) water.
5. S t a r t a soap bubble and measure the t i m e with a stopwatch t h a t i t takes t o t raverse a t least 500 m l . Repeat a t least twice more. Average the r e su l t s and ca lcu la te the flow rate by dividing the ca l ibra t ion volume by the average t i m e .
6. Record the following data: a. b.
d. e. f . g.
7 . If
C .
volume measured elapsed t i m e pressure drop a i r temperature atmospheric pressure serial number and model of the pump da te and name of operator
the pump used f o r sample co l lec t ion uses a rotameter, the cal ibrated flow rate must be adjusted f o r the ambient pressure and temperature during sampling :
where
v = Q = e = P, = P, =
Corrected sample volume, l i t e r s , Indicated flow r a t e , l i t e rs /min , Sampling time, min, Pressure during ca l ibra t ion , mm Hg , Pressure during sampling, mm Hg,
i
Equation 2-17
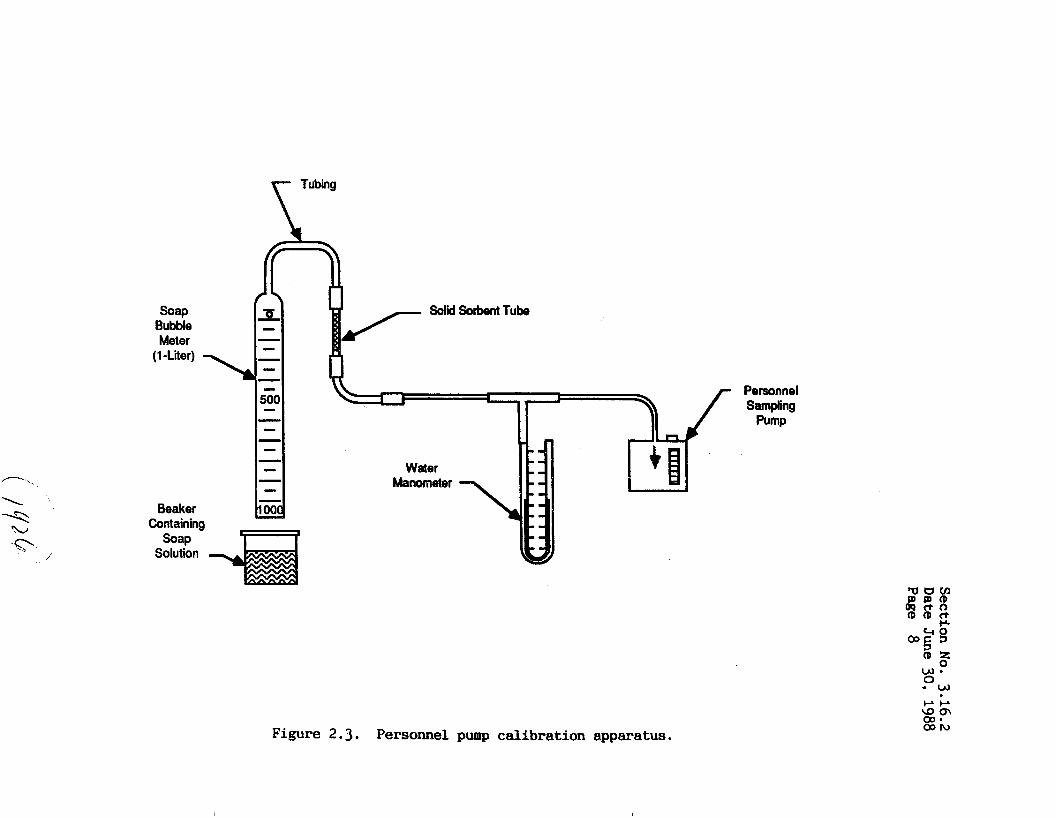
Section
No. 3.16.2
Date June 30, 1988
Page 8
Qi 3 4 a rl
B k
al a
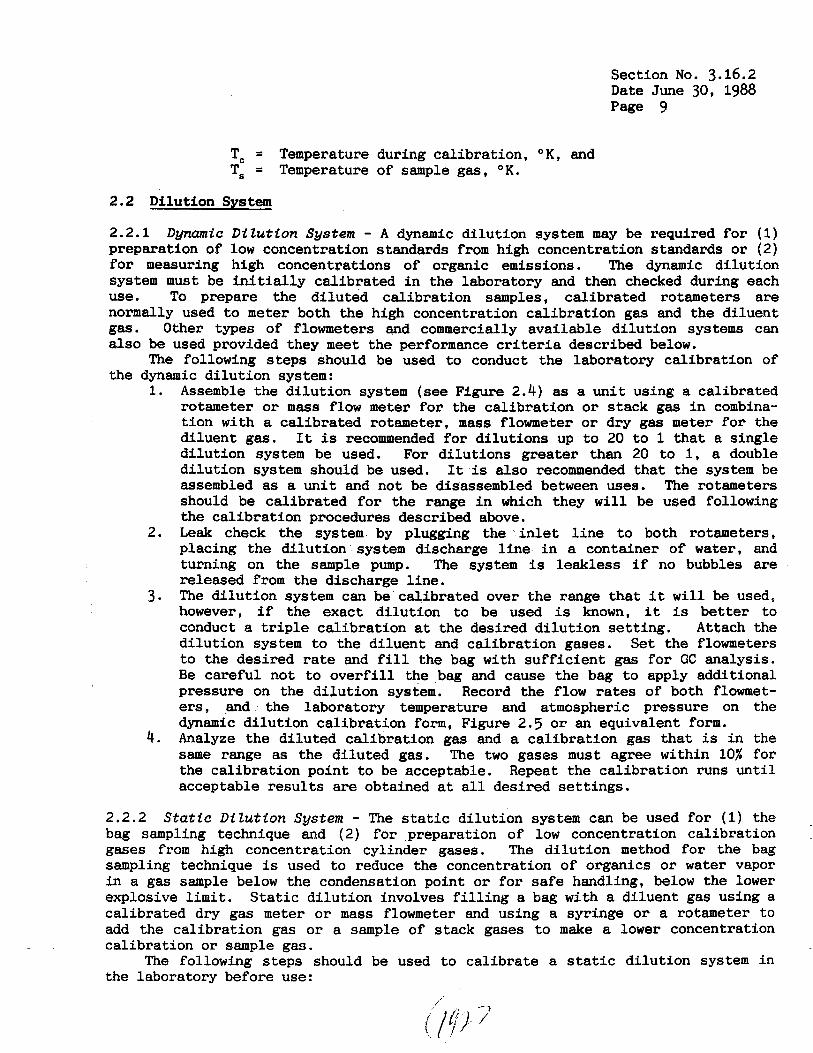
Section No. 3.16.2 Date June 30, 1988 Page 9
T, = Temperature during ca l ibra t ion , O K , and T, = Temperature of sample gas, OK.
2.2 Dilution System
2.2.1 Dgnamtc Dilution Sgstem - A dynamic d i lu t ion system may be required fo r (1) preparation of low concentration standards from high concentration standards o r (2) f o r measuring high concentrations of organic emissions. The dynamic d i lu t ion system must be i n i t i a l l y ca l ibra ted i n the laboratory and then checked during each use. To prepare the d i lu t ed ca l ibra t ion samples, ca l ibra ted rotameters are normally used t o meter both the high concentration ca l ib ra t ion gas and the d i luent gas. Other types of flowmeters and commercially ava i lab le d i lu t ion systems can a l so be used provided they meet the performance criteria described below.
The following s t eps should be used t o conduct the laboratory ca l ibra t ion of the dynamic d i lu t ion system:
1.
2.
3 .
4.
Assemble the d i lu t ion system (see Figure 2.4) as a u n i t using a calibrated rotameter o r mass flow meter f o r the ca l ib ra t ion or s tack gas i n combina- t ion with a calibrated rotameter, m a s s flowmeter o r dry gas meter f o r t h e d i luent gas. It is recommended f o r d i lu t ions up to 20 t o 1 t h a t a s ing le d i lu t ion system be used. For d i lu t ions greater than 20 t o 1, a double d i lu t ion system should be used. It is also recommended t h a t the system be assembled as a u n i t and not be disassembled between uses. The rotameters should be ca l ibra ted f o r the range i n which they w i l l be used following the ca l ib ra t ion procedures described above. Leak check the system by plugging the i n l e t l i n e to both rotameters, placing the d i lu t ion system discharge l i n e i n a container of water, and turning on the sample pump. The system is leakless i f no bubbles are released from the discharge l i ne . The d i lu t ion system can be ca l ibra ted over the range that i t w i l l be used, however, i f the exact d i lu t ion t o be used is known, it is b e t t e r t o conduct a t r i p l e ca l ib ra t ion at the desired d i lu t ion se t t i ng . Attach the d i lu t ion system to the d i luent and ca l ibra t ion gases. Set the flowmeters t o the desired rate and f i l l the bag with s u f f i c i e n t gas f o r GC analysis. Be carefu l not t o o v e r f i l l the bag and cause the bag t o apply additional pressure on the d i lu t ion system. Record the flow rates of both flowmet- ers, and the laboratory temperature and atmospheric pressure on the dynamic d i lu t ion ca l ib ra t ion form, Figure 2.5 o r an equivalent form. Analyze the d i lu t ed ca l ibra t ion gas and a ca l ib ra t ion gas tha t is i n the same range as the d i lu t ed gas. The two gases must agree within 10% for the ca l ibra t ion point t o be acceptable. Repeat the ca l ibra t ion runs u n t i l acceptable r e s u l t s are obtained a t a l l desired se t t i ngs .
2.2.2 Statfc DfZution System - The static d i lu t ion system can be used f o r (1) the bag sampling technique and (2) f o r preparation of low concentration ca l ibra t ion gases from high concentration cylinder gases. The d i lu t ion method fo r the bag sampling technique is used t o reduce the concentration of organics o r water vapor i n a gas sample below the condensation point o r f o r safe handling, below the lower explosive l i m i t . S t a t i c d i lu t ion involves f i l l i n g a bag with a d i luent gas using a cal ibrated dry gas meter o r m a s s flowmeter and using a syringe o r a rotameter t o add the ca l ibra t ion gas o r a sample of s tack gases t o make a lower concentration ca l ibra t ion o r sample gas.
The following steps should be used t o ca l ib ra t e a s ta t ic d i lu t ion system i n the laboratory before use:
,’ .- .
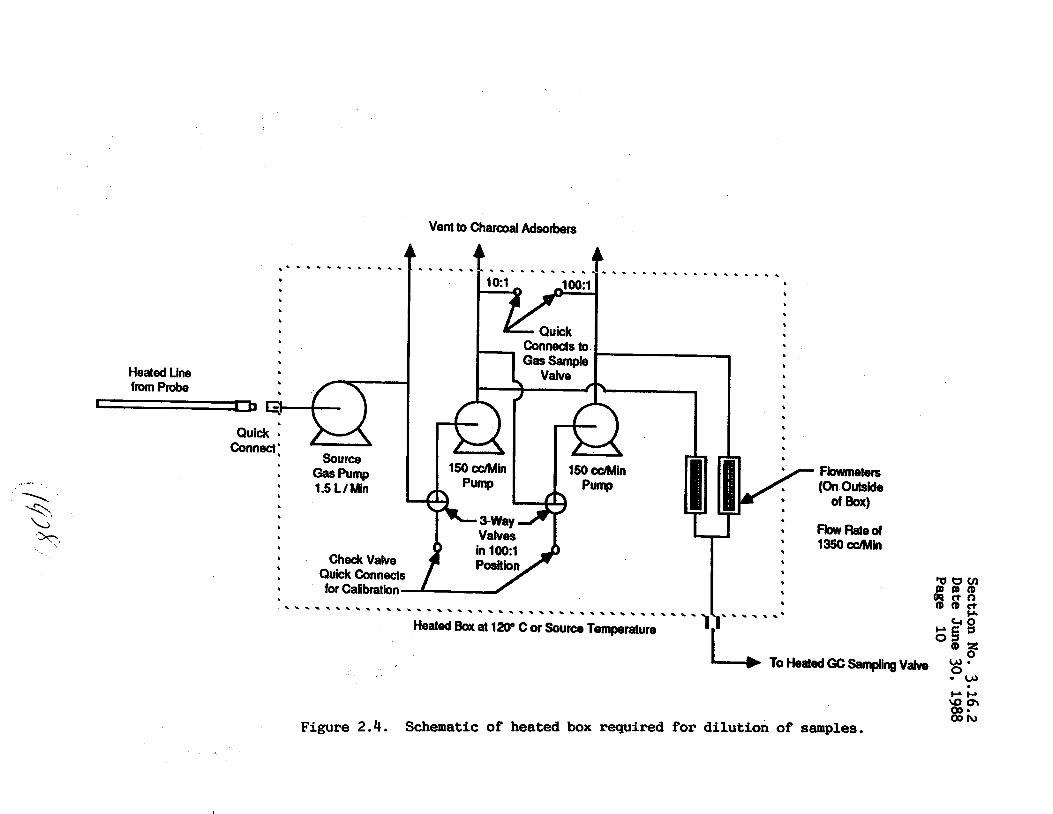
Section
No. 3 D
ate June 30, Page
10
.16.2 waa
a
.-...I...-*..-....
, , ,
, , , , , I
, I
I I ..
.
%I
0
%I
0
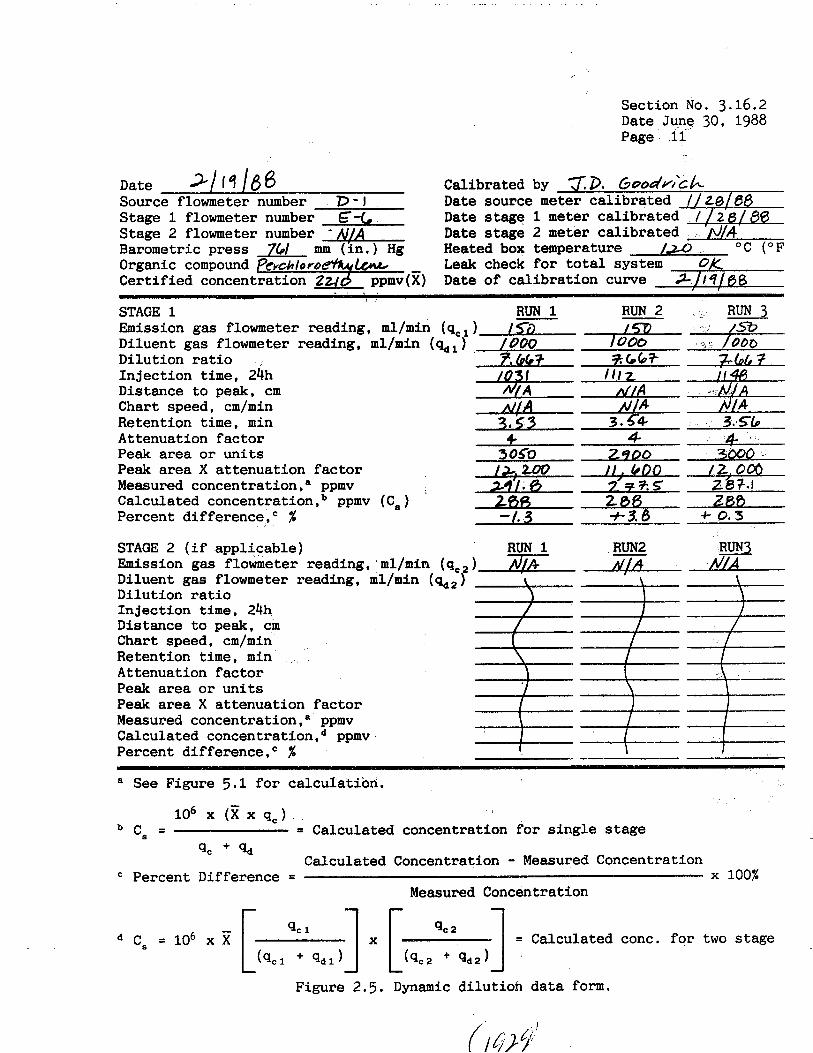
. . . . . ,. . . . . . . . . . ~ ~. . .
Section No. 3.16.2 Date June 30, 1988 Page ii
Calibrated by Date source meter calibrated
Date 21 14 166 Source flowmeter number D-I Stage 1 flowmeter number 6-(. Date stage 1 Stage 2 flowmeter number 'N /A Date stage 2 meter calibrated Barometric press 76/ mm (in.) H g Heated box temperature
Certified concentration Organic compound
STAGE 1 RUN 1 RUN 2 RUN 3 Emission gas flowmeter reading, ml/min ( q c l ) t5a Diluent gas flowmeter reading, ml/min Dilution ratio Injection time, 24h Distance to peak, cm Chart speed, cm/min Retention time, min
I
3 . 5 4 3.470 Attenuation factor 9 4 A Peak area or units 3 OCO 2900 3r)o_o Peak area X attenuation factor t 4 . u18 It a &DO /2. om Measured concentration," ppmv 2i3;c.l
088 Percent difference, % - t3.6 4- 0 . 5 Calculated concentration,b ppmv (C,)
STAGE 2 (if applicable) Emission gas f lowme ter reading, . ml/min (9, ) '/cl/n Diluent gas flowmeter reading, ml/min (qdp) Dilution ratio Injection time, 24h Distance to peak, cm Chart speed, cm/min Retention time, min Attenuation factor Peak area or units Peak area X attenuation factor Measured concentration,a ppmv Calculated concentration,d ppmv Percent differenceVc %
a See Figure 5.1 for calculation.
106 x ( j ? x 9,) c, = = Calculated concentration for single stage
qc + q d Calculated Concentration - Measured Concentration
Percent Difference = x 100% Measured Concentration
C, = lo6 x [ '" x [ qc2 )] = Calculated conc. for t w o stage (%I + %l ( q c 2 + q d 2
Figure 2.5. Dynamic dilutioh data form.

Section No. 3.16.2 Date June 30, 1988 Page 12
1. Assemble the s ta t ic d i lu t ion system (see Figure 4.3) and leak check the system by plugging i n l e t t o the d i lu t ion system, placing the discharge l i n e i n a container of water, and pul l ing a vacuum of about 1 i n . of Hg. The system is l eak less i f no bubbles are released from the discharge l ine . I f the system is not leak less , f ind the leak and correct i t .
2. Calculate as t he amount of d i luent gas needed t o obtain the desired d i lu t ion or ca l ib ra t ion gas concentration. Meter the desired amount of gas i n t o the bag. If the purpose of the s ta t ic d i lu t ion is to prepare a lower concentration of ca l ibra t ion gas, the ca l ibra t ion gas should be added t o the bag using a gas t i g h t syringe. Record the da ta on the static d i lu t ion system data form, Figure 2.6 or similar form. If the purpose of the static d i lu t ion system is t o collect a d i lu ted s tack sample, the calculated amount of d i luent gas is added to the bag and the s tack gas is metered i n t o the bag from the stack. To calibrate t h i s system, the calculated amount o f , d i l u e n t gas should be metered i n t o the bag and then a ca l ib ra t ion gas should be metered i n t o the bag with the flowmeter t h a t is t o be used i n the f i e l d . Record t h e data on the s ta t ic d i lu t ion system data form, Figure 2.6 or similar da ta form.
3. Analyze the d i lu t ed ca l ibra t ion gas and analyze a d i f f e ren t ca l ibra t ion gas t h a t is i n the range of the d i lu ted ca l ib ra t ion gas. The two gases must agree within 10% of each o ther f o r the system to be acceptable.
2.3 Thermometer
The thermometers(s) on the metering systems and the sample probes and l i n e s should be i n i t i a l l y compared with a mercury-in-glass thermometer t h a t meets ASTM E- l No. 63C or 63F spec i f ica t ions :
1.
2 .
3.
4.
Place the thermometer t o be ca l ibra ted and the mercury-in-glass thermo- meter i n a bath of boi l ing water. Compare the readings after the bath s t a b i l i z e s and then record on the ca l ibra t ion da ta form, Figure 2.7 or equivalent. A l l o w both thermometers t o come to room temperature. Compare the readings a f t e r t h e thermometers s t a b i l i z e . The thermometer is acceptable i f the values agree within 3OC (5.4OF) a t both points . Prior to each f i e l d t r i p , compare the temperature reading of the mercury- in-glass thermometer a t room temperature with t h a t of the thermometer t h a t is part of the metering system. If the values are not within 6OC (10.80~) of each o ther , replace or r eca l ib ra t e the meter thermometer.
2.4 Barometer
The f i e l d barometer should be adjusted i n i t i a l l y and before each test series t o agree within 2.54 mm (-0.1 i n . ) Hg with a mercury-in-glass barometer or with the pressure value reported from a nearby National Weather Service S ta t ion and correct- ed f o r e levat ion. The tester should be aware tha t the National Weather Service readings are normally corrected t o sea leve l : uncorrected readings should be obtained. The correct ion for the e levat ion difference between the weather s t a t i o n and the sampling poin t should be applied a t a rate of -2.5 mm Hg/3O m (-0.1 i n . Hg/100 f t ) e levat ion increase, or vice versa f o r e levat ion decrease.
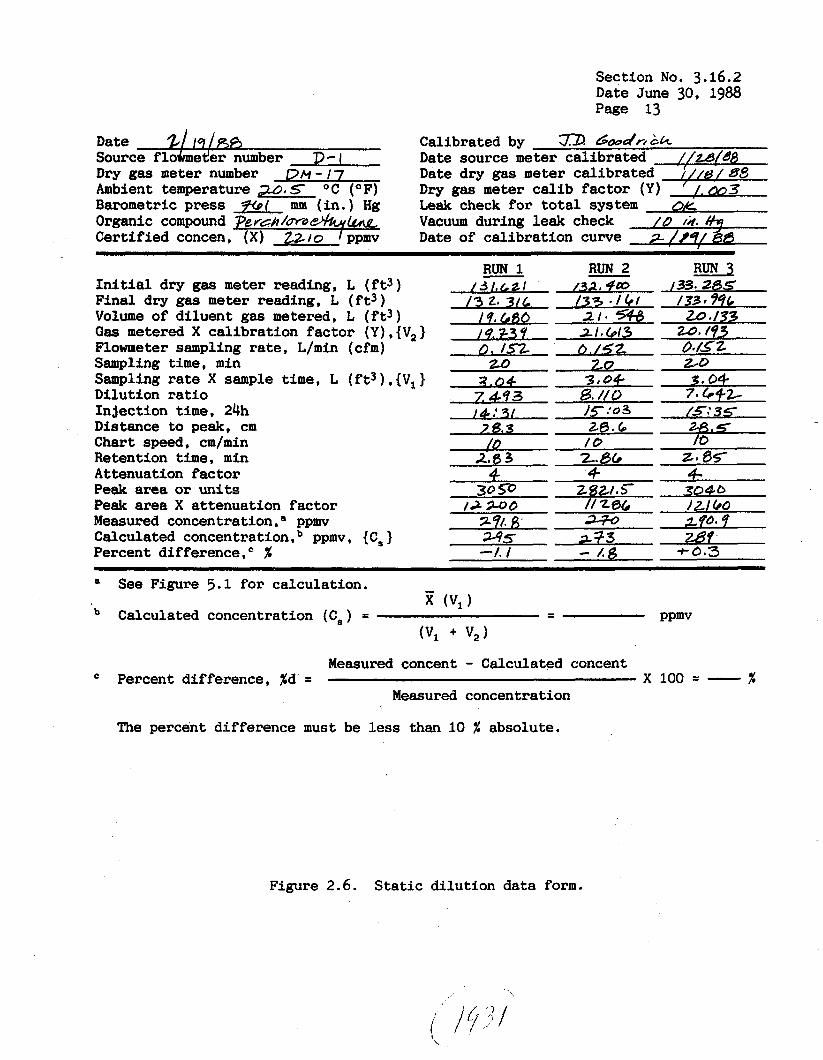
Section No. 3.16.2 Date June 30, 1988 Page 13
Calibrated by &drt& D- I Date source meter calibrated / / z B / B B
Ambient temperature w. 5 O C (OF) Dry gas meter ca l ib factor (Y) ' /-dm 3
Organic compound ?eVGh/Wd&&u Vacuum during leak check /o 12. h
t Dry gas meter number D M - 1 7 Date dry gas meter calibrated i / / & / EM
Barometric press %( mm ( in . ) Hg Leak check for t o t a l system OK
Certified concen, (X) 2210 lppmv Date of calibration curve s /9?/ &A
I n i t i a l dry gas meter reading, L ( f t .3) Final dry gas meter reading, L ( f t 3 ) Volume of diluent gas metered, L ( f t 3 ) Om metered X cal ibrat ion factor (Y),{V,} Flowmeter sampling rate, L/min (cfm) Sampling t i m e , min Sampling rate X sample time, L ( f t 3 ) , {V, } Dilution r a t i o Injection time, 24h Distance to peak, cm Chart speed, cm/min Retention time, min Attenuation factor Peak area o r un i t s Peak area X attenuation factor Measured concentration," ppmv Calculated concentration , ppmv , { C, } Percent difference,' %
a See Figure 5.1 fo r calculation. - PPmv - - x (V,)
(V, + V,) Calculated concentration (C,) =
Measured concent - Calculated concent
Measured concentration
The percent difference must be less than 10 % absolute.
' Percent difference, %d = x 100 = - x
Figure 2.6. Sta t i c di lut ion data form.
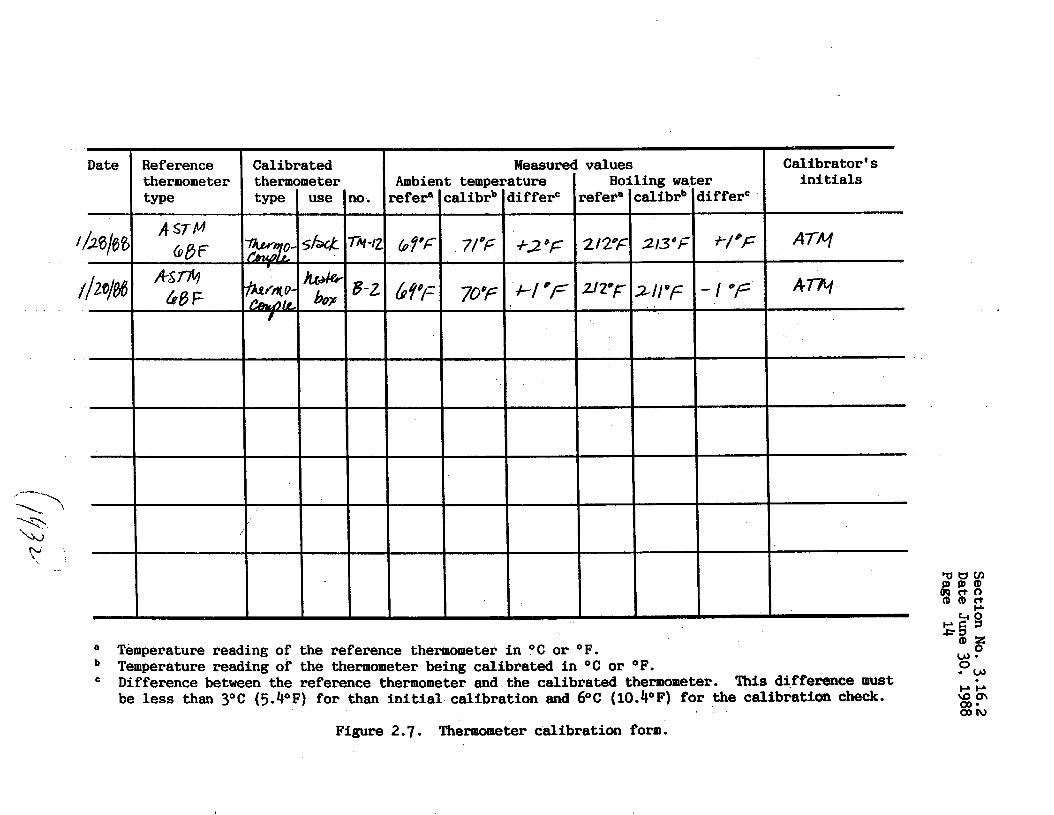
a Temperature reading of the reference thermometer i n O C or OF. Temperature reading of the thermometer being calibrated i n O C or OF. Difference between the reference thermometer and the calibrated thermometer. be less than 3 O C ( 5 . 4 O F ) for than i n i t i a l calibration and 6°C (10.4OF) for the calibration check.
Figure 2.7. Thermometer calibration form.
This difference must
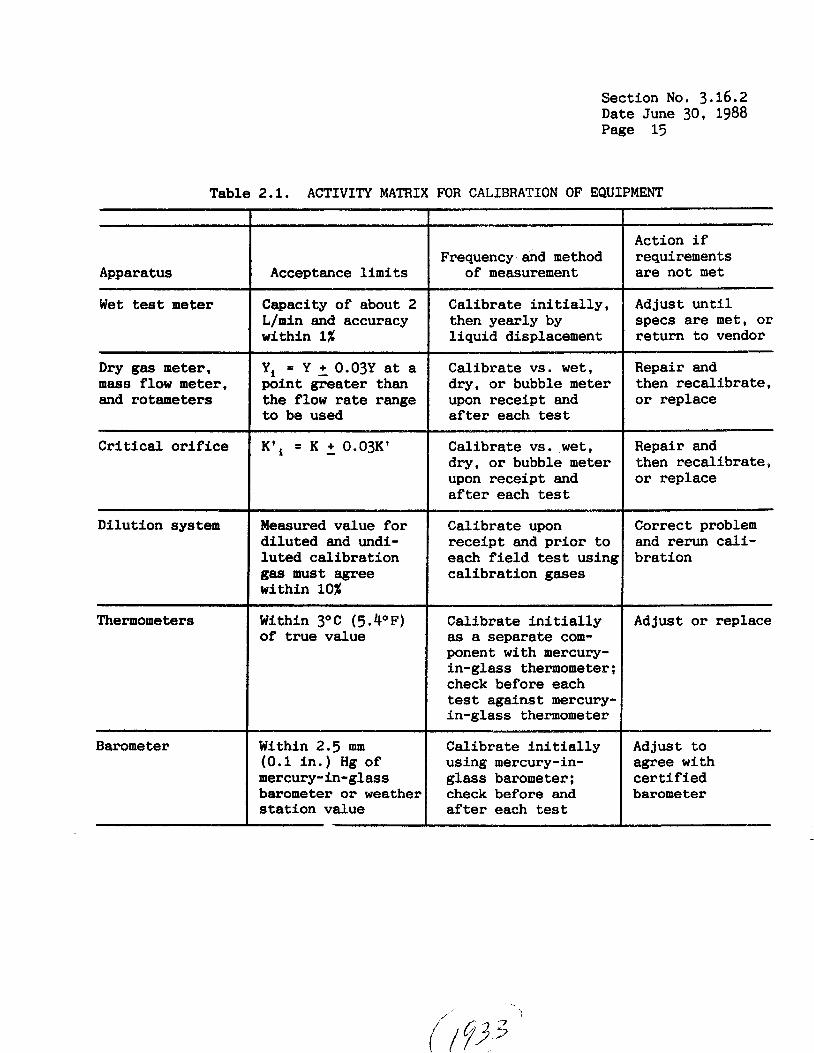
Section No. 3.16.2 Date June 30* 1988 Page 15
Table 2.1. ACTIVITY M A T R I X FOR CALIBRATION OF EQUIPMENT
Apparatus
Wet test meter
Dry gas meter, m a s s flow meter, and rotameters
Critical orifice
Dilution system
Thermometers
Barometer
Frequency and method Acceptance l i m i t s of measurement
t o be used after each test
d i lu t ed and undi- l u t ed ca l ib ra t ion each f i e l d test using
ca l ib ra t ion gases
check before each test against mercury- in-glass thermometer
Within 2.5 mm Calibrate i n i t i a l l y (0.1 i n . ) Hg of using mercury-in- mercury-in-glass glass barometer; barometer or weather check before and s t a t i o n value after each test
Action i f requirements are not met
Adjust u n t i l specs are m e t , or re turn t o vendor
Repair and then r eca l ib ra t e , or replace
Repair and then reca l ibra te , or replace
Correct problem and rerun cali- bra t ion
Adjust or replace
Adjust to agree with c e r t i f i e d barometer

Section No. 3.16.3 Date June 30, 1988 Page 1
3.0 PRESAMPLING OPERATIONS This sec t ion addresses two major areas of presampling operations for Method
18: (1) preparation f o r , performance o f , and in te rpre ta t ion of r e s u l t s for the preliminary survey and (2) preparation for the f i n a l sampling. This sect ion de- sc r ibes the preliminary survey as i t applies t o Method 18; for addi t ional general information on preliminary surveys, see Section 3.0 of t h i s Handbook. The qua l i ty assurance a c t i v i t i e s f o r the preliminary survey a c t i v i t i e s and the presampling a c t i v i t i e s for f i n a l t e s t i n g are summarized i n Tables 3.1 and 3.2, respectively, a t the end of t h i s section.
3.1 Preliminary Survey Measurements
The preliminary survey measurements are needed to properly design the f i n a l emission test sampling and analysis protocol. The primary object ive of the prelim- inary survey is t o collect a preliminary survey sample for determining which sampl- ing procedure is most appropriate and for developing the optimum analytical pro- cedures. Using the preliminary survey sample, estimates of the source concentra- t i on are made and t h e major organic components i n the gas stream are ident i f ied . Also, any compounds t h a t may i n t e r f e r e with the quent i ta t ion of the target anal- y t e ( s ) are iden t i f i ed and the appropriate changes i n the ana ly t ica l procedures are made. Other measurements made during the preliminary survey include sampling s i te dimensions and gas stream properties. The preliminary survey is also used t o obtain a descr ipt ion of the process being sampled, t o determine sampling l o g i s t i c s , and, when possible, t o collect bulk process samples and use emission screening techniques. Use the data form shown i n Figure 3.1 t o record the preliminary survey information.
3.2 Preliminary Survey Preparation
This sect ion addresses the equipment and preparatory a c t i v i t i e s needed t o conduct the preliminary survey. Figure 3.2 can serve as an equipment checkl i s t , packing list, and/or equipment s t a t u s form f o r the preliminary survey.
3.2.1 Fleasurement of Flue Gas Properties - The apparatus t h a t may be required t o supplement information obtained from plant personnel during the preliminary survey concerning the moisture l eve l , temperature, and static pressure of the source should be prepared for the preliminary survey as follows:
Barometer - The f i e l d barometer should be compared with a mercury-in-glass barometer or with a National Weather Service S ta t ion (see Subsection 2.4) reading p r io r t o each f ie ld test.
Wet Bulb/Dry Bulb Thermometers - It is recommended t h a t for sources with s tack temperatures a t or below 59"C, w e t bulb/dry bulb thermometers be used t o determine stack gas moisture content. The thermometers should be compared with a mercury-in- glass thermometer at room temperature prior t o each f i e l d t r i p . The w e t bulb/dry bulb measurement may also be used, with the p r io r approval of the Administrator, t o determine stack gas moisture for sources where the s tack temperature exceeds 59°C.
Method 4 Equipment - For sources with stack temperatures above 59°C. Method 4 equipment is recommended t o determine s tack gas moisture content. Prepare the
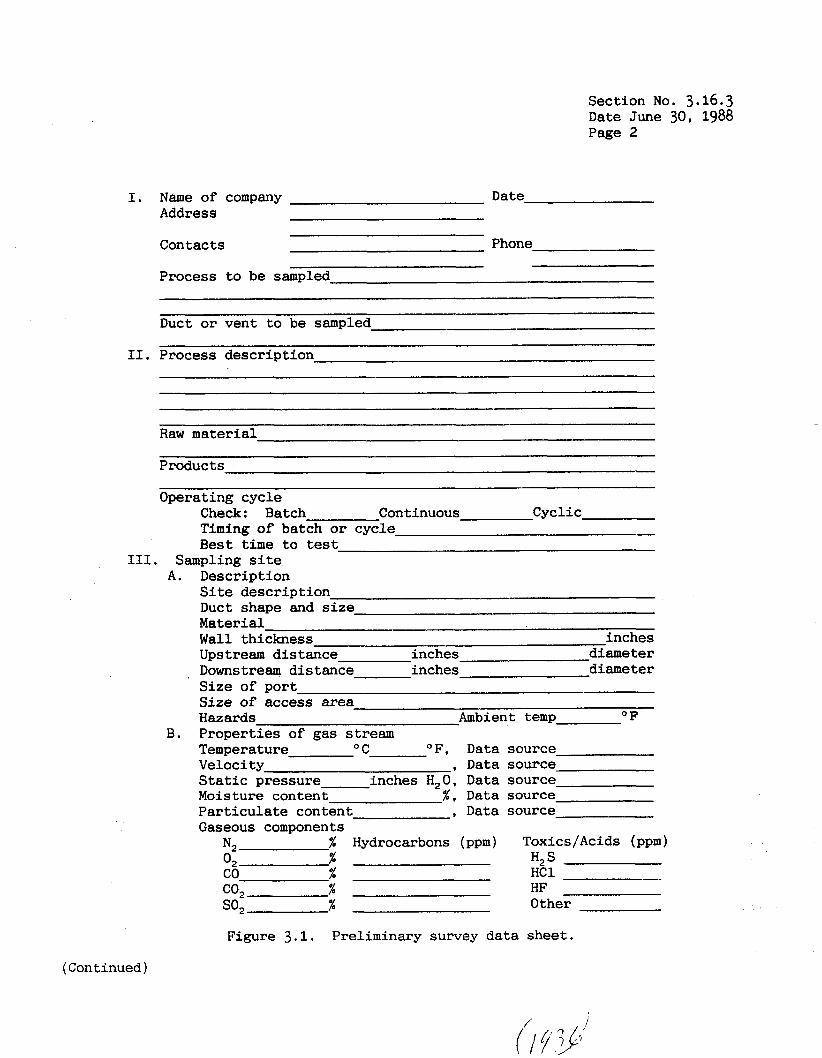
Section No. 3.16.3 Date June 30, 1988 Page 2
I. N a m e of company Address
Contacts
Date
Phone ~~ ~~
Process t o be sampled
Duct or vent t o be sampled
11. Process descr ipt ion
I11
Raw material
Products
Operating cycle Check: Batch Continuous Cyclic Timing of batch o r cycle B e s t t i m e t o test . Sampling si te
A.
B.
Description S i t e descr ipt ion Duct shape and s i z e Material Wall thickness inches Upstream dis tance inches diameter Downstream dis tance inches diameter S ize of por t S ize of access area Hazards Ambient temp OF
Propert ies of gas stream Temperature O C OF, Data source Ueloci t y , Data source S t a t i c pressure inches H,O, Data source Moisture content %, Data source Pa r t i cu la t e content , Data source Gaseous components
N2 % Hydrocarbons (ppm) Toxics/Acids (ppm) 02 co % co2 so2 %
% H2S HC1
Other
Preliminary survey data sheet.
% HF
Figure 3.1.
(Continued)
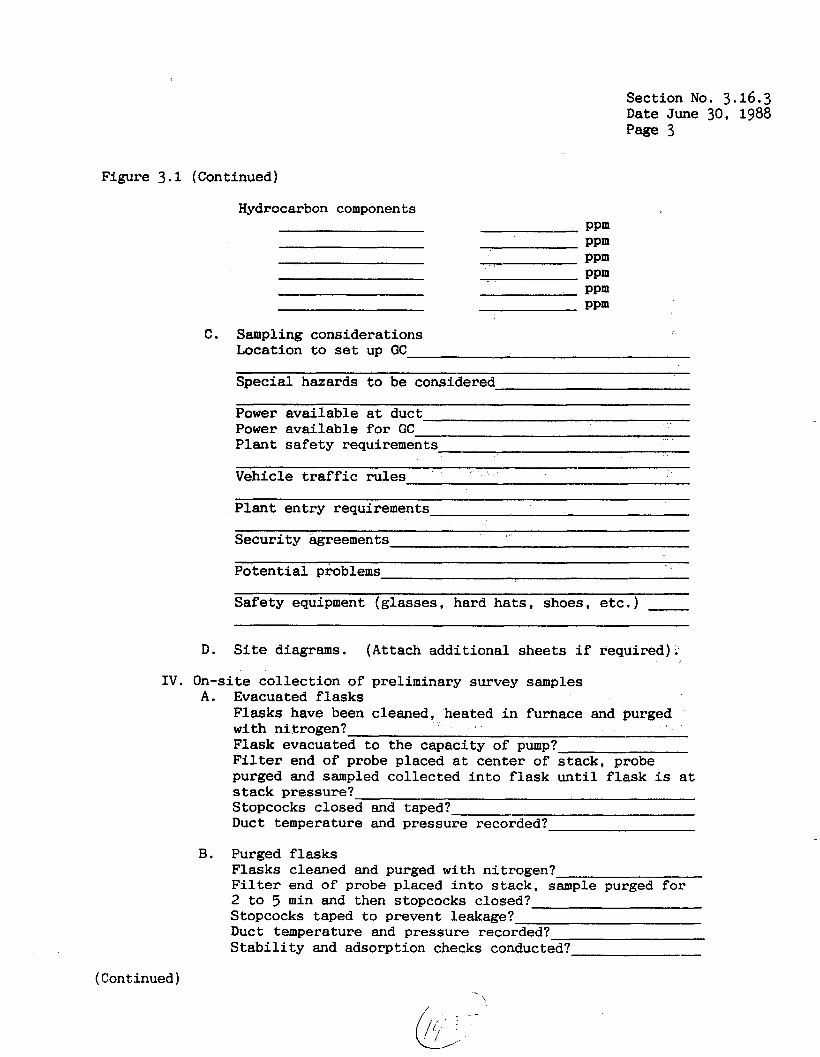
Section No. 3.16.3 Date June 30, 1988 Page 3
F i j p r e 3.1 (Continued)
Hydrocarbon components
C. Sampling considerations
PPm PPm PPm PPm PPm PPm
Location t o set up GC
Special hazards t o be considered- ~ ~
Power avai lable a t duct Power avai lable f o r GC P lan t s a fe ty requirements
Vehicle traffic ru l e s
P lan t en t ry requirements
Securi ty agreements
Po ten t i a l problems
Safety equipment (glasses, hard ha t s , shoes, etc.)
D. S i t e diagrams. (Attach addi t ional sheets if required);
I V . On-site co l lec t ion of preliminary survey samples A. Evacuated f l a sks
Flasks have been cleaned, heated i n furnace and purged with nitrogen? Flask evacuated t o the capacity of pump? F i l t e r end of probe placed a t center of s tack , probe purged and sampled col lected i n t o f l a sk u n t i l f l a sk is a t s t ack pressure? Stopcocks closed and taped? Duct temperature and pressure recorded?
B. Purged f l a sks Flasks cleaned and purged wi th nitrogen? F i l t e r end of probe placed i n t o s tack, sample purged f o r 2 to 5 min and then stopcocks closed? Stopcocks taped t o prevent leakage? Duct temperature and pressure recorded? S t a b i l i t y and adsorption checks conducted? -
(Continued)

Section Ny. 3.16.3 Date June 30, 1988 Page 4
Figure 3.1 (Continued)
C. Flexible bags Bags have been blanked checked and leak checked? Sampling system leak checked? F i l t e r end of probe placed i n t o center of s tack and sample obtained at a proportional rate f o r appropriate amount of time? buct temperature , barometric pressure , ambient temperature , flow rate, s ta t ic pressure, and i n i t i a l and f i n a l sampling time recorded? Analysis performed within 2 hr? S t a b i l i t y and adsorption checks conducted?
D. Adsorption tubes Proper adsorption tube(s ) selected based on the l i k e l y analytes? Probe or adsorption tube placed i n t o center of s tack and sample obtained a t a constant rate w i t h a ca l ibra ted system f o r appropriate time based on the expected concen- t r a t i o n s of analytes? Total sample time and sample flow rate ( o r the number of pump s t rokes ) , the barometric pressure, and ambient temperature recorded? Water vapor w a s less than 2% o r measures were taken t o pro tec t or increase the adsorption capacity of the adsorption tube(s )?
E. Qual i ty assurance performance audi t samples Qual i ty assurance audi t samples col lected i n the same manner as the emission samples?
F. Bulk samples and screening techniques Bulk emission sample(s) collected? Bulk l i qu id sample(s) collected? Detector tubes o r other screening techniques used?
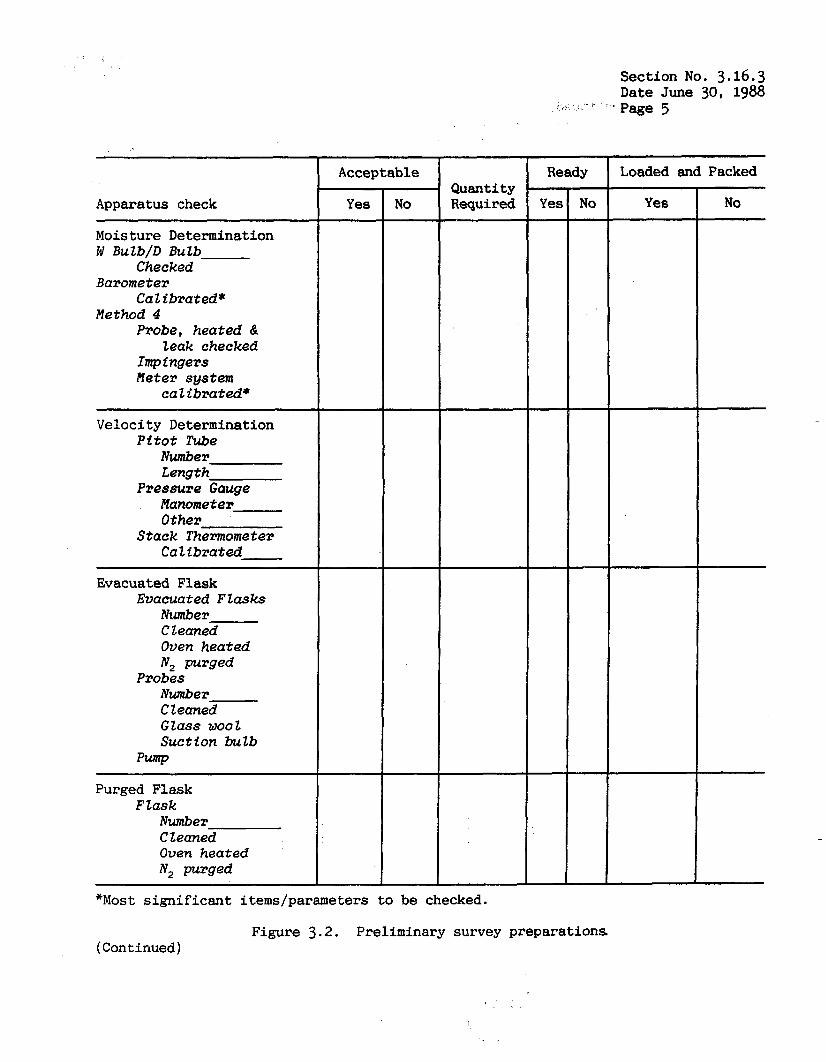
Section No. 3.16.3 Date June 30, 1988
” Page 5 ,. ; ;- i
Apparatus check
Moisture Determination W Bulb/D Bulb
Barometer
Method 4
Checked
Calibrated*
Probe, heated & teak checked
Impingers Meter system
ca 1 ibrated* ~~ ~~~
Velocity Determination Pttot Tube
Number Length
Pressure Gauge Manometer Other
Stack Thermometer Calibrated
~ ~ ~~ ~
Evacuated Flask Evacuated Flasks
Number Cleaned Oven heated N2 purged
Probes Number Cleaned Glass woo 1 Suction bulb
pump
Purged Flask Flask
Number Cleaned Oven heated N2 purged
Acceptable
Yea - No
Quantity Required
-
Ready
No -
*Most significant items/parameters to be checked.
Figure 3.2. Preliminary survey preparations (Continued)
Loaded and Packed
Yes NO
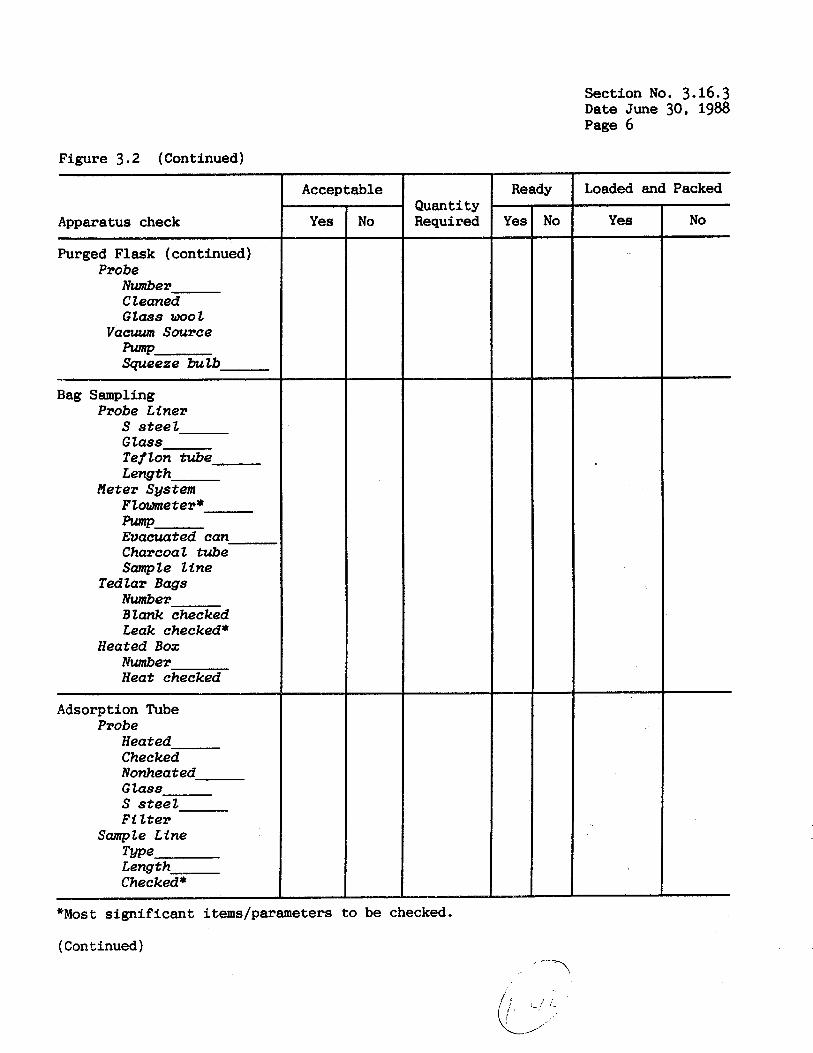
Section No. 3.16.3 Date June 30, 1988 Page 6
Apparatus check Yes
Purged Flask (continued) Probe
Number Cleaned Glass wool
Vacuum Source pump Squeeze bulb
Bag Sampling Probe Liner
S s t ee l Glass Teflon tube Length
Meter Sgstem Flowmeter* Aunp Evacuated can Charcoal tube Sample line
Ted tar Bags Number Blank checked Leak checked*
Heated Box Number Heat checked
Figure 3.2 (Continued)
Adsorption Tube Probe
Heated Checked Nonheated Glass S s t ee l Fi l ter
Sample Line Tme Length Checked*
Ready I
Yes
*Most significant items/parameters to be checked.
(Continued) ' - --1
Loaded and Packed
Yes No

Section No. 3 .16 .3 Date June 30, 1988 Page 7
Figure 3.2 (Continued)
Acceptable Loaded and Packed
Apparatus check
Pump and Meters
I Orifice Ca l ibrated* Rotameter Calibrated*
Timer Adsorption Tubes
T w e
Bulk Samples 20-ml Jars .
Cteaned
I No Quantity Required
"Most s i g n i f i c a n t items/parameters to be checked.

Section No. 3.16.3 Date June 30, 1988 Page 8
equipment f o r sampling following the procedures described i n Section 3.3.3 of t h i s Handbook. Method 4 equipment may a l so be used t o determine the s tack gas moisture f o r sources where the s tack temperature is at or below 59°C.
S-Tgpe Pitot Tube and Dffferential PresrnrTe Gauge - Prepare the S-type p i t o t tube and the d i f f e r e n t i a l pressure gauge f o r sampling followihg the procedures de- scribed i n Section 3.1.3 of t h i s Handbook.
3.2.2 Glass Ftask Sampling - The apparatus and reagents required f o r the collec- t ion of preliminary survey samples using glass sampling f l a sks are prepared as described below. Alternative equipment found su i t ab le may be used subject t o the approval of the Administrator.
Probe - I f a heated probe is t o be used f o r sampling, then the probe's heating system should be checked t o see tha t it is operating properly. The probe should be cleaned in te rna l ly by brushing first with tap water, then with deionized d i s t i l l e d water, and f i n a l l y with acetone. Allow the probe to air dry. The probe should be sealed a t the i n l e t end and checked f o r leaks by applying a vacuum of 380 mm (15 in . ) Hg. See Subsection 1.0 f o r leak check procedure. The probe is considered leak f r ee under these conditions i f no loss of vacuum is seen a f t e r one minute. Any leaks detected should be corrected or the probe should be rejected. If the probe has an external sheath, the in t eg r i ty of the seal between the sheath and the probe l i n e r should be checked t o ensure ambient a i r does not d i l u t e the gas sample.
Tefton Ttlbtng - Prepare sect ions of tubing f o r connections between the probe and each f l a sk (or bag or tube) t h a t cons t i tu tes a preliminary suryey sample col- l ec t ion device. Clean the tubing using the procedure described above for the probe.
Quick Connects - The quick corinects should be new or cleaned according t o the manufacturer's recommendations. Leak check the quick connects as described i n Subsection 1.0.
Glass Sampttng Ftasks - Prepare the g lass sampling f l a sks f o r co l lec t ing preliminary survey samples as follows: Remove the stopcocks from both ends of the f lasks , and wipe the p a r t s to remove any grease. Clean the stopcocks, bar re l s , and receivers with chloroform. Clean a l l g lass pa r t s with a soap solut ion, then r inse with tap water followed by deionized d i s t i l l e d water. Place the f lasks i n a cool glass annealing furnace and heat the furnace t o 550°C. Maintain the f l a sks i n the oven a t t h i s temperature f o r one hour. After one hour, shut off and open the furnace t o allow the f l a sks t o cool. Return the Teflon stopcocks t o the glass f lasks ( i f g lass stopcocks are used, apply a l i g h t coating of vacuum grease t o the stopcocks before re turning t o the f lasks . ) With both stopcocks open, purge each assembled f l a sk with high pur i ty nitrogen f o r 2 t o 5 minutes. Close off the ou t l e t stopcock followed by t h e i n l e t stopcock t o maintain ED s l i g h t pos i t ive nitrogen pressure i n the f lask . Secure the stopcocks with tape t o prevent them from opening accidentally.
High-Vacuum Pump - A high-vacuum pump w i l l be required f o r preliminary survey Check the operation of the
Check for minimum pump vacuum of 75 sample col lect ion using the evacuated f lask procedure. pump p r io r t o going t o the f i e l d as follows: mm (3 i n . ) Hg absolute by attaching a Hg-filled U-tube manometer t o the pump i n l e t
Section No. 3.16.3 Date June 30, 1988 Page 9
and turning on the pump. If the minimum vacuum cannot be reached, then repa i r or replace the pump.
Rubber Suction Bulb - A rubber suction bulb w i l l be required f o r preliminary survey sample col lect ion using the purged f lask procedure. The rubber suction bulb should be checked f o r proper operation p r io r t o going t o the f i e l d as follows: Attach the bulb t o a water manometer, o r equivalent, and squeeze the bulb u n t i l a vacuum of a t least 250 mm (10 i n . ) H,O is reached. Repair or replace the squeeze bulb i f su f f i c i en t vacuum cannot be developed.
3.2.3 Ftezibte Bag Procedure - A f l ex ib l e bag of Tedlar o r aluminized Mylar can be used t o co l l ec t preliminary survey samples. If it is ant ic ipated t h a t Tedlar bags w i l l be selected as the f i n a l sampling method, then it is recommended t h a t the preliminary survey sample be col lected using a Tedlar bag. I n addition t o the apparatus described i n Subsection 3.2.2 f o r the glass f l a sks (with the exception of the f lasks and the high-vacuum pump) the apparatus l i s t e d below w i l l be required and should be prepared as follows:
TedZar or Atmintzed Mylar Bags - Prepare new bags for preliminary survey sampling by leak checking the bags before going to the f i e ld . The bags should also be checked f o r contamination by f i l l i n g with hydrocarbon-free air or nitrogen during the leak check. The bags are checked as follows: Connect a water manome- ter , or equivalent, using a tee connector, between the check valve quick connect on the bag and a pressure source (or hydrocarbon-free a i r or nitrogen f o r conducting the contamination check). Loss of pressure over a 30-second period indicates a leak. Alternatively, leave the bag pressurized overnight: a def la ted bag the following day is ind ica t ive of a leak. Reject or repa i r any bags with leaks. After the hydrocarbon-free air or nitrogen has remained i n the bag f o r 24 hours, analyze the bag contents using a GC with a flame ionizat ion detector on the most sens i t ive se t t ing . The bag should be re- jected i f any organic compounds ate detected. If any organic compounds are detected, the bags may be used i f they are not the compounds to be sampled and analyzed.
Pressurize the bag t o 5 t o 10 cm (2 t o 4 i n . ) 40.
Rigid Leak-Proof Containers - Rigid containers can be used with the bags for co l lec t ing preliminary survey samples. The r ig id containers used t o contain the Tedlar bags during sampling should be checked f o r leaks p r i o r t o going t o the field. The container should be leak checked with the bag i n place as follows: Using a tee connector, connect a water manometer o r equivalent, between a pressure source and the container ou t le t . Pressurize the container to 5 t o 10 cm (2 to b in . ) Hg. Any loss of pressure after 30 seconds indicates a leak. Reject or repair the r ig id container i f a leak is indicated,
Direct Pump Sampling System - A d i rec t pump sampling system can be used i n place of the r i g i d containers f o r co l lec t ing preliminary survey samples. If t h i s method is selected, then the system should be assembled and leak checked p r io r to going t o the f i e l d as follows: Assemble the system (see Figure 4.5). Bypass the Tedlar bag and its protect ive container by attaching the vacuum l i n e d i r ec t ly a f t e r the rotameter using the quick connects on the sample and vacuum l ines . Plug t h e probe i n l e t and turn on the vacuum pump. I f the system is leak f r ee , the rotameter should eventually indicate no flow. Alternatively, the sample l i n e that is attached t o the sample bag can be placed i n water. If bubbling s tops, then the system is leak f ree .
Section No. 3.16.3 Date June 30, 1988 Page 10
Needle Valve and Rotameter - Pr io r to each f i e l d t r i p or at any sign of er- ratic behavior, the f l o w control valve and the rotameter should be cleaned accor- ding to the maintenance procedure recommended by the manufacturer.
3.2.4 Adsorption Tube Sampling - The adsorption tube sampling procedure can a l so be used t o collect the preliminary survey sample. If it is ant ic ipa ted tha t ad- sorpt ion tubes w i l l be se lec ted as the f i n a l sampling method, then it is recom- mended t h a t t h e preliminary survey samples be col lected using tubes containing each po ten t i a l type of adsorbent. I n addi t ion to the apparatus described i n Section 3.2.1 f o r the glass f l a sks (with the exception of the f l a sks and a high-vacuum pump) the apparatus l i s t e d below w i l l be required and should be prepared as fol- lows :
Adsorption Tubes - Check to see t h a t the proper type of tube has been obtained f o r co l l ec t ing the target organic compounds. Refer to Table B i n the Methods High- l i g h t s Section to determine the proper adsorption material. Check to see t h a t the supply of adsorption tubes is s u f f i c i e n t to conduct the emission test, including f i e l d blanks and desorption e f f ic iency determinations.
Personnel Sampling Pump - A personnel sampling pump is used t o collect the adsorption tube samples. The pump should be ca l ibra ted following the procedures described i n Subsection 2.1.4.
Extraction Solvents - An ext rac t ion solvent w i l l be required t o prepare the Refer t o Table B i n the preliminary survey adsorption tube sample(s) for analysis.
Methods Highlights Section t o determine the proper ex t rac t ion solvent.
3.3 Preliminary Survey Sample Collection
The preliminary survey sample co l lec t ion includes f l u e gas or duct moisture and ve loc i ty determinations i n addition to co l lec t ion of ac tua l f l u e gas or duct samples.
3.3.1 Prettminargj Survegj Moisture Determination - I f the moisture content of the f l u e gas i n t he duct t o be tested cannot be obtained from the p l an t personnel, i t is determined using e i t h e r w e t bulb/dry bulb thermometers or Method 4 sampling apparatus, depending on the f l u e gas temperature. If the f l u e gas temperature cannot be obtained from p l a n t personnel, then determine the f l u e gas temperature using a calibrated thermocouple, thermometer, or equivalent temperature measuring device.
Wet Bulb/Dry Bulb Procedure - For f l u e gas streams a t or below 59"C, the moisture content of the f l u e gas should be determined using w e t bulb/dry bulb thermometers and the partial pressure equation shown below. Obtain the w e t bulb/dry bulb temperatures as follows:
1. Moisten the w e t bulb thermometer wick with deionized d is t i l l ed water. 2. I n s e r t the thermometers i n t o the f l u e gas stream and monitor the wet bulb
temperature. 3. When the w e t bulb temperature has s t ab i l i zed , record both the w e t bulb and
dry bulb thermometer temperatures. 4. Calculate the f l u e gas moisture content using the equations below.
Section No. 3.16.3 Date June 30, 1988 Page 11
Equation 3-1
%H,O = w2 - (0.000367 x (Td-Tw) x (1+(Tw-32)/1571)) x 100 Equation 3-2
where
w2 = Calculated constant, sa tura t ion % H,O a t T, , T, = Wet bulb temperature, OF, T, = Dry bulb temperature, O F ,
P, = Barometric pressure, i n . Hg , and P, = S t a t i c pressure of duct, i n . H 2 0 .
Method 4 Moisture Procedure - Follow the procedure for Method 4 described i n Section 3.3 of t h i s Handbook.
Method 2 Vetocity Procedure - Follow the procedure for Method 2 described i n Section 3.1 of t h i s Handbook t o determine the f l u e gas or duct veloci ty a t the sampling point . If t he veloci ty va r i e s by more than 10% during the projected sample run t i m e , then proportional sampling w i l l be required as described in 'Sub- sec t ion 4.0. Because of the small s i z e of some ducts, Methods 2A, 2C, or 2D may have to be used. Follow the criteria and procedures described i n the applicable method . 3.3-2 glass f l a s k
Collection of Samples with Glass Sampling Flasks - Using the precleaned sampling f l a sks , preliminary survey samples are col lected using the evacuated procedure or the purged f l a sk procedure.
Evacuated Flask Procedure - Collect preliminary survey samples using the
1. Using a high-vacuum pump which is connected t o one stopcock while the other stopcock remains closed, evacuate each precleaned f l a sk t o the capacity of the pump. A mercury manometer can be connected between the pump and the f l a s k using a tee connector t o ind ica te when the m a x i m u m vacuum is achieved. A t t h i s point , record the vacuum, and close off the stopcock leading t o the pump.
2. Remove the tubing leading t o the pump and a t tach a glass tee (6-mm out- s i d e diameter, or equivalent) to the f l a sk i n l e t with a shor t piece of Teflon tubing.
3. Connect the end of the sampling probe t o the glass tee using a short length of Teflon tubing. The tubing must be of s u f f i c i e n t length t o reach the sampling point a t the centroid of or no c loser than 1 meter t o the duct w a l l .
4. Connect the rubber suct ion bulb t o the t h i r d leg of the tee with a piece of Teflon tubing or su i t ab le f l ex ib l e tubing.
5. Place a plug of glass wool i n the probe i n l e t , enlarged to approximately 12-mm outside diameter, t o serve as a f i l ter t o remove pa r t i cu la t e mat- ter.
6. Place the i n l e t ( f i l t e r e d ) end of the probe a t the sampling point and purge the probe and sample l i n e by repeatedly squeezing the rubber suc- t i on bulb u n t i l a t least 7 a i r changes of the probe and sample l i n e have occurred.
evacuated f l a s k procedure as follows:
. ,/ '
Section No. 3.16.3 Date June 30, 1988 Page 12
7.
8.
9.
10.
11.
After the probe and the sample l i n e are completely purged, leave the squeeze bulb i n place. and open the i n l e t stopcock of the sampling f lask Leave the i n l e t stopcock open un t i l the pressure i n the sampling flask. reaches the duct pressure. This should take about 15 seconds. Close the i n l e t stopcock. Remove the probe from the duct and disconnect t he glass tee from the f lask . Tape the stopcocks closed and label the f l a s k w i t h the plant name, date, and sampling locat ion, time, and sampling personnel. Immediately after sampling, determine the f l u e gas temperature with a ca l ibra ted thermocouple, thermometer, or equivalent temperature measuring device, and determine the static pressure of t h e duct and the veloci ty over a period of time equal t o the predicted sample run time following the procedures described i n Section 3.1 i n t h i s Handbook.
Purged Flask Procedure - Collect preliminary survey samples using the purged f lask procedure as follows:
1.
2.
3.
4.
5.
6 .
7.
a. 9.
Connect the small end of the sampling probe, of s u f f i c i e n t length to reach the centroid of the duct to be sampled, to the i n l e t stopcock of a precleaned glass sampling f l a sk a s u f f i c i e n t length of Teflon tubing. Connect the rubber suction bulb to the o ther stopcock with a piece of Teflon tubing or su i t ab le f l ex ib l e tubing. Place a plug of glass wool i n the probe i n l e t , enlarged t o approximately 12-mm OD, to serve as a f i l ter t o remove pa r t i cu la t e matter. Place the i n l e t ( f i l t e r e d ) end of the -probe a t the centroid of or no closer than 1 meter t o the duct wall. Purge the probe, sample l i n e , and sample f l a s k by repeatedly squeezing the rubber suct ion bulb un t i l approximately 7 air changes of the system have occarred . After the probe, sample l i n e , and f l a sk are completely purged, c lose off the stopcock near t he suct ion bulb, and then c lose off the stopcock con- nected to the probe. Remove the probe from the duct, and disconnect both the probe and the suction bulb from the f lask . Tape the stopcocks closed and l abe l the f l a sk w i t h t he p lan t name, da te , and sampling loca t ion , time, and sampling personnel. Immediately a f t e r sampling, determine the f l u e gas temperature with a ca l ibra ted thermocouple, thermometer, o r equivalent temperature measuring device, and determine the s ta t ic pressure of the duct and the veloci ty over a period of time equal t o the predicted sample run time following the procedures described i n Section 3.1 i n t h i s Handbook.
3.3.3 Flexible Bag Procedure - The f l ex ib l e bags used to c o l l e c t preliminary survey samples must be leak checked and demonstrated to be free of contamination following the procedure described i n Subsection 3.2.2. The preliminary survey sample co l lec t ion using f l e x i b l e bags can be conducted a t a constant rate following the procedure described i n Subsecti-an 4.3 for the evacuated container sampling procedure, t he d i r e c t pump sampling procedure, or, i n explosive areas, the explo- s ion r i s k area sampling procedure. The f l u e gas or duct ve loc i ty and other process parameters should be determined f o r designing the f i n a l sampling proced- ures.
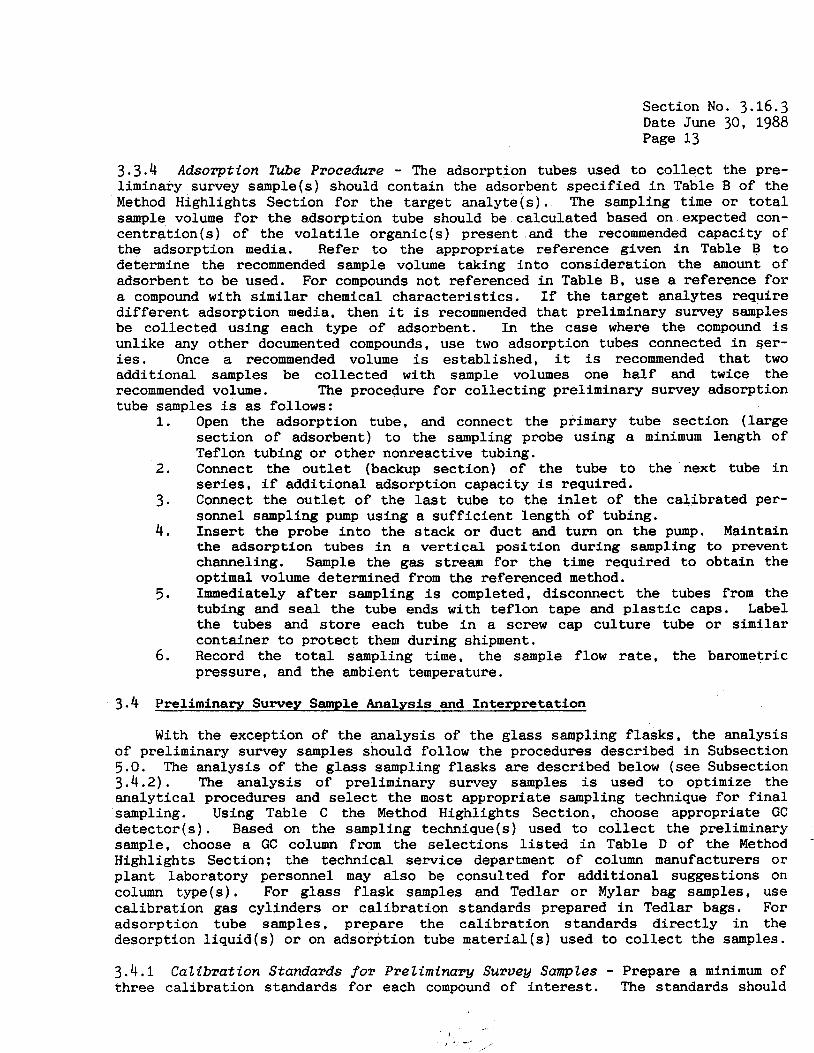
Section No. 3.16.3 Date June 30, 1988 Page 13
3.3.4 Adsorption Tube Procedure - The adsorption tubes used t o co l l ec t the pre- liminary survey sample(s) should contain the adsorbent spec i f ied i n Table B of the Method Highlights Section f o r the t a rge t ana ly t e ( s ) . The sampling t i m e o r t o t a l sample volume f o r the adsorption tube should be calculated based on expected con- cen t r a t ion ( s ) of the v o l a t i l e organic(s ) present and the recommended capacity of t he adsorption media. Refer t o the appropriate reference given i n Table B t o determine the recommended sample volume taking i n t o consideration the amount of adsorbent t o be used. For compounds not referenced i n Table B. use a reference f o r a compound with similar chemical charac te r i s t ics . I f the target analytes require d i f f e ren t adsorption media. then it is recommended t h a t preliminary survey samples be col lected using each type of adsorbent. I n the case where the compound is unlike any other documented compounds, use two adsorption tubes connected i n Ser- ies. Once a recommended volume is establ ished, i t is recommended tha t two addi t ional samples be collected w i t h sample volumes one half and twice the recommended volume. The procedure f o r co l lec t ing preliminary survey adsorption tube samples is as follows:
1.
2.
3. 4.
5 .
6.
Open the adsorption tube, and connect the primary tube sect ion ( l a rge sect ion of adsorbent) t o the sampling probe using a minimum length of Teflon tubing o r o ther nonreactive tubing. Connect t he o u t l e t (backup sect ion) of the tube t o the next tube i n series, i f addi t ional adsorption capacity is required. Connect the o u t l e t of t he last tube t o the i n l e t of t he cal ibrated per- sonnel sampling pump using a su f f i c i en t length of tubing. In se r t the probe i n t o the s tack or duct and turn on t h e pump. Maintain the adsorption tubes i n a v e r t i c a l posi t ion during sampling t o prevent channeling. Sample the gas stream f o r the t i m e required t o obtain the optimal volume determined from the referenced method. Immediately a f t e r sampling is completed, disconnect t he tubes from the tubing and seal the tube ends with te f lon tape and plastic caps. Label the tubes and store each tube i n a screw cap cu l tu re tube o r similar container t o pro tec t them during shipment. Record the t o t a l sampling t i m e , the sample flow rate, the barometric pressure, and the ambient temperature.
3.4 Preliminary Survey Sample Analysis and Interpretation
With the exception of the analysis of the glass sampling f l a s k s , the analysis of preliminary survey samples should follow the procedures described i n Subsection 5.0. The analysis of the glass sampling f l a sks are described below (see Subsection 3.4.2). The ana lys is of preliminary survey samples is used t o optimize the analytical procedures and select the most appropriate sampling technique fo r f i n a l sampling. Using Table C the Method Highlights Section, choose appropriate GC d e t e c t o r ( s ) . Based on the sampling technique(s) used t o c o l l e c t the preliminary sample, choose a GC column from the se lec t ions l i s t e d i n Table D of the Method Highlights Section: the technical service department of column manufacturers or plant laboratory personnel may a l so be consulted f o r addi t ional suggestions on column type(s ) . For glass f l a sk samples and Tedlar o r Mylar bag samples, use ca l ibra t ion gas cyl inders or ca l ib ra t ion standards prepared i n Tedlar bags. For adsorpt ion tube samples, prepare t h e ca l ib ra t ion standards d i r e c t l y i n the desorption l i q u i d ( s ) o r on adsorption tube material(s) used t o c o l l e c t the samples.
3.4.1 Calibration Standards f o r Preliminary Survey Samples - Prepare a minimum of three ca l ibra t ion standards f o r each compound of i n t e r e s t . The standards should
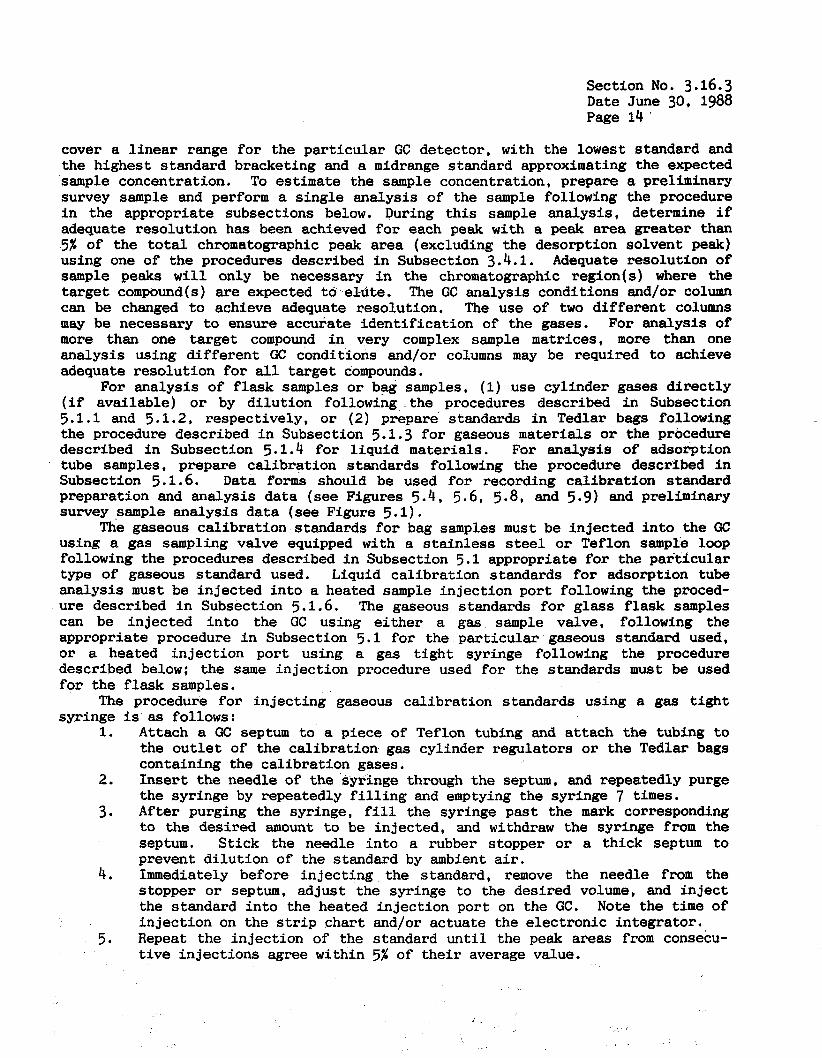
Section No. 3.16.3 Date June 30, 1988 Page 1 4 '
cover a l i n e a r range f o r the pa r t i cu la r GC detector , with the lowest standard and the highest standard bracketing and a midrange standard approximating the expected sample concentration. To estimate the sample concentration, prepare a preliminary survey sample and perform a s ing le analysis of the sample following the procedure i n the appropriate subsections below. During t h i s sample analysis , determine if adequate resolut ion has been achieved for each peak with a peak area greater than 5% of the total chromatographic peak area (excluding the desorption solvent peak) using one of the procedures described i n Subsection 3.4.1. Adequate resolut ion of sample peaks w i l l only be necessary i n the chromatographic region(s) where the target compound(s) are expected to e ld t e . The GC analysis conditions and/or column can be changed to achieve adequate resolut ion. The use of two d i f f e ren t columns may be necessary to ensure accurate iden t i f i ca t ion of the gases. For analysis of more than one target compound i n very complex sample matrices, more than one analysis using d i f f e ren t GC conditions and/or columns may be required to achieve adequate reso lu t ion f o r all target compounds.
For analysis of f l a s k samples or bag samples, (1) use cyl inder gases d i r ec t ly ( i f avai lable) o r by d i lu t ion following the procedures described i n Subsection 5.1.1 and 5.1.2, respectively, o r (2) prepare' standards i n Tedlar bags following the procedure described i n Subsection 5.1.3 f o r gaseous materials or the procedure described i n Subsection 5.1.4 f o r l i qu id materials. For analysis of adsorption tube samples, prepare ca l ibra t ion standards following the procedure described i n Subsection 5.1.6. Data forms should be used f o r recording ca l ib ra t ion standard preparation and analysis data (see Figures 5.4, 5.6, 5.8, and 5.9) and preliminary survey sample ana lys i s data (see Figure 5.1).
The gaseous ca l ib ra t ion standards for bag samples must be in jec ted i n t o the GC using a gas sampling valve equipped w i t h a s t a i n l e s s steel or Teflon sample loop following the procedures described i n Subsection 5.1 appropriate f o r the parkicular type of gaseous standard used. Liquid ca l ibra t ion standards for adsorption tube analysis must be in jec ted i n t o a heated sample in jec t ion por t following the proced- ure described i n Subsection 5.1.6. The gaseous standards for glass f l a s k samples can be in jec ted i n t o the GC using e i t h e r a gas sample valve, following the appropriate procedure i n Subsection 5.1 f o r the pa r t i cu la r gaseous standard used, or a heated in j ec t ion por t using a gas t i g h t syringe following the procedure described below: the same in jec t ion procedure used f o r the standards m u s t be used for the f l a sk samples.
The procedure f o r i n j ec t ing gaseous ca l ibra t ion standards using a gas t igh t syringe is as follows:
1. Attach a GC septum t o a piece of Teflon tubing and a t tach the tubing to the ou t l e t of the ca l ibra t ion gas cylinder regulators or the Tedlar bags containing the ca l ibra t ion gases.
2. I n s e r t the needle of the syringe through the septum, and repeatedly purge the syringe by repeatedly f i l l i n g and emptying the syringe 7 times.
3. After purging the syringe, f i l l the syringe past t he mark corresponding t o the desired amount t o be in jec ted , and withdraw the syringe from the septum. S t ick the needle i n t o a rubber stopper or a thick septum to prevent d i lu t ion of the standard by ambient air .
4. Immediately before in j ec t ing the standard, remove the needle from the stopper or septum, ad jus t the syringe t o the desired volume, and i n j e c t the standard i n t o the heated in jec t ion port on the GC. Note the t i m e of in j ec t ion on the s t r i p char t and/or actuate the e lec t ronic in tegra tor .
5. Repeat the in jec t ion of the standard u n t i l the peak areas from consecu- t i v e in j ec t ions agree within 5% of t h e i r average value.
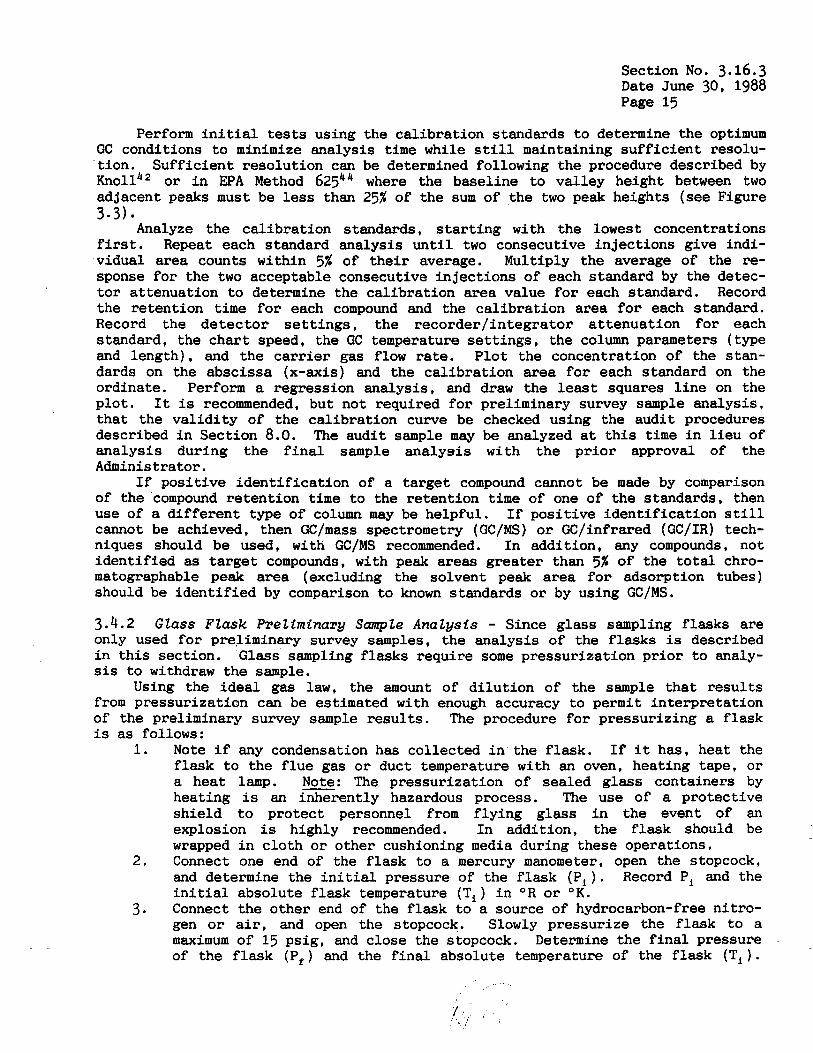
Section No. 3.16.3 Date June 30, 1988 Page 15
Perform i n i t i a l tests using the ca l ibra t ion standards t o determine the optimum GC conditions t o minimize analysis time while s t i l l maintaining s u f f i c i e n t resolu- t ion. Suf f ic ien t resolut ion can be determined following the procedure described by
o r i n EPA Method 62544 where the basel ine t o val ley height between two adjacent peaks must be less than 25% of the sum of the two peak heights (see Figure
Analyze the ca l ib ra t ion standards, s t a r t i n g with the lowest concentrations first. Repeat each standard analysis u n t i l two consecutive in jec t ions give indi- vidual area counts within 5% of t h e i r average. Multiply the average of the re- sponse f o r the two acceptable consecutive in jec t ions of each standard by the detec- t o r attenuation t o determine the ca l ibra t ion area value f o r each standard. Record the retent ion time for each compound and the ca l ib ra t ion area f o r each standard. Record the d e t e c t o r s e t t i n g s , t he r eco rde r / in t eg ra to r a t tenuat ion fo r each standard, the cha r t speed, the GC temperature se t t i ngs , the column parameters (type and length) , and the carrier gas flow rate. P l o t the concentration of the stan- dards on the abscissa (x-axis) and the ca l ibra t ion area f o r each standard on the ordinate. Perform a regression analysis , and draw the least squares l i n e on the p lo t . It is recommended, but not required f o r preliminary survey sample analysis , t ha t the v a l i d i t y of the ca l ibra t ion curve be checked using the audi t procedures described i n Section 8.0. The audi t sample may be analyzed a t t h i s time i n l i e u of ana lys i s during t h e f i n a l sample ana lys i s with the p r i o r approval of the Administrator.
I f pos i t ive iden t i f i ca t ion of a target compound cannot be made by comparison of the compound re ten t ion time t o the retent ion time of one of the standards, then use of a d i f f e ren t type of column may be helpful . If pos i t ive iden t i f i ca t ion still cannot be achieved, then GC/mass spectrometry (GC/MS) or GC/infrared ( G C / I R ) tech- niques should be used, with GC/MS recommended. In addi t ion, any compounds, not ident i f ied as t a r g e t compounds, with peak areas greater than 5% of the t o t a l chro- matographable peak area (excluding the solvent peak area f o r adsorption tubes) should be iden t i f i ed by comparison t o known standards o r by using GC/MS.
3.4.2 Glass Flask Preliminary Sample Anatysis - Since glass sampling f lasks are only used fo r preliminary survey samples, the analysis of the f l a sks is described i n t h i s section. G l a s s sampling f l a sks require some pressurizat ion p r i o r t o analy- sis to withdraw the sample.
Using the i d e a l gas l a w , the amount of d i lu t ion of the sample t h a t r e su l t s from pressurizat ion can be estimated with enough accuracy t o permit in te rpre ta t ion of the preliminary survey sample results. The procedure f o r pressurizing a f lask is as follows:
3 .3 )
1.
2.
3.
Note if any condensation has col lected i n the f lask. If i t has, heat the f l a sk t o the f l u e gas or duct temperature with an oven, heating tape, o r a heat lamp. Note: The pressurizat ion of sealed glass containers by heating is an inherently hazardous process. The use of a protect ive sh i e ld t o protect personnel from f ly ing glass i n the event of an explosion is highly recommended. I n addition, the f lask should be wrapped i n c lo th o r other cushioning media during these operations. Connect one end of the f l a sk t o a mercury manometer, open the stopcock, and determine the i n i t i a l pressure of the f l a sk (Pi ) . Record Pi and the i n i t i a l absolute f l a sk temperature (Ti) i n OR o r O K . Connect the other end of the f l a sk t o a source of hydrocarbon-free n i t ro- gen or a i r , and open the stopcock. Slowly pressurize the f l a sk t o a maximum of 15 psig, and close the stopcock. Determine the f i n a l pressure of the f l a s k (P,) and the f i n a l absolute temperature of the f l a sk (Ti).
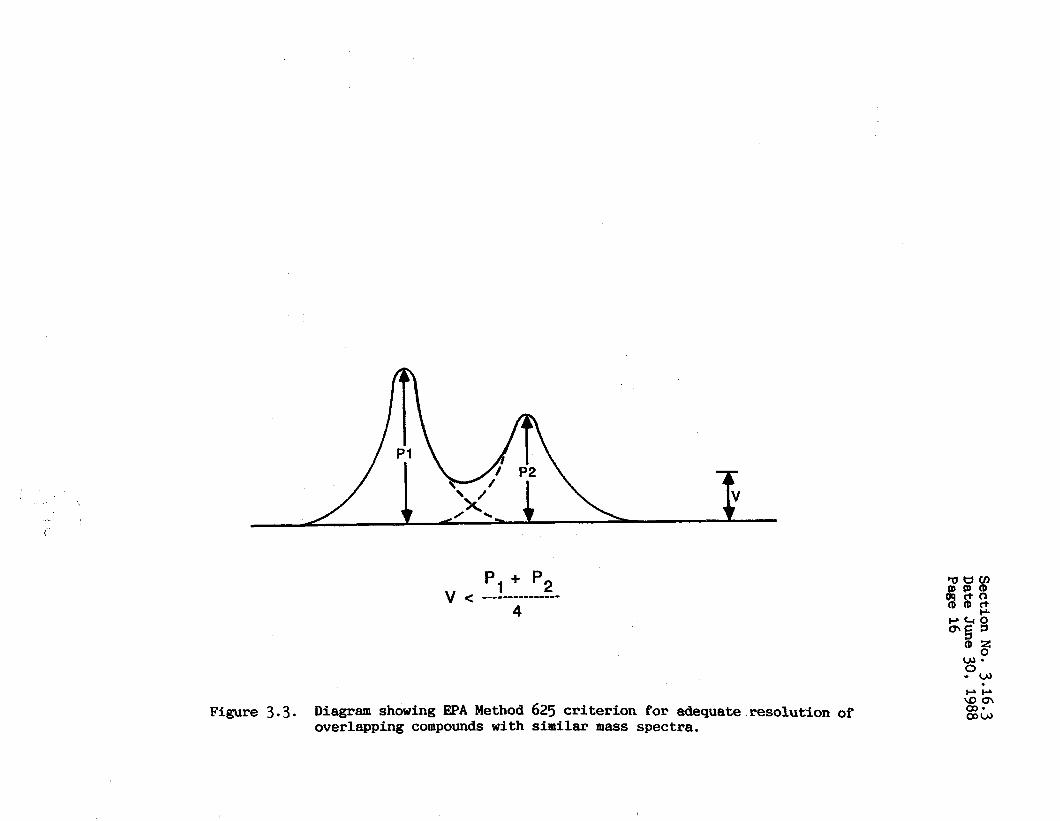
Figure 3 .3 . Diagram showing EPA Method 625 criterion for adequate resolution of overlapping compounds with similar mass spectra.

Section No. 3.16.3 Date June 30, 1988 Page 17
- Note: The pressurizat ion of sealed glass containers is an inherently hazardous process. The use of a protect ive sh i e ld t o protect personnel from f ly ing glass i n the event of an explosion is highly recommended. In addi t ion, the f l a sk should be wrapped i n c lo th or other cushioning media during these operations. Calculate the f i r s t d i lu t ion fac tor ( D , ) using the following formula: 4.
p, Ti D. = Equation 3-2
5. Allow the f l a sk t o equ i l ib ra t e f o r 10 minutes. Note i f any condensation has formed. If condensation has formed i n the f l a s k and the f l a sk did not i n i t i a l l y required heating, heat the f lask t o a temperature su f f i c i en t to vaporize the condensate. If the condensate cannot be vaporized or if the f l a sk was already heated and more condensate formed during pressuriza- t i on , the sample cannot be analyzed accurately.
6. Close the stopcocks and disconnect the manometer and d i lu t ion gas. Analyze the contents of a pressurized f l a sk using a sample introduced i n t o the
1. Connect the sample f l a sk t o the in jec t ion valve with the valve i n the load posi t ion.
2. Open the stopcock connected t o the valve, and allow the gas sample to flow through the sample loop a t 100 ml/min f o r 30 seconds (determined with a rotameter connected t o the o u t l e t of the sample loop) or purge with 5 times the sample loop volume, whichever is less. Close the stop- cock, and allow the sample loop to return to ambient pressure.
3 . Actuate the sample valve t o i n j e c t the sample and record the in jec t ion t i m e .
4. Examine the chromatogram and determine if adequate resolut ion has been achieved between individual target compound peaks and between ta rge t compound peaks and any in t e r f e r ing compound peak with an area grea te r than 5% of the t o t a l area of a l l peaks (excluding the desorption solvent peak) using the procedure described i n Subsection 3.4.1.
5. Determine the re ten t ion t i m e f o r each peak by dividing the distance of the peak m a x i m u m from the in jec t ion point by the char t speed.
6. Repeat the ana lys i s , and determine the peak area and re ten t ion t i m e f o r each target compound iden t i f i ed during the second analysis . Although not required f o r the preliminary survey sample analysis , the peak areas for each target compound from consecutive in jec t ions should agree within 5% of the average peak area. The retent ion times between the t w o in jec t ions should agree within 0.5 seconds or 1% of the adjusted re ten t ion t i m e (compound re ten t ion t i m e minus the t i m e of e lu t ion of unretained peaks), whichever is greater.
Analyze the contents of a pressurized f l a sk using a sample introduced i n t o the GC v i a a gas t i g h t syringe and a heated in jec t ion por t sample by the following procedure:
1. Attach a GC septum t o one of the stopcocks on the glass flask. (Note: Glass sampling f l a sks can be purchased with an i n t eg ra l septum port . )
2 Inse r t the needle of the syringe through the septum, and purge the sy- ringe by repeatedly f i l l i n g and emptying the syringe 7 t i m e s .
3 . After purging the syr inge, f i l l the syringe past the mark corresponding t o the desired amount t o be injected, and withdraw the syringe from the
GC v i a a gas sampling valve by the following procedure:
Section N o . 3.16.3 Date June 30, 1988 Page 18
4.
5.
6.
septum. S t ick the prevent d i lu t ion of Immediately before stopper o r septum,
needle i n t o a rubber stopper o r a thick septum to the standard by ambient a i r . i n j ec t ing the sample, remove the needle from the ad jus t the syringe down t o the desired volume, and
i n j e c t the sample i n t o the heated in jec t ion por t on the GC. Note the in j ec t ion time on the s t r i p char t and/or actuate the e l ec t ron ic integra- t o r . Determine the re ten t ion t i m e for each peak by dividing the dis tance of the peak m a x i m u m from the in j ec t ion point by the cha r t speed. Repeat the analysis , and determine the re ten t ion times f o r each peak f o r the second analysis . The re ten t ion times of successive in j ec t ions should agree within 0.5 seconds or within 1% of the mean of the adjusted re ten t ion times, whichever is greater.
3.4.3 Analysis of Preliminary Survey Bag Samples - Follow the procedures described i n Subsection 5.3.1 f o r t he analysis of bag samples. To assess the s t a b i l i t y of the gas sample i n Tedlar bags, perform a second analysis after a t i m e period equal- l i n g the period between sample co l lec t ion and the first analysis . If the concen- t r a t i o n of the sample col lected i n a Tedlar bag decreases by more than 10% between the first and second analysis , then an accepted sampling method o ther than Tedlar bags should be considered.
Perform a re ten t ion check on the bag sample by successively evacuating the bag and r e f i l l i n g i t with hydrocarbon-free air o r nitrogen one o r more times. Analyze the bag contents for the target compound(s), allow the gas to sit i n the bag overnight, and reanalyze bag contents for the target compound(s). I f any target compound is detected i n the bag at a concentration greater than 5% of the or ig ina l concentration, then an accepted sampling method o ther than Tedlar bags should be considered.
3.4.5 Analysis of Preliminary Survey Adsorption Tube Samples - Follow the proced- ures described i n Subsection 5.3.4 f o r t he analysis of adsorption tube samples. A minimum desorption e f f ic iency of 50% must be obtained. If 50% desorption effici- ency cannot be achieved using the referenced procedures from Table B i n the Method Highlights Section, then t r y longer desorption times, more vigorous desorption techniques and/or o ther desorption solvents. If 50% desorption e f f ic iency still cannot be accomplished, then an accepted sampling method o the r than adsorption tubes should be considered.
3.4.6 Interpretation of Preliminary Survey Results - To select the most su i t ab le sampling and analytical method for the f i n a l f i e l d test, the r e s u l t s of the prelim- inary survey must be properly interpreted. The major po in ts t o consider are (1) the sampling loca t ion , ( 2 ) the parameters of the process being t e s t ed , (3) the f l u e gas moisture and temperature and the f l u e o r duct static pressure, (4 ) s t a b i l i t y of the gas sample i n bags, (5) the desorption e f f ic iency of the target compounds from adsorption tubes, and ( 6 ) the resolving capabi l i ty , precis ion, accuracy, and speed of the GC analysis . Thus, f l u e gas o r duct parameters and components present determine which sampling and ana ly t i ca l methodologies w i l l be the most appropriate.
Sampling Locatton - The hazards associated w i t h t he sampling locat ion w i l l influence the type of sampling methodology which can be used. I n explosion r i s k areas where use of pumps, heated probes, o r a GC with a flame ioniza t ion detector (FID) would be prohibited, the explosion r i s k area sampling procedure can be used safe ly . Close a t t en t ion must be paid t o maintaining the proper sampling rate when
Section No. 3.16.3 Date June 30, 1988 Page 19
using the evacuated can i s t e r as a vacuum source. It may be possible a t ce r t a in hazardous locat ions, t o loca te the co l lec t ion device (bag o r adsorption tube) i n the explosion r i s k area near the source and operate the sampling pump a safe dis- tance away. Also, i n t r i n s i c a l l y safe personnel sampling pumps could be used i n ce r t a in hazardous areas provided the required sampling rate can be maintained. Hazardous sampling locat ions may not be su i t ab le for d i r e c t o r d i lu t ion interface sampling when using an electr ical ly-heated probe and sample l i ne .
Other physical factors concerning the sampling locat ion w i l l also influence which sampling method is most su i tab le . These fac to r s w i l l be site-specific and are beyond the scope of t h i s Handbook.
Process Parameters - The par t icu lar process parameters per ta ining to the generation of the organic emissions and the effect the operation has on the emission leve ls w i l l influence which sampling technique w i l l be most su i tab le . In the case of a continuous process where emission l eve l s are constant, each of the Method 18 sampling techniques should be s u i t a b l e with regard to the process parameters. For processes operating i n a batch or cyclic mode, the bag or adsorp- t i on tube integrated sampling techniques may be more su i t ab le compared t o the in te r face techniques where grab samples are analyzed.
Flue Gas or Duct Condftions - The f l u e gas or duct moisture and temperature w i l l have a major influence on se lec t ing t h e most su i t ab le sampling technique. High moisture w i l l affect both bag samples and adsorption tube samples. For s i tua- t ions where moisture may be a problem, the in t e r f ace techniques are recommended provided the 5% criteria f o r consecutive in jec t ions , described i n Subsections 5.3.2 and 5.3.4, can be m e t . Condensation i n bag samples may r e s u l t i n the target organ- i c compounds being absorbed i n t o the condensate, or, at extremely high concen- t r a t ions , being the condensate itself. The heated bag sampling technique may be su i t ab le provided on-si te analysis is conducted when it is not practical t o keep the bags heated u n t i l analysis at the base laboratory. Condensation m a y a l so be avoided by using a d i lu t ed bag sample col lected by p r e f i l l i n g the bag with a known quantity of hydrocarbon-free air or nitrogen p r i o r t o sampling and accurately metering the gas sample i n t o the bag during sampling.
Moisture reduces the adsorptive capacity of ce r t a in types of adsorbents (pr i - marily charcoal) . For sampling with Bdsorption tubes a t sources with moisture above 3%, a silica gel tube may be inser ted i n f ron t of the primary adsorption tube: otherwise, two or more adsorption tubes connected i n series shouJd be used. The first tube becomes a sacrificial tube and should be positioned ve r t i ca l ly during sampling. A disadvantage of t h i s approach is that the addi t ional tubes w i l l also require analysis . Alternatively, a moisture knock-out jar can be used i n f ront of the adsorption tube. A s varying amounts of the organic emissions w i l l also condense ( t h e amount of each organic removed from the gas stream w i l l largely depend on the individual compound's v o l a t i l i t y and s o l u b i l i t y characteristics), the l iqu id collected must be retained f o r analysis. Accurate quant i ta t ion of various organics i n the condensed l i q u i d ( s ) may involve several steps and is generally problematic.
The f l u e gas temperature may a l so d i c t a t e which sampling technique can be used due t o l imi ta t ions of the sampling equipment.
Bag Sample Stability and Target Compound Retention - If on-si te analysis of bag samples is not feasible and the samples are returned t o the base laboratory for analysis , then the s t a b i l i t y of the gas sample i n the bag w i l l be a factor and should be determined. While the s t a b i l i t y of organics i n bags has been demonstra-
Section No. 3.16.3 Date June 30, 1988 Page 20
ted i n numerous laboratory evaluations, an ac tua l source sample could contain other unknown components which may a f f e c t sample s t a b i l i t y . If the preliminary survey sample analysis ind ica tes t h a t the gas sample is not s t a b l e , then one of the alter- na t ive sampling procedures should be used. The check should be conducted a t an elevated temperature i f the bag is t o be heated during sampling.
The re ten t ion of the target compounds by the Tedlar bag should also be check- ed. This check w i l l ind ica te any sample l o s s not determined by the s t a b i l i t y check. If the re ten t ion of a t a rge t compound by the Tedlar bag is unacceptably high, then the bag sampling technique is not s u i t a b l e for t h a t target compound and one of the a l t e rna t ive sampling procedures should be used. Heating of the bag during sampling and ana lys i s may reduce the retent ion.
Adsorptton Tube Desorptton Efftctency - The desorption e f f ic iency determined f o r the adsorption tubes must be >5O;C. If >5O% desorption e f f ic iency cannot be achieved with the referenced procedure, then more vigorous desorption techniques and/or solvents should be evaluated. The desorption e f f ic iency , as determined by the procedures described i n Subsection 5.1.6, w i l l not ind ica te i f the gas sample matrix w i l l affect the desorption of the t a rge t compounds. If acceptable desorption e f f ic iency cannot be achieved, then one of the a l t e rna t ive sampling procedures should be used. Also, the adsorption e f f ic iency must be grea te r than 90%. The breakthrough volume must not be exceeded.
Calibration Standards and GC Anatysis - The a v a i l a b i l i t y of ca l ibra t ion stan- dards may d i c t a t e which sampling technique can be used. The GC analysis may a l so d i c t a t e which sampling technique w i l l be the most su i t ab le . For accurate analysis , adequate resolut ion must be achieved between target compounds and between any in t e r f e r ing compounds and target compounds. During preliminary survey sample analysis , acceptable resolut ion may not be achievable on a gas sample but may be accomplished with the adsorption tube sample, o r v ice versa. Thus, the sampling technique which gives acceptable resolut ion during sample analysis must be select- ed. I n some s i t u a t i o n s where analysis of more than one target compound is requir- ed, two o r more analyses of the same sample under d i f f e r e n t GC conditions and/or with d i f f e ren t columns may be necessary t o achieve adequate resolut ion.
Acceptable accuracy, as demonstrated by audi t sample analysis , must a l so be achieved f o r sample ana lys i s by e i t h e r gas o r l i qu id in jec t ion . Again the sampling technique t h a t gives acceptable accuracy during sample ana lys i s must be selected. The sampling technique t h a t gives acceptable precis ion, as demonstrated by consecu- t i v e r ep l i ca t e in j ec t ions , must be selected. Minimizing the analysis time is par- t i c u l a r l y important f o r t he in t e r f ace techniques. A s discussed above, the preci- s ion l i m i t s may be hard to achieve w i t h the in t e r f ace techniques with a long analy- sis time under var iab le o r cyc l ic emission conditions.
3.5 Apparatus Check and Calibration
Figure 3.4 summarizes the pretest apparatus checks and ca l ib ra t ion and can be used as a p r e t e s t operations checkl is t . Figure 3.5 can serve as an equipment packing list and s t a t u s report form.
3.5.1 Probe - If a heated probe is required f o r the se lec ted sampling procedure, then the probe's heat ing system should be checked t o see t h a t i t is operating prop- e r ly . The probe should be cleaned in t e rna l ly by brushing first with tap water, then with deionized d i s t i l l e d water, and f ina l ly ,wi th acetone. Allow the probe t o a i r dry, then the probe should be heated and purged with air o r nitrogen. The
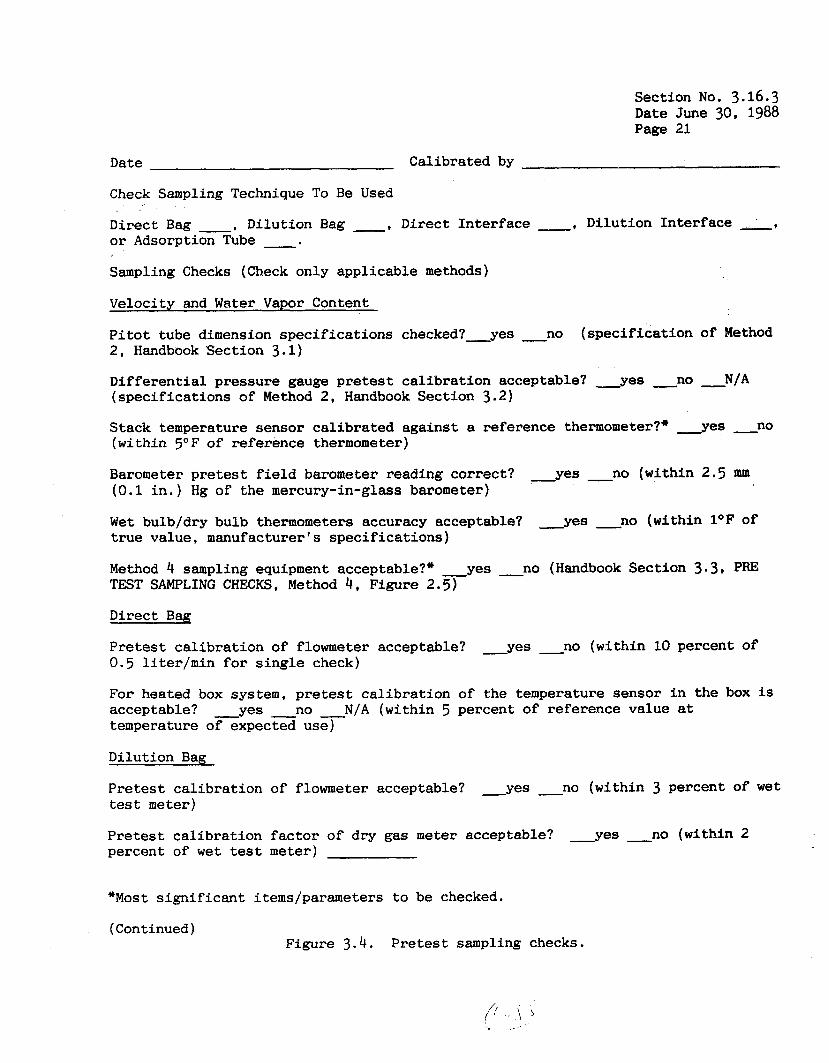
Section No. 3.16.3 Date June 30, 1988 Page 21
Date Calibrated by
Check Sampling Technique To B e Used
Direct Bag , Dilution Bag , Direct In te r face , Dilution Interface , , o r Adsorption Tube . Sampling Checks (Check only applicable methods)
Velocity and Water Vapor Content
P i t o t tube dimension spec i f ica t ions checked?-yes -no 2, Handbook Section 3.1)
Dif fe ren t ia l pressure gauge pretest ca l ibra t ion acceptable? y e s n o N / A ( spec i f ica t ions of Method 2, Handbook Section 3.2)
Stack temperature sensor ca l ibra ted against a reference thermometer?* y e s n o (within 5 O F of reference thermometer)
( spec i f ica t ion of Method
Barometer p re t e s t f i e l d barometer reading correct? (0 .1 i n . ) Hg of the mercury-in-glass barometer)
Wet bulb/dry bulb thermometers accuracy acceptable? t rue value, manufacturer's spec i f ica t ions)
y e s n o (within 2.5
y e s n o (within 1°F Of
Method 4 sampling equipment acceptable?" y e s -no (Handbook Section 3.3, PRE TEST SAMPLING CHECKS, Method 4 , Figure 2.5)
Direct Bag
Pretest ca l ib ra t ion of flowmeter acceptable? 0.5 l i t e r /min for s i n g l e check)
y e s -no (within 10 percent of
For heated box system, pretest ca l ib ra t ion of the temperature sensor i n the box is acceptable? temperature of expected use)
-yes -no N / A (within 5 percent of reference value a t
Dilution Bag
Pretest ca l ibra t ion of flowmeter acceptable? test meter)
-yes -no (within 3 percent of wet
Pretest ca l ibra t ion factor of dry gas meter acceptable? percent of w e t test meter)
y e s -no (within 2
*Most s ign i f i can t items/parameters t o be checked.
(Continued) Figure 3.4. P re t e s t sampling checks.
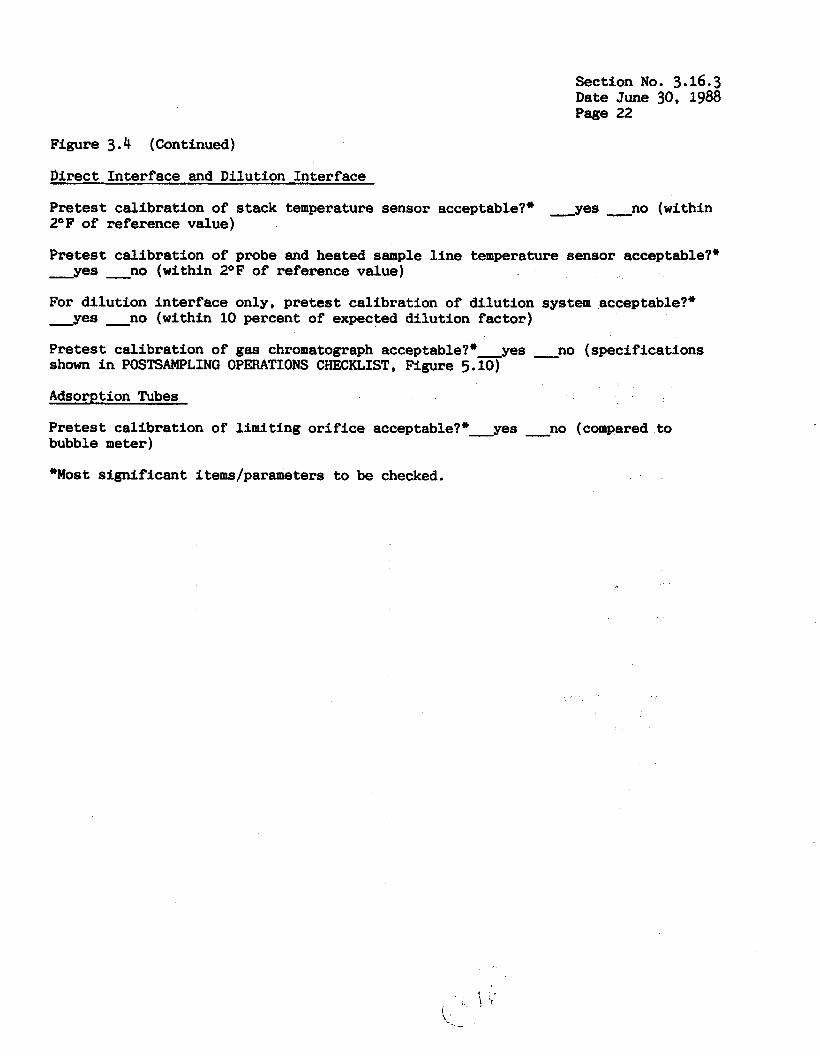
Section No. 3.16.3 Date June 30, 1988 Page 22
Figure 3.4 (Continued)
Direct Interface and Dilution Interface
P re t e s t ca l ibra t ion of s tack temperature sensor acceptable?* 2OF of reference value)
y e s n o (within
Pretest ca l ibra t ion of probe and heated sample l i n e temperature sensor acceptable?* y e s n o (within 2OF of reference value)
For d i lu t ion in te r face only, pretest cal ibrat ion of d i lu t ion system acceptable?* y e s n o (within 10 percent of expected d i lu t ion fac tor )
Pretest ca l ibra t ion of gas chromatograph acceptable?*-yes n o (specif icat ions shown i n POSTSAMPLINQ OPERATIONS CHECKLIST, Figure 5.10)
Adsorption Tubes
Pre tes t ca l ibra t ion of l imi t ing o r i f i c e acceptable?*-yes n o (compared to bubble meter)
*Most s ign i f icant items/parameters t o be checked.
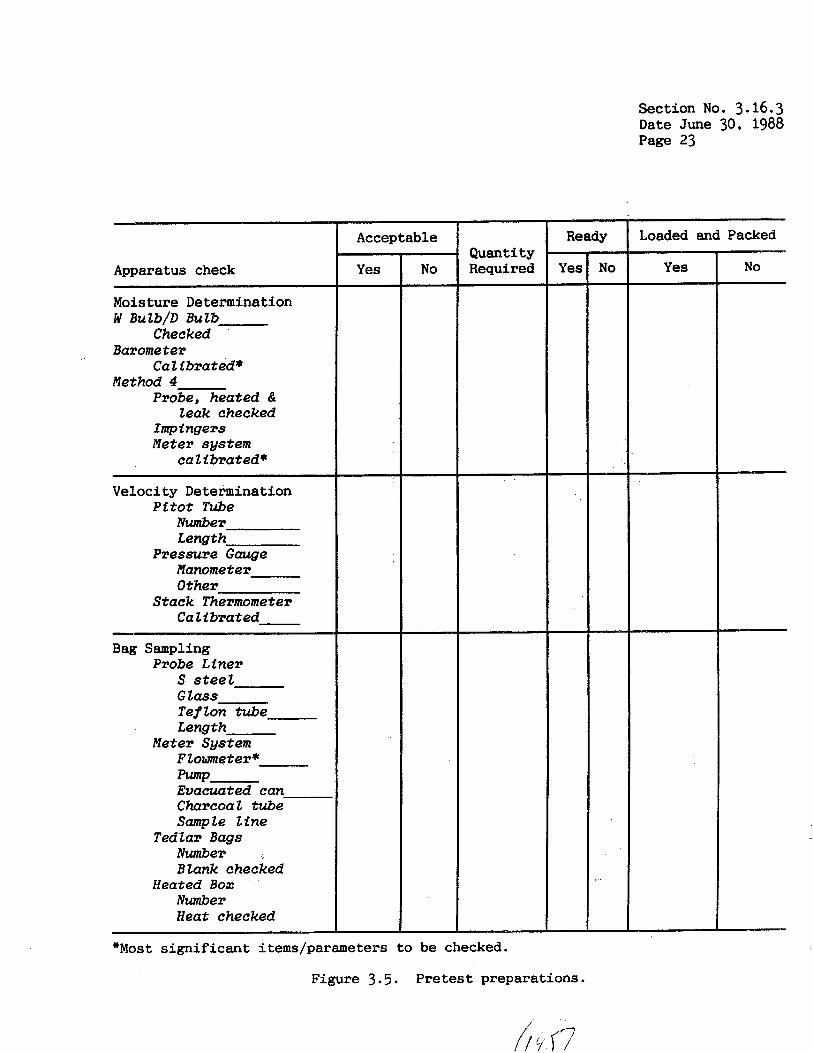
Section No. 3.16.3 Date June 30. 1988 Page 23
Apparatus check
Moisture Determination W Bulb/D Bulb
Barometer
Method 4
Checked
Ca l i brated*
Probe, heated & leak checked
Imp ingers Meter system
calibrated*
Velocity Determination
Number Length
Pressure Gauge Manometer Other
Stack Thermometer Calibrated
Pitot Tube
Bag Sampling Probe Liner
S steel Glass Tef ton tube Length
Meter System F tome ter * Evacuated can Charcoal tube Sample tins
Tedlar Bags Number Blank checked
Number Heat checked
pump
Heated Box
Acceptable
Yes - No
Quanti Requir
*Most significant items/parameters to be checked.
Ready Loaded and Packed
Yes No
Figure 3 . 5 . Pretest preparations.
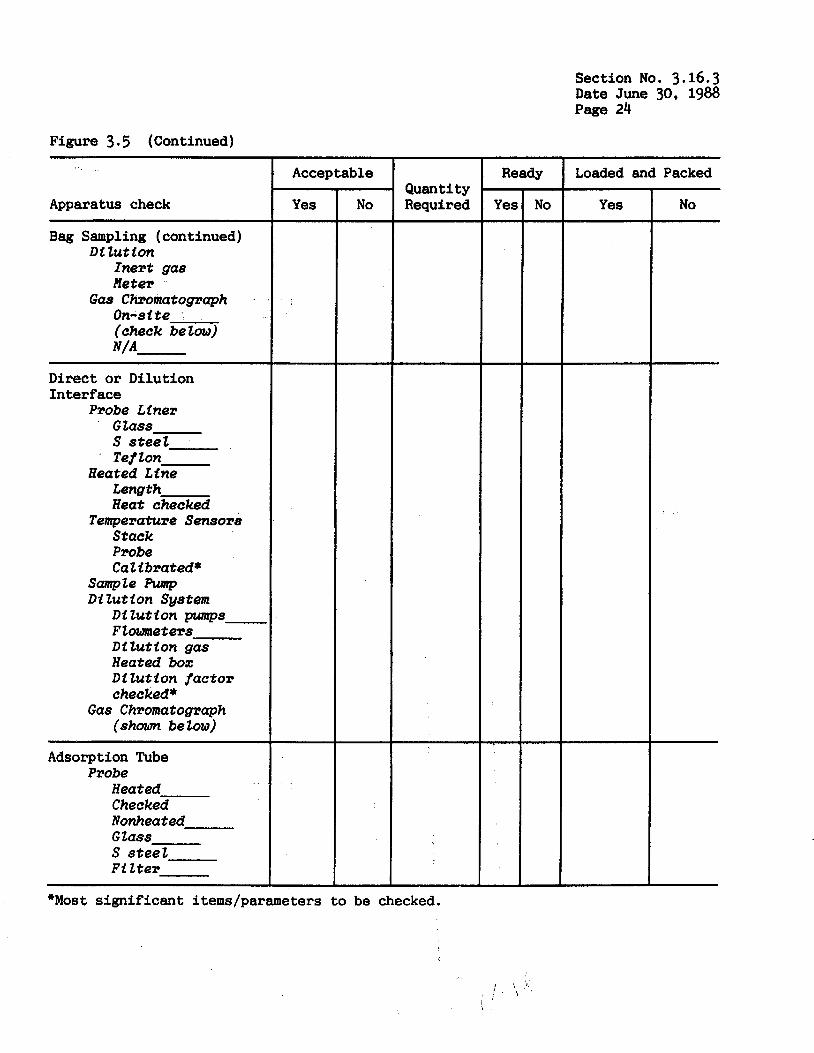
Figure 3.5 (Continued)
Apparatus check ~~
Bag Sampling (continued) Di lution
Inert gas Meter
On-site (check below)
Gas Chromatograph
N/A
Direct or Dilution Interface
Probe Liner Glass S steel Tef ton
Heated Line Length Heat checked
Temperature Sensors Stack Probe Calibrated*
Sample pwnp Di lution Sgstem
Dilution pumps Flometers Dilution gas Heated box Di lution factor checked*
(shown be low) Gas Chromatograph
Adsorption Tube Probe
Heated Checked Nonhea t ed Glass S s tee l Fi lter
Acceptable
Yes - No
Quantity Required
Ready - Yes -
-
-
Section No. 3.16.3 Date June 30, 1988 Page 24
Loaded and Packed
Yes No
*Most s ign i f i cant items/parameters to be checked.
i
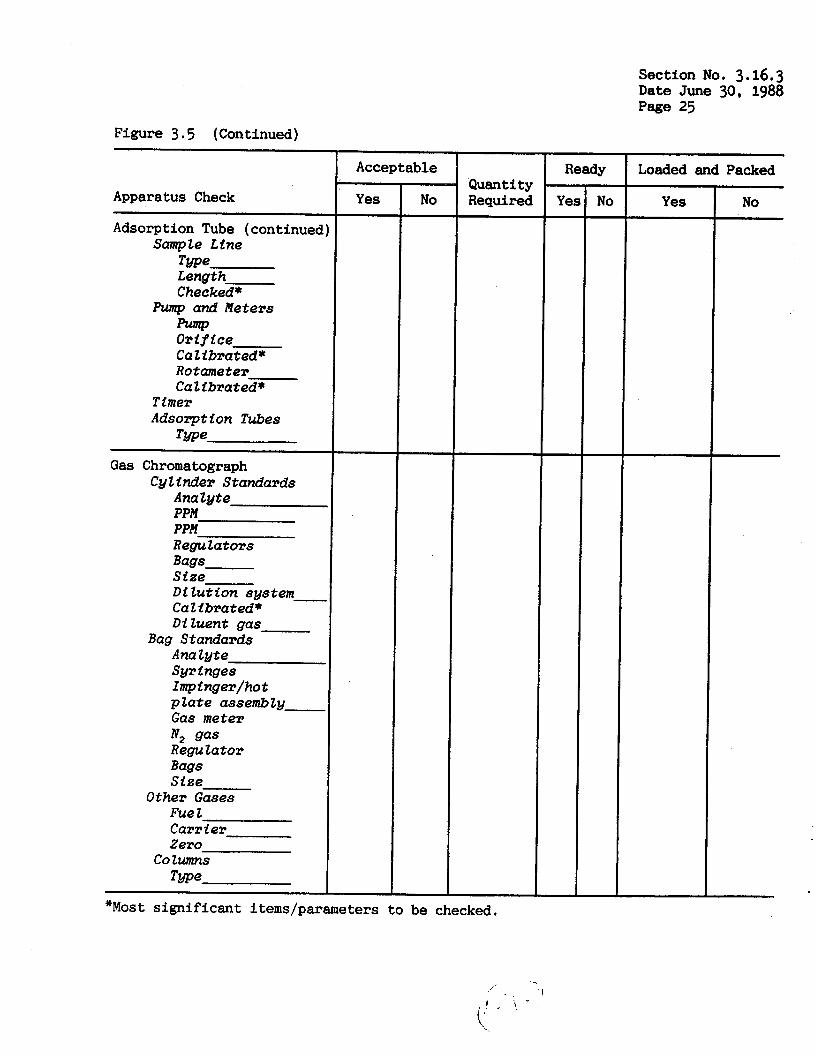
Section No. 3.16.3 Date June 30, 1988 page 25
Figure 3 .5 (Continued)
Acceptable
Apparatus Check
Adsorption Tube (continued Sample Line
Twe Length Checked *
Pump and Heters F U l m OriPice Calibrated* Rotameter Calibrated*
Timer Adsorption Tubes
Twe
Gas Chromatograph Cyl inder Standards
Analyte PPM PPM Regulators Bags Size Dilution system- Ca 1 i brated * D i luent gas
Bag Standards Ana lute Syr inges Impinger/hot p l a t e assembly Gas meter
Regulator Bags
N2 gas
S i ze Other Gases
Fue 1 Carr i er Zero
Columns Twe
Yes -
No Quantity Required
"Most s ignif icant items/parameters to be checked.
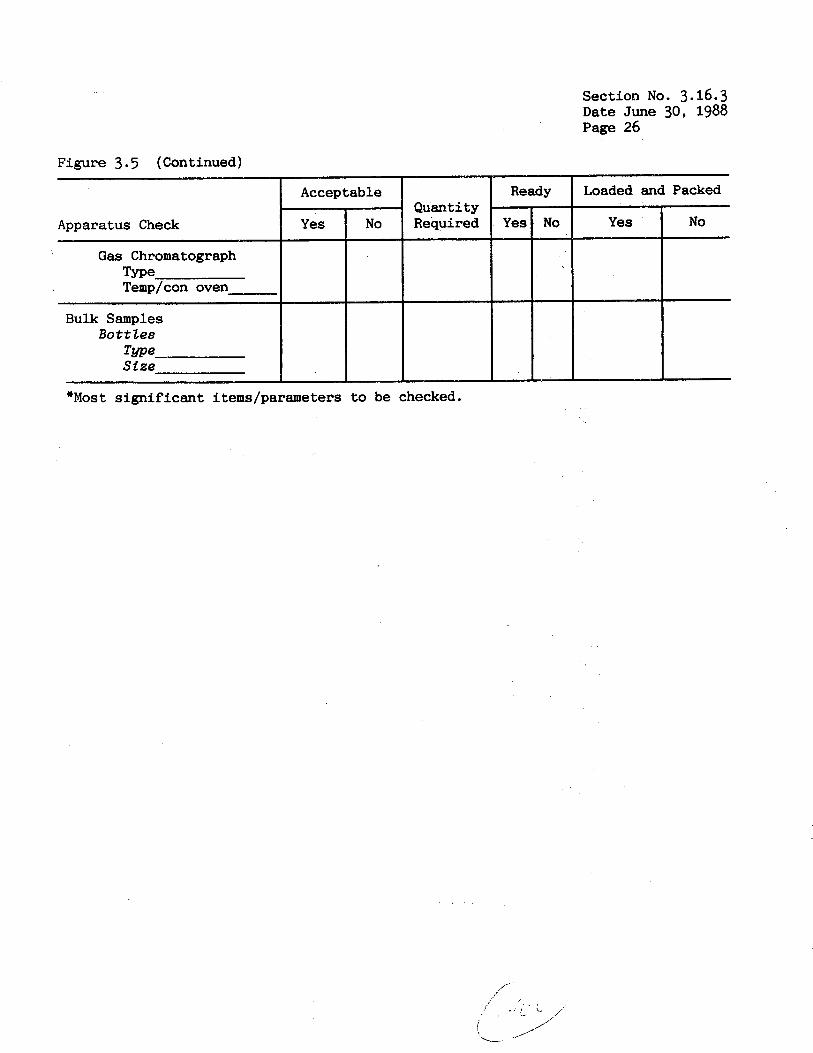
Figure 3 . 5 (Continued)
Accep
Apparatus Check
Gas Chromatograph Type Temp/con oven
Bulk Samples Bottles
m e Size
Yes
Section No . 3.16.3 Date June 30, 1988 Page 26
to be checked. "Most significant items/parameters
Section No. 3.16.3 Date June 30, 1988 Page 27
probe should be sealed a t the i n l e t end and checked f o r leaks by applying a vacuum of 10 i n . H,O. See Subsection 1.0 f o r the probe leak check procedure. The probe is considered leakf ree under these conditions if no loss of vacuum is seen after one minute. Any leaks should be corrected or the probe should be rejected. If the probe has an ex terna l sheath, the i n t e g r i t y of the seal between the sheath and the probe l i n e r should be checked t o ensure ambient a i r does not d i l u t e the gas sample.
3.5.2 t o bag or tube samples.
Teflon Tubing - Prepare enough sect ions of tubing f o r connecting the probe
3.5.3 Quick Connects or Equivalent - The quick connects, or t h e i r equivalents, should be new or cleaned according t o the manufacturer's recommendations. Leak check the quick connects as described i n Subsection 1.0.
3.5 .4 Barometer - The f i e l d barometer should be compared with the mercury-in-glass barometer or with a National Weather Service S ta t ion reading p r i o r t o each f i e l d test.
3.5.5 Wet Bu Zb/Dry Bu tb Thermometers - For sourcee with s tack temperatures below 59°C where w e t bulb/dry bulb thermometers w i l l be used t o determine s tack gas moisture content, the thermometers should be compared with the mercury-in-glass thermometer a t room temperature p r i o r to each f i e l d t r i p .
3.5.6 Method 4 Equipment - Where Method 4 w i l l be used to determine s tack gas moisture content, prepare the equipment for sampling following the procedures described i n Section 3 .3 .3 0.f t h i s Handbook.
3.5 .7 S-tgpe Pitot Tube and Differential Pressure Gauge - Prepare the S-type p i t o t tube and the d i f f e r e n t i a l pressure gauge for sampling following the procedures de- scribed i n Section 3 .1 .3 of t h i s Handbook.
3 . 5 . 8 Sampting Pump - Check the sampling pump for del ivery rate and leaks before going to the f i e l d as follows: Attach a 0 to 5 l i t e r /minute rotameter t o the o u t l e t of the pump and turn on the pump. Check the flow rate indicated by the rotameter. Reject o r repair the pump i f t he flow rate is not a t least 1 liter/mi- nute. the pump. If the pump is leak f r e e then the rotameter should eventually indicate no f l o w .
If the flow is adequate, then conduct a leak check by plugging the i n l e t of
Repair or replace the pump i f a leak is indicated.
3.5.9 Tedtap Bags - Prepare new Tedlar bags for sampling by leak checking the bags before going t o the f i e l d . The bags should also be checked for contamination by f i l l i n g with hydrocarbon-free a i r or nitrogen during the leak check. The bags are checked as follows: Connect a water manometer, or equivalent, using a tee con- nector between the check valve quick connect on the bag and a pressure source (or hydrocarbon-free a i r or nitrogen for conducting the contamination check). Pres- sur ize the bag t o 5 t o 10 cna ( 2 to 4 i n . ) H,O and disconnect the quick connect. Loss of pressure over a 10 minute period ind ica tes a leak. Alternat ively, leave the bag pressurized overnight; a def la ted bag the following day is indica t ive of a leak. Reject or repair any bags w i t h leaks. A f t e r t he hydrocarbon-free a i r or nitrogen has remained i n the bag f o r 24 hours, analyze with a flame ioniza t ion de tec tor on the most sens i t i ve re jec ted i f any organic compounds are detected t h a t may of any of the t a r g e t compound(s).
the bag contents using a GC set t ing. The bag should be i n t e r f e r e with the analysis

Section No. 3.16.3 Date June 30, 1988 Page 28
3.5.10 Rigid Leak-Proof Containers - The r i g i d containers used t o contain the Tedlar bags during sampling should be checked f o r leaks p r i o r t o going t o the f i e ld . The container should be leak checked with the bag i n place as follows: Connect a water manometer, or equivalent, using a tee connector between a pressure source and the container ou t l e t . Pressurize the container t o 5 t o 10 c m (2 t o 4 i n . ) Hg. Any l o s s of pressure a f t e r 10 minutes indicates a leak. Reject or repa i r the r i g i d container i f a leak is indicated.
3.5.11 Direct Pump Sampling Sgstem - If the direct pump sampling system is select- ed, then the system should be assembled and leak checked p r io r t o going t o the f i e l d as follows: Assemble the system (see Figure 4.5). Attach a vacuum l i n e and a rotameter t o the i n l e t quick connect. Plug the probe i n l e t and turn on the vacuum pump. I f the system is leakfree up to the pump, the rotameter should even- tua l ly indicate no flow. An a l t e rna te procedure t o leak check the system up t o the male i n l e t check valve quick connect is as follows: Connect a water manometer, or equivalent, using a tee connector between a pressure source and the i n l e t end of the probe. Pressurize the system t o 5 t o 10 cm (2 t o 4 in . ) Hg. Any los s of pressure a f t e r 30 seconds indicates a leak. Reject or repair the sampling system i f a leak is indicated. Check t o see if the pump is contaminating the sampling system by f i l l i n g a second contamination-free Tedlar bag with hydrocarbon-free air or nitrogen, and with the system assembled p u l l the hydrocarbon-free a i r or n i t r - ogen from the second Tedlar bag i n t o the f i r s t Tedlar bag using the pump. Analyze the first bag contents using a GC with a flame ionizat ion detector on the most sens i t ive se t t ing . The pump should be rejected or repaired, cleaned, and checked again if any organic compounds are detected tha t may i n t e r f e r e with the analysis of any of the target compound(s).
3.5.12 Needle Valve and Rotameter - Pr ior t o each f i e l d t r i p or a t sign of erratic behavior, the flow control valve and the rotameter should be cleaned according t o the maintenance procedure recommended by the manufacturer.
3.5.13 Teflon Probe - For bag sampling i n an explosion r i s k area, prepare a new Teflon probe o r clean a used Teflon probe following the procedure described i n Subsection 3.5.1. Leak check the Teflon probe as follows: Attach a mercury manome- ter, with a tee connector, and a vacuum pump t o the o u t l e t of the probe. Plug the i n l e t end of the probe and apply a vacuum of 10 in . H,O. The probe is considered leak f r e e under these conditions i f no lo s s of vacuum is seen after one minute. Any leaks should be corrected or the probe should be rejected.
3.5.14 Explosion R i s k Area Sampling &stem - The explosion r i s k area sampling system should be leak checked as follows: Evacuate the steel drum. Assemble the system (see Figure 4.6), with the pinch clamp open, t he sample bag leak checked and evacuated, and d i rec t iona l needle valve closed. Attach a mercury manometer t o the i n l e t of the Teflon probe. The rotameter should eventually indicate no flow. Once there is no flow, note the manometer reading. The system is considered leak f r e e under these conditions i f no l o s s of vacuum is seen after one minute. It is recommended tha t an explosion-proof pump be used i n the explosion risk area or a regular pump be used outs ide the r i s k area. Follow the procedures described fo r
Open the needle valve.
Any leaks should be corrected or the system should be rejected.
these pumps.
3.5.15 Heated Bag Sample Container and Sample Lines - I f o ther modifieg-bag ing techniques are selected due to condensation observed during sampling,
sampl- heated

Section No. 3.16.3 Date June 30, 1988 Page 29
bag sample containers and sample l i n e s w i l l be required. The heating systems of t h i s equipment should be checked p r i o r t o going t o the f i e l d to see t h a t they a re operating properly. The sample l i n e s should be cleaned following the procedure described f o r the sampling probe i n Subsection 3.5.1. The heated sampling system should be assembled and leak checked prior t o going t o the f i e l d as follows: Assemble the system (see Figure 4.5). Attach a vacuum pump and a rotameter t o the i n l e t quick connect. Plug the probe i n l e t and turn on the vacuum pump. If the system is leak free, the rotameter should eventually ind ica te no flow. An alter- na te procedure t o leak check the system up t o the female o u t l e t check valve quick connect on the bag container is as follows: Connect a water manometer, o r equiva- lent, using a tee connector between a pressure source‘ ahd the i n l e t end of the probe. Pressurize the system t o 5 t o 10 cm (2 to 4 in . ) Hg. Any loss of pressure after 30 seconds ind ica tes a leak. Reject or r epa i r the sampling system i f a leak is indicated.
3.5.16 Direct InterJ‘ace S&tptLng System - ‘The heating system of the sampling probe should be checked prior to going t o the f i e l d i f heat ing is required to maintain the gas sample above the duct temperature and/or to prevent condensation. The probe should also be cleaned and leak checked following the procedures describ- ed i n Subsection 3.5.1. I f the probe has an external sheath, the i n t e g r i t y of the seal between the sheath and the probe l i n e r should be checked to ensure ambient air does not d i l u t e t he gas sample. The sample l i n e should be cleaned following the procedure described for the sampling probe i n Subsection 3.5.1. The heating system of the sample l i n e should be checked before going t o the f i e l d to see that i t is operating properly. The d i r e c t i n t e r f ace sampling system should be assembled and leak checked prior t o going t o the f i e l d as follows: Assemble the system (see Figure 4.5). Switch the gas sampling valve t o the i n j e c t pos i t ion , and plug the o u t l e t from the sample valve. Connect a water manometer, or equivalent, using a tee connector between a pressure source and the i n l e t end of the probe. Pressurize the system t o 5 to 10 c m (2 t o 4 in . ) Hg. Any loss of pressure after 30 seconds ind ica tes a leak.
3.5.17 Dilution Interface SampZfng Sgstem - The equipment required for d i l u t i o n in te r face sampling is the same as required for direct in t e r f ace sampling, w i t h the addition of 8 heated d i lu t ion system and a l a rge r heated sample pump. The heating systems should be checked t o see tha t they are operating properly. P r io r t o each f ie ld t r i p or a t s ign of erratic behavior, a l l flowmeters should be cleaned accord- i ng t o the maintenance procedure recommended by the manufacturer. The flowmeters should a l so be calibrated following the procedures described i n Subsection 2.1.3. The d i lu t ion in t e r f ace sampling system should also be checked f o r leaks as follows: Assemble the system (see Figure 4.6) . Connect a water manometer, o r equivalent, using a tee connector between a pressure source and t h e irilet end of the probe. Plug the three o u t l e t vents t o the charcoal adsorbers md the ou’tlet of the two flowmeters. Pressurize the system t o 5 t o 10 cm (2 t o ‘ 4 i n . ) Hg. Any los s of pressure after 30 seconds ind ica tes a leak. Reject or repair the system if a leak is indicated. It is advisable t o ve r i fy the operation of the d i lu t ion system prior t o going to the f i e l d following the procedures described i n Subsections 4.3.7 and 5.3.3.
3.5.18 Gus Chromatography System - Refer t o Table C i n the Method Highlights Section t o ensure t h a t the proper detector has been selec’ted f o r the target organic compounds. P r io r t o taking the gas chromatography system to the f ield, check that a l l systems are-opera t ing properly. Consult the operator’s manual for procedures
Reject or repair the sampling system i f a leak is indicated.
Section No. 3.16.3 Date June 30, 1988 Page 30
t o ve r i fy t h a t the equipment is operating properly. Check t o see t h a t a l l cylinder gas regulators , connections, and tubing are functioning properly and are leak free. This is pa r t i cu la r ly important when using hydrogen and oxygen. Consult with the regulator manufacturer f o r procedures on checking pressure regulators. Connections and tubing can be checked f o r leaks by pressurizing with the gas and wetting with a soap solut ion o r o ther commercially avai lable solutions. Any bubbles forming on the connections ind ica te a leak. Tighten or replace any leaking connections. An a l t e rna t ive leak check procedure f o r carrier gas is as follows: Plug the o u t l e t of the ana ly t ica l column. Turn off the cylin- der valve and note pressure on the regulator gauge and, i f equipped, the GC pres- sure gauge. Any l o s s of pressure ind ica tes a leak. Locate the leak using a soap solut ion or work backwards through the carrier gas flow path disconnecting each component and plugging the carrier gas flow u n t i l the leak is located. a similar check should be made of the gas sampling valve, sample loop, and connections.
It is advisable t o take t o the f i e l d an adequate supply of spare parts, sep- tums, d i f fe ren t s i z e sample loops, ex t r a ana ly t ica l columns, and o ther re la ted equipment t h a t may f a i l o r de t e r io ra t e during the emission test. The generation of response fac tors f o r each t a rge t organic compound, r e l a t i v e t o a s ing le organic compound, should be confirmed i n the laboratory p r io r t o going t o the f i e l d . The confirmation procedure involving preparation and analysis of ca l ibra t ion standards containing multiple organic compounds is described i n Section 5.1.6.
Pressurize the tubing and connections.
3.6 Reagents and Equipment
The following reagents and equipment may be required 'to conduct the emission test depending on the sampling method selected. These materials are generally ac- quired from commercial vendors. Cer t i f ica t ion of pur i ty and/or analysis should be obtained f o r adsorption tubes, ca l ibra t ion and zero gases, and l iqu id organic com- pounds.
3.6.1 Charcoat Adsorber - Check t o see tha t the supply of charcoal adsorbent is su f f i c i en t t o last f o r the e n t i r e f i e l d test period.
3.6.2 Adsorptfon Tubes - I f adsorption tube sampling is to be conducted, check t o see t h a t the proper type of tube has been obtained f o r co l lec t ing the target or- ganic compounds. Refer t o Table B i n the Methods Highlights Section t o determine the proper adsorption material. Check t o see t h a t the supply of adsorption tubes is su f f i c i en t t o conduct the emission test, including f i e l d blanks and f o r desorp- t ion eff ic iency determinations.
3.6.4 GC Carrier Gas - Check the GC operator 's manual and the GC column manufac- t u r e r t o see tha t the GC carrier gas type and grade are compatible wi th the GC and the column. Check t o see tha t the supply of carrier gas is su f f i c i en t t o l as t the e n t i r e f ie ld test period.
3.6.4 Auxitiary GC Gases - Check t o see i f the proper type and grade of auxi l iary gases required by the GC detector have been obtained. Consult with the GC detector manufacturer t o determine the proper type and grade of auxi l ia ry gases required. Check t o see tha t the supply of auxi l ia ry gases is s u f f i c i e n t t o l as t the e n t i r e f i e l d test period.
3.6.5 Catibration Gases - Check t o see i f the correct ca l ibra t ion gases i n the re- quired range have been obtained. I f avai lable , commercial cyl inder gases may be
Section No. 3.16.3 Date June 30, 1988 Page 31
used i f t h e i r concentrations have been ce r t i f i ed by d i r e c t analysis; cylinder gases with t i g h t e r tolerances on t h e i r concentrations are preferred. Check t o see t h a t the supply of ca l ibra t ion gases is su f f i c i en t t o last the e n t i r e f i e ld test period.
3.6.6 Catfbratfon Gas Dttutfon Sustem - Prior t o each f i e l d t r i p or at the sign of erratic behavior, any flow control valves or rotameters used i n the d i lu t ion system should be cleaned according t o the maintenance procedure recommended by the manu- facturer . The rotameters or other metering devices used with a single-stage or two-stage d i lu t ion system should be cal ibrated p r i o r t o going t o the f i e l d follow-
, ing the procedures described i n Subsection 2.2. It is advisable t o check the d i lu t ion ratio of the d i lu t ion system p r io r t o going t o the f i e l d following the procedures described i n Subsections 4.3.7 and 5.3.3.
3.6.7 Zero Gas - Check t o see tha t the zero gas meets the requirements f o r being hydrocarbon-free (less than 0.1 ppm, of organic material as propane or carbon equi- valent) . Check t o see tha t the supply of zero gas is su f f i c i en t t o last the e n t i r e f i e l d test period.
3.6.8 A u d f t Gases - Check t o see t h a t the required audi t gases i n the proper range have been acquired. Consult Table A i n the Method Highlights Section fo r audi t gases avai lable f r o m the EPA f o r the ta rge t organic compounds. The ava i l ab i l i t y and ranges of audi t gases can be determined by contacting:
Environmental Protection Agency Environmental Monitoring Systems Laboratory Qual i ty Assurance Division (MD-77B) Research Triangle P k k , North Carolina 27711 Attention: Audit Cylinder Gas Coordinator
For audi t gases obtained from a commercial gas manufacturer, check t h a t t he manu- facturer has (1) c e r t i f i e d the gas i n a manner similar t o the procedure described i n 40 CFR Par t 61, Appendix B, Method 106, Section 5.2.3.1 and (2) obtained an independent analysis of the audi t cylinder t h a t v e r i f i e s t h a t the audi t gas concen- t r a t ion is within 5% of the manufacturer's s t a t ed concentration.
3.6.9 Organfc Compounds tor Preparing Gaseous Standards - I f gaseous standards are t o be prepared i n the f i e l d , check t o see i f the organic compounds t o be used are a t least 99.9% pure or, i f less than 99.9%. of known pur i ty necessary t o calculate the gaseous standard concentration. Record the manufacturer's l o t number for each standard compound.
3.6.10 Equipment for Preparing Gaseous Standards by Liquid or Gas Injection- Confirm tha t the Tedlar bags t o contain the gaseous standards have been leak check- ed following the procedures described i n Subsection 3.5.9. Check t o see t h a t t he syringes selected are gas-tight, cover the range needed (1.0- t o 10-microliters for l iqu ids and 0.5 m l for gases) , and are accurate t o within 1%. Confirm tha t the dry gas meter and temperature gauge have been cal ibrated following the procedures described in Subsection 2.0. Clean the midget impinger assembly with detergent and t ap water, and then r in se with deionized d i s t i l l e d water. Check the system for leaks as follows: Assemble the appropriate system for preparing standards (see Figure 5.5 f o r gaseous materials or Figure 5.6 for l iqu id materials). F i t t he in jec t ion por t with a new septum. F i l l the Tedlar bag and pressurize the system t o 5 t o 10 cm (2 t o 4 i n . ) Hg. Any loss of pressure after 10 minutes indicates a

Section No. 3.16.3 Date June 30, 1988 Page 32
leak. Reject or repair the system i f a leak is indicated.
' 3.7 Packing Equiplaent for Shipment
The packing techniques described i n this section are not requirements, but are suggestions baaed on previous f i e l d experience. The type of packaging for equip- ment w i n g t o the f ie ld depends on the mode of transportation. Typically, packing equipment for transport by a common carrier w i l l require the greatest degree of e f f o r t t o ensure the equipment arr ives on-site i n its original condition. When possible, de l ica te equipment should be packed i n the or ig ina l shipping containers. For convenience, label a l l containers with the contents f o r easy ident i f icat ion i n the f ie ld . The most common mode of packing w i l l be i n a van or trailer, where the equipment w i l l remain during transport. More sophisticated test firms have t r a i - lers or trucks dedicated t o the type of sampling being conducted. These uni t s are often designed to allow the test equipment and instruments t o remain set up during transport. This approach minimizes the time and e f f o r t required t o set up before and breakdown after a test. A dedicated test vehicle provides a working environ- ment tha t greatly enhances the qual i ty of work that can be performed.
3.7.1 Probe - Pack the probe i n a r ig id case protected by polyurethane foam, poly- ethylene bubble-pack, or other sui table packing material. Seal the i n l e t and ou t l e t of the probe with tape or other su i tab le material. Protect any protruding glass ends f r o m breakage by inser t ion in to rigid plast ic pipe l ined w i t h foam or other packing material.
3.7.2 Teflon Tubing, Sample Lines, and Vacuum Lines - A l l tubing, sample l ines , and vacuum l ines should be coiled and secured w i t h tape. Coils should be large enough not to crimp tubing or excessively s t r a i n the heat sheath. Seal a l l open- ings with tape.
3.7.3 Quick Connects, F l o w Control Valves and other Connectors - A l l connectors, valves, and other s m a l l par ts should be packed i n s m a l l pa r t s cabinets, t rays with divided compartments, or storage chests w i t h labeled drawers t o provide quick and easy accesa to the desired par t .
3.7.4 Barometer - The field barometer should be packed i n a r ig id container, securely mounted i n r ig id foam. The barometer case should be packed i n a larger box designated to contain de l ica te or fragile equipment.
3.7.5 Thermometers and Thermocouple Readouts - Thermometers and thermocouple read- outs should be packed i n the or iginal carrying case* i f possible. Glass thermome- ters should be packed i n a r ig id tube t o prevent breakage. These items, i n t h e i r smaller packing, should a l so be packed i n a larger box designated to contain del i - cate or f r ag i l e equipment.
3.7.6 Method 4 Equipment - cedures recommended i n Section 3.3.3 of th i s Handbook.
Method 4 equipment should be packed following the pro-
3.7.7 S-tgpe Pttot Tube and Differential Pressure Gauge - The S-type p i t o t tube, when not mounted on the sampling probe, should packed i n a r igid case and wrapped w i t h polyurethane foam, polyethylene bubble-pack, or other su i tab le type of packing material. Seal all openings with tape or other, su i tab le material. The differen- t i a l pressure gauge, i f not par t of a meter box, should be mounted i n a r ig id
Section No. 3.16.3 Date June 30, 1988 Page 33
housing. The gauge should be wrapped with polyurethane foam, polyethylene bubble- pack, or other su i tab le material, and packed i n a la rger box designated f o r de l i - cate and f r a g i l e equipment.
3.7.8 Glasmre - A l l glassware should be packed i n the or ig ina l shipping contain- ers, i f avai lable , and s tored together i n a la rger r ig id container marked "Fragile! G l a s s . " Otherwise, wrap the glassware with polyurethane foam, polyethylene bubble- pack, or other su i t ab le material, and pack i n a r i g i d foam-lined container marked "Fragile ! G l a s s . "
3.7.9 Tedlar Bags - Preferably, transport the Ted la r bags to the f i e l d i n individ- ua l r i g i d containers used f o r sampling. If t h i s is not possible, pack the bags, individually, i n corrugated cardboard boxes with the connectors secured such tha t they do not contact and puncture the bags.
3.7.10 fo r transport , should be packed i n a r ig id foam-lined container.
3.7.11 i n t o i n a r ig id container su i t ab le for shipment.
3.7.12 Gas Chromatograph Sgstem - The gas chromatograph and anc i l la ry systems should be packed i n the o r ig ina l shipping container f o r transport . Although it is not recommended, the GC can be transported with out addi t ional packaging i n a van or trailer provided the GC is secured properly against movement and other equipment is not packed i n a manner where i t could f a l l on the instrument. For transport i n dedicated test vehicles, the instruments should be mounted i n shock absorbing devices. A l l gas l i n e s and ana ly t ica l columns should be capped to prevent con- ' tamination and/or oxidation during shipment.
Sampling Aunps - Sampling pumps, i f not mounted i n a r i g i d housing su i tab le
Dilution Interface System - The d i lu t ion in te r face system should be b u i l t
3.7.13 Gas Culinders - A l l gas cylinders should be transported with t h e i r protec- t i v e cylinder heads securely attached. The cylinders should be secured horizontal- l y so t ha t they do not r o l l together or ver t i ca l ly i n a spec ia l ly designed cylinder rack. B e aware of and adhere t o a l l Federal, S ta te , and loca l regulations involv- ing the transport of compressed and flammable gases, par t icu lar ly through tunnels.
3.7.14 Liquid Organic Compounds - Liquid organic compounds should be shipped with the container top sealed with e l ec t r i c i ans tape and s tored i n a sealed p l a s t i c bag. Packed each container i n its or ig ina l shipping box, i f available. Otherwise, wrap each container individually with polyurethane foam, polyethylene bubble-pack, o r other su i tab le material and place i n a box designated f o r chemicals.
3.7.15 Dry Gas Meters - Dry gas meters not housed i n a r i g i d meter box su i tab le fo r transport should be wrapped with polyurethane foam, polyethylene bubble-pack, or other su i tab le material, and packed i n a la rger box designated f o r de l ica te or f r a g i l e equipment.
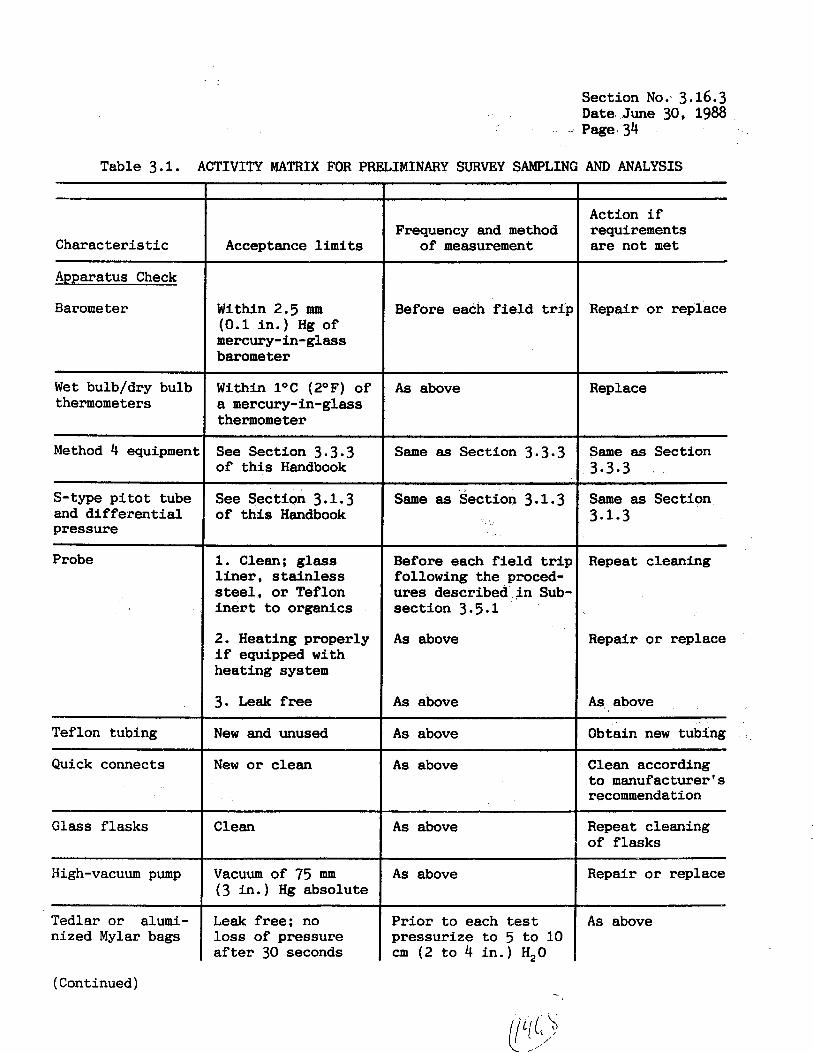
. .
Section No: 3.16.3 Date June 30, 1988 Page 34
Table 3.1. ACTIVITY MATRIX FOR PRELIMINARY SURVEY SAMPLING AND ANALYSIS
Action i f requirements are not m e t
Frequency and method of measurement Character is t ic Acceptance l i m i t s
Apparatus Check
Barometer Repair o r replace Within 2.5 mm (0.1 i n . ) Hg of mercury-in-glass barometer
Before each field t r i p
Wet bulb/dry bulb thermometers
Within l 0 C (2OF) of a mercury-in-glass thermometer
As above Replace
Method 4 equipment See Section 3.3.3 of t h i s Handbook
Same as Section 3.3.3 Same as Section 3.3.3
S-type p i t o t tube and d i f f e r e n t i a l pressure
Same as Section 3.1.3 See Section 3.1.3 of t h i s Handbook
Same as Section 3.1.3
Repeat cleaning Probe Before each f ie ld t r i p following the proced- ures described i n Sub- sec t ion 3.5.1
1. C l e a n ; glass l i n e r , s t a i n l e s s steel, or Teflon i n e r t t o organics
Repair o r replace 2. Heating properly i f equipped with heating system
A s above
A s above 3. Leak f r e e A s above
Teflon tubing N e w and unused ~ ~~
A s above Obtain new tubing
Quick connects New or clean As above Clean according t o manufacturer's recommendation
G l a s s f l asks C l e a n Repeat cleaning of f l a sks
A s above
High-vacuum pump Repair o r replace A s above Vacuum of 75 mm (3 i n . ) H g absolute
Leak free: no l o s s of pressure a f t e r 30 seconds
Tedlar o r alumi- nized Mylar bags
P r io r t o each test pressurize t o 5 t o 10 c m (2 t o 4 i n . ) H,O
A s above
(Continued)

Section No. 3.16.3 Date June 30, 1988 page 35
Teflon tubing
On-site Measure- ments and Sampling
Wet bulb/dry bulb measurement
Table 3.1 (Continued)
extract ion solvent
New and unused
1. Wet bulb wick moistened
2. Wet bulb temper- a ture s tab i l ized
3. Record w e t bulb and dry bulb temperature
Character is t ic Acceptance l i m i t s
e a r a t u s Check
R i g i d containers Leak free: no lo s s of pressure after 30 seconds
Direct pump teak free; no sampling system los s of pressure
after 30 seconds
Needle valve and Clean r o tame ter
Adsorption Tube Procedure
Adsorption tubes Proper type of adsorption material
Personnel sampling Calibrated PWP
Frequency and method of measurement
Pr ior t o each test pressurize t o 5 t o 10 cm (2 t o 4 in . ) H,O
A s above
Prior t o each t r i p or a t the sign of erratic behavior
Before each f i e l d t r i g
A s above
Prior t o extraction of tubes f o r analysis
Before each f i e l d t r i p
Pr ior t o each measurement
During measurement
Immediately a f t e r w e t bulb temperature s t ab i l i ze s
Action i f requirements are not met
Repair or replace
A s above
Clean following manufacturer ’ s recommendations
Replace wi th proper type
Repair or replace
Replace with proper type
Obtain new tubing
Moisten
Allow to s t a b i l i z e
Repeat measurement
(Continued)
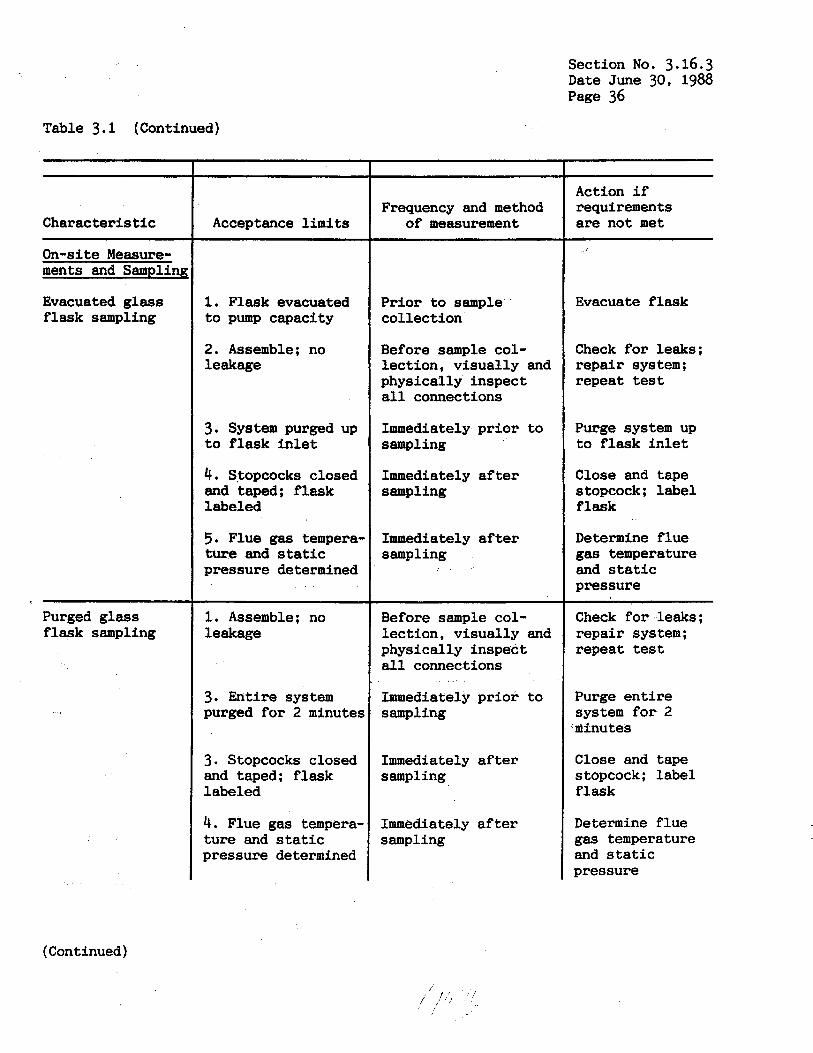
Section No. 3.16.3 Date June 30, 1988 Page 36
Table 3.1 (Continued)
Characterist ic
On-site Measure- ments and Samplint
Evacuated g lass f lask sampling
Purged glass f lask sampling
Acceptance l i m i t s
1. Flask evacuated t o pump capacity
2. Assemble: no leakage
3. System purged up t o f l a sk i n l e t
4. Stopcocks closed and taped; f lask labeled
5. Flue gas tempera- tu re and static pressure determined
1. Assemble; no leakage
3. Entire system purged f o r 2 minutes
3. Stopcocks closed and taped; f lask labeled
4. Flue gas tempera- tu re and static pressure determined
Frequency and method of measurement
Prior t o sample col lect ion
Before sample col- lect ion, visual ly and physically inspect a l l connections
Immediately p r io r t o sampling
Immediately a f t e r s amp1 ing
Immediately after sampling
Before sample col- lect ion, visual ly and physically inspect a l l connections
Immediately p r io r t o sampling
Immediately after sampling
Immediately a f t e r sampling
Action i f requirements are not met
Evacuate f lask
Check f o r leaks: repair system: repeat test
Purge system up t o f lask i n l e t
Close and tape stopcock: labe l f lask
Determine f lue gas temperature and s t a t i c pressure
Check f o r leaks; repair system; repeat test
Purge e n t i r e system f o r 2 minutes
Close and tape stopcock; label f lask
Determine f lue gas temperature and s t a t i c pressure
(Continued)
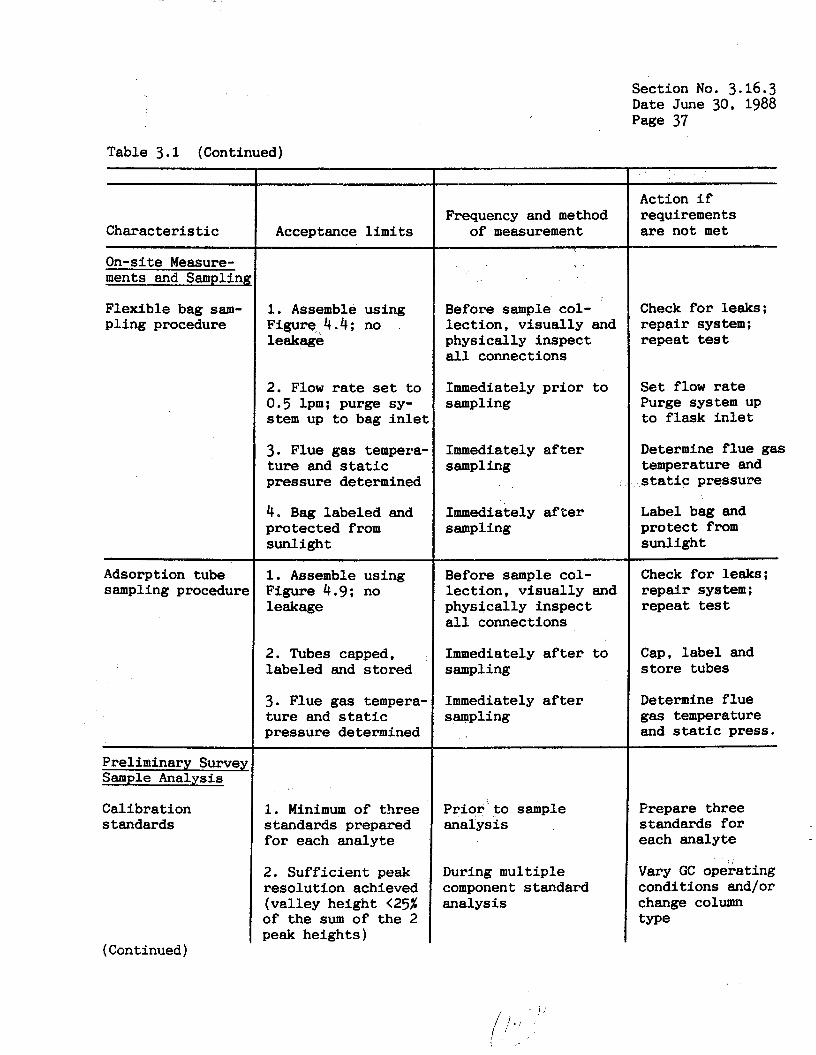
Section No. 3.16.3 Date June 30, 1988 Page 37
Table 3.1 (Continued)
Character is t ic
On-site Measure- ments and Samplin,
Flexible bag sam- pl ing procedure
Adsorption tube sampling procedurc
Calibration standards
(Continued)
Acceptance l i m i t s
1. Assemble using Figure 4.4; no leakage
2. Flow rate set t o 0.5 l p m ; purge sy- stem up to bag in le t
3. Flue gas tempera- t u re and static pressure determined
4. B a g labeled and protected from sunl ight
1. Assemble using Figure 4.9; no leakage
2. Tubes capped, labeled and s tored
3. Flue gas tempera- t u r e and s ta t ic pressure determined
1. Minimum of three standards prepared for each analyte
2. Suf f i c i en t peak resolut ion achieved (va l ley height (25% of the sum of the 2 peak heights)
Frequency and method of measurement
Before sample col- l ec t ion , v i sua l ly and physically inspect a l l connections
Immediately p r i o r to sampling
Immediately a f t e r sampling
Immediately after sampling
Before sample col- l ec t ion , v i sua l ly and physically inspect a l l connections
Immediately after t o sampling
Immediately after sampling
Prior' t o sample analysis
During multiple component standard analysis
Action if requirements are not met
Check for leaks; repa i r system: repeat test
Se t flow rate Purge system up t o f l a sk i n l e t
Determine f l u e gas temperature and s ta t ic pressure
Label bag and pro tec t from sunl ight
Check f o r leaks: repair sys tern ; repeat test
Cap, l abe l and s t o r e tubes
Determine f l u e gas temperature and s ta t ic press.
Prepare three standards for each analyte
Vary GC operating conditions and/or change column type
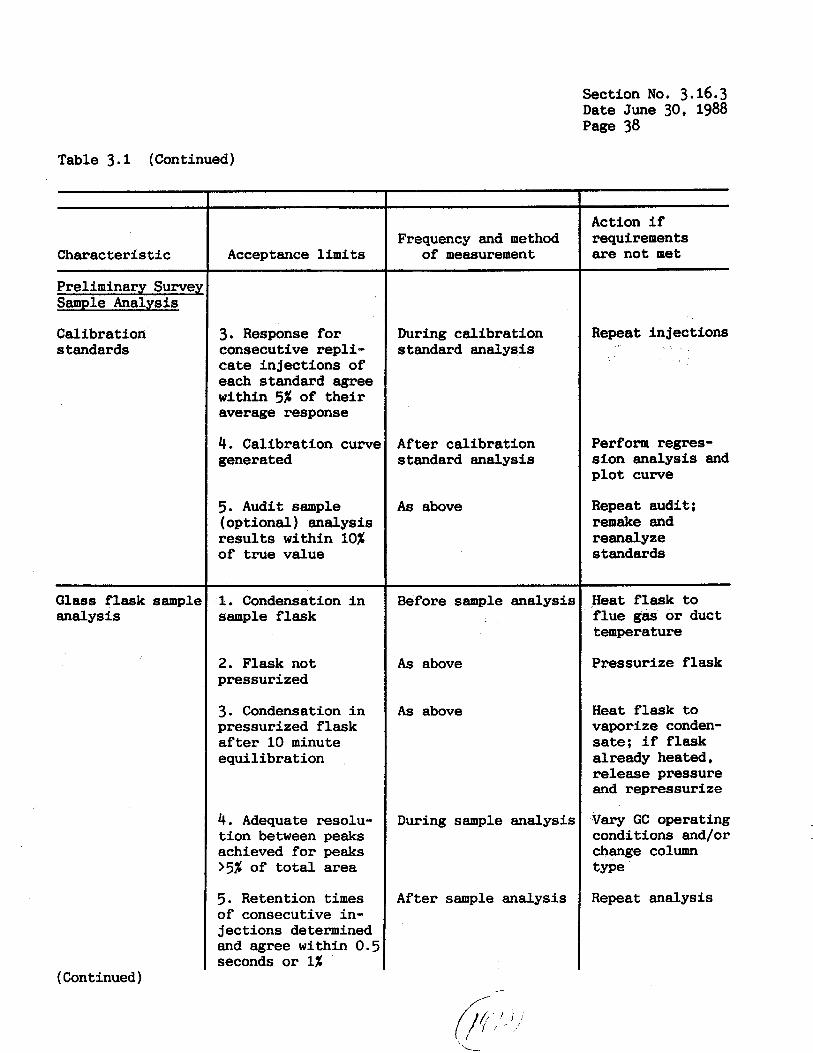
Section No. 3.16.3 Date June 30, 1988 Page 38
Table 3.1 (Continued)
Characteristic
Preliminary Surve; Sample Analysis
Calibration standards
G l a s s f lask samplt analysis
(Continued)
3. Response f o r consecutive rep l i - cate inject ions of each standard agree within 5% of the i r average response
4. Calibration curve generated
5. Audit sample (optional) analysis resu l t s within 10% of t rue value
I. Condensation i n sample f lask
2. Flask not pressurized
3. Condensation i n pressurized f lask a f t e r 10 minute equilibration
4. Adequate resolu- t ion between peaks achieved fo r peaks >5$ of t o t a l area
5. Retention times of consecutive in- jections determined and agree within 0.5 seconds or 1%
Frequency and method of measurement
During calibration standard analysis
After calibration standard analysis
As above
Before sample analysis
A s above
A s above
During sample analysis
After sample analysis
Action if requirements are not m e t
Repeat injections
Perform regres- sion analysis and p lo t curve
Repeat audit: remake and reanalyze standards
Heat f lask t o f lue gas or duct temperature
Pressurize flask
H e a t f l ask t o vaporize conden- sate: i f f lask already heated, release pressure and repressurize
Vary GC operating conditions and/or change column type
Repeat analysis
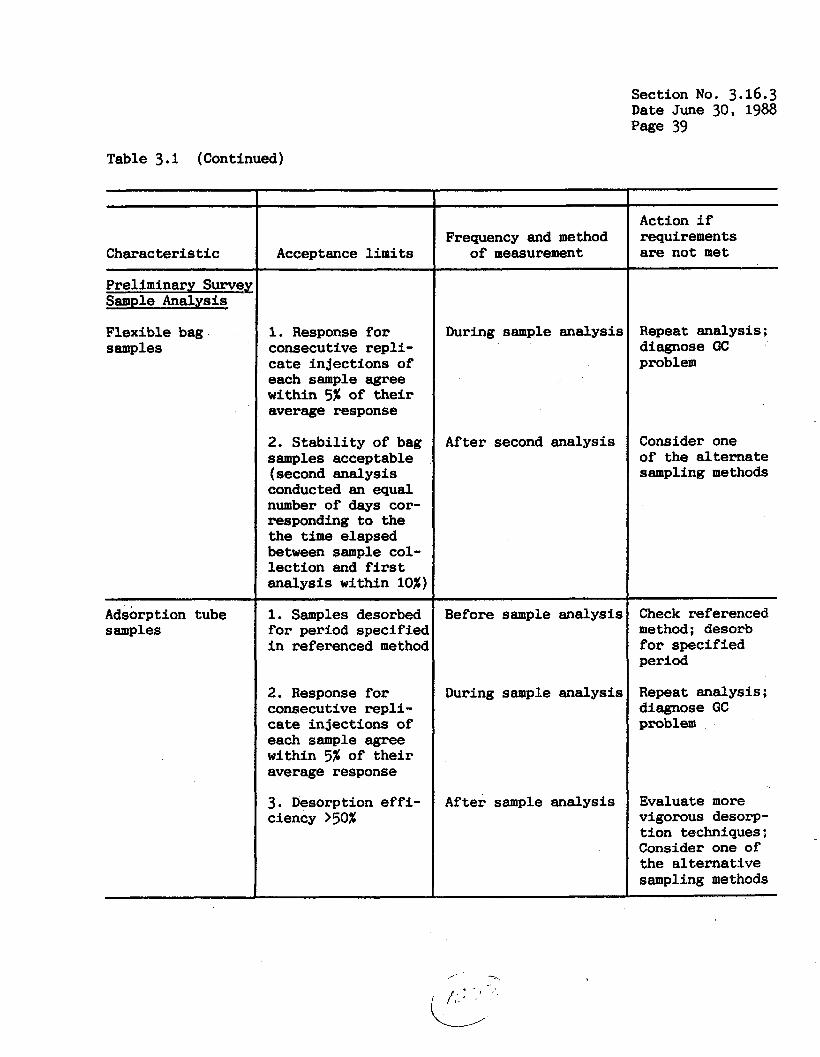
Section No. 3.16.3 Date June 30. 1988 Page 39
Table 3.1 (Continued)
Characteristic
Preliminary Survel Sample Analysis
Flexible bag samples
Adsorption tube samples
Acceptance l i m i t s
1. Response f o r consecutive repl i - cate injections of each sample agree within 5% of the i r average response
2. Stab i l i t y of bag samples acceptable (second analysis conducted an equal number of days cor- responding t o the the t i m e elapsed between sample col- lect ion and first analysis within 10%)
1. Samples desorbed fo r period specified i n referenced method
2. Response fo r Consecutive repl i - cate injections of each sample agree within 5% of the i r average response
3. Desorption e f f i - ciency >5O%
Frequency and method of measurement
During sample analysis
After second analysis
Before sample analysis
During sample analysis
After sample analysis
Action i f requirements are not met
Repeat analysis; diagnose GC problem
Consider one of the al ternate sampling methods
Check referenced method; desorb f o r specified period
Repeat analysis; diagnose GC problem
Evaluate more vigorous desorp- t ion techniques ; Consider one of the al ternat ive sampling methods
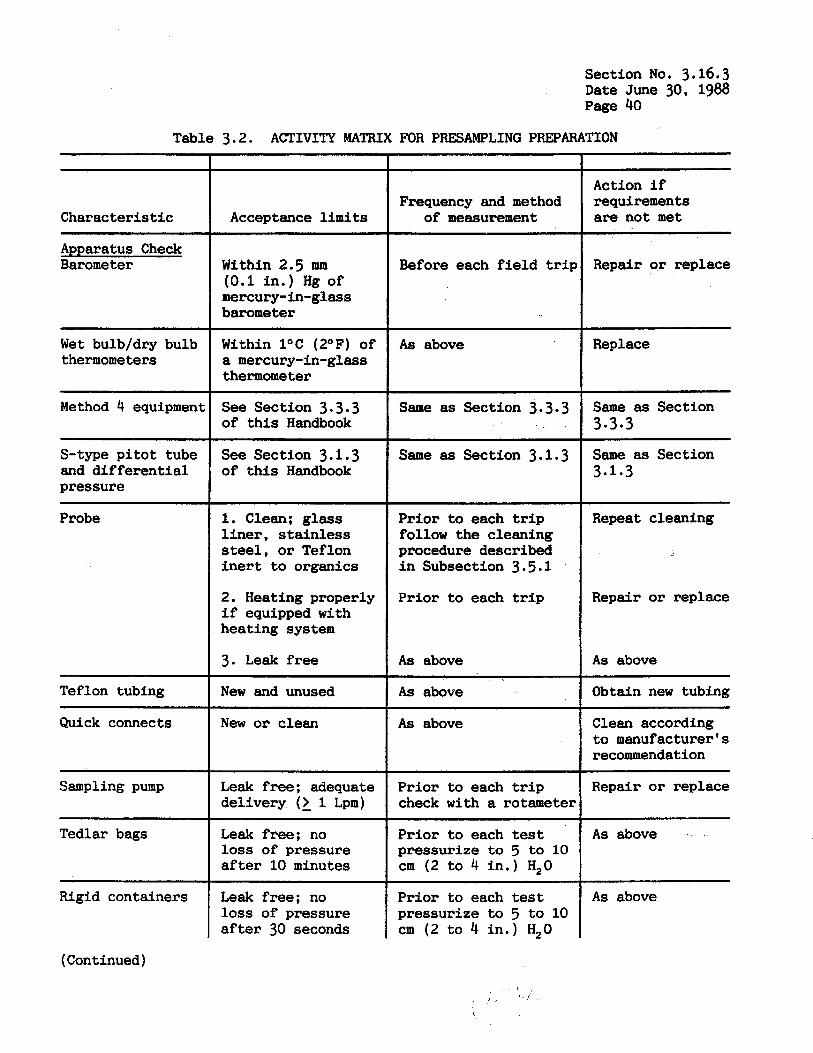
Section No. 3.16.3 Date June 30, 1988 Page 40
Table 3.2. ACTIVITY MATRIX FOR PRESAMPLING PREPARATION
Frequency and method Character is t ic Acceptance l i m i t s of measurement
Apparatus Check Barometer Within 2.5 mrn Before each f i e l d t r i p
(0.1 in . ) Hg of mercury-in-glass barometer
Wet bulb/dry bulb Within l ° C (2OF) of A s above thermometers a mercury-in-glass
thermometer
Method 4 equipment See Section 3.3.3 Same as Section 3.3.3 of t h i s Handbook
S-type p i t o t tube See Section 3.1.3 Same as Section 3.1.3 and d i f f e ren t i a l of this Handbook pressure
Probe 1. C l e a n : glass Prior to each t r i p l i n e r , s t a i n l e s s follow the cleaning steel, or Teflon procedure described i n e r t t o organics i n Subsection 3.5.1
2. Heating properly P r io r t o each t r i p i f equipped with heating system
3. Leak free A s above
Teflon tubing New and unused As above
Quick connects New or clean A s above
Sampling pump Leak free: adequate Prior t o each t r i p del ivery (2 1 Lpm) check with a rotameter
Tedlar bags Leak free; no Prior t o each test loss of pressure pressurize to 5 t o 10 a f t e r 10 minutes cm (2 t o 4 i n . ) H,O
Rigid containers Leak f r ee ; no P r io r t o each test l o s s of pressure after 30 seconds
pressurize to 5 t o 10 cm (2 t o 4 i n . ) H,O
(Continued)
Action i f requirements are not m e t
Repair or replace
Replace
Same as Section 393.3
Same as Section 3.1.3
Repeat cleaning
Repair or replace
A s above
Obtain new tubing
Clean according t o manufacturer's recommendation
Repair or replace
A s above
As above

'7 Section No. 3.16.3 Date June 30, 1988 Page 41
Direct in te r face sampling system
Dilution in te r face sampling system
Table 3.2 (Continued)
2. Heating properly A s above
1. Heating properly A 8 above
2. Leakfree (no A s above flow a t rotameter with probe plugged)
1. Heating properly A s above
2. Flowmeters C a l i - Calibrate p r io r t o brated each test against a
bubble meter or spirometer
Charac,teristic
Gas chromatograph equipment
Acceptance l i m i t s
3. Leakfree; no l o s s of pressure after 30 seconds
Leakfree, opera- t iona l , and su f f i - c i en t spare parts for the duration of the f i e l d test
Frequency and method of measurement
~~
Apparatus Check
Direct pump sampling system
Needle valve and r o t ame ter
Leakfree; no loss of pressure after 30 seconds
Clean
Pr ior t o each test pressurize t o 5 t o 10 cm (2 t o 4 i n . ) %O
Pr ior t o each t r i p or a t the sign of e r r a t i c behavior
Explosion r i s k Leakfree (no vacuum area sampling loss after 1 minute) sys tern
Heated bag sampling container
1. Leakfree; no l o s s of pressure after 30 seconds
~~ ~~ ~~
Pr ior t o each t r i p
Prior t o each test pressurize t o 5 t o 10 cm (2 t o 4 in.) H,O
Pr ior t o each test pressurize to 5 t o 10 cm (2 t o 4 i n . ) H,O
Pr ior t o f i e l d test check system for leaks, access opera- t iona l condition, and inventory spare p a r t s
Action i f requirements are not m e t
As above
~~
Clean following manufacturer's recommendations
Repair or replace
A s above
As above
A s above
A s abdve I . ,
A s above
Cal ibrate
Consult the operator 's manual
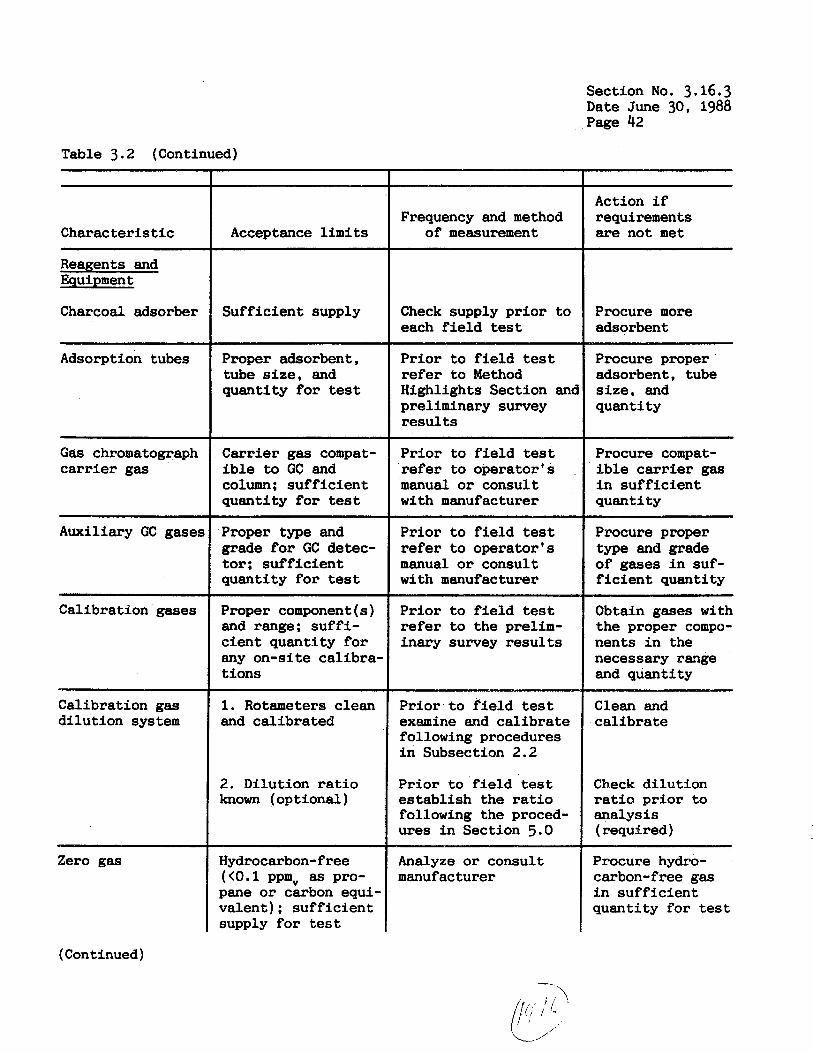
Section No. 3.16.3 Date June 30, 1988 Page 42
Table 3.2 (Continued)
Action i f requirements are not m e t
Frequency and method of measurement Character is t ic Acceptance l i m i t s
Reagents and Equipment
Charcoal adsorber Procure more adsorbent
Suf f ic ien t supply Check supply p r io r t o each f i e l d test
Adsorption tubes Proper adsorbent, tube s i z e , and quantity f o r test
P r io r t o f i e l d test refer t o Method Highlights Section a n d preliminary survey r e s u l t s
Procure proper adsorbent * tube s i z e , and quantity
Gas chromatograph carrier gas
Carrier gas compat- i b l e to GC and column; su f f i c i en t quantity for test
Pr ior t o f i e l d test refer t o operator 's manual or consult w i t h manufacturer
Procure compat- i b l e carrier gas i n su f f i c i en t quant i ty
~~
Auxiliary GC gaser Proper type and grade for GC detec- tor: su f f i c i en t quantity f o r test
Pr ior t o f i e l d test refer t o operator 's manual or consult with manufacturer
Procure proper type and grade of gases i n suf- f i c i e n t quantity
Calibration gases Proper component(s) and range; su f f i - c i en t quant i ty f o r any on-si te cal ibra- t ions
Pr ior t o f ie ld test r e f e r t o the prelim- inary survey r e s u l t s
Obtain gases with the proper compo- nents i n the necessary range and quantity
Calibration gas di lu t ion system
Pr ior t o f i e l d test examine and calibrate following procedures i n Subsection 2 .2
Clean and calibrate
1. Rotameters clean and cal ibrated
2. Dilution r a t i o known (optional )
Prior t o f i e ld test es tab l i sh the r a t i o following the proced- ures i n Section 5.0
Check d i lu t ion r a t i o prior t o analysis (required)
Analyze or consult manufacturer
Procure hydro- carbon-free gas i n su f f i c i en t quant i ty for test
Zero gas Hydrocarbon-free ( < O . 1 ppm, as pro- pane or carbon equi- va len t ) ; su f f i c i en t supply f o r test
(Continued)
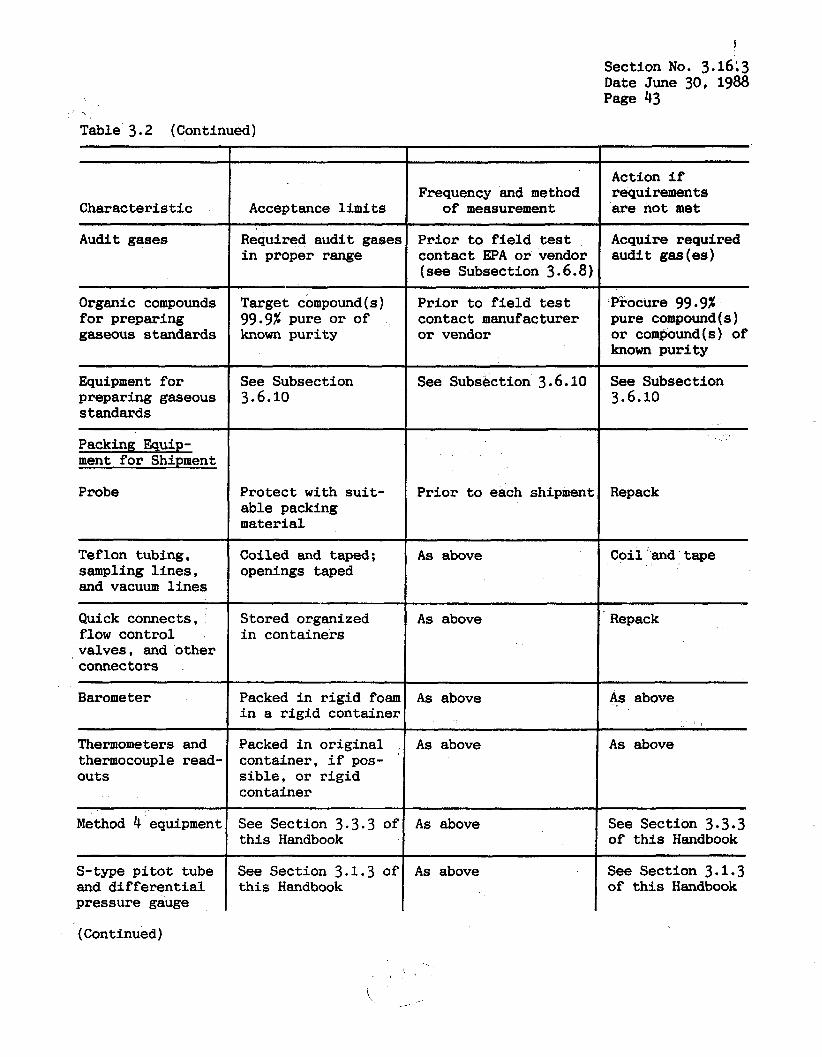
Section No. 3.16i3 Date June 30, 1988 Page 43
Table 3.2 (Continued)
Frequency and method Characterist ic Acceptance l i m i t s of measurement
Audit gases Required audit gases Pr ior t o f i e l d test i n proper range contact EPA o r vendor
(see Subsection 3.6.8)
Organic compounds Target compound(s) Pr ior t o f i e l d test f o r preparing 99.9% pure o r of contact manufacturer gaseous standards known puri ty o r vendor
Equipment for See Subsection See Subsection 3.6.10
standards
Packing Equip- ment for Shipment
Probe Protect with su i t - Pr ior t o each shipment
preparing gaseous 3.6.10
able packing material
Teflon tubing, Coiled and taped; A s above sampling l i nes , openings taped and vacuum l i n e s
Quick connects, Stored organized As above flow control i n containers valves, and other connectors
Barometer Packed i n r ig id foam A s above i n a r ig id container
Thermometers and Packed i n or iginal A s above thermocouple read- container, i f pos- '
outs s i b l e , or r ig id container
Method 4 equipment See Section 3.3.3 of As above t h i s Handbook
S-type p i t o t tube See Section 3.1.3 of As above and d i f f e ren t i a l t h i s Handbook pressure gauge
Action i f requirements are not met
Acquire required audi t gas(es)
Procure 99.9% pure compound(s) or compound(s) of known puri ty
See Subsection 3.6.10
Repack
Coil and tape
Repack
A s above
A s above
See Section 3.3.3 of t h i s Handbook
See Section 3.1.3 of t h i s Handbook
(Continued)
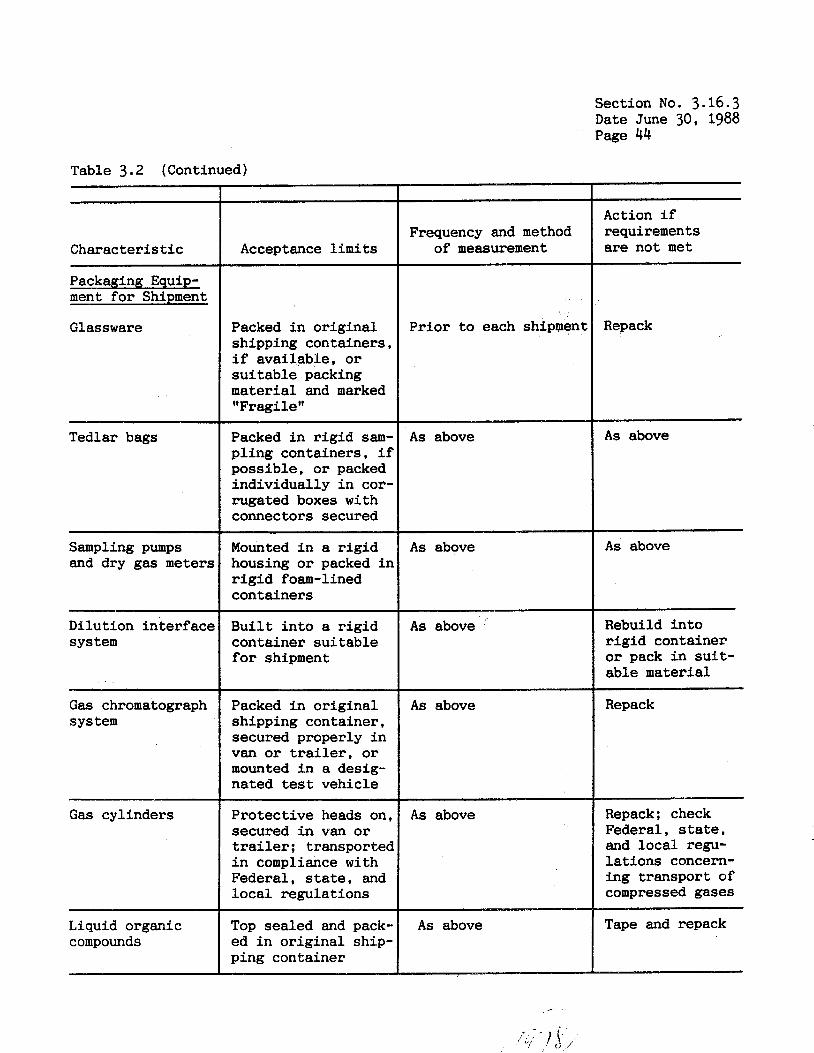
Section No. 3.16.3 Date June 30, 1988 Page 44
Table 3.2 (Continued)
Character is t ic
Packaging Equip- ment f o r Shipment
G 1 as sware
Tedlar bags
Sampling pumps and dry gas meters
Dilution interface sys t e m
Gas chromatograph sys t e m
Gas cylinders
Liquid organic compounds
Packed i n or ig ina l shipping containers, i f avai lable , o r su i t ab le packing material and marked " Fr agi 1 e '' Packed i n r ig id sam- p l ing containers, i f possible , o r packed individual ly i n cor- rugated boxes with connectors secured
P r io r t o each shipment
As above
Mounted i n a r i g i d housing or packed i n r i g i d foam-lined containers
As above
Bu i l t i n t o a r ig id container su i t ab le f o r shipment
As above
Packed i n or ig ina l A s above shipping container, secured properly i n van or trailer, or mounted i n a desig- nated test vehicle
Protect ive heads on, As above secured i n van or trailer; transported i n compliance with Federal, s t a t e , and l o c a l regulations
Top sealed and pack- ed i n o r ig ina l ship- ping container
A s above
Action i f requirements are not met
Repack
As above
As above
Rebuild i n t o r i g i d container or pack i n s u i t - able material
Repack
Repack; check Federal, s t a t e , and loca l regu- l a t ions concern- ing transport of compressed gases
Tape and repack
Section No. 3.16.4 Date June 30, 1988 Page 1
4.0 ON-SITE MEASUREMENTS On-site a c t i v i t i e s inc lude t ranspor t ing the equipment to the test site,
unpacking and assembling the sampling and/or analytical equipment, then conducting the sampling and/or analysis f o r the predetermined organic compound(s). The qual- i t y assurance a c t i v i t i e s f o r the on-si te measurements are summarized i n Table 4 . 1 a t the end of t h i s sect ion. Copies of a l l f i e l d da t a forms mentioned i n t h i s sec t ion are i n Subsection 3.16.12. The on-si te measurements checkl i s t , Figure 4.10 a t the end of t h i s sec t ion , provides the tester with a quick method f o r checking requirements during sampling.
4.1 Transportation of Equipment to the Sampling Site
The most e f f i c i e n t means of t ransport ing the equipment from ground l eve l to the sampling site (of ten above ground l eve l ) should be decided during the preliminary survey or by prior correspondence. Care should be taken t o prevent damage t o the equipment or i n ju ry t o test personnel during the moving. A clean "laboratory" type area free of excessive dust and organic compounds should be located and designated for preparing the sampling systems and conducting sample recovery and analysis , if applicable.
4.2 Preliminary Measurements and Setup
Method 18 s t rongly recommends t h a t a preliminary survey and/or laboratory evaluation be conducted prior to sampling and analysis . Unless adequate p r io r knowledge of t he source or information is ava i lab le , the presurvey procedures described i n Subsection 3.0 on presampling operatlons should be followed t o select an acceptable sampling and analytical approach.
The accuracy of the sampling system(s) following handling and transportation to the sampling site is determined using a cyl inder gas audi t . The i n t e g r i t y of t h e system(s) is confirmed after setup by conducting the individual system check described below f o r t he appl icable sampling method. Preliminary measurements w i l l always include determining the s tack dimensions and the f l u e gas moisture. Other measurements which may be made depending upon the requirements of the applicable regulations and the source operations include a flow rate determination, veloci ty check, and s tack gas temperature range measurement.
One of the primary concerns f o r any organic sampling program must be safety. The tester should always question the f a c i l i t y representat ive concerning general plant safety requirements and safety i n regard to sampling a t the selected sampling site. Every sampling and analysis protocol should address the safety considerations involved i n performing the protocol. Because there a re numerous safety considerations involved i n organic sampling, it is beyond the scope of t h i s Handbook t o discuss each one i n d e t a i l . However, i t cannot be over-emphasiwd tha t the tester must always be aware of the sa fe ty hazards.
-
4.3 Sampling
The following subsections discuss the procedures f o r each Method 18 sampling technique. A t t h i s po in t , the tester has selected the proper sampling technique and checked the se lec ted sampling system. I f t h i s has not been accomplished, the user should refer t o Subsection 3.0 p r i o r t o conducting the f i e l d test.
Section No. 3.16.4 Date June 30, 1988 Page 2
Because of the complexity i n sampling organic compounds from the var ie ty of po ten t ia l source types, only the more common problems are addressed f o r each sam- pl ing method. Recommended qual i ty assurance/control checks and procedures are provided t o assess the s u i t a b i l i t y of the sampling technique f o r the samples to be collected. Because of the r e l a t i v e compactness of the equipment and the low cost of many of the sampling techniques, the tester may be able to u t i l i z e two d i f f e ren t sampling techniques a t the same time with l i t t l e addi t ional effort. The samples from the backup or secondary technique are not analyzed i f the primary technique proves sa t i s f ac to ry . For example, the tester might e a s i l y run an adsorption tube system as a backup to an evacuated bag system. A t some facil i t ies, it may be necessary to conduct two techniques simgly t o accurately measure a l l the organic compounds of i n t e r e s t . "he tester should always be aware t h a t a change i n process operations such as raw materials, moisture content, operation mode, and temperature can render a previously acceptable sampling technique unacceptable.
The specific sampling system descr ipt ions are provided below.
4.3.1 Evacuated Container Sampling (Heated and Unheated) - I n t h i s procedure , sample bags are f i l l ed by evacuating the r igid a i r - t i g h t containers t h a t hold them. The s u i t a b i l i t y of the bags f o r sampling should have been confirmed by permeation and re ten t ion checks using t h e spec i f i c organic compounds of i n t e r e s t during the presurvey operations. The means of transporting the bags t o the laboratory fo r analysis within the specif ied time should a l so have been determined. Delays i n shipping and/or analysis can r e s u l t i n significant changes i n concentration for many compounds.
On-site sampling includes the following steps: 1. 2. 3. 4. 5. 6. 7. 8. 9.
Conducting preliminary measurements and setup. Preparation and setup of sampling system. Preparation of the probe. Connection of electrical serv ice and leak check of sampling system. Inser t ion of probe i n t o duct and sea l ing of port . Purging of sampling system. Proportional sampling. Recording data. Recovering sample and transportkon t o laboratory.
Preltminaru Measurements and Setup - The sampling si te should be checked t o ensure t h a t adequate electrical serv ice is available. The s tack dimensions are measured and recorded on a da ta sheet similar t o the ones shown i n Figures 4.1, 4.2 and 4.3. The moisture content of the f l u e gas is used t o cor rec t the measured concentrations t o a dry basis . It is typical ly measured p r i o r to sampling using w e t bulb/dry bulb thermometers or Method 4 (see Subsection 3.2); t he determination should be performed a t a time when proces's operations are l i k e they w i l l be during f i n a l sampling. If the process u t i l i z e s and emits ambient a i r , a s l i n g psychro- meter may be used to measure the moisture content of the ambient a i r i n the area of process air uptake. The moisture content value is also used to confirm that the sampling approach selected is acceptable.
Prior t o f i n a l sampling, the tester must determine i f the f i n a l r e s u l t s are to be presented on a concentration bas is o r a mass emission bas is . I f they w i l l be presented only on a concentration basis, only the concentrations of the specified organics and the s tack gas moisture content must be measured. If the mass emission rate of any compound is to be presented, the flow rate of the stack gas using a ve loc i ty t raverse must a l so be determined. In t h i s case, although not required by Method 18, i t is preferable tha t the sampling location be selected in accordance

Plant Rub& C ~ W I L. Flowmeter calib.(Y) 0.976 Dilution system: (dynamic) Ci ty P/a+i, NC Container type: bag % emission flowsetting N/iJ Operator ,+Q c > V r / C V syringe diluent flowsetting d/A
Stack dia , mm ( in . ) c / i t . Container number E6 -6 Final leak check 2 m3/min (cfm)
S t a t i c press 0 mm ( in . ) H,O Barometric press mm &f) Hg -b-fF&&
canister Dilution system: (static) Container volume, 30 liters emission flowsetting N/A
Average (AP) 0. c ( in . ) %O Vacuum during leak check /o Sample box number ,V/A I n i t i a l flowmeter s e t t c /.oz Pitot tube (C,) n.94 Average stack temp 674 Sampling point location
m ( in . ) H,O
Figure 4.6. Field sampling data form for container sampling.
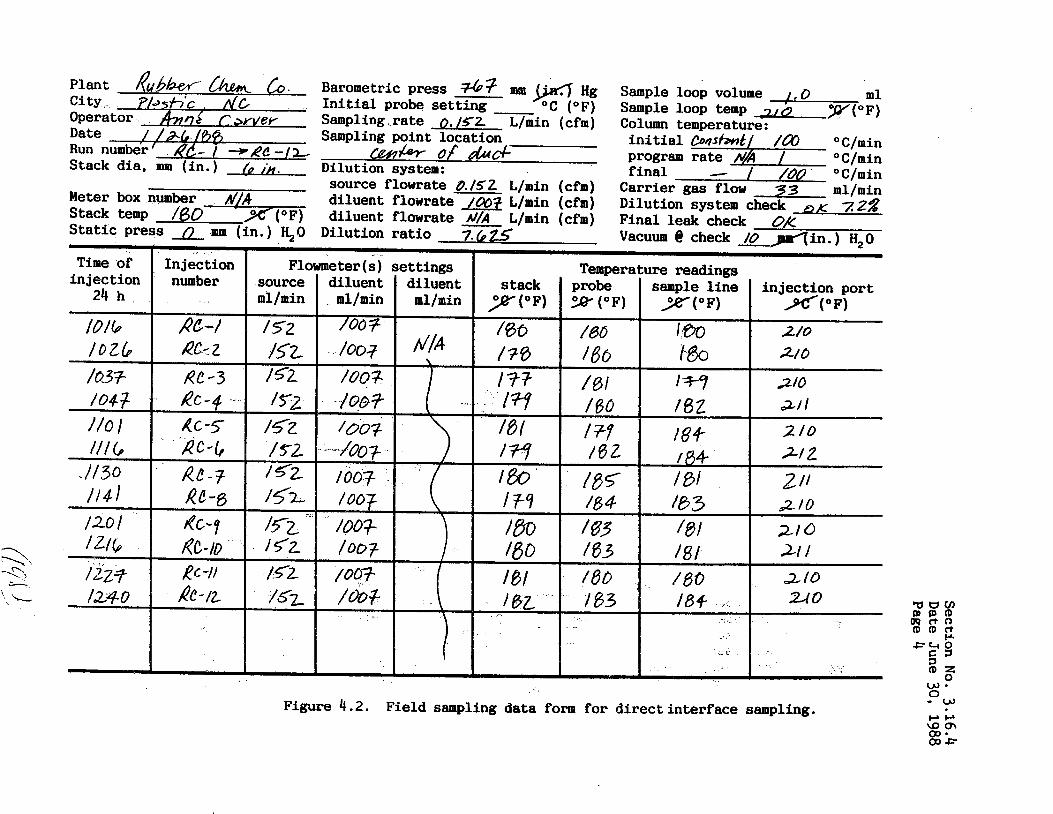
Section No. 3.16.4
Date June 30, 1988 Page 4
t-i- R
CL
I
'0
) a
d
lY
Y
t--
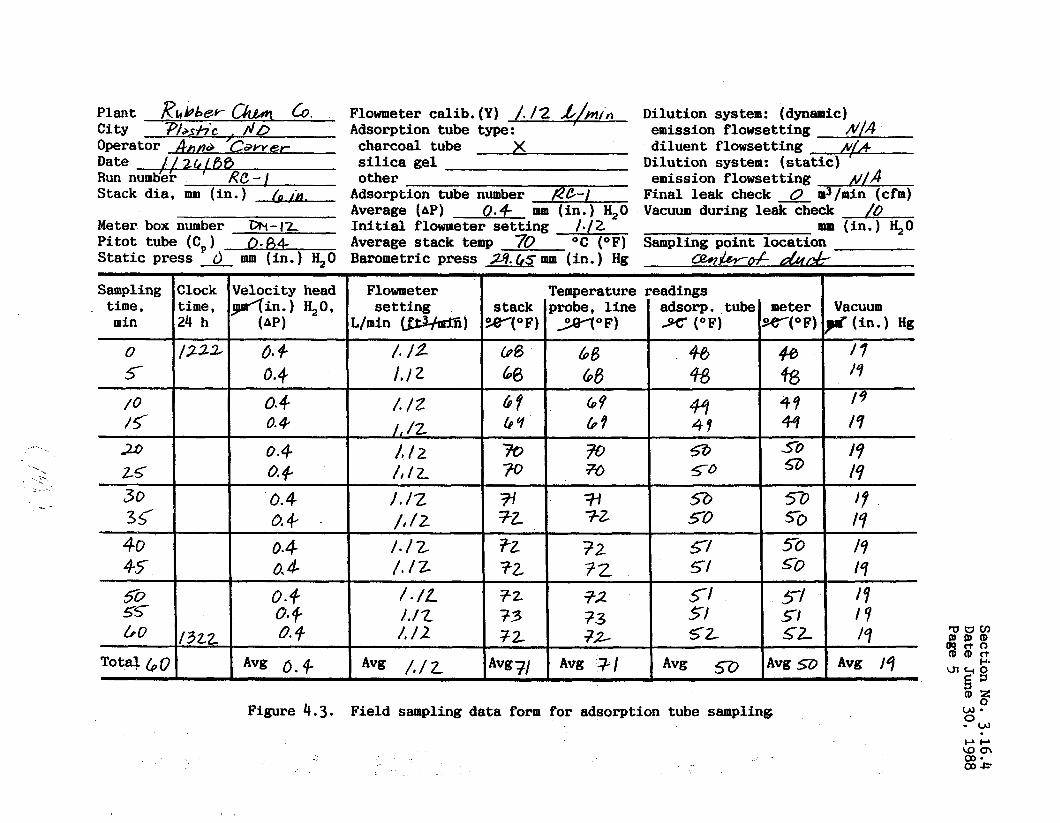
-
Date / / a t / A B
Stack d ia , m ( in . ) /Dm Run numb?& R c - i
~- Meter box number -%-)2 P i t o t tube (C,) 0. A4- S t a t i c press d nun ( in.) %O
Flowmeter cal ib . (Y) /. /2 J / m / n Adsorption tube type: charcoal tube X silica gel other
Adsorption tube number RC-1 Average (AP) 0.9 mm ( in . ) %O I n i t i a l flowmeter s e t t i n g /./2 Average stack temp 70 O C (OF)
Barometric press 2 9 . &S mm (in. ) Hg
Dilution system: (dynamic) emission flowsetting N/A diluent f lowsetting MA
emission flowsetting /v/A Dilution system: ( s t a t i c ) '
Final leak check 0 d / m i n (cfm) Vacuum during leak check /O
mm ( in . ) %O Sampling point location
m7+os A&
Figure 4.3. Field sampling da ta form for adsorption tube sampling
i, tDz
0 W' 9 ,
Section No. 3.16.4 Date June 30, 1988 Page 6
with Method 1. I f t h i s is impractical , i t should be se lec ted to minimize flow disturbances. The number and locat ions of sampling points f o r the ve loc i ty t raverse are se lec ted according t o Method 1 (see Section 3.0.1 of t h i s Handbook); the trav- erse is conducted according to Method 2 (see Section 3.1 of t h i s Handbook). Note: The Method 18 sampling w i l l be conducted a t a s ingle point.
Method 18 requires t h a t samples be col lected proportionally, meaning t h a t the sampling rate must be kept proportional to the s tack gas veloc i ty a t the sampling point during the sampling period. If the process has a steady state flow (con- stant), then the flow rate does not have to be varied during sampling. The major- i t y of sources of organic emissions are of t h i s type because they use constant rate fans. If the tester can confirm from the f a c i l i t y t h a t the source of i n t e r e s t has a steady state flow (e.g., i t uses a constant rate f a n ) , then sampling can be conduc- ted a t a constant rate and no concurrent veloci ty measurements need to be made. If it is not known whether the process is steady state or if i t is not steady state, then ve loc i ty measurements ( t h e veloci ty head) must be made a t the point to be sampled. This can be done during the preliminary survey or before f i n a l sampling, but should be done when the process operations are l i k e they w i l l be during the f i n a l sampling. The average veloci ty head ( p i t o t reading) and range of f luc tua t ion is determined and then u t i l i z e d to e s t ab l i sh the proper f l o w rate s e t t i n g s during sampling. If i t is found t h a t the process is not steady state, then the veloci ty head must be monitored during sampling t o maintain a constant proportion between the sample flow rate and the flow rate in the duct.
Se lec t a total sampling t i m e g rea te r than or equal to the minimum total s a p - l i n g t i m e specif ied i n the applicable emission standard. The number of minutes between readings while sampling should be an integer . It is des i rab le f o r the time between readings t o be such t h a t the flow rate does not change more than 20% during t h i s period.
If i t w a s determined from the l i t e r a t u r e or the preliminary survey laboratory work t h a t the sampling system must be heated during sample co l lec t ion and analysis , the average s tack temperature is used as the reference temperature f o r the i n i t i a l heating of the system and should be determined. Then, the s tack temperature at- the sampling point is measured and recorded during sampling t o ad jus t the heating system j u s t above the s tack temperature o r the dew point. I n addi t ion, the use of a heated sampling system typica l ly requires t h a t the analysis be conducted on-site s ince i t is not p rac t i ca l t o maintain the sample bag a t elevated temperatures fo r long periods of time.
Sampling &stern Preparation - Prepare the probe and sampling t r a i n i n the laboratory area (see Figure 4 . 4 ) . F i r s t , place a loosely packed f i l ter of glass wool i n the end of the probe. Attach a sample bag t h a t has been previously leak checked t o the sample container l i d . Seal the i n l e t t o the probe and the sample container l i d to the container body. Transport the container and probe to the sampling site.
Proporttonal Sampling - Sampling must be conducted a t a rate i n constant proportion t o the stack gas flow a t the sampling point. Thus, for a steady state operation, the sampling flow rate is not varied during the run. For a non-steady state process, the sampling flow rate is varied i n proportion t o the changing velocity. The veloci ty is monitored by measuring the veloci ty head (AP) which is l i n e a r l y re la ted to the square of the velocity. A recommended method for deter- mining proportional sampling rates is as follows:
1. Conduct a single point veloci ty check as previously spec i f ied , and determine the average veloci ty head (APaVg) t o be sampled.
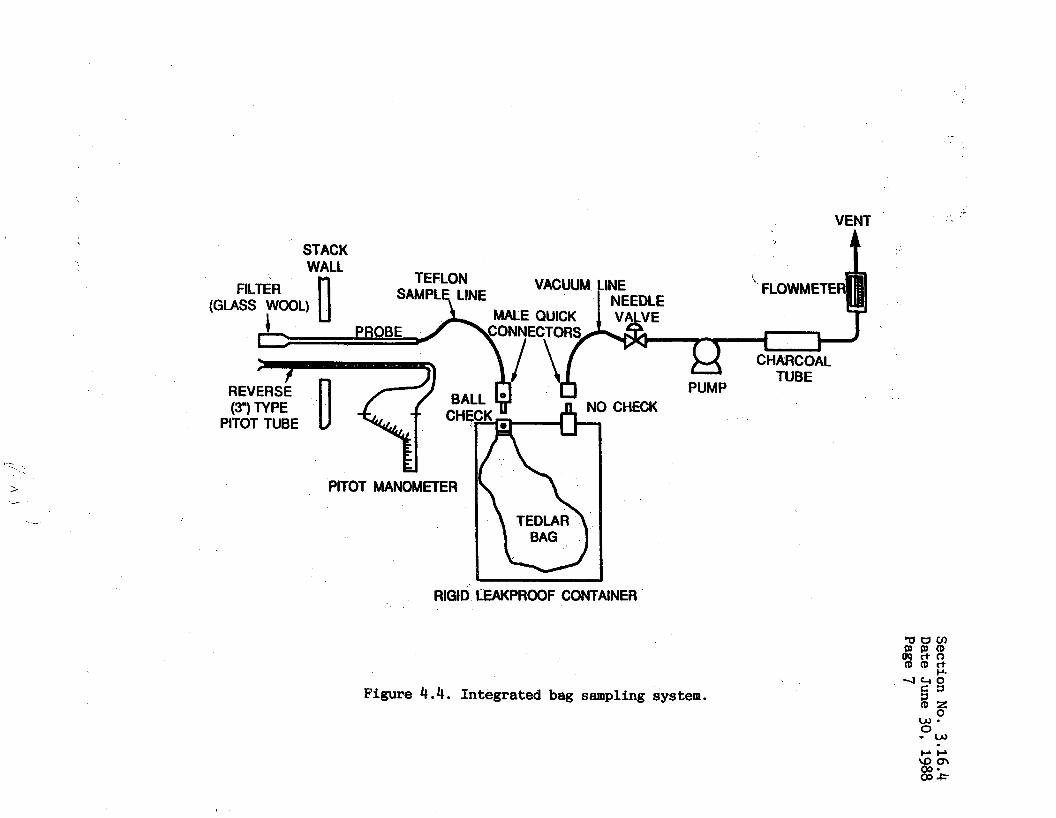
VENT
STACK I WALL Y
TEFLON VACUUM tMN:EDLE FILTER SAMPL LINE
(GLASS WOOL) 0 7 .. I
\ FLOWMETE
V PROBE
CHARCOAL TUBE
CHECK PUMP
I
RIGID LEAKPROOF CONTAINER
Figure 4.4. Integrated bag sampling system.
. ..
W ' 0 - w Y Y
Section No. 3.16.4 Date June 30, 1988 Page 8
2. The average sampling flow rate f o r the test is determined p r io r t o the s tar t of the run. Typically, the average sampling flow rate is about 0.5 L/min which w i l l y i e ld approximately 30 l i ters of sample. The flow rate chosen i n the laboratory should f i l l the bag t o about th ree fourths of its capacity during the sample run. The average flow rate chosen is then assigned t o the average ve loc i ty head measured.
3. The flow rate t o be used during sampling when the veloci ty head var ies from the average is calculated using the following equation.
where
Qs = % (:J’* Equation 4-1
Q,, = Average sampling r a t e , L/min (f t3/min) , Q, = Calculated sampling rate, L/min (f t3/min) , AP = Actual ve loc i ty head, mm ( i n . ) H,0, and
AP,,, = Average ve loc i ty head, mm ( i n . ) H,O.
4. Determine the rotameter s e t t i n g f o r the sampling rate (9,) from the rota-
Using t h i s procedure w i l l provide f o r the cor rec t sampling rate and the proper f i l l i n g of the sample bag. Follow the procedure below to obtain an integrated sample.
1. If a heat ing system is required, turn on the heating system and set a t average s tack temperature determined from the pretest measurements.
2. L e a k check the sampling t r a i n j u s t p r i o r to sampling by connecting a U- tube, inc l ined manometer, o r equivalent a t the probe i n l e t and pul l ing a vacuum of > 10 i n . H,O. Close the needle valve and then turn the pump off. The vacuum- should remain s t ab le f o r a t least 30 seconds. If a leak is found, repair before proceeding; i f not , slowly release the vacuum gauge. This leak check is optional .
3. If the system is being heated, wait f o r i t t o come t o the proper tempe- ra ture . Place the probe i n the s tack at the sampling point: centroid of the s tack o r no closer t o the walls than 1 meter. Seal the sampling por t t o prevent d i l u t i o n of the s tack gas by inleakage of ambient a i r .
4. Disconnect the f l e x i b l e bag. Purge the system by turning on the pump and drawing a t least 5 times the sampling system volume through the t r a i n , o r purge for 10 minutes, whichever is grea te r .
5. Adjust the flow rate t o the proper s e t t i n g based on the ve loc i ty pressure (during the purging, f o r non-steady state processes).
6 . Connect the f l e x i b l e bag t o the sampling t r a i n ( t h e connections should ensure a leakf ree system), and begin sampling. The rate must remain propor- t i o n a l t o the s tack gas veloci ty f o r the t o t a l sampling time spec i f ied by the standard of performance f o r the industry being sampled.
7 . Record a l l da t a required (5 minute in t e rva l s , miniumum) on the f i e l d samp- l i n g da ta form (see Figure 4 .1) . The flow rate and sample t r a i n heating system should be adjusted a f t e r every p i t o t and temperature reading t o the cor rec t l eve l .
8. Disconnect and seal the f l ex ib l e bag upon completion of sampling. Take care ~
not t o d i l u t e the contents with ambient a i r . 9 . Label each bag clearly and uniquely t o iden t i fy i t with i t s corresponding
da ta form and/or run. If the system is a heated system, the sample bag must
meter ca l ib ra t ion curve, and ad jus t the rotameter accordingly.
Section No. 3.16.4 Date June 30, 1988 Page 9
be maintained at the s tack temperature through sample analysis .
Sample Recoverg and Transport t o Laboratory - Sample recovery should be performed so as t o prevent contamination of the bag sample and maintain sample in t eg r i ty . The bag should remain leakfree, protected from direct sunl ight , main- tained a t a temperature t h a t w i l l prevent condensation of any of the gases, and s tored i n a safe place to prevent damage or tampering p r i o r t o analysis. It is recommended t h a t bag samples be analyzed within two hours of sample co l lec t ion , however, many of the organic compounds are stable enough t o allow a few days prior t o analysis . Upon completion of the t e s t i n g and sample recovery, a l l the data forms should be checked for completeness and the sample bags reexamined fo r proper ident i f ica t ion .
Common Problems - The most common problems encountered with bag sampling techniques are (1) adsorption of t h e gases on the bag, (2) permeation of the gases through the bag, (3) react ion of gases i n the bag, (4 ) condensation of the gases or water vapor i n the bag, and (5) leaks developing i n the bag during tes t ing , trans- po r t , and/or analysis . A s described previously i n Subsection 3.0, the bags must be checked for s t a b i l i t y and retent ion of the compound i n the bag. I f the compound's concentration s ign i f i can t ly diminishes between the t i m e the sample run is completed and the time of analysis , then the bag technique w i l l have t o be modified o r rejec- ted. One modification t h a t can be used to reduce both re ten t ion and/or condensa- t i on is addition of a heating system. Heating is generally applied during sample col lec t ion and maintained through analysis. However, heating may increase the permeation rate. Another option is the use of heat lamps applied t o the sample bags after sample co l lec t ion and during sample analysis . Two other techniques tha t have been used t o prevent condensation are (1) addi t ion of a knockout trap t o remove water vapor and heavy organics from the sample stream, and (2) use of sorbents such as Tenax to remove the high boi l ing point organics. The tester must demonst ra te t h a t t h e o r g a n i c compound(s) of i n t e r e s t are n o t removed. Alternatively, sample and/or water vapor condensation may be reduced by the use of the p re f i l l eds bag technique. The p r e f i l l i n g of the bag lowers the concentration of the organic and/or water vapor, thereby eliminating condensation.
If the gases are reac t ing i n the bag, then the bag material can be changed, t h e time between sample co l lec t ion and analysis reduced, o r a d i f f e ren t technique used such as d i r ec t i n t e r f ace sampling. Methods t o reduce bag leak problems are proper construction of the sample bags, conducting addi t ional runs, using a backup sample col lect ion technique such as an another bag sampling system or an adsorption tube sampling system, and care wi th handling the sampling bags. Also, steel canisters can be used i n place of the bags. If the organic compounds are s t a b l e with time, the use of steel canisters may better ensure the safe ty of the sample especially if the samples must be air freighted to the laboratory f o r analysis .
4.3.2 Direct Pwnp Samptfng - Direct pump sampling is conducted i n a manner s imilar t o evacuated container sampling, with the exception tha t the needle valve and the pump are located between the probe and sample bag and the sample exposed surfaces of both must be constructed of s t a i n l e s s steel, Teflon o r other material not affec- ted by the s tack gas (see Figure 4.5). Due t o the addi t ional l ikelihood tha t sample may be lost i n the needle valve and pump, i t is recommended t h a t the probe, sample l i n e , needle valve, and pump be heated. If i t has or can be shown t h a t t h i s not a concern, da ta forms and the system has
then t h e heating may be eliminated. A l l precautions, procedures, cr i ter ia from Subsection 4.3.1 above can be applied. Ensure tha t
been adequately purged before a t taching the bag and sampling.

Stainless
Reverse
Pitot Tube (37 Type
Protective Container
Figure 4.5. D i r e c t pump sampling system.
Section No. 3.16.4 Date June 30, 1988 Page 11
4.3.3 Explosion Risk Area Bag Sampling - Explosion r i s k area bag sampling is a l s o similar to evacuated container sampling. The major difference is tha t no electri- c a l components can be used i n the explosion r i s k area. A s previously mentioned i n Subsection 1.0, the first option of the tester is to loca te the electrical equip- ment (e.g., the pump) outs ide the explosion r i s k area and run a long f l ex ib l e l i n e to the container. If t h a t option is not possible, an evacuated steel container may be used as shown i n FigJre 4.6. This option may involve a poten t ia l spark hazard and must be checked.though the plant s a fe ty officer. No electrical heating of the system w i l l l i k e l y be allowed. If an evacuated steel container is used, the leek check can be conducted outs ide the explosion r i s k area and the probe can be purged with a hand squeeze pump. The tester may wish t o consider an a l t e rna t ive method of sampling such as adsorption tubes and an i n t r i n s i c a l l y e s a f e personnel sampling pump o r the syringe method. The primary concern must be safety i n an explosion r i s k area and a l l operations must be out l ined i n wr i t ing and cleared through the Plant Safety Officer. The same criteria as described above f o r s u i t a b i l i t y of the bag w i l l apply and must be m e t .
4.3.4 Prefilled Bag Sampling - The p r e f i l l e d bag sampling technique is s i m i l a r t o the heated direct pump sampling method. The major difference is that the sample bag is p r e f i l l e d with a known volume of nitrogen, hydrocarbon-free air , or cleaned, dr ied ambient a i r p r i o r t o sampling and the volume of gas sampled must be accu- r a t e l y determined (see Figure 4.5). When using a flowmeter or metering pump, the m a x i m u m d i lu t ion that should be attempted Ps 10 to 1. Alternat ively, a heated, gas t i g h t syringe may be used t o c o l l e c t the gas a t the source and i n j e c t i t i n t o the sample bag. A heated, gas t i g h t syringe can be used f o r d i lu t ions of 5 t o 1 when the d i lu t ion is performed i n the syringe and 50 t o 1 when performed i n the bag. The use of a heated, gas t i g h t syringe should follow the procedures shown below i n Subsection 4.3.5. Both techniques should be ve r i f i ed i n the laboratory using higher concentrations of ca l ib ra t ion gases and must be within 10% of the calculated value. The technique is ver i f i ed i n t h e f i e l d by d i l u t i n g the audi t gases i n the same manner as the s t ack gases (see Subsection 8.0 f o r audi t ing procedures).
Following are the recommended steps to conduct p r e f i l l e d bag sampling: 1.
2.
3 .
4.
5 .
The sampling should be conducted proportionally as described above i n Sub- sect ion 4.3.1. Calculation of the average sampling rate vs. the average P w i l l be t h e same with the exception t h a t the volume of the pref i l led i n e r t gas must be taken i n t o account. The s u i t a b i l i t y of the p r e f i l l e d bag sampling technique should have been checked i n the laboratory. This would include ca lcu la t ing the d i lu t ion f ac to r required t o obtain an acceptable sample concentration. I n the laboratory area, f i l l the sample bag (previously leak checked) w i t h the calculated volume of i n e r t gas. Because of the poten t ia l for leaks, bags should be f i l l e d the same day they are used. The i n e r t gas volume must be determined with a calibrated dry gas meter or m a s s flowmeter. The bag should be sealed and taken to the sampling site. A t the sampling site, the sampling system is leak checked without the sampling bag attached. Turn on the heating system and heat the system to the s tack temperature. Connect a U-tube H,O manometer or equivalent t o the i n l e t of the probe. After the system comes t o the desired temperature, turn on the pump and p u l l a vacuum of about 10 i n . of H20. Turn off the needle valve and shut off t he pump. If there is no noticeable leak within 30 seconds, then the system is leak free. Place the probe i n the stack a t the sampling point (centroid or no less
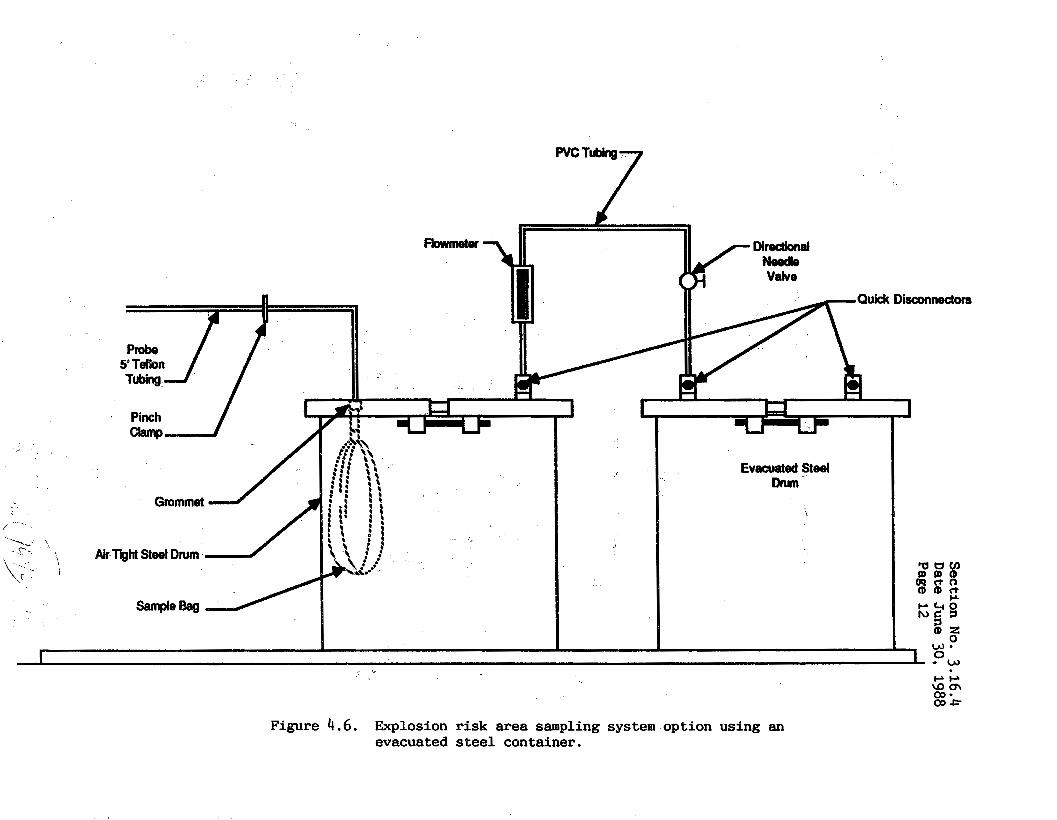
, -.
Section No. 3.16.4 Date June 30, 1988 Page 12
1
Section No. 3.16.4 Date June 30, 1988 Page 13
than 1 meter from the w a l l ) and seal the por t so there w i l l be no inleakage of ainbient air . Turn on t h e pump and purge the system f o r 10 minutes. During the time t h a t t h e system is purging, determine and set the proper flow rate based on the AP.
6. Turn off the pump and attach the sample bag. 7. The sampling w i l l be conducted proportionally. The stack temperature and
heating system temperature should be monitored and recorded. Record the data on the sampling da ta form (Figure 4 .1 ) .
8. A t the conclusion of the run, turn off the pump and remove the probe from the duct.
9. Conduct a f i n a l leak check, The system should pass the leak check: if it does not pass, repeat the run.
4.3.5 Heated Suringe SantpIing - The heated syringe technique can be used with the pr ior approval of the Administrator. This technique should only be used when other techniques are impractical. The heated syringe technique requires on-site analysis w i t h three syringes col lected and analyzed f o r each run. The requirements for the use of the syringes are the same as f o r t h e bag with regard t o the react ion of the gases with time and the retent ion of t h e gases i n the syringe.
Following are the procedures recommended f o r the syringe sampling technique:
Compare the heating system
Remove the bag and seal it.
1.
2.
3.
4.
5 .
6 . 7 .
If heating is required, then the syringe must be encased i n material that has a high densi ty to maintain the proper temperature. Alternatively, an external heating system can be used tha t keeps the syringe a t the proper temperature un t i l j u s t before use and t o which the syringe can be immedi- ately returned. The access port should be extremely small to prevent inleakage of ambient air. The por t may be covered with Teflon or other nonreactive material tha t w i l l allow the syringe t o penetrate the material for sampling. For the direct in jec t ion method (no d i l u t i o n ) , place the syringe needle i n t o the stack and f i l l and discharge the f u l l volume that w i l l be sampled three times. Then, draw the emission sample i n t o the syringe, immediately seal the syringe and re turn t o the heating system, i f applicable. The second and th i rd syringes are sampled a t equal time in t e rva l s spanning the required sample (run) time. The syringe samples must not be taken one immediately after another. For the d i lu t ed syringe method, the i n e r t gas is introduced i n t o the syringe three times and discharged, Following th i s , the proper volume of i n e r t gas is pulled i n t o the syringe. The syringe is then placed i n t o the duct and the proper volume of s tack gas is added. Immediately remove the syringe needle from the duct, seal the syringe, and return to the heating system, i f applicable. For the bag d i lu ted syringe method, the bag should be pref i l led with the proper volume of i n e r t gas. The sampling is conducted as described above and the sample in jec ted i n t o the bag through a septum. Record the data on a f i e l d sampling data form (can adapt Figure 4.1) . Since the method requires a proportional sample to be col lected, the veloci ty head (AP) should be recorded a t about the same time that each sample is co l l ec t ed . The concentrat ions can then be mathematically corrected t o provide an integrated value. If the process is a constant source operation (less than 10% change i n flow over the sampling period), i t is not necessary t o correct t he measured values.
Section No. 3.16.4 Date June 30, 1988 Page 14
4.3.6 Direct Intertace Sampling - The d i r e c t in te r face procedure can be used provided t h a t t he moisture content of the s tack gas does not i n t e r f e r e with the analysis procedure, the physical requirements of the equipment can be met a t the s i t e , and the source gas concentration is low enough that detector sa tura t ion is not a problem. Adhere t o a l l s a fe ty requirements when using t h i s method, Because of the amount of time the GC takes t o resolve the organic compounds prior t o t h e i r ana lys i s , the GC can only typ ica l ly make three analyses i n a one-hour period. Therefore, the number of in j ec t ions i n the d i r e c t i n t e r f ace method is grea t ly l i m - i t e d by the resolut ion time. A t least three in jec t ions must be conducted per sample run.
Following are the procedures recommended f o r ex t rac t ing a sample from the s tack , t ransport ing the sample through a heated sample l i n e , and introducing it t o the heated sample loop and the GC. The analysis of the sample is described i n Subsection 5.0.
1. 2.
3 .
4.
5.
6.
7.
a. 9.
10.
4.3.7
Assemble the system as shown Figure 4.7, making a l l connections t igh t . Turn on the sampling system heaters. Se t the heaters to maintain the s tack temperature as indicated by the stack thermocouple. If t h i s temperature is above the safe operating temperature of the Teflon components, adjust the heating system t o maintain a temperature adequate to prevent condensation of water and organic compounds. Turn on the sampling pumps and set the flow rate a t the proper se t t ing . Typically 1 L/min is used. After the system reaches the same temperature as the s tack , connect a U- tube H,O manometer o r eqivalent to the i n l e t of the probe. Pu l l a vacuum of about 10 i n . of H,O, and shut off the needle valve and then the pump. b The vacuum should remain s t a b l e f o r 30 seconds. If the system leaks, repa i r and then recheck the system, Calibrate t h e system as described i n Subsection 5.0. Repeat u n t i l dupl icate analyses are within 5% of t h e i r mean value (Subsection 5.0). Conduct the analyses of the two audi t samples as described i n Subsection 8.1. The r e s u l t s must agree within 10% of the t rue value ( o r greater, i f specified on the cy l inder ) . If the r e s u l t s do not agree, r epa i r the system and repeat the analyses u n t i l agreement is met o r u n t i l approval is given by the representat ive of the Administrator. After the audi t has been successfully completed, place the i n l e t of the probe a t the centroid of the duct, o r a t a point no closer to the walls than 1 meter, and draw s tack gas i n t o the probe, heated l i n e , and sample loop. Purge the system f o r a least 10 minutes. Record the f i e l d sampling data on a form such as Figure 4.2. Conduct the analysis of the sample as described i n Subsection 5.0. Record the data on the applicable data form (Figure 5.1, Subsection 5.0). Ensure t h a t t he probe and sample l i n e s a re maintained a t O°C to 3'C above the s tack temperature (or a temperature which prevents condensation). Conduct the pos t t e s t ca l ibra t ion as described i n Subsection 5.0.
Di lutt'on t i on of organi sa tura t ing the
Interface Sampling - Source samples t h a t contain a high concentra- .c materials may require d i lu t ion p r io r to ana lys i s t o prevent
GC detector. The apparatus required f o r t h i s d i r e c t interface procedure is basically the same as described above, except a d i lu t ion system is added between the heated sample l i n e and the gas sampling valve. The apparatus is arranged so that either a 1O:l or 1OO:l di lu t ion of the source gas can be directed t o the chromatograph. The descr ipt ion of the apparatus is presented i n Subsection
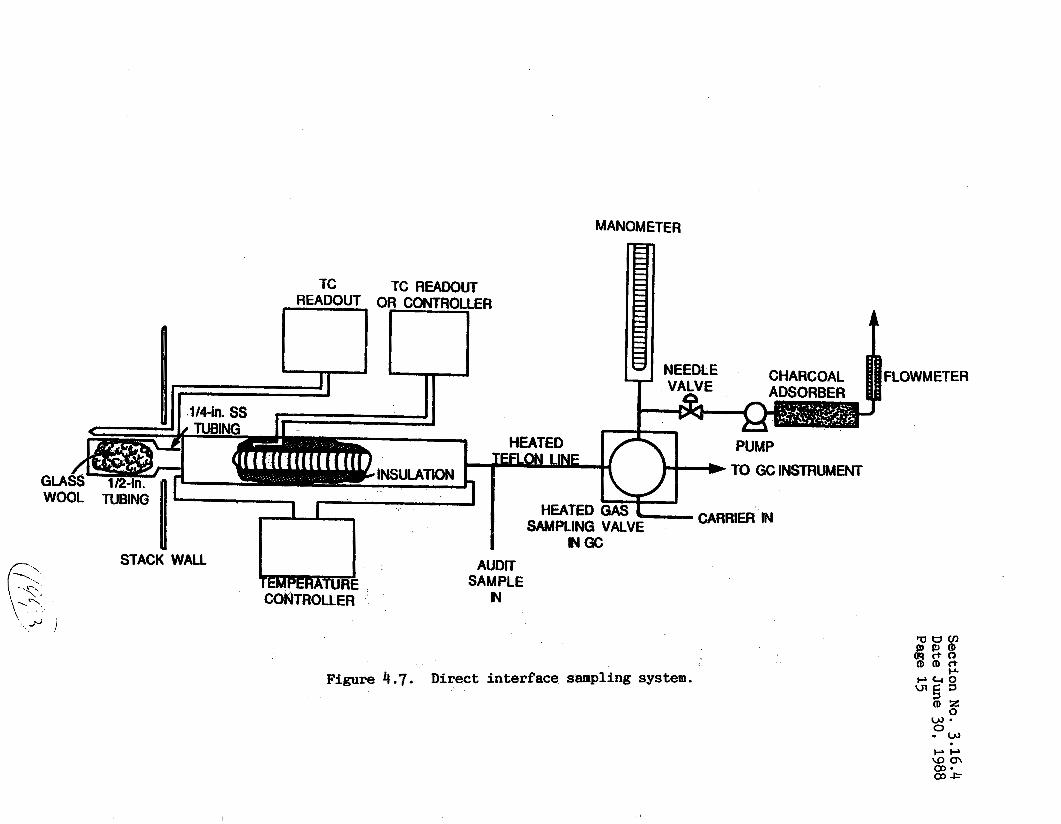
MANOMETER
CHARCOAL
TO GCINSTRUMENT
AUDIT SAMPLE
STACK WALL
N \\< CONTROLLER \A l j
I
Figure 4 .7 . Direct interface sampling system.
Section No. 3.16.4 Date June 30, 1988 Page 16
1.1.9 and the p r e t e s t ca l ibra t ion of the apparatus is presented i n Subsection 2.2.1.
Following are the procedures recommended for ext rac t ing a sample from the s tack , d i l u t i n g the gas t o the proper leve l , t ransport ing the sample through a heated sample l i n e , and introducing it t o the heated sample loop and the GC. The analysis of the sample is described i n Subsection 5.0.
1.
2.
3 .
4.
5.
6.
7.
8.
I f
Assemble the apparatus by connecting the heated box, as shown i n Figure 4.8, between the heated sample l i n e from the probe and the gas sampling valve on the chromatograph. Vent the source gas from the gas sampling valve d i r e c t l y to the charcoal f i l t e r , e l iminat ing the pump and rotameter. Measure the s t ack temperature, and ad jus t a l l heating units to a temper- ature O°C t o 3OC above t h i s temperature. I f t he temperature is above the safe operat ing temperature of the Teflon components, ad jus t t he heating t o maintain a temperature high enough t o prevent condensation of water and organic compounds. A f t e r t he heaters have come t o the proper temperature, connect a U-tube H 2 0 manometer or eqivalent t o the i n l e t of the probe. Turn on the pump and pu l l a vacuum of about 10 i n . of H 2 0 . Shut off the needle valve and then turn off the pump. If a leak is present , r epa i r and then recheck the system. Verify operat ion of the d i lu t ion system by introducing a ca l ib ra t ion gas a t the i n l e t of the probe. The d i lu ted ca l ib ra t ion gas should be within 10% of the calculated value. If the r e s u l t s for t he d i lu t ed ca l ib ra t ion gas are not within 10% of the expected values, determine whether the GC and/or the d i lu t ion system is i n error. If the analyses are not within acceptable l i m i t s because of the d i lu t ion system, cor rec t i t t o provide the proper d i lu t ion factors. Make t h i s correct ion by d i l u t i n g a high concentration standard gas mixture to ad jus t the d i lu t ion r a t i o as required. Verify the GC operation using a low concentration standard by d iver t ing the gas i n t o the sample loop and bypassing the d i lu t ion system as described i n Subsection 5.1. If these analyses are not within acceptable l i m i t s , correct the GC by r eca l ib ra t ion , etc. Conduct the analyses of the two audi t samples as described i n Subsection 8.1 using e i t h e r t he d i lu t ion system or d i rec t ly connect the gas sampling valve as required. The r e s u l t s must agree within 10% of the t r u e value or greater value if specif ied on the cylinder. If the r e s u l t s do not agree, r epa i r the system and repeat the analyses u n t i l agreement is met or u n t i l approval is given by the representat ive of the Administrator. After the d i l u t i o n system and GC op'rhtioqs are properly ve r i f i ed and t h e audi t successful ly completed, place the probe a t the centroid of the duct or a t a point no closer t o the walls than 1 meter, and purge the sampling system for a t least 10 minutes a t the proper flow rate, Conduct the analy- sis of the sample as described i n Subsection 5.0. Record the f i e l d and ana ly t i ca l data on the applicable data forms (Figures 4.2 and 5.1). Ensure t h a t the probe, d i lu t ion system, and sample l i n e s are maintained a t O°C t o 3 O C above the stack temperature (or a temperature which prevents conden- sa t ion ) . Conduct the p o s t t e s t ca l ibra t ion and ve r i f i ca t ion of t he d i lu t ion system as described i n Subsection 5.0.
the d i lu t ion system is used for bag sampling, t h e procedures f o r ver i fying
The vacuum reading should remain s t a b l e for 30 seconds.
operation of the d i lu t ion system w i l l be the same a s shown above. The d i lu ted ca l ibra t ion gas w i l l be col lected i n a bag and then ver i f ied . Also the aud i t samples w i l l be co l lec ted i n a bag and analyzed. Acceptable r e s u l t s must be
, i
1 !. 4

! Heated Line
............. . . b
+cd- from Probe - Quick
Connect: Source . GasPump
1.5 L/Min . . . L Check Valve
...
Vent to Charcoal Adsorbers
4 4 .......... ............ ...... a
-Quick I . Connects to Gas Sample
Valve
Flowmeters (On Outside
of b x )
FlowRateof 135occllrlin
...................................... . To Heated GC Sampling
Heated Box at 12W C or Source Temperature
Figure 4.8. Schematic diagram of the heated box required for di lut ion interface sampling.
Valve
Section No. 3.16.4 Date June 30, 1988 Page 18
obtained for the audi t samples prior t o analysis of the f i e l d samples.
1.
2.
3.
4.
5.
6 .
4.3.8 Adsorptfon Tube Samptfng - Adsorption tube sampling can be used for those organics specified i n the Method Highlights Section, Table B, and for other com- pounds as specif ied i n the National I n s t i t u t e of Occupational Safety and Health (NIOSH) methods. the laboratory as discussed i n Subsectzons 3.3 and 3.4 o r through the use of the l i t e r a t u r e . This check w i l l include se lec t ing the proper adsorption material, and then checking the capacity, breakthrough volume , adsorption e f f ic iency , and desorp- t i on efficiency. The adsorption e f f ic iency can be greatly affected by the presence of water vapor and other organics in , and temperature of the stack gas. If sam- pl ing is conducted for more than one organic compound, the adsorption and desorp- t i on eff ic iency checks must consider each. Because changes i n process and control equipment conditions can greatly affect a l l of t he parameters stated above, i t is recommended as a standard operating procedure t h a t more than one adsorption tube be used. The first tube is analyzed as described i n Subsection 5.0. I f no problems are found, then the second tube can be discarded. If problems with the first tube's adsorption eff ic iency are discovered, then the primary sec t ion of the second tube can still be analyzed and the r e s u l t s included with those of the primary portion of the first tube.
The se lec t ion end use 'of adsorption tubes must be val idated i n
Following are the recommended procedures for adsorption tube sampling: The sampling system is assembled as shown i n Figure 4.9. The adsorption tube(s) m u s t be maintained i n a v e r t i c a l d i rec t ion f o r sampling. This is done to prevent channeling of the gases along the side of a tube. It is recommended that the sampling probe be eliminated when possible. If a sample probe is used, i t should be cleaned p r i o r t o its i n i t i a l use with the ex t rac t ion solvent. Teflon tubing should be used f o r the probe and sample l i ne . J u s t p r io r to sampling, break off the ends of the adsorption tubes t o provide an opening a t least one-half of the in t e rna l diameter. Audit samples must be col lected on the adsorption tubes during the test program as described i n Subsection 8.0. Since on-si te analysis is typically not conducted when using adsorption tubes, it is recommended t h a t two samples be col lected from each of t h e two audi t cylinders. This allows the tester a second chance t o obtain the proper value f o r each aud i t cylinder. P r io r to sampling and the col lec t ion of the audi t samples, the sampling system must be leak checked by connecting a U-tube H,O manometer or equivalent to the i n l e t of the sample probe o r adsorption tube. Turn the pump on and pu l l a vacuum of about 10 in . of H,O. Shut off the needle valve and then turn of f the pump. The vacuum must remain stable f o r 30 seconds. If the flow rate i n the duct var ies by more than 10% during t h e sampling period, the sample should be collected proportionally. The proportional sampling procedures w i l l be the same as described f o r the bag sampling. The only difference is t h a t instead of using t h e volume of the bag as the l imi t ing factor to determine the average sampling rate, the breakthrough volume is the l imi t ing fac tor . If the source is a constant rate source (less than a 10% change i n flow rate f o r the sampling per iod) , the samples can be col lected a t a constant rate. Prepare the field blank j u s t p r i o r to sampling. The f i e l d blank w i l l be handled i n be same manner as the f i e l d samples and should be from the same l o t as t he other adsorption tubes'. The flow rate meter must have been calibrated i n the laboratory prior t o
If a leak is present , repair and recheck the system.
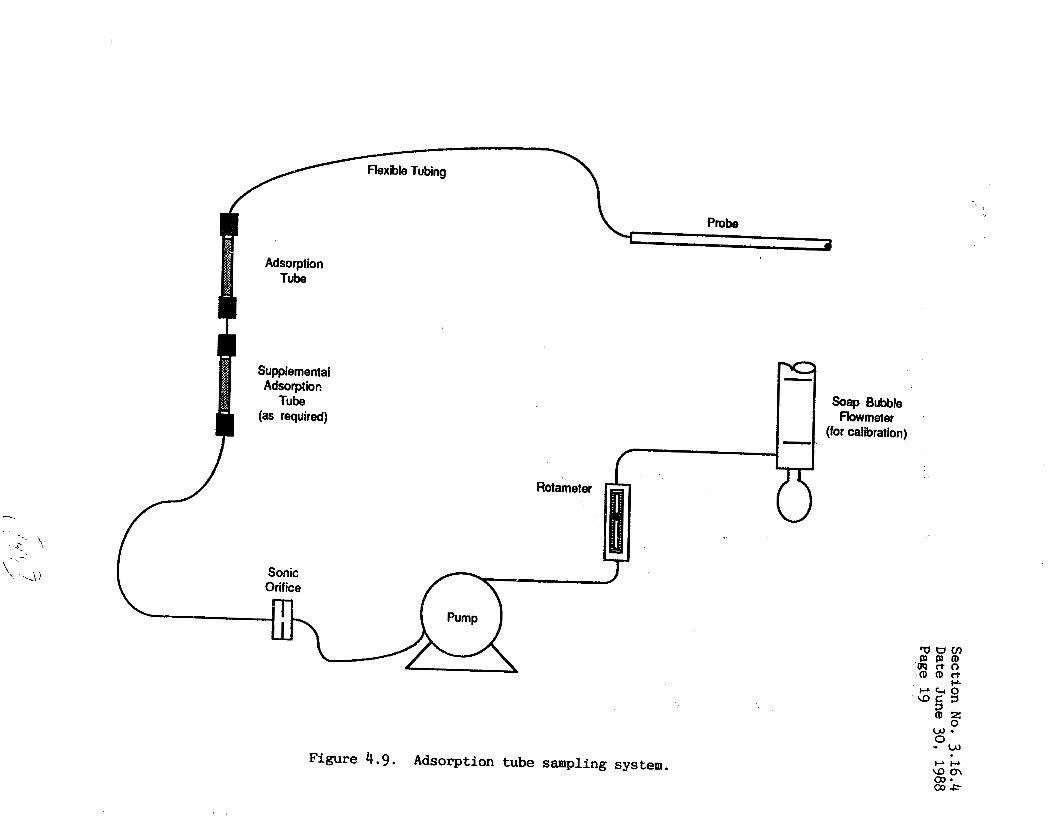
-I I-
t
m 5
M c
E
Section No. 3.16.4 D
ate June 30, 1988
Page 19
Section No. 3.16.4 Date June 30, 1988 Page 20
the f i e l d t r i p as described i n Subsection 2.1. The volume of sample co l l - ected must be accurately known f o r adsorption tube sampling.
7. The sample run time must be equal t o or greater than tha t specified by the applicable regulation. During each sample run, the data should be recorded on the sample da ta form (Figure 4.3 or equivalent) .
8. A t the conclusion of each run, conduct another leak check a s described above. If the system does not pass the leak check, the run should be rejected, the leak located and repaired, and another run conducted.
9. After completing a successful leak check, remove the adsorption tube from the holder and seal both ends with plastic caps. The tubes should be packed l i g h t l y with padding t o minimize the chance of breakage. If the samples are to be held for an extended period of time, they should be kept cool t o reduce the amount, of migration of the organic from the primary sec t ion to the secondary sect ion. Note: Pack the tubes separately from bulk samples to avoid possible contamination.
10. It is recommended, tha t a t the conclusion of the test , the sample probe (if used) be r insed i n t o a 20-ml glass s c i n t i l l a t i o n v i a l with about 5 to 10 m l of t h e desorption solvent . This sample w i l l be analyzed as a check on the loss of the organic i n the probe during sampling. If more than 10% of the total sample col lec ted i n the adsorption tubes is present i n the probe, the samples should be rejected or the sample catch adjusted to account for the lo s s . Alternat ively, the probe can be r insed after each run and the r in se added to the desorption solvent p r i o r to analysis.
11. A t the conclusion of the test program, check a l l samples to ensure that they are uniquely iden t i f i ed and check a l l data sheets to ensure that a l l da t a has been recorded.
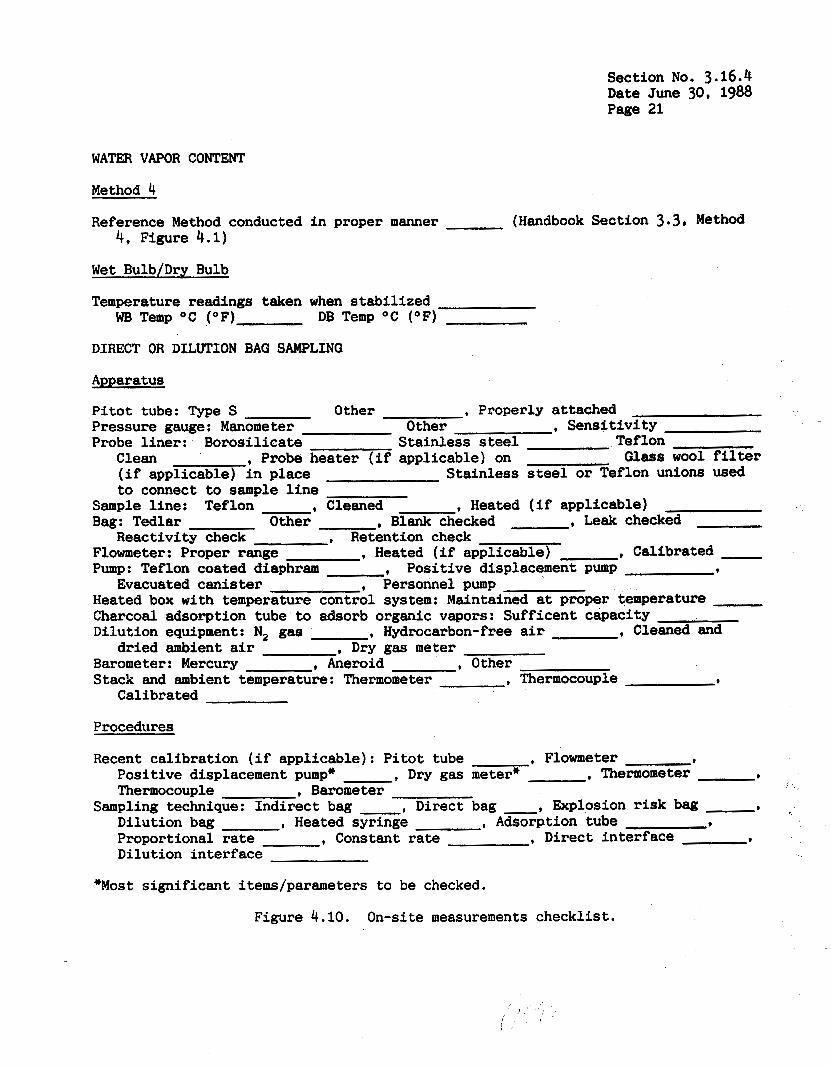
Section No. 3.16.4 Date June 30, 1988 Page 21
WATER VAPOR CONTENT
Method 4
Reference Method conducted i n proper manner (Handbook Section 3.3, Method 4, Figure 4.1)
Wet Bulb/Dry Bulb
Temperature readings taken when s t ab i l i zed DB Temp O C (OF) WB Temp O C (OF)
DIRECT OR DILUTION BAG SAMPLING
Apparatus
P i t o t tube: Type S 0 ther * Properly attached Pressure gauge: Manometer Other , Sens i t i v i ty Probe l i ne r : Borosilicate Sta in less steel Teflon
Clean , Probe heater ( i f applicable) on Glass wool filter (if applicable) i n place to connect t o sample l i n e
Reactivity check , Retention check
Evacuated canister * Personnel pump
Sta in less steel or Teflon unions used
Sample l ine : Teflon , Cleaned , Heated ( i f applicable) Bag: Tedlar Other * Blank checked , Leak checked
Flowmeter: Proper range , Heated (if applicable) , Calibrated Pump: Teflon coated diaphram , Posi t ive displacement pump
Heated box with temperature control system: Maintained at proper temperature Charcoal adsorption tube t o adsorb organic vapors: Suff icent capacity Dilution equipment: N2 gas , Hydrocarbon-free a i r , Cleaned and , Dry gas meter Barometer: Mercury , Aneroid * Other Stack and ambient temperature: Thermometer * Thermocouple ,
- *
dried ambient air
Calibrated
Procedures
Recent ca l ibra t ion (if appl icable) : P i t o t tube Posi t ive displacement pump* Thermocouple , Barometer
Sampling technique: Ind i rec t bag , Direct bag , Explosion r i s k bag
Proportional rate * Constant rate Dilution in t e r f ace 9
* Flowmeter , Thermometer 9
* Dry gas meter" *
Dilution bag Heated syringe , Adsorption tube * Direct in te r face *
"Most s ign i f icant items/parameters t o be checked.
Figure 4.10. On-site measurements checkl is t .
! ' , , I . ' . I ,
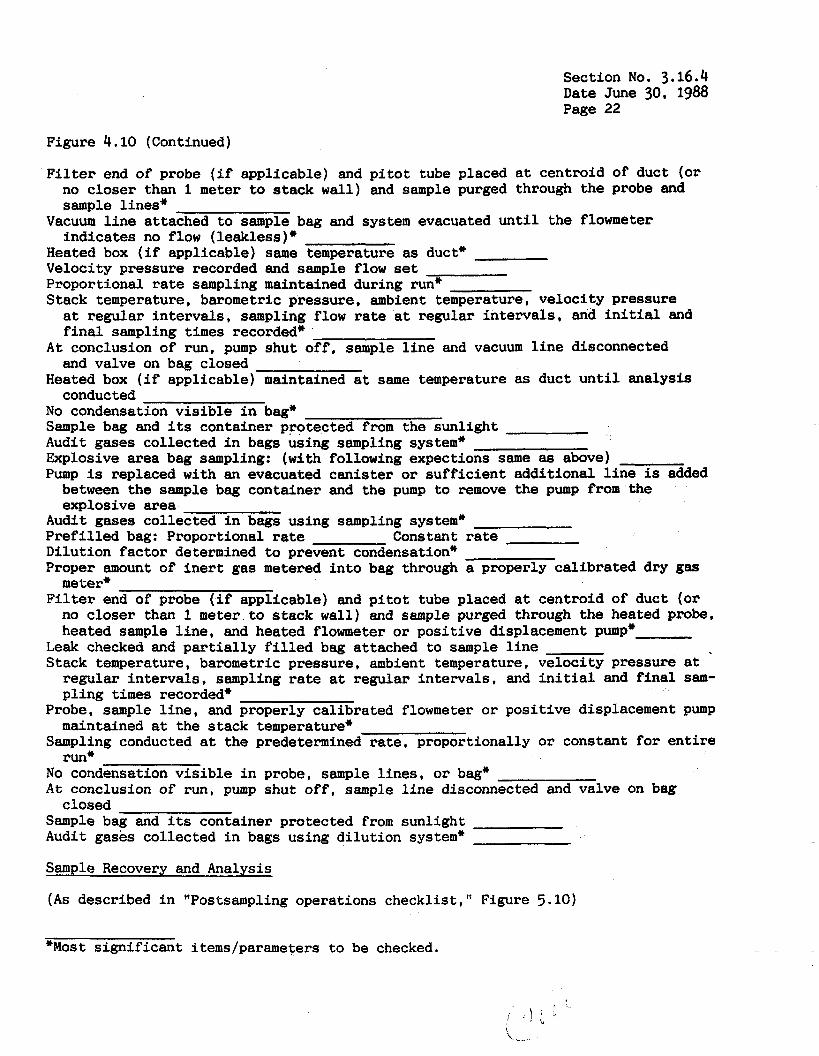
Section No. 3.16.4 Date June 30, 1988 Page 22
Figure 4.10 (Continued)
F i l t e r end of probe ( i f applicable) and p i t o t tube placed a t centroid of duct (o r no closer than 1 meter to stack w a l l ) and sample purged through the probe and sample l ines*
ind ica tes no flow (leakless)* Vacuum l i n e attached to sample bag and system evacuated u n t i l the flowmeter
Heated box (if applicable) same temperature as duct* Velocity pressure recorded and sample flow set Proportional rate sampling maintained during run* Stack temperature, barometric pressure, ambient temperature, ve loc i ty pressure
a t regular i n t e rva l s , sampling flow rate a t regular i n t e rva l s , and i n i t i a l and final sampling times recorded*
A t conclusion of run, pump shut off, sample l i n e and vacuum l i n e disconnected and valve on bag closed
Heated box ( i f applicable) maintained a t same temperature as duct u n t i l analysis conducted
N o condensation v i s i b l e i n bag* Sample bag and its container protected from the sunl ight Audit gases col lected i n bags using sampling sys tern* Explosive area bag sampling: (with following expections same as above) Pump is replaced with an evacuated canister or s u f f i c i e n t addi t iona l l i n e is added
between the sample bag container and the pump to remove the pump from the explosive area
Audit gases collected i n bags using sampling system* Pre f i l l ed bag: Proportional rate Constant rate Dilution f ac to r determined to prevent condensation" Proper amount of i n e r t gas metered i n t o bag through a properly ca l ibra ted dry gas
F i l t e r end of probe ( i f applicable) and p i t o t tube placed a t centroid of duct (or meter*
no closer than 1 meter to stack w a l l ) and sample purged through the heated probe, heated sample l i n e , and heated flowmeter o r pos i t ive displacement pump*
Leak checked and p a r t i a l l y f i l l e d bag attached to sample l i n e Stack temperature, barometric pressure, ambient temperature, ve loc i ty pressure a t
regular i n t e rva l s , sampling rate at regular in t e rva l s , and i n i t i a l and f i n a l sam- pl ing times recorded*
Probe, sample l i n e , and properly calibrated flowmeter or pos i t ive displacement pump maintained a t the stack temperature*
run" Sampling conducted a t the predetermined rate, proportionally o r constant f o r e n t i r e
No condensation v i s i b l e i n probe, sample l i n e s , or bag* A t conclusion of run, pump shut o f f , sample l i n e disconnected and valve on bag
Sample bag and its container protected from sunl ight Audit gases collected i n bags using d i lu t ion system"
closed
Sample Recovery and Analysis
( A s described i n "Pos tsampling operations checklist , I' Figure 5.10)
"Most s ign i f ic&t i temslparameters t o be checked.
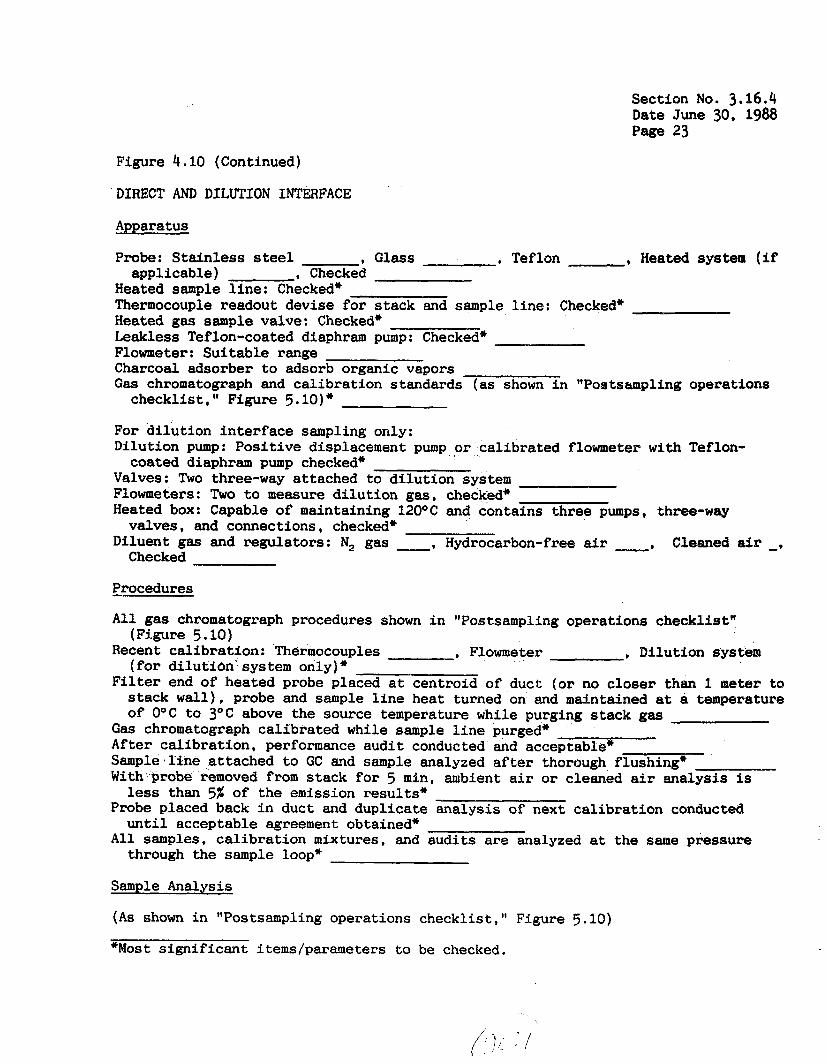
Section No. 3.16.4 Date June 30, 1988 Page 23
Figure 4.10 (Continued)
DIRECT AND DILUTION INTERFACE
Apparatus
, Heated system (if Probe: S ta in less steel , Glass , Teflon
Heated sample l i n e : Checked" Thermocouple readout devise f o r s tack and sample l ine : Checked" Heated gas sample valve: Checked* Leakless Teflon-coated diaphram pump: Checked" Flowmeter: Sui tab le range Charcoal adsorber to adsorb organic vapors Gas chromatograph and ca l ibra t ion standards (as shown in "Postsampling Operations
applicable) , Checked
checkl is t , " Figure 5.10) * For d i lu t ion in t e r f ace sampling only: Dilution pump: Pos i t ive displacement pump or ca l ibra ted flowmeter with Teflon-
coated diax>hram D U ~ D checked* - *
Valves: Two three-way attached t o d i lu t ion system Flowmeters: Two t o measure d i lu t ion gas, checked" Heated box: Capable of maintaining 12OOC and contains three pumps, three-way
valves, and connections, checked*
Checked Diluent gas and regulators: N, gas , Hydrocarbon-free air -, Cleaned air -,
Procedures
A l l gas chromatograph procedures shown i n "Postsampling operations checklist ' ' (Figure 5.10)
Recent ca l ibra t ion : 'Thermocouples , Flowmeter , Dilution system (for di lut idn 'system only)*
F i l t e r end of heated probe placed a t centroid of duct; (or no c lose r than 1 meter to s tack w a l l ) , probe and sample l i n e heat turned on and maintained a t a temperature of O°C t o 3OC above the source temperature while purging s tack gas
G a s chromatograph calibrated while sample l i n e purged" After ca l ibra t ion , performance audi t conducted and acceptable* Sample ' l i n e attached t o GC and sample analyzed after thorough flushing* With probe removed from s tack for 5 min, ambient a i r or cleaned a i r analysis is
Probe placed back i n duct and dupl icate analysis of next ca l ib ra t ion conducted
A l l samples, ca l ib ra t ion mixtures, and audi t s are analyzed a t the same pressure
less than 5% of the emission resul ts" - u n t i l acceptable agreement obtained"
through the sample loop"
Sample Analysis
( A s shown i n "Postsampling operations checkl i s t , " Figure 5.10)
*Most s ign i f i can t items/parameters to be checked.
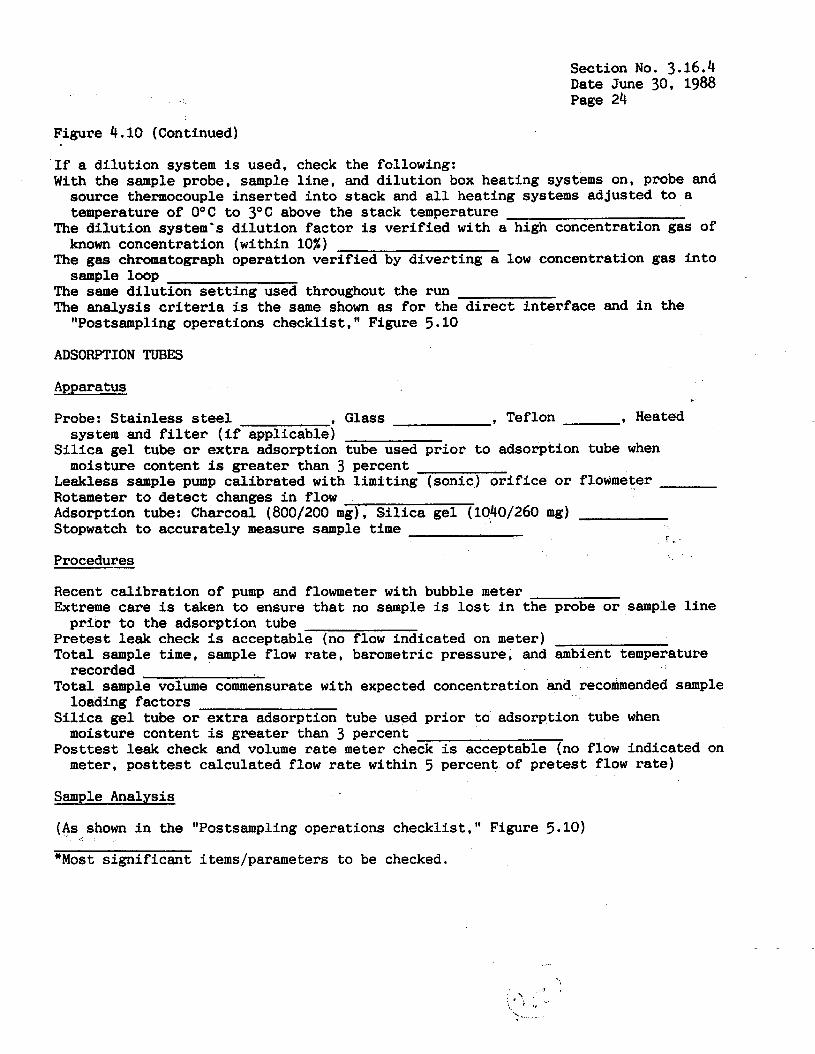
Section No. 3.16.4 Date June 30, 1988 Page 24
Figure 4.10 (Continued)
I f a d i lu t ion system is used, check t h e following: With the sample probe, sample l i n e , and d i lu t ion box heating systems on, probe and
source thermocouple inser ted i n t o stack and a l l heating systems adjusted t o a temperature of O°C to 3 O C above the s tack temperature
The d i lu t ion system's d i lu t ion fac tor is ve r i f i ed with a high concentration gas of known concentration (within 10%)
The gas chromatograph operation ver i f ied by d iver t ing a low concentration gas i n t o sample loop
The same d i lu t ion s e t t i n g used throughout the run The analysis criteria is the same shown as f o r the d i r e c t i n t e r f ace and i n the
"Pos t skp l ing operations checkl is t , " Figure 5.10
ADSORPTION TUBES
Apparatus
Probe: S ta in less steel , Glass , Teflon , Heated
S i l i c a gel tube or e x t r a adsorption tube used prior t o adsorption tube when
Leakless sample pump ca l ibra ted with l imi t ing (sonic) o r i f i c e or flowmeter Rotameter t o de t ec t changes i n flow Adsorption tube: Charcoal (800/200 mg), S i l i c a ge l (1040/260 mg) Stopwatch t o accurately measure sample t i m e
Procedures
Recent ca l ibra t ion of pump and flowmeter with bubble meter Extreme care is taken t o ensure t h a t no sample is l o s t i n the probe or sample l i n e
system and f i l t e r ( i f applicable)
moisture content is greater than 3 percent
r -
p r i o r t o the adsorption tube P re t e s t leak check is acceptable (no flow indicated on meter) Total sample time, sample flow r a t e , barometric pressure, and ambient temperature
recorded Total sample volume commensurate with expected concentration and recommended sample
loading factors S i l i c a gel tube or e x t r a adsorption tube used p r i o r t o adsorption tube when
moisture content is grea ter than 3 percent
meter, posttest calculated flow rate within 5 percent of p r e t e s t flow rate) Posttest leak check and volume rate meter check is acceptable (no flow indicated on
Sample Analysis
( A s shown i n the "Postsampling operations checkl is t , " Figure 5.10)
"Most s ign i f i can t items/parameters to be checked.
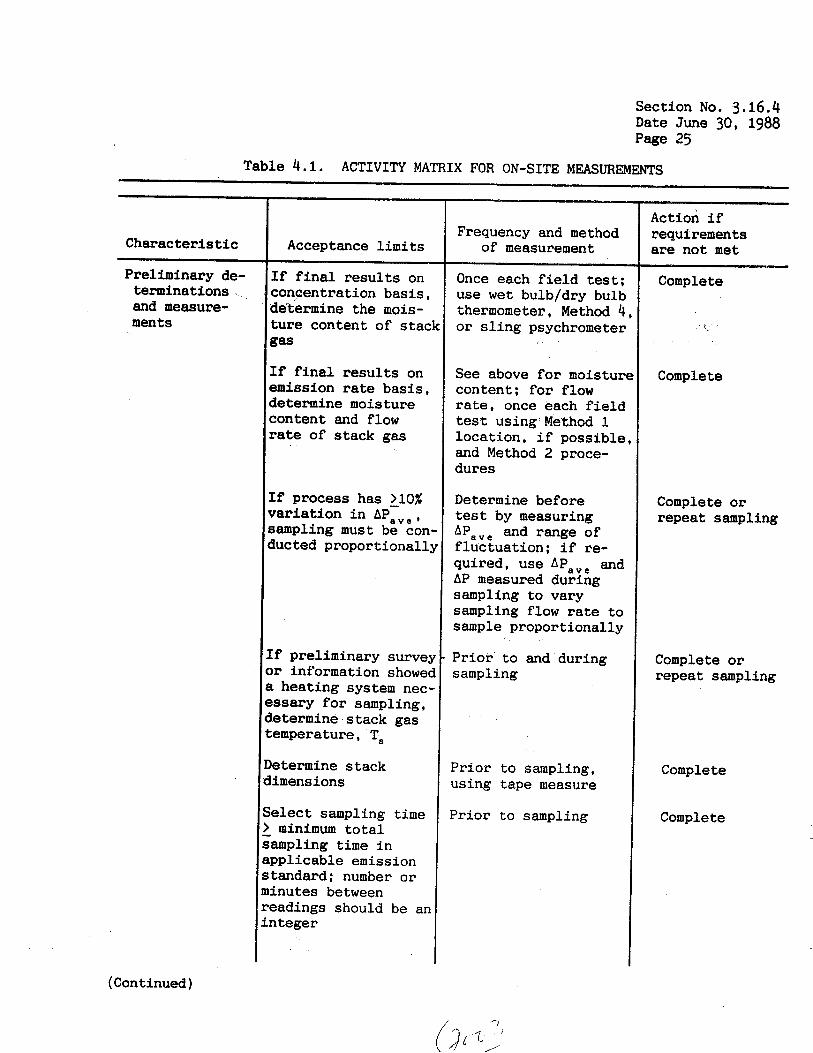
Section No. 3.16.4 Date June 30, 1988 Page 25
Table 4.1. ACTIVITY MATRIX FOR ON-SITE MEASUREMENTS
Character is t ic
Preliminary de- terminations . and measure- ments
Acceptance l i m i t s
If f i n a l results on concentration basis, de'termine the mois- t u r e content of stac g-
If f i n a l r e s u l t s on emission rate basis, determine moisture content and flow rate of stack gas
If process has 210% irariation i n APave , sampling must be con, fucted proportionall:
:f preliminary survel )r information showec i heat ing system nec- rssary f o r sampling, letermine stack gas iemperature, T,
letermine stack imensions
elect sampling time minimum t o t a l
ampling time i n pplicable emission tandard; number or inu tes between eadings should be an nteger
Frequency and method of measurement
Once each f i e l d test; use w e t bulb/dry bulb thermometer, Method 4 or s l i n g psychrometer
See above f o r moistur content; f o r flow r a t e , once each f i e ld test using Method 1 locat ion, i f possible and Method 2 proce- dures
Determine before test by measuring APavc and range of f luc tua t ion ; i f re- quired, use APave and AP measured during sampling to vary sampling flow rate t o sample proportionally
P r io r t o and during sampling
Prior t o sampling, using tape measure
Prior t o sampling
Action i f requirements are not m e t
~- Complete
Complete
Complete or repeat sampling
Complete or repeat sampling
Complete
Complete
(Continued)
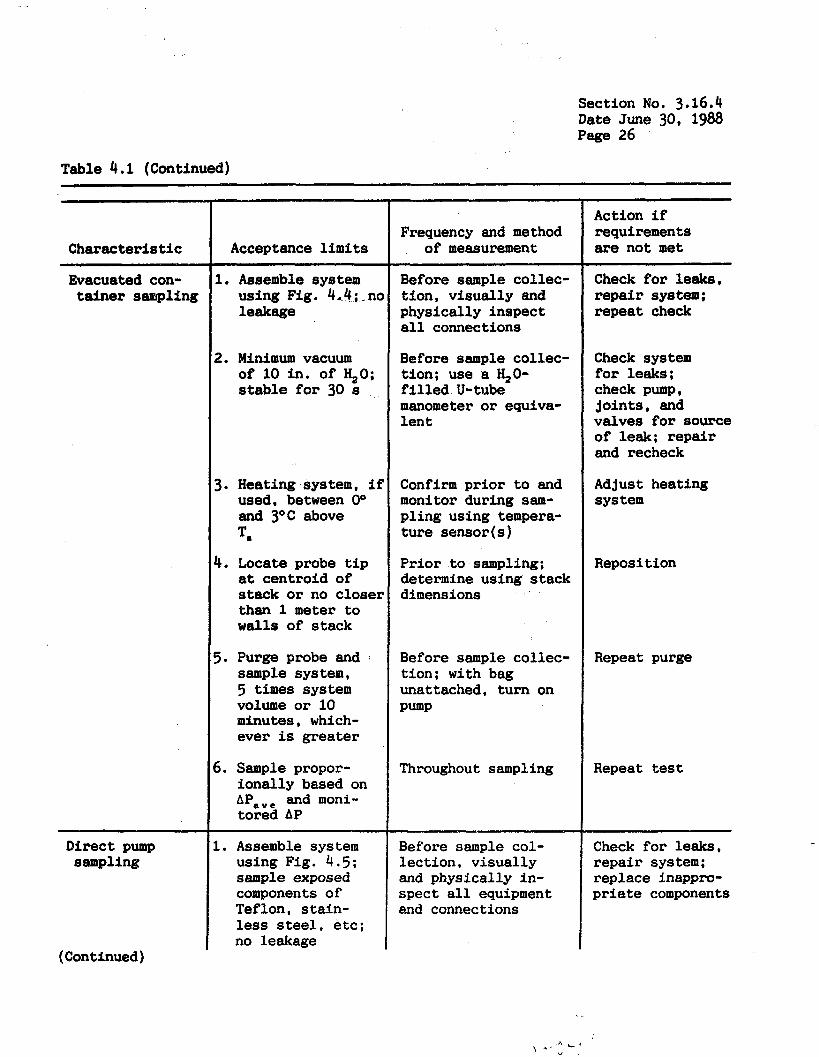
Section No. 3.16.4
Page 26 Date June 30, 1988
Table 4.1 (Continued)
Characteristic
Evacuated con- t a ine r sampling
Direct pump sampling
(Continued)
Acceptance limits
1. Assemble system using Fig. 4,4;-no leakage
2. Minimum vacuum of 10 in . of H,O; stable f o r 30 s
3. Heating system, i f used, between Oo and 3OC above T,
4. Locate probe t i p a t centroid of stack or no closer than 1 meter t o w a l l s of stack
5. Purge probe and sample system, 5 times system volume or 10 minutes, which- ever is greater
6 . Sample propor- iona l ly based on AP,,, and moni- tored AP
1. Assemble system using Fig. 4.5; sample exposed components of Teflon, s t a in - less steel, etc; no leakage
Frequency and method of measurement
Before sample collec- t ion , visually and physically inspect a l l connections
Before sample collec- t ion; use a %O- f i l l e d U-tube manometer or equiva- l e n t
Confirm p r io r to and monitor during sam- pl ing using tempera- tu re sensor (s )
Pr io r to sampling; determine using stack dimensions
Before sample collec- tion: with bag unattached, tu rn on Pump
Throughout sampling
Before sample col- l ec t ion , v i sua l ly and physically in- spect a l l equipment and connections
Action i f requirements are not met
~~~ ~
Check for leaks, repair system; repeat check
Check system for leaks ; check pump, j o i n t s , and valves f o r source of leak; repair and recheck
Adjust heating sys t e m
Reposition
Repeat purge
Repeat test
Check for leaks, repair system: replace inappro- priate components
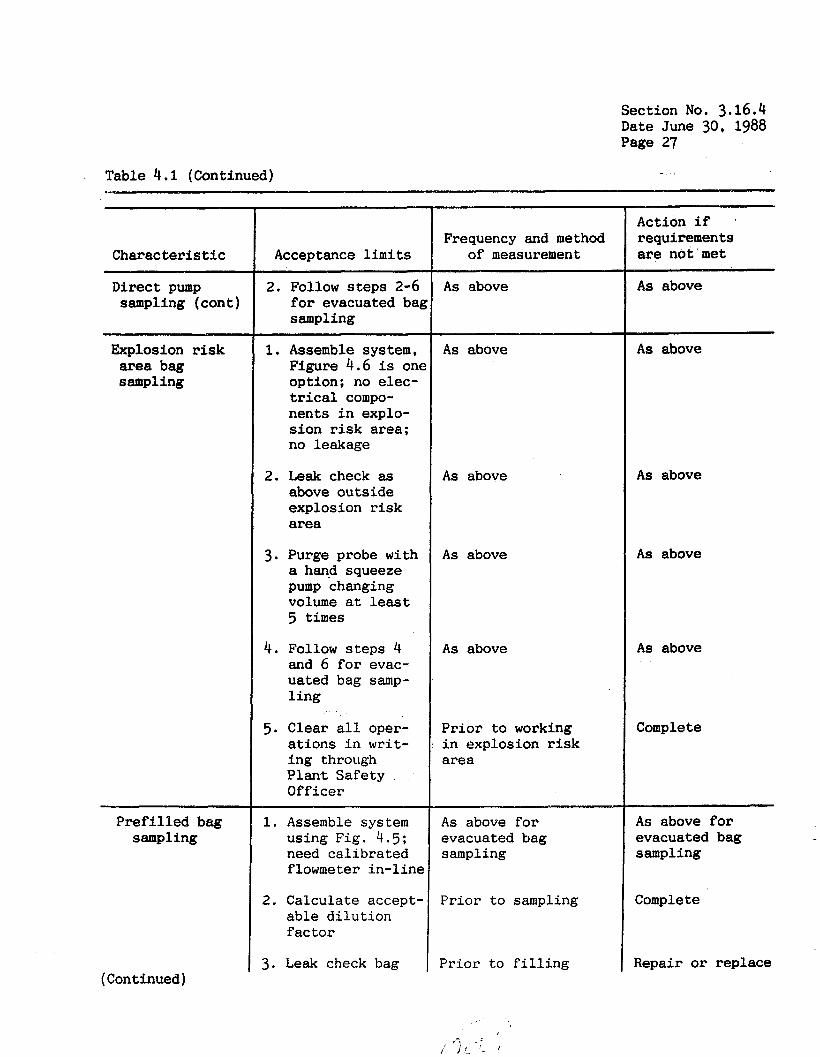
Section No. 3.16.4 Date June 30, 1988 Page 27
Table 4.1 (Continued)
~
Character is t ic
Direct pump sampling (cont)
Explosion r i s k area bag sampling
P re f i l l ed bag sampling
Acceptance limits
2. Follow s teps 2-6 for evacuated bag sampling
1. Assemble system, Figure 4.6 is one option: no elec- t r ical compo- nents i n explo- s ion r i s k area; no leakage
2. Leak check as above outs ide explosion r i s k area
3. Purge probe with a hand squeeze pump changing volume a t least 5 times
4. Follow steps 4 and 6 f o r evac- uated bag samp- l i n g
5. Clear a l l oper- a t ions i n w r i t - ing through Plan t Safety Off icer
1. Assemble system using Fig. 4.5; need ca l ibra ted flowmeter i n - l i ne
2 . Calculate accept- able d i lu t ion f ac to r
3. Leak check bag
Frequency and method of measurement
As above
As above
A s above
A s above
As above
P r io r t o working i n explosion r i s k area
As above f o r evacuated bag s ampl ing
P r io r t o sampling
P r i o r t o f i l l i n g
Action if requirements are not met
A s above
A s above
A s above
A s above
A s above
Complete
A s above f o r evacuated bag s ampl ing
Complete
Repair o r replace (Continued)
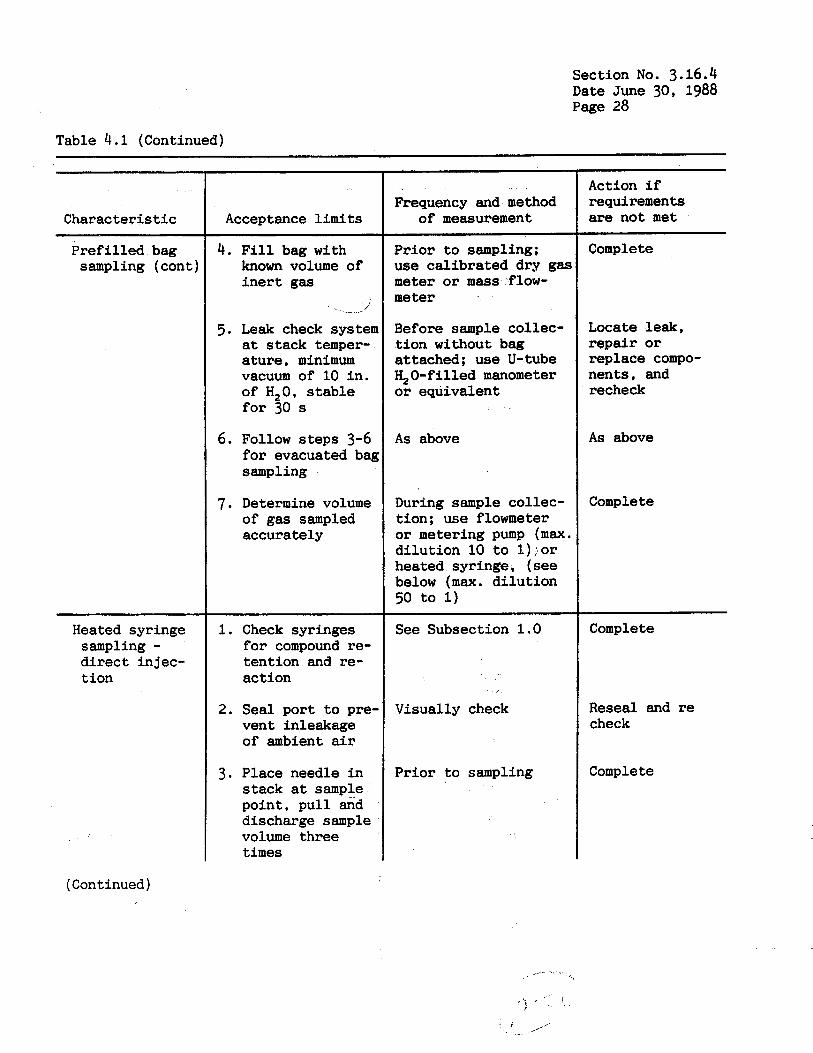
Section No. 3.16.4 Date June 30, 1988 Page 28
Table 4.1 (Continued)
Character is t ic
Prefilled bag sampling (cont)
Heated syringe sampling - d i r e c t injec- t ion
(Continued)
Acceptance l i m i t s
4. F i l l bag with known volume of i n e r t gas
... ‘ / l
5. Leak check systen a t stack temper- a ture , minimum vacuum of 10 i n . of H,O, s t ab le f o r 30 s
6. Follow s teps 3-6 f o r evacuated bag sampling
7. Determine volume of gas sampled accurately
1. Check syringes f o r compound re- tent ion and re- act ion
2. Seal port t o pre- vent inleakage of ambient air
3. Place needle i n s tack a t sample, point , p u l l and discharge sample volume three times
Frequency and method of measurement
P r io r t o sampling; use ca l ibra ted dry gas meter o r m a s s flow- meter
Before sample co1:Lec- t ion without bag attached; use U-tube H, 0- f i l l e d manometer o r equivalent
A s above
During sample collec- t ion; use flowmeter o r metering pump ( m a x . d i lu t ion 10 t o 1) o r heated syringe, (see below ( m u . d i l u t ion 50 t o 1)
See Subsection 1.0
Visually check
Pr ior t o sampling
Action if requirements are not met
Complete
Locate leak, repair o r replace compo- nents, and recheck
A s above
Complete
Complete
Reseal and re check
Complete
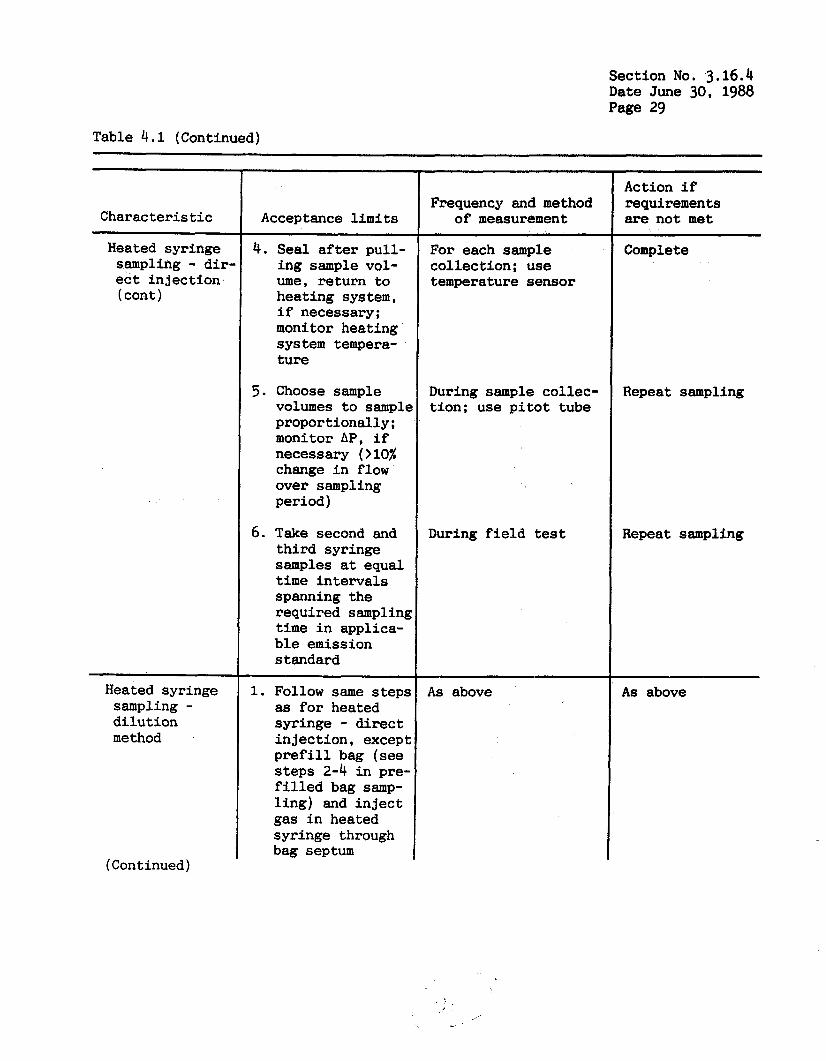
Section No. 3.16.4 Date June 30, 1988 Page 29
Table 4 .1 (Continued)
Character is t ic
Heated syringe sampling - d i r - ect in jec t ion (cont)
Heated syringe sampling - d i lu t ion method
(Continued)
Acceptance l i m i t s
4.
5.
6.
Seal a f t e r pul l - i n g sample vol- ume, re turn to heat ing system, i f necessary; monitor heating sys tem tempera- tu re
Choose sample volumes t o sample proportionally; monitor AP, i f necessary (>lo% change i n flow over sampling period)
Take second and t h i rd syringe samples at equal time in t e rva l s spanning the required samplin8 t i m e i n applica- b l e emission standard
~
1. Follow same steps as f o r heated syringe - d i r e c t in jec t ion , except pref i l l bag (see steps 2-4 i n pre- f i l l e d bag s a p - l i ng ) and i n j e c t gas i n heated syringe through bag septum
Frequency and method of measurement
~~ - ~~- ~~~
For each sample col lec t ion ; use temperature sensor
During sample col lec- t ion ; use p i t o t tube
During f i e ld test
~ ~
As above
Action if requirements are not m e t
Complete
Repeat sampling
Repeat sampling
As above
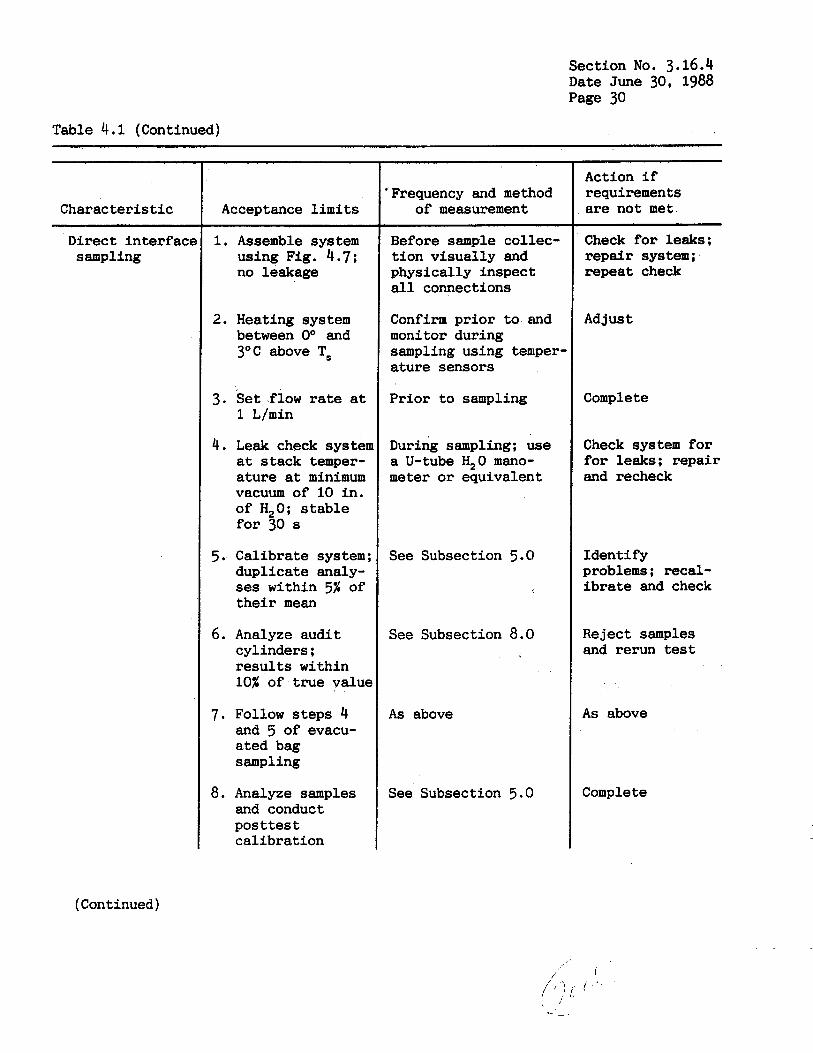
Section No. 3.16.4 Date June 30, 1988 Page 30
Table 4 .1 (Continued)
Character is t ic
Direct i n t e r f a c sampling
Acceptance l i m i t s
1.
2.
3.
4.
5.
6.
7.
8.
Assemble system using Fig. 4.7; no leakage
Heating system between 0" and 3°C above T,
Set flow rate at 1 L/min
Leak check sys t e a t s tack temper- a tu re a t minimum vacuum of 10 i n . of H,O; s t a b l e for 30 s
Calibrate system dupl icate analy- ses within 5% of t h e i r mean
Analyze audi t cylinders: r e s u l t s within 10% of t rue valu
Follow steps 4 and 5 of evacu- ated bag sampling
Analyze samples and conduct pos t t e s t ca l ibra t ion
'Frequency and method of measurement
Before sample collec- t i on v isua l ly and physically inspect a l l connections
Confirm p r i o r to and monitor during sampling using temper- a tu re sensors
P r io r t o sampling
During sampling: use a U-tube H,O mano- meter o r equivalent
See Subsection 5.0
See Subsection 8.0
A s above
See Subsection 5.0
Action i f requirements are not met
Check for leaks: repair system; repeat check
Adjust
Complete
Check system f o r for leaks: repair and recheck
Ident i fy problems : recal- ibrate and check
Reject samples and rerun test
A s above
Complete
(Continued)
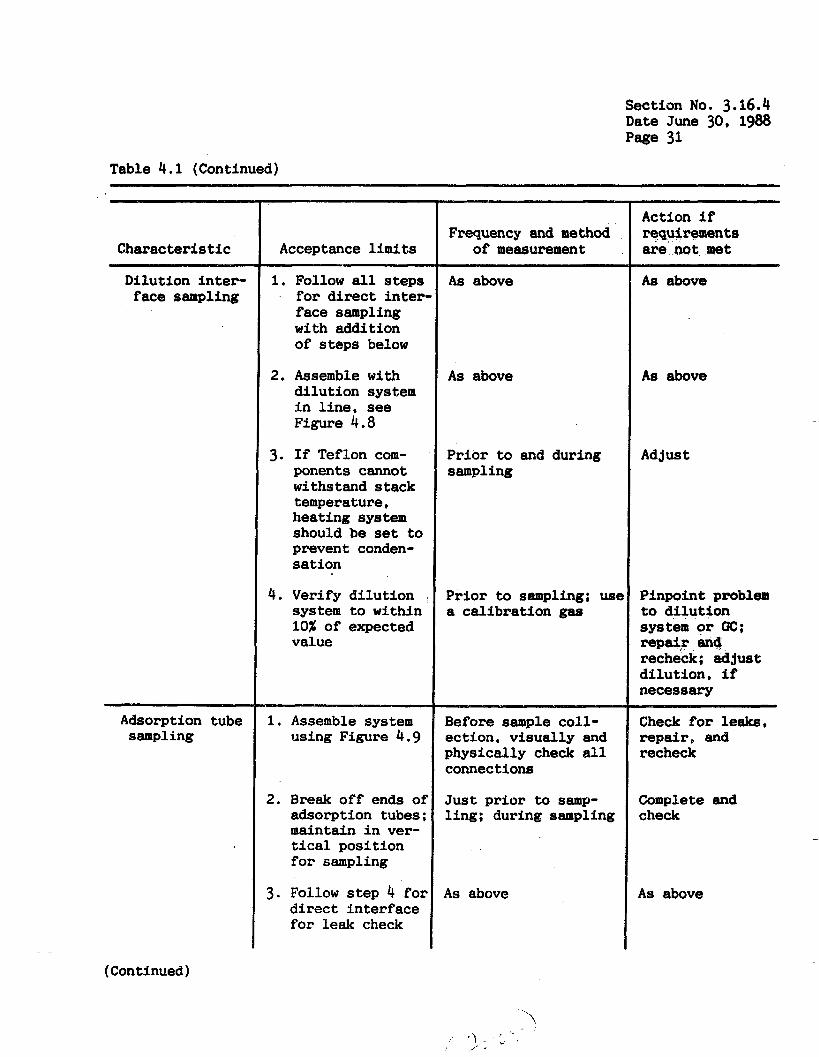
Section No. 3.16.4 Date June 30, 1988 pace 31
Table 4 .1 (Continued)
Characterist ic
Dilution in te r - face sampling
Adsorption tube sampling
Acceptance limits
1. Follow a l l steps . fo r direct i n t e r
face sampling with addition of steps below
2. Assemble with di lut ion system i n l i ne , see Figure 4.8
3. If Teflon com- ponents cannot withstand stack temperature, heating system should be set t o prevent conden- sat ion
4. Verify di lut ion system to within 10% of expected value
1. Assemble system using Figure 4.9
2 . Break off ends of adsorption tubes; maintain i n ver- t ical position fo r sampling
3. Follow step 4 for d i rec t interface for leak check
Frequency and method of measurement
As above
As above
Prior t o and during sampling
Prior t o sampling: use a calibration gas
Before sample col l - ection, visually and physically check a l l connections
Jus t pr ior t o samp- l i ng ; during sampling
A s above
Action if requirements are not met
As above
As above
Adjust
Pinpoint problem t o d i lu t ion system o r QC; repair en4 recheck; adjust dilut ion, if necessary
Check f o r leaks, repair , and recheck
Complete and check
A s above
(Continued)

Table 4 .1 (Continued)
Section No. 3.16.4 Date June 30, 1988 Page 32
Characteris t i c
Adsorption tube sampling (cont
Sample recovery
Acceptance l i m i t s
4 . Conduct sampling proportionally', i f the flow rate var ies more than 10%
5. Determine samp- l i n g time, 1. re- quirement of applicable emission standarc
6. Run f i e l d blanks
7. Perform pos t t e s t leak check as above
1. If applicable, remove samples from sampling sys t e m
2 . Protect bag samp- les from sunlight and maintain a t a temperature w h i c h w i l l prevent con- densa t ion
3. Analyze bag sam- ples within two hours of sampling
4. For adsorption tube samples, perform a t least one probe r i n s e with desorption solvent t o con- firm t h a t 510% of sample is col- lected i n probe
Frequency and method of measurement
During sampling
P r io r t o sampling
Once each set of samples
A s above
Following sampling
Following sampling
Following sampling
Following sampling; analyze sample with GC
Action i f requirements are not met
Repeat test
Complete
Complete
Reject sample, rerun test
Complete
Complete
Complete
Adjust sample values to account f o r probe catch
(Continued)
\ I
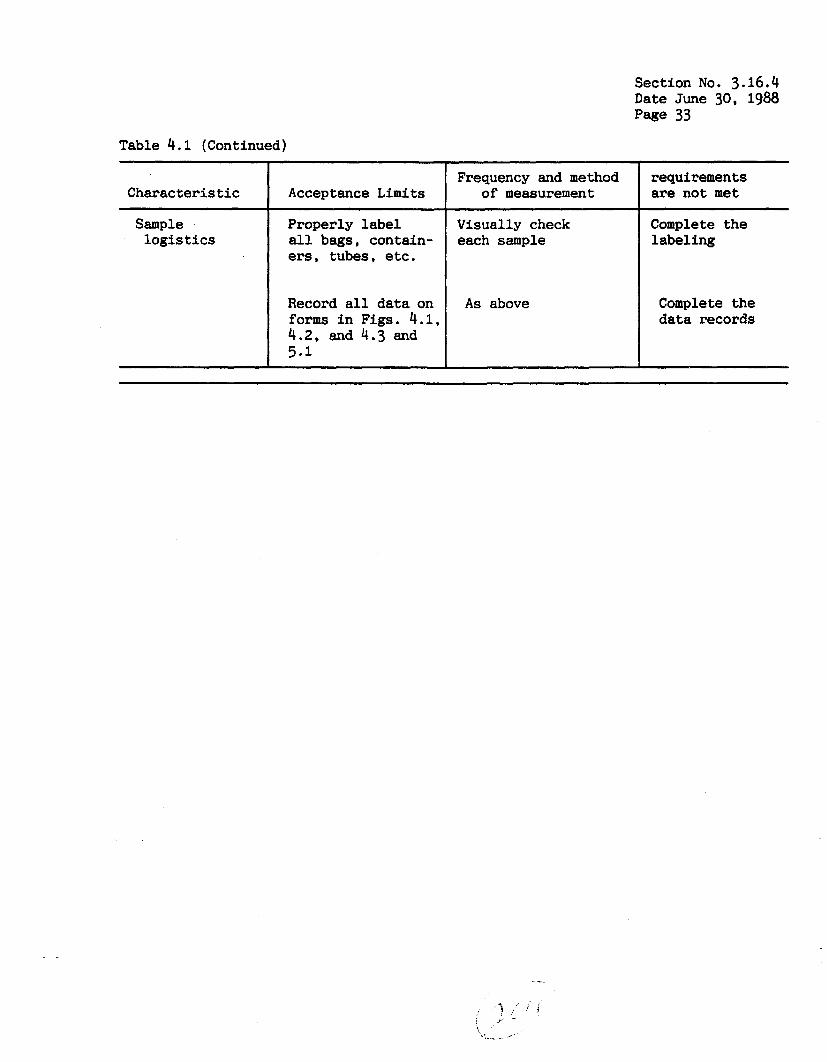
Section No. 3.16.4 Date June 30, 1988 Page 33
Table 4 . 1 (Continued)
Characteristic
Sample log i s t i c s
Acceptance L i m i t s
Properly label a l l bags, contain- ers, tubes, etc.
Record a l l data on forms i n Figs. 4 . 1 , 4 .2 , and 4 .3 and 5.1
Frequency and method of measurement
Visually check each sample
A s above
requirements are not m e t
Complete the labeling
Complete the data records


Section N o . 3.16.5 Date June 30, 1988 Page 1
5 . 0 POSTSAMPLING OPERATIONS The postsampling operations f o r Method 18 include preparation of ca l ibra t ion
standards appropriate f o r the sampling technique used, determination of desorption eff ic iency and co l l ec t ion e f f ic iency f o r adsorption tubes ( i f used), adsorption tube sample preparation, sample analysis , and determination of acceptable resolu- t i on and precis ion. See Subsection 3.1.5 f o r postsampling operations re la ted to veloci ty determinations and Subs-ection 3.3.5 f o r postsampling operations re la ted t o determination of the f l u e gas o r duct moisture. Figure 5.10 a t the end of t h i s sect ion provides a checkl i s t f o r monitoring the postsampling operations. Table 5.1 a t t he end of the sec t ion summarizes the qua l i ty assurance a c t i v i t i e s associated with the postsampling operations.
5 . 1 Preparation of Calibration Standards
Calibrat ion standards are t o be prepared p r i o r t o sample analysis following the procedures described i n the following subsections. Refer t o Table E i n the Method Highlights Section f o r recommendations on the procedures su i t ab le f o r selec- ted compounds. Note t h a t there are two basic types of standards, gaseous or l i q - uid; the type prepared depends on the type of sample col lected. Gaseous C a l i - brat ion standards w i l l be.needed p r i o r t o the analysis of preliminary survey sam- p les col lected i n glass f l a sks o r bags, and f i n a l samples col lected i n bags o r by d i r e c t and d i l u t i o n in t e r f ace sampling. There are three techniques f o r preparing gaseous standards, depending on a v a i l a b i l i t y and the chemical cha rac t e r i s t i c s of the standard compound(s); gas cyl inder standards may also be used d i r ec t ly , if the proper concentration ranges are avai lable . Liquid ca l ib ra t ion standards are re- quired f o r the ana lys i s of adsorption tube samples from the preliminary survey and/or the f i n a l sampling, as w e l l as t o determine the desorption eff ic iency; there are two techniques for preparing l i qu id ca l ib ra t ion standards. The concentrations of the ca l ib ra t ion standards should bracket the expected concentrations of the t a rge t compound(s) a t the source being tes ted. Specif ic procedures f o r preparing and analyzing each type of standard are described below.
For each target compound, a minimum of three d i f f e r e n t standard concentra- t ions are required t o c a l i b r a t e t he GC. An exception t o t h i s requirement involves developing r e l a t i v e response fac tors f o r each compound t o be tes ted as compared to a s ing le organic compound. Once i n the f i e l d , the GC is ca l ibra ted f o r a l l ta rge t compounds using the s i n g l e organic. The v a l i d i t y of t h i s procedure must be f i r s t be proven i n the laboratory p r i o r to the test. To save time, multiple component standards can be prepared and analyzed provided the e lu t ion order of the components is known.
It is recommended t h a t the l i n e a r i t y of the ca l ib ra t ion curve be checked comparing the ac tua l concentration of the ca l ib ra t ion standards t o the concentra- t i on of the standards calculated using the standard peak areas and the l i n e a r re- gression equation. The recommended cr i ter ia f o r l i n e a r i t y is f o r the calculated concentration f o r each standard be within 7% of the ac tua l concentration.
After e s t ab l i sh ing the GC ca l ibra t ion curve, an analysis of the audi t cyl- inder is performed as described i n Subsection 8.1. For an instrument d r i f t check, a second a n a l y s i s of the ca l ib ra t ion standards and generation of a second ca l ibra t ion curve i s required following sample analysis . The area values f o r the first and second analyses of each standard must be within 5% of t h e i r average. I f t h i s c r i t e r i o n cannot be m e t , then the sample values obtained using the f i r s t and second ca l ib ra t ion curves should be averaged. I n addi t ion, i f report ing such
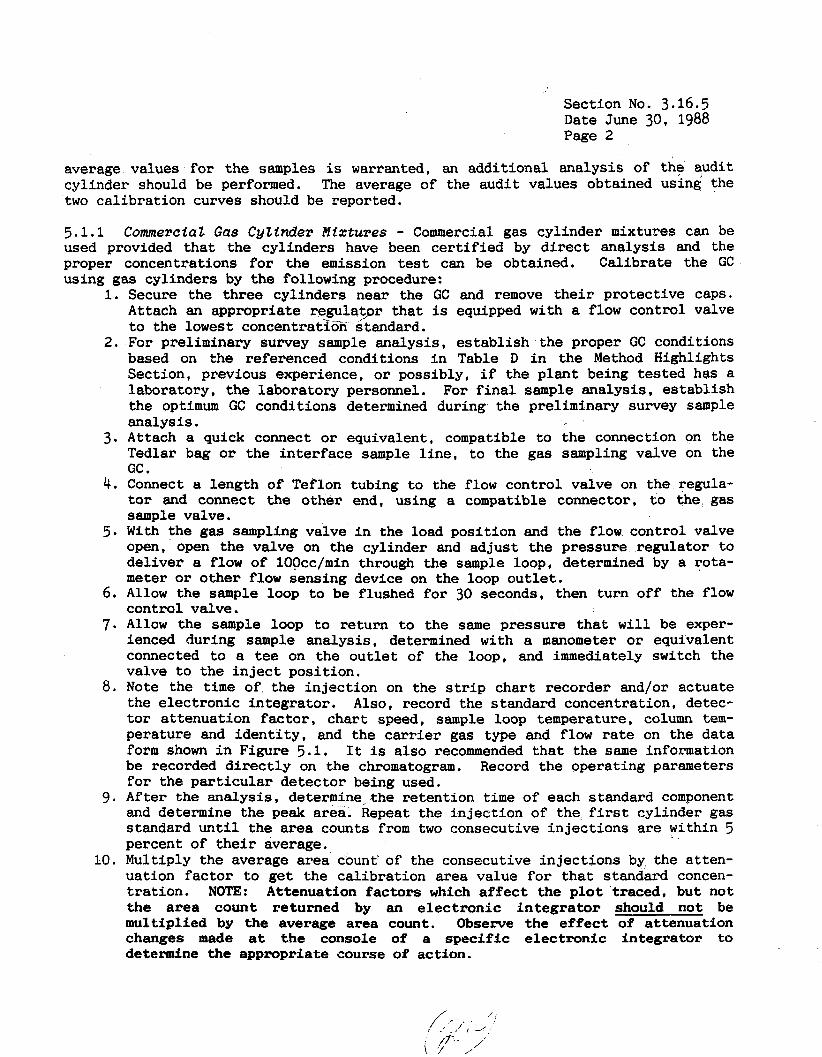
Section No. 3.16.5 Date June 30, 1988 Page 2
average values f o r t he samples is warranted, cylinder should be performed. The average of two ca l ibra t ion curves should be reported.
an addi t ional analysis of the audit the audi t values obtained using the
5 .1 .1 Commercial Gas Cytinder Mixtures - Commercial gas cyl inder mixtures can be used provided t h a t the cyl inders have been certified by d i r e c t analysis and the proper concentrations f o r the emission test can be obtained. Cal ibrate the GC using gas cyl inders by the following procedure:
1.
2 .
3 .
4.
5.
6.
7.
a.
9.
10.
Secure the three cylinders-near the GC and remove t h e i r protect ive caps. Attach an appropriate r e g u l a p r t h a t is equipped with a flow control valve to the lowest concentration standard. For preliminary survey sample analysis, e s t ab l i sh the proper GC conditions based on the referenced conditions i n Table D i n the Method Highlights Section, previous experience, o r possibly, i f the p lan t being tes ted has a laboratory, t h e laboratory personnel. For f i n a l sample analysis, es tab l i sh the optimum GC conditions determined during the preliminary survey sample analysis . Attach a quick connect or equivalent, compatible to the connection on the Tedlar bag or the in t e r f ace sample l i n e , t o the gas sampling valve on the GC . Connect a length of Teflon tubing t o the flow control valve on the regula- tor and connect the other end, using a compatible connector, t o t he gas sample valve. With the gas sampling valve i n the load posi t ion and the flow control valve open, open the valve on the cylinder and ad jus t the pressure regulator t o de l iver a flow of 100cc/min through the sample loop, determined by a rota- meter or o the r flow sensing device on the loop o u t l e t . Allow the sample loop t o be flushed for 30 seconds, then turn off the flow control valve. Allow the sample loop t o re turn to the same pressure tha t w i l l be exper- ienced during sample analysis , determined with a manometer or equivalent connected to a tee on the o u t l e t of the loop, and immediately switch the valve t o the i n j e c t posi t ion. Note the t i m e of the in j ec t ion on the s t r i p chart recorder and/or actuate the e lec t ronic in tegra tor . Also, record the standard concentration, detec- t o r a t tenuat ion f ac to r , char t speed, sample loop temperature, column t e m - perature and i d e n t i t y , and the carrier gas type and flow rate on the da ta form shown i n Figure 5.1. It is also recommended t h a t the same information be recorded directly on the chromatogram. Record the operating parameters for the pa r t i cu la r de tec tor being used. After the analysis, determine t h e re tent ion t i m e of each standard component and determine the peak area. Repeat the in jec t ion of the first cylinder gas standard u n t i l the area counts from two consecutive in j ec t ions are within 5 percent of t h e i r average. Multiply the average area count of the consecutive in j ec t ions by the at ten- uation f ac to r t o get the ca l ibra t ion area value for t h a t standard concen- t r a t ion . NOTE: Attenuation factors which affect the plot traced, but not t h e area count re turned by an e l e c t r o n i c i n t e g r a t o r should not be multiplied by the average area count. Observe the effect of attenuation changes made a t t h e console determine the appropriate course
of a specific electronic integrator to of action.
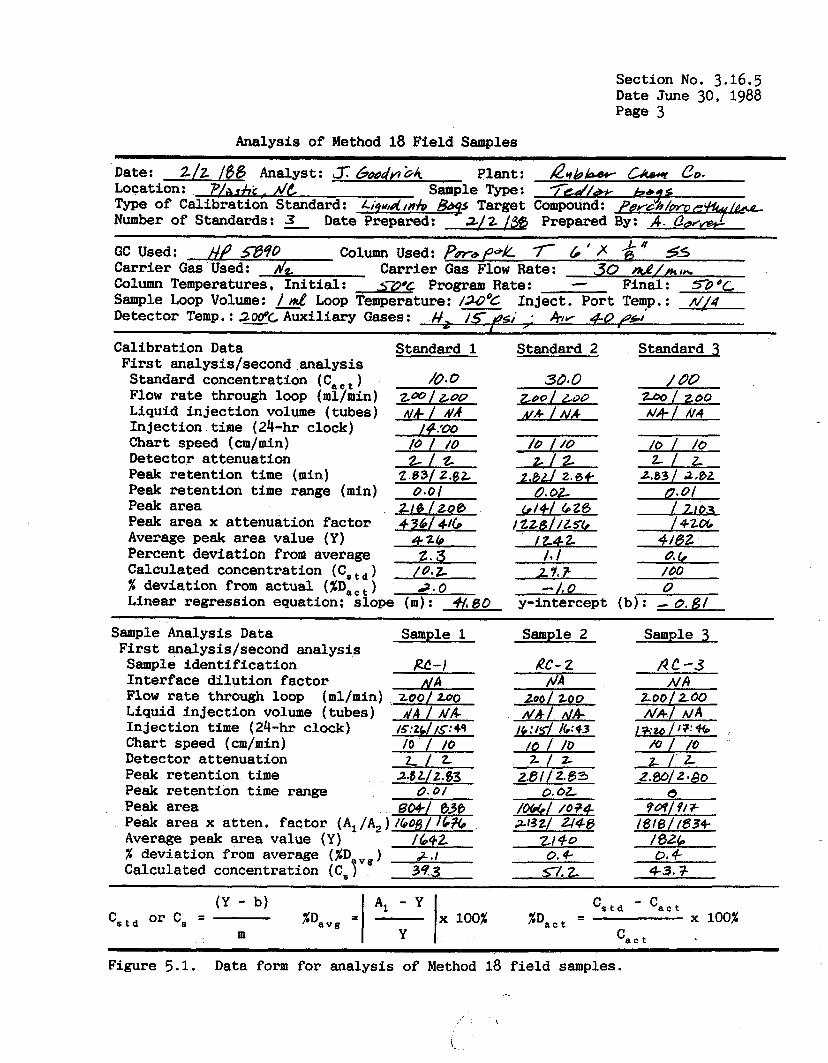
Section No. 3.16.5 Date June 30, 1988 Page 3
Cstd or C, = SDavg - - (Y - b)
m
Analysis of Method 18 Field Samples
A, - Y CStd - Cact Y Cact
x 100% %'act = x 100%
Date: 212 /$8 Analyst: T60oJr./ Location: P / u h i . ML Sa! Type of Calibration Standard: X ,
b4 Plant: Gle Type:
m./o &s Target Number of Standards: - 3 Date Prepared: - 2 / 2 /3@
Column Used: p'a Pdk 7- 6 ' A & # 55 30 d / m I&
Final: 50°C Column Temperatures, Initial: .s-oic Program Rate: c
Detector Temp. : 2oooc Auxiliary Gases: #. F s s ; : 4IV QOP5-J Sample Loop Volume: 1 d Loop Temperature: /;rood Inject. Port Temp. : "/4 -
Calibration Data Standard 1 Standard 2 Standard 3 First analysis/second analysis Standard concentration (C, ) /o. 0 Flow rate through loop (ml/min) zm/tou Liquid injection volume (tubes) A/&/ d A Injection time (24-hr clock)
Detector attenuation z / z Peak retention time (min) 2.63/ Z $ t Peak retention time range (min) Q.O/ Peak area 216 /200 Peak area x attenuation factor 4 36/ 4/69 Average peak area value (Y) 4-26 Percent deviation from average 2.3 Calculated concentration (Cstd) /On& % deviation from actual (XD,, ) 2.0 Linear regression equation: slope (m): 4/,60
/o / /o 2 / t
0.01 A A 8 3 / 3.82
/ 42oG 4/02 0. & /DO 0
(b): - b . B /
Sample Analysis Data Sample 1 Sample 2 Sample 3 First analysis/second analysis Sample identification RC-) Rc- 2 AC-3 Interface dilution factor NA NA N A Flow rate through loop (ml/min) zoo/aOo zoo/ 2 0 0 i L b O / t 0 0 Liquid injection volume (tubes) dA/ M A N A / dA- MA/ M A Injection time (24-hr clock) 1 .'w / I 7: * Chart speed (cm/min) /o / 10 /b / / D m / /o Detector attenuation L / z 2 / % k . / L Peak retention time 24 t / 2.63 2.6t/Z.i33 2.m/ 2 I$O
/ m b / /5: 49 Jb : Is*/ 16 : 93
~
Peak retention time range
Peak area x atten. Peak area
Average peak area value (Y) /de2
0. o/
factor (Al /4 ) Z deviation from average (%D ",) Calculated concentration (C, 'f 3q3
k ,I
Figure 5.1. Data form for analysis of Method 18 field samples. -
\
t.
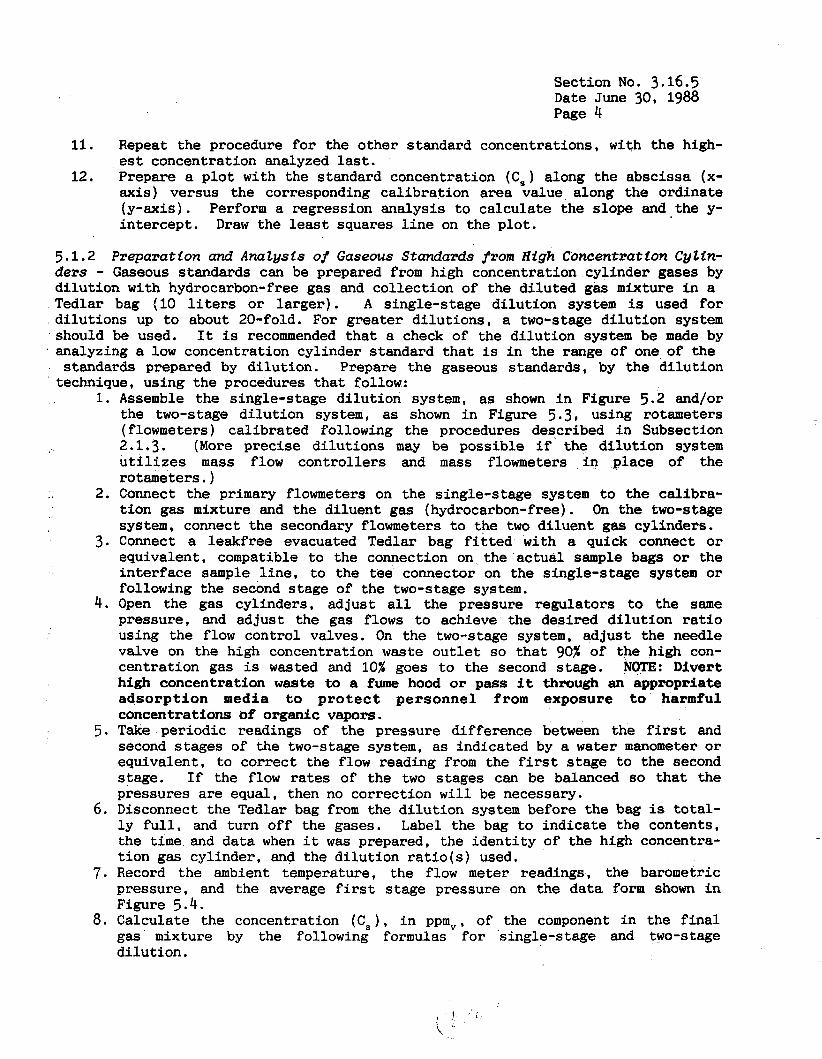
Section No. 3.16.5 Date June 30, 1988 Page 4
11. Repeat the procedure fo r the other standard concentrations, with the high- est concentration analyzed last.
12. Prepare a p l o t with the standard concentration ( C , ) along the abscissa (x- axis) versus the corresponding ca l ibra t ion area value along the ordinate (y-axis) . Perform a regression analysis to ca lcu la te the slope and the y- in te rcept . D r a w the least squares l i n e on the p lo t .
5.1.2 Preparation and Analysis OJ' Gaseous Standards from High Concentration Cglin- ders - Gaseous standards can be prepared from high concentration cyl inder gases by d i lu t ion with hydrocarbon-free gas and co l lec t ion of the d i lu ted gas mixture i n a Tedlar bag { l o l i ters o r larger). A single-stage d i lu t ion system is used for d i lu t ions up to about 20-fold. For grea ter d i lu t ions , a two-stage d i lu t ion system should be used. It is recommended t h a t a check of the d i lu t ion system be made by analyzing a l o w concentration cylinder standard t h a t is i n the range of one.of the standards prepared by d i lu t ion . Prepare the gaseous standards, by the d i lu t ion
technique, using the procedures that follow: 1.
2 .
39
4.
5.
6.
7 .
8.
Assemble the single-stage d i lu t ion system, as shown i n Figure 5.2 and/or the two-stage d i lu t ion system, as shown i n Figure 5 . 3 , using rotameters (flowmeters) ca l ibra ted following the procedures described i n Subsection 2.1.3. (More precise d i lu t ions may be possible i f the d i lu t ion system u t i l i z e s mass flow cont ro l le rs and mass flowmeters i n place of the rotameters.) Connect the primary flowmeters on the single-stage system t o the cal ibra- t i on gas mixture and the di luent gas (hydrocarbon-free). On the two-stage system, connect the secondary flowmeters t o the two d i luent gas cylinders. Connect a leakfree evacuated Tedlar bag f i t t e d with a quick connect o r equivalent, compatible t o the connection on the ac tua l sample bags o r the in te r face sample l i n e , to the tee connector on the single-stage system or following the second stage of the two-stage system. Open the gas cylinders, adjust a l l the pressure regulators to the same pressure, and adjust the gas flows t o achieve the desired d i lu t ion r a t i o using the flow control valves. On the two-stage system, ad jus t the needle valve on the high concentration waste o u t l e t so t h a t 90% of the high con- centrat ion gas is wasted and 10% goes t o the second stage. NOTE: Divert high concentration w a s t e to a fume hood or pass it through an appropriate a d s o r p t i o n media t o p r o t e c t pe r sonne l from exposure to harmful concentrations of organic vapors. Take per iodic readings of the pressure difference between the first and second stages of the two-stage system, as indicated by a water manometer o r equivalent, t o correct the flow reading from the first stage t o the second stage. If the flow rates of the two s tages can be balanced so t h a t the pressures are equal, then no correction w i l l be necessary. Disconnect the Tedlar bag from the d i lu t ion system before the bag is t o t a l - l y f u l l , and turn off the gases. Label the bag to ind ica te the contents, the t i m e and data when i t was prepared, the iden t i ty of the high concentra- t i on gas cylinder, and the d i lu t ion r a t i o ( s ) used. Record the ambient temperature, the flow meter readings, the barometric pressure, and the average f i r s t stage pressure on the da t a form shown i n Figure 5.4. Calculate the concentration (Cs), i n ppmv, of the component i n the f i n a l gas mixture by the following formulas f o r 'single-stage and two-stage d i lu t ion .
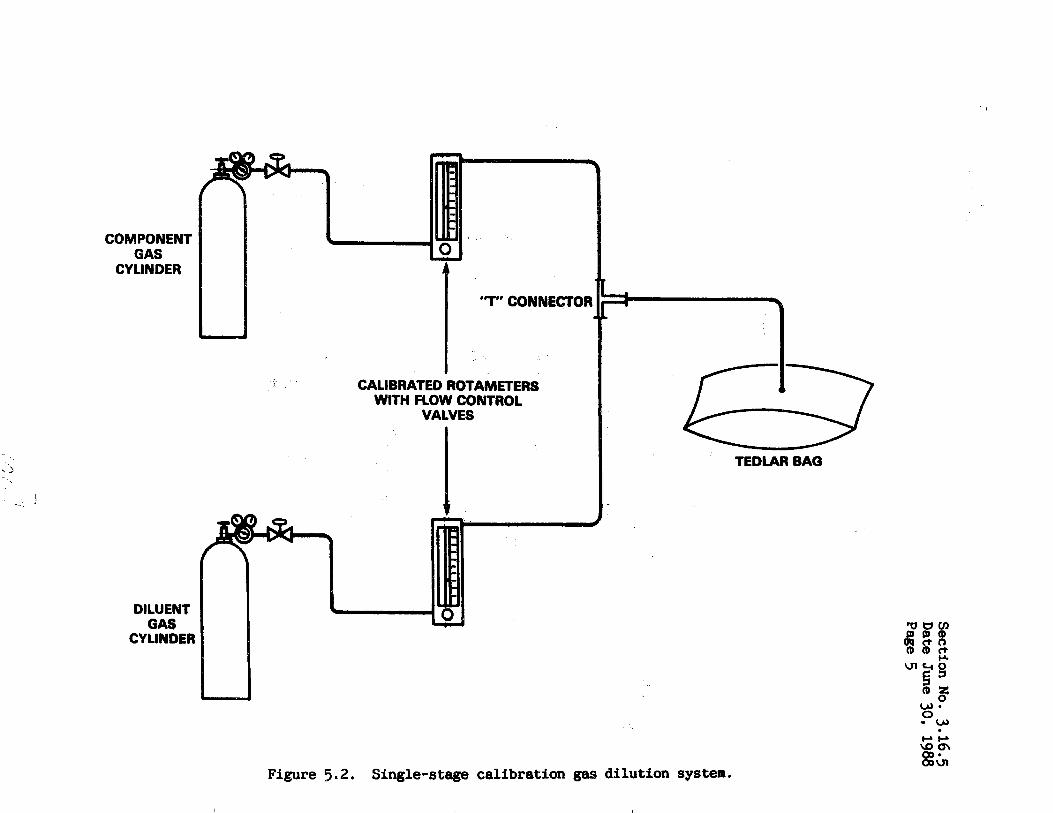
COMPONENT GAS
CY UNDER r '7" CONNECTOR
CALIBRATED ROTAMETERS WITH FLOW CONTROL
VALVES
DILUENT GAS
1 TEDIAR BAG
CYLINDER
Figure 5.2 , Single-stage calibration gas dilution system.
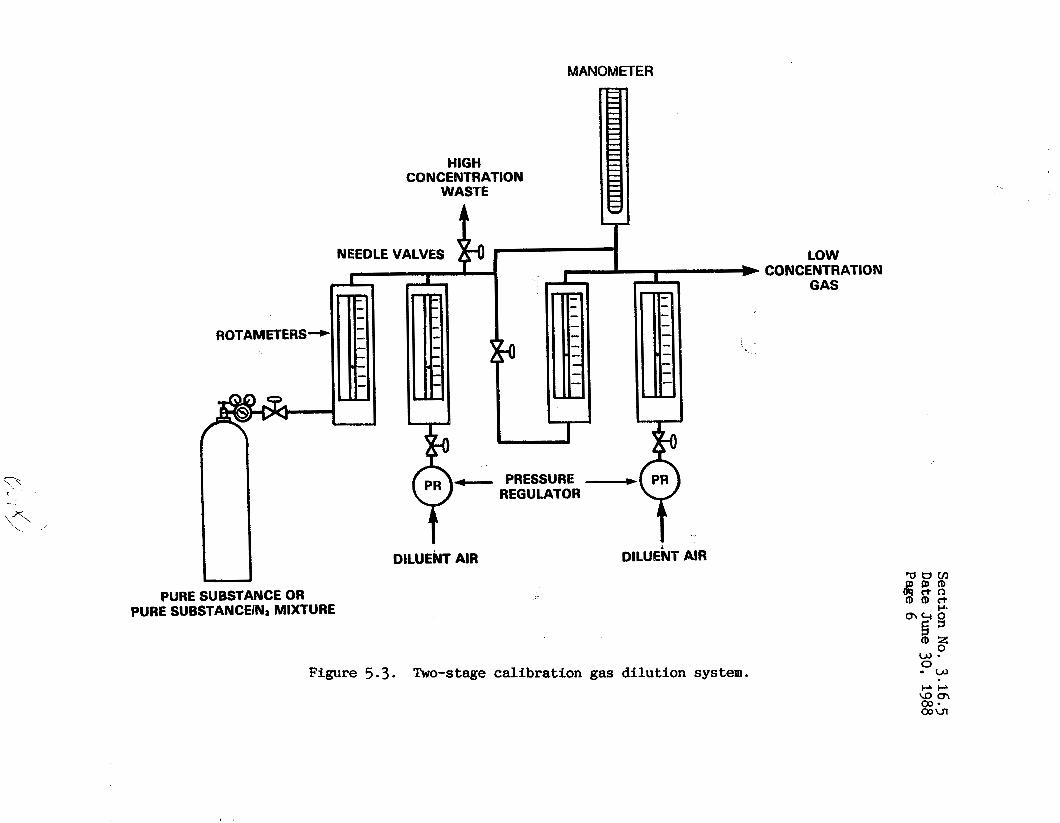
a
u
E 3 a
d >
W
W
w
2
I 1
t I I
in
9 Section No. 3.16.5
Date June 30, 1988
Page 6
L)
9 I
In
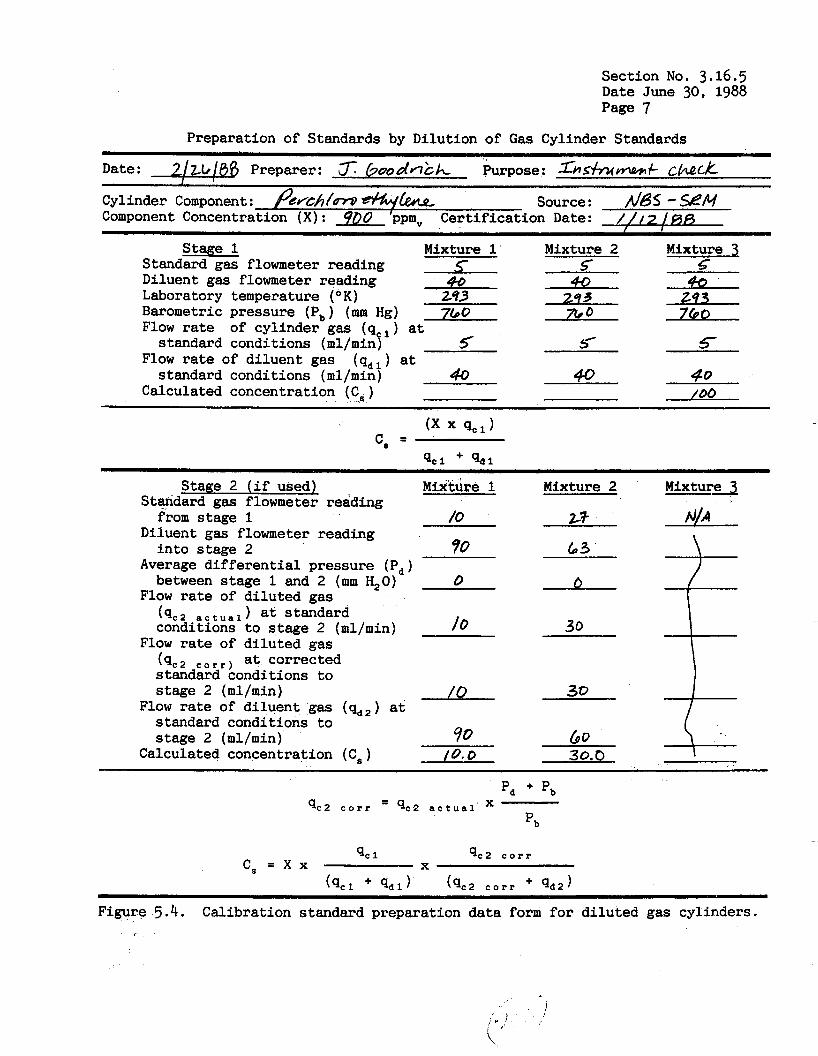
Section No. 3.16.5 Date June 30, 1988 Page 7
Preparation of Standards by Dilution of Gas Cylinder Standards
Cylinder Component: P&flih/nV leyre Source: d6S - ! Z M Component Concentration (X) : 900 ‘ppmv Certification Date: / I 1 7 /BR
Mixture 3 Stage 1 Mixture 1 Mixture 2 Standard gas flowmeter reading 5 5 5
40 L Diluent gas flowmeter reading 90 Barometric pressure (P,) (mm H g ) 760 7(*0 760 standard conditions (ml/minf 5 5‘ 5
standard conditions (ml/min) 40 eo 40 Calculated concentration (C,) /I90
293 2 9 3 Laboratory temperature ( O K ) 2‘?3
Flow rate
Flow rate of diluent gas
of cylinder gas (q 1 ) at
( qdl ) at
(X x qcJ c, =
q c 1 + qdl
Stage 2 (if used Standard gas flowmete; reading from stage 1
Diluent gas flowmeter reading into stage 2
Average differential pressure (P,) between stage 1 and 2 (mm H,O)
Flow rate of diluted gas
conditions to stage 2 (ml/min) Flow rate of diluted gas
( q c 2 corr) at corrected standard conditions to stage 2 (ml/min)
standard conditions to stage 2 (ml/min)
(qc2 a c t u a l ) at standard
Flow rate of diluent gas (qd2) at
Calculated concentration (C,)
Mixture 1 Mixture 2
/ O 30
/o 30
Mixturd
- q c 2 c o r r - q c 2 a c t u a l ’
’b
qc 1 q c 2 c o r r c, = x x X
Figure 5 . 4 , Calibration standard preparation data form for diluted gas cylinders.
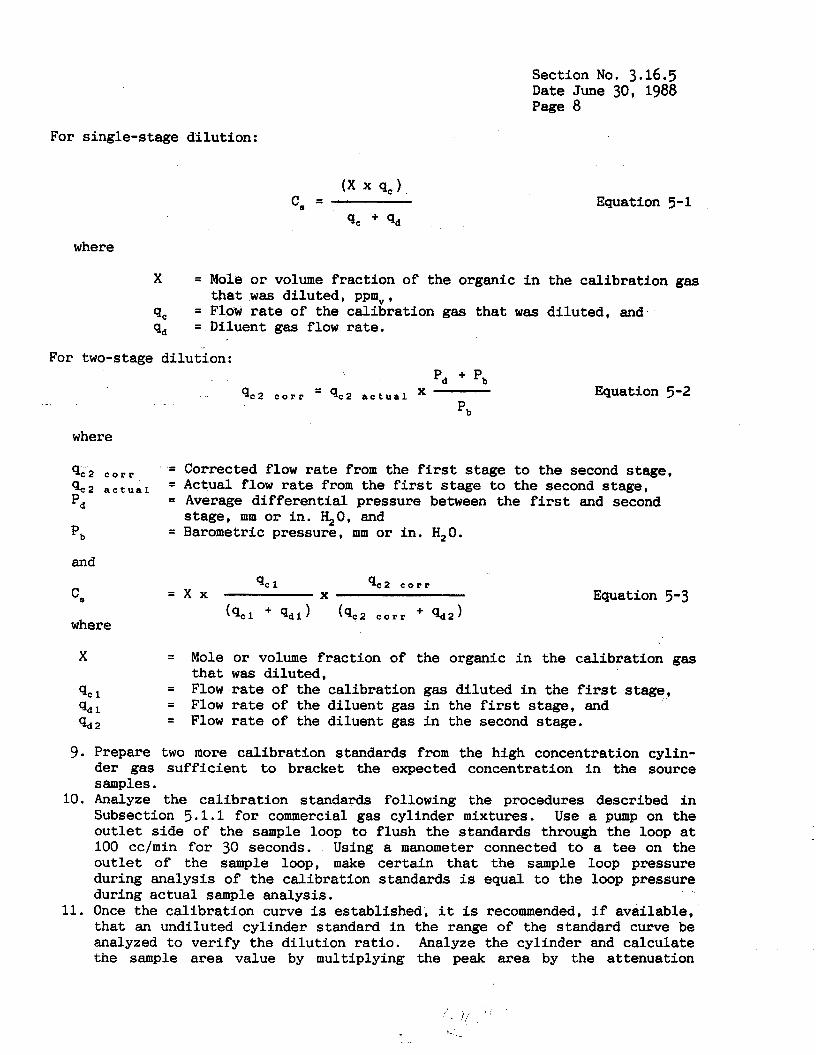
Section No. 3.16.5 Date June 30, 1988 Page 8
For single-stage dilution:
(X x 9,) c, = Equation 5-1
q c + qd
where
X
q, qd
= Mole or volume fraction of the organic in the calibration gas
= Flow rate of the calibration gas that w a s diluted, and = Diluent gas flow rate.
that was diluted, ppm,,
For two-stage dilution:
- q c 2 c o r r - q c 2 a c t u a l
where
'd + 'b
'b
Equation 5-2
rst stage to the seconl I stage, ' = Corrected flow rate from the f q c 2 c o r r q,, a c t u a l 'd
'b
= Actual flow rate from the first stage to the second stage, = Average differential pressure between the first and second
= Barometric pressure, mm or in. H 2 0 . stage, mm or in. H 2 0 , and
and q c 1 q c 2 c o r r
cs = x x X
( q c l + q d l ) (qc2 c o r r + q d 2 ) where
Equation 5-3
X = Mole or volume fraction of the organic in the calibration gas
q c 1 qd 1 = Flow rate of the diluent gas in the first stage, and q d 2
that was diluted, Flow rate of the calibration gas diluted in the first stage,
Flow rate of the diluent gas in the second stage.
=
=
9. Prepare two more calibration standards from the high concentration cylin- der gas sufficient to bracket the expected concentration in the source samples.
10. Analyze the calibration standards following the procedures described in Subsection 5.1.1 for commercial gas cylinder mixtures. Use a pump on the outlet side of the sample loop to flush the standards through the loop at 100 cc/min for 30 seconds. Using a manometer connected to a tee on the outlet of the sample loop, make certain that the sample loop pressure during analysis of the calibration standards is equal to the loop pressure during actual sample analysis.
11. Once the calibration curve is established, it is recommended, if available, that an undiluted cylinder standard in the range of the standard curve be analyzed to verify the dilution ratio. Analyze the cylinder and calculate the sample area value by multiplying the peak area by the attenuation
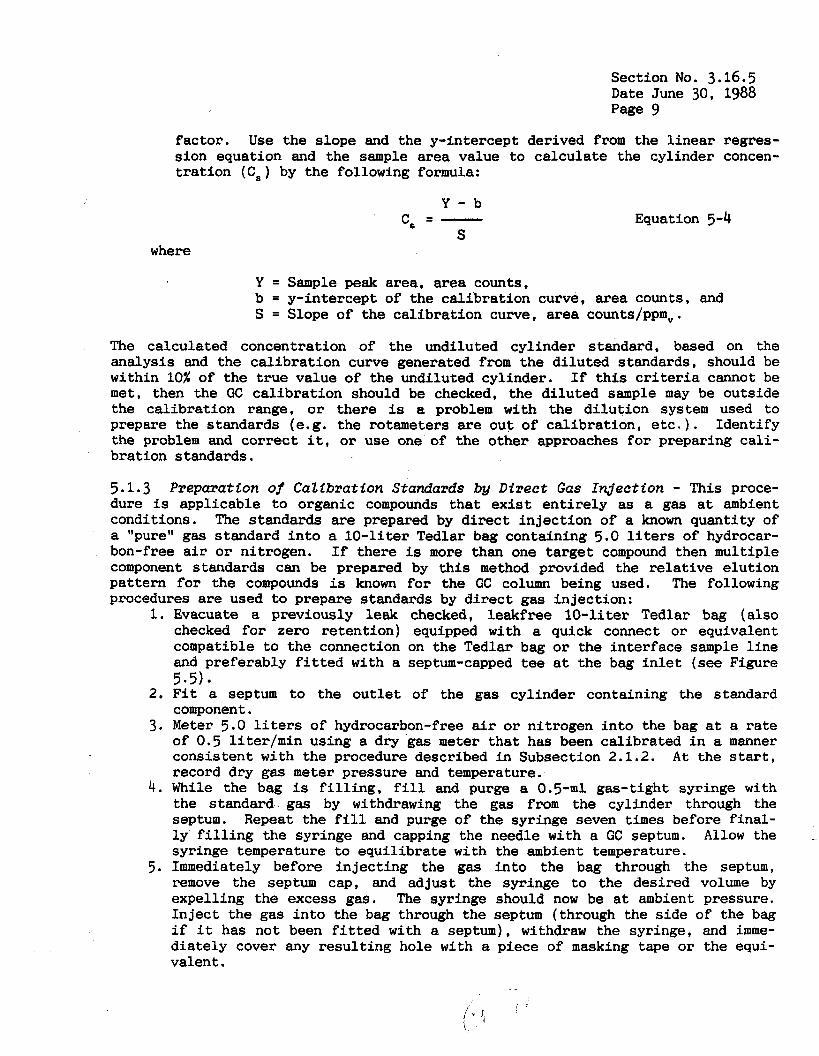
Section No. 3.16.5 Date June 30, 1988 Page 9
fac tor . Use the s lope and the y-Intercept derived from the l i n e a r regres- s ion equation and the sample area value t o calculate the cylinder concen- t r a t ion (C , ) by the following formula:
Y - b
S c, = - Equation 5-4
where
Y = Sample peak area, area counts, b = y-intercept of the ca l ibra t ion curve, area counts, and S = Slope of the ca l ibra t ion curve, area counts/ppmv.
The calculated concentration of the undiluted cyl inder standard, based on the analysis and the ca l ib ra t ion curve generated from the d i lu ted standards, should be within 10% of the t rue value of the undiluted cylinder. If t h i s criteria cannot be met, then the GC calibration should be checked, the d i lu t ed sample may be outside the ca l ibra t ion range, or there is a problem with the d i lu t ion system used t o prepare the standards (e.g. the rotameters are out of ca l ibra t ion , e tc . ) . Ident i fy the problem and correct i t , or use one of the other approaches f o r preparing C a l i - brat ion standards.
1.
2.
3.
4.
5.
5.1.3 Ppeparation of Catibratton Standards bg Direct Gas Iwection - This proce- dure is applicable t o organic compounds t h a t exist e n t i r e l y as a gas a t ambient conditions. The standards are prepared by d i r e c t i n j ec t ion of a known quant i ty of a "pure'v gas standard i n t o a 1 0 - l i t e r Tedlar bag containing 5.0 liters of hydrocar- bon-free a i r or nitrogen. X f there is more than one target compound then multiple component standards can be prepared by t h i s method provided the r e l a t ive e lu t ion pa t te rn for the compounds is known f o r the GC column being used. The following procedures are used t o prepare standards by d i r e c t gas inject ion:
Evacuate a previously leak checked, leakfree 10-liter Tedlar bag (a l so checked for zero retent ion) equipped with a quick connect o r equivalent compatible t o the connection on the Tedlar bag or the in te r face sample l i n e and preferably f i t t e d with a septum-capped tee a t the bag i n l e t (see Figure
F i t a septum t o the ou t l e t of the gas cylinder containing the standard component. Meter 5.0 l i ters of hydrocarbon-free a i r or nitrogen i n t o the bag a t a rate of 0.5 l i t e r /min using a dry gas meter t h a t has been cal ibrated i n a manner consis tent w i t h the procedure described i n Subsection 2.1.2. A t the s t a r t , record dry gas meter pressure and temperature. While the bag is f i l l i n g , f i l l and purge a O . 5 - m l gas-t ight syringe with the standard gas by withdrawing the gas from the cylinder through the septum. Repeat the f i l l and purge of the syringe seven times before f ina l - l y f i l l i n g the syringe and capping the needle with a GC septum. Allow the syringe temperature t o equi l ibra te with the ambient temperature. Immediately before in j ec t ing the gas i n t o the bag through the septum, remove the septum cap, and adjust the syringe to the desired volume by expelling the excess gas. The syringe should now be a t ambient pressure. In j ec t the gas i n t o the bag through the septum (through the s ide of the bag i f it has not been f i t t e d with a septum) , withdraw the syringe, and i m m e - d i a t e ly cover any r e su l t i ng hole with a piece of masking tape or the equi- valen t .
5.5)
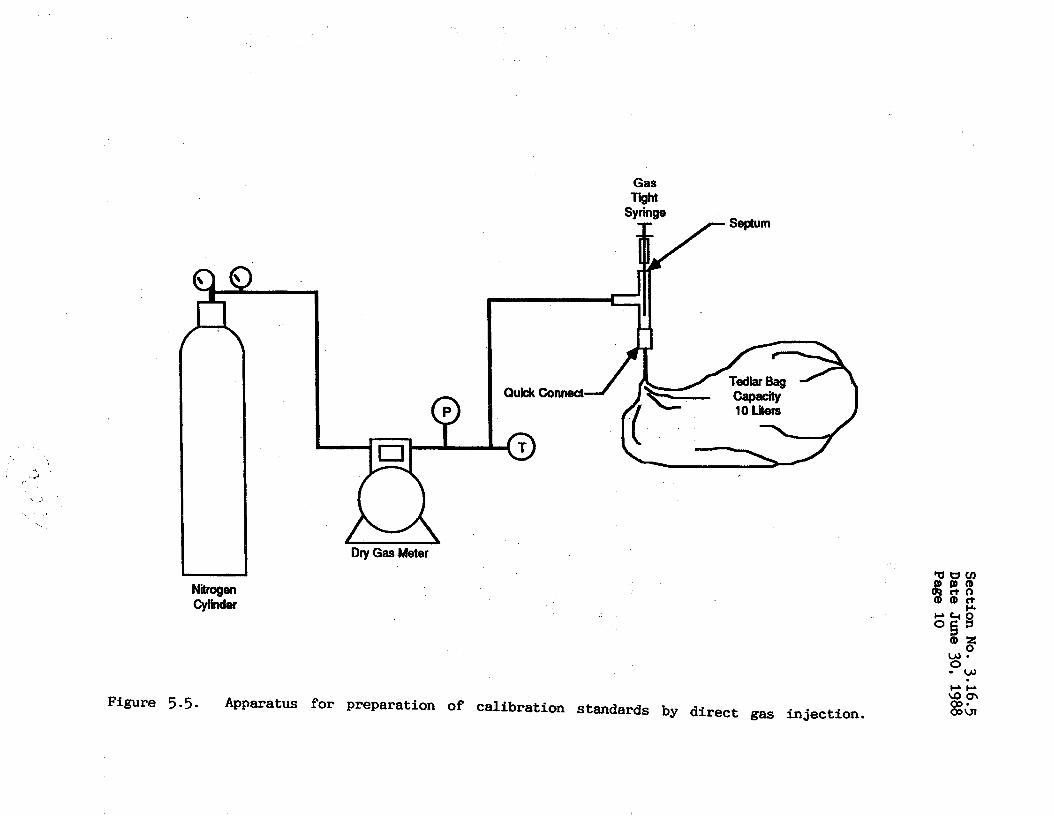
r-
Section No. 3.16.5 D
ate June 30, 1988 Page 10
1% zE
I
h
P
m
8 k
0
cu 3 2 8 u a 0
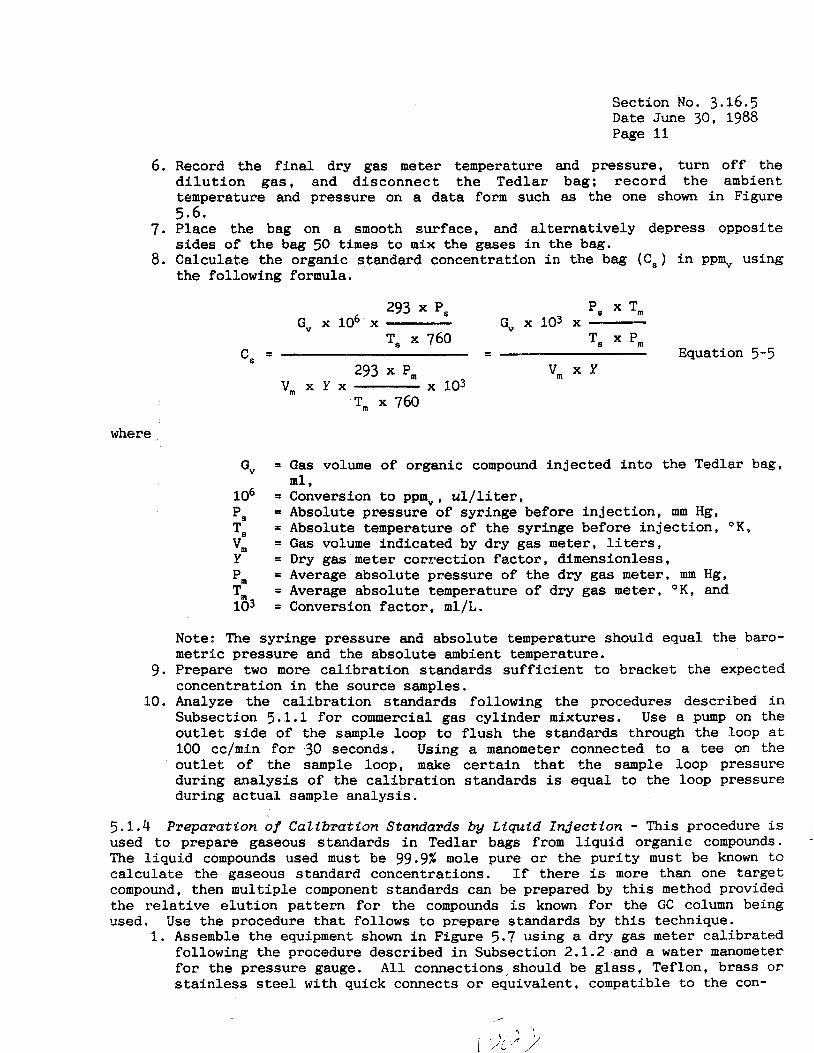
Section No. 3.16.5 Date June 30, 1988 Page 11
6.
7 .
8.
where
9 .
10.
Record the f i n a l dry gas meter temperature d i l u t i o n gas, and d isconnec t t h e Tedlar temperature and pressure on a da ta form such 5.6.
and pressure, turn off the bag; record t h e ambient as the one shown i n Figure
Place the bag on a smooth surface, and a l t e rna t ive ly depress opposite s ides of the bag 50 times t o mix the gases i n the bag. Calculate the organic standard concentration i n the bag ( C , ) i n ppm, using the following formula.
293 x p, Pa x Tm
T, x 760 T s x Pm G, x lo6' x G, x 103 x
c, = - - Equation 5-5 293 x p, v, x Y
V , , , X Y X x 103 'T, x 760
G, =
106 = P,
'm
pm
103 =
I
T, =
Y -
T,,, =
- - - - -
G a s volume of organic compound in jec ted i n t o the Tedlar bag, m l . Conversion t o ppm,, u l / l i t e r . Absolute pressure of syringe before in j ec t ion , mm Hg, Absolute temperature of the syringe before in j ec t ion , O K , Gas volume indicated by dry gas meter, l i t e r s , Dry gas meter correct ion f ac to r , dimensionless, Average absolute pressure of the dry gas meter, mm Hg, Average absolute temperature of dry gas meter, O K , and Conversion f ac to r , ml /L .
Note: The syringe pressure and absolute temperature should equal the baro- metric pressure and the absolute ambient temperature. Prepare t w o more ca l ib ra t ion standards s u f f i c i e n t to bracket the expected concentration i n the source samples. Analyze the ca l ibra t ion standards following the procedures described i n Subsection 5.1.1 f o r commercial gas cylinder mixtures. U s e a pump on the o u t l e t s i d e of the sample loop t o f lush the standards through the loop a t 100 cc/min f o r 30 seconds. Using a manometer connected t o a tee on the o u t l e t of the sample loop, make ce r t a in t h a t the sample loop pressure during ana lys i s of the ca l ib ra t ion standards is equal t o the loop pressure during ac tua l sample analysis .
5.1.4 Preparation of Calibration Standards by Liquid Injection - This procedure is used t o prepare gaseous standards i n Tedlar bags from l i q u i d organic compounds. -
The l iqu id compounds used must be 99.9% mole pure or the pur i ty must be known to ca lcu la te the gaseous standard concentrations. If there is more than one ta rge t compound, then multiple component standards can be prepared by t h i s method provided the r e l a t i v e e lu t ion pa t te rn f o r the compounds is known f o r the GC column being wed . Use the procedure t h a t follows t o prepare standards by t h i s technique.
1. Assemble the equipment shown i n Figure 5.7 using a dry gas meter ca l ibra ted following the procedure described i n Subsection 2.1.2 and a water manometer f o r the pressure gauge. A l l connections,should be g l a s s , Teflon, brass o r s t a i n l e s s steel with quick connects or equivalent, compatible t o the con-
,
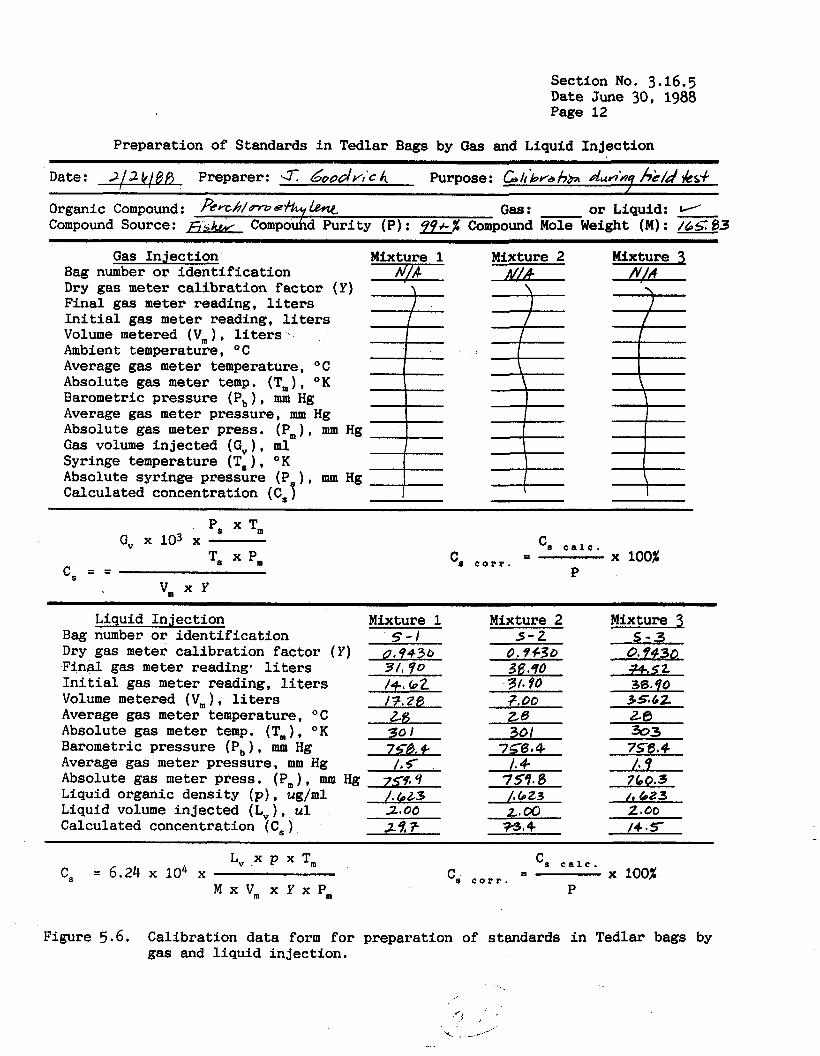
Section No. 3.16.5 Date June 30, 1988 Page 12
Preparation of Standards i n Tedlar Bags by Gas and Liquid Injection
Date: 2/24!@fi Preparer: 47 600t/v,'c ti Purpose: G /r iwa hb ~ M * W he/. ks+
Organic Compound: f i Y C & - o e h f hnt Gas : or Liquid: Compound Source: f i5kcc / Compouhd Puri ty (P): 9911-X Compound Mole Weight (M): /6s1783
Gas In jec t ion Bag number or iden t i f i ca t ion Dry gas meter ca l ib ra t ion factor Final gas meter reading, l i ters I n i t i a l gas meter reading, liters Volume metered (Vm ) , liters .
Mixture 1 1
Mixture 2 r//A.
Mixture 3 z Ambient temperature, O C
Average gas meter temperature, O C
Absolute gas meter temp. (TJ* OK Barometric pressure ( P b ) * mm Hg Average gas meter pressure, mm H g Absolute gas meter press. (P,), mm Hg Gas volume in jec ted ( G , ) , m l Syringe temperature (T, ) , O K
Absolute syringe pressure (P ) * mm Hg Calculated concentration (C,
Ps x Tm G.. x 103 x c- __ ._ 8 C I A O . - - x 100% Cs c o r r .
v, x Y
Mixture 3 Liquid In jec t ion Mixture 1 Mixture 2 Bag number or i den t i f i ca t ion s - I 5 - 2 s - 3 Dry gas meter ca l ibra t ion factor (Y) 0.9430 0.9c30 0.9430 Final gas meter reading. liters 31' 90 38.40 *,sz I n i t i a l gas meter reading, liters /4 ,62 Yf * 90 36. do
Average gas meter temperature, O C as 26 .ze Absolute gas meter temp. (Tm) , O K 30 I 30 I -3
Average gas meter pressure, mm Hg /, s- 1.4 /* 9
Liquid volume in jec ted (L, ) , ul 2 0 0 28 00 2.00 Calculated concentration (C,) 29. ic ?3* 4 / 4 . 5
Volume metered (V,), liters /3 .25 9.00 35.62
Barometric pressure (Pb ) , mm H g 7S8 I 4
Absolute gas meter press. (P,)* mm H g 7 5 9, Y 754.8 760.3
7 6 4.
Liquid organic densi ty (p ) , ug/ml /. GL3 /m623 /* 623
C, = 6.24
Figure 5.6.
L, .x P x T, 104
M x V m x Y x P ,
" 's c a l c . - - x 100%
'8 c o r r . P
Calibration da ta form f o r preparation of standards i n Tedlar bags by gas and l iqu id in jec t ion ,

L
Sectio
n N
o. 3.16.5 D
ate June 30, 1988 P
age 13
8 E
0 c
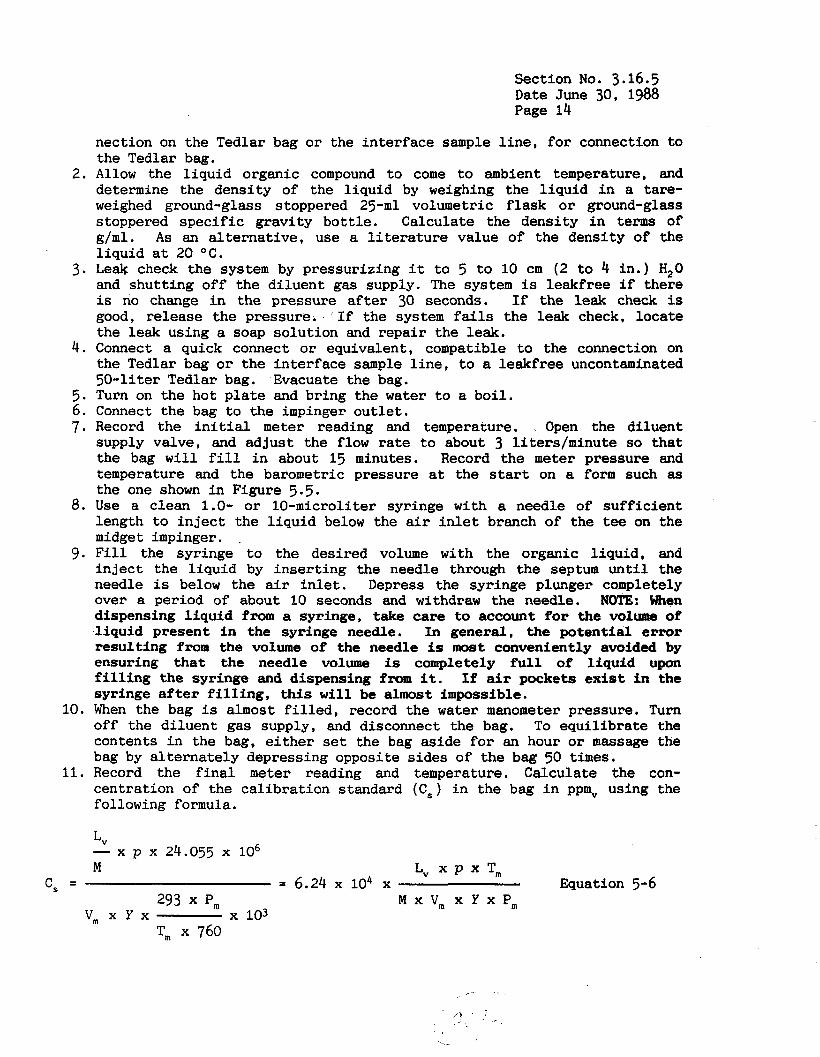
Section No. 3.16.5 Date June 30, 1988 Page 14
nection on the Tedlar bag o r the in te r face sample l i n e , f o r connection t o the Tedlar bag.
2. Allow the l i qu id organic compound t o come t o ambient temperature, and determine the density of the l i qu id by weighing the l iqu id i n a tare- weighed ground-glass stoppered 25-1111 volumetric f l a sk o r ground-glass stoppered spec i f i c gravi ty bot t le . Calculate the densi ty i n terms of g/ml. As an a l t e rna t ive , use a literature value of the densi ty of the l i qu id a t 20 O C .
3. Leak check the system by pressurizing it t o 5 t o 10 cm (2 to 4 in . ) H,O and shut t ing off the d i luent gas supply. The system is leakfree i f there is no change i n the pressure a f t e r 30 seconds. If the leak check is good, release the pressure. If the system f a i l s the leak check, locate the leak using a soap solut ion and repa i r the leak.
4. Connect a quick connect o r equivalent, compatible to the connection on the Tedlar bag o r the in te r face sample l i n e , t o a leakfree uncontaminated 50-liter Tedlar bag. Evacuate the bag.
5. Turn on the hot p l a t e and bring the water to a bo i l . 6. Connect the bag t o the impinger ou t l e t . 7. Record the i n i t i a l meter reading and temperature. Open the di luent
supply valve, and ad jus t the flow rate t o about 3 l i ters /minute so t ha t the bag w i l l f i l l i n about 15 minutes. Record the meter pressure and temperature and the barometric pressure a t the start on a form such as the one shown i n Figure 5.5.
8. Use a clean 1.0- o r 10-microliter syringe with a needle of su f f i c i en t length t o i n j e c t the l i qu id below the a i r i n l e t branch of the tee on the midget impinger. .
9 . F i l l the syringe t o the desired volume with the organic l iqu id , and i n j e c t the l i qu id by in se r t ing the needle through the septum u n t i l the needle is below the air i n l e t . Depress the syringe plunger completely over a period of about 10 seconds and withdraw the needle. NOTE: When dispensing l i qu id f r o m a syringe, take care to account for the volume of l i qu id present i n the syringe needle. I n general , the poten t ia l error resu l t ing from the volume of the needle is most conveniently avoided by ensuring t h a t the needle volume is completely f u l l of l iqu id upon f i l l i n g the syringe and dispensing from it. If air pockets exis t i n the syringe after f i l l i n g , t h i s w i l l be almost impossible.
10. When the bag is almost f i l l e d , record the water manometer pressure. Turn off the d i luent gas supply, and disconnect the bag. To equi l ibra te the contents i n the bag, e i t h e r set the bag aside f o r an hour or massage the bag by a l t e rna te ly depressing opposite s ides of the bag 50 times.
11. Record the f i n a l meter reading and temperature. Calculate the con- centrat ion of the ca l ibra t ion standard (C,) i n the bag i n ppm, using the following formula.
L" - x p x 24.055 x lo6 M L" x P x T,
cs = = 6.24 x 10⁴ x Equation 5-6 293 x p,
T, x 760
M x V, x Y x P, V , X Y X x 103
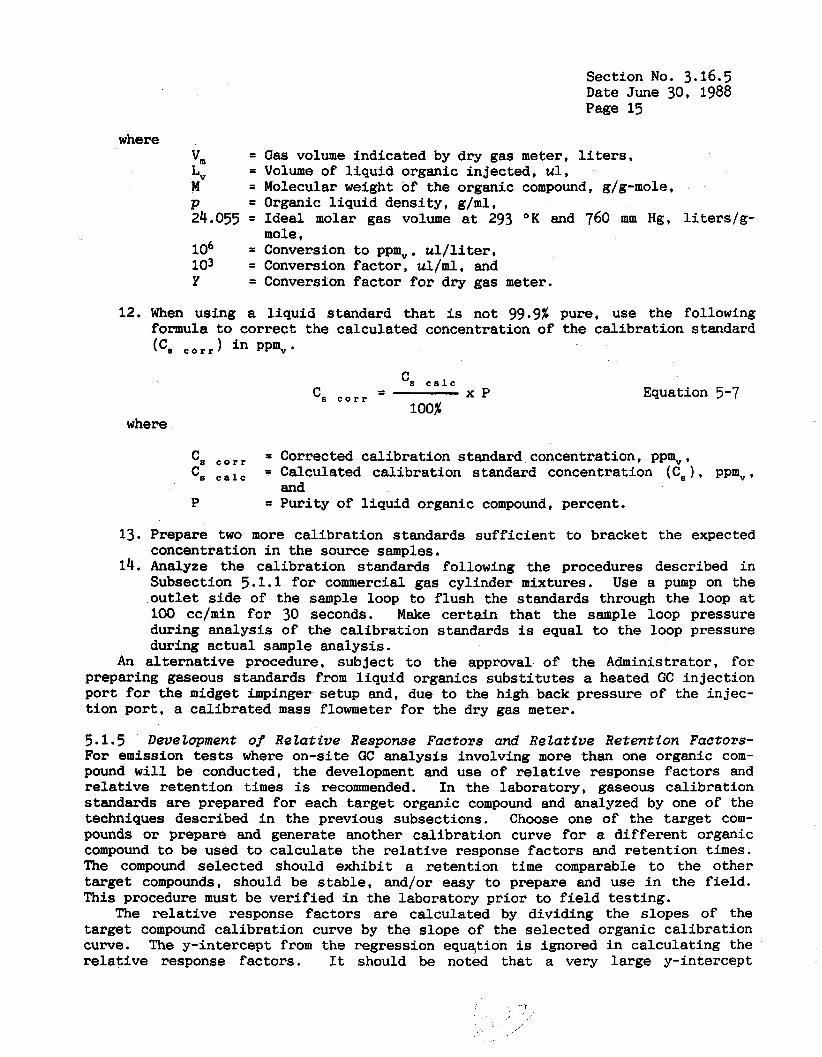
Section No. 3.16.5 Date June 30, 1988 Page 15
where
12. When using a
Gas volume indicated by dry gas meter, liters, Volume of l i qu id organic injected, u l , Molecular weight of the organic compound, g/g-mole, Organic l i qu id densi ty , g/ml, Ideal molar gas volume a t 293 O K and 760 mm Hg, l i t e r s / g - mole , Conversion t o ppmv, u l / l i t e r , Conversion f ac to r , ullml, and Conversion fac tor f o r dry gas meter.
l i qu id standard t h a t is not 99.9% pure, use the following formula to correct the calculated concentration of the ca l ib ra t ion standard (C, c o r r ) i n PPmv*
Cs c a l c
100% X P - - Cs c o r r Equation 5-7
where
Cs c o r r = Corrected ca l ibra t ion standard concentration, ppm,, C, talc = Calculated ca l ibra t ion standard concentration ( C B ) , ppm,,
P = Pur i ty of l i qu id organic compound, percent. and
13. Prepare two more ca l ibra t ion standards su f f i c i en t to bracket the expected concentration i n the source samples.
14. Analyze t h e ca l ibra t ion standards following the procedures described i n Subsection 5.1.1 for commercial gas cylinder mixtures. Use a pump on t h e o u t l e t s i d e of the sample loop to f lush the standards through the loop at 100 cc/min for 30 seconds. Make ce r t a in t h a t the sample loop pressure during analysis of the ca l ibra t ion standards is equal t o the loop pressure during ac tua l sample analysis.
An a l t e rna t ive procedure, subject to the approval of the Administrator, fo r preparing gaseous standards from l iqu id organics subs t i t u t e s a heated GC in jec t ion port f o r the midget impinger setup and, due to the high back pressure of the injec- t ion por t , a ca l ibra ted mass flowmeter f o r the dry gas meter.
5.1.5 Development of Relative Response Factors and Relative Retention Factors- For emission tests where on-si te GC analysis involving more than one organic com- pound w i l l be conducted, the development and use of r e l a t i v e response fac tors and r e l a t i v e re ten t ion times is recommended. I n the laboratory, gaseous ca l ibra t ion standards are prepared f o r each t a rge t organic compound and analyzed by one of the techniques described i n the previous subsections. Choose one of the t a rge t com- pounds or prepare and generate another ca l ibra t ion curve f o r a d i f f e r e n t organic compound t o be used t o ca lcu la te the r e l a t i v e response f ac to r s and re ten t ion times. The compound se lec ted should exhib i t a re tent ion t i m e comparable t o t h e other target compounds, should be s t ab le , and/or easy to prepare and use i n the f i e ld . This procedure must be ve r i f i ed i n the laboratory p r io r t o f i e l d tes t ing .
The r e l a t i v e response fac tors are calculated by dividing the slopes of the target compound ca l ibra t ion curve by the slope of the selected organic ca l ibra t ion curve. The y-intercept from the regression equation is ignored i n ca lcu la t ing the r e l a t i v e response factors . It should be noted tha t a very large y-intercept
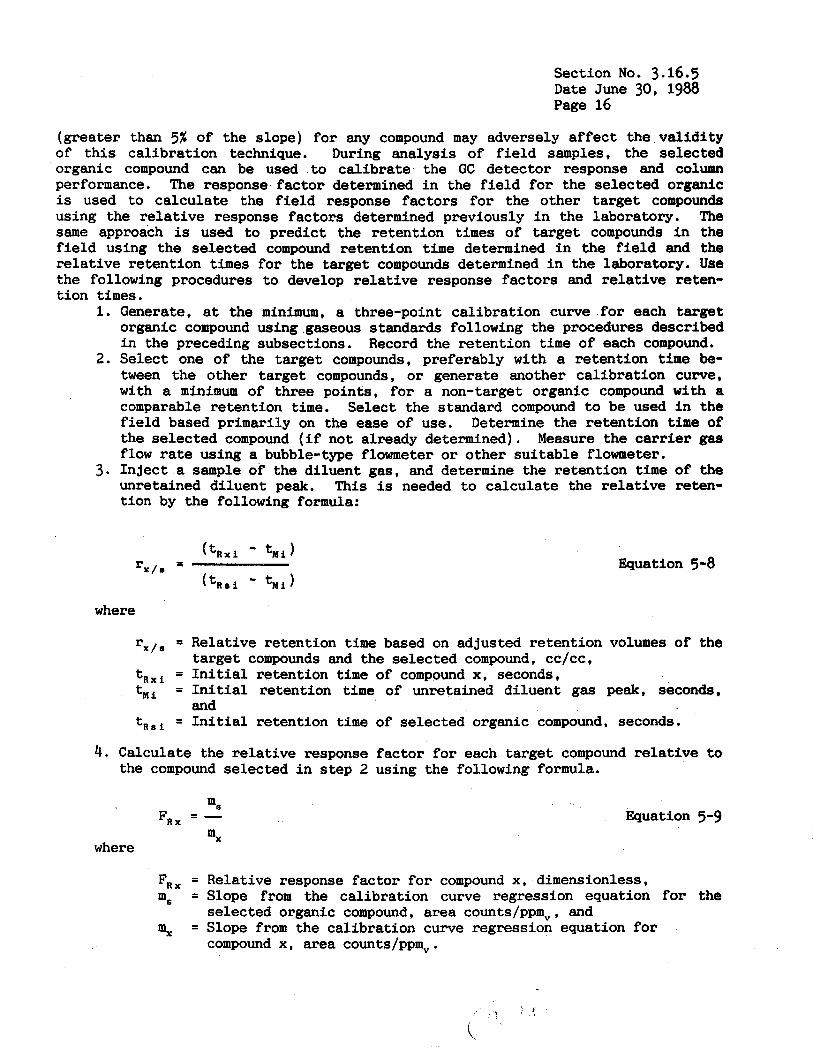
Section No. 3.16.5 Date June 30, 1988 Page 16
(greater than 5% of the slope) fo r any compound may adversely a f f e c t the va l id i ty of t h i s ca l ibra t ion technique. During analysis of f i e l d samples, the selected organic compound can be used t o ca l ib ra t e the GC detector response and column performance. The response fac tor determined i n the f i e l d f o r the selected organic is used t o ca lcu la te the f i e l d response fac tors for the other t a rge t compounds using the r e l a t i v e response fac tors determined previously i n the laboratory. The same approach is used t o predict the retent ion times of ta rge t compounds i n the f i e l d using the selected compound retent ion t i m e determined i n the f i e l d and the r e l a t i v e retent ion times f o r the target compounds determined i n the laboratory. Use the following procedures t o develop r e l a t i v e response fac tors and r e l a t ive reten- t ion times.
1.
2.
3 .
Generate, at the minimum, a three-point ca l ibra t ion curve for each target organic compound using gaseous standards following the procedures described i n the preceding subsections. Select one of the ta rge t compounds, preferably with a retent ion time be- tween the other target compounds, or generate another ca l ibra t ion curve, with a minimum of three points, f o r a non-target organic compound w i t h a comparable re tent ion t i m e . Select the standard compound t o be used i n the f ield based primarily on the ease of use. Determine the retent ion time of the selected compound ( i f not already determined). Measure the carrier gas flow rate using a bubble-type flowmeter or other suitable flowmeter. In j ec t a sample of the di luent gas, and determine the retent ion time of the unretained d i luent peak. This is needed t o ca lcu la te the r e l a t i v e reten- t ion by the following formula:
Record the re tent ion time of each compound.
Equation 5-8
Relative retent ion time based on adjusted retent ion volumes of the target compounds and the selected compound, cc/cc, I n i t i a l re tent ion time of compound x, seconds, I n i t i a l re tent ion time of unretained d i luent gas peak, seconds, and I n i t i a l re tent ion time of selected organic compound, seconds.
4. Calculate the r e l a t ive response factor for each target compound r e l a t i v e t o the compound selected i n step 2 using the following formula.
- F*x - where
FRx = m, =
mx - -
Equation 5-9
Relative response fac tor f o r compound x, dimensionless, Slope from the ca l ibra t ion curve regression equation f o r the selected organic compound, area counts/ppmv, and Slope from the ca l ibra t ion curve regression equation fo r compound x, area counts/ppm,.
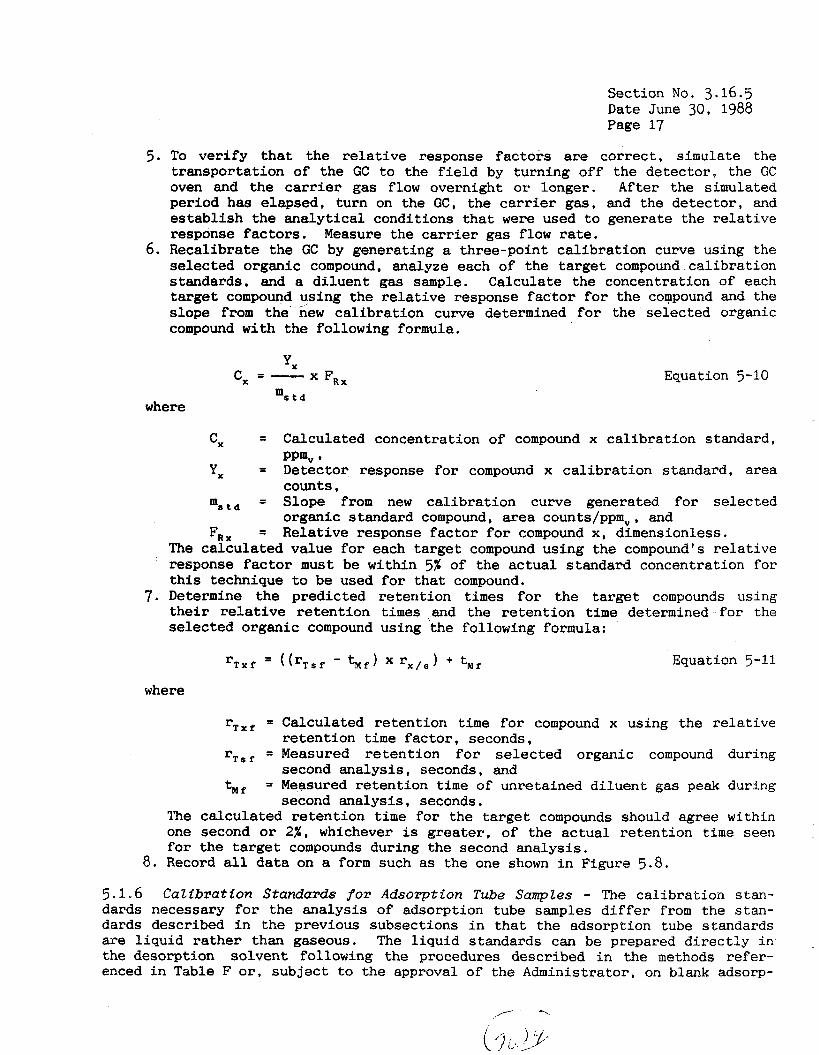
Section No. 3.16.5 Date June 30, 1988 Page 17
5. To ver i fy t h a t the r e l a t i v e response fac tors are cor rec t , s i m u l a t e the t ransportat ion of the GC t o the f i e l d by turning off the detector , t h e GC oven and the carrier gas flow overnight o r longer. After the simulated period has elapsed, turn on the GC, the carrier gas , and the detector , and e s t ab l i sh the ana ly t ica l conditions t h a t were used t o generate the r e l a t ive response factors. Measure the carrier gas flow rate.
6 . Recalibrate the GC by generating a three-point ca l ib ra t ion curve using the selected organic compound, analyze each of the target compound ca l ibra t ion standards, and a d i luent gas sample. Calculate the concentration of each target compound using the r e l a t i v e response f ac to r f o r the compound and the slope from the new ca l ibra t ion curve determined f o r the selected organic compound with the following formula.
V A
FRx c, = - m s t d
where
Equation 5-10
C X = Calculated concentration of compound x ca l ibra t ion standard,
Y X = Detector response f o r compound x ca l ib ra t ion standard, area
m s t d = Slope from new ca l ib ra t ion curve generated f o r selected
F,, = Relat ive response f ac to r f o r compound x, dimensionless. The calculated value f o r each target compound using the compound's r e l a t ive response factor must be within 5% of the ac tua l standard concentration for t h i s technique t o be used f o r t h a t compound.
7. Determine the predicted retent ion times f o r the t a rge t compounds using their r e l a t i v e re ten t ion times and the re ten t ion t i m e determined f o r the selected organic compound using the following formula:
PPm, 1
counts ,
organic standard compound, area counts/ppmv, and
Equation 5-11
where
rTxf = Calculated retent ion time f o r compound x using the r e l a t ive
rTsf = Measured r e t en t ion f o r s e l ec t ed organic compound during
tM, = Measured retent ion t i m e of unretained d i luent gas peak during
The calculated re ten t ion t i m e f o r the target compounds should agree within one second or 2%, whichever is greater, of the ac tua l re tent ion time seen fo r the target compounds during the second analysis .
re ten t ion t i m e f ac to r , seconds,
second analysis , seconds, and
second analysis , seconds.
8. Record a l l da t a on a form such as the one shown i n Figure 5.8.
5.1.6 Calibration Standards for Adsorption Tube Samples - The ca l ibra t ion stan- dards necessary f o r the analysis of adsorption tube samples d i f f e r from the stan- dards described i n the previous subsections i n t h a t the adsorption tube standards are l iqu id r a the r than gaseous. The l iqu id standards can be prepared d i r ec t ly i n the desorption solvent following the procedures described i n the methods refer- enced i n Table F o r , subjec t t o the approval of the Administrator, on blank adsorp-

. . . . . . . . . - . . . - ._ . . - .. . - -.
Section No. 3.16.5 Date June 30, 1988 Page 18
Development of Relative Response Factors and Relative Retention Factors
Target Compound Calibration Data First analysis/verify analysis
Standard 1
Standard concentration 7 . 0 5 p p Flow rate through loop (ml/min) Loo/ m Liquid injection volume @u6es) Injection time (24-hr clock) 14!00/ f 4 : 3 Chart speed /Oc+in/ 10 Detector attenuation z / z Peak retention time ( t, , / tR , ) t . 4 3 / 2.44 Peak retention time range 0.02 Peak area 373 / 346 Peak area x atten. factor ( Y , / Y , ) 74b / b42 Verification analysis conc.(Cx) 9. ze Percent deviation from actual -6.2% Calculated retention time (rTxf) 2-42 Percent deviation from actual -6.6%
Linear regression equation; slope (m,) : 73.46
MI+/ NA,
Standard 2 Standard 3
97. I 52 .4 +/. 4
2.42
y-intercept (b) : /O.qb -5%- 0.6%
Surrogate Calibration Data Standard 1 Standard 2 Standard 3 First analysis/second analysis
Standard concentration /o -0 ppn 3 0 . 0 p p ~ /oo ppHz Flow rate through loop (ml/min) ouw/ 2-00 a o 0 / 2 0 0 2Qo/zoo Liquid injection volume (tubes) A(&/ n/P M4-/dA AM / d4 Injection time (24-hr clock) i4!U/ 1 4 2 6 14 Sl/ /5!I2 ]q!49/ h : C 4 Chart speed fOcmfrrii/ lo 10 / 1 0 /o / 10 Detector attenuation I / I 1 / I z/ 2 Peak retention time range 0.02 0.01 0.01 Peak area 963 / 964 >?&Jm 4 431G/d;FS2 Peak area x attenuation factor % 3 / 9 64 d-%6/2-?qq 743 2/ 9.504
Linear regression equation; slope (ms ) : 44.39 (m,) : 9S. /0 y-intercept (b) : -/B.b9
Peak retention time ( tR / t, ) 3.26/ 3.28 3.23/ 3.26 3.27/ 3.2 6
Nonretained peak retention time ( tMi /tMf) : 0.91 / 0.43
Relative Response Factor (FR, ) : /. 2F Relative Retention Factor (rx,s : 0.6
ms F,, = -
mx
- rx/s -
Figure 5.8. Data form for development of relative response and relative retention factors.
/
/
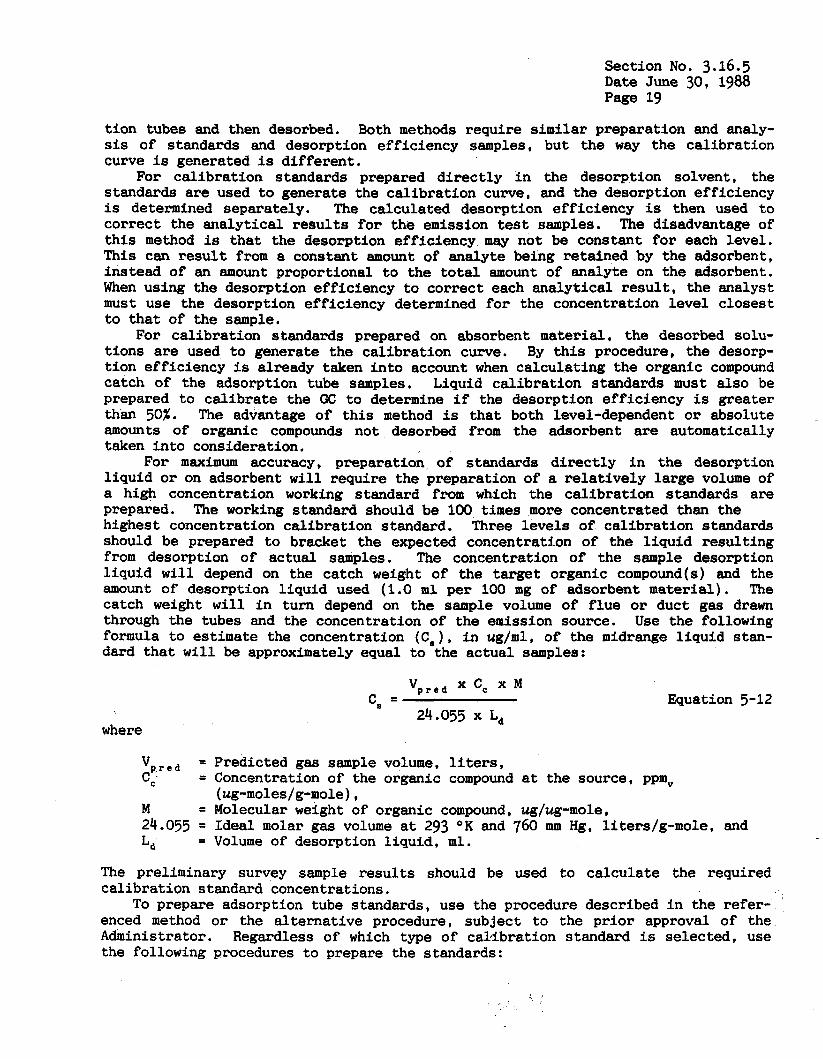
Section No. 3.16.5 Date June 30, 1988 Page 19
t ion tubes and then desorbed. Both methods require similar preparation and analy- sis of standards and desorption efficiency samples, but the way the cal ibrat ion curve is generated is d i f fe ren t .
For cal ibrat ion standards prepared directly i n the desorption solvent, the standards a re used t o generate the cal ibrat ion curve, and the desorption efficiency is determined separately. The calculated desorption efficiency is then used t o correct the analyt ical r e su l t s f o r the emission test samples. The disadvantage of th i s method is tha t the desorption efficiency m a y not be constant f o r each level. This can r e s u l t from a constant amount of analyte being retained by the adsorbent, instead of an amount proportional t o the t o t a l amount of analyte on the adsorbent. When using the desorption efficiency t o correct each analyt ical r e su l t , the analyst must use the desorption efficiency determined f o r the concentration leve l closest t o that of the sample.
For cal ibrat ion standards prepared on absorbent material, the desorbed solu- t ions are used t o generate the cal ibrat ion curve. By t h i s procedure, the desorp- t ion efficiency is already taken in to account when calculating the organic compound catch of the adsorption tube samples. Liquid cal ibrat ion standards must also be prepared t o calibrate the GC t o determine i f the desorption efficiency is greater than 50%. The advantage of t h i s method is that both level-dependent or absolute amounts of organic compounds not desorbed from the adsorbent a m automatically taken in to consideration.
For m a x i m u m accuracy, preparation of standards directly i n the desorption l iqu id or on adsorbent w i l l require the preparation of a re la t ive ly large volume of a high concentration working standard from which the cal ibrat ion standards are prepared. highest concentration cal ibrat ion standard. Three levels of cal ibrat ion standards should be prepared t o bracket t he expected concentration of the l iqu id resul t ing from desorption of actual samples. The concentration of the sample desorption l iquid w i l l depend on the catch weight of the target organic compound(s) and the amount of desorption l iquid used (1.0 ml per 100 mg of adsorbent material). The catch weight w i l l i n turn depend on the sample volume of f lue o r duct gas drawn through the tubes and the concentration of the emission source. U s e the following formula t o estimate the concentration (Cs), i n ug/ml, of the midrange l iquid stan- dard tha t w i l l be approximately equal to the actual samples:
The working standard should be 100 times more concentrated than the
where
" P M d xC, x M
24.055 x L, c, = Equation 5-12
Predicted gas sample volume, liters, Concentration of the organic compound a t the source, ppm, (ug-moles/g-mole), Molecular weight of organic compound, ug/ug-mole, Ideal molar gas volume a t 293 O K and 760 mm Hg, liters/g-mole, and Volume of desorption l iquid, m l .
The preliminary survey sample r e su l t s should be used t o calculate the required cal ibrat ion standard concentrations.
To prepare adsorption tube standards, use the procedure described i n the refer- enced method o r the al ternat ive procedure, subject t o the p r io r approval of the Administrator. Regardless of which type of caldbration standard is selected, use the following procedures t o prepare the standards:
Section No. 3.16.5 Date June 30, 1988 Page 20
1. Prepare a working standard fo r each organic compound by weighing each com- pound in to an individual tare-weighed ground-glass stoppered 25O-ml volume- t r i c f lask. Dissolve the compound i n the proper desorption solvent speci- fied by the referenced method i n Table E of the Method Highlights Section. Dilute the solution t o volume. Refrigerate the working standard when not being used.
2 . Using a clean microli ter syringe, transfer the required amount of working standard t o a v i a l equipped with a Teflon-lined septum top, and add suff i - c ient desorption solvent t o achieve a f ina l volume equal t o t h e volume of desorption solvent required fo r actual samples. Cap the v i a l with the top, shake the v i a l t o mix the contents. NOTE: When dispensing liquid from a syringe, take care to account for the volume of liquid present in the syringe needle. In general, the potential error resulting f m m the volume of the needle is most conveniently avoided by ensuring that the needle volume is completely full of liquid upon filling the syringe and dispensing from it. If air pockets exist in the syringe after filling, this will be almost impossible.
3. Establish the optimum GC conditions determined during the analysis of the preliminary survey samples.
4. Select a suitably sized injection syringe (5- or 10-ul), and flush the syringe with acetone (or some other sui table solvent i f acetone is the standard component) t o clean the syringe.
5. Flush t h e syringe with standard solution by withdrawing a syringe f u l l of the solution from the septum v ia l , and dispensing the solution in to a beaker containing charcoal adsorbent.
6 . R e f i l l the syringe with standard solution, withdraw the syringe from the v i a l , and wipe the syringe needle with a laboratory tissue.
7. Adjust the syringe volume down t o the desired amount (see NOTE under Step 2), and in j ec t in to the GC. Note the time of the injection on the s t r i p chart recorder and/or actuate the electronic integrator. Also, record the standard concentration, detector attenuation factor, chart speed, injection port temperature, column temperature and ident i ty , and the carrier gas type and flow rate on the form shown i n Figure 5.9. It is also recommended that the same information be recorded d i r ec t ly on the chromatogram. Record the operating parameters for the par t icular detector being used.
8. A f t e r t h e analysis, determine the retention time of the standard component and determine the peak area. Repeat the injection of the first l i q u i d standard u n t i l the area count from two consecutive injections yield area counts within 5 percent of t he i r average.
9 . Multiply the average area count of the consecutive injections by the atten- uation factor t o get the calibration area value for tha t standard concen- t ra t ion.
10. Repeat the procedure for the other standard concentrations. 11. Prepare a plot with the standard concentration (C,) along the abscissa (x-
axis) versus the corresponding calibration area values along the ordinate (y-axis). Perform a regression analysis t o calculate the slope and the y- intercept.
To determine the desorption efficiency for the target organic compound(s) requires spiking the target organic compound(s) onto the absorbent material and desorbing the compound(s) using the same procedures t h a t w i l l be used for actual samples; the desorption solution is then analyzed. The spikes should be prepared a t three levels i n the range of the source samples. The following procedures are used t o determine the desorption efficiency:
D r a w the least squares l i n e on the plot.
.
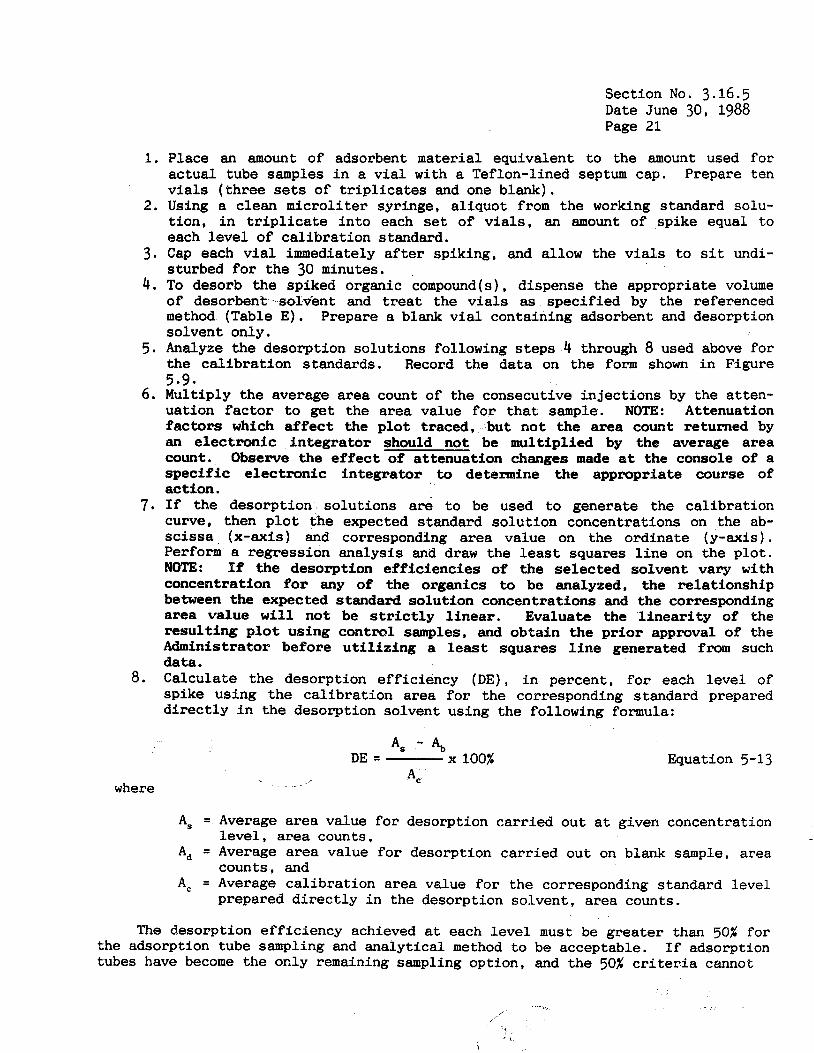
Section No. 3.16.5 Date June 30, 1988 Page 21
1.
2.
3 .
4.
5.
6.
7.
8.
where
Place an amount of adsorbent material equivalent t o the amount used f o r ac tua l tube samples i n a v i a l with a Teflon-lined septum cap. Prepare ten v i a l s ( t h ree sets of t r i p l i c a t e s and one blank). Using a clean micro l i te r syringe, a l iquot from the working standard solu- t ion , i n t r i p l i c a t e i n t o each set of v i a l s , an amount of spike equal t o each l e v e l of ca l ib ra t ion standard. Cap each v i a l immediately a f t e r spiking, and allow the v i a l s t o s i t undi- sturbed for the 30 minutes. To desorb the spiked organic compound(s), dispense the appropriate volume of desorbent sozvent and treat the v i a l s as spec i f ied by the referenced method (Table E ) . Prepare a blank v i a l containing adsorbent and desorption solvent only. Analyze the desorption solut ions following s t eps 4 through 8 used above fo r the ca l ib ra t ion standards. Record the da ta on the form shown i n Figure 5.9. Multiply the average area count of the consecutive in jec t ions by the at ten- uation factor to get the area value f o r t h a t sample. NOTE: Attenuation factors which affect the p lot traced, but not the area count returned by rin electronic integrator should not be multiplied by the average area count. Observe the effect of attenuation changes made a t the console of a spec i f ic e lectronic integrator to determine the appropriate course of action. If the desorption solut ions are t o be used t o generate the ca l ibra t ion curve, then p l o t the expected standard so lu t ion concentrations on the ab- scissa (x-axis) and corresponding area value on the ordinate (y-axis) . Perform a regression analysis and draw the least squares l i n e on the p lo t . NOTE: If the desorption e f f i c i enc ie s of the selected solvent vary with concentration for any of the organics to be analyzed, the re la t ionship between the expected standard solution concentrations and the corresponding area value w i l l not be s t r i c t l y l inear. Evaluate the l i n e a r i t y of the resulting p l o t using control samples, and obtain the prior approval of the Administrator before u t i l i z i n g a least squares l i n e generated from such data. Calculate t he desorption e f f ic iency (DE), i n percent , f o r each l eve l of spike using t h e ca l ib ra t ion area f o r the corresponding standard prepared d i r e c t l y i n the desorption solvent using the following formula:
As - A, DE = x 100%
_-,
Equation 5-13
As = Average area value f o r desorption car r ied out a t given concentration l e v e l , area counts,
A, = Average area value f o r desorption ca r r i ed out on blank sample, area counts, and
A, = Average ca l ib ra t ion area value f o r the corresponding standard leve l prepared d i r e c t l y i n the desorption solvent , area counts.
The desorption e f f ic iency achieved a t each l e v e l must be greater than 50% f o r I f adsorption the adsorption tube sampling and ana ly t ica l method to be acceptable.
tubes have become the only remaining sampling option, and the 50% criteria cannot
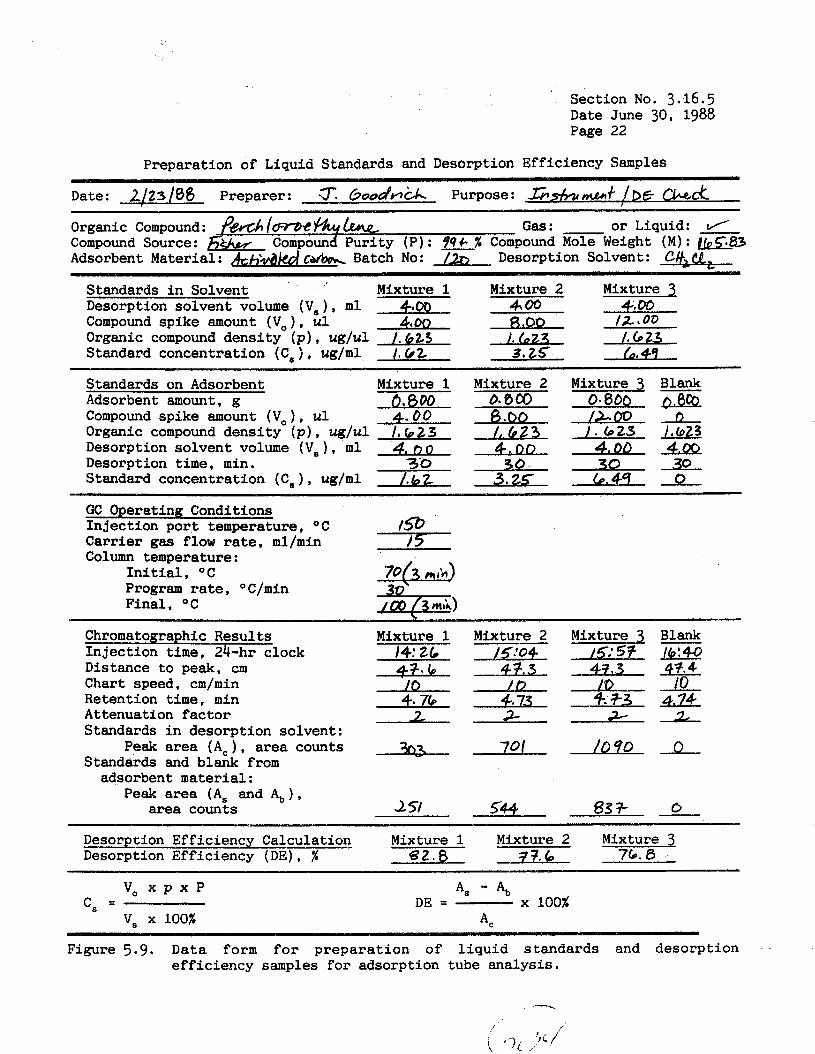
Section No. 3.l6.5 Date June 30, 1988 Page 22
Preparation of Liquid Standards and Desorption Efficiency Samples
Date: 2/23/68 Preparer: r. bwd'&h Purpose: G s h m e * l f , /DG cL.e dr Organic Compound : f& 1-C hh k Gas : o r Liquid: rl Compound Source: E&,- Adsorbent Material: hh;pdM c& Batch No: /& Desorption Solvent: C#,uce,
compound Puri ty ( P ) : 999- % Compound Mole Weight ( M ) : b5.83
Standards i n Solvent Mixture 1 Mixture 2 Mixture 3 Desorption solvent volume ( V s ) , m l 4.00 400 4. m Compound spike amount (Vo ) , u l 4.00 R .OO /z * 00
Standard concentration ( C s ) , ug/ml I . [ft L. 4 9 Organic compound densi ty ( p ) , ug/ul /.623 /. 6 23
Standards on Adsorbent Mixture 1 Mixture 2 Mixture 3 B l a n k Adsorbent amount, g 6.000 6- 6C0 0*860 aBao Compound spike amount ( V o ) , u l 4.00 -EmcL J & Q L L Organic compound densi ty ( p ) , ug/ul / ,b23 -ffJLEL /.b23 Isto23 Desorption solvent volume (Vs), m l 4 0 0 DO -4.LQL4.06 Desorption t i m e , min. 30 30 Standard concentration ( C s ) , ug/ml /.bZ 3. zc 0
GC Operating Conditions Inject ion por t temperature, O C lsb Carrier gas flow rate, ml/min / S Column temperature:
I n i t i a l , OC Program rate, OC/min Final , O C
Chromatographic Results Mixture 1 Mixture 2 Mixture 3 Blank In jec t ion time, 24-hr clock 14: 26 /5:04- /5:s3 rn Distance t o peak, c m CfF*b 43.3, -% AZL Chart speed, cm/min lb Jb A 1 0 Retention time, min +.+3 4.74 Attenuation f a c t o r 2 3- -2
Peak area (A, ) , area counts $3 701 mL
area counts 2 st 549 €33 7- 0
Standards i n desorption solvent:
Standards and blank from adsorbent material:
Peak area (A, and A, ) ,
Desorption Efficiency Calculation Mixture 1 Mixture 2 Mixture 3 Desorption Efficiency (DE), % 8 2 . 0 77.6 76. €5-
V , x p x P
v, x 100% c5 =
- DE = x 100%
A c
Figure 5.9. Data form f o r p repa ra t ion of l i q u i d standards and desorpt ion e f f ic iency samples for adsorption tube analysis.

Section No. 3.16.5 Date June 30, 1988 Page 23
be m e t , then, subject t o the p r i o r approval of t he Administrator, explore more vigorous desorption techniques such as longer desorption times, soni f ica t ion of the v i a l s during desorption, and/or o ther desorption solvents.
5.2 Audit Sample Analysis
After analysis of the ca l ibra t ion standards, and generation of a ca l ibra t ion curve, conduct the analysis of the audi t cy l inder (s ) . Audit samples should be introduced i n t o the GC by the same procedure used f o r the ca l ib ra t ion standards. If possible, the aud i t sample should be introduced i n t o the probe f o r the direct and d i lu t ion in te r face techniques. The audi t sample analysis must agree within 10% of the ac tua l concentration of the audi t sample before sample analysis can begin. If the audi t criteria is not met, f i r s t t r y reca l ibra t ing the GC with the ex is t ing standards, and then reanalyze the audi t sample(s). If the 10% criteria still cannot be met, remake the standards, reca l ibra te t he GC, and reanalyze the audi t sample u n t i l the criteria is m e t or a representative of the Administrator decides d i f fe ren t ly .
5.3 Sample Analysis
After the GC has been ca l ibra ted and the analysis of the audi t sample(s) has been conducted successfully, the samples can be analyzed. Use the same procedures for sample analysis t h a t were used to analyze the ca l ibra t ion standards. Record the GC condlitiarrs and the analytical da ta on the form providlil fn Figure 5.1. The following sUb$bctions describe the procedures f o r analyzing Trs$izir bag samples, d i r e c t and d i ld t ion in te r face samples, adsorption tube samples, m d heated syringe samples.
5.3.1 Analysis of Bag Samples - The following procedures are t o be used to analyze emission samples col lected i n Tedlar bags using a GC ca l ibra ted with gaseous C a l i - b ra t ion standards prepared following one o r more of the procedures described i n Subsection 5.1.
1.
2.
3.
4.
5 .
6.
Attach a quick connect, or similar connecting device t h a t is compatible with the connection on the Tedlar bag t o the gas sampling valve on the GC. Attach d manometer connected t o a tee on the o u t l e t of the sample loop. With the gas sampling valve i n the load posi t ion, a t tach the first Tedlar bag sample t o the valve. Use a pump on the o u t l e t s ide of t he sample loop to f lush the sample through the loop a t 100 cc/min for 30 seconds. Turn of f t he pump, allow the sample loop t o re turn to the same pressure used during ca l ib ra t ion standard analysis, and immediately switch the valve t o the i n j e c t posit ion. Note the time of the in jec t ion on the s t r i p char t recorder and/or actuate the e lec t ronic in tegra tor . Also, record the sample iden t i ty , detector attenudtion fac tor , char t speed, sample loop temperatiire, column tempera- tu re a d i den t i ty , and the carrier gas type and flow rate dn a da ta form Such as Figure 5.1. It is a l so recommended t h a t the dame information be recorded d i r e c t l y on the chromatogram. Record the operating parameters f o r the pa r t i cu la r detector being used. Examine the chromatogram t o ensure t h a t adequate resolut ion is being achieved for the major components of the sample. If adequate resolut ion is not being achieved, vary the GC conditions u n t i l resolut ion is achieved, and reanalyze the standards t o reca l ibra te the GC a t the new conditions. After conducting the analysis with acceptable peak resolut ion, determine the re ten t ion t i m e of the sample components and compare them to the reten-
Section No. 3.16.5 Date June 30, 1988 Page 24
7.
a.
9.
10.
t ion times f o r the standard compounds. To qua l i ta t ive ly ident i fy an indi- vidual sample component as a ta rge t compound, the retent ion time f o r the component must match within 0.5 seconds or l%, whichever is sea t e r , of the retent ion time of the ta rge t compound determined with the ca l ibra t ion standards . Repeat the in jec t ion of the f i r s t sample u n t i l the area count f o r each ident i f ied ta rge t compound from two consecutive in jec t ions give area counts within 5 percent of t h e i r average. Multiply the average area count of the consecutive in jec t ions by the a t ten- uation fac tor t o ge t the area value f o r t ha t sample, and record the area value on the da ta form provided i n Figure 5.1. NOTE: When dispensing liquid from a syringe, take care to account for the volume of liquid present in the syringe needle. In general, the potential error resulting from the volume of the needle is most conveniently avoided by ensuring that the needle volume is completely full of liquid upon filling the syringe and dispensing from it. If air pockets exist in the syringe after filling, t h i s will be almost impossible. Repeat the procedure f o r the other two samples col lected at the same sampl- ing location. Immediately following the analysis of the last sample, reanalyze the cali- brat ion standards, and compare the area values f o r each standard t o the corresponding area values from the f i r s t ca l ibra t ion analysis. If the individual area values are within 5% of t h e i r mean value, use the mean values t o generate a f i n a l ca l ibra t ion curve f o r determining the sample concentrations. If the individual values are not within 5% of t h e i r mean values, generate a ca l ibra t ion curve using the r e su l t s of the second analy- sis of the ca l ibra t ion standards, and report the sample r e s u l t s compared t o both standard curves.
Determine the bag sample water content by measuring the temperature and the barometric pressure near the bag. U s e water sa tura t ion vapor pressure chart . assum- ing the r e l a t ive humidity of the bag t o be 100% unless a lower value is known, t o determine the water vapor content as a decimal f igure (% divided by 100). If the bag has been heated during sampling, the f l u e gas o r duct moisture content should be determined using Method 4.
5.3.2 Anatysts of Direct Interface Samples - Pr io r t o analysis of the d i r ec t in te r face sample, the GC should be cal ibrated using a set of gaseous standards prepared by one of the techniques described i n Subsection 5.1 and a successful analysis of an audi t sample should be completed. I f possible. the audi t samples should be introduced d i r ec t ly i n t o the probe. Otherwise, the audi t samples are introduced i n t o the sample l i n e immediately following the probe. The ca l ibra t ion is done by disconnecting the sample l i n e coming from the probe, from the gas sampl- ing valve sample loop i n l e t , and connecting the ca l ibra t ion standards t o the loop fo r analysis. During the analysis of the ca l ibra t ion standards and the audi t sample(s), make ce r t a in tha t the sample loop pressure immediately p r i o r t o the inject ion of the standards is a t the same pressure tha t w i l l be used for sample analysis. To analyze the d i r ec t in te r face samples a f t e r GC ca l ibra t ion , use the following procedures:
1. Reconnect the sample l i n e t o the i n l e t of the gas sample loop, switch the valve t o the load posit ion, and turn on the sampling pump. Adjust the sampling rate t o a t least 100 cc/minute, and, f o r the f i r s t sample, purge the sample l i n e long enough t o f lush the sample loop and the preceding volume of tubing a minimum of 7 times.

2.
3.
4 .
5.
6 .
7.
8.
9.
10.
Section No. 3.16.5 Date June 30, 1988 Page 25
After purging the sampling system and the sample loop, decrease the sample flow using the needle valve downstream of the loop u n t i l the loop pressure, measured by a water manometer connected t o EL tee a t the o u t l e t of loop, is equal t o the pressure used during ca l ibra t ion . Once the loop is a t the correct pressure, immediately switch the sample valve t o the i n j e c t posit ion. Note the time of the in jec t ion on the s t r i p char t recorder and/or actuate the e lec t ronic in tegra tor . The flow through the sample l ine can be returned t o 100cc/min after sample in jec t ion , and, after the unretained compounds are detected, t he gas sample valve can be switched back to the load posi t ion. The system , w i l l then be ready to i n j e c t the second sample as soon as the f i r s t analysis is completed. Record the sample iden t i ty , de tec tor a t tenuat ion ifactor, char t speed, sample loop temperature, column temperature and iden t i ty , and the carrier gas type and flow rate on a form such as Figure 5.1. It i s also recom- mended t h a t the same information be recorded d i r e c t l y on the chromatogram. Record the operat ing parameters f o r the pa r t i cu la r detector being used. Examine the chromatogram t o ensure tha t adequate reso lu t ion is being achieved f o r the major components of the sample. I f adequate resolut ion is not being achieved, vary the GC conditions u n t i l r e s o l u t i o n . i s achieved, and reanalyze the standards t o recalibrate the GC a t the new conditions. Immediately after the first analysis is complete, repeat steps 2 and 3 t o begin the ana lys i s of the second sample. After conducting the analysis of the f i r s t sample w i t h acceptable peak resolut ion, determine the retent ion t i m e of the sample components and compare them to the re ten t ion t i m e s f o r the standard compounds. To quali- t a t i v e l y i d e n t i f y an individual sample component as a target compound, the re ten t ion t i m e f o r the component must match, within 0.5 seconds or I%, whichever is greater, the re ten t ion t i m e of the t a r g e t compound determined with the ca l ib ra t ion standards. A t the completion of the analysis of the second sample, determine if the area counts for the t w o consecutive in j ec t ions give area counts within 5 percent of t h e i r average. If t h i s c r i t e r i o n cannot 'be m e t due t o the length of the ana lys i s , and the emissions are known t o vary because of a cyclic or batch process, then the analysis r e s u l t s can still be used wi th the pr ior approval of the Administrator. Analyze a minimum of three samples col lected by direct in t e r f ace t o consti- t u t e an emissions test. Immediately following the analysis of the last sample. reanalyze the Cali- brat ion standards, and compare the area values for each standard t o the corresponding area values from the f i r s t ca l ib ra t ion analysis. If the individual area values a re within 5% of their m e a n value, use the mean values to generate a f i n a l ca l ib ra t ion curve t o determine the sample concentrations. If the individual values are not within 5% of their mean values, generate a ca l ib ra t ion curve using the r e s u l t s of the second analy- sis of the ca l ib ra t ion standards, and report the sample r e s u l t s compared to both standard curves.
5.3.3 Analysis of Dilution Interface Samples - For the analysis of d i lu t ion in t e r - face samples, the procedures described f o r d i r e c t i n t e r f ace sampling i n Subsection 5.3.2 should be followed, wi th t h e addition of a check of the d i lu t ion system.
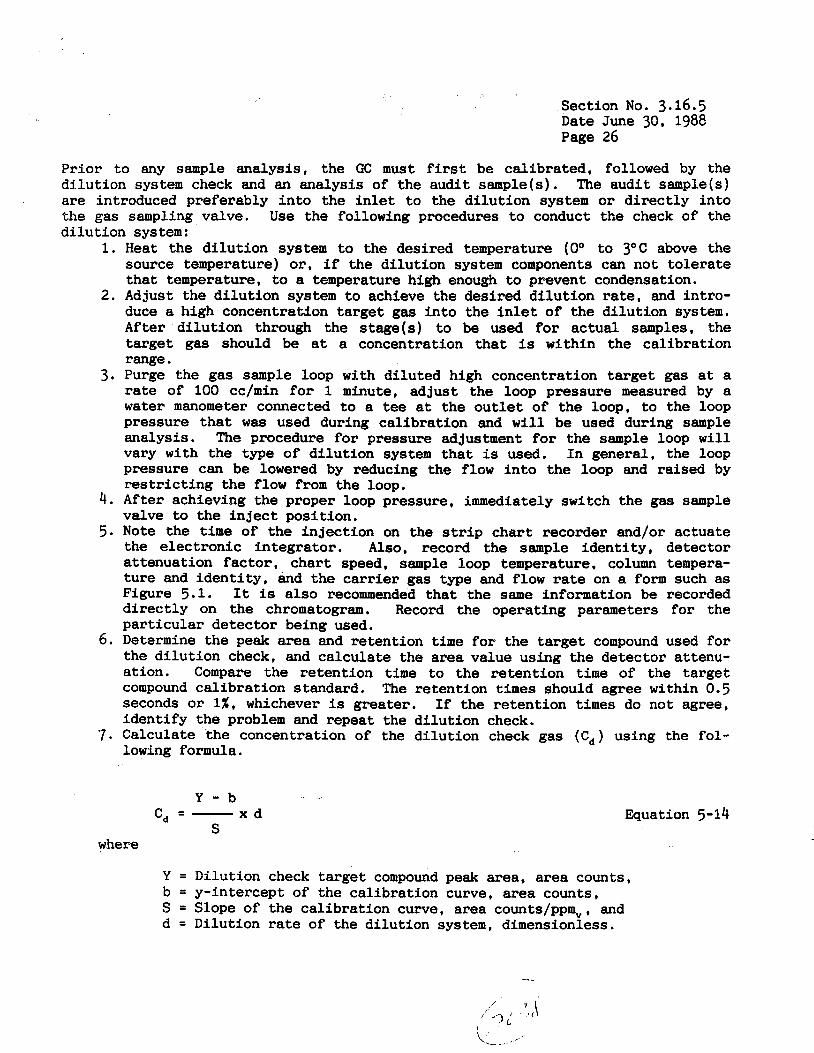
Section No. 3.16.5 Date June 30, 1988 Page 26
Pr ior t o any sample analysis , the GC must first be cal ibrated, followed by the d i lu t ion system check and an analysis of the audi t sample(s). The audi t sample(s) are introduced preferably i n t o the i n l e t t o the d i lu t ion system or d i rec t ly in to the gas sampling valve. Use the following procedures t o conduct the check of the d i lu t ion system:
1. Heat the d i lu t ion system t o the desired temperature (Oo t o 3 O C above the source temperature) or, i f the d i lu t ion system components can not t o l e ra t e that temperature, to a temperature high enough t o prevent condensation.
2. Adjust the d i lu t ion system t o achieve the desired d i lu t ion rate, and in t ro- duce a high concentration ta rge t gas i n t o the i n l e t of the d i lu t ion system. After d i lu t ion through the stage(s) t o be used f o r ac tua l samples, the ta rge t gas should be a t a concentration t h a t is within the ca l ibra t ion range.
3. Purge the gas sample loop wZth d i lu ted high concentration t a rge t gas a t a rate of 100 cc/min f o r 1 minute, adjust the loop pressure measured by a water manometer connected t o a tee a t the o u t l e t of the loop, t o the loop pressure t h a t w a s used during ca l ibra t ion and w i l l be used during sample analysis. The procedure f o r pressure adjustment f o r t he sample loop w i l l vary with the type of d i lu t ion system that is used. I n general , the loop pressure can be lowered by reducing the flow i n t o the loop and raised by r e s t r i c t i n g the flow from the loop.
4 . After achieving the proper loop pressure, immediately switch the gas sample valve t o the i n j e c t posit ion.
5. Note the t i m e of the in jec t ion on the s t r i p char t recorder and/or actuate the e lec t ronic in tegra tor . Also, record the sample iden t i ty , detector attenuation fac tor , cha r t speed, sample loop temperature, column tempera- tu re and iden t i ty , fins the carrier gas type and flow rate on a form such as Figure 5.1. It is a l s o recommended tha t the same information be recorded d i rec t ly on the chromatogram. Record the operating parameters fo r the pa r t i cu la r detector being used.
6. Determine the peak area and retent ion t i m e f o r the t a rge t compound used fo r the d i lu t ion check, and ca lcu la te the area value using the detector attenu- ation. Compare the retent ion time t o the retent ion t i m e of the ta rge t compound ca l ibra t ion standard. The retent ion t i m e s should agree within 0.5 seconds or lX, whichever is greater. I f the retent ion times do not agree, ident i fy the problem and repeat the d i lu t ion check.
7. Calculate the concentration of the d i lu t ion check gas (C,) using the fol- lowing formula.
Y - b c, = - x d
S Equation 5-14
where
Y = Dilution check ta rge t compound peak area, area counts, b = y-intercept of the ca l ibra t ion curve, area counts, S = Slope of the ca l ibra t ion curve, area counts/ppmv, and d = Dilution rate of the d i lu t ion system, dimensionless.
Section No. 3.16.5 Date June 30, 1988 Page 27
8. If the calculated value for the d i lu t ion check gas is not within 10% of the actual d i lu t ion check gas, then determine i f the GC or the d i lu t ion system is i n e r ror . Check the ca l ibra t ion of the GC by analyzing one of the cali- brat ion samples d i r e c t l y bypassing the d i lu t ion system. I f the GC is properly cal ibrated, then adjust the d i lu t ion system, and repeat the analy- sis of the d i lu t ion check gas u n t i l the calculated r e s u l t s are within 10% of the ac tua l concentration.
Once the d i lu t ion system and the GC are operating properly, analyze the audi t sample(s) . Upon completion of a successful audi t , the system is ready t o analyze samples following the procedures described i n Subsection 5.3.2. To load the sample from the d i lu t ion system may not require a pump on the o u t l e t of the sample loop, but ca l ibra t ion of the GC using standards prepared i n Tedlar bags w i l l require a pump. The system should be configured so t ha t the pump can be taken of f l i n e when it is not needed.
5.3.4 Analysts of Adsorption Tube Samples - Pr ior t o the analysis of adsorption tube samples, the t a rge t compounds adsorbed on the adsorption material must be desorbed. The procedures found t o give acceptable desorption e f f i c i enc ie s deter- mined i n Subsection 5.1.4 should be used. The procedures for the analysis of the sample desorption solut ions are the same as those used f o r the standards. During sample analysis , the sample col lect ion eff ic iency must be determined. Use the following procedures t o determine the co l lec t ion efficiency:
1.
2.
3.
4.
5 .
6.
Desorb the primary and backup sect ions of the tubes separately using the procedures found t o give acceptable (50%) desorption eff ic iency fo r the spiked adsorption material. U s e the same f i n a l volume of desorption solu- t i on for t he samples as w a s used for the standard solutions. If more than one adsorption tube w a s used i n series per test run, delay desorbing the addi t ional tubes u n t i l the analysis of the primary and backup sect ion of t he first tube is complete, and the col lect ion e f f ic iency for the first tube determined. Select the samples from the sampling run when the f lue gas or duct moisture was the highest and, i f known, when the ta rge t com- pound concentrations were the highest and analyze them f i r s t . Cal ibrate the GC using standards prepared d i r ec t ly i n desorption solvent or prepared on adsorbent and desorbed. Se lec t a su i tab ly s ized in jec t ion syringe (5- or 10-ul), and f lush the syringe with acetone (or some other su i t ab le solvent i f acetone is a target compound) t o clean the syringe. Flush the syringe with the desorption solut ion from the tube 's backup sect ion by withdrawing a syringe f u l l of the solut ion from the septum v i a l , and dispensing the solut ion i n t o a beaker containing charcoal adsorbent. R e f i l l the syringe w i t h the backup sect ion desorption solut ion, withdraw the syringe from the vial, and wipe the syringe needle with a laboratory t i s s u e . Adjust the syringe volume down t o the amount used f o r i n j ec t ing standards and i n j e c t the sample i n t o the GC. Note the time of the in jec t ion on the s t r i p char t recorder and/or actuate the e lec t ronic integrator . Also, record the sample iden t i ty , detector attenuation f ac to r , char t speed, in jec t ion por t temperature, column temperature and iden t i ty , and the carri- er gas type and flow rate on the data form shown i n Figure 5.1. It is also recommended that the same information be
( ' L
recorded d i r ec t ly on the chromato-
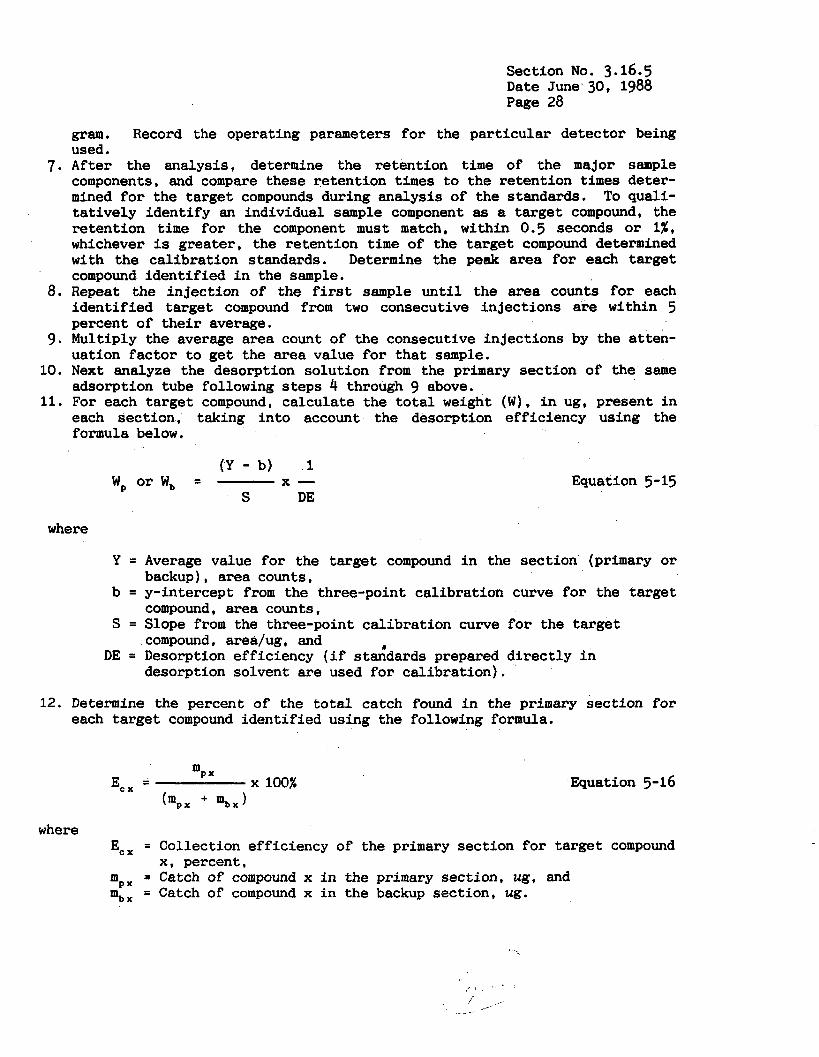
Section No. 3.16.5 Date June' 30, 1988 Page 28
7.
8.
9.
10.
11.
gram. Record the operating parameters f o r the pa r t i cu la r detector being used. After the analysis , determine the retent ion time of the major sample components, and compare these retent ion times to the retent ion times deter- mined f o r the ta rge t compounds during analysis of the standards. To quali- t a t i ve ly ident i fy an individual sample component as a t a rge t compound, the retent ion time f o r the component must match, within 0.5 seconds or l%, whichever is grea ter , the re tent ion time of the ta rge t compound determined with the ca l ibra t ion standards. Determine the peak area f o r each ta rge t compound iden t i f i ed i n the sample. Repeat the in jec t ion of the f i r s t sample u n t i l the area counts for each iden t i f i ed ta rge t compound from two consecutive in jec t ions are within 5 percent of t h e i r average. Multiply the average area count of the consecutive in jec t ions by the atten- uation fac tor t o get the area value f o r t h a t sample. Next analyze the desorption solut ion from the primary sect ion of the same adsorption tube following steps 4 through 9 above. For each ta rge t compound, ca lcu la te the t o t a l weight (W), i n ug, present i n each sect ion, taking i n t o account the desorption eff ic iency using the formula below.
( Y - b) 1
S DE W, or W, = x - Equation 5-15
where
Y =
b =
S =
DE =
Average value f o r the target compound i n the sect ion (primary or backup), area counts, y-intercept from the three-point ca l ibra t ion curve f o r the ta rge t compound, area counts, Slope from the three-point ca l ibra t ion curve f o r the target compound, area/ug , and Desorption eff ic iency ( i f s t iddards prepared d i r ec t ly i n desorption solvent are used f o r ca l ibra t ion) .
12. Determine the percent of the t o t a l catch found i n the primary sect ion f o r each target compound ident i f ied using the following formula.
E c x = ( m p x + m b x )
X 100% Equation 5-16
where Ec, = Collection efficiency of the primary sect ion f o r ta rge t compound
mpx = Catch of compound x i n the primary sect ion, ug, and mb, = Catch of compound x i n the backup sect ion, ug.
x, percent,
12.
13
Section No. 3.16.5 Date June 30, 1988 Page 29
If the co l lec t ion eff ic iency for the primary sect ion f o r each ta rge t com- pound iden t i f i ed is go%, then the col lect ion e f f ic iency f o r t h a t compound is acceptable. I f the col lect ion eff ic iency f o r all the ta rge t compounds iden t i f i ed i n the sample is acceptable, then the analysis of any additional tubes used i n series behind the f i r s t tube w i l l not be necessary. Proceed with the analysis of the other adsorption tube samples. If the co l lec t ion eff ic iency f o r any iden t i f i ed target compound is not acceptable, then analyze the second tube ( i f used) connected i n series and determine the co l lec t ion eff ic iency f o r t h a t tube using the steps described above. If the second tube does not exhib i t acceptable col lect ion and 8 t h i rd tube w a s used, analyze the t h i r d tube. If acceptable col lect ion e f f ic iency cannot be demonstrated f o r the sampling system, then the emis- s ion test using adsorption tubes w i l l not be acceptable. Immediately following the analysis of the last sample, reanalyze the ca l i - brat ion standards, and compare the area values f o r each standard t o the corresponding area values from the first ca l ibra t ion analysis. If the individual area values are within 5% of t h e i r mean value, use the mean values t o generate a f i n a l ca l ibra t ion curve f o r determining the sample concentrations. If the individual values are not within 5% of t h e i r mean values, generate a ca l ibra t ion curve using the r e s u l t s of the second analy- sis of the ca l ib ra t ion standards, and report the sample r e s u l t s compared to both standard curves.
dures : 1.
2.
3 .
4.
5 .
5.3.5 Anatgsis of Heated Sgringe Gas Samptes bg Direct InJection - For the analy- sis of samples col lec ted i n heated syringes, the GC w i l l have t o be equipped w i t h an in jec t ion septum f i t t e d t o the gas sampling valve sample loop i n l e t . Calibrate the GC following one of the procedures described i n Subsection 5.1 f o r gaseous ca l ibra t ion standards. Analyze the heated syringe samples by the following proce-
Attach a GC septum t o a quick connect, o r equivalent, compatible with t h e connector on the gas sampling valve, and a t tach t h i s connector t o the gas sampling valve. I n s e r t the needle of the heated syringe through the septum, and purge the sample loop by in j ec t ing a volume of the gas sample a t least ten times greater than the sample loop volume. Allow the sample loop pressure, measured by a water manometer connected t o a tee on the o u t l e t of the sample loop, t o reach the same loop pressure seen during analysis of the ca l ibra t ion standards, and immediately switch the gas sample valve t o the i n j e c t posit ion. Note the t i m e of the in jec t ion on the strip char t recorder and/or actuate the e l ec t ron ic in tegra tor . Also, record the sample iden t i ty , detector a t tenuat ion f ac to r , char t speed, sample loop temperature and volume, column temperature and iden t i ty , and the carrier gas type and flow rate on a form such as Figure 5.1. It is a l so recommended t h a t the same information be recorded d i r e c t l y on the chromatogram. Record the operating parameters for the pa r t i cu la r detector being used. Examine the chromatogram t o ensure t h a t adequate resolut ion is being achieved f o r the major components of the sample. If adequate resolution is not being achieved, vary the GC conditions u n t i l resolut ion is achieved, and reanalyze t h e standards t o reca l ibra te the GC a t the new conditions.

Section No. 3.16.5 Date June 30, 1988 Page 30
6., After conducting the analysis with acceptable peak resolution, determine the retent ion t i m e of the sample components and compare them t o the reten- t ion times f o r the standard compounds. To qua l i t a t ive ly ident i fy an indi- vidual sample component as a ta rge t compound, the retent ion time for the component must match, within 0.5 seconds or 1%, whichever is greater , the re tent ion time of the target compound determined with the cal ibrat ion standards .
7. Repeat the in j ec t ion of the first sample u n t i l the area counts fo r each ident i f ied t a rge t compound from two consecutive in jec t ions are within 5 percent of t h e i r average.
8. Multiply the average area count of the consecutive in jec t ions by the atten- uation f ac to r t o ge t the area value f o r t h a t sample.
9. Repeat the procedure f o r the other two samples col lected at the same sampl- ing location.
10. Immediately following the analysis of the last sample, reanalyze the C a l i - bration standards, and compare the area values f o r each standard t o the corresponding area values from the f i r s t ca l ibra t ion analysis. If the individual area values are within 5% of t h e i r mean value, use the mean values t o generate a f i n a l ca l ibra t ion curve f o r determining the sample concentrations. If the individual values are not within 5% of t h e i r mean values, generate a ca l ibra t ion curve using the r e s u l t s of the second analy- sis of the ca l ibra t ion standards, and report the sample results compared t o both standard curves.
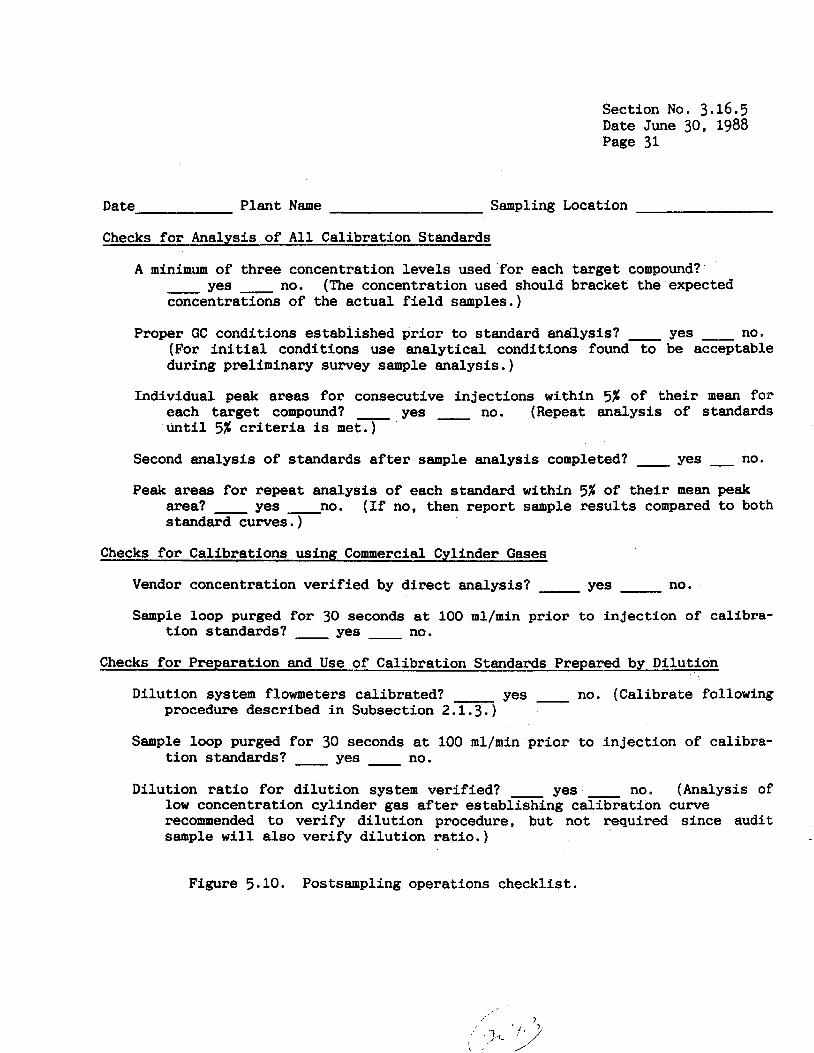
Section No. 3.16.5 Date June 30, 1988 Page 31
Date Plant Name Sampling Location
Checks for Analysis of All Calibration Standards
A minimum of three concentration levels used for each target compound? - Yes - no. concentrations of the actual field samples.)
(The concentration used should bracket the expected
Proper GC Conditions established prior to standard analysis? yes no. (For initial conditions use analytical conditions found to be acceptable during preliminary survey sample analysis.)
Individual peak areas for consecutive injections within 5% of their mean for each target compound? yes - no. (Repeat analysis of standards until 5% criteria is met.)
Second analysis of standards after sample analysis completed? yes - no. Peak areas for repeat analysis of each standard within 5% of their mean peak
area? yes no. (If no, then report sample results compared to both standard curves.)
Checks for Calibrations usinR Commercial Cylinder Gases
Vendor concentration verified by direct analysis? yes no.
Sample loop purged for 30 seconds at 100 ml/min prior to injection of calibsa- tion standards? yes no.
Checks for Preparation and Use of Calibration Standards Prepared by Dilutiotl
Dilution system flowmeters calibrated? yes no. (Calibrate following procedure described in Subsection 2.1.3.)
Sample loop purged for 30 seconds at 100 ml/min prior to injection of calibra- tion standards? - yes no.
Dilution ratio for dilution system verified? yes no. (Analysis of low concentration cylinder gas after establishing calibration curve recommended to verify dilution procedure, but not required since audit sample will also verify dilution ratio.)
Figure 5.10. Postsampling operations checklist.

Section No. 3.16.5 Date June 30, 1988 Page 32
Figure 5.10 (Continued)
Checks for Preparation and Use of Calibration Standards by Direct Injection Of Gaseous Compounds or Liquid Injection
Tedlar bag used to contain prepared standard leak and contamination free? Yes - no -*
Dry gas meter used to fill bag calibrated? yes no. (Calibrate meter following procedure described in Subsection 2.1.2.)
Organic standard material used for injection 99.9% pure? - yes - no. (If no, then determine purity and use to correct calculated calibration standard concentration.)
Prepared standard allowed to equilibrate prior to injection? - yes - no. (Massage bag by alternately depressing opposite ends 50 times.)
Sample loop purged for 30 seconds at 100 ml/min prior to injection of calibra- tion standards? yes no.
Development of Relative Response Factors and Retention Times
Suitable target organic or surrogate compound selected? yes no. (Select compound that is stable, easy to prepare in the field, and has a retention time similar to the target organic compounds.)
Relative response factors and retention times verified in the laboratory prior to actual field use? yes - no. procedure described in Subsection 5.1.4. )
(If no, verify following the
Checks fo r Preparation, Use. and Determination of Desorption Efficiency for Adsorp- tion Tube Standards
Organic standard material used for injection 99.9% pure? yes no. (If no, then determine purity and use to correct calculated calibration standard concentration.)
, I
Correct adsorbent material and desorption solvent selected? yes no. (Refer to Table B in Method Highlights Section for proper adsorbent material and desorption solvent.)
Desorption efficiency determined for adsorbent to be used for field sampling? - yes - no. (If no, follow the procedure described in Subsection 5.1.5.)
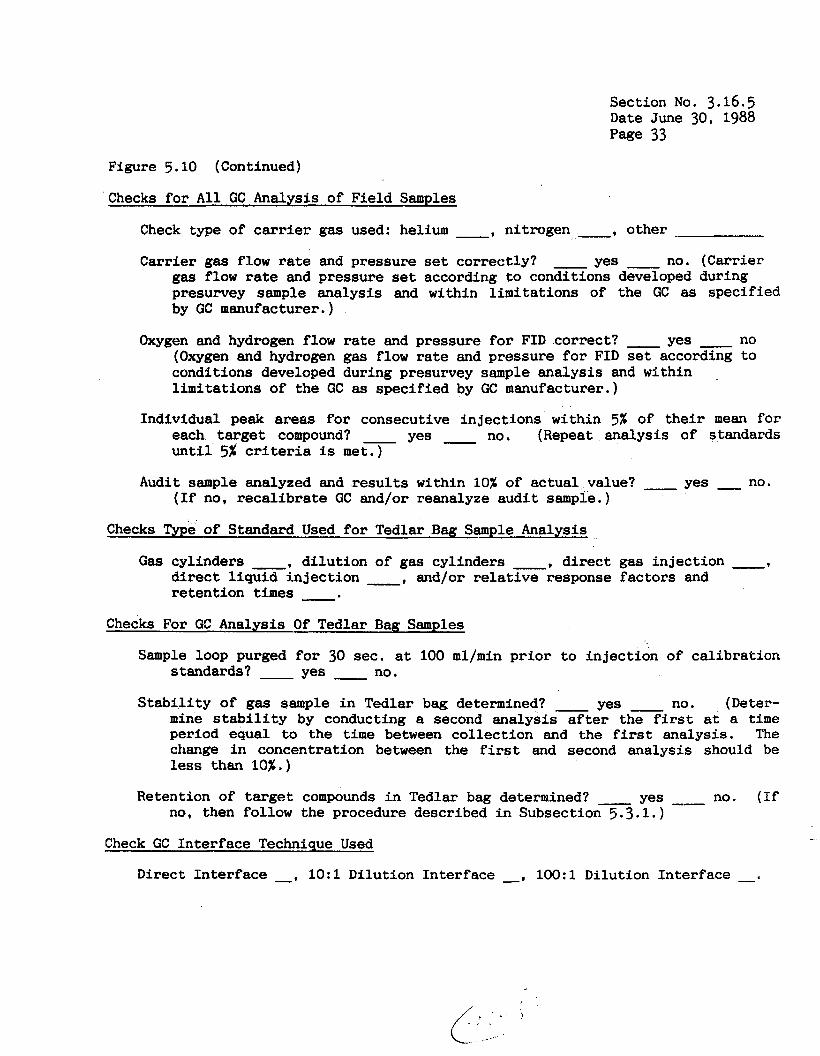
Section No. 3.16.5 Date June 30, 1988 page 33
Figure 5.10 (Continued)
Checks f o r All GC Analysis of Field Samples
Check type of carrier gas used: helium , nitrogen , other
Carrier gas flow rate and pressure set correct ly? yes no. (Carrier gas flow rate and pressure set according t o conditions developed during presurvey sample analysis and within l imi ta t ions of the GC as specified by GC manufacturer.)
Oxygen and hydrogen flow rate and pressure f o r FID correct? yes no (Oxygen and hydrogen gas flow rate and pressure f o r FID set according t o conditions developed during presurvey sample analysis and within l imi ta t ions of the GC as specif ied by GC manufacturer.)
Individual peak areas f o r consecutive in jec t ions within 5% of their mean for each target compound? yes no. (Repeat analysis of standards u n t i l 5% criteria is m e t . )
Audit sample analyzed and r e s u l t s within 10% of ac tua l value? yes - no. (If no, r eca l ib ra t e GC and/or reanalyze audi t sample.)
Checks Type of Standard Used f o r Tedlar Bag Sample Analysis
G a s cylinders , d i lu t ion of gas cylinders , d i r e c t gas in jec t ion , d i r e c t l i q u i d in j ec t ion , and/or r e l a t i v e response fac tors and retent ion times .
Checks For GG Analysis O f Tedlar Bag Samples
Sample loop purged f o r 30 sec. at 100 ml/min prior t o in jec t ion of ca l ibra t ion standards? yes no.
S t a b i l i t y of gas sample i n Tedlar bag determined? yes no. (Deter- mine s t a b i l i t y by conducting a second analysis a f t e r t he first a t a t i m e period equal t o the t i m e between co l lec t ion and the first analysis. The change i n concentration between the f i r s t and second analysis should be less than 10%.
Retention of target compounds i n Tedlar bag determined? yes no. (If no, then follow the procedure described i n Subsection 5.3.1.)
Check GC In te r face Technique Used
Direct In te r face -, 1 O : l Dilution In te r face -, 1 O O : l Dilution In te r face -.

Section No. 3.16.5 Date June 3O* 1988 Page 34
Figure 5.10 (Continued)
Checks For S u i t a b i l i t y of GC Interface Technique
Analytical interference due t o moisture content of source gas? yes - no. (Moisture i n the source gas must not i n t e r f e r e with analysis i n regard
baseline-to-valley height between adjacent peaks is less than 25% of the sum of the two adjacent peaks.)
t o peak resolut ion according t o EPA Method 625 c r i t e r i o n where the
Physical requirements f o r equipment met on-site? yes no. (The physical requirements for the equipment include shel tered environment, "clean" * uninterrupted power source su i ted f o r equipment * and adherence t o safe ty aspects re la ted t o explosion risk areas.)
Source gas concentration below l eve l of GC detector saturat ion? y e s - no. (Concentrations delivered t o the detector can be reduced by using smaller gas sample loops and/or d i lu t ion in te r face . )
Sampling systems purged with 7 changes of system volume p r i o r t o sample analysis? - yes - no.
Check Type(s) of Standards Used f o r Interface Techniques
Gas cylinders d i lu t ion of gas cylinders * d i r e c t gas indection d i r e c t l iqu id in jec t ion -* and/or r e l a t ive response fac tors and retent ion times .
Checks For Dilution Interface Analytical Apparatus
Dilution rate ver i f ied (within 10%) by introducing high concentration gas through d i lu t ion system and analyzing d i lu ted gas? yes no.. (If d i lu t ion rate not ver i f ied , then f i r s t check ca l ibra t ion of GC by reanalyzing a ca l ibra t ion standard and then adjust d i lu t ion system t o give desired r a t i o ) .
Sampling systems purged with 7 changes of system volume p r io r t o sample analysis? - yes no.
Check Type of Standard Used f o r Adsorption Tube Analysis
Prepared d i r e c t l y i n desorption solvent and/or prepared on adsorbent and desorbed .
Checks f o r GC Analysis of Adsorption Tube Samples
Desorption procedure used ident ica l t o procedure used t o determine the desorption efficiency? yes - no.
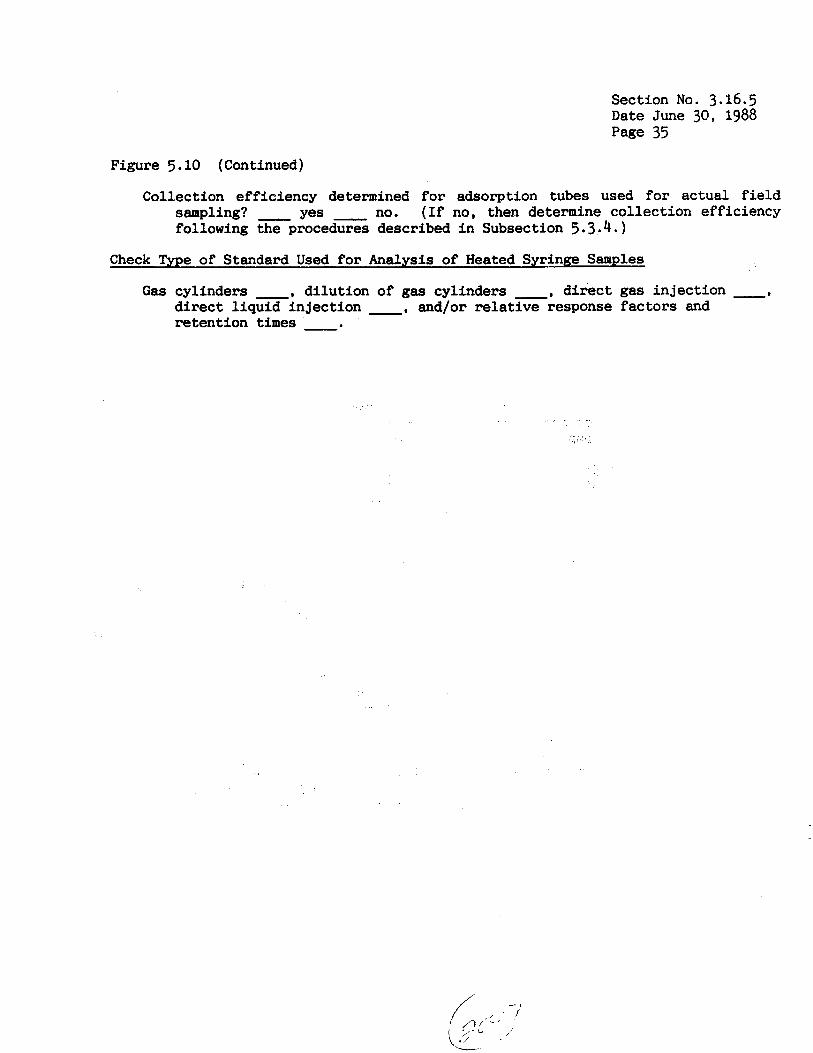
Section No. 3.16.5 Date June 30, 1988 Page 35
Figure 5.10 (Continued)
Collection efficiency determined for adsorption tubes used for actual field sampling? yes no. (If no, then determine collection efficiency following the procedures described in Subsection 5.3.4. )
Check Type of Standard Used for Analysis of Heated Syringe Samples
Gas cylinders -, dilution of gas cylinders , direct gas injection -, direct liquid injection , and/or relative response factors and retention times .
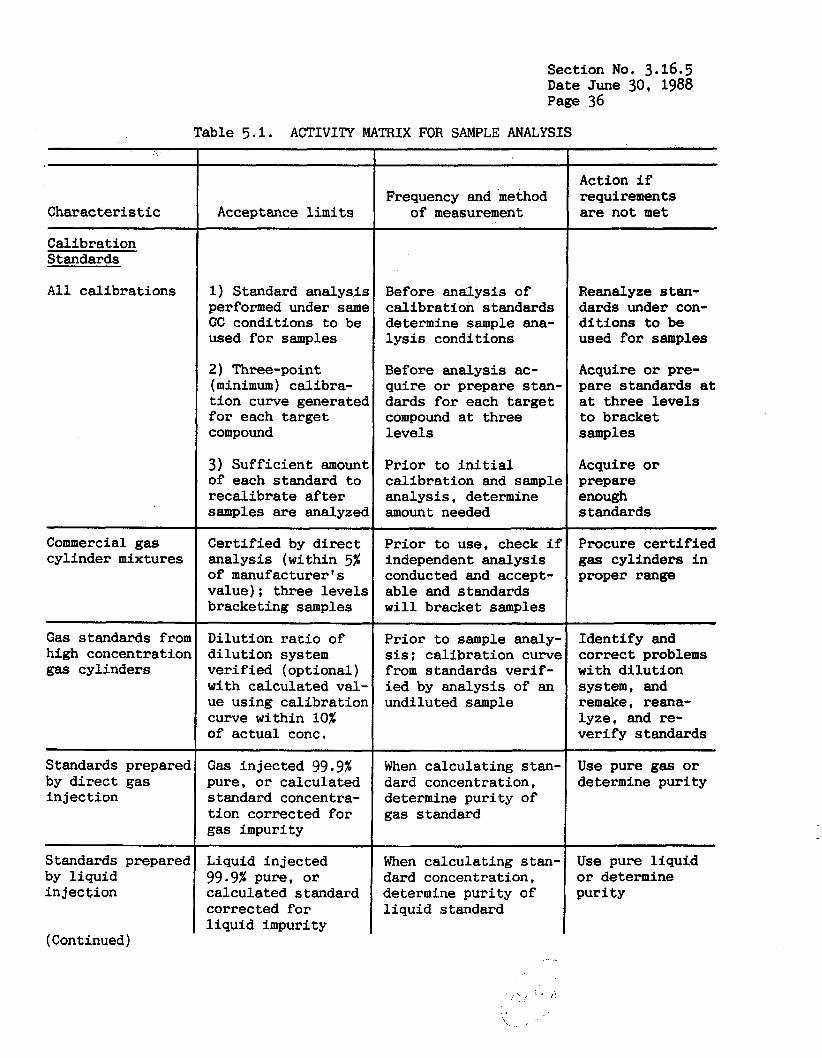
Section No. 3.16.5 Date June 30, 1988 Page 36
Table 5.1. ACTIVITY MATRIX FOR SAMPLE ANALYSIS
Charac te r i s t ic
Calibration Standards
A l l ca l ibra t ions
Commercial gas cylinder mixtures
Gas standards fron high concentratior gas cyl inders
Standards prepared by d i r e c t gas in jec t ion
Standards prepared by l i qu id in jec t ion
(Continued)
Acceptance l i m i t s
1) Standard analysis performed under same GC conditions t o be used f o r samples
2) Three-point (minimum) calibra- t i on curve generatec f o r each ta rge t compound
3) Suff ic ien t amoun~ of each standard t o reca l ibra te after samples are analyzec
Certified by direct analysis (within 5% of manufacturer's value) : three levels bracketing samples
~~
Dilution r a t i o of d i lu t ion system ve r i f i ed (optional) with calculated val- ue using ca l ibra t ior curve within 10% of ac tua l conc.
Gas injected 99.9% pure, o r calculated standard concentra- t i on corrected f o r gas impurity
Liquid injected 99.9% pure, o r calculated standard corrected f o r l i qu id impurity
Frequency and method of measurement
Before analysis of ca l ibra t ion standards determine sample ana- l y s i s conditions
Before analysis ac- qui re o r prepare stan- dards f o r each target compound a t three l eve l s
Prior t o i n i t i a l ca l ibra t ion and sample analysis, determine amount needed
P r io r t o use, check i f independent analysis conducted and accept- able and standards w i l l bracket samples
_. ~~~ ~~~
Pr io r t o sample analy- sis; ca l ibra t ion curve from standards ver i f - i ed by analysis of an undiluted sample
When calculat ing s tan- dard concentration, determine pur i ty of gas standard
When calculat ing stan- dard concentration, determine pur i ty of l i qu id standard
Action i f requirements are not m e t
Reanalyze stan- dards under con- d i t i ons to be used f o r samples
Acquire or pre- pare standards at a t three leve ls to bracket samples
Acquire or prepare enough standards
Procure c e r t i f i e d gas cylinders i n proper range
Ident i fy and cor rec t problems wi th d i lu t ion system, and remake, reana- lyze, and re- ve r i fy standards
Use pure gas o r determine pur i ty
~~
Use pure l iqu id or determine purity
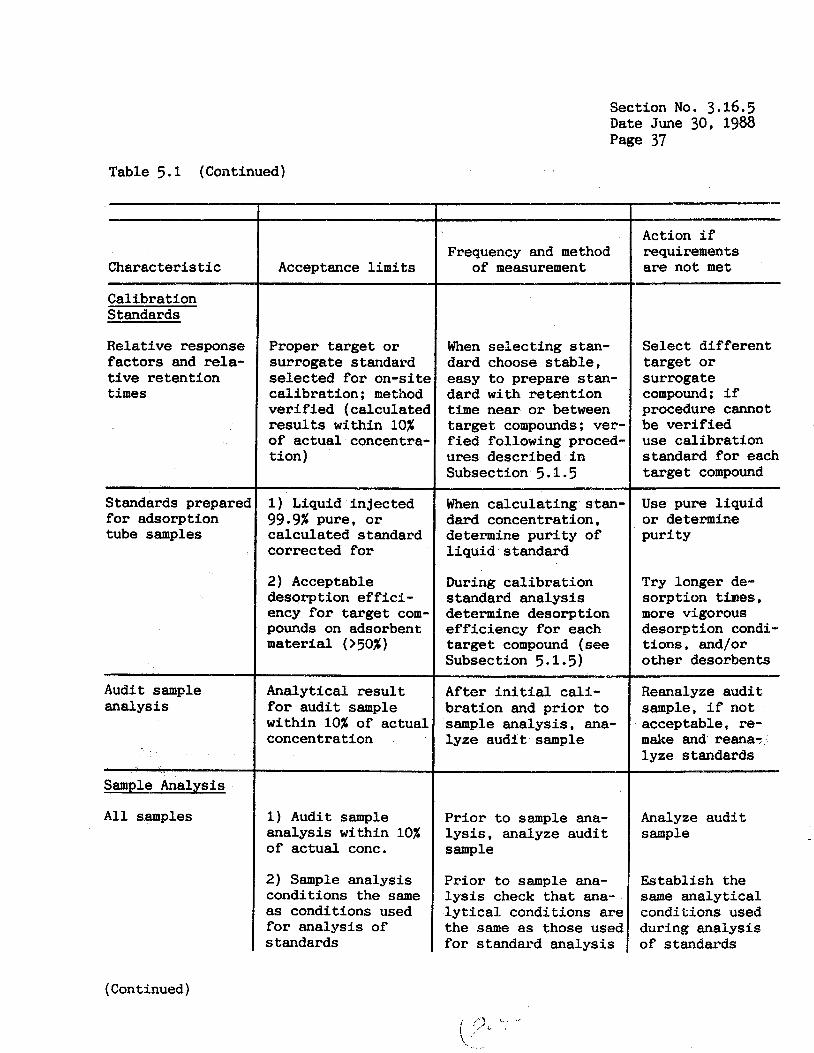
Section No. 3.16.5 Date June 30, 1988 Page 37
Table 5.1 (Continued)
Character is t ic
Calibration Standards
Relative response f ac to r s and rela- t i v e retent ion times
Standards preparec f o r adsorption tube samples
Audit sample analysis
,
- Sample Analysis
A l l samples
Acceptance l i m i t s
Proper target or surrogate standard se lec ted f o r on-site ca l ibra t ion ; method v e r i f i e d (calculatec r e s u l t s within 10% of ac tua l concentra- t i on )
1) Liquid in jec ted 99.9% pure, or calculated standard corrected f o r
2) Acceptable desorption effici- ency for target com- pounds on adsorbent material (>SO%)
Analytical r e s u l t for audi t sample within 10% of actual concentration
1) Audit sample ana lys i s within 10% of ac tua l conc.
2) Sample analysis conditions the same as conditions used for analysis of standards
Frequency and method of measurement
When se l ec t ing stan- dard choose s t a b l e , easy t o prepare s tan- dard w i t h re ten t ion t i m e near o r between target compounds; ver- f ied following proced- ures described i n Subsection 5.1.5
When ca lcu la t ing s tan- dard concentration, determine pu r i ty of l i q u i d standard
During ca l ib ra t ion standard ana lys i s determine desorption e f f ic iency for each target compound (see Subsection 5.1.5)
After i n i t i a l C a l i - b ra t ion and p r i o r t o sample ana lys i s , ma- lyze audi t sample
P r io r t o sample ana- l y s i s , analyze audi t sample
P r io r t o sample ma- l y s i s check tha t ma- l y t i c a l conditions are the same as those used for standard analysis
Action i f requirements are not met
Select d i f f e ren t target o r surrogate compound; i f procedure cannot be ve r i f i ed use ca l ibra t ion standard f o r each target compound
Use pure l i qu id or determine pur i ty
Try longer de- sorpt ion times, more vigorous desorption condi- t ions , and/or o ther desorbents
Reanalyze audi t sample, if not acceptable, re- make and reana- lyze standards
Analyze audi t sample
Establ ish the same analytical conditions used during analysis of standards
(Continued)
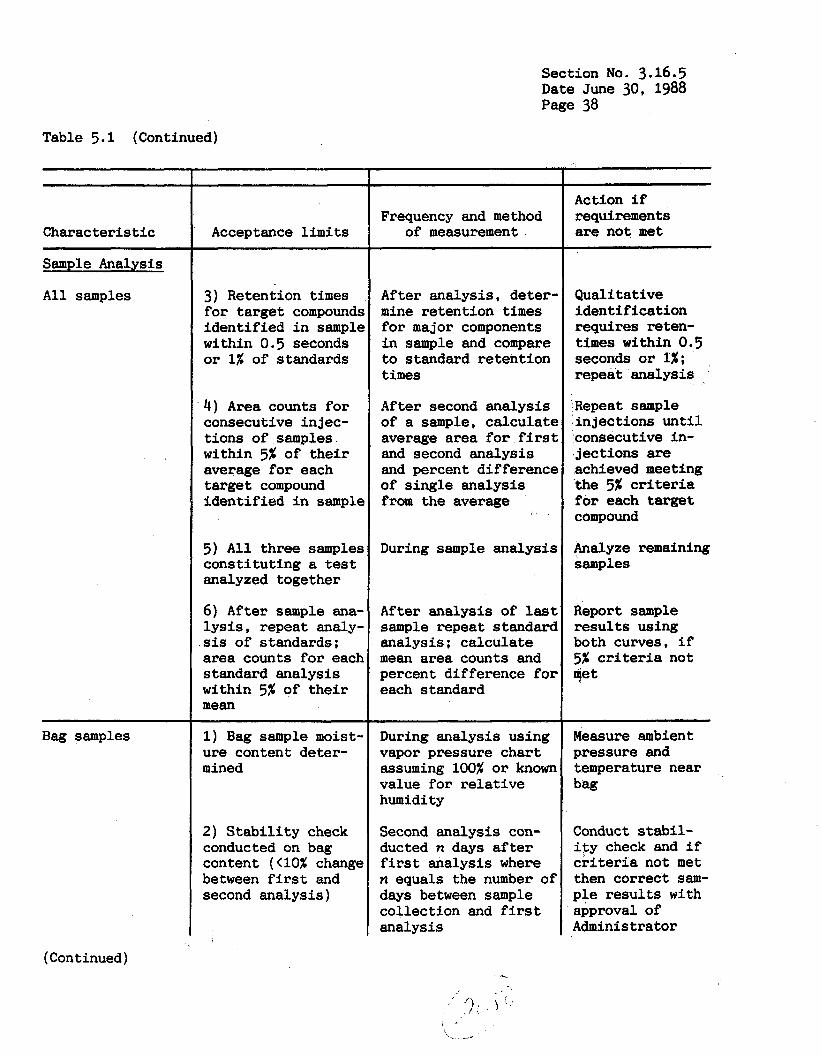
Section No. 3.16.5 Date June 30, 1988 Page 38
Table 5.1 (Continued)
Characteristic
Sample Analysis
A l l samples
~ ~
Bag samples
Acceptance l i m i t s
3) Retention times for target compounds iden t i f i ed i n sample within 0.5 seconds or 1% of standards
4) Area counts for consecutive injec- t ions of samples within 5% of the i r average f o r each target compound iden t i f i ed i n sample
5) A l l three samples cons t i tu t ing a test analyzed together
6) After sample ana- l y s i s , repeat analy- sis of standards; area counts f o r each standard analysis within 5% of their mean
1) Bag sample moist- ure content deter- mined
2) S t a b i l i t y check conducted on bag content (<lo% change between first and second analysis)
Frequency and method of measurement .
After analysis , deter- mine retent ion times f o r major components i n sample and compare t o standard retent ion times
After second analysis of a sample, calculate average area f o r first and second analysis and percent difference of s ing le analysis from the average
During sample analysis
After analysis of last sample repeat standard analysis; ca lcu la te mean area counts and percent difference for each standard
During analysis using vapor pressure chart assuming 100% o r known value for r e l a t i v e humidity
Second analysis con- ducted n days after first analysis where n equals the number of days between sample col lect ion and first analysis
Action i f requirements are not met
Qual i ta t ive ident i f ica t ion requires reten- times within 0.5 seconds o r 1%; repeat analysis
Repeat sample inject ions u n t i l consecutive in- ject ions are achieved meeting the 5% criteria for each target compound
Analyze remaining samples
Report sample re su l t s using both curves, i f 5% criteria not 9et
~
Measure ambient pressure and temperature near bag
Conduct stabil- i t y check and i f criteria not met then correct sam- ple r e su l t s with approval of Administrator
(Continued)
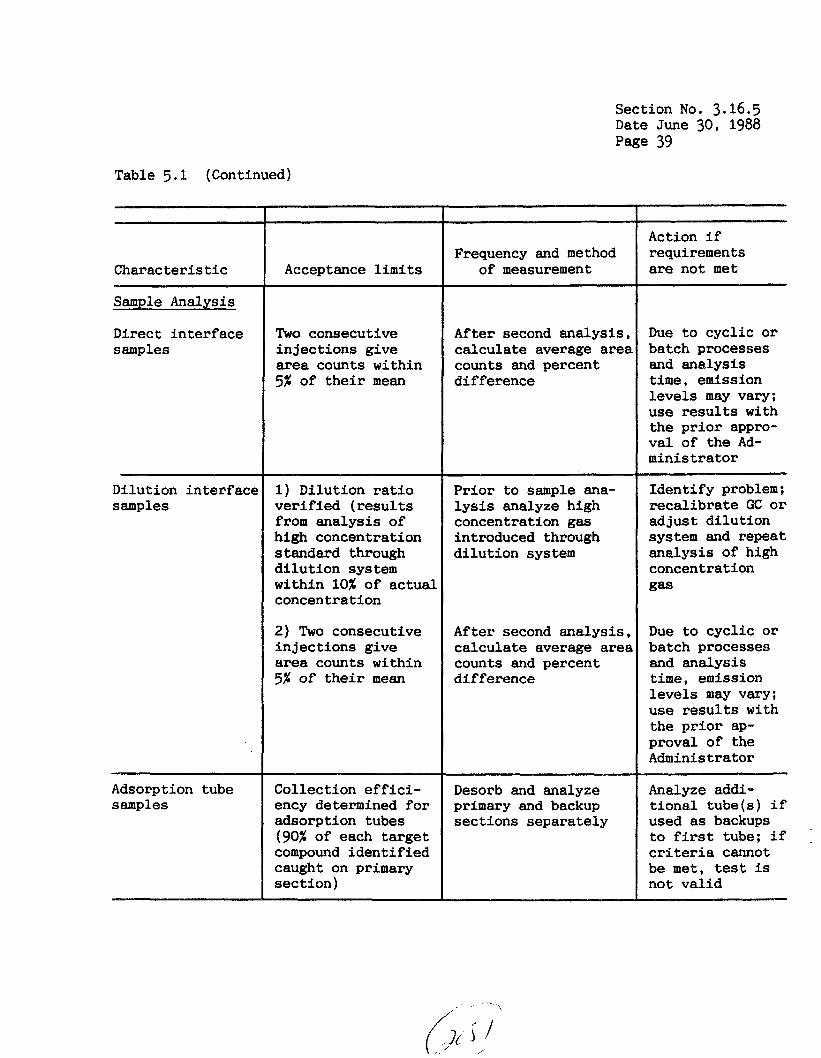
Section No. 3.16.5 Date June 30, 1988 Page 39
Table 5.1 (Continued)
Charac te r i s t ic
Sample Analysis
Direct in t e r f ace samples
Dilution in te r face samples
Adsorption tube samples
Acceptance l i m i t s
Two consecutive in j ec t ions give area counts within 5% of t h e i r mean
1) Dilution r a t i o ve r i f i ed ( r e s u l t s from analysis of high concentration standard through d i lu t ion system within 10% of ac tua l concentration
2) Two consecutive in j ec t ions give area counts within 5% of t h e i r mean
Collection effici- ency determined for adsorption tubes (90% of each target compound iden t i f i ed caught on primary sec t ion)
Frequency and method of measurement
After second ana lys i s , ca lcu la te average area counts and percent difference
P r io r t o sample ana- l y s i s analyze high concentration gas introduced through d i lu t ion system
After second ana lys i s , ca lcu la te average area counts and percent difference
Desorb and analyze primary and backup sect ions separately
Action if requirements are not met
Due t o cyc l ic or batch processes and analysis time, emission l eve l s may Vary; use r e s u l t s with the p r i o r appro- v a l of the Ad- minis t ra tor
Ident i fy problem; r eca l ib ra t e GC OF adjus t d i lu t ion system and repeat ana lys i s of high concentration gas
Due to cyc l ic or batch processes and analysis t i m e , emission l e v e l s may vary; use r e s u l t s with the p r i o r ap- proval of the Administrator
Analyze addi- t i o n a l tube(s ) if used as backups to first tube; if cr i ter ia cannot be m e t , test is not va l id

> , - ' , . c .
. c:
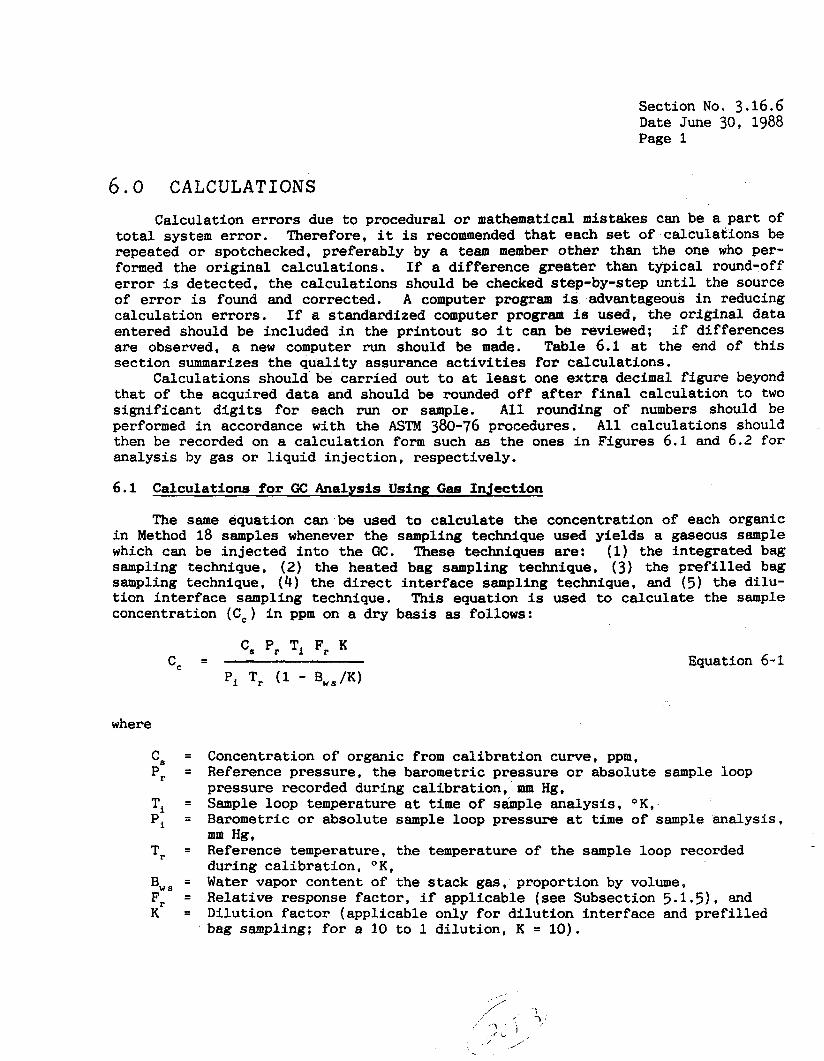
Section No. 3.16.6 Date June 30, 1988 Page 1
6.0 CALCULATIONS Calculation errors due to procedural or mathematical mistakes can be a p a r t of
t o t a l system e r ro r . Therefore, i t is recommended t h a t each set of calculat ions be repeated or spotchecked, preferably by a team member o the r than the one who per- formed the o r ig ina l calculat ions. If a difference greater than typ ica l round-off e r r o r is detected, t he calculat ions should be checked step-by-step u n t i l the source of e r r o r is found and corrected, A computer program is advantageous i n reducing calculat ion errors. If a standardized computer program is used, the or ig ina l data entered should be included i n the pr intout so it can be reviewed: i f differences are observed, a new computer run should be made. Table 6.1 at the end of t h i s sect ion summarizes the qua l i t y assurance a c t i v i t i e s f o r calculat ions.
Calculations should be car r ied out t o a t least one e x t r a decimal f igure beyond t h a t of the acquired data and should be rounded of f after f i n a l calculat ion t o two s igni f icant d i g i t s for each run or sample. A l l rounding of numbers should be performed i n accordance with the ASTM 380-76 procedures. A l l ca lculat ions should then be recorded on a calculat ion form such as the ones i n Figures 6.1 and 6.2 for analysis by gas or l i q u i d in j ec t ion , respectively.
6.1 Calculations for GC Analysis Using Gas In jec t ion
The same equation can be used to ca lcu la te the concentration of each organic i n Method 18 samples whenever the sampling technique used y ie lds a gaseous sample which can be in j ec t ed i n t o the GC. These techniques are: (1) the integrated bag sampling technique, (2) the heated bag sampling technique, (3) the pref'illed bag sampling technique, (4) the d i r e c t in te r face sampling technique, and (5) the di lu- t i on in t e r f ace sampling technique. This equation is used t o ca lcu la te the sample concentration (C,) i n ppm on a dry bas is as follows:
Equation 6-1
where
CB = Concentration of organic from ca l ib ra t ion curve, ppm, Pr = Reference pressure, t he barometric pressure or absolute sample loop
Ti Pi
Tr = Reference temperature, the temperature of t he sample loop recorded
Bws = Fr = Relat ive response f ac to r , i f applicable (see Subsection 5.1.5)g and K = Dilution factor (appl icable only for d i l u t i o n in t e r f ace and pref i l led
pressure recorded during ca l ibra t ion , mm Hg,
Barometric or absolute sample loop pressure a t t i m e of sample analysis , mm m,
= Sample loop temperature a t time of sample analysis, OK,. =
during ca l ib ra t ion , OK, Water vapor content of t he s tack gas , proportion by volumep
bag sampling; f o r a 10 t o 1 d i lu t ion , K = 10).
,/' ':
,,/",l . '; ? . r ; ' ,/ , ;.
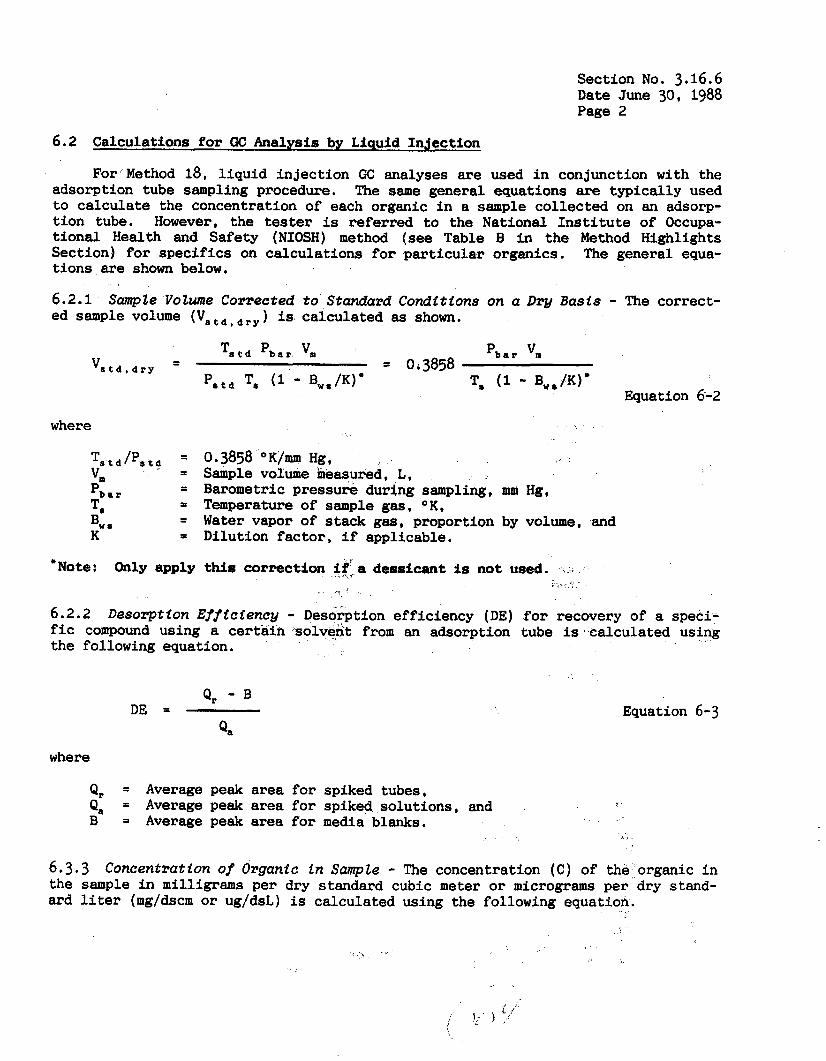
Section No. 3.16.6 Date June 30, 1988 Page 2
6.2 Calculations for GC Analysis by Liquid Injection
For Method 18, l i q u i d injection GC analyses are used i n conjunction with the adsorption tube sampling procedure. The same general equations are t y p i c a l l y used to calculate the concentration of each organic i n B sample collected on an adsorp- t ion tube. However, the tester is referred t o the National I n s t i t u t e of Occupa- t ional Health and Safety (NIOSH) method (see Table B i n the Method Highlights Section) fo r specifics on calculations fo r par t icular organics. The general equa- t ions are shown below.
6.2.1 ed sample volume ( V s t d , d r y ) is calculated as shown.
Sample Votume Corrected to Standard Condittons on a Dry Basfs - The correct-
..
T, (1 - BW8/K)" Equation 6-2
where
T , t d / P a t d = 0*3858 OK/= Hg, v m = Sample volume measured, L, Pb.r = Barometric pressure during sampling, mm Hg, T, = Temperature of sample gas, O K ,
BW 8 = Water vapor of stack gas, proportion by volume, and K = Dilution factor , if applicable.
"Note: Only apply this correcti a dess3-t is not used.
6.2.2 Desmption Efftcfencg - Desorption efficiency (DE) for recovery of a speci- f i c compound using a cer ta in solvent from an adsorption tube is calculated using the following equation.
Qr - B Qa
DE = Equation 6-3
where
Qr = Average peak area fo r spiked tubes, Q, = Average peak area for spiked solutions, and B = Average peak area f o r media blanks.
6.3.3 Concentration of Organfc fn Sample - The concentration ( C ) of the organic i n the sample in milligrams per dry standard cubic meter or micrograms per dry stand- ard l i ter (mg/dscm o r ug/dsL) is calculated using the following equatioli.
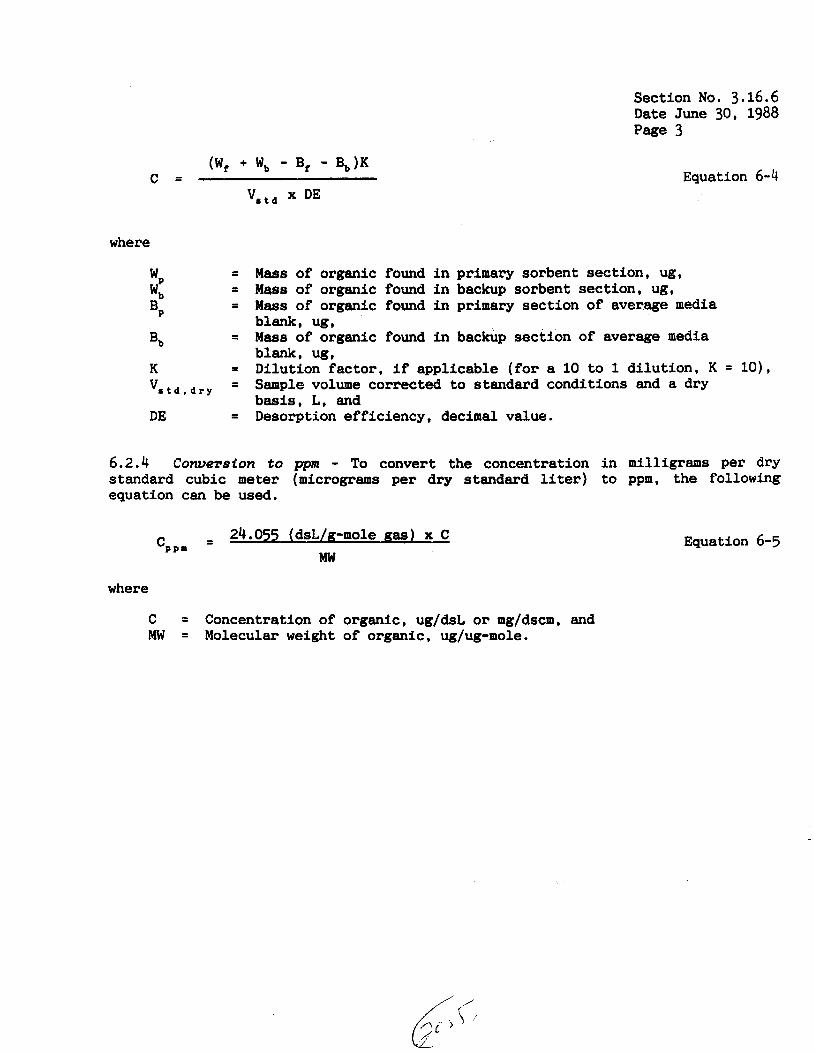
Section No. 3.16.6 Date June 30, 1988 Page 3
Equation 6-4
where
= Mass of organic found i n primary sorbent section, ug, = Mass of organic found in backup sorbent section, ug, =
=
wP W b
BP Mass of organic found i n primary section of average media
Mass of organic found i n backup section of average media bid, U g ,
blank, U g , B b
K = Dilution factor, i f applicable ( fo r a 10 t o 1 di lut ion, K = 101, V e t * , d r y
DE = Desorption efficiency, decimal value.
= Sample volume corrected t o standard conditions and a dry basis , L , and
6.2.4 Conversion t o ppm - To convert the concentration i n milligrams per dry standard cubic meter (micrograms per dry standard liter) t o ppm, the following equation can be used.
f 24.055 (dsL/g-mole as) x C
Mw C P P M
where
C = Concentration of organic, ug/dsL or mg/dscm, and MW = Molecular weight of organic, ug/ug-mole.
Equation 6-5
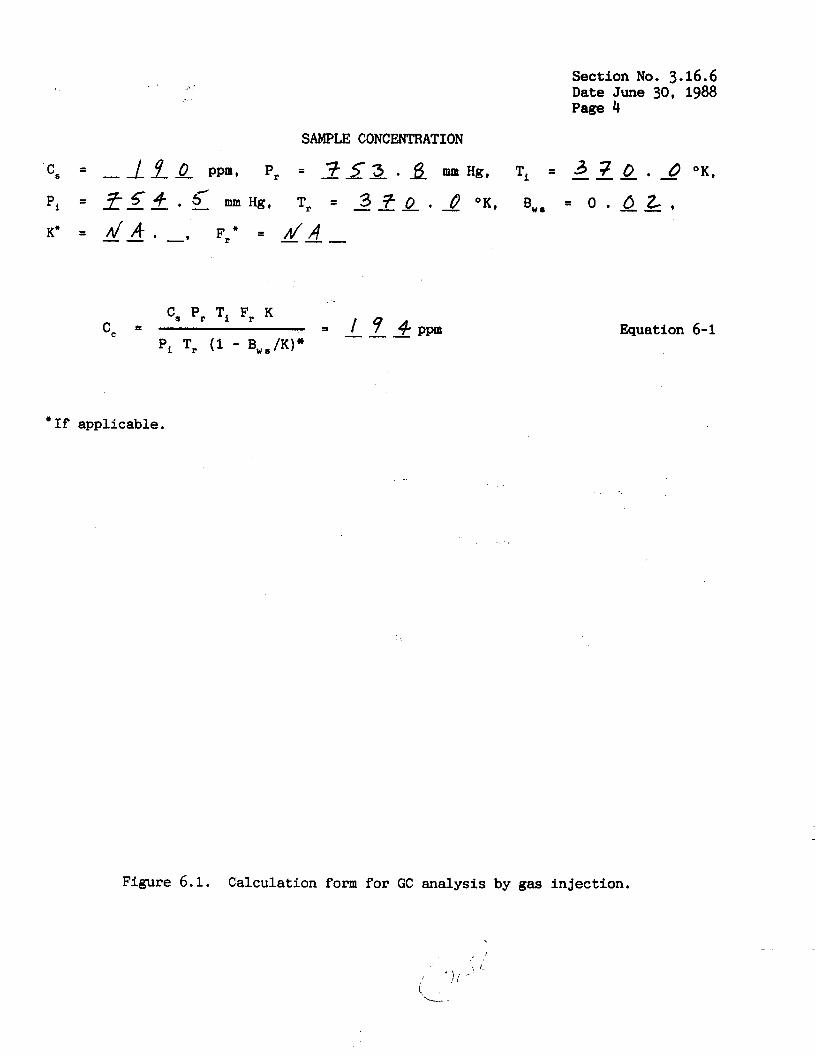
Section No. 3.16.6 Date June 30, 1988 Page 4
If applicable.
Equation 6-1
Figure 6.1. Calculation form for GC analysis by gas injection.
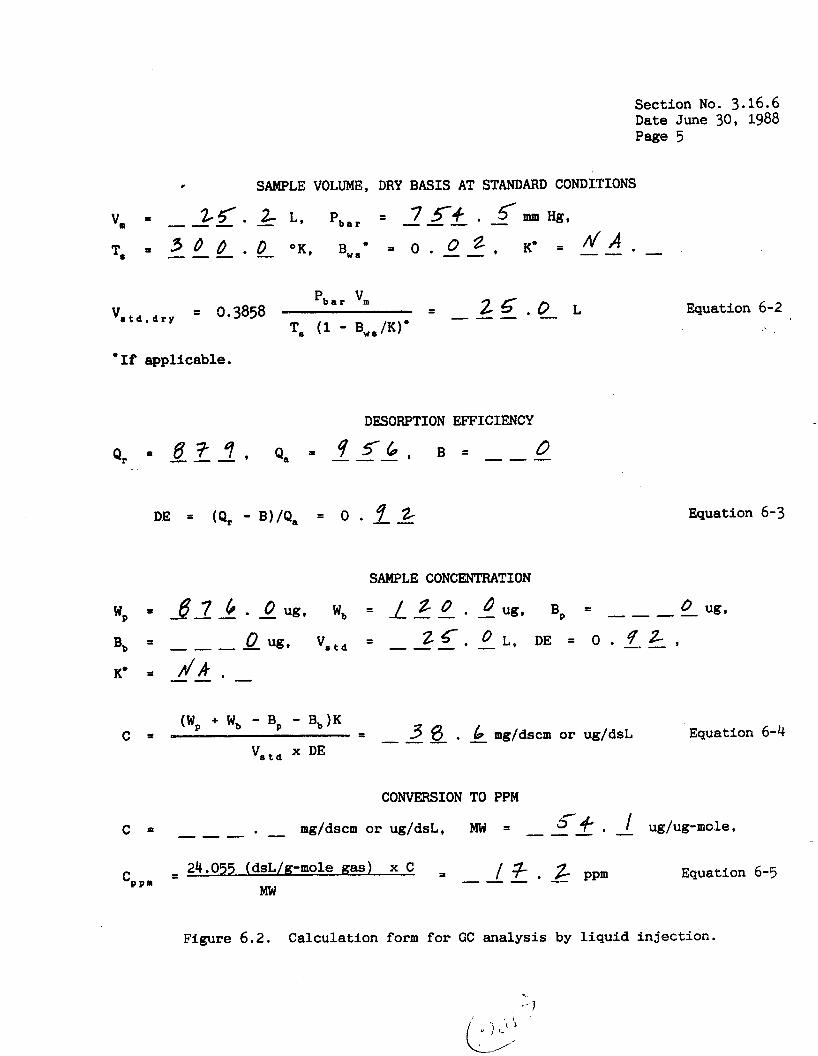
Section No. 3.16.6 Date June 30, 1988 Page 5
Equation 6-2
" If applicable.
DESORPTION EFFICIENCY
(Wp + W, - Bp - B,)K 3 6 . -b- mg/dsem or ug/dsL Equation 6-4 - - --- c +
" S t d DE
CONVERSION TO PPM
c = --- - mg/dscm or ug/dsL, MW = --- 3-e , - I ug/ug-mole,
/ + . ppm - 24.055 (dsL/g-mole gas) x C - - --- - Mw CPP.
Equation 6-5
Figure 6.2. Calculation form for GC analysis by liquid injection.
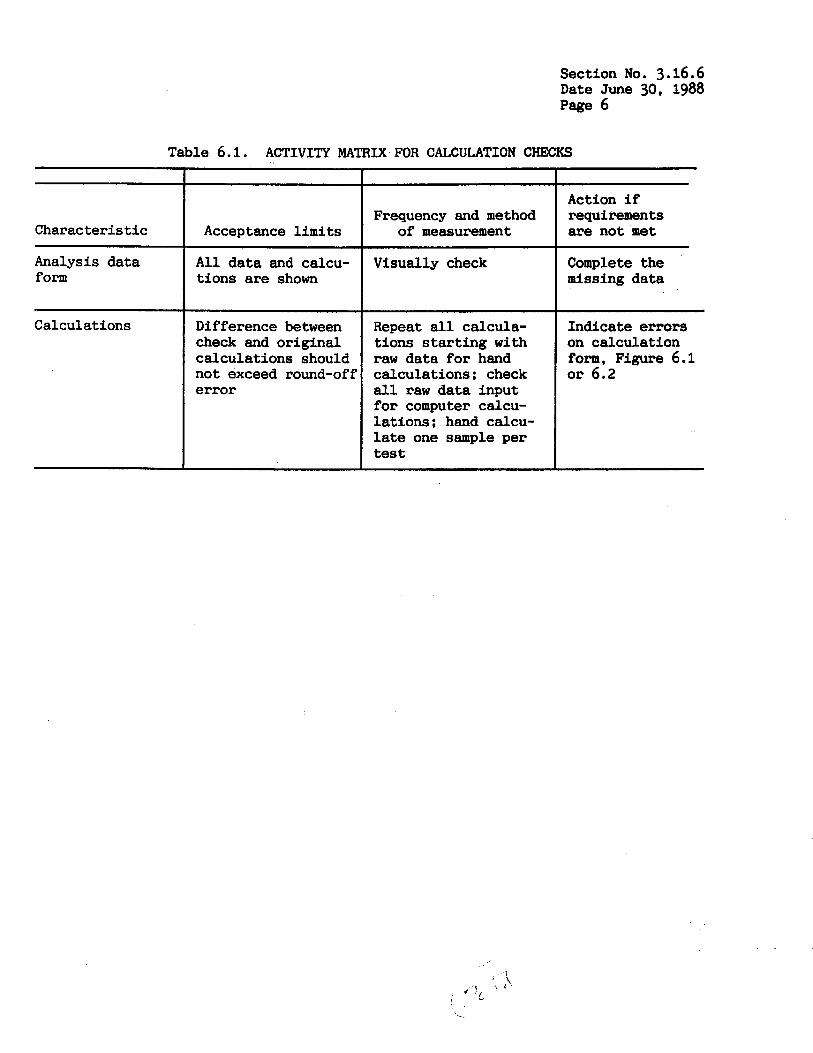
TE
~ --
Acceptance l i m i t s
A l l da ta and calcu- t ions are shown
3 6.
Action i f Frequency and method requirements
of measurement are not m e t
Visually check Complete the missing data
. ACTIVITY MATRIX FOR
Section No. 3.16.6 Date June 30, 1988 page 6
ALCULATION CHECKS
Characterist ic
Analysis data form
Calculations Difference between check and original calculations should not exceed round-off e r ro r
Repeat a l l calcula- t ions s t a r t i n g with r a w data for hand calculations: check a l l raw data input for computer calcu- la t ions ; hand calcu- late one sample per test
Indicate e r rors on calculation form. Figure 6.1 or 6.2
I
Section No. 3.16.7 Date June 30, 1988 Page 1
7.0 MAINTENANCE The normal use of emission-testing equipment subjects it t o corrosive gases,
extremes i n temperature, vibrat ion, and shock. Keeping the equipment i n good operating order over an extended period of t i m e requires knowledge of the equipment and a program of rout ine maintenance which is performed quarter ly or after 2830 L (100 f t 3 ) of operation, whichever is greater. I n addition to the quar te r ly main- tenance, a year ly cleaning of pumps and metering systems is recommended. Main- tenance procedures for the various components are summarized i n Table 7.1 a t the end of the sect ion. The following procedures are not required, but are recommended t o increase the r e l i a b i l i t y of the equipment.
Several types of pumps may be used t o perform Method 18; the two most common are the fiber vane pump w i t h i n - l i ne o i l e r and the diaphragm pump. The fiber vane pump requires a per iodic check of the o i l e r jar. Its contents should be t r ans lu - cent: the o i l should be changed i f not translucent. Use the o i l spec i f ied by the manufacturer. If none is specif ied, use SAE-10 nondetergent o i l . Whenever a f iber vane pump starts to run e r r a t i c a l l y or during the yearly disassembly, the head should be removed and the f i b e r vanes changed. Erratic operation of a diaphragm pump is normally due to e i t h e r a bad diaphragm (causing leakage) or to malfunctions of t he valves, which should be cleaned annually by complete disassembly.
7.2 D r y Gas Meter
Dry gas meters should be checked for excess o i l or corrosion of the components by removing the top p l a t e every 3 months. Meters should be disassembled and a l l components cleaned and checked whenever the ro ta t ion of the d i a l s is e r r a t i c , whenever the meter w i l l not calibrate properly over the required flow rate range, and during the yearly maintenance.
7 .3 Rotameter
Rotameters should be disassembled and cleaned according to the manufacturer's ins t ruc t ions using only recommended cleaning f l u i d s every 3 months or upon e r r a t i c operation.
7.4 Marnometer
The f l u i d i n the manometers should be changed whenever there is discolorat ion or v i s i b l e matter i n the f l u i d , and during the yearly disassembly.
7.5 Sampling Train
A l l remaining sampling t r a i n components should be v isua l ly checked every 3 months and completely disassembled and cleaned o r replaced yearly. Many items, such as quick disconnects, should be replaced whenever damaged r a the r than checked per iodical ly . Normally, the best procedure f o r maintenance i n the f i e l d is t o have on hand another e n t i r e un i t such as a p u p , Tedlar bags and containers , o r heated sample l i n e r a the r than replacing individual components.

7.6 Gas Chromatograph
Section No. 3.16.7 Date June 30, 1988 Page 2
Maintenance a c t i v i t i e s and schedules for gas chromatographs are make and model specific. It is therefore recommended that the analyst consult the operator’s manual for instructions re lat ive to maintenance practices and procedures.
... . ..*

Section No. 3.16.7 Date June 30, 1988 Page 3
Table 7.1. ACTIVITY MATRIX FOR EQUIPMENT MAINTENANCE CHECKS
Frequency and method of measurement
Action i f require- ments are not met Apparatus Acceptance limits
Fiber vane Pump
In- l ine o i l e r f r e e of leaks
Periodically check o i l e r jar; remove head and change f i b e r vanes
Replace as needed
Diaphragm PUP
Leak-free valves functioning proper15
Clean valves during yearly disassembly
Replace when leaking or mal- functioning
Replace par t s as needed, o r replace meter
Dry gas meter No excess o i l , corrosion, or er- ratic ro ta t ion of the d i a l
Check every 3 mo. for excess o i l or corro- s ion by removing the top p la te : check valves and diaphragm yearly and whenever meter d i a l runs erra- t ica l ly or whenever meter w i l l not cal- i b r a t e
Clean every 3 mo. or whenever b a l l does not move freely
Rep 1 ace Ro tame ter Clean and no erra- tic behavior
Manometer Replace par t s as needed
No discolorat ion or v i s i b l e matter i n the f l u i d
Check per iodical ly and during disassemb- 1 Y
Sampling t r a i n components
No damage Visually check every 3 mo.; completely disassemble and clean or replace yearly
I f f a i l u r e noted, replace appro- p r i a t e components
See owner's manual See owner's manual Gas chroma- See owner's manual tograph

Section No. 3.16.8 Date June 30, 1988 Page 1
8 .0 AUDITING PROCEDURES A n audi t is an independent assessment of da ta qua l i ty . Independence is
achieved i f the ind iv idua l (s ) performing the audi t and t h e i r standards and equipment are d i f f e ren t from the regular f i e l d team and the i r standards and equipment. Routine qua l i ty assurance checks by a f i e l d team are necessary to generate good qual i ty data , but they are not p a r t of the audi t ing procedure. Table 8.1 a t the end of t h i s sect ion summarizes the qua l i ty assurance functions for audi t ing .
Based on the requirements of Method 18 and the r e s u l t s of col laborat ive test- ing of o ther Reference Methods, two spec i f i c performance audi t s are recommended:
1. An audi t of the sampling and analysis of Method 18 is required f o r NSPS and recommended f o r o ther purposes.
2. And audi t of the da ta processing is recommended. It is suggested t h a t a systems audi t be conducted as spec i f ied by the qua l i ty
assurance coordinator i n addi t ion to these performance audi ts . The two performance audi t s and the systems audi t are described i n detail i n Subsections 8.1 and 8.2, respectively.
8.1 Performance Audits - Performance aud i t s are conducted t o evaluate quant i ta t ive ly the qua l i ty of
da ta produced by the t o t a l measurement system (sample co l lec t ion , sample analysis , and data processing). It is required that cylinder gas performance audi ts be performed once during every NSPS test u t i l i z i n g Method 18 and i t is recommended t h a t a cylinder gas audi t be performed once during any enforcement source test u t i l i z i n g Method. 18 conducted under regulations other than NSPS.
8.1.1 Performance Audit of the Field Test - As s t a t ed i n Section 6 . 5 of 40 CFR 60, Appendix A, Method 18, immediately after the preparation of the ca l ib ra t ion curves and p r i o r t o the sample analysis , the analysis audi t described i n 40 CFR 61, Appen- d ix C , Procedure 2: "Procedure f o r Field Auditing GC Analysis," should be per- formed. The information required to document the analysis of the audi t sample(s) has been included on the example data sheets shown i n Figures 8.1 and 8.2; the complete t e x t of the procedure is reproduced i n Section 3.16.10. The audi t anal- yses s h a l l agree within 10 percent (or other spec i f ied value, as explained below) of the t rue value. When avai lable , the tester may obtain audi t cylinders by contacting: U.S. Environmental Protect ion Agency, Atmospheric Research and Exposure Assessment Laboratory, Qua l i ty Assurance Division (MD-7'j'B). Research Triangle Park, North Carolina 27711. Audit cyl inders obtained from a commercial gas manufacturer may be used provided t h a t (1) the gas manufacturer certif ies the audi t cylinder i n a manner similar t o the procedure described i n 40 CFR 61, Appendix B, Method 106, Section 5.2.3.1, and (2) the gas manufacturer obtains an independent analysis. Independent analysis is defined as an analysis performed by an individual other than the individual who performs the gas manufacturer's analysis, while using ca l ib ra t ion standards and analysis equipment d i f f e ren t from those used f o r the gas manufacturer 's analysis . Verif icat ion is completed and acceptable when the independent analysis concentration i s within 5 percent of the gas manufacturer's concentration.
Responsibilities of the Audit Supervisor - The primary r e s p o n s i b i l i l t i e s of the audi t supervisor are t o ensure that the proper audi t gas cy l inder (s ) are or-
Section No. 3.16.8 Date June 30, 1988 Page 2
dered and safe-guarded, and t o in t e rp re t the r e s u l t s obtained by the analyst . When audi t ing sampling systems t h a t do not d i l u t e the s tack gases during samp-
l i ng , the audi t gases ordered must consis t of the same organic compound(s) t h a t are being tes ted ; for emissim standards on a concentration basis , the audi t gas concentration(s) must be range of 25% to 250% of the applicable standard. I f two cylinders are not av e, then one cylinder can be used. I f the audi t cylinder value is between 5 and 20 ppm, the agreement should be within 15 percent of the s t a t ed audi t cylinder value. It is strongly recommended t h a t audi t cylinder values below 5 ppm not be used. For emission standards which specify a control eff ic iency, the concentration of the audi t gases should be i n the range of 25% t o 250% of the expected stack gas amcentration. If two cylinders are not available, tbe audi t can be conducted using one cylinder.
The audi t supervisor must ensure t h a t the audi t gas cy l inder (s ) are shipped t o the correct address, and t o prevent vandalism, ver i fy t h a t they are stored i n a safe locat ion both before and after the audit . Also, the audi t cylinders should not be analyzed when the pressure drops below 200 ps i . The audi t supervisor then ensures t h a t the audi t s are conducted as described below.
The audi t supervisor must also i n t e rp re t the audi t r e su l t s . When the measured concentration agrees within 10 percent (or 15 percent for cylinders between 5 and 20 ppm) of the t rue value, he d i r e c t s the analyst to begin analyzing the source samples. When the measured Concentration does not agree within the specified c r i t e r ion , the analyst should f i r s t recheck the ana ly t ica l system and calculations, and then repeat the audit . If the analyst fails the second audi t , the audit supervisor should have knowledge of the agency's policy f o r f a i lu re . If the r e s u l t ( s ) are close to the allowed percentage or a consis tent b i a s is present, the supervisor may wish to al low.the analyst use of a correction f ac to r t o be applied a t a later date; however, the analyst must make a s ign i f i can t e f f o r t t o f ind the discrepancy and correct it. If the e r r o r cannot be found, the audi t supervisor should allow analysis of the samples, and then conduct the audi t again.
During the audi t , the audi t supervisor should record the appropriate" cylinder number(s), cylinder pressure(s) (a t the end of the a u d i t ) , and the calculated con- centrat ions on the "Field audi t report form", Figure 8.1. The individual being audited must not , under any circumstances, b e . t o l d the ac tua l audi t concentrations u n t i l the calculated concentration(s) have been submitted to the audi t supervisor and are considered acceptable.
When audi t ing sampling systems t h a t d i l u t e the emissions during col lect ion, the audi t gas concentration value used i n the calculat ions can either be based on (1) the undiluted concentration using the cri teria discussed above or ( 2 ) the expected concentration of the gases following d i lu t ion during col lect ion using the same d i lu t ion f ac to r as used f o r the emission samples.
The audi t procedures t h a t follow are presented according to the type of samp- l i n g system used t o collect the 'organic emissions and whether the samples are analyzed on-si te o r at the base laboratory a t a later date.
Container (Bag, Syringe, and Canister) Sampling with On-site Analysis - The cylinder gas performance audi t f o r rigid-container bag, syringe, o r canister samp- l i n g with on-si te analysis consis ts of an on-site audi t j u s t p r io r to the analysis of the emission samples. The recommended procedures f o r conducting the audi t are as follows:
1. The audi t samples should be collected i n the type of container t ha t w i l l be used during the sample col lect ion. However, to conserve on the use of the audi t gas(es), i t is usually not necessqy t o use the rest of the sampling system t o co l l ec t the" samples f o r unheated container
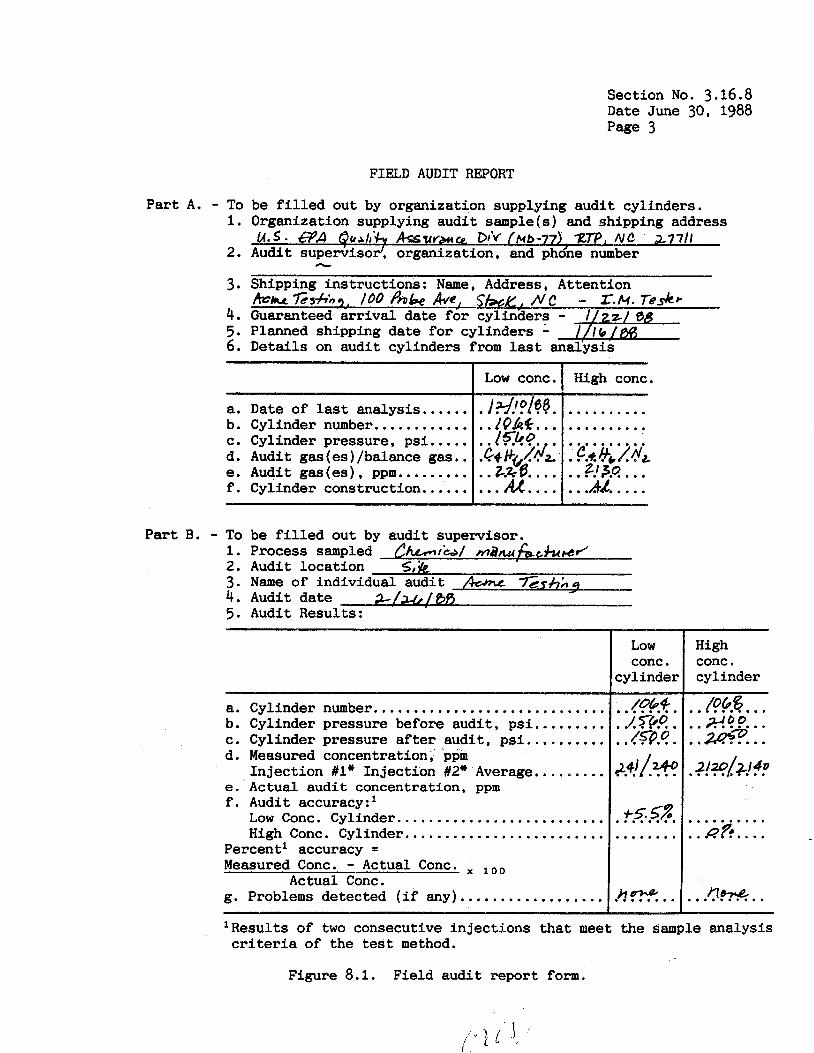
Section No. 3.16.8 Date June 30. 1988 Page 3
FIELD AUDIT REPORT
Part A. - To 1.
2.
3.
4. 5. 6.
be filled out by organization supplying audit cylinders. Organization supplying audit sample(s) and shipping address
Audit supekisor! organization, and phdne number
Shipping instructions: Name, Address, Attention tba %s&,, 100 PO& h e , y k ~ , NC - X.M. reskp Guaranteed arrival date for cylinaers Planned shipping date for cylinders - Details on audit cylinders from last
0 . 5 - @A 0 U A h . k A S U V ~ O b ' r f fNb-77) ZP, NC 27111
h
a. Date of last analysis ...... b. Cylinder number............ c. Cylinder pressure. psi ..... d. Audit gas(es)/balance gas.. e. Audit gas(es), ppm......... f. Cylinder construction......
.......... .......... .......... ..... 'C + h&L!.dL .. ?!3.q.. . .. .A&. ....
Part B. - To be filled out by audit supervisor. 1. Process sampled- &hid/ mi)rt&(kcrFUrcJ 2. Audit location 5, jre
4. Audit date &/zop$3 5. Audit Results:
3. Name of individual audit &h= z3hA 9
Low conc .
cylinder
a. Cylinder number............ b. Cylinder pressure before audit . psi.. c. Cylinder pressure after audit, psi.
High conc . cylinder
.......... 106 6
.. Z??. .. . .m?. .. d. Measured concentration, ppm
Injection #I* Injection #2* Average. ........ e. Actual audit concentration, ppm f . Audit accuracy:l
Low Conc. Cylinder .......................... High Conc. Cylinder .........................
Percent' accuracy = Measured Conc. - Actual Conc.
Actual Conc. g. Problems detected (if any) ..................
3-5 5% ........ ........
h- ........
.......... .. .Q?i. ...
0% .......... lResults of two consecutive injections that meet the sample analysis criteria of the test method.
Figure 8.1. Field audit report form.
Section No. 3.16.8 Date June 30, 1988 Page 4
2.
sampling. Problems related t o the reaction o r re tent ion of the organic compounds w i l l s t i l l occur i n the container. Other i n t e r f e ren t s i n the stack gas such as water vapor and other organics w i l l not be present i n the audi t cylinders and thus, re la ted problems w i l l not be assessed. For heated container systems, i t may be necessary t o use the sampling system to c o l l e c t the audi t gas. However, i f the gases must be heated t o prevent condensation, it is l i k e l y t h a t an audi t gas cylinder w i l l not be avai lable . The audi t samples should remain i n the appropriate container approx- imately the same length of time t h a t the source samples w i l l s t ay p r io r t o analysis . After. the preparation of the ca l ibra t ion curve, a minimum of two consecutive analyses of each audi t cylinder gas should be conducted. The analyses must agree within 5% of the average. The audi t r e s u l t s should be calculated by the analyst (o r representative) and given to the audi t supervisor. The audi t supervisor w i l l record all the information and da ta on the"Fie1d audi t report form" and then inform the analyst of the s t a t u s of the audi t . The equations fo r calculat ion of e r r o r are included on the form.
Container (Bag and Canister) Sampling with Ott-site Analysis - For cylinder gas performance audi ts associated w i t h rigid-container bag or canis te r samples that
, are analyzed o f f - s i t e , i t is recommended t h a t the audi t be conducted o f f - s i t e j u s t p r i o r t o the emission test ( i f the agency desires) and then repeated during the o f f - s i t e sample analysis as a qual i ty eontrol measure. The use of the pretest audi t w i l l help ensure that the analytical system w i l l be acceptable p r io r t o tes t ing . Alternatively, the audi t gas can be col lected i n the appropriate con- t a i n e r on-site or o f f - s i t e , and then analyzed j u s t p r i o r t o the analysis of the f i e l d samples. It is recommended t h a t the tester f i l l a t least t w o containers with the audi t gas t o guard against a leak causing a failed audi t . Since the use of the performance audit is t o both assess and improve the da ta qua l i ty , the use of the pretest audi t w i l l provide the tes te r /ana lys t with a b e t t e r chance of obtaining acceptable data. The recommended procedure f o r conducting the audi t is the same as above with the exception t h a t the audi t supervisor w i l l l i k e l y not be present during the audi t and the da ta w i l l be reported by telephone.
Direct Interface Sampling - Since d i r ec t in te r face sampling involves on-site analysis , the performance audi t is conducted on-site after the ca l ibra t ion of the GC and p r io r t o sampling. The audi t gas cylinder is attached t o the i n l e t of the sampling probe. Two consecutive analyses of the audi t gas must be within 5% of the average of the two analyses. The tester/analyst then ca lcu la tes the r e su l t s and informs the audi t supervisor. The audi t supervisor records a l l information and r e s u l t s on the "Field audi t report form" and then informs the tes te r /ana lys t as to the acceptability of the r e su l t s .
Di'lutton Intertace Sampling - Since d i lu t ion in te r face sampling involves on- si te analysis, the performance audi t is conducted on-si te after the ca l ibra t ion of the GC and p r io r t o sampling. I f the audi t gas cylinder obtained has a concentra- t ion near the d i lu ted sample concentration, the audi t gas is introduced d i r ec t ly i n t o t h e sample por t on the GC. If the audi t gas cylinder obtained has a concen- t r a t ion close t o the expected sample concentration, then the audi t gas is int ro- duced i n t o the d i lu t ion system. The audi t supervisor may wish t o order one cylin- der t o assess both the d i lu t ion system and the analytical system and another cylin- de r t o assess only the ana ly t ica l system. Follow the same procedures described
Section No. 3.16.8 Date June 30, 1988 Page 5
above f o r recording
AdsoTption Tube conducted o f f - s i t e .
the information and reporting the results.
Sampting - The analysis for adsorption tube sampling is usually Therefore, the audi t analysis ,is conducted o f f - s i t e . Again,
the recommended procedure is t o conduct the audi t once p r io r t o the test and again following the test. Though the audi t sample could be analyzed by direct in jec t ion , the inclusion of the chromatogram printout i n the report w i l l prove tha t the audi t r e s u l t s were obtained through adsorption tube sampling and a solvent extract ion. Alternatively, the audi t samples can be col lected on-si te or of f - s i t e and then analyzed j u s t p r i o r to the analysis of the f i e ld samples. Since the a u d i t supervisor w i l l l i k e l y not be present during the analysis, the r e s u l t s are reported by telephone.
To c o l l e c t the audi t gas with the adsorption tube sampling t r a i n , connect a sample "T" t o the l i n e from the audi t gas cylinder. Place the adsorption tube sampling system on one leg of the "T"; connect a rotameter t o the other leg. With the sampling system o f f , turn on the audi t gas flow u n t i l the rotameter reads 2 lpm. Turn on the sampling system and sample the audi t gas for t he specif ied run t i m e . Approximately 1 lpm should be discharged through the rotameter.
8.1.2 Performance Audit of Data Processing - Calculation e r ro r s are prevalent i n processing data. Data processing e r ro r s can be determined by audi t ing the recorded da ta on the f ie ld 'and laboratory forms. The or ig ina l and audi t (check) calcula- t ions should agree within round-off e r ro r ; i f not, a l l of the remaining da ta should be checked. The data processing may a l so be audited by providing the tes t ing laboratory with specific da ta sets (exactly as would appear i n the f i e l d ) , and by requesting t h a t the da t a calculat ion be completed and t h a t the r e s u l t s be returned to the agency. This audi t i s useful i n checking both computer programs and manual methods of da ta processing.
8.2 Systems Audit
A systems audi t is an on-si te , qua l i t a t ive inspection and review of the t o t a l measurement system (sample col lect ion, sample analysis, e tc . ) . I n i t i a l l y , a systems audi t is recommended for each enforcement source test, defined here as a series of three runs a t one source. After the test team gains experience with the method, the frequency of audi t ing may be reduced -- f o r example, t o once every four tests .
The audi tor should have extensive background experience i n source sampling, spec i f i ca l ly with the measurement system being audited. The functions of the audi tor are summarized below:
1. Inform the t e s t ing team of the r e su l t s of pretest audi t s , specifying any area(s) that need special a t ten t ion or improvement.
2. Observe procedures and techniques of the f i e l d team during sample collec- t ion.
3 . Check/vesify records of apparatus ca l ibra t ion checks and qua l i ty control used i n the laboratory analysis of control samples from previous source tests, where applicable.
4. Record the r e s u l t s of the audi t , and forward them with comments t o the test team management so t h a t appropriate co r rec t ive ac t ion may b e i n i t i a t e d .
While on s i t e , the audi tor observes the source test team's overa l l perfor- mance, including the following specific operations:
Section No. 3.16.8 Date June 30, 1988 Page 6
1.
2. 3. Collecting the sample at a proportional rate (if applicable) or constant
4. 5. Conducting the initial and final check on the dilution system (if appli-
6. Sample documentation procedures, sample recovery, and preparation of
7. Conducting sample analyses (if conducted on-site).
Conducting the GC calibration and conducting the performance audit (if the analysis is conducted on-site). Setting up and leak testing the sampling train.
rate at the specified flow rate. Conducting the final leak check and recovery of the samples.
cable).
samples for shipment (if applicable).
Figure 8.2 is a suggested checklist for the auditor.
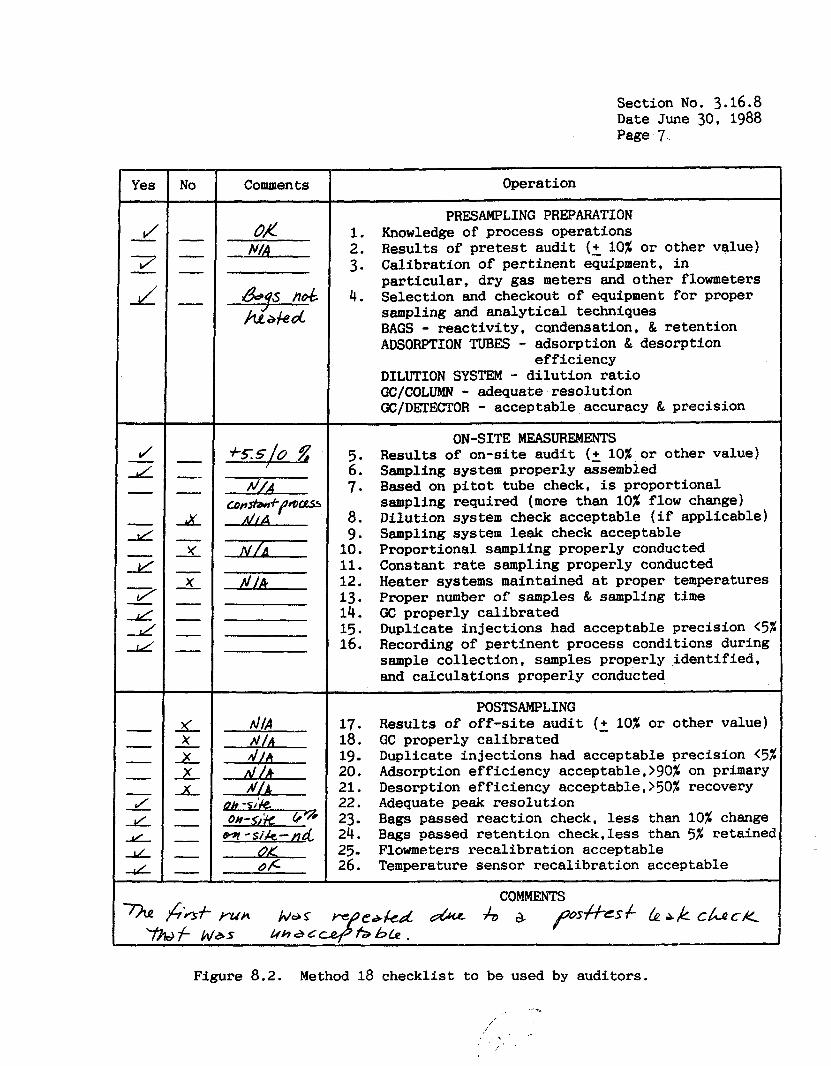
Section No. 3.16.8 Date June 30, 1988 Page 7
Y
Y - -
Comments
N/d
Opera tion
PRESAMPLING PREPARATION 1. Knowledge of process operations 2. 3. Calibration of pertinent equipment, in
4. Selection and checkout of equipment for proper
Results of pretest audit (2 10% or other value)
particular, dry gas meters and other flowmeters
sampling and analytical techniques BAGS - reactivity, candensation, & retention ADSORPTION TUBES - adsorption & desorption
efficiency DILUTION SYSTEM - dilution ratio GC/COLUMN - adequate resolution GC/DEI'ECTOR - acceptable accuracy & precision
ON-SITE MEASUREMENTS 5. 6 . Sampling system properly assembled 7. Based on pitot tube check, is proportional
8. 9. 10. Proportional sampling properly conducted 11. 12. 13. 14. GC properly calibrated 15. 16.
Results of on-site audit (+ 10% or other value)
sampling required (more than 10% flow change) Dilution system check acceptable (if applicable) Sampling system leak check acceptable
Constant rate sampling properly conducted Heater systems maintained at proper temperatures Proper number of samples & sampling time
Duplicate injections had acceptable precision (51 Recording of pertinent process conditions during sample collection, samples properly identified, and calculations properly conducted
17. 18. 19 20. 21. 22. 23 24. 25 26.
POSTS AMPLING Results of off-site audit (2 10% or other value) GC properly calibrated Duplicate injections had acceptable precision (5% Adsorption efficiency acceptable,>gO% on primary Desorption efficiency acceptable,>50% recovery Adequate peak resolution Bags passed reaction check, less than 10% change Bags passed retention check,less than 5% retained Flowmeters recalibration acceptable Temperature sensor recalibration acceptable
COMMENTS
Figure 8.2 . Method 18 checklist to be used by auditors.
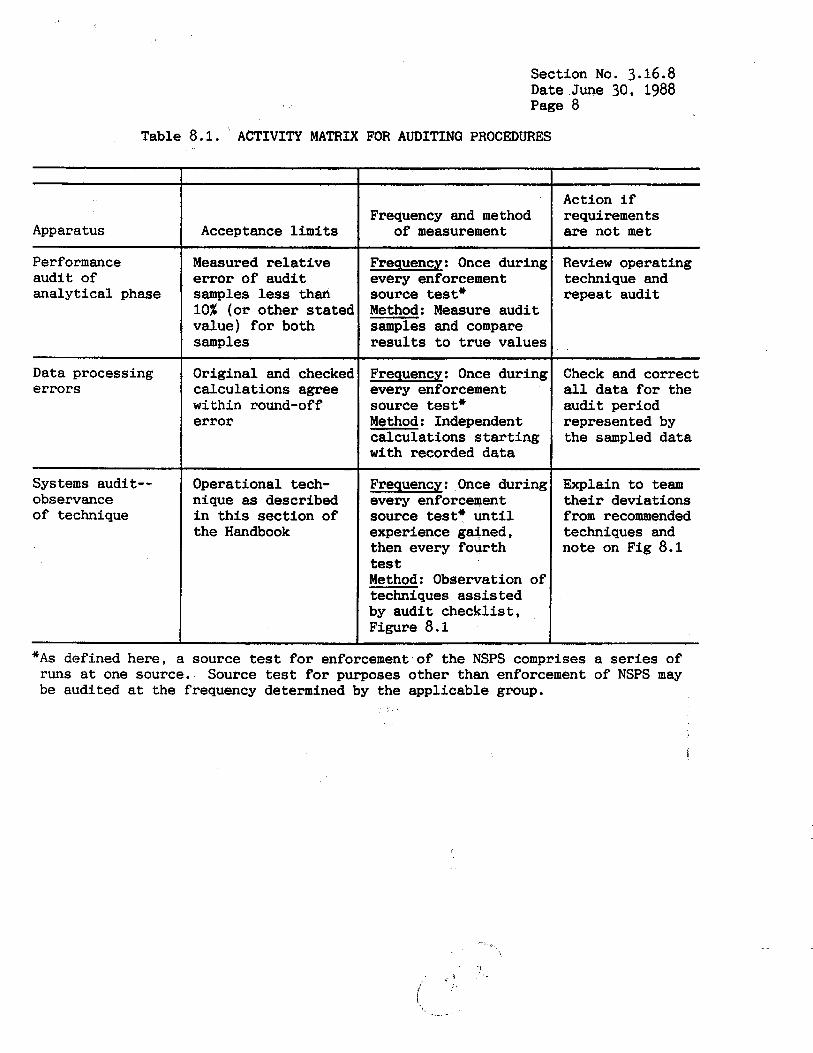
Section No. 3.16.8 Date June 30, 1988 Page 8
Table 8.1. A C T I V I T Y MATRIX FOR AUDITINQ PROCEDURES
Apparatus
Performance audi t of ana ly t ica l phase
Data processing e r ro r s
Systems audit-- observance of technique
Acceptance limits
Measured r e l a t i v e error of audi t samples less than 10% (or other stated value) f o r both samples
Original and checked calculat ions agree within round-off e r r o r
Operational tech- nique as described i n t h i s sect ion of the Handbook
Frequency and method of measurement
Frequencx: Once during every enforcement source test* Method: Measure audi t samples and compare r e s u l t s t o t r u e values
Frequency: Once during every enforcement source test" Method: Independent calculat ions s t a r t i n g with recorded da ta
Frequency: Once during every enforcement source test" u n t i l experience gained, then every fourth test Method: Observation of techniques a s s i s t ed by audi t checkl i s t , Figure 8.1
~~~~ ~ ~~
Action i f requirements are not met
Review operating technique and repeat audi t
Check and correct a l l data for the audi t period represented by the sampled data
Explain to team t h e i r deviations from recommended techniques and note on Fig 8.1
"As defined here, a source test for enforcement of the NSPS comprises a series of runs a t one source. Source test for purposes other than enforcement of NSPS may be audited a t the frequency determined by the applicable group.
- - . -.
Section No. 3.16.9 Date June 30, 1988 Page 1
9.Q RECOMMENDED STANDARD$ FOR ESTABLISHING TRACEABILITY To achieve data of desired q u a l i t y , two e s s e n t i a l considerat ions are
necessary: (1) the measurement process must bu i n a state of statistical control a t the time of the measurement, and (2) the systematic e r r o r s , when combined wi th the random v a r i a t i o n (errors or measurment), must r e s u l t i n an acceptable uncertainty. As evidence i n support of good qua l i ty da ta , it is necessary t o perform qula i ty control checks and independent audi t s of the measurement process; t o document these data: and t o use materials, instruments, and measurement procedures t h a t can be t raced t o an apropriate standard of reference.
Data must be rout inely obtained by repeat measurements of standar reference samples (primary, secondary, and/or working standards) and the establishment of a condi t ion of process control . The working ca l ib ra t ion standards should be traceable to standards of higher accuracy.
Audit samples (as discussed i n Section 3.16.8) must be used t o va l ida te test r e s u l t s f o r compliance determinat ion purposes and are recommendeed as an independent check on the measurement process when the method is performed for other purposes.

. .
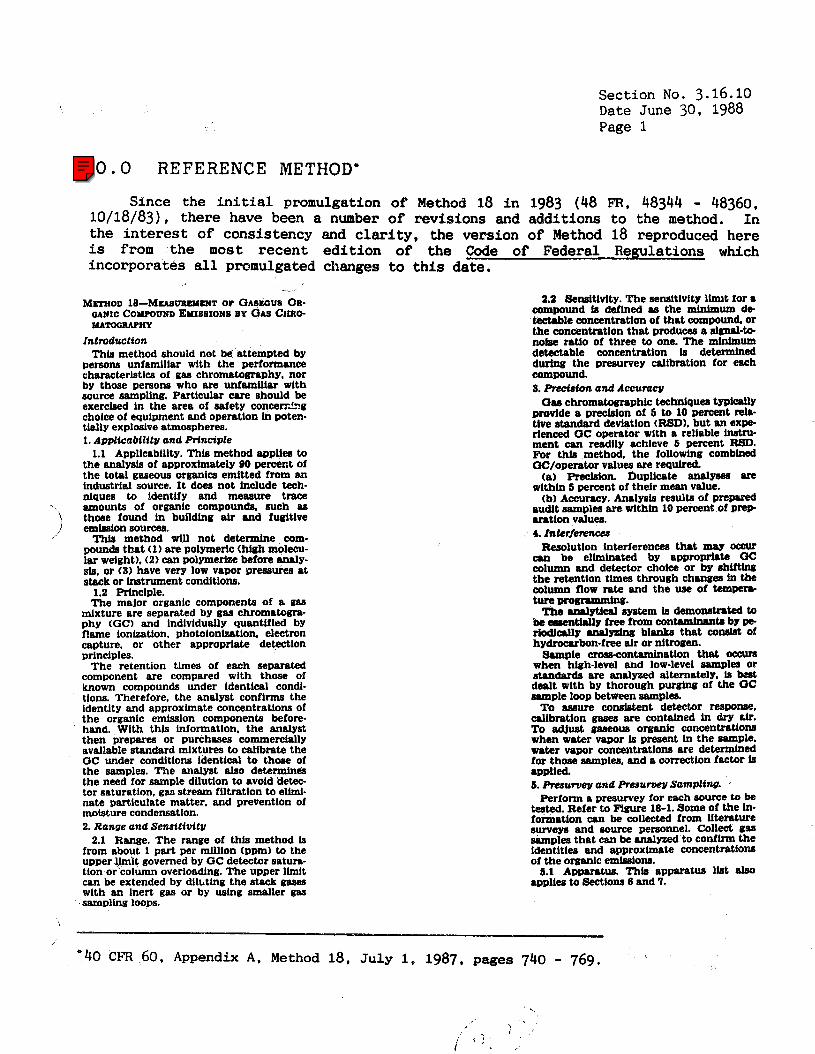
Section No. 3.16.10 Date June 30, 1988 Page 1
10.0 REFERENCE METHOD' Since the i n i t i a l promulgation of Method 18 i n 1983 (48 FR, 48344 - 48360,
10/18/83), there have been a number of revisions and additions t o the method. In the i n t e r e s t of consistency is from the most recent incorporates a l l promulgated
and c l a r i t y , the version of Method 18 reproduced here e d i t i o n of the Code of Federal Regulations which changes t o t h i s date.
M-OD 18-MCMrmtu~ OP GASEOUS OR- aAHIC COMPOUND EMISSIONS BY GAS CiiRO- LUTOGRAPHY
Introduction This method should not be attempted by
persons unfamlllar wlth the performance characterlstlcs of gas chromatography, nor by those persons who are unfemlllar wlth source sampling. Partlcular care should be exercised In the area of safety concerAg cholce of equlpment and operation In poten- tlally exploslve atmospheres. 1. Applicability and mnciple
1.1 Appllcrrbillty. This method applies to the analysie of approximately 90 pemr.t of the total gaseous organics emltted from en industrld source. I t d m not Include tech- nlques to Identify and measure trace amounts of orgmlc compounds. such 88 those found In bufldlng alr and fudtfve emlsslon sources. Thb method will not detenulne com-
gounpls that ( 1 ) are polymeric (hlgh molecu- lar welght). (2) can polymerize before 8naly- sie. or (3) have very low vapor pressures at stack or instrument conditions.
1.2 Principle. The major organic components of a g8.9
mlxture are separated by gas chromatom phy (GC) and indlvldually quantlfled by flame ionlzatlon. photolonlzstlon, electron capture, or other appropriate detection principles.
The retention tlmes of each separated component are compared wlth those of known compounds under Identlcal condl- tlons. Therefore, the analyst conflrms the Identlty and approxlmate concentrations of the organic emission components before- hand. Wlth thts Lnfomatlon. the analyst then prep- or purcheaes commerclally avdable standard mlxtures to csllbrate the GC under condltlons Identlcal to those of the samples. The analyst also determines the need for sample dflutlon to avoid detec- tor saturation. gaa stream flltratlon to ellml- nate partlculate matter. and preventlon of mobture condensatton. 2. Range and Senaffivfty
2.1 Range. The range of thh method te from about 1 part per mllllon (ppm) to the upper llmlt governed by GC detector satura- tion or column overloadlng. The upper llmit can be extended by d l l d n g the stack gases wlth an Inert gas or by uslng smaller gas samplins loops.
i
\
2.2 Seneitlvlty. The sensltivtty l h t for a compound is defined as the mlnimum de kctable concentration of that compound or the concentration that produces a 6lunal-b nohe ratlo of three to one. The ~ M ~ L U D detectable concentratlon Is determined durlng the prenurvey callbratlon for each compound 3. RecWon and A c e u r n
GOB chromatographic techalques tVplcPllV provide a preclelon of 6 to 10 percent rela- tive standard devlatlon (RSD). but an e x p rlenced C3C operator wlth a reliable Instru- ment can readlly achleve 6 percuLt R8D. For thls method, the following combined OC/operator values are repulred.
(a) Preclelon. Duplicate anal- Bn within 5 percent of thelr mean value. (bl Accuracy. Analysis results of prelwed
audlt samples are wlthln 10 percent of p m amtion values. 1. Interferenctx
Resolution interferences that may OCEuT can be eliminated by approPri4t.e (3C column and detector cholce or by n h K U the retentlon times through changes in the column now rate and the use of tern-
The enr3ytleal system le d e m O M t . t e d to be emsentially free from contunlnmta by pe- riodically analyzing blanks that coasiSt of hydrocarbon-free alr or dtroeen.
Sample crosscontaminatlon that occurs when hlgh-level and low-level sampla or standards are analyzed alternately. b be& dealt wlth by thorough purglno of the OC sample loop between ssrnples. To assure consistent detector response,
d b r a t l o n geses are contained In d.W ah. To adjust gaseous 0-c concentratlone when water vapor le present In the SmUPle. water vapor concentrations are determined for those aamples. and a correctlon factor is applied. 1. Raurvey and presurvey Sampling.
Perform a presumey for each BOU~CC e0 be tested. Refer to Flgure 18-1. Some of the In- formation can be collected from litemture surveys and source personnel. Collect gas samples that can be analyzed to conflrm the Identities and approximate concentratlorn of the organic emlsslons.
5.1 Apparatus. Thh apparatus list also applles to Sectlons 6 and 1.
~ R ~ ~ .
"40 CFH 60, Appendix A , Method 18, July 1, 1987, pages 74s - 769.
US EPA EMC
The Federal Register Version Presented was published with this Report but has been supeceded. Users should use the most recent version of EPA Method 18 rather than the method presented.
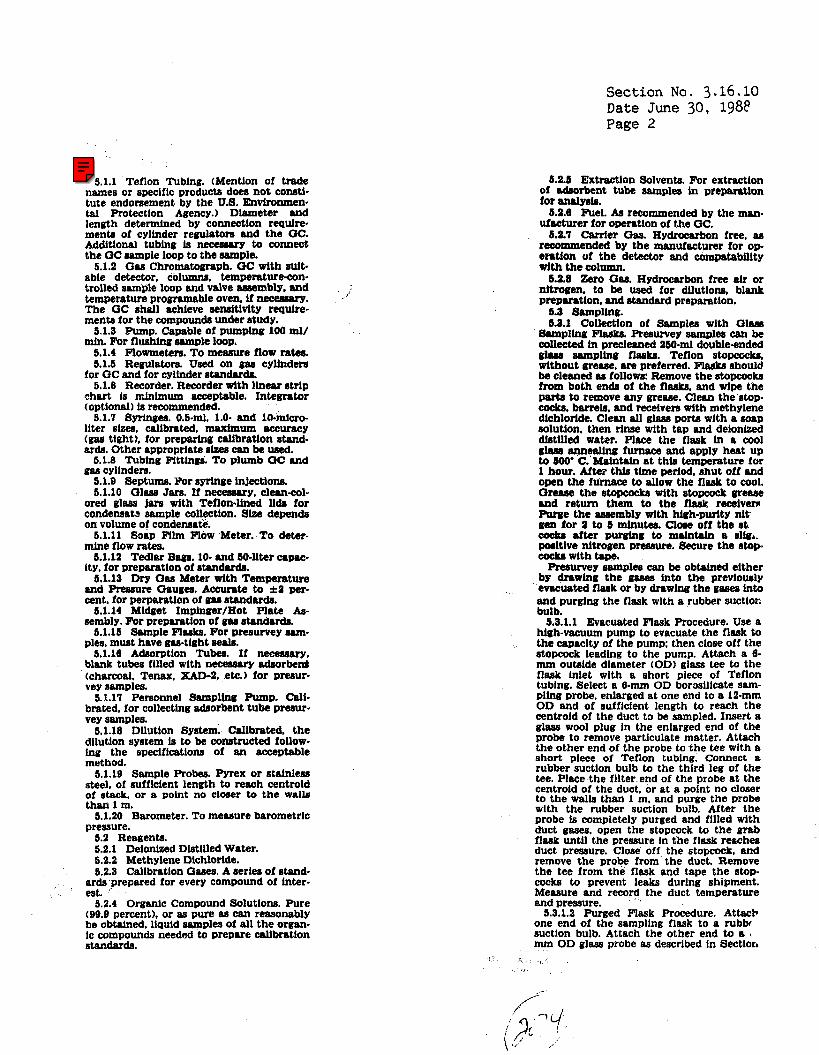
Section No. 3.16.10 Date June 30, 198t Page 2
5.1.1 Teflon Tubing. (Mentlon of trade names or speclflc products does not Eonatl- tute endorsement by the U.8. Environmen- tal Protectlon Agency.) Dlameter and length determined by connectlon repulre- ments of cylinder regulator8 and the OC. Addltlonal tublng Ls nesemry to connect the OC m p l e loop to the sample.
able detector, columns, temperaturecon- trolled sample loop and valve essembly, and temperature programable oven, if n m . The OC sMl achieve sensitivity require- ments for the compound8 under rtudy.
5.1.3 Pump. Capable Of PUmPinrr 100 ml/ mln. For flushine Barnple loop.
5.1.4 Flowmetem. To measure flow rates. 5.1.5 Regulators. Used on g~ cylinders
for OC and for cylinder standards. 5.1.6 Recorder. Recorder with linear strip
chart Is mlnlmum acceptable. Integrator toptlonal) is recommended.
llter slzes. callbrated. maximum aecurecy tea8 tlght), for preparlng Wbratlon stand- ard. Other appropriate rIze8 can be used.
6.1.6 Tubing Mttlng8. To plumb QC and gas cylinders.
1.1.9 Septum. For syrlwe Wectlons. 5.1.10 GI- Jam. If necessary. clerncol-
ored e l m lare with Teflon-lined Ilds for condenaatz sample collectlon. She depends on volume of condensate.
5.1.11 Soap Mlm Flow Meter. To deter- mine flow rates.
Ity, for preperatlon of rtandardo. 6.1.13 Dry OM Meter wlth Temperature
and Pneeure Oeuges. Acauate to f 3 per- cent, for perparatlon of O M rtandard8.
6.1.14 Midget Impineer/Hot Plate As- sembly. For Preparation of gM standards.
5.1.15 Sample Flruh. For presurvey s m ~ - plm. must have gas-tfght m u .
5.1.16 Adsorption Tubes. If neceasry, blank tubes illled wlth neceseuy adsorbed (charcoal. ena ax. xAD-2. etc.) for presur- vey samplw.
5.1.17 Pemonnel Sempllng Pump. Call- brated, for collecting &orbent tube presur- vey samples.
5.1.18 Dilution System. Cdbrated. the dilution System Is to be constructed follow- h g the speclflcatlons of an acceptable method.
5.1.19 Sample Probee. Pyrex or stainless steel. of sufficient length to reach centrold of stack. or a polnt no closer to the wails than 1 m.
5.1.20 Barometer. To measure barometrlc pressure.
1.2 Reagents. 5.2.1 Deionized DLstlUed Water. 5.2.2 Methylene Dlchlortde. 1.2.3 Callbratlon Oases. A serles of atand-
ards prepared for every compound of Inter- eat.
5.2.4 Organic Compound Solutlons. Pure (99.0 percent). or as pure as can reasonably be obtained. liquld samples of all the organ- ic compounds needed to prepare callbratlon Standards.
5.1.2 GM Chromtopraph. G c with d t -
5.1.7 Syrfnges. O.S-ml, 1.0- and 1O-ml~r0-
5.1.12 Tedlar B W . 10- md 50-llter
5.2.5 Extrnctlon Solvents. For extractlon of dwrbent tube aamples in preparrrtlon for malysb. 6.3.6 Fuel. As recommended by the man-
ufacturer for operatlon of the ac. 5.2.7 Carrier Oas. Hydrocsrbon free, as
recommended by the manufacturer for op. eprtton uf the detector and compatablllty wlth the column.
5.2.8 Zero Gas. Hydrocarbon free alr or nitrogen. to be used for dllutlons, blank premratlon. and standard preparatlon. 6.3 Sampling. 5.8.1 Collection of Samples wlth O l w
&mpllnp Flasks. Presrprvey earnplea can be collected in preclerned 25O-ml double-ended g h aampllng flasks. Teflon stopcock& without grease, are preferred. FlasLs should be cleaned M follows: &move the rtopcockn from both ends of the flasks. and wlpe the partd to remove any greese. Clean the stop- cock~. barrels. and receivers wlth methylene dichlodde. Clean all glass ports wlth a soap solutlon. then rinse with tap and deionized diatllled water. Place the flask In a cool gla6n annealhie furnace and apply heat up to 600' C. Maintain at this temperature for 1 hour. After thls t h e period, shut off and own the furnsce to allow the flesk to m l . O r e m the stopcoclta with s t o m grease and return them to the f h k recelvem Rvpe the Pssembly with hlgh-purlty ni t gen for 2 to 6 mlnuka Cloae off the 8k
poritlve nitrogen prwaure. Secure the a t o p cocks wlth tape.
Presurvey esmplcs can be obtaLned either by dnrwlno the PI~KS into the prevlously evacuated flask or by drawlng the eases into and purglng the flask wlth a rubber suctlon; bulb.
5.3.1.1 Evacuated Flask Procedure. Use a high-vacuum pump to evacuate the flask to the cspaclty of the pump: then close off the stopcock leading to the pump. Attach a 6- mm outslde diameter (OD) glass tee to the flask Inlet with a short piece of Teflon tubing. Select a 6-mm OD boroslllcate s m - p h g probe. enlarged at one end to a 12-mm OD and of sufflclent length to reach the centrold of the duct to be sampled. Insert a glass wool plug In the enlarged end of the probe to remove particulate matter. Attach the other end of the probe to the tee wlth a short plece of Tenon tublng. Connect a rubber suctlon bulb to the third leg of the tee. Place the fllter end of the probe at the centrold of the duct, or at a polnt no closer to the wall8 than 1 rn. and purge the probe wlth the rubber suctlon bulb. After the probe Is completely purged and fllled with duct gases. open the stopcock to the grab flask untll the pressure in the flask reaches duct pressure. Close off the stopcock. and remove the probe from the duct. Remove the tee from the flask and tape the stop- cock8 to prevent leaks during shlpment. Measure and record the duct temperature land pressure.
5.3.1.2 Purged Flask Procedure. AttacP one end of the sampllng flask to a rubbf suction bulb. Attach the other end to a \
nun OD glass probe as descrlbed in Sectlon
after p u r a g to ldnm a 81kL
US EPA EMC
The Federal Register Version Presented was published with this Report but has been supeceded. Users should use the most recent version of EPA Method 18 rather than the method presented.
Section No. 3.16.10 Date June 30, 1988 Page 3
5.3.1.1. Place the filter end of the probe at the centroid of the duct, or at a point no closer to the walls than 1 m, and apply s u e tion wlth the bulb to completely purge the probe and flask. After the flask hm been purged. close off the stopcock near the suc- tion bulb, and then close the stopcock near the probe. Remove the probe from the duct, and disconnect both the probe and suction bulb. Tape the stopcocks to prevent leakage durlng shipment. Measure and record the duct temperature and pressure.
5.9.2 Flexible Bag Procedure. Tedlar or aluminized Mylar bags can also be used to obtaln the presurvey sample. Uqe new bags. and leak check them before field use. In ad- dltlon, check the bag before use for con- taminatlon by filling It with nitrogen or slr. and analyzing the gas by GC at high senel- tlvlty. Experience indicates that It is dealra- ble to allow the inert gas to remeln in the bag about 24 hours or longer to check for desorption of organics from the bag. Follow the leak check and sample collection proce- dures given in Section 7.1.
5.3.3 Determlnstion of Moisture Content. For combustion or water-controlled process- es. obtain the moisture content from plant personnel or by meastirement during the presurvey. If the source is below 59' C. measure the wet bulb and dry bulb terngera- tures. and calculate the moisture content using a psychrometrlc chart. At hlgher tern, peratures, use Method 4 to determine the moisture content.
6.4 Determination of Static Pressure. Obtaln the static pressure from the plmt personnel or measurement. If a type S pitot tube and an Inclined manometer are ueed. take care to allgn the pitot tube 90' from the direction of the flow. Disconnect One Of the tubes to the manometer. and read the static pressure; note whether the reading Is positlve or negative.
5.5 Collection of Presurvey Samplea with Adsorption Tube. Follow Section 7.4 for pre- survey sampling. 6. Analysis Development
6.1 Selection of GC Parameters. 6.1.1 Column Choke. Based on the initial
contact with plant personnel concerning the plant process and the anticipated emkslons. choose a column that providea good resolu- tion and rapld analysis tlme. The choice of an approprlate column can be aided by a lit- erature search, contact wlth manufacturers of C3C columns, and discussion with Penion- nel at the emlssion soum.
Most column manufacturers keep excel- lent records of their products. Their techni- cal servlce departmente may be able to rec- ommend approprlate columns and detector type for separating the anticipated corn- pounds, and they may be able to provide in- formation on interferences. optimum oper- ating conditions, and column IhltatlOnti.
plants with analytical 1aboraeOries may also be able to provide informatton On aR proprlate analytical procedures.
6.1.2 Preliminary GC Adjustment. Uslne the standards and column obtained in See- tfon 6.1.1. perform initla1 tests to determine appropriate GC condltlons that provide good resolutlon and minimum anelYsb time for the compounds of interest.
6.1.3 Preparation of Presurvey Samples. If the ssmples were collected on an adsorb- ent. extract the samgle 89 recommended by the manufacturer for removal of the com- pounds with a solvent sultable to the type of OC analyala. Prepare other samples In an appropriate manner.
81.1.4 Resurvey Sample Analysis. Before anelyefs. heat the presurvey sample to the duct temperature to vaporize any condensed material. Analyze the samples by the GC procedure, and compare the retentlon times ogalnst those of the calibration samples that contain the components expected to be In the stream. If any compounds cannot be Identifled wlth certainty by this procedure, identtfy them by other means such as GC/ maas spectroscopy (GC/MS) or GC/lnfrared technlques. A GC/MS system is recom- mended. Use the GC conditions deterrnlned by the
procedures of Section 6.1.2 for the f h t in- jection. Vary the GC parameters during subsequent Injections to determine the opti- . mum settlngs. Once the optimum settings have been determined. perform repeat inlec- tlons of the sample to determine the reten- tion t h e of each compound. To :nlect a sample, draw sample through the loop at a constant rate (100 ml/min for 30 seconds). Be careful not to pressurlze the gas in the loop. Turn off the pump and allow the gas in the sample loop to come to ambtent pres- sure. Activate the sample valve, and record lnJectlon time, loop temperature, column temperature, carrier flow rate, chart speed. and attenuator setting. Calculate the reten- tion t h e of each peak uslng the distance from injection to the peak maximum divld- ed by the chart speed. Retention times should be repeatable wlthin 0.5 seconds.
If the concentrations are too hlgh for aP- proprlate detector response, a smaller sample loop or dllutlons may be used for gas samples. and. for liquid samples, dilution wlth solvent is appropriate. Use the stand- ard curves (Section 6.3) to obtain an estl- mate of the concentratlons.
Identify all peaks by comparing the known retention times of compounds ex- pected to be in the retentlon times of peaks in the sample. Identify any remaining un- Identifled peaks which have areas larger than 5 percent of the total using a GC/MW or estimatlon of possible compounds by thelr retention tlmes compared to known compounds. with confirmation by further QC analysis.
6.7 Calibration Standards. Prepare or obtaln enough callbration standards so that there are three dlfferent concentratlons of each I organic compound expected to be measured In the source sample. For each or- m l c compound, select those concentrations that bracket the concentrations expected in the source samples. A callbration standard
, may contain more than one organlc com- pound. If available. commercial cylinder g w s may be used if their concentrations hsve been certified by dlrect analysls.
If samples are collected In adsorbent tubes (charcoal, XAD-0. Tenax. etc.). Prepare or obtain standards ln the same solvent used for the sample extraction procedure. Refer to Section 7.4.3.
US EPA EMC
The Federal Register Version Presented was published with this Report but has been supeceded. Users should use the most recent version of EPA Method 18 rather than the method presented.
Verify the stablllty of all standards for the time Periods they are used. If gas stand- ards are prepared in the laboratory, use one or more of the following procedures.
6.2.1 Preparatlon of Standards from High Concentratlon Cylinder Standards. Obtain enough high concentration cyllnder stmdmb to represent all the organic com- pounds expected In thesource namplen.
Use these high con2efifratlon standards to prepare lower concentration standards by
To prepare the diluted callbratlon sun- ples, calibrated rotameters are normally used to meter both the hlgh concentration calibratlon gas and the dlluent gas. Other types of flowmeters and commerctally avail- able dllutlon systems can also be used.
Calibrate each flowmeter before use by placing it between the diluent gas supply and suitably slzed bubble meter. splrometer, or wet test meter. Record 1 1 data shown on Figure 18-4. WhIle it is desirable to callbmte the cylinder gea flowmeter with cylinder gM. the available Quantity and cost may preclude It. The error Introduced by uslng the dlluent gas for callbration b innignifi. cant for gas mixtures of UP to LOO0 to 2.000 ppm of each organic component. Once the flowmetera are calibrated. con.
nect the flowmeten to the calibratlon and diluent g811 supplies using 8-mm Teflon tubing. Connect the outlet side of the flow- meters through a connector to a leak-free Tedlar bag 811 shown in M w e 18-6. (See Sectlon 7.1 for bag leekcheck procedures.) m u s t the gas flow to provide the d m h d Mutton, and fU1 the bag with sufflclent pas for GC calibration. Be careful not to overflll and cause the bag to apply addltlonal p m - sure on the dllution system. Record the flow rates of both flowmeters. and the Iaborato- ry temperature and atmospherlc pressure. Calculate the concentration C. In ppm of each organlc In the dlluted gas as follow:
dllution. 88 Shown by Flw~ 18-6 and 18-6.
where: Eq. 18-1 lO'=Converston to ppm. X=Mole or volume fraction of the organic
&=Flow rate of the calibratlon gas to be dl-
qpDiluent ma flow rate. Single-stage dllutlonn should be used to pre- pare calibratlon mixtures up to about 120 dtlutlon factor.
For greater dilutions. a double dilution syatem Is recommended, as shown In Mgure 18-6. Fill the Tedlar bag with the dllute gas from the second stage. Record the laborato- ry temperature, barometric pressure. and statlc pressure readings. Correct the flow readlng for temperature and pressure. Cal- culate the concentrstlon C, Ln ppm of the organic in the final gas mixture as follows:
in the callbration gas to be diluted.
luted.
i
Section No. 3.16.10 Date June 30, 1988 Page 4
Eq. 18-2
Whem 1O'nConverslon to ppm. X=Mole or volume fr8ctlon of the o r g d c
&=Flow rate of the callbration gan to be dl-
flow rate of the callbration pas to be dl-
&=Flow rate of diluent gaa in stage 1. ~l l -Flow ram of diluent gls In stage 4.
Etwther detslb of the caUbratlon methods for flowmetem end the dllutlon amtem can be found in Citation 21 in the Blblloqrrrphy.
6.2.2 Pnpsratlon of Standards from Vohtlle Materlala. Record dl data shown on pleure 184.
6.2.2.1 Gaa Wectlon Technique. This procedure b applkable to organic com- pounds that exist entirely UI a gls at unbi- ant mndltionn. Evacuate a IOllter Tadlu bag thrt haa passed a leak-check (nee 8ec- tlon 1.1). and meter in 6.0 lltem of alr or ni- trogen through a dry g M meter that han been calibrated in a manner colliristent wlth tAe procedure d d b e d In 8ectlon 6.1.1 of Method 1. While the bag b f W h g use a 0.6- ml syringe to Inject a known Quantitp of "pure" gas of the organlc compound through the wall of the baOI or through a septumapped tea at the bag inlet. With- draw the syringe needle, and lmmedlsteb cover the result- hole with a piece of mtwking tam. In a llke msnner. Prepore dl- lutiona havlng other concultratlonn. Re-
a :midmum of three concentrations. place each bag on a smooth surface, and al- ternately d e p m opposite sldes of the . h g so times to h the gnae-8 Record the aver- age meter temperature and p r a m . the gaa volume and the barometric preaSUre. Record the syringe temperature and pre5 sure before lnJectioa tration C. In pum aa follows:
In the allbration plu to be dlluted.
luted In sum? 1. luted In ntage 2.
c.leulate esch organic standard con--
- 5 c, = - *g3 pm 1000
" m y -% m
vrn r Eq. 18-3
US EPA EMC
The Federal Register Version Presented was published with this Report but has been supeceded. Users should use the most recent version of EPA Method 18 rather than the method presented.
Section No. 3.16.10 Date June 30, 1988 Page 5
where: 0.43~ volume or 0-c compound ~n.
f-dl ml. r o 6 ~ C ~ n ~ e m I ~ n to ppln. P,-Ab#olute premure of rvrllue before In-
l d o a . mm He. T,=AWlute temperature of ryringe before
Inlectlon, ‘K. V = = M volume lndhted by dry g u meter,
lltem. Y=Dw g& meter dbrat lon factor, dhen-
SlOnleU. P.=AWlute pressure of dry gu meter. mm
HE. T,=Absolute tempmture of dry gM meter, ‘K.
laOO=Convenion factor. mlflter. 6.2.2.2 Liquid Injection TechnIque. Uae
the eauipment shown in ploure 18-8. Call- brate the dry em meter Y dmcrlbed In &c- #on 6.2.2.1 wlth a wet test meter or a spl- rOmetU. Uae a water manometer for the re mu re osuqe and elm, Teflon, braas, or st.ialess steel for all connectioas. Connect a Wve to the inlet of the SO-llter Tedl~u bag.
To ureppn the stpndu&. esaemble the equipment as shown In -re 18-8, and leak-check the system. Completely evacuate the b 4 . lW the bag wlth hydrocubon-fm ah, and wacuate the bag again. close the inlet valve.
Turn on the hot plate, and allow the -8ter to rerch boiling, Connect the bag to
h lrnplnuer outlet. Record the inltt.l Jter readhe. open the b.0 inlet valve. .nd
rsm the cylinder. A d j u t the rate ,YO that the bag will be completely fllled in approxi- mately 15 minutes.‘Record meter prerrw and temperature. and local barometric pres- sure.
W o w the llquld organic to equilibrate to room temperature. FIl1 the 1.0- or 10-mlcro- llter syringe to the dealred llquld volume with the organic. Place the syringe ride into the ltnpinger Met using the septum
ing & stream. Use a needle of suffidmt length to permit Wectlon of the llquld below the alr met branch of the tee. Remove the S m e .
When the bag is fflled, stop the pump. and close the bag inlet valve. Record the flMl meter resdlng, temperature, and p w .
Disconnect the bag from the mhWer outlet. and elther set it sllde for at leut 1 hour, or massage the b8g to insure WWhte mtxlng. MeMUre the solvent liquid durslty at
room temperature by accurately webhine a known volume of the [email protected] on an d Y t - ical balance to the neerest 1.0 mtUrun. A ground-glw stoppered 26-mll volumetric flask or a glass-stoppered speclflc OrPv l tY bottle L suitable for weighing. Calculate the result in terms of g/mt As an altemtlve. literature values of the density of the liquid at 20 ‘C may be used.
Calculate each orgMic standard concen- tration C. in ppm as follows:
provided and h jwt the liquid tnto the flow-
Lv (24.055 x l o b ) 7- 4 L, P T,,,
V m = 6.24 x I0 cs *
293 Pm “ m Y q - 750 1000
Eq. 18-4
where: L-Liauld volume of 0q.niC 4ected, pl.
mL
and 160 mm Ho. llbn/g-mole.
pl-ldfquid 0- dOII81tY Y datumlned g/
MdUoleculu weight Of 0-C. g/g-mole. 24.055-Ided g~ molar volume at 299 ‘E
lO@=Convernlon to vum. lOOO=Convenlon factor. pl/ml. 63 Revumtlon of Callbratdon Curves.
Establbh proper Qc mdltlom then flu the umpllng loop for SO mnde at a rats of 100 ml/mln. Mow the rrmple loop prewure to equUbrate to itmospheric prenuure, and .cu1I.te the Lalection valve. Record the rtrndvd concentlrtton. attenuator factor, 4ectlon time. chvt speed, retmtlon time, peak ueh aunpk loop t8muerature. column tempemture. .nd carrier EM now rate. Repeat the rtaudard lnlection untU two con- recutlve 4sCUoar olve are8 count8 wlthin 5 percent of thdr amwre. The average value multipled by the .ttcnrutor frctor b then the allbration w1 value for the concenb- tlon.
Repeat thk proc4dun for each rt.ndud prsp.pe a graphla plot of ~centmtdon tC.1 vemw the callbratlon area valuer. Per- form a regreaelon analyd6. and dmw the IeMt souarea m.
6.4 Relrtlve Iteapow Iprctora. The call- bration curve genesated from the stmduds for arlnole orgurlccur usually be related to erch of the lndivldual OC remonae curves that me developed h the laboratom for .U the compomch h the mum. In the field, standmb for that alngle orolnic UII then be wed to “allbrrte” the aC far all the or- gads prcrent. ThL procedure should f h t be confirmed in the labratory by urepulno and ammine callbratlon st.n&r& contain- lng multiple organic compoundr.
6.5 Qurllty Assurance for L8boratory Rocdwm. Immediately after the prepus- tion of the dbrat lon CUNW md urlor to the prosurvey aanwle M . l ~ s f k the m 4 m b
dlx C. Roccdure 1: “Rochdure for Held Au- dit- aC AmIy&,” should be perfomad. The lnfomtlon npulnd to document the amlyals of the audlt samplcs hu been h- cluded on the example data sheeta ahown in PTgurea 18-3 and 18-7. The audlt 8MlY8w should agree wIth the audit concentmtione wialthfn 10 percent. When available. the terkr may obWn audit cyllnden by con- tsctlng: U.8. Environmental Protection Agency, Environmentsl MonltorhZ 8~6-
8 d t d d b d in 40 CPR put 61. A p m -
US EPA EMC
The Federal Register Version Presented was published with this Report but has been supeceded. Users should use the most recent version of EPA Method 18 rather than the method presented.
Section No. 3.16.10 Date June 30, 1988 Page 6
Laboratory. QusUty A88Urance Divlrlon (MD-771, Research Mangle Park, North Cuolina 27711. Audit CYlInder8 obtained from a commerclai par manufacturer may be wd provlded that (a) the 0.s manufac- turer certifies the audlt cvllnder in a mmner rlmilPr to the procedure dascrlbcd in 40 CFR Part 61. Appendlx B, Method 106, Section b.2.3.1. and (b) the manufactur- er o b W an Independent analyab of the audit cylinder8 to verify thb analysb. Inde- pendent enrlyrb b defined M UI .rulV8b performed by an Individual other than the
turer’r anal~nls, while wing callbration &andar& and analvain ewipment different from those used for the gas m@nufacturer% an8IyaIa VerIflcation b complete and ac- ceptable when the IndeDendont anaI~~I6 concentration is within b percent of the EM manufacturer‘r concentration. 7. plnd Sam#in# and And- M u m
COnddarlM d e B tilrme rad the mum cwditlona select an rppropmte srmpllnl and amlvab procedure (&&Ion dtwen flame b a huvd and no intriudca- 10 safe aC k 8uit.blq u# the flexible bag collection tecMque or an rrborption te&. nlcrue. If the source tempemtun h below lWC, and the organic COI&LU~&UIOM are Rllt.ble for the detsetor to be utcd u8e the direct int8rf- method. If tht =urea gMe8 muin dilution. w a dnutlon lntmface .ad elther the bag m u l e or adaorutfon tubem. The choke between these two techniquta wiU depend on the phydca layout of the dte. the mum temuanture. and the stor- we 8tabiUty of the compousdr If collected la the b8g. Sample pow armpound6 by dibect lnterfaclng or dllutlon lnt8rfachg to prevent Mmple 1- by .drorptlon on the ha. sla 7.1.1 Evcmutcd container sunpung pro-
cedure. In thb procbdure, the b.e are fillad by encuulno the r&id &-tight 00nt.lnm that hold the bag#. Use a field m p l e data 8heet u & o w In Figure 18-10. collect trfp U c a b aample from each m l e loution 7.1.1.1 Appamtuh 7.1.1.1.1 probe. Stahha rteel, Pprex
gla68, or Teflon t u b h probe, acawdhg to
Teflon tubing of dficient length to wn- nect to the mum bu. Uae nhinlew &el or Teflon unionr to conueat probe and aunple Illlo. 7.1.1.1.1 Quick coancotr. W e (2) and
female (1) of atah lea rteel coumtructlon. 7.1.1.1.3 Needle Valve. To control qu
flow. 7.1.1.1.4 Pump. Leakleu8 Tefloncooted
diaphrrllm-tm pump or cqulvalent. To d e liver at leaat 1 lIter/mln 7.1.1.1.5 chucolil Adrorption Tube. Tube
filled with activated cbrcal, with 0- wool plugs at each end, to adsorb o m vapom. 7.1.1.1.6 Flometer. 0 to boo-ml flow
nuwe; w l t h m8nufecturer’6 calibration curve.
Individurl who perfom the rmmui.C-
7.1,7.1,1.3. Or 7.4). &l IdtU8tbll8 W h m 8 hp-
7.1 lateerted~.o8.mpllapand~nrlo-
the dUCt kmperrtun, nlth 6.4-rnm OD
7.1.1.2 8 W p l h pmccdurs. To ob- a mwle. amamble the ample tmln M shown in 18-0. Leak check both the bag and the container. Connect the v m u m line from the needle valve to the Teflon sunple line from the probe. Place the end of the pmbe at the antrold of the stack, or at a polnt no closer to the w u than 1 m, and rtut the Pump wlth the needle valve adjut- ed to Held 8 flow of 0.6 lkr/mlnute. &r 8lloWing ruffldent time to purge the Ilns E U V ~ ~ t hw. coma& the vacuum line to the bag, and evacuate until the rotameter Indlcatea no flow. Then mition the sunple and vacuum llned for sampling. and begin the actual mm. Leepino the rate ur+ portlonrrl to the StreL velocfty. 16 a p m u - tioa dlrect the ma exltfnr the rotuneter away from aunpllnp phnonneL At the end of the aumle period. shut off the pum~, dbcoancct the 6ample line from the bag, md dlrconnset the Y.CUUIII line from the brs oontrlaar. Ibcord the 10urce tenwm- ture, bwmetr lc rmemure, ambient t6mpslr- ture, 68mpmr flow mte, and M U and flnrl mmpung tlms on the &ta beet uhown ln prourc 18-10. Protect the Tedlu b8e and ib cont.inar from nunlight. When wdble. perfom the mrJY& withln 2 h o w of 68mple collectioa 7.1.2 meet pump 8 . m ~ ~ procedure.
mllow 1.1.1. except place the pump and needle valve between the probe and the b.0. Use 8 pump and needle valve comWucted of rt.inley rkel or mme other material not af- ’ fcctsd by the rt8ck 0.a Leak check the ey&em, and then purge with &a& mm ‘ before the connectba to the preVtouElY emmated brs.
7.1.8 asplwlon Rbk Are8 Bur S a w U Procedure. Follow 7.11 except npl.cs the pump with another evacuated can (6ea F&um 18-08). U8e thb methwl whenever then is 8 posldbntty of explorion due to pump& hated probH. or other flame duelno wulpment.
adunr. In the event that condeneation h obarrrcd In the bas while collectI4 the wmplt and a direct laterface astern cannot be uwd. heat the bag during collection. and m8lntdn it at a ruitably elevated temwra- turs during all SuWuent operations. (Note: Take an to lesk check the ~Prrtcm prior to the dnutiom w M not to enate a potentially expldve atmosghsre.1 16 IM al- tenutive, collect the aample ma, and almul- t.neourlp dilute it in the Tedlar bw. ~n the lint procedure, heat the box con-
tainlng the sample b.0 to the wurce tern- petrture. provided the components of the bag and the a u r r o u a W box uu Withstand this temperature. Then tMsport the br(l M rapidly M gnwalble to the U Y t i d areS while malnklnlao the heatlng. or cover the box wlth an imulatlng blanket. In the 8x18- lytlcal area, keep the box heated to source temperature until analv@. Be 6u.m that the method of hertine the box end the control for the heating &cult are compatible with the safety ratrictiona required In each area.
7.1.4 Other Modlfiad Be8 8amPllng
US EPA EMC
The Federal Register Version Presented was published with this Report but has been supeceded. Users should use the most recent version of EPA Method 18 rather than the method presented.
Section No. 3.16.10 Date June 30, 1988 Page 7
TO UM the second procedure, Drefill the Tedlpr bag wlth 8 k n O W I l QUaIltltY Of inert OM. Meter the inert ges into the bag a a ~ r d -
to the ppoccdure for the pnperrrtion of gas concentration st.ndsrds of volattle
mte the midget imphct~ M l o a Take the ppptiy fmed bag to the source. and meter me source g~ into the baa throueh heated spmpling and a heated flowmeter, rn Teflon W t l v e dlaplecernent pump. Verify the dilution factora periodically through dl- lutlon and analysis of eases of known con- centration.
7.1.5 Arulpels 61 Bag Samples. 7.1.6.1 Apparatus. Same aa Section 5. A
minimum of three gas standards are re- q-.
7.1.5.2 Procedure. Eutablkh proper OC operathg condltlom aa described in Sectlon 6.3. and record all data lhted in Flgure 18-7. Prepare the OC 80 that gas be drawn through the sample valve. Flush the sample loop with gas from one of the three callbra- tion mixtures, and actlvate the valve. Qbtaln a t leaat two chromatogram for the mixture. The results an acceptable when the peak PC~M from two consecutive Injec- tiOM agree to wfthln 5 percent of thelr aver- we. If they do not, run addltlonal analyses or correct the analytical techniqua until thie requirement Is met. Then analyze the other two dbra t lon mixtune In the same manner. Prepare a calibration curve M de- Scribed In the Mme manner. R e p a n a call- bration curve M described in h t l o n 6.3. AnaIm the source gas 6amplea by con-
necting each bag to the 8ampUng valve with a plece of Teflon tub- Identifled Zor that bag. Follow the specifications on repllcate Maiyse!~ specifled for the calibration gases. Record the data lbted In FYgure 16-11. If ce- Items do not apply. use the notatlon "N.A." Alter all samplcs have been ana- lused. remat the a n n l y w of the callbratlon gas mlxturea. and generate a second callbra- tion curve. Use an average of the two curves to determine the sample gaa concentrations. If the two calibration curves dlffer by more than 6 pemnt from their mean value, then report the final results by comparlson to both callbration curves.
7.1.8 DetermLnstlon of Bag Water Vapor Content. Meeeure and reeord the ambient temperature and barometric pressure near the bag. mom a water saturation vapor PIwsure table, detennlne and record the water vapor content 85 a declmarl flgure. t h u m e the relative humidity to be 100 per- cent unlese a lesaer value k known.) If the boo hes been maintalr~ed at an elevated tem- perature aa descrlbed in m i o n 7.1.4. deter- mine the stuck gna water content by Method 4.
7.1.7 Qualtty Assurance. Immediately prior to the analysis of the stack gas sam- ple& perform audit analYseS 88 dmribed Ln Section 6.5. The audlt analyses must agree wlth the audlt concentratlons wlthln I0 per- cent. If the results are acceptable. proceed wlth the analyses of the source samples. If they do not agree within 10 percent, then determine the reawn for the dlscrepancy. and take wrrectlve sctlon before proceed- ing.
Uqad mteu (8cctlon 6.2.2.2). but e w -
7.1.8 Emiselon Calculatlona. From the av- e w e crllbratlon curve descrlbed In Section 7.1.5.. select the value of C. that corraponde to the peak area Calculate the concentpa- tlon C, in ppm. dry bash. of each 0-c Ln the gmple M follom:
C.=Concentratlon of the organic from the ulibratlon curve, ppm.
P,=Reference preseure, the barometric pressure or absolute sample loop pres- sure ncorded during callbration. nun a.
T,=Bample loop temperature at the t h e of Mmple analysis. 'K.
F,-Relatlve response factor (if appltcable. see 8ection 6.4).
P,=Berometric or absolute sample loop prerrsure at t h e of sample analyela, rn He.
T.=Reference temmrature. the tewwm- ture of the BBmple loop recorded during calIbration.'K.
&=Water vapor cont@nt of the bag sample or rtack gee. proportlon by volume.
7.2 Dlrect Interface Sampling and Andy- & Procedure. The dlrect interface proce- dure can be used provided that the moisture content of the gas does not lnterfere with the Malysle procedure. the physlcal require- ments of the equipment can be met at the rlte, and the source gas concentration IE low enough that detector eeturatton h not problem. Adhere to all safety requiremen& wlth thk method. ...
7.2.1 Appuatus. 7.1.1.1 Probe. Constructed of 8talnleSS
steel. Pyrex glass, or Teflon t u b b 88 re- quired by duct temperature. 6.4-mm OD, sn- larged at duct end to contain g W W o o l plug. If necessary. heat the probe with heat- In# tape or a a ~ . ~ ~ l a l heating unlt cspeble Of maintainhg duct temperature.
7.2.1.2 Sample Lines. 6.4-mm QD Teflon lines. heattraced to prevent condensatIan of material.
7.2.1.5 Qulck Connects. To connect sample line to gas sampling valve on OC In- strument and to pump unft used to wlth- draw source gas. Use a Quick connect or tpdvalent on the cylinder or bag contalnhE dlbration gse to ellow conneeelon of the calibration gas to the gas samplhg valve.
7.2.1.4 Thermocouple Readout Device. Potentiometer or dlgltal thermometer. to meaaure source temperature and probe tern- perature.
7.2.1.5 Heated Gas Sampling Valve. of two-poaltlon, slx-port design, to allow sample loop to be purged wlth source gas or to direct source gee into the OC lnfmment.
7.2.1.8 Needle Valve. To control gas BBm- pllno rate from the source.
US EPA EMC
The Federal Register Version Presented was published with this Report but has been supeceded. Users should use the most recent version of EPA Method 18 rather than the method presented.
Section No. 3.16.10 Date June 30, 1988 Page 8
7.21.7 Pump. Leaklea Teflon.amted dit p-tm pump or e~ulvrlent, capable of at levt 1 liter/minute srmpllng rate. 7.21,8 Flowmeter. Of nuitable m e to
mawfc mnpllng mte. 1.2.1.0 chueorl Acborber. To adrorb or-
malt vapor collected from the mum to prevent exmure of pcmonnel to source OM. 7.21.10 ols Wllndera Carrier 01ll
thdum or nltmgen). and oxygen and hy- drogen for a flame iontvtion detector (BTD) l i O P e b u s e d 75.1.11 OM Chromtograph. Capable of
being moved into the field, with detector, hated gaa sumpling valve, column reaulred to complete sepustlon of dealred c o m w Pent& and option for temperature program- miao. 7.2.1.12 Rccorder/Inteylrtor. To record
mdulk 93.29 Procedure. To obtrln a sample. M-
semble the rumpling aprrtem M shown in Rmm 18-12. Make sure all connections are tight. Turn on the probe md sample line heatem. Aa the temperature of the probe urb heated line approaches the aowce tem- perature M indicated on the thSnnocOURle readout device, control the heathif to nulu- trin a temperrtun of 0 to 3% above the muma temperature. WhUe the probe and heated line u e belnr heated. dbcomect the sample line from the su aaa~pllng valve, and attach the h e from the aubration ees mlxture. Flmh the sample loop with call- bntion and umlyze a portlon of that yu Record the reduita. Mtu the calibra- tion 8811 aaaIple hm been fluhed into the QC IIMtrument. turn the gan sumpling valve to fluh posltfon, then nconnect the probe 8smDle llne to the Wve. Place the inlet of the probe at the centroid of the duct, or at a mint no closer to the w& than 1 m, and draw murce gaa into the probe. heated line, urd umple loop. After thorough flushing, uulm the sample ueing the name condi- tiom M for the calibration gas mixture. Rcwt the aarlmb on an addltiona~ Mmple. MeMUre the peak arem for the two srmglcr. and if they do not agree to within 6 pvcent of their mean value. enalqze addi- tional samples until two consecutive analp gcI thb criteria. Record the data After conslatent results are obtained, remove the probe from the aource and arm- 1m a second callbratton gas mlxture. Rccord thla calibration data and the other muired data on the data sheet shown in Figure 18-11. deleting the dilution gae Mar- nutlon. ( N m Take care to drsw all ~~mples , call-
bration mixtures. and audita through the rumple loop at the m e pressure.) 7.2.3 Determtnrrtion of Stack OM Mole-
ture Content. Use Method 4 to measure the StrCL ops moisture content.
7.1.4 Quality Aaaurance. Same an Section 7.1.7. Introduce the audit ~ e ~ e c l in the m p l e line immediately fQlIowIne the probe.
7.2.5 Emhion Calculations. Same 81 Sec- tion 7.1.8.
7.3 Dilution Interface Sampling and AMlyEia proadure. 6oourcs rumple6 thnt contain a hkh concsntntion of organic ma- terhla may require dilutlon prlor to W a b to prevent 8atur8tlne the Qc detector. The appurtua rsqulred for thh dlrect Interface procedure is bodally the name rn thst de- scrtbed In the Section 7.2, except a dllutlon sgltem b 8dded between the heat~d mnwle line urd the EM umpllno valve. The mtua b ~~MUUUJ m that either a 1O:l or 1m1 dllutfon of the aource gu clrn be di- rected to the chromatommh. A pump of k u e r csp.City b rbo req- and thb pump m u t be heated and placed in the syatem bttween the mnple line and the dl- lutlon oppustua 7.3.1 Apparotua. The equipment required
in addltion to that specified for the direct
7.9.1.1 Sarmle Pump. Leaklea Teflon- hh?rfaCet8Y8m is M fOuOU'S:
=ffl d l r rpm- tgpc that - with-d b&g heated to lWC Md deliver 1.6 litem/ minuk. 7.9.1.2 Dilution Pumps. Two Model A-160
Komhyr Teflon positive displacement tgpc dellverhg 150 cc/&ute. or equivalent. As an option, calibrated flowmeten can be wed in conjunction with Teflon-mStUd dla- Phrrsmpumps. 7.3.1.3 V8lvm TWO Teflon three-ww
valves, aultable for connectin0 to 6.4-mm OD Teflon tub-. 7.3.1.4 Flowmeters. W o . for measure-
ment of dlluent gas. e.pectad deliven flow rate to be 1.350 e/min. 7.3.1.5 Wuent OM with CyWers and
Repuletom. OM can be nitrogen or clean dry air, dependlno on the nature of the murceeasw. 7.3.1.6 Heated Box. Suitable for behe
hated to l2VC. to contain the three pumps. three-way valves, and assoclsted coMectiona The box should be equipped with connect fltting6 to facilitate con- nection of: (1) The heated Mmple line from the probe. (2) the gos s u m p U valve. (3) the clrlibration gaa mlxturea and (4) dlluent gaa llnea A schematic dlagnm of the corn- ponenta and connections is shown in - 18-13.
(NOTE Care muat be taken to leak check the system prior to the d l lu t io~ so M not to create a potentlelly explosive atmosphere.)
The heated box shown in PTmre 18-13 is designed to recelve a heated line from the probe. An optional deslm is to build a probe unit that attach- dlrectly to the heated box. In thh way, the heated box Contplns the controls for the probe heatem. Or. if the box is place-d aerinet the duct !?em mu- pied. it may be poaclible to ellminote the probe heatem. In either cane. a heated Teflon m e LP used to connect the heated box to the gas samplillp valve on the -0- mrrtoOrrrpn
.. .
US EPA EMC
The Federal Register Version Presented was published with this Report but has been supeceded. Users should use the most recent version of EPA Method 18 rather than the method presented.
Section No. 3.16.10 Date June 30, 1988 Page 9
7.3.2 m d u r e . Assemble the appubtu by connecthe the heaW box. ahown In Flours 38-13. between the heated m u l e line from the probe and the mu snmpllne valve on the chromatograph Vent the murce g8s from the OM wnpling valve d- rectly to the ch8rco.l illtar, ellmin.tln. the pump and rotameter. Heat the -1e pro&?, lYmOle Ilne. and heated box. lnrert the probe and ~ l u r c ~ thermocouple to the centroid of the duct. or to 8 point no cl-r to the wall6 than 1 m. M e w r e thelloura temuerame. 8nd adjust all heaths unlta to a Kmpcrature 0 to 3% above thb tempera- ture. If thh temperature I6 above the W e opentlng tamerature of the Teflon comm nena adjut the heating to m8InWn 8 tem- perature hleh enough to m n t condenm tlm of wbkr and orgsnIc compounds. Verlfy the operrtion of the dllutlon rprtcm by 8 hbh concentr8tlon gu Of known compodtion though either the 10:1 or 100.1 dilution rtrer. M appmprtrte. (If neceaauy, wy the flow of the duuent pu to obtrln other dllutlan ratlac) &termhe the concentmtlon of the dnuted allblrtlon ma udno the dllutIon f8cbr 8nd the mi-
Remrd the UeAnont du. on the data rhhet shown In FIsure 18-11. If the dab on the dt- luted ul lbmth s u are not wtthln 10 per- cent of the e.#ded v8lm detamhe whethk the dmm&mmph or the dllutlan rprtan L in emm. aadmrrwt It. Verlfy the
6- by dlverthg the g u into the nmt le loop. bpprrrin( the dlluflon ynkm. If theme nrnlimm ue not wtthln aaaptable Uf* - thedi lUt iOnryrtsm tovrovfde the dsdred dllutlon f.etorr. M8ke tblr coi- recUon by dllutlne 8 hkhumcenbtlon -gu -ure to dhut the dllutlon l - 8 t l O U ~ U h d .
.tloar am 68tkf8cbrY. Droaed wtth the
. lu lydr0f~gu.nuinklnln( therrmc dilution aetin$r u mod for the Rewrt the u u b a a uatil two coImcutlve orlusr do not vug by more than 5 percent from their mean value M obtdned,
Rew.t the .rulgllr of the allbmion g u mlnhua to Var i iY equipment owlrt ion AnWso the two field audit aumu udng &her the dUutlon 6v8tem. or dlrectIy eon- nect to the ma urnpiing valve M raquhd. Record.Ud.t..ndmportthe reaulta ta the wilt wpsrplror.
ture Content. 8une u Seaion 7.23. 7.1.4.
brrtlon - Drepucd thc hbmb-.
O m - udru 8 low
Ones dllUtlOn 65%- m d OC o m -
7.1.1 or m au ~ o i c
7.3.4 Qu8lity Amurance. &me aa W o n
7.3.6 Emission Calculrtlonr. Bame 86 8ee- tion 7.2& with the dilution frctOr avvlhd.
7.1 Adsorption Tube Procedure (Alterna- tive Procedure). It L suggested that the teakr refer to the National Inr r t I tUta of Oc- cupational Safety and H d t h (NIOSH) method for the particuhr org8nlca to be samp~ed. The principal interferent WU be water vapor. If water vapor Is present at concentratlorn above 3 percent. silica gel should be used in front of the charcoal. Where more than one compound L prewnt In the emiaslons. then develop rehtive d- sorptive cspaclty hfonnstion.
7.4.1 Addltfon8l Appuutua In uldition to the equipment llrted in the NI- method for the puticulu ora8nlc(s) to be urnpled. the following I t a m (or eaultmkat)
7.4.1.1 Probe (Optlolul). B0-W grUr or stainhe 6- approx!m8tely &mm &ion L 8 problem. and filter telther In- stack or outatack heated to stack tempera- tun) to remove putlalate amtbr. In momt mancu, a pius or r w -1 ~r 8 H- torg fllter.
7.4.1.2 Fle%ible Tublar. To CQllllCct pro& to admmtlon tubed Uae a m8&ri8l that ex- hibit# mlolm8l llimple drorptioa
7.4.11 Leaklma Sample pump. Flow con-
limftlng ~6onic) orulcea to P A & pumplag rua from .gproxhutew LO to 100 cc/min.
7.4.1.4 BUbble-Tube Rormetsr. Volum~ . o c u r r c y a l t h i a * 1 p e ~ t o a l l b r r t a PtrmD.
7.1.16 To m l l r u .Ilcl ~ r a t e a w r 8 t I c u L
7.4.1.6 AdBOmtlOB Tubar 8 h f h r to 0- rpediled by NIOSE exce& the amount# of -t per prfmnrp/kChrp #ctlolrr ue 800/100 nu for chM#l tuba and 10WMO
for dllc8 gel tubJ. An Ba 8ltemauve. the tuba -td.Q 8 - d- arbentnrchuTcnuocorxAD-z
7.4.1.7 Bwometer. Accumte to I mm ge, to memm 8tmomhSrle wemure durhe nmDllne.adPronpcriEbrrtion
7.4.1.8 m. 0 to 100 fo dctcct in now mte durlru.rmplllu.
7.4.2 8Dd borlprlr It b 6W- gatad that the tcotcr follon the rrmplfna ud uwdm Dartlon of the raaecth NIam method mctlon entltled "proa- dm." -ti? the DumD and Umlm orl- ilccflow mte WrOuQh drorpttasrtubsrrlth the bubble tube Bonmafsr before IIIIIOUM. The lumple mbm can be mtd u a''ra- drarwng loop" for fhb o#nrtlon. Record the mbimt u m .pd buometric prsr~ra. Than, d u r i n ( m U U C W mm frmeter to verliy that the pump 8nd orlffce S r m p l h r u a ~ - t . the sunple at the centroid of the duct. or at a point no closer to the wall6 than 1 m. Mln- imfee the length of flexible tubing between the probe and aQorption tubm. Several ad- mrption tubes can be connected in 6erle6. if the extr8 ad6orptive caprcity in needed. Pro- vide the grs sample to the sample s~atem at a preaoure sufficlent for the lixdthg orifice to function im a so& orifice. Record the tow time and sample flow rate (or the number of pump 6trOkeE). the barometric pramre. and ambient tempereture. Obtain a t0t.l sample volume commernurrte with the expected concentrationts) of the volatile Org8nic( I ) present. and recommended sample loading factom tweioht tmmple per weight adsorption media). Laborrtory tests prtor to actual sampW may be n- to predetermine thb volume. When more than one organic fs preaent in the emlarfons. then develop relative sdsorptive agec i ty in- fomation. If water vapor I6 present in the m p l e at concentratlorn above 2 to 3 Per- cant. the adsorptive capacity may be mere
W 6rugcrted.
ID. alth 8 hatlne tf artSr d m -
-&& C O m t ' m a pump, W k b 8 & Of
U6G 8 llsmple probe. If required. to obt.in
US EPA EMC
The Federal Register Version Presented was published with this Report but has been supeceded. Users should use the most recent version of EPA Method 18 rather than the method presented.
Section No. 3.16.10 Date June 30. 1988 Page 10
ly reduced Omrate the gas chromatograph auwrdlne to the manufacture's instructlom. After establlshlng optlmum conditions, veriiy and document these condltlons
samples (see SecUon 7.4.4.3). thm the emb- don samples. Repeat the analyola of each mmple untu the relative dsviatlon of two wlwcutive fnlCct10~ d w not exceed 5 per- cent.
7.4.5 Strrndards sad Callbratlon. The standards be prepored uxordlng to the nsuective NIOSH method Use a minlmum of three dlfferent atandam& select the con- centrrrtlons to bracket the expected average ample concentratlon. Perform the callbra- tion before and after each day8 sample analy8ea. Prepare the Ubrstlon curve by Using the leest muarea method
7.4.4 Qurrl i tY Ibnurmcc. 7.4.4.1 Detemimtlon of Deaorption Effi-
ciency. Durhg the testhg program, deter- mine the desorption efficiency h the ex- pected Mmple concentration range for each batch of adsomtion me& to be used Use an internal standard. A minimum desorp- tion efficiency of 50 pcrecnt shal l be ob- tained. Repeat the demrptton determine- tion Unwl the relatlve dcvLation of two con- secutive determiMtlons docs not exceed 5 wrcsnt. Use the avenge desorption effi- ciency of these two consecutive determiae- tione for the correction specffied in Section 7.4.4.5. If the desorvtlon efficiency of the compound(s) of intereat is queetlonable under actual sampling conditions, uw of the Method of Standurd Addltlon6 may be help fu l to determiue thh value.
7.4.4.2 Determtnation of Sample Collec- tion Efficiency. For the riource semples, ana- lyze the primsry and backup portions of the
portion exceeds 10 percent of the total amount (primary and backup). repeat the sampling with a larger samplhg portion.
7.4.4.3 Analyab Audit. Immediately before the sample analyses. analyze the two audits in accordance with Section 7.4.2. The analysis audit shall agree with the audit concentratlon W t h h 10 percent.
7.4.4.4 Pump Leak Checks and Volume Flow Rate Checks. Perform both of these checks Lrrrmdately after samvllng with all sampling train components in place. Per- form all leak checks according to the manu- facturer's instructions, and record the re- sult~. use the bubble-tube flowmeter to measure the pump volume flow rate with the orifice used in the test sampling, and the result. If it has changed by more than 5 but leas than 20 percent. calculate an aver- age flow rate for the test. If the flow rate has changed by more than 20 percent. reca- Ubrate the pump and repeat the samplhg.
7.4.4.5 Calculations. W calculations CM be performed according to the respective NIOSE method. Correct all sample volumes to standard conditions. If a sample dilution syatem ha8 been used. multiply the results by the apptopriate dilutlon ratlo. Correct all results by dividing by the desorptlon effi- ciency (decimal value). Report results as ppm by volume. dry basts.
durine sll OPeratiOM. Anrlple the audit
BdsorptlOn tubes SeDWSklY. If the baekUD
7.6 Reportino of Results. At the comple tton of the fleld analysis portlon of the rtUdY. enmm that the data sheets shown h FIuure 18-11 have been completed. Summa- rice this data on the data sheetd shown in .preue 18-11. 8. Biblroomohv
1. heriain W e t y for Te8tlng utd Mate-
Atmomhere by OM Chromatommphy. ABTM D 28W71, Part 23. Phlladelphta. Pa 19.0M)-OMI.1073.
2. Cotrzon, V. V. Methodolopg for C0)lect- in0 and m* oroanlc Air PoUutantd. U.8. Envlronmentrrl Protection Agency.
arp 1079. 3. Dravnte4 A, B. K. Er~toragMH. J.
whltiield. A. OpOnnell, and T. Euruwald EIIvlronmenW Science sad Tcchnolopg.
4. Eggertaen, F. T.. and F. M. Nehn. OM Chronuto&mmhic Analrsis of n u l n e Ex- h8-t and Atmomhere. Andytlcal Chemls- trg. 30(6): 1040-1043.1058.
5. FealrheUer. W. R.. P. J. MM. D. €I. EIurb, and 0. L Harris. Tcchnlcal Manual for Proce~ BSmpllM Stramw for Organic hf8krhb. U.S. EIIvlronmental protection AeencY. Rescuch Murgle part. NC. Pub&
172 p.
rI8l6. CI ThrOUUh C a EYdrocUbOns in the
publication NO. EPA-800/2-70-041. Fkbm-
5(32):1200-1222. 1971.
cation NO. EPA 600/2-7&122. lrpril 1076.
6. FR. 30 FR OSlS-0323.1974. 7. Pa. 30 FR 3W732880.1974. 8. F'R. 41 FR 23069-23072 Bnd 23016d
9. F'R, 41 FR 46669-46571.1976. 23090. 1976.
10. Fa. 42 FR 41771-41776.1977. 11. Fishbein. L. Chromatography of Envi-
ronmental Hazards, Volume 11. Elsevier Sci- entlfic Publishing Company. NY, NY. 1973.
12. Hamersma, J. W.. S. L Reynolds. and R. F. Maddalone. EPA/IERGRTP Proce- dures Manual: Level 1 Environmental As- sessment. U.S. Environmental Ro$ection Agency. Research Mangle Park, NC. Publi- cation No. EPA 600/276-l6Oa. June 1976. 130 p.
13. Harris. J. C.. M. J. Hayes. P. L. LeW, and D. B. Lindsay. EPA/IERGRW P m e - dures for Level 2 Semplhg and Analysis of Organic Materials. US. Environmental Pro- tection Agency. Research Trlangle Park. NC. Publication No. EPA 600/7-79-033. fib- ruary 1979.154 p.
grammed Temperature Gas Chromatom phy. John Wiley & Sons, Inc. New York. 1966.
15. Intersociety Committee. Methods of Air Sampling and Analysis. AmerkCan Health Association. Washington. DC. 1072.
16. Jones, P. W.. R. D. Orammu. P. E. Strup. and T. B. Stanford. Environmental Science and Technology. 10:806-810. 1976.
17. McNalr Hun Bunelll. E. J. Basic GoS Chromatography. Consolidated Printers. Berkeley. 1960.
18. Nelson, 0. 0. Controlled Test Atmos- pheres. Princlplea and Tecmques. Ann Arbor. Ann Arbor Science Publishers. 1971. 247 p.
14. Harris. W. E.. H. W. Hebfood. Pro-
US EPA EMC
The Federal Register Version Presented was published with this Report but has been supeceded. Users should use the most recent version of EPA Method 18 rather than the method presented.
19. NIOSH Manual of Analytical Methods. Volumes 1, 2, 3. 4, 5. 6, 7. U.S. Department of Health and Human Services National In- stitute for Occupational Safety and Health. Center for Disesse Control. 4676 Columbia Parkway, Cincinnati. Ohio 45226. April 1977-August 1981. May be available from the Superintendent of Documents. Govem- ment Printing Office. Washington. DC 20402. Stock Number/Price: VohIfhe 1 4 1 7 - 033-00267-3/$13, Volume 2417-033-00360- 6/$11, Volume 3-017-033-00281-4/$14, Volume 4417-033-00317-3/$7.25, Volume 5417-033-00349-1/$10. Volume 6-017-033- 00369-8/$9. and Volume 7-017-033-00396- 5/$7. Prlces subject to change. Foreign orders add 25 percent.
20. Schuetzle. D.. T. J. Prater. and S. R. Ruddell. Sampling and Analysis of Emls- sions from Stationary Sources; 1. Odor and Total Hydrocarbons. Journal of the Alr Pol- lution Control hocihtion. 25(9):925-932. 1975.
21. Snyder, A. D.. F. N. Hodpon, M. A. Kemmer and J. R. McKendree. Utility of Solid Sorbents for Sampling Organic Emls- sions from Stationary Sources. U.S. Envi- ronmental Protection Agency. Research Tri- angle Park, NC Publication No. EPA 600/2- 76-201. July 1976.71 p.
22. Tentative Method for Continuous Analysis of Total Hydrocarbons in the At- mosphere. Intersociety Committee. Ameri- can Public Health Assoclstion. Weshineton.
23. Xwerg. G.. CRC Handbook of Chroma- tography. Volumes I and 11. Sherma. Joseph ted.). CRC Press. Cleveland. 1972.
DC 1972. p. 184-186.
Section No. 3.16.10 Date June 30, 1988 Page 11
\
US EPA EMC
The Federal Register Version Presented was published with this Report but has been supeceded. Users should use the most recent version of EPA Method 18 rather than the method presented.

8 .
hct or vent to be tmpld
11. kotesr description
bw o l k r l a l
R o d U C t S
Operating cyclr Check: l r tch Cont4nuous Cycllc Tidng e t batch or cycle lest Ulu to a r t
Flgun 18-0. Pnllmlnrry survey data sheet.
Compound Retantion tho AttenU8tiOn
US EPA EMC
The Federal Register Version Presented was published with this Report but has been supeceded. Users should use the most recent version of EPA Method 18 rather than the method presented.
US EPA EMC
The Federal Register Version Presented was published with this Report but has been supeceded. Users should use the most recent version of EPA Method 18 rather than the method presented.
US EPA EMC
The Federal Register Version Presented was published with this Report but has been supeceded. Users should use the most recent version of EPA Method 18 rather than the method presented.

Preparation o f Standards I n Tedlar Bags and Cal Ibrat lon Curve
Standards M i x t u r e mixture
Q1 Q2 --
FlQlUte r Calibration
F lavc te r mnba or l den t i f l c r t t on
Calibration devlce I x ) : Bubble meter- Sprraeter- Wet tes t wter- Readings a t laboratory condi tions:
F l O Y t c r type Standards Pnparatlon Data:
Organlc: Bag nubcr o r reenti f icat ion Dry gas aeter calibration factor Final meter reading ( l i t e r s ) In1 t i a l aeter reading (1 1 ters 1 Metered v o l u c ( l i t e r s ) Average meter tmperature (70 Average meter pressure. gauge (n Hg) Average atmspherlc pressure (I Hg) Average meter pressure, absolute (I Hg) Syringe temperature (10 Syrlage pressure, absolute (111 Hg)
V o l w of gas i n syrlnge (m1)
Density o f liquid organic (g/ml)
V o l w o f l i q u i d I n syrlnge (ill
(Sect1 on 6.2.2.1)
(Sectlon 6.2.2.1)
(Section 6.2.2.1)
(Section 6.2.2.2)
(Sectlon 6.2.2.2)
Labokory temperatire (flab) *K Laboratory barorctrlc pressure- - H9
Flow data: F louc te r
readlng I . I pressure (as mrked)l I(abso1ute) - Calibration device
-Tin 1 (rin) tws void Iflo* rateb
I I
a = Voltme o f gas maswed by cal ibrat ion device, corrected to standard condi t lons ( 11 tars) . --
b Callbration device gas vo lme / t iw .
Plot flometer reding a y i n s t fiw ra te (standard conditions). a d draw a ~ 0 0 t h m e . flow &ice Ult 1s vlrcosity dependent, i t my be necarury to v a t r a ' f d l y ' of callbratfor curves that cmer thc opera t l y pressure md tcqrratwe ranger of 'ute florrter.
W i l e the fo l l odng tcchnigcr sbauld be ver i f ied k f o r r appllcatlon. l t MY k possible to calculate f l o w ra te readings for rotaetors a t stmdard conlit ions Qrtd as follows:
If the florcter bdng c a l l b r a t d i s a m-ter or otlwt 6C Operating Conditions:
Sample loop vol l rc (m1) Sample loop temperature IT) t a r r i e r gas flow rate Iallmin) Colun temperatun
t n i t l a l ('C) Rate cfun l I*C/min) Final ~ * c ? --
Organic Peak fdenti f lcat lon and
Injection tiw (24-hr clock) Distance to park (a) Chart speed ( a h i n ) Organic retention tiw h l n ) Attenuation factor Peak helght ( 1 Peak area (3 Peak area x attenuation factor (4) Calculated concentration (pp.1
\- Calculatrb Concentratlons:
(Equation 18-3 o r 16-41
Flor rate (standard conditions)
P l o t peak area x attenuation factor against calculated concentration to obtain callbration curve.
Figure 18-3. Standards prepared tn Tedlar bags and cal ibrat ion curve.
Figure 18-4.
,
US EPA EMC
The Federal Register Version Presented was published with this Report but has been supeceded. Users should use the most recent version of EPA Method 18 rather than the method presented.
US EPA EMC
The Federal Register Version Presented was published with this Report but has been supeceded. Users should use the most recent version of EPA Method 18 rather than the method presented.
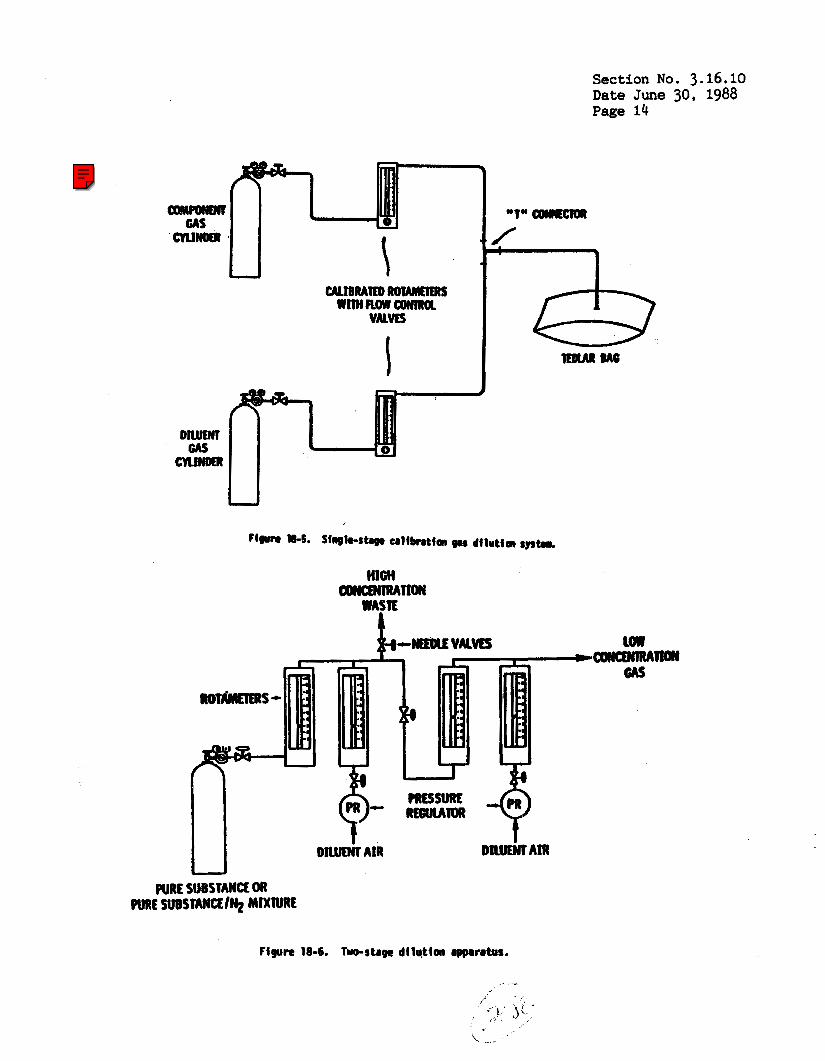
Section No. 3.16.10 Date June 30, 1988 Page 14
I 1
1, -
Dfluan AIR U PURE SUISTANCE. OR
OUR€ SUBSTMCE/% MIXNRE
Figure 18-6. Two-stage dllu.tlon IppmtOt.
US EPA EMC
The Federal Register Version Presented was published with this Report but has been supeceded. Users should use the most recent version of EPA Method 18 rather than the method presented.
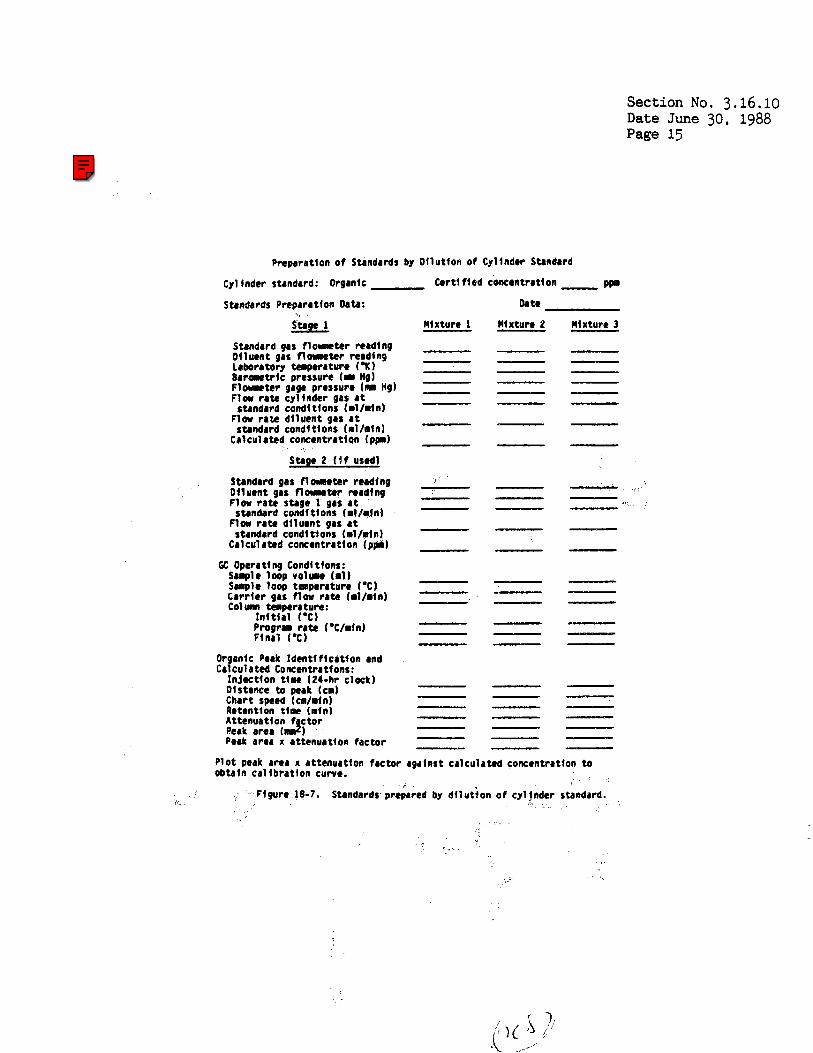
Section No. 3.16.10 Date June 30, 1988 Page 15
Pnparatlon o f Standards by Ollutlon o f Cyl inder Standard
Cylinder standard: Organic Certi f l e d comentratlon pp
Standards Preparatlon Datd: \I .
SiBge 1
Standard gas f lometer reading Dfluent gas f l O r c t e r readfng Laboratory teaprrature ( O K )
B i r m t r l c pressure (II Hg) F l o v c t e r gage pressure (nn Hg) Flew rate cylinder gas a t standard condi t lonr (al/min)
Flow rate dlluent gas a t standard conditions ( m l b i n )
Calculated concentration ( p p )
Stage 2 (If used)
Standard gas f l o r rn te r readlng Olluent gar flovaur reading Flow rate stage 1 gas a t standard conditions (al/ain)
Flow ra te dl luent gas a t standard conditions (al/pln)
Calculated concentration ( p p )
Saaple loop v o l u r (1111) Swple 'loop temperature ('C) Carrlcr gas flow rate (al/ain) C o l ~ temperature:
l n i t i a l I'C) Program rate ('C/aln) Final (*C)
Organic Peak ldent i f icat lon and Cal cul a ted Concentrations:
In ject lon t l ae (24-hr clock) Dlstance to peak ( c d Chart speed (cn/aln) Retention t iae ( d n ) Attenuatlon f c to r Peak area (ma& Peak area x attenuation factor
GC Operating Condl tions:
Mixture 1
Date
Mixture 2 Mlxtura 3
- z
Plot perk area x attenuation factor rgdinst calculated conccntrrtlon to obtdin ca l lb ta t ion curve.
Figure 18-7. Standrrds prepared by dilution o f cyl jnder standard.
US EPA EMC
The Federal Register Version Presented was published with this Report but has been supeceded. Users should use the most recent version of EPA Method 18 rather than the method presented.
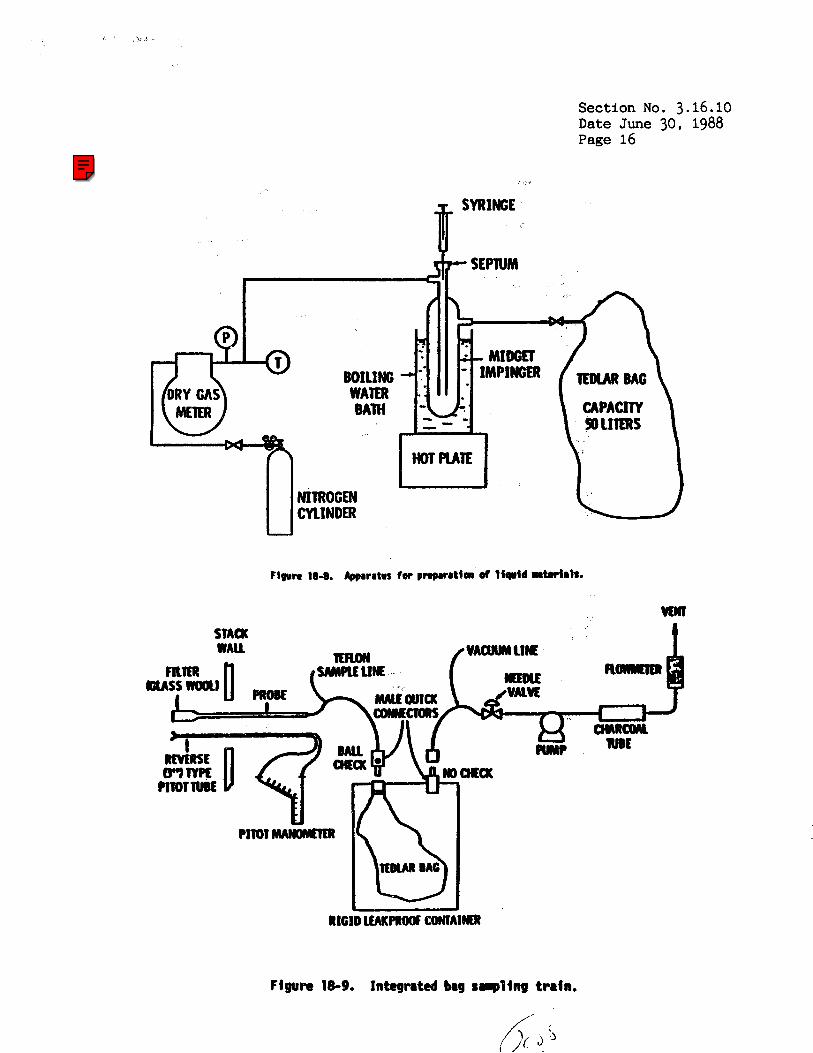
Section No. 3.16.10 Date June 30, 1988 Page 16
, I
, SYRINGE
- SEQIIIM
I
BOIlIM WATER BATH
NITROGEN CYLINDER U
Figure 10-8. ¶tus
W
for prepwatton d llgrld mtrrlalS.
Flgum 18-9. Integrated brg tmpllng trrln.
US EPA EMC
The Federal Register Version Presented was published with this Report but has been supeceded. Users should use the most recent version of EPA Method 18 rather than the method presented.

Section No. 3.16.1~ Date June 30. 1988 Page 17
w t
Alr TI@ Steel Rr
I 7
k9 - $art ti- Finish time
Flgun 18-10. Flrld sample drtr sheet - %dhr bag col1ectlon I*-.
US EPA EMC
The Federal Register Version Presented was published with this Report but has been supeceded. Users should use the most recent version of EPA Method 18 rather than the method presented.
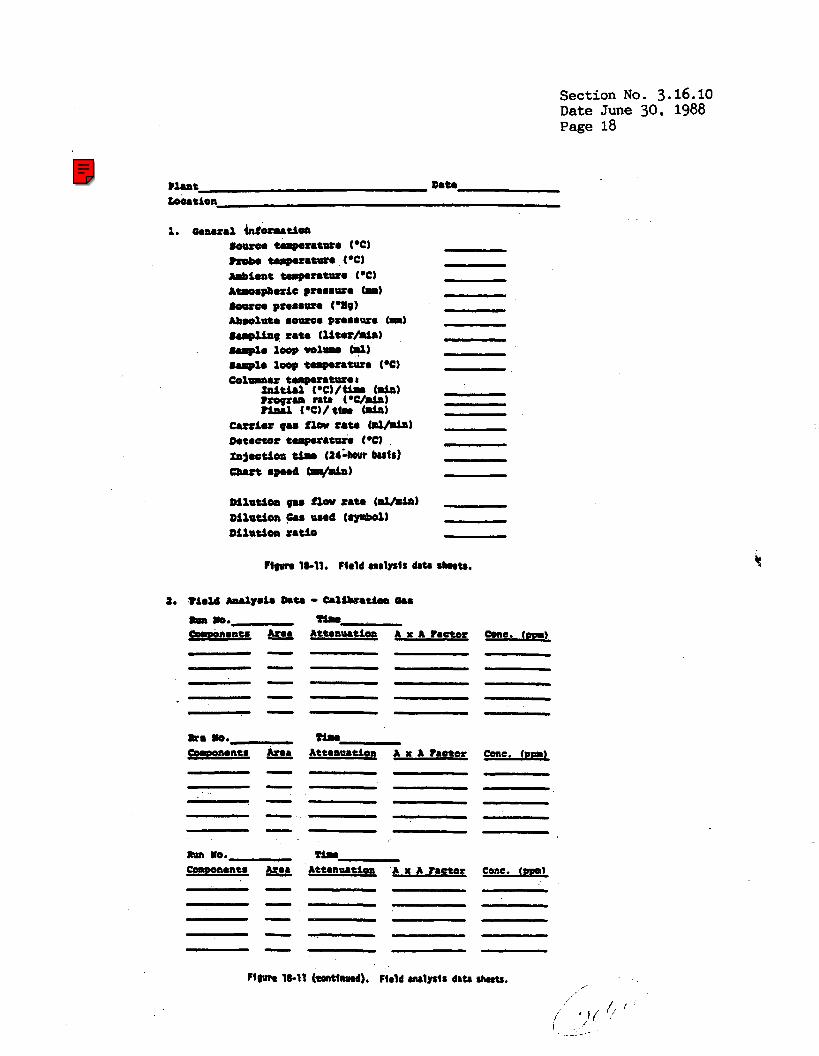
Section No. 3.16.10 Date June 30, 1988 Page 18
a.
a.
m.0 lo. Cwwnentr
ha lo. Coaponmntr k..
F&m Attanrutioa A x A ?actor
TLrw Attenuation A x A ?aetor
tL. Attmnrutioa A x A ?actoh
a
Cone. (m)
,
US EPA EMC
The Federal Register Version Presented was published with this Report but has been supeceded. Users should use the most recent version of EPA Method 18 rather than the method presented.
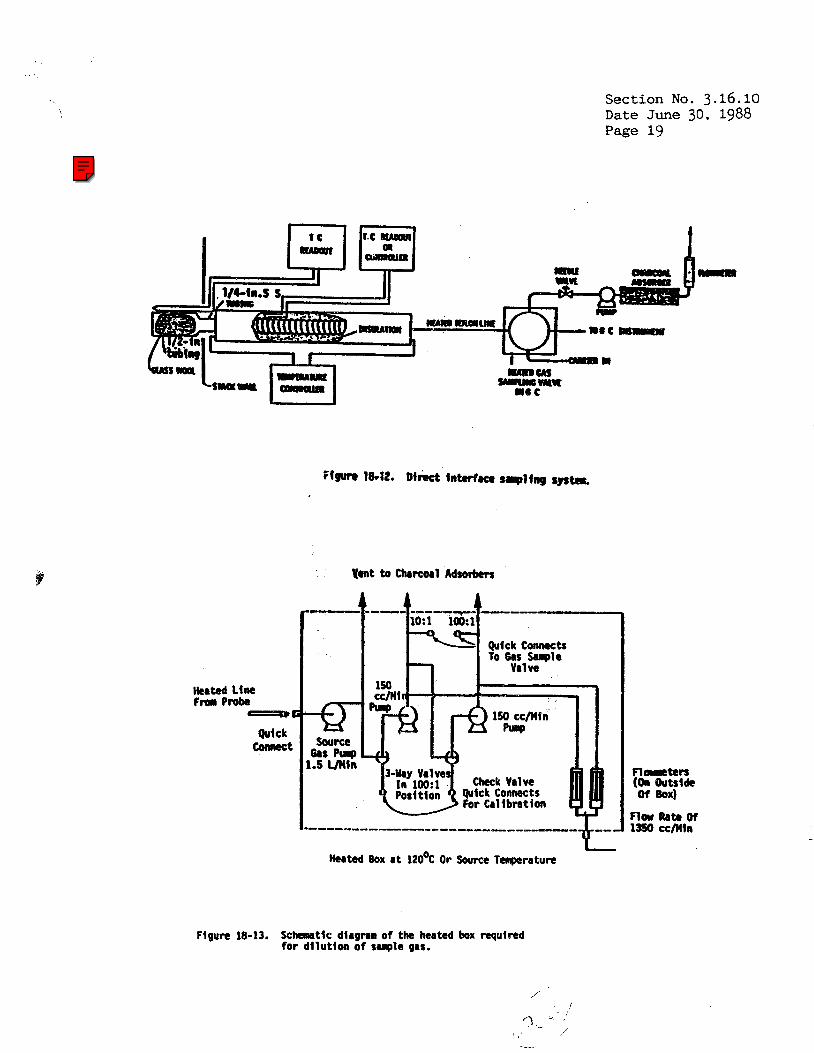
Section No. 3.16.10 Date June 30. 1988 Page 19
Figure 18-13. khcslatlc diagram of the heated box required for di lut ion o f tuple gas.
Fl#tten (on outride of -4
fla Rate W 1358 cc/nin
,' !
US EPA EMC
The Federal Register Version Presented was published with this Report but has been supeceded. Users should use the most recent version of EPA Method 18 rather than the method presented.
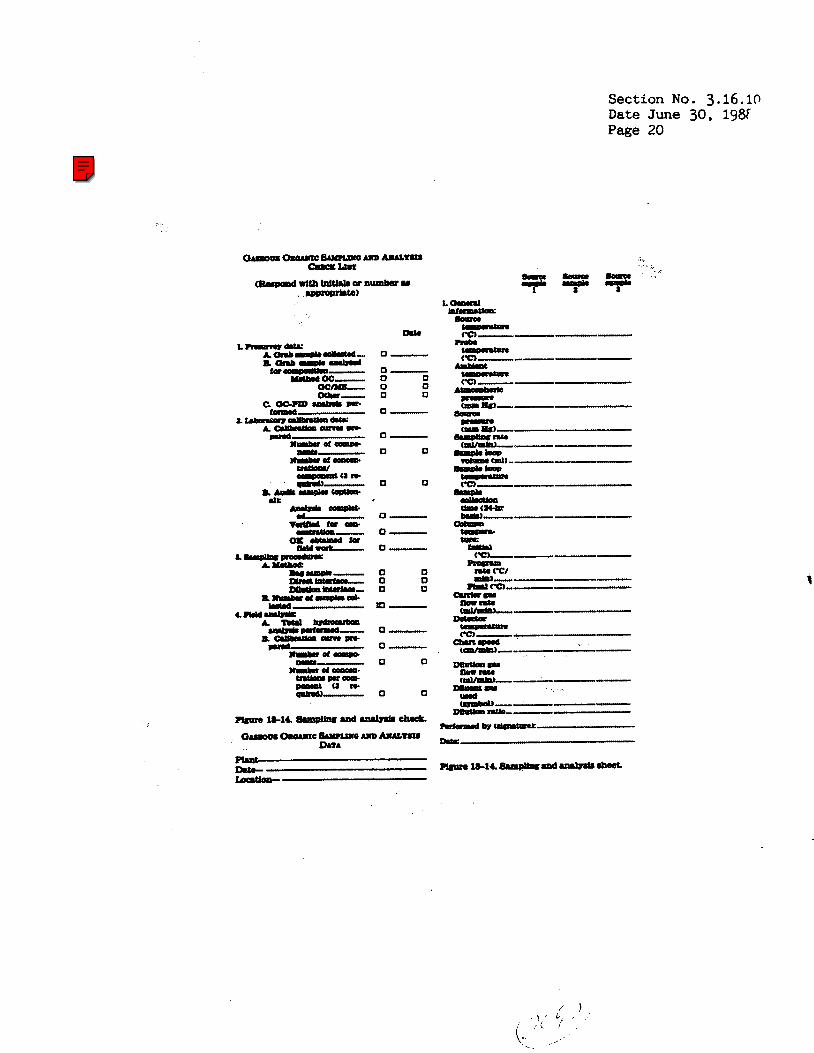
Section No. 3.16.10 Date June 30. 19M Page 20
0- 0 n 0 n n n 0-
0-
0 0
0 0
0-
0-
0-
0 0 0 0 0 0
0-
0-
0 0
0 0
i
US EPA EMC
The Federal Register Version Presented was published with this Report but has been supeceded. Users should use the most recent version of EPA Method 18 rather than the method presented.
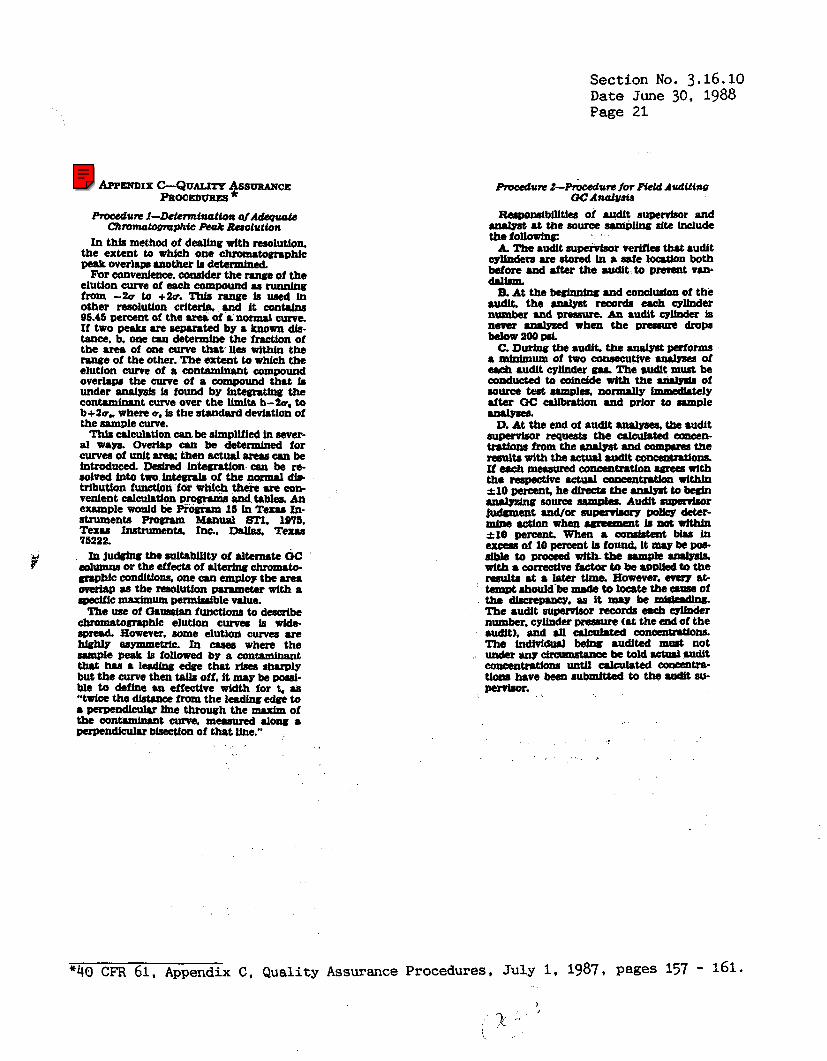
Section No. 3.16.10 Date June 30, 1988 Page 21
& P ~ I X C-QUUITY A~SWCC wlocmrmcs*
proccdum l--Dclct?#tincr(fon M A W & clhmmatonruphic Peak Reaolution
In this method of derllno with resolution, the extent to which one chromatographic mak overlapr rnother h determhed,
For convenknce. d d e r the range of the elution curve of each compound M from -2v to +2c. Thb range Ls used in other nsolutlon crltuls, ond It cont.lns 96.45 percent of the area of a normal c u r v ~ If two peaks are scpurted by a known db- tance. b. one can determlnc the frscflon of the pfea of one curve that Ues withla the range of the other. The extent to w h k h the elution curve of a contaminrnt compound overlapa the curve of a compound that k under PllPlJrels la found by the conhminant m e over the Wta b-2v. to b+2um where a, 18 the standard devhtlon of the aample m e .
Thl8 calculation cau be simpluied In sever- al warn Overlap can be determined for curves of unit a r a then actual areman be h t m d u ~ Desired Inteeration can be re solved Into two In- of the normal d b trlbutlon funct4on for wuch there am con- venlent calcpL.tlon program cmd tabled. An example would be Promam 15 in Texaa In- atruments Proeram bUnW STl. 1976. Texas Inatrumurta Inc, Dallas, TexM 75222. ~n judeing the suihbUtY of ternat ate OC
wlumna or the tffecta of altering chromate graphic condltfom. one can employ the area h p 88 the reaelution m e t e r with a ~cmaJrlmumpermlsdblevslue.
The use of Gawn9Jan functions to deaulbe chrolrurtornaphic elution curves is wide rpnrd However, some elution c m e s are Wh4 mymmetric In crses where the mwle peak Li followed by a contamlnant that ha8 a ladIng edge that riaea rharpig but the curve then tail8 off, It may be pad- ble to deflne an effeetfve widtb for & au “twla the from the leading edge to a Dnwndiculu llne through the maxim of the contaminant curve. mc.BuIcd .lory a Oapcndicuh blsectlon of that llne.”
$
procedum Z-Pnxedunfor Flcld Adit ino QCAnCJW
-blUtitl, of audit supeRtsor and umlmt at the source -ling site Lnclude thefolloning: A. The audit superstsar verlflea thu audit
Cymdem M atorad in 8 rrie loutton both before .nd .tbr the audit to wmnt vm- d&lbml
8. At the beeimhe and concludan of the urdlt. the sl45t record6 each comer never analmed when the prerrurr drops baoW2ooI3SL
C. DurbrO the sudlt. me ana46t paionrrs a mlntmum of two consecutive of each audlt coUnder 0.r The audit murt be coLductcd to coincide with the mmlyda of souwe teat limplea wullullp Immrrl(ltrlv after Qc caUbration and prlor La rrmple anames. D. At the end of audit uulyrrea t& audit
awendsor nquesb the aUd8t.d coneen- tmtlona from theuulgdand commma the results with thr returl udlt c o ~ o n s . If ach meuuued concentratJon agrccu wi th the rcspectior actual wnceatmth rlthln k10 pcrant, he dlrecta the .nrlyrt to beein .nrlytinq source mawis Audit Rg#rrfsor Judmnex~t and/or supemlamy policy deter- mlw retion when aamawnt la Doc rtthln f10 guccnt. When a combtent bha in exaas of 10 pucmt Is found it m8ybePOQ. dbte to P- r l tk the rrmph alaalm& with a corrective factart0 be apulkdto the reaulta at a later time. Howsvsr. m r ~ , at- temd rbould be matie to loate the CMIW of
dbcIemncY. 98 it mry be mw-iuns. ThC audit supvvbor nxord6 crcb colhder number, cylinder pre86ure <at the end of the rudlt). and J1 crlcul.ted conceamthm The indivldu8l be- 8udited must not un&r any dramurtraac be told actual wdlt COrEentrationa uaw aLEulrtcd eoncentra- ti- have been 8Ubmlttcd fo the UWM 8U- Pervisor.
number md D m bs audit C g W iS
. . I . . . .
‘40 CFR 61, Appendix C, Quality Assurance Procedures, July 1, 1987, pages 157 - 161.
US EPA EMC
The Federal Register Version Presented was published with this Report but has been supeceded. Users should use the most recent version of EPA Method 18 rather than the method presented.
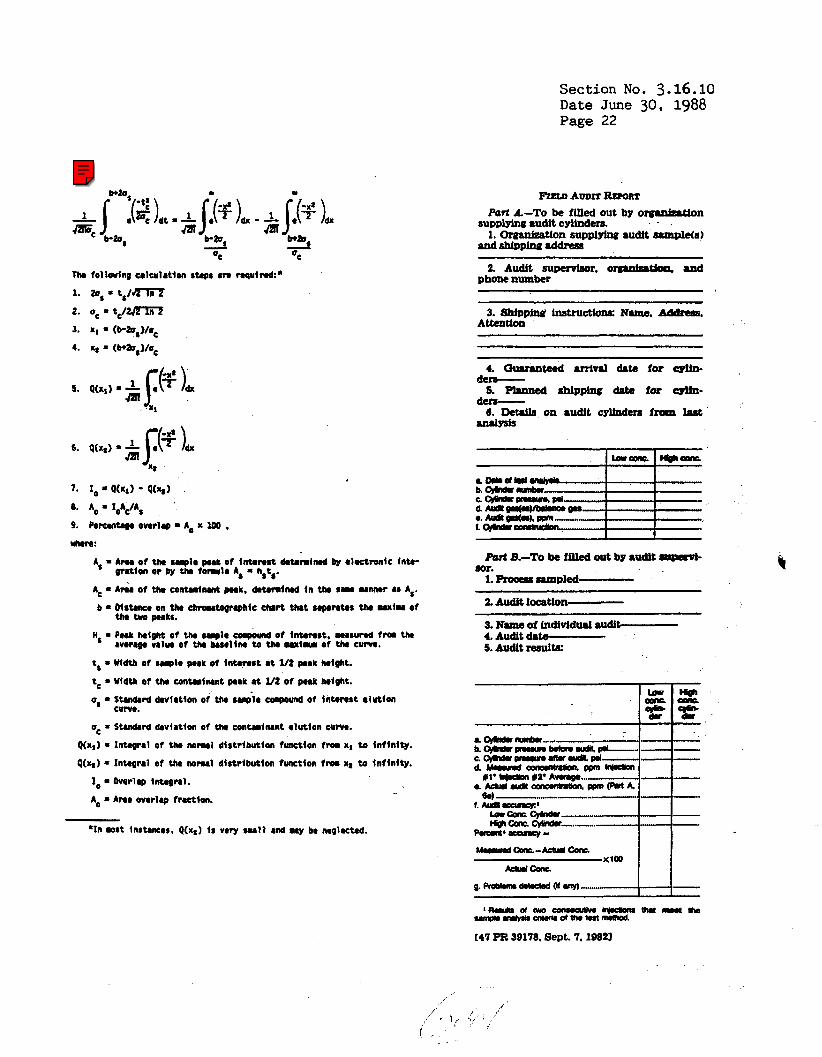
Section No. 3.16.10 Date June 30. 1988 Page 22
I
9. krcentrgr overlap = 'Lo x Loo , *lW:
* In lost Inrtancrs. Q(x;) 11 v e y r u l l a d uy be cnglrctzd.
US EPA EMC
The Federal Register Version Presented was published with this Report but has been supeceded. Users should use the most recent version of EPA Method 18 rather than the method presented.

Section No. 3.16.11 Date June 30, 1988 page 1
11.0 REFERENCES
1.
2.
3.
4.
5.
6.
7.
8.
9.
10.
11.
12.
Method 18 - Measurement of Gaseous Organic Compound I Emissions by G a s Chromatography. Federal Register, Volume 48, No. 202, October 18, 1983, page 48344.
Amendments to Method 18. Federal Register, Volume 49, No. 105, M a y 30, 1984, page 22608.
Miscellaneous Clarifications and Addition of Concentration Equations to Method 18. Federal Register, Volume 52, No. 33, February 19, -1987, page 5105
Stability of Parts-Per-Million Organic Cylinder Qases and Results of Source Test Analysis Audits, Status Report #8. U. S. Environmental. Protection Agency Publication No. ~~~-600/2-86-117, January 1987. Also available f r o m NTIS as Publication No. PB 87-141461.
Traceability Protocol for Establishing True Concentration of Gases Used for Calibration and Audits of Continuous Source Emission Monitors (Protocol N o . 1). Section 3.0.4. Quality Assurance Handbook, Volume 111, Stationary Source Specific Methods, U. S. Environmental Protection Agency Publication No. EpA-600/4-77-027b , June 15, 1978.
Methanol, Method 2WO. NIOSH Manual of Analytical Methods, Volume 2, Third Edition, U. S. Department 1984.
Alcohols X, Method 1400. NIOSH Third Edition, U. S. Department 1984.
Alcohols 11, Method 1401. NIOSH Third Edition, U. S. Department 1984.
of Health and Human
Manual of Analytical of Health and Human
Manual of Analytical of Health and Human
Services, February
Methods, Volume 1, Sewices , February
Methods, Volume 1, Services , February
Hydrocarbons, BP 36 - 126’ C, Method 1500. NIOSH Manual of Analytical Methods, Volume 2, Third Edition, U. S. Department of Health and Human Services, February 1984.
Development of Methods for Sampling 1,3-Butadiene. Interim Report prepared under U. S. -Environmental Protection Agency Contract Number 68-02-3993 , March 1987.
Hexachlorocyclopentadiene , Method 2518. NIOSH Manual of Analytical Methods, Volume 2, Third Edition, U. S. Department of Health and Human Services , February 1984.
Method 110 - Determination of Benzene from Stationary Sources, Proposed Rule. Federal Register , Volume 45 , No. 77 , April 18 , 1980. page 26677.
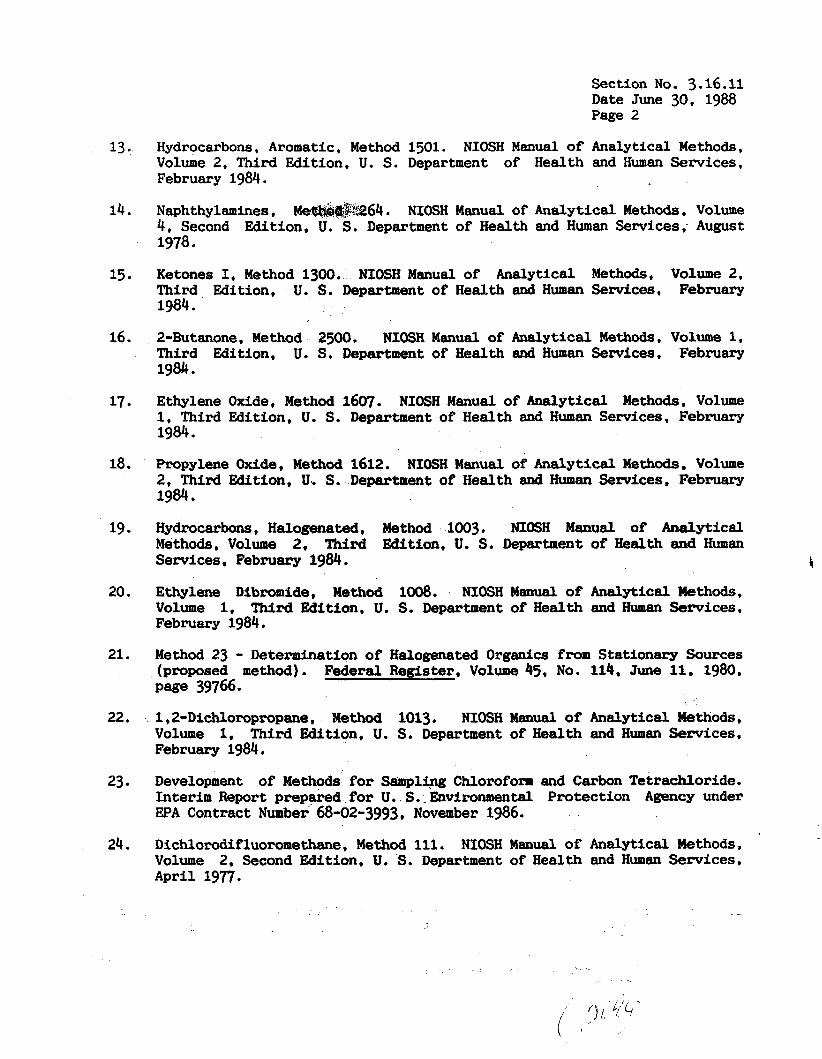
Section No. 3.16.11 Date June 30, 1988 Page 2
13.
14.
15
16.
17
18.
19 0
20.
21.
22.
23
24.
Hydrocarbons, Aromatic, Method 1501. NIOSH Manual of Volume 2, Third Edition, U. S. Department of Health February 1984.
Analytical Methods * and Human Services,
Naphthylamines, Met%&@i%64. NZOSH Manual of Analytical Methods, Volume 4, Second Edition, U. S. Department of H e a l t h and Human Services; August 1978.
Ketones I, Method 1300. NIOSH Manual of Analytical Methods, Volume 2. Third Edition, U. S. Department of Health and Human Services, February 1984.
2-Butanone. Method 2500. NIOSH Manual of Analytical Methods, Volume 1, Third Edition, U. S. Department of Health and Human Services, February 1984.
Ethylene Oxide, Method 1607. NIOSH Manual of Analytical Methods, Volume 1, Third Edition, U. S. Department of Health and Human Services, February 1984.
Propylene Oxide, Method 1612. NIOSH Manual of Analytical Methods. Volume 2, Third Edition, U. S. Department of Health and Human Services, February 1984.
Hydrocarbons, Halogenated, Method 1003. NIOSH Manual of Analytical Methods, Volume 2, Third Edition, U. S. Department of Health and Human Services, February 1984. 4
Ethylene Dibromide, Method 1008. NIOSH Manual of Analytical Methods. Volume 1, Third Edition, U. S. Department of Health and Human Services, February 1984.
Method 23 - Determination of Halogenated Organics from Stationary Sources (proposed method). Federal Register, Volume 45* No. 114, June 11. 1980, Page 39766.
1,2-Dichloropmpane, Method 1013. NIOSH Manual of Anelytical Mthods, Volume 1, Third Edition, U. S. Department of Health and Human Services, February 1984,
Development of Methods for Sampling Chlorofom and Carbon Tetrachloride. Interim Report prepared for U. S..Environmental Protection Agency under EPA Contract Number 68-02-3993, November 1986.
D i c h l o r o d i f l u o r o m e t , Method 111. NIOSH Manual of Analytical Methods, Volume 2. Second Edition, U. S. Department of Health and Human Services, April 1977.
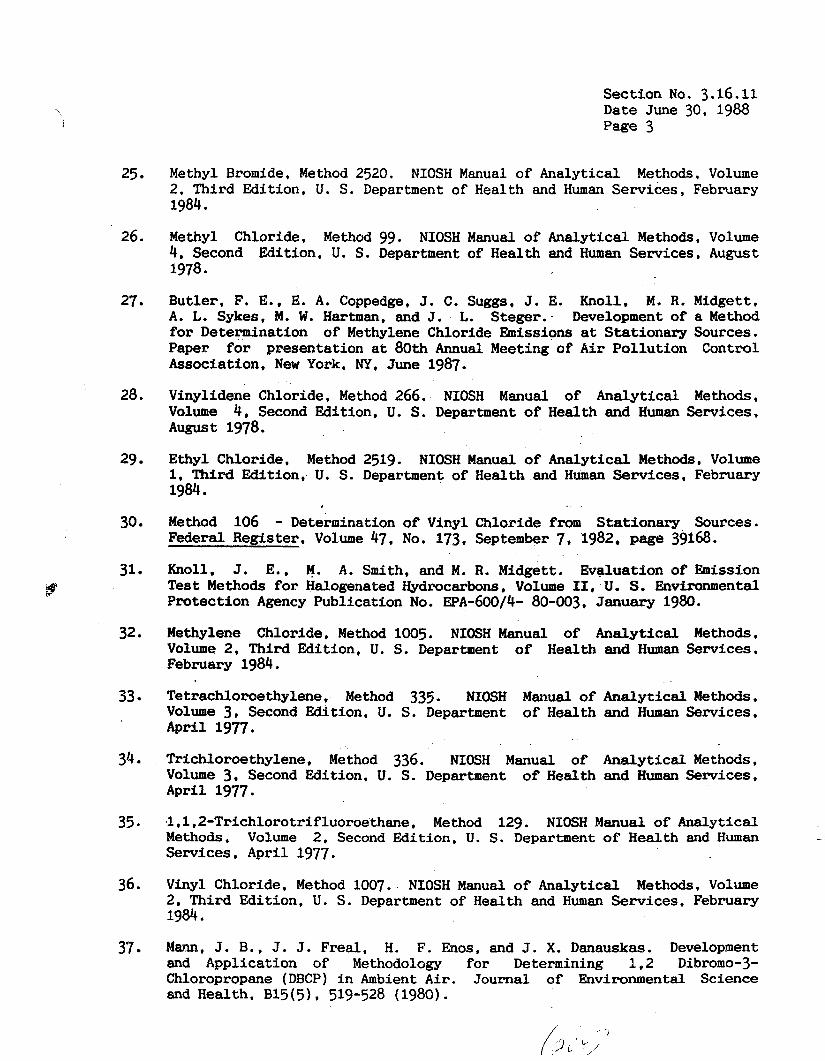
Section No. 3.16.11 Date June 30, 1988 Page 3
25
26.
27
28.
29
30
31 y
32
33
34
35 *
37
Methyl Bromide, Method 2520. NIOSH Manual of Analytical Methods, Volume 2, Third Edition, U. S. Department of Health and Human Services, February 1984.
Methyl Chloride, Method 99. NIOSH Manual of Analytical Methods, Volume 4, Second Edition, U. S. Department of Health and Human Services, August 1978 9
But l e r , F. E., E. A. Coppedge, J. C. Suggs, J. E. Knoll, M. R. Midgett, A. L. Sykes, M. W. Hartman, and J. L. Steger: Development of a Method for Determination of Methylene Chloride Emissions at Stationary Sources. Paper for presentation a t 80th Annual Meeting of A i r Pollution Control Association, New York, NY, June 1987.
Vinylidene Chloride, Method 266. NIOSH Manual of Analytical Methods, Volume 4, Second Edition, U. S. Department of Health and Human Services. August 1978.
Ethyl Chloride, Method 2519. NIOSH Manual of Analytical Methods, Volume 1, Third Edition, U. S . Department of Health and Human Services, February 1984.
Method 106 - Determination of Vinyl Chloride from Stationary Sources. Federal Register, Volume 47, No. 173. September 7, 1982. page 39168.
Knoll, J. E., M. A. Smith, and M. R. Midgett. Evaluation 0f Emission Test Methods for Halogenated Hydrocarbons, Volume 11, U. S. Envimnmental Protection Agency Publication No. EpA-600/4- 80-003, January 1980.
Methylene Chloride, Method 1005. NIOSH Manual of Analytical Methods, Volume 2, Third Edition, U. S. Department of Health February 1984.
Tetrachloroethylene, Method 335. NIOSH Ma~ual of Volume 3, Second Edition, U. S. Department of Health April 1977.
Trichloroethylene, Method 336. NIOSH Manual of Volume 3, Second Edition, U. S. Department of Health Apr i l 1977.
and Human Services.
Analytical Methods, and Human Services,
Analytical Methods , and Human Services,
~1,1,2-Trichlorotrifluoroethane, Method 129. NIQSH Manual of Analytical Methods, Volume 2, Second Edition, U. S. Department of Hea l th and Human Services, April 1977.
Vinyl Chloride, Method 1007. NIQSH Manual of Analytical Methods, Volume 2, Third Edition, U. S. Department of Health and Human Services, February 1984 *
M m , J. B., J. J. F r e d , H. F. Enos. and J. X. Danauskas. Development and Application of Methodology for Determining 1.2 Dibromo-3- Chloropropane (DBCP) i n Ambient Air. Journal of Environmental Science and Health, B15(5), 519-528 (1980).
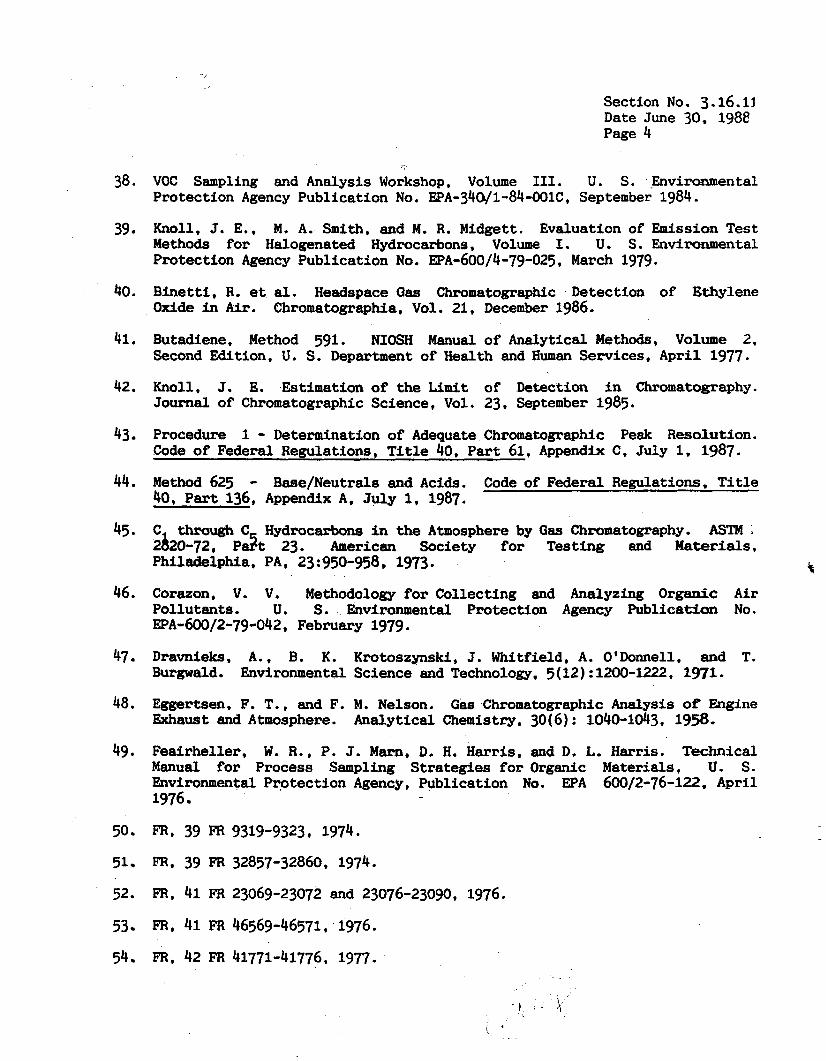
Section No. 3.16.11 Date June 30. 1988 Page 4
38
39
40.
41.
42.
43
44.
45 9
46.
47
48.
49 9
50
51
52 9
53
54
VOC Sampling and Analysis Workshop, Volume 111. U. S. .Ehvironmental Protection Agency Publication No. EpA-34a/l-84-001C, September 1984.
Knoll, J. E., M. A. Smith, and M. R. Midgett. Evaluation of Emission Test Methods for Halogenated Hydrocarbons, Volume I. U. S. Environmental Protection Agency Publication No. EpA-600/4-79-025 , March 1979.
B i n e t t i , R, et al. Headspace Gas Chromatographic Detection of Ethylene Oxide i n A i r . Chromatographia, Vol. 21, December 1986.
Butadiene, Method 591. NIOSH Manual of Analytical Methods, Volume 2, Second Edition. U. S. Department of Health and Human Services, Apri l 1977.
Knoll, J. E. Estimation of the L i m i t of Detection i n Chromatography. Journal of Chromatographic Science, Vol . 23 , September 1985.
Procedure 1 - Determination of Adequate Chromatographic Peak Resolution. Code of Federal Regulations, T i t l e 40, Part 61, Appendix C, July 1, 1987.
Method 625 - Base/Neutrals and A c i d s . Code of Federal Regulations. T i t l e 40, Part 136, Appendix A, July 1, 1987.
C through C Hydrocarbons in the Atmosphere by Gas Chromatography. ASTM I
2h20-72. P a t 23. American Society for Testing and Materials, Philadelphia, PA, 23 : 950-958, 1973.
Corazon, V. V. Methodology for Collecting and Analyzing Organic Air Pollutants. U. S. Environmental Protection Agency Publication No. EPA-600/2-79-042 , February 1979.
f
Dravnieks, A. , B. K. Krotoszpski, J. Whitfield, A. O’Donnell, and T. Burgwald. Environmental Science and Technology. 5(12):12Oo-l2Z, 1971.
Eggertsen, F. T., and F. M. Nelson. Gas Chromatographic Analysis of Engine Exhaust and Atmosphere. Analytical Chemistry, 30(6) : 1040-1043, 1958.
Feairheller, W. R. , P. J. M a r n , D. H. H a r r i s , and D. L. H a r r i s . Technical Manual for Process Sampling Strategies for Organic Materials. U. S. Environmental Protection Agency, Publication No. EPA 600/2-76-122. A p r i l 1976
m, 39 9319-9323, 1974.
FR, 39 FR 32857-32860, 1974.
FR, 41 FR 23069-23072 and 23076-23090, 1976.
FR, 41 FR 46569-46571, 1976.
Section No. 3.16.11 Date June 30, 1988 page 5
55. Fishbein, L. Chromatography of Environmental Hazards, Volume 11. Elsevier Scient i f ic Publishing Company, N e w York, New York, 1973.
56. Hamersma, J . W . , S. L. Reynolds, and R. F. Maddalone. EPA/IERL Procedures Manual: Level 1 Environmental Assessment, U. S. Environmental Protection Agency Publication No. EPA 600/276/160a, June 1976.
57. Harris, J. C., M. J. Hayes, P. L. Levins, and D. B. Lindsay. EPA/IERL Procedures f o r Level 2 Sampling and Analysis of Organic Materials. U. S. Environmental Protection Agency Publication No. EPA 600/7-79-033, February 1979
58. H a r r i s , W. E., H. W. Habgood. Programmed Temperature Gas Chromatography. John Wiley & Sons, Inc. New York, 1966.
59. Methods of Air Sampling and Analysis. Intersociety Committee, American Health Association, Washington, D. C. , 1972.
60. Jones, P. W., R. D. Grammer, P. E. Strup, and T. B. Stanford. Environmental Science and Technology, 10:$06-810, 1976.
61. McNair H a n Bunelli, E. J. Basic Gas Chromatography. Consolidated Printers , Berkeley , 1969.
62. Nelson, G. 0. Controlled T e s t Atmospheres, Principles and Techniques. Arbor, Ann Arbor Science Publishers, 1971.
Ann
63. Schuetzle. D. , T. J. Prater, and S. R. Ruddell. Sampling and Analysis of Emissions from Stationary Sources; I. Odor and Total Hydrocarbons. Journal of the A i r Pollution Control Association, 1975.
v
64. Snyder, A. D., F. N. Hodgson, M. A. Kemmer, and J. R. McKendree. U t i l i t y of Solid Sorbents for Sampling Organic Emissions from Stationary Sources. U. S . Environmental Protection Agency Publication No. EPA 600/2-76-201 J u l y 1976.
65. Tentative Method f o r Continuous Analysis of Total Hydrocarbons i n the Atmosphere. Intersociety Committee, American Public Health Association, Washington, D.C., 1972.
66. Zwerg, G. CRC Handbook of Chromatography, Volumes I and 11. CRC P r e s s , Cleveland, 1972.

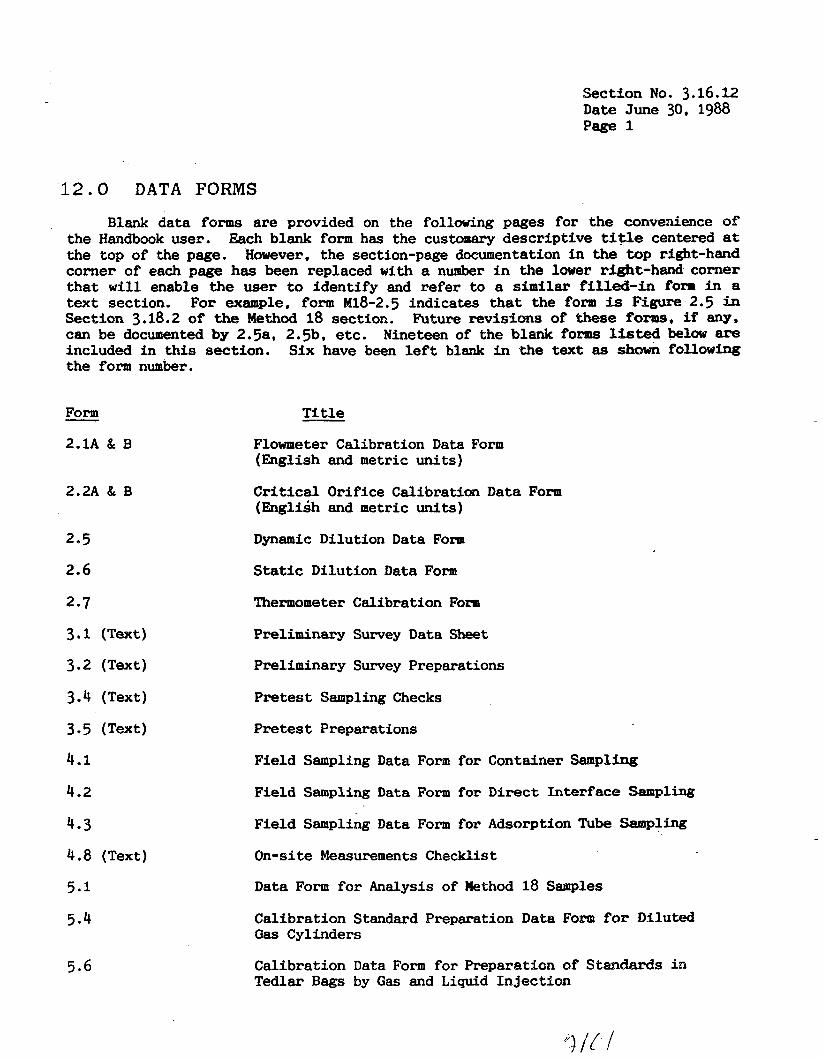
Section No. 3.16.12 Date June 30. 1988 page 1
12.0 DATA FORMS B l a n k data forms are provided on the following pages for the convenience of
the Handbook user. Each blank form has the customary descriptive t i t le centered at the top of the page. However, the section-page documentation i n the top right-hand corner of each page has been replaced with a number i n the lower right-hand corner t ha t w i l l enable the user to ident i fy and refer to a s i m i l a r filled-in fom i n a t ex t section. For example, form ~18-2 .5 indicates t h a t the form is Figure 2.5 in Section 3.18.2 of the Method 18 section. Future revisions of these forms, if any. can be documented by 2.5a, 2.5b, etc. Nineteen of the blank forms lhted below a m included i n this section. Six have been left blank i n the tex t as shown following the form number.
Form
2.1A & B
-
2.2A & B
T i t l e
Flowmeter Calibration Data Form (English and metric uni ts)
Critical Orifice Calibration Data Form (English and metric units)
2.5 Dynamic Dilution Data Form
2.6 S t a t i c Dilution Data Form
2.7 Thermometer Calibration Form
3.1 (Text) Preliminary Survey Data Sheet
3.2 (Text) Preliminary Survey Preparations
3.4 (Text) Pre tes t Sampling Checks
3.5 (Text) Pre tes t Preparations
4.1 Field Sampling Data Form for Container Sampldng
4.2 Field Sampling Data Form for D i r e c t In terface sdimplhg
4.3
4.8 (Text)
5.1
5.4
5.6
Field Sampling Data Form for Adsorption Tube Sampling
On-si te Measurements Checklist
Data Form for Analysis of Method 18 Samples
Calibration Standard Preparation Data Form for Diluted Gas Cylinders
Calibration Data Form for Preparation of Stam3mds in Tedlar Bags by Gas and Liquid Inject ion

5.8
Section No. 3.16.12 Date June 30, 1988 page 2
Data Form for Development of Response and Relative Retention Factors
5.9 5.10 (Text) Postsampling Operations Checklist
6.1 7 - Calculation Form for GC Analysis by G a s Injection
6.2
8.1 Field Audit Report Form
8.2
Data Form for Preparation of Liquid Standards and Desorption Efficiency Samples for Adsorption Tube Analysis
Calculation Form for GC Analysis by Liquid Injection
Method 18 Checklist to be Used by Auditors
,
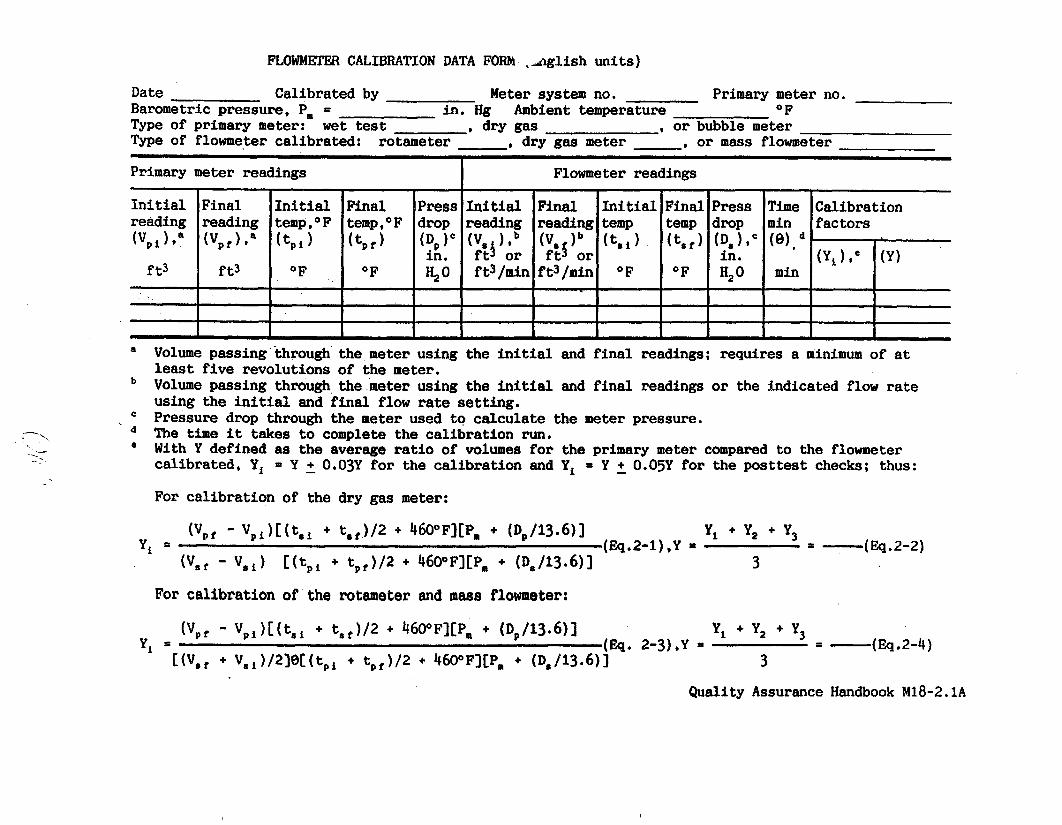
FLXIWMETER CALIBRATION DATA FORh ,Ajglish units)
Date Calibrated by Meter system no. Primary meter no.
Type of flowmeter calibrated: rotameter , dry gas meter , or mass flowmeter
Barometric pressure, P, = in. H g Ambient temperature O F
Type of primary meter: w e t test , dry gas , or bubble meter
I
Primary meter readings ~
I n i t i a l temp, O F
( t p i )
O F
I I I I 1 1 I I I a Volume passing through the meter using the i n i t i a l and f ina l readings: requires a minimum of at
least f ive revolutions of the meter. Volume passing through the meter using the i n i t i a l and f ina l readings or the indicated flow rate using the i n i t i a l and f ina l flow rate sett ing. Pressure drop through t he meter used t o calculate the meter pressure. The time it takes t o complete the calibration run. With Y defined a8 the average r a t io of volumes for the primary meter compared to the flowmeter caUbrated, Y, = Y - + O.O3Y for the calibration and Y, = Y - + O.O5Y for the posttest checks; thus:
For calibration of the dry gas meter:
' . - ', . -
'
I
Y, + Y2 + Y, Yi = (Eq.2-1),Y - D- (Eq.2-2)
( V p f - V p i ) [ ( t s i + t s f ) / 2 + 4a°F][P,, + (D,/13.6)1
('at - '6i) [ ( t p i + t p f ) / 2 + 460°F1CP, ' (D,/13*6)3 3
For calibration of the rotameter and mass flowmeter:
Yl + Y2 + Y, (Eq 2-4 1 Y, = (&I* 2-31.Y = - - - wpf - V p i ) [ ( t , , + t6,m + 4 6 0 0 ~ 1 ~ ~ ~ + ( ~ ~ 1 3 . 6 ~
C(V,f + v6i)/2IeC(tpi + t , f ) / 2 + '+60°FlCPm + (Ds/13*6)1 3
Quality Assurance Handbook M18-2.1A

FLOWMETER CALIBRATION DATA FORM (metric uni t s )
Time min (01,
min
Date Calibrated by Meter system no. Primary meter no. Barometric pressure, P, = mm Hg Ambient temperature O C
Type of primary meter: w e t test , dry gas , or bubble meter Type of flowmeter calibrated: rotameter , dry gas meter , or mass flowmeter
Calibration factors
( Y J 2 (Y)
I Primary meter readings
I n i t i a l temp, OF ( t P i )
OC
Flowmeter readings
Final Pres I n i t i a l temp, O F drop reading (tPJ (DJ ( V p ) . b
mm m or O C %O m./min
reading ( V P i 1
m3
reading
m3
(VPf 1 ,a
I I ~
I
Final ( I n i t i a l ( F i n a l
U a Volume passing through the meter using the i n i t i a l and f i n a l readings and requires a minimum of a t
least f i v e revolutions of the meter. Volume passing through the meter using the i n i t i a l and f i n a l readings or the indicated flow rate using the i n i t i a l and final flow rate setting. Pressure drop through the meter used to calculate the meter pressure. The time it takes to complete the cal ibrat ion run. With Y defined as the average r a t i o of volumes for the primary meter compared t o the flowmeter cal ibrated, Yi = Y 2 O.O3Y f o r the cal ibrat ion and Yi = Y 2 O.O5Y for the pos t tes t checks; thus,
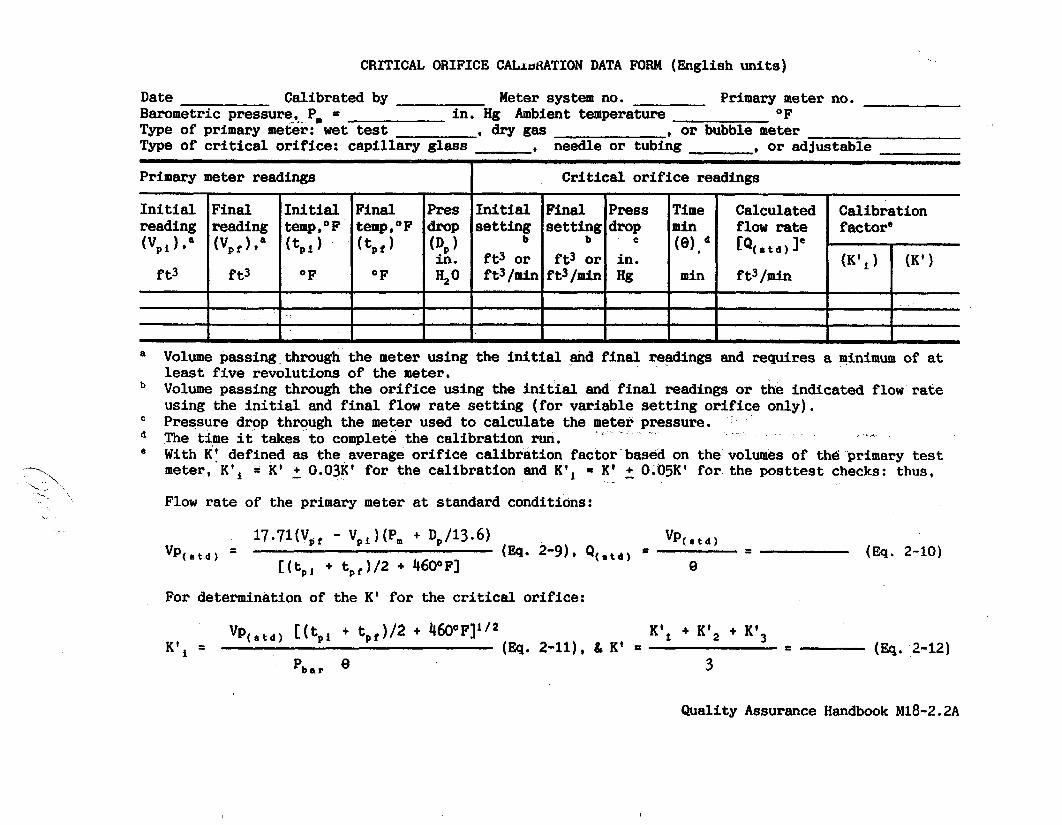
CRITICAL ORIFICE CALiaMTION DATA FORM (English uni ts)
Primary meter readings
I n i t i a l Final I n i t i a l Final Pres reading reading temptoF temp,OF drop
in. f t3 f t 3 O F OF %O
c V p , L a ( V P f L * (t,J bPJ (D,)
.. .
Critical o r i f i ce readings
Initial Final Press Time Calculated Calibration setting setting drop min f low rate factorC
8 CQ,,,,)l' -
f t 3 or f t 3 or in. (K 'J (K') b
ft3/min ft3/min Hg min ft3/min
I
Date Calibrated by Meter system no. Primary meter no.
Type of primary meter: wet test * dry Type of critical orifice: capil lary glass * needle or tubing , or adjustable
Barometric pressure, P, = in. Hg Ambient temperature O F
or bubble meter
For determination of the K' f o r the critical orifice:
VP( d t d ) [(tpi + tp,) /2 + 46O0Fl1/* K', + K', + K t 3 (Eq. 2-12) K', = (Eq. 2-11), & K' = t
'bar 8 3
Quality Assurance Handbook M18-2.2A

CRITICAL ORIFICE CALIBRATION DATA FORM (metric uni t s )
Date Calibrated by Meter system no. Primary meter no.
Type of primary meter: wet test , dry gas , or bubble meter Type of cr i t ical orifice: capi l la ry glass
Barometric pressure, P, = mm Hg Ambient temperature O C
, needle or tubing , or adjustable
Primary meter readings
I n i t i a l Final I n i t i a l reading reading temp , OF i WP, 1 t a ( V P f 1 c a b p i 1
L I L p c
Final Pres temp,OF drop (tPJ (D,)
O C *2O
mm
Critical o r i f i c e readings
I n i t i a l Final Press Time Calculated Calibration se t t ing s e t t i n g drop min flow ra t e factore
C CQ(std)le b b
L or L or mm (K'J (K') L/min L/min Hg min L/min
a Volume passirig through the meter using the i n i t i a l and f i n a l readings and requires a minimum of a t least f i v e revolutions of the meter. Volume passing through the orifice using the i n i t i a l and f i n a l readings or the indicated flow rate using the i n i t i a l and f i n a l flow rate se t t i ng (for var iable s e t t i n g o r i f i c e only). Pressure drop through the meter used to calculate the meter pressure. The time it takes to complete the ca l ibra t ion run. With K' defined as the average orifice cal ibrat ion factor based on t he volumes of the primary test meter, K', = K' + 0.03K1 for the ca l ibra t ion and K', = K' + O.O5K' for the post tes t checks; thus ,
Flow rate of the primary meter a t standard conditions:
----. \
... '., 2 >.
\
- -
"P( , t , ) C(tp, + t,,)/2 + 273OCI1'2 K' , + K t 2 + K', (Eq. 2-16) -. (Eq. 2-15), & K' = - - - K', =
Pb, r 0 3
Quality Assurance Handbook W18-2.2B
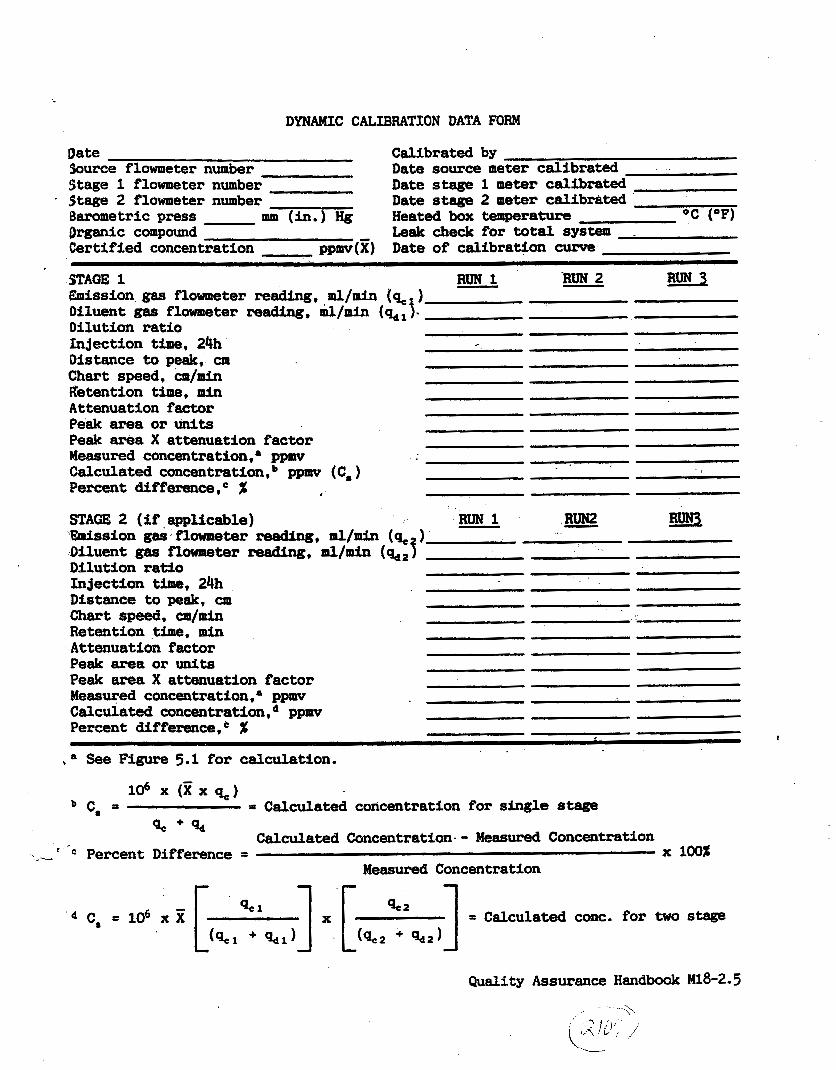
DYNAMIC CALIBRATION DATA FORM
Date Calibrated by Source flowmeter number Stage 1 flowmeter number Stage 2 flowmeter number
Organic compound Certified concentration ppmv(E) Date of calibration curve
!Z!AQE 1 Emission gas flowmeter reading, ml/min (s ) Diluent gas flowmeter reading, ml/min (sit. Dilution ratio
Date source meter calibrated Date stage 1 meter calibrated Date stage 2 meter calibrated
Leak check for total system Barometric press nm (in.) H g Heated box - r a m oc (OF)
- RUN 1 RUN - 2 B!2
Injection time, 24h Distance to peak, cm Chart speed, cm/min Retention time, min Attenuation factor Peak area or units Peak area X attenuation factor Measured concentration,. ppmv Calculated concentration , Percent difference,= $
ppmv (C, )
RUN2 STAGE 2 (if applicable) - RUN1 - ‘emission gas flowmeter reading, m l / m i n (% ) Diluent gas flowmeter reading, ml/min (sap! Dilution ratio Injection time, 24h Distance to peak, cp1 Chart speed, m/min Retention time, min Attenuation factor Peak area or units Peak area X attenuation factor Measured concentration, a ppmv Calculated concentration, ppmv Percent difference,e %
1
See Figure 5.1 for calculation.
r ” c --
‘ d
106 x ( Z X %) c, = = Calculated concentration for single stw
Calculated Concentration-- Measured Concentration
Measured Concentration
% + %
Percent Difference = x 100%
Quality Assurance Handbook
stage
~18-2.5
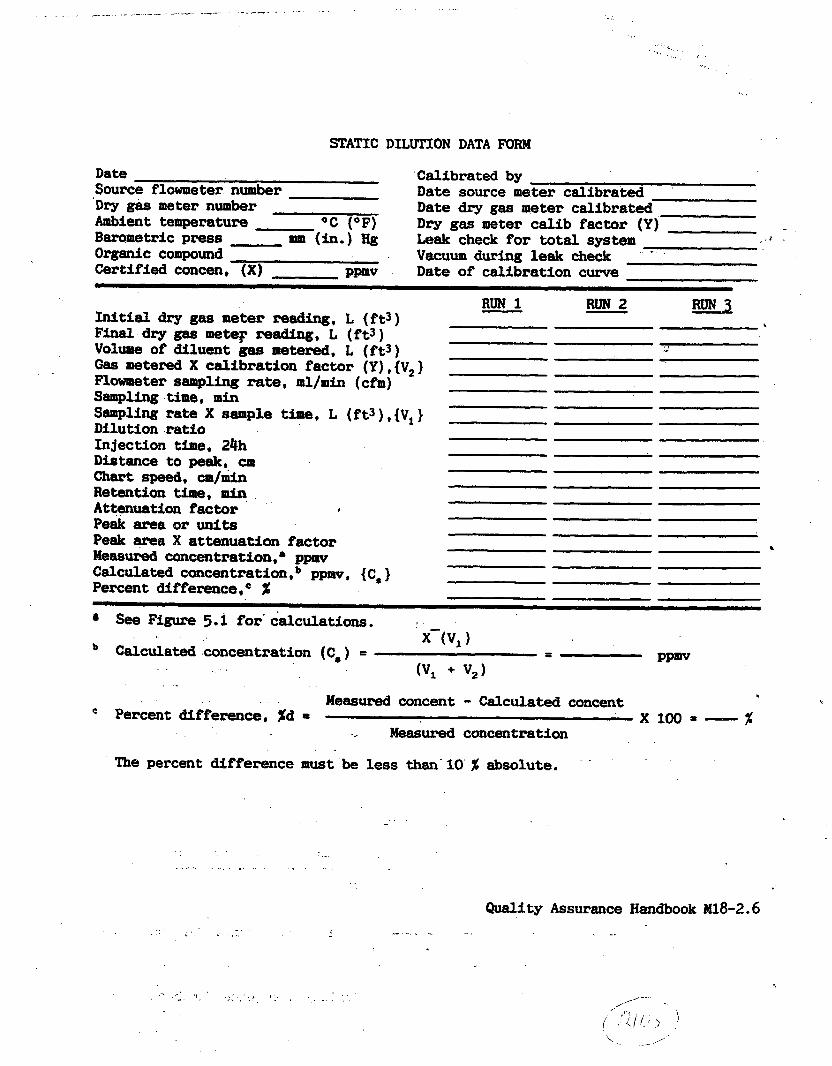
. . . ....... .._-. ---.-- . _-._, . . . . . . . . . .
STATIC DILUTION DATA FORM
Date Calibrated by Source flowmeter number Dry gas meter number
Barometric press am (in.) Hg Leak check for total system Organic compound Certified concen, (X) PPmv Date of calibration curve
Date source meter calibrated Date dry gas meter calibrated
Vacuum during leak check
Ambient temperature O C (OF) Dry gas meter ca l ib factor (Y) -- I
Initial dry gaa meter reading, L ( f t 3 ) Final dry gas mete^ readirq, L ( f t 3 ) Volume of diluent gas nmtered, L ( f t 3 ) Gas metered X calibration factor (Y)*{V2} Flowmeter sampling rate, m l / m i n (cfm) Sampling time, m i n Sampling rate X sample time, L ( f t 3 ) * {V, } Dilution ra t io Injection time, 24h Distance to peak, cm Chart speed, cm/min Retention time, ruin Attenuation factor Peak area or units Peak area X attenuation factor Measured concentration,. ppmv Calculated concentration,b ppmv, {c, } Percent difference,C X
L
see Figure 5.i for' calculations. x 3 , 1
Calculated concentration (C,) =
Percent difference, %d
The percent difference
. . . . . . . . . . . . . . . . . . .
I . . . . . . .
Measured concent - Calculated concent ic t X 1 0 0 = -
, Measured concentration
must be less than-10 X absolute.
. -. . . . .
Quality Assurance Handbook ~18-2.6 > - - . - . -.
P
. . .- :: ', .~ _ . . * !.. - . . . . . . . . . . . . . . . .
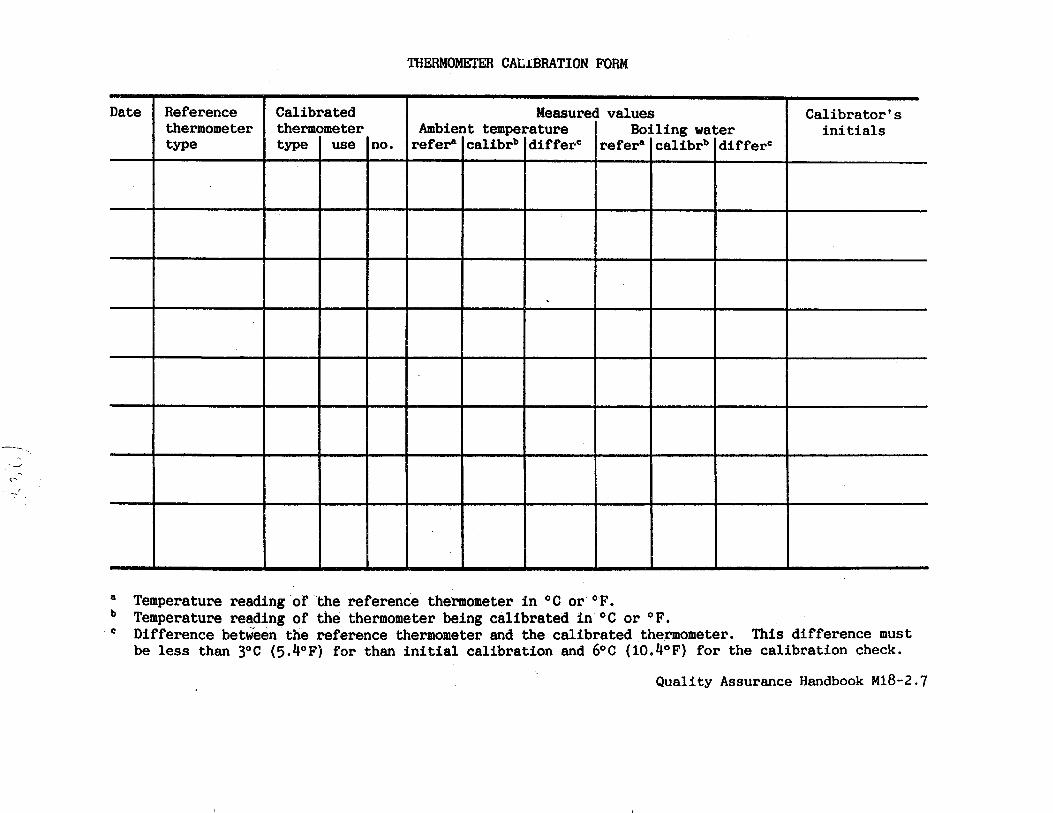
THERMOMETER CALlBFiATION FORM
values Calibrator's
Temperature reading of the reference the'rmometer i n O @ or OF. Temperature reading of the thermometer being calibrated i n O C or OF.
' Difference between the reference thermometer and the calibrated thermometer. This difference must be less than 3 O C (5 .4OF) for than initial calibration and 6 0 ~ (10.4OF) for the calibration check.
Quality Assurance Handbook M18-2.7
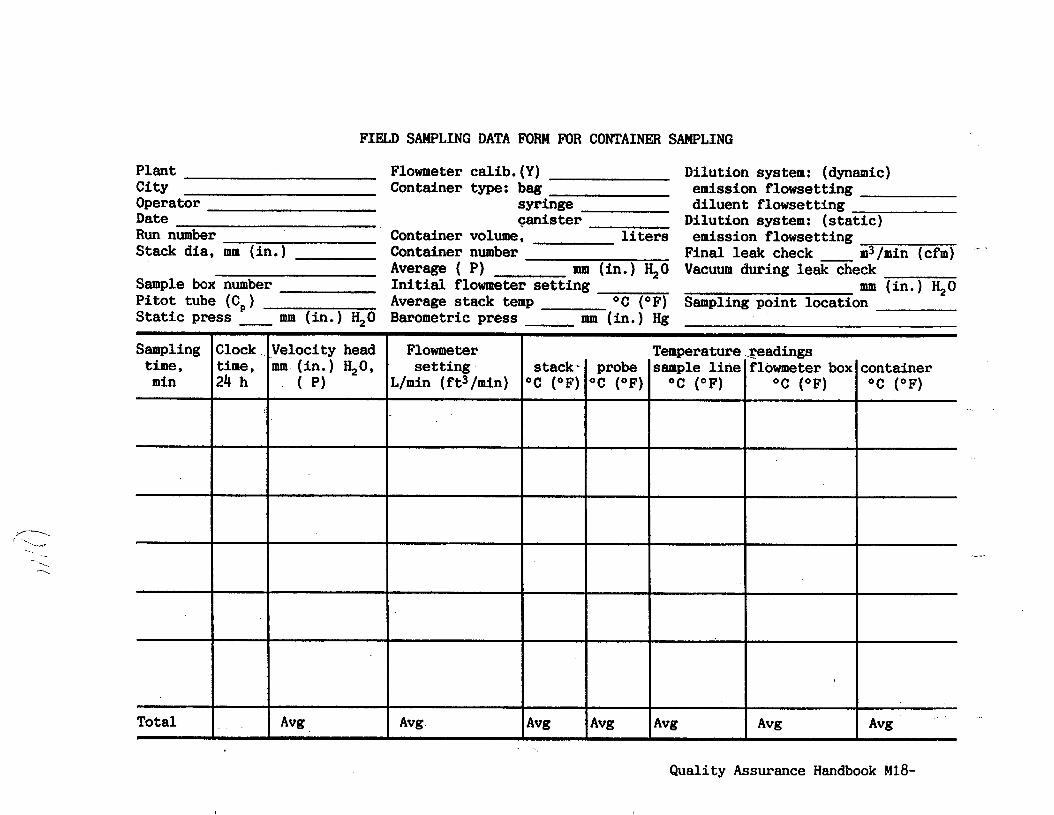
FIELD SAMPLING DATA FORM FOR CONTAINER SAMPLING
Plant Flowmeter calib. (Y) Dilution system: (dynamic) c i t y Container type: bag emission flowsetting Operator syringe d i luent flowsetting Date canis te r Dilution system: (static) Run number Container volume, liters emission flowsetting Stack dia , mm ( in . ) Container number Final leak check - m3/min (cfm)
Average ( P) mm ( in . ) 4 0 Vacuum during leak check Sample box number I n i t i a l flowmeter s e t t i n g mm ( in . ) H20 P i t o t tube (C,) Average stack temp O C (OF) Sampling point location S t a t i c press - mm (in.) H,O Barometric press mm ( in . ) Hg
Clock Velocity head I Temperature readings sample l i n e flowmeter box container
O C (OF) O C (OF) O C (OF)
I
Quali ty Assurance Handbook M18-
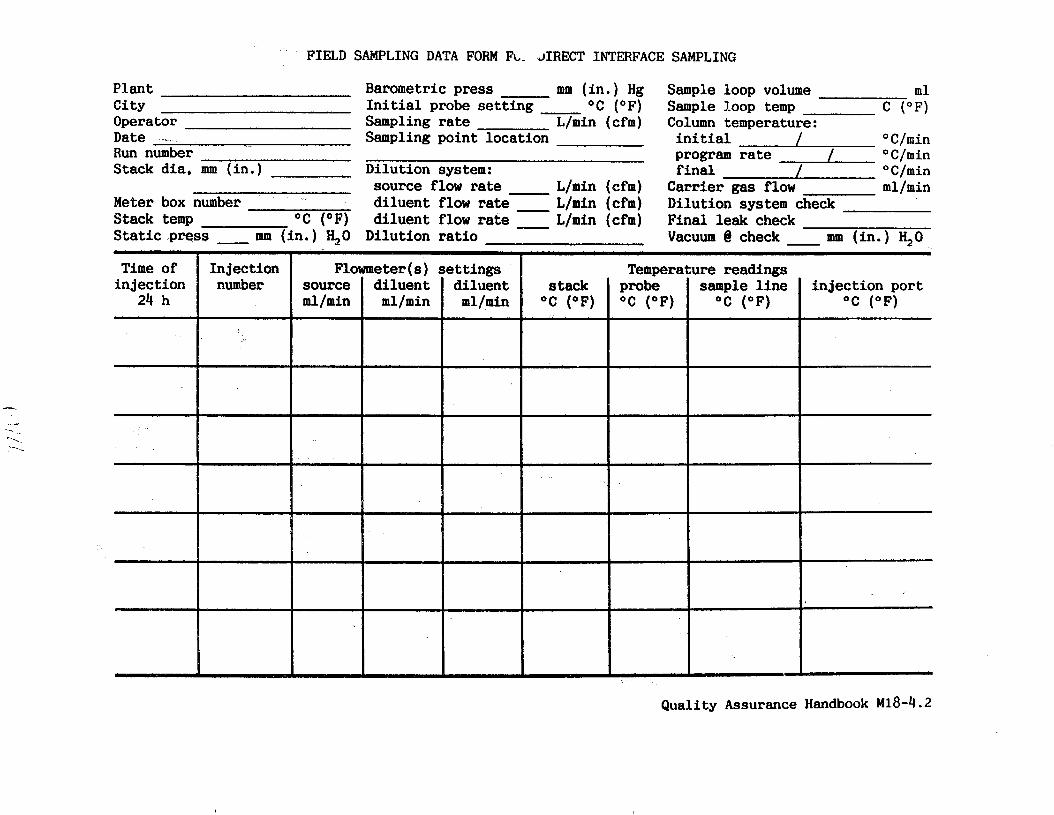
FIELD SAMPLING DATA FORM FL- ARECT INTERFACE SAMPLING
1.
Plant c i t y Operator Date Run number Stack dia , mm (in.)
Meter box number Stack temp O C (OF) S t a t i c press mm ( in . ) 4 0
Time of inject ion
24 h
Barometric press mm ( i n . ) Hg Sample loop volume Ull I n i t i a l probe s e t t i n g O C (OF) Sample loop temp c (OF) Sampling rate L/min (cfm) Column temperature: Sampling point location
Dilution system: source flow rate L/min (cfm) d i luent flow rate L/min (cfm) d i luent flow rate L/min (cfm)
Dilution ratio
i n i t i a l / OC/min program rate / OC/min f i n a l / OC/min
Carrier gas flow ml/min Dilution system check Final leak check Vacuum Q check mm ( in . ) %O
e t t i ngs di luent
Temperature readings
O C (OF) O C (OF) O C (OF)
Q u a l i t y Assurance Handbook M18-4.2
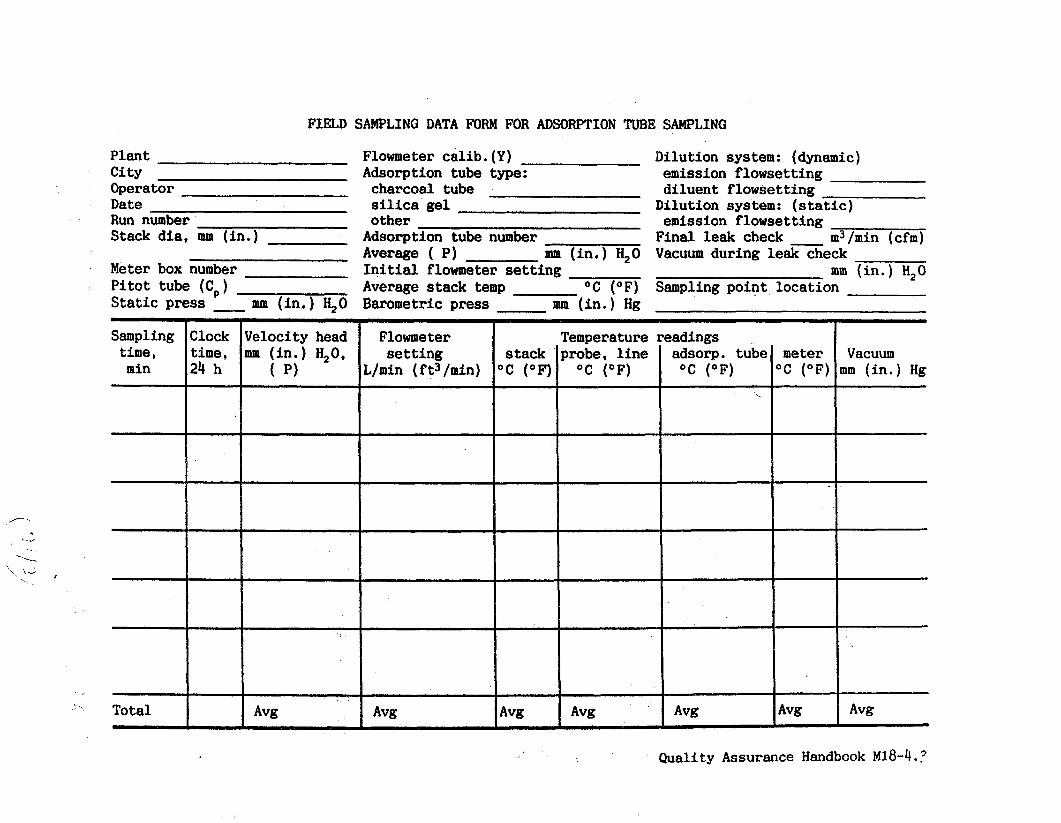
FIELD SAMPLING DATA FORM FOR ADSORPTION TUBE SAMPLING
,/- .
Plant City Opera tor Date ---- Run number Stack dia, mm (in.)
Meter box number Pitot tube (Cp ) Static press - mm (in.) & O
Sampling Clock Velocity head time, time, mm (in.) H,O, min 24 h ( P)
Flowmeter calib.(Y) Adsorption tube type: charcoal tube silica gel other Adsorption tube number Average ( P) mm (in.) H,O Initial flowmeter setting Average stack temp O C (OF)
Barometric press mm (in.) Hg
Dilution system: (dynamic)
Dilution system: (static)
emission flowsetting diluent flowsetting
emission flowsetting Final leak check m3/min (cfm) Vacuum during leak check
Sampling point location mm (in.) H,O
Flowmeter setting
L/min ( f t3 /min)
Quality Assurance Handbook M18-4.3
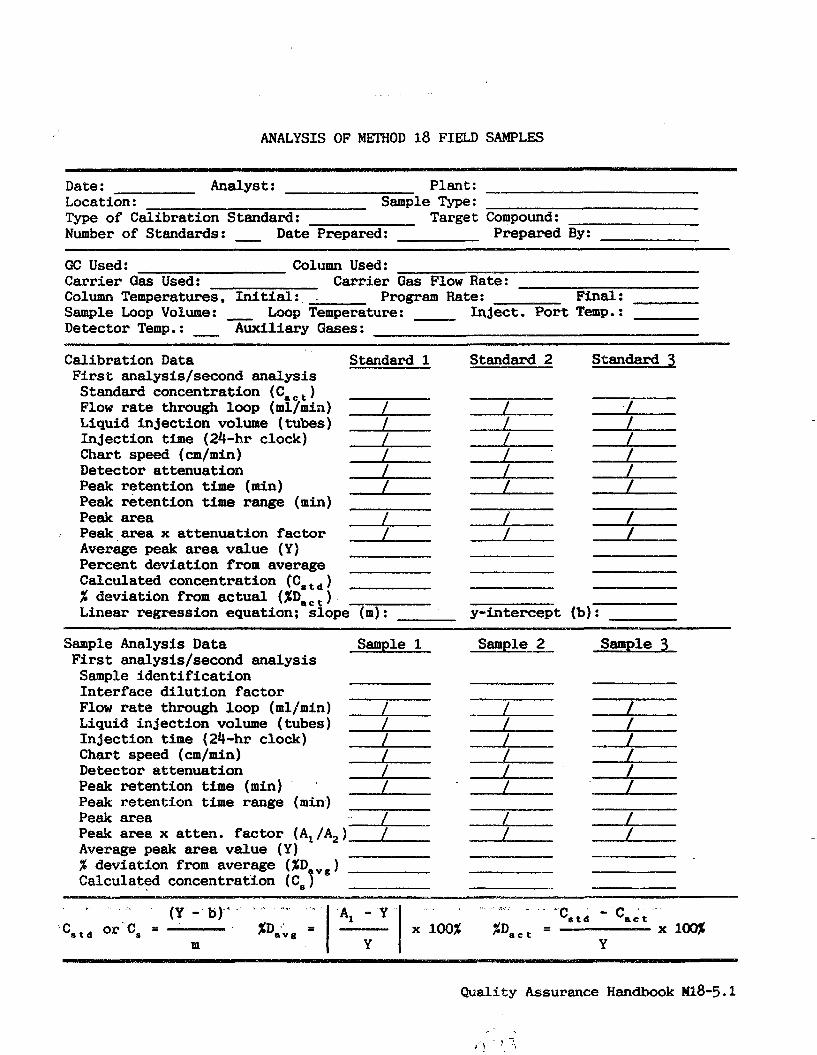
ANALYSIS OF METHOD 18 FIELD SAMPLES
.* (Y - b)* '
\ C s t d or C, = XD& = ILI
Date: Analyst : Plant: Location: Sample Type: Type of Calibration Standard: Number of Standards: - Date Prepared: Prepared By:
Target Compound :
. - , . - I
-'atd - 'act A, - Y x 1m - x 100% %Daet -
Y Y
Gc used: Column used: Carrier Gas Used: Carrier G a s Flow Rate: Column Temperatures, I n i t i a l : , Program Rate: Final: Sample Loop Volume: - Loop Temperature: Inject. Port Temp. : Detector Temp.: - Auxiliary G a s e s :
~ ~~ ~~ ~ ~ ~~~ ~
Calibration Data Standard 1 F i r s t analysis/second analysis Standard Concentration ( C a c t ) Flow rate through loop (ml/min) / Liquid injection volume (tubes) / Injection t i m e (24-hr clock) L Chart speed ( c m / m i n ) A Detector attenuation L Peak retention t i m e ( d n ) L Peak area J Peak retention t i m e range (min)
Peak area x attenuation factor Average peak area value (Y) Percent deviation f r o m average Calculated concentration (C, ) % deviation f r o m ac tua l (XD,,,) Linear regression equation: slope (m):
/
Standard 2
y-intercept
Standard 3
Sample h a l y s i s Data Sample 1 Sample 2 Sample 3 F i r s t analysis/second analysis Sample ident i f ica t ion Interface d i lu t ion fac tor Flow rate through loop (mlpmin) / / / Liquid inject ion volume (tubes) / / / Injection t i m e (24-hr clock) LL __LI_ Chart speed (cm/min) / L A Detector attenuation L L A Peak retention t i m e (min) A - L L Peak area L LL Peak area x atten. fac tor (A,/A,) / __1______L__
Peak retention t i m e range (min)
Average peak area value (Y) % deviation from average (%D v g )
Calculated concentration (C, 1
Quality Assurance Handbook Ml8-5.1

PREPARATION OF' STANDARDS BY DILUTION OF GAS CYLINDER STANDARDS
Cylinder Component: Source : Component Concentration ( X j : ppm, Certif ication Date :
Stage 1 Mixture 1 Standard gas flowmeter reading Diluent gas flowmeter reading Laboratory temperature (OK)
Barometric pressure (P,) (mm Hg) Flow rate of cylinder gas (q l ) at
standard conditions (ml/minf Flow rate of di luent gas (% ) at
standard conditions (ml/min) Calculated concentration (C, )
x q c 1
q c 1 + qdl c, =
Mixture 3 Mixture 2
Stage 2 ( i f used) Mixture 1 Standard gas flowmeter reading
Diluent gas flowmeter reading from stage 1
in to stage 2 Average d i f f e ren t i a l pressure (P, )
between stage 1 and 2 (mm S O ) - -
conditions t o stage 2 ' (ml/min) Flow rate of di luted gas
( q c 2 c o r r ) at corrected standard conditions t o
Flow rate of d i lu ted gas ) at standard ( q 2 a c t u a l
stage 2 (ml/min) Flow rate of di luent gas (qA9) at --
standard conditions t o stage 2 (ml/min)
Calculated concentration (C, )
Mixture 2 Mixture 3
'd + 'b q c 2 c u r r = qC2 a c t u a l
'b
qc 1 q c 2 c o r r
( q c 1 + ~ 1 ) ( q c 2 c o r r + % 2 )
c , = x x X
Quali ty Assurance Handbook MI8
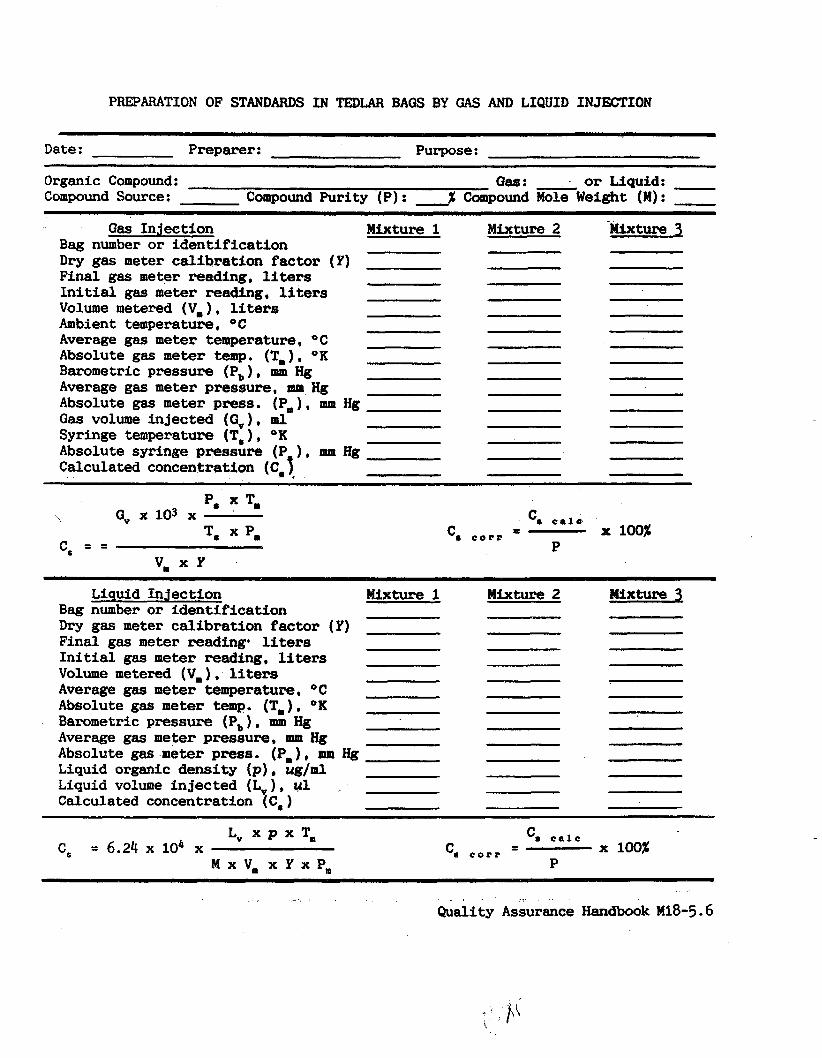
PREPARATION OF STANDARDS I N TEDLAR BAGS BY GAS AND LIQUID INJETION
~ ~ - ~~~
Date : Preparer : Purpose :
Organic Compound: Gas: or Liquid: Compound Source: Compound Purity (P): % Compound Mole Weight (M) :
Gas Injection Bag number or ident i f ica t ion Dry gas meter cal ibrat ion factor (Y) Final gas meter reading, liters I n i t i a l gas meter reading, liters Volume metered (V,), liters Ambient temperature, O C
Average gas meter temperature, OC Absolute gas meter temp. (T,), OK Barometric pressure (P, ) * mm Hg Average gas meter pressure, mm Hg Absolute gas meter press. (P,) * mm Hg G a s volume injected ((3"). m l Syringe temperature (T, ) , OK Absolute syringe pressure (P ), mm Hg Calculated concentration ( c ~ f
Mixture 1 Mixture 2 - _ Mixture 2
P8 *. G, x 103 x calc
C, corr 0 x 100% P
Liquid Injection Bag number or ident i f ica t ion Dry gas meter cal ibrat ion fac tor Final gas meter reading liters I n i t i a l gas meter reading, liters Volume metered (V,)* liters
~~
Mixture 1 Mixture 2
Average gas meter temperature, O C
Absolute gas meter temp. {T,), OK
Barometric pressure (P,) , mm Hg Average gas meter pressure* mm Hg Absolute gas meter press. (P,) , mm Hg Liquid organic density ( p ) , ug/ml Liquid volume injected (LV)* ul Calculated concentration (C,)
L" x P x T, c, = 6.24 104
M x V , x Y x P , ~~ ~-
* - , Quaiity Assurance Handbook M18-5.6
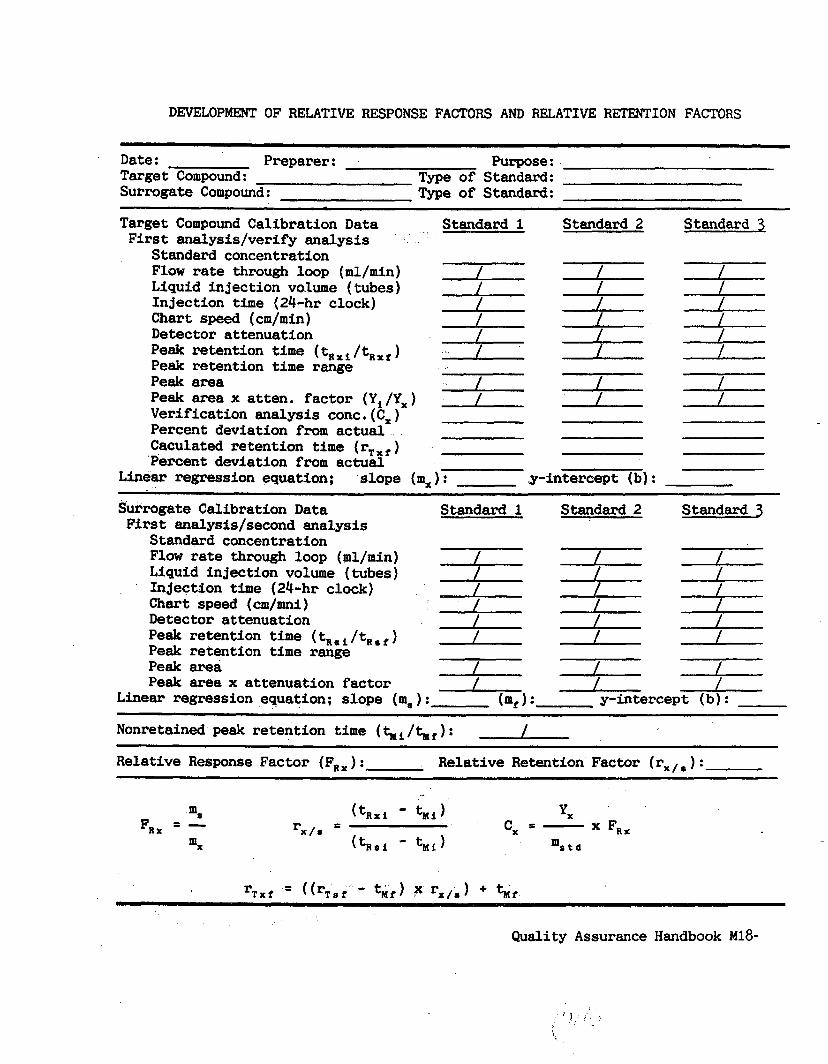
DEVELOPMENT OF RELATIVE RESPONSE FACTORS AND RELATIVE RETENTION FACTORS
Date: Preparer : Purpose : Target Compound: Type of Standard: Surrogate Compound: Type of Standard:
Target Compound Calibration Data F i r s t analysis/verify analysis
Standard 1
Standard concentration Flow rate through loop (ml/min) L Liquid injection vollume (tubes) L Injection time (24-hr clock) L Chart speed (cm/min) L Detector attenuation L Peak retention time (tRXi/tRxf) L Peak retention t i m e range - - Peak area L Peak area x atten. factor ( Y , / Y , ) Verification analysis conc . (Cx ) Percent deviation from actual Caculated retention time (rTxf ) Percent deviation from actual
/
L i n e a r regression equation; slope (s): Y'
Standard 2 Standard 3
. intercept (b) :
Surrogate Calibration Data
Standard concentration Flow rate through loop (ml/min) Liquid injection volume (tubes) Injection time (24-hr clock) Chart speed (cm/mni) Detector attenuation Peak retention t i m e (tRoi/tRsi) Peak retention t i m e range Peak area Peak area x attenuation factor
Linear regression equation: slope (a8
F i r s t analysfs/second analysis Standard 1 Standard 2 Standard 3
y-intercept (b) : ~ ~ ~~
~ ~~
Nonretained peak retention time (4i/hf): / Relative Response Factor (FRx): Relative Retention Factor (rxIs):
m8 - F R X - -
mx
*X
F R ~ c, = - m r t d
Quality Assurance Handbook M18-
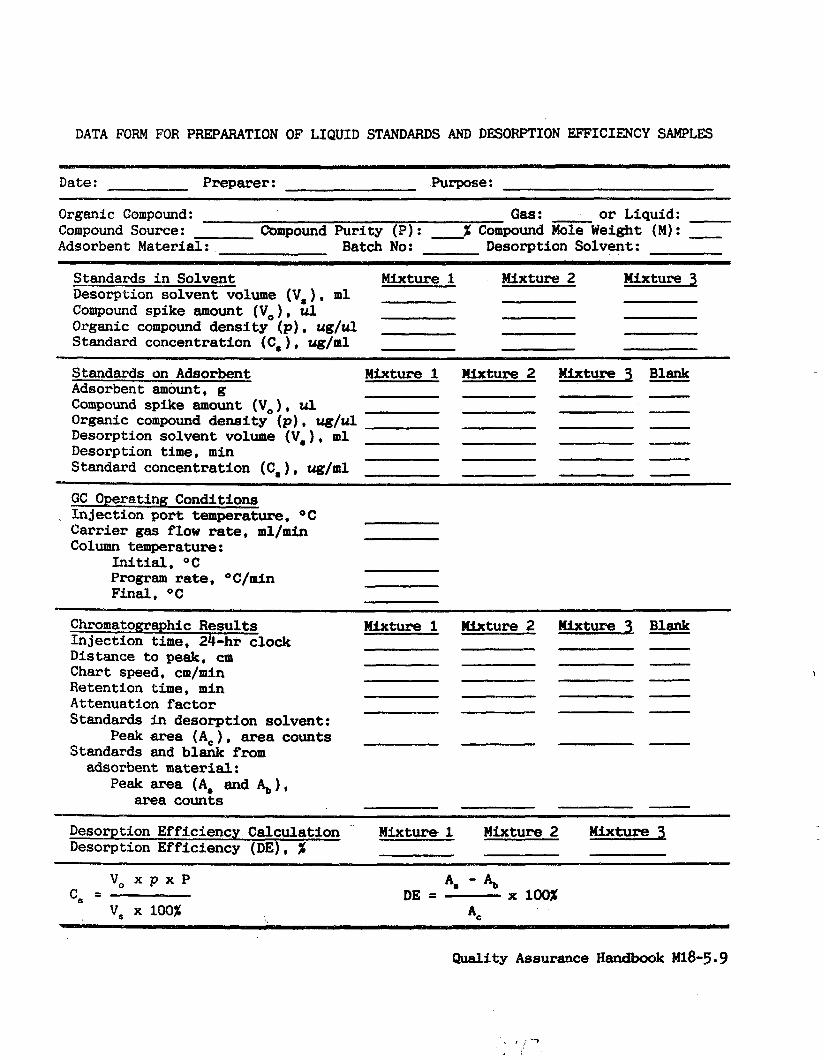
DATA FORM FOR PREPARATION OF LIQUID STANDARDS AND DESORPTION EFFICIENCY SAMPLES
~ ~- Date : Preparer : Purpose :
Compound Source: ~
Adsorbent B
GRS: or Liquid: Compound Purity ( a ) : --% Compound Mole Weight ( M ) : -
la ter ia l : Batch No: Desorption Solvent:
Standards i n Solvent Mixture 1 Desorption solvent volume ( V a ) , m l Compound spike amount (V, ) , ul Organic compound density (p), ug/ul Standard concentration (Ca ) , u g / m l
Mixture 2 Mixture 5
~
Standards on Adsorbent Mixture 1 Mixture2 Euxture 3 Blank Adsorbent amount, g Compound spike amount (V, ) , ul Organic compound density (p), ug/ul
Desorption t i m e , min
- Dessrption solvent volume ( V a l , ml
Standard concentration (Ca) , u g / m l - - -
GC OperatinR Conditions Injection port temperature. OC Carrier gas flow rate, ml/min Column temperature:
In i t ia l , o c Program rate, OC/min Final, O C
Chromatographic Results Injection time, 24-hr clock Distance t o peak, cm Chart speed, cm/min Retention t i m e , min Attenuation fac tor Standards i n desorption solvent:
Peak area (A, ) , area counts Standards and blank f r o m
adsorbent material: Peak area (A,, and 41,
area counts
Mixture 1 HiXture2 HixtuPe 3 Blank - I
Desorption Efficiency Calculation Mixture], Mixture2 Mixture 3 Desorption Efficiency (DE), X;
v, x p x P
v, x 100% c, = x 100%
4 - Ab DE =
Quality Assurance Handbook M18-5.9

CALCULATION FORM FOR GC ANALYSIS BY GAS INJECTION
SAMPLE CONCENTRATION
. .
If applicable.
Equation 6-1
Quality 'Assurance Handbook M18-6.1
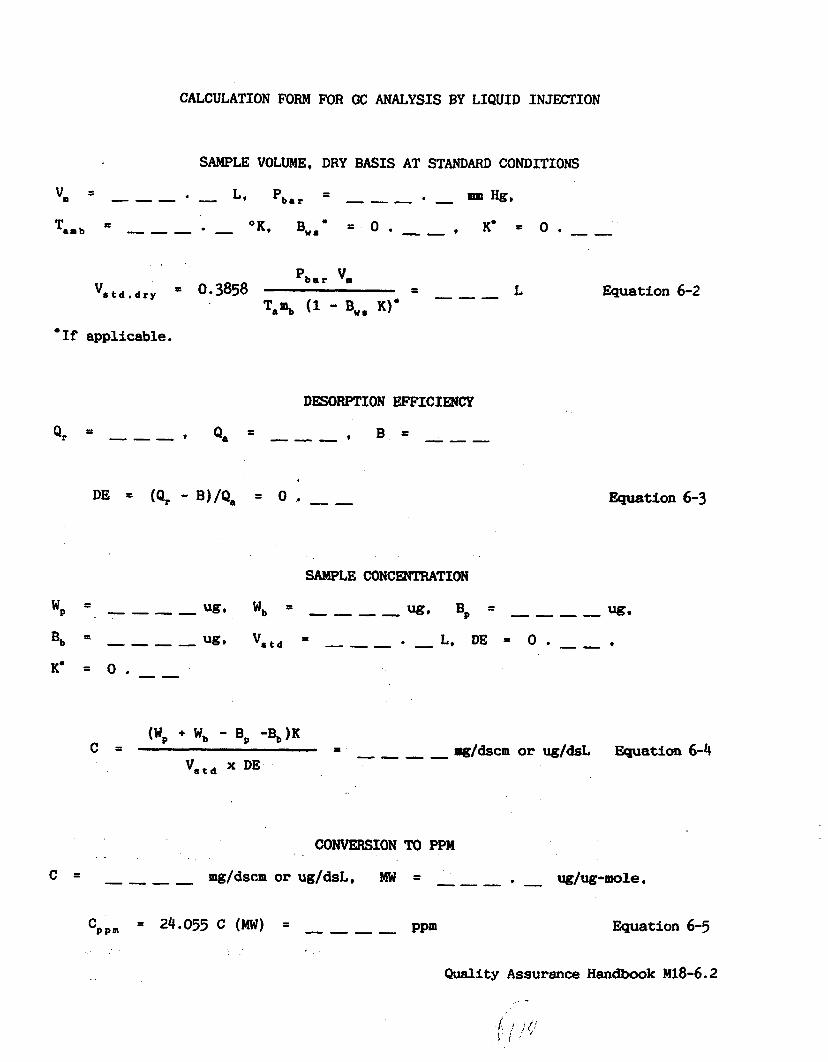
CALCULATION FORM FOR GC ANALYSIS BY LIQUID INJECL'ION
' s t d . d r y 'bar 'm
= 0.3858
If applicable.
Equation 6-2
Equation 6-3
SAMPLE CONCENTRATION
CONVERSION TO PPM . .
ug/ug-mole, ---- mg/dscm or u g / d s L , MW = --- - c =
'p p m = 24.055 C (MW) = PPm Equation 6-5 ----
Quality A s s u r a n c e Handbook M18-6.2

FIELD AUDIT REPORT
Par t A. - To be f i l l e d out by organization supplying aud i t cylinders. 1. Organization supplying audi t sample(s) and shipping address
2. Audit supervisor, organization, and phone number
3. Shipping instructions: Name, Address, Attention
4. Guaranteed arrival date for cylinders - 5. Planned shipping date for cylinders - 6. Details on audit cylinders from l a s t analysis
..
a. Date of last analysis.. .... b. Cylinder number............ c. Cylinder pressure, psi.. ... d. Audit gas(es)/balance gas.. 8. Audit gas(es), ppm......... f. Cylinder construction......
Low conc.
.......... .......... .......... .......... .......... ..........
High conc.
.......... .......... .......... .......... .......... .......... Part B. - To be f i l l ed out by audit supervisor.
1. Process sampled. 2. Audit location 3. Name of individual audit 4. Audit da te 5. Audit Results:
a. Cylinder number............................. b. Cylinder pressure before audit, ps i ......... c. Cylinder pressure after audit, psi. ......... d. Measured concentration, ppm
Injection #1* Injection #2* Average... ...... 8. Actual audi t concentration, ppm f. Audit accuracy:l
Percentf accuracy = Measured Conc. - Actual Conc.
Actual Conc. g. Problems detected ( i f any)..................
Low Conc. Cylinder .......................... High Conc. Cylinder.. .......................
Low conc .
cylinder
........ ........ ........
........
........ ........
........
High conc . cylinder
.......... .......... ..........
..........
.......... ..........
.......... lResults of two consecutive injections that meet the sample analysis criteria of the test method.
Quality Assurance Handbook M18-8.
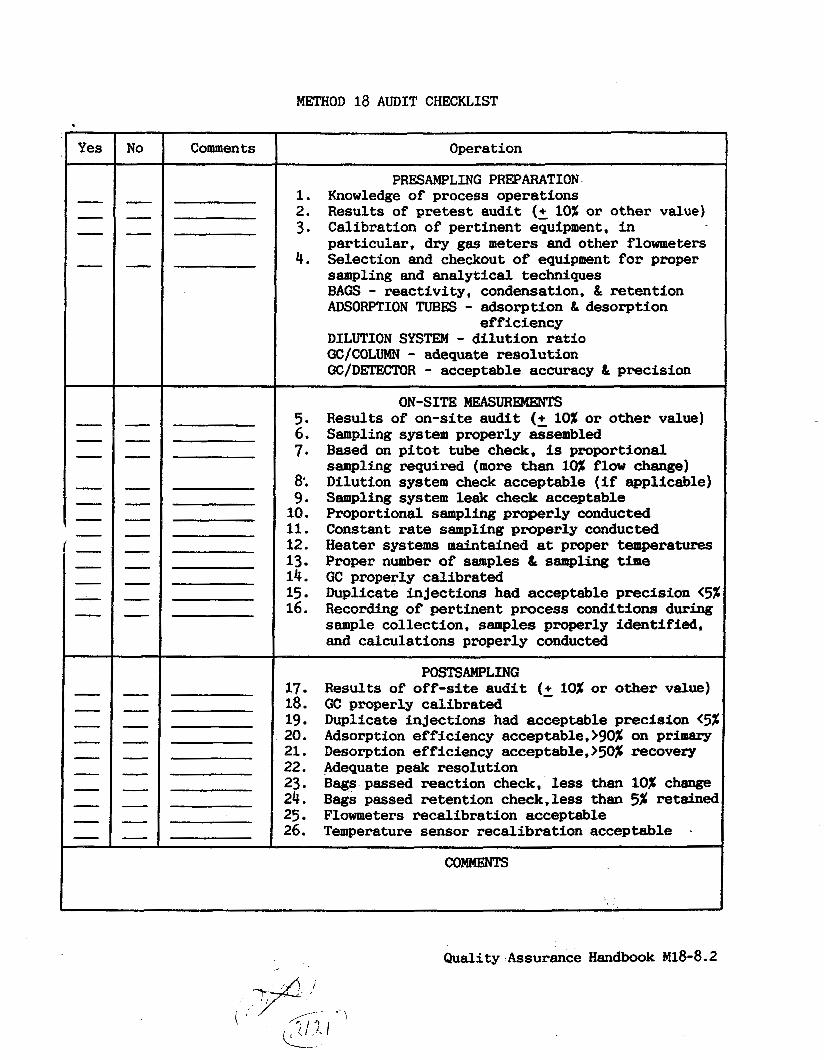
METHOD 18 AUDIT CHECKLIST
Comments Operation
PRESAMPLING PREPARATION 1. Knowledge of process operations 2. Results of pretest audit (+ 10% or other value) 3. Calibration of pertinent equipment, in
particular, dry gas meters and other flowmeters 4. Selection and checkout of equipment f o r proper
sampling and analytical techniques BAGS - react ivi ty , condensation, & retention ADSORPTION TUBES - adsorption & desorption
DILUTION SYSTEM - di lu t ion r a t io GC/COLUMN - adequate resolution GC/DETECTOR - acceptable accuracy & precision
eff ic iency
5. 6. 7.
9. 10. 11. 12. 13 14. 15 16.
a:
- 17
19 20. 21. 22. 23 24. 25 26.
la.
ON-SITE MEASUREMENTS Results of on-site audi t (+ 10% or other value) Sampling sys t e m properly &embled Based on p i t o t tube check, is proportional sampling required (more than 10% flow change) Dilution system check acceptable ( i f applicable) Sampling system leak check acceptable Proportional sampling properly conducted Constant rate sampling properly conducted Heater systems maintained at proper temperatures Proper number of samples & sampling time GC properly calibrated Duplicate injections had acceptable precision (51 Recording of pertinent process conditions during sample collection, samples properly ident i f ied, and calculations properly conducted
POSTSAMPLING Results of of f - s i te audi t (2 10% or other value) GC properly calibrated Duplicate injections had acceptable precision (51 Adsorption efficiency acceptable,>gQ% on primary Desorption efficiency acceptable, >50% recovery Adequate peak resolution Bags passed reaction check, less than 10% change Bags passed retention check,less than 5% retain& Flowmeters recalibration acceptable Temperature sensor recalibration acceptable .
Qual i ty Assurance Handbook M18-8.2