3D scanning systems for metric documentation and diagnostic study of Cultural Heritage. From the...
13
Gabriele Bitelli editor A Associazione U Universitari di T Topografia e e C Cartografia STUDI PRESENTATI ALLA NONA EDIZIONE DEL PREMIO AUTeC STUDIES PRESENTED TO THE NINTH EDITION OF THE AUTeC AWARD R R I I C C E E R R C C H H E E D D I I G G E E O O M M A A T T I I C C A A 2 2 0 0 1 1 3 3
Transcript of 3D scanning systems for metric documentation and diagnostic study of Cultural Heritage. From the...

Gabriele Bitelli editor
AAssociazione UUniversitari di TTopografia ee CCartografia
SSTTUUDDII PPRREESSEENNTTAATTII AALLLLAA NNOONNAA EEDDIIZZIIOONNEE DDEELL PPRREEMMIIOO AAUUTTeeCC SSTTUUDDIIEESS PPRREESSEENNTTEEDD TTOO TTHHEE NNIINNTTHH EEDDIITTIIOONN OOFF TTHHEE AAUUTTeeCC AAWWAARRDD
RRIICCEERRCCHHEE DDII GGEEOOMMAATTIICCAA 22001133

AAssociazione UUniversitari di TTopografia ee CCartografia
Indice / Index
Capaldo
Paola
HIGH RESOLUTION RADARGRAMMETRY WITH COSMO-SKYMED, TERRASAR-X AND RADARSAT-2 IMAGERY p. 7
Dabove Paolo
QUALITY CONTROL OF THE KINEMATIC POSITIONING INTO GNSS
NETWORKS
p. 17
De Gaetani Carlo Iapige
COVARIANCE MODELS FOR GEODETIC APPLICATIONS OF COLLOCATION p. 27
Guastaferro Francesca
CHANGE DETECTION TECHNIQUES AND GIS ANALYSIS APPLIED TO
SATELLITE IMAGES FOR MAPPING OF BURNED AREAS
p. 37
Nascetti Andrea
HIGH RESOLUTION RADARGRAMMETRY: DEVELOPMENT AND
IMPLEMENTATION OF AN INNOVATIVE IMAGE MATCHING STRATEGY
p. 47
Nobile Alessia
3D SCANNING SYSTEMS FOR METRIC DOCUMENTATION AND
DIAGNOSTIC STUDY OF CULTURAL HERITAGE.
p. 57
Saveriano Francesco
TECHNIQUES FOR MONITORING DEFORMATIONS OF THE TERRITORY p. 67
Steffenino Sara
URBAN LAND COVER MAPPING USING MEDIUM SPATIAL RESOLUTION
SATELLITE IMAGERIES: EFFECTIVENESS OF DECISION TREE CLASSIFIER
p. 75

3D SCANNING SYSTEMS FOR METRIC DOCUMENTATION
AND DIAGNOSTIC STUDY OF CULTURAL HERITAGE.
FROM THE SCALE OF THE BUILDING TO THE URBAN ONE: THE CASE STUDIES
OF THE BASILICA DELL’UMILTA’ IN PISTOIA AND THE SAN GIMIGNANO TOWERS
A. Nobile
Architect e PhD in Electronic Technologies for Cultural and Environmental Heritage
Laser scanner surveyor freelance, Florence, Italy - [email protected]
KEY WORDS: Cultural Heritage, Architecture, Laser scanning, Data acquisition, Data processing, Structural and Diagnostic Analysis
ABSTRACT:
Goal of the research has been to test laser scanning acquisition, management and threedimensional representation methods and techniques
to provide a valid documentation and diagnostics support aimed at the preservation of our cultural built heritage. The widespread use
of scanning techniques does not allow to consider concluded yet a research topic that today is mistakenly identifi ed especially with the
phase of data acquisition. Actually the problem is postponed to the later stages of processing and representation and there are many
issues partially solved through an attempt of cultural integration between restoration, geomatics and electronics: it is both a challenge
and an opportunity, which carries along an effort to overcome language barriers, due to different cultural backgrounds, methodological
approaches and educational paths.
The above-mentioned case-studies raised the awareness that, on the basis of the 3D data set, which can be updated and queried at any
time, it’s always possible to adjust the processing phase according to the fi xed goals shared by all the professionals and the skills involved.
It is therefore proposed a innovative use of the laser scanning surveying technique: attention is not specifi cally given to the artistic and
architectural elements and the aim is not only to represent an object in three-dimensions in order to make qualitative assessments on
its historical and cultural value.
The need for an “irrefutabile model”, which can be used to orient any restoration plan, globally frames the research.
1. INTRODUCTION
1.1 Scientifi c and operational background
The knowledge of a site is the fi rst step towards fi nding a suitable
preservation strategy, and the documentation is the fi rst step of
this process of knowledge (Eppich and Chabbi, 2007).
In recent years the use of computer technology in the fi eld of
Cultural Heritage and Fine Arts has gradually increased: we
are witnessing the creation of 3D digital models of objects of
different sizes and characteristics (monuments, archaeological
sites or artefacts, monumental architecture, etc.) for both the
documentation and the conservation and the displaying.
This gradual growth of interest stems from the availability of
new technologies for the digitization and from the appeal of tools
allowing innovative ways of exploration and documentation,
which arouse inquisitiveness in the non-experts.
The potential of recent instruments has generated new
operating procedures, accelerating and economizing graphics’
production and allowing the defi nition of new products and their
dissemination.
The conventional drawings, typically two-dimensional, are still
effective in the representation of artefacts characteristically free-
form (for example, the archaeological ruins) and when you should
refer to specifi c vertical or horizontal sections.
The limit is noticeable when the reproduction of reality is needed
with its defects, exceptions, permanencies, overlapping and
interferences; a reality moulded by the fl ow of time and from
those shapes ever designed but simply sculpted, which enriched
the built beyond the original scheme.
In this regard, Saint-Aubin in 1999 defi nes the survey as “a tool
that tries to get the representation of the actual shape of the
building with the defi ciencies, irregularities, changes, additions,
deletions, restorations superimposed over time; a teaching tool,
since it wants to allow the understanding of the functioning of
the work in the complexity of its history and analyze patterns to
which it relates and the innovations introduced; and fi nally a tool
to know the state of health, the structure and its failures and to
look for the therapy from an irrefutable document”.
1.2 Aim of the research
The research addresses and deepens the issues related to the use
of laser scanner for Cultural Heritage, particularly focusing on
the close relationship between the 3D metric documentation and
the investigations aimed to the critical interpretation of large
monumental buildings.
The study was approached on a multi-scale level:
- at the scale of the building, with the Basilica of Santa Maria
dell’Umiltà in Pistoia, under the agreement signed between the
research laboratory of Geomatics for Cultural Heritage of the
University of Florence and the Superintendence for the Historical,
Artistic and Ethno-anthropological Heritage for the provinces
of Florence, Pistoia and Prato, in view of the restoration and
consolidation of the relevant Renaissance structure;
- at the urban scale, with the San Gimignano towers, within the
project “Seismic Risk in Monumental Buildings (RISEM)” funded
by Tuscany Region and coordinated by the Department of Civil
and Environmental Engineering of the University of Florence, for
the identifi cation of seismic risk.
57

2. THE BASILICA OF SANTA MARIA
DELL’UMILTA’ IN PISTOIA
2.1 Historic framework
The Basilica of Santa Maria dell’Umiltà is the most important
example of monumental Renaissance architecture in Pistoia.
The design of the geometric system is by Giuliano da Sangallo,
cooperating with his brother Antonio, Francione and Pollaiuolo;
the construction management, however, was in charge of the
architect Ventura Vitoni from Pistoia who would be replaced, in the
mid-sixteenth century, by Giorgio Vasari as designer and project
manager of the majestic double-shelled dome.
The monumental complex is divided into parts that correspond
essentially to the succession of its constructive phases.
The vestibule by Sangallo, built on the original medieval church,
has a rectangular base, a central dome on pendentives and wings
covered by barrel vaults.
The Vitonian octagonal hall grows vertically in the sequence
of three architectural orders of decreasing height, in addition
to the Vasarian construction of tambour, dome and lantern. The
architectural orders match with the interior walkways that divide
the wall structure in two shells.
The fi rst stone of the Basilica was placed in September 1495
and the construction continues for almost one century. In fact,
in 1569, when the dome is completed in its structures, the fi rst
damages occurred. However, due to the continuous occurrence of
the cracks, the Grand Duke Francesco I entrusts the consolidation
project to Bartolomeo Ammannati, which ascribes to Vasari the
responsibility of the damages, in particular due to the lantern’s
exorbitant load.
His remedies, while allowing to move beyond the height of
the crisis, do not eliminate the causes of damages that continue
cyclically to occur. The last restoration dates back to 1966.
The prolonged absence of maintenance and conservation of the
monumental complex has prompted a widespread state of decay
and has led the Ministry of Heritage and Culture to sign, in 2008,
a Memorandum of Understanding with the Diocese of Pistoia
and the Fondazione Cassa di Risparmio di Pistoia e Pescia for
the start of the fi rst actions to restore the building, designed and
managed by the Government Department responsible.
The MoU has provided the idea for the research agreement with
the Laboratory GeCo and the author’s study, from 2008 to 2011,
within academic research grants.
2.2 3D digital survey
The structure’s spatial arrangement, the geometric complexity
of the ambient and of the vaulted spaces, the decorations’
wealth have called for the integration of different measurement
techniques (topographic and satellite systems, 3D scanning
systems and digital photogrammetry). The prearranged objective
was to supply info-graphic representations with high levels of
detail, metrically correct and in conformity with the fi nality of
the survey and the scale of graphic representation identifi ed as
most opportune for the analysis of both the structure and the
decorations.
The in situ work has been carried out in fi ve measurement
campaigns (Tucci et al., 2012).
A topographic net, including the internal and external vertices
of the Basilica, has been created (‘Zenith Ingegneria s.r.l’, a
spinoff of the Engineering Department, University of Ferrara).
The measurements have been carried out with both a total
station (TPS802, Leica Geosystems) and geodetic GPS receivers
(GPS1200, Leica Geosystems). The maximum planimetric range
of the network, which is extended in parallel to via Madonna, is
equal to about 480 m x 170 m, while the proportional development
ranges from 0 up to about 47 m.
The calculation and the compensation of the coordinates of the
vertices of the main network were performed with rigorous
methods applying the least squares principle. The results are
varying depending on the network’s type and hierarchy (Table 1).
The survey of the interior and of a large part of the exterior
was realized with a phase-based scanner (HDS6000, Leica
Geosystems). For the survey of the dome and of the lantern a
time-of-fl ight scanner has been necessary (Scanstation2, Leica
Geosystems), for the greater instrument/object distance (about
100 - 150 m).
The resolution has been planned for each scans on the basis of
the shapes and of the dimensions of the investigated spaces. To
estimate the acquisition times we considered both the scans’
execution times and the instrument’s movement ones.
We performed 164 scan stations for a total amount of 57 GB of
raw data.
The acquired data were aligned mainly through points with known
coordinates and, consequently, referenced in the topographic local
system. The alignment was solved with a residual lower than 1 cm.
The overall three-dimensional model, consisting of over 3 billion
points, was organized in sub-projects to facilitate the visualization,
management and analyses on portions architecturally coherent.
2.3 Architectural output
The task of interpreting the point model, in order to identify both
the geometries and the anomalies, is not easy for an inexperienced
operator. The critical understanding, that with other survey
techniques is done in situ, here is postponed to the phase of
graphic rendering. The essential basis on which to sketch out a
proper drawing, allowing to associate to the geometry, already
studied, assimilated and decoded, the metric dimensions of the
3D database.
From the point model eighteen architectural boards were prepared:
in particular, for the basilica: fi ve plans, a longitudinal section
(Figure 1) and three elevation drawings (via Vitoni, via Madonna
and the courtyard). For the vestibule: two plans of the extrados (an
architectural plan and a structural one) and the development of
the intrados of the eastern barrel vault, one longitudinal and two
cross sections, the photomap of the main façade. For the octagonal
hall: a cross section and a transverse one.
Net type σmed
(m) σmax
(m)
Main
x = 0.002
y = 0.003
q = 0.001
x = 0.004
y = 0.005
q = 0.004
Minor
x = 0.005
y = 0.003
q = 0.001
x = 0.007
y = 0.007
q = 0.001
GPS
x = 0.006
y = 0.018
q = 0.006
x = 0.012
y = 0.029
q = 0.029
Table 1. Average and maximum standard deviation
for the three types of network
58

2.4 Diagnostic and structural output
The metric documentation provided is a key part in the project
of restoration and consolidation. Specifi cally, it was possible
to deepen the knowledge of the construction showing, for
the vestibule: the out of plumb of the outer cladding and the
misalignment of the vaults’ coffers. For the octagonal hall and for
the dome it was possible to identify: the thicknesses of the two
shells; materials and constructive techniques; internal connections;
the number, size and position of the ribs and of the chains; the
crack; the interventions of consolidation; the links between
construction technique and deformations.
Figure 1. Detail of the longitudinal section.
Original in scale 1:50
Figure 2. On the left, the small dome’s drawing by Giovan Battista Bettini (1725). On the right, which highlights the little dome’s
drawing showing the panels located above the iron chain. In the top right: section of the panel with the metal tie-rod highlighted in red
2.4.1 The Vestibule: The state of degradation and instability of
the vestibule, in particular of the dome and of the barrel vaults,
already exposed in 1725 by Giovan Battista Bettini in his report
with some surveys of the status quo (Romby, 1992), concerning
the out of curve of the stone tiles of the three upper rings of the
dome. It’s interesting to note that the encircling chain perfectly
fulfi lls its structural function while maintaining the position of
the panels at the lower heights. The upper part, however, is free
to move due to the thin shell of 25 cm, formed by 10 cm of stone
and 15 cm of coating clay. To overcome this problem has been
provided for the insertion of metal tie-rods capable of welding the
stone tiles on the bricks of the extrados (Figure 2).
Among the other consolidation interventions proposed we can
mention:
- the repositioning in plumb of the walls through the insertion of
metal chains;
- the raising of the main facade to set the new roof;
- the construction of two buttresses in facade to support in the
restoration of the dome and roof (Figure 3).
The most signifi cant deformation is the outside warping of all of
the fronts except the northern one stiffened by the octagonal hall.
The extraction of the fi ve cross-sections showed an accentuated
out of plumb in the two sections almost tangent in the dome’s
springer. This thesis confi rms the weaknesses already identifi ed
in the eighteenth century and which, as noted, continue to exist
despite the addition of the chains.
The orthogonal view of all the cross sections eloquently
summarizes the distribution of the deformation: maximum
at the dome’s springer, null in correspondence to the chains,
demonstrating the fact that these fulfi ll their structural function
(Figure 4).
The out of plumb individuated in the outer walls results in a
deformation of the barrel vault, accentuated in the east front,
probably never restored by the intervention of the eighteenth
century (Figure 5).
The deformations were quantified on all the façades of the
vestibule through the comparison with a vertical reference plane.
The diagnostic outputs confi rmed what has already emerged from
the critical interpretation of historical documents and architectural
boards.
The elevation map, made by extracting portions of points every
5 cm, is shown in false color calibrated to represent the different
elevations of the front from a zero height (almost in plumb, in red).
The elevation maps in false colors have been further elaborated in
contour lines (Figure 6) to improve the readability. The warping of
59
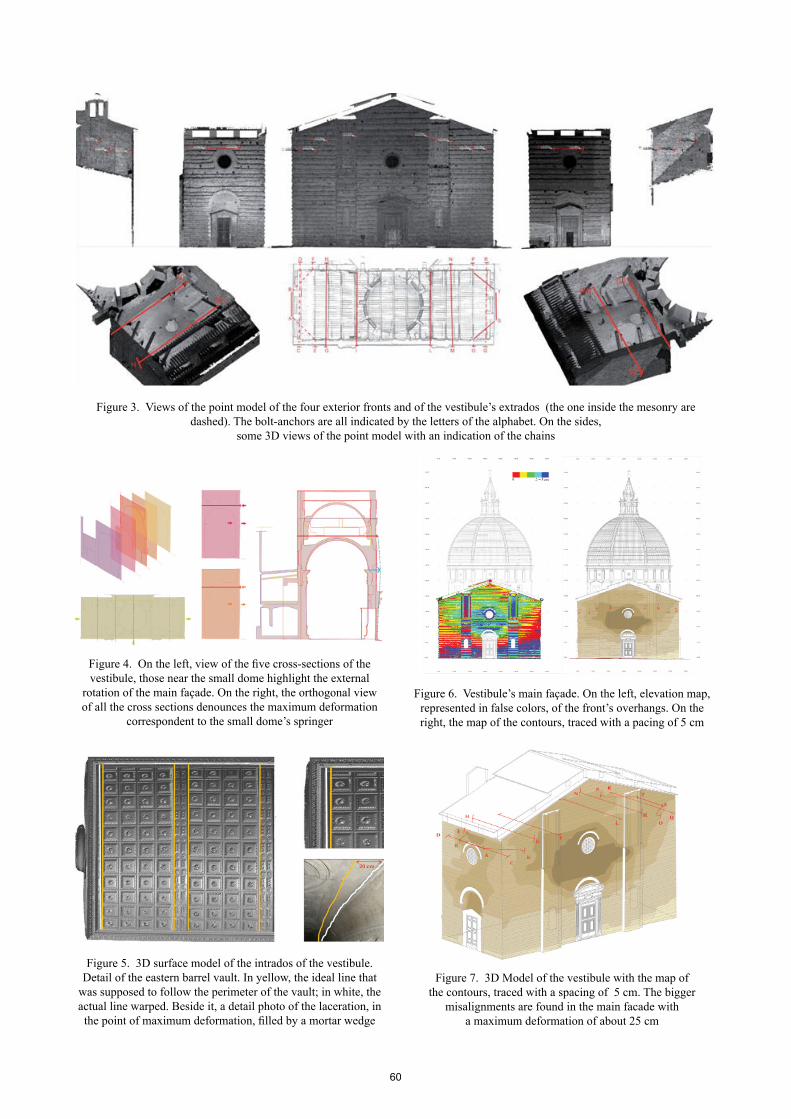
Figure 4. On the left, view of the fi ve cross-sections of the
vestibule, those near the small dome highlight the external
rotation of the main façade. On the right, the orthogonal view
of all the cross sections denounces the maximum deformation
correspondent to the small dome’s springer
Figure 5. 3D surface model of the intrados of the vestibule.
Detail of the eastern barrel vault. In yellow, the ideal line that
was supposed to follow the perimeter of the vault; in white, the
actual line warped. Beside it, a detail photo of the laceration, in
the point of maximum deformation, fi lled by a mortar wedge
Figure 6. Vestibule’s main façade. On the left, elevation map,
represented in false colors, of the front’s overhangs. On the
right, the map of the contours, traced with a pacing of 5 cm
Figure 7. 3D Model of the vestibule with the map of
the contours, traced with a spacing of 5 cm. The bigger
misalignments are found in the main facade with
a maximum deformation of about 25 cm
Figure 3. Views of the point model of the four exterior fronts and of the vestibule’s extrados (the one inside the mesonry are
dashed). The bolt-anchors are all indicated by the letters of the alphabet. On the sides,
some 3D views of the point model with an indication of the chains
60

Figure 8. Executive project of consolidation with the
introduction of a new structural system, spider-shaped circling
the small dome, formed by ten steel rods and two new
metal chains near the eastern and western fronts
(Prof. Carlo Blasi, University of Parma)
Figure 9. 3D Model of the vestibule with an indication of the
eighteenth century chains (in red) and of the new metal chains
(Prof. Carlo Blasi, University of Parma)
the main facade is evident, with a maximum in the central part of
20-25 cm, near the dome’s springer, which lessen, reaching zero
in correspondence of the metal chains I and L.
The northern front, however, present deformations near zero
thanks to the stiffening due to the adjacent octagonal body.
On the side façades, the higher out of plumb is near the springer
of the barrel vaults, bigger on the courtyard and smaller towards
via Vitoni as was to be expected since the large deformation of
the barrel vault in the south-east corner. We are, in fact, in the
order of 10 - 15 cm in the east front and 5 - 10 cm in the west one.
Even in this case, the warping is attenuated, to zero, in
correspondence of the chains ST and BA.
The hypsometric map has been reported on the 3D model to get
a complete view of the out of plumb in order to reach a deeper
knowledge of the process of cause and effect, associating to each
deformation the possible ineffectiveness or non-existence of the
structural elements (Figure 7).
The graphics elaborated by the three-dimensional survey, provided
a metric documentation supporting the executive consolidation
project (Prof. Carlo Blasi, University of Parma), which introduced a
spider encircling the small dome, formed by ten steel rods, and two
new metal chains near the eastern and the western fronts (Figure 8).
In the 3D model, we can appreciate the new structural system, in
yellow, and the connection with the preexistent chains, in red. The
structural analysis has confi rmed the calculation of deformations:
new stiffening elements were inserted in correspondence of the
maximum out of plumb as in the front, chains 3 - 4, and in the side
façades, chains 6 - 7 and 1 - 12 (Figure 9).
2.4.2 Octagonal hall and dome: The two shells of the octagonal
hall have a wall section almost equal (about 1 m for the outer shell
and 80 cm for the inner one).
The dome is hemispherical with an outside diameter of 26.70
and inside diameter of 21.70 m. Its double shell grows along the
extension of the lower double-shell. Only from around 33 - 34
m, the thickness tapers gradually to reach a minimum of 35 cm
below the lantern (Figure 10).
The two shells are connected by means of 32 ribs: 8 angular, 16
median and 8 central which support the lantern.
The outer covering of the octagonal hall:
- is composed of pebbles, rough-hewn sandstone and brick for the
fi rst three architectural orders. The brickwork is set with irregular
ledges and presents no scarfi ng: only in correspondence of the
edges sandstone blocks of various sizes are inserted to reinforce
the structure.
- is entirely laid in horizontal courses of brick punctuated by pillars
and cornices of sandstone in the tambour.
The dome is covered with brick tiles on the rib vaults and copper
on the corner ribs.
The layers of bricks, in the ribs and in the internal covering of
masonry, are horizontal with a slight inclination that in the top does
not exceed 20° - 25°. The round silhouette of the dome is obtained
by approximation through the progressive overhang of a row on the
other, towards the top where reaches 4 - 5 cm (Tucci et al., 2012).
It is this constructive feature in horizontal rows to question, even
today, the dome by Vasari. The fi rst to investigate the technique
is Lafri, in its “Relatione” of 1620. He states that “The shells are
bad manipulate, because now move to the third acute, now to
semicircle, then return to the third acute, and so they go swaying;
then to another third that are the angles of the ribs of the dome
that scrape so that false intersections are created”.
In summary, he ascribes the instability at the poor quality of the
bricks (from fl uvial and not mining extraction) and to the mediocre
construction technique devoid of clamping between the vaults,
between the vaults and the ribs and between the two shells probably
61

caused by the inconstant presence of Vasari on the construction site.
The bricks have variable sizes, in thickness and length, grossly laid
loosely and bound together by irregular and thick mortar layers,
thicker than one centimeter (Figure 11).
Later, in 1753, also Giovan Battista Nelli with his “Discorsi di
Architettura” investigates the construction technique taking as
a reference the Brunelleschi’s dome (inner diameter, 45 m; outer
Figure 10. Cross-section of the octagonal hall and of the dome.
Original in scale 1:50
Figure 11. Detail of a corner: on the left, between adjacent
vaults and on the right, between vault and rib.
It is evident the lack of connection
Figure 12. Dome of Santa Maria del Fiore in Florence. On the
left, isometric cross-section of the “corda blanda” (bland rope)
track (Drawing by L. Ippolito and C. Peroni); on the right,
graphical representation and fi berglass model of a
portion of the edge (Corazzi and Conti, 2011)
diameter, 54 m; cathedral height, 116.50 m; dome height, 34 m),
characterized by bricks layers curved upward, to form what is
called a “bland rope”.
The “bland ropes”, according to Salvatore Di Pasquale, have the
great advantage of achieving a structural continuity between two
adjacent vaults also thanks to the use of angular bricks in the
edges (Figure 12).
Vasari, while clearly inspired by the work of Brunelleschi in the
double shell structure and in the lantern, opts for a different and
approximate construction technique that causes the fi rst lesions
only few years after its conclusion.
There are two groups of lesions:
- the fi rst, due to the weak link between the vaults, is mainly along
the edges of all the vaults on both shells where the discontinuity
points mentioned by Di Pasquale are created;
- the second, due to the relative movement between the two
shells, cuts the median ribs and those of the lantern, causing
Figure 13. Domes comparison: in red,
that Vasari one; in black, the Brunelleschi one.
On the top right, comparison of construction techniques:
the Brunelleschi “corda blanda” (bland rope)
against the Vasari horizontal bricks layers
62

worrying detachments between the shells and the ribs.
The causes can be:
- the thickness of the outer shell, too similar to that of the inner
shell while, generally, it is signifi cantly lower to avoid burdening
the underlying structure. Just think of the one of Brunelleschi’s
dome which is about 0.70 m compared to 2.30 m of the inner shell;
- the excessive weight of the lantern, 1/18 of the total weight
compared to 1/25 of the Florentine lantern;
- the construction technique of the shells, in horizontal rows, and
without clamping the corners;
- The profi le of the dome, which Vasari designed semicircular
instead of the pointed arch designed by Vitoni (Figure 13).
To contrast the fi rst group of damages 8 hoops were inserted, 7 on
the extrados of the outer shell of the dome and 1 on the extrados
of the inner shell at the level of the tambour.
The consolidation interventions carried out to contrast the second
group of crack provided for the insertion of 21 chains crossing
the two shells both in the tambour and in the dome.
For each chain has been suggested a dating and attribution
carefully following the interpretation of the historical documents.
The chains have all been tabulated in a chart indicating the type,
planimetric and altimetric position, the structural function, dating
and a hypothetical attribution.
The total number of chains is 78, of which 39 in the dome (Tucci
et al., 2012).
3. THE SAN GIMIGNANO TOWERS
The historic centre of San Gimignano has been chosen as a pilot
site because it represents an urban environment unique in the world
for its monuments strongly at risk in the event of an earthquake.
The territory is located in an area of relatively low seismic hazard,
with the highest recorded event in 1869 with an intensity of VII
on the Mercalli scale. The effects, although not disastrous, are still
representative of a particularly intense and widespread damage
to the monuments, thus resulting in the importance of estimate
of shaking expected during future seismic events, potentially
dangerous for this type of building with a predominant vertical
development.
3.1 Historic framework
The oldest formation of San Gimignano dates back at least to
the third century BC as evidenced by the several archaeological
discoveries in the surrounding area.
In 1199, in its full economic splendour, the centre gained its
communal independence but not without infi ghting between
Guelphs and Ghibellines. An urban aristocratic class arose
and expressed his political and social supremacy through the
construction of 72 towers. Today there are only 16, while the
others can only be glimpsed within the urban fabric.
3.2 3D digital survey
The survey with laser scanning technique was carried out by the
author, 2011-2012, as part of an academic research fellowship at
the GeCo Laboratory of the University of Florence.
To allow for documentation of both the towers and the urban
context in which they are included we adopted a multi-scale
approach with a common referencing of data.
The work on-site, organized in fi ve measurement campaigns
(Figure 14), has been carried out with a range phase-based laser
scanner (HDS6000, Leica Geosystems): 41 scan position for a
total amount of 44 GB of raw data.
The acquired data were aligned mainly through homologous points
and referenced in a local system coincident with one of the scan
locations. The registration has been solved with a residual error
of about 1 centimetre. The overall three-dimensional model is
constituted by more than 1.5 billion points.
3.3 3D wireframe output
On one hand, the 3D model allowed the possibility of creating
a cartography within which the individual buildings could be
contextualized. Second, the reading of the relations linking
the towers: typological scheme, constructive, constituent and
distributive characters.
To document the scale of the building we surveyed the external
geometry of each tower with the aim to defi ne the conservation status
and allow the construction of a metric support for the interpretation of
the structural behaviour through a successive numerical modelling.
In particular, at the urban scale, it was performed the three-
dimensional metric acquisition with laser scanner of the exterior
surfaces of thirteen towers: Salvucci, Pettini, Chigi, Collegiata,
Propositura, Grossa, Rognosa, Ardinghelli, Becci, Cugnanesi, Coppi
– Campatelli (Figures 15 and 16).
Figure 14. Reference plan of the historical center of San
Gimignano with indication of the towers captured
for each measurement campaign
Figure 15. Top view of the overall point model. In orange, the
towers captured. Note the position of the origin of the
reference system in Piazza delle Erbe
63

3.4 Diagnostic and structural output
At the scale of the building, considering the twin towers of the two
most important families (the Guelphs Salvucci and the Ghibellines
Ardinghelli) as a case study:
- the analysis of structural transformations;
- geometric analysis to locate the geometric centre of gravity;
- the computation of the deformation.
3.4.1 Analysis on the geometry of the 3D model: The diagnostic
use of the laser scanner, especially for structural scopes, is clear when
it is possible to carry out analysis of the geometry from the point
cloud to extract parameters and useful information for the purposes
of assessment of the stability of the structure. A signifi cant fi nding
is the identifi cation of overhangs, particularly important in the case
of slender structures.
The analysis of verticality of the pairs of towers was initially
performed by exporting some slices of reduced thickness (1 cm)
from the model. The double symmetry of the structure has allowed
defi ning the geometric centre of gravity of each section in the 3D
space. The trend of the axis, obtained by connecting the centres of
gravity, showed:
- the Salvucci Towers, swerving negligibly in North-South direction
(maximum distance lesser than 2 cm for the northern tower; 4 cm for
the southern one), while in the East direction has been found for the
southern tower, a slight deviation by the vertical (maximum distance
8 cm) and for the northern tower a deviation greater than 18 cm
(Figures 17 and 18). The overhang so measured is the planimetric
distance between the centre of gravity of the fi rst horizontal section
(at a height of 9 m) and the top of the towers (at a height of 42.38
m for the northern tower and of 44.24 m for the southern one).
- the Ardinghelli Towers, a negligible swerving in East-West direction
(maximum distance lesser than 6 cm), while in the north-south
direction, was found a considerable deviation from the vertical for
both the towers, but in the opposite direction: the southern tower
presents a deviation just over 18 cm in the southerly direction; the
northern tower has a deviation just over 26 cm in the North direction
(Figure 19). The out of plumb so measured is the planimetric distance
between the centre of gravity of the fi rst horizontal section (at a height
of 3.73 m) and the top of the towers (30.76 m the northern tower and
23.77 m the southern one excluding the slopes of the roof).
Figure 18. Salvucci Towers, on the left. Figure 19. Ardinghelli Towers, on the right.
Graph of displacements in x and y given in cm of the geometric center of gravity of the horizontal sections
Figure 17. Salvucci Towers. 3D point model, displayed in gray
scale, indicating the horizontal section profi les useful for the
defi nition of the geometric center of gravity
NORTHERN TOWER
SOUTHERN TOWER
SOUTHERN TOWER
NORTHERN TOWER
Figure 16. View of the 3D wireframe models of the
exterior of the towers
64

Figure 20. Ardinghelli towers. On the left, the towers in their
original structure (De Fleury, 1874). In the middle, a picture
of 1915-1920 with a view of the northern tower before the rise
(Alinari Archive). On the right, picture of the current state
Figure 21. Ardinghelli Towers. Analysis of horizontal
(light blue) and vertical deviation (in red)
Figure 22. Ardinghelli Towers. Summary plan of the direction
of overhang of the external structure. The directions of incline
are indicated by means of arrows with length qualitatively
proportional to the overhang (in red the resulting vector)
(1.97° south) than that of the underlying medieval structure (1.15°
to the north) on the northern front, while the same inclination (0.86°
and 0.83° to the north) on the southern front (Figure 23).
The analysis of the deformation, compared to the interpolating
reference plane, has shown continuous changes of direction, with
alternating concavity and bulges.
In particular, for the northern tower (Figure 24), the observed
deviations from the reference plane are:
- from top to bottom, in the northern and southern fronts affected by
the greater inclination, with a bulge of the order of 5 - 6 cm in the
adjacent portion to the seam between the old medieval masonry and
the one rebuilt in the second decade of the ‘900 (elevation of about
23 m, coinciding with the height of the southern tower);
- in the direction south - north, in the eastern and western fronts, so as
to follow the direction of the slope (north, in fact) with a distribution
that suggests a confi guration linked to torsion phenomena.
Similarly, but in the opposite direction, in the southern tower (Figure
PIAZZA DUOMO
PIAZZA DELLA CISTERNA
In relation to the short time spent for the survey (20% of the total)
and processing (80% of the total), this method of investigation and
restitution of the geometric characteristics allows an accurate analysis
of the height and incline (with an accuracy of about 1 centimetre) of
structures characterized by an elevated height and therefore not simply
detectable with other techniques.
3.4.2 Analysis of construction transformations: The drawings
have allowed the identifi cation of construction transformations that
have invested the four towers. While the Salvucci Towers have been
interested by minor transformations due mainly to the change of use
(commercial businesses on the ground fl oor in Via San Matteo and
residence on the upper levels), the Ardinghelli Towers have undergone
determinants structural alterations. The fi rst signifi cant intervention
dates back to 1870 when, after the earthquake of 26th of September
1869, the towers were reduced at the same height. It is probably
because of this earthquake, the maximum recorded in the town, that
the towers acquired the current wide apart arrangement.
This evident inclined conformation did not prevent, however, the
construction of a raising on the northern tower in 1920 approximately
(Figure 20).
3.4.3 The computation of the deformations: Starting from the 3D
database of the Ardinghelli towers we made an assessment of the
deformations by comparing the façades with two reference planes:
a fi rst one vertical, to observe large deviations of the tower, mainly
due to the incline; the second one, interpolating, to highlight the
irregularities and deformations compared to a not altered situation.
Not having, as often happens, previous surveys characterized
by the same precision and information density, with respect to
which calculating the deformation as differential displacement,
the differences between the points on the towers’ surfaces and the
reference plane, i.e. the deviations, were considered as deformations,
or better, as overall deformations with respect to a hypothetical
condition of regularity of the structures (Doglioni et al., 2007).
The actual deviations of the four fronts of both the towers (Figures
21-24) with respect to the vertical reference plane, confi rm the results
obtained from the geometric analysis of the 3D model: the southern
tower presents a signifi cant deviation from the vertical on the northern
side (slope of 0.87°, out of plumb of 31 cm) and, conversely, the
northern tower has an equal deviation from the vertical in the opposite
direction, on the southern side (slope 0.85°, out of plumb of 41 cm,
assuming it as a single deformed section; slope of 0.86 ° in the oldest
part and of 0,83° of the portion of the twentieth century in the case
of two sections).
It’s interesting to note that the raising of the northern tower, from
the height of about 23 m, has an inclination in the opposite direction
65

Figure 23. Ardinghelli Towers. Analysis of vertical deviations
measured on the northern tower. The slope is calculated by
dividing the tower into two sections: the medieval
and twentieth-century addition
Figure 24. Ardinghelli Towers. Elevation map, represented in
false colors, the overhangs of the fronts. The false colors have
been calibrated to represent the different levels of elevation of
the front from a zero quota (almost plumbed, shown in red,
in the case of a vertical reference plane; portion adherent
to the best fi tting plane, indicated in red, in the case of
the interpolating reference plane) with 5 cm delta
24), the observed deviations from the reference plane are:
- from top to bottom, in the northern and southern fronts affected
by the greater inclination;
- in the direction north-south, in the eastern and western fronts, so as
to follow the direction of the slope (south, in fact) with a distribution
that suggests a confi guration linked to torsion phenomena.
This reveals that the fronts are curved and segmented and still largely
altered compared to ideal conditions.
The observations provided, if included in a framework of general
study including analysis confi rming a state of “fatigue” of the
masonry due to the effect of the tower’s own weight, can be of great
interest and should be taken into account for evaluation about the
stability of the structure (Pesci et al., 2011).
4. ACKNOWLEDGEMENTS
The author would like to thank Professor Carlo Atzeni for willingness
and courtesy and Professor Grazia Tucci for technical and logistical
support.
5. REFERENCES
Archivio Storico Alinari, Edizioni Brogi, Id Number BGA-F-013553-0000
Corazzi, R., Conti, G., 2011, Il segreto della cupola del Brunelleschi
a Firenze, Pontecorboli Editore, Florence, ISBN 978-88-970801-0-7.
De Fleury, R., 1874, La Toscane au moyen âge, lettres sur l’architecture
civile et militaire en 1400, A. Morel, Paris, France.
Di Pasquale S., 2002, La costruzione della cupola di Santa Maria del
Fiore, Biblioteca Marsilio, Venice, Italy.
Doglioni, F., Mazzotti, P., 2007, Codice di pratica per gli interventi
di miglioramento sismico nel restauro del patrimonio architettonico,
Edizione Regione Marche, Ancona, Italy, ISBN 88-9026-690-2.
Eppich, R., Chabbi, A., 2007, Recording, Documentation, Information
Management for the Conservation of Heritage Places: Illustrated
Examples, The Getty Conservation Institute, Los Angeles, USA, ISBN
978-0-89236-946-1.
Lafri, J., 1620, Relatione di Jacopo Lafri Architetto Pistoiese sopra la
Cupola Grande della Chiesa della Madonna dell’Umiltà della Città
Antichissima di Pistoia, Biblioteca Nazionale Centrale, Fondo Rossi
Cassigoli, Florence, Italy, ms. misc. 335.
Nelli, G. B., 1753, Discorsi di Architettura, Per gli eredi Paperini,
Florence, Italy.
Pesci, A., Bonali, E., Casula, G., Boschi, E., 2011, Le informazioni
estraibili dal dato laser scanner per lo studio di edifici storici.
Archeomatica, A&C2000 srl, Rome, Italy, n. 3/2011, ISSN 2037-2485,
pp. 12 – 16.
Romby, G. C., 1992, La Basilica della Madonna dell’Umiltà di Pistoia:
tre secoli di restauro. In: Proceedings of the Congress “Centenario
del miracolo della Madonna dell’Umiltà a Pistoia”, Pistoia, Italy, pp.
87-110.
Saint Aubin, J. P., 1999, Il rilievo e la rappresentazione dell’architettura,
Moretti&Vitali, Bergamo, Italy.
Tucci, G., Nobile, A., Riemma, M., 2012, Laser scanner surveys and
the study of the geometry and structure of the dome in the Basilica della
Madonna dell’Umiltà. in Pistoia. In: Proceedings of the International
Congress “Domes in the World”, Florence, Italy, ISBN 9788840442112.
NORTHERN TOWER
VE
RT
ICA
L R
EF
ER
EN
CE P
LA
NE
INT
ER
PO
LA
TIN
G R
EF
ER
EN
CE P
LA
NE
SOUTHERN TOWER
VE
RT
ICA
L R
EF
ER
EN
CE P
LA
NE
INT
ER
PO
LA
TIN
G R
EF
ER
EN
CE P
LA
NE
66

con il supporto di
ISBN 978-88-905917-3-0
Dicembre 2013