
Globalization, economic interpenetration and business ethics in emerging markets (2009)
Upload
independentCategory
view
3download
0
3D Face Recognition UsingSimulated Annealing and the
Surface Interpenetration MeasureChaua C. Queirolo, Student Member, IEEE, Luciano Silva, Member, IEEE,
Olga R.P. Bellon, Member, IEEE, and Maurıcio Pamplona Segundo
Abstract—This paper presents a novel automatic framework to perform 3D face recognition. The proposed method uses a Simulated
Annealing-based approach (SA) for range image registration with the Surface Interpenetration Measure (SIM), as similarity measure,
in order to match two face images. The authentication score is obtained by combining the SIM values corresponding to the matching of
four different face regions: circular and elliptical areas around the nose, forehead, and the entire face region. Then, a modified SA
approach is proposed taking advantage of invariant face regions to better handle facial expressions. Comprehensive experiments were
performed on the FRGC v2 database, the largest available database of 3D face images composed of 4,007 images with different facial
expressions. The experiments simulated both verification and identification systems and the results compared to those reported by
state-of-the-art works. By using all of the images in the database, a verification rate of 96.5 percent was achieved at a False
Acceptance Rate (FAR) of 0.1 percent. In the identification scenario, a rank-one accuracy of 98.4 percent was achieved. To the best of
our knowledge, this is the highest rank-one score ever achieved for the FRGC v2 database when compared to results published in the
literature.
Index Terms—3D face recognition, Surface Interpenetration Measure (SIM), range image registration.
Ç
1 INTRODUCTION
FACE recognition is a very challenging subject. So far,studies in 2D face recognition have reached significant
development, but still bear limitations mostly due to posevariation, illumination, and facial expression [38]. One wayto overcome such limitations is the use of face depthinformation. In the 1990s, 3D face recognition stood out dueto advances of 3D imaging sensors. However, 3D imagesalso have limitations, such as the presence of noise anddifficult image acquisition [7].
A common approach for 3D face recognition is the use ofregistration techniques to perform range image matching.The Iterative Closest Point (ICP) [5] algorithm, or one of itsvariants, is usually sought to accomplish this task. TheMean Squared Error (MSE), minimized during the conver-gence process, is then used to compute the similaritybetween two face images [8], [9], [14], [24]. This approachcan also be employed with deformation techniques tomodel facial expressions, minimizing its effects on facerecognition [17], [19], [23].
The performance of both 2D and 3D face recognitionsystems can be verified on the Face Recognition GrandChallenge (FRGC) [29]. The FRGC is an internationalbenchmarking composed of six challenging problems with
its expected performance guidelines. The third experi-ment, i.e., ROC III, regards the 3D face recognitionproblem using a challenging database composed of4,007 images from 466 subjects displaying different facialexpressions. For this experiment, the goal is to achieve averification rate of 98.0 percent at a False Acceptance Rate(FAR) of 0.1 percent [29].
We present a complete framework for face recognitionusing only 3D information (range images) as input. Theframework can be employed in both verification andidentification systems and has four main stages (see Fig. 1):
1. image acquisition,2. preprocessing,3. matching, and4. authentication.
Initially, the 3D face image can be acquired by differenttechniques, such as laser and structured light scanners [15]. Inthe preprocessing stage, the input image is smoothed and theface region is automatically detected and segmented. Then,some facial feature points are detected to be used during thematching process [33]. Each segmented face region ismatched with its corresponding one in the database. ASimulated Annealing-based approach (SA) for rangeimage registration runs the process by using two robustmeasures to assess alignment precision: 1) M-estimatorSample Consensus (MSAC) [37] and 2) Surface Interpene-tration Measure (SIM) [36]. In previous works, the SIMshowed to be a discriminatory measure when working onface images [4], [30].
A modified SA approach is also employed to handle facialexpression effects during face matching. At last, anauthentication score is computed based on the SIM values
206 IEEE TRANSACTIONS ON PATTERN ANALYSIS AND MACHINE INTELLIGENCE, VOL. 32, NO. 2, FEBRUARY 2010
. The authors are with the Departamento de Informatica, UniversidadeFederal do Parana, Caixa Postal 19092, Curitiba, PR 81531-980, Brazil.E-mail: {chaua, luciano, olga, mauricio}@inf.ufpr.br.
Manuscript received 30 Apr. 2008; revised 16 Sept. 2008; accepted 15 Dec.2008; published online 5 Jan. 2009.Recommended for acceptance by H. Wechsler.For information on obtaining reprints of this article, please send e-mail to:[email protected], and reference IEEECS Log NumberTPAMI-2008-04-0265.Digital Object Identifier no. 10.1109/TPAMI.2009.14.
0162-8828/10/$26.00 � 2010 IEEE Published by the IEEE Computer Society

obtained from the alignment of each region. This score isuseful for 1) verifying whether two face images belong or notto the same person and 2) retrieving the identity of a subject.
One major contribution of our work is to propose theSIM as similarity score between two 3D face images.Differently from previous works in the literature whichfocus on range image matching using ICP (guided only byMSE), we rely on the fact that in [36] it was proven that MSEcould allow imprecise local convergence for range imageregistration, even when improved ICP-based approachesare used [16], [32]. Moreover, in [36] it is suggested thatMSE is a good measure to start the image registrationprocess, but the SIM is more suitable to be used at “the endof the game” to assess the quality of the registration.
We performed experiments on the FRGC v2 database,including experiments in controlled data sets and thebenchmarking experiments. The verification experimentsinclude an analysis of the results based on 0 percent FAR.We also present a complete analysis of the results withcomparisons against the most relevant related works [10],
[14], [19], [22], [27], [28]. This analysis is one of the mostcomprehensive reported in the literature regarding 3D facerecognition on the FRGC v2 database, from our bestknowledge. Faltemier et al. [14] also present a completeset of experiments. Details of our experiments can beverified at the IMAGO Research Group homepage [1].
This paper is organized as follows: Section 2 discussesthe main related works. Section 3 presents details about theimages available in the FRGC v2 database. Section 4describes the preprocessing stage. Section 5 regards theproposed method for face image matching and Section 6regards the 3D face authentication process. Section 7presents the experimental results and Section 8 concludeswith the final remarks.
2 RELATED WORKS
This section reviews the most relevant works regarding 3D
face recognition which use the FRGC v2 database. They
QUEIROLO ET AL.: 3D FACE RECOGNITION USING SIMULATED ANNEALING AND THE SURFACE INTERPENETRATION MEASURE 207
Fig. 1. The main stages of the framework for 3D face authentication.

compute the similarity score between two face imagesmostly based on the MSE minimized during the 3D imagematching, sometimes combined with other measures.
Chang et al. [8] describe a method called Adaptive RigidMultiregion Selection (ARMS). ARMS uses three differentoverlapping regions around the nose: 1) circle, 2) ellipse,and 3) the nose itself. The nose region was designatedbecause it is invariant in the presence of facial expression.Each region is matched with its corresponding one usingICP and the resulting Root Mean Square Error (RMSE) ofeach alignment is combined using the product rule. Thisvalue is then used as similarity measure between faceimages. Experiments were performed using the super set ofimages from the FRGC, composed of 4,485 3D face images.A rank-one accuracy of 97.1 percent was achieved whenusing a data set composed of neutral images and a rank-oneaccuracy of 87.1 percent when using a data set containingfaces with facial expression.
Maurer et al. [27] introduce a method that combines 3Dand 2D face images. The 2D face recognition is performedusing commercial software, although authors suggest that itcan be replaced by any other approach. The 3D shaperecognition is based on the ICP algorithm and uses distancemap as similarity measure between two faces. The scores,computed from texture and shape, are combined using aweighted sum rule. They used the FRGC v2 database andachieved a verification rate of 87 percent at 0.1 percent FAR,when using only shape information. The authors classifiedthe main error sources affecting their method in threecategories: 1) distorted shape images, 2) 2D and 3D imageswith different facial expressions, and 3) others, e.g., haircovering the face.
Husken et al. [18] propose a fusion between 2D and 3DHierarchical Graph Matching (HGM) to perform facerecognition. This approach uses an elastic graph that carriestexture information and positions of facial landmarks. Thegraph is automatically adapted to a face using theselandmarks, e.g., nose, eyes, and mouth. The distancesbetween two graphs are used as the similarity score todistinguish two face images. Experiments were performedin the FRGC v2 database, and a verification rate of86.9 percent at 0.1 percent FAR was achieved when usingonly 3D images.
Lin et al. [22] describe a method that fuses thesummation invariant features extracted from differentregions for face classification. Ten rectangular areas areselected from the input range image and then a subset of thesummation invariant features is extracted. The matchingscore from each region is combined using the sum rule or aweighted sum rule optimized by the Linear DiscriminantAnalysis (LDA). Using LDA to define weights allowed theachievement of higher recognition rates. Experiments wereexecuted on the FRGC v2 database, and for the ROC IIIexperiment they achieved 90.0 percent of verification rate,at 0.1 percent FAR.
Mian et al. [28] describe a multimodal 2D+3D facerecognition system. Initially, the 3D face image pose isautomatically corrected and normalized along with itstexture image. For 2D face images the Scale-Invariant FeatureTransform (SIFT) is applied to detect local features in faces.This method shows to be more robust regarding facialexpression and illumination when compared to the PrincipalComponent Analysis (PCA) baseline performance. The
similarity between 2D face images is determined by theeuclidean distance of facial feature descriptors. For 3Dface images, first the face is segmented into two regions:1) the eyes and forehead region and 2) the nose region.Then, these regions are matched with their correspondingones using the ICP algorithm. The final similarity score isobtained by combining scores from each matchingapproach. Considering only results for the 3D face images,a verification rate of 86.6 percent was achieved at0.1 percent FAR. By using a neutral gallery and allremaining images as probes, this verification rate isincreased to 98.5 percent at 0.1 percent FAR.
Cook et al. [10] employ Log-Gabor filter to execute 3Dface recognition. After applying the filter, the face image issegmented into 49 squared regions and further decomposedby three scale filters totalizing 147 subregions. The PCA isapplied to each filter response from each subregion torepresent the face with 147 features. The Mahalanobis-Cossine distance is employed to compute the similaritybetween two feature vectors. In the experimental results,the best performance was achieved by using 75 centralsubregions. On the FRGC v2 database, they reported a rank-one accuracy of 96.2 percent and a verification rate of92.3 percent, at 0.1 percent FAR.
Kakadiaris et al. [19] present a fully automated frame-work for 3D face recognition using the Annotated FaceModel (AFM) to overcome the facial expression problems.An AFM is previously created to be used during alignmentand deformed in the matching stage, allowing the creationof a metadata for authentication. In earlier steps of theframework, the input image is processed for spike removaland hole filling. A subsample of the data is created toimprove the method efficiency. Before the fitting procedurestarts, the raw data are aligned to the AFM model using amultistage matching method which combines three match-ing procedures: 1) Spin Images, 2) ICP, and 3) SA onZ-buffers. A deformed model is obtained after the fittingprocess and it is converted into a geometric model and anormal map. Each image is then treated separately usingtwo wavelet transformations, Pyramid and Haar. Authen-tication is computed in wavelet domain by assessing adifferent distance metric for each wavelet type. In theROC III experiment of the FRGC v2, they reported averification rate of 97.0 percent, at 0.1 percent FAR. Also,they reported a rank-one performance of 97.0 percent.
Al-Osaimi et al. [3] present an approach for 3D facerecognition using deformable models. A PCA subspace iscreated based on the facial expression deformation. Initially,the training stage requires neutral and nonneutral imagesfrom each subject. Each pair is cropped and fine alignedusing the ICP to verify the shape residues. A PCA subspaceis built using the shape residues, which consequently canmodel a generic facial expression deformation. Then, thesimilarity is computed by evaluating the morphed 3D faces.The experiments were conducted in the FRGC v2 databaseusing different data sets. They report a verification rate of98.35 percent and 97.7 percent, at 0.1 percent FAR, whenusing neutral and non-neutral data sets, respectively. In theROC III experiment, they achieved 94.1 percent of verifica-tion rate, at 0.1 percent FAR.
208 IEEE TRANSACTIONS ON PATTERN ANALYSIS AND MACHINE INTELLIGENCE, VOL. 32, NO. 2, FEBRUARY 2010

Faltemier et al. [14] develop a system that consists in thefusion of 28 spherical regions extracted from the face. Theseregions are then combined using the ICP algorithm. Thedistance obtained from the matching of each region wascombined using different approaches, and the best resultswere reported using Consensus Voting and Borda Counting.To make the system more robust for small variations, whichmay occur in some face regions, different small regions areused for matching. Experiments on the FRGC v2 databaseachieved a verification rate of 93.2 percent at 0.1 percent FARand a rank-one performance of 97.2 percent.
For a survey of works related to 3D and multimodal2D+3D face recognition the reader should refer to [2], [7].As observed in this section, most works successfullyemploy the ICP algorithm for 3D face recognition [8], [14],[27], [28]. Then, the MSE, sometimes combined with othermeasures, is used as the similarity score. In this paper, wepresent a novel approach applying the SIM to obtain moreprecise results.
3 3D FACE IMAGE DATABASE
In our experiments, we use the FRGC v2 database, thelargest available database of 3D face images, composed of4,007 images from 466 different subjects [29]. Each personhas a varying number of images, up to 22 images, andamong these subjects 56 have only one image. All imageshave resolution of 640� 480 and they were acquired by aMinolta Vivid 910 laser scanner. The face images havefrontal pose and several types of facial expression. The mostcommon facial expressions available in the database are:neutral, happy, sad, disgusting, surprised, and puffy cheek.Moreover, some images present artifacts which we havecategorized as follows:
1. stretched or distorted images,2. nose absence,3. holes around nose, or4. “waves” around mouth.
Examples of these images are presented in Fig. 2. Thefilename of each image in the database is included in thefigure caption.
For instance, the disturbance presented in 1 was causedbecause the subject moved during the acquisition process.The second problem regards the distance between theperson and the acquiring system. If a person is too close,closer regions such as nose may not be properly scanned
because of focal range limitations. Besides, the laser sensorcannot deal well with transparent regions and regions withhigh specularity, which causes holes in the scanned image,e.g., in the eyes and around the nose. Bowyer et al. [7]addressed this issue and identified several situations thataffect range image quality, such as environment illumina-tion. Some of these peculiarities from the FRGC v2 databasehave also been reported by Maurer et al. [27].
Aiming the verification of the robustness of ourapproach for 3D face recognition, we manually classifiedthe FRGC v2 database according to facial expression andnoise level (regarding the artifacts). We performed acareful facial expression classification because the oneprovided by FRGC has some misclassified images. Thisprobably occurred because the classification was madeaccording to the prompting request, whereas an outsideobserver may assign a different label to the image. Fig. 3shows examples of faces classified as neutral expression byFRGC, but those actually have facial expression. In thispaper, the database is segmented into different sets ofimages as presented in Table 1.
We classified the FRGC v2 database into three data setsaccording to holes in the eye region: 1) without holes, in51 images, 2) small holes, in 1,300 images, and 3) largeholes, in 2,656 images. This occurs because the eye istranslucent and the light stripe is refracted instead of beingreflected. Due to this, the laser scanner cannot properlycapture a reflection and then no information is produced inthis region. We noticed that almost all the images from thedatabase presented artifacts. Because of this, we do notconsider the eyeholes as a disturbance. Further experimentsto verify its influence in the recognition process arepresented in Section 7.2.1.
We also noticed two subjects that, besides havingdifferent identifications in the FRGC v2 database, areactually the same person, as confirmed by the FRGC
QUEIROLO ET AL.: 3D FACE RECOGNITION USING SIMULATED ANNEALING AND THE SURFACE INTERPENETRATION MEASURE 209
Fig. 2. Example of images with artifacts: (a) stretched/deformed images(04746d44), (b) face images without the nose (04505d222), (c) holesaround the nose (04531d293), and (d) waves around the mouth(04514d324).
Fig. 3. Example of images classified as neutral in the FRGC v2
database: (a) 04476d230 and (b) 04587d114.
TABLE 1FRGC v2 Face Image Classification

organization. The “impostor” identification number in thedatabase is 04643, and the other subject identification is04783. This label was rectified for our experiments.
4 3D FACE IMAGE PREPROCESSING
In this stage, the region of interest (i.e., face region) isextracted from the input image. The input images havesome areas that may interfere in the 3D face matching, suchas hair, neck, and ears. Initially, the face image is smoothedwith a median filter. The segmentation process uses ourown approach based on the depth of range maps and it isbasically composed of two main stages: 1) locating homo-geneous regions in the input image by combining regionclustering and edge information and 2) identifying candi-date regions that belong to the face region by an ellipsedetection method based on the Hough Transform. This fullyautomatic approach can correctly segment 99 percent offaces from FRGC v2 database (3,991 of 4,007). Thesegmented faces that were not classified as correct arethose with some remaining nonface regions (usually hair,neck, or head accessories). Yet we use the segmentedimages without any postprocessing in the experiments.More details about the image segmentation approach aredescribed in [33].
After the face region is segmented, six feature points aredetected to extract rigid regions of the face and improve thematching process: the inner right and left eye corners, theright and left nose corners, and the nose tip and base, asshown in Fig. 4a. To perform this task we use our ownapproach that is able to detect automatically the eye cornersand the nose features (i.e., tip, corners, and base) in99.92 percent and 99.6 percent of the images from FRGC v2,respectively. The nose features were not correctly detecteddue to nose absence only in three images (see Fig. 4b). The eyecorners could not be correctly detected in 16 images due to thehead pose rotation (see Fig. 4c). In our experiments, we usedthe points as they were detected. However, these images hadminor negative impact in our results due to our hierarchicalapproach that uses different regions (see Section 6.1). Furtherdetails are presented in [33].
In this paper, four regions of the face are considered(see Fig. 5):
1. the circular area around the nose,2. the elliptical area around the nose,3. the upper head, including eyes, nose, and forehead,
and4. the entire face region.
Regions 1 and 2 are used because the nose area suffersless influence from facial expression as compared to otherface regions [8]. Both regions have the same shape as theones proposed by Chang et al. [8] and they can be extractedby applying geometry functions in feature coordinates.Figs. 5b and 5c show an example of these regions.
In [4], it is stated that, when using the SIM, the noseregion alone is not enough discriminatory for face recogni-tion because it represents only a small fraction of the face;therefore, regions 3 and 4 were also used because they havemore information about the face. Region 3 is obtained byselecting all face points above the nose base point, as shownin Fig. 5d. Therefore, the four segmented regions are used toperform face recognition.
5 3D FACE MATCHING
In [34], the authors present an extensive comparisonbetween the ICP guided by the MSE and a stochasticapproach based on Genetic Algorithm (GA) guided by theSIM. They present results showing that the ICP tends toconverge to local minimum solutions due to the MSE. Onthe other hand, when using the SIM combined with astochastic approach, it is possible to converge to a globalminimum. Although GA obtains more precise results forrange image registration, it is extremely time consuming.Later works [35], [36] showed that the SIM is morediscriminating than the MSE when assessing the alignmentof two range images.
In [4], the Genetic Algorithm is replaced by theSimulated Annealing, which is much faster than the GA,but still slower than the ICP. This work presents acomparison between the ICP and SA and show that SAproduces better results. Moreover, it is noticed that, for 3Dface recognition, the SIM works well even with alignmentsproduced by the ICP.
In the present work, we use the SA to perform the rangeimage matching using two robust measures: 1) MSAC [37]and 2) SIM [35], [36]. The SA starts the registration processusing the MSAC and the final tuning is achieved by usingthe SIM. The resulting SIM value is then used to assess thefinal 3D face matching. The following sections present abrief explanation regarding the SIM and SA.
5.1 Surface Interpenetration Measure
The SIM was developed by analyzing visual results of twoaligned surfaces, each one rendered in a different color,crossing over each other (i.e., like an interweaving)
210 IEEE TRANSACTIONS ON PATTERN ANALYSIS AND MACHINE INTELLIGENCE, VOL. 32, NO. 2, FEBRUARY 2010
Fig. 4. Feature points detection: (a) six feature points, (b) wrong nosepoints, and (c) wrong eye corners detection.
Fig. 5. Segmented regions from a same face: (a) entire face anddetected feature points, (b) circular nose area, (c) elliptical nose area,and (d) upper head.

repeatedly in the overlapping area. The interpenetrationeffect results from the very nature of real range data, whichpresents slightly rough surfaces with small local distortionscaused by limitations of the acquiring system [11], [36].
Through the quantification of interpenetration, one canmore precisely assess the registration results and provide ahighly robust control. Registrations of two range imagespresenting good interpenetration have high SIM values anderroneous alignments produce low SIM values and thosesmall differences in MSE can yield significant differences inSIM. Furthermore, alignments with high SIM present a verylow interpoint distance between the two surfaces. That is,SIM is a far more sensitive indicator of alignment qualitywhen comparing “reasonable” alignments.
For more details of this measure, the reader should referto [35], [36]. The SIM pseudocode is presented inAlgorithm 1. As suggested in [35], some constraints wereapplied to SIM to avoid incorrect corresponding points andobtain more precise alignments. A constraint m ¼ 5 wasdefined as the maximum angle allowed between normalvectors at c and p, ~nc, and ~np, respectively. Anotherconstraint was defined to eliminate the correspondingpoints on surfaces boundaries. In this case, p 2 C if c 62 D,with D the set of boundary points in B, with boundarythickness defined as b ¼ 1. The window centered in p wasdefined as n ¼ 5, as suggested in [36].
Algorithm 1. Surface Interpenetration Measure—SIM.
Require: Two range images A and B
1: for p 2 A do
2: Define a n� n neighborhood Np centered in p;
3: Search the corresponding point c of p in B, with
c 62 D;
4: Compute angle � between normal vectors ~np and ~nc,regarding points p and c;
5: if � < m and 9qi; qj 2 Np, with qi 6¼ qj such that qi; qjare disposed on opposite sides
of the tangent plane at c
6: CðA;BÞ ( CðA;BÞS
p;
7: end if
8: end for
9: returnCðA;BÞjAj
5.2 SA Approach for Range Image Registration
The SA [20] is a stochastic algorithm for local search. From aninitial candidate solution, SA iteratively searches a betterneighbor solution to the problem as compared to the currentone. The main difference between SA and other local searchalgorithms, e.g., Hill Climbing, is that SA can accept a worsesolution than the current candidate during the iterativeprocess; therefore, SA does not remain “tied” to local minimaand, because of this, it has a higher chance of reaching its goal,which is a solution close enough to the global one.
The SA method requires the modeling of the problem insuch a way that it is possible to move from a candidatesolution to any neighbor one. For registration of two rangeimages, six parameters (regarding rotation and translationon X, Y , and Z axis, respectively) are defined as a“transformation vector.” When applying this vector to oneimage, it is possible to align it with another one.
Our SA-based approach basically has three main stages:1) initial solution, 2) coarse alignment, and 3) fine alignment,which are illustrated in Fig. 6. First, an initial solution isobtained by aligning two face images by their center of mass.This procedure is a rigid transformation which aligns bothimages to the same coordinate system and consequentlyprovides a faster convergence process. A coarse alignment isperformed using an SA-based searching procedure tominimize a robust assessment measure based on MSACestimator [37], which is combined with resulting MSE ofcorresponding points between the two face images. MSACdefines a threshold that classifies corresponding pointseither as inliers or outliers. The error associated to outliers isa fixed penalty and to inliers is the error measure itself. Byreducing the error associated to outliers, their influence isminimized on registration process and, therefore, a betteralignment can be obtained. In the last step, a fine alignmentis obtained by an SA-based searching procedure using SIMas assessment measure, where the goal is to maximizeinterpenetrating points between the two faces.
The “temperature” parameter t is reduced very slowlyand two iterations are performed for each allowed“temperature” until the final one is achieved, otherwisesystem becomes frozen [25]. The initial t0 must be “hot”enough to accept almost every neighbor solution from thecandidate one. If it is set to a low value, then final solutionmight be close to the initial one; otherwise, the searchprocedure will run randomly at least in initial stages of SA.Initial “temperature” was empirically defined as t0 ¼ 0:002and t0 ¼ 0:07 for stages 2) and 3), respectively. With thesevalues for t0, approximately 60 percent of worst solutionsare accepted. According to Rayward-Smith et al. [31], this isa criterion that should be met for initial “temperature.” Thestop criterion can be attested if best solution does notchange within k iterations (i.e., the system is frozen).
The search procedure is performed by adding smallrandom values within ½�1; 1� to each element of transforma-tion vector in an attempt to reach better neighbor solutions.In our experiments, we observed that not all valid points arerequired to obtain a good alignment; instead, a samplingrate s of valid points equally spaced is used. Consequently,
QUEIROLO ET AL.: 3D FACE RECOGNITION USING SIMULATED ANNEALING AND THE SURFACE INTERPENETRATION MEASURE 211
Fig. 6. SA main stages: 1) initial solution, 2) coarse alignment usingMSAC, and 3) fine alignment using SIM.

it is possible to boost algorithm speed and still achieve good
alignments. For our experiments we defined s ¼ 20 and
s ¼ 30, for stages 2) and 3) respectively, and we defined
k ¼ 200. Although we only use a sample of points, the final
SIM value that assesses alignment is computed taking into
account all valid points from both surfaces. The MSAC
threshold was defined as T ¼ 3:0, which represents the
inlier boundary distance for corresponding points. These
threshold values were empirically defined using a set of
images from FRGC v1 database, and then validated on a
larger data set.
5.3 Modified SA Approach for 3D Face Matching
We observed that the matching between a neutral face andanother with expression may lead to imprecise alignments.These alignments produce low SIM values that conse-quently affect the authentication process. Consequently,and also because a happy expression is the most commonwhen people take pictures, we present a modified SAprocedure to improve results in these situations. Byobserving the faces with happy expression one can see thatthe most affected regions are the cheek and mouth areas.
The main idea of this approach is to guide the matching
of a neutral face with the other one with expression to areas
that have more expression invariant (e.g., the nose and
forehead regions). Other authors have employed similar
approaches. Martinez [26] proposes a method for 2D face
recognition to deal with the occlusion problem. The main
idea is to segment the face image into several regions, and
analyze each one of them individually. Faltemier et al. [14]
segment the face into 28 regions, which are aligned with
their corresponding ones. Then the regions that presented
fewer disturbances are combined to produce the authenti-
cation score.During the SA registration process, the matching is
guided to be stronger on those invariant areas. This
approach is performed by dividing a face in nine sectors,
based on feature points detected by the end of preproces-
sing stage, as presented in Section 4. Fig. 7 shows the nine
sectors and invariant regions used during matching.In the original matching process, the SIM is computed
based on the number of interpenetrating points from a
surface A in respect to B. In this modified approach, each
interpenetrating point q that belongs to one of the invariant
regions receives a high weight (i.e., w ¼ 500); otherwise, it
receives a penalty, w ¼ 0. The final SIM score is still
achieved by setting to all interpenetrating points with w ¼ 1.
The modified SA approach for face matching is more
suitable when we have to compare a neutral face image
with others having facial expressions. One possibility is to
apply this technique when the normal face matching fails
during recognition process. This can be performed by using
a hierarchical model [12]. Results using this approach can
be verified in Section 6.
6 3D FACE AUTHENTICATION
To accomplish 3D face authentication we used the SIMscores computed by matching segmented facial regions. Iftwo face images are from the same person, the matchingproduces a high SIM value; otherwise, it computes a lowSIM value. We performed one first experiment to verifywhich region produced the best result for face recognition.Each image from the neutral noiseless data set was matchedto all the other neutral noiseless images in the FRGC v2database, and the verification rate was computed at0 percent FAR. Table 2 shows verification results usingonly each region. The first column describes the face regionused, followed by the verification rate. The last columnpresents the number of false rejections, i.e., number ofcombinations from the same subjects that were rejected.
By observing these results, the face and the elliptical noseregions presented the highest verification rates. Resultsshow that the modified SA procedure presented inferiorresults when compared to the original SA approach.However, in [30], we stated that modified SA was moresuitable when comparing neutral face images to others withexpression, and an improvement of 15 percent was reportedover original SA approach. Then, we performed a secondexperiment, in which we combined scores for each regionusing the sum rule. The value obtained from the sum is thenused as similarity score for two faces. Results are presentedin Table 3.
The best performance was achieved combining all
regions. Some other works also employ the sum rule to
combine different measures [8], [14], [24]. In fact, Kittler
et al. [21] prove that the sum rule outperforms other
combination classifiers. By including the SIM computed for
the modified SA matching into the sum rule, the number of
false rejections was reduced from 56 to 39 cases; therefore,
we decided to use the metric C þE þ U þ F þM as the
similarity score of our method. This score is also suitable for
both identification and verification systems. In fact, other
approaches can be used to combine classifiers, e.g., product
rule, which is employed by [8].
212 IEEE TRANSACTIONS ON PATTERN ANALYSIS AND MACHINE INTELLIGENCE, VOL. 32, NO. 2, FEBRUARY 2010
Fig. 7. Sectors used for the modified SA approach: (a) original approach,(b) face sectors, and (c) brighter sectors used for matching.
TABLE 2Verification Rate for Each Face Region, at 0 Percent FAR

6.1 Hierarchical Evaluation Model
We have developed a hierarchical model to be applied in
verification systems using 0 percent FAR [12]. In this
approach, one region is analyzed only if the matching score
of the previous one was not sufficient to determine whether
images belong to the same subject or not.
The matching classification is based on two thresholds:
1) recognition threshold, and 2) rejection threshold. If the
matching score is higher than the recognition threshold,
both images are assumed to belong to the same person. If
lower than a rejection threshold, images are labeled as
being from different subjects. In case the matching score
lies between the thresholds, no affirmation can be made
and the next region of hierarchy is then used for a new
classification attempt. We employed the same strategy
proposed by Drovetto et al. [12] to define rejection and
acceptance thresholds, where these values are automati-
cally defined to avoid false rejection and false acceptance,
respectively. As a result, the hierarchical evaluation model
is more appropriated when dealing with systems that
require a 0 percent FAR.This method aims to achieve high verification rates and
keep execution time short. The order in which each regionis processed plays an important role since smaller ones(e.g., nose) can be computed faster than larger ones.Consequently, the average execution time tends to be nearthe necessary to match smaller regions (usually around
4 seconds). In the last hierarchy level, the matching score of
all regions are combined using the sum rule. This approach
can boost verification rate because sometimes one single
region can lead to the correct result while the combination
of all regions cannot. This particular situation can be
observed on images that have hair occlusion, noise, or
facial expression [12].
6.2 Extended Hierarchical Evaluation Model
We also propose an extended version of the hierarchy
approach. In each step of the hierarchy, instead of assessing
only the matching score obtained at that level, the sum of all
levels computed to the moment is also used. The matching
hierarchy was defined as the following levels:
1. circle,2. elliptical,3. upper head,4. face region, and5. face region using the modified SA.
At the end of the hierarchy, the sum of all regions is used
to verify whether images belong or not to the same subject.Fig. 8 illustrates how this approach is organized. In total,
28 measures are computed and the sum of the five SIM
values is the last one to be assessed. The computed
measures for each level are shown in Table 4.
QUEIROLO ET AL.: 3D FACE RECOGNITION USING SIMULATED ANNEALING AND THE SURFACE INTERPENETRATION MEASURE 213
TABLE 4Scores Computed at Each Level of the Hierarchy
Fig. 8. Hierarchical evaluation model diagram [12].
TABLE 3Verification Rate Combining All Face Regions, at 0 Percent FAR
7 EXPERIMENTAL RESULTS
Experiments were performed intending to reproduce a
genuine face recognition system, where matching is per-
formed between an acquired face image with others stored in
a database. The experiments assessed two types of authenti-
cation systems: verification and identification. In verification
systems, the objective is to answer if a person is who he/she
claims to be. The performance is measured assessing the
verification rate achieved at a predefined FAR. When using a
0 percent FAR, it is possible to ensure that any nonauthorized
person is going to be accepted in the authentication system.
Identification systems retrieve the identity of a person
comparing the input image with the entire database. The
system outputs a rank of the most similar faces based on
similarity score. Performance is measured using rank-one
accuracy, which indicates when the best matching score is
actually from the same subjects [6].For experiments, the FRGC v2 database was segmented
into several controlled data sets, each one with an
increasing level of difficulty, i.e., addition of images with
expression and artifacts. Table 5 shows the data sets
followed by their respective description, based on classifi-
cation described in Table 1. We performed a comparison of
each image with all other remaining ones in the database,
totaling more than 40 million combinations. Then, all of the
matching results were divided into several data sets for a
detailed analysis. All combinations were split into several
groups and executed in parallel. For these experiments, the
label of subject 04643 was changed to 04783. The FRGC
organizers confirmed that they actually are the same people
(see Section 3).
7.1 SA-Based Approach Performance
The time constraint is one of the main worries when using
SA to perform 3D face matching in an authentication
system. We performed an experiment using a controlled
environment for time analysis. A set of 200 random images
were selected and combined with each other, totaling
19,900 combinations. We used a computer with the
following configuration: Linux O.S., Intel Pentium D
3.4 GHz, cache of 2 MB and 1 GB of memory. Table 6
presents the average execution time of the SA approach
regarding the matching of two face regions.
7.2 Experiment I: Verification
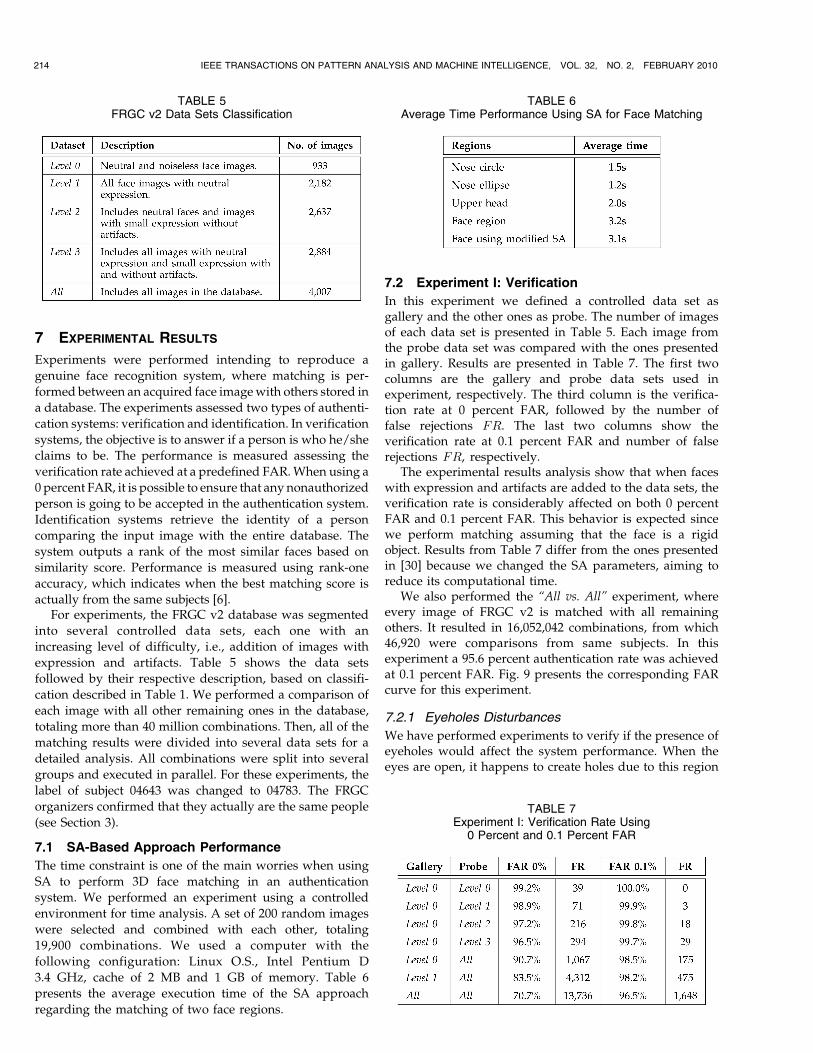
In this experiment we defined a controlled data set asgallery and the other ones as probe. The number of imagesof each data set is presented in Table 5. Each image fromthe probe data set was compared with the ones presentedin gallery. Results are presented in Table 7. The first twocolumns are the gallery and probe data sets used inexperiment, respectively. The third column is the verifica-tion rate at 0 percent FAR, followed by the number offalse rejections FR. The last two columns show theverification rate at 0.1 percent FAR and number of falserejections FR, respectively.
The experimental results analysis show that when faceswith expression and artifacts are added to the data sets, theverification rate is considerably affected on both 0 percentFAR and 0.1 percent FAR. This behavior is expected sincewe perform matching assuming that the face is a rigidobject. Results from Table 7 differ from the ones presentedin [30] because we changed the SA parameters, aiming toreduce its computational time.
We also performed the “All vs. All” experiment, whereevery image of FRGC v2 is matched with all remainingothers. It resulted in 16,052,042 combinations, from which46,920 were comparisons from same subjects. In thisexperiment a 95.6 percent authentication rate was achievedat 0.1 percent FAR. Fig. 9 presents the corresponding FARcurve for this experiment.
7.2.1 Eyeholes Disturbances
We have performed experiments to verify if the presence ofeyeholes would affect the system performance. When theeyes are open, it happens to create holes due to this region
214 IEEE TRANSACTIONS ON PATTERN ANALYSIS AND MACHINE INTELLIGENCE, VOL. 32, NO. 2, FEBRUARY 2010
TABLE 5FRGC v2 Data Sets Classification
TABLE 6Average Time Performance Using SA for Face Matching
TABLE 7Experiment I: Verification Rate Using
0 Percent and 0.1 Percent FAR

specularity and, when the eyes are closed, the eyelashesmay not be correctly scanned. We used only the Level 0 dataset in this experiment to verify if the eyeholes really affectthe matching procedure. This data set was segmented in1) without holes, 2) small holes, and 3) large holes. In total,7,400 comparisons were computed by comparing all imageswithout holes against those images with holes.
For the upper head and face regions, a verification rate of97.4 percent and 94.7 percent were computed, respectively.Both circular and elliptical nose regions achieved averification rate of 100.0 percent. However, when usingthe sum rule, a verification rate of 100 percent wasachieved, using 0 percent FAR. In fact, the eyeholes maydisturb the upper head and face matching procedure. But,since we use the nose region, the eyeholes disturbances canbe avoided. One way to avoid it is to use the hierarchicalmodel, described in Section 6.1.
7.3 Experiment II: Identification
For the identification experiment, we defined probe andgallery data sets. In this experiment, we defined four datasets as gallery:
1. Level 0, with 933 images,2. Level 1, with the 2,182 images,3. First with 465 images corresponding to the first
image from each subject that appears into thedatabase, and
4. All, with 4,007 images.
The probe data set for each gallery includes all theremaining images from the database, which are not in thegallery data set. From the probe data set, only the subjectswith a corresponding image in the gallery were evaluated.For the experiment using the All data set, each subject fromprobe was compared with the other 4,006 remaining onesstored in the database. The Cumulative Match Curve(CMC) is presented in Fig. 10, and the results achieved forrank one are presented in Table 8.
Comparing a 3D face image against a huge database maynot be very practical due to time constraints using the SA oreven the ICP. Faltemier et al. [14] considered that time delaywould be feasible in verification scenarios, e.g., airportcheck-in. Besides, there are options to deal with the time-consuming issue. In our experiments, we include some
improvements to speed up SA, such as adding a prealign-ment stage based in the center of mass and using only asample of the image points to perform the alignment. Mianet al. [28] propose a rejection classifier, which eliminates97 percent of images from the database. Then, the 3D facecomparison are applied only to small subsets.
By observing the experimental results, the proposedapproach achieved a rank-one recognition higher than98 percent. The experiment All vs. All presented the highestrecognition rate because one subject may have more thanone image stored into the gallery data set. In fact, Faltemieret al. [13] show that by using a gallery composed of multipleimages it is possible to obtain higher performance.
7.4 Experiment III: FRGC ROC III
This experiment is suggested by the FRGC program, asdescribed in [29]. The gallery data set was defined withimages from fall 2003 and the probe data set containingimages taken during spring 2004. The time intervalbetween both data sets makes its feasibility more difficult.For this experiment, we performed both verification andidentification experiments and results are shown in Table 9.In the verification experiment, when using 0 percent FARan authentication score of 77.2 percent was achieved. Forthe identification experiment, a rank-one accuracy of99.6 percent was achieved. Fig. 11 presents FAR andCMC curves for this experiment.
7.5 Experiment IV: Hierarchical Evaluation Model
Results for verification experiments at 0 percent FAR canbe improved by employing the hierarchical-based ap-proach for range image matching. Table 10 shows a
QUEIROLO ET AL.: 3D FACE RECOGNITION USING SIMULATED ANNEALING AND THE SURFACE INTERPENETRATION MEASURE 215
Fig. 10. Plot of CMC curves: (a) Level 0 vs. Others, (b) Level 1 vs.Others, (c) First vs. Others, and (d) All vs. All.
TABLE 8Experiment II: Rank-One Recognition Rate
Fig. 9. System performance for the “All vs. All” experiment.

comparison between performance when using the sumrule as an assessment measure, the hierarchical evaluationmodel, H, as proposed in [12], and the extendedhierarchical approach, EH, described in Section 6.1.
Based on these experimental results one can see that theuse of the hierarchical evaluation model makes it possible toboost recognition performance. Moreover, our extendedapproach produced better results when compared with theother two.
7.6 Comparison with Other Methods
Some authors have published their results using the FRGC v2
database. We reproduced the same experiments using all
the images, including those with artifacts, to provide a
comparison with the performance of other methods. Be-
sides, we noticed that the recognition results presented in
this section were the same with or without this adjustment.
Table 11 shows a verification experiment using All vs. Alldata set. Table 12 presents rank-one results using First vs.Others data set, and results from FRGC ROC III are availablein Table 13.
For the FRGC ROC III, we performed the sameexperiment described in [19], which uses two data sets,one with only neutral images and the other with only thoseimages with facial expression. These data sets wereobtained using the classification provided by the FRGC v2database. Results are presented in Table 14.
216 IEEE TRANSACTIONS ON PATTERN ANALYSIS AND MACHINE INTELLIGENCE, VOL. 32, NO. 2, FEBRUARY 2010
TABLE 10Experiment IV: Verification Rate at 0 Percent FAR
Fig. 11. Performance on experiment FRGC ROC III: (a) FAR Curve and(b) CMC Curve.
TABLE 11Verification Results Using the All vs. All Data Set,
at 0.1 Percent FAR
TABLE 12Identification Results Using First vs. Others Data Set
TABLE 13Verification Results for FRGC ROC III, at 0.1 Percent FAR
TABLE 9Experiment III: Results for FRGC ROC III

The results support that our method produces betterperformance for the first two experiments when comparedwith the other works. In FRGC ROC III experiment, ourmethod achieved a score very close to the one presented in[19]. When using data sets classified by expressions, ourmethod has the best performance in the neutral data set, butslightly lower performance compared to the non-neutraldata set. One of the main reasons is that we perform thematching procedure assuming that the face is a rigid object.Other authors who employ similar approaches to performmatching also report this limitation and, to reduce theexpression impact, they focus on small and invariant faceareas [8], [14]. Kakadiaris et al. [19] can deal better with theexpression effects because their framework includes de-formable face models in the matching process, whichimproves the efficiency of their method.
7.7 Experiment V: Recognition Rate Improvement
One of the constrains applied to the SA was limiting thenumber of iterations k (see Section 5.2) to keep the executiontime feasible. We performed one experiment to verifywhether the recognition rate could be improved, when weallow the SA larger number of iterations. In this experiment,the SIM was recomputed by using SA with k ¼ 2;000 onthose matches that were false accepted and false rejected.Since our objective is to improve the SIM matching score,this set of combinations is the one which will probablyachieve a higher score.
Initially, this approach was applied in the set of thecombinations between different subjects that would beaccepted with 0.5 percent FAR in both All vs. All and Fall vs.Spring experiments. Afterward, the set of false rejection wasdefined and the matching using more iteration wasperformed. Then, the table with all the results was updatedand the verification and rank-one recognition rate werecomputed. Table 15 presents the achieved results.
As observed, when we allow the SA a larger number ofiterations, we can outperform the recognition rate in bothverification and authentication modes. It can be stated thatthe SIM presents a high potential when employed assimilarity measure for 3D face recognition.
8 FINAL REMARKS
In this paper, we presented an automatic framework for 3Dface recognition. Our method uses a Simulated Annealing-based approach for range image registration with theSurface Interpenetration Measure. Initially, the face isextracted from the input image and segmented into fourregions. Each region is matched with its corresponding onefrom an image that was previously enrolled in a database.
When performing matching of the entire face region, amodified SA approach is employed to minimize facialexpression effects. The similarity score is attained bycombining all the computed SIM values using the sum rule.
We performed extensive experiments on the FRGC v2database to evaluate the performance of our method. Thedatabase was manually segmented into different data setsaccording to the images facial expression intensity andnoise level. Then we made an accurate analysis regardingour method behavior. We also detected a subject with twodifferent identities in the database with this analysis. Byusing this novel approach one can distinguish whether twoface images with neutral expression belong to the samesubject or not with a verification rate of 99 percent, at0 percent FAR. From the experimental results we observedthat, when comparing a neutral face with other faces withexpressions, the performance of our method slightlydecreases. When using all images in the database, in the“All vs. All” experiment, faces still can be recognized with96.5 percent accuracy, at 0.1 percent FAR.
We also developed an extended approach of thehierarchical evaluation method to perform a verificationexperiment at 0 percent FAR [12]. By including partial sumrules during hierarchy analysis, we improved the verifica-tion rate from 70.7 percent to 77.5 percent, in the “All vs.All” experiment. In the FRGC ROC III experiment, weachieved a verification rate of 96.6 percent, at 0.1 percentFAR, and a rank-one accuracy of 98.3 percent. Although ourmethod is affected when images contain facial expressionand artifacts, we obtained results very close to the onereported by Kakadiaris et al. [19], which employs deform-able face models to deal with the facial expressions.Moreover, we performed an experiment to verify whetherthe recognition rate could be improved if the time constraintis avoided. The SA matching was performed using a largernumber of iterations, and the results improved the recogni-tion rate. With this, we show the potential of the SIM assimilarity score for 3D face recognition.
QUEIROLO ET AL.: 3D FACE RECOGNITION USING SIMULATED ANNEALING AND THE SURFACE INTERPENETRATION MEASURE 217
TABLE 15Experiment V: Recognition Rate
TABLE 14Verification Results for FRGC ROC III Experiment
in Different Data Sets, at 0.1 Percent FAR

In an identification scenario, our method achieves a
98.4 percent recognition rate when using the “First vs.
Others” data set. Also, for all the experiments performed in
the identification mode, our method achieved rank-one
accuracy greater than 98 percent. To the best of our
knowledge, these are the best results for this experiment
reported in the literature.
ACKNOWLEDGMENTS
The authors gratefully acknowledge CNPq, CAPES, and
FINEP for financial support. Also, the authors would like to
thank Dr. Jonathon Phillips, Dr. Kevin Bowyer, and
Dr. Patrick Flynn for allowing them to use the images.
REFERENCES
[1] “IMAGO Research Group: 3D Face Recognition Homepage,”http://www.imago.ufpr.br/3D_Face_Recognition, 2009.
[2] A.F. Abate, M. Nappi, D. Riccio, and G. Sabatino, “2D and 3D FaceRecognition: A Survey,” Pattern Recognition Letters, vol. 28, no. 14,pp. 1885-1906, 2007.
[3] F. Al Osaimi, M. Bennamoun, and A. Mian, “An ExpressionDeformation Approach to Non-Rigid 3D Face Recognition,” Int’l J.Computer Vision, vol. 81, pp. 302-316, 2009.
[4] O.R.P. Bellon, L. Silva, C. Queirolo, S. Drovetto Jr., and M.P.Segundo, “3D Face Image Registration for Face Matching Guidedby the Surface Interpenetration Measure,” Proc. IEEE Int’l Conf.Image Processing, pp. 2661-2664, 2006.
[5] P.J. Besl and N.D. McKay, “A Method for Registration of 3-DShapes,” IEEE Trans. Pattern Analysis and Machine Intelligence,vol. 14, no. 2, pp. 239-256, Feb. 1992.
[6] R. Bolle, J. Connell, S. Pankanti, N. Ratha, and A. Senior, Guide toBiometrics. Springer Verlag, 2003.
[7] K.W. Bowyer, K. Chang, and P.J. Flynn, “A Survey ofApproaches and Challenges in 3D and Multi-Modal 3D+2DFace Recognition,” Computer Vision and Image Understanding,vol. 101, pp. 1-15, 2006.
[8] K.I. Chang, K.W. Bowyer, and P.J. Flynn, “Multiple Nose RegionMatching for 3D Face Recognition under Varying Facial Expres-sion,” IEEE Trans. Pattern Analysis and Machine Intelligence, vol. 28,no. 10, pp. 1695-1700, Oct. 2006.
[9] J. Cook, V. Chandran, S. Sridharan, and C. Fookes, “FaceRecognition from 3D Data Using Iterative Closest PointAlgorithm and Gaussian Mixture Models,” Proc. Int’l Symp.3D Data Processing, Visualization, and Transmission, pp. 502-509,2004.
[10] J. Cook, C. McCool, V. Chandran, and S. Sridharan, “Combined2D/3D Face Recognition Using Log-Gabor Templates,” Proc. IEEEInt’l Conf. Video and Signal Based Surveillance, p. 83, 2006.
[11] G. Dalley and P.J. Flynn, “Range Image Registration: A SoftwarePlatform and Empirical Evaluation,” Proc. Int’l Conf. 3-D DigitalImaging and Modeling, pp. 246-253, 2001.
[12] S. Drovetto Jr., L. Silva, and O.R.P. Bellon, “HierarchicalEvaluation Model for 3D Face Recognition,” Proc. Int’l Conf.Computer Vision Theory and Applications, vol. 2, pp. 67-74, 2008.
[13] T. Faltemier, K. Bowyer, and P. Flynn, “Using a Multi-InstanceEnrollment Representation to Improve 3D Face Recognition,”Proc. Int’l Conf. Biometrics: Theory, Applications, and Systems, vol. 1,pp. 1-6, 2007.
[14] T. Faltemier, K.W. Bowyer, and P.J. Flynn, “A Region Ensemblefor 3D Face Recognition,” IEEE Trans. Information Forensics andSecurity, vol. 3, no. 1, pp. 62-73, Mar. 2008.
[15] P.J. Flynn, T. Faltemier, and K.W. Bowyer, “3D Face Recognition,”Handbook of Biometrics, A.K. Jain, A. Ross, and P.J. Flynn, eds.,chapter 11, pp. 211-229, Springer, 2008.
[16] N. Gelfand, L. Ikemoto, S. Rusinkiewicz, and M. Levoy,“Geometrically Stable Sampling for the ICP Algorithm,” Proc.Int’l Conf. 3-D Digital Imaging and Modeling, pp. 260-267, 2003.
[17] J. Huang, B. Heisele, and V. Blanz, “Component-Based FaceRecognition with 3D Morphable Models,” Proc. Int’l Conf.Audio and Video-Based Biometric Person Authentication, pp. 27-34,2003.
[18] M. Husken, M. Brauckmann, S. Gehlen, and C.V. der Malsburg,“Strategies and Benefits of Fusion of 2D and 3D Face Recogni-tion,” Proc. IEEE Conf. Computer Vision and Pattern Recognition,pp. 174-174, 2005.
[19] I. Kakadiaris, G. Passalis, G. Toderici, N. Murtuza, and T.Theoharis, “Three-Dimensional Face Recognition in the Presenceof Facial Expression: An Annotated Deformable Model Ap-proach,” IEEE Trans. Pattern Analysis and Machine Intelligence,vol. 29, no. 4, pp. 640-649, Apr. 2007.
[20] S. Kirkpatrick, C.D. Gelatt, and M.P. Vecchi, “Optimization bySimulated Annealing,” Science, vol. 220, no. 4598, pp. 671-680,1983.
[21] J. Kittler, M. Hatef, R. Duin, and J. Matas, “On CombiningClassifiers,” IEEE Trans. Pattern Analysis and Machine Intelligence,vol. 20, no. 3, pp. 226-239, Mar. 1998.
[22] W.-Y. Lin, K.-C. Wong, N. Boston, and Y.H. Hu, “3D FaceRecognition under Expression Variations Using Similarity MetricsFusion,” Proc. IEEE Int’l Conf. Multimedia and Expo, pp. 727-730,2007.
[23] X. Lu and A.K. Jain, “Deformation Modeling for Robust 3D FaceMatching,” Proc. IEEE Conf. Computer Vision and Pattern Recogni-tion, vol. 2, pp. 1377-1383, 2006.
[24] X. Lu, A.K. Jain, and D. Colbry, “Matching 2.5D Face Scans to 3DModels,” IEEE Trans. Pattern Analysis and Machine Intelligence,vol. 28, no. 1, pp. 31-43, Jan. 2006.
[25] M. Lundy and A. Mees, “Convergence of an AnnealingAlgorithm,” Math. Programming: Series A and B, vol. 34, no. 1,pp. 111-124, 1986.
[26] A. Martinez, “Recognizing Imprecisely Localized, Partially Oc-cluded, and Expression Variant Faces from a Single Sample PerClass,” IEEE Trans. Pattern Analysis and Machine Intelligence,vol. 24, no. 6, pp. 748-763, June 2002.
[27] T. Maurer, D. Guigonis, I. Maslov, B. Pesenti, A. Tsaregor-odtsev, D. West, and G. Medioni, “Performance of GeometrixActiveID 3D Face Recognition Engine on the FRGC Data,”Proc. IEEE Conf. Computer Vision and Pattern Recognition,pp. 154-154, 2005.
[28] A. Mian, M. Bennamoun, and R. Owens, “An Efficient Multi-modal 2D-3D Hybrid Approach to Automatic Face Recognition,”IEEE Trans. Pattern Analysis and Machine Intelligence, vol. 29, no. 11,pp. 1927-1943, June 2007.
[29] P.J. Phillips, P.J. Flynn, T. Scruggs, K.W. Bowyer, J. Chang, K.Hoffman, J. Marques, J. Min, and W. Worek, “Overview of theFace Recognition Grand Challenge,” Proc. IEEE Conf. ComputerVision and Pattern Recognition, pp. 947-954, 2005.
[30] C. Queirolo, M.P. Segundo, O.R.P. Bellon, and L. Silva, “Noiseversus Facial Expression on 3D Face Recognition,” Proc. Int’l Conf.Image Analysis and Processing, pp. 171-176, 2007.
[31] V.J. Rayward-Smith, I.H. Osman, C.R. Reeves, and G.D. Smith,Modern Heuristic Search Methods. John Wiley & Sons Ltd., 1996.
[32] S. Rusinkiewicz and M. Levoy, “Efficient Variants of the ICPAlgorithm,” Proc. Int’l Conf. 3-D Digital Imaging and Modeling,pp. 145-152, 2001.
[33] M.P. Segundo, C. Queirolo, O.R.P. Bellon, and L. Silva, “Auto-matic 3D Facial Segmentation and Landmark Detection,” Proc.Int’l Conf. Image Analysis and Processing, pp. 431-436, 2007.
[34] L. Silva, O.R.P. Bellon, P.F.U. Gotardo, and K.L. Boyer, “RangeImage Registration Using Enhanced Genetic Algorithms,” Proc.IEEE Int’l Conf. Image Processing, vol. 2, pp. 711-714, 2003.
[35] L. Silva, O.R.P. Bellon, and K. Boyer, Robust Range ImageRegistration Using Genetic Algorithms and the Surface InterpenetrationMeasure, vol. 60. World Scientific Publishing, 2005.
[36] L. Silva, O.R.P. Bellon, and K. Boyer, “Robust Range ImageRegistration Using the Surface Interpenetration Measure andEnhanced Genetic Algorithms,” IEEE Trans. Pattern Analysis andMachine Intelligence, vol. 27, no. 5, pp. 762-776, May 2005.
[37] P. Torr and A. Zisserman, “MLESAC: A New Robust Estimatorwith Application to Estimating Image Geometry,” Computer Visionand Image Understanding, vol. 78, pp. 138-156, 2000.
[38] W. Zhao, R. Chellappa, P.J. Phillips, and A. Rosenfeld, “FaceRecognition: A Literature Survey,” ACM Computing Surveys,vol. 35, no. 4, pp. 399-458, 2003.
218 IEEE TRANSACTIONS ON PATTERN ANALYSIS AND MACHINE INTELLIGENCE, VOL. 32, NO. 2, FEBRUARY 2010

Chaua C. Queirolo received the BS degree incomputer science from the Universidade Feder-al do Parana (UFPR), Brazil, in 2007, and hisundergraduate research work received awardsfrom the Brazilian Computer Society. He joinedthe IMAGO Research Group in 2004. Since2008, he has been an MSc student at IMAGO.He is a student member of the IEEE, the IEEEComputer Society, and the Brazilian ComputerSociety. His research interests include range
imaging, computer vision, computer games, and dinosaurs.
Luciano Silva received the BS and MScdegrees in informatics from the UniversidadeFederal do Parana (UFPR), Brazil, in 1998 and2000, respectively, and the PhD degree inelectrical engineering and industrial informaticsfrom the Universidade Tecnologica Federal doParana (UTFPR), Brazil, in 2003. He joined theIMAGO Research Group in 1996. From 2002 to2003, he did doctoral studies from the SignalAnalysis and Machine Perception Laboratory at
Ohio State University. Since 2004, he has been with the InformaticsDepartment of UFPR, where he is currently an associate professor. Hisundergraduate work and master’s dissertation received awards from theBrazilian Computer Society. In 2004, he received the First Place Awardin the Doctoral Dissertation Contest of the XVII Brazilian Symposium onComputer and Image Processing. His research interests includecomputer vision, 2D/3D image analysis, and assistive technologies.He is a member of the IEEE and the Brazilian Computer Society.
Olga R.P. Bellon received the BS degree inelectrical engineering in 1987 from the Uni-versidade Federal do Espirito Santo (UFES),Brazil, and the MSc and PhD degrees fromthe Universidade Estadual de Campinas (UNI-CAMP), Brazil, in electrical engineering, in1990 and 1997, respectively. In 1995, shefounded the IMAGO Research Group at theUniversidade Federal do Parana (UFPR),where she is a professor. From 1997 to
2000, she was the head of the Graduate Program of Informatics.From 2000 to 2002, she was the general research coordinator of theUFPR. From 2002 to 2003, she spent a sabbatical year in the SignalAnalysis and Machine Perception Laboratory at Ohio State Uni-versity. In 2004, she was the general chair of the XVII BrazilianSymposium on Computer and Image Processing jointly with II Ibero-American Symposium on Computer Graphics. In 2007, she waselected president of the Special Committee in Computer Graphicsand Image Processing of the Brazilian Computer Society. Her mainresearch interests lie in biometrics, pattern recognition, range imageanalysis, digital preservation of natural and cultural assets and virtualmuseums, image mining, and medical imaging. She is a member ofthe IEEE, the IEEE Computer Society, the Brazilian ComputerSociety, and the Brazilian Health Informatics Society.
Maurıcio Pamplona Segundo received the BSdegree in computer science from the Universi-dade Federal do Parana (UFPR), Brazil, in2007, and his undergraduate research workreceived awards from the Brazilian ComputerSociety. He joined the IMAGO Research Groupin 2005. Since 2008, he has been an MScstudent at IMAGO. His research interestsinclude biometrics, automatic features extrac-tion, pattern recognition, image segmentation,
image registration, and security.
. For more information on this or any other computing topic,please visit our Digital Library at www.computer.org/publications/dlib.
QUEIROLO ET AL.: 3D FACE RECOGNITION USING SIMULATED ANNEALING AND THE SURFACE INTERPENETRATION MEASURE 219
Copyright © 2022 FDOKUMEN