33._vca4d_zambia_maize_november_2021.pdf 4.37 MB
247
-
Upload
khangminh22 -
Category
Documents
-
view
1 -
download
0
Transcript of 33._vca4d_zambia_maize_november_2021.pdf 4.37 MB


Value Chain Analysis for Development (VCA4D) is a tool funded by the European Commission / INTPA and is implemented in partnership with Agrinatura.
Agrinatura (http://agrinatura-eu.eu) is the European Alliance of Universities and Research Centers involved in agricultural research and capacity building for development.
The information and knowledge produced through the value chain studies are intended to support
the Delegations of the European Union and their partners in improving policy dialogue, investing in value chains and better understanding the changes linked to their actions
VCA4D uses a systematic methodological framework for analysing value chains in agriculture, livestock, fishery, aquaculture and agroforestry. More information including reports and
communication material can be found at: https://europa.eu/capacity4dev/value-chain-analysis-for-development-vca4d-
Team Composition Economist: Jean-Louis Fusillier Social expert: Alistair Sutherland Environmental expert: Ricardo Villani National expert: Antony Chapoto
The report was produced through the financial support of the European Union. Its content is the sole responsibility of its authors and does not necessarily reflect the views of the European Union. The report has been realised within a project financed by the European Union (VCA4D CTR 2016/375-804).
Citation of this report: Fusillier J-L, Sutherland A., Villani R., Chapoto A.., 2021. Maize Value Chain Analysis in Zambia. Report for the European Union, DG-INTPA Value Chain Analysis for Development Project (VCA4D CTR 2016/375-804), 222p + annexes.
VCA4D Project Management Unit Support Heval Yildirim, Marie-Hélène Dabat | Methodological Giorgia Mei, Sara Baumgart, Olimpia Orlandoni | Project management and graphic design

3
TABLE OF CONTENTS
ACRONYMS ............................................................................................................................................. 8 ACKNOWLEDGEMENTS .......................................................................................................................... 10 EXECUTIVE SUMMARY ............................................................................................................................ 11 INTRODUCTION ...................................................................................................................................... 21 1. FUNCTIONAL ANALYSIS ................................................................................................................. 22
1.1 OVERVIEW OF MAIZE PRODUCTS FLOWS AND MARKET SUPPLY ........................................................................ 22 1.1.1 Trends in maize production and domestic supply: a booming and fluctuating production ..................... 22 1.1.2 Resources and uses maize balance: predominance of food uses but expanding demand for feed ........... 23 1.1.3 Regional maize flows: a central “maize belt” with potential shift of production to northern ................. 24
1.2 PROCESSES AND PRODUCTS ...................................................................................................................... 27 1.2.1 Cultivation and post-harvest .............................................................................................................. 27 1.2.2 Transport of grains, aggregation and trading ...................................................................................... 30 1.2.3 Milling ............................................................................................................................................... 31 1.2.4 Secondary processing ........................................................................................................................ 33
1.3 ACTORS, FUNCTIONS AND STRATEGIES ....................................................................................................... 34 1.3.1 Input and service Providers ................................................................................................................ 34 1.3.2 Maize Producers/Farmers ................................................................................................................... 37 1.3.3 Aggregators and Traders .................................................................................................................. 44 1.3.4 Millers and Feed makers ................................................................................................................... 48 1.3.5 Brewers.............................................................................................................................................50 1.3.6 Maize based snack foods and drink manufacturers..............................................................................52 1.3.7 Retailers............................................................................................................................................52
1.4 MARKETING CHANNELS LINKING ACTORS AND MAIZE FLOWS ESTIMATES ........................................................... 53 1.4.1 Marketing channels ........................................................................................................................... 53 1.4.2 Synthesis on maize flows between actors ........................................................................................... 54
1.5 GOVERNANCE OF THE VALUE CHAIN, MARKET COORDINATION AND POLICY ........................................................ 57
2. ECONOMIC ANALYSIS .....................................................................................................................60
2.1 OBJECTIVES AND METHODOLOGY .............................................................................................................. 60 2.1.1 Design of the economic accounting model applied to the Zambian maize VC ...................................... 60 2.1.2 Data sources, accuracy, scope and limitations ....................................................................................65
2.2 FINANCIAL ANALYSIS OF ACTORS ............................................................................................................... 69 2.2.1 Farmers’ profitability ........................................................................................................................ 69 2.2.2 Traders’ profitability .......................................................................................................................... 74 2.2.3 Millers’ profitability ............................................................................................................................ 76 2.2.4 Conclusion to CQ 1.1 on profitability of maize activities for actors ........................................................ 78
2.3 EFFECTS OF THE MAIZE VC WITHIN THE NATIONAL ECONOMY, CONTRIBUTION TO ECONOMIC GROWTH .................. 79 2.3.1 Resources-uses Accounts for VC segments .......................................................................................... 79 2.3.2 Consolidated account of maize Value Chain and direct effects ............................................................ 82 2.3.3 Direct and indirect effects, contribution of maize VC to Zambia GDP ................................................... 83 2.3.4 Contribution of maize VC to the public finances ................................................................................. 84 2.3.5 Contribution of maize VC to the balance of trade ................................................................................85
2.4 SUSTAINABILITY WITHIN THE GLOBAL ECONOMY AND REGIONAL COMPETITIVENESS ............................................85 2.5 CONCLUSION TO FRAMING QUESTION 1 - WHAT IS THE CONTRIBUTION OF THE VC TO ECONOMIC GROWTH? .......... 87 2.6 GROWTH INCLUSIVENESS ......................................................................................................................... 88
2.6.1 Income distribution within the maize VC ............................................................................................ 88 2.6.2 Prospect on opportunities and limitation for inclusive economic growth .............................................. 89
2.7 CONCLUSION TO FRAMING QUESTION 2: IS THE ECONOMIC GROWTH INCLUSIVE? .............................................. 99 2.8 SUMMARY TABLE OF ECONOMIC INDICATORS ............................................................................................. 101

4
3. SOCIAL ANALYSIS ......................................................................................................................... 103
3.1 BACKGROUND ....................................................................................................................................... 103 3.2 WORKING CONDITIONS ........................................................................................................................... 106
3.2.1 Respect of labour rights ................................................................................................................... 106 3.2.2 Child Labour .................................................................................................................................... 107 3.2.3 Job safety ........................................................................................................................................ 107 3.2.4 Attractiveness ................................................................................................................................. 108 3.2.5 Working Conditions Summary .......................................................................................................... 109
3.3 LAND AND WATER RIGHTS ....................................................................................................................... 110 3.3.1 Equity, compensation and justice ..................................................................................................... 110 3.3.2 Land and Water Rights Summary .................................................................................................... 111
3.4 GENDER EQUALITY ................................................................................................................................. 111 3.4.1 Economic activities .......................................................................................................................... 112 3.4.2 Access to resources and services ....................................................................................................... 113 3.4.3 Decision making .............................................................................................................................. 120 3.4.4 Leadership and empowerment ......................................................................................................... 122 3.4.5 Hardship and division of labour ........................................................................................................ 124 3.4.6 Gender Equality Summary ............................................................................................................... 127
3.5 FOOD AND NUTRITION SECURITY .............................................................................................................. 129 3.5.1 Availability of food – given the increased importance of maize as a small holder crop ......................... 129 3.5.2 Accessibility of food ......................................................................................................................... 133 3.5.3 Utilisation and nutritional adequacy ................................................................................................. 135 3.5.4 Stability .......................................................................................................................................... 140 3.5.5 Food and Nutrition Summary ........................................................................................................... 145
3.6 SOCIAL CAPITAL ..................................................................................................................................... 147 3.6.1 Strength of producer organisations .................................................................................................. 147 3.6.2 Information and confidence ............................................................................................................. 148 3.6.3 Social involvement .......................................................................................................................... 150 3.6.4 Social Capital Summary................................................................................................................... 151
3.7 LIVING CONDITIONS ................................................................................................................................ 151 3.7.1 Health services ................................................................................................................................ 151 3.7.2 Housing .......................................................................................................................................... 152 3.7.3 Education and training .................................................................................................................... 153 3.7.4 Mobility........................................................................................................................................... 154 3.7.5 Living Conditions Summary ............................................................................................................. 154
3.8 FRAMING QUESTION 3: IS THE MAIZE VALUE CHAIN SOCIALLY SUSTAINABLE? .................................................. 155
4. ENVIRONMENTAL ANALYSIS ........................................................................................................ 158
4.1 INTRODUCTION ...................................................................................................................................... 158 4.2 GOAL AND SCOPE OF THE ENVIRONMENTAL ANALYSIS ................................................................................. 158
4.2.1 Systems boundaries ......................................................................................................................... 161 4.2.2 Studied value chain, functional unit and allocation approach ............................................................ 163 4.2.3 Data sources ................................................................................................................................... 166 4.2.4 Data quality and main limitations and assumptions .......................................................................... 167
4.3 LIFE CYCLE INVENTORY ........................................................................................................................... 168 4.3.1 Maize cultivation and post-harvest at farm ...................................................................................... 169 4.3.2 Transport and aggregation of grain .................................................................................................. 174 4.3.3 Pre-processing and processing ......................................................................................................... 174 4.3.4 Transport from mill .......................................................................................................................... 176
4.4 RESULTS: LIFE CYCLE IMPACT ASSESSMENT ................................................................................................ 176 4.4.1 Life cycle impact assessment method ............................................................................................... 176 4.4.2 Environmental impacts at farm-gate ................................................................................................ 177

5
4.4.3 Environmental impacts at the stages of the value chain: local and commercial sub-chain ....................... 182 4.5 COMPARISONS OF RESULTS WITH EVIDENCE/DATA FROM LITERATURE ............................................................. 191 4.6 UNCERTAINTIES AND ROBUSTNESS OF RESULTS ................................................................................................. 192 4.7 DISCUSSION: ENVIRONMENTAL SUSTAINABILITY OF MAIZE VC IN ZAMBIA ........................................................ 192 4.8 CONCLUSION: ENVIRONMENTAL SUSTAINABILITY OF MAIZE VC IN ZAMBIA ...................................................... 198
5. CONCLUSIONS - RECOMMENDATIONS .......................................................................................... 200 BIBLIOGRAPHY/ REFERENCE LIST ......................................................................................................... 209 6. ANNEXS ........................................................................................................................................ 223
6.1 FUNCTIONAL ANALYSIS ADDENDUM ......................................................................................................... 223 Input and service providers ........................................................................................................................... 223
6.2 ECONOMIC ANALYSIS ADDENDUM ........................................................................................................... 228 6.3 SOCIAL IMPACT ANALYSIS ADDENDUM...................................................................................................... 234 6.4 ENVIRONMENTAL ANALYSIS ADDENDUM ................................................................................................... 237 6.5 AGENDA OF MISSION AND INFORMANTS CONSULTED .................................................................................. 246

6
List of tables
Table 1: Maize balance Supply and Uses Zambia Year 2018 ...................................................................... 24 Table 2 : Categorisation of maize cropping systems in small and medium scale farms in Zambia 2017-2018 cropping season ...................................................................................................................................... 29 Table 3: Technical coefficients applied for cropping systems .................................................................... 30 Table 4 :Technical coefficients applied for trading ...................................................................................... 31 Table 5: Technical coefficients applied for milling ....................................................................................... 33 Table 6: Characteristics of small and medium scale farming households in Zambia (based on 2017-18 season) by four farmer categories Source: RALS 2019 data processing by IAPRI ................................... 38 Table 7: Small and Medium Scale Maize Grower production and sales 2017-18 Growing Season - by 3 Categories of Maize Producers ....................................................................................................................... 38 Table 8: Factors that might contribute to household maize cropping strategies .................................... 42 Table 9: Computation and financial indicators for activities accounts ...................................................... 62 Table 10: Value added accounting model ..................................................................................................... 63 Table 11: Social Accounting Matrix (SAM) structure .................................................................................... 64 Table 12: Accounts for the Zambia maize VC SAM ....................................................................................... 64 Table 13: Price breakdown of maize products ............................................................................................. 67 Table 14: Size distribution of Traders 2018 ................................................................................................... 68 Table 15: Scale of operation and seasonality of maize activities 2018 ..................................................... 69 Table 16: Productivities of maize cropping systems Zambia 2018 ............................................................ 71 Table 17: Maize Cropping pattern at Farm level Zambia 2018 ................................................................... 73 Table 18: Maize market pricing and volumes Year 2018/19 for Traders accounts ................................. 75 Table 19: Coefficients for induced Imports and Value Added ................................................................... 83 Table 20: Direct and Indirect effects of the Maize VC (in million ZMW) .................................................... 84 Table 21: Import Parity Price of Maize grain & Nominal Protection Coefficient ...................................... 86 Table 22: Output and Tradable Inputs values for Grain supplied by Traders and Farmers to Millers (600 K Mt) in Millions ZMW ..................................................................................................................................... 87 Table 23: Summary Table of Economic Indicators ..................................................................................... 102 Table 24: Access to FISP Subsidy and FSP Fertilizer by Type of Household ............................................ 117 Table 25: Percent of Households Acquiring DIS and E-Voucher FISP Inputs by landholding size and Gender of Household Head. ......................................................................................................................... 118 Table 26: Percentage of Family Labour Hours in Cultivation Provided by a Woman, by Activity, Main Maize Field - 2010/11 Source:(Republic of Zambia, 2011)......................................................................... 124 Table 27: Contribution to sub-chain 1 and sub-chain 2 of each cropping system (kg at harvest moisture content -13%-) to 1 kg of maize grain milled. ............................................................................................. 171 Table 28: Summary of impact categories included in each damage category of the ReCiPe 2016 method used in this study. ........................................................................................................................................... 177 Table 29: Cultivation stage (including land clearing and residue combustion) - midpoint impact categories per kg of grain produced by each farming system and by the combination of farming systems contributing to the local sub-chain and to the commercial sub-chain (FU: 1 KG). ................. 179 Table 30: Cultivation stage (including land clearing and residue combustion) - midpoint impact categories per hectare of maize cultivation by each farming system and by the combination of farming systems contributing to the local sub-chain and to the commercial sub-chain (FU: 1 HA). ................. 180 Table 31: Sub-chain 1 midpoint impact categories per kg of maize meal produced. ........................... 190 Table 32: Sub-chain 2 midpoint impact categories per kg of maize meal produced. Source: authors ........................................................................................................................................................................... 191

7
Table 33: Comparison of the maize Global Warming Potential results of maize cultivation in Zambia with some values from literature ................................................................................................................. 191
List of figures Figure 1: Production, Imports & Exports Maize grain Zambia 1980-2019 ................................................ 22 Figure 2: Maize cropping suitability map for Zambia .................................................................................. 25 Figure 3: Production of maize per district 2017/2018 ................................................................................. 26 Figure 4: Map of deficit districts in food insecurity 2019 ........................................................................... 27 Figure 5: Flows chart of Zambian maize VC 2018 Thousands metric tons of grain or processed product ............................................................................................................................................................................. 55 Figure 6: Matrix of flows Zambian maize VC 2018 in thousands Metric Tons .......................................... 56 Figure 7: Conceptual model of Zambia maize VC accounting for financial and economic assessment ............................................................................................................................................................................. 61 Figure 8: Marketing season of Maize by Farm cropping system type Marketing Year 2018/19 .......... 68 Figure 9: Breakdown of Value of Production + subsidies per hectare per Maize Cropping system Zambia 2018 .................................................................................................................................................................... 70 Figure 10: costs and Gross operating profit Maize production per Farm type ........................................ 73 Figure 11: cost and Gross Operating Profit of Maize Marketing Year 2018/19 ........................................ 75 Figure 12: cost and Gross Operating Profit of Industrial Mill 30 000 Mt maize processed/year 2018 77 Figure 13: cost and Gross Operating Profit of Small Mill, 2018/19 ............................................................ 78 Figure 14: Operating account of the segment Seeds and agro input supply ........................................... 79 Figure 15: Operating account of the segment Maize grain cropping ........................................................ 80 Figure 16: Operating account of the segment Trading private & public ................................................... 80 Figure 17: Operating account of the segment Industrial Milling ................................................................ 81 Figure 18: Operating account of the segment Small-scale Milling ............................................................. 81 Figure 19: Output values of the Maize VC ..................................................................................................... 82 Figure 20: Operating Account of the Maize VC ............................................................................................. 83 Figure 21: Distribution of Incomes to VC Actors (Gross operating profit, Wages and Financial interests) ............................................................................................................................................................................. 89 Figure 22: Social Profile of the Maize VC in Zambia ................................................................................... 105 Figure 23: Farmer Assessments of percentage of households growing hybrid maize over 5 presidential Eras since 1980. .............................................................................................................................................. 131 Figure 24: Prices of maize products in a local rural market July 2019- July 2020 ................................... 132 Figure 25: Comparing levels of household adequacy with maize production: Provincial Data ........... 141 Figure 26: Household Food Adequacy and Maize Sales in Zambia’s Ten Provinces: 2015 and 2019 comparison ...................................................................................................................................................... 142 Figure 27: Monthly Prices of White Maize Grain in Four Rural District Markets July 2019 to July 2020 ........................................................................................................................................................................... 145 Figure 28: a small-scale maize mill (A) and an industrial maize mill (B) in Zambia ................................ 161 Figure 29: System boundaries from cradle to retailer of the maize value chain in Zambia. ................ 162 Figure 30: System boundaries and grain/products flows within the two sub-chains. FU: 1 kg of meal (flows are shown for 1 kg of meal produced at small-scale mills and for 1 kg of meal from large-scale facilities transported to the retailer). All figures in the flowchart are in kg. ........................................... 169 Figure 31: Cultivation Stage (Including Land Clearing and Residue Combustion) - Selection of Midpoint Impact Categories. Original units were substituted by an index number (100). FU: 1 kg of Grain. .... 179
8
Figure 32: Cultivation Stage (Including Land Clearing and Residue Combustion)- Selection of Midpoint Impact Categories. Original units were substituted by an index number (100). FU: 1 ha of maize cultivation. ....................................................................................................................................................... 180 Figure 33: Cultivation Stage, Low to High Inputs Systems and Systems Contributing to the Local Sub-chain and to the Commercial Sub-chain. Values for Each Impact Category. Single scores for 1 kg of Grain. ................................................................................................................................................................ 181 Figure 34: Endpoint Impacts for Each Damage Category for the Cultivation Stage. Low to High Inputs Systems and Weighted Average of Cropping Systems Contributing to the Local Sub-chain and to the Commercial Sub-chain. Single scores for 1 kg of grain. ............................................................................ 182 Figure 35: Sub-chain 1: Relative Values of Each Midpoint Impact Category of 1 kg Maize Meal at Mill Gate, Produced in an Electricity-powered Small-scale Mill. ...................................................................... 183 Figure 36: Sub-chain 1: Relative Values of Each Midpoint Impact Category of 1 kg Maize Meal at Mill Gate, Produced in a Diesel-powered Small-scale mill. .............................................................................. 184 Figure 37: Sub-chain 1 Midpoint Impact Categories for all Life Cycle Stages (Upstream phases are common to both electricity and diesel-powered technologies). For the milling stage both options are shown. Single scores for 1 kg of maize meal at mill gate. ......................................................................... 184 Figure 38: Sub-chain 1 endpoint damage categories for all life cycle stages of the production of 1 kg of maize meal, produced at small-scale mills. Upstream phases are common to both electricity and diesel-powered technologies. For the milling stage both options are shown. Single scores for 1 kg of maize meal at mill gate. ................................................................................................................................. 185 Figure 39: Sub-chain 1 - contribution to endpoint impacts of each life cycle stage - local sub-chain. Single scores for 1 kg of maize meal at mill-gate. ...................................................................................... 186 Figure 40: endpoint results per area of protection of the production of 1 kg of maize meal within sub-chain 1. ............................................................................................................................................................. 186 Figure 41: Sub-chain 2, relative values of each midpoint impact category of 1 kg of packaged maize meal at retailer, produced through industrial milling. .............................................................................. 187 Figure 42: Sub-chain 2, endpoint impact categories for all life cycle stages – single scores for 1 kg of packaged maize meal at retailer produced through industrial milling. .................................................. 188 Figure 43: Endpoint damage categories for all life cycle stages of the production of 1 kg of packaged maize meal at retailer, produced through industrial milling. ................................................................... 188 Figure 44: Contribution to endpoint impacts of each life cycle stage - industrial milling. UF: 1 kg of packed maize meal at retailer ....................................................................................................................... 189 Figure 45: endpoint results per area of protection of the production of 1 kg of maize meal within sub-chain 2. ............................................................................................................................................................. 189 Figure 46: sub-chain 1, summary showing the shares of each lifecycle stage, maize meal produced at small-scale mills (electric). ............................................................................................................................. 193 Figure 47: sub-chain 1, summary showing the shares of each lifecycle stage, maize meal produced at small-scale mills (diesel). ................................................................................................................................ 194 Figure 48: sub-chain 2 (maize meal produced through industrial milling), summary showing the shares of each stage of the lifecycle. ........................................................................................................................ 194 Figure 49: Ecoregions of Zambia, annual growth rate in maize production in a selection of districts (with high contributions to the total production, i.e., 73%) and grain yields at national level and maize yield. ........................................................................................................................................................................... 196
Acronyms
CA Conservation Agriculture

9
CFS Crop Forecast Survey CIMMYT International Maize and Wheat Improvement Centre CSO Central Statistical Office DIS Direct Input Support DMMU Disaster Management and Mitigation Unit DRC Democratic Republic of Congo EDF European Development Fund EU European Union FISP Farmer Input Support Program FRA Food Reserve Agency FSP Food Security Pack GDP Gross Domestic Product GMO Genetically Modified Organism GTAZ Grain Traders Association of Zambia ha Hectare HCI Household Commercialization Index HDDS Household Dietary Diversity Score HI High Input HI-IR High Input Irrigated HI-R High Input Rainfed IAPRI Indaba Agricultural Policy and Research Institute IMIC International Maize Improvement Consortium LI Low input MAZ Millers Association of Zambia MI Medium Input MLN Maize Lethal Necrosis MoA Ministry of Agriculture Mt Metric ton M ZMW Million Zambian Kwacha NFB National Food Balance NGO Non-governmental Organisation OPV Open Pollinated Variety PHS Post-Harvest Survey RALS Rural Agricultural Livelihood Survey SAFEX South African Futures Exchange SAM Social Accounting Matrix SSCI Seed Certification and Control Institute TAF Technical Assistance Facility UN United Nations VAC Vulnerability Assessment Committee VC Value Chain VCA4D Value Chain Analysis for Development WFP World Food Programme ZAMACE Zambian Commodity Exchange ZARI Zambia Agricultural Research Institute ZMW Zambian Kwacha ZNFU Zambia National Farmers Union

10
ACKNOWLEDGEMENTS
The authors would like to thank stakeholders in the maize value chain in Zambia for their willingness to avail themselves for interviews and to provide information during the course of this study. In particular, thanks are due to the many farmers, processors, traders, private sector organizations, government and quasi government institutions. We also acknowledge the support provided by colleagues at the Project Management Unit (PMU) of the VCA4D project. We are grateful to the EC Directorate-General for International Partnerships (INTPA-F3) and the EU Delegation in Zambia for funding and providing valuable feedback during the study.
Notwithstanding the above, we state that the conclusions, views and recommendations stated in this report are those of the authors and do not necessarily represent the views of EC INTPA-F3 or the EU Delegation in Zambia.

11
EXECUTIVE SUMMARY
Background: The study forms part of the Value chain analysis for development project with a focus on maize in Zambia. It responds to the four framing questions asked to inform about stakes, challenges and potential areas of sustainable development support on this value chain (VC): 1) what is the contribution of the maize VC to economic growth in Zambia? 2) is this economic growth inclusive? 3) is the maize VC socially sustainable; and 4) is the maize VC environmentally sustainable? The maize VC in Zambia is well documented, maize being the national staple food, with a long history of policy intervention and regulation. This study aims to provide quantitative data based on relevant indicators as well as qualitative insights to support evidence-based decision making on investment strategies and policy dialogue to promote sustained and inclusive growth in the maize VC. Scope: This VC study covers the classical actors of an agricultural chain: farmers, traders and processers (millers in this case). The study also considers as direct actors of the VC, input suppliers of seeds and fertilizer for two reasons: i) the improved seeds are an important output of the maize VC and the basic activity of large farms involved in maize; ii) the provision of subsidized fertilizer through direct public supply or private dealers is the key measure of an active public policy to support maize production. Hence the products considered in this VC are both intermediate commodities (seeds, grain for food and feed, meal for breweries and snacks industries, co-product bran for feed) and final products for consumers (mealie meal and home processed grain). Secondary processing industries (Breweries, Snack food, and Feed manufacture) using maize meal as an ingredient mixed with other raw commodities, are out of our scope. The geographical scope is the whole Zambia for an assessment at national level in line with policy concern on the commodity. A geographical focus is on five districts of central and northern Zambia where small and medium scale maize production is strong and generally increasing, and in the two main urban areas (Lusaka and the Copperbelt) where the maize storage and milling capacity is concentrated. The study covers flows of maize at national and local levels, and the scope was influenced by opportunities to learn from the Technical Assistance Facility (TAF) support to commercial milling operations. The economic and environmental modelling deals with impacts of maize related activities of actors above. The social impact analysis has a main focus on small-scale maize growers. Methodology: The team used the standard methodology developed for the VCA4D Project. Specific methods used included extensive literature review, analysis of existing databases (particularly the Rural Agricultural Livelihoods Survey data and Crop Forecasting Survey data), semi-structured interviews of key actors, focused group discussions with farmers, statistical analysis underpinning the functional analysis, Social Accounting Matrix for the economic analysis, the social analysis framework and spreadsheet tool called the Social Profile, and Life Cycle Analysis (LCA) using the software platform (SIMAPRO) for analysis of environmental sustainability and impact assessment. Regular consultations between team members were used to confirm the study scope, agree the base year for analysis and agree on different categories of maize growers, maize traders and maize millers. A second field visit was not possible due to COVID-19 restrictions. To ensure all important data gaps remaining after the first field visit were adequately addressed, additional consultations and surveys were designed by the

12
team, implemented under the leadership of the national expert with findings incorporated into the final analysis. A validation workshop to enable stakeholders to engage with the emerging conclusions was intended but not possible at the time of writing due to continuing COVID-19 travel restrictions. Main Findings and Recommendations Functional analysis Maize is the dominant staple food of Zambia, with a production fluctuating in a range of 2 to 3.5 million Mt. After a steady growth of the production in the decade 2000, the country has reached self- sufficiency and has even some surplus to export conjuncturally. 85 to 90% of the production is used for food, hence Zambian people are among the largest consumers of maize (120 to 170 kg/head/year) in Africa. Nearly half of this production is home consumed in rural and peri urban areas and half is processed by industries into meal for urbans. Hence this VC is characterized by a partial commercialization which implies that market mechanisms are not fully operating to regulate supply and demand. The reference year chosen is 2018 (marketing year 2018/19) with a slight surplus on the domestic market. The main actors covered by this maize VC study are: - four categories of maize producers (large-scale, and three categories of small and medium-scale; higher external input, medium external input and low external input); three categories of grain aggregators/traders (private and public large scale and private small-scale); and two categories of millers (large-scale and small scale). Additional actors covered by the functional analysis, inclusion analysis and study recommendations are: public service providers (maize research and agricultural extension services), private input and service providers (seed companies, fertilizer companies, agro-chemical companies, mechanical equipment providers, small agro dealers); and public sector input support programmes (Farmer Input Support Program-FISP and FSP- Food Security Pack). The different categories of maize growers have differing strategies, constraints and opportunities for more sustainable development. Market and institutional conditions favour commercial maize seed production by well-developed large-scale farms with central pivot irrigation with opportunities for further expansion of hybrid maize seed production for export (subject to demand from neighbouring countries). Vertical integration of maize into the poultry, pig and dairy sectors by larger scale farming operations provides a way of adding value to maize produced reducing risks and transaction costs associated with selling the crop. Large-scale production of maize grain for sale to millers carries considerable risk due to price uncertainty and also agro-climatic variability in some areas. Small and medium scale farmers growing maize for sale using higher levels of external inputs face similar risks to large scale farmers. The risks for this category are highest in remoter areas where prices paid are lower and the maize grain market is not well developed. Financial risks are lower for small-scale farmers using medium levels of external inputs. A significant proportion of farmers in this category have the opportunity to benefit from subsidised supplies of fertilizer and hybrid seed, lowering their production costs. An added advantage that this category has is that some of the maize produced with subsidised inputs is used for their own consumption; input subsidies help to improve their household food security. Small-scale farmers using low levels of external inputs on maize do not benefit from subsidies to these inputs (hybrid seeds, fertilizer), and face a higher risk of food insecurity. In addition, farmers in this category have more burdensome labour as they don’t regularly use fertilizer and hybrid seed. The combined use of these inputs generally reduces the labour burden per unit area. This

13
suggests an opportunity for a more equitable distribution of maize subsidy benefits to enable farmers in the low external input category to become more food secure. Maize trading, while generally profitable, can be risky, particularly for the large-scale traders. The risks are increased due to uncertainties with regard to government regulation of maize exports, and also government involvement in setting the floor price for maize each season. Smaller traders and aggregators have lower storage costs and reduce their risks by operating on the basis of a fast turn around time between buying and re-selling at smallish margins. The Food Reserve Agency (FRA) is government’s maize trading arm which competes with private traders for purchase of grain. Most of the grain purchased by FRA is held as a strategic food reserve and released to commercial millers at below market price with the aim of evening out seasonal peaks in maize meal costs for urban consumers. The FRA provides a guaranteed market for small-scale farmer’s surplus maize in remoter areas where private traders are generally less active. The combined effect of FISP and FRA has been to encourage maize production, as a platform for small-holder agricultural commercialisation, in remoter areas of Zambia. However, this has been achieved at a high cost to the public purse. There are opportunities for a phased reduction and re-targeting of the level of subsidies in order to achieve a more economically sustainable maize VC which complements other small-holder agricultural VCs. Maize grain milling is generally a large-scale enterprise with minimal risks as they are downstream the chain with access to subsidized grain. Partly due to the lower risks, there has been significant capital investment in this sector, including investment through TAF. Commercial millers compete for brand loyalty and also lobby government for quotas of subsidised FRA maize and also tenders for supply of food relief. Small-scale millers operate in peri-urban and rural areas and have a different customer base from commercial millers. While their level of capital investment is low, so are returns on capital due to seasonal fluctuation in demand, high energy costs, and also competition in some areas where there are more small-scale mill owners. Solar powered mills have been piloted to reduce energy costs, but with limited impact to date for various reasons. Coordination processes for maize marketing are characterized by spot market relations between small/medium farmers and traders. There is almost no contract farming for maize, cooperatives organized by public administration for small-scale farmers are not involved in maize marketing. Governance of the maize VC has a long history of government involvement. This is due to the perceived strategic importance of maize to national food security, and related political levers linked to the publicly popular interventions; production subsidies, price influencing and maize food relief targeting disaster areas. Public investment in maize research and seed certification, along with private investment in seed production, have played a major role in increased national maize production and a strong hybrid maize seed export enterprise. Fertilizer, agro-chemical and mechanical equipment companies mainly gear their operations towards large-scale farmers, providing limited services to small-scale farmers growing maize. There are opportunities for them to enhance their reach through services such as soil testing and fertilizer blending, and supply and maintenance of a wider range of lower cost labour saving farm equipment to improve the productivity of the small-holder maize sector. There are also opportunities for further empowering local entrepreneurs and cooperatives to improve the services provided to small-scale farmers, including technical advice, input supply on credit and support with marketing. However, the current extent of government involvement in the maize VC makes such initiatives risky.

14
The study identified a growth in various enterprises which add value to maize, generate employment opportunities and provide income (including export income). This includes stockfeed, opaque beer, maize based beverages and snack foods. The contribution of the Maize VC to Zambia’s economic growth The agricultural sector is of strategic importance in Zambia’s economy, accounting for 60% of the labour force, but with a low value added performance, as its contribution to Gross Domestic Product has steadily declined, falling to less than 3% in 2020. Maize grain and seed are by far the first agricultural product accounting for 5.07 billion ZMW which is 31% of the value of Zambian agricultural production in 2018, reference year with a surplus in maize production (3.3 million Mt). Downstream activities in trading and milling add some value to a limited extent, the value of Production of the maize VC (meal for food, bran and grain for feed and export, seed for export) is 7.87 billion ZMW. The direct Value added of maize VC is estimated at 3.33 billion ZMW for 2018, this is 42% of value of Production. Intermediate consumption is then of relatively high level, it is mainly fertilizer for cultivation, and for a smaller amount energy for milling. Indirect effects through linkages to upstream activities (mainly transport, maintenance, packaging and electricity) bring a quite important additional indirect Value added, it increases Value added by a coefficient of 1.59. Hence, the direct and indirect Value added that means the Total Value Added of the maize VC is estimated at 5.3 billion ZMW. The economic contribution of maize VC is then 1.9% of Zambian GDP. Relatively to the whole agri-food chains of Zambia, the direct Value added of the maize VC is 24% of the combined sectors agricultural and food industries Value added. This underlines the fact that maize milling is a low value-added sector. However, this rate is dependent of the VC delimitation. Industries using some maize grain as a raw commodity (breweries, snacks, poultry breeding) with higher value-added rates are outside our maize VC scope. If maize VC has a limited impact in term of wealth generation, however it has a large effect upon income distribution. Incomes received from maize VC by farmers (including opportunity value of home consumption), salaried workers, enterprise and financial institutions reach 6.16 billion ZMW in 2018. This high-income effect results of public support to subsidize prices of inputs (seeds and fertilizer) and of grain, for 2.83 billion ZMW. Beneficiaries of input subsidies are the farmers (with only half of them having access) with a discount on input prices estimated for 1.4 billion ZMW. Seed providers also benefit of the incentive to uptake improved seeds. For grain market intervention of FRA, industrial millers are the direct beneficiaries through subsidized supply of grain for 0.64 billion ZMW. Urban consumers are indirect beneficiaries through meal price stabilization. These subsidies benefit also to the numerous agents managing the public system of inputs and grain provision, receiving an income estimated at 0.9 billion ZMW. Maize VC places a heavy burden on public finance, receiving half of public funding to Ministry of Agriculture. The efficiency of this public support to the maize VC seems low; public organizations for inputs supply and grain collection record very high management costs compared to the private sector. Main criticisms of the present maize policy are (i) the inequalities between actors whether they have access or not to subsidy programs (ii) the diversion of funds which could otherwise address the main challenge of low productivity and uncertain sustainability of smallholder cropping systems.

15
Despite this public support, maize cropping has low profitability for farmers involved in commercial production. It is a low value crop with price at farm gate below import parity price in 2018. Small and medium scale farms experience poor efficiency of inputs and low yields. Large mechanised farms face high costs and they focus on seed production which is much more profitable than maize grain. Actors downstream achieve higher profitability but they face contrasting situations. Trading of maize can be highly profitable, but it is exposed to high risk of market volatility, in particular caused by unpredictable grain reserve intervention on the market. Industrial milling is a mature business, quite secured with acceptable profitability even though their process has a limited value added for a mass consumption food product. Milling appears a leading business in the maize VC, supported by the public grain reserve as it receives maize release at a subsidized price. Small mills are widely distributed and run often far under their processing capacity, their profitability is relatively low. The maize VC has a negative contribution to the balance of trade in 2018 given the dependence on imported fertilizers for 1.87 billion ZMW, and the restrictions on exports for grain and meal implemented to support abundant supply of domestic market and lower prices. However Zambian maize seems to have a potential to develop exports to neighbouring countries where demand for maize is fast increasing and grain market prices are generally higher. Geographic central position in the Southern African region, bordering 6 different countries which are food oriented towards maize, is an advantage for Zambia. International competitiveness indicators of Zambian maize based on ratios of domestic price related to international price has a limited significance. In fact, maize grain market prices are strongly influenced by the intervention of FRA which controls 30 % of commercialized maize, and by subsidies on inputs. With this caveat in mind, calculation with an import parity price of South African white maize, gives a Nominal Protection Coefficient of 0.8 and Effective Protection Coefficient of 0.81 for the 2018/19 marketing year. Zambian maize seems competitive with respect to South African maize. However, this is sensitive to the maize surplus level of South Africa and rand currency exchange rate. The competitiveness of Zambian maize relies to a large extent on a low remuneration of small holders labour (below minimal wage) and on seed and fertilizer subsidy. The large mechanised farms are not competitive for maize in 2018, their cost of production is above the import parity price. Hence most of large farms have exited the maize grain market and have focused on seed production. Is the economic growth inclusive? The significant increase in the volume of maize produced since 2000, most of it by small-scale farmers, and increasing number of actors involved in the various input supply and value addition activities, has provided increased employment and income generation opportunities both in rural and urban areas. The increased volume of small-scale in agro-input supply and maize trading has provided useful income earning opportunities, particularly for younger men in rural areas where paid employment opportunities are scarce. The volume of production subsidies to small-scale farmers has increased, and the number of beneficiaries has also increased following a decision in 2016 to halve the size of the package so that more farmers could benefit. However, a significant proportion of small-scale farmers, including those in areas well suited for maize production are not receiving FISP support. Moreover, in areas less well suited for maize production, farmers who do participate in FISP achieve generally lower returns. Hybrid maize seed production is far less inclusive, being restricted to relatively

16
few commercial farming operations with the required infrastructure and an established relationship with seed companies. Small and micro-scale trading in maize and maize products provides a significant income earning for many people unable to compete in formal employment markets as it does not have barriers to entry relating to education or qualifications. The more economically rewarding sides of this trading tends to be seasonal, and occupied by younger men. Women are mostly involved in micro-level processing and trading of maize products which is less somewhat seasonal steady and offers much lower income generating opportunities. Large scale milling is the least inclusive segment of the maize VC, requiring significant amounts of capital to enter. Milling is relatively competitive. Large scale milling requires high levels of technical and management and significant investment in modern plant and equipment in order to remain viable longer term. Access to FRA maize quotas is also a factor which affects profitability and is only available to large-scale millers. Small-scale milling requires much less start-up capital, but the returns are also relatively low. In terms of inclusion through consumption, maize is now the main staple food for the majority of rural and urban households, and in real terms the price of maize meal has dropped over the past decade. Moreover, because maize is the main ingredient in poultry feed, and the price of eggs and poultry meat has become more affordable compared to other sources of animal protein, increased maize production has indirectly resulted in the inclusion of more urban and peri-urban households consuming eggs and chicken and to a lesser extent milk and pork (Onumah, G. et al; 2018).
Is the Maize VC socially sustainable?
Application of the social sustainability methodology to the maize VC identifies social capital, food and nutrition and gender equality as domains of greatest concern rather than working conditions, land and water rights and living conditions. Small-scale farmers producing maize (for food and for sale) face a range of risks and vulnerabilities. The development of social capital (e.g. through producer cooperatives, and lasting relationships between local input providers, traders and farmers) is weakened at local level by historically strong dependence on a publicly funded top-down system for

17
supporting maize production and marketing, and also a maize-centric disaster relief programme. The result is a “dependency syndrome” culture, rather than fostering a spirit of self-reliance and enterprise. This also plays out at the local level in terms of household food security and nutrition. Poorer households, unable to produce (or retain) enough maize for their own requirements, become dependent on the richer local households for their food supply during the hungry period, exchanging their labour in return for grain. Typically, women with young children from poorer households spend significant time away from their homes in search of work and/or food and as a result they are not available to provide regular and suitable meals for their young children. While the causes of stunting are complex, rates of under 5-year-old stunting are often high in traditional maize producing areas and also in areas where maize production is on the increase. For poorer households unable to afford fertilizer or hybrid seed at market prices, and not in receipt of subsidised inputs, risks related to growing maize increase, along with food insecurity risks due to climate variability, pest and disease challenge and declining soil fertility. These same farmers may then be offered maize as food relief, continuing a culture of “maize dependency”. Smallholder growing of maize as a cash crop tends increase gender inequality in male headed households. Increasing the area cropped to maize and the volume of maize production increases the labour burden of wives; particularly for weeding, harvesting and post-harvest shelling and cleaning. Yet in most households the male head makes the decision about sale of the maize produced and use of the money from maize sales. Gender inequalities are also pronounced in grain trading, the cooperative movement, and the commercial seed growing and marketing sectors where positions of prominence and influence are dominated by males. Small-scale farmers have almost no say in the choice of maize seed varieties and types of fertilizer provided through FISP. They have very limited influence on commercial input suppliers, and negligible access to credit or inputs on a pay later basis, or to favourable forward contracts with maize traders. Environmental sustainability of the Maize VC Environmental LCA regarding the sustainability of the maize value chain in Zambia address three core impact questions: human health, ecosystems quality and resources depletion. These domains are covered by the ReCiPe 2016 impact assessment method applied in the present study. A summary answer is provided below to each of the three framing questions.
What is the potential impact of the maize value chain on human health?
A medium level of environmental impact was determined for this domain. Indeed, human health is the second most affected domain, with contributions to the overall impact of the maize value chain of around 30% (being the remaining around 70% due to potential damage to ecosystems, as it will be discussed in the next section). The main cause of potential damage to human health is global warming, which to a large extent is due to cropland expansion into virgin land for maize cultivation. Smaller contributions to potential damage to human health derive from particulate matter formation, due to production and transport of external inputs. Also crop residue combustion contributes to the formation of particulate matter. There are further but limited contributions to particulate matter formation from ammonia emissions due to nitrogen fertilization (in the higher input cropping systems). Cropland expansion and low yields impacts also the ecosystem quality; strategies that can potentially contribute to reducing cropland expansion are discussed in the recommendations section below. There are additional human health hazards associated with herbicide and pesticide application on crops. These risks tend to be localized and may be reversible. Feasible mitigation measures are

18
available and may be implemented by following environmental regulations and best environmental management practices. These practices also regard the correct disposal of packaging material contaminated with residues of chemicals. The adoption of such measures needs to be encouraged in Zambia, for instance, through awareness campaigns involving the local leadership, extension services, agri-businesses and agro-dealers.
What is the potential impact of the maize value chain on ecosystem quality? The largest impact of the maize value chain in Zambia concerns ecosystem quality. Ecosystem is mainly affected by land use and land use change and by global warming. Indeed, according to the ReCiPe method, land use leads to “damage to ecosystems due to changes of land cover/land use intensification, leading to soil disturbance and loss of habitat which, in turn leads to “potentially disappeared fraction of species”. This implies a risk of biodiversity loss due to land use and land use change associated with maize cultivation. The high rates of land use (agricultural land occupation) observed are associated with the low grain yields that characterize the prevailing cropping systems in Zambia. Although land use change triggered by maize cropland expansion into virgin land does not occur at a high rate, its impact on ecosystem quality is large since land use change has incidence on two indicators associated with this domain, namely land use and global warming. Global warming is mainly due to organic carbon loss as a result of cropland expansion into virgin land for maize cultivation, while GHG emission from other sources (fertilization, mechanical operations, transport, milling) are much lower.
What is the potential impact of the maize value chain on resources depletion? Resource depletion is the area with the lowest impact even in the cases of higher input cropping systems and of the less efficient milling technologies of small-scale village mills. The contribution to the overall environmental impact of both components of this domain, mineral and fossil resources scarcity, is negligible. In addition, the following points related to the core questions should be highlighted: Considering the environmental impact from the perspective of the various stages of the value chain, the largest contribution derives from stages associated to grain production. Indeed, most of the impact is generated at farm level from (1) land clearing for maize cultivation and (2) cultivation activities, including combustion of field residues. Much lower impact is generated at downstream phases, namely transport of grains and milling. Increasing maize yields would largely influence the environmental profile of the whole value chain by potentially reducing agricultural land occupation and land use change. Improving yields and reducing post-harvest loss would contribute to releasing pressure on land and to the reduction of the part of forest degradation triggered by cropland expansion, which are the main issues that prevent this value chain from being environmentally sustainable. Reducing storage losses can also contribute to significant improvements of the environmental profile of the whole value chain, considering that post-harvest losses have large incidence on the efficiency ratio of output to land area cultivated.

19
Recommendations
Maize production has recorded a remarkable growth during last decade driven by food needs and market opportunities. This growth has been achieved mainly through extension of the cropped area at the expense of virgin land and through conventional intensification based on hybrid seeds, mineral fertilizers and herbicide. Addressing issues related to low yields of small-scale farmers is key to attain a significant improvement of both economic, social and environmental performance of the maize VC in Zambia. There is potential scope to address this issue, including first improvement in conventional cropping intensification through adequate crop management for key operations such as fertilization (availability of appropriate fertilizer and timely application), mechanical weeding, crop association (beans with maize). Second is transition to more environmentally sustainable cropping systems such as those proposed through conservation agriculture approaches, but it remains a challenge. Indeed, according to the Conservation Agriculture Scaling-Up project - CASU Final Evaluation (FAO, 2018), the main constraints for the uptake of conservation agriculture (CA) were the lack of inputs and equipment, knowledge and markets. Furthermore, an evaluation of Conservation Agriculture undertaken in 2016, concluded that the adoption rate was low in spite of over 20 years of promotion. Nevertheless, the CASU project also revealed that some stakeholders consider that perhaps in the current period, when land availability is more limited and there are increasing droughts, farmers see the benefit of conservation agriculture more clearly. Low immediate benefits of CA systems for farmers and low capacity to wait the delay for soil resource improvement justify specific supports such as payments for environmental services. To tackle this general main challenge of low productivity and sustainability of small-holders maize cultivation, several areas of interventions are presented hereafter:
i) Policy and institutional perspective
• Review the design of the FISP programme with a view to achieving more equitable access to subsidised farm inputs by small-scale farmers, with an expanded choice of inputs to reduce the tendency towards maize mono-culture (repeated planting of maize on the same household field year after year without rotation)1 by less well-endowed households,
• Identify policy measures, such as public private partnerships, to encourage private input providers to improve the range of products and services available to the more commercially oriented small and medium scale farmers, including soil testing, fertilizer blending, and labour saving technology to raise productivity.
• Review the current levels of public expenditure on FISP and the activities of the FRA, to identify cost saving measures that would release pressure on the public purse and ensure more public funds to support strategic research and extension efforts in order to ensure longer term sustainability of the maize VC. This includes continued support to maize breeding and agronomy and integrated soil management solutions for small-scale farmers.
1 Continuous planting of maize on the same plot year after year is common for poorer households, who do intercrop some of this maize with cucurbits (pumpkins, squash and cucumbers) and food legumes (cowpeas and climbing beans).

20
• In maize growing areas often receiving disaster relief, support initiatives to store maize locally for resale/release during hunger months – reducing dependency on food relief provided from urban centres. This would reduce environmental pollution and expenses relating to transportation of food relief while also generating some local employment opportunities.
• In relation to the above, invest in capacity strengthening in the maize trading sector to increase opportunities for small traders and local cooperatives to participate on a level playing field with larger players, and in particular encourage more women to become involved in maize trading and local cooperatives.
ii) Technical perspective
• To ease the labour burden in weeding maize, reduce a growing dependence of small-scale
farmers on herbicides, undertake adaptive research on more effective mechanical weeding systems and tillage tools both for farmers with access to animal power and those without.
• To address nutritional and health deficits, re-new the focus on promotion of orange maize varieties with improved nutritional qualities (high lysine and vitamin A), with a particular geographical focus on areas where the prevalence of under 5 stunting and/or vitamin A deficiency is high.
• Using public funds saved from review of FISP and FRA operations, enhance the quality and level of agricultural advisory services and input supply (e.g. hermitic PICS bags to reduce on-farm storage losses) to reduce the current risks to growing maize, improve the opportunities for value addition at local level and reduce the environmental footprint of the maize crop.
Further Research (short term studies)
• Factors which underlie child malnutrition in maize growing areas to inform the Scaling up Nutrition (SUN) programme currently being rolled out in Zambia,
• Deeper analysis of the factors which are driving increased production of maize in drought
prone districts where risks of crop failure is increasing (including reasons by previous programmes to promote drought tolerant crops have not been effective),
• Desk study of the potential benefits and risks of reduced government intervention in the maize
VC, with reference to other comparable countries that have tried this with their main staple food crop,
• In-depth audit of the maize trade and subsidy sector, with a view to identifying opportunities
for increasing efficiencies in the value chain and reducing current burden on the public purse.

21
INTRODUCTION
The Zambian maize value chain is of particular interest for EU/INTPA as it is a sector supported by the 11th EDF with the programs “Sustainable Commercialization of Zambia's Smallholder Farmers”, “Conservation agriculture project” and with African Agriculture and Trade Investment Fund (AATIF). The VC analysis aims to provide information and indicators on the performance and impact of the maize chain in Zambia in order to document the background and rationale of this support. It follows a methodology experienced in many chains, based on a multidisciplinary diagnosis, including economic, social and environmental assessment. The EU intervention in Zambia, in line with government’s vision for agriculture development, targets in particular small-scale farmers to improve their productivity, secure their food supply and get a better integration in the market. Hence, it is expected that the study should help provide critical information needed to address the enhancement of small-scale farmers, their performance and position in the chain. Especially, attention is put on their integration in the maize value chain (VC), for input supply and access to output markets through contract or stabilized longer term relations. The scope of this VC study covers the classical actors of an agricultural chain: farmers, traders and processers (millers in this case). The study also considers the VC as direct actors input suppliers of seeds and fertilizer for two reasons: 1) the improved seeds are an important output of the maize VC and the basic activity of large farms involved in maize; 2) the provision of subsidized fertilizer through direct public supply or private dealers is the key measure of an active public policy to support maize production. Hence the products considered in this VC are both intermediate commodities (seeds, grain for food and feed, meal for breweries and snacks industries, co-product bran for feed) and final products for consumers (mealie meal and home processed grain). The geographical scope is the whole Zambia for an assessment at national level in line with policy concern on the commodity. A geographical focus is on some districts of central and northern Zambia where small and medium scale maize production is strong and generally increasing, and in the two main urban areas (Lusaka and the Copperbelt) where the maize storage and milling capacity is concentrated. The standard methodology developed for the VCA4D Project is implemented to address the four framing questions: (i) what is the contribution of the maize VC to economic growth in Zambia? (ii) is this economic growth inclusive? (iii) is the maize VC socially sustainable; and (iv) is the maize VC environmentally sustainable? Specific methods used include extensive literature review, analysis of existing databases (particularly the Rural Agricultural Livelihoods Survey data and Crop Forecasting Survey data), semi-structured interviews of key actors, focused group discussions with farmers, statistical analysis underpinning the functional analysis, Social Accounting Matrix for the economic analysis, the social analysis framework and spreadsheet tool called Social Profile, and Life Cycle Analysis (LCA) using the software platform (SIMAPRO) for analysis of environmental sustainability and impact assessment.

22
1. FUNCTIONAL ANALYSIS
1.1 Overview of maize products flows and market supply
1.1.1 Trends in maize production and domestic supply: a booming and fluctuating production
Zambian agriculture is strongly oriented on maize production (Chapoto A, Sitko N., 2015). Maize covers in present time nearly 1.5 million hectares which is 40% for arable land dedicated to annual crops. 90 % of the 1.6 million rural households grow maize. The production is nowadays around 3 million Mt, hence it reaches per capita, the level of 170 kg/year which is among the highest ratio for Africa. Maize is by far the main national staple food providing 70% of the country’s caloric requirements. Zambian diet is poorly diversified, the main alternative starch staples to maize being cassava, millet, sorghum, rice and wheat. The predominance of maize in agriculture and food diet is longstanding (Chapoto, 2015). But the production has also increased in a large extent in the decade 2000’s, passing from the range 0.5 – 1million Mt in late 1990’s - early 2000’s, to the range of 2 – 3.5 million Mt in the decade 2010 (Figure 1). The supply status of Zambian maize market hence evolves from a chronical deficit to an unstable level of surplus.
FIGURE 1: PRODUCTION, IMPORTS & EXPORTS MAIZE GRAIN ZAMBIA 1980-2019 Sources: CFS, CSO, FAO
This remarkable increase is mainly due to cropped area increase driven by incentives of the market and public policy: fast expanding feed demand for poultry (+10% per year), for which maize is a
0
500,000
1,000,000
1,500,000
2,000,000
2,500,000
3,000,000
3,500,000
4,000,000
tons
Production Imports Exports

23
basic raw commodity; private investment in milling capacities and marketing promotion through brands; export opportunities with maize shortages in neighbouring countries; public enhancement program for small-scale farmers through inputs subsidies and stabilized maize purchased price. These factors increase the attractiveness of maize as a cash crop. In farming systems, the relative abundance of lands has led to this extensive growth. The limited increase in maize yield per unit area is however a source of disappointment, especially in the light of the efforts put on seeds and fertilizer distribution. The national average yield of nearly 2 t/ha highlights the remaining poor managed cropping practices on maize of small-scale farmers facing numerous physical and economic constraints such as: drought; depletion of natural soil fertility and increased weed, pest and disease pressures (which increase with semi-permanent cultivation); cash limitations to purchase inputs and equipment and limited access to agricultural services (e.g. soil testing and technical advice).
After the record of 3.6 million Mt. in 2016/2017 season, the maize production has experienced a drop in 2017/2018 and 2018/2019, falling to 2 million Mt. Hence, market supply was considered in risk of deficit for the first time since 2008, depending on stocks availability. The main reason is a drought that affected some large growing areas in southern and western provinces. Maize is obviously dependent on climate conditions as it is cultivated rainfed. Annual fluctuations in yields reflects these climatic hazards of dry spells in the south, and floods in the North. But a major part of Zambia is considered to have a relatively suitable climate with a quite secure 4 months rainy season (Figure 1.2). The south western part is the exception, facing a climate change trend towards increased frequency of droughts. Another reason based on organizational concerns, for production decline is also argued. It is the loss of maize attractiveness for farmers as prices are considered too low for profitability after several years of surplus production and a reference to a low maize parity price indexed to the world market. The closure of the export outlet in 2018 with ban measures, and the exit of major traders from Zambia decrease the confidence in maize market opportunity especially for large scale farmers who remains outside this production despite their potential.
1.1.2 Resources and uses maize balance: predominance of food uses but expanding demand for feed
The maize balance sheet for year 2018 (cropping season 2017/2018) is given in table 1. This 2018 market supply situation can be considered as a reference representative of the 2009-2019 decade. The production of 2.4 million Mt. according to official statistics based on CFS forecast is close to the average of the decade (2.7 million Mt.). The post-harvest RAL Survey estimates the actual maize production 2018 even more with a level 3.2 million Mt. Such a production can supply the domestic demand and provide small surplus. Market shortages observed in the lean season 2018/19 are locally situated and results in distributional problems from surplus to deficit areas.

24
sourcetons % flour grits bran
of available prod 0,75 0,05 0,2
Production harvested small-medium farms 3 200 000 RALSProduction harvested large farms seeds 50 000 improved seeds ZNFUProduction harvested large farms grains 105 000 CFSLosses post harvest 160 000 5% of production CFSAvailable production 3 195 000 100%Opening stocks 844 000 NFBImports 1 000 CSOtotal Supply available 4 040 000
seeds 45 000 1,4% NFBOn farm consumption food and storage 1 536 000 48% RALSOn farm consumption feed bran from grain processed 307 200 assumptionMarketed production 1 614 000 51% RALSMillers for food 1 400 000 grain processed in flour and bran 1 050 000 280 000 MAZMillers for brewery industry 124 700 grain processed in roller & grits 60 000 40 000 NFBFeed industry 284 300 whole grain, bran not included NFBExports grain formal 22 900 CSOExports informal cross border trade 200 000 NFBExports seeds 20 000 CSOCarry-over stock 407 100 assumptiontotal Uses 4 040 000
USES
grain raw commodityprocessed products get from
raw commodity
SUPPLY
TABLE 1: MAIZE BALANCE SUPPLY AND USES ZAMBIA YEAR 2018 Sources: NFB with revised production from RALS
The maize requirements for Zambia domestic demand are nowadays estimated around 2.45 million Mt with 2 million Mt (82%) dedicated to food (processed in flour, security storage included), 0.3 million Mt (12%) for animal feeding, mainly poultry, and 0.15 million Mt for industrial brewery (6%). The last decade, production was then in a light excess, leading to a capacity of exports for 0.3 M t per year. Feed industry benefits also from the high availability of bran, accounting for 0.3 M t, in addition to its maize grain supply. On supply side, a main feature of the maize market is the relative low proportion of maize production sold by farmers, only around half of the production. Farmers are mostly small-scale farmers under 2 ha and their first objective is to fill their food needs. For many of them, commercialization is residual. This structure of production has an important implication for the maize market functioning and maize price setting. A small change in production level, depending on a climatic or biotic hazard, will have a large impact on the supply placed on the market. This can explain the importance of interannual storage to regulate the market.
1.1.3 Regional maize flows: a central “maize belt” with potential shift of production to northern
A large part of Zambia has the benefit of a humid subtropical climate (700 to 1200 mm rainfall) with elevation of a great plateau, which grants favorable conditions to maize cropping. Hence maize is widespread in the whole country with some inter regional differences in its cropping pattern share,
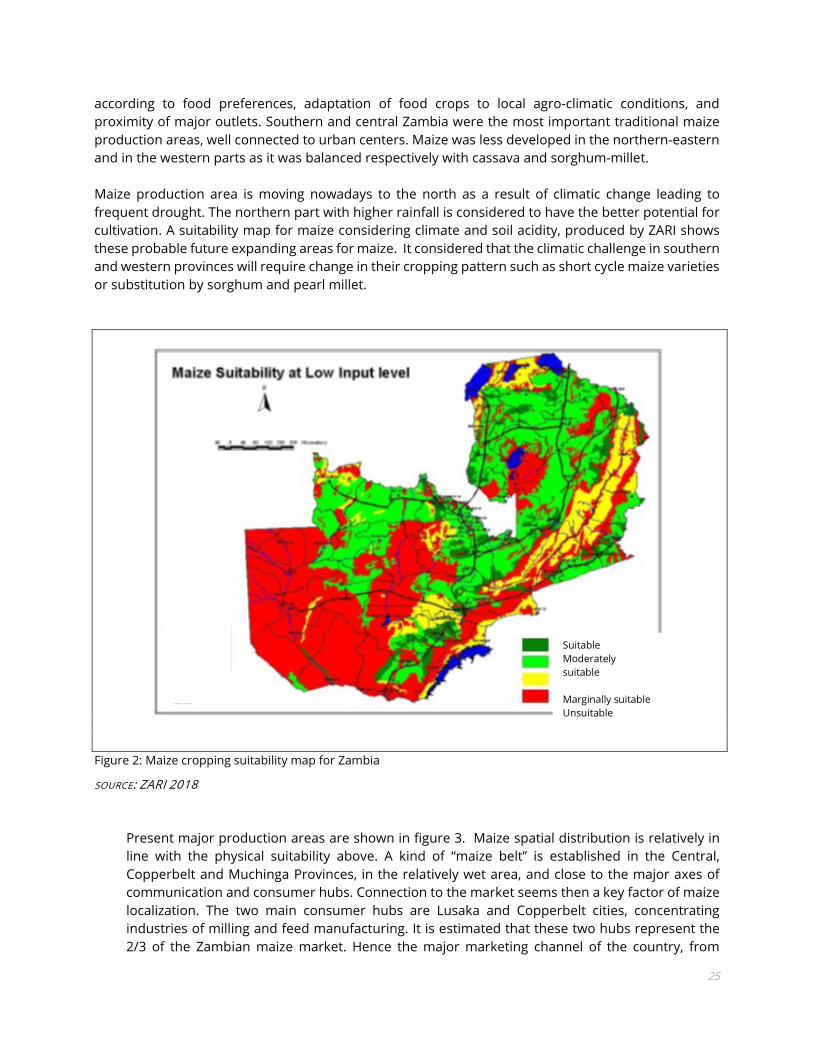
25
according to food preferences, adaptation of food crops to local agro-climatic conditions, and proximity of major outlets. Southern and central Zambia were the most important traditional maize production areas, well connected to urban centers. Maize was less developed in the northern-eastern and in the western parts as it was balanced respectively with cassava and sorghum-millet.
Maize production area is moving nowadays to the north as a result of climatic change leading to frequent drought. The northern part with higher rainfall is considered to have the better potential for cultivation. A suitability map for maize considering climate and soil acidity, produced by ZARI shows these probable future expanding areas for maize. It considered that the climatic challenge in southern and western provinces will require change in their cropping pattern such as short cycle maize varieties or substitution by sorghum and pearl millet.
Figure 2: Maize cropping suitability map for Zambia
SOURCE: ZARI 2018
Present major production areas are shown in figure 3. Maize spatial distribution is relatively in line with the physical suitability above. A kind of “maize belt” is established in the Central, Copperbelt and Muchinga Provinces, in the relatively wet area, and close to the major axes of communication and consumer hubs. Connection to the market seems then a key factor of maize localization. The two main consumer hubs are Lusaka and Copperbelt cities, concentrating industries of milling and feed manufacturing. It is estimated that these two hubs represent the 2/3 of the Zambian maize market. Hence the major marketing channel of the country, from
Suitable Moderately suitable Marginally suitable Unsuitable

26
surplus areas to consumer center, are on a medium distance between 100 to 400 kms. The Northern, despite its favorable cropping condition, provides a marginal supply to the maize market as it is a remoted area, more linked with neighborhood countries.
FIGURE 3: PRODUCTION OF MAIZE PER DISTRICT 2017/2018 Sources: data RALS, mapping IAPRI
Maize deficit rural areas are mostly located in the southern and western districts affected by dry spells, and acidic soils with low fertility. Low means of production of these farmers can also contribute to this deficit. No irrigation facilities are available for small-scale farmers to secure against drought and even though there were, it would be difficult for small farmers to afford cost of irrigation on a low value crop as maize. Crop failure can lead to food insecurity in remote areas which are not attractive for private traders. In a “normal year” as 2018 in which there was a slight surplus nationally, the food shortages registered were related to distributional problems to move the surplus in time to the remote areas affected. In 2019 cropping year was affected by a severe drought with a drop in grain production, 25% of the rural population was estimated in food deficit with a particular concern of southern and western regions (see map figure 4).

27
FIGURE 4: MAP OF DEFICIT DISTRICTS IN FOOD INSECURITY 2019 Source SADC ZVAC
1.2 Processes and products
This part follows the different processes along the chain, from maize raw commodity to final products provided to consumers: cultivation, aggregating, milling, brewery. It provides the technical coefficients used for economic and environmental modelling.
1.2.1 Cultivation and post-harvest
Maize cropping In Zambia presents two main features. First, it is mostly based on manual or animal traction technologies which are implemented by small and medium-scale farmers, less than 20 ha per farm (Chapoto, 2019). Motorised farming in large holdings account for less than 5% of total maize production in the recent years and is concentrated on seeds production. Secondly, maize is mostly cultivated under rainfed conditions, during the rainy season from December to April. An exception is the ”early maize”, which is sown around one month before the beginning of the rainy season and therefore requires irrigation during the initial period of the crop cycle. Due to the high cost of irrigation infrastructure, early maize requires a capital-intensive cropping system, implemented in large scale farms. Besides, early maize, harvested when the rainy season is still ongoing, requires grain dryers to ensure a rapid reduction of the moisture content of grains. Supplemental irrigation can also occur in large farms equipped with central pivots, for rainy season maize in case of dry spells (usually of duration of 8 days or more). The main differentiation factor of current maize cropping systems (in smallholders) is the level of commercial inputs used: improved seeds, fertilizer, herbicides. According to the Zambia Agricultural Status Report 2018 (IAPRI, 2018), only 51 % of the rural households used fertilizer in the 2017/2018 agricultural season; among small-scale farmers, a given portion cultivate maize without any external
28
inputs. This corresponds to the category “low external inputs cropping system”. Two other cropping systems have been identified from the RALS –Rural Agricultural Livelihoods Survey: medium input (MI) and high input (HI). The RALS survey included only small and medium scale farms less than 20 ha. For the characterization of the cropping systems of large-scale motorized farms (>20 ha of total cultivated area, using in all cases higher levels of inputs compared to those of small and medium scale farms) data from the Zambia National Farmers Union will be used alongside data obtained through meetings with large scale farmers during the first field mission (2-14 February 2020). Large scale farmers are further classified into two types: high input rainfed (for grain) and high input irrigated (mostly for seed). They are until now marginal in maize production but have a potential for increase. Finally five types of maize cropping systems defined by external input levels used, mechanization and water control are differentiated for the purposes of the economic and environmental analysis: (i) Small-scale Low input system (SS LI), implemented in farms with less than 20 ha of cultivated area that used retained (recycled) seeds and no other inputs, nor mechanization. (ii) Small-scale Medium inputs system (SS MI), from farms with less than 20 ha of cultivated area that used at least one of the three types of external inputs considered (certified seeds, fertilizers or herbicides), not mechanized. (iii) Small-scale High inputs system (SS HI), from farms with less than 20 ha of cultivated area that used at least two of the three types of inputs considered (certified seeds, fertilizers or herbicides), where the only mechanized operation is shelling.
(iv) Large-scale High input motorized rainfed system (LS-Rainfed): carried out within large farms of over 20 ha of cultivated area that use inputs at a higher level. This category includes large commercial farms (both corporate and familial, with a large variation in terms of area of maize cultivated, ranging from 20 to up to 1,000 hectares per grower). Cultivation operations from tilling to harvesting are fully mechanized, in the reference year this category produced only rainfed maize. (v) Large-scale High input irrigated- system (LS-Irrigated): farm size as above. This group produce maize under supplemental irrigation. Certified maize seeds are produced by this category of farmers. Cultivation operations from tilling to harvesting are fully mechanized. Table 2 shows all combinations used for the definition of input level categories among small/medium scale farms. Inputs were measured in terms of: fertilization level (three levels of total quantity applied per ha of basal NPK compound + topdressing fertilizer with reference to recommendation from extension service); use/no use of certified seed (use of certified seeds –OPV or hybrid– or retained grains used as propagation material); use/no use of herbicide.
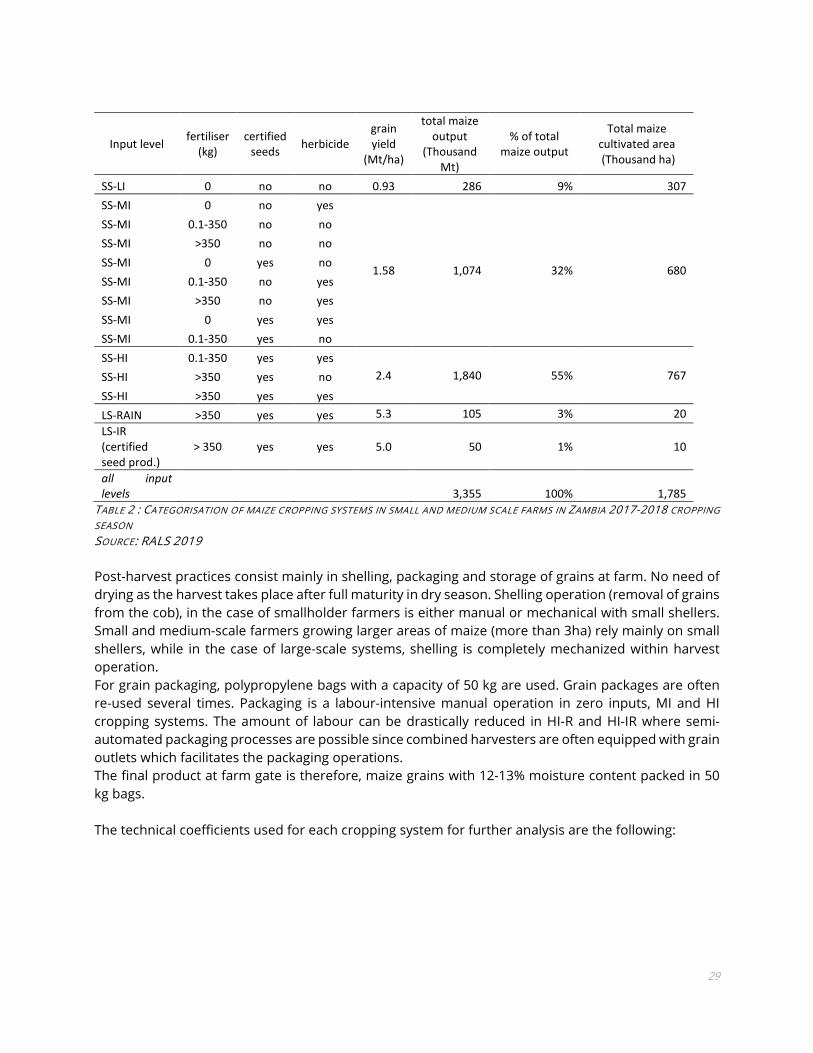
29
Input level fertiliser (kg)
certified seeds herbicide
grain yield
(Mt/ha)
total maize output
(Thousand Mt)
% of total maize output
Total maize cultivated area (Thousand ha)
SS-LI 0 no no 0.93 286 9% 307 SS-MI 0 no yes
1.58 1,074 32% 680
SS-MI 0.1-350 no no SS-MI >350 no no SS-MI 0 yes no SS-MI 0.1-350 no yes SS-MI >350 no yes SS-MI 0 yes yes SS-MI 0.1-350 yes no SS-HI 0.1-350 yes yes
2.4 1,840 55% 767 SS-HI >350 yes no SS-HI >350 yes yes LS-RAIN >350 yes yes 5.3 105 3% 20 LS-IR (certified seed prod.)
> 350 yes yes 5.0 50 1% 10
all input levels 3,355 100% 1,785
TABLE 2 : CATEGORISATION OF MAIZE CROPPING SYSTEMS IN SMALL AND MEDIUM SCALE FARMS IN ZAMBIA 2017-2018 CROPPING SEASON SOURCE: RALS 2019 Post-harvest practices consist mainly in shelling, packaging and storage of grains at farm. No need of drying as the harvest takes place after full maturity in dry season. Shelling operation (removal of grains from the cob), in the case of smallholder farmers is either manual or mechanical with small shellers. Small and medium-scale farmers growing larger areas of maize (more than 3ha) rely mainly on small shellers, while in the case of large-scale systems, shelling is completely mechanized within harvest operation. For grain packaging, polypropylene bags with a capacity of 50 kg are used. Grain packages are often re-used several times. Packaging is a labour-intensive manual operation in zero inputs, MI and HI cropping systems. The amount of labour can be drastically reduced in HI-R and HI-IR where semi-automated packaging processes are possible since combined harvesters are often equipped with grain outlets which facilitates the packaging operations. The final product at farm gate is therefore, maize grains with 12-13% moisture content packed in 50 kg bags. The technical coefficients used for each cropping system for further analysis are the following:

30
TABLE 3: TECHNICAL COEFFICIENTS APPLIED FOR CROPPING SYSTEMS
1.2.2 Transport of grains, aggregation and trading
Marketed maize is transported from farms to aggregation depots using several different paths and means of transport. These paths are very variable in terms of distances and load size; differences may depend on several factors, including farm size and/or input level and distances to towns/market centres and capacity of the farmer to organize transport to markets offering better prices (mills, grain trading companies). One common transport path to mills comprises the following: - short distance transport by vans from farms to local trader camps; - short distance transport by 3.5-7 Mt capacity truck to a site accessible by large trucks (30 Mt capacity); - long distance transport to grain trading companies or to any intermediate aggregation depot (30 Mt load trucks); - transport from trading companies warehouses to mills. In the aggregation phase, according to the type of aggregator some activities such as pre-cleaning of grains and re-packaging might take place. At storage in aggregation depots, fumigation with phosphine tablets or similar fumigant product might also take place. Handling of grains is variable, from completely manual to partially mechanized handling. Technical coefficients associated with the three main trading activities (private aggregating, private large trading with storage and public grain collection), used in VC modelling are as follows:
Low inputs
Medium inputs
High inputs
rainfed grain
irrigated seeds
maize output ton grain/ha 1 1,8 2,5 6 5seeds kg/ha 25 25 25 25 25
unit N/ha 49 81 168 211unit P/ha 16 27 128 118L burn down /ha 3 2 2L pre-emergence/ha 1 1L insecticide /ha 0,9 0,9L fungicide /ha 0,3 0,3L fuel cultivation/ha 120 120Kwh/m3 irrigation 0,2
water m3/ha 4000manual man days/ha 65 85 55with animal man-d/ha 50 60 35
energy
labour
Small & medium crop syst Large crop syst
fertilizer
herbicide
pesticide
Technical coefficients for cropping systems

31
TABLE 4 :TECHNICAL COEFFICIENTS APPLIED FOR TRADING
1.2.3 Milling
Maize milling processes in Zambia can be categorized according to scale (milling capacity) and type of milling technology. These are industrial mills (large to medium scale roll mills with milling capacity >1.5 ton/h) and small-scale mills, mostly village level mills operating with two machinery types: hammer mills, and grinding-wheel mills, commonly simply referred to as “hammer mills”. Industrial milling The process in an industrial mill from grain intake to packaging of the final products and co-products is the following:
• Grain intake and pre-cleaning: maize grains are received, following quality control (moisture content, % of foreign matter, aflatoxins) in the milling facility and transferred from trucks to warehouses or silos. Grains are generally stored in bags, nevertheless according to a recent survey (IAPRI, 2014) close to 14% of the total quantity of grains is stored in silos (bulk storage). Storage in bags is labour intensive since most handling of packaged grains is manual. Silos for bulk grain storage systems rely on semi-automatic systems that operate aerators and electric conveyors and elevators for grain movement. Fumigant tablets are used to control infestation by insects and rodents at storage. Programmed fumigations are carried out throughout the period of storage of grains.
Grains are stored with approximately 12-13% moisture content. Before the actual milling operation, by means of a sieving operation, grains are graded and cleaned. Foreign material and broken grains referred to as “screenings” are separated from the maize kernels by means of sieves powered with electricity. Screening constitutes approximately 1.5% of the total weight of entering material.
• Conditioning: grains are prepared for milling through the addition of water. The added moisture facilitates removal of the bran during the milling operation. Moisture of grains is therefore increased from 12-13% to 15% to 20% - depending on the type of desired final product - for a period of approximately 12 hours. Some of this additional moisture remains in the bran, the rest evaporates due to the friction generated by the mill rolls, as a result, the moisture of the final product (mealie meal) is equal to that of the original storage moisture of grains.
• Milling: the core stage of maize grain processing is the milling phase. In many industrial mills throughout the country this is carried out in state-of-the-art roll mills. The average extraction percentage for breakfast meal was estimated at about 62%, 22% for roller meal and 16% for maize bran (IAPRI, 2016). Mills can adapt their extraction percentages according to the market demand. For instance, one mill visited by the team during the first field mission sourced grits
Aggregating
Trading urban
storage FRAdistance km 300 30 600unit cost ZMW/ t.km 0,9 0,6 1,3
Capital rotation storage duration months 0,5 3 6
Transport
Technical coefficients for Trading

32
to brewing/snacks industries, and therefore the facility produced approximately 56% breakfast meal, 14% roller meal, 10% grits and 20% bran. Smaller amounts of other maize products are produced by some of the industrial millers. The range of these products include samp (polished maize grains) for household consumption and other types of products intended for further processing such as maize grits (for lager beer or snack production) and corn flour (mainly for bakery products).
• Packaging is generally a semi-automatic process. Different packaging formats are produced for the several types of products, ranging from 5 kg to 50 kg. For small packaging formats, plastic material is used while larger formats are packaged in polypropylene bags. Bran is typically packaged in re-used 50 kg bags, originally used at farms for packaging grains. The vast majority of mealie meal is packaged in 25 kg polypropylene bags.
• Storage of milled grains: packed products are stored until transport to distribution depots takes place. In some industrial mills, for stacking and truck loading operations, diesel fuelled forklifts and/or conveyors powered with electricity are used while in the vast majority of mills, handling of packed products is a manual operation.
Within the industrial milling process, from grain intake to packaging, the main inputs other than grains, are water and electricity (or fuel, when mills are powered by diesel generators, which happens frequently due to instability in the supply of electricity). Nevertheless, milling process can be considered a very low energy intensive process. Also, water consumption is not very relevant; during conditioning approximately 3 grams of water are used for each kg of maize grains. Small-scale milling This type of milling comprises technologies of hammer mills and grinding-wheel mills. Maize processing in small-scale mills is rather simple with some variations according to the technology:
• in hammer mills, hammers grind dry grains through impact. Grains are fed into the mill with the typical storage moisture content (12-13%), so ‘dry’ grains are crushed by impact with articulated hammers rotating at great speed (3,000 rpm or more) in a grinding chamber. According to the manufacturers, the number of hammers can vary from 6 to 24 for installed powers from 2.2 to 7.5 kW (Cruz, 2019).
• in grind wheel mills, shortly before the crushing operation, grains are slightly moistened – excessive moisture decreases the flow by clogging the grinding wheels –. Instead of crushing by impact, this type of mill uses grinding wheels for crushing. The product obtained is a mixture of grits, bran and flour which are separated by winnowing. Installed powers of this type of mills range from 3 to 7 kW (Cruz, 2019).
The range of products that can be obtain from small-scale mills comprises: breakfast meal, roller meal and samp, maize kernels that have been broken but not as fine as grits or mealie meal (breakfast or roller meal). As co-product, bran is obtained at a rate of around 20%. Solar-powered mills (installed in the country under the Solar Milling initiative) are also to be included in the small-scale milling category. Their activity in milling is until now marginal so they are not considered in the technical alternatives used in the VC modelling, hereafter.

33
TABLE 5: TECHNICAL COEFFICIENTS APPLIED FOR MILLING
1.2.4 Secondary processing
A number of milled products are intended for further processing. There is evidence that beer brewing is dominant among these secondary processes in the maize VC. According to the type of product, grits or roller meal is used for brewing. While the use of roller meal (for chibuku –opaque beer-) implies a process not investigated by the team, for clear beer brewing a somehow standard process can be expected to take place. The typical brewing processes that take place in clear beer brewing is briefly described below:
• Mashing: It is the first step of the brewing process. Mashing consists in a hot water steeping process during which the starchy content of the mash is hydrolysed, producing a liquor called sweet wort. In the mashing process, hot water between 71 and 82°C is used to increase the efficiency of wort extraction. When brewing with maize grits, typically, a portion of malted barley or other malted cereals are added to the mash.
• Mash filtration: In this phase the wort is separated from the mash. The extracted grain, termed “spent grain” is most often used as livestock feed.
• Wort boiling: Boiling sterilizes the wort, coagulates grain protein, stops enzyme activity, drives off volatile compounds, causes metal ions, tannin substances and lipids to form insoluble complexes and cultivates colour and flavour.
• Wort cooling: In an industrial and semi-industrial brewing process, the boiled wort is clarified through sedimentation, filtration, centrifugation or whirlpool before cooling, which occurs by means of water cooling systems based on heat exchangers.
• Fermentation: Once the wort is cooled, the fermentation process can take place. During fermentation, the added yeast metabolizes the fermentable sugars in the wort to produce alcohol and carbon dioxide. At the end of the fermentation process, which takes 2-3 days, the yeast rises to the surface forming a foam that is skimmed off, re-cultivated and used several times.
• Maturation: Beer aging or conditioning is the final step in beer production. The beer is cooled and stored in order to settle yeast and other precipitates and to allow the beer to mature and stabilize. The beer at this stage is cooled to temperatures ranging from -1 to 10 °C.
• Filtration: In industrial breweries a diatomaceous earth filter is typically used to remove any remaining yeast.
• Packaging: Beer is usually packaged in glass or PET bottles, aluminium cans or steel kegs. • Pasteurization: Before being packaged in kegs or once it has been packaged in bottles, beer
must be cleaned of all remaining harmful bacteria, which, especially in the case of a beer that is expected to have a long shelf life, is achieved through pasteurization, the process of heating beer to 60 °C to destroy all biological contaminants. After this final operation, the packaged beer is ready for distribution.
Small milling
Industrial milling
Processing capacity kg grain/hour 100 7000kg meal 0,8 0,8kg bran 0,2 0,2motor power Kw 12electric Kwh/t 85 39fuel L/t 22
Conversion rate for 1 kg grain
Technical coefficients for Milling
Energy

34
1.3 Actors, Functions and Strategies
Characteristics and behaviour of actors of the maize value chain are presented according to their position in the chain following the basic steps: (i) inputs supply (ii) maize production (iii) trading (iv) first processing (v) second processing (vi) retail. A strategic diagnosis including the function, strategy, constraints and opportunities is drawn up for each actor category. The two last segments are included in the strategic diagnosis of the VC as they play a role in the chain as downstream actors, but they are not considered in economic and environmental analysis.
1.3.1 Input and service Providers
• Agro-input Companies
Seed companies Functions: More than 6 private seed companies, some multi-national and some national, oversee the production (under licence and regulations), distribution and sale of improved maize seed in Zambia. Variety registration and seed production activities are regulated by the Seed Certification and Control Institute (SCCI), a department of the Ministry of Agriculture. All these seed companies sell hybrid seed as their main line of business. A smaller number also sell a limited range of OPV seed within the national seed market. Most of the seed companies also produce large amounts of improved maize seed (mostly hybrids) for export to neighbouring countries. Strategies: The main focus is on hybrid maize seed because it is in high demand and the most profitable line which farmers need to buy each year. Hybrid seed production adds high value to improved breeding lines, many of which are produced using public funds by CIMMYT. Larger seed companies also invest in their own maize breeding activities to complement the public sector research. Seed companies comply with the stringent requirements for multi-locational testing prior to release and registration of new varieties, as they are aware that the market is very competitive and their products need to be of a high standard to compete. Some of the new entrants to the seed market have ensured that their varieties are included in FISP packages in order to gain wide exposure and potential future uptake by small-holder farmers. Seed companies tend to channel their distribution towards areas of Zambia where they know their maize varieties are better known and more popular. Seed brands and hybrid maize varieties are also aggressively promoted through widespread advertising on roadside billboards, shop signage, roadside demonstration plots and through “buy one get one free deal”. Most hybrid seed is produced on contracting out arrangements with commercial farmers in Zambia who have access to irrigation, with seed companies doing their own quality control. Production of maize seed for export is a major element of the business strategy of larger companies which adds significant value to the inputs required, both for the seed companies and the seed growers. Constraints: In spite of a fairly crowded market, no major constraints to further development of the hybrid maize seed industry in Zambia were identified. A possible limitation of further development of hybrids is the incapacity of most small-scale farmers to achieve the yield potential of hybrids due to poor inputs application. Opportunities: The scope for further expansion and growth of the maize seed industry is considered to be considerable, particularly producing seed for export. There is also potential for further development of maize varieties for the national market. This would be under the scenario where smallholder maize production becomes increasingly efficient and sophisticated, with increased scope for gaining advantage from varieties developed to suit to particular environmental conditions and management practices, and local food preferences.
35
Agrochemical companies Function: As with inorganic fertilizer, an increasing number of private sector companies are importing a range of agro-chemicals used for maize production. Many different brands of herbicides (pre and post emergent, selective and non-selective) and also insecticides for maize field and storage pests, are generally available in rural market centres for purchase by small-scale farmers. There is no government subsidy for these inputs, unless farmers with E-vouchers on FSIP use their vouchers to purchase herbicide or insecticide for their maize. Herbicide provides a very valuable additional weed control tool for small holder maize production, particularly for those with limited access to animal power in higher rainfall areas and for all smallholders in seasons of prolonged early rainfall when mechanical weeding is less effective. Strategies: Herbicides and pesticides are sold on a strictly cash only basis to small-holder farmers. Commercial farmers can often negotiate delayed payment arrangements for these inputs. There is some vertical integration by agro-trading companies who buy maize and other grains for cash and may supply agro-inputs (herbicide and fertilizers) on credit arrangements as part of contract farming arrangements. Some grain traders import and sell agro-chemicals at affordable prices and provide technical advice on their use as a way of building a basis for future trading relationships with farming communities. Generally, sales are accompanied with technical advice on request. Some companies will visit farms to deliver products and provide on the spot crop protection advice. Constraints: With a free market operating for agro-chemicals, and the generally low transport costs compared with fertilizer and seed, there are few constraints to further growth in this part of the value chain. The current relatively low level of farm equipment for mechanized land preparation fosters the use of herbicide, this trend constitutes in the long term a risk of damage for environment and human health. Opportunities: As many of the products are new, have different brand names, and have different uses, there is significant scope for improving the level of technical advice in the use of agro-chemicals by small-holders, including safe use, economical use and use which safe-guards the environment and does not impact negatively on the follow-on crop in the case of herbicides. Smaller Distributors (Agro-dealers) Function: Small agro-dealerships located in rural service centres are a relatively new feature of the rural economy providing retailing of maize inputs and other services to smallholders growing maize. They function as important outlets for the fertilizer, agro-chemical, seed and farm equipment companies, bringing these inputs along with some technical advice closer to smallholder farmers. Agro-dealerships provide income and employment opportunities for rural youth. Strategies: The more successful of the agro-dealers provide a range of services in addition to farm inputs which enable them to manage their cash flow across the year, given the seasonal nature of input supply. Some function as aggregators of grain, including maize, sometimes grown through contract farming arrangements. The more successful work in partnership with local extension services in promoting their services to rural households and have credit lines with their suppliers (Arneson et al, 2017). Constraints: This is quite a high-risk enterprise. The challenges include season to season fluctuations in demand due to climatic variation, business skills, cash flow management and difficulties in hiring staff with the appropriate competencies and values. A further challenge has been E-FISP, which while providing potential for increased business was linked to problems of late payment by government for inputs provided, and also uncertainty about future business when the scheme was not expanded as originally planned.
36
Opportunities: If the policy and decisions regarding E-FISP were predictable this would provide more certainty for the small agro-dealerships. Further diversification into non-maize agro-enterprises which are not subject to government subsidies, including other grain crops and small livestock enterprises. Training in key technical areas and business management skills would help to increase the prospects of more sustainable small agro-enterprises in rural areas. Ministry of Agriculture – Farmer Input Support Programme (FISP) Function: Apart from a temporary cessation under the World Bank structural adjustment conditions of the 1990s, Zambian government support of national food security through the subsidy of small-holder maize production has been in place for over 50 years. FISP has focused primarily on providing half hectare packages of fertilizer and hybrid maize, with inputs for some other crops, mainly in areas less suited to maize growing. FISP has been in place for ten years, during which time the volume of maize produced by smallholder farmers has generally increased. Strategies: In the 2015/16 season a FISP flexible e-voucher was piloted in 13 districts and extended to 39 districts the following season. The piloting was rated a success and the scheme was implemented nationwide in 2017-18, with the aim of giving farmers more choice in which inputs they use, reducing rent-seeking risks (including “ghost farmers”) and reducing delays in farmers getting their inputs. The scheme has continued for two further seasons, but with a partial reversal in approach. In the current season, e-vouchers were limited to districts mainly susceptible to drought, while in the majority of districts FISP reverted to direct provision of fertilizer and seed. Constraints: The e-voucher system, when rolled out nationally did experience challenges. It seems these were mostly around providing funds for timely redeeming of e-vouchers by farmers, which were attributed to delays in uploading funding by government and delays by the various banks in delivery of the cards or making payments to agro-dealers. Some of the difficulties were seen as “teething problems” related to setting up a new system. During the rapid appraisal exercise in October 2020 the general consensus from those consulted in four districts was that the direct input support system provided farmers with a greater level of certainty about input supply. Farmers pointed out that e-vouchers did not provide a safe-guard against price increases but did in theory provide more choices. It is also possible that progress with e-vouchers has been hampered by a perceived loss of rent seeking opportunities and political leverage opportunities possible through the direct input support method of delivery. Opportunities: A fuller review of the pros and cons of the two options for delivering subsidies to small-scale farmers, including explorations of improving the efficiency, reliability, equity and targeting of a smallholder subsidy programme. This could include the benefits of a robust system for the national registration of all eligible farmers. Ministry of Community Development, Food Security Pack (FSP) Programme Function: FSP is a social safety net programme targeting the poor and vulnerable but viable farming households, initiated in 2000. Since its inception it has disbursed inputs to over 700,000 households, or approximately 35,000 households per year, approximately 18% of its annual target of 200,000, and this percentage reduced significantly from 2015. Strategy: Careful targeting of households below the poverty datum line, using clear eligibility criteria, with the aim of “weaning off” households after two years of participation. The strategy was aligned with the agricultural diversification agenda, and inputs provided covered a wide range of crops in addition to maize, as well as small livestock. Constraints and Opportunities: The FSP programme has had very limited reach in recent years. In 2017 is was assessed that « in the past 3 years the programme has only reached out to about 0.6% of the

37
people living in extreme poverty (Makungu, 2017, p.17). In the 2018/19 season the RALS survey found that « only 0.9% of the farmers nationwide acquired the government fertilizer through the food security pack » (Chapoto & Subukanya, 2019, p53). The opportunities for a revival or reformulation of FSP as a substantive mechanism for addressing rural poverty through improving the productivity of maize and agricultural activities of Zambia’s poorer small-scale farmers was not explored during the study.
1.3.2 Maize Producers/Farmers
The Ministry of Agriculture categorises farmers on the basis of farm size (cultivated area). Anyone with a cropped area of 20+ha2 is classified as “large-scale farmer”, those cultivating 5-20ha are “medium-scale farmers” and those cultivating up to 4.99 ha are “small-scale farmers”. In 2019 the number of small and medium scale farming households was over 1.6 million. Over 1.18 million (72%) of these cultivated less than 2 ha of their land. Approximately 344,000 (21%) cultivated between 2 and 4.99 ha of their land, while the remaining 115,000 (7%) cultivated between 5 and 19.99 ha. Maize is the most common crop for these small and medium size farmers, grown by 87% of them (1.4 million households). Maize represents 50% of their cultivated land, it is largely dominant in every farm size category. The term “large-scale” farmers covers a very wide range, as it can include farmers on customary land granted to them by chiefs who rely mainly on oxen or small tractors for rainfed cultivation of areas between 20-30 ha on the one hand, and multi-national companies allocated large farms on state land totally over 3000 has with several state of the art pivot irrigation systems of up to 100 ha each pivot. The term small-scale farmer also includes a range of farming strategies, ranging from hand hoe cultivation of less than 1ha mainly for household food on the one hand, to cultivating 3-4has, at least 2-3 has of which is allocated to cash cropping. “Medium-scale farmers” are also a somewhat diversified category, and include some “part-time” farmers who have jobs in urban areas and cultivate relatively proportions of their land-holding on the one hand, retirees who have become farmers as a retirement strategy, and farmers who have depended almost entirely on farming for their income for most of their adult lives (Sitko and Jayne, 2014; Jayne et al, 2014).
• Small and Medium Scale Farmers In order to provide a more nuanced analysis of maize producers, rather than use farm size or cultivated areas, this study has adopted a classification of the cropping system based on the extent of external inputs used to produce maize. This is a proxy of capital-based intensification in maize production which is not fully correlated with farm size. These three main categories of small and medium scale farmers growing maize have been identified; zero input (22%), medium input (45%) and higher external input (20%). The term “higher” rather than “high” has been chosen because farmers in this category use significantly lower levels of inputs than do large-scale farmers, particularly the large-scale commercial farmers growing maize. The term “external” input refers to production inputs which are usually produced by companies for sale to farmers (certified seed, fertilizers, agro-chemicals), but may also be provided through subsidy or credit arrangements.
2 the area of the farm cultivated to all crops

38
Farmer category - .1 to 19.99 Ha. (Small and Medium Scale Farmers)
Number and proportion of all farming households
Average total cropped area by farm
Average maize cropped area by farm
Don’t grow maize 212,489 (13%) 0.0ha. Low external input small and medium scale maize producer -
362,885 (22%)
1.6 ha
0.8 ha
Medium external input small & medium scale maize producer
742,490 (45%)
1.7 ha
0.9 ha
Higher external input small and medium scale maize producer
325,451 (20%)
3.8 ha
2.4 ha
TABLE 6: CHARACTERISTICS OF SMALL AND MEDIUM SCALE FARMING HOUSEHOLDS IN ZAMBIA (BASED ON 2017-18 SEASON) BY FOUR FARMER CATEGORIES SOURCE: RALS 2019 DATA PROCESSING BY IAPRI The extent to which each of these three categories contributes to overall maize production, maize sold to traders, and the per capita of maize production per household member varies enormously (Table 4). Of note is that 3% of the marketed maize is produced without external inputs; implying that a proportion of farm households are producing more maize than they need without using purchased inputs. This has implications for soil nutrient mining, clearing of new land for cultivation and longer environmental sustainability.
Low Input Maize Medium Input Maize High Input Maize Proportion of households in each category
25% 52% 23%
Total maize harvested Metric tons
286,816 1,073,299 1,839,159
Total maize sold -Metric tons
49,016 350,922 1,214,069
Average % of own maize produced sold
17% 33% 66%
Contribution to total volume of maize sales
3% 22% 75%
Contribution of total volume of maize production
9% 34% 57%
Per capita maize production (based on average household size)
168kg/head** 283 kg/head 957 kg/head
Table 7: Small and Medium Scale Maize Grower production and sales 2017-18 Growing Season - by 3 Categories of Maize Producers Source: Data from the RALS 2019 survey provided by IAPRI. ** Average for developing countries is 172kg/head - http://www.fao.org/3/y4252e/y4252e04b.htm

39
Farmers producing with “Low external input” maize (362,885 households - 22%) Function: This category’s function within the maize VC is meeting household food needs with minimal use of resources which cost or generate foreign exchange (fertilizer, agro-chemicals and certified seed). Their contribution to total maize production is 9%, and they contribute 3% of all the maize grain sold to traders and sell 17% of the maize they produce. A further function of this 25% of rural maize producers is to produce maize largely unsubsidised (only 3-4% were FISP recipients in the previous three years). Strategy: 80% of this farmer category cultivate less than 2 ha; their main farming strategy being to produce food for the household, with sale of crops as a second aim. Only 20% of farmers in this category sell their maize as grain. Many of them don’t produce enough to last to the next season; 44% purchase maize and 26% buy maize meal when their own stores run out. They typically use local maize seed (90%) or recycled hybrid seed (10%). Nearly half (45%) have access to animal traction which significantly reduces the labour burden for low input maize production. They tend to live further from towns and market centres and as a result are less well placed to access maize production inputs and markets than the farmers using medium and high levels of purchased inputs for maize (Table 8. Constraints: The main constraint to increasing maize production in this category is affordable access to fertilizer, certified maize seed of varieties with good food and storage qualities. Limited access to an attractive market for sale of their surplus maize in a good year is also a constraint. Opportunities: Widening the FSIP subsidy to include this category would almost certainly increase their per capita volume of maize produced, but it would also place a much bigger burden on the public purse; the costs could outweigh the benefits particularly as remoteness will increase the costs of FISP input subsidy and also the costs FRA purchasing at a guaranteed price. These farmers are using a production strategy which produces what is effectively “organic maize”, but without a mechanism for certifying the maize as organic. The market potential for this could be further explored. Farmers producing “medium external input” maize (742,490 households - 45%) Function: This category’s function within the maize VC combines meeting household food needs with sale of surplus maize. Their contribution to total maize production is substantial (34%) and they contribute 22% of all the maize grain sold to traders. 75% of this category of farmers cultivate less than 2 ha. Strategy: Nearly half (48%) in this category sell their maize as grain but producing enough maize for household food is the main maize production aim for farmers in this category. Growing maize as a cash crop is an important secondary driver for about half of this category. Some households in this category don’t produce enough maize to last them to the next season (or they sell maize knowing they will need to buy it again when they run out) as 32% purchase maize grain and 27% buy maize meal. A significant proportion of this category depend on FISP; between 32-41% of them were recipients over the previous three years. This category tends to live closer to towns and market centres than the farmers using no purchased inputs for maize (Table 5). They typically use hybrid maize seed (71%) local seed (28%) or recycled hybrid seed (5%). 44% have access to animal traction (borrowed or owned) which potentially improves their maize productivity (returns to household labour and inputs of improved seed and fertilizer). Constraints: The main constraint to increasing profitable maize production by this category could be a combination of 1) limited access to affordable credit for inputs (fertilizer, certified maize seed and
40
herbicides), 2) enough accessible suitable land3 and 3) easy access to markets with predicable maize prices. Withdrawal of FISP would negatively impact a significant minority in this category. Opportunities: If the various barriers to contract farming could be addressed, this category would stand to benefit most from fair contract farming arrangements for maize. Most likely either withdrawal of FISP, or having only E-vouchers for FISP, would improve the conditions for contract farming arrangements to develop. Farmers producing “higher external input” maize (325,451 households - 20%) Function: About half (51%) of this category cultivate less than 2 ha. Half of the medium scale farmers (5-20 ha) are in this category; the level of external inputs used tends to increase with the size. The majority (80%) sell maize grain to traders and this accounts for 75% of all the maize grain sold by small and medium scale farmers. This category clearly functions in the maize VC as the main contributor to urban food security, and also to the livestock feed sector which is increasingly important to Zambia’s internal maize grain market. Strategy: Maize as a cash crop which is easy to grow and sell is the main driver. Growing maize for household food is secondary but nevertheless important; 7% also use local seed for their food and only 16% purchase maize grain or maize meal. FISP is significant to the majority in this category; 57-65% were recipients over the previous three years. FISP lowers their overall cost of production as they blend FISP with purchase of inputs at local market prices. All farmers in this category use hybrid maize seed, and none use recycled hybrid seed. A high proportion 60% have animal traction and 30% use herbicides, both of which are important for achieving higher returns to labour, and land to some extent. Constraints: The main constraints to increasing profitable maize production by this category are similar to the medium input category. Improving their access to affordable credit for inputs and equipment, enough nearby suitable land for expansion, and markets with predicable maize prices would be helpful. Withdrawal of FSIP would negatively impact the majority in this category. Opportunities: If the various barriers to contract farming could be addressed, this category would also stand to benefit most from fair contract farming arrangements for maize. Due to the higher volumes of maize produced, farmers in this category are most likely to benefit from warehouse receipts schemes which would address credit constraints and also hopefully reduce their susceptibility to seasonal price fluctuations. Comparison of some factors affecting the 3 categories of small and medium maize growers Comparing the three categories of small and medium maize growers, a differentiating factor which stands out is the extent of market orientation. The high external input maize producer category is highly market-oriented, while the zero external input producer category is highly household food oriented. An outstanding factor contributing to the differentiation between external input levels is inclusion in FISP (Table 8, 2nd row). This almost certainly accounts for the higher levels of use of hybrid seed and fertilizer in the medium and higher input categories, when compared to the zero external input category. Herbicide use is also clearly an important differentiator between the high external input category and the medium external input category, enabling the 40% of farmers in the high input category without animal traction to practice timely weed control over larger areas. Other factors indicating a correlation and possible influence on the level of external inputs used are: animal traction, use of hired labour, education and gender of household head and the extent of
3 Having sufficient arable land for a sustainable crop rotation/improved fallow cycle. Having not enough for continuous cultivation of maize using higher inputs not only would result in reduced dietary diversity, but also declining productivity and profitability over time as a result of soil depletion and increased pest and disease challenges.

41
remoteness. Animal traction enables larger areas to be planted and also weeded on time and helps with transportation of inputs and harvested maize. Hired labour is particularly important to timely planting, weeding and fertilizer application, and also harvesting to reduce in field crop losses. Capacity to hire labour typically depends on having cash to pay labourers, or maize grain to pay them in kind. Educational level of household head may impact on general level of aspiration in a household, may simply reflect the age of a household head (older household heads may typically have received less education, may also have less cash to qualify for FISP, may have fewer household members to feed so have less perceived need for FISP). Female headed households may be less oriented to growing maize as a cash crop (may favour another cash crop such as groundnuts or beans) and may have more limited access to animal traction and labour for land preparation. They may also be less likely to belong to a cooperative; a pre-requisite for accessing FISP. Female headed households may also tend to be older (if widowed or divorced) than male headed households, which may impact on their farming strategies. Remoteness negatively impacts on easy and timely access to inputs and also the price paid for these, as well as ready access to markets for selling maize. Access to credit does not appear to be a clear differentiating factor. Renting of land is relatively uncommon although slightly more common for higher external input producers, perhaps indicative of a strategy of expanding their area beyond their land holding by renting from others nearby as they become more proficient in growing maize. Use of manure is also slightly higher among this category, most probably reflecting that they are likely to own more livestock. Average household size does increase slightly as the level of external inputs goes up. this implies a slightly larger household labour resource, which combined with an increase in animal traction probably makes some contribution to very major difference in the per capita differences in maize productivity between the three categories.

42
Factors Low Input Maize Medium Input Maize High Input Maize Sell maize to traders 20% 48% 80% Supplied by FISP 2018-19
4% 41% 65%
Average fertilizer used kg/ha
0kg 259kg 339kg
Use hybrid seed % of households
0% 71% 100%
Use herbicide 0% 3% 30% Have animal traction 45% 44% 60% Use hired labour 31% 47% 65% HH head average educational level
4 years 6 years 7.4 years
% of female headed households
34% 27% 13%
Average distance to town km.
47km 38km 38km
Av. Distance to market centre km.
32km 22km 22km
Av HH size 4.7 people 5.1 people 5.9 people Receive credit 18% 16% 19% Av distance to hammer mill
2.9 2.4km 1.9km
Use manure 8% 10% 13% Use machinery .2% 1% 3% Rent land 3% 5% 7%
TABLE 8: FACTORS THAT MIGHT CONTRIBUTE TO HOUSEHOLD MAIZE CROPPING STRATEGIES SOURCE: DATA FROM THE RALS 2019 SURVEY PROVIDED BY IAPRI.
Non maize growers (212,489 households - 13%) Function: The majority of small and medium scale farm households not growing maize cultivate areas of less than 2ha. The indirect function of these farmers on the maize VC, by not growing maize, is to free up foreign exchange (imported fertilizer and agro-chemicals and exported certified maize seed). These households can be also consumers of maize purchased from their vicinity. Strategy: These farming households will typically grow one of more alternative starch staples. In high rainfall areas with acid soils this is usually a combination of cassava and finger millet and some sorghum. In lower rainfall areas with sandy soils this is usually sorghum and pearl millet and small areas of cassava. Rice is grown in areas of Western and Northern Zambia with suitable dambos where conditions for maize are not good as soils are sandy and/or acidic. Many of these households also live in remote areas with limited access to markets. This category of households may also buy small quantities of maize from other farmers to blend with their own staple crops to make nsima for the family meals. Constraints and opportunities: The bio-physical constraints (limited rainfall, unsuitable soils) to maize production, combined with remoteness, mean further investment in maize research and development for this category would have very limited impact.

43
• Large-scale Maize Growers – more than 20ha
This category of farmers is diverse. There are many factors of differentiation, including type of land title, investment sources and scale, credit access, areas of specialisation, mechanisation level, area cultivated, access to water for irrigation level, level of vertical integration, financial resilience). Some large-scale maize growers farm on customary land allocated to them by local chiefs or local families and also on large blocks of state land for which they typically have 99-year leases. These blocks range in size from 250 ha on the more recent Farm Blocks, to several thousand ha on the older Farm Blocks. A number of large corporations have been allocated or have acquired large blocks of land over the past 20 years, as part of Zambia’s strategy to encourage investment in agriculture. The term “large-scale maize growers” could be misleading, because in most cases growing maize for food is usually a relatively minor enterprise on the larger commercial farms in Zambia. Function: This category is the most heterogenous, with various functions within the maize VC. There is great variation in area of maize cultivated, ranging from 20 to up to 1,000 hectares per grower. Production of hybrid seed maize is the most important function for large scale commercial maize growers, supplying both the national demand for hybrid maize and large quantities for export. One grower can plant more than 50 ha of seed maize with yields of up to 7.5 tons/ha. A second function is growing maize for sale to millers of maize meal. A third important function for farmers with intensive livestock enterprises is growing maize for stockfeed; either as grain (for poultry and pigs) or as silage (for dairy farmers). A fourth function is growing maize for sale as roasted or boiled green maize. A fifth function is to grow popcorn maize for the confectionary market. A sixth function on larger farms, is growing maize for employees and their families. Strategies
• Seed maize: Farmers with large areas of cultivatable land and irrigation compete for contracts to grow seed maize for the various commercial seed companies. Large areas are required to provide isolation (from unwanted cross pollination) of plots. Irrigation is needed to minimise risks from dry spells and also to allow early planting of the long season hybrids. Seed maize is probably the most profitable field crop in Zambia, and high levels of external inputs, mechanisation and precision management are used in order to get the best yields and returns to investment. One or more of the largest farms have become involved as shareholders in the seed industry, such is the attractiveness of this sector.
• Food maize: Growing food maize has not been popular for most large-scale commercial farmers for many years because of the low profitability compared to other crops (wheat and soya), as they generally cannot compete with small and medium scale maize growers on cost. A further reason given for not growing food maize is that if export restrictions are imposed, then growers will not be able to sell their surplus maize to neighbouring countries offering a good price. Much of the food maize usually grown by “large-scale” maize growers is on customary land allocated by chiefs, or on the newer farm blocks on farms which don’t have irrigation. In some years, large scale commercial farmers have also grown large areas of food maize. This has usually been a result of some form of agreement (often semi-formal) with government which has appealed to the commercial farming community, through the Zambia National Farmers Union (ZNFU) to participate in growing food to meet national food security needs. Most recently, in mid-2019, following a drought in the south of Zambia, the government met with commercial farmers who have irrigation and proposed that if they planted early maize, that could be harvested in April, when prices are high, the government would pay a premium price for dry maize delivered before the end of June. The benefit of this to large scale commercial farmers is that adding maize as one of their major crops (to soya and wheat) would

44
provide an improved crop rotation. There was also a proposal that if very large surpluses of maize can be produced every year, then government would stop restricting maize exports. It remains to be seen how this will work out in practice this season and over the coming years.
• Maize for stockfeed: Commercial farmers who have poultry (broilers and/or layers) and/or pigs and have large areas of cultivable land mostly grow maize to mix with their stockfeed. This is rainfed maize produced under very similar management to food maize. This is a means of vertical integration which can reduce production costs, and risk on supply for feed. In some cases the manure from the livestock enterprise is used on the maize fields, which significantly reduces fertilizer costs and also provides an effective way of managing livestock effluent.
• Popcorn: There is a good local and export market for popcorn, which is grown by a number of medium and large-scale farmers. Yields are not as high as for hybrid maize, but popcorn is easier to store due to its hard grain. It can be grown as a lower input “catch crop”, after the main maize crop has been planted to use up spare land.
• Green maize: On commercial farms close to large urban areas green maize is grown, often as an early irrigated crop to produce green maize from October through to early January, before the rainfed maize is ready to be eaten green. Some farmers are now planting yellow hybrids for green maize, as it is said to be sweeter.
• Maize for workers: Commercial farmers usually have a number of employees who live with their families on the farm. Typically, these workers receive a weekly or monthly ration of maize produced on the farm (this could be some of the maize produced for food maize or stock feed). Alternatively, or in addition, the employees may be allocated plots of land within the farm on which they can grow their own maize and other crops.
Constraints: The main constraint to farmers seeking entry into the seed maize sector is access to large enough blocks of land for isolation, and capital to purchase the equipment required, particularly irrigation. The main constraint to expanding areas of seed maize for farmers who have large blocks of land and irrigation equipment, would seem to be getting large enough quotas from seed companies that understandably try to spread risk by having larger numbers of growers with smaller allocations, rather than a few growers with large allocations. Opportunities: Large-scale farmers have generally wide reserve of arable land dedicated to grazing or fallows (1/3 of land in Mkushi Farm block in 2019/20). This is a potential area for maize extension, as this crop is a perfect complement of their grain cropping system. Early maize grain production, harvested in March-April is of particular interest because of its high price. This crop needs irrigation at sowing and emergence stage and large-scale farms have generally the required equipment (central pivot), although they are often limited by water resource availability. Another opportunity on market side is the possibility to secure outlets with contract as a large scale of production favours contracting with traders.
1.3.3 Aggregators and Traders
• Local aggregators – from the area of production – provide connections, relationship and transport, make profit, provide local employment. They are young men mostly.
Function: Local maize grain aggregators provide a key link between small-scale scattered farmers and commercial enterprises which buy grain for storage and resale or processing. They provide a ready and accessible market for farmers producing smaller surpluses of maize (e.g. up to 30 bags for sale) who will pay cash on delivery to nearby buying points which small-scale farmers can reach using scotch-carts or bicycles. In cases where farmers have a significant amount of maize to sell (e.g. 20 or

45
more bags) local aggregators may arrange for transport to collect the maize from the farm at a pre-agreed price. Aggregators assess the quality of maize (grain moisture content), check the weight, and re-bag, if necessary, for onward transportation purposes. They usually pay farmers cash on delivery. Local aggregators collect enough maize to fill a 30 Mt truck and then arrange for transportation to the buyer. Strategies: Local aggregators usually have established relationships with local farmers and may themselves be local farmers who also trade in grain. Established relationships enable them to secure more regular supplies of grain each season, although their prices still have to be competitive with other local aggregators. They establish seasonal buying points close to local settlements (for security) and roads which are accessible to larger trucks. Local aggregators provide local employment and hands-on learning for young people who assist them with buying, aggregating, stacking safe storage and loading. Their commercial success depends on being able to buy and aggregate large quantities of quality grain within a relatively short period of time, and to negotiate economic transport rates and the best possible selling price with potential buyers. Their strategy is to buy as much and as quickly as possible so that they can deliver to the buyer and return to continue to buy as quickly as possible, as their margins are usually quite small. They do not usually have contracts with local farmers. Local aggregators aim to sell their grain quickly for the best possible price. They do have longer term relationships (but not forward contracts) with their main customers (millers, grain traders and large poultry farms), but getting the best price overrides selling to the same customer. Constraints: The main constraint local aggregators face is access to sufficient capital to start their business, as they have to buy on a cash basis. They also face degraded conditions of rural roads, especially at harvest time after rainy season, which increases their transport costs. Opportunities: As they usually have good relationships with local farmers, there is potential for them to develop contractual relationships around the supply of maize inputs in return for an agreed quantity or value of maize grain after harvest. Such an arrangement would depend on them being able to secure late payment terms for the inputs they provide from a trader or processor who would be willing to take the risk and who is able to access finance on good terms.
• Large Traders (wholesalers and brokers) Function: To buy and sell grain in large quantities (usually buy in 30 Mt lots to sell on later in larger quantities). Their operations often include quality assurance and safe storage in warehouses which they own or lease. Strategies: Most large traders buy and sell on their own behalf, but a few act as brokers, which reduces their risk and does not require large working capital. Large traders, to be successful, require a very good understanding of how grain markets work, including international markets. In the case of maize in Zambia, they also need a good understanding of the effects of government intervention in the market, both through subsidy and through export control. This may require relationships with influencers of government decisions, and may require an element of lobbying and participation in consultative forums. Also important to their success are establishing trusting longer term relationships with maize milling companies so that they can buy with a measure of confidence that they have a ready market at a predictable price. They develop relationships with local aggregators which provides a measure of continuity and certainty to their seasonal transactions. As transport is major cost element, good relationships with truckers are also very important, including taking advantage of lower rates in cases of trucks returning otherwise empty. Large traders have invested heavily in grain storage facilities over the past decade, in anticipation of increasing production and more opportunities for grain export, and also speculation when prices rise in times of shortage.

46
Constraints: While managing risk is part and parcel of the grain trader’s business model, large traders argue that if a free market in maize was allowed to operate through the permanent lifting of export bans and removal of government subsidies of maize, this would further reduce their risks and “level the playing field”. Opportunities: It is argued that with less government intervention in the maize exports, maize grain prices would tend to stabilise over time providing more opportunities for contract farming arrangements with small-scale farmers that face some maize production constraints relating to lack of capital for inputs. This hypothesis could be tested out now that levels of production usually exceed the national requirement.
• Food Reserve Agency (FRA) – national food security reserve – Function: Established in 1995, this government agency aims to “ensure a reliable supply and meet local shortfalls in the supply of designated agricultural commodities, mostly maize. This agency also addresses issues affecting the food reserve and the stabilisation of prices. FRA's goal is to complete the value chain by providing market access to small-scale farmers in rural areas.”4 With regard to maize, FRA’s main function can be summarised as intervention to prevent unduly high price increases for maize meal in urban areas during times of national shortage, and providing a “fair price” for smallholder maize in remoter areas where private sector trader prices are “unfair”. In this regard the FRA “complements” the effect of subsidised smallholder maize inputs provided to remoter areas through FISP and FSP – providing a “double subsidy” to small-scale farmers selling maize to FRA in these areas. Since FRA was established, particularly in response to high world maize grain prices from 2008-2014, there has been massive private sector investment in grain storage facilities in Zambia, and the private sector has played an increasingly active role in the maize market. Strategies: The current target for a strategic food reserve is 600,000 Mt (approximately 30 % of the domestic demand for food maize). In order to encourage lower maize meal prices during months when maize stocks are running lower (usually from December to April) the FRA releases a proportion of its reserve to millers at below market price, on the understanding that millers will blend this with their own stocks and sell to retailers at an agreed lower price (than would be the case if this cheaper maize was not released). These millers mostly distribute their maize meal through larger supermarkets which are easier to monitor in terms of their selling price. Not all millers are a party to this arrangement. Their maize meal prices are not limited by the lower price agreement, and they will set them at what they think the market will allow, during lean seasons. During times of plenty, FRA may sell off part of its stored reserve at below the cost of purchase and storage in order to make room for newer maize, so that its stocks remain of the required standard for food maize. Each year, after harvest, the FRA announces the price at which it will buy maize from smallholder farmers. The FRA buying price influences, but does not determine, the price that private traders pay to farmers. If the FRA purchases more maize than the amount required for the food reserve, then it may also sell off part of this at a loss in order to reduce future storage costs. Constraints: In the 2018-19 season, market prices increased following a drought in the south of Zambia. Competition between private grain traders and their customers was strong, and FRA was not able to buy sufficient maize to meet the 600,000 Mt food research target. There was a further constraint in that government did not have sufficient funds to allocate to FRA to buy all the maize required. This meant that there were significant delays in the payments made to farmers for maize they delivered to FRA, which discouraged some farmers from selling to FRA. FRA has high recurrent overheads, as it needs to pay staff salaries and maintain storage facilities even in areas where the
4 INFOBWANA (2021) https://thebestofzambia.com/orgs/food-reserve-agency

47
stores are empty or not operating to capacity. FRA has to maintain very high-quality standards for the maize that it buys, as its maize is generally stored for longer than the maize purchased by the private sector. This also discourages some farmers and local aggregators from selling to FRA because either their maize may be rejected, or they may be required to spend time and labour cleaning/sieving, grading and re-bagging their maize before it can be accepted. A constraint to achieving the objective of lower urban maize meal prices during times of shortage, is the practice of informal traders buying up stocks of 25kg breakfast meal from super-markets and then re-selling (sometimes by re-packaging and sometimes not) this at higher prices through local markets. Opportunities: While FRA plays an important role in underpinning national food security, there are opportunities for further adjusting the way that it performs this role, in order to lower the cost to the public purse. For example, overheads and losses from reselling purchased stocks at a lower price may be significantly reduced if most of the food reserve purchasing and storage function is sub-contracted to the private sector. Moreover, a national campaign, promoting the health benefits of less refined maize meal (roller and super roller) might help to further reduce urban price fluctuations in maize meal. This is because millers compete to produce the “whitest” breakfast meal, increasing the remaining fraction of the grain which potentially goes to produce roller meal (more nutritious than breakfast meal) for the table. However, much of the roller meal produced by millers is not marketed for food but goes into the production of opaque beer (Chibuku) and into stockfeed.
• Relief Agencies/Programmes Disaster Management and Mitigation Unit (DMMU) Function: DMMU falls under the office of the Vice-President and was set up in 1994. Its function is to coordinate disaster management activities responding to extreme events such as droughts and floods. Strategies: DMMU works through its partners in government, NGOs and UN systems to deliver disaster relieve. Disaster relief takes various forms; the most common in Zambia is food relief responding to the effects of drought. Maize grain and/or maize meal is usually the main element in food aid. In 2018, DMMU delivered 35,000 Mt of maize. Disaster relief also aims to put in place measures to restore livelihoods, as well as preventive measures. Challenges and Opportunities: Challenges and opportunities were not explored in the study, as this operation is relatively marginal as a proportion of maize flows in normal years. World Food Programme– Function: WFP has been present since 1967 and has strengthened the government’s capacity to address food and nutritional needs, including drought response. WFP purchases maize and other food grains produced in Zambia for re-distribution within targeted districts of Zambia and neighbouring countries. WFP also provides some advisory and logistical support to the DMMU (WFP, 2019). Strategies: WFP has grain storage depots located at strategic points in the country to enable timely distribution to higher risk areas. WFP purchases grain from large traders and also does some of its own local procurement. WFP’s strategy in Zambia generates demand for both maize and complementary legume crops. For example, following the 2018-19 drought affecting Southern Zambia, the WFP US$40 million response plan included delivery 38,475 Mt of maize meal to 13 affected districts, market monitoring services in selected emergency cash transfer districts and purchase of 22,676 Mt of pulses for distribution in 31 districts. In addition, WFP has worked with the Ministry of Education to support the Home-Grown School Meals programme which provides a market for smallholder vegetables, beans and cowpeas.

48
Constraints: Dependence on public policy for maize domestic market regulation. By now, no permission to build grain warehouses on south of Lake Tanganyika as a base for export to relief operations in affected areas of East Africa. Opportunities: Could WFP offer contracts for maize to Zambian small-scale farmers?
1.3.4 Millers and Feed makers
• Industrial Millers (mainly for the maize meal market - national and export) Function: The Millers Association of Zambia (MAZ) includes most of the industrial mills with 78 registered plants, only five large operators missing. The minimum capacity to be registered with MAZ is 1.5 metric ton per hour. Each mill is registered separately, which enables larger millers to register more than one mill, which may be advantageous when it comes to pitching for contracts. The main function in the maize VC of large industrial millers is to supply urban consumers with the preferred quality of refined maize meal known as breakfast meal. Much of this is for the Zambian market but a significant amount of breakfast meal is also exported to neighbouring countries, particularly DRC. In addition to producing breakfast meal for sale, large millers also produce it for food relief purposes for food relief agencies, either nationally or for export. A lesser function is to produce a less refined and less expensive product (roller or super roller) for a minority of urban consumers who prefer this. Other maize products are also produced in smaller amounts by some of the industrial millers for further processing, including maize grits (for clear beer and sweet beer products), fine maize flour (for confectioners), roller meal for opaque beer (chibuku). In addition, a few millers produce “samp” (polished maize) for the retail market. Maize bran is a by-product from milling the other products and goes into stock feed (either nationally or for export). Another minor by-product are the sievings and sweepings which are sold locally for stock feed. In times of hardship maize bran and sweepings may also be mixed to bulk out maize flour for human food. Strategies: The past ten years have seen heavy private sector investment into the milling industry, which has been seen as a safe investment option in comparison with other parts of the maize VC. Economies of scale are also seen as a main way to get competitive advantage. As a result of this investment, there is currently considerable excess maize milling capacity in Zambia. This investment has been encouraged also by growing export opportunities and also by a long-standing arrangement between larger millers and government, whereby a portion of the national food reserve is sold to millers registered with MAZ at below market price during times of high maize prices in an attempt to keep breakfast meal prices lower between December and April. Through this arrangement (known as the “tri-partite agreement”), millers compete with each other for favour with government in order to be included in the annual allocations of cheaper maize. The larger millers usually combine maize and wheat milling functions, which have similar food safety standards and synergies relating to logistics and economies of scale. Wheat is important for millers profitability as wheat flour is a higher value product. There is strong competition to establish a market reputation for quality breakfast meal, and significant consumer loyalty to particular brands, which are often quite localised, such that the market share does not exceed 12% for any one milling company. New entrants have to work hard in order to establish a brand and customer loyalty. All the millers have invested in grain storage capacity, with the aim of buying maize to store when prices are lower, between June and August each year. Nearly all their maize grain purchases are from traders on a spot purchase basis at mill gate, rather than on contracts with farmers or traders. Constraints: The main constraint facing millers would appear to be fluctuating maize prices, which makes it more difficult for millers to manage their costs. In addition, smaller millers face strong

49
competition from the larger millers who have been able to invest heavily in the latest plant and equipment (for storage and milling) which offer economy of scale benefits. Opportunities: Forward Contracts with traders or farmer groups could be an option if the market supply and prices fluctuate less. Branding for export of GMO-free maize meal at a premium price.
• Stock feed manufacturers Manufacturing for resale – Function: Stock feed companies produce a range of products containing maize for the commercial livestock industry and also for a growing pet food market. There are several large producers of stock feed, and a number of new companies have also entered this market. This includes a range of products for broilers, layers, pigs, dairy and fish farming. These products are produced for the national market, and increasingly for export to neighbouring countries. Maize is an important ingredient for all livestock feeds, typically comprising between 30 and 60 % of the commonly used feeds. This is growing sector, and the amount of Zambia’s total maize production going into the livestock feed industry is currently estimated to be around 10%. A significant proportion of commercial livestock products (particularly eggs, and also pork, chicken and some dairy products) produced using this feed are also exported, mostly to the DRC. Strategies: At least one of the main stock feed companies has vertically integrated, mostly into segments of the poultry industry, including elements such as day-old chicks, broilers, and layers, which provide relatively fast returns to investment. There is increasing investment into large state of the art stock feed plants which focus only on livestock feed and provide economies of scale. These plants have very large storage capacity, to ensure continuity of grain supply for their feed. Like maize meal millers, stock feed manufacturers try and buy as much as their storage allows when maize prices are lowest. They also buy mostly from private traders and aggregators, on a spot purchase basis, and rarely on contract. Because the quality standards for stock feed maize are less stringent than for maize meal, consignments which have rejected by the latter are often taken to stock feed companies. Nevertheless, in times when maize in short supply, such as during January 2020, in one area visited by the team a stock feed company was offering the highest price to farmers (K5 per kg – approx. US333 per Mt.). Some large millers have diversified their activity with a production line dedicated to feed, and a store network for distribution to smaller stockbreeders. Constraints: The main constraint mentioned (in 2017 in the Egg VC study) was fluctuation and lack of predictability in the prices for maize and soya, which was seen to be negatively influenced by government intervention (through import and export restrictions). Opportunities: Increasing demand on animal products in domestic and export markets. Livestock Producers who manufacture feed Function: Larger poultry, pig and dairy farms produce their own animal feed. Strategies: As do the commercial millers and livestock feed companies, larger livestock producers with storage capacity buy maize when prices are lower, and store for later use when feed and maize prices are higher. Producing feed on the farm helps to lower their costs of production and even costs out over the year. Some also prefer this as it provides better quality control and flexibility in terms of mixing ratios. Some livestock farms also grow maize specifically for stock feed. Constraints: The main constraint is limited capacity for storage of maize grain. For the medium and smaller poultry, pig and dairy farmers feed mixing equipment and knowledge is also a constraint, as well as capital to invest in storage purchase of maize stocks. Opportunities: Loan facilities for medium and smaller livestock farmers to invest in grain storage and feed mixing to lower and level out their production costs.

50
• Solar mills – Government project under Cooperatives
Function: Government, through technical cooperation with China, has invested in Solar Mills for use in rural administrative and market centres. The Solar mills are being managed by the Zambia Cooperative Federation Constraints: Solar mills are functioning at a very low level and have not yet been proven to be viable. They face problems in many areas. On technical side, the solar equipment seems to have difficulties to provide the level of energy required for milling during the wet season in particular in northern regions. On organizational side, the cooperative are public driven entities with low involvement of members that can lead to deficiencies in management. On the commercial side, solar mills face competition from small privately owned hammer mills which have over-capacity and provide a service for the small volume requirements of rural customers.
• Small-Scale Hammer or grinding mills Function: In rural and peri-urban areas, small mills, known as “hammer mills” provide maize growing households with a highly valued maize milling service. Most of the hammer mills are privately owned and managed, but some are run by community groups and cooperatives. Most rural and peri-urban households have access to a hammer mill within walking or cycling distance of their homes. Typically, women who have grown maize on the household food plot, carry a bucket of maize to the mill for processing. Hammer mills produce similar maize meal products to those produced by large commercial mills, including breakfast meal, super roller, roller, grits and samp when they combine hammer and grinding wheel technology to refine flour. Maize bran is the main by-product which is usually retained by the owner for feeding to livestock (pigs or poultry). Hammer mills are typically powered by diesel, except in peri-urban areas where electricity is used instead. Strategies: This type of milling can provide a tailored service with the precise quality of flour desired by the customer. This quality of service and the convenience due to proximity can justify a relative high milling costs compared to the industrial milling cost. Generally, it provides a much cheaper source of mealie meal for rural households than commercially produced mealie meal as indicated during the rapid appraisal of district markets (See section 3.5 in Social Analysis) Constraints: Rising cost of electricity is affecting the milling costs in peri-urban areas, and load shedding is also impacting the regularity of the service. The demand for this service is highest in the period for late April to November, when most households have some of their own maize to process for food. Demand reduces from December which does impact on cash flow generated for the owners which may otherwise be invested in other farming operations. Opportunities: As there is generally over-capacity in this part of the maize processing chain, the opportunities for expansion are limited. Improvements in design which lower the energy requirements would confer longer term benefits in cases where equipment is being replaced.
1.3.5 Brewers
• Large industrial breweries Function: In urban areas commercial breweries produce a range of beer products for sale to the local market within a reasonable distribution range. In the Copperbelt this includes sales across the border into DRC. The largest commercial brewer produces clear beers, which attract a premium price for higher income consumers. Maize grits are used for clear beer, which is a relatively minor element of the cost of production. Strategy, constraints and opportunities: exploration outside scope of the study.

51
• Smaller commercial breweries
Function: Smaller commercial breweries compete to target a much larger market for chibuku (opaque beer) which is generally consumed by people (mostly men) in the lower income bracket. The competition is highest in Lusaka and the Copperbelt towns where most of these breweries are located. There is less competition in the other provincial and district centres, which have commercial breweries. The main ingredient for chibuku is roller meal, which is in abundant supply in all the main urban centres where millers produce breakfast meal. Strategy, constraints and opportunities: exploration was outside scope of the study
• Village level brewers Adding value processes “7 days” alcoholic and chibwantu/maheyu (sweet beer not alcoholic),
Function: Processing of maize at village level by households to add value is widespread. In addition to the usual at least twice daily preparation of nshima, other maize based value added products include samp (dehulled maize kernals) mixed with other ingredients for meals, soaked roasted grains for snacks (maize nuts known as “chiwaya”), beer (sweet non-alcoholic and sour alcoholic), and local confectionary made from pounded green maize. Non-alcoholic “sweet beer” (chibwantu, maheyu) is used as a mid-morning snack, typically taken to the crop fields for refreshment during the growing season. It is usually flavoured with roots (munkoyo) and sugar may be added as well. Household processing of sweet beer has been made easier with the widespread introduction of rural hammer mills, which can produce maize grits for the purpose. Brewing of a sour alcoholic beer similar to chibuku (known locally as “7 days”) is widespread. Brewing 7 days beer is a more complex and labour intensive process than sweet beer. It requires malting of maize grain, drying and then pounding in a wooden mortar and pestle, and boiling in large drums and fermentation prior to serving. Strategies: Sweet beer is commonly made not only for household consumption but also for sale in rural market centres, providing women with an income earning opportunity. “7 days” beer is more commonly brewed by women after the maize harvest, and is usually brewed for social drinking purposes, ceremonial occasions (e.g. weddings, funerals, initiation ceremonies, placation of ancestral spirits), and also sometimes for communal work parties. Brewing for social drinking purposes is an economic activity which adds value to maize. Its commercial value at village level has been given as one reason why village level maize grain prices can be higher than the maize price in rural markets (Long, 1993). Constraints: The manufacturers of Chibuku beer are very active in marketing and distributing their product to rural areas using tankers, which are emptied into barrels and sold in the rural market centres. Improvement to rural roads serves to further extend the market for Chibuku into remoter rural areas. It is likely that this has impacted on the production of village level “7 days” beer for social drinking. Adding value to maize through village level brewing is labour intensive. In addition, brewing and selling alcohol has been discouraged by some Chiefs and by Church pastors due to the negative impact it has on behaviour and marital relations. During an interview with farmers in Masansa area a female farmer stated, “I used to do brew beer for a business, but I no longer do it because most of the people here are now Christians, and don’t drink any more”. In future, commercial production of sweet beer products may eat into the market for locally produced sweet beer. Opportunities: Scope for more village level processing of sweet beer for sale, to compete with the manufactured sweet beer products.

52
1.3.6 Maize based snack foods and drink manufacturers
Function: Over the past ten years there has been a large increase in the use of maize in the commercial production of snack foods for a growing urban and peri-urban market with disposable cash income. This growth has been led by two companies, one of which started with potato crisps before diversifying into maize based snacks. Snacks include popcorn (various flavours), corn chips, loops, and other snack foods containing maize. These snacks are attractively packaged, with names and added flavours to appeal to young people, and occupy shelves in all of the main supermarkets, and are also sold in small kiosks and in the urban and peri-urban market stalls across Zambia. Significant quantities of these snacks are also exported to DRC, mainly through informal channels. Maize based yogurt drinks, using local names associated with sweet beer (maheu, chibwantu, thobwa) is another large growth industry adding value to maize using similar distribution channels. Strategy, constraints and opportunities: exploration outside scope of the study
1.3.7 Retailers
• Large Supermarkets Function: The past 20 years has seen the emergence of supermarket chains as increasing dominant in retailing food products to consumers in urban and peri-urban populations in Zambia. The new South African supermarket chains, with strong buying power and economy of scale, now compete very strongly with smaller family run local supermarkets and groceries which dominated this sector up to 2000. The large supermarkets provide a major outlet for all maize-based food products, including maize meal, maize snacks, maize based soft drinks and beer. Strategies: During months of mealie meal shortage/higher prices the large supermarkets are signed up to selling breakfast meal at a lower than average price. This does draw in customers, but also peti-traders who buy and then resell. Supermarkets aiming to cater for the higher income bracket differentiate themselves by not selling 25kg bags of maize meal, the largest they sell being 10kg.
Constraints and opportunities: exploration outside scope of the study
• Smaller Retailers (small supermarkets, kiosks, local market stands). Function: Small family run groceries and stalls on local markets are also an important distribution channel for maize based food products, including grain, maize meal, grits, samp and sweet beer. Strategies: In local markets small traders either re-sell commercial mealie meal as packaged or break up 25kg bags of maize meal to sell in small packages (pamelas) sufficient for one or two family meals. In some rural markets small traders are also farmers who take their own maize to the local hammer mill for processing, and then re-package and sell in small packets. Further detail on the scale of operations is contained in the rapid appraisal of district markets (See section 3.5 in Social Analysis) Constraints and opportunities: exploration outside scope of the study.

53
1.4 Marketing channels linking actors and maize flows estimates
1.4.1 Marketing channels
Maize grain commodity is produced and processed through different technologies and is valued by various outlets as a final product or as an intermediate good entering in other industries (beverages, food snacks, feed for livestock). Hence maize VC is composed of many channels characterized by the set of actors involved. The quantification of flows at the detailed level of channels and market segments is a tricky question as there can be discrepancy between statistical sources. In particular for year 2018, flows assessment faces the problem of a large gap between the Crop Forecast Survey on which relies the National Food Balance (NFB) and the RALS. We consider here the post-harvest data provided by RALS. This survey offer advantage to inform all destinations of production considering the different segments for 2018/2019 marketing season. Hence RALS is the base of our quantitative assessment of the VC. For the final outlets of the VC, we used the CSO and NFB data. To check consistency of these last estimates, interviews with representatives of MAZ and GTAZ were used. The marketing channels identified are the following: (i) The auto-consumption channel, where production and consumption take place in the same unit, generally rural households, and also to some extent the peri-urbans. An extension of this channel to consider is the direct exchange between neighbouring households or inside familial networks, often under non monetarized, gift or in kind, transactions. This channel involves however another actor: the small miller for processing as most of the grain is mechanically processed. Large diffusion of small mills in nearly every village favours the use of hammer or grinding milling as an external service. This channel is by far the first for the volume handled, it represents around 1.1 million Mt so 40 % of the available production in a favourable year as 2018. All types of small and medium scale farmers are concerned by this channel, their strategy is to cover their subsistence needs with their own production. (ii) The food supply local channel inside the district for small centres and rural markets. It involves one intermediary between producer and consumer, a small local trader who buy and sell grain at retail. The processing is done at small mill, as a service provide to the consumer. This trading is often a seasonal activity. This channel seems of minor importance, except in border areas where local markets are very active with informal exports. RALS estimates maize purchase by rural households is 0.14 million Mt in 2018. But maize handled by local traders for district small centres markets is likely not included here, this flow is aggregated in RALS with trade for main cities. Hence an assumption of a market of 0.3 million Mt for this channel seems a realistic estimate. These local traders can face an increasing competition for retailing their grain with roller meal provided by large mills who tend to expand their markets. (iii) the food supply long distance private trade channel for urban areas. This channel involves the large industrial mills concentrated in main cities, and who supply meals through modern and traditional retail shops (and also a small volume of an intermediate good, grits for the breweries, and meal for snack foods). It is the main channel for marketed maize, estimated at 0.6 million Mt. There are three variants within this channel according to the nature and number of intermediaries between producers and millers.

54
iii-a direct supply of mill by farmers generally large and medium ones, this counts for 0.11 million Mt, according to RALS 2019. iii-b a one-step supply of mill with one intermediary, a local aggregator of the production area, mostly during peak season when large maize availability reduces the producer price and the time spend to load a truck. iii-c a two-step supply of mill, the channel involves an aggregator and a large trader who ensure storage. The aggregator being independent or in contract as agent of the trader. Large traders supply millers in particular during the lean season, given their storage capacity. (iv) the food supply long distance public FRA channel. FRA is the most important actor in maize trade, it buys directly to small and medium scale farmers, provide storage and supply large millers for 0.4 million Mt per year in average (40% of their supply). (v) the food relief channel for deficient rural areas. It is supplied by FRA and distributed by DMMU. It varies a lot inter annually, according to the level of harvest of the year. In 2018/19 marketing year, this channel counts only for 0.035 million Mt. (vi) the feed supply channels. It involves the same suppliers than for the millers: small and medium farmers, aggregators and traders. Their maize grain supply is estimated in NFB at 0.29 million Mt. They are also supplied by a second channel from millers for bran, an important sub-product of the food channel (for 0.25 million Mt). (vii) the export channel, most of it for food, involves small local traders of borders regions, and large traders. Formal grain exports count for only 0.028 million Mt. (CSO) as restriction on exports were applied in 2018. But informal exports are estimate by IAPRI surveys to be four times larger, reaching around 0.1 million Mt. Grain exports are then estimates at 0.128 million Mt. Another export channel is for bran with 0.04 million Mt. The overall domestic market for maize grain in Zambia is then estimated around 1.5 million Mt, and there is in addition a range of 1 to 1.4 million Mt for home consumption in rural and peri urban households. It is noticeable that the same actors, small and medium farmers, aggregators and traders are involved in both marketing channels for food, and feed. They arbitrate their marketing destination according to price opportunities. Competition for access to primary grain can then occur between private and public food channels, and also secondarily with feed and export. On the final food market side, local channel with small milling and long-distance channel with industrial milling seems more complementary than in a competition, they provide different services and address different types of households.
1.4.2 Synthesis on maize flows between actors
An overview of the maize VC channels and actors is given in the flow chart Figure 5 and detailed flows quantification is presented in the following matrix figure 6. Flows are estimated for 2017/2018 cropping season, harvested in April to June 2018 and marketed from May 2018 to April 2019. Conversion rate for meal and grits, with bran as sub-product, are estimated at the conventional coefficient of 0.8. Some flows belong to informal trade without any statistics, it concerns bran sales, main part of grain exports, grain purchase by urban households directly from farmers, service of

55
hammer/grinding milling delivered to households. These are estimated from expert opinions of IAPRI and professionals met during the mission. Finally, two key parameters are assumed to get a consistent balance of supply and use of maize products. These are Post harvest losses (increased at a 10% rate instead of the normative NFB rate of 5% for all grains which seems underestimated) and Stock variations. Especially carry over stock in farms is assumed at a rate of 10% of the production as 2018 was a year with slight surplus.
Figure 5: Flows chart of Zambian maize VC 2018 Thousands metric tons of grain or processed product Sources: RALS, CSO, MAZ, NFB and Authors’ estimates from interviews

Sources: RALS, CSO, MAZ, NFB, and Authors’ estimates from interviews

1.5 Governance of the value chain, market coordination and policy
Value chain governance refers to relationships between actors, coordination processes to match supply and demand both in terms of quantities and qualities, and public regulations. For agricultural commodities, this governance is classically determined by product’s characteristics, complexity of transactions, supply and demand structure involving leading firms and dependant actors (Gereffi et al., 2005). Maize as part of grain sector is a basic commodity with low grade differentiation, good storability, basic processing to final output. As the dominant staple food, maize cropping is also widespread throughout the country, scattered over hundred thousand of small producers. Economies of scale in processing leads to a concentration of the milling sector. Such value chain configuration implies a relative ease of transactions, low cost of switching to new partners, high capacity of suppliers to meet requirements of buyers. Hence, the maize chain fits with the typical market-based coordination category, according to Gereffi’s classification. This coordination takes on the shape of spot market transactions. Even if personal relations can be engaged in maize trading, contracts, formal or informal are very rare according to all stakeholders met. Beside this dominant category of spot market coordination, lies also at a marginal extent a maize channel with hierarchical coordination; this is related to vertical integration of agribusiness firms devoted mostly to feed and livestock. The market-based coordination of Zambian maize value chain doesn’t take place in a free competitive market but is highly regulated by public authorities. Maize is a strategic commodity for the food security of the country, and also for rural development, hence of major public interest. The particular challenge of this market regulation is the price dilemma to match opposite interests of urban consumers for whom maize and derived maize products as poultry and eggs, is a main item in their budget (Chisanga and Zulu-Mbata, 2018)5, and rural producers whose income relies largely on maize. The main market regulation instrument is the Food Reserve Agency that acts as the pilot of the maize VC. FRA is by far the main actor in trading with 400.000 t under its control, around a quarter of the maize market. FRA handled as much maize grain as the cumulative total of the top 15 private traders. This dominant market share leads FRA to establish the driver price of maize grain at production stage. FRA starts buying maize from producers after harvesting and drying around July and private traders then follow its buying price. Private traders can however get an advantage in the competition for grain with FRA as they pay cash the farmers for delivery. FRA stores the maize and releases it to the millers at a subsidized price in the lean season, hence subsidizing indirectly the consumers. A trade policy is associated with FRA intervention on maize market, it concerns import and the export regulation subject to permit delivery. This regulation was strongly enforced in the recent years, in particular in 2018/19 with export bans that affected large Zambian traders. Neighbouring countries as DRC and Tanzania have an important maize market which is an attractive outlet for Zambian traders. In a year like 2018 with limited expected surplus of maize production, the FRA faced difficulties for supply at the price announced at the beginning of marketing season, not enough attractive for farmers; then the export ban was implemented to hold the production domestically.
5 Who found that urban households spent 11,8% of their food budget in maize and 12 % in poultry and eggs in 2015; but for the poorest class of households the share of maize reached nearly 50% of their food budget.

58
The provision of subsidized inputs (maize seeds and fertilizer) to small-scale farmers is the other main instrument for food security, it is supposed enhancing the supply of the market by increasing production and productivity. Last food security intervention, relief food is also distributed by DMMU and WFP in rural areas facing natural disaster. It is largely acknowledged that such staple food market at the base of a country’s food security needs public regulation to overcome market failures that can be numerous in a context of a partial integrated economy with low infrastructure development as is the case in Zambia (Timmer et al, 1983). First, the structure of the maize market with only half of the production commercialized, and a strong rainfed dependence, provides instability, as hazard on production level due to climatic or pest event have a great impact on marketed surplus. Subsistence producers are less sensitive to the market price which should play a key incentive role to match supply and demand. Second, lack of reliable information on production and inventories level is also a main source of market failure. Zambian traders and millers hold large maize stocks determinant for short term supply, but they are naturally reluctant to communicate as inventories is a strategic information for their bargaining power on the market. The existence of professional organizations, as ZNFU, GTAZ, MAZ, with a broad participation of stakeholders, is an asset for regulation but their commitment to provide information, especially on inventories, seems limited. Beyond this well accepted principle of public intervention for market regulation, there are many debates on how best to implement this regulation. The issue of impacts and efficiency of maize policy, and its instruments applied for the market regulation, has been widely studied during the last two decades (Dorosh et al, 2009; Mason et al 2011) , especially by IAPRI (Samboko et al, 2019; Chisanga et al 2018; Harman et al 2017; Chapoto et al 2009; Chapoto et al 2015, Chapoto et al 2017; Kuteya et al 2014; Kuteya et al 2012; Nkonde et al 2011; Tembo et al 2010; Govereh, et al 2008). These studies point out several failures in the management of public instruments for market regulation. The main objective of maize price stabilisation is not achieved according to IAPRI (Chapoto, 2019c). FRA intervention is considered to have adverse effects caused by the absence of a clear policy of timeliness purchases and releases on the market with predefined price stabilisation targets. These effects are increasing uncertainty on short term market conditions for stakeholders, and by consequence leads to disinvestment of the traders of the maize market. Export restrictions are also strongly criticized by traders, producers and IAPRI experts as they are ad hoc measures, often disconnected from the actual supply situation of the domestic market (as in 2018/19 season). They deprive the Zambian maize VC of a major dynamic outlet, sending wrong incentive to producers for the medium term. The producers of northern regions who are far from main consumption centres are particularly penalized by export bans despite their higher productive potential. The second objective of food security and transfer to poor class consumers seems not reached either, IAPRI consider that subsidized maize to millers does not lower retail maize meal prices. Finally, the very high cost of FRA operations compared to private traders leads to consider public regulation poorly efficient. This conclusion should however be tempered by the fact that FRA operates all over the country with equal price conditions for farmers, hence it serves also remote areas where private traders and selling opportunities are rare. This maize policy analysis is linked to a number of proposed changes regarding how FRA and FISP operates, but few of these changes have been implemented to date. The slow uptake of the proposed
59
changes highlights the difficulty of dealing with a matter which has strong implications for income transfer, wellbeing of mass consumers and possibly rent seeking of some actors; all these aspects have been political implications. A main benefit of these policy studies has been fostering a dialogue between stakeholders and government. This is a positive outcome because the strengthening of institutions through stakeholder dialogue is acknowledged as an asset for competitiveness of a value chain.

60
2. ECONOMIC ANALYSIS
2.1 Objectives and methodology
The financial and economic analysis of the Value Chain concerns two scales of investigation. On the one hand, it addresses the key actors’ activities of the chain: the maize cropping, trading and milling. How are these activities profitable for the agents? Beyond a detailed instant measurement of operating profits and returns for the reference year, longer term financial viability and its factors are discussed. Distribution of income and value added between actors along the chain is also an economic concern, revealing value formation influenced by costs structure and power relations on markets. On the other hand, an aggregated scale of the whole Zambian maize chain is considered to analyse the effects of the chain within the national economy. Thus, are assessed different contributions of the chain: to growth generation (part of gross domestic product), to the public finances (balance of taxes and subsidies), to the balance of trade (through imports of intermediate goods and services and exports of maize), and to social inclusion (through income distribution and employment creation). An international perspective is also given to address the competitiveness of the chain, although maize in Zambia is mostly a domestic commodity sourced and marketed within the country. The following economic analysis is then providing answers to the two framing questions:
1- What is the contribution of the value chain to economic growth? 2- Is this economic growth inclusive?
2.1.1 Design of the economic accounting model applied to the Zambian maize VC
Economic effects of the VC are based on income and value added calculations involving the operating accounts of activities and actors. The absence of a formal accounting system for most of actors, or for corporates, the lack of access to their analytical accounting, lead the study to build an accounting model to inform with surveys, literature and public statistics. The model designed here is organized into four levels: (i) The activity level per basic unit of work: the unit area for cropping (1 hectare), the seasonal (lean/peak) batch for trading (30 Mt transported for local aggregator, 5000 Mt warehoused for large trader), the milling unit (72 Mt/year for small scale and 30,000 Mt processed for large industrial mill); these last units corresponding to local standards. (ii) The actor level for the maize related activity, involving the typical size of the actor. For diversified actors, the focus on maize may induce a bias as the synergies between different activities could be underestimated (as common equipment sharing, reduction of transaction costs for actors generally diversified in all types of grains). (iii) The chain segment level which is an aggregation of the actors at a same step of the chain; typically: Input supply, Agricultural production, Trading-aggregating, Milling. Relevance of such intermediate level lies on the distributive issue of the VC. Milling has to be differentiated here in small scale and industrial, as these activities form separate channels (local versus long distance). (iv) The whole maize chain level aggregating all the actors for macro analysis

61
The set of activities and actors’ accounts are in line with the boundaries and structural characterization of the VC (see part 1. Functional analysis). For activities, accounts include five cropping systems for agricultural production; four aggregating and wholesaling seasonal activities for trading; two small scale and industrial units for milling (human consumption meal only). The agents’ accounts size the activities realized at the scale of the production unit. For small scale farmers, the size of reference considered is 0.8 ha maize for those with a Low Inputs cropping system, 1 ha for Medium Inputs, and 2 ha for High Inputs. Large scale farmers have a mix cropping pattern of motorized Rainfed grain and Irrigated seeds, their size and mix differ whether they are individual entrepreneur (15 ha maize) or corporate (50 ha). For traders, the two typical sizes considered are 1200 t maize /year for local aggregator involved in transport (loading batch of 30 Mt trucks) and 20 000 Mt for large trader doing storage (capacity of 5000 Mt). The main actor in trading is the public FRA operating 400 000 Mt/year. For millers, typical size is 72 Mt/year for small scale and 30 000 Mt for large scale industrial miller. Figure 7 presents the VC conceptual model for financial and economic assessment with a four levels approach and unit size, total volume and numbers of actors.
Two accounting methods are used respectively at micro level for financial analysis of actors, and at macro level for economic effects assessment of the VC within Zambian economy. For the financial analysis, we used the activity-based accounting method called Direct costing, (see Table 9) as we focused on the maize activity of agents that are generally diversified. Hence, the key financial indicator calculated is the Gross Operating Profit of the maize activity (i.e. margin on direct

62
variable cost). Profit after direct variable and fixed costs, including direct depreciation should have been also assessed but we missed data on depreciation of fixed equipment. For comparative purpose, all operating accounts are then balanced at the Gross Operating Profit level. For large agro business activities, Full costing method including general costs (indirect costs to maize activity) allocation through analytical accounting would have been preferable as general costs, such as common equipment, overheads are of great importance, but this is strategic information for firms in a competitive market and hence access to the data was restricted.
item Financial indicator + Value of Production
(sales and home-consumption) Subsidies for operations
=> Revenues - Variable costs
Inputs (goods & services) Hired Labor (wages and salaries) Financial charge Taxes on operations
=> Gross Operating Profit of the activity
- Direct Fixed costs
Depreciation dedicated equipment Land fees, ….
=> Operating Profit on Fixed and Variable costs direct to the activity
- General indirects imputed costs
Depreciation common equipment Overheads, ….
=> Net Operating Profit on Full costs
TABLE 9: COMPUTATION AND FINANCIAL INDICATORS FOR ACTIVITIES ACCOUNTS
For economic impacts on growth generation and distributive issues, the assessment is based on the “Effects method” focusing on Value added indicator, (see Table 10). Gross Output is here without the subsidies, and Intermediate consumptions are deducted to obtain the Value added. The Value added plus the subsidies cover wages paid for hired labour, financial charges, taxes, land rent and the final balance, operating income (gross or net according to depreciation removal or not). For our study we consider the Value added before depreciation as depreciation data for industries were missing.

63
item Economic indicator + Value of production
=> Gross Output without subsidy - Intermediate Consumptions
Inputs (goods & services)
=> Gross Value Added - Capital depreciation Depreciation of fixed
equipment
=> Net Value Added Value added Distributive effects Income Transfer to institutional sectors
Hired Labour Wages to Households Financial charge Interest to Financial institutions Taxes minus Subsidies Taxes to Public institutions Land rent Land fees to Land owners Operating income Net operating profit to
entrepreneurs
TABLE 10: VALUE ADDED ACCOUNTING MODEL SOURCE: VC4D METHODOLOGY
Economic analysis concerns wealth generation and its distribution, and also transfer from public sector which is of particular importance in the Zambian maize VC. This implies a broader approach of the VC including agro input supply activity as inputs subsidies for seeds and fertilizer are one of the main instruments of the maize policy. These subsidized inputs through the Farmer Input Support Programme (FISP) direct supply or support to private agro dealers (e-voucher system) are almost entirely devoted to maize production. Given the main importance in agricultural sector and the complexity of the maize VC which has multi-products, and multi-uses of the grain output, with subsidies at both inputs and outputs sides, we choose an integrating tool, the Social Accounting Matrix to display the flows and link activities, products and actors of the VC. Such matrix has two advantages: (i) it allows to check data consistency through accounts balancing. Equalizing rows and columns for Activities and Goods and Services accounts is a challenging issue given the various sources of data used with varying quality. Hence, balancing has required assumptions on some data, generally items of the value added; and (ii) indirect effects can be computed through a process of matrix inversion. The structure of the matrix is as follows:

64
TABLE 11: SOCIAL ACCOUNTING MATRIX (SAM) STRUCTURE For a VC assessment, the most important accounts are those of Activities in column giving the direct Value Added by the sum (a) + (b) + (c) + (d) – (e) and spillover effects on upstream sectors with the Input-Output sub-table (i). Specification of the matrix for the Zambian maize VC is based on the following accounts. Hence, we develop an accounting Matrix of 46 rows x 46 columns.
Specific Accounts defined for directs effects maize VC
Accounts of CSO supply and uses, input-output tables
ACTIVITIES
Private agro input supply / Public FISP Small farming Low/ Medium/ High inputs Large farming Rainfed grain/ Irrigated seeds Private Trading / Public FRA Milling Industrial / Small
Manufacturing chemical, plastics Manufacturing food, beverages Machinery install & repair Electricity generation & distribution Transport & storage Wholesale & retail trade
GOODS & SERVICES
Maize seeds commercial / subsidized Fertilizer bulk / commercial retail / subsidized Maize grain commercial / subsidized Meal / Grits / Bran / Milling service Other goods & services
Petroleum & gas Electricity Plastics products (for packaging) Maintenance repair Transport service
INSTITUTIONS Farmers households Other households
Households Enterprises Financial institutions Public administration
REST OF THE WORLD
Imports Exports
TABLE 12: ACCOUNTS FOR THE ZAMBIA MAIZE VC SAM
Households Enterprises Financial Instit Public Admin.
ACTIVITIES Domestic Production Subsidies (e) Activity
revenue
GOODS &SERVICES
Intermediate Consumption (i)
Final Consumption Export Investment Demand
Households Labour Income (a) transfer Profit distributed Financial
products transfer transfer HH Income
Enterprises Gross Income (b) transfer Earnings Eses
Financial institutions
Financial Charges (c) Financial ch. transfer Earnings FI
Public Administration
Taxes on production (d)
Taxes on goods Taxes Taxes Taxes transfer transfer Public revenue
REST OF THEWORLD
Imports transfer transfer transfer transfer Foreign outflow
CAPITAL Accumulation
savings savings savings savings Foreign savings Savings
Total Gross Output Supply HH expenditures Entrep expenditures FI expenditures Public
expenditures Foreign Inflow Investment
TotalACTIVITIES GOODS &SERVICES
INSTITUTIONS REST of theWORLD
CAPITAL Accumulation

65
2.1.2 Data sources, accuracy, scope and limitations
For financial analysis, estimation of costs and profit of key activities and actors is based on an analytical detailed approach of primary parameters: technical coefficients and unit prices. For economic analysis at VC national level, we used preferentially macro data coming from national statistics and accounting system. Aggregation at macro level of the individual accounts from financial analysis was done in some few cases but face the problem of high diversity of actors and statistical representativeness. Three main data sources are used: (i) The documentation provided, especially from the Indaba Agricultural Policy Institute (IAPRI), abundant on the maize VC as this crop is the main focus of agricultural policy. For cropping assessment, the IAPRI study on cost of maize production6 gives an initial reference. The professional organizations for large scale grains actors including the Zambia national farmers Union ((ZNFU), Grain Traders Association of Zambia (GTAZ) and Millers Association of Zambia (MAZ) provided key figures and volumes handled by their members. (ii) The public data on production, marketing, consumption, especially the RALS and CFS of Ministry of Agriculture, these surveys being designed to be statistically representative of small and medium scale farmers at national level (Chapoto & Subakanya, 2019)7. Specific RALS data processing done by IAPRI upon request of the study allows cropping systems activities and farms quantification with acceptable accuracy. This includes cropped area, yield, production, destination of output, inputs use, equipment, type of labour. Central Statistical Office is also a key source providing macro-data of National Food Balance, essential to quantify the output flows of the VC and also coefficients from supply-Uses and Inputs-Outputs tables for direct and indirect effects calculation (although these last data dates back to 2010).
(iii) Interviews of key actors during the mission (February 2020) and the additional survey (September-October 2020) especially with small scale stakeholders (small millers, local aggregators and rural market traders) for which there is lack of official data. The data processed for financial accounting models are of three kinds: Technical coefficients (yields and conversion rates of input-output functions), Prices of inputs and outputs, Size of actor (volume handled). Technical coefficients Selecting technical coefficients face the problem of the large heterogeneity of technologies and performance for some activities and possible bias to choose a reference value. The range of variability of technical coefficients is diverse according to the segment of activity considered. For cropping, the variability is very high as we deal with a national approach integrating various agro-pedo-climatic and farming systems conditions. The technical coefficients chosen derived from RALS are presented in the Functional analysis part. Within the small and medium-scale farmer types, the low resource endowment of farmers leads them to develop various sub-optimal cropping practices resulting in a
6 Burke et al , 2011, using data from the 2010 Crop Forcasting Survey with a sample of 11 200 maize growing farms. 7 IAPRI Rural Agricultural Livelihoods Survey, 2019 Survey Report. The RAL Survey is a panel survey (2012, 2015 and 2019) using the 2010 census sampling frame. The 2019 sample counts 7241 households expected to be statistically representative at provincial and national levels.

66
high variability of the key coefficient maize yield (range of less than 1 to 5 Mt grain/ha). Large motorized farms have more optimized cropping systems, hence a lower variability in yields but a wide array of chemical inputs used. For milling, processing technologies are much more controlled and there is some standards commonly accepted by professional for inputs consumption (mostly energy) and products conversion rate. The key coefficient for grain conversion is 0.8 meal and 0.2 bran. For small milling, the energy source (fuel or electricity) is the main technical differentiation factor. For trading, technical coefficients are related to transport efficiency and rate of stock turnover. Losses in shrinkage and spillage are under 2%, then negligible given the range of uncertainty of trading data. These coefficients depend on the marketing channel (distance, remoteness of supply, roads, loading and storing conditions) and the season (availability of supply).
Confidence in data accuracy is quite good for cropping and milling activities. For small cropping systems, we choose coefficients related to a typical expert based system with consistency in input-output function, instead of a purely statistical average from RALS8. For large motorized farms, our references are based on two sources: First, ZNFU who monitor a standard cost of production, used in particular for dialogue with MoA on maize pricing policy. Second, accounting data provided by two farms visited during the mission in Mkushi area, is related to one corporate and one individual. The problem raising on these formal budgets is the allocation of general costs to maize cropping, especially the high mechanization cost, possibly dependant of accounting norms that may not reflect reality. For trading, data are subject to a higher uncertainty. They are sourced from our meetings with few stakeholders providing vague estimates. High variability in transport conditions makes difficult to choose a precise reference. The absence of accounting data available for FRA leads us to use personal assumptions that may be questionable. Pricing system Maize grain market prices are monitored by several surveys: Zambia Statistics Agency (formerly CSO), IAPRI and price data reported in RALS 2019. Hence price data accuracy is satisfactory for most products and market stages. Two products are however out of the scope of statistical surveys: the grits for breweries and bran sold to millers. Estimates were then done with limited confidence, as estimates were informed by interviews with few stakeholders participating in these market segments. Seasonal approach is of course necessary to cope with prices variability. It is summarized in a simplified two seasons differentiation: post-harvest peak season and lean hunger season. Pricing system used as reference is then given in table 13.
8 In particular, the high inputs small scale cropping system defined by improved seeds and fertilizer use has heterogeneous use of other inputs: herbicide, insecticide, manure. We consider this system with an herbicide use at conventional dose and no insecticide, although RALS reports 30 % of these farmers using herbicide, 16 % insecticide (mostly chlorpyrifos for armyworm control) and 13% manure.
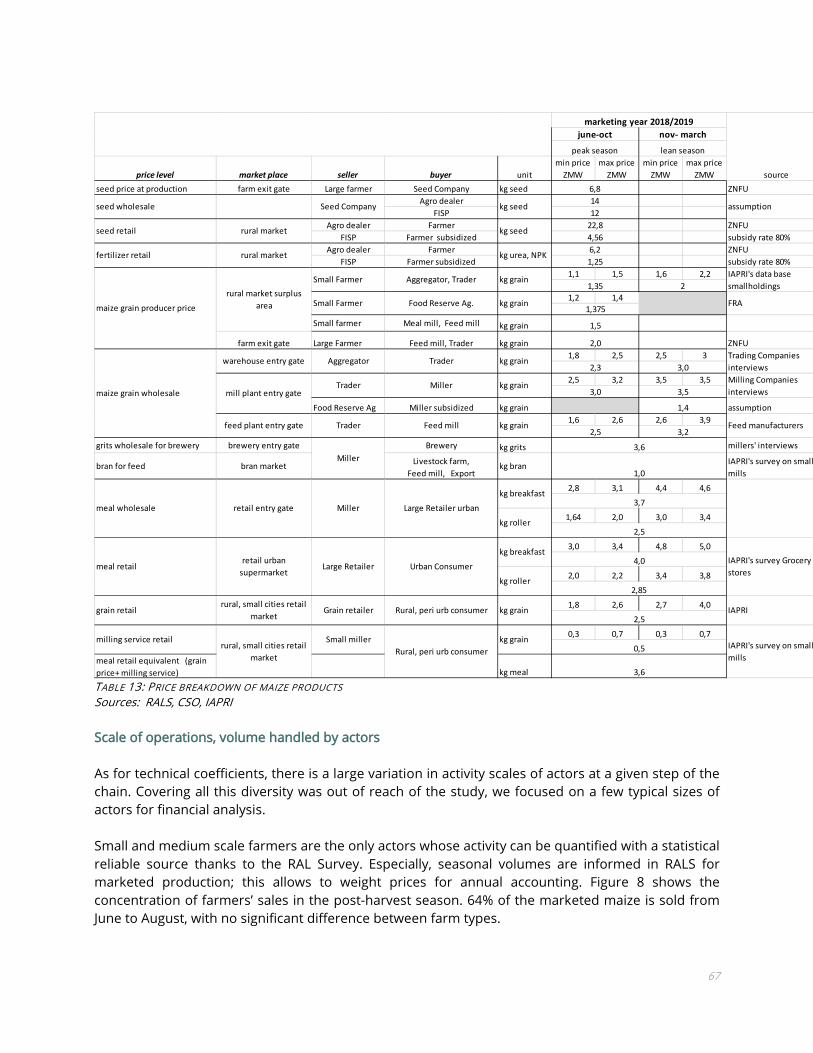
67
TABLE 13: PRICE BREAKDOWN OF MAIZE PRODUCTS Sources: RALS, CSO, IAPRI Scale of operations, volume handled by actors As for technical coefficients, there is a large variation in activity scales of actors at a given step of the chain. Covering all this diversity was out of reach of the study, we focused on a few typical sizes of actors for financial analysis. Small and medium scale farmers are the only actors whose activity can be quantified with a statistical reliable source thanks to the RAL Survey. Especially, seasonal volumes are informed in RALS for marketed production; this allows to weight prices for annual accounting. Figure 8 shows the concentration of farmers’ sales in the post-harvest season. 64% of the marketed maize is sold from June to August, with no significant difference between farm types.
price level market place seller buyer unitmin price
ZMWmax price
ZMWmin price
ZMWmax price
ZMWseed price at production farm exit gate Large farmer Seed Company kg seed ZNFU
Agro dealerFISP
Agro dealer Farmer ZNFUFISP Farmer subsidized subsidy rate 80%
Agro dealer Farmer ZNFUFISP Farmer subsidized subsidy rate 80%
1,1 1,5 1,6 2,2
1,2 1,4
Small farmer Meal mill, Feed mill kg grain
farm exit gate Large Farmer Feed mill, Trader kg grain ZNFU1,8 2,5 2,5 3
2,5 3,2 3,5 3,5
Food Reserve Ag Miller subsidized kg grain assumption1,6 2,6 2,6 3,9
grits wholesale for brewery brewery entry gate Brewery kg grits millers' interviews
bran for feed bran market Livestock farm, Feed mill, Export
kg bran IAPRI's survey on small mills
2,8 3,1 4,4 4,6
1,64 2,0 3,0 3,4
3,0 3,4 4,8 5,0
2,0 2,2 3,4 3,8
1,8 2,6 2,7 4,0
0,3 0,7 0,3 0,7
meal retail equivalent (grain price+ milling service) kg meal
assumption
FRA
Trading Companies interviewsMilling Companies interviews
Feed manufacturers
1,0
3,6
source
IAPRI's survey on small mills
kg urea, NPK
kg grain
kg grain
kg grain
kg grain
kg grain
kg breakfast
kg breakfast
kg roller
kg roller
kg grain
IAPRI's data base smallholdings
IAPRI
Small millerrural, small cities retail
market
kg grainmilling service retail0,5
3,6
Rural, peri urb consumer
2,5
Large Retailer
Miller Large Retailer urban
IAPRI's survey Grocery stores
Urban Consumer
Grain retailer Rural, peri urb consumer
2,85
3,7
2,5
4,0
meal wholesale
meal retail
retail entry gate
retail urban supermarket
grain retailrural, small cities retail
market
Miller
rural market surplus area
Trader Miller
rural market
rural market
maize grain wholesale
2,5 3,2Trader Feed mill
mill plant entry gate
1,4
Small Farmer Aggregator, Trader
Small Farmer Food Reserve Ag.
1,5
feed plant entry gate
maize grain producer price
6,8
22,8
1412
4,56
seed wholesale
1,256,2
seed retail
Seed Company
fertilizer retail
2,0
1,375
1,35
kg seed
kg seed
warehouse entry gate2,3 3,0
Aggregator Trader
3,0 3,5
marketing year 2018/2019june-oct nov- march
peak season lean season
2

68
FIGURE 8: MARKETING SEASON OF MAIZE BY FARM CROPPING SYSTEM TYPE MARKETING YEAR 2018/19 Source: RALS 2019 Data processed by IAPRI For traders and millers, we used information provided by experts and stakeholders met during the mission with focus on one or two main variants but this view remains partial. Size distribution of actors is roughly estimated from GTAZ members who counts 144 professionals. Most larger traders are members of GTAZ but smaller actors are poorly represented (Table 14). Maize represents nearly half of the grain trading, large traders being involved also in soya beans and wheat and small traders in pulses and soya beans. The reference size selected for the financial analysis is 1200 Mt maize for small trader doing aggregation and 20 000 Mt for large trader involved in storage.
TABLE 14: SIZE DISTRIBUTION OF TRADERS 2018
Source: GTAZ For millers, range of activity size is also wide even for a given technology. The small hammer milling capacity vary from 80 to 300 kg/hour and we considered the reference of 100 kg/hour. Industrial milling starts at a capacity of 1.5 Mt/hour and some plants reach up to 40 Mt/hour. We selected a reference of 7 Mt/hour corresponding to a mill visited. The actual activity of mills is generally under this processing capacity. We assumed a capacity utilization rate of 66 % in the reference industrial mill, hence processing 30 000 Mt/year. We considered a smaller utilization rate of 25 % for small mills (72 Mt processed/year) as their activity seems more seasonal in a number of areas where maize grain is getting scarce from December to April.
0
100
200
300
400
500
600
700
800
900
jun-aug sept-nov dec-feb mar-may
Thou
sand
s MTo
ns
Low inputs medium inputs high inputs
27%
8%1%
64%
Trader size type volume of grain traded /year
Number of traders
small 1000 – 2000 Mt 117 medium 2000 – 6000 Mt 12 large corporate 6000 – 150 000 Mt 15

69
Characterization of activity scales of actors and seasonal flows are given in Table 15
TABLE 15: SCALE OF OPERATION AND SEASONALITY OF MAIZE ACTIVITIES 2018 Sources: RALS, Authors’ surveys
2.2 Financial analysis of actors
The profitability of maize based activities is assessed for the three categories of actors of the VC : Farmers, Traders and Millers. For traders, we consider those involved in long distance channel. Assessment is based on above data and references for 2018. Beyond this year snapshot, highest variable factors that may affect longer term financial viability are also addressed.
2.2.1 Farmers’ profitability
Maize cropping systems budget Comparative economic performance of the different cropping systems is outlined by crop budget at plot level for a unit of 1 ha. Figure 9 shows the breakdown of Production value per unit area (subsidies included) with cost structure and residual income (Gross operating profit).
chain step Actor - segment size unitRange of
activity size
Reference typical Maize Activity size
Maize grain Volume /actor
tons/ year
Grain Production year 2018
kt
Marketed Production
year 2018/19 kt
peak season
june-oct
lean season
nov-mayLarge Farmer individual 5 ha 25 30 30 100%Large Farmer corporate 40 ha 200 20 20 100%Small Farmer Low Inputs 0.7 to 1.3 ha 0.8 ha 0,8 287 49
Small Farmer Medium Inputs 0.8 to 1.5 ha 1 ha 1,8 1073 351
Small farmer High Inputs 1.9 to 3.8 ha 2 ha 5 1839 1214Large Farmer individual 10 ha 60 90 90Large Farmer corporate 10 ha 60 10 10Aggregator 0.1 Million ZMW 1200 578 75% 25%Large Trader 15 Million ZMW 20 000 530 60% 40%
Food Reserve Agency 400 000 400 100%Large industrial Miller 1.5 to 40 t/h 7 t/ hour 30 000 950 50% 50%Small scale Miller 0.07 to 0.3 t/h 0.1 t/hour 72 1300 60% 40%
working capital for
maize
processing capacity
Milling for meal
grain trading
maize seeds
distribution of sales by season
80% 20%
seed maize area
maize cropped
area
Total Volume per segmentVolume per actor
grain production
100%

70
Figure 9: Breakdown of Value of Production + subsidies per hectare per Maize Cropping system Zambia 2018 Sources: RALS 2019, IAPRI, Authors’ estimations Value of production per ha ranges greatly (1400 to 12 000 ZMW/ha) according to two factors. First obviously, the yield related to a cropping system, is linked to the level of input use and mechanization (from 1 to 6 t/ha). Second, the subsidy on key inputs (seed and fertilizer) have also a great impact on farmer financial flows. However, not all farmers qualify to access inputs through FISP. Only 40% of farmers received in 2018 the subsidized inputs package9. The Small-scale Lower inputs cropping system defined by no use of improved seeds and fertilizer performs low yield limiting their Gross Operating Profit at 1320 ZMW/ha. This profit is close to the value of production because the cost of production is almost entirely labour which is an opportunity cost and not financial. Very small producers with less than 1.5 ha total cropped area are dominant in this system. Their maize production is devoted to subsistence so the estimated value of production is an opportunity value conventionally fixed at average market price that could be underestimated. The disposal of a maize stock for food in the hunger season has a value of insurance not accounted in our figure.
9 The subsidized inputs package in 2018 consisted of 10 kg hybrid seeds, 100 kg urea and 100 kg compound, corresponding to a normative requirement of 0.5 ha. 80% of this cost is subsidized. In practice, a farm can get more than 1 package as several members of the family can be registered on the beneficiaries list.
-1000
0
1000
2000
3000
4000
5000
6000
7000
8000
9000
10000
11000
12000
SS Low inputs1t/ha
SS Mediuminputs 1,8t/ha
SSMed.Inp.Subsid.
1,8t/ha
SS High inp.Sub. 2,5t/ha
LSMotor.Rainfed
6t/ha
ZMW
/ h
ecta
re
seeds
fertilizer
chemicals
other (bags)
mecanical-energy
hired labor
tax
input subsidy
rest of income

71
For SS Medium inputs cropping system, only 41% of these farmers received subsidies in 2018, hence we have to consider both accounts with and without subsidy. The average yield for this system is close to the national average of 1.8 Mt/ha but it has a Gross Operating Profit of only 777 ZMW/ha without subsidy. Inputs at full cost represent 70% of the value of production. With input subsidy, the Gross Operating Profit of this system has a threefold increase reaching 2130 ZMW/ha, mainly because fertilizer and seed accounts for a great portion of the production costs. The SS Higher inputs cropping system is generally subsidized, 65% of these farmers got the input subsidies in 2018. With such subsidies and a yield up to 2.5 Mt/ha, the Gross Operating Profit of this system is around 2000 ZMW/ha so similar to the Medium input system subsidized. The efficiency of inputs use seems low in this system. Hence, the profit relies totally on the subsidy. Fertilizer represents more than 50% of the financial cost of production, as labour is mostly provided by family. This system has however some hired labour averaging 500 ZMW/ha (14% of cost of production) and a mechanization cost for shelling accounting for 10 % of the cost of production. The Large scale Rainfed cropping system of motorized farms over 20 ha is not eligible to input subsidy and according to accounts available, experienced a null margin on maize in 2018 market condition at 170 US $/t maize grain (2 ZMW/kg). Its cost of production, mainly fertilizer and mechanization, is estimated at nearly 1 000 US$/ha (or 12,000 ZMW/ha), hence the yield reference of 6 t/ha is at breakeven point. The system is very capital-intensive with hired labour accounting for only 5% of the cost of production. Large farms make a profit on maize cropping only with seeds which is a very high value of production, seeds prices are 3.4 times higher than the normal maize grain price. Gross Operating Profit with irrigated seeds system is estimated at 25 000 ZMW/ha. Technical and economic performances of these standard cropping systems are summarized in Table 16.
SS low inputs
SS medium inputs SS high inputs Large S Rainfed
No subsidy
No subsidy
With subsidy
No subsidy
With subsidy
No subsidy
Land productivity kg maize/ha
1000 kg 1800 kg 2500 kg 6000 kg
Gross Margin ZMW/ha
1320 780 2130 -20* 2000* -10
Nitrogen (N) productivity kg maize/ N use
- 37 kg 31 kg 36 kg
Labor productivity Gross Margin ZMW/day
Manual Animal traction
20
26
9
13
25
35
0
0
35
55
Capital return Value of Production / Input investment
1,45
1,15
TABLE 16: PRODUCTIVITIES OF MAIZE CROPPING SYSTEMS ZAMBIA 2018 Source: Crop budgets Authors’ estimation * SS-HI system includes a hired labor cost of 500 ZMW/ha, the others SS haven’t

72
Economic performances in small-scale cropping systems are not improved much with external input-based intensification. Return to capital invested in input is low (below 1.5) without subsidy. Fertilizer use efficiency in particular is low, hence the results suggest that fertilizer cost impede the margin when it is not subsidized. Extensive cultivation of maize without fertilizer can be economically attractive if the yield can reach 2 t/ha. This strategy can occur in land abundant areas where new land is cleared, or where the farmer has sufficient cleared land to practice long periods of fallowing to renew soil fertility. Maize cropping for commercial purpose provides generally a low labour productivity in small scale systems, the 20 to 30 ZMW daily profit achieved corresponds to the minimum wage of basic casual workers. The availability of animal traction and input subsidy raises labour productivity to 55 ZMW/day. Maize cropping for subsistence can be seen differently with a higher productivity as the value of output should be valorised at the opportunity cost of purchasing maize in hunger season when grain market price is two times higher. A limitation of such financial short term costs approach relies on the fact that it does not consider costs of externalities. Natural capital consumption is important in maize systems when they are monocropping or with shifting cultivation10. Soil fertility depletion seems of particular concern in low and medium inputs systems which are likely not sustainable with cropping practices references we used. Nitrogen dose applied are respectively considered at 0 and 50 unit N/ha, hence maintaining fertility requires to mobilize fallows or forest clearing. Increasing pressure on land in many parts of Zambia makes difficult to maintain long term fallows needed for traditional shifting cultivation and explain a trend of soil degradation (acidification, loss of organic matter). A study by IEED-Hivos (Bandel & Nerger, 2018)11 proposed an assessment of maize cultivation systems full cost based on monetarised values for environmental externalities in Central Province Zambia 2018. It concluded that the actual costs of production for maize is 2 times higher for small rainfed mono cropping system, and 2.5 times higher for large irrigated systems, than what is accounted in market prices. This additional environmental cost is composed of erosion (58% of externality cost12), greenhouse gas emissions (22%) and water pollution (20%). Impact is negligeable for biodiversity. We consider however these results with caution for two reasons. First, environmental externalities are generally valued at a very high cost which remains hypothetical as it is not revealed by a market or a tax. Second, this Zambian case study has several weaknesses: the sample is only 10 farms, not representative as two systems (on 3) consider irrigation although it is marginal for maize grain; the baseline financial cost is very high and the smaller maize cropping system selected seems inconsistent with a yield of 800 kg/ha for 100 N units used. The maize grain full cost estimated by the study is more than 7 ZMW/kg which is 5 times the present market price, so totally out of reach of purchasing capacity of Zambian stakeholders. If such high-cost recovery was imposed on the market, it would probably have high social externalities as food access problems.
10 RALS estimates 7% for maize fields 2018 were in the previous year a fallow or a forest. 11 Bandel T, Nerger R., 2018 : The so called ‘True cost accounting” method used is based on the “Natural Capital Protocol framework” with monetary values defined by FAO (2oi4). 12 soil loss due to erosion seems very excessive in this study and would only apply to a few areas where maize is grown on hillsides without terracing. But most of Zambia’s maize, including in Central Province, is grown on flattish land and with relatively low levels of soil run-off

73
Economic results at Farm level We have to consider the type of maize (subsidized or not for small farms, grain or seeds for large scale farms) in the cropping pattern to scale up economic results at the farm level (Table 17).
SS low inputs Farm
SS Medium inputs Farm
SS high inputs Farm
Large Farm individual
Large Farm corporate
Maize grain non subsidized
0,8 ha 0,1 ha 1 ha 10 ha 10 ha
Maize grain subsidized
- 0,9 ha 1 ha - -
Maize seeds 5 ha 40 ha TABLE 17: MAIZE CROPPING PATTERN AT FARM LEVEL ZAMBIA 2018 Source: RALS & Authors’ estimations Figure 10 shows costs and gross operating profit (income) of the five farm types:
FIGURE 10: COSTS AND GROSS OPERATING PROFIT MAIZE PRODUCTION PER FARM TYPE Source: Authors’ calculations from crop budgets There is an important size effect on economic results of farm types, as yield, cropped area and subsidy level (for small farms) are correlated. The three small farm types produce 800 kg to 5 Mt maize grain /farm and earn a gross income of 1000 to 2000 ZMW which seems modest. The two large farm types earn hundred thousand of ZMW thanks to maize seeds production (with general fixed costs included in the income). The exit of most large farms from maize grain market in recent years highlights the lack of profitability of intensive motorized cropping system at grain price lower than 2 ZMW/kg (160
-1000
0
1000
2000
3000
4000
5000
6000
7000
8000
9000
10000
SS Low inputs0.8 ha
SS Mediuminputs 1ha
SS High inputs2 ha
ZMW
/ f
arm
(m
aize
cro
p)
Intermed.Consumpthired labor
tax
input subsidy
rest of income
0
100000
200000
300000
400000
500000
600000
700000
800000
900000
1000000
1100000
1200000
1300000
1400000
1500000
Large Scale Individuals10ha grain + 5ha seeds
Large Scale Corporate10ha grain + 40ha seeds
Large farm > 20 haSmall & medium farm < 20 ha

74
US$/Mt). The few large farms maintaining some maize grain are those integrated in a livestock business or needing a minimal crop rotation with soya and wheat. In terms of economic attractiveness of maize grain for farmers, we have to consider the two functions of maize. The first priority is own subsistence of the farmer family; this role is disconnected of market incentives. Food preference, cropping habits, sensitivity to public promotion make maize attractive for subsistence farmers even when they experienced low yields and unfavourable market conditions. The smaller farm type with Low Input system is in particular in such subsistence strategy; more than 80% of its production is for home consumption. Secondly is the commercial purpose for maize surplus. Farm types with Medium and Higher Input systems commercialize 1/3 and 2/3 of their production respectively, so can be sensitive to market incentives. With an income around 2000 ZMW, maize systems record a low profitability for small farm types in 2018. Labour productivity is around 20 to 30 ZMW/day which is close to minimum wage in Zambia. But maize has the advantage to get a quite secure outlet from FRA which buys grain for Strategic Grain Reserve (SGR) or alternative markets provided by the many private traders operating in various districts. More worrying for financial viability in mid-term, is the fact that this income is mainly relying on the input subsidy. Without subsidy, the High Input system farm type would not have made profit in maize cropping in 2018.
2.2.2 Traders’ profitability
Traders intermediaries for long distance marketing channels handle thousands or tens of thousands tons of maize so their economic size has no comparison with farmers, even large farms. They should be in a dominant position on the market in front of scattered producers but their power is limited by FRA who has a big maize market share and whose buying price tend to influence the market prices in post-harvest season. Profit of traders is determined by the working capital they are able to invest, the speed of capital turnover, the commercial margin between purchasing and selling prices, and the control of approach costs (transport, handling). The two types of traders considered here have complementary strategies. The aggregator with limited working capital (100 000 ZMW) is involved in transport with quick rotation. He/she handles 1200 Mt grain/year, mostly during the post-harvest season. The large trader settled in main urban centre close to mill outlet is involved in storing, he buys in post-harvest from aggregators independent or mandated and sell throughout the year. The large trade working capital is several millions ZMW for 20 000 Mt traded grain/year. The 2018 market conditions considered for traders’ accounts and trade activity of FRA are given in Table 18.

75
TABLE 18: MAIZE MARKET PRICING AND VOLUMES YEAR 2018/19 FOR TRADERS ACCOUNTS Sources: IAPRI and Authors’ assumptions The Margin ratio (selling/buying price) around 1.5 to 1.7 for the aggregator and 1.2 to 1.3 for the large trader, that may sound a lot but costs of aggregating to cover are quite important especially for transport and transaction costs with scattered farmers. The cost structure and income estimated for the two types of traders in marketing year 2018/19 is shown in Figure 11.
FIGURE 11: COST AND GROSS OPERATING PROFIT OF MAIZE MARKETING YEAR 2018/19 Sources: IAPRI and Authors’ assumptions
AggregatorLarge trader with storage
Food Reserve Agency
purchase price (1) ZMW/Mt 1350 2300 1375sales price (2) ZMW/Mt 2300 3000gross margin ratio (2) / (1) 1,70 1,30quantity purchased Mt 900 16 000 175 000quantity sold Mt 900 12 000 0purchase price (3) ZMW/Mt 2000 3000sales price (4) ZMW/Mt 3000 3500 1400gross margin ratio (3) / (4) 1,50 1,17quantity purchased Mt 300 4 000 0quantity sold Mt 300 8 000 380 000*
* 205 000 Mt from stock release
peak season jun-oct 2018
lean season nov 2018-may 2019
unit
0
500
1000
1500
2000
2500
3000
Aggregator 1200 t/year
Thou
sand
s ZM
W /y
ear
maize purchase
transport &packagingwarehousing
labor
tax
financial charge
profit
0
10000
20000
30000
40000
50000
60000
70000
Large Trader 20 000 t/year
Thou
sand
s ZM
W /y
ear

76
Maize trading seems here highly profitable, providing an income of several hundred thousand of ZMW for the aggregator and several millions for the large trader. For the aggregator, this apparent high income covers an opportunity cost for their own capital invested and family labour mobilized. However, the market conditions considered for 2018 appear as an optimistic scenario when trading runs well. Traders operates in a relative open competitive market as there is low barriers to market entry for small traders, mostly the capital constraint. Several large trading companies operating in the Southern Africa region are also present in Zambia. Traders face the classical risk of uncertainties on future prices and outlets. This risk is increased for large traders who store by unpredictable intervention of FRA. FRA provides 30 to 40% of the millers’ maize supply at a subsidized price that traders can’t compete. This price is generally close to the producer price and sometimes lower than producer price depending on the subsidy level. The operating costs of FRA are covered by a huge public funding, which according to the 2018 budget was 1 051 million ZMW (or US$ 90 Millions). FRA marketing cost (excluding maize purchase) can then be estimated at 2.5 ZMW/kg which normally 1.5 time more than private is trading (operating costs and profit estimated at 1.65 ZMW/kg). The difference between FRA buying price and market price depends on the season. During shortfall years private sector often out competes FRA in terms of prices. This was the case in 2019/20 marketing season. FRA is supposed to release grain to millers in the lean season to stabilize the price, but earlier release can occur when private stocks are still abundant, hence putting private business at a loss. This event of inappropriate timeliness of FRA release happened in 2019 and was aggravated by an export ban for maize. Some major trading companies were hit hard and experienced huge losses for grain that they had bought at a high price and two of them have since decided to disinvest from Zambia. Maize price volatility at short term has then to be considered to assess profitability of trading, meaning the average figure as above has a limited significance.
2.2.3 Millers’ profitability
Industrial mills Milling industry is a key step to drive the VC, providing final outputs and having several sources of supply (direct farmers, traders, FRA) in particular with privileged access to the FRA subsidized grain. Its mealie meal output (breakfast and roller meal) are essential consuming goods free of tax, and prices are freely set by contracts with retailers. In primary processing industries subject to economies of scale, as milling, equipment depreciation and general costs (overheads, administrative staff, common equipment, etc.) are important in the full cost, but these were not accessible for our assessment. We only got an estimate for rate of machinery utilization in the two firms visited. This indicates a slight over capacity in maize milling with a rate of 66 % at present (30 000 t grain processed/year for a mill capacity of 7 tons/hour). Profitability is then assessed with Gross Operating Profit (income) estimates including equipment depreciation likely high at this current utilization rate.

77
FIGURE 12: COST AND GROSS OPERATING PROFIT OF INDUSTRIAL MILL 30 000 MT MAIZE PROCESSED/YEAR 2018 Sources: IAPRI, MAZ and Authors’ interviews The value of production of 88 million ZMW for this typical mill is composed for 70% of maize supply cost. Gross Operating Profit of maize milling (before depreciation and general costs) is 11 million ZMW. The industry is profitable but this result is achieved mainly because the mill had access to subsidized maize grain supply from FRA. Difference between supply cost at average market price and FRA selling price is an implicit subsidy to the mill equivalent to 14 million ZMW, which is a greater amount than current gross income. Without such subsidy, mills should increase their mealie meal output selling price by 16% in order to maintain their income, but such increase would have a depressive effect on the maize meal market. Mills dependence on FRA maize policy is a weak point of this industry. Market opportunities for maize meal exports exists in DRC, close to Copperbelt mills but this trade is banned to show up domestic supply and cushion local retail prices. There are mixed reviews from the public, farmers and support and business community about this policy of imposing export bans on processed commodities. However, informal trade is occurring for both subsidized and unsubsidised product but is not quantified here. Small-scale hammer/ grinder mills Economic performance of small mills depends on the type of energy used, fuel or electricity, and on capacity utilization rate. The advantage of a small-scale unit is of course, its flexibility, functioning as a service provider with low capital and able to sustain a low utilization rate. The reference milling unit is assumed at 25 % utilization rate leading to a 72 Mt grain processed per year.
* including equipment depreciation
0,0
10,0
20,0
30,0
40,0
50,0
60,0
70,0
80,0
90,0
100,0
G.Product Breakdown implicit FRA subsidy
Mili
ons Z
MW
maize from market
subsidized maize FRA
energy, bags, other
labor
financial charges
gross income*
implicit subsidy

78
FIGURE 13: COST AND GROSS OPERATING PROFIT OF SMALL MILL, 2018/19 Sources: IAPRI survey of 14 grinding mills oct 2020 and Authors’ assumptions The value of production earned from milling service and bran sales, is estimated at 40 000 ZMW with different cost and income structure according to energy source. The main type spread across rural areas is fuel powered grinding/hammer mills, with the highest energy costs (50% of the gross product) and making the business less profitable (gross operating profit of 14 000 ZMW). Energy cost is reduced by half in electric powered mill which gives an average profit of 22 000 ZMW. In general, small mills weakness is the lower energy efficiency and hence profitability is sensitive to the cost of energy. Price competitiveness of small mill output compared to industrial meal depends on the source and cost of grain considered. Small mills run essentially with home produced or locally supplied grains. At a grain cost of 2.4 ZMW/kg, the meal cost for consumer after milling service payment, is 3.6 ZMW/kg, which is competitive compared to industrial product for breakfast meal (retail price 4 ZMW/kg on average 2018) but more expensive for roller meal (2.85 ZMW/kg).
2.2.4 Conclusion to CQ 1.1 on profitability of maize activities for actors
Although half of the production remains for subsistence farmers, maize tends to be increasingly commercialized with profitability concerns. The reference year 2018 is marked by a relatively good situation of maize market supply, but the profitability encountered by the different stakeholders along the chain is variable. Small farmers experienced a low profitability, with a labour productivity close to minimum rural wage; large farmers were pushed out of the market by a maize price under their cost of production. Traders and millers have a higher profitability but with a permanent high risk-taking for traders involved in storage. It has to be noted that profitability is dependent on pricing system for maize VC, subject to high variation and strong public orientation. The reference prices used for 2018 are not market based prices reflecting an equilibrium between supply and demand. Volumes of exchanges and prices set up could
0,0
5,0
10,0
15,0
20,0
25,0
30,0
35,0
40,0
45,0
fuel mill 72t/year electric mill 72 t/year
Thou
sand
s ZM
W
energy - oil
spare partshammers
labour wage
gross income

79
change in a large extent at every step of the chain according to the level of public support invested in crop inputs and maize market intervention.
2.3 Effects of the maize VC within the national economy, contribution to economic growth
2.3.1 Resources-uses Accounts for VC segments
This economic assessment performs a two-step consolidation for accounts from the Social Accounting Matrix 2018: (i) at the segment level computing each of the four stages of the chain (Seeds and Inputs supply, Grain cropping, Trading, Milling industrial and service) and then (ii) at the whole chain level.
Seeds and agro inputs supply The private sector for seeds production and inputs supply records an income of 550 million ZMW thanks to export and domestic seeds, and fertilizer distribution. The huge amount of subsidy allocated to public FISP fertilizer and seeds distribution for maize (1,785 million ZMW) dampens the Value Added. This subsidy is arbitrarily attributed to this segment (through FISP account) leading to a negative Value Added of – 669 million ZMW. But in fact, the subsidy is to the benefit of farmers and Value Addition should be interpreted at the overall VC consolidated account. Private agro inputs supply shows a positive Value Added of 500 million ZMW.
FIGURE 14: OPERATING ACCOUNT OF THE SEGMENT SEEDS AND AGRO INPUT SUPPLY
Source: Authors’ SAM for Zambia maize VC 2018
Maize grain cropping Nearly half of maize output is home consumed so this account is sensitive to the opportunity value of maize kept in farms for own uses. We consider here a value similar to the average price of maize sold. This assumption might underestimate the value comparing to the perception of farmers who are generally sensitive to the price in lean and hunger season. For a maize grain output estimated at 4,720 million ZMW, the total cropping Value Added reaches 2,720 million ZMW (57% of output value). The
0
500
1000
1500
2000
2500
3000
3500
4000
Uses Resources
Mill
ions
ZM
W
seeds export
seeds local
fertilizer
chemicals
FISP subsidy
imported IC
domestic IC
labour
financial charge
tax
gross income
ValueAdded- 669 M

80
access to subsidized inputs for half of the farmers increases income of the segment and reduces the part of intermediate consumption in value of production.
FIGURE 15: OPERATING ACCOUNT OF THE SEGMENT MAIZE GRAIN CROPPING
Source: Authors’ SAM for Zambia maize VC 2018
Trading
This account consolidates the trade intermediaries both private actors and public FRA. Private traders are involved in the different grain outlets for food, feed and export, recording a value of production of 2,980 million ZMW on which they get a Gross Operating Profit of 858 million ZMW. The large FRA subsidy of 1,051 million ZMW dampen the Value Added of the trading segment, estimated at 470 million (Figure 16).
FIGURE 16: OPERATING ACCOUNT OF THE SEGMENT TRADING PRIVATE & PUBLIC
Source: Authors’ SAM for Zambia maize VC 2018
0
500
1000
1500
2000
2500
3000
3500
4000
4500
5000
Uses Resources
Mill
ions
ZM
W
grain sold
grain home conso
intra chain inputs
other IC
labour
financial charge
tax
gross income
ValueAdded2 720 M
0
500
1000
1500
2000
2500
3000
3500
4000
4500
5000
Uses Resources
Mill
ions
ZM
W
grain to millersgrain to HHgrain to food aidgrain to feedgrain to exportbran to exportFRA subsidyintra chain grainother IClabourfinancial chargetaxgross income
ValueAdded470 M

81
Industrial Milling This segment has a value of production, mostly meal, of 2,776 million ZMW and a Value Added of 473 million ZMW (17% of Gross Output). The subsidized grain supplied by FRA lowers the cost of intermediate consumption.
FIGURE 17: OPERATING ACCOUNT OF THE SEGMENT INDUSTRIAL MILLING
Source: Authors’ SAM for Zambia maize VC 2018 Small scale milling The value of production of this segment is the milling service paid by consumers and the bran sold, reaching 644 million ZMW with a high part of Value added for 338 million ZMW (52% of Gross Output).
FIGURE 18: OPERATİNG ACCOUNT OF THE SEGMENT SMALL-SCALE MILLING
Source: Authors’ SAM for Zambia maize VC 2018
0
500
1000
1500
2000
2500
3000
3500
Uses Resources
Mill
ions
ZM
W
meal for food
grits & roller forbeerbran
intra chain grain
other IC
labour
financial charge
tax
gross incomeValueAdded473 M
0
100
200
300
400
500
600
700
800
Uses Resources
Mill
ions
ZM
W
milling service
bran
energy IC
other IC
labour
financialcharge
ValueAdded338 M

82
2.3.2 Consolidated account of maize Value Chain and direct effects
The outputs of the maize VC include final consumption goods (grain home consumed or processed by households, industrial meal for food) and intermediate goods used by downstream industries out of the scope of the VC (grain and bran for feed, grits and roller for beer and snacks) or exported (seeds, grain and bran). Their value is estimated for 7876 million ZMW in 2018 (Figure 19).
FIGURE 19: OUTPUT VALUES OF THE MAIZE VC Source: Authors’ SAM for Zambia maize VC 2018
The food products represent 73% of the VC outputs value, the grain and bran for feed 12%, the grain for industry 3% and the exports (seeds, grain and bran) 12%. This export output segment might be underestimated as restrictions on exports for grain implemented in 2018 and permanent ban for meal are bypassed by informal channels poorly known. Hence, outputs and value added of trading is probably underestimated. The share of grain home consumed in farms seems to be very high in 2018, and possibly over estimated, hiding a greater informal export trade. The consolidated account of the maize VC is shown in Figure 20 (see also Table 7 in Annexe 6.2).
gra in for home consumption;
2100
gra in for households direct
supply; 715
gra in food aid; 56meal for food;
2366
service small milling; 550
gri ts and roller for beer; 223
gra in for feed; 696
bran for feed; 233
gra in export; 480
bran export; 97 seeds export; 360
Total Maize Outputs value: 7 876 M ZMW

83
FIGURE 20: OPERATING ACCOUNT OF THE MAIZE VC Source: Authors’ SAM for Zambia maize VC 2018
The Direct Value added of the maize VC is estimated at 3332 million ZMW. The incomes received by households, enterprises, financial and public institutions are much higher, reaching 6160 million ZMW because of the subsidy delivered through FISP and FRA, for 2836 million ZMW. This subsidy accounts for 46 % of all incomes of the VC. Such public support plays an essential role to ensure an abundant supply to fill the domestic maize demand. Beside food demand, this support benefits also indirectly to industries; it favours the use of maize as starch raw commodity. Directs imports of the VC are fertilizers and agro chemicals, their real cost (non-subsidized) is 1985 million ZMW which represents around 40% of maize grain output at farm gate.
2.3.3 Direct and indirect effects, contribution of maize VC to Zambia GDP
The total effects of the VC on the economy including indirect spillover effects on the suppliers (mainly transport, packaging, energy, maintenance) are given by coefficients computed from Social Accounting Matrix. These coefficients express the imported value and local Value Added incorporated in 1 unit value of a final VC product.
grain home consumption
grain store gate
meal grits bran service milling
seeds export
Imports 0,40 0,282 0,278 0,281 0,298 0,346 0,49 Value Added
0,60 0,718 0,722 0,719 0,702 0,654 0,51
TABLE 19: COEFFICIENTS FOR INDUCED IMPORTS AND VALUE ADDED Source: Authors’ Maize VC SAM 2018
0
1000
2000
3000
4000
5000
6000
7000
8000
9000
10000
11000
Uses Resources
Mill
ions
ZM
W
seeds exportgrain & bran exportgrain & bran for feedgrits & roller for beerservice small millinggrain& meal for foodgrain home consum.subsidies FISP-FRAimported ICdomestic IClabourfinancial chargetaxgross income
ValueAdded3 332 M

84
The rate of induced Value Added (including direct and indirects effects) in output is higher for processed products. This is due to the large weight of imported fertilizer in grain value, fertilizer efficiency in maize cropping being low and full cost is much higher than paid cost by farmers. With indirect effects, total Value added is 1.6 times higher than direct effect. The total Value added of maize VC is estimated 5 300 million ZMW (table 20). The maize VC, hence delimited, from seeds and fertilizer supply to meal and other intermediate outputs, including indirect effects, accounts for 1.9% of Zambian GDP in 2018. This indicator shows a low part of this basic staple chain in whole economy but it has to be compared to the weight of agriculture which is only 3.3% of GDP, Zambian economy being largely oriented on mining and services. Contribution to agricultural sector of maize VC concerns maize farming delivering grain and seed. The Value added of this cropping segment is estimated 2 931 million ZMW, at the paid cost for fertilizer and seeds. Hence, without considering the input subsidy (1 785 million), maize raw products (grain and seed) contribute to 32% of agriculture GDP.
Directs effects Indirects effects Total Directs + Indirects effects
Output value 7 876 Value Added 3 332 1 968 5 300 Imports 1 985 591 2 576 Domestic IC 2 559 Distributive effects with subsidies – Gross income to institutions
Subsidies 2 836
Total Gross incomes 6 168 Farmer households 2 344
Other households (workers, employees, public staff)
1 643
Small entrepreneurs (aggregators, millers)
693
Firms (milling, trading, seeds) 1 267 Financial institutions 201
Public administration 20 TABLE 20: DIRECT AND INDIRECT EFFECTS OF THE MAIZE VC (IN MILLION ZMW) Source: Authors’ Zambia Maize VC SAM 2018 The rate of integration of maize VC into the economy is 67 %, showing that maize activities are relatively well linked to upstream sectors and contributes significantly to growth generation.
2.3.4 Contribution of maize VC to the public finances
Maize production is by far the main focus of agricultural policy for food security purpose and hence a high source of public spending. Even if its part is declining during last decade, the maize VC still receives 56 % of public budget to agriculture in 2018, and 50% in 2020. These public support concern provision

85
of subsidized maize seed and fertilizer by FISP for 1785 million ZMW and purchase of grain by FRA to release to millers for 1051 million ZMW in 2018. On the revenue side for public budget, the maize activities and goods are subject to very low tax, these being estimated at 20 million ZMW. However, this figure underestimates the real contribution to public finance as our SAM considers only tax on activities (operations) but not on incomes (profit, wages) of institutions (households, entrepreneurs, and firms). The gross income computed is only based on maize activities and operational costs. Structural costs are not attributed to activities, frequent diversification of operators being a constraint for such attribution. Even though there is a lack of data on net income of the maize VC institutions and real tax paid, the huge importance of subsidies (2836 million ZMW) makes the maize VC a major public funds consuming sector.
2.3.5 Contribution of maize VC to the balance of trade
Maize production is oriented by the public authorities on the supply of the domestic market. Hence, performance of the maize VC in terms of trade balance has a limited meaning. It is dependent of public regulations on trade which were restrictive in 2018 with a ban on grain export, in addition to a quasi-permanent ban for meal products. This trade restriction is by-passed given high demand in DRC and conjecturally Tanzania and Malawi. The high potential for maize cropping in the northern Zambian border areas favours informal exports. Data on exports are then very uncertain. Formal grain exports are 46 million ZMW in 2018 but IAPRI estimates informal border trade can be 10 times higher, hence we consider 480 million in our SAM assessment. Seeds and bran exports have also some importance, representing respectively 360 and 97 million ZMW. Informal meal export is probably also existing for DRC given the numerous mills located in the Copper belt neighbourhood area but there is no quantification available. Fertilizer promotion programs and also chemical use development (mainly herbicide) implies high direct imports for 1 985 million ZMW in 2018. In the current situation of this particular year with a ban on export despite a surplus, the maize VC performs likely a negative balance of trade. The estimated balance around -1000 million ZMW, is however of low confidence given uncertainty on informal exports.
2.4 Sustainability within the global economy and regional competitiveness
Zambia has achieved for many years a self-sufficiency for maize and the production evolves from one year to another from low to high surplus. Hence, the issue of international competitiveness for Zambian maize is nowadays laid in term of potential for development of export rather than import substitution. The regional demand for maize in southern and eastern Africa is increasing rapidly both for food and feed while the production fluctuates with climate hazards. Neighbour countries DRC, Tanzania, Kenya and Malawi maize markets are attractive opportunities of particular interest for Zambian trading companies and some commercial farmers. Zambian maize is none GMO, which is an advantage to export to free GMO countries. But until now, Zambian authorities are reluctant to

86
liberalize this regional and cross border trade. For policy makers, maize production is intended to supply domestic food demand. International competitiveness and export promotion is not their immediate concern. Assessment of competitiveness indicators is based on international market prices which do not fit well with the case of Zambian maize grain. For Zambia, the commodity is white maize primarily grown for food, while international maize market refers to yellow maize, generally for feed. There are no regularly published international market prices for white maize. The exchanges of white maize take place mostly in the macro region of southern and eastern Africa, with the Republic of South Africa as the main supplier. Hence, the best reference price for white maize seems to be the one of Johannesburg market, SAFEX. South Africa is the main competitor to Zambia for maize, so the reference price used is equivalent to an Import Parity Price (IPP) for Zambia. We consider competitiveness of grain delivered by trader at miller’s entry gate. Table 21 shows regional SAFEX maize price, cost of transfer (transport, handing) to Zambia forming IPP to compare with domestic wholesale market price. A limit of this assessment based on 2018/19 reference is the high variation of the SAFEX price determined by maize surplus level of South Africa and also currency exchange rate US $ - Rand.
2016/17 2017/18 2018/19 Joburg SAFEX Yellow maize US $/Mt 218 151 182 Joburg SAFEX White maize (a) US $/Mt 263 144 183 Transfer cost Randfontein RSA-Lusaka 1576 km (b)
US $/Mt 150 136 136*
Import parity Price White maize for Zambia (a) + (b)
US $/Mt 413 280 319
Currency rate
ZMW/US $ 9,8 10,2 11,8
IPP White maize Lusaka (c) ZMW/ Mt 4044 2851 3764 Domestic wholesale price at miller entry gate Lusaka (d)
ZMW/ Mt 3000
Nominal Protection coefficient (d)/(c)
0.80
TABLE 21: IMPORT PARITY PRICE OF MAIZE GRAIN & NOMINAL PROTECTION COEFFICIENT Sources: (a) Grain SA, 2019; (b) IAPRI and *Authors’ assumption; (d) Authors’ interviews, 2020 The Regional price for white maize grain is 2.16 ZMW/kg in 2018/19 which is close to the average price in Zambia at entry gate to trader warehouse (after aggregation). After transport and handling cost to Zambia, import parity price of maize is 3.76 ZMW/kg then higher than domestic maize price at miller entry gate around 3 ZMW/kg. Zambia domestic market benefit from the protection conferred by its landlocked position. Hence the Nominal Protection Coefficient (NPC) is estimated 0.8 in 2018/19 (Table 21). For international competitiveness, the Effective Protection Coefficient (EPC) is a better indicator as it takes into account policy effects both on products and on inputs. Large subsidies on fertilizer and seeds are then offset.

87
OUTPUT VALUE
GRAIN AT MILLER
ENTRY GATE
TRADABLE INPUTS FOR
CROPPING TRADABLE INPUTS FOR
TRADING TOTAL TRADABLE
INPUTS
AT DOMESTIC PRICES
1 800 a
336
277
613 b
AT IMPORT PARITY PRICES
2 256 C
512
270
782 d
TABLE 22: OUTPUT AND TRADABLE INPUTS VALUES FOR GRAIN SUPPLIED BY TRADERS AND FARMERS TO MILLERS (600 K MT) IN
MILLIONS ZMW SOURCE: AUTHORS’ SAM ZAMBIA MAIZE VC 2018 The ratio (a – b) / (c - d) gives an Effective Protection Coefficient of 0.81 in 2018 (Table 22). NPC and EPC indicates Zambia maize grain production is competitive in Southern Africa region. However, these indicators rely on volatile prices, both international as well as domestic. The competitive position of Zambian maize VC should be tempered by some weakness. Grain production is dependent on imported fertilizer which are used with low efficiency; the low domestic grain market prices observed in 2017 and 2018 resulted in a low remuneration of small farmers and an exit of most large farmers from maize production.
2.5 Conclusion to Framing Question 1 - What is the contribution of the VC to economic growth?
Maize, as the main staple food product of Zambia, consumed by both rural and urban people represents a large part (one third) of agriculture GDP. This part is even greater in terms of land occupation, maize covering nearly half of national annual crops area, making Zambia a country over-specialized in maize, with food and environmental risks associated. Value addition by upstream input supply activities and downstream milling industry is however relatively low. The whole maize VC with its indirect spillover effects contributes to 1.9% to Zambian GDP. Maize meals are low value products, the priority for public authorities being the availability of an affordable food for urban and rural households. For most farmers, maize primary vocation is to fill family’s food needs. Commercial outlets for maize are increasing with the demand for food and feed mills but the economic attractivity remains low for farmers. Most of farmers are facing low and fluctuating farm gate prices, and low yields due to climate hazards as well as soil degradation linked to maize monocropping. Maize support policies, in particular large seeds and fertilizer subsidies haven’t been so far efficient in terms of yield improvement and income transfer to smaller farmers. Neighbouring countries, in particular DRC, also represent a large market opportunity for Zambian maize and could foster economic growth. Zambia's maize VC appears to be competitive in its context of Southern and Eastern African region; maize grain prices at farm and store gate being lower than those of the main competitor, Republic of South Africa, in 2018/19, even though this relies partly on subsidies. Northern part of Zambia has adequate climate and good productive potential for maize to seize regional market opportunities. Another asset of Zambia is its highly developed sector for seeds production. However, maize export has been offset so far by a restrictive commercial policy prioritizing domestic supply.

88
Maize VC’s large macro-economic impact is then related to its massive and widespread production encouraged by a strong public support. At micro level, farms experience low performance with poor efficiency of inputs used.
2.6 Growth inclusiveness
2.6.1 Income distribution within the maize VC
Income generation and its distribution among stakeholders is given at a consolidated maize VC level and direct effect. It must be interpreted cautiously with consideration to particular features of this VC, and to limitations in data processing and data accuracy on value added breakdown for some activities. Maize production is for nearly half part home consumed by households; this implies that farmers have a high share of maize VC consolidated output and also income. The farmers’ income is sensitive to an opportunity value of the production that is subject to different assessment methods. We choose an average market-based price at selling period as the reference year 2018 was with a large global surplus. But in a different context of lack of production, the opportunity cost of maize at lean hunger season should also be considered for home consumption valuation, hence increasing the value of production for farmers. Maize VC has diverse channels for several outputs, with a variable involvement of different categories of actors. Income share of each category is dependent of the volume handled, hence distributional issues should require a fragmented approach on each market channel. Participation of most actors to the different channels makes difficult such approach that would require detailed actors’ analytical accounting per outlet. The scope of the study being the whole maize VC, a detailed assessment of each market channel (short distance grain, urban meal, feed, export, grits and roller for brewery) was out of reach of the study. Incomes earned by some stakeholders are strongly increased by large subsidies on input from FISP and on grain by FRA. Subsidies are 2.83 billion ZMW in 2018, it is a supplemental resource for the VC, in addition to output value (total resource increase by 36%). FISP and FRA have then been included as actors of the VC. Apart their public allocation and product purchase and release, no data was available on their costs and wages, assumptions were required. Data were not accessible on full costs and net income. General costs (common costs for all activities of the actors, not only attributed to maize) and depreciation are of particular importance for large-scale operators as traders, industrial millers, motorized farms. For small-scale actors, Gross and Net Operating Profit are nearly the same. Hence comparison between large and small-scale actors has here a limited relevance. The consolidated income (gross operating profit + wages + taxes + financial charges) of the maize VC is estimated 6 168 million ZMW in 2018. The distribution of this income for independent actors, wages for salaried workers and financial charge is shown in Figure 21.

89
FIGURE 21: DISTRIBUTION OF INCOMES TO VC ACTORS (GROSS OPERATING PROFIT, WAGES AND FINANCIAL INTERESTS) Source: Authors’ SAM for Zambia maize VC 2018 Distribution of income among VC actor’s categories shows great disparities given the size of population involved. Small farmers in 2018 were estimated to be about 1.43 million households getting only 38% of total VC income. Small millers (second largest with 20 000 actors) get around 5 % of total income, a share similar to the industrial mills that are only 70 units. Aggregators and traders are several thousands of units with 14% of VC income, concentrated in larger traders. Concentration of income is classically related to capital concentration in the trading and milling segments. The maize VC has a relatively low level of salaried workers. Agro input dealers, farms, trading and mills have all together an estimate of 743 million ZMW for salaries and wages (12% of total VC incomes). This figure is in contrast with employees of public agencies FISP and FRA with wages estimated at 14% of VC income. Management and hired labour cost are likely absorbing one third of the subsidy allocated to the maize VC (estimate based on assumption to balance public accounts in the SAM but subject to uncertainty). The various scales of activities involved in the different steps of the maize VC for input supplying, cropping, trading and processing, reflect some relatively low barriers to entry for small entrepreneurs. This highlights a potential of the VC to contribute to an inclusive growth, discussed in following section.
2.6.2 Prospect on opportunities and limitation for inclusive economic growth
The maize VC provides a range of opportunities for inclusive economic growth. In urban areas this is through paid employment or self-employment/micro-enterprises in the processing/manufacturing and retailing segments. In rural areas inclusion is mainly through small-scale production of maize, and
small farmers
large farmers
small millers
large millersfarms
large mills
FISP-FRA
0
500
1000
1500
2000
2500
3000
agro inputdealers
farmers aggegatorstraders
millers salariedworkers
financialinstitutions
Mill
ions
ZMW
90
also through employment and micro enterprises in the input supply, trading and local processing segments. Some barriers to entry and limitations to inclusion are also present.
2.6.2.1 Inclusion in paid employment opportunities
Paid employment includes fulltime salaried employment and seasonal or casual employment which is paid at a day rate or on a piecework basis. Employment in Input supply Input supply services providing particular benefits to small-scale farmers include maize research (particularly plant breeding for sub-optimal conditions), maize seed production, agro-chemical supply and safe-use advice, and public extension services involved in technical demonstrations and in the administration of FISP direct input supply of fertilizer and maize seed. This segment provides significant opportunities for qualified professional and technical staff, as well as administrative staff and drivers. Within the public sector, a significant proportion of Ministry of Agriculture professional and technical staff are involved in research (maize breeding, agronomy, crop protection, testing of new varieties and chemicals), extension (including FSIP administration and crop forecasting) and regulatory activities (seed inspection, export permits) relating to maize production (including seed production). Within the private sector, at least eight large seed companies, for whom hybrid maize is their main enterprise, each employ a range of professional, managerial and technical staff to run their operations, including significant export operations. A similar number of companies employ, to a lesser degree professional and technical staff to provide fertilizer and agro-chemicals related services (e.g. soil testing, blending, scouting, crop protection advice) farmers. Regarding agricultural mechanisation, a smaller number of companies in this sector employ engineers and mechanics for a limited range of manufacturing, supply, maintenance and repair of farm machinery which is used for maize and other crops (wheat and soya). All of the organisations providing inputs into maize production also employ significant numbers of administrative staff, drivers and also lower paid staff (e.g. security, labourers and office orderlies) on permanent contracts. In addition, they also provide a limited amount of casual and seasonal employment (e.g. for maize research, testing and demonstration plots, and for loading, off-loading, storage during peak periods etc.) The public sector and larger companies all have non-discriminatory staff recruitment policies which address gender. It was not possible to obtain the data for employed numbers of different categories of staff in this segment of the VC, broken down by gender or age. Anecdotal evidence suggests that the Ministry of Agriculture and larger companies do all employ some women in senior professional, technical and/or management positions, but they usually represent a minority. One reason for this is that Zambia’s agricultural universities and colleges, in spite of lower entrance requirements for women, train less female than male graduates. Whatever their gender, young people applying for a public or corporate private sector position in this sector will usually require a relatively high standard of academic and technical qualification (e.g. a degree or diploma in agriculture or related subjects). For medium and small agro-input dealers maize inputs (seed, fertilizer, herbicides, insecticides and farm tools used in maize production and processing) are a significant part of their business volume. Smaller agro-input shops provide some permanent employment opportunities, which are generally lower paid and require lower qualifications than jobs in government or larger companies. As many of

91
these sales points are located in rural centres, they provide more accessible employment for rural youth compared to the large maize input companies which mostly based in Lusaka with a few outlets in provincial capitals. Data provided on request by MUSIKA, an organisation supporting market development in agriculture, indicates that there are approximately 2,000 small and medium scale enterprises (SMEs) servicing agriculture, and many of these provide employment in rural sub-centres13. A needs assessment of these SMEs identified significant challenges in recruiting staff with adequate working knowledge within the agricultural field, and “specific recruitment challenges in finding qualified staff with relevant experience in agriculture”, noting they were not able to afford the salaries requested skilled candidates14. Employment in Maize production The largest contributor to paid employment in this segment are the small and medium-scale maize farming households who hired labour on a seasonal basis. Data for the 2017/18 season indicates that 12% (approx. 171,000) of rural households who grow maize hired seasonal labour to work on their crops, while 17% (approx. 243,000) hired animal draft power (which includes payment of the person working the animals). There are no significant barriers to entry to this type of employment, which is generally low paid. For agricultural graduates, the maize production segment provides fewer employment opportunities than the public and private input supply segment. Many large commercial farms grow seed maize (rather than food maize) and may employ a Zambian graduate (usually at diploma or certificate level) as well as an expatriate farm manager. Most of the fulltime employees on commercial farms do not have formal training in agriculture but are recruited from rural areas where they have hands-on knowledge and are trained on the job. The commercial farms producing seed maize, also provide low paid unskilled seasonal work during peak periods. Some of the smaller family-owned commercial farms without central pivot irrigation produce maize for sale to millers. They usually have a few fulltime workers and also employ seasonal workers. They are rarely able to attract any agricultural graduate, unless this is a son or daughter or relative who is ear-marked to take over the farm when the owner retires. In such cases it is becoming more common for the children of newer commercial farm owners to encourage one of their children to go to agricultural college or university with a view to taking over the farming operation longer term. Employment in Aggregation and Trading A small number of large grain trading companies provide both fulltime and seasonal employment in their maize buying, aggregation, storage and distribution activities. Maize constitutes the major part of their grain business volume. These companies provide relatively a few opportunities for technical staff (e.g. lab technicians, mechanics, electricians) and managers for buying points and warehouses, and mainly employ unqualified and low paid seasonal staff. Better employment opportunities are
13For example, MUSIKA, has 546 agricultural small and medium scale enterprises (SMEs) on its database. 92% of these are owned by individuals and the remainder by associations, cooperatives or trusts. Of the 92% owned by individuals, 63% have male owners, 23% have female owners, and 8% are both male and female owned. The majority of these are located in provinces were maize is the main food and cash crop and supply of maize seed, fertilizer and agrochemicals (herbicides and pesticides) used on maize will be a significant part of the business. 14 Arneson, S., Firth, M. & Ngoma, E. (2017) A Needs Assessment of Rural Agribusinesses: The Commercial Viability of SMEs. Study undertaken for MUSIKA and WFP Zambia by Business Development Services Africa. Confidential report.
92
provided by the Food Reserve Agency (FRA) a parastatal which deals primarily in maize buying, storage and selling, employs a significant number of professional, technical and management staff, as well as warehouse staff on fulltime contracts. In addition, the World Food Programme also employs professional, technical and management staff, as well as other categories of fulltime employee, to manage its programmes of grain storage and food relief distribution, of which maize plays a central part. It is presumed that all of these organisations are signed up to the principle of non-discriminatory staff recruitment and retention? A large number of smaller traders and aggregators provide mainly seasonal employment opportunities for many younger people, mainly young men. There are numerous seasonal buying points for maize in the main maize production rural areas. These are either at rural market centres, or in villages situated on feeder roads. At each buying point there may be up to 10 or 15 buying stations representing the same number of small-scale grain aggregators/traders. The buying stations are usually operated by young men employed by the aggregator who inspect the grain before weighing it and purchasing from farmers at the agreed price. Aggregators also employ young men from the local area to help them with stacking and loading bags of grain, and also to ensure the grain is not stolen overnight. The process of inspecting, weighing, buying (sometimes re-bagging), stacking and loading a 30-ton truck with maize grain involves a team of 6 to 7 young men who can earn a reasonable income during the peak season15. This segment is male dominated. The main barrier for women entering into this sector appears to be a combination of the physical strength required for moving grain bags each weighing 50-70kg, and the life-style hardships (spending many nights away from home, sleeping outside to secure grain waiting for collection. We learned that there are some women who are successful in grain trading, who mainly buy from larger commercial farms, including lower quality maize grain for stock-feed, or popcorn for sale to confectioners or export to DRC. The transportation of large quantities of maize grain from farms to mills and storage in warehouses generate significant employment in the road haulage sector. This is mainly for drivers and indirectly for staff involved in vehicle maintenance and logistics management16. Collection of local taxes for grain exported from districts also indirectly generates a small amount of rural employment. In addition to maize trading into the urban or export value chain, trading of maize and maize products at local level is also an important micro-enterprise activity all rural areas. Nationally 28% of maize sales are made either to other households (19.5%) or to local people who resell locally (8.5%), and this does generate cash income for a substantial number of households.17
15 During the busiest time of the year a team of 6 or 7 can load up to four 30-ton trucks per day. The team is paid ZMW500 per truck, giving a maximum daily income of between Zm280 and Zm300 per day (us$15-16) per team member. 16 Data on the contribution of maize transportation to employment was not available during the study, and would require additional resources to estimate, but it is likely to be significant. 17 The total number of households growing maize is 1,474,052 (89.7% of 1,643,314), and of these48.1% sell maize (709,000 households are sellers. Of these 19.5% (138,258) sell to neighbours and gain an income. A further 8.5% (60,265) sell to local retailers/marketeers. If one sale per week provides an income for one local retailer/marketeer, then this volume of sales provide a source of enterprise for 1,158 people.

93
Employment in Primary Processing Industrial millers provide significant employment opportunities in the urban areas. There are over 78 large milling plants located in Lusaka, Copperbelt Towns, and some larger towns in Southern, Eastern, Central and Northern Provinces. Maize constitutes by far the largest volume of their milling operations. Each mill employs managers and a range of fulltime technical, administrative and manual workers. As most mills also have large silos for grain storage, they also employ staff on temporary contracts during the main grain buying period (June to September). There are few barriers to entry for employment in this sector in terms of formal qualifications, but there is gender bias. Physical strength is required for the many manual operations involved, and perhaps for this reason the majority of mill employees are younger men. A basic level of literacy and numeracy is required for some of the more skilled jobs. Milling is the most skilled and highly paid job (apart from senior managers), but most millers start as labourers and work their way up into this role through on-the-job training and also short courses (including correspondence courses). Larger mills have their own labs operated by technicians – one technician can service the needs of a very large mill. Transportation of primary processed products (maize meal) from the mills to retail distribution points also generates some employment for drivers and related workers. 1600 solar powered hammer mills provided through a joint venture between the governments of Zambia and China provide a further source of employment, which each mill having a watchman and an operator (3,200 jobs) employed by the local cooperative society. Currently these are not operating at capacity. Hammer mills are typically owned by enterprising “emergent” farmers with other enterprises running alongside maize production. There are an estimated 29,000 rural households owning a hammer mill, and a further 21,500 owning hand mills18. This type of local milling provides a source of household income through charges to customers but its impact on formal paid employment is relatively small because small hammer mills are often operated by a family member, or by an employee who also has other jobs on the farm. The primary effect of hammer milling is “labour saving”; relieving the drudgery of pounding maize by hand, which is a female task in both rural and peri-urban households. This frees up female time for other work in the household and on the farm. Hammer mills are also “cash-saving” for rural households who run out of their own maize but buy local maize and have it locally milled which is much cheaper than purchasing and transporting commercially produced maize meal. Some urban households also use hammer mills in the same way, both to save money and also because they prefer the taste. Ownership of both hammer mills and hand mills has increased since 201519, indicating that these provide a valued service and barriers to ownership are relatively low. Employment Secondary Processing The team did not gather data relating to employment on the secondary processing segment of the maize VC, which includes stockfeed, brewing and maize snacks and beverages. This segment is nonetheless important in generating employment opportunities.
18 The RALS 2019 survey of a representative sample of 1,600,00 rural households found that 2.8% of rural households own a hammer mill and 1.8% owned a hand mill. 19 The ownership of hammer mills increased from 1.3% in 2015 to 1.8% in 2019, and the increase in handmill ownership was from 1.1% to 1.3%. RALS 2019 and RALS, 2015.

94
Commercial stockfeed companies provide similar types of employment opportunities to maize milling. The number and range of jobs are fewer due to lower volumes and less regulation. As with maize milling, stockfeed manufacture is largely a male employment domain, for similar reasons, women being mainly employed in administrative roles. The larger poultry and dairy farms also produce their own stockfeed, as part of a vertical integration strategy. These farm operations also employ staff whose main role is to ensure this aspect of the business is done efficiently to the required standard. Commercial breweries which use maize as their main ingredient in opaque beer (chibuku) provide significant employment opportunities, both in production and distribution operations. Commercial manufacturers of snack and non-alcoholic beverages with maize as the main ingredient are another provider of employment opportunities which, based on anecdotal evidence, is rapidly increasing in importance. Employment in Wholesale and Retailing- Maize meal and other maize based products (e.g. samp, maize snacks, opaque beer, non-alcoholic maize beverages and popcorn) are important stock items for wholesalers, supermarkets and grocery retailers of various sizes in all of Zambia’s urban areas. In this way they contribute to employment opportunities for the staff who work in these enterprises, most of whom are younger. These enterprises tend to employ more female than male workers; with till operation and administrative work mainly being done by females, and off-loading, shelf stacking and security by males. As this segment is year-round it mainly employs fulltime staff, with fewer casual workers than the other segments.
2.6.2.2 Inclusion in enterprise opportunities
Enterprise opportunities, including self-employment, are found in various segments of the maize VC : selling products and services for maize production; trading in maize grain; processing maize products; and trading in maize products. Barriers to taking up opportunities and oligopolistic tendencies are summarised below.
Input segment Research and extension services relating to smallholder maize production are oligopolistic in that they are funded and managed by the public sector under the Ministry of Agriculture. There is some inclusion of other players through collaboration between ZARI’s maize research team and the private Golden Valley Agricultural Research Trust (GART) and the University of Zambia. This forms the National Agricultural Research System (NARS), which collaborates with CIMMYT which holds a mandate for international research on maize. Until recently NARS maize research in Zambia focused on producing public goods. The recent introduction of a royalty levy as part of a cost-recovery strategy for public research institutes, means that new maize hybrid maize varieties now provide a revenue generating opportunity for a publicly funded organisation. Production of certified hybrid maize seed for national use and for export provides a major enterprise opportunity. Since economic liberalisation, the past 20 years has witnessed the transition from oligopoly, with one parastatal (Zamseed) being the only registered seed company operating in Zambia,

95
to strong commercial competition, with more than 7 commercial seed companies selling hybrid maize. Hybrid maize is much more profitable for seed companies than open pollinated varieties (OPVs). The past investment in improved OPVs has not translated into easily accessibility of these varieties to small-scale farmers; a burgeoning seed maize industry has not provided small-scale farmers with access to the results of public sector investment in OPV maize research. Government subsidy of hybrid maize, through FSIP, has also reduced the effective demand for OPV maize, because many farmers rely on getting hybrid seed at a very low price.20 Economic liberalisation has also resulted in a less oligopolistic agro-chemical situation. The past 20 years have seen a significant increase in companies importing and blending fertilizers for maize and importing and distributing a range of agro-chemicals for maize production. This development has significantly widened the range of agro-chemical products available to small-scale farmers. The proportion of smallholder farmers accessing fertilizer has been increasing in recent years, both via FISP and through purchase at market price.21 However, smallholder access to the most suitable fertilizer blends, informed by soil analysis, is still virtually non-existent. FISP subsidies are also significantly reducing the incentives for fertilizer companies to provide more bespoke fertilizer advisory and supply services to small-scale farmers. The possibility of “rent seeking behaviour” around government fertilizer importation and distribution has also been identified as a potential hindrance to the potential development of more innovative approaches to improving smallholder fertilizer use efficiency (Chapoto, et al, 2015). Business opportunities for investment in mechanisation services for smallholder maize farmers are present, but not well developed. More recently a “rent to own” farm equipment scheme has been initiated, with some success, and this has potential for labour saving equipment such as planters and maize shellers, which could be hired out as a service. The availability of skilled agricultural equipment advisors able to provide technical guidance, and mechanics able to repair and service farm equipment is also a potential constraint to further development of this input. A further constraint is access to sufficient upfront finance to venture into this sector which is longer term, unlike seed, fertiliser and chemicals which are seasonal with fast turnover. By far the largest opportunity for small-scale enterprise is the retailing of maize seed, fertiliser and agro-chemicals in rural areas. Significant opportunities for younger men and women to enter into this sector were provided through the E-FISP programme, which was expanded and subsequently scaled back, reducing these opportunities. This remains a significant opportunity for employment and small business development. Entry is made easier when the large agro-input companies for seed, fertiliser and chemicals based in Lusaka can extend lines of credit to small agro-input dealers located in the rural areas. The recent scaling back of E-FISP and increase of direct input support has reduced small agro-dealership enterprise opportunities.
20 Zamseed is no longer a parastatal company as it is now privatised. 21 For example, RALS data indicates the following: in the 2010/11 season over 700,000 rural households did not acquire fertilizer, while in the 2013/14 season the number who did not acquire fertilizer was less than 600,000. In Central Province, where maize is widely grown as a cash crop, 75% of farmers used fertilizer in the 2013/14 season, and by the 2017/18 season it was 85% of households. Nationally, 26% of households used fertilizer in the 2013/14 season. By the 2017/18 season it was 63% of households.

96
Maize production segment Growing maize for seed is much more profitable than growing maize for grain, with significant barriers to entry. This enterprise is limited to farmers with large land holdings (sufficient for isolation), water resources (dams or boreholes), on the national grid electricity and expensive irrigation equipment. Additional requirements are a relationship of trust with a seed company, and employees trained in the technical aspects of seed production. These requirements mean that a significant number of commercial farmers who do not have at least one of the required elements, and all medium and small-scale farm households are excluded from this enterprise and are likely to remain so into the foreseeable future. Barriers to the production of hybrid maize for sale into the food chain are low and have been made purposely lower through government subsidy (FSIP) of maize production. Under the current policy environment, maize production is a socially inclusive activity, which involves the majority of rural households, and also some urban and peri-urban households with access to land22. This level of inclusion in the maize VC is further supported through government policies relating to consumption and food relief. Government subsidy of maize meal prices for over 50 years has helped to establish a culture in which maize is equivalent to food in urban and, increasingly, in many rural areas also. Food relief to the rural areas experiencing droughts has invariably included maize grain or maize meal, as the main element, further promoting the “maize=food” culture in some rural areas where growing maize is risky in years of inadequate rainfall and generally unprofitable as a cash crop when rainfall is adequate. Currently the main factors limiting more farmers from taking up, or increasing, their production of maize for sale are the costs of production and marketing. Most disadvantaged in this respect are farmers staying in remoter areas where transport costs impact on both the costs of inputs and of transport of grain to buying points. Additional limiting factors, aside from climatic and soil conditions, are access to credit and uncertainty about future price. Even if credit was available for expanding maize production, many farmers view this as a risk option in a situation when future prices are uncertain. For this reason, the majority of “commercial” farmers no longer grow maize for sale as grain. A scenario being debated is a significant reduction of subsidies to maize (production and consumption) and reduced regulation of the maize market. It is argued, by some, that this will encourage a more market driven behaviour in the maize VC, which is likely to result in increased maize production and more stability of prices and production levels in the medium term. To support a more liberalised policy on maize, additional investment would be required into research and development activities in the maize sector, to ensure a steady improvement in maize production technology and the institutional support (I.e. credit, technical advice) for its delivery to farmers. This will provide a basis reducing risks and uncertainties of climate change and the effects of competition from other maize producing countries (e.g. dumping of maize surpluses from the Americas, and competition from countries in the region). Under such a scenario maize production is likely to become increasing concentrated in parts of the country which are most suited in terms of climate and soils, and where transport costs to the points of primary processing are lower. For such a situation to include and positively impact
22 Crop forecasting data indicates that most of these households are in the peri-urban areas of the Copperbelt, where more land is available. Around Lusaka the area of maize cultivated has declined significantly over the past decade, largely due to land pressure.

97
smallholder farmers in the potential growth areas, the development of production technology and institutional support would need to be geared towards their local circumstances23. Aggregation and trading segment As an enterprise dominated by international finance and expertise, large-scale commercial grain aggregation and trading is virtually off-limits for Zambian entrepreneurs. This is due both to the level of risk involved in speculative buying, and challenges in accessing large amounts of financial backing. Ownership and/or leasing of grain storage allows for lower-level strategic selling and/or speculative maize grain trading. Some businessmen have invested in district level storage facilities to enable them to buy maize (either directly from farmers, through agents or from smaller traders) when prices are low with the aim of re-selling when prices increase. There are also some commercial farmers who grow larger areas of maize have storage on their farms and also by maize from neighbouring small-scale farmers which they store and sell later in the year when prices are higher. Both of these strategies require significant finance to invest in warehousing and up-front purchase of grain. Trading at a smaller scale, by aggregating, transporting in 30-ton trucks and selling for cash requires lower levels of finance as the model is buying and re-selling within a period of 1-2 weeks, rather than months, and does not involve storage costs. There are large numbers of this type of trader, estimated at 88% of all traders, referred to locally as “brief-case buyers”, who handle the largest volumes of trade, estimated at around 84% in one study (Haantuba, nd) . This level of trading involves the lowest risks and has lower barriers to entry and is well within the reach of enterprising individuals with the required skills, social capital and start-up capital (Sitko and Jayne, 2014b). Maize grain trading within and across districts, not directly to the main urban centres of Lusaka and the Copperbelt, accounts for 67% of the total volume of trade according one study, while only 29% of volume purchased in the districts is sold directly to Lusaka or the Copperbelt. Given that most of the maize grain sold by farmers is eventually processed in the Copperbelt and Lusaka, where milling capacity is concentrated, this data suggests that much of the maize handled by small grain traders is sold on to other traders. The same study records that only 4% of the traded maize is sold into DRC. It is likely that the actual figure is much higher than this, particularly because return to investment examples in this study indicate the highest return is from purchasing maize in Mkushi District and exporting to the DRC (Haantuba, slide 8). Barriers to maize trading as a small enterprise appear relatively low. Evidence collected during the field visits and an earlier study indicate that the grain traders tend to be younger people24 who have accessed start-up capital through loans from relatives, or small start-up enterprises, including acting as agents for larger traders. A fairly recent study of grain traders reports a population of 1,205 traders in 28 districts (Haantuba, nd, slide 4). In addition, some emergent farmers who own small trucks (up to 10 tons) buy grain from neighbouring farmers which they transport and sell on to (e.g. to nearby mills, large poultry farms or larger traders). There is sub-category of smaller maize traders, who operate at a much more local level, mostly buying and selling small quantities of grain within the
23 For example, on farm testing of new varieties in specific locations, targeting distribution and sale of maize varieties adapted to specific locations, local soil testing to inform blending and targeting of fertilizers to specific locations, support to financial aspects (e.g. input credit or warehouse receipts), agronomic and crop protection advisory services. 24 For example a 1996 study of maize traders in Eastern Province (Chiwele, et al 1996), found that the modal age of small-scale traders was 15-25 years old, while the modal age of medium scale traders was 26-35, suggesting that the volume of trade increased with experience. In terms of gender, this study found that while the small trader category was gender balanced, the medium scale category was 81% male.

98
district, with the lowest barriers of entry. The number of this type of trader is estimated to be the same as the “brief-case buyers” but their share of the volume of trade is much lower, estimated at 10% of the total volume, compared to 74% of traded volume for the traders who assemble and sell to millers and large traders. A further very significant volume of trade to DRC of maize meal and maize products, (chibuku, popcorn and maize snacks) provides many micro-enterprise/self-employment opportunities. This includes small-scale traders, small warehouse owners, smaller transporters and porters hired by small traders to carry goods across the border into DRC. Primary Processing segment For over 30 years, ownership of a small hammer mill has provided an opportunity for smaller entrepreneurs living in rural and peri-urban areas. Owners of small hammer mills provide a milling service to local customers for a fee based on volume (e.g. price per bucket). This service is in high demand throughout rural and peri-urban areas where maize is grown. A number of local companies sell a range of hammer mills (diesel, or electric). It is likely that the number of small hammer mills currently in operation, while increasing, could be close to meeting the current level of demand25. The main opportunity for entry into this enterprise would be in the rural areas of significant population growth which are also growing larger quantities of maize and where maize is becoming increasing important for household food (e.g. Northern Zambia). In 2015, 1.5% of male headed households and 1.1% of female headed households owned a hammer mill, indicating that ownership of this asset is not restricted to men26. The main barriers to entry are start-up capital, assuming there is sufficient local demand to make this a viable enterprise. Secondary Processing segment Secondary processing at a large scale in stock-feed, opaque beer, snacks and beverages currently involves significant capital investment, technical expertise and also compliance with food standards. For this reason, barriers to entry into this potentially lucrative part of the maize VC are very high for smaller local entrepreneurs compared with trading and primary processing activities. Artisanal secondary processing of maize based products, at local level, selling through the local markets in rural and urban areas, have provided a source of potential income for many rural women and some urban women. For example, brewing and sale of non-alcoholic “sweet beer” (maheu, chibwantu, tobwa) and alcoholic opaque beer (“7 days”), has been widespread in the past, but there appears to be increasing competition from commercial products and artisanal secondary processing is possibly a declining opportunity27.
25 RALS 2019 data indicates that the over 50% of rural households travel 1km or less to a hammer mill. In some provinces the average distance is over 3km, 4.1km in Eastern Province and 3.1 in Western Province, which indicates there is potential for new owners in some rural areas, depending on the level of demand. Further information is required on the costs of setting up and running a small hammer mill, and the minimum number of households needed to use the service, in order to make this a viable investment. 26 Republic of Zambia (2016) 2015 Living Conditions Monitoring Survey Report. Central Statistics Office. Table 10.9 https://www.zamstats.gov.zm/phocadownload/Living_Conditions/2015%20Living%20Conditions%20Monitoring%20Survey%20Report.pdf 27 The reasons include increased competition from commercial brewed opaque beer (chibuku) and also maize based beverage drinks, and changing moral values associated with both the brewing and drinking alcoholic beer. Maize is also used in making

99
Retailing segment The past 20 years has witnessed a process of “colonisation” of Zambia’s cities and towns by shopping malls and large supermarket chains. A consequence of this is that the once important smaller private supermarket retailers have been largely squeezed out of the market of selling to Zambia’s increasingly important upper and middle-income households. Local markets and some private supermarkets remain important in the higher density urban areas of the cities and large towns, and also in the rural market centres. Maize meal is an essential stock item for small supermarkets and small grocery shops (kantembas) in urban areas, as it brings in customers who also buy other items. The barriers to entry for this level of retailing are relatively low, and it attracts people already successful in market trading. There is also a significant local trade in maize grain and maize products (maize meal, grits and samp) in local markets with very few barriers to entry. In rural areas there are markets at all of the district headquarters, and also some markets in addition. These markets hold a range of various micro-enterprises, including retailers of maize products in small quantities including maize grain, mealie meal, samp, grits, and sweet beer. The study did not cover this aspect in great detail, but four of district markets visited during the rapid appraisal. These markets had on average of 88 sellers per market selling some kind of maize product. If the four markets visited were fairly representative, then this would suggest that around 10,000 micro-enterprises selling maize grain and other products to other local people in Zambia’s 117 rural district markets. The evidence from the rapid appraisal showed that this type of micro-enterprise is dominated by women micro-traders who buy and sell these products in small quantities to households which use them for their meal preparation28.
2.7 Conclusion to Framing Question 2: Is the economic growth inclusive?
The increased volume of maize grain production by small-scale farmers, commercial seed production by large-scale farmers, and increased private sector involvement in the various maize related input supply and value addition activities, has provided increased employment and enterprise opportunities along the value chain. Increased demand for improved technology among small-scale farmers, along with liberalisation of the input sector has encouraged investment and competition in hybrid seed production, fertilizer and agro-chemical supply, and has brought this technology within easier reach of small-scale farmers. Subsidy of improved inputs through FISP has played an important part in this growth in demand. Opportunities for enterprise and employment in rural areas increased when the electronic voucher system was introduced as an alternative channel for delivering FISP. However, problems with making this system work as intended has increased the risks for small-scale agro-dealers in rural areas. The
preparing hot meals for sale in rural and urban markets, and also in making some snack foods at household level which are sold in local markets. This area of micro-enterprise was not investigated during the study. It is potentially a significant source of income for some lower income households, which might merit further investigation. 28 For example, one micro-trader may purchase a 50kg bag of maize grain and take this for grinding at a local hammer mill, and then re-package the mill grain into 1 or 2kg bags (locally referred to as “pamelas”). Another micro-trader may buy one or two 50kg bags of maize grain, and then re-sell in tins at local markets to families who take this for grinding at the local hammer mill. Yet another may buy 2 bags of maize, take this to a local hammer mill for processing into grits, and sell this, along with roots (mukoyo) to women who make sweet beer for their households, or for sale to other households.

100
Direct Input Supply (DIS) system has continued to be the main channel used. This has reduced opportunities for healthy competition and entrance of smaller players into the input supply sector of the VC, and the scope for rent-seeking behaviour remains an issue in the administration of FISP. In an effort to make FISP more inclusive of the small-scale farming population, the volume of production subsidies to small-scale farmers has increased, and the number of FISP beneficiaries has also increased since 2016. However, while efforts have been made to widen access to FISP, a significant proportion of small-scale farmers, including those in areas well suited for maize production are not receiving FISP support. Moreover, in areas less well suited for maize production, farmers who do participate in FISP achieve generally lower returns. Relatively low and unpredictable farm gate prices for maize grain have discouraged large-scale commercial farmers from producing it. For this type of farmer, hybrid maize seed production is far more profitable than grain production. This profitable sub-sector of the VC is restricted to relatively few commercial farming operations possessing the required infrastructure and an established relationship with commercial seed companies. Maize trading into the urban areas and cross-border markets has provided useful income earning opportunities in rural areas where paid employment opportunities are scarce. This opportunity has been taken up particularly for younger men and some enterprising women. Small and micro-scale processing and trading of maize grain and maize products provides a significant income earning for rural people unable to compete in formal employment markets which have barriers to entry relating to education or qualifications. The more economically rewarding and higher risk sides of this trading tends to be seasonal, and occupied by younger men. Women are mostly involved in micro-level processing and trading of maize products which is less seasonal, has lower risks and starting capital requirements, and offers lower income generating opportunities. Milling is the least inclusive segment of the maize VC, requiring significant amounts of capital to enter. Milling is relatively competitive. Large-scale milling requires high levels of technical and management and significant investment in modern plant and equipment in order to remain viable longer term. Access to FRA maize quotas is also a factor which affects profitability and is only available to large-scale millers. Small-scale milling requires less start-up capital, but the returns are also relatively low. This sub-sector is mainly open to enterprising wealthier rural households or individuals who have retired to rural areas to invest in farming. Government and NGO initiatives to encourage greater inclusion, through group formation and rural cooperatives, to compete in small-scale milling have not been very effective to date. There has also been a significant growth in the use of maize for products other than the staple diet of maize meal, including stockfeed, various beverages and snack foods produced by commercial companies mainly for the urban and informal export markets. These value addition enterprises are mainly unregulated, open to various scales of enterprise and investment and provide significant opportunities for employment and small-scale trading in urban areas and cross-border centres. In terms of inclusion through consumption, maize is the main staple food for the majority of rural and urban households. In real terms the price of maize meal has dropped over the past decade which has benefitted households who do not grow enough for their own consumption, mainly urban households. Maize is the main ingredient in poultry feed, and the relatively low price of maize grain has made eggs

101
and poultry meat more affordable compared to other sources of animal protein; more urban and peri-urban households are consuming eggs and chicken and to a lesser extent milk and pork than previously.
2.8 Summary Table of Economic Indicators
Economic indicators are given for year 2018 which has been a slight surplus year for maize production with an average market price at production stage relatively low, below import parity price (170 US/t)
Core Questions Indicators Results obtained
CQ1.1 How profitable and sustainable are the VC activities for the entities involved?
Gross income (operating profit) by type of actor for maize activity
Small-scale farmer (0.8 to 2 ha maize) part time occupation (50 to 120 days/year): 1000 to 3000 ZMW Large farmer corporate (40 ha seeds): 700 000 ZMW Local Aggregator (1200 t/year): 0,5 to 1 million ZMW Large Trader (20 000 t/year): 7 to 12 million ZMW Large Miller (30 000 t/year): 11 million ZMW Small Miller (72 t/year): 14 000 to 22 000 ZMW
Benchmark of farmers’ net income with minimum wage
25 ZMW/day Small-scale farmers’ average incomes are slightly lower than the minimum wage.
CQ1.2 What is the contribution of the VC to the GDP?
Total VA (direct + indirect) 5300 million ZMW VA share of the GDP Zambia 1,9 % Rate of integration into the Economy (total VA/VC Production)
67 %
CQ1.3 What is the contribution of the VC to the agriculture sector GDP?
VA maize & seed share of the Agriculture sector GDP
32 %
CQ1.4 What is the contribution of the VC to the public finances?
Public Funds Balance
Subsidy to FISP- FRA: 2836 million ZMW Taxes on maize operations (tax on income excluded): 20 million ZMW The public funds balance is negative.
CQ1.5 What is the contribution of the VC to the balance of trade?
VC Balance of trade -1000 million ZMW (informal export certainly underestimated)
Total imports / VC production 33%
CQ1.6 Is the VC viable in the international
economy? Nominal Protection Coefficient (NPC) 0.8
Effective Protection Coefficient (EPC) 0.81
Domestic Resource Cost Ratio (DRC) n.a.
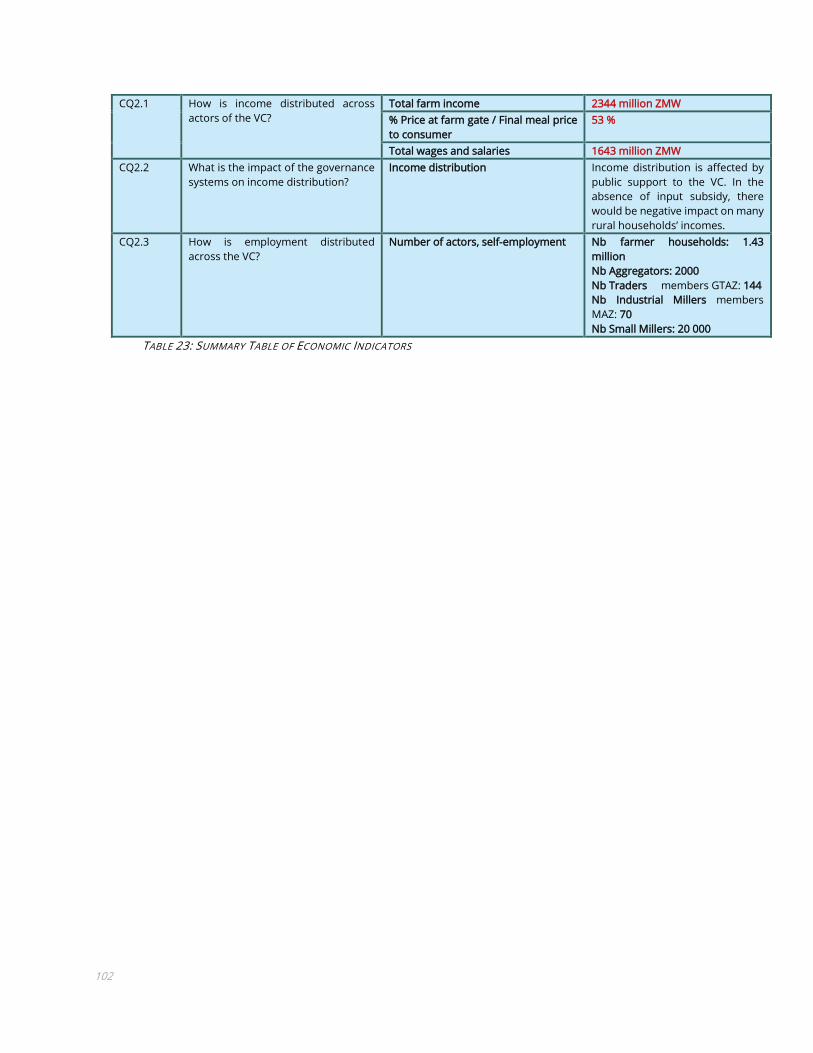
102
CQ2.1 How is income distributed across actors of the VC?
Total farm income 2344 million ZMW % Price at farm gate / Final meal price to consumer
53 %
Total wages and salaries 1643 million ZMW CQ2.2 What is the impact of the governance
systems on income distribution? Income distribution Income distribution is affected by
public support to the VC. In the absence of input subsidy, there would be negative impact on many rural households’ incomes.
CQ2.3 How is employment distributed across the VC?
Number of actors, self-employment
Nb farmer households: 1.43 million Nb Aggregators: 2000 Nb Traders members GTAZ: 144 Nb Industrial Millers members MAZ: 70 Nb Small Millers: 20 000
TABLE 23: SUMMARY TABLE OF ECONOMIC INDICATORS
103
3. SOCIAL ANALYSIS
3.1 Background
A brief overview sets the context for assessing Maize VC social sustainability using the six social profile domains. Maize, as the national staple food crop, occupies a central place in Zambian family life. Most Zambian families eat maize in some form at least once daily, and also grow some maize to eat green and, if they have enough land, to harvest dry, store and process into mealie meal. Low-income urban families without their own land to grow maize, commonly seek out unused pieces of land nearby where they can grow some maize. All families also plant a small area of maize in their yard for “green maize” where there is room. Families living in the lower density urban and peri-urban areas commonly grow seasonal maize in vacant plots. In rural areas, crop production provides the main source of employment and income and maize provides a significant part of this income, directly or indirectly. As a cash crop maize provides direct income. Household expenditure is reduced by maize grown as a household food crop. Value is generated through using maize stover for feeding ruminants, feeding bran and damaged grain to monogastrics (poultry and pigs) and adding value by processing maize grain into snack food and beverages for sale. The small-scale farmers producing the great part of Zambia’s maize are not autonomous enterprises but embedded within rural social organization. Crop production is undertaken by semi-autonomous households situated within small settlements. A typical Zambian rural household is a two generational unit of production, consumption and re-production. Households are a part of a settlement, known as “village”.29 Households are typically established upon marriage. Most commonly the wife moves to her husband’s village, where the couple are allocated land to grow crops, a separate place to store grain, cook, and build a house for sleeping, storing belongings30. In some areas it is not uncommon for husbands marry into the village of their wife31. In such cases the couple may be allocated land to cultivate, or in some traditions the husband will prepare land for
29 A village can be defined as a settlement with a recognised “head”, traditionally called the “village headman”, a term used in the British colonial system for purposes of taxation and administration. This system continued post-independence. Each headman, now known as “village head”, has a register of the names of members of their village. Each local Zambian language has a specific word, which is often translated as “village”, and typically is used to refer to a group of households clustered together, and usually related by kinship or marriage to the extended family head. In some rural areas such “village” settlements are scattered, while in other areas (e.g. parts of Eastern, Luapula and Northern Provinces) “villages” may be a section of larger more concentrated settlements which include several different family heads, each with a grouping of households under them. 30 Recent survey data indicates that 76% of male headed households are related to the headman through a blood tie, rather than through a marital tie.30 If the husband dies the woman may remain in her late husband’s village, or she may return to her maternal or paternal village (with or without her children), set up household there where she will be allocated a space to build a house and land to cultivate. This is also common. 31 Chapoto, A. and Subakanya, M. (2019) found that 78% of female headed households are related to the headman through a blood tie, rather than through a marital tie. As 77% of these were widows, which suggests that following the death of their husbands, it is more common for widows in rural areas to move back to their own blood relatives, than to stay with their husband’s relatives. Female household heads who never marry, or who are separated or divorced, also usually live with their relatives; 90% in this category had a blood tie with the headman. This indicates that ties between women and their blood
104
his mother-in-law and wife to cultivate32. After some years the husband is usually granted permission to move with his wife and children to live in the village of his relatives. It would appear that residence patterns, which reflect the importance of matrilineal kinship ties, are still widespread in rural areas.33 Household location within settlements usually related through kinship or marriage means that households are part of a larger unit which influences some aspects of resource management, including land, animal draft power, claims on labour and various forms of mutual assistance relating to childcare, cooking, fetching firewood and water, herding animals, house building and repair, gifts of food and financial assistance. Related households typically share in the use of important assets such as farming equipment (e.g. ploughs, rippers, sprayers, scotch-carts), bicycles and mobile phones. Rural-urban linkages vary in strength but are still important. Rural settlements will typically have relatives (siblings or children) living in urban areas, who they may assist by sending grain, and who also assist them financially or purchase fertilizer and seed. For purposes of data collection and analysis, household are the most relevant unit of production making decisions on crop and variety choice, area cultivated, crop management and management of the produce, including sale and storage for household use.
Methodology A two-stage approach was used. The first stage, undertaken between February and August 2020, was to gather and analyse data from the following sources and compile a first draft social impact analysis:
a) Published literature on relevant areas of social impact in peer reviewed journals, conference papers and quality assured papers and reports from research organisations (particularly from IAPRI).
b) Reports and bulletins from international organisations and national government agencies, c) Grey literature, including unpublished reports on maize and newspaper articles in the
national press, d) Key informant interviews and focused group discussions undertaken by the social expert
with key actors from the main segments of the maize VC undertaken during a two-week field visit in February 2020. Key actors interviewed included; agricultural policy makers, senior technical staff involved in maize research and extension, industrial scale and small scale millers of maize, large and small scale maize traders, commercial farmers, small-scale farmers.
e) Analysis of data from crop forecasting and other surveys on aspects of small-scale maize production, marketing, and production of other crops dating back to 2002 for purposes of trend analysis.
relatives remain very strong through the cycles of bereavement and divorce, which is indicative of the matrilineal orientation of the kinship system in much of rural Zambia. 32 Th is w as t ra di t ional ly the norm i n Bemba spe aking areas o f Northern Zambia (Moore and Vaughn; 1994) 33 Chapoto, A. and Subakanya, M. (2019) found that 25% of male headed households indicated that they were related to the headman through a marital tie, while 46% of male headed households said that the headman/headwoman was related to the spouse of the male household head This suggests in some male headed households both husband and wife see themselves as related to the headman, possibly as a result of “cross-cousin” marriages which used in many matrilineal societies as a means of strengthening clan alliances.

105
f) Data from the 2019 RALS survey dataset, provided by IAPRI on request in a structured format to address specific social impact areas identified. This enabled further analysis of issues and topics not fully covered in the RALs reports and other available literature,
g) Substantial knowledge of the social expert on the social structure and small-scale maize based farming systems and delivery of agricultural services in rural Zambia from the since 1983.
The second stage was to address gaps identified in the draft social impact analysis. This would normally have been addressed through a second field visit, including fieldwork in rural areas. As the second visit was not possible due to COVID-19, these gaps were addressed through correspondence with key stakeholders who were key informants, and by designing a rapid qualitative appraisal with input from all team members. The rapid appraisal was led by the national expert and two colleagues. The rapid appraisal covered areas of social inclusion and impact, broader issues relevant to the functional analysis and issues related to the (economic and environmental) cross-disciplinary aspects of the VC study. The results of the rapid appraisal were peer reviewed by the experts in the maize VC team, and some additional points were then followed up with individuals who had been interviewed to clarify further information.
The overall analysis involved the gathering of data from the above eight data sources for each of the social impact areas. For each dimension of social impact, the aim was to triangulate data from at least two or three separate sources, summarise the main evidence available, and arrive at an assessment of social impact. This included identifying any important gaps in information indicative of requiring further research. Challenges faced are detailed in Annex 6.3.
FIGURE 22: SOCIAL PROFILE OF THE MAIZE VC IN ZAMBIA

106
3.2 Working conditions
The extent to which working conditions throughout the Zambia Maize VC are socially acceptable and sustainable is assessed in this section. The focus is primarily on the commercialised segments of the VC defined within the boundaries of this study which are subject to aspects of government regulation, including corporate commercial maize farming, large-scale maize trading and commercial maize milling. An exception is the safe use of agricultural chemicals by small-scale farmers, which falls within the mandate of government extension services in terms of monitoring and education in safe-use. This focus is implied by the framing of questions relating to working conditions. It would be difficult to apply these questions to parts of the value chain which are not subject to regulation, but are mainly undertaken by “self-employed” individuals and households who do not use formal employment contracts. While some rural households are more commercially integrated than others in their farming operations, they function as family units of production and consumption which are largely self-regulated in relation to working conditions.
3.2.1 Respect of labour rights
Zambia’s legal and policy framework is supportive of labour rights for fulltime employees. Zambia has long-standing legislation on minimum wages and employment conditions (Minimum Wages and Conditions of Employment Act, 1982), and a recently revised employment code (The Employment Code Act, 2019). Labour laws in Zambia are in line with the 8 fundamental ILO international labour conventions and the International Covenant on Economic, Social and Cultural Rights (ICESCR) and International Covenant on Civil and Political Rights (ICCPR) (ICLG, 2020). The larger private sector employers are signed up to legislation relating to labour rights, allow for freedom of association and collective bargaining and minimise risks relating to forced labour and discriminatory practices. Employment policies and standards applied by specific private sector employers do appear to vary. 3.2.1.1 To what extent do workers benefit from enforceable and fair contracts? Commercial farmers have clear written contracts with fulltime employees. Up to 2019 these contracts were based on the Zambia Farm Employers Association collective agreement. The 2019 Employment Code Act introduced revised conditions of employment to be applied across all sectors. The ZNFU has argued that the new conditions of employment appear to be designed for larger companies operating in urban areas, and the mining sector. The ZNFU (representing commercial farmers) is negotiating for an exemption to aspects of the new conditions in order to safe-guard the sustainability of their enterprises34. Large traders and commercial millers are also governed by the new legislation, but being based in urban areas are better able to accommodate the cost implications of improvements to conditions of service. However, there is concern among women that the new conditions, particularly those relating to maternity leave and associated benefits, will disadvantage them because employers will (covertly) decide to employ men in cases where both candidates have similar levels of experience and qualifications. All of these actors employ casual workers during peak periods for manual and routine administrative tasks. This category of employee has the least security of employment and the lowest level of remuneration and benefits.
34 At the time of writing it is understood that finalising this discussion on an exemption for the agricultural sector has been held up by the COVID-19 pandemic.

107
3.2.1.1 To what extent are any risks of discrimination in employment for specific categories of the population minimised?
As noted above, workers employed on a casual or temporary basis are most at risk of discrimination and unfavourable treatment by employers because they are not well protected by the current employment legislation in relation to discriminatory practices
3.2.2 Child Labour
Officially housework and agricultural tasks undertaken by children is regarded as child labour, and in 2008 it was assessed that the majority of children in Zambia work for their family in an unpaid capacity, and 92% of these children work in agriculture, seasonally on their family fields, or for payment on the fields of neighbours (Unicef, 2012). They are also expected to attend education as well. This is reflected in the timing of school holidays35. While children undertaking work within their family home and on their family farm without payment is regarded as culturally appropriate, in 2008, about 9% of rural children aged 7-14 (of both genders) undertook paid work exclusively, for “an average of 5 hours per day” (Unicef, 2012, p29-30). This is most likely children from families not able to afford to send a child to school who need the extra income a child can earn.
3.2.2.1 Are children protected from exposure to harmful jobs?
On commercial farms, children of employees living on the farm attend school and are not allowed into the mechanised work areas or stores used for agro-chemicals as a health and safety precaution. Most commercial farms provide basic level schools, which ensures that children of school age are supervised and occupied during the day. In rural maize producing households using herbicides, mixing and application of herbicides to the maize fields is generally done by adults, usually by young men. In some areas there is a norm that women do not mix or spray chemicals for health and safety reasons.
3.2.3 Job safety
3.2.3.1 Degree of protection from accidents and health damages (in any segment of the value chain)?
In 2016 it was noted by a journalist that Zambia lacked “clear-cut health and safety legislation to deal with agriculture. The sector is generally regulated by the Occupational Safety and Health Act of 2010 which is poorly applied in practice and inadequately enforced by labour inspectors who are inadequately resourced and rarely ever visit farm enterprises (Mwango, 2016). Interviews with a small number of commercial farm owners and managers indicated that generally there is a good level of awareness of health and safety risks, and that relevant training and protective clothing is provided to employees on the larger commercial farms. In the large commercial milling operations visited the team saw evidence of health and safety inspection certificates, machinery fitted with protective guards and
35 One month school holidays enable children to provide assistance at times of peak labour. The Christmas holidays from early December to early January enable older children to help with the more labour-intensive tasks on the maize fields, including planting, weeding and fertilizer application. The Easter Holidays, from mid-April to mid-May coincide with harvesting maize.

108
safety notices, and protective clothing and provision of face masks for dust. It was noted that some employees chose not to use the face masks provided as they found them uncomfortable to work in. Risks are lower in the small and medium scale sector due to the lower levels of agrochemical use, but the risk is increasing rapidly due to increased use. Of the over 1.4 million small and medium scale farming households growing maize, 28% used herbicides in the 2017/18 season, compared to 14% four years earlier, in the 2013/14 season 36. Herbicide usage at field level was still low however, at about 5% of all fields cultivated in the 2017/18 season37. Less than 1% of households reported using field insecticides in the 2017/18 season, the season following the first outbreak in 2016/17. Subsequent outbreaks of Fall Army Worm across Zambia have resulted increasing chemical use, but data on the level of usage by small-scale farmers since 2017/18 is not available. Fall Army worm continues to cause widespread damage, including in the current (2020-21) season (Armyworm Network, 2021). Synthetic pyrethroids are recommended as a control measure and have been promoted for their relative safety38.
3.2.4 Attractiveness
3.2.4.1 To what extent are remunerations in accordance with local standards?
Generally larger commercial farms visited provided a relatively good basic standard of housing, basic schools and health services for their workers who mostly live on the farms with their families. They reported a low rate of staff turnover, which enables them to train their staff who they initially recruit as labourers, and promote those who have relevant skills and aptitude to more senior positions. This system also provides incentives for more ambitious younger employees. Employment in the small and medium scale trading segment is largely informal and unregulated. Grain traders agree terms of employment verbally with local youth. For example, they may pay them a fixed amount for loading a 30-ton truck. The rate would need to be sufficiently attractive to get enough labour, which may vary according to the other rural cash earning opportunities for young men during the marketing season (e.g. Brick making, house building and repair, charcoal, digging wells and latrines). Employment in the milling sector is reasonably attractive for younger men, as they have opportunities to gain internal promotion from manual tasks to skilled work, including milling, which is relatively well paid.
36 The two most recent RALS reports (Chapoto and Zulu, Mbata 2015 and Chapoto and Subakanya, 2019) did not indicate if the herbicide was used on maize or used on all crops in the two seasons covered. Some of the herbicide would have been used on Soyabean, which is grown in rotation with maize and is increasing in its importance as a cash crop. 37 Analysis of 2017/18 season data on use at field level, rather than at household level, provided by the national expert (Dr Chapoto), indicated that herbicides were used on 4.6% of fields, 5% in male headed households and 3.5% in female headed households. 38 Some studies have raised concerns about the possible links between pyrethroid and problems in children with asthma and allergies, sexual development, breast cancer and other health risks as summarised in a chemical safety and regulatory intelligence network (Chemical Watch, n.d.). However, a recent maize field experiment in Nigeria and a study of residues of vegetables in Ghana indicate that the synthetic pyrethroids do not leave residues at harmful levels on leaves and grain, and pose a minimal risk in this regard (Togoa et al; 2018 and Akomea-Frempong, et al 2017)

109
3.2.4.2 Are conditions of activities attractive for youth?
Working on a commercial farm is generally not an attractive proposition for young men or women. The reason is that for unmarried people there is less social activity going on a commercial farm, compared to a village located near a rural market centre. Another reason is that in a village setting they can eat with their parents, while on a farm they would need to cook for themselves, as well as work all day. From the point of view of the commercial farmer, employing a single young person with an agricultural qualification is more risky than training on the job a young married person who has the proven aptitude to learn on the job. It is more risky because the young single qualified person may be easily attracted into another job which pays more, or is closer to social amenities. Apparently, most of the children of farm workers prefer to move to urban areas to find employment, and do not stay and work on the same farm. The milling sector is similar, in that most of the manual operations are performed by younger men. The more skilled and better paid work in mills is also undertaken by men, most of whom have been promoted from manual work and trained on the job into more skilled work. Because of this means of promotion, young women are not commonly found working in grain mills, except in administrative roles.
3.2.5 Working Conditions Summary
The main categories of the population not protected by employment legislation on working conditions are the unemployed youth, and the less educated older adults from lower income households who do lack permanent jobs or micro-enterprises and rely on temporary contracts. This risk is generic across most sectors of the economy. Regarding child labour, in rural households it is common and expected practice for children to assist their parents with tasks around the household, including activities relating to the maize production calendar. Children are expected to undertake tasks, as age-appropriate, as part of belonging to a household, and this is regarded as essential to equipping them with the attitudes and life-skills they will need as adults. It is illegal to employ children on commercial farms, large-scale trading and milling operations, and there is no evidence to indicate that such employment takes place. With respect to job safety, risks of accidents are highest in the mechanised commercial farming segment, transportation and milling segments of the value chain. Risks are high in the commercial farming segment, due to the electrical equipment and heavy machinery and the range and volume of agro-chemicals used. The approach to remuneration differs to some extent, depending on the level of commercialisation and corporate governance. The large corporate commercial farm visited growing maize seed stated that it is required by its board to provide remuneration levels which are better than those offered by some other commercial farms owned by families and individuals. Somewhat smaller family owned commercial farms visited appear to put more emphasis on empowering their workers and families with plots of land to cultivate and with inputs for these plots. In the small maize aggregator and trader segment, young men tend to provide most of the labour, and also act as buyers. This is a locally available employment option in a context of limited alternative rural employment opportunities for young men. This work is not attractive for young women due to the

110
heavy lifting and need to sleep overnight outside to guard the purchased maize prior to loading. Larger grain trading operations also tend to employ younger men due to the heaving lifting involved.
3.3 Land and water rights
3.3.1 Equity, compensation and justice
3.3.1.1 Do the locally applied rules promote secure and equitable tenure rights or access to land and water?
In Zambia there are no private property rights in land itself, which cannot be sold, but is either under the custody of Chiefs (Customary Land), or the State (Leasehold or reserve land). On customary land, rights are initially acquired either through clearing new land and/or through an allocation of existing land by a village head39. Currently, allocation of land by village heads should usually be sanctioned by area Chiefs, although this is not always the case in practice40. The norms and rules relating to land tenure have been in a state of transition for over 20 years, with customary tenure operating alongside legislation and practices which allow customary land under the jurisdiction of chiefs and local families to be converted either into leasehold land with title deeds, or, more recently, into a protected right with the issue of “chiefs certificates”. Research has raised concerns of “land grabbing” to the detriment or rural farming households (Sitko and Chamberlin, 2016). A recent study the use of chief’s certificates in Eastern Province suggests that this practice, intended to improve security of rights, is potentially worsening equality of access to land and encouraging rent-seeking behaviour by local chiefs (Green & Norberg, 2018). In areas where land is scarce, and where there is interest from investors in acquiring land, chiefs’ certificates have been promoted as supporting local families to secure and protect their customary rights in the event that a title to this land is issued to an investor, or to claim for compensation (DanChurchAid, n.d.). While according to the Zambian law land itself cannot be sold, only the commercial value of the improvements the land in question, money does change hands in exchange for rights to land, including crop land in rural areas. If a family Head “sells” part of the family land to non-family members, with the sanction of the local chief, then their descendants effectively lose their claims to this family land. Individual family members affected in this way can go to their local chief, or to a headman in another area where there is still currently land available, to request alternative land to settle on. As land becomes scarcer and more highly valued in rural areas, this option will become more difficult. An informal “rental” or lending system for cropping is now practiced in many rural areas by a minority of households as a relatively new development. A recent survey indicates that 1.7% of land is rented in and 0.5% is rented out, while 2% is borrowed in and 0.8% is borrowed out (Chapoto and Subakanya, 2019). The practice of renting is nevertheless indicative of increasing market integration of the rural economy where land is increasingly seen to have a commercial value.
39 Gaining rights by clearing new land is not currently common, due to population increase but it was apparently common in the past. In the past when land was more plentiful this would have followed a newcomer gaining permission to settle in an area which could be granted by the local chief or elders.
40 An interview with a member of the House of Chiefs during the first field mission noted that it is commonly reported that Chief’s hear about land transactions after they have already been agreed between individuals.

111
The House of Chiefs, who play a role in the allocation of customary land to newcomers to their areas, have voiced their concerns with regard to the draft 2018 Land Policy, including the practice issue of title on customary land, proposing that this process is stopped and that only Chiefs Certificates can be issued41. The stated concern of the Chiefs is that of land scarcity. That if customary land is not protected from conversion to titled land by investors, there will be insufficient land to for their subjects in the future. In the rapid appraisal study gathered some data on how much new land had been cleared in the past two areas, which can be taken as a proxy for local land availability for cultivation. The trend of the proportion of new land being cleared per household indicated that land in the main maize producing areas becomes less available the closer the situation in relation to markets. In Chibombo, the district closest to Lusaka only one out of 20 households had cleared any new land. The land cleared was described as “fallow land”. In Mkushi District, more distant from markets, all 14 households interviewed had cleared some new land. The amount of new land cleared in the past two years was on average 20% of the land holding of each household. In Mpika, which is more remote than Mkushi, 11 of the 12 households had cleared new land. Here the new land cleared was on average 10% of the land holding of each household, indicating greater land availability.
3.3.2 Land and Water Rights Summary
Recent data does indicate that there is a perceived scarcity of cropping land in rural areas, and that this is particularly pronounced in the more densely populated provinces. For example, over 80% of households in Southern Province indicated that there was no land available to be allocated to them for farming in their village. The figure was also high for Eastern (76%), Copperbelt (76%), Central (74%) and Lusaka (68%) Provinces. The general trend of crop land becoming less available, particularly in areas which have the advantage of proximity to markets, has important implications for any programme aiming to increase the levels of maize production by small and medium scale farmers. As land becomes scarcer the productivity per unit area will need to increase if small and medium scale farmers are to continue to contribute to increased national maize production in future years.
3.4 Gender equality
Regarding the implementation of policies relating to gender equality and mainstreaming in the public sector, there has been a significant slowing down in more recent years. During the 1980s significant efforts were made towards women’s empowerment and gender mainstreaming in the which did impact policies and to some extent practices at senior levels in the functions relating to agricultural research, extension and planning. A 2010 gender mainstreaming audit of agricultural programmes in Zambia found that they had significantly impacted on household decision making, while the capacity of agricultural extension staff to internalise gender mainstreaming principles was less well developed than hoped for (Farnworth & Munachonga, 2010). A recent assessment by FAO found that significant challenges remain in terms of gender mainstreaming in the agricultural extension service delivery (FAO, 2018a). A number of recommendations are listed to improve gender mainstreaming which if
41 The national press reported that The House of Chiefs walked out of a meeting in 2018 in protest to the new policy (Lusaka Times, 2018)

112
implemented would address aspects of gender blindness/unconscious bias currently prevalent in the delivery of extension services 42.
3.4.1 Economic activities
3.4.1.1 Are risks of women being excluded from certain segments of the value chain minimised?
The wider legal and policy framework in Zambia is broadly supportive of female inclusion in economic activities, including agriculture. With regard to professional and technical positions, support for gender inclusiveness is reflected in government policy, and also the stated policies of the larger companies. Public agricultural training institutions (Universities and Colleges) have for over a decade had policies to increase the enrolment of female students, which significantly lowers the risk of exclusion. The effects of these policies are most evident in the public sector research and extension services. For example, the national maize research team and the seed certification services were headed by female graduates until recently. The extension service, in relation to the proportion of female agriculture graduates, employs a relatively high proportion of women in technical positions. The risk of exclusion of females is highest in the segments of the VC dominated by larger commercial private sector actors, particularly the agro-input suppliers (hybrid seed companies, fertilizer and agro-chemicals) commercial seed maize growers, large-scale commercial trader and millers. It was not possible to access gender disaggregated data on employment of farm managers and manager/owners of commercial maize seed producing farms, large grain traders or mill owners/managers. However, during field visits, with one exception, all the managers interviewed were male. The miller technicians we met during visits to mills were all male, and most of these started as labourers and trained on the job43. The labouring tasks in commercial milling involve heavy lifting and are seen as male tasks, and this effectively closes down opportunities for most women to learn the hands-on skills involved in milling. The exception we came across was a female business graduate who had entered the family milling business and, in this way had picked up the knowledge and skills needed to become the managing director of the mill. In these segments, formal training in agriculture, trading and milling is not a requirement, and many Zambian women have the necessary levels of skill, knowledge, social capital and access to finance to operate effectively. Moreover, a number of programmes promoting female inclusion in small-scale enterprises have been in place for over 20 years, as have government and NGO policies of female inclusion in agriculture, not least through the FISP and FSP programmes which have focused largely on maize production, and other programmes promoting smallholder integration into markets such as MUSIKA’s programme using Making Markets work for the Poor methodology which works through the private sector (Redd, 2020). Rural women are very involved in the maize production activities of their households, either as household heads (28%) or as spouses of in monogamous male headed households (62%) or polygamous households (10%), (Chapoto & Subakanya, 2019).44.
42 FAO, 2018a, makes a number of specific recommendations relating to gender mainstreaming in the Ministry of Agriculture - p. 43-44 43 One of the smaller commercial mills visited had a female co-owner/general manager, who had taken over the running of the business from its founder, her late uncle, who had mentored her.

113
3.4.1.2 To what extent are women active in the value chain (as producers, processors, workers, traders)
Women are very active in maize production. As farming household members they are involved, in varying degrees, in most or all of the production stages45. Women are the primary actors in the processing of maize grain for household uses, and also producing maize based products for sale locally. Women are also involved in maize grain trading. A study of maize grain trading undertaken in 1996 in Eastern Province found that small grain traders were equally likely to be female or male, but that medium and larger grain traders were more likely to be male (Chiwele, et al 1996). While recent quantitative data on the gender of maize traders is not available. During the first field visit, observations in Central Province indicated that this sector is currently mainly male dominated, by younger men. Some women trading in grain are more likely to focus either on local small-scale trading, or on specialist niches, such as popcorn, and buying lower grade maize for the feed industry. FAO‘s 2018 National Gender Profile of Agriculture, drawing on various national survey sources between 2012 and 2015, echoes what we learned during interviews with smaller grain traders that women are generally disadvantaged from participation in the maize trading sector because their domestic responsibilities restrict their ability to spend long periods away from home (FAO,2018).
3.4.2 Access to resources and services
3.4.2.1 Do women have ownership of assets (other than land)? – Customarily, some assets are assigned by gender, and inherited along gender lines. Traditionally, women inherited household items relating to cooking, jewellery and female clothing. Men inherited weapons, some tools, male clothing and items with ceremonial significance. As the majority of the ethnic groups in Zambia were matrilineal in orientation, women could own and inherit livestock in areas where livestock keeping was common. In national law, women can own all the same categories of assets as men, including motor vehicles and houses. Inheritance laws in Zambia introduced over 30 years ago were designed to protect women’s property rights in the context of a matrilineal inheritance system which resulted in mistreatment of widows in many areas of the country46. The new laws are generally observed and enforced, with some exceptions47. Actual ownership and control of moveable assets important for maize production, processing and marketing such as draft animals, cultivation implements, knapsack sprayers, shellers, scotch-carts, bicycles, hammer mills, and mobile phones is usually by individuals. In most rural areas the oxen, ox-drawn equipment, scotch carts and sprayers tend to be owned, controlled and operated by men within the household or extended family. In female headed households these assets may be owned and controlled by the female head, and operated by her male relatives (sons or nephews). While assets are
45 Detailed national level data on the labour contribution by women and men is documented in Shipekesa & Jayne (2012. Additional data collected from 5 farmer focused groups in 4 districts in 2020 as part of this study also confirmed the active involvement of women in nearly all stages of production, showing also that levels of female activity do vary somewhat between areas due to both cultural and technological influences, See Appendix 1 Maize Value Chain Study Zambia, Rapid appraisal of Gaps in System Trends and Social Impact, Analysis of Findings, January 2021. 46 This took place because when a husband died it was common practice for maternal relatives to claim the property, leaving the wife and her children without an inheritance – Traditionally the widows’ children were expected to inherit from their mother’s brothers (their maternal uncles). 47 The main exception is when the relatives of the widow’s husband make threats, particularly the use of witchcraft, against the widow and/or her relatives, and out of fear the widow does not assert her legal rights.

114
owned by individual household heads, use of these assets is usually shared with related households living in the extended family settlement or village48. With regard to maize productivity, ownership is a significant advantage because when timing is key, the owner controls when the assets are available for their own use, and when they allow others to use the assets, or hire it out the asset for payment. In most of rural Zambia women can inherit important assets, but their share of the inheritance is generally smaller than that of men. RALS 2019 found that for the household heads who had recently inherited cattle, female heads had inherited on average 14 cattle, while male heads had inherited on average 47 cattle; more than three times as many. RALS 2019 household level data clearly shows that nationally male headed households are more than twice as likely as female headed households to own farm assets which are important for maize production and marketing. For example 27% of male headed households owned trained oxen/cows compared to 13% of female headed households; 28% of male headed households owned ox—ploughs compared to 13% of female headed households and 27% of male headed households owned knapsack sprayers compared to 10% of female headed households 3.49 This gives male headed households a strong advantage in terms of the timeliness of land preparation, planting and weeding (mechanical or chemical) of maize, which translates into prospects for improved returns to household cash and labour invested in the maize crop. The relationship between ownership of key agricultural assets such as draft animals, levels of maize production and productivity (per unit area) is not linear. This was made clear during the rapid appraisal. Some households in both Mpika and Mkushi districts relying on hand hoe cultivation, neither owning or hiring draft animals, produced more maize and achieved higher yields per unit area than some households who either owned or hired draft animals. In Chibombo district, in a focus group of 7 women representing households experiencing seasonal food deficit, 6 of these had access to hired oxen and one owned oxen.
3.4.2.1 Do women have equal land rights as men?
The most recent RALS survey found that female headed households were equally as likely to as male headed households to have their own upland cultivated land, slightly more likely to have fallow land and slightly less likely to have virgin land or “garden” land (Chapoto & Subakanya, 2019 p 15). All of the female headed households interviewed in the four districts covered by the rapid appraisal had their own land to cultivate. Currently the most common customary marriage practice in most of rural Zambia is virilocal. Under this system a woman’s rights to land are through her husband. The newly established household is allocated land to cultivate by the village or family head. Once the marriage is well established, married women may be given a separate parcel of land to cultivate their own crops. If this is done, they are still expected to provide labour on the husband’s main field. If their children remain in the village as adults,
48 There are a few instances of group ownership of larger assets. For example, a women’s group may own and operate a hammer mill or a maize sheller, usually through an NGO project. 49 The same survey found even greater differentials between male and female headed households in the ownership of other farm assets such as scotch carts (13% to 5%), wheel barrows (11% to 5%), knapsack sprayers (27% to 10%) - Chapoto & Subakanya (2019), Table 8.3.

115
they will also have rights to cultivate land there, particularly since the passing of legislation to protect widows inheritance rights. In cases of virilocal marriage, and the couple divorce, a woman’s right to land in her village of origin remain. She can return to live there (with her children) and will be allocated land to cultivate by the village head. Her children will have a similar claim on land to cultivate if they remain in that village as adults. Some marriages are still uxorilocal, and the husband goes to live in the village of his wife upon marriage. In such cases the new household is allocated land to cultivate by the village/family head by virtue of the woman’s claim to village membership as a kinswoman of the head. In such cases the woman is usually accorded more authority in decision making on use of the land. RALS 2019 data indicates that inheritance of rights to land from relatives is second in importance to allocation by a chief/headman/woman. The data indicates that female headed households are not less likely to inherit rights to land, but that the amount of land they inherit rights to is nearly half of that inherited by male household heads (6ha compared to 11ha)50. In some cases rights to land are obtained by married men approaching a headman who is not their relative, and who allocates vacant land to them. The boundaries of the allocation are defined, and a payment may be made in recognition of the agreement. It is common in such situations for the incoming family to subsequently become related to the host village through marriage of their children. A son of the incoming family may marry a daughter of the host community, or vice versa. This strengthens the relationship between the incoming family and the host community, a relationship marked by mutual respect and friendship and the incoming family is more fully accepted into community membership. The above system allows for considerable geographical movement of households between areas and for fluidity in village/community membership. This system has, over the past 40 plus years, enabled pioneer minded small-scale farmers to move to new areas where land is available, and expand their farming operations, becoming a category defined in a recent study as “emergent” farmers51. This system of access to land has favoured men as household heads. In a “male-centric” system of customary land allocation, commercialisation of crop production is more likely to develop in male headed households. This is apparent from the results of a survey of “emergent farmers” which covered the 2015/16 season and found that less than 5% of emergent farming households were headed by women (Banda et al., 2018). The RALS 2019 survey found that of the over 53,000 rural households cultivating between 5 and 20 ha and producing maize using a high level of inputs, less than 10% were female headed (Chapoto & Subakanya, 2019).
50 RALS data analysed on request for the social expert by IAPRI 51 This study defined emergent farmers as those who own or control between 10 and 200 hectares of land (although they may cultivate only a fraction of their total land). The study found that the occupation of 84% of the father’s and 91% of the mothers of emergent farmers was fulltime farming. 62% of the emergent farmers acquired land allocated by chiefs or headmen, and 75% of them farmed land that was idle at the time of acquisition. 79% of the emergent farmers held land on a customary basis, without a title (Banda, et al 2018)

116
3.4.2.2 Do women have access to credit?
In practice, acquiring loans from commercial lending schemes was extremely low (0.4%) for all small-scale farmers in the 2017/18 season (Chapoto and Subakanya, 2019, Table 6.3). Finance institutions are reluctant to lend to rural households due to the level of risks and the high transaction costs of administering a loan. Smallholder farmers are also reluctant to borrow from commercial institutions when interest rates are high, the maize market price is un-predictable, there is a long period to wait for investment, and the production costs are high relative to the potential margins. Moreover, a history of maize production subsidy (currently 80% of the cost of improved seed and fertilizer through FSIP) has created a dependency culture, such that commercial borrowing for maize production is considered by most to be an option of final resort. If small-scale farmers, including women farmers, are able access to FISP or FSP subsidies this is much less risky financially. RALS data indicates a small difference (17% compared to 15%) between male headed households female headed households in accessing any type of agricultural loan (Chapoto & Subakanya, 2019 p. 84). The sources of the loans did vary for these two types of households. 9% of male headed households acquired a loan through outgrower schemes, compared to 4% for female headed households (Chapoto & Subakanya, 2019, Table 6.3). Outgrower scheme loans acquired were probably not for maize, but for other cash crops such as cotton, tobacco, soyabeans and groundnuts. However, it is not uncommon for farmers who receive fertilizer as part of a loan package to produce cotton or soya bean, to use some or all of this fertilizer on their maize crop. Female headed households were more likely to access loans through community-based savings groups (4.5% female headed compared to 2.2% male headed) and slightly more likely to acquire informal loans from family/friends/informal money lenders; 6% of female headed compared to 5% of male headed households (Chapoto & Subakanya, 2019, Table 6.3). The data does not indicate what crops these sources of loans were for, but likely that some of the money was used to buy fertilizer for the household maize crop. When asked for the main reason for not purchasing fertilizer from a commercial source since the 2017/18 season, 81% of female headed households said that they did not have cash, while 71% of male headed households gave this as the main reason. This indicates that while the majority of rural households face a cash constraint, this is more common for female headed households.
3.4.2.3 Do women have access to other services
The most significant “other service” which is an alternative to credit, is subsidized maize inputs for small-scale farmers, through the Farmer Input Support Programme (FISP) and also through Food Security Packs (FSP). Women heading households do access both FISP and FSP. RALS data for the 2017/18 and 2018/19 seasons indicate that female households were at a disadvantage in that they were 1) less likely than male headed households to be selected for FISP, 2) acquired a lesser proportion of their fertilizer from FISP, and 3) were significantly less likely to have more than one household member who received FISP. Regarding access to fertilizer via FSP at no cost to the household, apart from transportation from the nearest source, female headed households were more advantaged. However, FSP, compared to FISP, is of minor importance for household maize production (less than 1% received FSP fertilizer).

117
Female
Headed Households
Monogamous Male Headed Households
Polygamous Male Headed Households
All type of household
Household member selected for FISP, either E Voucher or DIS in 2018/19 season
29% 38% 39% 35%
Percent of the households’ fertilizer which was acquired from FISP the 2017/18 season.
55% 58% 58% 57%
More than one household member received FISP fertilizer through E Voucher or DIS in 2017/18 season - % of households
6% 22% 26% 19%
Access to FSP fertilizer 2.0% 0.6% 0.3% 0.9% TABLE 24: ACCESS TO FISP SUBSIDY AND FSP FERTILIZER BY TYPE OF HOUSEHOLD Sources: Chapoto and Subakanya, 2019 Table 5; RALS data provided by IAPRI on request. In order to receive FISP, households need to be members of a local cooperative and they need money to cover both membership fee and the 20% down payment for the subsidised inputs. Discussions with extension staff during the rapid appraisal in four districts indicated that men are much more likely to put their names forward for cooperative membership than women, and that the leadership positions in cooperatives are male dominated. RALS data indicates (via cooperative membership), FSP, and related agricultural extension services. RALS data indicates that 37% of female headed households have a member of a farmer cooperative, group or association, compared to 49% of male headed households52. FISP, in contrast to FSP, continues to encourage use of higher levels of external inputs (fertilizer and hybrid seed). One of the main structural factors to consider is that female headed households are more likely to be resource poor and therefore have limited access to the cash needed to access FISP inputs. Commonly given reasons for not receiving FISP in 2018 were “not being a registered farmer” (32%), “not being able to afford the FISP down payment” (30%) and “not being able to afford cooperative/farmer group membership” (12%).53 Data shows that female headed households were only slightly less likely to access FISP E-Vouchers to acquire fertilizer than male headed households in the 2018/19 season (55% compared to 58%). This suggests that access to cash is a significant barrier for both female and male headed households who might otherwise be able to access FISP. Reviews of FISP implementation have found the benefits tend to steer towards farming households which are less resource constrained who tend to cultivate larger areas of maize. More than one household member can apply for FISP support, which means that a husband, wife and even an adult child living with them do in some cases apply and receive FSIP support. In this situation, the household is using women‘s rights to FISP as a means of accessing extra subsidy. The extent to which women as
52 Data provided on request by IAPRI. 53 Chapoto & Subakanya, 2019, Table 5.4 Reasons for not receiving FISP.

118
household members truly benefit from this arrangement is a subject for further research. It is likely that women will benefit most when they are heads of the household which accesses FISP. The variation in access to FISP between male and female headed households is also correlated with the differences in land holding size (Table 25).
Landholding size Female Headed acquiring DIS
Male Headed acquiring DIS
Female Headed acquiring E-voucher
Male Headed Households E-voucher
Less than 0.5ha 6% 2% 7% 4% 0.5 to less than 2ha.
39% 22% 35% 21%
2-less than 5ha 34% 42% 40% 38% 5- less than 10 ha 18% 21% 14% 23% More than 10ha. 3% 14% 4% 19%
TABLE 25: PERCENT OF HOUSEHOLDS ACQUIRING DIS AND E-VOUCHER FISP INPUTS BY LANDHOLDING SIZE AND GENDER OF HOUSEHOLD HEAD. Sources: Chapoto and Subakanya, 2019 Table 5; RALS data provided by IAPRI on request. Female headed households cultivating less than 2ha were more likely to receive FISP inputs through both E-Vouchers and through Direct Input Support than male headed households cultivating less than 2ha in the 2018/19 season. The reverse was the case for households cultivating more than 2ha; male headed households were more likely to have received FISP input through E-Vouchers and Direct Input Support, larger areas54. This reflects the general trend of male headed households cultivating larger areas than female headed households. This may have implications for smallholder maize productivity and targeting of subsidies. In the 2011/12 season, farmers cultivating smaller areas of less than 1ha were found to achieve a higher return on fertilizer used compared to farmers cultivating larger areas 55. A more targeted approach to FISP which included larger numbers of farmers cultivating smaller areas could result not only in more efficient use of hybrid seed and fertilizer, but also increased access by poorer female headed households to input subsidies. Because FSP is targeted at the more vulnerable households, it potentially is more likely to include female headed households, although the overall number of beneficiaries is relatively low. Only 0.9% of rural households received fertilizer through FSP, but female headed households were more likely than male headed households to acquire fertilizer through FSP; 2.1% compared to 0.5% (Chapoto, A. & Subakanya, M. 2019). FSP reached 54,000 households (about 3.5% of all rural households) in the 2018/19 season (Republic of Zambia, n.d.). However, not all of these received services for white maize production. FSP has increasingly focused on nutritional impact by providing seeds for food legumes
54 Chapoto & Subakanya, 2019, Figure 5.6 55 Burke, et al, 2012 – found that in the 2011/12 Season, 64% of the FISP fertilizer was distributed to households cultivating over 2 ha., and 20% to households cultivating more than 5 ha., but that farmers cultivating less than 1 ha achieved a higher return on their fertilizer than farmers cultivating larger areas. Similar findings came from a review undertaken by Mason & Tembo, (2015) using data from the 2012 RALS and earlier surveys.

119
(groundnuts, beans, cowpeas) and fortified orange maize, emphasising the use of conservation farming techniques such as cereal legume rotations. FSP tends to target areas of Zambia more prone to drought and hunger and therefore is unlikely to benefit poorer households in the main maize producing areas of Zambia. While FSP is steering more vulnerable households away from engagement with the white hybrid maize value chain, access to some fertilizer for use on maize for household food is important for vulnerable female headed households. Agricultural extension advice is another important public service provided in rural areas through trained extension officers56. RALS 2019 survey data clearly shows that public extension workers are by far the most important avenue through which farmers receive advice on conservation agriculture and are cited as the main source in about half of cases 57. Other studies suggest the same58. This is the case for both male and female headed households. There are slight differences between male and female headed households in the reported frequency of the content of advice on aspects of conservation agriculture received from government extension staff. RALS 2019 data indicates that on average 41% of female headed households compared to 48% of male headed households had received technical advice relating to conservation agriculture59. This may suggest a slight unconscious bias of the public extension system towards male headed households, and probably towards male farmers as the household head60. Discussion with female extension staff during the first field visit indicated that they experience difficulty being accepted by male farmers and have to work harder than their male counterparts at “proving themselves” before being accepted by the local farming community. Regarding other sources of technical advice on conservation agriculture, RALS data indicates that friends and family are much more important than private agro-input suppliers and contract farming arrangements. The RALS 019 dataset indicates that less than 1% of households (0.7% of female headed households and 0.9% of male headed households) received advice on Zero Tillage from private input suppliers and contract farming companies. This advice was received from fellow farmers by 13% of female headed households and 11% of male headed households. It was received from relatives or parents by 6% of female headed households and by 8% of male headed households. In this respect female headed households rely slightly more on fellow farmer friends, while male headed households rely slightly more on parents or other relatives61.
56 Agricultural extension services operate on an area basis through a system adopted in Zambia in 1978 and based on the World Bank Train and Visit model of extension (Sutherland, 1988). Details of the extension system have been modified since then, but the same basic administrative structure remains. Each District has an extension office with subject matter specialists, who support area based extension officers in a network of ”blocks” and ”camps”. The District is divided into Blocks, each under a “Block Officer“ and each block is divided into Camps, each under a Camp Officer. Each camp is then divided into sections, which are groups of villages. Camp officers usually have a set pattern of visiting different sections on particular days of the week, and local farmers organise themselves to ensure effective communication. 57 RALS 2019 data provided to the team by IAPRI shows that government agricultural extension was cited as the main source of advice in 49% of cases. The next most frequently cited sources of advice were “fellow farmers” (12%), ZNFU conservation farming unit (8%), parents or relatives (8%), cooperative farmer group (4%) and Radio/TV (2.5%). 58 A recent evaluation of an Oxfam project connecting female farmers to markets found based on interviews with 747 women, found that “the vast majority of those surveyed said they accessed government extension services”. (Morgan, et al 2019, p18) 59 Based on data from the 2019 RALS dataset further analysed based on an average of frequency responses in relation to 15 distinct technical messages on aspects of conservation agriculture.

120
3.4.2.4 Do women take part in decisions on the purchase, sale or transfer of assets?
As noted above, land cannot legally be sold in Zambia, but improvements can be. Information gathered during the field visit indicate that family heads, usually male, do “sell” parcels of land to newcomers who have settled in an area (for example teachers, health workers, extension workers; both male and female). Some Chiefs are discouraging this practice, as relatives of the “seller” are complaining that this means they no longer have sufficient land to cultivate. RALS 2019 dataset indicated that less than 1% of households reported selling an old house or land for lack of food/money for food (0.5% female headed households and 0.2% male headed households). The survey did not ask if in the male headed households which sold land or an old house the women were involved in the decision. Regarding other relevant assets, such as draft animals, ploughs, knapsack sprayers and scotch-carts, these are owned by individuals, both male and female. The individual owners have the authority to sell the assets they own (see 3.2.1). Because use of these assets is often shared between relatives within a settlement, their owner is expected to consider the implications before deciding to sell such assets. It is not unheard of for a man to sell an asset, such as a draft animal, without consulting their wife, but this would be locally regarded as being irresponsible. RALS 2019 found that nationally in 19% of cases a woman makes the decision to sell cattle. This is the most relevant decision on asset transfer with regard to the maize VC, due to the importance of cattle for draft power. The percentage of women deciding to sell was higher for sale of smaller categories of livestock is higher: pigs (30%), goats (33%) and village chickens (56%). This pattern suggests that women who do not own cattle or other important disposable assets are largely dependent on the goodwill of their husbands or close male relatives to involve them in the decision making on purchase, sale or transfer of assets.
3.4.3 Decision making
3.4.3.1 To what extent do women take part in the decisions related to maize production?
This question addresses intra-household decision making which is very difficult to assess at value chain level, given that more than a million households in Zambia produce maize. The assessment here is informed by an understanding of prevalent cultural norms, by large-scale RALS surveys and other studies asking questions about this, and also through a rapid appraisal undertaken specifically for this study. The prevalent cultural norm is that in male headed households, the man is formally responsible for making the production decisions relating to maize. This includes the location and size of the area to be planted, the procurement of inputs and the timing of the various production and harvesting operations. In female headed households the norm is that the woman as head of household is responsible for feeding her household, and as such is responsible for making decisions about crop production. RALS 2019 data which covers all parts of Zambia confirms that in the majority of cases the above norm holds true. In male headed households a female was the main decision maker on how to manage the field in only 12% of cases. In female headed households the main decision maker on how to manage the field was a male in only 5% of the cases. In female headed households it is rare for the head of household to defer on how to use their field to a male relative who is not a household member; only .3% of cases (Chapoto & Subakanya, 2019). A 2015 survey in Eastern Zambia covering 235 randomly

121
selected households in Eastern Zambia found that decisions on maize production were made jointly by the husband and wife (Nyanga, et al, 2020).
3.4.3.2 To what extent are women autonomous in the organisation of their work on maize?
Survey data and data gathered during the rapid appraisal make it very clear that maize production is seen as involving women, men and older children in varying degrees in different operations. It is not seen as the work for women alone62. With regard to the organisation of work by women on maize, women as heads of households have autonomy, while as spouses they have very limited autonomy. While women have decision making autonomy as household heads, for some production operations they are nevertheless often dependent on men who are not their husbands, such as pre-planting cultivation and spraying with herbicides. Where the husband is the main decision maker, the wife is expected to comply with decisions and be available to provide their time and labour for key operations on maize. Most of the planting, weeding, fertilizer application and harvesting is typically undertaken by the household members together. Where the female household head or wife is the recognised decision maker, they are in charge of organising the work on maize. In all situations, household interdependencies exert a significant influence on decision making. While most married women have limited autonomy in organising their work on maize, the trend towards greater consultation by married men with their spouse/s does increase the involvement of women in decisions about maize production operations
3.4.3.3 Do women have control over income from maize?
According to analysis of RALS 2019 data, women in male headed households rarely make decisions on how to use the income from the sale of maize. In the 2018-19 season only 9% of such women are reported to have made the decision on how to use the income from the sale of the maize crop (Chapoto & Subakanya, 2019, Table 4.5). In this respect seed cotton is the only other crop listed where the proportion of women deciding how to use the income from sales is lower (6%) (Chapoto & Subakanya, 2019). The implication is that in male headed households where maize is the main or only cash crop women have very little control over the income from maize63. Discussion with a mixed focused group of farmers in Mpongwe District during the first field visit indicated that generally married women depend on their husband to receive a share of the income generated from maize sales. Both men and women concurred that it is common traditionally for a husband to buy items of clothing or household items for their wife, rather than giving them cash. They added that in some male headed households the wife is consulted in the planning of how spend any income from maize sales, for example how much to allocate to purchase of inputs for the next season, and how much to allocate to payment of school fees.
62 See Shipekesa and Jayne, 2012, and also Annex 1 rapid appraisal report which includes focus group assessments of the different contributions assessments of labour contributions by gender categories to the maize production operations, and how this has changed over the past 4 decades. 63 A study of women’s decision-making control in groundnut production and sale in Zambia challenges some of the results of previous research on the impact of commercialisation on female control of income from crops traditionally grown by women (Kasanda, 2017). Using data from the RALS 2015 survey Kasanda found that women make up 38% of producers in Zambia’s groundnuts sub-sector but accounted for 49% of the total number of people controlling groundnut selling decisions.

122
Regarding who makes the decision to sell maize, as distinct from the decision on how to use the income from sale, RALS 2019 data indicates more delegation by the household head: 15% in male headed households and 31% in female headed households64. In the case of male household heads the delegation is most likely to be delegated to their spouse (10% of cases). In female headed households the person delegated to is not indicated, but this is most likely to be a close relative, such as an adult child in the household. Who makes the final decision on sale was explored in focus group discussions with mixed groups of male and female farmers in 4 districts as part of the rapid appraisal exercise. In all focus group farmers said that men make the final decision on sale of maize in married households. They also said that discussion between married couples does take place in some but not all households. The trend in the frequency of discussion was estimated by some focus groups to be increasing and by other groups to be decreasing. Some of the focus groups said that when couples discuss this, they have good outcomes and households that don’t discuss tend to be dysfunctional.
3.4.3.4 Do women earn independent income from maize production?
Compared with other food crops, maize is the food crop where women are least likely to have made the decision independently on how to use the income from crop sales (Chapoto & Subakanya, 2019, Table 6). They are more likely to control income in the case of other food crops such as sweet potato (36%) fruit and vegetables (34%), groundnuts (33%), Millet (30%), Cassava (29%) or beans/cowpeas (25%). In some parts of Zambia these crops are mainly controlled by women. For example, for in North Western Province this is the case for 84% of sorghum sales and 65% of maize sales. In Southern Province this is the case for 62% of groundnut sales and 48% of white flesh sweet potato sales and 100% of orange flesh sweet potato sales. According to RALS data, nationally, less than half (48%) of households, both male and female-headed, sold maize from their own production from the 2017/18 season (Chapoto & Subakanya, 2019. Table 4.2). Moreover, nationally only 36% of rural households were “net sellers”, selling more maize than they purchased in this season. However, because of the two-stage process described about, it is likely that the RALS maize sales figures don’t include many of the lower order transactions with maize made by women, including value addition. From the maize store controlled by the wife, amounts may be taken for processing and resale locally as maize meal, beer or sweet beer. The household store may also be sold as grain in small quantities to other households or in local marketplaces in order to raise cash to buy other essential household items.
3.4.4 Leadership and empowerment
3.4.4.1 Are women members of groups, trade unions, farmers' organisations?
For maize production, the most significant organisations for rural women are local cooperatives and also local savings groups (village banking). Cooperative membership is primarily important for accessing FSIP inputs (subsidised fertilizer and hybrid maize seed). Less than half (45%) of rural households indicated that they belonged to a farmer cooperative in the 2018/19 season. Male headed households were more likely to be cooperative members (49%) than female headed households (37%).
64 Data from the RALS 2019 dataset provided on request.
123
During the rapid appraisal district level key informants clearly stated that cooperative membership was predominantly male. Local savings groups are a potential source of borrowing for maize production. 12% of female headed households belonged to savings groups compared to 11% of male headed households. For households that don’t receive FISP these groups could provide a source of borrowing for purchase of fertilizer, maize seed or herbicides. Women’s groups are another form of local support: 18% of male headed households belong to women’s groups, compared to 17% of female headed households65. Women’s groups have minimal engagement with smallholder maize production activities. With regard to post-production nodes of the maize VC, there are trade associations for grain trading and milling to which women could belong. Membership of these associations tends to be made up of larger enterprises, including companies. Data, including gender disaggregated data, on smaller enterprises involved in this segment of the maize VC was not available.
3.4.4.2 Do women have leadership positions within the organisations they are part of?
Zambia, in common with neighbouring countries is assessed as having a relatively high gender inequality rating 66. As noted earlier, most of the commercialised segments of the maize value chain are male dominated, from the bottom up. It is common for the predominantly male employees who start in lower paid manual roles, to be promoted internally into more senior positions, perpetuating gender inequality of leadership in most of the maize value chain. The official policy of the Zambian Cooperative Federation is that Leadership of cooperatives is open to both genders. However, a study and a current project provide indications that gender imbalance in leadership remains an issue in the maize producing rural areas.67 Interviews with key informants during the rapid appraisal further confirmed leadership positions in the cooperative movement are predominantly occupied by men, even though in some districts there is a policy that 30% of these positions should be occupied by women.
3.4.4.3 Do women speak in public?
In rural areas traditional public assemblies tend to be male dominated, and older married men tend to have the loudest voice. Typically, men and women sit or stand separately in public meetings. Men tend to lead the discussion and do most of the talking. Women can be consulted during a discussion or may raise their hand to contribute.
65 It is most likely that the wife in a male headed household is the registered women’s group member. However, some women’s groups do also have male group members. 66 According to a recent measure of gender inequality based on UNDP Human Development Report data for 2019 which uses indicators or reproductive health, empowerment and participation in the labour market, Zambia ranked 137th out of 162 countries. For comparison with neighbouring countries: some had higher rankings: Namibia 106, Botswana 116, Mozambique 127, Zimbabwe 129, and some lower rankings Tanzania 140, Malawi 142, DRC 144, Angola 148. http://hdr.undp.org/en/composite/GII 67 A Recent Case Study of Cooperative Performance found that gender imbalance is an issue on the leadership of the cooperative movement (Siame, 2018). A Christian Aid project in Central Province, Making Agriculture a Business, has a “Gender Equality and Social Inclusion Training” component which indicates this is an issue which has been identified as important (Zulu and Chipili, 2018).

124
The pattern is different in public meetings convened by agricultural extension staff and NGOs. The meeting facilitators will usually make specific efforts to ensure that women attending are given a voice on the issues under discussion. Some meetings can be led by women. For example, in some areas there are female chiefs or village heads who can preside over a meeting. Female extension workers can also lead meetings.
3.4.5 Hardship and division of labour
3.4.5.1 To what extent are the overall work loads of men and women equal (including domestic work and child care)?
The focus is evidence on the hardship of different tasks, and male, female and children’s workloads relating to maize production up to maize storage at household level. Focus groups and camp extension officers were asked which three tasks in maize production were the most demanding, for resource poorer and resource richer households. The three tasks, most demanding for all households, were weeding, land preparation and harvesting. The ranking differed somewhat between resource poorer and resource richer households. Resource poorer households gave a higher ranking to land preparation and weeding, while resource richer households gave a higher ranking to harvesting; a reflection of their larger areas and yields, and also that resource richer households are more likely to use animal draft or herbicides for weeding. A crop forecasting survey undertaken in 2011, asking over 10,000 households about labour hours input into the largest staple crop field, reported that “agricultural labour activities are roughly equally split between males and females” and households reported that women provided on average 51% of the labour hours (Shipekesa & Jayne 2012, p.3).
Activity % of labour hours provided by a woman Land Preparation 50% Planting 54% Fertilizer application 50% Weeding 53% Harvesting 52% Transporting crop to homestead 49% Shelling and packing 52% Total average 51%
TABLE 26: PERCENTAGE OF FAMILY LABOUR HOURS IN CULTIVATION PROVIDED BY A WOMAN, BY ACTIVITY, MAIN MAIZE FIELD - 2010/11 SOURCE: (REPUBLIC OF ZAMBIA, 2011) These findings, as the study itself notes, are somewhat surprising, as older studies found significant gender differences in the assigning of crop production tasks; women tend to have a much larger role in maize planting, fertilizer application, weeding and harvesting68. It is possible that as this information
68 Based on the social experts 10 years’ experience, between 1983 and 1993 of undertaking farming systems surveys in maize based small-scale farming systems, and reviewing surveys at household level, undertaken by others in the farming systems research team (e.g. Bolt and Silavwe, 1988).

125
is based on self-reporting by households, rather than on empirical data collected on household labour inputs, that these figures may not reflect the actual situation. A study in Southern Province in 2000 found that gender roles were important in agricultural production at that time, including the organisation of labour (Kalinda et al, 2000). Qualitative surveys of labour burden undertaken in rural Zambia in the late 1980s indicated a clear gender-based division of labour, and that women generally worked longer hours than men69. The studies also found that it was not uncommon for some women to undertake male tasks (such as ploughing and inter-row cultivation with oxen) when no men were available to do these70. This was also reported during fieldwork in Mpongwe District on the egg value chain study undertaken in 2017.In view of the above disparity between large-scale survey data and smaller studies, the rapid appraisal explored this area in some detail. Rapid appraisal findings suggest that gender roles in maize production remain important. In all four districts camp extension officers and focus groups agreed than land preparation is primarily a male task and that men do contribute most of the labour to this task.71 Weeding was seen as a task mostly done by women and children which men can also do in varying amounts. Men’s contribution to weeding maize was assessed as higher in areas where herbicides are used and also where animal draft power is very important, indicating that both technologies are important in reducing the labour burden for women and older children. With harvesting and shelling maize, there was even more variation in the assessments made. In Mungwi and Mpika Districts both camp extension staff and farmers all indicated that women and children contribute more than men. In Mkushi district in one camp the extension office assessed that men with children contribute only 30% to harvesting and shelling, while in two different camps the extension officers estimated that men contributed 60-80% of the labour. In Chibombo district men were assessed as making a 60-70% contribution by the camp extension officer, while a group of women assessed the men’s contribution at 40%. RALS data on hire of manual labour in the 2017-18 agricultural season indicated no difference between female headed and male headed households in hiring manual labour (12% in both cases). The operations where labour hire was most important were manual tillage (26%), manual weeding (23%) and harvesting (12%) and land clearing/stumping (11%). Land clearing and manual tillage tend to be seen as male tasks, while weeding and harvesting tend to be seen as women and children’s work. This could imply that the extra labour burden is roughly equal. However, as there is no data on the gender of the people hired to perform these tasks this is an assumption that should be tested through empirical data collection on labour hire in maize production. In summary, there is some variation between areas in the gender equality of labour contributions to maize production. A more precise assessment of the contribution of men and women to small-holder maize production requires additional in-depth research.
69 Personal experience of undertaking gender disaggregated farm labour analysis during participatory rural appraisals and farming systems surveys in maize producing areas of Zambia between 1983 and 1993. 70 Flexibility in gender roles has been linked to economic insecurity in urban areas of Zambia (Evans, 2014) and it is also likely that there could be a similar trend in rural areas, although at a lower rate. 71 Camp extension officers estimates of adult male contribution to land preparation ranged from 60 to 98%.

126
3.4.5.2 Are risks of women being subject to strenuous work minimised (e.g. using labour saving technologies)?
RALS data found that in the 2017-18 season, 24% of female headed households hired animal draft power compared to 15% of male headed households (Chapoto & Subakanya, 2019 Figure 3.5, p29.). This indicates that female household heads reduce their labour burden during land preparation and planting when they have the resource to do so. A slightly higher percentage of female headed households than male headed households hire labour for land preparation. The pattern is reversed for all other post land preparation operations (planting, fertilizer application, weeding, harvesting, shelling and packing). Manual tillage and weeding are the most common reasons for hiring labour by both types of households. A project appraisal undertaken in Eastern Province found that when households hired labour, the majority of people employed were either women (52%) or youth (33%) (Mpundu et al 2018). This suggests that in Eastern Province the risk of women being subject to strenuous work is high. The pattern may be different in other provinces. A number of changes/innovations over the past 20-40 years have relieved the labour burden for rural women involved in maize production and processing. Herbicides have provided an innovation, affordable for some households, to reduce the labour burden in weeding maize. This option is most suited to higher rainfall areas for households who cannot do inter-row weed control using draft animals (with a plough or inter-row cultivator). There has been a significant increase in herbicide use nationally; from 14% of households in the 2013-13 season to 28% in the 2017-18 season. In Northern Province, a high rainfall region, 50% of households used herbicides in the 2017-18 season. During the rapid appraisal district and camp extension staff confirmed that this trend is likely to continue, while noting that many households lack the ready cash to purchase herbicides. Asked for their views on the implications for women of increasing the area planted to maize, camp extension officers unanimously agreed that this increases their workload, particularly for weeding and harvesting. Focus groups in Mungwi district, where households growing maize lack animal draft power, were clear that increase the area planted to maize resulted in women taking on “men’s tasks”, particularly land preparation and harvesting. Focus groups in Mkushi noted that declining soil fertility was increasing the labour burden for women, because larger areas had to be cultivated to compensate for the decline. In Chibombo district focus groups noted that in households growing maize as a cash crop (rather than just as a food crop) women’s workload is increased, while their decision making is reduced. Mechanisation of maize shelling potentially reduces the labour required after harvest, but ownership of mechanical shellers is minimal, and so most households still use more labour-intensive methods. Local hammer mills, which is widespread, has greatly reduced the extent of female drudgery in hand pounding maize. Hammer mills are widely available and relatively accessible in most provinces,

127
although access is lower in Eastern Province compared to other provinces where maize is the main staple72. Development of various rural services and infrastructure have also significantly reduced the walking time and also drudgery for women and children. Communal boreholes have reduced the distances many households need to travel for drinking water collection, which is typically a women’s or child’s task. Increased numbers of rural clinics and primary schools have reduced the travelling distance for women and children attending these on foot. Increasing numbers of local market centres have also reduced the average walking time spent by women (to sell produce or buy household items).
3.4.6 Gender Equality Summary
There is a clear lag between the development of national policies on gender equality/equity, and changes to attitudes and behaviour, both in organisations (public and private sector) and in rural communities. The risks of female exclusion are lower in the trading, production and processing segments of the maize VC where smaller-scale private sector actors are very active. This includes local agro-input trading, grain and maize meal trading and retailing, maize production, and artisanal processing and retailing of maize products. Data on small agro-dealers indicates that most are owned by individuals, with men nearly three times more likely to be owners than women, with 6% being jointly owned, and 8% owned by groups such as cooperatives or associations73. While women are very much included in maize production activities, in male headed households, the cultural norm is that women rely on decision making from their husbands in most matters relating to maize production (see Section 3.3, Decision Making). In some circumstances, a husband’s decision-making role is delegated to their wife/wives. This would be happened when a husband is very old or sick and not able to go the fields, or if the husband is running a business or in employment leaving him little time for farming. Data collected during this study in a rapid appraisal of 4 district level markets undertaken in October 2020 found that small-scale trading in maize grain and commercial mealie meal tended to be male dominated, with relatively few women participating. However, small-scale trading in small packets of mealie meal (“pamelas”), maize rice (samp), maize grits, and sweet beer brewed from maize (maheu/chibwantu) were almost exclusively a women’s activity74. As noted earlier, women rarely occupy the manual and technical roles in the larger commercial maize trading and commercial milling plants. The explanation given for this by men working in these roles is the nature of the work (e.g. heavy lifting and/or spending long periods away from home rough sleeping) and also the common practice of recruiting technical staff internally, from the pool of male manual workers. Cultural perceptions of gender capabilities and vulnerabilities undoubtedly influence explanations of limited numbers of women in these parts of the maize VC.
72 The average distance to a hammer mill is 4.1km in Eastern Province compared to 1.8km in Central Province. (Chapoto & Subakanya, 2019, p117) 73 Data kindly provided on request by James Luhana, Project Manager, Agribusiness Accelerate Initiative, MUSIKA is that, of 546 agro-enterprises on its 2019 database, 348 were owned by men and 123 by women and 33 by both genders. 74 See Appendix 1: Maize Value Chain Study Zambia, Rapid appraisal of Gaps in System Trends and Social Impact, Analysis of Findings, January 2021

128
Land rights held by women in rural areas are embedded within local kinship and marriage relationships. The majority of ethnic groups occupying customary land in Zambia have matrilineal kinship, and practice either virilocal (women moves to the husband’s village) or uxorilocal (husband moves to the wife’s village) residence upon marriage. Rights to crop land in areas of customary land holding are held by families and usually administered my male heads of extended families. The basic principle followed is that access to land to cultivate is part and parcel of belonging to a local community. This system provides rural women in the matrilineal areas with a life-long attachment to their community of birth, in which their families will have rights to land. While traditional rules relating to marriage and access to land are clear, there has always been a significant level of geographical mobility of households within rural areas, which is a typical feature of matrilineal kinship. It is quite common for couples to move from the village where they started married life, and move to another village where one of them may have a relative who is a village head who is willing to welcome them and allocate them land to cultivate. If their children remain in that village as adults, they will also have rights to cultivate land there. In such cases it is typically the man as the household head who will negotiate the move to another village. There are no legal or explicit policy barriers to women small holder producers being given access to credit in their own names. Many rural households lack access to loans for maize, and lack the cash to purchase maize inputs, but women as heads of households are slightly more disadvantaged in this respect. This slight disadvantage is magnified further when the de facto access of female headed households to government subsidy through FISP is considered. There are no legal or policy barriers to women smallholder producers accessing FISP and FSP. However, cultural attitudes and financial limitations are two factors which can limit women, including female heads of households, from accessing FISP in equal measure to men and male household heads. Discussions during the rapid appraisal of how this works out in practice, informants state that practice varies between households within a community. In some there is a lot of discussion and joint decision making between husband and wife, while in other households the man makes the main decisions about maize production (see Annex 1). An evaluation of the Ministry of Agriculture’s “household approach” to agricultural extension and marketing, which emphasises joint planning, reported that consultation between husband and wife in agricultural decision making has becoming increasingly common as a result of this extension approach (Farnworth & Munachonga, 2010 p36). In summary, the evidence points to an overall trend towards increased involvement of women in decisions relating to maize production in the small-holder sector. Exploration of household decision making on maize sales in the focus group discussions indicates a two-stage process. The first stage is the decision about how much of the household maize harvest to sell on the market, and how much to keep for family needs. In male headed households the norm is that men decide how much maize to sell, and women have control of the maize which is set aside for the family. It is expected that some of the maize stored for the family will be given away to relatives and sold when urgent needs arise such as paying school fees or medical costs. Household level data from the focus group discussions indicates that households producing large surpluses tend to set aside much more than they can consume while households producing a small surplus set aside only a little more than they think they will need to consume before the next harvest. This suggests that the

129
maize stored in this way functions like a “easy access savings account” that they can easily draw on in times of need. Women will only earn significant amounts of truly “independent” income from maize production as heads of households which can produce regular surpluses of maize for sale. Typically, female headed households are less commercially oriented, as indicated by having a significantly lower “household commercialisation index” than male headed households75. Risks to women undertaking strenuous work in maize production and processing have been reduced over the past few decades due to the uptake of new technology, but at the same time an increase in the area planted to maize, including growing maize for sale, generally increases women’s workload. There remains scope for further reduction of women’s workload. In resource richer households this includes use of mechanical shellers. For women in resource poorer households improving their access to animal draft power or herbicides is an option.
3.5 Food and nutrition security
3.5.1 Availability of food – given the increased importance of maize as a small holder crop
Maize has increased in importance as the main staple food in Zambia, and generally has increased in its availability in rural areas. Maize has displaced small grains (sorghum, finger millet and pearl millet) as a staple food for rural households. Since national independence in 1963, the government has actively encouraged smallholder maize production and consumption through a range of support, including a maize focused public research, extension and marketing services, subsidised and/or free seed and fertilizer, and a maize-centric food relief approach. Understanding the impacts of government support and subsidy for maize therefore provides a crucial context for assessing the impact of the maize VC on food security and nutrition. This applies both for rural households producing maize, and for urban households relying on purchase of affordable maize meal as their staple diet. Since 2000, much of the additional maize produced by small-scale farmers is in higher rainfall areas of Central, Muchinga and Northern Provinces where the climate and soils are generally suitable. A range of adapted high yielding hybrid varieties, heavily subsidized through the FISP programme have contributed to increased maize production. Smallholder maize production subsidies have encouraged adoption of improved technology in Zambia, including use of chemical fertilizer (Smale & Mason, 2014). In both the 2018/19 and the 2013/14 seasons, nationally, 54% of small-scale farming households made cash purchases of fertilizer, with over 70% of farmers in Central Province making cash purchase in the 2013/14 season76.
75 The household commercialisation index measures the proportion of maize produced that is sold, rather than being kept for household use (Chapoto & Subakanya, 2019, Figure 4.3, p 45). 76 In the 2018/19 season the percentage of farmers making cash purchases of fertilizer was highest in Copperbelt Province (67.7%), followed by Muchinga Province (65%) and Central Province (64.9%) (Chapoto & Subakanya, 2019, Table 5.1. The RALS data for the 2013/14 season data indicates a similar pattern; Central Province (73%), Copperbelt Province (69%) and Muchinga Province (59%) (Chapoto & Zulu-Mbata, 2015).

130
RALS data indicates that in areas where growing maize as a cash crop is well established the main source of hybrid seed is cash purchase at the full price, rather than the subsidised hybrid seed provided through FISP. For example, in Central Province during the 2018/19 season cash purchase of hybrid seed was the main source for 61% of households, compared to FISP as the main source for 21% of households (Chapoto & Subakanya, 2019 Figure 5.3, p 63).77 While small-scale farmers may be willing to access fertilizer on credit, this is not common. In the 2017-18 season only 11% of households accessed fertilizer on loan. This was mainly through out-grower schemes for other cash crops such as cotton, which provide fertilizer which some farmers divert for use on their staple food maize crop78. The willingness of small-scale farmers to use their own cash and/or join out-grower schemes to access fertilizer, is indicative of the increasing importance of maize as a food crop in rural Zambia, and also a growing dependency on external inputs for the production of the household’s main food source. With regard to the impact of FISP on food availability, it is less clear to what extent input subsidies for maize have impacted on the choices made by small-scale farmers on how much of their crop land to plant to maize and how much to plant to alternative food crops.
3.5.1.1 Does the local production of food increase?
The level of local food production has generally increased as the total area of land planted to maize by small-scale farmers has increased. For example, in the 2017/18 season, 84% of the more than 1 million small-scale farmers cultivating less than 2 ha of land, planted on average 1 ha of maize79. While this is the national trend, there are significant local variations. In many districts smallholder maize production has been increasing at a relatively high rate, but in other districts the rate of increase has been low or negative. The higher rates of production increase are mostly in rural districts located in Agroecological Region 3 across Northern Zambia. Relatively few districts of Region 2a, the traditional maize growing area, have high rates of maize 80. Perhaps surprisingly, four rural districts in Region 1, considered as risky for maize production, have even higher rates of increased maize production than many districts with more rainfall 81. Districts in which the trend of maize production is either
77 In Southern Province, the province with the longest history of smallholder maize production for sale, purchase of hybrid see was the main source for 51% of households, while FISP was the main source for only 11% of households in the 2018/19 season (Chapoto & Subakanya, 2019). 78 There was geographical variation within Zambia in the importance of outgrower schemes for accessing fertilizer. In Eastern Province early 30% of households reporting loan purchases through out-grower schemes (Chapoto & Subakanya, 2019, Table 5.1). This is possibly a result of the relatively high proportion of out grower schemes for cotton, soyabean and also tobacco in Eastern Province compared to other provinces. 79 For households cultivating between 2 and 5 ha, 94% grew maize, with an average area of 1.6ha. For farmers cultivating between 5-20ha and 97% grew maize with an average area planted of 2.6ha. This national trend indicates that for small and medium scale farming households, producing maize for sale on the market remains important as a strategy as the overall area cultivated beyond 5ha . 80 Based on Crop Forecasting Survey data 3 districts in more southerly Region 2a where the average level of production has increased by more than 200% over the previous 10 years to 2018/19 are in rank order: Itezhi-Tezhi, Kalomo and Lundazi. 81 Based on Crop Forecasting Survey data rural districts in Region 1 where the level of maize production has increased significantly during the 10 years up to 2018/19 are: Siavonga (584%), Kazungula (461%) and Gwembe (343%), Sinazongwe (230%).

131
low or negative are mainly urban districts, including Lusaka and the Copperbelt towns.82 There are also rural districts with low and in two cases negative maize production increase levels. Analysis of crop forecasting data indicates that this is due to increasing importance of alternative cash crops grown by small-scale farmers83. Assessments of hybrid maize production trends over the past forty years by 6 focus groups of farmers in these districts adds support to this prediction, Figure 23.
FIGURE 23: FARMER ASSESSMENTS OF PERCENTAGE OF HOUSEHOLDS GROWING HYBRID MAIZE OVER 5 PRESIDENTIAL ERAS SINCE 1980.
3.5.1.2 Are food supplies increasing on local markets?
Maize is grown by 87% of rural households, but 95% of rural households consume maize which indicates that there is maize available for rural households to buy if they don’t produce any. RALS data indicates that local markets in maize enable households to sell maize at times when they urgently need the cash for another purpose, and to buy maize when their store of maize has run out prior to the next harvest. A significant proportion of rural households growing maize purchase more maize than they sell. Less than 5% of households neither buy or sell the maize they grow84. After the 2017-18 “average” season for maize production, 59% of rural households growing maize were net maize buyers (Chapoto & Subakanya, 2019 Figure 4.4.). This compares with 39% of maize growers who were “net
82 The urban districts with a negative trend of maize production are: Lusaka (-68%), Chililabombwe (-14%) and Livingstone (-4%). Urban districts with lower levels of maize production increase are: Luanshya (15%), Kabwe (39%), Ndola (45%), Kitwe (54%), and Chingola (55%). 83 Those with decreasing production are Mongu (-11%) and Mkushi (-11%). Those with low levels of increase include Mazabuka (45%) and Mpongwe (49%). Decrease or low levels of increase in smallholder maize production are most likely due to an increased importance of other cash crops. In Mkushi District the other crop was soyabean, in Mpongwe District soyabean and groundnuts and in Mazabuka it was a combination of cotton, sunflower and groundnuts. In Mongu District it was rice. In all of these districts. vegetables have become increasingly important as a dry season cash crop. 84 Chapoto & Subakanya, 2019, Figure 4.4, indicates that 4.7% of households are in ”Autarky” being neither buyers or sellers of maize.

132
buyers” of maize in the 2013-14 season following a bumper maize harvest (Chapoto & Zulu-Mbata, 2015). In the 2017-18 season, only 36% of the 48% sold who sold maize, sold more maize than they purchased (Chapoto & Subakanya, 2019). Of the maize marketed by the 48% of households selling maize 21% of sales were made locally to other households, and 8% to retailer/marketeers who then resell at local markets. Other studies also indicate that the maize VC is improving the volume of maize grain in local markets. Studies of maize trading (Hantuba, n.d.; Chiwele et al, 1996). Data collected on prices at local markets clearly show that the locally produced maize products, including local maize meal, are generally much more affordable than the breakfast meal produced by large-scale industrial mills which is subsidised (Figure 24). This suggests potential for further development of local maize markets and reduction of costs relating to the production and transportation of commercially produced maize meal.
FIGURE 24: PRICES OF MAIZE PRODUCTS IN A LOCAL RURAL MARKET JULY 2019- JULY 2020
The connection between increasing maize production and changing levels of production of other food crops is less clear. It may be that increasing or declining levels of small-holder maize production may impact on the production of other types of food (from both crops and livestock) which are sold in local markets. RALS data on this is not readily available85. During the rapid appraisal, eight focus groups of farmers were asked for their opinion on the impact that increasing in the area planted to maize would have on household food security. All eight groups said that this would increase household food security, either by providing maize for other households not producing enough of it, or through using the income from sales of maize to purchase other food crops or food items.
85 RALS data does not include production levels and other details of crops sold other than maize. Crop forecasting data, while including more crops, has historically focused on cash crops, and not systematically included other local food crops, particularly cassava, which is the main alternative staple food to maize, Addressing this question fully requires a separate study including a detailed analysis of how increase production of smallholder maize is impacting smallholder production of other types of food which are sold into local markers (e.g. other grains, tubers, legumes, vegetables, and livestock products).
ZMK 0.00ZMK 2.00ZMK 4.00ZMK 6.00ZMK 8.00
Monthly Price Variation Maize Products - John C. Market, Chibombo District
Local cup of maheu -350ml Local roller meal pamela
Subsidised 25Kg breakfast meal Local grits for maheu
Local samp for meals White maize grain

133
An analysis of the results of national surveys of household expenditure, specifically food budgets, indicate that food consumption patterns in Zambia have changed between 1996 and 2015, driven by income growth and also by urbanisation (Chisanga & Zulu-Mbata, 2018). The data indicates that there is a connection between increasing levels of maize production during this period and changing levels of availability and affordability of some types of food in rural and urban markets. A notable change is the increasing importance of poultry and also eggs, both of which include maize-based stockfeed as the main production cost. The real price of poultry meat more than halved (from ZMW50 to ZMW19 per kg) during this period, while the proportion of the budget spent more than doubled for urban households (from 4% to 9%) and increased from 4% to 6% for rural households. There is a similar, but less pronounced pattern for eggs. This implies that increased maize production is contributing to increased supplies of affordable poultry and eggs for both rural and urban households. The expenditure data shows that both urban and rural households have reduced the proportion of their food budget spent on maize, and increased expenditure on wheat products over this period. This reduction in expenditure on maize did not imply a reduction in the amount of maize purchased by households because the real price of maize meal more than halved, while the real price of wheat slightly increased between 1998 and 201586. Most likely government subsidies through FRA and FISP contributed to this trend.
3.5.2 Accessibility of food
3.5.2.1 Do people have more income to allocate to food?
This question can be looked at from the following perspectives: - - a general trend: do rural households have more income to allocate to food than previously? - a household level sale of maize effect: do those rural households selling maize have more income to allocate to food? - the effect of production subsidies on households: do maize production subsidies help rural households to have more income to allocate to food General trend In terms of more income in general, the 2015 national survey of living conditions provides data which is indicative of choices made with regard to food budgets. It is assumed that food is the most important household item for poorer households, and that choosing to spend a lower proportion of income on food indicates that households are generally better off. For rural households between 2010 and 2015, the proportion of household income spent on food fell, from 49% to 41%, while the proportion of rural household expenditure on non-food items increased from 35% to 44%, indicating a trend of rural households having relatively more income which, in principle, they could allocate to food.
86 For urban households, maize constituted 18% of expenditure in 1996. This fell to 12% in 2015, while expenditure on wheat increase from 8.0% to 9.9%. Over the same period rural household expenditure on maize reduced from 26% to 16%, while expenditure on wheat increased from 1.6% to 3.8%. The real price of a 25kg bag of breakfast meal in1998 was ZMW169 and in 2015 was ZMW73. The real price for 3kg of wheat flour in 1998 was ZMW17 and in 2015 was ZMW19 (Chisanga & Zulu-Mbata, 2018, p.15).

134
This interpretation of the data needs to be qualified. National survey data on income includes, in addition to expenditure on food, a household’s consumption from its own production of food (expressed as a financial value) and from gifts or food relief. A reduction in the proportion of income allocated to food for rural households could indicate that while the volume of their production has not declined, the market value of the volume of food produced has declined87. Household sale of maize effect Detailed data is lacking on the extent to which sales of maize by rural households are used for their food budget. A general assessment can be made based on the general pattern of household decision making around maize sales. Small-scale farmers usually sell the bulk of their harvested maize in one or two main transactions88. Based on discussions with farmers during the first field visit in one district and in four more districts as part of the rapid appraisal, the uses of income from these main transactions is mainly for non-food purchases, as school fees, medicals costs, funerals, inputs for the next season, equipment, clothing or household items. One group of farmers indicated that cash from sales can be spent on alcoholic drink, adding that his is becoming less common. Farmer responses also indicated that some of the income earned from main sales of maize is allocated to “groceries” – this term is usually applied to items such as sugar, salt, cooking oil and soap. For resource richer households could also include items like bread, milk, meat or fish. In addition, farmers indicated that in addition to the main sales of maize, as the time progresses, some households sell small quantities of maize from the allocation which has been put aside for household use. Such small sales are used to purchase food items like cooking oil, sugar, salt and vegetables during the more hungry months (October to January) while waiting for the next seasons food crops to mature. Maize production subsidy effect Households in receipt of FISP maize packages, who practice a high level of crop management, have access to good soils and climatic conditions, are most likely to have extra income from maize which they could allocate to buying other foods. Data on access to FISP indicates that this subsidy is more likely to be accessed by resource richer households able to afford the 20% down payment and also more likely to have more than one household member accessing FISP. Such households are more likely to produce a surplus of maize for sale, and more likely than poorer households to use some of the income from sale of maize on other food items. Resource poorer households able to afford the 20% down payment also benefit a lot from FISP, mainly in the form of increased maize production for their own food, or for sale to meet other pressing needs (e.g. school fees, medical costs).
87 Data on maize production from annual crop forecast surveys suggests this interpretation could be correct. There has been a general trend of a per capita increase maize production in many districts since 2010, while over the same period the real price of maize has fallen87. A further indication that this was the case is an increase in the proportion of the household food budget income spent on non-starch staple foods, particularly vegetables poultry and eggs, both in rural and urban households. Data indicates that the proportion of expenditure on starch foods declined from 45% in 1998 to 29% in 2015(Chisanga & Zulu-Mbata, 2018, Table 6 and Figure 10). For vegetables, the trend suggested is that of households having more income to buy and/or more time to spend on growing vegetables. For meat, the trend suggests that households have partly substituted buying beef for buying and/or rearing chickens to eat. 88 78% of households who sold maize, reporting only one transaction, and a further 14% reported only two transactions in the 2018-19 season (Chapoto & Subakanya, 2019).

135
3.5.2.2 Are (relative) consumers food prices decreasing?
An analysis of household consumption patterns, based on 4 living conditions monitoring surveys undertaken between 1996 and 2015, clearly indicates that real prices of most categories of food have decreased over time during this period. Notably real prices of maize meal more than halved over this 20-year period, while prices of chicken, milk, vegetables, traditional starch staples and pulses have also fallen significantly. The real prices of wheat flour, kapenta, beef and sweet potato leaves have remained constant or slightly increased (Chisanga & Zulu-Mbata, 2018). While this trend is generally positive for rural households who are net purchasers of food it implies that rural households who are mostly net producers of food are probably being paid less for the crops that they sell, than they were paid 20 years previously. This trend could also be indicative of increased efficiencies in transport and marketing of food products over this period, and also improvements in smallholder production efficiency89. The trend in declining prices of staple food crops, pulses and vegetables implies that smallholder production of these basic food crops for the market is becoming more specialised and more commercialised. After planting enough for estimated household food requirements, because real prices paid are generally falling, small-scale farmers are likely to be more selective in choosing which crops they plant as “cash crops” (I.e. they plant with an expectation of generating income from sales). In areas where markets are not well developed, maize is a “safe bet” because it has a guaranteed market via FRA, and is particularly safe if a surplus for sale is achieved using FISP inputs.
3.5.3 Utilisation and nutritional adequacy
3.5.3.1 Is the nutritional quality of available food improving?
This important question is explored from three angles:
• The impact of the increasing importance of maize relative to other starch staples in the rural diet,
• Efforts to improve the nutritional quality of maize, and • Changes in rural diet indirectly linked to increased smallholder maize production
Maize increased use as household staple food In much of rural Zambia maize has become increasingly important in household diets, at the expense of other starch staples, particularly sorghum and millets and, to some extent, cassava also. What is the impact of this on nutritional quality of household diets? The answer is quite complex. Each important alternative starch staple crops have particular nutritional benefits. Cassava roots and leaves have minerals and vitamins particularly important for human health and are higher in protein
89 Efficiency can be measured in terms of returns to the value of labour and/or cash inputs which are likely to be the most limiting factors. This is distinct from looking at productivity per unit area.

136
than other root crops90. Sorghum is a good source of some vitamins and minerals, has high levels of resistant starch and has protein levels similar to wheat.91 Millets grown in Zambia, mainly finger millet and pearl millet, also have a similar range of health benefits to sorghum.92 While the sorghum and millets have generally declined in importance relative to maize, sweet potato has increased in importance as both a household food and a cash crop. Sweet potato is rich in vitamins A and C, and in iron, phosphorous and calcium (Suparno et al., 2016). For over ten years, orange flesh sweet potatoes have been promoted to address vitamin A deficiency, with some success.93 The leaves of some varieties of sweet potato (kalembula) are highly valued as a vegetable in Zambia imbued with health properties and has retained a high market value compared to other vegetables.94 A strategy used in many rural areas which utilizes the nutritional benefits of alternative starch staples is by blending them with maize meal. In higher rainfall areas where cassava is important as a staple food, cassava flour and maize meal are often blended to make nsima, eaten as the main meal by all rural households at least one or two times a day in areas of Zambia where cassava is the main staple, but gradually decreasing in importance compared to maize. In low rainfall areas where maize meal can be mixed with sorghum or millet flour for making nsima, this option is decreasing due to the overall increasing use of maize as the pre-dominant staple food. Improving the nutritional quality of maize Processing of cereals, and also cassava, through fermentation is a widespread and scientifically proven method for improving the nutritional content (Singh, et al. 2015), including blending maize with grain legumes (Mbata, et al. 2008). Research into the nutritional and health benefits of maize, including a focus on its phytochemical compounds and benefits of corn oil and resistant starch continues (Shah, et al., 2016). A range of methods of fermenting cereal grain were widely practiced traditionally in Zambia and are still being practice in rural areas. One of the most widespread is making “sweet beer” from through fermentation of maize flour, with additional of some other natural ingredients such as millet or sorghum flour or roots for flavouring. Recent doctoral research in Mkushi District of Zambia has shown that traditional produced sweet beer has nutritional and health benefits, including potential for increasing B vitamins and healthy gut bacteria for children under 5 years old (Chileshi, 2019). In the context of the increasing overall importance of maize meal in household diets, there is limited information on extent to which household level fermentation of maize and other starch staples is currently being practices, and the implications for nutrition. This is a potential area for further research.
90 Cassava flour is rich in some B-complex vitamins and some essential minerals (zinc, magnesium, copper, iron and manganese), and is high in resistant starch which carries health benefits (Montagnac et al, 2009). Cassava leaves are rich in proteins, minerals (potassium, calcium, magnesium) and vitamins (C and K), but can be toxic if not properly processed (Latif & Muller, 2015) . 91 The low starch and protein digestibility of sorghum make it a promising food for people with diabetes and obesity (Zhang et al, 2017) 92 The two commonly grown types of millet are finger millet grown in high rainfall areas, and pearl millet grown in drier areas of Zambia. Finger millet has a high content of calcium, dietary fibre and phenolic compounds (Devi et al, 2014). Pearl millet has a higher energy and protein content than most other cereal grains, and also valuable minerals and vitamins (Burton, et al; 1972;Taylor & Duodu, 2017). 93 For an example of an evaluation in one orange flesh sweet potato project in Eastern Province, Zambia see Sakala et al (2018) 94 For example see this link promoting kalembula https://www.themastonline.com/2018/05/30/kalembula-is-food-for-those-who-treasure-life-chilufya/

137
Efforts by maize breeders to assess and improve the nutritional qualities of maize, through “bio-fortification” to improve the protein quality and vitamin A content have been underway for some time and are continuing. Research into improving protein content of maize, “quality protein maize” (QPM), initiated by CIMMYT in the 1970s, has been underway in Southern Africa for over 20 years (Vasal, 2000). Research ongoing for using molecular breeding techniques to speed up the process for breeding nutritionally enriched maize is assessed as promising (Prasanna et al, 2020). While the benefits for human health of QPM maize are established, and research in Eastern Province shows positive benefits for households growing QPM maize, uptake by small-scale farmers has been relatively low so far (Manda et al, 2016). This is for institutional reasons relating to stakeholder collaboration and the requirements of isolation of QPM maize from “normal maize” (Tandzi et al, 2017). It is not clear if any of the released QPM maize varieties are currently being produced and sold by commercial seed companies in Zambia? To address vitamin A deficiency, researchers in Zambia have released and promoted varieties of “orange maize” in recent years. While consumer acceptance ratings of orange maize were initially favourable (Meenakshi et al.,2010), according to a recent evaluation orange maize not yet been widely adopted by small-scale farmers, in spite of donor and government backed efforts (AgResults, 2020). The reasons appear to be largely institutional within the maize seed and maize milling sectors. Indirect impacts of increased maize production Other elements of rural diets have changed over the period that maize has become more important. Household food budget data indicates that consumption of vegetables, poultry and eggs has significantly increased in rural households since 1998 (Mofya-Mukuka, et al 2019, Figure 11, p16). This could indicate that in some respects the nutritional balance in rural household diets has improved over the same period that maize production has increased. The possible impact of maize production on these other improvements is less clear. For example, it can be reasonably assumed that the trend of increasing maize production at lower real prices has supported the Zambian broiler and egg industry to flourish; improving the availability of poultry meat and eggs to rural and lower income households. Because vegetables are mostly cultivated during the dry season, when there is a low demand for labour and cash inputs into maize production, household labour and cash are available for vegetable production. The connection between increasing maize production and increasing vegetable availability is less obvious. It is possible that some of the cash raised form sales of maize is invested in vegetable production. This possibility would need to be verified by further data on the use at household level of income from maize sales.
3.5.3.2 Are nutritional practices being improved?
The main focus of monitoring nutritional status has been on children aged under 5, and on women of child-bearing age, to acknowledge the importance of maternal nutrition. Nutritional status of under 5-year-olds monitoring has focused on stunting (chronic malnutrition), wasting (acute malnutrition) and more recently overweight. In Zambia, nutritional deficiency and related mortalities are most pronounced for the under 5-year-olds, with kwashiorkor being the most common type of severe acute malnutrition in both urban and rural areas (Munthali et al 2015). Nationally data shows that nutritional outcomes are improving. The most recent estimate (2019) is that about 35% of children under 5 have stunting, 12% are underweight and 4% have acute malnutrition. In 2001, the levels for all three indicators were much higher; 53% stunting, 23%

138
underweight and 6% acute malnutrition. However, the reduction in stunting is not sufficient to reach the sustainable development target of 15% by 2030 (Mofya-Mukuka, et al 2019). What might be the contribution of increase smallholder maize to the reduction in stunting rates? The link between child nutrition (kwashiorkor) and a low protein infant diet based largely on starch staple foods, including maize, is firmly established (e.g. Williams, 1933; Brewster et al, 1997). Households having an improved supply of maize as the main family staple throughout the year would not be expected to make a big difference to under 5 stunting rates. Research indicates that growing enough maize for the household is no guarantee that under 5 nutrition outcomes will be good. A study of stunting in rural households from Sinda District, a traditional maize production area in Eastern Province with a 50% rate of stunting of under 5s was undertaken in 2016. This study found that while household food insecurity status was a significant factor, the other main factors relating to under 5 stunting were child diet, income, mother’s education and participation of mother in nutrition training. In this study the average agricultural production diversity score was similar for households with stunting and those without stunting (Mulenga et al., 2017). This suggests that, with regard to stunting, decisions about which crops to grow are less important than decisions about utilisation of the crops produced, and particularly practices around preparation of infant meals. This study also highlights a context in which a district is seen to be “food secure”, as assessed by the level of maize production, but at the same time had levels of infant stunting above the national average. The inter-relationship between nutrition and the uptake of maize cash cropping by small-scale farmers has not been fully explored in recent research in Zambia. However past research on this has suggested a link between hybrid maize uptake and household nutritional status. Studies undertaken in Northern Province in the late 1980s found a link between increased levels of small-holder maize production for sale, and declining areas of other food crops, particularly leguminous “relish” crops.95This was explained as a consequence of women spending more time on tasks relating to maize planting and weeding, and having less time to devote to other ”traditional” food crops. Subsequent research to explore women‘s views on the reason for a reduction of food intake and poor nutrition in rural households in Northern Province found that lack of sufficient “relish“ was the main reason given, and that this was linked to both a decline in the quality of relish crops grown as a result of uptake of hybrid maize cultivation, and also insufficient cash to buy relish in poorer households who had sold food crops to raise cash earlier in the year (Moore & Vaughan, 1994, p. 185-7). For such households, reducing the number of cooked meals per day was the coping strategy for not having enough ”relish”, negatively impacting on the nutrition in the household. The views of farmers and local extension staff on the potential impact on infant nutrition of increased hybrid maize production were explored during the rapid appraisal exercise. This proved to be a challenging task. Views of both extension staff and farmers regarding the prevalence of stunting varied from on area to another. On balance the weight of opinion was that increasing the area planted to maize would improve household nutrition and food security. The following points were made: -
95 These include studies which analysed household level data collected during the 1980s to evaluate an integrated rural development programme in Mpika District (Sharpe, 1987) and to assess nutritional status of households to inform agricultural research interventions in Northern Province, Zambia (Bolt, 1989).

139
• For resource richer increased hybrid maize would improve infant nutrition, because the extra income earned from maize can be used to purchase more nutritious foods,
• for poorer households, increased maize production improves household food security, so less time is spent away from the home looking for food, and there is more time for attending to the needs of children in the home,
• Growing more maize results in a less varied household diet because area planted to other crops goes down for some households,
• There is a risk in some households that income earned from maize is not used for improved diet but other purposes,
• The main nutritional gain would be from farmers growing orange maize which has improved nutritional content. .
Analysis of available data on levels of infant stunting and the rate of maize production increase at provincial and district levels was undertaken to provisionally assess a possible association between the two variables. A provincial level analysis indicates that higher rates of infant stunting tend to occur in the provinces of Northern Zambia which have higher rates of maize production increase and higher rainfall. The results also indicate that in some provinces with modest levels of maize production increase, infant stunting rates can be both above the national average (e.g. Eastern Province) or below the national average (e.g. Southern Province). The details of this are in appendix 1. Analysis at district level, if urban districts are excluded from the analysis96, indicates a similar pattern for districts in agroecological regions 3 and 2a. In Region 3, 18 districts with a high rate of maize production increase the average rate of under 5 stunting is 43.6%, compared with 41.2% in 13 districts with a lower rate of maize production increase. There is a similar pattern in Region 2a. In 9 districts with a slightly higher rate of maize production increase the rate of under 5 stunting is 38.6%, compared to 37.2% in 9 districts there the rate of maize production increase is lower. This difference may not be significant. The 6 districts in Region 1 present a quite different pattern. All have infant stunting rates at or below the national average, but massive differences in maize production increase rates, ranging from 583% at the highest level to 53% at the lowest level. This contrast suggests that quite different conditions for infant nutrition prevail in the drier districts. Factors accounting for this could include greater resilience at household level in due to coping strategies developed to manage seasonal and inter-annual fluctuations in food supply, and greater engagement with food relief operations following climate shocks. An evaluation of efforts under the Scaling Up Nutrition (SUN) programme in Zambia, focusing on a project which provided training of farmers in four districts on the nutritional benefits of agronomic
96 Analysis undertaken using crop forecasting data provided by IAPRI and data on nutritional status analysis maps in the Global Nutrition Report (2019) https://globalnutritionreport.org/resources/nutrition-profiles/africa/eastern-africa/zambia/. Levels of maize production increase are low and under-5 stunting rates are generally low in urban districts. The low levels of increase in maize production in urban districts are probably a result of increased pressure on cropping land in peri-urban areas, while lower under 5 stunting rates is due to higher incomes and improved availability of a wider range of foods in peri-urban and urban areas.

140
practices, including crop choice, found that this training did have a positive effect on dietary intake in these districts (Gondwe et al. 2017). The reasons behind infant stunting are multiple, including household income, feeding practices, birth spacing, cultural attitudes, diet, gender and prevalence of diseases. A recent assessment in Zambia identifies the need for “a study to understand the factors that have contributed to a five percent reduction in child stunting between 2013/14 and 2019” (Mofya-Mukuka, et al 2019, p25).
3.5.3.3 Is dietary diversity increased?
In terms of the diversity of staple foods, increasing smallholder dependence on maize is associated with a decline in the diversity of other staple foods consumed. One study found that between 1996 and 2015, the proportion of household expenditure on other “traditional” staple crops (cassava, sorghum and millets) in Zambia declined; for urban households from .9% to .4% and for rural households from 13% to 5% (Chisanga & Olipa-Zulu, 2017, Table 5). This decline in expenditure was steeper than the reduction of the proportion of expenditure on maize in both urban and rural households over the same period. This suggests that in terms of staple crops, dietary diversity has decreased in rural households. Data on dietary diversity of all foods show a disparity between urban and rural areas and the gender of household heads. The “minimum dietary diversity for women” indicator, which is applied to women aged 19-49 years old as a proxy for micro-nutrient adequacy, shows that over 80% of women in Lusaka and Kitwe met the minimum dietary diversity, while in two rural districts in Western Province less than 10% of women met the minimum requirement (Mofya-Mukuka et al. 2019 p19). This disparity indicates that urban households generally have a wider choice on which foods to buy on a daily basis, and also generally have more income than rural households. Female headed rural households had lower dietary diversity scores (5.78) than male headed rural households (6.35). The reasons for this disparity are not clear from the available research, and are likely to be complex. A recent analysis of the impact of FISP and FRA maize purchases, using RALS data for 2010/11 and 2013/14, found that these policy instruments have a negative association with smallholder crop diversification. It concludes that “diversifying crop production in Zambia is necessary for raising rural farm income and food availability but less so for improving access to a diverse range of foods” (Mofya-Mukuka, & Hichaambwa, 2018 p1449). This conclusion suggests that local trade in food crops enables households not growing a particular crop to purchase this locally as an alternative to growing it. Further exploration of household level production, sale and purchase of a range of crops is necessary in order to more fully understand the relationship between dietary diversity and the general increase in smallholder maize production.
3.5.4 Stability
3.5.4.1 Is risk of periodic food shortage for households reduced?
The general risk of periodic food shortage remains high for rural households; in 2015 47% of households had months of inadequate food provisions while in 2019, 46% of households had inadequate food provisions (Mofya-Mukuka et al. 2019 p11). The main category of food identified as
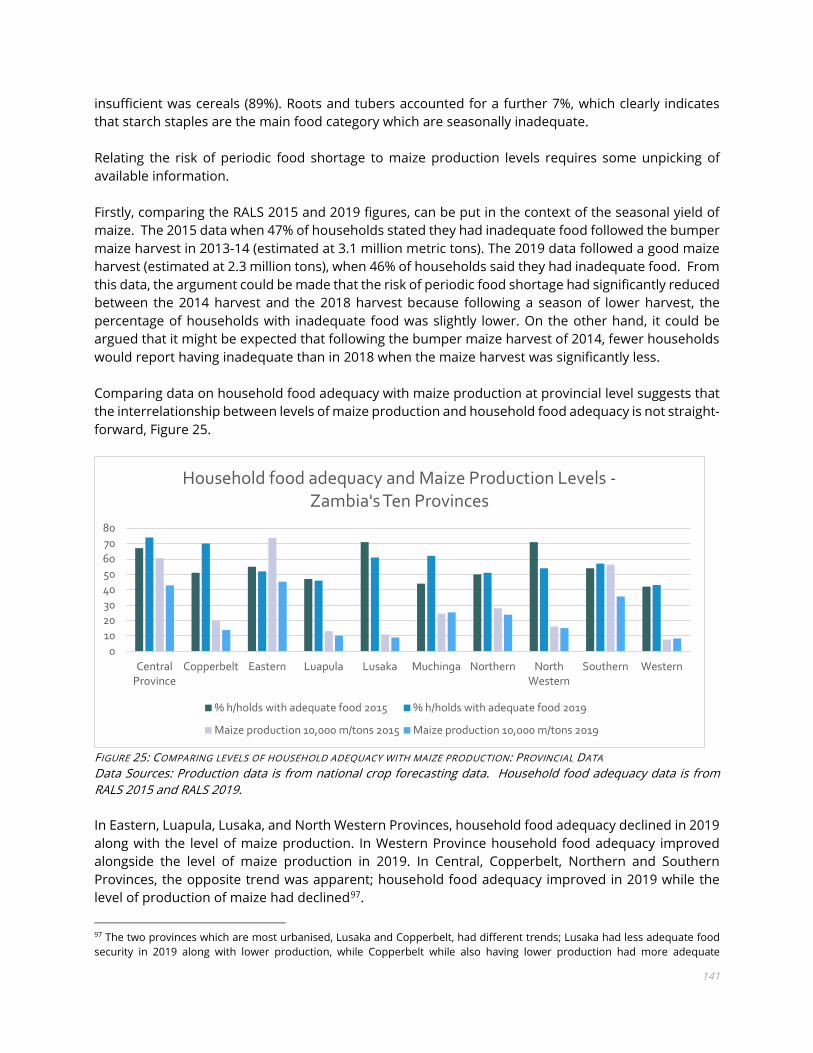
141
insufficient was cereals (89%). Roots and tubers accounted for a further 7%, which clearly indicates that starch staples are the main food category which are seasonally inadequate. Relating the risk of periodic food shortage to maize production levels requires some unpicking of available information. Firstly, comparing the RALS 2015 and 2019 figures, can be put in the context of the seasonal yield of maize. The 2015 data when 47% of households stated they had inadequate food followed the bumper maize harvest in 2013-14 (estimated at 3.1 million metric tons). The 2019 data followed a good maize harvest (estimated at 2.3 million tons), when 46% of households said they had inadequate food. From this data, the argument could be made that the risk of periodic food shortage had significantly reduced between the 2014 harvest and the 2018 harvest because following a season of lower harvest, the percentage of households with inadequate food was slightly lower. On the other hand, it could be argued that it might be expected that following the bumper maize harvest of 2014, fewer households would report having inadequate than in 2018 when the maize harvest was significantly less. Comparing data on household food adequacy with maize production at provincial level suggests that the interrelationship between levels of maize production and household food adequacy is not straight-forward, Figure 25.
FIGURE 25: COMPARING LEVELS OF HOUSEHOLD ADEQUACY WITH MAIZE PRODUCTION: PROVINCIAL DATA Data Sources: Production data is from national crop forecasting data. Household food adequacy data is from RALS 2015 and RALS 2019. In Eastern, Luapula, Lusaka, and North Western Provinces, household food adequacy declined in 2019 along with the level of maize production. In Western Province household food adequacy improved alongside the level of maize production in 2019. In Central, Copperbelt, Northern and Southern Provinces, the opposite trend was apparent; household food adequacy improved in 2019 while the level of production of maize had declined97.
97 The two provinces which are most urbanised, Lusaka and Copperbelt, had different trends; Lusaka had less adequate food security in 2019 along with lower production, while Copperbelt while also having lower production had more adequate
01020304050607080
CentralProvince
Copperbelt Eastern Luapula Lusaka Muchinga Northern NorthWestern
Southern Western
Household food adequacy and Maize Production Levels -Zambia's Ten Provinces
% h/holds with adequate food 2015 % h/holds with adequate food 2019
Maize production 10,000 m/tons 2015 Maize production 10,000 m/tons 2019

142
Of the maize produced by small-scale farmers, nationally about half of is sold and the remainder retained for home use. Figure 26 compares household food adequacy with expected maize sales data at Provincial level. .
FIGURE 26: HOUSEHOLD FOOD ADEQUACY AND MAIZE SALES IN ZAMBIA’S TEN PROVINCES: 2015 AND 2019 COMPARISON This data suggests that in most provinces (Central, Copperbelt, Muchinga, Northern, Southern and Western) household food adequacy improved in 2019 while sales of maize as a percentage of total production reduced. One interpretation of this is that sales on the open market reduced because households kept a larger proportion of their production for their own use, hence their food adequacy improved even though the overall level of production was less than in 2015. In four provinces that did not conform to this pattern (Eastern, Luapula, North-Western and Lusaka), the data indicates that household food adequacy worsened, while the percentage of maize sold also declined. In North-Western Province where the level of food adequacy reduced the most (by 17%) sales of maize only reduced by 3%. By contrast in Luapula where the level of food adequacy only reduced by 1%, sales of maize reduced by 12%. This pattern lends some further support to the interpretation that reducing the percentage of harvested maize that is sold at provincial level, enables an improvement in household food adequacy.
household food security in 2019. Comparing two rural provinces where maize has been the main traditional staple food for the longest period (around 80 years) in Eastern household food adequacy declined along with maize production in 2019, while in Southern household food adequacy increased while maize production declined in 2019. There is also a contrasting pattern in Northern and Muchinga, adjacent rural provinces where maize has more recently become an important staple and where the production of maize has been significantly increasing over the past two decades. In Northern food adequacy slightly improved, while maize production dropped in 2019, whereas in Muchinga food adequacy greatly improved by 18% (from 44% to 62%), when maize production increased to a lesser extent (4%). It may be that in these higher rainfall provinces which are far from urban areas and where maize prices to farmers are lower, more of the surplus maize being produced is being traded locally, resulting in improving food adequacy overall, even in years when production levels are lower or increase relatively less than household consumption levels.
0%10%20%30%40%50%60%70%80%
Household food adequacy and Maize Sales -Zambia's Ten Provinces
% h/holds with adequate food 2015 % h/holds with adequate food 2019
Sales as a percentage of production 2015 Sales as a percentage of production 2019

143
The seasonal pattern of household food shortage is very similar across Zambia, with levels of inadequacy rising sharply in December, and becoming very extreme in January and February, and then improving in March when new food crops become more widely available. RALS data indicates that the influence of maize production levels on the level of food shortage during the hungry months is unclear. For example, the proportion of rural households with adequate food was 7% in January and 6% in February 2019, compared to 3% in the same months of 2015, while the maize production was lower in 2019 than 2015. A further factor to consider, particularly with regard to both seasonal and longer-term patterns of food adequacy, is how maize differs from other starch staples in its growing requirements and storage qualities. Compared to other staple food crops grown in Zambia, maize is highly reliant on adequate rainfall. In the wider context of climate change, increasing dependence by rural households on maize as their main staple food increases their risk of local food deficits in years when the season is not favourable, due to inadequate rainfall, prolonged dry spells during tussling and flooding, water logging and lodging due to excessive rainfall and storms. In addition, serious pest or disease outbreaks are also a risk factor98. Climate related risks are highest in the lower rainfall regions, particularly Region 1 and parts of Region 2a, resulting in serious crop failure99. There are also some climate related risks in the higher rainfall areas, which can result in reduced maize production, but to a lesser extent 100. A longer-term aspect of increased risk from growing maize as the main household staple is soil fertility. Compared to other starch staples, maize requires fertile soil or annual application of chemical fertilizer or animal manure to provide reliable yields. Under the current smallholder systems of continuous or semi-permanent cultivation soil fertility has been declining, with increasing reliance on inorganic fertilizer to sustain yields. The impact of declining soil fertility is greatest on resource poor households, who lack the resources to re-locate to areas where more fertile land is available and who are not able to practice crop rotation or improved fallowing due to limited land size and also seed of legume crops. This constraint has been addressed by research and development through the development of stress tolerant maize varieties101. However, increasing dependence on chemical fertilizer renders households more vulnerable to the effects of having insufficient fertilizer when they need it (e.g. due to market price increase, lack of access to subsidised fertilizer, or late delivery). Specialization in a single staple crop, rather than a mix of staple crops, further increases the risk of large price fluctuations from year to year. This means that in a year when there is a bumper harvest, prices are low and so farmers have to sell comparatively more of their maize crop in order to raise the needed cash, and this can in term result in household food shortages during the hungry months. On the other hand, when the harvest is poor, prices increase in rural areas, and this may tempt some
98 Recent examples of pest and disease threats to the maize crop are widespread crop loss from Fall Army Worm, and the threat of Maize Lethal Necrosis Disease spreading from Tanzania (Kansiime, et al. 2019). 99 The biggest climate related risk in drier regions is a prolonged dry period when the maize is tassling/flowering (usually January). Other climate risks in drier regions are late onset of rains, a prolonged dry spell shortly after emergence, excessive rainfall during growing period (causing excessive weed growth/competition and soil loss. To some extent these risks have been reduced since 2007, through the introduction of new maize varieties which are more tolerant to drought, pests and diseases. 100 The biggest risk in higher rainfall areas affecting production is a prolonged dry period when maize is flowering (January or early February). Other climate related risks impact production are prolonged dry spells shortly after emergence, excessive rainfall during the growing period (causing leaching of nutrients, excessive weed growth/competition, soil loss and water logging), and excessive later rains (causing fungal rots on the cob). 101 This has been a consistent focus of CIMMYT support maize breeding efforts in Southern Africa for over 25 years, the most recent example being the ”Stress Tolerant Maize for Africa” project. https://www.cimmyt.org/projects/stress-tolerant-maize-for-africa-stma/
144
households in urgent need of cash to sell some of the maize they otherwise would need as food for later in the year. Data for three years (2012, 2015 and 2019) indicates that rural households are increasingly more likely to experience inadequate food provisions during the three months January to March, and slightly less likely to experience inadequate food provisions in the three months October to December102. While this data is only for three years, it could indicate that households are increasingly inclined to consume more of their stored crops, particularly their maize crop by December, with the hope of getting food from other sources before their own food crops become available in March. RALS data makes it very clear that a large proportion of rural households are net buyers of maize, buying more maize than they sell. In 2015 following a bumper maize harvest, 39% of rural households were net buyers, while in 2019, following a good but smaller maize harvest, 59% of rural households were net buyers. During the rapid appraisal in October, market sellers or maize and locally produced maize meal were interviewed about their customers. They explained that some of their customers were rural households who sold their maize and when they ran out of maize, they resorted to buying maize in small packets, enough for one or two meals.
3.5.4.2 Is excessive food price variation reduced?
The current policy of combined maize input and maize meal subsidies is designed to reduce price levels overall and to reduce excessive price increases of maize meal during months of low supply (December to March/April). The effectiveness of this policy has been questioned in recent publications which have argued that a more liberalised market approach would potentially reduce inter-annual price fluctuations and reduce publicly funded storage and handling costs (Chapoto et al, 2015). Data on the extent of price variation is to some extent conflicting. Data on the retail price of maize meal collected by the Central Statistical Office for the year 2014/15 indicate that the maize meal prices are comparatively stable, and more stable than maize grain prices.103 On the other hand, other data for 2016/17 suggests significant fluctuations in both maize meal and maize grain prices. For example, where milling capacity is concentrated in the main urban areas, such as Lusaka and Ndola maize meal prices fluctuated even more than in two of the provincial capitals, Chipata and Mansa. Maize grain wholesale prices also fluctuated significantly in the same urban areas104. This suggests that government intervention to control staple food prices in urban areas has not been as effective as intended.
102 Mofya-Mukuka, et al 2019, Figure 8 compares data on this from 2012, 2015 and 2019. http://www.iapri.org.zm/images/WorkingPapers/Nutrition.pdf 103 For example, CSO data for the year 2014-15 indicates that the price of breakfast meal changed only 2ngwe per kg over a 12-month period, while the price of roller meal was the same in 11 of the 12 months, when it fell by only 1ngwe per kg. However, the price of maize grain varied more than the price of maize meal, by up to 4ngwe per kg, indicating that consumer price subsidies look to be effective. Kabwe et al, (2019) Effects of Food Prices on Household Dietary Diversity of Rural Households in Zambia. Working Paper 149. IAPRI Table 4. A similar pattern still prevails in terms of the gap between variation in grain prices and variation in mealie meal prices (see Figure 5 in Mulenga and Chapoto, 2021). 104 Data provided by IAPRI Price System Data, based on wholesale prices per kg. average price for each of the 12 months February 2016 to January 2017: The range of price fluctuation for breakfast meal was: Lusaka(130ngwe/kg), Ndola (104ngwe/kg), Mansa (.95ngw/kg) and Chipata (.59ngwe/kg). For maize grain the range of price fluctuation was: Lusaka (1.26ngwe/kg), Ndola (.89ngwe/kg), Mansa (1.11 ngwe/kg) in Chipata (1.68ngwe/kg).

145
From another perspective, while price variations are quite marked, the ”real price“ of maize meal has declined since 1998. This means that price fluctuations have had lower impact than they would if the real price of maize meal had been stable or had increased 105. The reasons behind this reduction in real price is a potential topic for further analysis. A gradual improvement in living standards over the past decade and half up to 2018 could be one factor. Other factors could include improvements in smallholder productivity, high levels of subsidy, FRA pricing policy and more efficient input supply, marketing and transportation operations within the maize VC.
FIGURE 27: MONTHLY PRICES OF WHITE MAIZE GRAIN IN FOUR RURAL DISTRICT MARKETS JULY 2019 TO JULY 2020 Market price data for while maize grain collected during the rapid appraisal consistently indicated significant price changes of between 80% to180% change from low to high price in rural markets, Figure 27. This shows that rural households, while paying relatively less than urban households for the maize they purchase, are more affected than urban households by seasonal price increases for maize. In other words, government subsidies and price regulation of mealie meal produced by commercial mills is of far more benefit to urban households than rural households.
3.5.5 Food and Nutrition Summary
During the rapid appraisal of four maize growing districts, District extension staff in three of the districts predicted that smallholder maize production is likely to increase, while in Mkushi District they felt it would remain static or decline. The rapid appraisal gathered data on the sale of maize grain and maize products. In all four markets visited, mealie meal in small packages was widely available, and this trade was providing income for significant numbers of local people. In three of the four markets sales of maize grain, samp/grits and sweet beer were also important. Season price data indicated fluctuations in prices over the year related to variations in supply and demand in all of the maize products sold, apart from sweet beer, indicating that the local market for maize products is relatively well developed.
105 The proportion of the household budget spent on maize declined from 23% in 1998 to 14% in 2015, and the real price of breakfast meal decline from 169ZMW 73ZMW over the same period (Chisanga & Zulu-Mbata, 2017, Tables 4 & 5).
ZMK 0.00
ZMK 1.00
ZMK 2.00
ZMK 3.00
ZMK 4.00
ZMK 5.00
ZMK 6.00
Per Kg Price of White Maize in Four District Markets: July 2019 to July 2020
Mungwi Market Mpika Market Mkushi Market John C. Market

146
The benefits from economic growth on food accessibility have not been evenly distributed. While household incomes rose between 1996 and 2015 nationally, and rural poverty rates reduced slightly (from 82% to 77%) over this period, the disparity in income between rural and urban households increased. This implies that the benefits of income growth on household diet were greater for urban households, who had relatively more income to allocate to food than rural households had.106 The sale of maize does provide an income which could be spent on other types of food, but this is not the most compelling reason for selling maize and probably not the main use of such income. This income is more likely to be used for buying food items in resource richer households, and rarely so in resource poor households. The reason is that resource poor households are often in food deficit and would not usually have surplus maize to sell during the months (October to February), as these are the months when they would usually have to buy or borrow maize for their main meal of the day. Resource richer households are most likely to have a surplus of maize to sell, or loan, to poorer households at this time. If there was no subsidy for maize inputs, this would have a negative effect on rural household incomes, both in terms of cash income from maize sales to potentially buy food (resource richer households) and from improved access to maize grain and other maize bi-products for household use107. There does not appear to be a very clear inter-relationship between increased smallholder maize production and rates of child malnutrition. The linkages are complex. Improved understanding of these linkages requires a more fine-grained and local level of analysis. The weight of farmer and extension worker opinion suggests that increased smallholder maize production will generally improve infant nutrition, but opinions also suggest risks that it may not always do so. While various research and development initiatives can contribute to improved food availability at household level, they are unlikely to fully address chronic and periodic food shortages (see Annex 6.2). The reason is that for many decades rural households have been linked into the cash economy, and the sale of food crops appears to be increasingly common as a strategy for meeting cash needs. This means that households producing smaller amounts of food crops have nevertheless sold some of their grain to finance other needs, with the intention of raising money to purchase food later, or working for food, when their own food stocks run out. These households tend to have less assets (e.g. livestock, land, farm equipment, reliable cash income from employment or remittances) and also are more likely to be female headed. In summary, the risks of periodic household food shortage would be raised if households become increasingly dependent on maize as their main staple crop, while climate change and declining soil fertility increase the chances of lower yields, particularly for resource poorer households. Removal of subsidies on fertilizer and hybrid seed would further increase the risks of food scarcity during the months December through to February. This risk has partly been offset by the breeding and supply of
106 Chisanga & Zulu-Mbata (2018) found that in 2015 expenditure by urban households on maize had fallen from 18% of expenditure in 1996 to 12% in 2015 and was less than expenditure on other starch staples (14% made up of wheat, rice and potatoes). Over the same period rural household expenditure on maize had also fallen from 26% to 16%, which was more than expenditure on other starch staples (11%- made up of cassava, wheat, rice, other cereals and potatoes). 107 According the “Zambiainvest” website, in 2015 it was estimated that “each 200 MT of fertilizer distributed by the FSIP raises household income by 7.7% and reduces poverty severity by 3.6%” (http://www.zambiainvest.com/agriculture/zambia-launches-zmw-2-billion-farmer-input-support-program-fsip-2015-2016).

147
maize varieties which are more drought tolerant and also perform better under lower soil fertility conditions than the older hybrid varieties.
3.6 Social capital
3.6.1 Strength of producer organisations
3.6.1.1 Do formal and informal farmer organisations/cooperatives participate in the value chain?
In Zambia’s smallholder sector, the cooperative movement has, since national independence, been largely government driven, centralised, with limited member engagement. Rural cooperatives have mainly served as a mechanism for maize input distribution and marketing since the early 1990s (Ojermark & Chabala, 1994). This situation has continued. For example, until recently small-scale farming households wishing to register for FISP support had to register through a local farmer cooperative. Under this arrangement, local primary cooperatives had limited influence on the service they received, both in relation to the timeliness of delivery and the actual products delivered. Hence participation was largely as beneficiary households who wished to grow maize and receive subsidised inputs of fertilizer and hybrid seed. A recent study in Zambia concluded ”it appeared most cooperative members joined these agricultural cooperatives as one way to access subsidized farming inputs” (Mutambo, 2017 p41). Large commercial farms, by contrast, benefit from a well-organized association, the Zambian National Farmers Union, which provides a platform lobbying the public authorities.
3.6.1.2 How inclusive is group/cooperative membership?
In 1994 there was a strong gender bias, with an estimated female membership of 25% of the .8 million primary society members registered (Ojermark & Chabala, 1994). This bias appears to have been redressed to some extent, but there is still an imbalance. The RALS 2019 survey found that only 37% of female headed households were members of cooperatives compared to 49% of male headed households.108 One of the reasons given for not belonging to farmer cooperatives was “could not afford cooperative group membership“, the reason that 12% of respondents gave for not receiving FISP (Chapoto & Subakanya, 2019, Table 5.4). A recent study of commitment in smallholder agricultural cooperatives in Zambia postulates that men appear to be more committed than women, due to gender related cultural beliefs (Mutambo, 2017 p38).
3.6.1.3 Do groups have representative and accountable leadership?
The view from all four districts visited during the rapid appraisal was that leadership of local cooperatives is not representative in terms of gender balance, being male dominated, with a tendency to allocate any women in leadership to the role of secretary or treasurer, and not the chair role. The accountability of leadership of cooperatives and other groups was not explored in depth. However, given the very limited role of local cooperatives in meaningful decision making with regard to the maize VC, accountability to members is less of an issue than it might otherwise become.
108 Data tables provided by IAPRI.
148
3.6.1.4 Are farmer groups, cooperatives and associations able to negotiate in input or output markets?
As noted in section 3.6.1.1, the ability of cooperatives to negotiate in input and output markets is negligible in most districts. There are a few cases mentioned where cooperatives have a stronger role in crop marketing, but this was for crops other than maize.
3.6.2 Information and confidence
3.6.2.1 Do farmers in the value chain have access to information on agricultural practices, agricultural policies, and market prices?
As noted in Section 3.2.4, public extension services are the most important source of information among a range of other information sources on agriculture. RALS 2019 data indicates that the level of access to technical information varies significantly between provinces, and that the level of access depended on the specific advice given109. The highest levels of access reported were in Lusaka, Eastern and Southern Provinces, with lower levels in other provinces. The majority of the technical advice covered by the RALS survey related to maize production and storage, either directly or indirectly. For most small-scale farming households how to access FISP is the most important policy information. RALS 2019 data indicated that farmer said that access to information about FISP had improved, with 63% agreeing that access to information had improved compared to previous seasons, and 32% disagreeing (Chapoto & Subakanya, 2019, Figure 5.9). The survey also evidenced that the electronic voucher system being rolled out in the 2018-19 season provided a wider choice of inputs (57% agreeing and 35% disagreeing on this point). Improving farmer access to market prices has been the focus of a number of joint government/donor initiatives over the past 20 years, including mobile phone apps. However, there is limited evidence with regard to the effectiveness of these initiatives with regard to maize prices110. RALS 2019 data indicates that 64% of households indicated that they get access to information about agricultural commodity prices (67% of male headed households and 56% of female headed households). For all households the most common sources cited are radio (37%) and other farmers (35%), followed by government extension workers (8%) and traders/marketeers (8%)111. Female
109 For example, the percentage reporting being given advice on rotating cereals with legumes ranged from 41% in Western Province to 90% in Eastern Province. This range of variation could be due to several factors including variation between provinces in the general level of extension coverage, targeted messaging on topics, or the sample population drawn for the survey. Chapoto & Subakanya, 2019, Table 10.1. 110 While many farmers do have access to mobile phones and can use the internet, the information available could be confusing for them. For example, during August and September, which is an important time for selling maize, information on the ZNFU website on indicated a wide range of price offers, both within province, and between provinces. The prices on the ZNFU website are of limited use to the average small-scale farmer because they do not include the high costs associated with transporting maize to the buying points in District centres. 111 While traders may not be the most common sources of price information, they are very important in some areas, particularly those close to neighbouring countries such as DRC. A recent ZNFU article posted a week before the government floor price for maize was announced, indicates that a miller in the Copperbelt was offering 27% above the FRA floor price of zm2.2/kg, and that some farmers were being paid for their maize prior to harvest by private buyers from DRC (Chishimba, 2020). This suggests that some small-scale farmers rely on trusted relationships with buyers for price information.

149
headed households depend more on fellow farmers than male headed households, who rely relatively more on radio112.
3.6.2.2 To what extent is the relation between value chain actors perceived as trustworthy?
Producer to producer relations From a social impact perspective, trust-worthy relationships between small-scale farmers wishing to cooperate for mutual benefit, either to procure inputs and services or to market maize, are vital. The evidence is that levels of trust between small-scale farmers are low in Zambia, as is the case in other countries where small-scale farmers are the main producers of maize, such as Kenya (Meridian Institute, 2012). The reasons for low levels of trust between small-scale producers are several, including competition, social and geographical distance, and a top-down approach to the formation and operation of primary cooperative societies. Limited levels of trust within primary cooperatives has recently become evident in the poor performance of the management of an innovative project to use solar powered mills as a basis for local business development113. Producer to government relations FISP and FSP represents forms of social contract between government and small-scale farmers with regard to maize input supply, which have achieved a measure of trust. These programmes have been operating for nearly 20 years and many small-scale farmers have come to rely on them. RALS data on perceptions of the reliability of E-FISP in the 2018-19 seasons, suggests significant room for improvement in relation to the timeliness of input availability, the distance to get inputs and the price of inputs compared to previous seasons. Concerns have been identified about the potential for “rent seeking” behaviour by government officials through this arrangement, indicating that some mis-trust has been present (Chapoto et al, 2015). E-FISP has been introduced as a more transparent system with the potential to improve accountability and trust levels in FISP. During the rapid appraisal farmers in four districts were asked for their perceptions of E-FISP. The general consensus was that while farmers liked the idea of the choice offered by E-FISP, most of them would prefer the direct input system because it protects them from price increases and issues of supply when they need inputs for their maize crop. The FRA, as a trusted buyer of maize from small-scale farmers at an agreed floor price, is another form of social contract between government and small-scale farmers that has been in place for a similar period. This contract has enabled small-scale farmers in remoter areas to sell their surplus maize, often at a higher price than that offered by private traders during good seasons. The indication is that small-scale farmers are aware of the advantages and disadvantages of selling to FRA and make a calculated choice of who to sell to. The fiscal sustainability of this contract, and whether or not it represents a wise use of public funds, has been questioned (Mulenga et al, 2019). Contract farming is potentially a trust-based contract between producers and companies providing input supply and marketing services. Contract farming for maize has been localised and short-lived relative to FISP and appears to have practically died out with regard to maize. Contract farming with
112 RALS 2019 data provided by IAPRI. 113 Lack of trust among the cooperatives was identified as a challenge by a person involved monitoring the solar mills project. It appears that these mills have had some success in one of the high density areas of Lusaka. https://www.facebook.com/Zambia-Cooperative-federation-1181847031830544/?fref=nf
150
small-scale farmers has not taken off in a big way due to the high transaction costs involved (which are related to trust issues)114 and also because FISP has constituted a much better deal for farmers who can access it. Related to this, there is limited evidence of strong trusting relationships between small-scale farmers and local agro-dealers, who transact on a cash basis, rather than give credit terms. This could also be because local agro-dealers also have limited lines of credit from their suppliers, partly due to limited trust. The arrangements for consumer subsidy of maize meal are based on an agreement between commercial millers and government. The government trusts that its representatives will allocate the subsidised maize to commercial millers in a transparent and fair way. The government also trusts that the millers benefitting from the subsidised maize and the retail chains involved, will pass on the benefits to urban consumers by ensuring the maize meal they produce is sold at not more than the recommended price. However, studies have indicated that the full benefits of this subsidy have not trickled down to consumers (Chapoto, 2019b). In the relationship between maize traders and government, mis-trust appears prevalent in the language and sentiments expressed. “Briefcase buyers”, as small traders are widely known, are often given a negative image in the press by some politicians and government officials.115. Discussions with large grain traders during the first visit revealed their frustration with government intervention in the maize market, which they felt made it risky for them to seriously invest in more permanent infrastructure and trading relationships. Government policy and actions indicate that it is unsure if a more liberalised market for maize will deliver national food security and price stability. This is indicative of limited trust by government in the integrity of large traders with regard to balancing their business interests and national interests, or perhaps limited trust in free market mechanisms to sort out maize supply and demand issues.
3.6.3 Social involvement
3.6.3.1 Are there actions to ensure respect of traditional knowledge and resources?
Rather than the use of indigenous knowledge, a more recent focus of agricultural extension messaging to small-scale agriculture relevant to maize production is on “climate smart” agriculture, recently backed up with a “Climate Smart Investment Plan” (World Bank, 2019)116. The plan encourages farmer to farmer extension methods, but does not make reference to use of traditional knowledge, but aspects of climate smart agriculture being promoted include traditional practices common in parts of Zambia, such as animal manure application, inter-cropping, cereal-legume rotation, pitting, agro-forestry and use of adapted local varieties tolerant to climate related challenges.
114 Morgan et al (2019) found that “the vast majority of those surveyed said they accessed government extension services” p. 18 115 For example on 20th April 2020 this headline based on a statement from an opposition party leader appeared in the Lusaka Times ” Don’t to allow briefcase buyers to exploit” https://www.lusakatimes.com/2020/04/20/dont-to-allow-briefcase-buyers-to-exploit-hh-tells-small-holder-farmers/ In another recent post the chair of a district agricultural committee refers to briefcase buyers as “thieves who steal from farmers“ https://diggers.news/business/2020/04/06/fra-must-offer-good-crop-prices-in-2020-season-urge-sinda-farmers/ 116 This 160 page document, has maize plants on the front cover, includes economic analysis of different climate smart practices. Maize plants on the cover signals the symbolic importance of maize in Zambian agriculture.

151
3.6.3.2 Is there participation in voluntary communal activities for benefit of the community
This is not currently relevant to maize value chain. This was relevant when “food for work programmes operated in drought affected areas of Zambia the 1990s.
3.6.4 Social Capital Summary
During the rapid appraisal, district officials were interviewed with regard to the role of local cooperatives in the maize VC, particularly their role in influencing decisions made centrally about the provision of inputs for small-scale farmers through FISP. The view from all four districts visited was that local cooperatives do not have any meaningful say in the types of inputs they receive (i.e. which maize varieties and which types of fertilizer), and that they simply function as conduits for FISP. During the rapid appraisal, district officials, while not having gender disaggregated data available, expressed the view that membership of local cooperatives is dominated by men. Discussion with small-scale maize traders during the first field visit indicated that farmers who sell their maize rely a lot on other farmers for market information, and also have contact with agents who represent maize traders, or who trade in maize. Discussions with farmers during the rapid appraisal in four districts concluded that the most reliable source of price information on maize were government/FRA announcements via the radio or TV, followed by private traders and agricultural extension staff. Development of trusting relationships between smallholder producers and other important actors in the maize VC is relatively weak. Relations of trust appear to be relatively strong between the established commercial farmers and other VC actors, including input suppliers, millers and grain traders. Commercial farmers are able to access fertilizer and seed inputs on credit, and agree pre-harvest prices for produce with commercial millers.
3.7 Living conditions
3.7.1 Health services
3.7.1.1 Do households have access to health facilities?
For small-scale maize producers, the average distance of 5.8km to a clinic or rural health centre varies between provinces, ranging between 3.1 in Luapula Province to 8.5km in Muchinga Province (Chapoto & Subakanya, 2019, Table 10.3). The average distance is the same for both female and male headed households, but greater for polygamous households (6.4km) 117. One link between maize cultivation and access to health facilities is that access to extra land to cultivate more maize usually involves a households moving to an area which is more remote from a clinic. For this reason, the poorer households who value access to local government clinics and schools are reluctant to move to an area further away where more land might be available.
117 The likely explanation is that many of the polygamous households are pioneer farmers from southern areas, where polygamy is more common as a means for mobilising human capital for agricultural production, who have moved north to access larger areas of land to farm which are usually in areas which are further from rural service centres.

152
Many of the larger commercial farming operations growing maize (seed maize or early maize) have a clinic for their employees. Employees of maize trading and milling companies operating in urban areas live closer to public and private clinics and hospitals. Employees in management positions may also have private health access as part of their employment package.
3.7.1.2 Are health services affordable for households?
The policy since 2006 has been to provide rural health services without an access fee, and this has been assessed as improving access to health services for poorer households in both rural and urban areas (Hangoma et al, 2018). While access to hospitals is free, in rural areas access to distant hospitals requires money for transport and for upkeep away from home, and therefore is in practice more available for better endowed households. The same applies to purchasing of medication which may not always be available in rural clinics.
When asked about their reasons for selling maize during the rapid appraisal, emergency medical expenses were a commonly stated reason. This illustrates the link between the maize VC and access to health services, and for poorer households selling maize for this reason this is likely to be a trade-off between more immediate health problems and their food supply until the next harvest.
3.7.2 Housing
3.7.2.1 Do households have access to good quality accommodation?
RALS 2019 data indicates that 99% of rural households own their house (Chapoto & Subakanya, 2019, Table 8.2). Roughly half of these houses have low maintenance “improved” roofing (metal sheets) rather than traditional thatch which is high maintenance (but provides better air conditioning; cooler on hot days and warmer during cold nights). A higher proportion of male headed households (54%) have improved roofing compared to female headed households (47%). Cash raised from the sale of maize may be used to improve housing, because most house repairs and improvements are carried out during the dry season, after the maize harvest. However, during the rapid appraisal farmers did not mention house building or improvement as a reason for selling their maize. The larger commercial farming operations growing maize (seed maize or early maize) generally provide housing for their employees which is of a higher standard than the average standard in rural areas. Employees of maize trading and milling companies operating in urban areas typically live in rented accommodation of variable quality, depending on their level of income. Employees in more senior positions may receive a household allowance or own their own houses.

153
3.7.2.2 Do households have access to good quality water and sanitation facilities?
Rural households travel on average 2.7km to the nearest borehole to access clean water, but the actual distance varies considerably in different provinces of Zambia. Regarding sanitation facilities, some households have pit latrines, while others practice open defecation. The distance is travelled to collect clean water does impact on women’s labour burden but is determined by factors other than maize production118. However, money from the sale of maize may be used pay a local person to dig or deepen a well or dig or repair a pit latrine during the dry season. The larger commercial farming operations growing maize (seed maize or early maize) generally provide piped water at hand for all employees. They may provide flush toilets in the accommodation for more senior staff. Employees of maize trading and milling companies operating in urban areas typically have nearby access to good quality water, and those in more senior positions have piped water to their accommodation and flush toilets. Lower paid employees living in high density areas are more likely to have pit latrines and live in areas prone to water borne diseases, including cholera outbreaks, due to poor drainage infrastructure.
3.7.3 Education and training
3.7.3.1 Is primary education accessible to households?
Rural households travel on average 3.8km to the nearest basic primary school. As with access to piped water and clinics, the actual distance varies considerably in different provinces of Zambia. The distance travelled is largely determined by factors other than maize production. However, money from the sale of maize may be used pay secondary school fees. The larger commercial farming operations growing maize (seed maize or early maize) generally have basic schools on site. Often the farming company provides the infrastructure for the school and teachers housing, while the government pays the teacher’s salary. Employees of maize trading and milling companies operating in urban areas typically have nearby access to both primary and secondary schools.
3.7.3.2 Are secondary and/or vocational education accessible to households?
Access to secondary and vocational education is very limited for rural households. The exception is rural areas which have a secondary school or a trades training institute. Access to this type of education usually involves expenditure which is beyond the reach of many rural households. Money from the sale of maize may be used pay secondary school fees. Vocational training is under-developed
118 Chapoto & Subakanya, 2019 data analysis indicates the average distance varies between provinces, being .9km in Luapula Province and 4.8km in adjacent Northern Province (Table 10.3). The distance travelled tends to be less where people live in larger villages which have a borehole (25% of households are in this situation). The average figures for provinces may reflect the sample selection, rather than the situation on the ground.
154
in Zambia119, with limited support from potential private and social partners, compounding access by poorer rural households to this valuable resource. Employees of operating in urban areas typically have nearby access to both primary and secondary schools.
3.7.3.3 Existence and quality of in-service vocational training provided by the investors in the value chain?
The larger commercial farming operations growing maize, maize trading and milling companies tend to train employees “on-the-job”. This is an informal process and is typically recognised by staff being promoted to higher status positions which are more highly paid. This strategy generally lowers the demand for formal technical qualifications. Employers will sometimes support employees to take such qualifications if they consider these are essential to meet industry standards or regulatory requirements120. In one case a commercial farmer sent some of his staff to a local centre which provides training in sustainably agricultural methods, which they could use on their own plots.
3.7.4 Mobility
On a day-to-day basis, mobility of maize producers is not a major issue. For most households there is a trade-off between having their home either close to their fields or close to services (water points, schools, clinics). In all rural areas households usually get to and from their maize fields on foot. Transporting heavy items (fertilizer and maize grain) is typically done with either scotch-carts (where draft animals are available), bicycles or wheelbarrows.
Male headed households are more likely to own either scotch-carts (where draft animals are available), bicycles or wheelbarrows and often female headed households will depend on male owners to provide the service or use of these to move inputs and produce. The other heaving item to be transported is the water needed for spraying in cases where herbicides are used. This is typically carried by women and children from the nearest water source.
3.7.5 Living Conditions Summary
Regarding general living conditions, rural households growing maize tend to live within relatively easy reach of rural services, including clinics, schools, boreholes and rural roads. If they wish to get access to larger areas of cropping land this usually involves re-locating the household to a remoter area. Moving to a remoter location is a trade-off which many poorer households are reluctant to make. Rural households mostly have very limited access to secondary and vocational education.
119 From 2002, reform of technical training to replace a centrally funded system towards a demand driven one with effective private sector partnerships was supported by a project, but by 2011 had apparently made limited headway according to the World Bank project performance report. http://documents.worldbank.org/curated/en/909411468166492312/pdf/625850PPAR0P05000official0use0only0.pdf The situation appears not to have changed since then according to a more recent published review (Mulimbika & Karim, 2018) 120 Examples given during interviews with managers of commercial mills in Lusaka and the Copperbelt included supporting employees to qualifications in milling in Kenya or South Africa, or to do electrical technician training which is essential for operating and repairing equipment.

155
Employees on larger commercial farms and of larger traders and millers in urban areas generally have better access to health and education facilities and also better transport and communication services than the small-scale maize producers. Investment in improved rural roads (construction and maintenance) provides a solid basis for improving the efficiency of the maize VC along with other enterprises and publicly funded rural services, which in the longer term will improve rural living conditions.
3.8 Framing Question 3: Is the maize value chain socially sustainable?
Working conditions in the commercialised parts of the value chain are protected by employment legislation. This is respected by larger commercial operators including commercial farms, major grain trading operators and milling companies. The commercial farming sector is negotiating an exemption to parts of the Employment Code Act 2019, which they argue will undermine Zambia’s competitiveness in agriculture. Youth and the less educated older adults from lower income households in temporary or casual employment are least well protected by employment legislation. The small-scale production, processing and trading sectors of the value chain account for a large part of the volume of flows but fall outside the scope of the employment legislation. Small-scale production of marketed maize and small-scale milling and other processing relies on family and some casual labour. Aggregating and smaller scale maize trading also uses casual labour. Children in rural households do contribute labour to maize production activities after school or during school holidays as part of the family. Some older children also undertake paid casual labour for neighbours. The majority of rural households growing maize have secure access to land through customary tenure systems based on family ties and village membership. There is a perceived scarcity of cropping land in the more densely populated provinces. In some cases, family heads sell off part of the family land, effectively reducing access by the next generation in that family. As cropping land becomes scarcer the productivity per unit area will need to increase if small and medium scale farmers are to continue to contribute to increased national maize production in future years. Regarding gender equality, there has been a clear lag between the development of progressive national policies in the 1980s and changes to attitudes and behaviour since then. This lag applies to public and private sector organisations and rural communities. The risks of female disadvantage are generally lower where the scale of the operation is smaller. Agro-dealerships are nearly three times more likely to be owned by men than by women. Women are included in maize production activities, but in male headed households the cultural norm is that women rely on decision making from their husbands. Data from 4 district level markets found that small-scale trading in maize grain and commercial mealie meal tended to be male dominated, while trading in small packets of mealie meal (“pamelas”), maize rice (samp), maize grits, and sweet beer brewed from maize (maheu/chibwantu) were predominantly female enterprises. Women rarely occupy the manual and technical roles in the larger commercial maize trading and commercial milling plants; cultural perceptions of gender capabilities and vulnerabilities influence hiring decisions in these parts of the maize VC.

156
Land rights held by women in rural areas are embedded within local kinship and marriage relationships, which provides rural women in their matrilineal areas with a life-long attachment to their community of birth, in which their families will have rights to land. There are no explicit barriers to women maize producers being given access to credit or to subsidised inputs through FISP in their own name. However, cultural attitudes and financial limitations are two factors which tend to result in a lower proportion of female heads of households from accessing FISP compared to male household heads. Small-scale growing of maize as a cash crop tends increase gender inequality in male headed households, increasing the labour burden of wives; particularly for weeding, harvesting and post-harvest shelling and cleaning. In most households the male head makes the decision about sale of the maize produced and use of the money from maize sales. Gender inequalities are also pronounced in grain trading, the cooperative movement, and the commercial seed growing and marketing sectors where positions of prominence and influence are dominated by males. Risks to women undertaking strenuous work in maize production and processing have been reduced due to the uptake of new technology. Scope for further reduction of women’s workload in resource richer households includes use of mechanical shellers while in resource poorer households improved access to animal draft power or herbicides are options. The Ministry of Agriculture’s “household approach” to agricultural extension and marketing, is encouraging joint decision making. Available evidence points to a trend towards increased involvement of women in decisions relating to maize production in the small-holder sector, but with variation from one household to another and one area to another. In some cases, there is a lot of discussion and joint decision making, while in other households the man makes the main decisions about maize production and sale. A common norm for all households is that women have control of decision making about use of the maize stored for family food. Women only earn significant amounts of truly “independent” income from maize production when they are the head of household. With regard to household food security, increasing levels of rural household incorporation into a cash economy includes the strategy of selling food crops after harvest to meet urgent cash needs. Households producing smaller amounts of maize may sell some of their grain to finance other needs, with the intention of raising money to purchase food later, or working for payment in grain, when their own food stocks run out. These households tend to have less assets and are more likely to be female headed. The risks of periodic household food shortage increase as rural households become increasingly dependent on maize as their main staple crop. Climate risks and declining soil fertility increase their likelihood of lower maize yields per unit area. The benefits from economic growth on food accessibility are not evenly distributed; urban households have relatively more income to allocate to food than rural households. If the input subsidy for maize stopped, this would have a negative effect on many rural households. For resource richer households there would be a reduction in income from maize sales to potentially buy other food types, while for poorer households’ access to maize grain for household food security would reduce. With regard to nutrition, the causes of infant stunting are complex. Rates of under 5-year-old stunting are often high in traditional maize producing areas and are also high in areas where maize production is on the increase. The inter-relationship between increased smallholder maize production and rates

157
of child malnutrition is unclear and requires a more fine-grained and local level of analysis. Farmer and extension worker opinion is that increased smallholder maize production may improve infant nutrition but does not always do so. The development of social capital in the small-scale maize sector, through producer cooperatives, and long-term relations based on trust between local input providers, traders and farmers is weak. The development of these types of social capital at local level has been hindered by a historical focus on a subsidised top-down system for supporting maize production and marketing. This has undermined an ethos self-reliance and enterprise, and the continuing use of local cooperatives as the main conduit for FISP distribution is weakening grass-roots cooperative formation. Initiatives to establish contract farming for maize have not taken off. A maize-centric disaster relief programme has fostered a “dependency syndrome”. In communities where food deficit is endemic, maize and maize meal is distributed as food relief, continuing a culture of “maize dependency”. By contrast, relations of trust are relatively strong between the established commercial farmers and other VC actors, including input suppliers, millers and grain traders. Commercial farmers are able to access fertilizer and seed inputs on credit, and agree pre-harvest prices for produce with commercial millers. Regarding general living conditions, rural households growing maize tend to live within relatively easy reach of rural services, including clinics, schools, boreholes and rural roads. If they wish to get access to larger areas of cropping land this usually involves re-locating the household to a remoter area. Investment in improved rural roads (construction and maintenance) provides a solid basis for improving the efficiency of the maize VC along with other enterprises and rural services which in the longer term will improve rural living conditions.
158
4. ENVIRONMENTAL ANALYSIS
4.1 Introduction
This chapter focuses on the environmental analysis of the maize value chain in Zambia. The analysis is based on the Life Cycle Assessment (LCA) methodology described by two ISO norms (ISO 14040 and ISO 14044), even though it was not possible to strictly comply with all the criteria contained the ISO norms. The Life Cycle Assessment approach facilitates the identification of opportunities to improve resource efficiency and reduce emissions whilst taking into consideration potential trade-offs, which may occur between different types of impacts or different supply chain stages. The life cycle analysis encompasses the following main stages: extraction and production of all inputs –including those used for cultivation–, grain transportation and processing of grain into maize meal (which includes both breakfast meal and roller meal) for human consumption. The analysis follows four steps, which are reported in four parts of this analysis: 1) Goal and scope definition; 2) Life Cycle Inventory (LCI); 3) Impact assessment; 4) Interpretation of results.
4.2 Goal and scope of the environmental analysis
Given the lack of a complete and updated analysis of the maize value chain, EU/INTPA (former DEVCO) and DWS have requested an analysis aimed at improving the understanding of the value Chain (VC) functioning and at providing a baseline for measuring future changes in the maize production by providing “evidence-based information and robust indicators on the performance and impacts of the maize value chain in Zambia”, as stated in the Terms of Reference (ToR) of the Maize Value Chain Analysis in Zambia. Therefore, the main purpose of this LCA analysis is to provide insights into the environmental sustainability of the value chain under study in order to “support the Delegation of the European Union and their partners in improving policy dialogue, investing in value chains and better understanding the changes linked to their actions”, as described in the Methodological brief (v1.2, 2018). Taking this into consideration, the framing question “Is the VC environmentally sustainable?” was tackled in the most exhaustive way possible, considering the time frame of the study. The ReCiPe 2016121 (Huijbregts et al., 2017 and 2016)122 endpoint life cycle impact assessment method was selected in accordance with the indications of the EC/INTPA – VCA4D Methodological brief. Indeed, this document breaks down the framing question into three core questions, focused on the potential impact of the VC in terms of (1) resources depletion; (2) ecosystem quality, and (3) human health, which correspond to the areas of protection of the ReCiPe 2016 method.
121 The acronym ReCiPe was adopted as it provides a 'recipe' to calculate life cycle impact category indicators. The acronym also represents the initials of the institutes that were the major collaborators in its design: RIVM and Radboud University, CML, and PRé Consultants. 122 Huijbregts, M.A.J., Steinmann, Z.J.N., Elshout, P.M.F., Stam, G., Verones, F., Vieira, M., Zijp, M., Hollander, A., van Zelm, R., 2017. ReCiPe2016: a harmonised life cycle impact assessment method at midpoint and endpoint level. Int. J. Life Cycle Assess. 22, 138–147. doi:10.1007/s11367-016-1246-y

159
To determine the level of environmental sustainability of the value chain, the following three main objectives were defined:
• To quantify the potential environmental impacts of the current maize value chain in Zambia, based on available knowledge;
• To calculate the contribution to environmental impacts of the main stages of the life cycle of maize meal, which is the main product for human consumption obtained from maize and to highlight the environmental hotspots;
• To provide elements for discussion on the sustainability of the maize value chain in Zambia.
Within this framework, in order to explore the level of environmental sustainability of the maize value chain, the following secondary objectives were defined:
1) To evaluate and compare the environmental performance at farm-gate of four typologies of cropping systems that were identified according to the level of external inputs used (low, medium and high input systems, described in the Functional Analysis). An environmental evaluation at farm-gate is key for identifying the main hotspots within the agricultural production stage, since cultivation is often responsible of most impacts along food chains.
2) To determine the environmental impacts associated with the production of maize meal obtained from grain produced in Zambia considering two sub-chains: a local sub-chain (mostly for self-consumption) and a commercial (industrial) sub-chain.
Referred to point 2) above, contributions from each cropping system differ substantially according to the sub-chain. Sub-chain 1 or local sub-chain, is sourced at 65% by low/middle level input cropping systems (see table 4.2). This sub-chain involves small-scale mills (represented by diesel and electricity-powered facilities); grain is produced mainly for auto-consumption and, to a lesser extent, marketed locally for the provision of households that are net maize buyers. Sub-chain 2 or commercial (industrial) sub-chain involves large-scale milling of marketed grain, it is sourced at 76% by high input cropping systems. Cropping systems differ in terms of levels of external inputs used and of crop yields (which determine to a large extent the differences in terms of environmental performances between the two sub-chains). Milling facilities differ in terms of milling capacity (small-scale mills and industrial mills), type of milling technology and type of service they provide. In the present study, small-scale mills are represented by community-based micro-scale mechanized hammer mills or grinding-wheel mills or a combination of both in the same facility (also simply referred to as “hammer mills”). This type of facilities provides milling service to customers at a stipulated toll. Industrial mills are represented by medium to large scale roll mills with milling capacity >1.5 tons/hour, which are mostly concentrated in urban areas (most of the installed capacity is concentrated in Lusaka, Copperbelt, Central and Southern provinces).
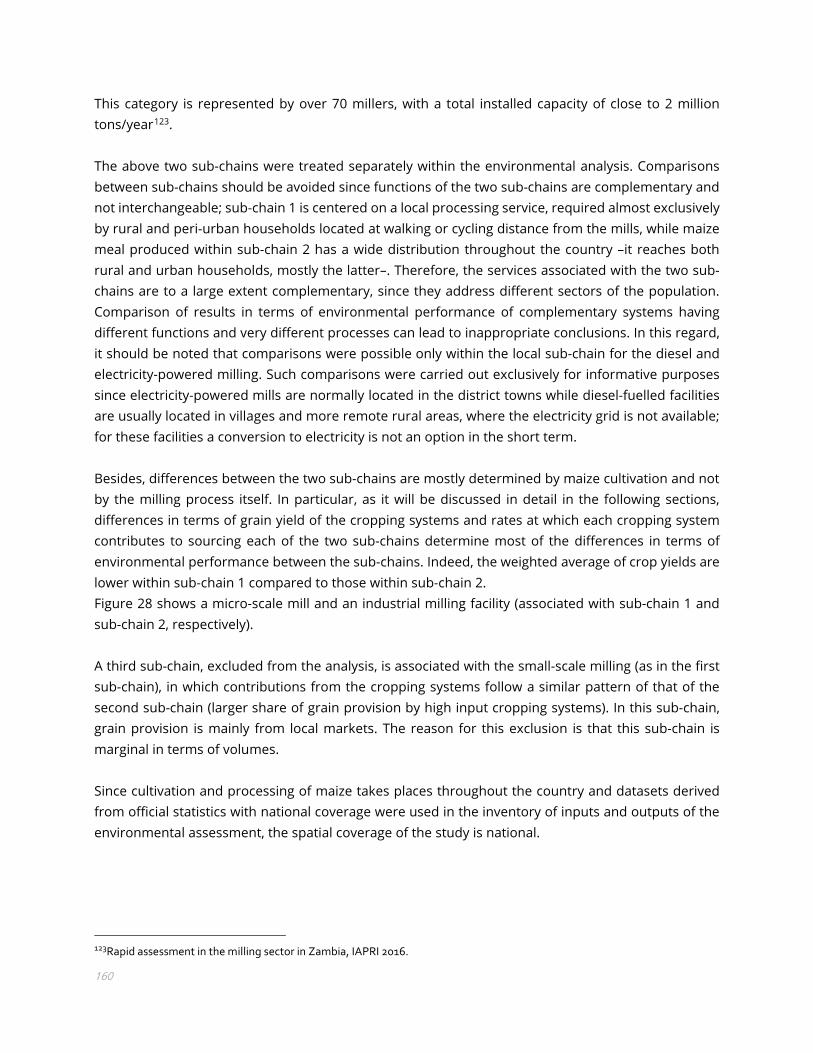
160
This category is represented by over 70 millers, with a total installed capacity of close to 2 million tons/year123. The above two sub-chains were treated separately within the environmental analysis. Comparisons between sub-chains should be avoided since functions of the two sub-chains are complementary and not interchangeable; sub-chain 1 is centered on a local processing service, required almost exclusively by rural and peri-urban households located at walking or cycling distance from the mills, while maize meal produced within sub-chain 2 has a wide distribution throughout the country –it reaches both rural and urban households, mostly the latter–. Therefore, the services associated with the two sub-chains are to a large extent complementary, since they address different sectors of the population. Comparison of results in terms of environmental performance of complementary systems having different functions and very different processes can lead to inappropriate conclusions. In this regard, it should be noted that comparisons were possible only within the local sub-chain for the diesel and electricity-powered milling. Such comparisons were carried out exclusively for informative purposes since electricity-powered mills are normally located in the district towns while diesel-fuelled facilities are usually located in villages and more remote rural areas, where the electricity grid is not available; for these facilities a conversion to electricity is not an option in the short term. Besides, differences between the two sub-chains are mostly determined by maize cultivation and not by the milling process itself. In particular, as it will be discussed in detail in the following sections, differences in terms of grain yield of the cropping systems and rates at which each cropping system contributes to sourcing each of the two sub-chains determine most of the differences in terms of environmental performance between the sub-chains. Indeed, the weighted average of crop yields are lower within sub-chain 1 compared to those within sub-chain 2. Figure 28 shows a micro-scale mill and an industrial milling facility (associated with sub-chain 1 and sub-chain 2, respectively). A third sub-chain, excluded from the analysis, is associated with the small-scale milling (as in the first sub-chain), in which contributions from the cropping systems follow a similar pattern of that of the second sub-chain (larger share of grain provision by high input cropping systems). In this sub-chain, grain provision is mainly from local markets. The reason for this exclusion is that this sub-chain is marginal in terms of volumes. Since cultivation and processing of maize takes places throughout the country and datasets derived from official statistics with national coverage were used in the inventory of inputs and outputs of the environmental assessment, the spatial coverage of the study is national.
123Rapid assessment in the milling sector in Zambia, IAPRI 2016.
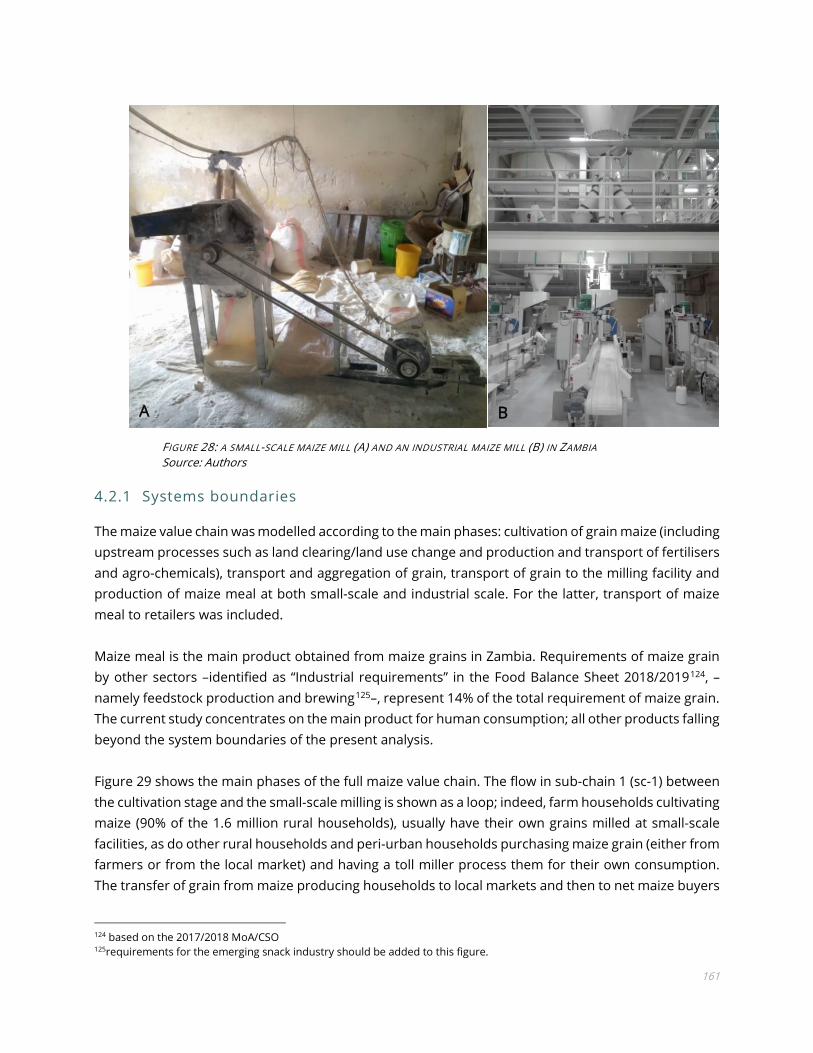
161
FIGURE 28: A SMALL-SCALE MAIZE MILL (A) AND AN INDUSTRIAL MAIZE MILL (B) IN ZAMBIA Source: Authors
4.2.1 Systems boundaries
The maize value chain was modelled according to the main phases: cultivation of grain maize (including upstream processes such as land clearing/land use change and production and transport of fertilisers and agro-chemicals), transport and aggregation of grain, transport of grain to the milling facility and production of maize meal at both small-scale and industrial scale. For the latter, transport of maize meal to retailers was included. Maize meal is the main product obtained from maize grains in Zambia. Requirements of maize grain by other sectors –identified as “Industrial requirements” in the Food Balance Sheet 2018/2019124, –namely feedstock production and brewing125–, represent 14% of the total requirement of maize grain. The current study concentrates on the main product for human consumption; all other products falling beyond the system boundaries of the present analysis. Figure 29 shows the main phases of the full maize value chain. The flow in sub-chain 1 (sc-1) between the cultivation stage and the small-scale milling is shown as a loop; indeed, farm households cultivating maize (90% of the 1.6 million rural households), usually have their own grains milled at small-scale facilities, as do other rural households and peri-urban households purchasing maize grain (either from farmers or from the local market) and having a toll miller process them for their own consumption. The transfer of grain from maize producing households to local markets and then to net maize buyers
124 based on the 2017/2018 MoA/CSO 125requirements for the emerging snack industry should be added to this figure.
A B
162
uses predominantly non-motorized transport. Therefore, no energy or materials consumption and no emissions were associated with this activity. This represents the third sub-chain that was excluded from the analysis for the reasons previously discussed. The boxes in the diagram showing local marketing and net buyer households are shown with dashed outlines, which indicates that this flow is not included in the analysis. Second stage processing after milling in sub-chain 1, namely production of alcoholic and non-alcoholic beer brewing was kept outside the system boundaries.
FIGURE 29: SYSTEM BOUNDARIES FROM CRADLE TO RETAILER OF THE MAIZE VALUE CHAIN IN ZAMBIA. Source: Authors
In order to limit the system boundaries to the same phases in both sub-chains, while in sub-chain 2, after milling and packaging, transport to retailers was included within the boundaries, in sub-chain 1, milling is the last activity considered, since the product is not retailed, rather it is transported to the household by the customer by non-motorized means. In sub-chain 1, secondary stage processing (beer brewing) was excluded from the system. Similarly, in sub-chain 2, stockfeed production from grains and from bran, was kept outside system boundaries, alongside second stage processing of maize grits and roller meal into beer and chibuku respectively and of maize grits into snacks. The analysis encompasses the production of all the key inputs, their use, their transport and correlated emissions at the different VC phases, infrastructure was excluded. In particular, the system includes the following:
• Production and transport of agricultural inputs (fertilisers, seeds, herbicides, insecticides) from the countries of production to a local warehouse, and from these to the farms;
163
• Land clearing and land occupation; • The agricultural practices within each farming system; • Field emissions associated with cultivation: emissions to air, soil and water; • Inputs for grain milling: water, electricity, diesel; • Transport operations along the chain; • Grain losses along the chain.
Atmospheric carbon dioxide captured by maize plants during the growth process was excluded from the system, since it is released in the atmosphere soon after harvest, upon consumption or degradation of the different parts of the plant. For this reason, no biogenic carbon dioxide from plant degradation was considered, resulting in a complete neutralization of CO2 capture and emission due to plant growth and consumption/decomposition.
4.2.2 Studied value chain, functional unit and allocation approach
The value chain includes crop production by four different cropping systems, on-farm post-harvest operations, aggregation and transport and maize meal production. A cradle-to-retailer126 evaluation was carried out for the two sub-chains previously described. They differ mostly in terms of shares of grain provision from each cropping system. These differences are relevant, given the high impacts of the stages related to cultivation (i.e., land clearing and the cultivation stage, which are treated as two separate phases) compared to those of other phases. Differences at downstream stages along the chain mainly regard milling capacity, technology and, as previously discussed, the type of service they provide, being: 1) the Local sub-chain linked to the small-scale processing (in electricity-powered mills and diesel-powered mills127) and 2) the Commercial sub-chain linked to the industrial milling. Within the Local sub-chain, comparisons in terms of environmental performances can be carried out between electric and diesel small-scale mills since both perform the same type of service. Nevertheless, it should be reminded that normally diesel-fueled mills are typically located areas where the electricity grid is not available. For sub-chain 1, the functional unit (FU) is 1 kg of unpacked maize meal at mill gate (customers would usually reuse their own maize grain bags or buckets for having the resulting meal packaged and transport it back to their households by walking or by bicycle). For sub-chain 2, the functional unit is 1 kg of maize meal and its packaging for retail, transported to the retailer. Activities within the retailer (i.e. electricity consumption for illumination and air conditioning or mechanized handling were excluded).
126 Completely within national borders, to account for the current export ban measures. Sub-chain 2 ends at the mill-gate; considering that no further energy or material consumption is associated with maize mill transport from small-scale mills to the consumer household. 127 Although a significant number of solar-powered mills have been installed, their contribution to the total output at national level- is low.

164
The use of bran as animal feed and in the feedstock industry is widespread in Zambia. The demand for this co-product seems to be increasing, therefore in order to take into account its monetary value, an economic allocation was used to attribute part of the environmental burdens to this co-product. Further functional units were included at farm gate for the four types of farming systems: 1 hectare of cultivated land and 1 kg of maize grain (13% moisture content) in order to provide complementary perspectives. Indeed, the agricultural production stage is often responsible for most impacts along food chains, which justifies a focus on the cultivation stage. This is particularly so when the final product is not highly processed, such as in the case of milled grain. The studied value chain and its general context is described below, including the main stages within the studied system, namely cultivation, post-harvest at farm, transport and aggregation and milling. For more details see the Functional Analysis. Maize cultivation and post-harvest at farm The main differentiation factor of the maize cropping systems considered in this study is the level of external inputs used: improved seeds, fertilisers and herbicides. According to the Zambia Agricultural Status Report 2018 (IAPRI, 2018), at national level only 51 percent of the rural households used fertiliser in the 2017/2018 agricultural season; farmers who did not use external inputs produced 9% of the total maize grain output of the country, in 18% of the total area dedicated to maize cultivation (Table 1.2, Functional Analysis). According to the level of external inputs used, four types of maize cropping systems were identified based on RALS data128, in combination with data from CFS 2017/2018, ZNFU crop budgets and crop budgets from individual large farms and corporations. In particular, RALS data was used for the characterization of small/medium scale farms (< 20 ha of cultivated areas), while all other aforementioned sources were used to characterize large farms (> 20 ha). The typologies of cropping systems considered are the following (see Functional Analysis for more details): (i) Small/Medium scale-Low input system (SS-LI); (ii) Small/Medium scale-Medium inputs system (SS-MI); (iii) Small/Medium scale Higher inputs system (SS-HI); (iv) Large scale-High input mechanized rainfed system (LS-RAIN). The characterization of the system for certified maize seed production was based on a modified version of the LS-RAIN system. Indeed, large farms produce also seeds, under irrigation. Therefore, for certified seed production, supplemental irrigation with pivot systems was considered in addition to the same types and quantities of inputs of the above system iv, this resulted in the Large scale-High input irrigated system (LS-IR), which represents the process of certified seed production used in the environmental analysis.
128RALS 2019 (Rural Agricultural Livelihoods Survey)

165
The main on-farm post-harvest activities are shelling (removal of grains from the cob), packaging and grain storage operations. Shelling is carried out mechanically with small shellers in the SS-HI system, while in the SS-LI and SS-MI shelling is usually a manual operation. In the case of LS-RAIN and LS-IR, shelling is completely mechanized within the harvest operation through combined harvesters. For grain packaging, polypropylene bags with a capacity of 50 kg are used. Grain packages are often re-used several times (especially in SS-LI, SS-MI and SS-HI systems). Transport of grain and aggregation Transport to small-scale mills within sub-chain 1, which are generally located at walking or cycling distance from the household, usually does not involve the use of motorized means. This is also the case of grain marketed locally, although there might be several actors involved. Marketed grain, sourcing large-scale mills within sub-chain 2, is transported from farms to aggregation depots using several different paths and means of transport. These paths are very variable in terms of distances and load size; differences may depend on several factors, including farm size and distances to towns/market centres and capacity of the farmer to organize transport to markets offering better prices (mills, grain trading companies). Milling Maize milling processes in Zambia were categorized according to scale and type of milling technology (see Functional Analysis). The categories are industrial mills (large to medium-scale roll mills with milling capacity >1.5 ton/h) and small-scale mills, mostly village level mills operating with two types of machinery: hammer mills, and grinding-wheel mills, commonly referred to as “hammer mills” which are either electricity-powered or diesel-powered. Industrial milling at large scale mills Industrial maize mills generally also process wheat grain although maize processing constitutes by far their main activity in terms of volume of milling operations. The processes within an industrial mill from grain intake to packaging of the final products and co-products was considered in the environmental assessment (for details of these processes, see Functional Analysis). Within the industrial milling process, from grain intake to packaging, the main inputs other than grain, are water and electricity or fuel, when mills are powered by diesel generators, which happens frequently due to instability in the supply of electricity. Small-scale milling

166
The small-scale mills provide a service at a toll for customers having their own grain milled. The final product is usually packed in re-used bags or taken to the household in re-usable containers such as buckets, so the output is “unpacked maize meal” (in the model, the environmental burden for production and disposal of bags was accounted for at the cultivation stage). A description of the small-scale milling is presented in the Functional Analysis. Transport to retailer Transport of maize meal from industrial mills, generally located in urban or peri-urban areas to retailers is carried out by truck. This transport was modelled as Transport, truck >20t, EURO2, 100%LF, empty return.
4.2.3 Data sources
The life cycle inventory of the environmental assessment was built on the following data: • Primary data: data and information collected during the field mission through interviews with key informants representing various segments in the value chain (February 2 to February 14, 2020), through a field survey held from June to August 2020 by a team led by the local expert, with the specific purpose of collecting LCI data and economic data referred to micro-scale mills (both electricity and diesel-powered) and through a field survey conducted in October 2020. Primary data was used for modelling the maize cultivation phase, for the transport and aggregation stage and for processing of grain into maize meal. In particular, for the cultivation stage, primary data were used mainly as complementary data and for validation of the main data sources, which were secondary data and official statistics with national coverage such as RALS 2019, which provides sample survey data. The survey uses the single household as unit of analysis; rural households in the country (ca. 1.6 million) are represented by a sample of 10,000 households). Further data sources were CFS and ZNFU. Primary data of the cultivation stage were mainly derived from focus groups held in Mpongwe and Masansa (11 and 13 smallholder farmers, respectively) and through meetings held at 4 large farms in Mkushi. For the aggregation and trading stage, overall, ten traders of all segments, small, medium and large were interviewed. For the processing stage, data were gathered from the Millers Association of Zambia (MAZ) and from visits to one medium and two large scale mills and to a small-scale mill. Through the aforementioned field survey of small-mills (June-August 2020) data were gathered from additional 14 small-scale milling operations, both electricity and diesel-powered; • Secondary data: large amounts of selected secondary literature and tailored statistical datasets were extracted from comprehensive and up-to-date national surveys, namely annual Crop Forecast Surveys (CFS) and Rural Agricultural Livelihood Panel Survey (RALS). These data were elaborated by the research team at IAPRI, by means of the SPSS® statistical software with the purpose of providing the team with the necessary input data. In particular, for the environmental analysis, LCI data were derived from a specific analysis of the RALS 2019 on small scale farmers, including total grain output, mechanization level, cropping practices (fertilisers application rates and use of herbicides) grain yield
167
per hectare and residue management within each farming system. Further information was derived from the literature, with the support of the expertise of the IAPRI research team. This is particularly the case of the estimations of direct land use change associated with maize cultivation expansion, which were based on data from an extensive literature review (national and regional), which included sources from IAPRI and relied on exchanges with experts at IAPRI. Farming systems not covered by RALS (farms >20 ha) were characterized using data from CFS, crop budgets from ZNFU and from individual corporations. For the background data, LCI databases, namely Ecoinvent (v 3.5), Agribalyse (v 1.3), Agrifootprint (v 4.0) and ELCD (v 3.2) databases were selected, using country-specific data from LCI databases when possible; this is the case for instance of grid electricity which refers to the specific grid mix of Zambia in the reference year.
4.2.4 Data quality and main limitations and assumptions
The agricultural stage was modelled using the 2019 Rural Agricultural Livelihoods Survey (RALS) data combined with data from CFS 2017/2018, ZNFU, and data obtained from interviews held by the team with individual farms and corporations. Most of the data used in this section were derived from RALS 2019, which covers several domains such as demographic characteristics of household members, farm land and land use, crop sales, fertiliser and seed acquisition, credit. The elaboration of the RALS 2019 data provided average results for each farming system of farms with less than 20 ha. Farming systems were identified according to their level of external inputs use (i.e., seeds, fertilisers, herbicides). For each farming system, average grain yield was calculated. Giving the robustness of the RALS survey, these input and output data were regarded as representative of the typical farm falling within each farming system. There is a well-known limitation of data especially referred to emissions within agricultural systems, which can vary substantially according to the site and even within the same field. In particular, regarding emissions originated through direct land use change, estimations required a strong effort, consisting in an extensive literature review (mostly national and regional) and exchanges with local experts. This led to an assumption of carbon stock loss and of emissions of harmful gases and particulates due to land use change triggered by maize cultivation. Indeed, from the information gathered, the forest cover loss is partially attributed to the agricultural expansion as one of the main drivers (alongside wood extraction, fire and infrastructure development, according to Vinya et al., 2011). Uncertainties associated with estimations of carbon loss and of direct emissions due to land use change are high, as they depend on several different factors (i.e., estimates of aboveground and belowground biomass, litter and soil organic carbon stocks). Furthermore, throughout the study, assumptions regarded typical transport distances, as well as typical moisture content of maize grain and an average extraction rate of main products/co-products (breakfast meal, roller meal and bran) for small mills and for industrial operations.

168
A cut-off was applied to minor energy consumptions and use of materials, for instance, at warehouses for grain handling since in most cases, handling is completely manual. Each miller may apply different extraction rates (which may also vary over time at each meal) depending on several factors including market demand and technical factors. Therefore, among several typical extraction rates129, 80% of mealie meal and 20% bran was selected as a standard extraction rate, used throughout this analysis. Variations in the extraction rates might influence the environmental performance of the system studied, by allocating different quantities of the environmental burden to the co-product. Nevertheless, milled grains are not a highly processed product, hence the milling processes involve relatively low contributions to environmental impacts, so that variations in the extraction rates are not expected to cause significant differences in the overall environmental performance of the VC.
4.3 Life cycle inventory
The life cycle inventory (LCI) for a product throughout its life cycle consists in the compilation of each unit process for which quantification is carried out in terms of inputs from the technosphere (i.e., materials, energy inputs) and from nature (i.e., land occupation) and of outputs, alongside the quantification of emissions to air, water and soil. The main stages and the boundaries of the studied system are shown in Figure 30. Coloured arrows show tracked flows; green arrows show grain flows from farms to small-scale mills (auto-consumption). Blue arrows show grain flows to industrial mills. Dotted grey arrows represent non-tracked flows (i.e., grain for feed production, grits or maize meal sourced to breweries). Grey boxes show phases falling outside the system boundaries (i.e., export, secondary processing, operations linked to retailing). The flow of grain from maize producing households to local markets –and from these to customers of small-scale mills– or directly to net maize buyers is shown in grey (boxes and solid arrows in grey colour inside the local sub-chain). This represents the sub-chain excluded from the present analysis. The main output (maize meal) is shown in yellow, while the co-product (considered for allocation) is shown as dotted orange arrows. Dark red arrows show losses along the chain (post-harvest losses at farm, losses at mills). Quantities are shown in kilograms; they refer to the contribution of each cropping system to the production of 1 kg of maize meal at micro-scale mills and of 1 kg of meal produced at large-scale mills (i.e., the functional unit of the analysis).
129 According to “Rapid Study on the Milling Sector in Zambia” (IAPRI, 2016), extractions rates ranged from 51% to 75% for breakfast meal, 10% to 37% for roller meal and 10% to 21% for maize bran. The efficiency in the utilization of maize grain to produce mealie meal and other outputs varies from miller to miller based on the technology employed.

169
For each cropping system, quantities are shown for retained seeds in the SS-LI system, harvested grain (at field gate) and for grain leaving the farm after storage at farm (at farm gate), for which post-harvest losses were considered –10% in small/medium scale farms, 9% in large farms–. At the milling stages, quantities are shown in terms of kg of grain with a moisture content of 13% entering the mills, kg of main product, of bran and of losses (in small-scale mills, mainly spilling and, in industrial mills, screenings –foreign material, separated through sorting, grading and cleaning operations–).
FIGURE 30: SYSTEM BOUNDARIES AND GRAIN/PRODUCTS FLOWS WITHIN THE TWO SUB-CHAINS. FU: 1 KG OF MEAL (FLOWS ARE SHOWN FOR 1 KG OF MEAL PRODUCED AT SMALL-SCALE MILLS AND FOR 1 KG OF MEAL FROM LARGE-SCALE FACILITIES TRANSPORTED TO THE RETAILER). ALL FIGURES IN THE FLOWCHART ARE IN KG. Notes: Solid grey arrows and grey boxes inside the local sub-chain = third sub-chain, excluded from the analysis (small-scale milling in which grain is sourced from local markets). Orange dotted lines and figures in orange colour: quantities of bran to which environmental burdens were allocated. Source: Authors
In the following paragraphs the inventory of inputs and outputs is described for each segment of the life cycle. Additional information regarding the inventory is shown in the appendixes.
4.3.1 Maize cultivation and post-harvest at farm
At the cultivation stage, the LCI data were derived from RALS 2019 results for the three farming systems falling within the small/medium scale farm category (details in Appendix I). For large scale

170
farms, which includes farms producing certified seeds, LCI data were derived from CFS 2017/2018, ZNFU crop budgets and crop budgets from individual large farms and corporations. Small/medium scale farms were categorized into three farming systems: Small/Medium scale-Low input system (SS-LI), Small scale-Medium input system (SS-MI) and Small scale-Higher input system (SS-HI): SS-LI: this system uses no external inputs and rely exclusively on retained seeds (grain from previous harvest, used as planting material at a rate of 25 kg/ha). All operations from land preparation to harvest are manual (animal draft power for land preparation used in some cases). Yield at field gate (at harvest, before on-farm storage) is 1 ton per hectare at 13% moisture content. Post-harvest loss during storage at farm, was assumed to be 10%130 (this applied to all small/medium scale farms), therefore, production per hectare at farm gate was 0.9 tons. Average area under maize cultivation was 0.85 ha in the reference year. SS-MI: external inputs for maize cultivation consist, on average, in 90 kg/ha of Basal fertilization (Compound D, NPK 10-20-10) and 90 kg/ha of Top dressing (Urea 46%). A seeding rate of 25 kg of certified seed (OPV or hybrid) was considered. All operations from land preparation to harvest are manual or with animal draft power. Grain production at farm gate is 1.62 tons/hectare, which corresponds to 1.8 t/ha at field gate. Average area under maize cultivation was 0.92 ha in the reference year. SS-HI: external inputs consist, on average, in 150 kg/ha of Basal fertilization –Compound D– and 150 kg/ha of Top dressing. A seeding rate of 25 kg of certified seed (OPV or hybrid) was considered, alongside the application of 3 L/ha of herbicide (glyphosate). All operations from land preparation to harvest are manual or with animal draft power. Grain production at field gate is 2.5 t/ha, while output at farm gate (after on-farm storage) is 2.25 tons/hectare. Average area under maize cultivation was 2.36 ha in the reference year. Post-harvest activities at small/medium scale farms consist mainly manual operations of in shelling (removal of grains from the cob), packaging and on-farm grain storage until consumption or commercialization. Forced drying is not carried out since harvest takes place after full maturity, in the dry season, when grains reach about 13% moisture content. Shelling in SS-LI and SS-MI systems is a manual operation (typically, the cobs are placed in a sack and they get beaten until they release the grains). The SS-HI system relies mainly on small shellers, for which consumption was 4.4 L diesel/ton of grain. The packaging material consists in polypropylene bags that contain 50 kg of grain that weights 110 grams. On average, bags were reused 10 times,
130 This figure may be regarded as a conservative figure; the African Postharvest Losses Information System estimated 17% PH loss of maize grain in Zambia (14% at farm and other losses in downstream phases along the chain up to the grain processing stage): https://www.aphlis.net/en/page/10/maps#/maps/dryweightloss?lang=en&year=20&crop=3

171
therefore, the quantity of packaging material produced and disposed of for 1 ton of grain was calculated as ((1,000 kg/50 kg)*0.110 kg)/10, resulting in 0.24 kg/ton of polypropylene bags used. Large scale farms comprise the High input mechanized rainfed system (LS-RAIN) and High input irrigated system (LS-IR), the latter being the cultivation system for certified seed production. These systems rely on mechanical operations from land preparation to harvest, including to some extent packaging of grain. Indeed, combined harvesters are often equipped with grain outlets especially designed to facilitate the packaging operations. Diesel fuel consumption for all mechanical operations is 126 L/ha. Seeding rate was 25 kg/ha of certified seeds. The estimated fertiliser application for the LS-RAIN system was 325 kg/ha of Compound D, 250 kg/ha of urea and 150 kg/ha of Diammonium phosphate. Based on LCI data, the same types of fertilisers were used at 400 kg/ha, 300 kg/ha and 100 kg/ha respectively in the LS-IR system for seed production. Herbicides were used at rates of 2 L/ha (glyphosate) and 1 L/ha (atrazine acetachlor) in both systems. The application of insecticide chlorpyrifos at 0.9 kg/ha and Emmamectin benzoate+lufenuron (denim fit) at 0.3 kg/ha was considered for both systems. On-farm post-harvest loss was estimated at 9%. Regarding post-harvest practices, the shelling operation is completely mechanized since it is carried out by combined harvesters while packaging operations remain manual. Bags for packaging weigh 110 g per 50 kg of grain, no reuse at farm for this material was considered, this is also valid for the LS-IR system. In addition, for LS-IR, supplemental irrigation by means of central pivot systems was considered. The estimated water consumption was 4,000 m3/ha. Based on Mayerhofer et al. (2010), the origin of irrigation water is 37.6% from river and 62.4% from groundwater. Specific electricity consumption for operating of the pumping station was estimated according to Da Silva, et al., 2019 at 0.2 kWh/m3. Therefore, a total consumption of 800 kWh/ha for the whole cropping season was calculated. According to farmers in this category interviewed by the team, irrigation systems are activated at times when electricity supply is available (the electricity supply in Zambia being very instable), so to avoid the high costs of using fuel for pumping. Therefore, it was assumed that the energy used for irrigation is exclusively grid electricity. The contribution from the four types of cropping systems to the grain output for the local sub-chain (self-consumption or locally marketed) and to the total grain output for the commercial sub-chain (sourcing industrial mills) is shown in Table 27. These contributions were used to calculate the environmental impacts of each sub-chain, i.e., combining the life cycle inventory of each farming system through weighted averages to assess the impacts of the sub-chain.
Maize cropping systems
All
farms SS-LI SS-MI SS-HI LS-RAIN (>20ha)
Contribution to the local sub-chain (sub-chain 1), kg* 1 0.16 0.49 0.35 0 Contribution to the commercial sub-chain (sub-chain 2), kg** 1 0.03 0.21 0.71 0.05
TABLE 27: CONTRIBUTION TO SUB-CHAIN 1 AND SUB-CHAIN 2 OF EACH CROPPING SYSTEM (KG AT HARVEST MOISTURE CONTENT -13%-) TO 1 KG OF MAIZE GRAIN MILLED.

172
Notes: SS-LI=Low input; SS-MI=Medium input; SS-HI=High input; LS-RAIN=High input mechanized, rainfed. *quantities of grain kept for auto-consumption + locally marketed grain, processed in small-scale mills, calculated by subtracting from the total output of each cropping system the quantity of marketed grain (sold to small-scale traders, large-scale wholesalers, FRA, Millers and to all other buyers -from RALS 2019-). ** for SS-LI, SS-MI, SS-HI, RALS 2019: quantity of maize processed in industrial mills, sold to: small-scale traders, large-scale wholesalers, FRA, Millers and to all other buyers; for LS-RAIN: Large Scale National CFS 2017/18 expected production. Source: Authors Within the local sub-chain, the contribution from the SS-LI system is quite significant (considering that this category produced, in the reference year, only 9% of the total grain output at national level). Indeed, the contribution to the local sub-chain was 16%. This percentage, added to the contribution of the SS-MI system (49%) adds up to 65%; most of the grain output within this sub-chain is produced by SS-LI and SS-MI systems. Within the commercial sub-chain, most of the contribution of grain sourcing large-scale mills derives from high input systems (SS-HI + LS-RAIN add up to 76%). Field emissions With regard to direct field emissions, N2O emissions (direct and indirect), NH3 and NO3 emissions from nitrogen fertilization and phosphorus emissions due to erosion and phosphate due to run-off were included in the analysis. Details on the calculations of field emissions are reported in Annexes 6.4. Crop residue management According to RALS data, crop residues are left on the field in approximately 50% of the areas under maize cultivation, in 20% of the area they are burnt after harvest, for various reasons (i.e., uncontrolled bush fires, hunting, as practice for minimizing labour burden) and the remaining 30% is grazed by animals; the latter was not included in the analysis as it is used by other production systems. for the portion of crop residues remaining in the field, N2O emissions from crop residues was estimated as reported in Annexes 6.4. For the portion burnt, estimations of aboveground biomass and emissions from combustion of this biomass were based on the IPCC 2006 approach and on EMEP EEA Emission factors. Irrigated areas dedicated to seed production, equipped with central pivot infrastructures are stable agricultural areas for which it was assumed that burning of crop residues is not a usual practice. Direct land use change Considering the significant rate of transformation of woodlands into arable lands dedicated to maize cultivation, estimations were made for aboveground biomass, litter and soil carbon loss, and also for belowground carbon loss, where applicable (in LS-RAIN also roots are removed from the field in order to allow mechanized operations). Furthermore, estimations were made for direct non-CO2 emissions

173
of litter combustion (N2O, CH4, CO, NO2, NMVOC particulates, SOx) due to clearing of forests131. These emissions refer only to litter combustion, since there is large uncertainty about the use of the biomass resulting from land clearing and the percentage of this biomass that is actually combusted. For this reason, combustion of biomass other than litter was considered outside the system. Estimations of forest biomass removal for land clearing were based on data from an extensive literature review (national and regional), which included sources from IAPRI (Ngoma et. al., 2019) and relied on exchanges with experts at IAPRI (Ngoma), in particular regarding the estimation of the proportion of land cleared annually for maize cultivation. Drivers of deforestation in Zambia are numerous and, at any specific site, the main drivers are closely interlinked and may vary from province to province. The top four leading drivers of deforestation are charcoal production, agricultural expansion, fuelwood collection and settlements (Vinya et al., 2011). It is therefore difficult to associate deforestation to one of those interlinked drivers, while at the same time it has been recognized by many authors132 that forest loss is caused to a significant extent by cropland expansion. Also, according to Estes et al. (2016), Zambia is a bellwether for the cropland expansion challenge in sub-Saharan Africa considering the country has great need to boost its food production and that at the same time the Miombo Woodland ecoregion ranks as the 17th richest ecoregion in the world in floral diversity (it contains some 3,800 plant species). The 2019 RALS questionnaires included questions on whether a household expanded cropland, on the size of the new plot, on prior land use and on the reason for expanding cropland. According to RALS, 2.3% of the maize area cultivated in the reference year was virgin land immediately before cultivation. This corresponds to 41,000 ha of virgin land converted to maize cultivation133, which is 16% of the estimated 250,000 ha of annual forest loss in Zambia. This expansion corresponds to 0.023 ha of virgin land converted to maize cultivation for each ha of maize. This rate of forest cover loss, having as driver maize cultivation area expansion, was applied to all farming systems, except to the typology representing the certified seed-production irrigated system. Indeed, irrigated areas dedicated to seed production, equipped with central pivot infrastructures, are stable agricultural areas for which it was assumed that land use change did not occur in recent years.
131Land clearing operations are carried out manually, without using fuels or materials; aboveground biomass (stem, branches of trees) is generally extracted while the remaining biomass (litter) is subject to burning on the field. 132About 60% (or 150,000 ha) of the estimated 250,000 ha of forests loss in Zambia per year is due to cropland expansion (Ngoma, 2019). The estimation reported in the Occasional Paper “Zambia country profile: Monitoring, reporting and verification for REDD+” (2014) is even higher: 90% of forest cover loss being caused by agricultural expansion. This expansion is certainly to some extent caused by maize cultivation, since the 56% of the croplands in the reference year were under maize cultivation (RALS, 2019). 133In the present analysis, only areas of virgin land cleared for maize cultivation were considered in the calculation of forest cover loss due to maize area expansion. Ngoma et al. (2019) included in their estimation of forest cover loss also expansion fallow lands older than 15 years (otherwise defined as « natural fallows »). If also natural fallows would be considered the total area of expansion in the reference year would be 97,000 ha.

174
It should be noted that the uncertainty associated with estimations of carbon loss and of direct emissions due to land use change is high, despite the strong effort made to disclose and re-elaborate information related to the issue. Indeed, variability of carbon stocks from site to site may be considerable as it depends on many different factors, including calculation methods proposed in the literature134. Data used for estimating the environmental impacts of direct land use change are reported in Appendix III.
4.3.2 Transport and aggregation of grain
This phase regards only marketed grain, sourcing the large-scale mills. After storage of grain at farms until commercialization, packaged grain is transported and aggregated before processing. As previously discussed, transport paths are very variable in terms of distances and load size. One of the common transport paths to industrial mills was represented, that comprises three phases:
• short distance transport (covered by bicycle, cart, draft animals) from farm gate to trader camp; no energy input was associated with this activity since it is rarely carried out using motorized means;
• short distance transport from trader camp to the site where large-capacity trucks are loaded (loading site). This intermediate transport phase is usually necessary since trader camps might be located in areas that are convenient for the local aggregation activities, not accessible to large trucks due to roads conditions that might not be suited for the transit of large trucks. In such cases, the distance between trader camps and loading site is as short as possible. A transport distance of 5 km was modelled, covered with a 3.5-7 t capacity truck;
• Long distance transport from loading sites to milling facilities or to large aggregation sites (warehouses of traders or FRA) or to intermediate points such as large aggregation depots, such as trading companies warehouse and from these to mills. It was assumed a transport distance of 300 km with large capacity trucks (30-ton payload).
The operations associated with handling of grain at warehouses, in aggregation depots or at mills, are most often completely manual. Only in some isolated cases handling is partially mechanized through the use of conveyors or forklifts, therefore in order to represent the most common case, manual operations were assumed for this phase. Furthermore, operations of pre-cleaning, cleaning and grading of grains are often performed exclusively at the mill.
4.3.3 Pre-processing and processing
Inventory data for pre-processing and milling phases were collected from two large and one medium scale industrial mills (located in Lusaka and Copperbelt), these were categorized as industrial mills. Data related to small mills were mainly derived from the ad-hoc survey conducted by the local expert (14 small scale mills). About half the quantity of grain processed into maize meal and other products
134choice of method has a large effect on the final carbon stock estimate. Depending on method, the aboveground estimates span from approximately an average of 15 tons of carbon /ha to 39 tons/ha across all forest types of Zambia (Kamelarczyk, 2009).

175
is milled in each of the two types of facilities considered, industrial and small-scale. Appendix III shows the LCI of this stage. Small-scale milling This type of milling comprises electricity and diesel-powered micro-scale mills with milling capacities of 100-300 tons/year per mill. Milling capacities are assumed to be used at a rate of about 25%, which corresponds to a milling rate of 70 ton/year per mill. About 30,000 facilities are scattered throughout the country. The evidence gathered by the local expert of the team led to the assumption that about 80% of the existing operations are diesel-powered while the remaining 20% (generally located in villages, where grid electricity is available) are electricity powered. A dry milling system was considered, with an energy consumption of 84.6 Wh/kg of grain milled for both electricity and diesel-powered, based on data gathered by the local expert during the June to August 2020 field survey of small-scale mills. Furthermore, spilling and milling losses were estimated at 2%. Extraction rates were 80% mealie meal/20% bran and the allocation applied was the same as that of the industrial mills (90% and 10% to mealie meal and bran respectively). It is worth pointing out that although small milling systems should not be compared with large milling systems, comparisons of environmental performance are possible between electricity-powered and diesel-powered small-scale mills, keeping in mind that diesel-powered mills are usually located where electricity from the network is not available. Large-scale milling Inventory data refers to process energy, grain losses and materials used in an industrial mill from grain intake to packaging of 1 kg of maize meal. As mentioned previously, grain is generally stored in bags which implies labour intensive handling operations, since handling of packaged grain is mostly manual. Screenings of foreign materials constitutes approximately 2% of the total weight of entering material. This value was considered as an additional loss of grain, that adds to the on-farm post-harvest loss. Therefore, for 1 kg of grain entering the milling process, 1.02 kg of grain is transported to the mill. It was considered that the water added for conditioning the grain (approximately 3 grams of water are used for each kg of maize grains) evaporates due to the friction generated by the mill rolls, as a result, the moisture content of the final product is equal to that of the original storage moisture of grain, i.e., 13%. Based on the extraction rates of 80%/20% meal/bran and their corresponding market value (4 ZMW/kg for breakfast, 2.85 ZMW/kg for roller, 1 ZMW/kg for bran), an economic allocation based on a coefficient (output mass x market value) was calculated. The resulting percentage of allocation are 90% and 10% to maize meal and to bran respectively. Details of the allocation procedure are shown in Appendix III. A combined use of grid energy and diesel generators for the total energy consumption from grain intake to packaging at mills (39 Wh/kg of grain milled) was considered. Due to instability in the supply of electricity, it was assumed that 80% of the required

176
energy is grid electricity, while the remaining 20% is produced at the plant through diesel-electric generating sets. The material input for packaging is a polypropylene bag. There are several formats of packaging which are widespread in the country, of capacities ranging from 5 kg to 25 kg. The most popular packaging format, a 25 kg capacity bag that weights 65 grams, was selected.
4.3.4 Transport from mill
The last stage of the life cycle is transport of maize meal from the mill gate to the retailer (commercial sub-chain alone). For this analysis, a transport distance of 30 km was considered to be a typical transport distance between mills and retailer. The impacts of transporting 1 kg of maize meal and its packaging over 30 km were therefore included in the analysis. Much greater transport distances may be required for maize meal delivered by FRA. Since the small-scale mills provide a service at a toll for costumers having their own grains milled there is no retailing involved and since the final product is usually packaged in re-used bags or in re-usable buckets) the final output is “unpacked maize meal at the milling facility”.
4.4 Results: life cycle impact assessment
4.4.1 Life cycle impact assessment method
Impact assessment translates the flows of materials, energy and emissions into and out of each process into the impacts their use or release has on the environment. For the evaluation of environmental impacts of the value chain, the ReCiPe 2016 endpoint life cycle impact assessment method was adopted. Endpoint indicators show the environmental impact of disaggregated (midpoint) indicators on three aggregated categories, being the effect on 1) human health, 2) on ecosystem quality and 3) on resource depletion. Midpoint indicators focus on single environmental problems, for example climate change or freshwater eutrophication. The indicators included in each damage category and their relationship with these categories are shown in Table 28. Aggregation of midpoint indicators into endpoint impact categories may simplify the interpretation of results and support decision-making, but at the same time, it has the drawback of increasing the uncertainties due to the models of weighing and normalization used to convert midpoint impacts in endpoint damage categories. Therefore, although endpoint indicators are required to assess impacts of the value chain on the three areas of protection covered by the core questions, also midpoint results are shown in order to provide insights about the most important single impact categories in the studied value chain and about how they relate to the three areas of protection. Besides, several environmental studies focus on the climate change indicator (in terms of Global Warming Potential, expressed as kg CO2 eq emissions) hence, it is useful to show results for this impact category for comparison reasons, as it will be seen in the section dedicated to comparisons with results with

177
evidence/data from literature. For this reason, to further support the interpretation of the results, also midpoint impacts results are shown. Evaluations were carried out both at farm-gate (for grain production) and at the level of the complete lifecycle of maize meal production.
Impact Category (midpoint)
Areas of protection (endpoint)
Description Human Health
Ecosystems Resource scarcity
Climate change X X Greenhouse gas emissions causing disturbances on the global climate system
Stratospheric ozone depletion X
Emissions of compounds such as chlorofluorocarbons or halons, which are responsible for the ozone hole phenomenon
Ionising radiation X Release of radioactive substances into the environment
Particulate matter formation X Emissions of particulate matter or particulate precursors,
which contribute to respiratory disorders
Photochemical ozone formation X X
Emissions of ozone precursor pollutants such as nitrogen oxides or volatile organic compounds, causing human health problems (irritation, asthma) or damage to plants
Terrestrial acidification X Emissions of acidifying pollutants, causing phenomena such
as acid rain, and damage to terrestrial ecosystems
Freshwater eutrophication X
Emissions of nutrients into the natural environment, causing disequilibria in freshwater ecosystems (proliferation of plant or animal species at the expense of other species)
Toxicity and ecotoxicity X X Emissions of pollutants toxic to human health and
ecosystems Water consumption X X Effects for human population and ecosystems of freshwater
consumption
Land use X Biodiversity changes due to land transformations and occupations
Mineral resource scarcity X Depletion of mineral ores
Fossil resource scarcity X Cumulated primary energy demand from fossil and nuclear
sources TABLE 28: SUMMARY OF IMPACT CATEGORIES INCLUDED IN EACH DAMAGE CATEGORY OF THE RECIPE 2016 METHOD USED IN THIS STUDY. Note: for simplicity, some midpoint impact categories are merged in this table (for instance, “Toxicity and ecotoxicity” representing terrestrial, freshwater and marine ecotoxicity and human cancerogenic and non-cancerogenic toxicity).
4.4.2 Environmental impacts at farm-gate
Environmental impacts at farm-gate (which includes impacts of the cultivation stage and related phases, namely land clearing/land use change and crop residues management), estimated for the four cropping systems are presented. Results also are compared with those of: 1) grain output at farm-gate for the local sub-chain, considering 1 kg of grain milled at small-scale mills, produced by SS-LI, SS-MI, SS-HI, in the proportions corresponding to their contributions to sub-chain 1: 0.16 kg, 0.49 kg and 0.35 kg (Table 27). 2) grain output at farm-gate for the commercial sub-chain (per each kg of grain milled in industrial facilities): 0.03 kg, 0.21 kg, 0.71 kg and 0.05 kg from SS-LI, SS-MI, SS-HI and LS-RAIN respectively, as shown in Table 27).

178
Table 29 shows the midpoint impact categories per kg of grain produced of all cropping systems. A selection of midpoint impact categories is represented in Figure 31, where original units were substituted by an index number (100) to make comparisons more immediate. The midpoint indicators with the highest incidence on the environmental impacts at farm gate (and also at full life-cycle level), were land use and global warming. Both indicators influence ecosystems, which makes up most of the overall impacts throughout the life cycle of maize meal production, considering that the largest impacts derive from the cultivation stage and the associated land clearing activities, as it will be discussed in the following sections (Figure 33, Figure 37, Figure 38, Figure 40 and Figure 42). Land use and global warming showed an inverse correlation between the levels of the impact and grain yields. The land use indicator is influenced both by land occupation135 –land use for cultivation– and by direct land use change. This impact category shows higher values under conditions of less efficient ratio of output to cultivated land area (when considering as functional unit the kg of grain produced). Global warming potential is associated to a large extent with direct land use change, which causes high levels of organic carbon loss. Contributions to global warming of all other activities at the cultivation stage, including emissions from fertilization, from mechanical operations and transport, are much smaller. In addition to land use and global warming, also particulate matter formation and freshwater eutrophication have moderate contributions to the overall impacts of the cultivation stage. Besides land use, also freshwater eutrophication136 affects ecosystem quality. Regarding human health, in addition to global warming, also particulate matter formation has a moderate incidence. In Table 29 and Figure 31 midpoint impacts are shown referred to 1 hectare of maize cultivation in absolute values and expressed in percentages, respectively. Results shown per unit area do not take into consideration the efficiency of the cultivation systems in terms of grain yield, rather, they simply consider the inputs per unit of area and the output is 1 ha of maize cultivation. For this reason, in the system with the highest input levels, indicators reach the highest values.
Impact category Unit Maize at
farm, SS-LI
Maize at farm,
SS-MI
Maize at farm, SS-HI
Maize at farm, LS-
RAIN
Maize at farm, for local sub-
chain
Maize at farm for commercial
sub-chain
Global warming kg CO2 eq 2.21 1.47 1.25 0.87 1.51 1.30 Stratospheric ozone depletion kg CFC11 eq 2.16E-06 8.49E-
9.65E-06 8.39E-06 7.88E-06 9.12E-06
Ionizing radiation kBq Co-60 eq 2.49E-05 4.32E-
4.21E-03 2.41E-03 1.69E-03 3.20E-03
135 According to the ReCiPe 2016 method, land use leads to «damage to ecosystems due to changes of land cover/land use intensification, leading to soil disturbance and loss of habitat which, in turn lead to potentially disappeared fraction of species». 136 Freshwater eutrophication causes potential damage to freshwater ecosystems. Eutrophication is a result of P loss due to soil erosion and, to a more limited extent, of application of the N and P fertilizers that are used in all cropping systems except in the SS-LI.

179
Ozone formation, Human health kg NOx eq 5.95E-04 5.65E-
6.43E-04 1.00E-03 5.97E-04 6.43E-04 Fine particulate matter formation kg PM2.5 eq 1.41E-04 4.69E-
5.99E-04 5.91E-04 4.62E-04 5.58E-04
Ozone formation, Terrestrial
kg NOx eq 9.58E-04 8.07E-
8.48E-04 1.15E-03 8.46E-04 8.58E-04 Terrestrial acidification kg SO2 eq 4.65E-04 3.03E-
3.72E-03 3.40E-03 2.86E-03 3.46E-03
Freshwater eutrophication kg P eq 1.01E-02 6.41E-
5.08E-03 2.71E-03 6.53E-03 5.39E-03 Marine eutrophication kg N eq 4.23E-09 1.31E-
1.76E-06 1.23E-06 6.79E-07 1.34E-06
Terrestrial ecotoxicity kg 1,4-DCB 0.0001 0.0220 0.0913 0.1700 0.0427 0.0779 Freshwater ecotoxicity kg 1,4-DCB 7.91E-08 1.72E-
2.04E-03 8.87E-02 1.56E-03 6.24E-03
Marine ecotoxicity kg 1,4-DCB 7.32E-07 4.35E-
3.93E-04 1.65E-02 3.51E-04 1.19E-03 Human carcinogenic toxicity kg 1,4-DCB 2.54E-07 8.13E-
1.24E-04 2.05E-04 8.33E-05 1.15E-04
Human non-carcinogenic toxicity kg 1,4-DCB 4.87E-06 1.55E-
3.14E-03 1.84E-02 1.86E-03 3.47E-03 Land use m2a crop eq 21.19 11.48 8.27 3.41 11.90 9.08 Mineral resource scarcity kg Cu eq 7.58E-08 8.67E-
1.04E-03 9.58E-04 7.89E-04 9.69E-04
Fossil resource scarcity kg oil eq 0.00043 0.0469 0.0683 0.0789 0.0469 0.0623 Water consumption m3 5.92E-07 0.01367 0.01002 0.00423 0.01021 0.01020
TABLE 29: CULTIVATION STAGE (INCLUDING LAND CLEARING AND RESIDUE COMBUSTION) - MIDPOINT IMPACT CATEGORIES PER KG OF GRAIN PRODUCED BY EACH FARMING SYSTEM AND BY THE COMBINATION OF FARMING SYSTEMS CONTRIBUTING TO THE LOCAL SUB-CHAIN AND TO THE COMMERCIAL SUB-CHAIN (FU: 1 KG). Source: Authors
FIGURE 31: CULTIVATION STAGE (INCLUDING LAND CLEARING AND RESIDUE COMBUSTION) - SELECTION OF MIDPOINT IMPACT CATEGORIES. ORIGINAL UNITS WERE SUBSTITUTED BY AN INDEX NUMBER (100). FU: 1 KG OF GRAIN.
Source: Authors
Impact category Unit Maize at
farm, SS-LI Maize at
farm, SS-MI Maize at
farm, SS-HI Maize at
farm, LI-RAIN
Maize at farm, for local sub-
chain
Maize at farm for
commercial sub-chain
Global warming kg CO2 eq 1,988 2,388 2,805 4,766 2,239 2,740 Stratospheric ozone depletion kg CFC11 eq 1.94E-03 1.38E-02 2.17E-02 4.58E-02 1.17E-02 1.92E-02 Ionizing radiation kBq Co-60 eq 0.02 0.70 9.47 13.15 2.50 6.72 Ozone formation, Human health kg NOx eq 0.54 0.91 1.45 5.49 0.88 1.35 Fine particulate matter formation kg PM2.5 eq 0.13 0.76 1.35 3.23 0.68 1.17
0% 20% 40% 60% 80% 100%
Water consumption (m3)
Fossil resource scarcity (kg oil eq)
Mineral resource scarcity (kg Cu eq)
Land use (m2a crop eq)
Human carcinogenic toxicity (kg 1,4-DCB)
Freshwater ecotoxicity (kg 1,4-DCB)
Terrestrial ecotoxicity (kg 1,4-DCB)
Freshwater eutrophication (kg P eq)
Fine particulate matter formation (kg PM2.5 eq)
Stratospheric ozone depletion (kg CFC11 eq)
Global warming (kg CO2 eq)
Maize at farm, SS-LI Maize at farm, SS-MIMaize at farm, SS-HI Maize at farm, LS-RAINMaize at farm (local sub-chain) Maize at farm (commercial sub-chain)

180
Ozone formation, Terrestrial ecosystems kg NOx eq 0.86 1.31 1.91 6.30 1.25 1.80 Terrestrial acidification kg SO2 eq 0.42 4.91 8.37 18.55 4.24 7.27 Freshwater eutrophication kg P eq 9.09 10.38 11.42 14.77 9.67 11.31 Marine eutrophication kg N eq 3.81E-06 2.12E-04 3.95E-03 6.71E-03 1.01E-03 2.81E-03 Terrestrial ecotoxicity kg 1,4-DCB 0.124 35.64 205.33 927.95 63.30 163.62 Freshwater ecotoxicity kg 1,4-DCB 7.12E-05 2.79 4.58 484.47 2.31 13.11 Marine ecotoxicity kg 1,4-DCB 6.59E-04 0.71 0.89 89.99 0.52 2.51 Human carcinogenic toxicity kg 1,4-DCB 2.29E-04 0.13 0.28 1.12 0.12 0.24 Human non-carcinogenic toxicity kg 1,4-DCB 4.39E-03 2.51 7.06 100.57 2.75 7.29 Land use m2a crop eq 19,067 18,593 18,597 18,598 17,633 19,077 Mineral resource scarcity kg Cu eq 6.82E-05 1.40 2.34 5.23 1.17 2.04 Fossil resource scarcity kg oil eq 0.39 76.00 153.57 430.97 69.53 130.77 Water consumption m3 5.33E-04 22.15 22.55 23.12 15.12 21.42 TABLE 30: CULTIVATION STAGE (INCLUDING LAND CLEARING AND RESIDUE COMBUSTION) - MIDPOINT IMPACT CATEGORIES PER HECTARE OF MAIZE CULTIVATION BY EACH FARMING SYSTEM AND BY THE COMBINATION OF FARMING SYSTEMS CONTRIBUTING TO THE LOCAL SUB-CHAIN AND TO THE COMMERCIAL SUB-CHAIN (FU: 1 HA). Source: Authors
FIGURE 32: CULTIVATION STAGE (INCLUDING LAND CLEARING AND RESIDUE COMBUSTION)- SELECTION OF MIDPOINT IMPACT CATEGORIES. ORIGINAL UNITS WERE SUBSTITUTED BY AN INDEX NUMBER (100). FU: 1 HA OF MAIZE CULTIVATION. source: authors Figure 32 shows the normalized midpoint impact categories and Figure 33 shows the endpoint values for the three domains. Cultivation of maize affected mostly the ecosystem quality, mainly due to land use (land use change and land occupation for cultivation) and to global warming caused by the organic carbon loss resulting from land use change. Ecosystem quality was also affected, at moderate level, by freshwater eutrophication.
0% 20% 40% 60% 80% 100%
Water consumption (m3)
Fossil resource scarcity (kg oil eq)
Mineral resource scarcity (kg Cu eq)
Land use (m2a crop eq)
Human carcinogenic toxicity (kg 1,4-DCB)
Freshwater ecotoxicity (kg 1,4-DCB)
Terrestrial ecotoxicity (kg 1,4-DCB)
Freshwater eutrophication (kg P eq)
Fine particulate matter formation (kg PM2.5 eq)
Stratospheric ozone depletion (kg CFC11 eq)
Global warming (kg CO2 eq)
Maize at farm, SS-LI Maize at farm, SS-MIMaize at farm, SS-HI Maize at farm, LS-RAINMaize at farm (local sub-chain) Maize at farm (commercial sub-chain)

181
Human health was affected to a lesser extent by maize cultivation. This damage category was influenced by global warming resulting from direct land use change, N2O emissions from soil and combustion emissions from mechanical operations. Human health was also affected by fine particulate matter formation, derived from production and transport of external inputs, crop residue combustion and, to a lesser extent, from ammonia emissions due to nitrogen fertilization and from mechanical operations (in the LS-RAIN system). Impacts on non-renewable resources, which encompasses mineral and fossil resources depletion, were negligible at the cultivation stage (and at full life-cycle level). The overall environmental performances are highly correlated with grain yield levels. The most affected domain was the ecosystem quality, associated with relatively high rates of land use change and land occupation for cultivation resulting from low grain yield, especially in lower input cropping systems. Therefore, the higher the grain yield, the lower would be the level of land occupation (and associated land use change) per kg of grain produced. Extensive agricultural land occupation, which also triggers clearing of land for cultivation, had large impacts on the environmental profile of the chain both at farm-gate and at full life-cycle level.
FIGURE 33: CULTIVATION STAGE, LOW TO HIGH INPUTS SYSTEMS AND SYSTEMS CONTRIBUTING TO THE LOCAL SUB-CHAIN AND TO THE COMMERCIAL SUB-CHAIN. VALUES FOR EACH IMPACT CATEGORY. SINGLE SCORES FOR 1 KG OF GRAIN.
GW, HH
GW, TEPM FE
Land use
0
20
40
60
80
100
120
140
Maize at farm,SS-LI
Maize at farm,SS-MI
Maize at farm,SS-HI
Maize at farm,LS-RAIN
Maize at farm(local sub-chain)
Maize at farm(commercialsub-chain)
mPt
Global warming, Human health Global warming, Terrestrial ecosystemsGlobal warming, Freshwater ecosystems Stratospheric ozone depletionIonizing radiation Ozone formation, Human healthFine particulate matter formation Ozone formation, Terrestrial ecosystemsTerrestrial acidification Freshwater eutrophicationMarine eutrophication Terrestrial ecotoxicityFreshwater ecotoxicity Marine ecotoxicityHuman carcinogenic toxicity Human non-carcinogenic toxicityLand use Mineral resource scarcityFossil resource scarcity Water consumption, Human healthWater consumption, Terrestrial ecosystem Water consumption, Aquatic ecosystems

182
Note: yields at farm-gate are (ton/ha/year): SS-LI=0.9; SS-MI=1.6; SS-HI=2.2; LS-RAIN=5.5; weighted average yield, grain for sub-chain 1=1.5; weighted average yield, grain for sub-chain 2=2.1 Impact categories shown in the labels are: GW,HH = Global Warming, Human health, GW,TE = Global Warming, Terrestrial ecosystems, FE = Freshwater eutrophication, PM = Particulate matter formation. Source: Authors
FIGURE 34: ENDPOINT IMPACTS FOR EACH DAMAGE CATEGORY FOR THE CULTIVATION STAGE. LOW TO HIGH INPUTS SYSTEMS AND WEIGHTED AVERAGE OF CROPPING SYSTEMS CONTRIBUTING TO THE LOCAL SUB-CHAIN AND TO THE COMMERCIAL SUB-CHAIN. SINGLE SCORES FOR 1 KG OF GRAIN. Source: Authors
4.4.3 Environmental impacts at the stages of the value chain: local and commercial sub-chain
In this section, life cycle results are shown for the local sub-chain considering both types of small-scale milling: diesel and electricity-powered and for the commercial sub-chain. To provide as much detail as possible, environmental impacts of activities at farm level, namely land use change, cultivation, and crop residues combustion, are shown as separate life cycle stages.
0
20
40
60
80
100
120
140M
aize
at f
arm
, SS-
LI
Mai
ze a
t far
m, S
S-M
I
Mai
ze a
t far
m, S
S-H
I
Mai
ze a
t far
m, L
S-RA
IN
Mai
ze a
t far
m (l
ocal
sub
chai
n)
Mai
ze a
t far
m (c
omm
erci
al s
ubch
ain)
mPt
Human health Ecosystems Resources

183
Life-cycle environmental impacts of sub-chain 1: impacts of 1 kg of unpackaged meal at mill-gate from the local sub-chain Relative contributions of each stage along the chain to midpoint impacts within sub-chain 1 are shown in Figure 35 and Figure 36 for grains processed at electricity-powered mills and at diesel-powered mills, respectively. In both types of mills, relative contribution of cultivation was the largest across most impact categories. Global warming, land use and ozone formation derived to a large extent from land use change. Crop residues combustion largely contributed to the ozone formation and fine particulate formation categories. Compared to the impacts of electricity-powered mills, in diesel-powered mills, energy use for milling had larger relative contributions to most impact categories. Nevertheless, as shown in Figure 37, when overall impacts are examined in terms of absolute values under the life-cycle single-score perspective, the contribution was very limited for all midpoint impact categories except land use and global warming (also particulate matter formation and freshwater eutrophication, to a lesser extent). The impacts of the milling operation had very small contributions to the overall environmental performance of the product. Milling had larger impacts in the case of diesel-powered processing, mainly due to fine particulate formation from the use of diesel fuel.
FIGURE 35: SUB-CHAIN 1: RELATIVE VALUES OF EACH MIDPOINT IMPACT CATEGORY OF 1 KG MAIZE MEAL AT MILL GATE, PRODUCED IN AN ELECTRICITY-POWERED SMALL-SCALE MILL. Source: Authors
102030405060708090
100
Glo
bal w
arm
ing
Stra
tosp
heric
ozo
ne…
Ioni
zing
rad
iatio
n
Ozo
ne fo
rmat
ion,
Hum
an…
Fine
par
ticul
ate
mat
ter…
Ozo
ne fo
rmat
ion,
…
Terr
estr
ial a
cidi
ficat
ion
Fres
hwat
er e
utro
phic
atio
n
Mar
ine
eutr
ophi
catio
n
Terr
estr
ial e
coto
xici
ty
Fres
hwat
er e
coto
xici
ty
Mar
ine
ecot
oxic
ity
Hum
an c
arci
noge
nic
toxi
city
Hum
an n
on-c
arci
noge
nic…
Land
use
Min
eral
reso
urce
sca
rcity
Foss
il re
sour
ce s
carc
ity
Wat
er c
onsu
mpt
ion
%
Land Use Change Cultivation Crop residues combustion Milling

184
FIGURE 36: SUB-CHAIN 1: RELATIVE VALUES OF EACH MIDPOINT IMPACT CATEGORY OF 1 KG MAIZE MEAL AT MILL GATE, PRODUCED IN A DIESEL-POWERED SMALL-SCALE MILL. source: Authors
FIGURE 37: SUB-CHAIN 1 MIDPOINT IMPACT CATEGORIES FOR ALL LIFE CYCLE STAGES (UPSTREAM PHASES ARE COMMON TO BOTH ELECTRICITY AND DIESEL-POWERED TECHNOLOGIES). FOR THE MILLING STAGE BOTH OPTIONS ARE SHOWN. SINGLE SCORES FOR 1 KG OF MAIZE MEAL AT MILL GATE. Note: Impact categories shown in the labels are: GW,HH = Global Warming, Human health, GW,TE = Global Warming, Terrestrial ecosystems, FE = Freshwater eutrophication, PM = Particulate matter formation. Source: Authors
102030405060708090
100
Glo
bal w
arm
ing
Stra
tosp
heric
ozo
ne d
eple
tion
Ioni
zing
rad
iatio
n
Ozo
ne fo
rmat
ion,
Hum
an h
ealth
Fine
par
ticul
ate
mat
ter…
Ozo
ne fo
rmat
ion,
Ter
rest
rial…
Terr
estr
ial a
cidi
ficat
ion
Fres
hwat
er e
utro
phic
atio
n
Mar
ine
eutr
ophi
catio
n
Terr
estr
ial e
coto
xici
ty
Fres
hwat
er e
coto
xici
ty
Mar
ine
ecot
oxic
ity
Hum
an c
arci
noge
nic
toxi
city
Hum
an n
on-c
arci
noge
nic…
Land
use
Min
eral
reso
urce
sca
rcity
Foss
il re
sour
ce s
carc
ity
Wat
er c
onsu
mpt
ion
%
Land Use Change Cultivation Crop residues combustion Milling
GW, HH
GW, TE
PMFE
Land use
5101520253035404550
Land Use Change Cultivation Crop residuescombustion
Milling (electric) Milling (diesel)
mP
t
Global warming, Human health Global warming, Terrestrial ecosystemsGlobal warming, Freshwater ecosystems Stratospheric ozone depletionIonizing radiation Ozone formation, Human healthFine particulate matter formation Ozone formation, Terrestrial ecosystemsTerrestrial acidification Freshwater eutrophicationMarine eutrophication Terrestrial ecotoxicityFreshwater ecotoxicity Marine ecotoxicityHuman carcinogenic toxicity Human non-carcinogenic toxicityLand use Mineral resource scarcityFossil resource scarcity Water consumption, Human health

185
Figure 38 shows the endpoint results for all life cycle stages of the production of 1 kg of maize meal within sub-chain 1 (electric and diesel options shown separately). The largest impacts were on ecosystem quality, which is mainly affected by land use and global warming. Ecosystems were also affected by potential freshwater eutrophication originated in the cultivation phase. Potential damage to human health was the second most important damage category; it was associated mainly with global warming (caused both by land use change and cultivation) and with particulate matter formation due to production and transport of external inputs, to combustion of crop residues, and to a lesser extent, to nitrogen fertilization, diesel fuel use for mechanical operations and milling operation in diesel powered mills.
FIGURE 38: SUB-CHAIN 1 ENDPOINT DAMAGE CATEGORIES FOR ALL LIFE CYCLE STAGES OF THE PRODUCTION OF 1 KG OF MAIZE MEAL, PRODUCED AT SMALL-SCALE MILLS. UPSTREAM PHASES ARE COMMON TO BOTH ELECTRICITY AND DIESEL-POWERED TECHNOLOGIES. FOR THE MILLING STAGE BOTH OPTIONS ARE SHOWN. SINGLE SCORES FOR 1 KG OF MAIZE MEAL AT MILL GATE. Source: Authors Figure 39 shows the contribution to endpoint impacts of each life cycle stage in the local sub-chain. The differences in terms of overall impacts are negligible, since these differences are determined by the milling stage alone, which as discussed previously, had very small contributions to the total environmental impacts. Figure 40 shows the endpoint results at full life cycle per area of protection, referred to the production of 1 kg of maize meal within sub-chain 1.
5
10
15
20
25
30
35
40
45
50
Land Use Change Cultivation Crop residuescombustion
Milling (electric) Milling (diesel)
mP
t
Human health Ecosystems Resources

186
FIGURE 39: SUB-CHAIN 1 - CONTRIBUTION TO ENDPOINT IMPACTS OF EACH LIFE CYCLE STAGE - LOCAL SUB-CHAIN. SINGLE SCORES FOR 1 KG OF MAIZE MEAL AT MILL-GATE. Source: Authors
FIGURE 40: ENDPOINT RESULTS PER AREA OF PROTECTION OF THE PRODUCTION OF 1 KG OF MAIZE MEAL WITHIN SUB-CHAIN 1. Source: Authors
Life-cycle environmental impacts of sub-chain 2: impacts of 1 kg of packaged meal at retailer from the commercial sub-chain Relative contribution of midpoint impact categories for sub-chain 2 is reported in Figure 41. Cultivation is the life cycle stage with the largest relative contribution in most impact categories. In terms of global warming potential and of land use, also relative contribution from land use change is large. In a few impact categories such as ozone formation and human toxicity, the contributions from downstream
0
20
40
60
80
100
120
1 kg of maize meal (local sub-chain/electric mill) 1 kg of maize meal (local sub-chain/diesel mill)
mP
t
Land Use Change Cultivation Crop residues combustion Milling
0
20
40
60
80
100
120
1 kg of maize meal (local sub-chain/electric mill) 1 kg of maize meal (local sub-chain/diesel mill)
mP
t
Human health Ecosystems Resources

187
phases are larger than those of land clearing or crop cultivation, mostly due to the combustion of fuels in these phases. As in sub-chain 1, when overall impacts are examined in terms of absolute values (Figure 42) it emerges that the contribution of categories other than land use change, global warming, particulate matter formation and freshwater eutrophication is very limited. Indeed, the impacts of downstream phases (grain transport and aggregation, milling and retailing) have very small contributions to the overall impacts of the life cycle of the product.
FIGURE 41: SUB-CHAIN 2, RELATIVE VALUES OF EACH MIDPOINT IMPACT CATEGORY OF 1 KG OF PACKAGED MAIZE MEAL AT RETAILER, PRODUCED THROUGH INDUSTRIAL MILLING. Source: Authors
Figure 43 shows the endpoint damage categories for all life cycle stages of the production of 1 kg of packaged maize meal produced through industrial processing. The largest impacts are in terms of ecosystem quality, which is mainly affected by land use and land transformation. Potential damage to human health is the second most important damage category; it is associated mainly with global warming. Human health is also affected by particulate matter formation. Resource depletion is the area with lowest impacts.
10
20
30
40
50
60
70
80
90
100
Glo
bal w
arm
ing
Stra
tosp
heric
ozo
ne d
eple
tion
Ioni
zing
rad
iatio
n
Ozo
ne fo
rmat
ion,
Hum
an h
ealth
Fine
par
ticul
ate
mat
ter
form
atio
n
Ozo
ne fo
rmat
ion,
Ter
rest
rial e
cosy
stem
s
Terr
estr
ial a
cidi
ficat
ion
Fres
hwat
er e
utro
phic
atio
n
Mar
ine
eutr
ophi
catio
n
Terr
estr
ial e
coto
xici
ty
Fres
hwat
er e
coto
xici
ty
Mar
ine
ecot
oxic
ity
Hum
an c
arci
noge
nic
toxi
city
Hum
an n
on-c
arci
noge
nic
toxi
city
Land
use
Min
eral
reso
urce
sca
rcity
Foss
il re
sour
ce s
carc
ity
Wat
er c
onsu
mpt
ion
%
Land Use Change Cultivation Crop residues combustion Transport, aggregation of grains Milling Transport to retailer

188
FIGURE 42: SUB-CHAIN 2, ENDPOINT IMPACT CATEGORIES FOR ALL LIFE CYCLE STAGES – SINGLE SCORES FOR 1 KG OF PACKAGED MAIZE MEAL AT RETAILER PRODUCED THROUGH INDUSTRIAL MILLING. Source: Authors
FIGURE 43: ENDPOINT DAMAGE CATEGORIES FOR ALL LIFE CYCLE STAGES OF THE PRODUCTION OF 1 KG OF PACKAGED MAIZE MEAL AT RETAILER, PRODUCED THROUGH INDUSTRIAL MILLING. Source: Authors
5
10
15
20
25
30
35
40
45
Land UseChange
Cultivation Crop residuescombustion
Transport,aggregation of
grains
Milling transport toretailer
mP
t
Global warming, Human health Global warming, Terrestrial ecosystemsGlobal warming, Freshwater ecosystems Stratospheric ozone depletionIonizing radiation Ozone formation, Human healthFine particulate matter formation Ozone formation, Terrestrial ecosystemsTerrestrial acidification Freshwater eutrophicationMarine eutrophication Terrestrial ecotoxicityFreshwater ecotoxicity Marine ecotoxicityHuman carcinogenic toxicity Human non-carcinogenic toxicityLand use Mineral resource scarcity
51015202530354045
Land UseChange
Cultivation Cropresidues
combustion
Transport,aggregation
of grains
Milling Transportto retailer
mP
t
Human health Ecosystems Resources

189
In Figure 44, the contribution to the overall endpoint impacts is shown for all life cycle stages of the production of 1 kg of packaged maize meal produced through sub-chain 2; most of the impacts are due to land use change and maize cultivation, while transport and grain aggregation, milling and transport of maize meal to retailer are activities that have very limited environmental impacts. Figure 45 shows the endpoint results at full life cycle per area of protection.
FIGURE 44: CONTRIBUTION TO ENDPOINT IMPACTS OF EACH LIFE CYCLE STAGE - INDUSTRIAL MILLING. UF: 1 KG OF PACKED MAIZE MEAL AT RETAILER Source: Authors
FIGURE 45: ENDPOINT RESULTS PER AREA OF PROTECTION OF THE PRODUCTION OF 1 KG OF MAIZE MEAL WITHIN SUB-CHAIN 2. Source: Authors
As previously discussed, results of the two sub-chains should not be compared, as they serve different markets and are complementary. Nevertheless, a clarification might be useful to better explain the differences observed. Since milled grain is not a highly processed product and therefore, as it was
0
20
40
60
80
100
1 kg of maize mill at retailer (from large-scale mill)
mP
t
transport to retailer MillingTransport, aggregation of grains Crop residues combustionCultivation Land Use Change
0
20
40
60
80
100
1 kg of maize mill at retailer (industrial sub-chain)
mP
t
Human health Ecosystems Resources

190
shown by the contribution analysis of environmental impacts along the chain, it has negligible impacts, differences are mostly determined by the phases associated with maize cultivation: land use change due to land clearing and the cultivation process. In particular, the differences observed are associated mainly with crop yield per hectare at farm gate; weighted average crop yield of farming systems contributing to the local sub-chain is 1.5 t/ha, compared to the 2.1 t/ha of grain sourcing the commercial sub-chain (sub-chain 2); a higher average yield is associated with less pressure on land. In Table 31 and Table 32, the life-cycle midpoint results are shown for maize meal at small-scale mills (sub-chain 1) and for maize meal at retailer (sub-chain 2), respectively. Although several midpoint impacts are higher in sub-chain 2, the contribution of those impacts is not comparable with the much larger contribution to endpoint impacts from land use and global warming.
Impact category Unit Maize meal, electric
small-scale mill Maize meal, diesel
small-scale mill
Global warming kg CO2 eq 1,74 1,77 Stratospheric ozone depletion kg CFC11 eq 9,06E-06 9,08E-06 Ionizing radiation kBq Co-60 eq 2,00E-03 2,28E-03 Ozone formation, Human health kg NOx eq 6,98E-04 1,18E-03 Fine particulate matter formation kg PM2.5 eq 5,40E-04 6,59E-04 Ozone formation, Terrestrial ecosystems kg NOx eq 9,84E-04 1,47E-03 Terrestrial acidification kg SO2 eq 3,31E-03 3,51E-03 Freshwater eutrophication kg P eq 7,50E-03 7,50E-03 Marine eutrophication kg N eq 8,95E-07 8,54E-07 Terrestrial ecotoxicity kg 1,4-DCB 1,06E-01 8,35E-02 Freshwater ecotoxicity kg 1,4-DCB 4,32E-03 1,85E-03 Marine ecotoxicity kg 1,4-DCB 3,52E-03 5,16E-04 Human carcinogenic toxicity kg 1,4-DCB 6,58E-04 2,41E-04 Human non-carcinogenic toxicity kg 1,4-DCB 1,48E-02 4,23E-03 Land use m2a crop eq 13,66 13,66 Mineral resource scarcity kg Cu eq 9,45E-04 9,16E-04 Fossil resource scarcity kg oil eq 5,49E-02 6,38E-02 Water consumption m3 1,17E-02 1,18E-02
TABLE 31: SUB-CHAIN 1 MIDPOINT IMPACT CATEGORIES PER KG OF MAIZE MEAL PRODUCED. Source: authors
.
Impact category Unit Maize meal at retailer, industrial mill
Global warming kg CO2 eq 1,58 Stratospheric ozone depletion kg CFC11 eq 1,08E-05 Ionizing radiation kBq Co-60 eq 4,11E-03 Ozone formation, Human health kg NOx eq 1,15E-03 Fine particulate matter formation kg PM2.5 eq 7,23E-04 Ozone formation, Terrestrial ecosystems kg NOx eq 1,41E-03 Terrestrial acidification kg SO2 eq 4,28E-03 Freshwater eutrophication kg P eq 6,37E-03 Marine eutrophication kg N eq 1,68E-06 Terrestrial ecotoxicity kg 1,4-DCB 1,51E-01 Freshwater ecotoxicity kg 1,4-DCB 7,56E-03 Marine ecotoxicity kg 1,4-DCB 1,69E-03 Human carcinogenic toxicity kg 1,4-DCB 3,14E-04 Human non-carcinogenic toxicity kg 1,4-DCB 7,19E-03 Land use m2a crop eq 10,74 Mineral resource scarcity kg Cu eq 1,15E-03

191
Fossil resource scarcity kg oil eq 8,87E-02 Water consumption m3 1,21E-02
TABLE 32: SUB-CHAIN 2 MIDPOINT IMPACT CATEGORIES PER KG OF MAIZE MEAL PRODUCED. SOURCE: AUTHORS
4.5 Comparisons of results with evidence/data from literature
Comparisons with LCA results obtained under different soil and climate conditions, with different cropping systems, system boundaries and assumptions –among other variables such as inclusion/exclusion of land use change– is not always straightforward and might not always be correct. Nevertheless, an attempt was made to check the results obtained in this study against those of literature. Many LCA studies are limited to the estimation of Global Warming Potential, of maize grain production, most of which refer to the two countries with the highest production worldwide, namely USA and China (Table 33). Considering that impacts from downstream phases (transport of grain and of mealie meal, milling) are relatively low, results at farm-gate capture most of the impacts of the chain.
Source Country GWP per unit area (kg CO2eq/ha)
GWP per unit yield (kg CO2 eq/kg grain)
Zhang et al., 2017 China 14,857 1.76 Zhang et al., 2018 China 3,700 - Wang et al., 2015 China - 1.01 Snyder et al., 2009 USA 3,080 - Kim et al., 2009 USA - 0.25 - 0.82* Farag et al., 2018 Egypt 2,500 0.31 Grant and Beer, 2006 Australia 5,200 - Supasri et al., 2020 Thailand -- 0.25 - 0.52 Ma et al., 2012 Canada 2,176 - 2,659 0.44 - 0.76 Wettsein, 2017 South Africa - 0.50 - 0.80 Wettsein, 2017 Argentina - 1.24 Agrifootprint, 2015 Argentina - 1.98** This study Zambia 1,988 - 4,766*** 0.87 - 2.21***
*in eight major producing counties in the US Corn Belt. **as in the present study, this result considers land use change from forest to cropland. ***minimum and maximum values, according to the cropping system.
TABLE 33: COMPARISON OF THE MAIZE GLOBAL WARMING POTENTIAL RESULTS OF MAIZE CULTIVATION IN ZAMBIA WITH SOME VALUES FROM LITERATURE Source: Authors, based on literature review.
It can be observed that the GWP values of the present study fall within the range of values obtained by other authors when carbon intensity per cultivated area is considered. Indeed, impacts per hectare cultivated range from 2,176 (Canada, Ma et al., 2012) to 14,857 kg CO2eq/ha (China, Zhang et al., 2017). Values of GWP per kg of grain obtained by other authors ranged from 0.25 to 1.98 kg CO2eq/kg grain (USA, Kim et al, 2018 and Argentina, Agri-footprint 2015, respectively). Within the present study, the cropping system with the lowest GWP, corresponding to LS-RAIN, was well within the range (0.87 kg CO2eq/kg grain) while the system with the highest GWP (SS-LI) fell outside the range (2.21 kg CO2eq/kg grain). Reasons for this high GWP value are the low grain yield (0.9 t/ha at farm gate) of this cropping

192
system and the effects of land transformation occurring in Zambia. The closest result from other authors was found in the Agri-footprint LCI database, which recorded the case of a maize cultivation system in Argentina (1.98 kg CO2eq/kg grain), where land transformation from forest to cropland occurred and its effect on GWP was assessed. It is worth pointing out that in many areas of the world, different countries have their own history of land clearing for agriculture, and they may be at different stages, Zambia being at a relatively early stage in the process compared to other countries. When considering the grain provision to each sub-chain the observed performance in terms of GWP is within the range found in literature. Indeed, the GWP of grain at farm-gate for the local and for the commercial sub-chains are 1.51 and 1.30 kg CO2 eq/kg grain, respectively.
4.6 Uncertainties and robustness of results
Data collected for the cultivation phase are reasonably robust. For the cultivation stage, they are based on the Rural Agricultural Livelihoods Survey 2019, which collected data from ca. 10,000 rural households, on the Crop Forecast Survey and on additional information from a number of interviews to small-holder farmers and large-scale farmers. Impacts of land use change resulting from land clearing for maize cultivation were modelled using information from RALS and from an extensive literature review, which involved exchanges with one of the authors of several publications covering the issue in Zambia. Nevertheless, within an LCA framework, it is important to keep in mind the sources of uncertainties in the interpretation of results and conclusions. The main uncertainties are as follows:
• estimations of carbon loss and of direct emissions due to land use change have associated uncertainties despite the extensive review of literature and RALS data elaboration on which they were based. Indeed, variability of carbon stocks from site to site is high as it depends on many different factors;
• for the calculation of field emissions at the cultivation phase and of emissions from biomass combustion (both of litter, within the land clearing activities and of crop residue after harvest), default emission factors from literature were used;
• Primary data in the life cycle inventory of the milling phase (both, large and small-scale) are derived from three selected large mills and 14 small-scale mills. Considering the number of both types is high (60 medium to large milling facilities and 20,000 small-scale mills), a full representativeness of the primary data collected cannot be claimed.
4.7 Discussion: environmental sustainability of maize VC in Zambia
Considering the impacts on the areas of protection, the largest impacts concern ecosystem quality, followed by potential damage to human health. Resource depletion is the area with the lowest impacts. Considering the impacts at the stages of the value chain, the main contribution to the overall environmental impacts derives (1) from direct land use change due to clearing of virgin land for cultivation and (2) from the agricultural production stage including crop residue burning, regardless of the sub-chain.

193
In sub-chain 1, higher overall impacts derive from land use change and from cultivation, with slightly smaller impacts from the latter compared to those of land use change. The contrary is observed in sub-chain 2; impacts of land use change are slightly smaller compared to those of the cultivation stage. This difference, and the overall lower environmental impact of the commercial sub-chain, are due to differences in grain yields obtained by the cropping systems that contribute to each sub-chain and to differences in their relative contribution rates to the grain output for each of the two sub-chains. Indeed, the average weighted yields were1.5 and 2.1 t/ha for the local and for the commercial sub-chains respectively. In the case of sub-chain 1, results for both options, electricity and diesel-powered small-scale mills are shown in Figure 46 and Figure 47 as a summary of the contributions of each lifecycle stage to the overall impact on human health, ecosystems and resources. Potential damage to human health was determined mainly by land use change and cultivation (95% when milling by electricity-powered facilities and 90% when milling by diesel-powered mills). In the case of electricity-powered milling, most of the remaining impacts on human health (5%) were due to crop residue combustion; while in the case of diesel-powered milling, the remaining impacts on human health (10%) were due equally to residues combustion and milling. Under both options, land use change and cultivation had a major contribution to potential damage to ecosystems (close to 100%). Resources were mostly affected by cultivation (98% and 82% respectively for electric and diesel-powered mills); contribution from milling reached 18% in case of diesel-powered processing. Although some significant differences were observed between milling technologies, resource depletion had limited contribution to the overall impacts, due to the relatively low level of mechanization for cultivation and in particular, to the relatively low levels of inputs required for milling, being maize meal not a highly processed product.
FIGURE 46: SUB-CHAIN 1, SUMMARY SHOWING THE SHARES OF EACH LIFECYCLE STAGE, MAIZE MEAL PRODUCED AT SMALL-SCALE MILLS (ELECTRIC). Source: Authors
0% 10% 20% 30% 40% 50% 60% 70% 80% 90% 100%
Resources
Ecosystems
Human health
Land Use Change CultivationCrop residues combustion Milling

194
FIGURE 47: SUB-CHAIN 1, SUMMARY SHOWING THE SHARES OF EACH LIFECYCLE STAGE, MAIZE MEAL PRODUCED AT SMALL-SCALE MILLS (DIESEL). Source: Authors Regarding sub-chain 2, land use change, cultivation and crop residue combustion had the largest contribution to potential damage to human health (96%) (Figure 48). Land use change and cultivation had a major contribution to ecosystem quality (99%). Impacts on resources were limited, with cultivation and transport of grain being the main contributing factors (93%).
FIGURE 48: SUB-CHAIN 2 (MAIZE MEAL PRODUCED THROUGH INDUSTRIAL MILLING), SUMMARY SHOWING THE SHARES OF EACH STAGE OF THE LIFECYCLE. Source Authors Considering that the main environmental issues of the maize value chain in Zambia are associated with direct land use change due to clearing of virgin land for cultivation and to the agricultural production stage, it is worth pointing out that the main drivers of direct land use change associated with maize cultivation are the need to increase grain production to meet subsistence food needs and also in response to market opportunities (Ngoma et al., 2019). This was confirmed through the focus groups discussions led by the local expert, held during the field survey in October 2020, during which farmers also informed that, in addition to the above two reasons for expanding cropland into virgin land, some expand their cropped area in order to be able to practice crop rotation. This is one of the
0% 10% 20% 30% 40% 50% 60% 70% 80% 90% 100%
Resources
Ecosystems
Human health
Land Use Change CultivationCrop residues combustion Milling
0% 10% 20% 30% 40% 50% 60% 70% 80% 90% 100%
Resources
Ecosystems
Human health
Land Use Change CultivationCrop residues combustion Transport, aggregation of grains

195
strategies in place for avoiding crop yield decline, therefore, the cropland area increase for crop rotation should reduce the need for deforestation in the longer term. There is evidence that at national level, increases of grain production seem to rely mostly on cropland expansion. Indeed, FAO statistics reveal that the national average maize grain yield has been steady in recent years (Figure 49). Districts with highest annual growth rate in maize production mostly overlap with the Zambezian Miombo Woodlands (Central and Southern) indicating a possible correlation between cropland expansion into forested areas and growth in maize production. According to Estes et al (2016) much of the cropland expansion in sub-Saharan Africa is likely to occur in higher rainfall areas, with substantial costs to biodiversity and carbon storage. They argue that Zambia presents an acute example of this challenge, with an expected tripling of population by 2050, good potential to expand maize and soya bean production, and large areas of relatively undisturbed Miombo woodland. In Figure 49, only districts with high contribution to the overall maize production are shown (added contributions were 73%).

196
FIGURE 49: ECOREGIONS OF ZAMBIA, ANNUAL GROWTH RATE IN MAIZE PRODUCTION IN A SELECTION OF DISTRICTS (WITH HIGH CONTRIBUTIONS TO THE TOTAL PRODUCTION, I.E., 73%) AND GRAIN YIELDS AT NATIONAL LEVEL AND MAIZE YIELD. Source: Authors (based on map of ecoregions of Zambia, Crop Forecast Survey and FAOSTAT). Strategies for releasing pressure on land (both on agricultural land occupation and on land cover change from forest to cropland) are issues that have been largely explored in Zambia. According to Vinya et al. (2011) drivers of deforestation are “numerous and, at any one site, [they] are closely interlinked”. Also, Richardson et al. (2015) highlight the issue of variations in the levels and causes of deforestation across the country and of the poor understanding of causality of forest degradation and loss of forest cover. According to the authors, wood extraction for charcoal is often followed by land clearing for agriculture because of the low marginal labour requirements to convert land after trees have been removed, or alternatively, the woody biomass from land cleared for agriculture may be used to produce charcoal. According to Ngoma et al. (2019), based on RALS results, most households (90%) expanded cropland. In any case, because the two main drivers of forest loss, charcoal production and agricultural expansion, work in tandem in Zambia (UNEP, 2015) and all main causes of deforestation are closely interlinked, addressing factors affecting forest clearing and forest degradation requires an integrated approach. Indeed, according to Chomba et al. (2014), among the main recommendations in this regard are the introduction of combinations of different options such as conservation farming and promotion of alternative livelihoods and the harmonization of policies related to forestry, land, agriculture and environment. Several options have been proposed to tackle the problem associated with low yields and cropland expansion including more ambitious strategies such as upscaling conservation practices and agroforestry systems. It is worth reminding that conservation agriculture (CA) is considered one of the potentially effective options to address low agricultural productivity in Zambia (Richardson et al, 2015) and therefore the associated issues of cropland expansion. Similarly, agroforestry systems have been promoted for decades in most southern African countries to build up soil fertility and to provide a basis for reducing the overall rate of deforestation on the continent (Garrity et al., 2010). Studies in Malawi and Zambia reported by Garriety et al. (2010) show an increasing adoption of intercropping of nitrogen fixing trees on farms, including Faidherbia albida. As incentive for adoption, the authors suggest the opportunity to link fertiliser subsidies directly to agroforestry investments on the farm in order to provide for long-term sustainability in nutrient supply and to build up soil fertility as the basis for sustained yields and improved efficiency of fertiliser response.
0
1
2
3
4
2009
2010
2011
2012
2013
2014
2015
2016
2017
2018
Zambia: maize grain yield (t/ha), FAO

197
It should be noted though, that Ngoma et al. (2019) did not find that adopting Climate Smart Agriculture had any significant effects on cropland expansion using a national sample. The authors conclude that this lack of correlation might indicate that Climate Smart Agriculture (CSA) alone might not avert expansion-led deforestation. Indeed, they state that technological intensification alone might not reduce deforestation unless it is complemented with improved natural resources management to control conversion of forestland to other uses. The authors add that CSA practices might be more likely to lead to win-win outcomes if accompanied by improved resource governance initiatives, such as payments for environmental services and better land use planning. Conservation agriculture, including practices such as improved crop rotations, improved fallows and green manures, but have had rather limited impact to date137. Indeed, conservation agriculture practices remain a challenge in terms of uptake. According to the Conservation Agriculture Scaling-Up project - CASU Final Evaluation (FAO, 2018), the main constraints for the uptake of conservation agriculture (CA) were the lack of inputs and equipment, knowledge and markets. Arslan et al. (2014) analyzed the intensity of adoption of two important pillars of CA: zero/minimum tillage and crop rotation, they found that in order to achieve effective and durable adoption of CA in Zambia, a better screening of agro-ecological and socio-economic constraints and incentives are needed. Also, it should be noted that although RALS provided detailed and robust data on crop yields for conventional cropping systems, there is no such information at national level in regard to CA. As previously discussed, another relevant impact category in this chain is particulate matter formation, affecting human health, which in part is originated from burning agricultural residues. This can be reduced through improved management of residues that imply avoiding their combustion and through measures to reduce wild fires, considering that according to RALS in the reference year crop residues of 20% of the cropland under maize cultivation were burnt. Also, reducing storage losses can contribute to significant improvements of the environmental profile of the whole value chain, considering that post-harvest losses have large incidence on the efficiency ratio of output to land area cultivated. This issue could be addressed in the short to mid-term by improving post-harvest storage at farm level. In this regard, one possible strategy would be supplying and giving information on the economic use of hermetic bags for on-farm storage of grains. There are additional human health hazards associated with herbicide and pesticide application on crops. These risks tend to be localized and may be reversible. Feasible mitigation measures are available and may be implemented by following environmental regulations and best environmental management practices. These practices also regard the correct disposal of packaging material contaminated with residues of chemicals. The adoption of such measures needs to be encouraged in
137 An evaluation of Conservation Agriculture undertaken in 2016, concluded that the adoption rate was low in spite of over 20 years of promotion (Working paper No. 114, IAPRI).
198
Zambia, for instance, through awareness campaigns involving the local leadership, extension services, agri-businesses and agro-dealers.
4.8 Conclusion: environmental sustainability of maize VC in Zambia
This environmental assessment of maize meal produced in Zambia provides an up-to-date reference regarding environmental profile of the maize value chain and allows to identify margins of improvement. The impact assessment method adopted (ReCiPe 2016), provided results in terms of potential damage to human health, ecosystems quality and resource depletion. Considering the impacts on the three areas of protection, the maize value chain in Zambia has larger impacts on the ecosystem quality, which is the domain with the largest contribution to the environmental profile of the value chain, particularly in the case of the local sub-chain; indeed, impacts on the ecosystem are high. There is a medium level of potential impacts on human health, while impacts on non-renewable resources depletion are very low. Increasing maize yields and reducing post-harvest grain losses would improve the environmental profile of the whole value chain by contributing to mitigate land clearing and land occupation issues, which are the most relevant environmental hotspots of the maize value chain in Zambia. In particular, grain yields influence the impact categories with highest contribution to the environmental performance of the value chain. These categories are land use (affecting ecosystems), and global warming (affecting both ecosystems and human health). Insights of the extent to which land occupation and land clearing are correlated to grain yield per hectare can be derived from a comparison of the endpoint values at farm-gate in Figure 33 and Figure 34, which show that as an effect of the higher grain yields of the higher input cultivation systems, overall impacts significantly decrease. Non-renewable resources are used at slightly higher rates under higher input cultivation systems but considering that this domain is affected at a very low level, differences are negligible whether agricultural input levels are lower or higher. Impacts on resource depletion at stages downstream along the chain (transport of grain, milling) are extremely low. Considering the impacts at the stages of the value chain, the largest contribution derives from stages associated to grain production at farm, namely (1) direct land use change due to clearing of virgin land for cultivation and (2) from the agricultural production stage, regardless of the sub-chain. Improving grain yields, and reducing post-harvest grain losses would potentially contribute to releasing pressure on land and to the reduction of the part of forest degradation triggered by cropland expansion, which are the main issues that prevent this value chain from being environmentally sustainable, especially in sub-chain 1, in which more virgin land is cleared per unit of grain produced.

199
According to Estes et al (2016), “rapidly rising populations and likely increases in incomes in sub-Saharan Africa make large areas of cropland expansion nearly inevitable”. The authors argue that cropland expansion is likely to occur in higher rainfall areas, with substantial costs to biodiversity and carbon storage. They highlight that Zambia presents an acute example of this challenge, with an expected tripling of population by 2050, good potential to expand maize and soya bean production, and large areas of relatively undisturbed miombo woodland. Land clearing is environmentally undesirable but can be economically attractive when large areas of forest land are available, as it can ensure a good productivity of labour without external inputs. Strategies to reduce the rates of land clearing in the short-to-medium term may include timely and adequate application of chemical fertilisers to prevent soil fertility drop. In the longer term, strategies should also include the introduction/upscaling of elements of conservation agriculture, tailored for the local conditions in each individual region. Reducing storage losses can also contribute to a significant improvement of the environmental profile of the whole value chain, this issue could be tackled in the short to mid-term through relatively simple solutions, such as the use hermetic bags for on-farm storage of grains.
200
5. CONCLUSIONS - RECOMMENDATIONS
Main results to the Framing Questions and findings of the overall diagnosis are summarized here, with consideration to dynamics of the growth of the VC, its benefits, challenges, opportunities and recommendations for further development. Framing Question 1: What is the contribution of the VC to economic growth? The profitability encountered by the different stakeholders along the chain is variable. Small farmers experienced a low profitability, with a labour productivity close to minimum rural wage; large farmers were pushed out of the market by a maize price under their cost of production. Traders and millers have a higher profitability but with a permanent high risk-taking for traders involved in storage. Maize, as the main staple food product of Zambia, consumed by both rural and urban people represents a large part (one third) of agriculture GDP. The whole maize VC with its indirect spillover effects contributes to 1.9% to Zambian GDP. Most of farmers are facing low and fluctuating farm gate prices, and low yields due to climate hazards as well as soil degradation linked to maize monocropping. Maize support policies, in particular large seeds and fertilizer subsidies haven’t been so far efficient in terms of yield improvement and income transfer to smaller farmers. Zambia's maize VC appears to be competitive in its context of Southern and Eastern African region; maize grain prices at farm and store gate being lower than those of the main competitor, Republic of South Africa, in 2018/19, even though this relies partly on subsidies. Northern part of Zambia has adequate climate and good productive potential for maize to seize regional market opportunities. Another asset of Zambia is its highly developed sector for seeds production. However, maize export has been offset so far by a restrictive commercial policy prioritizing domestic supply. Framing Question 2: Is this economic growth inclusive? The increased volume of maize grain production by small-scale farmers, commercial seed production by large-scale farmers, and increased private sector involvement in the various maize related input supply and value addition activities, has provided increased employment and enterprise opportunities along the value chain.
Increased demand for improved technology among small-scale farmers, along with liberalisation of the input sector has encouraged investment and competition in hybrid seed production, fertilizer and agro-chemical supply, and has brought this technology within easier reach of small-scale farmers. Subsidy of improved inputs through FISP has played an important part in this growth in demand. In an effort to make FISP more inclusive of the small-scale farming population, the volume of production subsidies to small-scale farmers has increased, and the number of FISP beneficiaries has also increased since 2016. However, while efforts have been made to widen access to FISP, a significant proportion of small-scale farmers, including those in areas well suited for maize production are not

201
receiving FISP support. Moreover, in areas less well suited for maize production, farmers who do participate in FISP achieve generally lower returns.
Relatively low and unpredictable farm gate prices for maize grain have discouraged large-scale commercial farmers from producing it. For this type of farmer, hybrid maize seed production is far more profitable than grain production.
Maize trading into the urban areas and cross-border markets has provided useful income earning opportunities in rural areas where paid employment opportunities are scarce. This opportunity has been taken up particularly for younger men and some enterprising women. Small and micro-scale processing and trading of maize grain and maize products provides a significant income earning for rural people unable to compete in formal employment markets which have barriers to entry relating to education or qualifications.
Milling is the least inclusive segment of the maize VC, requiring significant amounts of capital to enter. Milling is relatively competitive. Large-scale milling requires high levels of technical and management and significant investment in modern plant and equipment in order to remain viable longer term. Access to FRA maize quotas is also a factor which affects profitability and is only available to large-scale millers.
Framing Question 3: Is the VC socially sustainable?
Working conditions in the commercialised parts of the value chain are protected by employment legislation. This is respected by larger commercial operators including commercial farms, major grain trading operators and milling companies. Youth and the less educated older adults from lower income households in temporary or casual employment are least well protected by employment legislation. The small-scale production, processing and trading sectors of the value chain account for a large part of the volume of flows but fall outside the scope of the employment legislation.
The majority of rural households growing maize have secure access to land through customary tenure systems based on family ties and village membership. As cropping land becomes scarcer the productivity per unit area will need to increase if small and medium scale farmers are to continue to contribute to increased national maize production in future years.
Regarding gender equality, there has been a clear lag between the development of progressive national policies in the 1980s and changes to attitudes and behaviour since then. This lag applies to public and private sector organisations and rural communities. The risks of female disadvantage are generally lower where the scale of the operation is smaller. Women are included in maize production activities, but in male headed households the cultural norm is that women rely on decision making from their husbands. Women rarely occupy the manual and technical roles in the larger commercial maize trading and commercial milling plants; cultural perceptions of gender capabilities and vulnerabilities influence hiring decisions in these parts of the maize VC.

202
With regard to household food security, increasing levels of rural household incorporation into a cash economy includes the strategy of selling food crops after harvest to meet urgent cash needs. Households producing smaller amounts of maize may sell some of their grain to finance other needs, with the intention of raising money to purchase food later, or working for payment in grain, when their own food stocks run out. These households tend to have less assets and are more likely to be female headed. The risks of periodic household food shortage increase as rural households become increasingly dependent on maize as their main staple crop. Climate risks and declining soil fertility increase their likelihood of lower maize yields per unit area.
The benefits from economic growth on food accessibility are not evenly distributed; urban households have relatively more income to allocate to food than rural households. If the input subsidy for maize stopped, this would have a negative effect on many rural households. For resource richer households there would be a reduction in income from maize sales to potentially buy other food types, while for poorer households’ access to maize grain for household food security would reduce.
The development of social capital in the small-scale maize sector, through producer cooperatives, and long-term relations based on trust between local input providers, traders and farmers is weak. The development of these types of social capital at local level has been hindered by a historical focus on a subsidised top-down system for supporting maize production and marketing. This has undermined an ethos self-reliance and enterprise, and the continuing use of local cooperatives as the main conduit for FISP distribution is weakening grass-roots cooperative formation. Initiatives to establish contract farming for maize have not taken off.
By contrast, relations of trust are relatively strong between the established commercial farmers and other VC actors, including input suppliers, millers and grain traders. Commercial farmers are able to access fertilizer and seed inputs on credit, and agree pre-harvest prices for produce with commercial millers.
Regarding general living conditions, rural households growing maize tend to live within relatively easy reach of rural services, including clinics, schools, boreholes and rural roads. If they wish to get access to larger areas of cropping land this usually involves re-locating the household to a remoter area. Investment in improved rural roads (construction and maintenance) provides a solid basis for improving the efficiency of the maize VC along with other enterprises and rural services which in the longer term will improve rural living conditions.
Framing Question 4: Is the VC environmentally sustainable?
The maize value chain in Zambia has larger impacts on the ecosystem quality, which is the domain with the largest contribution to the environmental profile of the value chain, particularly in the case of the local sub-chain. There is a medium level of potential impacts on human health, while impacts on non-renewable resources depletion are very low.

203
Increasing maize yields and reducing post-harvest grain losses would improve the environmental profile of the whole value chain by contributing to mitigate land clearing and land occupation issues, which are the most relevant environmental hotspots of the maize value chain in Zambia. In particular, grain yields influence the impact categories with highest contribution to the environmental performance of the value chain. These categories are land use (affecting ecosystems), and global warming (affecting both ecosystems and human health).
Considering the impacts at the stages of the value chain, the largest contribution derives from stages associated to grain production at farm, namely (1) direct land use change due to clearing of virgin land for cultivation and (2) from the agricultural production stage, regardless of the sub-chain. Improving grain yields, and reducing post-harvest grain losses would potentially contribute to releasing pressure on land and to the reduction of the part of forest degradation triggered by cropland expansion, which are the main issues that prevent this value chain from being environmentally sustainable, especially in sub-chain 1, in which more virgin land is cleared per unit of grain produced.
Strategies to reduce the rates of land clearing in the short-to-medium term may include timely and adequate application of chemical fertilisers to prevent soil fertility drop. In the longer term, strategies should also include the introduction/upscaling of elements of conservation agriculture, tailored for the local conditions in each individual region.
Reducing storage losses can also contribute to a significant improvement of the environmental profile of the whole value chain, this issue could be tackled in the short to mid-term through relatively simple solutions, such as the use hermetic bags for on-farm storage of grains.
Maize VC Growth: Benefits and Drivers • Maize production in Zambia, has increased substantially over the past two decades, with many
positive benefits to the economy and the population at large. The urban population has benefited from a reliable and more affordable staple food supply. In many rural areas maize has provided a relatively reliable household food supply and also a significant cash income for a minority of households regularly selling their surplus production. Increasing supplies of maize grown in Zambia have stimulated and enabled rapid growth in the poultry (eggs and broilers), pig and also dairy industries. Zambia is now relatively competitive regionally not only in the production of maize grain, but also in the production of broiler meat, eggs, and maize based products (stockfeed, maize meal, opaque beer, and a range of confectionary products) a proportion of which are exported into DRC and other neighbouring countries.
• Increased production has mainly been achieved through area expansion. The reliable supply of
hybrid seed has enabled small-scale farmers to grow appropriate maize varieties in their locality, and they have mostly opted to grow hybrid maize rather than local or improved pollinated varieties. This supply has generally reduced the production risks for small-scale farmers who are the primary maize producers. Zambia has become one of the main maize seed producing

204
countries in the region, regularly exporting significant quantities of hybrid maize seed to other countries in East and Southern Africa.
• Increases in both maize grain production and maize seed production have been underpinned by
public and private investment. Commercial seed companies and seed producers have benefited from substantial initial public investment in research and seed certification services during the 1980s and 1990s. Private investment in locally based seed companies and agro-chemical importation has provided small-scale farmers with better access to improved inputs, which they purchase when they can afford them. Government subsidy of hybrid seed maize and fertilizer to small-scale farmers since 2001 has not only contributed to increased maize production, but also encouraged small-scale farmers to engage with markets and new agricultural technology as part of their livelihood strategies.
• Increased national maize production has been accompanied by substantial public and private investment in marketing of grain, in particular through FRA aggregating and warehousing facilities. FRA grain purchase at a very large scale all over the country has secured outlets for maize at a common national price. This is a strong incentive for production, especially for remote areas which used to face buyers’ failure and low grain prices. Private grain storage facilities, and maize milling (both industrial scale in urban area and small-scale in rural areas) have also encouraged maize production. In addition, there has been significant private investment in industries which use maize in the production of beverages, snack-foods and confectionary. These industries are becoming increasing important not only as a source of employment and products for the growing urban and peri-urban populations, but also for export into DRC.
Challenges While significant investment in the maize VC has delivered important economic and social benefits, this investment has been biased towards the urban population. Investment and related policy implementation have tended to stifle further private investment in the maize VC and neglected environmental, economic and social sustainability in rural areas. • The extent of government intervention in export controls, input supply and grain markets is a
potential disincentive to further private investment in new business opportunities which the maize VC provides, such as export outlets and new products. For example, ad hoc export bans of maize grain and maize meal has discouraged private sector investment by large grain traders’ who otherwise would provide a reliable market for small-scale farmers in accessible areas. Instead, the government through FRA increased its presence in the rural areas which increases the burden on the public purse.
• The combination of fluctuating and low maize prices, and frequent export bans of maize grain and maize meal, has reduced off-take by processors/millers from commercial farmers who have largely opted-out of maize as a rotation crop in preference for other crops such as soya beans, where there is less perceived interference by the government. This has made maize grain production a preserve of small-scale farmers.

205
• The negative effects of a “maize-centric” agricultural policy require serious consideration. Decades
of focus on maize has curtailed agricultural diversification; more than 50 percent of the agricultural budget is devoted to maize alone. Moreover, because the increase in maize production has been mainly through extension of the cropped area, at the expense of forest and grazing lands, this process threatens the sustainability of rural livelihoods; reducing the local supply of wood for fuel and construction and reducing opportunities for keeping cattle for animal draught power and manure production. Expansion of production through extension of the cropped area is indirectly encouraged through public subsidy and negatively impacts climate change and ecosystems quality.
• The significant involvement of government in market regulation through the sale of government maize stocks to millers below the market price favours the interests of urban consumers of maize and the large millers, rather than the rural producers of maize and small-scale millers who receive relatively low prices for their maize and milling services. The “real” price of maize meal in urban areas has declined in dollar terms, while the price small-scale farmers receive for their maize is generally providing a very low remuneration for their labour.
• Large- scale government intervention also results in unequal distribution of benefits between and within various stakeholder categories. In any one season, less than half of the rural households growing maize benefit from FISP subsidised inputs for maize production. Subsidies to industrial millers (through sale of FRA maize at below market price) does not include all industrial millers; the larger and more established millers tend to benefit while smaller industrial millers and hammer mill owners in the rural areas do not benefit.
• The over dependence of Zambian small-scale farmers on maize negatively impacts them in several
aspects. There is increased exposure to climate change effects (drought, flooding, climate related pest and disease outbreaks), reduced bargaining power in terms of selling price (particularly in years of bumper harvest), soil degradation arising from mono-cropping with fertilizers, poor infant nutrition related to a high-carb. infant diet, and a limited production of complementary food and cash crops.
• Despite a history of input subsidies, average maize yields are at a relatively low level, under 2 t/ha,
resulting in low productivity and low income for small-scale farmers. Conventional intensification with the package of hybrid seed, mineral fertilizer and herbicide-is the main approach promoted by agro-dealers and FISP, but these have likely adverse environmental effects on ecosystems and pose risks to human health. Transition to more sustainable cropping practices, as promoted through conservation farming programmes, remains a challenge in terms of uptake.
• Increased maize production during the 2000s drew on research investments during the 1980s and 1990s. There is a risk that without continued investment in relevant research, the sector will not be equipped to face newer challenges posed by climate change, soil fertility decline, new diseases and increasing pest challenges arising from agricultural intensification.

206
Opportunities and recommendations Given the history of past investment in the maize VC, it is necessary to review and re-focus public investment and shape policies that will encourage private investment in priority areas to meet the challenges above. Subsidies to maize input supply through FISP and to commercial maize millers through FRA, take up public funds, part of which could instead be invested to support activities contributing to a more sustainable future. This includes research and extension interventions addressing productivity, nutrition and sustainability constraints in the small-scale farming sector such as:
• Maize is likely to remain Zambia’s primary staple crop, so a portion of the agriculture budget
currently allocated to maize input subsidy can be used to enhance on-farm adaptive research in the main maize producing areas. This would focus on targeted technical messaging which promote improved productivity and resilience of the small-scale farmer.
• Increased support to small-scale mechanization, and expansion of draft animal power in the higher rainfall regions. This would ease the significant labour burden for households during land preparation and weeding and reduce dependence on herbicides 138.
• Develop, refine and promote conservation agriculture practices more closely tailored for the local conditions in each region, to address the relatively slow uptake of conservation agriculture.
• Continue investment in the development of maize varieties which are adapted to the local conditions in Zambia, tolerant to address biophysical constraints related to climate change and agricultural intensification. This could include on-farm testing of advanced lines in collaboration with plant breeders (of maize and complementary crops) and Zambian seed companies. This should be informed by a diagnostic study/analysis of the main limiting factors of small-scale maize productivity in the different regions of Zambia. This could include improved open pollinated varieties of maize for farmers not receiving FISP or FSP who cannot afford to purchase new seed each season.
• Continue investment in the promotion and utilisation of maize varieties with improved nutritional content (high lysine and vitamin A) to address nutritional deficits in rural areas. If the reluctance of commercial millers to process orange maize and seed companies to produce it, continue to pose barriers, this could be done through the FSP, school feeding programmes and NGOs working in rural areas in order to generate future demand and investment. Public education programmes may be required to address potential stigma and negative perceptions attached to the colour of
• 138 This would require inputs from veterinary services, animal nutrition, animal training, and implement fabrication
and repair enterprises. There is scope to invest in interested rural youth particularly young women as they are not well represented in the value chain by providing skills training and employment for the future. For farmers who lack draft animal power, alternative technologies to herbicide could be experimented for more effective mechanical weeding systems and tillage tools.

207
this maize. The voucher system used by FISP could also play a role, for example by doubling the value if farmers buy orange maize seed or adopt conservation agriculture practices.
There are also opportunities to address inequities arising from the current design and implementation of FISP and FSP and promote new opportunities in rural areas which could involve: • Review of the current targeting of both FISP and FSP. A large proportion of poorer rural households
active in farming do not receive FISP or FSP, and many who do receive it do not have a choice of inputs. FSP, while targeting “vulnerable yet viable” households reaches a very low proportion of such households. FSP could be further expanded and adjusted, whist the FISP can be reformed. One aim of the review would be to increase farmer choice of inputs and reduce maize dependency. This will encourage rural employment creation and diversification of cropping and the rural economy139.
• Reducing the maize focus of FISP and FSP packages will further underpin the current agricultural policies and strategies relating to diversification and resilience in the face of climate change. Supporting the promotion of cropping systems that enable rotation of cereals with other crops (food legumes, forage legumes, deep cash rooted crops) which are beneficial to soil fertility maintenance and reduce the risks of crop failure arising from climate change risks140.
Opportunities to encourage private investment and “seed funding” which will increase opportunities for rural employment and enterprise include: • Invest in business and technical training for owners and staff of small agro-dealerships to address
the current skills shortage in this sector. This could focus on rural areas where the demand for purchased agro-inputs is strong and/or increasing. This might be done via providing incentives to larger input suppliers to operate in remoter areas, or via support to NGOs operating in this sector.
• Support to organisations piloting different models of contract farming, with potential to include maize along with other crops. This is needed to address the currently low levels of trust and social capital within the maize VC. The aim would be to develop trust and social capital, reduce risks associated with weak social capital, and improve timely access to inputs, technical advice and markets for small-scale farmers who are credit constrained but ambitious in terms of increasing their productivity of all marketed crops. This may involve further support for local “village banking”
139 For example, the size of a FISP package could be reduced further, so that more farmers can potentially benefit. A flexible voucher with diverse inputs including legumes, soil fertility enhancement inputs, small farm equipment, and payment for mechanical services should be provided. Distributed through an electronic voucher through agro-dealers would result in agricultural diversification, create business opportunities and employment for the youth particularly women in agro-shops and reduce the cost of subsidy delivery to the small-scale farmers. More investment in building an efficient agro-dealer network is required to ensure a more efficient input delivery and ease access by farmers. This approach will be more sustainable than government prescribing what inputs to deliver to the farmers. For more commercially oriented farmers, other programmes can be promoted particularly to help increase their access to finance and mechanical power sources. 140 For example, farmers who redeem inputs that enhance soil fertility and/or nutrition could be remunerated through an increase in the value of their voucher. Incentivising good farming practices through the government subsidy would help to enhance adoption of climate smart practices as well as make Zambia’s production system nutrition sensitive. To address the challenges of declining soil fertility and low returns to fertilizer use in some areas where maize production is strong, support investment in services for soil testing and fertilizer blending with the aim of improving small-holder productivity for more commercially oriented smallholder farmers.

208
initiatives and also the warehouse receipt system which are mechanisms to strengthen social capital in rural areas.
Opportunities to improve local food availability and security and reduce costs associated with transportation of maize grain and maize meal include: • Addressing practices/policies which encourage small-scale farmers to sell maize at a low price after
harvest and then pay a high price for maize or maize meal, or depend on food relief, when they run out of grain before their next harvest. This could include providing incentives for greater use of local facilities for maize storage and milling and giving millers in remoter areas the option to purchase maize from local FRA stores at a lower price. This would help to reduce transport costs and the environmental impact of moving commercially milled maize meal from main urban centres to more distant maize producing rural areas.
• Grain post-harvest losses at farm level an issue, particularly in more higher rainfall northern regions, with significant impact on environmental as well as economic efficiency of the VC. The high environmental costs associated with production mean that any grain produced that is not consumed has significant environmental, as well as economic impact. To improve household food security and reduce storage losses, financial support could be provided to organisations engaged in the manufacture, supply and giving information and advice on the economic use of hermetic bags (PICS) for on farm storage of maize (and other grains). This could be part of FISP. Community level storage is another complementary strategy to be further explored, to reduce dependency on food relief and promote local community empowerment.
Further Research (short term studies)
• Factors which underlie child malnutrition in the important maize growing areas to inform the Scaling up Nutrition (SUN) programme currently being rolled out in Zambia,
• Deeper analysis of the factors which are driving increased production of maize in some drought prone districts where drought tolerant crops have been promoted for many years, and risks to food security posed by drought is increasing,
• Literature review of the potential benefits and risks of reduced government intervention in the maize VC, with reference to other comparable economies that have tried this with the main staple food crop,
• In-depth audit of the maize trade and subsidy sector, with a view to identifying opportunities for increasing efficiencies in the value chain and reducing current burden on the public purse.

209
Bibliography/ reference list
African Postharvest Losses Information System (APHLIS) https://www.aphlis.net/en last accessed August 10th, (2020) AgResults, (2020) Evaluation Findings: Zambia Biofortified Maize Challenge Project. Evaluator’s Lessons Learnt Series. Brief 6. December 2020 https://agresults.org/learning
Akomea-Frempong, S., Ofosu, I. W., Owusu-Ansah, E. D. G. J., & Darko, G. (2017). Health risks due to consumption of pesticides in ready-to-eat vegetables (salads) in Kumasi, Ghana. International Journal of Food Contamination, 4(1), 1-11. https://link.springer.com/article/10.1186/s40550-017-0058-6 Armyworm Network (2021) Latest Armyworm Forecast (December 2020) www.armyworm.org/latest-armyworm-forecast-december-2020/ Arneson, S., Firth, M. & Ngoma, M. (2017) A Needs Assessment of Rural Agribusinesses: The Commercial Viability of SMEs SME- Descriptive Study and Aggregator Assessments. Confidential report for MUSIKA and World Food Programme (WFP).- Not available online. Arslan, A., McCarthy, N., Lipper, L., Asfaw, S., & Cattaneo, A. (2014). Adoption and intensity of adoption of conservation farming practices in Zambia. Agriculture, ecosystems & environment, 187, 72-86. https://www.sciencedirect.com/science/article/abs/pii/S0167880913002776 Banda, A., Chapoto, A., & Zulu-Mbata, O (2018) Emergent Farmer Survey (EFS) Survey Report. Indaba Agricultural Policy Research Institute (IAPRI)Lusaka, Zambia. Downloadable at: http://www.iapri.org.zm Bandel, T. & Nerger, R., (2018) The true cost of maize production in Zambia’s Central Province. Hivos, IIED, Soil & More. Discussion Paper. https://southern-africa.hivos.org/assets/2018/10/True-Cost-of-Maize-in-Zambia.pdf Blécourt, M. D., Röder, A., Groengroeft, A., Baumann, S., Frantz, D., & Eschenbach, A. (2018). Deforestation for agricultural expansion in SW Zambia and NE Namibia and the impacts on soil fertility, soil organic carbon-and nutrient levels. Biodiversity and Ecology, 6, 242-250. https://www.cabdirect.org/cabdirect/abstract/20183356968 Bolt, R. (1989), Food Availability and Consumption Patterns in Northern Province, ARPT Trial Areas: First Report on ARPT 1988 Nutrition Data Collection. Kasama, Adaptive Research Planning Team, Research Branch, Ministry of Agriculture, Zambia. Unpublished report. Bolt, R & Silavwe, M. (1988) Economic Studies No. 2. Farming Systems and Household Economy in the Northern Province Plateau Region ARPT Trial Areas. Adaptive Research Planning Team, Research Branch, Ministry of Agriculture, Zambia. Unpublished report. Brewster, D. R., Manary, M. J., Menzies, I. S., Henry, R. L., & O’Loughlin, E. V. (1997). Comparison of milk and maize based diets in kwashiorkor. Archives of disease in childhood, 76(3), 242-248. https://adc.bmj.com/content/76/3/242.abstract

210
Buono da Silva Baptista, V., Córcoles, J. I., Colombo, A., & Moreno, M. Á. (2019). Feasibility of the use of variable speed drives in center pivot systems installed in plots with variable topography. Water, 11(10), 2192. https://www.mdpi.com/2073-4441/11/10/2192 Burke, W. J., Hichaambwa, M., Banda, D., & Jayne, T. S. (2011). The cost of maize production by smallholder farmers in Zambia , FSRP Working Paper 50. 28 p (No. 1093-2016-88009). https://citeseerx.ist.psu.edu/viewdoc/download?doi=10.1.1.224.9428&rep=rep1&type=pdf Burton, G. W., Wallace, A. T., & Rachie, K. O. (1972). Chemical composition and nutritive value of pearl millet (Pennisetum typhoides (Burm.) Stapf and EC Hubbard) grain 1. Crop Science, 12(2), 187-188. https://acsess.onlinelibrary.wiley.com/doi/abs/10.2135/cropsci1972.0011183X001200020009x Chapoto, A and T.S. Jayne (2009). Effects of Maize Marketing and Trade Policy on Price Unpredictability in Zambia. Food Security Research Project Working Paper No. 38. https://ageconsearch.umn.edu/record/54499/ Chapoto, A., Zulu-Mbata, O., Hoffman, B. D., Kabaghe, C., Sitko, N., Kuteya, A., & Zulu, B. (2015). The Politics of Maize in Zambia: Who holds the keys to change the status quo? (No. 1093-2016-87863). https://scholar.google.com/scholar?hl=en&as_sdt=0%2C5&q=the+politics+of+maize+in+zambia&btnG= Chapoto, A, (2019a), Household Income Portfolios and Poverty: Implications for public expenditure in Zambia (Zero Draft). Unpublished report. Chapoto, A. (2019b) The Maize Conundrum: Securing Zambia Food Security through Market Based Solutions in the 2019/20 Marketing Season. Unpublished report. Chapoto A. (2019c) The role of strategic food reserves in enhancing food security in developing countries. The case of Zambia. DAI, CIRAD https://docplayer.net/146795340-The-role-of-strategic-food-reserves-in-enhancing-food-security-in-developing-countries-the-case-of-zambia.html Chapoto A., Sitko N. (2015) Agriculture in Zambia. Past, Present and Future. IAPRI edition. https://catalog.libraries.psu.edu/catalog/32173720 Chapoto A., Chisanga B., Kuteya A., Kabwe S., (2015) Bumper Harvests a Curse or a Blessing for Zambia: Lessons from the 2014/15 Maize Marketing Season. Working Paper IAPRI No. 93 https://www.researchgate.net/publication/320946639_Bumper_Harvests_a_Curse_or_a_Blessing_for_Zambia_Lessons_from_the_201415_Maize_Marketing_Season Chapoto,A., Zulu-Mbata O., Hoffman B.D., Kabaghe C., Sitko N.J., Kuteya A., Zulu B. (2015). The Politics of Maize in Zambia: Who holds the Keys to Change the Status Quo? Working Paper No. 99. IAPRI. https://scholarship.law.cornell.edu/cgi/viewcontent.cgi?article=1061&context=zssj
Chapoto, A. & Subukanya, M. (2019) Rural Agricultural Livelihoods Survey. 2019 Report. December 2019. Indaba Agricultural Policy Research Institute, Lusaka., Zambia https://www.iapri.org.zm/rural-agricultural-livelihoods-survey-2019-report/

211
Chapoto, A. & Zulu-Mbata, O. (2016) Rural Agricultural Livelihoods Survey. 2015 Report. December 2019. Indaba Agricultural Policy Research Institute, Lusaka., Zambia https://www.iapri.org.zm/rural-agricultural-livelihoods-survey-2019-report/ Chemical Watch, (n.d.) Beyond Pesticides chemicalWATCH Factsheet https://www.beyondpesticides.org/assets/media/documents/mosquito/documents/SyntheticPyrethroids.pdf Chileshe, J. (2019). Nutrition, health and microbial ecology of traditional fermented foods in Zambia. https://edepot.wur.nl/499123 Chisanga, B., Chapoto, A., (2018) Grain Market Innovations and Investments in Zambia: Grain Market Opportunities for Smallholder Farmers. Working paper No. 135. IAPRI https://www.researchgate.net/publication/325153231_Grain_Marketing_Innovations_and_Investments_in_Zambia_Creating_Marketing_Opportunities_for_Smallholder_Farmers Chisanga, B., Zulu-Mbata, O. (2018). The changing food expenditure patterns and trends in Zambia: implications for agricultural policies. Food Security, 10(3), 721-740. https://link.springer.com/article/10.1007/s12571-018-0810-7 Chishimba, S.L. (2020) Marketing Season opens in Lufwanyama, May 18 Zambia National Farmers Union Website Article https://www.znfu.org.zm/articles Chiwele, D.K, Muyatwa-Sipula, P, Kalinda, H. (1996) Private Sector Response to Agricultural Marketing Liberalisation in Zambia: A Case Study of Eastern Province Maize Markets. Research Report No 107. Nordiska Afrikainstitutet Uppsala https://www.files.ethz.ch/isn/97894/107.pdf Cruz, J.F., Hounhouigan J., Havard M., Ferré T. (2019). Le transformation des grains. Collection Agricultures tropicales en poche. Quae, Pressses agronomiques de Gembloux, CTA, Versailles, Gembloux, Wageningen. 182 p. + cahier quadri 16 p. https://agritrop.cirad.fr/594973/1/ID594973.pdf Chomba B.M., Tembo O., Mutandi K., Mtongo C.S., Makano, A. (2012). Drivers of deforestation, identification of threatened forests and forest co-benefits other than carbon from REDD+ implementation in Zambia. A consultancy report prepared for the Forestry Department and the Food and Agriculture Organization of the United Nations under the national UN-REDD Programme: Ministry of Lands, Natural Resources and Environmental Protection. Lusaka, Zambia. http://ziflp.org.zm/wp-content/uploads/2018/09/Deforestation_Drivers_UNIQUE-1.pdf
De Blécourt M., Röder A., Groengroeft A., Baumann S., Frantz D., Eschenbach A. (2018) Deforestation for agricultural expansion in SW Zambia and NE Namibia and the impacts on soil fertility, soil organic carbon- and nutrient levels. In: Climate change and adaptive land management in southern Africa – assessments, changes, challenges, and solutions (ed. by Revermann R., Krewenka K.M., Schmiedel U., Olwoch J.M., Helmschrot J., Jürgens N.), pp. 242-250, Biodiversity & Ecology, 6, Klaus Hess Publishers, Göttingen & Windhoek. doi:10.7809/b-e.00330

212
Dan, Z., Jianbo, S., Fusuo, Z., Yu'e, L., & Weifeng, Z. (2017). Carbon Footprint of Grain Production in China. Scientific reports, 7(1), 4126. https://pubmed.ncbi.nlm.nih.gov/28663590/ DanChurchAid (no date) New models of securing customary land piloted in Zambia. https://www.danchurchaid.org/articles/new-models-of-securing-customary-land-piloted-in-zambia Day M., Gumbo D., Moombe K. B., Wijaya A., Sunderland T. (2014). Zambia country profile: Monitoring, reporting and verification for REDD+. Occasional paper N° 113. Bogor, Indonesia: CIFOR. https://www.researchgate.net/publication/268044926_Zambia_country_profile_Monitoring_reporting_and_verification_for_REDD Devi, P. B., Vijayabharathi, R., Sathyabama, S., Malleshi, N. G., & Priyadarisini, V. B. (2014). Health benefits of finger millet (Eleusine coracana L.) polyphenols and dietary fiber: a review. Journal of food science and technology, 51(6), 1021-1040. https://www.st-va.ncbi.nlm.nih.gov/pmc/articles/PMC4033754/ Dorosh, P.A, S. Dradri and S. Haggblade (2009). Regional trade, government policy and food security: Recent evidence from Zambia. Food Policy 34: 350–366 https://www.cabdirect.org/cabdirect/abstract/20093244553 ELD Initiative & UNEP (2015). The Economics of Land Degradation in Africa: Benefits of Action Outweigh the Costs. Available from www.eld-initiative.org Embassy of Sweden, (2008) Sida Gender Country Profile – Zambia. Sida, Department for Africa Estes, L. D., Searchinger, T., Spiegel, M., Tian, D., Sichinga, S., Mwale, M., ... & Caylor, K. K. (2016). Reconciling agriculture, carbon and biodiversity in a savannah transformation frontier. Philosophical Transactions of the Royal Society B: Biological Sciences, 371(1703), 20150316.https://royalsocietypublishing.org/doi/full/10.1098/rstb.2015.0316 European Environment Agency (2017). Emission Factor Database (EMEP/EEA), available at http://efdb.apps.eea.europa.eu/ Evans, A. (2014). ‘Women Can Do What Men Can Do’: The causes and consequences of growing flexibility in gender divisions of labour in Kitwe, Zambia. Journal of Southern African Studies, 40(5), 981-998. https://www.tandfonline.com/doi/full/10.1080/03057070.2014.946214 FAO (2014) Food wastage footprint: full cost accounting. Final report. www.fao.org/3/a-i3991e.pdf
FAO. (2018a). National Gender Profile of Agriculture and Rural Livelihoods – Zambia. Country Gender Assessment Series. Lusaka. http://www.fao.org/3/i8461en/I8461EN.pdf FAO (2018b). Final Evaluation of the Conservation Agriculture Scaling-Up (CASU) Project funded by the European Union (GCP/ZAM/074/EC). FAO Office of Evaluation, Project evaluation series. http://www.fao.org/evaluation/evaluation-digest/evaluations-detail/en/c/1147949/

213
Farag, A. A., El-Moula, M. M., Maze, M. M., El Gendy, R. A., & Radwan, H. A. (2018). Carbon footprint for wheat and corn under Egyptian condition. Future of Food: Journal on Food, Agriculture and Society, 6(2), 41-54.Retrieved from https://www.thefutureoffoodjournal.com/index.php/FOFJ/article/view/14
Farnworth, C. R. and Munachonga, M. (2010) Gender Approaches in Agricultural Programmes, Zambia Country Report. https://www.sida.se/globalassets/global/gender-in-agriculture-working-paper-2010-8-zambia.pdf Fusillier J.L, Sutherland A., Villani R., and A. Chapoto (2020) “Brief note of the Value chain analysis of Maize in Zambia”. Report submitted as part of Value Chain Analysis for Development (VCA4D) Project, DEVCO/EU. Garrity, D. P., Akinnifesi, F. K., Ajayi, O. C., Weldesemayat, S. G., Mowo, J. G., Kalinganire, A., ... & Bayala, J. (2010). Evergreen Agriculture: a robust approach to sustainable food security in Africa. Food security, 2(3), 197-214. https://link.springer.com/article/10.1007/s12571-010-0070-7 Gereffi G, Humphrey J, Sturgeon T (2005). The Governance of Global Value Chains. Review of International Political Economy, 12(1): 78-104 https://www.tandfonline.com/doi/abs/10.1080/09692290500049805 Global Nutrition Report (n.d.): Country Profile, Zambia https://globalnutritionreport.org/resources/nutrition-profiles/africa/eastern-africa/zambia/ Gondwe, T. M., Alamu, E. O., Musonda, M., Geresomo, N., & Maziya-Dixon, B. (2017). The relationship between training farmers in agronomic practices and diet diversification: a case study from an intervention under the Scaling Up Nutrition programme in Zambia. Agriculture & Food Security, 6(1), 1-7. https://agricultureandfoodsecurity.biomedcentral.com/articles/10.1186/s40066-017-0151-3 Govereh, J, T.S.Jayne, and A.Chapoto (2008). Assessment of Alternative Maize Trade and Market Policy Interventions in Zambia. Food Security Research Project Working Paper No. 33. Grant, T., & Beer, T. (2008). Life cycle assessment of greenhouse gas emissions from irrigated maize and their significance in the value chain. Australian Journal of Experimental Agriculture, 48(3), 375-381.https://www.publish.csiro.au/AN/fulltext/EA06099?subscribe=false Grant T., Beer T. (2006). Life cycle assessment of greenhouse gas emissions from irrigated maize. 5th Australian Conference on Life Cycle Assessment. Melbourne, 22-24 November 2006. Green, E. & Norberg, M. (2018) Traditional Landholding Certificates in Zambia: Preventing or Reinforcing Commodification and Inequality?, Journal of Southern African Studies, 44:4, 613-628, DOI: 10.1080/03057070.2018.1461490 https://www.tandfonline.com/doi/full/10.1080/03057070.2018.1461490H.M. Consultancy Services, (2005), Zambia: Country Gender Profile. Prepared for JICA, available at https://www.jica.go.jp/english/our_work/thematic_issues/gender/background/pdf/e05zam.pdf

214
Hangoma, P., Robberstad, B., & Aakvik, A. (2018). Does free public health care increase utilization and reduce spending? Heterogeneity and long-term effects. World development, 101, 334-350. https://www.sciencedirect.com/science/article/pii/S0305750X17302140 Hantuba, H. (n.d.) Small-Scale Maize Trading in Zambia, Study Findings. Powerpoint presentation https://www.fanrpan.org/archive/documents/d00056/presentation_Haantuba.pdf Harman L., Chapoto A. (2017) FISP and FRA reforms, investing savings into a package of smart social protection schemes for Zambia. IAPRI https://pdf.usaid.gov/pdf_docs/PA00SZ4R.pdf IAPRI (2016). Rapid study on the milling sector in Zambia. Unpublished report ICLG (2020) Zambia: Employment and Labour Laws and Regulations 2020 https://iclg.com/practice-areas/employment-and-labour-laws-and-regulations/zambia ISO 14040:2006, Environmental management – Life cycle assessment – Principles and framework. https://www.iso.org/standard/37456.html ISO 14044:2006, Environmental management – Life cycle assessment – Requirements and guideline. https://www.iso.org/standard/38498.html IPCC (2006). IPCC Guidelines for National Greenhouse Gas Inventories, Prepared by the National Greenhouse Gas Inventories Programme, Eggleston H.S., Buendia L., Miwa K., Ngara T. and Tanabe K. (eds). Published: IGES, Japan. https://www.ipcc-nggip.iges.or.jp/support/Primer_2006GLs.pdf Jayasundara, S., Wagner-Riddle, C., Dias, G., & Kariyapperuma, K. A. (2014). Energy and greenhouse gas intensity of corn (Zea mays L.) production in Ontario: A regional assessment. Canadian Journal of Soil Science, 94(1), 77-95. https://cdnsciencepub.com/doi/full/10.4141/cjss2013-044 Jayne, T. S., Chapoto, A., Sitko, N., Nkonde, C., Muyanga, M., & Chamberlin, J. (2014). Is the scramble for land in Africa foreclosing a smallholder agricultural expansion strategy?. Journal of International Affairs, 35-53https://www.researchgate.net/profile/Chewe-Nkonde-2/publication/268803247_Is_the_Scramble_for_Land_in_Africa_Foreclosing_a_Smallholder_Agricultural_Expansion_Strategy/links/54c7d0fd0cf289f0cecddef0/Is-the-Scramble-for-Land-in-Africa-Foreclosing-a-Smallholder-Agricultural-Expansion-Strategy.pdf Jellason, N. P., Robinson, E. J., Chapman, A. S., Neina, D., Devenish, A. J., Po, J. Y., & Adolph, B. (2021). A Systematic Review of Drivers and Constraints on Agricultural Expansion in Sub-Saharan Africa. Land, 10(3), 332. https://www.researchgate.net/publication/350941430_A_Systematic_Review_of_Drivers_and_Constraints_on_Agricultural_Expansion_in_Sub-Saharan_Africa Kabwe, S., Chengo-Chabwela, C., & Mulenga, K. (2018). Fall Armyworm Outbreak in Zambia: Responses, Impact on Maize Production and Food Security. http://www.iapri.org.zm/wp-content/uploads/2020/11/tp6.pdf

215
Kalinda, T., Filson, G., & Shute, J. (2000). Resources, household decision making and organisation of labour in food production among small-scale farmers in southern Zambia. Development Southern Africa, 17(2), 165-174. https://www.tandfonline.com/doi/abs/10.1080/713661404 Kamelarczyk, K. B. F. (2009). Carbon stock assessment and modelling in Zambia: a UN-REDD programme study. UNDP. https://www.worldcat.org/title/carbon-stock-assessment-and-modelling-in-zambia-a-un-redd-programme-study/oclc/548673307 Kansiime, M. K., Mugambi, I., Rwomushana, I., Nunda, W., Lamontagne‐Godwin, J., Rware, H., ... & Day, R. (2019). Farmer perception of fall armyworm (Spodoptera frugiderda JE Smith) and farm‐level management practices in Zambia. Pest management science, 75(10), 2840-2850. https://onlinelibrary.wiley.com/doi/full/10.1002/ps.5504 Kasanda, E. (2017). Gender and decision-making in agriculture: A case study of groundnuts farmers in Zambia (Doctoral dissertation, Kansas State University). https://krex.k-state.edu/dspace/handle/2097/35785 Kim, S., Dale, B. E., & Jenkins, R. (2009). Life cycle assessment of corn grain and corn stover in the United States. The International Journal of Life Cycle Assessment, 14(2), 160-174. https://link.springer.com/article/10.1007/s11367-008-0054-4
Kuteya, A. N, B. Chisanga, and J. Sitko (2014) Did the removal of subsidies in 2013 lead to higher mealie meal prices? Policy Bulletin No. 01. IAPRI. https://pdf.usaid.gov/pdf_docs/PA00KMWZ.pdf Kuteya, A. N, and T.S.Jayne (2012). Is the Government of Zambia’s Subsidy to Maize Millers Benefiting Consumers? Working Paper No. 67. IAPRI https://citeseerx.ist.psu.edu/viewdoc/download?doi=10.1.1.308.1739&rep=rep1&type=pdf Latif, S., & Müller, J. (2015). Potential of cassava leaves in human nutrition: a review. Trends in Food Science & Technology, 44(2), 147-158. https://www.sciencedirect.com/science/article/abs/pii/S0924224415000990 Laws of Zambia Chapter 276, Minimum Wages and Conditions of Employment Act, 1982 amended in 1994 https://zambialaws.com/principal-legislation/chapter-276minimum-wages-and-conditions-of-employment-act Liliane, N.T. Mutengwa, C.S. Ngonkeu, E.D. Woïn, N. & Gracen, V. (2017) "Breeding for quality protein maize (QPM) varieties: a review." Agronomy 7, no. 4:80. https://www.mdpi.com/2073-4395/7/4/80 Lusaka Times (2018) Headline House of Chiefs Reject Draft National Land Policy and Walk out of Meeting https://www.lusakatimes.com/2018/03/01/house-chiefs-reject-draft-national-land-policy-walk-meeting/ Ma, B.L., Liang, B.C., Biswas, D.K. et al. The carbon footprint of maize production as affected by nitrogen fertilizer and maize-legume rotations. Nutr Cycl Agroecosyst 94, 15–31 (2012). https://doi.org/10.1007/s10705-012-9522-0

216
Makungu, (2017) “Exploring the linkages and strengthening coordination between social protection and agriculture”, Ministry of Community Development and Social Welfare, Food Security Pack Programme. Powerpoint presentation. http://www.saspen.org/home/wp-content/uploads/2017/01/Makungu_FSP-PRSESENTATION-FOR-SOCIAL-PROTECTION-MEETING.pdf Manda, J., Gardebroek, C., Khonje, M. G., Alene, A. D., Mutenje, M., & Kassie, M. (2016). Determinants of child nutritional status in the eastern province of Zambia: the role of improved maize varieties. Food Security, 8(1), 239-253. https://link.springer.com/article/10.1007/s12571-015-0541-y Mason, N. M. and R.J. Myers (2011) The Effects of the Food Reserve Agency on Maize Market Prices in Zambia. Food Security Research Project Working Paper No. 60. https://onlinelibrary.wiley.com/doi/abs/10.1111/agec.12004 Mason, N. M., & Tembo, S. T. (2015). Is FISP Reducing Poverty among Smallholder Farm Households in Zambia? (No. 1092-2016-87521). https://ideas.repec.org/p/ags/midcpb/207020.html Matakala P.W., Kokwe M, Statz J. (2015). Zambia national strategy to reduce emissions from deforestation and forest degradation (REDD+). Mayerhofer C., Shamboko-Mbale B., Mweene R. (2010). Survey on Commercial Farming and Major Industries – Land Use, Groundwater Abstraction & Potential Pollution Sources. Report No.4 Development of a Groundwater Information & Management Program for the Lusaka Groundwater Systems. Lusaka, Zambia. https://www.bgr.bund.de/EN/Themen/Wasser/Projekte/abgeschlossen/TZ/Zambia/lu_report_4.pdf?__blob=publicationFile&v=5 Mbata, T. I., Ikenebomeh, M. J., & Ezeibe, S. (2009). Evaluation of mineral content and functional properties of fermented maize flour blended with bambara groundnut (Vigna subterranean L). African Journal of Food Science, 3(4), 107-112. https://www.researchgate.net/publication/254725621_ Meenakshi, J. V., Banerji, A., Manyong, V., Tomlins, K., Hamukwala, P., Zulu, R., & Mungoma, C. (2010). Consumer acceptance of provitamin A orange maize in rural Zambia (HarvestPlus Working Paper No. 4). https://gala.gre.ac.uk/id/eprint/11911/ Meridian Institute (2012) Science and Innovation for African Agricultural Value Chains Maize Value Chain Overview. https://static1.squarespace.com/static/537e8bcbe4b09ac6c31f0ae6/t/53dae32fe4b0754147f4fd19/1406853935070/CS_Maize_Value_Chain_Overview.pdf Mofya-Mukuka, R., & Hichaambwa, M. (2018). Livelihood effects of crop diversification: a panel data analysis of rural farm households in Zambia. Food Security, 10(6), 1449-1462. https://link.springer.com/article/10.1007%2Fs12571-018-0872-6

217
Mofya-Mukuka, R. & Kabisa, M. (2016) An Analysis of Indicators and Measurement Tools Used in Zambia to Measure the Impact of Agricultural Extension Programs on Gender Equity and Nutrition Outcomes. Working Paper No. 115. December 2016. http://www.iapri.org.zm/images/WorkingPapers/wp115_for_pdf_final_2.pdf Mofya-Mukuka, R., Banda, A. & Mwanamwenge, M. (2019) . Zambia Food Security and Nutrition Report. December 2019. http://www.iapri.org.zm/images/WorkingPapers/Nutrition.pdf
Montagnac, J. A., Davis, C. R., & Tanumihardjo, S. A. (2009). Nutritional value of cassava for use as a staple food and recent advances for improvement. Comprehensive reviews in food science and food safety, 8(3), 181-194. https://onlinelibrary.wiley.com/doi/full/10.1111/j.1541-4337.2009.00077.x Moore, H and Vaughn, M (1994) Cutting Down Trees: Gender, Nutrition and Agricultural Change in the Northern Province of Zambia, 1890-1990: Gender, Nutrition and Agricultural Change ... Zambia, 1890-1990 (Social History of Africa). Morgan, M., Stewart, A. & Lombardini, S. (2019) Making Market Systems Work for Women Farmers In Zambia A final evaluation of Oxfam’s Gendered Enterprise and Markets programme in the Copperbelt Region of Zambia. https://oxfamilibrary.openrepository.com/bitstream/handle/10546/620916/er-zambia-gem-evaluation-report-061219-en.pdf?sequence=1&isAllowed=y Mpundu, C., Lubinga, F., & Sichilima, T. (2018). Assessment of the Spin-off Effects of Improved Market Access on Rural Households. Musika Development Initiatives. https://www.musika.org.zm/wp-content/uploads/2019/02/Assessment_of_the_Spin-off_Effects_of_Improved_Market_Access.pdf Mulenga, B. & Chapoto, A. (2021) Zambia Maize Outlook and Regional Analysis 2020/2021. IAPRI. https://www.iapri.org.zm/wp-content/uploads/2020/12/2020_21_Maize_Market_Outlook.pdf Mulenga, C. B., Gubo, Q., & Matsalabi, A. A. (2017). Examining the factors influencing child stunting among rural households in Zambia: the case of Sinda District. Developing Country Studies, 7(8), 55-62. https://core.ac.uk/download/pdf/234683226.pdf Mulenga, B.P., Banda, A., Chapoto, A., Chisanga, B. (2019) Zambian Maize Outlook and Regional Analysis 2019/20. Issue 5. December 2019. IAPRI, Lusaka http://www.iapri.org.zm/images/WorkingPapers/outlook2019.pdf Mulimbika, F. & Karim, A.M. (2018) A review of technical education and vocational training in Zambia: Enhancing the role of social partners. International Journal of Academic Research and Development. Volume 3; Issue 3; May 2018; Page No. 140-155. http://www.academicjournal.in/download/1974/3-3-91-710.pdf Munthali, T., Jacobs, C., Sitali, L., Dambe, R., & Michelo, C. (2015). Mortality and morbidity patterns in under-five children with severe acute malnutrition (SAM) in Zambia: a five-year retrospective review of hospital-based records (2009–2013). Archives of Public Health, 73(1), 1-9. https://www.ncbi.nlm.nih.gov/pmc/articles/PMC4416273/

218
Mutale, C., Lungu, D. M., Muuka, F. P., (2010). Adaptability of rice cultivars to different ecologies in western province of Zambia. In Second RUFORUM Biennial Regional Conference on" Building capacity for food security in Africa", Entebbe, Uganda, 20-24 September 2010 (pp. 421-424). RUFORUM. https://www.mak.ac.ug/documents/RUFORUM/Mutale.pdf Mutambo, J. (2017). Factors affecting member commitment in small-holder farmer agricultural cooperatives in Zambia. [Netherlands]:[publisher not identified]. https://edepot.wur.nl/421024 Mwango, J (2016), Health and Safety in Agriculture. Zambia Daily Mail, 19th April 2016 http://www.daily-mail.co.zm/health-and-safety-in-agriculture/ Nemecek, T., Kägi, T., & Blaser, S. (2007). Life cycle inventories of agricultural production systems. Final report ecoinvent v2. 0 No, 15. https://www.researchgate.net/profile/Thomas_Nemecek2/publication/284329314_Life_cycle_inventories_of_agricultural_production_systems/links/5d95c28c458515c1d38f3551/Life-cycle-inventories-of-agricultural-production-systems.pdf Ngoma, H., Pelletier, J., Mulenga, B. P., & Subakanya, M. (2019). Climate-Smart Agriculture, Cropland Expansion, and Deforestation in Zambia: Linkages, Processes, and Drivers (No. 1879-2020-468). https://ageconsearch.umn.edu/record/303522/ Ngoma, H., Pelletier, J., Mulenga, B. P., & Subakanya, M. (2019). Climate-Smart Agriculture, Cropland Expansion, and Deforestation in Zambia: Linkages, Processes, and Drivers (No. 1879-2020-468). https://ageconsearch.umn.edu/record/303522/ Nkonde, C., N.M. Mason, N.J. Sitko, and T.S. Jayne. (2011). Who gained and Who lost from Zambia’s 2010 Maize Marketing Policies? Food Security Research Project Working Paper No. 49 https://ideas.repec.org/p/ags/midcwp/99610.html Nyanga, P. H., Umar, B. B., Chibamba, D., & Nchito, W. S. (2020). Dataset on Women's empowerment, land and donor-driven agricultural interventions in Eastern Zambia. Data in brief, 32, 106113. https://krex.k-state.edu/dspace/handle/2097/35785 Öjermark, P., & Chabala, C. (1994). The development of independent cooperatives in Zambia: a case-study (No. 8). Food & Agriculture Org.. http://www.fao.org/3/v4595e/v4595e05.htm#TopOfPage Onumah, G.E., Sutherland, A., Guerreiro de Brito, A., Chapoto, A. Farrall, H. (2018 Egg Value Chain Analysis in Zambia, VCA4D, Agrinatura, Brussels. Prasanna, B. M., Palacios-Rojas, N., Hossain, F., Muthusamy, V., Menkir, A., Dhliwayo, T., .& Fan, X. (2020). Molecular breeding for nutritionally enriched maize: status and prospects. Frontiers in genetics, 10, 1392. https://www.frontiersin.org/articles/10.3389/fgene.2019.01392/full Redd, D (2020) Agriculture for All. Musika Development Initiatives, Africa Outlook, Lusaka https://www.africaoutlookmag.com/company-profiles/1313-musika-development-initiatives/reader Republic of Zambia (2011) Crop Forecast Survey 2010-2011. Lusaka: Government of Zambia Central Statistical Office. https://www.yumpu.com/en/document/view/33282638/2010-2011-crop-forecast-survey-report-central-statistical-office

219
Republic of Zambia (2014) National Gender Policy, September 2014. Ministry of Gender and Child Development. Lusaka. Available at http://extwprlegs1.fao.org/docs/pdf/zam152916.pdf Republic of Zambia (2016) 2015 Living Conditions Monitoring Survey Report. Central Statistics Office. Lusaka https://www.zamstats.gov.zm/phocadownload/Living_Conditions/2015%20Living%20Conditions%20Monitoring%20Survey%20Report.pdf Republic of Zambia (n.d.) Food Security Pack – 2018/19 Inputs distribution Update, Ministry of Community Development and Social Services. https://www.mcdsw.gov.zm/?p=6543 Richardson, R. B., Olabisi, L. S., Sakana, N., Waldman, K., & Grabowski, P. (2015). The impact of sustainable intensification on landscapes and livelihoods (SILL) in Zambia. https://cgspace.cgiar.org/handle/10568/69008 Rural Agricultural Livelihoods Survey results (2019). Elaborated by Chapoto A. Sakala, P., Kunneke, E., & Faber, M. (2018). Household consumption of orange-fleshed sweet potato and its associated factors in Chipata District, Eastern Province Zambia. Food and nutrition bulletin, 39(1), 127-136. https://journals.sagepub.com/doi/10.1177/0379572117729979?icid=int.sj-abstract.similar-articles.2 Samboko P., Chapoto A., Banda A., Chisanga B. (2019) Agricultural Sector in Peril: Is Zambia Killing the Goose that lays the Golden Egg? Policy Brief No 98. IAPRI https://ageconsearch.umn.edu/ Siame, M. (2018). A Practical and Theoretical Approach to Social Venturing Entrepreneurship. Entrepreneurship: Trends and Challenges, 83. https://www.researchgate.net/publication/324954678_Performance_of_Zambia's_Co-operatives-A_Case_Study_of_Kabwe_Lusaka_Kafue_Based_Co-operatives Singh, A. K., Rehal, J., Kaur, A., & Jyot, G. (2015). Enhancement of attributes of cereals by germination and fermentation: a review. Critical Reviews in Food Science and Nutrition, 55(11), 1575-1589. https://www.tandfonline.com/doi/abs/10.1080/10408398.2012.706661 Shipekesa, A. M., & Jayne, T. S. (2012). Gender Control and Labour Input: Who Controls the Proceeds from Staple Crop Production among Zambian Farmers? (No. 1093-2016-87726). Sitko,N. and Chamberlin, J. (2016) The geography of Zambia’s customary land: Assessing the prospects for smallholder development. Land Use Policy. Vol 55, https://www.researchgate.net/publication/299586496_The_geography_of_Zambia's_customary_land_Assessing_the_prospects_for_smallholder_development Sitko, N. J., & Jayne, T. S. (2014a). Structural transformation or elite land capture? The growth of “emergent” farmers in Zambia. Food Policy, 48, 194-202. https://www.sciencedirect.com/science/article/pii/S0306919214000803

220
Sitko, N. J., & Jayne, T. S. (2014b). Exploitative briefcase businessmen, parasites, and other myths and legends: assembly traders and the performance of maize markets in eastern and southern Africa. World Development, 54, 56-67. https://www.sciencedirect.com/science/article/abs/pii/S0305750X13001770 Shah, T. R., Prasad, K., & Kumar, P. (2016). Maize—A potential source of human nutrition and health: A review. Cogent Food & Agriculture, 2(1), 1166995. https://www.tandfonline.com/doi/full/10.1080/23311932.2016.1166995?utm_source=TrendMD&utm_medium=cpc&utm_campaign=Cogent_Food_%2526_Agriculture_TrendMD_1 Sharpe, B. (1987), Agricultural Commercialisation, Nutrition and Health in Northern Province: A Review of Recent Research and Policy Options, Mpika, IRDP, Zambia Unpublished paper Smale, M., & Mason, N. (2014). Hybrid seed and the economic well-being of smallholder maize farmers in Zambia. Journal of Development Studies, 50(5), 680-695. https://www.tandfonline.com/doi/abs/10.1080/00220388.2014.887690 Snyder C.S., Bruulsema T.W., Jensen T.L., Fixen P.E. (2009). Review of greenhouse gas emissions from crop production systems and fertilizer management effects, Agriculture, Ecosystems & Environment, Volume 133, Issues 3–4, 2009, 247-266. https://www.sciencedirect.com/science/article/abs/pii/S0167880909001297 Snyder, C. S., Bruulsema, T. W., Jensen, T. L., & Fixen, P. E. (2009). Review of greenhouse gas emissions from crop production systems and fertilizer management effects. Agriculture, Ecosystems & Environment, 133(3-4),247-266. https://www.sciencedirect.com/science/article/abs/pii/S0167880909001297 Surendran, R., Cole, S. M., Longley, C., Kruijssen, F., & Sarapura, S. (2016). Gender inequalities in access to and benefits derived from the natural fishery in the Barotse Floodplain, Zambia, southern Africa. Asian Fisheries Science, 29(Special Issue), 49-71. https://www.cabdirect.org/cabdirect/abstract/20173069080 Suparno, A., Prabawardani, S., & Bob, A. (2016). The Nutritional Value of Sweet Potato Tubers [Ipomoea batatas (L.) Lamb.] Consumed by Infants and Children of Dani Tribe in Kurulu District, Baliem-Jayawijaya. https://pdfs.semanticscholar.org/857d/31c72519a0a24e5f3500066eddaafd4997bb.pdf Supasri T., Itsubo N., Gheewala S.H. et al. (2020). Life cycle assessment of maize cultivation and biomass utilization in northern Thailand. Scientific Reports 10, 3516. https://doi.org/10.1038/s41598-020-60532-2 Sutherland, A. (1988). Extension and farming systems research in Zambia. Training and Visit Extension in Practice. Agricultural Administration Unit Occasional Paper, 8, 49-78. Taylor, J. R., & Duodu, K. G. (2017). Sorghum and millets: Grain-quality characteristics and management of quality requirements. In Cereal Grains (pp. 317-351). Woodhead Publishing. https://www.sciencedirect.com/science/article/pii/B9780081007198000139

221
Tembo, G., A. Chapoto, T.S. Jayne, and M. Weber (2010). Fostering Food Market Development in Zambia. Zambia Social Science Journal 1.1: 39–60. https://scholarship.law.cornell.edu/zssj/vol1/iss1/5/ The Employment Code Act, 2019 http://www.parliament.gov.zm/sites/default/files/documents/acts/The%20Employment%20Code%20Act%20No.%203%20of%202019.pdf Timmer CP, Falcon WP, Pearson SR (1983) Food Policy Analysis. Johns Hopkins University Press for the World Bank, Baltimore https://documents1.worldbank.org/curated/en/308741468762347702/pdf/multi0page.pdf Togola, A., Meseka, S., Menkir, A., Badu-Apraku, B., Boukar, O., Tamò, M., & Djouaka, R. (2018). Measurement of pesticide residues from chemical control of the invasive Spodoptera frugiperda (Lepidoptera: Noctuidae) in a maize experimental field in Mokwa, Nigeria. International journal of environmental research and public health, 15(5), https://www.researchgate.net/publication/324764357_Measurement_of_Pesticide_Residues_from_Chemical_Control_of_the_Invasive_Spodoptera_frugiperda_Lepidoptera_Noctuidae_in_a_Maize_Experimental_Field_in_Mokwa_Nigeria Thomas, S. C., & Martin, A. R. (2012). Carbon content of tree tissues: a synthesis. Forests, 3(2), 332-352. https://www.mdpi.com/1999-4907/3/2/332
Unicef, (2012) Towards ending child labour in Zambia: An assessment of resource requirements Inter-agency country report, September 2012 http://www.ucw-project.org/attachment/ending_CL_Zambia_resource_requirements_201220121122_105629.pdf USAID (2018) Zambia Nutrition Profile; https://www.usaid.gov/sites/default/files/documents/1864/Zambia-Nutrition-Profile-Mar2018-508.pdf Vasal, S. K. (2000). The quality protein maize story. Food and Nutrition Bulletin, 21(4), 445-450.https://journals.sagepub.com/doi/abs/10.1177/156482650002100420 Vinya, R., Syampungani, S., Kasumu, E. C., Monde, C., & Kasubika, R. (2011). Preliminary study on the drivers of deforestation and potential for REDD+ in Zambia. Lusaka, Zambia: FAO/Zambian Ministry of Lands and Natural Resources. https://citeseerx.ist.psu.edu/viewdoc/download?doi=10.1.1.374.4984&rep=rep1&type=pdf Wang, Z. B., Wen, X. Y., Zhang, H. L., Lu, X. H., & Chen, F. (2015). Net energy yield and carbon footprint of summer corn under different N fertilizer rates in the North China Plain. Journal of Integrative Agriculture, 14(8), 1534-1541. https://www.sciencedirect.com/science/article/pii/S2095311915610425
Webb J., Hutchings N., Amon B. (2019). EMEP/EEA air pollutant emission inventory guidebook 2019, “3.F Field burning of agricultural wastes”. https://www.mdpi.com/2071-1050/9/10/1772
http://www.ucw-project.org/attachment/ending_CL_Zambia_resource_requirements_201220121122_105629.pdf
222
Wettstein, S., Muir, K., Scharfy, D., & Stucki, M. (2017). The environmental mitigation potential of photovoltaic-powered irrigation in the production of South African maize. Sustainability, 9(10), 1772. https://www.mdpi.com/2071-1050/9/10/1772 WFP (2019) Zambia Annual Country Report 2019: Country Strategic Plan 2019-2024. https://www.wfp.org/operations/zm02-zambia-country-strategic-plan-2019-2024 Williams, C. D. (1933). A nutritional disease of childhood associated with a maize diet. Archives of disease in childhood, 8(48), 423. https://www.ncbi.nlm.nih.gov/pmc/articles/PMC1975318/
World Bank (2019) Climate-Smart Agriculture Investment Plan Zambia: Analyses to support the climate-smart development of Zambia’s agriculture sector. http://documents.worldbank.org/curated/en/358291552021231101/pdf/Zambia-Climate-Smart-Agriculture-Investment-Plan-Analyses-to-Support-the-Climate-Smart-Development-of-Zambia-s-Agriculture-Sector.pdf Xiong, Y., Zhang, P., Warner, R. D., & Fang, Z. (2019). Sorghum grain: from genotype, nutrition, and phenolic profile to its health benefits and food applications. Comprehensive reviews in food science and food safety, 18(6), 2025-2046. https://onlinelibrary.wiley.com/doi/full/10.1111/1541-4337.12506
Zambia Statistics Agency. (2018) Crop Forecast Survey 2017/18. https://www.zamstats.gov.zm/index.php/publications/category/17-agriculture Zhang D., Shen J., Zhang F. et al. (2017). Carbon footprint of grain production in China. Scientific Reports 7, 4126. https://doi.org/10.1038/s41598-017-04182-x Zhang, G., Wang, X., Zhang, L., Xiong, K., Zheng, C., Lu, F., ... & Ouyang, Z. (2018). Carbon and water footprints of major cereal crops production in China. Journal of Cleaner Production, 194, 613-623. https://www.sciencedirect.com/science/article/abs/pii/S0959652618313519 ZNFU – Zambia National Farmers’ Union (2018). Crop budgets. Zulu-Mbata, O., Chapoto, A., & Hichaambwa, M. (2016). Determinants of conservation agriculture adoption among Zambian smallholder farmers (No. 1093-2016-88059). https://ageconsearch.umn.edu/record/251855/
Zulu, B. and Chipili, M. (2018) News article on Gender Equality Training for the Making Agriculture a Business Project. Joint Country Programme, Christian Aid. Zambia https://www.christianaid.org.uk/news/how-gender-equality-training-improving-farming-zambia

223
6. ANNEXS
6.1 Functional Analysis Addendum
Input and service providers Research Services
Function: The Maize Research Team in the Zambia Agricultural Research Institute (ZARI), a Department of the Ministry of Agriculture, undertakes applied research in maize breeding and agronomy. To assess demand and promote uptake, the maize team interfaces with the Farming Systems Team and Extension services. The University of Zambia School of Agriculture has a training and research function, and its staff have undertaken basic research on maize variety nitrogen use efficiency, weevil resistance and low phosphorus tolerance and conservation tillage. Hybrid maize breeding specifically for Zambian conditions began around 1980. Prior to this, Zambian farmers depended on hybrids developed in Zimbabwe and South Africa. Researchers in Zambia have collaborated with the International Maize and Wheat Improvement Centre (CIMMYT) for many years on breeding for resistance and tolerance (to disease, pests, heat stress, low soil fertility, aluminium toxicity) and on soil fertility management in maize based cropping systems. The early Zambian hybrids were produced and sold exclusively by Zamseed, a parastatal company, which has recently been privatised. Strategy: The maize varietal development strategy has been to use a multi-disciplinary approach to develop a range of seed varieties suited to the various agro-ecologies and with tolerance to the stresses of various diseases (maize streak, grey spot, cob-rot), pests (termites), and climatic factors (dry spells, high temperatures, late rains). New maize varieties were evaluated on-farm under smallholder management prior to release through the farming systems teams in each province. Research based agronomic recommendations for small-scale farmers growing maize were developed at national and provincial levels from the mid-1980s. The maize hybrids developed are of short, medium and long maturity, to suit Zambia’s three main ecological zones. Some of these hybrids have also been further improved by developing harder flint grain types (with improved storage pest resistance). The maize variety development strategy has rendered these hybrids well adapted to the wide range of agro-climatic variations and management conditions found under small-holder production. Recent attention has been given to improving nutrition through developing hybrid and OPV yellow/orange maize varieties to combat vitamin A deficiency which remains a significant issue in Zambia. To date several yellow maize hybrids and one OPV have been released. However, the uptake has been disappointingly slow due largely to a widespread cultural preference for white maize in urban and many rural areas. There also has been some reluctance among the various key players (e.g. millers and retailers) to take on the extra promotional activities, costs and risks involved with introducing a new product into the value chain. From the mid-1990s Zambian researchers participated in a 7-year regional research programme on soil fertility in maize based cropping systems in Southern Africa. This included research on the benefits of green manures, improved fallows, grain legume rotations, rock phosphate, lime and mono-ammonium phosphate, including a focus on acid soils. ZARI has recently produced a maize suitability map for Zambia, based on extensive soil and agro-climatic data analysis (Figure 2). Constraints: While Zambia is currently free from MLN, the risk of this spreading remains. ZARI’s maize team communicated the urgent need for further capacity development (both human and laboratory)

224
for double haploid and molecular marker breeding which can significantly speed up the variety development process. This capacity is required in order to continue to develop maize hybrids and OPVs which can perform well under the conditions facing Zambia’s smallholder farmers and to address new challenges, including resistance to the recent and widespread ravages of “fall army worm” and combat the future risk of MLN spreading from East Africa. A further constraint to smallholder maize production is the uncertain returns to fertilizer use. Research in the early 2000s showed that fertilizer use profitability is significantly impacted by late delivery, transportation costs, limited access to draft power and high interest rates for loans. However, this research was undertaken at a time when herbicide use by smallholder maize producers was not as widespread as it currently is. Opportunities: Under an increasingly liberalised market for hybrid maize seed in Zambia, the rights to these hybrids can now be sold to seed companies to produce seed for sale in Zambia and also for export to neighbouring countries interested in non-GMO cultivars. This new provision provides an opportunity for some cost recovery and more importantly for a more sustainable national maize breeding programme into the future. However, the downside of this opportunity is that it may further discourage the limited investment in further development of open pollinated maize varieties for smallholder farmers who do not wish to buy expensive hybrid seed every season especially as they have low input practices and low yields. ZARI has undertaken limited research on developing open pollinated populations of short and medium duration adapted to local conditions. These are currently produced in small quantities by ZARI as pre-basic seed for further seed multiplication by seed companies and other agencies, such as NGOs, but there is limited investment in making the OPVs more widely available. The International Maize Improvement Consortium for Africa (IMIC-Africa) is a platform established in 2018 promoting the sustainable development of the maize seed industry. This consortium formalizes the sharing of maize lines under development with public and private maize breeding programs, offers opportunities for training access to special services offered by CIMMYT in Africa including maize lethal necrosis (MLN) testing, doubled haploid development and molecular quality assurance/quality control. This provides opportunities for both public and private participation in a more refined maize varietal development programme which can respond to the opportunities provided by improved market conditions and input distribution networks for small-scale farmers growing maize in Zambia. Extension and Information Services Function: Public extension services to smallholder farmers are provided through the Department of Agriculture of the Ministry of Agriculture. This involves an extensive nationwide network of technical extension staff. Each district has an extension office with subject matter specialists, and districts are divided into operational areas; blocks, camps and zones. Blocks have a block officer and most camps have extension officers which are sub-divided into operational zones which are visited on a rotational basis, and within which farmers are encouraged to self-organise. Private input supply companies provide advice on use of their products. Strategy: From 1980 public extension focused strongly on agronomic advice on smallholder hybrid maize production. Since 2000 there has been a major emphasis on conservation agriculture methods by NGOs and public extension services for smallholder maize (minimum tillage, mulching, legume

225
rotation, use of animal manure and herbicides). For the past decade crop diversification away from maize has been emphasised. Additionally, for the past 20 years front line extension staff have been closely involved with implementation of the government programmes targeting small-scale farmers with subsidised hybrid maize seed and fertilizer packages. Provision of technical advice through private agro-dealers has become increasingly important, particularly regarding use of a widening range of agrochemicals available to small-scale farmers for weed and pest control. Smallholder farmers access to market information and potentially agronomic information has been significantly improved through mobile phone networks. Public extension services, with participation from seed company representatives, demonstrate the potential of a range of hybrid maize varieties from different seed companies through demonstration plots. Constraints: the effectiveness of public extension has for many years been hampered by difficult operating conditions and very limited operational funding. Frontline public extension officers cover vast areas with very limited resources and most lack transport. Moreover, poor public funding of applied research has meant that the flow of technical recommendations on smallholder maize production from research to extension has been weak for at least 20 years. Public resources allocated on subsidies to small-scale farmers has limited the amount available to fund research and extension directed to further improving smallholder maize productivity. Opportunities: there is potential for further fine-tuning of the technical information related to improving smallholder maize productivity. This would require an investment in adaptive research, undertaken jointly by public research and extension services, to ensure that all such technical information is verified under location specific on-farm conditions, and takes account of the main constraints currently faced by small-scale farmers (labour, lack of farm power, and cash/credit for key inputs). The potential benefit is improved area level targeting of maize inputs to local supply points, together with advice on cropping practices to maximise the returns of these low inputs for improved productivity. Agro-input Companies and services Fertilizer companies Function: A small proportion of inorganic fertilizers are produced in Zambia by Nitrogen Chemicals of Zambia, a parastatal which produces ammonium nitrate and compounds D and X for use on maize. An increasing number of private companies import and supply inorganic fertilizer, and the majority (over 70%) of this, feeds into the maize value chain for use by small-scale farmers and also for commercial farmers. Some of these companies blend products in Zambia, while others import already blended products. A significant proportion of the smallholder fertilizer supplied by these companies is distributed through government subsidised programmes (FISP and FSP) targeting small-scale farmers. Expansion of the E-voucher FISP programme in 2017-18 led to an increase in the number of fertilizer supply companies, as this was seen as an opportunity for a more open fertilizer market. The general trend is that a lower proportion of small-scale farmers are depending only on the subsidised fertilizer and a higher proportion are accessing fertilizer through private sector traders. Levels of fertilizer use per cultivated area of maize remain on the low side for small-scale farmers in Zambia compared with that on commercial farms in Zambia and in more developed countries. In the 2013/14 season, nearly 600,000 (just under half the total) smallholder farming households did not acquire fertilizer, while in the 2017/18 season just over half (51%) did use fertilizer - (IAPRI, 2018, p 15, 4.1).

226
Strategies: Strategies for gaining market share and securing a customer base differ according to the scale of farmer being serviced. Larger established fertilizer companies have a specialist side which provides commercial farmers with a bespoke service of soil testing and fertilizer formulation specific to different soil conditions within their cropping fields. These services are often supplied on delayed payment terms as a way of securing a long-term business relationship. A less specialist side of the fertilizer business targets the small-scale farmers, providing a supply of standard formulations of basal compound and top-dressing fertilizers for maize. Market share is gained through tendering for a quota under FISP and also by advertising and distribution through local agro-dealers. Suppliers of FISP quotas often have to wait several months for payment, and generally the price government pays for this fertilizer is higher than the market price in the local agro-dealers. Sales of unsubsidised fertilizer to small scale-farmers by agro-dealers is strictly on a cash basis. Constraints: Government subsidy of standard brand fertilizers, while providing farmers with less a less expensive source of fertilizer, discourages the development of a more customer oriented private sector fertilizer supply for small-scale farmers. Subsidised fertilizer often arrives late, and with limited choice. Comprehensive studies of smallholder fertilizer use profitability have shown that while returns to investment in fertilizer can be good, often the return is very risky. In most rural market centres small-scale farmers have a range of certified maize seed varieties and agro-chemicals for weed and pest control to choose from, and can exercise choice (within their budget limitations) to reduce the risks specific to their farms and local area. However, the range of inorganic fertilizers is very limited, affordable soil testing kits and information to inform the purchase of the best type of fertilizer are not available, hence the risks to investment in fertilizer remain high. Opportunities: With the current private sector fertilizer blending and soil testing capacity in place, together with a reasonable level of soil mapping at district level, there is potential for the private sector to work in partnership with ZARI and district extension services to provide small-scale farmers with an improved range of inorganic fertilizer choices, including soil testing. Removal of direct subsidy from standard fertilizers distributed through FISP and FSP would enable the development, in the medium term, of a more competitive private sector satisfying local needs of commercially oriented small-scale farmers better (see Section 5 Conclusion-Recommendations). Mechanical Equipment Services Function: Without herbicide smallholder maize productivity depends on timely tillage operations. Ox-drawn implements (ploughs, rippers, harrows, ridgers and interrow cultivators,) are important for land preparation and weed control. Combined with herbicide use, ox-drawn rippers are very cost effective for smallholder maize production. Some agro dealers import ox-drawn equipment, and one prominent company (SARO) fabricates a range of ox-drawn equipment. A number of companies import tractors and cultivation equipment. Some emergent farmers have purchased these for their own use also provide ploughing services to small scale farmers in their vicinity. Knapsack sprayers are important for small-scale farmers using herbicides on their maize crop. These are imported and generally available in local agro-dealers stores. A range of maize shellers are locally fabricated and sold. These are important for smallholder farmers with bigger maize plots. Strategies: Farm equipment suppliers usually provide spares as well. There have been times when tractors have been supplied on credit to emergent farmers, with payback arrangements in cash or grain over 3-5 years. Local stockists tend not to carry large stocks of farm machinery because sales are

227
usually seasonal and they do not want to tie up a lot of capital in items with slow turnover. Many small-scale farmers opt for ox-drawn equipment rather than tractors because of lower capital costs and easier maintenance. Constraints: With a free market operating there are no major constraints to importation and also local fabrication of farm equipment for small-scale farmers. Skills to maintain more complex farm equipment are generally scarce in rural areas. Local capacity of manufacture of more complex and high spec farm machinery is limited as well. Opportunities: More local fabrication of ox-drawn equipment adapted to conservation agriculture such as rippers, of particular interest to limit herbicide application. Training in tractor and farm machinery maintenance
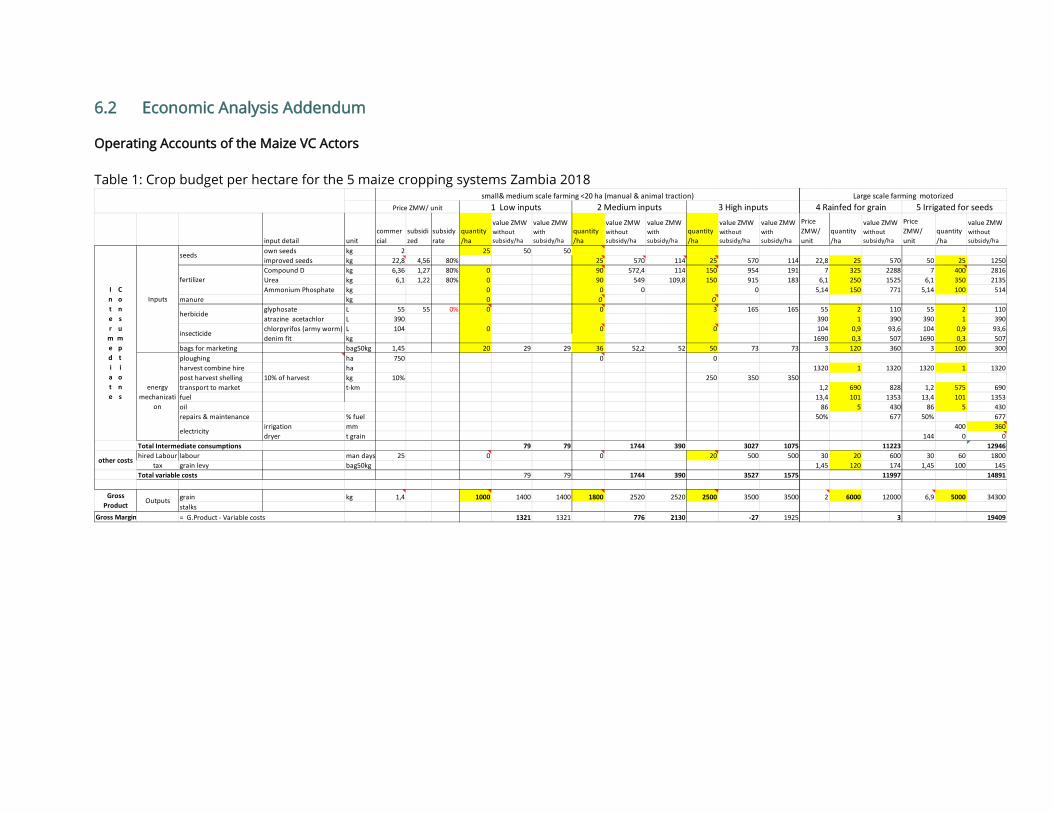
6.2 Economic Analysis Addendum
Operating Accounts of the Maize VC Actors Table 1: Crop budget per hectare for the 5 maize cropping systems Zambia 2018
input detail unitcommercial
subsidized
subsidy rate
quantity /ha
value ZMW without subsidy/ha
value ZMW with subsidy/ha
quantity /ha
value ZMW without subsidy/ha
value ZMW with subsidy/ha
quantity /ha
value ZMW without subsidy/ha
value ZMW with subsidy/ha
Price ZMW/ unit
quantity /ha
value ZMW without subsidy/ha
Price ZMW/ unit
quantity /ha
value ZMW without subsidy/ha
own seeds kg 2 25 50 50improved seeds kg 22,8 4,56 80% 25 570 114 25 570 114 22,8 25 570 50 25 1250Compound D kg 6,36 1,27 80% 0 90 572,4 114 150 954 191 7 325 2288 7 400 2816Urea kg 6,1 1,22 80% 0 90 549 109,8 150 915 183 6,1 250 1525 6,1 350 2135Ammonium Phosphate kg 0 0 0 0 5,14 150 771 5,14 100 514
manure kg 0 0 0glyphosate L 55 55 0% 0 0 3 165 165 55 2 110 55 2 110atrazine acetachlor L 390 390 1 390 390 1 390chlorpyrifos (army worm) L 104 0 0 0 104 0,9 93,6 104 0,9 93,6denim fit kg 1690 0,3 507 1690 0,3 507
bags for marketing bag50kg 1,45 20 29 29 36 52,2 52 50 73 73 3 120 360 3 100 300ploughing ha 750 0 0harvest combine hire ha 1320 1 1320 1320 1 1320post harvest shelling 10% of harvest kg 10% 250 350 350transport to market t-km 1,2 690 828 1,2 575 690fuel 13,4 101 1353 13,4 101 1353oil 86 5 430 86 5 430repairs & maintenance % fuel 50% 677 50% 677
irrigation mm 400 360dryer t grain 144 0 0
Total Intermediate consumptions 79 79 1744 390 3027 1075 11223 12946hired Labour labour man days 25 0 0 20 500 500 30 20 600 30 60 1800
tax grain levy bag50kg 1,45 120 174 1,45 100 145Total variable costs 79 79 1744 390 3527 1575 11997 14891
grain kg 1,4 1000 1400 1400 1800 2520 2520 2500 3500 3500 2 6000 12000 6,9 5000 34300stalks
Gross Margin = G.Product - Variable costs 1321 1321 776 2130 -27 1925 3 19409
Gross Product
Outputs
1 Low inputs 2 Medium inputs 3 High inputs
Inputs
seeds
fertilizer
Price ZMW/ unit
herbicide
insecticide
electricity
other costs
Inter
mediate
Consumptions
energy mechanizati
on
small& medium scale farming <20 ha (manual & animal traction) Large scale farming motorized5 Irrigated for seeds4 Rainfed for grain
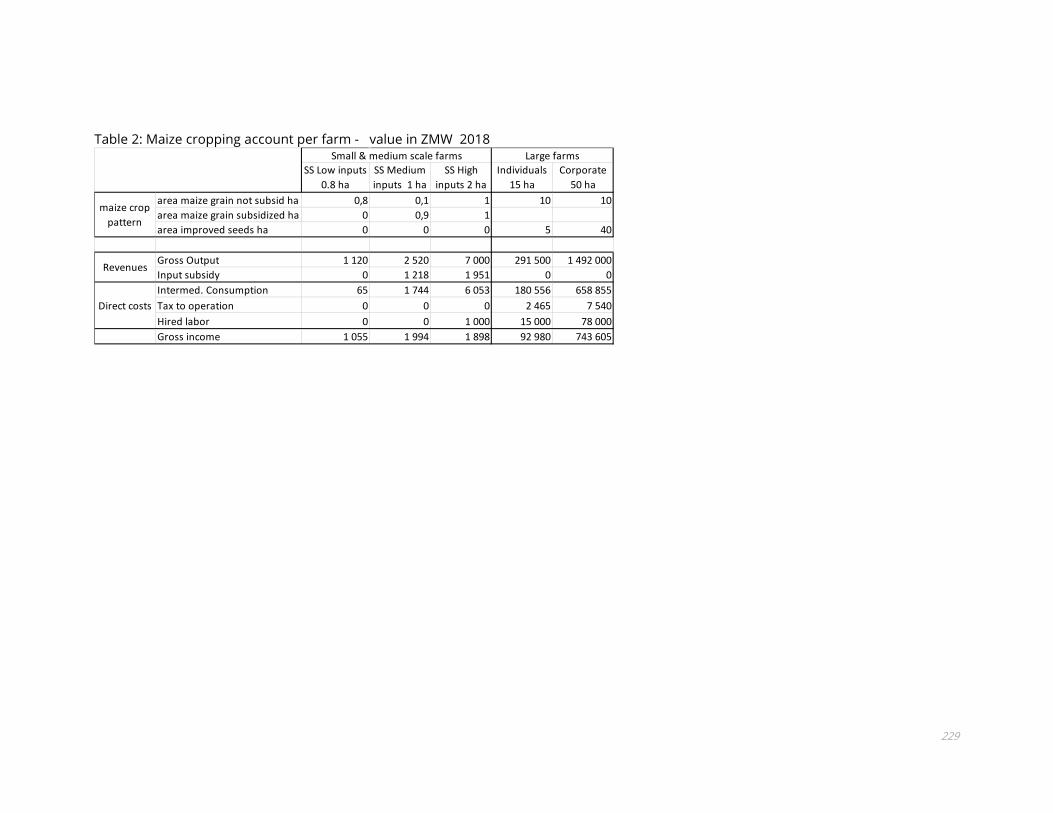
229
Table 2: Maize cropping account per farm - value in ZMW 2018
SS Low inputs 0.8 ha
SS Medium inputs 1 ha
SS High inputs 2 ha
Individuals 15 ha
Corporate 50 ha
area maize grain not subsid ha 0,8 0,1 1 10 10area maize grain subsidized ha 0 0,9 1area improved seeds ha 0 0 0 5 40
Gross Output 1 120 2 520 7 000 291 500 1 492 000Input subsidy 0 1 218 1 951 0 0Intermed. Consumption 65 1 744 6 053 180 556 658 855Tax to operation 0 0 0 2 465 7 540Hired labor 0 0 1 000 15 000 78 000Gross income 1 055 1 994 1 898 92 980 743 605
Revenues
Direct costs
Small & medium scale farms Large farms
maize crop pattern

230
Table 3: Maize trading account per operator Aggregator and Large trader - value in million ZMW 2018
scale of activity t/year scale of activity t/yearworking capital Million ZMW working capital Million ZMWdistance to outlet kms distance to outlet kmsstorage capacity t storage capacity taverage duration of storage 0 months duration of storage/cycle 3 monthsquantity transported / cycle 30 t quantity stored / cycle 5000 t
Year Year
unit quantity
price ZMW /unit
total value M ZMW quantity
price ZMW /unit
total value M ZMW
total value M ZMW quantity
price ZMW /unit
total value M ZMW quantity
price ZMW /unit
total value M ZMW
total value M ZMW
grain sold to traders t 900 2300 2,07 300 3000 0,9 2,97grain sold to meal mills t 10890 3000 32,7 6930 3500 24,3 56,925grain sold to feed mills t 990 2500 2,5 990 3200 3,2 5,643
Gross Product 2,07 0,90 2,97 11880 2958,33 35,1 7920 27,4 62,6grain purchased to farmers t 900 1350 1,22 300 2000 0,6 1,82grain purchased to aggregators t 16000 2300 36,8 4000 3000 12,0 48,8packaging polypropylane bag bag50kg 18000 2 0,036 6000 2 0,012 0,05 32000 2 0,064 8000 2 0,016 0,080transport short distance 10 t + long distance 300 km t-km 270000 0,9 0,243 90000 0,9 0,081 0,32 356400 0,6 0,214 237600 0,6 0,143 0,356fumigationwarehousing rent 4 x 3 months m2 (10 bags)/month 10000 25 1,5 10000 25 1,5 3,00losses spillage 1% 1% 1%
labour prospection, security, handling t 900 30 0,027 300 30 0,009 0,036weighting handling loading 20 permanent staff +20 casual 240 1000 0,24 240 1000 0,24 0,48interest on loans US $ rate 14% large traders capital 14% 14% 2,1 2,1
tax levy council 900 8,3 0,007 300 8,3 0,002 0,01 11880 8,3 0,099 7920 8,3 0,066 0,161,53 0,70 2,23 38,9 16,1 54,980,54 0,20 0,74 -3,8 11,4 7,59
20 00015,0
30
Direct CostsGross income
inputs
peak season jun-oct
Aggregator
lean season nov-may
12000,10300
0 5000technical and economic parameters
Large trader with storage
peak season lean season
financial cost
output

231
Table 4: Maize milling account-Large industrial miller-value in million ZMW 2018
capacity of processing 7 t/h 30042000 t/year rate of use capacity 71%
actual grain processed 30000 t/year meal flour 93%working capital 12,0 grits 5%
grain 1 breakfast 0,65roller 0,15bran 0,20
unitprice
ZMW/unitquantity /
year
total value million
ZMW/year % of costbreakfast kg or t 3,7 18135 67roller kg or t 2,5 4185 10grits kg or t 3,6 1200 4,3bran kg or t 1 5880 5,9total Gross Output 3,0 29400 88maize purchase farmerskg or t 1,5 3620 5maize purchase traders kg or t 3 14890 45maize subsidized FRA kg or t 1,4 11490 16fumigationwater m3bags packaging 1 600000 0,60electricity Zesco kwh 0,93 936 000 0,87fuel kwh 2 234 000 0,47spare parts 0,5other
Labor wages 6 8%Tax to operationFinancial charges 14% 1,7
total direct costs 76,4Gross Income 11,3implicit subsidy maize 1,23 11490 14,1
Technical parameters
for
duration days/year
conversion rate
outputs
inputs
87%
1,8%

232
Table 5: Maize milling account - Small-scale miller - value in ZMW 2018
0,1 t/h300 t/year rate of use capacity 24%
actual grain processed 72 t/year meal flour 78%working capital 0,01 bran 20%energy consumption 84,6 Kwh/t losses 2%functionning 720 h/year 50% bran kept by miller
1 tin 20L = 16 kg grain
unitprice
ZMW/unit quantity Value ZMWmilling service tin grain 8
kg grain 0,5 72000 36000bran kg bran 1 7200 7200total output 43200electricity kwh 1,9 6091 11330gas oil L 12 1555 18662oil 1 383spare parts hammers 2 195spar parts grinders
hired labor wages days 40 120 4800tax
27 04018 32516 16024 875
Gross Income for diesel motorGross Income for electric motor
total costs dieseltotal costs electric
outputs
inputs
capacity of processing
Technical parameters
motor 12 kW
conversion

233
Table 6: Aggregated operating account at segment level of the Maize Value chain- value in million ZMW 2018
Table 7: Aggregated operating account at Maize Value chain level-value in million ZMW 2018
Aggregating-Trading private & FRAUses Uses Uses Uses Uses
chemicals 157 grain home cons. 2100 grain to millers 1951 meal for food 2366 milling service 550fertilizer 1067 grain sold 2572 grain to HH 465 grits,roller for beer 223 bran 94seeds local 278 grain to feed 570 bran 187seeds export 360 grain to food aid 56
grain to export 480bran to export 97
Subsidy FISP allowance 1785 FRA allowance 1051intra chain Intermed Cons 1502 2168 2112domestic Intermed Cons 546 449 981 191 306imported Intermed Cons 1985labour 511 374 550 135 74financial charge 50 97 53tax 1,7 2,8 16gross income 553 2344 858 285 264
Total 3647 3647 4672 4672 4670 4670 2776 2776 644 644
Industrial Milling Small scale MillingResources Resources Resources Resources Resources
Outputs
Inputs supply private & FISP Maize grain cropping
value Output of the VC valueimported fertilizer 1875 grain for home consumption 2100imported agro chemicals 110 grain for households direct supply 715domestic intermediate cons 2558 grain food aid 56
meal for food 2366service small milling 550grits and roller for beer 223grain for feed 696bran for feed 233grain export 480bran export 97seeds export 360
total 7876 7876
labour 1644 Value added 3333financial charge 200 subsidies FISP FRA 2836tax 20,5gross income 4304Total 6169 6169
RESOURCESUSES
Value added 3333
Income Account
6.3 Social Impact Analysis Addendum
Challenges In undertaking the social impact assessment, several challenges arose which were new to the social expert, as he had not faced the egg value chain study undertaken in Zambia. Firstly, the comparatively huge volume of both quantitative and qualitative data available on each dimension of social impact required much more time to process. This data was abundant because maize has been very well researched and documented aspect of Zambia’s agricultural development, compared to eggs. Moreover, the vast array of data included different information sources which were inconsistent on some key points, while with eggs there were fewer information sources and therefore more consistency of data. Secondly, the large number of actors with strong connections to maize production, and the extent of variation within the actor population, implied a more fully considered approach to data analysis and actor categorisation. Thirdly, maize as a commodity was qualitatively different from eggs and soya. Maize is both the main staple food in rural areas and a commodity widely grown and traded, while eggs and soya are produced almost exclusively for sale by a much smaller number of actors. This implied that the role of maize within the rural households and communities had to be included in the analysis. Fourthly, unlike eggs and soya, maize is a commodity with ongoing government intervention and political sensitivity, influencing some dimensions of social impact in the value chain. Fifthly, many of the social profile questions are phrased in a way that requires knowledge, data and an assessment of trends over time. Again the volume of data on trends over time was such that there were not sufficient time and resources available to explore the trend data in the level of depth which would be possible in a fuller analysis of social impact.
Gender equality Gender equality in private sector organisations is an under-researched topic in Zambia and is given limited attention in key policy documents141. During the first field visit qualitative information on gender representation in the private sector organisations involved in large-scale commercial farming, maize trading and milling was gathered. Detailed quantitative information was not available on gender representation in key positions is not available. With regard to smallholder agriculture, there is much more gender disaggregated data available. The RALS surveys enable analysis based on the gender of household heads, particularly the comparison of households headed by women and those headed by men142. In addition to differentiating between gender of household heads, RALS surveys also explore a few aspects of decision making on the basis of gender of the decision maker, as distinct from the gender of the household head. This includes decision making on field management and technology adoption. Looking at the gender equality from the perspective of individual decision making lends allows some
141 Zambia’s National Gender Policy (Republic of Zambia, 2014) sets out aspirations for the private sector in relation to education and training of female employees and collection of gender disaggregated data. It notes that “In the private sector, a survey conducted by the Federation of Employers targeting 300 respondents of its members with 200 responding revealed that 22 percent of employees in senior management were females while only 9 percent of the females were Chief Executives in institutions.” Gender audits by JICA (H.M. Consultancy Services, 2005), FAO (FAO 2018a) and SIDA (Embassy of Sweden, 2008) make very limited reference to the private sector. 142 Two categories of male headed households identified are monogamous (62%) and polygamous (10%) households. Female headed households (27%) include widowed, divorced and separated women heading households. 1.5% of households fall into a residual category; “single”.

235
consideration of the importance of cultural norms and power relations that operated in key nodes of a value chain, as illustrated in a recent study of fisheries in Western Zambia143. Qualitative aspects of gender equality briefly explored in the first field visit in February 2020 were looked at in more detail through the rapid appraisal undertaken in October 2020. This provided some consideration of cultural norms in relation to specific areas of decision making within households, power relationship imbalances and farmer perceptions on the trend in their area. This included both farmer perspectives and extension workers assessments on the gendered aspects of labour contribution to maize production and decision making with regard to the sale of maize and control of maize within households. Food security and Nutritional Practices Exploring how increased smallholder production of maize and increased reliance on maize as the main starch staple by rural households, impacts on nutrition, particularly child nutrition proved to be a challenge. Examination of many sources made it clear that there are no simple answers to this question. Getting a comprehensive and reliable measures of some aspects of human nutrition nationally is a complex task (Mofya-Mukuka & Kabisa, 2016). Different indicators have been tried out in Zambia to assess nutritional outcomes. Each indicator has specific advantages and limitations of application, both geographically, and over time. In Zambia, the rural household is both the unit of production and the unit of consumption. Hence decisions about farming, particularly crop production and sale of produce, potentially directly impact on the household’s nutritional status. Decisions about food processing and allocation of food produced to individuals within the household are also important for nutritional outcomes. According to the Global Nutrition Report Zambia Country Profile (n.d.), gender differences in outcomes remains a factor; levels of under 5 stunting, wasting and underweight are higher for male infants than female infants, while levels of overweight for under 5s are higher for females than male infants. This pattern continues into childhood and adolescence; females aged 5-19 are less likely to be underweight and more likely to be overweight or obese. The same inequality is reflected in the adult population, with men more likely to be underweight and women more likely to be overweight. Comparisons of this type of data at provincial level enables limited conjecture about how household food adequacy may be related to changing levels of maize production and sales of maize on the market. However, further research and in-depth data analysis at household level is required in order to better understand the inter-relationship between trends in maize production, maize sales and household food adequacy. It can be argued that growing other staples, in addition to maize, is a strategy of better managing the risks relating to climate change, market fluctuations and soil fertility decline. In agro-climatic Region 1 pearl millet and sorghum were traditionally grown in addition to maize by many households. However generally the area planted to these crops has declined relative to maize over the past 40 years. Most of Region 1 falls into the southerly parts of Western and Southern Provinces, both of which have higher than average levels of households experiencing moderate or severe hunger.
143 This qualitative study into the inter-relationship between poverty and gender in the natural fishery value chain in Western Province of Zambia concluded that it is not poverty that drives gender inequalities, but certain norms, practices and power relations that operate in key nodes of the chain that are important to understand (Surendran, et al , 2016).

236
In Region 2a, there is a high level of dependency on maize as the starch staple, with the alternative staples (cassava, sorghum, millet and rice) much less important than in other regions. As a consequence many areas of Region 2a which produce a surplus of maize in ”normal” seasons were food deficit in the 2018-19 season due to a prolonged dry spell. However, Eastern and Central Province which occupy much of Region 2a, generally have lower levels of severe hunger than other rural provinces. This indicates that in “normal years”, and with the current levels of input subsidy, maize is a relatively reliable staple crop for household food security. Available data indicates that growing additional starch staples does not correlate with less hunger experienced by households in Region 3 and Region 2b where more alternative staples are produced. A recent assessment indicates that the severity of hunger is higher in these regions than in southern and eastern Zambia144. In most of Region 3, cassava is an important starch staple for all households, while finger millet and/or sorghum, or rice are also grown by some households in some areas. Finger millet and rice are often grown as cash crops, having a higher market value than maize, and so by the time of the main hunger period (December to February) most households will have run out of these grains. In this region, finger millet and sorghum are widely grown by women for brewing beer during the dry season in order to raise cash, rather than as a household food crop. Usually, their stocks of this grain have run out by December, when the hunger season usually starts. In Region 2b (most of Western Province), cassava, sorghum, pearl millet and rice are widely grown in addition to maize. These are grown as both food and also cash crops. This Region, having the least fertile soils, experiences the highest level of severe hunger and the lowest level of no hunger by households in Zambia. Related research efforts have focused on "climate smart" agriculture which often centre around maize as the main staple, including conservation agriculture, improved crop rotations, improved fallows and green manures, which have had rather limited impact to date145. Other research and development initiatives have focused on alternative starch staples to maize, including sorghum, cassava and rice. The development and promotion of improved sorghum and cassava varieties as alternative starch staples for drier areas of Zambia during the 1980s and 1990s.
144 Mofya-Mukuka, et al. 2019, Figure 5 indicates that severe hunger is most prevalent North-Western, Luapula and Northern Provinces, as well as in Western Province. 145 An evaluation of Conservation Agriculture undertaken in 2016, concluded that the adoption rate was low in spite of over 20 years of promotion (Zulu-Mbata, et al. 2016)
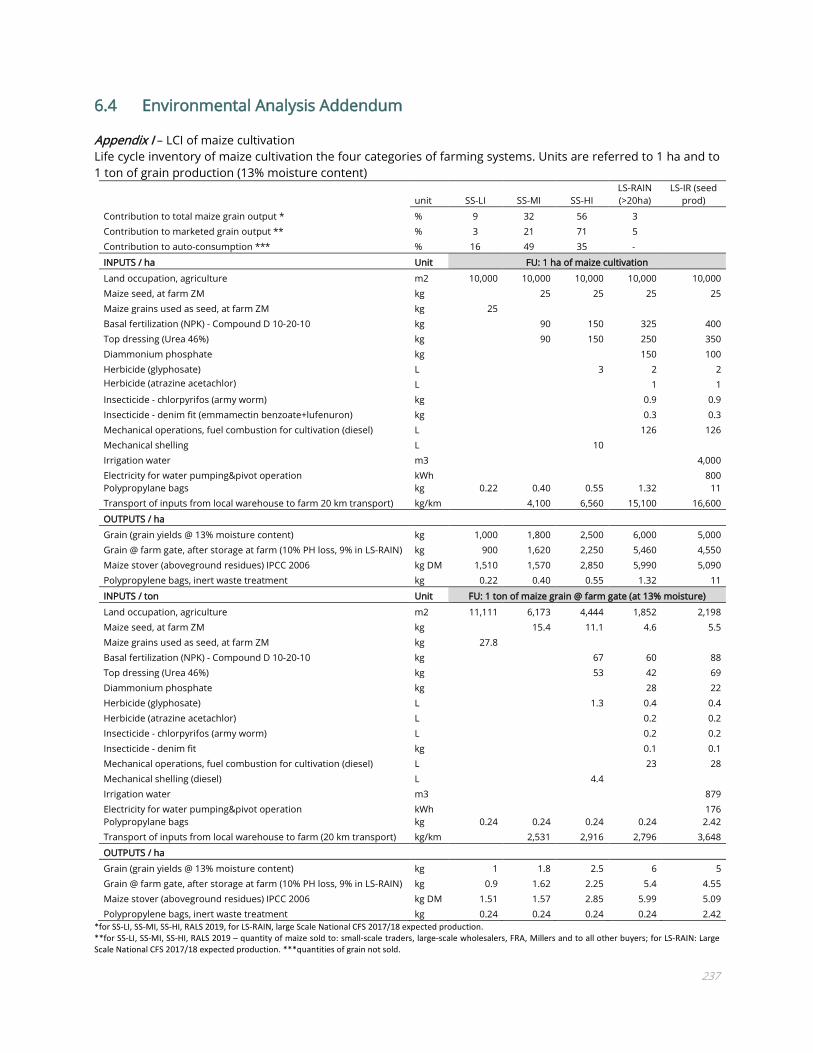
237
6.4 Environmental Analysis Addendum
Appendix I – LCI of maize cultivation Life cycle inventory of maize cultivation the four categories of farming systems. Units are referred to 1 ha and to 1 ton of grain production (13% moisture content)
unit SS-LI SS-MI SS-HI LS-RAIN (>20ha)
LS-IR (seed prod)
Contribution to total maize grain output * % 9 32 56 3 Contribution to marketed grain output ** % 3 21 71 5 Contribution to auto-consumption *** % 16 49 35 -
INPUTS / ha Unit FU: 1 ha of maize cultivation
Land occupation, agriculture m2 10,000 10,000 10,000 10,000 10,000 Maize seed, at farm ZM kg 25 25 25 25 Maize grains used as seed, at farm ZM kg 25 Basal fertilization (NPK) - Compound D 10-20-10 kg 90 150 325 400 Top dressing (Urea 46%) kg 90 150 250 350 Diammonium phosphate kg 150 100 Herbicide (glyphosate) L 3 2 2 Herbicide (atrazine acetachlor) L 1 1 Insecticide - chlorpyrifos (army worm) kg 0.9 0.9 Insecticide - denim fit (emmamectin benzoate+lufenuron) kg 0.3 0.3 Mechanical operations, fuel combustion for cultivation (diesel) L 126 126 Mechanical shelling L 10 Irrigation water m3 4,000 Electricity for water pumping&pivot operation kWh 800 Polypropylane bags kg 0.22 0.40 0.55 1.32 11 Transport of inputs from local warehouse to farm 20 km transport) kg/km 4,100 6,560 15,100 16,600
OUTPUTS / ha
Grain (grain yields @ 13% moisture content) kg 1,000 1,800 2,500 6,000 5,000 Grain @ farm gate, after storage at farm (10% PH loss, 9% in LS-RAIN) kg 900 1,620 2,250 5,460 4,550 Maize stover (aboveground residues) IPCC 2006 kg DM 1,510 1,570 2,850 5,990 5,090 Polypropylene bags, inert waste treatment kg 0.22 0.40 0.55 1.32 11
INPUTS / ton Unit FU: 1 ton of maize grain @ farm gate (at 13% moisture)
Land occupation, agriculture m2 11,111 6,173 4,444 1,852 2,198 Maize seed, at farm ZM kg 15.4 11.1 4.6 5.5 Maize grains used as seed, at farm ZM kg 27.8 Basal fertilization (NPK) - Compound D 10-20-10 kg 67 60 88 Top dressing (Urea 46%) kg 53 42 69 Diammonium phosphate kg 28 22 Herbicide (glyphosate) L 1.3 0.4 0.4 Herbicide (atrazine acetachlor) L 0.2 0.2 Insecticide - chlorpyrifos (army worm) L 0.2 0.2 Insecticide - denim fit kg 0.1 0.1 Mechanical operations, fuel combustion for cultivation (diesel) L 23 28 Mechanical shelling (diesel) L 4.4 Irrigation water m3 879 Electricity for water pumping&pivot operation kWh 176 Polypropylane bags kg 0.24 0.24 0.24 0.24 2.42 Transport of inputs from local warehouse to farm (20 km transport) kg/km 2,531 2,916 2,796 3,648
OUTPUTS / ha
Grain (grain yields @ 13% moisture content) kg 1 1.8 2.5 6 5 Grain @ farm gate, after storage at farm (10% PH loss, 9% in LS-RAIN) kg 0.9 1.62 2.25 5.4 4.55 Maize stover (aboveground residues) IPCC 2006 kg DM 1.51 1.57 2.85 5.99 5.09 Polypropylene bags, inert waste treatment kg 0.24 0.24 0.24 0.24 2.42
*for SS-LI, SS-MI, SS-HI, RALS 2019, for LS-RAIN, large Scale National CFS 2017/18 expected production. **for SS-LI, SS-MI, SS-HI, RALS 2019 – quantity of maize sold to: small-scale traders, large-scale wholesalers, FRA, Millers and to all other buyers; for LS-RAIN: Large Scale National CFS 2017/18 expected production. ***quantities of grain not sold.

238
Compound D, which is missing in the LCI databases was modelled as follows (referred to 1 kg of Compound D) using Agrifootprint 4.0 database:
Products with N, P or K
Amount N ratio P ratio K ratio Amount x ratio
Ammonium nitrate, as 100% (NH4)(NO3) (NPK 35-0-0), at plant/RER Mass
0.2858 35% 10 (N)
Triple superphosphate, as 80% Ca(H2PO4)2 (NPK 0-48-0), at plant/RER Mass
0.4166 48% 20 (P)
Potassium chloride (NPK 0-0-60), at plant/RER Mass
0.1665 60% 10 (K)
For Compound D, packaging was modelled as follows:
• Production of outer packaging (kg) used for 1kg compound D. As a proxy, we use the packaging of Ammonium nitrate, which corresponds to 0.06 kg Polypropylene fibres per each 25 kg of fertiliser produced (Agrifootprint);
• Production of inner packaging (kg) used for 1 kg compound D. As a proxy, we use the packaging of Ammonium nitrate, which corresponds to 0.0225 kg Polyethylente high density granulate per each 25 kg of fertiliser produced (Agrifootprint).
Modelling of transport of inputs: based on personal communications with IAPRI researchers and on the IMPORTS OF FERTILIZERS BY PARTNER (ABSOLUTE VALUES) - JANUARY 2018 TO JULY 2019 spreadsheet, transport for all fertilisers was modelled according to the following assumptions:
• Road transport by truck in country of production (UAE): 50 km • Transport, sea ship, 80000 DWT, 100%LF, long, from UAE to Beira, Mozambique [sea-
distances.org]: 3,400 km • Road transport by truck from Beira to a regional storehouse (assuming Mkushi): 1,400 km.
South Africa is the main import partner for chemicals, therefore for herbicides and pesticides, land transport from Johannesburg, ZA to a regional storehouse (assuming Mkushi) was considered, for a total distance of 1,900 km.

239
Appendix II Field emissions and crop residues management Field emissions N2O emissions are related to the amount of nitrogen supplied to the soil through nitrogen fertilization and to crop residues. The estimate of direct N2O emissions is calculated as the product of such amount of nitrogen and the N2O emission factor provided in the IPCC 2006 guidelines146. The single estimation of the amount of nitrogen from crop residues in the aboveground and belowground biomass took into consideration the grain yields for each category of farm and was based on the IPCC equation 11.7A (Vol. 4, Chapter 11) “Alternative approach to estimate FCR (using Table 11.2)”, which allows to calculate the annual amount of N2O emission from crop residues for maize (0.1 and 0.42 kg N2O/ha/year was calculated, respectively for the lower and the higher input cropping systems for grain production).The proportion of crop residues left on the fields, based on RALS 2019 statistics were considered for this calculation. NH3 volatilization from synthetic fertilisers and indirect N2O emissions from both NH3 volatilization and from NO3 leaching/runoff due to nitrogen fertilization were also calculated based on the IPCC 2006 guidelines. Phosphorus and phosphate emissions were calculated using the approach developed by Nemecek and Kagi (2007). Thus, for phosphorus emissions to water the following was considered:
• Leaching of soluble phosphate to groundwater (phosphate to ground water): for this emission the default value of 0.07 kg P/ha/year was used.
• Run-off of soluble phosphate to surface water (phosphate to river): the default value for arable land corrected for the amount of P input to soil from mineral fertiliser was adopted.
• Erosion of soil particles containing phosphorus (phosphorus to river): this emission refers to the quantity of soil eroded, the P content in soil eroded, an enrichment factor and the fraction of eroded soil that reaches the river. The quantity of soil eroded was estimated for the conditions of southern Africa, for which <10t/ha/year of soil eroded was reported (ELD, UNEP 2015). The resulting P emission was estimated at 8.8 kg/ha/year. It should be noted that the uncertainty associated with such estimation is high, considering that the emission factors of P highly depend on local conditions and also considering the unavailability of specific up-to-date soil erosion data referred to plots in the study area.
Crop residue management The estimation of the amount of nitrogen from crop residues in the aboveground and belowground biomass followed the IPCC 2006 approach, and therefore it took into consideration the grain yields for each category of farm. In this manner, for the portion of crop residues remaining in the field, N2O emissions from crop residues was estimated. For the portion burnt, aboveground biomass dry matter was calculated using the equation and default factors proposed for maize in table 11.2 IPCC 2006, (v4, Ch11). After calculating the value of 20% of the
146 N2O emission from field application of N fertilisers is calculated as 1% of the mass of N applied through fertilization multiplied by 44/28 to convert kg of N-N2O to kg of N2O.

240
aboveground biomass dry matter subject to fire, emission factors from Table 2.5, IPCC 2006 (vol 4, Ch 2) were applied for estimations of N2O, CH4, CO and NO2 emissions. For NMVOC, particulates and SOx, emission factors reported in the EMEP/EEA air pollutant emission inventory guidebook 2019 was adopted (Table 3-5, Tier 2 emission factors for source category 3.F Burning maize residues). Appendix III Direct land use change Deforestation and forest degradation are important environmental issues in Zambia, linked to expansion of agricultural lands, infrastructure development, woodfuel collection/charcoal production and uncontrolled bush fires (Vinya et al., 2011). We assumed that the carbon stock lost due to forest clearing corresponds to the carbon content in aboveground biomass (AGB), in litter and in the soil, while it was considered that the coarse and fine roots remain in the soil, since eradication is not carried out. The degradation of root biomass in soil is not included in the carbon lost since it would lead to much uncertainty to estimate the amount of carbon that will be oxidized to CO2 and the amount that will be humified to organic carbon. For the LS-RAIN system, also carbon loss due to belowground biomass (BGB) removal was considered, since for mechanized systems roots are usually removed. For the calculation of carbon stock in AGB, the value in terms of biomass density reported by Vinya et al. (2011) for forests in Zambia (8.38 t of ABG/ha) was adopted. Assuming 55% moisture content of felled trees147, this ABG value corresponds to 3.77 t of dry matter (DM) per ha. Considering a carbon content equal to 47% in DM148, the carbon stock loss was estimated at 17.7 t C ha. This value is within the range reported by Kamelarczyk (2009), in which it was estimated a carbon stock value of 15-24 t C ha for Zambian forests149. The carbon stock in litter was estimated according to the default values reported by IPCC (2006) which corresponds to 2.1 t C ha. This adds to the carbon stock loss in AGB. According to the value reported in literature about the mean value of organic carbon in agricultural soils in Zambia (on average 35.25 t C ha) and of organic carbon in woodlands (37.2 t C ha)150, it was possible to estimate soil carbon stock loss due to land use change (1.95 t C ha). The addition of the three pools, namely AGB, litter and soil, corresponds to the total carbon stock loss per hectare of cleared forest (21.7 t C ha). In order to estimate the area of forest cleared for each hectare of maize
147 http://www.fao.org/3/t0269e/t0269e08.htm 148 Thomas, S.C., Martin, A.R. Carbon Content of Tree Tissues: A Synthesis. Forests 2012, 3, 332-352. Also IPCC, 2006. 149 Bach Friis Kamelarczyk Carbon Stock Assessment and Modelling in Zambia a UN-REDD programme, 2009. 150 De Blécourt, M., Röder, A., Groengroeft, A., Baumann, S., Frantz, D. & Eschenbach, A. (2018) Deforestation for agricultural expansion in SW Zambia and NE Namibia and the impacts on soil fertility, soil organic carbon- and nutrient levels. In: Climate change and adaptive land management in southern Africa – assessments, changes, challenges, and solutions (ed. by Revermann, R., Krewenka, K.M., Schmiedel, U., Olwoch, J.M., Helmschrot, J. & Jürgens, N.), pp. 242-250, Biodiversity & Ecology, 6, Klaus Hess Publishers, Göttingen & Windhoek. doi:10.7809/b-e.00330.

241
cultivation in Zambia, RALS 2019 data was used. According to RALS, 2.3% of the maize area cultivated in the reference year was obtained from virgin land. This corresponds to a loss of 0.5 t C per each hectare under maize cultivation. For the calculation of carbon stock in BGB (applicable only to LS-RAIN system) the carbon stock pools for forest lands across all forest categories in Zambia (Kamelarczyk, 2009) was adopted. The reported density of BGB, expressed in terms of t C ha is 6.8. As a proxy for land clearing in the LS-RAIN system, the RALS 2019 data on rate of land clearing was used, this resulted in a BGB carbon loss of 0.15 t C per each hectare of maize cultivated under the LS-RAIN system. This quantity adds to the other pools, for a total of 0.65 t C loss in the LS-RAIN system. The land use change triggered by expansion of croplands for maize cultivation was modelled including in the inputs two land transformation flows, included in the ReCiPe 2016 method:
• Transformation, from forest, secondary (non-use) • Transformation, to annual crop, non-irrigated
The total carbon loss, from the biomass, from litter and from the soil, calculated for 1 ha of maize cultivation is shown in Table A.1.
Table A.1: Estimates of carbon loss due to direct land use change for maize cultivation expansion Variable Equation Unit Value Note
Aboveground biomass (AGB) A Mg C ha-1 17.72 Carbon in stem and branches
Belowground biomass (BGB) B Mg C ha-1 6.8 Carbon in roots Litter carbon stock loss C Mg C ha-1 2.1 Litter carbon stocks of
mature forests Soil carbon stock loss D Mg C ha-1 1.9 Includes carbon in soil
organic matter 100% of the carbon pools considered for SS-LI, SS-MI and SS-HI
E = A + C + D Mg C ha-1 21.72 100% of the carbon of 1 ha, includes aboveground
biomass carbon + carbon in litter + soil carbon
100% of the carbon pools considered for LS-RAIN
F = A + B+ C + D Mg C ha-1 28.52 100% of the carbon of 1 ha, includes aboveground
biomass carbon + belowground biomass
carbon + carbon in litter + soil carbon
Loss of C stock per ha of maize (SS-LI, SS-MI, SS-HI)
G = E x 0.023 Mg C ha-1 0.5 2.3% of carbon of 1 ha of maize cultivation, includes
aboveground biomass carbon + carbon in litter +
soil carbon Loss of C stock per ha of maize (SS-LI, SS-MI, SS.HI)
H = F x 0.023 Mg C ha-1 0.65 2.3% of carbon of 1 ha of maize cultivation, includes
aboveground biomass carbon + belowground
biomass + carbon in litter + soil carbon

242
Summarizing, the calculated carbon loss attributed to land use transformation due to the expansion of maize cultivation includes the carbon contained in wood, plus the carbon contained in litter and the carbon loss from soil, which in terms of CO2 emissions corresponds to 1,849.8 kg CO2 ha of maize cultivation (SS-LI, SS-MI, SS-HI), and to 2,429 kg CO2 ha of maize cultivation (LS-RAIN), where also below-ground biomass removal was considered. The emissions related to combustion of wood, other than CO2, were calculated using the emissions factor of IPCC 2006 guideline for CH4, N2O and from the EMEP-EEA guidelines151 for CO, NO2, NMVOC, SOx and particulates (EF, Fuel, Wood, technology: Open Fireplaces). The LCI of land transformation is shown in Table A.2. Carbon loss of the aforementioned pools are considered alongside emissions from burning of litter, which is part of the usual practice for land clearing. All operations are carried out manually. Combustion of aboveground biomass might take place as part of a downstream phase, for instance if used by household as fuelwood. Nevertheless, there is large uncertainty in terms of use of the biomass resulting from land clearing and the percentage of the biomass actually burnt. For this reason, combustion of aboveground biomass (aboveground and belowground, in the case of LS-RAIN) was considered outside the system.
Table A.2: Life cycle inventory of land transformation. FU: 1 ha of land under maize cultivation INPUTS Unit value Sources of data
Wood, feedstock kg 1,948 Vinya et al., 2011, RALS 2019
Transformation, from forest, secondary (non-use) m2 232 RALS 2019
Transformation, to annual crop, non-irrigated. m2 232 RALS 2019
OUTPUTS Unit value
Emission of CO2 due to land use change kg 1,849.8 Estimated using data from RALS
2009, Vinya et al., 2011, IPCC, 2006
Emission of CO2 due to land use change kg 1,849.8 Estimated using data from RALS
2009, Vinya et al., 2011, Kamelarczyk, 2009, IPCC, 2006
Emission of CH4 due to litter combustion g 240 Estimated using IPCC 2006 default
values
Emission of N2O due to litter combustion g 22 Estimated using IPCC 2006 default
values
Emission of CO due to litter combustion kg 6.8 Estimated using emission factor
from EMEP-EEA guidelines
Emission of NO2 due to litter combustion g 128 Estimated using emission factor
from EMEP-EEA guidelines
NMVOC due to litter combustion kg 1.5 Estimated using emission factor
from EMEP-EEA guidelines
Emission of SOx due to litter combustion g 28 Estimated using emission factor
from EMEP-EEA guidelines
151 European Environment Agency, 2019. EMEP/EEA Air Pollutant Emission Inventory Guidebook 2019. Technical Guidance to Prepare National Emission Inventories. EEA Technical report No 13/2019. Publications Office of the European Union, Luxembourg. https://www.eea.europa.eu/publications/emep-eea-guidebook-2019

243
Particulates, <10um due to litter combustion kg 2.1 Estimated using emission factor
from EMEP-EEA guidelines

244
Appendix IV – LCI of milling operations and allocation procedure LCI of electricity-powered and diesel-powered milling – UF: 1 kg of maize meal at mill
Inputs Value Unit Comment Electricity from national grid low voltage (ZM) or diesel, according to technology 106 Wh data from field surveys Maize grain for local sub-chain. (SS-LI+SS-MI+SS-HI), 1.275 kg 2% spills, milling losses Tap water for conditioning 0 kg dry milling Polypropylene bags 0 kg costumer's own reused bags Outputs Value Unit Comment
Maize meal, at mill 1 kg maize meal extraction rates are variable; one possible extraction rate selected
Maize bran, at mill 0.25 kg Bran (allocated) LCI of industrial milling + transport to retailer – UF: 1 kg of maize meal at retailer
Inputs Value Unit Comment Electricity from national grid medium voltage (ZM) 39 Wh 80% Electricity from diesel generator 9.7 Wh 20% Maize grain for commercial sub-chain (SS-LI+SS-MI+SS-HI+LS-RAIN), (before cleaning) 1.275 kg 2% of entering grain screenings (loss at sorting, cleaning, grading) Tap water for conditioning 0.037 kg 3% moisture addition to grain (conditioning) Polypropylene bags 5E-04 kg 1 PP bag for 50 kg grain weighs 25 g. Main output weight/50 kg
capacity of 1 bag x weight of 1 bag Transport to retailer 30 kgkm assuming a distance of 30 km from mill to retailer, Transport,
truck >20t, EURO2, 100%LF, empty return/GLO Outputs Value Unit Comment
Maize meal, at retailer 1 kg maize meal extraction rates are variable; one possible extraction rate selected
Maize bran, at mill-gate 0.25 kg bran (allocated) treatment of inert waste, inert material landfill 5E-04 kg PP bag disposal
To allocate environmental burdens to the by-product (bran) the economic approach was adopted using the following economic allocation parameters.
type of product Output rates (assumption)
value (ZMW/kg)
allocation coefficient
(price * output rates)
price*output rates (meal, bran, total)
allocation to product / co-
product
allocation value
breakfast meal 59 4 234 295 meal 0.9
roller meal 21 2.85 61 Bran 20 1 20 20 bran 0.1
Total 100 315 total 1

245

246
6.5 Agenda of mission and informants consulted
First Mission 3 - 14 feb 2020 JL Fusillier, A Chapoto, A Sutherland, R VillaniDate Time Who Location
3 feb 09:00 Ministry of Finance- Dingi Banda Lusaka14:00 Rehan / Director African Milling
Jomo Matululu / head Social Environment African Milling16:00 IAPRI CEO/Chance Kabaghe / Former FRA CEO17:00 Team meeting
4 feb 08:30 Director Policy and Planning/Director Agribusiness and Trdae Ministry of Agriculture (MoA) Mrs Kezia Katyamba (Director Agribusiness and Marketing) Mr. Kaunda Kapepula (Deputy Director Agribusiness and and Marketing)Mr. Christopher Mbewe (Chief Economist - Policy and Planning Department)Ms Harriet Matipa (Economist) - Policy and Planning Departnent
Lusaka
14:30 George Liocopolis / Zdenakie Grain Trading Lusaka5 feb 09:00 Chris Hawke / CHC Grain Trading Lusaka
11:30 Jacob Mwale/ ZAMACE Lusaka14:00 MAZ Andrew Chintala Lusaka
6 feb 06:00 Travel Lusaka to Copperbelt 13:00 DACO- Hosia Chibalamuna
District Comissioner - Kieth Maila14:00 Focus group discussion with small farmers in Mpongwe [category A & B] Mpongwe
7 feb 09:00 Mpongwe Milling / Joof Pistorious Kitwe14:00 Olympic Milling -
Priv. Tinashe Matewa (Group Financial Controller)Mupfudzw Mushipe (General Manager Sales
16:00 Kana Milling - Andrea Mulenga (Managing Director) Kitwe8 feb 08:00 Visit Kasumbalesa (cross border trade)- Egbert Phiri Kasumbalesa9 feb 08:00 PACO- Dr. Adreen Nansungwe
DACO-Reuben KabitiDMDO-Chingulu Sylvester
14:00 Lisimba Farm Mkushi10 feb 08:00 Meeting with small-scale traders in Mkushi
Senior Agrcultural Offcer - Diane SibotweDistrict Agricultural Coordinator -Reuben KabitiDistrict Marketing Development Offcer-Chingulu Sylvester
11:30 David Samutela, Rockshield Farms Mkushi14:00 Bruce Skinner, Yembekezela Farms Mkushi
11 feb 08:00 Focus group discussions with small-scale farmers -MkushiSenior Agricultural Officer - Diane SibotweDistrict Marketing Development Officer-Chingulu SylvesterAlexander Maroka (Masansa Block Officer)Mercy Sintalongo (Camp officer Masanza)Milinda (mboshi Camp Officer)
14:30 Agrivision Farm Derek Nicolle Mkushi bloc12 feb 09:00 Team Meeting Lusaka
12:30 Chieftainesss Muyeza Lusaka15:30 Friedrich Mahler & Chibwe Salati - Euopean Union Lusaka
13 feb 08:00 Team Meeting Lusaka14:00 Dr. Moses Mwale - Zambia Agricultural Research Institute (ZARI)
Victoria Ndeke (ZARI Breeder)Michael Phiri (ZARI Breeder)Hammer Miller - Wichani Farm Ltd (Winston. Mudenda Chizongo)
14 feb 08:00 Team meeting and wrap up 1st Mission
Mkushi-Masanza
Lusaka
Ndola
Lusaka
Mpongwe
Mkushi
Mkushi

247
Second Mission 12 - 17 oct 2020 A.Chapoto, B.Chisanga and M.ChilalaSygenta - Brian Mhango - Marketing Head Southern African & Seeds End Business Head Lusaka- Mukwa Road Seedco - Grace Bwanali LusakaMs Ella Chembe- Zambia National Farmers Union LusakaCEO/FRA - Chola Kafwabulula Lusaka
12-oct Gaston Phiri- District Agriculture Coordinating Officer (DACO)Cornelius Zimba-Senior Agricultural Officer (SAO)Survey in Mungwi market
13-oct Karen Chilembo Camp officer Mungwi WestFocus Group Discussion with farmers Chilunga Camp
15-oct Kenny Shakalima, Mufubushi camp officer FGD with farmers16-oct Charles Simukoko- Senior Agriculture Officer-SAO, Chimula Nkonde Phiri- Food Marketing Office
survey in Musakanya market, Mpika17-oct Rhoda Mwale, Milombwe Camp officer FGD with farmers
Brian Sibwando, Nshinso Camp officerNorvas Silavwe, Miloso Camp officerSurvey in Mkushi market
28-oct Danny Sichula- District Agricultural Coordinator-DACODr. Sally Chikuta-Senior Agriculture Officer-SAONicholas Obby Chanda -District Marketing Development Officer
29-oct Rebecca Zulu-Chola Keembe Central Camp OfficerFocus Group discussion with farmers Keembe Central Campsurvey in Chibombo market
Mkushi district
Chibombo District
Mungwi district
Mpika district