
Why should we be concerned about environmentally induced migration?
Upload
independentCategory
view
8download
0
VOLUME NO. 3 (2013), ISSUE NO. 12 (DECEMBER) ISSN 2231-4245
A Monthly Double-Blind Peer Reviewed (Refereed/Juried) Open Access International e-Journal - Included in the International Serial Directories
Indexed & Listed at: Ulrich's Periodicals Directory ©, ProQuest, U.S.A., EBSCO Publishing, U.S.A., Cabell’s Directories of Publishing Opportunities, U.S.A.,
Open J-Gage, India [link of the same is duly available at Inflibnet of University Grants Commission (U.G.C.)], Index Copernicus Publishers Panel, Poland with IC Value of 5.09 & number of libraries all around the world.
Circulated all over the world & Google has verified that scholars of more than 2980 Cities in 165 countries/territories are visiting our journal on regular basis.
Ground Floor, Building No. 1041-C-1, Devi Bhawan Bazar, JAGADHRI – 135 003, Yamunanagar, Haryana, INDIA
http://ijrcm.org.in/
VOLUME NO. 3 (2013), ISSUE NO. 12 (DECEMBER) ISSN 2231-4245
INTERNATIONAL JOURNAL OF RESEARCH IN COMMERCE, ECONOMICS & MANAGEMENT A Monthly Double-Blind Peer Reviewed (Refereed/Juried) Open Access International e-Journal - Included in the International Serial Directories
http://ijrcm.org.in/
ii
CONTENTS Sr. No. TITLE & NAME OF THE AUTHOR (S) Page
No.
1. PROFESSIONAL COMMITMENT IN HIGHER EDUCATION: AN EMPIRICAL STUDY H. SHAMINA & DR. VIJILA KENNEDY
1
2. STRESS MANAGEMENT IN RELATION TO SOCIO ECONOMIC STATUS OF SECONDARY SCHOOL STUDENTS DR. DEEPA. P & SUJA. P.V
5
3. PREDICTIVE ANALYTICS: A WAY TO PROACTIVE ACTIONS IN HUMAN RESOURCE MANAGEMENT VIKAS BANSAL
7
4. CAPITAL STRUCTURE AND ITS IMPACT ON PROFITABILITY: EVIDENCE FROM SRI LANKAN LISTED BANKS V. A. SUBRAMANIYAM & RAVIVATHANI THURAISINGAM
10
5. VALUE ADDITION OF FISHERY MARKETING, GAINS AND LOSSES ALONG THE SUPPLY CHAIN IN INDIA SHIFERAW MITIKU TEBEKA, EMMANUEL ZIVENGE, USHADEVI K.N & K. JESY THOMAS
14
6. A STUDY ON PRE-PURCHASE BEHAVIOR OF TWO WHEELER MOTORCYCLE USERS IN NELLORE DISTRICT, ANDHRA PRADESH, INDIA DR. D. V. RAMANA, DR. P. SUBBAIAH & P. V. L. NARASIMHA RAO
17
7. A FRAMEWORK OF AUDIT REPORT IN BANK AUDIT: STUDY ON LFAR, GHOSH & JILANI AND BASEL COMMITTEE REPORT DR. AKHIL MISHRA & NEHA JAISWAL
25
8. DEVELOPMENT OF SELF HELP GROUPS IN TAMIL NADU J. PAVITHRA & DR. M GANESAN
30
9. PROBLEMS OF PAIN AND PALLIATIVE CARE VOLUNTEERS IN KERALA DR. SANTHA S.
38
10. MICRO-FINANCE: A BOON TO THE SELF-HELP GROUP MEMBERS IN SIVAGANGAI DISTRICT, TAMIL NADU, INDIA CAPT. DR. JEYA KUMAR, KR. & DR. SREEDEVI.N
44
11. POLICY HOLDERS AWARENESS AND ADOPTION OF INFORMATION COMMUNICATION TECHNOLOGY OF LIFE INSURANCE CORPORATION OF INDIA S. RANI LAKSHMI & DR. P. SANTHI
51
12. HRM AND ETHICAL BEHAVIOUR: REVIEW AND CONCEPTUAL ANALYSIS DR. SUPRIYA CHOUDHARY
56
13. WOMEN ENTREPRENEURIAL OPPORTUNITIES IN FOOD INDUSTRY: A CASE OF CREMICA PRODUCTS VANIKA CHUGH & MANISH JHA
60
14. FACTORS INFLUENCING BRAND SWITCHING IN TELECOM INDUSTRY: WITH SPECIAL REFERENCE TO LUDHIANA CITY PREETI THAKUR, KARAN JOSHI & PRACHI KAPIL
65
15. ROLE OF FINANCIAL INSTITUTIONS IN DEVELOPMENT OF MSME AND AGRICULTURAL SECTOR IN INDIA: A VISION FOR YEAR 2020 AMOGH TALAN & GAURAV TALAN
73
16. IMPACT OF MONETARY POLICY ON BSE BANK STOCKS MANISHA LUTHRA & SHIKHA MAHAJAN
78
17. MOBILISATION AND MANAGEMENT OF FINANCIAL RESOURCES BY URBAN LOCAL BODIES YASHODA
80
18. AN EMPIRICAL ANALYSIS OF FACTORS AFFECTING INTERNET BANKING IN PUNJAB STATE (INDIA) RITU SEHGAL
83
19. RUPEE DOWNFALL: A THEORETICAL OUTLOOK GEORGE PAILY & ARUN B CHANDRAN
90
20. A COMPARATIVE STUDY ON THE PERFORMANCE OF SELECTED MUTUAL FUND TAX SAVING SCHEMES: AN IMPLICATION OF SHARPE’S MEASURE RAJIB DEB
95
21. AN ANALYSIS OF CASE STUDY PROPRIETORSHIP AND SATURATION - CASE STUDY SOURCE FROM ‘DHRUVA INSTITUTE OF MANAGEMENT HYDERABAD INDIA’: INTERNATIONAL CASE STUDY COMPETITION, AUTHOR: DR.JAGADEESHA.M ESAYAS DEGAGO & TESFAYE HAILU
103
22. EXPLORING THE FACTORS LEADING TOWARDS STUDENT DEVELOPMENT: A STUDY OF UNIVERSITY STUDENTS OF PAKISTAN HINA AFFANDI, NAHEED RAZA & ANUM AFFANDI
105
23. CUSTOMERS’ PERCEPTION TOWARDS ONLINE ADVERTISEMENT AND ITS IMPACT ON PURCHASE BEHAVIOUR VIPIN KUMAR
110
24. LOK ADALAT IN JAMMU AND KASHMIR: AN EMPIRICAL ANALYSIS UNANZA GULZAR
114
25. DISCLOSING NONFINANCIAL INFORMATION LEADS TO THE SHAREHOLDERS’ WEALTH MAXIMIZATION: EVIDENCE FROM BANGLADESHI LISTED FINANCIAL COMPANIES SALEH MOHAMMED MASHEHDUL ISLAM
117
26. CAN ECONOMIC VISION OF MAHATMA GANDHI MAKE HIM A DEMOCRATIC LEADER? NEHA BOTHRA
124
27. ANALYSIS OF EMPLOYMENT DISCRIMINATION OF SCS AND STS IN NATIONAL RURAL EMPLOYMENT GUARANTEE SCHEME (NREGS) SIDDHARTH RATHORE
128
28. EUROPEAN UNION AS A GLOBAL SECURITY ACTOR H.S VENKATESHA
134
29. FINANCIAL INCLUSION: A STUDY OF CANARA BANK AMANJOT SINGH
139
30. THE POPULATION GROWTH AND ECONOMIC DEVELOPMENT SANGHARSHA BALIRAM SAWALE & NEHA RAKESH NAMDEO
143
REQUEST FOR FEEDBACK & DISCLAIMER 146

VOLUME NO. 3 (2013), ISSUE NO. 12 (DECEMBER) ISSN 2231-4245
INTERNATIONAL JOURNAL OF RESEARCH IN COMMERCE, ECONOMICS & MANAGEMENT A Monthly Double-Blind Peer Reviewed (Refereed/Juried) Open Access International e-Journal - Included in the International Serial Directories
http://ijrcm.org.in/
iii
CHIEF PATRON PROF. K. K. AGGARWAL
Chairman, Malaviya National Institute of Technology, Jaipur (An institute of National Importance & fully funded by Ministry of Human Resource Development, Government of India)
Chancellor, K. R. Mangalam University, Gurgaon
Chancellor, Lingaya’s University, Faridabad
Founder Vice-Chancellor (1998-2008), Guru Gobind Singh Indraprastha University, Delhi
Ex. Pro Vice-Chancellor, Guru Jambheshwar University, Hisar
FOUNDER PATRON LATE SH. RAM BHAJAN AGGARWAL
Former State Minister for Home & Tourism, Government of Haryana
Former Vice-President, Dadri Education Society, Charkhi Dadri
Former President, Chinar Syntex Ltd. (Textile Mills), Bhiwani
CO-ORDINATOR DR. BHAVET
Faculty, Shree Ram Institute of Business & Management, Urjani
ADVISORS DR. PRIYA RANJAN TRIVEDI
Chancellor, The Global Open University, Nagaland
PROF. M. S. SENAM RAJU Director A. C. D., School of Management Studies, I.G.N.O.U., New Delhi
PROF. M. N. SHARMA Chairman, M.B.A., HaryanaCollege of Technology & Management, Kaithal
PROF. S. L. MAHANDRU Principal (Retd.), MaharajaAgrasenCollege, Jagadhri
EDITOR PROF. R. K. SHARMA
Professor, Bharti Vidyapeeth University Institute of Management & Research, New Delhi
CO-EDITOR DR. SAMBHAV GARG
Faculty, Shree Ram Institute of Business & Management, Urjani
EDITORIAL ADVISORY BOARD DR. RAJESH MODI
Faculty, Yanbu Industrial College, Kingdom of Saudi Arabia
PROF. SIKANDER KUMAR Chairman, Department of Economics, HimachalPradeshUniversity, Shimla, Himachal Pradesh
PROF. SANJIV MITTAL UniversitySchool of Management Studies, GuruGobindSinghI. P. University, Delhi
PROF. RAJENDER GUPTA Convener, Board of Studies in Economics, University of Jammu, Jammu
VOLUME NO. 3 (2013), ISSUE NO. 12 (DECEMBER) ISSN 2231-4245
INTERNATIONAL JOURNAL OF RESEARCH IN COMMERCE, ECONOMICS & MANAGEMENT A Monthly Double-Blind Peer Reviewed (Refereed/Juried) Open Access International e-Journal - Included in the International Serial Directories
http://ijrcm.org.in/
iv
PROF. NAWAB ALI KHAN Department of Commerce, Aligarh Muslim University, Aligarh, U.P.
PROF. S. P. TIWARI Head, Department of Economics & Rural Development, Dr. Ram Manohar Lohia Avadh University, Faizabad
DR. ANIL CHANDHOK Professor, Faculty of Management, Maharishi Markandeshwar University, Mullana, Ambala, Haryana
DR. ASHOK KUMAR CHAUHAN Reader, Department of Economics, KurukshetraUniversity, Kurukshetra
DR. SAMBHAVNA Faculty, I.I.T.M., Delhi
DR. MOHENDER KUMAR GUPTA Associate Professor, P.J.L.N.GovernmentCollege, Faridabad
DR. VIVEK CHAWLA Associate Professor, Kurukshetra University, Kurukshetra
DR. SHIVAKUMAR DEENE Asst. Professor, Dept. of Commerce, School of Business Studies, Central University of Karnataka, Gulbarga
ASSOCIATE EDITORS PROF. ABHAY BANSAL
Head, Department of Information Technology, Amity School of Engineering & Technology, Amity University, Noida
PARVEEN KHURANA Associate Professor, MukandLalNationalCollege, Yamuna Nagar
SHASHI KHURANA Associate Professor, S.M.S.KhalsaLubanaGirlsCollege, Barara, Ambala
SUNIL KUMAR KARWASRA Principal, AakashCollege of Education, ChanderKalan, Tohana, Fatehabad
DR. VIKAS CHOUDHARY Asst. Professor, N.I.T. (University), Kurukshetra
TECHNICAL ADVISOR AMITA
Faculty, Government M. S., Mohali
FINANCIAL ADVISORS DICKIN GOYAL
Advocate & Tax Adviser, Panchkula
NEENA Investment Consultant, Chambaghat, Solan, Himachal Pradesh
LEGAL ADVISORS JITENDER S. CHAHAL
Advocate, Punjab & Haryana High Court, Chandigarh U.T.
CHANDER BHUSHAN SHARMA Advocate & Consultant, District Courts, Yamunanagar at Jagadhri
SUPERINTENDENT SURENDER KUMAR POONIA

VOLUME NO. 3 (2013), ISSUE NO. 12 (DECEMBER) ISSN 2231-4245
INTERNATIONAL JOURNAL OF RESEARCH IN COMMERCE, ECONOMICS & MANAGEMENT A Monthly Double-Blind Peer Reviewed (Refereed/Juried) Open Access International e-Journal - Included in the International Serial Directories
http://ijrcm.org.in/
v
CALL FOR MANUSCRIPTS We invite unpublished novel, original, empirical and high quality research work pertaining to recent developments & practices in the areas of
Computer Science & Applications; Commerce; Business; Finance; Marketing; Human Resource Management; General Management; Banking;
Economics; Tourism Administration & Management; Education; Law; Library & Information Science; Defence & Strategic Studies; Electronic Science;
Corporate Governance; Industrial Relations; and emerging paradigms in allied subjects like Accounting; Accounting Information Systems; Accounting
Theory & Practice; Auditing; Behavioral Accounting; Behavioral Economics; Corporate Finance; Cost Accounting; Econometrics; Economic
Development; Economic History; Financial Institutions & Markets; Financial Services; Fiscal Policy; Government & Non Profit Accounting; Industrial
Organization; International Economics & Trade; International Finance; Macro Economics; Micro Economics; Rural Economics; Co-operation;
Demography: Development Planning; Development Studies; Applied Economics; Development Economics; Business Economics; Monetary Policy; Public
Policy Economics; Real Estate; Regional Economics; Political Science; Continuing Education; Labour Welfare; Philosophy; Psychology; Sociology; Tax
Accounting; Advertising & Promotion Management; Management Information Systems (MIS); Business Law; Public Responsibility & Ethics;
Communication; Direct Marketing; E-Commerce; Global Business; Health Care Administration; Labour Relations & Human Resource Management;
Marketing Research; Marketing Theory & Applications; Non-Profit Organizations; Office Administration/Management; Operations Research/Statistics;
Organizational Behavior & Theory; Organizational Development; Production/Operations; International Relations; Human Rights & Duties; Public
Administration; Population Studies; Purchasing/Materials Management; Retailing; Sales/Selling; Services; Small Business Entrepreneurship; Strategic
Management Policy; Technology/Innovation; Tourism & Hospitality; Transportation Distribution; Algorithms; Artificial Intelligence; Compilers &
Translation; Computer Aided Design (CAD); Computer Aided Manufacturing; Computer Graphics; Computer Organization & Architecture; Database
Structures & Systems; Discrete Structures; Internet; Management Information Systems; Modeling & Simulation; Neural Systems/Neural Networks;
Numerical Analysis/Scientific Computing; Object Oriented Programming; Operating Systems; Programming Languages; Robotics; Symbolic & Formal
Logic; Web Design and emerging paradigms in allied subjects.
Anybody can submit the soft copy of unpublished novel; original; empirical and high quality research work/manuscript anytime in M.S. Word format
after preparing the same as per our GUIDELINES FOR SUBMISSION; at our email address i.e. [email protected] or online by clicking the link online submission as given on our website (FOR ONLINE SUBMISSION, CLICK HERE).
GUIDELINES FOR SUBMISSION OF MANUSCRIPT
1. COVERING LETTER FOR SUBMISSION: DATED: _____________
THE EDITOR
IJRCM
Subject: SUBMISSION OF MANUSCRIPT IN THE AREA OF.
(e.g. Finance/Marketing/HRM/General Management/Economics/Psychology/Law/Computer/IT/Engineering/Mathematics/other, please specify)
DEAR SIR/MADAM
Please find my submission of manuscript entitled ‘___________________________________________’ for possible publication in your journals.
I hereby affirm that the contents of this manuscript are original. Furthermore, it has neither been published elsewhere in any language fully or partly, nor is it
under review for publication elsewhere.
I affirm that all the author (s) have seen and agreed to the submitted version of the manuscript and their inclusion of name (s) as co-author (s).
Also, if my/our manuscript is accepted, I/We agree to comply with the formalities as given on the website of the journal & you are free to publish our
contribution in any of your journals.
NAME OF CORRESPONDING AUTHOR: Designation:
Affiliation with full address, contact numbers & Pin Code:
Residential address with Pin Code:
Mobile Number (s):
Landline Number (s):
E-mail Address:
Alternate E-mail Address:
NOTES:
a) The whole manuscript is required to be in ONE MS WORD FILE only (pdf. version is liable to be rejected without any consideration), which will start from
the covering letter, inside the manuscript.
b) The sender is required to mentionthe following in the SUBJECT COLUMN of the mail:
New Manuscript for Review in the area of (Finance/Marketing/HRM/General Management/Economics/Psychology/Law/Computer/IT/
Engineering/Mathematics/other, please specify)
c) There is no need to give any text in the body of mail, except the cases where the author wishes to give any specific message w.r.t. to the manuscript.
d) The total size of the file containing the manuscript is required to be below 500 KB.
e) Abstract alone will not be considered for review, and the author is required to submit the complete manuscript in the first instance.
f) The journal gives acknowledgement w.r.t. the receipt of every email and in case of non-receipt of acknowledgment from the journal, w.r.t. the submission
of manuscript, within two days of submission, the corresponding author is required to demand for the same by sending separate mail to the journal.
2. MANUSCRIPT TITLE: The title of the paper should be in a 12 point Calibri Font. It should be bold typed, centered and fully capitalised.
3. AUTHOR NAME (S) & AFFILIATIONS: The author (s) full name, designation, affiliation (s), address, mobile/landline numbers, and email/alternate email address should be in italic & 11-point Calibri Font. It must be centered underneath the title.
4. ABSTRACT: Abstract should be in fully italicized text, not exceeding 250 words. The abstract must be informative and explain the background, aims, methods,
results & conclusion in a single para. Abbreviations must be mentioned in full.

VOLUME NO. 3 (2013), ISSUE NO. 12 (DECEMBER) ISSN 2231-4245
INTERNATIONAL JOURNAL OF RESEARCH IN COMMERCE, ECONOMICS & MANAGEMENT A Monthly Double-Blind Peer Reviewed (Refereed/Juried) Open Access International e-Journal - Included in the International Serial Directories
http://ijrcm.org.in/
vi
5. KEYWORDS: Abstract must be followed by a list of keywords, subject to the maximum of five. These should be arranged in alphabetic order separated by
commas and full stops at the end.
6. MANUSCRIPT: Manuscript must be in BRITISH ENGLISH prepared on a standard A4 size PORTRAIT SETTING PAPER. It must be prepared on a single space and
single column with 1” margin set for top, bottom, left and right. It should be typed in 8 point Calibri Font with page numbers at the bottom and centre of every
page. It should be free from grammatical, spelling and punctuation errors and must be thoroughly edited.
7. HEADINGS: All the headings should be in a 10 point Calibri Font. These must be bold-faced, aligned left and fully capitalised. Leave a blank line before each
heading.
8. SUB-HEADINGS: All the sub-headings should be in a 8 point Calibri Font. These must be bold-faced, aligned left and fully capitalised.
9. MAIN TEXT: The main text should follow the following sequence:
INTRODUCTION
REVIEW OF LITERATURE
NEED/IMPORTANCE OF THE STUDY
STATEMENT OF THE PROBLEM
OBJECTIVES
HYPOTHESES
RESEARCH METHODOLOGY
RESULTS & DISCUSSION
FINDINGS
RECOMMENDATIONS/SUGGESTIONS
CONCLUSIONS
SCOPE FOR FURTHER RESEARCH
ACKNOWLEDGMENTS
REFERENCES
APPENDIX/ANNEXURE
It should be in a 8 point Calibri Font, single spaced and justified. The manuscript should preferably not exceed 5000 WORDS.
10. FIGURES &TABLES: These should be simple, crystal clear, centered, separately numbered & self explained, and titles must be above the table/figure. Sources of data should be mentioned below the table/figure. It should be ensured that the tables/figures are referred to from the main text.
11. EQUATIONS:These should be consecutively numbered in parentheses, horizontally centered with equation number placed at the right.
12. REFERENCES: The list of all references should be alphabetically arranged. The author (s) should mention only the actually utilised references in the preparation
of manuscript and they are supposed to follow Harvard Style of Referencing. The author (s) are supposed to follow the references as per the following:
• All works cited in the text (including sources for tables and figures) should be listed alphabetically.
• Use (ed.) for one editor, and (ed.s) for multiple editors.
• When listing two or more works by one author, use --- (20xx), such as after Kohl (1997), use --- (2001), etc, in chronologically ascending order.
• Indicate (opening and closing) page numbers for articles in journals and for chapters in books.
• The title of books and journals should be in italics. Double quotation marks are used for titles of journal articles, book chapters, dissertations, reports, working
papers, unpublished material, etc.
• For titles in a language other than English, provide an English translation in parentheses.
• The location of endnotes within the text should be indicated by superscript numbers.
PLEASE USE THE FOLLOWING FOR STYLE AND PUNCTUATION IN REFERENCES: BOOKS
• Bowersox, Donald J., Closs, David J., (1996), "Logistical Management." Tata McGraw, Hill, New Delhi.
• Hunker, H.L. and A.J. Wright (1963), "Factors of Industrial Location in Ohio" Ohio State University, Nigeria.
CONTRIBUTIONS TO BOOKS
• Sharma T., Kwatra, G. (2008) Effectiveness of Social Advertising: A Study of Selected Campaigns, Corporate Social Responsibility, Edited by David Crowther &
Nicholas Capaldi, Ashgate Research Companion to Corporate Social Responsibility, Chapter 15, pp 287-303.
JOURNAL AND OTHER ARTICLES
• Schemenner, R.W., Huber, J.C. and Cook, R.L. (1987), "Geographic Differences and the Location of New Manufacturing Facilities," Journal of Urban Economics,
Vol. 21, No. 1, pp. 83-104.
CONFERENCE PAPERS
• Garg, Sambhav (2011): "Business Ethics" Paper presented at the Annual International Conference for the All India Management Association, New Delhi, India,
19–22 June.
UNPUBLISHED DISSERTATIONS AND THESES
• Kumar S. (2011): "Customer Value: A Comparative Study of Rural and Urban Customers," Thesis, Kurukshetra University, Kurukshetra.
ONLINE RESOURCES
• Always indicate the date that the source was accessed, as online resources are frequently updated or removed.
WEBSITES
• Garg, Bhavet (2011): Towards a New Natural Gas Policy, Political Weekly, Viewed on January 01, 2012 http://epw.in/user/viewabstract.jsp
VOLUME NO. 3 (2013), ISSUE NO. 12 (DECEMBER) ISSN 2231-4245
INTERNATIONAL JOURNAL OF RESEARCH IN COMMERCE, ECONOMICS & MANAGEMENT A Monthly Double-Blind Peer Reviewed (Refereed/Juried) Open Access International e-Journal - Included in the International Serial Directories
http://ijrcm.org.in/
1
PROFESSIONAL COMMITMENT IN HIGHER EDUCATION: AN EMPIRICAL STUDY
H. SHAMINA
ASST. PROFESSOR
WISDOM SCHOOL OF MANAGEMENT
GOMANGALAM
DR. VIJILA KENNEDY
DIRECTOR
KCT BUSINESS SCHOOL
KUMARAGURU COLLEGE OF TECHNOLOGY
COIMBATORE
ABSTRACT
India's higher education system is the third largest in the world, next to the United States and China. The paper aims at studying the institutional factors
influencing professional commitment of teachers in self-financing colleges affiliated to Bharathiar University, Coimbatore. A sample of 100 teachers was chosen
and questionnaire was used to collect data. Inter correlation matrix and Path analysis were used to analyze the data. Professional Autonomy, Feedback,
Participation in Decision making, Perceived Organizational support and Collegiality were the institutional factors chosen and it was found that all of them had a
strong relationship and influence on the Professional commitment of teachers. Professional Autonomy and Collegiality had a direct effect on Professional
Commitment of teachers in self-financing colleges.
KEYWORDS Professional commitment, Professional Autonomy, Perceived organizational support.
INTRODUCTION he growth and progress of a country mainly depends upon the teachers, and teachers are the nation builders. Teaching is the noblest profession and
hence, their well being and their commitment towards their profession is gaining significance recently, especially in higher educations. India's higher
education system is the third largest in the world, next to the United States and China. Indian higher education system has expanded at a fast pace by
adding nearly 20,000 colleges and more than 8 million students in a decade from 2000-01 to 2010-11. As of 2011, India has 42 central universities, 275 state
universities, 130 deemed universities, 90 private universities, 5 institutions established and functioning under the State Act, and 33 Institutes of National
Importance.
While there is clear and categorical recognition of the vital role that the teachers in colleges have to play in preparing future pillars of the nation, in terms of
professional competencies and commitments on their part, surprisingly, in the total enterprise of teachers, the most neglected group is the teachers themselves.
PROFESSIONAL COMMITMENT Vandenberg and Scarpello (1994) defined professional commitment as “a person’s belief in and acceptance of the values of his or her chosen occupation or line
of work, and a willingness to maintain membership in that occupation” (p. 535).
Professional Commitment is defined as the extent to which one is committed to one’s profession, identified elements including dedication and social obligation
(Hall 1968).
• Jeffrey j Bagraim (2003), Meyer et al (1993) defined three components of professional commitment
• Affective professional commitment (APC)
• Continuance professional commitment (CPC)
• Normative professional commitment (NPC).
Affective professional commitment (APC) refers to identification with, involvement in, and emotional attachment to the profession. Thus, employees with strong
affective professional commitment remain members of their profession because they want to do so.
Continuance professional commitment (CPC) refers to commitment based on the employee’s recognition of the costs associated with leaving their profession.
Employees with strong continuance commitment remain with their profession because they realize that they have much to lose by not doing so.
Normative professional commitment (NPC) refers to commitment based on a sense of obligation to the profession. Employees with strong normative
professional commitment remain members of their profession because they feel they ought to do so.
REVIEW OF LITERATURE The body of literature in industrial/organizational psychology represents a potentially fruitfuldomain of theory and research that may be applied to
understanding the relationship between teachers and the schools in which they are employed. But most of the researches are conducted only in schools and the
research has not focused much on the teacher’s professional commitment in higher education. Relatively little research; however, has addressed commitment
among teachers (e.g., Billingsley & Cross, 1992; Grady, 1989). Moreover, although recently there have been attempts to trace the diverse construct of
commitment (Firestone& Rosenblum, 1988), most research on teachers’ commitment examined it as a generic construct (e.g., Niehoff, 1997; Reames & Spencer,
1998).
The teacher commitment literature can be distilled for generalizations and assumptions about the ways that teachers define, describe and characterise
commitment. The current accepted conceptualizations of teacher commitment can be directly linked back to the research done in the 1970’s into organizational
commitment by Kanter (1974) and Mowday, Steers and Porter (1979). Teachers are thought to have commitments to the social context in which they work, or to
what Kanter (1974) describe as the ‘social system’. However, the overarching assumption is that teacher commitment is not one dimensional, but has many
layers and dimensions (Day, 2000, 2004; Nias 1981, 1996; Tyree, 1996). Professional commitment is of importance as it is associated with greater job effort and
involvement, i.e. committed employees are less likely to leave their position and display other withdrawal behaviour such as absenteeism (Singh & Billingsley,
1998).
PC AND PERCEIVED ORGANIZATIONAL SUPPORT Supportive leader behaviors and a generally facilitative organizational climate may be subsumed under a variable entitled “Perceived Organizational Support.”
Eisenberger, Huntington, Hutchison, and Sowa (1986) demonstrated that individuals tend to “form global beliefs concerning the extent to which the
organization values their contributions and cares about their well-being” (p. 504).Employees are frequently sensitive to relevant environmental and
organizational constraints that might limit the ability to provide them with desired rewards (Eisenberger, Cummings, Armeli, & Lynch, 1997). Employees who
T
VOLUME NO. 3 (2013), ISSUE NO. 12 (DECEMBER) ISSN 2231-4245
INTERNATIONAL JOURNAL OF RESEARCH IN COMMERCE, ECONOMICS & MANAGEMENT A Monthly Double-Blind Peer Reviewed (Refereed/Juried) Open Access International e-Journal - Included in the International Serial Directories
http://ijrcm.org.in/
2
experience a strong level of POS theoretically feel the need to reciprocate favorable organizational treatment with attitudes and behaviors that in turn benefit
the organization (Eisenberger et al., 1986). In support of this social exchange perspective, research has revealed that POS is positively related to job attendance
and measures of job performance (Eisenberger et al., 1986; Eisenberger, Fasolo, & Davis-LaMastro, 1990), the tendency to help coworkers (Shore & Wayne,
1993), the tendency to offer constructive suggestions for organizational improvement, and affective organizational commitment (Eisenberger et al., 1990).
PC AND PARTICIPATION IN DECISION MAKING PC is ‘‘the degree to which a person’s work performance affects his self-esteem’’ (Lodahl & Kejner, 1965, p. 25). For a person who is professionally committed,
work is a vital part of life. This means that both the work itself and the co-workers are very meaningful to the employee, in addition to the importance s/he
attaches to the organization as a whole. Active participation in decision-making increases involvement and PC, which result in a higher level of acceptance and
satisfaction. Evers (1990) suggested that teachers’ successful participation in decision-making could be explained by the feeling of ownership that comes from
initiating ideas rather than responding to others’ proposals. Gaziel and Weiss (1990) claimed that teachers’ participation, based on establishing a strong voice in
decisions and policies, was a characteristic of ‘‘professional orientation’’, and fostered better working relations among staff members. With regard to self-
efficacy, studies have shown that teachers with a greater sense of efficacy are more enthusiastic about teaching (Guskey, 1984), report a higher level of
commitment to teaching (Coladarci, 1992; Evans & Tribble, 1986), and are more likely to remain in teaching (Glickman & Tamashiro, 1982).
PC AND FEEDBACK An applied managerial perspective might suggest that a supervisor use as much performance feedback as possible, and indeed, the degree to which feedback
enhances performance has been amply documented (Annett, 1969; Nadler, 1979). It is desirable to study professional commitment as a moderator of the
feedback and performance relationship among professionals because commitment attitudes are likely to affect perceptions and reactions to different types of
role related feedback. Teachers feel more responsible for their actions which inturn influences their commitment (Salancik, 1977). For such persons, task
feedback is likely to be perceived as important due to expectations derived from professional training that performance standards should be defined and
monitored by the individual professional. Relatedly, positive supervisory feedback would likely be welcome by the professionally committed as an indication of
an absence of conflict between professional norms and organizational practices.
PC AND PROFESSIONAL AUTONOMY The extent to which the profession provides substantial freedom, independence and discretion to carry out the tasks is Professional Autonomy (Gegas and
Schwalbe 1983; Hackman and Oldham 1980; Rosenholtz and Simpson, 1990). Those high in professional commitment desire autonomy and resent organizational
intervention (Sorenson & Sorenson, 1974). The autonomous flexibility to pursue these core tasks is valued part of any professional work. Mathew and Zajac
found a positive correlation between Autonomy and professional commitment.( Hackman and Lawler; 1971;)
PC AND COLLEGIALITY Professionalism is characterized by high degree of collegiality which enables them to cope up with uncertainties encountered in their work (Blau & Scott
1962;).Stronger collegial ties and support from professional coworkers enhance the professional commitment of workers; Friedson 1984; Jean E Wallace 1985;
Nelson & Trubek 1992;Derber 1983).
NEED/IMPORTANCE OF THE STUDY There is a dearth of committed teachers in higher educations which is an important area to be addressed. Rate of attrition of Quality teachers is increasing and
hence the institution as well as the student community suffers a lot. Lower commitment creates the dilemmas that both affect badly the effectiveness of college
and cause teachers to be less successful in their professional performance or to leave the profession. The less committed teachers may both create difficulties
and cause the deviations in respect of the educational aims of the institution , for example in the classroom, the teachers may struggle to direct the students to
behave in accordance with different aims separated from the aims of the institution. Those types of negative attitudes may be recognized and prevented at the
proper time, if there is a real understanding of their commitment towards their profession.
STATEMENT OF THE PROBLEM Teachers today, leave their institutions as well as professions often due to some reasons. Teachers commitment in higher education are influenced by various
institutional factors like Autonomy, Decision making, collegiality, feedback, job satisfaction, Stress etc. Serious negative consequences like turnover, turn over
intentions, absenteeism can be prevented if the teachers are committed to their profession. Positive consequences like Organizational Citizenship behavior, job
performance and creativity in teaching can also be enhanced in committed teachers.Based on the review of literature; six institutional variables are identified to
have an impact of the professional commitment of teachers in higher educations. They are Professional Autonomy, Feedback, Participation in Decision making,
Perceived Organizational support and Collegiality.
OBJECTIVES 1. To study the institutional factors affecting the professional commitment of teachers.
2. To analyze the relationship between the factors and the professional commitment of teachers.
3. To suggest some measures to the institutions to enhance the commitment of the teachers.
HYPOTHESIS Ho: There is no significant relationship between Professional Autonomy and Professional Commitment of teachers in higher education.
H1: There is a significant relationship between Professional Autonomy and Professional Commitment of teachers in higher education.
Ho: There is no significant relationship between Feedback and Professional Commitment of teachers in higher education.
H2: There is a significant relationship between Feedback and Professional Commitment of teachers in higher education.
Ho: There is no significant relationship between Participation in Decision making and Professional Commitment of teachers in higher education.
H3: There is a significant relationship between Participation in Decision making and Professional Commitment of teachers in higher education.
Ho: There is no significant relationship between Perceived Organizational support and Professional Commitment of teachers in higher education.
H4: There is a significant relationship between Perceived organizational support and Professional Commitment of teachers in higher education.
Ho: There is no significant relationship between Collegiality and Professional Commitment of teachers in higher education.
H5: There is a significant relationship between Collegiality and Professional Commitment of teachers in higher education.
RESEARCH METHODOLOGY The study was conducted in Arts and science colleges affiliated to Bharathiar University, Coimbatore. In this study, 100 teachers working in Self-financing
colleges affiliated to Bharathiar University were chosen as samples. Selected colleges were chosen in Coimbatore district for the study and data collection was
done with the help of a questionnaire. Simple random sampling was used to collect the data.
SAMPLE SIZE It refers to the number of items to be selected from the universe to constitute as a sample. The sample size of the study was 100 and it was a descriptive study.
TOOLS USED Professional commitment scale of Meyer and Allen (1993) was used to collect data on PC. Questions on Collegiality were framed on the basis of the instrument
adapted from Professional teacher behavior: OCI by Hoy et al (2001). Questions on Feedback were adapted from Job Characteristics Inventory by Sims et al
VOLUME NO. 3 (2013), ISSUE NO. 12 (DECEMBER) ISSN 2231-4245
INTERNATIONAL JOURNAL OF RESEARCH IN COMMERCE, ECONOMICS & MANAGEMENT A Monthly Double-Blind Peer Reviewed (Refereed/Juried) Open Access International e-Journal - Included in the International Serial Directories
http://ijrcm.org.in/
3
(1976). Questions on Participation in decision making and Professional autonomy was taken from (Rosenholtz 1989), and (Eisenberger et al 1986)’s scale was
used to collect data on Perceived Organizational Support.
Correlation matrix was used to find the relationship between the institutional factors and the relationship of those factors with PC. Path analysis was done to
find the direct and indirect effect of the institutional variables on PC.
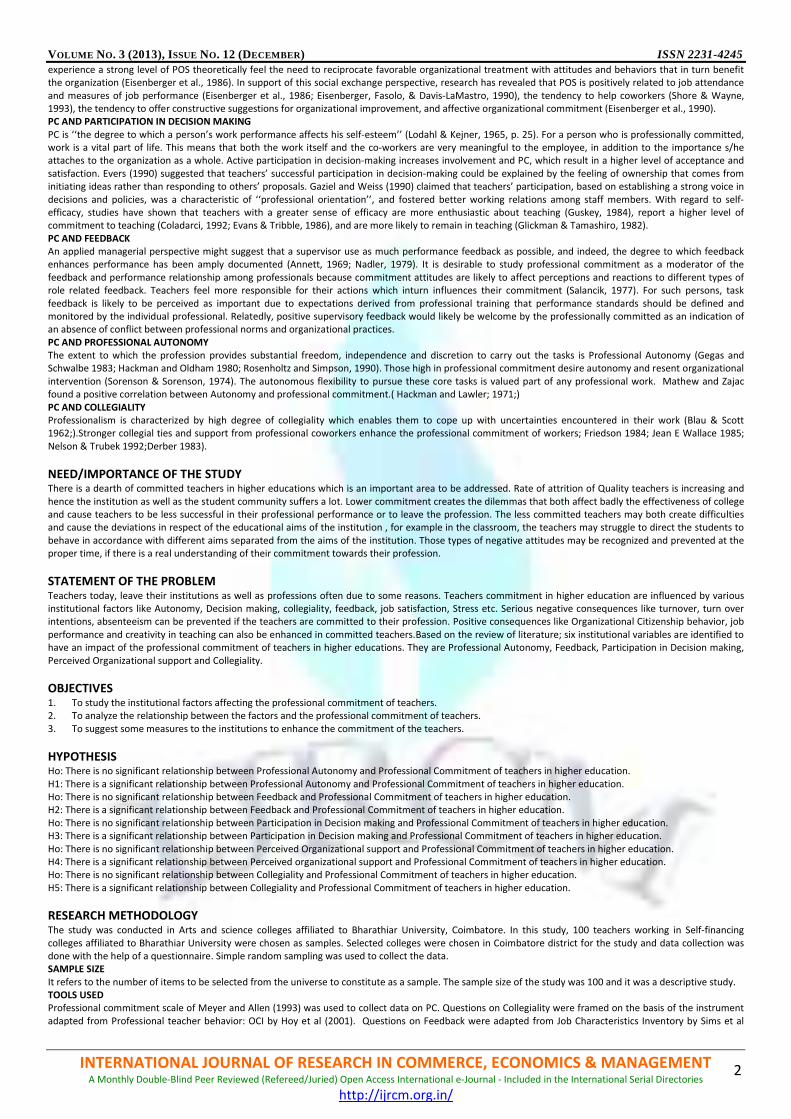
RESULTS AND DISCUSSIONS INSTITUTIONAL VARIABLES AND PROFESSIONAL COMMITMENT In order to study the relationship between institutional variables as well as institutional variables with professional commitment among the respondents, and
the consolidated inter-correlation matrix was computed and presented in the table no. 1 furnished below:
TABLE 1: INTER - CORRELATION MATRIX
Pro AutonomyFeedback Decision makingOrg supportCollegialityProf commit
Prof Autonomy-x1 1.00
Feedback-x2 0.23 1.00
Decision making-x3 0.24 0.47 1.00
Perceived Org support-x4 0.53 0.19 0.48 1.00
Collegiality-x5 0.56 0.29 0.47 0.82 1.00
Prof commit-y 0.54** 0.11* 0.23* 0.38* 0.53** 1.00
**-Significant at 1 % level
It is seen from the above table that the inter-correlation among all the explanatory variables X1, X2, X3, X4 and X5 is highly significant and positive. Further it is
also seen that all these explanatory variables are highly, significantly and positively correlated with the dependent variable Y( Professional Commitment).
PATH COEFFICIENT ANALYSIS The Path coefficient analysis is performed from the inter-correlation matrix, in order to study the direct response and indirect response of each explanatory
variable through other independent variables on the dependent variable.
The direct effect of each of the explanatory variables on the dependent variable and the indirect effect of each explanatory variable on the dependent variable
through other explanatory variables are furnished in the Table No. 2
TABLE 2: DIRECT & INDIRECT EFFECT OF EXPLANATORY VARIABLES ON Y-PROF COMMITMENT
Prof AutonomyFeedbackDecision makingOrg supportCollegialityProf commit
Prof Autonomy-X1 0.40 -0.03 0.02 -0.15 0.31 0.54
Feedback-X2 0.09 -0.12 0.04 -0.05 0.16 0.11
Decision making-X3 0.10 -0.06 0.08 -0.14 0.26 0.23
Perceived Org supp-X40.21 -0.02 0.04 -0.29 0.45 0.38
Collegiality-X5 0.22 -0.04 0.04 -0.24 0.55 0.53
It is seen from the above table that among the five explanatory variables, two explanatory variables namely X1-prof autonomy and X5-collegiality have higher
positive direct effect on the dependent variable Y-professional commitment. The variable X1 also has higher positive indirect effect on Y through X5. Similarly
the variable X5 also has positive indirect effect on the dependent variable through X1. Hence the two explanatory variables X1-prof autonomy and X5-collegiality
are substantially important contributing variables to Y-professional commitment.
FINDINGS 1. Professional Autonomy has a strong positive relationship with Professional Commitment. It has a high positive direct effect on PC.
2. Collegiality has strong positive relationship with Professional Commitment. It has a high positive direct effect on PC.
3. Feedback has strong positive relationship with Professional Commitment. It has an indirect effect on the dependent variable PC.
4. Participation in decision making has strong positive relationship with Professional Commitment. It has an indirect effect on the dependent variable PC.
5. Perceived Organizational support has strong positive relationship with Professional Commitment. It has an indirect effect on the dependent variable PC.
RECOMMENDATIONS The institutional factors in self-financing colleges have a strong impact and relationship with the professional commitment of teachers in higher education.
Professional autonomy and collegiality influences professional commitment directly. Hence higher education institutions should realize the importance of
professional commitment of teachers and concentrate in improving the working conditions of teachers that will enhance their commitment. The outcomes of
professional commitment like turnover and absenteeism can be minimized if the institutional factors are healthy so that quality teachers can be retained in
educational institutions.
CONCLUSION From the study, it clear that the institutional factors namely Professional Autonomy, Feedback, Participation in Decision making, Perceived Organizational
support and Collegiality have a positive relationship with the professional commitment. Teachers in higher education will be committed to their teaching
profession if these institutional variables are good.
SCOPE FOR FURTHER RESEARCH The present study focused on the institutional factors. Researches can be carried out to study the other variables that affect professional commitment and the
scope of research can be extended to other universities and colleges in the state.
REFERENCES BOOKS 1. Davis and Newstorm, Human behaviour at work, McGraw Hill Book Company, 1985.
2. Gregory Moorhead and Ricky. W. Griffin, Organizational Behaviour: Managing People and Organization, Biztantra, New Delhi.
3. Gregory Moorhead, Organizational Behaviour, Jaico Publishing House, 1999.
4. Hellrilgel, Slocum and Woodman, Organizational Behaviour, Southwestern.
5. Henri.L.Tosi and Neal.P.Mero, The Fundamentals of Organizational Behaviour, Blackwell Publishing, 2005.
6. John.W. Newstorm, Organizational Behaviour- Human Behaviour at work, Tata McGraw Hill Publishing Company, New Delhi, 2007.
JOURNALS 7. Blau, G., & Boal, K. (1989). Using job involvement and organizational commitment interactively to predict turnover. Journal of Management, 15, 115–127.
VOLUME NO. 3 (2013), ISSUE NO. 12 (DECEMBER) ISSN 2231-4245
INTERNATIONAL JOURNAL OF RESEARCH IN COMMERCE, ECONOMICS & MANAGEMENT A Monthly Double-Blind Peer Reviewed (Refereed/Juried) Open Access International e-Journal - Included in the International Serial Directories
http://ijrcm.org.in/
4
8. Bogler, R. (1994). University researchers’ views of private industry: Implications for educational administrators, academicians and the funding sources.
Journal of Educational Administration, 32(2), 68–85.
9. Darling-Hammond, L., & Sykes, G. (1999). In Teaching as the learning profession: handbook of policy and practice. San Francisco, CA: Jossey-Bass.
10. Eisenberger, R.Huntington, R., Hutchinson, S. and Sowa.D (1986). Perceived organizational support, Journal of Applied Psychology, 71(3), 500-507.
11. John P. Meyer, David J. Stanley, Lynne Herscovitch, and Laryssa Topolnytsky Affective, Continuance, and Normative Commitment to the Organization: A
Meta-analysis of Antecedents, Correlates, and Consequences, Journal of Vocational Behavior 61, 20–52 (2002) doi:10.1006 /jvbe.2001.1842
12. John P. Meyer, Natalie J. Allen* (1990). The measurement and antecedents of affective, continuance and normative commitment to the organization.
Journal of Occupational Psychology (1990), 63, 1-18
13. Salancik, G. R. (1977). Commitment and the control of organizational behavior and belief. B. M. Staw & G. R. Salancik (Eds), NOT' Directions in
Organizational Behavior. Chicago: St Clair Press.
WEBSITES
14. http://hum.sagepub.com/content/42/9/801.short
15. http://onlinelibrary.wiley.com/doi/10.1002/(SICI)1099-1379(199707)18:4%3C377::AID-JOB807%3E3.0.CO;2-1/abstract
16. http://wox.sagepub.com/content/20/3/368.short
17. http://www.emeraldinsight.com/journals.htm?articleid=869621&show=abstract
18. http://wwwkal.ums.edu.my/ljms/2010/LJMS_vol4_2010_1-13[1].pdf
VOLUME NO. 3 (2013), ISSUE NO. 12 (DECEMBER) ISSN 2231-4245
INTERNATIONAL JOURNAL OF RESEARCH IN COMMERCE, ECONOMICS & MANAGEMENT A Monthly Double-Blind Peer Reviewed (Refereed/Juried) Open Access International e-Journal - Included in the International Serial Directories
http://ijrcm.org.in/
5
STRESS MANAGEMENT IN RELATION TO SOCIO ECONOMIC STATUS OF SECONDARY SCHOOL STUDENTS
DR. DEEPA. P
PRINCIPAL
SREE NARAYANA COLLEGE OF TEACHER EDUCATION
CHELANNUR
SUJA. P.V
ASST. PROFESSOR
SREE NARAYANA COLLEGE OF TEACHER EDUCATION
CHELANNUR
ABSTRACT
This paper is an attempt to study the relationship between Stress Management and Socio Economic Status of Parents. Using convenient sampling technique 450
secondary school students were selected for the study. Statistical techniques used for the study include descriptive statistics like mean and standard deviation,
Inferential statistics like Karl pearson’s product moment co-efficient of correlation, Fisher’s t-test and test of significance of difference between two r’s. Findings
of the study show significant relationship between the variables under the study for the total sample and sub sample based on gender.
KEYWORDS
Stress Management, Socio Economic status.
INTRODUCTION tress prevents students from focussing and enjoying learning from behaving harmoniously and from unfolding their unique talents. Accumulated stress
causes frustration, depression and anxiety that can lead to attention deficit, hyper activity disorder, antisocial behavior and even violence. Hence the
teaching of stress has been considered as one of the major issues in our society. Now it has become common among the students and it can be
controlled by applying psychological techniques. The feeling of stress in any student can have both positive and negative consequence if not managed
systematically.
Stress management is the ability to reduce stress around or to cope in a competent manner with stressors. If the stressors are not properly managed the chronic
stress can develop into various types of physical and psychological problem. If the stress is balanced correctly it can be a positive element in our lives.
A healthy or moderate level of stress motivates one to take action, develop new skills and achieve performance and fulfill one’s potential. Stress is not
considered as a part of school, it becomes a part of life; learning how to anticipate, recognize and successfully manage stress is a important life skill.
Today students are faced with a number of problems and issues at school, home and their surroundings. The feeling of stress among the students has become a
routine affair as far from home, school and community. The young students are found higher level of stress at home, School, peers etc. Here comes the
significance of socio economic status like education, occupation, and income of parents.
Socio economic status is an Index of power and prestige of the family, it would therefore be ranking of a student by the society he lives in terms of his maternal
belongings and cultural possessions along with the degree of respect power and influence of students wields. The socio economic class in which student is born
has a great impact on difficult aspects of students life activities. The socio cultural environment of the students is assumed to be responsible for the superior
educational performance of the students. In order to erase the aversive effects of the daily hassles hardship problem or stressors the students have to find the
ways and means to alternate the stressor or devices of strategies to overcome the negative effect of stress. This kind of thinking helps in coping with stress.
The present culture of competition has brought drastic change in human psyche. It is the state of mind which feels and affects the student’s performance.
Various studies show that depression and stress are serious problems among a food number of teenagers. It also reveals that majority of the students are
depressed and seem to handle their problems not in constructive ways. The young students rely on passive or negative behaviour in their attempt to deal with
the problems. Thus the investigators through this paper are trying to find the significance of stress management in relation to socio economic status of
secondary school students.
REVIEW OF LITERATURE Prasad (2001) conducted a study on stress management training of outstation college students living in Chennai. The study reveals that there was significant
reduction in stress level and improvement in stress control. There was no significant difference between the post graduate and undergraduate students before
and after stress management training.
Njeri Kariuki (2003) conducted a study on the impact of stress management programmes on four students in secondary schools in Kenya and found that there is
stress influence on the students in their academic performance. The researcher recommends that schools need effective management programmes to enable
students to cope effectively with stress.
Krag et al. (2006) conducted a study on “School programmes targetting stress management in children and adolescent.” The study tentatively concluded that
school programmes targetting stress management or copying with skills are effective in reducing stress symptoms and enhancing coping skills.
Kumar Sunil (2009) studied the role of emotional intelligence in managing stress and anxiety at work place” Result of the study indicates that there was a
significant relationship between emotional intelligence and the variables of stress and anxiety. Stress management component and anxiety component emerges
as statistically significant with respect to the relationship with emotional intelligence.
Fabeem and Praveen (2012) studied the influence of socio economic status on achievement in science of secondary school students and found that there was a
significant difference in science achievement scores of upper and lower socio economic status class students. It was also found that there was much difference
in the achievement of students belonging to upper and middle class socio economic status.
OBJECTIVES OF THE STUDY 1. To assess the level of stress management among secondary school students.
2. To test the significance of the relationship between stress management and socio economic status of parents based on gender.
3. To compare the relationship of stress management with socio economic status of parents based on gender.
HYPOTHESES 1. There exists different level of stress management among secondary school students.
2. There exists significant relationship between stress management and socio-economic status of parents among secondary school students based on gender.
3. There exists significant difference in the correlation of stress management with socio-economic status of parents based on gender.
S

VOLUME NO. 3 (2013), ISSUE NO. 12 (DECEMBER) ISSN 2231-4245
INTERNATIONAL JOURNAL OF RESEARCH IN COMMERCE, ECONOMICS & MANAGEMENT A Monthly Double-Blind Peer Reviewed (Refereed/Juried) Open Access International e-Journal - Included in the International Serial Directories
http://ijrcm.org.in/
6
As a first step the investigator classified the sample into high, average and low based on the scores of stress management scale.
For this the investigator used the classificatory procedure of ‘σ ’distance from the Mean Students having scores above M+1σ ie, 108 were treated as the group
having high stress management. The group having scores below. M-1σ ie, 87 were treated as the group having low stress management. The scores between
M+1σ and M-1σ were treated as the group having average stress management.
The result obtained are given in Table 1
TABLE 1: DATA AND RESULT OF THE LEVEL OF STRESS MANAGEMENT FOR THE TOTAL SAMPLE OF SECONDARY SCHOOL STUDENTS.
Variable Category Total No. Percentage
Stress
Management
High
Average
Law
86
313
51
19.11
69.56
11.33
450 100
DISCUSSION The table reveals that majority of the secondary school students are moderate in their stress in managment level. It suggests that the number of high stress
management students is greater than the number of low stress management students. As a whole it can be said that the level of stress management is average
or satisfactory.
TABLE 2: DATA AND RESULT OF TEST OF SIGNIFICANCE OF COEFFICIENT OF CORRELATION BETWEEN STRESS MANAGEMENT AND SOCIO ECONOMIC STATUS
BASED ON GENDER
Gender N r Critical ratio
Boys 220 0.48 8.02
Girls 230 0.32 5.08
DISCUSSION Table 2 reveals that in case of boys when tested for significance the obtained t-value is 8.02. Which exceeds the table value 2.58, the required value for
significance at 0.01 level.
In case of girls, the obtained t-value is 5.08 which exceed the table value 2.58, the value required for significance at 0.01 level. This shows that in both the cases
when the independent variable socio-economic status increases the dependent variables stress management also increases.
TABLE 3: RESULT OF THE TEST OF SIGNIFICANCE OF DIFFERENCE IN ‘R’S OF STRESS MANAGEMENT AND SOCIO-ECONOMIC STATUS OF SECONDARY SCHOOL
STUDENTS BASED ON GENDER
Gender N r Zr transformation Crtical ratio
Boys 220 0.48 0.52 2.00
Girls 230 0.32 0.33
DISCUSSION From the above table the critical ratio was found to be greater than 1.96, the required value for significance at 0.05 level. This shows that there is a significant
difference in the correlation of stress management and socio economic status of Boys and Girls. Table 3 further shows that Boys exhibit higher correlation than
that of Girls.
All these discussions lead the investigator to conclude that relationship exists between stress management and socio economic status of parents among
secondary School students. Socio economic class in which student is born has a great impact on different aspects of student’s life.
CONCLUSION The present study reveals that stress management has a relation with socio economic status of parents. This throws light on the need for giving proper guidance
and counselling to students which help them to reduce stress and enhance their future efficiency.
REFERENCES 1. Aggarwal, J.C. (1996). Educational Research. An Introductions New Delhi: Arya Book Depot.
2. Best, J.W. & Kahn, J.V. (1996) Research in Education (7th
ed.1), New Delhi: Premtice Hall
3. Garrett, H.E (1971), Statistics in Psychology and Education. Bombay, Vakils Feffer and Simons Ltd.
4. Joseph, K.S (2003) Learning to cope with stress and Distress. Perspective in Education. Vol. 18 Pp23-24
5. Kavil, Lokesh (1997), Methodology of Educational Research, New Delhi Vikas Publishing Pvt. Ltd.
6. Kolapatti, M and Khadi P.B. (2004), Academic Stress and management among Pre university students. Asian Journal of Pschychology and EducationVol.
2Pp34-40.
7. M.B. Butch [Ed] Fourth survey of research in education, Vol. 1. New Delhi- NCERT
8. Rathere, Rachana (2011). Stress management strategies for establishing peace in Adolescence Edu tracks. Vol. 10Pp 23-25.
9. Selye. (1976). The stress of Life Newyork: MC Graw Hill Book Company.
10. Walt, Schafer (2000). Stress Management California: Cenage learning Pvt. Ltd.
VOLUME NO. 3 (2013), ISSUE NO. 12 (DECEMBER) ISSN 2231-4245
INTERNATIONAL JOURNAL OF RESEARCH IN COMMERCE, ECONOMICS & MANAGEMENT A Monthly Double-Blind Peer Reviewed (Refereed/Juried) Open Access International e-Journal - Included in the International Serial Directories
http://ijrcm.org.in/
7
PREDICTIVE ANALYTICS: A WAY TO PROACTIVE ACTIONS IN HUMAN RESOURCE MANAGEMENT
VIKAS BANSAL
BUSINESS CONSULTANT
# 968, SECTOR 40
GURGAON
ABSTRACT
The objective of this paper is to understand the predictive analytics and it’s relevance in hr. The paper will throw light on the use of predictive analytics in various
areas of hr to take proactive decisions and corresponding actions. The suggested strategy and method are based on the author’s experience as a consultant with
several organizations. It is found that the human resources practitioners need an understanding of practical, simple, valid and actionable approach to predictive
analytics and corresponding proactive actions. The analytics should focus on the entire proactive action decision making process, not only on corrective actions.
The paper proposes a new, more simple and valid approach to predictive analytics and subsequent proactive actions that has been tried successfully in some of
the leading companies.
KEYWORDS predictive analytics, proactive actions.
INTRODUCTION he predictions are difficult to make, especially when they are about the future"
The above quote is not a good start when discussing predictive analytics. It gets even more problematic when we realize what analytics exactly are.
Analytics refers to the process of breaking concepts or substances into smaller pieces, to understand their workings. How can you understand and
foresee the future? There is no concept or substance to break down yet. To go further, predictive analytics even sounds like an oxymoron.
Predictive is understanding an important situation beforehand: "If the organization have to increase production by X times, it will have to increase the number of
FTE(full time employees) Y times...", while analytics is evaluating the situation after it has actually happen in the post environment to take reactive actions; "the
attrition is high this year so we need to do something to increase employee satisfaction."
It is easy and very simple understanding of what predictive analytics actually mean. In this paper we will discuss what predictive analytics can and cannot do the
various categories of predictive analytics, and how to best apply them in the area of human resource management to ensure proactive decisions and actions.
PREDICTIVE ANALYTICS: THE TRADITIONAL VIEW According to Wikipedia "predictive analytics consist of a variety of techniques ranging from statistics, data mining and game theory that analyze current and
historical facts to make predictions about future events".
The variety of techniques is usually divided in three categories: predictive models, descriptive models and decision models. Predictive models look for certain
relationships and patterns that usually lead to a certain behavior, point to fraud, predict system failures, assess credit worthiness, and so forth. By determining
the explanatory variables, you can predict outcomes in the dependent variables. This can be used in various areas of business like financial analysis, human
resources and behavioral analysis, market and customer analysis and much more.
Predictions can be typically be used directly to make decisions that maximize benefit to the decision-maker. For example, employees who are more likely not to
perform in the future can have their performance improvement plan now. It is important to understand the difference between a prediction and a decision.
Data mining lets us make predictions, but predictions are useful to an agent only if they allow the agent to make decisions that have better outcomes. Some
people may feel that the focus in this course on maximizing profit is distasteful or disquieting. After all, maximizing profit for a business may be at the expense of
employee’s dissatisfaction, and may not benefit society at large. There are several responses to this feeling. First, maximizing profit in general is maximizing
efficiency. Society can use the tax system to spread the benefit of increased profit. Second, increased efficiency often comes from improved accuracy in
targeting, which benefits the people being targeted.
Descriptive models aim at creating segmentations, most often used to classify employees based on for instance socio demographic characteristics, life cycle,
profitability, product preferences and so forth. In a nutshell, the goal of descriptive analytics is to discover patterns in data. Descriptive and predictive analytics
together are often called “knowledge discovery in data” or KDD, but literally that name is a better fit for descriptive analytics. Finding patterns is often
fascinating and sometimes highly useful, but in general it is harder to obtain direct benefit from descriptive analytics than from predictive analytics. For example,
suppose that customers of whole foods tend to be liberal and wealthy. This pattern may be noteworthy and interesting, but what should whole foods do with
the finding? Often, the same finding suggests two courses of action that are both plausible, but contradictory. In such a case, the finding is really not useful in
the absence of additional knowledge. For example, perhaps whole foods should direct its marketing towards additional wealthy and liberal people. Or perhaps
that demographic is saturated, and it should aim its marketing at a currently less tapped, different, group of people?
Where predictive models focus on a specific event or behavior, descriptive models identify as many different relationships as possible.
Lastly, there are decision models that use optimization techniques to predict results of decisions. This branch of predictive analytics leans particularly heavily on
operations research, including areas such as resource optimization, route planning and so forth.
Unlike predictive models decision models are used offline to develop decision strategies. These strategies can be deployed in real time. Optimization combined
with decision modeling helps produce decision strategies that determine which actions to take on every customer or transaction, in order to mathematically
optimize results and meet defined constraints.
PROACTIVE ACTION RATHER THEN REACTIVE ACTION Proactive action at work is about making things happen at their best in the first go without any requirement to take a corrective action in case the results are not
as desired. It involves self-initiated, anticipatory action aimed at changing either the situation or oneself or others. Examples include taking charge to improve
work methods, proactive problem solving, using personal initiative, and proactive feedback seeking.
Traditionally, work psychology has focused on work characteristics to which employees adjust in order to perform their job (e.g., Hackman & Oldham, 1976), on
employees commitment to goals that are provided by the organization (Locke, Shaw, Saari, & Latham, 1981), and on social structures and cultures at work to
which new employees need to adapt (Van Maanen, 1976). In contrast, research on ‘active’ behavior focuses on how employees change the characteristics of
their job and situation (Frese, Garst, & Fay, 2007). For example, employees sometimes redefine the goals they are provided with by the organization to come up
with more challenging goals (Hacker, 1985), and actively influence socialization processes in order to improve the quality of their experiences at work (Ashford &
Black, 1996; Saks & Ashforth, 1996). These active behaviors have increasingly come to be referred to as examples of proactivity. What does it mean to be
proactive? In line with previous research (Grant & Ashford, 2008; Parker et al., 2006b), we define proactive behavior as self-directed and future-focused action in
an organization, in which the individual aims to bring about change, including change to the situation(e.g., introducing new work methods, influencing
organizational strategy) and/or change within oneself (e.g., learning new skills to cope with future demands). This definition concurs with lay definitions, which
highlight both a future focus (anticipation) and a change focus (taking control). Thus, the oxford english dictionary (2008) defines being proactive as “creating or
T
VOLUME NO. 3 (2013), ISSUE NO. 12 (DECEMBER) ISSN 2231-4245
INTERNATIONAL JOURNAL OF RESEARCH IN COMMERCE, ECONOMICS & MANAGEMENT A Monthly Double-Blind Peer Reviewed (Refereed/Juried) Open Access International e-Journal - Included in the International Serial Directories
http://ijrcm.org.in/
8
controlling a situation by taking the initiative and anticipating events or problems, rather than just reacting to them after they have occurred; (hence, more
generally) innovative, tending to make things happen”. As an example, personal initiative is a form of proactive behavior that involves going beyond assigned
tasks, developing one’s own goals, and attempting to solve problems that have not yet occurred (Frese & Fay, 2001). Taking charge is also an example of
proactive behavior, referring to active efforts to bring about change on work methods (Morrison & Phelps, 1999). Further examples include individuals
proactively shaping their work environment as a newcomer (Ashford & Black, 1996), actively building networks (Morrison, 2002), and persuading leaders to take
notice of important strategic issues (Dutton & Ashford, 1993). All of these behaviors have in common an emphasis on taking control of a situation by looking
ahead and initiating change. They are also all behaviors that are partially determined by disposition, and partially influenced by situational forces, such as job
design and leadership.
NEED FOR PREDICTIVE ANALYTICS IN HUMAN RESOURCE MANAGEMENT As worldwide economic and political conditions continue to concern business leaders, their attention turns to the various levers that can foster success in
uncertain times. Employee salaries make up close to half of many organizations’ operating expenses and can be even higher in some industries such as financial
services, so the contribution of the workforce to organization success is perhaps the most important lever to competitive advantage. In fact, the challenge of
containing costs while developing a high performing workforce is a primary challenge facing most companies today. But, do organizations know enough about
their workforce to optimize the workforce lever?
Leaving aside the obvious issue of where we get replacement workers for the retiring workforce, these two employee cohorts are quite different. The ways
organizations will hire and retain these workers going forward must be different as well. Retaining older workers requires retention programs that include part-
time or project-based work. Hiring gen-xers and gen-yers requires new approaches and retention programs that must provide them with career development
and choices about where, when and even how long to work each day. The older cohort is not yet as enamored with emerging social technologies that are
becoming the primary means of communication and collaboration for the younger workforce. The older cohort has a wealth of priceless intellectual capital that
organizations cannot afford to lose. The younger group offers innovative and creative ideas that are essential to navigate today’s technologies and economic
challenges and we must understand how best to tap their contributions. But, do organizations even know, at a glance, how their workforce is comprised?
Organizations struggle to understand their complex existing and potential workforce and how to use each effectively. Which applicants should they recruit?
Which of their hires do they wish to retain for their performance and productivity? Who amongst their internal talent do they wish to groom for career
advancement? What are the most effective compensation, benefits and development options that will optimize the organization’s competitiveness in the
marketplace? As we navigate today’s dynamic economy, do we need to retrench again or pursue growth? We want answers to these questions almost on a daily
basis, in addition to the most obvious one: what is our headcount?
Fortunately, it is now possible for organizations to excel at answering workforce-related questions using workforce analytics. We can know whether to bolster
training programs, tweak our benefits and compensation plans, or hire into or terminate from key talent pools. We need not turn to across-the-board cost
cutting measures and reductions in staff and services. We can sift through far more data and crunch many more numbers to determine who is performing well,
who will be needed, where will they be needed, with what skills, and at what cost? We can look at which individuals are achieving their performance goals and
see which of them have the competencies needed for today and tomorrow to build a competitive workforce. With breakdowns in place of competencies and of
skills needed for the future, along with performance metrics, organizations can thoughtfully manage their workforce with targeted training, development and
retention programs, see the value this support delivers, and even make predictions on future performance or retention. Workforce analytics enables not only a
view of the workforce today but offers true insights that can drive talent-related decisions and actions, resulting in improved performance in the future.
HR PREDICTIVE ANALYTICS SUBJECT AREAS AND RELATIVE PROACTIVE DECISIONS WORKFORCE PROFILE The study of workforce dynamics is the starting and most crucial point for predictive analytics. Analysis of headcount and headcount progress trends, turnover,
and span of control, providing a consistent view of the workforce to line managers and HR. Drilling down from this level, one can gain deep insight into the
recruiting life cycle, analyze staffing (i.e. Staffing levels, retention, diversity and performance), view employee performance by organization, see retention (i.e.
Retention hotspots or retention by top performers), and various other demographic trends. Users can view the entire organization by time periods and can
select a divisional, departmental, or workgroup view within the organizational hierarchy. With the tight integration between the workforce profile subject area,
with its dashboards and metrics, and the underlying HR system of record, managers can get various trends and support for decision making into hiring the right
type of candidates, prevention of attrition, manpower planning etc.
Managers can get a prediction on trends of attrition like which levels have more attrition, which age group, gender, experience level age, education family
profile people have shown trends of attrition and which all are the employees having many of the similar characteristics and hence are more prone to leave the
organization. Based on this various measures can be taken to identify and retain the employees in the organization.
HR PERFORMANCE From the HR performance predictive analysis, operational managers can forecast financial measures with key workforce metrics to demonstrate HR’s strategic
value in the workforce. For example, rising revenue per employee will lead to a particular level of organizational performance and will ultimately result in rising
contribution per employee in the return on human capital or how many employees are required to achieve a particular level of production and ultimately the
revenue and performance. It can also give an idea of which type of employees to be hired to increase the performance eg. How many line workers, line
supervisors and support personnel are required to achieve the desired level. The analysis can also be used to identify the characteristics of high performers and
to leverage the information to identify which all employees can perform better and the required proactive actions to be taken to ensure the desired level of
performance of those who are not expected to perform upto the mark in the analysis.
COMPENSATION By using compensation trend analysis and dashboards, payroll officers and compensation specialists can monitor the costs of payroll, overtime and variable
compensation and can project the future costs of these items.
Managers can view performance by company pay levels, comparing these either within the company’s own structure or to external competitive benchmarks
(compa-ratios). Compensation specialists and managers can link compensation with worker performance .with this view, managers can analyze high performers
with potential to fine tune their rewards to ensure their retention, thereby optimizing compensation plans while managing costs. The compensation team can
also take proactive actions to reduce the payroll costs emerging out of overtime and non performance. These actions can be taken in well advance by predicting
the future costs of the same. Also the analysis lays the foundation for the proactive actions to be taken by the payroll specialists for future budgetary
requirements for payroll and compensation. Also payroll specialists can establish a relationship between the performance of an employee and compensation
structure for future reference and action.
RECRUITING The recruiting and pre-configured analytical patterns provide a complete set of recruiting metrics that measure the efficiency and effectiveness of the entire
recruitment life cycle, from pre-hire to post-hire employment. It ensures opYmizaYon of candidate sourcing; analysis of the recruitment pipeline and ―hire-to-
retire process efficiency; analysis of time to fill to support optimization; monitoring of vacancies; and measurement of quality of hires and their retention by
source. This process does not stop at hire, but continues through employment and beyond to provide an ongoing quality of hire analysis.
With the recruitment subject area, recruiting specialists can see job applicants, hire ratios, and retention rates by recruiting source. They can drill into
performance of new hires to assess the quality of these hires. By analyzing these effectiveness metrics, an organization can fine tune its recruiting strategy,
balancing costs, retention, and performance. Based on the above data and a combination of number of demographic factors and other data HR specialists can

VOLUME NO. 3 (2013), ISSUE NO. 12 (DECEMBER) ISSN 2231-4245
INTERNATIONAL JOURNAL OF RESEARCH IN COMMERCE, ECONOMICS & MANAGEMENT A Monthly Double-Blind Peer Reviewed (Refereed/Juried) Open Access International e-Journal - Included in the International Serial Directories
http://ijrcm.org.in/
9
predict which all employees have high probability of flight and what strategy to follow to retain the best talent out of them. Also it can be related to predict the
best performers and follow the trends to select the best candidates.
Through the retention subject area and its dashboards, managers can view the voluntary turnover for top performers and can drill down to see the reasons they
are leaving. Then, guided through a set of workflow analyses, they can determine proactive actions to address any retention issue. Users can monitor
performance at first service milestone of new hires, along with separations and separation rate, assisting them to gain a total picture of new hire quality.
LEARNING ENROLLMENT AND COMPLETION From the learning management analysis and dashboards, specialists can assess learning offerings and how those programs affect employee performance and
tenure. They can monitor learning offering effectiveness and the costs to deliver by delivery option. For example, users gain insight into learning demand
through top enrollments by job , delivery methods, or organizational units and can identify the courses with the longest wait time. With this information, they
can fine tune the overall learning program, perhaps adding more courses or eliminating those not well attended. This can help in predicting which all training
should be conducted in future and what kind of training approach to be used for a particular type of skill and level. It may help in setting examples like to impart
soft skills lecture method is most effective, hence the training specialist can rework on the methodlogy to follow in the upcoming soft skill programs. It also
provides the basis to determine which training programs should be conducted most and with which methodology and trainer.
CONCLUSION To address the uncertainties of economic and political conditions, business leaders must be able to constantly fine tune and take proactive decisions about their
workforce. Fortunately, it is now possible for organizations to excel in answering questions about their workforce and making decisions to optimize the
workforce well in advance through the power of predictive analytics. Predictive hr analytics helps in delivering comprehensive dashboards, along with logical
analytical workflows through the action framework that deliver insights from available information to support future actions.
REFERENCES 1. Ashford, S. J., & Black, J. S. (1996). Proactivity during organizational entry: The role of desire forcontrol. Journal of Applied Psychology, 81(2), 199-214.
2. Frese, M., & Fay, D. (2001). Personal initiative (PI): An active performance concept for work inthe 21st century. Research in Organizational Behavior, 23,
133-187.
3. Frese, M., Garst, H., & Fay, D. (2007). Making things happen: Reciprocal relationships betweenwork characteristics and personal initiative in a four-wave
longitudinal structural equationmodel. Journal of Applied Psychology, 92(4), 1084-1102.
4. Grant, A. M., & Ashford, S. J. (2008). The dynamics of proactivity at work. Research inOrganizational Behavior, 28, 3-34.
5. Hacker, W. (1985). Activity: A fruitful concept in industrial psychology. In M. Frese & J. Sabini (Eds.), Goal directed behavior: The concept of action in
psychology (pp. 262-283).Hillsdale, NJ: Lawrence Erlbaum.
6. Hackman, J. R., & Oldham, G. R. (1976). Motivation through the design of work: Test of a theory.Organizational Behavior and Human Performance, 16(2),
250-279.
7. Locke, E. A., Shaw, K. N., Saari, L. M., & Latham, G. P. (1981). Goal setting and task performance: 1969-1980. Psychological Bulletin, 90(1), 125-152.
8. Morrison, E. W. (2002). Newcomers’ relationships: The role of social network ties during socialization. Academy of Management Journal, 45(6), 1149-1160.
9. Morrison, E. W., & Phelps, C. C. (1999). Taking charge at work: Extrarole efforts to initiate workplace change. Academy of Management Journal, 42(4), 403-
419.
10. Oracle (2011). HR Analytics: Driving Return on Human Capital Investment
11. Parker, S. K., Williams, H. M., & Turner, N. (2006b). Modeling the antecedents of proactive behavior at work. Journal of Applied Psychology, 91(3), 636-652.
12. Saks, A. M., & Ashforth, B. E. (1996). Proactive socialization and behavioral self-management. Journal of Vocational Behavior, 48(3), 301-323.
13. Van Maanen, J. (1976). Breaking in: Socialization to work. In R. Dubin (Ed.), Handbook of work, organization and society (pp. 67-130). Chicago: Rand
McNally.
VOLUME NO. 3 (2013), ISSUE NO. 12 (DECEMBER) ISSN 2231-4245
INTERNATIONAL JOURNAL OF RESEARCH IN COMMERCE, ECONOMICS & MANAGEMENT A Monthly Double-Blind Peer Reviewed (Refereed/Juried) Open Access International e-Journal - Included in the International Serial Directories
http://ijrcm.org.in/
10
CAPITAL STRUCTURE AND ITS IMPACT ON PROFITABILITY: EVIDENCE FROM SRI LANKAN LISTED BANKS
V. A. SUBRAMANIYAM
HEAD
DEPARTMENT OF FINANCIAL MANAGEMENT
FACULTY OF MANAGEMENT STUDIES & COMMERCE
UNIVERSITY OF JAFFNA
SRI LANKA
RAVIVATHANI THURAISINGAM
LECTURER
DEPARTMENT OF FINANCIAL MANAGEMENT
FACULTY OF MANAGEMENT STUDIES AND COMMERCE
UNIVERSITY OF JAFFNA
SRI LANKA
ABSTRACT
The purpose of this study were to determine relationship between two capital structure mechanisms (debt to equity and debt to total funds) and three
profitability measures (ROCE, ROE and NIM) of a sample of ten Sri Lankan listed banks from financial year 2008-2012.the data have been analyzed by using
descriptive statistics and correlation analysis to find out the association between the variables. The results show that there is a significant impact of capital
structure on ROCE while insignificant with ROE. The results also show that NIM is negatively correlated with debt to total funds. These results are consistent with
prior empirical studies. Further recommendations are also put forwarded in the research.
KEYWORDS
Capital structure, profitability ratios, banking industry.
INTRODUCTION apital structure is one of the most puzzling issues in corporate finance literature (Brounen & Eichholtz, 2001). The relationship between capital structure
and profitability is one that receives considerable attention in the finance literature. Each and every business organizations need adequate fund to run its
business effectively and efficiently. A firm can raise fund from different sources and take different forms. However, the capital can mainly be categorized
into two debt and equity. How a firm financed? Either with all debt or all equity or mix of both. What is the optimum mix that leads to the maximum value of a
firm? Capital structure theory deals with it. Thus the proportion of debt to equity is a strategic choice of corporate managers. In finance, the most debatable
topic is capital structure. The main issue of debate revolves around the optimal capital structure. So capital structure refers to the way a firm finances its assets
through some combination of equity, debt, or hybrid securities. A firm's capital structure is then the composition or 'structure' of its liabilities. Profitability is the ability of a firm to generate net income on a consistent basis. Ratios are used as a benchmark for evaluating the performance of a firm. Ratios
help to summarize large quantities of financial data and to make qualitative judgment about the firm’s profitability. So Capital structure decision is the vital one
since the profitability of an enterprise is directly affected by such decision. Hence, proper care and attention need to be given while determining capital
structure decision.
Basically, banks engage in financial intermediation to ensure efficient mobilization & disbursement of funds to the real sector of the economy. Though other
financial institutions exist to engage in the intermediation process banks are considered the most important financial intermediaries. The board of directors of
the bank should develop an appropriate capital structure, which is most advantageous to the bank. This can be done only when all those factors, which are
relevant to the bank’s capital structure decision, are properly analyzed and balanced.
This study analysis the impacts of capital structure on profitability of listed banks in Sri Lanka. The relationship between capital structure and profitability is one
that received considerable attention in the finance literature. The modern industrial firm must conduct its business in a highly complex and competitive business
environment. Therefore, these types of research findings will be benefited in selecting the capital structure to achieve the optimum level of firm’s profitability.
This study shows the statistical analysis carried out seeking to discover is there any relationship between capital structure and profitability of the listed banks in
Sri Lanka.
RESEARCH PROBLEM The capital structure decision of a bank is similar to that of a non financial firm. Although there are considerable inter industry differences in the capital structure
of firms due to the unique nature of each industry’s business, the intra-firm variations are attributed to the business and financial risk of individual firms. From
the foregoing discussions based on the available empirical literature, it is crystal clear that results from investigations into the relationship between capital
structure and profitability are inconclusive and requires more empirical work.
An important question facing companies in need of new finance is whether to raise debt or equity. In spite of the continuing theoretical debate on capital
structure, there is relatively little empirical evidence on how companies actually select between financing instruments at a given point of time in order to attain
optimum profitability. Hence, the main problem of this research is to what extent the capital structure impacts on profitability of listed banks in Sri Lanka?
OBJECTIVES OF THE STUDY The objectives of this research are geared towards the following:
• To identify the relationship between capital structure and profitability of listed banks in Sri Lanka.
• To find an optimal capital structure that would be associated with the best performance.
• To find out the impact of capital structure on profitability.
REVIEW OF LITERATURE One of the most important financial decisions facing companies is the choice between debt and equity capital (Glen & Pinto, 1994). This decision can effectively
and efficiently be taken when managers are first of all aware of how capital structure influences firm profitability. This is because; this awareness would enable
managers to know how profitable firms make their financing decisions in particular contexts to remain competitive. In the corporate finance literature, it is
believed that this decision differs from one economy to another depending on country level characteristics.
C

VOLUME NO. 3 (2013), ISSUE NO. 12 (DECEMBER) ISSN 2231-4245
INTERNATIONAL JOURNAL OF RESEARCH IN COMMERCE, ECONOMICS & MANAGEMENT A Monthly Double-Blind Peer Reviewed (Refereed/Juried) Open Access International e-Journal - Included in the International Serial Directories
http://ijrcm.org.in/
11
Dimitris, M. & Maria, P. (2008) investigated the relationship between capital structure, ownership structure and firm performance across different industries
using a sample of French manufacturing firms. They found that a negative relationship between past profitability and leverage and there will be a positive
relation between profitability and leverage.
Peterson & Rajan (1994) found a significantly positive association between profitability and debt ratios in a study designed to investigate the relationship. Ooi
(1999) argues that profitable firms are more attractive to financial institutions as lending prospects. The reason is that, those firms are expected to have higher
tax shields and low bankruptcy costs. According to Scher et al. (1993), start-up firms with higher anticipated profitability have higher debt to equity ratios. In a
study developed to investigate the relationship between profitability and firm leverage, Taub (1975) in a regression analysis of four profitability metrics against
debt ratio found a significantly positive association between debt and profitability.
According to Bos & Fetherston (1993), capital structure affects both profitability & riskiness of firms. These believe has been held by earlier researchers such as
Miller & Modigliani (1963) and Titman & Wessels, (1998). As a result, numerous studies have been conducted by academic writers to examine the impact of
capital structure on firm profitability.
According to Champion (1999) & Leibestein (1966), companies can use more debt to enhance their financial performance because of debt’s capability to cause
managers to improve productivity to avoid bankruptcy. The point here is that, debt must be repaid while dividend payment is not obligatory and can even be
postponed if the firm is financially hard up. Furthermore Roden & Lewellen (1995) observed a significantly positive association between profitability and total
debt in a study developed to find out the percentage of total debt in leverage buyouts. In a study designed to examine the effect the effect of capital structure
on profitability of listed firms on the Ghana Stock Exchange, Abor (2005) has reported a significantly positive relationship between the ratios of short term debt
to total assets & profitability but a negative association between the ratio of long term debt to total assets and profitability.
The relationship between capital structure and company profitability is always explained in the corporate finance literature within the framework of “Pecking
order theory”. Within this framework, firms would always prefer internal sources of finance as opposed to external sources (Myers, 1984; Myers & Majulf,
1984). These authors argue that internal funding which is specifically the use of retained earnings is cheaper as a source of finance relative to external funding
which is exclusively the use of debt and equity. This preference is due to the cost that is associated with the information asymmetry that exist between
managers and outside market participants thus making external funding expensive. Generally, the investors are of the view that managers would only issue over
valued shares and vice versa thereby raising cheap capital. Although this proposition may not always be true, investors often demand higher returns to
compensate when there is a new issue thus making external funding relatively expensive (Barclay & Smith, 2005). As a result, astute managers would ignore
external funding and use internal sources instead.
Titman & Wessels (1988) contend that firms with high profit levels, all things equal, would maintain relatively lower debt levels since they can realize such funds
form internal sources. Furthermore, Cassa & Holmes (2003) and Hall et al. (2004) all found negative relationship between profitability and both long-term debt
and short-term debt ratios.
Bourke (1989) reported that capital ratios are positively related to profitability. Bourke explained this by assuming that well capitalized banks may enjoy access
to cheaper and less risky sources of funds and better quality asset markets. Alternatively the prudence implied by high capital ratios may also be maintained in
their asset portfolio decisions with consequent improvement in loan loss provision and hence profitability.
The effect of the capital structure on profitability is non-trivial, especially for banks subject to regulatory requirements. Fischer, Henkel & Zechner (1989) show
that profitability is rather insensitive to the capital structure due to adjustment costs. Since banks are active players on the global capital markets, they face
relatively low transaction costs for adjusting their capital structure. Therefore it is likely that a bank’s tolerance with respect to deviations in its capital structure
from the target capital structure is very limited and that profits react fast to holding an in-efficient capital structure.
CONCEPTUALIZATION
FIG. 1: CONCEPTUALIZATION MODEL
OPERATIONALIZATION
Concept Variable Indicator Measurement
Capital Structure
Role of Debt and
Equity
Debt to Equity Debt x 100
Equity
Role of Debt and Total Funds Debt to Total
Funds Ratio Debt x 100
Debt + Equity
Profitability Return on Capital
Employed (ROCE)
Profit based on
Capital Employed
PBIT x 100
Capital Employed
Return on Equity Profit based on
Equity capital Net profit after interest and tax x 100
Equity
Net Interest Margin
Net interest based on Total assets Interest received – Interest paid x 100
Total assets
HYPOTHESES OF THE STUDY The following hypotheses are developed for testing.
H1: There is a positive relationship between debt to equity and ROE
H2: There is a positive relationship between Debt to Equity and ROCE
H3: There is a positive relationship between debt to equity and NIM
H4: There is a positive relationship between debt to Total Funds and ROE
H5: There is a positive relationship between debt to Total Funds and ROCE
H6: There is a positive relationship between debt to Total Funds and NIM
Capital
Structure
Profitability
� Debt/Equity
� Debt to Total Funds
� Return on Capital
Employed
� Return on Equity
� Net Interest Margin

VOLUME NO. 3 (2013), ISSUE NO. 12 (DECEMBER) ISSN 2231-4245
INTERNATIONAL JOURNAL OF RESEARCH IN COMMERCE, ECONOMICS & MANAGEMENT A Monthly Double-Blind Peer Reviewed (Refereed/Juried) Open Access International e-Journal - Included in the International Serial Directories
http://ijrcm.org.in/
12
METHODOLOGY DATA COLLECTION
This study uses secondary data for the analysis. The financial statements which are made up of income statements and balance sheets of the sample banks were
the main sources of data for this study. These were obtained from the Hand book of Listed Companies and the annual reports of respective banks. Further,
scholarly articles from academic journals, relevant text books on the subject and the internet search engines were also used. Specifically, the financial
statements of the banks in the sample are planning to collect for the period 2008-2012 and a balanced panel of ten banks emerged for the study.
SAMPLING DESIGN
The sample of this study composed of ten banks listed in the Colombo Stock Exchange and period of 5 years from 2008 to 2012. Bank Finance & Insurance sector
was selected for the present study among the 20 industry sectors. From this sector the following ten listed Sri Lankan banks were selected to carry out the
research;Commercial Bank of Ceylon Limited, Hatton National Bank Limited, Housing Development Finance Corporation Bank of Srilanka, Merchant Bank of
Srilanka PLC, National Development Bank PLC, Nations Trust Bank Limited, People’s Merchant Bank PLC, Sampath Bank Limited, Seylan Bank PLC, Seylan
Merchant Bank PLC.
DATA ANALYSIS
The quantitative research approach is employed to find out the findings of the research study. Since numerical and secondary data is used, quantitative
approach is considered to be a suitable approach for the study. The upper level of statistical significance for hypotheses testing was set at 5% and 1%. All
statistical test results were computed at the 1-tailed level of significance. Descriptive statistics are used to describe and summarize the behavior of the variables
in a study. Further, the following Statistical Tools are used in the study Correlation: - To identify the relationship between capital structure and profitability.
Regression: - To find out the impact of capital structure on profitability. Data analysis is done by using the SPSS package (Version 16.0).
RESEARCH MODEL A correlation analysis is used to investigate one variable from one or more other variables. Here also this analysis was performed to identify the impact of capital
structure on profitability.
To test the relationship between capital structure and profitability, the following function was considered.
P=ƒ (ROCE, ROE and NIM)
Which shows profitability is the function of capital structure.
Here capital structure is measured with the help of Debt to equity ratio and Debt to total funds ratio. It is important to note that the profitability is measured
with the help of three ratios namely Return on Capital employed, Return on equity and net interest margin.
RESULTS AND ANALYSIS DESCRIPTIVE STATISTICS OF THE VARIABLES
TABLE NO. 01: DESCRIPTIVE STATISTICS
N Minimum Maximam Mean Std.deviation
ROCE 10 9.32 25.42 14.8218 5.16101
ROE 10 -25.03 19.48 9.5116 18.51050
Net Interest Margin 10 3.49 8.22 4.9070 1.73385
Debt Equity 10 182.25 1535.88 825.1531 501.59839
Debt to Total Fund 10 77.48 152.39 88.6591 6.84658
Valid N (listwise) 10
The descriptive statistics above show that over the period under study, the profitability ratios measured by return on capital employed, return on equity and net
interest margin averaged 14.8, 9.5 and 4.9 respectively. The debt/equity ratio stood at 825.2 and debt to total funds averaged 88.7. This is an indication that
approximately 89% of total assets in the banking sector of Sri Lanka are represented by debt, confirming the fact that banks are highly geared institutions. The
maximum and minimum values for debt/equity ratio indicate that the debt/equity composition varies substantially among the listed banks in Sri Lanka
CORRELATION ANALYSIS TABLE NO. 02: CORRELATIONS MATRIX FOR CAPITAL STRUCTURE AND PROFITABILITY
Correlation analysis was built in order to test the linear relationship between various independent and dependent variables used in this study.
The above mentioned table shows the relationship between debt/equity ratio and return on capital employed. The correlation value is -.181 and which is not
significant. Debt/equity ratio shows a weak negative correlation with return on capital employed. The correlation value between debt to total funds and return
on capital employed is .549, which is significant at 0.01 levels. This reveals that there is a significant moderately positive relationship between debt to total funds
and return on capital employed. The correlation value between debt/equity ratio and return on equity is .077 and which is not significant. This shows that there
is a weak positive association between debt/equity ratio and return on equity.
The table mentioned above also illustrates the association between debt to total funds and net interest margin. The correlation value is -.637, which is significant
at 0.01 levels. This shows that there is a significant strong negative relationship between debt to total funds and net interest margin.
Debt to Equity Debt to Total Funds Ratio ROCE ROE Net Interest Margin
Debt to Equity Pearson Correlation 1
Sig. (2-tailed)
Debt to Total Funds Ratio Pearson Correlation .357* 1
Sig. (2-tailed) .011
ROCE Pearson Correlation .549**
.407**
1
Sig. (2-tailed) .000 .003
ROE Pearson Correlation .077 .101 -.181 1
Sig. (2-tailed) .595 .487 .208
Net Interest Margin Pearson Correlation .186 -.637**
.114 -.202 1
Sig. (2-tailed) .195 .000 .429 .159
*. Correlation is significant at the 0.05 level (2-tailed).
**. Correlation is significant at the 0.01 level (2-tailed).
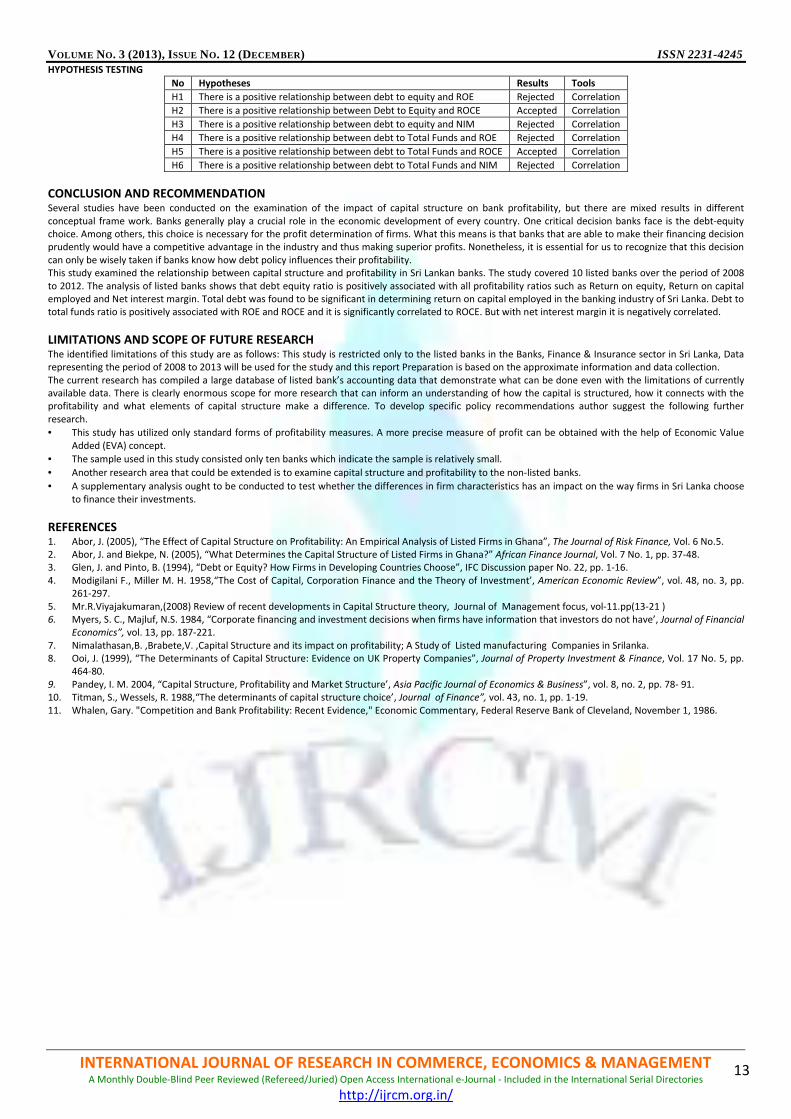
VOLUME NO. 3 (2013), ISSUE NO. 12 (DECEMBER) ISSN 2231-4245
INTERNATIONAL JOURNAL OF RESEARCH IN COMMERCE, ECONOMICS & MANAGEMENT A Monthly Double-Blind Peer Reviewed (Refereed/Juried) Open Access International e-Journal - Included in the International Serial Directories
http://ijrcm.org.in/
13
HYPOTHESIS TESTING
No Hypotheses Results Tools
H1 There is a positive relationship between debt to equity and ROE Rejected Correlation
H2 There is a positive relationship between Debt to Equity and ROCE Accepted Correlation
H3 There is a positive relationship between debt to equity and NIM Rejected Correlation
H4 There is a positive relationship between debt to Total Funds and ROE Rejected Correlation
H5 There is a positive relationship between debt to Total Funds and ROCE Accepted Correlation
H6 There is a positive relationship between debt to Total Funds and NIM Rejected Correlation
CONCLUSION AND RECOMMENDATION Several studies have been conducted on the examination of the impact of capital structure on bank profitability, but there are mixed results in different
conceptual frame work. Banks generally play a crucial role in the economic development of every country. One critical decision banks face is the debt-equity
choice. Among others, this choice is necessary for the profit determination of firms. What this means is that banks that are able to make their financing decision
prudently would have a competitive advantage in the industry and thus making superior profits. Nonetheless, it is essential for us to recognize that this decision
can only be wisely taken if banks know how debt policy influences their profitability.
This study examined the relationship between capital structure and profitability in Sri Lankan banks. The study covered 10 listed banks over the period of 2008
to 2012. The analysis of listed banks shows that debt equity ratio is positively associated with all profitability ratios such as Return on equity, Return on capital
employed and Net interest margin. Total debt was found to be significant in determining return on capital employed in the banking industry of Sri Lanka. Debt to
total funds ratio is positively associated with ROE and ROCE and it is significantly correlated to ROCE. But with net interest margin it is negatively correlated.
LIMITATIONS AND SCOPE OF FUTURE RESEARCH The identified limitations of this study are as follows: This study is restricted only to the listed banks in the Banks, Finance & Insurance sector in Sri Lanka, Data
representing the period of 2008 to 2013 will be used for the study and this report Preparation is based on the approximate information and data collection.
The current research has compiled a large database of listed bank’s accounting data that demonstrate what can be done even with the limitations of currently
available data. There is clearly enormous scope for more research that can inform an understanding of how the capital is structured, how it connects with the
profitability and what elements of capital structure make a difference. To develop specific policy recommendations author suggest the following further
research.
• This study has utilized only standard forms of profitability measures. A more precise measure of profit can be obtained with the help of Economic Value
Added (EVA) concept.
• The sample used in this study consisted only ten banks which indicate the sample is relatively small.
• Another research area that could be extended is to examine capital structure and profitability to the non-listed banks.
• A supplementary analysis ought to be conducted to test whether the differences in firm characteristics has an impact on the way firms in Sri Lanka choose
to finance their investments.
REFERENCES 1. Abor, J. (2005), “The Effect of Capital Structure on Profitability: An Empirical Analysis of Listed Firms in Ghana”, The Journal of Risk Finance, Vol. 6 No.5.
2. Abor, J. and Biekpe, N. (2005), “What Determines the Capital Structure of Listed Firms in Ghana?” African Finance Journal, Vol. 7 No. 1, pp. 37-48.
3. Glen, J. and Pinto, B. (1994), “Debt or Equity? How Firms in Developing Countries Choose”, IFC Discussion paper No. 22, pp. 1-16.
4. Modigilani F., Miller M. H. 1958,“The Cost of Capital, Corporation Finance and the Theory of Investment’, American Economic Review”, vol. 48, no. 3, pp.
261-297.
5. Mr.R.Viyajakumaran,(2008) Review of recent developments in Capital Structure theory, Journal of Management focus, vol-11.pp(13-21 ) 6. Myers, S. C., Majluf, N.S. 1984, “Corporate financing and investment decisions when firms have information that investors do not have’, Journal of Financial
Economics”, vol. 13, pp. 187-221.
7. Nimalathasan,B. ,Brabete,V. ,Capital Structure and its impact on profitability; A Study of Listed manufacturing Companies in Srilanka.
8. Ooi, J. (1999), “The Determinants of Capital Structure: Evidence on UK Property Companies”, Journal of Property Investment & Finance, Vol. 17 No. 5, pp.
464-80.
9. Pandey, I. M. 2004, “Capital Structure, Profitability and Market Structure’, Asia Pacific Journal of Economics & Business”, vol. 8, no. 2, pp. 78- 91.
10. Titman, S., Wessels, R. 1988,“The determinants of capital structure choice’, Journal of Finance”, vol. 43, no. 1, pp. 1-19.
11. Whalen, Gary. "Competition and Bank Profitability: Recent Evidence," Economic Commentary, Federal Reserve Bank of Cleveland, November 1, 1986.
VOLUME NO. 3 (2013), ISSUE NO. 12 (DECEMBER) ISSN 2231-4245
INTERNATIONAL JOURNAL OF RESEARCH IN COMMERCE, ECONOMICS & MANAGEMENT A Monthly Double-Blind Peer Reviewed (Refereed/Juried) Open Access International e-Journal - Included in the International Serial Directories
http://ijrcm.org.in/
14
VALUE ADDITION OF FISHERY MARKETING, GAINS AND LOSSES ALONG THE SUPPLY CHAIN IN INDIA
SHIFERAW MITIKU TEBEKA
RESEARCH SCHOLAR
COLLEGE OF CO-OPERATION, BANKING & MANAGEMENT
KERALA AGRICULTURAL UNIVERSITY
KAU PO
EMMANUEL ZIVENGE
RESEARCH SCHOLAR
COLLEGE OF HORTICULTURE
DEPARTMENT OF AGRICULTURAL ECONOMICS
KERALA AGRICULTURAL UNIVERSITY
KAU PO
USHADEVI K.N
ASSOCIATE PROFESSOR
COLLEGE OF CO-OPERATION, BANKING & MANAGEMENT
KERALA AGRICULTURAL UNIVERSITY
KAU PO
K. JESY THOMAS
PROFESSOR
COLLEGE OF HORTICULTURE
DEPARTMENT OF AGRICULTURAL ECONOMICS
KERALA AGRICULTURAL UNIVERSITY
KAU PO
ABSTRACT
Indian fisheries and aquaculture is an important sector. It provides food, nutritional security to the food basket, contributing to the agricultural exports and
engaging about fourteen million people in different activities. Despite rapid growth in total fish production, a fish farmers’ average annual production in India is
only 2 metric tonnes per person, compared to 172 tonnes in Norway, 72 tonnes in Chile, and 6 tonnes per fisherman in China. Thus, this study examines
challenges faced by the sector and opportunities that can be exploited to increase the market share along the supply chain. In order to examines challenges faced
by the sector and opportunities that can be exploited to increase the market share along the supply chain secondary data have been collected from different
organizations that include private and government organizations sources. Descriptive analysis was employed in this study. The study found that there was a
higher loss at producer level compared to marketing level and consumer level by 4.75% and 9.53% in marine fisheries sector and 2.96% and 9.42% in inland
fisheries sector respectively. The study conclude that, compromising the quality of any product at any stage of the supply chain would have an impact on the next
ladder of the chain similarly; quality deterioration at producer stage of the supply chain contributes for the percentage loss in the marketing stage of the supply
chain.
JEL CODES
M31, Q22.
KEYWORDS
Market, Value addition, Fish, supply chain.
INTRODUCTION ndian fisheries and aquaculture is an important sector. It provides food, nutritional security to the food basket, contributing to the agricultural exports and
engaging about fourteen million people in different activities. With diverse resources ranging from deep seas to lakes in the mountains and more than 10
percent of the global biodiversity in terms of fish and shellfish species, the country has shown continuous and sustained increments in fish production since
independence. Constituting about 4.4 percent of the global fish production, the sector contributes to 1.1 percent of the GDP and 4.7 percent of the agricultural
GDP. The total fish production of 6.57 million metric tonnes presently has nearly 55 percent contribution from the inland sector and nearly the same from
culture fisheries. Paradigm shifts in terms of increasing contributions from inland sector and further from aquaculture are significations over the years. With high
growth rates, the different facets of marine fisheries, coastal aquaculture, inland fisheries, freshwater aquaculture, coldwater fisheries to food, health, economy,
exports, employment and tourism of the country (National Fisheries Development Board, 2013).
According to the Food and Agriculture Organization (FAO) of the United Nations, fish output in India doubled between 1990 and 2010. India has 8,118 kilometres
of marine coastline, 3,827 fishing villages, and 1,914 traditional fish landing centers. India's fresh water resources consist of 195,210 kilometres
of rivers and canals, 2.9 million hectares of minor and major reservoirs, 2.4 million hectares of ponds and lakes, and about 0.8 million hectares of flood
plain wetlands and water bodies. As of 2010, the marine and freshwater resources offered a combined sustainable catch fishing potential of over 4 million
metric tonnes of fish. In addition, India's water and natural resources offer a tenfold growth potential in aquaculture (farm fishing) from 2010 harvest levels of
3.9 million metric tonnes of fish, if India were to adopt fishing knowledge, regulatory reforms, and sustainability policies adopted by China over the last two
decades.
The marine fish harvested in India consist of about 65 commercially important species/groups. Pelagic and mid water species contributed about 52% of the total
marine fish in 2004. India as one of major suppliers of fish in the world, in 2006 the country exported over 600,000 metric tonnes of fish, to some 90 countries,
I
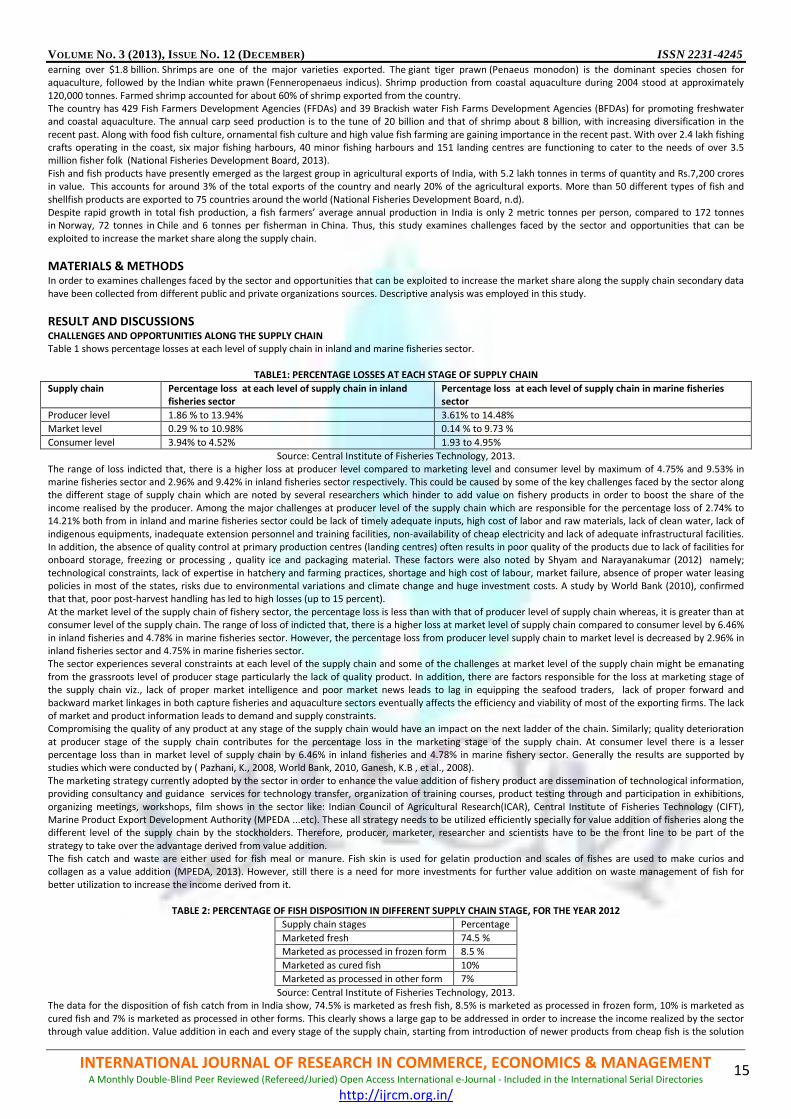
VOLUME NO. 3 (2013), ISSUE NO. 12 (DECEMBER) ISSN 2231-4245
INTERNATIONAL JOURNAL OF RESEARCH IN COMMERCE, ECONOMICS & MANAGEMENT A Monthly Double-Blind Peer Reviewed (Refereed/Juried) Open Access International e-Journal - Included in the International Serial Directories
http://ijrcm.org.in/
15
earning over $1.8 billion. Shrimps are one of the major varieties exported. The giant tiger prawn (Penaeus monodon) is the dominant species chosen for
aquaculture, followed by the Indian white prawn (Fenneropenaeus indicus). Shrimp production from coastal aquaculture during 2004 stood at approximately
120,000 tonnes. Farmed shrimp accounted for about 60% of shrimp exported from the country.
The country has 429 Fish Farmers Development Agencies (FFDAs) and 39 Brackish water Fish Farms Development Agencies (BFDAs) for promoting freshwater
and coastal aquaculture. The annual carp seed production is to the tune of 20 billion and that of shrimp about 8 billion, with increasing diversification in the
recent past. Along with food fish culture, ornamental fish culture and high value fish farming are gaining importance in the recent past. With over 2.4 lakh fishing
crafts operating in the coast, six major fishing harbours, 40 minor fishing harbours and 151 landing centres are functioning to cater to the needs of over 3.5
million fisher folk (National Fisheries Development Board, 2013).
Fish and fish products have presently emerged as the largest group in agricultural exports of India, with 5.2 lakh tonnes in terms of quantity and Rs.7,200 crores
in value. This accounts for around 3% of the total exports of the country and nearly 20% of the agricultural exports. More than 50 different types of fish and
shellfish products are exported to 75 countries around the world (National Fisheries Development Board, n.d).
Despite rapid growth in total fish production, a fish farmers’ average annual production in India is only 2 metric tonnes per person, compared to 172 tonnes
in Norway, 72 tonnes in Chile and 6 tonnes per fisherman in China. Thus, this study examines challenges faced by the sector and opportunities that can be
exploited to increase the market share along the supply chain.
MATERIALS & METHODS In order to examines challenges faced by the sector and opportunities that can be exploited to increase the market share along the supply chain secondary data
have been collected from different public and private organizations sources. Descriptive analysis was employed in this study.
RESULT AND DISCUSSIONS CHALLENGES AND OPPORTUNITIES ALONG THE SUPPLY CHAIN Table 1 shows percentage losses at each level of supply chain in inland and marine fisheries sector.
TABLE1: PERCENTAGE LOSSES AT EACH STAGE OF SUPPLY CHAIN
Supply chain Percentage loss at each level of supply chain in inland fisheries sector
Percentage loss at each level of supply chain in marine fisheries sector
Producer level 1.86 % to 13.94% 3.61% to 14.48%
Market level 0.29 % to 10.98% 0.14 % to 9.73 %
Consumer level 3.94% to 4.52% 1.93 to 4.95%
Source: Central Institute of Fisheries Technology, 2013.
The range of loss indicted that, there is a higher loss at producer level compared to marketing level and consumer level by maximum of 4.75% and 9.53% in
marine fisheries sector and 2.96% and 9.42% in inland fisheries sector respectively. This could be caused by some of the key challenges faced by the sector along
the different stage of supply chain which are noted by several researchers which hinder to add value on fishery products in order to boost the share of the
income realised by the producer. Among the major challenges at producer level of the supply chain which are responsible for the percentage loss of 2.74% to
14.21% both from in inland and marine fisheries sector could be lack of timely adequate inputs, high cost of labor and raw materials, lack of clean water, lack of
indigenous equipments, inadequate extension personnel and training facilities, non-availability of cheap electricity and lack of adequate infrastructural facilities.
In addition, the absence of quality control at primary production centres (landing centres) often results in poor quality of the products due to lack of facilities for
onboard storage, freezing or processing , quality ice and packaging material. These factors were also noted by Shyam and Narayanakumar (2012) namely;
technological constraints, lack of expertise in hatchery and farming practices, shortage and high cost of labour, market failure, absence of proper water leasing
policies in most of the states, risks due to environmental variations and climate change and huge investment costs. A study by World Bank (2010), confirmed
that that, poor post-harvest handling has led to high losses (up to 15 percent).
At the market level of the supply chain of fishery sector, the percentage loss is less than with that of producer level of supply chain whereas, it is greater than at
consumer level of the supply chain. The range of loss of indicted that, there is a higher loss at market level of supply chain compared to consumer level by 6.46%
in inland fisheries and 4.78% in marine fisheries sector. However, the percentage loss from producer level supply chain to market level is decreased by 2.96% in
inland fisheries sector and 4.75% in marine fisheries sector.
The sector experiences several constraints at each level of the supply chain and some of the challenges at market level of the supply chain might be emanating
from the grassroots level of producer stage particularly the lack of quality product. In addition, there are factors responsible for the loss at marketing stage of
the supply chain viz., lack of proper market intelligence and poor market news leads to lag in equipping the seafood traders, lack of proper forward and
backward market linkages in both capture fisheries and aquaculture sectors eventually affects the efficiency and viability of most of the exporting firms. The lack
of market and product information leads to demand and supply constraints.
Compromising the quality of any product at any stage of the supply chain would have an impact on the next ladder of the chain. Similarly; quality deterioration
at producer stage of the supply chain contributes for the percentage loss in the marketing stage of the supply chain. At consumer level there is a lesser
percentage loss than in market level of supply chain by 6.46% in inland fisheries and 4.78% in marine fishery sector. Generally the results are supported by
studies which were conducted by ( Pazhani, K., 2008, World Bank, 2010, Ganesh, K.B , et al., 2008).
The marketing strategy currently adopted by the sector in order to enhance the value addition of fishery product are dissemination of technological information,
providing consultancy and guidance services for technology transfer, organization of training courses, product testing through and participation in exhibitions,
organizing meetings, workshops, film shows in the sector like: Indian Council of Agricultural Research(ICAR), Central Institute of Fisheries Technology (CIFT),
Marine Product Export Development Authority (MPEDA ...etc). These all strategy needs to be utilized efficiently specially for value addition of fisheries along the
different level of the supply chain by the stockholders. Therefore, producer, marketer, researcher and scientists have to be the front line to be part of the
strategy to take over the advantage derived from value addition.
The fish catch and waste are either used for fish meal or manure. Fish skin is used for gelatin production and scales of fishes are used to make curios and
collagen as a value addition (MPEDA, 2013). However, still there is a need for more investments for further value addition on waste management of fish for
better utilization to increase the income derived from it.
TABLE 2: PERCENTAGE OF FISH DISPOSITION IN DIFFERENT SUPPLY CHAIN STAGE, FOR THE YEAR 2012
Supply chain stages Percentage
Marketed fresh 74.5 %
Marketed as processed in frozen form 8.5 %
Marketed as cured fish 10%
Marketed as processed in other form 7%
Source: Central Institute of Fisheries Technology, 2013.
The data for the disposition of fish catch from in India show, 74.5% is marketed as fresh fish, 8.5% is marketed as processed in frozen form, 10% is marketed as
cured fish and 7% is marketed as processed in other forms. This clearly shows a large gap to be addressed in order to increase the income realized by the sector
through value addition. Value addition in each and every stage of the supply chain, starting from introduction of newer products from cheap fish is the solution
VOLUME NO. 3 (2013), ISSUE NO. 12 (DECEMBER) ISSN 2231-4245
INTERNATIONAL JOURNAL OF RESEARCH IN COMMERCE, ECONOMICS & MANAGEMENT A Monthly Double-Blind Peer Reviewed (Refereed/Juried) Open Access International e-Journal - Included in the International Serial Directories
http://ijrcm.org.in/
16
to the existing fish marketing problem, particularly, in order to boost the income realized by the country from the sector. Scope for improvement in product
development is evident from the fact; ready-to-eat and ready-to-cook fish products have high demand in both domestic and export market. However, the
strategy adopted in India is lagging behind this fact. There is a huge gap that need to bridge, which is in a range of 74.5% of the fish catch marketed as fresh.
This can be one of the potential marketing opportunities to further add value in order to trap the high demand both domestic and export market.
Demand for fish and fishery products are increasing considerably, both at domestic and export front. This has been caused due to the health concerns and the
perception of fish as a healthy food with high levels of digestible protein and cholesterol lowering capabilities. This can be an opportunity to the fishermen as a
market expands. Thus, higher productivity, knowledge transfer for sustainable fishing, continued growth in fish production with increase in fish exports have the
potential for increasing the income of Indian fishermen.
The total production of fish in India for the year 2012 accounted 86.66 lakh tonnes, of this 52.95 lakh tonnes from inland fish and 33.75 lakh tonnes from marine
fish production. From the total production of fish in India, 862021 tonne of fish with Rs 16597.23 in crore were exported and the remaining fish produced were
consumed domestically. These empirical data clearly show there is a need to target the export market, because from the total production of fish in India,
7803979 tonne is being consumed domestically. There is a need to increase the volume of fish exported from India since; the export market is lucrative to the
sector.
RECOMMENDATIONS - Incorporating modern facilities at harbors and landing centers and improving hygienic and quality standards in fish handling and transportation in order to
make Indian fishery product demanded as it will be satisfying the world class standard.
- Quality standard should not be compromised regardless of where the fish is marketed whether it is in the domestic market or in the international market.
There is a need to introduce statuary measures in domestic fish marketing system to ensure hygiene standards as well as establishment of cold chain for
transportation and storage of fish to sustain its quality.
- In order to enhance the unit value realization, there is a need for factories to avail the row product into attractive ready to eat consumer products from
low value fishes so as to utilize discards into valuable resources.
- In order to prevent post harvest losses and hygienic handling of fish , extension schemes like using suitable fishing gears, use of ice boxes , improved
storage, packing and transportation conditions, training the various client groups on the improved handling practices and improved processing techniques
have to be intensified by various fisheries departments from government and private wings.
- Fish by nature is a highly perishable food, time factor is very crucial for management of this commodity. Therefore, in adding value at each stage of the
supply chain there is a need of basic infrastructural facility particularly, market ecosystem (storage facility like cold room).
CONCLUSION Individual and government effort is required to assure the quality standard of fish in order to ensure income realised by fish farmers at the grass root level and
along other stages of the supply chain is increased. Value addition on the existing product on each supply stage can bridge the unit value realised by the farmer
with existing difference at a fish farmers’ average annual production in India with the rest of the world like a fish farmers’ average annual production
in Norway, Chile, and China.
REFERENCES 1. Balasubramaniam, S. 2013. Extension methods in fisheries management. CIFT (Central Institute of Fisheries Technology).
2. FAO [Food and Agricultural organization]. 2010. The state of world fisheries and aquaculture. FAO of the United Nations. 2010.
3. Ganesh K.B, Dattaa, K.K., Joshia, P.K. Katihab, P.K., Sureshc, R., Ravisankard, T. Ravindranathe, K.and Menona M. 2008. Domestic Fish Marketing in India
Changing Structure, Conduct, Performance and Policies Agricultural Economics Research Review Vol. 21 (Conference Number) pp 345-354.
4. MPEDA [Marine Export Development Authority].2013. Fish products waste utilization.
5. National Fisheries Development Board. n.d. About Indian Fisheries. [online] Available: http://nfdb.ap.nic.in/html/aboutus.htm[10 Oct, 2013].
6. Pazhani Kanthiah .2008. Problems and Prospects of Small-Scale Fisheries Development in India. [online] Available: http://ir.library.oregonstate.edu/xmlui/
handle/1957/36973 [10 Oct 2013].
7. Shyam, S. S. and Narayanakumar, R.2012. Indian Seafood industry and post WTO A Policy Outlook. In Manual: World Trade Agreements and Indian
Fisheries Paradigms, APolicy Outlook.pp.329-346.
8. World Bank. 2010. India Marine Fisheries Issues, Opportunities and Transitions for Sustainable Development Agriculture and Rural Development Sector
Unit South Asia Region. [Online] Available:https://openknowledge.worldbank.org/bitstream/handle/10986/3002/542590ESW0whit0ries0 Report00PUB
LIC0.pdf?sequence=1 [09 Oct 2013].
VOLUME NO. 3 (2013), ISSUE NO. 12 (DECEMBER) ISSN 2231-4245
INTERNATIONAL JOURNAL OF RESEARCH IN COMMERCE, ECONOMICS & MANAGEMENT A Monthly Double-Blind Peer Reviewed (Refereed/Juried) Open Access International e-Journal - Included in the International Serial Directories
http://ijrcm.org.in/
17
A STUDY ON PRE-PURCHASE BEHAVIOR OF TWO WHEELER MOTORCYCLE USERS IN NELLORE DISTRICT, ANDHRA PRADESH, INDIA
DR. D. V. RAMANA
PROFESSOR
COLLEGE OF COMMERCE AND MANAGEMENT & INFORMATION SCIENCES
S.V.UNIVERSITY
TIRUPATHI
DR. P. SUBBAIAH
PROFESSOR
DEPARTMENT OF MANAGEMENT
SSN COLLEGE OF ENGINEERING & TECHNOLOGY
ONGOLE
P. V. L. NARASIMHA RAO
ASST. PROFESSOR
DEPARTMENT OF MANAGEMENT
SSN COLLEGE OF ENGINEERING & TECHNOLOGY
ONGOLE
ABSTRACT
Marketing is possibly the most important activity a business can partake in. Even the most brilliant products and services won’t survive without marketing efforts.
The marketing umbrella covers many different fields, from advertising to public relations to promotions to sales. Marketing combines all of these fields in order to
introduce product or service to potential customers. If you’re not using the channels in the best way, your potential customers won’t know about your product or
service. India is the second largest producer of two wheelers in the world. It stands next only to Japan in terms of number of two-wheelers produced, with the
entry of multinational players the competition in the two wheeler segment is increasing. As a result customers are getting a wider choice of brands at different
price slots and at high standards of quality. Under this scenario this study explores individual consumer buying dynamics and consumer buying behavior of
motorcycle users and allows the marketers to gain insights into why individuals act in certain consumption related ways and with learning what internal and
external influences compel them to act as they do. It will be helpful to producers to design and redesign marketing strategies to influence consumption decision of
buyer. The present paper is undertaken to study the influence of pre-purchase behavioral factors of the motorcycle users and their responses to understand the
perceptions about time elapsed between conceiving of idea and realization of it, demographic factors influence over it, and different sources of information
pursued by the customer before making the purchase. Analytical study was carried out by using a questionnaire and the collected data were analyzed by using
percentage, chi-square tests.
KEYWORDS Buying Behavior, Motivating factors, Purchase decision, Consumer psychology, Chi-square.
INTRODUCTION onsumer psychology studies how things like thoughts, culture and motivations impact how and why people buy products and services. Consumer
psychology is a specialty area that studies how our thoughts, beliefs, feelings and perceptions influence how people buy and relate to goods and services.
One formal definition of the field describes it as "the study of individuals, groups, or organizations and the processes they use to select, secure, use, and
dispose of products, services, experiences, or ideas to satisfy needs and the impacts that these processes have on the consumer and society"."Consumer
behavior is useful in how consumers choose businesses, products and services, The thought processes and emotions behind consumer decisions, How
environmental variables such as friends, family, media and culture influence buying decisions, What motivates people to choose one product over another, How
personal factors and individual difference affect people's buying choices, What marketers can do to effectively reach out to their target customers. Under this
scenario understanding the consumer buying behavior of motorcycle users allows the marketers to gain insights into why individuals act in certain consumption
related ways and with learning what internal and external influences compel them to act as they do. So the study of consumer buying behavior of motorcycles
users will be helpful to producers to design and redesign marketing strategies to influence consumption decision of buyer. At the same time it will be very useful
to customers while making their purchase decision. The study of buying behavior of motor cycle users is felt relevant in today’s changing market environment of
two-wheelers.
PRE-PURCHASE BEHAVIOR It has been set as one of the objectives of this study to examine the relative importance of the information sources used by the consumer; were collected from
the users of motor cycle in the district. In addition to the above, the influence of demographic variables over the time gap between contemplation of buying and
actual buying of motorcycle is also undertaken.
The variables selected are:
� Time gap between intention and actual purchase
� Type of Information sources explored by the customer before making purchase.
The above mentioned variables are in one way or the other, are relevant to all consumers irrespective of the place of purchase. So the focus in this article will be
to find out the cross relationships between these variables.
REVIEW OF LITERATURE The review of literature available on the consumer buyer behavior of two wheeler automobiles with main emphasis on motor bikes was carried out.
Lambert (1972)1 conducted a study to test whether behavioral differences existed among consumers who selected items priced differently within the same
product. The products chosen for the study were tape recorders, portable stereos, molded luggage, tooth paste, coffee, suntan lotion, and tennis rackets. The
C
VOLUME NO. 3 (2013), ISSUE NO. 12 (DECEMBER) ISSN 2231-4245
INTERNATIONAL JOURNAL OF RESEARCH IN COMMERCE, ECONOMICS & MANAGEMENT A Monthly Double-Blind Peer Reviewed (Refereed/Juried) Open Access International e-Journal - Included in the International Serial Directories
http://ijrcm.org.in/
18
findings revealed that persons who chose the high priced items perceived large quality variation within the product category and saw the consequences of a
poor choice as being undesirable. They were confident that quality was related to price and saw themselves as good judges of product quality. Their perceived
experience in purchasing the product was often high and they thought brand choice was likely to affect other people’s social judgment of them.
Bogart and Lehman (1973)2, in their psychological study of unaided brand recall by female household head, examined some factors related to brand recall.
Their findings indicted that brand recall was a complex and dynamic process.
Healy Overholser and Associates (1975) 3
are examples of commercial studies carried out in order to supply information to marketers considering the relative
influence of husbands and wives in family decision making, the results showed that husbands go on 39% of shopping trips 15% alone and 24% with their wives,
and that brands for which there was a consensus were more likely to be purchased.
O’Brien (1987)4 examined in his study four factors namely demographic, personality, sources of message, and product class and their effect on information
handling. The products chosen for the study were cars and breakfast. It was found that the factors had varying effects on information handling; search initiation
had no effect which suggested that substantial number of consumers failed to engage in extensive search prior to purchase. But unlike previous search, his study
focused on incentives for information seeking for a given product, how much would a utility maximizing consumer with a given preference gain from search.
Duncan and Olshavslay (1992)5
In a survey of 164 recent purchases of two wheelers showed that consumer beliefs about the market place and about their
capabilities as consumer accounted for 50 percent of the variance in extent of external search. The types of brand (domestic, foreign, or local) considered by a
consumer were found to be significantly related to the belief. The main objective of this research was to study the degree of relationship between market place
related beliefs and pre-purchase external information search behavior. The extent of external search for information exhibited by consumers prior to purchase
typically had been found to be very limited. In some cases little or no external search occurred.
Sekar.S (1995)
6 studied the “consumer values in product consumption patterns”, among the consumers in the city of Chennai, the consumers for the purpose of
the study were classified into ‘higher income’, ‘middle income’ and ‘lower income’ groups. the results revealed that the product consumption patterns of lower
income group of consumers appeared to be more influenced by their “physical value” while that of the middle income group was more influenced by their
epistemic value and that of higher Income consumers were influenced by their “social values”, hence the author concluded that the product consumption
patterns of the three income groups differed to their value orientation.
IMPORTANCE OF THE STUDY The trends of liberalization, privatization and globalization had given a high impetus to the automobile industry and in specific to the motor bike industry. A few
decades ago there were only few motor bike manufacturers and models, today there are a dozen manufacturers and a few dozen motor bike models in the
country. The situation is rich for a consumer to make a choice of the bike and at the same time there is difficulty with a large number of choices. In this context a
study of buying behavior of motor cycle users would be relevant in throwing light upon the various dimensions of purchase behavior and motor cycle industry. In
a fierce competitive market, analysis of factors that influence purchase decisions are pre-requisite for the manufacturers of two wheeler automobiles, because it
enables them to have an understanding of the current and future trends of two wheeler purchasers especially motor bike users and to match supply with the
changing pattern of demand. It can also help the marketers of motor bikes based on consumer behavior to formulate marketing strategies regarding their
product positioning and targeting.
STATEMENT OF THE PROBLEM Due to the stiff competition in the two wheeler segment customers have a wider choice in terms of number of brands, models and features at different price
slots, and all these transformed the expectations of the customers. Now the customers are expecting the manufacturers to provide the products as per their
tastes, preferences, habits, and lifestyles. The study of pre purchase behavior of motorcycle users is more appropriate to today’s marketing environment
because customers are more conscious and particular about the products and services they want to have. If the firm/marketer fails to understand what their
customers want, the products launched by the firm will be rejected in the market. In order to improve the new product success rate and to ensure customer
acceptance one has to make an effort to learn everything what one could about their prospective customers regarding their needs, preferences, changing
lifestyles, income levels and their purchasing patterns.
OBJECTIVES OF THE STUDY 1. To ascertain the time gap between intention (contemplation) to buy and actual purchase of motor cycle by the customers.
2. To analyze the demographic factors influence over the time gap between intention to buy and actual purchase of motor cycle.
3. To study and evaluate the different sources of information used by the customers and their role in the purchase decision.
HYPOTHESES 1. There is no significant difference among various advertisements which are as source of information in the purchase decision.
2. There is no significant difference of demographic factors influence over the time gap of contemplation of buying and actual buying of motorcycle.
RESEARCH METHODOLOGY The study is descriptive in nature. The researcher used a structured schedule to collect data from the respondents. Convenience sampling method is used.
SAMPLING DESIGN AND STATISTICAL TOOLS The study was confined to Nellore District in Andhra Pradesh. The sample consists of 252 customers, Convenience sampling was used. The study was conducted
during the month of May-July 2013. The collected data were tabulated and analyzed by using percentage, chi-square test and ANOVA.
SCOPE OF THE STUDY The present study mainly focused in the area of demographic factors influence over the time gap between conceiving of the idea to purchase a vehicle and
actual purchase of the vehicle, type of information sources used by the respondents to know about the product before they purchase. And how many brands did
they considered before purchase of the vehicle.
DATA ANALYSIS AND INTERPRETATION The data collected from the respondents were systematically analyzed and presented
Influence of the demographic factors over the purchase decision of the consumers is presented, and most influencing attributes of the motorcycle over the
purchase decision of customer are analyzed.

VOLUME NO. 3 (2013), ISSUE NO. 12 (DECEMBER) ISSN 2231-4245
INTERNATIONAL JOURNAL OF RESEARCH IN COMMERCE, ECONOMICS & MANAGEMENT A Monthly Double-Blind Peer Reviewed (Refereed/Juried) Open Access International e-Journal - Included in the International Serial Directories
http://ijrcm.org.in/
19
TABLE NO. 01: DEMOGRAPHIC PROFILE OF THE RESPONDENTS
Age of Respondents Percentage Education Percentage Occupation Percentage
Below—26 27.8 Up to tenth 10.70 Student 19.0
26---35 40.5 Intermediate 16.67 Business 22.2
36---45 20.2 Degree 35.31 Private employee 46.8
Above 45 11.5 Post Graduation 28.57 Government employee 7.1
Total 100.0 Others 8.70 Agriculture 2.0
Total 100.0 Professional 2.8
Total 100.0
Gender percentage Income (Rs/month) Percentage Marital Status Percentage
Male 98.0 Below-- 10,000 21.0 Married 57.9
Female 2.0 10,001--20,000 35.3 Unmarried 42.1
Total 100.0 20,001--30,000 22.2 Total 100.0
Above 30,000 2.4
No income 19.0
Total 100.0
(Source: Primary data)
From the above table.01 it is observed that there are 60.7% of the respondents between 26-45 years old. 63.88% of the respondents are graduates, 27.37% are
under graduates. 46.8 % of the respondent are private employees, and 22.2% are business people.57.5% of the respondents’ income is between Rs 10,000 to
30,000. 47.9% respondents are married and remaining is unmarried. 98% of the respondents are male.
TIME GAP BETWEEN INTENTION TO BUY AND ACTUAL PURCHASE Consumers delay a purchase decision because
� They are too busy.
� Do not like shopping.
� Fear of making wrong decisions.
� Price may decrease or better item may be available.
� Social risk (not meeting approval of society).
In addition to the above factors the customer have to consider various other factors while purchasing a motorcycle namely selection of dealer, taking the
advantage of discount facility, choice of model, wait for auspicious day, mode of payment i.e. to buy in cash or credit or hire purchase etc.
The time taken by the consumer from the time he/she first thought of purchasing a product to actual purchase is an important issue. In other words it can be
said that it is the ‘gestation’ period between need recognition and actual purchase. The first step in any type of consumer decision process is problem
recognition. This occurs when an individual perceives a difference between an ideal and actual state of affairs at any given point of time. When it occurs, the
human system is energized, and goals orientation starts. Seemingly unrelated activities now become organized to satisfy this state of arousal. In other words it
can be said that, the system is turned on and activated to engage in purposeful activity. So it is at this stage that the consumer starts thinking of purchasing a
product, this is called contemplation. The following table highlights the time gap between contemplation and actual purchase.
TABLE NO. 02: TIME GAP BETWEEN CONTEMPLATION AND ACTUAL PURCHASE
Time gap No.of Respondents Percentage
Up to one month 133 52.11
1--3 months 89 35.31
4--6 months 19 7.43
More than 6 months 11 4.35
Total 252 100.00
(Source: Primary data)
From the above table- 02 It is clear that 133(52.11) respondents took up to a month time to purchase the motorcycle from the time of contemplation, 89(35.31)
respondents took 1 to 3 months time to purchase the motorcycle from the time of contemplation, 19 (7.43) respondents took 4 to 6 months time, and 11(4.35)
respondents took more than six months time.
INFLUENCE OF DEMOGRAPHIC FACTORS OVER TIME GAP BETWEEN CONTEMPLATION AND ACTUAL PURCHASE An analysis to find out whether there is significant relation in the time taken between contemplation of buying and actual buying with various demographic
factors are attempted, to find out whether the association is present, if present to know how strong it is. The frequency distribution of demographic factors of
the respondents and time gap between contemplation and actual purchase are given in the following tables.
TABLE NO. 03: COMPARISON OF AGE GROUP WITH TIME GAP BETWEEN INTENTION TO BUY AND ACTUAL PURCHASE (Figures in brackets indicates column wise percentages)
Time Gap
Up to one month 1-3 months 4-6 months More than 6 months Total
Age group Below 26 20 (15.04) 37 (41.57) 9 (47.37) 4 (36.36) 70 (27.78)
26—35 61 (45.86) 31 (34.83) 7 (36.84) 3 (27.27) 102 (40.48)
36—45 37 (27.82) 11 (12.36) 3 (15.79) 0 (0.00) 51 (20.24)
above 45 15 (11.28) 10 (11.24) 0 (0.00) 4 (36.36) 29 (11.51)
Total 133 (100) 89 (100) 19 (100) 11 (100) 252 (100)
(Source: Primary data)
It is clear from the table.03, that 133 users took up to one month time to purchase a new vehicle out of this 61(45.86) respondents are in the age group of 26-35
years, and 37(27.82) respondents are in the age group of 36-45 years. Of the 89 respondents took one to three months time to purchase the vehicle, 37(41.57)
and 31(34.83) are in the age group of below 26 and 26-35 years respectively. 19 respondents took four to six months time, and only 11 respondents took more
than six months time.
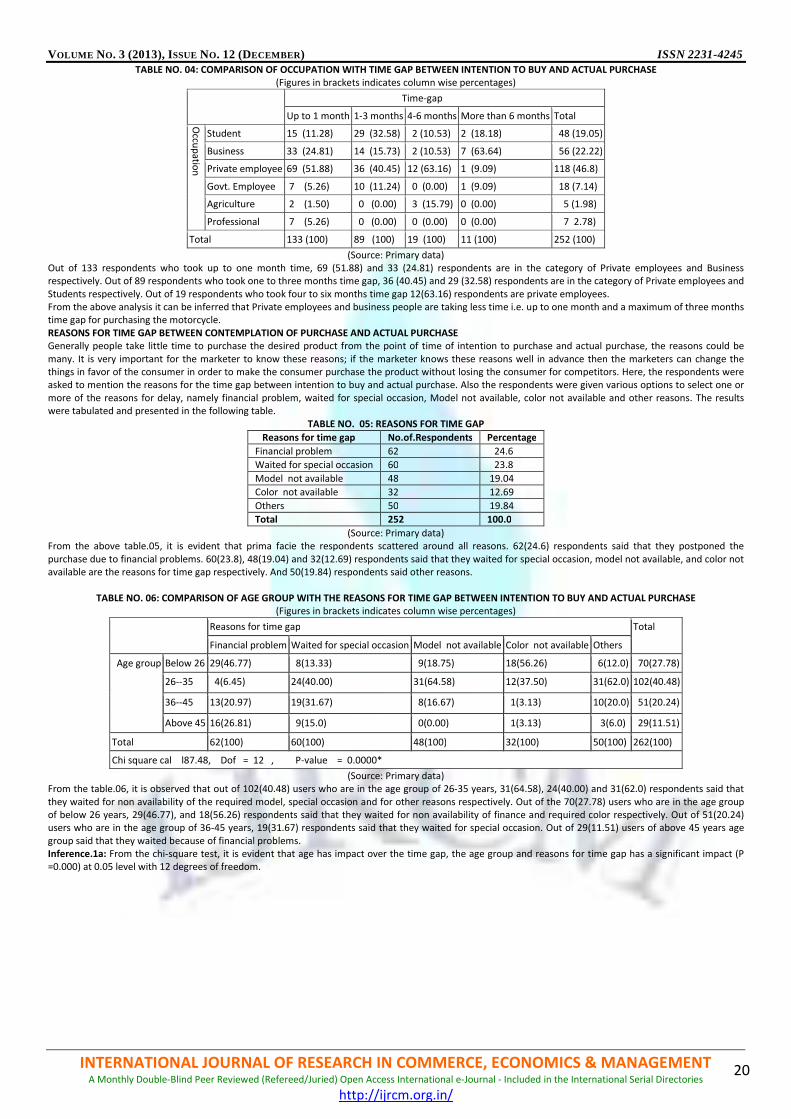
VOLUME NO. 3 (2013), ISSUE NO. 12 (DECEMBER) ISSN 2231-4245
INTERNATIONAL JOURNAL OF RESEARCH IN COMMERCE, ECONOMICS & MANAGEMENT A Monthly Double-Blind Peer Reviewed (Refereed/Juried) Open Access International e-Journal - Included in the International Serial Directories
http://ijrcm.org.in/
20
TABLE NO. 04: COMPARISON OF OCCUPATION WITH TIME GAP BETWEEN INTENTION TO BUY AND ACTUAL PURCHASE (Figures in brackets indicates column wise percentages)
Time-gap
Up to 1 month 1-3 months 4-6 months More than 6 months Total
Occu
pa
tion
Student 15 (11.28) 29 (32.58) 2 (10.53) 2 (18.18) 48 (19.05)
Business 33 (24.81) 14 (15.73) 2 (10.53) 7 (63.64) 56 (22.22)
Private employee 69 (51.88) 36 (40.45) 12 (63.16) 1 (9.09) 118 (46.8)
Govt. Employee 7 (5.26) 10 (11.24) 0 (0.00) 1 (9.09) 18 (7.14)
Agriculture 2 (1.50) 0 (0.00) 3 (15.79) 0 (0.00) 5 (1.98)
Professional 7 (5.26) 0 (0.00) 0 (0.00) 0 (0.00) 7 2.78)
Total 133 (100) 89 (100) 19 (100) 11 (100) 252 (100)
(Source: Primary data)
Out of 133 respondents who took up to one month time, 69 (51.88) and 33 (24.81) respondents are in the category of Private employees and Business
respectively. Out of 89 respondents who took one to three months time gap, 36 (40.45) and 29 (32.58) respondents are in the category of Private employees and
Students respectively. Out of 19 respondents who took four to six months time gap 12(63.16) respondents are private employees.
From the above analysis it can be inferred that Private employees and business people are taking less time i.e. up to one month and a maximum of three months
time gap for purchasing the motorcycle.
REASONS FOR TIME GAP BETWEEN CONTEMPLATION OF PURCHASE AND ACTUAL PURCHASE Generally people take little time to purchase the desired product from the point of time of intention to purchase and actual purchase, the reasons could be
many. It is very important for the marketer to know these reasons; if the marketer knows these reasons well in advance then the marketers can change the
things in favor of the consumer in order to make the consumer purchase the product without losing the consumer for competitors. Here, the respondents were
asked to mention the reasons for the time gap between intention to buy and actual purchase. Also the respondents were given various options to select one or
more of the reasons for delay, namely financial problem, waited for special occasion, Model not available, color not available and other reasons. The results
were tabulated and presented in the following table.
TABLE NO. 05: REASONS FOR TIME GAP
Reasons for time gap No.of.Respondents Percentage
Financial problem 62 24.6
Waited for special occasion 60 23.8
Model not available 48 19.04
Color not available 32 12.69
Others 50 19.84
Total 252 100.0
(Source: Primary data)
From the above table.05, it is evident that prima facie the respondents scattered around all reasons. 62(24.6) respondents said that they postponed the
purchase due to financial problems. 60(23.8), 48(19.04) and 32(12.69) respondents said that they waited for special occasion, model not available, and color not
available are the reasons for time gap respectively. And 50(19.84) respondents said other reasons.
TABLE NO. 06: COMPARISON OF AGE GROUP WITH THE REASONS FOR TIME GAP BETWEEN INTENTION TO BUY AND ACTUAL PURCHASE
(Figures in brackets indicates column wise percentages)
Reasons for time gap Total
Financial problem Waited for special occasion Model not available Color not available Others
Age group Below 26 29(46.77) 8(13.33) 9(18.75) 18(56.26) 6(12.0) 70(27.78)
26--35 4(6.45) 24(40.00) 31(64.58) 12(37.50) 31(62.0) 102(40.48)
36--45 13(20.97) 19(31.67) 8(16.67) 1(3.13) 10(20.0) 51(20.24)
Above 45 16(26.81) 9(15.0) 0(0.00) 1(3.13) 3(6.0) 29(11.51)
Total 62(100) 60(100) 48(100) 32(100) 50(100) 262(100)
Chi square cal l87.48, Dof = 12 , P-value = 0.0000*
(Source: Primary data)
From the table.06, it is observed that out of 102(40.48) users who are in the age group of 26-35 years, 31(64.58), 24(40.00) and 31(62.0) respondents said that
they waited for non availability of the required model, special occasion and for other reasons respectively. Out of the 70(27.78) users who are in the age group
of below 26 years, 29(46.77), and 18(56.26) respondents said that they waited for non availability of finance and required color respectively. Out of 51(20.24)
users who are in the age group of 36-45 years, 19(31.67) respondents said that they waited for special occasion. Out of 29(11.51) users of above 45 years age
group said that they waited because of financial problems.
Inference.1a: From the chi-square test, it is evident that age has impact over the time gap, the age group and reasons for time gap has a significant impact (P
=0.000) at 0.05 level with 12 degrees of freedom.
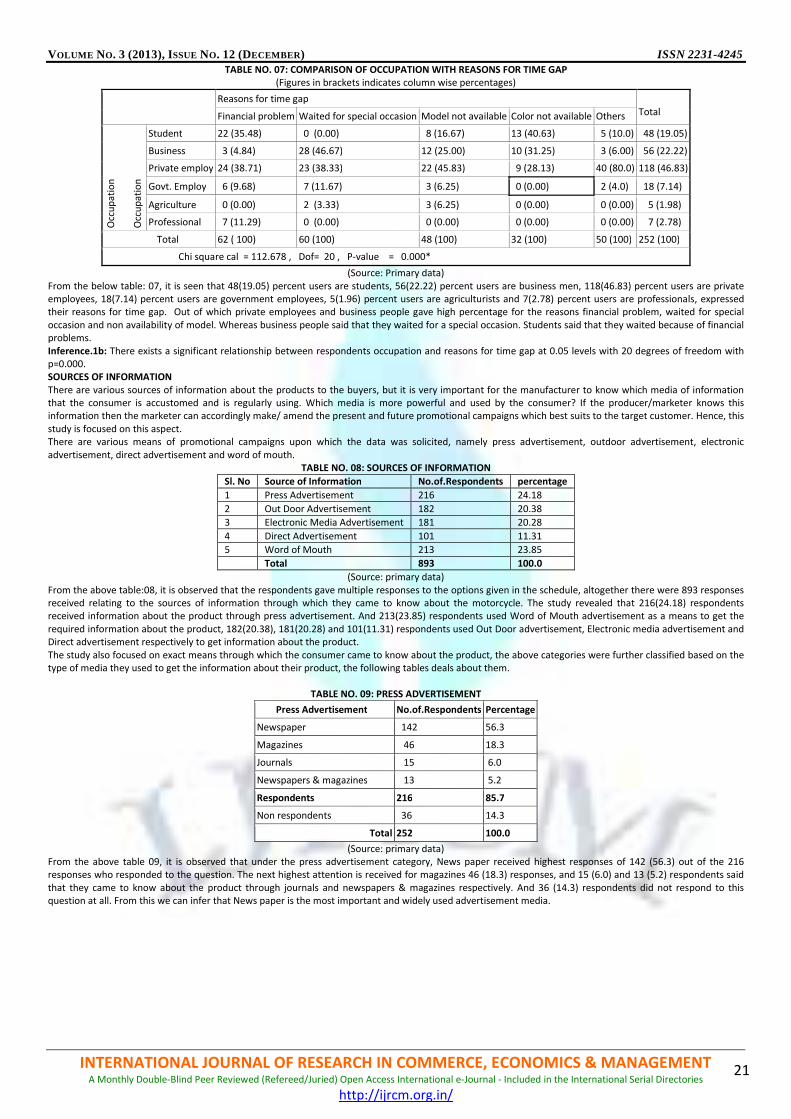
VOLUME NO. 3 (2013), ISSUE NO. 12 (DECEMBER) ISSN 2231-4245
INTERNATIONAL JOURNAL OF RESEARCH IN COMMERCE, ECONOMICS & MANAGEMENT A Monthly Double-Blind Peer Reviewed (Refereed/Juried) Open Access International e-Journal - Included in the International Serial Directories
http://ijrcm.org.in/
21
TABLE NO. 07: COMPARISON OF OCCUPATION WITH REASONS FOR TIME GAP (Figures in brackets indicates column wise percentages)
Reasons for time gap
Total Financial problem Waited for special occasion Model not available Color not available Others O
ccu
pa
tio
n
Occ
up
ati
on
Student 22 (35.48) 0 (0.00) 8 (16.67) 13 (40.63) 5 (10.0) 48 (19.05)
Business 3 (4.84) 28 (46.67) 12 (25.00) 10 (31.25) 3 (6.00) 56 (22.22)
Private employ 24 (38.71) 23 (38.33) 22 (45.83) 9 (28.13) 40 (80.0) 118 (46.83)
Govt. Employ 6 (9.68) 7 (11.67) 3 (6.25) 0 (0.00) 2 (4.0) 18 (7.14)
Agriculture 0 (0.00) 2 (3.33) 3 (6.25) 0 (0.00) 0 (0.00) 5 (1.98)
Professional 7 (11.29) 0 (0.00) 0 (0.00) 0 (0.00) 0 (0.00) 7 (2.78)
Total 62 ( 100) 60 (100) 48 (100) 32 (100) 50 (100) 252 (100)
Chi square cal = 112.678 , Dof= 20 , P-value = 0.000*
(Source: Primary data)
From the below table: 07, it is seen that 48(19.05) percent users are students, 56(22.22) percent users are business men, 118(46.83) percent users are private
employees, 18(7.14) percent users are government employees, 5(1.96) percent users are agriculturists and 7(2.78) percent users are professionals, expressed
their reasons for time gap. Out of which private employees and business people gave high percentage for the reasons financial problem, waited for special
occasion and non availability of model. Whereas business people said that they waited for a special occasion. Students said that they waited because of financial
problems.
Inference.1b: There exists a significant relationship between respondents occupation and reasons for time gap at 0.05 levels with 20 degrees of freedom with
p=0.000.
SOURCES OF INFORMATION There are various sources of information about the products to the buyers, but it is very important for the manufacturer to know which media of information
that the consumer is accustomed and is regularly using. Which media is more powerful and used by the consumer? If the producer/marketer knows this
information then the marketer can accordingly make/ amend the present and future promotional campaigns which best suits to the target customer. Hence, this
study is focused on this aspect.
There are various means of promotional campaigns upon which the data was solicited, namely press advertisement, outdoor advertisement, electronic
advertisement, direct advertisement and word of mouth.
TABLE NO. 08: SOURCES OF INFORMATION
Sl. No Source of Information No.of.Respondents percentage
1 Press Advertisement 216 24.18
2 Out Door Advertisement 182 20.38
3 Electronic Media Advertisement 181 20.28
4 Direct Advertisement 101 11.31
5 Word of Mouth 213 23.85
Total 893 100.0
(Source: primary data)
From the above table:08, it is observed that the respondents gave multiple responses to the options given in the schedule, altogether there were 893 responses
received relating to the sources of information through which they came to know about the motorcycle. The study revealed that 216(24.18) respondents
received information about the product through press advertisement. And 213(23.85) respondents used Word of Mouth advertisement as a means to get the
required information about the product, 182(20.38), 181(20.28) and 101(11.31) respondents used Out Door advertisement, Electronic media advertisement and
Direct advertisement respectively to get information about the product.
The study also focused on exact means through which the consumer came to know about the product, the above categories were further classified based on the
type of media they used to get the information about their product, the following tables deals about them.
TABLE NO. 09: PRESS ADVERTISEMENT
Press Advertisement No.of.Respondents Percentage
Newspaper 142 56.3
Magazines 46 18.3
Journals 15 6.0
Newspapers & magazines 13 5.2
Respondents 216 85.7
Non respondents 36 14.3
Total 252 100.0
(Source: primary data)
From the above table 09, it is observed that under the press advertisement category, News paper received highest responses of 142 (56.3) out of the 216
responses who responded to the question. The next highest attention is received for magazines 46 (18.3) responses, and 15 (6.0) and 13 (5.2) respondents said
that they came to know about the product through journals and newspapers & magazines respectively. And 36 (14.3) respondents did not respond to this
question at all. From this we can infer that News paper is the most important and widely used advertisement media.
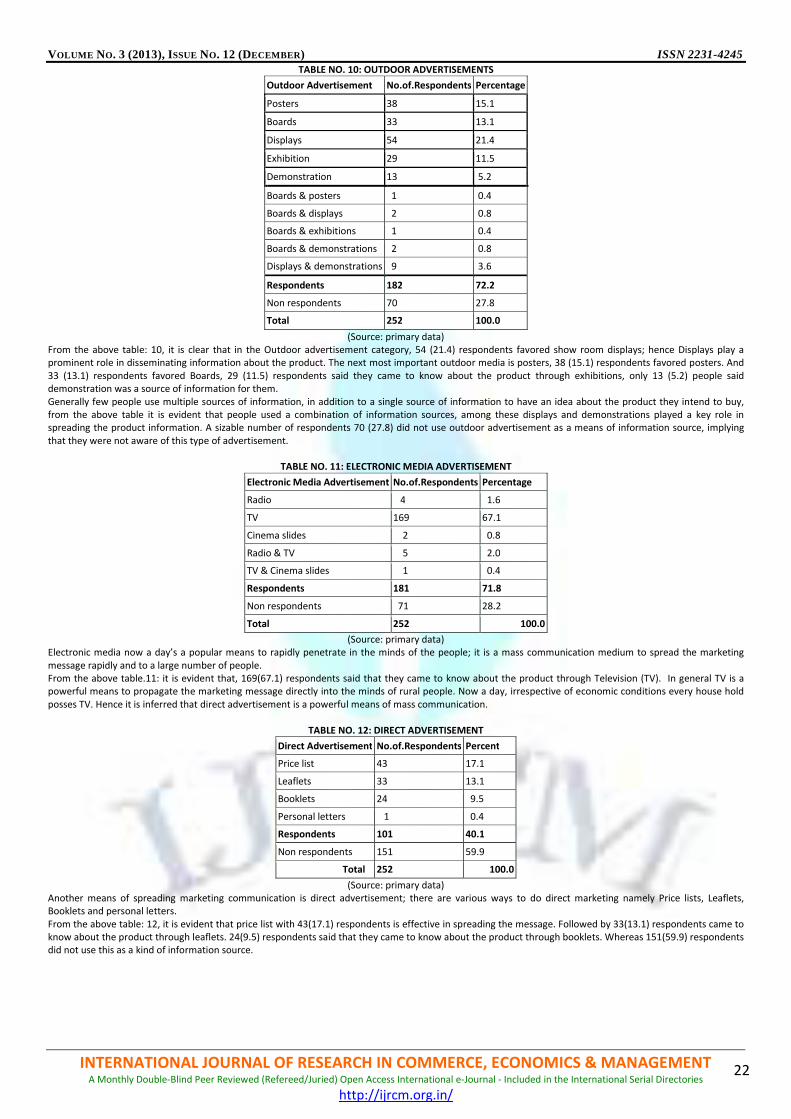
VOLUME NO. 3 (2013), ISSUE NO. 12 (DECEMBER) ISSN 2231-4245
INTERNATIONAL JOURNAL OF RESEARCH IN COMMERCE, ECONOMICS & MANAGEMENT A Monthly Double-Blind Peer Reviewed (Refereed/Juried) Open Access International e-Journal - Included in the International Serial Directories
http://ijrcm.org.in/
22
TABLE NO. 10: OUTDOOR ADVERTISEMENTS
Outdoor Advertisement No.of.Respondents Percentage
Posters 38 15.1
Boards 33 13.1
Displays 54 21.4
Exhibition 29 11.5
Demonstration 13 5.2
Boards & posters 1 0.4
Boards & displays 2 0.8
Boards & exhibitions 1 0.4
Boards & demonstrations 2 0.8
Displays & demonstrations 9 3.6
Respondents 182 72.2
Non respondents 70 27.8
Total 252 100.0
(Source: primary data)
From the above table: 10, it is clear that in the Outdoor advertisement category, 54 (21.4) respondents favored show room displays; hence Displays play a
prominent role in disseminating information about the product. The next most important outdoor media is posters, 38 (15.1) respondents favored posters. And
33 (13.1) respondents favored Boards, 29 (11.5) respondents said they came to know about the product through exhibitions, only 13 (5.2) people said
demonstration was a source of information for them.
Generally few people use multiple sources of information, in addition to a single source of information to have an idea about the product they intend to buy,
from the above table it is evident that people used a combination of information sources, among these displays and demonstrations played a key role in
spreading the product information. A sizable number of respondents 70 (27.8) did not use outdoor advertisement as a means of information source, implying
that they were not aware of this type of advertisement.
TABLE NO. 11: ELECTRONIC MEDIA ADVERTISEMENT
Electronic Media Advertisement No.of.Respondents Percentage
Radio 4 1.6
TV 169 67.1
Cinema slides 2 0.8
Radio & TV 5 2.0
TV & Cinema slides 1 0.4
Respondents 181 71.8
Non respondents 71 28.2
Total 252 100.0
(Source: primary data)
Electronic media now a day’s a popular means to rapidly penetrate in the minds of the people; it is a mass communication medium to spread the marketing
message rapidly and to a large number of people.
From the above table.11: it is evident that, 169(67.1) respondents said that they came to know about the product through Television (TV). In general TV is a
powerful means to propagate the marketing message directly into the minds of rural people. Now a day, irrespective of economic conditions every house hold
posses TV. Hence it is inferred that direct advertisement is a powerful means of mass communication.
TABLE NO. 12: DIRECT ADVERTISEMENT
Direct Advertisement No.of.Respondents Percent
Price list 43 17.1
Leaflets 33 13.1
Booklets 24 9.5
Personal letters 1 0.4
Respondents 101 40.1
Non respondents 151 59.9
Total 252 100.0
(Source: primary data)
Another means of spreading marketing communication is direct advertisement; there are various ways to do direct marketing namely Price lists, Leaflets,
Booklets and personal letters.
From the above table: 12, it is evident that price list with 43(17.1) respondents is effective in spreading the message. Followed by 33(13.1) respondents came to
know about the product through leaflets. 24(9.5) respondents said that they came to know about the product through booklets. Whereas 151(59.9) respondents
did not use this as a kind of information source.

VOLUME NO. 3 (2013), ISSUE NO. 12 (DECEMBER) ISSN 2231-4245
INTERNATIONAL JOURNAL OF RESEARCH IN COMMERCE, ECONOMICS & MANAGEMENT A Monthly Double-Blind Peer Reviewed (Refereed/Juried) Open Access International e-Journal - Included in the International Serial Directories
http://ijrcm.org.in/
23
TABLE NO. 13: WORD OF MOUTH
Word Of Mouth No.of.Respondents Percentage
Consumers 19 7.5
Friends 141 56.0
Colleagues 33 13.1
Sales personnel 10 4.0
Consumers & friends 9 3.6
Friends & Colleagues 1 0.4
Respondents 213 84.5
Non respondents 39 15.5
Total 252 100.0
(Source: primary data)
No doubt that among all means of marketing communication word of mouth plays an important and vital role and is more powerful in convincing the customer.
The credibility of word of mouth is far higher than that of other means of communication. That’s why marketers always aim to spread a positive word of mouth
communication about the company and its products.
From the above table: 13 it is evident that among the word of mouth communication, friends played a key role in spreading the message because 141(56.0)
respondents saying that they came to know about the product through friends. The next important means of word of mouth is colleagues and sales personnel
with 33(13.1) and 10(4.0) responses respectively. Finally 39(15.5) respondents were not responded to the question implying that they are not aware of this
mode of advertisement.
From the above analysis it is evident that Friends and Colleagues are the key persons in propagating information about the brands and their models. Usually,
consumers enquire their friends before making any purchase of durable goods which involve high cost.
Hypothesis: 2: There is no significant difference among various advertisements which are as sources of information in the purchase decision.
TABLE NO. 14: VARIOUS ADVERTISEMENTS AS SOURCES OF INFORMATION IN THE PURCHASE DECISION
SL.No Variable Statistical values Result
Chi-square calculated Table value D.o.f
1 Sources of information 48.14 9.488 4 Significant
Inference: From the above table-14, it is evident that the calculated value is more than that of the table value. Hence, the hypothesis is rejected and can be said
that there is significant difference among different sources of information. Therefore the claim is not valid.
FINDINGS 1. Demographic factors showed an impact over the purchase decision of the motorcycle users
2. 153(60.72%) Respondents are in the age group of 26-45 years, 104 respondents bought Hero Honda and 74 bought Bajaj motorcycles, and 32 bought TVS
motorcycles. (Results showed that Hero Honda and Bajaj are the most preferred brands.)
3. There are 145(71%) respondents whose income level is between Rs10, 001 to 30,000.
4. Respondents who are graduates and post graduates are 161(63.8%), below intermediate are 69(27.3%).
5. 118(46.82%) respondents are private employees, 56(22.22%) are business people, 48(19.04%) are students, and 18(7.14%) are government employees.
6. It is observed that 133(52.11) respondents took up to a month time to purchase the motorcycle from the time of contemplation, and 89(35.31)
respondents took 1 to 3 months time to purchase the motorcycle from the time of contemplation.
7. 102 (40.48) respondents are in the age group of 26-35 years out of which 61 (45.86) respondent took a month time.
8. Out of total 133 respondents who took up to one month time, 69 (51.88) and 33 (24.81) respondents are in the category of Private employees and Business
respectively
9. The study revealed that 24.18% respondents received information about the product through press advertisement. And 23.85%respondents used Word of
Mouth advertisement as a means to get the required information about the product, 20.38%, 20.28% and 11.31% respondents used Out Door
advertisement, Electronic media advertisement and Direct advertisement respectively to get information about the product.
10. News paper received highest responses of 142(56.3%) out of the 216 responses who responded to the question of print media.
11. In the Outdoor advertisement category, 54(21.4) respondents favored show room displays; and 33(13.1) respondents favored Boards, 29(11.5)
respondents said they came to know about the product through exhibitions
12. Out of 252 respondents, 169(67.1) respondents said that they came to know about the product through Television (TV).
13. Among the word of mouth communication, friends played a key role in spreading the message because 141(56.0) respondents saying that they came to
know about the product through friends.
14. From the hypothesis testing it is concluded that there is significant difference among different sources of information.
RECOMMENDATIONS/SUGGESTIONS 1. Students and private employees are taking up to a month time to realize the sale and they are in the age group of 26-35 years, so focus more on this
segment because this age group people change their mind frequently.
2. Financial problem and waiting for special occasion are the main reasons for waiting to take decision so; the companies must see that some kind of financial
arrangement should be made either with banks or with private financial institutions so as to provide quick and soft loans to customers.
3. Follow up of customers should be made after the first enquiry of the customer regarding the product; otherwise sometimes customers may lose interest.
4. Generally few people use multiple sources of information, in addition to a single source of information to have an idea about the product they intend to
buy. From the research it is evident that people used a combination of information sources, among these displays and demonstrations played a key role in
spreading the product information so put more emphasis on this.
5. News papers, displays television price list proved to be effective in spreading the communication so lay more emphasis on this too.
6. Friends in the category of word of mouth plays critical role in spreading the communication, so develop customer relationship development programs to
encourage the customers to spread good word of mouth publicity regarding the product.
CONCLUSION From the Chi-Square test it is evident that demographic factors of the motorcycle buyers showed influence over the purchase decision of motorcycle with
respect to time gap, it is also evident that consumers are not buying the product immediately after getting off idea, invariably they are taking some time to
purchase the product, majority of the customers are taking one to three months time gap between contemplation to buy and actual buying of the product.

VOLUME NO. 3 (2013), ISSUE NO. 12 (DECEMBER) ISSN 2231-4245
INTERNATIONAL JOURNAL OF RESEARCH IN COMMERCE, ECONOMICS & MANAGEMENT A Monthly Double-Blind Peer Reviewed (Refereed/Juried) Open Access International e-Journal - Included in the International Serial Directories
http://ijrcm.org.in/
24
Customers are using multiple sources of information to know about the product. Out of the available sources of information newspapers, television, price list
and displays remained as an important source of information. Friends are the most important source of information in the category of word of mouth publicity.
SCOPE FOR FURTHER RESEARCH The present study gives scope for further research in the area of who is the influential person who can change the purchase decision of the customer, what for
the vehicle is used, to what extent it is used, promotion and promotional offers attractive to customers. Next one can focus on the finance schemes and modes
of finance schemes attractive for customers and mode of purchase that customers prefer to buy the vehicle, and the kind of finance pattern does the buyer like.
Also the occasion on which buyers like to buy the vehicle can become scope for further research.
REFERENCES 1. Calvin P. Duncan and Olshavsky, External Search, the Role of Consumer Beliefs, Journal of Marketing Science, Vo. XIX, February, 1992. Pp.32-43.
2. Donald J. Hempel (1975), “Family role Structure and Housing Decisions”, Advances in Consumer Research, Vol.2; pp.71-80.
3. George Tesar Gerald G. Udell and G.M. Naidu (1974), “The role of Marketing in the Introduction of Technologically New Products: the Case of the Electric
Car”, Journal of the Academy of Marketing Science, Vol. 2(24); fall; pp.642-650.
4. Lessig V. Parker and Beverley B. Anderson (1974), “Do Different Consumers Operate under the Same Preference Model”, Journal of the Academy of
Marketing Science, Vol. 4(1); winter; pp.429-439.
5. Loudon David and AlbertJ. Della Bitta, “Consumer Behavior-Concepts and Applications” 3rd Edn; New York, McGraw-Hill International, 1998.
6. Majumdar, Ramanuj, (1991), “Marketing Research: Text, Applications and Case Studies”, Wiley Easten Limited, New Delhi.
7. Nishar Ahamad N. “Factors Determining Purchase and Post-purchase Behavior of Two Wheeler Users”, Published PhD dissertation, 1997, Department of
Commerce, University of Madras, India.
8. Ravichandran.M. (1988). “Consumer perceptions and purchase Decisions”. A study of Urban and semi urban consumers of durable goods. Unpublished PhD
Dissertation, Dept of Commerce, University of Madras (June).
9. Ronald P.Hill. (1987). “The Buying process: Effects of and on consumer mood states. “Advances in consumer research, vol.XIV, and p.435.
10. Sekar.S, “Consumer values in product consumption patterns”, a study based on selected income groups in madras city. Dept of commerce, University of
Madras 1985.
11. Terrence V. O’Brien, “Tracking Consumer Decision-making “. Journal of Marketing, January. Vol.35 (1); pp.34-40.
WEBSITE 12. http://www.siam.com.
VOLUME NO. 3 (2013), ISSUE NO. 12 (DECEMBER) ISSN 2231-4245
INTERNATIONAL JOURNAL OF RESEARCH IN COMMERCE, ECONOMICS & MANAGEMENT A Monthly Double-Blind Peer Reviewed (Refereed/Juried) Open Access International e-Journal - Included in the International Serial Directories
http://ijrcm.org.in/
25
A FRAMEWORK OF AUDIT REPORT IN BANK AUDIT: STUDY ON LFAR, GHOSH & JILANI AND BASEL COMMITTEE REPORT
DR. AKHIL MISHRA
PROFESSOR
FACULTY OF COMMERCE
BANARAS HINDU UNIVERSITY
VARANASI
NEHA JAISWAL
RESEARCH SCHOLAR
FACULTY OF COMMERCE
BANARAS HINDU UNIVERSITY
VARANASI
ABSTRACT
Audit of banking companies plays a very important role in India as it help to regulate it in right manner. As part of Statutory Audit of Banks, an auditor is required
to submit Audit Report as per requirement of the Banking Regulation Act,1949 which is a detailed questionnaire prepared by Reserve Bank of India (RBI). This
report is generally known as “Long Form Audit Report (LFAR), Ghosh & Jilani Committee Report & Basel Committee Report”. Thus, Audit report broadly gives true
and fair view of the financial statement and internal control system of the bank. Hence, RBI advised Banks to obtain LFAR from auditor since 1985. Audit report
which is mention as above is a separate report to be submitted to the management in the format, as prescribed by the RBI. The above Report is an excellent Audit
Planning Tool, based on questionnaire form about the assets, liabilities, Profit and Loss, general records, internal control and Capital Adequacy. The paper mainly
focuses to work out the facts regarding the framework & role of audit report in the bank audit.
KEYWORDS bank audit, audit report.
INTRODUCTION udit report is one of the important parts in Bank Audit, which is required to be submitted by the auditor as per the requirement of the Banking Regulation
Act 1949. The various reports like Statutory Branch Auditor’s report (Form 3CA and 3CD), MOC, LFAR, Ghosh/Jilani Report and various certificates (ATM
cash balance certificate, TDS certificate etc) signed by the bank manager, have to be submitted by the auditor. The study only focuses on the LFAR (Long
Form Audit Report), Ghosh & Jilani Committee report & Basel Committee Report. These are a detailed questionnaire prepared by the RBI. This report is basically
to examine or evaluate the efficiency and continuity of internal control system through management. RBI advised Public Sector Banks to obtain these reports
from the auditor. These reports are not a substitute for the statutory report but it is to be submitted to the management. These reports have also revised with
the consultation of ICAI and a few selected banks’ representatives, which reflect the changes in regulatory/ supervisory framework of banks as also the
expanded role of statutory auditors who are now required to include certain additional certification/ validations in their report.
Audit report is designed to focus on systematic issues in bank and tries to address them through the insight of the bank branch auditors. Report serves as an
excellent audit planning tool. By studying the questionnaire in detail the auditor can plan the audit effectively and allocate time to each area accordingly. LFAR
covers all the areas of the branch audit and is the end result of the auditor’s efforts and would reflect on professional competence and therefore should not be
treated as a mere questionnaire to be filled in a routine way.
FEATURES & FORMAT OF AUDIT REPORT LFAR, Ghosh & Jilani Committee Report & Basel committee report are the type of questionnaire which includes the specific questions related with the internal
control system, capital adequacy norms, Assets, Liabilities, P/L A/c and General records.
LFAR: Format of LFAR is decided by RBI and was introduced in 1985. This format has also been revised in 1992-93 and 2003. The present format of LFAR is
effective from 31 March 2003. Thus the prescribed format of LFAR for bank and branch audit is summarized here:
The questions in LFAR for banks audit are divided into four major categories:-
A. Assets: - Cash, Balances with RBI, SBI and other Banks, Money at call and short notice, Investment, Advances and Other Assets.
B. Liabilities: - Deposits, Other Liabilities and contingent Liabilities.
C. Profit and Loss Accounts.
D. General: - Books and Records, reconciliation of control and subsidiary records, Inter Branch Accounts, Audit/Inspections and Miscellaneous.
In addition to above areas, it also gives questionnaire applicable to specialized branches which deal with: Foreign Exchange Transactions, Very large advances (in
excess of Rs.100 crores), NPA such as Assets Recovery Management branches, Clearing house operation, normally referred to as service branches.
Ghosh Committee Recommendations Report: This is a high level committee report set up by the RBI under the chairman of Shri.A. Ghosh for the enquiry of
various aspects of fraud and malpractice in bank. This is applicable to branches, controlling office, head office and treasury operations of banks. This report is
divided into a Group A, B, C, D.
Group A: Recommendations which have to be implemented by the banks immediately.
Group B: Recommendations requiring RBI approval.
Group C: Recommendations requiring approval of Government of India.
Group D: Recommendations requiring further examination in consultation with IBA.
Jilani Committee Recommendation Report: This report was set up by the RBI in Feb 1995 under the chairman of Mr.Rashid Jilani to review the Internal Control
an Inspection/ Audit system in Banks. The statutory auditor is responsible to verify and report on such recommendation. The recommendation is further
categorized in three levels:
1. EDP environment in banks.
2. Inspection/Internal audit in the banks.
3. Miscellaneous aspects of functioning of banks.
Basel Committee Report: The Basel committee issued detailed documents on capital measurement and capital standards on 26th
June 2004 known as Basel
recommendations. It consists of three pillars: 1) Minimum Capital Requirements: which seek to refine the standardized rules. 2) Supervisory Review Process-
A
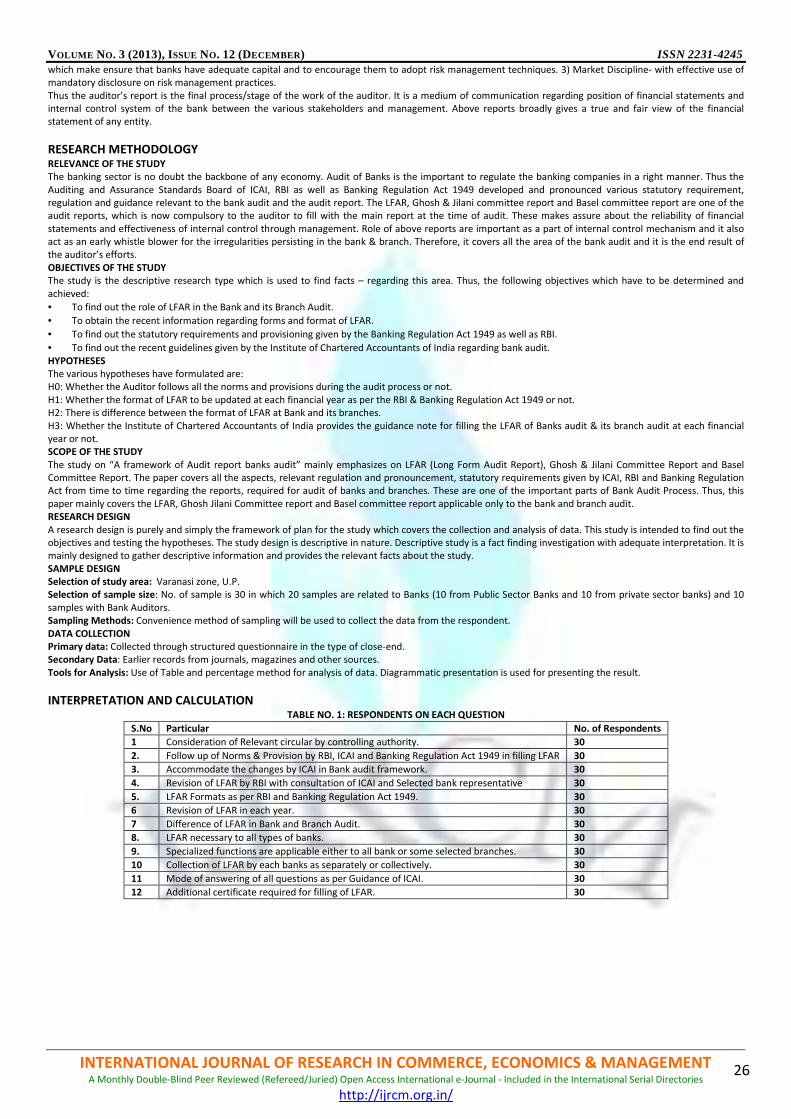
VOLUME NO. 3 (2013), ISSUE NO. 12 (DECEMBER) ISSN 2231-4245
INTERNATIONAL JOURNAL OF RESEARCH IN COMMERCE, ECONOMICS & MANAGEMENT A Monthly Double-Blind Peer Reviewed (Refereed/Juried) Open Access International e-Journal - Included in the International Serial Directories
http://ijrcm.org.in/
26
which make ensure that banks have adequate capital and to encourage them to adopt risk management techniques. 3) Market Discipline- with effective use of
mandatory disclosure on risk management practices. Thus the auditor’s report is the final process/stage of the work of the auditor. It is a medium of communication regarding position of financial statements and
internal control system of the bank between the various stakeholders and management. Above reports broadly gives a true and fair view of the financial
statement of any entity.
RESEARCH METHODOLOGY RELEVANCE OF THE STUDY The banking sector is no doubt the backbone of any economy. Audit of Banks is the important to regulate the banking companies in a right manner. Thus the
Auditing and Assurance Standards Board of ICAI, RBI as well as Banking Regulation Act 1949 developed and pronounced various statutory requirement,
regulation and guidance relevant to the bank audit and the audit report. The LFAR, Ghosh & Jilani committee report and Basel committee report are one of the
audit reports, which is now compulsory to the auditor to fill with the main report at the time of audit. These makes assure about the reliability of financial
statements and effectiveness of internal control through management. Role of above reports are important as a part of internal control mechanism and it also
act as an early whistle blower for the irregularities persisting in the bank & branch. Therefore, it covers all the area of the bank audit and it is the end result of
the auditor’s efforts.
OBJECTIVES OF THE STUDY The study is the descriptive research type which is used to find facts – regarding this area. Thus, the following objectives which have to be determined and
achieved:
• To find out the role of LFAR in the Bank and its Branch Audit.
• To obtain the recent information regarding forms and format of LFAR.
• To find out the statutory requirements and provisioning given by the Banking Regulation Act 1949 as well as RBI.
• To find out the recent guidelines given by the Institute of Chartered Accountants of India regarding bank audit.
HYPOTHESES The various hypotheses have formulated are:
H0: Whether the Auditor follows all the norms and provisions during the audit process or not.
H1: Whether the format of LFAR to be updated at each financial year as per the RBI & Banking Regulation Act 1949 or not.
H2: There is difference between the format of LFAR at Bank and its branches.
H3: Whether the Institute of Chartered Accountants of India provides the guidance note for filling the LFAR of Banks audit & its branch audit at each financial
year or not.
SCOPE OF THE STUDY The study on “A framework of Audit report banks audit” mainly emphasizes on LFAR (Long Form Audit Report), Ghosh & Jilani Committee Report and Basel
Committee Report. The paper covers all the aspects, relevant regulation and pronouncement, statutory requirements given by ICAI, RBI and Banking Regulation
Act from time to time regarding the reports, required for audit of banks and branches. These are one of the important parts of Bank Audit Process. Thus, this
paper mainly covers the LFAR, Ghosh Jilani Committee report and Basel committee report applicable only to the bank and branch audit.
RESEARCH DESIGN A research design is purely and simply the framework of plan for the study which covers the collection and analysis of data. This study is intended to find out the
objectives and testing the hypotheses. The study design is descriptive in nature. Descriptive study is a fact finding investigation with adequate interpretation. It is
mainly designed to gather descriptive information and provides the relevant facts about the study.
SAMPLE DESIGN Selection of study area: Varanasi zone, U.P.
Selection of sample size: No. of sample is 30 in which 20 samples are related to Banks (10 from Public Sector Banks and 10 from private sector banks) and 10
samples with Bank Auditors.
Sampling Methods: Convenience method of sampling will be used to collect the data from the respondent.
DATA COLLECTION Primary data: Collected through structured questionnaire in the type of close-end.
Secondary Data: Earlier records from journals, magazines and other sources.
Tools for Analysis: Use of Table and percentage method for analysis of data. Diagrammatic presentation is used for presenting the result.
INTERPRETATION AND CALCULATION TABLE NO. 1: RESPONDENTS ON EACH QUESTION
S.No Particular No. of Respondents
1 Consideration of Relevant circular by controlling authority. 30
2. Follow up of Norms & Provision by RBI, ICAI and Banking Regulation Act 1949 in filling LFAR 30
3. Accommodate the changes by ICAI in Bank audit framework. 30
4. Revision of LFAR by RBI with consultation of ICAI and Selected bank representative 30
5. LFAR Formats as per RBI and Banking Regulation Act 1949. 30
6 Revision of LFAR in each year. 30
7 Difference of LFAR in Bank and Branch Audit. 30
8. LFAR necessary to all types of banks. 30
9. Specialized functions are applicable either to all bank or some selected branches. 30
10 Collection of LFAR by each banks as separately or collectively. 30
11 Mode of answering of all questions as per Guidance of ICAI. 30
12 Additional certificate required for filling of LFAR. 30
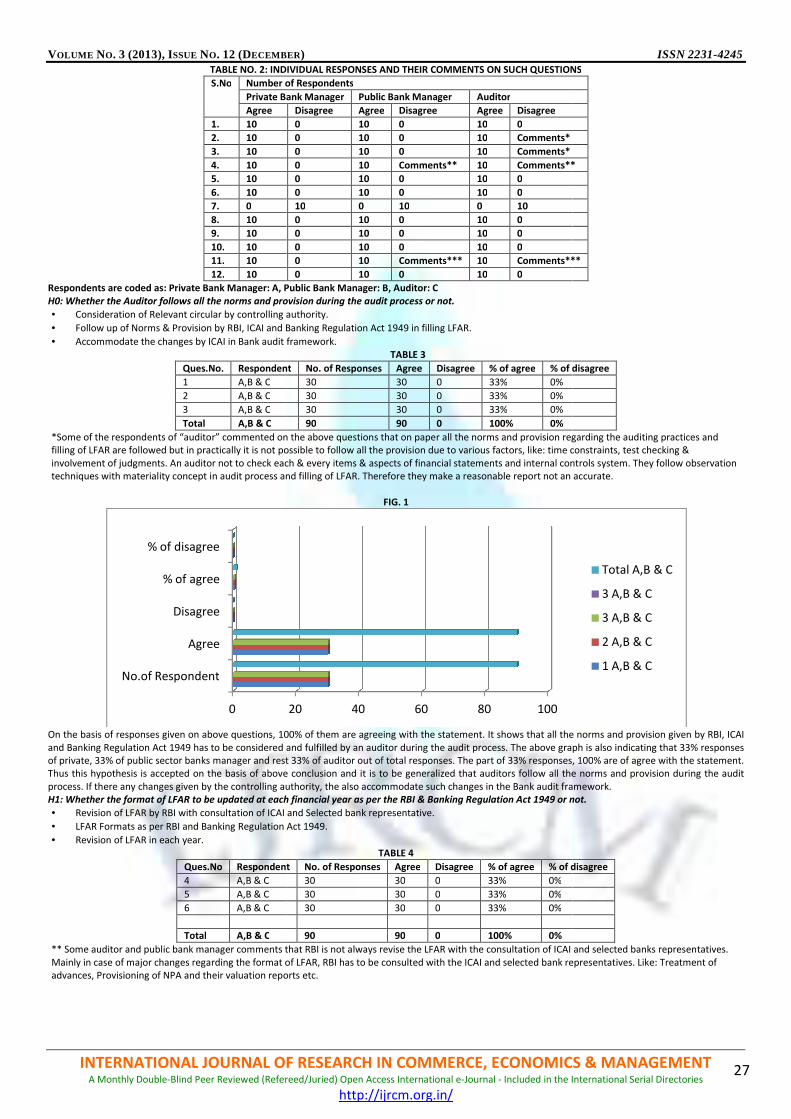
VOLUME NO. 3 (2013), ISSUE NO. 12 (DECEMBER
INTERNATIONAL JOURNAL OF RESEARCH IN COMA Monthly Double-Blind Peer Reviewed (Refereed
TABLE NO. 2: INDIVIDUAL RESPONSES
S.No
Number of Respondents
Private Bank Manager
Agree
1. 10
2. 10
3. 10
4. 10
5. 10
6. 10
7. 0
8. 10
9. 10
10. 10
11. 10
12. 10
Respondents are coded as: Private Bank Manager: A, Public Bank Manager: B, Auditor: CH0: Whether the Auditor follows all the norms and provision during the audit process or not.
• Consideration of Relevant circular by controlling authority.
• Follow up of Norms & Provision by RBI, ICAI and Banking Regulation Act 1949 in filling LFAR.
• Accommodate the changes by ICAI in Bank audit framework.
Ques.No. Respondent
1 A,B & C
2 A,B & C
3 A,B & C
Total A,B & C
*Some of the respondents of “auditor” commented on the above questions that on paper all the norms and provision regarding th
filling of LFAR are followed but in practically it is not possible to follow all the provision due to various factors, like:
involvement of judgments. An auditor not to check each & every items & aspects of f
techniques with materiality concept in audit process and filling of LFAR. Therefore they make a reasonable report not an accu
On the basis of responses given on above questions, 100% of them are agreeing with the statement. It shows that all the norms and provision given by RBI, ICAI
and Banking Regulation Act 1949 has to be considered and fulfilled by an auditor during the audit process. The above graph is
of private, 33% of public sector banks manager and rest 33% of auditor out of total responses. The part of 33% responses, 100
Thus this hypothesis is accepted on the basis of above conclusion and it
process. If there any changes given by the controlling authority, the also accommodate such changes in the Bank audit framewo
H1: Whether the format of LFAR to be updated at each financial year as per the RBI & Banking Regulation Act 1949 or not.
• Revision of LFAR by RBI with consultation of ICAI and Selected bank representative.
• LFAR Formats as per RBI and Banking Regulation Act 1949.
• Revision of LFAR in each year.
Ques.No Respondent
4 A,B & C
5 A,B & C
6 A,B & C
Total A,B & C
** Some auditor and public bank manager comments that RBI is not always revise the LFAR with the consultation of ICAI and selected banks representatives.
Mainly in case of major changes regarding the format of LFAR, RBI has to be consulted with the ICAI and selected bank represe
advances, Provisioning of NPA and their valuation reports etc.
0
No.of Respondent
Agree
Disagree
% of agree
% of disagree
ECEMBER)
INTERNATIONAL JOURNAL OF RESEARCH IN COMMERCE, ECONOMICS Refereed/Juried) Open Access International e-Journal - Included in the International Serial Directories
http://ijrcm.org.in/
INDIVIDUAL RESPONSES AND THEIR COMMENTS ON SUCH QUESTIONS
Number of Respondents
Private Bank Manager Public Bank Manager Auditor
Disagree Agree Disagree Agree Disagree
0 10 0 10 0
0 10 0 10 Comments*
0 10 0 10 Comments*
0 10 Comments** 10 Comments**
0 10 0 10 0
0 10 0 10 0
10 0 10 0 10
0 10 0 10 0
0 10 0 10 0
0 10 0 10 0
0 10 Comments*** 10 Comments***
0 10 0 10 0
Respondents are coded as: Private Bank Manager: A, Public Bank Manager: B, Auditor: C H0: Whether the Auditor follows all the norms and provision during the audit process or not.
controlling authority.
Follow up of Norms & Provision by RBI, ICAI and Banking Regulation Act 1949 in filling LFAR.
Accommodate the changes by ICAI in Bank audit framework.
TABLE 3
Respondent No. of Responses Agree Disagree % of agree % of disagree
30 30 0 33% 0%
30 30 0 33% 0%
30 30 0 33% 0%
90 90 0 100% 0%
*Some of the respondents of “auditor” commented on the above questions that on paper all the norms and provision regarding th
filling of LFAR are followed but in practically it is not possible to follow all the provision due to various factors, like: time constraints, test checking &
involvement of judgments. An auditor not to check each & every items & aspects of financial statements and internal controls system. They follow observation
techniques with materiality concept in audit process and filling of LFAR. Therefore they make a reasonable report not an accu
FIG. 1
questions, 100% of them are agreeing with the statement. It shows that all the norms and provision given by RBI, ICAI
and Banking Regulation Act 1949 has to be considered and fulfilled by an auditor during the audit process. The above graph is
of private, 33% of public sector banks manager and rest 33% of auditor out of total responses. The part of 33% responses, 100
Thus this hypothesis is accepted on the basis of above conclusion and it is to be generalized that auditors follow all the norms and provision during the audit
process. If there any changes given by the controlling authority, the also accommodate such changes in the Bank audit framewo
dated at each financial year as per the RBI & Banking Regulation Act 1949 or not.
Revision of LFAR by RBI with consultation of ICAI and Selected bank representative.
LFAR Formats as per RBI and Banking Regulation Act 1949.
TABLE 4
Respondent No. of Responses Agree Disagree % of agree % of disagree
30 30 0 33% 0%
30 30 0 33% 0%
30 30 0 33% 0%
90 90 0 100% 0%
comments that RBI is not always revise the LFAR with the consultation of ICAI and selected banks representatives.
Mainly in case of major changes regarding the format of LFAR, RBI has to be consulted with the ICAI and selected bank represe
advances, Provisioning of NPA and their valuation reports etc.
20 40 60 80 100
ISSN 2231-4245
MERCE, ECONOMICS & MANAGEMENT Included in the International Serial Directories
27
N SUCH QUESTIONS
Comments**
Comments***
disagree
*Some of the respondents of “auditor” commented on the above questions that on paper all the norms and provision regarding the auditing practices and
time constraints, test checking &
inancial statements and internal controls system. They follow observation
techniques with materiality concept in audit process and filling of LFAR. Therefore they make a reasonable report not an accurate.
questions, 100% of them are agreeing with the statement. It shows that all the norms and provision given by RBI, ICAI
and Banking Regulation Act 1949 has to be considered and fulfilled by an auditor during the audit process. The above graph is also indicating that 33% responses
of private, 33% of public sector banks manager and rest 33% of auditor out of total responses. The part of 33% responses, 100% are of agree with the statement.
is to be generalized that auditors follow all the norms and provision during the audit
process. If there any changes given by the controlling authority, the also accommodate such changes in the Bank audit framework.
dated at each financial year as per the RBI & Banking Regulation Act 1949 or not.
% of disagree
comments that RBI is not always revise the LFAR with the consultation of ICAI and selected banks representatives.
Mainly in case of major changes regarding the format of LFAR, RBI has to be consulted with the ICAI and selected bank representatives. Like: Treatment of
Total A,B & C
3 A,B & C
3 A,B & C
2 A,B & C
1 A,B & C

VOLUME NO. 3 (2013), ISSUE NO. 12 (DECEMBER
INTERNATIONAL JOURNAL OF RESEARCH IN COMA Monthly Double-Blind Peer Reviewed (Refereed
The above table and chart shows the total number of responses is 90 out of which 30
public bank manager. Out of total responses all of them are 100% agreeing with the statement. The individual percentage of ag
responses. No one is disagreeing with the statement. On such basis it is to be said that RBI is to formulate the LFAR with the consultation of the IC
selected bank representatives, Format of LFAR is also according to the RBI and Banking Regulation Act 1949. RBI is also
Therefore this hypothesis is strongly accepted. H2: There is difference between the format of LFAR at Bank and its branches.
• Difference of LFAR in Bank and Branch Audit.
• LFAR necessary to all types of banks.
• Specialised functions are applicable either to all bank or some selected branches.
• Collection of LFAR by each banks as separately or collectively.
Ques.No. Respondent
7 A,B & C
8 A,B & C
9 A,B & C
10 A,B & C
Total A,B & C
The above questions are completely related with bank audit. The LFAR is one of the important reports of bank audit, which is
Private, Public, Cooperative and Foreign Bank. For this verification, some questions is formulated and filled by the selected
30th
in a number. The number of each response is 30 in eac
all respondents are disagreeing with the statement about the differences in format of LFAR between banks and the branches. Th
is no any difference in LFAR for bank and branch audit. However some specialized functions like foreign exchange transaction,
etc are not to be performed by all the banks and the branches. But it is necessary to all banks to
the auditor. On this basis this hypothesis is not accepted and alternate hypothesis is “There is no difference in format of L
has been formulated and accepted.
H3: Whether the Institute of Chartered Accountants of India provides the guidance note for filling the LFAR of Banks audit &
financial year or not.
• Mode of answering of all questions as per Guidance of ICAI.
• Additional certificate required for filling of LFAR.
Ques.No. Respondent No.of Responses
11 A,B & C 30
12 A,B & C 30
Total A,B & C 60
*** Some bank manager and auditor comments whether
answering the questions and filling the LFAR is decided by ICAI with the object to make a correct representation. So that the
verified during the course of audit.
0
20
40
60
80
100
No.of
Respondent
Agree
0
20
40
60
80
100
120
A,B & C A,B & C
7 8
ECEMBER)
INTERNATIONAL JOURNAL OF RESEARCH IN COMMERCE, ECONOMICS Refereed/Juried) Open Access International e-Journal - Included in the International Serial Directories
http://ijrcm.org.in/
FIG. 2
The above table and chart shows the total number of responses is 90 out of which 30th
are from auditor, 30 from private bank manager and the rest 30 are from
public bank manager. Out of total responses all of them are 100% agreeing with the statement. The individual percentage of ag
agreeing with the statement. On such basis it is to be said that RBI is to formulate the LFAR with the consultation of the IC
selected bank representatives, Format of LFAR is also according to the RBI and Banking Regulation Act 1949. RBI is also
H2: There is difference between the format of LFAR at Bank and its branches.
Difference of LFAR in Bank and Branch Audit.
Specialised functions are applicable either to all bank or some selected branches.
Collection of LFAR by each banks as separately or collectively.
TABLE 5
Respondent No.of Responses Agree Disagree % of agree % of disagree
30 0 30 0% 25%
30 30 0 25% 0%
30 30 0 25% 0%
30 30 0 25% 0%
120 90 30 75% 25%
FIG. 3
The above questions are completely related with bank audit. The LFAR is one of the important reports of bank audit, which is
Private, Public, Cooperative and Foreign Bank. For this verification, some questions is formulated and filled by the selected
in a number. The number of each response is 30 in each question or of total responses. Out of which 100% answer is yes except the question no.7.In which
all respondents are disagreeing with the statement about the differences in format of LFAR between banks and the branches. Th
is no any difference in LFAR for bank and branch audit. However some specialized functions like foreign exchange transaction,
etc are not to be performed by all the banks and the branches. But it is necessary to all banks to obtain the LFAR either the branches or the head office from
the auditor. On this basis this hypothesis is not accepted and alternate hypothesis is “There is no difference in format of L
H3: Whether the Institute of Chartered Accountants of India provides the guidance note for filling the LFAR of Banks audit &
Mode of answering of all questions as per Guidance of ICAI.
e required for filling of LFAR.
TABLE 6
No.of Responses Agree Disagree % of agree % of disagree
30 0 50% 0%
30 0 50% 0%
60 0 100% 0%
*** Some bank manager and auditor comments whether the format of LFAR is decided by the RBI and banking Regulation Act 1949, but the manner of
answering the questions and filling the LFAR is decided by ICAI with the object to make a correct representation. So that the
Disagree % of agree % of disagree
A,B & C A,B & C A,B & C
9 10 Total
ISSN 2231-4245
MERCE, ECONOMICS & MANAGEMENT Included in the International Serial Directories
28
are from auditor, 30 from private bank manager and the rest 30 are from
public bank manager. Out of total responses all of them are 100% agreeing with the statement. The individual percentage of agreeing responses are 33% of total
agreeing with the statement. On such basis it is to be said that RBI is to formulate the LFAR with the consultation of the ICAI and some
selected bank representatives, Format of LFAR is also according to the RBI and Banking Regulation Act 1949. RBI is also revising it in each financial year.
% of disagree
The above questions are completely related with bank audit. The LFAR is one of the important reports of bank audit, which is necessary to all types of bank like
Private, Public, Cooperative and Foreign Bank. For this verification, some questions is formulated and filled by the selected person on sample basis which are of
or of total responses. Out of which 100% answer is yes except the question no.7.In which
all respondents are disagreeing with the statement about the differences in format of LFAR between banks and the branches. Thus it is generalized that there
is no any difference in LFAR for bank and branch audit. However some specialized functions like foreign exchange transaction, Large Advance Assets recovery
obtain the LFAR either the branches or the head office from
the auditor. On this basis this hypothesis is not accepted and alternate hypothesis is “There is no difference in format of LFAR between banks and branches”
H3: Whether the Institute of Chartered Accountants of India provides the guidance note for filling the LFAR of Banks audit & its branch audit at each
the format of LFAR is decided by the RBI and banking Regulation Act 1949, but the manner of
answering the questions and filling the LFAR is decided by ICAI with the object to make a correct representation. So that the stating the facts which has been
% of disagree
4 A,B & C
5 A,B & C
6 A,B & C
6 A,B & C
Total A,B & C
No.of Respondent
Agree
Disagree
% of agree
% of disagree

VOLUME NO. 3 (2013), ISSUE NO. 12 (DECEMBER
INTERNATIONAL JOURNAL OF RESEARCH IN COMA Monthly Double-Blind Peer Reviewed (Refereed
The 100% responses obtain from the respondent regarding the mode of answering of all questions as per guidance of ICAI and al
certificates for the filling of LFAR. Thus the 50% response received on each questions. Out of which 100% are agreeing with it. The total agreeing against each
response is 50%. It is generalized that ICAI issued the guidance note for auditing practices of banks and also for filling th
financial year. They also update it as per relevant statutory requirement. Finally the last hypothesis is also accepted.
CONCLUSION It is concluded that LFAR is one of the important audit reports or techniques for measuring the lacunae,
adopted by the management of bank. It is prepared by RBI and filled by an auditor during the course of audit. The filling of
and Basel Committee Report are the important process of auditing practices in Banks which have to be filled by the auditor during the audit process. There are
various statutory requirement and relevant norms & provision given by the RBI and Banking Regulation Act 1949. The ICAI has a
provision and norms in the guidance note of bank audit for the auditor. So that it should be universally acceptable by all ba
of statutory audit but not to other types of audit. LFAR, Ghosh & Jilani Committ
Planning tool. Thus an auditor must complete & submit main audit report as well as above reports simultaneously. These are no
statutory report but actually a management report. These reports are vast areas and are to be done along with the normal course of Bank Audit. Lastly
say that the good quality audit serving as the backbone of the strong banking system. It is only to be possible by the audi
Banking Industry, Risk Assessment and Internal Control, Items of Bank’s Financial Statements and Auditing Aspects, Long Form
Aspects.
REFERENCES 1. Accounting What The Numbers Mean, (Marshall, McManus, Viele 2008), Mc Graw Hill
2. Audit Committee Reports Before and After Sarbanes
3. Auditing & Assurance Services: A systematic approach. Messier, W and C. Emby. McGraw
4. Auditing Standard No. 16: Communications with Audit Committees
5. Banking Law and Practice by P N Varshney, Sultan Chand & Sons, New Delhi.
6. Enhancing transparency of the audit committee auditor oversight process
7. “Fundamental Analysis: The Auditor's Report" by I
8. Hoffelder K. (2012). New Audit Standard Encourages More Talking
9. Indian Banker, June 2007 Vol II No6 Indian Banks‟ Association Mumbai
10. Indian Banking 2010 Special issue 2004, vol 26 No I, IBA bulletin, IBA Mumbai
11. PPC's Guide to Auditor's Reports, Thomson Publishing Group, Vol. 1, Chapter 6:Uncertainties, Section 606: Going Concern Probl
12. Section 204 -- Auditor Reports to Audit Committees
13. Statement on Auditing Standards No. 59: The Auditor's Consideration of an Entity's Ability to Continue as a Going Concern, is
Standards Board
14. The Going-Concern Assumption Revisited: Assessing a Company's Future Viability
January 16, 2007
15. “Understanding the Auditor's Report" by CRF Online.org
16. “Using Disclaimers in Audit Reports: Discerning Between Shades of Opinion"
WEBSITE 17. http://www.aicpa.org/Research/Standards/AuditAttest/DownloadableDocuments/AU
0
20
40
60
ECEMBER)
INTERNATIONAL JOURNAL OF RESEARCH IN COMMERCE, ECONOMICS Refereed/Juried) Open Access International e-Journal - Included in the International Serial Directories
http://ijrcm.org.in/
FIG. 4
The 100% responses obtain from the respondent regarding the mode of answering of all questions as per guidance of ICAI and al
response received on each questions. Out of which 100% are agreeing with it. The total agreeing against each
response is 50%. It is generalized that ICAI issued the guidance note for auditing practices of banks and also for filling the LFAR for banks and b
financial year. They also update it as per relevant statutory requirement. Finally the last hypothesis is also accepted.
It is concluded that LFAR is one of the important audit reports or techniques for measuring the lacunae, shortcoming and failure the system of internal control
adopted by the management of bank. It is prepared by RBI and filled by an auditor during the course of audit. The filling of
tant process of auditing practices in Banks which have to be filled by the auditor during the audit process. There are
various statutory requirement and relevant norms & provision given by the RBI and Banking Regulation Act 1949. The ICAI has a
provision and norms in the guidance note of bank audit for the auditor. So that it should be universally acceptable by all ba
of statutory audit but not to other types of audit. LFAR, Ghosh & Jilani Committee report and Basel Committee report are use as the questionnaire in an Audit
Planning tool. Thus an auditor must complete & submit main audit report as well as above reports simultaneously. These are no
ually a management report. These reports are vast areas and are to be done along with the normal course of Bank Audit. Lastly
say that the good quality audit serving as the backbone of the strong banking system. It is only to be possible by the auditors who have a complete knowledge of
Banking Industry, Risk Assessment and Internal Control, Items of Bank’s Financial Statements and Auditing Aspects, Long Form
McManus, Viele 2008), Mc Graw Hill
Audit Committee Reports Before and After Sarbanes-Oxley: A Study of Companies Listed on the NYSE The CPA Journal.
A systematic approach. Messier, W and C. Emby. McGraw-Hill Ryerson Limited, 2005.
Auditing Standard No. 16: Communications with Audit Committees. PCAOB.
actice by P N Varshney, Sultan Chand & Sons, New Delhi.
Enhancing transparency of the audit committee auditor oversight process. Ernst & Young.
by Investopedia.com
New Audit Standard Encourages More Talking. CFO Magazine.
‟ Association Mumbai
Banking 2010 Special issue 2004, vol 26 No I, IBA bulletin, IBA Mumbai
PPC's Guide to Auditor's Reports, Thomson Publishing Group, Vol. 1, Chapter 6:Uncertainties, Section 606: Going Concern Probl
Auditor Reports to Audit Committees. Securities Lawyer's Deskbook.
Statement on Auditing Standards No. 59: The Auditor's Consideration of an Entity's Ability to Continue as a Going Concern, is
Concern Assumption Revisited: Assessing a Company's Future Viability by Elizabeth K. Venuti, CPA, PhD; The CPA Journal; 2004; retrieved
by CRF Online.org
Using Disclaimers in Audit Reports: Discerning Between Shades of Opinion" by Robert R. Davis, CPA Journal, 2004, retrieved on January 24, 2007
http://www.aicpa.org/Research/Standards/AuditAttest/DownloadableDocuments/AU-C-00705.pdf
11 A,B & C
12 A,B & C12 A,B & CTotal A,B & C
ISSN 2231-4245
MERCE, ECONOMICS & MANAGEMENT Included in the International Serial Directories
29
The 100% responses obtain from the respondent regarding the mode of answering of all questions as per guidance of ICAI and also requirement of additional
response received on each questions. Out of which 100% are agreeing with it. The total agreeing against each
e LFAR for banks and branch during each
shortcoming and failure the system of internal control
adopted by the management of bank. It is prepared by RBI and filled by an auditor during the course of audit. The filling of LFAR, Ghosh/Jilani Committee report
tant process of auditing practices in Banks which have to be filled by the auditor during the audit process. There are
various statutory requirement and relevant norms & provision given by the RBI and Banking Regulation Act 1949. The ICAI has also accommodated such
provision and norms in the guidance note of bank audit for the auditor. So that it should be universally acceptable by all banks. It is only to be applicable in type
ee report and Basel Committee report are use as the questionnaire in an Audit
Planning tool. Thus an auditor must complete & submit main audit report as well as above reports simultaneously. These are not a substitution of the main
ually a management report. These reports are vast areas and are to be done along with the normal course of Bank Audit. Lastly we can
tors who have a complete knowledge of
Banking Industry, Risk Assessment and Internal Control, Items of Bank’s Financial Statements and Auditing Aspects, Long Form Audit Reports and Special
The CPA Journal.
Hill Ryerson Limited, 2005.
PPC's Guide to Auditor's Reports, Thomson Publishing Group, Vol. 1, Chapter 6:Uncertainties, Section 606: Going Concern Problems
Statement on Auditing Standards No. 59: The Auditor's Consideration of an Entity's Ability to Continue as a Going Concern, issued by the Auditing
by Elizabeth K. Venuti, CPA, PhD; The CPA Journal; 2004; retrieved
, 2004, retrieved on January 24, 2007
11 A,B & C
12 A,B & C
12 A,B & C
Total A,B & C
VOLUME NO. 3 (2013), ISSUE NO. 12 (DECEMBER) ISSN 2231-4245
INTERNATIONAL JOURNAL OF RESEARCH IN COMMERCE, ECONOMICS & MANAGEMENT A Monthly Double-Blind Peer Reviewed (Refereed/Juried) Open Access International e-Journal - Included in the International Serial Directories
http://ijrcm.org.in/
30
DEVELOPMENT OF SELF HELP GROUPS IN TAMIL NADU
J. PAVITHRA
RESEARCH SCHOLAR
DEPARTMENT OF MANAGEMENT STUDIES
BHARATH UNIVERSITY
CHENNAI
DR. M GANESAN
PROFESSOR
DEPARTMENT OF MANAGEMENT STUDIES
BHARATH UNIVERSITY
CHENNAI
ABSTRACT
Microfinance in India has shown a major impact on the economically backward classes especially below the poverty line. In continuation to the great
achievement by the Nobel Prize winner, Mohammad Yunus India has also shown a keen interest in lighting the lives of the poor. Now, in India we can clearly
visualize the growth of microfinance institutions. Many banks are also giving different type of attractive loan schemes to the rural poor. The self help group model
which became popular in India gathered a huge response. The initiatives of NGO make it much more interesting to know about the functioning of the groups. The
self help group is now functioning in many states and the initiatives of Tamil Nadu is tremendous. The development of self help groups in Tamil Nadu gives an
idea about the initiatives of rural empowerment especially for the women through the projects initiated by the Government. The initiatives of the government are
really to be appreciated and recognized. The impact of self help groups in many districts by NGOS which provides an employment to enable then run their day to
day life. The SHG model and the efforts by the Tamil Nadu Government have removed the shadows of many lives to meet their family needs. All the efforts of the
government, NGOs, Banks have not gone in vain but have emerged as a successful one.
KEYWORDS Self help groupts, microfinance.
1. INTRODUCTION he back bone of our country is agriculture remains the same even now and the most inevitable poverty still needs to be eradicated. The main aim of
Millennium Development Goal is to eradicate poverty and to provide the basic needs. Especially the weaker section of the society, women in the yester
years were being neglected and are restricted only to their household chores and running their families. Today, we are proud to know that women are
entrepreneurs, and successful in many fields and the Women’s Reservation Bill being passed by the Government recently. Still it is a sad thing that many villages
in our country are striving for their day to day life and toil to make both ends meet.
The initiative taken by Mohammad Yunus, Founder of Grameen Bank and the receiver of the Nobel Prize paved the way to encourage women to start up their
small business and to fetch their income in order to run their families. He constructed the Self Help Group Model which made the women uplift their families.
This Self Help Group programme came into India through the inspiration given by the Nobel Prize Winner to uplift our country. Many NGOs came forward to
support the villages and to encourage them. The banks such as NABARD and other financial institutions took a big initiative to encourage the women and bring
self help group model a successful one in India.
This Self Help Group exists in every nook and corner of India, especially in Tamil Nadu which has gained utmost attraction and popularity as an inspiration for the
other states for encouraging women to start up small scale business by providing some financial facilities and making them to live a peaceful life and earn an
income for their family.
1.1 MEANING OF SELF HELP GROUP A self help group is a small homogenous group of rural/urban voluntarily formed to save and mutually agreed to contribute to a common fund to be lent to its
members as per group decisions. Here the women are formed into small groups. The group helps in a coordination with their peers. The groups meet regularly
for updation of information. Attendance becomes very important and in this stage the amount of savings is decided. Every member is expected to contribute
their ideas. The initial sum is contributed by an NGO or funding agency or Government, to which they have the access to money. Businesses may be started
based on the loan availed.
1.2 DEFINITION OF SELF HELP GROUPS According to The International Network for Mutual Help Centres defines Self Help Group (SHG) as “Self help or mutual support is a process wherein people
who share common experiences, situations or problems can offer each other a unique perspective that is not available from those who have not shared these
experiences. Self Help groups are run by and for group members.
1.3 OBJECTIVES OF SELF HELP GROUPS 1. To motivate women those below poverty line.
2. To make women equal to men.
3. To uplift self confidence among the women.
4. To bring out the potential in women.
5. To stop treating women as slaves.
6. To encourage unity among women.
7. To abolish dowry.
8. To enhance community harmony.
9. To educate women.
10. To give importance to differently abled persons.
11. To follow the small family norms.
12. To encourage women to take up village level administration.
13. To take part in political processes.
14. To voluntarily save from their income and expenditure.
15. To take small loans without having to pledge jewels for money.
16. To pay the school fees of children and meet emergency medical expenses.
17. To understand economic, political situations.
18. To devise schemes to meet the basic needs of the village or women themselves.
T
VOLUME NO. 3 (2013), ISSUE NO. 12 (DECEMBER) ISSN 2231-4245
INTERNATIONAL JOURNAL OF RESEARCH IN COMMERCE, ECONOMICS & MANAGEMENT A Monthly Double-Blind Peer Reviewed (Refereed/Juried) Open Access International e-Journal - Included in the International Serial Directories
http://ijrcm.org.in/
31
1.4 WORKING OF SHGs The Self help groups work in democratic way. The maximum number of members in a group is 20. One among them is selected as animator and 2 more
members are selected as representatives. The animator is selected for 2 years. The meeting of the group takes place every week. The group discusses about
their savings, rotation of the funds, repayment of loan and social and community action programmes.
1.5 PROCESS OF SHG FOR OBTAINING LOAN Stage 1: The group members make regular savings contribution. This contribution is maintained by the head or deposited in to the bank
Stage 2: The members start to borrow individually from the formed group on various terms and interest rate decided by the group.
Stage 3: The members open a savings account in the groups name with the bank for funds that are not needed by members and obtain loan from the bank.
Stage 4: Now the bank gives loan to the group and then used by the group to supplement its own funds for lending to its members.
Stage 5: These groups are formed from different faiths and communities
Stage 6: Politics is not allowed to be discussed at their meetings. Stage 7: A 12 month small mutual saving plan is initiated which helps the members to prove their ability to save funds and to pay interest.
2. HISTORY OF SELF HELP GROUP 2.1 THE START UP OF SHG The self help group was first originated in 1985 by Mysore Resettlement and Development Agency (MYRADA), which is now the official name is the largest Non
Governmental Organization with 487 staffs working directly with 1.5 million poor people. This NGO has initiated a microfinance institution named
Sanghamithra.. This organization was doing the revival of credit system. When a group of 15 to 20 members were given a task of reminding the groups of
repaying loan, were the groups have taken loan from the cooperatives. . The cooperative offered it to return to MYRADA, but MYRADA received no cooperation
from the groups. Then the MYRADA staff realized the need for training given to groups for conducting their meetings and repaying loans in a proper way. After
the training, the members were together as a team.
This encouraged the banks such as NABARD, RBI and Government to take an imitative for the self help groups.
2.2 THE UPLIFT OF SHGs (1987 TO 1992) In this period NABARD started supporting the NGOs initiatives for the upliftment of self help groups. In 1987, the NABARD initiated funds into the SHG/SAG
movement with MYRADA which submitted a proposal in 1986. In 1987 NABARD provided MYRADA a grant of 1 million in order to identify the affinity groups and
match their saving period of 3-6 months. This grant is based on the initiatives take up by MYRADA in promoting SHGs since 1985 As a result in 1989 NABARD
launched an action project in which similar grants were provided to other NGOs.
In 1990 RBI also encouraged this SHG strategy as an alternative credit model. In 1992, NABARD issued guidelines which would help as a framework for the SHG
model. This would allow banks to lend loans directly to the SHGs. After this, the Self Help – Bank Linkage Programme was launched in 1992. Even though RBI did
not draw any structured guidelines for the self help groups, it gave a helping hand for extending credit to the groups with some modifications.
2.3 SELF HELP – BANK LINKAGE PROGRAMME (FROM 1992) This programme was started in 1992 in order to link 500 Self help groups. Since a great start up was given by NABARD, it was a very easy way to link the banks
and these groups. At first, this programme was little bit slow but steadily picked up in 1999. This programme received enormous support from RBI, the Central
Government, and the State Government – notably Tamil Nadu, Andhra Pradesh, Maharashtra and Karnataka, and many NGOs have been supporting the SHGs.
2.4 GUIDELINES OF RBI TO THE BANK REGARDING SELF HELP GROUPS The Reserve Bank of India planned to study the functioning of SHGs and NGOs for expanding their activities and deepening the role in their rural sector. In
November 1994, the RBI constituted a working group comprising eminent NGO functionalities , academicians, consultants and bankers under the Chairmanship
of Shri SK kalia, the then managing director of NABARD . In April 1996, the group gave the following recommendations:
1. SHG AS A NORMAL LENDING ACTIVITY It should be treated as normal business activity of banks. The banks may consider lending to the group as a part of credit operations both at policy and
implementation level.
2. SEPARATE SEGMENT UNDER PRIORITY SECTOR In order to enable the banks to report their SHGs lending without difficulty it was decided that the bank should report their lending to SHGs to NGOs or lending
to SHG/member of SHGs/discrete individuals or small groups which are in the process of forming into SHGs under the new segment. It should be included by the
banks as the part of their lending to the weaker sections.
3. INCLUSION IN SERVICE AREA APPROACH Banks shall identify the potential branches for linkage and provide necessary support to the branches and include SHG lending within their Service Area Plan.
This Service Area Plan may fix their own programme of lending to SHGs. For receiving this benefit the SHGs would be indicated on a block wise basis in the
“Background Paper for Service Area Credit Plans”. The service area branch managers may be in constant support with the SHGs and NGOs for effecting the
linkage.
4. OPENING OF SAVINGS BANK ACCOUNT The SHG either registered or unregistered which are engaged in promoting savings habits among their members would be eligible to open savings bank account
with banks,
5. MARGIN AND SECURITY NORMS SHGS are sanctioned savings linked loans by the bank. RBI has advised banks to have flexibility with regard to margin security norms etc.
6. DOCUMENTATION The banks may have a simple documentation procedure for lending to SHGs. 7. PRESENCE OF DEFAULTERS IN SHGs The defaulters for financing the SHGs should come in an ordinary way. The SHG should not utilize bank as a defaulter.
8. TRAINING This is the most important thing as to train the field officers and effective controlling of other senior officials of the bank. The banks should organize a short term
training programmes for the field level functions.
9. MONITORING AND REVIEW OF SHG LENDING The progress of the bank should be reviewed at regular intervals. A progress report may be sent to NABARD and should reach within 30days of the half year.
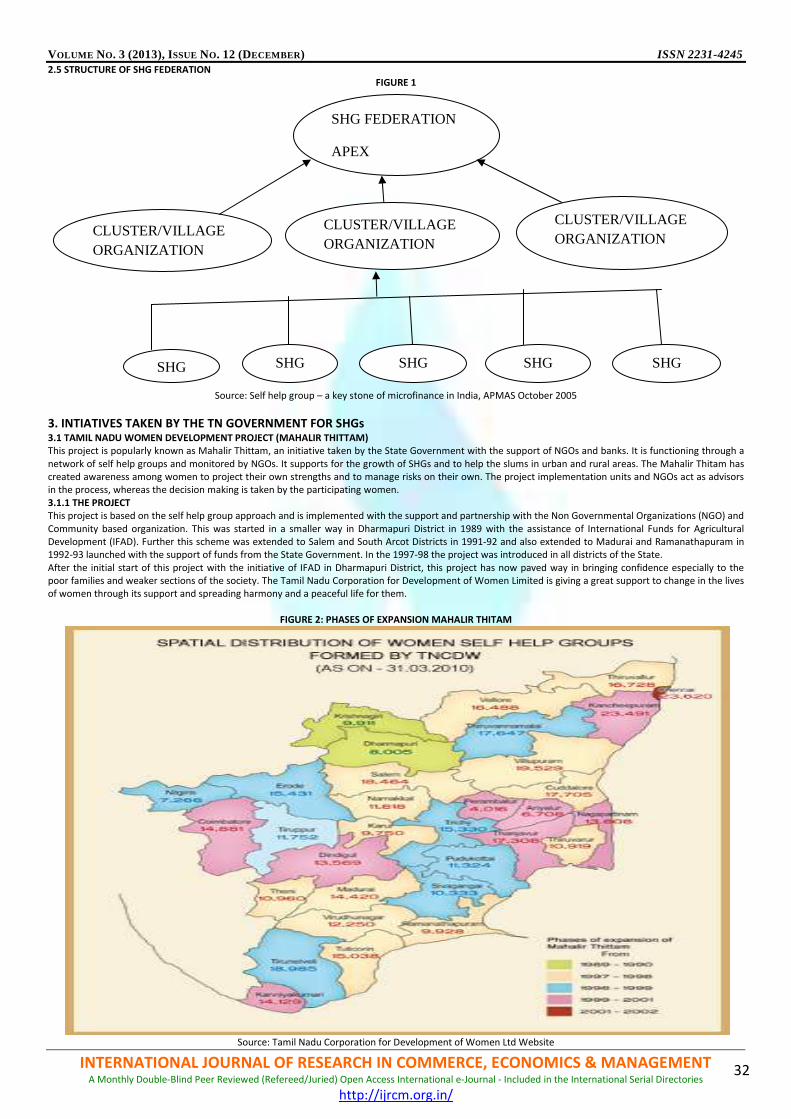
VOLUME NO. 3 (2013), ISSUE NO. 12 (DECEMBER) ISSN 2231-4245
INTERNATIONAL JOURNAL OF RESEARCH IN COMMERCE, ECONOMICS & MANAGEMENT A Monthly Double-Blind Peer Reviewed (Refereed/Juried) Open Access International e-Journal - Included in the International Serial Directories
http://ijrcm.org.in/
32
2.5 STRUCTURE OF SHG FEDERATION FIGURE 1
Source: Self help group – a key stone of microfinance in India, APMAS October 2005
3. INTIATIVES TAKEN BY THE TN GOVERNMENT FOR SHGs 3.1 TAMIL NADU WOMEN DEVELOPMENT PROJECT (MAHALIR THITTAM)
This project is popularly known as Mahalir Thittam, an initiative taken by the State Government with the support of NGOs and banks. It is functioning through a
network of self help groups and monitored by NGOs. It supports for the growth of SHGs and to help the slums in urban and rural areas. The Mahalir Thitam has
created awareness among women to project their own strengths and to manage risks on their own. The project implementation units and NGOs act as advisors
in the process, whereas the decision making is taken by the participating women.
3.1.1 THE PROJECT This project is based on the self help group approach and is implemented with the support and partnership with the Non Governmental Organizations (NGO) and
Community based organization. This was started in a smaller way in Dharmapuri District in 1989 with the assistance of International Funds for Agricultural
Development (IFAD). Further this scheme was extended to Salem and South Arcot Districts in 1991-92 and also extended to Madurai and Ramanathapuram in
1992-93 launched with the support of funds from the State Government. In the 1997-98 the project was introduced in all districts of the State.
After the initial start of this project with the initiative of IFAD in Dharmapuri District, this project has now paved way in bringing confidence especially to the
poor families and weaker sections of the society. The Tamil Nadu Corporation for Development of Women Limited is giving a great support to change in the lives
of women through its support and spreading harmony and a peaceful life for them.
FIGURE 2: PHASES OF EXPANSION MAHALIR THITAM
Source: Tamil Nadu Corporation for Development of Women Ltd Website
SHG FEDERATION
APEX
CLUSTER/VILLAGE ORGANIZATION
CLUSTER/VILLAGE ORGANIZATION
CLUSTER/VILLAGE ORGANIZATION
SHG SHG SHG SHG SHG

VOLUME NO. 3 (2013), ISSUE NO. 12 (DECEMBER) ISSN 2231-4245
INTERNATIONAL JOURNAL OF RESEARCH IN COMMERCE, ECONOMICS & MANAGEMENT A Monthly Double-Blind Peer Reviewed (Refereed/Juried) Open Access International e-Journal - Included in the International Serial Directories
http://ijrcm.org.in/
33
3.1.2 MAHALIR THITAM SELF HELP GROUPS The group consist of 12 to 20 women of the same socio economic background who join voluntarily and work together for their own upliftment. The women
members are in the age group between 18 to 60 years residing in the same area. NGOs and PLFs affiliated with the TNCDW undertake the activity of forming the
groups. They are trained to be a team of one and are helped to maintain regular savings. Training for a period of 6 months is being imparted to the group
members. After the training period the groups are rated for their credit linkage by a committee.
The rating Committee consisting of banks, NGOs, and Block level officer. The eligible groups are being given credit by the banks, TAHDCO, NABARD for providing
fund and economic activity. Various skill training programmes are conducted to help them to undertake self employment. The TNCDW takes continuous effort in
marketing the products of the groups for local sale and also to show case in exhibitions.
To encourage more women who are below the poverty line, the group formation is also being taken with a special focus, urban slum dwellers, and also by the
village panchayats.
3.1.3 IMPACT OF MAHALIR THITAM FIGURE 3: THE SUCCESS OF WOMEN IN MAHALIR THITAM
Source: Tamil Nadu Corporation for Development of Women Ltd, Website
The effort taken by the Tamil Nadu Government has brightened many poor women lives and of those who live below the poverty line as detailed below:-
1. This has improved the level of confidence and communication among the members
2. The awareness about various schemes given by the Government and the participation to these schemes has also increased.
3. The economic status of the women has increased leading to various activities.
4. These women have broken and crossed the caste and religious obstacles.
5. There is a high level of participation in Grama Sabha and Panchayati Raj Institutions.
6. More than 6800 members have won the Local Body Elections in 2006.
7. Easy access to bank loans as there is a high increase of SHGs
8. Lending problems have been solved to a large extent.
TABLE 1: THE DETAILS OF SHGS AS ON 31.3.2010
PARTICULARS DETAILS
No of SHGS 4,41,311
No of SHG Members 69.91 Lakhs
No of Rural SHGs 3,02,092
No of Members in Rural SHGs 48,33,472
No of Members in Urban SHGs 1,39,219
No of Members in Urban SHGs 21,57,894
Total Savings Rs. 2558 Crores
No of SHGs Linked 402,046
Total Credit Rs 8,129.61 Crores
Source: Tamil Nadu Corporation for Development of Women Website
3.2 TAMIL NADU ADI DRAVIDAR HOUSING AND DEVELOPMENT CORPORATION (TAHDCO): TAHDCO has developed financial support to the self help groups for employment and to empower them by taking up various economic activities such as
purchasing land for cultivation, coir making, agro processing units, restaurants/provision stores, transport activities such as mini buses, share autos, Power loom,
leather good, brick lines., tea cultivation, flowers, vegetable cultivation, floriculture etc. The corporation is helping the scheduled castes and scheduled tribes by
conducting ‘Entrepreneurship Development Programmes’ for a period of 7 days for the SC/ST Women in association with TAHDCO.
3.2.1 TRAINING PROGRAMMES FOR SC/ST WOMEN
TABLE 2: TRAINING PROGRAMMES CONDUCTED BY TAHDCO
SNO PROGRAMME TRAINING PERIOD ELIGIBLITY WHOM TO BE APPROACHED
1 Training for setting up self employment projects – Individuals 6 months to 1 year SC/ST District Manager, TAHDCO
2 Entreprenurship Development Programme Training – Self Help Groups 7 days SC/ST GROUPS District Manager, TAHDCO
Source: Tamil Nadu Adi Dravidar Housing and Development Corporation Website
3.2.2 FINANCIAL SUPPORT FROM TAHDCO The financial help may be provided if the group has been recognized by TNCDW under Mahalir Thitam. A sum of Rs 25000/- will be give to each group Rs
10,000/- as a subsidy and remaining 15000 as loan from the bank. The District Collectors are allocated with this fund to help the SC/ST in the district to those
who are beyond the reach of regular schemes to start up a small income programme with 100% subsidy subject to a maximum of 10,000/-
3.2.3 SCHEMES OFFERED BY TAHDCO The TAHDCO acts an agency in the implementation of the National Scheme of the Ministry of Social Justice and Empowerment, Government of India. The
schemes are:
� National Scheduled Caste Finance and Development Corporation Scheme (NSFDC)

VOLUME NO. 3 (2013), ISSUE NO. 12 (DECEMBER) ISSN 2231-4245
INTERNATIONAL JOURNAL OF RESEARCH IN COMMERCE, ECONOMICS & MANAGEMENT A Monthly Double-Blind Peer Reviewed (Refereed/Juried) Open Access International e-Journal - Included in the International Serial Directories
http://ijrcm.org.in/
34
� National Scheduled Tribes Finance and Development Corporation Scheme (NSTFDC)
� National Safai Karamacharis Finance and Development Corporation (NSKFD
� National Scheme for Liberation and Rehabilitation of Scavengers and Dependents (NSLRS) Scheme.
3.3 INITIATIVES BY THE FOREST DEPARTMENT, TAMIL NADU The forest department in Tamil Nadu has also initiated the women empowerment through self help groups. It has formed a Village Forest Council in each
village,. They are registered under the Societies Registration Act. 1975. The villages are represented by one male member and one female member. A committee
of around 5 to 15 members are elected by VFC.
This department will form groups in villages and follow guidelines given by the Tamil Nadu Cooperation for Development of Women for forming and the working
of groups. Each member of group will be allotted a sum of Rs 5000/- The department provides basic facilities such as construction of office buildings, staff
quarters and rest houses. It also provides wireless communication network, purchase of computers to improve information exchange, purchase of vehicles and
equipment to improve operational efficiency.
4. INTITATIVES TAKEN BY NGOS IN DISTRICTS OF TAMILNADU 4.1 A SELF HELP GROUP INITIATIVE ON LEASE OF STONE QUARRIES AT PUDUKOTTAI DISTRICT The lease of stone quarries taken up by the 50 self help groups has assured a steady income to 1000 women in Pudukottai District. A group consisting of 20
members take the lease of the stone quarries for 5 years period by depositing the lease amount from their savings. The quarries are located at Annavasal,
Viralimalai, Kunnadarkoil, Tirumayam, Ponnamaravathy blocks.
These women have plenty of experience in stone quarries for decades. They say that the private persons paid low wages to them. .One of the animator of self
help groups took 22 cents of stone quarries at Nattam Pannai Village near the town after depositing the lease amount of Rs 73000 for a period of 5 years..
The Pudukottai Cooperative Bank also help them by sanctioning loan for Rs 1.57 lakhs and also the Tamil Nadu Adi Dravidar Housing and Development
Corporation also gave an equal amount towards subsidy. They also ensured some tie ups for the road repair works. The District Society and Marketing Services
provided a Tipper Lorry for the transport of stone gravel from the quarry to the site.
On earning profit, the group starts repaying the loan. The profit is shared among the members.
FIGURE 4: PICTURE SHOWING THE SHG AT THE QUARRY SITE
Source: The Hindu, September 4 2006
4.2 INITIATIVES OF IVDP IN DHARMAPURI AND KRISHNAGIRI DISTRICT The Home International an NGO and Integrated Women Development Project started in 1987 have made a tie up to arrange funding and guarantee to
encourage the banks to lend to the poor families to develop their houses in Tamil Nadu rural and urban areas of Tamil Nadu. The IVDP was found in 1979. The
main of this project is to provide cost effective long term solutions to inadequate housing, water supply and Sanitation in Krishnagiri and Dharmapuri District. It
is built around mobilizing the self help groups.
In 2007, IVDP has helped 1,10,000 women to form about 5820 self help groups, enabling them to save more than 920 million rupees.
4.3 INITIATIVES IN SIVAGANGAI DISTRICT The women empowerment and nature development trust with WENDT, an NGO has initiated 25 women from 4 village self help groups in Sivagangai District. The
women will be trained in inter crops, organic manure and herbal pesticides. They will receive a sum of $170 for seeds, seedlings, and 6 sheep. They will grow a
variety of vegetables, grains, beans and ground nuts. Sheep manure will be used to assist with natural fertilization of the crops. Loan will be repaid at 10% per
year. Total income per year will be $630.
4.4 INITIATIVES BY SERVICE HOME FOR ACCELERATION FOR RURAL ECONOMY IN DINDUGAL DISTRICT SHARE a microfinance institution has participated in a workshop organized by this NGO. A training programme was conducted to the SHGs such as skill
programs, child health, HIV/AIDS, This project will be completed by December 31st 2010.
TABLE 3: DETAILS OF THE PROJECT TAKEN UP BY SELF HELP GROUPS
PROJECT NUMBER LOAN INCOME EXPENSE LOAN PAYMENT NET INCOME
Grinding Mill (group project) 5 $ 210 $ 850 $210 $ 105 $530 ($ 105 per women)
Grain Sales 6 $ 170 $255 $ 150 $ 15 $ 90
Petty Shop 2 $ 170 $ 255 $ 150 $ 15 $ 90
Sheep 6 $ 210 $ 850 $ 20 $ 235 $ 595/ year/$ 50/month
Source: Right Sharing of sources Website
4.5 INITIATIVES OF BHASAM TRUST IN SALEM DISTRICT This project is carried out by 25 women in Salem District in a 3 year project. The women will lease ½ acre of land. Training will be provided for doing cultivation,
harvestation, vermin-compost production, land reclamation, watering, manuring, pest control, and intercropping. This Project will be completed by June 30
2011.
VOLUME NO. 3 (2013), ISSUE NO. 12 (DECEMBER) ISSN 2231-4245
INTERNATIONAL JOURNAL OF RESEARCH IN COMMERCE, ECONOMICS & MANAGEMENT A Monthly Double-Blind Peer Reviewed (Refereed/Juried) Open Access International e-Journal - Included in the International Serial Directories
http://ijrcm.org.in/
35
4.6 INITIATIVES BY HOSUR DEVELOPMENT FOUNDATION IN KRISHNAGIRI DISTRICT
The foundation is giving training to the self help groups in Krishnagiri in saree designing. This has been initiated by the Tamil Nadu Government and also the
State Government in association with an NGO. The designing of saris is been taken by a group of 140 women. The monthly earning is Rs 20000. Their State and
Central Government have sanctioned some subsidies.
4.7 INITIATIVE BY GRAMALAYA IN TIRICHURAPALLI This is an initiative was developed by Gramalaya, An NGO established in 1987. This NGO was formed by group of youngsters. This NGO has initiated the idea of
having separate latrines in slum areas in consultation with the slum self help groups. This was named as The Child Friendly Toilets (CFT) especially constructed
for the children in the slum areas. This is being constructed under the Water Aid Urban Slum Health and Sanitation Improvement Programme in Tiruchy. This
toilet is free of cost for the children and has been constructed for educating cleanliness and hygiene to the children. A water tub and soap is kept in the toilet
and the care taker teaches the children the importance of hand washing and hygiene behaviour.
Sanitation and Hygiene Education (SHE) formed by women self help group look after the maintainence of the community toilets constructed under the Water
Aid Gramalaya Projects in their slums. Users pay 50 paise to allow them to use toilet. The women self help groups collect these money and keep an account of
them. The money is deposited into the bank every week. This team pays a watchman of Rs 1200 per month. The money is again rotated after spending for
cleaning material.
4.8 INITIATIVE OF ORGANIZATION OF DEVELOPMENT ACTION AND MAINTENANCE IN RAMANAD DISTRICT Organisation of Development, Action and Maintenance, an NGO It was established in 1995 under the Tamil Nadu Societies Registration Act of 1975. This
organization works across 278 villages. It has 900 self help groups with a total membership of 14000 women. The group consist of daily labourers such as
agricultural coolies, construction workers, match unit workers, charcoal workers and cotton spinning mill.
4.9 INITIATIVE OF IWDI IN CHENNAI AND THIRUVALLUR DISTRICT The IWDI is an approved NGO under the Mahalir Thitam Project. It has formed 1020 SHGs in Gummudipoondi, 1010 SHGs in Chennai and 25 SHGs in Cuddalore.
This NGO is arranging the women for micro credit loan, giving training for maintaining proper records and accounts. It is useful for the women to develop some
small businesses.
TABLE 4: ACHEIVEMENT OF IWDI IN MAHALIR THITAM
TARGET AREA GUMMUDIPOONDI CHENNAI CUDDALORE
SHG FORMATION 15300 WOMEN 15150 WOMEN 375 WOMEN
SHG TRAINING 15300 WOMEN 15150 WOMEN 375 WOMEN
A & R TRAINING 2040 WOMEN 2020 WOMEN 50 WOMEN
LOAN AMOUNT RS 3,77,55,000 RS 3,53,25,000 RS 12,50,000
SUBSIDY RS 70,00,000 RS 70,00,000 RS 2,50,000
INTEREST LOAN RS 7,58,76,614 RS 7,30,21,670 RS 8,25,000
Source: IWDI Website
5. LATEST NEW SCHEMES INTRODUCED BY GOVERNMENT AND NGOS The main objective of the society is to maintain a standard of living conditions of the poor people in education, health, social and environmental areas to bring
economic support programmes for women through SHG’s training for generation of income, disaster preparation, HIV prevention and so on. This society
receives loan from government financial institutions such as Rashtriya Makila Kosh and nationalized banks with a lower rate of interest and lends to SHGS
subject to a maximum limit fixed by the government.
The surplus interest is used in conducting training programmes to make further advances to SHGs. Micro credit can be accepted as an object of general public
utility.
5.1 ASSISTANCE OF SELF HELP GROUPS FOR YOUTH The Tamil Nadu Corporation for Women Development has provided skill training programmes for the unemployed youths in Tamil Nadu. This training was
conducted to over 20696 youths through reputed industries such as MRF, NOKIA, Saint Gobain etc to provide employment opportunities to the youth. The
government has provided revolving fund subsidy of Rs 10,000/- each for the youth self help groups.
5.2 MANIMEGALAI AWARDS
The government has started to encourage self help groups by awarding the groups and Panchayat Level Federations for their excellent performance and working
of the groups. This award is given for both State and District level SHGs.
5.3 WORLD BANK AIDED VAZHUNDU KATTUVOM PROJECT The World Bank has given financial support to Tamil Nadu Government to reduce rural poverty through the support of Community Driven Development (CDD)
approach. The main objective is to empower the poorest and develop and strengthen their livelihood, improving capacity building. The total investment for the
project is Rs 717 Crores and implemented to 2480 panchayats of 70 blocks covering 15 districts. This project addresses the SC/STs and other weaker and
vulnerable sections of the society.
5.4 SUPPLY OF SEWING MACHINES Sewing machines are supplied at free of cost to widows, destitute women, deserted wives, physically handicapped men and women below poverty line to
increase their self employment opportunities and for the betterment of their livelihood. This scheme will continue in 2009-10 with Rs 160.15 lakh.
5.5 MARRIAGE ASSISTANCE SCHEME This scheme was introduced in 1989 to help poor people to settle their daughter/sons marriage. In 2008-09, financial assistance of Rs 20,000/- per beneficiary
for girls above 18 years and approximately 90,000 poor families have been benefited under this scheme. In 2009-10 , a sum of Rs 25 lakhs is proposed and 166
widows are to get benefit under widow re marriage scheme 5.6 FAMILY COUNSELLING CENTRES These centres are run by NGOs in Tamil Nadu. Social Welfare Board. They provide counselling to maintain harmony and peace among the family members. An
amount of Rs 6.60 lakhs is proposed for the year 2009-10. 5.7 WELFARE FOR DIFFERENTLY ABLED PERSONS The Tamil Nadu Government has announced various policies for differently abled persons who have exceptional and extraordinary talents inspite of their
handicaps. A special recruitment drive was recently launched for filling up the vacancies for differently abled persons. Tamil Nadu is the first state to design and
implement schemes for the persons with mental retardation. There is a special allotment in state budget for differently absled persons. In the year 2010-11, the
government has allotted Rs 176 Crores in the current budget. It is clearly evident that industries provide an ample of opportunities to differently abled persons
such Aachi Masala and Sakthi Masala who has given plenty of opportunities to the differently abled persons based on their skills. The schemes introduced by
government for differently abled persons for the current year are as follows:

VOLUME NO. 3 (2013), ISSUE NO. 12 (DECEMBER) ISSN 2231-4245
INTERNATIONAL JOURNAL OF RESEARCH IN COMMERCE, ECONOMICS & MANAGEMENT A Monthly Double-Blind Peer Reviewed (Refereed/Juried) Open Access International e-Journal - Included in the International Serial Directories
http://ijrcm.org.in/
36
TABLE 5: LIST OF SCHEMES FOR DIFFERENTLY ABLED PERSONS
SNO NAME OF THE SCHEME BUDGET 2010 -
11 (In lakhs)
1 Death
630.30
2 Total irrecoverable Loss of Limbs
3 Loss of actual physical separation or total and
irrecoverable loss of one hand or one foot or total and irrecoverable loss of sight in one eye
4 Assistance on the natural death of a differently abled person
5 Assistance for delivery or the miscarriage of
pregnancy or the termination of pregnancy to a differently abled female members
6 Leather Knee Pad and Hand glouse
7 Fabricated Bunk stalls Working capital for Bunk stalls
8 Battery Operated Motorised Tricycle (Electric Scooter)
9 Motorised Tricycles (Petrol driven/Scooter)
10 Maintainenc Allowance to muscular Dystrophy Affected Persons. 630.10
11 Maintenance allowance to mentally retarted persons 3189.89
12 Unemployment Allowance to all categories of differently abled persons(graduates/post graduates/12th
/10th
) 156.30
13 Marriage to assistance (visually impaired/one arm one leg/hearing speech impaired 98.00
14 Assistance to differently abled law graduates 0.60
15 Free travel concession 308.21
16 Scholarships 261.00
17 Training programmes 28.97
18 Vocational Programmes 38.98
19 Programme for rehabilitation of differently abled programme 150.36
20 Supply of tricycles, wheel chairs, goggles, folding sticks, Braille watches, hearing aids, solar rechargeable batteries, callipers, crutchers,
artificial limbs,
75.00
21 Supply of motorised tricycles 50.00
22 Supply of modular artificial limbs 25.20
23 Supply of sewing machines 53.35
24 Cash Prize to top rankers in differently abled 29.44
25 Readers allowance 19.00
26 Scribe assistance 5.54
27 Homes for mental retardation 77.74
28 Day care centres for mentally challenged 9.40
29 State Awards 100.00
30 Government Homes 81.32
Source: Welfare of Differntly abled Persons, A policy Note.
5.8 LINK WORK SCHEME BY TAMIL NADU STATE AIDS CONTROL SOCIETY The link work scheme is a new concept to link the middle level health care workers are trained to play an important role for defence against HIV AIDS. The links
plays an important role in bridging a gap between the patient and doctor to build a community centred HIV model. This model has to aim of eliminating the
discrimination of HIV people in rural areas. This scheme creates a harmony among people who are living with HIV AIDS along with the collobaration of Village
Health Committees (VHC), Self Help Groups (SHG), Panchayathi Raj Institutions (PRI).In 2010, it focuses on capacity building of link work scheme, mid media
campaign in districts. State Level Initiatives such as HIV treatments, strengthen monitoring and evaluation.
5.9 SARVA SIKSHA ABHIYAN (SSA) (EDUCATION FOR ALL) It is an attempt to improve capabilities of all children through quality education. The aim of this is to provide elementary education to all children in the age of 6
to 14 by 2010 and to bridge social regional and general gaps, with the active participation of the community in the management of schools.
5.9.1 OBJECTIVES OF SSA
• All children in school, Education Guarentee Centre, Alternate School camp.
• Bridge all gender and community gaps.
• Universal retention by 2010.
• Focus on elementary education of satisfactory quality with emphasis on education for life.
5.9.2 FRAMEWORK OF SSA This project was worked out with the District Annual Work Plan. This project has adopted a bottom up approach to analyze the problems issues to address it in a
proper manner.
The State Core Planning Team takes care of planning for urban areas. This team consist of Directorate of School Education, Director of Elementary Education,
Director of Teacher Education Research and Training, Joint Director and Finance and Accounts officer SSA, Consultants of Finance and Statistics, Representatives
from Chennai Corporation, Adi Dravida and Tribal Welfare Dept, Social Welfare Dept, Physically Handicapped and Rehabilitation Dept, Rural Development Dept,
Backward Class Dept, Chief Engineer (Buildings) of the Directorate of Technical Education. The District core planning team functions under the Chairmanship of
District Collector. The team consist of District Programme Coordinator, Chief Educational Officer, Assistant Programme Officer, Statistical Officer, Principal,
Representatives from Health, Public and Social Welfare Dept.
The block level consist of Panchayat Union Chairman, Block Resource Centre Supervisor, Block Development Officer, Block Resource Teacher Educators, Assistant
Elementary Officers, 2 Headmasters. The School Habitation level core planning team comprises of Headmaster, President/Warden Member, Teachers, Parents,
and Women Self Help Group Members.
TABLE 6: SHARING PATTERN BETWEEN GOVERNMENT OF TAMIL NADU AND GOVERNMENT OF INDIA FOR SSA PROJECT
SNO FIVE YEAR PLAN PLAN PERIOD SHARING PATTERN GOI:GOTN
1
11th
Five Year Plan
2007-08 & 2008-09 65 : 55
2 2009-10 60:40
3 2010-11 55:45
4 2011-12 50:50
Source: www.ssa.tn.nic.in
5.9.3 NEW INITIATIVES AND PROJECTS � Activity Based Learning System.

VOLUME NO. 3 (2013), ISSUE NO. 12 (DECEMBER) ISSN 2231-4245
INTERNATIONAL JOURNAL OF RESEARCH IN COMMERCE, ECONOMICS & MANAGEMENT A Monthly Double-Blind Peer Reviewed (Refereed/Juried) Open Access International e-Journal - Included in the International Serial Directories
http://ijrcm.org.in/
37
� Activity Learning Method.
� Enriching English Language at the primary level.
� Design and development of Simply English.
� SSA.
� Science is fun.
� Development of SLM and Workbooks
� TV/DVD Player for every school.
� Mobile Science Van.
� Reading Cell Development.
� Special Residential Camps.
� Edusat.
5.9.3 PARTNERS IN IMPLEMENTATION
• Department of School Education, Government of Tamil Nadu.
• Directorate of Technical Education Research and Training, Chennai.
• National Informatics Centre, Chennai.
• British Council, India.
• Microsoft, India
• Intel, India.
TABLE 7: LIST OF SCHOOLS BY THE GOVERNMENT AND PRIVATE AIDED AND UNAIDED INSTITUTIONS IN THE YEAR 2009-10
SNO MANAGEMENT PRIMARY ONLY PRIMARY WITH UPPER
PRIMARY
PRIMARY WITH UPPER
PRIMARY/HIGHER SEC SCHOOL
UPPER
PRIMARY ONLY
UPPER PRIMARY &HIGHER
SEC SCHOOL
1 Government 22653 8278 70 14 4323
2 Private Aided 5062 1589 109 36 1628
3 Private Unaided 6104 564 3321 13 386
4 Others 146 38 172 66 10
Source: www.ssa.tn.nic.in
6 CONCLUSION The Self Help Groups in India has gained importance through the bank linkage model in the recent times. Now, there are many institutions who offer a hand to
abolish poverty and bring prosperity in the life of the poor. At present many banks are offering attractive schemes for the rural poor by joining hand with the
NGOs. Especially in Tamil Nadu, we can see a rapid change in the life of the poor women. This is due to the self help group model which has been brought into
India in many states and in Tamil Nadu.
6.1 EFFORTS TAKEN BY THE GOVERNMENT
The development of self help groups in Tamil Nadu through the Mahalir Thitam project initiated by MK Stalin, Deputy Chief Minister brings a warm welcome to
all poor rural women to build up their own business and run their family in an efficient manner. This project is now a successful project and is being welcomed
by the rural people. At present it has 4.41.311 SHGs which is a huge number. It is obviously seen that this project is a successful one.
The Tamil Nadu Adi Dravidar Housing Coorporation has also given an helping hand and a fruitful support to the poor people especially the SC/STs. The TADHCO
is also conducting training programmes in order to start up their businesses. They also provide attractive schemes especially for the SC/STs.
The Tamil Nadu Forest Department has also established its support by forming a village council to improve the self help groups through Tamil Nadu Corporation
for Development of Women. The forest department which is no way connected with the women empowerment has also done a tremendous job by establishing
groups through the council. It has also arranged facilities for providing loans to the groups.
The Government of Tamil Nadu has strived in helping physically challenged who are called as differently abled persons. The government has introduced various
schemes for the differently abled persons to come out successfully and to live a peaceful life and be a normal person among others. The government has also
introduced Sarva Siksha Abhiyan – education for all which brings out a vast importance of education to all even to the poorer sections of the society. This project
gives a strong encouragement to children to become educated. This project is also support by the Government of India which shows a tremendous importance
about education a need for all. The government has also introduced schemes for the survival of people with HIV AIDS and to lead a life without any
discrimination.
6.2 EFFORTS OF NGOs Many NGOs are encouraged to provide loans and help them to empower them. In several Districts, groups are formed to start up some business like to work in
stone quarries, to print designer sarees, providing sanitation, construction of friendly toilets, eradicating HIV/AIDS, agriculture cultivation etc. This has created
awareness among the rural people about the importance of sanitation and hygeine.
5.3 BRINGING LIGHT FROM THE DARKNESS TO THE RURAL WOMEN On the whole the Self Help Group model through mahalir thitam and other projects in Tamil Nadu has encouraged and has discovered the awareness to the poor
class especially the women to start up small business in order to run their family in a peaceful manner. The efforts of other corporation and NGOs has
enlightened many lives of the rural poor in Tamil Nadu from the darkness. It has also created an enormous awareness the rural poor about the hygiene and
sanitation aspect which has been an important aspect for the society. Finally to conclude, the efforts of the State Government has not gone in vain but has
created a light and trust among the poor to run their domestic life with peace and harmony.
With this end in view it is hoped that the Indian Rural population will get uplifted to form a better society in future
REFERENCES 1. CS Reddy and Sandeep Manak APMAS CEO, 2005, Self Help Groups: A key stone of microfinance in India – women empowerment and social security,
2. Gramalaya Foundaion, Tiruchurapalli
3. ODAM Foundations, Website
4. P Fernandaz – History and spread of self help affinity group movement in India.
5. R Ganapathy. T. V Seehalakshmi Sep 07-08, Economic empowerment of SHGs, Journal of Management, Sai Ram Institute of Management Studies Vol (2)
Issue (4) 77-83.
6. TADHCO – website
7. Tamil Nadu Corporation for Development of women – website
8. Tamil Nadu Forest Department – website
9. The Hindu – dated 4th
September 2006
10. Welfare of differently Abled Persons – A Policy Note.
11. www.andhranews.net – dated 23rd
March, 2009
12. www.rbi.org.in
13. www.rightsharingofworldresources.com
14. www.ssa.tn.nic.in
VOLUME NO. 3 (2013), ISSUE NO. 12 (DECEMBER) ISSN 2231-4245
INTERNATIONAL JOURNAL OF RESEARCH IN COMMERCE, ECONOMICS & MANAGEMENT A Monthly Double-Blind Peer Reviewed (Refereed/Juried) Open Access International e-Journal - Included in the International Serial Directories
http://ijrcm.org.in/
38
PROBLEMS OF PAIN AND PALLIATIVE CARE VOLUNTEERS IN KERALA
DR. SANTHA S.
ASSOCIATE PROFESSOR
POST GRADUATE DEPARTMENT OF COMMERCE & RESEARCH CENTRE
ST. PETER’S COLLEGE
KOLENCHERY
ABSTRACT
Volunteers are the sole of the palliative care movement. Volunteers who have life experience with terminal ill patients, the desire to help others/ learn more
about grief and loss, come to terms with their own morality usually come forward to become volunteer for palliative care service. The main objective of the study
is to analyze the problems faced by the Pain and Palliative Care volunteers in rendering the services effectively to the patients in Kerala. The respondents of the
study include Pain and Palliative care volunteers rendering Pain and Palliative care services in the State of Kerala. The volunteers have been selected from the
data base maintained by the Pain and Palliative care units of the districts selected as sample for the purpose of the study. For selecting the Pain and Palliative
care volunteers, the State of Kerala was first divided into three zones- south, central and north. From these zones, one district each representing south, central
and north (Alappuzha, Ernakulam and Kozhikode) have been selected at random. There were in all 79 Pain and Palliative care units in the selected districts of
Kerala (20 in Alappuzha, 22 in Ernakulam and 37 in Kozhikode) as on 31st
Oct 2010. All the units which render home care services have been selected for the
study. 12 units in Ernakulam, 11 units in Alappuzha and 32 units in Kozhikode are offering home care services. Thus, the total number of Pain and Palliative care
units selected as sample has come to 55. There are in all 2653 Palliative care volunteers in 55 units. 20 % of Pain and Palliative care volunteers have been selected
at random. The volunteers include both males and females (enrolled till 31st
Oct 2010). Thus the total sample has come to 531 volunteers. The data collected were
suitably classified and analyzed keeping in view the objectives of the study. For the purpose of analysis, statistical tools like averages, percentages, rank test and
Pearson’s Chi Square test were applied. The majority of the volunteers in Kerala were females. A few volunteers were providing palliative care without proper
training. Only a few volunteers were providing their services without any break. Some volunteers did not get adequate support of doctor/nurses for providing
required services to patients. Only a few volunteers always faced problems. The major problem of the volunteers was ‘problems from other team members in the
same locality/ different localities’. The major problem faced by them while dealing with the patients was that they were not able to reduce the stress of the
patients. Power politics was the major problem faced by the volunteers while dealing with the team members which hindered smooth functioning of the unit. The
first and foremost problems faced by male and female volunteers while dealing with the team members were lack of co-operation from the team members,
partiality and lack of good volunteers who co-operate with patients and their family members .Membership in Other organizations and financial problems’ was
the major personal problem faced by volunteers. A few volunteers were providing palliative care services without proper training. Only a few volunteers were
providing their services without any break. The major problem of the volunteers was problems from other team members in the same locality/ different localities.
The major problem faced by them while dealing with the patients was that they were not able to reduce the stress of the patients.
KEYWORDS
Neighbourhood Network in Palliative Care, Chi square test, Kruskal-Wallis Test.
INTRODUCTION olunteers are the sole of the palliative care movement. Volunteers who have life experience with terminal ill patients, the desire to help others/ learn
more about grief and loss, come to terms with their own morality usually come forward to become volunteer for palliative care service. Volunteering in
palliative care offers the intellectual and emotional stimulation of having to deal with the meaning of life and death, and gives an opportunity to reflect
on one’s own values and priorities.
The IOM (1999)1 stated that a shift is taking place from patient care in the hospital to family care in the home, which presents a special challenge for family or
friend caregivers. Such caregivers need help with learning health care delivery skills, problem solving, and use of community-based services.
Steve Conway(2008)2, in his study titled “Public health developments in palliative care services: the view from the UK” recommended for the encouragement of
growth of community oriented work .Community development provided opportunities to increase access to services and address the inequality of the
‘disadvantaged dying’.
SIGNIFICANCE OF THE STUDY Palliative care is a team work where the doctors’ help and nursing care constitute 30 % and 70 % of the help comes from volunteers, relatives and friends who
provide psychological care, social care, financial care and spiritual care to the patients. Volunteers are primary care givers who originate normally from the same
locality with local knowledge and good public contact through which they can make significant contributions in a team work by bridging the gap between the
patient community and outside world. Volunteers empower and mobilize communities to prevent diseases, save lives, and diminish suffering. Palliative care is
the continued supportive care and volunteers must have a deep commitment to their work on an ongoing basis. Palliative care volunteers must complement
professional work by covering the basic and vital personal and psychosocial requirements of the patients and their families – providing well-being and assuring
the best quality of life. Since they have to work in a team they are accountable to their programme’s vision, mission, values, standards, principles, and norms.
They must possess the skill to differentiate among the needs of their patients and their family members, team members and themselves.
For delivering proper palliative care , there should be a well integrated team with flexibility of leadership, good degree of trust, unselfishness , utilitarianism,
respect in each other’s skill and ability, high degree of mutual accountability, focus on the task etc. The network must be active so as to maintain continuity of
care and improving the coverage. For this the crucial ingredient is the ‘will and commitment’ of the volunteers. Volunteering is a social wealth which is the core
for the development and maintenance of democracy. Volunteers mobilize the community for the promotion of this wonderful movement. The multifaceted
nature of palliative care entails that it is best delivered by a multidisciplinary team working in partnership with patients and their families. For the proper
delivery of continuous complete home end-of-life care to patients, well integrated, responsible and accessible volunteers who have a thorough knowledge of
the factors that foster or hinder recourse to care is a must.
In a developing country like India, there is absence of well trained doctors, nurses, volunteers, palliative care training policies etc. for delivering quality care.
The number of active volunteers with unselfishness and utilitarianism is found to be negligible. Many of them who joined as volunteers in a unit do not or could
not continue their service due to several problems. There is the need for strengthening the training strategies. An analysis of the problems of volunteers would
help in identifying the exact reasons for their discontinuance/break of service and making suitable suggestions for their active participation in this movement.
Moreover, the review of earlier literature revealed that most of the studies in palliative care have been conducted in the field of medical science. No study has
so far been conducted for analyzing the role and involvement of pain and palliative care units in the community development. In this context the present topic
entitled “Problems of Pain and Palliative Care Volunteers in Kerala” assumes greater importance.
V
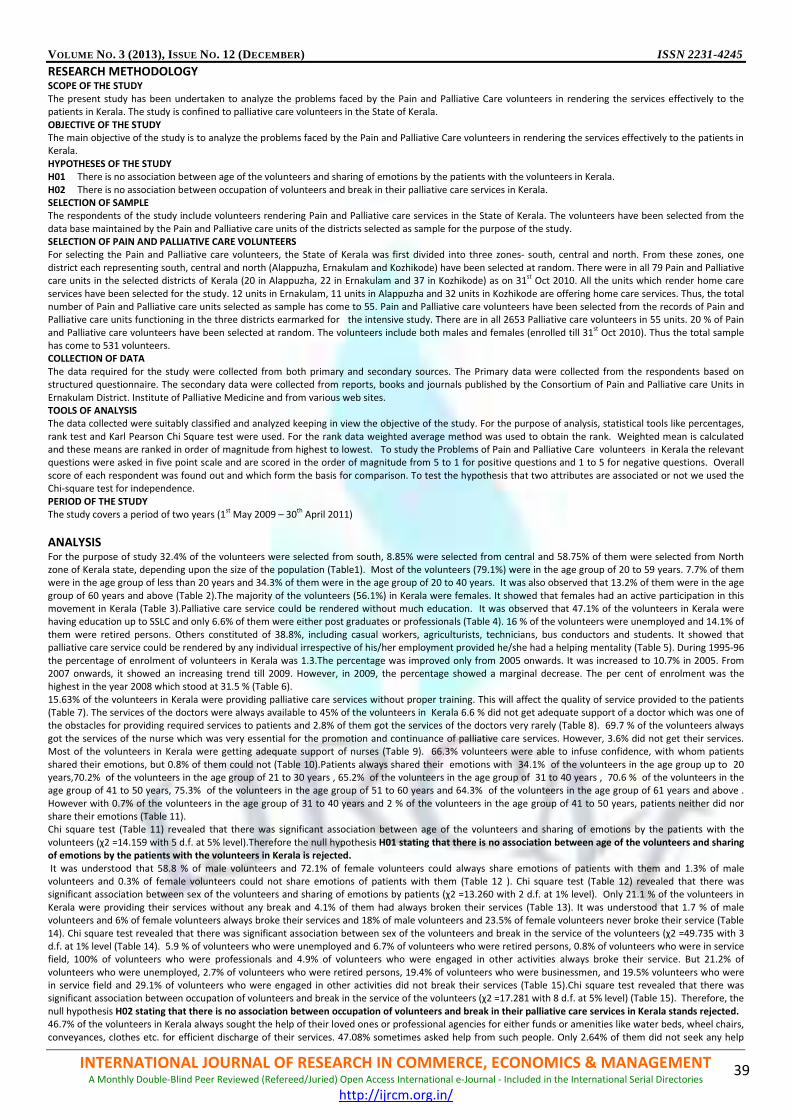
VOLUME NO. 3 (2013), ISSUE NO. 12 (DECEMBER) ISSN 2231-4245
INTERNATIONAL JOURNAL OF RESEARCH IN COMMERCE, ECONOMICS & MANAGEMENT A Monthly Double-Blind Peer Reviewed (Refereed/Juried) Open Access International e-Journal - Included in the International Serial Directories
http://ijrcm.org.in/
39
RESEARCH METHODOLOGY SCOPE OF THE STUDY The present study has been undertaken to analyze the problems faced by the Pain and Palliative Care volunteers in rendering the services effectively to the
patients in Kerala. The study is confined to palliative care volunteers in the State of Kerala.
OBJECTIVE OF THE STUDY The main objective of the study is to analyze the problems faced by the Pain and Palliative Care volunteers in rendering the services effectively to the patients in
Kerala.
HYPOTHESES OF THE STUDY H01 There is no association between age of the volunteers and sharing of emotions by the patients with the volunteers in Kerala.
H02 There is no association between occupation of volunteers and break in their palliative care services in Kerala.
SELECTION OF SAMPLE The respondents of the study include volunteers rendering Pain and Palliative care services in the State of Kerala. The volunteers have been selected from the
data base maintained by the Pain and Palliative care units of the districts selected as sample for the purpose of the study.
SELECTION OF PAIN AND PALLIATIVE CARE VOLUNTEERS For selecting the Pain and Palliative care volunteers, the State of Kerala was first divided into three zones- south, central and north. From these zones, one
district each representing south, central and north (Alappuzha, Ernakulam and Kozhikode) have been selected at random. There were in all 79 Pain and Palliative
care units in the selected districts of Kerala (20 in Alappuzha, 22 in Ernakulam and 37 in Kozhikode) as on 31st
Oct 2010. All the units which render home care
services have been selected for the study. 12 units in Ernakulam, 11 units in Alappuzha and 32 units in Kozhikode are offering home care services. Thus, the total
number of Pain and Palliative care units selected as sample has come to 55. Pain and Palliative care volunteers have been selected from the records of Pain and
Palliative care units functioning in the three districts earmarked for the intensive study. There are in all 2653 Palliative care volunteers in 55 units. 20 % of Pain
and Palliative care volunteers have been selected at random. The volunteers include both males and females (enrolled till 31st Oct 2010). Thus the total sample
has come to 531 volunteers.
COLLECTION OF DATA The data required for the study were collected from both primary and secondary sources. The Primary data were collected from the respondents based on
structured questionnaire. The secondary data were collected from reports, books and journals published by the Consortium of Pain and Palliative care Units in
Ernakulam District. Institute of Palliative Medicine and from various web sites.
TOOLS OF ANALYSIS The data collected were suitably classified and analyzed keeping in view the objective of the study. For the purpose of analysis, statistical tools like percentages,
rank test and Karl Pearson Chi Square test were used. For the rank data weighted average method was used to obtain the rank. Weighted mean is calculated
and these means are ranked in order of magnitude from highest to lowest. To study the Problems of Pain and Palliative Care volunteers in Kerala the relevant
questions were asked in five point scale and are scored in the order of magnitude from 5 to 1 for positive questions and 1 to 5 for negative questions. Overall
score of each respondent was found out and which form the basis for comparison. To test the hypothesis that two attributes are associated or not we used the
Chi-square test for independence.
PERIOD OF THE STUDY The study covers a period of two years (1
st May 2009 – 30
th April 2011)
ANALYSIS For the purpose of study 32.4% of the volunteers were selected from south, 8.85% were selected from central and 58.75% of them were selected from North
zone of Kerala state, depending upon the size of the population (Table1). Most of the volunteers (79.1%) were in the age group of 20 to 59 years. 7.7% of them
were in the age group of less than 20 years and 34.3% of them were in the age group of 20 to 40 years. It was also observed that 13.2% of them were in the age
group of 60 years and above (Table 2).The majority of the volunteers (56.1%) in Kerala were females. It showed that females had an active participation in this
movement in Kerala (Table 3).Palliative care service could be rendered without much education. It was observed that 47.1% of the volunteers in Kerala were
having education up to SSLC and only 6.6% of them were either post graduates or professionals (Table 4). 16 % of the volunteers were unemployed and 14.1% of
them were retired persons. Others constituted of 38.8%, including casual workers, agriculturists, technicians, bus conductors and students. It showed that
palliative care service could be rendered by any individual irrespective of his/her employment provided he/she had a helping mentality (Table 5). During 1995-96
the percentage of enrolment of volunteers in Kerala was 1.3.The percentage was improved only from 2005 onwards. It was increased to 10.7% in 2005. From
2007 onwards, it showed an increasing trend till 2009. However, in 2009, the percentage showed a marginal decrease. The per cent of enrolment was the
highest in the year 2008 which stood at 31.5 % (Table 6).
15.63% of the volunteers in Kerala were providing palliative care services without proper training. This will affect the quality of service provided to the patients
(Table 7). The services of the doctors were always available to 45% of the volunteers in Kerala 6.6 % did not get adequate support of a doctor which was one of
the obstacles for providing required services to patients and 2.8% of them got the services of the doctors very rarely (Table 8). 69.7 % of the volunteers always
got the services of the nurse which was very essential for the promotion and continuance of palliative care services. However, 3.6% did not get their services.
Most of the volunteers in Kerala were getting adequate support of nurses (Table 9). 66.3% volunteers were able to infuse confidence, with whom patients
shared their emotions, but 0.8% of them could not (Table 10).Patients always shared their emotions with 34.1% of the volunteers in the age group up to 20
years,70.2% of the volunteers in the age group of 21 to 30 years , 65.2% of the volunteers in the age group of 31 to 40 years , 70.6 % of the volunteers in the
age group of 41 to 50 years, 75.3% of the volunteers in the age group of 51 to 60 years and 64.3% of the volunteers in the age group of 61 years and above .
However with 0.7% of the volunteers in the age group of 31 to 40 years and 2 % of the volunteers in the age group of 41 to 50 years, patients neither did nor
share their emotions (Table 11).
Chi square test (Table 11) revealed that there was significant association between age of the volunteers and sharing of emotions by the patients with the
volunteers (χ2 =14.159 with 5 d.f. at 5% level).Therefore the null hypothesis H01 stating that there is no association between age of the volunteers and sharing of emotions by the patients with the volunteers in Kerala is rejected. It was understood that 58.8 % of male volunteers and 72.1% of female volunteers could always share emotions of patients with them and 1.3% of male
volunteers and 0.3% of female volunteers could not share emotions of patients with them (Table 12 ). Chi square test (Table 12) revealed that there was
significant association between sex of the volunteers and sharing of emotions by patients (χ2 =13.260 with 2 d.f. at 1% level). Only 21.1 % of the volunteers in
Kerala were providing their services without any break and 4.1% of them had always broken their services (Table 13). It was understood that 1.7 % of male
volunteers and 6% of female volunteers always broke their services and 18% of male volunteers and 23.5% of female volunteers never broke their service (Table
14). Chi square test revealed that there was significant association between sex of the volunteers and break in the service of the volunteers (χ2 =49.735 with 3
d.f. at 1% level (Table 14). 5.9 % of volunteers who were unemployed and 6.7% of volunteers who were retired persons, 0.8% of volunteers who were in service
field, 100% of volunteers who were professionals and 4.9% of volunteers who were engaged in other activities always broke their service. But 21.2% of
volunteers who were unemployed, 2.7% of volunteers who were retired persons, 19.4% of volunteers who were businessmen, and 19.5% volunteers who were
in service field and 29.1% of volunteers who were engaged in other activities did not break their services (Table 15).Chi square test revealed that there was
significant association between occupation of volunteers and break in the service of the volunteers (χ2 =17.281 with 8 d.f. at 5% level) (Table 15). Therefore, the
null hypothesis H02 stating that there is no association between occupation of volunteers and break in their palliative care services in Kerala stands rejected. 46.7% of the volunteers in Kerala always sought the help of their loved ones or professional agencies for either funds or amenities like water beds, wheel chairs,
conveyances, clothes etc. for efficient discharge of their services. 47.08% sometimes asked help from such people. Only 2.64% of them did not seek any help
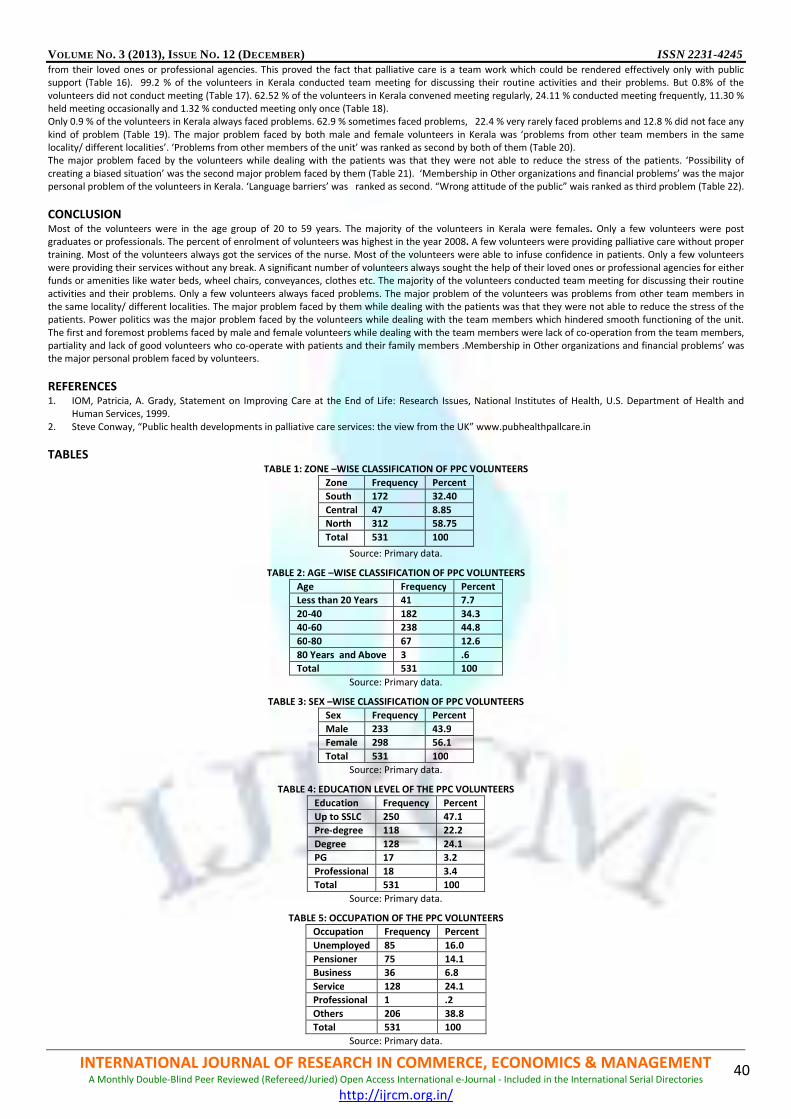
VOLUME NO. 3 (2013), ISSUE NO. 12 (DECEMBER) ISSN 2231-4245
INTERNATIONAL JOURNAL OF RESEARCH IN COMMERCE, ECONOMICS & MANAGEMENT A Monthly Double-Blind Peer Reviewed (Refereed/Juried) Open Access International e-Journal - Included in the International Serial Directories
http://ijrcm.org.in/
40
from their loved ones or professional agencies. This proved the fact that palliative care is a team work which could be rendered effectively only with public
support (Table 16). 99.2 % of the volunteers in Kerala conducted team meeting for discussing their routine activities and their problems. But 0.8% of the
volunteers did not conduct meeting (Table 17). 62.52 % of the volunteers in Kerala convened meeting regularly, 24.11 % conducted meeting frequently, 11.30 %
held meeting occasionally and 1.32 % conducted meeting only once (Table 18).
Only 0.9 % of the volunteers in Kerala always faced problems. 62.9 % sometimes faced problems, 22.4 % very rarely faced problems and 12.8 % did not face any
kind of problem (Table 19). The major problem faced by both male and female volunteers in Kerala was ‘problems from other team members in the same
locality/ different localities’. ‘Problems from other members of the unit’ was ranked as second by both of them (Table 20).
The major problem faced by the volunteers while dealing with the patients was that they were not able to reduce the stress of the patients. ‘Possibility of
creating a biased situation’ was the second major problem faced by them (Table 21). ‘Membership in Other organizations and financial problems’ was the major
personal problem of the volunteers in Kerala. ‘Language barriers’ was ranked as second. “Wrong attitude of the public” wais ranked as third problem (Table 22).
CONCLUSION Most of the volunteers were in the age group of 20 to 59 years. The majority of the volunteers in Kerala were females. Only a few volunteers were post
graduates or professionals. The percent of enrolment of volunteers was highest in the year 2008. A few volunteers were providing palliative care without proper
training. Most of the volunteers always got the services of the nurse. Most of the volunteers were able to infuse confidence in patients. Only a few volunteers
were providing their services without any break. A significant number of volunteers always sought the help of their loved ones or professional agencies for either
funds or amenities like water beds, wheel chairs, conveyances, clothes etc. The majority of the volunteers conducted team meeting for discussing their routine
activities and their problems. Only a few volunteers always faced problems. The major problem of the volunteers was problems from other team members in
the same locality/ different localities. The major problem faced by them while dealing with the patients was that they were not able to reduce the stress of the
patients. Power politics was the major problem faced by the volunteers while dealing with the team members which hindered smooth functioning of the unit.
The first and foremost problems faced by male and female volunteers while dealing with the team members were lack of co-operation from the team members,
partiality and lack of good volunteers who co-operate with patients and their family members .Membership in Other organizations and financial problems’ was
the major personal problem faced by volunteers.
REFERENCES 1. IOM, Patricia, A. Grady, Statement on Improving Care at the End of Life: Research Issues, National Institutes of Health, U.S. Department of Health and
Human Services, 1999.
2. Steve Conway, “Public health developments in palliative care services: the view from the UK” www.pubhealthpallcare.in
TABLES TABLE 1: ZONE –WISE CLASSIFICATION OF PPC VOLUNTEERS
Zone Frequency Percent
South 172 32.40
Central 47 8.85
North 312 58.75
Total 531 100
Source: Primary data.
TABLE 2: AGE –WISE CLASSIFICATION OF PPC VOLUNTEERS
Age Frequency Percent
Less than 20 Years 41 7.7
20-40 182 34.3
40-60 238 44.8
60-80 67 12.6
80 Years and Above 3 .6
Total 531 100
Source: Primary data.
TABLE 3: SEX –WISE CLASSIFICATION OF PPC VOLUNTEERS
Sex Frequency Percent
Male 233 43.9
Female 298 56.1
Total 531 100
Source: Primary data.
TABLE 4: EDUCATION LEVEL OF THE PPC VOLUNTEERS
Education Frequency Percent
Up to SSLC 250 47.1
Pre-degree 118 22.2
Degree 128 24.1
PG 17 3.2
Professional 18 3.4
Total 531 100
Source: Primary data.
TABLE 5: OCCUPATION OF THE PPC VOLUNTEERS
Occupation Frequency Percent
Unemployed 85 16.0
Pensioner 75 14.1
Business 36 6.8
Service 128 24.1
Professional 1 .2
Others 206 38.8
Total 531 100
Source: Primary data.

VOLUME NO. 3 (2013), ISSUE NO. 12 (DECEMBER) ISSN 2231-4245
INTERNATIONAL JOURNAL OF RESEARCH IN COMMERCE, ECONOMICS & MANAGEMENT A Monthly Double-Blind Peer Reviewed (Refereed/Juried) Open Access International e-Journal - Included in the International Serial Directories
http://ijrcm.org.in/
41
TABLE 6: YEAR ENROLMENT OF THE PPC VOLUNTEERS
Year of Enrolment Frequency Percent
1995 7 1.3
1998 2 .4
1999 1 .2
2000 3 .6
2002 9 1.7
2003 14 2.6
2004 8 1.5
2005 57 10.7
2006 24 4.5
2007 83 15.6
2008 167 31.5
2009 156 29.4
Total 531 100
Source: Primary data.
TABLE 7: TRAINING PROGRAMMES ATTENDED BY THE PPC VOLUNTEERS
Type of Training Frequency Percent
Volunteers Training 382 71.94
Others 66 12.43
Nil 83 15.63
Total 531 100
Source: Primary data.
TABLE 8: AVAILABILITY OF DOCTORS
Availability of Doctors Frequency Percent
Always 239 45.0
Some times 225 42.4
Very rare 15 2.8
No 35 6.6
No opinion 17 3.2
Total 531 100
Source: Primary data.
TABLE 9: AVAILABILITY OF NURSES FOR THE SERVICE
Availability Frequency Percent
Always 370 69.7
Some times 125 23.5
Very rare 15 2.8
No 19 3.6
No opinion 2 .4
Total 531 100
Source: Primary data.
TABLE 10: SHARING OF EMOTIONS BY PATIENTS WITH VOLUNTEERS
Responses Frequency Percent
Always 352 66.3
Some times 149 28.1
Very rare 22 4.1
No 4 .8
No opinion 4 .8
Total 531 100
Source: Primary data.
TABLE 11: AGE OF THE VOLUNTEERS AND SHARING OF EMOTIONS BY PATIENTS (Chi Square Test)
Age SHARING OF EMOTIONS BY PATIENTS
Always Sometimes Very Rare No No opinion Total
up to 20
Count 14 19 8 0 0 41
% within Age 34.1% 46.3% 19.5% .0% .0% 100%
21-30
Count 33 12 2 0 0 47
% within Age 70.2% 25.5% 4.3% .0% .0% 100%
31-40
Count 88 36 10 1 0 135
% within Age 65.2% 26.7% 7.4% .7% .0% 100%
41-50
Count 108 40 1 3 1 153
% within Age 70.6% 26.1% .7% 2.0% .7% 100%
51-60
Count 64 21 0 0 0 85
% within Age 75.3% 24.7% .0% .0% .0% 100%
61 Years & above
Count 45 21 1 0 3 70
% within Age 64.3% 30.0% 1.4% .0% 4.3% 100%
Total Count 352 149 22 4 4 531
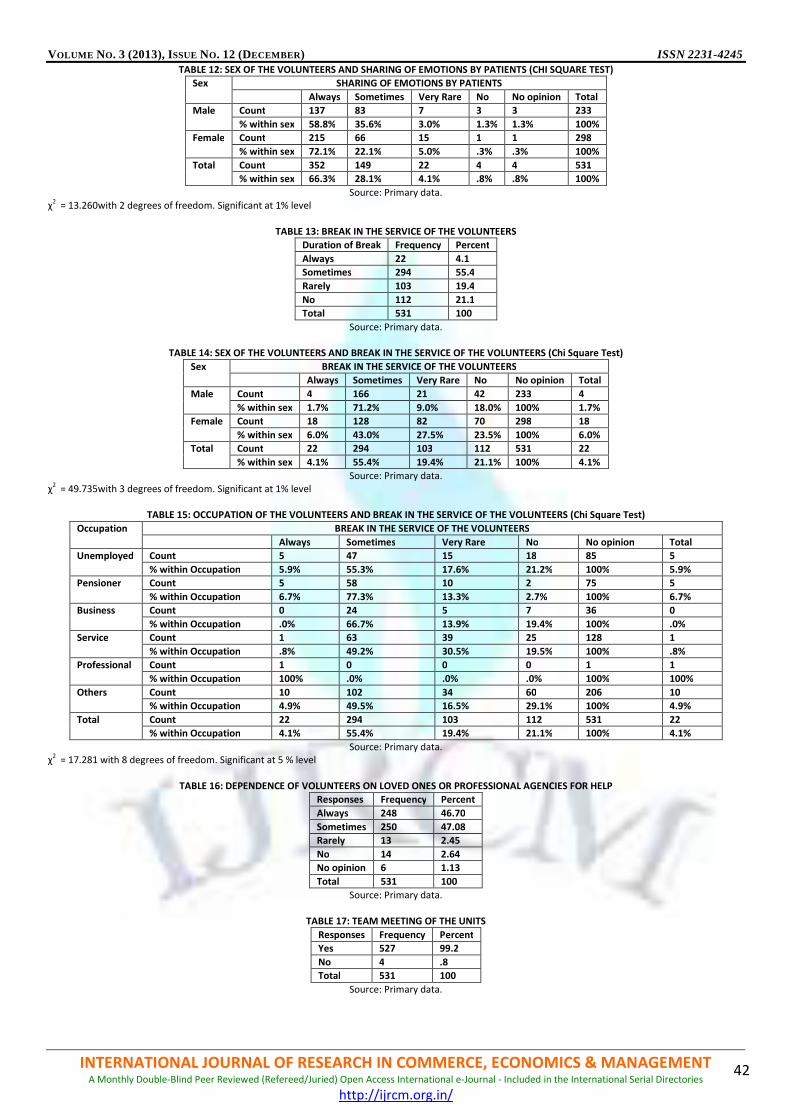
VOLUME NO. 3 (2013), ISSUE NO. 12 (DECEMBER) ISSN 2231-4245
INTERNATIONAL JOURNAL OF RESEARCH IN COMMERCE, ECONOMICS & MANAGEMENT A Monthly Double-Blind Peer Reviewed (Refereed/Juried) Open Access International e-Journal - Included in the International Serial Directories
http://ijrcm.org.in/
42
TABLE 12: SEX OF THE VOLUNTEERS AND SHARING OF EMOTIONS BY PATIENTS (CHI SQUARE TEST)
Sex SHARING OF EMOTIONS BY PATIENTS
Always Sometimes Very Rare No No opinion Total
Male Count 137 83 7 3 3 233
% within sex 58.8% 35.6% 3.0% 1.3% 1.3% 100%
Female Count 215 66 15 1 1 298
% within sex 72.1% 22.1% 5.0% .3% .3% 100%
Total Count 352 149 22 4 4 531
% within sex 66.3% 28.1% 4.1% .8% .8% 100%
Source: Primary data.
χ2
= 13.260with 2 degrees of freedom. Significant at 1% level
TABLE 13: BREAK IN THE SERVICE OF THE VOLUNTEERS
Duration of Break Frequency Percent
Always 22 4.1
Sometimes 294 55.4
Rarely 103 19.4
No 112 21.1
Total 531 100
Source: Primary data.
TABLE 14: SEX OF THE VOLUNTEERS AND BREAK IN THE SERVICE OF THE VOLUNTEERS (Chi Square Test)
Sex BREAK IN THE SERVICE OF THE VOLUNTEERS
Always Sometimes Very Rare No No opinion Total
Male Count 4 166 21 42 233 4
% within sex 1.7% 71.2% 9.0% 18.0% 100% 1.7%
Female Count 18 128 82 70 298 18
% within sex 6.0% 43.0% 27.5% 23.5% 100% 6.0%
Total Count 22 294 103 112 531 22
% within sex 4.1% 55.4% 19.4% 21.1% 100% 4.1%
Source: Primary data.
χ2
= 49.735with 3 degrees of freedom. Significant at 1% level
TABLE 15: OCCUPATION OF THE VOLUNTEERS AND BREAK IN THE SERVICE OF THE VOLUNTEERS (Chi Square Test)
Occupation BREAK IN THE SERVICE OF THE VOLUNTEERS
Always Sometimes Very Rare No No opinion Total
Unemployed Count 5 47 15 18 85 5
% within Occupation 5.9% 55.3% 17.6% 21.2% 100% 5.9%
Pensioner Count 5 58 10 2 75 5
% within Occupation 6.7% 77.3% 13.3% 2.7% 100% 6.7%
Business Count 0 24 5 7 36 0
% within Occupation .0% 66.7% 13.9% 19.4% 100% .0%
Service Count 1 63 39 25 128 1
% within Occupation .8% 49.2% 30.5% 19.5% 100% .8%
Professional Count 1 0 0 0 1 1
% within Occupation 100% .0% .0% .0% 100% 100%
Others Count 10 102 34 60 206 10
% within Occupation 4.9% 49.5% 16.5% 29.1% 100% 4.9%
Total Count 22 294 103 112 531 22
% within Occupation 4.1% 55.4% 19.4% 21.1% 100% 4.1%
Source: Primary data.
χ2
= 17.281 with 8 degrees of freedom. Significant at 5 % level
TABLE 16: DEPENDENCE OF VOLUNTEERS ON LOVED ONES OR PROFESSIONAL AGENCIES FOR HELP
Responses Frequency Percent
Always 248 46.70
Sometimes 250 47.08
Rarely 13 2.45
No 14 2.64
No opinion 6 1.13
Total 531 100
Source: Primary data.
TABLE 17: TEAM MEETING OF THE UNITS
Responses Frequency Percent
Yes 527 99.2
No 4 .8
Total 531 100
Source: Primary data.
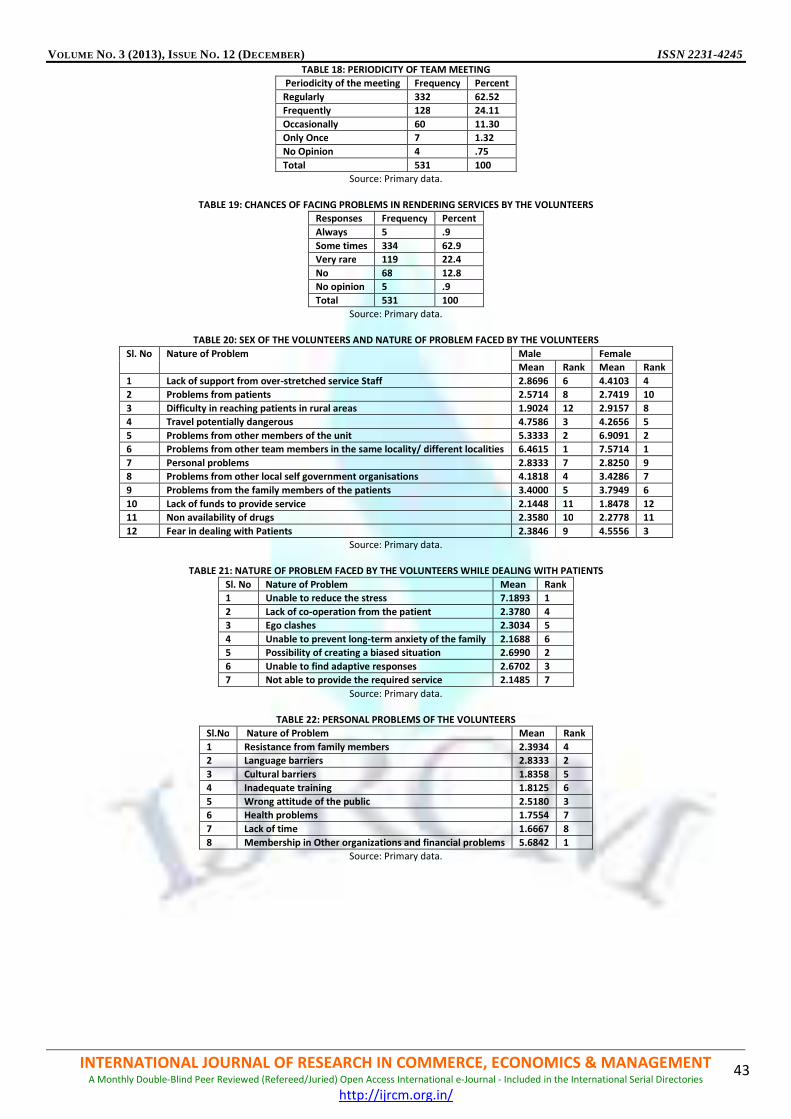
VOLUME NO. 3 (2013), ISSUE NO. 12 (DECEMBER) ISSN 2231-4245
INTERNATIONAL JOURNAL OF RESEARCH IN COMMERCE, ECONOMICS & MANAGEMENT A Monthly Double-Blind Peer Reviewed (Refereed/Juried) Open Access International e-Journal - Included in the International Serial Directories
http://ijrcm.org.in/
43
TABLE 18: PERIODICITY OF TEAM MEETING
Periodicity of the meeting Frequency Percent
Regularly 332 62.52
Frequently 128 24.11
Occasionally 60 11.30
Only Once 7 1.32
No Opinion 4 .75
Total 531 100
Source: Primary data.
TABLE 19: CHANCES OF FACING PROBLEMS IN RENDERING SERVICES BY THE VOLUNTEERS
Responses Frequency Percent
Always 5 .9
Some times 334 62.9
Very rare 119 22.4
No 68 12.8
No opinion 5 .9
Total 531 100
Source: Primary data.
TABLE 20: SEX OF THE VOLUNTEERS AND NATURE OF PROBLEM FACED BY THE VOLUNTEERS
Sl. No Nature of Problem Male Female
Mean Rank Mean Rank
1 Lack of support from over-stretched service Staff 2.8696 6 4.4103 4
2 Problems from patients 2.5714 8 2.7419 10
3 Difficulty in reaching patients in rural areas 1.9024 12 2.9157 8
4 Travel potentially dangerous 4.7586 3 4.2656 5
5 Problems from other members of the unit 5.3333 2 6.9091 2
6 Problems from other team members in the same locality/ different localities 6.4615 1 7.5714 1
7 Personal problems 2.8333 7 2.8250 9
8 Problems from other local self government organisations 4.1818 4 3.4286 7
9 Problems from the family members of the patients 3.4000 5 3.7949 6
10 Lack of funds to provide service 2.1448 11 1.8478 12
11 Non availability of drugs 2.3580 10 2.2778 11
12 Fear in dealing with Patients 2.3846 9 4.5556 3
Source: Primary data.
TABLE 21: NATURE OF PROBLEM FACED BY THE VOLUNTEERS WHILE DEALING WITH PATIENTS
Sl. No Nature of Problem Mean Rank
1 Unable to reduce the stress 7.1893 1
2 Lack of co-operation from the patient 2.3780 4
3 Ego clashes 2.3034 5
4 Unable to prevent long-term anxiety of the family 2.1688 6
5 Possibility of creating a biased situation 2.6990 2
6 Unable to find adaptive responses 2.6702 3
7 Not able to provide the required service 2.1485 7
Source: Primary data.
TABLE 22: PERSONAL PROBLEMS OF THE VOLUNTEERS
Sl.No Nature of Problem Mean Rank
1 Resistance from family members 2.3934 4
2 Language barriers 2.8333 2
3 Cultural barriers 1.8358 5
4 Inadequate training 1.8125 6
5 Wrong attitude of the public 2.5180 3
6 Health problems 1.7554 7
7 Lack of time 1.6667 8
8 Membership in Other organizations and financial problems 5.6842 1
Source: Primary data.
VOLUME NO. 3 (2013), ISSUE NO. 12 (DECEMBER) ISSN 2231-4245
INTERNATIONAL JOURNAL OF RESEARCH IN COMMERCE, ECONOMICS & MANAGEMENT A Monthly Double-Blind Peer Reviewed (Refereed/Juried) Open Access International e-Journal - Included in the International Serial Directories
http://ijrcm.org.in/
44
MICRO-FINANCE: A BOON TO THE SELF-HELP GROUP MEMBERS IN SIVAGANGAI DISTRICT, TAMIL NADU, INDIA
CAPT. DR. JEYA KUMAR, KR.
ASSOCIATE PROFESSOR OF ECONOMICS
ARUMUGAM PILLAI SEETHAI AMMAL COLLEGE
THIRUPPATTUR
DR. SREEDEVI.N
ASST. PROFESSOR OF ECONOMICS
ARUMUGAM PILLAI SEETHAI AMMAL COLLEGE
TIRUPPATTUR
ABSTRACT
Poor people, especially poor women have traditionally not been recognized as credit-worthy or able to save and thus they are not perceived to be a profitable
market of credit. This forces them to fall in the vicious cycle of everlasting high interest and high collateral loan from money lenders. The sine quo-non of any
anti-poverty strategy is the desire and innate capacity of the poor to uplift their conditions. Therefore, the need comes for innovative credit delivery systems
which deviate from formal collateral oriented lending institutions to informal structures. It has been felt all over the world today that micro-finance
performances can simultaneously help in alleviation of poverty and empowering women. The initiative of 1992 to make the traditional and formal banks to
extend financial services to deprived sections through informal Self Help Groups (SHGs), has now blossomed into a “monolith”micro Finance initiative. The most
backward district in Tamil Nadu, Sivagangai District has been selected for this study. With this background, the study was carried out with the objectives of
reviewing the present status of SHGs and Micro-Finance in India. The second objective is to analyze the impact of micro-finance on income and savings of the
respondents in Sivagangai District. The study was based on both primary and secondary data. Chi-Square, Paired ‘t’-test and ANOVA were applied for analysis.
KEYWORDS Anti-poverty, Backward, Empowerment, Informal Markets, Micro-Finance, Self-Help Groups.
INTRODUCTION icro-finance now means providing small scale financial services to people who operate very small or micro-enterprises, who work in agriculture, fishing
and herding, who provide services and other individuals or groups at the local levels of developing countries both rural and urban (Robinson, 1996).
The term ‘micro-finance’ is perceived to be a Paradigm shift in the quality of delivery of finance to micro-entrepreneurs. The old paradigm of micro-
finance envisaged providing credit to poor people basically residing in rural and semi urban areas at subsidized rates of interest through public or government
financial institutions. The new micro-finance continues to target the rural and urban poor household with emphasis on women borrowers, provision of finance
for asset creation and on the principle of ‘Borrower knows best’ (Kaladhar, 1997).
Microfinance programmes and institutions have become important components of strategies to reduce poverty and to promote micro enterprise development.
Sustainable employment and income generation for the rural poor are indicators of the success and potential of a credit programme.
Kulshrestha has identified Lack of capital as a serious constraint to development for women in rural areas. She identified the following difficulties that women
face in applying for credit.
1. Certification of identify.
2. Lack of assets for furnishing security.
3. The co-signing of loan by the husband since the women’s rights to property is often restricted.
4. Co-operating does not accept the women as a member if a make member of the family is already registered.
5. The necessity for traveling long distances frequently to transact the loan.
6. The majority of rural women are illiterate (Kulshrestha, 2000).
These constraints push the women to informal sources of finance. Though, borrowing from friends, relatives, moneylenders and pawnbrokers have several
advantages, Like easy access, immediate of loan disbursement, micro-loan sizes, minimum collateral, etc., the disadvantages outweigh these advantages. The
high interest rates prove to be very costly to the women and they become dragged in the vicious nets of moneylenders.
Therefore, there must be a system that can provide solutions to credit problems of women. It is in this context that micro-finance assumed great importance.
EMPOWERMENT OF WOMEN Discrimination of women from womb to tomb is well known. There is continued inequality and vulnerability in all sectors economic, social, political, education,
health care, nutrition and legal. As women are oppressed in all spheres of life, they need to be empowered in all walks of life.
Empowerment of women, means many things, they are
1. Recognizing women’s contribution, women’s knowledge.
2. Helping women fight their own fears, and feelings of inadequacy and inferiority.
3. Women enhancing their self-respect and self-dignity of women.
4. Women controlling their own bodies.
5. Women becoming economically independent and self-reliant.
6. Reducing women’s border of work, especially within the home.
7. Creating and strengthening women’s groups and organizations.
8. Promoting qualities of nurturing, caring, gentleness, not just in.
The concept of empowerment is the extension of power. The possibility of empowerment depends on two things. First, empowerment requires power that can
change. In other words, if power can change, then, empowerment is possible. Second, the concept of empowerment depends on the idea that power can
expand. The power is the cause and empowerment is the effect in an integrated relationship. Traditional social science emphasizes power as ‘influence and
control and such powers exist within the context of relationship between people and institutions.
The empowerment of rural women shall mean equipping village women to be economically independent and personally self-reliant, with a positive self esteem.
The rural empowered women shall be able to participate in the process of decision making at home and in public activities. The empowerment of rural women
ensures equal status, opportunity and freedom to develop them. This process of change leads to socio-economic empowerment through increased awareness of
their rights and duties as well as to resources.
M
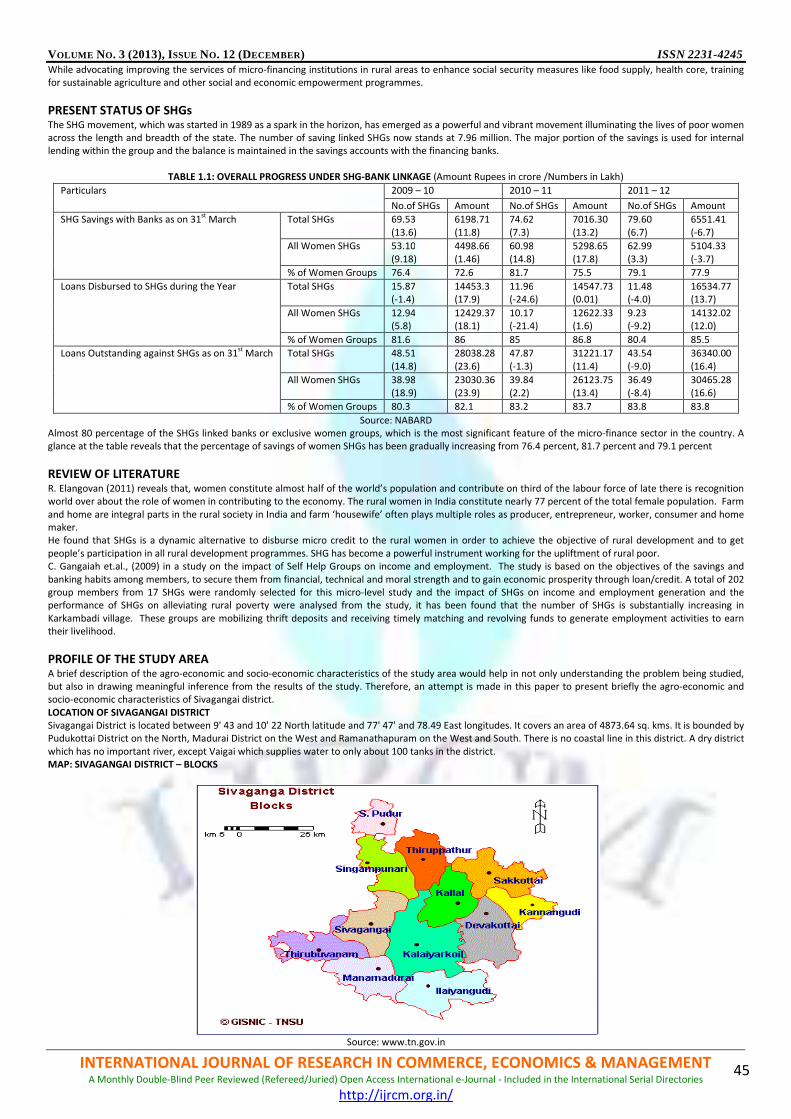
VOLUME NO. 3 (2013), ISSUE NO. 12 (DECEMBER) ISSN 2231-4245
INTERNATIONAL JOURNAL OF RESEARCH IN COMMERCE, ECONOMICS & MANAGEMENT A Monthly Double-Blind Peer Reviewed (Refereed/Juried) Open Access International e-Journal - Included in the International Serial Directories
http://ijrcm.org.in/
45
While advocating improving the services of micro-financing institutions in rural areas to enhance social security measures like food supply, health core, training
for sustainable agriculture and other social and economic empowerment programmes.
PRESENT STATUS OF SHGs The SHG movement, which was started in 1989 as a spark in the horizon, has emerged as a powerful and vibrant movement illuminating the lives of poor women
across the length and breadth of the state. The number of saving linked SHGs now stands at 7.96 million. The major portion of the savings is used for internal
lending within the group and the balance is maintained in the savings accounts with the financing banks.
TABLE 1.1: OVERALL PROGRESS UNDER SHG-BANK LINKAGE (Amount Rupees in crore /Numbers in Lakh)
Particulars 2009 – 10 2010 – 11 2011 – 12
No.of SHGs Amount No.of SHGs Amount No.of SHGs Amount
SHG Savings with Banks as on 31st March Total SHGs 69.53
(13.6)
6198.71
(11.8)
74.62
(7.3)
7016.30
(13.2)
79.60
(6.7)
6551.41
(-6.7)
All Women SHGs 53.10
(9.18)
4498.66
(1.46)
60.98
(14.8)
5298.65
(17.8)
62.99
(3.3)
5104.33
(-3.7)
% of Women Groups 76.4 72.6 81.7 75.5 79.1 77.9
Loans Disbursed to SHGs during the Year Total SHGs 15.87
(-1.4)
14453.3
(17.9)
11.96
(-24.6)
14547.73
(0.01)
11.48
(-4.0)
16534.77
(13.7)
All Women SHGs 12.94
(5.8)
12429.37
(18.1)
10.17
(-21.4)
12622.33
(1.6)
9.23
(-9.2)
14132.02
(12.0)
% of Women Groups 81.6 86 85 86.8 80.4 85.5
Loans Outstanding against SHGs as on 31st March Total SHGs 48.51
(14.8)
28038.28
(23.6)
47.87
(-1.3)
31221.17
(11.4)
43.54
(-9.0)
36340.00
(16.4)
All Women SHGs 38.98
(18.9)
23030.36
(23.9)
39.84
(2.2)
26123.75
(13.4)
36.49
(-8.4)
30465.28
(16.6)
% of Women Groups 80.3 82.1 83.2 83.7 83.8 83.8
Source: NABARD
Almost 80 percentage of the SHGs linked banks or exclusive women groups, which is the most significant feature of the micro-finance sector in the country. A
glance at the table reveals that the percentage of savings of women SHGs has been gradually increasing from 76.4 percent, 81.7 percent and 79.1 percent
REVIEW OF LITERATURE R. Elangovan (2011) reveals that, women constitute almost half of the world’s population and contribute on third of the labour force of late there is recognition
world over about the role of women in contributing to the economy. The rural women in India constitute nearly 77 percent of the total female population. Farm
and home are integral parts in the rural society in India and farm ‘housewife’ often plays multiple roles as producer, entrepreneur, worker, consumer and home
maker.
He found that SHGs is a dynamic alternative to disburse micro credit to the rural women in order to achieve the objective of rural development and to get
people’s participation in all rural development programmes. SHG has become a powerful instrument working for the upliftment of rural poor.
C. Gangaiah et.al., (2009) in a study on the impact of Self Help Groups on income and employment. The study is based on the objectives of the savings and
banking habits among members, to secure them from financial, technical and moral strength and to gain economic prosperity through loan/credit. A total of 202
group members from 17 SHGs were randomly selected for this micro-level study and the impact of SHGs on income and employment generation and the
performance of SHGs on alleviating rural poverty were analysed from the study, it has been found that the number of SHGs is substantially increasing in
Karkambadi village. These groups are mobilizing thrift deposits and receiving timely matching and revolving funds to generate employment activities to earn
their livelihood.
PROFILE OF THE STUDY AREA A brief description of the agro-economic and socio-economic characteristics of the study area would help in not only understanding the problem being studied,
but also in drawing meaningful inference from the results of the study. Therefore, an attempt is made in this paper to present briefly the agro-economic and
socio-economic characteristics of Sivagangai district.
LOCATION OF SIVAGANGAI DISTRICT Sivagangai District is located between 9' 43 and 10' 22 North latitude and 77' 47' and 78.49 East longitudes. It covers an area of 4873.64 sq. kms. It is bounded by
Pudukottai District on the North, Madurai District on the West and Ramanathapuram on the West and South. There is no coastal line in this district. A dry district
which has no important river, except Vaigai which supplies water to only about 100 tanks in the district.
MAP: SIVAGANGAI DISTRICT – BLOCKS
Source: www.tn.gov.in
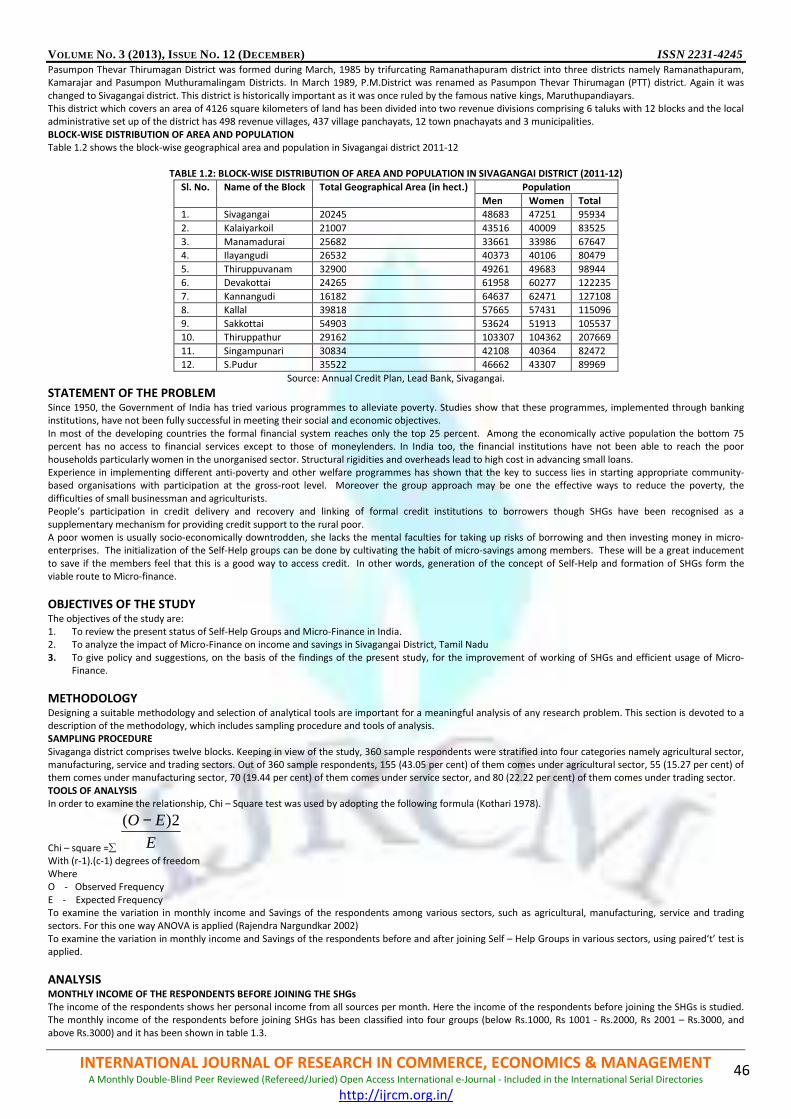
VOLUME NO. 3 (2013), ISSUE NO. 12 (DECEMBER) ISSN 2231-4245
INTERNATIONAL JOURNAL OF RESEARCH IN COMMERCE, ECONOMICS & MANAGEMENT A Monthly Double-Blind Peer Reviewed (Refereed/Juried) Open Access International e-Journal - Included in the International Serial Directories
http://ijrcm.org.in/
46
Pasumpon Thevar Thirumagan District was formed during March, 1985 by trifurcating Ramanathapuram district into three districts namely Ramanathapuram,
Kamarajar and Pasumpon Muthuramalingam Districts. In March 1989, P.M.District was renamed as Pasumpon Thevar Thirumagan (PTT) district. Again it was
changed to Sivagangai district. This district is historically important as it was once ruled by the famous native kings, Maruthupandiayars.
This district which covers an area of 4126 square kilometers of land has been divided into two revenue divisions comprising 6 taluks with 12 blocks and the local
administrative set up of the district has 498 revenue villages, 437 village panchayats, 12 town pnachayats and 3 municipalities.
BLOCK-WISE DISTRIBUTION OF AREA AND POPULATION
Table 1.2 shows the block-wise geographical area and population in Sivagangai district 2011-12
TABLE 1.2: BLOCK-WISE DISTRIBUTION OF AREA AND POPULATION IN SIVAGANGAI DISTRICT (2011-12)
Sl. No. Name of the Block Total Geographical Area (in hect.) Population
Men Women Total
1. Sivagangai 20245 48683 47251 95934
2. Kalaiyarkoil 21007 43516 40009 83525
3. Manamadurai 25682 33661 33986 67647
4. Ilayangudi 26532 40373 40106 80479
5. Thiruppuvanam 32900 49261 49683 98944
6. Devakottai 24265 61958 60277 122235
7. Kannangudi 16182 64637 62471 127108
8. Kallal 39818 57665 57431 115096
9. Sakkottai 54903 53624 51913 105537
10. Thiruppathur 29162 103307 104362 207669
11. Singampunari 30834 42108 40364 82472
12. S.Pudur 35522 46662 43307 89969
Source: Annual Credit Plan, Lead Bank, Sivagangai.
STATEMENT OF THE PROBLEM Since 1950, the Government of India has tried various programmes to alleviate poverty. Studies show that these programmes, implemented through banking
institutions, have not been fully successful in meeting their social and economic objectives.
In most of the developing countries the formal financial system reaches only the top 25 percent. Among the economically active population the bottom 75
percent has no access to financial services except to those of moneylenders. In India too, the financial institutions have not been able to reach the poor
households particularly women in the unorganised sector. Structural rigidities and overheads lead to high cost in advancing small loans.
Experience in implementing different anti-poverty and other welfare programmes has shown that the key to success lies in starting appropriate community-
based organisations with participation at the gross-root level. Moreover the group approach may be one the effective ways to reduce the poverty, the
difficulties of small businessman and agriculturists.
People’s participation in credit delivery and recovery and linking of formal credit institutions to borrowers though SHGs have been recognised as a
supplementary mechanism for providing credit support to the rural poor.
A poor women is usually socio-economically downtrodden, she lacks the mental faculties for taking up risks of borrowing and then investing money in micro-
enterprises. The initialization of the Self-Help groups can be done by cultivating the habit of micro-savings among members. These will be a great inducement
to save if the members feel that this is a good way to access credit. In other words, generation of the concept of Self-Help and formation of SHGs form the
viable route to Micro-finance.
OBJECTIVES OF THE STUDY The objectives of the study are:
1. To review the present status of Self-Help Groups and Micro-Finance in India.
2. To analyze the impact of Micro-Finance on income and savings in Sivagangai District, Tamil Nadu
3. To give policy and suggestions, on the basis of the findings of the present study, for the improvement of working of SHGs and efficient usage of Micro-
Finance.
METHODOLOGY Designing a suitable methodology and selection of analytical tools are important for a meaningful analysis of any research problem. This section is devoted to a
description of the methodology, which includes sampling procedure and tools of analysis.
SAMPLING PROCEDURE Sivaganga district comprises twelve blocks. Keeping in view of the study, 360 sample respondents were stratified into four categories namely agricultural sector,
manufacturing, service and trading sectors. Out of 360 sample respondents, 155 (43.05 per cent) of them comes under agricultural sector, 55 (15.27 per cent) of
them comes under manufacturing sector, 70 (19.44 per cent) of them comes under service sector, and 80 (22.22 per cent) of them comes under trading sector.
TOOLS OF ANALYSIS In order to examine the relationship, Chi – Square test was used by adopting the following formula (Kothari 1978).
Chi – square =∑ E
EO 2)( −
With (r-1).(c-1) degrees of freedom
Where
O - Observed Frequency
E - Expected Frequency
To examine the variation in monthly income and Savings of the respondents among various sectors, such as agricultural, manufacturing, service and trading
sectors. For this one way ANOVA is applied (Rajendra Nargundkar 2002)
To examine the variation in monthly income and Savings of the respondents before and after joining Self – Help Groups in various sectors, using paired‘t’ test is
applied.
ANALYSIS MONTHLY INCOME OF THE RESPONDENTS BEFORE JOINING THE SHGs
The income of the respondents shows her personal income from all sources per month. Here the income of the respondents before joining the SHGs is studied.
The monthly income of the respondents before joining SHGs has been classified into four groups (below Rs.1000, Rs 1001 - Rs.2000, Rs 2001 – Rs.3000, and
above Rs.3000) and it has been shown in table 1.3.
VOLUME NO. 3 (2013), ISSUE NO. 12 (DECEMBER) ISSN 2231-4245
INTERNATIONAL JOURNAL OF RESEARCH IN COMMERCE, ECONOMICS & MANAGEMENT A Monthly Double-Blind Peer Reviewed (Refereed/Juried) Open Access International e-Journal - Included in the International Serial Directories
http://ijrcm.org.in/
47
TABLE 1.3: CLASSIFICATION OF MONTHLY INCOME OF THE RESPONDENTS BEFORE JOINING THE SHGS
Monthly Income of the Respondents Agricultural Sector Manufacturing Sector Service Sector Trading Sector Total
Below 1000
50
[32.3]
17
[30.9]
18
[25.7]
20
[25.0]
105
[29.2]
Rs.1001- Rs.2000
69
[44.5]
13
[23.6]
18
[25.7]
25
[31.3]
125
[34.7]
Rs.2001- Rs.3000
24
[15.5]
14
[25.5]
21
[30.0]
24
[30.0]
83
[23.1]
Above Rs.3001
12
[7.7]
11
[20.0]
13
[18.6]
11
[13.8]
47
[13.1]
Total
155 [100.0]
55 [100.0]
70 [100.0]
80 [100.0]
360 [100.0]
Source: Primary data
Note: Figures in brackets are percentage to the total.
It is concluded from the table that the monthly income before joining self – help groups in the study area is that, about 29.2 per cent of the respondents come
under the category of below Rs.1000, 34.7 per cent of the respondents belong to the category of Rs.1001 to Rs.2000, 23.1 per cent of the respondents belong to
the category of Rs.2001 to Rs.3000, and 13.1 per cent of the respondents belong to the category of above Rs.3001.
MONTHLY INCOME OF THE RESPONDENTS AFTER JOINING THE SHGs
The monthly income of the respondents after joining the SHGs has been classified into four groups and it has been shown in table 1.4
TABLE 1.4: CLASSIFICATION OF MONTHLY INCOME OF THE RESPONDENTS AFTER JOINING THE SHGs
Monthly Income of the Respondents Agricultural Sector Manufacturing Sector Service Sector Trading Sector Total
Below 1000
7
[4.5]
4
[7.3]
8
[11.4]
3
[3.8]
22
[6.1]
Rs.1001- Rs.2000
44
[27.7]
14
[25.5]
5
[7.1]
18
[22.5]
80
[22.2]
Rs.2001- Rs.3000
54
[34.8]
12
[21.8]
13
[18.6]
21
[26.3]
100
[27.8]
Above Rs.3001
51
[32.9]
25
[45.5]
44
[62.9]
38
[47.5]
158
[43.9]
Total
155 [100.0]
55 [100.0]
70 [100.0]
80 [100.0]
360 [100.0]
Source: Primary data
Note: Figures in brackets are percentage to the total.
It has been observed from the table 1.4 that, out of 155 respondents in agricultural sector, 7 (4.5 per cent) of the respondents come under the monthly income
below Rs.1000, 43 (27.7 per cent) respondents come under the monthly income range of Rs.1001 to Rs.2000, 54 (34.8 per cent) respondents come under the
monthly income range of Rs.2001 to Rs.3000, and 51 (32.9 per cent) respondents come under the monthly income of Rs.3001 and above.
The table clearly shows that, out of 55 respondents in manufacturing sector, 4 (7.3 per cent) belong to below Rs.1000 level of income, 14 (25.5 per cent) of them
belong to the range of Rs.1001 to Rs.2000, 12 (21.8 per cent) of them belong to the range of Rs.2001 to Rs.3000, and 25 (45.5 per cent) of them belong to
Rs.3001 and above level of income.
Out of 70 respondents in service sector, 8 (11.4 per cent) respondents belong to below Rs.1000 level of monthly income, 5 (7.1 per cent) of the respondents
come under the range of Rs.1001 to Rs.2000, 13 (18.6 per cent) respondents come under the range of Rs.2001 to Rs.3000, and 44 (62.9 per cent) respondents
belong to Rs.3001 and above.
It is further inferred from the table, out of 80 respondents in trading sector, 3 (3.8 per cent) come under the monthly income below Rs.1000, 18 (22.5 per cent)
belong to Rs.1001 to 2000, 21 (26.3 per cent) belong to the category of Rs.2001 to Rs.3000, and 38 (47.5 per cent) belong to above Rs.3001.
Thus it could be concluded from the table regarding the monthly income after joining SHGs in the study area is that, about 6.1 per cent of the respondents come
under the category of below Rs.1000, 22.2 per cent of the respondents belong to the category of Rs.1001 to Rs.2000, 27.8 per cent of the respondents belong to
the category of Rs.2001 to Rs.3000, and 43.9 per cent of the respondents belong to the category of above Rs.3001.
A NULL-HYPOTHESIS IS FRAMED AND TESTED IN THIS STUDY
H0 = There is no relationship between monthly income of the respondents and the various sectors.
TABLE 1.5: RESULT OF CHI-SQUARE TEST: AFTER JOINING THE SHGs
Test Value d.f Asymp.Sig. (2-Sided) Table Value Result
Pearson Chi-square 30.242 9 0.000 16.9 Rejected
As the calculated value is greater than the table value at 5 per cent level of significance, the investigator rejects the null-hypothesis (Ho). Therefore there is some
relationship between the monthly income of the respondents and the various sectors in the study area.
VARIATION IN MONTHLY INCOME OF THE RESPONDENTS IN VARIOUS SECTORS In this section, an attempt has been made to examine the variation in monthly income of the respondents in various sectors, such as agricultural, manufacturing,
service and trading sectors. For this one way ANOVA is applied separately and the results are presented in table.1.6.
TABLE 1.6: ONE-WAY ANOVA TEST RESULTS OF MONTHLY INCOME OF THE RESPONDENTS IN VARIOUS SECTORS
Income Variation Sum of Squares Df Mean Square F-ratio Sig.
Between Groups 21336856 2 10668428.16 22.867* 0.000
Within groups 1.67E + 08 357 466537.421
Total 1.88E + 08 359
* Significant at 5 per cent level
The results of table.1.6 revealed that there was a significant variation in the monthly income of the respondents among the various sectors at 5 per cent level of
significance. Hence, it may be concluded that the monthly income of the respondents varied significantly among the various sectors such as agricultural sector,
manufacturing sector, service sector and trading sector.
VARIATION IN MONTHLY INCOME OF THE RESPONDENTS BEFORE AND AFTER JOINING THE SHGS IN THE VARIOUS SECTORS H0: There is no any difference in the income of the respondents before and after joining as a member of the Self – Help Group.
H1: There exists difference in the income of the respondents before and after joining as a member of the Self – Help Group.

VOLUME NO. 3 (2013), ISSUE NO. 12 (DECEMBER) ISSN 2231-4245
INTERNATIONAL JOURNAL OF RESEARCH IN COMMERCE, ECONOMICS & MANAGEMENT A Monthly Double-Blind Peer Reviewed (Refereed/Juried) Open Access International e-Journal - Included in the International Serial Directories
http://ijrcm.org.in/
48
TABLE 1.7: RESULTS OF THE PAIRED SAMPLES STATISTICS (MONTHLY INCOME)
Paired Income Mean N Std.Deviation Std.Error
Monthly Income after SHG membership 2670.8889 360 723.4449 38.1289
Monthly Income before SHG membership 1693.6944 360 958.2426 50.5038
TABLE 1.8: RESULTS OF THE PAIRED DIFFERENCES (MONTHLY INCOME)
Paired Monthly Income
Mean Std.Deviation
Std.Error Mean
99% confidence interval of the difference T Df Sig (2 tailed) Lower Upper
After- Before Joining SHG 977.1944 544.1271 28.6780 902.9301 1051.4588 34.075 359 0.000
The table (1.7& 1.8) shows that the 2- tailed significance of the test is 0.000, from the last column of table.4.83. This is the ‘p’ value, and it is less than the level of
significance at 0.01. Therefore, as per our decision, we have to reject the null-hypothesis at a significance level of 1 per cent, and conclude that there is some
significant difference in the monthly income of the respondents before and after joining as a member of self – help group. The mean income of the respondent
after joining as a member of self – help group is Rs.2670.8889 and before joining as a member of self – help group is Rs.1693.6944, and difference Rs.977.1944 is
statistically significant.
SAVINGS AMONG THE RESPONDENTS (PRE – SHGs) The savings of the respondents are the backbone of their future careers. The savings may be utilized for further development purposes or for the purchase of
properties and consumables. The respondent may have a higher individual income but her savings are highly influenced by the earnings and expenses of her
family members. The monthly savings of the respondents before joining as a member of self – help groups has been classified into four groups (Nil, Below
Rs.100, Rs.101 – 200, Rs.201 – Rs.300, and Above Rs.301) and it has been shown in table.1.9.
TABLE 1.9: SAVINGS AMONG THE MEMBERS (PRE – SHGs)
Monthly Savings of the Respondents Agricultural Sector Manufacturing Sector Service Sector Trading Sector Total
Nil 50
[32.3]
17
[30.9]
17
[24.3]
21
[26.3]
105
[29.2]
Below Rs.100 69
[44.5]
13
[23.6]
18
[25.7]
25
[31.3]
125
[34.7]
Rs.100- Rs.200 23
[14.8]
14
[25.5]
20
[28.6]
20
[25.0]
77
[21.4]
Rs.200 - 300
13
[8.4]
8
[14.5]
8
[11.4]
10
[12.5]
39
[10.8]
Above Rs.300 0
[0.0]
3
[5.5]
7
[10.0]
4
[5.0]
14
[3.9]
Total
155 [100.0]
55 [100.0]
70 [100.0]
80 [100.0]
360 [100.0]
Source: Primary data.
Note: Figures in brackets are percentage to the total.
In the study area, before joining the self-help groups the savings capacity of the respondents accounts only a meager amount. About 105 respondents had no
savings. Before the membership of self-help groups, majority of the respondents that is 34.7 per cent of the respondents had savings below Rs.100. 21.4 per
cent of the respondents constitute savings amount of Rs.100 to Rs.200. 10.8 per cent had a savings of Rs.200 to Rs.300. A very low percentage constituting 3.9
per cent of the respondents had savings above Rs.300.
SAVINGS OF THE RESPONDENTS AFTER JOINING AS A MEMBER OF THE SHGs The member earned more income after they joined as a member of self-help groups. The increase in income of the members leads to an increase in savings.
Savings per month among the members are calculated and classified as below Rs.100, Rs.100 to 200, Rs.200 to Rs.300, Rs.300 to Rs.400, and above Rs.400. The
distributions among the respondents are shown in table.1.10.
TABLE 1.10: SAVINGS AMONG THE MEMBERS (POST – SHGs)
Monthly Savings of the Respondents Agricultural Sector Manufacturing Sector Service Sector Trading Sector Total
Below Rs.100
50
[32.3]
17
[30.9]
17
[24.3]
21
[26.3]
105
[29.2]
Rs.101- Rs.200 59
[38.1]
9
[16.4]
14
[20.0]
19
[23.8]
101
[28.1]
Rs.201 - 300
22
[14.2]
14
[25.5]
19
[27.1]
19
[23.8]
74
[20.6]
Rs.301 - 400 24
[15.5]
12
[21.8]
14
[20.0]
17
[21.3]
67
[18.6]
Above Rs.401 0
[0.0]
3
[5.5]
6
[8.6]
4
[5.0]
13
[3.6]
Total
155 [100.0]
55 [100.0]
70 [100.0]
80 [100.0]
360 [100.0]
Source: Primary data
Note: Figures in brackets are percentage to the total.
It has been observed from the table 1.10, that out of 155 respondents in agricultural sector, 50 (32.3 per cent) of the respondents come under the monthly
savings below Rs.100, 59 (38.1 per cent) of the respondents come under the monthly savings range of Rs.101 to Rs.200, 22 (14.2 per cent) of the respondents
come under the monthly savings range of Rs.201 to Rs.300, 24 (15.5 per cent) of the respondents come under the monthly savings of Rs.301 to Rs.400, and there
is no monthly savings of Rs.401 and above.
The table clearly shows that, out of 55 respondents in manufacturing sector, 17 (30.9 per cent) belong to below Rs.100 level of savings, 9 (16.4 per cent) of them
belong to the range of Rs.101 to Rs.200, 14 (25.5 per cent) of them belong to the range of Rs.201 to Rs.300, 12 (21.8 per cent) of them belong to Rs.301 to
Rs400, and 3 (5.5 per cent) of them belong to Rs.401 and above level of savings per month.
Out of 70 respondents in service sector, 17 (24.3 per cent) of the respondents belong to below Rs.100 level of monthly savings, 14 (20.0 per cent) of the
respondents come under the range of Rs.101 to Rs.200 level of monthly savings, 19 (27.1 per cent) of the respondents come under the range of Rs.201 to Rs.300
level of monthly savings, 14 (20.0 per cent) of the respondents belong to Rs.301 to Rs.400, and 6 (8.6 per cent) of the respondents belong to Rs.401 and above.
It is further inferred from the table, out of 80 respondents in trading sector, 21 (26.3 per cent) of them come under the monthly savings below Rs.100, 19 (23.8
per cent) of them belong to Rs.101 to 200, 19 (23.8 per cent) of them belong to the category of Rs.201 to Rs.300, 17 (21.3 per cent) of them belong to Rs.301 to
Rs.400 and 4 (5.0 per cent) of them belong to above Rs.401.

VOLUME NO. 3 (2013), ISSUE NO. 12 (DECEMBER) ISSN 2231-4245
INTERNATIONAL JOURNAL OF RESEARCH IN COMMERCE, ECONOMICS & MANAGEMENT A Monthly Double-Blind Peer Reviewed (Refereed/Juried) Open Access International e-Journal - Included in the International Serial Directories
http://ijrcm.org.in/
49
Thus it could be concluded from the table regarding the monthly savings in the study area is that, about 29.2 per cent of the respondents come under the
category of below Rs.100, 28.1 per cent of the respondents belong to the category of Rs.101 to Rs.200, 20.6 per cent of the respondents belong to the category
of Rs.201 to Rs.300, 18.6 per cent of the respondents belong to the category of Rs.301 to Rs.400, and 3.6 per cent of the respondents belong to the category of
above Rs.401. Thus it is inferred that all the members had the capacity to save after joining as a member in SHGs.
A NULL-HYPOTHESIS IS FRAMED AND TESTED IN THIS STUDY
H0 = There is no relationship between monthly savings of the respondents and the various sectors.
TABLE 1.11: RESULT OF CHI-SQUARE TEST: SAVINGS AMONG THE MEMBERS (POST – SHGs)
Test Value d.f Asymp.Sig. (2-Sided) Table Value Result
Pearson Chi-square 30.104 12 0.003 21.0 Rejected
As the calculated value is greater than the table value at 5 per cent level of significance, the investigator rejects the null-hypothesis (Ho). Therefore there is some
relationship between the monthly savings of the respondents after joining the self-help groups and the various sectors.
VARIATION IN MONTHLY SAVINGS OF THE RESPONDENTS IN VARIOUS SECTORS In this section, an attempt has been made to examine the variation in monthly savings of the respondents among various sectors, such as agricultural,
manufacturing, service and trading sectors. For this one way ANOVA is applied separately and the results are presented in table.1.12.
TABLE 1.12: ONE-WAY ANOVA TEST RESULTS OF MONTHLY SAVINGS OF THE RESPONDENTS IN VARIOUS SECTORS
Savings Variation Sum of Squares Df Mean Square F-ratio Sig.
Between Groups 392368.8 2 196184.393 14.437* 0.000
Within groups 4851379 357 13589.298
Total 5243748 359
* Significant at 5 per cent level
The table.1.12 revealed that there was a significant variation in the monthly savings of the respondents among the various sectors at 5 per cent level of
significance. Hence, it may be concluded that the monthly savings of the respondents varied significantly among the various sectors such as agricultural sector,
manufacturing sector, service sector and trading sector.
VARIATION IN MONTHLY SAVINGS OF THE RESPONDENTS BEFORE AND AFTER JOINING THE SHGS IN THE VARIOUS SECTORS H0: There is no any difference in the savings of the respondents before and after joining as a member of the Self – Help Group.
H1: There is some difference in the savings of the respondents before and after joining as a member of the Self – Help Group.
TABLE 1.13: RESULTS OF THE PAIRED SAMPLES STATISTICS (MONTHLY SAVINGS)
Paired Savings Mean N Std.Deviation Std.Error
Monthly Savings after SHG membership 212.4306 360 120.8575 6.3698
Monthly Savings before SHG membership 83.3611 360 98.8152 5.2080
TABLE 1.14: RESULTS OF THE PAIRED DIFFERENCES (MONTHLY SAVINGS)
Paired Monthly Savings
Mean Std. Deviation
Std.Error Mean
99% confidence interval of the difference T Df Sig (2 tailed) Lower Upper
After- Before Joining SHG 129.0694 71.5285 3.7699 138.8319 119.3070 34.237 359 0.000
The table (1.13 & 1.14) shows that the 2- tailed significance of the test is 0.000, from the last column of table.4.85. This is the ‘p’ value, and it is less than the
level of significance at 0.01. Therefore, as per our decision, we have to reject the null-hypothesis at a significance level of 1 per cent, and conclude that there is
some significant difference in the monthly savings of the respondents before and after joining as a member of self – help group. The mean savings of the
respondent after joining as a member of self – help group is Rs.212.4306 and before joining as a member of self – help group is Rs.83.3611, and the difference
Rs.129.0694 is statistically significant.
FINDINGS The study aims at ascertaining the impact on the SHG members at post – SHG stage compared with pre – SHG stage. In this respect, the study attempts to
evaluate the changes for the members in their income and savings.
It could be concluded, regarding the monthly income after joining SHGs in the study area is that, about 6.1 per cent of the respondents come under the category
of below Rs.1000, 22.2 per cent of the respondents belong to the category of Rs.1001 to Rs.2000, 27.8 per cent of the respondents belong to the category of
Rs.2001 to Rs.3000, and 43.9 per cent of the respondents belong to the category of above Rs.3001.
It may be concluded that the monthly income of the respondents and their family size varied significantly among the various sectors such as agricultural sector,
manufacturing sector, service sector and trading sector.
It concludes that there is some significant difference in the monthly income of the respondents before and after joining as a member of self – help group. The
mean income of the respondent after joining as a member of self – help group is Rs.2670.8889 and before joining as a member of self – help group is
Rs.1693.6944, and difference Rs.977.1944 is statistically significant.
It could be concluded, regarding the monthly savings in the study area is that, about 29.2 per cent of the respondents come under the category of below Rs.100,
28.1 per cent of the respondents belong to the category of Rs.101 to Rs.200, 20.6 per cent of the respondents belong to the category of Rs.201 to Rs.300, 18.6
per cent of the respondents belong to the category of Rs.301 to Rs.400, and 3.6 per cent of the respondents belong to the category of above Rs.401. Thus it is
inferred that all the members had the capacity to save after joining as a member in SHGs.
It may be concluded that the monthly savings of the respondents and their family size varied significantly among the various sectors such as agricultural sector,
manufacturing sector, service sector and trading sector.
It concludes that there is some significant difference in the monthly savings of the respondents before and after joining as a member of self – help group. The
mean savings of the respondent after joining as a member of self – help group is Rs.212.4306 and before joining as a member of self – help group is Rs.83.3611,
and the difference Rs.129.0694 is statistically significant.
CONCLUSION The study observed that self – Help groups are emerging as a potential source of credit for women. Microfinance helps the weaker section all over the world in
alleviation of urban and rural poverty through promoting micro enterprises as a solution to the problem of unemployment and underemployment among the
poor. Thus, micro-finance serves as a tool in empowering rural women through poverty alleviation.
SUGGESTIONS In the light of the above discussion and findings, the following suggestions are made:
1. Savings by the members is one of the main indicators for economic development. So, the banks and post offices should introduce attractive, user – friendly
schemes to encourage the thrift habit among the members.
VOLUME NO. 3 (2013), ISSUE NO. 12 (DECEMBER) ISSN 2231-4245
INTERNATIONAL JOURNAL OF RESEARCH IN COMMERCE, ECONOMICS & MANAGEMENT A Monthly Double-Blind Peer Reviewed (Refereed/Juried) Open Access International e-Journal - Included in the International Serial Directories
http://ijrcm.org.in/
50
2. The SHG entrepreneurs face the problem of marketing the products produced by them. Arrangements should be made to market the products through
Public Distribution System (PDS).
3. SHG women are more concerned with poverty and its effect on society. Since they themselves fight against poverty by being members of SHG and move
upwards from below poverty line, in future, the poverty alleviation programmes can be implemented through SHGs, They can monitor themselves
effectively, with all enthusiasm and involvement.
4. A growing unhealthy competition is visible between Mahalir Thittam approved NGOs and other SHGs promoted by NGOs in the study area. Such unhealthy
competition much be removed otherwise it will spoil the entire concept of the programme. For this, the area or villages can be clearly segregated and only
one participation agency should be permitted in a village.
5. Overlapping and dual memberships should be avoided and mobility should not be encouraged among the SHG members between the groups.
6. The training system should link up with some kind of credit delivery mechanism whether formal or informal. It is suggested that more number of groups
should be linked with the banks so that their credit support would be strengthened.
7. Institutional credit facility must be extended to women to develop their managerial skill for prompt repayment consciousness.
8. Micro – Finance should be used to meet the immediate demand of the poor women – for Health, Education or consumption purposes. This will improve
the quality of their life and will be ready to take active participation in economic activities.
9. Exposure visits to other successful groups can be organized to share the knowledge, experience and expertise.
10. Income generating activity should be based on available local resources and a reasonably assured market with profits.
11. Regarding the enrolment of membership, SHGs consisting of members Below Poverty Line (BPL) should enroll only a person of Below Poverty Line. Then
only, they can utilize the economic benefits like the revolving fund and subsidies given by banks.
12. Among all the sectors, agricultural sector lacks behind in earning income. This sector can engage them in contract farming and cultivate profitable crops.
REFERENCES 1 C. Gangaiah, B. Nagaraja, C. Vasudevulu Naidu (2006), “Impact of SHGs on Income and Employment”, Kurukshetra, vol.54, no.5, March 2006.
2 Gupta, S.P. “Statistical Methods” Sultan Chand & Sons, New Delhi – 110 002, 1997.
3 Kaladhar, K. (1997).” Micro – Finance in India – design, structure and governance”, Economic and political weekly, October 18, pp, 2687 – 2706
4 Kothari, C.R., Quantitative Techniques, Vikas Publishing House Pvt. Ltd. New Delhi, 1978.
5 Kulshrestha, L.R (2000) “Micro – Finance, the new development paradigm for poor rural women” Kurushetra, November, pp 23 – 24.
6 NABARD, Status of Micro-Finance in India, 2011-2012
7 R. Elangovan (2006): Socio-Economic study of the SHGs – A Statistical Appraised of Villupuram district, 27th
Annual conference of the Association of
Economists of Tamil Nadu, pp.89-90.
8 Rajendra Nargundkar ,”Marketing Research” Tata McGraw – Hill publishing Company Limited, New Delhi, 2002
9 Robinson, M.S. (1996). “Addressing some key question in finance and poverty”, Journal of international development, Vol.8 No.2, pp 153 – 161.
10 Vinze, M.D. (1987). “Women Entrepreneurship in India”, Mittal Publications, Delhi.
VOLUME NO. 3 (2013), ISSUE NO. 12 (DECEMBER) ISSN 2231-4245
INTERNATIONAL JOURNAL OF RESEARCH IN COMMERCE, ECONOMICS & MANAGEMENT A Monthly Double-Blind Peer Reviewed (Refereed/Juried) Open Access International e-Journal - Included in the International Serial Directories
http://ijrcm.org.in/
51
POLICY HOLDERS AWARENESS AND ADOPTION OF INFORMATION COMMUNICATION TECHNOLOGY OF LIFE INSURANCE CORPORATION OF INDIA
S. RANI LAKSHMI
RESEARCH SCHOLOR
DEPARTMENT OF COMMERCE
AVINASHILINGAM INSTITUTE FOR HOME SCIENCE & HIGHER EDUCATION FOR WOMEN
COIMBATORE
DR. P. SANTHI
ASSOCIATE PROFESSOR
DEPARTMENT OF COMMERCE
AVINASHILINGAM INSTITUTE FOR HOME SCIENCE & HIGHER EDUCATION FOR WOMEN
COIMBATORE
ABSTRACT
Insurance is one of the major segments of financial markets. The insurance business is rewarded for managing the risk of other parties. The insurance sector is a
booming sector and the penetration in India is quiet low. The opening up of the insurance to the private sector has provided immense opportunities for both
public and the private industry for better utilization of insurance facilities. With the convergence of technologies it has become imperative to use ICT for
improving insurance. With this kind of situation prevailing, there has not been much progress in the coverage of population within this system of insurance. The
major objectives of the study are to ascertain the socio-economic profile of the respondents and to identify the awareness of the policyholders in LIC’s products
and ICT adoption by respondents for policy requirement, premium payment and for information needs. Methodology of the study is based on the analysis of the
data collected through structured questionnaire from 300 life insurance policy holders in Coimbatore city by using interview schedule method. Statistical tools like
percentage and ANOVA were employed for data analysis. The study reveals that the respondents have greater awareness towards the LIC policies and they are
more aware about the Endowment policy and Money back policies in the study area. LIC of India has to create awareness among female policy holders about the
Women policies. LIC websites, electronic payments and payments through savings bank accounts are gaining importance as mode of premium payments. The
agents help in marketing LIC policies by spreading the message of life insurance among the masses and the respondents depend on the agents for their insurance
needs.
KEYWORDS Information and communication technology (ICT), Policies, Information, Distribution.
INTRODUCTION ife insurance is universally acknowledged to be an institution, which eliminates 'risk', substituting certainty for uncertainty and comes to the timely aid of
the family in the unfortunate event of death of breadwinner. (Harpreet Singh Bedi and Preeti Singh, 2011). The Life Insurance Corporation of India is the
largest state-owned life insurance company in India, and also the country's largest investor. The Indian insurance industry was opened for private insurers
in the year 1999, with the enforcement and establishment of Insurance Regulatory And Development Authority Act. (Anshuja Tiwari and Babita Yadav, 2012). Even though the insurance sector is a booming sector its penetration in India is quiet low. With the convergence of technologies it has become imperative to use
information and communication technologies for improving insurance. In the insurance sector, ICT can provide a practical and enabling solution for improving
the quality of service. (Santhi and Arthi 2013). With this kind of situation prevailing, there has not been much progress in the coverage of population within this
system of insurance; only meager per cent coverage has been reported. Whether this is due to lack of awareness of insurance products and modalities on part of
the public is to be determined.
REVIEW OF LITERATURE According to Bhat, (2005), the penetration of insurance critically depends on the availability of insurance products and services. The huge untapped market,
proliferation of schemes, new product innovations, perception of insurable risks of Indian consumers, competitive pressures arising from integration of bank and
insurance, impact of information technology, and the role of insurance industry in financial services industry are some of the forces which shape the competitive
structure of the insurance industry. In India, reforms have helped to foster growth, but the insurance sector still remains mostly under-penetrated. It further
finds that the average number of policies (life and non-life) held by an Indian consumer is just 1.33 percent policies, compared with the average of 5.2 policies
per client for matured markets. (World Insurance Report, 2008). Clifford Paul et.al (2010), in their research revealed that awareness is low and needs to be
improved among the uneducated, lower age group and daily wage class. The study also shows that real growth in life insurance will occur when customers
realize the true value of life insurance beyond tax saving. Thus the penetration of insurance is very low in India. Sastry (2010) stated that India is among the
important emerging insurance markets in the world and that life insurance will grow very rapidly over the next decades in India. The major drivers of this growth
include sound economic fundamentals, a rising middle class, an improving regulatory framework, and rising risk awareness. Presently, life insurance is seen as a
mechanism through which investors can receive a tax break only. Often, these considerations act as incentives to buy life insurance policies but people need to
look at insurance as a long term saving instrument. There is a great need to study the awareness about varied insurance products of LIC of India to suit the
difference financial needs and adoption of ICT for enhancing the reach and for easy operation.
STATEMENT OF THE PROBLEM Life Insurance is customer based business where retention of existing customers is the biggest challenge in present-day cut throat market competition. The
declining market share is the biggest concern of LIC, after privatization. (Babita yadav, 2011). The success of the life insurance business depends on the
awareness of the policyholders about the products and satisfaction of the policyholders regarding the service rendered by LIC of India. As a consequence, Life
Insurance Corporation of India has undergone increasing pressure to the policyholder’s requirements. The main challenge before the insurance companies is to
constantly innovate new products to suit, ascertain changes in policyholder’s behavior, changing life style, government intervention, competitions, technology,
distribution network, automation, technological advancement, service quality and customer relationship management.
OBJECTIVES OF THE STUDY 1. To understand the awareness of insurance products of LIC of India and to test the association between socio-economic profile of the respondents.
L
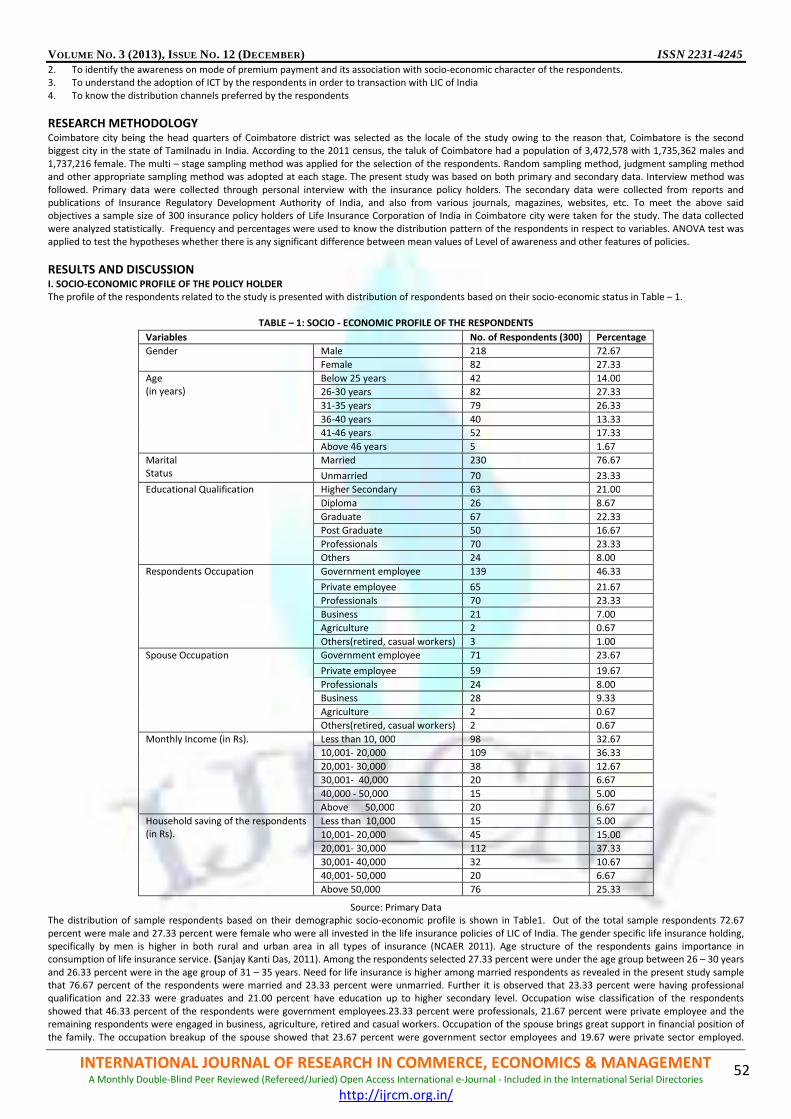
VOLUME NO. 3 (2013), ISSUE NO. 12 (DECEMBER) ISSN 2231-4245
INTERNATIONAL JOURNAL OF RESEARCH IN COMMERCE, ECONOMICS & MANAGEMENT A Monthly Double-Blind Peer Reviewed (Refereed/Juried) Open Access International e-Journal - Included in the International Serial Directories
http://ijrcm.org.in/
52
2. To identify the awareness on mode of premium payment and its association with socio-economic character of the respondents.
3. To understand the adoption of ICT by the respondents in order to transaction with LIC of India
4. To know the distribution channels preferred by the respondents
RESEARCH METHODOLOGY Coimbatore city being the head quarters of Coimbatore district was selected as the locale of the study owing to the reason that, Coimbatore is the second
biggest city in the state of Tamilnadu in India. According to the 2011 census, the taluk of Coimbatore had a population of 3,472,578 with 1,735,362 males and
1,737,216 female. The multi – stage sampling method was applied for the selection of the respondents. Random sampling method, judgment sampling method
and other appropriate sampling method was adopted at each stage. The present study was based on both primary and secondary data. Interview method was
followed. Primary data were collected through personal interview with the insurance policy holders. The secondary data were collected from reports and
publications of Insurance Regulatory Development Authority of India, and also from various journals, magazines, websites, etc. To meet the above said
objectives a sample size of 300 insurance policy holders of Life Insurance Corporation of India in Coimbatore city were taken for the study. The data collected
were analyzed statistically. Frequency and percentages were used to know the distribution pattern of the respondents in respect to variables. ANOVA test was
applied to test the hypotheses whether there is any significant difference between mean values of Level of awareness and other features of policies.
RESULTS AND DISCUSSION I. SOCIO-ECONOMIC PROFILE OF THE POLICY HOLDER The profile of the respondents related to the study is presented with distribution of respondents based on their socio-economic status in Table – 1.
TABLE – 1: SOCIO - ECONOMIC PROFILE OF THE RESPONDENTS
Source: Primary Data
The distribution of sample respondents based on their demographic socio-economic profile is shown in Table1. Out of the total sample respondents 72.67
percent were male and 27.33 percent were female who were all invested in the life insurance policies of LIC of India. The gender specific life insurance holding,
specifically by men is higher in both rural and urban area in all types of insurance (NCAER 2011). Age structure of the respondents gains importance in
consumption of life insurance service. (Sanjay Kanti Das, 2011). Among the respondents selected 27.33 percent were under the age group between 26 – 30 years
and 26.33 percent were in the age group of 31 – 35 years. Need for life insurance is higher among married respondents as revealed in the present study sample
that 76.67 percent of the respondents were married and 23.33 percent were unmarried. Further it is observed that 23.33 percent were having professional
qualification and 22.33 were graduates and 21.00 percent have education up to higher secondary level. Occupation wise classification of the respondents
showed that 46.33 percent of the respondents were government employees.23.33 percent were professionals, 21.67 percent were private employee and the
remaining respondents were engaged in business, agriculture, retired and casual workers. Occupation of the spouse brings great support in financial position of
the family. The occupation breakup of the spouse showed that 23.67 percent were government sector employees and 19.67 were private sector employed.
Variables No. of Respondents (300) Percentage
Gender Male 218 72.67
Female 82 27.33
Age
(in years)
Below 25 years 42 14.00
26-30 years 82 27.33
31-35 years 79 26.33
36-40 years 40 13.33
41-46 years 52 17.33
Above 46 years 5 1.67
Marital
Status
Married 230 76.67
Unmarried 70 23.33
Educational Qualification Higher Secondary 63 21.00
Diploma 26 8.67
Graduate 67 22.33
Post Graduate 50 16.67
Professionals 70 23.33
Others 24 8.00
Respondents Occupation Government employee 139 46.33
Private employee 65 21.67
Professionals 70 23.33
Business 21 7.00
Agriculture 2 0.67
Others(retired, casual workers) 3 1.00
Spouse Occupation Government employee 71 23.67
Private employee 59 19.67
Professionals 24 8.00
Business 28 9.33
Agriculture 2 0.67
Others(retired, casual workers) 2 0.67
Monthly Income (in Rs). Less than 10, 000 98 32.67
10,001- 20,000 109 36.33
20,001- 30,000 38 12.67
30,001- 40,000 20 6.67
40,000 - 50,000 15 5.00
Above 50,000 20 6.67
Household saving of the respondents
(in Rs).
Less than 10,000 15 5.00
10,001- 20,000 45 15.00
20,001- 30,000 112 37.33
30,001- 40,000 32 10.67
40,001- 50,000 20 6.67
Above 50,000 76 25.33
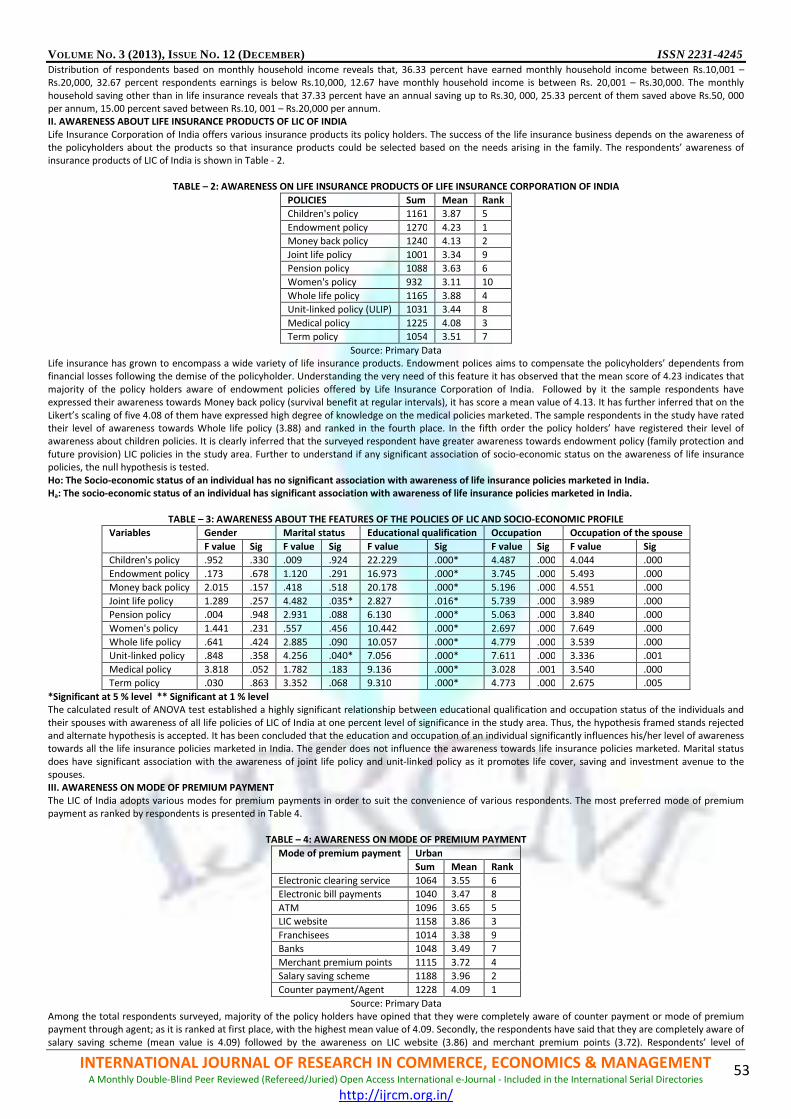
VOLUME NO. 3 (2013), ISSUE NO. 12 (DECEMBER) ISSN 2231-4245
INTERNATIONAL JOURNAL OF RESEARCH IN COMMERCE, ECONOMICS & MANAGEMENT A Monthly Double-Blind Peer Reviewed (Refereed/Juried) Open Access International e-Journal - Included in the International Serial Directories
http://ijrcm.org.in/
53
Distribution of respondents based on monthly household income reveals that, 36.33 percent have earned monthly household income between Rs.10,001 –
Rs.20,000, 32.67 percent respondents earnings is below Rs.10,000, 12.67 have monthly household income is between Rs. 20,001 – Rs.30,000. The monthly
household saving other than in life insurance reveals that 37.33 percent have an annual saving up to Rs.30, 000, 25.33 percent of them saved above Rs.50, 000
per annum, 15.00 percent saved between Rs.10, 001 – Rs.20,000 per annum.
II. AWARENESS ABOUT LIFE INSURANCE PRODUCTS OF LIC OF INDIA Life Insurance Corporation of India offers various insurance products its policy holders. The success of the life insurance business depends on the awareness of
the policyholders about the products so that insurance products could be selected based on the needs arising in the family. The respondents’ awareness of
insurance products of LIC of India is shown in Table - 2.
TABLE – 2: AWARENESS ON LIFE INSURANCE PRODUCTS OF LIFE INSURANCE CORPORATION OF INDIA
POLICIES Sum Mean Rank
Children's policy 1161 3.87 5
Endowment policy 1270 4.23 1
Money back policy 1240 4.13 2
Joint life policy 1001 3.34 9
Pension policy 1088 3.63 6
Women's policy 932 3.11 10
Whole life policy 1165 3.88 4
Unit-linked policy (ULIP) 1031 3.44 8
Medical policy 1225 4.08 3
Term policy 1054 3.51 7
Source: Primary Data
Life insurance has grown to encompass a wide variety of life insurance products. Endowment polices aims to compensate the policyholders’ dependents from
financial losses following the demise of the policyholder. Understanding the very need of this feature it has observed that the mean score of 4.23 indicates that
majority of the policy holders aware of endowment policies offered by Life Insurance Corporation of India. Followed by it the sample respondents have
expressed their awareness towards Money back policy (survival benefit at regular intervals), it has score a mean value of 4.13. It has further inferred that on the
Likert’s scaling of five 4.08 of them have expressed high degree of knowledge on the medical policies marketed. The sample respondents in the study have rated
their level of awareness towards Whole life policy (3.88) and ranked in the fourth place. In the fifth order the policy holders’ have registered their level of
awareness about children policies. It is clearly inferred that the surveyed respondent have greater awareness towards endowment policy (family protection and
future provision) LIC policies in the study area. Further to understand if any significant association of socio-economic status on the awareness of life insurance
policies, the null hypothesis is tested.
Ho: The Socio-economic status of an individual has no significant association with awareness of life insurance policies marketed in India. Ha: The socio-economic status of an individual has significant association with awareness of life insurance policies marketed in India.
TABLE – 3: AWARENESS ABOUT THE FEATURES OF THE POLICIES OF LIC AND SOCIO-ECONOMIC PROFILE
Variables Gender Marital status Educational qualification Occupation Occupation of the spouse
F value Sig F value Sig F value Sig F value Sig F value Sig
Children's policy .952 .330 .009 .924 22.229 .000* 4.487 .000 4.044 .000
Endowment policy .173 .678 1.120 .291 16.973 .000* 3.745 .000 5.493 .000
Money back policy 2.015 .157 .418 .518 20.178 .000* 5.196 .000 4.551 .000
Joint life policy 1.289 .257 4.482 .035* 2.827 .016* 5.739 .000 3.989 .000
Pension policy .004 .948 2.931 .088 6.130 .000* 5.063 .000 3.840 .000
Women's policy 1.441 .231 .557 .456 10.442 .000* 2.697 .000 7.649 .000
Whole life policy .641 .424 2.885 .090 10.057 .000* 4.779 .000 3.539 .000
Unit-linked policy .848 .358 4.256 .040* 7.056 .000* 7.611 .000 3.336 .001
Medical policy 3.818 .052 1.782 .183 9.136 .000* 3.028 .001 3.540 .000
Term policy .030 .863 3.352 .068 9.310 .000* 4.773 .000 2.675 .005
*Significant at 5 % level ** Significant at 1 % level The calculated result of ANOVA test established a highly significant relationship between educational qualification and occupation status of the individuals and
their spouses with awareness of all life policies of LIC of India at one percent level of significance in the study area. Thus, the hypothesis framed stands rejected
and alternate hypothesis is accepted. It has been concluded that the education and occupation of an individual significantly influences his/her level of awareness
towards all the life insurance policies marketed in India. The gender does not influence the awareness towards life insurance policies marketed. Marital status
does have significant association with the awareness of joint life policy and unit-linked policy as it promotes life cover, saving and investment avenue to the
spouses.
III. AWARENESS ON MODE OF PREMIUM PAYMENT The LIC of India adopts various modes for premium payments in order to suit the convenience of various respondents. The most preferred mode of premium
payment as ranked by respondents is presented in Table 4.
TABLE – 4: AWARENESS ON MODE OF PREMIUM PAYMENT
Mode of premium payment Urban
Sum Mean Rank
Electronic clearing service 1064 3.55 6
Electronic bill payments 1040 3.47 8
ATM 1096 3.65 5
LIC website 1158 3.86 3
Franchisees 1014 3.38 9
Banks 1048 3.49 7
Merchant premium points 1115 3.72 4
Salary saving scheme 1188 3.96 2
Counter payment/Agent 1228 4.09 1
Source: Primary Data
Among the total respondents surveyed, majority of the policy holders have opined that they were completely aware of counter payment or mode of premium
payment through agent; as it is ranked at first place, with the highest mean value of 4.09. Secondly, the respondents have said that they are completely aware of
salary saving scheme (mean value is 4.09) followed by the awareness on LIC website (3.86) and merchant premium points (3.72). Respondents’ level of

VOLUME NO. 3 (2013), ISSUE NO. 12 (DECEMBER) ISSN 2231-4245
INTERNATIONAL JOURNAL OF RESEARCH IN COMMERCE, ECONOMICS & MANAGEMENT A Monthly Double-Blind Peer Reviewed (Refereed/Juried) Open Access International e-Journal - Included in the International Serial Directories
http://ijrcm.org.in/
54
awareness towards ATM is ranked in the fifth place with a mean value of 3.65. Electronic clearing service is duly ranked in the sixth place as per the opinion
revealed by the surveyed respondents (mean value is 3.55). Sample subjects’ level of awareness towards banks (3.49), electronic bill payments (3.47) and
franchisees (3.38) were ranked in seventh, eighth and ninth places respectively. It is inferred that the most preferred mode of premium payment is payment in
the counters of LIC of India offices and remittances through agents. For those respondents who are employed, salary saving scheme serves the purpose of their
life insurance cover and premium payment. LIC websites, electronic payments and through Savings bank accounts are gaining importance as mode of premium
payments. In order to understand the socio-economic status and association with the mode for payment of premium null hypothesis is tested.
H0: Socio-economic status of respondents does not have significant association with awareness on mode of premium payment. Ha: Socio-economic status of respondents has significant association with awareness on mode of premium payment.
TABLE – 5: AWARENESS ON MODE OF PREMIUM PAYMENT AND SOCIO-ECONOMIC PROFILE
Variables Gender Marital status Educational qualification Occupation Occupation of the spouse
F value Sig F value Sig F value Sig F value Sig F value Sig
Electronic clearing service 2.653 .104 2.215 .138 7.615 .000 3.905 .000 2.902 .002
Electronic bill payments .685 .409 1.856 .174 5.445 .000 2.297 .010 4.409 .000
ATM 2.236 .136 1.850 .175 2.862 .016 3.421 .000 3.206 .001
LIC website 20.683 .000 .078 .780 8.559 .000 4.007 .000 8.065 .000
Franchisees 5.893 .016 .944 .332 3.076 .010 4.636 .000 4.498 .000
Banks 1.086 .298 1.499 .222 2.564 .027 5.038 .000 3.486 .000
Merchant premium points .273 .602 1.670 .197 7.672 .000 2.499 .005 1.601 .111
Salary saving scheme 28.395 .000 .541 .463 6.398 .000 3.017 .001 3.747 .000
Counter payment/Agent 35.406 .000 .630 .428 6.131 .000 2.246 .012 3.197 .001
Level of significance: 5 per cent
It has been inferred that the educational qualification and occupation status of the policy holders and their spouse occupation status directly influences their
level of awareness towards electronic mode of payment. The respondents’ gender and marital status were inferred to be insignificant variables. Thus, the
hypothesis stands accepted. It has concluded that the socio-economic status of an individual significantly influences his/her level of awareness towards
electronic mode of payment. The consumer education programme of LIC of India shall include instructions relating to get familiarity and usage of various
facilities created for easy remittance of premium.
IV. ADOPTION OF ICT FOR TRANSACTION WITH LIC OF INDIA Disseminations of information are a vital process for growth and development of any organization. Using ICT, LIC of India has brought in many facilities for quick
and easy transaction by its clients. The respondents’ views on awareness and adoption of such ICT facilities is analyzed and presented in Table - 6.
TABLE – 6: AWARENESS AND ADOPTION OF INFORMATION COMMUNICATION TECHNOLOGY (ICT) IN LIFE INSURANCE CORPORATION OF INDIA
Facilities
Sum Mean Rank
Information KIOSKS (online touch screen) 1058 3.53 4
Interactive voice response systems 972 3.24 8
Information center 1075 3.58 2
Short message service (SMS) 1027 3.42 5
Enterprise portals 1021 3.40 6
Information over the internet 1096 3.65 1
Satellite sampark branches 1006 3.35 7
Information service 1071 3.57 3
Source: Primary Data
The above table indicates the surveyed respondents’ awareness and adoption of information communication technology for information about Life Insurance
Corporation of India. Majority of the respondents have opined that they have very high degree of awareness towards information passed through internet; it is
ranked first with a mean of 3.65. Followed by, the policy holders were aware of information center operated by the Life Insurance Corporation of India from
where they can collect information about policies; it is ranked at second place with an average mean of 3.58. Information service, information KIOSKS (online
touch screen), short message service (SMS), enterprise portals and satellite sampark branches have been ranked in the third, fourth, fifth, sixth and seventh
places with an mean value of 3.57, 3.53, 3.42, 3.40 and 3.35 respectively. Finally, the respondents have expressed that they have moderate level of awareness
towards interactive voice response systems it has got a mean score of 3.24. In order to understand the socio-economic status and association with the
awareness and adoption of ICT in LIC of India, the null hypothesis is tested.
H0: Socio-economic status of an individual do not significantly influences his/her awareness and adoption of information communication technology (ICT) facilities of LIC of India. Ha: Socio-economic status of an individual significantly influences his/her awareness and adoption of information communication technology (ICT) facilities of LIC of India.
TABLE – 7: AWARENESS OF INFORMATION COMMUNICATION TECHNOLOGY (ICT) IN LIFE INSURANCE CORPORATION OF INDIA
Variables Gender Marital status Educational qualification Occupation Occupation of the spouse
F value Sig F value Sig F value Sig F value Sig F value Sig
Information KIOSKS (online touch screen) 3.041 .082 1.106 .294 4.340 .001 4.388 .000 8.250 .000
Interactive voice response systems .029 .865 .381 .537 2.040 .073 5.502 .000 3.383 .000
Information centre 5.814 .017 1.009 .316 2.941 .013 5.988 .000 5.867 .000
Short message service (SMS) .537 .464 1.800 .181 1.726 .129 4.245 .000 3.933 .000
Enterprise portals .076 .783 1.031 .311 1.220 .300 6.325 .000 5.866 .000
Information over the internet 9.613 .002 .022 .882 2.290 .046 2.755 .002 3.460 .000
Satellite sampark branches .009 .924 2.033 .155 4.998 .000 5.536 .000 4.405 .000
Information service 2.042 .154 .093 .760 5.114 .000 4.759 .000 4.969 .000
Level of significance: 5 per cent
From the above table it is inferred that gender of the respondents did not influence the awareness and adoption of ICT facilities in LIC of India by the
respondents except the information centre which is significant at five percent level and the information over internet which is statistically significant at one
percent level. Marital status has significant influence on the awareness of ICT facilities of LIC of India. Further the table obviously shows that education made the
respondents aware of Information KIOSKS, Satellite Sampark branches and Information services which are statistically significant at one percent level, followed
by Information centres and Information over internet which is significant at five percent level. Occupation of the respondents and occupation of the spouse also
influence the awareness about all the ICT facilities of LIC of India.
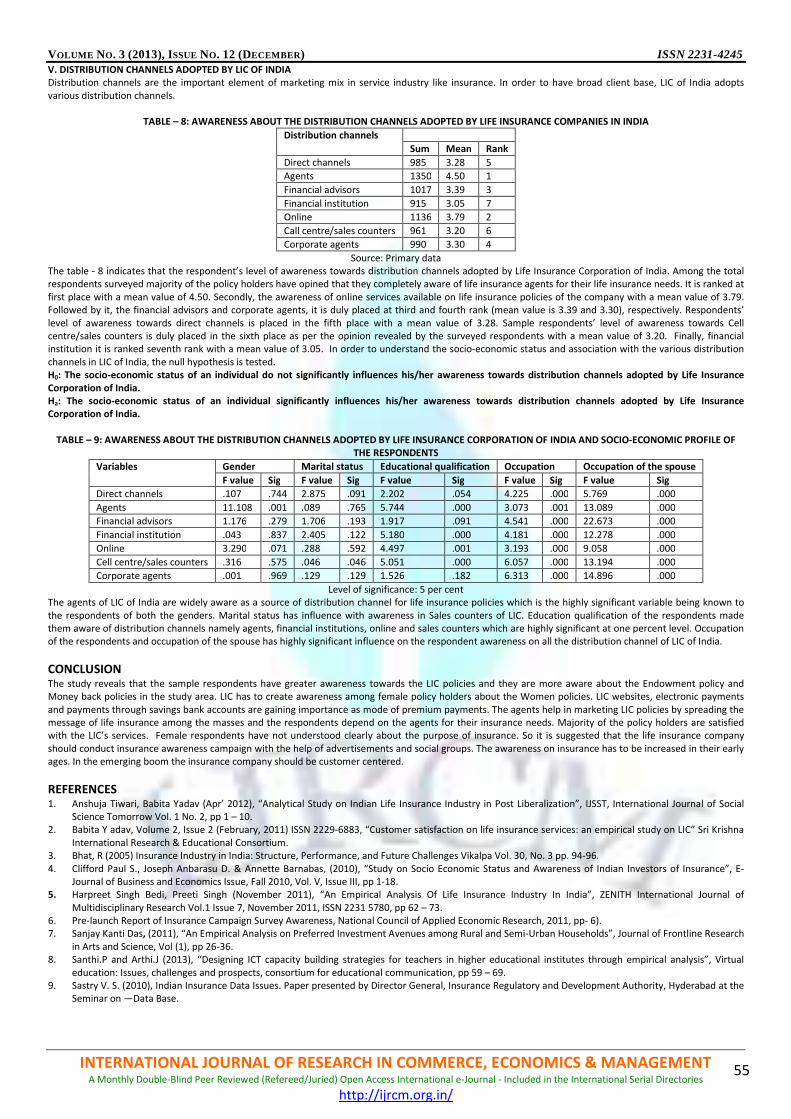
VOLUME NO. 3 (2013), ISSUE NO. 12 (DECEMBER) ISSN 2231-4245
INTERNATIONAL JOURNAL OF RESEARCH IN COMMERCE, ECONOMICS & MANAGEMENT A Monthly Double-Blind Peer Reviewed (Refereed/Juried) Open Access International e-Journal - Included in the International Serial Directories
http://ijrcm.org.in/
55
V. DISTRIBUTION CHANNELS ADOPTED BY LIC OF INDIA Distribution channels are the important element of marketing mix in service industry like insurance. In order to have broad client base, LIC of India adopts
various distribution channels.
TABLE – 8: AWARENESS ABOUT THE DISTRIBUTION CHANNELS ADOPTED BY LIFE INSURANCE COMPANIES IN INDIA
Distribution channels
Sum Mean Rank
Direct channels 985 3.28 5
Agents 1350 4.50 1
Financial advisors 1017 3.39 3
Financial institution 915 3.05 7
Online 1136 3.79 2
Call centre/sales counters 961 3.20 6
Corporate agents 990 3.30 4
Source: Primary data The table - 8 indicates that the respondent’s level of awareness towards distribution channels adopted by Life Insurance Corporation of India. Among the total
respondents surveyed majority of the policy holders have opined that they completely aware of life insurance agents for their life insurance needs. It is ranked at
first place with a mean value of 4.50. Secondly, the awareness of online services available on life insurance policies of the company with a mean value of 3.79.
Followed by it, the financial advisors and corporate agents, it is duly placed at third and fourth rank (mean value is 3.39 and 3.30), respectively. Respondents’
level of awareness towards direct channels is placed in the fifth place with a mean value of 3.28. Sample respondents’ level of awareness towards Cell
centre/sales counters is duly placed in the sixth place as per the opinion revealed by the surveyed respondents with a mean value of 3.20. Finally, financial
institution it is ranked seventh rank with a mean value of 3.05. In order to understand the socio-economic status and association with the various distribution
channels in LIC of India, the null hypothesis is tested.
H0: The socio-economic status of an individual do not significantly influences his/her awareness towards distribution channels adopted by Life Insurance Corporation of India. Ha: The socio-economic status of an individual significantly influences his/her awareness towards distribution channels adopted by Life Insurance Corporation of India.
TABLE – 9: AWARENESS ABOUT THE DISTRIBUTION CHANNELS ADOPTED BY LIFE INSURANCE CORPORATION OF INDIA AND SOCIO-ECONOMIC PROFILE OF THE RESPONDENTS
Variables Gender Marital status Educational qualification Occupation Occupation of the spouse
F value Sig F value Sig F value Sig F value Sig F value Sig
Direct channels .107 .744 2.875 .091 2.202 .054 4.225 .000 5.769 .000
Agents 11.108 .001 .089 .765 5.744 .000 3.073 .001 13.089 .000
Financial advisors 1.176 .279 1.706 .193 1.917 .091 4.541 .000 22.673 .000
Financial institution .043 .837 2.405 .122 5.180 .000 4.181 .000 12.278 .000
Online 3.290 .071 .288 .592 4.497 .001 3.193 .000 9.058 .000
Cell centre/sales counters .316 .575 .046 .046 5.051 .000 6.057 .000 13.194 .000
Corporate agents .001 .969 .129 .129 1.526 .182 6.313 .000 14.896 .000
Level of significance: 5 per cent
The agents of LIC of India are widely aware as a source of distribution channel for life insurance policies which is the highly significant variable being known to
the respondents of both the genders. Marital status has influence with awareness in Sales counters of LIC. Education qualification of the respondents made
them aware of distribution channels namely agents, financial institutions, online and sales counters which are highly significant at one percent level. Occupation
of the respondents and occupation of the spouse has highly significant influence on the respondent awareness on all the distribution channel of LIC of India.
CONCLUSION The study reveals that the sample respondents have greater awareness towards the LIC policies and they are more aware about the Endowment policy and
Money back policies in the study area. LIC has to create awareness among female policy holders about the Women policies. LIC websites, electronic payments
and payments through savings bank accounts are gaining importance as mode of premium payments. The agents help in marketing LIC policies by spreading the
message of life insurance among the masses and the respondents depend on the agents for their insurance needs. Majority of the policy holders are satisfied
with the LIC’s services. Female respondents have not understood clearly about the purpose of insurance. So it is suggested that the life insurance company
should conduct insurance awareness campaign with the help of advertisements and social groups. The awareness on insurance has to be increased in their early
ages. In the emerging boom the insurance company should be customer centered.
REFERENCES 1. Anshuja Tiwari, Babita Yadav (Apr’ 2012), “Analytical Study on Indian Life Insurance Industry in Post Liberalization”, IJSST, International Journal of Social
Science Tomorrow Vol. 1 No. 2, pp 1 – 10.
2. Babita Y adav, Volume 2, Issue 2 (February, 2011) ISSN 2229-6883, “Customer satisfaction on life insurance services: an empirical study on LIC” Sri Krishna
International Research & Educational Consortium.
3. Bhat, R (2005) Insurance Industry in India: Structure, Performance, and Future Challenges Vikalpa Vol. 30, No. 3 pp. 94-96.
4. Clifford Paul S., Joseph Anbarasu D. & Annette Barnabas, (2010), “Study on Socio Economic Status and Awareness of Indian Investors of Insurance”, E-
Journal of Business and Economics Issue, Fall 2010, Vol. V, Issue III, pp 1-18.
5. Harpreet Singh Bedi, Preeti Singh (November 2011), “An Empirical Analysis Of Life Insurance Industry In India”, ZENITH International Journal of
Multidisciplinary Research Vol.1 Issue 7, November 2011, ISSN 2231 5780, pp 62 – 73. 6. Pre-launch Report of Insurance Campaign Survey Awareness, National Council of Applied Economic Research, 2011, pp- 6).
7. Sanjay Kanti Das, (2011), “An Empirical Analysis on Preferred Investment Avenues among Rural and Semi-Urban Households”, Journal of Frontline Research
in Arts and Science, Vol (1), pp 26-36.
8. Santhi.P and Arthi.J (2013), “Designing ICT capacity building strategies for teachers in higher educational institutes through empirical analysis”, Virtual
education: Issues, challenges and prospects, consortium for educational communication, pp 59 – 69.
9. Sastry V. S. (2010), Indian Insurance Data Issues. Paper presented by Director General, Insurance Regulatory and Development Authority, Hyderabad at the
Seminar on ―Data Base.
VOLUME NO. 3 (2013), ISSUE NO. 12 (DECEMBER) ISSN 2231-4245
INTERNATIONAL JOURNAL OF RESEARCH IN COMMERCE, ECONOMICS & MANAGEMENT A Monthly Double-Blind Peer Reviewed (Refereed/Juried) Open Access International e-Journal - Included in the International Serial Directories
http://ijrcm.org.in/
56
HRM AND ETHICAL BEHAVIOUR: REVIEW AND CONCEPTUAL ANALYSIS
DR. SUPRIYA CHOUDHARY
READER
MAHARAJA SURAJMAL INSTITUTE
DELHI
ABSTRACT
Standards, values, morals and ethics have become increasingly complex in a postmodern society where absolutes have given way to tolerance and ambiguity.
This particularly affects managers in HR, where decisions will affect people’s jobs and their future employment. The research about strategic human resource
management (SHRM) has suggested that human resource professionals (HRPs) have the opportunity to play a greater role in contributing to organizational
success if they are effective in developing systems and policies aligned with the organization's values, goals, and mission. Whether in domestic or global
companies, ultimately, the commitment to business ethics and the foundation is built through organizational culture, with ethical values reflected in the
workplace. Ethical challenges abound in HRM. Each day, in the course of executing and communicating HR decisions, managers have the potential to change,
shape, redirect, and fundamentally alter the course of other people's lives. This paper reviews and develops the ethical analysis of human resource management
(HRM).
KEYWORDS
HR decisions, strategic human resource management, human resource professionals, business ethics, organizational culture.
INTRODUCTION ll HR practices have an ethical foundation. HR deals with the practical consequences of human behavior”.
Johnson, 2003 Human Resource Management is a business function that is concerned with managing relations between groups of people in their capacity as employees,
employers and managers. Inevitably, this process may raise questions about what the respective responsibilities and rights of each party are in this relationship,
and about what constitutes fair treatment. An ethical workplace is established through an organization’s culture, values and leadership. To promote ethical behavior, human resource professionals, people managers and senior management need to be knowledgeable about business ethics—from leadership, codes of conduct and related legislation to compliance training, ethical decision-making, and cultural and generational differences around ethics. Transparency, fairness
and communication are key for establishing and maintaining an ethical workplace. There are different schools of thought that differ in their viewpoint on role of ethics or ethics in human resource development. One group of thought leaders
believes that since in business, markets govern the organizational interests and these interests are met through people, the latter are therefore at the highest risk. They believe that markets claim profits in the name of stakeholders and unless we have protocols, standards and procedures the same will develop into a demon monopolizing markets and crushing human capital; HR ethics are become mandatory.
There is another group of ethicists inspired by neo-liberalism who believe that there are no business ethics apart from realization of higher profits through utilization of human resources. They argue that by utilizing human resources optimally, there is more value creation for the shareholders, organization and the
society and since employees are part of the society or organization, they are indirectly benefited. Nevertheless ethics in human resource management has become a perennial debate of late!
LITERATURE REVIEW On the whole, ethical issues have been of marginal significance to the unfolding academic debates around human resource management. The Harvard analytical
framework for HRM (Beer et al, 1984: 16) was one of the earlier models to suggest that, as well as organizational well-being, HRM had to concern itself with the promotion of individual and societal well-being. This reasserts the primacy of the stakeholder as opposed to the shareholder model of the firm, an issue on
which the battle lines have been clearly drawn in business ethics literature. The `business is the business of business’ proponents are aligned on one side(Friedman, 1962; Sternberg, 1994, 1997) and those who suggest that organizations should meet the needs of a wider range of stakeholders, including employees (Freeman, 1984;Royal Society of Arts, 1995; Wheeler and Sillanpaa, 1997), on the other.
There has also been some interest in the role of the HR specialist as a guardian of ethics, with the HR function assuming the role of `ethical stewardship’ and ethical leadership. Most discussion of this has appeared sporadically in professional HR journals. For example, some writers have stressed the HR manager’s role in raising awareness about ethical issues, in promoting ethical behavior and in disseminating ethical practices more widely among line and project managers.
Another ethical role for HR professionals involves communicating codes of ethical conduct, providing training in ethics, managing compliance and monitoring arrangements, and taking a lead in enforcement proceedings (Arkin, 1996; Pickard, 1995; Johns, 1995; Wehrmeyer, 1996). Where ethical conduct is questioned,
HR managers have traditionally overseen arrangements for the handling of discipline and grievances. For some (Connock and Johns, 1995), the mantle of ethical leadership should not just be worn by HR managers alone; the responsibility should also be placed firmly on the shoulders of the whole senior management team and line managers. This is an argument that is very much in keeping with moves to make HRM the concern of a wider group of organizational stakeholders.
Thus, if ethical concern has been an enduring, if occasionally low priority and even sporadic, concern in the history of professional personnel practice and academic inquiry, then why does it require more attention now? The answer lies in the changes which have taken place in HRM over the last two decades.
ETHICAL ISSUES IN HR Of all the organizational issues or problems, ethical issues are the most difficult ones to handle or deal with. Issues arise in employment, remuneration and benefits, industrial relations and health and safety.
FIG. 1: DIAGRAMMATIC REPRESENTATION OF HR ETHICAL ISSUES
A
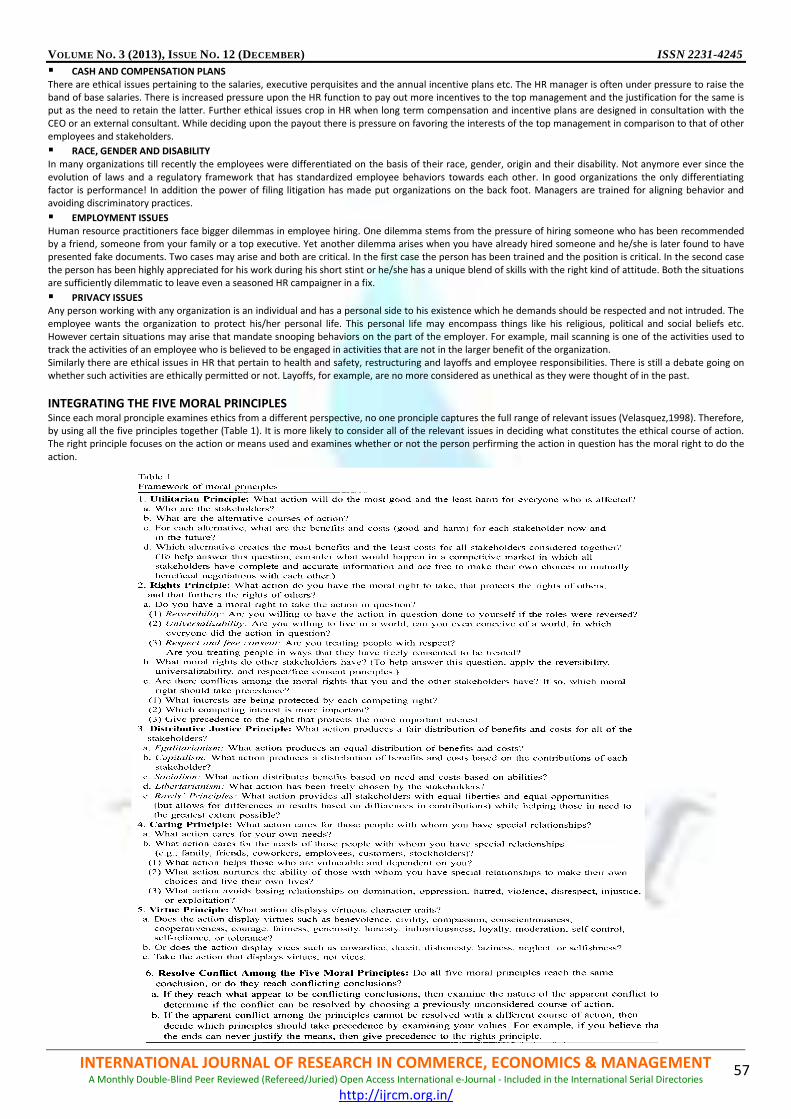
VOLUME NO. 3 (2013), ISSUE NO. 12 (DECEMBER) ISSN 2231-4245
INTERNATIONAL JOURNAL OF RESEARCH IN COMMERCE, ECONOMICS & MANAGEMENT A Monthly Double-Blind Peer Reviewed (Refereed/Juried) Open Access International e-Journal - Included in the International Serial Directories
http://ijrcm.org.in/
57
� CASH AND COMPENSATION PLANS There are ethical issues pertaining to the salaries, executive perquisites and the annual incentive plans etc. The HR manager is often under pressure to raise the band of base salaries. There is increased pressure upon the HR function to pay out more incentives to the top management and the justification for the same is put as the need to retain the latter. Further ethical issues crop in HR when long term compensation and incentive plans are designed in consultation with the
CEO or an external consultant. While deciding upon the payout there is pressure on favoring the interests of the top management in comparison to that of other employees and stakeholders.
� RACE, GENDER AND DISABILITY In many organizations till recently the employees were differentiated on the basis of their race, gender, origin and their disability. Not anymore ever since the
evolution of laws and a regulatory framework that has standardized employee behaviors towards each other. In good organizations the only differentiating factor is performance! In addition the power of filing litigation has made put organizations on the back foot. Managers are trained for aligning behavior and avoiding discriminatory practices.
� EMPLOYMENT ISSUES Human resource practitioners face bigger dilemmas in employee hiring. One dilemma stems from the pressure of hiring someone who has been recommended by a friend, someone from your family or a top executive. Yet another dilemma arises when you have already hired someone and he/she is later found to have presented fake documents. Two cases may arise and both are critical. In the first case the person has been trained and the position is critical. In the second case
the person has been highly appreciated for his work during his short stint or he/she has a unique blend of skills with the right kind of attitude. Both the situations are sufficiently dilemmatic to leave even a seasoned HR campaigner in a fix.
� PRIVACY ISSUES Any person working with any organization is an individual and has a personal side to his existence which he demands should be respected and not intruded. The
employee wants the organization to protect his/her personal life. This personal life may encompass things like his religious, political and social beliefs etc. However certain situations may arise that mandate snooping behaviors on the part of the employer. For example, mail scanning is one of the activities used to track the activities of an employee who is believed to be engaged in activities that are not in the larger benefit of the organization.
Similarly there are ethical issues in HR that pertain to health and safety, restructuring and layoffs and employee responsibilities. There is still a debate going on whether such activities are ethically permitted or not. Layoffs, for example, are no more considered as unethical as they were thought of in the past.
INTEGRATING THE FIVE MORAL PRINCIPLES Since each moral pronciple examines ethics from a different perspective, no one pronciple captures the full range of relevant issues (Velasquez,1998). Therefore, by using all the five principles together (Table 1). It is more likely to consider all of the relevant issues in deciding what constitutes the ethical course of action. The right principle focuses on the action or means used and examines whether or not the person perfirming the action in question has the moral right to do the
action.
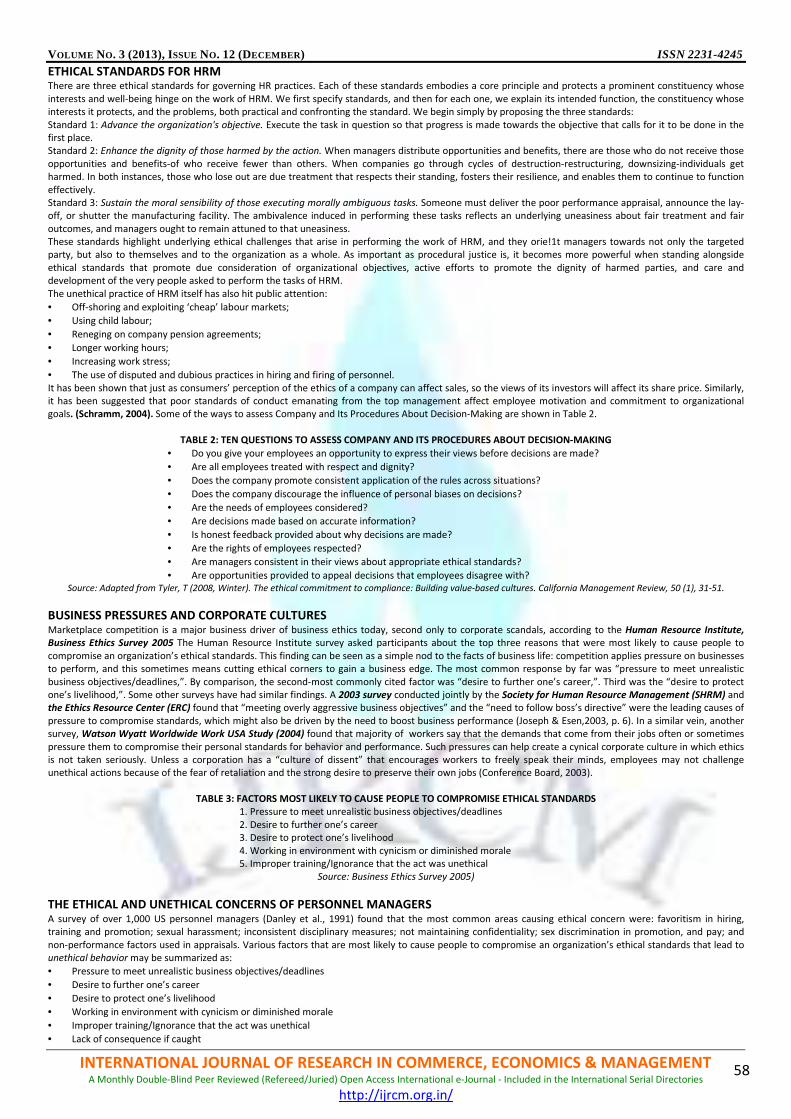
VOLUME NO. 3 (2013), ISSUE NO. 12 (DECEMBER) ISSN 2231-4245
INTERNATIONAL JOURNAL OF RESEARCH IN COMMERCE, ECONOMICS & MANAGEMENT A Monthly Double-Blind Peer Reviewed (Refereed/Juried) Open Access International e-Journal - Included in the International Serial Directories
http://ijrcm.org.in/
58
ETHICAL STANDARDS FOR HRM There are three ethical standards for governing HR practices. Each of these standards embodies a core principle and protects a prominent constituency whose
interests and well-being hinge on the work of HRM. We first specify standards, and then for each one, we explain its intended function, the constituency whose interests it protects, and the problems, both practical and confronting the standard. We begin simply by proposing the three standards:
Standard 1: Advance the organization's objective. Execute the task in question so that progress is made towards the objective that calls for it to be done in the first place. Standard 2: Enhance the dignity of those harmed by the action. When managers distribute opportunities and benefits, there are those who do not receive those
opportunities and benefits-of who receive fewer than others. When companies go through cycles of destruction-restructuring, downsizing-individuals get harmed. In both instances, those who lose out are due treatment that respects their standing, fosters their resilience, and enables them to continue to function
effectively. Standard 3: Sustain the moral sensibility of those executing morally ambiguous tasks. Someone must deliver the poor performance appraisal, announce the lay-off, or shutter the manufacturing facility. The ambivalence induced in performing these tasks reflects an underlying uneasiness about fair treatment and fair
outcomes, and managers ought to remain attuned to that uneasiness. These standards highlight underlying ethical challenges that arise in performing the work of HRM, and they orie!1t managers towards not only the targeted party, but also to themselves and to the organization as a whole. As important as procedural justice is, it becomes more powerful when standing alongside
ethical standards that promote due consideration of organizational objectives, active efforts to promote the dignity of harmed parties, and care and development of the very people asked to perform the tasks of HRM.
The unethical practice of HRM itself has also hit public attention:
• Off-shoring and exploiting ‘cheap’ labour markets;
• Using child labour;
• Reneging on company pension agreements;
• Longer working hours;
• Increasing work stress;
• The use of disputed and dubious practices in hiring and firing of personnel.
It has been shown that just as consumers’ perception of the ethics of a company can affect sales, so the views of its investors will affect its share price. Similarly, it has been suggested that poor standards of conduct emanating from the top management affect employee motivation and commitment to organizational goals. (Schramm, 2004). Some of the ways to assess Company and Its Procedures About Decision-Making are shown in Table 2.
TABLE 2: TEN QUESTIONS TO ASSESS COMPANY AND ITS PROCEDURES ABOUT DECISION-MAKING
• Do you give your employees an opportunity to express their views before decisions are made?
• Are all employees treated with respect and dignity?
• Does the company promote consistent application of the rules across situations?
• Does the company discourage the influence of personal biases on decisions?
• Are the needs of employees considered?
• Are decisions made based on accurate information?
• Is honest feedback provided about why decisions are made?
• Are the rights of employees respected?
• Are managers consistent in their views about appropriate ethical standards?
• Are opportunities provided to appeal decisions that employees disagree with? Source: Adapted from Tyler, T (2008, Winter). The ethical commitment to compliance: Building value-based cultures. California Management Review, 50 (1), 31-51.
BUSINESS PRESSURES AND CORPORATE CULTURES Marketplace competition is a major business driver of business ethics today, second only to corporate scandals, according to the Human Resource Institute,
Business Ethics Survey 2005 The Human Resource Institute survey asked participants about the top three reasons that were most likely to cause people to
compromise an organization’s ethical standards. This finding can be seen as a simple nod to the facts of business life: competition applies pressure on businesses to perform, and this sometimes means cutting ethical corners to gain a business edge. The most common response by far was “pressure to meet unrealistic
business objectives/deadlines,”. By comparison, the second-most commonly cited factor was “desire to further one’s career,”. Third was the “desire to protect one’s livelihood,”. Some other surveys have had similar findings. A 2003 survey conducted jointly by the Society for Human Resource Management (SHRM) and the Ethics Resource Center (ERC) found that “meeting overly aggressive business objectives” and the “need to follow boss’s directive” were the leading causes of
pressure to compromise standards, which might also be driven by the need to boost business performance (Joseph & Esen,2003, p. 6). In a similar vein, another survey, Watson Wyatt Worldwide Work USA Study (2004) found that majority of workers say that the demands that come from their jobs often or sometimes
pressure them to compromise their personal standards for behavior and performance. Such pressures can help create a cynical corporate culture in which ethics is not taken seriously. Unless a corporation has a “culture of dissent” that encourages workers to freely speak their minds, employees may not challenge unethical actions because of the fear of retaliation and the strong desire to preserve their own jobs (Conference Board, 2003).
TABLE 3: FACTORS MOST LIKELY TO CAUSE PEOPLE TO COMPROMISE ETHICAL STANDARDS 1. Pressure to meet unrealistic business objectives/deadlines
2. Desire to further one’s career 3. Desire to protect one’s livelihood
4. Working in environment with cynicism or diminished morale 5. Improper training/Ignorance that the act was unethical
Source: Business Ethics Survey 2005)
THE ETHICAL AND UNETHICAL CONCERNS OF PERSONNEL MANAGERS A survey of over 1,000 US personnel managers (Danley et al., 1991) found that the most common areas causing ethical concern were: favoritism in hiring, training and promotion; sexual harassment; inconsistent disciplinary measures; not maintaining confidentiality; sex discrimination in promotion, and pay; and
non-performance factors used in appraisals. Various factors that are most likely to cause people to compromise an organization’s ethical standards that lead to unethical behavior may be summarized as:
• Pressure to meet unrealistic business objectives/deadlines
• Desire to further one’s career
• Desire to protect one’s livelihood
• Working in environment with cynicism or diminished morale
• Improper training/Ignorance that the act was unethical
• Lack of consequence if caught
VOLUME NO. 3 (2013), ISSUE NO. 12 (DECEMBER) ISSN 2231-4245
INTERNATIONAL JOURNAL OF RESEARCH IN COMMERCE, ECONOMICS & MANAGEMENT A Monthly Double-Blind Peer Reviewed (Refereed/Juried) Open Access International e-Journal - Included in the International Serial Directories
http://ijrcm.org.in/
59
• Need to follow boss’s orders
• Peer pressure/Desire to be a team player
• Desire to steal from or harm the organization
• Wanting to help the organization survive
• Desire to save jobs
• A sense of loyalty
BUILD AN ETHICAL REWARD SYSTEM One of the most basic concepts of management principles states that if you desire a certain behavior, reinforce it. Using rewards and discipline effectively may
be the most powerful way to send signals about desirable and undesirable conduct. That means rewarding those who accomplish their goals by behaving in ways that are consistent with stated values. How ethical behavior is perceived by individual and reinforced by an organization determines the kind of ethical behavior
exhibited by employees. Therefore, if business leaders want to promote ethical behavior they must accept more responsibility for establishing their organization’s reinforcement system. Research in ethical behavior strongly supports the conclusion that if ethical behavior is desired, the performance measurement, appraisal and reward systems must be modified to account for ethical behavior. Accounting to Nielsen (1988), in many cases, managers choose to
do, go along with or ignore the unethical… because they want to avoid the possibility of punishment or to gain rewards…As a formal way to shaping the employees’ ethical behavior, management control systems play an important role, but it is impossible to implement management control systems of ethics if the company’s culture not support the ethical behavior. The control of ethics is an aspect of the entire control systems, if the company’s culture is to award the one
who achieves great financial accomplishment but will violate ethical standards, and then the system will work in a vacuum. As we know, some people may be trained or educated with proper ethical knowledge or value and further willing to follow a moral code of conduct to behavior ethically, but fail to maintain or
continue to perform ethically due to the stress from upper managers or the impact from peers or coworkers. Therefore, to be a successful in the business world, an organization should be able to effectively aware the importance of having a culture of ethics and further come out with strategy to acquire this culture. It is increasingly clear that the ethical culture of companies is set at the top, what top managers do, and the culture they establish and reinforce, makes a big
difference in the way lower-level employees act and in the way the organization as a whole acts when ethical dilemmas are faced. Surveys of different business executives indicate that the management’s behavior, more than anything else, sets the ethical tone of a firm. In other words, employees take their cues from
their management. If a firm’s managers adhere to obvious ethical norms in their business dealings, employees will likely follow their lead. In contrast, if managers act unethically, employees will see no reason to behave any differently. For example, an employee who observes a manager cheating on her expense account quickly learns that such behavior is acceptable (Cross & Miller, 2007). To build a culture for the ethical behavior, the top managers need to behave
ethical and set an ethical climate for entire company.
CONCLUSION
‘The entire concept of HRM is devoid of morality.’
Hart, 1993: 29 The ethics of HRM is about more than treating people sensitively or being fair and measured. Ethical behavior will affect a company’s performance for the long term while the short term benefits of unethical behavior might look positive, which influences more and more companies and scholars to find a way to motivate
employees’ ethical behavior. Organizational ethics are rules and standards that guide workplace behavior and moral principles. Many organizations establish a "code of ethics" that sets company expectations regarding ethical issues such as privacy, conflict of interest, discrimination and harassment and workplace diversity. Human resources personnel are charged with setting standards that promote ethical behavior in the workplace.
TABLE 4: ETHICAL BEHAVIOR IN HR OBJECTIVES
How far do you agree with the following list of HR objectives?
• In recruitment and selection: ensure that all assessment measures are fair and just.
• In reward management: ensure fairness in allocation of pay and benefits.
• In promotion and development: ensure equal opportunities and equal access.
• Ensure a safe working environment in both for all employees.
• Ensure that procedures are not unduly stressful, and that the needs of employees’ work–life balance are not compromised.
• When redundancies occur, to be fair and just in handling job losses.
• Deal effectively with all forms of bullying and harassment.
• In outsourcing and off shoring: ensure that contractors, consultants and franchisees are fair and honest in their dealings with employees, clients and
customers.
Ultimately, it is simple to be brave. Once one sees what the right thing to do is, one does it. Seeing what is the right thing to do is, in Kierkegaard’s phrase, to be in an instant: there is no ‘before’ and no ‘after’. One ceases to consider losses and gains; one stops imagining what is going to happen to oneself. In the ‘instant’ there is only the person and eternity. You close your eyes, take your hand off the rail you have been grabbing, and—there you go. Once in the water, you will
swim. Have courage, be brave. (Heller, 1990)
REFERENCES 1. Baviskar, S., Harned, P. J., and Seligson, A. L. (2005).National Business Ethics Survey 2005. Ethics Resource Center.
2. Betsy Stevens (2008). Corporate Ethical Codes: Effective Instruments For Influencing Behavior. Journal of Business Ethics, 2008,(78):601–609 3. Danley, J., Harrick, E., Strickland, D. and Sullivan, G. (1991). HR ethical situations, Human Resources Management, Vol. 26, pp. 1–12.
4. Goodpaster, K.E. (1984). Ethics in Management, Boston: Harvard Business Books. 5. Greenwood, M.R. (2002). Ethics and HRM: a review and conceptual analysis, Journal of Business Ethics , Vol. 36, No. 3, pp. 261–278. 6. Hart, T.J. (1993). Human resource management: time to exercise the militant tendency, Employee Relations , Vol. 15, No. 3, pp. 29–36
7. Johnson, R. (2003). HR must embrace ethics, People Management, Vol. 9, No. 1, pp. 8. Kelly, D (2001). “SHRM Study Reveals Global Ethical Dilemmas for HR.” (2001, April 26). Employment Alert, 4-5. 9. Legge, K. (1998): Is HRM ethical? Can HRM be ethical? In: M. Parker (ed): Ethics and organizations. London: Sage. pp. 150-172.
10. Ronald R. (1992). Sims. The Challenge of Ethical Behavior in Organizations. Journal Of Business Ethics ,1992, (11):505-513 11. Snell, R. S. (1993). Developing Skills for Ethical Management. London: Chapman and Hall.
12. Winstanley, D. and Woodall, J. (2000). Ethical Issues in Contemporary Human Resource Management. Basingstoke: Macmillan. 13. Wren, D.A. “Medieval or Modern? A Scholastic’s View of Business Ethics, Circa 1430.” (2000, November). Journal of Business Ethics, 109.

VOLUME NO. 3 (2013), ISSUE NO. 12 (DECEMBER) ISSN 2231-4245
INTERNATIONAL JOURNAL OF RESEARCH IN COMMERCE, ECONOMICS & MANAGEMENT A Monthly Double-Blind Peer Reviewed (Refereed/Juried) Open Access International e-Journal - Included in the International Serial Directories
http://ijrcm.org.in/
60
WOMEN ENTREPRENEURIAL OPPORTUNITIES IN FOOD INDUSTRY: A CASE OF CREMICA PRODUCTS
VANIKA CHUGH
ASST. PROFESSOR
DEPARTMENT OF MANAGEMENT
FAIRFIELD INSTITUTE OF MANAGEMENT & TECHNOLOGY
DELHI
MANISH JHA
SR. ASST.PROFESSOR
DEPARTMENT OF MANAGEMENT
FAIRFIELD INSTITUTE OF MANAGEMENT & TECHNOLOGY
DELHI
ABSTRACT
In India entrepreneurs are having great desire and ambition to build leading global businesses. In the service industry we find several of the fastest growing
industries in the advanced economies but the main focus on one industry makes it easier to identify societal changes that create new business opportunities and
to show the importance of these changes. Entrepreneurs should be clear about the market in which they are entering. Efficiency of service, hygiene, quality, and
overall value but the menu should be "Indian" rather than Indianised version of American food. Rapid growth of food processing industry is inevitable since
urbanization with globalization is changing life-style and food habits, rising prosperity is increasing demand for value added food products, more and more
women joining work force need sheer convenience of processed food, and large export opportunities exist globally where price realization is much better. Thus
what is of interest in the paper is how entrepreneurs will exploit the entrepreneurial Opportunities in food industry to build leading global businesses. Authors
have tried to find out the sources of entrepreneurial opportunities and have analyzed the service industry with special reference to food industry.
KEYWORDS
Business, Entrepreneur, Food Industry, Industry, Service.
1.0 INTRODUCTION ntrepreneurship refers to the act of setting up a new business or reviewing existing business so to take advantages of new opportunities. Thus,
entrepreneurs shape the economy by creating employment opportunities by inventing new product and services. Thus, entrepreneurs shape the economy by creating new wealth and new jobs and by inventing new products and services. The capacity and willingness to develop, organize and
manage a business venture along with any of its risks in order to make a profit. Entrepreneurs are arguably the most important factors in our economy the creators of new wealth and new jobs, the inventors of new products and services, and the revolutionizes of society and the economy. Yet despite their centrality, little is known about entrepreneurs what motivates them, how they emerge, why they succeed. We know even less about who becomes an
entrepreneur, and why. The most obvious example of entrepreneurship is the starting of new businesses. In economics, entrepreneurship combined with land, labor, natural resources and capital can produce profit. Entrepreneurial spirit is characterized by innovation and risk-taking, and is an essential part of a nation's
ability to succeed in an ever changing and increasingly However, an insight study reveals that it is not about making money, having the greatest ideas, knowing the best sales pitch, applying the best marketing strategy. The educated women do not want to limit their lives in the four walls of the house. They demand equal respect from their partners. The Indian culture made them only subordinates and executors of the decisions made by other male members, in the basic
family structure. While at least half the brainpower on earth belongs to women, women remain perhaps the world‘s most underutilized resource. Despite all the social hurdles, India is brimming with the success stories of women. They stand tall from the rest of the crowd and are applauded for their achievements in their respective field. It is in reality an attitude to create something new and an activity which creates value in the entire social eco-system. It is the psyche makeup of
a person. It is a state of mind, which develops naturally, based on his/ her surrounding and experiences, which makes him/ her think about life and career in a given way. The role of women entrepreneurs in the process of economic development has been recognized form nineties in various parts of the world. Today, in
the world of business, women entrepreneurship has become an essential movement in many countries and has been accepted in all areas of working. The United Nations report has also concluded that economic development is closely related to the advancement of women. In nations where women have advanced, economic growth has usually been steady. By contrast, in countries where women have been restricted, the economy has been stagnant.
Entrepreneurship has been globally felt as a developmental & progressive idea for business world. Therefore entrepreneurship is considered as vital ingredient for not only globalization but at the same time for creating diverse opportunities for future potential performers.
2.0 CONCEPT OF WOMEN ENTREPRENEURS Women have owned and operated businesses for decades, but they were not always recognized or given credit for their efforts. Often women entrepreneurs were "invisible" as they worked side by side with their husbands, and many only stepped into visible leadership positions when their husbands died. But a variety of factors have combined in recent years to contribute to the visibility and number of women who start their own businesses. According to U.S. Department of
Labor statistics, female participation in the workforce was less than 40 percent in 1960 but is predicted to reach 62 percent by the year 2015. Women entrepreneurs have been designated as the new engines for growth and the rising stars of the economies in developing countries to bring prosperity and welfare As women enter the workforce in ever-greater numbers, they gain professional experience, and managerial skills, both necessary to be successful
entrepreneurs. Flexibility is also a factor in many women's decision to start a business. Entrepreneurship is often seen as an ideal way to juggle the competing demands of career and family. Finally, the disparity in the salaries and wages that women earn as compared to men on average has been a factor in motivating
some women to decide to establish their own businesses. Developed nations have provided gender equality platforms to keep the woman workforce motivated to be entrepreneurs. However, women still face financial insecurity, business insurance & human resource challenges plus. Women entrepreneurship has attracted increasing attention in recent years in light of concrete evidence of the importance of new business creation for economic growth and development
Although the small businesses owned by women have traditionally been in the service sector, in recent years women entrepreneurs have been moving rapidly into manufacturing, construction, and other industrial fields. Women entrepreneurship has been recognized as an important source of economic growth.
Women entrepreneurs create new jobs for themselves and others and also provide society with different solutions to management, organization and business problems. However, they still represent a minority of all entrepreneurs. Women entrepreneurs often face gender-based barriers to starting and growing their businesses, like discriminatory property, matrimonial and inheritance laws and/or cultural practices; lack of access to formal finance mechanisms; limited
mobility and access to information and networks, etc. Women’s entrepreneurship can make a particularly strong contribution to the economic well-being of the family and communities, poverty reduction and women’s empowerment, thus contributing to the Millennium Development Goals (MDGs). Thus, governments
E

VOLUME NO. 3 (2013), ISSUE NO. 12 (DECEMBER) ISSN 2231-4245
INTERNATIONAL JOURNAL OF RESEARCH IN COMMERCE, ECONOMICS & MANAGEMENT A Monthly Double-Blind Peer Reviewed (Refereed/Juried) Open Access International e-Journal - Included in the International Serial Directories
http://ijrcm.org.in/
61
across the world as well as various developmental organizations are actively undertaking promotion of women entrepreneurs through various schemes, incentives and promotional measures.
Women entrepreneurs in the four southern states and Maharashtra account for over 50% of all women-led small-scale industrial units in India. Women business owners still face greater difficulties in gaining access to commercial credit and bidding on government contracts than do their male colleagues, and pockets of resistance to women entrepreneurs remain strong in some industries and geographic regions. But millions of successful businesses launched and managed by
women now dot America's business landscape, each a testament to the legitimacy of the aspirations and talents of the woman entrepreneur. For a woman entrepreneurship is not a new concept but certainly keeps woman hesitant to be among start ups due to societal and community trends and pressures. Many other factors do influence to keep woman away to be potential entrepreneurs especially in developing countries. However, Indian women have to go a long way
to achieve equal rights and position because traditions are deep rooted in Indian society where the sociological set up has been a male dominated one. Women are considered as weaker sex and always made to depend on men folk in their family and outside, throughout their life. Women are becoming entrepreneur for
discovering their inner potential, caliber in order to achieve self satisfaction. It can also provide a mean to make best use of their leisure hours.
3.0 POLICIES AND SCHEMES FOR WOMEN ENTREPRENEURS IN INDIA In India, the Micro, Small & Medium Enterprises development organizations, various State Small Industries Development Corporations, the nationalized banks and even NGOs are conducting various programmes including Entrepreneurship Development Programmes (EDPs) to cater to the needs of potential women
entrepreneurs, who may not have adequate educational background and skills. The Office of DC (MSME) has also opened a Women Cell to provide coordination and assistance to women entrepreneurs facing specific problems.
There are also several other schemes of the government at central and state level, which provide assistance for setting up training-cum-income generating activities for needy women to make them economically independent. Small Industries Development Bank of India (SIDBI) has also been implementing special schemes for women entrepreneurs. In addition to the special schemes for women entrepreneurs, various government schemes for MSMEs also provide certain
special incentives and concessions for women entrepreneurs. For instance, under Prime Minister’s Rozgar Yojana (PMRY), preference is given to women beneficiaries. The government has also made several relaxations for women to facilitate the participation of women beneficiaries in this scheme. Similarly, under the MSE Cluster Development Programme by Ministry of MSME, the contribution from the Ministry of MSME varies between 30-80% of the total project in case
of hard intervention, but in the case of clusters owned and managed by women entrepreneurs, contribution of the M/o MSME could be upto 90% of the project cost. Similarly, under the Credit Guarantee Fund Scheme for Micro and Small Enterprises, the guarantee cover is generally available upto 75% of the loans
extended; however the extent of guarantee cover is 80% for MSEs operated and/ or owned by women.
4.0 INTRODUCTION TO CREMICA GROUP The CREMICA Group, a widely diversified food products company from India, is an acknowledged frontrunner in both food retailing and food services industry. Established as a small enterprise by Mrs. Bector, a passionate food enthusiast, three decades ago, the group has today metamorphosed into a huge food
products conglomerate. The Group has been constantly setting benchmarks for the food processing industry through its incomparable products, innovative flavors and fillings, internationally certified production facilities, consistent quality and unmatched expertise. This coupled with the group’s commitment to
healthy eating has enabled it to emerge as a preferred consumer brand and a leading supplier to Indian and global food majors. The company was incorporated as 50:50 joint ventures with the Quaker Oats Company of U.S.A a Fortune 200 company. This project has been set up to produce liquid products such as, Tomato Ketchup, Mayonnaise, Tartar & Sandwich Spreads, Milk shake Syrups and Ice cream Toppings mainly for Mc Donald’s requirement in India and for the
neighboring countries. The plant has been operational from Oct. 1996. Quaker Oats Company withdrew from the joint venture in 1999-2000 and the name of the company changed from Quaker Cremica Foods (P) Ltd. to Mrs. Bector Food Specialities (P) Ltd. then company started institutional & retail market in addition
to Mc Donald. In the year 2001, the company was converted into public limited company. Today the group operates India’s largest tomato ketchup line and is country’s largest producer of ketchup portion packs capable of packing 2.5 million sachets per year! These high quality products have made a mark and are even exported to Europe Africa, Middle East, US and Australia.
4.1 PRODUCT RANGE OF CREMICA 1. Biscuits 2. Breads
3. Sauces 4. Bread Spreads
5. Ready to eat curries 6. Syrups Cremica is the third largest ketchup maker in the India and is the sole supplier of buns, liquid condiments, batter and breading to McDonalds India. Cremica
group does sales of Rs.200 crore (Rs.2 billion) and is an important link in the supply chain to the fast food industry with an inventory of buns, breads, sauces, ketchups and ice creams toppings to the likes of McDonalds and syrups and mayonnaise to Barista
5.0 LITERATURE REVIEW A study on motivation of woman entrepreneurship by Lee (1997) Concludes that women entrepreneurs are motivated by a high need for achievement, a slightly high need for dominance and moderate needs for affiliation and autonomy. Finds women entrepreneurs demonstrate a higher need for achievement and dominance than women employees but significant difference in the needs for affiliation and autonomy. On the barriers to success of women entrepreneurs
McElwee & Al-Riyami, (2003) establishes the factors that motivate women to become entrepreneurs. Opportunities for the growth and expansion of women’s entrepreneurship in Oman as well as barriers women encounter are discussed. While research on women entrepreneurs is extensive in developed countries, little has been done in this area in non-OECD and developing economies, results of a study by Hisrich & Öztürk, (1999) indicate that while the women
entrepreneurs exhibited many similarities with their counterparts in other countries they differed in other aspects such as in their reasons and motivation for starting a venture and problems encountered. These differences reflect in part the effect of a different social structure in a developing economy, particularly the
impact of occupational segregation, wage disparity, and participation in a non-supported sector of the economy. According to Naser et al., (2009) Financial support from the government especially in the start-up capital is an important factor that motivates women to establish their own businesses. Self-fulfillment, knowledge, skills and experience, including relationship to spouse/father business, are all important factors in the development of women entrepreneurs. On
the study of global training deficit of women entrepreneurs by Davis, (2012) it was found that The absence of leaning, training and professional development opportunities for women entrepreneurs is found to be an almost universal phenomenon. In the few examples where training has been planned and provided, the results have been very significant. According to Indrupati & Henari, (2012) social networking is a cheap and easy method of advertising and gives all
entrepreneurs a better chance of reaching their target market and, thereby, in succeeding in their ventures, with the rise in the use of social networking, entrepreneurs can now target their markets using online social networks. Social networking web sites allow businesses to introduce their products to specific
market segments, with low expense, and with a low chance of failure. A study on the role of cultural values in understanding the challenges faced by female entrepreneurs in Nigeria by Mordi et al., (2010) indicate that female entrepreneurs are generally confident and resourceful and that they enjoy the challenge of entrepreneurial activity. As in the West, they experience difficulties relating to family commitments and access to finance – as well as problems gaining
acceptance and accessing networks. Research on Factors influencing women business development in the developing countries by Hossain et al., (2009) revealed that women face problems in establishing their own businesses in every step that they take. The desire for financial independence and decision making,
market and informational network, availability of a start-up capital, knowledge and skills, and responsibility towards children are the main factors that impact women's decision to become self-entrepreneurs. Javadian & Singh, (2012) did an exploratory study on success of Women Entrepeneur found that Challenges

VOLUME NO. 3 (2013), ISSUE NO. 12 (DECEMBER) ISSN 2231-4245
INTERNATIONAL JOURNAL OF RESEARCH IN COMMERCE, ECONOMICS & MANAGEMENT A Monthly Double-Blind Peer Reviewed (Refereed/Juried) Open Access International e-Journal - Included in the International Serial Directories
http://ijrcm.org.in/
62
caused by the negative stereotypes and traditions of Iranian society are barriers successful Iranian women entrepreneurs had to overcome. The possession of personal internal factors such as high levels of self-efficacy and risk taking positively impacted these women's success. A research on Ethnic female business
owners more female or more ethnic entrepreneurs Panagiotis Piperopoulos, (2012) the results suggest that ethnic female entrepreneurs may share some common characteristics with their ethnic male entrepreneurial colleagues but ethnic women's unique qualities, characteristics, motivations, background and business views distinguish them from their male ethnic counterparts bringing forth more their femininity rather than their ethnicity. A study on Entrepreneurial
competencies of women entrepreneurs pursuing business growth by Mitchelmore & Rowley, (2013) states that there are four main clusters of competencies were identified: personal and relationship, business and management, entrepreneurial and human relations competencies. Whilst previous research on the competencies of entrepreneurs has identified the two clusters of business and management, and entrepreneurial competencies, the competencies in the other
two clusters have received less attention and have not been identified as clusters. Arguably, competencies in these clusters are valued more highly by female entrepreneurs than by their male counterparts. The research study on Going green Women Entrepreneurs and the Environment by Patrice Braun, (2010) it was
found that participating women had stronger environmental attitudes and commitment to the green entrepreneurship program than males, suggesting that women entrepreneurs may be more engaged in green issues than male entrepreneurs.A study on challenges facing by women entrepreneurs in Nigeria by Halkias et al.,(2011) no or few significant differences shown to exist between male and female business owners or managers once they have already started an
enterprise, there is a strong indication that Africa has sizeable hidden growth potential in its women. From the results presented, it is evident that female entrepreneurship in Nigeria is driven by micro-financing as well as family dynamics that work to shape and influence the birth of a business. The research study on Innovation by entrepreneurs in China the increasing prominence of women by Maryam Cheraghi, (2013) states that the entrepreneurs starting enterprises in
China, the proportion of women has increased dramatically over the years, approaching equality with the men. Women entrepreneurs compared to male entrepreneurs in China have increased in education, competences, opportunity motive and innovativeness. The increasing prominence of women in innovation
in China is unsurpassed by any other country in the sample and thus seems unique in the world. Studies on Female entrepreneurs' personal characteristics and motivation by Sarri & Trihopoulou, (2005) revealed that it is important that women entrepreneurs are not treated as a monolithic category: rather, policies and programs to support them should begin with a diagnosis of their personal characteristics and motives aimed at strengthening pull motives that comprise a base
for more viable and innovative entrepreneurial activity.
6.0 OBJECTIVES AND RESEARCH METHODOLOGY OF THE STUDY The study is based on secondary data which is collected from the published reports of RBI, NABARD, newspapers, journals, websites, etc. The study was planned
with the following objectives:
• To evaluate the factors responsible for encouraging women to become entrepreneurs
• To critically examine the problems faced by women entrepreneurs.
• To know about the success of Cremica products.
• To determine the possible success factors for women in such entrepreneurial activities.
• To identify the measure to remove the obstacle of women entrepreneurs.
7.0 REASONS FOR WOMEN BECOMING ENTREPRENEURS “Starting your own business can seem daunting. Many people shy away from starting their own business because of fear of the unknown and not wanting to
take the risk. But those that have taken the entrepreneurial path can attest that being your own boss can be very rewarding.” Women Entrepreneur’s a person who accepts challenging role to meet her personal needs and become economically independent. Women most often found
businesses in order to meet personal goals, such as gaining feelings of achievement and accomplishment. Women consider financial success as an external confirmation of their ability rather than as a primary goal or motivation to start a business, although millions of women entrepreneurs will grant that financial
profitability is important in its own right. Women start a business due to some traumatic event, such as divorce, discrimination due to pregnancy, the health of a family member, or economic reasons such as a layoff. Women are becoming entrepreneurs because they find the corporate world “toxic”, non-inclusive or hostile and women’s wants that they align with personal values and offers freedom and flexibility.
8.0 PROBLEMS FACED BY WOMEN ENTREPRENEUR IN INDIA Women entrepreneurs face a series of problems right from the beginning till the enterprise functions Being a woman itself poses various problems to a women entrepreneur , The problems of Indian women pertains to her responsibility towards family, society and lion work. The tradition, customs, socio cultural, ethics,
motherhood subordinates to ling husband and men, physically weak, hard work areas, feeling of insecurity, cannot be tough etc are some peculiar problems that the Indian women are coming across while they jump into entrepreneurship. Women in rural areas have to suffer still further. They face tough resistance from men. They are considered as helpers. The attitude of society towards her and constraints in which she has to live and work are not very conducive. Lack of
entrepreneurial aptitude is a matter of concern for women entrepreneurs. They have no entrepreneurial bent of mind. Even after attending various training programmers on entrepreneur ship women entrepreneurs fail to tide over the risks and troubles that may come up in an organizational working. Women
entrepreneurs because of their inherent nature, lack of self-confidence which is essentially a motivating factor in running an enterprise successfully.
9.0 MEASURES TO REMOVE THE OBSTACLES The elimination of obstacles for women entrepreneurship requires a major change in traditional attitudes and mindsets of people in society rather than being limited to only creation of opportunities for women. Hence, it is imperative to design programmes that will address to attitudinal changes, training, supportive
services. The basic requirement in development of women entrepreneurship is to make aware the women regarding her existence, her unique identity and her contribution towards the economic growth and development of country.
The basic instinct of entrepreneurship should be tried to be reaped into the minds of the women from their childhood. This could be achieved by carefully designing the curriculum that will impart the basic knowledge along with its practical implication regarding management (financial, legal etc.) of an enterprise. Adopting a structured skill training package can pave the way for development of women entrepreneurship. Such programmes can train, motivate and assist the
upcoming women entrepreneurship in achieving their ultimate goals. Various schemes like the World Bank sponsored programmes can be undertaken for such purposes. The course design should focus on imparting input on profitability, marketability and practical management lessons. Besides, there should be consideration in helping the women entrepreneurs in balancing their family life and work life. As a special concern, computer illiterate women can be trained on
Information Technology to take the advantage of new technology and automation. The established and successful women entrepreneurs can act as advisors for the upcoming women entrepreneurs. The initiatives taken from these well
established entrepreneurs for having interaction with such upcoming women entrepreneurs can be proved to be beneficial in terms of boosting their morale and confidence. It may result in more active involvement of women entrepreneurs in their enterprises. Infrastructure set up plays a vital role for any enterprise. Government can set some priorities for women entrepreneurs for allocation of industrial plots, sheds
and other amenities. However, precautionary measures should be undertaken to avoid the misuse of such facility by the men in the name of the women. Even in today’s era of modernization the women entrepreneurs depend on males of their family for marketing activities. This is simply because they lack the skill and confidence for undertaking such activities. Women development corporations should come forward to help the women entrepreneurs in arranging frequent
exhibitions and setting up marketing outlets to provide space for the display of products or advertisement about services made by women.
VOLUME NO. 3 (2013), ISSUE NO. 12 (DECEMBER) ISSN 2231-4245
INTERNATIONAL JOURNAL OF RESEARCH IN COMMERCE, ECONOMICS & MANAGEMENT A Monthly Double-Blind Peer Reviewed (Refereed/Juried) Open Access International e-Journal - Included in the International Serial Directories
http://ijrcm.org.in/
63
10.0 THE SUCCESS STORY OF CREMICA GROUP Mrs. Bector says she never faced problems in managing people."It is not about managing men or women; it is about dealing with people. Perhaps this attitude helped me and I always had full support of those working with me," The success comes in any profession especially if the profession is derived from the hobby or interest. We have a similar success story about The CREMICA
group. It was established in 1978 by Mrs. Rajni Bector turning her passion for Ice Cream making (also her hobby) into a small backyard enterprise. Mrs Bector established the CREMICA group today a widely diversified food products and services company. In the course of the past two decades, the CREMICA group has established itself as a huge food products conglomerate, leading the food processing business through its range of products, its internationally certified
production facilities, the consistency of its quality, and its unmatched expertise in the industry. Below are the steps of success in which Mrs. Bector made growth in her business to be the successful women entrepreneur.
• 1980- Mrs. Rajni Bector an arts graduate, founder of the MRS. BECTOR‘S CREMICA started her new career from a housewife to an entrepreneur with a meager investment of Rs. 20000/- for the manufacturing of Ice Creams & Bakery items from the backyard of her residence.
• 1982-Mr. Ajay Bector her eldest son joined her to help her with the increased business volumes.
• 1986: She started another unit at Ludhiana for the manufacturing of Bread and bakery biscuits with an investment of Rs. 1.00 Lac.
• 1989 ::Mrs. Bector‘s younger sons Akshay Bector & Anoop Bector after completing their education joined the business in and a unit for manufacture of
bread was established at Phillaur near Ludhiana for the manufacture of 50000 loaves of bread per day.
• 1991: Mrs. Bector started another fully automated unit for the manufacture of Biscuits at Phillaur with a capacity of 7200 M.T. of Biscuits per annum with
an investment of Rs.75.00 Lacs.
• 1992:Mrs. Bector‘s Cremica established a manufacturing facility for confectionery items followed by a unit for the manufacture of Namkeens.
• 1997: By seeing the quality of the products being manufactured McDonalds approached Mrs. Bector for supplies of various products i.e. buns, liquid
products and batters & breading. This was a golden opportunity for the Bector Family and the family entered into various Joint ventures so that
international expertise could help them produce international level products compared to the best in the world.
• 2002: A modern Bun Manufacturing facility manufacturing over 150000 Buns per shift was established at greater Noida for supplies to McDonalds. This is
one of the most modern units of its type in the country.
• 2003: A foray was made into Fresh Vegetable Processing and a modern facility for processing of fresh vegetables like lettuce, cut vegetables etc for
supplies to McDonalds was made at an investment of Rs. 15.00 Million.
• 2004: Mrs. Bector‘s Cremica entering into an Agreement with ITC Ltd. for the manufacture of Biscuits on contract manufacturing basis at Tahliwal, Distt Una (H.P.). A state of the art facility was established for the manufacture of 60000 M.T. of biscuits at a cost of over Rs. 25.00 Crores producing biscuits
valued at over Rs. 200 Crores P.A. This unit produces 30000 M.T. of biscuits for ITC under the SUNFEAST BRAND and 30000 M.T. under the Mrs. Bector‘s Cremica label. The Group also entered in to an agreement with Cadbury India Ltd. for supply of Cadbury Bytes with an investment of Rs. 3.00 Crores
producing goods valued at Rs. 30.00 Crores annually.
• 2007: The Group was offered an opportunity for Equity participation by Goldman Sachs. The liquid products & biscuit operations were valued by Goldman
Sachs at Rs. 500.00 Crores. The group offered Goldman Sachs 15% equity for Rs. 75.00 Crores to help speed up its expansions with the equity infusion.
11.0 CONCLUSION Women entrepreneur is presently the most discussed and encouraged concept all over the world. Today we are in a better position wherein women
participation in the field of entrepreneurship is increasing at a considerable rate. Women being the vital gender of the overall population have great capacity and potential to be the contributor in the overall economic development of any nation. Media plays the most important l role in entrepreneurial development by
creating and highlighting all such platforms which can bring out the creativity and innovation among the women and men to grow entrepreneurship culture in society. The educated women do not want to limit their lives in the four walls of the house. They demand equal respect from their partners. The Indian culture made them only subordinates and executors of the decisions made by other male members, in the basic family structure. However, it could have been a reason
strong enough to stop me from working, as women from affluent families did not work then. Efforts are being taken at the economy as brought promise of equality of opportunity in all spheres to the Indian women and laws guaranteed equal rights of participation in political process and equal opportunities and rights in education and employment were enacted. But unfortunately, the government sponsored development activities have benefited only a small section of
women i.e. the urban middle class women. Women sector occupies nearly 45% of the Indian population. At this juncture, effective steps are needed to provide entrepreneurial awareness, orientation and skill development programs to women. The role of Women entrepreneur in economic development is also being
recognized and steps are being taken to promote women entrepreneurship. Resurgence of entrepreneurship is the need of the hour emphasizing on educating women strata of population, spreading awareness and consciousness amongst women to outshine in the enterprise field, making them realize their strengths, and important position in the society and the great contribution they can make for their industry as well as the entire economy.
REFERENCES 1. Amzad Hossain, Kamal Naser, Asif Zaman, Rana Nuseibeh, (2009) "Factors influencing women business development in the developing countries: Evidence
from Bangladesh", International Journal of Organizational Analysis, Vol. 17 Iss: 3, pp.202 – 224.
2. Chima Mordi, Ruth Simpson, Satwinder Singh, Chinonye Okafor, (2010) "The role of cultural values in understanding the challenges faced by female entrepreneurs in Nigeria", Gender in Management: An International Journal, Vol. 25 Iss: 1, pp.5 – 21.
3. Daphne Halkias, Chinedum Nwajiuba, Nicholas Harkiolakis, Sylva M. Caracatsanis, (2011) "Challenges facing women entrepreneurs in Nigeria",
Management Research Review, Vol. 34 Iss: 2, pp.221 - 235 4. Golshan Javadian, Robert P. Singh, (2012) "Examining successful Iranian women entrepreneurs: an exploratory study", Gender in Management: An
International Journal, Vol. 27 Iss: 3, pp.148 – 164.
5. Hisrich, R.D., and Öztürk, S.A. (1999) "Women entrepreneurs in a developing economy", Journal of Management Development, Vol. 18 Iss: 2, pp.114 – 125. 6. Joel Indrupati, Tara Henari, (2012) "Entrepreneurial success, using online social networking: evaluation", Education, Business and Society: Contemporary
Middle Eastern Issues, Vol. 5 Iss: 1, pp.47 – 62. 7. Katerina Sarri, Anna Trihopoulou, (2005) "Female entrepreneurs' personal characteristics and motivation: a review of the Greek situation", Women In
Management Review, Vol. 20 Iss: 1, pp.24 – 36.
8. Lee, J. (1997) "The motivation of women entrepreneurs in Singapore", International Journal of Entrepreneurial Behaviour & Research, Vol. 3 Iss: 2, pp.93 – 110.
9. Maryam Cheraghi, (2013) "Innovation by entrepreneurs in China: the increasing prominence of women", Journal of Knowledge-based Innovation in China, Vol. 5 Iss: 3, pp.172 – 187.
10. McElwee, G., and Al-Riyami, R. (2003) "Women entrepreneurs in Oman: some barriers to success", Career Development International, Vol. 8 Iss: 7, pp.339
– 346. 11. Naser, K., Mohammed, W.R., and Nuseibeh, R. (2009) "Factors that affect women entrepreneurs: evidence from an emerging economy", International
Journal of Organizational Analysis, Vol. 17 Iss: 3, pp.225 – 247.
12. Panagiotis Piperopoulos, (2012) "Ethnic female business owners: more female or more ethnic entrepreneurs", Journal of Small Business and Enterprise Development, Vol. 19 Iss: 2, pp.192 – 208.

VOLUME NO. 3 (2013), ISSUE NO. 12 (DECEMBER) ISSN 2231-4245
INTERNATIONAL JOURNAL OF RESEARCH IN COMMERCE, ECONOMICS & MANAGEMENT A Monthly Double-Blind Peer Reviewed (Refereed/Juried) Open Access International e-Journal - Included in the International Serial Directories
http://ijrcm.org.in/
64
13. Patrice Braun, (2010) "Going green: women entrepreneurs and the environment", International Journal of Gender and Entrepreneurship, Vol. 2 Iss: 3, pp.245 - 259
14. Paul J. Davis, (2012) "The global training deficit: the scarcity of formal and informal professional development opportunities for women entrepreneurs", Industrial and Commercial Training, Vol. 44 Iss: 1, pp.19 – 25.
15. Siwan Mitchelmore, Jennifer Rowley, (2013) "Entrepreneurial competencies of women entrepreneurs pursuing business growth", Journal of Small Business
and Enterprise Development, Vol. 20 Iss: 1, pp.125 – 142. WEBSITES 16. http://smallb.in/%20/fund-your-business%20/additional-benefits-msmes%20/women-entrepreneurship Retrieved on 10th Nov 2013.
17. http://smallbusiness.chron.com/reasons-become-entrepreneur-2286.html. Retrieved on 10th Nov 2013. 18. http://www.businessdictionary.com/definition/entrepreneurship.html Retrieved on 10th Nov 2013.
19. http://www.inc.com/ilya-pozin/10-best-reasons-to-be-entrepreneur.html. Retrieved on 10th Nov 2013. 20. http://www.preservearticles.com/201101153366/problems-faced-by-women-entrepreneur.html. Retrieved on 10th Nov 2013.

VOLUME NO. 3 (2013), ISSUE NO. 12 (DECEMBER) ISSN 2231-4245
INTERNATIONAL JOURNAL OF RESEARCH IN COMMERCE, ECONOMICS & MANAGEMENT A Monthly Double-Blind Peer Reviewed (Refereed/Juried) Open Access International e-Journal - Included in the International Serial Directories
http://ijrcm.org.in/
65
FACTORS INFLUENCING BRAND SWITCHING IN TELECOM INDUSTRY: WITH SPECIAL REFERENCE TO LUDHIANA CITY
PREETI THAKUR
ASST. PROFESSOR
DEPARTMENT OF MANAGEMENT STUDIES
MAHARISHI MARKANDESHWAR UNIVERSITY
SOLAN
KARAN JOSHI
ASST. PROFESSOR
DEPARTMENT OF MANAGEMENT STUDIES
MAHARISHI MARKANDESHWAR UNIVERSITY
SOLAN
PRACHI KAPIL
ASST. PROFESSOR
DEPARTMENT OF MANAGEMENT STUDIES
MAHARISHI MARKANDESHWAR UNIVERSITY
SOLAN
ABSTRACT The purpose of this paper seeks to find out the factors that are influencing the brand switching in Telecom Industry, while giving the special reference to Ludhiana
City. The findings of this research shows that most preferred GSM service provider in Ludhiana is Vodafone (38%) and majority of respondents are using it from
1-2 years. Strong network coverage emerged the most influential in the selection of a particular GSM service provider. Convenience factors such as the after sales
service and the change in the place of residence are the most important factors in the switching behavior, then price issues are the second most important factor
for switching, which includes the excess balance deductions, call rate, hidden charges, and the internet charges.
KEYWORDS
MNP, GSM, CDMA, Brand Switching.
INTRODUCTION TELECOMMUNICATION
he Indian telecommunication network is the third largest in the world and the second largest among the emerging economies of Asia. The Indian telecom
sector is largely dominated by private operators that control a share of 87.9 per cent share of the entire sector. Among the top players in the telecom sector, Bharti Airtel owns the largest share at 21.75 per cent, followed by Vodafone (17.4 per cent), Reliance (13.98 per cent), state-owned BSNL (11.41
per cent), Tata (11.08 per cent) and Idea (10.97 per cent). Vodafone has recorded the fastest growth rate in the month of February, at 17.61 per cent in its
subscription base. As per statistics, the total mobile subscriber base in the country has hit 867.80 million on march, 2013 and it is further expected that this figure will steadily rise to 1.25 billion by 2015. It has also been projected that the users for the broadband base are going to reach 100 million mark by 2014, as the telecom companies
have rolled out their 3G services, as per the research study conducted by Crisil.
REVIEW OF LITERATURE Ahmed, M. et. al. (2011), has studied on Factors behind the Brand Loyalty, Developing and Proposing a Conceptual Model. The study is carried out to determine
the impact of key factors i.e. Price, Quality, Perceived value, Services and other factors (promotion, distribution, existence, social class, demographics etc) on brand loyalty of the customers and to propose a conceptual model. Durukan, T., Bozaci, I., (2011), has studied mobile number portability in turkey:an empirical analysis of consumer switching behaviour.The study was carried out to determine the consumer awareness and switching behaviour after the introduction of
mobile number portability in India. The objective of the study was to study the effects of mobile number portability on several factors were investigated like mobile traffic ,subscriber quantity, churn rate, penetration, market concentration, competition, transferred mobile numbers and monthly usage. Iqbal, T.,(2011), has studied mobile number portability in south asia. The study was carried out to determine the preconditions necessary for implementing Mobile Number Portability (MNP) in emerging South Asia. This paper explores Pakistan‟s experience in introducing Mobile Number Portability (MNP) and will investigate the suitability of introducing the same in India and the Maldives. The study also made it clear that multiple SIM use was to primarily make use of discounts for calling
on the same network; subscribers also relied on many connections to avail of better network prices. Kumaravel, V., Kandasamy, C., (2011), The study was carried out to determine Impact of mobile number portability on mobile users switchover behaviour-Indian mobile market. The objectives of the study was to to
find out network switching behavior of mobile users, reason for network switching, examine the growth of Mobile number portability in India, identify factors which determine the network switching behavior of mobile users, satisfaction level of current network service provider. This is obvious fact that all the mobile network service providers can not satisfy their customers equally despite they have their own facilities and options. The findings were that more number of
unhappy mobile service users are there in India. According to research IDEA Cellular, Bharti Airtel and Vodafone emerged as most preferred mobile service operators in terms of MNP, and they continued to gain customers from other service providers. Malhotra, G. et. al. (2011), has studied on Consumer Behavior towards Mobile Phone Service Provider - An Empirical Research on Mobile Number Portability in India. This research paper focuses on the different purposes
people use their mobile phones and their criteria of selection of a service provider in their region. Apart from that, with the new introduction of Mobile Number Portability (MNP) scheme there have been quite a lot of transitions of service-providers among the customers. Analysis of various factors and inputs collected in
the study shows varying customer satisfaction levels across different mobile subscribers.The research results shows that the behaviors of the consumers towards mobile service providers are influenced broadly by two factors service quality and cost to customers. Nitzan, I. & Libai, B. (2011), has studied on Social Effects on Customer Retention. This study explores the role of customers’ social network in their defection from a service provider. The authors use data on
communication among one million customers of a cellular company to create a large-scale social system composed of customers’ individual social networks. The study’s results indicate that exposure to a defecting neighbor is associated with an increase of 80% in the defection hazard, after controlling for a host of social,
T
VOLUME NO. 3 (2013), ISSUE NO. 12 (DECEMBER) ISSN 2231-4245
INTERNATIONAL JOURNAL OF RESEARCH IN COMMERCE, ECONOMICS & MANAGEMENT A Monthly Double-Blind Peer Reviewed (Refereed/Juried) Open Access International e-Journal - Included in the International Serial Directories
http://ijrcm.org.in/
66
personal, and purchase-related variables. This effect is comparable in both magnitude and nature to social effects observed in the highly researched case of product adoption: The extent of social influence on retention decays exponentially over time, and the likelihood of defection is affected by the strength and
homophile with defecting Neighbors and by these neighbors’ average number of connections. Siddiqui, K. (2011), has studied on Personality influences Customer Switching. The purpose of this study was to examine relationships between personality factors and customer switching for services. The study has various distinctive features. Previously there has been no meaningful research on the relationship between personality traits and customer switching variables.
The personality factor Openness to Experience emerged as a single predictor for Customer Switching for both services. Personality facets Artisictic Interests and Achievement Striving were consistent in providing major predictive Power predicting customer switching for the two services. A number of factors suggest that these results generalizable globally but they were subject to a number of limitations, and hence further research is warranted. Lyons, s., (2006), has studied the
benefits of mobile number portability. The study was carried out to determine MNP’s impact on market outcomes using international time-series cross-section data. Regression analysis was used in the following research which showed that modelling churn, initial estimation using OLS with fixed effects gave rise to
heteroscedasticity and autocorrelation. It was found that no significant effect of mobile number portability was there on churn or average prices for countries that applied less stringent target for maximum porting time and MNP reduced average prices and encouraged churn (a proxy for switching) when the switching process was rapid (e.g. less than 5days) but not when it was slower. It was also found that mobile number portability reduced retail prices but only when its
quality was high. Buehler, S., (2004), This paper examined the consequences of introducing mobile number portability (MNP). It was found that mobile number portability have subtle price effect as the incumbent lowered its fixed subscription fee as the entrant increased the price as it doesn’t wanted to compete for customers without mobile number portability. As mobile number portability was expected to divide providers of mobile services into supporters and opponents.
Lam, S. et. al. (2010), has studied on Resistance to Brand Switching When a Radically New Brand Is Introduced: A Social Identity Theory Perspective. Relative customer–brand identification with the incumbent apparently exerts a stronger longitudinal restraint on switching behavior than relative perceived value of the
incumbent. The study has important strategic implications for devising customer relationship strategies and brand investment. Alom, K., Khan, A., Meshquat, U. (2010), has studied on selection of cellular operations in Bangladesh: an empirical anlysis. Results reveal that two factors, brand image and perceived call rate, have strong positive and significant influence on consumers’ selection of a cellular operator in Bangladesh. Perceived value-added services and perceived
customer services have less impact compared to other factors, but have positive and significant influence on consumers’ brand selection. Only strong network coverage has shown comparatively less positive influence on brand selection. The study identifies unanswered questions and shows future research implications. Hanif M., (2010), the results of the study focused at customers of telecommunication companies showing that if a brand is fulfilling its promises, it
would enhance customer satisfaction and create a feeling in customer that he has chosen one of the best brand. This paper took into account all the dimensions that would be accounted for customer satisfaction like coverage quality, over all experience and fulfilment of communication needs. Research has shown that
customer satisfaction is created once the primary needs of customer are met by the brand. Sahay, A. & Sharma, N. (2010), has studied on Brand Relationships and Switching Behavior for Highly Used Products in Young Consumers. The results indicate that: young consumers do form relationships with brand(s) on all the six dimensions of consumer brand relationship that have been postulated in the literature, love and passion dimension of brand relationship is stronger amongst
teenagers as compared to young adults. Jahanzeb, S., Fatima, T. & Khan, B. (2010), has studied on An empirical analysis of customer loyalty in Pakistan’s telecommunication industry. The omnipresence of mobile phones in a developing country such as Pakistan suggests that genders share their usage for
technology and appreciate cellular service both on account of its utilitarian aspects, as well as hedonic features. Mobile service has become a communication channel that aids in marketing, maintains social networks and also facilitates an informal system of learning. Oyeniyi, O. j., (2009), The research has been conducted on Switching cost and customers loyalty in the mobile phone market: The Nigerian experience It described that assurance of service and reliability of
service was positively related to loyalty and when customers are satisfied they tend to be loyal. Zikiene, K., Petras, A. (2009), has studied Research of Factors Influencing Loyal Customer Switching Behavior. Knowing customer-specific factors that affect potential switching behavior of their loyal customers (defined through empirical research), companies could reduce the probability of occurrence of loyal customer switching behavior, find new ways to prevent customers’
turnover and make better targeted decisions regarding loyalty building. Findings of the empirical research showed, factors supporting customer switching behavior are by far more relevant for loyal customers than factors repressing customer switching behavior. The following factors supporting customer switching
behavior are also relevant for loyal customers: dissatisfactory quality, response to service failures, new value, core service failures, service encounter failures, and price issues; and the following factors repressing customer switching behavior are relevant for loyal customers: lack of perceived available or attractive alternatives, perceived risk and uncertainty costs, economic costs, and search and evaluation costs. Sathish, M., (2011), The research has been conducted on
Switching Behaviour in Cellular Service Provider: A Study with reference to Chennai. Poor network coverage, Frequent Network Problems, High call rates, Influence from family and friends were the most important factors which affected the switching behaviour. It was found that majority of the consumers were influenced by the family to select their service provider and a sizeable number of the consumers were influenced by their friends.
Kim, K. M., Park, C. M., (2004), They have studied the effects of customer satisfaction and switching barrier on customer loyalty in Korean mobile telecommunication services. This paper analyzed the effects on customer loyalty of customer satisfaction and the switching barrier, and the structural
relationship between these factors in the Korean mobile telecommunication services industry.The factors creating the switching barrier were closely connected with customers’ relationship-specific assets. Losses involved in removing special customer status or customer benefit programs, and move-in costs such as changing numbers, was also an important switching barrier for customers changing to other service providers. Trust and the personal relationships between the
company and the customer were also significant in the mobile telecommunication industry
OBJECTIVE OF THE STUDY � To know the factors considered by customers in selection of particular mobile phone service provider
� To study the factors behind brand switching from one cellular operator to another � To study the effect of mobile number portability (MNP) on brand switching
RESEARCH METHODOLOGY The research is descriptive in nature. The target population is the GSM service users of Ludhiana, Punjab. The sample size of the study will be 200 respondents.
Probability sampling technique is used as in probability sampling technique there are equal chance to select each and every respondent. Further simple random sampling is used. Primary data will be collected from the GSM service users with the help of structured questionnaire which will include close and open ended
questions. Secondary data is been collected from journals as well as magazines, newspapers and different websites. To analyze the factors influencing brand switching in telecom industry factor analysis will be used.

VOLUME NO. 3 (2013), ISSUE NO. 12 (DECEMBER) ISSN 2231-4245
INTERNATIONAL JOURNAL OF RESEARCH IN COMMERCE, ECONOMICS & MANAGEMENT A Monthly Double-Blind Peer Reviewed (Refereed/Juried) Open Access International e-Journal - Included in the International Serial Directories
http://ijrcm.org.in/
67
ANALYSIS & INTERPRETATION Factors Considered while selecting a particular mobile phone service provider:
DESCRIPTIVE STATISTICS
N Minimum Maximum Mean Std. Deviation
Brand Image 200 1 6 3.15 1.650
Call Rate 200 1 6 2.65 1.520
Strong Network Coverage 200 1 6 2.63 1.505
Value Added Service 200 1 6 4.40 1.530
Customer Service 200 1 6 4.22 1.494
Tariff Plan 200 1 6 3.75 1.631
Valid N (listwise) 200
ANALYSIS The preconditions for the selection of the particular GSM service provider was revealed by using the weighted average mean of the factors.( where 1 was ranked as the highest and 6 for the lowest). Thus it was observed that people give more weightage to strong network coverage in selecting a particular GSM service provider. Secondly they consider call rate to be the second most important factor. Then they see the brand image of the service provider before selecting
it and then the various tariff plans offers by the company. Customer service and value added service were considered the least in their selection of a particular GSM service provider.
INTERPRETATION OF THE CONSUMER SWITCHING BEHAVIOR The KMO value is 0.754, which is greater than 0.5 and this shows that the sample is adequate. The final statistics comprises the communality for all 28 variables and the Eigen value of all factors which have Eigen value of 1.
The first step in interpreting the output is to look at the factor extracted. The Eigen value table states that there are 8 factors which have Eigen value of 1. The last column in the table (cumulative percentage) shows that the 8 factors extracted together account for 55.615% of the total variance. This is a good deal because with only 8 factors (reducing them from 28) we have lost only about 44.385% of the information content, while 55.615% is retained by the 8 factors.
Thus, the overall conclusion from the above analysis is that the only 8 factors are considered important by the respondents among the 28 factors. And these 8 important factors are- convenience, Price Issues, Service, Social Factors, Network, Image & Speed, Internet charges & service failure.
CHI-SQUARE TESTS
Value df Asymp. Sig. (2-sided) Exact Sig. (2-sided) Exact Sig. (1-sided)
Pearson Chi-Square 47.496a 1 .000
Continuity Correctionb 45.382 1 .000
Likelihood Ratio 47.688 1 .000
Fisher's Exact Test .000 .000
Linear-by-Linear Association 47.259 1 .000
N of Valid Casesb 200
a. 0 cells (.0%) have expected count less than 5. The minimum expected count is 24.79.
b. Computed only for a 2x2 table
ANALYSIS:-The Chi – Square test output table we can see that a significance level of 0.000 (Pearson’s) has been achieved which is less than 0.05; hence we accept our null hypothesis. Thus we conclude that at 95% confidence level, there is no significant change in thinking of telecom consumers after introduction of MNP (mobile number portability). MOST INFLUENTIAL FACTOR CONSIDERED IN MOBILE NUMBER PORTABILITY NPar Tests
ONE-SAMPLE KOLMOGOROV-SMIRNOV TEST
Friend
circle
Peer
influence
Like because no
numberchange
From prepaid to
postpaid
From CDMA to
GSM
Attractive
plans
N 200 200 200 200 200 200
Normal Parametersa Mean 1.80 2.56 2.01 3.17 2.92 2.22
Std.
Deviation
.960 1.001 1.094 1.265 1.256 1.188
Most Extreme Differences
Absolute .264 .207 .267 .149 .156 .215
Positive .264 .207 .267 .148 .156 .215
Negative -.201 -.175 -.178 -.149 -.139 -.151
Kolmogorov-Smirnov Z 3.735 2.929 3.778 2.110 2.209 3.042
Asymp. Sig. (2-tailed) .000 .000 .000 .000 .000 .000
a. Test distribution is Normal.
ANALYSIS The Asymp. Sig. (2-tailed) should be less than 0.05, as we can see that it is .000, so we can proceed futher. If we see the absolute value in this table we will be able to find out the most important factors that are considered while using the MNP service. The most important factors that came out were that People are
mostly using the MNP service because there is no number change, their friend circle are their on that network, Attractive plans, Peer influence, from CDMA to GSM and from postpaid to prepaid. So we can say that the most lucrative part why people are using the MNP service because their number doesn’t changes and
it helps them to retain their contacts. Their friend circle are using particular service provider so he or she can also avail the benefits of same network services. The attractive plans / tariffs are attracting people to switch and grab the opportunity without changing their number.
VOLUME NO. 3 (2013), ISSUE NO. 12 (DECEMBER) ISSN 2231-4245
INTERNATIONAL JOURNAL OF RESEARCH IN COMMERCE, ECONOMICS & MANAGEMENT A Monthly Double-Blind Peer Reviewed (Refereed/Juried) Open Access International e-Journal - Included in the International Serial Directories
http://ijrcm.org.in/
68
FINDINGS • The most preferred GSM service provider in Ludhiana is Vodafone (38%) and majority of respondents are using it from 1-2 years, the second most
preferred service provider is Airtel (22%) and the majority of respondents are using it from 2-3 years, and the third most preferred service provider is Idea
(12.5%) and the majority of respondents are using it from past 1-2 years, then BSNL (9.50%) and maximum respondents are using it from 2-3 years, Reliance (9%) where the maximum respondents are using it from 1-2 years and lastly there are other service providers also which account for (9%) such as
Tata docomo, videocon etc. where the maximum people are using it from from past 1-2 years.
• Strong network coverage emerged the most influential in the selection of a particular GSM service provider. Secondly they consider Call rate to be the
most important factor then Brand Image, various Tariff Plans offered, Customer service and value added service.
• Convenience factors such as the after sales service and the change in the place of residence are the most important factors in the switching behavior, then
price issues are the second most important factor for switching, which includes the excess balance deductions, call rate, hidden charges, and the internet
charges. Thereafter social factors, Network, Image, Speed, Internet Charges and Service failures are the important factors for customer switching.
• Mobile Number Portability (MNP) has not taken its place in India; we say that there is no significant change after the introduction of MNP.
• People are mostly using the MNP service because there is no number change, friend circle, Attractive plans, Peer influence, from CDMA to GSM and from
postpaid to prepaid.
SUGGESTIONS • From the study, it is abundantly clear that lack of convenience lead the consumers to switch the service provider. So, mobile service providers need to
satisfy the Consumer with maximum convenience..
• Mobile service providers should invest more on improving their network coverage in order to retain their consumers.
• Mobile service providers have to provide more offers for family and friends. Enticing offers still hold a major sway.
• Mobile service provider should satisfy their current consumers by providing them innovative offers.
• Mobile service provider should accept valid feedbacks from consumers regularly and make sure that they satisfy the consumers.
LIMITATIONS As everything has its advantage and disadvantage, similarly conducting a market research project has its limitations too: the following are the limitations for this
project: 1. Sample size is 200 which does not account for the whole population.
2. The taste and preferences of a person keeps changing with time to time as well as it changes with days, and the occurrence of various events. 3. There may be some ambiguity in the response given by the Respondents. 4. As the research had limited time to be completed in so there is a boundation of time constraint in the study.
5. The economic condition and per capita income of the area might have some influence on the community in sample.
CONCLUSION In this rapidly changing and hugely competitive telecom sector companies are fighting hard for their survival and to explore new markets throughout the globe.
The feature of a particular GSM service provider plays an important role in the buying decision of customers. After analysing the findings of the study, we suggest that cellular service providers concentrate more on improving the service and quality by increasing network stability and setting tariff rates competitively. The findings also suggest that managers of these mobile operators should shift focus on building corporate image and analyse more carefully the
reason for consumers to switch brands in this industry in order to increase loyalty among these consumers. Factors such as - Convenience, Price issues, Service, Social factors, Network, Image and Speed, Internet charges and Service failure are considered to be the most important factors why consumers switch and by improving or enhancing these eight factors, the company will score high numbers among customers perception. Because customers preference towards various
GSM service providers mainly depends upon these eight factors. Also, the introduction of mobile number portability (MNP) hasn’t much influenced the customers a lot to shift from one brand to another.
REFERENCES 1. Ahmed, M. et. al. (2011), Factors behind the brand loyalty, developing and proposing a conceptual model, interdisciplinary journal of contemporary
research in business, copyright © 2011 Institute of Interdisciplinary Business Research 1217, July 2011, vol 3, no 3. 2. Alom, K., Khan, A. & Meshquat, U. (2010), selection of cellular operators in Bangladesh: An empirical analysis, Mobile Marketing Association, IJMM Winter
2010 Vol. 5. No. 2 3. Jahanzeb, S., Fatima, T. & Khan, B. ( 2010), An empirical analysis of customer loyalty in Pakistan’s telecommunication industry, Database Marketing &
Customer Strategy Management Vol.18,1,5–15, © 2011 Macmillan Publishers Ltd. 1741-2439 4. Lam, S. et. al. (2010), Resistance to Brand Switching When a Radically New Brand Is Introduced: A Social Identity Theory Perspective, Journal of Marketing,
Vol. 74 (November 2010), 128–146, 2010, American Marketing Association ISSN: 0022-2429 (print), 1547-7185 (electronic)
5. Malhotra, G. et. al. (2011), Consumer Behavior towards Mobile Phone Service Provider - An Empirical Research on Mobile Number Portability in India, Advances In Management, Vol. 4 (6) June (2011
6. Nitzan, I. & Libai, B. (2011), Social Effects on Customer Retention, Journal of Marketing Vol. 75 (November 2011), 24–38, © 2011, American Marketing
Association ISSN: 0022-2429 (print), 1547-7185 (electronic) 7. Sahay, A. & Sharma, N. (2010), Brand Relationships and Switching Behaviour for Highly Used Products in Young Consumers, vikalpa, volume 35, no 1,
january-march 2010 8. Siddiqui, K. (2011), Personality influences Customer Switching, interdisciplinary journal of contemporary research in business, copyright © 2011 Institute of
Interdisciplinary Business Research 363 february 2011,vol 2, no 10
9. Zikiene, K. & Petras, A. (2009), Research of Factors Influencing Loyal Customer Switching Behaviour, Faculty of Economics and Management, Vytautas Magnus University, Lithuania.ISSN 1392-1142,organizaciju vadyba: sisteminiai tyrimai: 2009.52
ANNEXURE FACTOR ANALYSIS
KMO AND BARTLETT'S TEST
Kaiser-Meyer-Olkin Measure of Sampling Adequacy. .754
Bartlett's Test of Sphericity Approx. Chi-Square 1.031E3
df 378
Sig. .000

VOLUME NO. 3 (2013), ISSUE NO. 12 (DECEMBER) ISSN 2231-4245
INTERNATIONAL JOURNAL OF RESEARCH IN COMMERCE, ECONOMICS & MANAGEMENT A Monthly Double-Blind Peer Reviewed (Refereed/Juried) Open Access International e-Journal - Included in the International Serial Directories
http://ijrcm.org.in/
69
COMMUNALITIES
Initial Extraction
I would switch to another network for low prices. 1.000 .413
I would switch because of the brand image of the mobile operator. 1.000 .583
I would switch to another network for 3G connectivity. 1.000 .646
I would switch to another network for strong network coverage. 1.000 .672
I would switch to another network for Wide network coverage. 1.000 .600
I would switch to another network for response to service failures. 1.000 .472
I would switch to another networkfor minimum level of congestion in the network. 1.000 .595
I would switch to another network for better value deals. 1.000 .464
I would switch to another network for call service failures. 1.000 .574
I would switch to another network for Excess balance deductions 1.000 .526
I would switch to another network for lack of perceived available or attractive offers. 1.000 .656
I would switch to another network for refusal to modify service or product. 1.000 .549
I would switch to another network for superior after sales service. 1.000 .564
I would switch to another network because of Long Wait Times for Consumer Service. 1.000 .624
I would switch to another network for change of the place of residence 1.000 .553
I would switch to another network for change in service personnel i.e. Call Center 1.000 .643
I would switch to another network as per the suggestion of my Retailer. 1.000 .497
I would switch to another network for variety seeking. 1.000 .574
I would switch to another network because of no new schemes or up gradation facility 1.000 .487
I would switch to another network because of unsuitable plans for different age group in my present service providers service. 1.000 .498
I would switch to another network because I feel the call rate is high. 1.000 .514
I would switch to another network because of hidden charges. 1.000 .530
I would switch to another network because of high SMS charge 1.000 .437
I would switch to another network because of high Internet charge 1.000 .572
I would switch to another network because of high Internet charge 1.000 .603
I would switch to another network because of Influence from family and friend 1.000 .493
I would switch to another network because of Fancy Number 1.000 .621
I would switch to another network because of high service charges for recharges 1.000 .614
Extraction Method: Principal Component Analysis.
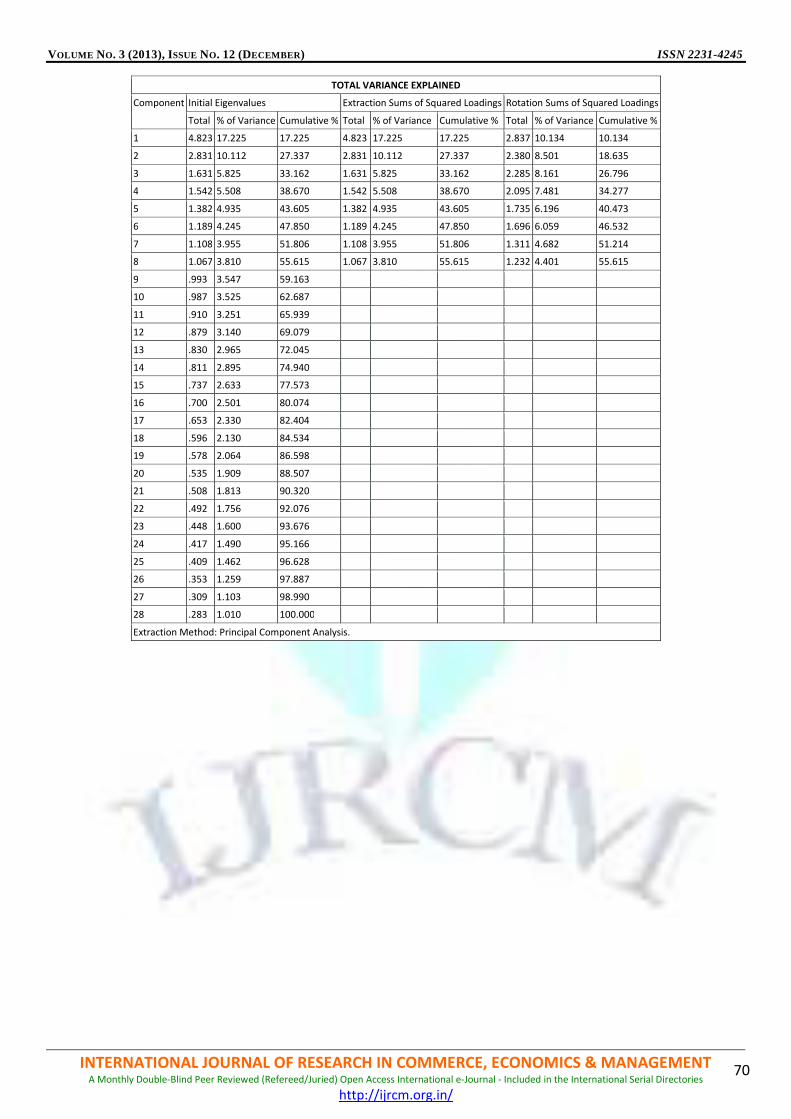
VOLUME NO. 3 (2013), ISSUE NO. 12 (DECEMBER) ISSN 2231-4245
INTERNATIONAL JOURNAL OF RESEARCH IN COMMERCE, ECONOMICS & MANAGEMENT A Monthly Double-Blind Peer Reviewed (Refereed/Juried) Open Access International e-Journal - Included in the International Serial Directories
http://ijrcm.org.in/
70
TOTAL VARIANCE EXPLAINED
Component Initial Eigenvalues Extraction Sums of Squared Loadings Rotation Sums of Squared Loadings
Total % of Variance Cumulative % Total % of Variance Cumulative % Total % of Variance Cumulative %
1 4.823 17.225 17.225 4.823 17.225 17.225 2.837 10.134 10.134
2 2.831 10.112 27.337 2.831 10.112 27.337 2.380 8.501 18.635
3 1.631 5.825 33.162 1.631 5.825 33.162 2.285 8.161 26.796
4 1.542 5.508 38.670 1.542 5.508 38.670 2.095 7.481 34.277
5 1.382 4.935 43.605 1.382 4.935 43.605 1.735 6.196 40.473
6 1.189 4.245 47.850 1.189 4.245 47.850 1.696 6.059 46.532
7 1.108 3.955 51.806 1.108 3.955 51.806 1.311 4.682 51.214
8 1.067 3.810 55.615 1.067 3.810 55.615 1.232 4.401 55.615
9 .993 3.547 59.163
10 .987 3.525 62.687
11 .910 3.251 65.939
12 .879 3.140 69.079
13 .830 2.965 72.045
14 .811 2.895 74.940
15 .737 2.633 77.573
16 .700 2.501 80.074
17 .653 2.330 82.404
18 .596 2.130 84.534
19 .578 2.064 86.598
20 .535 1.909 88.507
21 .508 1.813 90.320
22 .492 1.756 92.076
23 .448 1.600 93.676
24 .417 1.490 95.166
25 .409 1.462 96.628
26 .353 1.259 97.887
27 .309 1.103 98.990
28 .283 1.010 100.000
Extraction Method: Principal Component Analysis.

VOLUME NO. 3 (2013), ISSUE NO. 12 (DECEMBER) ISSN 2231-4245
INTERNATIONAL JOURNAL OF RESEARCH IN COMMERCE, ECONOMICS & MANAGEMENT A Monthly Double-Blind Peer Reviewed (Refereed/Juried) Open Access International e-Journal - Included in the International Serial Directories
http://ijrcm.org.in/
71
COMPONENT MATRIXa
COMPONENT
1 2 3 4 5 6 7 8
I would switch to another network for low prices. .421 .004 .366 -.102 -.022 .032 -.300 -.011
I would switch because of the brand image of the mobile operator. .324 -.207 .226 -.459 .200 .100 -.025 .351
I would switch to another network for 3G connectivity. .407 -.023 .392 -.221 .240 -.303 .207 .291
I would switch to another network for strong network coverage. .024 .509 .418 .214 .338 -.247 .090 -.093
I would switch to another network for Wide network coverage. .049 .372 .542 -.216 .261 .181 -.079 -.110
I would switch to another network for response to service failures. .313 .187 .344 .386 -.211 .105 .002 .125
I would switch to another networkfor minimum level of congestion in the network. .443 -.042 .328 .134 -.466 .161 .126 .111
I would switch to another network for better value deals. .501 .056 .183 .234 -.312 .050 .138 -.048
I would switch to another network for call service failures. .192 .249 .034 -.130 .126 .139 .627 -.169
I would switch to another network for Excess balance deductions .133 .514 -.181 -.202 .265 .309 -.069 -.009
I would switch to another network for lack of perceived available or attractive offers. .434 -.051 -.179 .415 .289 -.093 .410 -.011
I would switch to another network for refusal to modify service or product. .462 -.049 -.202 .242 .274 .037 .022 .396
I would switch to another network for superior after sales service. .495 -.003 -.131 .270 .417 -.076 -.217 .054
I would switch to another network because of Long Wait Times for Consumer Service. .426 -.063 -.296 7.698E-5 .212 .529 .042 -.157
I would switch to another network for change of the place of residence .517 -.232 .105 .165 .209 -.076 -.203 -.320
I would switch to another network for change in service personnel i.e. Call Center .651 -.154 .125 -.093 -.299 .124 .193 -.172
I would switch to another network as per the suggestion of my Retailer. .525 -.342 -.166 -.156 .059 -.010 .111 -.190
I would switch to another network for variety seeking. .712 -.200 -.039 -.098 .060 -.049 -.102 -.010
I would switch to another network because of no new schemes or up gradation facility .627 .020 -.029 .150 .008 -.079 -.225 -.110
I would switch to another network because of unsuitable plans for different age group in my present service providers service.
.503 -.266 -.011 .157 -.141 .289 -.195 .087
I would switch to another network because I feel the call rate is high. .101 .619 -.161 -.116 -.065 .069 -.162 -.213
I would switch to another network because of hidden charges. .059 .670 -.045 .025 -.022 .210 -.050 .167
I would switch to another network because of high SMS charge .070 .420 .110 .241 -.043 -.228 -.182 -.313
I would switch to another network because of high Internet charge .202 .388 -.273 .201 -.166 -.145 -.108 .454
I would switch to another network because of high Internet charge .213 .684 -.176 -.005 -.164 .054 .155 .080
I would switch to another network because of Influence from family and friend .482 .147 -.328 -.156 -.126 -.268 .003 -.140
I would switch to another network because of Fancy Number .459 .128 -.196 -.295 -.173 -.481 .075 -.031
I would switch to another network because of high service charges for recharges .526 .212 -.066 -.507 -.107 -.037 -.124 .053
Extraction Method: Principal Component Analysis.
a. 8 components extracted.

VOLUME NO. 3 (2013), ISSUE NO. 12 (DECEMBER) ISSN 2231-4245
INTERNATIONAL JOURNAL OF RESEARCH IN COMMERCE, ECONOMICS & MANAGEMENT A Monthly Double-Blind Peer Reviewed (Refereed/Juried) Open Access International e-Journal - Included in the International Serial Directories
http://ijrcm.org.in/
72
ROTATED COMPONENT MATRIXa
Component
1 2 3 4 5 6 7 8
I would switch to another network for low prices. .273 .076 .328 .093 .133 .324 -.161 -.262
I would switch because of the brand image of the mobile operator. .114 -.016 .034 .062 -.201 .723 -.031 -.032
I would switch to another network for 3G connectivity. .098 -.151 .125 .204 .273 .658 .114 .188
I would switch to another network for strong network coverage. .047 .196 .009 -.110 .760 .097 .024 .179
I would switch to another network for Wide network coverage. -.006 .372 .078 -.196 .387 .384 -.346 -.007
I would switch to another network for response to service failures. .106 .088 .592 -.140 .230 .007 .172 -.013
I would switch to another networkfor minimum level of congestion in the network. -.002 -.036 .756 .068 -.065 .114 .029 .022
I would switch to another network for better value deals. .166 .016 .623 .156 .060 -.034 .047 .128
I would switch to another network for call service failures. -.075 .225 .100 .097 .051 .100 -.143 .682
I would switch to another network for Excess balance deductions .125 .681 -.162 -.005 -.016 .101 -.007 .104
I would switch to another network for lack of perceived available or attractive offers. .453 -.127 .105 .055 .086 -.085 .292 .566
I would switch to another network for refusal to modify service or product. .467 .032 .070 -.016 -.115 .198 .499 .154
I would switch to another network for superior after sales service. .689 .056 -.032 .044 .123 .085 .247 .015
I would switch to another network because of Long Wait Times for Consumer Service. .505 .310 .075 -.057 -.422 -.012 -.125 .264
I would switch to another network for change of the place of residence .651 -.157 .163 .138 .126 .026 -.205 -.026
I would switch to another network for change in service personnel i.e. Call Center .233 -.030 .580 .344 -.189 .132 -.203 .195
I would switch to another network as per the suggestion of my Retailer. .418 -.164 .099 .358 -.274 .121 -.159 .206
I would switch to another network for variety seeking. .536 -.043 .242 .368 -.137 .269 .003 .010
I would switch to another network because of no new schemes or up gradation facility .546 .076 .289 .288 .077 .014 .057 -.085
I would switch to another network because of unsuitable plans for different age group in my present service providers service.
.432 -.027 .426 -.012 -.320 .068 .054 -.134
I would switch to another network because I feel the call rate is high. -.008 .629 -.014 .228 .163 -.178 -.060 -.063
I would switch to another network because of hidden charges. -.102 .659 .097 -.052 .149 -.008 .225 .008
I would switch to another network because of high SMS charge .099 .211 .101 .132 .506 -.290 -.052 -.109
I would switch to another network because of high Internet charge -.002 .284 .121 .178 .044 -.055 .652 -.121
I would switch to another network because of high Internet charge -.130 .609 .177 .238 .127 -.096 .258 .189
I would switch to another network because of Influence from family and friend .221 .146 .057 .636 -.033 -.061 .083 .068
I would switch to another network because of Fancy Number .056 .018 .053 .761 .072 .115 .116 .054
I would switch to another network because of high service charges for recharges .113 .355 .130 .544 -.122 .369 -.051 -.093
Extraction Method: Principal Component Analysis.
Rotation Method: Varimax with Kaiser Normalization.
a. Rotation converged in 21 iterations.
COMPONENT TRANSFORMATION MATRIX
Component 1 2 3 4 5 6 7 8
1 .641 .134 .498 .457 -.058 .283 .091 .151
2 -.214 .818 .021 .101 .477 -.100 .178 .071
3 -.158 -.177 .447 -.332 .528 .469 -.351 -.109
4 .320 -.204 .299 -.437 .289 -.565 .409 .079
5 .504 .060 -.621 -.315 .251 .336 -.013 .285
6 .088 .460 .245 -.584 -.553 .013 -.253 .096
7 -.333 -.158 .118 .044 -.038 .037 .044 .918
8 -.210 -.017 .044 -.195 -.190 .506 .777 -.141
Extraction Method: Principal Component Analysis. Rotation Method: Varimax with Kaiser Normalization.

VOLUME NO. 3 (2013), ISSUE NO. 12 (DECEMBER) ISSN 2231-4245
INTERNATIONAL JOURNAL OF RESEARCH IN COMMERCE, ECONOMICS & MANAGEMENT A Monthly Double-Blind Peer Reviewed (Refereed/Juried) Open Access International e-Journal - Included in the International Serial Directories
http://ijrcm.org.in/
73
ROLE OF FINANCIAL INSTITUTIONS IN DEVELOPMENT OF MSME AND AGRICULTURAL SECTOR IN INDIA: A VISION FOR YEAR 2020
AMOGH TALAN
ASST. PROFESSOR
SRI AUROBINDO COLLEGE (EVENING)
UNIVERSITY OF DELHI
NEW DELHI
GAURAV TALAN
TEAM SUPPORT SPECIALIST (RISK AND GOVERNANCE)
BARCLAYS FINANCE
NEW DELHI
ABSTRACT
Economic structures in emerging countries differ significantly from those of more developed ones, which demand different degrees of role of different types of
financing for the economies’ development. Financing of households, businesses, and the government are the three main financial activities in any country which
can be achieved through personal savings, capital markets or banks. While large companies can easily raise credit through bonds or equity, in a developing and
agriculture based country like India where SMEs and agricultural sector has a large contribution in country’s development, banks and other financial institutions
such as RRBs, MFIs, UCBs, NBFCs and NABARD must have to step in to provide easy credit to these sectors for their development. In our paper we discuss the
potential role of the financial institutions in the development of MSME and agricultural sector and make suggestions based on it, which could empower the
financial institutions to help develop MSME and agricultural sector over the course of next few years, especially by year 2020.
JEL CODE
G2
KEYWORDS
Financial institutions, economic development, SMEs, Agriculture.
INTRODUCTION SME Sector and agricultural sector have been known to possess a great amount of untapped potential for India’s economic development. Ironically, since the independence of India, both MSME sector and agricultural sector in particular have faced constant problems and their development has never
been close to its actual potential. Due to political and social turmoil in India policies for the upliftment of these sectors have been difficult to formulate. Though, as India’s development rate has been increasing and political and social stability has finally been achieved slowly, rules and policies focusing the development of these sectors have constantly been put forward by the government in recent times. In this paper we focus on the role of financial institutions in
the upliftment of MSME and agricultural sector, while pointing out the loopholes in the rules formulated by Indian government, RBI or NABARD, and suggestions on how these loopholes may be filled to achieve the Vision 2020. Vision 2020 is a status of MSME and agricultural sector that could potentially be achieved by the year 2020 with the help of initiatives taken by our government and financial institutions for their development. Such status warrants MSME and agriculture
sector to achieve a high rate of growth and high level of income generated at the lowest cost possible, which would empower the people related to these sectors and improve their standard of living.
REVIEW OF LITERATURE Vision and Potential Role of Financial Institutions in the Development of MSME Sector by Year 2020 Significance of Micro, Small and Medium Enterprises in India’s Economic Development MSME sector in India plays a key role in the development of the country via. reduction of poverty, inducing employment, and help in re-distribution of wealth to
name a few. Criteria (Shown in figure 1) to qualify as a micro, small or medium enterprise for manufacturing or service sector is laid down by the definitions provided by
world bank and Micro, Small and Medium Enterprise Development Act 2006. 1
WORLD BANK DEFINATION OF MSME FIGURE 1 (Figures in brackets are in USD)
Source: World Bank2
M
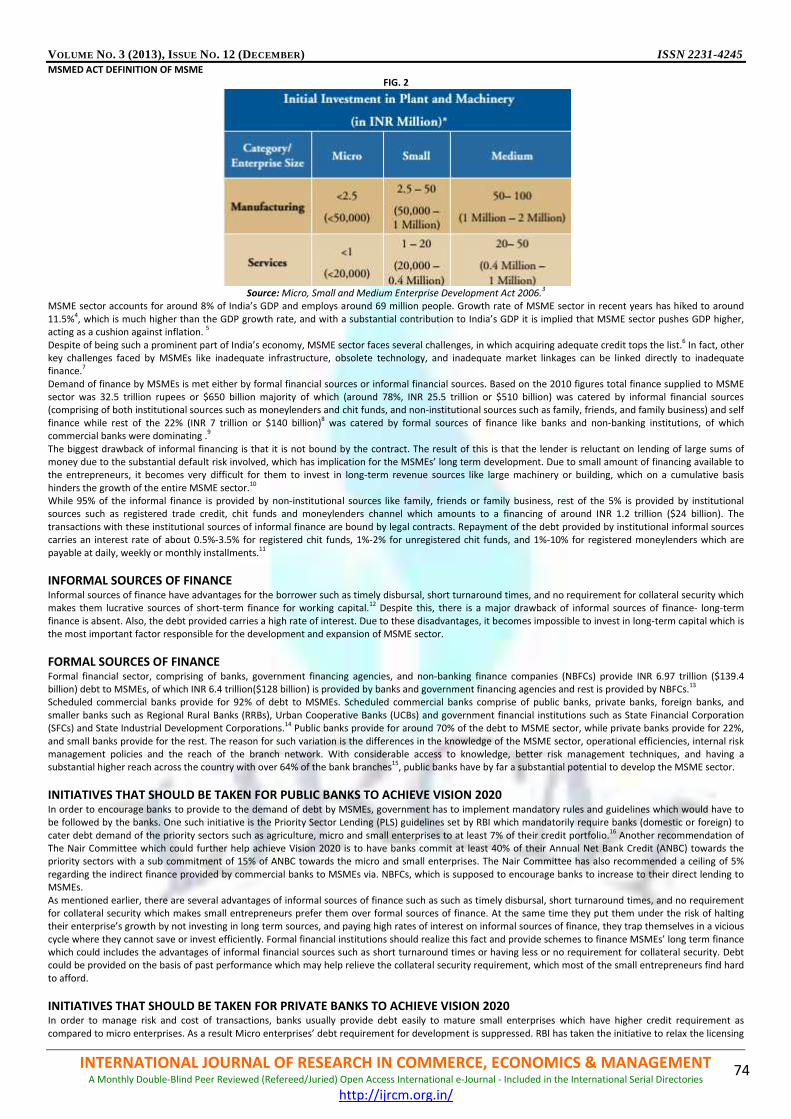
VOLUME NO. 3 (2013), ISSUE NO. 12 (DECEMBER) ISSN 2231-4245
INTERNATIONAL JOURNAL OF RESEARCH IN COMMERCE, ECONOMICS & MANAGEMENT A Monthly Double-Blind Peer Reviewed (Refereed/Juried) Open Access International e-Journal - Included in the International Serial Directories
http://ijrcm.org.in/
74
MSMED ACT DEFINITION OF MSME FIG. 2
Source: Micro, Small and Medium Enterprise Development Act 2006.
3
MSME sector accounts for around 8% of India’s GDP and employs around 69 million people. Growth rate of MSME sector in recent years has hiked to around
11.5%4, which is much higher than the GDP growth rate, and with a substantial contribution to India’s GDP it is implied that MSME sector pushes GDP higher,
acting as a cushion against inflation. 5
Despite of being such a prominent part of India’s economy, MSME sector faces several challenges, in which acquiring adequate credit tops the list.6 In fact, other
key challenges faced by MSMEs like inadequate infrastructure, obsolete technology, and inadequate market linkages can be linked directly to inadequate finance.
7
Demand of finance by MSMEs is met either by formal financial sources or informal financial sources. Based on the 2010 figures total finance supplied to MSME sector was 32.5 trillion rupees or $650 billion majority of which (around 78%, INR 25.5 trillion or $510 billion) was catered by informal financial sources (comprising of both institutional sources such as moneylenders and chit funds, and non-institutional sources such as family, friends, and family business) and self
finance while rest of the 22% (INR 7 trillion or $140 billion)8 was catered by formal sources of finance like banks and non-banking institutions, of which
commercial banks were dominating .9
The biggest drawback of informal financing is that it is not bound by the contract. The result of this is that the lender is reluctant on lending of large sums of money due to the substantial default risk involved, which has implication for the MSMEs’ long term development. Due to small amount of financing available to the entrepreneurs, it becomes very difficult for them to invest in long-term revenue sources like large machinery or building, which on a cumulative basis
hinders the growth of the entire MSME sector.10
While 95% of the informal finance is provided by non-institutional sources like family, friends or family business, rest of the 5% is provided by institutional sources such as registered trade credit, chit funds and moneylenders channel which amounts to a financing of around INR 1.2 trillion ($24 billion). The
transactions with these institutional sources of informal finance are bound by legal contracts. Repayment of the debt provided by institutional informal sources carries an interest rate of about 0.5%-3.5% for registered chit funds, 1%-2% for unregistered chit funds, and 1%-10% for registered moneylenders which are
payable at daily, weekly or monthly installments.11
INFORMAL SOURCES OF FINANCE Informal sources of finance have advantages for the borrower such as timely disbursal, short turnaround times, and no requirement for collateral security which makes them lucrative sources of short-term finance for working capital.
12 Despite this, there is a major drawback of informal sources of finance- long-term
finance is absent. Also, the debt provided carries a high rate of interest. Due to these disadvantages, it becomes impossible to invest in long-term capital which is the most important factor responsible for the development and expansion of MSME sector.
FORMAL SOURCES OF FINANCE Formal financial sector, comprising of banks, government financing agencies, and non-banking finance companies (NBFCs) provide INR 6.97 trillion ($139.4 billion) debt to MSMEs, of which INR 6.4 trillion($128 billion) is provided by banks and government financing agencies and rest is provided by NBFCs.
13
Scheduled commercial banks provide for 92% of debt to MSMEs. Scheduled commercial banks comprise of public banks, private banks, foreign banks, and
smaller banks such as Regional Rural Banks (RRBs), Urban Cooperative Banks (UCBs) and government financial institutions such as State Financial Corporation (SFCs) and State Industrial Development Corporations.
14 Public banks provide for around 70% of the debt to MSME sector, while private banks provide for 22%,
and small banks provide for the rest. The reason for such variation is the differences in the knowledge of the MSME sector, operational efficiencies, internal risk management policies and the reach of the branch network. With considerable access to knowledge, better risk management techniques, and having a substantial higher reach across the country with over 64% of the bank branches
15, public banks have by far a substantial potential to develop the MSME sector.
INITIATIVES THAT SHOULD BE TAKEN FOR PUBLIC BANKS TO ACHIEVE VISION 2020 In order to encourage banks to provide to the demand of debt by MSMEs, government has to implement mandatory rules and guidelines which would have to be followed by the banks. One such initiative is the Priority Sector Lending (PLS) guidelines set by RBI which mandatorily require banks (domestic or foreign) to
cater debt demand of the priority sectors such as agriculture, micro and small enterprises to at least 7% of their credit portfolio.16
Another recommendation of The Nair Committee which could further help achieve Vision 2020 is to have banks commit at least 40% of their Annual Net Bank Credit (ANBC) towards the priority sectors with a sub commitment of 15% of ANBC towards the micro and small enterprises. The Nair Committee has also recommended a ceiling of 5%
regarding the indirect finance provided by commercial banks to MSMEs via. NBFCs, which is supposed to encourage banks to increase to their direct lending to MSMEs.
As mentioned earlier, there are several advantages of informal sources of finance such as such as timely disbursal, short turnaround times, and no requirement for collateral security which makes small entrepreneurs prefer them over formal sources of finance. At the same time they put them under the risk of halting their enterprise’s growth by not investing in long term sources, and paying high rates of interest on informal sources of finance, they trap themselves in a vicious
cycle where they cannot save or invest efficiently. Formal financial institutions should realize this fact and provide schemes to finance MSMEs’ long term finance which could includes the advantages of informal financial sources such as short turnaround times or having less or no requirement for collateral security. Debt could be provided on the basis of past performance which may help relieve the collateral security requirement, which most of the small entrepreneurs find hard
to afford.
INITIATIVES THAT SHOULD BE TAKEN FOR PRIVATE BANKS TO ACHIEVE VISION 2020 In order to manage risk and cost of transactions, banks usually provide debt easily to mature small enterprises which have higher credit requirement as
compared to micro enterprises. As a result Micro enterprises’ debt requirement for development is suppressed. RBI has taken the initiative to relax the licensing

VOLUME NO. 3 (2013), ISSUE NO. 12 (DECEMBER) ISSN 2231-4245
INTERNATIONAL JOURNAL OF RESEARCH IN COMMERCE, ECONOMICS & MANAGEMENT A Monthly Double-Blind Peer Reviewed (Refereed/Juried) Open Access International e-Journal - Included in the International Serial Directories
http://ijrcm.org.in/
75
requirements for Tire II cities and below, yet banks (especially private and foreign) are reluctant on branch expansion for the costs involved and the fear of operational inefficiency. Hence, to tackle these issues the government and RBI should formulate better and uniform cost and risk management policies. Another
reason contributing to these issues is the non uniform processes for sourcing and underwriting of the finance given by public, private and foreign banks. While public banks manage risk by setting limits on the amounts approved, private and foreign banks segregate their sales and underwriting terms to manage risk. The more comprehensive the process of risk management is, timelier it would be for MSMEs to acquire finance. Hence, uniformity in risk management policies
would ensure a quicker disbursal of finance to MSMEs.
INITIATIVES THAT SHOULD BE TAKEN FOR SMALL BANKS TO ACHIEVE VISION 2020 Smaller banks such as RRBs, UCSs, SFCs and SIDCs have a much higher potential for outreach in smaller districts and villages than the commercial banks due to
better knowledge of local context and having primary information about the entrepreneurs. They are much more likely than commercial banks to establish one-to-one relationships with the entrepreneurs. Despite of having such a large potential, these institutions provide for only about 8% of the debt demand of the MSMEs. The reason for this anomaly is that RRBs operate in markets where resources are not readily available but unfortunately they have to face the
organization structures and operational costs similar to those of full-service banks. Policies should be formulated which should be custom made for branches in keeping in mind the area in which they are operating and keeping in mind their access to the resources. Branches should be given more autonomy so that they won’t have to rely on the sponsor bank. This coupled with specialized training provided to the branch personnel will likely solve the conflict of interest, weaker
decision making and poor governance problems. RBI should plan to acquire the high non-performing assets of such branches and dedicate resources for proper credit appraisals.
INITIATIVES THAT SHOULD BE TAKEN FOR NBFCs TO ACHIEVE VISION 2020 NBFCs are also considered to have a high potential to help develop the MSME sector. NBFCs usually cater to the financial demands of transport businesses, engineering, vendor supply chains and retail trade (Section 45-IA/B/C of the RBI Act, 1934) NBFCs carry much lower compliance overheads and are more flexible and carry lower operational costs in comparison with banks. Branch outreach is similar to that of RRBs and UCBs hence they have firsthand knowledge about the
entrepreneurs. Due to these advantages NBFCs are better placed to finance MSMEs which might be considered risky by banks. However they have disadvantages which our government should take care of. NBFCs cannot public deposits hence they have to heavily rely on commercial banks and promoter’s
equity for growth. Due to this, NBFCs tend to carry high costs of funds. Because of their operational strengths NBFCs are capable of providing differentiated products and personalized services. They can process loans much faster and allow flexible collateral options, where they tend to use immovable property as collateral too. In fact some larger NBFCs even offer collateral-free debt based on the cash flows and past financial performance. Taking this into account, it
becomes imperative for our government to take measures to lower their cost of funds and reduce their reliance on the commercial banks.
INITIATIVES THAT SHOULD BE TAKEN FOR NBFCs TO ACHIEVE VISION 2020 Micro Finance Institutions (MFIs) usually provide for the financial demands of unregistered and unorganized microenterprises segment. MFIs have unmatched
potential to reach the non-served areas, and have a better understanding of enterprises’ financial performance and potential which enable them to deliver customized services. However, despite of the huge market potential, MFIs usually provide for only the working capital requirements of the entrepreneurs while the long term debt is absent. Current regulations limit them to a loan size of INR 0.05 million ($1,000), or less. Hence, amendments in the policies and
regulations are required to enable them to finance the unregistered segment.17
INITIATIVES THAT SHOULD BE TAKEN FOR MICRO ENTERPRISES TO ACHIEVE VISION 2020 Micro enterprises have a high higher demand for the credit, though formal financial institutions are inclined to provide finance to small and medium enterprises,
with only 31% of the portfolio dedicated to micro enterprises and rest to small and medium enterprises. This results in fulfilling only 40-60% of the financial demand of micro enterprises.
18 A micro enterprise on an average s given a debt of INR 0.15 – 0.3 million ($3,000 – $6,000)
19 , while finance available to small
enterprises on an average is around INR 1.5 – 3.5 million ($30,000 – $70,000) and that to medium enterprises is INR 40 million – 50 million ($0.8 – 1 million).20
The reason attributed to this is the lower transaction cost that is involved in providing loans to small and medium enterprises. Also, micro enterprises are not able to provide adequate collateral to secure the loan. Hence, initiatives should be taken by RBI and government to lower the transaction costs of banks while providing credit to micro enterprises, and other alternatives, such as loan granted on the basis of cash flows and past financial performance should be taken in
place of collateral demand for the loan.
INITIATIVES THAT SHOULD BE TAKEN FOR SERVICE SECTOR TO ACHIEVE VISION 2020 If we look at the sector wise financing, we find that service sector receives much lesser financing as compared to the manufacturing sector. The reason is that
financial institutions do not have access to any benchmarks to measure and manage risk for service sector, as they have for manufacturing sector enterprises.21
Further in service sector enterprises, knowledge-based enterprises such as software cos., management and human resource consulting companies receive the lowest of the financing. Ironically these are the very enterprises which have a substantial potential to contribute to the nation’s development. Hence, initiatives
are needed by RBI or government to device risk management policies for the service sector enterprises.
INITIATIVES THAT SHOULD BE TAKEN FOR LOW INCOME STATES AND NORTH EASTERN STATES TO ACHIEVE VISION 2020 If we look at the region wise disbursal of finance, we find that Low Income States and North-eastern States receive the lowest amount of debt finance, with an
aggregate of 17% as compared to 83% for rest of the India.22
The reasons for non catering low income states are operational inefficiencies, infrastructural problems, and political instability. The reasons for not serving the north-eastern states are attributed to poor transportation infrastructure, security and law and order instability.
23 In order to improve the situation regarding the financing, it is imperative for the government to take macro-economic measures. More
entrepreneurial activities induced through financing could also lead to stability of these regions, and improvement of the standard of living of such reasons. Low income states and north-eastern states have low rate of industrialization and hence services firms have a much larger potential to develop. Unfortunately, as we
discussed, service sector is significantly lesser served by financial institutions due to non-uniformity of risk management practices. Hence, this warrants changes not only on macroeconomic level, but at other levels as well.
VISION AND POTENTIAL ROLE OF NABARD IN THE DEVELOPMENT OF RURAL AREAS AND AGRICULTURE SECTOR BY YEAR 2020 National Bank for Agriculture and Rural Development (NABARD) is an apex development bank which facilitates the credit flow for the promotion and
development of agriculture, small-scale industries, and cottage and handicrafts industry in rural areas. NABARD provides refinance to lending institutions, and loans to state governments, non government organizations (NGOs), panchayati raj institutions (PRIs) for the development of rural infrastructure development. It
also finances and monitors regional rural banks (RRBs) and cooperative banks for the same purpose. In this paper we will highlight few of the most recent and prominent schemes launched by NABARD which have a long term consequences which would help achieve Vision 2020.
NABARD INFRASTRUCTURE DEVELOPMENT ASSISTANCE (NIDA) Partnering with Boston Consulting Group, NABARD has undertaken an initiative called Nabard Infrastructure Development Assistance (NIDA), a credit support
product which would fund infrastructure projects by funding government owned institutions with longer repayment period of up to 15 years. The long term

VOLUME NO. 3 (2013), ISSUE NO. 12 (DECEMBER) ISSN 2231-4245
INTERNATIONAL JOURNAL OF RESEARCH IN COMMERCE, ECONOMICS & MANAGEMENT A Monthly Double-Blind Peer Reviewed (Refereed/Juried) Open Access International e-Journal - Included in the International Serial Directories
http://ijrcm.org.in/
76
advantage of this scheme would ensure to tackle the drawbacks of Rural Infrastructure Development Fund (RIDF). Under RIDF funding borrowing power of state governments is limited under Article 293, hence investment in rural infrastructure suffer from severe disadvantage under RIDF funding. Projects with larger
potential for development usually demand a high investment, which now can be made available through NIDA. Also, RIDF is highly politically motivated, which directs the funding in means other than those required for rural development. Infrastructure projects are prioritized for funding under RIDF which can directly be linked with political interference. With the introduction of NIDA, projects shall no longer be prioritized in the same manner as in RIDF, hence political
interference can be reduced to a great extent. NABARD Infrastructure Development Assistance programme would finance rural infrastructure projects by providing credit to state governments and other state-owned organizations, through direct credit based upon risk appraisal of the project involved.
24
NABARD WAREHOUSING SCHEME (NWS) 2013-14 One of the major challenges faced by Indian agriculturists is the damage occurred to the cultivated food grains due to extreme weather conditions of India, because either they cannot afford the warehousing facilities or because the warehousing facilities are so far away or unavailable in their region, that it becomes infeasible to store the food grains before distribution. For example, last winter rains alone deemed to have damaged 80 lakh tone of wheat grain in Punjab and
Haryana alone stored in open areas. Out of 121 lakh tone wheat stock, only 40 lakh tone gained warehouse protection.25
To avoid such tragedies in future, Reserve Bank of India issued guidelines for creation of Warehouse Infrastructure Fund (WIF) in NABARD. NABARD initiated NABARD Warehousing Scheme (NWS) 2013- 14 which would finance public and private sectors for construction of warehouses, silos, cold storages and other cold chain infrastructure in places
wherever necessary. Priority will be given to the projects proposed in Eastern & North Eastern due to the extreme weather conditions there and food grain deficit states. Credit will be offered to the state governments and organizations sponsored by the government and panchayati raj institutions, and even
individual entrepreneurs at a repayment period of 7 years. 26
PRODUCER ORGANIZATION DEVELOPMENT FUND (PODF) Most of the producer organizations in India are in infancy stage are not able to avail value chain addition advantages, and market linkage advantages because of having small scale of operations, fragmented supply chain, lack of marketing facilities and poor market linkages. India has around 13 crore farmer households of
which over 85% are marginal and small farmers who own less than 2 hectares of land on an average. Due to disorganization and fragmentation of land they are unable to adopt latest technology and use high yielding seeds or fertilizers in the production of food grains. Due to marketing and value chain inefficiencies faced
by them, they are unable to get a fair price for their produce. Recognizing the importance of the marketing infrastructure in advancing the efficiency of agricultural production and the supply chain thereof, NABARD uses PODF to initiate activities such as development of warehouses and cold chains, funding of storage infrastructure with assistance of marketing federations having primary agriculture cooperative societies (PACS) as their members. The biggest drawback
such federations and cooperatives have faced is the unavailability of timely and adequate credit support. With the help of PODF NABARD hopes to alleviate the value chain and marketing hurdles faced by farmers and small producer cooperatives.
27
BUSINESS CORRESPONDENCE MODEL Financial exclusion has been a bane in India for a very long time because of which a vast majority of poor have been unable to seek formal access to formal financial institutions, which in turn restricts them to access financial services made available by these formal financial institutions. When NABARD or any other government organization initiates programs for the upliftment of poor, such programs or services are offered to the poor via financial services, directly or
indirectly. If someone is financially excluded, it becomes almost impossible for him/her to avail such services. According to 2008 data from India’s National Sample Survey Office, 45.9 million farmer households, of the total 89.3 million farmer households, did not have access to formal credit. Research has shown a strong link between the level of financial exclusion and level of poverty and inequality (see table below): the higher the financial exclusion, the higher the
inequality and poverty. 28
FINANCIAL INCLUSION AND POVERTY INDICATORS AMONG SELECTED ASIAN COUNTRIES
TABLE 1
Source: World Bank, 2012
In 2006, Reserve Bank of India issued guidelines directing banks to assign Business Correspondents (BCs) to increase their outreach. A BC is an entity which acts as a teller for the banks, acts on its behalf and carries out a full range of financial transactions with the client.
29 NABARD has since joined the initiative of RBI and
help banks allot and train BCs in rural or underdeveloped areas. An NGO, MFI, post offices or NBFCs can act as a BC. The objective is to reach each village in the country in the phased manner over next three to five years. Banks can thus reach financially excluded people especially in rural areas through BCs and provide their full range of services at their doorsteps. This way a bank can reach out to backwards areas which lack formal financial facilities at a much faster rate and at
lower cost. This doorstep banking helps faster loan disbursement and recovery. Because NGOs and other BCs are linked personally to the clients, this improves loan performance and repayment rates.
30 This initiative has shown a significant achievement as the number of banking outlets increased from 54258 in 2010 to
107604 in 2011. Of these 84274 were business correspondence outlets and rest were brick and mortar branches with about 40% being added in villages with
VOLUME NO. 3 (2013), ISSUE NO. 12 (DECEMBER) ISSN 2231-4245
INTERNATIONAL JOURNAL OF RESEARCH IN COMMERCE, ECONOMICS & MANAGEMENT A Monthly Double-Blind Peer Reviewed (Refereed/Juried) Open Access International e-Journal - Included in the International Serial Directories
http://ijrcm.org.in/
77
populations under 2000. 31
As of June 2011, over 79 crore no-frills accounts (accounts with no requirement for a minimum balance) were opened by banks, in comparison with 49.3 crore accounts as of march 2010.
32
With the advent of this program, poor people who had to take high interest loans from money lenders in case of medical emergencies will now have access to finance. With the assistance from NABARD, over the years this program is supposed to help achieve an overall community development and social empowerment by reducing poverty and inequality.
DISCUSSION With the help of this paper we analyzed the present status of the role of financial institution in the development of MSME and agricultural sector, and made suggestions regarding the loopholes in the policies and rules that our government have formulated which could help achieve the Vision 2020. The status and
suggestions discussed are not comprehensive and are just little segment of the network of potential improvements and initiatives required to achieve the vision 2020. Non-financial sector also has a great role to play in the development of MSME and agricultural sector. Political and social factors can be highly responsible for the plight or upliftment of these sectors. Cultural factors matter to a great extent too. Over the time, attitude of people has been changing towards
entrepreneurship and a lot more people are being diverted to this sector. One reason could be unemployment. However, the need is for people to realize the real potential of these sectors and divert to them not due to unavailability of opportunities in other sectors, but due to availability of the opportunities in these sectors.
REFERENCES 1. http://msme.gov.in/ 2. http://www.worldbank.org/
3. http://msme.gov.in/ 4. Ministry of MSME, Annual Report, 2009-10; RBI 5. A Research Study on Needs, Gaps and Way Forward (November, 2012), International Finance Corporation, World Bank Group
6. Report of Working Group on Rehabilitation of Sick MSMEs, Reserve Bank of India. 7. How Important are Financing Constraints, Ayyagari, Kunt, Maksimovic, 2005.
8. Fourth All India MSME Census, 2007; SIDBI MSME Database, 2010, IFC-Intellecap Analysis. 9. RBI, SIDBI,SME Times – 2010, Primary Research, IFC-Intellecap Analysis. 10. A Research Study on Needs, Gaps and Way Forward (November, 2012), International Finance Corporation, World Bank Group
11. IFMR, All India Association of Chit Funds, IFC – Intellecap Analysis. 12. Financing Firms in India, Allen, Chakrabarti, De, Qain, 2007. 13. RBI, SIDBI, Sa-Dhan, Annual Reports of NBFCs, Primary Research; IFC-Intellecap Analysis.
14. RBI; SIDBI; Sa-Dhan, Annual Reports of NBFCs; SME Times, 2010; Primary Research; IFC-Intellecap Analysis. 15. Statistical tables relating to banks of India, Reserve Bank of India, 2009-10.
16. The Nair Committee Report on Priority Sector Lending, February 2012. 17. Report on financial performance of Indian MFIs, Sa-Dhan, 2010. 18. RBI, SIDBI, Primary Research, IFC-Intellecap Analysis.
19. RBI, Statistical Tables Relating to Banks of India, IFCIntellecap Analysis, Primary Research. 20. RBI, Statistical Tables Relating to Banks of India, IFCIntellecap Analysis, Primary Research.
21. RBI, SIDBI, Primary Research, IFC-Intellecap Analysis. 22. RBI, SIDBI, Primary Research, IFC-Intellecap Analysis. 23. Census, 2011.
24. www.nabard.org/ 25. The Times of India, ‘Rains damage food grains in Punjab, Haryana, 19/1/2013. 26. www.nabard.org/
27. www.nabard.org/ 28. U. Thorat, Inclusive Growth—Role of Banks in Emerging Economies, Reserve Bank of India, Mumbai, 2008.
29. Anupam Kishore, 2012. Business Correspondent model boosts financial inclusion in India, Federal Reserve bank of Minneapolis publication. 30. Anupam Kishore, 2012. Business Correspondent model boosts financial inclusion in India, Federal Reserve bank of Minneapolis publication. 31. Anupam Kishore, 2012. Business Correspondent model boosts financial inclusion in India, Federal Reserve bank of Minneapolis publication.
32. K. C. Chakrabarty, Financial Inclusion and Banks: Issues and Perspectives, Reserve Bank of India, New Delhi, 2011.
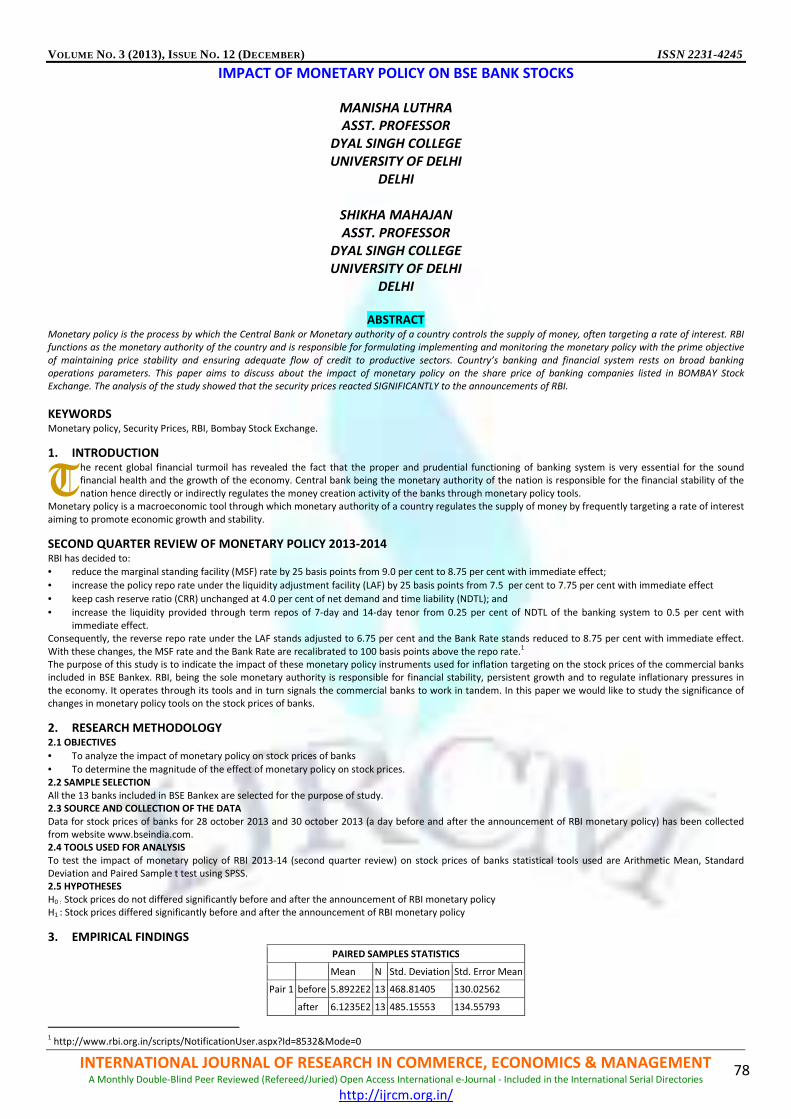
VOLUME NO. 3 (2013), ISSUE NO. 12 (DECEMBER) ISSN 2231-4245
INTERNATIONAL JOURNAL OF RESEARCH IN COMMERCE, ECONOMICS & MANAGEMENT A Monthly Double-Blind Peer Reviewed (Refereed/Juried) Open Access International e-Journal - Included in the International Serial Directories
http://ijrcm.org.in/
78
IMPACT OF MONETARY POLICY ON BSE BANK STOCKS
MANISHA LUTHRA
ASST. PROFESSOR
DYAL SINGH COLLEGE
UNIVERSITY OF DELHI
DELHI
SHIKHA MAHAJAN
ASST. PROFESSOR
DYAL SINGH COLLEGE
UNIVERSITY OF DELHI
DELHI
ABSTRACT
Monetary policy is the process by which the Central Bank or Monetary authority of a country controls the supply of money, often targeting a rate of interest. RBI
functions as the monetary authority of the country and is responsible for formulating implementing and monitoring the monetary policy with the prime objective
of maintaining price stability and ensuring adequate flow of credit to productive sectors. Country’s banking and financial system rests on broad banking
operations parameters. This paper aims to discuss about the impact of monetary policy on the share price of banking companies listed in BOMBAY Stock
Exchange. The analysis of the study showed that the security prices reacted SIGNIFICANTLY to the announcements of RBI.
KEYWORDS
Monetary policy, Security Prices, RBI, Bombay Stock Exchange.
1. INTRODUCTION he recent global financial turmoil has revealed the fact that the proper and prudential functioning of banking system is very essential for the sound financial health and the growth of the economy. Central bank being the monetary authority of the nation is responsible for the financial stability of the
nation hence directly or indirectly regulates the money creation activity of the banks through monetary policy tools. Monetary policy is a macroeconomic tool through which monetary authority of a country regulates the supply of money by frequently targeting a rate of interest
aiming to promote economic growth and stability.
SECOND QUARTER REVIEW OF MONETARY POLICY 2013-2014 RBI has decided to:
• reduce the marginal standing facility (MSF) rate by 25 basis points from 9.0 per cent to 8.75 per cent with immediate effect;
• increase the policy repo rate under the liquidity adjustment facility (LAF) by 25 basis points from 7.5 per cent to 7.75 per cent with immediate effect
• keep cash reserve ratio (CRR) unchanged at 4.0 per cent of net demand and time liability (NDTL); and
• increase the liquidity provided through term repos of 7-day and 14-day tenor from 0.25 per cent of NDTL of the banking system to 0.5 per cent with
immediate effect. Consequently, the reverse repo rate under the LAF stands adjusted to 6.75 per cent and the Bank Rate stands reduced to 8.75 per cent with immediate effect.
With these changes, the MSF rate and the Bank Rate are recalibrated to 100 basis points above the repo rate.1
The purpose of this study is to indicate the impact of these monetary policy instruments used for inflation targeting on the stock prices of the commercial banks included in BSE Bankex. RBI, being the sole monetary authority is responsible for financial stability, persistent growth and to regulate inflationary pressures in
the economy. It operates through its tools and in turn signals the commercial banks to work in tandem. In this paper we would like to study the significance of changes in monetary policy tools on the stock prices of banks.
2. RESEARCH METHODOLOGY 2.1 OBJECTIVES
• To analyze the impact of monetary policy on stock prices of banks
• To determine the magnitude of the effect of monetary policy on stock prices.
2.2 SAMPLE SELECTION All the 13 banks included in BSE Bankex are selected for the purpose of study. 2.3 SOURCE AND COLLECTION OF THE DATA Data for stock prices of banks for 28 october 2013 and 30 october 2013 (a day before and after the announcement of RBI monetary policy) has been collected from website www.bseindia.com. 2.4 TOOLS USED FOR ANALYSIS To test the impact of monetary policy of RBI 2013-14 (second quarter review) on stock prices of banks statistical tools used are Arithmetic Mean, Standard Deviation and Paired Sample t test using SPSS. 2.5 HYPOTHESES H0 : Stock prices do not differed significantly before and after the announcement of RBI monetary policy H1 : Stock prices differed significantly before and after the announcement of RBI monetary policy
3. EMPIRICAL FINDINGS PAIRED SAMPLES STATISTICS
Mean N Std. Deviation Std. Error Mean
Pair 1 before 5.8922E2 13 468.81405 130.02562
after 6.1235E2 13 485.15553 134.55793
1 http://www.rbi.org.in/scripts/NotificationUser.aspx?Id=8532&Mode=0
T
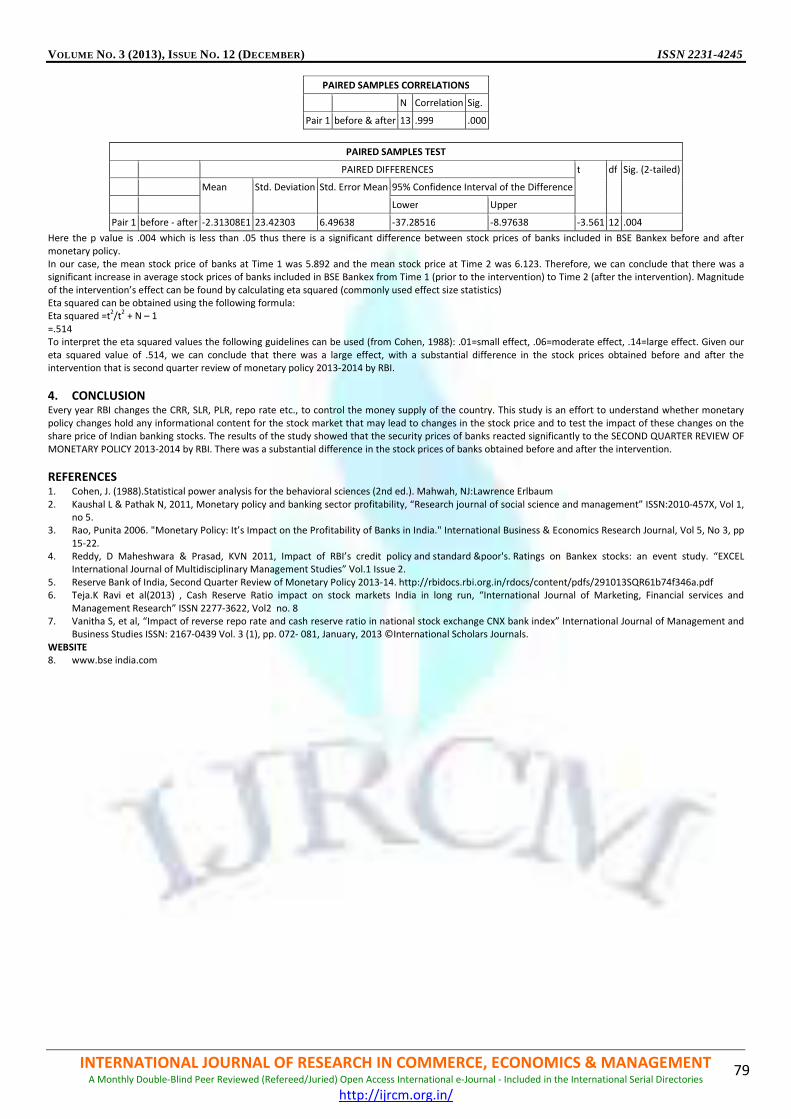
VOLUME NO. 3 (2013), ISSUE NO. 12 (DECEMBER) ISSN 2231-4245
INTERNATIONAL JOURNAL OF RESEARCH IN COMMERCE, ECONOMICS & MANAGEMENT A Monthly Double-Blind Peer Reviewed (Refereed/Juried) Open Access International e-Journal - Included in the International Serial Directories
http://ijrcm.org.in/
79
PAIRED SAMPLES CORRELATIONS
N Correlation Sig.
Pair 1 before & after 13 .999 .000
PAIRED SAMPLES TEST
PAIRED DIFFERENCES t df Sig. (2-tailed)
Mean Std. Deviation Std. Error Mean 95% Confidence Interval of the Difference
Lower Upper
Pair 1 before - after -2.31308E1 23.42303 6.49638 -37.28516 -8.97638 -3.561 12 .004
Here the p value is .004 which is less than .05 thus there is a significant difference between stock prices of banks included in BSE Bankex before and after
monetary policy. In our case, the mean stock price of banks at Time 1 was 5.892 and the mean stock price at Time 2 was 6.123. Therefore, we can conclude that there was a significant increase in average stock prices of banks included in BSE Bankex from Time 1 (prior to the intervention) to Time 2 (after the intervention). Magnitude
of the intervention’s effect can be found by calculating eta squared (commonly used effect size statistics) Eta squared can be obtained using the following formula: Eta squared =t
2/t
2 + N – 1
=.514 To interpret the eta squared values the following guidelines can be used (from Cohen, 1988): .01=small effect, .06=moderate effect, .14=large effect. Given our
eta squared value of .514, we can conclude that there was a large effect, with a substantial difference in the stock prices obtained before and after the intervention that is second quarter review of monetary policy 2013-2014 by RBI.
4. CONCLUSION Every year RBI changes the CRR, SLR, PLR, repo rate etc., to control the money supply of the country. This study is an effort to understand whether monetary
policy changes hold any informational content for the stock market that may lead to changes in the stock price and to test the impact of these changes on the share price of Indian banking stocks. The results of the study showed that the security prices of banks reacted significantly to the SECOND QUARTER REVIEW OF
MONETARY POLICY 2013-2014 by RBI. There was a substantial difference in the stock prices of banks obtained before and after the intervention.
REFERENCES 1. Cohen, J. (1988).Statistical power analysis for the behavioral sciences (2nd ed.). Mahwah, NJ:Lawrence Erlbaum
2. Kaushal L & Pathak N, 2011, Monetary policy and banking sector profitability, “Research journal of social science and management” ISSN:2010-457X, Vol 1, no 5.
3. Rao, Punita 2006. "Monetary Policy: It’s Impact on the Profitability of Banks in India." International Business & Economics Research Journal, Vol 5, No 3, pp
15-22. 4. Reddy, D Maheshwara & Prasad, KVN 2011, Impact of RBI’s credit policy and standard &poor's. Ratings on Bankex stocks: an event study. “EXCEL
International Journal of Multidisciplinary Management Studies” Vol.1 Issue 2.
5. Reserve Bank of India, Second Quarter Review of Monetary Policy 2013-14. http://rbidocs.rbi.org.in/rdocs/content/pdfs/291013SQR61b74f346a.pdf 6. Teja.K Ravi et al(2013) , Cash Reserve Ratio impact on stock markets India in long run, “International Journal of Marketing, Financial services and
Management Research” ISSN 2277-3622, Vol2 no. 8 7. Vanitha S, et al, “Impact of reverse repo rate and cash reserve ratio in national stock exchange CNX bank index” International Journal of Management and
Business Studies ISSN: 2167-0439 Vol. 3 (1), pp. 072- 081, January, 2013 ©International Scholars Journals.
WEBSITE 8. www.bse india.com
VOLUME NO. 3 (2013), ISSUE NO. 12 (DECEMBER) ISSN 2231-4245
INTERNATIONAL JOURNAL OF RESEARCH IN COMMERCE, ECONOMICS & MANAGEMENT A Monthly Double-Blind Peer Reviewed (Refereed/Juried) Open Access International e-Journal - Included in the International Serial Directories
http://ijrcm.org.in/
80
MOBILISATION AND MANAGEMENT OF FINANCIAL RESOURCES BY URBAN LOCAL BODIES
YASHODA
ASST. PROFESSOR
DEPARTMENT OF COMMERCE
GOVERNMENT FIRST GRADE WOMEN COLLEGE
SAGAR
ABSTRACT
Local Self-Government Institutions or Local Bodies in India, being at the cutting edge level of administration, directly influence the well-being of the people by
providing civic services and socio-economic infrastructure facilities. The Constitution (74th
Amendment) Act, 1992 has mandated grass root level democracy in
urban areas by assigning the task of preparation and implementation of plans for economic development and social justice to elected municipal councils and
wards committees. It has incorporated the Twelfth Schedule into the Constitution of India containing a list of 18 functions as the legitimate functional domain of
Urban Local Bodies (ULBs) in the country. In view of this position, the demands placed by the public on municipal authorities for the provision of various civic
services have increased considerably. Urban local bodies/municipalities play an important role in the planning and development of urban areas. However, most
studies undertaken to assess the functioning of municipalities in India point out that the performance of municipalities deteriorate over time. It is noted that
municipalities in India are confronted with a number of problems such as inefficiency in the conduct of business, ineffective participation by the weaker sections
of the population in local governance, weak financial condition, and lack of transparency in the planning and implementation of projects etc. which affect their
performance adversely. The present paper critically examines the devolution of functions and finances of the urban local bodies.
KEYWORDS
Local bodies, local Governance.
INTRODUCTION ntil 1992, local governments were not part of the Indian government’s planning and development strategy. A dramatic change in the federal system of India came with the introduction of the Constitution Amendment Act of 1992 conferring the status of the third level of government to local bodies. This
amendment took Indian democracy one step forward and added a new dimension to the federal system of government. Through this amendment the establishment of a local representative government empowered with administrative and financial abilities to deliver mandated services to its citizens came into force. It transferred responsibilities for services to urban local bodies that elect their own representatives and gave them the power to raise their own revenues
and authority to make investment decisions. The Constitution Amendment Act aimed to introduce strong grassroots level democracy through the establishment of urban local bodies, but left the issues of
their empowerment and operationalization to the discretion of the state governments. The state governments, as a part of municipal governance reforms, should amend their municipal legislation to comply with the spirit of the Constitutional Amendment. However, state municipal legislation mainly covers electoral reforms and there has been little effort towards widening the functional and financial domain of urban local bodies.
74th Amendment Act provides for the constitution, by every state, of a State Finance Commission, within one year of the amendment and thereafter every five years, regarding the financial resources of local bodies. Unfortunately, the recommendations of the Commission are not binding on the respective states. But still the Municipalities blame the State Governments that they are not getting the required finances to run the urban body. In spite of the fact that the 74th
Amendment visualizes the ‘people’s participation’ as one of the main objectives, the people actual participation in the municipal affairs of the city is still limited. Major cause of this attitude is that the people look towards the municipal bodies with inherent suspicion and take it for granted that their problems and
grievances will not be taken care of. Urban local bodies are in need of substantial funds to execute their constitutionally assigned functions. The legislature of a state may, by law, authorize an urban local body to levy and collect taxes, duties, tolls and fees. Central and state governments may also provide grants-in-aid to their urban local bodies. Thus there
are two main sources of revenue for urban local bodies, internal and external. Internal source revenue is commonly known as own source and it includes income generated from various taxes and non-taxes levied on the citizen. External source revenue mainly includes funds obtained from the central and state governments in the form of grants or loans. There may be other external sources of funds, for example, loans from domestic institutions or financial
intermediaries. Some urban local bodies have also chosen to raise money from capital markets by issuing bonds. In the case of ULBs in India, the 74th Amendment to the Constitution of India, 1992 identified enormous responsibilities for the urban local governments.
Besides the 18 items listed as municipal responsibilities in the Twelfth Schedule of the Constitution, the Legislature of a State, by law, can assign any tasks relating to: (i) the preparation of plans for economic development and social justice; and (ii) the implementation of schemes as may be entrusted to them.
OBJECTIVES OF THE STUDY 1. To describe sailent features of 74
th constitutional amendment.
2. To discuss the status of devolution of functions of the urban local bodies. 3. To examine the financial resources practiced by the urban local bodies.
METHODOLOGY The present study is conducted with the help the secondary data. The secondary data was collected from the annual reports, books, web site and other available literatures.
TYPES OF LOCAL GOVERNANCE 1) Constitutional status has been accorded to Urban Local Government bodies. Three tier structures has been envisaged, whereby there would be municipal
corporations, for larger areas, municipal councils for smaller areas, and nagar panchayats for villages in transition to becoming towns. Since, “Local Government” is a state subject, the state legislatures have been left within their powers to define the details of the powers and functions of different units
of urban government institutions whose broad outline only has been drawn by the Parliament. 2) Direct election to these Municipal bodies by the people in the manner as the elections are held for the Lok Sabha and State Assemblies has been provided.
For the purpose of elections, the Municipal elections are to be conducted by the State Election Commission.
3) Reservation of one-third of seats for women including women belonging to Scheduled Castes and Scheduled Tribes is ensured. 4) The State Finance Commission would ensure financial viability of the Municipalities. Municipal funds have been augmented through taxes, tolls, duties and
fees, grants-in aid. 5) Urban municipal institutions of self-government have been endowed with power and authority to formulate and implement schemes for economic
development and social justice on 18 subjects.
U
VOLUME NO. 3 (2013), ISSUE NO. 12 (DECEMBER) ISSN 2231-4245
INTERNATIONAL JOURNAL OF RESEARCH IN COMMERCE, ECONOMICS & MANAGEMENT A Monthly Double-Blind Peer Reviewed (Refereed/Juried) Open Access International e-Journal - Included in the International Serial Directories
http://ijrcm.org.in/
81
6) Developmental Committees, namely, (DPC) and Metropolitan Planning Committees have been constituted. Thus, planning in India has been decentralised up to the grassroots level.
7) For better proximity with citizens, wards committees have been constituted. 8) The 74th CAA and also the 73rd CAA (on Panchayats) have created local self government institutions throughout rural and urban India with powers (29 for rural and 18 for urban) delineated, devolution, deliberative and executive wings of government created, authority and responsibilities defined, developmental committees (DPC, MPC) and Finance Commission constituted; and
within each Municipality, Wards Committees and Zonal Committees have been constituted.
TYPES OF URBAN LOCAL BODIES The following types of urban local bodies are found in India:
1. Municipal Corporation- Municipal Corporation is established by the Act of state government for the big cities of states and by the Act of Parliament for the big cities of Union Territories. A corporation has three authorities. First is the corporation council headed by the Mayor, who is assisted by the Deputy Mayor. The councillors and Mayor are directly elected by the people. Council is a deliberative and legislative organ of the corporation. Second organ of the
corporation are the standing committees to deal with various activities like health, education, public works and are empowered to take decisions in their respective fields. The third authority of the Corporation is the Municipal Commissioner, who is a government officer and is responsible for the implementation of the decisions taken by the council and standing committees.
2. Municipalities- They are setup by the Acts of state legislature for the administration of small cities or towns. It also has three authorities. First the municipal council is the legislative branch of the municipality, and is headed by the Chairman, who in turn is assisted by a Deputy Chairman. The standing committees
facilitate the work of municipality in various fields such as health, taxation finance etc. The third authority of the municipality is the Chief Municipal Officer, who is appointed by the state government and is responsible for the general administration of the municipality. The municipality may be known by other names also such as Municipal Board, Municipal Council or Municipal Committee etc.
3. Notified Area Committee- This may be created either in a town which is fast developing or which may not fulfil the conditions for the creation of a municipality. It is known as Notified Area Committee because it is created through a notification of the state government published in the official gazette. It is not a statutory body and all its members and chairman are nominated by the government. It performs similar functions as performed by a municipality.
4. Town Area Committee-It is created by a separate Act of state government for the administration of small towns. It performs a limited number of functions like street lighting, drainage etc. As provided in the Act, it may be wholly elected or totally nominated or partly elected or partly nominated body.
5. Cantonment Boards- They are established to perform municipal functions for civilian population living in cantonment or military areas. Its noticeable feature is that it is created and works under the central Act of 1924 under the administrative control of Ministry of Defence. There are three types of Cantonment Boards depending upon the number of civilian population in the Cantonment Area. It consists of partly elected and partly nominated
members. The members are elected for a three year term. The military officer commanding the cantonment station is the ex officio chairman of the Cantonment Board.
6. Townships- Townships are established by a public sector undertaking as its housing colony to provide civil amenities to its employees living in township. It
has no elected members and its affairs are managed by a Town Administrator appointed by the public sector undertaking. 7. Port Trusts- Such urban bodies are established by an Act of the Parliament to manage and protect ports and to provide civic amenities to the port area. It is
headed by an official appointed by the central government. It has both elected and nominated members. 8. Special Purpose Agencies- The state governments establish some special purpose agencies to perform some specific functions of municipalities. They
function as separate bodies not under the control of municipalities. They may be created either by an act of State Legislature or by an order of the
executive. Some of these agencies are Housing Board, Water Supply Undertaking, Electricity Supply Undertakings, and Urban Development Authorities etc.
FUNCTIONS OF URBAN LOCAL BODIES 1. Urban Planning including town planning;
2. Regulation of land use and construction of buildings; 3. Planning for economic and social development; 4. Roads and bridges;
5. Water supply for domestic, industrial and commercial purposes; 6. Public health, sanitation conservancy and solid waste management;
7. Fire services; 8. Urban forestry, protection of the environment and promotion of ecological aspects; 9. Safe-guarding the interest of weaker sections of society, including the handicapped and mentally retarded;
10. Slums improvement and upgrading; 11. Urban poverty alleviation; 12. Provision of urban amenities and facilities such as parks, gardens, playgrounds;
13. Promotion of cultural, educational and aesthetic aspects; 14. Burials and burial grounds; cremations, cremation grounds and electric crematoriums;
15. Cattle pounds; prevention of cruelty to animals; 16. Vital statistics, including registration of births and deaths; 17. Public amenities, including street lighting, parking lots, bus stops and public conveniences; and
18. Regulation of slaughter houses and tanneries. In the case of ULBs in India, the 74th Amendment to the Constitution of India, 1992 identified enormous responsibilities for the urban local governments. Besides the 18 items listed as municipal responsibilities in the Twelfth Schedule of the Constitution, the Legislature of a State, by law, can assign any tasks
relating to: (i) the preparation of plans for economic development and social justice; and (ii) the implementation of schemes as may be entrusted to them.
FINANCES OF URBAN LOCAL BODIES It should be noted that urban local bodies prepare their Budgets on annual basis in the forms prescribed by the state government. Before execution, the Budget
is to be submitted to the state government in February for its approval. Only after the approval of the state government the Budget of a local body is implemented. The Budget is prepared on the basis of priority areas and availability of finances. Generally the sources of finances of a urban body are 0f four types:
1. Collection of Local Tax Revenue- Urban local bodies levy some taxes in their area; such as octroi, property tax, profession tax, entertainment tax, advertisement tax, animal tax, market tax, water tax, pilgrim tax, toll on new bridges etc. The revenue from taxes constitutes the two-third of the total
revenue of urban local bodies. Octroi has been abolished in some states which was a major source of income. 2. Non-Tax Revenue- It consists of fees, receipts, fines or income from remunerative activities of the urban local bodies. The fees is collected through various
forms and processing fees. These bodies also collect some non-tax revenue through parks and exhibition grounds.
3. Grants-in-Aid- The state government gives grants-in-aid to the urban local body for special purpose. Under the 74th Amendment, a State Finance Commission is established to recommend the principles governing the grants-in-aids to the urban local bodies by the state governments.
4. Loans- Under the respective Municipal Acts, the urban local bodies are entitled to raise loans from the state governments. The loans are to be paid back within prescribed time limit along with the interest. The proposals of loans are to be cleared by the Reserve Bank of India.

VOLUME NO. 3 (2013), ISSUE NO. 12 (DECEMBER) ISSN 2231-4245
INTERNATIONAL JOURNAL OF RESEARCH IN COMMERCE, ECONOMICS & MANAGEMENT A Monthly Double-Blind Peer Reviewed (Refereed/Juried) Open Access International e-Journal - Included in the International Serial Directories
http://ijrcm.org.in/
82
FINDINGS 1. In the wake of growing urbanization, it has been facing serious challenges to meet the requirements of urban infrastructure, municipal services,
environmental conservation, and urban poverty alleviation. Historically, local self-governments depend on financial transfers from the higher levels of government namely, the state and/or the central government. The finances of municipalities are in a very bad condition. Infact the financial position of
majority of the Urban Local Bodies is so poor that they are hardly in a position to meet the ever rising demand of funds for rendering municipal core services. Most of the urban local bodies are constrained in discharging their obligatory functions due to a limited resource base. Rapid growth of cities and towns is not matched by a corresponding increase in the revenue of ULBs.
2. The poor quality of services rendered by the ULBs is due to not only by a constraint of resources but also due to poor staffing and poor quality of management, among other reasons. The resource potentials of ULBs do not match with their functional responsibilities, leading to near absolute fiscal
dependence on State Government. Most of the ULBs are financially weak, generate negligible own resources considering the work they are expected to do, and hence are heavily grant dependent. Obligatory taxes (like house tax etc.) are grossly under exploited and have never been given a fair chance of implementation as per Rules prescribed by the State Government itself.
3. Local Bodies are faced with the uphill task of managing the rapid growth. Scarcity of resources, lack of knowledge and technology are hampering their ability to respond to the challenges faced. Information crisis and lack of endeavors to take innovative steps, is aggravating the situation. Moreover, there is little appreciation and support to indigenous efforts made to tackle the problem effectively
4. Local finance is thus characterized by a mismatch between functions devolved to ULBs and the devolution of tax authority. This mismatch is exacerbated by lack of (i) buoyancy and elasticity in local fiscal instruments, (ii) lack of taxes with wide base, (iii) abolition of buoyant and elastic source of revenue as in
India- (Octroi), and (iv) dependence on only one or two taxes that are not easy to implement.
SUGGESTIONS 1. There is lack of comprehensive and consistent municipal finance database. There is an imperative need to develop robust database for municipal finance
and the same may be made public on a regular basis. In the absence of reliable data source for the ULBs, accurate plan and innovations cannot be framed.
For this, National Municipal Accounting Manual may be adopted and enabled for developing an online Municipal Finance Information System. 2. In order to improve municipal amenities provided by ULBs, they need to be made professional institutions. They have to play a specific role in reducing the
unbalanced growth of urban areas. 3. There is a need to specify the amount required and the expenditure to be incurred for providing basic services and as to which are the resources to be
devolved to lower level governments.
4. There is no inbuilt freedom in devolving grants. Hence the lower level government should gradually increase tax effort and encompass new revenue collection avenues, project loan and public donations etc.
CONCLUSION Indian urban local bodies have the status of third tier local government. The imbalances in the functions and finances have made the urban local bodies dependent on grants from upper tiers of government. In addition there are urban local bodies that have insufficient financial resources due to their failure to adequately exploit existing sources of revenues. However, the local level governments do not have a defined power structure, functional/fiscal domain, and
capacity like the higher levels of government. Historically, the provincial governments have controlled the urban local self-governments and have not devolved adequate powers and responsibilities to them. The capacity of the urban local self-governments has still not been strengthened to cope with the growing challenges of urbanization, poverty, environment, infrastructure, and services.
REFERENCES 1. Dr. Gangadhar Jha Nimish Jha, Urban local government in India, Published in urban world, Mumabi 2. J.P Gupta, Urban Local Self governance institution in Punjab. Chandigarh.
3. RamaKrishna Nallathiga, Analyzing the finances of urban local bodies in India. Hyderabad. 4. The 74
th constitutional amendment
5. The report of state finance commission

VOLUME NO. 3 (2013), ISSUE NO. 12 (DECEMBER) ISSN 2231-4245
INTERNATIONAL JOURNAL OF RESEARCH IN COMMERCE, ECONOMICS & MANAGEMENT A Monthly Double-Blind Peer Reviewed (Refereed/Juried) Open Access International e-Journal - Included in the International Serial Directories
http://ijrcm.org.in/
83
AN EMPIRICAL ANALYSIS OF FACTORS AFFECTING INTERNET BANKING IN PUNJAB STATE (INDIA)
RITU SEHGAL
ASST. PROFESSOR
DAV INSTITUTE OF ENGINEERING & TECHNOLOGY
JALANDHAR
ABSTRACT
This study is an attempt to know the perception of banking customers towards Internet banking and to find out the factors which a customer selects to choose a
bank for Internet banking. The data has been collected from 120 respondents of public sector banks and private sector banks in the State of Punjab. Among public
sector banks, State Bank of India (SBI), Punjab National Bank (PNB), Canara bank and among private sector banks Industrial Credit and Investment Corporation of
India (ICICI Bank), Housing Development Finance Corporate (HDFC) bank and Axis bank in the State of Punjab were taken for study. The data was collected in the
month of January-February 2013. 12 factors named accessibility, easiness, simple to perform, flexibility, user-friendly, website accuracy, product portfolio,
technical characteristics, cost effectiveness, efficiency, responsiveness & convenience and security & reliability were come out after applying factor analysis
technique.
KEYWORDS Accessibility, Reliability, Security.
INTRODUCTION ow- a- days due to the Globalization and technological advancements, banks are bestowing many new and advanced facilities/services to their customers to fulfill their needs as per their expectations. The advanced way of providing services to the banking customers is electronic banking. The
various services through electronic banking are Internet banking, Electronic Fund Transfer (EFT), Electronic Clearing Services (ECS), ATMs, National Electronic Fund Transfer (NEFT) system, card based payment systems and Indian financial Network (INFINET). Internet banking is the major focus of modern banking system which has resulted in increasing number of customers switching from traditional banking to such banking channel which can be used through
Internet. Moles (2000) asserted that Internet banking may bring a drastic transformation in the way banks build and maintain close relationships with customers. Therefore, it is important for the banks to recognize the importance of improving Internet banking services so that existing customers can receive desired level of Internet services and newer customers can also be attracted towards that bank. Various studies also found that the factors which are linked
with the Internet banking services such as security, reliability, convenience, trust, wide range of services etc. also affect the Internet banking usage and customers’ perception.
LITERATURE REVIEW A number of studies have been done to analyze the customers’ views and perception to find out the factors affecting Internet banking. Parasuraman et al., (1985) developed the 22 items SERVQUAL instrument to measure the level of service quality by the discrepancy which exists between customers’ perceptions
and expectations of the service received across the five dimensions. Awamleh and Fernandes (2005) conducted a study to assess the extent of adoption and find out the factors that affect the satisfaction of Internet banking users. The results revealed that three factors named independence, convenience and security were more important for customer satisfaction. Malhotra and Singh (2007) in their article titled ‘Determinants of Internet Banking Adoption by Banks in India’
attempted to discover the factors affecting a bank’s decision to adopt Internet banking. The study revealed that the larger banks with younger age private ownership, higher expenses for assets, higher deposits and lower branch intensity evidenced a higher profitability of adoption of this new technology. It was also found that banks with lower market share also saw the Internet banking technology as a means to increase the market share by attracting more and more
customers through this new channel delivery. Singhal and Padhmanabhan (2008) in their study explored the major factors responsible for Internet banking, based on respondents’ perception on various Internet applications. The major five independent set of factors associated with the internet banking features were
extracted from the factor analysis, which were utility request, security, utility, ticket booking and fund transfer. Sakthivel (2008) found that ‘convenience’ is the most important factor for the customers to go for e-banking services. Liao et al., (2009) for their study collected data from 670 customers. In this study, the role of privacy concerns, trust and their antecedents had been examined and found to be very important. Devi and Malarvizhi (2010) in their study conducted a
survey on 50 customers using e-banking services. The respondents were asked to express their opinion on the factors which influenced them in the usage of e-banking services. The respondents highly agreed that the most important factors which influenced them to adopt e-banking services were—convenient accessibility, followed by speed of use, easy availability and self-service. In this study, the factors extracted after factor analysis were consumer’s satisfaction,
problems in e-banking, bank’s reliability, bank’s efficiency and accessibility.
RESEARCH OBJECTIVES The objective of this study is to find out the factors which encourage customers for use of Internet banking services. This study has also been conducted to
evaluate customers’ perceptions of Internet banking.
RESEARCH METHODOLOGY Apposite with the objectives of the present study, the relevant data has been obtained from secondary as well as primary sources. The various secondary
information sources used for the present research include various journals and magazines. The primary data was collected from 120 respondents of public sector banks and private sector banks. Out of which, 56 respondents were from public sector banks and 64 respondents from private sector banks. A well-structured questionnaire was prepared and distributed to the customers of State Bank of India (SBI), Punjab National Bank (PNB), Canara bank among public sector banks
and Industrial Credit and Investment Corporation of India (ICICI Bank), Housing Development Finance Corporate (HDFC) bank and Axis bank among private sector banks in the State of Punjab. Convenience and judgment sampling techniques were adopted in the selection of the bank customers. Data was collected in the months of January-February 2013. For analyzing the data, percentages, five point Likert Scaling technique and factor analysis were applied. The data was
analyzed using Statistical Package for the Social Sciences (SPSS).
N

VOLUME NO. 3 (2013), ISSUE NO. 12 (DECEMBER) ISSN 2231-4245
INTERNATIONAL JOURNAL OF RESEARCH IN COMMERCE, ECONOMICS & MANAGEMENT A Monthly Double-Blind Peer Reviewed (Refereed/Juried) Open Access International e-Journal - Included in the International Serial Directories
http://ijrcm.org.in/
84
DATA ANALYSIS AND INTERPRETATION The data collected through survey was analyzed for accomplishment of the stated objectives. Table I depicts the factors that a customer selects to choose a
bank for Internet banking facility.
TABLE I: TABULAR PRESENTATION OF FACTORS THAT A CUSTOMER SELECTS TO CHOOSE A BANK FOR INTERNET BANKING FACILITY
Ten significant factors from various studies have been taken in Table 1. It reveals that in case of public sector banks the factor ‘customer base’ with highest weighted mean of 1.929 has been found to be the most important factor that a customer selects to choose a bank for using Internet banking facility. The second
important factor that customer selects is ‘had traditional bank account with the same bank’ with weighted mean of 1.857 followed by the factor ‘trust on bank’ with weighted mean of 1.821, ‘reputation of bank’ with weighted mean 1.714, ‘home page presentation’ and ‘cost effectiveness’ with weighted mean of 1.536 for both factors, ‘large size bank’ with weighted mean of 1.214, ‘’availability of wide range of services’ with weighted mean of 1.071, ‘preference towards a
particular category of bank’ with weighted mean of .929 and ‘sufficient advertisement’ with weighted mean of .214. In case of private sector banks it was found that the factor ‘had traditional bank account with the same bank ‘with highest weighted mean of 1.969 has been found to be the most important factor that a
customer selects to choose a bank for using Internet banking facility. The second important factor that customer selects is ‘customer base’ with weighted mean of 1.906 followed by the factor ‘reputation of the bank’ with weighted mean of 1.875, ‘trust on bank’ with weighted mean of 1.625, ‘availability of wide range of services’ with weighted mean of 1.563, ‘cost effectiveness’ with weighted mean of 1.438, ‘large size bank’ with weighted mean of 1.344, ‘preference towards a
particular category of bank’ with weighted mean of 1.281, ‘home page presentation’ with weighted mean of’ 1.188 and ‘sufficient advertisement’ with weighted mean of .219.
FACTOR ANALYSIS Factor analysis has been applied to investigate the relationship among the variables which were supposed to determine or affect consumers’ perspectives on Internet banking services. 45 selected variables were framed in the final questionnaire which contains most of the statements in assertive form. These statements were evaluated on 5-point Likert scale by the respondents. Data collected through questionnaire provided inputs for factor analysis.
For analysis, first of all Kaiser-Meyer-Olkin measure of sampling adequacy was calculated to test the sampling adequacy and it was 0.617. Table II shows the Kaiser-Meyer-Olkin measure of sampling adequacy. It indicates that the sample is good enough for sampling. The overall significance of correlation matrix was
tested with Bartlett test of sphericity (chi-square= 7276.744 and significant at 0.000). This supports the validity of applying the factor analysis.
TABLE II: KMO AND BARTLETT'S TEST
Kaiser-Meyer-Olkin Measure of Sampling Adequacy. 0.617
Bartlett's Test of Sphericity Approx. Chi-Square 7276.744
df 990.000
Sig. 0.000
Here, Principal component analysis was employed for extracting factors. The rotation method used was Varimax with Kaiser Normalization. In the present research the factor loadings greater than .45 (ignoring signs) has been considered to meet the level. Table III shows the variance of the variables and Table IV
shows the Component matrix.
S.No. Variables Public sector banks Private sector banks
Sum Wt. Mean Sum Wt. Mean
1 Large size bank 68 1.214 86 1.344
2 Customer base 108 1.929 122 1.906
3 Had traditional bank account with the same bank 104 1.857 126 1.969
4 Trust on bank 102 1.821 104 1.625
5 Reputation of the bank 96 1.714 120 1.875
6 Home page presentation 86 1.536 76 1.188
7 Availability of wide range of services 60 1.071 100 1.563
8 Sufficient Advertisement 12 .214 14 .219
9 Cost effectiveness 86 1.536 92 1.438
10 Preference towards a particular category of bank 52 .929 82 1.281
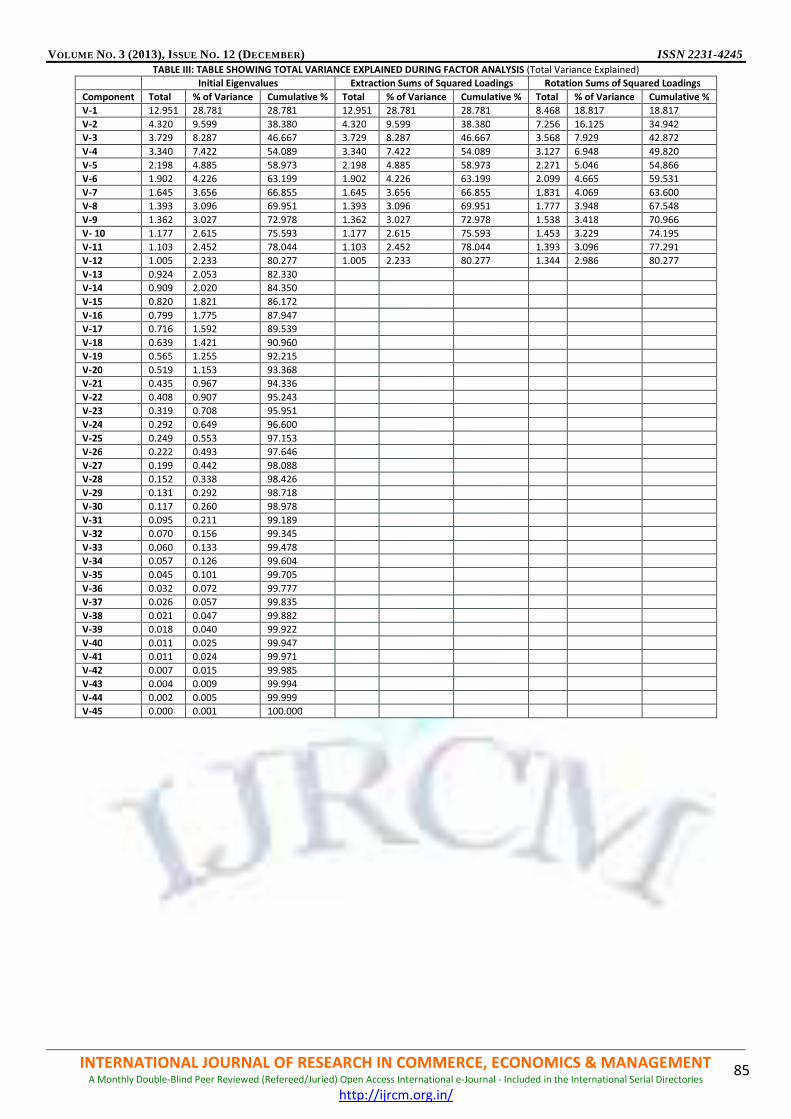
VOLUME NO. 3 (2013), ISSUE NO. 12 (DECEMBER) ISSN 2231-4245
INTERNATIONAL JOURNAL OF RESEARCH IN COMMERCE, ECONOMICS & MANAGEMENT A Monthly Double-Blind Peer Reviewed (Refereed/Juried) Open Access International e-Journal - Included in the International Serial Directories
http://ijrcm.org.in/
85
TABLE III: TABLE SHOWING TOTAL VARIANCE EXPLAINED DURING FACTOR ANALYSIS (Total Variance Explained)
Initial Eigenvalues Extraction Sums of Squared Loadings Rotation Sums of Squared Loadings
Component Total % of Variance Cumulative % Total % of Variance Cumulative % Total % of Variance Cumulative %
V-1 12.951 28.781 28.781 12.951 28.781 28.781 8.468 18.817 18.817
V-2 4.320 9.599 38.380 4.320 9.599 38.380 7.256 16.125 34.942
V-3 3.729 8.287 46.667 3.729 8.287 46.667 3.568 7.929 42.872
V-4 3.340 7.422 54.089 3.340 7.422 54.089 3.127 6.948 49.820
V-5 2.198 4.885 58.973 2.198 4.885 58.973 2.271 5.046 54.866
V-6 1.902 4.226 63.199 1.902 4.226 63.199 2.099 4.665 59.531
V-7 1.645 3.656 66.855 1.645 3.656 66.855 1.831 4.069 63.600
V-8 1.393 3.096 69.951 1.393 3.096 69.951 1.777 3.948 67.548
V-9 1.362 3.027 72.978 1.362 3.027 72.978 1.538 3.418 70.966
V- 10 1.177 2.615 75.593 1.177 2.615 75.593 1.453 3.229 74.195
V-11 1.103 2.452 78.044 1.103 2.452 78.044 1.393 3.096 77.291
V-12 1.005 2.233 80.277 1.005 2.233 80.277 1.344 2.986 80.277
V-13 0.924 2.053 82.330
V-14 0.909 2.020 84.350
V-15 0.820 1.821 86.172
V-16 0.799 1.775 87.947
V-17 0.716 1.592 89.539
V-18 0.639 1.421 90.960
V-19 0.565 1.255 92.215
V-20 0.519 1.153 93.368
V-21 0.435 0.967 94.336
V-22 0.408 0.907 95.243
V-23 0.319 0.708 95.951
V-24 0.292 0.649 96.600
V-25 0.249 0.553 97.153
V-26 0.222 0.493 97.646
V-27 0.199 0.442 98.088
V-28 0.152 0.338 98.426
V-29 0.131 0.292 98.718
V-30 0.117 0.260 98.978
V-31 0.095 0.211 99.189
V-32 0.070 0.156 99.345
V-33 0.060 0.133 99.478
V-34 0.057 0.126 99.604
V-35 0.045 0.101 99.705
V-36 0.032 0.072 99.777
V-37 0.026 0.057 99.835
V-38 0.021 0.047 99.882
V-39 0.018 0.040 99.922
V-40 0.011 0.025 99.947
V-41 0.011 0.024 99.971
V-42 0.007 0.015 99.985
V-43 0.004 0.009 99.994
V-44 0.002 0.005 99.999
V-45 0.000 0.001 100.000
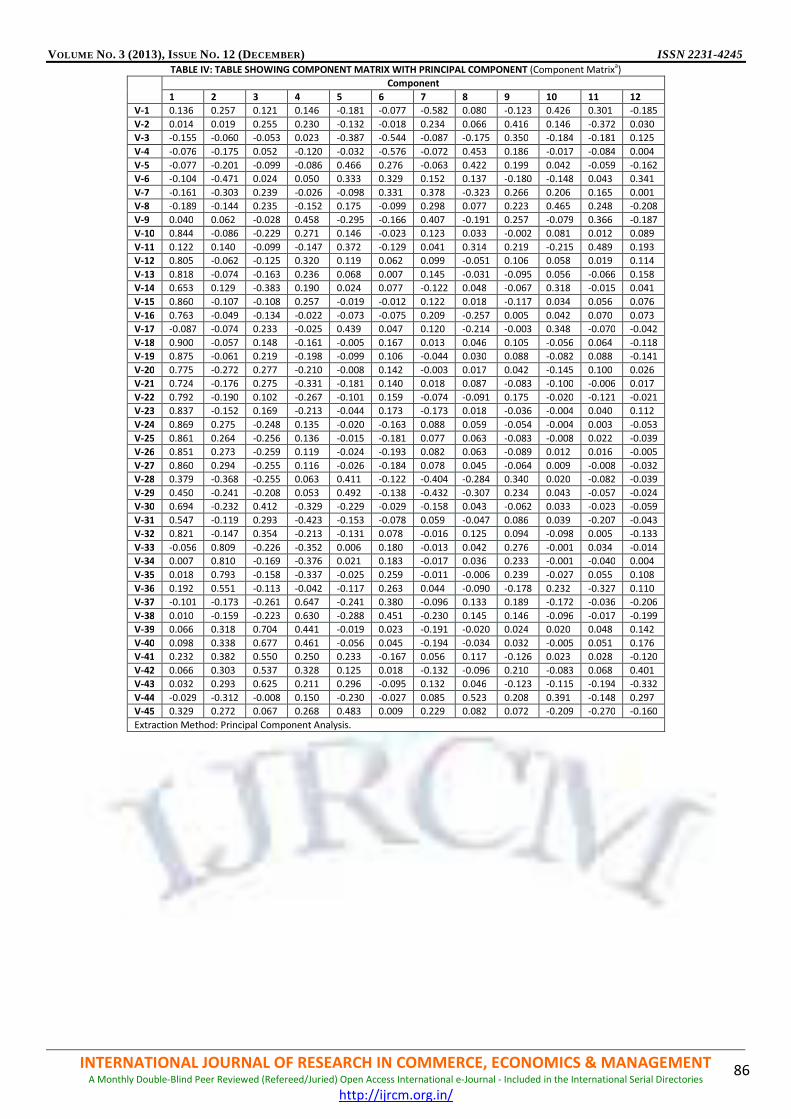
VOLUME NO. 3 (2013), ISSUE NO. 12 (DECEMBER) ISSN 2231-4245
INTERNATIONAL JOURNAL OF RESEARCH IN COMMERCE, ECONOMICS & MANAGEMENT A Monthly Double-Blind Peer Reviewed (Refereed/Juried) Open Access International e-Journal - Included in the International Serial Directories
http://ijrcm.org.in/
86
TABLE IV: TABLE SHOWING COMPONENT MATRIX WITH PRINCIPAL COMPONENT (Component Matrixa)
Component
1 2 3 4 5 6 7 8 9 10 11 12
V-1 0.136 0.257 0.121 0.146 -0.181 -0.077 -0.582 0.080 -0.123 0.426 0.301 -0.185
V-2 0.014 0.019 0.255 0.230 -0.132 -0.018 0.234 0.066 0.416 0.146 -0.372 0.030
V-3 -0.155 -0.060 -0.053 0.023 -0.387 -0.544 -0.087 -0.175 0.350 -0.184 -0.181 0.125
V-4 -0.076 -0.175 0.052 -0.120 -0.032 -0.576 -0.072 0.453 0.186 -0.017 -0.084 0.004
V-5 -0.077 -0.201 -0.099 -0.086 0.466 0.276 -0.063 0.422 0.199 0.042 -0.059 -0.162
V-6 -0.104 -0.471 0.024 0.050 0.333 0.329 0.152 0.137 -0.180 -0.148 0.043 0.341
V-7 -0.161 -0.303 0.239 -0.026 -0.098 0.331 0.378 -0.323 0.266 0.206 0.165 0.001
V-8 -0.189 -0.144 0.235 -0.152 0.175 -0.099 0.298 0.077 0.223 0.465 0.248 -0.208
V-9 0.040 0.062 -0.028 0.458 -0.295 -0.166 0.407 -0.191 0.257 -0.079 0.366 -0.187
V-10 0.844 -0.086 -0.229 0.271 0.146 -0.023 0.123 0.033 -0.002 0.081 0.012 0.089
V-11 0.122 0.140 -0.099 -0.147 0.372 -0.129 0.041 0.314 0.219 -0.215 0.489 0.193
V-12 0.805 -0.062 -0.125 0.320 0.119 0.062 0.099 -0.051 0.106 0.058 0.019 0.114
V-13 0.818 -0.074 -0.163 0.236 0.068 0.007 0.145 -0.031 -0.095 0.056 -0.066 0.158
V-14 0.653 0.129 -0.383 0.190 0.024 0.077 -0.122 0.048 -0.067 0.318 -0.015 0.041
V-15 0.860 -0.107 -0.108 0.257 -0.019 -0.012 0.122 0.018 -0.117 0.034 0.056 0.076
V-16 0.763 -0.049 -0.134 -0.022 -0.073 -0.075 0.209 -0.257 0.005 0.042 0.070 0.073
V-17 -0.087 -0.074 0.233 -0.025 0.439 0.047 0.120 -0.214 -0.003 0.348 -0.070 -0.042
V-18 0.900 -0.057 0.148 -0.161 -0.005 0.167 0.013 0.046 0.105 -0.056 0.064 -0.118
V-19 0.875 -0.061 0.219 -0.198 -0.099 0.106 -0.044 0.030 0.088 -0.082 0.088 -0.141
V-20 0.775 -0.272 0.277 -0.210 -0.008 0.142 -0.003 0.017 0.042 -0.145 0.100 0.026
V-21 0.724 -0.176 0.275 -0.331 -0.181 0.140 0.018 0.087 -0.083 -0.100 -0.006 0.017
V-22 0.792 -0.190 0.102 -0.267 -0.101 0.159 -0.074 -0.091 0.175 -0.020 -0.121 -0.021
V-23 0.837 -0.152 0.169 -0.213 -0.044 0.173 -0.173 0.018 -0.036 -0.004 0.040 0.112
V-24 0.869 0.275 -0.248 0.135 -0.020 -0.163 0.088 0.059 -0.054 -0.004 0.003 -0.053
V-25 0.861 0.264 -0.256 0.136 -0.015 -0.181 0.077 0.063 -0.083 -0.008 0.022 -0.039
V-26 0.851 0.273 -0.259 0.119 -0.024 -0.193 0.082 0.063 -0.089 0.012 0.016 -0.005
V-27 0.860 0.294 -0.255 0.116 -0.026 -0.184 0.078 0.045 -0.064 0.009 -0.008 -0.032
V-28 0.379 -0.368 -0.255 0.063 0.411 -0.122 -0.404 -0.284 0.340 0.020 -0.082 -0.039
V-29 0.450 -0.241 -0.208 0.053 0.492 -0.138 -0.432 -0.307 0.234 0.043 -0.057 -0.024
V-30 0.694 -0.232 0.412 -0.329 -0.229 -0.029 -0.158 0.043 -0.062 0.033 -0.023 -0.059
V-31 0.547 -0.119 0.293 -0.423 -0.153 -0.078 0.059 -0.047 0.086 0.039 -0.207 -0.043
V-32 0.821 -0.147 0.354 -0.213 -0.131 0.078 -0.016 0.125 0.094 -0.098 0.005 -0.133
V-33 -0.056 0.809 -0.226 -0.352 0.006 0.180 -0.013 0.042 0.276 -0.001 0.034 -0.014
V-34 0.007 0.810 -0.169 -0.376 0.021 0.183 -0.017 0.036 0.233 -0.001 -0.040 0.004
V-35 0.018 0.793 -0.158 -0.337 -0.025 0.259 -0.011 -0.006 0.239 -0.027 0.055 0.108
V-36 0.192 0.551 -0.113 -0.042 -0.117 0.263 0.044 -0.090 -0.178 0.232 -0.327 0.110
V-37 -0.101 -0.173 -0.261 0.647 -0.241 0.380 -0.096 0.133 0.189 -0.172 -0.036 -0.206
V-38 0.010 -0.159 -0.223 0.630 -0.288 0.451 -0.230 0.145 0.146 -0.096 -0.017 -0.199
V-39 0.066 0.318 0.704 0.441 -0.019 0.023 -0.191 -0.020 0.024 0.020 0.048 0.142
V-40 0.098 0.338 0.677 0.461 -0.056 0.045 -0.194 -0.034 0.032 -0.005 0.051 0.176
V-41 0.232 0.382 0.550 0.250 0.233 -0.167 0.056 0.117 -0.126 0.023 0.028 -0.120
V-42 0.066 0.303 0.537 0.328 0.125 0.018 -0.132 -0.096 0.210 -0.083 0.068 0.401
V-43 0.032 0.293 0.625 0.211 0.296 -0.095 0.132 0.046 -0.123 -0.115 -0.194 -0.332
V-44 -0.029 -0.312 -0.008 0.150 -0.230 -0.027 0.085 0.523 0.208 0.391 -0.148 0.297
V-45 0.329 0.272 0.067 0.268 0.483 0.009 0.229 0.082 0.072 -0.209 -0.270 -0.160
Extraction Method: Principal Component Analysis.
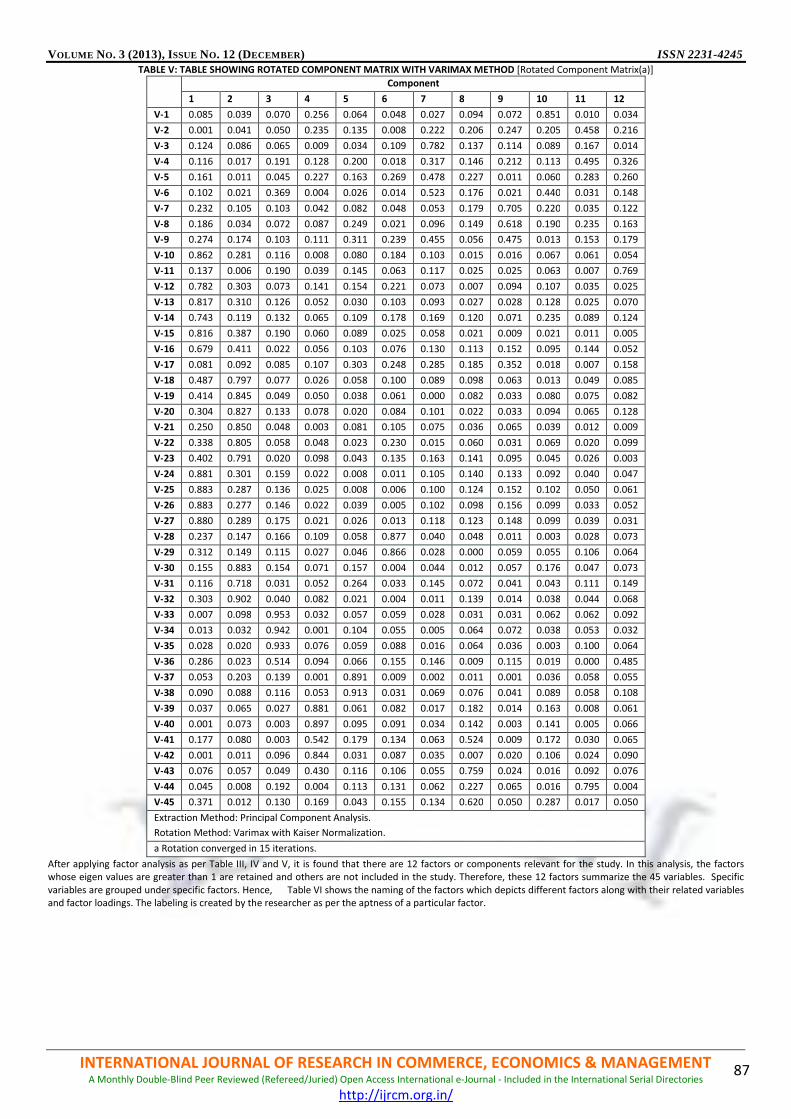
VOLUME NO. 3 (2013), ISSUE NO. 12 (DECEMBER) ISSN 2231-4245
INTERNATIONAL JOURNAL OF RESEARCH IN COMMERCE, ECONOMICS & MANAGEMENT A Monthly Double-Blind Peer Reviewed (Refereed/Juried) Open Access International e-Journal - Included in the International Serial Directories
http://ijrcm.org.in/
87
TABLE V: TABLE SHOWING ROTATED COMPONENT MATRIX WITH VARIMAX METHOD [Rotated Component Matrix(a)]
Component
1 2 3 4 5 6 7 8 9 10 11 12
V-1 0.085 0.039 0.070 0.256 0.064 0.048 0.027 0.094 0.072 0.851 0.010 0.034
V-2 0.001 0.041 0.050 0.235 0.135 0.008 0.222 0.206 0.247 0.205 0.458 0.216
V-3 0.124 0.086 0.065 0.009 0.034 0.109 0.782 0.137 0.114 0.089 0.167 0.014
V-4 0.116 0.017 0.191 0.128 0.200 0.018 0.317 0.146 0.212 0.113 0.495 0.326
V-5 0.161 0.011 0.045 0.227 0.163 0.269 0.478 0.227 0.011 0.060 0.283 0.260
V-6 0.102 0.021 0.369 0.004 0.026 0.014 0.523 0.176 0.021 0.440 0.031 0.148
V-7 0.232 0.105 0.103 0.042 0.082 0.048 0.053 0.179 0.705 0.220 0.035 0.122
V-8 0.186 0.034 0.072 0.087 0.249 0.021 0.096 0.149 0.618 0.190 0.235 0.163
V-9 0.274 0.174 0.103 0.111 0.311 0.239 0.455 0.056 0.475 0.013 0.153 0.179
V-10 0.862 0.281 0.116 0.008 0.080 0.184 0.103 0.015 0.016 0.067 0.061 0.054
V-11 0.137 0.006 0.190 0.039 0.145 0.063 0.117 0.025 0.025 0.063 0.007 0.769
V-12 0.782 0.303 0.073 0.141 0.154 0.221 0.073 0.007 0.094 0.107 0.035 0.025
V-13 0.817 0.310 0.126 0.052 0.030 0.103 0.093 0.027 0.028 0.128 0.025 0.070
V-14 0.743 0.119 0.132 0.065 0.109 0.178 0.169 0.120 0.071 0.235 0.089 0.124
V-15 0.816 0.387 0.190 0.060 0.089 0.025 0.058 0.021 0.009 0.021 0.011 0.005
V-16 0.679 0.411 0.022 0.056 0.103 0.076 0.130 0.113 0.152 0.095 0.144 0.052
V-17 0.081 0.092 0.085 0.107 0.303 0.248 0.285 0.185 0.352 0.018 0.007 0.158
V-18 0.487 0.797 0.077 0.026 0.058 0.100 0.089 0.098 0.063 0.013 0.049 0.085
V-19 0.414 0.845 0.049 0.050 0.038 0.061 0.000 0.082 0.033 0.080 0.075 0.082
V-20 0.304 0.827 0.133 0.078 0.020 0.084 0.101 0.022 0.033 0.094 0.065 0.128
V-21 0.250 0.850 0.048 0.003 0.081 0.105 0.075 0.036 0.065 0.039 0.012 0.009
V-22 0.338 0.805 0.058 0.048 0.023 0.230 0.015 0.060 0.031 0.069 0.020 0.099
V-23 0.402 0.791 0.020 0.098 0.043 0.135 0.163 0.141 0.095 0.045 0.026 0.003
V-24 0.881 0.301 0.159 0.022 0.008 0.011 0.105 0.140 0.133 0.092 0.040 0.047
V-25 0.883 0.287 0.136 0.025 0.008 0.006 0.100 0.124 0.152 0.102 0.050 0.061
V-26 0.883 0.277 0.146 0.022 0.039 0.005 0.102 0.098 0.156 0.099 0.033 0.052
V-27 0.880 0.289 0.175 0.021 0.026 0.013 0.118 0.123 0.148 0.099 0.039 0.031
V-28 0.237 0.147 0.166 0.109 0.058 0.877 0.040 0.048 0.011 0.003 0.028 0.073
V-29 0.312 0.149 0.115 0.027 0.046 0.866 0.028 0.000 0.059 0.055 0.106 0.064
V-30 0.155 0.883 0.154 0.071 0.157 0.004 0.044 0.012 0.057 0.176 0.047 0.073
V-31 0.116 0.718 0.031 0.052 0.264 0.033 0.145 0.072 0.041 0.043 0.111 0.149
V-32 0.303 0.902 0.040 0.082 0.021 0.004 0.011 0.139 0.014 0.038 0.044 0.068
V-33 0.007 0.098 0.953 0.032 0.057 0.059 0.028 0.031 0.031 0.062 0.062 0.092
V-34 0.013 0.032 0.942 0.001 0.104 0.055 0.005 0.064 0.072 0.038 0.053 0.032
V-35 0.028 0.020 0.933 0.076 0.059 0.088 0.016 0.064 0.036 0.003 0.100 0.064
V-36 0.286 0.023 0.514 0.094 0.066 0.155 0.146 0.009 0.115 0.019 0.000 0.485
V-37 0.053 0.203 0.139 0.001 0.891 0.009 0.002 0.011 0.001 0.036 0.058 0.055
V-38 0.090 0.088 0.116 0.053 0.913 0.031 0.069 0.076 0.041 0.089 0.058 0.108
V-39 0.037 0.065 0.027 0.881 0.061 0.082 0.017 0.182 0.014 0.163 0.008 0.061
V-40 0.001 0.073 0.003 0.897 0.095 0.091 0.034 0.142 0.003 0.141 0.005 0.066
V-41 0.177 0.080 0.003 0.542 0.179 0.134 0.063 0.524 0.009 0.172 0.030 0.065
V-42 0.001 0.011 0.096 0.844 0.031 0.087 0.035 0.007 0.020 0.106 0.024 0.090
V-43 0.076 0.057 0.049 0.430 0.116 0.106 0.055 0.759 0.024 0.016 0.092 0.076
V-44 0.045 0.008 0.192 0.004 0.113 0.131 0.062 0.227 0.065 0.016 0.795 0.004
V-45 0.371 0.012 0.130 0.169 0.043 0.155 0.134 0.620 0.050 0.287 0.017 0.050
Extraction Method: Principal Component Analysis.
Rotation Method: Varimax with Kaiser Normalization.
a Rotation converged in 15 iterations.
After applying factor analysis as per Table III, IV and V, it is found that there are 12 factors or components relevant for the study. In this analysis, the factors whose eigen values are greater than 1 are retained and others are not included in the study. Therefore, these 12 factors summarize the 45 variables. Specific
variables are grouped under specific factors. Hence, Table VI shows the naming of the factors which depicts different factors along with their related variables and factor loadings. The labeling is created by the researcher as per the aptness of a particular factor.
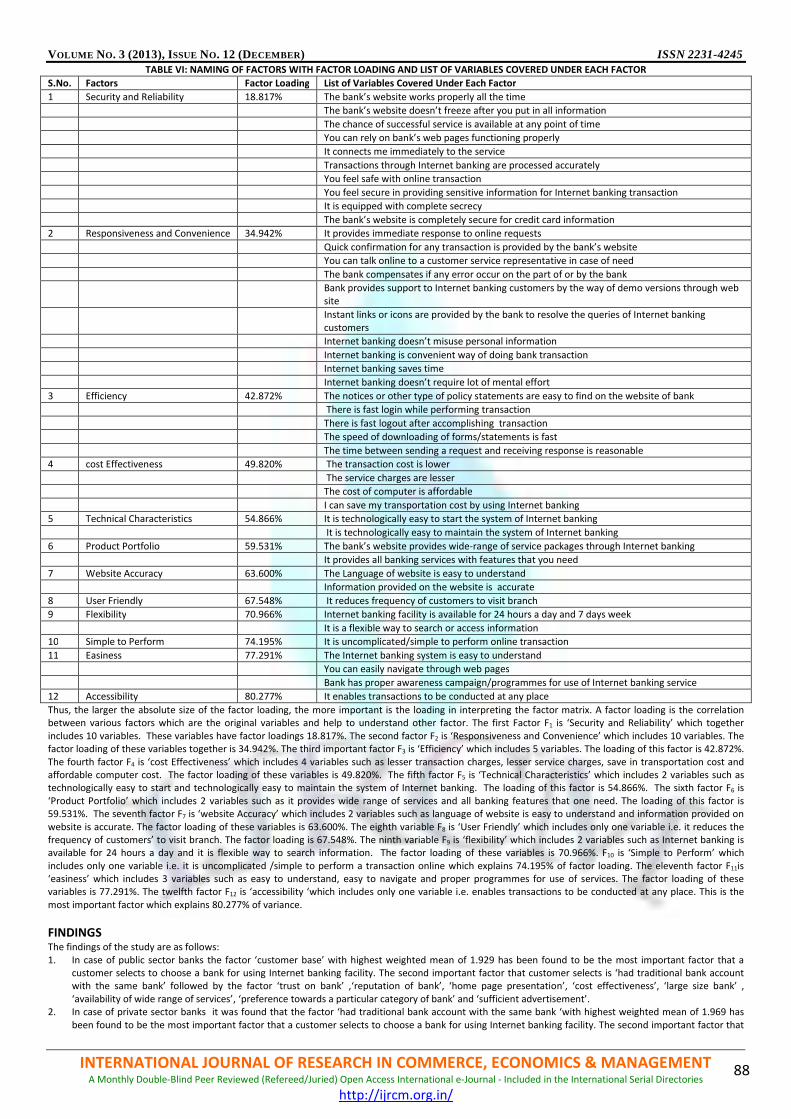
VOLUME NO. 3 (2013), ISSUE NO. 12 (DECEMBER) ISSN 2231-4245
INTERNATIONAL JOURNAL OF RESEARCH IN COMMERCE, ECONOMICS & MANAGEMENT A Monthly Double-Blind Peer Reviewed (Refereed/Juried) Open Access International e-Journal - Included in the International Serial Directories
http://ijrcm.org.in/
88
TABLE VI: NAMING OF FACTORS WITH FACTOR LOADING AND LIST OF VARIABLES COVERED UNDER EACH FACTOR
S.No. Factors Factor Loading List of Variables Covered Under Each Factor
1 Security and Reliability 18.817% The bank’s website works properly all the time
The bank’s website doesn’t freeze after you put in all information
The chance of successful service is available at any point of time
You can rely on bank’s web pages functioning properly
It connects me immediately to the service
Transactions through Internet banking are processed accurately
You feel safe with online transaction
You feel secure in providing sensitive information for Internet banking transaction
It is equipped with complete secrecy
The bank’s website is completely secure for credit card information
2 Responsiveness and Convenience 34.942% It provides immediate response to online requests
Quick confirmation for any transaction is provided by the bank’s website
You can talk online to a customer service representative in case of need
The bank compensates if any error occur on the part of or by the bank
Bank provides support to Internet banking customers by the way of demo versions through web
site
Instant links or icons are provided by the bank to resolve the queries of Internet banking
customers
Internet banking doesn’t misuse personal information
Internet banking is convenient way of doing bank transaction
Internet banking saves time
Internet banking doesn’t require lot of mental effort
3 Efficiency 42.872% The notices or other type of policy statements are easy to find on the website of bank
There is fast login while performing transaction
There is fast logout after accomplishing transaction
The speed of downloading of forms/statements is fast
The time between sending a request and receiving response is reasonable
4 cost Effectiveness 49.820% The transaction cost is lower
The service charges are lesser
The cost of computer is affordable
I can save my transportation cost by using Internet banking
5 Technical Characteristics 54.866% It is technologically easy to start the system of Internet banking
It is technologically easy to maintain the system of Internet banking
6 Product Portfolio 59.531% The bank’s website provides wide-range of service packages through Internet banking
It provides all banking services with features that you need
7 Website Accuracy 63.600% The Language of website is easy to understand
Information provided on the website is accurate
8 User Friendly 67.548% It reduces frequency of customers to visit branch
9 Flexibility 70.966% Internet banking facility is available for 24 hours a day and 7 days week
It is a flexible way to search or access information
10 Simple to Perform 74.195% It is uncomplicated/simple to perform online transaction
11 Easiness 77.291% The Internet banking system is easy to understand
You can easily navigate through web pages
Bank has proper awareness campaign/programmes for use of Internet banking service
12 Accessibility 80.277% It enables transactions to be conducted at any place
Thus, the larger the absolute size of the factor loading, the more important is the loading in interpreting the factor matrix. A factor loading is the correlation between various factors which are the original variables and help to understand other factor. The first Factor F1 is ‘Security and Reliability’ which together
includes 10 variables. These variables have factor loadings 18.817%. The second factor F2 is ‘Responsiveness and Convenience’ which includes 10 variables. The factor loading of these variables together is 34.942%. The third important factor F3 is ‘Efficiency’ which includes 5 variables. The loading of this factor is 42.872%.
The fourth factor F4 is ‘cost Effectiveness’ which includes 4 variables such as lesser transaction charges, lesser service charges, save in transportation cost and affordable computer cost. The factor loading of these variables is 49.820%. The fifth factor F5 is ‘Technical Characteristics’ which includes 2 variables such as technologically easy to start and technologically easy to maintain the system of Internet banking. The loading of this factor is 54.866%. The sixth factor F6 is
‘Product Portfolio’ which includes 2 variables such as it provides wide range of services and all banking features that one need. The loading of this factor is 59.531%. The seventh factor F7 is ‘website Accuracy’ which includes 2 variables such as language of website is easy to understand and information provided on
website is accurate. The factor loading of these variables is 63.600%. The eighth variable F8 is ‘User Friendly’ which includes only one variable i.e. it reduces the frequency of customers’ to visit branch. The factor loading is 67.548%. The ninth variable F9 is ‘flexibility’ which includes 2 variables such as Internet banking is available for 24 hours a day and it is flexible way to search information. The factor loading of these variables is 70.966%. F10 is ‘Simple to Perform’ which
includes only one variable i.e. it is uncomplicated /simple to perform a transaction online which explains 74.195% of factor loading. The eleventh factor F11is ‘easiness’ which includes 3 variables such as easy to understand, easy to navigate and proper programmes for use of services. The factor loading of these variables is 77.291%. The twelfth factor F12 is ‘accessibility ‘which includes only one variable i.e. enables transactions to be conducted at any place. This is the
most important factor which explains 80.277% of variance.
FINDINGS The findings of the study are as follows:
1. In case of public sector banks the factor ‘customer base’ with highest weighted mean of 1.929 has been found to be the most important factor that a customer selects to choose a bank for using Internet banking facility. The second important factor that customer selects is ‘had traditional bank account with the same bank’ followed by the factor ‘trust on bank’ ,‘reputation of bank’, ‘home page presentation’, ‘cost effectiveness’, ‘large size bank’ ,
‘availability of wide range of services’, ‘preference towards a particular category of bank’ and ‘sufficient advertisement’. 2. In case of private sector banks it was found that the factor ‘had traditional bank account with the same bank ‘with highest weighted mean of 1.969 has
been found to be the most important factor that a customer selects to choose a bank for using Internet banking facility. The second important factor that
VOLUME NO. 3 (2013), ISSUE NO. 12 (DECEMBER) ISSN 2231-4245
INTERNATIONAL JOURNAL OF RESEARCH IN COMMERCE, ECONOMICS & MANAGEMENT A Monthly Double-Blind Peer Reviewed (Refereed/Juried) Open Access International e-Journal - Included in the International Serial Directories
http://ijrcm.org.in/
89
customer selects is ‘customer base’ followed by the factor ‘reputation of the bank’, ‘trust on bank’, ‘availability of wide range of services’, ‘cost effectiveness’, ‘large size bank’ ,‘preference towards a particular category of bank’ ,‘home page presentation’ and ‘sufficient advertisement’
3. The analysis come up with 12 factors named Accessibility (with highest factor loading 80.277%), easiness, simple to perform, flexibility, user-friendly, website accuracy, product portfolio, technical characteristics, cost effectiveness, efficiency, responsiveness & convenience and security & reliability(with factor loading 18.817%).
CONCLUSION Thus, in today’s competitive environment, banking sector need to pay attention towards a number of factors concerned with Internet banking. The results of this study have practical implication for bank manager as these can help to plan their strategies to improve their Internet banking services by considering the
important factors which a customer selects to choose a bank for Internet banking services. Bank officials can also consider the 12 factors which come-out after this analysis. The factors are accessibility, easiness, simple to perform, flexibility, user-friendly, website accuracy, product portfolio, technical characteristics, cost effectiveness, efficiency, responsiveness & convenience and security & reliability. Thus, this study explains various factors that affect customer satisfaction and
importance of each factor which can be very useful for banking sector to implement in the system.
REFERENCES 1. Awamleh, R. and Fernandes, C. 2005. Internet Banking: An Empirical Investigation into the Extent of Adoption by Banks and the Determinants of Customer
Satisfaction in the United Arab Emirates. Journal of Internet Banking and Research, 10(1). 2. Devi, P.A. and Malarvizhi, V. 2010. Customers’ Perception of e-banking: A Factor Analysis IUP. Journal of Management Research, 9(6), 7-20. 3. Liao, c., To, P., Hsieh, T. and Liu, C. 2009. An Empirical Study of Factors Influencing the Adoption of Internet Banking, Proceedings of American Conference
on Information Systems (AMCIS). 4. Malhotra, P. and Singh, B. 2007. Determinants of Internet Banking Adoption by Banks in India. Emerald Internet Research, 17(3), 323-339. 5. Parasuraman, A., Zeithaml. A.A. and Berry, L.L.1985. A Conceptual Model of service Quality and its Implications for Future Research. Journal of Marketing,
49, 41-50. 6. Sakthivel N. 2008. Customers’ Perception of ATM Services: A Comparative Analysis. Professional Banker, March, 66-74.
7. Singhal, D. and Padhmanabhan, V. 2008. A Study on Customer Perception towards Internet banking: Identifying Major Contributing Factors. The Journal of Nepalese Business Studies, 5(1), 101-111.
WEBSITES 8. http://economictimes.indiatimes.com/Banking/articles 9. http://en.wikipedia.org/wiki/State_Bank_of_India 10. www.banknetindia.com
11. www.iba.org.in 12. www.indiabankassociation.org
13. www.rbi.co.in
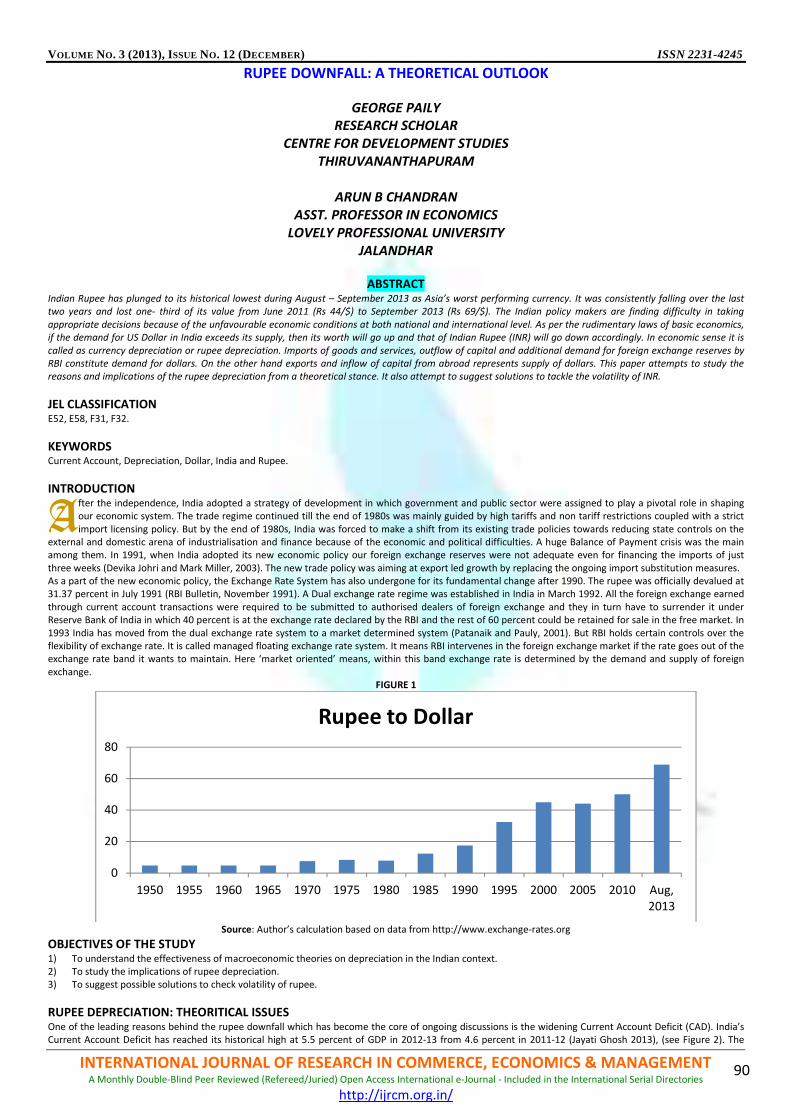
VOLUME NO. 3 (2013), ISSUE NO. 12 (DECEMBER) ISSN 2231-4245
INTERNATIONAL JOURNAL OF RESEARCH IN COMMERCE, ECONOMICS & MANAGEMENT A Monthly Double-Blind Peer Reviewed (Refereed/Juried) Open Access International e-Journal - Included in the International Serial Directories
http://ijrcm.org.in/
90
RUPEE DOWNFALL: A THEORETICAL OUTLOOK
GEORGE PAILY
RESEARCH SCHOLAR
CENTRE FOR DEVELOPMENT STUDIES
THIRUVANANTHAPURAM
ARUN B CHANDRAN
ASST. PROFESSOR IN ECONOMICS
LOVELY PROFESSIONAL UNIVERSITY
JALANDHAR
ABSTRACT
Indian Rupee has plunged to its historical lowest during August – September 2013 as Asia’s worst performing currency. It was consistently falling over the last
two years and lost one- third of its value from June 2011 (Rs 44/$) to September 2013 (Rs 69/$). The Indian policy makers are finding difficulty in taking
appropriate decisions because of the unfavourable economic conditions at both national and international level. As per the rudimentary laws of basic economics,
if the demand for US Dollar in India exceeds its supply, then its worth will go up and that of Indian Rupee (INR) will go down accordingly. In economic sense it is
called as currency depreciation or rupee depreciation. Imports of goods and services, outflow of capital and additional demand for foreign exchange reserves by
RBI constitute demand for dollars. On the other hand exports and inflow of capital from abroad represents supply of dollars. This paper attempts to study the
reasons and implications of the rupee depreciation from a theoretical stance. It also attempt to suggest solutions to tackle the volatility of INR.
JEL CLASSIFICATION
E52, E58, F31, F32.
KEYWORDS
Current Account, Depreciation, Dollar, India and Rupee.
INTRODUCTION fter the independence, India adopted a strategy of development in which government and public sector were assigned to play a pivotal role in shaping our economic system. The trade regime continued till the end of 1980s was mainly guided by high tariffs and non tariff restrictions coupled with a strict
import licensing policy. But by the end of 1980s, India was forced to make a shift from its existing trade policies towards reducing state controls on the external and domestic arena of industrialisation and finance because of the economic and political difficulties. A huge Balance of Payment crisis was the main among them. In 1991, when India adopted its new economic policy our foreign exchange reserves were not adequate even for financing the imports of just
three weeks (Devika Johri and Mark Miller, 2003). The new trade policy was aiming at export led growth by replacing the ongoing import substitution measures. As a part of the new economic policy, the Exchange Rate System has also undergone for its fundamental change after 1990. The rupee was officially devalued at 31.37 percent in July 1991 (RBI Bulletin, November 1991). A Dual exchange rate regime was established in India in March 1992. All the foreign exchange earned
through current account transactions were required to be submitted to authorised dealers of foreign exchange and they in turn have to surrender it under Reserve Bank of India in which 40 percent is at the exchange rate declared by the RBI and the rest of 60 percent could be retained for sale in the free market. In
1993 India has moved from the dual exchange rate system to a market determined system (Patanaik and Pauly, 2001). But RBI holds certain controls over the flexibility of exchange rate. It is called managed floating exchange rate system. It means RBI intervenes in the foreign exchange market if the rate goes out of the exchange rate band it wants to maintain. Here ‘market oriented’ means, within this band exchange rate is determined by the demand and supply of foreign
exchange. FIGURE 1
Source: Author’s calculation based on data from http://www.exchange-rates.org
OBJECTIVES OF THE STUDY 1) To understand the effectiveness of macroeconomic theories on depreciation in the Indian context. 2) To study the implications of rupee depreciation. 3) To suggest possible solutions to check volatility of rupee.
RUPEE DEPRECIATION: THEORITICAL ISSUES One of the leading reasons behind the rupee downfall which has become the core of ongoing discussions is the widening Current Account Deficit (CAD). India’s Current Account Deficit has reached its historical high at 5.5 percent of GDP in 2012-13 from 4.6 percent in 2011-12 (Jayati Ghosh 2013), (see Figure 2). The
0
20
40
60
80
1950 1955 1960 1965 1970 1975 1980 1985 1990 1995 2000 2005 2010 Aug,
2013
Rupee to Dollar
A

VOLUME NO. 3 (2013), ISSUE NO. 12 (DECEMBER) ISSN 2231-4245
INTERNATIONAL JOURNAL OF RESEARCH IN COMMERCE, ECONOMICS & MANAGEMENT A Monthly Double-Blind Peer Reviewed (Refereed/Juried) Open Access International e-Journal - Included in the International Serial Directories
http://ijrcm.org.in/
91
Current Account Deficit (CAD) can be economically analysed on the basis of both domestic as well as international trade perspectives. In the international point of view, CAD is the trade balance (difference between exports and imports) and balance on invisibles. Secondly at the national point of view CAD is identical to
the gap between domestic savings and investment. If the value of net exports or the gap mentioned above is positive, there is Current Account Surplus. The identity between domestic as well as international point of view (see Figure 3) can be shown below.
FIGURE 2
According to the basic national income identity, Y = C + I + G + NX
Y – C – G = I + NX
Where Y – C- G is the total national savings (private savings + public savings)
S = I + NX
S – I = NX
FIGURE 3
Source: Macroeconomics by Gregory Mankiew
The equilibrium real exchange rate (€) is determined by the equality between net exports (NX) and S-I gap. Suppose for any reason, the net exports declines. In
order to establish the identity given above the real exchange rate must decrease. It means domestic currency depreciate with respect to the foreign currency. Remember that in the day to day life by the term ‘exchange rate’ we mean nominal exchange rate. Nominal Exchange Rate between two countries is the price at
which residents of those countries trade. In other words, more simply it is the relative price of the currency of two countries. On the other hand, Real Exchange Rate is the relative price of the goods of two countries. It tells us the rate at which we can trade the goods of one country for the goods of another. The Real Exchange rate is sometimes called terms of trade. This conceptual difference does not make any problem for our analysis, because both go in the same direction.
DEPRECIATION OF RUPEE: COUNTRY SPECIFIC ISSUES After the economic reforms, India’s exports have increased dramatically from 18 billion in 1990-91 to 309 billion in 2011-12. The growth rate was substantial till the global crisis of 2008. Though there was a revival of exports in the next financial year, it has again slowed down. One of the main reasons for the rapid slow
down of India’s exports was the change in the pattern of exports after the reforms. Instead of labour intensive goods in 1990s, India’s exports now mainly concentrate on highly capital intensive goods such as engineering products and germs and jewelleries and services. Capital goods industry and service sector of the global economy was the most affected by the financial meltdown. That is why the Chinese economy could maintain a positive trade balance even in the
midst of global crisis as they specialise in the production of labour intensive manufactured goods. Although exports have grown during the last two decades, it could not keep up with growth in imports. Exports-GDP ratio has increased by 11 percentage points between 1991 and 2011 where as import-GDP has grown by 18 percentage points (C Rangarajan, 2013). As per the data on January 2011, India’s total export is
24.64 percent of GDP where as imports has arisen to 29.85 percent of GDP (see Figure 4 and 5).

VOLUME NO. 3 (2013), ISSUE NO. 12 (DECEMBER) ISSN 2231-4245
INTERNATIONAL JOURNAL OF RESEARCH IN COMMERCE, ECONOMICS & MANAGEMENT A Monthly Double-Blind Peer Reviewed (Refereed/Juried) Open Access International e-Journal - Included in the International Serial Directories
http://ijrcm.org.in/
92
FIGURE 4 FIGURE 5
Source: tradingeconomics.com
From the Figures given above, it can be see that the gap between exports and imports is widening year after year. One of the important issue to be addressed here is why can’t India reduce its imports to bring CAD at a reasonable level. In April 2013, the exports have increased by 2 percent compared to April 2012. But
during the same period imports has increased by 11 percent and it ultimately resulted in 26 percent increase in the trade deficit (Jayati Ghosh, 2013). The recent growth of imports is mainly attributed to petroleum products and valuables such as gold which are generally having less price elasticity of demand in nature (mostly shows positive income elasticity). Oil and gold import accounts 35 and 11 percent respectively in India’s trade bill. Oil imports as a proportion of GDP
doubled between 2004-05 and 2011-12. Non oil imports have also recorded an increase from 14.4 to 18.5 percent of GDP during the same period (Rangarajan 2013). Among the non oil imports, gold has become a prominent contributor increasing from 1.5 to 2.5 percent of the GDP from 2004-05 to 2010-11. Because of
higher perceived returns on gold holdings and traditional nature of Indians to absorb more and more gold, the demand for gold as an investment tool has been increasing over time. The quote made by John Maynard Keynes about India a century ago as “that sink for precious metals” has been perfectly realised here. Gold has been a good investment tool and status symbol in India historically. With the limited access to financial instruments especially in the rural areas, gold
and silver are the popular saving instruments. Almost all of India’s demand for raw gold is met through imports. Trends shows that the demand for gold as a non jewellery item is steadily increasing over time (see Figure 6)
FIGURE 6
Source: Economic Survey 2012-13, Govt of India
In the year 2011-12, both oil and gold imports recorded a sharp increase compared to previous year with a growth rate of 45 and 40 percent respectively relative to 22 and 18 percent. As a result, the merchandise trade balance has declined significantly especially since 2004-05.
The ongoing current account deficit can be financed only by increased capital inflow which creates a surplus in the capital account. Over the past two decades, the composition of India’s capital account has been undergone for substantial change. In 1990-91, Foreign Direct Investment (FDI) and Portfolio Investment
constituted a small portion where as in the year 2011-12 it is about 60 percentage of the capital account. Capital flows rise during the favourable cycles and fall in the bad times of business cycles. If the Current Account Deficit is not financed by an equivalent amount of capital inflow from abroad, then people will buy foreign exchange from the Reserve Bank of India, to make the excess payments of imports. It will reduce the forex reserves held by the Reserve Bank. If the RBI
gets worried about its foreign exchange reserves and want to conserve them, it will devalue rupee. This is the connection between trade deficit, inflation and depreciation. On 20
th May 2013, Rupee – Dollar Exchange Rates were Rs 54.98/dollar. Soon after, on 22
nd May, Ben Bernanke, chairman of Federal Reserve has announced its
new policy of quantitative easing. i.e. the policy of keeping down the interest rates by injecting liquidity into the system. Bernanke’s announcement have prompted the speculators to shift their funds from India to US capital markets where the interested rates are expected to rise and this has caused the further
depreciation of Indian rupee along with all other currencies. And on 28th
august 2013, rupee has reached at its lowest point of around 69 per dollar. Take an example how does a policy change in a foreign country lead to capital flight from India. Suppose a foreign investor (say, from USA) invest $200 in India through portfolio investment. Let the prevailing interest rate in India be 10 percent and the exchange rate Rs 50 per dollar. Therefore in rupee terms she has invested Rs
10000 and this money grows to 10000 (1+ 10/100) = 11000 which is equal to $220. If she expects a depreciation of rupee to Rs 60 per dollar, then the principal after the same time period will be only $183.3 (i.e. 11000/60 = 183.33). In this case her loss is 9 percent of money she has invested. So what she can do at this time is shift her capital from India either to USA or any other country where the interest rate is expected to rise.
Though the monetary and fiscal policies of a foreign nation affects the exchange rates of its trading partners, the sole reason behind the recent rapid fall of rupee can’t be fully attributed to Fed’s policy (Prabhat Patnaik 2013). Bernanke’s announcement might have had an additional effect on the plunge of rupee, but
the rupee has been falling down quite a long time before. More over rupee is losing its value not with US Dollar only, but it has been against all other major currencies (see Fig 7). Therefore beyond the influence of international economic conditions, there exist some intrinsic characteristic features of Indian economy which is also responsible for the fall of its currency value.
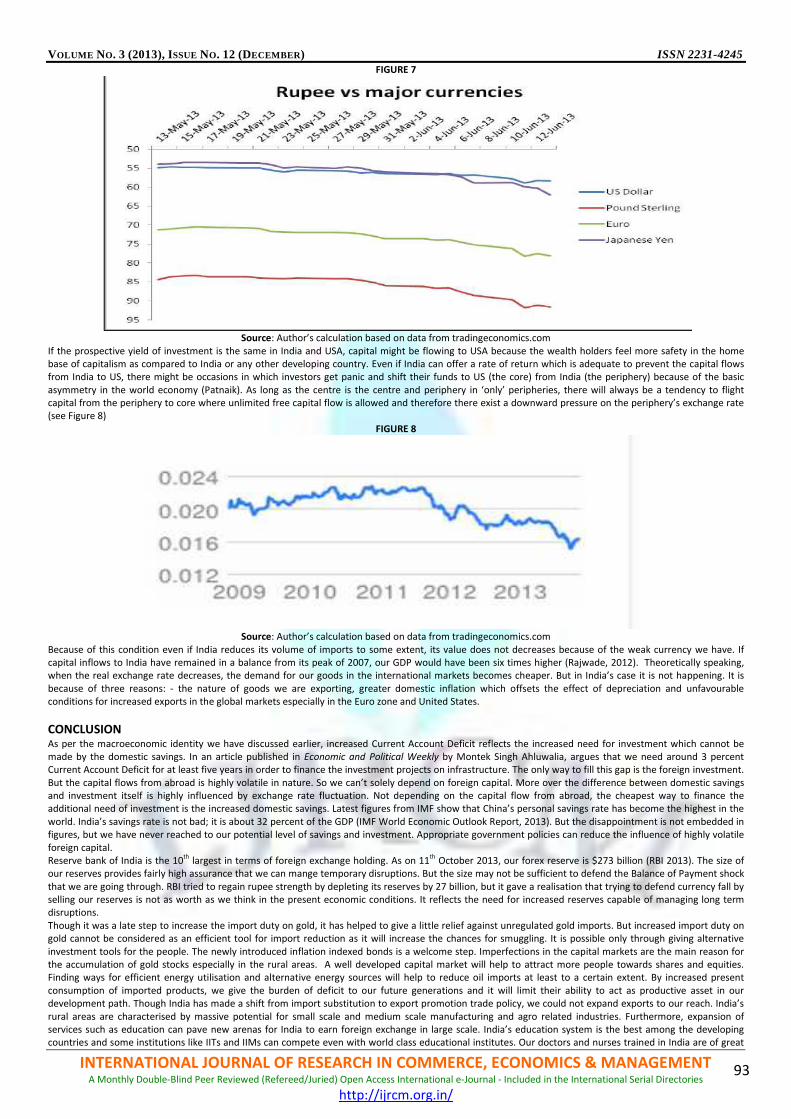
VOLUME NO. 3 (2013), ISSUE NO. 12 (DECEMBER) ISSN 2231-4245
INTERNATIONAL JOURNAL OF RESEARCH IN COMMERCE, ECONOMICS & MANAGEMENT A Monthly Double-Blind Peer Reviewed (Refereed/Juried) Open Access International e-Journal - Included in the International Serial Directories
http://ijrcm.org.in/
93
FIGURE 7
Source: Author’s calculation based on data from tradingeconomics.com
If the prospective yield of investment is the same in India and USA, capital might be flowing to USA because the wealth holders feel more safety in the home base of capitalism as compared to India or any other developing country. Even if India can offer a rate of return which is adequate to prevent the capital flows from India to US, there might be occasions in which investors get panic and shift their funds to US (the core) from India (the periphery) because of the basic
asymmetry in the world economy (Patnaik). As long as the centre is the centre and periphery in ‘only’ peripheries, there will always be a tendency to flight capital from the periphery to core where unlimited free capital flow is allowed and therefore there exist a downward pressure on the periphery’s exchange rate (see Figure 8)
FIGURE 8
Source: Author’s calculation based on data from tradingeconomics.com
Because of this condition even if India reduces its volume of imports to some extent, its value does not decreases because of the weak currency we have. If capital inflows to India have remained in a balance from its peak of 2007, our GDP would have been six times higher (Rajwade, 2012). Theoretically speaking, when the real exchange rate decreases, the demand for our goods in the international markets becomes cheaper. But in India’s case it is not happening. It is
because of three reasons: - the nature of goods we are exporting, greater domestic inflation which offsets the effect of depreciation and unfavourable conditions for increased exports in the global markets especially in the Euro zone and United States.
CONCLUSION As per the macroeconomic identity we have discussed earlier, increased Current Account Deficit reflects the increased need for investment which cannot be made by the domestic savings. In an article published in Economic and Political Weekly by Montek Singh Ahluwalia, argues that we need around 3 percent Current Account Deficit for at least five years in order to finance the investment projects on infrastructure. The only way to fill this gap is the foreign investment.
But the capital flows from abroad is highly volatile in nature. So we can’t solely depend on foreign capital. More over the difference between domestic savings and investment itself is highly influenced by exchange rate fluctuation. Not depending on the capital flow from abroad, the cheapest way to finance the additional need of investment is the increased domestic savings. Latest figures from IMF show that China’s personal savings rate has become the highest in the
world. India’s savings rate is not bad; it is about 32 percent of the GDP (IMF World Economic Outlook Report, 2013). But the disappointment is not embedded in figures, but we have never reached to our potential level of savings and investment. Appropriate government policies can reduce the influence of highly volatile
foreign capital. Reserve bank of India is the 10
th largest in terms of foreign exchange holding. As on 11
th October 2013, our forex reserve is $273 billion (RBI 2013). The size of
our reserves provides fairly high assurance that we can mange temporary disruptions. But the size may not be sufficient to defend the Balance of Payment shock
that we are going through. RBI tried to regain rupee strength by depleting its reserves by 27 billion, but it gave a realisation that trying to defend currency fall by selling our reserves is not as worth as we think in the present economic conditions. It reflects the need for increased reserves capable of managing long term disruptions.
Though it was a late step to increase the import duty on gold, it has helped to give a little relief against unregulated gold imports. But increased import duty on gold cannot be considered as an efficient tool for import reduction as it will increase the chances for smuggling. It is possible only through giving alternative
investment tools for the people. The newly introduced inflation indexed bonds is a welcome step. Imperfections in the capital markets are the main reason for the accumulation of gold stocks especially in the rural areas. A well developed capital market will help to attract more people towards shares and equities. Finding ways for efficient energy utilisation and alternative energy sources will help to reduce oil imports at least to a certain extent. By increased present
consumption of imported products, we give the burden of deficit to our future generations and it will limit their ability to act as productive asset in our development path. Though India has made a shift from import substitution to export promotion trade policy, we could not expand exports to our reach. India’s
rural areas are characterised by massive potential for small scale and medium scale manufacturing and agro related industries. Furthermore, expansion of services such as education can pave new arenas for India to earn foreign exchange in large scale. India’s education system is the best among the developing countries and some institutions like IITs and IIMs can compete even with world class educational institutes. Our doctors and nurses trained in India are of great

VOLUME NO. 3 (2013), ISSUE NO. 12 (DECEMBER) ISSN 2231-4245
INTERNATIONAL JOURNAL OF RESEARCH IN COMMERCE, ECONOMICS & MANAGEMENT A Monthly Double-Blind Peer Reviewed (Refereed/Juried) Open Access International e-Journal - Included in the International Serial Directories
http://ijrcm.org.in/
94
demand in the western labour markets. Compared to western countries, education in India is relatively cheap. More over PTAs and FTAs with unexplored markets such as Africa and Latin America may open new ways for boosting our exports in the long run.
REFERENCES 1. Bose, P. (2013). Capital Flows and External Vulnerability Examining the Recent Trends in India. Available: http:// www.macroscan.org/anl/apr13/
pdf/Capital_Flows.pdf . Last accessed 9th Dec 2013. 2. Chandrasekhar, C. 2013, “A Long View of the Rupee”, The Hindu, 11th June, p. Opinion.
3. Ghosh, J. (2013). The Falling, Falling…Rupee. Frontline. 30 (13). 4. International Monetary Fund. (2013). World Economic Outlook Report. Available: http://www.imf.org/external/pubs/ft/weo/2013/01/. Last accessed 9th
Dec 2013. 5. Maniw, G (2010). Macroeconomics. New York: Worth Publishers. 6. Patnaik, P. 2013. The Fall of the Rupee. People's Democracy, XXXVII (27).
7. Rajwade, A. (2012). The Fall of the Rupee: Background, Remedy and Policy. Economic & Political Weekly. xlvii (2), p10-14. 8. Rangarajan, C. and Mishra, P. (2013). India’s External Sector Do We Need to Worry?. Economic & Political Weekly. xlviII (7), p52-57. 9. Rohit. (2013). The Slide of the Rupee: Is Bernanke Responsible?. Economic & Political Weekly. xlviii (31), p10-12.
VOLUME NO. 3 (2013), ISSUE NO. 12 (DECEMBER) ISSN 2231-4245
INTERNATIONAL JOURNAL OF RESEARCH IN COMMERCE, ECONOMICS & MANAGEMENT A Monthly Double-Blind Peer Reviewed (Refereed/Juried) Open Access International e-Journal - Included in the International Serial Directories
http://ijrcm.org.in/
95
A COMPARATIVE STUDY ON THE PERFORMANCE OF SELECTED MUTUAL FUND TAX SAVING SCHEMES: AN IMPLICATION OF SHARPE’S MEASURE
RAJIB DEB
GUEST LECTURER
DEPARTMENT OF COMMERCE
DHARMANAGAR GOVERNMENT DEGREE COLLEGE
DHARMANAGAR
ABSTRACT
With the emergence of the capital market, the Indian capital market also witnessed a significant institutional development in the form of a diversified structure of
Mutual Funds. A Mutual Fund is a special type of investment institution that acts as an investment conduit. It pools the savings, particularly of the relatively small
investors, and invests them in a well-diversified portfolio of sound investment. Mutual Funds have become a widely popular and effective way for investors to
participate in financial markets. It can play a central role in an individual's investment strategy under the guidance of a portfolio manager who makes investment
decisions on behalf of Mutual Fund unit holders. In this present study an attempt has been made to find out the performance of various Tax saving Mutual Fund
schemes offered by various Mutual Fund companies. Tax saving Mutual Fund scheme is one of the important constituents of Mutual Fund Companies and it has
been gaining demand rapidly due to its tax advantage. In this paper the performance evaluation of some of the Tax saving schemes of Mutual Fund is carried out
through relative performance index, such as Sharpe’s Ratio. The present study will also give an idea to the investor as a financial advisor regarding investment in
Mutual Fund schemes. (BlackRock Investments)
KEYWORDS Mutual Fund, Sharpe’s measure, Tax saving Schemes.
INTRODUCTION ith the emergence of the capital market, the Indian capital market also witnessed a significant institutional development in the form of a diversified structure of Mutual Funds. A Mutual Fund is a special type of investment institution that acts as an investment conduit. It pools the savings, particularly of the relatively small investors, and invests them in a well-diversified portfolio of sound investment. Mutual Funds have become a
widely popular and effective way for investors to participate in financial markets. It can play a central role in an individual's investment strategy under the guidance of a portfolio manager who makes investment decisions on behalf of Mutual Fund unit holders. (BlackRock Investments) Over the past decades, Mutual Funds have increasingly become the investor’s vehicle of choice for long-term investment. A wide variety of Mutual Fund
schemes has also been developed by the fund-managers to attract the investors. Tax-saving Mutual Funds are one of this types which attracts the customers because it gives the tax-payer a deduction up to Rs. 1, 00,000 under section 80C of Income Tax Act. The tax payers, who want their money to grow at a higher
rate compared to other traditional tax saving avenues, are attracted by this scheme.(Elite)
MEANING AND DEFINITIONS OF MUTUAL FUNDS A Mutual Fund is a type of professionally managed collective investment vehicle that pools money from many investors to purchase securities. While there is no legal definition of the term "Mutual Fund", the term is most commonly applied only to those collective investment vehicles (i.e. investment companies) that are
regulated and available to the general public for purchase. (Padmaja, 2013) Securities and Exchange Board of India (Mutual Fund) Regulations, 1996 define “Mutual Fund” as, “a fund established in the form of a trust to raise monies
through the sale of units to the public or a section of the people under one or more schemes for investing in securities, including “Money market instruments”. “Mutual Fund as financial intermediaries which being a wide variety of securities within the reach of the most modern investors.”(Tripathy, 2010)
Frank Relicy “The Mutual Fund is an important vehicle for bringing wealth holder and deficit units together or directly.”(Ibid.)
James Pierce
A Mutual Fund is an investment vehicle that pools the money of the investors having common goal. In return, every investor own their respective share of the fund based on their investment. The ownership of the fund is thus joint or “mutual”; the fund belongs to all investors. A single investor’s ownership of the fund is in the same proportion as the
amount of the contribution made by him or her bears to the total amount of the fund.
OVERVIEW OF MUTUAL FUND INDUSTRY The most important trend in the Mutual Fund (MF) Industry is the aggressive expansion of the foreign owned MF companies and the decline of the companies
floated by nationalized banks and smaller private sector players. Many nationalized banks got into the Mutual Fund business in the early nineties and got off to a good start due to the stock market boom prevailing then. The Mutual Fund industry in India started in 1963 with the formation of Unit Trust of India, at the initiative of the Government of India and Reserve Bank of
India. The history of Mutual Funds in India can be broadly divided into four distinct phases: FIRST PHASE – 1964-87 Unit Trust of India (UTI) was established on 1963 by an Act of Parliament. It was set up by the Reserve Bank of India and functioned under the Regulatory and
administrative control of the Reserve Bank of India. In 1978 UTI was de-linked from the RBI and the Industrial Development Bank of India (IDBI) took over the regulatory and administrative control in place of RBI. The first scheme launched by UTI was Unit Scheme 1964. At the end of 1988 UTI had Rs.6,700 crores of
assets under management. SECOND PHASE – 1987-1993 (ENTRY OF PUBLIC SECTOR FUNDS) 1987 marked the entry of non- UTI, public sector Mutual Funds set up by public sector banks and Life Insurance Corporation of India (LIC) and General Insurance
Corporation of India (GIC). SBI Mutual Fund was the first non- UTI Mutual Fund established in June 1987 followed by Can bank Mutual Fund (Dec 87), Punjab National Bank Mutual Fund (Aug 89), Indian Bank Mutual Fund (Nov 89), Bank of India (Jun 90), Bank of Baroda Mutual Fund (Oct 92). LIC established its Mutual Fund in June 1989 while GIC had set up its Mutual Fund in December 1990. At the end of 1993, the Mutual Fund industry had assets under management of
Rs.47,004 crores. THIRD PHASE – 1993-2003 (ENTRY OF PRIVATE SECTOR FUNDS) With the entry of private sector funds in 1993, a new era started in the Indian Mutual Fund industry, giving the Indian investors a wider choice of fund families. Also, 1993 was the year in which the first Mutual Fund Regulations came into being, under which all Mutual Funds, except UTI were to be registered and governed. The erstwhile Kothari Pioneer (now merged with Franklin Templeton) was the first private sector Mutual Fund registered in July1993.The 1993 SEBI
W
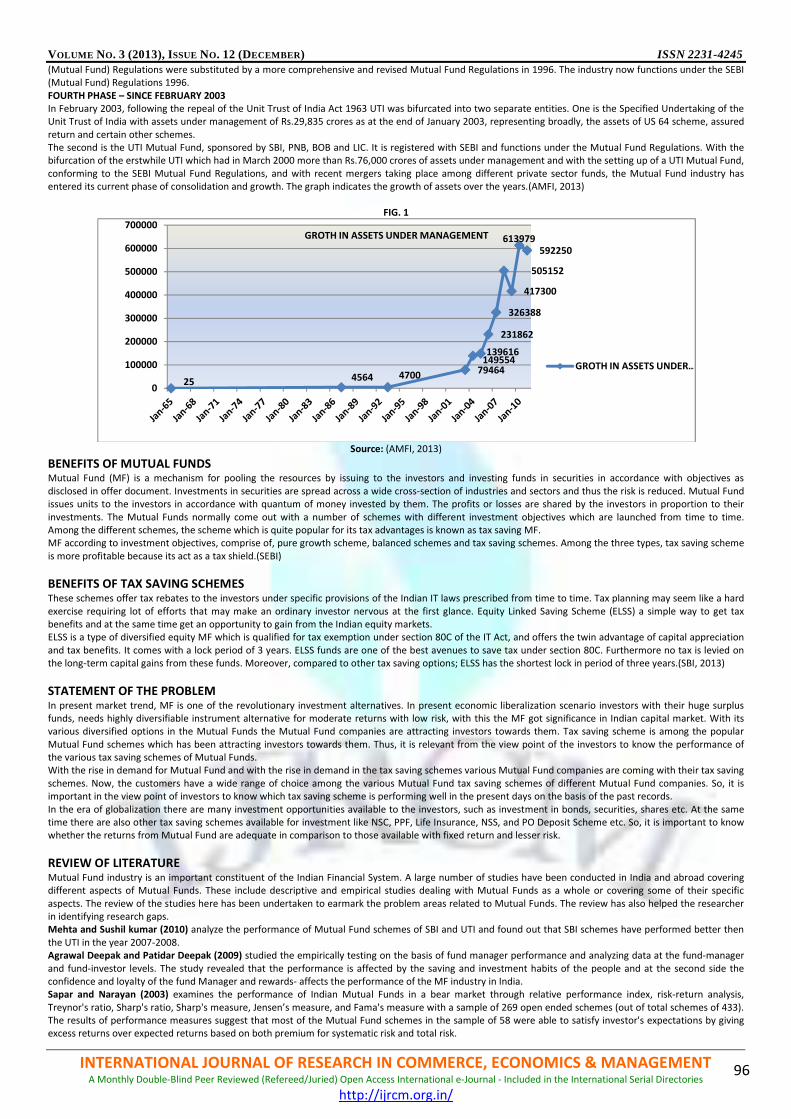
VOLUME NO. 3 (2013), ISSUE NO. 12 (DECEMBER) ISSN 2231-4245
INTERNATIONAL JOURNAL OF RESEARCH IN COMMERCE, ECONOMICS & MANAGEMENT A Monthly Double-Blind Peer Reviewed (Refereed/Juried) Open Access International e-Journal - Included in the International Serial Directories
http://ijrcm.org.in/
96
(Mutual Fund) Regulations were substituted by a more comprehensive and revised Mutual Fund Regulations in 1996. The industry now functions under the SEBI (Mutual Fund) Regulations 1996.
FOURTH PHASE – SINCE FEBRUARY 2003 In February 2003, following the repeal of the Unit Trust of India Act 1963 UTI was bifurcated into two separate entities. One is the Specified Undertaking of the Unit Trust of India with assets under management of Rs.29,835 crores as at the end of January 2003, representing broadly, the assets of US 64 scheme, assured
return and certain other schemes. The second is the UTI Mutual Fund, sponsored by SBI, PNB, BOB and LIC. It is registered with SEBI and functions under the Mutual Fund Regulations. With the bifurcation of the erstwhile UTI which had in March 2000 more than Rs.76,000 crores of assets under management and with the setting up of a UTI Mutual Fund,
conforming to the SEBI Mutual Fund Regulations, and with recent mergers taking place among different private sector funds, the Mutual Fund industry has entered its current phase of consolidation and growth. The graph indicates the growth of assets over the years.(AMFI, 2013)
FIG. 1
Source: (AMFI, 2013)
BENEFITS OF MUTUAL FUNDS Mutual Fund (MF) is a mechanism for pooling the resources by issuing to the investors and investing funds in securities in accordance with objectives as
disclosed in offer document. Investments in securities are spread across a wide cross-section of industries and sectors and thus the risk is reduced. Mutual Fund issues units to the investors in accordance with quantum of money invested by them. The profits or losses are shared by the investors in proportion to their
investments. The Mutual Funds normally come out with a number of schemes with different investment objectives which are launched from time to time. Among the different schemes, the scheme which is quite popular for its tax advantages is known as tax saving MF. MF according to investment objectives, comprise of, pure growth scheme, balanced schemes and tax saving schemes. Among the three types, tax saving scheme
is more profitable because its act as a tax shield.(SEBI)
BENEFITS OF TAX SAVING SCHEMES These schemes offer tax rebates to the investors under specific provisions of the Indian IT laws prescribed from time to time. Tax planning may seem like a hard
exercise requiring lot of efforts that may make an ordinary investor nervous at the first glance. Equity Linked Saving Scheme (ELSS) a simple way to get tax benefits and at the same time get an opportunity to gain from the Indian equity markets. ELSS is a type of diversified equity MF which is qualified for tax exemption under section 80C of the IT Act, and offers the twin advantage of capital appreciation
and tax benefits. It comes with a lock period of 3 years. ELSS funds are one of the best avenues to save tax under section 80C. Furthermore no tax is levied on the long-term capital gains from these funds. Moreover, compared to other tax saving options; ELSS has the shortest lock in period of three years.(SBI, 2013)
STATEMENT OF THE PROBLEM In present market trend, MF is one of the revolutionary investment alternatives. In present economic liberalization scenario investors with their huge surplus funds, needs highly diversifiable instrument alternative for moderate returns with low risk, with this the MF got significance in Indian capital market. With its various diversified options in the Mutual Funds the Mutual Fund companies are attracting investors towards them. Tax saving scheme is among the popular
Mutual Fund schemes which has been attracting investors towards them. Thus, it is relevant from the view point of the investors to know the performance of the various tax saving schemes of Mutual Funds. With the rise in demand for Mutual Fund and with the rise in demand in the tax saving schemes various Mutual Fund companies are coming with their tax saving
schemes. Now, the customers have a wide range of choice among the various Mutual Fund tax saving schemes of different Mutual Fund companies. So, it is important in the view point of investors to know which tax saving scheme is performing well in the present days on the basis of the past records.
In the era of globalization there are many investment opportunities available to the investors, such as investment in bonds, securities, shares etc. At the same time there are also other tax saving schemes available for investment like NSC, PPF, Life Insurance, NSS, and PO Deposit Scheme etc. So, it is important to know whether the returns from Mutual Fund are adequate in comparison to those available with fixed return and lesser risk.
REVIEW OF LITERATURE Mutual Fund industry is an important constituent of the Indian Financial System. A large number of studies have been conducted in India and abroad covering different aspects of Mutual Funds. These include descriptive and empirical studies dealing with Mutual Funds as a whole or covering some of their specific
aspects. The review of the studies here has been undertaken to earmark the problem areas related to Mutual Funds. The review has also helped the researcher in identifying research gaps. Mehta and Sushil kumar (2010) analyze the performance of Mutual Fund schemes of SBI and UTI and found out that SBI schemes have performed better then
the UTI in the year 2007-2008. Agrawal Deepak and Patidar Deepak (2009) studied the empirically testing on the basis of fund manager performance and analyzing data at the fund-manager
and fund-investor levels. The study revealed that the performance is affected by the saving and investment habits of the people and at the second side the confidence and loyalty of the fund Manager and rewards- affects the performance of the MF industry in India. Sapar and Narayan (2003) examines the performance of Indian Mutual Funds in a bear market through relative performance index, risk-return analysis,
Treynor's ratio, Sharp's ratio, Sharp's measure, Jensen’s measure, and Fama's measure with a sample of 269 open ended schemes (out of total schemes of 433). The results of performance measures suggest that most of the Mutual Fund schemes in the sample of 58 were able to satisfy investor's expectations by giving excess returns over expected returns based on both premium for systematic risk and total risk.
25 4564 4700 79464
139616149554
231862
326388
505152
417300
613979592250
0
100000
200000
300000
400000
500000
600000
700000GROTH IN ASSETS UNDER MANAGEMENT
GROTH IN ASSETS UNDER …
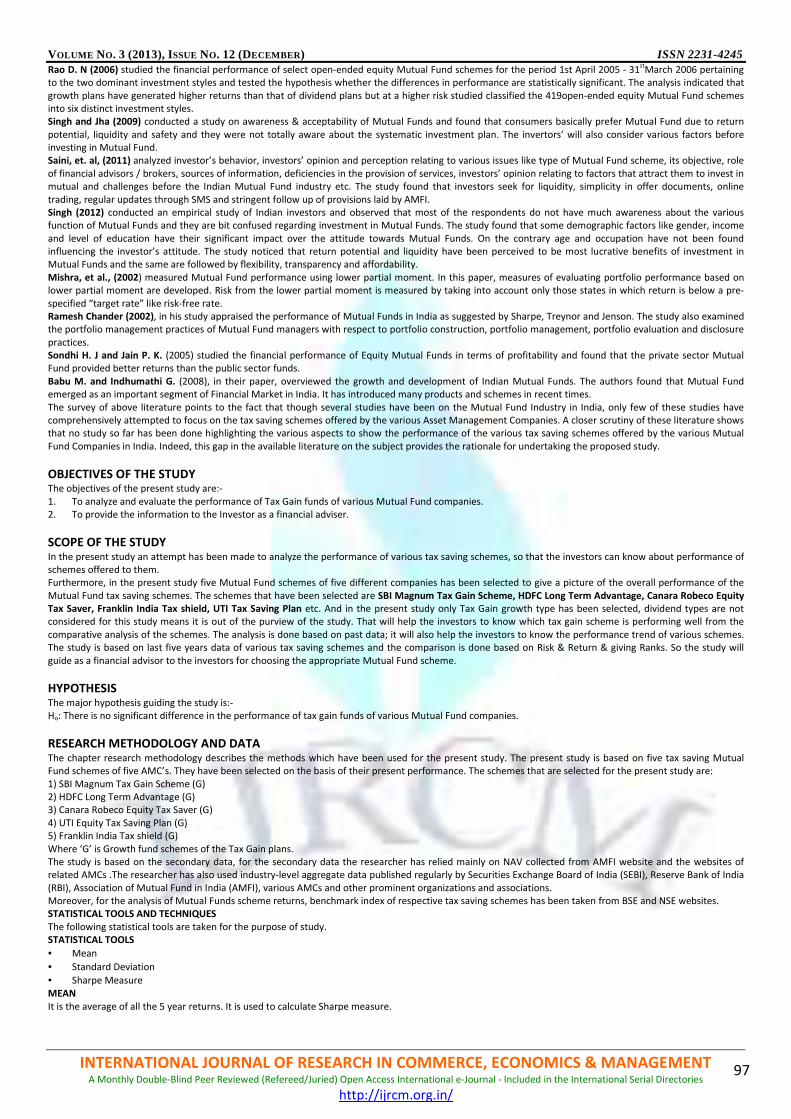
VOLUME NO. 3 (2013), ISSUE NO. 12 (DECEMBER) ISSN 2231-4245
INTERNATIONAL JOURNAL OF RESEARCH IN COMMERCE, ECONOMICS & MANAGEMENT A Monthly Double-Blind Peer Reviewed (Refereed/Juried) Open Access International e-Journal - Included in the International Serial Directories
http://ijrcm.org.in/
97
Rao D. N (2006) studied the financial performance of select open-ended equity Mutual Fund schemes for the period 1st April 2005 - 31stMarch 2006 pertaining
to the two dominant investment styles and tested the hypothesis whether the differences in performance are statistically significant. The analysis indicated that
growth plans have generated higher returns than that of dividend plans but at a higher risk studied classified the 419open-ended equity Mutual Fund schemes into six distinct investment styles. Singh and Jha (2009) conducted a study on awareness & acceptability of Mutual Funds and found that consumers basically prefer Mutual Fund due to return
potential, liquidity and safety and they were not totally aware about the systematic investment plan. The invertors’ will also consider various factors before investing in Mutual Fund. Saini, et. al, (2011) analyzed investor’s behavior, investors’ opinion and perception relating to various issues like type of Mutual Fund scheme, its objective, role
of financial advisors / brokers, sources of information, deficiencies in the provision of services, investors’ opinion relating to factors that attract them to invest in mutual and challenges before the Indian Mutual Fund industry etc. The study found that investors seek for liquidity, simplicity in offer documents, online
trading, regular updates through SMS and stringent follow up of provisions laid by AMFI. Singh (2012) conducted an empirical study of Indian investors and observed that most of the respondents do not have much awareness about the various function of Mutual Funds and they are bit confused regarding investment in Mutual Funds. The study found that some demographic factors like gender, income
and level of education have their significant impact over the attitude towards Mutual Funds. On the contrary age and occupation have not been found influencing the investor’s attitude. The study noticed that return potential and liquidity have been perceived to be most lucrative benefits of investment in Mutual Funds and the same are followed by flexibility, transparency and affordability.
Mishra, et al., (2002) measured Mutual Fund performance using lower partial moment. In this paper, measures of evaluating portfolio performance based on lower partial moment are developed. Risk from the lower partial moment is measured by taking into account only those states in which return is below a pre-
specified “target rate” like risk-free rate. Ramesh Chander (2002), in his study appraised the performance of Mutual Funds in India as suggested by Sharpe, Treynor and Jenson. The study also examined the portfolio management practices of Mutual Fund managers with respect to portfolio construction, portfolio management, portfolio evaluation and disclosure
practices. Sondhi H. J and Jain P. K. (2005) studied the financial performance of Equity Mutual Funds in terms of profitability and found that the private sector Mutual Fund provided better returns than the public sector funds.
Babu M. and Indhumathi G. (2008), in their paper, overviewed the growth and development of Indian Mutual Funds. The authors found that Mutual Fund emerged as an important segment of Financial Market in India. It has introduced many products and schemes in recent times.
The survey of above literature points to the fact that though several studies have been on the Mutual Fund Industry in India, only few of these studies have comprehensively attempted to focus on the tax saving schemes offered by the various Asset Management Companies. A closer scrutiny of these literature shows that no study so far has been done highlighting the various aspects to show the performance of the various tax saving schemes offered by the various Mutual
Fund Companies in India. Indeed, this gap in the available literature on the subject provides the rationale for undertaking the proposed study.
OBJECTIVES OF THE STUDY
The objectives of the present study are:-
1. To analyze and evaluate the performance of Tax Gain funds of various Mutual Fund companies. 2. To provide the information to the Investor as a financial adviser.
SCOPE OF THE STUDY In the present study an attempt has been made to analyze the performance of various tax saving schemes, so that the investors can know about performance of schemes offered to them. Furthermore, in the present study five Mutual Fund schemes of five different companies has been selected to give a picture of the overall performance of the
Mutual Fund tax saving schemes. The schemes that have been selected are SBI Magnum Tax Gain Scheme, HDFC Long Term Advantage, Canara Robeco Equity Tax Saver, Franklin India Tax shield, UTI Tax Saving Plan etc. And in the present study only Tax Gain growth type has been selected, dividend types are not considered for this study means it is out of the purview of the study. That will help the investors to know which tax gain scheme is performing well from the
comparative analysis of the schemes. The analysis is done based on past data; it will also help the investors to know the performance trend of various schemes. The study is based on last five years data of various tax saving schemes and the comparison is done based on Risk & Return & giving Ranks. So the study will
guide as a financial advisor to the investors for choosing the appropriate Mutual Fund scheme.
HYPOTHESIS
The major hypothesis guiding the study is:- Ho: There is no significant difference in the performance of tax gain funds of various Mutual Fund companies.
RESEARCH METHODOLOGY AND DATA The chapter research methodology describes the methods which have been used for the present study. The present study is based on five tax saving Mutual Fund schemes of five AMC’s. They have been selected on the basis of their present performance. The schemes that are selected for the present study are:
1) SBI Magnum Tax Gain Scheme (G) 2) HDFC Long Term Advantage (G) 3) Canara Robeco Equity Tax Saver (G)
4) UTI Equity Tax Saving Plan (G) 5) Franklin India Tax shield (G)
Where ‘G’ is Growth fund schemes of the Tax Gain plans. The study is based on the secondary data, for the secondary data the researcher has relied mainly on NAV collected from AMFI website and the websites of related AMCs .The researcher has also used industry-level aggregate data published regularly by Securities Exchange Board of India (SEBI), Reserve Bank of India
(RBI), Association of Mutual Fund in India (AMFI), various AMCs and other prominent organizations and associations. Moreover, for the analysis of Mutual Funds scheme returns, benchmark index of respective tax saving schemes has been taken from BSE and NSE websites. STATISTICAL TOOLS AND TECHNIQUES The following statistical tools are taken for the purpose of study. STATISTICAL TOOLS
• Mean
• Standard Deviation
• Sharpe Measure
MEAN
It is the average of all the 5 year returns. It is used to calculate Sharpe measure.

VOLUME NO. 3 (2013), ISSUE NO. 12 (DECEMBER) ISSN 2231-4245
INTERNATIONAL JOURNAL OF RESEARCH IN COMMERCE, ECONOMICS & MANAGEMENT A Monthly Double-Blind Peer Reviewed (Refereed/Juried) Open Access International e-Journal - Included in the International Serial Directories
http://ijrcm.org.in/
98
STANDARD DEVIATION Standard deviation measures the dispersion of data from its mean. In plain English, the more that data is spread apart, the higher the difference is from the
norm. In finance, standard deviation is applied to the annual rate of return of an investment to measure its volatility (risk). A volatile stock would have a high standard deviation. With Mutual Funds, the standard deviation tells us how much the return on a fund is deviating from the expected returns based on its historical performance. The formula for calculating Standard Deviation is
SD=� ������∑ �� − ������� ���
where,
Rp = Represents the individual fund returns.
������ = Represents the Average returns.
T = Total periods. SHARPE RATIO Sharpe Model has been developed by Nobel laureate economist William Sharpe. This ratio measures risk-adjusted performance of funds. It is calculated by subtracting the risk-free rate of return (U.S. Treasury Bond) from the rate of return for an investment and dividing the result by the investment’s standard deviation of its return. The Sharpe ratio tells investors whether an investment's returns are due to smart investment decisions or the result of excess risk. This
measurement is very useful because although one portfolio or security can reap higher returns than its peers, it is only a good investment if those higher returns do not come with too much additional risk. The greater an investment's Sharpe ratio, the better its risk-adjusted performance.
According to Sharpe, it is the total risk of the fund that the investors are concerned about. So, the model evaluates funds on the basis of reward per unit of total risk. Symbolically, it can be written as: Sharpe Ratio (Si) = (Ri - Rf)/SD where, SD is standard deviation of the fund,
Ri represents return on fund, and Rf is risk free rate of return. While a high and positive Sharpe Ratio shows a superior risk-adjusted performance of a fund, a low and negative Sharpe Ratio is an indication of unfavorable
performance. NET ASSET VALUE (NAV) Net Asset Value is the market value of the assets of the scheme minus its liabilities. The per unit NAV is the net asset value of the scheme divided by the number
of units outstanding on the Valuation Date. So if a fund had assets of Rs. 50 lakh and there are one lakh shares of the fund, then the price per share (or NAV) is Rs. 50.00.
The Net Asset Value (NAV) of each of the above mentioned Mutual Funds over the last five years is taken into account from the AMFI site to find out the standard deviation of each of the funds. These are taken into account to measure the returns of those funds. The returns are compared with that of their benchmark index return. The returns of these funds over the last five years are also be analyzed.
FUNDS RETURNS Funds return has been calculated with the help of NAV. The following formula is being used to calculate the returns:
Returns= [ ] × 100 NAVt-1 = NAV at the beginning date. NAVt = NAV at the closing date/end of the period. BENCHMARK RETURNS Likewise Benchmark returns are computed with the help of benchmark index which has been collected from BSE and NSE sites. RISK-FREE RATE OF RETURN Risk free rate of return has been taken as 7.5%.
RESULTS AND DISCUSSION PERFORMANCE EVALUATION OF TAX SAVING MUTUAL FUNDS Portfolio managers evaluate their portfolio performance and identify the sources of strength and weakness. The evaluation of the portfolio provides a feedback
about the performance to evolve a better management strategy. Even through evaluation of portfolio performance is considered to be the last stage of investment process, the managed portfolios are commonly known as Mutual Funds. Various managed portfolios are prevalent in the capital market. Their relative merits of return and risk criteria have to be evaluated. The evaluation part is very important and needs a lot of concentration. The statistical tools help in this study in reaching at suitable results. In the present study, statistical tools like mean, standard deviation and the most important tool which evaluates the performance is the Sharpe index model has been used. In the
following tables X represents the fund return and Y represents the benchmark returns. 1) SBI MAGNUM TAX GAIN SCHEME (G)
Fund Type: Open-Ended
Investment Plan: Growth
Asset Size (Rs cr): 4578.79 (Mar-30-2013)
Minimum Investment: Rs.500
Launch Date : Mar 31, 1993
Benchmark : S & P BSE 100
Fund Manager : Jayesh Shroff
Source: (Moneycontrol, 2013) Average yearly return= 4.83% Std. Deviation= 14.91
YEAR FROM NAV TO DATE NAV % Returns(X) % Returns(Y)
1 01/07/07 48.52 30/06/08 42.36 -12.70 -7.82
2 01/07/08 40.82 30/06/09 45.65 11.83 7.44
3 01/07/09 47 30/06/10 59.47 26.53 24.42
4 01/07/10 59.47 30/06/11 59.26 -0.35 4.39
5 01/07/11 59.26 30/06/12 58.58 -1.15 -7.66
SUM=24.17
NAVt – NAVt-1
NAVt-1

VOLUME NO. 3 (2013), ISSUE NO. 12 (DECEMBER
INTERNATIONAL JOURNAL OF RESEARCH IN COMA Monthly Double-Blind Peer Reviewed (Refereed
The SBI Magnum Tax Gain scheme performed very poor in last five years. In this period, it gives the highest return in return i.e. -7.82 in 1.7.07 to 30.6.08 and average return given by this fund is 4.83% per year.
GRAPHICAL REPRESENTATION OF RETURNS IN COMPARE TO BENCHMARK RETURNS
2) HDFC LONG TERM ADVANTAGE (G)
Fund Type:
Investment Plan:
Asset Size (Rs cr):
Minimum Investment:
Launch Date :
Benchmark :
Fund Manager :
Average yearly return= 113.08% Std. Deviation= 173.41 The returns of HDFC Long Term Advantage scheme are very volatile in last five year. In this period, it gives the highest and
325.22 and lowest return i.e. -8.33 in 1.7.07 to 30.6.08where as average return given by this fund is GRAPHICAL PRESENTATION OF RETURNS
3) CANARA ROBECO EQUITY TAX SAVER (G) Source: (Moneycontrol, 2013)
YEAR
1 01/07/07
2 01/07/08
3 01/07/09
4 01/07/10
5 01/07/11
Average yearly return= 13.40% Std. Deviation= 22.70 The Canara Robeco equity tax saver performed average in last five year. In this period, it gives the highest return in
return i.e. -7.82 in 1.7.07to 30.6.08.whereas average return given by this fund is
-20.00
0.00
20.00
40.00
30/06/2008
-12.70-7.82
-200.00
0.00
200.00
400.00
30/06/2008
-24.53 -8.33
YEAR FROM
1 01/07/07
2 01/07/08
3 01/07/09
4 01/07/10
5 01/07/11
ECEMBER)
INTERNATIONAL JOURNAL OF RESEARCH IN COMMERCE, ECONOMICS Refereed/Juried) Open Access International e-Journal - Included in the International Serial Directories
http://ijrcm.org.in/
The SBI Magnum Tax Gain scheme performed very poor in last five years. In this period, it gives the highest return in 1.7.09 to 30.6.10and average return given by this fund is 4.83% per year.
GRAPHICAL REPRESENTATION OF RETURNS IN COMPARE TO BENCHMARK RETURNS
FIG. 2
Fund Type: Open-Ended
Investment Plan: Growth
Asset Size (Rs cr): 854.55(Mar-30-2013)
Minimum Investment: Rs.500
Launch Date : Jan 02, 2001
Benchmark : BSE Sensitive Index
Fund Manager : Chirag Staved/Miten Lathia
Source: (Moneycontrol, 2013)
The returns of HDFC Long Term Advantage scheme are very volatile in last five year. In this period, it gives the highest and
where as average return given by this fund is 113.08% per year.
FIG. 3
FROM NAV TO DATE NAV % Returns(X) % Returns(Y)
15.45 30/06/08 13.38 -13.41 -7.82
12.98 30/06/09 17.13 31.94 7.44
17.32 30/06/10 24.48 41.34 24.42
24.52 30/06/11 26.24 7.01 4.39
26.31 30/06/12 26.34 0.11 -7.66
SUM=67.00
The Canara Robeco equity tax saver performed average in last five year. In this period, it gives the highest return in 1.7.09 to 30.6.10.whereas average return given by this fund is 13.4% per year.
30/06/2009 30/06/2010 30/06/2011 30/06/2012
11.83
26.53
-0.35 -1.157.82
7.44
24.42
4.39
Return X (%) Return Y (%)
30/06/2009 30/06/2010 30/06/2011 30/06/2012
-8.30
325.22278.85
-5.818.337.52 22.02 6.60
Return X (%) Return Y (%)
FROM NAV TO DATE NAV % Returns(X) % Returns(Y)
43.83 30/06/08 33.08 -24.53 -8.33
32.11 30/06/09 29.44 -8.30 7.52
29.73 30/06/10 126.43 325.22 22.02
36.80 30/06/11 139.42 278.85 6.60
139.63 30/06/12 131.51 -5.81 -8.14
SUM=565.42
Fund Type: Open-Ended
Investment Plan: Growth
Asset Size (Rs cr): 549.87 (Mar-30-2013)
Minimum Investment: Rs.500
Launch Date : Mar 31, 1993
Benchmark : BSE 100
Fund Manager : Krishna Sanghvi
ISSN 2231-4245
MERCE, ECONOMICS & MANAGEMENT Included in the International Serial Directories
99
1.7.09 to 30.6.10 which is 26.53 and lowest
The returns of HDFC Long Term Advantage scheme are very volatile in last five year. In this period, it gives the highest and return in 1.7.09 to 30.6.10 which is
% Returns(Y)
1.7.09 to 30.6.10 which is 41.34 and lowest
30/06/2012
-7.66
30/06/2012
-8.14
% Returns(Y)
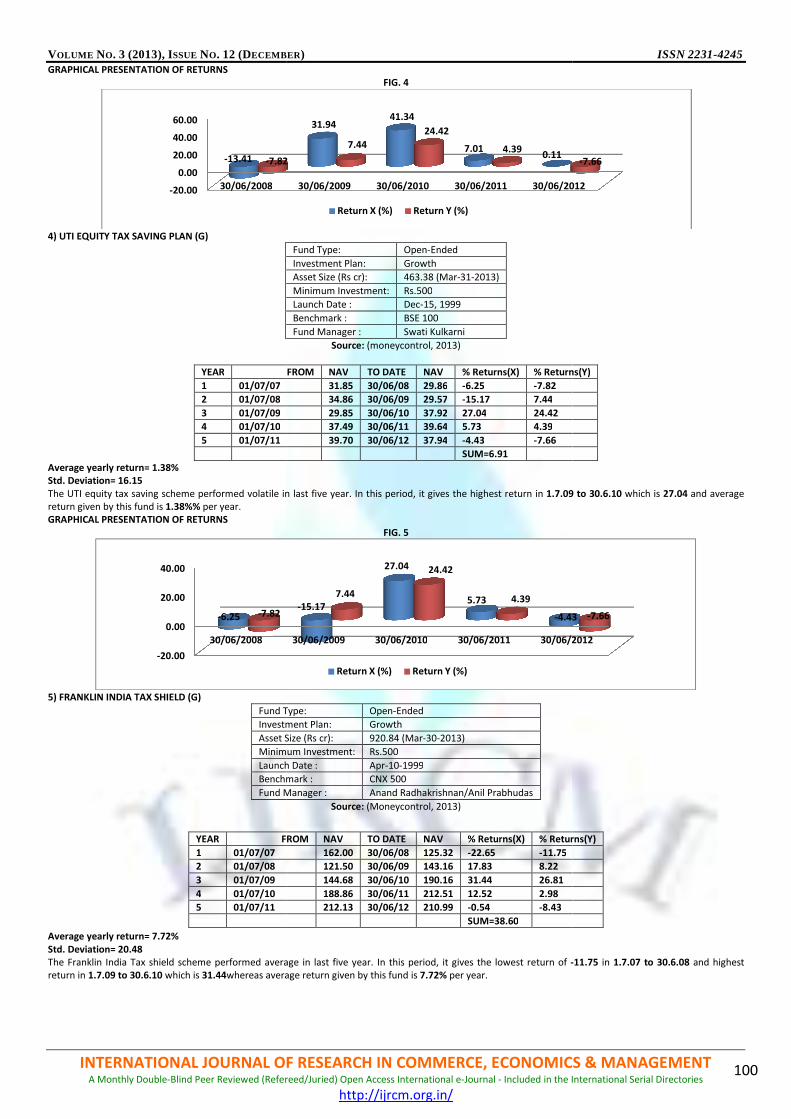
VOLUME NO. 3 (2013), ISSUE NO. 12 (DECEMBER
INTERNATIONAL JOURNAL OF RESEARCH IN COMA Monthly Double-Blind Peer Reviewed (Refereed
GRAPHICAL PRESENTATION OF RETURNS
4) UTI EQUITY TAX SAVING PLAN (G)
YEAR
1 01/07/07
2 01/07/08
3 01/07/09
4 01/07/10
5 01/07/11
Average yearly return= 1.38% Std. Deviation= 16.15 The UTI equity tax saving scheme performed volatile in last five year. In this period, it gives the highest return in return given by this fund is 1.38%% per year. GRAPHICAL PRESENTATION OF RETURNS
5) FRANKLIN INDIA TAX SHIELD (G)
Fund Type:
Investment Plan:
Asset Size (Rs cr):
Minimum Investment:
Launch Date :
Benchmark :
Fund Manager :
Average yearly return= 7.72% Std. Deviation= 20.48 The Franklin India Tax shield scheme performed average in last five year. In this period, it gives the lowest return of return in 1.7.09 to 30.6.10 which is 31.44whereas average return given by this fund is
-20.00
0.00
20.00
40.00
60.00
30/06/2008
-13.41 -7.82
-20.00
0.00
20.00
40.00
30/06/2008
-6.25 -7.82
YEAR FROM
1 01/07/07
2 01/07/08
3 01/07/09
4 01/07/10
5 01/07/11
ECEMBER)
INTERNATIONAL JOURNAL OF RESEARCH IN COMMERCE, ECONOMICS Refereed/Juried) Open Access International e-Journal - Included in the International Serial Directories
http://ijrcm.org.in/
FIG. 4
Fund Type: Open-Ended
Investment Plan: Growth
Asset Size (Rs cr): 463.38 (Mar-31-2013)
Minimum Investment: Rs.500
Launch Date : Dec-15, 1999
Benchmark : BSE 100
Fund Manager : Swati Kulkarni
Source: (moneycontrol, 2013)
FROM NAV TO DATE NAV % Returns(X) % Returns(Y)
31.85 30/06/08 29.86 -6.25 -7.82
34.86 30/06/09 29.57 -15.17 7.44
29.85 30/06/10 37.92 27.04 24.42
37.49 30/06/11 39.64 5.73 4.39
39.70 30/06/12 37.94 -4.43 -7.66
SUM=6.91
The UTI equity tax saving scheme performed volatile in last five year. In this period, it gives the highest return in 1.7.09 to 30.6.10
FIG. 5
Fund Type: Open-Ended
Investment Plan: Growth
Asset Size (Rs cr): 920.84 (Mar-30-2013)
Minimum Investment: Rs.500
Launch Date : Apr-10-1999
Benchmark : CNX 500
Fund Manager : Anand Radhakrishnan/Anil Prabhudas
Source: (Moneycontrol, 2013)
The Franklin India Tax shield scheme performed average in last five year. In this period, it gives the lowest return of -whereas average return given by this fund is 7.72% per year.
30/06/2009 30/06/2010 30/06/2011 30/06/2012
31.9441.34
7.010.11
7.82
7.44
24.42
4.39
Return X (%) Return Y (%)
30/06/2009 30/06/2010 30/06/2011 30/06/2012
-15.17
27.04
5.73
-4.43
7.44
24.42
4.39
Return X (%) Return Y (%)
FROM NAV TO DATE NAV % Returns(X) % Returns(Y)
162.00 30/06/08 125.32 -22.65 -11.75
121.50 30/06/09 143.16 17.83 8.22
144.68 30/06/10 190.16 31.44 26.81
188.86 30/06/11 212.51 12.52 2.98
212.13 30/06/12 210.99 -0.54 -8.43
SUM=38.60
ISSN 2231-4245
MERCE, ECONOMICS & MANAGEMENT Included in the International Serial Directories
100
% Returns(Y)
1.7.09 to 30.6.10 which is 27.04 and average
-11.75 in 1.7.07 to 30.6.08 and highest
30/06/2012
-7.66
30/06/2012
4.43 -7.66
% Returns(Y)
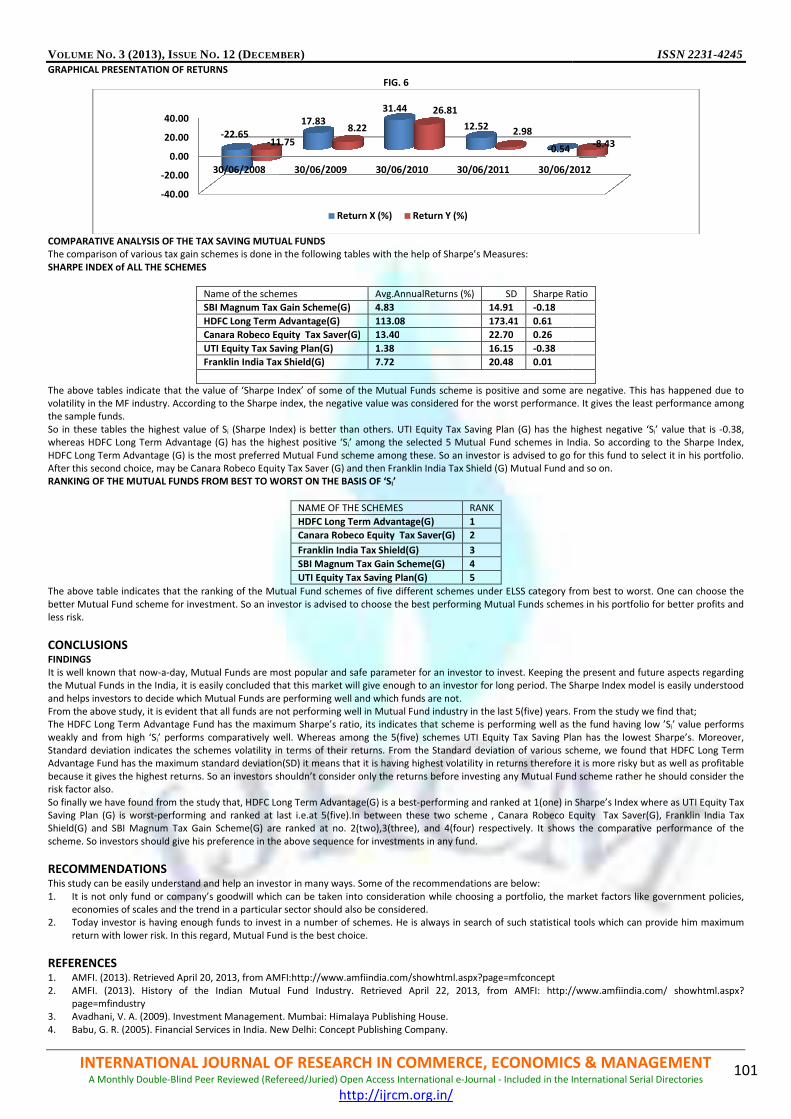
VOLUME NO. 3 (2013), ISSUE NO. 12 (DECEMBER
INTERNATIONAL JOURNAL OF RESEARCH IN COMA Monthly Double-Blind Peer Reviewed (Refereed
GRAPHICAL PRESENTATION OF RETURNS
COMPARATIVE ANALYSIS OF THE TAX SAVING MUTUAL FUNDSThe comparison of various tax gain schemes is done in the following tables with the help of Sharpe’s Measures:
SHARPE INDEX of ALL THE SCHEMES
Name of the schemes
SBI Magnum Tax Gain Scheme(G)
HDFC Long Term Advantage(G)
Canara Robeco Equity Tax Saver(G)
UTI Equity Tax Saving Plan(G)
Franklin India Tax Shield(G)
The above tables indicate that the value of ‘Sharpe Index’ of some of the Mutual Funds scheme is positive and some are negativolatility in the MF industry. According to the Sharpe index, the negative value was considered for ththe sample funds.
So in these tables the highest value of Si (Sharpe Index) is better than others. UTI Equity Tax Saving Plan (G) has the highest negative ‘Swhereas HDFC Long Term Advantage (G) has the highest positive ‘S
HDFC Long Term Advantage (G) is the most preferred Mutual Fund scheme among these. So an investor is advised to go for tAfter this second choice, may be Canara Robeco Equity Tax Saver (G) and then Franklin India Tax Shield (G) Mutual Fund and soRANKING OF THE MUTUAL FUNDS FROM BEST TO WORST ON THE BASIS OF ‘S
The above table indicates that the ranking of the Mutual Fund schemes of
better Mutual Fund scheme for investment. So an investor is advised to choose the best performing Mutual Funds schemes in hisless risk.
CONCLUSIONS FINDINGS It is well known that now-a-day, Mutual Funds are most popular and safe parameter for an investor to invest. Keeping the present and future aspects regarthe Mutual Funds in the India, it is easily concluded that this market will give
and helps investors to decide which Mutual Funds are performing well and which funds are not. From the above study, it is evident that all funds are not performing well in Mutual Fund industry in the last 5(five) years.The HDFC Long Term Advantage Fund has the maximum Sharpe’s ratio, its indicates that scheme is perfo
weakly and from high ‘Si’ performs comparatively well. Whereas among the 5(five) schemes UTI Equity Tax Saving Plan has the lowest Sharpe’s. MoreoverStandard deviation indicates the schemes volatility in terms of their returns. From the Standard deviation of various scheme, we found that HDFC Long Term Advantage Fund has the maximum standard deviation(SD) it means that it is having highest volatility in returns therefore it i
because it gives the highest returns. So an investors shouldn’t consider only the returns before investing any Mutual Fund scrisk factor also.
So finally we have found from the study that, HDFC Long Term AdvanSaving Plan (G) is worst-performing and ranked at last i.e.at 5(five).In between these two scheme , Canara Robeco Equity Tax Saver(G), Franklin IndiaShield(G) and SBI Magnum Tax Gain Scheme(G) are ranked at no. 2(two),3(three), and 4(four) respectively. It shows the comparative perfo
scheme. So investors should give his preference in the above sequence for investments in any fund.
RECOMMENDATIONS This study can be easily understand and help an investor in many ways. Some of the recommendations are below:
1. It is not only fund or company’s goodwill which can be taken into consideration while choosing a portfolio, the market factoreconomies of scales and the trend in a particular sector should also be considered.
2. Today investor is having enough funds to invest in a number of schemes. He is always in search of such statistical tools whic
return with lower risk. In this regard, Mutual Fund is the best choice.
REFERENCES 1. AMFI. (2013). Retrieved April 20, 2013, from AMFI:http://www.amfiindia.com/showhtml.aspx?page=mfconcept
2. AMFI. (2013). History of the Indian Mutual Fund Industry. Retrieved April 22, 2013, from AMFI: page=mfindustry
3. Avadhani, V. A. (2009). Investment Management. Mumbai: Himalaya
4. Babu, G. R. (2005). Financial Services in India. New Delhi: Concept Publishing Company.
-40.00
-20.00
0.00
20.00
40.00
30/06/2008
-22.65-11.75
ECEMBER)
INTERNATIONAL JOURNAL OF RESEARCH IN COMMERCE, ECONOMICS Refereed/Juried) Open Access International e-Journal - Included in the International Serial Directories
http://ijrcm.org.in/
FIG. 6
TUAL FUNDS The comparison of various tax gain schemes is done in the following tables with the help of Sharpe’s Measures:
of the schemes Avg.AnnualReturns (%) SD Sharpe Ratio
SBI Magnum Tax Gain Scheme(G) 4.83 14.91 -0.18
HDFC Long Term Advantage(G) 113.08 173.41 0.61
Canara Robeco Equity Tax Saver(G) 13.40 22.70 0.26
UTI Equity Tax Saving Plan(G) 1.38 16.15 -0.38
Franklin India Tax Shield(G) 7.72 20.48 0.01
The above tables indicate that the value of ‘Sharpe Index’ of some of the Mutual Funds scheme is positive and some are negativolatility in the MF industry. According to the Sharpe index, the negative value was considered for the worst performance. It gives the least performance among
(Sharpe Index) is better than others. UTI Equity Tax Saving Plan (G) has the highest negative ‘Sg Term Advantage (G) has the highest positive ‘Si’ among the selected 5 Mutual Fund schemes in India. So according to the Sharpe Index,
HDFC Long Term Advantage (G) is the most preferred Mutual Fund scheme among these. So an investor is advised to go for tAfter this second choice, may be Canara Robeco Equity Tax Saver (G) and then Franklin India Tax Shield (G) Mutual Fund and soRANKING OF THE MUTUAL FUNDS FROM BEST TO WORST ON THE BASIS OF ‘SI’
NAME OF THE SCHEMES RANK
HDFC Long Term Advantage(G) 1
Canara Robeco Equity Tax Saver(G) 2
Franklin India Tax Shield(G) 3
SBI Magnum Tax Gain Scheme(G) 4
UTI Equity Tax Saving Plan(G) 5
The above table indicates that the ranking of the Mutual Fund schemes of five different schemes under ELSS category from best to worst. One can choose the
better Mutual Fund scheme for investment. So an investor is advised to choose the best performing Mutual Funds schemes in his
day, Mutual Funds are most popular and safe parameter for an investor to invest. Keeping the present and future aspects regarthe Mutual Funds in the India, it is easily concluded that this market will give enough to an investor for long period. The Sharpe Index model is easily understood
and helps investors to decide which Mutual Funds are performing well and which funds are not. From the above study, it is evident that all funds are not performing well in Mutual Fund industry in the last 5(five) years. The HDFC Long Term Advantage Fund has the maximum Sharpe’s ratio, its indicates that scheme is performing well as the fund having low ’S
’ performs comparatively well. Whereas among the 5(five) schemes UTI Equity Tax Saving Plan has the lowest Sharpe’s. Moreoverin terms of their returns. From the Standard deviation of various scheme, we found that HDFC Long Term
Advantage Fund has the maximum standard deviation(SD) it means that it is having highest volatility in returns therefore it i
because it gives the highest returns. So an investors shouldn’t consider only the returns before investing any Mutual Fund sc
So finally we have found from the study that, HDFC Long Term Advantage(G) is a best-performing and ranked at 1(one) in Sharpe’s Index where as UTI Equity Tax performing and ranked at last i.e.at 5(five).In between these two scheme , Canara Robeco Equity Tax Saver(G), Franklin India
and SBI Magnum Tax Gain Scheme(G) are ranked at no. 2(two),3(three), and 4(four) respectively. It shows the comparative perfo
scheme. So investors should give his preference in the above sequence for investments in any fund.
This study can be easily understand and help an investor in many ways. Some of the recommendations are below: It is not only fund or company’s goodwill which can be taken into consideration while choosing a portfolio, the market factoreconomies of scales and the trend in a particular sector should also be considered. Today investor is having enough funds to invest in a number of schemes. He is always in search of such statistical tools whic
wer risk. In this regard, Mutual Fund is the best choice.
AMFI. (2013). Retrieved April 20, 2013, from AMFI:http://www.amfiindia.com/showhtml.aspx?page=mfconcept
AMFI. (2013). History of the Indian Mutual Fund Industry. Retrieved April 22, 2013, from AMFI: http://www.amfiindia.com/
Avadhani, V. A. (2009). Investment Management. Mumbai: Himalaya Publishing House.
Babu, G. R. (2005). Financial Services in India. New Delhi: Concept Publishing Company.
30/06/2009 30/06/2010 30/06/2011 30/06/2012
17.8331.44
12.52
-0.5411.75
8.22
26.81
2.98
Return X (%) Return Y (%)
ISSN 2231-4245
MERCE, ECONOMICS & MANAGEMENT Included in the International Serial Directories
101
Sharpe Ratio
The above tables indicate that the value of ‘Sharpe Index’ of some of the Mutual Funds scheme is positive and some are negative. This has happened due to e worst performance. It gives the least performance among
(Sharpe Index) is better than others. UTI Equity Tax Saving Plan (G) has the highest negative ‘Si’ value that is -0.38, ’ among the selected 5 Mutual Fund schemes in India. So according to the Sharpe Index,
HDFC Long Term Advantage (G) is the most preferred Mutual Fund scheme among these. So an investor is advised to go for this fund to select it in his portfolio. After this second choice, may be Canara Robeco Equity Tax Saver (G) and then Franklin India Tax Shield (G) Mutual Fund and so on.
five different schemes under ELSS category from best to worst. One can choose the
better Mutual Fund scheme for investment. So an investor is advised to choose the best performing Mutual Funds schemes in his portfolio for better profits and
day, Mutual Funds are most popular and safe parameter for an investor to invest. Keeping the present and future aspects regarding enough to an investor for long period. The Sharpe Index model is easily understood
From the study we find that; rming well as the fund having low ’Si’ value performs
’ performs comparatively well. Whereas among the 5(five) schemes UTI Equity Tax Saving Plan has the lowest Sharpe’s. Moreover, in terms of their returns. From the Standard deviation of various scheme, we found that HDFC Long Term
Advantage Fund has the maximum standard deviation(SD) it means that it is having highest volatility in returns therefore it is more risky but as well as profitable
because it gives the highest returns. So an investors shouldn’t consider only the returns before investing any Mutual Fund scheme rather he should consider the
performing and ranked at 1(one) in Sharpe’s Index where as UTI Equity Tax performing and ranked at last i.e.at 5(five).In between these two scheme , Canara Robeco Equity Tax Saver(G), Franklin India Tax
and SBI Magnum Tax Gain Scheme(G) are ranked at no. 2(two),3(three), and 4(four) respectively. It shows the comparative performance of the
It is not only fund or company’s goodwill which can be taken into consideration while choosing a portfolio, the market factors like government policies,
Today investor is having enough funds to invest in a number of schemes. He is always in search of such statistical tools which can provide him maximum
http://www.amfiindia.com/ showhtml.aspx?
30/06/2012
-8.43

VOLUME NO. 3 (2013), ISSUE NO. 12 (DECEMBER) ISSN 2231-4245
INTERNATIONAL JOURNAL OF RESEARCH IN COMMERCE, ECONOMICS & MANAGEMENT A Monthly Double-Blind Peer Reviewed (Refereed/Juried) Open Access International e-Journal - Included in the International Serial Directories
http://ijrcm.org.in/
102
5. BlackRock Investments. (n.d.). A Guide to Mutual Fund Investing. Retrieved February 25, 2013, from BlackRock:http://www2.blackrock.com/us/individual-investors/insight-education/investingbasics/guide-to-mutual-fund-investing
6. D.Agarwal. (2009). A Comparative Study of Equity Based Mutual Fund of Reliane and HDFC. 7. D.Agarwal. (2006). Measuring performance of Indian Mutual Funds. Prabandhan , 179-185. 8. Dhume, P. S., & Ramesh, B. (2011). Performance Analysis of Indian Mutual Funds with Special Reference to Sector Funds. The Indian Journal of Commerce ,
64 (4), 48-60. 9. Elite. (n.d.). ELSS - An ideal instrument for tax saving. Retrieved June 1, 2013, from moneycontrol.com: http://www.moneycontrol.com/
master_your_money/stocks_news_consumption.php?autono=814106
10. Gupta, S. K., Agarwal, N., & Gupta, N. (2009). Financial Market Operations (B.Com Edition ed.). New Delhi: Kalyani Publishers. 11. Khan, M. Y., & Jain, P. K. (2009). Management Accounting and Financial Analysis. New Delhi: Tata McGraw-Hill.
12. Kiran, R., & Walia, N. (2009). An Analysis of Investor's Risk Perception towards Mutual Funds Services. International Journal of Business Management, 4 (5), 106-120.
13. Kothari, C. (1985). Research Methodology- Methods and Techniques. New Delhi: Wiley Eastern Limited.
14. Kundu, A. (2009). Stock Selection Performance of Mutual Fund Managers in India: An Empirical Study. Journal of Business and Economin Issues, 1 (1), 59-73.
15. Machiraju, H. R. (2007). Indian Financial System. Mumbai: Vikas Publishing House Pvt. Ltd.
16. Moneycontrol. (2013, March 30). Canara Robeco Equity Tax Saver (G). Retrieved May 14, 2013, from Moneycontrol Website: http://www.money control.com/mutual-funds/nav/canararobecoequitytaxsaverg/MCA152
17. Moneycontrol. (2013, March 30). Franklin India Tax Shield (G). Retrieved May 11, 2013, from Moneycontrol Website: http://www.moneycontrol.com/ mutual-funds/nav/franklin-india-tax-shield/MKP007
18. Moneycontrol. (2013, March 30). HDFC Long Term Advantage Fund (G). Retrieved May 14, 2013, from Moneycontrol Website: http://www.moneyco
ntrol.com/ mutual-funds/nav/hdfclongtermadvantagefundg/MHD009 19. Moneycontrol. (2013, March 30). SBI Magnum Tax Gain Scheme - Direct Plan (G). Retrieved May 14, 2013, from Moneycontrol Website: http://www.
moneyc ontrol.com/ mutual-funds/nav/sbimagnumtaxgainschemedirectplang/MSB499
20. moneycontrol. (2013, March 30). UTI Equity Tax Savings Plan (G) . Retrieved May 12, 2013, from Moneycontrol Website: http://www.moneycontrol.com/ mutual-funds/nav/utiequitytaxsavingsplang/MUT025
21. Padmaja, R. (2013). A Study of Consumer Behavior towards Mutual Funds with special reference to ICICI Prudential Mutual Funds, Vijaywada. International Journal of Management Research and Business Strategy , 2 (2).
22. S.Guha. (2008). Performance of Indian Equity Mutual Funds vis-s-vis their Style Benchmarks. The ICFAI Journal of Applied Finance , 49-81.
23. S.P.Madhumati. (2005). Characteristics & Performance evaluation of Indian Mutual Funds in India. 9th Indian Institute of Capital Market Conference . 24. SBI. (2013). SBI Mutual Fund. Retrieved April 26, 2013, from SBI Mutual Fund: http://www.sbimf.com/Financial_Planning/Save_Tax.aspx
25. SEBI. (n.d.). SECURITIES AND EXCHANGE BOARD OF INDIA. Retrieved April 25, 2013, from SECURITIES AND EXCHANGE BOARD OF INDIA: http://www.sebi.gov.in/faq/mf_faq.html
26. Tripathy, N. P. (2010). Mutual Funds in India. New Delhi: FB Excel Books.
27. Sapar, Narayan Rao and Madava, Ravindran, Performance Evaluation of Indian Mutual Funds. Available 28. at SSRN: http://ssrn.com/abstract=433100 or http://dx.doi.org/10.2139/ssrn.433100 29. Rao, D. N., Investment Styles and Performance of Equity Mutual Funds in India (August 6, 2006).Available at SSRN: http://ssrn.com/abstract=922595
orhttp://dx.doi.org/10.2139/ssrn.922595 30. Selvam, Murugesan and Palanisamy, Bhuvaneswari, Analysis of Risk and Return Relationship of Indian
31. Equity (Dividend) Mutual Fund Schemes (2011). Available at SSRN: http://ssrn.com/abstract=1862214

VOLUME NO. 3 (2013), ISSUE NO. 12 (DECEMBER) ISSN 2231-4245
INTERNATIONAL JOURNAL OF RESEARCH IN COMMERCE, ECONOMICS & MANAGEMENT A Monthly Double-Blind Peer Reviewed (Refereed/Juried) Open Access International e-Journal - Included in the International Serial Directories
http://ijrcm.org.in/
103
AN ANALYSIS OF CASE STUDY PROPRIETORSHIP AND SATURATION (CASE STUDY SOURCE FROM ‘DHRUVA INSTITUTE OF MANAGEMENT HYDERABAD INDIA’: INTERNATIONAL CASE STUDY
COMPETITION, AUTHOR: DR.JAGADEESHA.M)
ESAYAS DEGAGO
LECTUER
JIGJIGA UNIVERSITY
ETHIOPIA
TESFAYE HAILU
STUDENT
DILLA UNIVERSITY
ETHIOPIA
ABSTRACT
This study of proprietorship and saturation in case Chandrika soaps and Nirma aware us how much it is perilous doing business recklessly. With those firms
transparency is absolutely unimaginable. The proprietors of the businesses they are utterly ignorant about organizational integrity which is highly important to
have the employees’ commitment. The proprietors are hiring their relatives and kith’s and kin’s instead of acquiring knowledgeable and professional worker from
the outside labor market. Focusing on personal benefit becomes a blurry do not to see at potential and existing customer interest and define their organization
from customer point of view. This leads them to saturation and finally winding up of the business. Poor integrity, rewards and motivations catalyzes the failure of
both Chandrika soaps and Nirma. In contrary, the study acquaints us how much the sales person is eager challenging tasks even if the conditions are unpleasant.
KEYWORDS
Integrity, Reward, Motivation.
INTRODUCTION
s we understood from the case the moral, willingness, and aspiration from the sides of the employee is always high to do the work effectively and use his
efforts without any reservation if the organization is in a position to motivate him. In addition the sales person is deprived of what he deserves. And the organization is highly maintained by relatives of the proprietor than their merits to the position, and it is simply possible to observe the organization have
no departments which is assigned with specific duty to perform or organizational structure is neglected by the company which gives every body responsibility for his action and take care of the work as part of his activity. This gives the chance for embezzlement, fraud and bribes. Managers or we can say proprietors or the relatives are not in a position to accept the recommendation made by experts to improve the market share and increase sales level of the organization. Rather
they concentrate for their own personal benefit and they are highly confident on their personal temporary wealth. Why we said temporary wealth, anything can disappear if it is not managed properly.
LITERATURE REVIEW In this business environment, satisfy the customer is a sacred cow. Even most retailers are doing that. Sales managers and store managers everywhere are imploring their people to put the customer first. But they’re only playing catch up. In the new world of commerce, satisfying is only the beginning ... So don’t satisfy customers, everyone does that. Surprise them. Give them something they don’t expect.’’
Sales, and selling and the sales force, is inherently a part of the marketing mix. It must be deployed appropriately if it is to play its part and have a significant effect on the whole. That means that those people undertaking the sales task must be professional: able to communicate persuasively and create the necessary relationship with customers. It also means that the efforts of sales staff must be properly coordinated and therefore well managed: sales management is
therefore important, and can directly influence results (Forsyth, 2002). Motivation accounts for the level and persistence of a person’s effort expended at work (John R. Schermerhorn, 2010).
Although it is important that employees be genuinely interested and motivated to perform well, it is equally important that organizations reward people for their performance. Increasing levels of intrinsic motivation involves either increasing employees’ level of competence that they can perform tasks, enhancing their perceptions of control over their behavior, or providing challenges in the work environment (Luthans, 2011).
Reward refers to all forms of benefits employees receive as part of an employment relationship and it is the center-piece of the employment relationship. The reward must be competitive to encourage membership of the organization. In other words, it must attract and retain qualified and competent people to the organization. Rewards that are perceived by prospective members to be inadequate or inequitable will make it difficult for the organization to attract the types
of people necessary for success (Gold, 2000). Importance of merit or knowledge and skill to work: - Knowledge, Skills and Abilities are the special qualifications and personal attributes that you need to have
for a particular job. These are the unique requirements that the hiring agency wants to find in the person selected to fill a particular job. A primary purpose of KSAs is to measure those qualities that will set one candidate apart from the others. Chandrika” soaps should have to avoid using of impartiality for his relatives and give emphasis for those peoples who have the required qualities like the sales person they lost to the competitor.
Motivation:-Motivation is important for business because it's the strong, driving force that can mean the difference between failure and success in business. Motivation plays a critical role in achieving goals and business objectives and is equally as important for companies that work in a team-based environment or in
a workplace comprised of workers who work independently. Motivation has become increasingly important for organizations and companies of all sizes that want to reach their organizational objectives in a competitive marketplace. Top performers of an organization consistently provide high-quality work; maintain a high level of productivity and overcome obstacles or challenges. Helping all employees maintain a high level of motivation can help keep employees committed
to working hard and contributing as much value as possible to the organization. Motivation can be increased with incentives, feedback, reward programs, empowerment and ensuring that the workplace meets basic needs and requirements for each employee.
MOTIVATION IS IMPORTANT TO A BUSINESS AS: 1. The more motivated the employees are, the more empowered the team is. 2. The more is the team work and individual employee contribution, more profitable and successful is the business. 3. During period of amendments, there will be more adaptability and creativity.
4. Motivation will lead to an optimistic and challenging attitude at work place.
A
VOLUME NO. 3 (2013), ISSUE NO. 12 (DECEMBER) ISSN 2231-4245
INTERNATIONAL JOURNAL OF RESEARCH IN COMMERCE, ECONOMICS & MANAGEMENT A Monthly Double-Blind Peer Reviewed (Refereed/Juried) Open Access International e-Journal - Included in the International Serial Directories
http://ijrcm.org.in/
104
Integrity:-Integrity is the inner sense of "wholeness" deriving from qualities such as honesty and consistency of character. As such, one may judge that others "have integrity" to the extent that they act according to the values, beliefs and principles they claim to hold.
Integrity is being honest and doing what is right no matter the circumstances. Integrity requires you to make the right choice, even when you may not receive personal gain from the outcome, and to put your own personal agenda aside for the greater good of the organization and the people. Integrity is essential for lasting success and provides a work environment with three key qualities: stability, safety and reference.
OBJECTIVES OF THE STUDY The main objective of this study is to build organizational integration that help to get the maximum effort of employee towards organizational objective.in top of that the study helps to accustom reward and motivation as organizational success tool. Finally, the study highlights how the organization gets benefited if they
give much more emphasis to the importance of knowledge based business process.
ANALYSIS AND DISCUSSION
For the failure of Chandrika soaps has accounted different factors. First, they did not give as much emphasis to the importance of skill, knowledge and experience rather they prefer to do things instinctually. Second, they are absolutely ignored the importance of organizational integrity. Again they are not
conscious of retaining skilled person and how much it costs losing them, and they didn’t considered the relationship between productivity and employee motivation, retaining, and other factors. The issue to be solved must get an immediate solution, but this is not the case in Chandrika soaps that we have seen
the response given to sales person resignation issue. The consequences of getting out of for the proprietors of Chandrika soaps was the cumulative effects of the above mentioned problems and their ignorance to rectify them immediately. The acquirer of Chandrika soaps Wipro 2002 has taken remedy for his newly acquired business. Wipro 2002 has implemented the advice given to Chandrika soaps earlier by sales person of the business and get succeeded. The sales person
left an organization or company and hired by other competitive firm or well-known organizations like Nirma. The sales person encountered the same thing in Nirma. Whatever objective and strategy you have it is meaningless without effective implementation and responsible body for the activities. We have seen what is happening in the organization, anybody/manager can deal with distributors if the deal have mutual
personal benefit. The management is highly impartial to their friends and families. They stood only for their own personal benefit and there is no as much feasibility study concerning where to distribute and who shall distribute. The lack of feasibility study and greediness of colleting the costs back and ignoring rural
or retail outlets costs them huge sum of money later. They considered whole sale as the major source of their income, but this is not reality because wholesale lacks accessibility/reachability and flexibility. However micro distributers have a merit of the accessibility and flexibility in top of that they are source of information for new design and product development. It is possible for micro distributers to have a great customer relationship management system, Seamless point-of-sale registration & data capture, Regular, contextual, passive marketing which indirectly benefits the organization. This may lead us to ask how it benefits the organization. Simply they are not a maker of the product rather they buy a product and make available it to the final consumer. The increment of sale increases the production and sales level of the producing company. Making satisfy and keeping micro distributers means having a great market share. But
Nirma is concentrating on whole sale which brings temporary backups of money gradually leads to failure due to loosing of customer. Both firms Nirma as well as Chandrika soaps are failed in transmitting a sense of honesty and integrity to each member of the organization. Character and
integrity in a leader is not really something you can describe; it is something that is demonstrated. It shows in everything the leader says and does.
CONCLUSION Companies with inscrutable financials and complex business structures are riskier and less valuable investments. No transparency/responsibility is less information which means less certainty for investors. Lack of transparency/responsibility can mean nasty surprises to come. Understanding your audience (customer and potential customer) brings invaluable success to the organization and outmaneuvers competitors. The organization should have a capability to manage resources, such as employees to effectively gain an advantage over competitors. The company's organizational capabilities
must focus on the business's ability to meet customer demand not personal gain. The responsiveness of an organization is its ability to change in response to customer demand. Knowledge and skilled employees are organizational capabilities that provide a company with the ability to respond to customer demands and remain flexible to changes in the business environment. Managing a talented
workforce is an organizational capability that provides a competitive advantage in the marketplace Good customer relationships ensure the continued growth and competitiveness in the market. The relationship starts having the right paths or distributing
goods with effective and sound channels of distribution that ensure flexibility and accessibility. The relationship between the organization and its customers is an organizational capability that affects sales, reputation and loyalty for future business.
REFERENCES 1. Forsyth, P. (2002). Sales Management. United Kingdom: Capstone Publishing (a Wiley company).
2. Gold, J. B. (2000). Human Resource Management: Theory and Practice. London: MACMILLAN PRESS LTD. 3. Jagadeesha M. international case study competition, proprietorship and saturation. (2012), pp 1-3
4. John R. Schermerhorn, J. J.-B. (2010). Organizational Behavior. New Jersey: John Wiley & Sons, Inc. 5. Luthans, F. (2011). Organizational Behavior: An Evidence-Based Approach. McGraw-Hill/Irwin. 6. Charles Ray/ helium.com created March 03, 2009 accessed December 22, 2012
7. eHow.com/why is motivation important? 8. Luanne Kelchner/smallbusiness.chron.com

VOLUME NO. 3 (2013), ISSUE NO. 12 (DECEMBER) ISSN 2231-4245
INTERNATIONAL JOURNAL OF RESEARCH IN COMMERCE, ECONOMICS & MANAGEMENT A Monthly Double-Blind Peer Reviewed (Refereed/Juried) Open Access International e-Journal - Included in the International Serial Directories
http://ijrcm.org.in/
105
EXPLORING THE FACTORS LEADING TOWARDS STUDENT DEVELOPMENT: A STUDY OF UNIVERSITY STUDENTS OF PAKISTAN
HINA AFFANDI
LECTURER
FOUNDATION UNIVERSITY
RAWALPINDI CAMPUS
RAWALPINDI
NAHEED RAZA
INSTRUCTOR
ARMED FORCE POST GRADUATE MEDICAL INSTITUTE
RAWALPINDI
ANUM AFFANDI
ALUMNI
ARMY PUBLIC COLLEGE OF MANAGEMENT & SCIENCE
RAWALPINDI
ABSTRACT
Student development period is the period of developing students mentally and morally so that they are able to better think, decide and strengthen their character
and abilities. Pakistan is lacking in providing quality and justified education. This research will explore the factors that are responsible for the development of
students and specify the hidden forces that affect the student development in a negative way. The main intention of this study is to find out the relationship
among reward and recognition, teacher training and research and development and student development. For this purpose two institutes were selected for the
analysis. The judgment of this study are that teachers in Pakistan are getting training and reward and recognition but students are not developing due to the fact
that teachers are not taking their job responsibility properly and problem in recruiting them. Research and development have positive impact on the student
development because while performing research students can develop his/her knowledge skill and abilities as well as have a sense of social responsibility.
KEYWORDS Student development, justified education, quality education.
INTRODUCTION lobalization has led to the integration of different countries of the world and these countries are now competing with each other globally in each and every aspect. So, accordingly we also have to make our vision broader with these changing circumstances. One has to introduce and ensure good quality
work practices in order to be productive in any field and also has to adapt to changes occurring in external and internal environment. Every country has some resources but what matters is how effectively and efficiently a country is making the use of the resources available to perform its different operations. Pakistan is also confronted with a number of challenges at international level in its different sectors. Likewise, if being specific to our research area we can see
that the educational sector of Pakistan is facing substantial challenges in todays globalize world. The students are the most valuable assets of any country because they contribute to a larger extent in maintaining a good future of a country and they represent the standard of their country’s educational practices when interacting with people at international level.
To survive in today’s world basic education is necessary but now along with survival we have to strive to compete internationally. So instead of providing only the basic education in an ordinary manner major emphasis should be on the development of students in such a creative and constructive way to make them a
productive asset for a country in order to ensure future prosperity. So effectiveness should be introduced in providing quality education for grooming students well in all aspects. In our research we are focusing mainly the educational and learning standards that are provided at university level in Pakistan and how we can improve them so that they will lead to better development of students. Unfortunately in Pakistan education is not being given the desired attention. So we
have to explore the factors and understand the need for well groomed students because we can not deny the fact that they are the future of our country. Student development involves developing them in all areas such as their academic development, personal development, educational satisfaction and career development. If all these factors are up to the mark they will ultimately result in development of students. Now there are further different factors contributing
to this regard. These variables are directly linked with the development of students. These factors may include reward and recognition, research and development and teacher training. They are positively related for the development of students.
LITERATURE REVIEW STUDENT DEVELOPMENT (DEPENDENT VARIABLE) 'Winston, Ender, and Miller (1982) defined student development as: "a systematic process based on close student-advisor relationship intended to aid students in achieving educational, career, and personal goals through the utilization of the full range of institutional and community resources. It both stimulates and
supports students in their quest for an enriched quality of life. It reflects the institution's mission of total student development and is most likely to be realized when the academic affairs and student affairs divisions collaborate in its implementation."
The effective scales regarding development of student can be in form of student academic satisfaction, their academic development, career development of students, personal development of students and finally professional development of students when they are in their professional fields. These all dimensions comprise effective development of students in all areas. But according to Komives, Woodard, & assoc (1996) student development comprises of:
1. Developing Competence 2. Managing Emotions
3. Moving Through Autonomy Toward Interdependence 4. Developing Mature Interpersonal Relationships 5. Establishing Identity
6. Developing Purpose 7. Developing Integrity
G
VOLUME NO. 3 (2013), ISSUE NO. 12 (DECEMBER) ISSN 2231-4245
INTERNATIONAL JOURNAL OF RESEARCH IN COMMERCE, ECONOMICS & MANAGEMENT A Monthly Double-Blind Peer Reviewed (Refereed/Juried) Open Access International e-Journal - Included in the International Serial Directories
http://ijrcm.org.in/
106
Student development has become the main focus of attention as it has multiple numbers of stakeholders like faculty, parents and community members and student affairs units are becoming the primary focus for these stakeholders. Where there are agreed set of student development values these student
development activities are doing quite well and playing an important role in providing valuable, pioneering and innovative services whereas absent agreed upon these vales values will induce greater risk due to improper and irregular planning for managing internal and external pressures ANONYMOUS (2004).
Different authors have made attempts to develop educational model TERRY, HARB, HECKER AND WILDING (2001) presented the comprehensive model which
shows that an excellent opportunity can be provided in developing the students by giving them a creative improved and flexible environment of learning and this will help the institutions in achieving desired results. Incorporating creativity in providing education for development of students will induce quality in learning and will be helpful in providing conducive and flexible
environment of opportunities. REWARD AND RECOGNITION (INDEPENDENT VARIABLE) Liz Ostendorf, an APQC KM specialist, defines rewards and recognition as “These are terms that are tossed around a lot, and we need to be clear on what we’re talking about and that we’re talking about this from the KM perspective. Knowledge management requires a unique view of rewards and recognition.” Intel Sr. Mgr defined Rewards and recognitions as “Rewards and recognitions are fine; but they should be focused on showing people that we truly appreciate
their efforts.” These definitions show that through rewards and recognitions performance a person in charge of work can be increased. Creative use of these rewards reinforces constructive behaviors and improves performance of faculty when they are rewarded properly.
Rewards and teachers commitment to their work are directly related and as rewards increases commitment will also increase and so is the performance and consequently quality of the work will improve through the use of more creative and innovative methods that will be adopted when teachers are more dedicated
towards their jobs and responsibilities. There exists a positive relationship between faculty adoption of innovation and extrinsic rewards and motivation. (Nancy
D. Albers-Miller, Robert D. Straughan, Penelope J. Prenshaw, 2001). INSTRUCTOR TRAINING (INDEPENDENT VARIABLE) John Dewey and John J. McDermott define teachers as, “the teacher is engaged, not simply in the training of individuals, but in the formation of the proper social life. Every teacher should realize the dignity of his calling; that he is a social servant set apart for the maintenance of proper social order and the securing of the right social growth”.
Raymond Stone defined training as, “the activities that teach employees how to better perform their present job”. Training of teachers enhances their skills and abilities and need for training of teachers has become obvious as the forces for change in the field of teacher
education are rising drastically as part of systemic education restructuring initiatives in a wide-ranging of economically developed and developing nations (Charles A. Peck, Chrysan Gallucci, Tine Sloan, Ann Lippincott 2008). The teacher education program shared professional discourse adds to maximize the complication of the teachers' thinking about their teaching and recommend that as they learn to express their actual ways of thinking in the common discourse.
As a result of this teachers gain better control over their classroom practice and better able to shape it to their own ends (Donald Freeman, 1991). Richard J. Shavelson and Paula Stern in 1981 evaluate the research expansion prepared on teachers' instructive thoughts, judgments, and decisions over the past
decade and recognize areas of substantive and methodological research required to progress teaching practice. (Richard J. Shavelson, Paula Stern, 1981). By aligning content standards with evaluation and meaningful edification, the teachers developed a strength of knowledge regarding content standards, enhanced their capability to devise evaluation, learned to better link evaluation with instruction, and intended for involvement for students who persistent to struggle with
reading and writing( Nancy Frey, Douglas Fisher, 2009). Therefore instructor training is crucial for student development. If instructor is not trained than student development always exhausted. RESEARCH AND DEVELOPMENT (INDEPENDENT VARIABLE) From BNET Business Dictionary, research and development is defined as, “The pursuit of new knowledge and ideas and the application of that knowledge to exploit new opportunities to the commercial advantage of a business”.
The education world and work world are dependent on each other and the assimilation of formal and informal learning is crucial requirement for developing the expertise required in reply to the changes scheduled in working life (Päivi Tynjälä 2007). The standard of research consequence improve the significance of cooperative
learning methods which is supportive in escalating student achievement,
positive race relations, shared concern
among students, student self-
esteem, and other constructive outcomes. (Robert E. Slavin, 1980). Cognitive development is dependent on a multifaceted set of individual differences. Cultural and social variables profoundly impact students benefit from the education they are receiving. Therefore quality education is a virtual concept, and perception differs from student to students, even in the similar classroom that
depends on a multiple variables including background, personality and motivation. (Todd Lubart 2004). Students during research analyze from different sources. After investigating the data from the surveys and the interviews of the students consider to their
exploit of different source form. There are three steps of students' information needs, and associate them to the expanding the students' research. Most of the students are primarily unfamiliar with many source types and increasing understanding helps to contribute to the students' development of information search expertise (Nancy Law; Samuel Kai-Wah Chu 2007).
DIMENSIONS AND ANTECEDENTS OF VIRTUAL LEARNING ENVIRONMENTS EFFECTIVENESS (Gabriele Piccoll, Rami Ahmad, Blake Ives 2001)
Gabriele Piccoll, Rami Ahmad, and Blake Ives in 2001 presented a broad model “Dimensions and Antecedents of Virtual Learning Environments”, and describes
that effectiveness is the result of sum of human dimension and design dimension. Hence, student development counts many factors which leads students towards critical thinking, personal and professional development. Therefore, research and development is necessary for the development of students. Research and development plays a constructive role in developing student
personality, skills, knowledge and abilities.
METHODOLOGY INTRODUCTION This section speaks to precede the study of factors effecting student development on the university student of Pakistan. It offer details of the research design (sample size, survey, questionnaire source, description of instruments), details regarding the sample, research model and variables (independent variables and dependent variables), hypotheses and response rate, chosen measurement instruments and means of data collection, and data analysis. The key objective of
this chapter is to outline the steps followed in performing the research. OBJECTIVES OF RESEARCH STUDY The extensive purpose of the present study is to explore the relationship between the research and development, teacher training and reward and recognition
on student development. RESEARCH DESIGN Typically in primary researches, survey is considered as effective practice. Our research study is a relational for exploring link among the research and development, teacher training and reward and recognition on student development. For the concrete research work, information was collected from the students and teachers of two institutes. Their students and teachers were requested to respond to all questions up to the best of their knowledge with the
indication of their feelings. SURVEY A systematic and objective approach was practiced. The target was that the result should be more or less productive conceptually by an equally qualified
researcher. The research environment was studied as it persists without distressing.

VOLUME NO. 3 (2013), ISSUE NO. 12 (DECEMBER) ISSN 2231-4245
INTERNATIONAL JOURNAL OF RESEARCH IN COMMERCE, ECONOMICS & MANAGEMENT A Monthly Double-Blind Peer Reviewed (Refereed/Juried) Open Access International e-Journal - Included in the International Serial Directories
http://ijrcm.org.in/
107
SAMPLE SIZE A total detail of sampling technique was used to select 50 teachers and 150 students. Education sector was selected for the sample because the higher
education has been improved in Pakistan in last few years and many students are getting professional education. POPULATION This research was conducted on Education sector (two educational institutes) in Pakistan. Therefore the target population was teachers and students.
QUESTIONNAIRE ADOPTION Primary data was collected with the help of two different questionnaires. The first questionnaire was specifically designed to appraise the applicability of Research and Development activities within the institute and the extent to which student perceives their individual development during academic time span.
The questionnaire was supported with demographic sections to know the age, gender, tenure, employment, education etc. this section was based on tick-boxes while the other section was based on five point likert scale ranging from from 1. Strongly disagree, to 5. Strongly agree, developed by Renis Likert to enable
respondents to answer questions according to the intensity of their attitude. Since teachers were in better position to apprise about fair reward and recognition policies and training opportunities provided by the institute. Therefore a separate questionnaire was designed for teachers to measure Reward and Recognition as well as Teacher Training. This questionnaire had two sections such as
demographics and the other to measure the construct of Reward and Recognition and Teacher Training. The responses for questions made use of different methods like tick-boxes, circling answers. Demographic section was based on tick-boxes while other section was based on five point likert scale ranging from 1. Strongly disagree, to 5. Strongly agree.
DISTRIBUTION AND RESPONSES 150 copies of the questionnaire (50 for teachers and 100 for students) were given to each institution for making the figure 200 for two institutes. 256
questionnaires (50 for teachers and 205 for students) were received in response for final analysis. Details are as under:
Institution Questionnaire’s Distributed Responses Received %age Response
University Of Health Sciences, Lahore 150 100 66%
Army Public College Of Management And Sciences, RWP 150 105 70%
MULTIPLE REGRESSION ANALYSIS The common purpose of Multiple Regression Analysis (the term was first used by Pearson, 1908) is to find out more about the relationship among a number of independent and a dependent. Reality is composite. Often there may be some possible reason connected with a problem; and similarly there may be several
factors essential for a solution. Ordinary least squares linear regression is the mainly general used type of regression for forecasting the value of one dependent variable from the value of one independent variable. It is also broadly used for predicting the value of one dependent variable from the values of two or more independent variables. When there are two or more independent variables, it is called multiple regression analysis.
VARIABLES (INDEPENDENT VARIABLES AND DEPENDENT VARIABLES) As described earlier, the dependent variable is student development and is of key interest. Three independent variables are Reward and Recognition, teacher
Training, and Research and Development HYPOTHESES Exploratory research was used to establish Hypotheses which will be tested for drawing definite conclusion. These conclusions will be tested for validity to lay
the foundation for decision making. Conclusive research will be used for testing of hypotheses generated by exploratory research. Descriptive research was used and not the experimental one. RESEARCH MODEL The diagram below shows theoretical research model for three independent variables and one dependent variable: H1: Reward and recognition has a positive relationship with the student development.
H2: Research and development has constructive role in the student development. H3: Teacher training plays a positive and productive role in the student development. Unit of analysis is an individual student and individual teacher because we wish to know how the responds to instrument, the questionnaire particularly adopted
to achieve the objectives of the study.
The data collection 100% covers the idea to be examined. Additionally, the process was closely administered. Precise wording were downloaded from the Internet site to avoid incongruity in the formulation of the questionnaire. Check responses pattern was embraced so that the respondents feel easy to respond.
Primary data collected was more perfect than secondary data.
ANALYSIS OF THE COLLECTED DATA First section of the Questionnaire is composed of demographic data of respondents and it has 4 questions for students and 7 questions for teachers.
Statistical information in numerous areas was observed. First, mean differences in demographic data were analyzed. Second, descriptive statistics were used to examine the means scores, standard deviation, and other information. A third additional analysis was conducted to determine if there were any statistically significant differences in the mean scores. These analyses included independent sample Pearson correlations, Regression, t-tests, etc.
Following Statistical tools are used for data analysis: MEANS AND STANDARD DEVIATIONS The descriptive statistics talk about Means and Standard Deviations for variables. While using Likert scale questions, it is suitable to go for means, since the number that is coded can provide us a sense for which path the average answer is. The standard deviation is also essential as it give us a suggestion of the average distance from the mean. A low standard deviation would mean that mainly observations gather around the mean. A high standard deviation would
Reward and recognition
Research and development
Teacher training
Student development
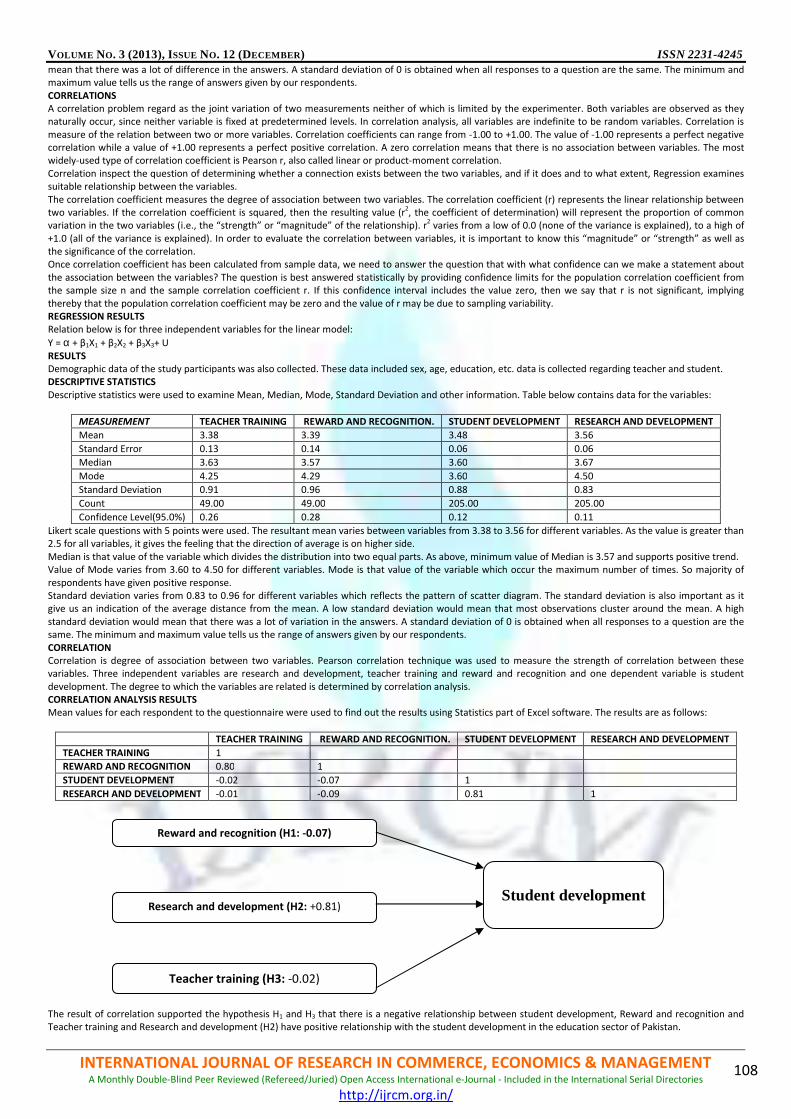
VOLUME NO. 3 (2013), ISSUE NO. 12 (DECEMBER) ISSN 2231-4245
INTERNATIONAL JOURNAL OF RESEARCH IN COMMERCE, ECONOMICS & MANAGEMENT A Monthly Double-Blind Peer Reviewed (Refereed/Juried) Open Access International e-Journal - Included in the International Serial Directories
http://ijrcm.org.in/
108
mean that there was a lot of difference in the answers. A standard deviation of 0 is obtained when all responses to a question are the same. The minimum and maximum value tells us the range of answers given by our respondents.
CORRELATIONS A correlation problem regard as the joint variation of two measurements neither of which is limited by the experimenter. Both variables are observed as they naturally occur, since neither variable is fixed at predetermined levels. In correlation analysis, all variables are indefinite to be random variables. Correlation is
measure of the relation between two or more variables. Correlation coefficients can range from -1.00 to +1.00. The value of -1.00 represents a perfect negative correlation while a value of +1.00 represents a perfect positive correlation. A zero correlation means that there is no association between variables. The most widely-used type of correlation coefficient is Pearson r, also called linear or product-moment correlation.
Correlation inspect the question of determining whether a connection exists between the two variables, and if it does and to what extent, Regression examines suitable relationship between the variables.
The correlation coefficient measures the degree of association between two variables. The correlation coefficient (r) represents the linear relationship between two variables. If the correlation coefficient is squared, then the resulting value (r
2, the coefficient of determination) will represent the proportion of common
variation in the two variables (i.e., the “strength” or “magnitude” of the relationship). r2 varies from a low of 0.0 (none of the variance is explained), to a high of
+1.0 (all of the variance is explained). In order to evaluate the correlation between variables, it is important to know this “magnitude” or “strength” as well as the significance of the correlation. Once correlation coefficient has been calculated from sample data, we need to answer the question that with what confidence can we make a statement about
the association between the variables? The question is best answered statistically by providing confidence limits for the population correlation coefficient from the sample size n and the sample correlation coefficient r. If this confidence interval includes the value zero, then we say that r is not significant, implying
thereby that the population correlation coefficient may be zero and the value of r may be due to sampling variability. REGRESSION RESULTS Relation below is for three independent variables for the linear model:
Y = α + β1X1 + β2X2 + β3X3+ U
RESULTS Demographic data of the study participants was also collected. These data included sex, age, education, etc. data is collected regarding teacher and student. DESCRIPTIVE STATISTICS Descriptive statistics were used to examine Mean, Median, Mode, Standard Deviation and other information. Table below contains data for the variables:
MEASUREMENT TEACHER TRAINING REWARD AND RECOGNITION. STUDENT DEVELOPMENT RESEARCH AND DEVELOPMENT
Mean 3.38 3.39 3.48 3.56
Standard Error 0.13 0.14 0.06 0.06
Median 3.63 3.57 3.60 3.67
Mode 4.25 4.29 3.60 4.50
Standard Deviation 0.91 0.96 0.88 0.83
Count 49.00 49.00 205.00 205.00
Confidence Level(95.0%) 0.26 0.28 0.12 0.11
Likert scale questions with 5 points were used. The resultant mean varies between variables from 3.38 to 3.56 for different variables. As the value is greater than 2.5 for all variables, it gives the feeling that the direction of average is on higher side.
Median is that value of the variable which divides the distribution into two equal parts. As above, minimum value of Median is 3.57 and supports positive trend. Value of Mode varies from 3.60 to 4.50 for different variables. Mode is that value of the variable which occur the maximum number of times. So majority of
respondents have given positive response. Standard deviation varies from 0.83 to 0.96 for different variables which reflects the pattern of scatter diagram. The standard deviation is also important as it give us an indication of the average distance from the mean. A low standard deviation would mean that most observations cluster around the mean. A high
standard deviation would mean that there was a lot of variation in the answers. A standard deviation of 0 is obtained when all responses to a question are the same. The minimum and maximum value tells us the range of answers given by our respondents.
CORRELATION Correlation is degree of association between two variables. Pearson correlation technique was used to measure the strength of correlation between these variables. Three independent variables are research and development, teacher training and reward and recognition and one dependent variable is student
development. The degree to which the variables are related is determined by correlation analysis. CORRELATION ANALYSIS RESULTS Mean values for each respondent to the questionnaire were used to find out the results using Statistics part of Excel software. The results are as follows:
TEACHER TRAINING REWARD AND RECOGNITION. STUDENT DEVELOPMENT RESEARCH AND DEVELOPMENT
TEACHER TRAINING 1
REWARD AND RECOGNITION 0.80 1
STUDENT DEVELOPMENT -0.02 -0.07 1
RESEARCH AND DEVELOPMENT -0.01 -0.09 0.81 1
The result of correlation supported the hypothesis H1 and H3 that there is a negative relationship between student development, Reward and recognition and Teacher training and Research and development (H2) have positive relationship with the student development in the education sector of Pakistan.
Reward and recognition (H1: -0.07)
Research and development (H2: +0.81)
Teacher training (H3: -0.02)
Student development
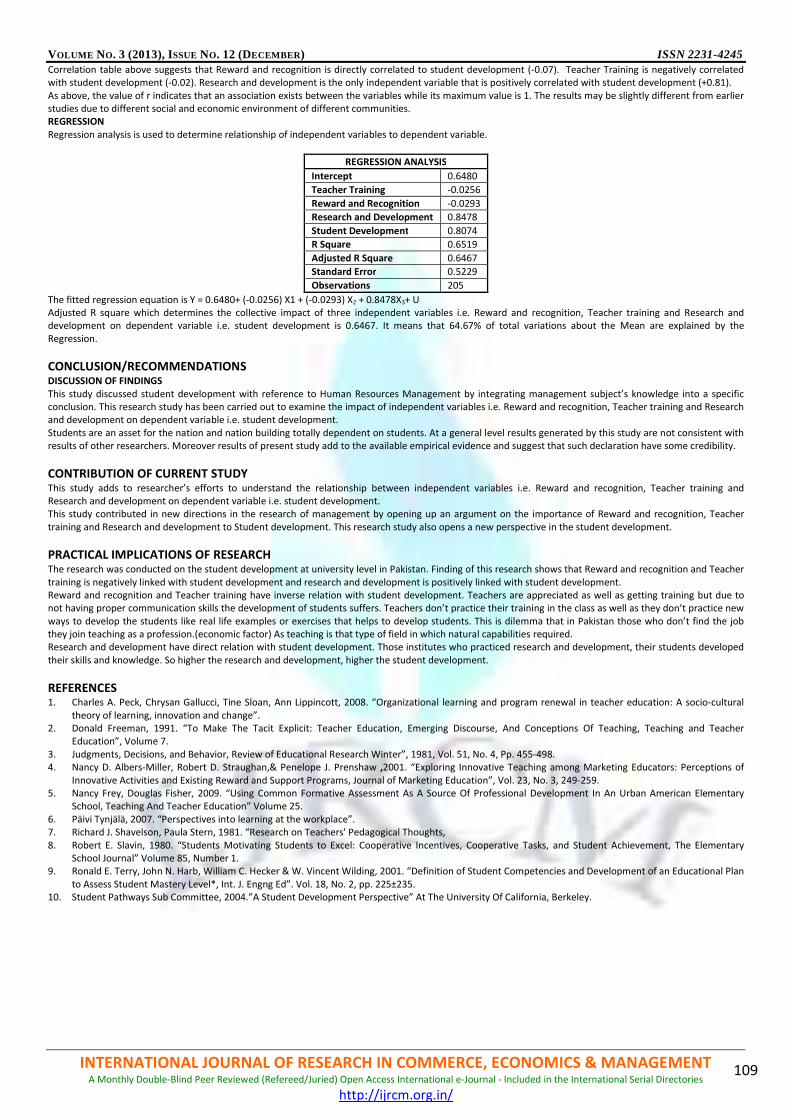
VOLUME NO. 3 (2013), ISSUE NO. 12 (DECEMBER) ISSN 2231-4245
INTERNATIONAL JOURNAL OF RESEARCH IN COMMERCE, ECONOMICS & MANAGEMENT A Monthly Double-Blind Peer Reviewed (Refereed/Juried) Open Access International e-Journal - Included in the International Serial Directories
http://ijrcm.org.in/
109
Correlation table above suggests that Reward and recognition is directly correlated to student development (-0.07). Teacher Training is negatively correlated with student development (-0.02). Research and development is the only independent variable that is positively correlated with student development (+0.81).
As above, the value of r indicates that an association exists between the variables while its maximum value is 1. The results may be slightly different from earlier studies due to different social and economic environment of different communities. REGRESSION Regression analysis is used to determine relationship of independent variables to dependent variable.
REGRESSION ANALYSIS
Intercept 0.6480
Teacher Training -0.0256
Reward and Recognition -0.0293
Research and Development 0.8478
Student Development 0.8074
R Square 0.6519
Adjusted R Square 0.6467
Standard Error 0.5229
Observations 205
The fitted regression equation is Y = 0.6480+ (-0.0256) X1 + (-0.0293) X2 + 0.8478X3+ U Adjusted R square which determines the collective impact of three independent variables i.e. Reward and recognition, Teacher training and Research and development on dependent variable i.e. student development is 0.6467. It means that 64.67% of total variations about the Mean are explained by the
Regression.
CONCLUSION/RECOMMENDATIONS DISCUSSION OF FINDINGS This study discussed student development with reference to Human Resources Management by integrating management subject’s knowledge into a specific conclusion. This research study has been carried out to examine the impact of independent variables i.e. Reward and recognition, Teacher training and Research and development on dependent variable i.e. student development.
Students are an asset for the nation and nation building totally dependent on students. At a general level results generated by this study are not consistent with results of other researchers. Moreover results of present study add to the available empirical evidence and suggest that such declaration have some credibility.
CONTRIBUTION OF CURRENT STUDY This study adds to researcher’s efforts to understand the relationship between independent variables i.e. Reward and recognition, Teacher training and Research and development on dependent variable i.e. student development. This study contributed in new directions in the research of management by opening up an argument on the importance of Reward and recognition, Teacher
training and Research and development to Student development. This research study also opens a new perspective in the student development.
PRACTICAL IMPLICATIONS OF RESEARCH The research was conducted on the student development at university level in Pakistan. Finding of this research shows that Reward and recognition and Teacher
training is negatively linked with student development and research and development is positively linked with student development. Reward and recognition and Teacher training have inverse relation with student development. Teachers are appreciated as well as getting training but due to not having proper communication skills the development of students suffers. Teachers don’t practice their training in the class as well as they don’t practice new
ways to develop the students like real life examples or exercises that helps to develop students. This is dilemma that in Pakistan those who don’t find the job they join teaching as a profession.(economic factor) As teaching is that type of field in which natural capabilities required. Research and development have direct relation with student development. Those institutes who practiced research and development, their students developed
their skills and knowledge. So higher the research and development, higher the student development.
REFERENCES 1. Charles A. Peck, Chrysan Gallucci, Tine Sloan, Ann Lippincott, 2008. “Organizational learning and program renewal in teacher education: A socio-cultural
theory of learning, innovation and change”. 2. Donald Freeman, 1991. “To Make The Tacit Explicit: Teacher Education, Emerging Discourse, And Conceptions Of Teaching, Teaching and Teacher
Education”, Volume 7.
3. Judgments, Decisions, and Behavior, Review of Educational Research Winter”, 1981, Vol. 51, No. 4, Pp. 455-498. 4. Nancy D. Albers-Miller, Robert D. Straughan,& Penelope J. Prenshaw ,2001. “Exploring Innovative Teaching among Marketing Educators: Perceptions of
Innovative Activities and Existing Reward and Support Programs, Journal of Marketing Education”, Vol. 23, No. 3, 249-259. 5. Nancy Frey, Douglas Fisher, 2009. “Using Common Formative Assessment As A Source Of Professional Development In An Urban American Elementary
School, Teaching And Teacher Education” Volume 25.
6. Päivi Tynjälä, 2007. “Perspectives into learning at the workplace”. 7. Richard J. Shavelson, Paula Stern, 1981. “Research on Teachers' Pedagogical Thoughts,
8. Robert E. Slavin, 1980. “Students Motivating Students to Excel: Cooperative Incentives, Cooperative Tasks, and Student Achievement, The Elementary School Journal” Volume 85, Number 1.
9. Ronald E. Terry, John N. Harb, William C. Hecker & W. Vincent Wilding, 2001. “Definition of Student Competencies and Development of an Educational Plan
to Assess Student Mastery Level*, Int. J. Engng Ed”. Vol. 18, No. 2, pp. 225±235. 10. Student Pathways Sub Committee, 2004.”A Student Development Perspective” At The University Of California, Berkeley.

VOLUME NO. 3 (2013), ISSUE NO. 12 (DECEMBER) ISSN 2231-4245
INTERNATIONAL JOURNAL OF RESEARCH IN COMMERCE, ECONOMICS & MANAGEMENT A Monthly Double-Blind Peer Reviewed (Refereed/Juried) Open Access International e-Journal - Included in the International Serial Directories
http://ijrcm.org.in/
110
CUSTOMERS’ PERCEPTION TOWARDS ONLINE ADVERTISEMENT AND ITS IMPACT ON PURCHASE BEHAVIOUR
VIPIN KUMAR
TEACHING ASSOCIATE
DEPARTMENT OF BUSINESS ADMINISTRATION
CHAUDHARY DEVI LAL UNIVERSITY
SIRSA
ABSTRACT
Online advertising is a form of advertising that uses the Internet and World Wide Web in order to deliver marketing messages and attract customers. A major
result of online advertising is information and content that is not limited by geography or time. The emerging area of interactive advertising presents fresh
challenges for advertisers who have hitherto adopted an interruptive strategy.Examples of online advertising include contextual ads on search engine results
pages, banner ads, Rich Media Ads, Social network advertising. The objective of the study is to analyze the customers’ perception toward online advertisement
and its impact on the purchase behavior. For the study primary data have been used that is collected directly from sample respondents through questionnaire by
adopting random sampling, 50 respondents have been taken from the Sirsa district and the data was analyzed by using various statistical techniques such as
percentage and frequency and it is concluded that online advertising is rapidly expanding its wings across the globe and India is no exception to this phenomenon
because majority of the respondents in this study have good perception and positive attitude towards online advertisement and according to them it has greater
impact on purchase behaviour because majority of the respondents shows their trust on the online advertisement and they use it as a reference for purchasing.
KEYWORDS Customer perception, online advertisement.
INTRODUCTION nline advertising is a form of advertising that uses the Internet and World Wide Web in order to deliver marketing messages and attract customers. A major result of online advertising is information and content that is not limited by geography or time. The emerging area of interactive advertising presents fresh challenges for advertisers who have hitherto adopted an interruptive strategy.Examples of online advertising include contextual ads
on search engine results pages, banner ads, Rich Media Ads, Social network advertising, online classified advertising, advertising networks and e-mail marketing, including e-mail spam. Online video directories for brands are a good example of interactive advertising. These directories complement television advertising and allow the viewer to
view the commercials of a number of brands. If the advertiser has opted for a response feature, the viewer may then choose to visit the brand’s website, or interact with the advertiser through other touch points such as email, chat or phone. Response to brand communication is instantaneous, and conversion to
business is very high. This is because in contrast to conventional forms of interruptive advertising, the viewer has actually chosen to see the commercial.
REVIEW OF LITERATURE S. Chandra Vathana Nila, Dr. N.Kalyana Raman (2013) This study examines the consumer attitudes to commercialization of the Internet, and specifically focuses on Internet users’ belief and attitudes about internet advertising and it is found that the internet advertisement is highly influence the consumer’s
to buy the product, making purchase involvement and make the purchase of the products easier. Abdul Azeem, Ziaul Haq (2012) The purpose of this study is to discusses internet marketing relevance and investigates antecedents of consumer attitudes
toward Internet Advertisement. The analysis is based on a consumer survey conducted In India. In the findings the study has provided thorough information on the impact of various factors on internet advertising i.e. entertainment, information credibility, economy and value. This factors are significant predictors of attitude towards internet advertising.
Ashraf Bany Mohammed, Mohammed Alkubise (2012) This study seeks to explore the factors that contribute to the effectiveness of online advertisements and affect consumer purchasing intention from the perspective of developing countries. Based on a five dimensions theoretical model, this study empirically
analyzes the effect of online advertisement on purchasing intention using data collected from 339 Jordanian university students. Results show that Income, Internet skills, Internet usage per day, advertisement content and advertisement location are significant factors that affect the effectiveness of online advertisement.
Marie-Claude Boudreau, Richard T. Watson (2006) The results show that misalignment between corporate global strategy and web advertising strategy is reasonably common. For two thirds of the companies in our sample, there was imperfect alignment. The paper suggests three reasons why this can be, and offer a tool that enables organizations to recognize how they should handle design and content matters for the combination of corporate and national web sites.
D. Venkoba Rao (2006) Price, quality of service and information, speed and reliability of delivery, ease of on-line ordering, and trust towards vendors, are some of the factors. The seven identified consumer concerns about making online purchases are security of transactions, customer support, quality of
products/services, legitimacy of firm selling product/ service, price, privacy, and documentation. Product availability is the main factor and limited selection of products and services or outdated information is most likely to keep Internet non-purchasers from purchasing online. Newman, Eric J., Donald E. Stem, Jr, David E. Sprott (2004) Of the many approaches to building a brand’s image on the Internet, a Web site is one of the most
important tools for managers. An important decision made by Web site managers is whether to place banner advertisements on their brand’s Web site (e.g. The New Yorker Web site placing an ad for polo.com). While banner advertisements are widespread in the marketplace, it is unclear whether Web sites containing such advertisements may be harming themselves by such a practice. This study addresses this issue by investigating the impact of banner advertisement and
Web site congruity on consumer attitudes toward a brand’s Web site. The results of an experiment indicate that if managers include such advertisements on their Web site, these advertisements should be consistent with the Web site brand and that certain consumer characteristics should be considered. Implications
of the research for brand management and advertising on the Internet are provided. Chanaka Jayawardhena, Len Tiu Wright, Rosalind Masterson (2003) This paper examines the literature concerning consumers’ purchasing on the Internet and reports on a project that contained qualitative findings with the help of quantitative data to uncover consumer purchase orientations for financial services. The
findings showed support for the literature concerning similarities in the treatment of consumer purchase orientations and gender. However, the outcomes of purchase intentions did not necessarily correlate with consumer segmentation according to original purchase orientations. The conclusions take into account the need for e-retailers to recognise that online financial services consumers have a significantly higher level of control in the purchase process and are motivated by
this in using the Internet. Ronald E. Goldsmith, Barbara A. Lafferty (2002) The purpose of the present study was to test four hypotheses regarding the effects of viewing Web sites on
Internet advertising. We surveyed a convenience sample of 329 undergraduate students, asking them to recall brand names seen on the Internet, to describe perceived advantages and disadvantages of online advertising, and to recall ads encountered in all media and whether they liked these or not. Visiting Web sites appeared to increase aided recall of brands seen on the Internet and to improve consumers’ views of the brand. Consumers who felt that Web sites improved
O
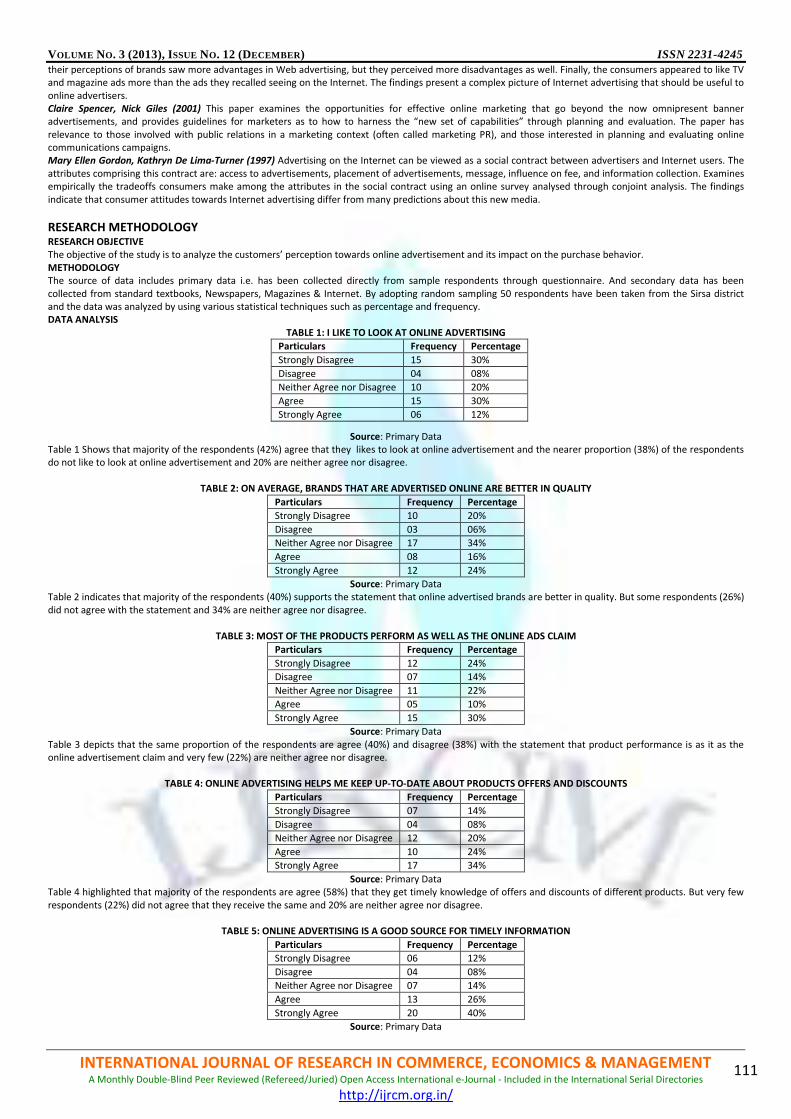
VOLUME NO. 3 (2013), ISSUE NO. 12 (DECEMBER) ISSN 2231-4245
INTERNATIONAL JOURNAL OF RESEARCH IN COMMERCE, ECONOMICS & MANAGEMENT A Monthly Double-Blind Peer Reviewed (Refereed/Juried) Open Access International e-Journal - Included in the International Serial Directories
http://ijrcm.org.in/
111
their perceptions of brands saw more advantages in Web advertising, but they perceived more disadvantages as well. Finally, the consumers appeared to like TV and magazine ads more than the ads they recalled seeing on the Internet. The findings present a complex picture of Internet advertising that should be useful to
online advertisers. Claire Spencer, Nick Giles (2001) This paper examines the opportunities for effective online marketing that go beyond the now omnipresent banner advertisements, and provides guidelines for marketers as to how to harness the “new set of capabilities” through planning and evaluation. The paper has
relevance to those involved with public relations in a marketing context (often called marketing PR), and those interested in planning and evaluating online communications campaigns. Mary Ellen Gordon, Kathryn De Lima-Turner (1997) Advertising on the Internet can be viewed as a social contract between advertisers and Internet users. The
attributes comprising this contract are: access to advertisements, placement of advertisements, message, influence on fee, and information collection. Examines empirically the tradeoffs consumers make among the attributes in the social contract using an online survey analysed through conjoint analysis. The findings
indicate that consumer attitudes towards Internet advertising differ from many predictions about this new media.
RESEARCH METHODOLOGY RESEARCH OBJECTIVE The objective of the study is to analyze the customers’ perception towards online advertisement and its impact on the purchase behavior. METHODOLOGY The source of data includes primary data i.e. has been collected directly from sample respondents through questionnaire. And secondary data has been
collected from standard textbooks, Newspapers, Magazines & Internet. By adopting random sampling 50 respondents have been taken from the Sirsa district and the data was analyzed by using various statistical techniques such as percentage and frequency. DATA ANALYSIS
TABLE 1: I LIKE TO LOOK AT ONLINE ADVERTISING
Source: Primary Data Table 1 Shows that majority of the respondents (42%) agree that they likes to look at online advertisement and the nearer proportion (38%) of the respondents do not like to look at online advertisement and 20% are neither agree nor disagree.
TABLE 2: ON AVERAGE, BRANDS THAT ARE ADVERTISED ONLINE ARE BETTER IN QUALITY
Particulars Frequency Percentage
Strongly Disagree 10 20%
Disagree 03 06%
Neither Agree nor Disagree 17 34%
Agree 08 16%
Strongly Agree 12 24%
Source: Primary Data Table 2 indicates that majority of the respondents (40%) supports the statement that online advertised brands are better in quality. But some respondents (26%)
did not agree with the statement and 34% are neither agree nor disagree.
TABLE 3: MOST OF THE PRODUCTS PERFORM AS WELL AS THE ONLINE ADS CLAIM
Particulars Frequency Percentage
Strongly Disagree 12 24%
Disagree 07 14%
Neither Agree nor Disagree 11 22%
Agree 05 10%
Strongly Agree 15 30%
Source: Primary Data
Table 3 depicts that the same proportion of the respondents are agree (40%) and disagree (38%) with the statement that product performance is as it as the online advertisement claim and very few (22%) are neither agree nor disagree.
TABLE 4: ONLINE ADVERTISING HELPS ME KEEP UP-TO-DATE ABOUT PRODUCTS OFFERS AND DISCOUNTS
Particulars Frequency Percentage
Strongly Disagree 07 14%
Disagree 04 08%
Neither Agree nor Disagree 12 20%
Agree 10 24%
Strongly Agree 17 34%
Source: Primary Data Table 4 highlighted that majority of the respondents are agree (58%) that they get timely knowledge of offers and discounts of different products. But very few
respondents (22%) did not agree that they receive the same and 20% are neither agree nor disagree.
TABLE 5: ONLINE ADVERTISING IS A GOOD SOURCE FOR TIMELY INFORMATION
Particulars Frequency Percentage
Strongly Disagree 06 12%
Disagree 04 08%
Neither Agree nor Disagree 07 14%
Agree 13 26%
Strongly Agree 20 40%
Source: Primary Data
Particulars Frequency Percentage
Strongly Disagree 15 30%
Disagree 04 08%
Neither Agree nor Disagree 10 20%
Agree 15 30%
Strongly Agree 06 12%

VOLUME NO. 3 (2013), ISSUE NO. 12 (DECEMBER) ISSN 2231-4245
INTERNATIONAL JOURNAL OF RESEARCH IN COMMERCE, ECONOMICS & MANAGEMENT A Monthly Double-Blind Peer Reviewed (Refereed/Juried) Open Access International e-Journal - Included in the International Serial Directories
http://ijrcm.org.in/
112
Table 5 shows that Majority of the respondents (66%) gets the timely information with the help of online advertisement and for few respondents (20%) it is not the good source of information and 14% are neither agree nor disagree with the statement.
TABLE 6: I FEEL THAT ONLINE ADVERTISEMENT IS IRRITATING
Particulars Frequency Percentage
Strongly Disagree 18 36%
Disagree 07 14%
Neither Agree nor Disagree 08 16%
Agree 10 20%
Strongly Agree 07 14%
Source: Primary Data Table 6 indicates that for majority of the respondents (50%) online advertisement is not irritating. But some respondents (34%) feel irritating with it and 16% are neither agree nor disagree.
TABLE 7: ONLINE ADVERTISEMENTS ARE ALMOST EVERYWHERE ON INTERNET
Particulars Frequency Percentage
Strongly Disagree 10 20%
Disagree 06 12%
Neither Agree nor Disagree 07 14%
Agree 07 14%
Strongly Agree 20 40%
Source: Primary Data Table 7 depicts that majority of the respondents (54%) agree that online advertisement are almost everywhere on internet, few respondents (32%) don’t think so and 14% are neither agree nor disagree with this statement.
TABLE 8: I USE ONLINE ADVERTISING AS A REFERENCE FOR PURCHASING
Particulars Frequency Percentage
Strongly Disagree 10 20%
Disagree 06 12%
Neither Agree nor Disagree 09 18%
Agree 10 20%
Strongly Agree 15 30%
Source: Primary Data Table: 08 highlighted that majority of the respondents (50%) purchase through the online advertisement. But there are some respondents (42%) also those do
not use online advertisement as a reference for purchasing and 18% are neither agree nor disagree with this statement.
TABLE 09: I CAN TRUST ON ONLINE ADVERTISEMENTS
Particulars Frequency Percentage
Strongly Disagree 14 28%
Disagree 06 12%
Neither Agree nor Disagree 07 14%
Agree 13 26%
Strongly Agree 10 20%
Source: Primary Data
Table: 09 shows that majority of the respondents (46%) agree that they can trust on online advertisement, some respondents (40%) don’t want to trust on online advertisements and 14% are neither agree nor disagree.
CONCLUSION It is concluded that online advertising is rapidly expanding its wings across the globe and India is no exception to this phenomenon because majority of the respondents in this study likes to look at online advertisement with a reason that majority of the products are better in quality and they perform as well as the online advertisement claims. They also get the timely and up to date information of the products. Online advertisement now a day’s making a big space in the
consumer market because it is found in the study that majority of the customers did not get irritate as they with the traditional advertisement. Majority of the respondents are trust on the online advertisement and they use it as a reference for purchasing.
REFERENCES BOOKS 1. Singhal, Sanjeev, “ Internet Banking-The Second Wave:”, Tata Mc graw Hill Publication, 2003 JOURNAL AND OTHER ARTICALS 2. Azeem Abdul, Ziaul Haq (2012) Perception towards Internet Advertising :A Study With Reference to Three Different Demographic Groups, Global Business
and Management Research : An International Journal, Vol.4,No.1
3. Chanaka Jayawardhena, Len Tiu Wright, Rosalind Masterson, (2003) "An investigation of online consumer purchasing", Qualitative Market Research: An International Journal, Vol. 6 Iss: 1, pp.58 – 65.
4. Claire Spencer, Nick Giles, (2001) "The planning, implementation and evaluation of an online marketing campaign", Journal of Communication
Management, Vol. 5 Iss: 3, pp.287 - 299. 5. Goldsmith, Barbara A. Lafferty (2002), "Consumer Response to websites and their influence on Advertising Effectiveness," Internet Research: Electronic
Networking Applications and Policy, 12 (4), 318-328.
6. Kshatriya, Kavita, (2004), “Management Trends (A Journal of Department of Business Management)” Article- Internet Banking. 7. Macquarie, D. (1983). “Mass Communication Theory: An Introduction. London:”, Sage Publication,pp206-216.
8. Marie-Claude Boudreau, Richard T. Watson, (2006) "Internet advertising strategy alignment", Internet Research, Vol. 16 Iss: 1, pp.23 – 37 9. Mary Ellen Gordon, Kathryn De Lima-Turner. "Consumer attitudes towards internet advertising - A social contract perspective”. International Marketing
Review 14 (5), pages 362-375, 1997.
10. Mohammed Ashraf Bany, Alkubise, Mohammed , (2012) “How do Online Advertisements Affects Consumer Purchasing Intention: Empirical Evidence from a Developing Country” European Journal of Business and Management, ISSN 2222-1905 (Paper) ISSN 2222-2839 (Online) Vol 4, No.7.
11. Newman, Eric J., Donald E. Stem, Jr., and David E. Sprott (2004), “Banner Advertisement and Website Congruity Effects on Consumer Web Site
Perceptions,” Industrial Management and Data Systems, 104 (3/4), 273-294.

VOLUME NO. 3 (2013), ISSUE NO. 12 (DECEMBER) ISSN 2231-4245
INTERNATIONAL JOURNAL OF RESEARCH IN COMMERCE, ECONOMICS & MANAGEMENT A Monthly Double-Blind Peer Reviewed (Refereed/Juried) Open Access International e-Journal - Included in the International Serial Directories
http://ijrcm.org.in/
113
12. Rao. D.Venkoba (2006), Determinants of Purchase Behaviour of Online Consumers. Osmania Journal of Management, 16(2), pp. 255-257. 13. Rotzoll, Heffner(1989), “Advertising and the Classical Liberal World View”, International journal of advertising ,pp(4-12)
14. S. Chandra Vathana Nila, Dr. N.Kalyana Raman (2013), Consumer Attitude Towards Internet Advertisement, Indian Journal of Applied Research, ISSN - 2249-555 ,Volume : 3, Issue : 3
15. Schlosser, A.E.; Shavitt, S.; and Kanfer(1999), “ A. Survey of Internet users’ attitudes toward internet advertising”, journal of interactive marketing ,pp 7-22
WEBSITES 16. http://www.buzzle.com/articles/email-marketing,Viewed in 2012 17. Asia Mobile and Broadband Report, Viewed on Dec. 2012,http://www.internetworldstats.com/stats3.htm
18. http://en.wikipedia.org/wiki/Online_advertising, Viewed on July 2012
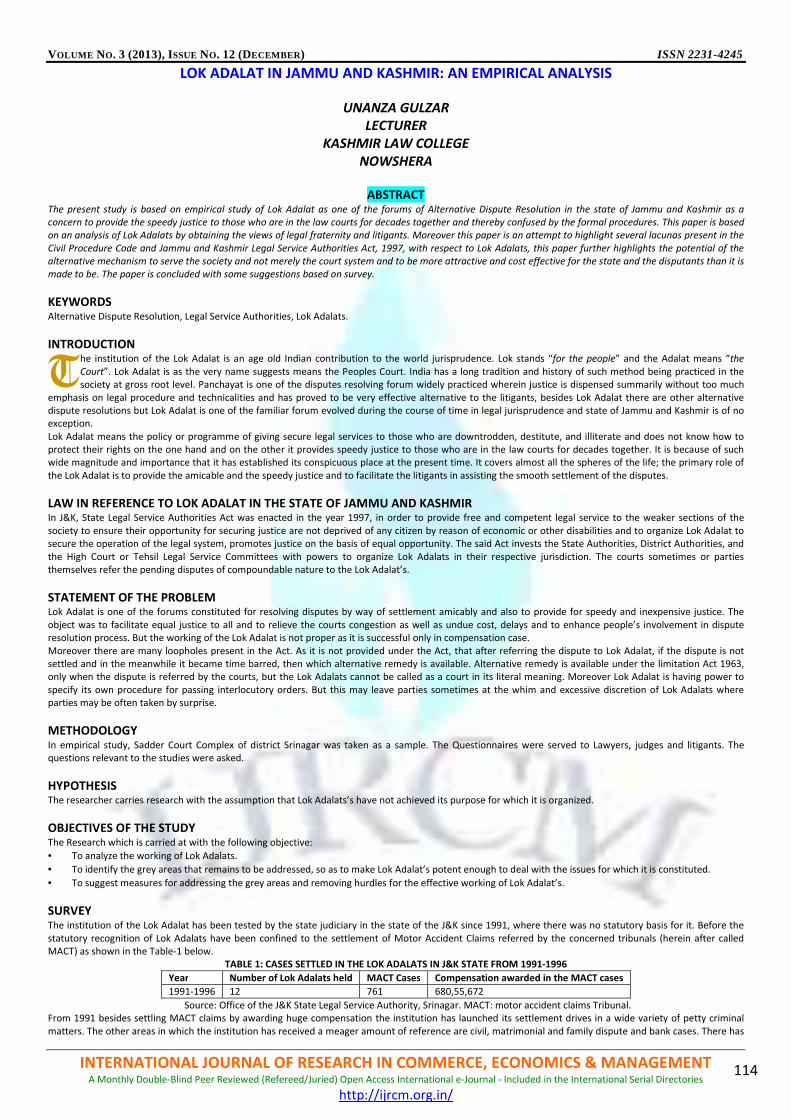
VOLUME NO. 3 (2013), ISSUE NO. 12 (DECEMBER) ISSN 2231-4245
INTERNATIONAL JOURNAL OF RESEARCH IN COMMERCE, ECONOMICS & MANAGEMENT A Monthly Double-Blind Peer Reviewed (Refereed/Juried) Open Access International e-Journal - Included in the International Serial Directories
http://ijrcm.org.in/
114
LOK ADALAT IN JAMMU AND KASHMIR: AN EMPIRICAL ANALYSIS
UNANZA GULZAR
LECTURER
KASHMIR LAW COLLEGE
NOWSHERA
ABSTRACT
The present study is based on empirical study of Lok Adalat as one of the forums of Alternative Dispute Resolution in the state of Jammu and Kashmir as a
concern to provide the speedy justice to those who are in the law courts for decades together and thereby confused by the formal procedures. This paper is based
on an analysis of Lok Adalats by obtaining the views of legal fraternity and litigants. Moreover this paper is an attempt to highlight several lacunas present in the
Civil Procedure Code and Jammu and Kashmir Legal Service Authorities Act, 1997, with respect to Lok Adalats, this paper further highlights the potential of the
alternative mechanism to serve the society and not merely the court system and to be more attractive and cost effective for the state and the disputants than it is
made to be. The paper is concluded with some suggestions based on survey.
KEYWORDS Alternative Dispute Resolution, Legal Service Authorities, Lok Adalats.
INTRODUCTION he institution of the Lok Adalat is an age old Indian contribution to the world jurisprudence. Lok stands “for the people” and the Adalat means “the
Court”. Lok Adalat is as the very name suggests means the Peoples Court. India has a long tradition and history of such method being practiced in the society at gross root level. Panchayat is one of the disputes resolving forum widely practiced wherein justice is dispensed summarily without too much
emphasis on legal procedure and technicalities and has proved to be very effective alternative to the litigants, besides Lok Adalat there are other alternative dispute resolutions but Lok Adalat is one of the familiar forum evolved during the course of time in legal jurisprudence and state of Jammu and Kashmir is of no exception.
Lok Adalat means the policy or programme of giving secure legal services to those who are downtrodden, destitute, and illiterate and does not know how to protect their rights on the one hand and on the other it provides speedy justice to those who are in the law courts for decades together. It is because of such wide magnitude and importance that it has established its conspicuous place at the present time. It covers almost all the spheres of the life; the primary role of
the Lok Adalat is to provide the amicable and the speedy justice and to facilitate the litigants in assisting the smooth settlement of the disputes.
LAW IN REFERENCE TO LOK ADALAT IN THE STATE OF JAMMU AND KASHMIR In J&K, State Legal Service Authorities Act was enacted in the year 1997, in order to provide free and competent legal service to the weaker sections of the
society to ensure their opportunity for securing justice are not deprived of any citizen by reason of economic or other disabilities and to organize Lok Adalat to secure the operation of the legal system, promotes justice on the basis of equal opportunity. The said Act invests the State Authorities, District Authorities, and
the High Court or Tehsil Legal Service Committees with powers to organize Lok Adalats in their respective jurisdiction. The courts sometimes or parties themselves refer the pending disputes of compoundable nature to the Lok Adalat’s.
STATEMENT OF THE PROBLEM Lok Adalat is one of the forums constituted for resolving disputes by way of settlement amicably and also to provide for speedy and inexpensive justice. The
object was to facilitate equal justice to all and to relieve the courts congestion as well as undue cost, delays and to enhance people’s involvement in dispute resolution process. But the working of the Lok Adalat is not proper as it is successful only in compensation case.
Moreover there are many loopholes present in the Act. As it is not provided under the Act, that after referring the dispute to Lok Adalat, if the dispute is not settled and in the meanwhile it became time barred, then which alternative remedy is available. Alternative remedy is available under the limitation Act 1963, only when the dispute is referred by the courts, but the Lok Adalats cannot be called as a court in its literal meaning. Moreover Lok Adalat is having power to
specify its own procedure for passing interlocutory orders. But this may leave parties sometimes at the whim and excessive discretion of Lok Adalats where parties may be often taken by surprise.
METHODOLOGY In empirical study, Sadder Court Complex of district Srinagar was taken as a sample. The Questionnaires were served to Lawyers, judges and litigants. The questions relevant to the studies were asked.
HYPOTHESIS The researcher carries research with the assumption that Lok Adalats’s have not achieved its purpose for which it is organized.
OBJECTIVES OF THE STUDY The Research which is carried at with the following objective:
• To analyze the working of Lok Adalats.
• To identify the grey areas that remains to be addressed, so as to make Lok Adalat’s potent enough to deal with the issues for which it is constituted.
• To suggest measures for addressing the grey areas and removing hurdles for the effective working of Lok Adalat’s.
SURVEY The institution of the Lok Adalat has been tested by the state judiciary in the state of the J&K since 1991, where there was no statutory basis for it. Before the
statutory recognition of Lok Adalats have been confined to the settlement of Motor Accident Claims referred by the concerned tribunals (herein after called MACT) as shown in the Table-1 below.
TABLE 1: CASES SETTLED IN THE LOK ADALATS IN J&K STATE FROM 1991-1996
Year Number of Lok Adalats held MACT Cases Compensation awarded in the MACT cases
1991-1996 12 761 680,55,672
Source: Office of the J&K State Legal Service Authority, Srinagar. MACT: motor accident claims Tribunal.
From 1991 besides settling MACT claims by awarding huge compensation the institution has launched its settlement drives in a wide variety of petty criminal
matters. The other areas in which the institution has received a meager amount of reference are civil, matrimonial and family dispute and bank cases. There has
T
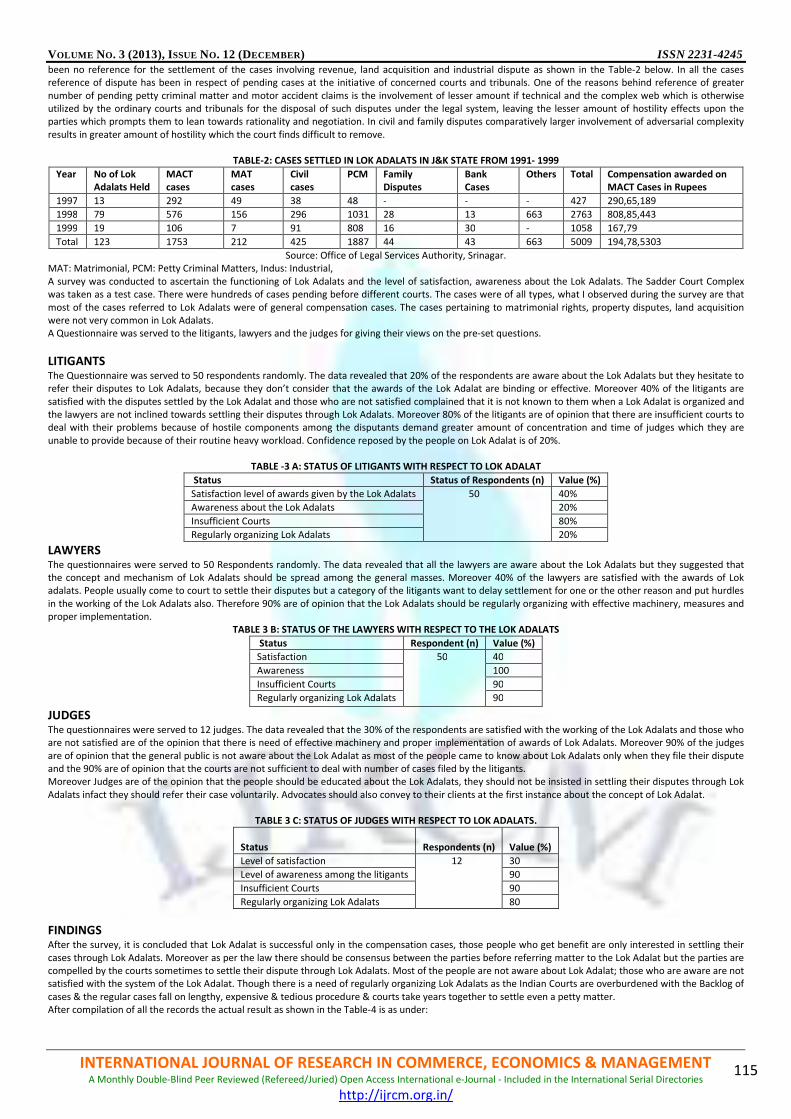
VOLUME NO. 3 (2013), ISSUE NO. 12 (DECEMBER) ISSN 2231-4245
INTERNATIONAL JOURNAL OF RESEARCH IN COMMERCE, ECONOMICS & MANAGEMENT A Monthly Double-Blind Peer Reviewed (Refereed/Juried) Open Access International e-Journal - Included in the International Serial Directories
http://ijrcm.org.in/
115
been no reference for the settlement of the cases involving revenue, land acquisition and industrial dispute as shown in the Table-2 below. In all the cases reference of dispute has been in respect of pending cases at the initiative of concerned courts and tribunals. One of the reasons behind reference of greater
number of pending petty criminal matter and motor accident claims is the involvement of lesser amount if technical and the complex web which is otherwise utilized by the ordinary courts and tribunals for the disposal of such disputes under the legal system, leaving the lesser amount of hostility effects upon the parties which prompts them to lean towards rationality and negotiation. In civil and family disputes comparatively larger involvement of adversarial complexity
results in greater amount of hostility which the court finds difficult to remove.
TABLE-2: CASES SETTLED IN LOK ADALATS IN J&K STATE FROM 1991- 1999
Year No of Lok Adalats Held
MACT cases
MAT cases
Civil cases
PCM Family Disputes
Bank Cases
Others Total
Compensation awarded on MACT Cases in Rupees
1997 13 292 49 38 48 - - - 427 290,65,189
1998 79 576 156 296 1031 28 13 663 2763 808,85,443
1999 19 106 7 91 808 16 30 - 1058 167,79
Total 123 1753 212 425 1887 44 43 663 5009 194,78,5303
Source: Office of Legal Services Authority, Srinagar. MAT: Matrimonial, PCM: Petty Criminal Matters, Indus: Industrial,
A survey was conducted to ascertain the functioning of Lok Adalats and the level of satisfaction, awareness about the Lok Adalats. The Sadder Court Complex was taken as a test case. There were hundreds of cases pending before different courts. The cases were of all types, what I observed during the survey are that
most of the cases referred to Lok Adalats were of general compensation cases. The cases pertaining to matrimonial rights, property disputes, land acquisition were not very common in Lok Adalats. A Questionnaire was served to the litigants, lawyers and the judges for giving their views on the pre-set questions.
LITIGANTS The Questionnaire was served to 50 respondents randomly. The data revealed that 20% of the respondents are aware about the Lok Adalats but they hesitate to refer their disputes to Lok Adalats, because they don’t consider that the awards of the Lok Adalat are binding or effective. Moreover 40% of the litigants are
satisfied with the disputes settled by the Lok Adalat and those who are not satisfied complained that it is not known to them when a Lok Adalat is organized and the lawyers are not inclined towards settling their disputes through Lok Adalats. Moreover 80% of the litigants are of opinion that there are insufficient courts to deal with their problems because of hostile components among the disputants demand greater amount of concentration and time of judges which they are
unable to provide because of their routine heavy workload. Confidence reposed by the people on Lok Adalat is of 20%.
TABLE -3 A: STATUS OF LITIGANTS WITH RESPECT TO LOK ADALAT
Status Status of Respondents (n) Value (%)
Satisfaction level of awards given by the Lok Adalats 50 40%
Awareness about the Lok Adalats 20%
Insufficient Courts 80%
Regularly organizing Lok Adalats 20%
LAWYERS The questionnaires were served to 50 Respondents randomly. The data revealed that all the lawyers are aware about the Lok Adalats but they suggested that the concept and mechanism of Lok Adalats should be spread among the general masses. Moreover 40% of the lawyers are satisfied with the awards of Lok adalats. People usually come to court to settle their disputes but a category of the litigants want to delay settlement for one or the other reason and put hurdles
in the working of the Lok Adalats also. Therefore 90% are of opinion that the Lok Adalats should be regularly organizing with effective machinery, measures and proper implementation.
TABLE 3 B: STATUS OF THE LAWYERS WITH RESPECT TO THE LOK ADALATS
Status Respondent (n) Value (%)
Satisfaction 50 40
Awareness 100
Insufficient Courts 90
Regularly organizing Lok Adalats 90
JUDGES The questionnaires were served to 12 judges. The data revealed that the 30% of the respondents are satisfied with the working of the Lok Adalats and those who are not satisfied are of the opinion that there is need of effective machinery and proper implementation of awards of Lok Adalats. Moreover 90% of the judges
are of opinion that the general public is not aware about the Lok Adalat as most of the people came to know about Lok Adalats only when they file their dispute and the 90% are of opinion that the courts are not sufficient to deal with number of cases filed by the litigants. Moreover Judges are of the opinion that the people should be educated about the Lok Adalats, they should not be insisted in settling their disputes through Lok
Adalats infact they should refer their case voluntarily. Advocates should also convey to their clients at the first instance about the concept of Lok Adalat.
TABLE 3 C: STATUS OF JUDGES WITH RESPECT TO LOK ADALATS.
Status
Respondents (n)
Value (%)
Level of satisfaction 12 30
Level of awareness among the litigants 90
Insufficient Courts 90
Regularly organizing Lok Adalats 80
FINDINGS After the survey, it is concluded that Lok Adalat is successful only in the compensation cases, those people who get benefit are only interested in settling their
cases through Lok Adalats. Moreover as per the law there should be consensus between the parties before referring matter to the Lok Adalat but the parties are compelled by the courts sometimes to settle their dispute through Lok Adalats. Most of the people are not aware about Lok Adalat; those who are aware are not satisfied with the system of the Lok Adalat. Though there is a need of regularly organizing Lok Adalats as the Indian Courts are overburdened with the Backlog of
cases & the regular cases fall on lengthy, expensive & tedious procedure & courts take years together to settle even a petty matter. After compilation of all the records the actual result as shown in the Table-4 is as under:

VOLUME NO. 3 (2013), ISSUE NO. 12 (DECEMBER) ISSN 2231-4245
INTERNATIONAL JOURNAL OF RESEARCH IN COMMERCE, ECONOMICS & MANAGEMENT A Monthly Double-Blind Peer Reviewed (Refereed/Juried) Open Access International e-Journal - Included in the International Serial Directories
http://ijrcm.org.in/
116
TABLE- 4: STATUS OF LITIGANTS, LAWYERS AND JUDGES WITH RESPECT TO LOK ADALAT
Status Respondents (n) Value (%)
Satisfaction 112 36%
Awareness 70%
Insufficient Courts 86%
Regularly Organizing Lok Adalats 63%
• 36% of the respondents are satisfied with the working of Lok Adalat, but the remaining 64% are of the opinion that the J&K Legal Service Authority Act,
hesitate to handover the stamp of a Court to the Lok Adalat.
• 70% of the respondents are not aware about the Lok Adalats as an alternative dispute resolution mechanism with a procedural flexibility and speedy trial
of disputes. Moreover parties are not aware that there is no court fee if the matter is to be settled through Lok Adalats and the award of the Lok Adalat is
binding on the parties.
• 86% of the respondents are of the opinion that there are insufficient courts to deal with the number of cases filed by the litigants as day by day disputes
are increasing but the courts are few to deal.
• 63% of the respondents are of the opinion that there is a need to regularly organize Lok Adalats with effective machinery and implementation in Jammu
and Kashmir. Lok Adalat is to be hold by the concerned agencies for a long as the timely working of the Lok Adalat has not only to give relief to the litigants
but it will relieve the courts from the burden of long pendency of cases. Moreover the parties to the dispute can directly interact with the judge through their counsel which is not possible in regular courts of law.
CONCLUSION Lok Adalat is one of the forums of ADR constituted for resolving disputes by way of settlement amicably. It provides speedy & inexpensive justice because Courts take otherwise years to settle even a petty matter. The litigants is often confused by the formal procedure in the courts, to provide effective dispute resolution to facilitate equal justice to relieve the court congestion as well as the undue cost, delays & to enhance the people’s involvement in dispute resolution process,
the ADR movement has taken birth in India. This was the object to be fulfilled through Lok Adalat, but now Lok Adalat is not fulfilling those reasons behind it. People are now thinking whether justice delivery system has failed us or we have failed justice delivery system, which is to be held responsible. Inspite of the law provided in the CPC & in the Legal Service Authorities Act 1997, with respect to Lok Adalats, there is not proper implementation of the law. If we compare the
organization & the working of the Lok Adalat of our State with other states then it is not better.
SUGGESTIONS The Survey conducted indicated that the system of the Lok Adalat prevalent in the state of J&K is not good. Therefore in order to improve it following
suggestions are recommended:- 1) In western countries, it is mandatory that the parties are first called to settle their dispute amicably, if any issue is not settled than that is referred to the
court but in India disputes are referred after two or three years later of pending before the court to the Lok Adalat. Therefore the researcher suggests that
the same procedure should be adopted in our country & for that purpose an amendment should be made in the Civil Procedure Code. 2) The researcher argues that in spite of voluntarily provision for referring dispute to Lok Adalat, the parties are compelled to refer the matter to Lok Adalat
and that is the violation of law. Therefore the researcher suggests that it should be based on consensus method; therefore there is the need of proper implementation of law.
3) The researcher suggests that the Permanent Lok Adalat should be established in the state of J&K.
4) The researcher suggests that awareness to the common man about the Lok Adalat should be given at the beginning of filing of the case through counseling centers. Moreover the benefits of the Lok Adalat should be communicated through media which will ultimately compel the people to organize Lok Adalat themselves.
5) The researcher suggests that the expertise & judges need to be trained & updated for achieving & maintaining professional excellence. Young lawyers need to be educated about their role in settlement of disputes in Lok Adalats, such as they need to inculcate a habit of resolution & persuasion during the
conduct of Lok Adalat. For this purpose legal service Authorities need to make honest & dedicated endeavors instead of making pump & show in the media.
6) Judges should not give preference to the quantity of disposal but to the quality of disposal of cases in the interest of justice. This is the main defect
observed by our people & the higher judicial & legal fraternity in general in constraining J&K High Court to make an observations taking strong exception to the disposal of cases which have social as well as moral implications such as, offences under Food Adulterations Act which is not compoundable but were made compoundable in Lok Adalats which sends wrong signals in the society & at the same time criminal minded people were petted up to repeat the
offence, therefore making penative clauses redundant. Therefore the researcher suggests that the judicial officers need to re-visit the conception of their adjudication of cases in Lok Adalat’s. Moreover Courts should also take interest in deciding matter other than compensation matters with justice.
REFERENCES 1. Jammu and Kashmir Legal Service Authorities Act, 1997. 2. M. Ayub Dar (1999), “Lok Adalat in Jammu and Kashmir: The Process, Practice and problems, Kashmir university law review, pp 77.
3. M.G.Chitakra (1993), “Lok adalat and poor”. Ashish publishing house, New Delhi, pp 60. 4. N.R.M.Menon (1986), “Lok Adalat: Peoples Programme for Speedy Justice” Indian Bar Review, vol 3(2), pp 129-132. 5. S.K. Sarkar (2012), “Law Relating to lok adalat and legal aid”. Orient Publishing Company, Allahabad, pp 3-4.
6. The Jammu and Kashmir Legal Service Authorities Rules, 1996.
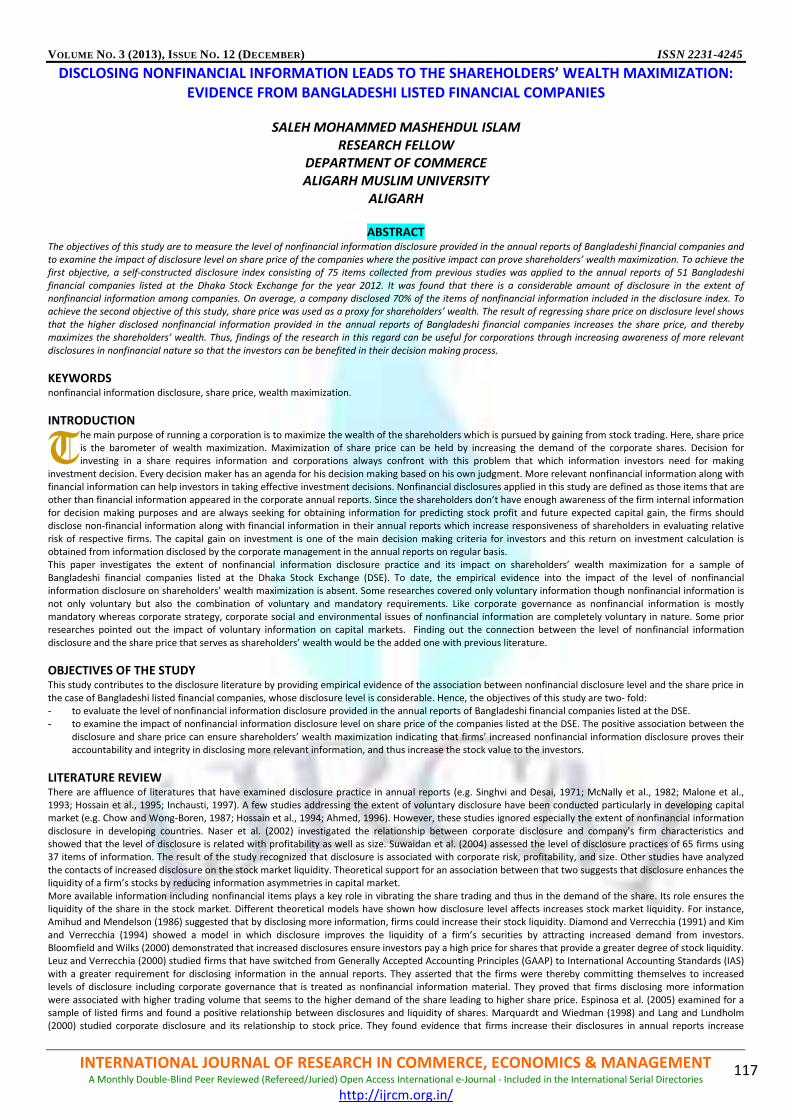
VOLUME NO. 3 (2013), ISSUE NO. 12 (DECEMBER) ISSN 2231-4245
INTERNATIONAL JOURNAL OF RESEARCH IN COMMERCE, ECONOMICS & MANAGEMENT A Monthly Double-Blind Peer Reviewed (Refereed/Juried) Open Access International e-Journal - Included in the International Serial Directories
http://ijrcm.org.in/
117
DISCLOSING NONFINANCIAL INFORMATION LEADS TO THE SHAREHOLDERS’ WEALTH MAXIMIZATION: EVIDENCE FROM BANGLADESHI LISTED FINANCIAL COMPANIES
SALEH MOHAMMED MASHEHDUL ISLAM
RESEARCH FELLOW
DEPARTMENT OF COMMERCE
ALIGARH MUSLIM UNIVERSITY
ALIGARH
ABSTRACT
The objectives of this study are to measure the level of nonfinancial information disclosure provided in the annual reports of Bangladeshi financial companies and
to examine the impact of disclosure level on share price of the companies where the positive impact can prove shareholders’ wealth maximization. To achieve the
first objective, a self-constructed disclosure index consisting of 75 items collected from previous studies was applied to the annual reports of 51 Bangladeshi
financial companies listed at the Dhaka Stock Exchange for the year 2012. It was found that there is a considerable amount of disclosure in the extent of
nonfinancial information among companies. On average, a company disclosed 70% of the items of nonfinancial information included in the disclosure index. To
achieve the second objective of this study, share price was used as a proxy for shareholders’ wealth. The result of regressing share price on disclosure level shows
that the higher disclosed nonfinancial information provided in the annual reports of Bangladeshi financial companies increases the share price, and thereby
maximizes the shareholders’ wealth. Thus, findings of the research in this regard can be useful for corporations through increasing awareness of more relevant
disclosures in nonfinancial nature so that the investors can be benefited in their decision making process.
KEYWORDS
nonfinancial information disclosure, share price, wealth maximization.
INTRODUCTION he main purpose of running a corporation is to maximize the wealth of the shareholders which is pursued by gaining from stock trading. Here, share price is the barometer of wealth maximization. Maximization of share price can be held by increasing the demand of the corporate shares. Decision for investing in a share requires information and corporations always confront with this problem that which information investors need for making
investment decision. Every decision maker has an agenda for his decision making based on his own judgment. More relevant nonfinancial information along with financial information can help investors in taking effective investment decisions. Nonfinancial disclosures applied in this study are defined as those items that are other than financial information appeared in the corporate annual reports. Since the shareholders don’t have enough awareness of the firm internal information
for decision making purposes and are always seeking for obtaining information for predicting stock profit and future expected capital gain, the firms should disclose non-financial information along with financial information in their annual reports which increase responsiveness of shareholders in evaluating relative
risk of respective firms. The capital gain on investment is one of the main decision making criteria for investors and this return on investment calculation is obtained from information disclosed by the corporate management in the annual reports on regular basis. This paper investigates the extent of nonfinancial information disclosure practice and its impact on shareholders’ wealth maximization for a sample of
Bangladeshi financial companies listed at the Dhaka Stock Exchange (DSE). To date, the empirical evidence into the impact of the level of nonfinancial information disclosure on shareholders’ wealth maximization is absent. Some researches covered only voluntary information though nonfinancial information is
not only voluntary but also the combination of voluntary and mandatory requirements. Like corporate governance as nonfinancial information is mostly mandatory whereas corporate strategy, corporate social and environmental issues of nonfinancial information are completely voluntary in nature. Some prior researches pointed out the impact of voluntary information on capital markets. Finding out the connection between the level of nonfinancial information
disclosure and the share price that serves as shareholders’ wealth would be the added one with previous literature.
OBJECTIVES OF THE STUDY This study contributes to the disclosure literature by providing empirical evidence of the association between nonfinancial disclosure level and the share price in
the case of Bangladeshi listed financial companies, whose disclosure level is considerable. Hence, the objectives of this study are two- fold: - to evaluate the level of nonfinancial information disclosure provided in the annual reports of Bangladeshi financial companies listed at the DSE. - to examine the impact of nonfinancial information disclosure level on share price of the companies listed at the DSE. The positive association between the
disclosure and share price can ensure shareholders’ wealth maximization indicating that firms’ increased nonfinancial information disclosure proves their accountability and integrity in disclosing more relevant information, and thus increase the stock value to the investors.
LITERATURE REVIEW There are affluence of literatures that have examined disclosure practice in annual reports (e.g. Singhvi and Desai, 1971; McNally et al., 1982; Malone et al., 1993; Hossain et al., 1995; Inchausti, 1997). A few studies addressing the extent of voluntary disclosure have been conducted particularly in developing capital market (e.g. Chow and Wong-Boren, 1987; Hossain et al., 1994; Ahmed, 1996). However, these studies ignored especially the extent of nonfinancial information
disclosure in developing countries. Naser et al. (2002) investigated the relationship between corporate disclosure and company's firm characteristics and showed that the level of disclosure is related with profitability as well as size. Suwaidan et al. (2004) assessed the level of disclosure practices of 65 firms using 37 items of information. The result of the study recognized that disclosure is associated with corporate risk, profitability, and size. Other studies have analyzed
the contacts of increased disclosure on the stock market liquidity. Theoretical support for an association between that two suggests that disclosure enhances the liquidity of a firm’s stocks by reducing information asymmetries in capital market.
More available information including nonfinancial items plays a key role in vibrating the share trading and thus in the demand of the share. Its role ensures the liquidity of the share in the stock market. Different theoretical models have shown how disclosure level affects increases stock market liquidity. For instance, Amihud and Mendelson (1986) suggested that by disclosing more information, firms could increase their stock liquidity. Diamond and Verrecchia (1991) and Kim
and Verrecchia (1994) showed a model in which disclosure improves the liquidity of a firm’s securities by attracting increased demand from investors. Bloomfield and Wilks (2000) demonstrated that increased disclosures ensure investors pay a high price for shares that provide a greater degree of stock liquidity. Leuz and Verrecchia (2000) studied firms that have switched from Generally Accepted Accounting Principles (GAAP) to International Accounting Standards (IAS)
with a greater requirement for disclosing information in the annual reports. They asserted that the firms were thereby committing themselves to increased levels of disclosure including corporate governance that is treated as nonfinancial information material. They proved that firms disclosing more information
were associated with higher trading volume that seems to the higher demand of the share leading to higher share price. Espinosa et al. (2005) examined for a sample of listed firms and found a positive relationship between disclosures and liquidity of shares. Marquardt and Wiedman (1998) and Lang and Lundholm (2000) studied corporate disclosure and its relationship to stock price. They found evidence that firms increase their disclosures in annual reports increase
T
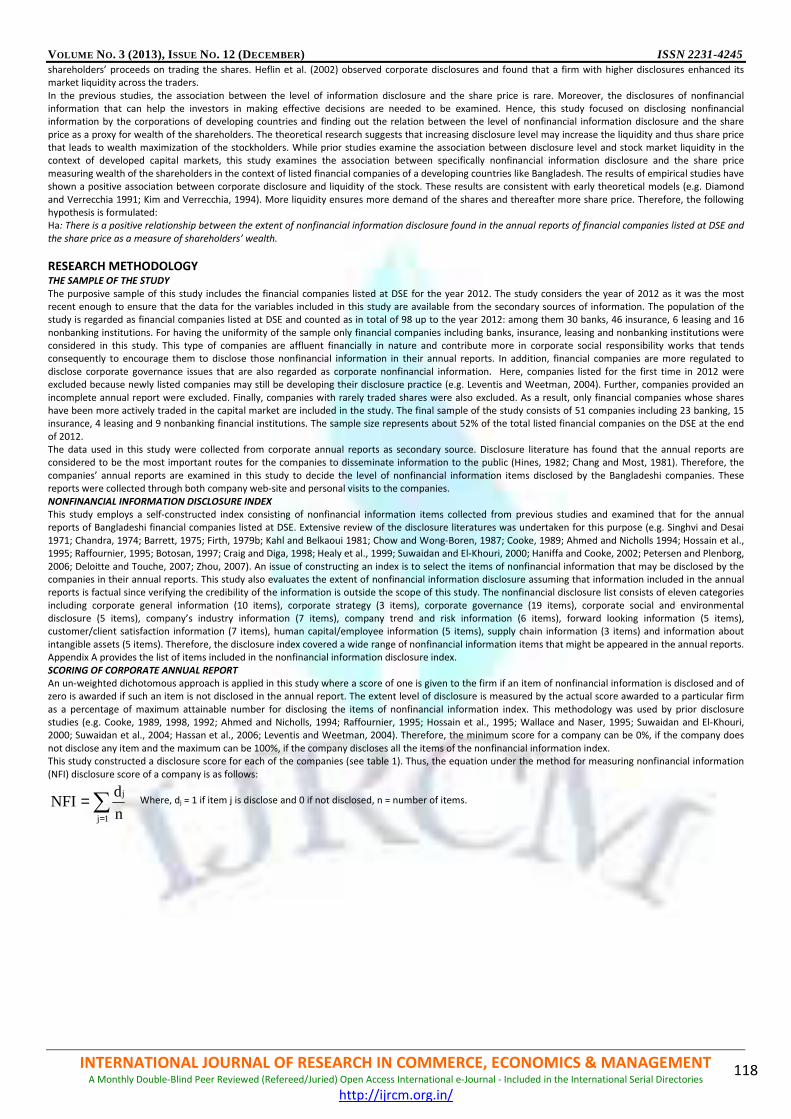
VOLUME NO. 3 (2013), ISSUE NO. 12 (DECEMBER) ISSN 2231-4245
INTERNATIONAL JOURNAL OF RESEARCH IN COMMERCE, ECONOMICS & MANAGEMENT A Monthly Double-Blind Peer Reviewed (Refereed/Juried) Open Access International e-Journal - Included in the International Serial Directories
http://ijrcm.org.in/
118
shareholders’ proceeds on trading the shares. Heflin et al. (2002) observed corporate disclosures and found that a firm with higher disclosures enhanced its market liquidity across the traders.
In the previous studies, the association between the level of information disclosure and the share price is rare. Moreover, the disclosures of nonfinancial information that can help the investors in making effective decisions are needed to be examined. Hence, this study focused on disclosing nonfinancial information by the corporations of developing countries and finding out the relation between the level of nonfinancial information disclosure and the share
price as a proxy for wealth of the shareholders. The theoretical research suggests that increasing disclosure level may increase the liquidity and thus share price that leads to wealth maximization of the stockholders. While prior studies examine the association between disclosure level and stock market liquidity in the context of developed capital markets, this study examines the association between specifically nonfinancial information disclosure and the share price
measuring wealth of the shareholders in the context of listed financial companies of a developing countries like Bangladesh. The results of empirical studies have shown a positive association between corporate disclosure and liquidity of the stock. These results are consistent with early theoretical models (e.g. Diamond
and Verrecchia 1991; Kim and Verrecchia, 1994). More liquidity ensures more demand of the shares and thereafter more share price. Therefore, the following hypothesis is formulated: Ha: There is a positive relationship between the extent of nonfinancial information disclosure found in the annual reports of financial companies listed at DSE and
the share price as a measure of shareholders’ wealth.
RESEARCH METHODOLOGY THE SAMPLE OF THE STUDY
The purposive sample of this study includes the financial companies listed at DSE for the year 2012. The study considers the year of 2012 as it was the most recent enough to ensure that the data for the variables included in this study are available from the secondary sources of information. The population of the study is regarded as financial companies listed at DSE and counted as in total of 98 up to the year 2012: among them 30 banks, 46 insurance, 6 leasing and 16
nonbanking institutions. For having the uniformity of the sample only financial companies including banks, insurance, leasing and nonbanking institutions were considered in this study. This type of companies are affluent financially in nature and contribute more in corporate social responsibility works that tends consequently to encourage them to disclose those nonfinancial information in their annual reports. In addition, financial companies are more regulated to
disclose corporate governance issues that are also regarded as corporate nonfinancial information. Here, companies listed for the first time in 2012 were excluded because newly listed companies may still be developing their disclosure practice (e.g. Leventis and Weetman, 2004). Further, companies provided an
incomplete annual report were excluded. Finally, companies with rarely traded shares were also excluded. As a result, only financial companies whose shares have been more actively traded in the capital market are included in the study. The final sample of the study consists of 51 companies including 23 banking, 15 insurance, 4 leasing and 9 nonbanking financial institutions. The sample size represents about 52% of the total listed financial companies on the DSE at the end
of 2012. The data used in this study were collected from corporate annual reports as secondary source. Disclosure literature has found that the annual reports are considered to be the most important routes for the companies to disseminate information to the public (Hines, 1982; Chang and Most, 1981). Therefore, the
companies’ annual reports are examined in this study to decide the level of nonfinancial information items disclosed by the Bangladeshi companies. These reports were collected through both company web-site and personal visits to the companies.
NONFINANCIAL INFORMATION DISCLOSURE INDEX
This study employs a self-constructed index consisting of nonfinancial information items collected from previous studies and examined that for the annual reports of Bangladeshi financial companies listed at DSE. Extensive review of the disclosure literatures was undertaken for this purpose (e.g. Singhvi and Desai
1971; Chandra, 1974; Barrett, 1975; Firth, 1979b; Kahl and Belkaoui 1981; Chow and Wong-Boren, 1987; Cooke, 1989; Ahmed and Nicholls 1994; Hossain et al., 1995; Raffournier, 1995; Botosan, 1997; Craig and Diga, 1998; Healy et al., 1999; Suwaidan and El-Khouri, 2000; Haniffa and Cooke, 2002; Petersen and Plenborg,
2006; Deloitte and Touche, 2007; Zhou, 2007). An issue of constructing an index is to select the items of nonfinancial information that may be disclosed by the companies in their annual reports. This study also evaluates the extent of nonfinancial information disclosure assuming that information included in the annual reports is factual since verifying the credibility of the information is outside the scope of this study. The nonfinancial disclosure list consists of eleven categories
including corporate general information (10 items), corporate strategy (3 items), corporate governance (19 items), corporate social and environmental disclosure (5 items), company’s industry information (7 items), company trend and risk information (6 items), forward looking information (5 items), customer/client satisfaction information (7 items), human capital/employee information (5 items), supply chain information (3 items) and information about
intangible assets (5 items). Therefore, the disclosure index covered a wide range of nonfinancial information items that might be appeared in the annual reports. Appendix A provides the list of items included in the nonfinancial information disclosure index.
SCORING OF CORPORATE ANNUAL REPORT
An un-weighted dichotomous approach is applied in this study where a score of one is given to the firm if an item of nonfinancial information is disclosed and of zero is awarded if such an item is not disclosed in the annual report. The extent level of disclosure is measured by the actual score awarded to a particular firm
as a percentage of maximum attainable number for disclosing the items of nonfinancial information index. This methodology was used by prior disclosure studies (e.g. Cooke, 1989, 1998, 1992; Ahmed and Nicholls, 1994; Raffournier, 1995; Hossain et al., 1995; Wallace and Naser, 1995; Suwaidan and El-Khouri, 2000; Suwaidan et al., 2004; Hassan et al., 2006; Leventis and Weetman, 2004). Therefore, the minimum score for a company can be 0%, if the company does
not disclose any item and the maximum can be 100%, if the company discloses all the items of the nonfinancial information index. This study constructed a disclosure score for each of the companies (see table 1). Thus, the equation under the method for measuring nonfinancial information
(NFI) disclosure score of a company is as follows: Where, dj = 1 if item j is disclose and 0 if not disclosed, n = number of items.
∑=
=1j
j
n
dNFI
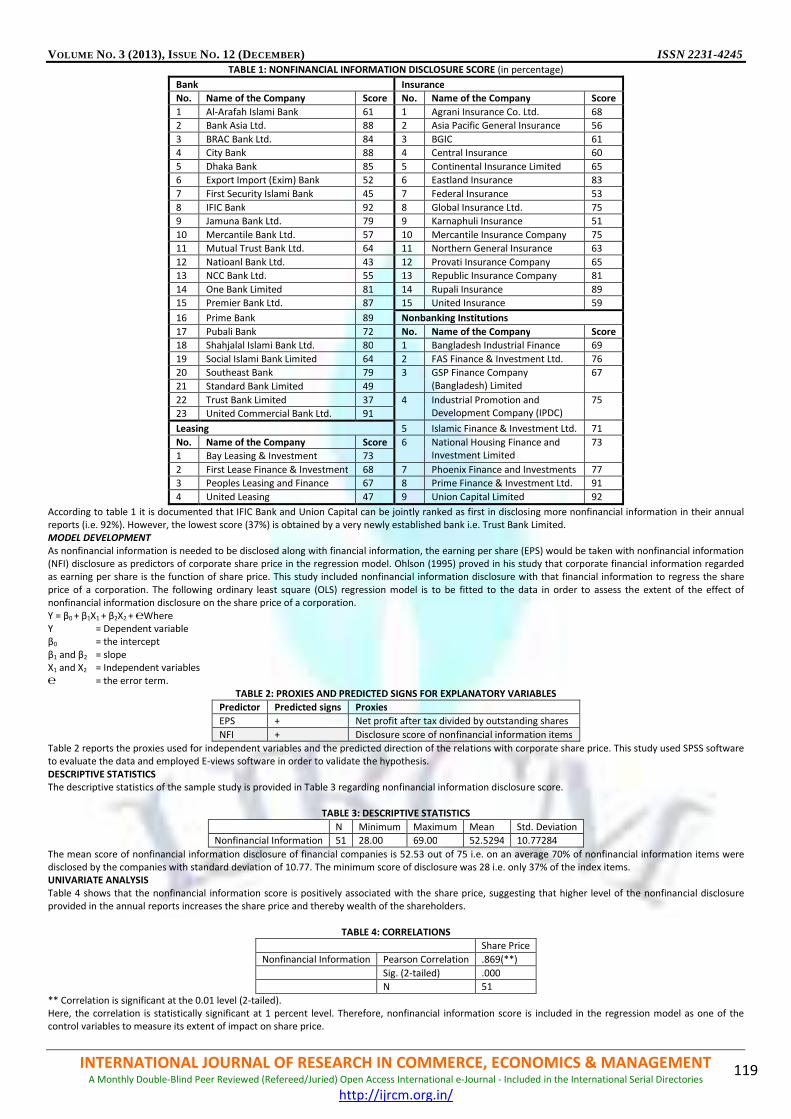
VOLUME NO. 3 (2013), ISSUE NO. 12 (DECEMBER) ISSN 2231-4245
INTERNATIONAL JOURNAL OF RESEARCH IN COMMERCE, ECONOMICS & MANAGEMENT A Monthly Double-Blind Peer Reviewed (Refereed/Juried) Open Access International e-Journal - Included in the International Serial Directories
http://ijrcm.org.in/
119
TABLE 1: NONFINANCIAL INFORMATION DISCLOSURE SCORE (in percentage)
Bank Insurance
No. Name of the Company Score No. Name of the Company Score
1 Al-Arafah Islami Bank 61 1 Agrani Insurance Co. Ltd. 68
2 Bank Asia Ltd. 88 2 Asia Pacific General Insurance 56
3 BRAC Bank Ltd. 84 3 BGIC 61
4 City Bank 88 4 Central Insurance 60
5 Dhaka Bank 85 5 Continental Insurance Limited 65
6 Export Import (Exim) Bank 52 6 Eastland Insurance 83
7 First Security Islami Bank 45 7 Federal Insurance 53
8 IFIC Bank 92 8 Global Insurance Ltd. 75
9 Jamuna Bank Ltd. 79 9 Karnaphuli Insurance 51
10 Mercantile Bank Ltd. 57 10 Mercantile Insurance Company 75
11 Mutual Trust Bank Ltd. 64 11 Northern General Insurance 63
12 Natioanl Bank Ltd. 43 12 Provati Insurance Company 65
13 NCC Bank Ltd. 55 13 Republic Insurance Company 81
14 One Bank Limited 81 14 Rupali Insurance 89
15 Premier Bank Ltd. 87 15 United Insurance 59
16 Prime Bank 89 Nonbanking Institutions
17 Pubali Bank 72 No. Name of the Company Score
18 Shahjalal Islami Bank Ltd. 80 1 Bangladesh Industrial Finance 69
19 Social Islami Bank Limited 64 2 FAS Finance & Investment Ltd. 76
20 Southeast Bank 79 3 GSP Finance Company
(Bangladesh) Limited
67
21 Standard Bank Limited 49
22 Trust Bank Limited 37 4 Industrial Promotion and Development Company (IPDC)
75
23 United Commercial Bank Ltd. 91
Leasing 5 Islamic Finance & Investment Ltd. 71
No. Name of the Company Score 6 National Housing Finance and Investment Limited
73
1 Bay Leasing & Investment 73
2 First Lease Finance & Investment 68 7 Phoenix Finance and Investments 77
3 Peoples Leasing and Finance 67 8 Prime Finance & Investment Ltd. 91
4 United Leasing 47 9 Union Capital Limited 92
According to table 1 it is documented that IFIC Bank and Union Capital can be jointly ranked as first in disclosing more nonfinancial information in their annual reports (i.e. 92%). However, the lowest score (37%) is obtained by a very newly established bank i.e. Trust Bank Limited. MODEL DEVELOPMENT
As nonfinancial information is needed to be disclosed along with financial information, the earning per share (EPS) would be taken with nonfinancial information (NFI) disclosure as predictors of corporate share price in the regression model. Ohlson (1995) proved in his study that corporate financial information regarded as earning per share is the function of share price. This study included nonfinancial information disclosure with that financial information to regress the share
price of a corporation. The following ordinary least square (OLS) regression model is to be fitted to the data in order to assess the extent of the effect of nonfinancial information disclosure on the share price of a corporation.
Y = β0 + β1X1 + β2X2 + ℮ Where Y = Dependent variable β0 = the intercept
β1 and β2 = slope X1 and X2 = Independent variables
℮ = the error term. TABLE 2: PROXIES AND PREDICTED SIGNS FOR EXPLANATORY VARIABLES
Predictor Predicted signs Proxies
EPS + Net profit after tax divided by outstanding shares
NFI + Disclosure score of nonfinancial information items
Table 2 reports the proxies used for independent variables and the predicted direction of the relations with corporate share price. This study used SPSS software to evaluate the data and employed E-views software in order to validate the hypothesis.
DESCRIPTIVE STATISTICS The descriptive statistics of the sample study is provided in Table 3 regarding nonfinancial information disclosure score.
TABLE 3: DESCRIPTIVE STATISTICS
N Minimum Maximum Mean Std. Deviation
Nonfinancial Information 51 28.00 69.00 52.5294 10.77284
The mean score of nonfinancial information disclosure of financial companies is 52.53 out of 75 i.e. on an average 70% of nonfinancial information items were disclosed by the companies with standard deviation of 10.77. The minimum score of disclosure was 28 i.e. only 37% of the index items. UNIVARIATE ANALYSIS Table 4 shows that the nonfinancial information score is positively associated with the share price, suggesting that higher level of the nonfinancial disclosure provided in the annual reports increases the share price and thereby wealth of the shareholders.
TABLE 4: CORRELATIONS
Share Price
Nonfinancial Information Pearson Correlation .869(**)
Sig. (2-tailed) .000
N 51
** Correlation is significant at the 0.01 level (2-tailed). Here, the correlation is statistically significant at 1 percent level. Therefore, nonfinancial information score is included in the regression model as one of the control variables to measure its extent of impact on share price.
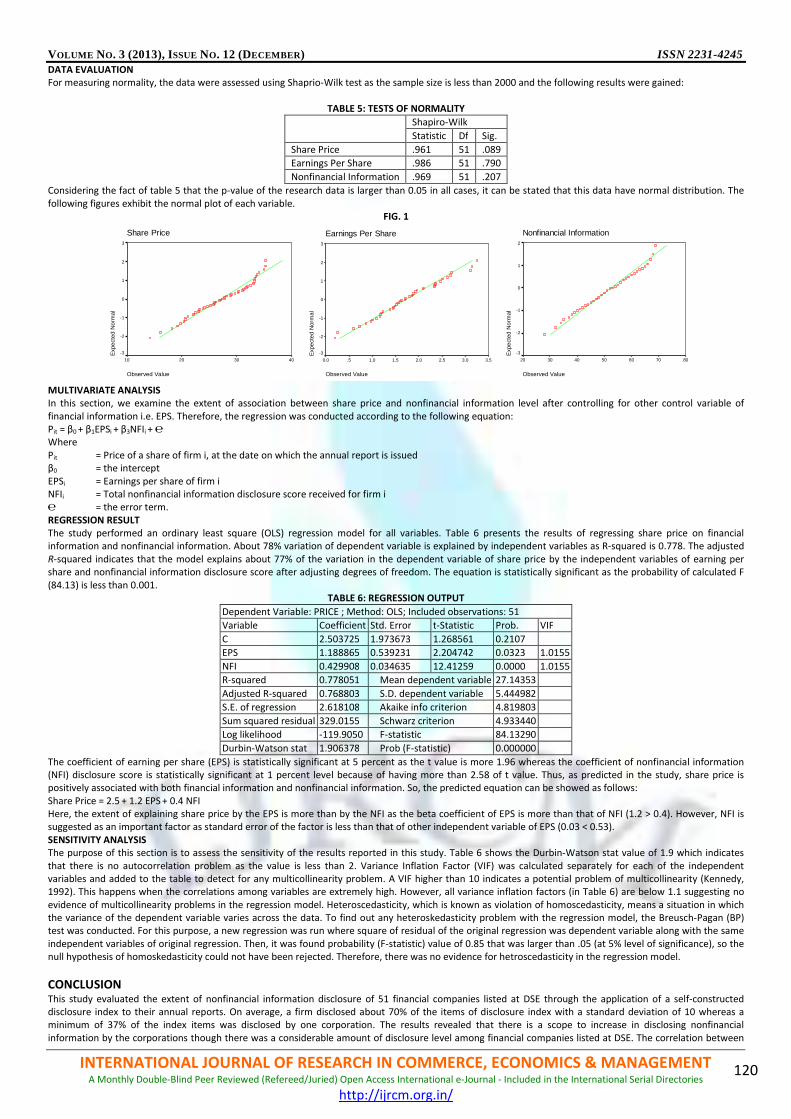
VOLUME NO. 3 (2013), ISSUE NO. 12 (DECEMBER) ISSN 2231-4245
INTERNATIONAL JOURNAL OF RESEARCH IN COMMERCE, ECONOMICS & MANAGEMENT A Monthly Double-Blind Peer Reviewed (Refereed/Juried) Open Access International e-Journal - Included in the International Serial Directories
http://ijrcm.org.in/
120
DATA EVALUATION For measuring normality, the data were assessed using Shaprio-Wilk test as the sample size is less than 2000 and the following results were gained:
TABLE 5: TESTS OF NORMALITY
Shapiro-Wilk
Statistic Df Sig.
Share Price .961 51 .089
Earnings Per Share .986 51 .790
Nonfinancial Information .969 51 .207
Considering the fact of table 5 that the p-value of the research data is larger than 0.05 in all cases, it can be stated that this data have normal distribution. The
following figures exhibit the normal plot of each variable. FIG. 1
Share Price
Observed Value
40302010
Exp
ect
ed N
orm
al
3
2
1
0
-1
-2
-3
Earnings Per Share
Observed Value
3.53.02.52.01.51.0.50.0
Exp
ect
ed
Nor
ma
l
3
2
1
0
-1
-2
-3
Nonfinancial Information
Observed Value
80706050403020
Exp
ect
ed N
orm
al
2
1
0
-1
-2
-3
MULTIVARIATE ANALYSIS In this section, we examine the extent of association between share price and nonfinancial information level after controlling for other control variable of
financial information i.e. EPS. Therefore, the regression was conducted according to the following equation: Pit = β0 + β1EPSi + β3NFIi + ℮ Where
Pit = Price of a share of firm i, at the date on which the annual report is issued β0 = the intercept
EPSi = Earnings per share of firm i NFIi = Total nonfinancial information disclosure score received for firm i ℮ = the error term.
REGRESSION RESULT The study performed an ordinary least square (OLS) regression model for all variables. Table 6 presents the results of regressing share price on financial information and nonfinancial information. About 78% variation of dependent variable is explained by independent variables as R-squared is 0.778. The adjusted
R-squared indicates that the model explains about 77% of the variation in the dependent variable of share price by the independent variables of earning per share and nonfinancial information disclosure score after adjusting degrees of freedom. The equation is statistically significant as the probability of calculated F
(84.13) is less than 0.001. TABLE 6: REGRESSION OUTPUT
Dependent Variable: PRICE ; Method: OLS; Included observations: 51
Variable Coefficient Std. Error t-Statistic Prob. VIF
C 2.503725 1.973673 1.268561 0.2107
EPS 1.188865 0.539231 2.204742 0.0323 1.0155
NFI 0.429908 0.034635 12.41259 0.0000 1.0155
R-squared 0.778051 Mean dependent variable 27.14353
Adjusted R-squared 0.768803 S.D. dependent variable 5.444982
S.E. of regression 2.618108 Akaike info criterion 4.819803
Sum squared residual 329.0155 Schwarz criterion 4.933440
Log likelihood -119.9050 F-statistic 84.13290
Durbin-Watson stat 1.906378 Prob (F-statistic) 0.000000
The coefficient of earning per share (EPS) is statistically significant at 5 percent as the t value is more 1.96 whereas the coefficient of nonfinancial information (NFI) disclosure score is statistically significant at 1 percent level because of having more than 2.58 of t value. Thus, as predicted in the study, share price is positively associated with both financial information and nonfinancial information. So, the predicted equation can be showed as follows:
Share Price = 2.5 + 1.2 EPS + 0.4 NFI Here, the extent of explaining share price by the EPS is more than by the NFI as the beta coefficient of EPS is more than that of NFI (1.2 > 0.4). However, NFI is suggested as an important factor as standard error of the factor is less than that of other independent variable of EPS (0.03 < 0.53).
SENSITIVITY ANALYSIS The purpose of this section is to assess the sensitivity of the results reported in this study. Table 6 shows the Durbin-Watson stat value of 1.9 which indicates
that there is no autocorrelation problem as the value is less than 2. Variance Inflation Factor (VIF) was calculated separately for each of the independent variables and added to the table to detect for any multicollinearity problem. A VIF higher than 10 indicates a potential problem of multicollinearity (Kennedy, 1992). This happens when the correlations among variables are extremely high. However, all variance inflation factors (in Table 6) are below 1.1 suggesting no
evidence of multicollinearity problems in the regression model. Heteroscedasticity, which is known as violation of homoscedasticity, means a situation in which the variance of the dependent variable varies across the data. To find out any heteroskedasticity problem with the regression model, the Breusch-Pagan (BP) test was conducted. For this purpose, a new regression was run where square of residual of the original regression was dependent variable along with the same
independent variables of original regression. Then, it was found probability (F-statistic) value of 0.85 that was larger than .05 (at 5% level of significance), so the null hypothesis of homoskedasticity could not have been rejected. Therefore, there was no evidence for hetroscedasticity in the regression model.
CONCLUSION This study evaluated the extent of nonfinancial information disclosure of 51 financial companies listed at DSE through the application of a self-constructed disclosure index to their annual reports. On average, a firm disclosed about 70% of the items of disclosure index with a standard deviation of 10 whereas a minimum of 37% of the index items was disclosed by one corporation. The results revealed that there is a scope to increase in disclosing nonfinancial
information by the corporations though there was a considerable amount of disclosure level among financial companies listed at DSE. The correlation between

VOLUME NO. 3 (2013), ISSUE NO. 12 (DECEMBER) ISSN 2231-4245
INTERNATIONAL JOURNAL OF RESEARCH IN COMMERCE, ECONOMICS & MANAGEMENT A Monthly Double-Blind Peer Reviewed (Refereed/Juried) Open Access International e-Journal - Included in the International Serial Directories
http://ijrcm.org.in/
121
nonfinancial information disclosure level and the share price was found to be positively and highly coordinated to each other. Before doing multivariate analysis the data were evaluated for the assessment of normality. Then, a regression was run to find out the extent of impact for disclosing nonfinancial information by
the corporation. Both financial and nonfinancial information were considered as control variables for the regression test. In addition, an analysis was added to the study to assess the sensitivity of the regression results. The regression result suggests that disclosing nonfinancial information should be regarded as an important factor in regressing share price of a corporation though the extent of explaining share price by financial information disclosure is significant. The result
of the study was consistent with the hypothesis of the study (Ha) on showing that the higher level of nonfinancial information disclosure provided in the annual reports increases the market price and thereby wealth of the shareholders. Therefore, it is recommended that listed Bangladeshi companies ought to disclose more nonfinancial along with financial information via annual reports for the sake of wealth maximization of the shareholders.
REFERENCES 1. Ahmed, K. (1996), “Disclosure policy choice and corporate characteristics: A study of Bangladesh” Asia-Pacific Journal of Accounting, Vol. 3, No. 1, pp. 183-
203.
2. Ahmed, K., and Nicholls, D. (1994), “The impact of non-financial company characteristics on mandatory disclosure compliance in developing countries: The case of Bangladesh”, The International Journal of Accounting, Vol. 29, No.1, pp. 62 – 77.
3. Amihud, Y., and Mendelson, H. (1986), “Asset pricing and the bid-ask spread”, Journal of Financial Economic, Vol. 17, No. 2, pp. 223-249.
4. Barrett, M. (1975), “Annual report disclosure: Are American reports superior?”, Journal of International Business Studies, Vol. 6, No. 2, pp. 15-24. 5. Bloomfield, R., and Wilks, T. (2000), “Disclosure effect in the laboratory: Liquidity, depth, and the cost of equity capital”, The Accounting Review, Vol. 75,
No.1, pp. 13-41. 6. Botosan, C. (1997), “Disclosure level and cost of equity capital”, The Accounting Review, Vol. 72, No. 3, pp. 323-349. 7. Chandra, G. (1974), “A study of the consensus on disclosure among public accountants and security analysis”, The Accounting Review, Vol. 49, No. 4, pp.
733-742. 8. Chang, L., and Most, K. (1981), “An international comparison of investor uses of financial statements”, International Journal of Accounting Education and
Research, Vol. 17, No. 1, pp. 43- 60.
9. Chow, C., and Wong-Boren, A. (1987), “Voluntary Financial disclosure by Mexican corporations”, The Accounting Review, Vol. 62, No. 3, pp. 533- 541. 10. Cooke TE. (1992), “The impact of size, stock market listing and industry type on disclosure in the annual reports of Japanese listed corporations”,
Accounting and Business Research, Vol. 22, No. 87, pp. 229–237. 11. Cooke, T. (1989), “Voluntary corporate disclosure by Swedish companies”, Journal of International Financial Management and Accounting, Vol. 1, No. 2, pp.
171- 195.
12. Cooke, T. (1998), “Regression analysis in accounting disclosure studies”, Accounting and Business Research, Vol. 28, No. 3, pp. 209- 224. 13. Craig R, and Diga J. (1998), “Corporate accounting disclosure in ASEAN”, Journal of International Financial Management and Accounting, Vul. 9, No. 3, pp.
247–273.
14. Deloitte and Touche (2007): “Understanding Performance Drivers through the Use of Non-Financial Measurements”, Audit Committee Conversations: A Deloitte Academy event, Melbourne, May 2007.
15. Diamond, D., and Verrecchia, R. (1991), “Disclosure, liquidity and cost of equity capital”, Journal of Finance, Vol. 46, No. 4, pp. 1325- 1359. 16. Espinosa, M., Tapia, M., and Trombetta, M. (2005): “Disclosure and liquidity”, Working Paper, University Calos, Madrid. 17. Firth, M. (1979b), “The impact of size, stock market listing and auditors on voluntary disclosure in corporate annual reports”, Accounting and Business
Research, Vol. 9, No. 36, pp. 273- 280. 18. Haniffa, R., and Cooke, T. (2002), “Culture, corporate governance and disclosure in Malaysian corporations”, ABACUS, Vol. 36, No. 3, pp. 317- 773.
19. Hassan, O., Giorgioni, G., and Romily, P. (2006), “The extent of financial disclosure and its determinants in an emerging capital market: The case of Egypt”, International Journal of Accounting, Auditing, and Performance Evaluation, Vol. 3, No. 1, pp. 41- 67.
20. Healy, P; Hutton, A., and Palepu, K. (1999), “Stock performance and intermediation changes surrounding sustained increases in disclosure”, Contemporary
Accounting Research, Vol. 16, No. 3, pp. 485-520. 21. Heflin, F., Shaw, K.W., and Wild, J.J. (2002): “Disclosure quality and market liquidity”, Working Paper, Robert H. Smith School of Business, College Park, MD. 22. Hines, R.D. (1982), “The usefulness of annual reports; the anomaly between the efficient market hypothesis and shareholder surveys”, Accounting and
Business Research, Vol. 12, No. 48, pp. 296- 309. 23. Hossain, M., Perera, M., and Rahman, A. (1995), “Voluntary disclosure in the annual reports of New Zealand companies”, Journal of International Financial
Management & Accounting, Vol. 6, No. 1, pp. 69-87. 24. Hossain, M., Tan, L., and Adams, M. (1994), “Voluntary disclosure in an emerging capital market: Some empirical evidence from companies listed on the
Kuala Lumpur stock exchange”, International Journal of Accounting, Vol. 29, No. 4, pp. 334- 351.
25. Inchausti, B. (1997), “The influence of company characteristics and accounting regulation on information disclosed by Spanish firms”, The European Accounting Review, Vol. 6, No. 1, pp. 45-68.
26. Kahl A, and Belkaoui A. (1981), “Bank annual report disclosure adequacy internationally”, Accounting and Business Research, Summer: 189–196.
27. Kennedy, P. (1992), “A guide to econometric”. Basil Blackwell Ltd: Oxford. 28. Kim, O., and Verrecchia, R. (1994), “Market liquidity and volume around earnings announcements”, Journal of Accounting and Economics, Vol. 17, No. 1,
pp. 41- 68. 29. Lang, M., and Lundholm, R. (2000), “Voluntary disclosure and equity offerings: reducing information asymmetry or hyping the stock?”, Contemporary
Accounting Research, Vol. 17, No. 4, pp. 623- 662.
30. Leuz, C., and Verrecchia, R. (2000), “The economic consequences of increased disclosure”, Journal of Accounting Research, Vol. 38, No. 3, pp. 91- 124. 31. Leventis, S., and Weetman, P. (2004), “Impression management: dual language reporting and voluntary disclosure”, Accounting Forum, Vol. 28, No. 3, pp.
307- 328. 32. Malone, D., Fries, C., and Jones, T. (1993), “An empirical investigation of the extent of disclosure in the oil and gas industry”, Journal of Accounting,
Auditing and Finance, Vol. 23, No. 3, pp. 249- 273.
33. Marquardt, C., and Wiedman, C. (1998), “Voluntary disclosure, information asymmetry, and insider selling through secondary offerings”, Contemporary Accounting Research, Vol. 15, No.4, pp. 505- 537.
34. McNally, G., Eng, L., and Hasseldine, C. (1982), “Corporate financial reporting in New Zealand: An analysis of users preferences, corporate characteristics
and disclosure practices for discretionary information”, Accounting and Business Research, Vol. 13, No. 49, pp. 11– 20. 35. Naser, K., Alkhatib, K., and Karbari, Y. (2002), “Empirical evidence on the depth of corporate information disclosure in developing countries: The case of
Jordan”, International Journal of Commerce and Management, Vol. 12, No.3/4, pp. 122- 134. 36. Ohlson, J. A. (1995), “Earnings, book values and dividends in equity valuation”, Contemporary Accounting Research, Vol. 11, No. 2, pp. 661-687. 37. Petersen, C., and Plenborg, T. (2006), “Voluntary disclosure and information asymmetry in Denmark”, Journal of International Accounting, Auditing and
Taxation, Vol. 15, No. 2, pp. 127- 149. 38. Raffournier, B. (1995), “The determinants of voluntary financial disclosure by Swiss listed companies”, The European Accounting Review, Vol. 4, No. 2, pp.
261- 280.
39. Singhvi, S., and Desai, H. (1971), “An empirical analysis of the quality of corporate financial disclosure”, Accounting Review, Vol. 46, No. 1, pp. 129- 138.
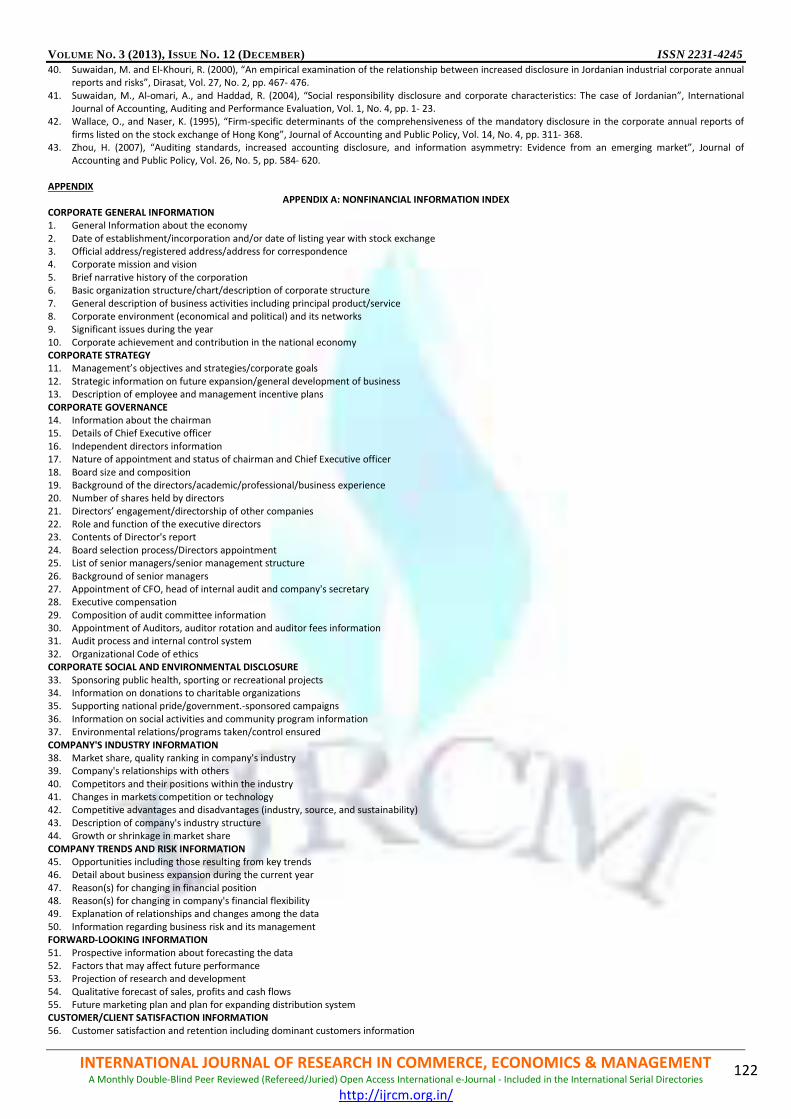
VOLUME NO. 3 (2013), ISSUE NO. 12 (DECEMBER) ISSN 2231-4245
INTERNATIONAL JOURNAL OF RESEARCH IN COMMERCE, ECONOMICS & MANAGEMENT A Monthly Double-Blind Peer Reviewed (Refereed/Juried) Open Access International e-Journal - Included in the International Serial Directories
http://ijrcm.org.in/
122
40. Suwaidan, M. and El-Khouri, R. (2000), “An empirical examination of the relationship between increased disclosure in Jordanian industrial corporate annual reports and risks”, Dirasat, Vol. 27, No. 2, pp. 467- 476.
41. Suwaidan, M., Al-omari, A., and Haddad, R. (2004), “Social responsibility disclosure and corporate characteristics: The case of Jordanian”, International Journal of Accounting, Auditing and Performance Evaluation, Vol. 1, No. 4, pp. 1- 23.
42. Wallace, O., and Naser, K. (1995), “Firm-specific determinants of the comprehensiveness of the mandatory disclosure in the corporate annual reports of
firms listed on the stock exchange of Hong Kong”, Journal of Accounting and Public Policy, Vol. 14, No. 4, pp. 311- 368. 43. Zhou, H. (2007), “Auditing standards, increased accounting disclosure, and information asymmetry: Evidence from an emerging market”, Journal of
Accounting and Public Policy, Vol. 26, No. 5, pp. 584- 620.
APPENDIX
APPENDIX A: NONFINANCIAL INFORMATION INDEX CORPORATE GENERAL INFORMATION 1. General Information about the economy
2. Date of establishment/incorporation and/or date of listing year with stock exchange 3. Official address/registered address/address for correspondence 4. Corporate mission and vision
5. Brief narrative history of the corporation 6. Basic organization structure/chart/description of corporate structure
7. General description of business activities including principal product/service 8. Corporate environment (economical and political) and its networks 9. Significant issues during the year
10. Corporate achievement and contribution in the national economy CORPORATE STRATEGY 11. Management’s objectives and strategies/corporate goals
12. Strategic information on future expansion/general development of business 13. Description of employee and management incentive plans
CORPORATE GOVERNANCE 14. Information about the chairman 15. Details of Chief Executive officer
16. Independent directors information 17. Nature of appointment and status of chairman and Chief Executive officer
18. Board size and composition 19. Background of the directors/academic/professional/business experience 20. Number of shares held by directors
21. Directors’ engagement/directorship of other companies 22. Role and function of the executive directors 23. Contents of Director's report
24. Board selection process/Directors appointment 25. List of senior managers/senior management structure
26. Background of senior managers 27. Appointment of CFO, head of internal audit and company's secretary 28. Executive compensation
29. Composition of audit committee information 30. Appointment of Auditors, auditor rotation and auditor fees information 31. Audit process and internal control system
32. Organizational Code of ethics CORPORATE SOCIAL AND ENVIRONMENTAL DISCLOSURE 33. Sponsoring public health, sporting or recreational projects 34. Information on donations to charitable organizations 35. Supporting national pride/government.-sponsored campaigns
36. Information on social activities and community program information 37. Environmental relations/programs taken/control ensured
COMPANY'S INDUSTRY INFORMATION 38. Market share, quality ranking in company's industry 39. Company's relationships with others
40. Competitors and their positions within the industry 41. Changes in markets competition or technology 42. Competitive advantages and disadvantages (industry, source, and sustainability)
43. Description of company's industry structure 44. Growth or shrinkage in market share
COMPANY TRENDS AND RISK INFORMATION 45. Opportunities including those resulting from key trends 46. Detail about business expansion during the current year
47. Reason(s) for changing in financial position 48. Reason(s) for changing in company's financial flexibility 49. Explanation of relationships and changes among the data
50. Information regarding business risk and its management FORWARD-LOOKING INFORMATION 51. Prospective information about forecasting the data 52. Factors that may affect future performance 53. Projection of research and development
54. Qualitative forecast of sales, profits and cash flows 55. Future marketing plan and plan for expanding distribution system CUSTOMER/CLIENT SATISFACTION INFORMATION 56. Customer satisfaction and retention including dominant customers information

VOLUME NO. 3 (2013), ISSUE NO. 12 (DECEMBER) ISSN 2231-4245
INTERNATIONAL JOURNAL OF RESEARCH IN COMMERCE, ECONOMICS & MANAGEMENT A Monthly Double-Blind Peer Reviewed (Refereed/Juried) Open Access International e-Journal - Included in the International Serial Directories
http://ijrcm.org.in/
123
57. Information about product/service innovation 58. Product safety/service quality Information
59. Diversity of product/service information 60. Marketing program effectiveness 61. Market reputation and brand perceptions
62. Product defects, repairs, return or dissatisfaction of services information HUMAN CAPITAL (EMPLOYEE) INFORMATION 63. Employee engagement and retention information
64. Information about organizational culture 65. Employee training/Human Capital Development
66. Human/Employee rights information 67. Occupational health and safety information SUPPLY CHAIN INFORMATION: 68. Information regarding supplier/dealer/broker/merchant/service provider 69. Information regarding availability or scarcity of supply of products or services 70. Information about manufacturer warranty/safety of services
INFORMATION ABOUT THE INTANGIBLE ASSETS: 71. Important patents, trademarks, licenses etc. information
72. Information about brand reputation / service rating information 73. Information regarding level of expertise of the employees 74. Management quality information
75. Information about technological know how
VOLUME NO. 3 (2013), ISSUE NO. 12 (DECEMBER) ISSN 2231-4245
INTERNATIONAL JOURNAL OF RESEARCH IN COMMERCE, ECONOMICS & MANAGEMENT A Monthly Double-Blind Peer Reviewed (Refereed/Juried) Open Access International e-Journal - Included in the International Serial Directories
http://ijrcm.org.in/
124
CAN ECONOMIC VISION OF MAHATMA GANDHI MAKE HIM A DEMOCRATIC LEADER?
NEHA BOTHRA
RESEARCH SCHOLAR
DEPARTMENT OF FINANCIAL STUDIES
UNIVERSITY OF DELHI
NEW DELHI
ABSTRACT
A day seldom passes without stories appearing in the newspapers about democratic leadership. Leadership does not end with the person who shows the
characteristics. Leadership is a journey; moving from one point to another – Leadership is moving from one level to another; even if you return to the same point you will have a different level of thinking and understanding. Leadership needs followers, it requires dedication. This might be the reason why it is a bit complex
to understand Leadership as a whole. India – the land of role models for leadership like Mahatma Gandhi, Rabindranath Tagore, Jawaharlal Nehru etc. Gandhi established the credibility by leading through example, he established himself as a real servant of the people of India, empowering the general public practicing what he preached even the small things like spinning yarn to make his clothes. He resorted to simple and poor living, just like millions in the country, hence
people looked at Gandhi as one of their own, and they could see their own sufferings in him. Capitalism and Socialism are the two accepted economic systems with serious drawbacks. However, one very complete and well-thought-out alternative economic system is Gandhian economics. This paper tries to present the
overall socioeconomic thoughts of Gandhiji as an origin of alternative development. The work explores his ideas for a "post-modern" construction of India, where his views on Swadeshi, his theory of Trusteeship and his images of an ideal village economy are examined. I am trying to locate the solution of recent economic situation through Gandhian economic vision, to re-examine the outstanding qualities of leadership that Gandhi provided and deconstruct the
constituent components of his leadership to arrive at a better understanding of the qualities and effectiveness of leadership. This study explores the democratic leadership qualities of Gandhi in relation to economic vision.
KEYWORDS
Democratic leader, Mahatma Gandhi, capitalism, socialism, swadeshi, trusteeship, Swaraj.
INTRODUCTION oday we are the citizens of a free and democratic country, India, but years back, India was not a liberated nation. British ruled India and a long struggle were carried out to achieve freedom for India. This Indian freedom struggle could have been an entirely impossible dream if it had not been people like
Mahatma Gandhi, Pt. Jawahar Lal Nehru, and Netaji Subash Chandra Bose. The whole India was guided competently by these people towards the attainment of independence. We call them leaders. The question here arises: why were these people chosen as leaders and what were their characteristics?
Which policies were created them? During the course of democratic movement in liberating British ruled India, democratic leadership played crucial function. Therefore, appraising the definition of democratic leadership is essential in understanding both democratic leadership and the progress made in democratic movements. Here I am going to discuss the economic vision of Mahatma Gandhi; the vision that makes him a democratic leader.
A traveler, who came from Europe to India, was asked: ‘What do you wish to see in India?’ His reply was: 'The Himalayas, The Taj Mahal and Mahatma Gandhi.'It was neither wealth nor power that made Gandhiji so famous. He became famous for certain good quality that he possessed. He always practiced what he taught.
“Gandhiji was, above all, the astute political leader of a class the bourgeoisie, in whose class interests he always acted." E.M.S. Namboodiripad
“The earth has sufficient resources to satisfy one’s needs, but not for one’s greed.” - M. K. Gandhi
OBJECTIVES OF THE PAPER The paper covers the following objectives: 1. To analyze the extent of Gandhi to be called a democratic leader.
2. To consider the parameter that defines a leader for the ordinary Indian – the masses. 3. To determine the Economic Vision of Gandhi that made him a democratic leader.
4. To locate the solution of contemporary economic situation through Gandhian economic thought. 5. To study the concept of alternative development in the current scenario.
RELEVANCE OF THE PAPER Today, every economy is seeking to attain the economic growth. Numerous economists gave their economic theories. Confusion goes on…which policy to be
opted and which one should be left. Getting the consent of all the denizens in every decision making is not possible. So to give a solution to this situation we select our representatives- our leaders, politicians and this is how the entire government is formed. India- the highest electorate and known for its democracy
has and had multiple leaders. Many of them came, worked and left. But very few are remembered for long. One leader who followed every preaching of his own, led the life of the masses, may be an economist who is still found on the most crucial part of our economy- currency notes …Yes I am going to discuss about the father of our nation- Mahatma Gandhi. He always said that True economics stands for social justice; it promotes the good of all including the weakest and is
indispensable for decent life. For him, the economy was meaningful to the extent that it opened out the possibility of well-being for all people. The trade-off between utility and loyalty is exemplified in Gandhi’s explanation of the principle of neighborliness. These paper discuses what made Gandhi a “Gandhi”? This paper is also going to discuss about the Economic thoughts that he carried which impelled us to call him a “democratic leader”.
CHARACTERISTICS OF DEMOCRATIC LEADERSHIP Anderson (1959) defined the democratic leader as one who shares decision making with the other members. He asserted that democratic leadership is associated with higher morale in most situations. Hackman and Johnson (1996) supported Anderson’s explanation of the relationship between democratic
leadership and productivity. Democratic leadership is associated with increased follower productivity, satisfaction, involvement, and commitment (Hackman & Johnson, 1996). Member satisfaction and nominations for leadership are greater under democratic leadership (Bass, 1990; Stogdill, 1974). As noted earlier, participation is a core characteristic of democratic leadership; and the ideal of democratic leadership is friendly, helpful, and encouraging participation (Luthar,
1996). Chemers (1984) also defined democratic leadership as emphasizing group participation. Thus, participation is the major characteristic of democratic leadership (Bass, 1990). On the other hand, Kuczmarski and Kuczmarski (1995) cited the characteristics of a democratic leader as knowledgeable, influential,
stimulating, a winner of cooperation, a provider of logical consequences, encouraging, permitting of self-determination, guiding, a good listener and respecting, and situation-centered. Gastil (1994) defined the characteristics of democratic leadership as distributing responsibility among the membership, empowering
T
VOLUME NO. 3 (2013), ISSUE NO. 12 (DECEMBER) ISSN 2231-4245
INTERNATIONAL JOURNAL OF RESEARCH IN COMMERCE, ECONOMICS & MANAGEMENT A Monthly Double-Blind Peer Reviewed (Refereed/Juried) Open Access International e-Journal - Included in the International Serial Directories
http://ijrcm.org.in/
125
group members, and aiding the group’s decision-making process. This paper deals with the economic thoughts of Gandhi and whether these thoughts created him as a democratic leader?
GANDHI: A MASS LEADER, A DEMOCRATIC LEADER AND AN ECONOMIC VISIONERY Mohandas Karamchand Gandhi (1869-1948) developed a vibrant critique of the mode of development and also of the very idea of ‘civilization’ as it was then exemplified by the western nations. This model of ideology, as he argued, rested on violence and exploitation (slavery and then colonization), and abandoned both morality and spirituality, while creating new needs which were impossible to satisfy. The industrialization and globalization of the economy, he argued, a
disaster for India. For Gandhi, the economy was meaningful to the extent that it opened out the possibility of well-being for all people (Sarvodaya). That implied a system of production, of distribution and consumption defined by the essential needs of most deprived people in the society (Antyodaya—‘the least’) with the
aim of supporting the highest values of human life. His understanding of the path to sarvodaya was through a village economy which maximized the powers of the traditional Indian handcrafts and only employed modern machines that allowed for a ‘production by the masses’ rather than ‘mass production’ (Friedman, 2008). The three concepts so central to Gandhi’s Economic idea:
� Swaraj is political and economic independence but also the liberation of the human being from all systems and ideologies which would undermine human
dignity.
� Swadeshi Gandhi's vision of a free India was not a nation-state but a confederation of self-governing, self-reliant, self-employed people living in village
communities, deriving their right livelihood from the products of their homesteads. Maximum economic and political power - including the power to decide what could be imported into or exported from the village - would remain in the hands of the village assemblies.
� Trusteeship, predominance given to ethics and the common good. It provides a means by which the wealthy people would be the trustees of trusts that
looked after the welfare of the people in general. Gandhi believed that the rich people could be persuaded to part with their wealth to help the poor. Putting it in Gandhiji's words "Supposing I have come by a fair amount of wealth – either by way of legacy, or by means of trade and industry – I must know that all that wealth does not belong to me; what belongs to me is the right to an honourable livelihood, no better than that enjoyed by millions of others.
The rest of my wealth belongs to the community and must be used for the welfare of the community." (Godinot,2010) Seven criteria characterize economic independence according to Gandhi:
� Elimination of poverty and the minimizing of wealth.
� Self-sufficiency of each unit in its basic needs.
� Identification of basic human needs and the means of meeting them.
� Agriculture that is respectful of the environment as a basis for the creation of a durable economy.
� Production that is based as far as possible on small groups.
� Control and elimination of distorted views by basic education and technical formation.
� Limitations to the concentration of economic power. (Godinot,2010) Two features of the Gandhian mode ought to assure for it a very special place in the history of economic thought. First, Gandhiji advocated the precept of
limitation of wants to take care of one's need and not greed. This is a counterpoise to the entire edifice of mainstream economic thinking which is based on the notion of a continuous expansion of the goods space to satisfy unlimited wants. It is conceivable that this may yet turn out to be the single major Gandhian insight that could dictate the agenda of the long-term sustainability of the ecosystem. The second has to do with the idea of focusing on the well-being of the
poorest and weakest member of society that is contained in Gandhiji's talisman. This was one of the last notes that Gandhiji left behind in 1948. This was an intrinsic part of Gandhiji's moral view of the world. (Nayak, 2005) Mahatma Gandhi never created a body of literature known by the name ‘Gandhian Economics’. He neither claimed to be an economist nor was trained in
Economics. He was not a voracious reader of economic literature. Nevertheless, he expressed his views on economics at various points of time in his life. His reflections on Economics found expression in his writings and thoughts. Students of Gandhian thought and writings collated his reflections on economics and
created a body of literature known as ‘Gandhian Economics’. The literature thus created is known to be enormous enough to be unparalleled in the history of modern Indian economic thought. The synthesis of the ideas of Mahatma Gandhi with the ideas of the modern world will create a more holistic and integrated society. It will deliver more happiness, generate more altruistic economic surplus and bring about a more egalitarian society than what is now available to us.
Gandhi claimed that “True economics never militates against the highest ethical standard just as all true ethics must also be good economics…. True economics stands for social justice; it promotes the good of all including the weakest and is indispensable for decent life”. Subhash Mehta writing on Gandhi’s economic
philosophy says that, Khaddar economics was based on ethics and self sufficiency. That the ideal of man is spiritual progress first and last and no economic progress can violate this principle. Gandhian economics lay emphasis on spiritual satisfaction. Spiritualism holds sway over consumerism. Gandhi emphasized on minimizing wants and keeping away from luxuries. (Mehta, 2004). Gandhi never advocated the destruction of factories and machines but sought regulation of their excesses. He felt that production and consumption must be decentralized and both these functions must take place near the source of production. Gandhi had explained that his small scale rural based economic system was not based on the rejection of machinery but on objection to the craze for machinery. Gandhi wanted people to consume locally produced goods and
particularly village industry produced goods instead of imported or factory goods. Diwan and Lutz point out that Swadeshi demands the sacrifice of utility for the sake of loyalty. The trade-off between utility and loyalty is exemplified in Gandhi’s explanation of the principle of neighborliness. He said, “I refuse to buy from
anybody anything however nice or beautiful if it interferes with my growth or injures those whom nature has made my first care” (Swadeshi and Nationalism, Young India, 12 March, 1925). According to Gandhi’s theory of trusteeship, the rich will be free to possess their wealth but will use only that part of their wealth which is required to satisfy
their needs and hold the rest in trust for the use of the society. Non-violence was subsumed in the principle of trusteeship and if the rich did not come forward to help the poor by holding their surplus wealth in trust, Gandhi had the weapon of non-cooperation for he believed that the rich cannot accumulate wealth without the cooperation of the poor. Gandhi wanted to delegitimize gross accumulation of wealth and follow trusteeship as a principle of economic conscience.
Gandhi felt that the rich could be persuaded through moral pressure to become trustees. And if the capitalists still refuse to act as trustees, ownership of wealth can be regulated through legislation (Harijan, 25th October, 1952). Gandhi wanted capitalism to be replaced by trusteeship where in no person will accumulate
wealth beyond his needs and part the balance of his wealth to the trust and production will not be guided by desire but by need. Mr. Jamnalal Bajaj was greatly inspired by the Gandhian idea of trusteeship and went on to set up the Jamnalal Seva Trust at Wardha in Maharashtra. Sarvodaya means the rising of all in the society. In the economic context, it means the economic welfare of all. Gandhi believed that the followers of non-
violence will not stop at the utilitarian principle ‘greatest good of the greatest number’ but move ahead and achieve the greatest good of all. Reflecting on the problems of industrialization, Gandhi observed that “any machinery which does not deprive masses of men of the opportunity to labour but which helps the
individual and adds to his efficiency and which a man can handle at will without being its slave was a good thing” (A discussion, Harijan, 22nd
June, 1935). In 1928, Gandhi said, “According to me, the economic constitution of India and for that matter the world should be such that no one under it should suffer from wants of food and clothing. In other words, everybody should be able to get sufficient work to enable him to make the two ends meet. And this ideal can be
universally realized only if the means of production of the elementary necessaries of life remain the control of the masses. These should be freely available to all as God’s air and water are or ought to be, they should not be made a vehicle of traffic for the exploitation of others. This monopolization by any country, nation or group of persons would be unjust. The neglect of this simple principle is the cause of destitution that we witness today not only in this unhappy land but other
parts of the world too”. (Mehta, 2004).

VOLUME NO. 3 (2013), ISSUE NO. 12 (DECEMBER) ISSN 2231-4245
INTERNATIONAL JOURNAL OF RESEARCH IN COMMERCE, ECONOMICS & MANAGEMENT A Monthly Double-Blind Peer Reviewed (Refereed/Juried) Open Access International e-Journal - Included in the International Serial Directories
http://ijrcm.org.in/
126
CONCLUSION Gandhian economics represent an alternative to mainstream economic ideologies as a way to promote economic self-sufficiency without an emphasis on
material pursuits or compromising human development. Gandhi's emphasis on peace, "trusteeship" and co-operation has been touted as an alternative to competition as well as conflict between different economic and income classes in societies. Gandhian focus on human development is also seen as an effective
emphasis on the eradication of poverty, social conflict and backwardness in developing nations. Now if we think about democracy or democratic leader, both works for the development of nation and masses. Gandhian economic thought centres on sustainable growth focus on man against machine and reducing economic inequality. Even well-known Economist like Arnold Toynbee in his book, “Future of
Asia and Africa” advocates the same philosophy that Gandhi advocated. Louis Fisher opines, “The Institution of Parliament has lost its relevance. Violence threatens to engulf Asian and African sub-continent.” In this situation, with every passing day, Mahatma Gandhi’s influence is increasing. Fisher feels that unless
we follow the Gandhian model, we are leading to a situation where Capitalists – a microscopic minority of society – will become all too powerful. In the present context of Globalization of Indian Economy, it can be said that Fisher’s words are more true today than ever before. He had submitted that countries of Asia and Africa must retain their own uniqueness and not submit to the blind growth Capitalism. Today’s economic policies are at the behest of international pressures
and the common man finds no need for them. Gandhiji wanted to build social justice and welfare amalgamated with economy where as today’s economic policies dictates terms on its own, not evolving out of any social means but for political pragmatism. Mahatma Gandhi, who wished for a stateless democracy fully based upon non-violence, more or less, supports the system of the day on the one hand, and he
expressed his desires to work continuously for improvements until it comes within the domain of Ahimsa on the other. Democracy, according to the best definition of Abraham Lincoln, “is the government of the people, for the people and by the people.”
In democracy, there is a greater possibility of peace in comparison to any other form of the system. It is because people are connected with the system directly as well as indirectly at every level; it provides maximum opportunity to people for progress or development and, above all, its people can themselves decide the mode of their welfare. And it is for this reason that today a big portion of the world happens to be under democratic system of government. From beginning to
end economic vision, Gandhi was tried to make an environment where everybody has a right to create their own space for development, think for nation building through Swaraj, Swadesh, Trusteeship, Sarvodaya and Antyodaya. We cited the characteristics of a democratic leader as knowledgeable, influential, a winner of cooperation, a provider of logical consequences, encouraging, permitting of self-determination, guiding, a good listener and respecting, and situation-
centered. So these are the attributes that altogether made Gandhi a “Gandhi”. Now it’s not easy to deny calling him a great, ideal and national leader who throughout his life worked for the masses. This impelled us to agree that his economic thought made him a democratic leader.
REFERENCES 1. A Handbook of Sarvodaya, Part One, Compiled by Subhash Mehta, Geeta Prakashan, 2004. 2. A Handbook of Sarvodaya, Part Two, Compiled by Subhash Mehta, Geeta Prakashan, 2004. 3. Anderson, R. C. (1959). Learning in discussions: A resume of the authoritarian democratic Studies. Harvard Educational Review, 29, 201-212.
4. Bass, B.M. (1990). Bass & Stogdill’s handbook of leadership: Theory, research & Managerial applications (3rd ed.). New York: Free Press. 5. Bell, D. (1965). Notes on authoritarian and democratic leadership. In A. W. Gouldner, Studies in leadership: Leadership and democratic action. New York:
Russell & Russell. 6. Chemers, M. M. (1984). The social, organizational, and cultural context of effective leadership. In B. Kellerman, Leadership: Multidisciplinary perspectives.
Englewood Cliffs, NJ: Prentice-Hall.
7. Dasgupta, A. K. (1996). Gandhi's Economic Thought. New York: Routledge. 8. Dreze, J. and Sen, A. K. (1989) Hunger and Public Action, Oxford: Oxford University Press.
9. Dube, S. C. (1988) Modernization and Development: The Search for Alternative Paradigms, Tokyo: The United Nations University. 10. Fischer, L. (1995) The Life of Mahatma Gandhi, 6th edn, Bombay: Atul Goradia at Siddhi Printers. 11. Friedman, Joseph S. (2008) "Mahatma Gandhi's Vision for the Future of India: The Role of Enlightened Anarchy," Penn History Review: Vol. 16: Iss. 1, Article
5. 12. Fukazawa, H. (1966) "Mohandasu Karamuchando Gandi -- Tokuni Sono Keizaishiso ni tsuite" ("Mohandas Karamchand Gandhi -- his Economic Ideas"),
Hitotsubashi Ronso (The Hitotsubashi Review) 55(4): 589-610.
13. Galtung, J., O'Brien, P. and Preiswerk, R. (eds) (1980) Self-Reliance: A Strategy for Development, London: Bogle-L'Ouverture Publications. 14. Gandhi, M. K. (1922) Hind Swaraj or Indian Home Rule, 5th edn, Madras: Ganesh & Co.
15. Gandhi, M. K. (1945) Constructive Programme: Its Meaning and Place, Ahmedabad: Navajivan Publishing House. 16. Gandhi, M. K. (1947) India of My Dream, Ahmedabad: Navajivan Publishing House. 17. Gandhi, M. K. (1957) Economic and Industrial Life and Relations, 3 Vols., V. B. Kher (ed.), Ahmedabad: Navajivan Publishing House.
18. Gandhi, M. K. (1958-1994) The Collected Works of Mahatma Gandhi, 100 Vols., Ahmedabad: The Publications Division, Ministry of Information and Broadcasting, The Government of India.
19. Gandhi, M. K. (1968) The Collected Works of Mahatma Gandhi, 6 Vols., S. Narayan (ed.), Ahmedabad: Navajivan Publishing House.
20. Gillingham, P. N.(1980) "The Making of Good Work," in E. F. Schumacher (ed.) Good Work, New York: Harper & Row: 147-217. 21. Godinot, Etienne. (2010) “An Outline of Gandhi’s Economic Thought” The Papers of an International Conference Sponsored by Ekta Parishad and Gandhi
International in Bhopal, India, 2010. 22. Gupte, P. B. (2000, January 31) The Mahatma's Message : 'Think about Tomorrow, but Act for Today,' Gandhi Said. Not a Bad Millennial Mantra. Newsweek
International, 4.
23. Hossain, M. (1988) Credit for Alleviation of Rural Poverty: The Grameen Bank in Bangladesh, Research Report 65, Washington, D. C.: International Food Policy Research Institute.
24. Ishii, K. (1994) "Mahatoma Gandi no Shakaikeizaishiso -- Jutakushaseidoriron wo Chushin toshite" ("The Socio-Economic Philosophy of Mahatma Gandhi:
with a Particular Focus on his Theory of Trusteeship"), Keizaironso (The Economic Review) 154(1): 72-91. 25. Krishna,S.(2013,January 10)Tomorrow never dies.ET (Delhi).
26. Macy, J. (1985) Dharma and Development: Religion as Resource in the Sarvodaya Selfhelp Movement, West Hartford: Kumarian Press. 27. Marx, K. and Engels, F. (1979) Karl Marx Frederick Engels Collected Works: 1853-54, Vol. 12, Moscow: Progress Publishers. 28. Naito, M. (1987) Gandi wo meguru Seinen Gunzo, Tokyo: Sanseido.
29. Nakamura, H. (1957) "Gandi to Indo Nashonarizumu -- Suwadeshi Undo no Kento," Shiso, April, Tokyo: Iwanami Shoten: 39-51. 30. Namboodiripad, E. M. S. (1958) The Mahatma and the Ism, New Delhi: People's Publishing House (Private) Ltd.
31. Narayan, S. (1960) Principles of Gandhian Planning, Allahabad: Kitab Mahal. 32. Nayak,pulin(2005). Gandhian economics is relevant,TOI,2
nd oct.2005.
33. Nayar, Pyarelal (1956-1958) Mahatma Gandhi: The Last Phase, 2 Vols., Ahmedabad: Navajivan Publishing House.
34. Nehru, J. (1962) An Autobiography, with Musings on Recent Events in India, Allied Private Limited. 35. Nishikawa, J. (1978) Keizaihatten no riron (Theories of Economic Development), 2nd edition, Tokyo: Nippon Hyoronsha. 36. Sachs, I. (1980) "Gandhi and Development -- A European View," in Galtung, J., O'Brien, P. and Preiswerk, R. (eds) Self-Reliance: A Strategy for Development,
London: Bogle-L'Ouverture Publications: 45-57. 37. Sakamoto, T. (1969) Ganji, Tokyo: Shimizu Shoin.
38. Schumacher, E. F. (1973) Small is Beautiful: A Study of Economics as if People Mattered, London: Blond & Briggs Ltd.

VOLUME NO. 3 (2013), ISSUE NO. 12 (DECEMBER) ISSN 2231-4245
INTERNATIONAL JOURNAL OF RESEARCH IN COMMERCE, ECONOMICS & MANAGEMENT A Monthly Double-Blind Peer Reviewed (Refereed/Juried) Open Access International e-Journal - Included in the International Serial Directories
http://ijrcm.org.in/
127
39. Schumacher, E. F. (1980) Good Work, New York: Harper & Row. 40. Shinoda, T. (1981) "Gandi to Charuka Undo," in M. Tomioka and H. Kajimura (eds) Hattentojokeizai no Kenkyu, Tokyo: Sekai Shoin: 259-291.
41. Singhal, A.(2013,January 8)India’s multiple cliffs. The economic times (Delhi). 42. Smith, A. (1904) An Inquiry into the Nature and Causes of the Wealth of Nations, 4 Vols., London: Methuen & Co. 43. Tendulkar, D. G. (1951-1954) Mahatma: Life of Mohandas Karamchand Gandhi, 8 Vols., Bombay: The Time of India Press.
44. The Other Economic Summit (TOES) (1986) The Living Economy: A New Economics in the Making, London: Routledge & Kegan Paul. 45. Wood, B. (1985) Alias Papa: A Life of Fritz Schumacher, Oxford: Oxford University Press.
VOLUME NO. 3 (2013), ISSUE NO. 12 (DECEMBER) ISSN 2231-4245
INTERNATIONAL JOURNAL OF RESEARCH IN COMMERCE, ECONOMICS & MANAGEMENT A Monthly Double-Blind Peer Reviewed (Refereed/Juried) Open Access International e-Journal - Included in the International Serial Directories
http://ijrcm.org.in/
128
ANALYSIS OF EMPLOYMENT DISCRIMINATION OF SCS AND STS IN NATIONAL RURAL EMPLOYMENT GUARANTEE SCHEME (NREGS)
SIDDHARTH RATHORE
ALUMNI
DEPARTMENT OF ECONOMICS
DELHI SCHOOL OF ECONOMICS
UNIVERSITY OF DELHI
NEW DELHI
ABSTRACT
The paper analyses evidence of any discrimination against or in favor of Scheduled castes (SC) and Scheduled Tribes (ST) in National Rural Employment Guarantee
Scheme (NREGS). Through construction of a state-wise SC/ST Index, we find evidence of discrimination in favor of both SCs and STs in most of the states. Based on
our finding we try to assess, by running regression models, the reason because of which these communities may be getting favored. Through the analysis this
paper reaches the conclusion that these communities (SCs/STs) have been self targeted due to their underlying characteristics of low levels of relative literacy and
income.
KEYWORDS
SC; ST; NREGA; EGA; MPCE.
LIST OF ABBREVIATIONS • SC - Scheduled Caste
• ST - Scheduled Tribe
• NREGA - National Rural Employment Guarantee Act
• NREGS - National Rural Employment Guarantee Scheme
• Govt. - Government
• EGA - Employment Guarantee Act
• MPCE - Monthly Per Capital Consumption Expenditure
INTRODUCTION e find lot of evidence of discrimination against SCs and STs in almost all spheres of the Indian economy. There may be different reasons for discrimination (statistical, taste based etc.), however, the end result is that these communities are locked up in a low level equilibrium characterized by low levels of educational attainment, consumption, income, etc. In this paper, we try to analyze evidence of discrimination against or in favor of
SCs and STs in the recently implemented policy of employment guarantee in rural districts. The policy is known as National Rural Employment Scheme. The National Rural Employment Guarantee Act (NREGA, also known as National Rural Employment Guarantee Scheme, NREGS) is an Indian legislation enacted in 2005. The idea is to give a legal guarantee of employment to anyone who is willing to do casual manual labor at the statutory minimum wage (set by the state
govt.). Any adult who applies for work under the Act is entitled to being employed on public works within 15 days of applying. If work is not provided within 15 days, he/she is entitled to an unemployment allowance. Thus, an Employment Guarantee Act provides a universal and enforceable legal right to the most basic
form of employment. It is a step towards legal enforcement of the right to work, as an aspect of the fundamental right to live with dignity. However, NREGA is a kind of “half-hearted” Employment Guarantee Act. Under this Act, the entitlement for work is subject to some important limitations. For instance, the work guarantee applies in rural areas only, and is limited to “100 days per household per year”. Also the kinds of projects associated with this
scheme are very limited and their selection is quite arbitrary. This does not mean that the NREGA is worthless. For the first time, the Act provides employment opportunities to rural laborers as a matter of right. It is also a major departure from elitist economic policies, and a potential stepping stone towards other forms of social security. In this and other ways, the Act is a real “breakthrough”.
The potential benefits to the rural society from this programme are enormous. An effective Employment Guarantee Act (EGA) would help to protect rural households from poverty and hunger. One hundred days of guaranteed employment at the minimum wage is not a great privilege, but for those who live on the
margin of subsistence, it can make a big difference. Secondly, the Act is likely to lead to a substantial reduction of rural-urban migration: if work is available in the village, many families will stay in place instead of heading for the cities. Thirdly, guaranteed employment can be a major source of empowerment for women. Based on past experience, women are likely to account for a large proportion of laborers employed under the Act, and guaranteed employment will give
them some economic independence. Fourthly, the Employment Guarantee Act is an opportunity to create useful assets in rural areas. For instance, there is plenty of scope for building productive water-harvesting structures through labor-intensive methods. Fifthly, guaranteed employment is likely to change power
equations in the rural society, and to foster a more equitable social order. Last but not least, the Employment Guarantee Act is a means of strengthening the bargaining power of unorganized workers. This, in turn, could help them to struggle for other important entitlements, such as minimum wages and social security.
Given the potential implications of this programme, we need to assess its impact on social structure of the Indian rural society.
EVALUATION OF DISCRIMINATION IN NREGA DATA SOURCE Since the programme has been started recently, not much work has been done in lieu of discrimination aspect within NREGA. For our paper, to analyze evidence of discrimination in favor or against SCs and STs in NREGA, we have used employment data of SCs and STs for the year 2006-07, given in terms of person days per year. The data for employment has been picked up from the website of Ministry of Rural Development of India. Further, for the construction of SC/ST
discrimination index, population figures for the year 2006-07 have been picked from the website of India Stat. This exercise is done for 27 Indian states. KEY ASSUMPTIONS
• We were given SC/ST population for the year 2001, to derive the figure for 2006-07; we have used the decadal growth rate of SCs and STs.
• The Data on literacy has been provided for the year 2001, we have assumed literacy ratio of SCs and STs to be the same even in 2006.
• MPCE of 2006 for ST and SC has been extrapolated from the growth rate of total MPCE from 2004 to 2006.
• MPCE of 2006 for eastern states were not available, hence average of neighboring states (growth rate of MPCE) has been used as proxy.
DISCRIMINATION INDEX The discrimination index that we have constructed is a crude measure of discrimination. The Index would indicate what proportion of total NREGA works are done by SCs (STs), in proportion to their population share. The indices have been constructed in the following way:
W

VOLUME NO. 3 (2013), ISSUE NO. 12 (DECEMBER) ISSN 2231-4245
INTERNATIONAL JOURNAL OF RESEARCH IN COMMERCE, ECONOMICS & MANAGEMENT A Monthly Double-Blind Peer Reviewed (Refereed/Juried) Open Access International e-Journal - Included in the International Serial Directories
http://ijrcm.org.in/
129
SC Discrimination Index = (SC person days / Total person days) i
(SC rural population / Total rural population) i
ST Discrimination Index = (ST person days / Total person days) i (ST rural population / Total rural population) i
(The subscript i represents state) Since NREGA projects are limited to rural areas, we have taken total SC (ST) rural population as a proportion of that state’s total rural population. Now if the index number calculated from our data is equal to 1, it would represent that No discrimination against SCs (STs) is present. If it is greater than 1, it
would mean discrimination in favor of SCs (STs) and an index number of value less than 1 indicates discrimination against SCs (STs).Further, due to lack of data, the discrimination index values for some states are coming out to be nil. We would ignore such states for further analysis. The state wise discrimination indices
for SCs (STs) are given below. TABLE 1
SC DISCRIMINATION From the table above, we can observe that, for most states the index number value is greater than one, implying prevalence of discrimination in favor of SCs (excessive participation of SCs). The plausibility of this result is a matter that would be discussed in the next section. For states like Tripura and Rajasthan, the
value of the index is quite close to one, so there is no clear evidence of discrimination against or in favor of SCs. The states showing discrimination against SCs are Jammu and Kashmir, Meghalaya and Sikkim. However, it cannot be said with certainty that there is prevalence of discrimination against SCs in these states
because the total number of person days of work under NREGA in these states was quite low, hence the possibility of high variance in numbers. So we can safely conclude that there is case of discrimination in favor of SCs. Now the question is that, whether the result we are getting due to some specific government policy measure to target SCs or is it due to some feature of NREGA policy itself due to which SCs are being self targeted to their differentiated community
characteristics. The answer to this question too would be probed in the next section.
No. States SC Index ST Index
1 ANDHRA PRADESH 1.5061 1.4395
2 ARUNACHAL PRADESH 0.0000 1.3783
3 ASSAM 1.2219 3.2053
4 BIHAR 2.8725 3.5837
5 CHHATTISGARH 1.0013 1.1470
6 GUJARAT 1.0928 2.6907
7 HARYANA 3.2076 0.0000
8 HIMACHAL PRADESH 1.1065 4.8084
9 JAMMU AND KASHMIR 0.6140 1.5810
10 JHARKHAND 1.8199 1.2711
11 KARNATAKA 1.6775 2.2501
12 KERALA 1.7013 7.6227
13 MADHYA PRADESH 1.0171 1.9117
14 MAHARASHTRA 1.4576 3.3686
15 MANIPUR 0.0000 2.6510
16 MEGHALAYA 0.3561 0.4285
17 MIZORAM 0.0000 0.9686
18 NAGALAND 0.0000 1.6318
19 ORISSA 1.2751 1.8489
20 PUNJAB 1.9687 0.0000
21 RAJASTHAN 0.8817 4.0761
22 SIKKIM 0.1555 4.3169
23 TAMIL NADU 2.3041 1.5387
24 TRIPURA 0.8662 1.5864
25 UTTAR PRADESH 2.3699 41.2872
26 UTTRANCHAL 0.0000 0.0000
27 WEST BENGAL 1.5469 2.8665

VOLUME NO. 3 (2013), ISSUE NO. 12 (DECEMBER) ISSN 2231-4245
INTERNATIONAL JOURNAL OF RESEARCH IN COMMERCE, ECONOMICS & MANAGEMENT A Monthly Double-Blind Peer Reviewed (Refereed/Juried) Open Access International e-Journal - Included in the International Serial Directories
http://ijrcm.org.in/
130
FIG. 1
ST DISCRIMINATION We observe, from the table above, that for all states but one, the index value is coming out to be greater than one. Therefore there is clear evidence of
discrimination in favor of STs across states. Further, we observe that the index value for the state of Uttar Pradesh is very large, this is due to the fact that the percentage of STs in rural areas is very low (0.0008%), as a result the denominator ( Total ST rural population / Total rural population) while calculating the index value is very low. This is also the reason behind high index values in case of states like Kerela and Himachal Pradesh. Now in case of STs too we face the same
question: whether the excessive participation of STs in NREGS, a resultant of govt. initiative, or is it because of certain special characteristics of ST community due to which this group becomes self targeted in lieu of NREGA programme.
Therefore, the index on a whole indicates that there exists discrimination in favor of SCs and STs for most of the Indian states. The result is quite surprising, given the fact that SCs and STs usually face discrimination against them in most of the cases. Hence, we would now probe into the anomaly of our result.
FIG. 2 IS THERE DISCRIMINATION IN FAVOR OF SCs AND STs To answer this question, we need to analyze the reason(s) for excessive participation of SCs and STs in this programme. One possible explanation is that
Government has specifically designed the policy of NREGS for empowerment of SCs and STs. However, in the policy formulation of NREGS, there is nothing mentioned with respect to reservation of jobs for SCs (STs). Also there is no mentioning in the Act regarding projects being undertaken on lands of SCs (STs). The policy just states that “one member per rural household is eligible for guaranteed employment, to do casual manual unskilled labor at the statutory minimum wage, for 100 days in a year”. We should take note of these two features (highlighted) of the policy. Now it is quite plausible that an uneducated and unemployed person would like to participate in this programme since this would offer them certain minimum
income. Persons with these characteristics would be even more attracted towards this programme as their opportunity cost is almost zero. Therefore, we would like to probe into the fact that whether the excessive participation of SCs and STs due to low levels of literacy and low household income levels in their communities. If this is true then, we can say that, it is these particular community characteristics (low literacy and low income level) that make SCs/STs self
targeted in this programme. To analyze this, we build the following regression model for the year 2006-07: SC Index = β1 + β2 (SC literacy / Total literacy) + β3 (SC MPCE / Total MPCE) + µ
SC Index
00.5
11.5
22.5
33.5
AN
DH
RA
PR
AD
ES
H
CH
HA
TT
ISG
AR
H
JAM
MU
AN
DK
AS
HM
IR
MA
DH
YA
PR
AD
ES
H
MIZ
OR
AM
RA
JAS
TH
AN
UT
TA
RP
RA
DE
SH
states
Sc
inde
x
SC Index (H/J)
ST Index
05
1015202530354045
AN
DH
RA
PR
AD
ES
H
CH
HA
TTIS
GA
RH
JAM
MU
AN
DK
AS
HM
IR
MA
DH
YA
PR
AD
ES
H
MIZ
OR
AM
RA
JAS
TH
AN
UT
TA
RP
RA
DE
SH
Inde
x V
alue
ST Index (I/K)
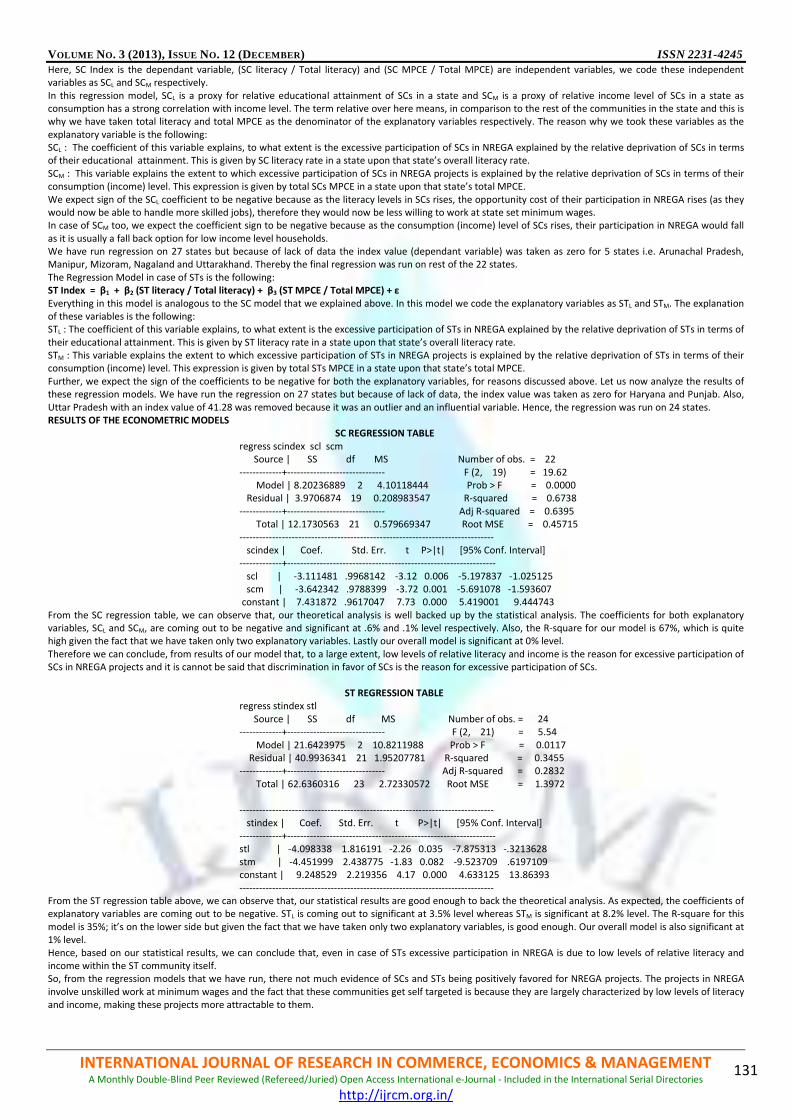
VOLUME NO. 3 (2013), ISSUE NO. 12 (DECEMBER) ISSN 2231-4245
INTERNATIONAL JOURNAL OF RESEARCH IN COMMERCE, ECONOMICS & MANAGEMENT A Monthly Double-Blind Peer Reviewed (Refereed/Juried) Open Access International e-Journal - Included in the International Serial Directories
http://ijrcm.org.in/
131
Here, SC Index is the dependant variable, (SC literacy / Total literacy) and (SC MPCE / Total MPCE) are independent variables, we code these independent variables as SCL and SCM respectively.
In this regression model, SCL is a proxy for relative educational attainment of SCs in a state and SCM is a proxy of relative income level of SCs in a state as consumption has a strong correlation with income level. The term relative over here means, in comparison to the rest of the communities in the state and this is why we have taken total literacy and total MPCE as the denominator of the explanatory variables respectively. The reason why we took these variables as the
explanatory variable is the following: SCL : The coefficient of this variable explains, to what extent is the excessive participation of SCs in NREGA explained by the relative deprivation of SCs in terms of their educational attainment. This is given by SC literacy rate in a state upon that state’s overall literacy rate.
SCM : This variable explains the extent to which excessive participation of SCs in NREGA projects is explained by the relative deprivation of SCs in terms of their consumption (income) level. This expression is given by total SCs MPCE in a state upon that state’s total MPCE.
We expect sign of the SCL coefficient to be negative because as the literacy levels in SCs rises, the opportunity cost of their participation in NREGA rises (as they would now be able to handle more skilled jobs), therefore they would now be less willing to work at state set minimum wages. In case of SCM too, we expect the coefficient sign to be negative because as the consumption (income) level of SCs rises, their participation in NREGA would fall
as it is usually a fall back option for low income level households. We have run regression on 27 states but because of lack of data the index value (dependant variable) was taken as zero for 5 states i.e. Arunachal Pradesh, Manipur, Mizoram, Nagaland and Uttarakhand. Thereby the final regression was run on rest of the 22 states.
The Regression Model in case of STs is the following: ST Index = β1 + β2 (ST literacy / Total literacy) + β3 (ST MPCE / Total MPCE) + ε Everything in this model is analogous to the SC model that we explained above. In this model we code the explanatory variables as STL and STM. The explanation of these variables is the following: STL : The coefficient of this variable explains, to what extent is the excessive participation of STs in NREGA explained by the relative deprivation of STs in terms of
their educational attainment. This is given by ST literacy rate in a state upon that state’s overall literacy rate. STM : This variable explains the extent to which excessive participation of STs in NREGA projects is explained by the relative deprivation of STs in terms of their consumption (income) level. This expression is given by total STs MPCE in a state upon that state’s total MPCE.
Further, we expect the sign of the coefficients to be negative for both the explanatory variables, for reasons discussed above. Let us now analyze the results of these regression models. We have run the regression on 27 states but because of lack of data, the index value was taken as zero for Haryana and Punjab. Also,
Uttar Pradesh with an index value of 41.28 was removed because it was an outlier and an influential variable. Hence, the regression was run on 24 states. RESULTS OF THE ECONOMETRIC MODELS
SC REGRESSION TABLE regress scindex scl scm Source | SS df MS Number of obs. = 22
-------------+------------------------------ F (2, 19) = 19.62 Model | 8.20236889 2 4.10118444 Prob > F = 0.0000 Residual | 3.9706874 19 0.208983547 R-squared = 0.6738
-------------+------------------------------ Adj R-squared = 0.6395 Total | 12.1730563 21 0.579669347 Root MSE = 0.45715 ------------------------------------------------------------------------------
scindex | Coef. Std. Err. t P>|t| [95% Conf. Interval] -------------+----------------------------------------------------------------
scl | -3.111481 .9968142 -3.12 0.006 -5.197837 -1.025125 scm | -3.642342 .9788399 -3.72 0.001 -5.691078 -1.593607 constant | 7.431872 .9617047 7.73 0.000 5.419001 9.444743
From the SC regression table, we can observe that, our theoretical analysis is well backed up by the statistical analysis. The coefficients for both explanatory variables, SCL and SCM, are coming out to be negative and significant at .6% and .1% level respectively. Also, the R-square for our model is 67%, which is quite high given the fact that we have taken only two explanatory variables. Lastly our overall model is significant at 0% level.
Therefore we can conclude, from results of our model that, to a large extent, low levels of relative literacy and income is the reason for excessive participation of SCs in NREGA projects and it is cannot be said that discrimination in favor of SCs is the reason for excessive participation of SCs.
ST REGRESSION TABLE
regress stindex stl
Source | SS df MS Number of obs. = 24 -------------+------------------------------ F (2, 21) = 5.54
Model | 21.6423975 2 10.8211988 Prob > F = 0.0117 Residual | 40.9936341 21 1.95207781 R-squared = 0.3455 -------------+------------------------------ Adj R-squared = 0.2832
Total | 62.6360316 23 2.72330572 Root MSE = 1.3972 ------------------------------------------------------------------------------
stindex | Coef. Std. Err. t P>|t| [95% Conf. Interval] -------------+----------------------------------------------------------------
stl | -4.098338 1.816191 -2.26 0.035 -7.875313 -.3213628 stm | -4.451999 2.438775 -1.83 0.082 -9.523709 .6197109 constant | 9.248529 2.219356 4.17 0.000 4.633125 13.86393
------------------------------------------------------------------------------ From the ST regression table above, we can observe that, our statistical results are good enough to back the theoretical analysis. As expected, the coefficients of explanatory variables are coming out to be negative. STL is coming out to significant at 3.5% level whereas STM is significant at 8.2% level. The R-square for this
model is 35%; it’s on the lower side but given the fact that we have taken only two explanatory variables, is good enough. Our overall model is also significant at 1% level.
Hence, based on our statistical results, we can conclude that, even in case of STs excessive participation in NREGA is due to low levels of relative literacy and income within the ST community itself. So, from the regression models that we have run, there not much evidence of SCs and STs being positively favored for NREGA projects. The projects in NREGA
involve unskilled work at minimum wages and the fact that these communities get self targeted is because they are largely characterized by low levels of literacy and income, making these projects more attractable to them.
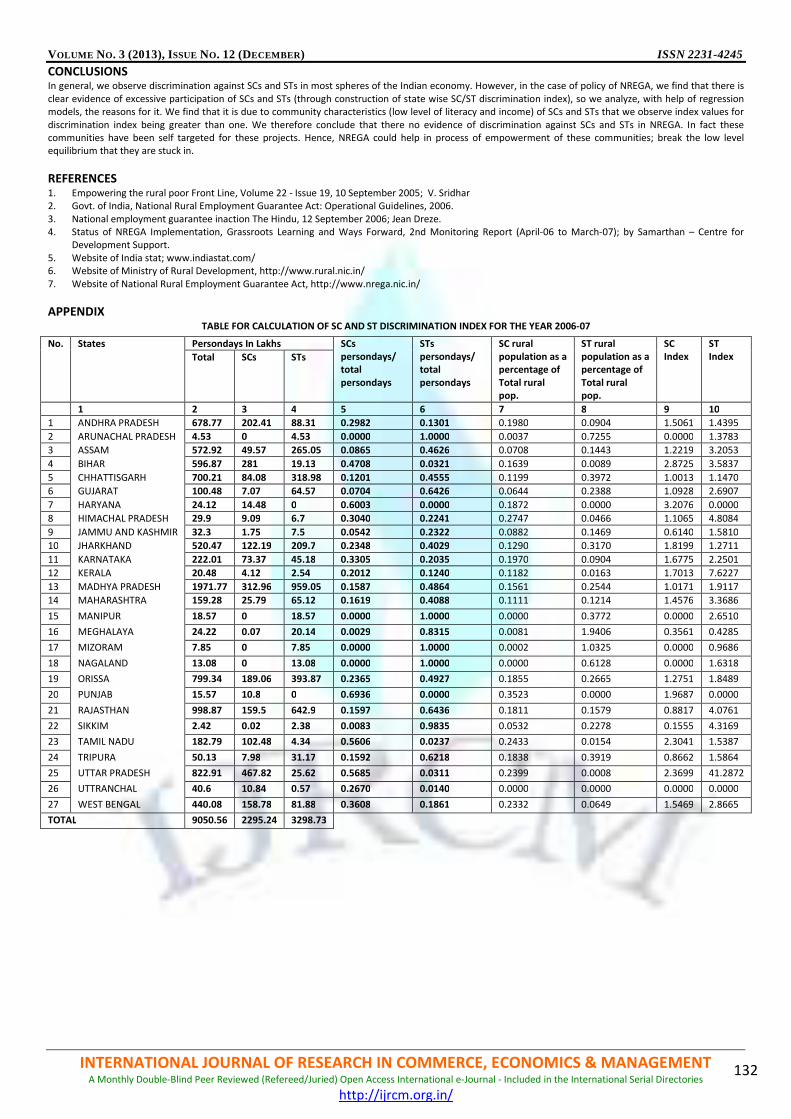
VOLUME NO. 3 (2013), ISSUE NO. 12 (DECEMBER) ISSN 2231-4245
INTERNATIONAL JOURNAL OF RESEARCH IN COMMERCE, ECONOMICS & MANAGEMENT A Monthly Double-Blind Peer Reviewed (Refereed/Juried) Open Access International e-Journal - Included in the International Serial Directories
http://ijrcm.org.in/
132
CONCLUSIONS In general, we observe discrimination against SCs and STs in most spheres of the Indian economy. However, in the case of policy of NREGA, we find that there is
clear evidence of excessive participation of SCs and STs (through construction of state wise SC/ST discrimination index), so we analyze, with help of regression models, the reasons for it. We find that it is due to community characteristics (low level of literacy and income) of SCs and STs that we observe index values for
discrimination index being greater than one. We therefore conclude that there no evidence of discrimination against SCs and STs in NREGA. In fact these communities have been self targeted for these projects. Hence, NREGA could help in process of empowerment of these communities; break the low level equilibrium that they are stuck in.
REFERENCES
1. Empowering the rural poor Front Line, Volume 22 - Issue 19, 10 September 2005; V. Sridhar 2. Govt. of India, National Rural Employment Guarantee Act: Operational Guidelines, 2006.
3. National employment guarantee inaction The Hindu, 12 September 2006; Jean Dreze. 4. Status of NREGA Implementation, Grassroots Learning and Ways Forward, 2nd Monitoring Report (April-06 to March-07); by Samarthan – Centre for
Development Support.
5. Website of India stat; www.indiastat.com/ 6. Website of Ministry of Rural Development, http://www.rural.nic.in/
7. Website of National Rural Employment Guarantee Act, http://www.nrega.nic.in/
APPENDIX TABLE FOR CALCULATION OF SC AND ST DISCRIMINATION INDEX FOR THE YEAR 2006-07
No. States Persondays In Lakhs SCs persondays/ total persondays
STs persondays/ total persondays
SC rural population as a percentage of Total rural pop.
ST rural population as a percentage of Total rural pop.
SC Index
ST Index Total SCs STs
1 2 3 4 5 6 7 8 9 10
1 ANDHRA PRADESH 678.77 202.41 88.31 0.2982 0.1301 0.1980 0.0904 1.5061 1.4395
2 ARUNACHAL PRADESH 4.53 0 4.53 0.0000 1.0000 0.0037 0.7255 0.0000 1.3783
3 ASSAM 572.92 49.57 265.05 0.0865 0.4626 0.0708 0.1443 1.2219 3.2053
4 BIHAR 596.87 281 19.13 0.4708 0.0321 0.1639 0.0089 2.8725 3.5837
5 CHHATTISGARH 700.21 84.08 318.98 0.1201 0.4555 0.1199 0.3972 1.0013 1.1470
6 GUJARAT 100.48 7.07 64.57 0.0704 0.6426 0.0644 0.2388 1.0928 2.6907
7 HARYANA 24.12 14.48 0 0.6003 0.0000 0.1872 0.0000 3.2076 0.0000
8 HIMACHAL PRADESH 29.9 9.09 6.7 0.3040 0.2241 0.2747 0.0466 1.1065 4.8084
9 JAMMU AND KASHMIR 32.3 1.75 7.5 0.0542 0.2322 0.0882 0.1469 0.6140 1.5810
10 JHARKHAND 520.47 122.19 209.7 0.2348 0.4029 0.1290 0.3170 1.8199 1.2711
11 KARNATAKA 222.01 73.37 45.18 0.3305 0.2035 0.1970 0.0904 1.6775 2.2501
12 KERALA 20.48 4.12 2.54 0.2012 0.1240 0.1182 0.0163 1.7013 7.6227
13 MADHYA PRADESH 1971.77 312.96 959.05 0.1587 0.4864 0.1561 0.2544 1.0171 1.9117
14 MAHARASHTRA 159.28 25.79 65.12 0.1619 0.4088 0.1111 0.1214 1.4576 3.3686
15 MANIPUR 18.57 0 18.57 0.0000 1.0000 0.0000 0.3772 0.0000 2.6510
16 MEGHALAYA 24.22 0.07 20.14 0.0029 0.8315 0.0081 1.9406 0.3561 0.4285
17 MIZORAM 7.85 0 7.85 0.0000 1.0000 0.0002 1.0325 0.0000 0.9686
18 NAGALAND 13.08 0 13.08 0.0000 1.0000 0.0000 0.6128 0.0000 1.6318
19 ORISSA 799.34 189.06 393.87 0.2365 0.4927 0.1855 0.2665 1.2751 1.8489
20 PUNJAB 15.57 10.8 0 0.6936 0.0000 0.3523 0.0000 1.9687 0.0000
21 RAJASTHAN 998.87 159.5 642.9 0.1597 0.6436 0.1811 0.1579 0.8817 4.0761
22 SIKKIM 2.42 0.02 2.38 0.0083 0.9835 0.0532 0.2278 0.1555 4.3169
23 TAMIL NADU 182.79 102.48 4.34 0.5606 0.0237 0.2433 0.0154 2.3041 1.5387
24 TRIPURA 50.13 7.98 31.17 0.1592 0.6218 0.1838 0.3919 0.8662 1.5864
25 UTTAR PRADESH 822.91 467.82 25.62 0.5685 0.0311 0.2399 0.0008 2.3699 41.2872
26 UTTRANCHAL 40.6 10.84 0.57 0.2670 0.0140 0.0000 0.0000 0.0000 0.0000
27 WEST BENGAL 440.08 158.78 81.88 0.3608 0.1861 0.2332 0.0649 1.5469 2.8665
TOTAL 9050.56 2295.24 3298.73

VOLUME NO. 3 (2013), ISSUE NO. 12 (DECEMBER) ISSN 2231-4245
INTERNATIONAL JOURNAL OF RESEARCH IN COMMERCE, ECONOMICS & MANAGEMENT A Monthly Double-Blind Peer Reviewed (Refereed/Juried) Open Access International e-Journal - Included in the International Serial Directories
http://ijrcm.org.in/
133
TABLE FOR VALUES FOR EXPLANATORY VARIABLES FOR THE YEAR 2006-07
No. States SCs /Total Literacy in the States (SCL)
STs/Total Literacy in the States (STL)
SC MPCE/Total MPCE (SCM)
ST MPCE/Total MPCE (STM)
1 ANDHRA PRADESH 0.8843 0.6122 0.8455 0.7344
2 ARUNACHAL PRADESH 1.2449 0.9138 1.4307 1.0157
3 ASSAM 1.0553 0.5877 0.9409 1.0315
4 BIHAR 0.6064 0.5994 0.8264 0.9460
5 CHHATTISGARH 0.9892 0.8051 1.1518 0.8508
6 GUJARAT 1.0203 0.6909 0.8750 0.8113
7 HARYANA 0.8159 0.0000 0.6639 1.1435
8 HIMACHAL PRADESH 0.9190 0.4562 0.7965 0.9858
9 JAMMU AND KASHMIR 1.0631 0.7328 0.9385 0.9072
10 JHARKHAND 0.7015 0.6989 0.9001 0.9150
11 KARNATAKA 0.7943 0.7248 0.8216 0.8394
12 KERALA 0.9098 0.7079 0.7433 0.5113
13 MADHYA PRADESH 0.9199 0.6462 0.8741 0.7806
14 MAHARASHTRA 0.9350 0.7179 0.8053 0.7365
15 MANIPUR 1.0255 0.9340 0.9504 0.9000
16 MEGHALAYA 0.8994 0.9799 0.9834 0.9952
17 MIZORAM 1.0045 1.0061 1.6097 1.0019
18 NAGALAND 0.0000 0.9902 0.0000 1.0091
19 ORISSA 0.8796 0.5922 0.9098 0.7119
20 PUNJAB 0.8063 0.0000 0.7698 0.7566
21 RAJASTHAN 0.8642 0.7394 0.8924 0.7857
22 SIKKIM 0.9157 0.3759 1.0940 0.9518
23 TAMIL NADU 0.8599 0.5650 0.7909 0.8267
24 TRIPURA 1.0205 0.7716 0.9853 0.8934
25 UTTAR PRADESH 0.8224 0.6240 0.8534 0.8994
26 UTTRANCHAL 0.8855 0.8831 0.8560 0.8787
27 WEST BENGAL 0.8601 0.6327 0.9421 0.7865

VOLUME NO. 3 (2013), ISSUE NO. 12 (DECEMBER) ISSN 2231-4245
INTERNATIONAL JOURNAL OF RESEARCH IN COMMERCE, ECONOMICS & MANAGEMENT A Monthly Double-Blind Peer Reviewed (Refereed/Juried) Open Access International e-Journal - Included in the International Serial Directories
http://ijrcm.org.in/
134
EUROPEAN UNION AS A GLOBAL SECURITY ACTOR
H.S VENKATESHA
RESEARCH SCHOLAR
MANGALORE UNIVERSITY
MANGALAGANGOTRI CAMPUS
KONAJE
ABSTRACT
The European Union (EU) is rising as a global economic and political actor, a role which the Lisbon Treaty aims to develop. Until now the international order is
changing quickly, from the post-Cold War years in some inchoate form of multi-polarity. In with the purpose of the emerging world, both the established and the
rising powers face massive tasks in important the contours of a consensual new order which will deal effectively with the interconnect security challenges of the
21st century. The EU‟s global security role, status as an international actor is clearly demonstrated in this paper. This paper approaches the issue of EU's actors in
international affairs by way of institutionally informed conversation possible role-sets for the EU in the international arena, and to how major regional
organization to adopt the security in the international arena would assess these roles and also discuss on Common security and defence policy missions involving
the international crisis.
KEYWORDS EU, CSDP, CSDP missions, Regional organization (Middle East, Asia, Africa).
INTRODUCTION ince the European Union (EU) started to become politically active role, not only towards its Member States, but also to address global issues its Common Foreign and Security Policy (CFSP), there has been a fundamental debate whether this activity could actually be considered as an EU foreign policy. However, due to the EU’s wide-ranging global involvement and its increased capabilities, it seems to be established that indeed, the EU has a
foreign policy. Since the first half of 20
th century the European continent was the theatre of conflicts, which brought millions of dead humans and lots of destruction. For all of
the centuries, Europe had a lot of bloody wars, only France and Germany for the period 1870 to 1945 fought three times2. After the 1945 European continent
members were slowly started integration of United Europe, but idea of integration was conceived in the effect of the Second World War. Its main aim was to stop again of conflict and destruction in Western Europe
3, although such aims were never clearly stated.
The end of Second World War moves towards European integration was seen by many as an escape from the extreme forms of nationalism that had devastated the continent. In 1946 Winston Churchill has told statement cal for ‘United States of Europe ‘becoming louder
4. On the basis of the speech in 1949 the Council of
Europe was established as the first pan-European organization. In the year of 1950, the French foreign minister Robert Suchman proposed a community to integrate the coal and steel industries of Europe – these being the two elements necessary to make weapons of war
5. In 1951 Belgium, France, Italy, Luxembourg
Netherlands and the including Germany signed treaty of Paris creating the European Coal and Steel Community (ECSC). This treaty main aim begins to unite
European countries economically and politically to secure lasting peace.
HISTORY OF EUROPEAN FOREIGN AND SECURITY POLICY The origins of Security and defense architecture of Europe can be found in after the Second World War situation. The security and defense issues starting in late
1940’s cooperation of the European communities, can be idea of “European Defense community” (EDC) was a plan proposed in 1950 by Rene Pleven then the French Prime Minister, in response to the American call for the rearmament of West Germany. The intention was to form a pan-European defense force as an alternative to Germany's proposed accession to NATO meant to harness its military potential in case of conflict with the Soviet bloc. The EDC was to include
West Germany, France, Italy and the Benelux countries. A treaty was signed on 27 May 1952, but Communists opposed a plan tying France to the capitalist USA and setting it in opposition to the Communist bloc
6.
The EDC went for ratification in the French National Assembly on 30 August 1954, and failed by a vote of 319 against 264. After the failed attempts at creating
defense and political community, the EU leaders met at the Messina Conference and established the Spaak committee which produced the Spaak report. The Spaak committee was Intergovernmental Committee set up by the Messina Conference in Brussels started on 9 July 1955 and ended on 20 April 1956
7, when the
Heads of Delegation of the six Member States of the ECSC approved the Spaak report. In May 1956 the report was accepted at the Venice Conference where the decision was taken to organize an Intergovernmental Conference. The committees examined the common market, investments and social issues, conventional energy, nuclear energy and public transport and works
8.
In 1970 the EU was introduced the European Political Cooperation (EPC); EPC was created as a forum for coordinating the member states’ foreign policy based on Intergovernmental cooperation. This was the first step towards on political union. EPC is not static, but a process which continues to develop and evolve. Its origins go back to the 1950s, when cooperation on foreign policy was seen as an integral part of building a new Europe after the war, a Europe which could
speak with a single voice to the rest of the world. But it was only in 1970, when foreign ministers approved the 'Luxembourg Report9, that the basic procedures
of EPC were established10
.
The EPC vision of a collective geopolitical role an integrated Europe in Worldwide. Their main aim was at the harmonization of views and an alignment of positions in foreign affairs to be expanding integration beyond the economic and diplomatic fields. It was first articulated in the early 1970`s under the notion of Europe as a global civilian power, in light of the first enlargement round of the European community in 1973 and the super power rivalry of the Cold War.
2 Available martial on this website on http://www.parliament.ge/files/1_901_108571_2.pdf, access by Mangalore University , date 19/11/2013
3 Achim, hurrelmann, The European Union the history and institutions, downloaded by Mangalore University date 19-11-2013 http://www6.carleton.ca/ces/
eulearning/ccms/wp-content/ccms-files/Hurrelmann-EU-History-and-Institutions.pdf 4 The History of European Union , http://en.wikipedia.org/wiki/History_of_the_European_Union
5 See Robert Suchman declaration following EU official website on http://europa.eu/about-eu/basic-information/symbols/europe-day/schuman-declaration
/index_en.htm 6 The European defense committee, http://en.wikipedia.org/wiki/European_Defence_Community downloaded by Mangalore University 27/11/2013
7 Sources by Virtual Resource Centre for Knowledge about Europe, published 2012 access date 19-11-2013 http://www.cvce.eu/content/publication/2007
/3/9/42cd3d3b-e28b-4b4a-8e588107b106ac15/publishable_en.pdf 8 Ibid
9 European political co-operation Report, Office for Official Publications of the European Communities, 1988, downloaded by Mangalore university date 25-11-
2013 10
ibid
S

VOLUME NO. 3 (2013), ISSUE NO. 12 (DECEMBER) ISSN 2231-4245
INTERNATIONAL JOURNAL OF RESEARCH IN COMMERCE, ECONOMICS & MANAGEMENT A Monthly Double-Blind Peer Reviewed (Refereed/Juried) Open Access International e-Journal - Included in the International Serial Directories
http://ijrcm.org.in/
135
Europe was envisioned to become an influential, but more peaceful and civilian actor in world politics11
. However the European countries a wand of a collective Europe developing imperial ambition similar to those of its member states. Since then the process of cooperation has gradually been developed, expanded and
formalized in a number of stages, culminating in the entry into force of the Single European Act (SEA) on 1 July 1987. The Single Act puts EPC on a Treaty basis for the first time, although it remains quite distinct from the structures and procedures of the Community.
EU AS A GLOBAL SECURITY ACTOR? The Treaty on European Union (TEU), signed in Maastricht on 7 February 1992, entered into force on 1 November 1993. This Treaty is the result of within
member states and other countries events. At outside Europe, the collapse of communism in Eastern Europe and the outlook of German reunification led to a commitment to reinforce the Community's international position. At within the member countries, the EU wished to supplement the progress achieved by
the Single European Act with other reforms. This led to the convening of two Inter-Governmental Conferences, one on EMU and the other on political union. The TEU was created a single institutional framework based on three pillars –the first pillar European Economic Community (EEC) the second pillar Common Foreign and Security Policy (CFSP) and third pillar police and judicial cooperation. The second pillar of CFSP is the organized, agreed foreign policy of the EU for
mainly security and defense diplomacy and actions. CFSP deals only with a specific part of the EU’s external relations, which domains include mainly trade and commercial policy and other areas such as funding to third countries, etc. Decisions require unanimity among member states in the Council of the EU, but once agreed, certain aspects can be further decided by qualified majority voting (QMV) and finally foreign policy is chaired and represented by the EU's High
representative. The CFSP sees the NATO responsible for the territorial defense of Europe and "peace-making". However, since 1999, the EU was responsible for implementing
missions, such as "peace-keeping" and policing of treaties, etc. A phrase that is often used to describe the relationship between the EU forces and NATO is "separable, but not separate":
The same forces and capabilities form the basis of both EU and NATO efforts, but portions can be allocated to the EU if necessary.
Concerning missions, the right of first refusal exists: the EU may only act if NATO first decides not to12
.
The EU was launched first global military operation in the Former Yugoslav Republic of Macedonia (FYROM/CONCORDIA) on 31 March 2003. The operation made use of NATO assets and capabilities, which was made possible by the completion of work on EU-NATO arrangements. The core aim of CONCORDIA was, at the explicit request of the FYROM government, to contribute further to a stable secure environment and to allow the implementation of the August 2001. The
operation contributed to the efforts to achieve a peaceful, democratic and prosperous country, as part of a region of stable countries, where an international security presence is no longer needed. This operation was completed on 15 December 2003
13.
The settlement of Brussels Summit a chance for a new Europe has emerged – not, perhaps, the constitution of Valery Giscard d’Estaing’s dreams, but something even more important: a strategy for reshaping global politics. The truly significant business in Brussels came before attention turned to the draft constitution, as the European Council agreed to establish a military planning capability and approved Javier Solana’s European Security Strategy (ESS)
14. While the proposed
constitution included a mutual defence clause that is now in limbo, the more concrete decisions remain valid in their own right. ESS sets out three broad strategic objectives for EU policymakers: First, most immediately, the EU should take necessary actions to address a considerable list of global challenges and security threats, including regional conflicts, proliferation of weapons of mass destruction, terrorism, state failure, organized crime,
disease, and destabilizing poverty. Second, the EU should focus particularly on building regional security in its neighborhood: the Balkans, the Caucasus, the Mediterranean region, and the Middle East. Third, over the longer term, the EU should seek the construction of a rules-based, multilateral world order in which
international law, peace, and security are ensured by strong regional and global institutions. The ESS is the document in which the EU clarifies its security strategy which is aimed at achieving a secure Europe in a better world, identifying the threats facing the Union, defining its strategic objectives and setting out the political implications for Europe. The ESS has been an important reference framework for the EU
since its inception in 2003. Without strategy an actor can only really be a ‘reactor’ to events and developments. In the ESS the EU now has a strategy, with which it has the potential of shifting boundaries and shaping the World.
15
The entry in to Lisbon treaty 1 December 2009, ESDP was renamed Common Security and Defense Policy (CSDP), in additionally this treaty introduced the new post of High Representative of Union foreign and security policy, the post merges CSFP and Commissioner of External relations. The Lisbon Treaty formally endorses the extension of the so-called ‘Petersberg Tasks’, that now include ‘joint disarmament operations, humanitarian and rescue tasks, military advice and
assistance tasks, conflict prevention and peace-keeping tasks, tasks of combat forces in crisis management, including peacemaking and post-conflict stabilization’. These tasks may contribute to the fight against terrorism, including by ‘supporting third states in combating terrorism in their territories’. Finally, political and military solidarity among EU Member States is in the Treaty via the inclusion of a mutual assistance clause, and a ‘solidarity clause’.
CSDP MISSIONS16
CSDP is establishing a more robust active mission around the world. The EU member states have been exploring ways to increase their military capabilities and promote greater defense integration. These efforts have met with limited success thus far. Civilian missions and capabilities, however, are also central
components of CSDP; the majority of CSDP missions have been civilian operations in areas such as police training and rule of law. External policies in technical areas such as trade, humanitarian aid, development assistance, enlargement, and neighborhood policy are formulated and managed through a “community” process at the level of the EU institutions
17. These are the EU’s most deeply integrated external policies. Given events in North Africa, the Middle East, and some
of the former Soviet states, EU policymakers have been rethinking how such external policy tools might be used to better effect. As of June 2013, there are 16 active CSDP missions in different regions: 4 military operations and 12missions of a civilian nature. Four of these active missions,
one military and three civilian, have been launched since the summer of 2012; all four new missions are in Africa (Mali, Niger/Sahel, South Sudan, and Horn of Africa). An additional 12 CSDP missions—4 military and 8 civilian—have been concluded in recent years. EU missions are generally undertaken on the basis of a U.N. mandate or with the agreement of the host country.
ACTIVE MISSION IN AFRICA The re-establishment of security and permanent peace in Mali is a most important issue for the stability of the Sahel region and, in the wider sense, for Africa and Europe. On 18 February 2013, at the request of the Malian authorities, and in accordance with international decisions on the subject, in particular United
11
Preben Hansen, and Flemming Andre Larsen, “The European Political Co-operation 1982.”ISSN 0107-6183 http://aei.pitt.edu/4542/1/EPC _factsheet_denm ark.pdf 12
Jochen Rehrl and Hans-Bernhard Weisserth, (ed) Handbook on CSDP The Common Security and Defence Policy of the European Union, Publication of the
Federal Ministry of Defence and Sports of the Republic of Austria, 2010 13
European External Action Service, FYROM/CONCORDIA, CSDP missions, http://www.eeas.europa.eu/csdp/missions-and-operations/concordia/mission-description/index_en.htm downloaded by Mangalore university date 27-11-2013 14
Mark Leonard and Richard Gowan, Global Europe, Implementing the European Security Strategy, downloaded by Mangalore University date:21-11-2013, http://fpc.org.uk/fsblob/187.pdf 15
Sven Biscop, ed… The EU and the European Security Strategy Forging a Global Europe , Rutledge Advances in European Politics Sweden http://www.egmontinstitute.be/news/08/Flyer-Biscop-Andersson-ESS.pdf 16
For a map CSDP missions, http://www.eeas.europa.eu/csdp/missions-and-operations/ 17
Derek E. Mix , The European Union: Foreign and Security Policy, Congressional Research Service, working paper 7-5700 , April 8, 2013, http://www.fas.org/sgp/crs/row/R41959.pdf

VOLUME NO. 3 (2013), ISSUE NO. 12 (DECEMBER) ISSN 2231-4245
INTERNATIONAL JOURNAL OF RESEARCH IN COMMERCE, ECONOMICS & MANAGEMENT A Monthly Double-Blind Peer Reviewed (Refereed/Juried) Open Access International e-Journal - Included in the International Serial Directories
http://ijrcm.org.in/
136
Nations Security Council Resolution 2085 (2012), the EU launched a training mission for Malian armed forces, EUTM Mali18
. In this operation under the responsibility of the Council and of the High Representative of the Union for Foreign Affairs and Security Policy, the Political and Security Committee (PSC) will
exercise the political control and strategic direction of the EU military mission. The EU is implementing a comprehensive approach to the crisis in the Sahel region. The EU is the largest contributor to Mali's development. At the donors' conference in Brussels on 15 May 2013 for Mali, the international community made
commitments worth €3.2 billion (including €523 million from the European Commission). The EU is determined to maintain its commitment to Mali, to help the Malian authorities consolidate peace and security and more generally to find lasting solutions to the crisis in the Sahel region, in close coordination with other regional and international stakeholders
19.
The EU launched a civilian training mission called EUCAP SAHEL Niger in July 2012. With about 50 staff, the mission aims to increase the capacity of the Nigerien police and security forces to combat terrorism and organized crime, with the broader objective of re-establishment of political stability, governance, and security
in Niger and the Sahel region. The Sahel has a prominent place in EU policy. Europe has numerous interests in the region, ranging from combating security threats, terrorism, organized crime and illegal migration to assuring energy security. The intensification of the crisis in Mali has highlighted the risk of instability in the region's countries and confirmed the relevance of the regional approach taken in the European Union's strategy for the Sahel, which the Council adopted
in March 2011. The impact of the crisis on bordering countries, particularly Niger, calls for a firm response from the security forces. The EU also began a civilian mission to strengthen airport security in South Sudan in September 2012. The EU Aviation Security Mission (EUAVSEC) will have up to 64 personnel
20. EUAVSEC is the EU’s first engagement in South Sudan under the EU's CSDP and is financed within the framework of the EU’s CFSP. The
mission responds to South Sudan's request for an EU support to strengthening security at Juba International Airport, as part of the international community’s overall assistance to the country. A key challenge for South Sudan is to establish a fully operational transport hub for commercial and passenger purposes.
Improving the airport security will not only contribute to the fight against crime and international terrorism, but also enable the increased flow of people and goods, thus helping to boost trade and promote regional integration.
MIDDLE EAST AND ASIA The EU Police Mission in Afghanistan was set up in 2007 in the context of the international community's efforts to support the Afghans in taking responsibility
for law and order. EUPOL has a high value as the only multilateral actor able to provide highly qualified civilian policing expertise as well as Rule of Law expertise. This civilian CSDP mission is part of the overall EU commitment to Afghanistan and of a coordinated EU approach that includes local political guidance provided
by the EU Special Representative and a reconstruction effort managed notably through the EU delegation in Kabul. EUPOL Afghanistan is deployed at central (Kabul), regional and provincial levels, in several Provincial Reconstruction Teams (PRTs). On the picture above you see EUPOLs handover of the Ring of Steel to the Afghan Police
21. The Mission has approximately 350 international and 200 local staff and also 23 Member States plus two contributing states on Canada,
Croatia. Moreover mission end will be mandate on 31 December 2014. The EU Integrated Rule of Law Mission for Iraq (EUJUST LEX-Iraq) is a civilian crisis management mission conducted under the CSDP. EUJUST LEX-Iraq is the EU's first integrated rule of law mission in the world. The aim this mission was to strengthen the rule of law and to promote a culture of respect for human rights in
Iraq by providing professional development opportunities for high and mid-level Iraqi officials from the criminal justice system. The core aim is to contribute to a consolidation of security by underpinning the system of rule of law
22. After the successful shift in-country, the majority of the Mission’s activities are taking place
in Iraq; either facilitated the assistance of EU cooperation with other international actors. And also fourth extension of its mandate, the Council of the EU agreed that EUJUST LEX-Iraq would be extended until 31 December 2013. European some experts remain concerned that a strong EU might act as a counterweight of the U.S. power, others maintain that an assertive and capable EU is
very much in the interest of the United States. The focus of the transatlantic relationship has changed since the end of the Cold War: it is now largely about the United States and Europe working together to manage a range of global problems and U.S.-EU cooperation holds the greatest potential for successfully tackling
many of today’s emergent threats and concerns23
.Nevertheless, NATO remains the dominant institutional foundation for transatlantic security affairs. U.S. policymakers have supported efforts to develop EU security policies on the condition that they do not weaken NATO, where the United States has a strong voice on European security issues. Despite their overlapping membership, the EU and NATO have struggled to work out an effective cooperative relationship.
Analysts suggest that sorting out the dynamics of the U.S- EU NATO relationship to allow for a comprehensive and effective use of Euro-Atlantic resources and capabilities will be a key challenge for U.S. and European policymakers in the years ahead
24.
In today’s changing world the EU is called upon to assume increased responsibilities in the maintenance of international peace and security, in order to
guarantee the security of its citizens and the promotion of its values and interests. To this end, in its conclusions of December 2012, the European Council expressed its commitment to enhancing the effectiveness of the CSDP as a tangible contribution to international crisis management. In December 2013 the head
of the European Defence Agency presented his new report with further proposals and actions to strengthen CSDP. It stresses the importance of enabling the EU to assume increased responsibilities as a security provider, at the international level and in particular in its neighborhood, thereby also enhancing its own security and its role as a strategic global actor.
The EU council believes that the EU through CSDP and other instruments has a strong role to play through its unique comprehensive approach to preventing and managing conflicts and their causes. It stresses the importance of working with its partners, in particular the UN, NATO, OSCE, and African Union, as well as strategic partners and partner countries in its neighborhood, with due respect to the institutional framework and decision-making autonomy of the EU. The
EU faces long standing and emerging security challenges, within a rapidly changing and complex geostrategic environment, while the financial crisis is posing challenges to the security and defence capabilities of the European countries. In this context, the Council underlines that security and defence matter.
Furthermore, the Council signals that European interdependence is becoming increasingly paramount and therefore stresses the need to address these challenges together, making the best use of scarce national and Union resources through increased and more systematic cooperation and coordination among Member States, and making coherent and effective use of EU's instruments and policies.
The EU Council strongly supports a robust follow-up process to ensure and monitor concrete progress and sustain the momentum across all three clusters of effectiveness, visibility and impact of CSDP, capability development, and industry and market. As part of this process, it welcomes the analysis of the EU’s
strategic context set out in the High Representative’s CSDP report as a basis for further assessing EU’s challenges and opportunities in the strategic environment and considering priorities for further actions and for regional engagement. CSDP crisis management missions and operations continue to provide a tangible and effective contribution of the EU to international peace and security. Today the EU deploys more than 7000 staff, in 12 civilian missions and 4 military operations.
18
EEAS, EUTM Mali, face sheet date September 2013 http://www.consilium.europa.eu/eeas/security-defence/eu-operations/eutm-mali?lang=fr. Downloaded
by Mangalore university date 26-11-2013 19
EEAS, EUTM Mali, face sheet date September 2013 http://www.consilium.europa.eu/eeas/security-defence/eu-operations/eutm-mali?lang=fr. Downloaded by Mangalore university date 26-11-2013 20
EEAS, EUAVSEC South Sudan, http://www.consilium.europa.eu/eeas/security-defence/eu-operations/euavsec-southsudan? lang=fr. 21
EEAS, EUPOL AFGHANISTAN face sheet date may 2013 http://www.eeas.europa.eu/csdp/missions-and-operations/eupol-afghanistan/pdf/03052013_
factsheet_eupol-afghanistan_en.pdf downloaded by Mangalore university 26-11-2013 22
EEAS EUJUST LEX-Iraq dated http://www.eeas.europa.eu/csdp/missions-and-operations/eujust-lex-iraq/mission-description/index_en.htm 23
Derek E. Mix , The European Union: Foreign and Security Policy, Congressional Research Service, working paper 7-5700 , April 8, 2013, http://www.fas.org/
sgp/crs/row/R41959.pdf 24
ibid
VOLUME NO. 3 (2013), ISSUE NO. 12 (DECEMBER) ISSN 2231-4245
INTERNATIONAL JOURNAL OF RESEARCH IN COMMERCE, ECONOMICS & MANAGEMENT A Monthly Double-Blind Peer Reviewed (Refereed/Juried) Open Access International e-Journal - Included in the International Serial Directories
http://ijrcm.org.in/
137
The EU accept that a number of regional strategies are in place, in particular for the Sahel and the Horn of Africa, to ensure a joined-up approach encompassing security that enhances the overall impact of EU action and delivers enduring results. It underlines the need to elaborate new regional strategies where
necessary, or update existing ones, thereby further strengthening the regional perspective and close cooperation between the different CSDP missions and operations in a region. They should also take into account the sustainment of EU actions through for example capacity building of partner countries and regional organizations.
The EU Council emphasizes that internal and external security dimensions are increasingly interlinked. It underlines the importance to continue to strengthen the ties between CSDP and Freedom/Security/Justice (FSJ) actors, so as to foster a greater understanding of respective objectives and ensure mutual benefits. This will, inter alia, help to cope with important horizontal issues such as illegal immigration, organized crime and terrorism. In this context, the greater
contribution of EU agencies (EUROPOL, FRONTEX, and CEPOL) as well as of INTERPOL to CSDP should be further accelerated, as appropriate. The EU Council stresses its commitment to working in close collaboration with its partners. The Union will continue building and operationalizing regional and
bilateral partnerships to be able to cooperate in crisis management. Work will continue to be taken forward within the existing framework, as defined by various European Councils and subsequent arrangements and with due respect to the institutional framework and decision-making autonomy of the EU. In light of this, the Council
25:
• EU supports long-standing cooperation with the United Nations in crisis management, building on the experience gained in working together in different
theatres, pursuing regular high level dialogue, including through the EU-UN Steering Committee and taking forward the EU-UN Plan of Action to enhance CSDP support to UN peacekeeping, including in the area of rapid response;
• Secondly coherent and mutually reinforcing EU-NATO cooperation in crisis management, in particular in areas where both operate side by side, and on
military capability development where requirements overlap, in order to seek synergies, ensure complementarily of effort and avoid unnecessary
duplication; it encourages further implementation of practical steps for effective EU cooperation with NATO while keeping with the overall objective of building a true organization to organization relationship;
• EU relations progress made in the peace and security partnership between the EU and the African Union, strengthening dialogue, making the African Peace
and Security Architecture (APSA) fully operational and providing predictable funding for AU’s peacekeeping operations, and looks forward to giving
renewed impetus at the forthcoming EU-Africa summit of April 2014;
• the close cooperation with the OSCE on shared issues in crisis management; and encourages dialogue by engaging with regional flora with a security
dimension;
• The EU accepted the valuable contributions and political support of partner countries to CSDP missions and operations, and encourages pursuing the
further signing of Framework Participation Agreements.
• The EU encourages and fosters contributing partners’ support to CSDP, with a focus on non-EU NATO Allies, strategic partners, partner countries in the
neighborhood, notably the Mediterranean and Eastern partners (including through the newly established Eastern Partnership Panel on CSDP) and other individual partner countries, including by developing regular security and defense dialogues within the framework of EU political dialogues with these partners, and offering opportunities for training and advice, including through the European Security and Defense College.
CONCUSSION CSDP plays into wider assessments about changing European worldviews and threat perceptions. Many Europeans continue to believe that traditional military threats remain a concern that necessitate the maintenance of military power for territorial self-defense or, when necessary, in an out-of-area context.
Increasingly, however, many others in Europe do not regard traditional military threats as a primary security concern. Instead, European threat perceptions tend to emphasize the broad threats posed to societies by challenges rooted in economics, demographics, climate, environment, migration, and terrorism. The utility of military force in addressing such threats is limited, and it is therefore accorded a relatively diminished role in the EU’s strategic thinking. Instead, the future
roles of European militaries might center on stabilization, peacekeeping, and crisis management. EU likely to play a more active role in global affairs, the EU has developed a CFSP and a CSDP. On many foreign policy and security issues, the 27 EU member
states exert a powerful collective influence. On the other hand, some critics assert that on the whole the EU remains an economic power only, and that its foreign and security policies have little global impact
26. Some of the shortcomings in the EU’s external policies stem from the inherent difficulties of reaching a
complete consensus among the member state governments. Moreover, past institutional arrangements have often failed to coordinate the EU’s full range of
resources.
REFERENCES 1. Mix, Derek E., (2013), “The European Union: Foreign and Security Policy”, Congressional Research Service, working paper 7-5700.
2. Rehrl, Jochen. and Hans-Bernhard Weisserth, (2010) “Handbook on CSDP The Common Security and Defence Policy of the European Union”, Federal Ministry of Defence and Sports of the Republic of Austria, Austrila.
3. Jakub Zajaczkowski, (2012) “EU strategy towards South Asia” in this paper prepared on JNU Jean Monnet Chair International Conference, theme on “India
and the European Union: Perceptions and perspectives “, Jawaharlal Nehru University, New Delhi 1-2 4. Sung-Hoon, Park and Heungchong Kim,(2005) “Asia Strategy of the European Union and Asia-EU Economic Relations: Basic Concepts and New
Developments, paper presented at the international conference on “The EU-Asia Relations: Building Multilateralism?” hosted by Hong Kong Baptist
University on May 20-21, 5. Michael, Weissmann. (2013) “A European strategy towards east Asia moving from good intentions to action” UL occasional papers, April 2013,
http://www.ui.se/eng/upl/files/89609.pdf 6. European political co-operation Report,(2013) Office for Official Publications of the European Communities, 1988, downloaded by Mangalore university
date 25-11-2013
7. Noel M. Morada, (2012) “Europe and Southeast Asia: ASEAN-EU Interregionalism between Pluralist and Solidarist Societies”, Review of European Studies Vol. 4, No. 3; http://dx.doi.org/10.5539/res.v4n3p89.
8. Kant, K. Bhargava, Ananya, Mukherjee Reed, (2009) “the European Union, South Asia and Democracy in Development: Dialogue and Partnership, International IDEA, Sweden, http://www.idea.int/resources/analysis/loader.cfm?csmodule=security/getfile&pageid=35009
9. Preben Hansen, and Flemming Andre Larsen,(2013) “The European Political Co-operation 1982. ”ISSN 0107-6183 http://aei.pitt.edu/4542/1/
EPC_factsheet_denmark.pdf 10. Frank Umbach, (2013) “EU-ASEAN Political and Security Dialogue at the Beginning of the 21 Century: Prospects for Interregional Cooperation on
International Terrorism”, working paper pdf.
11. Constance Chevallier– Govers (2002) “Enlargement and The Common Foreign and security policy of the European Union “in Rajendra K.Jain Ed. The European Union in world Politics, Radiant New Delhi, pp 194 to 217.
25
Press note on Council conclusions on Common Security and Defence Policy, EDUCATIO, YOUTH, CULTURE and SPORT Council meeting Brussels, 25 - 26 November 2013 http://www.consilium.europa.eu/Newsroom 26
Derek E. Mix , The European Union: Foreign and Security Policy, Congressional Research Service, working paper 7-5700 , April 8, 2013, http://www.fas.org /sgp/crs/row/R41959.pdf

VOLUME NO. 3 (2013), ISSUE NO. 12 (DECEMBER) ISSN 2231-4245
INTERNATIONAL JOURNAL OF RESEARCH IN COMMERCE, ECONOMICS & MANAGEMENT A Monthly Double-Blind Peer Reviewed (Refereed/Juried) Open Access International e-Journal - Included in the International Serial Directories
http://ijrcm.org.in/
138
12. Sven Biscop, ed… The EU and the European Security Strategy Forging a Global Europe Rutledge Advances in European Politics Sweden http://www.egmontinstitute.be/news/08/Flyer-Biscop-Andersson-ESS.pdf
13. Christian, Molling, (2008)“ESDP After Lisbon More Coherent and capable?” Journal of CSS Analysis in security policy, Vol-3, No-28, pp 1 to 5. 14. Christoph,O Meyar “(2011) The purpose and pitfales of constructivist Forecasting insights from Strategic cluture research for the European union’s
Evolution as a Military power , Journal of International studies Quarterlly , willy publisher Malden Vol-55, No-3 pp 589 to 599.
15. Press note on Council conclusions on Common Security and Defence Policy, Education, youth, culture and sport Council meeting Brussels, 25 - 26 November 2013 http://www.consilium.europa.eu/Newsroom
16. Map for CSDP missions, http://www.eeas.europa.eu/csdp/missions-and operations/
17. EU-India Summit, European Union Factsheet,(2013) available material on Access date 05-11-2013http://eeas.europa.eu/delegations/india/ eu_india/ political_relations/strategic_partnership/index_en.htm
18. Jan Zielonka, (2008) “Europe as a global actor: empire by example?”, International Affairs 84: 3 (2008) 471–484 Journal Compilation, Australia Blackwell 19. http://www.cesruc.org/uploads/soft/130221/1-130221192504.pdf 20. Quille, Gerrard (2008) “The Lisbon Treaty and its implications for CFSP/ESDP, DEEXPO/B/POLL Dep./Note/2008_014 Feb 2008.
21. Hunter, E Robert. (2002) “The European Security and Defense Policy NATO’s Companion—or Competitor?, Rand Europe National Defense Research Institute publishres Pittsburgh 2002.
22. Julia Schmidt,. (2009) Common Foreign and Security Policy and European Security and Defence policy, CYELP 5 [2009] 239-259.
23. Jelena Babic, (2010) “The Common Foreign and security policy of the European Union after the Lisbon treaty” Journal of The Belgrade centre for security policy year 5 No 17 2010 pp 3 to 12.
VOLUME NO. 3 (2013), ISSUE NO. 12 (DECEMBER) ISSN 2231-4245
INTERNATIONAL JOURNAL OF RESEARCH IN COMMERCE, ECONOMICS & MANAGEMENT A Monthly Double-Blind Peer Reviewed (Refereed/Juried) Open Access International e-Journal - Included in the International Serial Directories
http://ijrcm.org.in/
139
FINANCIAL INCLUSION: A STUDY OF CANARA BANK
AMANJOT SINGH
RESEARCH SCHOLAR
PUNJABI UNIVERSITY
PATIALA
ABSTRACT
One of the main conditions promulgated by RBI, for the award of new banking licenses, is the opening of 25% of the branches in the rural areas. In India, financial
inclusion first featured in 2005, when it was introduced by K.C. Chakraborthy, the chairman of Indian Bank. The study gives us an insight into the financial
inclusion work done by the Canara bank over a period of time. The inclusion is not only limited to the opening of rural branches through business correspondents
or branches yet it also includes the financial literacy efforts on the part of the bank. The research is an analytical research and the information has been obtained
through secondary resources, published on the website of the ban, newspaper, research journals, articles etc. The financial inclusion index is based on three basic
dimensions of an inclusive financial system –banking penetration, availability of the banking services and usage of the banking system. The Government has
allotted 1,573 villages to the Bank all over the country, having over 2,000 population, for coverage under financial inclusion. Of these, 1,573 villages, 150 villages
will be covered under Bank / Branch model and the balance 1,423 villages will be covered by Business Correspondent (BC) model. The Financial Inclusion villages
during 2011-12 & 2012-13 have shown good results with more than 9.20 lacs a/cs and `1522 Crs business as at end of May 013, with an average of 3913 a/cs and
`6.48 Crs business per branch. During the year 2012-13, 123 Farmers' club have been formed. The financial inclusion has an multiplier effect as the weaker section
shall be exhorted to save and participate in the economy
KEYWORDS
Business Correspondents, Canara Bank, Financial Inclusion, RBI.
INTRODUCTION ne of the main conditions promulgated by RBI, for the award of new banking licenses, is the opening of 25% of the branches in the rural areas. An
estimated 2.5 billion working-age adults globally have no access to the types of formal financial services. The financial inclusion is not restricted only to the opening of the branches rather it is the base for the creation of financial literacy among the economically handicapped society.
Financial inclusion is the delivery of financial services at low or even zero level costs to the weaker and the low income level society, hassle-free and in complex
form do include the micro insurance, pension and micro credit. The Reserve Bank of India (RBI) set up the Khan Commission in 2004 to look into financial inclusion and the recommendations of the commission were incorporated into the mid-term review of the policy (2005–06). In the report RBI exhorted the
banks with a view to achieving greater financial inclusion to make available a basic "no-frills" banking account. In India, financial inclusion first featured in 2005, when it was introduced by K.C. Chakraborthy, the chairman of Indian Bank. Mangalam became the first village in India where all households were provided banking facilities.
• Norms were relaxed for people intending to open accounts with annual deposits of less than Rs. 50,000.
• General credit cards (GCCs) were issued to the poor and the disadvantaged with a view to help them access easy credit.
• In January 2006, the Reserve Bank permitted commercial banks to make use of the services of non-governmental organizations (NGOs/SHGs), micro-
finance institutions, and other civil society organizations as intermediaries for providing financial and banking services. These intermediaries could be used as business facilitators or business correspondents by commercial banks.
• The Reserve Bank of India’s vision for 2020 is to open nearly 600 million new customers' accounts and service them through a variety of channels by
leveraging on IT. However, illiteracy and the low income savings and lack of bank branches in rural areas continue to be a roadblock to financial inclusion in
many states and there is inadequate legal and financial structure.
• Levels of income inequality (as measured by Gini coefficients) are negatively correlated with levels of financial inclusion
LITERATURE REVIEW (Chauhan, 2013) highlighted, India is at the moderate level regarding financial inclusion as compared to other countries regarding the number of branches, ATMs, bank credit and bank deposits. The RBI have adopted various measures such as no-frill account, use of regional language, simple KYC norms etc to
strengthen the financial inclusion but there is a need of viable and sustainable business models for its success. (Ganeshkumar, 2013) Studied that branch density in a state measures the opportunity for financial inclusion in India. Literacy is a prerequisite for creating
investment awareness, and hence intuitively it seems to be a key tool for financial inclusion. It is not possible to achieve financial inclusion only by creating investment awareness, without significantly improving the investment opportunities in India. (Ananth, 2012), Three core operating principles differentiating the KGFS model: (1) complete coverage of the population in a focused geographic area, (2)
customized client wealth management services, and (3) a broad range of products. The KGFS model demonstrates how a business model can be reconfigured to pursue complete financial inclusion: committing to reach as many households as possible in a service area, putting client needs at the centre, and offering a wide range of needed services.
IMPORTANCE OF STUDY The study gives us an insight into the financial inclusion work done by the Canara bank over a period of time. The inclusion is not only limited to the opening of rural branches through business correspondents or branches yet it also includes the financial literacy efforts on the part of the bank. The Canara bank is doing a
considerable work so as to spread financial literacy among the rural and other customers. Through the research, an attempt has been made to highlight the branch density/coverage of the bank in inclusion priority areas as well as the other inclusion activities undertaken.
RESEARCH OBJECTIVE • To study the conceptual framework of financial inclusion and bank's contribution.
• To analyse the branch density of the bank in lead districts.
• To highlight the other initiatives of the bank with regards to the financial inclusion plan.
RESEARCH METHODOLOGY The research has been under taken to analyse the contribution of the bank with regards to the financial inclusion plan. The research is an analytical research and
the information has been obtained through secondary resources, published on the website of the ban, newspaper, research journals, articles etc.. An attempt has been made to exhibit the bank's activities vis-a-vis financial inclusion. A list of lead districts has been published by the bank on its website. On the basis of
these lead districts, the states have been taken into consideration to analyse the branch density in the states.
O
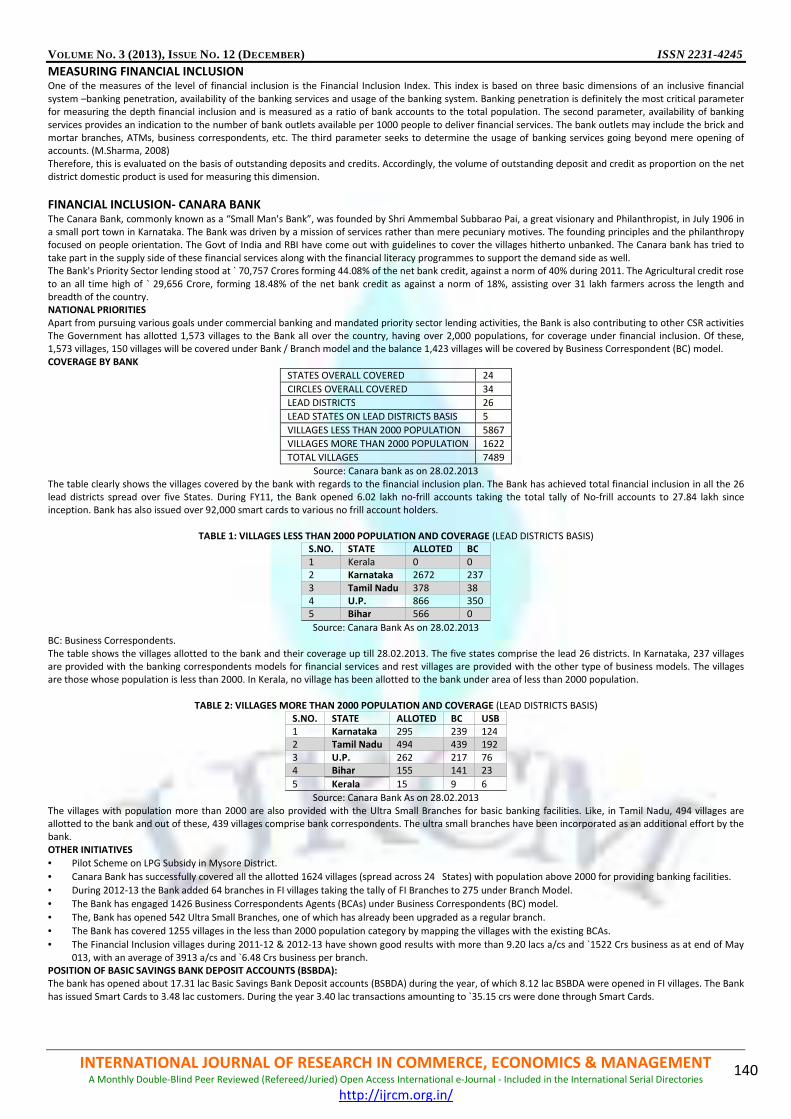
VOLUME NO. 3 (2013), ISSUE NO. 12 (DECEMBER) ISSN 2231-4245
INTERNATIONAL JOURNAL OF RESEARCH IN COMMERCE, ECONOMICS & MANAGEMENT A Monthly Double-Blind Peer Reviewed (Refereed/Juried) Open Access International e-Journal - Included in the International Serial Directories
http://ijrcm.org.in/
140
MEASURING FINANCIAL INCLUSION One of the measures of the level of financial inclusion is the Financial Inclusion Index. This index is based on three basic dimensions of an inclusive financial
system –banking penetration, availability of the banking services and usage of the banking system. Banking penetration is definitely the most critical parameter for measuring the depth financial inclusion and is measured as a ratio of bank accounts to the total population. The second parameter, availability of banking
services provides an indication to the number of bank outlets available per 1000 people to deliver financial services. The bank outlets may include the brick and mortar branches, ATMs, business correspondents, etc. The third parameter seeks to determine the usage of banking services going beyond mere opening of accounts. (M.Sharma, 2008)
Therefore, this is evaluated on the basis of outstanding deposits and credits. Accordingly, the volume of outstanding deposit and credit as proportion on the net district domestic product is used for measuring this dimension.
FINANCIAL INCLUSION- CANARA BANK The Canara Bank, commonly known as a “Small Man's Bank”, was founded by Shri Ammembal Subbarao Pai, a great visionary and Philanthropist, in July 1906 in a small port town in Karnataka. The Bank was driven by a mission of services rather than mere pecuniary motives. The founding principles and the philanthropy focused on people orientation. The Govt of India and RBI have come out with guidelines to cover the villages hitherto unbanked. The Canara bank has tried to
take part in the supply side of these financial services along with the financial literacy programmes to support the demand side as well. The Bank's Priority Sector lending stood at ` 70,757 Crores forming 44.08% of the net bank credit, against a norm of 40% during 2011. The Agricultural credit rose
to an all time high of ` 29,656 Crore, forming 18.48% of the net bank credit as against a norm of 18%, assisting over 31 lakh farmers across the length and breadth of the country. NATIONAL PRIORITIES Apart from pursuing various goals under commercial banking and mandated priority sector lending activities, the Bank is also contributing to other CSR activities The Government has allotted 1,573 villages to the Bank all over the country, having over 2,000 populations, for coverage under financial inclusion. Of these, 1,573 villages, 150 villages will be covered under Bank / Branch model and the balance 1,423 villages will be covered by Business Correspondent (BC) model.
COVERAGE BY BANK
STATES OVERALL COVERED 24
CIRCLES OVERALL COVERED 34
LEAD DISTRICTS 26
LEAD STATES ON LEAD DISTRICTS BASIS 5
VILLAGES LESS THAN 2000 POPULATION 5867
VILLAGES MORE THAN 2000 POPULATION 1622
TOTAL VILLAGES 7489
Source: Canara bank as on 28.02.2013
The table clearly shows the villages covered by the bank with regards to the financial inclusion plan. The Bank has achieved total financial inclusion in all the 26 lead districts spread over five States. During FY11, the Bank opened 6.02 lakh no-frill accounts taking the total tally of No-frill accounts to 27.84 lakh since inception. Bank has also issued over 92,000 smart cards to various no frill account holders.
TABLE 1: VILLAGES LESS THAN 2000 POPULATION AND COVERAGE (LEAD DISTRICTS BASIS)
S.NO. STATE ALLOTED BC
1 Kerala 0 0 2 Karnataka 2672 237
3 Tamil Nadu 378 38 4 U.P. 866 350 5 Bihar 566 0
Source: Canara Bank As on 28.02.2013 BC: Business Correspondents.
The table shows the villages allotted to the bank and their coverage up till 28.02.2013. The five states comprise the lead 26 districts. In Karnataka, 237 villages are provided with the banking correspondents models for financial services and rest villages are provided with the other type of business models. The villages are those whose population is less than 2000. In Kerala, no village has been allotted to the bank under area of less than 2000 population.
TABLE 2: VILLAGES MORE THAN 2000 POPULATION AND COVERAGE (LEAD DISTRICTS BASIS)
S.NO. STATE ALLOTED BC USB 1 Karnataka 295 239 124 2 Tamil Nadu 494 439 192
3 U.P. 262 217 76 4 Bihar 155 141 23
5 Kerala 15 9 6
Source: Canara Bank As on 28.02.2013
The villages with population more than 2000 are also provided with the Ultra Small Branches for basic banking facilities. Like, in Tamil Nadu, 494 villages are allotted to the bank and out of these, 439 villages comprise bank correspondents. The ultra small branches have been incorporated as an additional effort by the bank.
OTHER INITIATIVES
• Pilot Scheme on LPG Subsidy in Mysore District.
• Canara Bank has successfully covered all the allotted 1624 villages (spread across 24 States) with population above 2000 for providing banking facilities.
• During 2012-13 the Bank added 64 branches in FI villages taking the tally of FI Branches to 275 under Branch Model.
• The Bank has engaged 1426 Business Correspondents Agents (BCAs) under Business Correspondents (BC) model.
• The, Bank has opened 542 Ultra Small Branches, one of which has already been upgraded as a regular branch.
• The Bank has covered 1255 villages in the less than 2000 population category by mapping the villages with the existing BCAs.
• The Financial Inclusion villages during 2011-12 & 2012-13 have shown good results with more than 9.20 lacs a/cs and `1522 Crs business as at end of May
013, with an average of 3913 a/cs and `6.48 Crs business per branch. POSITION OF BASIC SAVINGS BANK DEPOSIT ACCOUNTS (BSBDA): The bank has opened about 17.31 lac Basic Savings Bank Deposit accounts (BSBDA) during the year, of which 8.12 lac BSBDA were opened in FI villages. The Bank
has issued Smart Cards to 3.48 lac customers. During the year 3.40 lac transactions amounting to `35.15 crs were done through Smart Cards.

VOLUME NO. 3 (2013), ISSUE NO. 12 (DECEMBER) ISSN 2231-4245
INTERNATIONAL JOURNAL OF RESEARCH IN COMMERCE, ECONOMICS & MANAGEMENT A Monthly Double-Blind Peer Reviewed (Refereed/Juried) Open Access International e-Journal - Included in the International Serial Directories
http://ijrcm.org.in/
141
TABLE: 3 LEAD CIRCLES AND SAVING BANK ACCOUNTS S.NO STATE CIRCLE BASIC SAVINGS BANK ACCOUNTS OPENED UPTO BALANCES RS. CRORES Mar-12 Feb-13 % Change Mar-12 Feb-13 % Change 1 Karnataka Bang(M) 73262 89313 22 14.97 17.58 17
Bang(R) 140434 207208 48 22.13 29.22 32 Hubli 151494 197031 30 21.6 27.07 25 Mysore 74743 107905 44 11.81 16.77 42
Shimoga 74728 102863 38 14.14 19.32 37 2 Tamil Nadu Coimbatore 228184 333676 46 30.62 40.18 31
Madurai 202605 301771 49 16.56 25.51 54 Trichy 292689 479652 64 28.75 47.23 64 3 Kerala Calicut 128883 156289 21 15.5 19.77 28
Trivandrum 114323 123874 8 15.07 18.36 22 4 U.P Agra 295733 375823 27 68.4 82.57 21 5 Bihar Patna 246420 294027 19 63.71 89.97 41
Source: Canara Bank Website (Dec-2013) The Table depicts that the Bank has enhanced the considerable number of saving bank accounts within one year in different circles. This has also increased the
balances and in some cases like in Trivandrum the percentage increase in saving bank accounts is 8% whereas the percentage increase in balances is 22% within the period of one year thereby depicting the fact that demand side has increased manifold in the region. The correlation between percentage change in saving accounts in different regions and the percentage change in the balances in the bank is 0.743. This exhibits the positive correlation between them.
MICRO INSURANCE The Bank provided life coverage to 31117 group members under Micro Insurance policy during the financial year 2012-13. During this year Bank has added 4926
members taking the total group members covered to 56111 cumulatively. MICRO FINANCE BRANCHES Bank is also catering to urban poor & Micro Finance Branches have been opened in urban Centres. A total of 19 Micro Finance Branches contributed business of `
211 Crs. CREDIT LINKAGE Besides opening BSBDA, the Bank has endeavoured its effort to provide host of other facilities like In-Built Overdrafts (IODs), Kisan Credit Cards (KCCs), General
Credit Cards(GCCs), Differential Rate of Interest scheme (DRI), Self Help Groups (SHGs), Micro Credit Groups (MCGs), Micro Insurance and Micro Pension under Canara Nayee Disha Scheme.
FINANCIAL LITERACY CENTRES (FLCS) During the year 2012-13, 123 Farmers' club have been formed. Presently the Bank has more than 1500 farmers' club all over the country. These farmers' club disseminate information to the rural people about the banking products and advanced technology.
ENGAGING ANCHOR NGOS FOR PROMOTING WOMEN SHGS (WSHGS) IN BACKWARD DISTRICTS The Bank has the Lead Bank responsibility in Chitradurga Dist. in Karnataka state, Waynad and Palakkad dist. in Kerala state, which are classified as backward districts. As per the guidelines of the Ministry of Finance, Govt. of India, Bank has signed MOU with Shree Kshetra Dharmasthala Rural Development Programme
(SKDRDP) in Chitradurga dist., Waynad Social Service Society Manantwadi in Waynad dist., & People Service Society and Hope Foundation in Palakkad dist. in Kerala state for implementation of the scheme.
POSITION OF FINANCIAL INCLUSION IN SPONSORED REGIONAL RURAL BANKS Two sponsored RRBs are 100% CBS compliant and have implemented financial inclusion plan in all 368 allotted villages by opening 20 Brick and Mortar branches, 348 Ultra Small Branches and appointing 348 Business Correspondents.
IMPLEMENTATION OF DBT SCHEME IN THE BANK The Bank has already campaigned for 'One Family One Account' as a precursor to Direct benefits transfer implementation. Bank has already ensured that CBS
can capture Aadhaar numbers. Bank has provided adequate number of access points i.e. branch, ATM, cash dispenser, BCA, etc, to enable the beneficiaries to withdraw the money as per their ease and convenience. Aadhaar lookup facility has been enabled. BIOMETRIC ATMS The Bank has installed 29 Bio metric ATMs. These Bio Metric ATMs enable the rural illiterate customers to access their accounts using Biometric features like finger prints and withdraw the amount or get balance confirmation, using colour codes. All the new ATMs being installed in Rural / Semi urban areas can also be bio metric enabled based on need.
CANARA GRAMIN VIKAS VAHINI The Bank has provided Canara Gramin Vikas Vahini Vehicles in 37 districts across the country, with an objective of providing Financial Literacy and awareness
about Bank's products and Banking facilities among the rural households.
SUGGESTIONS More focus should be on the Business correspondents as they can be helpful in providing the basic as well as other banking services to the rural poor. The attention must be given to the fact that how much the rural poor is accustomed with the banking services. The research undertaken by the bank should go
beforehand and this would help the bank to reach out the bottom. (KAPOOR, 2013)
CONCLUSION For the inclusive development, the contribution and support to the weaker section can not be ignored. The bank is running on a right track in providing the
banking and other financial services to the priority sector/ weaker sector. The major responsibility on the part of the banking sector is to enhance the financial literacy among the rural customers. The financial behaviour of the account holders should be analysed with a view to know their banking habits. The information technology should be exploited at the best possible way so as to provide quality services to the poor. The financial inclusion has an multiplier effect as the
weaker section shall be exhorted to save and participate in the economy. The commercial banks are making use of different business models in order to render services to the weaker strata but its pace should be enhanced for the future.
LIMITATIONS The research is in relation to canara bank only. The contribution by the other banks can also be studied.
REFERENCES 1. Ananth, C. a. (2012). The pursuit of complete Financial Inclusion: The KGFS model in India. CGAP.
2. Chauhan, A. A. (2013). A Study on Overview Of Financial Inclusion in India. Indian Jouranl of Research, 3. 3. G.Balasubramanian, L. K. (n.d.). Micro Finance Products and the role of Securities Market. NSE Working Paper Series.
VOLUME NO. 3 (2013), ISSUE NO. 12 (DECEMBER) ISSN 2231-4245
INTERNATIONAL JOURNAL OF RESEARCH IN COMMERCE, ECONOMICS & MANAGEMENT A Monthly Double-Blind Peer Reviewed (Refereed/Juried) Open Access International e-Journal - Included in the International Serial Directories
http://ijrcm.org.in/
142
4. Ganeshkumar. (2013). Overview of Financial Inclusion in India. International Jounal of Management and Developement Studies. 5. KAPOOR, P. (2013). Study of financial inclusion in Banking Industry in India. International Jouranl of Research in Commerce & Management.
6. M.Sharma. (2008). Index of financial inclusion. Indian Council for Research on International Economic Relations. WEBSITES 7. http://en.wikipedia.org/wiki/Financial_inclusion
8. http://indiagovernance.gov.in/files/financial-inclusion.pdf 9. http://rbidocs.rbi.org.in/rdocs/Speeches/PDFs/ISCHF230712_F.pdf 10. http://www.canarabank.com/English/scripts/FinancialInclusionHome.aspx
11. http://www.esocialsciences.com/data/articles/Document1143200840.755932.pdf 12. http://www.rbi.org.in/scripts/BS_SpeechesView.aspx?Id=836
VOLUME NO. 3 (2013), ISSUE NO. 12 (DECEMBER) ISSN 2231-4245
INTERNATIONAL JOURNAL OF RESEARCH IN COMMERCE, ECONOMICS & MANAGEMENT A Monthly Double-Blind Peer Reviewed (Refereed/Juried) Open Access International e-Journal - Included in the International Serial Directories
http://ijrcm.org.in/
143
THE POPULATION GROWTH AND ECONOMIC DEVELOPMENT
SANGHARSHA BALIRAM SAWALE
AMBEDKAR NAGAR
WEEKLY MARKET, MALKAPUR, BULDHANA
NEHA RAKESH NAMDEO
SURVEY NO. 88, PLOT NO. 123B
KAMAL KUNJ VIHAR, TAPI NAGAR, BHUSAWAL
ABSTRACT
All countries at any time have some people living there. This number constitutes the size of population of that country at that time. This number, however is
continuously changing through births, death and immigration, increase in the number of people in a country during a period of time is called the growth of
population. In recent times, policymakers in the country have shown great concern in the economic growth of the nation. Both urban and rural economies have
come under the lens of the policy makers to check what the real factor that enhance economic growth. However, it has been accepted that economic growth is
mainly affected by the population explosion, because the more the human activities the more driven economy will be and this in turn brings the needed growth in
the economy. For instance, fewer people live in rural areas which have little or no economic problem compared to urban, semi urban areas that have more
population. The federal Govt. at one time or the other has introduced many policies to continuously enhance economic growth through the distribution of the
nation’s population evenly. It was thus realized that one of the factors responsible for the development of human capital formation in turn affects the economic
growth of nation. This study examines the effects of population on economic development in India as well as used trend three stages of demographic transition
and India’s population population size and growth trends during from 1971 to 2011. The study revealed that population growth has negative impact on economic
sustainability. The study later proffers various policies which Govt. can implement for better economic development.
KEYWORDS India’s population, Economic Development, Remedies for population explosion.
INTRODUCTION ndia and many other third world countries are now passing through phase of population explosion. It is being argued that this situation has arisen because economic development in these countries has failed to maintain pace with population growth. Over six billion people exist on earth today and an increase
of about 97 million people occurs a growing population leads to several environmental issues as well as social problem. An increasing population can be attributes to several variables. Within countries, we can credit the growth to increased immigration or lack of migration. Lack of education and contraceptive
and the need od desire for more children also adds to the population. In more developed countries we can attributes the population rises to better medical care, thus a longer life- span and/ or fewer deaths. As a result of this over population we experience social issues such as increased rates of poverty, crime, disease, population, and more. These threats a very necessary to be addressed, as they will affect people world wide. It is important that we look at these problems since
every human has the ability to prevent future damages and adjust their lifestyle to decelerates this increase in population. But we can see according to neo- Malthusian population problem is an investable result of the reproductive behavior of man. The theory of demographic transition, however, rejects this view an asserts that the population explosion implying a sudden spurt in the rate of population growth is a transitory
phenomeono that occurs in the second stage of demographic transition due to a rapid fall in the mortality rate without a corresponding fall in the birth rate. According to that theory of demographic transition, every country passes through three stages of demographic transition that was most important for
preventing economic development. That stages were empirically verifiable. In the first stage of demographic transition high birth rate is matched by an equally high death rate, and thus population remains stable over a long period. The second stage of demographic transition characterized by rapid growth of population because despite sustaintial reduction in the mortality rate there is no corresponding decline in the birth rate. In third stage of demographic transition, the birth
rate declines significantly and thus the rate of population growth remains low. In this way in a country where economy has not grown adequately for a long time and sizable section of population has remained below the poverty line, this is really a grave situation. But in this present condition all situation are changing and now the country can hope to overcome the problem of population explosion.
If the process of industrialization accompanied by urbanization is fast and education become widespread. We can imagine in recent time, policymakers in the country has shown great concern in the economic growth of the nation. Both urban and rural economies in India have come under the lens of the policy makers
to check what the real factors that enhance economic growth.
REVIEW OF LITERATURE 1) Ghosh B.N (1993), in his population economics, gives theoretical background for population growth, urbanization, migration, fertility, mortality etc. and
tries to answer what, why, how much, when questions on demographic variables.
2) Study has been conducted by M. K. Jain, Ninanti Ghosh and won Bae kim on trends in urbanization in their book titled “ Emerging trends of urbanization in India- an analysis of 1991 census Result, Elaborates study has been done by them on multi various aspect of urbanization in India on the basis of 1991 census figures.
3) Nair P. S (1985), in the study of interstate period migration in India 1971-11 levels and trends tries to reinstate the relationship between migration and distance with the help of empirical data.
4) Adediran Adewole (2012), IJPSS VOL.2, The study revealed that population growth has positive and significant impact on economic sustainability proxied as
a real GDP and per capita income.
OBJECTIVES OF THE STUDY The present study is direct towards the following objectives 1) To provide undertake activities aimed to achieved population stabilization 2) To facilitate the development of a vigorous peoples movement in favour of the national efforts for population stabilization. 3) Explain how economic growth affects the rate of growth of population
METHODOLOGY In the present article, at the outset of the article the formal population and economic development has been discussed. The source of data is different
periodicals. E –news papers, Journals, in the relevant field, magazines, different reports etc. the details of which have been duly report in the references section which implies that the data base of the articles is secondary in nature. In the present article, India’s is secondary in nature. In the present articles, India’s population: size and growth trends, causes of rapid growth of population, population and economic development and the future has been studied in details. The
period of study from 1997 to 2011.
I

VOLUME NO. 3 (2013), ISSUE NO. 12 (DECEMBER) ISSN 2231-4245
INTERNATIONAL JOURNAL OF RESEARCH IN COMMERCE, ECONOMICS & MANAGEMENT A Monthly Double-Blind Peer Reviewed (Refereed/Juried) Open Access International e-Journal - Included in the International Serial Directories
http://ijrcm.org.in/
144
INDIA’S POPULATION: SIZE GROWTH TRENDS As per as the size of population is concerned, India ranks second in the world next only to china. Infact the population of India at 121.02 crore in 2011 is almost
equal to the combined population of the USA, Indonesia, Brazil, Pakistan, Bangladesh and Japan put together which is 121.43 crore in this context, it may also be pointed out that USA is the third largest country in terms of population size. These facts clearly indicate that the pressure of the population on the land in this
country is very high. According to census of 1901, the population of the country was 23.83 crore. Since, then in the period of 110 years the population of the country has increased by more than 97 crore. This if viewed in the context of the relatively slow economic growth, is really as alarming situation. However the population has not
increased in this country at a uniform rate. This is obvious from the population figure given in table.
Census year Population in crore Average annual G.Rate %
1971 54.82 2.20
1981 68.33 2.22
1991 84.64 ..16
2001 102.87 1.97
2011 121.02 1.64
Source: Govt. of India, Census of India provisional population trend, 2011
CAUSES OF THE RAPID GROWTH OF POPULATION We have seen broadly, there are three possible causes of an increase in the population of a country 1) a high birth rate 2) a relatively lower death rate 3)
immigration. India’s population has most increased much due to immigration. In India, the population has rapidly increased leading to population explosion. Factors leading to steady decline in the death rate while birth rate remained are stated. We have given next in a nature.
1) FACTORS LEADING TO DECLINE IN MORTALITY RATE
• Control of epidemic such as a cholera and smallpox
• Improved supply of drinking water
• Improved situation and hygiene
• Explosion of education and increased literacy. etc.
2) ECONOMIC FACTORS CAUSING THE HIGH BIRTH RATE
• Predominance of Agriculture
• Slow immunization process
• Widespread poverty etc.
3) SOCIAL FACTOR LEADING TO HIGH BIRTH RATE
• Lower age at the time of marriage
• Joint family system
• Lack of education
POPULATION AND ECONOMIC DEVELOPMENT In India, the over whelming view is that the countries existing population is an obstacle to economic development considering the available utilizable resources and the level of technological progress. Further, growth in population will result in an additional burden on the economy in the sense that it will make larger
demand on resources for unproductive consumption in India is the major constraint on its economic development. However, there are certain economist who argue that population growth is not an obstacle. We are given different point of view below.
1) Population growth and the declining land man ratio 2) Population growth and capital formation 3) Other adverse effects of population growth
i) Adverse impact on employment situation ii) Adverse impact on per capita income and standard of living
iii) Shortage and import of food grains. iv) Adverse impact of feeding growing population v) Present change in occupational distribution of population
INDIAS POPULATION: THE FUTURE Absolute level of population in India was 102.9 crore in 2001. According to the tech. group on population projections constituted by the national commission (2006), the rate of growth of population which was a high as 1.93% per annum during 1990s is expected to fall to 0.9 by 2026 and thus population is projected to
increase to 140.0 crore by 2026. Tim Dyson has estimated the population in 2026 at about 142 crore In regional pattern Dyson estimates that more than half of the demographic transition during 2001-26 will occur in the main Northern States I.e. Bihar, MP, UP, Rajasthan. The population of these four states will increase by around 45-55% over this period. But most of the other states will grow by only about 20-30%
As well as according to Dyson has described on urbanization projections will be about 36% in 2016 ( Up from 27.9% in 2011). The two specially dynamic urban regional system – the first stretching through out much of Western Gujarat and Maharashtra and the second centered around Delhi will continue to dominate the country urban structure.
CONCLUSION The economic evidence reveals that population growth expert positive and significant effect on economic growth measured as per capita income and real Gross domestic product in India between 1971 to 2011.
The statistical characteristics relates abilities to perform social and economic role are not in to consideration which includes literacy, educational attainments, intellectual capacity, professional skill and experience. On the other hand, analytical technique examined the significant effect of population on economic growth in India as well as population growth is an obstacle
then it will improvement has given through remedies.
RECOMMENDATION A nation that involves the welfare of the people are population policies but the concerned here with policies related to changes in the quality of the population
and its geographical distribution in the member of human beings their education and skills and where and how they live relative to the space and resources available to each person. The rate of changes of population size the level of fertility and mortality, the distribution significantly interact with the social and economic welfare of the people.
VOLUME NO. 3 (2013), ISSUE NO. 12 (DECEMBER) ISSN 2231-4245
INTERNATIONAL JOURNAL OF RESEARCH IN COMMERCE, ECONOMICS & MANAGEMENT A Monthly Double-Blind Peer Reviewed (Refereed/Juried) Open Access International e-Journal - Included in the International Serial Directories
http://ijrcm.org.in/
145
Improvement of the social/ human welfare of the people and population related policies to promote growth in national output as population increases. Such policies includes to deal with the existing population problem, broadly two fold measures would be required
A) ECONOMIC MEASURES In economic measures which are being suggested by us, the following points are most important 1) Expansion of the industrial sector
2) Creation of employment opportunities in urban areas 3) Equitable distribution of income and removal of poverty B) SOCIAL MEASURES Population explosion is as much a social problem as it is an economic problem. All social evils must be removed are following: 1) Education contribution of education in bringing down the birth rate
2) Improving the stratus of women 3) Raising the minimum age of marriage
REFERENCES 1. Adediran Adewole (2012): Effects of population on economic Development in Nigeria: A quantitive assessment, IJPPS vol 2. Issue 5
2. Government of India (2008): Planning commission, Eleventh five year plan 2007-12 Delhi 3. Jeane Dreze and Amartya Sen (1996): India- economic development and social oppprtunity, Delhi pp.167-8
4. Joshi P.C (1974) : population and poverty- moral Discord in Ashish Bose, population in India’s development, Delhi.p.84 5. Krishnan T. N (1992) : Population poverty and employment in India EPW p.2480 6. Mohmad mamdani (1976) : The ideology of population control, EPW : special number p.1143
7. Sen B. R (1969): lectured delivered at conference on population policy and programmed. Dec 19-23s
VOLUME NO. 3 (2013), ISSUE NO. 12 (DECEMBER) ISSN 2231-4245
INTERNATIONAL JOURNAL OF RESEARCH IN COMMERCE, ECONOMICS & MANAGEMENT A Monthly Double-Blind Peer Reviewed (Refereed/Juried) Open Access International e-Journal - Included in the International Serial Directories
http://ijrcm.org.in/
146
REQUEST FOR FEEDBACK
Dear Readers
At the very outset, International Journal of Research in Commerce, Economics & Management (IJRCM)
acknowledges & appreciates your efforts in showing interest in our present issue under your kind perusal.
I would like to request you tosupply your critical comments and suggestions about the material published
in this issue as well as on the journal as a whole, on our [email protected] for further
improvements in the interest of research.
If youhave any queries please feel free to contact us on our E-mail [email protected].
I am sure that your feedback and deliberations would make future issues better – a result of our joint
effort.
Looking forward an appropriate consideration.
With sincere regards
Thanking you profoundly
Academically yours Sd/-
Co-ordinator
DISCLAIMER The information and opinions presented in the Journal reflect the views of the authors and not of the
Journal or its Editorial Board or the Publishers/Editors. Publication does not constitute endorsement by the
journal. Neither the Journal nor its publishers/Editors/Editorial Board nor anyone else involved in creating,
producing or delivering the journal or the materials contained therein, assumes any liability or
responsibility for the accuracy, completeness, or usefulness of any information provided in the journal, nor
shall they be liable for any direct, indirect, incidental, special, consequential or punitive damages arising
out of the use of information/material contained in the journal. The journal, nor its publishers/Editors/
Editorial Board, nor any other party involved in the preparation of material contained in the journal
represents or warrants that the information contained herein is in every respect accurate or complete, and
they are not responsible for any errors or omissions or for the results obtained from the use of such
material. Readers are encouraged to confirm the information contained herein with other sources. The
responsibility of the contents and the opinions expressed in this journal is exclusively of the author (s)
concerned.
VOLUME NO. 3 (2013), ISSUE NO. 12 (DECEMBER) ISSN 2231-4245
INTERNATIONAL JOURNAL OF RESEARCH IN COMMERCE, ECONOMICS & MANAGEMENT A Monthly Double-Blind Peer Reviewed (Refereed/Juried) Open Access International e-Journal - Included in the International Serial Directories
http://ijrcm.org.in/
III
Copyright © 2022 FDOKUMEN