2nd International Forum on Water and Food - GOV.UK
305
1
-
Upload
khangminh22 -
Category
Documents
-
view
0 -
download
0
Transcript of 2nd International Forum on Water and Food - GOV.UK

1

I

II
CGIAR Challenge Program on Water and Food
2nd International Forum on Water and Food
Fighting Poverty Through Sustainable Water Use: Volumes I, II, III and IV. Proceedings of the CGIAR Challenge Program on Water and Food 2nd International Forum on Water and Food, Addis Ababa, Ethiopia, November 10—14, 2008. Proceedings Volume I ISBN 978-92-990053-0-9 Volume II ISBN 978-92-990053-1-6 Volume III ISBN 978-92-990053-2-3 Volume IV ISBN 978-92-990053-3-0

I
Acknowledgements
The CGIAR Challenge Program on Water and Food would like to thank all those in its community-of-practice who contributed to the production of these four volumes of papers and posters.
Humphreys, E., Bayot, R.S., van Brakel, M., Gichuki, F., Svendsen, M., White, D., Wester, P., Huber-Lee, A., Cook, S., Douthwaite, B., Hoanh, C.T., Johnson, N., Nguyen-Khoa, S., Vidal, A., MacIntyre, I., and MacIntyre, R. (Editors) 2008. Fighting Poverty Through Sustainable Water Use: Volumes I, II, III and IV. Proceedings of the CGIAR Challenge Program on Water and Food 2nd International Forum on Water and Food, Addis Ababa, Ethiopia, November 10—14, 2008. The CGIAR Challenge Program on Water and Food, Colombo. 297pp. ISBN 978-92-990053-1-6 Front cover design: Meskerm Gosaya, Emmer Advertising, Addis Ababa, Ethiopia Pre-press assembly: Yoseph Ali, MDSC, Addis Ababa, Ethiopia
Note on cover design: The Amharic lettering in the lower right hand corner translates as “International Program and Water and Food”. The colours in the keyline at the bottom of the page are those of the Ethiopian Flag, and the obelisk is a famous landmark of Axum – a historic city of Ethiopia and a world treasure. Their inclusion on the cover and use in other Forum print materials is recognition of the wonderful hospitality of the Ethiopian people and a thank you for being such a generous host country for the 2nd International Forum on Water and Food.

II
Foreword
Every two years the CGIAR Challenge Program on Water and Food holds an International Forum on Water and Food, during which we present our research results, debate these, and consider ways in which we can better deliver these into impact. Another important function of this second Forum is to consolidate CPWF research priorities for our second 5-year phase starting in 2009.
We are particularly glad to introduce these four volumes of papers and posters originating from CPWF phase one projects. All papers were peer-reviewed, and a total of 154 papers selected for publication in these proceedings. They include papers from all 9 Basin Focal Projects, 30 of the 1st competitive call projects, 3 of the Small Grants projects for innovation, and 2 Themes.
We wish to congratulate all of you who contributed papers to these proceedings, and thank you for the tremendous enthusiasm and cooperation enabling us to meet very tight publication deadlines so that all papers could be available, in hard copy, at the Forum. All this was achieved in less than 9 months, from the time of the call for Abstracts to release at the Forum.
We are also proud of the excellent teamwork of the CPWF Theme Leaders and Basin Focal Project Leadership teams, who worked very hard reviewing abstracts, reviewing and editing papers, checking revised papers, and who designed and selected the papers for the sessions, based on your submissions.
The publication of these proceedings is the result of a truly CPWF global community effort. We also thank Reg and Ida MacIntyre for their careful editing to tight deadlines.
The papers and posters are provided in 4 volumes as follows:
Volume I – 4 invited Key Concept Papers from the Phase 1 projects, and 1 invited Keynote Paper from Dr Carlos Sere, DG of ILRI entitled ‘Swimming upstream’ – the water and livestock nexus, and 36 papers on Cross-cutting topics: Agriculture, water and health; Governance: linking communities across boundaries; Innovative modelling tools; Participatory modelling and knowledge integration; and Resilience to climate change
Volume II – 44 papers from Phase 1 projects directly relevant to the CPWF Phase 2 Topic 1 Increasing rainwater productivity and 21 papers relevant to Topic 2 Multi-purpose water systems
Volume III –23 papers from Phase 1 projects directly relevant to CPWF Phase 2 Topic 3 Water benefits sharing for poverty alleviation and conflict resolution, and 25 papers relevant to Topic 4 Drivers and processes of change
Volume IV – 40 Project Posters by Phase 1 Projects of the Challenge Program on Water and Food
Five years is at the same time long from an outside perspective, but short for multi-disciplinary projects including partners from different horizons, backgrounds, and often river basins. These Proceedings present many, but not all, of the fine achievements and outcomes of the CPWF Phase 1 projects.
Dr. Jonathan Woolley Dr. Alain Vidal, Cemagref
Program Coordinator Forum Convener, Chair Organising Committee
CGIAR Challenge Program on Water and Food
www.waterandfood.org

III
Table of Contents
ACKNOWLEDGEMENTS ................................................................................................................................... II FOREWORD .................................................................................................................................................. II TABLE OF CONTENTS ...................................................................................................................................... II
INCREASING CROP WATER PRODUCTIVITY THROUGH OPTIMIZING THE USE OF SCARCE IRRIGATION WATER RESOURCES ......................................................................................................................... 1
PA035 ASSESSING WATER SUPPLY AND DEMAND FOR DRY SEASON RICE IN COASTAL POLDERS OF BANGLADESH ................. 1 PA205 QUALITY AND GROUNDWATER LEVEL DYNAMICS AT TWO COASTAL SITES OF BANGLADESH: IMPLICATIONS FOR
IRRIGATION DEVELOPMENT ................................................................................................................... 7 PA047 FIELD EVAPOTRANSPIRATION AND WATER USE EFFICIENCY OF AEROBIC RICE UNDER DIFFERENT WATER TREATMENTS
IN THE NORTH CHINA PLAIN ................................................................................................................ 12 PA044 OPTIMIZING YIELD, WATER REQUIREMENTS, AND WATER PRODUCTIVITY OF AEROBIC RICE FOR THE NORTH CHINA
PLAIN ............................................................................................................................................. 16 PA023 WATER REGIMES AND NUTRIENT REQUIREMENTS FOR AEROBIC RICE PRODUCTION SYSTEM ............................... 21 PA043 INCREASING ON‐FARM WATER PRODUCTIVITY THROUGH AFFORDABLE MICROIRRIGATION VEGETABLE‐BASED
TECHNOLOGY IN CAMBODIA ................................................................................................................ 25 PA046 CROP WATER PRODUCTIVITY IN INDIA: SOME POTENTIAL IMPROVEMENTS ...................................................... 30 PA081 VARIATIONS IN GROUNDWATER USE, WATER PRODUCTIVITY AND PROFITABILITY ACROSS A CANAL COMMAND IN THE
INDO‐GANAGETIC BASIN .................................................................................................................... 35 PA017 GRAIN FILLING CHARACTERISTIC AND YIELD FORMATION OF WATER‐SAVING AEROBIC RICE HANDAO297 AS AFFECTED
BY N APPLICATION AND SOIL TYPE ......................................................................................................... 40 PA005 WATER AVAILABILITY DEFICIT IN RAINFED FARMING FOR SEMIARID MZINGWANE CATCHMENT, ZIMBABWE .......... 44 PA027 WATER PRODUCTIVITY IN THE SALT‐PRONE AREAS OF LOWER KARKHEH RIVER BASIN, IRAN .............................. 48 PA031 BEST IRRIGATION MANAGEMENT PRACTICES FOR IMPROVING WATER PRODUCTIVITY IN SALT‐PRONE AREAS OF LOWER
KARKHEH RIVER BASIN ....................................................................................................................... 52
INCREASING LIVESTOCK WATER PRODUCTIVITY ............................................................................. 57
PA158 OPPORTUNITIES FOR INCREASING LIVESTOCK WATER PRODUCTIVITY IN SUDAN ............................................... 57 PA157 OPTIONS TO IMPROVE LIVESTOCK‐WATER PRODUCTIVITY (LWP) IN THE CATTLE CORRIDOR WITHIN THE WHITE NILE
SUB‐BASIN IN UGANDA ...................................................................................................................... 61 PA155 CATTLE MANURE AND RESEEDING EFFECTS ON PASTURE PRODUCTIVITY ......................................................... 65 PA148 UPPER CATCHMENT MANAGEMENT AND WATER COVER PLANTS EFFECTS ON THE QUALITY AND QUANTITY OF WATER
IN SURFACE RESERVOIRS ..................................................................................................................... 70 PA162 SOCIOECONOMIC FACTORS AFFECTING LIVESTOCK WATER PRODUCTIVITY IN RAINFED PASTORAL PRODUCTION
SYSTEMS ......................................................................................................................................... 75 PA156 LIVESTOCK WATER PRODUCTIVITY IN RELATION TO NATURAL RESOURCE MANAGEMENT IN MIXED CROP‐LIVESTOCK
PRODUCTION SYSTEMS OF THE BLUE NILE RIVER BASIN, ETHIOPIA .............................................................. 79 PO010 IMPACTS OF ACCESS TO RESOURCES ON WATER PRODUCTIVITY: THE CASE OF THE BLUE NILE ............................. 83 PA150 ESTIMATION OF LIVESTOCK, DOMESTIC USE, AND CROP WATER PRODUCTIVITIES OF SG‐2000 WATER HARVESTING
PILOT PROJECTS IN ETHIOPIA .............................................................................................................. 88 PO015 COST‐EFFECTIVE ASSESSMENTS OF LIVESTOCK‐WATER PRODUCTIVITY USING PREVIOUS ANIMAL FEEDING TRIALS...... 92 PA090 WHY GENDER MATTERS: REFLECTIONS FROM THE LIVESTOCK‐WATER PRODUCTIVITY RESEARCH PROJECT .............. 97 PA149 FACILITATING ADOPTION OF LIVESTOCK WATER PRODUCTIVITY INTERVENTIONS IN CROP‐LIVESTOCK SYSTEMS ...... 101 PA152 GIS‐BASED MULTICRITERIA DECISION ANALYSIS FOR LAND SUITABILITY MODELING OF LIVESTOCK PRODUCTION IN
TANA SUBBASIN, ETHIOPIA ............................................................................................................... 106 PO016 RESPONSE‐INDUCING SUSTAINABILITY EVALUATION (RISE) LINKING AGRICULTURAL PRACTICES AND WATER
PRODUCTIVITY ................................................................................................................................ 110

IV
PO013 AN ANALYSIS OF LIVESTOCK PRODUCTION IN CAPRICORN, MOPANI AND SEKHUKHUNE DISTRICTS OF SOUTH AFRICA ................................................................................................................................................... 115
INTEGRATION OF GERMPLASM AND MANAGEMENT FOR SUSTAINABLE WATER PRODUCTIVITY IMPROVEMENT IN RAINFED CROPPING ....................................................................................... 120
PA021 QUANTIFYING WATER PRODUCTIVITY IN RAINFED CROPPING SYSTEMS IN LIMPOPO PROVINCE, SOUTH AFRICA .... 120 PA006 SIMULATED YIELDS AND WATER PRODUCTIVITY OF RAINFED GRAIN CROPS IN THE VOLTA BASIN: FERTILIZER IMPACT
................................................................................................................................................... 125 PA002 EFFICIENT RAINWATER HARVESTING AND NUTRIENT MANAGEMENT FOR HIGH CROP PRODUCTIVITY IN VOLTA BASIN
................................................................................................................................................... 131 PA014 IMPROVING CROP PRODUCTIVITY AND FARMER INCOME USING FERTILIZER MICRODOSING AND THE WARRANTAGE
SYSTEM IN THE VOLTA BASIN ............................................................................................................. 135 PA088 INCORPORATING GENDER ANALYSIS IN ASSESSING THE NEEDS, OPPORTUNITIES AND BENEFITS FROM RESEARCH AND
TECHNOLOGY DEVELOPMENT FOR SALT‐AFFECTED RICE AREAS: A CASE IN EASTERN UTTAR PRADESH, INDIA ...... 140 PA202 GERMPLASM AND MANAGEMENT STRATEGIES FOR ENHANCING PRODUCTIVITY OF SALT‐AFFECTED AREAS .......... 145 PA009 IS THE QUESUNGUAL SYSTEM AN OPTION FOR SMALLHOLDERS IN DRY HILLSIDE AGROECOSYSTEMS? ................. 150 PA072 IS SOIL CARBON SEQUESTRATION PART OF THE BUNDLE OF ECOSYSTEM SERVICES PROVIDED BY CONSERVATION
AGRICULTURE IN THE ANDES? ............................................................................................................ 155 PA022 SIMULATING SORGHUM YIELD RESPONSE TO MINERAL FERTILIZER IN SEMI‐ARID NORTHERN GHANA .................. 160 PA015 IMPROVING WATER AND LAND PRODUCTIVITY THROUGH TECHNOLOGY INTEGRATION IN SALINE SODIC SOILS OF THE
INDO‐GANGETIC BASIN .................................................................................................................... 163 PA026 BREEDING SALT‐TOLERANT RICE VARIETIES IN VIETNAM ........................................................................... 167 PA012 EVALUATION OF AGRONOMIC MANAGEMENT PRACTICES FOR ENHANCING CHICKPEA YIELD IN KARKHEH RIVER BASIN
IN IRAN ......................................................................................................................................... 170 PO022 LAND SUITABILITY EVALUATION IN MEREK WATERSHED, KARKHEH RIVER BASIN ........................................... 174 PA096 EFFECT OF AZOTOBACTER AND AZOSPIRILLUM ON THE YIELD OF WHEAT (TRITICUM AESTIVUM) AND BARLEY
(HORDEUM VULGARE) IN KERMANSHAH AND LORESTAN, IRAN ................................................................ 178 PA165 WATER PRODUCTIVITY ESTIMATES IN THE VOLTA BASIN, WEST AFRICA ....................................................... 182 PA010 EFFECT OF CONSERVATION AGRICULTURE ON THE SOIL BIOCHEMICAL CHARACTERS IN SEMI‐ARID AREA OF NORTH
CHINA .......................................................................................................................................... 186 PA028 INTRODUCTION OF SALT‐TOLERANT WHEAT, BARLEY, AND SORGHUM VARIETIES IN SALINE AREAS OF THE KARKHEH
RIVER BASIN .................................................................................................................................. 190 PA018 MARKETING SMALL PACKS OF FERTILIZER IN LIMPOPO PROVINCE, SOUTH AFRICA ......................................... 194
CATALYSING COLLECTIVE ACTION IN WATER MANAGEMENT AND SCALING UP AND OUT IN MULTIPLE USE SYSTEMS .............................................................................................................. 201
PA064 EMPOWERING COMMUNITIES TO CO‐MANAGE NATURAL RESOURCES:IMPACTS OF THE CONVERSATORIO DE ACCIÓN CIUDADANA ................................................................................................................................... 201
PA063 SUSTAINABLE RESOURCE MANAGEMENT: AN INSTITUTIONAL PERSPECTIVE ................................................... 206 PA053 EFFECTS OF COMPANION MODELING ON WATER MANAGEMENT: COMPARATIVE ANALYSIS ACROSS FIVE SITES IN
BHUTAN AND THAILAND .................................................................................................................. 210 PA107 COMMUNITY‐LEVEL MULTIPLE‐USE WATER SERVICES: MUS TO CLIMB THE WATER LADDER ............................. 217 PA052 COLLECTIVE ACTION IN WATER MANAGEMENT THROUGH REGIONAL NETWORKS: CRITICAL REFLECTIONS FROM M‐
POWER EXPERIENCES ..................................................................................................................... 222 PA111 MUS UPSCALING AND OUTSCALING: FROM HOUSEHOLD TO COMMUNITY LEVEL AND NATIONAL WATER LAW IN
THAILAND ..................................................................................................................................... 227 PA087 AN EVALUATION OF POLICY IMPACTS IN THAILAND, SOUTH AFRICA, ZIMBABWE AND ETHIOPIA OF THE MULTIPLE USE
SYSTEMS PROJECT ........................................................................................................................... 232

V
COLLECTIVE APPROACHES TO FISH PRODUCTION ......................................................................... 233
PA116 FISHERIES AND LIVELIHOODS IN DISPUTE AROUND PAK MUN DAM, THAILAND ............................................. 233 PA062 MANAGING RESILIENCE IN WEST AFRICAN SMALL‐SCALE FISHERIES ............................................................ 237 PA163 ENHANCEMENTS AND INSTITUTIONAL ARRANGEMENTS FOR SCALING‐UP FISH PRODUCTIVITY OF TROPICAL
RESERVOIRS IN INDO‐GANGETIC BASIN ................................................................................................ 241 PA146 COMMUNITY‐BASED FISH CULTURE IN SEASONAL FLOODPLAINS AND IRRIGATION SYSTEMS .............................. 246 PA161 INSTITUTIONAL ISSUES ON MANAGEMENT OF SEASONAL FLOODPLAINS UNDER COMMUNITY‐BASED AQUACULTURE TO
BENEFIT THE POOR IN BANGLADESH .................................................................................................... 250 PA151 FISHERIES PRODUCTIVITY AND ITS CONTRIBUTION TO OVERALL AGRICULTURAL PRODUCTION IN THE LOWER MEKONG
RIVER BASIN .................................................................................................................................. 254 PA164 TECHNICAL ISSUES ON MANAGEMENT OF SEASONAL FLOODPLAINS UNDER COMMUNITY‐BASED FISH CULTURE IN
BANGLADESH ................................................................................................................................. 258
TOOLS FOR UNDERSTANDING COLLECTIVE ACTION AROUND WATER MANAGEMENT .................. 262
PA024 AGENT‐BASED MODELING AND SIMULATION OF INTEGRATED RICE‐SHRIMP FARMING IN BAC LIEU PROVINCE, MEKONG DELTA, VIETNAM .............................................................................................................. 262
PA033 AGENT‐BASED MODELING OF THE INTERACTION BETWEEN WATER AND LABOR AVAILABILITY IN THE RAINFED RICE
ECOSYSTEM OF NORTHEAST THAILAND ................................................................................................ 267 PA060 AGENT‐BASED MODELING TO FACILITATE RESILIENT WATER MANAGEMENT IN SOUTHEAST AND SOUTH ASIA ...... 271 PA059 MONITORING USE INCREASES COOPERATION AMONG WATER USERS IN THE MEKONG DELTA OF CAMBODIA AND
VIETNAM ...................................................................................................................................... 275 PA055 ENHANCING STAKEHOLDER PARTICIPATION IN REGULATION STUDIES OF THE EQUATORIAL LAKES ....................... 280 PA067 VERTICAL ASYMMETRIES AND COLLECTIVE ACTION IN WATERSHED MANAGEMENT ......................................... 284 PA058 INTERACTIVE MODELS TO CATALYZE COLLECTIVE WATER MANAGEMENT:A COMPANION MODELING APPROACH IN
NORTHERN THAILAND ...................................................................................................................... 292

1
Increasing crop water productivity through optimizing the use of scarce irrigation water resources
Assessing water supply and demand for dry season rice in coastal polders of Bangladesh
Abul Kalam Sharifullah1, To Phuc Tuong2, Manoranjan K. Mondal3, and D. Franco4
1International Rice Research Institute, presently at Bangladesh Academy for Rural Development, [email protected]
2International Rice Research Institute, Los Baños, Laguna, Philippines, [email protected] 3International Rice Research Institute, presently at Building Resources Across Communities (BRAC),
BRAC Centre (13th floor), 75 Mohakhali, Dhaka 1212, [email protected] 4University of the Philippines at Los Baños, Los Baños, Laguna, Philippines, [email protected]
Abstract
Salinity intrusion prohibits the use of river water for irrigation of dry season (boro) rice in the coastal zone of Bangladesh. This can be overcome by using water stored in the canal networks within the polders for irrigation when river water becomes saline. It is not yet known, however, whether this technology can be adapted on a large scale. By using systems approaches, this study compared the water demand of boro rice with the storage capacity of the canal networks to assess the area of boro rice that can be grown in the polders. A two-season field experiment was carried out in a typical coastal polder to quantify responses of crop growth, yield, and irrigation water demand to different planting dates. Experimental results were used to calibrate and evaluate the model ORYZA2000, which was then used to quantify the probabilistic yields and water demand of boro rice over a 20-year period. Rice crops planted in October suffered from cold temperature, resulting in low harvest index (HI). Delaying the planting after 10 November did not result in yield gain but increased the water requirement from the canal storage substantially. Oryza2000 simulated satisfactorily the total rice biomass, and water requirement, but needed some modifications to take into account the effects of low temperature on HI to enable it to satisfactorily simulate yields of boro rice. The optimum planting time for highest productivity with respect to storage water was from 1 to 10 November. The area of boro rice that can be irrigated from water storage was about 15% of the rice area of the polder in at least 50% of years. This can be increased to 40% of the area if the canals are dredged according to the plan by the Bangladesh Water Development Board. The potential of large-scale adaptation of boro rice warrants the investment to increase the water storage capacity of the polder. Development of cold-tolerant rice varieties can further increase the potential area because they can be planted earlier and hence reduce water requirements.
Media grab
Up to 40% of rice land in the coastal polder areas of Bangladesh can be planted with dry season (boro) rice.
Introduction
Bangladesh faces an enormous challenge in trying to achieve food self-sufficiency for its growing population. The coastal zone of Bangladesh, covering an area of 2.83 million ha, is the least productive agricultural zone. Because of salinity intrusion in the dry season, rice cultivation is limited to a single rainy season crop (aman rice). The area, however, has potential for development. Mondal et al. (2006) showed that with proper water management an additional rice crop could be grown in the dry period after the aman rice in the coastal polder areas. Growing dry season (boro) rice in the area involves two distinct stages of irrigation. The first stage (when river water salinity is low, with electrical conductivity EC < 4 dS/m, usually before mid February) is gravity irrigation by letting river water in through sluices at high tides. The second stage starts when the river water EC > 4 dS/m. Just before the river water becomes saline, it could be taken into and stored in the on-farm canal networks. The stored water could be used to irrigate the dry season rice by pumping onto the fields until shortly before harvest time. The possibility of out-scaling the technology, i.e. for wide scale adoption of boro rice cropping, has not been systematically investigated. This is hampered by: (1) the lack of data on the water requirement of the boro rice crop; (2) the optimal planting time for high yield and water productivity with respect to the amount of water pumped from the canal network; (3) the storage capacity of the internal canal networks of polders; and (4) the time when river water becomes too saline for irrigation.

2
The main objective of the study was to determine the potential for increasing boro rice production in the polder areas in the coastal zones of Bangladesh through effective utilization of the available land and water resources. This was achieved through a systems approach, combining field activities and crop modeling using ORYZA2000 (Bouman and van Laar, 2006), to quantify probabilistic yields and water requirements of boro rice crop for different times of establishment and varieties, and to balance the water requirement with storage capacity of the internal canal networks of a typical polder in the coastal zone.
Methods
The study site (Polder 30, between 22° 37' and 22°46' North and 89°27' and 89°33' East) is located in Batiaghata Upazila in Khulna district, southwestern Bangladesh. The gross area of the polder is about 7725 ha with a net cultivable area of about 4867 ha (IPSWAM, 2007). The polder is protected from high tides by an embankment 40 km long and 4.3 m wide at the crest. The hydraulic system of the polder is controlled by a system of sluices. The water level of the surrounding rivers fluctuates daily due to tidal effects. During high tide, the water level can rise from 1 to 2.8 m above land level, creating opportunities for gravity irrigation when the water river is not too saline.
The research was organized in three activities as schematically shown in Figure 1.
Activity 1 Activity 2 Activity 3
Figure 1. Key research activities in the coastal zone of Bangladesh.
Field experiment
An experiment was carried out in the 2005–06 and 2006–07 dry seasons (DS) with a split plot design. The main plots were four dates of seeding (D1 = 22nd Oct, D2 = 1st Nov, D3 = 7th Nov, and D4 = 15th Nov). The subplots were two cultivars (BRRIdhan 28, a popular variety also known as BR-28 and PVS B8).
Field Experiment for determining yield & water requirement with different seeding dates & varieties
Calibration and evaluation of ORYZA 2000
Determine probabilistic yield and water req. of b i (20 )
Probabilistic storage requirement per unit area for irrigation after river water b li
Collecting secondary data, monitoring river water salinity to determine probabilistic dates when river water b li
‐ Canal x‐section measurement
‐ Survey for canal/pond excavation
Determine storage capability of the internal hydraulic
t f th ld
Potential area for dry season (boro)

3
Seedlings were transplanted when they acquired four leaves, at three to four seedlings per hill and spacing of 20 cm x 20 cm. All plots were irrigated until 2 weeks before harvest. The amount of irrigation water applied to each plot was measured using a V-notch. This amount was checked against daily subsidence of the water level in the fields, measured by a staff gauge. The subsidence was equivalent to total field water requirement (evapotranspiration (ET) + percolation (P) + seepage (S)). Two 1 m x 1 m GI tanks (0.4 m height, installed to depth of 0.25 m) one with a bottom and one bottomless, were installed in the four main plots. Subsidence of water level in the boxes was monitored daily for the measurement of ET and P. A rain gauge and a class A evaporation pan were installed in the field. Urea was applied at 120 kg N/ha in four equal splits (basal, 25 days after transplanting (DAT); 5 to 7 days before panicle initiation (PI), and heading). Basal incorporation at last harrowing also included 60 kg P2O5/ha, 40 kg K2O/ha, 10 kg ZnSO4/ha, and 60 kg CaSO4/ha. Crop phenology, biomass, its partitioning and leaf area index (LAI) at critical growth stages, grain yield, and yield components were monitored following standard procedures. Water and crop data were analyzed with standard split-plot analysis of variance (ANOVA) techniques. River water salinity measurement and data collection The (EC) of river water was monitored daily to check its suitability for irrigation. When river water EC approached 4 dS/m, sluice gates were opened at high tide to intake river water into the canals to their maximum capacity. Storage water was used for irrigation until the end of the season. The daily recorded EC at the study sites did not differ significantly from those recorded at Khulna, a national permanent water quality monitoring station. Daily Khulna EC data were subjected to frequency analysis to determine the 50% probability of exceedence (Pexcd) of the date when EC = 4 dS/m, beyond which (cut-off date) the river water cannot be used for irrigation. Crop growth modeling Crop data from the third seeding of the 2006–07 DS crop were used to generate variety- and site-specific parameters required by ORYZA2000. They were the crop development rate, percentage partitioning of biomass into its components, indigenous nitrogen uptake, and S&P. The model was then evaluated using data from 2005–06 and other seeding dates of the 2006-07 crops, according to the procedure described by Bouman and van Laar (2006). The third step involved scenario analysis over a period of 20 years (using climatic data from Khulna) of the effects of eight different seeding dates (every 5 days from 15 October) on crop yield and water requirement of the two varieties. Storage capacity Total hydraulic storage within the polder was determined from the length and cross-sections of the canal networks and other small water bodies (ponds/ditches) within the polder. Since most of the canals in the study polder were silted, the Bangladesh Water Development Board (BWDB) developed a plan to dredge and widen the canals (IPSWAM 2007). This plan was consulted to determine the future storage capacity of the water bodies of the polder. Results and discussion In both years, grain yields varied with seeding date and variety. Grain yields of the first two seeding dates were significantly lower than those of the later seeding dates (Table 1). The lower yields of the earlier seeding dates were mainly attributed to their lower number of spikelets/m2 and lower percentage of filled spikelets (data not shown), resulting in significantly lower harvest index (HI) than those of the last two seeding dates (Table 1). Earlier seeding dates exposed the reproductive stage of the crop to low temperature, affecting the spikelet formation processes. This is supported by the linear correlation between HI and the average daily minimum temperature from panicle initiation (PI) to the flowering stage of the crop (Figure 2, for BR 28 – similar results were obtained for PSV-B8). The average ET increased from 1.7 mm/d in November to 3.5 mm/d in March; and the average S&P rates from 2.1 mm/d to 3.6 mm/d over the same period. The total irrigation amount of D1 was significantly lower than those of other treatments in 2006-07 (Table 1). There was no significant difference in total irrigation water among the last three seeding dates. The effects of higher daily ET and S&P of the later seeding dates on water requirement were balanced by their shorter duration (due to higher temperature during their crop period), resulting in equivalent water requirements. The amount of irrigation taken from canal storage increased as the seeding dates were delayed. The difference of maturity period for the first and last seeding dates was about 15 days; however, almost twice the amount of irrigation water was taken from the canal storage for the last seeding than for the first seeding (Table 1, for the 2006–07 DS season). In the experiment, river water remained suitable for irrigation until the end of January, and most of the irrigation for the D1 crop came directly from the river because the crop matured at the beginning of March, while the D3 and D4 plots had a higher dependency on canal storage water to meet the irrigation water demand after January until they matured in April.

4
The long-term salinity data analysis indicated that the cut-off date corresponding to Pexcd = 50% for using river water was the second week of February.
Table 1. Yield, harvest index (HI), total irrigation water, and irrigation from canal storage for two rice varieties seeded in different dates in 2006-07 DS crop. 2005-06 DS crop had similar results.
Seeding dates
Yield (kg/ha) HI Irrigation water (mm)
BR-28 PVS-B8 Diff. BR-28 PVS-B8 Total Canal storage
D1 = 22 Oct 703 da 940 d ns 0.07 c 0.08 c 621.2 b 142.7 c
D2 = 1st Nov 2394 c 2878 b * 0.24 b 0.34 b 721.8 a 223.1 b
D3 = 7 Nov 5036 a 5218 a ns 0.47 a 0.49 a 758.8 a 267.8 a
D4 = 15 Nov 4501 b 5111 a * 0.43 a 0.47 a 761.3 a 278.3 a
aIn each column means followed by the same letter are not significantly different at 5% level by LSD. Mean values are averaged over four replications.
* = significant at 5% level by LSD and ns = not significant. The storage capacity of the canal system was about 2,592,164 m3. After subtracting the “dead volume” and the volume needed for fisheries, the extractable volume was 2,137,445 m3. If the canals are dredged and widened according to the plan of BWDB, the extractable volume for irrigation will increase to 5,575,118 m3.
R2 = 0.720
0.1
0.2
0.3
0.4
0.5
0 2 4 6 8 10 12 14 16 18 20 22 24Average daily Min. temp. deg C (PI to FL)
Harve
st In
dex (H
I
Figure 2. Relationship between HI and the average daily minimum temperature from panicle initiation (PI) and flowering (FL) for cultivar BR-28.
The simulated LAI, total biomass, and ET (Figure 3a, b, and d) satisfactorily agreed with the measured values. In Figure 3c, the simulated yields that exceeded the measured values corresponded to the early seeding dates (15-31 October). This is because ORYZA2000 has not adequately taken into account the effects of low temperature on spikelet formation and pollination. Rice yields obtained by multiplying the simulated biomass by HI (which was obtained from Figure 2) agreed well with the measured values. This method of yield simulation was used in the scenario analysis.
0
1
2
3
4
5
0 20 40 60 80 100 120 140 160Days after seeding
LAI
MeasuredSimulated
0
2000
4000
6000
8000
10000
12000
14000
0 2000 4000 6000 8000 10000 12000 14000
Measured biomass (Kg/ha)
Sim
ulat
ed b
iom
ass (
Kg/
ha)

5
Figure 3. Oryza2000 simulated vs. measured (a) LAI, (b) total above-ground biomass, (c) grain yield, and (d) ET (mm/d) for cultivar BR28, in four seeding dates of 2005-06 and 2006-07 dry season crops. The simulated grain yields (Sim yield) were from simulation Oryza2000 and from simulated biomass multiplied by HI in Figure 1. Similar results were obtained for PSV-B8. The solid line is the 1:1 relationship.
Simulation using 20 years of climate data showed that rice yield increased steadily from about 2,000 to 5,000 kg/ha as the seeding date was delayed from 15 October to 10 November at all probabilities of exceedence. Seeding later than 10 November did not increase yield but increased considerably the amount of irrigation water taken from the canal storage (Figure 4). As a result, the maximum water productivity with respect to irrigation from canal storage was obtained when seeding was carried out on 5 November. At Pexd = 50% the maximum water productivity was 2.2 g/kg.
The area that can be brought into boro rice cultivation declined steadily as the seeding date was delayed (Figure 4, showing the future scenario when canals are dredged according to the BWDB’s plan). The total boro rice production, however, maximizes at a seeding date of 5 November (Figure 4), corresponding to the seeding date with maximum water productivity (with respect to irrigation water from canal storage). With this seeding date and at Pexd = 50%, the boro rice area that can be irrigated from the storage of the present canals (i.e. silted) is 740 ha (15% of the rice area). This can be increased to 1,924 ha (40% of the rice area) if the canals are dredged. These will bring an additional 3,700 t (present canal conditions) and 9,600 t (dredged canals) of rice to Polder 30, compared with 13,000 t presently produced by the aman rice crop.
0
100
200
300
400
500
600
15-Oct 20-Oct 25-Oct 31-Oct 5-Nov 10-Nov 15-Nov 20-Nov
Seeding dates
Water
req
. fro
m sto
rage
010002000300040005000600070008000900010000
Area
cov
./Tot
al p
rod
Figure 4. Irrigation water from canal storage (diamond, in mm); the expected area of boro rice (x, in ha) that can be irrigated when canals are dredged according to the plan of BWDB; total boro rice production (rectangle, in tons) when canals are dredged; and boro rice production (triangle, in tons) in the present (i.e. silted) canal condition. All values correspond to the probability of exceedence of 50%, using 20-year simulation.
Conclusions and recommendations
The time of seeding had contrasting effects on the two components of water productivity of boro rice grown in the South Western coast of Bangladesh. Seeding before November resulted in very low yields due to cold stress at the critical reproductive stages of boro rice. Late-seeding required more water to be taken from the limited storage capacity of the canal network, and therefore will reduce the area that can be irrigated. A systems approach, using crop modeling, allowed us to analyze the trade-offs between the two components over a 20-year period. With the optimum dates of seeding around 1–10 November, and with proper water management, 15% of the rice land can be planted with boro rice after the aman season. The percentage can be increased to 40% with some investments to improving
01000200030004000500060007000
0 1000 2000 3000 4000 5000 6000 7000
Measured yield (Kg/ha)
Sim
ulat
ed y
ield
(Kg/
ha)
Sim Biomass x HISim yield
ET (mm/day)
0.01.02.03.04.05.06.07.08.09.0
10.0
0.0 1.0 2.0 3.0 4.0 5.0 6.0 7.0 8.0 9.0 10.0Measured ET (mm/day)
Sim
ulat
ed E
T (m
m/d
ay)

6
the conditions of the canals. Developing cold-tolerant varieties that can be planted early, hence reducing water required from the canal storage, can also increase the area of boro rice.
Acknowledgments
This paper presents findings from PN10 ‘Coastal resource management for improving livelihoods,’ a project of the CGIAR Challenge Program on Water and Food in collaboration with Dr Sharifullah’s PhD studies supported by IRRI.
References
Bouman, B.A.M., and H.H. Van Laar. 2006. Description and evaluation of the rice growth model ORYZA2000 under nitrogen-limited conditions. Agricultural System, 87: 249-73.
Integrated Planning for Sustainable Water Management (IPSWAM). 2007. Integrated water management planning study in polder 30. Technical Report number 7 (draft). IPSWAM and BWDB, Dhaka, Bangladesh.
Mondal, M.K., T.P. Tuong, S.P. Ritu, M.H.K. Choudhury, A.M. Chasi, P.K. Majumder, M.M. Islam, and S.K. Adhikary. 2006. Coastal water resource use for higher productivity: participatory research for increasing cropping intensity in Bangladesh. In Environment and Livelihoods in Tropical Coastal zones: Managing Agriculture-Fishery-Aquaculture Conflicts. C.T. Hoanh, T.P. Tuong, J.L. Gowing, and B. Hardy (eds.) 72-85. IRRI, Philippines, and IWMI, Sri-Lanka.

7
Quality and groundwater level dynamics at two coastal sites of Bangladesh: implications for irrigation development
M.K. Mondal1, T.P. Tuong2, and M.A. Sattar3
1Crop and Environmental Sciences Division, IRRI, Los Baños, Philippines; present address: Building Resources Across Communities (BRAC), BRAC Centre (13th floor), 75 Mohakhali, Dhaka 1212,
Bangladesh. Email: [email protected]
2Crop and Environmental Sciences Division, IRRI, Los Banos, Philippines, Email: [email protected]
3Irrigation and Water Management Division, BRRI, Gazipur, Bangladesh, Email: [email protected]
Abstract Most ricelands in the coastal region of Bangladesh remain fallow in the dry season because surface water resources are saline and unsuitable for rice irrigation, while groundwater (GW) is not intensively utilized because of the fear of salt-water intrusion into coastal aquifers. A study was undertaken at Batiaghata and Tala upazilas (sub-district) of the southwest region of Bangladesh to test the hypothesis that GW is suitable for irrigation and that its withdrawal for dry season rice cultivation would not result in salt-water intrusion into the aquifers. The depth of the phreatic water surface and electrical conductivity (EC) of groundwater were monitored weekly for 2-3 years along transects perpendicular to the adjacent river on two polders. The GW EC was < 2 dS/m at Tala and 4 dS/m at Batiaghata. At both sites, there was no increase in EC during the monitoring period. The phreatic depth at Tala declined to about 300 cm during each dry season, and to 80 cm at Batiaghata. Deeper drawdown of GW in Tala might have been caused by the intensive pumping for dry season rice irrigation, which farmers have practiced for about 5 years. The phreatic depth is close to the soil surface at both sites during the rainy season. The complete recovery of the phreatic levels suggests that there was adequate recharge to replenish the aquifers. Full replenishment and no increase in EC imply that the use of GW for dry season irrigation can be sustainable in Tala. Irrigation with marginal quality GW in Batiaghata, however, may cause salinity buildup in the soil profile. The findings suggest that the suitability of GW for dry season irrigation is rather site specific, and the use of GW warrants careful studies. Media grab The suitability of groundwater in the coastal region of Bangladesh for irrigation is site specific. Proper investigation is needed before development of dry season irrigation. Introduction Traditionally farmers of the coastal region of Bangladesh cultivate low-yielding (2.0-2.5 t/ha) local rice varieties under rainfed conditions in the wet season (Karim, 2006). Some farmers grow rice or raise shrimp (Mondal et al., 2006; Karim, 2006; Islam, 2006) in the dry season, but most lands remain fallow due to high soil salinity and lack of good quality irrigation water. While groundwater is intensively used for dry season irrigation in many parts of Bangladesh (BRRI, 2004; Rashid, 2006), this is not the case for the coastal zone for fear of GW depletion and salt water intrusion in the coastal aquifers (ICZMP, 2004). Locally, farmers have been using GW to irrigate dry season rice for about 5-10 years on a limited scale in the southwest region of Bangladesh, but there are concerns about whether this practice is sustainable. Very limited information on the characteristics of coastal aquifers is available to address this concern. The present study was undertaken to test the hypothesis that GW is suitable for irrigation and that its withdrawal for irrigation in the dry season does not deplete the GW, nor result in salt-water intrusion into the aquifers.
The general objective was to determine the suitability and sustainability of GW for irrigation development in the dry season in the coastal regions of Bangladesh. This was achieved by quantifying temporal (over 2-3 years) and spatial variability of the GW phreatic depth and salinity dynamics at two sites in the southwest coastal region of Bangladesh.
8
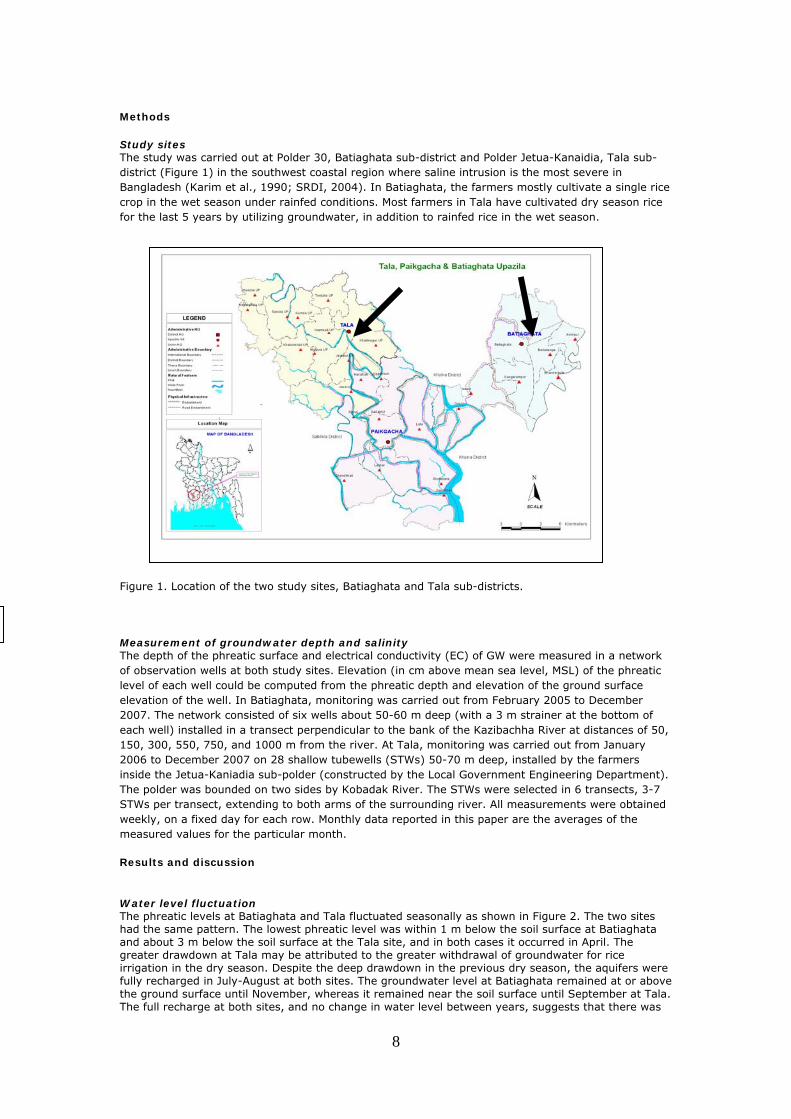
Methods Study sites The study was carried out at Polder 30, Batiaghata sub-district and Polder Jetua-Kanaidia, Tala sub-district (Figure 1) in the southwest coastal region where saline intrusion is the most severe in Bangladesh (Karim et al., 1990; SRDI, 2004). In Batiaghata, the farmers mostly cultivate a single rice crop in the wet season under rainfed conditions. Most farmers in Tala have cultivated dry season rice for the last 5 years by utilizing groundwater, in addition to rainfed rice in the wet season.
Figure 1. Location of the two study sites, Batiaghata and Tala sub-districts.
Measurement of groundwater depth and salinity The depth of the phreatic surface and electrical conductivity (EC) of GW were measured in a network of observation wells at both study sites. Elevation (in cm above mean sea level, MSL) of the phreatic level of each well could be computed from the phreatic depth and elevation of the ground surface elevation of the well. In Batiaghata, monitoring was carried out from February 2005 to December 2007. The network consisted of six wells about 50-60 m deep (with a 3 m strainer at the bottom of each well) installed in a transect perpendicular to the bank of the Kazibachha River at distances of 50, 150, 300, 550, 750, and 1000 m from the river. At Tala, monitoring was carried out from January 2006 to December 2007 on 28 shallow tubewells (STWs) 50-70 m deep, installed by the farmers inside the Jetua-Kaniadia sub-polder (constructed by the Local Government Engineering Department). The polder was bounded on two sides by Kobadak River. The STWs were selected in 6 transects, 3-7 STWs per transect, extending to both arms of the surrounding river. All measurements were obtained weekly, on a fixed day for each row. Monthly data reported in this paper are the averages of the measured values for the particular month.
Results and discussion
Water level fluctuation The phreatic levels at Batiaghata and Tala fluctuated seasonally as shown in Figure 2. The two sites had the same pattern. The lowest phreatic level was within 1 m below the soil surface at Batiaghata and about 3 m below the soil surface at the Tala site, and in both cases it occurred in April. The greater drawdown at Tala may be attributed to the greater withdrawal of groundwater for rice irrigation in the dry season. Despite the deep drawdown in the previous dry season, the aquifers were fully recharged in July-August at both sites. The groundwater level at Batiaghata remained at or above the ground surface until November, whereas it remained near the soil surface until September at Tala. The full recharge at both sites, and no change in water level between years, suggests that there was

9
no 'mining' of the groundwater. BWDB (1999) reported a similar recharge pattern in almost all locations studied in the coastal region of Bangladesh. The elevation of the phreatic level of different STWs at Tala during the drawdown (in the first half of April) and recharge (third week of August) periods is shown in Figure 3. In general there was no definite change in the mean elevation of the phreatic water level with distance from the river. This implies that there were no flows from the river to the inland or vice versa in either period, suggesting there was no direct connection between the aquifer and the surrounding river.
-350
-300
-250
-200
-150
-100
-50
0
50
Jan-0
5
Mar
May
Jul
Sep
Nov
Jan-0
6
Mar
May
Jul
Sep
Nov
Jan-0
7
Mar
May
Jul
Sep
Nov
Month-year
Depth
of
phre
atic
surf
ace
(cm
)
TalaBatiaghata
Figure 2. Mean monthly depth of phreatic surface from the ground level in Batiaghata and Tala upazilas of Khulna and Satkhira district, Bangladesh (vertical and capped bars indicate standard errors of the means of 11-56 values per month).
-400
-300
-200
-100
0
100
200
300
400
0 200 400 600 800 1000
Distance from the river (m)
Ele
vati
on o
f phre
atic
surf
ace
(cm
)
April 2006 August 2006
April 2007 August 2007
Figure 3. Elevation (in cm above MSL) of the phreatic surface at drawdown (April) and recharge (August) periods as a function of the distance from the Kobadak River at Jetua-Kanaidia polder in Tala upazila of Satkhira district, Bangladesh.
Dynamics of groundwater salinity Mean monthly EC of the groundwater at Batiaghata and Tala is shown in Figure 4. They varied between 3 and 4 dS/m at Batiaghata and 1-2 dS/m at Tala. In general, there was some seasonal fluctuation of EC, but there was no clear annual increase in EC in the study period. The relatively low

10
EC at Batiaghata during the 2005–2006 dry season (November 2005 and May 2006) was unusual, since it is expected EC would be higher in the DS than in the rainy season.
0.0
1.0
2.0
3.0
4.0
5.0
6.0
Jan 0
5
Mar
May
Jul
Sep
Nov
Jan 0
6
Mar
May
Jul
Sep
Nov
Jan 0
7
Mar
May
Jul
Sep
Nov
Gro
undwate
r Salin
ity (dS/m
) BatiaghataTala
Figure 4. Mean monthly electrical conductivity (EC) of groundwater at Batiaghata and Tala sub-districts, Bangladesh (vertical and capped bars indicate standard error of the means of 8-24 values per month).
The change of EC of the STWs with respect to the distance from the nearest river bank at Tala during the drawdown period (April) is shown in Figure 5. Sixteen STWs (57% of STWs) had EC <1.0 dS/m, irrespective of their distances from the river. Four STWs had EC between 3 and 5 dS/m. The mean monthly EC of these STWs was around 3 dS/m. Their EC gradually went up to 3-5 dS/m as the dry season proceeded. Though the distances from the river to the salt-affected wells (< 200 m) were less than those of other wells, it was not possible to conclude that the salt contamination was caused by their proximity to the river. There were other STWs that were nearer to the river for which EC remained < 1 dS/m. It was observed that the four contaminated STWs were in places with relatively lower elevation than the surroundings. The contamination might have been due to faulty construction of the wells, which might have allowed vertical leakage, allowing salt water intrusion from the soil surface. The contamination would increase with the drawdown created by pumping groundwater. Faulty construction of the STWs is not uncommon because the wells were constructed by local untrained personnel (BWDB, 1999).
0
1
2
3
4
5
0 200 400 600 800 1000
Distance from the river (m)
Gro
undw
ater
EC
(dS
/m)
April 2006
April 2007
Figure 5. Electrical conductivity (EC) of groundwater as a function of the distance from the adjacent river at Jetua-Kanaidia polder in Tala sub-district, Bangladesh.
11
Conclusions and recommendations The groundwater table at Batiaghata and Tala recovered during the rainy season. The complete recovery of the phreatic levels indicates that there is adequate recharge to replenish the aquifers. There was no indication of 'mining' due to irrigation of dry season rice in Tala. Groundwater salinity in Tala sub-district mostly remained < 3 dS/m and can be used for irrigation of dry season rice. Since the aquifer was fully recharged by August and there was no sign of salinity intrusion during the dry season from the river, the use of groundwater for dry season irrigation can be sustainable in Tala. Though there was no sign of salinity intrusion in Batiaghata, its GW has marginal quality. It can be used for short term, supplementary irrigations during the rainy season (at the beginning of the season or during dry spells) as suggested by Mondal et al. (2006). Long term irrigation with groundwater at Batiaghata may cause salinity buildup in the soil profile. The findings suggest that the suitability of groundwater for dry season irrigation is rather site specific, and its use for irrigation warrants careful studies. Acknowledgments
This paper presents findings from PN10, ‘Coastal resource management for improving livelihoods,’ a project of the CGIAR Challenge Program on Water and Food.
References Bangladesh Rice Research Institute (BRRI). 2004. Annual Report for 2004. Bangladesh Rice Research
Institute, Gazipur, Bangladesh.
Bangladesh Water Development Board (BWDB). 1999. Groundwater quality report: WATER-3 (99), Groundwater survey and investigation, BWDB, Dhaka, Bangladesh.
Integrated coastal zone management plan (ICZMP). 2004. Concept note on Groundwater management in coastal zone of Bangladesh, Water Resources Planning Organization, Dhaka, Bangladesh.
Islam, M.R. 2006. Managing diverse land uses in coastal Bangladesh: Institutional approaches. In Environment and Livelihoods in Tropical Coastal Zones: Managing Agriculture-Fishery-Aquaculture Conflicts. C.T. Hoanh, T.P. Tuong, and J.W. Gowing (eds.) 232-48. UK: CABI Publishing.
Karim, Z., S.G. Hussain, and M. Ahmed. 1990. Salinity problems and crop intensification in the coastal regions of Bangladesh. Soils Publication No.33, Soils and Irrigation Division, BARC, Farmgate, Dhaka 1215, Bangladesh:1-20.
Karim, M.R. 2006. Brackish water shrimp cultivation threatens permanent damage to coastal agriculture in Bangladesh. In Environment and Livelihoods in Tropical Coastal Zones: Managing Agriculture-Fishery-Aquaculture Conflicts. C.T. Hoanh, T.P. Tuong, and J.W. Gowing (eds.) 61-71. UK: CABI Publishing.
Mondal, M.K., T.P. Tuong, S.P. Ritu, M.H.K. Chowdhury, A.M. Chasi, P.K. Majumder, M.M. Islam, and S.K. Adhikary. 2006. Coastal water resource use for higher productivity: Participatory research for increasing cropping intensity in Bangladesh. In Environment and Livelihoods in Tropical Coastal Zones: Managing Agriculture-Fishery-Aquaculture Conflicts. C.T. Hoanh, T.P. Tuong, and J.W. Gowing (eds.) 72-84. UK: CABI Publishing.
Rashid, M.A. 2006. Groundwater management for rice irrigation in barind areas of Bangladesh. PhD diss., Bangladesh Agricultural University.
SRDI. 2004. Soil salinity map of Bangladesh. Soil Resources Development Institute, Dhaka, Bangladesh.
12
Field evapotranspiration and water use efficiency of aerobic rice under different water treatments in the North China Plain
XiaoGuang Yang1, ChangYing Xue1,3, XiaoJun Cui1, HuaQi. Wang1, B.A.M. Bouman2
1 China Agricultural University, 2 Yuanmingyuan West Rd., Beijing, 100094, China [email protected]
2 International Rice Research Institute, Manila, Philippines 3 Henan Institute of Meteorology, Zhengzhou, 450003
Abstract Decreasing water availability threatens agricultural productivity in the North China Plain. Improved understanding of crop evapotranspiration (ET) at different growing stages, and of the effects of deficit irrigation on crop ET and yield, are needed to help design more efficient irrigation practices to increase crop water productivity. Four experiments were conducted in Beijing from 2001 to 2004 with four irrigation treatments each year: adequate irrigation throughout the growing season (W1), limited irrigation before panicle initiation (PI) (W2), limited irrigation after PI (W3), and limited irrigation throughout the growing season (W4). Crop ET was calculated from the soil water balance equation, and soil evaporation was measured using micro-lysimeters installed between the plant rows. Total ET over the whole growing season varied from 574 to 630 mm over years and treatments. The highest daily ET occurred at the booting to heading stage and averaged 9.8 mm. Therefore, booting to heading is the key stage of water requirement for aerobic rice. More than 40% of total ET occurred during the period from emergence to PI, however, most of this was due to soil evaporation. Therefore, to further improve water use efficiency (WUE), measures are needed to reduce soil evaporation at this stage. WUE was highest in the treatment with limited irrigation before PI but sufficient irrigation thereafter. Media grab Water use efficiency of aerobic rice could be improved by reducing soil evaporation during the vegetative stage. Introduction The system of aerobic rice is a new way of growing specially developed cultivars of rice in aerobic soil conditions, as is done for wheat and maize. The system was developed because of the threat to rice production of increasing water scarcity. From the 1980s to 2002, the area of aerobic rice expanded rapidly to about 80,000 ha in the North China Plain (NCP) (Wang et al., 2002). Though the growing season of aerobic rice is during the rainiest time of year, the distribution and/or amount of rainfall is usually inadequate to fully meet the water requirements of aerobic rice. Supplementary irrigation is essential for aerobic rice in the NCP (Yang et al., 2005; Bouman et al., 2006). Evapotranspiration is an important part of the field water cycle and has significant influences on crop growth, development, and yield. Improved understanding of ET at different growing stages, and of the effects of deficit irrigation on crop ET and yield, is needed to help design more efficient irrigation practices to increase crop water productivity. Information about the contribution of soil evaporation (E, a non-benefical loss of water) to ET can also help design measures to increase WUE. Although much is known about E and ET characteristics and the relationship between ET and crop yield (e.g. Sun et al., 2004; Zhang et al., 2006), there have been few studies of aerobic rice systems. We report here the results of field experiments at Beijing to determine ET and E, and the effects of irrigation management on ET, yield, and WUE of aerobic rice. Methods Field experiments were carried out at Changping Experiment Station (40°02′N, 116°10′E; 43 m ASL) of the China Agricultural University in Beijing from 2001 to 2004. The soils were sandy loams (fluvisol) derived from river sediments. In all years, the groundwater table was deeper than 20 m. Aerobic rice variety HD297 was grown in all four years. Four irrigation treatments (W1, W2, W3, and W4) were applied with four replicates in all years: adequate irrigation throughout the growing season (W1), limited irrigation before PI (W2), limited irrigation after PI (W3), and limited irrigation throughout the growing season (W4). The nitrogen (N) application was 225 kg/ha applied in three splits at sowing (30%), tillering (40%), and booting (30%), respectively. In all years, the seeds were hand dibbled at 3 cm deep in rows 30 cm apart, at a seeding rate of 120 kg/ha. The sowing date was from May 14 to 16 and maturity date was from October 5 to 11. In all experiments, plots were bunded and separated by 1 m-wide strips of bare soil. The plots were kept weed-free by an application of pre-emergence herbicide and hand weeding after crop establishment. Fertilizers (P, K, Fe, Zn) and pesticides were applied as appropriate for optimum crop protection (Yang et al., 2005). The method of irrigation was surface flooding, and irrigation water was applied through flexible hoses connected to a subsurface

13
pressurized pipe system lifting water from a deep groundwater well. The depth to the water table is more than 20 m. Daily rainfall was measured with a rainfall meter next to our fields. The amount of irrigation water applied was measured with flow meters installed in the flexible hoses. We used a neutron probe to measure soil moisture content in each water treatment in two replicates at selected times in the growing season at 20-cm depth intervals between 0 and 160 cm. The probe was regularly calibrated for different soil layers using readings for a range of soil water content and soil bulk density data. The data were collected several times during the growing season to get an adequate range of water content for the calibration. In 2003, soil evaporation was measured by micro-lysimeter (Boast and Robertson, 1982). Three micro-lysimeters were installed between rows in each plot. To ensure that soil moisture content was the same in the micro-lysimeters as in a field, soil in micro-lysimeters was changed every three days. Each micro-lysimeter was weighed at 8:00 am every day. Soil evaporation was calculated from the weight loss over two days. At harvest, total aboveground biomass was measured from two 1-m row sections. Grain yield was measured from the whole plot in 2001 and 2002, from a 3.3 m2 area in 2003, and from 10 m2 in 2004, and was expressed at 14% moisture content. According to Zhang et al. (1999), the contribution of capillary rise to the crop root zone is almost zero in the NCP when the water table is below 4 m. Hence, soil water balance in our experiments can be described by the following equation RDETIPW −−−+=Δ (1) where P is the amount of precipitation, I is irrigation, ET is crop evapotranspiration, D is deep percolation beyond root zone, R is the amount of runoff, and WΔ is the change of soil water storage. The 30-cm high soil bunds around each plot prevented runoff. Deep drainage was also considered to be negligible, as the amount of rainfall and irrigation never exceeded the available water-holding capacity to the maximum soil-sampling depth (160 cm) for determination of WΔ . Therefore, the soil water balance equation was simplified as: ETIPW −+=Δ (2) Consequently, ET could be calculated using formula (2). ET consists of crop transpiration (T) and soil evaporation (E). In our study, E was measured by micro-lysimeter, and T was calculated as ET-E. Water productivity was calculated as grain yield (14%) divided by the seasonal combined water inputs by irrigation and rainfall (WPIR), and as grain yield divided by the seasonal ET (WPET). Results Water input Total rainfall was 253, 386, 404, and 495 mm during the whole growing period of aerobic rice in 2001, 2002, 2003, and 2004, respectively, with 34, 54, 49 and 62% falling before PI each year (Table 1). Irrigation water decreased from 2001 to 2004 because of increased rainfall. Total irrigation water was similar in W2 and W3, while the percentage of irrigation applied before PI was lower in W2 than in W3. In W2, water applied before PI accounted for 31, 0, 33 and 29% of total irrigation in 2001, 2002, 2003 and 2004, respectively. However, the percentage was 57, 100, 67 and 43% in W3 in four years. Table 1 Total irrigation (I, mm) and rainfall (R, mm), and evapotranspiration (ET, mm) during each growth stage of aerobic rice and its percentages (P, %).
Year Treatment Emergence-
PI PI-
booting Booting- flowering
Flowering- maturity Total
ET Total
I Total
R ET P ET P ET P ET P
2001
W1 283 49.4 80 14.0 83 14.4 128 22.3 574 283 253 W2 217 44.3 72 14.7 83 17.0 118 24.0 490 217 W3 286 54.5 86 16.4 69 13.1 84 16.0 525 233 W4 228 50.0 72 15.8 67 14.6 90 19.7 456 167
2002
W1 301 47.9 55 8.8 111 17.6 162 25.8 630 222 386 W2 196 39.0 38 7.5 114 22.6 155 30.8 502 74 W3 300 54.3 65 11.8 75 13.5 113 20.4 553 148 W4 198 46.3 40 9.3 80 18.7 110 25.7 427 0
2003
W1 274 46.7 64 10.8 82 14.0 168 28.6 587 220 404 W2 234 46.3 35 6.9 72 14.3 165 32.5 506 150 W3 279 51.6 59 11.0 55 10.1 147 27.3 540 180 W4 235 49.1 38 8.0 58 12.2 147 30.7 479 110
2004
W1 286 48.2 59 9.9 88 14.8 162 27.2 594 130 495 W2 274 48.5 54 9.5 82 14.5 156 27.5 565 90 W3 267 48.5 58 10.5 76 13.9 149 27.1 549 85 W4 258 51.5 50 10.1 72 14.4 120 24.0 501 30
Avg
W1 286 48.1 65 10.9 91 15.2 155 26.0 597 214 385 W2 230 44.5 50 9.7 88 17.1 149 28.7 517 133 W3 283 52.2 67 12.4 69 12.7 123 22.7 542 162 W4 230 49.2 50 10.8 69 15.0 117 25.0 466 77

14
Crop evapotranspiration In all years, total ET during the entire growth period increased with water input, and it was highest in W1, followed by W3, W2 and W4 (Table 1). Compared with the highest value in W1, ET was reduced by 13.3, 9.2 and 21.8% in W2, W3 and W4, respectively. During the periods from emergence to PI and PI to booting, ET in W1 and W3 was higher than that in W2 and W4, however, from booting to flowering and flowering to maturity, ET of W1 and W2 was higher than of W3 and W4. Among the four stages, ET was highest at the stage of emergence to PI, then the stage of flowering to maturity. ET at the stage of emergence to PI in W2 was 19.6 and 18.7% higher than that in W1 and W3. Over the entire season, average daily ET decreased in the order W1, W3, W2 and W4 (Fig.1). From emergence to PI and PI to booting, daily ET of W1 and W3 was higher than of W2 and W4, however, from booting to flowering and flowering to maturity, daily ET of W1 and W2 was higher than W3 and W4. Daily ET was highest at the stage of booting to flowering and lowest at the stage of flowering to maturity.
Daily ET (mm/day)
0
2
4
6
8
10
12
E-PI PI-B B-FL FL-M Whole
W1 W2
W3 W4
Figure 1. Averaged daily ET during each growth stage of aerobic rice over four years. Soil evaporation and crop transpiration Data on soil evaporation, crop transpiration, and their percentages of total ET in 2003 are given in Table 2. There was very little difference in soil evaporation among water treatments at any stage. In all treatments, the percentage of total ET as soil evaporation was highest from emergence to PI, and it was highest in W1 (49.3%) and lowest in W3 (41.8%). Over the entire season, the proportion of ET as soil evaporation ranged between 2.5 and 33.6%. Crop transpiration for the entire season increased with water input, and was highest in W1 (438 mm) and lowest in W4 (325 mm). From emergence to PI and PI to booting, transpiration in W1 and W3 was higher than that in W2 and W4. It was higher, however, in W1 and W2 than in W3 and W4 from booting to flowering. Partly due to the long periods from emergence to PI and flowering to maturity, crop transpiration was higher than in the two stages; it averaged 146 mm and 175 mm across water treatments, respectively. Table 2. Soil evaporation and crop transpiration at each growth stage of aerobic rice, and percentages.
Treatment
Emergence - PI
PI - booting
Booting - flowering
Flowering - maturity
Entire season
E (mm)
W1 122 7 5 16 150 W2 110 14 10 19 152 W3 116 7 6 19 148 W4 117 11 7 19 153
T (mm)
W1 172 37 46 182 436 W2 124 21 42 166 353 W3 173 32 9 178 392 W4 116 26 9 175 326
E/ET (%)
W1 44.5 10.9 6.1 3.9 25.5 W2 47.0 40.0 13.9 11.5 30.2 W3 41.8 11.9 10.9 12.9 33.6 W4 49.3 28.9 12.1 12.9 32.0
T/ET (%)
W1 55.5 89.1 93.9 96.1 74.5 W2 43.0 60.0 86.1 88.5 69.8 W3 58.2 88.1 89.1 87.1 66.4 W4 50.7 71.1 87.9 87.1 68.0
Water productivity Yields of respective water treatments were much lower in 2003 than in the other three years, due to much lower grain filling (Fig. 2a). Yield was affected by water treatment in all four years. Compared with the sufficient water treatment W1, yield of W2, W3, and W4 was decreased by 17.9, 11.5, and 28.2% in 2001, and by 17.9, 2.0, and 37.4% in 2002. In 2003, yield was highest in W2, and was 8.6, 46.8, and 90.6% higher than in W1, W3, and W4, respectively. The differences in yield between water treatments in 2004 were smaller than in the other three years, and yield was the same in W1 and W2, but was decreased by 8.4 and 16.6% in W3 and W4, respectively compared with W1 and W2. Due to the low yield in 2003, WPET was significantly lower in 2003 than in the other three years when WPET ranged from 0.71 to 1.0 kg/m3. In 2001, 2003, and 2004, WPET was highest in W2 and lowest in W4. In W2, WPET was increased 7.9 and 11.5% in 2001, 27.2 and 100.3% in 2003, and 5.9 and 6.9% in 2004, compared with W1 and W3, respectively. In 2002, WPET was highest in W3 followed by W2. It was 2.9% higher in W2 than in W1. The trends in WPIR were similar to the trends in WPET. The average values of WPIR over the four years were 0.62, 0.75, 0.29, and 0.83 kg/m3 in W1, W2, W3, and W4, respectively.

15
Discussion
Crop ET was highest from emergence to PI and accounted for about 44.5-52.2% of total ET during the entire season, mainly due to the long duration of this stage, and high radiation, high temperature, and low rainfall at this stage. Crop ET was decreased by 19.6 and 18.7% in W2 compared with that in W1 and W3 at this stage. The highest daily ET occurred from booting to flowering. At this stage, aerobic rice experiences the transition from vegetative growth to reproductive growth and water requirement is highest. Crop transpiration is also strong at this stage because of fully expanded leaves and large canopy. This stage, therefore, is the most important for avoiding water deficit stress in aerobic rice. Soil evaporation accounted for about 25.5-33.6% of crop ET for the growing season. This result is comparable to data for winter wheat (31.4%) and summer maize (45%) in the North China Plain (Sun et al., 2004; Zhang et al., 1999). From emergence to PI, 40-50% of the ET was from soil evaporation, because at this stage the plants are still small and LAI is low, and the soil surface is exposed. With limited irrigation during this stage, followed by adequate irrigation after PI (W2), yield was decreased slightly but water productivity was significantly increased compared with W1 and W3. After PI, sufficient water supply in W2 enabled flowering and grain filling reasonable yield. This irrigation regime was therefore most beneficial for high yield of aerobic rice.
WPIR(kg/m3)
0.0
0.2
0.4
0.6
0.8
1.0
1.2
1.4
2001 2002 2003 2004
W1 W2
W3 W4
WPET(kg/m3)
0.0
0.2
0.4
0.6
0.8
1.0
1.2
1.4
2001 2002 2003 2004
W1 W2
W3 W4
Yield (t/ha)
012345678
2001 2002 2003 2004
W1 W2
W3 W4
(a) (b) (c) Figure 2 Yield (a) and water productivity (b, WPET and c, WPIR) of different water treatments in 2001-2004. Conclusions and recommendations Under well irrigated conditions, average seasonal ET of aerobic rice was 596 mm. It was decreased to 516 mm with slight water stress between emergence and PI. Crop ET from emergence to PI is about 48.5% of ET during the entire season, however, 40-50% of this is from soil evaporation. This suggests that water productivity could be increased by measures to decrease soil evaporation at the early stage. The stage from booting to flowering has the highest demand for water to meet ET (9.8 mm/day), and this stage is also sensitive to water stress. Consequently, water supply should be assured at this stage for high yield. To save irrigation water and increase its water productivity, irrigation can be limited before PI with a slight yield decrease. Acknowledgments This paper presents findings from PN16 ‘Developing a System of Temperate and Tropical Aerobic Rice in Asia (STAR),’ a project of the CGIAR Challenge Program on Water and Food. It was also supported by the Swiss Agency for Development and Cooperation (SDC) through the water work group of the Irrigated Rice Research Consortium (IRRC). References Boast CW, and T.M. Robertson. 1982. A micro-lysimeter method for determining evaporation from
bare soil: description and laboratory evaluation. Soil Sci.Soc.Am.J., 46: 689-96. Bouman B.A.M., Yang Xiaoguang, Wang Huaqi, Wang Zhimin, Zhao Junfang, and Chen Bin. 2006.
Performance of aerobic rice varieties under irrigated conditions in North China, Journal of Field Crops Research, 97: 53-65.
Sun H.Y., C.M. Liu, X.Y. Zhang, Y.Q. Zhang, and D. Pei. 2004. The changing laws of the diurnal evapotranspiration and soil evaporation in the winter wheat of the North China Plain. Chinese Journal of Eco-Agriculture, 12(3):62-4.
Wang H.Q., B.A.M. Bouman, D.L. Zhao, et al. 2002. Aerobic rice in northern China: opportunities and challenges. Proc. of the International Workshop on Water-Wise Rice Production, Los Baños, Philippines, pp. 143-54.
Yang Xiaoguang, B.A.M. Bouman, Wang Huaqi, Wang Zhimin, Zhao Junfang, and Chen Bin. 2005. Performance of temperate aerobic rice under different water regimes in North China. Agric. Water Man. 74:107-122.
Zhang H., X. Wang, M. You, and C. Liu. 1999. Water-yield relations and water use efficiency of winter wheat in the North China Plain. Irrigation Sci., 19:37-45.
Zhang Y.J., Z.M. Ma, B. Deng, and S.Z. Luo. 2006. Evapotranspiration characteristics and its relationships to the yield of spring wheat under limited irrigation. Triticeae Crops, 26(4):98-102.

16
Optimizing yield, water requirements, and water productivity of aerobic rice for the North
China Plain
ChangYing Xue1,3, XiaoGuang Yang1, B.A.M. Bouman2, Wei Deng3, HuaQi Wang1
1China Agricultural University, 2 Yuanmingyuan West Rd., Beijing, 100094, China [email protected]
2International Rice Research Institute, DAPO Box 7777, Metro Manila, Philippines 3Henan Institute of Meteorology, Zhengzhou, 450003, China
Abstract Water resources for agriculture are rapidly declining in the North China Plain. Water-efficient agricultural technologies need to be developed. Aerobic rice is a new crop production system in which rice is grown in nonflooded and nonsaturated aerobic soil. To date, knowledge is scarce on obtainable yields and water requirements to assist farmers in improving their management. We present results from field experiments with aerobic rice variety HD297 near Beijing, from 2002 to 2004. The crop growth simulation model ORYZA2000 was used to extrapolate the experimental results to different weather conditions, irrigation management, and soil types. We quantified yields, water inputs, water use, and water productivities. On typical freely-draining soils of the North China Plain, aerobic rice yields can reach 6-6.8 t/ha, with a total water input between 589 and 797 mm (rainfall 477 mm and irrigation 112-320 mm). For efficient water use, the irrigation water can be supplied in 2-4 applications, and should aim at keeping the soil water tension in the root zone below 100-200 kPa. Under those conditions, the amount of water use by evapotranspiration was 458-483 mm. The water productivity with respect to total water input (irrigation plus rainfall) was 0.89-1.05 g grain/kg, and with respect to evapotranspiration, 1.28-1.42 g grain/kg. Drought around flowering should be avoided to minimize the risk of spikelet sterility and low grain yields. Media grab Rice yields of 6-7 t/ha can be achieved with only 2-4 irrigations with the system of aerobic rice production in the North China Plain. Introduction Fresh water availability for irrigation is decreasing because of increasing competition from urban and industrial development, degrading irrigation infrastructure, and degrading water quality in the North China Plain (NCP), an important agricultural area in China. Aerobic rice is a new crop production system in which rice is grown in nonflooded and nonsaturated aerobic soil, similar to wheat and maize (Bouman et al., 2006). It may be an attractive option to farmers where water is too scarce to grow lowland rice. Since its introduction in the NCP in the mid-1980s, the area of aerobic rice has expanded rapidly, and was estimated to be 80,000 ha in 2002 (Wang et al., 2002). Yang et al. (2005) and Bouman et al. (2006) reported on yield, water use, and water productivity of aerobic rice cultivars grown under different irrigation regimes in a field experiment near Beijing in 2001-2002. Using variety HD297, they obtained yields of 3-3.5 t/ha with 450-500 mm total water input (rainfall plus irrigation), and 4.7-5.3 t/ha with 650 mm water input and more. More data are needed on other environmental conditions to understand better yield potentials and irrigation water needs of aerobic rice in the NCP. Crop growth simulation models are an ideal tool to explore yield potentials and water needs under a variety of environmental and management conditions. We used ORYZA2000 to extrapolate these experimental results obtained in Beijing to different weather conditions, irrigation management, and soil types that are typical of the NCP. The ultimate objective is to quantify yield potential, water productivity, and water needs of aerobic rice, and to provide suggestions for irrigation water management. Methods The three years of experimental data collected near Beijing from 2002 to 2004 were used to determine parameters (using one year of data) and to evaluate the ORYZA2000 model (using the two remaining years of data). The evaluated variables included total above-ground biomass, biomass of crop organs, leaf area index, grain yield, and soil water tension. ORYZA2000 was then used to explore the effects of different irrigation regimes on yield, water requirements, and water productivity of aerobic rice with different soils using historical weather data from Beijing. Water requirements were expressed by evapotranspiration (ET) and by water inputs by rainfall and irrigation. ET flows are real water losses that deplete water from the system (Molden et al., 2003), whereas total water inputs satisfy the ET needs plus any deep percolation losses and additions to the soil water storage. Results and discussion Our experimental yields ranged from 0.5 to 4.5 t/ha with 578-688 mm total water input in 2003, and from 4.6 to 6.0 t/ha with 605-705 mm total water input in 2004. For comparison, the 2001-2002

17
experiments in Beijing yielded 2.5-5.3 t/ha with 500-900 mm total water input (Bouman et al., 2006; Yang et al., 2005). At another site close to Beijing, Tao et al. (2006) reported yields of 5.7-6.1 t/ha with irrigation applied when the soil water tension at 15 cm depth exceeded 15 kPa, resulting in around 1400 mm total water input. At Kaifeng, Feng et al. (2007) reported experimental yields of 2.4-3.6 t/ha, using 750-1100 mm total water input. The lower yields at Kaifeng might be a consequence of shorter crop growth duration at Kaifeng (90 days) than at Beijing (135 days). ORYZA2000 reproduced total biomass accumulation, grain yield, and leaf area development of aerobic rice reasonably well (Fig. 1), and with about the same level of accuracy as reported for lowland rice and for aerobic rice at Kaifeng. In our validation set, the RMSEn of simulated yield was 19% (Xue, 2008), which was two times the CV of measured yield, and 3-8 percentage points higher than reported for lowland rice. The SAHEL water balance module for freely-draining soils adequately simulated the dynamics of soil water tension in the root zone between 0 and 100 kPa. Our RMSEn values of 64-72% for soil water tension were somewhat lower than values of 77-104% (Belder et al., 2007), 123% (Boling et al., 2007), and 69-107% (Feng et al., 2007) reported for lowland rice using the more detailed PADDY or SAWAH modules.
Figure 1. Simulated versus measured values in calibration set (a, b, c) and validation set (d, e, f) of LAI, biomass of whole crop, and yield. Solid lines are the 1:1 relationship. Average maximum simulated yields were 6.8-7.5 t/ha with soil water potentials in the root zone staying between 0 and 100 kPa. These yields were 0.8-1.5 t/ha higher than the maximum of 6 t/ha obtained in our field experiments. There may be at least three reasons for this difference. First, in nearly all of our treatments, there were periods when the tensiometers failed to record because the threshold of 100 kPa was exceeded, so that higher soil water tensions occurred that could have reduced yields. When simulated soil water tensions were allowed to reach 200 kPa, yields dropped to 6-6.1 t/ha (Fig. 2a). Second, aerobic rice is a relatively new crop and best management practices still need to be developed. Therefore, the management applied in our field experiments may not have resulted in the highest possible yields. Third, the variety HD297 might have been sink limited under high-yielding conditions. Analyzing yield formation in HD297, Bouman et al. (2006) reported that the source strength (quantified by light use efficiency) of this variety was comparable to that of lowland varieties with yield potentials of more than 8 t/ha. The panicle size of HD297, however, may be too small to attain such yields (visual observation by authors). Simulated yields sharply decreased with irrigation water application withheld until soil tension exceeded 100 kPa. Even under completely rainfed conditions, however, yields were still 2.7-4 t/ha, depending on soil type. ORYA2000 may not, however, adequately simulate yield with severe drought around flowering (as indicated by the poor simulation results for the 2003 experiment). Total water input declined sharply as irrigation threshold increased from 10 to 50 kPa, and then declined slowly as the threshold increased beyond 50 kPa (Fig. 2b). Since yield followed the opposite trend to irrigation threshold, water productivity WPIR was maximum at intermediate thresholds (Fig. 2c). When water resources are more limiting than land, the best irrigation management for farmers would optimize water productivity rather than grain yield (Bouman and Tuong, 2001). In our simulations, the highest WPIR was obtained at irrigation thresholds of 100-200 kPa, with yields of 6-6.8 t/ha, and only 112-320 mm irrigation water applied (and 477 mm rainfall). In farmers’ practice such irrigation amounts would be applied in 2-4 splits of 50-75 mm each, which is about the irrigation frequency used by early aerobic rice farmers in the Kaifeng area (Bouman et al., 2007). This irrigation
0
2
4
6
8
10
12 Simulated LAI (-)
a
0
5000
10000
15000
20000 Simulated biomass (kg/ha)b
0
2000
4000
6000
8000 Simulated yield (kg/ha) c
0 2 4 6 8
1012
0 2 4 6 8 10 12 Measured LAI (-)
d
0
5000
10000
15000
20000
0 5000 10000 15000 20000Measured biomass (kg/ha)
e
0
2000
4000
6000
8000
0 2000 4000 6000 8000Measured yield (kg/ha)
f

18
water requirement is even lower than that for winter wheat in the NCP (Sun et al., 2006), but higher than that for summer maize (Wang et al., 2001).
Yield (kg/ha)
0
1500
3000
4500
6000
7500
9000
10 20 30 50 70 100 200 500 RThreshold of soil w ater tension (kPa)
EXP03 SILOAM EXP02
a
Rainfall and irrigation (mm)
0
400
800
1200
1600
2000
20 30 50 70 100 200 500 RThreshold of soil w ater tension (kPa)
EXP03 SILOAMEXP02
b
WPIR (g/kg)
0.00.20.40.60.81.01.21.41.61.8
10 20 30 50 70 100 200 500 RThreshold of soil w ater tension (kPa)
EXP03 SILOAMEXP02
c
WPET (g/kg)
0.00.20.40.60.81.01.21.41.61.8
10 20 30 50 70 100 200 500 RThreshold of soil w ater tension (kPa)
EXP03 SILOAM EXP02
d Figure 2. Average simulation results over 34 years as a function of threshold level of soil water tension for irrigation on five soils: yield (a), rainfall plus irrigation (b), water productivity based on total water input WPIR (c), water productivity based on evapotranspiration WPET (d). The error bars indicate the standard deviation. Evapotranspiration (ET) was quite stable over a wide range of irrigation thresholds, and only declined slightly from about 690 mm at 20 kPa to 370-416 mm under purely rainfed conditions. At 20 kPa, the total water inputs were 1300-1739 mm (depending on soil type), and hence some 610-1049 mm of water left the root zone by deep percolation. The amount of deep percolation gradually decreased to 61-107 mm under purely rainfed conditions. Although deep percolation is a loss to farmers, it reenters

19
the hydrological cycle and is potentially available for reuse, for example by groundwater pumping (Hafeez et al., 2007). Therefore, for irrigation system managers where deep drainage losses can be reused, the optimum irrigation scenario could be when the highest water productivity with respect to evapotranspiration is obtained (Loeve et al., 2004). In our simulations, highest levels of WPET were obtained with irrigation thresholds between 10 and 100 kPa (Fig. 2d). Irrigation thresholds of 100-200 kPa therefore seem a suitable balance between the interests of farmers (striving for high WPIR) and irrigation system managers (striving for high WPET). Soil type had relatively little effect on yield except under purely rainfed conditions, with the lighter-textured soil with lowest soil water holding capacity having lowest yields. Soil type had the strongest effect on irrigation water inputs with irrigation application thresholds below 70 kPa. The effect of soil type was most pronounced on input water productivity: WPIR decreased on soils with decreasing water-holding capacity. Conclusions and recommendations Field experiments and simulations show that, on typical freely-draining soils of the NCP, aerobic rice yields with HD297 can reach 6-6.8 t/ha, with a total water input between 589 and 797 (rainfall = 477m and irrigation water = 112-320mm). For efficient water use, the irrigation water can be supplied in 2-4 applications and should aim at keeping the soil water tension in the root zone below 100-200 kPa. Drought around flowering should be avoided by targeted irrigation applications to avoid the risk of spikelet sterility that would result in low grain yields. To further increase yield and productivity of aerobic rice in the NCP, future research priorities should include: 1. Management. Optimizing the productivity of aerobic rice in a cropping system context. Studies should address the potential to increase yields through improved crop management practices such as establishment and nutrient management. Moreover, such studies should look at the potential role of aerobic rice in multiple cropping systems and crop rotations, and should address whole cropping system productivity. 2. Germplasm improvement. The development of new varieties should focus on the potential for yield increase through increasing the sink size and harvest index of the current variety HD297. 3. Model improvement. The current version of ORYZA2000 captures the effect of water stress at flowering through the effect of increased canopy temperature on spikelet sterility only (Bouman et al., 2001). More insight in the mechanisms of spikelet sterility should be obtained and built into ORYZA2000, especially at soil water tensions above 100 kPa.
1.1 Acknowledgments This paper presents findings from PN16 'Developing a System of Temperate and Tropical Aerobic Rice in Asia (STAR),' a project of the CGIAR Challenge Program on Water and Food. It was also supported by the Swiss Agency for Development and Cooperation (SDC) through the water work group of the Irrigated Rice Research Consortium (IRRC), and by the Chinese Government through the '863' project of '2006AA100203-04' and the '948' project of '2006-G52A-Q08.' References Belder P., B.A.M. Bouman, and J.H.J. Spiertz. 2007. Exploring options for water savings in lowland rice
using a modeling approach. Agric Syst 92: 91-114. Boling, A.A., B.A.M. Bouman, T.P. Tuong, M.V.R. Murty, and S.Y. Jatmiko. 2007. Modelling the effect
of groundwater depth on yield-increasing interventions in rainfed lowland rice in Central Java. Indonesia. Agric Syst 92:115-139.
Bouman, B.A.M., L.P. Feng, T.P. Tuong, G.A. Lu, and H.Q. Wang. 2007. Exploring options to grow rice
using less water in northern China using a modeling approach II: Quantifying yield, water balance components, and water productivity. Agric Water Manage 88: 23-33.
Bouman, B.A.M., and T.P. Tuong. 2001. Field water management to save water and increase its
productivity in irrigated lowland rice. Agric Water Manage 49: 11-30. Bouman, B.A.M., X.G. Yang, H.Q. Wang, Z.M. Wang, J.F. Zhao, and B. Chen. 2006. Performance of
aerobic rice varieties under irrigated conditions in North China. Field Crops Res 97: 53-65. Feng, L.P., B.A.M. Bouman, T.P. Tuong, R.J. Cabangon, Y.L. Li, G.A. Lu, and Y.H. Feng. 2007.
Exploring options to grow rice under water-short conditions in northern China using a modeling approach. I: Field experiments and model evaluation. Agric Water Manage 88: 1-13.

20
Hafeez, M.M., B.A.M. Bouman, N. Van de Giessen, and P. Vlek. 2007. Scale effects on water use and water productivity in a rice-based irrigation system (UPRIIS) in the Philippines, Agric Water Manage 92: 81-89.
Loeve, R., B. Dong, D. Molden, Y.H. Li, C.D. Chen, and J.Z. Wang. 2004. Issues of scale in water
productivity in the Zhanghe irrigation system: implications for irrigation in the basin context. Paddy and Water Environment 2: 227-236.
Molden, D., H. Murray-Rust, R. Sakthivadivel, and I. Makin. 2003. A water productivity framework for
understanding and action In: Kijne, J.W., Barker, R., Molden, D. (Eds.), Water productivity in agriculture: limits and opportunities for improvement, CABI Publishing, Wallingford, UK, pp 1-18.
Sun, H.Y., C.M. Liu, X.Y. Zhang, Y.J. Shen, and Y.Q. Zhang. 2006. Effects of irrigation on water
balance, yield and WUE of winter wheat in the North China Plain. Agric Water Manage 85: 211-218.
Tao, H.B., H. Brueck, K. Dittert, C. Kreye, S. Lin, and B. Sattelmacher. 2006. Growth and yield
formation of rice (Oryza sativa L.) in the water-saving ground cover rice production system (GCRPS). Field Crops Res 95: 1-12.
Wang, H.X., L. Zhang, W.R. Dawes, and C.M. Liu. 2001. Improving water use efficiency of irrigated
crops in the North China Plain-measurements and modeling. Agric Water Manage 48: 151-167.
Wang, H.Q., B.A.M. Bouman, D.L. Zhao, C.G. Wang, and P.F. Moya. 2002. Aerobic rice in northern
China: opportunities and challenges. Proc. of the International Workshop on Water-Wise Rice Production, Los Baños, Philippines, pp. 143-54.
Xue, C.Y. 2008. Reduction of drought risk by deficit irrigation in aerobic rice in Beijing area.
Dissertation. China Agricultural University, Beijing, China, pp. 51. Yang, X.G., B.A.M. Bouman, H.Q. Wang, Z.M. Wang, J.F. Zhao, and B. Chen. 2005. Performance of
temperate aerobic rice under different water regimes in North China. Agric Water Manage 74: 107-122.

21
Water regimes and nutrient requirements for aerobic rice production system
J. B. Soriano1
1Bulacan Agricultural State College, Bulacan, Philippines [email protected]
Abstract With the decline of the already limited water available for rice production, there is a need to adopt water-saving measures such as aerobic rice to meet the challenge of feeding billions of people living and relying on rice. This study was conducted to help develop nitrogen (N), phosphorus (P), and irrigation recommendations for the aerobic rice production system, using PSB Rc-9 rice variety in the Province of Bulucan, Philippines. A water regime by N rate experiment was established to evaluate the effect of water regimes and N rates on agronomic and yield response of PSB Rc-9. The effect of P rate was also studied in the superimposed microplots within the maximum N rate (165 kg N/ha) treatment. Increasing N rate from 0 to 60 kg N/ha significantly increased yield from 2.6 to 3.4 t/ha, and there was no further increase in yield at higher N rates. Increasing the P rate above the basal amount of 60 kg P/ha did not affect crop growth and yield. Thus the optimum fertilizer regime for aerobic rice was 60 kg N/ha and 60 kg P/ha. Mean yields of all irrigation treatments were similar (3.2 t/ha), and water productivity was highest (0.48 kg/m3) with an irrigation regime at every 14 days irrigation interval (2 cm) until tillering, then weekly (4 cm) until flowering, twice a week from one week before to one week after flowering (4 cm), and once every 10 days after flowering until maturity (4 cm). The results should be validated through further experiments and field demonstrations in farming communities where aerobic rice cultivation is highly applicable to further develop recommended management practices. Media grab Optimum rate of nitrogen and phosphorus fertilizers and appropriate water management for aerobic rice systems are relevant factors to improve resource use efficiencies and productivity. Introduction Increased competition for water and climate change are reducing the amount of water available for agriculture in the Philippines. Rice is the major staple for the large and growing population of the Philippines, and the major user of water. Therefore, new ways must be sought to produce more rice with less water (Guerra et al., 1998). The Aerobic Rice System involves growing input-responsive, drought-tolerant rice varieties in nonflooded and non-puddled soil using supplementary irrigation and fertilizers to achieve high yields (Bouman, 2001). Nitrogen (N) is the most limiting nutrient to rice growth and yield in almost all environments (Yoshida, 1981). One major consequence of inadequate N is reduced leaf area, thereby limiting light interception, photosynthesis, and finally biomass growth, grain yield, and water productivity (Sinclair, 1990). Since the concept of aerobic rice is new, relatively few insights exist into water, N, and P dynamics and their interactions, and the management of irrigation and fertilizers to optimize yield and resource use efficiency. Where water is more limiting than land, it has been argued that water productivity becomes more important than yield or ‘land productivity’ (Guerra et al., 1998; Tuong and Bouman, 2003). Substantial yield and water productivity gains are possible with the application of appropriate nutrients in combination with optimum water management adapted to the target environments. Thus, the objective of this research was to: (1) evaluate the agronomic and yield performance of PSB Rc-9 under different water regimes and N rates; (2) determine water productivity and N use efficiencies under aerobic rice production systems; and (3) evaluate the effect of P addition on the growth and yield of PSB Rc-9. Methodology The field site was located at San Ildefonso, Bulacan Province, Philippines (15°44' N, 120°31' E). The field was prepared under dry soil conditions, with two plowings, harrowing, and land leveling. Seeding was done manually in rows 25 cm apart. Seeds (60 kg/ha) were hand-dibbled 2 cm deep and covered with soil. After seeding, a flush irrigation of about 3 cm depth was done to enhance germination. A preemergence herbicide was applied 2 days after the first irrigation, and postemergence herbicide was sprayed 10 days after emergence (DAE). Phosphorus (0-18-0) and potassium (0-0-60) fertilizers at 60 kg/ha were applied in two splits: 30 kg/ha basal by incorporating with the soil in the rows about 2 cm deep before seeding, and 30 kg/ha was applied on the rows at maximum tillering. Two studies were conducted in the same experimental area during the 2007 dry season (January-May): (1) a water management (W) by N rate study (WxN), and (2) a P addition study in microplots in selected treatments of the WxN experiment (WxP). The WxN study was a split-plot randomized

22
complete block design with four replications. Water regime treatments (mainplot) were; W1, twice a week irrigation, W2, once a week (weekly) from germination to one week before flowering, twice a week from one week before to one week after flowering, weekly after flowering until maturity, and W3, every 14 days until tillering, weekly until flowering, twice a week from one week before to one week after flowering, once every 10 days after flowering until maturity. N treatments (subplot) were: no N (N0), 60 kg/ha (N60), 120 kg/ha (N120), and 165 kg/ha (N165). For all water treatments, the irrigation depth at sowing was 3 cm, 2 cm from emergence until tillering, and 4 cm from tillering onwards. N was applied as ammonium sulfate (21-0-0-12S) at 11, 35 and 50 DAE in three equal splits. Aboveground plant samples were taken from a 50 cm row in two locations in all plots for the determination of tiller count, plant height, biomass and N uptake at the following growth stages: mid-tillering (MT), panicle initiation (PI), flowering (FI), and physiological maturity (PM). Crop growth rate was computed using weekly plant height from 11 to 95 DAE. The efficiency of applied N fertilizer to the rice crop was assessed using five different indices (Dobermann and Fairhurst, 1999); (1) partial factor productivity (PFP), (2) agronomic efficiency (AE), (3) recovery efficiency (RE), (4) physiological efficiency (PE), and (5) internal efficiency (IE). Grain yield was determined from the designated harvest area of 6 m2 from the center of the plots. Water productivity was calculated as grain yield at 14% moisture content divided by total water input from rainfall plus irrigation. In the WxP study, additional P fertilizer was applied to microplots (1m x 1m) in the N165 treatment under W1 and W3. The microplots were surrounded by a metal plate 45 cm high and inserted 15 cm into the soil. In this study, W1 and W3 were the mainplots and ‘additional P rate’ were the subplots with three treatments: 0 kg/ha (P60), 60 kg/ha (P120), and 120 kg/ha (P180). Average weekly growth rate of the crop was based on weekly plant height taken from 11 DAE up to 95 DAE. Tiller count in the microplots was monitored at 11, 32, 60, and 95 DAE. Grain yield adjusted to 14% moisture content was obtained from the whole area of the microplot. Depth or volume of irrigation water was measured using the discharge of the delivery hose connected in the pump, time of irrigation, and surface area of the plot. Calibration of water discharge from the delivery hose was done by measuring the discharged water using graduated cylinder at a certain time and fixed engine rpm. It was done in a series of trials at different sections or length of delivery hose. With the given depth of irrigation, size of plot, and average discharge of the delivery hose, the time of irrigation for every plot was computed. Results and discussion Crop performance There was no significant interaction between W and N treatments with the different agronomic parameters. Plant height at physiological maturity (PM), growth rate and tiller production and grain yield increased with increasing N rate (Table 1). Maximum grain yield was achieved with only 60 kg N/ha. There was no effect of water regime on any parameter measured, including grain yield, except for growth rate (increase in plant height), with faster growth in W1 than W2, but plant height was similar in all water regimes at maturity. There was no significant effect of either water regime or N rate on total biomass at PM. There was additional grain yield of 28, 25 and 30% for applied 60, 120, and 165 kg N/ha, respectively, compared with yield of the plot without N fertilizer. Table 1. Agronomic response as affected by water regime and N rate.
Agronomic data Water regime N regime
W1 W2 W3 N0 N60 N120 N165
Plant height (cm) 93.2 87.4 91.6 79.0x 90.5y 94.5yz 98.9z Growth rate (cm/week)1 6.09a2 5.61b 5.97ab 4.98z 5.88y 6.18y 6.51x Productive tillers (no./m2) 495 536 539 476y 508 x 564 x 547x Biomass (t/ha) 10.7 11.2 11.9 12.3 10.9 10.6 11.3 Grain yield (t/ha) 3.18 3.14 3.22 2.64y 3.37x 3.29x 3.43x
1From 11-95 DAE. 2Means followed by a common letter in a row are not significantly different at 5% level of significance using LSD. Added P fertilizer did not affect any of the crop parameters monitored, and plants under the wetter regime (W1) grew faster but produced fewer tillers (Table 2). Likewise, no significant effect was found of added P on the grain yield of PSB Rc-9 at PM. Data showed that rate of P fertilizer should be limited to 60 kg/ha. Nitrogen uptake There was no significant interaction between W and N on nitrogen uptake. Nitrogen uptake was significantly affected by water regime at panicle initiation and flowering but not at maximum tillering

23
Table 2. Agronomic data as affected by water regime and additional P in the microplots.
Agronomic data Water regime N Regime
W1 W3 P60 P120 P180 Plant height (cm) 107a1 100b 105 101 105
Growth rate (cm/week) 6.94a 6.46b 6.77 6.56 6.78
Tiller count (no./m2) 546a 603b 588 576 559 Grain yield (t/ha) 3.16 a 2.49 b 2.71 3.07 2.69
Means followed by a common letter in a row are not significantly different at 5% level of significance using LSD. and PM (Figure 1). Generally, N uptake was lower in the wettest regime (W1), perhaps due to greater leaching. There was a significant effect of N rate on N uptake at all stages, with N uptake increasing with N rate up to the maximum rate (except at maximum tillering) (Figure 2).
Nitrogen use efficiency Partial factor productivity (PFP), physiological efficiency (PE), and agronomic efficiency (AE) of N fertilizer were highest with 60 kg N/ha, and declined as N rate increased beyond this. Results showed that additional yield of 12.2 kg grain/kg N applied was produced at 60 kg N/ha. Maximum recovery efficiency (53%) occurred with application of 120 kg N/ha. De Datta (1981) reported an N recovery efficiency of 41% under continuously flooded conditions, and 20% under submerged-nonsubmerged regime (SNS) conditions. Theoretically, PE should be close to 50 kg/kg N taken up from fertilizer. N60
produced an additional 39.6 kg of grain for each additional kg of N uptake. The zero N treatment had the highest internal efficiency of 275 kg grain/kg N taken up from indigenous soil N. Table 3. N use efficiencies as affected by N rate.
N rate Grain yield
(kg/ha) N uptake (kg/ha)*
PFP (kg grain/ kg N applied)
AE (kg grain
increased/kg N
applied)
RE (kg N uptake/kg N applied)
PE (kg grain/ kg N uptake)
IE (kg grain/ kg N uptake)
N0 2,640 9.60 - - - - 275 N60 3,370 28.0 56.2 12.2 0.31 39.6 120 N120 3,290 73.2 27.4 5.42 0.53 10.2 44.9 N165 3,430 95.0 20.8 4.79 0.52 9.21 36.1
*N uptake at PM. Water inputs and productivity Grain yield and water productivity with respect to irrigation plus rainfall are presented in Table 4. Irrigation and rainfall amounts varied because of different irrigation treatments and crop duration, which was affected by water regime. Total rainfall depth during the growing season (January-June 2007) was 425 mm. Water productivity decreased as total water input increased. Highest water productivity occurred in W3 (0.48 kg grain/m3 water input), and the lowest was found in W1 with a water productivity of 0.29 kg grain/m3 water. Water productivity in this experiment is comparable to values reported by Tuong (1999) for the best performing aerobic rice treatments, with a water productivity of around 0.5 kg grain/m3 water. In this experiment, average grain yield under W3 was lower by 36% but lower water inputs by 54% with a corresponding higher water productivity of 31% as compared with the average grain yield in irrigated rice of 5 t/ha with water input of 15,000 m3/ha (IRRI, 1997).
0.00
20.00
40.00
60.00
80.00
100.00
120.00
140.00
N0 N60 N120 N165
Nitrogen Rate
N u
pta
ke (kg h
a-1)
MTPIFLPM
0
20
40
60
80
100
120
W1 W2 W3
Water Regime
N U
ptak
e (k
g ha
-1)
MTPIFLPM
W1 W2 W3
N Uptake (kg/ha)
N0 N60 N120 N165
N Uptake (kg/ha)
Figure 1. Average N uptake (kg/ha) at different growth stages as affected by
water regimes
Figure 2. Average N uptake (kg/ha) at different growth stages as affected by
nitrogen rates

24
Table 4. Water productivity as affected by average grain yield and water inputs.
Water regime
Average grain yield
(kg/ha)
Water input (m3/ha) Water productivity (kg grain/m3 water)
Irrigation Rainfall Total W1 3,180 9,700 1,360 11,060 0.29 W2 3,140 6,100 1,370 7,470 0.42 W3 3,220 5,100 1,600 6,700 0.48
Conclusions Nitrogen rate significantly affected growth and yield of PSB Rc-9 under aerobic rice production systems. There was no significant effect of water regime on the yield of PSB Rc-9. Water inputs and productivity with the tested water regimes showed comparable results to those of irrigated rice. Average N recovery under the aerobic rice production systems was lower by 16% compared with the target N recovery in well-managed irrigated rice. Added P fertilizer did not affect the growth and grain yield of PSB Rc-9 under the aerobic rice production system. Irrigation once every 14 days until tillering with 2 cm irrigation depth, once a week until flowering with 4 cm irrigation depth, twice a week from one week before to one week after flowering with 4 cm irrigation depth, and once every 10 days after flowering until maturity with 4 cm irrigation depth was the most efficient water regime tested for aerobic rice production systems, without compromising yield. The optimum N fertilizer rate was 60 kg N/ha which was applied in three equal splits. The results from this experiment should be tested through applied experiments and field demonstrations in a range of locations, and to inform the design of the best bet management practices for a range of sites and locations. Acknowledgments I sincerely thank a number of individuals who have extended endless support, inspiration, and propitious assistance in the completion of this work: Dr. Armando N. Espino, Jr., Dr. Melissa E. Agulto, Dr. Romeo B. Gavino, Dr. Ireneo C. Agulto, and Dr. Fedirico O. Perez, all highly competent and very supportive members of my advisory committee from the Institute of Graduate Studies, Central Luzon State University, Science City of Muñoz, Philippines, for their ideas and valuable suggestions. To Dr. Bas A. M. Bouman, co-chair of the advisory committee and senior IRRI scientist, for providing the general framework of the study, sharing expertise in the field of research, and allowing me to get financial assistance for my studies from the fund of the ongoing BASC-IRRI project. This work was undertaken with assistance from PN16 ‘Aerobic Rice System,’ a project of the CGIAR Challenge Program on Water and Food.
References Bouman, B.A.M. 2001. Water-efficient management strategies in rice production. Int. Rice Res. Notes
26 (2): 17-22. De Datta, S.K., 1981. Principles and practices of rice production. IRRI, Los Baños, Philippines, 618 pp. Dobermann, A., and T. Fairhurst. 1999. Field handbook. Nutritional disorders and nutrient
management in Rice. IRRI, PPI/PPIC. Guerra, L.C., S.I. Bhuiyan, T.P. Tuong, and R. Barker. 1998. Producing more rice with less water from
irrigated systems. SWIM Paper 5. IWMI/IRRI, Colombo, Sri Lanka, 24 pp. International Rice Research Institute (IRRI). 1997. Rice Almanac. 2nd ed. Los Baños, Philippines: IRRI.
181 pp. Sinclair, T.R. 1990. Nitrogen influence on the physiology of crop yield. In: Theoretical Production
Ecology: Reflections and Prospects. (R. Rabbinge, J.Goudriaan, H. van Keulen, F.W.T. Penning de Vries, and H.H. van Laar (eds.) Pudoc, Wageningen.
Tuong, T.P. 1999. In: Water use in crop production. (Ed.) M.B. Kirkham, Productive water use in rice
production: Opportunities and limitations. The Haworth Press Inc., pp. 241-64. Tuong, T.P., and B.A.M. Bouman. 2003. Water productivity in Agriculture: Limits and Opportunities for
Improvement. (Eds.) J.W. Kijne, R. Barker, and D. Molden. Rice production in water-scarce environments. In: CABI Publishing, UK, pp. 53–67.
Yoshida, S. 1981. Fundamentals of rice crop science. International Rice Research Institute, Los Baños,
Philippines, 269 pp.

25
Increasing on-farm water productivity through affordable microirrigation
vegetable-based technology in Cambodia
M. Palada1, S. Bhattarai2, M. Roberts3, N. Baxter3, M. Bhattarai1, R. Kimsan3, S. Kan3 and D. Wu1
1AVRDC–The World Vegetable Center, Shanhua, Tainan, Taiwan 2Central Queensland University, Rockhampton, Australia
3International Development Enterprises, Phnom Penh, Cambodia manuel. [email protected]
Abstract Using affordable drip irrigation systems to grow high-value crops, including vegetables, can increase water use efficiency and improve labor productivity in water-limited regions. Research was conducted in Cambodia during two consecutive dry seasons (2006-2007) to evaluate and compare efficiencies in water use, labor, and production inputs in vegetable cultivation under drip, furrow, and traditional hand-watering methods. On-farm trials involving 40-50 farmers were established in Svay Rieng and Prey Ving districts of Cambodia to determine the efficiency and productivity of six vegetables under three irrigation methods. An affordable (low-cost) drip irrigation drum kit developed by International Development Enterprises (IDE) was used in all trials. In 2006, drip irrigation resulted in 95% and 85% increases in water and labor productivity, respectively, compared to the traditional practices of hand watering and furrow irrigation. Economic returns to labor increased by 67%. Drip irrigation increased yield and decreased labor use by almost 50%. In 2007, integration of improved crop management methods, such as combining fertilizer with drip irrigation, increased yield by 30%, water use efficiency by 20%, and net returns from cucumber production by 15%. Overall, average labor use decreased 83% with drip irrigation and increased net returns by 153%. This project demonstrates the benefits of affordable microirrigation, coupled with high-value vegetable production, in increasing on-farm water productivity in regions where irrigation water is a limited resource during the dry season. Media grab Affordable drip irrigation benefits small-scale, resource-poor vegetable farmers in Cambodia by reducing the amount of water and labor applied to vegetable crops. Introduction Food crop production in most rural regions of Cambodia is based predominantly on subsistence agriculture. Most farmers grow one crop of rice and most of the land is left fallow during the dry season. Poor water delivery techniques limit the expansion of vegetable production in this region during the dry season. The traditional practice of hand watering is labor intensive, thus, vegetable production contributes less than 10% of farmers’ incomes. Furthermore, farmers growing vegetables as a source of income are not responding to market demands; they grow traditional crops using traditional watering and cultural practices, and do not produce vegetable varieties sought by consumers. Recently, a number of innovations have been made for small-scale farmers to manage water effectively during the dry season, and increase on-farm water efficiency using simple, affordable microirrigation systems (Postelet al., 2001; Polak and Yoder, 2006). Microirrigation schemes have been promoted mostly by NGOs rather than by mainstream government agencies. Realizing that better access to water is critical for growing vegetables and other off-season crops to increase farm incomes and alleviate poverty, many NGOs have been promoting small, divisible forms of microirrigation technology. These are affordable to many smallholder farmers in Asia and Africa, even to farmers with small plots who earn less than US$1 a day (Polak and Yoder, 2006). Affordable microirrigation vegetable-based (AMIV) technology integrates simple, low-cost microirrigation techniques into vegetable farming systems for resource-poor farmers. The major aim of this project was to demonstrate market-based strategies that could enable resource-poor farmers to earn an income similar to or better than farmers who are competitive and commercially oriented producers. Specifically, the objective of the project was to introduce an affordable and low-cost drip irrigation system to smallholder farmers, and to assess the technical performance and suitability of the technology from social and economic perspectives as well as marketability. Methods The project was located in the Mekong Delta Basin, in Svay Teap and Svay Chrum Districts in Svay Reing Province, Cambodia. In 2006, 49 trial plots were established by farmers. Each farmer planted one or two vegetable crops of their choice. Vegetables grown included cucumber, bitter gourd, long bean, eggplant, and tomato. A basic study to compare hand watering and furrow irrigation (‘farmer’s practice’) and drip irrigation using the IDE drum kit was conducted by each farmer in varying plot

26
sizes, ranging from 42 to 140 m2 (farmer’s practice) and 80 to 500 m2 (drip irrigation). The drum kit consists of 130 tiny 1 mm-diameter pipes called "microtubes," fitted to 5 rows of 12-mm diameter pipes called "laterals." These laterals are connected to a drum of water by a 16-mm diameter pipe called ‘sub-main’ (Postelet al., 2001). Both methods were evaluated in terms of: 1) technical performance (water savings, labor savings, and yield increase); 2) suitability (problems or constraints, effect on men and women, ideas for improvement); and 3) marketability (perceived benefits, price to pay, technology design, information received). Water use was measured in liters by the number of sprinkler cans, buckets, or drums of known volume each time water was applied. In 2007, similar trials were conducted by farmers, but fertilizer treatments were superimposed on selected vegetables including cucumber and yard-long bean. The fertilizer treatments consisted of conventional NPK commercial fertilizer and the NPK briquettes developed by the International Center for Soil Fertility (IFDC–previously known as the International Fertilizer Development Center) containing 30% N, 12% P2O5, and 198% K2O. The NPK briquettes were applied 8-10 cm deep in the soil (deep placement). Data were collected on water use, marketable yield, labor expended in watering and weeding, and other socioeconomic parameters. Statistical analyses were performed in SYSTAT ver. 12 and Excel. Multifactor analysis of variance (ANOVA) was used to compare the effect of irrigation methods and fertilizer source. Unplanned pair wise comparisons were performed using LSD test to interpret interactions between factors. Results In 2006, drip irrigation reduced water use by an average of 43% across all crops, and increased total yield of vegetable crops by 15% (Table 1). Total labor use was also reduced by 38% in drip-irrigated plots compared to farmer’s practice of hand watering. Overall net income in drip-irrigated plots was 3% higher than plots under farmer’s practice (Table 1). The increase in yield coupled with the decrease in water and labor usage led to a significant improvement in water and labor productivity. The return on labor amounts to about US$3.75 per eight-hour workday, three times the average farm labor wage of about US$1.25 per day. Table 1. Effect of drip irrigation on water usage, yield, income and labor use in vegetable production. Cambodia, Dry season, 2006.
Parameter
CIDA-CPWF FP DP
CARE FP DP
Total FP DP VAR (%)
Total water usage (mm) n/a* n/a* 189 108 189 108 -43
Total yield (kg/m2) 0.96 1.13 0.47 0.54 0.52 0.60 +15
Income and expenditures (riel/m2) Gross income Total expenditures** Seed*** Fertilizer Pesticides Fuel Net income
868 970 139 180 39 24 65 61 35 26 0 69 729 790
270 287 25 28 0 0 14 16 1 1 10 11 246 259
336 350 +4 36 41 +13 4 2 +47 19 20 +2 4 3 -24 9 16 +81 299 309 +3
Labor usage (hr/m2) Bed preparation System installation Planting Irrigation Weeding Total labor use
0.10 0.12 0.00 0.09 0.02 0.03 0.49 0.09 0.04 0.03 0.79 0.36
0.07 0.06 0.00 0.03 0.01 0.01 0.11 0.03 0.03 0.01 0.22 0.15
0.07 0.07 -5 0.00 0.03 n/a 0.01 0.01 -11 0.15 0.04 -76 0.03 0.02 -41 0.27 0.17 -38
FP =Farmer’s Practice; DP = Drip; *Excluded due to unmeasured rainfall; **Cost of drip system not included; ***Seed costs for CARE farmers subsidized. 1 USD($) = 4000 riel. CIDA = Canadian International Development Agency; CPWF = Challenge Program on Water and Food; CARE = Christian Action Research and Education. The low net income (3%) in drip-irrigated plots was partly due to slightly higher expenses and produce being used for home consumption. Despite the low net return from drip irrigation, follow-up surveys indicated strong support by farmers for drip irrigation. All farmers indicated they intended to use the drip system again in the next season. Farmers responses support the quantitative results that showed increases in labor and water productivity (Table 2). According to trial farmers, the three biggest advantages of the drip system were time, labor, and water savings. More than 70% of farmers nominated these advantages. Other benefits mentioned included better soil moisture, aeration, fewer weeds, easier to irrigate, and healthier crop. In 2007, differences in marketable yield, water use, and efficiency were observed between drip irrigated plots and farmer’s practice. There was a consistent trend for higher yields of all vegetables under drip irrigation, with significant differences in the cases of cucumber, sponge gourd, and eggplant (Table 3). Differences in yield were significant for cucumber, sponge gourd and eggplant. Water use was significantly lower in drip-irrigated plots than plots under hand watering for cucumber

27
and yard-long bean. The low water use and higher yields resulted in a consistent trend for high water-use efficiency in drip-irrigated plots with significant differences for cucumber, sponge gourd, and eggplant (Table 3). Overall, labor for weeding and irrigating was reduced under drip irrigation (data not included). Average net return was 153% higher with drip irrigation than hand watering (data not shown). Table 2. Advantages of drip irrigation as identified by farmers in Cambodia, dry season, 2006.
Advantage/Feature
CIDA-CPWF (%)
Care (%)
Total (%)
Time saving 91 81 84
Labor saving 82 71 75
Water saving 64 76 72
Soil has good moisture 36 62 53
Fewer weeds 18 62 47
Easy to irrigate/use 36 48 44
Healthy crops 18 38 31
Table 3. Marketable yield, water use and efficiency of vegetables under drip and hand watering system. Cambodia, Dry season, 2007.
Crop1 Yield (t/ha) Drip HW t-val
Water Use (ML/ha) Drip HW t-val
WUE (t/ML) Drip HW t-val
Cucumber (18) 6.7 5.9 2.01* 1.94 3.28 2.28** 3.73 2.65 1.88*
Yard-long bean (14) 6.5 6.1 NS 3.28 5.06 2.22** 2.23 1.75 NS
Sponge gourd (3) 5.9 3.2 2.04* 1.46 1.55 NS 5.94 2.60 2.32*
Eggplant (2) 4.1 3.0 2.17* 2.20 2.09 NS 3.57 1.68 2.19*
Bitter gourd (1) 3.1 1.4 NA 4.65 2.83 NA 0.66 0.49 NA
1Figures in parentheses are numbers of farmer trials. NS=not significant; NA=not applicable; *=significant; **=highly significant; HW = hand watering; WUE = water use efficiency. The response of cucumber to irrigation was significant, and to fertilizer application at the p<0.10. Marketable yield was significantly higher in drip-irrigated plots than hand-watered plots, whereas yield from deep placement fertilizer (NPK briquette) was higher than conventional fertilizer (Table 4). Drip irrigation used significantly less water (less than half of hand watering), with about three times higher efficiency in water use in drip-irrigated plots and fertilizer deep placement plots. A similar result was obtained for yard-long bean, but the difference in marketable yield between drip- and hand-watered plots was not significant (data not included).
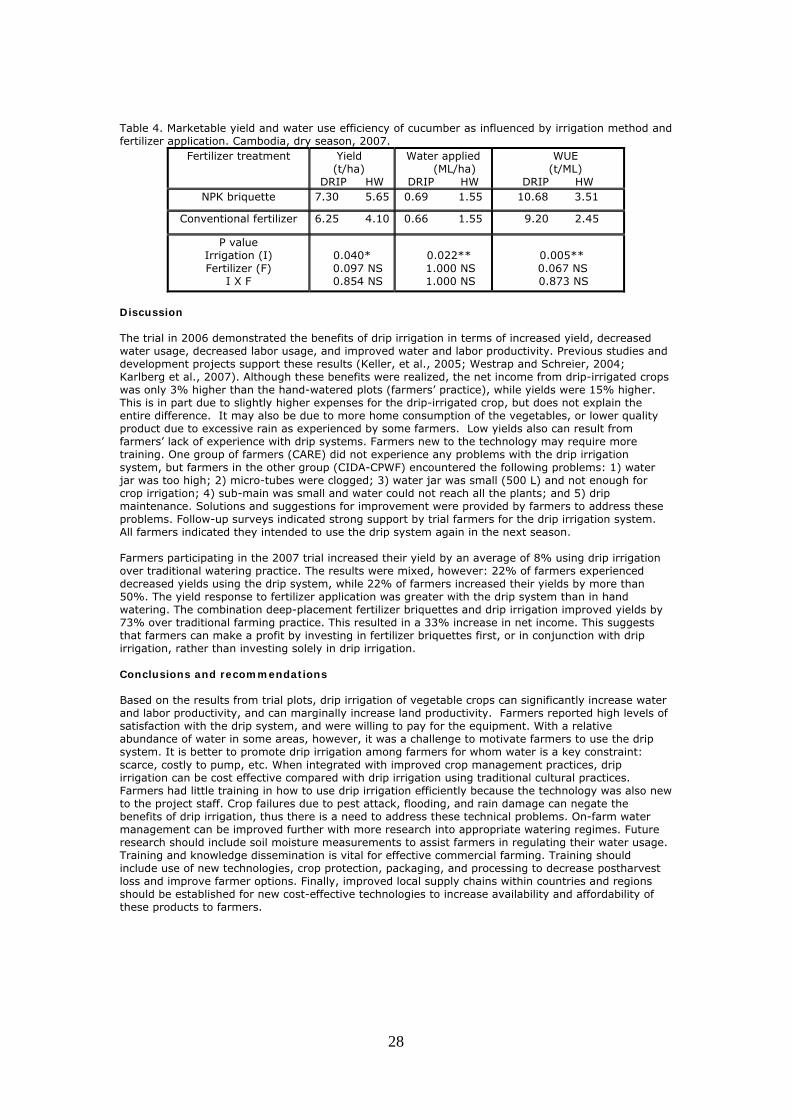
28
Table 4. Marketable yield and water use efficiency of cucumber as influenced by irrigation method and fertilizer application. Cambodia, dry season, 2007.
Fertilizer treatment Yield (t/ha)
DRIP HW
Water applied (ML/ha) DRIP HW
WUE (t/ML)
DRIP HW NPK briquette 7.30 5.65 0.69 1.55 10.68 3.51
Conventional fertilizer 6.25 4.10 0.66 1.55 9.20 2.45
P value Irrigation (I) Fertilizer (F)
I X F
0.040*
0.097 NS 0.854 NS
0.022**
1.000 NS 1.000 NS
0.005**
0.067 NS 0.873 NS
Discussion The trial in 2006 demonstrated the benefits of drip irrigation in terms of increased yield, decreased water usage, decreased labor usage, and improved water and labor productivity. Previous studies and development projects support these results (Keller, et al., 2005; Westrap and Schreier, 2004; Karlberg et al., 2007). Although these benefits were realized, the net income from drip-irrigated crops was only 3% higher than the hand-watered plots (farmers’ practice), while yields were 15% higher. This is in part due to slightly higher expenses for the drip-irrigated crop, but does not explain the entire difference. It may also be due to more home consumption of the vegetables, or lower quality product due to excessive rain as experienced by some farmers. Low yields also can result from farmers’ lack of experience with drip systems. Farmers new to the technology may require more training. One group of farmers (CARE) did not experience any problems with the drip irrigation system, but farmers in the other group (CIDA-CPWF) encountered the following problems: 1) water jar was too high; 2) micro-tubes were clogged; 3) water jar was small (500 L) and not enough for crop irrigation; 4) sub-main was small and water could not reach all the plants; and 5) drip maintenance. Solutions and suggestions for improvement were provided by farmers to address these problems. Follow-up surveys indicated strong support by trial farmers for the drip irrigation system. All farmers indicated they intended to use the drip system again in the next season. Farmers participating in the 2007 trial increased their yield by an average of 8% using drip irrigation over traditional watering practice. The results were mixed, however: 22% of farmers experienced decreased yields using the drip system, while 22% of farmers increased their yields by more than 50%. The yield response to fertilizer application was greater with the drip system than in hand watering. The combination deep-placement fertilizer briquettes and drip irrigation improved yields by 73% over traditional farming practice. This resulted in a 33% increase in net income. This suggests that farmers can make a profit by investing in fertilizer briquettes first, or in conjunction with drip irrigation, rather than investing solely in drip irrigation. Conclusions and recommendations Based on the results from trial plots, drip irrigation of vegetable crops can significantly increase water and labor productivity, and can marginally increase land productivity. Farmers reported high levels of satisfaction with the drip system, and were willing to pay for the equipment. With a relative abundance of water in some areas, however, it was a challenge to motivate farmers to use the drip system. It is better to promote drip irrigation among farmers for whom water is a key constraint: scarce, costly to pump, etc. When integrated with improved crop management practices, drip irrigation can be cost effective compared with drip irrigation using traditional cultural practices. Farmers had little training in how to use drip irrigation efficiently because the technology was also new to the project staff. Crop failures due to pest attack, flooding, and rain damage can negate the benefits of drip irrigation, thus there is a need to address these technical problems. On-farm water management can be improved further with more research into appropriate watering regimes. Future research should include soil moisture measurements to assist farmers in regulating their water usage. Training and knowledge dissemination is vital for effective commercial farming. Training should include use of new technologies, crop protection, packaging, and processing to decrease postharvest loss and improve farmer options. Finally, improved local supply chains within countries and regions should be established for new cost-effective technologies to increase availability and affordability of these products to farmers.

29
Acknowledgments This paper presents findings from SG502 ’Market Strategies for Water Productivity – Demonstration and Documentation of Innovative Market-based Strategies to Realize Agricultural Income through Increased On-farm Water Productivity and Market Integration,’ a project of the CGIAR Challenge Program on Water and Food. References Karlberg, L., J. Rockstrom, J. Annandale, and J. Steyn. 2007. Low-cost drip irrigation–A suitable technology for southern Africa? An example with tomatoes using saline irrigation water. Agric. Water
Man. 89:59-70. Keller, J., J. Ray, A. Keller, X. Luo, and R. Yoder. 2005. New low-cost irrigation technologies for small farms. In: Proc. 19th International Congress on Irrigation and Drainage. Beijing, China, Sept. 2005. 5
p. Polak, P., and R. Yoder. 2006. Creating wealth from groundwater for dollar-a-day farmers: Where the silent revolution and the four revolutions to end rural poverty meet. Hydrogeology J. 14:424-432. Postel, S., P. Polak, F. Gonzales, and J. Keller. 2001. Drip irrigation for small farmers. A new initiative
to alleviate hunger and poverty. Water Institute 26:3-13. Westrap, S., and H. Schreier. 2004. A comparison between low-cost drip irrigation, conventional drip
irrigation, and hand watering in Nepal Agric. Water Manag. 64:143-160.

30
Crop water productivity in India: some potential improvements
Upali A. Amarasinghe1 and Bharat R. Sharma1
1International Water Management Institute, New Delhi Office, India [email protected]
Abstract Grains, the staple food in India, provide 65% of daily nutritional supply in India. With increasing population and diversifying consumption patterns, production will have to increase significantly to meet additional food and feed grain demand. At present grain production (205 million t) uses 65% of the cropped area, 62% of the total consumptive water use, and 69% of the total irrigation deliveries. But with increasing water demand for other high-value crops, and from other sectors, grain production will face stiff competition for scarce water resources. Improving water productivity (WP) is one option for coping with water scarcity. This paper discusses some potential improvements of WP of grains in India. WP of grains in India is very low compared to other major grain-producing countries. WP across districts varies significantly at similar levels of yield or at similar levels of consumptive water use (crop evapotranspiration). Small amounts of supplemental irrigation in districts with low irrigation water use or rainfed crops can significantly increase both yield and WP. Significant scope also exists for reducing the gap between actual and maximum yield, which enhances both yield and WP. Deficit irrigation can increase WP and production in districts with high consumptive water use. Expanding the yield frontier and reducing the yield gap with existing water use can help India meet most of its grain and water needs. Media grab Improving water productivity by just 1% annually through supplemental irrigation in rainfed districts and deficit irrigation in intensively irrigated areas provides the greatest opportunity for meeting the future food and feed demand without further overstressing river basins of India. Introduction National food security and livelihood security of the increasing rural population dependent on limited land resources were key drivers of the green revolution in the 1970s. This was achieved in favorable agroecologies through the introduction of improved varieties, increased use of inputs, and expansion of irrigation. A significant gain in food production through increased land productivity was the main outcome. India is the second most populated country with 1 out of 6 billion of the world's population in 2000. It is the largest grain producer in the world with 124 out of 730 million ha of the world's grain area. India also has 205 out of 1915 million of the world’s grain production. It still has one of the lowest land productivities among the major food-producing countries (1.7 t/ha versus 4.0 t/ha in China, and 5.8 t/ha in USA). Doubling land productivity in five decades from now could help India to meet most of its increasing food demand, from about 202 million t in 2000 to about 380-400 million t by 2050). But unlike four decades ago, water, a critical factor for crop production and other uses by humans and ecosystems, is also becoming a scarce resource. With increasing water scarcity, the need to increase water productivity (WP) is receiving significant attention. Many regions in India are reaching the threshold of physical water scarcity (Amarasinghe et al., 2007a). This is primarily due to inadequate water resources to meet increasing water demand in different sectors. One option proposed for meeting increasing water demand is large inter-basin water transfers. Among alternative options, improving productivity of water use has significant potential. Thus, like the campaign for more crop per unit of land during the period of the green revolution, improving WP is also gaining prominence now. This paper focuses on ways of improving WP of grains in India. It assesses the extent and determinants of spatial variations of WP of grains and pathways of increasing it. Methodology and data Grain crops in this study consisted of rice (milled equivalent), wheat, maize, other coarse cereals, and pulses. WP is defined as total production per unit of consumptive water use (kg/m3). Consumptive water use (CWU) in irrigated areas is defined as actual evapotranspiration (ET) during the crop growth period. The net irrigation (evapotranspiration) (NET) requirement is the difference between Et and effective rainfall. CWU in rainfed areas is estimated as effective rainfall (Amarasinghe and Sharma, 2008). A brief account of spatial variation of WP of grains across states and districts in India is presented (for more details refer to Amarasinghe and Sharma, 2008). Pathways of increasing WP at district levels, and their potential, are assessed. We hypothesize that a significant potential exists for increasing WP through small levels of supplementary irrigation in rainfed areas and small deficit irrigation in irrigated areas. To test this, first we estimate the maximum yield and WP functions of grains. Next we assess

31
the potential increase of yield or WP through supplementary or additional irrigation, no additional irrigation, and deficit irrigation. Data for the study consists of district level land use and crop production in 2000. These data were collected from various government of India and other sources (Amarasinghe and Sharma, 2008). Climate data (monthly potential evapotranspiration and rainfall) were taken from the Climate and Water Atlas (IWMI, 2001). We considered the 20 major states that contribute about 99% of the total consumptive water use and 98% of the total production of grain in India (Figure 1). In 2000, India had 124 million ha under grains, produced 205 million t of grains, and depleted 425 km3 of water as CWU. Of the total area under grains, 54 million ha was irrigated, and that contributed to 68% of the total production and 54% of the CWU. In 2000, India withdrew 428 km3 of water to meet the irrigation requirement of 154 km3, of which the former is 69% of the total irrigation demand, and the latter is 65% of the total CWU in irrigated areas.
Figure 1. District level WP across major states. Results and discussion Spatial variation of water productivity In 2000, the numerator of WP includes irrigation deliveries, WP of grains is only 0.29 kg/m3 of grains in India was only 0.48 kg/m3 of consumptive water use (CWU). Between states it varied from 0.21 to 1.01 kg/m3. Among the differences we observed: • Punjab (PU), Haryana (HR), and Uttar Pradesh (UP) in the Indo-Gangetic Basin (IGB) have
the highest water productivities of grains. The rice-wheat dominated cropping pattern with irrigation contributing significantly to the higher WP in these states. Bihar, however, also in the IGB with 82% of the area under wheat and rice, has low WP. In Bihar, 60% of the area is irrigated, but irrigation contributes only 33% of the CWU. Effective rainfall meets much of the CWU in Bihar at present.
• West Bengal (WB), a major part of which is in the IGB, and Andhra Pradesh (AP), Tamil Nadu (TN), and Kerala in peninsular basins with rice-dominated cropping patterns, have moderate to high WP. Although irrigation contributes a major part of CWU in AP and TN, its contribution is low in WB and Kerala.
• Maharashtra, Madhya Pradesh (MP), Karnataka and Gujarat, with a mixture of cropping patterns (more than 50% of the area under maize and other coarse cereals and pulses) have lower WP. In Maharashtra and Karnataka, irrigation covers only 15 and 23% of area, respectively, and contributes 17 and 28% of the CWU. Irrigation in MP and Gujarat covers 29% of the grain area, but contributes 52 and 41% of the CWU.
• Orissa, Chattisgarh and Jharkhand, have the lowest water productivities, and share 12.8% of the total CWU but contribute only 6.3% of the grain production. Rainfed rice dominates cropping patterns in these states.

32
Differences of WP in irrigation and rainfed areas explain a significant part of the variation in total water productivity1. Additionally, the land use and the cropping patterns of grain significantly influence water productivity differences between states. In 2000, irrigation covered 43% of the total grain crop area in India but contributed 68% of the total production. Thus proper use of irrigation with appropriate cropping patterns can increase both yield and WP in many districts. These are discussed below, by assessing the relationship between yield and CWU at the district level. The water productivity of all districts varies from 0.11 kg/m3 to 1.25 kg/m3 (Figure 1). WP in the first to fourth quartiles varies from 0.11- 0.34, 0.34-0.45, 0.45-0.60, and 0.60-1.25 kg/m3. Districts in the fourth quartile of water productivities account for only 22% of total grain area and 22% of total CWU, but contribute 38% of total grain production. Irrigation provides water supply to 72% of the total grain area in this group, and contributes 60% of total CWU. In irrigated areas, irrigation accounts for a major part (72%) of total CWU. Districts in the first quartile of water productivities, however, account for 29% of total CWU and 30% of the total grain area. These districts contribute only 15% of total crop production, however. Effective rainfall, the main source of CWU in this group, accounts for 83% of total CWU. From the spatial variations of yield and WP of grains, and also the extent of irrigation of grain crops across districts, we observe that: • Yield variation explains a major part of the variation in WP across districts (ln (WP) =
0.34+0.65 ln (yield), adjusted R2= 59%). • Except for a few districts with low CWU, irrigation is a major determinant of higher yield and
hence higher water productivity. There is, however, significant variation of yield and WP within different levels of irrigation. Coefficients of variation of yield and WP across different categories of irrigation vary from 20 to 51% and 23 to 50%, respectively.
These observations show that providing small amounts of irrigation could be a major boost for increasing yield and hence WP in mainly rainfed districts. Recent research (Sharma et al., 2006) indicates that providing a small supplemental irrigation of about 100 mm during critical water stress periods of crop growth can significantly increase crop yields in major rainfed districts. A significant scope also exists for increasing yield in many districts with moderate to high irrigation inputs. Improving non-water inputs with improved water management could also be strategies for increasing yield and returns per unit of water consumed (Molden et al., 2003). All these offer opportunities for increasing the numerator of WP calculation. Is there scope for increasing WP by changing the denominator–the consumptive water use? Several studies (Kijne et al., 2003), have discussed potential impacts in different countries for different crops with deficit irrigation. We discuss them in the context of India in the next section.
Pathways of increasing WP Several strategies exist for increasing WP in Indian districts (Figure 2). WP can be increased significantly by: • Increasing the numerator (or yield) by bridging the gap between actual and maximum yield
at present, or by providing additional irrigation or selecting appropriate crop choices in mainly rainfed districts.
• Decreasing the denominator (or CWU per unit land) without losing any yield or returns to a unit of water consumed.
The relationship between average yield and consumptive water use fits a Cob-Douglas function (ln(yield) = 2.48-.18 ln(CWU), R2= .29). We used the 2-3 highest values of yield in each category of CWU (0-50, 50-100, 100-150, 150-200, etc.) for estimating the maximum yield function. We also depict two marginal yield curves (d (max yield)/d(CWU)) for increases in CWU of 100 and 200mm.
1 TWP = 0.021 + 0.59 IWP + 0.37 RWP + 0.11 PCGRIRAR-0.09 PCRIAR, Adjusted R2= 97% (.029) (0.06) (0.05) (0.05) (0.02) Values within parentheses are the standard errors of the estimates. TWP, IWP and RWP are total, irrigated, and rainfed water productivity, PCGRIRAR is the irrigated grain area as a % of total grain area, and PCRIAR is the percentage of rice area in grain.

33
Figure 2. Relationship of yield and consumptive water use (CWU) of grains. Reducing the yield gap The first strategy in WP improvement should be to increase yield without additional CWU. At present, a significant gap exists between average and maximum yield in all levels of CWU. And the range of yield, i.e. maximum-minimum, increases in districts with moderate to high CWU. If the gap between actual and maximum grain yield of each district can be reduced by 25% without additional CWU, total production could be increased from 203 Mt to 252 Mt from the same land and water use, through water and crop management. This increases WP from 0.48 kg/m3 to 0.60 kg/m3. A reduction of the yield gap by 50, 75, and 100% could increase the production to 300, 349, and 397 million Mt, respectively, and WP to 0.72, 0.83, and 0.97 kg/m3, respectively. Providing additional irrigation The second strategy for WP improvement is to provide additional irrigation in districts with low CWU and which are predominantly rainfed. The marginal yield curves, d(yield)/d(CWU), show that increasing CWU could significantly increase yield in many districts. With 100 mm of additional CWU, maximum yield can be doubled in districts with less than 150 mm of CWU (Figure 2). With 200 mm of additional CWU yield can be doubled in districts with less than 215 mm of CWU. Many of these districts can increase yield significantly with a small amount of supplemental irrigation. The gain in yield decreases with supplemental irrigation beyond 215 mm CWU and becomes negative after 475 mm. Growth in WP, however, becomes negative in many districts with CWU well below 475 mm. The marginal WP curves show that additional irrigation can more than double WP in districts with only low CWU (below 150 mm of CWU). WP growth becomes negative with additional irrigation after 225 mm of CWU. This shows that with the present level of yield and WP frontiers, additional irrigation would increase both yield and WP in districts with only low CWU (below 225 mm at present). Between 225 and 475 mm of CWU, yield increases but WP decreases. Additional irrigation beyond 475 mm CWU would have negative incremental benefits on both yield and WP.
-1.0
0.0
1.0
2.0
3.0
4.0
5.0
0 50 100 150 200 250 300 350 400 450 500 550 600 650 700 750
CWU (mm)
Yield (ton/ha)
-1.0
0.0
1.0
2.0
3.0
4.0
5.0
d(max yield)d(CWU)
Yield Max yield function
Aveage yield d(max yield)/d(CWU)-100mm
d(max yield)/d(mm)-200mm
ln(y) = -0.64 ln(x) 2 + 7.93ln(x) - 16.31 R2 = 0.96

34
Deficit irrigation The third strategy for increasing WP is decreasing consumptive water use through deficit irrigation. Reducing CWU through deficit irrigation where CWU is greater than 475 mm, would increase both yield and WP (Figure 2). And deficit irrigation between 225 and 475 mm of CWU would only increase WP. Even with some loss of yield, however, this strategy can use the saved water for increasing production. In India, 251 districts with more than 25% irrigated grain area, will have 10% less grain yield with 25 mm of deficit irrigation. This group of districts has 63% of the total grain area of India, and contributes to 79% of total grain production. Deficit irrigation of 25 mm on existing areas can save 14% of the NET requirement. If all that saved NET is used for producing grain, this can provide 8% additional production. Deficit irrigation of 50 mm can save 27% of NET and increase production by 17%. Deficit irrigation can increase grain production in all districts with a significant irrigated area. Deficit irrigation can help most in districts where there is scarcity of water but not land. Conclusion Although WP of India is generally higher where there is more irrigation, it varies significantly across districts with similar CWU or with similar yield levels. There is significant scope for increasing WP by increasing yield through both better water and other input management. Water management includes supplemental irrigation in districts with low CWU, no additional irrigation in districts with moderate CWU, and deficit irrigation in districts with high CWU. Reducing the existing yield gap in many districts with moderate to high CWU can increase both yield and WP. In fact, a substantial part of the future grain demand alone can be met by reducing the gap between actual and maximum yield. A combination of better water and other input management would contribute to this yield increase. Districts with high CWU can benefit from deficit irrigation, which can save water with only a marginal loss of yield. Saved water can then be used for additional crop production or other human or ecosystem use. Our analysis shows a significant net increase in crop production with deficit irrigation in many districts. Acknowledgments This paper presents findings from PN48 ‘Strategic Analysis of India’s River Linking Project’, a project of the CGIAR Challenge Program on Water and Food. References Amarasinghe, U.A., T. Shah, H. Turral, and B. Anand. 2007. India’s Water Futures to 2025-2050:
Business as Usual Scenario and Deviations. IWMI Research Report 123. Colombo, Sri Lanka: International Water Management Institute.
Amarasinghe U.A., and B. Sharma. 2008. Spatial Variation of Crop Water Productivity of India and
Potential for Improvements. Draft report prepared for the IWMI-CPWF project 'Strategic Analysis of India’s River Linking Project '
IWMI. 2001. IWMI climate and water atlas. Colombo, Sri Lanka: IWMI CD-ROM. Kijne, J.W., R. Barker, and D. Molden. 2003. Water Productivity in Agriculture: Limits and
Opportunities for Improvements. Comprehensive Assessment of Water Management in Agriculture Series 1. UK: CAB International.
Molden, D., H. Murray-Rust, and R. Sakthivadivel. 2003. A Water-productivity Framework for
Understanding and Action. In Kijne, J.W., Barker, R., and Molden, D. (eds). Water Productivity in Agriculture: Limits and Opportunities for Improvements. Comprehensive Assessment of Water Management in Agriculture Series 1. UK: CAB International.
Sharma, B.R., B. Sharma, K.V. Rao, K.P.R. Vittal, and U.A. Amarasinghe. 2006. Realizing the potential
of rainfed agriculture in India. Drafts prepared for the IWMI-CPWF project on 'Strategic Analyses of India’s National River-Linking Project.' Accessible via nrlp.iwmi.org

35
Variations in groundwater use, water productivity and profitability across
a canal command in the Indo-Ganagetic Basin
Ravish Chandra1, B.R. Sharma2, V.K. Bhatt3, Shailender Singh4, and Vivek Kapadia5 1R.A.U., Bihar, Pusa (Samastipur)
2IWMI, New Delhi 3CSWCRTI ,Chandigarh
4CGWB,Chandigarh 5Irrig. Dept., Government of Gujarat
email:[email protected] Abstract The northwest Indo-Gangetic plain, where rice-wheat is the main cropping system, is one of the most important agricultural regions in India. It contributes nearly 52% of the national food production. Increasing pressure on agriculture due to increasing food requirements, climate change, fluctuating markets, and fragmentation of land calls for efficient resource management. We investigated the effect of unequal distribution of canal water in land and water productivity of the rice-wheat cropping system in terms of head-tail relationships in Bhakra Canal command This paper presents an analysis of water productivity, land productivity, and profitability at the farmer field level in the command area of Pabnawa minor (tertiary canal) of Bhakra irrigation system. The groundwater contribution in the canal command is very high. Water productivity increases from head to tail due to wastage of canal water upstream and judicious use of groundwater at the tail end. Farmers practicing conjunctive use have higher profitability than tubewell irrigators and canal irrigators. The cost of water increases from head to tail, but because of the flat rate charge for electricity there is only a small difference in the costs of water for paddy and wheat. This system of intensive irrigated agriculture is unsustainable in the long run because of declining water tables and high use of energy. Higher profitability in rice and flat rate of electricity are causing water table decline at a very rapid speed. Therefore under a business-as-usual scenario, continuation of the rice-wheat cropping pattern is likely. Media grab Groundwater is important in canal command areas of the Indo-Ganagetic Basin. Farmers with access to canal and groundwater resources are in a win-win situation with highest profitability and moderate water productivity. Introduction The northwest Indo-Gangetic plain, where rice-wheat is the main cropping system, is one of the most important agricultural regions in India, because it contributes 52% of the national food production. (Abrol, 1999). In this region fresh water from canals is supplied through a rotational Warabandi system (Malhotra, 1982), which has been designed to provide equitable water supplies. Canal water allowance, however, is generally not sufficient to irrigate the total landholding of the farmer. Substantial seepage from earthen distribution channels and illegal use of canal water by head-end farmers create large variations in supply, spatially as well as temporally. Because of this variation in supply and the low reliability of canal water supplies, groundwater has become important, including in the irrigated canal command of Bhakra system. Such an overdependence on groundwater and weak regulatory mechanisms for water use have resulted in growing water scarcity and an increasing threat to the sustainability of water-intensive cropping systems. The challenge for irrigated agriculture will be to grow more food with less water (Guerra et al., 1998). The old notion of increased input applications will have to be changed, and new paradigms of optimized resource use in sustainable ways need to be evolved. The focus of improving land productivity has to be shifted toward improving water productivity. Therefore it is extremely important to address some of the issues at the field level. This investigation studied water productivity in a rice-wheat cropping system at the field level in Pabnawa minor of Bhakra canal command of Haryana in India. This study also tried to assess profitability of farmers across the canal command, and the contribution of groundwater in total irrigation across the canal command. Methods The study area is the command area of Pabnawa minor (tertiary canal) of Bhakra irrigation system, located in the semiarid tropics in Haryana, India at 29°31' - 30°12' N and 76°10' – 76°43' E. Average annual rainfall is 625 mm, about 80% of which is received during the monsoon period (July to September). Average evapotranspiration is about 1550 mm. For this study, villages (Jyotisar and Raogarh) at the head of the Pabnawa minor, Barna in the middle, Pabnawa at the far middle, and Faral in the tail stretch of the Pabnawa minor were selected. Details of four watercourses supplying canal water to them are summarized in Table 1.

36
Fields of 122 farmers (at least 30 farmers in each of the four stretches–with at least 10 located in the head, middle, and tail reaches of each watercourse) were selected for detailed data collection. Information on agricultural practices, irrigation water supply from tubewells and canal water, cropping pattern, cost of cultivation, and yields were collected through specifically designed questionnaires. The primary data for this study were collected for rabi 2006-07 and kharif 2007. Gauge readings of the canal were collected for the last 3 years from Kurukshetra Irrigation division. Discharges of tubewells were estimated using the coordinate method (Michael, 1978). Historical data regarding the canal irrigated area, water table fluctuations, and various other data related to groundwater were collected from Kurukshetra Irrigation Division, Agriculture Department and Groundwater Cell. Table 1. Details of selected watercourses. Watercourse (stretch of canal) Design discharge (m3/sec) Gross command area (ha) Pabnawa 2820R (Head ) 0.028 231.6 Pabnawa 23400R (Middle) 0.040 213.6 Pabnawa 53705L (Far Middle) 0.041 320.2 Pabnawa 80000L (Tail) 0.052 283.0
Results Groundwater use Crop production is directly related to canal water supply. The rigid schedule of water distribution and the inadequacy of the canal water supply do not provide much scope to the farmers for decision-making in respect of canal water utilization. Their decisions are mostly limited to managing the readily available groundwater. The canal irrigated area in Pabnawa minor is shrinking due to management inadequacies. From 1995 to 2005, the canal irrigated area decreased in the middle reach by 11% to 65% during the kharif season and by 11% to 44% during the rabi season. Tubewell water use is very high in the tail and far middle reaches in both seasons. Table 2. Use (cm) of canal water and groundwater for irrigation during rabi and kharif season in 2006-7. Season Sources of irrigation PH (Head) PM (Middle) PN (Far Middle) PT (Tail)
Rabi (wheat) Canal) 6.8 10.0 3.1 0.84
Groundwater 18.3 12.8 19.5 19.8
Kharif (Paddy) Canal 61.7 97.3 40.3 3.2
Groundwater 94.3 55.9 101 116
Water productivity at field level Water productivity (WP) refers to the benefits derived from use of water. It is expressed in terms of kg/ m3 of water or Rs/m3 (Indian Rupees) of water. Productivity of total irrigation water (canal + groundwater) increases from head to tail stretches for coarse paddy (2007), Basmati (2007), and decreases from head to tail for wheat (2006-07) (Table 3). The irrigation water productivity for coarse paddy and basmati paddy is higher by 35% and 21% for the tail stretch as compared to the head stretch. This is probably because of wastage of low-cost canal water in the upper reaches, and careful use of groundwater in the tail stretch. Electricity is supplied every alternate day for 6-7 hours, and hence the tailend farmers have to use these electricity supply hours judiciously. The same phenomenon is found for irrigation water productivity within the stretch. For wheat, irrigation water productivity is lower by 12% in the tail stretch and by 2.5% in the far middle stretch than in the head stretch. This was unexpected as the wheat crop in the tail stretch was badly affected due to heavy rain in February 2007 (216 mm). The soil in the tail stretch is clay loam, which encourages water stagnation and yield loss. Water productivity of paddy and wheat for different sources of irrigation is given in Table 4. The highest irrigation water productivity for paddy is for tubewell irrigated farmers, followed by conjunctive users and then by canal-irrigated farms. Irrigation water productivity is Rs3.63/m3 for coarse rice, Rs5.62/m3 for basmati rice, and Rs14.87/m3 for wheat. The information gives an impression that farmers are cheaply using water for paddy as compared to wheat. But it is worth noting that farmers tend to maximize their crop income, and basmati rice gives the highest gross margin per hectare, followed by coarse rice, and then wheat. This emphasizes the challenge of enhancing water productivity while increasing or sustaining the economic benefits to the farmer.
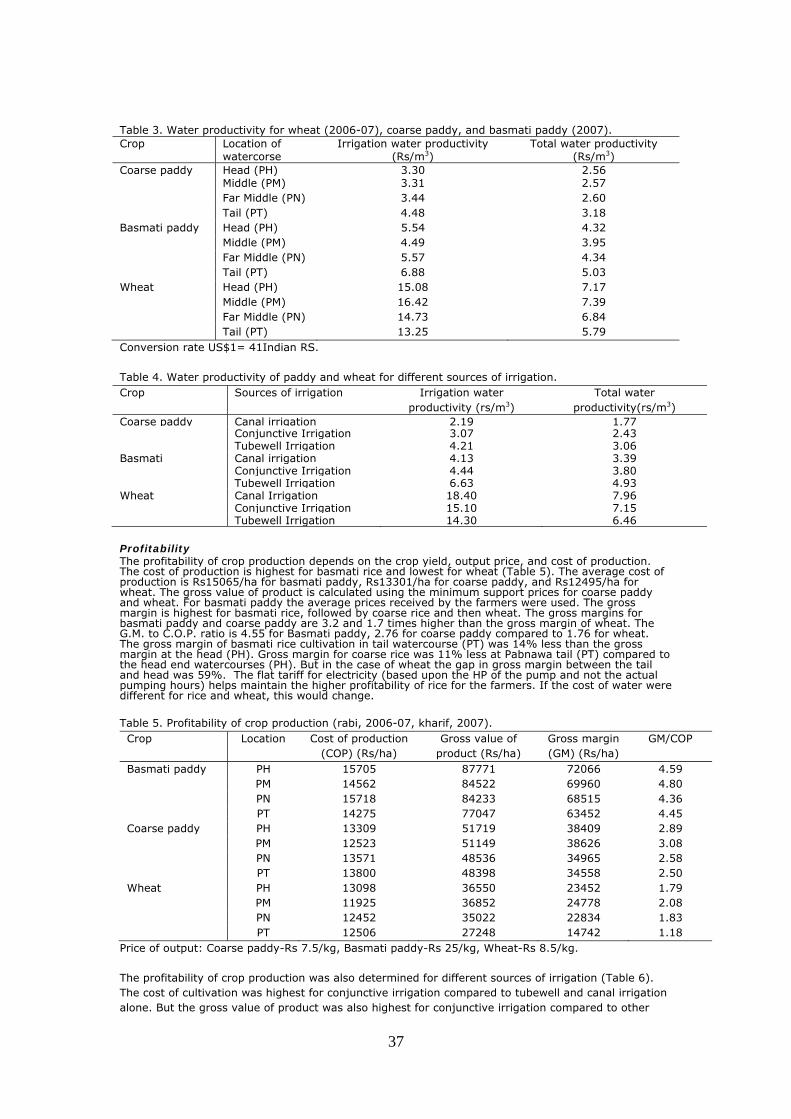
37
Table 3. Water productivity for wheat (2006-07), coarse paddy, and basmati paddy (2007). Crop Location of
watercorse Irrigation water productivity
(Rs/m3) Total water productivity
(Rs/m3) Coarse paddy Head (PH) 3.30 2.56 Middle (PM) 3.31 2.57 Far Middle (PN) 3.44 2.60 Tail (PT) 4.48 3.18 Basmati paddy Head (PH) 5.54 4.32 Middle (PM) 4.49 3.95 Far Middle (PN) 5.57 4.34 Tail (PT) 6.88 5.03 Wheat Head (PH) 15.08 7.17 Middle (PM) 16.42 7.39 Far Middle (PN) 14.73 6.84 Tail (PT) 13.25 5.79 Conversion rate US$1= 41Indian RS. Table 4. Water productivity of paddy and wheat for different sources of irrigation. Crop Sources of irrigation Irrigation water
productivity (rs/m3) Total water
productivity(rs/m3) Coarse paddy Canal irrigation 2.19 1.77 Conjunctive Irrigation 3.07 2.43 Tubewell Irrigation 4.21 3.06 Basmati Canal irrigation 4.13 3.39 Conjunctive Irrigation 4.44 3.80 Tubewell Irrigation 6.63 4.93 Wheat Canal Irrigation 18.40 7.96 Conjunctive Irrigation 15.10 7.15 Tubewell Irrigation 14.30 6.46 Profitability The profitability of crop production depends on the crop yield, output price, and cost of production. The cost of production is highest for basmati rice and lowest for wheat (Table 5). The average cost of production is Rs15065/ha for basmati paddy, Rs13301/ha for coarse paddy, and Rs12495/ha for wheat. The gross value of product is calculated using the minimum support prices for coarse paddy and wheat. For basmati paddy the average prices received by the farmers were used. The gross margin is highest for basmati rice, followed by coarse rice and then wheat. The gross margins for basmati paddy and coarse paddy are 3.2 and 1.7 times higher than the gross margin of wheat. The G.M. to C.O.P. ratio is 4.55 for Basmati paddy, 2.76 for coarse paddy compared to 1.76 for wheat. The gross margin of basmati rice cultivation in tail watercourse (PT) was 14% less than the gross margin at the head (PH). Gross margin for coarse rice was 11% less at Pabnawa tail (PT) compared to the head end watercourses (PH). But in the case of wheat the gap in gross margin between the tail and head was 59%. The flat tariff for electricity (based upon the HP of the pump and not the actual pumping hours) helps maintain the higher profitability of rice for the farmers. If the cost of water were different for rice and wheat, this would change. Table 5. Profitability of crop production (rabi, 2006-07, kharif, 2007). Crop Location Cost of production
(COP) (Rs/ha) Gross value of
product (Rs/ha) Gross margin (GM) (Rs/ha)
GM/COP
Basmati paddy PH 15705 87771 72066 4.59 PM 14562 84522 69960 4.80 PN 15718 84233 68515 4.36 PT 14275 77047 63452 4.45 Coarse paddy PH 13309 51719 38409 2.89 PM 12523 51149 38626 3.08 PN 13571 48536 34965 2.58 PT 13800 48398 34558 2.50 Wheat PH 13098 36550 23452 1.79 PM 11925 36852 24778 2.08 PN 12452 35022 22834 1.83 PT 12506 27248 14742 1.18
Price of output: Coarse paddy-Rs 7.5/kg, Basmati paddy-Rs 25/kg, Wheat-Rs 8.5/kg. The profitability of crop production was also determined for different sources of irrigation (Table 6). The cost of cultivation was highest for conjunctive irrigation compared to tubewell and canal irrigation alone. But the gross value of product was also highest for conjunctive irrigation compared to other

38
sources of irrigation, resulting in higher gross margin for conjunctive irrigation of basmati paddy and coarse paddy. This analysis suggests that with the flat rate of electricity and higher return of paddy, high water use will continue. There is an urgent need to look into this serious issue. Table 6. Profitability of crop production under different sources of irrigation. Crop Sources of irrigation Cost of production
(COP) (Rs/ha) Gross value of
product (Rs/ha) Gross margin (GM) (Rs/ha)
GM/COP
Basmati paddy
Canal 11399 40218 28819 2.53
Conjunctive 13673 51201 37528 2.74
Tubewell 13334 50062 36728 2.75
Coarse paddy
Canal 14568 82550 67982 4.67
Conjunctive 15942 84373 68431 4.29
Tubewell 14297 82544 68247 4.77
Wheat Canal 12330 36703 24373 1.98
Conjunctive 12512 36828 24207 1.93
Tubewell 12521 31424 18903 1.51
Price of output: Coarse paddy-Rs 7.5/kg, Basmati paddy-Rs 25/kg, Wheat-Rs 8.5/kg. Options for improvement Artificial recharge of groundwater Harnessing surplus monsoon flows and canal flows to recharge the aquifer system could, in principle, augment groundwater resources. Artificial groundwater recharge should be done on a priority basis, through rooftop rainwater harvesting and a combination of recharge shafts and injection wells (CGWB, 2004). The impact assessment of artificial groundwater recharge by combination of recharge shafts and injection wells in Haryana has 3.45 M m3 runoff water recharged in one year and the rate of watertable decline reduced from 1.175 m/year to 0.25 m/year. Recharging of confined aquifers by injection tubewells in Kurukshetra district indicates water recharges at the rate of 7.2 m3/day/tubewell (Kaledhonkar et al., 2003). In 2002-03 many farmers of this area changed from centrifugal to submersible pumps. The abandoned wells and pipes are still there and can be modified and used for groundwater recharge. Conjunctive use of water Conjunctive use of water from different sources is considered to be a valuable tool to overcome the constraints of the surface and groundwater systems, if operated independently. A typical canal irrigator in this area gets surface water 12-18 times a year. Most of these head-end farmers also have tubewells for supplemental irrigation. The ratio of canal water and tubewell water for head-end farmers is about 70:30. But if this ratio can be reversed to 30:70 and the surplus canal water can be transferred to tail-end farmers it will minimize tubewell water use. The lining of watercourses is also essential for conjunctive use of water. The lining of watercourse no. 23400R of Pabnawa minor has increased the irrigated area from 18 ha to 40 ha. This lined watercourse can also be used while irrigating from tubewell. Conjunctive use planning requires establishment of firm water supplies and their distribution and use of groundwater and allocation of water to different users. Promotion of resource conservation technologies The use of resource conservation technologies needs to be encouraged by providing subsidies to farmers to adopt technologies such as zero tillage, bed planting, laser leveling, and SRI technique for growing paddy. It will improve groundwater use efficiency. Chandra et al. (2007) suggest superiority of zero tillage over conventional tillage in wheat in terms of irrigation water productivity, land productivity, and profitability of crops. Similarly, bed planting and laser leveling have great potential. At the same time there should be some incentives for farmers to save water. Conclusions and recommendations In the canal water distribution system, a gap between head and tail farmgate supply always exists, and the system investigated is no exception. The inadequate, inequitable, and irregular canal water supply has led to shrinkage of the canal irrigated area over time and groundwater is playing an important role in crop production. Groundwater accounts for more than 50% of the total irrigation water use in the Pabnawa canal command. Water productivity increases from head to tail watercourses for coarse and basmati rice. This trend is due to wastage of low-cost canal water upstream and judicious use of costly groundwater at the tail end. The gross margin is highest for basmati rice, followed by coarse rice and wheat. The higher profitability of rice and flat rate electricity charges result in high water use for canal and groundwater, causing water table decline. This system of intensive irrigated agriculture is unsustainable in the long run, because of declining water tables and high use of energy. In the short term, food security, poorly designed electricity tariffs, and high minimum support price for rice need to be rationalized.

39
Conjunctive use farmers have the highest profitability and moderate water productivity compared to tubewell irrigators and canal irrigators. Conjunctive use of water from different sources is considered to be a valuable tool to overcome the constraints of the surface and groundwater systems, if operated independently. This study produced some important policy recommendations: • There is an urgent need to enact groundwater legislation to stop indiscriminate exploitation.
A state groundwater body should be set up to regulate and control groundwater development and management on a sustainable basis.
• There should be strong incentives to the farmers for establishing artificial groundwater recharge structures in the form of waiving electricity costs.
• The use of a flat rate for electricity, combined with unreliable electric supply, provides little incentive for efficient use of groundwater. The electricity rate in these states has not changed in the past 10-15 years. There is a need to increase the flat rate by 10-15% and to base it on actual usage or to regulate the power supply hours.
• Conjunctive use farmers have the highest profitability. Conjunctive use planning requires the establishment of firm water supplies and their distribution, effects of water development and use of groundwater, and allocation of water to different users.
• Resource conservation technologies need to be encouraged by providing subsidies to farmers to adopt technologies such as zero tillage, bed planting, laser leveling, and SRI technique for growing paddy. This will improve groundwater use efficiency.
• Artificial groundwater recharge should be done on a priority basis, through rooftop rainwater harvesting, and combination of recharge shafts and injection wells (CGWB, 2004).
Acknowledgments This paper presents findings from PN42 'Groundwater Governance in Asia: Theory and Practice,' a project of the CGIAR Challenge Program on Water and Food. References Abrol, I.P. 1999. Sustaining Rice-Wheat System Productivity in the Indo-Gangetic Plain: Water
Management Related Issues: Agricultural Water Management Related Issues. Agricultural Water Management 40: 31-5.
Central Groundwater Board (CGWB). 2004. Water security through groundwater management in
Haryana. North Western Region, Chandigarh. Chandra, Ravish, A. Sikka, S. Singh, R. Gupta, A.K. Upadhyaya, and R. Sakthivadivel. 2007. Impact of
resource conserving technologies on water use and water productivity in Pabnawa minor of Bhakra canal system. Rice-Wheat Consortium Technical Bulletin 10.
Guerra, L.C., S.I. Bhuiyan, T.P. Tuong, and R. Barker. 1998. Producing more rice with less water from
irrigated systems. SWIM Paper 5. Sri Lanka, Colombo: International Water Management Institute.
Kaledhonkar, M.J., O.P. Singh, S.K. Ambast, N.K. Tyagi, and K.C. Tyagi. 2003. Artificial groundwater
recharge through recharge tubewells: a case study, IE (I) Journal-AG, 84: 28-32. Malhotra, S.P. 1982. Warabandi system and its infrastructure. Central Board of Irrigation and Power.
Publication No.146. New Delhi, India. Michael, A.M. 1978. Irrigation: Theory and Practice. Vikash Publication, New Delhi, India. Molden D., and R. Sakthivadivel. 1997. Water accounting for water use and productivity of water.
Water Resources Development, 15: 55-71.

40
Grain filling characteristic and yield formation of water-saving aerobic rice handao297 as affected by N application and soil type
F.T. Wei1,2, H.B. Tao1, L.M. Zhang2, P. Wang1, B.A.M. Bouman3, S. Lin2
1College of Agronomy and Biotechnology, China Agricultural University, 100193 Beijing, China
[email protected] 2College of Environment and Resources, China Agricultural University, 100193 Beijing, China
3Crop, Soil and Water Sciences Division, International Rice Research Institute (IRRI), Philippines
Abstract Water-saving aerobic rice Handao 297 (HD297) faces a problem of low harvest index and low percentage of filled grain. Field experiments were carried out at farm and station sites with different physical and chemical soil properties in 2006, to investigate the characteristics of grain-filling and dry matter accumulation/ translocation as affected by N application and soil type. Grain yield ranged from 3.3 to 4.4 ha and was 14% higher on average on the fertile soil site (farm site) than the poor soil site (station site). There was no significant difference in translocation efficiency among treatments, which ranged from 14.4 to 38.4%. SPAD values of flag leaves decreased rapidly about 16 days after flowering. The contribution of pre-anthesis assimilate to grain (CAVG) was 21.8-67.4%. Superior grain reached the maximum grain-filling rate 15 days earlier than inferior grain, which demonstrated that HD297 is asynchronous and has low yield potential. Poor dry matter translocation and production after flowering were also reasons for low grain yield. Grain-filling and thus dry matter transportation/production after flowering were improved by nitrogen application on the low fertility soil at the station site. Media grab The asynchronized characteristic of aerobic rice Handao297 might be an important cause of its low yield potential, and new synchronized varieties should be bred and tested. Introduction Aerobic rice is a recently developed rice type that will respond to inputs and give reasonable yields when grown under nonpuddled, nonponded soil conditions (Bouman, 2001). The grain yield of aerobic rice is higher than that of traditional upland rice, but lower than flooded rice (Peng et al., 2006). In 2005, a pre-experiment was conducted under high fertility soil conditions. In this experiment, shoot dry matter of HD297 was as much as 15 t/ha, but harvest index and percentages of filled grain were only 0.33 and 60%, respectively, implying a problem of dry matter translocation during the reproductive stage. Low dry matter translocation in turn limited grain-filling, which resulted in low percentage of filled grain and thus yield. Grain-filling is determined by genetic characteristics, management such as water and nitrogen inputs, and soil properties. Genetically, there are two grain-filling patterns, synchronized and asynchronized. For synchronized genotypes, the superior (top of panicle) and inferior (base of panicle) grain reached rapid grain-filling periods (RGFP) at similar dates, while those of asynchronized genotpyes reached RGFP at different dates (Yang et al., 2000a). Rapid synchronized genotypes have high yield potential and a high percentage of filled grain, while asynchronized genotypes show the opposite trend. With asynchronized genotypes, the grain-filling rate of inferior grain can be improved through better management, which provides the possibility of improving the grain yield of aerobic rice. The objectives of this paper are to firstly clarify the characteristic of grain-filling of HD297, then analyze the effect of management (N fertilization) and soil types on its grain-filling and yield formation characteristics. Materials and methods Field experiments were conducted at Shangzhuang Experimental Station (39°54′N, 116°24′E 'station site,' SS) of China Agricultural University, a former maize field with a deep groundwater table, and 17 km away at Shangzhuang Experimental Farm ('farm site,' FS), a rice field with shallow groundwater table in Beijing, North China (Zhang, 2008). Soil fertility of FS was higher than SS. The experiment was a completely randomized block design with four replications and the plot size was 6m×10m. The N application rates were zero nitrogen (N0) and 150 kg/ha (N150) as urea-N, of which 30% was applied at sowing, 40% at tiller initiation, and 30% at panicle initiation. Handao297 was direct seeded at 67.5 kg/ha, 30 cm row space. Rice was seeded on May 2006 and harvested in October. At the time of sowing, 56 kg/ha P2O5, 56 kg/ha K2O, 22.5 kg/ha iron sulfate (FeSO4) and 15 kg/ha zinc sulfate (ZnSO4) were applied. During the heading stage, about 100 panicles that headed on the same day were tagged in each plot. Five to ten tagged panicles from each plot were sampled in 3-day intervals from anthesis to 6 days after anthesis (DAA) and at 6-day intervals from 6 DAA to maturity. The sampled panicles were

41
divided into three parts, superior, middle, and inferior. Grains on the apical position of the top primary branch were taken as superior grain (SG) and those on the lowest secondary branch were sampled as inferior grain (IG) (except sterility) according to Bo and Cai (1989). Grain was oven-dried at 80°C to constant weight. The grain-filling progress was fitted by Richards’ (1959) equation and grain growth equation was described by Zhu et al. (1988): W = A / (1+Be-kt)1/N , where W is the grain weight (mg); A is the final grain weight (mg); t is the time after flowering (d); B, K, N are coefficients determined by regression. The aboveground biomass was determined at flowering from two rows of 0.5 m and at maturity from two rows of 1.0 m, after drying at 80°C to constant weight. An area of 9 m 2 was harvested to analyze grain yield (14% water content), the number of panicles per square meter (PM), the number of grains per square meter (GM), percentage of filled grain (PFG), and 1000-grain weight (TGW). SPAD values of flag leaves after flowering were measured. Data were analyzed by the GLM procedure of the Statistical Analysis System (SAS, version 8.0). Results and discussion Grain yield and PFG of HD297 at both sites ranged from 3.3 to 4.3 t/ha and 60 to 84%, respectively (Table 1). Grain yield at FS (higher fertility soil) was significantly higher than that at SS without N fertilizer (N0), but the difference between two sites was smaller with 150 kg/N ha (N150). N application significantly improved grain yield at SS, while there was no effect on grain yield at FS. Among yield components, panicle number per square meter (PM) increased after N application, but percentage of filled grain (PFG) and 1000-grain weight (TGW) decreased at both sites, which implied shortcomings on grain-filling at the reproductive stage (Table 1). Table 1. Grain yield (14% water content), panicles per panicle (PM), grain per panicle (GP), percentage of filled grain (PFG), 1000-grain weight (TGW), straw dry matter accumulation (DM), dry matter translocation (DMT), dry matter translocation efficiency (DMTE), contribution of pre-anthesis assimilate to grain yield (CAVG) of aerobic rice Handao297 under different nitrogen treatments.
Source of Yield PM GP PFG TGW DM (t/ha) DMT DMTE CAVG Variation (t/ha) (/m2) (%) (g) Flowering Maturity (t/ha) (%) (%) Farm site N0 4.3 a A 244 b A 72 a A 81.2 a A 29.2 a
A 5.0 b A 4.2 a A 0.8 a
A 15.3 a A
21.8 a A
N150 4.4 a A 306 a A 80 a A 59.5 b B 27.6 b A
7.7 a A 4.9 a A 2.8 a A
33.2 a A
67.4 a A
Station site
N0 3.3 b B 201 b B 63 a A 84.0 a A 27.5 a B
4.5 b A 4.5 b A 0.7 b A
14.4 a A
23.4 a A
N150 3.9 a A 233 a B 74 a A 78.0 b A 26.1 b B
5.8 a B 5.8 a B 2.4 a A
38.4 a A
59.4 a A
a. Figures within each column and experimental site followed by the same small letters are not significantly different; figures within each column and N rate followed by the same capital letters are not significantly different, α=5%. b. DMT=DM(Flowering-Maturity); DMTE=DMT/ DM(Flowering)×100%; CAVG=DMT/ Grain yield×100%. The time to reach the maximum grain-filling rate (Tmax) was used to evaluate the grain-filling pattern of rice (Gu 2001). The average Tmax of SG and IG was 10.3 and 24.9, respectively. The difference of Tmax between SG and IG was more than 10 days (about 14.6 days) (Fig. 1, Table 2), which indicated a typical asynchronized grain-filling pattern of HD297. The yield potential of asynchronized genotypes is normally low (Yang et al, 2000). Figure 1. Grain-filling rate and grain-filling progress of superior and inferior grain under farm site (FS) and station site (SS). a SG—superior grain; IG—inferior grain.
0
6
12
18
24
30
0 15 30 45 60
Days after flowering
Gra
in-f
illing
pro
gre
ss
(mg p
er
gra
in)
0.0
0.6
1.2
1.8
2.4
0 15 30 45 60
Days after flowering
Gra
in-f
illing
rate
(mg p
er
gra
in p
er
day) FS SGSS SGFS IGSS IG
0
6
12
18
24
30
0 15 30 45 60
Days after flowering
Gra
in-f
illing
pro
gre
ss
(mg p
er
gra
in)
0.0
0.6
1.2
1.8
2.4
0 15 30 45 60
Days after flowering
Gra
in-f
illing
rate
(mg p
er
gra
in p
er
day)
0
6
12
18
24
30
0 15 30 45 60
Days after flowering
Gra
in-f
illing
pro
gre
ss
(mg p
er
gra
in)
0
6
12
18
24
30
0 15 30 45 60
Days after flowering
Gra
in-f
illing
pro
gre
ss
(mg p
er
gra
in)
0.0
0.6
1.2
1.8
2.4
0 15 30 45 60
Days after flowering
Gra
in-f
illing
rate
(mg p
er
gra
in p
er
day) FS SGSS SGFS IGSS IG
FS SGSS SGFS IGSS IG

42
Table 2. Parameters and sub-parameters, final grain weight (A), day of reaching the maximum grain-filling rate (Tmax), active grain-filling days (D), the maximum grain-filling rate (Gmax), and the average grain-filling rate (Gav) of Richards equation of aerobic rice HD297 under different nitrogen treatments and experimental sites.
Nitrogen application decreased Tmax and increased the active grain-filling days (D) of both superior and inferior grain (Table 2). Therefore, active grain-filling started earlier and lasted longer, which related to increased dry matter translocation (DMT) after N input at both sites (Table 1). Compared to SG, IG had much lower maximum grain-filling rate (Gmax) and average grain-filling rate (Gav), but longer grain-filling days (D). This large gap between SG and IG suggested the possibility of increasing yield through improving the grain-filling of IG. Although Gmax and Gav of inferior grain were not affected by N150, it is possible that grain yield might be increased through optimizing nitrogen application timing or genetic improvement (Zhang, 2008). SPAD values increased after N application at both sites, especially at the low fertility site (SS). Moreover, SPAD values of the flag leaves decreased rapidly 16 days after flowering, reflecting the reduction of photosynthetic capacity (Figure 2). Dry matter accumulation after flowering was about 32.0% of total shoot dry matter, which directly proved poor photosynthesis of HD297 during this period. Low photosynthesis after flowering would be another cause of low grain-filling that limits grain yield. The contribution of pre-anthesis assimilate to grain increased with N input, so improving photosynthetic efficiency of leaves through changing N application rate or time could increase grain yield (Table 1). Figure 2. SPAD values of flag leaves after flowering at farm site (left) and station site (right). Conclusions and Recommendations Aerobic rice Handao 297 was shown to have an asynchronized grain-filling pattern, which is part of the cause of low grain yield of this genotype. The asynchronized pattern means that the grain-filling rate was improved by nitrogen application at the low fertility site, and was higher on a high fertility soil (farm site). Low dry matter accumulation occurred during grain filling, limiting dry matter translocation from stems/leaves into panicles/grains, and low percentage of filled grains, were observed and may limit yield. We suggest that genetic improvement is needed to overcome these limitations.
Grain Site N rate A Tmax D Gmax Gav position (kg/ha) (mg) (day) (days) (mg/grain d) SG FS 0 23.2 12.5 16.3 1.97 1.42 150 24.4 10.1 18.9 1.86 1.29 SS 0 22.9 9.8 17.9 1.85 1.28 150 22.6 8.8 20.7 1.61 1.09 Mean 23.3 10.3 18.5 1.82 1.27 IG FS 0 22.5 27.4 66.2 0.49 0.34 150 22.1 25.7 69.0 0.47 0.32 SS 0 17.9 22.9 50.7 0.52 0.35 150 15.5 23.7 49.3 0.46 0.31 Mean 19.5 24.9 58.8 0.49 0.33
0
10
20
30
40
50
60
0 5 10 15 20 25
Days after flowering
SP
AD
va
lues
0
10
20
30
40
50
60
0 5 10 15 20 25
Days after flowering
SP
AD
va
lues
N2N0
0
10
20
30
40
50
60
0 5 10 15 20 25
Days after flowering
SP
AD
va
lues
0
10
20
30
40
50
60
0 5 10 15 20 25
Days after flowering
SP
AD
va
lues
0
10
20
30
40
50
60
0 5 10 15 20 25
Days after flowering
SP
AD
va
lues
0
10
20
30
40
50
60
0 5 10 15 20 25
Days after flowering
SP
AD
va
lues
N2N0N2N0

43
Acknowledgments This work was part of the CGIAR Challenge Program on Water and Food Project PN8 'Developing a System of Temperate and Tropical Aerobic Rice in Asia (STAR) ' It was also supported by the National Nature Science Foundation of China (NSFC, 30370841). References Bouman, B.A.M. 2001. Water-efficient management strategies in rice production. Int. Rice Res. Notes,
16(2): 17-22. Bo, X.F., and Y.P. Cai. 1989. Relationship between abscisic acid and grain filling of rice and wheat.
Plant Physiology Telecommunication. 25(3): 40-41. Gu, S.L., Q.S. Zhu, J.C. Yang, and S.B. Peng. 2001. Analysis on grain filling characteristics for
different rice types. Acta Agronomica Sinica, 27(1): 7-14. Peng, S.P., B.A.M. Bouman, R.M. Visperas, A. Castañeda, L.X. Nie, and H.K. Park. 2006. Comparison
between aerobic and flooded rice in the tropics: Agronomic performance in an eight-season experiment. Field Crops Research, 96: 252–259.
Richards, F. 1959. A flexible growth function for empirical use. Exp. Bot., 10: 290-300. Yang, J.C., S.B. Peng, R.M. Visperas, A.L. Sanico, Q.S. Zhu, and S.L. Gu. 2000. Grain filling pattern
and cytokinin content in the grains and roots of rice. Plant Growth Regulation, 30: 261–70. Zhang, L.M. 2008. Effect of nitrogen fertilizer application on yield formation and nitrogen uptake of
aerobic rice in North China. PhD Thesis, Kiel University. Zhu, Q.S., X.Z. Cao, and Y.Q. Luo. 1988. Growth analysis in the process of grain-filling in rice. Acta
Agronomica.
44
Water availability deficit in rainfed farming for semiarid Mzingwane Catchment, Zimbabwe
A. Mhizha1,2, and B. Chibulu2
1School of Civil and Environmental Engineering, University of Witwatersrand, Johannesburg, South
Africa 2Department of Civil Engineering, University of Zimbabwe, Harare, Zimbabwe. [email protected],
[email protected], [email protected] Abstract Rainfed farming in semiarid regions is often affected by water shortage caused by mid season dry spells rather than low annual rainfall. Analyzing the water shortage experienced during a growing season helps in the design of appropriate interventions for mitigating against the negative impacts of the dry spells. Water availability deficit for rainfed farming in Zhulube catchment in the Limpopo River Basin was studied to provide a basis for research in interventions such as rainwater harvesting. The results show considerable potential for rainwater harvesting to improve crop production. Media grab Crop water availability deficit, which is key to risk mitigation during dry spells, can be estimated using a simple spreadsheet-based model. Introduction Most smallholder farmers in semiarid regions of developing countries rely on rainfed farming for crop production. The crops, however, are negatively affected by temporal rainfall variability that is characterized by mid-season dry spells, leading to food insecurity (Rockström, 2000). A dry spell is defined as a continuous period of no rainfall during a rainfall season lasting for 10 days or more (Stewart, 1988; Sivakumar et al., 1993; Rockström et al., 2003). Crops suffer water stress that results in yield reduction. Occurrence of dry spells varies from year to year in the length of the dry spell period and the number of dry spells within a rainfall season (Chibulu, 2007). Severe dry spells lasting more than 4 weeks result in crops reaching a permanent wilting point and eventually total crop failure. Relieving the negative effects of dry spells is possible where the severity is limited, and rainwater harvesting is one way of doing this. To select and design the most appropriate mitigation technique, it is important to know how much water is required or should be made available by the technique. The water deficit during dry spells should therefore be analyzed. Studies on soil moisture deficit are reported by Shaw (1990) for various crops on a monthly basis to help irrigation engineers plan for irrigation schemes, rather than to help water managers plan for rainwater harvesting systems. In the latter, the water to reduce the water availability deficit has to come from rainfall events prior to a dry spell. The deficit for shorter durations than one month therefore becomes critical. Rainwater harvesting is increasingly being considered as a viable strategy for improving food production in rainfed agriculture for semiarid areas of developing countries. The southern African region is largely made up of semiarid regions, such as the Limpopo River Basin. Rainfall is low and highly variable. Frequent crop failure occurs in smallholder farms. Various studies have been carried out under the CGIAR Challenge Program on Water and Food (CPWF) to improve food productivity in the Limpopo Basin. Some nongovernmental organizations have introduced water conservation technologies to improve water availability for crop growth. One such innovation is the introduction of a modified from of contour ridges, referred to as dead level contours, whose effectiveness has not been evaluated. As a way of evaluating rainwater harvesting technologies, the improvement in water availability after their adoption should be measured. Estimation of water availability deficit enables evaluation of mitigation measures against effects of dry spells. This study proposes a model for use in estimating water availability deficit in a semiarid region using Zhulube Catchment as a case study. Zhulube Catchment is the catchment area of Zhulube Dam that is constructed on the Tshazi River, a left bank tributary of Mzingwane River. The Mzingwane River is a tributary of the Limpopo River. The dam supplies water to a 40 ha irrigation scheme. It is, however, under threat of sedimentation because poor land use practices in its 21 km2 catchment area (see map in Dondofema, 2007).

45
Methods We developed a model for estimating water availability deficit. The model was coded in a computer spreadsheet where input data are entered. Input data were obtained from various studies that have been carried out in the Zhulube Catchment by various researchers (see Acknowledgments). Theory and modeling Water availability for crop growth under rainfed agriculture is considered as the soil moisture within the root zone of the crops. To assess the water deficit, the water balance of the soil profile constituting the root zone should be considered (Figure 1). The inflow into this profile is infiltration, lateral soil moisture flow, and capillary rise. The outflow consists of lateral flow, percolation, and evapotranspiration. The water balance equation is represented by: dS/dt = F + Cap + Qin - Qout – Perc – ET Equation 1 In equation 1, dS/dt is change in storage (soil moisture) during the time, F is infiltration, Cap is the capillary rise, Perc is the percolation to groundwater, and ET is evapotranspiration during the time. Qin and Qout are the lateral flow into and out of the soil profile during the time period. The exchange of water between the root zone and the groundwater zone through percolation and capillary rise occurs when the moisture in the root zone exceeds field capacity or when the water table is close to the root zone. This is usually not the case in most semiarid conditions, as the water stored in the root zone will rarely find its way beyond the root zone. If the width of the soil profile considered is small enough, the lateral flow into the soil profile and out can be considered to be the same. Equation 1 can therefore be reduced to equation 2: dS/dt = F – ET. Equation 2 Water availability deficit occurs when available soil moisture is less than field capacity. Thus, the water availability deficit algorithm can then be represented in equation 3: WAD = FC – ASM + F – ET; if ASM < FC Equation 3 = 0; if ASM > or = FC WAD is the water availability deficit during the time step t, ASM is the available soil moisture during the time step t-1, FC is field capacity.
The parameters that need to be determined during a time step are infiltration and evapotranspiration. Infiltration can be estimated in terms of daily precipitation using the Horton infiltration equation, provided the time of a rainfall is known. Storm duration can be related to the amount of rainfall received through an empirical equation as modified from the Department of Meteorological Services
Qout
Qin
Perc
Cap
F
ET
Figure 1: Water movement in the root zone soil profile.

46
formulas for storm duration, as shown below. In this study a constant daily evaporation figure has been assumed. T = [2050 log(P)]/dt, T is storm duration, P is daily precipitation, and dt is time of day related to units of storm duration. The storm duration time can be taken as the infiltration time in Horton’s equation. Thus potential cumulative infiltration is then given by: F = fct + (fo-fc)/k (1- e-kt) Where F is cumulative infiltration for the day, fc is constant infiltration rate reached when steady state conditions are reached, fo is initial infiltration rate, k is recession constant, and t is the equivalent storm duration for the daily precipitation. The water availability model then requires input consisting of time series data and soil characteristic data of infiltration capacity, recession constant, and field capacity. The time series data consists of daily rainfall and open pan evaporation data. Results The results (Figure 2) obtained are still preliminary. The empirical formulas for the estimation of storm duration and evapotranspiration still need refinement by using data from the study area. Discussion The model is able to predict periods when soil moisture deficit is expected to be high as well as when it is expected to be low. It could not be established, however, whether the model accurately predicts the soil moisture deficit as data on soil moisture were not available. The study is ongoing, and the model will be calibrated when necessary data becomes available. The area below the water availability deficit gives the amount of water that a rainwater harvesting technology should provide. Different amounts are required to mitigate against different dry spells that occur, and after different rainfall amounts.
Water Availability Deficit During 2006/7 Rainfall Season
-5
0
5
10
15
20
25
30
35
40
45
50
0 50 100 150 200 250
Period (days)
Wat
er (m
m)
WAD Rainfall
Figure 2: Variation of water availability within the Zhulube Catchment, Zimbabwe. Source: Ngwenya, 2006; Chibulu, 2007.

47
Conclusions and recommendations A model for estimating water availability deficit was developed. The model for Zhulube Catchment still requires refinement through the use of additional data, as well as verification when soil moisture data are obtained. Acknowledgments This paper presents findings from PN17 ‘IWRM for Improved Rural Livelihoods,’ a project of the CGIAR Challenge Program on Water and Food. The authors are grateful for the funding provided. The work of the WaterNet IWRM Masters’ students who collected data in the field, Prudence Ngwenya, Blenda Chibulu, and Farai Dondifema, is warmly acknowledged. References Chibulu, B. 2007. Effect of Rainfall Variability on Crop Yield Under Semi-Arid Conditions at Sub
Catchment Level, MSc Thesis, University of Zimbabwe. Dondofema F. 2007. Relationships Between Gulley Characteristics and Environmental Factors in the
Zhulube Meso-Catchment: Implications for Water Resources Management, MSc Thesis, University of Zimbabwe.
Ngwenya P.T. 2006. Effect of Grazing Management on the Hydrological Processes of Rangeland Soils
in Insiza District, Zimbabwe, MSc Thesis, University of Zimbabwe. Rockström, J. 2000. Water Resources Management In Smallholder Farms In Eastern And Southern
Africa : An Overview. Phys. Chem. Earth (B) 25(3): 275–83. Elsevier Ltd. Rockström, J., J. Barron, and P. Fox. 2003. Water productivity in rainfed agriculture: Challenges and
opportunities for smallholder farmers in drought prone tropical agro-ecosystems. Shaw, E.M. 1990. Hydrology in Practice, Second Edition, Chapman and Hall, London. Sivakumar, M.V.K., A. Maidoukia, and R.D. Stern. (1993). Agroclimatology of West Africa: Niger.
Information Bulletin no 5. Patancheru, India: International Crops Research Institute for the Semi-Arid Topics.
Stewart, J.J. 1988. Response farming in rainfed agriculture. Wharf Foundation Press, Davis.

48
Water productivity in the salt-prone areas of Lower Karkheh River Basin, Iran
N. Heydari1, S. Absalan2, F. Abbas1, M. Qadir3, H. Farahani3, and T. Oweis3
1Agricultural Engineering Research Institute, P.O. Box 31585-845, Karaj, Iran, Fax:+98-261-2706277,
email: [email protected] 2Agricultural Engineering Research Div., Khuzestan (Ahwaz) Agricultural Research Center, P.O. Box
61335-3341, Ahwaz, Iran 3International Center for Agricultural Research in the Dry Areas (ICARDA), Aleppo, Syria
Abstract Waterlogging and soil salinity are major threats to the productivity and sustainability of agriculture in the Lower Karkheh River Basin (LKRB). More than 78% of agricultural production in Dasht-e Azadegan region of LKRB is dominated by grains, mainly wheat and barely. The problem of soil salinity is exacerbated due to poor farmer practices and inadequate drainage networks. Soil salinity is the major cause of low yields and low water productivity (WP). In general, the main cause of soil salinity is the high water table, varying between 1.2-3.0 m below the soil surface. The objective of this research was to evaluate WP of irrigated wheat under saline conditions and to develop management guidelines to reduce salinity and waterlogging. The research was conducted in 14 farmers’ fields, typical of the farms in the region, during cropping seasons in 2006-07 and 2007-08. Variation in irrigation WP was high, ranging from 0.1 to 2.1 kg/m3. There were four main sources of inefficiencies: (1) sociocultural problems (e.g. low farming skills, low motivation for investing in irrigation management and on-farm improvement activities, and low motivation for participatory works); (2) limitations out of farmers’ control and authority (e.g. irrigation intervals and rationing, and shortage of agricultural inputs); (3) technical and infrastructure limitations and problems; and (4) farmer managerial problems and limitations associated with irrigation (e.g. flow control, irrigation and land preparation methods, and improvements in water intake structures). These can be overcome easily and do not need major investment. Media grab Water productivity of irrigated wheat under saline-waterlogged conditions is low in the Karkeh River Basin, but it can be improved with simple irrigation management techniques. Introduction The Karkheh River Basin (KRB) is one of the large basins in Iran, where dryland and irrigated agricultural production systems are practiced. Water in the KRB is limited and becoming scarcer as population and demand are increasing (Anonymous, 2007). KRB’s agricultural strategy identifies water productivity improvement as a top priority. The KRB encompasses one of the poorest regions of Iran, because it has very poor infrastructure and was severely affected by the war with Iraq. Low production under dry farming and irrigated conditions are issues of crucial importance to increase per capita income of farmers in the basin. Two major agricultural production systems exist in the KRB: the dryland system in the upstream, together with some areas with supplementary irrigation and limited areas that are fully irrigated areas; and fully irrigated areas located predominantly in the lower basin. The dryland areas are well established and cover most of the basin agricultural lands, occupying about 900,000 ha. About 380,000 ha are currently irrigated, but this is expected to expand by 340,000 ha following completion of the irrigation schemes downstream of Karkheh Reservoir Dam (Anonymous, 2007). The main source of irrigation water is direct pumping from the Karkheh River. There are also limited irrigation networks in the region (mainly pumping from the river to the canal). Waterlogging and soil salinity are the major threats to water productivity and sustainable agricultural production in the southern parts of LKRB (Hajrasuliha, 1970). Heavy soil texture and recharge from upstream areas cause waterlogging and secondary salinization, due to high water tables (1.2-3 m). This situation is a result of large water losses caused by inefficient irrigation and lack of land leveling. The problem is likely to worsen with the current plans for expansion of irrigation networks in the region. In the southern parts of LKRB, mainly in Dasht-e Azadegan plain (DA), the problem of soil salinity is magnified due to lack of farmers’ knowledge and skills, inadequate drainage networks, and absence of new and improved farm practices. Current crops in Dasht-e Azadegan are diversified and include cereals such as wheat, barely, and rice; vegetables such as watermelon, tomato, and cucumber, and fodder crops such as alfalfa, barely, corn, and Sudan grass. More than 78% of agricultural production

49
in DA region is dominated by grains, mainly wheat and barley. This is due to saline-sodic soil with high toxicity, which makes cultivation of other crops almost impossible. Farmers, however, are more interested in wheat due to subsidies and low production costs. There are no available data on WP of irrigated crops in LKRB. A preliminary survey suggested that wheat irrigation water productivity is approximately 0.6 kg/m3 (Heydari, 2006). The objectives of this research are to evaluate the water productivity (WP) of irrigated wheat in the Dasht-e Azadegan plain in LKRB, and to find out the managerial problems and limitations to improved productivity, and to recommend simple and adoptable management guidelines to reduce salinity and waterlogging and thus increase crop yield and WP. Materials and methods The research was conducted in 14 farmers’ fields located in the DA plain in Khuzestan Province, during the 2006-07 and 2007-08 cropping seasons. The fields were typical of the farms in the region, and the farmers grew their own varieties and used their own management. The measured parameters were water inflow and outflow, and a wide range of soil properties including texture, salinity, pH, organic matter, P, K, Fe, Mn, Zn, Cu, depth, and quality (EC) of groundwater during growing season, and crop yield. Some soil and water characteristics of the fields measured before planting the first crop are given in Table 1. Crop yield and yield components were measured through 20 field samples (1.0 m x 1.0 m quadrats) before harvest. The amount of applied irrigation water was measured by WSC (Washington State College) flumes. The irrigation intervals were as practiced by the farmers. The WP was calculated by dividing grain yield (14% moisture) by irrigation amount. Table 1. Some soil and water characteristics of the study farms at the time of planting.
EC of ground water (dS/m)
Depth of water table (cm)
ECe (dS/m) Soil texture Area (ha) Field
8.8 105 26.4 SiL 1.05 F1 39 205 10 SiCL 1.47 F2
71.5 180 52.6 CL 4.49 F3 31 195 17 C 3.44 F4 48 182 21.5 C 1.73 F5 46 173 21.3 SiC 0.46 F6 8.7 213 10.5 C 5.24 F7 34 207 51.4 SiL 3.79 F8 48 193 17.8 SiCL 4.86 F9 19 153 16.2 SiC 3.71 F10 88 205 15.9 SiC 6.92 F11 15 172 21.6 SiC 1.17 F12 98 213 16.8 CL 1.93 F13 24 186 81.3 C 23.48 F14
Results and discussion There was a wide range in irrigation amount (2190-4140 m3/ha), yield (0.5-4.9 t/ha), and irrigation WP (0.1-2.1 kg/m3) (Table 2). Based on the latest agricultural statistics, Iran produced 67 Mt of agricultural products, which consumed 84 BCM of water. Therefore, currently the country’s average WP is almost 0.8 kg/m3 which seems quite low compared with the world’s average value (around 1.5 kg/m3) (Heydari et al., 2005). Previous results of field studies conducted in three provinces in Iran (Kerman, Golestan, and Khuzestan) indicated that WP of farmer-managed irrigated wheat is in the range of 0.56-1.46 kg/m3 (Heydari et al., 2006). Zwart and Bastiaanssen (2004) based on review of 84 references on WP during the past 25 years determined that the average WP of wheat is 1.09 kg/m3. The range of WP is generally wide and, for wheat, varied between 0.6 and 1.7 kg/m3.
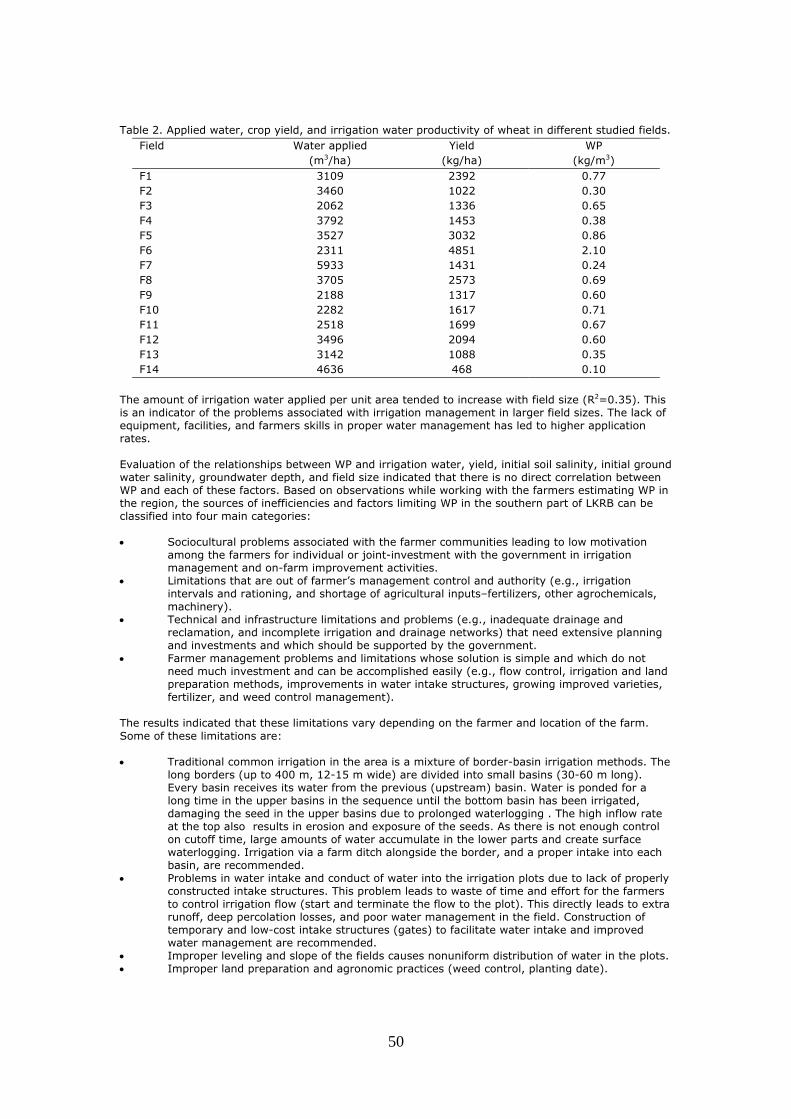
50
Table 2. Applied water, crop yield, and irrigation water productivity of wheat in different studied fields. WP
(kg/m3) Yield
(kg/ha) Water applied
(m3/ha) Field
0.77 2392 3109 F1 0.30 1022 3460 F2 0.65 1336 2062 F3 0.38 1453 3792 F4 0.86 3032 3527 F5 2.10 4851 2311 F6 0.24 1431 5933 F7 0.69 2573 3705 F8 0.60 1317 2188 F9 0.71 1617 2282 F10 0.67 1699 2518 F11 0.60 2094 3496 F12 0.35 1088 3142 F13 0.10 468 4636 F14
The amount of irrigation water applied per unit area tended to increase with field size (R2=0.35). This is an indicator of the problems associated with irrigation management in larger field sizes. The lack of equipment, facilities, and farmers skills in proper water management has led to higher application rates. Evaluation of the relationships between WP and irrigation water, yield, initial soil salinity, initial ground water salinity, groundwater depth, and field size indicated that there is no direct correlation between WP and each of these factors. Based on observations while working with the farmers estimating WP in the region, the sources of inefficiencies and factors limiting WP in the southern part of LKRB can be classified into four main categories: • Sociocultural problems associated with the farmer communities leading to low motivation
among the farmers for individual or joint-investment with the government in irrigation management and on-farm improvement activities.
• Limitations that are out of farmer’s management control and authority (e.g., irrigation intervals and rationing, and shortage of agricultural inputs–fertilizers, other agrochemicals, machinery).
• Technical and infrastructure limitations and problems (e.g., inadequate drainage and reclamation, and incomplete irrigation and drainage networks) that need extensive planning and investments and which should be supported by the government.
• Farmer management problems and limitations whose solution is simple and which do not need much investment and can be accomplished easily (e.g., flow control, irrigation and land preparation methods, improvements in water intake structures, growing improved varieties, fertilizer, and weed control management).
The results indicated that these limitations vary depending on the farmer and location of the farm. Some of these limitations are: • Traditional common irrigation in the area is a mixture of border-basin irrigation methods. The
long borders (up to 400 m, 12-15 m wide) are divided into small basins (30-60 m long). Every basin receives its water from the previous (upstream) basin. Water is ponded for a long time in the upper basins in the sequence until the bottom basin has been irrigated, damaging the seed in the upper basins due to prolonged waterlogging . The high inflow rate at the top also results in erosion and exposure of the seeds. As there is not enough control on cutoff time, large amounts of water accumulate in the lower parts and create surface waterlogging. Irrigation via a farm ditch alongside the border, and a proper intake into each basin, are recommended.
• Problems in water intake and conduct of water into the irrigation plots due to lack of properly constructed intake structures. This problem leads to waste of time and effort for the farmers to control irrigation flow (start and terminate the flow to the plot). This directly leads to extra runoff, deep percolation losses, and poor water management in the field. Construction of temporary and low-cost intake structures (gates) to facilitate water intake and improved water management are recommended.
• Improper leveling and slope of the fields causes nonuniform distribution of water in the plots. • Improper land preparation and agronomic practices (weed control, planting date).

51
Conclusions and recommendations Considering the above limitations and problems, the following solutions are recommended to improve WP in the saline area of LKRB: • Conversion of traditional and locally common irrigation methods to proper basin/border
methods. • Construction of fixed and low-cost water intake structures on farm ditches. • Proper land leveling and bedding according to farm slope. • Application of onfarm management improvement instructions provided by rural extension
services. • Farmer training and supervision by irrigation experts for guidance, and enhancement of
irrigation management. • Preparing the required conditions and enabling environment for volumetric allocation of water
to the farmers through extension services. Acknowledgments This paper presents findings from PN08 'Improving Water Productivity in Karkheh River Basin,' a project of the CGIAR Challenge Program on Water and Food. References Anonymous. 2007. Some observations and information collected during different field visits from lower
KRB during the CP-KRB project. Hajrasuliha, S. 1970. Irrigation and drainage practices in Haft-Tappeh cane sugar project, In. 8th,
Near East, South Asia Regional Irrigation Practices Seminar, Kabul, Afghanistan. Sponsored by United States Agency for International Development. Utah: Utah State University Printing Service, 117-143.
Heydari, N. 2006. Land degradation in Lower KRB: Diagnostic analysis of salinity, waterlogging,
sedimentation and wetland issues. Presentation in Workshop on Land, Water and Environmental Management in the Karkheh River Basin: Challenges and Opportunities, Held by IWMI-Iran office in May 24, 2006, SPII Campus, Karaj, Iran.
Heydari, N., A. Eslami, A. Ghadami, A. Kanoni, M.E. Asadi, and M.H. Khajehabdollahi. 2006.
Determination of water productivity of some major crops in different regions of Iran. Res. Rep. No. 84/988, Iranian Agr. Eng. Res. Ins., Karaj, Iran (in Persian).
Heydari, N., A. Keshavarz, and H. Dehghanisanij. 2005. Agricultural water consumption management
in Iran considering aridity and drought incidences. Proceedings of National Conference on Prevention of Losses from National Resources, Academy of Science of Iran, June 15-16, 2005, Tehran, Iran (in Persian).
Zwart, S.J., and W.G.M. Bastiaanssen. 2004. Review of measured crop water productivity values for
irrigated wheat, rice, cotton, and maize. J. Agr. Water Management, 69:115-33.

52
Best irrigation management practices for improving water productivity in salt-prone areas
of Lower Karkheh River Basin
N. Heydari1, S. Absalan2, F. Abbasi1, E. Dehghan1, H. Farahani3, A. Javadi1, M. Qadir3, and T. Oweis3
1Agricultural Engineering Research Institute, P.O. Box 31585-845, Karaj, Iran, Fax:+98-261-2706277,
Email: [email protected] 2Agricultural Engineering Research Div., Khuzestan (Ahwaz) Agricultural Research Center, P.O. Box
61335-3341, Ahwaz, Iran. 3International Center for Agricultural Research in the Dry Areas (ICARDA), Aleppo, Syria.
Abstract The Karkheh River Basin (KRB) is one of the nine Benchmark Basins of the CGIAR Challenge Program on Water and Food (CPWF). Despite generally favorable climate, soil, and water resources for agricultural production, overall agricultural water productivity, especially in the lower and downstream areas of the KRB (mainly Dasht-e Azadegan (DA) plain in the Basin outlet), is very low (about 0.6 kg/m3). This is mainly due to inefficient use of these resources, including lack of sound agronomic, water, and salinity management practices. In the Lower KRB (DA plain) human factors together with the heavy soil texture, recharge of water table by subsurface flows from upstream areas, and low irrigation efficiency cause waterlogging and soil salinity, which are the major threats to water productivity and sustainable agricultural production in this plain. Wheat is the main cultivated crop in this area. Sound irrigation management solutions that can be adapted and adopted by the farmers are needed to help improve agricultural WP and livelihood of the communities. The main objective of this research was to find cost-effective and short-term solutions for solving these problems, and to improve water productivity (WP) of wheat in the salt-prone areas of the lower KRB. The research was conducted in the DA plain, during two cropping seasons (2006-07 and 2007-08). The treatments were a combination of two irrigation methods (Border and Basin) and three sowing methods (centrifugal broadcaster, seed drill machine (TAKA type), and three-row bed seeder (Barzegar-e-Hamadani type), which were compared with a control (farmer traditional irrigation and sowing methods). Crop yield and other components and the volume of applied irrigation water were measured. Border irrigation with the centrifugal sowing method or Hamadani sowing methods provided the highest WP in the first and second years , at 1.60 and 1.88 kg/m3, respectively. Border irrigation had the highest WP (1.36, 1.74 kg/m3 in the first and second years), whereas the farmer-managed treatment (traditional border-basin irrigation method under centrifugal sowing with 350 kg/ha seed) had the lowest, 0.61 and 0.81 kg/m3 in the first and second years. There was no significant difference (α=0.05) in yield between applied treatments and the control treatment in the first year. In the second year, however, because of severe drought, the improvement in WP of the treatments in comparison to the control was higher. The seed rates used in the TAKA and Hamadani sowing methods were almost 50% less than with the centrifugal broadcaster method, and seed germination and establishment of the crop was higher with the former leading to higher yields. The improved border and basin methods can be recommended, but the basin irrigation method is more adoptable and sustainable in the region because of sociocultural conditions of the area. Considering the 50% reduction in seed consumption, high establishment of the crop, and better conveyance and advance of water in irigation strips, use of the seed drill machine (TAKA type) or three rows bed seeder (Barzegar-e-Hamadani type) are recommended. Media Grab Improvement of traditional surface irrigation methods in the saline and waterlogged areas can help ameliorate the situation and improve crop water productivity. Introduction The Karkheh River Basin (KRB) is one of the main agricultural basins in Iran. Despite favorable potentials with respect to climate, soil, and water resources, the overall agricultural water productivity (WP) of the basin, especially in the lower and downstream areas of KRB (about 0.6 kg/m3), is relatively low. This is mainly due to inefficient use of these resources through lack of sound agronomic, water, and salinity management practices. The Lower KRB (LKRB) is typically hot and almost arid, and agricultural production is essentially dependent on irrigation. This area is designated for further development following the model of the adjacent Dez irrigation district in Iran. It is estimated that about 1 million ha are irrigable in KRB, of

53
which about 380,000 ha are currently under irrigated agriculture annually. About 340,000 ha of additional available arable lands will be brought under irrigation following completion of irrigation networks below the Karkheh Dam in the LKRB. On the other hand, frequent droughts and recent trends in increased use of water in the upper KRB, due to expansion of irrigated areas and supplemental irrigation, will make it more difficult to supply sufficient irrigation water for the developed areas below Karkheh Dam in the LKRB. Waterlogging and soil salinity are the major threats to WP and sustainable agricultural production in the DA plain (Hajrasuliha, 1970).The large areas of saline/sodic soils in LKRB are partly natural and partly caused by human activity. The main cause of salinity in the LKRB is excessive deep percolation due to poor irrigation management. The soil texture in the area is mainly heavy with low hydraulic conductivity. The overall natural drainage is very low and there is a natural tendency for waterlogging and secondary salinization. The installation of drainage networks could provide a rapid solution for the salinity-waterlogging problem. Based on past trends, however, expansion of drainage networks will not be in parallel with the development of irrigation networks in the region. Therefore, the mitigation of salinity and waterlogging hazards and agricultural WP improvement in the LKRB should be tackled by soil, water, and crop management and overall it is a complex issue that needs integrated planning and action. Wheat is the main cultivated crop in the LKRB, with average yield of 1.5 t/ha. Irrigation management practices are traditional and the region suffers from poor water management that is partly due to lack of modern irrigation infrastructure and onfarm improvement activities. Therefore, sound solutions that can be adopted by the farmers are necessary. It is evident that the basic approaches to solving this problem will mainly be the construction and or completion of modern irrigation and drainage networks, and managing the system based on integrated and scientific programs. But such programs are costly and time consuming, and may not become effective in the near future. Research activities related to water-table management, soil salinity control, irrigation water management, selection of suitable crop varieties, and improved agronomic practices will help improve agricultural WP and farmers’ livelihoods in this region. It will ameliorate the current situation without requiring heavy investments. Based on review of 84 references on WP during the past 25 years, Zwart and Bastiaanssen (2004) found that the average WP of wheat is 1.09 kg/m3. The range of WP is wide and varies between 0.6 and 1.7 kg/m3. Fahong et al. (2004) compared basin and furrow irrigation of wheat and concluded that cultivation of wheat in flat basins with flood irrigation causes surface sealing, reduces irrigation efficiency, and increases fertilizer losses. They found that furrow irrigation of wheat led to a 17% reduction in water consumption, increased irrigation efficiency (21-30%), increased fertilizer efficiency, and reduced crop disease. The main objective of our research was to find cost-effective and short-term solutions to problems of waterlogging and salinity, using the following approaches: • Recognition of simple management practices for reducing soil salinity hazards and improving
agricultural WP. • Comparison of WP under different irrigation methods and management (i.e., traditional vs.
improved border-basin irrigation method). • Investigation of the effect of different cultivation/sowing methods on wheat WP. Methods This research was conducted during the cropping seasons of 2006-07 and 2007-08 in the DA plain, located in the most southern part of the delta of the Karkheh River. The area is located between 47° 55` to 48° 30` E longitude and 31° 15` to 31o 45` N lattitude and is 3 - 12 m above mean sea level. Soil texture was silty clay loam to clay-loam, average soil pH was 7.8, and average soil salinity at depths of 0-90 cm was 10.5 dS/m. The source of irrigation water was the Karkheh River. The EC of the groundwater and irrigation water were 11.3 and 1.4 dS/m, respectively. Sowing and harvesting dates were in November and May, respectively. Groundwater depth at the beginning of the growing season, before the start of rainfall and irrigation, was 237 cm, and in winter, following irrigation, the groundwater depth varied from 35 to 98 cm below the soil surface. The research treatments were as follow:

54
T1= border irrigation + sowing by centrifugal broadcaster + one pass disc. T2= border irrigation + sowing by seed drill (TAKA type). T3= border irrigation + sowing by three rows bed seeder (Barzegar-e-Hamadani type). T4= basin irrigation + sowing by centrifugal broadcaster + one pass disc. T5= basin irrigation + sowing by seed drill machine (TAKA type). T6= basin irrigation + sowing by three-row bed seeder (Barzegar-e-Hamadani type). Tc= traditional irrigation and sowing method by farmer (as control).
The dimensions of the border and basin treatments were 160 m x 10 m (for T1, T2, T3) and 40 m x 10 m (for T4, T5, T6), respectively. These dimensions were considered to be optimal based on SCS recommendations. The traditional method of irrigation (control) was similar to a combination of basin and border irrigation. Farmers choose border length according to their farm dimensions (usually 100-400 m), and then divide the borders into several basins 30-70 m long, depending on field topography. They fill the first basin and then transfer water to the second one, and so on. The width of borders was usually between 5 and 14 m. Chamran wheat variety was sown in all the treatments. The seed rate was 250 kg in treatments sown by centrifugal broadcaster and managed under optimized irrigation (T1, T4). The other treatments (T2,
T3, T5, T6) were sown using a seed drill (TAKA) or a three-row bed seeder (Hamadani) at 180 kg seed/ha. In the control treatment (Tc), which was sown by centrifugal broadcaster and managed by the farmer, the seed rate was 350 kg/ha. Other farming practices were the same for all treatments. Soil chemical characteristis measured before planting (Table 1) and water table depth fluctuations during cropping season (Figure 1) are presented. Table 1. Soil chemical characteristics measured before planting (avg of three samples and 2 years).
Soil depth (cm)
EC pH O.C P K Fe Zn Cu Mg (dS/m) (%) (ppm) (ppm) (ppm) (ppm) (ppm) (ppm)
0-30 15.0 7.7 0.4 4.2 166 3.8 1.5 0.6 5.2 30-60 12.9 7.9 0.1 2.0 89 2.3 0.1 0.4 1.2 60-90 15.2 7.9 0.1 1.5 56 3.1 0.1 0.6 1.5
date
-237.0
-122.0-98.0 -105.0
-130.0
-34.7
-80.7-96.3
-132.3
-250
-200
-150
-100
-50
0Nov.23 Dec.3 Dec.21 Dec.26 Feb.1 Feb.15 Feb.26 Mar.18 Apr.8
the average of ground water depth for 3 points in farm
cm
Figure 1. Variation of the groundwater depth (average of three points) during growing season. Crop yield and yield components were measured through sampling (20 samples, 1 m x 1 m) before harvest. The amount of applied irrigation water was measured by WSC (Washington State College) flumes. There was no difference between the farmer and optimum management treatments in terms of interval and number of irrigations. In fact, the difference was in how to manage water flow on the land and the method of irrigation, both of which directly affected water consumption. Results Border irrigation with the centrifugal and Hamadani sowing methods (T1, T3) provided the highest water productivities in both years, being 1.60 and 1.88 kg/m3 respectively. Among the irrigation methods, the optimum border irrigation had the maximum WP (1.36 , 1.74 kg/m3) each year, whereas the farmer control treatment (traditional border-basin irrigation method under centrifugal sowing with 350 kg seed used) had the lowest WP of 0.61 and 0.81 kg/m3 (Table 2). There was no significant difference (α=0.05) in yield between treatments. In the second year of experiments,

55
however, because of severe drought, the improvement in WP of the treatments in comparison to the control was even higher. Although the consumption of seed used in TAKA and Hamadani sowing methed was 50% less, establishment was higher than with the centrifugal method (Table 3). Table 2. Yield, amount of water applied, and water productivity (WP) of studied treatments.
Irrigation method Sowing method
Yield (kg/ha)
Applied water (m3/ha)
WP (kg/m3)
WP (avg of
irrigation treatment)
(kg/m3)
2006-07
2007-08 2006-07
2007-08 2006-07
2006-
07
2007-
08 Basin-border (farmer)
Centrifugal 1953 1940 3205 2388 0.61 0.81 0.61 0.81
Optimum border
Centrifugal 2590 2144 1618 1348 1.60 1.59
1.36 1.74 Taka 2434 2471 1774 1414 1.37 1.75
Hamadani 1901 2400 1729 1277 1.10 1.88
Optimum basin
Centrifugal 2730 2251 2394 1663 1.14 1.35
1.04 1.53 Taka 2521 2606 2417 1633 1.04 1.60
Hamadani 2198 2564 2344 1576 0.94 1.63
Table 3. Seed consumption, number of shrub and sprouting percentage of the treatments.
Irrigation method
Sowing method
Seed consumption rate (kg/ha)
Plant density (no./m2)
Sprouting (%)
Yield (kg /ha)
2006-07 2007-08 2006-07 2007-08
2006-07 2007-08 2006-
07 2007-
08 Basin-border (farmer)
Centrifugal 350 350 247 270 34 31
1953 1940
Optimum border
Centrifugal 250 250 341 290 56 47 2308 2338Taka 180 180 262 302 60 61
Hamadani 180 180 286 316 65 64
Optimum basin
Centrifugal 250 250 387 320 63 52 2483 2474 Taka 180 180 332 321 75 65
Hamadani 180 180 353 352 80 71 Conclusions and recommendations Improved basin or border irrigation methods can be recommended for the improvement of water management and WP in the studied area. The basin irrigation method, however, is more adaptive and sustainable because it is better suited to the sociocultural conditions of the area. The reasons for this are: • It requires low levels of land leveling and uniform slope along the irrigation plot so requires
low levels of onfarm improvement activities. • It is more adoptive to farm micro relief caused by common cultivation practices. • It requires less labor (considering shortages in agricultural labor in the area). • It requires less control on flow considering the high rate of flow variation. • The Basin method provides precultivation leaching opportunities, a common practice for
reducing soil salinity prior sowing, which in local language is called 'Makhar' water (considering high levels of salinity and its variation in the wheat farms of the area).
Because of a 50% reduction in seed consumption, high rate of seed germination, and better flow of water, the use of the seed drill (TAKA type) or three-row bed seeder (Barzegar-e-Hamadani type) is recommended. Overall, soil salinity and waterlogging, in addition to the other sources of inefficiencies in agricultural WP improvement, are the major limiting factors in the LKRB. These problems are somewhat due to physical characteristics of the region, but are mainly problems created by human activity and can be

56
managed by proper measures, including infrastructure activities (hardware) and to a greater extent by water management (software) measures. Acknowledgments This paper presents findings from PN08 ‘Improving Water Productivity in Karkheh River Basin,' a project of the CGIAR Challenge Program on Water and Food. References Fahong, W., W. Xuqing, and K. Sayre. 2004. Comparison of conventional, flood irrigated, flat planting
with furrow irrigated, raised bed planting for winter wheat in China. Field Crops Research, 87(1): 35-42.
Hajrasuliha, S. 1970. Irrigation and drainage practices in Haft-Tappeh cane sugar project, In: 8th Near
East, South Asia Regional Irrigation Practices Seminar, Kabul, Afghanistan. Sponsored by United States Agency for International Development. Utah: Utah State University Printing Service, 117-43.
Zwart, S.J., and W.G.M. Bastiaanssen. 2004. Review of measured crop water productivity values for
irrigated wheat, rice, cotton, and maize. J. Agr. Water Management, 69: 115-33.

57
Increasing livestock water productivity
Opportunities for increasing livestock water productivity in Sudan
H. Faki1, I. El-Dukheri1, M. Mekki2, and D. Peden3
1Agricultural Economics and Policy Research Center, Agricultural Research Corporation, Sudan [email protected]
2Sudan University of Science and Technology, Sudan, 3International Livestock Research Institute, Ethiopia
Abstract Livestock and irrigated and rainfed crop production make up most of Sudan’s agricultural GDP. Sudan is highly dependent on Nile waters flowing from upstream countries and on rainfed cropping and grazing within the country. This region has experienced high human and livestock population growth rates, increased cropping and widespread deforestation. This study addresses livestock water productivity (LWP) in the central belt of Sudan. In most of the belt there is a severe drinking water shortage for both animals and people. Livestock also suffer from feed shortages. The research suggests that LWP is low near watering points, because high animal concentration has degraded the nearby pastures. LWP is also low far from watering points because lack of water prevents animals from accessing otherwise available feed. The study concludes that improved natural resources legislation, institutional arrangements, marketing of livetock products, and veterinary care, combined with efforts to optimally expand watering sites while limiting animal densities near them, can help increase LWP in an environmentally sustainable manner. Media grab Better balancing of livestock densities with available feed and drinking water resources can help increase livestock water productivity, thereby improving productive assets for the poor in Sudan. Introduction Sudan’s livestock numbered about 138 million animals in 2006 (MoARF, 2006), playing pivotal roles in the economy, contributing 22% to total GDP, and providing livelihoods for many people. In five out of the 15 states of North Sudan, income from livestock exceeds that from crops, and in four others it forms over 40% of agricultural income (Faki and Nur, 2008). Livestock therefore contribute significantly to poverty reduction. Most domestic animals depend partly on the waters of the Nile for feed production and for drinking, especially during the dry season. Without access to the Nile in dry periods, livestock could not fully benefit from vast grazing lands accessible during more favorable periods. Yet the sector faces tremendous challenges created by fragile and loosely controlled natural resources in predominantly transhumant and nomadic natural pastures. Suboptimal, rather than misuse, of land and water resources, especially in rainfed areas, leads to resource degradation and variable and low livestock productivity. The situation originates from decades-long irrational communal exploitation of land, leading to competition over land and water, and contributing to conflicts for which water scarcity is an important driver (WFP, 2007). Emerging understanding suggests that better integration of livestock and water development can help improve agricultural water productivity in the Nile region (Peden et al., 2007). Our results highlight the need to balance and harmonize the spatial distribution and balance of livestock, land, and water resources in Sudan. The results are based on a synthesis of literature reviews and analyses of secondary data, recognizing that relatively little integrated consideration has been given to the links between river basin water, the region’s extensive livestock sector, and its demands for water. Results and discussion Major characteristics of the central belt of Sudan The central part of Sudan extends from its western to eastern borders (roughly between latitudes 10o and 20o N), and is the hub of Sudan’s crop and livestock production. Regional livestock movements often involve crossing borders with South Sudan and bordering countries, especially Chad, Central African Republic, and Ethiopia. The belt’s link to the Nile Basin is strong in terms of irrigated livestock activities from the Nile and its tributaries, livestock mobility between rainfed and irrigated systems, and livestock trade with other Nile Basin countries such as Ethiopia. The belt covers 75% of Sudan, accommodates 80% of its people, and hosts 73% of Sudan’s total livestock. Rainfall is the major water source, ranging from less than 100 mm/year in the far north to about 800 mm/year in the south. Surface water is available from the Nile system (see Kirby et al.,

58
2007) and seasonal rivers in the east where most major irrigation schemes exist. The western region depends primarily on rainfall, groundwater, and some seasonal streams. Livestock rearing is a major livelihood strategy dependent on natural pastures and partly on irrigated fodder. Modern peri-urban dairy farms are increasingly important. Historical developments in use patterns resulted in serious degradation of the region’s rich natural resources. Consequently, most of the acute poverty in the country lies within the belt, but civil strife is also a factor. Livestock-water related problems differ in severity across the belt. Development of pressures on natural resources Four factors place pressure on and underpin the currently inefficient use of natural resources: land tenure, population growth, crop expansion, and increasing livestock numbers. Land issue The Land Resettlement and Registration Ordinance that dates back to 1925 is still largely in force (De Wit, 2001). All unregistered land belongs to the Government, but community rights are recognized over its use under customary rules. Individual land registration is limited; while long land lease applies in public irrigation schemes and large semimechanized rainfed private holdings. Despite incentives to increase herds irrationally under communal land use, fairly balanced management and protection of natural resources and harnessing local conflicts had been practiced within the traditional leadership systems. But two legal developments in the 1970s had far-reaching implications on land use. First, the Unregistered Land Act of 1970 transferred all unregistered land to the Government from rural dwellers, especially pastoralists, compromising communal and tribal ownership (De Wit, 2001). Second, the Local Government Act of 1971 dismantled traditional authorities and largely transferred their functions to local governments that have limited experience and resources to handle issues such as local conflicts. Thus, control over natural resources has undergone profound relaxation resulting in misuse through deforestation and overgrazing. Official regulations governing access to pasture and water in rainfed areas remain rudimentary, but 1984 legislation allowed for pasture land allocation to communities. Water use legislation has been confined to water-pumping from the Nile and its tributaries for irrigation purposes. The existing legal setting for land, pastureland, water, and forests has been diverse and contradictory, giving little or no attention to traditional land use systems, especially grazing (De Wit, 2001). The land issue has strongly emerged within the Comprehensive Peace Agreement (CPA) of 2005 that ended the South-North war. The CPA authorizes national and regional land commissions to consider mechanisms that transfer current land use rights to long-term lease rights. This will convey additional value to lease holders and encourage more rational use of natural resources. (Pellekaan and Faki, 2008). Human and livestock population growth and crop expansion Fifty years ago, available land far exceeded demand and natural resources sustained the people’s livelihoods even under problematic land use patterns (Tothill, 1948). Yet water supply in pastoral areas was generally more limiting than fodder, resulting in limited livestock grazing around watering sites with consequent fodder scarcity and low-quality drinking water. The prevailing land tenure system has aggravated these constraints. Increases in human and livestock populations and croplands (Table 1), as well as deforestation (UNEP, 2007) have exerted high pressure on land and water resources. In irrigated areas, drinking water is abundant but fodder is scarce, and periodic movement to pastoral areas and fallow land is a normal practice. Table 1. Growth in human and livestock population and crop areas within the belt, 1973-2007.
Region Human population
(million) Livestock population
(million) Crop areas
(million ha*)
1973 2007 1973 2007 Average
1971-1976 Average
2003-2007 Khartoum 1.096 6.203 0.506 1.310 0.01 0.08 Central 3.623 8.079 7.031 31.603 1.64 3.48 Eastern 1.497 4.335 2.472 8.955 1.07 2.87 Kordofan 2.098 4.128 6.819 24.529 2.57 3.91 Darfur 2.077 7.198 11.039 30.374 0.94 3.23 Total 10.391 29.943 27.867 96.771 6.23 13.57 Growth (%)** 3.02 3.56 2.2 *1 ha=2.38 feddans. **Average Annual Growth (%)–exponential for human and livestock population. Source: Authors’ computations from various records of the Central Bureau of Statistics, Ministry of Agriculture & Forests, Ministry of Animal Resources and Fisheries, Sudan. Livestock population growth rates (Table 1) exceed those of people implying that per capita livestock numbers are growing at 0.53%/year, but they vary among regions. They are highest in the Central region (2.0%) and Kordofan (1.72%), but negative in Khartoum and Darfur due to migration influxes. Growth rates in terms of Tropical Livestock Units (TLU) have been lower in all regions (except the

59
Central), indicating a shift towards small ruminants. During the same period, cropping increased by 2.2%/year implying that unless yields increase, per capita production of food will decrease. Although beyond the scope of this paper, deforestation is significant and amplifies pressure on grazing and water resources. Between 1972 and 2001, 67% of the forests disappeared (UNEP, 2007). Water and feed balances and sustainable livestock water productivity Water supply for livestock is critical, especially in the dry season in pastoral areas when use is made of human-made water points. For many years, the government embarked on establishing water sources in the form of wells, dams, small pumps, and ‘hafirs’ (a water harvesting system in which earth embankments catch and store rainwater according to topographic contours). Between 1989 and 2007 the annual total rural water supply from these sources increased from about 100 million to 349 million m3. Water, however, supplied for household and animal consumption must be weighed against requirements. In most states in the belt, there is a drinking water deficit (Table 2). Table 2. Average daily rural drinking water availability from available human-made infrastructures, demand, and balance (m3/day) in different states within Sudan’s central belt, 2007.
State/Region Available
water
Average drinking demand
Peak drinking demand
Balance at average demand
Balance at peak Demand
Red Sea 126410 20075 31677 106335 94733 Kassala 43972 61441 86709 -17469 -42737 Gedarif 55096 66417 85896 -11321 -30800 Blue Nile 19133 151871 203441 -132738 -184309 Sennar 32839 71622 92136 -38783 -59297 Gezira 61507 140928 170469 -79421 -108963 White Nile 48184 118823 156805 -70639 -108621 Greater Kordofan 244488 335245 464446 -90757 -219959 North Darfur 52448 87478 115947 -35030 -63499 South Darfur 51088 187184 235637 -136096 -184549 West Darfur 29495 172336 229290 -142842 -199795 Khartoum 83210 24979 28083 58231 55127 *Requirements are calculated according to Payne (1990): average demand 25, 30, 4, 4 l/day for cattle, camels, sheep, and goats; at peak summer months, respective values: 35, 65, 4.5, and 4.5 l/day. Human rural requirements are 20 l/day/person according to the Ministry of Irrigation. Source: Available water computed from data of the Ministry of Irrigation; Livestock in 2007 estimated from data of MoARF (2006). Most of the pressures and water imbalances exist in the states of West and South Darfur, West Kordofan, Blue Nile, Gezira, and White Nile. Within states, many areas still lack drinking water infrastructure. But the latter three states are endowed with rich and fairly permanent surface water sources, leaving most of the pressures in the former three states. Positive balances exist in Khartoum and Red Sea states because of proximity to the Nile River and high priority for water development respectively. The map does not depict the distribution within states, implying that further analyses are needed within them. Although drinking water is critical, feed availability is jeopardized by low and variable rainfall in pastoral areas, which provide about 74% of animal intake. Feed shortages (pasture and crop residues) amount to 2.3 million t dry matter (17%) in North Kordofan in 2007/08, 1.24 million t in the White Nile (12%), and 30% in South Darfur (Ahmed El-Wakil, personal contacts). Total feed requirements in the country, projected at 200 million t for 2008, are hardly covered by available sources, where an 8% gap is estimated (Ministry of Agriculture, 2004). Nutritive value of pastures has been negatively affected by land degradation and overgrazing. Livestock water productivity in rainfed areas at a basin level requires managing livestock and water resources in ways that reduce excessive positive feed-water balances, and reduce or eliminate negative balances. Accordingly, livestock productivity is low, and abortion, morbidity, and mortality losses are high. Fertility rates of sheep range from 60 to 83%, and the lambing rate drops to 71 and 49% in medium and poor seasons, respectively (El Rasheed, 2005). Conclusions Breakdowns and changes in governance of water and pasture resources and increasing pressure on natural resources have contributed to low livestock productivity and land and water degradation in pastoral areas of the Sudanese Nile. Access to water for feed production and drinking is a critical constraint. On one hand, LWP is low near the watering points because overgrazing causes soil and vegetation loss. Available rainfall produces little feed if vegetation is absent. On the other hand, LWP is also low far from watering points because animals cannot get access to surplus available feed. There is need to limit grazing near watering points and to expand watering points into areas where there is surplus/unused pasture. Improvement in legislative structure and institutional arrangements,

60
promotion of community-based natural resources management and marketing opportunities, and provision of better veterinary services can help increase LWP in this important part of the Nile Basin. Acknowledgments This paper presents findings from PN37, ‘Nile Basin livestock water productivity,’ a project of the CGIAR Challenge Program on Water and Food. The authors are grateful to Alemu Asfaw for his assistance with the spatial map. References De Wit, P. 2001. Legality and legitimacy: A study of the access to land, pasture and water; Sudan. A
study financed by the European Community; prepared for the IGAD Partner Forum Working Group on Planning for Peace in Sudan by the Food and Agriculture Organization of the United Nations; Draft, FAO 2001.
El Rasheed M. 2005. Determinants of market supply of sheep in the Sudan: Case study of Kordofan
area. Ph.D. Thesis, University of Khartoum, Sudan. Faki, H., and E. Nur. 2008. Poverty assessment and mapping in the Sudan. A study draft report
prepared in cooperation with ICARDA and IFAD (forthcoming as ICARDA publication). Kirby, M., J. Eastham, M. Mainuddin, and M. Thomas. 2007. Basin water accounting. Cali Workshop,
September 2007. CSIRO. Ministry of Agriculture. 2004. The Fifth Year Strategy for Developing the Agricultural Sector, Policy
Paper detailing the Strategy for the livestock sector. MoARF (Ministry of Animal Resources and Fisheries). 2006. Statistical Bulletin for Animal Resources,
Issue No. 15-16, General Administration for Planning and Economics of Animal Resources, Animal Resources Economics Administration, Khartoum.
Peden, D., G. Tadesse, and A. Misra. 2007. Water and livestock for human development. In Water for
food, water for life: A comprehensive assessment of water management in agriculture, ed. David Molden. 485-514. London: Earthscan and Colombo: International Water Management Institute.
Pellekaan J.vH., and H. Faki. 2008. Sudan DTIS: Trade in agricultural products. The World Bank
(forthcoming). Tothill J.D. ed. 1948. Agriculture in the Sudan: A Handbook of Agriculture as Practiced in the Anglo-
Egyptian Sudan. London: Oxford University Press. UNEP. 2007. Sudan Post Conflict Environmental Assessment. Nairobi: United Nations Environment
Programme. WFP. 2007. Sudan: Comprehensive Food Security and Vulnerability Analysis (CFSVA).
61
Options to improve livestock-water productivity (LWP) in the cattle corridor within the
White Nile sub-basin in Uganda
D. Mpairwe1, D. Mutetikka1, G.H. Kiwuwa1, S. Mugerwa1, B. Owoyesigire1 , E. Zziwa1, D. Peden2
1Department of Animal Science, Makerere University, P.O. Box 7062, Kampala, Uganda
2International Livestock Research Institute, P. O. Box 5689, Addis Ababa, Ethiopia Corresponding author: [email protected]
Abstract The ‘cattle corridor’ is generally too dry for crop production and suffers from land degradation caused by overgrazing and indiscrimate harvesting of trees for charcoal burning. Drinking water is seasonally scarce forcing farmers to migrate with their animals to the Nile. Makerere University established a study site in Kiruhura and Nakasongola districts within the cattle corridor, as part of the CPWF Nile Livestock Water Productivity (LWP) project, to identify options for enhancing LWP and increasing animal production. The sustainability of water harvesting systems, options for reseeding highly degraded pastures, and gender and social-science dimensions of livestock keepers were studied. This paper is a synthesis of the work and suggests options for improving LWP, livelihoods, and environmental sustainability. Rehabilitation trials suggested use of cattle manure as the key to reseeding highly degraded areas. Total dry matter (DM) production, ground cover, and species richness were greatly increased by manure application. Water resource utilization and livestock productivity in the pastoral communities were seriously affected by inadequate water, gender, land ownership and utilization, access to and ownership of water sources, and distance to a water source. Sedimentation, evaporation, and degradation of water are critical factors that reduce the availability and quality of water. Media grab With control of termites permitting restoration of pasture vegetation, here comes the opportunity to improve the quality and sustainability of water in reservoirs. Introduction Livestock water productivity (LWP) is a measure of the amount of water depleted to produce animal products and services. It is computed from the livestock benefits divided by the amount of water depleted for production (∑ Beneficial outputs/∑ Water depleted). Since agriculture uses up to 80% of the world’s developed water resources, the overarching challenge is to produce current and future food supplies in sustainable ways without using more water. Uganda’s rangelands are highly degraded. Nutritious pasture and topsoil have been lost through overgrazing and charcoal production. Without adequate vegetation cover, rain washes soil down slopes filling water bodies such as ponds that provide water for livestock and domestic purposes. During the dry season, the situation is exacerbated by termites, which quickly consume virtually all useful plant material including forages on which livestock depend. Degraded pastures upslope are sources of sediment that quickly fills the tanks, thereby reducing their water-holding capacity. Without drinking water, livestock are forced to travel long distances in the dry season in search of watering sites. Lost pasture, coupled with jeopardized drinking water, is a threat to livestock-based livelihoods. In essence, livestock water productivity is very low and the land is not suitable for alternative livelihood strategies. The LWP project in Uganda was initiated with the objective of identifying options to improve management of livestock and water resources. The study was aimed at contributing to innovative efforts to ensure that livestock efficiently and effectively use available water resources in the Nile River Basin. Methods The study approach was integrated research on livestock and water management in collaboration with the local administration (Nakasongola District), together with local livestock-keeping communities. The research comprised: (a) a community-based initiative for harvesting and managing water resources in the rangelands; and (b) four graduate research projects aimed at: (i) establishing the socioeconomic factors that affect LWP and estimating LWP in rainfed pastoral production systems (Owoyesigire et al., 2008), (ii) rehabilitation of degraded rangelands with extensive bare patches through reseeding, fencing, and use of cattle manure, to restore pasture productivity while controlling soil erosion for improved livestock water productivity (Mugerwa et al., 2008); (iii) determining the effect of upper catchment management and water cover plants on the quality and quantity of water in reservoirs for improved livestock water productivity (Zziwa et al., 2008). Results and discussion Socioeconomic study Over 90% of the pastoral keepers ranked inadequate water supply as the main cause for migrating with their herds of cattle toward rivers and lakeshores. The other reasons for migration ranked in order of importance, included: lack of pasture, conflict and competition among farmers for land, desertification, disease epidemics, economic development, and government policies of relocating people for national economic activities like game and forest reserves. The study also revealed that
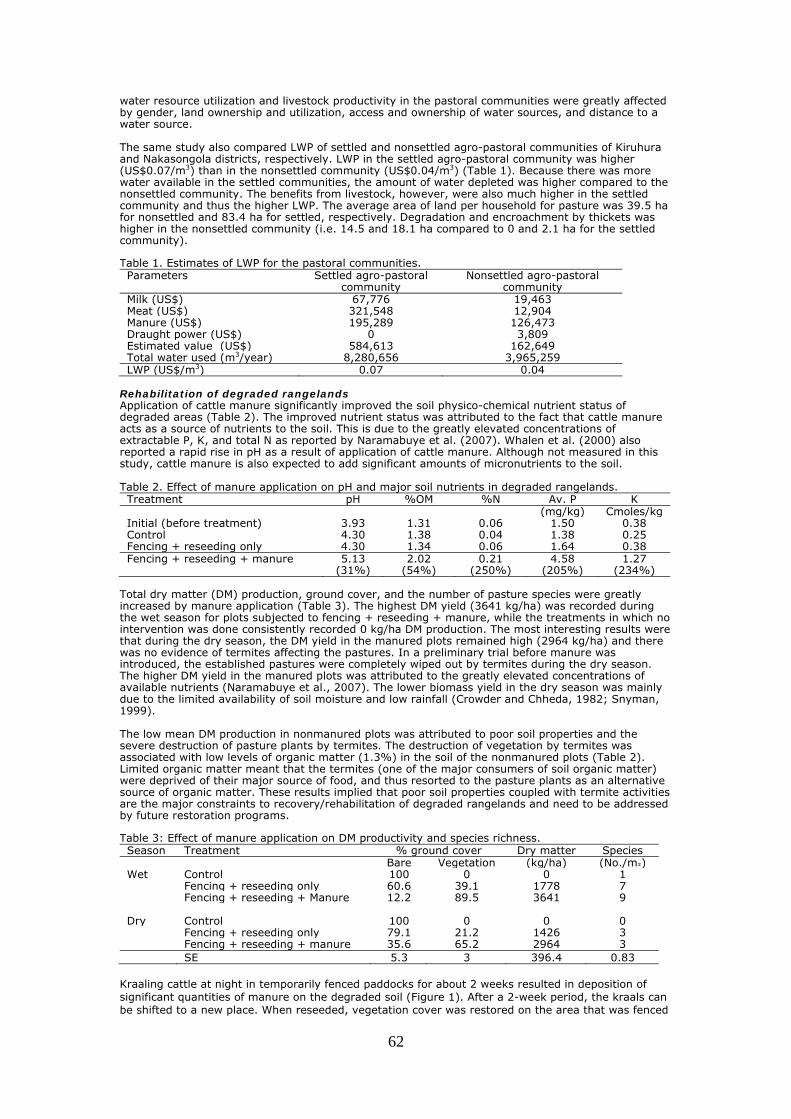
62
water resource utilization and livestock productivity in the pastoral communities were greatly affected by gender, land ownership and utilization, access and ownership of water sources, and distance to a water source. The same study also compared LWP of settled and nonsettled agro-pastoral communities of Kiruhura and Nakasongola districts, respectively. LWP in the settled agro-pastoral community was higher (US$0.07/m3) than in the nonsettled community (US$0.04/m3) (Table 1). Because there was more water available in the settled communities, the amount of water depleted was higher compared to the nonsettled community. The benefits from livestock, however, were also much higher in the settled community and thus the higher LWP. The average area of land per household for pasture was 39.5 ha for nonsettled and 83.4 ha for settled, respectively. Degradation and encroachment by thickets was higher in the nonsettled community (i.e. 14.5 and 18.1 ha compared to 0 and 2.1 ha for the settled community). Table 1. Estimates of LWP for the pastoral communities. Parameters Settled agro-pastoral
community Nonsettled agro-pastoral
community Milk (US$) 67,776 19,463 Meat (US$) 321,548 12,904 Manure (US$) 195,289 126,473 Draught power (US$) 0 3,809 Estimated value (US$) 584,613 162,649 Total water used (m3/year) 8,280,656 3,965,259 LWP (US$/m3) 0.07 0.04
Rehabilitation of degraded rangelands Application of cattle manure significantly improved the soil physico-chemical nutrient status of degraded areas (Table 2). The improved nutrient status was attributed to the fact that cattle manure acts as a source of nutrients to the soil. This is due to the greatly elevated concentrations of extractable P, K, and total N as reported by Naramabuye et al. (2007). Whalen et al. (2000) also reported a rapid rise in pH as a result of application of cattle manure. Although not measured in this study, cattle manure is also expected to add significant amounts of micronutrients to the soil. Table 2. Effect of manure application on pH and major soil nutrients in degraded rangelands. Treatment pH %OM %N Av. P K (mg/kg) Cmoles/kg Initial (before treatment) 3.93 1.31 0.06 1.50 0.38 Control 4.30 1.38 0.04 1.38 0.25 Fencing + reseeding only 4.30 1.34 0.06 1.64 0.38 Fencing + reseeding + manure 5.13
(31%) 2.02
(54%) 0.21
(250%) 4.58
(205%) 1.27
(234%) Total dry matter (DM) production, ground cover, and the number of pasture species were greatly increased by manure application (Table 3). The highest DM yield (3641 kg/ha) was recorded during the wet season for plots subjected to fencing + reseeding + manure, while the treatments in which no intervention was done consistently recorded 0 kg/ha DM production. The most interesting results were that during the dry season, the DM yield in the manured plots remained high (2964 kg/ha) and there was no evidence of termites affecting the pastures. In a preliminary trial before manure was introduced, the established pastures were completely wiped out by termites during the dry season. The higher DM yield in the manured plots was attributed to the greatly elevated concentrations of available nutrients (Naramabuye et al., 2007). The lower biomass yield in the dry season was mainly due to the limited availability of soil moisture and low rainfall (Crowder and Chheda, 1982; Snyman, 1999). The low mean DM production in nonmanured plots was attributed to poor soil properties and the severe destruction of pasture plants by termites. The destruction of vegetation by termites was associated with low levels of organic matter (1.3%) in the soil of the nonmanured plots (Table 2). Limited organic matter meant that the termites (one of the major consumers of soil organic matter) were deprived of their major source of food, and thus resorted to the pasture plants as an alternative source of organic matter. These results implied that poor soil properties coupled with termite activities are the major constraints to recovery/rehabilitation of degraded rangelands and need to be addressed by future restoration programs. Table 3: Effect of manure application on DM productivity and species richness. Season Treatment % ground cover Dry matter Species Bare Vegetation (kg/ha) (No./m²) Wet Control 100 0 0 1 Fencing + reseeding only 60.6 39.1 1778 7 Fencing + reseeding + Manure 12.2 89.5 3641 9 Dry Control 100 0 0 0 Fencing + reseeding only 79.1 21.2 1426 3 Fencing + reseeding + manure 35.6 65.2 2964 3 SE 5.3 3 396.4 0.83
Kraaling cattle at night in temporarily fenced paddocks for about 2 weeks resulted in deposition of significant quantities of manure on the degraded soil (Figure 1). After a 2-week period, the kraals can be shifted to a new place. When reseeded, vegetation cover was restored on the area that was fenced

63
and manured (Figure 2). The termites appeared to feed on the manure rather than the grasses. In effect, the application of the manure served as a biological control to deter termites from consuming the newly seeded pasture grasses, giving the vegetation time to mature. It is also possible that reestablishment of vegetative cover may have caused a shift in the mix of termite species and possibly reduced the numbers that feed on pasture grasses. The researchers also noted that after manuring and reseeding pastures, termites reduced their attacks on wooden fence posts. Upper catchment management Valley tanks receiving water from unvegetated upper catchments and gullies experienced high rates of sedimentation, 501 m3 in 18 months compared to 23 m3 in valley tanks with vegetated catchments (Table 4). Sedimentation, evaporation, and degradation of water are critical factors that reduce the availability and quality of water in pastoral communities. Table 4. Effect of upper catchment management and water cover plants on the quantity of water and of silt deposition in valley tanks. Period Max. vol. of
water (m3) Volume of silt deposited (m3)
Reduction in pond capacity (%)
Unprotected (degraded) catchment
Nov. 06 –Apr. 07 1260 233 16.9 Apr. 07 – Oct. 07 1135 15 1.3 Oct. 07 – Apr. 08 1001 253 22.4
Total 501 Protected (vegetated) catchment
Nov. 06 –Apr. 07 1861 - - Apr. 07 – Oct. 07 1857 9 0.48 Oct. 07 – Apr. 08 1846 14 0.76
Total 23 Table 5. Effect of pond management on quality of water for livestock and domestic purposes in pastoral communities of the White Nile sub-basin.
Parameters Uncovered ponds Ponds with Azolla, Pistia Nymphaea
Ponds with Lemna spp.
Good mgt Poor mgt
pH 6.88 6.60 6.60 6.60 Ammonium (NH4
+) 1.24 4.41 1.62 0.69 Nitrates NO3
-) 0.05 1.04 0.10 0.12 Nitrites (NO2
-) 0.02 0.28 0.07 0.05 Total nitrogen (tn) 0.93 7.75 2.84 2.10 Total phosphorus (tp) 1.64 1.84 1.87 0.26 Total dissolved solutes (tds) 42.5 36.5 29.3 49.5 Total suspended solids (TSS) (mg/L) 35 107 64 30 Turbidity (FAU) 40.5 189 63.1 21.5 Total coliform (CFU/100ml) 5312 6828 23923 1147 Total fecal coliform (CFU/100ml) 248 656 4490 350
Mineral nutrients, dissolved solutes, suspended solids and turbidity are generally high in unvegetated catchments and open gullies and lowest in vegetated catchments and gullies (Table 5). Aquatic plants are common on the surface of valley tanks in the cattle corridor. Valley tanks covered by Nymphaea spp., Azolla ssp., and Pistia spp. had higher NH4
+, NO2-, TN, and TP concentrations and coliform counts
than uncovered valley tanks. Valley tanks, however, covered by Lemna spp. had lower nutrient and coliform counts. These findings could be explained by the fact that some macrophytic plants form a dense mat cover on water surfaces (Azolla and Pistia) and create anaerobic conditions that favor the proliferation of microorganisms in water. The decay and decomposition of dead macrophytic plants recycles N and P thus increasing their concentrations in the water. The higher the plant biomass, the greater the amount of nutrients recycled (Hoyer and Canfield, 1997). In particular, Azolla spp are known to have a symbiotic association with a bacteria Anaebaena azollea (Rogers, 1996). This increases the decomposition and imparts a foul smell to the water which subsequently reduces livestock water intake or make animals reject such water. This explains the farmers’ complaint especially in Kiruhura district, that water in some ponds smells 'bad' especially during the dry season. These results confirmed the farmers’ allegations. The dams that were covered with plants had the foul-smelling water. Conclusions A multifaceted approach to improving LWP involving communities in management of upper catchment, effective use of manure, and identification of suitable cover plants and understanding the socioeconomic dynamics of pastoralists is key to improving LWP and hence livelihood and sustainability.

64
Acknowledgments This paper presents findings from PN37, ‘Nile Basin Livestock-water productivity,’ a project of the CGIAR Challenge Program on Water and Food. References Crowder, L.V., and H.R.Chheda.1982.Tropical Grassland Husbandry. Tropical Agriculture
Series.Longman Group Ltd. 562 pp. Harrington, G.N.1968.The effect of picloram on Acacia hockii De Wild, when applied in different
months, different times of day and in different formulations. Proc.9th British Weed Control Conference.
Hoyer, V. Mark, and E. Daniel Canfield. 1997. Aquatic plant management in lakes and reservoirs. Paper prepared by the North American Lake Management Society and the Aquatic Plant Management Society.
Malo, J.E., and F. Suerez. 1995.Establishment of pasture species on cow dung: the role of endozoochrous seeds. Journal of Vegetation Science 6:169-74.
Mugerwa, S., D. Mpairwe, E.N. Sabiiti, D.Mutetikka, G.H. Kiwuwa, E. Zziwa, and D. Peden. 2008. Effect of cattle manure and reseeding on pasture productivity. Paper submitted to be presented at the CPWF Second International Forum on Water and Food, Addis Ababa, Ethiopia, November 10-14, 2008.
Naramabuye, F.X., R.J Haynes, and A.T. Modi. 2007. Cattle manure and grass residues as liming materials in a subsistence farming system. Agriculture, Ecosystems and Environment, 124: 136-41.
Owoyesigire, B., D, Mpairwe, D. Mutetika, B. Bashasa, G.H. Kiwuwa, and D. Peden. 2008. Socioeconomic factors affecting livestock water productivity in rainfed pastoral production systems. Paper submitted to be presented at the CPWF Second International Forum on Water and Food, Addis Ababa, Ethiopia. November 10-14, 2008.
Peden, D., G. Taddesse, and A.K. Misra. 2007. Water and livestock for human development. In: Molden (ed.) Water for Food, Water for Life: A Comprehensive Assessment of Water Management in Agriculture. London: Earthscan, and Colombo: International Water Management Institute.
Snyman, A.H. 1999. Short term effects of soil water, defoliation and rangeland condition on productivity of a semi-arid rangeland. South Africa Journal of Arid Environments, 43: 47-62.
Whalen, J.K., Chang Chi, G.W. Clayton, and J.P. Carefoot. 2000. Cattle manure amendments can raise soil pH of acidic soils. Soils Science Society of America Journal, 64: 962-66.
Zziwa, E., D. Mpairwe, J. Kyambande, M. Iwadra, D. Mutetika, G.H. Kiwuwa, S. Mugerwa, and D. Peden. 2008. Effect of upper catchment management and water cover plants on the quality and quantity of water in surface reservoirs. Paper submitted to be presented at the CPWF Second International Forum on Water and Food, Addis Ababa, Ethiopia, November 10-14, 2008.
Photo 1. Typical degraded grazing land near Nakasongola, Uganda, with high levels of run‐off and near zero water productivity. Termites consume any pasture vegetation that grows. In its present condition, this land cannot support livestock production
Photo 2. Fencing + reseeding + kraaling livestock to deposit manure restores pastures and apparently results as a biological control measure whereby termites shift their diets from pasture vegetation to manure enabling restoration of pasture and

65
Cattle manure and reseeding effects on pasture productivity
S.Mugerwa1, D.Mpairwe1, E.N. Sabiiti2, D. Mutetikka1, G. Kiwuwa1, E. Zziwa1, and D. Peden3
1Department of Animal Science, Faculty of Agriculture, Makerere University, Uganda 2Department of Crop Science, Faculty of Agriculture, Makerere University. Uganda 3International Livestock Research Institute, P.O. Box 5689, Addis Ababa, Ethiopia
Corresponding author: [email protected] Abstract Uganda’s rangelands are seriously degraded due to overgrazing, which causes loss of vegetation cover and soil erosion. Consequently, soils have low levels of nitrogen, phosphorus, potassium, and soil organic matter (SOM). Low SOM eventually increases the destructive effects of termites on pasture. Under such conditions, water is used inefficiently regardless of the quantity received, leading to low livestock water productivity. This work was aimed at rehabilitation of degraded pastures through reseeding, fencing, and use of manure for improved livestock water productivity. The effects of these treatments on pasture productivity in wet and dry seasons are presented. In both seasons, dry matter yields varied significantly with treatments. Highest dry matter yields (3820 kg/ha) occurred in the manured reseeded treatment. Vegetative ground cover was significantly affected by the interaction between season and treatment. Control plots had no vegetative cover in either season, whereas only 2% and 29% of the manured reseeded plots had bare ground in the wet and dry seasons, respectively. Generally, manured plots showed high dry matter production, species richness, percentage cover, and drastic changes in botanical composition compared to nonmanured plots. Reseeding and manure application is an effective and practical intervention to rehabilitate degraded rangelands and increase livestock water productivity. Media grab Reseeding and manure application are effective and affordable ways of rehabilitating and increasing livestock water productivity in degraded rangelands in the Nile Basin. Introduction In Uganda, rangelands cover approximately 84,000 km2 or 40% of the total land area. They are of great economic importance because they support about 95% of the cattle population. Furthermore, about 85% of milk and beef are produced from cattle on natural pastures in the rangelands (Mpairwe, 1999). The current problem facing rangelands in Uganda is degradation, which has been attributed to overgrazing and cutting trees for charcoal burning. When degradation caused by intensive herbivory sets in, it initially affects plant population demography, causing diversity and productivity to decline. A reduction in perennial plant cover then facilitates the establishment of ephemeral and weedy species. Ultimately vegetation cover is lost and geohydrological processes are severely altered (Kraaij and Milton, 2006). The condition of the rangelands in Nakasongola district is characterized by poor, sparse, and unstable vegetation cover, heavy soil erosion, and severe encroachment of weedy species. The situation is exacerbated in the dry seasons by termites, which cut the remaining grass cover as they search for moisture and organic matter. This has created very large areas of land with bare ground locally called 'Biharamata.' Milton (1994) suggested that an optimistic management approach, which includes reseeding and stock withdrawal (fencing off animals) from overgrazed areas, could optimize the restoration potential of degraded rangelands). This study was therefore undertaken with the objective of restoring the lost vegetation cover through use of different rehabilitation interventions. Methods The study was undertaken in Nakasongola district (550 140’N, 320 50’E), which forms part of Uganda’s cattle corridor. Temperatures range between 25 and 350C. Annual rainfall varies between 500 and 1000 mm. Soils are generally lightly textured and of alluvial origin. The vegetation type is open deciduous savannah woodland with short grasses. Trees include Ceasalpinia decapetala and Zanthoxylum chalybeum.

66
The experiment involved a 2 x 6 (season and rehabilitation treatments) factorial arrangement in a complete randomized design. The trial ran from June 2007 to June 2008 covering two wet and two dry seasons. Six treatments were compared: (MO) manuring only, (FO) fencing only, (RO) reseeding only, (MR) manure left on the soil surface plus reseeding, (MRI) manure incorporated into the soil plus reseeding, and (C) control (no manuring, fencing, or reseeding). Manuring was done by night kraaling a herd of 80 cattle for a period of two weeks in each plot. Two grass and two legume species were used for reseeding using the strip planting method. The legume species comprised of Centrocema pubescens and siratro sown at a seed rate of 4 kg/ha. The grasses Panicum coloratum var. makarikariense, Panicum maximum, Brachiaria ruziziensis, and Brachiaria brizantha were sown using rooted splits. Single superphosphate (SSP) was applied a week before planting at a rate of 125kg/ha. Plots remained ungrazed during the study period. Soil samples were taken randomly in each plot to a depth of 15cm before treatments were applied and after each season, to determine total nitrogen and organic matter, available phosphorus, available potassium, magnesium, calcium, sodium, and soil pH. Data collected included: pasture botanical composition, dry matter yield, growth rate, species richness, and ground cover. A 1 m2 quadrat was randomly placed over the pasture canopy at four locations in each plot. The above-ground pasture vegetation within each quadrat was hand harvested (cut at ground level) using a sharp knife, put in polythene bags, and weighed. The samples were dried at 600 C to a constant dry weight for 72 hours in an air-circulating electric oven to determine the mean dry matter yield for each plot, and later the chemical composition. Species richness was determined by recording the average number of individual species per quadrat per plot. Botanical composition, cover, and growth rate were determined using Tothill's methods (1978). The data were subjected to analysis of variance using SAS General Linear Model procedure. Results The dry matter yield, percentage ground cover, growth rate, and species richness for different rehabilitation treatments in the different seasons are given in Table 1. In both seasons, the dry matter yield varied significantly (p ≤ 0.0234) with treatments. Mean dry matter production (3300 kg/ha) from manured plots was 125% higher than that from non-manured plots (1600 kg/ha). Season significantly affected dry matter production (p ≤ .0001). Mean dry matter production (2890 kg/ha) in the wet season was 23% higher than in the dry season (2340 kg/ha), with highest and lowest mean dry matter yields recorded for MR and C treatments, respectively. Table 1. Dry matter yield, percentage ground cover, growth rate, and species richness for different rehabilitation treatments in different seasons. % Cover Season
Treatment
Bare
Forbs
Grass
Weeds
DM (kg/ha)
Growth rate (cm)
Species (no./m2)
Wet Control 100 0 0 0 0 0 1 MR 2.4 37.5 56 3.2 4500 5.2 9 MRI 22.8 31.5 43 2.2 2710 8.7 10 MO 11.5 11.3 74 3.2 3700 10.7 9 RO 50.4 17.6 31 0.4 1940 2.7 9 FO 70.8 0 29.2 0 1600 10.1 5 Dry Control 100 0 0 0 0 0 0 MR 29.1 15.3 54.5 1 3130 -3.4 4 MRI 49.1 8.6 42.7 2.3 2500 -5.6 3 MO 28.7 2.7 68.2 0.7 3250 -4.5 2 RO 72 7.9 20.1 0.5 1680 7.2 2 FO 86.1 0 13.6 0 1160 9.8 1 SE 5.3 3 5 0.9 396 6.5 0.83 Significance (p. values) Treatment 0.0001 0.0001 0.0001 0.0003 0.0234 0.0858 0.0001 Season 0.0001 0.0001 0.0227 0.098 0.0001 0.4859 0.0001 Season*Treat 0.0498 0.0001 0.4114 0.33 0.4229 0.4229 0.0003

67
Regardless of the season, the control plots remained bare (100% bare ground) throughout the two years. Manuring significantly (p<0.0001) increased the percentage vegetation cover in the study area. Generally, the percentage of bare ground for nonmanured plots was 5 and 2 times more than that for manured plots in the wet and dry seasons, respectively. Furthermore, the percentage bare ground for all treatments shows an average increase of 21% in the dry season. A similar trend was observed for fodder and grass cover. Pasture growth rates were not affected (p > 0.05) by either season or the rehabilitation intervention treatments (Table 1). There were, however, significant season and treatment interactions for species richness (Table 1). The highest species richness (10 species per m2) was shown by MRI treatment in the wet season, and the lowest, (1 and 0 species per m2) by FO and control treatments, respectively, in the dry season. The botanical composition for different rehabilitation treatments under different seasons (species listed when cover is at least 1%) is presented in Table 2. In both seasons, treatments caused drastic increases in percentage species cover. Cynodon dactylon was the dominant species in all manured plots, whereas Sporobolus marginatus and Hyparrhenia hirta were the dominant species in nonmanured (non-reseeded) plots. Overall, the percentage species cover for all species showed an average decrease of 3.5% in the dry season. Table 2. Botanical composition (% species cover) for different rehabilitation treatments under different seasons (species listed if % cover is at least 1%). Wet season Dry season Treat C MR MRI MO RO FO C MR MRI MO RO FO Bs 0 14.3 17.1 14.9 22.9 8.6 0 10 12.5 19.3 11.3 - CP 0 7.2 8.9 - 10.7 - 0 5 3.1 - 3 - Cs 0 6.5 1.7 6.1 - - 0 5 - 2.7 - - Cd 0 26.7 14.5 37.1 - - 0 30 17.8 23.6 - - Da 0 13.2 7.3 27 - - 0 11.8 7.6 24.4 - - Hh 0 - - - - 7.2 0 - - - -
5.2
Ma 0 23.3 8.9 - 12.2 - 0 6 5.4 - 3.1 - Mv 0 - - - 4.3 - 0 - - - 1.1 - Ps 0 3 2.1 - 4.3 - 0 3.8 2.1 - - - Ss 0 - - - - - 0 - 2.3 - - - Se 0 - - - 1 2.3 0 - - - - - So 0 3.3 1.8 2.4 - - 0 - - - - - Sr 0 - - - - - 0 - - - 3.8 - Sm 0 - - - - - 0 - - - -
5.6
Bs (Brachiaria spp), Cp (Centrosema pubescens), Cs (Commelina spp), Cd (Cynodon dactylon), Da (Dactyloctenium aegyptium), Hh (Hyparrhenia hirta), Ma (Macroptilium atropurpureum), Mv (Mitracarpus villosus), Ps (Panicum species), Ss (Saccharum spontaneum), Se (Setaria sphacelata), So (Solanum spp), Sr (Sida rumbifolia). Sm (Sporobolus marginatus) Discussion Mean dry matter production from manured plots was significantly higher than that on nonmanured plots. A possible explanation is that cattle manure improved soil pH, soil organic matter, and the nutrient status of degraded soils (Table 3). The low mean dry matter production (1380 kg/ha) for RO treatment, despite addition of SSP fertilizer, was partly attributed to severe destruction of pasture plants by termites 3 weeks post emergence. The possible cause of this destructive behavior by termites may be due to the extremely low levels of organic matter in plots with no manure. It was hypothesized that due to lack of alternative sources of food (organic matter), the termites resorted to the established pasture plants. This implies that termites present an additional barrier to recovery/rehabilitation of degraded rangelands and therefore need to be controlled. There is, however, a need to do more confirmatory studies about termite activity in the area.

68
Table 3. Soil (0-15 cm) parameters for the different rehabilitation treatments. Parameter Before treatments After two seasons
MO MR MRI RO FO C MO MR MRI RO FO C
pH 3.5 3.4 3.6 3.7 4.3 4.3 5.2 4.9 5.3 4.3 4.3 4.3
SOM(%) 1.04 1.33 1.34 1.22 1.38 1.38 2.03 1.9 2.13 1.3 1.38 1.38
% N 0.08 0.07 0.09 0.09 0.04 0.04 0.2 0.2 0.22 0.09 0.04 0.04
Av.P(mg/kg) 1.5 1.64 1.33 1.9 1.38 1.38 5.42 4.0 4.34 1.9 1.38 1.38
K(Cmoles/kg) 0.39 0.87 0.3 0.5 0.25 0.25 1.2 1.42 1.2 0.5 0.25 0.25
The significant differences between dry matter production across seasons were attributed to low availability of water (Snyman, 1999). Rainfall is the greatest single factor affecting plant growth and herbage dry matter production in tropical countries. Similarly, the general reduction in species richness in the dry season was attributed to the low water availability, since many pasture species (especially annual species) rarely withstand drought conditions. The implication of our findings is that the suitability of any restoration/rehabilitation treatment in improving dry matter production will always depend on water availability. In addition, failure of vegetation cover in the control treatment was attributed to continued soil erosion. Khresat et al. (1998) noted that the development of large bare patches, which is a result of overgrazing, eventually facilitates high rates of erosion. Consequently, the soils in these rangelands have relatively low levels of nitrogen, phosphorus, potassium, and organic matter. This tends to inhibit grass growth, especially for the less competitive species such as B. brizantha, Panicum, and Setaria spp. The highest percentage of vegetation cover exhibited by the manured plots was attributed to the improved soil nutrient status (Table 3), and the growth characteristics of the dominant species, especially Cynodon dactylon (Table 2). Cynodon dactylon is perennial and spreads quickly by stolons and rhizomes to cover a large area in a short time (Skerman and Riveros, 1990). The grass responds strongly to farmyard manure application and quickly invades areas with animal manure. The grass highly favors sites with animal manure since cattle kraals and/or cattle paddocks are some of its natural habitats. On the other hand, Hyparrhenia hirta was the dominant species on nonmanured plots due to its wide soil tolerance, including dry, hard, rocky soils, and deep dry sand with very low nutrient levels (Skerman and Riveros, 1990). From these results, it was therefore recommended that, in any programs aimed at restoration of vegetation in degraded rangelands of Uganda, the technology of manure application and reseeding with manure, favoured grass species such as Cynadon spp., and drought-resistant forage species such as Hyparrhenia spp. should be included. Manured plots had higher species richness than nonmanured plots, and this was also attributed to the improved nutrient status by the cattle manure particularly N, P, and K, and OM (Table 3). Harrington (1968) noted that these nutrients are usually limiting and always inhibit the establishment of particular pasture species such as B. brizantha and Panicum spp. among others. The fact that cattle dung is a source of a variety of endozoochorous seeds, which germinate into a variety of pasture species (Malo and Suarez, 1995), could also have contributed to the increased vegetation cover in the manured plots. Our results agree with the findings of Girma et al. (2003), who determined that species richness was higher on manured plots than on nonmanured plots regardless of the grazing pressure. Restoring the ground cover and pasture production is vital to increasing livestock water productivity, because this results in more feed for production, reduced surface runoff, evaporation, silting of water reservoirs, and increased water infiltration and transpiration. Conclusion The destruction of pasture seedlings by termites in nonmanured plots gave the answer to why most interventions aimed at rehabilitating degraded rangelands have failed in the past. The improved vegetation cover and species richness in the manured plots, irrespective of the season, showed that poor soil properties (particularly low N, P, K, and OM) are the major constraints to rehabilitation of degraded rangelands. Reseeding and application of cattle manure on degraded bare patches is an

69
effective, practical, and affordable way of recovering the lost vegetation cover in degraded rangelands. The practice of kraaling cattle in fenced paddocks, together with reseeding, provides the answer to rehabilitating degraded rangelands, and therefore there is need to up-scale the technology. Acknowledgments This paper presents findings from PN37, ‘Nile Basin Livestock-water productivity,’ a project of the CGIAR Challenge Program on Water and Food. References Girma, T., D. Peden, A. Abyie, and A. Wagnew. 2003. Effect of manure on grazing lands in Ethiopia.
East African Highlands Mountain Research and Development, 23(4):156-160. Harrington, G.N. 1968.The effect of picloram on Acacia hocki de Wild, when applied in different
months, different times of day and in different formulations. Proceedings of the 9th British Weed Control Conference.
Khresat, S.A., Z. Rawajifih, and M. Mohammed. 1998. Land degradation in North-western Jordan:
causes and processes. Journal of Arid Environments, 39: 623-29. Kraaij, T., and S.J. Milton. 2006. Vegetation changes (1995-2004) in semi arid Karoo shrubland,
South Africa: Effects of rainfall, wild herbivores and change in land use. Journal of Arid Environments, 64: 174-92.
Malo, J.E., and F. Suarez. 1995. Establishment of pasture species on cow dung: the role of
endozoochrous seeds. Journal of Vegetation Science, 6:169-74. Milton, S.J. 1994. Growth, flowering and recruitment of shrubs in grazed and protected rangelands in
the arid Karoo, South Africa, Vegetation, 111: 17-27. Mpairwe, R.D. 1999. Improving feed resources in agro-pastoral systems for rangeland development in
Uganda. In: E.N. Sabiiti, C. Tizikara, and M.P. Nampala (Eds.): Sustainable Utilization of Dryland Ecosystems for Livestock Development. Proceedings of the First National Dryland Husbandry Project Workshop. Kazo, Mbarara District, Uganda (31 May-2 June 1999).
Skerman, P.J., and F. Riveros. 1990.Tropical Grasses. FAO Plant Production and Protection Series
No.23. 832 pp. Snyman, A. 1999. Short term effects of soil water, defoliation and rangeland condition on productivity
of a semi-arid rangeland in South Africa. Journal of Arid Environments, 43: 47-62. Tothhill, C.J. 1978. Measuring Botanical Composition of Grasslands. In L.‘t Mannetje (Ed.)
Measurement of Grassland Vegetation and Animal Production. CSIRO Division of Tropical Agronomy. Cunningham Laboratory. Brisbane, Queensland, Australia.

70
Upper catchment management and water cover plants effects on the quality and quantity of water in surface reservoirs
E. Zziwa1, D. Mpairwe1, J. Kyambande2, M. Iwadra3, D. Mutetika1, G.l Kiwuwa1, S. Mugerwa, and D.
Peden4
1Department of Animal Science, Faculty of Agriculture, Makerere University, Uganda 2Department of Chemistry, Faculty of science, Makerere University. Uganda
3Department of Agricultural Engineering, Faculty of Agriculture, Makerere University, Uganda 4International Livestock Research Institute, P.O. Box 5689, Addis Ababa, Ethiopia
[email protected] Abstract The effects of upper catchment management and water plants on water quantity and quality in two Ugandan pastoral communities were investigated. The objective was to assess effects of land and livestock management on water resources and livestock water productivity. Water quality and quantity in valley tanks were monitored. Results indicate that upper catchment management significantly affected total coliform (TC), fecal coliform (FC), NH4
+, NO2-, total nitrogen, total phosphorus, TSS, and
turbidity. Valley tanks in catchments with unvegetated catchments and gullies were more contaminated than in vegetated catchments and gullies. Reseeding of an unvegetated upper catchment greatly decreased the concentration of NH4
+, NO2-, NO3
-, TP, and turbidity. Silt from unvegetated catchments and gullies reduced reservoir storage capacity by 248 m3 in a year. Valley tanks covered with Nymphaea spp. had significantly higher concentrations of NH4
+, NO2-, NO3
-, TN, TDS, TSS, pH, and turbidity, whereas Azolla spp. were associated with higher TP, TC, and FC than other cover plants. Unvegetated upper catchments and gullies have detrimental impacts on water quality and reservoir capacity. Evaporation, sedimentation, and degradation of water quality were critical factors that reduced the availability and quality of water in pastoral communities. Only valley tanks with vegetated catchments and gullies and those covered with Lemna species had acceptable levels of FC. Media grab Vegetated upper catchments and gullies and use of suitable cover plants improve water quality, reduce sedimentation and degradation of surface water resources in pastoral communities. Introduction Valley tanks are the major sources of water for livestock and humans in the pastoral rangeland communities of Uganda. These water resources, however, face major problems of siltation and seasonal fluctuation of water quality and quantity that greatly affects livestock productivity (Sabiiti, 2001; MWLE and DWD, 2003). Poor upper catchment and water resource management lead to contamination, sedimentation, eutrophication, and enhanced discharge into water reservoirs.The amounts of water used directly by livestock for drinking are relatively small, with much larger amounts being used to produce feed (Peden et al., 2003). Water contained in feed is highly variable (Sirohi et al., 1997). When the water content of the feed ingested is low, drinking water requirements increase and provision of water to livestock becomes the main concern (Degen, 1997). The quantity of water consumed per unit weight gain increases as the dry season progresses because the forage becomes senescent and moisture content declines (Willms et al., 2002). Factors that increase water loss and degradation of surface water resources, or that increase water intake per unit of livestock product and service produced, negatively affect livestock water productivity (Peden et al., 2007). To improve the livestock water productivity management, it is necessary to understand the impacts of upper catchment management and water cover plants on water quality and quantity. Methods Site The study was conducted in the pastoral communities of Nakasongola and Kiruhura districts within the
Nile Basin where livestock production is the most important agricultural activity. The two districts experience a bimodal annual rainfall pattern ranging from 500 to 1000 mm (MAAIF, 2003) with periodic droughts. Temperatures range from 24 to 35ºC. The dominant vegetation type in both

71
districts is open savannah woodland with short grasses highly suitable for pasture. Tree species include Commbretum, Terminalia, Acacia ceasalpinia decapetala, and Zanthoxylum chalybeum.
Water quality and quantity monitoring were done on eight valley tanks supplied with water from un-vegetated catchments, vegetated catchments, vegetated gullies and open gullies, and on eight valley tanks covered by Azolla, Lemna, Pistia and Nymphaea spp. from November 2006 to October 2007. All dams used in these experiments were under similar livestock watering practices (watering in troughs), because an earlier pilot study had shown that valley tanks where direct watering is practiced had higher nutrient and microbial concentrations than their counterparts. Measurement of reservoir volume A concrete block tied on a calibrated rope was used to establish the depth profile of the valley tanks by measuring the depth of water at 2-m intervals following ropes tied at a distance of 10 m across the width of the valley tank, using a small wooden boat. An evaporation pan (A-/class) and a rain gauge were installed and used to measure evaporation (mm) and precipitation (mm). The number of animals drinking from a given valley tank were counted and the volume of water taken by animals was measured by counting the number of 10 L buckets used to fill water troughs during watering. Water quality analysis Water samples were collected and delivered to the laboratory in an icebox, where they were frozen until analysis was made within 36 hours. A spectrophotometer (HACH, DR/4000) was used to measure NO2
-, NO3-, NH4
+, total nitrogen (TN), total phosphorus (TP), total dissolved solutes (TDS), and turbidity (FAU). Total suspended solids (TSS) (mg/l) were determined by filtering and weighing oven-dried sediments collected on prewashed Whatman GF/F Glass filters. pH was measured using WTH pH meter LF 90. Total and faecal coliform concentration (most probable number–MPN) of colony-forming units (CFU) per 100 ml was measured according to the coliform test, with membrane lauryl sulfate broth and incubated at 440c for 18-24 hours. Student’s t-tests were performed in STATA to determine significant differences in water quality between treatments. Results Reservoir hydrology Annual precipitation was higher than annual evaporation. However, evaporation was higher than precipitation in dry seasons. Valley tanks experienced high annual evaporative water loss (Table 1). Valley tanks receiving water from unvegetated upper catchments and gullies experienced high rates of sedimentation (248 m3 in one year) and water degradation (46.5 m3 in dry season). Table 1. Monthly rainfall (R, mm), evaporation (Ev, mm) and volume of water in valley tanks (m3) in un-vegetated (UV) and vegetated (V) catchments. Nov Dec Jan Feb Ma
r Apr May June Jul Au
g Sept Oct AE
v VS
R 152 52 0 0 36 143 146 39 131 78 240 258 Ev 47 59 75 70 54 71 72 49 54 51 43 58 UV
1380
361 47* - 736
1140
1140
979 709 756
1130
1130
850
248
V 1860
1530
1170
591
265
529 1860
1610
1060
589
1390
1850
607
7
AEv–Annual evaporative loss from valley tanks (m3) and VS–Volume of silt deposited (sedimentation) into valley tanks (m3). Italic text indicates full capacity of valley tanks, *Degraded water. Effect of upper catchment on water quality NH4
+, NO2-, NO3
-, TN, TP, TDS, TSS, and turbidity were generally high in valley tanks with unvegetated catchments and open gullies, and lower in valley tanks with vegetated catchments and gullies (Fig. 1). There were significant differences between treatments and seasons, with high concentrations of NH4
+, NO2
-, NO3-, TP, TDS, TSS, and turbidity being observed in the rainy season. Management interventions
geared at revegetation of the upper catchment (reseeding, fencing, fencing and reseeding) significantly (p < 0.0001) reduced water pollution compared to the control (where no intervention was made on unvegetated catchment) (Table 2).

72
Table 2. Effect of upper catchment management interventions on valley tank water quality. Treatment NH4
+ NO2- NO3
- TN TP TDS TSS Turbidity pH Reseeding (R) 0.66 0.02 0.01 2.52 0.13 30 112 1110 5.95 Fencing (F) 0.94 0.01 0.05 1.86 0.18 22 96 571 5.92 R + F 1.33 0.07 0.13 2.33 2.14 22 115 1060 6.05 Control 4.27 0.38 0.42 4.95 2.19 37 120 3500 5.67 LSD 0.15 0.02 0.03 0.18 0.08 13 9 32 0.05 Effect of water cover crops on water quality Valley tanks covered with Nymphaea spp. had significantly (p < 0.01) higher NO2
-, NO3
-, TN and TDS
concentrations. Azolla spp. were associated with significantly higher TC and FC concentrations, and Lemna spp. were associated with significantly lower TC, FC, TSS, and turbidity (Figure 2). NH4
-, TP and pH were not significantly different (p > 0.01) between treatments in all seasons.
Figure 1. Effect of upper catchment management on water quality.
0 20 40 60 80
100
120
140
TDS TSS TURB pH TDS TSS TURB pH
DRY SEASON RAIN SEASON
Concentration (mg/L) and pH
Unvegetated catchment Vegetated catchment
Open gully Vegetated gully
0 0.5
1 1.5
2 2.5
3 3.5
4 4.5
5
NH4 NO2 NO3 TN TP NH4 NO2 NO3 TN TP
DRY SEASON RAIN SEASON
Concentration (mg/L)
Unvegetated catchment Vegetated catchment
Open gully Vegetated gully

73
Figure 2. Effect of water cover plants on water quality. Discussion Reservoir hydrology Although evaporation increases with surface area (Ferhat and Ozhan, 2006), high TDS and TSS concentrations in valley tanks with unvegetated catchments and open gullies (Figure 2) also increases evaporation rates due to increased heat conduction. Bare ground in the upper catchment increases runoff speed and erosion resulting in reservoir sedimentation. This explains the reduction in the capacity of reservoirs with unvegetated catchments and gullies. The deposited sediments increase TSS, which reduces the quality of water and imparts a muddy smell which makes animals reject the degraded water. This implies that high water evaporation, sedimentation of reservoirs, and water degradation cause significant water losses from valley tanks. Upper catchment management The presence of vegetation in upper catchments and gullies stabilizes the soil, and reduces storm water velocity, thereby reducing soil erosion, manure and nutrient deposition, and reservoir sedimentation. Vegetation also increases water quality through its functioning as sponges, absorbing and filtering out sediments and nutrients from runoff. This is consistent with earlier studies that showed that maintaining good plant cover in upper catchments and gullies is one of the most effective ways to reduce the amount of siltation and to keep nutrients out of reservoirs (Streamlines, 1998; Simmons 2004). Water cover plants Numerous biological and physical processes transform nitrogen between various forms. Ammonification, nitrification, and denitrification are the major nitrogen transformation processes. Reservoirs with macrophytes that have a high biomass yield (Pistia spp and Nymphaea spp) have high levels of NH4
+ and phosphorus released through decomposition than low biomass plants (Azolla spp and Lemna spp). Azolla spp and Pistia spp form a dense mat cover on water surfaces that creates anaerobic conditions. This reduces nitrification and increases denitrification, thus the lower levels of nitrates and nitrites compared to Nymphaea spp and Lemna spp. The roots of Pistia spp, Nymphaea
0
20
40
60
80
100
120
TDS TSS TURB pH TDS TSS TURB pH
DRY SEASON RAIN SEASON
Concentration (mg/L) and pH
Nymphaea Lemna Azolla Pistia
0
1
2
3
4
5
6
7
NH4 NO2NO3 TN TP NH4 NO2NO3 TN TP
DRY SEASON RAIN SEASON
Concentration (mg/L)
Nymphaea Lemna Azolla Pistia

74
spp, and Azolla spp often detach and suspend in the water column. This increases the TSS and turbidity in reservoirs covered by such plants, as opposed to Lemna spp that do not have distinct plant parts that can disengage into water. Lemna spp also present a high surface area over which sediments are adsorbed, thus significantly reducing turbidity. The decomposition of decayed aquatic plants increases bacterial concentration. Limited water aeration increases bacterial concentrations because of the favorable anaerobic conditions. Azolla spp and Pistia spp thus have higher coliform counts than Lemna spp and Nymphaea spp. This is supported by earlier research that indicated that Azolla spp have a symbiotic association with a bacteria Anaebaena azollea, hence the higher bacterial concentrations in valley tanks covered by Azolla spp. Conclusion Unvegetated upper catchments and open gullies have detrimental impacts on water quality and reservoir capacity. Without vegetation in the upper catchments and gullies, water quality is greatly impaired and reservoir sedimentation and water degradation greatly increase. Rainfall amount is not the factor limiting the amount of water available in reservoirs to sustain livestock and human needs through dry seasons in the pastoral communities of Uganda. Evaporation, sedimentation, and degradation of water quality are critical factors that reduce the availability of water in pastoral communities. Use of Lemna spp, may be of great importance in reducing evaporative water loss and increasing water quality, since the plant is known to reduce evaporation by 20% from open water resources. Water from all valley tanks had nutrient concentrations falling below the maximum recommended intake for livestock drinking water. Only valley tanks receiving water from vegetated catchments and gullies and those covered by Lemna spp had fecal coliform counts falling below the recommended concentration (<100) for livestock drinking water (ANZECC, 2000). Acknowledgments This paper presents findings from PN37, ‘Nile Basin livestock–water productivity,’ a project of the CGIAR Challenge Program on Water and Food and from by the Comprehensive Assessment of Water Management in Agriculture. References ADB. 2002. African Development Bank: Uganda Livestock Development Programme, Re-appraisal
Report. Water for Production Strategy. 2nd Draft review. 40p. ANZECC. 2000. Australian and New Zealand Environment and Conservation Council. Water Quality
Guidelines. http://www.mfe.gov.nz/publications/water/anzecc-water-quality-guide-02/. Degen, A.A. 1997. Fat-tailed Awassi and German mutton Merino sheep under semi-arid conditions
Total body water and water turnover during pregnancy and lactation. Agric. Sci. (Cambridge) 88: 99-704.
Ferhat, G., and S. Ozhan. 2006. Water loss through evaporation from water surfaces of lakes and
reservoirs in Turkey. Official publication of the European Water Association (EWA 2006). MWLE and DWD. 2003. Ministry of Water, Lands and Environment and Directorate of Water
Development (Uganda). Water sector reform: Water for production strategy 2003 - 2015, August 2003.
Peden, D., G. Tadesse, and M. Mulugeta. 2003. Improving the Water Productivity of Livestock: An
Opportunity for Poverty Reduction. In: P. McCornick, A. Kammara, and G. Tadesse, (Eds.) Integrated Water and Land Management Research and Capacity Building Priorities for Ethiopia. Proceedings of A MoWR/EARO/IWMI/ILRI International Workshop, 2 - 4 Dec. 2002. Addis Ababa: ILRI.
Peden, D., G. Tadesse, and A.K. Misra. 2007. Water and livestock for human development. In David
Molden (Ed.) Water for food, water for life: A comprehensive assessment of water management in agriculture. London: Earthscan and Colombo: International Water Management Institute, p. 485-514.
Sabiiti, E.N. 2001. Pasture and range management. In: J.K. Mukiibi: Agriculture in Uganda. Volume
IV. Livestock and Fisheries, pp. 196–288. Simmons, C.J. 2004. Water quality and its dependency on the presence of vegetation within the
stream bed and along the banks of tributaries in the Dog River water shed. Department of Earth Sciences, University of South Alabama, Mobile, AL, 36688.
Sirohi, S.K., S.A. Karim, and A.K. Misra. 1997. Nutrient intake and utilization in sheep fed with Prickly
Pear cactus. Arid Environments, 36: 161-66. Streamlines. 1998. Greenways and stream buffers. Newsletter for North Carolina water supply and
water shed administrators. Volume 3, Number 1. March, 2008. Willms, W.D., O.R. Kenzie, T.A. McCallister, D. Colwell, D. Viera, T.E. Wilmshurst, and M. Olson. 2002.
Effects of water quality on cattle performance. J. Range Management, 55: 452–60.
75
Socioeconomic factors affecting livestock water productivity in
rainfed pastoral production systems
Owoyesigire Brian1, D. Mpairwe1, D. Mutetika1, B. Bashasa2, G. Kiwuwa1, and D. Peden3
1Department of Animal Science, Makerere University, P.O. Box 7062, Kampala, Uganda 2Department of Agricultural Economics and Agribusiness, Makerere University
3International Livestock Research Institute (ILRI), P.O Box 5689, Addis Ababa, Ethiopia Corresponding author: [email protected]
Abstract A study was conducted in Nakasongola and Kiruhura pastoral communities of Uganda to estimate livestock water productivity (LWP), and establish socioeconomic factors that affect LWP in rainfed pastoral production systems of the Nile Basin watershed. A semistructured questionnaire was administered to 185 households. Crop water requirements and livestock benefits were estimated and data used to compute LWP. The main factors affecting LWP included gender within the household, level of education, land ownership and utilization, access and ownership of water sources, and tree harvesting for use in charcoal burning. Livestock water sources included: boreholes, wells, ponds, valley dams, swamps, rivers, and lakes. Livestock water sources varied with seasons with an average distance of 7 km in the dry season and 3 km in the wet season. Important livestock beneficial outputs included milk, meat, and sales from live animals. Average annual milk production was 3260 l/household in Nakasongola and 15,070 l/household in Kiruhura. In all the surveyed pastoral communities, LWP was < US$/1m3. It was concluded that to improve LWP, pastoral communities should improve overall allocation and use of water and land resources for all users. Media grab Well-managed settlement of pastoralists may foster higher livestock water productivity, and also help reduce poverty in the Nile Basin. Introduction Livestock production makes up about 25% of the world’s agricultural GDP (Mengesha et al., 1998), occupies two-thirds of the world’s surface under agriculture, and sustains 20 million pastoral families. In Uganda, livestock production accounts for 17% of the agricultural gross domestic product (GDP) and 7.5% of the total GDP (MAAIF, 2003). Agricultural productivity is normally and universally measured with respect to land and rarely with respect to water. Nevertheless, water is becoming increasingly scarce, especially in the drought-prone semi-arid and arid areas. Water is essential for human consumption and for other domestic purposes. It is also vital for watering livestock, producing feeds, crop production, and for processing agricultural products. As the human population increases, per capita water use will also increase due to increased demand for food, including livestock products such as milk, meat, and eggs. Managing this demand for additional water dictates a thorough understanding of livestock water productivity (LWP). LWP is measured as the ratio of beneficial outputs to amount of water depleted in producing them (Peden et al., 2007). Although studies of LWP on other communities have been carried out, no such studies have been conducted in the pastoral communities of Uganda. This study was therefore initiated to establish socioeconomic factors affecting LWP, and estimate LWP using the pastoral communities of Nakasongola and Kiruhura districts as a case study. Methods The study was conducted in the districts of Nakasongola and Kiruhura within the Nile Basin, where pastoral livestock production is the most important agricultural activity. A household survey was conducted using a pretested semistructured questionnaire. The questions were designed to obtain information from respondents on general household characteristics, herd size and ownership, benefits from livestock, crops grown, amount of water consumed, issues of overgrazing, water sources, and challenges faced in managing them. Field measurements of acreage under various crops and area under pastures were also conducted at household/plot level. A total of 185 households participated in the study. The household survey was designed to cover settled agropastoral and nonsettled agropastoralist communities.

76
The amount of water depleted by crops and pastures was estimated using the pan evaporation
method. Pan evaporation is related to the reference evapotranspiration ETo (eq.1), by an empirically derived pan coefficient (Richard et al. 1998).
ETo =Kp Epan . . . . . . . . . . . . . . . . . . . . . Eq.1 Where: ETo = reference crop evapotranspiration (mm/day; Kp = pan coefficient and Epan = pan evaporation (mm/day). Crop evapotranspiration/crop water requirements (CWR), which is the amount of beneficial water depleted, was derived by the formula CWR = ETm X growing period X area planted. The maximum ETm relates to ETo by multiplying it with their respective crop coefficients Kc.
Modified model by Girma Taddesse et al (2006) was used to compute the beneficial outputs from
livestock
Lo =Σ (DP +MP + Pm + HS) * P + Σ {(Mc * My) -Ms} *Mpr ……………..Eq.2
Lo = livestock output (US$), Dp = Total acres plowed * Price of plowing an acre; Mc = number of milking cows, My = milk yield/cow (kg or liter); Ms = milk self consumption (kg or liter), Mpr = milk price per kg or liter of milk; Mp = manure production = Animal number * average daily manure production (kg)* price per kg; Pm = produced meat = livestock slaughtered-meat self consumption (kg)* price per kg; HS = hides and skins = slaughtered animal * Price per kg of hides skins Livestock water productivity was derived using the formula ∑ (Beneficial outputs) LWP = ----------------------------------- …………………………… Eq.3
∑ (depleted + degraded water) Data were compiled and analyzed using an SPSS package. Comparisons were based on differences by resource ownership, gender, and livestock type within pastoral communities, using frequency distributions and percentages. Livestock water productivity indices were derived by use of MS Excel spread sheet modified by Amare (2006). Results and discussion General household information The largest percentage of respondents were male: 78 in the settled and 85 in the nonsettled communities. Education level varied from primary, secondary, post-secondary, and those that had never gone to school. The proportion of the respondents that had not gone to school in all the communities was high: 41% in the non-settled and 37% in the settled agropastoral communities. The overall family size was 11.6, although families in the settled pastoral system had relatively larger families (12) compared to the non-settled pastoral system (10.8). The average livestock herd size for the nonsettled pastoral systems were 64, 5, 0.9, 4.4, and 0.5 for cattle, goats, sheep, poultry, and pigs, repectively. The corresponding numbers for the settled agropastoral system were much higher (cattle 98, goats 20, sheep 2.4, and pigs 0.6, except poultry 3.7). More men than women and children owned livestock. Ownership by women and children increased in small stock especially in poultry, where men had the lowest ownership. Access, ownership and utilization of production resources Although all the households had access to land, 33.3% did not own land in the nonsettled and 8% in the settled agropastoral communities. Levels of land ownership included government, private (men, women), and communal. In the nonsettled pastoral community of Nakasongola, more land is owned by government (27%) compared to the settled community (8%). The results indicate that land acquisition by individuals affects the mobility of the pastoralists. As individualization of land ownership increases, mobility decreases. The results further revealed that land ownership still remains a male domain, as they own a significantly higher percentage (57% for the nonsettled and 86% for the settled communities). Land use patterns were similar in all the communities (Table 1). The proportion of degraded land and land encroached by thickets was high in nonsettled pastoral system. Land degradation was attributed to increased overstocking and harvesting of trees for charcoal burning. Increased land degredation and encroachment by thickets reduces the quality and quantity of pasture biomass available, thus lowering animal productivity.

77
Table 1. Land utilisation per household in hectares. Category Nonsettled Settled Pasture 39.5±55 83.4±146.5 Cultivated 2.42±2.9 1.7±2.3 Degraded 14.5±44 0 Thickets encroached 18.1±40.4 2.1±5.5 Available water resources and utilization The available water resources in the study area included: valley tanks, wells, boreholes, lakes/swamps, and ponds. Valley tanks (ponds) were the most abundant water resource (Table 2), although cases of drying up during the dry season were common. Utilization of natural lakes as a source of water significantly increased during the dry season. Table 2. Percentage households using various water sources in different seasons. Non-settled Settled Water sources Wet season Dry season Wet season Dry season Valley tanks 63 28 44 83 Well 47 0 47 0 Borehole 15 11 7 0 Lake 10 58 2 17 Pond 9 3 0 0 Access to water especially in the dry season was the the major factor affecting LWP. As a strategy to offset water problems in the dry season, families have to shift and or trek/travel long distances to permanent water sources such as lakes and rivers. Most of the farmers revealed that they shift and concentrate along the River Nile and the shores of Lake Kyoga. Farmers also reported that when they shift, there is an incresed loss of animals due to death, mainly as a result of diseases and shortage of pastures around the new settlements. This has a direct effect on productivity in terms of growth rates and milk yield, and hence the LWP. The average distance to a water source in the dry season was 7 km for nonsettled and 6 km for settled systems. In the wet season, the distance covered to water source was shorter (3.0 and 1 km). Access to water directly affects LWP as livestock travel long distances, and this results in loss of body condition and a reduction in benefits such as milk. This increased movement of livestock and people to access water usually results in increased conflicts due to competition for water, consequently reducing animal productivity. Ownership of water sources was mainly communal, and the mean percentage was 73 in the nonsettled and 82 in the settled pastoral communities (Table 3). As the water resource ownership becomes more public/communally owned, the responsibility for its maintenance is not owned by any individual. Management of water resources, especially valley tanks, directly affects their ability to hold water throughout the year since most of them dry up due to increased silting. Silt accumulation in the valley tanks reduces the amount of water available for livestock, thereby lowering animal productivity. Table 3. Ownership and management of available water resources in percentages. Nonsettled agropastoral Settled agropastoral
Water resources
Ownership Valley tanks Well Borehole Valley tanks Well Borehole
Man 9 57 0 0 86 2 Woman 5 0 0 0 0 0
Family 11 0 17 18 14 0
Community 36 43 67 46 0 90 Government 34 0 17 36 0 8
Landlord 5 0 0 0 0
Management
None 40 0 41 0 0 0
Man 9 57 0 16 85 0 Woman 6 0 0 0 0
Family 9 0 0 33 10 15
Community 27 43 59 50 5 85 Government 9 0 0 0 0 0

78
Landlord 0 0 0 0 0 0 Livestock water productivity The two communities cultivate similar crops, except cotton, which was rarely cultivated in the settled agropastoral system of Kiruhura. The estimated crop water requirements using pan evaporation methods is given in Table 4. Livestock water productivity in the settled agropastoral community was higher (0.07 US$/m3) than in the nonsettled community 0.04 US$/m3 (Table 5). There was more water available in the settled communities, and therefore the amount of water depleted was higher compared to the nonsettled community (Table 4). In settled communities, there have been attempts to improve the genotypes by crossing the local livestock with Friesian cattle and Boer goats. Therefore higher livestock benefits have been realized from increased sales of live animals and high milk yields. In addition, the settled community had more land available for pastures per household (83.4 ha) and less land degraded and encroached by thickets compared to the nonsettled one (Table 1). This provides more pastures for the animals. Table 4. Water requirements for different crops in the study area.
Nonsettled agropastoral system Settled agropastoral system
Crop Area ETm LGP CWR Area ETm LGP CWR
(m2) m3/year (m2) m3/year Banana 7700 0.00176 547 7413 166000 0.00176 547 159812
Cotton 113000 0.001248 190 26795 0 0 0 0
Cassava 255000 0.00088 270 60588 17400 0.00088 270 66528
Maize 107000 0.00168 110 19774 21900 0.00168 110 29933
Sorghum 17600 0.00192 130 4393 44000 0.00192 130 10983
Beans 30100 0.00168 95 4804 40000 0.00168 95 6384
S. potato 168000 0.00104 128 22365 26900 0.00104 128 22364
Groundnut 135000 0.001408 130 24710 40500 0.001408 130 40635
Millet 46500 0.00112 105 5468 20000 0.00112 105 6586
Grassland 23740000 0.0012 133 3788904 51316000 0.0012 133 8190035
Total 3,965,259 8,280,656
Table 5. Estimates of LIVESTOCK water productivity for the pastoral communities. Parameters Settled agropastoral
community Nonsettled agropastoral community
Milk (US$) 67,776 19,463 Meat (US$) 321,548 12,904 Manure (US$) 195,289 126,473 Draught power (US$) 0 3,809 Estimated value (US$) 584,613 162,649 Total water used (m3/year) 8,280,656 3,965,259 LWP (US$/m3) 0.07 0.04
Conclusions Livestock water productivity in the pastoral communities is affected by access and ownership of production resources of land, water, and livestock. Increased land degradation coupled with an increase in encroachment of thickets affected pasture availability for livestock, thereby reducing LWP. Distances covered to access water by livestock especially in the dry season in the pastoral communities was high, thereby negatively influencing LWP. To improve LWP, pastoral communities should improve allocation and use of water and land resources for all users. Acknowledgments This paper presents findings from PN37, ‘Nile Basin livestock-water productivity,’ a project of the CGIAR Challenge Program on Water and Food. References Richard, G.A., S. Luis, P.R. Dirk, and S. Martin.1998. Crop Evaponspiration–Guidelines for computing
crop water requirements: Irrigation and Drainage Paper No.56. FAO publication. Peden, D., G. Tadesse, and A.K. Misra. 2007. Water and livestock for human development: In: David
Molden (ed.), Water for food, water for life: A comprehensive assessment of water management in agriculture. London: Earthscan and Colombo: International Water Management Institute, pp 485-514.
Sumner, M.D., and J.M. Jacobs. 2004. Utility of Penman-Monteith, Priestley-Taylor, Reference
evapotranspiration, and pan evaporation methods to estimate pasture evapotranspiration. Journal of Hydrology 308 (2005): 81-104. Elsevier B.V.
Mengesha, Y., S. Ehui, M. Jabbar, and B. Shapiro. 1998. Livestock production, consumption and trade:
key indicators. Livestock Policy Analysis Brief No 11. ILRI, Addis Ababa.

79
Livestock water productivity in relation to natural resource management in mixed
crop-livestock production systems of the Blue Nile River Basin, Ethiopia
M. Alemayehu1, D. Peden2, G. Taddese2, A. Haileselassie2 and W. Ayalneh2
1Ethiopian Institute of Agricultural Research, Addis Ababa, Ethiopia. E-mail:
2International Livestock Research Institute, Addis Ababa, Ethiopia Corresponding authors: [email protected] & [email protected]
Abstract Mixed crop-livestock farming is the most important production system in the Ethiopian highlands. Traditional livestock management practices often jeopardize water quality, human and animal health, and aggravate water mediated land degradation. The objectives of this study focused on determining livestock water productivity and investigating the effect of traditional livestock management patterns on sustainability of natural resource use in the Blue Nile Subbasin. Overall, livestock water productivity (LWP) was about 0.65 Birr/m3 of water under the traditional farming practices. LWP tended to increase proportionally with the volume share of crop residue in livestock feed. Communally owned and open unrestricted grazing land suffered most from erosive runoff events, with the concomitant sedimentation amounting to more than 40 t/ha at a slope of 15-25% by washing away pasture top soil. Traditional farming practices have evolved toward maximizing water use efficiency by exercising a double cropping pattern which takes advantage of residual moisture left after first cropping. This practice favors availability of more feed resources in the dry season, and thus contributes to increased livestock productivity. There is great opportunity to further increase LWP by implementing practical and relevant interventions that improve existing low levels of animal productivity. Media grab Livestock water productivity likely increases with an increase in the proportion of the volume share of crop residues in livestock feed to meet the annual requirement. Introduction In Ethiopia, the present level of livestock productivity is low. For instance, beef productivity (110 carcass kg/head) is about 25-30% lower than the average for East Africa (143 kg/head) (FAO, 1997). Milk production from indigenous cows ranges from 200 to 250 kg in a lactation period of 150-200 days. Mean carcass weight of small ruminants is 10 kg/animal. There is a vicious cycle of increasing human population leading to more intense pressure to convert pastures to cropland, and to raise livestock stocking rates by keeping larger numbers of animals on a unit area of land, to maintain rural incomes. This leads to natural resource degradation, which in turn reduces the capacity of the feed resources to support livestock and the people that rely on them. A great challenge for the country is therefore to change present agricultural production toward sustainable farming systems based on better natural resource management. Ethiopia is prone to water-mediated threats causing a high degree of soil erosion and land degradation (Degefu, 2003). Water supply services in Ethiopia are among the lowest in Africa. Only 19% of the country’s population and 11.5% of the rural population have access to safe water (Rahmatto, 1999). There is an urgent need for better water resource management and sustainable development. Livestock production in mixed crop-livestock production systems of Ethiopia has hardly been considered as an integral part of water resource development. Water development projects targeted at rural water supply and irrigation are inevitably impacted by livestock causing pollution of water and degradation of the natural resource around the water points. This paper investigates livestock water productivity under rain-fed agriculture, in which the bulk of animal feed comes from grazing of nonirrigated pasture and crop residues and by-products. Methods The study was carried out on-farm in Gumara watershed areas of the Blue Nile Basin to assess livestock water productivity and natural resource management in mixed crop/livestock production systems at community and household levels.

80
Livestock water productivity was assessed under three different cropping scenarios in mixed crop/livestock farming practices. The scenarios of mixed crop/livestock farming in the Gumara watershed for this particular study were: • Rice and niger seed-based (locally named ‘noug,’ (Guizotia abysinica) cropping complex that
dominates in the plain area at an altitude of 1700-1800/m; • Teff, finger millet, wheat, and maize-based cropping complex occupying the areas with
elevations between 1900 and 2300 m; and • Barley, wheat/triticale, and potato-based cropping complex that dominates ecologies with
elevations greater than 2400 m. Fifteen smallholder farmers were selected from each of the three strata to monitor livestock performance and services at household and community levels on a year-round basis. Crop and livestock production were monitored over a one-year period at household and community levels. Livestock water productivity was determined at household level by summing of benefits obtained from livestock per unit of water input used for all aspects of livestock production. The effect of different strategies of pasture management on natural resource use management was assessed under three distinct ownership regimes: 1) communally owned and open unrestricted grazing; 2) community owned pasture supported with local by-laws; and 3) privately owned enclosed pasture. Two distinct slope levels (<10%, 15-25%) were identified for each pasture land type. A 4 x 2 m2 plot was demarcated with iron sheet and a metal gutter at the lower end of the plot. This device was put at each slope level in three replications to measure runoff and sedimentation. All the plots were accessible for grazing, as was the surrounding grazing land being managed by the community itself. The collected data was subjected to statistical analysis in SAS. Results and discussion The barley-potato based cropping complex appeared to integrate sheep production more than other livestock as this is agroecologically favorable with increasing rural human population density (Table 1). Horses serve as the main source of draught power in this area. Cattle are kept in a larger number per household toward the plain area where rice-noug based cropping complex predominates. Farmers tend to keep all kinds of livestock in mixture in varying proportions. Hence, livestock production is an integral part of the mixed crop-livestock farming practice. Farmers tend to make a choice of livestock species deemed to be best adapted to the local context. Livestock productivity in Gumara watershed area was noticed to be suboptimal with milk yield ranging from 0.6 to 1.8 l/day and the average live-weight of mature cattle reaching about 210 kg/head. It is now essential to improve livestock productivity through introduction of multipurpose forage crops that help to increase quality feed production and minimize soil erosion. Moreover, the traditional livestock production must target at keeping few but more productive animals in accord with carrying capacity of the existing pasture. Table 1. Livestock holding of a household in different cropping systems of the mixed crop-livestock farming practices in Gumara watershed areas.
Cropping system Livestock holding at a household level TLU* Cattle heads Shoats Equine
Barley-potato based complex 3.6±0.3 4.2±1.6 14.4±4.5 2.37±2.1 Teff-finger millet–wheat based complex
3.7±0.2 7.7±1.8 5.5±2.4 1.9±1.7
Rice-noug based complex 3.0±0.3 9.1±1.6 4.0±2.2 1.2±2.1 SE = standard error. Livestock water productivity (LWP) In computing LWP benefits from livestock, milk production, carcass weight, draught use, and manure values per unit of water used for raising the mix of livestock species owned by a household. Virtual water in the crop residue was accounted for, with reference to its relative value to that of grain, based on local market prices. LWP tends to increase with an increase in the proportion of crop residues used to meet annual livestock feed requirements (Table 2). Overall LWP appeared to be 0.65 Birr/m3 of water input under traditional mixed crop/livestock farming in Gumara watershed area. The higher LWP under rice-noug based cropping complex (Table 2) can probably be explained by the double cropping practice that exploits the residual moisture after the end of the main rainy season. This practice favors the availability of more crop-residues as supplemental feed resources during dry season at times when feed supply becomes critical. The present estimate of LWP is derived empirically and appears a

81
little bit lower than that estimated by Peden et al. (2007). This lower estimate might be associated with subsistence-based livestock production in this area, unlike the situation described by Peden et al. (2007) in Awash Valley where marketing opportunities, through encouraging farmers to fatten beef and small ruminants around areas of sugar industries, might be related to better livestock productivity. Table 2. Livestock water productivity in different cropping systems of the mixed crop-livestock farming in the Blue Nile Basin. Cropping system Proportion of crop-residues
produced/annual feed requirement (%)
LWP (Birr*/m3)
Barley-potato based 28.7 0.60 Teff-finger millet–wheat based 31.6 0.54 Rice-noug based 56.8 0.82 Mean 39.0 0.65
*1USD = 9.76 Birr. Influence of livestock management on natural resources The impact of traditional livestock raising practices on aggravating runoff and soil erosion takes different scales and patterns, and depends on the ownership type and management of pasturelands. Communally owned and open unrestricted grazing management was found most susceptible to erosive runoff with the resulting sedimentation amounting to more than 40 t/ha at slopes of 15-25% (Table 3) during the main rainy season alone. There is considerable opportunity for improving this situation through altering the way communal grazing lands are managed and utilized. This particular case study shows that the level of soil erosion, measured as sediment load, was reduced by more than 60% on the same slope as a result of the changes in using community-based pastureland. These changes were communally agreed upon and supported with local by-laws. The present finding on soil loss from grazing pastures on flat lands is in agreement with the reports of Girma et al. (2002). The figures from grazing lands of 15-25% slopes are higher than those reported by Girma et al. (2002), particularly in open and unrestricted grazing lands, because of differences in terrain, stocking density, and rainfall intensity. Table 3. Runoff volume and sediment load of the main rainy season from pastures having different ownership patterns and slopes. Pastureland ownership pattern Slope of the
pastureland (%)
Runoff (m3/ha) Sediment load (t/ha)
Communally-owned and open unrestricted grazing
<10 10,125.0 26.3 15-25 12,825.0 45.27
Community-owned pasture supported with local by-laws
<10 3,307.5 7.84 15-25 4,927.5 14.24
Privately owned enclosed pasture
<10 1,147.5 1.65 15-25 1,687.5 3.39
SE± 607.5 1.47 Conclusions Livestock water productivity is likely to increase with an increase in the proportion of crop residues in meeting the total livestock feed requirements. Integrated mixed crop/livestock farming systems offer ample opportunity to improve upon the existing very low level of productivity per head of animal. Integrating suitable multipurpose forage crops with existing farming systems will help increase supply of nutritious livestock feed, improve fertility of crop lands and minimize erosion of top soil. Promotion of community-based initiatives for improving utilization of communal grazing lands will further increase LWP. These initiatives will focus on practical ways of increasing communal pasture productivity through renovation of degraded grazing land and alleviation of the overstocking problem. This would ultimately bring about increased livestock productivity in a sustainable manner.

82
Acknowledgments
This paper presents findings from PN37, ‘Nile Basin livestock-water productivity,’ a project of the CGIAR Challenge Program on Water and Food and from by the Comprehensive Assessment of Water Management in Agriculture. Finally, our thanks go to the farmers who participated in the on-farm project activities in the Gumara watershed, Blue Nile River Basin, Ethiopia. References Degefu, G.T. 2003. The Nile: Historical Legal and Developmental Perspectives. New York, USA. Pp.
429. FAO (Food and Agriculture Organization of the United Nations). 1997. Irrigation potential in Africa: A
basin approach. FAO Land and Water Bulletin 4. FAO, Rome, Italy. Girma, T., M. Saleem, A. Astatke, and W. Ayalneh. 2002. Effect of grazing on plant attributes and
hydrological properties in the sloping lands of the east African highlands. Journal of Environmental Management, 30(3):406-17.
Peden, D., T. Girma, and A.K. Misra. 2007. Water and livestock for human development. In: Molden
D. (ed.). Water for food, water for life: A Comprehensive Assessment of Water Management in Agriculture. London: Earthscan, and Colombo: International Water Management Institute. Pp. 487-514
Rahmatto, D. 1999. Water resource development in Ethiopia: Issues of sustainability and
participation. Forum for Social Studies, Addis Ababa, Ethiopia. Pp. 29.

83
Impacts of access to resources on water productivity: the case of the Blue Nile
A. Haileslassie1, S. Gebreselassie1, D. Peden1, T. Amede2, and K. Descheemaeker2
1International Livestock Research Institute (ILRI)
2International Livestock Research Institute/International Water Management Institute (IWMI)
Abstract Producing more product per unit of agricultural water used is a key for future food and environmental security. We report how access to productive resources (here referred as level of wealth and poverty), such as land and livestock, affects farmers’ management decisions and resultant water productivity (WP); and how in mixed crop-livestock systems, WP of crops and livestock complement each other. The mixed farming systems in the highlands of Blue Nile Basin (Gumera, Ethiopia) were selected. Farm data were collected from 180 randomly selected households, using a structured questionnaire. The sample farm households were stratified into three wealth categories (rich, medium, and poor) using a participatory wealth ranking method. New LocClim (version 1.06) was used to estimate evapotranspired water in producing animal feed and food-crops, and beneficial outputs of livestock and crop yields were calculated from primary data and empirical knowledge. Finally WP was estimated as ratio of beneficial outputs to water depleted. Our results indicated significantly lower WP values for the poor farm households. In view of the results, we concluded that poverty alleviation and fostering pro-poor intervention technologies must be part of strategies to ensure sustainable water use. Media grab CPWF research in Ethiopian Blue Nile River Basin suggests that poverty reduction and pro-poor water management technologies are fundamental to increase water productivity. Introduction In a recent global comprehensive assessment of water management in agriculture, Molden et al. (2007) emphasized the necessity and opportunity for increasing agricultural water productivity in sub-Saharan Africa as one means to reduce poverty and increase food security. In this context, increasing agricultural WP includes crops and livestock and is an effective means of intensifying agricultural production and reducing environmental degradation. The inclusion of livestock in WP concepts is relatively new, but like its counterpart, crop-water productivity (CWP), it is based on principles of water accounting (Molden et al., 2003). The CPWF project, Nile Livestock-Water Productivity (LWP), set out to integrate livestock use of and impact on Nile River water resources into the WP framework. Peden et al. (2007) developed an LWP assessment framework with the intent of understanding how livestock affect basin water resources in different production systems. This paper describes the application of this LWP framework in the mixed crop-livestock systems in the Gumera watershed (Blue Nile River Basin in Ethiopia). The discussion draws conclusions about the relationship between CWP and LWP, and tests the hypothesis that reducing poverty may lead to increased WP. Materials and methods Study area and farm survey Gumera watershed is situated on the northeastern escarpment of the Blue Nile Basin in the western Ethiopian Highlands. It covers an area of 1644 km2 with a considerable variation in soils and climate. Mixed crop-livestock farming systems are typical in Gumera. Depending on local agroclimatic conditions a variety of crops are grown. In the lower altitude ranges (1700-1806 m where flooding frequently occurs, rice (Oryza sativa) is the most important crop. Farmers usually practice relay cropping to make use of the residual moisture after the flood, and plant chickpea (Cicer arietinum) or rough pea (Lathyrus hirsutus). In the mid altitude range (~1800-2300 m) maize (Zea mays) and finger millet (Eleusine coracana) dominate the cropping pattern. There are also areas where teff (Eragrostis tef) and wheat (Triticum durum and Triticum aestivum) have significant coverage. On the high mountains (~2300-3700 m) cereals such as barley (Hordeum vulgare), pulses (e.g. faba bean, Vicia faba), and tuber crops such as potato (Solanum tuberosum) are important. Livestock are also important household ventures. Farmers manage different livestock groups in the Gumera watershed: cattle (e.g. Bos indicus), sheep (Ovis aries), goat (Capra hircus), horse (Equus caballus), and donkey

84
(Equus asinus). Livestock provide meat, milk, and energy. Manure fulfils an important role through nutrient cycling between and within farms, which enables the continued use of smallholder farms. Crop and livestock enterprises are complementary and competitive: complementary in the sense that livestock are a source of traction power, sources of organic fertilizer, and cash for inorganic fertilizer, whilst crop residues provide up to 30% of livestock feed sources. At the same time they are competitive for land and water. WP studies for crop-livestock systems in Ethiopia revealed strong variability across different spatial scales. To get more insight on how this variability is related to farm households’ access to resources and to capture interaction between the different farm enterprises (i.e. livestock and crops), nine Peasant Associations (PAs) covering the major systems of the Gumera watershed, were selected. Then, in each of the PAs, 20 farm households were randomly selected for interview (systematic-random sampling). Participatory wealth ranking methods were used to group those sample farms into three wealth categories (rich, medium, and poor–Haileslassie et al., 2007). Major criteria used in the wealth ranking exercises focused on productive resources such as arable landholding, oxen number, and other livestock group ownership. We used structured and pretested questionnaires to collect data on landholding, areas under different crops, type of crops cultivated, crop productivity, grazing land management, crop residue use, livestock holding, breed, livestock productivity, prices of livestock products, and services. Conceptualization and quantification of water productivity The concept of livestock and crop water productivity Generally, WP can be defined as the ratio of products and services to the amount of water depleted and degraded in producing these goods and services (in kg/m3, USD/m3, kj/m3 (Kijne et al., 2003)). For CWP, total dry or fresh biomass of harvested products and byproducts can be used as numerator. Frequently, the quantity of water depleted by evapotranspiration is used as the denominator. LWP concept is a relatively new idea, but like its counterpart CWP, it is based on principles of water accounting (Molden et al., 2003): it takes the values of livestock products and services as a numerator and water depleted and degraded in producing livestock feed as denominator. In this study only depleted water is considered. Quantification of depleted water and beneficial outputs of crops and livestock Penman-Monteith methods have been used successfully to estimate reference crop evapotranspiration as presented in New LocClim (version 1.06 (FAO, 2005)). In this study, the same procedures were applied. We used either quantities of grain and tubers or their financial values (as a denominator) to estimate the CWP. In the denominator we used the evapotranspired water during crop growth period. To relate crop evapotranspiration (ETc, mm/day) to ETO and to calculate evapotranspired water from the different crops, private and communal grazing lands, literature values of the crop coefficients (Kc) were used. Then, the amount of water that goes to the grain and (as a residue) to livestock compartment was separated using harvest index of the different crops. Part of the evapotranspired water that goes to the residues was used as denominator for LWP estimation. We focused on products and services of livestock reported by the sample farm households. To quantify those products and services, total livestock populations of each household were converted to Tropical Livestock Unit (TLU) using a conversion factor of 0.79 for cattle, 0.1 for sheep and goats, and 0.66 for equines (Haileslassie et al., 2007). Dung production was calculated using dry weight daily dung production of 3.3 kg/day/TLU for ruminants and 2.4 kg/day for equines (Haileslassie et al., 2007). The nutrient value of manure was calculated based on literature sources and converted to fertilizer equivalent monetary values (e.g. Lupwayi et al., 2000; Haileslassie et al., 2007). Annual milk production was estimated as a function of: number of lactating cows, lactation period and milk production in liters/day/ cow and this was converted to monetary values. We estimated meat production using parameters such as: off-take rate, carcass weight, and average slaughter age for different livestock species and applied a similar procedure to estimate the values of hides and skins. Traction power is the key livestock’s beneficial output as reported by farm households in the Gumera watershed. We collected data on the daily hiring cost of draft animals (e.g. oxen) and number of working days/year spent for plowing, threshing, and transport in every sample farm household. All statistical analyses such as one-way analysis of variance (ANOVA) and correlations were performed with SPSS 12 for windows.
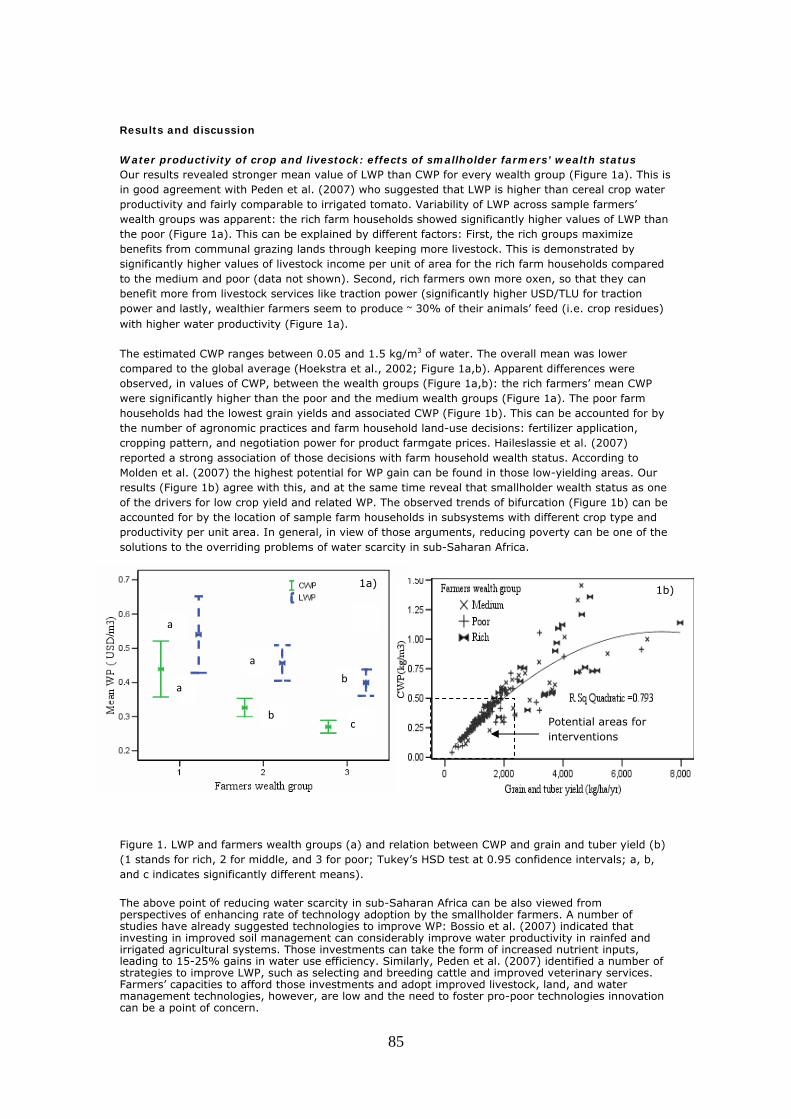
85
Results and discussion Water productivity of crop and livestock: effects of smallholder farmers’ wealth status Our results revealed stronger mean value of LWP than CWP for every wealth group (Figure 1a). This is in good agreement with Peden et al. (2007) who suggested that LWP is higher than cereal crop water productivity and fairly comparable to irrigated tomato. Variability of LWP across sample farmers’ wealth groups was apparent: the rich farm households showed significantly higher values of LWP than the poor (Figure 1a). This can be explained by different factors: First, the rich groups maximize benefits from communal grazing lands through keeping more livestock. This is demonstrated by significantly higher values of livestock income per unit of area for the rich farm households compared to the medium and poor (data not shown). Second, rich farmers own more oxen, so that they can benefit more from livestock services like traction power (significantly higher USD/TLU for traction power and lastly, wealthier farmers seem to produce ~ 30% of their animals’ feed (i.e. crop residues) with higher water productivity (Figure 1a). The estimated CWP ranges between 0.05 and 1.5 kg/m3 of water. The overall mean was lower compared to the global average (Hoekstra et al., 2002; Figure 1a,b). Apparent differences were observed, in values of CWP, between the wealth groups (Figure 1a,b): the rich farmers’ mean CWP were significantly higher than the poor and the medium wealth groups (Figure 1a). The poor farm households had the lowest grain yields and associated CWP (Figure 1b). This can be accounted for by the number of agronomic practices and farm household land-use decisions: fertilizer application, cropping pattern, and negotiation power for product farmgate prices. Haileslassie et al. (2007) reported a strong association of those decisions with farm household wealth status. According to Molden et al. (2007) the highest potential for WP gain can be found in those low-yielding areas. Our results (Figure 1b) agree with this, and at the same time reveal that smallholder wealth status as one of the drivers for low crop yield and related WP. The observed trends of bifurcation (Figure 1b) can be accounted for by the location of sample farm households in subsystems with different crop type and productivity per unit area. In general, in view of those arguments, reducing poverty can be one of the solutions to the overriding problems of water scarcity in sub-Saharan Africa. Figure 1. LWP and farmers wealth groups (a) and relation between CWP and grain and tuber yield (b) (1 stands for rich, 2 for middle, and 3 for poor; Tukey’s HSD test at 0.95 confidence intervals; a, b, and c indicates significantly different means). The above point of reducing water scarcity in sub-Saharan Africa can be also viewed from perspectives of enhancing rate of technology adoption by the smallholder farmers. A number of studies have already suggested technologies to improve WP: Bossio et al. (2007) indicated that investing in improved soil management can considerably improve water productivity in rainfed and irrigated agricultural systems. Those investments can take the form of increased nutrient inputs, leading to 15-25% gains in water use efficiency. Similarly, Peden et al. (2007) identified a number of strategies to improve LWP, such as selecting and breeding cattle and improved veterinary services. Farmers’ capacities to afford those investments and adopt improved livestock, land, and water management technologies, however, are low and the need to foster pro-poor technologies innovation can be a point of concern.
1a)
a
a
b
a
c
b
1b)
Potential areas for interventions

86
Relation between crop and livestock water productivity: implications for land rehabilitation The relation between CWP and LWP and LWP and arable landholding size is shown in Figure 2a and 2b. In Figure 2a, LWP decreases with increasing CWP for relatively low CWP. After a certain turning point the two variables relate positively. It can be argued that the low CWP is an indicator of low crop yields associated with land degradation such as nutrient mining. It is also noticeable that some areas of the Gumera watershed are not suitable for crop production due to terrain structure. Theoretically, both circumstances can lead to a shift in land use (marginalized arable land to grazing area) and farmers’ livelihood strategies (e.g. livestock focused). This relation can be clearly observed from Figure 2a. In general these processes describe the negative relation between CWP and LWP. More interesting is the case where both LWP and CWP increase. This trend might not be the result of increases in livestock beneficial outputs. It is explained by the fact that a significant amount of crop residues, produced with better water productivity, is transferred to the livestock enterprise. In view of enhancing sustainable crop-livestock systems, intensification of these complementarities can be a good opportunity. The challenge is, however, to bring changes in areas of negative LWP and CWP relations, where important parts of our observations lie (Figure 2b). Peden et al. (2007), suggested a number of scenarios including land rehabilitation. Figure 2. Relations between LWP and CWP (a) and arable land size of farm households and LWP (b). Conclusions and recommendations This study explores how farm wealth status affects WP, and to see complementarities and competitiveness between CWP and LWP. In view of the results, it is concluded that level of wealth of smallholder farmers is one of the causes of low WP. This means also that ability of farmers to pay for improved livestock, land, and water management technology is an important determinant of whether farmers will adopt it or not. Therefore, empowering the poor to implement those strategies and use water more effectively, should receive priority in measures to combat unsustainable water management practices. It is also realized that intensification of uses of the available natural resources in these areas increases overall system productivity. This will obviously enhance the complementarities of the crop and livestock compartments of a farm. Acknowledgments This paper presents findings from PN 37, ‘Nile River basin livestock-water productivity,’ a project of the CGIAR Challenge Program on Water and Food (CPWF). The authors are grateful to CPWF and sample farm households for unreserved willingness to provide information.
2b) 2a)
Desired trend

87
References Bossio, D., C.W, William, K. Geheb, G. Van Lynden, and B. Mati. 2007. Conserving land and protecting
water. In Water for Food, Water for Life: A Comprehensive Assessment of Water Management in Agriculture., D. Molden (ed.) 551-83. London: Earthscan.
FAO. 2005. Local climate estimator (New LockClim 1.06). Rome: Food and Agricultural Organization of
the United Nations. Haileslassie, A., J. Priess, E. Veldkamp, and J.P. Lesschen. 2007. Nutrient flows and balances at the
field and farm scale: exploring effects of land-use strategies and access to resources. Agricultural System, 94: 459-70.
Kijne, J.W., R. Barker, and D. Molden (eds.). 2003. Water Productivity in Agriculture: Limits and
Opportunities for Improvement. Comprehensive Assessment of Water Management in Agriculture Series 1. Wallingford: CABI.
Lupwayi, N.Z., M. Girma, and I. Haque. 2000. Plant nutrients of cattle manures from small-scale
farms and experimental stations in the Ethiopian Highlands. Agric. Ecosyst. Enriron. 78: 57-63.
Molden, D., T.Y. Oweis, P. Steduto, J.W. Kijne, M.A. Hanjara, and P.S. Bindrban. 2007 Pathways for
increasing agricultural water productivity. In Water for Food, Water for Life: A Comprehensive Assessment of Water Management in Agriculture. D. Molden (ed.) 280-310. London: Earthscan.
Molden, D., H. Murray-Rust, R. Sakthivadivel, and I. Makin. 2003. A water-productivity framework for
understanding and action. In Water Productivity in Agriculture: Limits and Opportunities for Improvement. Comprehensive Assessment of Water Management in Agriculture Series 1. J.W. Kijne, R. Barker, and D. Molden (eds.) 1–18. Wallingford: CABI.
Peden, D., G. Taddesse, and A.K. Misra. 2007. Water and livestock for human development. In Water
for Food, Water for Life: A Comprehensive Assessment of Water Management in Agriculture. D. Molden (ed.) London: Earthscan.

88
Estimation of livestock, domestic use, and crop water productivities of
SG-2000 Water Harvesting Pilot Projects in Ethiopia
M. Tulu1, E. Boelee2, G. Taddesse3, D. Peden3 and D. Aredo4
1Bahir-Dar University, Bahir-Dar; 2International Water Management Institute, Addis Ababa; 3International Livestock Research Institute, Addis Ababa; 4Sasakawa Global-2000, Addis Ababa,
Ethiopia [email protected] Abstract The quantification of water productivity of each activity in agriculture is important to improve the allocation of scarce water resources and the efficiency of their use. The major objective of this paper is to estimate the water productivity of domestic use, livestock, and crops in Sasakawa Global-2000 (SG-2000) water harvesting pilot projects in Ethiopia. The research work was entirely based upon secondary data obtained from various organizations and publications. Water productivity was calculated using simple arithmetic methods and values of parameters from various sources. Water productivity of livestock, domestic use, and crop production was estimated at US$4.82, 25.06, and 0.95/m3 of water, respectively (1US$ = 8.5 Ethiopian Birr (ETB) in 2008). To show the scarcity value of water or the opportunity cost of investment in water development, these productivity values were recalculated taking the value of water in rural areas as the denominator. The resulting productivity magnitudes for livestock, domestic use, and crop water were, respectively, US$1.60, 8.50, and 0.32/dollar of water. The results show that water used for domestic purposes and livestock generated positive gross returns for rural households in the study areas. Media grab In household-level water harvesting systems in Ethiopia, water productivity was greatest for domestic water use, though the investment was initially aimed at agriculture and domestic use is overlooked by planners. Providing sufficient water for rural people helps to eradicate poverty in Ethiopia. Introduction The negative impacts of water scarcity on agricultural production and health are pronounced in developing countries because they lack sufficient resources to adopt appropriate technologies to mitigate these problems. Natural occurrences such as drought, desertification, climate change, influences of human activities in agriculture, population growth, deforestation, and land use changes constitute the major causes of increasing scarcity and decreasing quality of fresh water. As the scarcity of water worsens, the production of food may decline while the population continues to increase in developing countries. Under these circumstances the ever-increasing demand for food must be met by increasing the productivity of water and land, which are scarce resources in arid and semiarid areas. Many development projects intended to alleviate poverty in developing countries concentrate on water mobilization, such as irrigation projects aimed at crop production. In the agricultural sector, however, there are complementary activities that are important for eradicating poverty in developing countries. Thus it is important to quantify the magnitude of benefits and to increase awareness of policymakers to the benefits derived from any water investment. The major objective of this study is to estimate water productivity of livestock, domestic use, and crop production in several pilot water harvesting projects in Oromia and southern regions of Ethiopia. People in the study areas practiced a mixed crop-livestock farming system in which the major income source is crop production using traditional methods of cultivation. The average family size was eight and most households cultivated 1.8 ha or less. Most beneficial households had their own livestock with an average herd size of 11 cattle. Most households (72%) in the study areas used open grazing as the main source of cattle feed. Each household in the study area had its own water harvesting structure in the homestead. The harvested water was used for livestock, domestic uses, and crop production. Many of the households (77%) irrigated 0.03 to 1.5 ha of their own land.

89
Methods The empirical analysis was based on the census data obtained from the baseline survey on water harvesting pilot projects conducted in July 2006 by the nongovernmental organization SG-2000 in Oromia and Southern Regions of Ethiopia. In addition, other sources of information were used, such as the International Livestock Research Institute (ILRI), the International Water Management Institute (IWMI), Ethiopia’s Central Statistical Authority (CSA), Ministry of Agriculture, Oromia Irrigation Development Authority, Oromia Health Bureau, and Ministry of Finance and Economic Development. The productivity analysis was done using simple arithmetic methods. To measure the productivity of any input used in production, usually the value of total output per unit of input is calculated. Water productivity can be calculated with the formula
WP = sum of values of all outputs produced using water as input. quantity of water depleted in the production
The data of the numerator of the WP equation were collected as gross value of output (GVO) and not in the form of the net value of output (NVO) because of the availability of data. Livestock water productivity (LWP) LWP can be defined as the sum of beneficial outputs of livestock per total depleted and degraded water in livestock production. Depleted water is the amount of water that is used for feed production, washing, drinking, and barn management. Degraded water, on the other hand, is contaminated water not suitable for further use due to pollution (Molden at al., 2003). In this study, the amount of depleted water included only water depleted in the production of feed (crop residues and grass) and drinking. Water used for animal washing, barn management, and polluted water were not considered due to lack of data. LWP was calculated with the following formula, where i represents different livestock products and services (Molden et al., 2003).
LWP = ∑=
n
i waterdepletedofquantityiservicesandproductslivestockofvalue
1
.
The numerator is the sum of the values of the product and services of farm animals such as milk, meat, hides and skin, manure, animal power (plowing and thrashing), and transport. The amount of water depleted to produce those outputs and the amounts of outputs that can be produced from a given population of livestock were calculated using the parameters estimated by Asrat et al. (2006) and Pallas (1986, in Peden et al. 2005). The water requirements for crop residues and grass for 1 tropical livestock unit (TLU) are 136 and 1557 m3/year, respectively (Asrat et al., 2006). According to Pallas (1986, in Peden et al., 2005) the voluntary daily water intake (liter/TLU) in the dry season with an average temperature of 27°C is 27.1 l/TLU/day for cattle, 40 for sheep and goats, 21.9 for camels, and 27.4 for donkeys. To avoid double counting the water requirements for crop residues were excluded from the calculation of LWP, because these were incorporated in the estimation of crop water productivity below. Domestic water productivity (DWP) Domestic use included water used for drinking, cooking, bathing, washing clothes and utensils, food processing, house construction, and production of handcrafts. We used the WHO estimate of 20 l/capita/day as a basic requirement of water for moderate health in poor developing countries (Howard and Bartram, 2003). This was divided between drinking (3 l), cooking (2 l) and 15 l for personal hygiene. The value of the numerator of the DWP equation is also based on parameters obtained from other sources (especially CSA, 2005). Thus,
DWP = sum of all domestic outputs produced using water as input quantity of water depleted in domestic production
The activities and outputs included in domestic use of water were: (1) drinking, bathing, laundry, washing utensils, and food processing, which together give an output of improved health (better hygiene and sanitation); (2) cooked foodstuffs; (3) brewed local drinks; (4) mud plaster or bricks made for construction; and (5) produced handicrafts.

90
Crop water productivity (CWP) The total amount of water harvested in a given period of time is equivalent to the sum of water used for livestock, domestic use, crop production, and losses. Since each household used 53.2 m3/year (22%) for livestock and 19.4 m3/year (8%) for domestic uses, and assuming 252 m3 (10%) is lost due to seepage, then from the total harvested water in a year, the water available for crop production would be 1512 m3 (60%). Based on information from SG-2000 we can safely assume that all this water was in fact used for the production of vegetables and other crops. The CWP is calculated using the usual formula but the denominator is not the magnitude of the crop water requirements, but the amount of water left in the reservoirs for vegetables and crop production after livestock and domestic use and losses. Hence the value of CWP assumed that rainfall was not used for the production of crops. Even if we consider the opportunity cost of rainfall in production it would not change the value of CWP since the price of rain is zero.
irrigationforavailiablewaterofAmountplotsirrigatedongrowncropsothervegetablesofvaluesalesTotalCWP &
= .
To see the opportunity cost of water in alternative uses (the value of water sacrificed to produce the given level of output), we used the price of water in the study area which is US$2.94/m3. Then using the equations but changing the denominators into value, we obtained the gain from each activity (LWPm, DWPm and CWPm) in terms of per unit of money devoted to supply the resource-water. Results and discussion The results of the study show average water productivities of US$4.82/m3 of water for livestock, 25.06 for domestic uses, and 0.95 for crops. In terms of the monetary value of the resource LWPm, DWPm and CWPm, constitute US$1.60, 8.50, and 0.32/dollar of water, respectively. In terms of both measures, domestic water productivity (DWP) is highest, followed by LWP, while CWP the lowest. Previous estimates of LWP in Ethiopia were calculated to be between US$ 0.25, and 0.31/m3 (Ayalneh et al., 2004), much lower than the value of US$4.82/m3 that we found. This difference may be caused by differences in market access, availability and cost of feed, cattle breeds, and level of education of farmers. It is remarkable that while crop production appeared infeasible in terms of CWPm
(US$0.32/US$), farmers were still growing crops. A probable reason for this is that water harvesting structures are highly subsidized investments in Ethiopia, while capital investments for livestock are much less accessible to poor farmers. Conclusions and recommendations Water productivity from domestic uses and livestock are found satisfactory and attractive. Even if the water productivity of one sector is higher than the other, however, it would be very difficult to recommend that households use water only for activities that have high WP values. In daily rural life the three sectors (livestock, domestic use, and crop production) are complementary and necessary. This is illustrated by the fact that regardless of the lower CWP, farmers in the study areas have widely used the harvested water for horticultural and other crop production. The high values of domestic water productivity are most relevant to planners and policymakers as the importance of domestic use of water to the contribution of the overall output of households are often overlooked. Providing citizens with the minimum amount of water for drinking and other domestic purposes could have a spillover effect on all other activities in a household. In areas where health problems are serious, sufficient water for hygiene and sanitation can play an important role in getting people out of poverty. Though the main objective of introducing water harvesting technologies in the study areas was to secure food through irrigation practices, the importance of domestic use of water was clearly shown by its high water productivity values. The implication is that water development investments such as water harvesting and even irrigation projects should be designed in such a way as to ensure multiple use water services that improve the welfare of farmers in rural Ethiopia. Thus, an integrated approach toward the systematic development of multiple use water services (MUS) could be a major strategy to alleviate rural poverty.

91
Acknowledgments This paper presents findings from PN37 ‘Livestock Water Productivity in the Nile Basin’ and also contributes to PN28 ‘Multiple Water Use,’ both projects of the CGIAR Challenge Program on Water and Food. The paper is the result of an internship program of the first author to complete an MSc in Environmental Science, Wageningen University, the Netherlands, supported by ILRI and IWMI in Addis Ababa, Ethiopia. We also thank Ato Wagnew Ayalneh, Dr. Amare Haileselassie, Ato Solomon Gebreselassie and Ato Michael Asrat from ILRI for their valuable discussions and support in the research process. References Asrat, M., D. Peden, D. Molden, G. Taddesse, A. Haileselassie, and T. Gidyelew. 2006. Spread sheet
model to assess livestock water productivity in the Nile River Basin, Ethiopia. (unpublished) International Livestock Research Institute, Addis Ababa, Ethiopia.
Ayalneh, W., A. Astatke, R. Puskur, D. Peden, and G. Taddesse. 2004. Livestock water productivity in
four community-based small scale irrigation schemes in the Awash Basin of Ethiopia. International Livestock Research Institute, Addis Ababa, Ethiopia.
CSA. 2005. Retail prices of goods and services (annual average prices July 2004-June 2005),
Statistical Bulletin No. 345, Central Statistical Authority, Addis Ababa, Ethiopia. Howard, G., and J. Bartram. 2003. Domestic water quantity, service level and health. World Health
Organization, Geneva, Switzerland. Molden, D., H. Murray-Rust, R. Sakthivadivel, and I. Makin. 2003. A water-productivity framework for
understanding and action. In Water productivity in agriculture: limits and opportunities for improvement. J.W. Kijne, R. Barker, and D. Molden (eds.). CABI Publication, Wallingford UK and Cambridge MA, USA.
Peden, D., A. Freeman, A. Astatke, and A. Notenbaert. 2005. Investment options for integrated water-livestock-crop production in sub-Saharan Africa, a contribution by ILRI: A report prepared by IWMI for a collaborative program of NEPAD, African Development Bank, FAO, IFAD, and the World Bank.

Cost-effective Assessments of Livestock-water Productivity Using Previous Animal Feeding Trials
S. Gebreselassie1, D. Peden1, A. Haileslassie1, D. Mpairwe2
1International Livestock Research Institute (ILRI), , Addis Ababa, Ethiopia ([email protected])
2Makerere University, P.O. Box 7062, Kampala, Uganda
Abstract
Assessments of Livestock Water Productivity (LWP) require land, water, livestock, and climatic data. Thus it is claimed to be time consuming and expensive. In this paper we report the results of a study on the effects of feed, age and weight on LWP using previous feeding trial data at ILRI Debre Zeit, Ethiopia. In the feeding trials, various feed types were combined with different proportions to make 16 unique rations. These were fed to experimental animals of different age, and weight. We estimated the LWP as the ratio of livestock products and services to the depleted water in producing these feeds. There were apparent differences in values of LWP across feed types, age and weight of experimental animals. The value of LWP tends to increase with increasing age and weight of dairy cows. There were also significant impacts of feed composition on LWP values. The highest LWP values were observed for oats, vetch and wheat bran mixes. This paper, therefore, provides an insight of the conversion effectiveness of some feed types. In conclusion, optimal feed composition and better herd management can be adapted to enhance LWP. We also found that using existing experimental data in identifying system specific strategies, for sustainable water use, is a cost-effective approach.
Media Grab
Changing dietary composition of animals’ feeds may help increase the water productivity of animal
source food consumed by people. Introduction
One of the major challenges facing global agriculture is to sustainably increase food production
without depleting more agricultural water. Increasing agricultural water productivity is therefore a priority issue. Crop-water productivity (CWP) is the ratio of economic or biological yield of a crop to the total amount of water depleted including evaporation, transpiration and discharge. From an agricultural water productivity perspective, livestock use of and impact on water resources has been largely neglected (Peden et al. 2007). The concept of LWP like its counterpart, CWP, is based on principles of water accounting and its applications to a controlled animal feeding trial is costly and time consuming. Yet, there is a need to assess LWP for many species of livestock, in diverse production systems and with numerous combinations of feeds and forages to obtain a global understanding of animals’ demands for water and how livestock use of water can be effectively minimized. Peden et al. (2007) identified several strategies for increasing LWP. They include strategic sourcing of animal feeds composed of highly water productive vegetation and enhancing animal production. Many traditional animal feeding trials have been conducted previously, but they were not designed to assess LWP. This paper summarizes a methodological approach to cost-effectively using existing feeding trial data and case study results on the effects of feed composition, age and weight on LWP (Mpairwe 1998). Methodology
In light of the need to estimate actual water productivity in cost effective way, the work was
undertaken by re-analyses of feed trial data sets that had already been documented in ILRI’s Debre Zeit field stations for other purposes (Mpairwe 1998). Estimating the beneficial outputs The beneficial outputs considered for this study are milk, meat, manure and traction. Production and values of these outputs were estimated from the experimental data and past literature values.
92

93
Animal feed water requirements
As major components of the feed, these trails were crop and crop by products and we follow procedures of Crop Water Requirement (CWR) to estimate the water requirements of animal feeds (feed crop water requirement (FCWR)) used in the experiment. Crop water requirements are normally expressed by the rate of evapotranspiration (ET). The evaporative demand can be expressed as the reference evapotranspiration (ETo) which predicts the effect of climate on the level of crop evapotranspiration. Empirically-determined crop coefficients (Kc) can be used to relate ETo to crop evapotranspiration (ETc) when water supply fully meets the water requirement of the crop (Smith 2000). The value of kc varies with crop and development stage.
Stepwise calculation of Crop Water Requirement (CWR):
i) Crop Evapotranspiration (ETc) (mm/day) = ETo * Kc (1)
ETo (mm) = Estimated using pan evaporation (using meteorological data obtained from D/Zeit met station)
Kc=Crop coefficient for each crop type is obtained from FAO data base (FAO 1992)
ii) Crop Water Requirement (CWR) = ETc * Growing period * area planted (2)
Computation of livestock water productivity
Livestock water productivity, (Peden et al. 2007), will depend on the livestock benefits derived from livestock to the amount of water depleted for the production of different livestock products/outputs.
depletedWater
outputsBeneficialLWP
∑
∑= (3)
Results
Table 1. presents LWP value of dairy cows by the type of feed they were fed during the experimental period. Accordingly animals which were fed with Oats vetch+.9lablab +3.75wheat bran and maize lablab+.5 lablab +3.75wheat bran had the highest LWP value (0.64 US$/m3). On the other extreme side, those fed with oats + vetch + adlibitum had the lowest values of LWP (0.27 US$/m3).
Feed Type1 FCWR
(m3)
Milk Meat Manure Total LWP
(US$/m3)
Maize lablab adlibitum 5441 828 688 2 1518 0.28
Maize lablab + .5 lablab 3796 872 722 3 1596 0.42
Maize lablab + .5 lablab+1.25 wheat bran
3777 966 714 2 1682 0.44
Maize lablab + .5 lablab+2.5 wheat bran 3511 1096 740 3 1839 0.52
Maize lablab + .5 lablab +3.75 wheat bran
3036 1191 754 3 1948 0.64
Maize lablab + .4 lablab 5509 867 713 2 1583 0.29
Maize lablab + .8 lablab 4779 719 744 2 1466 0.31

94
Table 1. Effect of feed source on livestock production and water productivity expressed as US dollars.
1The numbers given along with the feed types (except wheat bran) in the table indicate the amount of that feed type fed as percentage of the total body weight of the animal under the experiment. However, the numbers before the wheat bran is the graded level (kg dry matter). The feed types without figures were fed adlibitum (Mpairwe 1998).
Table 2 below shows LWP by age group of cows under the feeding experiment. The result shows that there is positive relation between age and values of LWP: an increase in the age of cows’ results in increase in LWP values. We found the lowest (0.34 US$/m3) for cows less than five years and it increased to as high as 0.41 US$/m3 for those cows in the age category of 8 years and above.
Table 2. Effects of age of dairy cows on values LWP expressed as US dollars
Probability is based on General Linear Model (GLM) procedure using t test (LSD); along columns, means with the same letter are not significantly different at p < 0.05.
In addition to improved nutritional quality, selection of improved breeds and species of livestock that are more productive or better adapted to agro-environmental conditions, improved animal health and appropriate herd structure and management are suggested as strategies to improve LWP. Table 3 demonstrates effects of weight of dairy cows on values LWP (categorised in four weight groups). The result indicated that increase in weight of animal results in increased in values of LWP: i.e. LWP value is lowest (0.32 US$/m3) for lower weight groups (300-350).
Maize lablab + 1.2 lablab 4025 735 775 2 1512 0.38
Oats vetch adlibitum 5279 687 722 2 1411 0.27
Oats vetch + .9 lablab 3936 907 737 2 1646 0.42
Oats vetch + .9 lablab +1.25 wheat bran
3437 992 688 2 1683 0.49
Oats vetch + .9 lablab +2.5 wheat bran 3125 1086 677 2 1765 0.56
Oats vetch + .9 lablab +3.75 wheat bran
2937 1118 775 3 1895 0.64
Oats vetch + 0.4 lablab 4989 858 722 2 1582 0.32
Oats vetch + 0.8 lablab 5150 823 756 2 1581 0.31
Oats vetch + 1.2 lablab 4451 865 735 2 1602 0.36
Age categories
FCWR (m3)
Milk Meat Manure Total LWP
(US$/m3)
<5 yrs 4497 782a 731a 2 1515 0.34
5-7 yrs 4202 894b 722a 2 1619 0.39
> 8 yrs 4263 993c 759b 3 1755 0.41
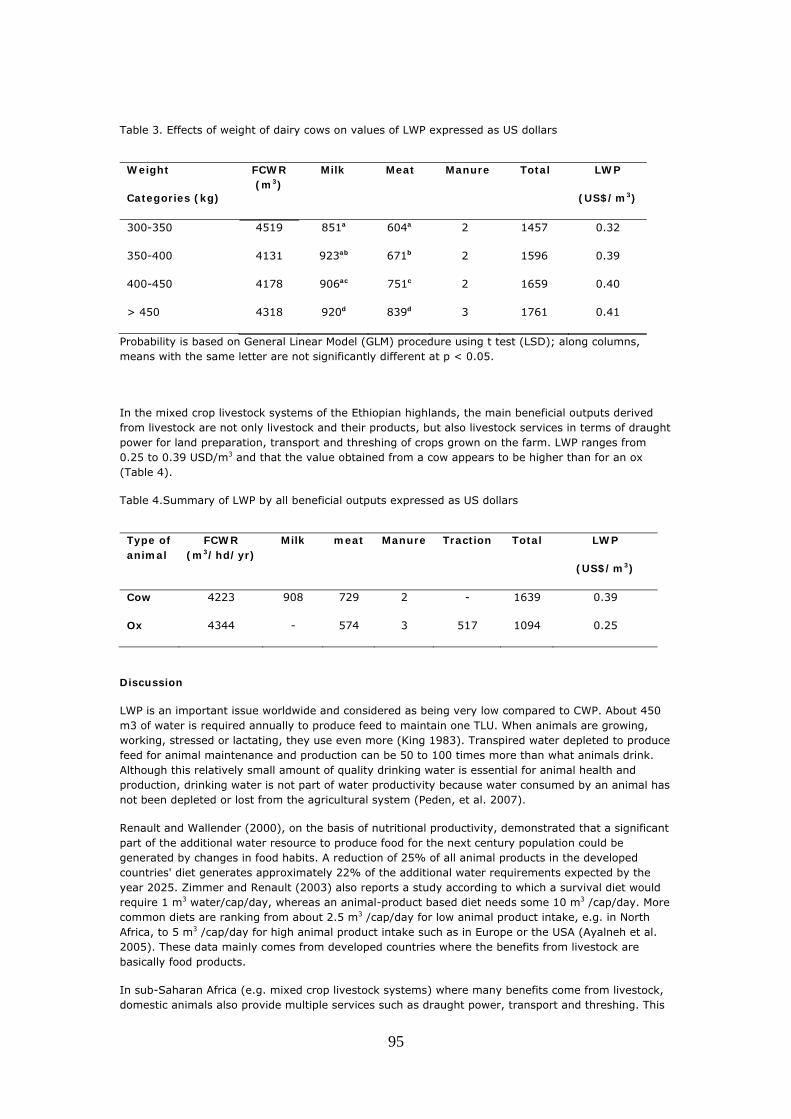
95
Table 3. Effects of weight of dairy cows on values of LWP expressed as US dollars
Weight
Categories (kg)
FCWR (m3)
Milk Meat Manure Total LWP
(US$/m3)
300-350 4519 851a 604a 2 1457 0.32
350-400 4131 923ab 671b 2 1596 0.39
400-450 4178 906ac 751c 2 1659 0.40
> 450 4318 920d 839d 3 1761 0.41
Probability is based on General Linear Model (GLM) procedure using t test (LSD); along columns, means with the same letter are not significantly different at p < 0.05.
In the mixed crop livestock systems of the Ethiopian highlands, the main beneficial outputs derived from livestock are not only livestock and their products, but also livestock services in terms of draught power for land preparation, transport and threshing of crops grown on the farm. LWP ranges from 0.25 to 0.39 USD/m3 and that the value obtained from a cow appears to be higher than for an ox (Table 4).
Table 4.Summary of LWP by all beneficial outputs expressed as US dollars
Type of animal
FCWR (m3/hd/yr)
Milk meat Manure Traction Total LWP
(US$/m3)
Cow 4223 908 729 2 - 1639 0.39
Ox 4344 - 574 3 517 1094 0.25
Discussion
LWP is an important issue worldwide and considered as being very low compared to CWP. About 450 m3 of water is required annually to produce feed to maintain one TLU. When animals are growing, working, stressed or lactating, they use even more (King 1983). Transpired water depleted to produce feed for animal maintenance and production can be 50 to 100 times more than what animals drink. Although this relatively small amount of quality drinking water is essential for animal health and production, drinking water is not part of water productivity because water consumed by an animal has not been depleted or lost from the agricultural system (Peden, et al. 2007).
Renault and Wallender (2000), on the basis of nutritional productivity, demonstrated that a significant part of the additional water resource to produce food for the next century population could be generated by changes in food habits. A reduction of 25% of all animal products in the developed countries' diet generates approximately 22% of the additional water requirements expected by the year 2025. Zimmer and Renault (2003) also reports a study according to which a survival diet would require 1 m3 water/cap/day, whereas an animal-product based diet needs some 10 m3 /cap/day. More common diets are ranking from about 2.5 m3 /cap/day for low animal product intake, e.g. in North Africa, to 5 m3 /cap/day for high animal product intake such as in Europe or the USA (Ayalneh et al. 2005). These data mainly comes from developed countries where the benefits from livestock are basically food products.
In sub-Saharan Africa (e.g. mixed crop livestock systems) where many benefits come from livestock, domestic animals also provide multiple services such as draught power, transport and threshing. This

96
multiple use, by itself, implies an increased LWP. Peden et al. (2007) also clearly indicated that LWP in sub-Saharan African can be significantly improved if farmers can adapt strategies like switching to feed sources with higher WP, using crop residues and by products as a feed, encouraging more efficient grazing, using improved breeds and heard management strategies. Our results from one case study in Ethiopia suggest that strategic feed sourcing and giving high emphasis in improving the quality of feed can help increase LWP. But at the same time, this study underlines the need for disaggregating of those strategies and has close observation on the age and weight structure of animals for effective improvements of LWP.
Conclusions and recommendations
The findings from this work indicate some strategies and technological options such as use of more water productive feed producing vegetation, better heard management (appropriate heard structure such as age and weight, etc.) that should be taken into account to enhance LWP. LWP appears to be higher in large cattle than smaller ones with in the breeds used in this study. For cows, dairy production contributes more than half of the benefits derived from them. For oxen, traction power appears to be equally important to meat production. In Africa, livestock have higher water productivity than reported in developed countries because they provide multiple benefits and much of the feed that they consume is derived from crop residues and by products that have relatively high levels of feed crop water productivity. Overall, generalizations about the inefficient use of water resources for livestock production in developing countries can be misleading. In contrast, LWP in mixed crop-livestock systems appears to compare favourably with crop production. Such generalization can be disaggregated and system specific strategies can be formulated by using existing experimental data in more cost effective way. This case study also confirms that great opportunities exist to cost-effectively assess LWP in situation where appropriate previous animal feeding trial data exist, but more case studies are needed to validate the global applicability of our research results.
1.2 Acknowledgements
This paper presents findings from PN37 ‘Nile basin Livestock water productivity’, a project of the CGIAR Challenge Program on Water and Food.
Literature cited
Ayalneh, W., A. Astatke, K. Sonder, R. Puskur, D. Peden, and G. Tadesse. 2005. Livestock water productivity of four community-based small-scale irrigation schemes in the Upper Awash River Basin of Ethiopia. International Livestock Research Institute. pp. 15.
FAO (Food and Agriculture Organization). 1992. CROPWAT, a computer program for irrigation planning and management. Author, Smith M. Irrigation and Drainage Paper 46, Rome, Italy.
King, J. 1983. Livestock water needs in pastoral Africa in relation to climate and forage. Nairobi: International Livestock Research Institute.
Mpairwe, D. 1998. Integration of forage legumes with cereal crops for improved grain yield, forage production and utilization for smallholder dairy production systems. PhD dissertation, Makerere
University, Uganda.
Peden, D., G. Taddesse, A.K. Misra. 2007. Water and livestock for human development. In Molden, D. (Ed), Water for food, water for life: A comprehensive assessment of water management in agriculture. London: Earthscan and Colombo: International Water Management Institute.
Renault D., and W. Wallender. 2000. Nutritional water productivity and diets. Agricultural
Water Management. 45:275–296.
Zimmer, D., and D. Renault. 2003 ‘Virtual water in food production and global trade: Review of methodological issues and preliminary results’ In Virtual water trade, proceedings of the international expert meeting on virtual water trade, value of water. Research report series no. 12, The Netherlands.

97
Why gender matters: reflections from the livestock-water productivity research project
Everisto Mapedza1, Tilahun Amede1,2, Kim Geheb1, Don Peden2, Eline Boelee1, Tegegne Sewmehon Demissie3, Esther van Hoeve, and Barbara van Koppen1
1International Water Management Institute (IWMI), 2International Livestock Research Institute (ILRI)
3ARARI and Bonn University. [email protected] or [email protected]
Abstract Livestock water productivity (LWP) is becoming a major area of research. IWMI and ILRI are attempting to understand the gender implications of different interventions to increase LWP, through research funded by BMZ (Bundesministerium für Wirtschaftliche Zusammenarbeit und Entwicklung). This paper draws on research conducted in Ethiopia and Zimbabwe and also the wealth of information emerging from the Multiple Use Systems Project (CPWF Project 28 on www.musproject.net). Some of the emerging results show that technological innovations are not gender neutral, because their design, timing, and labor requirements have differential gender implications. Some technological interventions to increase livestock water productivity might result in more work for women and fewer benefits going to the women. Secondly, gender and power relationships also shape the benefit terrain, which results in differential access and control of the benefits from the improved livestock water productivity. What matters is not just improving livestock water productivity, but the type of livestock targeted. Smaller livestock are seen to be largely benefiting women, thereby improving education and health prospects of the children within poorer households more than larger livestock. Therefore improving LWP does not necessarily result in improved well-being for men, women, and children and reduce poverty at large. Gender nuanced interventions are likely to contribute toward improvements in the livelihoods of both men and women. Media grab Gender is central in understanding the impact of ‘development’ interventions for increased Livestock Water Productivity, targeting poor women and poor men. Introduction Gender is a central organizing principle of societies and often governs the processes of production and reproduction, consumption, and distribution. Gender roles are the 'social definition' of women and men, and vary among different societies and cultures, classes and ages, and during different periods in history. They vary greatly across the Nile Basin and sub-Saharan Africa at large. Gender-specific roles and responsibilities are often conditioned by household structure, access to resources, political stability, and ecological conditions. Gender research in rural development is therefore essential in poverty reduction and sustainability of development interventions (van Hoeve, undated). Within sub-Saharan Africa, livestock are perceived as playing a major role in poverty alleviation (Peden et al., 2007; ILRI, 2000, 2002) and environmental services. LWP is part of overall productivity of water for food production, and is defined here as the scale dependent efficiency of direct and indirect use of water for provision of livestock products and services It includes water for production of livestock products and services and takes into account the impact of livestock on water quality, availability, and value to subsequent users (Peden et al., 2007). It needs to be viewed using a gendered lens, however, that will enable an assessment of the differential impact of the proposed interventions on poor women and men. Rural development in sub-Saharan Africa has attempted to improve the livelihoods of the poor people, but has resulted in the entrenchment of central power (Ferguson, 1990) or has not taken into account the gendered dimension of poverty. It has often only improved the well-being of well-off male-headed households, leaving poor females and males worse off (cf.van Hoeve and van Koppen 2005). This BMZ-funded research promotes gender equity as a moral imperative in reaching the Challenge Program on Water and Food's poverty reduction and livelihood goals. It uses gender analyses and gender-balanced participation as a requirement of 'good science' (ILRI). Gender-conscious research is more likely to contribute to poverty reduction.

98
Conceptual framework: a gendered sustainable livelihood framework (GSLF)
This research draws upon the Gendered Sustainable Livelihood Framework (GSLF) (Figure 1), which was developed by van Hoeve and van Koppen (2005). This framework in Figure 1 largely borrows from the Department for International Development framework on sustainable livelihoods, which merges together DFID’s SLF with the gendered framework that was developed by Feldstein and Poats (1989) (cf. van Hoeve and van Koppen, 2005).
Figure 1. The Gendered Sustainable Livelihood Framework (van Hoeve and van Koppen, 2005).
Livelihood assets (five assets)
Costs to access assets
Access/ control
Livestock as an asset
Keeping livestock as a strategy/activity
Benefits /outputs or outcomes/
Access/ control
Risks/vulnerability contexts=shocks, trends, seasonality/
Institutional contexts
M
W
H
C
G
M
W
H
C
G
Local/ community
Government or private
Natural - Water - Land - Feed
Water? Feed? Land?
Where? How much? In what cost? (Time,
labor, price?) Which mechanism helps to
optimize water use?
-Soil fertility -Biodiversity -Optimum water use
Human - Labor - Knowledge - Skills
-Nutrition
Physical - Water infrastructure - Services
-Traction -Transport -Energy/fuel
Financial - Cash to purchase or pay for goods and services
-Income -Insurance -Coping
Social - Resource sharing groups - Gifts, bride price - Cultural festivals
-Status -Social security
Key: M = Men; W = Women; H = House hold; C = Community, G= Government : The last two columns - Vulnerability and Institutional - help to show the different constraints and opportunities of livestock keeping in the context of other productive and nonproductive activities in the system.
In the first column, there are the five livelihoods assets: natural, human, physical, financial, and social. Examples of each of the assets are listed under the respective asset type. The second column looks at the costs to access the assets. This is further disaggregated by gender to demonstrate the costs of different interventions within the household and in the community at large. Gendered labor contribution This research project attempts to analyze not only the overall labor requirements of new interventions, but disaggregated along gender lines. For instance, if a new ‘cut and carry’ scheme is introduced, depending on the specific circumstances, it might result in increased labor requirements for women through collecting fodder for the livestock. If cattle herding was previously the responsibility of boys and men, is the result of an increased workload for the women (cf. van Hoeve and van Koppen, 2005). Such extra labor requirements have also to be further juxtaposed on the different types of households. De jure female-headed households tend to have labor constraints for their agricultural activities when compared with de facto female-headed households, where the male heads of household are based in urban areas and tend to send remittances that can then be used to

99
hire extra labor. Male-headed households tend to have more labor reserve than the two types of female-headed households (cf. ICRISAT, 2007; van Hoeve and van Koppen, 2005). It is, however, important that the intra-household assessments also look at the impact of women labor contribution in male headed households. Some studies have demonstrated that in some irrigated areas in the Awash River Basin of Ethiopia women in male-headed households were worse off than women who headed their own households and had access to irrigation plots (Aredo et al., 2006). The Access/Control column shown in Figure 1 identifies who has access and control of the input attribute. Quality of labor available is also an important issue, especially in countries in Southern Africa that have been negatively affected by HIV/AIDS. The result is a dominance of elderly and widows in rural areas. The available quality of labor is already overstretched due to caring for the sick, especially in South Africa, where the sick tend to move to rural areas when they are too weak to continue working (Mapedza et al., 2008). Gendered control and access of benefits from livestock The right side of Figure 1 looks at outputs, or the benefits coming from improved LWP. The benefits include income, insurance, and draft power (depending on the type of livestock). The next column–Access/Control–looks at who benefits from increased income. How does one also access increased income? Often women and children contribute most of the labor requirements, but the income distribution does not reflect that contribution. Studies by ICRISAT (2007) have demonstrated that women tend to have access and control of benefits derived from small livestock (cf. Van Koppen et al., 2005). Aredo et al (undated) further point out that marketing for large livestock such as cattle is tilted in favor of males. In such circumstances, promotion of small livestock such as goat and chicken might help reduce poverty amongst the women. The ICRISAT study also found that income controlled by women was also significantly contributing toward schooling of the children. For example, benefits such as increased milk production may not benefit women and children because the males sell the milk to buy alcohol. Children and women are worse off when their labor requirements increase without any benefits accruing to them. The access and control of benefits terrain is also shaped by the political, economic, and institutional contexts. Laws and rules on livestock and land tenure will directly and indirectly impinge on who has access and who benefits from the improved LWP. Institutions–from local to community level–and how they are nested to national level, also has important implications in access and control of benefits by both women and men. New innovations meant to improve LWP might also affect social relationships Not all innovations toward improving LWP negatively affect women. If there are better forages that will result in less time spent on harvesting and collecting forages, this will be beneficial to the women. If clean water is made available for multiple use systems that include livestock and domestic requirements, this will save time previously spent collecting water for domestic, livestock, and other uses (cf. van Koppen et al., 2005). This frees the women to carry out other duties such as spending more quality time with their children and family. For the children, this might also entail more time available to play and to do their homework. Improved milk production as a result of improved fodder quality might benefit the family through improved nutrition for the family. In Lege Dini watershed in Eastern Ethiopia, livestock productivity increased with improved water supply services. Milking livestock is a responsibility of women, and an ability to have fewer animals that yielded more milk provided women with higher incomes for reduced labor (Van Hoeve, undated). This was one of the very few sources of cash income for women in this area. They organized themselves into a milk group, where they would daily gather any surplus milk (left over after home consumption) and mix it, regardless of animal types. This milk is marketed to the nearest town, almost an hour drive, and group members rotate who goes to the market and keeps the revenue (Van Hoeve, undated). The women used this additional income for improved hygiene at the household level and for school costs (Jeths, 2006). If women derive benefits and financial independence as a result of improved livestock water productivity, this might result in the empowerment of women beyond crop and livestock issues. Such empowerment might result in women renegotiating their position and status in the household. Such household reconfiguration will, in a small way, contribute to the increased esteem of poor women and men in sub-Saharan Africa. This paper and associated research emphasize the following recommendations: • Gender matters in LWP and has to be seriously evaluated. • Development initiatives should avoid using ‘labor contribution’ as an indicator of
empowerment and participation. It is important to note what women are getting relative to their contribution. Special attention should be given to the labor contribution by children and what the consequences are of increased or reduced workloads, e.g. enrolment in schools.
100
• Preconceptions about the well-being of married and female-headed households should be assessed for each context. In Ethiopia’s Awash River Basin, female-headed households were observed to be well off because they had access to irrigation land.
• Impact of HIV and AIDS has to be considered in view of the labor and time requirements of the different types of interventions.
• Access and control of benefits has to be assessed. This has to be linked to the inter- and intra-household power dynamics and institutions that help alter and shape the structure of incentives, and determine who has access and control.
Conclusion and recommendations Whilst it is important to note that improving LWP is central to improving the livelihoods of communities in rural sub-Saharan Africa, it is equally important to further evaluate what such improvements imply for different members within the household. Technological innovations are not gender neutral but their design, timing, and labor requirements will have differential gender implications for poor women, men, and children. If the household benefits, it does not mean that the welfare of all household members is improved. A gendered livelihoods approach enables a critical assessment of the winners and losers at the intra- and inter-household levels. Such an approach is informative and will enable the restructuring of the type of livestock to focus on in certain communities to get maximum benefits from interventions. Development is meant to reduce poverty for the most vulnerable. The LWP research being carried out under the auspices of the BMZ project, and building upon the earlier CPWF research, hopes to contribute toward meeting such objectives with lessons distilled from the sub-Saharan Africa region. Acknowledgments This paper is a result of the ongoing research on LWP funded by the Bundesministerium für Wirtschaftliche Zusammenarbeit und Entwicklung (BMZ). The paper acknowledges the benefits from the research project’s synergies with other projects, which were also funded by the CGIAR’s Challenge Program on Water and Food (especially PN37 ‘Livestock Water Productivity in the Nile Basin’ and PN28 ‘Multiple Water Use’). References Aredo, D., D. Peden, and G. Taddese. 2006. Gender, Irrigation and Livestock: Exploring the Nexus.
ILRI Report. Feldstein, H.S., and S.V. Poats. 1989. Conceptual Framework for Gender Analysis in Farming Systems
Research and Extension, p 9-25. In Working Together. Gender Analysis in Agriculture. H.S. Feldstein and S.V. Poats (eds.) Connecticut: Kumarian Press.
Ferguson, J. 1990. The Anti-Politics Machine: Development, Depoliticization, and Bureaucratic Power
in Lesotho. Cambridge: Cambridge University Press. ICRISAT. 2007. Challenge Program on Water and Food, Project 1: Baseline Survey Report: South
Africa and Zimbabwe. Bulawayo: ICRISAT. ILRI 2000. Livestock a pathway out of poverty; lLRI’s strategy to 2010. ILRI 2002. Livestock a pathway out of poverty–ILRI’s strategy to 2010, ILRI, Nairobi, 24 pp. Jeths, M. 2006. Institutional environment and the local coping strategies for multiple use of water in
Legedini, Ethiopia. MSc thesis. Irrigation and Water Engineering, Wageningen University, Wageningen, The Netherlands.
Mapedza, E., S. Moraradet, C. Cheron, and M. Magombeyi. 2008.Socio-economic conditions and
agricultural water management practices of smallholders in Quaternary Catchment B72A, Olifants River Basin, South Africa. Pretoria: IWMI.
Peden, D., G. Tadesse, and A.K. Misra. 2007. Water and livestock for human development. In Molden
D (ed.) Water for Food, Water for Life. Earthscan, London, and International Water Management Institute, Colombo. p.485.
van Hoeve, E. (undated). Gender Research. ILRI. van Hoeve E., and B. van Koppen. 2006. Beyond fetching water for livestock: A gendered sustainable
livelihood framework to assess livestock-water productivity. ILRI Working Paper 1. Nairobi: ILRI.
van Koppen, B., E. Boelee, and S.B. Awulachew. 2005. Integrating Water Needs for Livestock –based Livelihoods in Multiple-Use Water Development Approaches: State of the Art and Knowledge Gaps. International Water Management Institute, 2 September.

101
Facilitating adoption of livestock water productivity interventions in crop-livestock systems
T. Amede1,2, K. Deschemaekeer1,2, K. Geheb2,3, E. Mapdezi2, A. Haileselassie1 and D. Peden1
1International Livestock Research Institute, 2International Water Management Institute, 3Challenge
Program on Water and Food, Addis Ababa, Ethiopia. [email protected] Abstract There is an increasing pressure on water resources in sub-Saharan Africa due to unprecedented and competing demand for water between agriculture, ecosystem services, and other uses. Various technologies and practices have been developed in the region to increase the productivity of crop and livestock systems, particularly by national agricultural research systems (NARS) and CGIAR (Consultative Group on International Agricultural Research) centers. These technologies and practices have failed to be adopted by the end-users, however, because the interventions were developed without considering the socioeconomic concerns of target communities, their systems, and their institutions. They commonly fail to respond to social preferences, indigenous knowledge, and local skills. Participatory research proved to be effective in enabling small-scale farmers and local decision-makers to identify and develop technologies, but adoption of interventions by the end-users at a wider scale remains challenging. This paper presents success factors that would help research and development actors to combine social, institutional, technological, and policy interventions to bring short-term economic benefits and long-term positive environmental services through integrated processes. Media grab Improving water productivity in sub-Saharan Africa requires a shift from actions merely focusing on the supply side to inclusive institutional and policy actions responding to the demand side. Introduction Conventional research and extension approaches that are commodity-oriented and promoting a ‘linear’ transfer model (research to extension to farmers) have tried to address agricultural problems facing resource-poor farmers. There is now clear evidence from adoption studies and from direct feedback from farmers, that technologies developed using this conventional approach, with limited involvement of farmers, that on-station generated technologies were not always relevant to farmers because there were few avenues to consider the socioeconomic and agroecological circumstances of the end-users. Although livestock has a great economic and social importance for the majority of the world’s poor (Parthasarathy Rao et al., 2005), improved livestock management interventions and veterinary services are rarely reaching the rural poor. Population growth, urbanization, economic growth, and flourishing markets all lead to increasing demands for animal products (Delgado, 2003), while the productivity of animals remained low. Moreover, with growing human populations, growing incomes, and changing diets, more water is needed to meet the increasing food demands (Molden et al., 2007). The current problems of water scarcity are aggravated by several factors (Gleick, 2003). There is a huge loss of water in various agricultural and nonagricultural systems, which are associated with uncontrolled evaporation, water depletion through excessive run-off, water pollution due to excessive use of chemicals, and water contamination by industrial activities. Water management interventions at farm, landscape, and higher scales are often poorly adopted and implemented, which leads to high social and environmental costs (Molden et al., 2007). Climate change puts extra pressure on sustainable water resources management (Molden et al., 2007). The increasing global importance of the livestock sector is another important factor as livestock production systems deplete, degrade and pollute enormous quantities of fresh water (Steinfeld et al., 2006). The interventions related to improved livestock-water management, however, are either not readily available for end-users or they are rarely suitable to the socioeconomic situations. A shift is required away from actions merely focusing on the supply side or the ‘hard path’ (Gleick, 2003; de Fraiture et al., 2007) to actions facilitating demand for livestock and water management interventions. Appropriate policies and institutions must be developed and local communities must be involved in decision-making (Gleick, 2003; de Fraiture et al., 2007). There are three basic livestock-keeping strategies that can help achieve this (Peden et al., 2007). These are optimal feed sourcing, enhancing animal productivity, and conserving water resources. In addition, providing drinking water to livestock, especially cattle, is a proven practice that when done well can increase effective and
102
productive use of water. These are interventions mostly developed through approaches to solve individual system constraints, and hardly consider livestock-water interactions. Conventional approaches are usually commodity-oriented, discipline-based where the mode of transfer of technologies to farmers is assumed to be ‘linear’ (i.e. from research to extension then to farmers). Other factors are not considered in the linear approach. These include sociocultural, market opportunities, socioeconomic status, leadership, off-farm work, task orientation, literacy level, policy and institutional setup, which affect the adoption and dissemination of technology (Solano et al., 2006). Furthermore, most of the technologies are generated on-station through researcher-designed and researcher-managed trials. Direct feedback from farmers as well as several adoption studies (Amede et al., 2001) have clearly shown that technologies developed using this conventional approach are often not appropriate to subsistence farmers, thus leading to low adoption. The objective of this paper is to present experiences in dissemination and adoption of interventions related to crop, land, water, and livestock management that emerged from eight case studies in Ethiopia (Amede et al., 2004). The information reported comes from a field study held by an assessment team with farmers, participating researchers, governmental and nongovernmental personnel, institution leaders, and key informants validated by recent field surveys targeting interventions related to livestock and water management. Materials and Methods An assessment team made up of researchers, extension personnel and NGOs was assembled to undertake the exercise. After the assessment framework was developed through a three-day facilitated workshop (by Dr J Hagmann), a process was conceived as a way to identify the elements for effective research for development. Four assessment teams, consisting of 4-5 members drawn from different disciplines and institutions, to apply the assessment framework to understand better the elements required for effective research, and the potential of PR approach in Ethiopia using a case study approach. These included project experiences from the African Highlands Initiative in Southern Ethiopia, the Joint Vertisol Project (JVP) by the International Livestock Research Institute (ILRI) in Ginchi, Participatory Research for Integrated Agro-Ecosystem Management (PRIAM) by CIAT in Nazareth, Farmers Participatory Research (FPR) Project (FARM Africa, Awassa), the Cool Season Food and Forage Legumes Project based in Holetta, and an Integrated Pest Management project based in Melkassa. The overall assessment was planned and implemented in four phases: preparation, data collection, analysis and interpretation, and report writing. Four main methods were used during the case study assessment: review of relevant documents, focus group discussions, key informant interviews and field observations. A generic checklist was iteratively developed so it could be used by all groups to extract relevant information and was based on the overall assessment framework developed during the planning workshop. Each assessment team developed its own workplan and time schedule for contacting relevant stakeholders (organizations and individuals) for discussion, field visits, gathering secondary information, data analysis, interpretation, and draft report writing. Group discussions were held with researchers, farmers, staff of districts and/or zonal Bureau of Agriculture (BoA) and other relevant stakeholders. Field observations using transect walks were made to sample sites to get first-hand information about the area in general, and the project undertakings in particular. Information obtained from group interviews was fine-tuned through key informant interviews with individuals who knew the details of the project and its implementation procedures. Review of secondary data helped to gain a general understanding of the project background, its rationale, objectives, approaches, expected outputs, and other related issues. Whereas discussions with those directly involved in implementation focused mainly on the project background, objectives, planning, and implementation procedures and to describe participatory approaches used, benefits resulted from participation, problems and challenges encountered, strengths and weaknesses, and impacts of (changes resulting from) the approaches used from the perspective of farmers, researchers, and other collaborating partners. Results and Discussion Targeting production systems and clients Scaling-up of technologies beyond the contact farmers, which received continual technical and material support, remained challenging. Horizontal and geographical spread of technologies has been also limited, even with the facilitation of public institutions and NGOs. Besides unfit characteristics of technologies across agroecologies and social strata, the spread of technologies and approaches that demand collective decision and policy support (e.g. grazing land management) is very much limited. Contrasting production systems and socioeconomic categories demand diverse technological innovations and approaches to bring immediate change. Diversity in production objectives among stakeholders, for example with some households concentrating on marketable livestock-related commodities and others on food security and self-sufficiency, also required targeting of technological interventions. Resource-poor farmers, especially those far away from markets, faced difficult

103
decisions over the use of scarce resources in their production systems, including land, labor, nutrients, and water. Decisions on the allocation of resources were often made associated with immediate financial gains and food security, with limited assessment or appreciation of the impact of management decisions on other system components (e.g. feed production, soil fertility management). There was a need to characterize, package, and disseminate them to various recommendation domains (agroecologies, cropping systems, cultural values, system niches, and other system scenarios). Farmer-to-farmer dissemination of technologies through existing social networks–be they defined by area of residence, friendship, kinship, marriage, religion or other factors–was one successful approach (Adamo, 2001) though the reach was limited. Moreover, the production systems within this region differ in agroecology, socioeconomic, and policy dimensions as they also experienced different institutional constraints and household priorities. The interaction with research and development also varied from community to community. The important constraints were identified by the general community along with potential and relevant solutions. For instance, the major farming constraints identified by farmers in the East African highlands related to livestock and water management included shortage of livestock feed, lack of access to markets and credit, and limited access to improved varieties of forages and crops (Amede et al., 2006). Identification of key entry points 'Entry point' is an initial action that is strategically applied to assure smooth and effective engagement with communities and institutions. Entry points were essential to build trust between the community and outside actors, arouse their interest and keep their spirit high in all case studies. Entry points had certain properties that led to the desired objectives of promoting 'win-win technologies' at farm and higher scales. These included various interventions in the form of attractive technologies, policies, and other incentives. The most apparent entry points, however, were often crop varieties, although farmers slowly shifted their engagement to water conservation measures and bund management that combined fruit trees and multipurpose forages. The type of entry points commonly determined whether farmers were keen to maintain partnerships to experiment with researchers and extensionists or not, and whether farmers were capacitated enough to try, innovate, and solve their problems without the involvement of external actors (Amede et al., 2001). Strategically, entry points must have certain properties that will lead to the desired objectives of promoting win-win technologies. These characteristics identified from the case studies were: i) of high priority, problem-solving to the community; ii) quick in bringing benefits, particularly higher household income; iii) successful, as early successes go a long way to enhance enthusiasm and trust; iv) accessible to most households, so that unequal benefits do not compromise the enthusiasm of large portions of the community; and v) technologies that are easy to multiply and manage, simple to solve and to be adopted by different sectors of the community. Selection of entry point has to be followed with capacity-building of farmers (training, provision of improved seeds and fertilizers) so that they could test and acquire the necessary skills. Promoting linked technologies The term ‘linked technologies’ was coined to define interrelated technologies applied simultaneously at plot level to render multiple benefits and facilitate adoption of technologies. The research teams employed several participatory techniques to link individual technologies to foster visible farm benefits (Amede et al., 2006). It facilitated change from commodity-oriented to a more holistic and systems approach, whereby farmers were in the forefront throughout technology development, dissemination, and impact assessment.

104
Figure 1. Step-wise integration of various technologies and approaches to improve natural resources management in the Ethiopian highlands (Amede et al., 2006). In general, the 'linked technology' approach best enabled development workers, research organizations and recipient communities to jointly address poverty and natural resources degradation in a holistic manner. As farmers’ interest gradually increased in adopting the simple entry point technologies, the research teams created access to a wider range of, and more complex and linked, technologies (Figure 1). By linking the entry point technologies with soil conservation (e.g. forage grasses and multipurpose trees), farmers in southern Ethiopia were able to get multiple benefits in the form of increased crop yield, livestock feed, and fuelwood. Further intensification was possible with more horticultural crops, production of fodder (grasses and leguminous trees and shrubs) for zero grazing, while serving soil conservation and other uses.
Strengthening linkages and partnerships among stakeholders It was critical to create favorable linkage mechanisms among the actors to provide more options, other interventions, and expertise. This was done through holding periodic stakeholder meetings and workshops for feedback exchange and experience sharing to create a common understanding of visions, goals, and objectives. Building genuine partnerships and linkages with farmers, related organizations, and development actors (for instance, Ministry of Agriculture, input supply institutions, local organizations, and market) facilitates dissemination. Stakeholder partnerships were negotiated in such a way that each party clearly understood and fulfilled their responsibility, and were committed to work together. The commodity approach required that it be augmented with an integrated agroecosystems approach so that interrelated enterprises, heterogeneous circumstances, and innovation systems can be taken into account. This required an ability to analyze and work with systems by many development partners. Supportive research and extension management systems and organization Creation of a favorable policy and conducive working environment in research and extension systems played a pivotal role in the internal and external efficiency of technology dissemination processes. This was demonstrated by the establishment of researcher-farmer-extension linkage steering groups at the Ethiopian Institute of Agricultural Research. Availability of adequate resources coupled with good and visionary leadership was needed for the execution of effective extension. Basket of technological options There was a need to ensure sustainability of technology use by improving access to and availability of multiple technological options (e.g. annual forages with various maturity periods). The technological options were those appropriate to the needs, interests, and local conditions of the farmers. Involvement of end-users in the development of the technologies heightened the probability of appropriateness and therefore adoption. Local organizational capacity Facilitation of farmer organizations helped improve effective technology development and dissemination and collective action. A community change management approach was required for group facilitation in managing common natural resources (e.g. grazing land management). Organizing farmers into strong farmer research groups (FRGs) created an entry point into the community for researchers, extension personnel, and development staff to work closely together (Amede et al., 2006). Empowering the groups using participatory approaches was fundamental to enable them to meaningfully participate. Moreover, working together requires patience and respect of the communities’ social values and affairs. Farmer capacities were built through training, visits, and experience-sharing discussions, and general facilitation. Market orientation Promotion of effective technology utilization required effective market orientation by research and by farmers. Forage and water management interventions were linked to marketable livestock enterprises. There was a need for consideration of agencies and actors associated with markets as a key stakeholder. Institutions helped farmers to identify market imperfections and incorporate the interests and priorities of stakeholders involved in marketing fields. Community facilitation Facilitators with appropriate skills and experience were needed to organize actors and help their groups to function. This was critical to build social capital for managing communal resources. It was also an efficient tool to reach many farmers quickly. They helped to build capacity so they can make demands, manage themselves, participate in R&D activities, and have their own activities. Farmers are empowered and their ability improved to conduct their own experiments considering resource status, wealth, age, and other stratification that might affect needs and priorities. It was crucial to document farmers ITK and build upon it by the R&D agenda.

105
Conclusions Current policies need to be adjusted to support technology generation and dissemination ensuring that large numbers of farmers have access and can use them. There was a need to foster supportive and conducive infrastructure and related policies to ensure that research, extension, and development outputs reach users. Similarly, ILRI and IWMI have recognized the need to make research more demand-driven and responsive to client needs by ensuring the participation of users in the process of agricultural technology development, and through developing the capacity and confidence of those making the demands. In general, principles and values inherent in effective dissemination of LWP interventions may include: 1. Inclusiveness: Different social groups of farmers should have equal access and opportunity to be part of research processes and participate in the decision-making process on communal and their own specific problems (problem differentiation). 2. Monitoring to improve research and extension processes: There is a need to continuously monitor progress at farm and landscape level, whether or not research is problem-driven and demand-oriented, and examine the relevance of research to the community to improve our approaches and strategies so as to deliver technical options in a sustainable manner. 3. Trust and value indigenous knowledge and skills: Researchers and service providers should understand systems and farmers’ situations, value farmers’ knowledge, and trust in farmers’ potentials and capabilities (e.g. that they are experts in their own situation). This calls for building genuine partnerships with farmers and other stakeholders. 4. Build capacity for self reliance and empowerment: There is a need to build farmers’ capacity to manage their own affairs (self reliance), improve stakeholder participation (dialogue, interactive, multiple ways), improve access to choice of technologies, create flexibility and options, improve quality of facilitation, develop a sense of joint ownership (role clarification, trust, transparency, confidence) and promote experiential learning – a way of learning-by-doing that is relevant both for researchers and farmers. Acknowledgments This paper presents findings from PN 37, 'Livestock-water productivity,' a project of the CGIAR Challenge Program on Water and Food. References Adamo, A. 2001. Participatory agricultural research processes in Ethiopia using farmers social
networks as entry points. Occasional publication Series No. 33. Colombia: CIAT. Amede, T., R. Kirkby, and A. Stroud. 2006. Intensification pathways from farmer strategies to
sustainable livelihoods: AHIs’ experience. Currents: 40/41: 30-37. SLU. Sweden. Amede, T., T. Belachew, and E. Geta. 2001. Reversing the degradation of arable land in Ethiopian
Highlands. Managing African Soils: No. 23. IIED–London. Amede, A., H. Assefa, and A. Stroud. (eds.) 2004. Participatory Research in Action. Ethiopian
Experiences. Ethiopian Agricultural Research Organization and the African Highlands Initiative. Addis Ababa. 152 pp.
de Fraiture, C., D. Wichelns, J. Rockström, and E. Kemp-Benedict. 2007. Looking ahead to 2050:
scenarios of alternative investment approaches. In: Comprehensive Assessment of Water Management in Agriculture. London: Earthscan, and Colombo: IWMI, pp. 91-145.
Delgado, C.L. 2003. Rising consumption of meat and milk in developing countries has created a new
food revolution. Journal of Nutrition 133: 3907S-10S. Gleick, P.. 2003. Global freshwater resources: Soft path solutions for the 21st century. Science, 302:
1524–28. Molden, D., K. Frenken, R. Barker, de C. Fraiture, B. Mati, M. Svendsen, C. Sadoff, and C. Finlayson.
2007. Trends in water and agricultural development. In: Comprehensive Assessment of Water Management in Agriculture. London: Earthscan, and Colombo: International Water Management Institute, pp. 57-89.
Parthasarathy Rao, P., P.S. Birthal, and J. Ndjeunga. 2005. Crop–Livestock Economies in the Semi-
Arid Tropics: Facts, Trends and Outlook. International Crops Research Institute for the Semi-Arid Tropics, Patancheru, Andhra Pradesh, India. 68 pp.
Peden, D., Girma Tadesse, and A. Misra. 2007. Water and livestock for human development. In:
Comprehensive Assessment of Water Management in Agriculture. London: Earthscan, and Colombo: International Water Management Institute, pp. 485-514.
Solano, C., H. León, E. Pérez, L. Tole, R.H. Fawcett, and M. Herrero. 2006. Using farmer decision-
making profiles and managerial capacity as predictors of farm management and performance in Costa Rican dairy farms. Agricultural Systems, 88, (2-3): Pages 395-428.
Steinfeld, H., P. Gerber, T. Wassenaar, V. Castel, M. Rosales, and C. de Haan. 2006. Livestock’s long
shadow. Environmental Issues and Options. FAO, Rome. 390 p.

106
GIS-based multicriteria decision analysis for land suitability modeling of livestock production in Tana subbasin, Ethiopia
Alemayehu Abebe ([email protected]), Dagnachew Legesse ([email protected]), Don
Peden ([email protected]), Girma Tadesse ([email protected]) International Livestock Research Institute (ILRI), P.o.Box: 5689, Addis Ababa, Ethiopia
Addis Ababa University (AAU), P.O.Box: 1176, Addis Ababa, Ethiopia Abstract Land suitability analysis is of paramount importance to identify suitable land for livestock production while causing minimum impact to the environment. This paper presents an approach of multicriteria decision analysis to generate a land suitability model for livestock in a spatial decision support platform. The following decision criteria are based on: land use, slope gradient, soil type, and rainfall availability. Spatial modeling techniques of weighted linear combination (WLC) are utilized to generate the land suitability model, wherein continuous criteria are standardized to a common numeric range, and then combined by means of a weighted average. Five suitability classes are identified with varying degrees of suitability. The spatial multicriteria analysis results revealed that about 47% of the study area is most suitable for livestock production. About 23% of the subbasin is moderately suitable for livestock production. And 2.2% of the study area is identified to be least suitable. Areas that were found to be currently not suitable are 2.7% and permanently not suitable 0.01%. The study area, Tana Subbasin, is optimally located on suitable land for livestock production, as most of the basin is covered by optimal land use cover, gentle slope, fertile soil type, and optimal rainfall availability. Nevertheless, the current livestock distribution is concentrated on marginal areas that need further intervention to improve livestock productivity. Media grab This study attempted to develop a land suitability model for livestock production in the Tanasubbasin in Ethiopia, using GIS-based multicriteria decision analysis. Introduction Livestock production contributes the highest share to Ethiopia’s Agricultural GDP. Livestock play a vital role, adding to stability of farm incomes, food security, and farming systems. Livestock are kept as a form of insurance and a means of storing savings (Winrock, 1992). The emphasis given to livestock production in Ethiopia is still inadequate, however. Since the land resource is limited, proper usage could alleviate poverty in the country (Atesmachew Bizuwerk, 2005). Although livestock production is a vital component of the agricultural systems, it has so far been overlooked in integrated land and water management for food security in poverty alleviation strategies. Suitable land use is a key element for livestock production. Optimal land utilization is the most important factor in livestock production systems in sub-Saharan Africa. A GIS-based spatial decision support system represents a suitable framework for land suitability decision-making. Therefore, locating suitable areas of livestock production using GIS-based multicriteria decision analysis would provide indispensable decision support to improve livestock productivity. In this study a pair-wise comparison method is used. This method has been tested theoretically and empirically for a variety of decision situations, including spatial decision-making Malczewski (1997). This approach is appropriate to achieve high degree spatial decision accuracy, but must be based on sound theoretical foundations. Empirical applications suggest that the pair-wise comparison method is one of the most effective techniques for spatial decision-making including GIS-based approaches. Methods The study area, Tana Subbasin is located south in the Amhara Regional State in the Blue Nile River Basin, which encompasses a total area of 15,054 km2. In this study a pair-wise comparison method is adopted to develop criterion weights. The information is broken down to simple pair-wise comparison in which only two criteria need be considered at a time. This facilitates the weighting process, and will likely produce a more robust set of criteria weights. IDRISI software is used to implement the above method of pair-wise comparisons developed by Saaty (1977) in the context of a decision-making process known as the analytical hierarchy process (AHP). The method involves pair-wise comparisons to create a ratio matrix.

107
Since the complete pair-wise comparison matrix contains multiple paths by which the relative importance of criteria can be assessed, it is also possible to determine the degree of consistency that has been used in developing the ratings. The consistency ratio (CR) indicates the probability that the matrix ratings were randomly generated. Saaty (1977) indicates that matrices with CR ratings greater than 0.10 should be re-evaluated. In this study the consistency ratio calculated for the matrices is 0.04. According to Saaty (1977), this value is acceptable and the criterion weights are assigned to all the parameters. The study resulted in mapping optimal livestock production using multicriteria decision analysis for evaluating model parameters: land use, land cover, slope, soil type, and rainfall availability. All input data layers for the MCDA are converted into a raster data model since the weighted overlay analysis environment accepts integer raster as input. Constraints of the model water bodies and urban areas are assigned a restricted value that the corresponding areas cannot be used for livestock production in the GIS based multicriteria decision analysis. The suitability model outcomes are reclassified into six suitability classes in accordance with the FAO (1985) suitability class. Thus, S1 indicated areas with the most suitable classes for livestock production, whereas S2 showed areas with moderately suitable land for livestock production. Furthermore, S3 indicated locations with least suitable class. There are two classes, that are not suitable. The first N1 indicates locations that are currently not suitable for livestock production, whereas N2 implies areas that are permanently not suitable for livestock production. And R represents areas restricted from the modeling. Results and Discussion The results indicate that areas with gentle slope, fertile soil types that are suitable for agriculture, and high rainfall are identified as most suitable (S1) locations for livestock production in the Tana Subbasin. 46.9% of the study area is most suitable for livestock production, covering an area of 6953 km². Besides areas with moderate slope gradient, optimal rainfall availability, grassland and moderately fertile soil types are identified to be moderately suitable (S2) for livestock production. These areas comprise of 23.3% of the study area, covering 3453.12km², which indeed is the largest in the suitability classification results. Out of the total area 2.2 % (320.8km²) are identified to be least suitable (S3). The suitability results suggest that 2.7% covering an area of 403.9 km² are currently not suitable (N1) for livestock production. Areas with steep slope gradient, infertile soil type, low rainfall availability, and land use and lands cover type of shrub and woodland are identified as permanently not suitable (N2) for livestock production. This part of the study area encompasses 0.01% with a total area of 1.32 km². In the multicriteria decision analysis, some areas such as water body, urban areas, and forests are excluded (as a constraint layer) from the weighted overlay analysis. As a result, 24.9% of the study area comprising 3696 km² is restricted (R) from the suitability modeling. Urban areas are identified as restricted due to stipulations from city administration for development of infrastructure. Similarly, freshwater bodies, especially lakes, are restricted from the land suitability analysis because of their importance for environmental sustainability of the basin. The largest part of the area, 46.9% is considered ‘most suitable’ for livestock production. In addition, 23% of the total area is identified as moderately suitable. Only 0.01% of the study area is permanently not suitable, which is negligible. Thus, the largest portion of the study area is identified to be optimally suitable for livestock production. The current livestock population is highest at higher altitudes in peripheral areas of the Tana Subbasin. The density of livestock in most central parts of the study area is sparse. The concentration of denser animal population exists in the highlands. In contrast, the MCDA result (Figure 1.) shows that the central parts of the study area are optimally suitable for livestock production. The peripheral regions are relatively marginal for livestock production, since most of the evaluation criteria taken into account in the multicriteria evaluation for the peripheral regions indicated low suitability for animal production. These areas are land resources with steep slopes, infertile soil characteristics, and less rainfall availability as compared to the central parts of the study area. As a result, the current spatial distribution of livestock production needs intervention so as to keep the land resources sustainable and maintain productivity. Any intervention plan, however, should take into account other land uses and stakeholders. Trade-offs have to be made where current land uses

108
possibly conflict with relocation of livestock, and the implication of such interventions should be considered.
Figure 1. Land suitability map for livestock production. Generally, based on the evaluation criteria of the weighted overlay analysis, the following are considered as constraints for livestock production: areas with steep slope, infertile soil type, inadequate rainfall, and land use/land cover. Conclusions This study attempted to develop a suitability model for livestock production that could support decision-making process in the Tana Subbasin of the Blue Nile River Basin, Ethiopia, using GIS-based multicriteria decision analysis. Findings suggest that larger areas of the basin are located on suitable land for livestock production. Most of the study area is covered by optimal land use/land cover, gentle slope, fertile soil type, and adequately available water for feed growth that make it highly favorable. Nevertheless, the existing spatial distribution of livestock population concentrated on peripheral higher altitudes, whereas livestock density is sparse on most of the suitable land in the basin. The current trend on livestock distribution contributes to degradation of the land resources, and low livestock productivity. Therefore, relocation of livestock production to more suitable areas based on the results of the GIS-based multicriteria decision analysis should be implemented. The practical feasibility of implementation likely depends on a range of factors that go far beyond the scope of a GIS-based multicriteria evaluation as done in this study. A multicriteria evaluation should take the trade-offs into account. Therefore one should be careful about drawing far-reaching management conclusions from the results as presented in this study, which appears to focus on livestock suitability alone. All in all, the Tana Subbasin, according to the findings, is identified as having immense land suitable for

109
livestock production. Thus the basin has a remarkable potential to reduce poverty and improve food security for the increasing human population in the basin. Acknowledgment This paper presents findings from PN37, ‘Nile Basin livestock-water productivity’, a project of the CGIAR Challenge Program on Water and Food and from by the Comprehensive Assessment of Water Management in Agriculture. We acknowledge the Addis Ababa University and International Livestock Research Institute (ILRI) for their support in the course of the study. References Bizuwerk, Atismachew. 2005. GIS Application for analysis of Land Suitability and Determination of
Grazing Pressure in Upland of the Awash River Basin, Ethiopia. International Livestock Research Institute (ILRI), Addis Ababa, Ethiopia.
Eastman, J.R. 1993. Decision Theory and GIS, Proceedings, Africa GIS93, UNITAR, Geneva. FAO. 1985. Guidelines: Land Evaluation for Irrigated Agriculture. FAO Soils Bulletin 55, Rome. Malczewski, J. 1997. Progagation of Errors in Multi-criteria Location Analysis: A Case Study. Multiple
Criteria Decision Making: Proceedings of the Twelfth International Conference. Hagen (Germany): 1995. G. Fandel, and T. Gal (eds.) Berlin: Springer-Verlag. 154-65.
Saaty, T.L. 1977. A Scaling Method for Priorities in Hierarchical Structures. J. Math. Psychology, 15:
234-81.
Winrock International. 1992. Assessment of Animal Agriculture in Sub-Saharan Africa. Morrilton,
Arkansas, USA, Winrock International.

110
Response-inducing sustainability evaluation (RISE) linking agricultural practices and
water productivity
M. Pineau1, W. Ayalneh2, C. Studer1, and D. Peden2
1Swiss College of Agriculture SHL, Zollikofen, Switzerland; [email protected]
2International Livestock Research Institute (ILRI), Addis Ababa, Ethiopia
Abstract
Within the Nile LWP project, the sustainability of prevailing agricultural production practices was analyzed in four locations of the Gumera watershed of Lake Tana by using the holistic sustainability assessment tool RISE (Response-Inducing Sustainability Evaluation; http://rise.shl.bfh.ch). The study revealed major sustainability deficits in farm economics and social security (lack of safety nets) on the 29 farms assessed. Intensive cultivation and grazing puts biodiversity under pressure. Crop protection could be considerably improved. Soils are threatened by erosion, a problem intensified by heavy mechanical cultivation and lack of erosion control measures. Water pollution by livestock feces is a serious threat and may be reduced by proper manure storage, and preventing livestock from entering open water. Very little water is used apart from crop and fodder production. Although farmers don't perceive water scarcity, agricultural productivity of available water is low, mainly due to low yields and suboptimal water management. Any management practice contributing to increased yields will positively affect water productivity of crops and–mainly through feed production–of livestock. Soil and water conservation practices and conservation agriculture technologies may improve both yields and efficient use of available water. The RISE approach could reveal a number of intervention points where sustainability deficits can be addressed.
Media grab Increasing crop and fodder yields through appropriate agronomic practices and soil and water conservation measures may help increase agricultural water productivity in Ethiopia.
Introduction Sustainable production of sufficient food to feed millions of people in developing countries requires more productive use of agricultural water (Molden, 2007). This implies producing more food with less water. In the Nile River Basin, livestock are an integral and major component of agriculture, but are often overlooked in the context of water resources development. Similarly, livestock development has tended to ignore water apart from limited consideration of animal drinking requirements. The CGIAR Challenge Program on Water and Food (CPWF) has undertaken research intended to improve livestock water productivity (LWP), defined here as the ratio of the sum of the benefits of animal products and services produced to the volume of water depleted in producing these benefits. Attempts to assess LWP suggest that increasing water productivity is a key to reducing poverty (Peden et al., 2007), but agricultural practices adopted to enable this are often unsustainable. In contrast, farmers’ with wealth levels may be better able to adopt LWP enhancing practices. There is a need to identify bottlenecks that make poor farmers’ agricultural practices unsustainable, and to use this knowledge to establish farming enterprises that lift people out of poverty while using water and other resources more effectively and efficiently. This paper reports findings from a case study in the Gumera watershed of the Blue Nile Highlands, which assessed sustainability, of agricultural practices using RISE, a model for response-inducing sustainability evaluation (Häni et al., 2007). These results are discussed in the context of CPWF efforts to increase LWP.
Methods RISE is an indicator-based tool developed at the Swiss College of Agriculture SHL that allows assessing the sustainability of agricultural production and trends at whole-farm level. The holistic sustainability assessment follows a systems approach and covers ecological, economic, and social dimensions (Häni et al., 2007). The sustainability evaluation is based on data collection at the farm level using a comprehensive questionnaire. Computer-aided calculation of twelve indicators identifies strengths (potentials) and weaknesses with regard to sustainability, and intervention points for

111
Legend:
State (S) 0 pts = problematic situation 100 pts = good situation Driving force (D)
0 pts = low risks 100 pts = high risks ▬ Degree of sustainability (DS) positive: 10 ≤ x ≤ 100 pts border area: -10 ≤ x ≤10 pts negative: -100 ≤ x ≤ -10 pts
improvements are discussed with the farmer. RISE can also be used to assess groups of farms and provide information about general sustainability deficits under prevailing conditions. In large-scale studies, RISE unfolds one of its particular strengths: while information to answer research questions is collected, simultaneous assessment analysis and feedback to farmers raise awareness and stimulate improvements at the farm level. RISE has so far been successfully applied on more than 250 farms in highly diverse environments.
The sustainability of agricultural production was analyzed with RISE on a sample of 29 farms in Farta and Fogera woredas (districts), Lake Tana area, Ethiopia. The farms comprise between 0.8 and 5.3 ha of agricultural land (plus rented surfaces), and are partly irrigated. They are located at different levels in the Gumera watershed and belong to four peasant associations (Table1).
Table 1. Number and characteristics of farms assessed using RISE (Gumera watershed, Ethiopia). Peasant association Location Farms assessed Farming systems Maynet Upland (2850 m) 8 Mixed and dairy Worken Upland (2400 m) 7 1 crop only, mixed, dairy Wareta Lowland (1850 m) 6 Mixed and dairy Kuhar Lowland (1800 m) 8 Mixed In addition to the standard RISE questionnaire some further questions on livestock diseases, type of water sources, household consumption (energy and food), distance to water sources and plots, crop diversification, and the farmers' perception of constraints and options were asked. To further deepen understanding of the context, informal interviews were conducted with various other stakeholders. The RISE approach requires feedback to the farmers to validate analysis results, to increase awareness and understanding about sustainability issues, and to initiate measures to improve the prevailing situation where necessary in collaboration with extension. In contrast to the typical individual feedback, the analysis results were discussed with groups of farmers (one per peasant association). This prevented on one hand personalized discussion of options, and on the other hand group dynamics lead to lively discussions and exchange of experiences.
Results and discussion
Major sustainability deficits in agricultural production The RISE sustainability analysis assesses 12 indicators that are calculated from more than 60 parameters. Although the RISE sustainability polygon (Figure 1) provides a broad overview by presenting aggregated indicator values, it is important to examine also individual parameter values because certain sustainability problems may be masked by aggregation.
The sustainability evaluation with RISE revealed significant deficits in farm economics on the 29 farms assessed. Most farmers mainly produce for self consumption (70% of production). Operating income from farming (including household consumption at market prices and changes in stocks) is between US$30 and 4345 (avg. US$1110) a year; considering interest on debts, expenses for personnel, and fees for rented land, six out of the 29 farms analyzed produce a net loss (avg. benefit is US$730). Low and very volatile prices for agricultural products are certainly a reason for the lack of market orientation of many farmers. Since practically all capital generated remains in the region, the assessed
Fig.1:
Average RISE indicator values (aggregated state and driving force parameters and degree of sustainability) of 29 farms evaluated in Farta and Fogera woredas, Lake Tana area, Ethiopia.

112
farms have a positive effect on the local economy–a major strength identified through the RISE assessments, although the low salaries paid don't render agriculture a very attractive métier.
Weaknesses with regard to social security in the RISE analysis are mainly related to a lack of safety nets (insurances or informal risk reduction schemes in cases of retirement, unemployment, health, accident or disability, and protection from dismissal in cases of sickness, accident, or maternity), and low potentially payable salaries (due to the low economic performance). Working conditions are satisfactory except for the lack of opportunities to gain further qualifications and the lack of vacations. Aggregated ecological indicator values calculated by RISE are not alarming but poor with regard to biodiversity and N and P emission potential. Analyzing individual parameters, however, reveals that there is ample room for improvements in various domains. A high proportion of intensively used land comprising only few natural elements that could enrich biodiversity (such as hedges) put biodiversity under pressure. Nutrient surplus and inadequate manure storage and application methods present serious pollution risks to the environment. Crop protection could be considerably improved by choosing suitable varieties and crop rotations, and by measures and practices fostering biodiversity. Soils are threatened by erosion, a problem aggravated by intensive mechanical cultivation and lacking erosion control measures (except for contour planting which is common practice). The farms use practically no external energy for agricultural production; however, 880-1260 kg dung and 2.7-3.5 t of wood are used in the farmers' households, a significant export of nutrients from the farming system.
Water availability, management, and protection Access to water is not perceived as a problem by the interviewed farmers, although they often have to walk farther to get good quality water during the dry season. In the highlands, farmers mainly depend on springs (79%) and river water (29%), in lowlands on springs (34%), rivers (33%), hand pumps and wells (13%), shallow groundwater (13%), and tap water (7%). The farmers interviewed did not notice significant changes in water availability or quality during recent years. River water quality decreases from upstream to downstream, however. Very little water is used in livestock husbandry (apart from water for fodder production) or agricultural activities other than crop production.
Water productivity in crop production (including green water) is low compared to other production systems (e.g. 0.03 kg wheat/m3 or 0.56 kg potato/m3). Water productivity is positively correlated with the use of irrigation that is mainly applied in potato, rice, and vegetable production. In lowlands water is generally used more efficiently than in highlands, although precipitation in highlands is lower; it is likely that significant runoff on steep slopes without soil and water conservation (SWC) measures is one reason for low water productivity in the highlands. More important for low water productivity, however, are the very low yields realized (avg. 450 kg wheat/ha or 1700 kg potato/ha) which are significantly smaller in highlands than in lowlands. It has further been observed that well-off farmers (with high incomes and greater agricultural expenditures) use water more efficiently than poorer farmers.
Water pollution by livestock feces, especially by livestock entering water bodies, is a serious issue in the project area, particularly in view of upstream-downstream relations and (human and animal) health. But also inadequate manure storage contributes to water pollution risks. Wastewater disposal is far from sustainable but does not pose a serious problem due to low wastewater quantities
Fig.2:
RISE water parameter values of 29 farms evaluated in Farta and Fogera woredas, Lake Tana area, Ethiopia.
Parameters for calculating the water indicator: WR_SP1: Water availability and sources WR_SP2: Water quality and trends WR_DP1: Water use and productivity: WR_DP1a: Water use and productivity in crop production WR_DP1b: Water use in livestock husbandry WR_DP2: Risk factors for water quality WR_DP2a: Water pollution by manure WR_DP2b: Water pollution by silage leachate WR_DP2c: Waste water production and treatment/disposal WR_DP2d: Water protection by soil conservation/cultivation WR_DP2e: Soil permeability (nutrients/pollutants) Boxplot: circles denote average values
0102030405060708090
100
WR_S
P1
WR_S
P2
WR_D
P1a
WR_D
P1b
WR_D
P2a
WR_D
P2b
WR_D
P2c
WR_D
P2d
WR_D
P2e

113
produced. Implementation of measures to protect water quality by soil conservation or cultivation practices varies considerably; thus the observed problems of soil erosion also affect water quality.
Options to improve the situation Improving yields by making better use of available resources such as water, manure, and compost could certainly improve the economic situation to a certain extent. As well, labor-related issues (e.g. by increasing low labor productivity due to scattered plots through land consolidation, or making better use of church-imposed holidays) leave ample room for improvement. Production diversification and market orientation may be fostered through cooperatives (as demonstrated by the Wareta Milk Farmer or the Kuhar Multipurpose Farmer Cooperatives) or through farmer-industry partnerships. To improve social security through some sort of safety nets, awareness building regarding informal arrangements seems important as long as no respective policy action for formal insurance systems takes place. Furthermore, farmers should be motivated to capitalize on any opportunity for additional education and training, particularly since (due to church rules) ample time for such activities exists. Farmers are aware of certain benefits of high biodiversity. Pressure on productive land is high (not least due to the low yields realized), however, and there is little room for ecological compensation areas and biodiversity-enhancing elements, except if they are combined with productive and protective benefits such as contour-line hedges for (fuel) wood production and erosion control. Diversification of production may not only increase biodiversity, but also allow for integrated crop and pest management by cultivating suited species and varieties, and implementing proper crop rotations. Access to appropriate seed and knowledge about market opportunities is needed to diversify production. Training may be required regarding cultivation practices for certain crops, and about the principles and practice of integrated crop management (e.g. the use of damage thresholds).
Because crop yields are very low, high stocking rates and occasional purchase of fertilizer contribute to nutrient surplus on almost all farms analyzed, although large amounts are exported from the farming system in the form of dung and wood for fuel. More effective utilization of organic fertilizers could ease this problem and at the same time contribute to better yields (with positive effects on the economic situation). Percolation and runoff from manure storage places could be reduced (by shelters and runoff collectors), which would contribute to more efficient nutrient management. Soil erosion is a serious problem that not only threatens soil productivity but also water quality. The implementation of SWC and erosion control measures (in addition to contour planting) could protect soils from degradation, and simultaneously contribute to increased crop yields, by reducing runoff and increasing water productivity. Conservation agriculture practices (such as conservation tillage, mulching, or cover cropping) could protect soils and increase water use efficiency.
Low water productivity in crops and pastures is related to low yields and suboptimal water management. Any management practice that contributes to increased yields has positive effects on water productivity. Improved nutrient management (manure, composting), proper crop rotations, adapted varieties with reasonable yield potential, crop protection, and SWC measures may increase crop yields and thus water productivity. Such options address all three strategies for improving livestock water productivity outlined by Peden et al. (2007): Improving yields of fodder crops (including pastures) increases water productivity in feed sourcing, SWC measures conserve and make better use of water, and producing an adequate selection of feed crops enhances livestock productivity. Although many of these options also exert positive effects on other sustainability aspects (e.g. on soil conservation and economic efficiency), trade-offs are to be expected: Higher and expensive fertilizer inputs, for example, can increase pest and disease susceptibility of crops, contribute to further nutrient surplus, threaten water quality, and negatively affect biodiversity. Land degradation and low productivity are particularly obvious and widespread on common (grazing) lands. Changes in common land management (such as payment of access/use fees or a soft privatization) may be required to improve (water) productivity on common lands and better protect them against degradation.
Protecting water from pollution is important because not only livestock but also the population still depends to a great extent on surface water resources. Proper manure storage (possibly combined with wastewater treatment) will reduce pressure on water quality. To prevent livestock from entering open water courses it might be useful to divert water to watering places, possibly with overflows feeding

114
irrigation systems ('fertigation'). Organization for common management may be required to improve protection of water resources.
Conclusions and recommendations Based on the identification of critical sustainability issues through RISE assessments in the smallholder farming systems of Gumera watershed, various options to improve the prevailing situation could be identified and discussed with the concerned farmers. Options to improve water productivity are mainly related to increasing yields in crop and feed production (including pasture management), since water use for other purposes in livestock husbandry is low. Complemented with SWC technologies to make better use of precipitation, such options address all three strategies to improve livestock water productivity: feed sourcing, water conservation, and livestock productivity improvement. It is also important to protect water from pollution, in particular from animal feces, to safeguard human and animal health and welfare.
Several options to improve the RISE tool have been identified. Implications related to the dependency of farmers on common property resources have to be integrated better into the tool (e.g. with regard to nutrient flows or resource degradation). Seasonality should be considered to a greater extent for more precise explanations and conclusions on water balance and water productivity. Furthermore, the integration of on-farm energy production and exports should be improved.
Acknowledgments This paper presents findings from PN37, 'Nile Basin Livestock Water Productivity,' a project of the CGIAR Challenge Program on Water and Food. The authors express their sincerest thanks to G. Tadesse and A. Haileslassie from ILRI, and C. Thalmann and H. Porsche from SHL for their valuable support.
References Häni, F., A. Stämpfli, T. Gerber, H. Porsche, C. Thalmann, and C. Studer. 2007. RISE: A tool for improving sustainability in agriculture. A case study with tea farms in southern India. In: F. Häni, L. Pinter, and H.R. Herren (eds.) Sustainable Agriculture–From Common Principles to Common Practice. Earthprint publications. 262pp. plus comprehensive CD. Molden, D. 2007. Summary for decision makers. In D. Molden (ed.) Water for Food, Water for Life: A Comprehensive Assessment of Water Management in Agriculture. London: Earthscan and Colombo: International Water Management Institute, pp. 1-37. Peden, D., G. Tadesse, and A. Misra. 2007. Water and livestock for human development. In D. Molden (ed.) Water for Food, Water for Life: A Comprehensive Assessment of Water Management in Agriculture. London: Earthscan and Colombo: International Water Management Institute, pp. 485-514.

115
An analysis of livestock production in Capricorn, Mopani and Sekhukhune districts of South Africa
S. Mpandeli1, T. Simalenga1, M. Siambi2, J. Mkhari3 and R. Ramugondo3
1 Agricultural Research Council-Institute for Soil, Climate and Water, Private Bag X 79 Pretoria 0001, South Africa. 2 International Crop Research Institute for the Semi-Arid Tropics, PO Box 776, Lilongwe, Malawi. 3Limpopo Department of Agriculture, Private Bag X 9487, Polokwane
0159. South Africa. [email protected]
Abstract
Livestock still play a major role in most rural parts of Limpopo Province, South Africa. Some households use livestock for different purposes: draught, transportation, ceremonial, and bride wealth. In the late 1960s and 1970s most of the households in the province were livestock owners. This situation is changing as a result of migration of laborers to urban areas, poor rainfall distribution, drought , and poor access to land. During the baseline survey it was found that the majority of households in Sekhukhune district own goats (29%) compared to the other households in Mopani (15%) and Capricorn (14%) districts. Due to high climate variability in Limpopo Province, Sekhukhune district is suitable for goat production because of the poor rainfall distribution. Although Sekhukhune had a high proportion of households owning goats, they are really not making any significant contribution to the Provincial Growth Product (PGP) in the province. Goat meat is not sold in any formal market or supermarkets. Challenges facing the commercialization of livestock in rural provinces such as Limpopo are poor management of small stock and organization of farmers. Media grab Limpopo Province is well known for producing high-quality agricultural products. The province is rich in minerals and cultural diversity, however, two fundamental socioeconomic problems face the people: unemployment and poverty. Introduction Limpopo Province is situated in the northeast of South Africa and covers an area of 123,910 km², or 10, 2% of the area of South Africa. Limpopo Province is regarded as one of the poorest provinces in South Africa, with large numbers in rural areas (Oni et al., 2003; Mnisi et al., 2004). Limpopo is made up of five districts, of which Sekhukhune is the poorest. The province has a low Human Development Index, with high unemployment (48.8%), poverty (77%), and illiteracy (Statistics of South Africa, 2001 and 2003; HSRC, 2004). There is, however, general recognition amongst South Africans of the need to address problems arising from unemployment, poverty, income inequality, and disparities in access to services amongst the population (Mnisi et al., 2004, www.limpopo.gov.za/economy). The 2001 census statistics estimate that the size of the population in Limpopo Province had reached 5.2 million, 11.8% of the population of the country (Statistics South Africa, 2001). There are several reasons for keeping livestock in Capricorn, Mopani, and Sekhukhune districts, and it varies from household to household (Mnisi et al., 2004). According to Gootjes et al., (1992), some of the reasons for keeping livestock include a source of additional income and food provision. Livestock production may sometimes complement arable farming through provision of draught power and manure through enhancing the sustainability of the farming system (Mnisi et al., 2004; Raidimi et al., 2006). In some of the districts certain households are keeping livestock as part of their investment, token of status, and as security. In some instances livestock production promotes production and redistribution of wealth and may subsequently have considerable impact on rural development (Gootjes et al., 1992; and Raidimi et al., 2006). Methods The survey was targeted at smallholder households resident in the Limpopo River Basin. A three-stage
sampling frame was used for selecting districts, villages and households to be interviewed. Households
not classified as smallholder farmers were not targeted in the survey, and examples of such
households include teachers, households at mini urban centers in the communal areas, as well as
other civil servants.

116
The districts in which the survey was conducted were purposely selected. Before the interviews started with households in Capricorn, Mopani, and Sekhukhune districts, a village meeting was held with all community representatives present: chiefs, indunas, local councilors, and NGOs. Twenty enumerators (both student interns and extension officers) were trained in Polokwane and the questionnaires were tested in Turfloop village outside Polokwane town before implementation. In total 1000 households were interviewed in the districts. The main objectives were to obtain information on:
• Livestock production in all three districts in the province. • Ownership by gender of household head. • The need for communal households to commercialize livestock (e.g. goats).
Results and discussion Cattle ownership Most households (more than 75%) in the districts did not own cattle. Sekhukhune had the highest proportion of households (24%) owning cattle, Capricorn had 22%, and Mopani 18%. Most of the households owning cattle owned a herd of less than 10. Some of the households in Sekhukhune mentioned that cattle are good livestock species because they are saleable and one gets more profit per animal. The biggest challenge in Sekhukhune, however, is the grazing land, which is decreasing due to increased pressure on the land.
Table 1. Cattle ownership by district, 2004-05 season. District Proportion of households owning (%)
none 1 to 5 6 to 10 11 and above South Africa Capricorn (n=323) 78.3 10.8 6.8 4.0
Mopani (n=340) 81.8 8.8 4.1 5.3 Sekhukhune (n=342) 76.3 14.6 7.3 1.8
Households with male heads owned more cattle than households headed by a female in the three districts.
Table 2. Cattle ownership by district and gender of household heads for South African households, 2004-05 season. District Gender of head Proportion of households owning (%)
none 1 to 5 6 to 10 11 and above Capricorn Male (n=143) 69.9 16.8 7.7 5.6
Female (n=180) 85.0 6.1 6.1 2.8 Mopani Male (n=166) 75.9 12.0 4.8 7.2
Female (n=174) 87.4 5.7 3.4 3.4 Sekhukhune Male (n=156) 71.8 16.7 8.3 3.2
Female (n=184) 79.9 13.0 6.5 0.5
Women’s’ responsibilities in most households were categorized as child care, cleaning, and cooking. Very few women have been farming cattle, and they have little control over it even though they are responsible for caring of livestock. Most female-headed households owned less than five cattle, with a higher proportion of households with a male head owned larger herds. Goat ownership Sekhukhune had the highest proportion (29%) of households owning goats, compared to Capricorn (15%) and Mopani (14%). In Capricorn and Mopani, fewer households had goats because goat meat is less preferred because is smelly. This is causing a decrease in the numbers of goats in both districts.
Table 3. Goat ownership by district 2005-06.
District Proportion of households owning (%) none 1 to 5 6 to 10 11 and above
South Africa Capricorn (n=323) 85.4 6.5 4.6 3.4 Mopani (n=340) 85.6 7.9 4.4 2.1 Sekhukhune (n=342) 71.1 14.6 9.6 4.7

117
Sekhukhune has a semiarid climate and vegetation that is dominated by thorny acacia bushes (Mnisi et al., 2004). This environment is most suitable for the production of goats because they are 60% browsers and tolerate dry conditions (Peacock, 1996; Mnisi et al., 2004). According to Mnisi et al. (2004), Sekhukhune has the second highest number of goats in Limpopo Province. As was the case with cattle ownership, goat ownership was analyzed by gender of the household head. The analysis revealed that a higher proportion of male-headed households owned goats compared to the female-headed households in South Africa. The male-headed households also owned larger herds. According to Mnisi et al. (2004), goat meat and milk can produce a wide range of products, although most rural households in Capricorn and Mopani are unaware of them. Some households use goat skins as mats and also for ceremonial purposes. Goats are presently marketed live, and no slaughtering is done at official abattoirs (Mnisi et al., 2004). In Sekhukhune, for example, goat milk is getting publicity with the high rates of HIV/AIDS infection, as goat milk is believed to contain special antibodies for infected children (Mnisi et al., 2004).
Table 4. Goat ownership by district and gender of household head in South Africa. District Gender of head Proportion of households owning (%)
none 1 to 5 6 to 10 11 and above
Capricorn Male (n=143) 80.4 9.1 5.6 4.9 Female (n=180) 89.4 4.4 3.9 2.2
Mopani Male (n=166) 81.3 10.2 7.2 1.2 Female (n=174) 89.7 5.7 1.7 2.9
Sekhukhune Male (n=156) 66.0 16.0 10.3 7.7 Female (n=184) 75.5 13.0 9.2 2.2
Projections suggest an increase in goat numbers for Sekhukhune, Capricorn, and Waterberg, but a reduction in the remaining districts of Bohlabela, Vhembe, and Mopani (Oni et al., 2003; Mnisi et al., 2004). Since 2000, Limpopo Province has been experiencing droughts in Sekhukhune, Capricorn, and Mopani. During droughts, goats suffered fewer losses than other species of livestock because of their feeding behavior (Mnisi et al., 2004). Sekhukhune had higher proportions of household-owned goats. Sekhukhune has the climate and vegetation that is suitable for goats, and goats are kept in communal households (Mnisi et al., 2004). There are several reasons why goats in Sekhukhune and in other districts are not more widely reared: poor breeding programs, poor management practices, unfavorable marketing potential for households to sell through formal markets (Mnisi et al., 2004). Results from the baseline surveys show that goats are really not making a significant contribution to income of households in Capricorn and Mopani districts because they are not being produced for the formal market. Chicken ownership Mopani had the highest proportion (57%) of households owning chickens compared to Sekhukhune and Capricorn. The Limpopo Provincial Department of Agriculture is distributing chickens to vulnerable communities under the poverty alleviation and enhancement of rural livelihood strategies. Such initiatives have significantly increased the proportion of households owning chickens, despite the threats from Newcastle Disease. Some of the reasons mentioned by householders in Mopani when asked why they had higher proportions of chickens included: easy to sell, easy to manage, easy to market, and there are good market opportunities.
Table 5. Chicken ownership by district, 2005-06 season. District Proportion of households owning (%)
none 1 to 5 6 to 10 11 and above South Africa Capricorn 70.9 15.2 9.9 4.0
Mopani 42.6 16.8 20.3 20.3 Sekhukhune 63.7 18.4 12.3 5.6
Chickens are commonly owned by females with the right to dispose of them. In Capricorn, Mopani, and Sekhukhune, however, a higher proportion of male-headed households owned chickens compared to the female-headed households. As already noted on goat and cattle ownership, male-headed households owned larger flocks of chickens compared to households headed by females. In the other districts a higher proportion of male-headed households owned chickens compared households headed by females.

118
Ownership of other livestock Other livestock including donkeys, sheep, and pigs, are not commonly owned in Capricorn, Mopani, and Sekhukhune. In all three districts, the main types of livestock kept include cattle, goats, sheep, donkeys, and pigs. It was noted during the surveys that most households in all three districts have lower number of pigs compared to other livestock such as cattle and goats. The reason for having lower numbers is because of the higher costs involved in feeding pigs. In Mopani and Sekhukhune, pigs are not allowed to roam around in the villages due to high chance of spreading diseases (Raidimi et al., 2006). According to Mnisi et al. (2004), these livestock are kept in the kraals in the backyards. In all three districts other livestock such as sheep and pigs are traded informally. The buyers in the village buy directly from the farming households, and as a result no commissions are charged. Generally less than 4% of households in each of the districts owned donkeys. In districts such as Mopani and Sekhukhune, donkeys are used for transport and draught. Two percent or less of households owned pigs. Sekhukhune had the highest proportion (9.1%) of households that owned sheep compared to the other two districts. Sheep in Sekhukhune are exotic, but their numbers are increasing compared to other districts.
Table 6. Ownership of other livestock by district, 2005-06 season. District Proportion of households owning (%)
Donkeys Pigs Sheep South Africa Capricorn 2.5 1.9 4.3
Mopani 3.5 1.5 0.0 Sekhukhune 2.6 2.0 9.1
Sources of information on livestock technologies Access to information on livestock issues vary between households. According to Dapaah et al. (2001) and Minsi et al. (2004), most livestock farmers exchange information amongst themselves, and allege that some of the information disseminated to them by extension officers is not sufficient. The agricultural extension officers and other farmers were identified as the most common sources of information on livestock technologies. A significant proportion of households in Capricorn (54.5%) and Sekhukhune (56.4%) did not know where to get information on livestock technologies, which indicates a huge gap in information provision. The research institutions and nongovernmental organizations were not regarded as a source of information in all three districts. In South Africa these were not identified as a source of information. This poses serious challenges to other institutions such as the Agricultural Research Council and other livestock companies in the province. The dissemination of information to most households seems to be limiting factors in the three districts. Access to information on livestock prices is critical if smallholder farmers are to fully participate in livestock markets. A significant proportion of households in the three districts identified other farmers as a common source of information on livestock prices. Radio and the print media were not identified as sources of information, although Mopani had a relatively higher proportion (12.1%) of households citing it as an important source of information. The agricultural extension officers as noted earlier were not cited by many households as a source of information on livestock prices. Conclusions and recommendations In Sekhukhune, for example, biophysical factors such as rainfall and soil type are considered major limiting factors to the development of agricultural production. Agricultural production in Limpopo Province was at risk due to drought and other natural disasters (Oni et al., 2003). It is not surprising to see that districts such as Sekhukhune are good for goat production. Goats can survive harsh conditions and they are easy to keep. In Capricorn and Mopani, the preferred livestock are cattle and there are also reasons why households in those districts prefer them: they fetch a good price, and they are easily saleable. Cattle adapt and cope well in Capricorn and Mopani. Most households in all three districts have lower numbers of pigs compared to other livestock, because of the higher costs in feeding pigs. Acknowledgments This paper presents findings from PN1 ‘Crop water technology and markets,’ a project of the CGIAR Challenge Program on Water and Food.

119
References Dapaah, K. H., R. Hai, D. T. Hanh, I. Kanang, and M.M. Than. 2001. Towards sustainable communal
land use systems- current constraints and research and development opportunities for sustainable livestock production systems for the resource-poor in Ganyese and Kudamane district in the North West Province of South Africa. ICRA Working Document Series 94, The North-West Department of Agriculture.
Grootjes, C. P., G. Dew Hertog, R. De Jong, and A. J. Nel. 1992. Proceedings of the international
workshop: Livestock production in rural development. Development of livestock policies. International Centre for Development Oriented Research in Agriculture (ICRA). Wageningen. Netherlands, 20-31 January 1992, Wageningen.
Human Sciences Research Council (HSRC). 2004: Poverty rates in South Africa. Report presented at
the National Department of Health. March 14. Limpopo Provincial Government. 2002: Limpopo accessed at www.limpopo.gov.za on 24 July 2003. Mnisi, P.E., A.N. Tefere, M.D. Gayathri, C. Mukisira, M. Muthui, C. Murungweni, and O. Sebitloane.
2004. Goat production and livelihoods systems in Sekhukhune district of the Limpopo Province. ICRA Working Document Series 118.
Oni, S., A.E. Nesamvuni, J. J Odhiambo, and M. C. Dagada. 2003. In: Agriculture as a cornerstone of
the economy of Limpopo Province. Agricultural policies and institutions in agricultural investment, financing and credit in the Limpopo Province. Department of Agricultural Economics and Extension, South Africa, Volume1 (12).
Oni, S.A., C.L. Obi, A. Okorie, D. Thabede, and A. Jordan. 2002. Impact of HIV/AIDS on rural
households, small holder agricultural production and orphans in the Limpopo Province of South Africa, A case study in the Limpopo Province. P. 2-18.
Peacock, K. 1996. Goat Production Manual. Raidimi, N., B. Grwambi, U. Kolanisi, N. Maine, K. Mphahlele, Khomotso Ramaifo. 2006. Livelihoods in
the rural areas of Blouberg municipality (Gemarke & Early Dawn villages), Limpopo Province of South Africa. ICRA Working Document Series 129. The North-West Department of Agriculture.

120
Integration of germplasm and management for sustainable water productivity improvement in rainfed cropping
Quantifying water productivity in rainfed cropping systems in Limpopo Province,
South Africa
John Dimes1 and Phonnie du Toit2
1ICRISAT–Bulawayo, Zimbabwe [email protected] 2Grain Crops Institute, Potchefstroom, South Africa
Abstract This paper reports results of on-farm experimentation to quantify water productivity of maize, groundnut, and cowpea crops in the 2007-08 cropping season in Limpopo Province, South Africa. The observed crop yield and soil water and nutrient data are used to evaluate the APSIM model’s performance in simulating WP and soil water balance for maize and legume crops. There was very close agreement between observed and predicted biomass, grain yield, and changes in soil water content. The model provided outputs to fill measurement gaps in water balance components of the field experimentation, thereby allowing more detailed and appropriate calculations for comparing the WP of the different crops. Media grab The APSIM model performed remarkably well in predicting the crop yields and water balance of major crops in Limpopo Province, making it a key analytical tool for evaluating technologies for increasing yield and crop water productivity. Introduction
Maize production dominates the smallholder farming system in Limpopo Province of South Africa, although crop yields in these systems translate into very poor water productivity (WP)–in the order of 1-2 kg grain per mm rainfall per ha. Crop simulation analysis, supported with results from on-farm trials, suggests that WP could be increased by 50-100% if smallholder maize farmers used small doses of topdress N fertilizer and improved agronomy (Dimes and Carberry, 2008). Because the price of fertilizer has increased by more than 100% in recent times, a stronger case for expanding legume production as a means of increasing N inputs into these cropping systems is emerging. A comparison of WP for different crops and fertility management will help guide public and private sector investment aimed at improving agricultural output of smallholder farmers in the province.
Our results of on-farm experimentation to quantify WP of maize, groundnut, and cowpea in the 2007-08 cropping season are given. The observed crop yield and soil water and nutrient data were used to evaluate the performance of the Agricultural Production Systems (APSIM) model in simulating WP, yield, and soil water balance for maize and legume crops in Limpopo province. Methods FIELD EXPERIMENTATION
Field experiments were conducted at Tafelkop, a smallholder farming village located on the Nebo Tableland in Sekukhune District of Limpopo Province. The soils are shallow (up to 1.0 m rooting depth) loamy sands to sandy loams. The rainfall season is unimodal (October/November to March/April) with an average annual total of 500 mm. The Grain Crops Institute and the smallholder farmer association at Tafelkop established varietal trials of groundnut and bambara nut in the 2007-08 cropping season. Separate trials were established for each legume species, with six cultivars and three replicates laid out in a RCBD design. Demonstration plots of maize (PAN6479) and cowpea (Betch White) were established with the farmer association in adjoining plots to the legume varietal trials. Replicated treatment plots of Nyanda groundnut and SB7-1 Bambara were sampled (9.1 m2) at crop maturity for stover and grain yield. Bulk samples were also taken from the maize (stover 72 m2, grain 109 m2) and cowpea (36 m2) demonstration plots to

121
determine stover and grain yield. Groundnut and maize were sown on November 14, while bambara and cowpea were sown on December 5. Maize received 15 kg N/ha as starter fertilizer at planting, and a topdress application of 14 kg N/ha on January 14, 2008. Maize was harvested on April 29, groundnut on March 26, and cowpea on March 18. ICRISAT monitored the trial plots for changes in soil water content during crop growth using gravimetric methods. Soil sampling commenced on December 12, 2007, in the groundnut and bambara trials. Subsequent samplings took place on February 22 (all four crop areas), March 29 (groundnut, maize, and cowpea), and May 5 (Bambara), 2008. Sampling depth intervals were 0-0.1m, 0.1-0.3m, 0.3-0.6m, and 0.6-0.9m. Three soil cores were taken at each sampling, either across treatment replicates or within the final harvest area of the maize and groundnut. Gravimetric water contents were converted to volumetric using a bulk density of 1.5 g/cm3 in all soil layers. Soils collected on December 12 were analyzed for pH and percentOC. The farm owner of the trial field recorded daily rainfall at the site. MODEL ANALYSIS
Plant biomass, grain yield, and soil water balance of the maize, groundnut, and cowpea crops were simulated using the APSIM cropping systems model (Keating et al., 2002; Version 6.0), and model outputs were compared to observed data. Model input parameters for the maize (Pan6479) and groundnut (Nyanda) cultivars had been previously estimated (Dimes and Carberry, 2008; Ncube et al., 2008). Growth and yield of Betch White cowpea were adequately simulated using the short duration ‘Banjo’ cultivar description in APSIM. (As yet, there is no Bambara module in APSIM.) Dates of crop sowing and N fertilizer applications in the model were specified according to experimentation (see above). Plant populations were specified in the model according to measured populations at field harvest: maize–2.3 plants/m2, groundnut–11.7 plants/m2, cowpea–8.8 plants/m2. Soil parameters for simulation of the soil water and N balances in the nominated rooting depth of the soil (0.9 m) were specified as shown in Table 1. The crop lower limit of plant extractable water (LL) and the soil drained upper limit (DUL) were derived using the measured soil water contents as a guide. The plant available water capacity (PAWC) of the soil layers to the nominated rooting depth is 90 mm. The Runoff Curve Number and soil evaporation coefficients were chosen based on previous simulation studies in these environments (Ncube et al., 2008) Table 1. APSIM input parameters used in simulation of Tafelkop experiments.
Layer Number 1 2 3 4 SoilWat parameters
Layer thickness (mm) 100 200 300 300 Bulk density (g/cm3) 1.50 1.50 1.40 1.40
SAT 0.250 0.270 0.300 0.320 DUL 0.140 0.155 0.176 0.185 LL15 0.052 0.064 0.070 0.081
Airdry 0.045 0.052 0.070 0.081 Swcon 0.5 0.5 0.4 0.4
CN2_bare 85 U 3
Cona 4
Soil N parameters Organic C (%) 0.51 0.46 0.32 0.22
Finert 0.40 0.50 0.80 0.90 Fbiom 0.04 0.020 0.01 0.01
Nitrate-N (mg/kg) 3.79 1.52 0.76 0.38 Ammonium-N (mg/kg) 0.98 0.49 0.25 0.25
Soil C:N 12
Crop parameters LL (maize, groundnut, and
cowpea) 0.052 0.064 0.070 0.081
Kl 0.08 0.08 0.08 0.08 Xf 1.0 1.0 1.0 1.0

122
Soil water and N conditions at sowing of crops were not measured. The start date of simulations was therefore chosen as October 1 with the initial soil water content of layers specified at LL and starting mineral N in the profile set to 15 g NO3--N/ha and 5 kg NH4+-N/ha. Only daily rainfall data were collected at the site. Daily radiation data from a nearby (within 30 km) climate station (Marble Hall, 29º 37' E, 25º 03' S, altitude 878 m), and daily temperature data from a distant site (150km) of similar altitude to Tafelkop (Polokwane, altitude 1153m), were used as climate inputs to the model, in conjunction with the measured rainfall. The rainfall record collected by the farmer, however, indicated incidences of periodic totals as daily amounts. These were reallocated or adjusted based on the rainfall distribution recorded at Marble Hall and rainfall amounts recorded at a site close by.
1.3 Results and discussion There was very close agreement between observed and predicted total biomass and grain yield (RMSDgrain = 257 kg/ha, RMSDtbm = 436 kg/ha) of the three experimental crops grown at Tafelkop (Figure 1). There was closer agreement for predicted maize yields compared to the two legume crops, for which grain and biomass yields were slightly under-predicted. In general, however, the observed differences in plant growth and yield due to species and crop duration and the interaction of these effects and planting dates with rainfall distributions (wet December and January, dry February) were very well captured by the APSIM modelling platform used in this analysis.
0
500
1000
1500
2000
2500
3000
3500
Cowpea Groundnut Maize
Gra
in Y
ield
(kg
ha-1
)
Obs_GrnPred_Grn
0
1000
2000
3000
4000
5000
6000
7000
8000
Cowpea Groundnut Maize
Tota
lBio
mas
s(k
gha
-1)
Obs_TBMPred_TBM
Figure 1. Observed and predicted grain yield and total biomass of cowpea, groundnut, and maize crops grown at Tafelkop in the 2007-08 cropping season. The observed and predicted soil water contents at sampling dates in maize, groundnut, and cowpea plots are shown in Figure 2. There is close agreement between the predicted and observed soil water contents (rmsdtsw = 7 mm), and their distributions in the sampled rooting layers for all three crops on December 12. Similarly, the crop water use by maize and cowpea up to February 22 is well predicted by the model. This was not the case for groundnut, for which simulated soil water use by the crop below 0.3 m was noticeably overpredicted on this date.

123
(a)
0
100200
300400
500600
700800
0.000 0.050 0.100 0.150 0.200
soil water (mm/mm)so
ilde
pth
(mm
)
Figure 2. Observed and predicted water contents of soil layers on December 12, 2007, February 22, and March 29, 2008, under (a) maize, (b) groundnut, and (c) cowpea. An important test of the model’s performance in simulating the water balance was how well the model predicted the water content and distribution of the soil layers as measured on March 29, following the late rainfall in March. As seen in Figure 2, the observed refilling and distribution of soil water on March 29 under each crop is well predicted by the model. Overall, the performance of APSIM in predicting changes in soil water under the maize crop was most reliable (rmsdtsw = 7 mm), followed by cowpea (rmsdtsw = 10 mm), and groundnut (rmsdtsw = 14 mm). The simulated in-crop water balance (i.e. sowing to crop maturity) of the maize and cowpea grown at Tafelkop in the 2007-08 season shows runoff and soil evaporation higher than crop transpiration (Table 2). For groundnut, simulated crop transpiration comprises the largest portion of the water balance, but there is some uncertainty with this estimate given the overprediction of crop water uptake implicit in the predicted soil water contents on February 22, as seen in Figure 2b. Using in-crop rainfall in Table 2 as the reference water for assessing crop productivity in conjunction with measured grain yields (Figure 1), the calculated WP (kg grain/mm of rainfall/ha) of the three crops is maize = 6.0 kg/mm/ha; groundnut = 6.0 kg/mm/ha, and cowpea = 3.8 kg/mm/ha. Including crop water use of stored water at the time of sowing (as estimated by the model), (delta_sw in Table 2), reduces the WP estimates: maize = 5.6, groundnut = 5.4, and cowpea = 3 kg/mm.ha. A notable aspect of this analysis is the very low WP of the short-duration cowpea relative to the longer duration maize and groundnut. For this above-average rainfall season, and with a distribution favoring the longer duration crops, this result can be considered to be highly season-specific. Table 2. Simulated components of the soil water balance of maize, groundnut, and cowpea crops grown at Tafelkop in 2007-08. Crop In-crop
rainfall (mm)
Ep (mm)
Runoff (mm)
Drain (mm)
Es (mm)
Delta_sw (mm)
Water balance (mm)
Maize 485 115 170 78 158 -35 520 Gnut 485 209 119 65 145 -53 538 Cowpea 311 101 123 86 112 -86 417 % of water use as: Ep
Runoff Drain Es
Maize 22 33 15 30 Gnut 39 22 12 27 Cowpea 24 29 21 27 In-crop rainfall – sowing to crop maturity. Ep – crop transpiration; Es – soil evaporation; Drain – drainage below 0.9m Water balance = rainfall - delta_sw Delta_sw = Soil water storage at crop maturity - soil water stored at sowing.
(c)
0100
200300400500
600700800
0.000 0.050 0.100 0.150 0.200
soil water (mm/mm)
soil
dept
h(m
m)
Pred_D12 Pred_F22 Pred_M29Obs_Dec12 Obs_Feb22 Obs_Mar29
(b)
0100200300400500600700800
0.000 0.050 0.100 0.150 0.200
soil water (mm/mm)
soil
dept
h(m
m)

124
Conclusions and recommendations APSIM’s good performance in simulating the observed crop growth and yield of the three crops and the associated observed changes in soil water contents in the rooting zones is encouraging with regard to its application to quantify WP of crops in Limpopo Province. Firstly, reliable prediction of total biomass is a prerequisite to simulation of the soil water balance. This is because simulated crop water uptake and canopy cover estimates by the crop have important feedback mechanisms on simulation of soil water balance processes such as partitioning of rainfall into runoff and infiltration, and soil evaporation. Secondly, reliable partitioning of biomass to grain yield across the species is essential in determining estimates of WP that can be used with confidence in comparing the different cropping options, from a biological yield perspective or, more particularly, on a economic basis (e.g. to take account of the high value of legume grain relative to cereal grain). Thirdly, although the only component of the soil water balance measured in the experimentation was changes in soil water storage, the good agreements achieved in predicting the different soil water distribution profiles observed over the course of the crops provide indirect evidence for having confidence in the simulated outputs for the other components of the water balance: crop water use, runoff, drainage, and soil evaporation. As a consequence, the model offers a cost-effective tool to provide reliable estimates of the water balance in these rainfed cropping systems. Acknowledgments This paper presents findings from PN17 ‘IWRM for Improved Rural Livelihoods,’ a project of the CGIAR Challenge Program on Water and Food. References Dimes J., and P. Carberry. 2008. Improved fertilizer recommendations and policy for dry regions of
Southern Africa. Project Final Report. ACIAR, Canberra, Australia, 47 pp. Keating, B.A., et al. 2002. The Agricultural Production Systems Simulator (APSIM): its history and
current capability. Eur. J. Agron. 18:267-88. Ncube, B., J.P. Dimes, M.T. van Wijk, S.J. Twomlow, and, K.E. Giller. 2008. Productivity and residual
benefits of grain legumes to sorghum under semi-arid conditions in southwestern Zimbabwe: Unravelling the effects of water and nitrogen using a simulation model. Field Crops Research. In press.

125
Simulated yields and water productivity of rainfed grain crops in
the Volta Basin: fertilizer impact
M.J. Fisher1, I. Terrasson2, W. Andah3, and J. Lemoalle2
1Centro Internacional de Agricultura Tropical CIAT, Cali, Colombia [email protected] 2Institut de Recherche pour le Développement IRD, Montpellier, France
3Water Research Institute WRI, Accra, Ghana
ABSTRACT
To explain why actual productivity and water productivity is so low in the Volta Basin, we examined variation in simulated yield and water productivity of three crops, maize, sorghum, and millet, along a transect of approximately 900 km, running from Brofoyedru (Ghana) to Bilantal (Burkina Faso). We conclude that: Maize and other crops fail on sandy soils even in the wettest areas without fertilizer. Fertilizer produces good responses in maize yield and water productivity, but the response is increasingly risky as we move north along the transect. Because of the low planting density used, sorghum is less drought risky over the middle sections of the transect, but it responds weakly to fertilizer. Millet seems to provide value through large production of above-ground biomass. This production seems responsive to fertilizer and resistant to drought throughout all but the most northerly part of the transect.
MEDIA GRAB
In the Volta Basin, yields of maize and other grain crops sown without fertilizer often fail on sandy soils even in wetter areas. Fertilizer dramatically reduces the risk of crop failure and could enhance food security.
INTRODUCTION
Most of sub-Saharan Africa has poor soils, with rainfall that is variable and unreliable, both within and between years. Coupled with low levels of agronomic technology, the result is low yields in rainfed agriculture, often insufficient to provide even subsistence for the rural poor. The population increases forecasted will exacerbate the problem (Millennium Ecosystem Assessment, 2005).
Soil and conservation techniques can help improve both yields and water productivity and decrease vulnerability to erratic rainfall. Field experiments (e.g. PN5 of CPWF; Bationo and Mokwunye, 1991) indicate that the use of fertilizers can also increase crop yields.
To explain why actual productivity and water productivity are so low in the Volta Basin, we present a case study in the Volta Basin to examine the yield responses to fertilizers using the DSSAT simulation crop models. We chose a North-South transect across the basin to represent the large range of annual rainfall in the region.
METHODS
SITES The Ouagadougou meridian (1.53º W) was chosen because there was an existing set of 30 years’ weather data for Ouagadougou airport, with daily measurement of maximum and minimum temperatures, rainfall, and solar radiation. These data are compared below with 99 years’ data generated by MarkSim (Jones, 2003). Using Ougadougou’s latitude (12.37º N) as the datum, we extended the transect south to 6.37º N and north to 15.37º N, at intervals of 1.5º latitude, or about 160 km. Each site was named for the nearest town (or village) contained in the MarkSim shape file for African towns (afrtowns.shp) (Table 1).

126
Table 1. Nearest towns/villages to the sites on the Volta Basin transect. Nominal latitude (º N) Location Latitude (º N) Longitude (º W) Mean annual rainfall* (mm)
6.37 Brofoyedru 6.24 1.52 1480 7.87 Fiakwasa 7.77 1.35 1260 9.37 Chutadi 9.36 1.51 1160
10.87 Nakong 10.80 1.43 1100 12.37 Ouagadougou 12.37 1.53 840 13.87 Bourzanga 13.68 1.55 610 15.37 Bilantal 15.29 1.56 440
*Calculated from the 99-years’ data generated by MarkSim.
Annual rainfall decreases and daily mean temperature and diurnal temperature range during the rainy season increase from the south to the north on the meridian transect (Figure 2). Moreover, rainfall distribution changes from bimodal in the southernmost sites (Brofoyedru and Fiakwasa) to unimodal at Chutadi, becoming more strongly unimodal farther north. The atmospheric evaporative demand increases with increasing temperature with a gradient from south to north.
Figure 1. Map of the Volta Basin showing the transect, the sites, and the named locations.
SIMULATION MODELING
Simulation modeling allows us to identify problems in agronomic management, rainfall distribution, and soils that limit crop performance. We accordingly simulated yields of maize, millet, and sorghum at the seven sites across the transect. A brief description of the model chosen, the Decision Support System for Agrotechnology Transfer models (DSSAT), follows.
DSSAT consists of a suite of crop simulation models (Jones et al., 2003), including most cereals. The simulation uses a daily time step, although some processes, especially those related to photosynthesis, are simulated on time steps as short as one hour. The model requires input of daily data of rainfall, maximum and minimum temperatures, and solar radiation. The user specifies the appropriate agronomic management to be applied (crop variety, sowing density, row spacing, seed rate, fertilizer application, and other factors such as irrigation and pest damage, which we did not include). Sowing date can be specified, or automatic sowing is allowed when a specific amount of soil water is available within a window of sowing dates.
The DSSAT model requires soils data with a minimum of drained upper limit, lower limit, saturated water content, and a 'root growth factor' for each layer in the soil profile. We used data for nine soils in Niger from the WISE database (Batjes, 1995), modified for use with crop simulation models (Gijsman et al., 2007).

127
Examination of the output data of the simulations showed that the yield probability curves fell into three distinct groups, broadly according to soil texture (Table 2). The subsequent data reported are for the grouped soils.
Weather data We used climate data for each site from the WorldClim data set, with a resolution of 30 arcseconds (about 1 km at the equator) as input to MarkSim. We generated 99 years’ weather data for each site using MarkSim (Jones and Thornton, 2000).
Agronomic considerations After experimenting with many combinations of automatic sowing, the final protocol we chose was to start all simulations on 1 January, and to trigger sowing when there was 60% of 30 mm of available soil water (ASW) in the profile. The date after which sowing was allowed was set at 16 March at Brofoyedru, and half a month later for each 1.5º latitude northward progression, culminating with 16 June at Bilantal.
Seeding rates for all three crops were set at 3 plants/m2 in 1-m rows, which approximates those used in the basin where mixed crops (e.g., sorghum and niebe or bissap) is a commonly used risk-avoiding sowing method.
Table 2. Summary of the soils for Niger in the WISE database (Batjes, 1995) used in the Volta Basin meridian transect.
Soil (WI_xxNEnnn)1 SCS Family Texture
Soil depth (cm)
ASW2 (mm)
Depth to hold ~30mm ASW
(cm) Soil group 1 LV0073 Haplic Luvisol Sand 140 98 45 AR016 Ferralic Arenosol Sand 201 123 50 LX014 Haplic Lixisol Sand 201 123 50 Soil group 2 AC0082 Haplic Acrisol Sand 201 165 40 AC012 Haplic Acrisol Loamy sand 201 168 35 AC009 Haplic Acrisol Sand 211 171 40 Soil group 3 LX011 Plinthic Lixisol Loamy sand 201 189 30 PT010 Eutric Plinthosol Sandy loam 201 202 30 FL015 Eutric Fluvisol Clay loam 196 172 25
1The WISE code; xx is the code for the SCS family, NE is for Niger, and nnn is the WISE sequence number. 2ASW, available soil water. 3The soil code in the form xxnnn. Since we have no basis for creating genetic coefficients for the cereal germplasm grown in the Volta Basin, we chose a pragmatic approach. We chose the same millet variety used in the example for the ICRISAT Nohemy station in the DSSAT distribution package. It presumably reflects the characteristics of the germplasm grown in Niger, and, in the absence of better information, is likely to be similar to that grown in the Volta. The maize variety was one listed by the West African Seed Growers’ Association and for which the genetic coefficients were defined in the DSSAT package. The sorghum variety chosen was Hegari, a variety of West African origin. The fertilizer treatment was also chosen pragmatically as a low-level application that might be used to determine response to fertilizer. Phosphorus was simulated, but examination of the simulation output data showed that it had little effect.
RESULTS
Water productivity of grain yield The salient features for the seven sites, three crops, three soil groups, and two fertilizer levels are (Table 3).

128
Table 3. Water productivity (50% probability for the 99 years tested) for simulated grain crops grown with and without fertilizer on a 9-degree transect on the meridian of Ouagadougou (1.53ºW) in the Volta Basin, West Africa, using the DSSAT4 crop simulation package. Units are kg grain/m3 water. Soil group Crop Soil group 1 Millet (kg grain/m3 water) Sorghum (kg grain/m3 water) Maize (kg grain/m3 water) Fertilizer N0P0 N45P13 N0P0 N45P13 N0P0 N45P13
6.37º N 0.09 0.39 0.17 0.46 0.45 1.00 7.87º N 0.17 0.35 0.28 0.45 0.37 0.90 9.37º N 0.17 0.37 0.30 0.46 0.39 0.89
10.87º N 0.13 0.37 0.24 0.41 0.32 0.85 12.37º N 0.18 0.34 0.32 0.40 0.39 0.72 13.87º N 0.06 0.21 0.13 0.37 0.20 1.00 15.37º N 0.12 0.17 0.24 0.36 0.28 0.50
Soil group 2 Millet Sorghum Maize Fertilizer N0P0 N45P13 N0P0 N45P13 N0P0 N45P13
6.37º N 0.38 0.68 0.44 0.46 0.80 1.25 7.87º N 0.35 0.51 0.44 0.41 0.69 1.15 9.37º N 0.35 0.55 0.45 0.46 0.76 1.15
10.87º N 0.35 0.61 0.42 0.44 0.72 1.14 12.37º N 0.35 0.54 0.40 0.41 0.63 0.99 13.87º N 0.19 0.33 0.37 0.41 0.50 1.25 15.37º N 0.17 0.21 0.34 0.37 0.47 0.61
Soil group 3 Millet Sorghum Maize Fertilizer N0P0 N45P13 N0P0 N45P13 N0P0 N45P13
6.37º N 0.44 0.74 0.41 0.42 0.87 1.21 7.87º N 0.37 0.52 0.42 0.40 0.76 1.10 9.37º N 0.37 0.56 0.41 0.41 0.82 1.11
10.87º N 0.42 0.66 0.40 0.40 0.83 1.09 12.37º N 0.38 0.54 0.36 0.36 0.73 0.96 13.87º N 0.22 0.39 0.37 0.37 0.54 1.21 15.37º N 0.18 0.19 0.33 0.33 0.52 0.62
Maize Maize has high WP in the coastal zone (latitude less than Chutadi, 9.366º N). Three of the sandy soils in the absence of fertilizer have low WP in at least 50% of years because of substantial leaching of N before sowing. By the latitude of Ouagadougou (12.37º N), WP has fallen dramatically. At this latitude and further north, the leaching effect is substantially less, as might be expected.

129
Figure 2. Risk as estimated by the 20 percentile of cumulative yield probability for simulated grain crops grown with and without fertilizer on a 9-degree transect on the meridian of Ouagadougou (1.53ºW) in the Volta Basin, West Africa, using the DSSAT4 crop simulation package. At Brofoyedru (6.37º N) there is a substantial effect of fertilizer, which greatly improves the performance on the sandy soils. By the latitude of Ouagadougou (12.37º N) there is still some fertilizer response, but it is undoubtedly not economic. Further north, the fertilizer response is only in the minority of years.
Millet Millet overall has much lower WP than maize, such that at latitudes where maize grows it would not be the crop of choice in terms of WP. However, its advantages occur in terms of forage production,
20 percentile, no fertilizer
0
1000
2000
3000
4000
5000
6 9 12 15
Latitude, ¼N
Mai
ze g
rain
yie
ld, k
g/ha
Group 1 Group 2 Group 3
20 percentile, N45P13
0
1000
2000
3000
4000
5000
6 9 12 15
Latitude, ¼NM
aize
gra
in y
ield
, kg/
ha
Group 1 Group 2 Group 3
20 percentile, N45P13
0
1000
2000
3000
4000
5000
6 9 12 15
Latitude, ¼N
Mill
et g
rain
yie
ld, k
g/ha
Group 1 Group 2 Group 3
20 percentile, no fertilizer
0
1000
2000
3000
4000
5000
6 9 12 15
Latitude, ¼N
Mill
et g
rain
yie
ld, k
g/ha
Group 1 Group 2 Group 3

130
especially in lower rainfall environments of Ouagadougou and further north. The same effect of N leaching occurs on three sandy soils.
Sorghum In all cases, because of the low sowing density, sorghum gives very low WP at all latitudes, with no response to fertilizer, but with much lower risk than either maize or millet, even at the higher latitudes. Clearly, 3 plants/m2, which the sowing density that farmers in the Basin use, is a risk-avoidance strategy. Yields are low, but reliably so, and farmers’ investment in the crop is minimal.
Grain yield The cultivated area of the main crops varies from north to south in the Volta Basin, with millet and sorghum progressively decreasing to the benefit of maize and tubers. This shift results from farming strategies, where the rainfall distribution takes its place.
The graphs (Figure 2) of the 20 percentiles demonstrate how the degree of risk increases from south to north on the transect, between the soil groups, and that fertilizer greatly lessens risk, especially on the group 1 (sandy) soils. The effect is much more pronounced with maize than for millet. Fertilizer had little effect in reducing the risk with sorghum (data not presented), principally because the low
plant densities used already constitute a risk avoidance strategy. Millet seems to provide value through large production of above-ground biomass (data not presented). This production seems responsive to fertilizer and resistant to drought effect throughout all but the most northerly part of the transect.
CONCLUSIONS
Yield potential decreases greatly from south to north, with sandy soils having much less yield potential than the others. Actual yields and WP are both well below their potential. Fertilizer can increase both but it gets increasingly risky toward the north.
Simulated water productivity for grain yield declines from south to north because of the higher evaporative demands associated with higher temperatures. Fertilizer substantially increases water productivity at lower latitudes, but it becomes less effective at higher latitudes.
Our results confirm that yields can be improved with fertilizers, without increasing the risk of crop failure for farmers. Fertilizers would help in providing self sufficiency if a policy to develop food crops production and markets in the basin countries is put into action.
REFERENCES
Bationo A., and A.U. Mokwunye. 1991. Alleviating soil fertility constraints to increased crop production
in West Africa: The experience in the Sahel. Fertilizer Research, 29: 95-115.
Batjes, N.H. (ed.) 1995. A homogenized soil data file for global environmental research: A subset of
FAO, ISRIC and NRCS profiles (version 1.0). Working Paper and Preprint 95/10b. Gijsman, A.J., P.K. Thornton, and G. Hoogenboom. 2007. Using the WISE database to parameterize
soil inputs for crop simulation models. Computers and Electronics in Agriculture, 56: 85-100. Jones, P.G., and P.K. Thornton. 2000. MarkSim: Software to generate daily weather data for Latin
America and Africa. Agronomy Journal, 92: 445–53. Jones, J.W., G. Hoogenboom, C.H. Porter, K.J. Boote, W.D. Batchelor, L.A. Hunt, P.W. Wilkens, U
Singh, A.J. Gijsman, and J.T. Ritchie. 2003. The DSSAT cropping system model. European Journal of Agronomy, 18: 235–65.
Millennium Ecosystem Assessment. 2005. Ecosystems and Human Well-Being: Synthesis. Washington,
D.C.: Island Press.

131
Efficient rainwater harvesting and nutrient management for high crop productivity in Volta Basin
M. Fosu1, S. Sawadogo-Kabore2, A. Bationo3, R. Tabo4, S.S. Buah1. R. Kanton1, M. Bonzi2, D. Fatondji4, O. Hassane4, and A. Abdou4
1Savanna Agricultural Research Institute SARI), P.O. Box 52, Tamale
2Institut de l’Environnement et de Recherches Agricoles (INERA), Burkina Faso 3Centro Internacional de Agricultura Tropical (CIAT)
4International Crops Research Institute for the Semi-Arid Tropics (ICRISAT) [email protected]
Abstract In the Volta Basin crop productivity is low due to erratic and unpredictable rainfall, and poor soil fertility. To improve crop productivity promising technologies of integrated soil, water and nutrient management, namely the Sahelian Eco-Farm (SEF), and tied ridging were evaluated in Ghana in partnership with farmers. The SEF combined the use of Acacia trees (Acacia coli), microcatchments or half moons, and high value trees (Ziziphus mauritania) planted inside the half moons, and sorghum and cowpea planted in rotation or continuous system. The half moons served as soil and water conservation structures to channel and retain water around the Ziziphus trees. Acacia prunings were incorporated in the cropped areas. Sorghum grain yield was increased by rotation with cowpea compared with continuous sorghum system, inside and outside the SEF. Yields were not significantly influenced by introducing trees into the cropping system. Cowpea did not appear to benefit from rotation until the fourth year. Acacia coli had rapid growth and survived the dry seasons. Water harvesting using tied ridging increased yield (by up to 20%) and water productivity of maize and sorghum, and there was a consistent trend for this effect to be enhanced when fertilizer was applied, and the enhancement was significant in one out of three trials. Media grab In-field rainwater harvesting (tied-ridging) and fertilizer application increased crop and water productivity, and the response to fertilizer tends to increase with tied-ridges. Introduction Food production in the Volta Basin is characterized by rainfed subsistence agriculture, low use of external inputs, and low and declining soil fertility. More than half of the basin is semi-arid with annual rainfall ranging between 150 and 1100 mm. The rainfall is monomodal and erratic with wide seasonal variations of up to 20% or more (Kasei, 1988). The two conditions of erratic rainfall and low soil fertility are the most important limitations to agricultural productivity in the area, with perennial food deficit in most of the countries within the basin. To increase food production in the basin, these two key conditions need to be addressed. Traditional cropping systems have sustained food production over the years though at low levels. In evaluating the traditional cropping systems, Dakora and Keya (1997) concluded that legume-cereal rotations were far more sustainable than intercropping systems. Organic and mineral fertilizers have been shown to improve cereal yields in the basin (Schlecht et al., 2006; Fosu et al., 2004). Although fertilizer application consistently improves crop production, the results of tied-ridging have not been consistent. In addition, the combined effect of tied-ridges and soil fertility amendment has not been widely tested. An integrated soil, water, and nutrient management approach holds promise to managing erratic rainfall and low soil fertility in sub-Saharan Africa. The objectives of the work presented here were to evaluate an integrated crop management system within the Sahelian/Savannah Eco-Farm (SEF) system developed by ICRISAT, and the interactions between tied-ridging and fertilization on crop production in the Volta Basin. Methods Two experiments were conducted at Navrongo and Tamale in Ghana. The systems tested were: (1) crop rotation (continuous sorghum, continuous cowpea, and sorghum-cowpea rotation) within and outside a Sahelian/Savanna Eco-Farm (SEF) system over 4 years (2004-07), and (2) tied-ridging and fertilizer application in 2006 and 2007. The SEF, which was conducted on-station at Navrongo, combines the use of Acacia coli, microcatchments, or half moons, high value trees such as Ziziphus mauritania planted inside the half moons, and sorghum and cowpea planted in rotation or continuous, each year in a RCBD with three replicates. There were two rows of A. coli and one row of Z. mauritania in each plot of 15 x 30 m. The half moons installed within grassed contour bunds served as soil and water conservation structures to channel and retain rainwater around the Ziziphus trees. Acadia coli, a drought-resistant leguminous tree, was pruned annually after 2 years, and incorporated at the time of land preparation within the cereal and legume plots.

132
The tied-ridging was tested on-station (at Nyankpala) and on-farm (farmer managed, at Tamale) in Ghana and compared open ridges and tied-ridges without or with fertilizer (N60P30K30 kg/ha) using maize and sorghum as test crops. The tying was done 6 weeks after planting at 0.8 m intervals. The trial design on-station was a 2 x 2 factorial arranged in a RCBD with three replicates. On-farm, each farmer served as a replicate and the plot size was 10 m x 10 m. Results and discussion Integrated cropping system Over the 4 years, there was no effect of the SEF on crop yield (Table 1), i.e. there was no yield loss as a result of reduced crop area or competition for water, nutrients, and light by the trees. Yields within or outside the SEF were similar each year for sorghum and cowpea in respective rotations. In the continuous system, sorghum grain yield was similar in all systems in the first year, but after 2 years (i.e. the first sorghum crop after cowpea), yield of continuously cropped sorghum was significantly lower than yield of sorghum grown in rotation with cowpea (yield reduction of about one-third). As for sorghum, there was no effect of the SEF on yield of cowpea grown continuously or in rotation with sorghum (Table 2). In the 4th year, there was a significant effect of rotation on cowpea yield, with around a 50% increase in yield of cowpea grown in rotation with sorghum in comparison with continuous cowpea (Table 2). The mean cowpea yield over the experimental period was below 1 t/ha. In the SEF, Acacia coli grew rapidly and survived the long dry season probably partly due to the water storage from the half moons. In 2006, the firewood obtained from A. coli pruning was 3.6 t/ha, and in 2007 it was 3.1 t/ha, valued at US$78.1 and 62.0, respectively. The Ziziphus fruit harvested in 2007 was 96 kg/ha. The harvest from these trees is additional benefit to the SEF system. Incorporation of the A. coli prunings in the SEF plots did not improve sorghum and cowpea yields over the No-SEF system (Table 1 and 2). This may be due to the slow decomposition observed for A. coli leaves (data not included). Table 1. Effect of integrated cropping system on sorghum yield (t/ha) at Navrongo, 2004–07. Treatment 2004 2005 2006 2007 Mean SEF + sorghumƒ in rotation with cowpea 2.21 - 2.04a - 2.13 SEF+ sorghum continuous 2.15 1.28 1.37b 1.33 1.54 No SEF + sorghum in rotation with cowpea 2.14 - 2.15a - 2.15 No SEF+ sorghum continuous 2.02 1.72 1.48b 1.31 1.63 SEF +cowpeaγ in rotation with sorghum - 1.81 - 1.41 1.61 No SEF +cowpea in rotation with sorghum - 1.77 - 1.52 1.65 LSD NS NS - NS - ƒSorghum begins rotation; γCowpea begins rotation. Table 2: Effect of integrated cropping system on cowpea yield at Navrongo, 2004–07. Treatment 2004 2005 2006 2007 Mean SEF +cowpeaγ in rotation with sorghum 0.80 - 0.81 - 0.81 SEF+ cowpea continuous 0.86 0.54 1.01 0.52 0.73 No SEF +cowpea in rotation with sorghum 0.71 - 1.09 - 0.90 No SEF+ cowpea continuous 0.64 0.79 0.98 0.48 0.72 SEF + sorghumƒ in rotation with cowpea - 0.59 - 1.19 0.89 No SEF + sorghum in rotation with cowpea - 0.76 - 0.84 0.80 LSD NS NS NS 0.44 - Tied-ridges and fertilizer application On-station at Nyankpala, there was no interaction between tied-ridging and fertilizer rate on maize grain and stover yield in 2006 (Table 3). Water harvesting had no effect on maize biomass or yield production. There was, however,a highly significant effect of fertilizer application on grain and stover yield. The highest water productivity was obtained when fertilizer was applied (Tables 3 and 4). Table 3. Effect of water harvesting on maize yield at Nyankpala (on-station) 2006. Treatment Grain yield (t/ha) Stover (t/ha) Water productivity
(kg/mm) Water harvesting No tied ridging 1.1 2.4 2.0 Tied ridging 1.5 3.1 2.7 LSD ns ns Soil amendment No fertilizer 0.48 1.2 0.87 N60P30K30 2.13 4.3 3.84 LSD 0.07 0.14 P>F Wat-h 0.18 0.2 Soil-a 0.0001 0.0001

133
Wat-h x Soil-a 0.32 0.34 Wat-h = water harvesting; Soil-a = soil amendment. On farmers’ fields also, there was no fertilizer by tied-ridging interaction effect, but there were significant effects of water harvesting and fertilizer on maize grain yield and of fertilizer on stover yield (Table 4). Table 4. Effect of water harvesting on maize yield at Tamale (on-farm) 2006. Treatment Grain yield (t/ha) Stover (t/ha) Water productivity (kg/mm) Water harvesting No tied ridging 0.81 2.3 1.5 Tied ridging 0.97 2.4 1.7 LSD 0.14 ns Soil amendment No fertilizer 0.46 1.9 0.8 N60P30K30 1.33 2.7 2.4 LSD 0.40 0.23 P>F Wat-h 0.03 0.32 Soil-a 0.004 0.006 Wat-h x Soil-a 0.26 0.78 In 2007, a signficant water harvesting by fertilizer interaction effect was observed on sorghum yield at Navrongo (Figure 2). In other words, there was a greater response to fertilizer in the presence of tied ridges. Tied-ridging on-station at Nyangkpala in 2006 was conducted on slightly sloping land (about 2.7% slope), which was gravelly on the surface. The slope, in addition to the expected low water retention of the soil, may have accounted for the beneficial effect of tied-ridging in 2006, when the rainfall distribution was poor (Figure 1). The response to tied-ridging in 2007 was contrary to expectation given the high rainfall (860 mm from July to October) experienced in the area. The water productivity was 0.9, 1.1, 1.5, and 2.4 kg/mm of rain for control, TR-F, NTR+F, and TR+F, respectively (see Figure 2 for definition). The effect of tied-ridging may have been important in minimizing the effect of terminal drought as the rains stopped abruptly in Navrongo in 2007.
Figure 1. Rainfall in 2006 and long-term mean (1953-2006) at Nyankpala.
0
50
100
150
200
250
Jan Feb Mar Apr May Jun Jul Aug Sep Oct Nov Dec
Month
Rai
nfal
l (m
m)
2006 1953-2006Total 2006 = 824.4 mmMean 1953-2006 = 1032.9 mm

134
Figure 2. Effect of tied-ridge on sorghum yield at Navrongo, 2007 TR = tied-ridge; F=NPK 60-30-30 kg/ha, control=No tied ridging, no fertilizer. Conclusions and recommendations Crop rotation is an important component of integrated soil fertility management. SEF has potential for diversification of smallholder cropping systems, but its benefits need to be further demonstrated. A complete picture of the productivity of the integrated cropping system can be assessed only after economic analysis. Water harvesting with tied-ridges under fertilization enhances water productivity and crop yields. Tied-ridge appear to be more effective when there is slope and the water-holding capacity of the soil is low. Further research on different slopes, soil types, climate conditions and time of tying are needed to establish the conditions under which tied-ridges are most effective. Acknowledgments This paper presents findings from PN5 'Methodologies for enhancing soil, water and nutrient use efficiency,' a project of the CGIAR Challenge Program on Water and Food (CPWF). The authors wish to acknowlege financial support from CPWF and Theme 1 leader for useful suggestions on water productivity measurements, and also the directors of the institutes of the authors for their material support. References Dakora F.D., and S.O. Keya. 1997. Contribution of legume nitrogen fixation to sustainable agriculture
in sub-Saharan Africa. Soil Biol. Biochem. 29: 809-17. Fosu M., Ronald F. Kühne, and Paul P.L.G. Vlek. 2004. Improving maize yield in the Guinea Savanna
zone of Ghana with leguminous cover crops and PK fertilization. Journal of Agronomy 3: 115-21
Kasei, C.N. 1988. The physical environment of semi-arid Ghana. In: P.W. Unger, T.V. Sneed, W.R.
Jordan, and R Jensen (eds.). Challenges in dryland agriculture. A global perspective. pp. 350-354. Proc. Intern. Conf. on Dryland Farming. August 15-19. 1988. Amarillo/Bushland, Texas, USA.
Miriti J.M., M.M. Odera, S.K. Kimani, J.N. Kihumba, A.O. Esilaba, and G.N. Ngae. 2003. On-farm
demonstrations to determine farmers’ subjective preference for technology-specific attributes in tied-ridges: Preliminary results. Paper presented at the 1st KARI adaptive research conference 16-19 June, 2003. Nairobi, Kenya.
Schlecht E., A. Buerkert, E. Tielkes, and A. Bationo. 2006. A critical analysis of challenges and
opportunities for soil fertility restoration in Sudano-Sahelian West Africa. Nutrient Cycling in Agroecosystems 76: 109–36.
0
500
1000
1500
2000
2500
Control TR-F NTR+F TR+F
Treatment
Sorghum grain yield (kg/ha)
lsd (5%)

135
Improving crop productivity and farmer income using fertilizer microdosing and the warrantage system in the Volta Basin
S. Sawadogo-Kaboré1, M. Fosu2, R. Tabo3, R. Kanton2, S. Buah2, A. Bationo3, S. Ouédraogo1, S. Pale1,
M. Bonzi1, K. Ouattara1, O.Hassane3, D. Fatondji3, H. Sigue1, and A. Abdou3
1Institut de l’Environnement et de Recherches Agricoles (INERA), Burkina Faso 3International Crops Research Institute for the Semi-Arid Tropics (ICRISAT Savanna Agricultural
Research Institute SARI), P.O. Box 52, Tamale 4Centro Internacional de Agricultura Tropical (CIAT) [email protected]
Abstract In the Volta Basin, poor soil fertility and low water availability are the major constraints to crop production. Fertilizer microdosing technology involves application of small quantities of fertilizers in the planting hole. It increases fertilizer use efficiency and yields while minimizing input costs. Recognizing that liquidity constraints often prevent farmers from intensifying their production system, the 'warrantage' or inventory credit system helps to remove barriers to the adoption of soil fertility restoration. Fertilizer microdosing was tested in partnership with 32 farmers in Navrongo and Tamale, Ghana. Farmer field schools (FFS) were established at Kandigah in Kassena Nankana District of Upper East Region, Ghana, where 21 farmers were trained in microdosing. In Burkina, microdosing resulted in an increase in yield of 25-40% compared to controls. Warrantage was implemented in Ziga and Saala in Burkina Faso from 2005-2007, with a major emphasis on the training of farmer associations. In Ghana, microdosing increased maize yields by more than 50% compared to the controls. By using the warrantage system, farmers increased the value of their grain stocks by 42 % in Ziga and 21% in Saala. Media grab Microdosing combined with a warrantage system increases rainwater productivity and farmer revenue, and gives farmers better access to credit. Introduction Most of the people in the Volta Basin are resource-poor farmer families relying on rainfed agriculture for their livelihoods. Temporal and spatial variability of rainfall results in high risks for farmers. Intensive cultivation of farmlands with low external inputs has led to a significant decline in soil fertility, resulting in low agricultural productivity, which is the main cause of poverty and food insecurity. Efficient use of fertilizers combined with good market management of agriculture products may help farmers to achieve food security and improve livelihoods. This paper presents the results of a combination of the microdosing technology with improved crop varieties to increase cropland and water productivity and fertilizer efficiency. It also presents an innovative approach for increasing farmer’s incomes through the warrantage system. Microdosing experiments in farmer’s fields as well as in farmer’s field schools (FFS) included a range of fertilizer formulas in Burkina Faso and Ghana research areas. The warrantage system was applied to give farmers the opportunity to access credit, to generate revenues from dry season economic activities, and to facilitate acquisition of inputs. Methods Fertilizer microdosing experiments The demonstration tests consisted of two plots per farmer, each plot measuring 0.25 ha (2500 m2). Each technology was repeated by four farmers. Treatments consisted of the farmers’ practice (control) and one 'improved' technology on each farm. The earlier recommended broadcasting system of fertilizer application is about 100 kg/ha of compound fertilizer (NPK = 15:15:15 for Ghana, and 14:23:14 for Burkina Faso), whereas the fertilizer microdosing involves 4-6 grams per hill of compound fertilizer (NPK) corresponding to 40-60 kg compound fertilizer/ha, or 2 grams of sulfate of ammonia (SA) per hill (20 kg SA/ha). Farmers used their own densities in the control plots, but were requested to follow the recommended densities in the microdosing plots, with guidance from the field technicians. Plant densities under farmer practice varied between 5000 and 6000 hills/ha whereas the recommended densities in the microdosing plots ranged from 10,000 to 20,000 hills/ha. The same planting date was recommended for treatments and control, to be done when the soil was moist enough for germination of seeds. The farmers weeded as needed, in some cases on the advice of field

136
technicians. Harvesting was done by the farmers under the supervision of field technicians. Data collection was done by the field technicians. In Ghana, experiments were carried out on farm with 20 farmers in 2005 and 2006. Treatments included microdosing, recommended fertilizer rates, and no fertilizer, using improved varieties of sorghum (Kapaala) and maize (Obatampa) and farmers’ varieties. The microdose rate was 60 kg/ha of NPK (l5:l5:l5) plus 60 kg/ha of sulfate of ammonia (SA) using 2 g NPK + 2 g (SA)/hill at planting, whereas the recommended rate is 240 kg NPK l5-l5-15/ha using 8 NPK g /hill + 4 g SA/hill. The following treatments were compared: • T1: Improved variety with microdose. • T2: Improved variety with recommended fertilizer rate. • T3: Farmer variety + micro dose. • T4: Farmer variety with recommended fertilizer rate. • T5: Farmer variety with no fertilizer (Control). In Burkina Faso during the cropping seasons in 2005-2007, four microdosing formulations were tested with 32 farmers each year in their fields to select the best formula for improved varieties of the main crops in the study regions: maize (Espoir) continuously cropped in Saala village in the southwest, and sorghum (Kapelga) grown in rotation with cowpea (KVX.39-2D-5X) in the north (Ziga village). Apart from the control, all fertilizer treatments were tested in the presence of water harvesting measures (stone rows (cp) and zaï). The micro dosing formulations were: • NPK: 14:23:14 at 60 kg/ha on all crops corresponding to 8.4 kg N/ha and 13.8 kg P/ha. • Urea: 40 kg/ha on sorghum and 60 kg/ha on maize, corresponding to 18.4 and 27.6
kg/N/ha. • BP (Burkina phosphate rocks): 200 kg/ha for all crops corresponding to 21.7 kg P/ha. • Organic matter (OM): 2.5 t/ha for all crops. The treatments are described below: • Tech1 = cp + Zai + OM. • Tech2 = cp + Zai + NPK+ urea. • Tech3 = cp + Zai + OM + urea + BP. • Tech4 = cp + Zai + OM + urea + BP +NPK. • Tech5 (control): farmer practice (no fertilizer, no water harvesting). Rainwater productivity (RWP) RWP was calculated at Ziga in 2007 using the total rainfall (Rain) between planting and harvest and grain yield:
RainYieldRWP = (kg/mm/ha)
Rainfall data were collected from rain gauges installed in each farmer demonstration field. Data were analyzed by ANOVA using the general linear model (GLM), and the software package SPSS (Statistical Package for the Social Sciences). Warrantage
The methodology to implement the warrantage system in Saala and Ziga was based on Participatory Learning and Action (PLA) methods. Participatory Rural Appraisal (PRA) and a literature review were undertaken in 2005 to characterize the two sites in terms of socioeconomic status: infrastructure, internal and external relationships between farmer organizations, and development partners (public, private, and NGO). Infrastructure included farmers’ product storage capacity and quality. Sensitization sessions with the target public and training sessions were organized to establish memoranda of understanding (MOU) with partners in both villages. Sensitization sessions involved meetings with the target groups, financial institutions, development partners, NGOs, and the project manager group. The training curriculum included explaining the warrantage credit system, warrantage function and monitoring, revenue generating activities, and management and market organization. Warrantage was implemented in the two villages in 2005 and 2006. Its impact was evaluated from the induced benefits, the income generating activities (IGA) management, and farmers’ capacity building through economic analysis and an impact study.

137
Description of the sites In both sites, rainfall varies in time and space. Mean rainfall is about 800 mm/year in Navrongo and Saala. In Ziga, mean annual rainfall is around 650 mm. Rainfall has high spatio-temporal variability in all locations. In addition to rainfall limitations, soil characteristics determine land use, crop productivity and small farmer livelihoods in the Volta Basin. The major soils of the Navrongo area belong to the Tanchera association and consist mainly of Puga series (Eutric Plintosol), Tanchera series (Endoeutric-Stagnic Plintosol), Pu Series (Eutri Gleyic Regosol), Kupela series (Eutric Gleysol) and Berenyasi series (Gleyic Arenosol). The soils are mainly loamy sand and sandy loam on the surface. Bulk density ranged from 1.7-1.9 mg/m3 and total porosity of the topsoil was 34-37%. Organic carbon was 0.5-0.7% and saturated hydraulic conductivity (Ks) at the surface was 4.5 mm/h. Soils in Ziga are eroded soils overlying gravelly material. In Saala, the soils are lixisols overlaying sandy-clayey material, and luvisols overlaying clayey material. These soils have low organic C and total N contents because of low biomass production and a high rate of decomposition (Mokwunye et al., 1996). N and P are limiting nutrients in all site soils. In Ziga and Saala, trading is based on the local market system. Markets are held every 3 days and distances vary from 10-70 km. Farmers have no access to credit for revenue-generating activities and agricultural investments (fertilizers, pesticides, insecticides). Agricultural products are sold at very low prices during the harvesting period (October, November) for cash for social needs such as school fees. Later on in the dry season (April, May), prices increase and traders make higher profits from farmers out of their products. Results and discussion Yields There was a consistent trend toward higher yields of all fertilizer treatments in comparison with farmer practice at all locations. In 2005 at Nyankpala, there were significant, large yield increases with all fertilized treatments in maize, but for sorghum the yield increase was only significant with the highest (recommended) amount of fertilizer hum, at Nyankpala in 2005 (Figure 1). Conversely, sorghum and cowpea responded significantly to all fertilizer treatments averaged over 3 years at Ziga in Burkina Faso, while maize was less responsive (Figures 2, 3). At Saala in year 2, maize yields were very low as a result of flooding early in the season followed by a very dry season. In Ghana, maize yields increased many-fold over the control for all fertilizer treatments, while in Burkina there was an increase of at least 25% in cereal yields and 39% in cowpea yield with the technologies compared to the controls. Tabo et al. (2006) found that microdosing optimizes nutrient use efficiency, while Zougmoré et al. (2004) found that the combination of water harvesting technologies and fertilizer improved water and nutrient use efficiencies and thereby increased crop yield.
Figure 1. Yield of maize and sorghum at Nyankpala (Ghana) 2005. Error bars are least significant differences at p=0.05 (Lsd).
Sorghum Grain Yields
0
200
400
600
800
1000
1200
1400
Tech1 Tech2 Tech3 Tech4 Control
Treatments
kg/h
a
Maize Grain Yields
0200400600800
10001200140016001800
Tech1 Tech2 Tech3 Tech4 Control
Treatments
kg/h
a
Sorghum Grain Yields
0100200300400500600700800
T1 T2 T3 T4 T5
Treatments
kg/h
a
Maize Grain Yields
0
500
1000
1500
2000
2500
T1 T2 T3 T4 T5
Treatments
kg/h
a

138
Figure 2. Sorghum and maize means yields (averages 2005-2007) per technology as compared to farmers practices in Ziga (Burkina Faso). Error bars are standard errors Figure 3. Cowpea mean yields (averages 2005-07) per technology as compared to farmers practices in Ziga (Burkina Faso). Error bars are standard errors. Rainfall water productivity In 2007 at Ziga, rainwater productivity was significantly higher on Tech 4 than Tech 1 and the control plots, for sorghum and cowpea (Figure 4). Tech 3 and Tech 1 are intermediate between the control and Tech 4 in terms of amount of fertilizer. The combination of water harvesting technique with mineral and organic fertilizers improved water productivity compared to the farmers’ traditional practice (control).
2,137a
1,724ab
1,299b0,974c
1,808 ab
3,218a
2,082ab
1,759bc
2,11ab
1,202b
0
0,5
1
1,5
2
2,5
3
3,5
Control Tech 1 Tech 2 Tech 3 Tech 4
Treatments Numbers followied by the same letter, for the same crop, are
not statistically different at p=0.05
Rai
n w
ater
pro
duct
ivity
(kg/
mm
/ha)
Cow pea
Sorghum
Figure 4. Rainwater productivity (kg/mm/ha) for cowpea and sorghum per treatment at Ziga, 2007. Warrantage results
In each village a storage house of at least 30 t was identified. Nevertheless, partnerships between farmers, extension services, and NGOs were poorly developed due to lack of consultation and lack of financials means. Therefore, the project research approach was appreciated by farmers and all partners. Indeed, at both villages, a tripartite MOU was established between a decentralized financial institution (the Direction Régionale des Caisses Populaires), the village farmers’ organization, and INERA through Project CPWF5. The protocols describe the role of each of the partners in the warrantage system as well as the conditions for farmers to access credit and its reimbursement. One-hundred farmers from the two villages were trained in different aspects of credit and market management. This resulted in farmer’s capacity-building in terms of decision-making for better agricultural product management, credit handling, and income generation. Each village formed its own management committee comprising a credit manager, a stock manager, and a warehouseman/storekeeper.
The quantity of warranted products is given in Table 1. There were more product types in Saala than Ziga. Crops are more diversified in Saala due to higher annual rainfall and higher soil fertility. In 2006 the quantities of products involved in the warrantage increased compared to 2005: by 35% in Ziga and by 495% in Saala. This shows the increasing interest of farmers in the warrantage system. The
Cowpea Grain Yields
0
200
400
600
800
1000
1200
1400
1600
Tech1 Tech2 Tech3 Tech4 Control
Treatments
Kg/
ha

139
number of farmers involved in the credit, however, decreased in Ziga, while in Salla it increased (by 19%). This was due to the late credit release in Ziga (February instead of December). Table 1. Nature and quantities of products in 2005-2006 (1) and 2006-2007 (2) for warrantage (in kg). Site Year White
Sorghum Red Sorghum
Millet Maize Rice Ground nut
Cowpea
Soybean
Sesame
Total Increasing Rate (%)
Ziga 1 1 312 - - - - 5 600 656 - - 7 569 2 2 112 - 96 - - 6 776 1 168 - - 10 154 34 Total 3 424 - 96 - - 12 376 1 824 - - 17 720 Saala 1 - 256 - 944 30 - 64 - - 1 295 2 - 384 - 3 296 2 340 1 260 272 32 96 7 682 493 Total - 640 - 4 240 2 370 1 260 336 32 96 8 974 Table 2. Number of producers warranting their agricultural products for credit acquisition. Site Period Producers who warrant their
products Producers who accessed credit
Ziga Dec 2005-May 2006 32 0 Dec 2006-June 2007 31 20 Saala Dec 2005-May 2006 21 0 Dec 2006-June 2007 25 09 The total amount of credit for income generating activities (IGA) is shown in Table 3: about 461,000 and 636,000 CFA (US$1300 and 1800), respectively, in Saala and Ziga. Diversification of IGA in both sites demonstrates the farmers’ capacity in understanding market systems for cash flow. In Ziga, IGA included: sheep and cattle fattening, trading (cereals, cowpea, leather, and livestock), local transformation (snacks, local beer (dolo), cooking ingredients). In Saala activities included fattening (pigs, small ruminants), butchery and trading (cereals, cigarettes, batteries). At both sites, credit was totally reimbursed in May before the bank released the stored products to the farmers. The warrantage system improved farmers’ incomes in two ways: (1) product value increased during the storage period by 3-4 times the initial value; (2) IGAs ensured cash activities during the dry season. Overall benefit of 42% in Ziga and 21% in Saala are shown in Table 3. Table 3. Evaluation of 2006-2007 warrantage operation benefits in CFA francs (‘000). Site Value at
storage Credit requested
Value in May
Additional value
Pledged savings
Bank Interest
Bank fees
Storage fees
Gain Benefit in %
Ziga 684 636 929 244 107 23.3 26.4 12.4 289 42.3
Saala 512 461 671 158 0 26.8 13.6 9.72 108 21.1
For the first 2 years, the benefits of the warrantage system went mainly to social expenses: school fees, marriage (Ouedraogo et al., 2007). It was used also for seed and fertilizer acquisition. An economic impact study is ongoing to identify the destination and use of warrantage benefits. Conclusion In Ghana and Burkina Faso, the technologies developed with farmers increased sorghum, maize, and cowpea yields. The warrantage system helped improve the farmers’ livelihoods. Efforts are being made by the farmers’ associations to set up input shops that will be linked to their warehouses and their savings and credit schemes. Acknowledgments This paper presents findings from PN5 ‘Enhancing rainwater and nutrient use efficiency for improved crop productivity, farm income and rural livelihoods in the Volta Basin,’ a project of the CGIAR Challenge Program on Water and Food. We would like to thank all collaborators and partners for their efforts in participating in this research in Ghana and Burkina Faso. We wish to express our sincere gratitude to the reviewers for their comments and suggestions to improve the paper. References Ouedraogo, S., H. Sigue, S. Pale, and B. Tapsoba. 2007 Rapport d’activités OUTPUT 3: Volet
warrantage dans les sites d’intervention (Ziga, province du Yatenga et Saala, province du Ioba). 40 pp.
Tabo, R., A. Bationo, K.M. Diallo, O. Hassane, and S. Koala. 2006. Fertiliser micro-dosing for the
prosperity of small-scale farmers in the Sahel. Final report. Agroecosystems Report No. 23, ICRISAT, Niamey (Niger). 28 pp.
Zougmoré, R., A. Mando, and L. Stroosnijder. 2004 Effect of soil and water conservation and nutrient
management on the soil–plant water balance in semi-arid Burkina Faso. Agricultural Water Management, 65: 103–20.

140
Incorporating gender analysis in assessing the needs, opportunities and benefits from research and technology development for salt-affected rice areas: a case in
Eastern Uttar Pradesh, India
T. Paris1, A. Singh2, A. Cueno1, A. Ismail1, R.P. Singh2, P.C. Ram2, and Jagdish Singh2
1Social Sciences Division, International Rice Research Institute, Philippines [email protected] 2Narendra Deva University of Agricultural Technology (NDUAT), Faizabad, Uttar Pradesh, India
Abstract In eastern Uttar Pradesh, sodicity is a major problem in rainfed areas grown under rice. The problem is more severe during the dry season, preventing farmers from growing a second crop of rice. Aside from sodicity, farming households are faced with drought and submergence that result in low rice yields. To address these problems, the International Rice Research Institute (IRRI) in collaboration with Narendra Deva University of Agricultural Technology (NDUAT) initiated research in eastern Uttar Pradesh, India, under CPWF Project 7 'Development of Technologies to Harness the Productivity Potential of Salt-Affected Areas of the Indo-Gangetic Plains and Mekong Delta' in 2004. The project conducted baseline socioeconomic surveys, including gender analysis, 2in assessing the needs and constraints in rice productivity, as well as opportunities for improving the livelihoods of men and women farmers. A pretested structured questionnaire was used in conducting farm-household surveys at selected villages with sodic problems. Based on the results of the surveys, women’s labor participation in rice farming is highest among the marginal and small farming households who belong to the lowest rung of the social ladder. Women from lower caste farming households with nonsodic lands contributed 63% to total labor inputs in rice production, while those with sodic lands provided 59%. Most of these women are illiterate and face several constraints to increasing rice productivity, such as lack of access to seeds of varieties tolerant to sodicity, and lack of knowledge on nutrient management practices. To overcome these constraints, the project deliberately involved women and men in technology evaluation and dissemination. Salt-tolerant lines/varieties and nutrient management technologies (use of pressmud3, pressmud+zinc sulfate, and Sesbania3) were validated by men and women farmers on their own fields. Focus group discussions revealed the benefits derived by women in participating in the project activities such as: a) increased crop yields; b) gained confidence in applying knowledge on new rice varieties and in expressing their opinions regarding new technologies; and c) recognition as farmers. Media grab
This work demonstrates that the inclusion of women in the project led to increased crop yields, improved their confidence in applying new knowledge on new rice varieties, improved skills in nutrient management, and enhanced their recognition as farmers. Introduction In India, the area affected by salinity is about 8.5 million ha, and eastern Uttar Pradesh has 1.29 million ha area affected by sodicity. Uttar Pradesh is one of the largest states where agriculture and rice production, in particular, is the main livelihood of the rural population. Due to erratic rainfall distribution, sodicity, soil micronutrient deficiencies, and productivity of major crops such as rice, wheat, and other crops (pulses and oilseed) are low. Most of the farmers are resource-poor with marginal landholdings (<1 ha). Farmers who have supplementary irrigation sources are few, and the high cost of diesel is a major constraint to crop productivity. Resource-poor farmers living in stress-prone rice environments rely heavily on family members, especially the women in performing rice production and processing operations, livestock management, and expenditure-saving activities. Social and cultural norms that are biased toward men, however, deprive women of new knowledge and technologies required for ensuring food (rice) under stress-prone environments. A study by FAO (1997) also shows that only 5% of agricultural extension services reach women. It is also true that development programs generally do not consider social and gender factors. To address these problems, IRRI and NDUAT initiated a collaborative research project in 2004 on the development of technologies to harness the productivity potential of salt-affected areas of the Indo-
2 Gender analysis has become the commonly accepted term for analyzing gender roles and intra- and inter-household dynamics. It asks the questions: 'who does what activities, who has access to and control of resources' in identifying needs, constraints and opportunities for poor women. Gender analysis is also used within farming systems, and applying that analysis to decisions about agricultural research and development activities that can benefit women. 3 Pressmud is a byproduct of sugar which came from nearby factory sugarcane;
3 Sesbania refers to crops that are used as green manure. Pressmud and sesbania are effective in enhancing soil fertility and rice productivity in sodic soils.
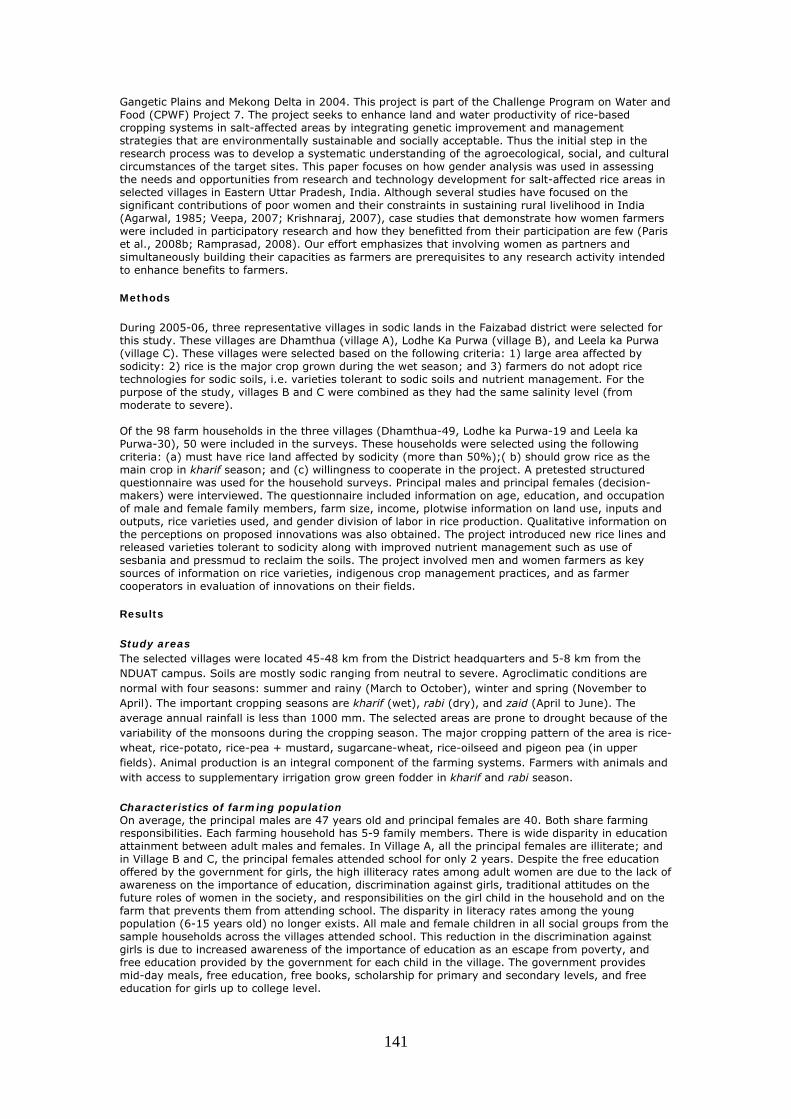
141
Gangetic Plains and Mekong Delta in 2004. This project is part of the Challenge Program on Water and Food (CPWF) Project 7. The project seeks to enhance land and water productivity of rice-based cropping systems in salt-affected areas by integrating genetic improvement and management strategies that are environmentally sustainable and socially acceptable. Thus the initial step in the research process was to develop a systematic understanding of the agroecological, social, and cultural circumstances of the target sites. This paper focuses on how gender analysis was used in assessing the needs and opportunities from research and technology development for salt-affected rice areas in selected villages in Eastern Uttar Pradesh, India. Although several studies have focused on the significant contributions of poor women and their constraints in sustaining rural livelihood in India (Agarwal, 1985; Veepa, 2007; Krishnaraj, 2007), case studies that demonstrate how women farmers were included in participatory research and how they benefitted from their participation are few (Paris et al., 2008b; Ramprasad, 2008). Our effort emphasizes that involving women as partners and simultaneously building their capacities as farmers are prerequisites to any research activity intended to enhance benefits to farmers. Methods During 2005-06, three representative villages in sodic lands in the Faizabad district were selected for this study. These villages are Dhamthua (village A), Lodhe Ka Purwa (village B), and Leela ka Purwa (village C). These villages were selected based on the following criteria: 1) large area affected by sodicity: 2) rice is the major crop grown during the wet season; and 3) farmers do not adopt rice technologies for sodic soils, i.e. varieties tolerant to sodic soils and nutrient management. For the purpose of the study, villages B and C were combined as they had the same salinity level (from moderate to severe). Of the 98 farm households in the three villages (Dhamthua-49, Lodhe ka Purwa-19 and Leela ka Purwa-30), 50 were included in the surveys. These households were selected using the following criteria: (a) must have rice land affected by sodicity (more than 50%);( b) should grow rice as the main crop in kharif season; and (c) willingness to cooperate in the project. A pretested structured questionnaire was used for the household surveys. Principal males and principal females (decision-makers) were interviewed. The questionnaire included information on age, education, and occupation of male and female family members, farm size, income, plotwise information on land use, inputs and outputs, rice varieties used, and gender division of labor in rice production. Qualitative information on the perceptions on proposed innovations was also obtained. The project introduced new rice lines and released varieties tolerant to sodicity along with improved nutrient management such as use of sesbania and pressmud to reclaim the soils. The project involved men and women farmers as key sources of information on rice varieties, indigenous crop management practices, and as farmer cooperators in evaluation of innovations on their fields. Results Study areas The selected villages were located 45-48 km from the District headquarters and 5-8 km from the NDUAT campus. Soils are mostly sodic ranging from neutral to severe. Agroclimatic conditions are normal with four seasons: summer and rainy (March to October), winter and spring (November to April). The important cropping seasons are kharif (wet), rabi (dry), and zaid (April to June). The average annual rainfall is less than 1000 mm. The selected areas are prone to drought because of the variability of the monsoons during the cropping season. The major cropping pattern of the area is rice-wheat, rice-potato, rice-pea + mustard, sugarcane-wheat, rice-oilseed and pigeon pea (in upper fields). Animal production is an integral component of the farming systems. Farmers with animals and with access to supplementary irrigation grow green fodder in kharif and rabi season. Characteristics of farming population On average, the principal males are 47 years old and principal females are 40. Both share farming responsibilities. Each farming household has 5-9 family members. There is wide disparity in education attainment between adult males and females. In Village A, all the principal females are illiterate; and in Village B and C, the principal females attended school for only 2 years. Despite the free education offered by the government for girls, the high illiteracy rates among adult women are due to the lack of awareness on the importance of education, discrimination against girls, traditional attitudes on the future roles of women in the society, and responsibilities on the girl child in the household and on the farm that prevents them from attending school. The disparity in literacy rates among the young population (6-15 years old) no longer exists. All male and female children in all social groups from the sample households across the villages attended school. This reduction in the discrimination against girls is due to increased awareness of the importance of education as an escape from poverty, and free education provided by the government for each child in the village. The government provides mid-day meals, free education, free books, scholarship for primary and secondary levels, and free education for girls up to college level.

142
Size of farm holdings All sites were dominated by backward and scheduled castes (lower caste) households that are mostly marginal (0.4 ha) and small (1.3 ha). The upper caste households have fairly larger farm sizes averaging 2.6 ha. The upper caste households generally rent out their lands to lower caste landholders because of management problems and the high cost of cultivation. Sources of income Farming households diversify their income portfolio due to risks in farming. Family members are engaged in crop, livestock, off-farm and non-farm activities. Female family members from the lower caste work as hired laborers in other farms within the village and have less access to non-farm income outside the village. Most households, however, have one or more male adults who are engaged in non-farm employment. Male adults either work in adjacent villages, in the city as daily laborers, or as seasonal or long-term migrants. Other non-farm activities are either as day laborers or permanent employees in government or the private sectors. Gender division of labor in rice production Based on the results of the surveys, women’s labor participation in rice farming is highest among the marginal and small farming households who belong to the lowest rung of the social ladder. These findings are similar in other salt-affected areas in eastern Uttar Pradesh (Paris et al., 2008a). In rice cultivation, female laborers (either as family, exchange or hired basis) do all major activities, including pulling of seedlings in the seedbeds, carrying the seedlings to the main fields, transplanting, weeding, harvesting, and threshing (manual). Gender analysis undertaken through in-depth studies in two villages in India revealed that adoption of new technologies enhanced task specialization where activities were performed exclusively by a particular gender in order to optimize available household labor resources (Kollie and Bantilan, 1997). The findings revealed that gender roles were segregated into type of work and into market and domestic activities, where men gain greater control over market-related activities and women over the domestic realm. Female family members among households who have non-sodic lands contribute 63% to total labor inputs in rice production, and those with sodic lands provide 59%. Women among the upper caste farming households do not work on the fields. Among the upper caste households, landowners usually hire more women than men to work on their fields. These women belong to the small and marginal farming and landless households. Aside from women’s labor participation in rice production, they provide labor in rice postharvest such as seed cleaning, selection, and storage. They also prepare rice into many rice products. In wheat production, plowing and threshing are mechanized. Men are mainly responsible for irrigating fields, broadcasting seeds, applying chemical fertilizer, while women do the weeding and other crop operations. Participation in farm-related decision-making Traditionally, the principal males or male heads of households dominate in household and farm-related decision-making. In situations wherein the principal males are away for a longer period of time, however, the principal females are left behind to work or supervise field activities. The breaking down of joint families into nuclear households also compels women to take on more farm responsibilities. They become de facto heads of households as farm managers. Principal females of nuclear families have more decision-making power in farm-related activities compared with women where the principal males are present. Needs, opportunities, and farmers’ feedback on technological innovations Farmers evaluated several salt-tolerant varieties and nutrient management technologies. Salt-tolerant varieties Usar Dhan 3, CSR 23, and CSR 30 were evaluated by farmer cooperators on their own fields. Aside from salt-tolerant lines/varieties, farmers validated nutrient management technologies (use of pressmud, pressmud+zinc sulfate, and sesbania) on their sodic lands. Farmers like Usar Dhan 3 and CSR 23 because they are of medium duration. These varieties fit nicely in the time window for rice–wheat cropping systems. Usar Dhan 3 and CSR 23, which are of medium duration, are suitable for the upland and medium lands where other crops such as wheat, potato, and pulses, can be grown during the rabi season. This variety has good germination and tillering ability (20-25 tillers from 2-3 plants). Farmers with assured irrigation (underground tubewells) preferred sesbania green manuring as well as pressmud technology. Poor farmers without irrigation, however, showed their preference for the pressmud technology. Farmers were also convinced and agreed on the benefits of the pressmud technology in improving soil fertility, since they obtained higher yields of rice and the succeeding wheat crop in rabi season from the same plot in which pressmud was applied in rice fields during wet season. Farmers also observed the benefits on sesbania on the succeeding wheat crop, but the effect was lower than pressmud technology. Some farmers said that 'We have been cultivating sodic fields for several years but we never got such a bumper harvest of rice.'

143
Women’s perceptions on the benefits of their participation in project activities Focus group discussions with women revealed the following benefits in their participation in the project activities: (a) increased crop yields; (b) improved confidence in applying new knowledge on new rice varieties and improved skills in nutrient management; and (c) enhanced recognition as farmers. Increased crop yields Farmer cooperators, men and women, who used pressmud and sesbania revealed that during the last 2-3 seasons, rice and wheat yields increased by 30-50% in their fields. Before the project, they left the fields fallow due to sodicity. Before the project, most of the farmers were not able to manage the field because of high labor and material costs. Thus farmers are willing to apply sesbania and green manure on their sodic plots because they are cheaper than chemical fertilizer. As mentioned by the women: 'Previously seeds did not germinate in our sodic plots; now we have better yields. We will ask our husbands to bring pressmud from the sugarmill so that we will continue to have good yields.' Gained confidence in applying knowledge on new rice varieties and in expressing their opinions regarding new technologies Before the project, women engaged in rice farming were rarely consulted by scientists. In this project, women farmers were deliberately invited as cooperators in participatory varietal selection, focus group discussions, and field days. Their opinions with regard to new varieties and introduced crop management practices were elicited along with the men. Thus after involving them in the project, the women gained confidence in applying their knowledge on new rice varieties and in expressing their opinions regarding new technologies. The women cooperators mentioned that improved soil health increased the crop yields of rice and wheat, thus increasing their food security as well as their income. Due to low yields, their production was just enough for their consumption. Now they are able to sell some of their crops. They mentioned that salt-tolerant variety CSR 23 is good for sodic soil in terms of duration, plant height, threshability, milling recovery, taste, and for puffed rice. Straw is also preferred by animals. Usar Dhan 3 is high yielding (>3 t/ha) and of medium duration, with long slender grains with bright appearance. It is also suitable for sodic land, but cooked rice taste is inferior. Duration is important because farmers want the variety that fits into their cropping system. Early rabi crops are grown as succeeding crop after rice. Farmers preferred short to medium duration varieties to escape the terminal drought, particularly in the flowering stage. Farmers’ existing varieties Sarjoo52 and NDR359 performed better than earlier in those plots where CNRM technologies were introduced. 'We are happy that male scientists are asking our opinions in rice or other crop cultivation and appreciating our suggestions.' Recognition as farmers The inclusion of women as farmer-cooperators in focus group discussions and farmer-managed trials led to the recognition of their roles as farmers/food producers. As mentioned by women farmer cooperators, 'This is the first time that scientists talked to us and provided us with information on how we can increase crop production on sodic soils. Although we had been working in the fields for a long time, we did not realize that there are new methods in farming and new seeds of varieties that can survive in sodic soils. Now we are hopeful that we can increase our rice yields. Now that we attend field days and planning meetings, we feel that we are now recognized as farmers rather than laborers in our farms. Ensuring that our family will have something to eat today and tomorrow will mainly depend on us.' Other women said that 'Earlier we only worked as laborers in our field. We believe that we are destined to be poor and can only contribute by doing heavy work. However, by joining the project we have increased our knowledge and we can now help our husbands in making decisions related to crop production. Thus we feel that our status also improved.' Conclusions and recommendations In this CPWF project, baseline socioeconomic surveys, including gender analysis, were conducted to identify gender-differentiated constraints to crop productivity in salt-affected environments. Men and women were involved in farmer-participatory testing of stress-tolerant varieties, and associated nutrient management technologies such as green manuring with sesbania and use of pressmud. These technologies were refined, validated, and out-scaled to reach their end beneficiaries, including men and women farmers. Men and women were given instructions on how to apply these technologies and then test them on their own fields. Women benefitted by producing increased crop yields, applying knowledge on new rice varieties and in expressing their opinions regarding new technologies, and enjoy their new recognition as farmers/food producers not as farm laborers. Biological and social scientists should continue to work together to include not only men but also women as end users and potential beneficiaries of research projects. Our project will continue to enhance the capacities of NARES partners in including men and women in farmer participatory approaches in varietal selection and validation of nutrient management technologies. The inclusion of both men and women farmers in rice research and technology development will bring hope for a better life to the disadvantaged families, especially the women, whose livelihoods depend on rice. Acknowledgments This paper presents findings from Project 7 ‘Technologies to harness the productivity of salt affected areas,’ a project of the CGIAR Challenge Program on Water and Food. We are grateful to the Indian

144
Council of Agricultural Research (ICAR) and the NDUAT research team for their enormous support in this project. References Agarwal, B. 1985. Work participation of rural women in the Third World: Some data and conceptual
biases. Economic and Political Weekly, vol XX No 51 and 52. Review of Agriculture, December 21-28, 1985.
Bantilan M.C.S., and R. Padmaja. 2008. Empowerment through social capital build-up: gender
dimensions in technology uptake. Expt. Agric, 44: 61-80. Cambridge University Press. Food and Agricultural Organization (FAO). 1997. Gender the Key to Sustainable and Food Security.
Rome. Kollie, R.D., and M.C.S. Bantilan. 1997. Gender-related impacts of improved agricultural technologies:
identification of indicators from a case study. Gender Technology and Development, 1:37-393.
Krishnarj, M. 2077. Gender, food security and rural livelihoods. M.S. Swaminathan Research
Foundation, Chennai, India. Paris, T., A. Singh, V.N. Singh, and P.C. Ram. 2008c. Mainstreaming social and gender concerns in
participatory varietal improvement for rainfed environments in eastern India. In: A. Arunachalam (ed.) Participatory Plant Breeding and Knowledge Management for Strengthening Rural Livelihoods. M.S. Swaminathan Research Foundation, Chennai, India. p. 102-29.
Paris, T., S. Sanjoy, D.P. Singh, .K.R. Mahata, A.D. Cueno, S. Zolvinski, and A.Ismail. 2008a. In: C.T.
Hoanh, B. Szuster, S.P. Kam, A. Noble, A.M. Ismail (eds.) Tropical Deltas and Coastal Zones Community, Environment and Food Production at the Land-Water Interface. CABI Publishing (In press).
Paris, T., A. Singh, A Cueno, and V. Singh. 2008b. Assessing the impact of participatory research in
rice breeding on women farmers: a case study in eastern Uttar Pradesh, India. Experimental Agriculture, 44: 97-112. Cambridge University Press.
Paris, T., Nabi Shabi, A. Salahuddin, N. Magor. 2006. The right to learn. Women want more
agricultural advice. In: P.V. Mele, A. Salahuddin, and N. Magor (eds.) Innovations in rural extension. Case studies from Bangladesh. Los Baños, Philippines: International Rice Research Institute (IRRI) and United Kingdom: CABI Publishing, p. 15-28.
Ramprasad, V. 2008. Social benefits of gender-differentiated participation in Seed improvement, a
prerequisite for participatory plant breeding. In: A. Arunachalam (ed.) Participatory Plant Breeding and Knowledge Management for Strengthening Rural Livelihoods. M.S. Swaminathan Research Foundation, Chennai, India. p. 155-63.
Veepa, S.S. 2007. The feminization of agriculture and the marginalization of women’s economic stake.
In: M. Krishnaraj (ed.) Gender, Food Security and Rural Livelihoods. M.S. Swaminathan Research Foundation, Chennai, India. p. 1-23.

145
Germplasm and management strategies for enhancing productivity of salt-affected areas
A. M. Ismail1, M.J. Thomson1, T. Paris1, R.K. Singh1, G. Gregorio1, S. Haefele1, G. Singh2,
R.K. Gautam2, S.K. Sharma2, D.P. Singh3, P.C. Ram4, M.A. Salam5, T.N. Lang6, M.A. Draz7, A. Moumeni8, V. Vadez9, A. Dhakhee10, and E. Blumwald11
1International Rice Research Institute, Manila, Philippines
2Central Soil Salinity Research Institute, Karnal, India 3Central Rice Research Institute, Cuttack, India
4ND University of Agriculture and Technology, Fiazabad, India 5Bangladesh Rice Research Institute, Gazipur, Bangladesh
6Cuu Long Delta Rice Research Institute, Vietnam 7Rice Research and Training Center, Sakha, Egypt
8Rice Research Institute of Iran, Rasht, Iran 9ICRISAT, India
10ICBA, Dubai 11University of California, Davis, USA Email: [email protected]
Abstract The productivity of salt-affected coastal and inland areas is seriously hindered by salt stress, and disproportionately affects poor farmers. Our work involves identification of rice and non-rice crops and varieties tolerant to salt stress; unraveling the underlying mechanisms of tolerance, transferring tolerance into suitable varieties, and evaluating them in partnership with farmers. Conventional and modern breeding strategies are used including the development and use of molecular markers, to greatly speed the breeding process. Through a network of germplasm exchange, breeding lines were selected by seven NARES in three river basins, and numerous salt-tolerant lines were either released as varieties for commercial use or promoted for release as in India, Bangladesh, and Vietnam. Affordable integrated crop, nutrient, and other natural resources management practices, including soil sodicity/salinity mitigation strategies, were developed in association with salt-tolerant material. These strategies include proper seedling nursery management, integrated use of organic, inorganic, and bio-fertilizers, water management, and the use of cheap amendments such as 'pressmud,' are being validated and out-scaled through farmer participatory approaches. Use of tolerant varieties also helped reduce the amount of gypsum required to reclaim sodic soils to only 0.25 of the recommended levels. Effective cropping patterns were developed through adjusting the cropping calendar, which became feasible with the availability of short-maturing salt-tolerant varieties. Through partnership with ICRISAT and ICBA, new non-rice crops were introduced for the dry season where freshwater resources are scarce, and in areas where salinity is too high, rice-shrimp/fish systems were evaluated. These interventions demonstrated enormous potential for enhancing land and water productivity and farmers’ income in salt-affected areas. Media grab There is enormous potential to improve food security and livelihoods for millions of the world’s poorest people struggling to survive on salt-affected soils, through the adoption of simple and affordable management strategies combined with salt-tolerant crops. Introduction High salt stress is an ever-existing and worsening problem, progressively degrading lands and resulting in low productivity in over 20 million ha in coastal and inland Asia. Coastal salinity, caused by seawater intrusion and shallow saline water tables, is severe during the dry season, while flooding in the monsoon season limits cropping to rice. In inland areas, saline and sodic soils are widespread and progressively expanding because of improper water management. Rice is suitable for rehabilitating salt-affected soils because it can grow under flooding and has high potential for genetic improvement. But rice productivity in salt-affected areas is low and could be raised by 1–2 t/ha, providing food for millions of the poorest people and making use of some of the least exploited land and water resources. The project objective is to enhance land and water productivity of rice-based cropping systems in salt-affected areas, by integrating genetic improvement and management strategies that are environmentally sustainable and socially acceptable. Building on past research accomplishments, the project uses science-based and impact-oriented approaches to develop interventions that are

146
appropriate to local farmers’ conditions. Both conventional and modern breeding tools are being used to accelerate the development of salt-tolerant crop varieties, which are being evaluated with matching crop and natural resource management practices within a farming systems’ context. Furthermore, opportunities are being explored for increasing crop intensity and diversity to improve farmers’ incomes and livelihoods. Methods Most of the germplasm shared with partners through this project was generated at IRRI; however, some lines generated by NARES partners were also included in the different testing networks. Detailed descriptions of the approaches used in the generation of this germplasm, and in the selection and dissemination of adapted material at particular sites, and its subsequent participatory evaluation and feedback are presented elsewhere (Gregorio et al., 2002; Lang et al., 2008; Salam et al., 2008; Singh et al., 2008a). Examples of the approaches used for the development and validation of crop and nutrient management practices are summarized in Singh et al. (2008b) and Ram et al. (2008), and on crop intensification in Mahata et al. (2008). Both breeding lines and management practices are evaluated in target areas jointly by farmers and local researchers using participatory varietal selection (Salam et al., 2008). Conventional approaches for introducing improved varieties have had limited success in unfavorable ecosystems in Asia, such as in salt-affected areas, mainly because of the complexity and coexistence of multiple stresses, variable farmers’ preferences, and site-specific adaptation requirements. To accelerate the development and adoption of new varieties, integrated approaches were followed using conventional and modern breeding tools, and involving beneficiaries in evaluation and validation of new elite breeding lines. Developing broadly adapted varieties is more viable for these areas because abiotic stresses are particularly variable and complex, and growing conditions are too risky to persuade farmers to invest in inputs. In most cases, superior performance of genotypes under experimental conditions does not guarantee similar performance in farmers’ fields, and occasionally farmers reject genotypes that yield well in the field if they do not satisfy their specific preferences. In view of these difficulties, the project uses participatory varietal selection (PVS), where farmers take part in varietal screening and adaptation testing, to accelerate adoption (Salam et al., 2008), using germplasm from breeding networks such as the International Network for Genetic Evaluation of Rice (INGER), particularly its International Rice Soil Stress Tolerance Observational Nursery (IRSSTON). Salt-tolerant lines were selected based on adaptation and consumer preferences and sent to each partner institution each year. Promising lines were selected through PVS trials, and some were released or promoted for release as varieties in various countries. Proper crop and nutrient management options were also being developed, particularly for the new varieties. On-farm trials were conducted in most of the project sites using salt-tolerant varieties and selected nutrient management options involving various combinations of green manures, chemical, organic, and bio-fertilizers, and local industrial by-products such as 'pressmud,' a by-product of the sugarcane industry. Successful strategies are being evaluated and out-scaled in partnership with farmers. Results and discussion Germplasm development and dissemination In most areas, farmers increased their paddy yield from < 2 t/ha to >3.5 t/ha using improved varieties and management. In some situations, these technologies made the difference between a failed crop (zero yield) and a yield of 2-3 t/ha. As a result, neighboring farmers were also encouraged to adopt these new varieties. The success of the PVS model was recently witnessed by the release of BRRIdhan 47 as the first salt-tolerant variety for the dry season in coastal Bangladesh (Salam et al., 2008). In addition, numerous lines with substantially higher levels of tolerance were identified including four varieties introduced from Vietnam into Bangladesh, some of them with >1 t/ha of yield advantage over the current popular varieties (Salam et al., 2008). In coastal Vietnam, some varieties were developed that can yield 4-5 t/ha under salt stress of 6-9 dS/m, and which are now being out-scaled (Lang et al., 2008). Significant progress was also made in developing varieties adapted to the inland saline and sodic soils as in Lucknow and Faizabad in UP, India. Varieties such as CSR30, an aromatic fine-grain, salt-tolerant variety, and CSR23, recently became popular among farmers. Introducing PVS increased the adoption rate and helped in soliciting feedback from farmers to devise better breeding strategies and customized breeding materials. When combined with appropriate management strategies, the next generation of tolerant rice varieties will contribute substantially toward increasing and sustaining rice production in these fragile ecosystems. Previous work at IRRI identified several salt tolerance quantitative trait loci (QTLs), including Saltol, a major QTL on chromosome 1 (Ismail et al., 2007). Saltol was fine-mapped and is currently being introgressed into a number of popular varieties including IR64, BRRIdhan 28, and BR11. This helps to greatly shorten the breeding cycle (from 6 to 10 years to ~2.5 years) and increase the chances of adoption by introducing tolerance into popular varieties. Efforts were also devoted to the collection and evaluation of landraces at each site as prospective sources of new tolerance traits for use in breeding.
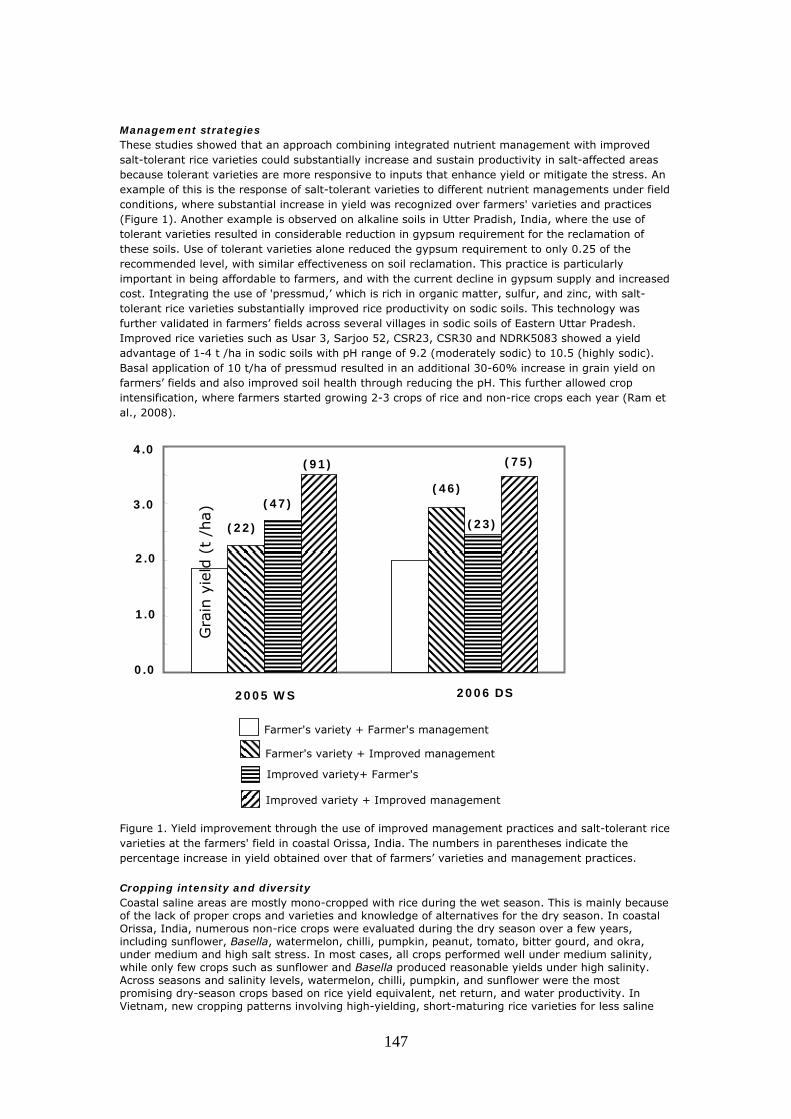
147
Management strategies These studies showed that an approach combining integrated nutrient management with improved salt-tolerant rice varieties could substantially increase and sustain productivity in salt-affected areas because tolerant varieties are more responsive to inputs that enhance yield or mitigate the stress. An example of this is the response of salt-tolerant varieties to different nutrient managements under field conditions, where substantial increase in yield was recognized over farmers' varieties and practices (Figure 1). Another example is observed on alkaline soils in Utter Pradish, India, where the use of tolerant varieties resulted in considerable reduction in gypsum requirement for the reclamation of these soils. Use of tolerant varieties alone reduced the gypsum requirement to only 0.25 of the recommended level, with similar effectiveness on soil reclamation. This practice is particularly important in being affordable to farmers, and with the current decline in gypsum supply and increased cost. Integrating the use of 'pressmud,’ which is rich in organic matter, sulfur, and zinc, with salt-tolerant rice varieties substantially improved rice productivity on sodic soils. This technology was further validated in farmers’ fields across several villages in sodic soils of Eastern Uttar Pradesh. Improved rice varieties such as Usar 3, Sarjoo 52, CSR23, CSR30 and NDRK5083 showed a yield advantage of 1-4 t /ha in sodic soils with pH range of 9.2 (moderately sodic) to 10.5 (highly sodic). Basal application of 10 t/ha of pressmud resulted in an additional 30-60% increase in grain yield on farmers’ fields and also improved soil health through reducing the pH. This further allowed crop intensification, where farmers started growing 2-3 crops of rice and non-rice crops each year (Ram et al., 2008).
Figure 1. Yield improvement through the use of improved management practices and salt-tolerant rice varieties at the farmers' field in coastal Orissa, India. The numbers in parentheses indicate the percentage increase in yield obtained over that of farmers’ varieties and management practices. Cropping intensity and diversity Coastal saline areas are mostly mono-cropped with rice during the wet season. This is mainly because of the lack of proper crops and varieties and knowledge of alternatives for the dry season. In coastal Orissa, India, numerous non-rice crops were evaluated during the dry season over a few years, including sunflower, Basella, watermelon, chilli, pumpkin, peanut, tomato, bitter gourd, and okra, under medium and high salt stress. In most cases, all crops performed well under medium salinity, while only few crops such as sunflower and Basella produced reasonable yields under high salinity. Across seasons and salinity levels, watermelon, chilli, pumpkin, and sunflower were the most promising dry-season crops based on rice yield equivalent, net return, and water productivity. In Vietnam, new cropping patterns involving high-yielding, short-maturing rice varieties for less saline
2005 WS 2006 DS
0.0
1.0
2.0
3.0
4.0
(22) (23)
(46)
(75) (91)
(47)
Farmer's variety + Farmer's management
Farmer's variety + Improved management
Improved variety+ Farmer's
Improved variety + Improved management
Gra
in y
ield
(t
/ha)

148
areas with ample fresh water during the dry season, non-rice, high value crops such as soybean and peanuts for areas where fresh water is scarce, and rice-aquaculture systems for areas where salinity is high during the dry season, were evaluated. The introduction of short-maturing rice varieties coupled with water harvesting and proper management of irrigation water enabled doubling the cropping intensity and annual grain yield in South Bangladesh. Apparently, considerable opportunities exist for diversification of rice-based systems in saline ecosystems. Farmers’ responses to adoption of the new non-rice crops are encouraging and demand for seed is increasing rapidly in these areas. Conclusions and recommendations In this project, greater emphasis was devoted to germplasm enhancement through: 1) development and use of molecular tools to speed up breeding; 2) strengthening the capacity of local breeding programs; and 3) exchange and testing of new varieties and breeding lines of rice and non-rice crops. Through these efforts, adaptive high-yielding breeding lines were identified and some were released as varieties. Good progress was made in the collection and evaluation of landraces from salt-affected areas in different countries as new sources of tolerance. ICRISAT and ICBA contributed new upland crops and varieties suitable for salt-affected areas, including food and forage crops, doubling the cropping intensity in some of the project areas. Non-rice crops such as sunflower, chilli, watermelon and okra, sweet potato, peanuts and soybean, are now being promoted in areas with limited water availability for the dry season, and most farmers have reported good harvests. Rainwater harvesting is effective for expanding the cropping area during the dry season in coastal ecosystems. The project also developed efficient management and low-cost reclamation technologies to maximize the performance of tolerant crop varieties. The benefits of combining improved salt-tolerant rice varieties with matching management practices were demonstrated through on-farm trials, giving substantial increases in yield. Expansion of rice and non-rice crops during the dry season is now possible for the first time in Orissa and some parts of Utter Pradesh, India, South Bangladesh and Vietnam, with significant increase in food availability, employment and income. More efforts are needed to ensure that these technologies are further refined, validated, and out-scaled to reach their ultimate beneficiaries. Greater attention should be paid to these unfavorable salt-affected areas to explore and exploit their enormous potential for better system productivity for the millions of poor people who struggle to survive in these areas. Acknowledgments This paper presents findings from PN7 ‘Technologies to harness the productivity of salt-affected areas,’ a project of the CGIAR Challenge Program on Water and Food. We are grateful to our NARES partners for their enormous support. We also acknowledge the support of IRRI and the Generation Challenge Program through Project 2, particularly in molecular breeding. References Gregorio, G.B., D. Senadhira, R.D. Mendoza, N.L. Manigbas, J.P. Roxas, and C.Q. Guerta. 2002.
Progress in breeding for salinity tolerance and associated abiotic stresses in rice. Field Crops Res 76: 91-101.
Ismail, A.M., S. Heuer, M.J. Thomson, and M. Wissuwa. 2007. Genetic and genomic approaches to
develop rice germplasm for problem soils. Plant Mol. Biol., 65:547–70. Lang, N.T., B.C. Buu, N.V. Viet, and A.M. Ismail. 2008. Strategies for Improving and Stabilizing
Agriculture and Food Productivity in the Mekong Delta. In: C.T. Hoanh, B. Szuster, S.P. Kam, A. Noble, A.M. Ismail (eds.) Tropical Deltas and Coastal Zones Community, Environment and Food Production at the Land-Water Interface. CABI Publishing (In press).
Mahata, K.R., D.P. Singh, S. Saha, A.M. Ismail, and S.M. Haefele. 2008. Improving rice productivity in
coastal saline soils of the Mahanadi delta through integrated nutrient management. In: C.T. Hoanh, B. Szuster, S.P. Kam, A. Noble, and A.M. Ismail (eds.) Tropical Deltas and Coastal Zones Community, Environment and Food Production at the Land-Water Interface. CABI Publishing (In press).
Ram, P.C., P.N. Singh, O.P. Verma, A.M. Ismail, N. Singh, A.P. Srivastava, S.P. Singh, and R.K. Singh.
2008. Improving water and land productivity through technology integration in saline sodic soils of the Indo Gangetic Basin. (This volume).
Salam, M.A., Z.I. Seraj, T.L. Aditya, M.R. Islam, M.S. Rahman, M.A. Rahman, M.A.R. Bhuiyan, M.K.
Uddin, M.K. Mandal, A.M. Ismail, D.L. Adorada, R.D. Mendoza, E.B. Tumimbang-Raiz, and G.B. Gregorio. 2008. The trail of rice varietal development with crop management for the coastal wetlands of Bangladesh. In: C.T. Hoanh, B. Szuster, S.P. Kam, A. Noble, A.M. Ismail (eds.) Tropical Deltas and Coastal Zones Community, Environment and Food Production at the Land-Water Interface. CABI Publishing (In press).

149
Singh, R.K., E. Redona, G.B. Gregorio, A.M. Salam, R. Islam, D.P. Singh, P. Sen, S. Saha, K.R. Mahata, S.G. Sharma, M.P. Pandey, A.G. Sajise, R. Mendoza, M.C. Toledo, A. Dante, A.M. Ismail, T. Paris, S. Haefele, M. Thomson, S. Zolviniski, Y.P. Singh, A.K. Nayak, R.B. Singh, V.K. Mishra, D.K. Sharma, R.K. Gautam, P.C. Ram, P.N. Singh, O.P. Verma, A. Singh, and Lang N.T. 2008a. Right rice in the right place: Systematic exchange and farmer-centered evaluation of rice germplasm for salt-affected areas. In: C.T. Hoanh, B. Szuster, S.P. Kam, A. Noble, and A.M. Ismail (eds.) Tropical Deltas and Coastal Zones Community, Environment and Food Production at the Land-Water Interface. CABI Publishing (In press).
Singh, D.P., K.R. Mahata, S. Saha, and A.M. Ismail. 2008b. Crop diversification for improving water
productivity and rural livelihoods in coastal saline soils of the Mahanadi delta. In: C.T. Hoanh, B. Szuster, S.P. Kam, A. Noble, and A.M. Ismail (eds.) Tropical Deltas and Coastal Zones Community, Environment and Food Production at the Land-Water Interface. CABI Publishing (In press).

150
Is the Quesungual System an option for smallholders in dry hillside agroecosystems?
A. Castro1, M. Rivera1, O. Ferreira2, J. Pavon3, E. García4, E. Amezquita5, M. Ayarza5,
E. Barrios6, M. Rondon7, N. Pauli8, M.E. Baltodano9, B. Mendoza10, L.A. Welchez11, Simon Cook12, Jorge Rubiano12, N. Johnson13, and I. Rao1.
1CIAT-Colombia
2ESNACIFOR, Honduras 3INTA, Nicaragua 4CIAT-Honduras
5CORPOICA, Colombia 6EMBRAPA, Brazil
7IDRC, Canada 8UWA, Australia 9CIAT-Nicaragua 10UNA, Nicaragua 11FAO-Honduras
12CPWF-BFP Coordination 13CPWF-Theme 2
[email protected] Abstract The Quesungual Slash and Mulch Agroforestry System (QSMAS) is a smallholder production system with a group of technologies for the sustainable management of water, soil and nutrient resources in drought-prone areas of hillside agroecosystems of the sub-humid tropics. QSMAS integrates local and technical knowledge and provides resource-poor farmers with an alternative to the non-sustainable, environmentally unfriendly slash and burn (SB) traditional production system. The main objective of this study was to determine the key principles behind the biophysical resilience of QSMAS and its capacity to sustain crop production and alleviate water deficits on steeper slopes with risk of soil erosion. Activities included the evaluation of QSMAS performance compared to the traditional slash-and-burn system in terms of water dynamics (including crop water productivity), nutrient dynamics, and greenhouse gas fluxes (including global warming potential). Results indicate that the application of the four principles behind QSMAS productivity and sustainability (no slash-and-burn, permanent soil cover, minimal disturbance of soil, and improved fertilizer practice), has positive effects on the soil-plant-atmosphere continuum, soil quality, and on landscapes and the environment. Validation in Nicaragua and Colombia underpin the potential of QSMAS to enhance support for livelihoods in vulnerable rural areas. Media grab An improved indigenous agricultural production system may be adaptable to replace the non-sustainable, environmentally unfriendly slash-and-burn system traditionally used by resource-poor farmers in hillside sub-humid tropical regions. Introduction The Quesungual Slash and Mulch Agroforestry System (QSMAS) is a smallholder production system with a group of technologies for the sustainable management of water, soil, and nutrient resources in drought-prone areas of hillside agroecosystems of the sub-humid tropics. QSMAS is an indigenous production system identified by technicians and then improved in collaboration with local farmers, resulting in a suitable option to replace the slash and burn (SB) traditional system. QSMAS is being practiced by resource-poor smallholders in southwest Honduras to produce major staples (maize, bean, sorghum), where the system has been successfully adopted by over 6,000 resource-poor farmers on 7,000 ha. Widespread adoption of QSMAS has been driven by its biophysical and socioeconomic benefits at multiple scales ranging from farm (increased crop-water productivity, food security) to landscape (better amount and quality of available water, resilience to extreme water deficits and to excess water) (Ayarza and Wélchez, 2004; TSBF/CIAT, 2003). Adoption of QSMAS has contributed to improved livelihoods of the rural poor through increased water resources and food security in sub-humid hillside areas, while maintaining the soil and plant genetic resources for future generations. The main objective of the work described in this paper was to determine the key principles behind the

151
biophysical resilience of QSMAS by defining the role of the management components of the system and QSMAS’ capacity to sustain crop production and alleviate water deficits on steeper slopes with high risk of soil erosion. Methods The performance of QSMAS was studied in southwest Honduras, within the Lempa River upper watershed department (district) of Lempira, from 2005 to 2007. Mean annual (bimodal) precipitation is ~1400 mm falling from early May to late October, with a long dry season of up to 6 months. Field plots were established in April 2005 for the comparison of five main treatments (replicated on three different farms): QSMAS of three different ages (<2, 5-7 and >10 years old), the traditional SB system, and secondary forest (SF) as reference. The four production system treatments (QSMAS of different ages and SB) were split in order to apply a fertilizer treatment (addition vs. no addition). Studies included: monitoring and analysis of soil water dynamics, crop yield and water productivity, nutrient (N and P) and soil organic matter dynamics, greenhouse gas (GHG) fluxes, global warming potential (GWP), energy4 sustainability index and ecological footprint index. Water dynamics were evaluated through the assessment of infiltration, runoff and soil water availability during the rainy and dry seasons of 2007. Water infiltration and runoff were evaluated through rainfall simulation for 30 minutes using two intensities (80 and 115 mm/ha). Soil water content was evaluated through soil sampling at three depths (0-10, 10-20 and 20-40 cm). Susceptibility of the soil to erosion was determined in erosion plots (5 m length x 1.5 m width) over 3 years. Soil losses were determined through the comparison of the indices of soil erodibility K-USLE [(t/ha.h/(MJ.mm)] and Ki-WEPP (kg/s/m4), corresponding to the Universal Soil Loss Equation (Wischmeier and Smith, 1978) and to the Water Erosion Prediction Project (Nearing et al., 1989), respectively. Nutrient losses through erosion were quantified by determining total contents of N, P, K, Ca and Mg from samples of eroded soils. Water quality was assessed through the determination of NO3
-, NH4+, P, PO4
3- and soluble solids in samples collected 45 days after planting (DAP). Both eroded soil and water samples were collected in the erosion plots in 2007. Crop water productivity (CWP), expressed as kg of grain produced per m3 of water used as evapotranspiration, was calculated using the crop yield and soil water data obtained in 2007 and by estimating the evapotranspiration according to the method of Penman and Monteith (FAO, 1998). Measurements for the study on nutrient dynamics included: (1) decomposition of and nutrient release from biomass of trees, shrubs, and annual crops, using the litterbag technique (Shanks and Olson, 1961); (2) N aerobic mineralization (NH4
+ and NO3- + NO2
-), determined by mineralization of the whole soil (Anderson and Ingram, 1993); (3) partitioning of soil total P following a shortened sequential P fractionation (Tiessen and Moir, 1993, after Hedley et al., 1982); (4) size-density fractionation of soil organic matter (SOM) in the soil (Meijboom et al., 1995; Barrios et al., 1996); and (5) nutrient partitioning of crop biomass. GHG fluxes including N2O, CH4 and CO2 were determined using the closed chamber technique, with 16 sampling dates from July 2005 to July 2006. Global warming potential (GWP) was determined using CH4 and N2O fluxes, and C stocks in soil (soil organic carbon) and in tree biomass. GWP values were extrapolated to the region where QSMAS is practiced and were projected in time considering land use change. An energy evaluation was conducted to quantify resource use and system sustainability, using data from plots and relationships (energy input per unit of energy output) reported in other studies. Results and discussion During the rainy season, SB had the lowest infiltration (29.8 mm) and highest runoff (12.0 mm). In contrast, QSMAS >10 years had the highest infiltration (38.5 mm) and lowest runoff (4.8 mm). SF had the highest infiltration (43.9 mm) and lowest runoff (1.6 mm) during the dry season. SB system again showed the lowest infiltration (41.9 mm) and highest runoff (2.4 mm), while QSMAS 5-7 and QSMAS >10 years had higher infiltration (44.3 and 43.9 mm, respectively), and lower runoff (0.91 mm). SB had lower infiltration and higher runoff than QSMAS, during both the rainy and dry seasons. In the rainy season available soil water (0-40 cm) varied between 0.09 and 0.104 m/m, with QSMAS <2 and QSMAS 5-7 showing higher values than SF (by 16 and 10%, respectively). In the dry season the amount of available water varied between 0.11 and 0.127 m/m in SB and QSMAS <2, respectively. The mean value of available soil water content (0-40 cm soil depth) in QSMAS systems was significantly greater than that of SB system (Figure 2), suggesting increased availability of water for crop growth. These improvements in QSMAS were related to changes in soil porosity due to increases in mesoporosity (30%) and macroporosity (19%), and decreased the soil bulk density. This increased the plant available soil water storage capacity and availability of water for crops in the dry
4(defined by H.T. Odum (1996) as the total solar equivalent of available energy that is needed directly and indirectly in making a product, good or service).

152
season, and increased the capture of rainfall at the beginning of the rainy season. The highest soil loss occurred in 2005, and was highest in SB followed by QSMAS and SF (Figure 1). The same trend was observed in 2006 and 2007. Soil losses from SB were 5.6 times greater than the average losses from the three QSMAS treatments, and 22 times greater than the losses from SF. Using the rainfall simulator, higher indices of soil erodibility were also observed with the SB system in both seasons, while SF presented the lower indices. As expected due to higher soil loss, the SB system had greater nutrient losses (kg/ha) of N (9.9), P (1.3), K (6.9), Ca (22.8) and Mg (24.2). Similarly, as QSMAS lost less soil it also had lower nutrient losses. SF presented the lowest losses (kg/ha) of N (1.7), P (0.2), K (1.2), Ca (2.6) and Mg (2.7). Water quality was poorest in SB system, with highest content (mg/L) of total P and PO4
3− (2.30 and 0.29, respectively), and best in QSMAS >10 (0.18 and 0.25, respectively). In the same way, SB system had the highest values (mg/L) of NO3
− and NH4+ (7.97 and 0.70, respectively), while QSMAS
5-7 showed the lowest content of NO3− (6.13) and QSMAS >10 of NH4
+ (0.24). Highest soluble solids (mg/L) was observed with QSMAS 5-7 (183.3), and lowest with QSMAS <2 (83.3). SF presented values (mg/L) of 0.65 for P, 0.43 for PO4
3−, 4.73 for NO3−, 0.92 for NH4
+, and 25.0 for total soluble solids. Crop water productivity (CWP, kg/m3) for maize was greatest in fertilized systems of QSMAS <2 (0.48) and least with QSMAS >10 (0.18 kg/m3) (Figure 3). In plots with no fertilizer application, the highest CWP was observed with QSMAS <2 (0.26) and the lowest with SB (0.10). In both fertilized and nonfertilized systems, CWP for common bean was greatest in QSMAS <2 (0.32 and 0.27 kg/m3, respectively) and least with SB (0.10 and 0.07 kg/m3). Fertilization increased CWP for both maize (by 92%) and common bean (by 23%). These results may reflect adequate available soil water during the maize crop in the rainy season, when precipitation was higher than evapotranspiration (ET). In the case of common bean, available water content in the soil decreased from flowering to physiological maturity, with lower precipitation than ET and therefore with a negative water balance. Under these conditions, QSMAS showed greater available water content in soil that resulted in greater grain yield and CWP. Total soil N content was not different among land use systems (LUS) within each year. Trends across the years, however, showed that the content of N decreased with time in the SB system while it increased in QSMAS (with the highest increase in QSMAS >10) and in SF. The comparison of total N in SB system vs. QSMAS <2 (with a similar period under production) and SF (the natural condition which is disturbed for the establishment of either QSMAS or SB), suggest that the use of SB can drive rapid reduction of this nutrient in the landscape while QSMAS maintains and even increases the pool of N from the moment the system is established. Over the 3 years, potential N mineralization (N-min) was not different between LUS. The study on P dynamics showed different trends in SB and SF, with SB showing an increase in the organic (Po) pool and QSMAS increasing its inorganic (Pi) pool. In terms of P availability, over the years the average size of P pools relative to total P were: available P (AP) 12% of total P, moderately available P (MAP) 29%, and residual (not available) P (RP) 59%. The RP pool tended to increase and MAP and AP pools tended to decrease over time in the SB system relative to SF, while QSMAS (average of <2 and >10 years old plots) exhibited the opposite tendency (Figure 4). The similar behavior in N-min and P available pools among production systems is a positive finding, because it implies the following: (i) QSMAS is as good as SB as a source of N and P, even though in QSMAS their content is more a result of biologically mediated process than of an accelerated process that drives immediate availability of nutrients, such as burning; and (ii) QSMAS performs consistently over time, suggesting that this form of management may provide a sustainable source of N and P. Additionally, at similar rates of N-mineralization, the N balance in SB system is expected to be less positive than in QSMAS, considering that yearly SB has lower additions of N (no fertilization and fewer sources of biomass) and higher losses of N through burning (volatilization losses of ammonia and wind-related losses of ash) than QSMAS.

153
Figure 1. Accumulated soil losses in three land use systems in 2005. QSMAS value is the average of three different
Soil
eros
ion
(t ha
-1)
0
20
40
60
80
200520062007
LSD 0.05
= 9.40Slash &
Burn
QSMASSecondary
Forest
LSD 0.05
= 9.40
Soil
eros
ion
(t ha
-1)
0
20
40
60
80
200520062007
LSD 0.05
= 9.40Slash &
Burn
QSMASSecondary
Forest
LSD 0.05
= 9.40
Figure 2. Average available soil water content in the dry season of 2007. QSMAS value is the averge of three different ages.
Avai
labl
e w
ater
con
tent
(m3
m-3
)
0.00
0.08
0.10
0.12
0.14
LSD 0.05
= 0.015
Slash & Burn
LSD 0.05
= 0.015
QSMAS SecondaryForest
Avai
labl
e w
ater
con
tent
(m3
m-3
)
0.00
0.08
0.10
0.12
0.14
LSD 0.05
= 0.015
Slash & Burn
LSD 0.05
= 0.015
QSMAS SecondaryForest
Figure 3. Crop water productivity in two land use systems (mean of treatments with and without fertilization). LSD(P>0.05) are 0.14 for maize and 0.10 for common bean.
B 2 7 0
Cro
p w
ater
pro
duct
ivity
(kg
m-3
)
0.0
0.1
0.2
0.3
0.4
0.5
0.6
Bean
Maize LSD 0.05 = 0.14
LSD0.05 = 0.10
Slash &Burn
QSMAS <2
QSMAS 5-7
QSMAS >10
Maize Bean
LSD = 0
B 2 7 0
Cro
p w
ater
pro
duct
ivity
(kg
m-3
)
0.0
0.1
0.2
0.3
0.4
0.5
0.6
Bean
Maize LSD 0.05 = 0.14
LSD0.05 = 0.10
Slash &Burn
QSMAS <2
QSMAS 5-7
QSMAS >10
Maize Bean
LSD = 0
Maize Maize Bean
LSD = 0Bean
LSD = 0
GW
P (k
g C
O2 e
quiv
alen
ts h
a-1 y
-1)
0
10000
20000
30000
40000
50000
Slash and BurnQSMASSecondary Forest
GW
P (k
g C
O2 e
quiv
alen
ts h
a-1 y
-1)
0
10000
20000
30000
40000
50000
Slash and BurnQSMASSecondary Forest
Figure 5. Global Warming Potential (GWP) in a 20-year scenario of three land use systems in Lempira, southwest Honduras.
Cha
nge
(%) i
n P
pool
-200
0
200
400
600
800
SB - APSB - MAPSB - RPQSMAS - APQSMAS - MAPQSMAS - RP
2005 2006 2007
Cha
nge
(%) i
n P
pool
-200
0
200
400
600
800
SB - APSB - MAPSB - RPQSMAS - APQSMAS - MAPQSMAS - RP
2005 2006 2007
Figure 4. Changes on P pools in soil from SB without fertilization and QSMAS (average of fertilized QSMAS plots of <2 and >10 years old) in relation to the SF.
Results from the study on GHG emissions showed that QSMAS and SF were CH4 net sinks, with values (mg CH4 /m/year) of -102 and -36, respectively. The only CH4 net source was SB, with 150 mg CH4 /m2/year. All LUS were found to be N2O and CO2 sinks, resulting from natural processes (SOM decomposition) and from management (fertilization). QSMAS presented a much lower GWP (10.5 Mg Equiv. CO2) than SB system (40.9 Mg Equiv. CO2) (Figure 5). SF had a very low GWP (1.14 Mg Equiv. CO2). According to land use change trends, when projecting GWP to the region where QSMAS is practiced and using a 20-year time horizon, we estimate a decrease of 0.10 Tg Equiv. CO2. Higher C stocks in soil and tree biomass indicate a gradual accumulation of C in SF and QSMAS >10. In the energy evaluation major differences were observed in the eroded soil variable, with higher values in the SB system. SF and QSMAS had less environmental impact than SB as noted in the Environmental Loading Ratio with values of 0.63, 0.14, and 0.02, respectively. SB presented the higher Ecological Footprint Index. Sustainability Index values were 34.8 for SB, 135.6 for QSMAS, and 4123.8 for SF.
154
Conclusions and recommendations The improved knowledge and understanding of the QSMAS system and the results from field studies lead to the following general conclusions: • The set of technologies responsible for the success of QSMAS can be synthesized in four basic
principles that contribute synergistically to its superior performance: (1) no SB, through the management of natural vegetation; (2) permanent soil cover, through the continual deposition of biomass from trees, shrubs, and weeds, and through crop residues; (3) minimal disturbance of soil, through the use of no tillage, direct seeding, and reduced soil disturbance during agronomic practices; and (4) efficient use of fertilizer, through the appropriate application of fertilizers.
• Management practices based on the key principles result in increased C synthesis and accumulation, accelerated nutrient cycling, and improved crop water productivity in a resilient production system, thereby enhancing support for livelihoods through water-efficient and soil-conserving technologies in vulnerable rural areas.
• Experience in on-farm participatory validation suggests that QSMAS will be readily accepted and adopted by smallholders in similar agroecosystems, and it also will receive strong support from local authorities and policy makers.
Acknowledgments This paper presents findings from PN15 ‘Unraveling the mysteries of the Quesungual Agroforestry System,’ a project of the CGIAR Challenge Program on Water and Food. It is co-executed by the Tropical Soil Biology and Fertility Institute of CIAT-Latin America, Integrated Management of Soil Consortium (MIS, in Spanish) in Central America, Inter-institutional Consortium for Sustainable Agriculture in Hillsides (CIPASLA, in Spanish), and National University of Colombia–Palmira. References Anderson, J.M., and J.S. Ingram. 1993. Tropical Soil Biology and Fertility. A Handbook of Methods.
CAB International. Wallingford. 88 p. Barrios, E.; Buresh, R.J.; Sprent, J.I. 1996. Organic matter in soil particle size and density fractions
from maize and legume cropping systems. Soil Biol. Biochem, 28(2):185-193. FAO. 1998. Crop evapotranspiration–Guidelines for computing crop water requirements. Irrigation and
Drainage Paper 56. Rome, Italy. Hedley, M.J., J. Stewart, and B. Chauhan. 1982. Changes in Inorganic and Organic Phosphorus
Fractions Induced by Cultivation Practices and by Laboratory Incubations. Soil Sci. Soc. Am. J. 46:970-976.
Meijboom, F.W., J. Hassink, and M. Van Noordwijk. 1995. Density fractionation of soil macroorganic
matter using silica suspensions. Soil Biol. Biochem., 27:1109-1111. Nearing, M.A., G.R. Foster, L.J. Lane, and S.C. Finkner. 1989. A process-based soil erosion model for
USDA-Water Erosion Prediction Project Technology. Transaction Am. Soc. Agricultural Engineers, 32:1587-1593.
Shanks, R.F., and J.S. Olson. 1961. First-year breakdown of leaf litter in southern Appalachian Forest.
Sci., 134:194-195. Tiessen, H., and J.O. Moir. 1993. Characterization of available P by sequential extraction. In M.R.
Carter, (Ed.) Soil Sampling and Methods of Analysis. Florida, USA. Pp 75-86. Wischmeier, W.H., and D.D. Smith. 1978. Predicting rainfall erosion losses. A guide for conservation
planning. United States Department of Agriculture, USDA, Agriculture Handbook N° 282.

155
Is soil carbon sequestration part of the bundle of ecosystem services provided by
conservation agriculture in the Andes?
M. Quintero1, N. Comerford, R. Estrada1 and F. Marin3
1International Center for Tropical Agriculture (CIAT), Cali, Colombia [email protected],
[email protected] 2University of Florida. [email protected]
3Universidad Nacional de Colombia, Palmira, Colombia Abstract The positive role that conservation agriculture (CA) has on ecosystem services in the Fuquene watershed (in the Andes of Colombia) derives from better soil water retention, sediment retention and water infiltration located in the Andes. Soil carbon retention could be, however, an additional soil ecosystem service inside the 'bundle' of services provided by CA in this watershed. The objective of this research was to compare soil organic carbon (SOC) content and its stability in different soil aggregate sizes under traditional tillage and CA (reduced tillage, green manuring, permanent cover) in a potato-based production system. Soil organic matter (SOM) and SOC contents were not significantly increased with CA, and the stability of carbon was lower in production systems with these practices. This was explained by lower soil moisture with traditional practice, and by the naturally high OM content and deep A horizon (~0.2 g/g, 72 cm A horizon) of these soils. Although the stability of carbon was not increased, the CA practices are ensuring the nondisruption of aggregates that has a positive effect on water-related soil characteristics such as porosity, hydraulic conductivity, and soil moisture. Media grab In the Andes conservation agriculture practices ensure soil aggregate protection against mechanical breakdown reducing the probability of emitting C to the atmosphere and improving water movement throughout the soil, which favors the volume of stream flows. Introduction Much of the world’s carbon is held in soils (more than 41%) and another significant part is in the atmosphere, as carbon dioxide (20%). Soil disturbance for crop production is, however, reducing soil carbon and augmenting the atmospheric carbon pool. Golchin et al. (1995) classifies light fraction soil organic carbon (SOC) into free particulate organic carbon and occluded organic carbon. Bremer et al. (1994) found that the SOC light fraction is a sensitive indicator of management-induced effects on SOC. SOC accumulation to some degree depends on the amount of soil disturbance. Disrupting macroaggregates exposes the microaggregate carbon pool to decomposition (Bajracharya et al., 1997). Management systems involving high C inputs and reduced tillage should favor C storage directly by reducing aggregate breakdown and by enhancing SOM-mediated aggregation (Angers, 1992; Carter, 1992; Beare et al., 1994). Conservation agriculture (CA) is one of the management systems practiced in the watershed of Fúquene Lake, located in the valleys of Ubaté and Chiquinquirá, north of Bogotá, Colombia. These practices were introduced to reduce erosion from potato farms on very steep slopes, which is causing sedimentation and eutrophication of the lake. This lake provides potable water to more than half a million people downstream. Although the benefits of reduced sediments and increased net income of farmers are recognized (Rubiano et al., 2006), there are no studies about the impact of these practices on soil carbon protection. The objective of this research, therefore, was to determine carbon content and its stability in stable soil aggregates in two different systems (traditional tillage vs. CA). To achieve this, the protected carbon in soil micro- and macroaggregates was measured using sonication techniques. The hypotheses were that with CA: (1) soil organic matter content is increased; (2) the stability of carbon contained in aggregates is increased; and (3) the SOM (and the SOC) is more stable in smaller size fractions of aggregates.

156
Methods Two potato production systems (traditional tillage, CA with minimum tillage with incorporation of green manures and permanent plant cover for 7 years) were compared at six sites (three sites per system) within the Fuquene watershed. The soils are Andisols and are classified as Lithic Hapludands (IGAC, 2000). The sites were selected with the same characteristics in terms of: (1) landscape position; (2) land cover; (3) slope; and (4) rainfall intensity. At each site, two pits were dug, soil horizons were identified, and three soil samples were taken per soil horizon. Fresh samples were segregated and classified by size using dry-sieving with a nest of sieves with 5, 2, 1, 0.5 and <0.5 mm screen size. Additional samples were taken to measure saturated hydraulic conductivity, soil moisture, porosity, and bulk density. In general, three horizons were found in the profiles with average thicknesses of 72 cm (horizon I, top), 21 cm (horizon II), and 56 cm (horizon III, bottom). Soil organic matter content of each aggregate size class was extracted using a sonication procedure (North, 1976; Six et al., 2001). Through this procedure, some of the SOM in the aggregates was extracted while the rest of the SOC remained in the aggregates even after sonication. The organic matter extracted from the aggregates by sonication was called AOM (aggregate OM) as it contained fine organic matter from inside aggregates. Organic matter remaining in the same particle size class after sonication was termed particulate organic matter (POM). Different levels of energy were applied to see how AOM and POM are affected by the degree of disruption. The AOM and POM were measured through the loss on ignition procedure, and %AOM was calculated as percentage of total SOM (AOM+POM). All SOM measurements were converted to estimates of SOC concentration by multiplying by the Van Bemmelen factor of 0.58 (Lal et al., 1998). It was expressed as percent of total organic matter in each sample. Data analyses The effects of production system on %AOM and SOC were analyzed using analysis of variance (ANOVA) with soil horizon, type of management practice and aggregate size fraction as fixed effects. Differences were considered significant at p<0.05. There were significant effects of horizon and size fraction on %AOM and SOC. Therefore further statistical analysis was done separately for each size fraction and horizon. A post hoc comparison procedure with the Tukey-Cramer adjustment was used. The SOM and AOM values were correlated to physical soil characteristics using a linear model. Results Soil organic carbon concentration and tillage systems The average concentration of SOC in the soil profile was not significantly affected by the management system, and averaged 0.12 g/g with CA and 0.09 g/g with traditional tillage. SOC was significantly higher in the top horizon (0.13 g/g) than in the deepest horizon (0.05 g/g). Aggregate stability and SOM content As the ultrasonic energy applied to the soil increased, more aggregates were destroyed, increasing the amount of AOM removed (Table 1). The effect of size fractions on % AOM was highly significant (p<0.01). The 5 mm fraction released significantly less organic matter than the smallest size fraction (0.5 mm). Table 1. Average values of AOM for different aggregate size fractions.
Aggregated Organic Matter (AOM) (%) Size fraction
(mm) Average Tukey group
0.5 99.4 a 1.0 95.3 ab 2.0 87.1 ab 5.0 83.2 b
Note: Inside the same column, averages with the same letter are not statistically different. There was no significant size fraction x tillage system interaction for the AOM. However, %AOM was higher in the 2 and 1 mm size fractions under CA than with traditional tillage (Figure 1). Also, %AOM was higher in the horizon II and III with CA than with traditional tillage, but with similar values in horizon I (Figure 2).

157
0
20
40
60
80
100
120
0 1 2 3 4 5 6Size fraction (mm)
Agg
rega
ted
Org
anic
Mat
ter (
%)
Conservation Agriculture Traditional Agriculture
Figure 1. Effect of size fraction on %AOM.
I II III80
82
84
86
88
90
92
94
96
98
100
Agg
rega
ted
Org
anic
Mat
ter (
%)
Horizon
Conservation Agriculture Traditional Agriculture
Figure 2. Effect of horizon on %AOM variable.
AOM, SOM, and physical soil characteristics Simple correlation analyses using a linear model showed that, for CA, aggregate organic matter (g/g) was negatively correlated with the aggregate size (5 mm) (p < 0.01; Figure 1) and positively correlated with soil moisture (p < 0.05; data not shown). Also, there was a positive correlation of total organic mater (g/g) with hydraulic conductivity, total porosity, and macroporosity in conservation and traditional agriculture treatments (data not shown). The soil moisture and hydraulic conductivity were higher in CA. The average soil moisture for the soil profile in CA was 52% while in traditional agriculture it was 39%. The average hydraulic conductivity was 12 cm/h in CA soil profiles and 5 cm/h in traditional agriculture. The total organic matter was negatively correlated with bulk density in conservation and traditional agriculture systems. In general, bulk density had a negative correlation with saturated hydraulic conductivity, total porosity, macroporosity, and soil moisture.

158
Discussion SOM and SOC contents The soils of the study sites are Andisols and according to IGAC (2000) are classified as Lithic Hapludands. The high concentration of organic carbon is in line with the high organic matter concentration characteristic of Andosols. The accumulation of organic matter in these soils is determined by the environmental conditions of the paramo ecosystem, which is characterized by low temperatures and high plant biomass (pastures) inputs and low decomposition rates. The lack of significant differences between SOC concentration in CA vs traditional agriculture sites may reflect the difficulty of detecting small changes in SOM against such a high background level, even after 7 years of CA in these soils. The high accumulation of OM in these soils is reflected in the large depth (mean 72 cm) of horizon I. Also, the capacity of these high organic matter soils to store further C may be near maximum. Finally, the lack of significant differences between the production systems may be due to the fact that in the traditional tillage system, potato is rotated every 2-3 years with 2-3 years of pastures (average of 2.7t DM/ha/year). Therefore the benefits of CA could be more related to nutritional benefits, reduction of runoff, and improvement of water movement in the soil profile rather than change in SOC per se (see below). Aggregation and SOM stability The results showed no effect of production system on aggregate stability of organic carbon stability in the aggregates, rejecting the second hypothesis. In fact, the aggregates from CA in horizons II and III, and from the 2 and 1 mm size fractions, released more organic matter than the equivalents from the traditional system. The higher stability of traditional agriculture soil aggregates may result from greater drying of the soil than under CA. Soil moisture was higher in CA sites, especially in horizons II (63 vs. 44%) and III (48 vs. 32%). In Andisols, the presence of minerals such as ferrihydrate and allophone results in irreversible hardening when the soil is dried beyond a certain level (Maeda et al.‚ 1977); the drier the soil, the stronger the aggregates. Other authors have also found that the strength of the bonds between organic materials and mineral particles decreases with increasing water content, resulting in lower stability (Reid and Goss, 1982; Perfect et al., 1990; Gollany et al., 1991; Caron and Kay, 1992 cited in Lal et al., 1992). However in the CA sites the risk of releasing that SOC contained in aggregates is low because of the use of minimum tillage. While it is recognized that microaggregates protect SOC (Six et al., 2000), we found that in these soils the trend was counter to the third hypothesis, as OM in aggregates of 5mm size fraction was more stable than in the smaller fractions. Similar results were obtained in Spodosols of Florida where the highest strength was obtained in macroaggregates (Sarkhot et al., 2005). This trend is less apparent in horizon III, which could be related to the fact that the content of clay is higher in deeper horizons, making the OM more strongly attached to the microaggregates (the average percentage of clay content in horizon III was 39%, in horizon II 32%, and 19% in horizon I). The percentage of OM released after applying higher amounts of energy (11.7-15.4 kJ) was high on most soil samples (>80% of total organic matter), and only 17.4% of soil samples released <80% of the total organic matter of the samples. This means that most of the organic carbon is in the aggregate pool and the remaining is POM. This result is in line with other studies that have found that 90% of SOM was located within soil aggregates (Jastrow et al., 1996). This highlights the importance of conserving the aggregation of these soils and reducing its mechanical breakdown by tillage or soil erosion. It is worth noting that this sonication procedure measures the stability of aggregates to mechanical breakdown and does not indicate the susceptibility to microbial breakdown. Conclusions and recommendations In Andisols of this Colombian watershed, CA practices had a negligible effect on SOM and SOC concentration. This may be due to the already high SOM content in these soils. In these soils, the benefits of CA (minimum tillage and permanent cover) are related to improving soil characteristics important for increasing infiltration and storage and reducing runoff and erosion, such as hydraulic conductivity, porosity, and bulk density. Probably it also contributes to increased nutrient availability and to reduced soil runoff. In addition, CA practices did not increase SOM stability in aggregates, which may be related to the higher soil moisture in the CA system. It is important to note that CA

159
ensures that the accumulated OM is not released from aggregates as soil disturbance is minimal in this system. Since more than 80% of the total organic matter is contained in the aggregates it is important to avoid the disruption of aggregates by mechanical forces in these paramo soils. Also the importance of macroaggregates for SOC stability is important in these soils, even more than microaggregate stability, contrary to our initial expectations. Finally, there is a need to apply the same methodology to explore the effects of CA on SOM and SOC content and its stability in other type of soils with lower COM and with different clay contents. Acknowledgments This paper presents findings from PN22 ‘Payment for Environmental Services (PES) as a mechanism for promoting rural development in the upper watersheds of the tropics,’ a project of the CGIAR Challenge Program on Water and Food. Also this research is part of a Master's thesis of the University of Florida. Special thanks to Arnulfo Rodriguez from the soil physics laboratory of CIAT who helped during the field work and lab analyses. References Angers, D.A. 1992. Changes in soil aggregation and organic carbon under corn and alfalfa. Soil Sci.
Soc. Am. J. 56:1244-49. Bajracharya, R.M., R. Lal, and J.M. Kimble. 1997. Soil Organic Carbon Distribution in Aggregates and
Primary Particle Fractions as Influenced by Erosion Phases and Landscape Position. In Soil processes and the carbon cycle. R. Lal, J.M. Kimble, R.F. Follet, and B.A. Stewart. (eds.) CRC Press. Boca Raton, USA. 353-67.
Beare, M.H., P.F. Hendrix, and D.C. Coleman. 1994. Water-stable aggregates and organic matter
fractions in conventional and no-tillage soils. Soil Sci. Soc. Am. J. 58:777-86. Bremer, E., H.H. Janzen, and A.M. Johnston. 1994. Sensitivity of total, light fraction and mineralizable
organic matter to management practices in a Lethbridge soil. Can. J. Soil Sci. 74:131-8. Carter, M.R. 1992. Influence of reduced tillage systems on organic matter, microbial biomass,
macroaggregate distribution and structural stability of the surface soil in a humid climate. Soil Tillage Res. 23:361-72.
Golchin, A., P. Clarke, J.M. Oades, and J.O. Skjemstad. 1995. The effects of cultivation on the
composition of organic matter and structural stability of soils. Aust. J. Soil Res. 33: 975-93. Instituto Geografico Agustin Codazzi (IGAC). 2000. Estudio general de suelos y zonificación de tierras
del departamento de Cundinamarca. Bogotá, D.C. Colombia. Jastrow, J.D., T.W. Boutton, and R.M. Miller. 1996. Carbon dynamics of aggregate-associated organic
matter estimated by 13C-natural abundance. Soil Sci. Soc. of Am. J. 60:801-7. Lal, R., J.M. Kimble, R.F. Follet, and B.A. Stewart. 1998. Soil processes and the carbon cycle. CRC
Press LLC. Boca Raton, Florida. USA. Maeda, T., H. Takenada, and B.P. Warkentin. 1977. Physical properties of allophane soils. Advances in
Agronomy. 29:229-61. North, P.F. 1976. Towards an absolute measurement of soil structural stability using ultrasound. J.
Soil Sci. 27:451-59. Rubiano, J., M. Quintero, R.D. Estrada, and A. Moreno. 2006. Multiscale analysis for promoting
integrated watershed management. Water International 31(3), (in press) Sarkhot, D.V., N. B. Comerford, E.J. Jokela, W.G. Harris, and J. Reeves. 2005. Soil Carbon in a
Forested Sandy Coastal Plain Spodosol: Methods Considerations and Initial Results. PhD. Diss. University of Florida.
Six, J., K. Paustian, E.T. Elliott, and C. Combrink. 2000. Soil structure and organic matter: I.
Distribution of aggregate-size classes and aggregate-associated carbon. Soil Sci. Soc. of Am. J. 64, 681-9.
Six, J., G. Guggenberger, K. Paustian, L. Haumaier, E.T. Elliott, and W. Zech. 2001. Sources and
composition of soil organic matter fractions between and within soil aggregates. European J. Soil Sci. 52:607-18.

160
Simulating sorghum yield response to mineral fertilizer in semi-arid northern Ghana
Dilys S. Kpongor1, Ramadjita Tabo3, Andre Bationo4, Mathias Fosu5, and Paul Vlek2
1University of Ghana, Institute of Agricultural Research, Kpong Research Station, P.O.Box LG 68,
Legon, Accra, Ghana 2ZEF, Zentrum für Entwicklungsforschung, University of Bonn, Walter-flex str. 3, D – 53113 Bonn,
Germany 3International Crop Research Institute for the Semi-Arid Tropics (ICRISAT)-West and Central Africa
Unit. P.O.Box 12404, Niamey, Niger 4Tropical Soil Biology and Fertility Institute of CIAT (TSBF-CIAT), P.O.Box 30677-00100, Nairobi,
Kenya 5CSIR-Savanna Agricultural Research Institute, P.O. Box 52, Tamale. Ghana
Abstract In the past, farmers used long fallow periods to restore soil fertility of their fields. This practice has now given way to continuous cropping of the same fields thereby leading to low crop yields. There is therefore a need to evaluate various options of improving soil fertility and crop productivity. In our work, the Decision Support System for Agrotechnology Transfer (DSSAT) was used to assess the yield response of sorghum to varying levels of mineral fertilizers in Navrongo, northern Ghana. DSSAT predicted well the effects of the varying levels of mineral fertilizers on total biomass and crop yields, with an internal efficiency of the model (E1) of 0.63 and 0.69, respectively. Application of 40 kg N/ha
in the homestead yielded the best value-to-cost ratio, whereas 80 kg N/ha1 produced the highest value to cost ratio in the bush farms. Yield projection into 2035 showed that the amount and distribution of rainfall poses a higher risk to efficient use of mineral fertilizer on soils with low organic matter (bush farm) content than to soil with higher (homestead) content of organic matter. Also, food security can only be assured by using inorganic fertilizer and organic matter. Media grab The use of organic matter and mineral fertilizers and supplementary irrigation are critical for continuous food production on sandy soils in smallholder farming systems. Introduction In the semi-arid region of Ghana in the Volta Basin, poor soil fertility is one the most limiting factors to crop production, along with low water availability due to erratic and poorly distributed rainfall. This is further aggravated by the soil texture, which is mainly sandy (average 70% sand). Farmers have small fields surrounding the house, known as homestead fields, and larger fields farther away called bush fields. The homestead fields receive limited amounts of animal manure from the homestead. Traditionally, farmers practiced bush fallow as a way of restoring soil fertility in the bush fields after cultivating them for some years. This has, however, now given way to continuous cropping due to growing pressure on land, thereby degrading the soil. The practice has rendered the soil poor in fertility, hence farmers are forced to restrict the cultivation of cereals to the homestead where they can provide limited amounts of animal manure and the bush farms are cultivated mainly with legumes. Sorghum is an important crop in the study region due its ability to withstand drought, among other desirable features. Cultivars used by farmers are the locally adapted ones that are less responsive to mineral fertilizer application. The cultivar (ICSV III) used in this study is an improved one that responds to mineral fertilizer. DSSAT was the crop simulation model (CSM) used in the study, which sets out to assess the yield response of sorghum to mineral fertilizer and to assess the sustainability of grains in light of the erratic rainfall pattern for two different fertilizer management practices. Materials and method The study was conducted at Navrongo, in the semi-arid portion of the northern part of Ghana (10° 15” and 11° 10” N and 0° and 1° 0” W). Experiments were set up under two management regimes; the homestead, which benefits from some amount of organic manure, and the bush farm, where no manure is applied and which is also characterized by annual bush burning. The sorghum variety ICSV III (a pure-line cultivar developed at ICRISAT Asia center) was used as the test crop. Data collected on sorghum grown under limited water and nutrient stress on two different planting dates in farmers’ fields were used to calibrate the DSSAT CSM for the study area. Data collected for model calibration included grain yield, total biomass, and phenological data (days to flag leaf stage, days to flowering). To evaluate the performance of the model, two experiments were set up on the July 12 and 26, 2005: one in the homestead and the other in the bush farm. Sorghum was sown by direct dibbling at about 5 cm depth, 0.75-m row spacing, and 12 plants/m2. Four levels (0, 40, 80, and 120 kg/ha) of inorganic N fertilizer were applied in a randomized complete block design. Treatments were replicated seven times in the homestead and four times in the bush farms. Data on grain and biomass yield collected from these experiments were used to evaluate model performance.

161
Model description and application The DSSAT CSM utilizes data from soil, weather, and crop management practices. Details of the model can be found in Jones et al. (2003) and Ritchie et al. (1998). The model was used to assess the sustainability of grain sorghum production as affected by the variation in seasonal weather patterns. Fifteen years of weather data (1990–2004) for the study area were used to project over a longer period, and to assess the impact of the distribution of weather pattern on long-term crop production on given scenarios. Statistical analysis RMSE and modified coefficient of internal efficiency (E1) were used to access model performance.
RMSE = [n-1∑ CalcYield( - measYield ) 2]0.5
∑∑
=
=
−
−−= n
i obsi
n
i ii
MeanObserved
SimulatedObservedE
1
11 1
The sustainable yield index (SYI) suggested by Singh et al. (1990) was used to assess the sustainability of the two management systems (homestead and bush farm).
( ) 1−−= ma YYSYI σ
where Ya is the mean yield, σ the standard deviation, and Ym is the maximum yield obtained under each set of management systems. Also, cost benefit analysis of using fertilizers in each of the management systems was undertaken. Results and discussion
Table 1. Performance of the model. Sorghum grain yield response to different fertilizer rates was reasonably predicted by the DSSAT–CSM with an internal efficiency of 0.63 and a RMSE of 0.44 t /ha. Total biomass production was also well predicted. A comparison of observed and simulated values of both grain and biomass indicated no significant differences (p = 0.05). The E1 values obtained for both management systems were above 0.6 (Table 1). The RMSE were also low and comparable with those of Mavromatis et al. (2001) in their study on developing genetic coefficients for CSM with data from crop performance trials. Location Grain Total biomass
RMSE (t /ha) E1 RMSE (t /ha) E1
Homestead 0.23 0.68 0.60 0.71
Bush farm 0.37 0.62 0.65 0.69
Overall 0.44 0.63 0.90 0.69
The amount and distribution of rainfall poses a higher risk to efficient use of mineral fertilizer on both management systems, with the risks being higher in the bush farm soil with lower organic matter content, as opposed to the homestead soils that are relatively enriched by the annual application of manure. Table 2. Summary statistics of grain yield projected over 30 years period The use of inorganic fertilizer to produce sorghum was economically feasible in both the bush farm and the homestead, with the latter being more economical. Sustainability indices of the various management scenarios as influenced mainly by changing weather pattern over 30 years are shown in Table 2. The highest SYI (0.84) was obtained in the homestead management system where 40 kg N / ha mineral fertilizer was applied. The least sustainable management system (SYI = 0.36) was the bush farm where no fertilizer was applied over the simulation period. Scenarios Mean Stdev Max Min SYI Bush farm 0 kg/ha 0.71 0.264 1.2 0.3 0.36 Homestead 0 kg/ha 1.48 0.256 1.8 1.0 0.67 Bush farm 80 kg/ha 2.86 0.316 3.2 2.0 0.79 Homestead 40 kg/ha 3.16 0.220 3.2 2.2 0.84 Sustainable management practices, however, imply more than maintaining yields (Bhattacharyya et al., 2008; Lynam and Herdt, 1989) hence AE, which provides information on the efficiency with which fertilizers are used, was also examined. Applying 40 kg N/ha in the homestead was more agronomically efficient than applying 80 kg N/ha in the bush farm (Figure 1). This is indicated by the consistently higher AE values illustrated in the figure. Regression analysis for the two data sets shows an increasing trend (slope = 0.077, r2 = 1.4 E2) in grain yield over the long term for the homestead production, whilst that for the bush farm remains relatively stable (slope = 0.008, r2 = 4.0 E4). Differences in AE between the two systems can also be attributed to differences in soil organic matter (soil fertility), which positively influences the soil chemical and physical properties that are necessary
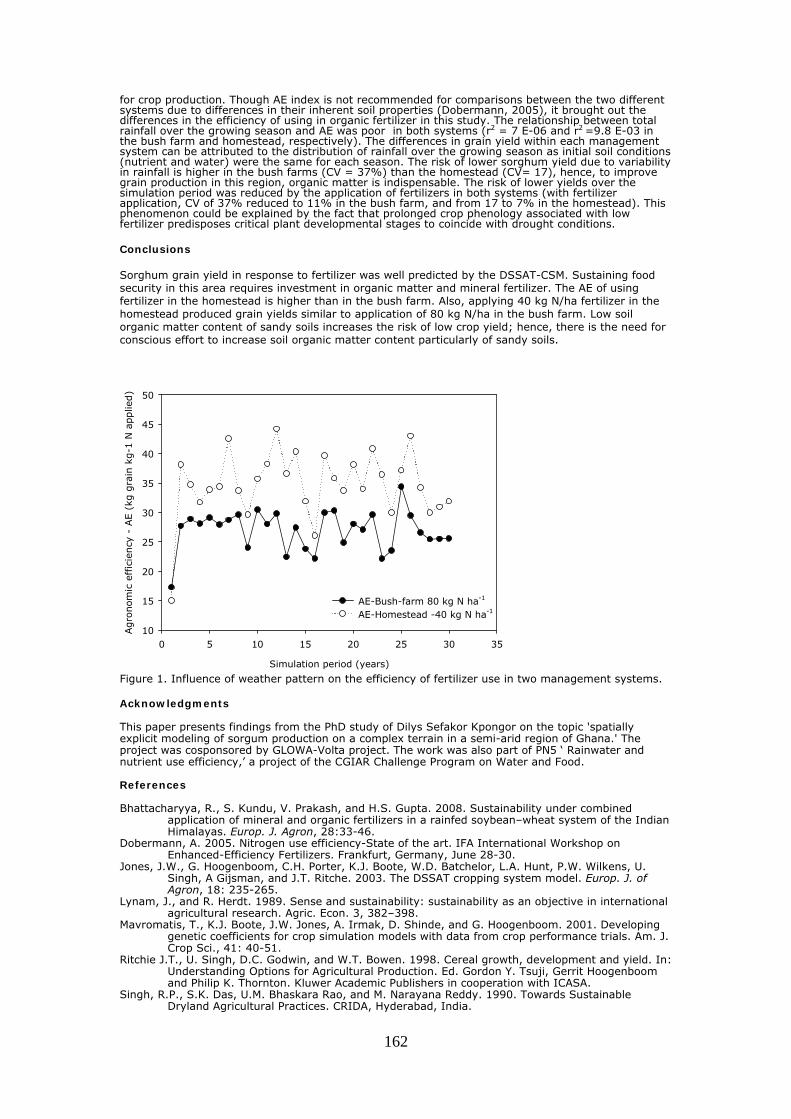
162
for crop production. Though AE index is not recommended for comparisons between the two different systems due to differences in their inherent soil properties (Dobermann, 2005), it brought out the differences in the efficiency of using in organic fertilizer in this study. The relationship between total rainfall over the growing season and AE was poor in both systems (r2 = 7 E-06 and r2 =9.8 E-03 in the bush farm and homestead, respectively). The differences in grain yield within each management system can be attributed to the distribution of rainfall over the growing season as initial soil conditions (nutrient and water) were the same for each season. The risk of lower sorghum yield due to variability in rainfall is higher in the bush farms (CV = 37%) than the homestead (CV= 17), hence, to improve grain production in this region, organic matter is indispensable. The risk of lower yields over the simulation period was reduced by the application of fertilizers in both systems (with fertilizer application, CV of 37% reduced to 11% in the bush farm, and from 17 to 7% in the homestead). This phenomenon could be explained by the fact that prolonged crop phenology associated with low fertilizer predisposes critical plant developmental stages to coincide with drought conditions. Conclusions Sorghum grain yield in response to fertilizer was well predicted by the DSSAT-CSM. Sustaining food security in this area requires investment in organic matter and mineral fertilizer. The AE of using fertilizer in the homestead is higher than in the bush farm. Also, applying 40 kg N/ha fertilizer in the homestead produced grain yields similar to application of 80 kg N/ha in the bush farm. Low soil organic matter content of sandy soils increases the risk of low crop yield; hence, there is the need for conscious effort to increase soil organic matter content particularly of sandy soils.
Simulation period (years)
0 5 10 15 20 25 30 35
Agro
nom
ic e
ffic
iency
- A
E (
kg g
rain
kg-1
N a
pplie
d)
10
15
20
25
30
35
40
45
50
AE-Bush-farm 80 kg N ha-1 AE-Homestead -40 kg N ha-1
Figure 1. Influence of weather pattern on the efficiency of fertilizer use in two management systems. Acknowledgments This paper presents findings from the PhD study of Dilys Sefakor Kpongor on the topic 'spatially explicit modeling of sorgum production on a complex terrain in a semi-arid region of Ghana.' The project was cosponsored by GLOWA-Volta project. The work was also part of PN5 ‘ Rainwater and nutrient use efficiency,’ a project of the CGIAR Challenge Program on Water and Food. References Bhattacharyya, R., S. Kundu, V. Prakash, and H.S. Gupta. 2008. Sustainability under combined
application of mineral and organic fertilizers in a rainfed soybean–wheat system of the Indian Himalayas. Europ. J. Agron, 28:33-46.
Dobermann, A. 2005. Nitrogen use efficiency-State of the art. IFA International Workshop on Enhanced-Efficiency Fertilizers. Frankfurt, Germany, June 28-30.
Jones, J.W., G. Hoogenboom, C.H. Porter, K.J. Boote, W.D. Batchelor, L.A. Hunt, P.W. Wilkens, U. Singh, A Gijsman, and J.T. Ritche. 2003. The DSSAT cropping system model. Europ. J. of Agron, 18: 235-265.
Lynam, J., and R. Herdt. 1989. Sense and sustainability: sustainability as an objective in international agricultural research. Agric. Econ. 3, 382–398.
Mavromatis, T., K.J. Boote, J.W. Jones, A. Irmak, D. Shinde, and G. Hoogenboom. 2001. Developing genetic coefficients for crop simulation models with data from crop performance trials. Am. J. Crop Sci., 41: 40-51.
Ritchie J.T., U. Singh, D.C. Godwin, and W.T. Bowen. 1998. Cereal growth, development and yield. In: Understanding Options for Agricultural Production. Ed. Gordon Y. Tsuji, Gerrit Hoogenboom and Philip K. Thornton. Kluwer Academic Publishers in cooperation with ICASA.
Singh, R.P., S.K. Das, U.M. Bhaskara Rao, and M. Narayana Reddy. 1990. Towards Sustainable Dryland Agricultural Practices. CRIDA, Hyderabad, India.

163
Improving water and land productivity through technology integration in saline sodic soils
of the Indo-Gangetic Basin
P.C. Ram1, P.N. Singh1, O.P. Verma1, Ismail Abdelbagi2, N. Singh1, A. Punam Srivastava1,3, S.P. Singh1, and R.K. Singh2
1Centre of Advanced Studies in Plant Physiology, Dept. of Crop Physiology, N. D. University of
Agriculture and Technology, Kumarganj, Faizabad, India 2Crop and Environmental Sciences Division, IRRI, Los Baños, Philippines
3Department of Botany, Lucknow University, Lucknow, India
Abstract Nearly 100 M ha of agricultural lands are affected by soil salinity and alkalinity globally, of which about 22 M ha are in Asia and 11 M ha in India alone. Approximately 10 M ha of agricultural land is lost annually due to salinization and water logging, endangering food security of the ever-increasing world population. Salt-affected soils are highly degraded and encompass a variety of complexities including high pH, high soluble salts, deficiency and toxicity of one or several micronutrients, and poor water-holding capacity leading to low productivity. These soils have immense productivity potential, however, which can be harnessed through proper technology intervention. Even a modest improvement of yields in such soils can ensure food security of millions of hungry and impoverished people. Sodic soil reclamation is successful using inorganic amendments like gypsum and pyrite, but these amendments are expensive and not easily accessible to many poor farmers. We explored the possibilities of integrating 'pressmud,’ an easily accessible organic by-product of sugar factories and rich in sulphur and zinc, with salt-tolerant rice varieties to improve the productivity of sodic soils. This technology was successfully validated in farmer’s fields across several villages in target hot spots of sodic soils in Eastern Uttar Pradesh. A farmer participatory approach was followed for technology validation and to ensure adoption. The promising rice varieties preferred by the farmers were Usar 3, Sarjoo 52, CSR23, CSR30, and NDRK5083 which produced yields ranging between 1-4 t /ha in soils having a pH range of 9.2 (moderately sodic) to 10.5 (highly sodic). Improvement of rice yields of 30-60% was reported by farmers by the basal application of 10 t/ha 'pressmud' along with normal recommended doses of fertilizers in highly sodic soils (pH 9.5-10.2). Basal application of pressmud was done 10 days prior to transplanting followed by 5 cm water ponding. Pressmud application increased rice yield through increase in biomass, ear bearing tillers, and grain fertility. Soil health also improved as evident from better fertility and lower soil pH at harvest and during subsequent years. Sodic soils which were unable to sustain even a single good rice crop became highly productive land within 2-3 years, with two to three crops per year. Improving sodic land productivity through natural resource management may also improve water productivity, farmer’s economy, and livelihood. It is concluded that pressmud could be a cost effective and easily accessible technology within the reach of rice farmers, and can effectively be used to improve the productivity of sodic soils by integration with salt-tolerant rice varieties. This will also ensure the food security and improve the livelihood of poor farmers living in the Indo-Gangetic Basin of India. Media grab The use of sugar mill waste (pressmud) combined with improved (salt-tolerant) varieties can provide food security for millions of poor farmers trying to subsist on poor and non-productive sodic lands. Introduction Uttar Pradesh is one of the largest and most populous states in the Indo-Gangetic Basin (IGB) of India. Agriculture is the main activity of the impoverished poor people of this area, and rice-wheat is the main cropping system. The soil of Uttar Pradesh is mainly alluvial and productive, but about 1.3 M ha are affected by soil salinity and sodicity, especially in the eastern part of the state. These soils have several inherent problems including high pH, low organic carbon and nitrogen, poor hydraulic conductivity, zinc and iron deficiency, and poor microbial activities that render them highly unsuitable

164
for cultivation. Even under rainfed conditions, subsurface soil always remains waterlogged and anoxic-inducing accumulation of toxic metabolites that adversely affect root respiration and growth (Ponnamperuma, 1972; Setter and Waters, 2003). Iron, aluminium, and manganese accumulate to toxic levels in waterlogged duplex soil of Australia (Khabaz-Saberi et al., 2006). Reclamation of these soils for cultivation using chemical amendments is an expensive and time-consuming process which the poor farmers of these areas cannot afford. A number of soil reclamation projects have been launched by the U.P. Bhumi Sudhar Nigam, Lucknow, primarily to bring ‘C’ class (barren-no crop) sodic soils under cultivation. They succeeded in their mission of reclaiming such soils but these benefits did not reach many small and marginal landholders of B (mono crop) and A (double crop) class sodic soils. Rice is the only crop that can be grown in highly sodic soils with proper management skills. Incorporation of organic materials such as crop residues, green-manure crops, pressmud, and water hyacinth have been advocated to improve soil organic matter, structure, and water infiltration, and decrease pH. These provide safeguards against adverse effects of salinity and sodicity (Swarup, 1981, 1988, 2004). Farmers mostly grow traditional rice varieties and use farmyard manure (FYM) for soil reclamation. This is a slow process and may take several years to ameliorate these soils. Lack of irrigation facilities also limits the ability to harness sodic soils for crop production. Salt-tolerant varieties along with soil amendments could be suitable technologies for bringing such saline and sodic soils under cultivation. Recently a few salt-tolerant varieties have been developed, but have not reached most of the farmers. Gypsum and pyrites are the most effective soil reclamation agents, but they are expensive and beyond the reach of the poor farmers. Pressmud, a byproduct of sugar factories, is readily available and less expensive (US$50-60/ha) compared to gypsum (US$375-400/ha), and can also be used as organic amendment for sodic soil reclamation. As part of the Challenge Programme on Water and Food (CPWF), we explored the possibility of using pressmud and salt-tolerant varieties together to harness the sodic soils of eastern Uttar Pradesh. Methodology The pressmud technology along with salt-tolerant varieties was validated in Dhamthua and Parua Khas villages of Faizabad and Deeh village of Sultanpur districts during 2005, 2006, and 2007 wet seasons. The soils of these villages are predominantly sodic with high pH values ranging between 9.0 and 10.0 and poor soil fertility. Small and marginal farmers with sodic land were selected for technology validation and farmers provided with 5 kg of seeds of tolerant rice varieties and pressmud @ 10t/ha. Soil samples were collected prior to pressmud application and at harvest, and analyzed for various soil parameters including pH. Composition of pressmud Pressmud is a byproduct of sugar factories and contains several nutrients that are quite useful in improving health and productivity of sodic soils (Table 1). It contains about 1% calcium oxide, and reclaims sodic soil by replacing Na+ from the soil complex. It also has 10% sulfur which forms sulfuric acid and lowers soil pH. In addition, it supplements sulfur supply of the plants and enriches the soil with organic carbon and nitrogen, leading to better soil structure and growth and yield of rice. Table 1. Nutrient composition of pressmud.
S.N. Constituents Values-% 1. Nitrogen 1.0-1.2 2. Zinc 0.025-0.027
3. P2O5 2.5-3.2 4. K2O 1.5-1.8
5. CaO 1.0-1.2
6. Sulfur 10-12
7. Organic carbon 10-15 Pressmud application and transplanting The trials were conducted at the main experiment station of Narendra Deva University of Agriculture and Technology, Kumarganj, Faizabad, India, and also in farmers' fields in target areas. Pressmud @10t/ha and zinc sulphate @20 kg/ha were thoroughly mixed in the topsoil (0-15 cm) 10-12 days prior to puddling and transplanting, and 5 cm water was continuously ponded in the fields. Thirty-five to forty day-old seedlings were planted. The trials at farmers’ fields were managed by the farmers under the overall supervision of the researchers. All agronomic practices and fertilizer applications
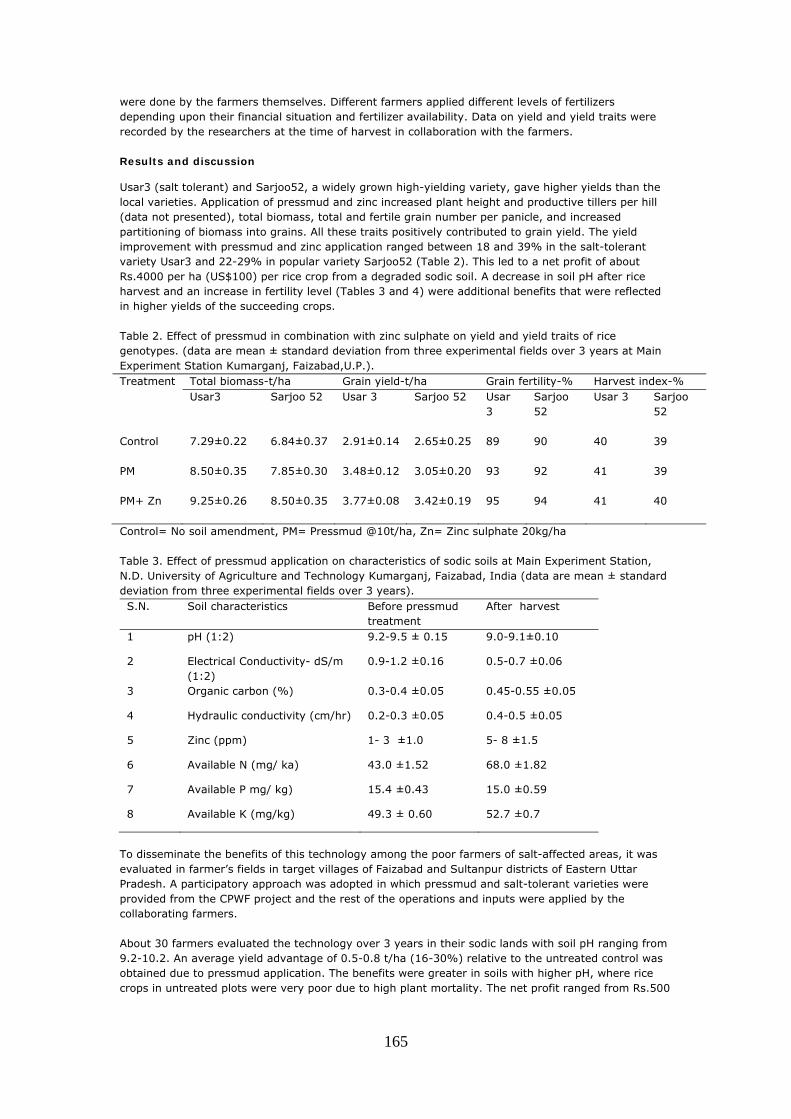
165
were done by the farmers themselves. Different farmers applied different levels of fertilizers depending upon their financial situation and fertilizer availability. Data on yield and yield traits were recorded by the researchers at the time of harvest in collaboration with the farmers. Results and discussion
Usar3 (salt tolerant) and Sarjoo52, a widely grown high-yielding variety, gave higher yields than the local varieties. Application of pressmud and zinc increased plant height and productive tillers per hill (data not presented), total biomass, total and fertile grain number per panicle, and increased partitioning of biomass into grains. All these traits positively contributed to grain yield. The yield improvement with pressmud and zinc application ranged between 18 and 39% in the salt-tolerant variety Usar3 and 22-29% in popular variety Sarjoo52 (Table 2). This led to a net profit of about Rs.4000 per ha (US$100) per rice crop from a degraded sodic soil. A decrease in soil pH after rice harvest and an increase in fertility level (Tables 3 and 4) were additional benefits that were reflected in higher yields of the succeeding crops. Table 2. Effect of pressmud in combination with zinc sulphate on yield and yield traits of rice genotypes. (data are mean ± standard deviation from three experimental fields over 3 years at Main Experiment Station Kumarganj, Faizabad,U.P.). Treatment Total biomass-t/ha Grain yield-t/ha Grain fertility-% Harvest index-%
Usar3 Sarjoo 52 Usar 3 Sarjoo 52 Usar 3
Sarjoo 52
Usar 3 Sarjoo 52
Control 7.29±0.22 6.84±0.37 2.91±0.14 2.65±0.25
89 90 40 39
PM 8.50±0.35
7.85±0.30 3.48±0.12 3.05±0.20 93 92 41 39
PM+ Zn 9.25±0.26 8.50±0.35 3.77±0.08
3.42±0.19
95 94 41 40
Control= No soil amendment, PM= Pressmud @10t/ha, Zn= Zinc sulphate 20kg/ha Table 3. Effect of pressmud application on characteristics of sodic soils at Main Experiment Station, N.D. University of Agriculture and Technology Kumarganj, Faizabad, India (data are mean ± standard deviation from three experimental fields over 3 years). S.N. Soil characteristics
Before pressmud treatment
After harvest
1 pH (1:2) 9.2-9.5 ± 0.15 9.0-9.1±0.10
2 Electrical Conductivity- dS/m (1:2)
0.9-1.2 ±0.16 0.5-0.7 ±0.06
3 Organic carbon (%) 0.3-0.4 ±0.05 0.45-0.55 ±0.05
4 Hydraulic conductivity (cm/hr) 0.2-0.3 ±0.05 0.4-0.5 ±0.05
5 Zinc (ppm) 1- 3 ±1.0 5- 8 ±1.5
6 Available N (mg/ ka) 43.0 ±1.52 68.0 ±1.82
7 Available P mg/ kg) 15.4 ±0.43 15.0 ±0.59
8 Available K (mg/kg) 49.3 ± 0.60 52.7 ±0.7
To disseminate the benefits of this technology among the poor farmers of salt-affected areas, it was evaluated in farmer’s fields in target villages of Faizabad and Sultanpur districts of Eastern Uttar Pradesh. A participatory approach was adopted in which pressmud and salt-tolerant varieties were provided from the CPWF project and the rest of the operations and inputs were applied by the collaborating farmers. About 30 farmers evaluated the technology over 3 years in their sodic lands with soil pH ranging from 9.2-10.2. An average yield advantage of 0.5-0.8 t/ha (16-30%) relative to the untreated control was obtained due to pressmud application. The benefits were greater in soils with higher pH, where rice crops in untreated plots were very poor due to high plant mortality. The net profit ranged from Rs.500

166
to 3500 per ha (US$13-88) from a single rice crop, from the lands that normally remained barren, and which the farmers were earlier reluctant to cultivate due to highly degraded soil. Table 4. Evaluation of the beneficial effects of pressmud on rice yields in farmers’ fields on sodic soils in Eastern Uttar Pradesh (Data are mean ± standard deviation from 30 farmers fields over 3 years).
Variety No of farmers
Average grain yield (t/ha) Yield increase due to pressmud
(%)
Grain fertility range (%)
Soil pH range
Control Pressmud (10 t/ha)
Control Pressmud (10 t/ha)
Usar 3 16 2.62±0.62 3.39±0.61 30 50-75 66-89 9.3-10.2
Sarjoo 52 5 2.70± 0.14
3.15±0.32 16 74-85 90-93 9.2-9.6
CSR 23 5 1.83±0.41 2.35±0.39 28 65-80 75-88 9.4-10.0
NDRK 5083 4 2.70±0.14 3.48±0.15 29 75-88 83-90 9.2-9.5
The noteworthy benefit is the improvement in soil health within 2-3 years, which normally would have taken several years through traditional approaches. Farmers were overwhelmed by seeing good crops of rice and wheat within three years in fields that they thought could never become productive. Consequently, the pressmud technology became popular among the collaborating farmers and was also appreciated by other farmers who visited the experimental fields during field days organized yearly before harvest. The farmers of the other villages possessing sodic lands were also interested in participating in this project. We are now upscaling the technology in other districts of eastern Uttar Pradesh with similar ecosystems in order to harness the productivity potential of saline sodic soils. Conclusion The beneficial effects of pressmud application on sodic soil health and productivity are of paramount importance for the poor farmers of Uttar Pradesh in the Indo-Gangetic Basin of India. Assuming an average yield advantage of 20% over the existing rice yield of 2.5 t/ha, an estimated gain of about 0.5 million of paddy annually will be achieved from only 50% of the area of the sodic lands (presumed to be under rice cultivation) in Uttar Pradesh. This additional rice yield may ensure food security and improve the livelihood of the farmers of Uttar Pradesh, one of the most populous and impoverished states in India. Concerted efforts are needed, however, by the national and international agencies to provide timely inputs and other resources such as irrigation and fertilizers to realize the maximum benefits from the technology. Government and nongovernment extension agencies should also come forward to disseminate this technology to the remote salt-affected areas that still do not have access to modern information technology. Acknowledgments This paper presents results from PN7 ‘Improving productivity in salt-affected areas,’ a project of the CGIAR Challenge Program on Water and Food. The authors are also grateful to Narendra Deva University of Agriculture and Technology for providing financial and technical support for experimental work, including soil analysis. References Khabaz-Saberi, H., T.L. Setter, and I. Waters. 2006. Waterlogging induced toxic accumulation of iron,
aluminium and manganese in wheat (Triticum aestivum L. CV) genotypes in duplex soil. Journal of Plant Nutrition, 29: 899-912.
Ponnamperuma, F.N. 1972. The chemistry of submerged soils. Advances in Agronomy, 24:29-96. Setter, T.L., and I. Waters. 2003. Review of prospects for germplasm improvement for waterlogging
tolerance in wheat, barley and oats. Plant and Soil, 253: 1-34. Swarup, A. 1981. Effect of duration of pre-submergence and amendments on the growth of rice and
wheat on sodic soil. Journal of Agronomy Crop Science, 150:333-38. Swarup, A. 1988. Influence of organic matter and flooding on the chemical and electrochemical
properties of sodic soil and rice growth. Plant and Soil, 106: 135-41. Swarup, A. 2004. Chemistry of sodic soils and fertility management. In: Advances in sodic land
reclamation. U.P. Council of Agricultural Research, Lucknow, India, 26-52.

167
Breeding salt-tolerant rice varieties in Vietnam
Nguyen Thi Lang1, B.C. Buu2, A.M. Ismail3
1Cuu Long Delta Rice Research Institute, CoDo, Can Tho, Viet Nam [email protected]
2Institute of Agricultural Science for Southern Vietnam (IAS) [email protected] 3International Rice research Institute, Philippines (IRRI) [email protected]
Abstract Accumulation of salt in the soil leads to reductions in crop and livestock productivity. Saline soils in Vietnam are estimated to cover about 1 millilion ha. Rice is predominantly grown in these areas and improving salt stress tolerance in rice is one of the most important objectives of Vietnamese breeding programs. Molecular markers combined with selective genotyping were used to map quantitative trait loci (QTLs) associated with tolerance to salt stress. Salt-tolerant cultivar AS996 was crossed to IR50404 and 229 recombinant inbred lines (RILs) were developed by single seed descent. Another backcross population, IR64/OMCS2000//IR64 was developed and 217 BC2F2 lines were analyzed. A highly significant association with salinity tolerance was detected at the SSR locus RM223 on chromosome 8. Furthermore, the genotypes of 93 varieties were determined at RM223 giving an accuracy of > 95% in identifying salt-tolerant plants. RM223 was subsequently used for selecting tolerant plants while developing OM4498, which was recently released as a variety in Vietnam. The results of the germplasm survey of the BC2F2 line will be useful for the selection of parents for use in breeding programs aimed at transferring these genes from one genetic background to another through marker assisted selection.
Media grab Use of advanced technology is making it possible to greatly speed up the incorporation of salt tolerance into locally adapted, high-yielding rice varieties. Introduction Rice (Oryza sativa) is sensitive to salinity, which affects one-fifth of the irrigated land worldwide. Progress in breeding to enhance salinity tolerance has been slow due to limited knowledge about the genetics of tolerance, the complexity of the several tolerance mechanisms involved, inadequate screening techniques, low selection efficiency, and poor understanding of the interactions of salinity with the environment. Through recent developments in molecular marker analysis, it is now feasible to analyze both simply inherited and quantitative traits, and then identify individual genes controlling the trait of interest. Molecular markers can now be used to tag quantitative trait loci and to evaluate their contribution to the phenotype by selecting for favorable alleles at these loci using marker-assisted selection (MAS) to accelerate genetic improvement. Advanced backcross analysis can be used to evaluate mapped donor introgressions in the genetic background of an elite recurrent parent. For rice, QTLs for salt tolerance have been identified using microsatellites (SSRs), with 108 markers used for analysis of recombinant inbreds derived from the cross between the varieties Tesanai and CB (Lang et al., 2001). We investigated the genetic basis of salinity tolerance using SSR markers, and analyzed mapping populations developed from two crosses: IR64 with OMCS2000 and IR50404 with AS996. The main objective was to identify microsatellite markers linked to salinity tolerance with phenotyping done under greenhouse conditions. A second objective was to test whether introgression of the identified QTLs into some lines will enhance tolerance of salt stress in the field. Material and methods Two populations were developed. The first involved AS996 (salt-tolerant) and IR64 (sensitive) with 96 BC2F2 lines derived from these parents. The second involved a backcross of IR64 with OMCS2000. The promising BC1 plants were selected for desirable phenotypic traits and backcrossed to IR64 to generate BC2 plants. About 219 BC2F2 were screened for salt tolerance at 12 dS/m using Yoshida nutrient solution (Gregorio et al., 1997). Salinization of the nutrient solution started 3 days after germination at 3 dS/m and then increased by 3 dS/m at 3-day intervals until it reached 12 dS/m, which was maintained through to the end of the experiment. Seedlings were rated for their salinity tolerance at 16 and 18 days after the imposition of salt stress. The solution was changed every 5 days and the pH was adjusted daily to 5.0. Agronomic characteristics such as plant height, panicle length, tiller per hill, spikelet per panicle, and grain yield were investigated and compared with those of the

168
control plants at maturity. Three replications were used per line. Analysis of variance and mean comparisons of the data from saline field conditions were carried out. Genotyping of BC2F2 families using microsatellite markers DNA was extracted using the CTAB method (Lang, 2002), and used for PCR reactions to evaluate the fragment patterns of each marker. Amplification products were obtained using RM223 forward: 5’-ACAGTATCCAAGGCCCTGG-3’, and backward 5’-CACGTGAGACAAAGACGGAG-3’ primers. To construct the SSR map and to assign the particular linkage groups to chromosomes, a set of previously identified polymorphic SSR markers was used. Linkage groups were ordered using MAPMARKER (Lander et al., 1987) and reconfirmed using the 'GROUP' > program. Map units (cM) were derived using the Kosambi function (Kosambi, 1944). QTL analysis was performed using single-marker linear regression following Tanksley (1993). The presence of the marker allele associated with salt stress tolerance was coded 1 and the allele associated with sensitivity was coded 0. The data were analyzed using MAPMARKER and interval analysis was conducted with MAPMARKER/QTL for QTL detection with the threshold for declaring a QTL for protein of LOD> 3.0. Results and discussion Phenotypic variation in salinity tolerance The phenotypic responses to salinity among the BC2F2 families are shown in Figure 1. A continuous distribution of growth was observed in this population indicating quantitative inheritance. For shoot dry weight (SDW) and root dry weight (RDW), large variations were noticed in the population. RDW ranged from 45 to 110 mg and SDW ranged from 200 to 350 mg.
Figure 1. Screening for salt tolerance in BC2F2 at seedling stage at EC 0 (left O and 12 (right) dS/m.
Figure 2. PCR products of BC2F2 population from IR64/OMCS2000, with primers of RM315 marker.
Polymorphism of SSR markers and marker segregation Initially, the parents were surveyed for polymorphism using a set of 150 microsatellite markers. About 38 markers were identified as polymorphic between IR64 and OMCS2000, and 47 markers are polymorphic between IR50404 and AS996. The overall level of polymorphism between the two parents was 23.7%, which is too low for AS996, despite the large morphological differences between these parental lines. For the cross of IR64/OMCS2000, 95% of the selected SSR markers were polymorphic in the parents IR64 and OMCS2000. The BC2F2 population was evaluated using 34 SSRs, and 98% of the makers were homozygotes and 2% were heterozygotes. Allele frequencies were 47.6% IR64 and 51.58% OMCS2000. For the IR50404/AS996 cross, 92% of the SSRs were polymorphic. The BC2F2 population was evaluated using 44 SSRs, and 97.5% of the markers were homozygotes and 2.5% were heterozygotes, with allele frequencies of 55.5% IR50404 and 37.5% AS996. Construction of genetic linkage map Grouping of markers was carried out by a two point linkage analysis with a LOD score of 4 and a recombination fraction D of 0.3. For the BC2F2 population from the cross of IR64/OMCS2000, 34 markers were used to construct a framework map and a total length of 148.6 cM was recovered for two chromosomes, 1 and 8 (Figure 3). Two QTLs were significantly associated with tolerance, one on chromosome 1 at marker RM315 and the other on chromosome 8 at marker RM223.

169
Figure 3. Microsatellite linkage map of rice chromosome 1 and 8. The markers were mapped in the indica/indica IR64/OMCS2000 BC2F2 population. Marker-assisted selection for salt tolerance Major quantitative traits loci (QTLs) underlying many agronomically important traits have been mapped, allowing the integration of biotechnology with the conventional breeding to speed the development of modern high-yielding varieties. Currently, the use of MAS for simply inherited traits is gaining increasing importance in breeding programs. In this study, about 217 BC2F2 lines from the cross IR64/OMCS2000/IR64 were analyzed and regression analyses based on SSR allele class differences were performed. Highly significant associations were detected at the SSR locus RM223 on chromosome 8. This marker was then used to select breeding lines possessing this locus and the results showed an accuracy of more than 95% in identifying tolerant plants. This marker was successfully used in the development of OM4498 from the cross IR64/OMCS2000/IR64, which was released as a new variety in 2007 in Vietnam. Beside the two major QTLs on chromosomes 1 and 8, few minor QTLs were also detected at other loci. Conclusions This study identified QTLs associated with seedling survival under salt stress conditions and provides a starting point for examining the effects of the underlining genes in rice. The study provided detailed information on the relative importance of genomic segments and could increase our understanding of the genetic basis of salt tolerance once the genes involved were identified. Further, studies are needed to confirm the contribution of these two QTLs to salinity tolerance under field conditions and in different genetic backgrounds. Acknowledgments This paper presents findings of PN7 ‘Technologies to harness the productivity of salt affected areas,’ a project of the CGIAR Challenge Program on Water and Food, in collaboration with IRRI and TraVinh programs of the Vietnamese Government. References Gregorio, G.B, D. Senadhira, and R.D.Mendoza. 1997. Screening rice for salinity tolerance.
International Rice Research Institute, Discussion Paper Series No. 22, 30 p. Kosambi, D.D. 1944. The estimation of map distances from recombination values. Ann. Engen, 12:
172-175. Lander, E.S, P. Green, J. Abrahamson, A. Barlow, M.J. Daly, S.E. Lincoln, and L. Newburg. 1987.
Mapmarker: An interactive computer package for constructing primary genetic linkage maps of experimental and natural populations. Genomics 1:174-181.
Lang, N.T. 2002. Protocol for Basics of Biotechnology. Agricultural Publishing House, Ho chi Minh City, Vietnam.
Lang, N.T., S. Yanagihara, and B.C. Buu. 2001. A microsatellite marker for a gene conferring salt tolerance on rice at the vegetative and reproductive stages. SABRAO J. Breed. Genet., 33:1-10.
Tanksley, S.D. 1993. Mapping polygenes. Annu. Rev. Genet., 27:205–34.

170
Evaluation of agronomic management practices for enhancing chickpea yield in Karkheh River Basin in Iran
S.H. Sabaghpour1, P. Pezashkpour1, I. Kerami1, A. Ghaffari1, M. Pala2, J. Anthofer2 , F. Feri 1, A.
Nemeti, F. Mahmoodi1, H. Azizi3, A. Hasanvand4
1 Dryland Agricultural Research Institute, Iran [email protected] 2 formerly at International Center for Agricultural Research in the Dry Areas (ICARDA), Aleppo, Syria
3 Jihad-e- Agricultural Organization of Kermanshah Province, Iran 4 Jihad-e- Agricultural Organization of Lorestan Province, Iran
Abstract Development of chickpea cultivars with high and stable yields and with suitable characteristics for different environments and for autumn and spring planting is very important for improving water productivity in rainfed agriculture. The objective of this research was to compare autumn and spring planting with advanced chickpea genotypes in farmers’ fields in Merek and Honam watersheds. Three improved varieties and a local check were in a randomized complete block design with four replications during two years (2005-07). The results of a combined analysis of variance for sowing date showed that autumn planting produced significantly higher yields than spring planting. Higher productivity in autumn planting in comparison to spring planting is due to higher water use efficiency. A significant difference was also found among the genotypes; Arman and Azad with 1499 and 1373 kg/ha produced the highest yield under autumn planting. Also Azad and the local check with 760 and 751 kg/ha produced the highest yield under spring planting. Economic analysis showed that the research recommendations (fall planting, improved agronomic management and improved varieties) had higher net benefits than the farmers’ methods. Water productivity analysis indicated that genotypes in autumn planting had higher economical water productivity than spring planting in both watersheds. Media grab Planting chickpea in fall instead of spring can more than double the water productivity of rainfed chickpea cultivation in Karkheh River Basin. Introduction Legumes are an excellent source of good quality protein in the diets of people and they are also valuable as animal feed. Legumes also increase and sustain the productivity of soil and when grown in rotation with cereals, and reduce chances of build-up of diseases, insect-pests and weeds for the following cereal crops (Sabaghpour 2004). Iran ranks fourth in world in chickpea production, after India, Pakistan and Turkey. Average chickpea productivity in Iran is 400 kg/ha. Most farmers grow chickpea in marginal areas in spring. Due to lack of rainfall during flowering, podding and seed filling, terminal drought stress is a major abiotic stress affecting chickpea productivity in Iran (Sabaghpour et al, 2006). Low productivity is also due to the use of local varieties with low yield potential and poor agronomic practices such as broadcast sowing, use of a furrow turning plough for covering the seed, low seed rate (about 16 seeds/m2) and unsuitable planting dept. The local chickpea varieties are harvested by hand because of prostrate growth habit, resulting in high harvesting cost. The majority of the chickpea crop in Iran (95%) is planted under rainfed conditions. The rainfed yield for chickpea is about 34% less than that of the irrigated area. This indicates that improving moisture conservation in rainfed areas may improve the rainfed yield. Singh and Hawtin (1979) reported that winter-sown chickpea gave higher seed yield than the traditional spring-sown chickpea. Saxena (1980) studied the effect of successive delays in date of sowing from autumn, through winter, spring and reported a linear reduction in the yield as sowing was delayed. The results of research station experiments showed that autumn planting had 72-79 percent higher yield than spring planting in Kermanshah and Lorestan due to higher water use efficiency (Sabaghpour 2004). Studies conducted at ICARDA, Syria revealed that the winter-sown crop is prone to damage by ascochyta blight and cold, both of which can be avoided by spring sowing (Hawtin and Singh 1984). Thus, lack of blight- and cold– tolerant cultivars has been the major reason for growing spring-sown chickpea. Reddy and Singh (1990) studied the relationship between ascochyta blight severity and yield loss in winter sown chickpea for three years at ICARDA. They found less than 10% yield loss in disease-resistant lines, compared with a loss of more than 80% in susceptible ones. The agronomy of chickpea cultivation including date of sowing, seed rate, method of sowing, plant population, weed control, method of harvesting and high potential chickpea lines with resistance to ascochyta blight and cold tolerance has been researched and recommendations have been developed for different areas. The objective of this study is to evaluate improved chickpea varieties and agronomic management under dryland conditions in the Karkheh River Basin in cooperation with farmers and to compare the economic aspects of the research recommendations versus the conventional methods.
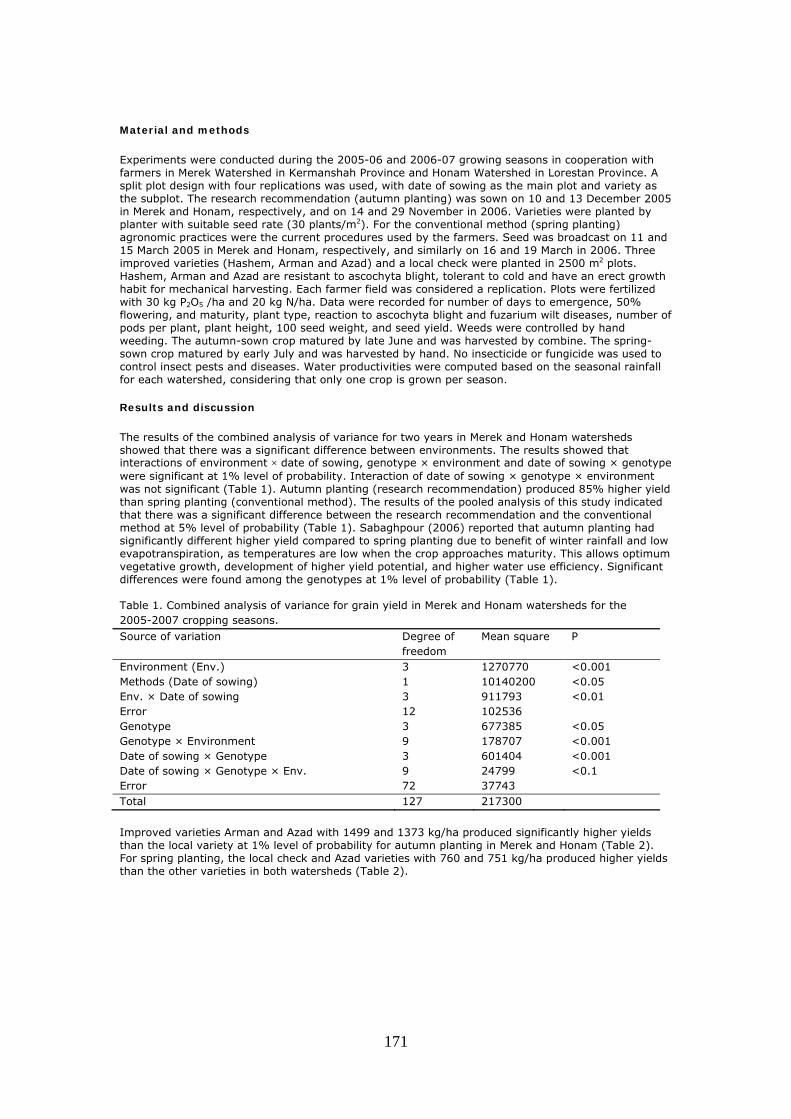
171
Material and methods Experiments were conducted during the 2005-06 and 2006-07 growing seasons in cooperation with farmers in Merek Watershed in Kermanshah Province and Honam Watershed in Lorestan Province. A split plot design with four replications was used, with date of sowing as the main plot and variety as the subplot. The research recommendation (autumn planting) was sown on 10 and 13 December 2005 in Merek and Honam, respectively, and on 14 and 29 November in 2006. Varieties were planted by planter with suitable seed rate (30 plants/m2). For the conventional method (spring planting) agronomic practices were the current procedures used by the farmers. Seed was broadcast on 11 and 15 March 2005 in Merek and Honam, respectively, and similarly on 16 and 19 March in 2006. Three improved varieties (Hashem, Arman and Azad) and a local check were planted in 2500 m2 plots. Hashem, Arman and Azad are resistant to ascochyta blight, tolerant to cold and have an erect growth habit for mechanical harvesting. Each farmer field was considered a replication. Plots were fertilized with 30 kg P2O5 /ha and 20 kg N/ha. Data were recorded for number of days to emergence, 50% flowering, and maturity, plant type, reaction to ascochyta blight and fuzarium wilt diseases, number of pods per plant, plant height, 100 seed weight, and seed yield. Weeds were controlled by hand weeding. The autumn-sown crop matured by late June and was harvested by combine. The spring-sown crop matured by early July and was harvested by hand. No insecticide or fungicide was used to control insect pests and diseases. Water productivities were computed based on the seasonal rainfall for each watershed, considering that only one crop is grown per season. Results and discussion The results of the combined analysis of variance for two years in Merek and Honam watersheds showed that there was a significant difference between environments. The results showed that interactions of environment × date of sowing, genotype × environment and date of sowing × genotype were significant at 1% level of probability. Interaction of date of sowing × genotype × environment was not significant (Table 1). Autumn planting (research recommendation) produced 85% higher yield than spring planting (conventional method). The results of the pooled analysis of this study indicated that there was a significant difference between the research recommendation and the conventional method at 5% level of probability (Table 1). Sabaghpour (2006) reported that autumn planting had significantly different higher yield compared to spring planting due to benefit of winter rainfall and low evapotranspiration, as temperatures are low when the crop approaches maturity. This allows optimum vegetative growth, development of higher yield potential, and higher water use efficiency. Significant differences were found among the genotypes at 1% level of probability (Table 1). Table 1. Combined analysis of variance for grain yield in Merek and Honam watersheds for the 2005-2007 cropping seasons.
Source of variation Degree of freedom
Mean square P
Environment (Env.) 3 1270770 <0.001 Methods (Date of sowing) 1 10140200 <0.05 Env. × Date of sowing 3 911793 <0.01 Error 12 102536 Genotype 3 677385 <0.05 Genotype × Environment 9 178707 <0.001 Date of sowing × Genotype 3 601404 <0.001 Date of sowing × Genotype × Env. 9 24799 <0.1 Error 72 37743 Total 127 217300 Improved varieties Arman and Azad with 1499 and 1373 kg/ha produced significantly higher yields than the local variety at 1% level of probability for autumn planting in Merek and Honam (Table 2). For spring planting, the local check and Azad varieties with 760 and 751 kg/ha produced higher yields than the other varieties in both watersheds (Table 2).

172
Table 2. Agronomic characteristics for autumn planting in Merek and Honam in 2005-2007. Genotype PTa DMb PHc 100 SWd
(g) ABe Yield
(kg/ha) Relative
yield %
Classf
Autumn planting Hashem E 191 41 25 3 1088 115 B Arman E 181 40 28 3 1498 158 A Azad E 178 38 31 3 1373 145 A Local check SE 181 28 30 5 947 100 C Spring planting Hashem E 116 36 27 3 490 64 B Arman E 106 33 28 3 654 86 A Azad E 104 35 29 3 751 99 A Local check SE 103 25 32 4 760 100 A a PT= Plant type, b DM= days to maturity, c PH= Plant height, d 100 seed weight, e AB= Ascochyta blight, f letters indicate significantly different yields at the 5% and 1% probability level for each planting date. Economic analysis showed that the research recommendation resulted in a net income of $880/ha, as compared with $412/ha for the conventional method (Table 3). In Honam watershed rainfall for the 2005-06 season was 540 mm and 572 mm in 2006-07. Water productivity analysis indicated higher rainfall water productivity (kg/m3, $/m3) under fall planting than under spring planting in both watersheds. The results for Honam watershed are presented in Table 4. The water productivity for fall planting (0.27 kg/m3) was twice as high as for spring planting (0.13 kg/m3). Similar results were obtained for Merek watershed. Arman and Azad are resistant to ascochyta blight and are suitable for mechanical harvest. Therefore, these are superior varieties for autumn planting for both sites. Table 3. Economic comparison of research recommendation (fall planting) and conventional method (spring planting) of chickpea production in Honam and Merek watersheds. Methods Gross income
($/ha) Expenses
($/ha) Net income over check
($/ha) Conventional 613 201 Research recommendation
1127 247 468
Table 4. Water productivity of different chickpea genotypes in Honam watershed during 2005-07. Genotype Season Yield
Autumn planting kg/ha
Yield Spring
planting kg/ha
WPa Autumn planting kg/m3
WP Spring
planting kg/m3
EWPb Autumn planting
$/m3
EWP Spring
planting $/m3
Hashem 2005-06 1451 481 0.27 0.09 0.16 0.05 Arman 2005-06 2058 588 0.38 0.11 0.22 0.06 Azad 2005-06 1880 721 0.35 0.13 0.20 0.08 Local check 2005-06 1364 800 0.25 0.15 0.15 0.09 Hashem 2006-07 1159 643 0.20 0.11 0.12 0.07 Arman 2006-07 1847 1053 0.32 0.18 0.19 0.11 Azad 2006-07 1447 723 0.25 0.13 0.15 0.07 Local check 2006-07 857 653 0.15 0.11 0.09 0.07 a WP= water productivity, b EWP= economic water productivity Conclusions and recommendations Autumn planting had significantly t higher yield than spring planting due to the benefit of winter rainfall and low evapotranspiration, as temperatures are low when the crop approaches maturity. This allows optimum vegetative growth, development of higher yield potential, and higher water use efficiency. The improved varieties Arman, Azad and Hashem produced significantly higher yield than the local variety at autumn planting in Merek and Honam. With spring planting, the local check and Azad produced higher yield than other varieties. Economic analysis showed that the research recommendation was more profitable than the conventional method. Water productivity analysis indicated that genotypes in autumn planting had higher economic water productivity than spring planting in both sites. Arman, Azad and Hashem are resistant to ascochyta blight and erect growth habit which are suitable for mechanical harvest in comparison to local check. Therefore, Arman, Azad are superior varieties for autumn for both sites. Azad variety is resistant to ascochyta blight, erect

173
growth habit and large seed size. Therefore, this variety and local check are suitable for spring planting for both sites. Acknowledgements This paper presents findings from PN24 ‘Livelihood resilience in dry areas’, a project of the CGIAR Challenge Program on Water and Food. The work was supported by the International Center for Agricultural Research in the Dry Areas (ICARDA) and the Agricultural Extension, Education and Research Organization (AEERO) of Iran. The authors would like to thank the Dryland Agricultural Research Institute (DARI) and the Agricultural and Natural Resource Research Centers Lorestan Provinces for technical assistance. References Hawtin, G.C., and K.B. Singh. 1984. Prospects and potential of winter sowing of chickpea in the
Mediterranean region. In Ascochyta blight and winter sowing of chickpea, ed. M.C. Saxena and K.B. Singh. 7-16. The Hague, The Netherlands: Martinus Nijhoff/Dr. W. Junk Publ.
Reddy, M.V. and K.B. Singh. 1990. Relationship between ascochyta blight severity and yield loss in
chickpea and identification of resistant lines. Phytopathol. Medit. 29:32-38. Sabaghpour. S.H., A.A Mahmoodi, A. Saeed, M. Kamel, R.S. Malhotra. 2006. Study on chickpea
drought tolerance lines under dryland condition of Iran. Indian Journal of Crop Science 1-2. Sabaghpour. S.H. 2004. Present status and future prospects of food legume in Iran. In Role of
Legumes in Crop diversification and Poverty Reduction in Asia. ed. S. Pande and C.L.L Gowda, 75-86. Patancheru, AP, India: ICRISAT.
Saxena, M.C. 1980. Recent advance in chickpea agronomy. In Proceeding of international workshop
on chickpea improvement, 28 Feb-2 Mar 1979, in Patancheru, AP, India. 89-96. Patancheru, AP, India: ICRISAT.
Singh, K.B. and G.C. Hawtin. 1979. Winter planting of chickpea. International Chickpea Newsletter
1:4.
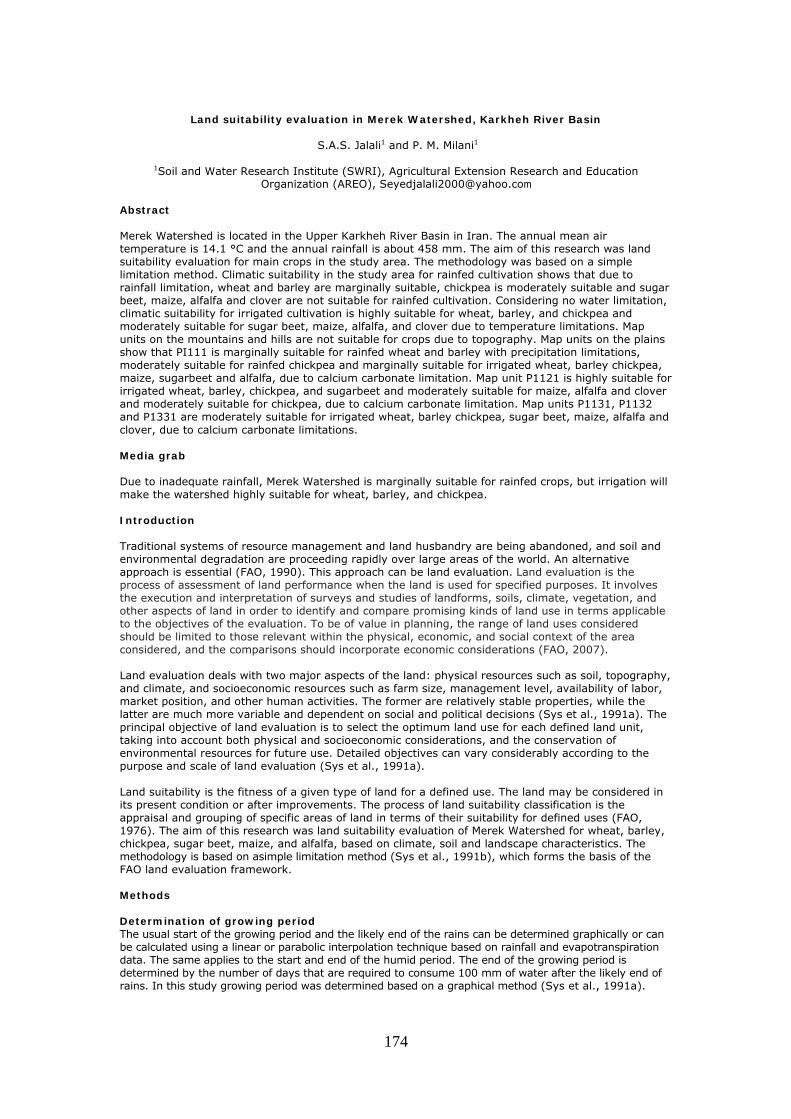
174
Land suitability evaluation in Merek Watershed, Karkheh River Basin
S.A.S. Jalali1 and P. M. Milani1
1Soil and Water Research Institute (SWRI), Agricultural Extension Research and Education
Organization (AREO), [email protected] Abstract Merek Watershed is located in the Upper Karkheh River Basin in Iran. The annual mean air temperature is 14.1 °C and the annual rainfall is about 458 mm. The aim of this research was land suitability evaluation for main crops in the study area. The methodology was based on a simple limitation method. Climatic suitability in the study area for rainfed cultivation shows that due to rainfall limitation, wheat and barley are marginally suitable, chickpea is moderately suitable and sugar beet, maize, alfalfa and clover are not suitable for rainfed cultivation. Considering no water limitation, climatic suitability for irrigated cultivation is highly suitable for wheat, barley, and chickpea and moderately suitable for sugar beet, maize, alfalfa, and clover due to temperature limitations. Map units on the mountains and hills are not suitable for crops due to topography. Map units on the plains show that PI111 is marginally suitable for rainfed wheat and barley with precipitation limitations, moderately suitable for rainfed chickpea and marginally suitable for irrigated wheat, barley chickpea, maize, sugarbeet and alfalfa, due to calcium carbonate limitation. Map unit P1121 is highly suitable for irrigated wheat, barley, chickpea, and sugarbeet and moderately suitable for maize, alfalfa and clover and moderately suitable for chickpea, due to calcium carbonate limitation. Map units P1131, P1132 and P1331 are moderately suitable for irrigated wheat, barley chickpea, sugar beet, maize, alfalfa and clover, due to calcium carbonate limitations. Media grab Due to inadequate rainfall, Merek Watershed is marginally suitable for rainfed crops, but irrigation will make the watershed highly suitable for wheat, barley, and chickpea. Introduction Traditional systems of resource management and land husbandry are being abandoned, and soil and environmental degradation are proceeding rapidly over large areas of the world. An alternative approach is essential (FAO, 1990). This approach can be land evaluation. Land evaluation is the process of assessment of land performance when the land is used for specified purposes. It involves the execution and interpretation of surveys and studies of landforms, soils, climate, vegetation, and other aspects of land in order to identify and compare promising kinds of land use in terms applicable to the objectives of the evaluation. To be of value in planning, the range of land uses considered should be limited to those relevant within the physical, economic, and social context of the area considered, and the comparisons should incorporate economic considerations (FAO, 2007). Land evaluation deals with two major aspects of the land: physical resources such as soil, topography, and climate, and socioeconomic resources such as farm size, management level, availability of labor, market position, and other human activities. The former are relatively stable properties, while the latter are much more variable and dependent on social and political decisions (Sys et al., 1991a). The principal objective of land evaluation is to select the optimum land use for each defined land unit, taking into account both physical and socioeconomic considerations, and the conservation of environmental resources for future use. Detailed objectives can vary considerably according to the purpose and scale of land evaluation (Sys et al., 1991a). Land suitability is the fitness of a given type of land for a defined use. The land may be considered in its present condition or after improvements. The process of land suitability classification is the appraisal and grouping of specific areas of land in terms of their suitability for defined uses (FAO, 1976). The aim of this research was land suitability evaluation of Merek Watershed for wheat, barley, chickpea, sugar beet, maize, and alfalfa, based on climate, soil and landscape characteristics. The methodology is based on asimple limitation method (Sys et al., 1991b), which forms the basis of the FAO land evaluation framework. Methods Determination of growing period The usual start of the growing period and the likely end of the rains can be determined graphically or can be calculated using a linear or parabolic interpolation technique based on rainfall and evapotranspiration data. The same applies to the start and end of the humid period. The end of the growing period is determined by the number of days that are required to consume 100 mm of water after the likely end of rains. In this study growing period was determined based on a graphical method (Sys et al., 1991a).

175
Land suitability classification The limitation approach suggests five level scales in the range of limitations, where the “severe” level is used when the property is marginal. The different levels in the degree of limitation are defined as follows: • No limitation: The characteristic (quality) is optimal for plant growth. • Slight limitations: The characteristic is nearly optimal for the land utilization type, and affects
productivity not more than 20% with regard to optimum yield. • Moderate limitations: The characteristics have moderate influence on yield decrease; however,
benefits can still be made and use of land remains profitable. • Severe limitations: The characteristic has such an influence on productivity of land that the use
becomes marginal for considered land utilization type. • Very severe limitations: The characteristics not only decrease the yields below profitable levels,
but may totally prohibit the use of the soil for the considered land use. The limitation levels could be expressed as land classes. This means that for each land characteristic or quality, one can define: S1, very suitable; S2, moderately suitable; S3, marginally suitable; N1, unsuitable but susceptible for correction; N2, unsuitable and not susceptible. In this case, no or only slight limitations define the S1 level, moderate limitations the S2 levels, severe limitations the S3 level, and very severe limitations the N1 and N2 levels. The definition of the classes can be done using the simple or maximum limitation method. Application of the simple limitation method implies that requirement tables have to be produced for each land utilization type, such as crop requirement tables from Sys et al. (1993). The methodology suggests in the first instance evaluation of the climatic characteristics (rainfall, temperature, relative humidity, and radiation) with the aim of the determining one class level to be introduced in the total evaluation. The class level of the climatic characteristics corresponds with the lowest class level of all four climatic characteristics. Land classes are defined according to the lowest class level of only one or more characteristics. Results and discussion Determination of growing period The growing period in the study area starts November 5 and ends April 25 (155 days). The humid period starts November 27 and ends March 2 (71 days) (Figure 1).
0
50
100
150
200
250
300
350
SEP OCT NOV DEC JAN FEB MAR APR MAY JUN JUL AUGMonths
ETO
-Rai
nfal
l (m
m)
Rainfall (mm)Eto/2Etoa b
c d
Figure 4. Growing period curve of study area: start of growing period (a), end of growing period (b), start of humid period (c), and end of humid period (d). Land suitability classification Climatic suitability for wheat and barley shows that due to low rainfall during the crop cycle and low rainfall during the ripening stage, the watershed is marginally suitable for rainfed wheat and barley and is highly suitable for irrigated wheat and barley. Similarly, the watershed is moderately suitable for rainfed chickpea and is highly suitable for irrigated chickpea. Climatic suitability for sugar beet shows that due to very low rainfall during the crop cycle, it is not suitable for rainfed sugar beet but is highly suitable for irrigated sugar beet. Climatic suitability for maize shows that, because of very low rainfall during the crop cycle, the watershed is not suitable for rainfed maize, but is moderately suitable for irrigated maize, due to the minimum temperature. Climatic suitability for alfalfa shows

176
that, due to very low rainfall during crop cycle, it is not suitable for rainfed alfalfa, but is moderately suitable for irrigated alfalfa due to mean temperatures. Land suitability for these crops shows that 1401 ha of the area (6%) are highly suitable, 10,549 ha (44%) are moderately suitable due to gravel limitation, and 2134 ha (9%) are marginally suitable due to calcium carbonate limitation. A total of 8842 ha (37%) are unsuitable due to topography, and 56 ha are not suitable due to gravel limitation. Since land suitability considers climate, soil, and landscape, the final land suitability for irrigated crops for different map units in the study area (Figure 2) are summarized as follows: Map units Mo211, Mo212, Mo311, Mo312, Mo321, Mo322, Mo332, HI111, HI121, HI221, and HI231, due to topography limitations are not suitable for wheat, barley, chickpea, sugar beet , maize, alfalfa, and clover in the study area. Map unit PI111 is marginally suitable for rainfed wheat and barley with precipitation limitation, moderately suitable for rainfed chickpea due to low rainfall during the crop cycle, and marginally suitable for irrigated wheat, barley chickpea, maize, sugar beet, and alfalfa due to calcium carbonate limitation. Map unit PI121 is marginally suitable for rainfed wheat and barley with precipitation limitation and moderately limitation for rainfed chickpea due to low rainfall during crop cycle and highly suitable for irrigated wheat, barley chickpea, and sugar beet and moderately suitable for maize, alfalfa and clover due to rainfall limitation and moderately suitable for chickpea due to calcium carbonate limitations. Map units PI131, 132, and PI331 are marginally suitable for rainfed wheat and barley with precipitation limitations, and moderately suitable for rainfed chickpea due to low rainfall during the crop cycle, and moderately suitable for irrigated wheat, barley, chickpea, sugar beet, maize, alfalfa, and clover due to calcium carbonate limitation.
Figure 2. Map units distribution in the study area. Conclusions and recommendations Climatic suitability for rainfed cultivation shows that Merek Watershed is marginally suitable for wheat and barley, moderately suitable for chickpea, and not suitable for sugar beet, maize, alfalfa and clover. The main landscape and soil limitations in the study area are topography and calcium carbonate. Climatic characteristics cannot be improved, except low rainfall, which can be compensated for by irrigation. Soil and landscape characteristics such as soil physical and chemical characteristics cannot be changed, and the subclasses that have such limitations such as calcium carbonate will remain without change in the future. Topography limitations, if slight or moderate, can be improved by leveling the lands for crop cultivation.

177
Acknowledgments This paper presents findings from PN24 ‘Livelihood resilience in dry areas,’ a project of the CGIAR Challenge Program on Water and Food. We appreciate the support of ICARDA and the Soil and Water Research Institute (SWRI), Agricultural Extension, Education and Research Organization (AEERO), for their support for this project. REFERENCES FAO. 1976. A framework for land evaluation. FAO Soils Bulletin No. 32. Rome: FAO. FAO. 1990. Land evaluation for development. Rome: FAO. FAO. 2007. Land evaluation towards a revised framework. Land and Water Discussion Paper 6. Rome:
FAO. Sys, C., E. Van Ranst, and J. Debaveye. 1991a. Land evaluation part I, principles in land evaluation
and crop production calculation. Agricultural Publication No. 7. Brussels, Belgium: General Administration for Development Cooperation.
Sys, C., E. Van Ranst, and J. Debaveye. 1991b. Land evaluation part II, methods in land evaluation.
Agricultural Publication No. 7. Brussels, Belgium: General Administration for Development Cooperation.
Sys, C., E. Van Ranst, and J. Debaveye. 1993. Land evaluation part III, crop requirements.
Agricultural Publication No. 7. Brussels, Belgium: General Administration for Development Cooperation.

178
Effect of Azotobacter and Azospirillum on the yield of wheat (Triticum aestivum) and barley (Hordeum vulgare) in Kermanshah and Lorestan, Iran
P.M. Milani1 and J. Anthofer2
1Soil and Water Research Institute (SWRI), Tehran, Iran [email protected]
2International Center for Agricultural Research in the Dry Areas (ICARDA), Aleppo, Syria Abstract To reduce farmers’ dependency on mineral fertilizers, to increase water use efficiency, and to increase households’ incomes, participatory on-farm research trials to test the effect of the inoculums of Azotobacter and Azospirillum on the yields of wheat and barley were conducted in the upper catchments of Karkheh River, Iran, in 2005-06 and 2006-07. In 2005-06, grain yield of inoculated irrigated wheat increased by 11%, while the yields of rainfed barley increased by 36% compared to the untreated control. In 2006-07, inoculation of irrigated wheat significantly increased grain yields from 3656 to 4536 kg/ha. The risk for a randomly selected farmer not to obtain a determined yield target was always lower for the inoculation treatment than for the control. Grain yields of inoculated rainfed wheat increased by 11% on average. Adaptability analysis revealed that the yield increase was independent from the farmer’s location, hence the technology is robust and yield increases remain constant with improved environmental conditions. The probability that the Azotobacter treatment outperforms the untreated control at a randomly chosen farming environment in Merek was 73%. The marginal costs for the inoculation treatment were low and equivalent to about 14 and 27 kg grain per hectare for rainfed and irrigated wheat or barley, respectively. These preliminary results suggest that inoculation of wheat and barley are low-cost and environment-friendly options with low agronomic and economic risk for farmers to increase yields, water productivity, and income. Media grab Biofertilizers Azotobacter and Azospirillum can increase water productivity of rainfed and irrigated cereals in the dry areas, and have been quickly adopted by farmers in the Karkheh River Basin. Introduction The main sources of income in the rural areas of the Karkheh River Basin rely on crop production and animal husbandry. Crop production is dominated by wheat and barley. In 2006, the irrigated land comprised only 8% and 24% of the total arable land in Merek, Kermanshah province, and Honam, Lorestan province, respectively. The total wheat area was 44% in Merek and 49% in Honam. Barley was grown on 9% of the arable land in Merek and on 22% in Honam. Crop yields are generally low. Mean grain yields of irrigated wheat, rainfed wheat, and rainfed barley in Honam are 3750, 1350, and 1500 kg ha, respectively. In Merek, the situation is similar, with average yields of 4500, 1500, and 1200 kg ha for irrigated wheat, rainfed wheat, and rainfed barley, respectively. Therefore, any crop improvement will have a substantial impact on farmers’ livelihood. At the same time, increased yields would also have a positive impact on a more efficient use of the scarce water resources. At present, the government in Iran is heavily subsidizing mineral fertilizers for wheat, and offers guaranteed prices to achieve the national policy on self sufficiency for wheat. Besides environmental concerns of the use of high rates of chemical fertilizers, agricultural subsidies put a considerable burden on Iran’s economy. Biofertilizers are inoculums of soil-borne beneficial organisms. Research on biofertilizers in Iran began in 1995 when the Soil Biology Research Division was added to the Soil and Water Research Institute (Khavazi et al., 2005). Today, emphasis is put on plant growth regulating bacteria, microorganisms that are capable of increasing the rate of plant growth by direct or indirect mechanisms. Secretion of vitamins and amino acids, auxins, and fixing atmospheric nitrogen by Azotobacter and Azospirillum are among the direct mechanisms of increasing root development and plant growth (Radwan, 2002; Khavazi et al., 2005; Akbari et al., 2007). Secretion of siderophores and hydrogen cyanides and antibiotics that control some plant diseases are additional effects of improving the growth rate and yields of plants such as wheat and barley (Khavazi et al., 2005). Recent studies have even detected synergistic effects of plant growth promoting rhizobacteria (such as Azospirillum and Azotobacter) and Rhizobium on nodulation and nitrogen fixation of legumes (Tilak et al., 2006). The current study aimed to investigate the effect of Azotobacter and Azospirillum biofertilizer on crop yield, water use efficiency, and households’ incomes in farmer-managed trials at various locations in the upper catchments of Karkheh River Basin.

179
Methods From 2005 to 2007 farmer-managed on-farm trials were conducted under rainfed conditions in two pilot sites of the Upper Karkheh River in southwest Iran: Merek plain in Kermanshah and Honam in Lorestan province. The participatory nature of the research approach required a simplified experimental design with only one test plot (Azotobacter treatment) and one control plot at each farmer’s location. One part served as a control without Azotobacter and Azospirillium inoculation, and the other part was planted with either wheat or barley seeds inoculated with Azotobacter and Azospirillum. Wheat and barley seeds were inoculated with Azotobacter and Azospirillium by spraying 'Nitroxin' over the seeds (1.5 liters per 100 kg of seeds). Sixteen interested farmers opted to test Azotobacter and Azospirillium inoculants on rainfed wheat, 22 farmers on irrigated wheat, and seven farmers on rainfed barley in two sites. Farmers were allowed to use their own cultivar, sowing density, and management practices. In both years, local collaborators recorded grain and straw yields at harvest in July for each farmer by taking 10 subsamples, 1.0 m2 in size, from both plots. Subsamples were cut at soil surface, and threshed separately with a mechanical thresher. Water productivity (WP) was calculated based on yields and rainfall data recorded by the meteorological stations in the respective sites and years. Where sufficient data were available, the paired data sets were also used to assess the adaptability of the Azotobacter treatment to the productivity level of each farmer’s location. To this end, for each farmers location the yield mean (MEAN) of both treatments, defined as [0.5 (YAzo+Yctrl)], was computed as environmental index. The yields of each individual treatment were plotted against the environmental index and linear regressions were calculated. Interpretation of the results followed those described by Hildebrand and Russell (1996). Larger data sets were also used to assess the risk of either technology to fall below a critical yield level. Where normality of data was given, the probability that the yield γ of this technology falls below a critical level λ in a randomly chosen environment j was calculated by Pr(γj < λ) = Φ[(λ - μ) σ-1], (Eskridge, 1990) where Φ is the cumulative distribution function of the standard normal distribution, μ is the mean yield of the technology, and σ is the standard deviation. For a direct comparison of the Azotobacter technology with the farmers’ practice, the probability of one system outperforming the other one was calculated by: Pr(Dj > 0) = Φ[δ (σD
-1)], (Eskridge and Mumm, 1992) where Dj is the yield difference between the two technologies in a randomly chosen location, Φ is the cumulative distribution function of the standard normal distribution, δ = μ1 – μ2, μ1 and μ2 are the mean yields of the two technologies, and σD is the standard deviation of the difference Dj . Economic risk analysis was based on net returns per treatment. Since the main interest was in treatment differences, only the return and cost factors differing among treatments were taken into account. Results In the 2005-06 season, Azotobacter and Azospirillum inoculums increased grain yields of irrigated wheat from 8346 kg/ha to 9265 kg/ha, a difference of 11%. The average net return difference between the Azotobacter and the untreated control treatment was 1.9 million Rials (US$211) per hectare (±0.72 million Rials). In the same season, rainfed barley yields increased by 36% from 2356 to 3197 kg/ha when seeds were inoculated with Azotobacter and Azospirillum. This was equivalent to an increase in WP from 0.44 to 0.59. The average net return difference between the two treatments was 1.8 million Rials (US$162) per hectare (±0.38 Rials). In 2006-07, the Azotobacter and Azospirillium treatment increased grain yields of irrigated wheat from 3656 to 4536 kg/ha in Honam. The adaptability analysis revealed that yield differences varied among locations and significantly increased with improved productivity levels (environmental index) of the farm site. Hence, there was an above-average yield response with higher environmental index. The risk analysis discovered that regardless of the critical yield of choice, it was always more likely to achieve that yield level with the Azotobacter than with the control. For instance, there was a 71% risk for the control to fall below a yield level of 4000 kg/ha while the corresponding risk for the Azotobacter treatment was only 30%. Comparing the two treatments, there was only a 13% risk that the Azotobacter was outperformed by the control treatment, if grain yield was the parameter. The marginal costs for the Azotobacter application in irrigated wheat were equivalent to only 40 kg of grain per hectare. The economic risk of Azotobacter application to be outperformed by the control was only 14% and therefore similarly low as the agronomic risk. The inoculants also increased grain yields

180
and WP of rainfed wheat and barley in the same year, but due to the high variability between sites and the low number of participating farmers, the high differences were not significant. Yield increases were detected, however, at all farming locations, and in rainfed barley, yields; and WP even doubled as affected by Azotobacter inoculation. The marginal costs for the Azotobacter application in rainfed wheat or barley were equivalent to only 21 kg of grain per hectare. The net return difference between Azotobacter treated rainfed wheat and the untreated control and between rainfed barley and its control was 0.89 million Rials (US$99) per hectare (±0.47 million Rials) and 2.96 million Rials (US$328) per hectare (±1.01 million Rials), respectively. In Merek, where the inoculants were tested for the first time during the 2006-07 season, Azotobacter treated rainfed wheat yields increased on average, but only moderately, from 1314 to 1457 kg/ha. This was associated with an increase in WP from 0.21 to 0.24. Moreover, the adaptability analysis showed similar yield increases regardless of the environmental index. The probability to fall below a critical yield level was always higher for the control treatment than for the Azotobacter treatment, but the risk difference between the two treatments was never higher than 15%. Moreover, there was a 27 and 30% risk of the Azotobacter treatment to be outperformed by the control treatment, respectively, when yield and net return were the criteria. The average net return difference between the Azotobacter and the control treatment were only 0.27 million Rials (US$30) per hectare (±0.14 million Rials). Based on data of the provincial agricultural service centers, in 2006-07 farming households in Honam cultivated 2.2 ha irrigated wheat, 5.9 ha rainfed wheat, and 3.7 ha rainfed barley. If Azotobacter is adopted on all the fields, the household income would increase by US$2232 per year. In Merek, an average household cultivated 0.6 ha irrigated wheat, 5.1 ha rainfed wheat, 0.15 ha of irrigated barley and 1.05 ha of rainfed barley during the 2006-07 season. The sole adoption of Azotobacter on rainfed wheat could increase household income by 1.36 million Rials (US$151) per year. Discussion Azotobacter and Azospirillum significantly increased wheat and barley yields in both years and in irrigated land as well as in rainfed crops. The Merek experiment in 2006-07 showed that the biofertilizers significantly increased rainfed wheat yields and the increase was independent from the environmental index, hence regardless of the productivity level at a given farmer location, such an increase can be expected. The situation in Honam was different. Although the inoculation treatment increased irrigated wheat yields on average by 24%, the obtained difference depended on the farmer’s location. With increasing environmental index, the yield difference between the two treatments also increased, while in poorer environments the difference diminished. The environmental conditions with respect to soils, elevations, and slopes in the Merek watershed, which comprises a long and wide even valley, are more homogeneous (De Pauw et al., 2008), which accounts for the lower variability of the yield difference between Azotobacter inoculated and untreated wheat. In contrast, the Honam watershed is more diverse, which explains the significant farmers’ fields' effects. The effect of the inoculants on wheat was less pronounced than the effect on barley. In 2005-06, the biofertilizer treatment increased irrigated grain yields by 11% in Honam, while the yields of rainfed barley increased by 36%. In the following year, grain yields of irrigated wheat increased by 24%, while rainfed barley yields doubled. These differences in response are suggested to be an effect of the fertility level of the soils and the fertilizer application. Wheat, and in particular irrigated wheat, is grown on the most fertile soils and receives the highest amounts of mineral fertilizers. On the contrary, rainfed barley is grown on the most marginal soils with low inherent fertility, on gravel-rich hilly land, and receives little attention and no mineral fertilizers. This observation is supported by other researchers (Rai and Gaur, 1988; Ali et al., 2005). The stronger effect of the biofertilizer on barley compared to wheat is especially important for poorer households, who often have no access to the more fertile soils in the center of the valley and to irrigated land. Inoculation of wheat and barley seeds with Azotobacter and Azospirillum was also a suitable entry-point technology for the PTD approach of the project. The technology is relatively simple and easy to apply for farmers; it is cheap; and it does not require major changes of the farming system or the management practices. Over a wide range of farming environments, it proved to be superior compared to the common farmers’ practice, and it poses a low economic risk of failure. The increasing number of farmers asking for the technology proves the suitability for farming households in the upper catchments of Karkeh River Basin in Iran. The economic analyses revealed that the Azotobacter technology has a high potential to increase farm household income and, therefore, may serve as an option to reduce poverty. Conclusions and recommendations Azotobacter and Azospirillum inoculants are well adapted technologies to dry mountainous areas of the Karkheh River Basin. The biofertilizers significantly increased wheat and barley yields and net returns. Moreover, there was a low economic risk for the Azotobacter treatment to be outperformed by the control treatment. The technology is cheap, easy to handle, does not change major parts of the farming and cropping system, and is easily available. Therefore, it can serve as a strategic component

181
for farmers to cope with the harsh environments and to increase livelihood resilience in Upper Karkheh River Basin and in similar areas. Acknowledgments This paper presents findings from PN24 ‘Livelihood Resilience in dry areas,’ a project of the CGIAR Challenge Program on Water and Food. References Akbari, G.A., S.M. Arab, H.A. Alikhani, I. Allahdadi, and M.H. Arzanesh. 2007. Isolation and selection
of indigenous Azospirillum spp. and the IAA of superior strains effects on wheat roots. World J. Agric. Sc., 3(4): 523-9.
Ali, S., M. Hamza, G. Amin, M. Fayez, M. El-Tahan, M. Monib, and N. Hegazi. 2005. Production of
biofertilizers using baker’s yeast effluent and their application to wheat and barley grown in north Sinai deserts. Archives of Agron. Soil Sc., 51(6): 589-604.
De Pauw, E., A. Mirghasemi, A. Ghaffari, and B. Nseir. 2008. Agro ecological zones of Karkheh River
Basin. Research Report, ICARDA, Aleppo, Syria. Eskridge, K.M. 1990. Selection of stable cultivars using a safety first rule. Crop Science, 30: 369-74. Eskridge, K.M. and R.F. Mumm. 1992. Choosing plant cultivars based on the probability of
outperforming a check. Theoret. Appl. Genet., 84: 894-900. Hildebrand, P.E., and J.T. Russell. 1996. Adaptability Analysis–A Method for the Design, Analysis and
Interpretation of On-Farm Research-Extension. Iowa State University Press, Ames, Iowa, USA, 189 pp.
Khavazi, K., H. Asadi-Rahmani, and M.J. Malakouti (eds.) 2005. Necessity for the production of
biofertilizers in Iran. Tehran, Iran: Soil and Water Research Institute (SWRI). Radwan, F.I. 2002. Response of some maize cultivars to VA mycorrhizal inoculation, biofertilization
and soil nitrogen application. Alex. J. Agric. Res., 43: 43-56. Rai, S.N., and A.C. Gaur. 1988. Characterization of Azotobacter spp. and effect of Azotobacter and
Azospirillum inoculant on the yield and N-uptake of wheat crop. Plant and Soil, 109: 131-4. Tilak, K.V.B.R., N. Ranganayaki, and C. Manoharachari. 2006. Synergistic effects of plant-growth
promoting rhizobacteria and Rhizobium on nodulation and nitrogen fixation by pigeonpea (Cajanus cajan). Europe. J. Soil Sc., 57(1): 67-71.

182
Water productivity estimates in the Volta Basin, West Africa
J.C. Clanet1, W. Andah2, D. de Condappa, and J. Lemoalle1
1Institut de Recherche pour le Développement, UMR G-EAU, Montpellier, France, [email protected]
2Water Research Institute, Accra, Ghana Abstract An attempt to estimate integrated water productivity (WP) in the Volta Basin is presented, including rainfed crops, livestock, and fisheries. WP for cereals and tubers have been derived from national statistics and rainfall. WP for livestock and for fisheries in Lake Volta, however, could not be estimated properly as the water consumed or depleted by these activities could not be estimated properly. Media grab The water productivity concept could be applied to agriculture production but not to gathering activities such as fisheries or transhumant livestock keeping in the Volta Basin. Introduction Because agriculture is the main consumer of water at the global level, and considering the general increase in water scarcity, increasing the production per unit of water has been identified as one of the world's most serious problems requiring urgent attention. Other limiting factors can be considered, however, and lead to other indicators: availability of land area, labor availability, energy, and financial inputs. Water efficiency or water productivity (WP) is one form of agricultural efficiency that may be analyzed, with the objective of a reduction in the water consumption by agriculture while maintaining or increasing production. It has been developed mainly for irrigated crops, for which it is a robust measure of the ability of agricultural systems to convert water into food (Le Houérou, 1984 ; Molden et al., 2003). It seems useful to extend the concept to include other types of livelihood support, such as mixed cropping, pasture, fisheries, or forests, and to define actionable goals of agricultural water management for poverty alleviation (Kijne et al., 2003; Cook et al., 2006; Hussain et al., 2007). If water productivity could be applied to all rural activities, and especially to the array of food production, then a common matrix would allow comparisons of the different productions within a single system of units and help in water allocation policies. The possibility of such an approach was tested on the Volta Basin (West Africa) during the Basin Focal Project–Volta. The Volta Basin is a transboundary area of 394,100 km2, which lies mainly in Ghana (42%) and Burkina Faso (42%), while Benin, Togo, Côte-d’Ivoire, and Mali share the remaining 16%. Our work focuses on the upstream Burkinabe and the downstream Ghanaian parts of the basin. The upper part of the Volta Basin lies in semiarid Burkina Faso, and the rivers flow toward the more humid Ghana. The priority in Burkina Faso is to develop water conservation, with numerous small dams and some medium size reservoirs. Lake Volta, in the lower part of the basin, was created to generate hydropower at Akosombo (1,020 MW). It is a high priority for Ghana. In the basin, rainfed agriculture is by far the dominant cropping system, being practiced on more than 95 % of the cultivated area. The different uses of water in different parts of the basin set the scene for the need of some consultation processes for water allocation, in a context of climate change and a population increase of 2.5 to 3 % per year (Andah et al., 2004; de Condappa et al., 2008). The water productivity approach can help in identifying which types of production make the best use of the available resource, and where improvements can be made. Water productivity Water productivity is defined as output per unit of water depleted. Output may be measured in terms of the amount or value of crops or livestock produced or (at least in principle) the value of water in domestic, urban, industrial, hydropower or environmental uses. Water is considered to be consumed or depleted when it is unavailable for further use, for example, when it is evaporated or transpired, or polluted to the point where it can no longer be used.

183
Figure 1. Field scale water productivity for maize and sorghum in the Volta Basin. Map generated by BFP Volta with data from Ministry of Food and Agriculture, Ghana (MOFA), and by the Ministère de l’Hydraulique, de l’Agriculture et des Ressources Halieutiques of Burkina Faso (MAHRH), mean values for 1992-2000. Rainfall from Climate Research Unit (Lemoalle, 2008). Water productivity of food crops Basin scale Water productivity at the basin scale was estimated as the amount of food crop production (in the Ghana and Burkina Faso parts of the basin) divided by the amount of rainfall received by the total corresponding area (a), and by the cultivated area only (b). The related figures are: WP(a) food crop calculated for total area : 51 kcal/m3 for the year 2000. WP(b) food crop calculated for cultivated area only : 466 kcal/m3 for the same year. In the Volta Basin, WP(a) is quite low. This is largely because of the small area devoted to crops relative to the area of savannah or grasslands, or nonarable lands. Most water is depleted through evapotranspiration in uncultivated areas. At the basin scale, crop water productivity would increase if a larger proportion of arable land in the basin were to be cultivated. WP(b) is also low, because of poor soils, low inputs, rain variability, and low technology. The farmers’ strategy is to maximize their work power and to reduce the risk of failure, not to improve water productivity. Field scale Water productivity at the field scale was estimated as yield divided by the volume of rainfall received by the cultivated area. Crop water productivity is generally higher for maize than for sorghum or millet. Mean values for crop water productivity were 0.15 kg/m3 (±0.05) for maize, 0.10 kg/m3 (±0.03) for sorghum, and 0.08 kg/m3 (±0.03) for millet. The spatial distributions in the Volta Basin of field-scale water productivity for maize and sorghum are shown in Figure 1. Relationships between maize, millet, and sorghum yields and annual rainfall were analyzed. Maize yields were found to be partly correlated with annual rainfall, with a strong dispersion (R2=0.2). In other words, maize yields tend to be higher where rainfall is more favorable. No such correlations were found between sorghum or millet yields and annual rainfall (R2=0.05 and R2=0.03, respectively). Water productivity was found to be partly correlated with rainfall for sorghum and millet (R2=0.3), but not for maize (R2=0.06). The water productivity of sorghum as a function of annual rainfall is represented in Figure 2. These relationships may be explained as follows: in the northern part of the basin, maize yields are constrained by inadequate moisture, while in the southern part of the basin, maize takes advantage of higher rainfall levels and yields more. Higher rainfall leads to higher yields, so water productivity (yield divided by rainfall) is relatively flat across the basin. In contrast, yields for sorghum and millet do not increase as rainfall becomes more abundant. This means that water productivity for these crops declines in wetter areas. These crops are less able than maize to take advantage of increased moisture to produce higher yields, but their yields do not decrease as much as that of maize in drier areas or in drier years.

184
WPr sorghum kg/m3
0
0,1
0,2
0,3
0,4
400 900 1400 Rainfall (mm)
Figure 2. An example of the biased relationship between rainfall and water productivity: water productivity of sorghum as a function of annual rainfall. Data from MHARH and MOFA and CRU rainfall (Lemoalle, 2008). WP of livestock and fisheries Water productivity has been introduced mainly as an indicator of irrigation performance. The concept applies when some volume of water, or some area of rainfall, is dedicated to a productive use. It applies to agriculture, not to a gathering activity. Fishing is typically a gathering activity. Livestock production can be typically an agricultural activity in industrial countries, but can also be partially a gathering activity in developing countries with free access to rangeland. If fisheries are considered, either in the ocean or in inland water bodies, the water is not dedicated nor consumed for fish production. Fisheries are gathering activities and no denominator can be identified for WP computation. Some marginal WP, however, can be estimated on some occasions if some water is dedicated to improve the fishery. This can occur for ecological flows in rivers or in order to increase the inundated area of a floodplain, and thus its total production. In both cases, an increase in fish catch ∆P can be associated with some water volume ∆W, dedicated to this increase. The marginal water productivity is ∆WP =∆P/∆W. In most industrial countries, a specific area is dedicated to fodder and feed production for the cattle. If these are rainfed, the rainfall over this specific area is the denominator of the livestock WP. The virtual content of the other elements of the cattle feed may also be computed. The consumption for watering the animals is a very small fraction of the feed water content. In semiarid tropical environments, the cattle mostly feed on wild rangeland which is often not delineated. It is therefore difficult to estimate the rain water which has allowed the growth of the fodder. WP of other productions The other main productions using water are cash crops (mostly rainfed), and hydropower from lakes Volta, Bagré, and Kompienga. These productions are best qualified by their economic returns (in US$). The water used for hydropower is more difficult to estimate. The hydrologic budget can be computed for a hydroelectric reservoir, with the net evaporation loss from the lake surface used in the WP denominator It should, however, be considered that the services that can be provided by the water below the dam are not identical to the services provided by the same water at the reservoir surface, e.g. for irrigation at an intermediate altitude. The services provided by (blue) water do not seem to be taken into account in the WP approach. Conclusions The concepts of WP and of virtual water have proven useful in focusing on the question of the sustainability of water use by agriculture worldwide, although agricultural WP indicators do not always capture the full range of benefits and costs associated with water use (Hussain et al., 2007). Consideration should be given in particular to the overall benefits or value of water at various levels for larger growth and poverty alleviation impacts, considering the sustainability of the systems.
Water productivity is largely scale and context specific. For example, the organic rich drainage water of a fish pond may be considered as consumed in some instances, if delivered to a river, but may be regarded as useful water if it is to be used for irrigation. The WP of the fish pond changes considerably

185
according to the use of its drainage water, and to the scale considered (fish pond alone, or fish pond plus irrigated field). Although WP seems well adapted to basin scale analyses, it may not apply equally to all the various activities in a basin. Gathering activities, as opposed to agricultural activities, are not properly taken into account, except when marginal WP can be involved. Gathering activities are typically fishing and livestock rearing in wild rangeland. At the farm or family scale, resilience to natural variability, especially to unreliable rainfall, is a dominant component of the family strategy in semiarid environments. This applies equally to rainfed cultivation and to livestock rearing where minimizing the risk does not always result in increasing WP. Acknowledgments This paper presents findings from PN55 ‘Basin Focal Project: Volta Basin,’ a project of the CGIAR Challenge Program on Water and Food. Agriculture production data have been provided by the Ministry of Food and Agriculture, Ghana (MOFA), and by the Ministère de l’Hydraulique, de l’Agriculture et des Ressources Halieutiques of Burkina Faso (MAHRH). The authors also acknowledge useful comments by an anonymous reviewer. References Andah, W., N. van de Giesen, A. Huber-Lee, and C. A. Biney. 2004. Can we maintain food production
without losing hydropower? The Volta Basin (West Africa). pp 181-94 In: Climate Change in Contrasting River Basins. J.C.J.H. Aerts and P. Droogers (eds.) CABI Publishing, Wallingford UK, 264 p.
Cook S., F. Gichuki, and H. Turral. 2006. Agricultural Water Productivity: Estimation at plot, farm and
basin scale. Basin Focal Project Working Paper 2, 18 p. http://www.waterandfood.org/publications/basin-focal-projects.html
de Condappa, D., A. Chaponnière, W. Andah, and J. Lemoalle. 2008. Decision-Tool for Water Allocation in the Volta Basin. International Forum for Water and Food, Addis Ababa, November.
Hussain, I., H. Turral, D. Molden, and M.D. Ahmad. 2007. Measuring and enhancing the value of
agricultural water in irrigated basins. Irrig. Sci., 25: 263-82. Kijne, J.W., R. Barker, and D. Molden (eds.) 2003. Water Productivity in Agriculture: Limits and
Opportunities for Improvement. CABI Publishing, Wallingford, UK. Le Houérou, H.N. 1984. Rain use efficiency: a unifying concept in arid-land ecology. Journal of Arid
Environments, 7: 213-47. Lemoalle, J., 2008. Synthesis of findings for the Volta. Basin focal Projects, Challege Program on
Water and Food. Molden, D., H .Murray-Rust, R. Sakthivadivel, and I. Makin. 2003. A water productivity framework for
understanding and action. In: J.W. Kijne, R. Barker, and D. Molden (eds.) Water Productivity in Agriculture: Limits and Opportunities for Improvement. CABI Publishing, Wallingford, UK. pp. 1–18.

186
Effect of conservation agriculture on the soil biochemical characters in semi-arid area of
north China
He WenQing1, Liu EnKe1, Yan ChangRong1, Bram Govaerts2, Mei XuRong1, Zhao CaiXia3, Liu Qin1, Liu Shuang1, and Antonio Castellanos2
1Institute of Environment and Sustainable Development in Agriculture, Chinese Academy of
Agricultural Sciences(CAAS) , Postal 100086, Beijing, China [email protected] ; [email protected] 2International Maize and Wheat Improvement Centre(CIMMYT), Apdo. Postal 6-641,06600 Mexico,
D.F., Mexico 3HeBei Agricultural University, Postal 071001, BaoDing, China
Abstract A study on microbial biomass C (MBC) and N (MBN) content and soil enzyme activities (dehydrogenase, acidic phosphatase, β-glucosidase, and urease) under different tillage systems was carried out for a 4-year experiment in a semi-arid area of north China. Two different tillage systems were compared: conservation agriculture–zero tillage with straw mulching (CA), and conventional tillage with the crop residues removed (CT). Soil analyses were performed on samples collected at four depths (0-5 cm, 5-10 cm, 10-20 cm, 20-30 cm). Zero tillage significantly increased crop residue accumulation on the soil surface. In general, higher organic matter content, MBC, MBN and enzyme activities were found in the more superficial layers of soil under CA than under CT. Biological properties showed a pronounced decrease with increasing soil depth for both tillage systems. Conservation agriculture was the more effective practice for improving soil chemical and biochemical qualities. Media grab Conservation agriculture (reduced tillage with straw mulching) improves soil chemical and biochemical qualities. Introduction Soil biochemical characteristics such as soil organic matter (SOM) content, soil microbial biomass and soil enzyme activity are important indictors of soil health. Tillage and residue management have a direct effect on soil biochemical characteristics. Soil organic matter distribution, nutrient cycling, and microbial activity are usually influenced by the type and the degree of soil tillage (Salinas-Garcia et al., 2002). Research has shown that soil organic matter and soil microbial biomass and activity respond to crop and soil management practices such as tillage and residue incorporation (Kaiser and Heinemeyer, 1993). Traditional extensive tillage (moldboard plowing with residues removed or burnt) often causes a rapid loss of SOM leading to a decrease of soil biological activity and impairment of chemical properties over time. The efficiency of conservation agriculture (CA) (zero or reduced tillage with residues retained) to reduce soil erosion and improve soil quality is universally recognized. Numerous studies have shown that decreasing tillage intensity or increasing the amount of surface residues on the soil surface result in higher organic C and N and improved soil quality (Heeman et al., 1995; Soon et al., 2001). Soil degradation is a concern in semi-arid areas of north China due to serious soil erosion, especially on crop lands where conventional tillage practices have resulted in moderate to severe soil erosion. Numerous studies in this region have shown that conservation tillage can increase soil moisture, reduce wind erosion and increase crop yield (Wang et al., 2007), but most of the research has focused on changes in soil physical and chemical properties to date. In contrast, information on the effects of CA on biological processes such as soil enzyme activities, which mediate nutrient cycling and influence their acquisition during active crop growth stages, is limited. The purpose of this study was to determine the effects of different tillage systems and residue management on the dynamics of SOC, microbial biomass characteristics and soil enzyme activity, and also the effects of soil enzymes on soil microorganism activity and nutrient cycling in a semi-arid area of north China. We hypothesized that a CA system would have a positive effect by increasing SOM and soil fertility and enhancing soil microbial functionality. Materials and methods Site characteristics description and experimental design The experiment was carried out in Shouyang County, Shanxi Province, China (37°32′-38°6′N,112°46′-113°26′E) at 1300 m above sea level. The location has a semi-arid warm temperate continental climate with a mean annual precipitation of 474 mm, most of the rain falling between July and September. Evaporation is 1714 mm and exceeds rainfall throughout the year. The mean annual

187
temperature is 8.14 °C, mean annual sunshine is 2679 h, and mean length of the growing period is 130 days. The soil is classified as Cinnamon soils. The main crops are maize, millet, and sorghum. The experiment was started in 2004 and compared two tillage/residue management treatments (called 'tillage' treatments for simplicity): CT+RM–conventional tillage (CT)–30 cm deep moldboard plowing, with all crop residues removed for fodder (RM), and a CA treatment ZT+RK–zero tillage (ZT) with the residues kept (RK) on the soil surface after harvest (standing in the field). The plot area was 380 m2 (19 m×20 m). No disease or insect pest controls were applied. Urea (300 kg/ha) was applied as top dressing in the jointing stage of maize every year. Maize was planted each year in late May. Soil sampling Soil sampling was carried out in October 2007 (after harvesting maize) – collected using a 5 cm diameter coring tube from 10 locations in each plot. The soil was divided into layers of 0-5, 5-10, 10-20, and 20-30 cm and respective layers from within each plot were composted. After carefully removing the surface organic materials and fine roots, each mixed soil sample was divided into two parts. One part was air-dried for the estimation of soil chemical properties and the other part was sieved through a 2 mm screen and incubated at 25oC for 2 weeks to enable uniform rewetting and to stabilize microbial activity after the initial disturbances. Soil chemical and biological properties analysis Soil organic matter (SOM) was determined by wet oxidation (Black, 1965) and the percentage of organic carbon was calculated by applying the Van Bemmelen factor of 1.73 (Piper, 1950). Soil total nitrogen (STN) and total phosphorus (STP) were measured using the method of Bao (2000). Microbial biomass C and MBN were estimated by fumigation–extraction (Brookes et al., 1985; Vance et al., 1987). Soil enzyme activities (dehydrogenase, β-glucosidase, alkaline phosphatase, urease) were determined by the method of Wu et al. (2006). Statistical analysis All statistical work was done using the SPSS 11.0 for Windows. One-way ANOVA was used to analyze means, to least significant difference at the 5% level. Results and discussion Soil organic carbon (SOC), soil total N (STN), and soil total phosphorus (STP) Soil tillage greatly affected soil chemical properties, and values declined with depth in all treatments. CA increased SOC content by around 10% in the 0-5 and 5-10 cm layers, but had no effect in deeper layers (Table 1). This was probably due to increased carbon input from residue retention (Brevik et al., 2002). Table 1. Soil profile chemical properties under different tillage systems.
Indicators Tillage treatment Depth (cm)
0-5 5-10 10-20 20-30
Soil organic carbon (mg/g)
ZT+RK 15.3* 14.6* 13.1 11.7
CT+RM 13.7 13.4 13.6 12.2
Soil total nitrogen (mg/g)
ZT+RK 6.93* 6.28* 5.17 * 3.88
CT+RM 5.76 5.44 4.23 3.52
Soil total phosphorus (mg/g)
ZT+RK 0.83* 0.78 0.68 0.66
CT+RM 0.76 0.74 0.71* 0.65
*Symbol identifies significant difference between treatments in the same soil layer at the 5% level. Soil total N showed the same trend as SOC in relation to different tillage treatments. In the 0-5 cm layer, STN under CA was increased by 18.9% compared to CT, while in the 5-10 cm layer, STN was increased by 7.4% (Table1). Below 10 cm, the STN differences were not significant. Soil total P under CA was 8.6% higher than under CT in the 0–5 cm layer (Table 1). In the 10–20 cm soil layers, the STP content was 10.2% lower under CA than under CT. In the 5-10 and 20–30 cm layers, the difference was not significant. Long-term zero tillage management commonly leads to a stratification of available P in soils (Zibilske et al., 2002). The topsoil accumulation of P in CT+RM is attributed to the limited downward movement of particle bound P in zero tillage soils and the upward movement of nutrients from deeper layers through nutrient uptake by roots (Urioste et al., 2006).

188
Soil microbial biomass carbon (MBC), microbial biomass nitrogen (MBN), and enzymatic activities Microbial biomass C and N were significantly affected by both soil depth and tillage system. MBC varied from 136 to 312 mg/g in CA and from 120 to 166 mg/g under CT (Table 2). MBN varied from 25 to 64 mg/g in the soil under CA and from 26 to 47 mg/g under CT. In the 0-5 and 5-10 cm soil layers, MBC and MBN were significantly higher under CA than CT. In the 0–5 cm layer, microbial biomass C and N were 88 and 73% higher under CA than under CT. Microbial biomass C and N decreased with soil depth, more so under CA. Soil subjected to CA accumulates crop residues and organic C in the surface layers, providing substrates for soil microorganisms near the soil surface. As a consequence, the soil microbial biomass and various soil microbial processes increase in surface soils under CA (Roldán et al., 2007). Table 2. Soil profile biological properties under different tillage systems. MBC = microbial biomass carbon, MBN = microbial biomass nitrogen.
Indicators Tillage treatment Depth (cm)
0-5 5-10 10-20 20-30
MBC (mg/g) ZT+RK 312* 218* 152 136 CT+RM 166 138 130 120
MBN (mg/g) ZT+RK 64* 45 37 25 CT+RM 47 36 32 26
Dehydrogenase (mg TPF/ kg⋅24h)
ZT+RK 45* 26 22 5 CT+RM 37 28 25 14
Alkaline phosphatase (mg PNP/ kg⋅h)
ZT+RK 475* 351 * 310 209 CT+RM 289 228 217 112
β-glucosidase (mg PNP/ kg⋅h)
ZT+RK 353* 316* 270 186 CT+RM 257 203 199 107
Urease (mg NH3/ kg⋅h)
ZT+RK 13 12 11 8 CT+RM 10 10 9 8
*Symbol identifies significant difference between treatments in the same soil layer at the 5% level. Since dehydrogenase activity is only present in viable cells, it is thought to reflect the total range of oxidative activity of soil microflora, and consequently may be considered to be a good indicator of microbial activity (Nannipieri et al., 1990). Tillage system had significant effects on soil dehydrogenase activity (Table 2). The dehydrogenase activity ranged from 5.2 to 44.8 mg TPF/kg⋅24h in the soil under CA and from 13.8 to 36.8 mg TPF/ kg⋅24h under CT. Zero tillage resulted in a significant increase in dehydrogenase activity at the 0-5 cm layer. In the 5-30 cm depth, there was no significant difference in dehydrogenase activity between treatments CA and CT. Other authors have reported similar results under no tillage or conventional tillage under semi-arid conditions (Madejón et al., 2007). The phosphatases are a broad group of enzymes that hydrolyze esters and anhydrides of phosphoric acid. Tillage treatment had a significant effect on alkaline phosphatase activity (Table 2), particularly in the 0-5 and 5-10 cm soil depths, where CA significantly increased it by at least 53.7% compared to CT. In the 10-30 cm depth, values for both treatments were similar. Kremer and Li (2003) showed that phosphatase activity in soils under organic management was greater than under conventional management. The β-glucosidase activity varied from 186 to 353 mg PNP kg/1 in the soil under CA and from 107 to 257 mg PNP/ kg⋅h under CT (Table 2). Averaged across the depths, β-glucosidase activity under CA was 46.7% higher than under CT. β-glucosidase, an enzyme already reported as an early indicator of changes in soil properties induced by tillage systems (Ekenler and Tabatabai, 2003), catalyzes the hydrolysis of various β-glucosides during the decomposition of organic materials. This fact could indeed explain the increase in β-glucosidase initially observed as a result of CA with straw cover treatment. Conclusions Four years after the tillage treatments commenced in semi-arid north China, there were significant treatment effects on soil chemical properties, microbial biomass, and soil enzymatic activities. SOC, TN, and TP in the topsoil (0-10) were greater under the CA system (zero tillage with residue retention on) than under conventional tillage with residues removed. The CA system promoted surface accumulation of crop residues and was more effective in improving soil biochemical quality than the conventional tillage system. The beneficial effects of CA on soil quality were more noticeable in the surface (0–10 cm) than below. In addition, the microbial biomass and enzyme activity showed higher sensitivity to soil management practices than the chemical properties. These variables might be useful soil quality indicators once their critical values have been determined for different conditions.

189
Acknowledgments This paper presents findings from PN12 ‘Conservation Agriculture for the Dry-land Areas of the Yellow River Basin,’ a project of the CGIAR Challenge Program on Water and Food. It was accomplished by all the members of dryland farming research group in the Institute of Environment and Sustainable Development in Agriculture, CAAS. References Bao, S.D. 2000. Soil and Agricultural Chemistry Analysis (in Chinese). Beijing: China Agricultural
Press. Black, C.A. 1965. Methods of Soil Analysis, Part I and II. Amer. Soc. Inc. Pub., Madison, U.S.A., pp.
770–79. Brevik, E., T. Fenton, and L. Moran. 2002. Effect of soil compaction on organic carbon amounts and
distribution, south-central Iowa. Environ. Pollut. 116, 137–141. Brookes, P.C., A. Landman, G. Pruden, and D.S. Jenkinson. 1985. Chloroform fumigation and the
release of soil nitrogen: a rapid direct extraction method for measuring microbial biomass nitrogen in soil. Soil Biol. Biochem. 17: 837–42.
Embacher, A., A. Zsolnay, A. Gattinger, and J.C. Munch. 2007. The dynamics of water extractable
organic matter (WEOM) in common arable topsoils: I. Quantity, quality and function over a three year period. Geoderma, 139: 11–22.
Ekenler M., and M.A. Tabatabai. 2003. Effects of liming and tillage systems on microbial biomass and
glycosidases in soils. Biol. Fertil. Soils 39:51–61. Heeman, D.P., W.J. McGhie, F.M. Thomson, and K.Y. Chan. 1995. Decline in soil organic carbon and
total nitrogen in relation to tillage, stubble management, and rotation. Aust. J. Exp. Agric. 35: 877–884.
Kaiser, E.A., and O. Heinemeyer. 1993. Seasonal variations of soil microbial biomass carbon within
the plow layer. Soil Biol. Biochem. 25: 1649–55. Kremer, R.I., J. Li. 2003. Developing weed-suppressive soils through improved soil quality
management. Soil Till. Res. 72: 193–202. Madejón, E., F Moreno, J.M. Murillo, and F. Pelegrín. 2006. Soil biochemical response to long-term
conservation tillage under semi-arid Mediterranean conditions. Soil & Tillage Research. 94: 346–52.
Nannipieri, P., S. Grego, and B. Ceccanti. 1990. Ecological significance of biological activity. In: Bollag,
J.-M., Stotzky, G. (Eds.), Soil Biochemistry, vol. 6. Marcel Dekker, New York, pp. 293–355. Piper, C.S. 1950. Soil and plant analysis. Adelaide Univ: Hassel Press Australia. Roldán, A., J.R. Salinas-Garcí, M.M. Alguacil, and F. Caravaca. 2007. Soil sustainability indicators
following conservation tillage practices under subtropical maize and bean crops. Soil Till. Res. 93: 273–82.
Salinas-Garcý´a, J.R., Vela´zquez-Garcý´a, J.J., Gallardo-Valdez, M.,Dý´az-Mederos, P., Caballero-
Herna´ndez, F., apia-Vargas, L.M., Rosales-Robles, E. 2002. Tillage effects on micro biomass and nutrient distribution in soils under rain-fed corn production in central-western Mexico. Soil Till. Res. 66: 143–152.
Soon, Y.K., G.W. Clayton, and W.A. Rice. 2001. Tillage and previous crop effects on dynamics of
nitrogen in a wheat–soil system. Agron. J. 93: 842–49. Urioste, A.M., G.G. Hevia, E.N. Hepper, L.E. Anton, A.A. Bono, and D.E. Buschiazzo. 2006. Cultivation
effects on the distribution of organic carbon, total nitrogen and phosphorus in soils of the semi-arid region of Argentinian Pampas. Geoderma, 136: 621–630.
Vance, E.D., P.C. Brookes, and D.S. Jenkinson. 1987. An extraction method for measuring soil
microbial biomass C. Soil Biol. Biochem. 19: 703–07. Wang, X.B., D.X. Cai, W.B. Hoogmoed, O. Oenema, and U. D. Perdok. 2007. Developments in
conservation tillage in rainfed regions of North China. Soil Till. Res. 93: 239–50. Wu, J.S., Lin, Q.M., Huang, Q.Y. and Xiao, H.A. 2006. Soil microbial biomass-Methods and Application
(in Chinese). Beijing: Weather Press. Wright, A.L., Dou, F., Hons, F.M. 2007. Soil organic C and N distribution for wheat cropping systems
after 20 years of conservation tillage in central Texas. Agr. Ecosyst. Environ. 121: 376–82. Zibilske, L.M., J.M. Bradford, and J.R. Smart. 2002. Conservation tillage induced changes in organic
carbon, total nitrogen and available phosphorus in a semi-arid alkaline subtropical soil. Soil Till. Res. 66: 153–163.

190
Introduction of salt-tolerant wheat, barley, and sorghum varieties in saline areas of the
Karkheh River Basin
G.H. Ranjbar1, S.A.M. Cheraghi2, A. Anagholi1, G. L. Ayene3, M.H. Rahimian1, and M. Qadir4,5
1,2National Salinity Research Center, Yazd, Iran 3Khuzestan Agricultural and Natural Resources Research Center, Ahvaz, Iran
4International Center for Agricultural Research in the Dry Areas, Aleppo, Syria 5International Water Management Institute, Colombo, Sri Lanka [email protected]
Abstract Salinity is a major problem in irrigated areas of the lower Karkheh River Basin (LKRB) where high groundwater level has compounded the situation. Use of salt-tolerant genotypes, such as high-yielding salt-tolerant wheat, barley, and sorghum varieties, is a potential short-term consideration to address the growing salinity problem in the area. In a field study, we evaluated seven wheat genotypes, six barley genotypes, and eight sorghum varieties (four lines and four hybrids) in individual experiments at Dasht-e Azadegan. The experiments were arranged as randomized complete block designs with three replications during 2005-2008 for wheat and barley and 2006-2007 for sorghum experiments. Results of the wheat experiments showed that Sistan, Kavir, and Bam had the highest yields (4.7, 4.5 and 4.4 t/ha), while Verinak produced the least (3.2 t/ha). Based on the results of the barley experiment, On-4 (3.3 t/ha) and M 81-19l (3.0 t/ha) produced the highest grain yield. For sorghum, KFS4 (104.2 t/ha) had the highest fodder yield for 2 years among pure lines. For hybrid varieties, Speedfeed (117.0 t/ha) had the highest fodder yield for the first year, but in the second year Jumbo produced the highest yield with no significant differences with Speedfeed and Sugargraze. Considering that 90% of the planted area in this region under cereal cultivation has an average yield of 2 t/ha, the introduction of high-yielding salt-tolerant varieties could have a positive impact on total crop production and water productivity. Media grab Yield increases of up to 50% are possible through the use of salt-tolerant crop species in the irrigatated areas of the Karkeh River Basin. Introduction Salinity and waterlogging co-exist in the lower reaches of several river basins throughout the world, affecting agricultural production and the livelihoods of the affected communities (Wichelns and Oster, 2006). The same applies to the lower Karkheh River Basin (LKRB) of Iran. Efforts being made to overcome salinity and waterlogging problems consist of engineering solutions such as installation of a drainage system to manage the drainage effluent generated by irrigated agriculture. This is a long-term strategy, however, as drainage installation is expensive. The areas under salt-affected and waterlogged soils are expanding because of inappropriate on-farm water and soil management. Selection and cultivation of high-yielding salt-tolerant varieties of different crops is a potential interim strategy to fulfill the needs of the communities relying on these soils for their livelihoods (Ayers and Westcot, 1989). Many crops show intraspecific variation in response to salinity, including wheat (Kingsbury and Epstein, 1984, 1986; Parida and Das, 2004). Barley is one of the most salt-tolerant crop species, but there are also wide variations among its genotypes under saline conditions (Royo and Aragues, 1999). Sorghum is moderately salt-tolerant (Maas et al., 1986). Generally, substantial genotypic differences exist among sorghum cultivars in response to salinity stress (Sunseri et al., 2002; Netondo et al., 2004). The objective of this study was to compare yield of some salt-tolerant wheat, barley, and sorghum varieties in the saline areas of LKRB. Methods This study was conducted at Dasht-e Azadegan in Khuzestan Province during 2005-2008. Dasht-e Azadegan is located in the LKRB and lies between 31o 04’ 35” to 31o 51’ 39” N and 47o 46’ 34” to 48o
35’ 12” E. Wheat, barley, and sorghum genotypes were examined in separate experiments.

191
Wheat crops were grown in 4 × 7 m plots with each plot containing 18 rows of each genotype. The rows were spaced 0.2 m apart. Prior to sowing triple super phosphate was mixed into the top 0.25 m of soil at a rate of 115 kg P/ha. To assure adequate N fertility throughout the experiment urea was added at the rate of 150 kg N/ha. Herbicides were applied to control weeds whenever necessary. The salt-tolerant genotypes were Bam, Akbari, Sistan, Kavir and Roshan. The local wheat cultivars were Chamran and Verinak. The treatments for barley experiments were two cultivars (Afzal and Reyhan) and four barley lines (Karon × Kavir, M80-9, M-81-19, and On-4). Barley rows were spaced 0.2 m apart with sowing density of 350 seeds/m2. Each plot was 4.0 m × 6.5 m, so that 18 rows of each genotype were sown in every plot. Wheat and barley genotypes were sown in November 2005, 2006, and 2007. To determine grain and straw yield of wheat and barley genotypes, a 3 m2 area was harvested from the center of each plot. In the sorghum experiment, the treatments included four hybrid varieties (Speedfeed, Sugargraze, Jumbo, and Nectar) and four pure lines (KFS1, KFS2, KFS3, and KFS4. Each plot was 6.0 m long and 1.8 m wide and contained 6 rows, which were spaced 0.3 m apart. At four occasions during the experiments (planting, stem elongation, flowering, grain filling) soil samples were taken to a depth of 0.9 m for salinity measurement of saturated extracts. All experiments were laid out in a randomized complete block design with three replications. The data collected were subjected to variance analysis using SAS software. Statistical differences among the means were determined using Duncan's new multiple range test. Results and discussion Root zone salinity Crops were irrigated during the growing season with irrigation water diverted from Kharkheh River. Salinity of the river water was around 1 dS/m. The relatively good quality of irrigation water leached the salts, which were deposited in the soil during the fallow season as a result of high evaporative demand and high water-table level. As shown in Fig 1, crops were affected by salinity during the growing season in addition to other environmental stresses (waterlogging and end of the season heat stress).
0
30
60
90
0 2 4 6 8 10 12ECe(dS/m)
Dep
th(c
m)
200520062007
0
30
60
90
0 2 4 6 8 10 12 14ECe(dS/m)
Dep
th(c
m)
Figure 1. Average soil salinity for different growing seasons. Wheat Statistical analysis of combined grain yield for 3 years showed that yield performance of the genotypes varied significantly. Among the genotypes, Sistan and Verinak produced the highest and lowest grain yield, respectively, regardless of the year. The mean grain yields of Sistan, Kavir, Bam, Chamran, Roshan, Akbari, and Verinak were 4.7, 4.5, 4.4, 4.3, 4.1, 3.9, and 3.2 t/ha, respectively. Comparison of mean grain yield of genotypes in each year showed that Sistan produced the highest grain yield except in 2005-2006 (Table 1). The mean grain yield of Sistan for the whole experiment was 11 and 47% more than Chamran and Verinak (local varieties), respectively. Verinak showed the lowest grain yield compared to the other varieties for 3 years. From the present study, it appears that all genotypes have the same main stem leaf number, and the same phenology except for Verinak (data not shown). In spite of this, Sistan, Kavir, and Bam showed higher yield than the others. There are many genetic factors that affect grain yield under saline
0
30
60
90
0 2 4 6 8 10ECe(dS/m)
Dep
th(c
m)
Wheat Barley Sorghum

192
conditions, such as the number of tillers and leaf area duration (Hay and Walker, 1989). The number of tillers per plant for Sistan, Kavir, Bam, Chamran, Roshan, Akbari, and Verinak were 4.0, 3.0, 3.5, 2.2, 4.1, 3.7, and 2.0, respectively. In fact, salt-tolerant genotypes produced more tillers than the local varieties. Roshan produced the most tillers during the growing season, but it lodged at the end of the season and its grain yield was markedly reduced. The other very important factors affecting grain yield under stressed conditions are leaf area and the duration of the grain filling period. Field observations showed that varieties like Sistan, Bam, and Kavir had the highest ground cover and longest grain filling period. This allows for more mobilization of soluble carbohydrates from other parts of the plant to the developing grains. Short grain filling period could be a factor causing low yield in some varieties such as Verinak. Barley Combined analysis of variance showed that On-4 produced the highest and Afzal the lowest grain yields regardless of the year. The mean grain yields of On-4, Reyhan, M80-9, M81-19, Karon x Kavir, and Afzal were 3.3, 3.1, 2.8, 3.0, 2.9, and 1.7 t/ha, respectively (Table 2). The barley genotypes produced the same grain yield each year except for Afzal. High-yielding barley varieties are always tall plants. Thus a variety that has a strong stem and does not lodge in the field can produce the highest grain yield (Hay and Walker, 1989). Field observations showed that lodging percentage for On-4, Reyhan, M80-9, M81-19, Karon x Kavir, and Afzal were 0, 20, 3, 0, 10, and 55, respectively. Therefore, based on the results of grain yield and lodging percentage, On-4 and M81-19 could be considered as new barley genotypes for the LKRB. Table 1. Comparison of mean grain yield for wheat genotypes during 2005-2008. Genotypes 2005-2006 2006-2007 2007-2008 Kavir 4.1a 3.9ab 5.4ab Roshan 3.8ab 3.7ab 4.6bc Bam 4.5a 4.2a 4.6bc Akbari 3.2bc 3.2bc 5.4ab Sistan 3.9ab 4.3a 5.7a Chamran 3.8ab 4.0a 5.0b Verinak 2.7c 2.9c 4.1c Means followed by the same letter were not significantly different (Duncan’s 5%). Table 2. Yield comparison of barley genotypes during 2005-2008. Genotypes 2005-2006 2006-2007 2007-2008 Reyhan 3.3a 3.6a 2.5ab M80-9 2.6b 2.9ab 3.0a M81-19 3.4a 3.4a 2.3bc On-4 3.6a 3.3a 3.1a Karon × Kavir 3.2ab 2.9ab 2.7ab Afzal 1.0c 2.2b 1.7c Means follow by the same letter were not significantly different ( Duncan’s 5%). Sorghum KFS4 produced the maximum fresh matter of 100.7 t/ha in 2006, followed by KFS2 and KFS1, with 92.7 and 86.3 t/ha, respectively, which were not significantly different. A minimum of 66.9 t/ha fresh matter was observed for KFS3 in 2006 (Table 3). Again, in the second year (2007), the maximum fresh matter was measured for KFS4, at 107.7 t/ha. For hybrid varieties, Speedfeed produced the maximum fresh matter yield of 117.0 t/ha in the first year, followed by Sugargraze, Nectar, and Jumbo, which were in the same Duncan's group with 89.3, 81.9, and 70.2 t/ha, respectively (Table 3). In the second year, Jumbo produced the highest fodder yield with 130.4 t/ha followed by Speedfeed (124.6 t/ha) and Sugargraze (120.7 t/ha), which were not significantly different. Nectar hybrid variety had the lowest fodder yield in the second year. The highest dry matter yield of 23.6 t/ha was measured for KFS4, followed by KFS2 and KFS1, with 22.8 and 20.6 t/ha, respectively in first year, which were not significantly different. KFS3 produced minimum dry matter of 17.0 t/ha among lines in the first year. KFS4 produced the highest dry matter yield of 30.1 t/ha in the second year, again followed by KFS3 (27.7 t/ha) with no significant difference. Dry matter production of Speedfeed, Sugargraze, and Jumbo hybrid varieties differed significantly in the first year (Table 3). The highest total dry matter yield of 28.3 t/ha was measured for Speedfeed. Sugargraze and Nectar produced the next highest dry matter (22.3 and 18.7 t/ha). Total dry matter of both varieties was not significantly different in the first year. Jumbo had the lowest hybrid dry matter yield of 17.1 t/ha in 2006, and the highest yield of 32.6 t/ha in the second year. Combined analysis of dry matter showed that Speedfeed produced the highest dry matter yield for the two years of 30.5 t/ha (data not shown).
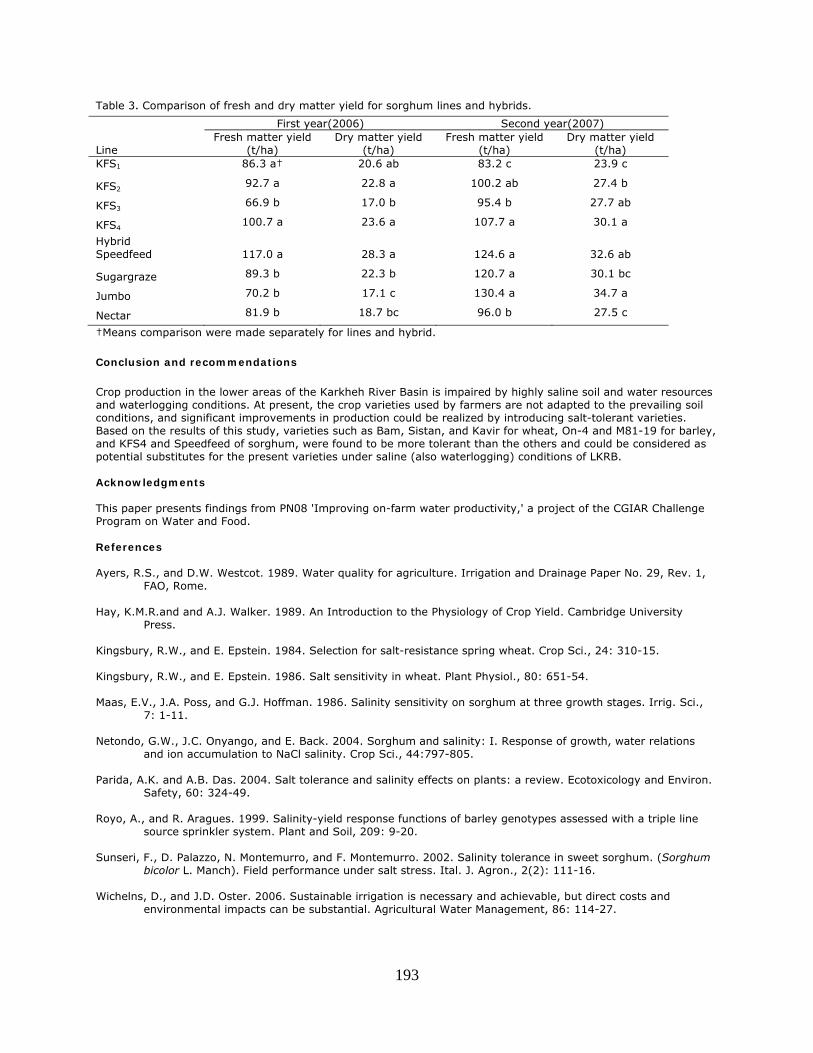
193
Table 3. Comparison of fresh and dry matter yield for sorghum lines and hybrids.
Line
First year(2006) Second year(2007) Fresh matter yield
(t/ha) Dry matter yield
(t/ha) Fresh matter yield
(t/ha) Dry matter yield
(t/ha) KFS1 86.3 a† 20.6 ab 83.2 c 23.9 c
KFS2 92.7 a 22.8 a 100.2 ab 27.4 b
KFS3 66.9 b 17.0 b 95.4 b 27.7 ab
KFS4 100.7 a 23.6 a 107.7 a 30.1 a
Hybrid Speedfeed 117.0 a 28.3 a 124.6 a 32.6 ab
Sugargraze 89.3 b 22.3 b 120.7 a 30.1 bc
Jumbo 70.2 b 17.1 c 130.4 a 34.7 a
Nectar 81.9 b 18.7 bc 96.0 b 27.5 c
†Means comparison were made separately for lines and hybrid. Conclusion and recommendations Crop production in the lower areas of the Karkheh River Basin is impaired by highly saline soil and water resources and waterlogging conditions. At present, the crop varieties used by farmers are not adapted to the prevailing soil conditions, and significant improvements in production could be realized by introducing salt-tolerant varieties. Based on the results of this study, varieties such as Bam, Sistan, and Kavir for wheat, On-4 and M81-19 for barley, and KFS4 and Speedfeed of sorghum, were found to be more tolerant than the others and could be considered as potential substitutes for the present varieties under saline (also waterlogging) conditions of LKRB. Acknowledgments This paper presents findings from PN08 'Improving on-farm water productivity,' a project of the CGIAR Challenge Program on Water and Food. References Ayers, R.S., and D.W. Westcot. 1989. Water quality for agriculture. Irrigation and Drainage Paper No. 29, Rev. 1,
FAO, Rome. Hay, K.M.R.and and A.J. Walker. 1989. An Introduction to the Physiology of Crop Yield. Cambridge University
Press. Kingsbury, R.W., and E. Epstein. 1984. Selection for salt-resistance spring wheat. Crop Sci., 24: 310-15. Kingsbury, R.W., and E. Epstein. 1986. Salt sensitivity in wheat. Plant Physiol., 80: 651-54. Maas, E.V., J.A. Poss, and G.J. Hoffman. 1986. Salinity sensitivity on sorghum at three growth stages. Irrig. Sci.,
7: 1-11. Netondo, G.W., J.C. Onyango, and E. Back. 2004. Sorghum and salinity: I. Response of growth, water relations
and ion accumulation to NaCl salinity. Crop Sci., 44:797-805. Parida, A.K. and A.B. Das. 2004. Salt tolerance and salinity effects on plants: a review. Ecotoxicology and Environ.
Safety, 60: 324-49. Royo, A., and R. Aragues. 1999. Salinity-yield response functions of barley genotypes assessed with a triple line
source sprinkler system. Plant and Soil, 209: 9-20. Sunseri, F., D. Palazzo, N. Montemurro, and F. Montemurro. 2002. Salinity tolerance in sweet sorghum. (Sorghum
bicolor L. Manch). Field performance under salt stress. Ital. J. Agron., 2(2): 111-16. Wichelns, D., and J.D. Oster. 2006. Sustainable irrigation is necessary and achievable, but direct costs and
environmental impacts can be substantial. Agricultural Water Management, 86: 114-27.

194
Marketing small packs of fertilizer in Limpopo Province, South Africa
J. Simpungwe1, T. Pedzisa2, M. Masenya3, and I. Minde4
1Progress Milling, South Africa, P.O. Box 386 Polokwane 0700, South Africa. [email protected]
2Scientific Officer (Economics), ICRISAT, Bulawayo, Zimbabwe 3Director, Corporate Communication, Progress Milling, P.O. Box 386, Polokwane 0700, South Africa
4Principal Scientist (Economics), ICRISAT, Bulawayo, Zimbabwe Abstract It has been asserted that resource-poor farmers do not buy fertilizers because they are unable to afford the large-size packages, and that farmers could sustainably increase the use of fertilizer if smaller (more affordable) packages were made available to them. Therefore, SASOL Nitro, Progress Milling, Limpopo Department of Agriculture, Agricultural Research Council, and the International Crops Research Institute for the Semi-Arid Tropics (ICRISAT) collaborated to supply different-sized packs of fertilizers, especially ammonium nitrate, to farmers in Limpopo Province, and to monitor its use. This was done over three seasons–2004-5 to 2007-8. Small pre-packed fertilizer packs were supplied to the Province by Sasol Nitro through Progress Milling–a private food processing and inputs supply company. Progress Milling then distributed the packs to its depots (over 100) located in communities throughout the province. This paper reports on the outcome and experiences from the project (CPWFPN1) aimed at assesing whether farmers could sustainably increase the use of fertilizer if more affordable packages were made available to them. Generally, fertilizer in South Africa is packed in 50 kg bags. On average, a 50 kg fertilizer bag of compound fertilizer would cost R242 (equivalent to US$30). Sasol Nitro packed the fertilizers into 10 kg and 20 kg packages which cost R48 (US$6) and R97 (US$12), respectively, and ensured that it was available to farmers at all Progress Milling depots. Most of the first-time fertilizer users opted for smaller packs because they could experiment with less risk, and lower costs. Media grab Supplying fertilizer in small packs has improved fertilizer access for poor smallholders in Limpopo Province, South Africa. Introduction Agricultural production in sub-Saharan Africa is hampered by low use of inputs such as improved seeds and mineral fertilizers, low inherent soil fertility, and nutrient-depleted soils in much of the continent (Henao and Baanante, 2006; IFPRI, 1999; Mwangi, 1996). Millions of smallholder farmers suffer poverty and hunger because they are unaware of the correct inputs required to achieve subsistence yields from increasingly depleted soils. To achieve yield gains needed to meet food requirements of the rapidly growing population, Africa must significantly increase its current low levels of inorganic fertilizer use and intensify its production systems. African farmers, however, have little access to fertilizers and cannot always afford them. In response to various constraints faced by farmers, a consortium of partners–ICRISAT, Limpopo Department of Agriculture (LDA), SASOL Nitro, Progress Milling, and Limpopo Agricultural Strategic Team (LIMPAST)–teamed up to design a program aimed at providing fertilizer of various pack sizes to a selected number of Progress Milling depots. This initiative builds on a 2-year LDA-supported experiment and trials with farmers on improved soil and water management technologies. The trials included microdosing, which is precision (through time and space) application of small doses aimed at maximizing returns from small investments in fertilizers. The principle underlying provision of small packs is to make fertilizer affordable to many who cannot meet the full cost of the traditional 50 kg bags–creating convenient access to farmers as the fertilizer would be sent to a depot close to them. This program is aimed at laying a foundation for a rapid uptake of fertilizer through increased participation of the private sector. From 2004-2007, the consortium worked together to improve access to fertilizer by packaging fertilizer into smaller packs and improving deliveries to local distribution depots owned by Progress Milling–a more than 50-year-old company operating in Limpopo Province. Progress Milling has over 100 depots in the province. Its core business is to process locally produced crops and to supply agricultural inputs. Progress Milling collaborates with SASOL Nitro (which manufactures the fertilizers), and PANNAR, in the supply of inputs. When farmers deliver grain to the depots, they have three options: leave it there for storage for sale at a future date; exchange with a milled bag of

195
grain of the same weight and pay a small milling fee; or sell to Progress Milling straight away. Progress Milling has gained the confidence of the farmers as a secure market as well as a secure source of food, since farmers can collect milled grain at any time of the year as long they have delivered grain to the depot. Methods Qualitative and quantitative data were obtained from various sources through desk reviews (secondary data) and from primary data obtained through field work designed and implemented by the research team. Two household surveys were carried out to obtain the primary data subsequently used to address the research questions. The preliminary survey was held in 2005-06 and 75 farmers were interviewed in the first round. The target group consisted of farmers who had bought fertilizer for the farming season 2005-06. A reconnaissance survey covering Progress Milling depots preceded this survey. It focused on depots that had sold small-pack fertilizer to assess the state of the depots (Minde and Pedzisa, 2008). The 13 depots were selected randomly out of 73 depots in the province that had a record of having received fertilizers for the season under reference. In addition, selection for inclusion was based on there having been on-farm trials on fertilizers around the depot. Agricultural extension officers who were within the vicinity of the depots were interviewed as part of the reconnaissance survey and they also assisted in the survey. A larger and more in-depth farmer survey was carried out in 2006-07 targeting 180 randomly selected farmers consisting of 120 buyers and 60 nonbuyers. The main instrument used for data collection was a questionnaire, while descriptive statistics were the main analytical technique. After preliminary drafting of the questionnaires, the instrument was critically examined and fine-tuned before commencement of fieldwork. Results and Discussion Findings from the preliminary survey confirm that the more experienced farmers were not necessarily experienced in fertilizer use, because 20% of the sample farmers only started using fertilizer in 2005-06 season, thereby constituting first-time users. Inherent household characteristics such as age, farming experience, and household size are not significantly different between buyers and nonbuyers. Cattle ownership is high among nonbuyers but the subsequent quantities of cattle manure used on maize are lower among nonbuyers (Minde and Pedzisa, 2008). The income of buyers of fertilizer will be expected to be higher because they get additional income from crop sales. The most common source of income, however, for smallholder farmers in Limpopo Province is the government pension grant, disability grant, and child grant for children below 14 years–posing a challenge to new technologies since they need to provide appreciable additional income to be adopted. The landholding between buyers and nonbuyers is not significantly different. Education is an important factor in distinguishing buyers from nonbuyers, and it is hypothesized that education enlightens so that farmers are better able to appreciate new technologies as they come. Moreover, it is these educated farmers who are always targeted by extension officers for trials and training. The compounded effect will result in educated people appreciating and hence using fertilizer more compared to those who are not educated. The extension meetings are more widely attended by buyers than by nonbuyers, because these farmers need to learn and consult more with local extension officers. Fertilizer use increases the yield of cereals, and this can be confirmed by the yield differentials between buyers and nonbuyers. When the season is good as it was in 2005-06, the difference in yield was highly significant. In 2006-07, however, which was a bad season, the yield difference was only significant at the 10% level. Only 35% of the respondents used soil fertility enhancements other than mineral fertilizers such as chicken and cattle manure. Chemical fertilizers are applied solely to maize, except for the irrigation schemes where they specialize in horticultural crops. Different methods were used to apply fertilizer depending on whether it was basal fertilizer or top-dressing. Targeted application methods were commonly used to apply the fertilizers. Spot application of top-dressing fertilizer using a bottle top is a technique referred to as microdosing, and this was deliberately promoted by ICRISAT in Zimbabwe as well as South Africa, particularly in Limpopo Province. Buyers of fertilizer had much higher incomes and years of education (Table 1), and slightly larger landholdings. Their crop yields were at least double those of nonbuyers, and they participated more often in extension meetings. Buyers and nonbuyers of fertilizer were similar in terms of average age (58 years), farming experience (17 years), cattle ownership (7 per household), and quantity of manure used (1000 kg/household each season).

196
Table 1. Distinguishing characteristics of buyers and nonbuyers. Descriptive variable Buyers Nonbuyers t-value Age (years) 59.36 58.45 0.604 Farming experience (years) 17.59 16.39 0.500 Schooling (years) 6.08 4.0 3.292** Household size 6.74 6.31 0.803 Land holding (ha) 1.63 1.37 1.178* 2005/06 cereal production 2303.48 1074.78 3.197** 2006/07 cereal production 619.48 291.24 1.867* Number of extension meetings 4.34 2.04 3.231** Number of cattle owned 6.9 7.3 -0.173 Quantity cattle manure applied to maize (kg) 1486.52 1190.37 0.977 Annual income 26,327.74 15,317.51 1.848* *10% level of significance **5% level of significance Source: ICRISAT Survey data 2007. Most farmers (60.3%) bought fertilizer from the local Progress Milling depot for the cropping season 2006-07 than from any other source. The other sources of fertilizer included urban wholesalers, local and distant retail shops, as well as the local depot of a competitor company called Northern Transvaal Koopeative (NTK.) The initiative of supplying fertilizer through Progress Milling depots was born of a private-public partnership that strengthened over the year, and saw more fertilizer supplied through local depots. The opening up of local depots resulted in fertilizer being available to the smallholder farmer thus addressing the access constraint. Amongst the households in the survey sample, farmers who bought fertilizer from urban wholesalers were declining in number, whilst those who sourced fertilizer from the local depot were increasing in number over the 3 years (Figure 1). The total investment outlay required to buy a 10-kg pack is five times less than the investment required to buy a 50-kg bag. The investment required to buy a 50-kg bag might be equivalent to the price of a goat, whereas the cost of a 10-kg bag would be the same as the price of a chicken. The price per unit, however, between a small pack and the 50kg pack is not very different. Farmers were still paying the same price per kg for the pack size they bought for the two fertilizer types (Table 2). The cost of fertilizer per kg could not have influenced the farmer’s decision to buy small packs, but it is the total investment required to buy a particular pack size. Table 2. Average price of different pack sizes by fertilizer type 2006-07. Fertilizer type Price per unit (Rand)
10-kg packs 20-kg packs 50-kg packs
CAN/LAN 30.5 61.00 151.23 NPK (2.3.2) 33.3 65.00 150.01 Price per kg of NPK (2.3.2) 3.33 3.25 3.00 Source: ICRISAT Survey data 2007. It was revealed that, though Progress Milling local depot provided fertilizer to many farmers (44%) in the past 5 years, urban wholesalers were the most popular option supplying fertilizer to almost 55% of the farmers. Over time, Progress Milling local depot captured most of the fertilizer customers. Within the past two seasons, Progress Milling has dominated the fertilizer market for smallholder farmers with a market share of 78% (Figure 1). This is because of the convenience to the farmers of having fertilizer closer to their homestead. Urban wholesalers provided the cheapest fertilizer as expected, because wholesalers buy direct from the manufacturer and sell in bulk. It would seem that the 50-kg bags provided a cheaper option of buying fertilizer for the farmers but there is a hidden cost. By virtue of volume and weight of the 50-kg bag added by the distance, it becomes inevitable to pay for transport. All the farmers who bought the 10-kg packs did not pay the transport cost because they carried the fertilizer by head.

197
A small number of farmers have received training and conducted trials but these seem to be on the increase in Limpopo Province. Farmers are learning about banding and spot application as ways of applying fertilizers. At least 80% of the nonbuyers have never attempted to use fertilizer. The most important reason cited by farmers was that fertilizer was too expensive and therefore unaffordable. The second constraint was lack of information about availability and use of fertilizers. Characteristics of buyers Farmers were characterized into those with experience in fertilizer use, and those without experience. The experienced group was subdivided into those who regularly apply fertilizer, and those who occasionally apply fertilizer. Most farmers with experience in fertilizer use and who consistently applied fertilizer purchased 50-kg packs of fertilizer (Figure 2). On the other hand, some farmers with experience in fertilizer use who use fertilizer only occasionally usually purchased smaller packs. Their use of fertilizer was irregular depending on whether they had money, whether they considered their soil to be fertile enough, or whether they preferred to use manure. First time fertilizer users only purchased small packs. These were generally poor farmers who could not afford the larger 50-kg bags and who were still in the learning phase about fertilizer use. These farmers also owned smaller plots or were involved in backyard vegetable gardens. Figure 2. Fertilizer pack size preferences of different fertilizer users. Source: ICRISAT Survey data 2007.
020406080
100
Consistent Occasional First Time
% farmers with
experience
5kg
10kg
50kg

198
First-time users of fertilizers opted for smaller 5-kg packs while consistent users bought larger packs (Figure 2). The relatively more use of large packs could also be that smaller packs may not have been abundantly available at the time and place of buying to enable farmers to have a choice. About three-quarters of farmers who bought the 10-kg pack have less than 5 years of using fertilizer. The remainder has between 5-10 years of fertilizer use experience. More than half of the farmers who bought 20-kg bags are fairly new in the practice of using fertilizer. It can be noted that the majority of those buying 50-kg packs have quite some experience in using fertilizer of between 5 and 10 years. One possible inference here is that first-time users of fertilizer who are still experimenting buy the small packs (especially the 10-kg packs). Farmers who have been using fertilizer for many years are likely to buy the 50-kg packs because they have gone beyond the trial stages. Small packs therefore provide an essential starting point for using chemical fertilizers. In terms of purchases of fertilizers, 50-kg packs dominated the fertilizer sales in the survey areas (Figure 3). This could be associated with the unavailability of small fertilizer packs at the required time. Affordability was the most popular reason for buying small-pack fertilizer, followed by poverty, which is strongly related to affordability (Figure 4). This result also demonstrates that smallholder farmers are considerate of the cost implications of production. Figure 3. Farmer purchases by pack size in the survey area for 2006-07. Source: ICRISAT Survey data 2007. Figure 4. Reasons for buying small pack fertilizer. Source: ICRISAT Survey data 2007.
10kg packs 5%
20kg packs 6%
50kg packs89%
01020304050607080
% of farmers citing reason

199
Fertilizer use by crop Most of the 20- and 50-kg packs were used for maize production, while the 10-kg packs were used for maize and vegetable production (Figure 5). Fertilizer use for vegetables was almost entirely from small packs. Figure 5. Uses of fertilizer packs in 2006-07. Source: ICRISAT Survey data 2007. Most farmers used spot application (i.e. applying the fertilizer directly at the base of plant) rather than broadcast or banding (Figure 6). Farmers who purchased small-pack fertilizers used spot application methods more frequently than farmers who used banding or broadcasting. This confirms that they were considerate of the cost of fertilizer and thus ensured that the application was most efficient. Figure 6. Fertilizer application methods. Source: ICRISAT Survey data 2007.
010
2030
405060
708090
100
maize vegetables Bamabara Proportion of fertilizer packs applied to crops
10kg 20kg 50kg
0102030405060708090
100
Banding Broadcast Spot application
% of farmers using method
10kg pack 20kg pack 50kg pack

200
In general, smallholder farmers in the area were skeptical about inorganic fertilizers. Farmers cited the following reasons for avoiding using chemical fertilizer: fertilizers are expensive, there is a risk of burning crops especially under moisture stress, and there is a preference for organic manures. Conclusions and recommendations The distinction between nonbuyers and buyers of fertilizer could only be explained in terms of annual income earned, the education level attained, size of landholding, number of extension meetings attended, as well as the levels of cereal production in any given year. The factors that determine pack size preference were not clear from this study, because the sample was skewed toward those who bought the 50-kg bags. A closer analysis revealed that among those who bought the 10-kg packs were inexperienced in fertilizer use. The farmers were trying fertilizer for the first time or were second-time users. Seasoned farmers who use fertilizer consistently bought 50-kg bags. This, therefore, implies that there is a market for small-pack fertilizer among the first-time users. Cash resources did not come out as a constraint as hypothesized. There is not enough evidence to conclude that farmers who bought the small packs were cash constrained. On the contrary, these farmers fell into the third quartile of the income ranking. The place for small packs in smallholder agriculture needs to be further investigated and ascertained using a balanced sample with farmers who have equal access to all pack sizes. Demonstration trials and training in microdosing can enhance the use of small packs for the purposes of experimenting as a stepping stone to increased fertilizer use. Farmers who have stopped using fertilizer because of financial constraints can resume through purchase of small packs that are affordable. The public-private partnership between ICRISAT, LPDA, SASOL Nitro, and Progress Milling, has managed to improve fertilizer access to smallholder farmers in Limpopo Province. The partnership is still to improve the capacity of smallholder farmers to use fertilizer through training and hosting of on-farm trials, and improving access to fertilizer at the village level is critical because few villagers’ stock fertilizer–farmers buy from the nearest town, paying extra for transport. It is paramount to build the private sector capacity for input supply in rural areas as well as supply small packs through community-based retail shops. Furthermore, policy reforms are necessary to create well functioning fertilizer markets and reduce transaction costs. Acknowledgments This paper presents findings from PN 1, ‘Crop water technology and markets,’ a project of the CGIAR Challenge Program on Water and Food. References Henao, J., and C. Baanante. 2006. Agricultural Production and Soil Nutrient Mining in Africa. Implications for
Resource Conservation and Policy Development. IFDC. Alabama, USA. IFPRI. 1999. Nutrient Depletion in the Agricultural Soils of Africa. 2020 Brief No. 62. IFPRI, Washington. Mwangi, W. 1996. Low Use of Fertilizers and Low Productivity in sub-Saharan Africa. Paper 96-05. CIMMYT. Natural
Resource Group, Mexico. Minde, I.J., and T. Pedzisa. 2008. Improving access and utilization of fertilizer by smallholder farmers in the
Limpopo Province of South Africa. A Project Report submitted in partial fulfillment of the requirements of CPWF Project 1.

201
Catalysing collective action in water management and scaling up and out in
multiple use systems
Empowering communities to co-manage natural resources: impacts of the Conversatorio de Acción Ciudadana
C. Candelo1, L. Cantillo2, J. Gonzalez2, A.M. Roldan1, and N. Johnson3
1WWF-Colombia, Cali, Colombia. [email protected]
2Consultants, Bogota, Colombia 3Centro Internacional de Agricultura Tropical (CIAT), Cali, Colombia
Abstract Community participation is recognized as an essential part of equitable and sustainable watershed management, however, meaningful participation is difficult to achieve when communities are unorganized, unaware of their legal rights and responsibilities, and lacking the information, education and confidence necessary to interact with other more powerful stakeholders. The conversatorio de accion ciudadana (CAC) is an innovative methodology for empowering communities to participate actively and effectively in the governance and management of natural resources. This paper presents the results of three CACs conducted in the Colombian watershed between 2005 and 2007. The experiences are analyzed based on participant observation, process documentation, and an ex post evaluation. The three CACs led to over 75 specific commitments on the part of authorities to improve conditions in watersheds. Important human and social capital impacts were also documented, as well as changes in relations between communities and institutions. Media grab In one day, empowered communities negotiated over 75 concrete commitments from public and private institutions to improve environmental and social conditions in three Colombian watersheds. Introduction It is widely recognized that effective and equitable watershed management requires the participation of all relevant stakeholders. Since upstream land use affects downstream water quality and quantity, downstream residents may suffer (or benefit) as a result of actions of those living upstream (Swallow et al., 2006). Regulation is one way to manage potential conflicts, but the high costs of monitoring and enforcement means that compliance is often low. In theory, stakeholder participation in watershed management can be a solution to these challenges. If stakeholders are involved in the decision-making, they are more likely to reach agreements that are mutually acceptable and therefore respected (FAO, 2006). In practice, the power inequities between different stakeholder groups often make it difficult for them to interact on a level playing field. The conversatorio de accion ciudadana (CAC) is a politico-legal mechanism for achieving meaningful participation by civil society. It is based on the idea of civil society and authorities conversing in familiar terms about issues of importance to both, and arriving at agreements for action. The methodology, which consists of three phases–preparation, negotiation, and follow-up–is designed to address the inequities in power and information between communities and government institutions that often prohibit communities from exercising their constitutional rights to participate and to hold their representatives accountable. Developed by Asdes (La Corporacion Asesoria para el Desarollo) a Colombian NGO, and first implemented with support from WWF-Colombia in the late 1990s (Beardon, 2008), the CAC’s point of entry is the Colombian constitution and the rights and responsibilities that citizens are entitled to but often do not know how to use. Training in concrete legal instruments that ordinary individuals can use to obtain information or compel government agencies to fulfill their obligations in a timely manner is accompanied by efforts to build social capital and improve people’s knowledge of their natural resources. While the focus is on the community, training courses are also offered for public servants since in reality many of them are also unaware of their roles and responsibilities under the constitution, especially in relation to citizen participation.

202
The three pronged (environmental, social, and legal) capacity building or 'preparation' phase culminates in a one-day public meeting to which communities invite representatives of the authorities whose mandates include the key social and environmental issues identified by the communities in the preparation phase. A structured negotiation takes place leading to signed agreement by representatives of institutions to undertake specific actions to improve social welfare and natural resource management. In the follow-up phase of the CAC, community representatives ensure that institutions comply with their commitments. CACs were conducted in three Colombian watersheds between 2004 and 2007 (these dates cover preparation and negotiation phases since the follow up is ongoing), two under the Scales project (Fuquene, October 2005-February 2007) and Coello (December 2005-May 2007), and one led by WWF and partners (Güiza, October 2004‐October 2006). This paper assesses the impacts of the processes and identifies lessons for improving and scaling-up the methodology. Methods The information presented in this paper comes from a variety of sources including project documentation and direct observation of the processes and interaction with participants. In 2007, the Scales project commissioned an external review of the three CAC processes (Cantillo and Gonzalez, 2008a, b, c, undated) The evaluation methodology consisted of five steps or 'Moments': (1) Definition of scope and focus of the study with the project partners; (2) Reconstruction of the experience, again with the main partners; (3) Analysis of secondary data; (4) Collection of primary data, including interviews with participants from the communities, representatives of institutions, and elected officials in the watershed; and (5) Analysis. Results and discussion While all followed the same general methodology, each CAC was implemented in a slightly different way due to differences in the lead organizations, the social, political, and biophysical contexts, the available resources, and the level of support from organizations like ASDES and WWF. Why these differences occurred and how they affected the outcomes form part of the discussion of impacts. The types of impacts considered are: (1) Agreement signed on the day of the meeting; (2) Human and social capital impacts among participants from communities; (3) Relationships between communities and public institutions. Impacts on poverty and the environment are not addressed since these are of a long-term nature, however, implications for these kinds of impacts can be inferred from the shorter-term impacts that are presented. Signed agreements The CAC in Güiza, held on October 28, 2006, was the best attended. In addition to the institutional representatives, the state governor and two mayors were in attendance. The relatively high profile of the Güiza CAC is likely due to the fact that the first and only other CAC ever implemented had been held in the same region several years earlier. Also, the meeting was held in the state capital rather than in the watershed itself, due to security concerns relating to Colombia’s armed conflict. Thirty agreements were signed with 13 institutions including municipalities, the environmental authority, and departments such as health, agriculture, and planning (Cantillo and Gonzalez, 2008c). Though most agreements were nonmonetary, a total of more than US$1.7 million was committed for activities such as watershed planning, water and sanitation, health, and agriculture. The CAC in Fuquene was held on February 28, 2007, in the regional capital, Ubaté. Eleven institutions attended, however, organizers were somewhat disappointed by the turnout since mayors did not attend and several sent representatives without authority to make commitments. Unlike in Güiza, in Fuquene there had been no prior experience with CACs, relatively little work on community organization prior to initiating the process, and no history with WWF or ASDES on which to build. Thus Fuquene, in spite of its advantages in terms of accessibility and security relative to Coello and Güiza, was in some ways the most difficult of the three environments. Nonetheless, 25 agreements were signed with 10 institutions (Cantillo and Gonzalez, 2008a). More than US$13 million was committed for a range of activities including water treatment, conservation of protected areas, and productive projects with communities, however, 85% of this was from a federal emergency aid package that was announced after damaging floods in April 2006, but had been slow to be disbursed. In Coello, the CAC was held on May 10, 2007, in the state capital of Ibague, which is located within the watershed. Attendance was relatively good, including institutional representatives, elected officials, and even members of the

203
general public. Thirty agreements were signed with 14 institutions. A total of US$600,000 was committed, less than in the others but as in the case of Güiza, the funds represented 'new' commitments for actions to be initiated in the current fiscal year, in this case for the purchase of land in environmentally sensitive parts of the watershed. The total Scales project investment in the two CACs it supported was approximately US$150,000 to cover staff time and logistics. To fully cost the CACs we would need to estimate both the partners’ contributions–significant in Coello and Güiza–and the considerable time invested by the communities. The return on that investment would include not only the money committed on the day of the CAC, but also the nonmonetary commitments to implement policies and programs, or in some cases to involve communities explicitly in decision-making processes, which arguably could lead to much greater economic benefits over the long term. Human and social capital impacts on participants The CACs appear to have had major impacts on the human and social capital of the participants (Cantillo and Gonzalez, 2008a, b, c; Fujisaka, 2008; Participatory video). Baseline information is not available on human and social capital levels prior to the project, so the assessment is based on what was observed by project implementers over the course of the project and what the participants themselves say. In the Scales-supported CACs, an explicit attempt was made to target poor communities (Johnson et al., 2007), however, within those communities participation in the project activities was voluntary so those who chose to be involved are likely to have been among the more educated, innovative, or socially active people in the target communities. In Güiza, most of the CAC participants had previously been involved in a WWF-led course and were known to be people with leadership skills and an interest in environmental issues. The specific interventions that the CACs undertook to increase human capital included training on legal rights and how to exercise them; hands-on analysis of environmental issues such as water quality, soil erosion or loss of biodiversity; workshops on identifying and analyzing problems and formulating solutions; and, especially for those who were 'questioners' in the CAC itself, coaching on how to formulate questions, arguments, and counter-arguments, and how to speak in public. In some cases such as Fuquene, the main contribution to social capital occurred when participants from different communities came together to do training activities. Fundación Humedales developed a series of games to demonstrate legal and environmental concepts to people with low levels of formal education. In Coello, the coordinators were able to undertake activities such as a regional Water Forum, and the Coello Expedition, in which 40 people from all parts of the watershed spent 4 days following the river from its origin in the páramo to its outlet, learning first-hand about the watershed and about each other. In the evaluations, participants mentioned these events as having been important opportunities to learn about the watershed issues and to gain an understanding of the challenges faced by people living in other parts of the watershed. In both Scales communities, economic games were conducted both as a research activity to understand better the factors that support or inhibit collective action in watersheds, and as a development activity in which watershed residents participate as 'players' in 'games' or scenarios designed to reflect the actual incentives people face when deciding how to use resources that have both individual and social costs and benefits (Cardenas and Ostrom, 2004). The games made explicit some of the reasons behind the lack of cooperation that many people observe, and generated discussion on how to address the problem. The consensus, however, from the communities was that they could have been better articulated into the CAC process. In all cases, changes in human and social capital were observed and were documented through interviews, including increased skills, knowledge, and confidence (Cantillo and Gonzalez, 2008a, b, c; Fujisaka, 2008). Concrete applications by individuals of legal instruments such as tutelas or derechos de peticion led to the resolution of personal and community problems, providing benefits to participants and perhaps more importantly building confidence and commitment to the CAC process. In Fuquene, a two-decades-old conflict between two communities about access to a water source in which the municipality had long denied responsibility was resolved when participants in a CAC training were able to compel a revision of the case, which led to a reversal of the mayor’s position and a commitment to build necessary infrastructure to allow the downstream community to access the water. Impacts were observed in all three sites, however, where education levels were low, progress was slower and methodologies had to be adapted to make them accessible. In Fuquene, fewer people benefited since budget constraints prevented inclusion of more communities–Fuquene and Guiza focused on three municipalities while

204
Coello covered six–and limited the number of times the full group could meet. Interviews conducted with non-participants say that knowledge of the CAC declines as distance from the process increases (Fujisaka, 2008) which suggests that spillover benefits are likely to be small, at least in the short run. Political violence in Coello and Guiza also reduced participation of some people in the process. Changes in relations between communities and public institutions As a result of the process, some community members have changed their perceptions of institutions and vice versa. Many community participants previously had a negative perception of public institutions, fueled in part by their perceived inaccessibility. As a result of the CAC experience, they have gained confidence in dealing with institutions, and in some cases have gained greater understanding of and sympathy for the constraints that the institutions themselves face in trying to carry out their obligations. Representatives of institutions experienced similar changes in perceptions of the communities. According to several representatives interviewed as part of the evaluation, prior to the CAC, they often viewed communities as uninformed and hostile. As a result of the CAC, that perception changed to one of seeing the communities as constructive partners with whom institutions could collaborate to achieve shared objectives. This occurred not only with public sector institutions, but also with private sector ones such as the USOCOELLO irrigation district, which provides water to one of the major commercial agricultural zones in Colombia in the lower part of the Coello watershed. Impacts at the level of institutions seemed to be greater in Coello than in Fuquene, where the limited prior interaction with the institutions led some to feel that they were 'put against the wall' in the CAC. There was more criticism in Fuquene than Coello on the part of the institutions, however, one representative acknowledged that some of this was due to the fact that some of the institutions in the Fuquene were particularly ineffective and untransparent and therefore felt threatened by the community’s insistence that they comply with their responsibilities. Conclusions and recommendations The CAC methodology, as implemented in three Colombian watersheds between 2005 and 2007, led to 76 concrete commitments on the part of institutions to make improvements in welfare on watershed residents and the management of watershed resources. An assessment in late 2007 showed that compliance rates were relatively high, especially in the communities that had stronger follow-up processes. The CAC methodology also had significant human and social capital impacts on community members who participated, and led to changes in the ways that communities and institutions perceive each other, in some cases, moving from antagonism to respectful collaboration. While estimating an economic rate of return is beyond the scope of this assessment, relative to the size of the investment made in carrying out the CACs, the impacts appear to be large, indicating a high rate of return. The main lesson from this experience is that a CAC takes time. The Scales project initially estimated that the preparation phase would take 3-6 months, when in reality it took a year and a half and even then had it not been for the Scales project deadlines, more time could have been used to properly prepare the communities and make the institutional contacts. Resource limitations were a part of this, but the main explanation was simply that the methodology was being applied in the local contexts by the local partners for the first time so it was difficult to estimate the time needed. The methodological guide being produced by the WWF and partners will provide more detail to organizations interested in implementing the methodology to permit them to plan accordingly. In addition to the dedication of sufficient time and resources, perhaps the most critical determinant of success is the presence of a committed local organization with experience in community organization. In Fuquene and Coello the lead NGOs were relatively local in their scope prior to the CAC, but were interested in working at higher scales to address watershed issues. As such, both succeeded in increasing the recognition at the watershed scale and increased their visibility. Scales project partners had experience in Fuquene and Coello prior to the initiation of the Scales project. In Fuquene, the experience was more of a research nature, and as a result there was more information and analysis available on the environmental and socioeconomic issues in the watershed. In Coello, experience had a research and a community development component and this appears to have provided a stronger base for the CAC.

205
Another key lesson was to link early with the public institutions to be invited to the CAC, since involving them in the process seems to lead to more meaningful participation in the negotiation phase. This is important both for public and private sector actors. In neither CAC, did the major private sector actors–e.g. dairy and potato farmers in Fuquene or rice farmers and CEMEX in Coello–play a major role. The basic CAC methodology is focused on communities and public institutions, however, the private sector is increasingly important in watershed management and innovative ways of engaging them need to be explored. Finally, the impacts of the CAC will be larger and will likely be more widely distributed if more community members can be involved. A core team will always lead the process, however, so more emphasis can be put on having them share progress and seek feedback from their communities. Increasing the presence of the general public at the CAC itself will also make it clear to the public institutions that the people asking questions have the support of their communities. Acknowledgments We would like to acknowledge the organizations (Fundación Humedales, Corporación Semillas de Agua, and La Reserva Natural la Planada) and especially the communities who not only carried out the conversatorios, but also participated in the other Scales project activities and the various evaluations and follow-up activities. This paper presents findings from PN20, 'Scales,' a project of the CGIAR Challenge Program on Water and Food. References Beardon, Hannah. 2008. Building Hope from Chaos: Culture, Politics and the Protection of the Colombian Pacific
Mangroves. WWF-UK (www.wwf.org.uk). Cantillo, L., and J. Gonzalez. 2008a. Sistematizacion del Conversatorio de Accion Ciudadana del al Cuenca del la
Laguna de Fuquene, Cundinamarca and Boyaca, Colombia, Scales project document (in Spanish). Cantillo, L., and J. Gonzalez. 2008b. Sistematizacion del Conversatorio de Accion Ciudadana del al Cuenca del Rio
Coello, Tolima, Colombia, Scales project document (in Spanish). Cantillo, L., and J. Gonzalez. 2008c. Sistematizacion del Conversatorio de Accion Ciudadana del al Cuenca del Rio
Güiza, Nariño, Colombia, Scales project document (in Spanish). Cantillo, L., and J. Gonzalez. no date. Sistematizacion de los conversatorios de accion ciudadana de la Cuenca de la
Laguna de Fuquene, y las cuencas de los rios Güiza y Coello, Scales project document. Cárdenas, J.-C., and E. Ostrom. 2004. What do people bring to the game? Experiments in the field about
cooperation in the commons. Agricultural Systems, 82: 307-26. FAO. 2006. The new generation of watershed management programmes and projects: A resource book for
practitioners and local decision-makers based on the findings and recommendations of a FAO review, FAO Forestry Paper 150 (http://www.fao.org/docrep/009/a0644e/a0644e00.htm).
Fujisaka, S. 2008. Impacts of the CPWF/Escalas in the Rio Coello watershed (draft CPWF/BFP/Impact Assessment
document). Johnson, N., J. García, J.E. Rubiano, M. Quintero, R.D. Estrada, E. Mwangi, A. Peralta, and S. Granados. 2007.
Watershed management and poverty alleviation in the Colombian Andes. In review at Water Alternatives (a revised version of paper presented at the International Forum on Water and Food, Vientiane, Laos, Nov. 12-17, 2006.
Swallow, B., N. Johnson, R. Meinzen-Dick, and A. Knox. 2006. The challenges of cross-scale collective action in
watersheds. Water International, 31(3):361-76.

206
Sustainable resource management: an institutional perspective
D. Pant1, R. Chopra2, D. Sen2, and P. Shrestha3
1IWMI [email protected]
2People's Science Institute [email protected] 3Action for Conservation and Sustainability (ACS), Nepal [email protected]
Abstract Government policies on water and forest resource management both in Nepal and India are sector oriented. Although forest and water users groups in Nepal are more influential compared to their counterparts in India, due to customs and usufruct rights, independent management of resources still occurs in both countries. Since the needs of other users are rarely taken into account, the functional linkage among resource users, mainly the forest and water users groups in the watershed, is weak. Many areas are challenged by inequitable access to productive resources and benefit sharing within and across the users group. This is also due to the lack of an institution that facilitates integrated natural resource management (INRM). To address the institutional gap for resource management with a holistic approach, the research project facilitated the creation of a platform to encourage user group interaction by enabling them to present their views and interests, and to learn from the experiences of each other. The platform is expected to strengthen relationships with local organizations, government agencies and other external organizations for expanded and integrated activities on land and water management. Ultimately, the platform could evolve to act as up-scaled institutions for INRM at catchment level. Media grab Up-scaling of existing resource management institutions is necessary for CBINRM at catchment level. Introduction Poor rural women and men face critical food security and livelihood challenges, particularly in marginal upper catchments of the Nepal and Indian Himalayas. Restricted access to often-degraded water, land, and forest resources combined with low productivity of open-access resources result in seasonal or permanent out-migration leading to the loss of traditional knowledge, labor for management, and community solidarity to address resource degradation. Functioning models of Community-Based Natural Resource Management (CBNRM) seem to work for a single critical resource, e.g., forest. Examples of more integrated approaches tend to be found only at a small scale, in one or just a few communities. Yet communities need to manage multiple resources, particularly forests and water, and also have to address resource competition issues with other communities, e.g., upstream/downstream resource use and availability. An action research project was implemented to contribute to enhanced sustainable livelihood opportunities and reduced vulnerability for poor rural people in upper catchments in Nepal and India, through improved understanding of existing linkages or limitations among institutions for integrated natural resource management. The objective of the study was to analyze forest- and water-based livelihoods opportunities and constraints through the lens of institutional dynamics exhibited by various resource management groups and institutions at the sub-basin level. This study attempted to understand: • What are the institutional roles of each of the resource user groups in the management of natural resources? • How are these user groups linked to each other in contributing to resource management? Methods The study was carried out at Begnas, and Hilaugad, Western Nepal, and Uttarakhand, India, watersheds (Figure 1). A review of the literature on the existing policy, legal, and institutional frameworks for Natural Resources Management (NRM) in Nepal and Uttarakhand, India, was done (Boje and Wolfe, 1989; and CGIAR, 2000). A reconnaissance survey was conducted for the selection of a micro watershed and its communities for detailed study. During the reconnaissance survey, transect walks were conducted along different routes in the basin area to gain insight into the sociophysical features and natural resources of the basin. Key information on the villages, farming system, water uses systems, local resource use patterns, livelihoods, and the institutional framework for

207
resource management were collected through informal discussions with the local community. This was followed by household surveys, focus group discussions, and measurements during the field study. At the end of the reconnaissance survey, a one-day workshop was organized to initiate dialogue with local users on research activities. For the purposes of the study, six and five villages in Begnas and Hilaugad watersheds were selected from the upper, middle, and lower reaches of the watersheds.
#S
#S
#S
#S
#S
#S
#S
#S
#S
#S#S
#S
#S
#S
#S#S
#S
#S
#S
#S
#S
#S
#S
#S #S
#S
#S
#S
#S
#S
#S#S
#S
#S
#S
#S
#S
#S
#S#S
#S
#S
#S#S
#S
#S
#S #S
#S
#S
#S
#S#S
#S
#S
#S
#S
#S
#S
#S#S
#S
#S
#S
#S
#S
#S
#S
#S
#S
#S#S
#S
#S
#S
#S
#S
#S
#S
#S
#S
#S
#S
#S
#S
#S
#S
#S
#S#S
#S
#S
#S
#S
#S
#S
#S
#S
#S
#S
#S
#S
#S
#S
#S
#S
#S#S
#S
#S
#S
#S
#S
#S
#S
#S
#S
#S
#S
Begnas Tal Bajar
Pandechaur
Sisuwa
Bhandar Dhik
Kadelgau
Pokhari
Madi
Gagangauda Bajar
Talbesi
Betyani
Ulleri
N
Land use land cover,1996
2 0 2
Kilometers
Landuse.shpCultivationForestBushGrassSandChannelRiver CliffLake/pond
RoadHighway
Rivers or streamBasin boundary
#S Settlement
Begnas - Rupa Tal Catchment and Irrigation Command Area
Figure 1. Begnas-Rupa Watershed, Nepal, and Hillaugand Watershed, India. Results and discussion Nepal The review of policy, legal, and institutional provisions in relation to the integrated natural resources management (INRM) indicated that these are sector oriented and contain overlaps and contradictions. Therefore, it generates a disconnect among organizations and encourages vertical and horizontal disintegration rather than integration. This is because the sectoral line agencies have vertical linkage with local stakeholders, and their activities are guided by relevant sectoral policies. The ownership right of the water is vested with the government, although customary water-rights are recognized. From field observations, it was revealed that the livelihood of the people with respect to resource management is based on agriculture. The people in the upper watershed are poor in comparison to the downstream users. One of the reasons is insufficient availability and poor management of farmer managed irrigation systems (FMISs). This is due to the traditional land-based water rights practices and inability to mobilize adequate resources for the improvement of infrastructure. The improvement in the infrastructure and redefining the existing water rights could provide benefits to the farmers. But due to lack of linkage with the external agencies, because of their informal nature, they have not been able to access external support needed for infrastructure improvement. Another important factor is that the upper watershed is the source of water to the Begnas irrigation system and the drinking water scheme serving the downstream towns. Likewise, the Forest Users Groups (FUG) are formally organized and have been managing forest that is community owned. Households in the community have access to forest products, mainly the firewood. Organizationally, they are strong, but their linkage with other institutions downstream is nonexistent. There is no linkage between the local forestry institution (CFUG) and local water institution (WUA) in terms of managing resources. Though several water user groups are functioning downstream, the irrigation users group of the government-supported irrigation system Begnas Irrigation System and the fishers group who raise fish in the lake, are the important users in terms of obtaining benefit from the environmental services from the forest and water management. But, functional linkage among them is weak, as each of the user groups is trying to maximize the benefit from the lake without making substantial contributions for its sustenance. In such a situation, quite often, conflicts arise within and among the institutions due to their diverging interests. The interest of various resource user groups is reflected through their organizational undertakings. As far as water delivery at the system level is concerned, it was assumed that users could manage the internal water distribution on their own in an equitable way without needing external input. This assumption is not turning into reality, mainly because of lack of resources and inadequate communication among users. As a result, in many water use systems, water distribution has remained inequitable leading to several types of water use conflicts. Thus, improvement in governance and actualization of equitable and reliable delivery of water at the system level are prerequisites for functional linkages at the basin level. The resource users recognize the water-forest (upstream–downstream) linkage although it is not clearly visible and users are unable to identify and establish this. One of the mechanisms for this linkage is to establish that the benefit downstream is due to the action of upstream users’ and the cost/benefit needs to be ascertained. This

208
would facilitate the introduction of Environmental Services Fees (ESF). Besides, the enforcement of ESF is not possible without an intermediary who plays the role of mediator between the resource users upstream and downstream. Foremost of all, the users need to acknowledge and accept the concept of ESF, which is quite new to them. Establishing such linkages at the basin level would be possible only when the governance at the system level is improved to enable users’ equitable access to and benefit from resources. In this respect, a holistic approach of catchment management in consultation with relevant stakeholders can create a win-win situation for all of them. This is not happening due to lack of relevant policies that delineate the roles and responsibilities of both external and local organizations in common property resource management. This clearly points to a need for integrated management of resources in the catchment. In order to address the problem for CBINRM, this research project facilitated the formation of a platform, with representation from resource users, local institutions, and other stakeholders who were directly or indirectly affected by resource management in the catchment. The platform has been officially registered with relevant government agencies, and has acquired legal recognition. It is expected that users could learn from the experiences of each other, and some of the experiences should be shared among them for better resource management. For this, the users group could strengthen relationships with local institutions, government agencies, and other external institutions for expanded mandates for integrated activities on land and water management. Ultimately, the platform could be facilitated to act as up-scaled institutions for integrated natural resource management at catchment level.
Uttarakhand, India Ownership rights of water is vested with the state government; there is no explicit formulation on customary rights. In 2004-05, the Uttarakhand government circulated a draft State Water Policy document in which a clear statement regarding ownership, control, and rights over water resources was missing. As a result, local communities and institutions could have had only a limited role in the various aspects of water resource management, viz., ownership, planning, development, use, and maintenance of the resources and systems. While the draft seemed to recognize a need for involving the local communities, even going to the extent of saying 'A paradigm shift towards participation of local community in management of water resources should be done,' the nature of the 'paradigm shift' had not been spelled out. Instead, the emphasis is on management of schemes installed by the line departments, rather than on decentralized governance of water resources. The civil society organizations actively mobilized public opinion against the derogatory move by organizing well-meaning debates. This thwarted government’s move to sneak in the policy framework through the back door, and activists demanded ownership and first use rights over the natural resources. In the past few decades, in order to incorporate an element of decentralized governance, the government had encouraged, established, and fostered institutions at the grassroots level in the rural areas, especially the formation of Van Panchayats (institutions of local self-government). Even though such institutions continue to proliferate, the sense of ownership by the community is lacking. Van panchayats are perceived as a government exercise. They are not demand driven, and the user’s role is not explicitly spelled out, so the participatory management is in question. The 73rd Amendment of the Constitution has cast a Constitutional imperative on all the State Governments to come up with an appropriate Panchayat Raj Act detailing meaningful democratic devolution of functions, functionaries, and funds. Specifically, it empowers States to endow panchayats with such powers and authority to enable them to function as institutions of self-government, and goes on to list Water Management, Minor Irrigation, and Watershed Development as subjects under the jurisdiction of panchayats. It also envisages transfer of power to forest self-governing bodies.
From the field study it was observed that the irrigated lands have only modest productivity and community forests are degraded. Presently, there are serious implications for community-based natural resource management, especially in the era of massive shifts of livelihoods from agriculture to off-farm employment. This process of shifting of the primary source of income from agriculture to non-farm employment has reduced incentive for the rural communities to participate in various activities required to manage common property resources. Even the field studies indicate that families were not interested in offering voluntary labor for community activities such as the management and maintenance of community irrigation systems. As state control through legal, policy, and administrative provisions over natural resources has grown in the past, the local communities have become alienated. The rural communities now do not display sufficient interest in any initiative taken by the government. Most of the institutions for resource management are dysfunctional. The people do not show ownership of development programs or processes, though some voluntary organizations are working to alter this situation. Thus it becomes naturally imperative that there is a need to improve the condition but which can only become possible through community management. For this there will have to be a felt urgency to reestablish the traditional arrangements whereby the people not only enjoyed ownership of the natural resources but also managed the affairs in a sustainable manner.

209
To address the weak institutional base for INRM at the catchment level, this research project facilitated the formation of a ‘platform,’ with representation from resource users, local institutions and other stakeholders who were directly or indirectly affected by resource management in the catchment. The effectiveness of the ‘platform,’ however, will be known from its future activities. A comparison of the situation in Nepal and India revealed that both water and forest user groups in Nepal are organizationally strong compared to India, largely due to the policy and legal support. Therefore, the representatives to ‘platform’ in Nepal were from the respective user groups, whereas in the case of India the representatives were selected from a large number of users. Whether this makes a difference in their functioning is yet to be seen, as they have just started. CONCLUSIONS AND RECOMMENDATIONS Historically, users at the local level have protected, managed, and made beneficial use of the available natural resources for their livelihood. Therefore, the local users invested their resources in the development and management of natural resources with locally available technology. The FMIS and guls are the typical example of this collective action in Nepal and India, respectively. Over a period of time these natural resources became an important source of revenue for the government and therefore, government-introduced control mechanisms through various measures. Gradually, the government took over the ownership rights of these resources and usufruct rights were given to the users. Based on the discussions above in Nepal and lndia, the following conclusions could be drawn and are important in the context of INRM. In Nepal, there are various stakeholders for the management of natural resources with formal and informal organizations, and among them forest and water users group are quite strong. In practice, all the user groups are working independently and have little interaction with each other in terms of natural resource management. There exist inequities in access to resource use and benefit from it to users within and across the resource users. This inequity is an obstacle for the integrated approach, and needs to be addressed. Developing an appropriate compensation mechanism for the positive outcome of the activities of the upstream users would be helpful in establishing upstream-downstream linkage. Likewise, the resource management pattern in India indicates lack of strong policy, legal, and institutional support to encourage users to organize themselves for the management of the resources. Besides, the declining share of income from agriculture and related activities compared to the income from off-farm employment is also the reason for less interest in natural resource management. The users, however, recognize their role in managing natural resources, and that all users’ groups wish to work in an integrated manner. The external stakeholders in this respect can play an important role for the integrated approach by facilitating the processes. The ‘platform’ concept has been introduced to facilitate INRM at the local level through users’ participation in Nepal and India. Recommendations A legal framework clearly defining the customary right, usufruct right, and statutory right needs to be developed in both countries to address the issues on roles and responsibilities of various stakeholders, along with issues on intersectoral or interbasin resource management. The emerging equation between local elected institutions and the users groups in resource management needs to be taken into account. Institutionally, the functioning of the ‘platform’ needs to be helped for some time to come as it learns to handle its responsibilities independently. Acknowledgments This paper presents findings from PN23 ‘Resource Management for Sustainable Livelihoods,’ a project of the CGIAR Challenge Program on Water and Food. Also, the authors would like to acknowledge the contributions of project partners: Department of Irrigation, Government of Nepal, Institute of Water and Human Resource Development, Stockholm Environment Institute, York, and the Society for Rural Urban Partnership (SORUP) Nepal. References Boje, D.M., and T.J. Wolfe. 1989. Transorganizational Development: Contributions to theory and practice. In: H.J.
Leavitt, L.R. Pondy, and D.M. Boije (eds.) Readings in Managerial Psychology. The University of Chicago Press, Chicago, USA.
CGIAR. 2000. Integrated Natural Resource Management Research in the CGIAR. A brief report on the Consultative
Group on International Agricultural Research (CGIAR). Integrated Natural Resources Management (INRM) workshop held in Penang, Malaysia, 21–25 August 2000. Consultative Group on International Agricultural Research, Washington, D.C, USA.

210
Effects of companion modeling on water management:
comparative analysis across five sites in Bhutan and Thailand
T.R. Gurung1, P. Promburom2, W. Naivinit3, M. Thongnoi4, C. Barnaud5, and G. Trébuil6
1Council for RNR Research of Bhutan, Ministry of Agriculture, Bhutan [email protected] 2Multiple Cropping Centre, Chiang Mai University, Thailand & Ph.D. candidate at Lyon I University, France
3Faculty of Agriculture, Ubon Ratchatani University, Thailand & Ph.D. candidate at Chulalongkorn and Paris X Universities
4Faculty of Agriculture, Ubon Ratchatani University, Thailand 5CIRAD UPR GREEN, Montpellier, F-34398 France & Ph.D candidate at Paris X University
6UPR GREEN, Montpellier, F-34398 France & CU-CIRAD ComMod Project, Chulalongkorn University, Bangkok, Thailand
Abstract The transdisciplinary companion modeling (ComMod) approach for adaptive renewable resource management aims to facilitate knowledge integration, collective learning, creative negotiation, and institutional innovation about concrete problems faced by communities. In this paper, we compare the effects of different ComMod processes on collective water management at five sites located in northeast and northern Thailand, and west-central Bhutan. At the three highland sites, agricultural commercialization leads stakeholders to review the local water management rules, while in northeastern Thailand land/water management dynamics are interlinked with labor migrations and the market integration of farming activities. The main effects of the ComMod processes at these sites are analyzed based on a common framework focusing on the stimulated processes of individual and collective learning, communication, negotiation, and coordinated action. The following effects are documented: individual learning about the current situation, increased awareness of a collective problem, understanding each other’s perceptions, reaching a common agreement on the problem, exploration of new water management rules, implementation of new practices, and institutional innovation. The discussion focuses on how methodological choices made in the implementation of ComMod influenced the observed effects. The factors contributing to, or limiting, the achievement of institutional innovation are underlined, in particular the role of the local institutional context and the possibility to establish interinstitutional dialogue among multiple levels of organization are highlighted. Finally, we point out the need for specific monitoring and evaluation procedures adapted to such highly interactive and adaptive processes. Media grab ComMod, a pragmatic methodological approach, facilitates communication between social hierarchies relaxing the conflict situation and strategizing water management issues. Introduction Traditionally a public good not to be expropriated, 'Water' has become a highly contested renewable resource as a valuable part of cultural identity worldview. This has resulted from the pressure of diverse users and declining clean water, compounded by the breakdown of social fabrics due to globalization vis-à-vis commercialization. As seen by the changing and conflicting stakeholder role from relevance of issue to their ability to influence, further makes it a multidimensional problem. Within the complexity of multiple socioecological systems, modeling approaches offer pragmatic means to enhance the better understanding and strategizing of water management issues. The contrasting problems associated with water use and management in different sites across Thailand and Bhutan provide a unique methodological challenge (Bousquet et al., 2005). Developing a common understanding among stakeholders to harness collective decisions can achieve longer lasting influences and impacts. Companion modeling (ComMod) approach facilitates dialogue and shared learning through collaborative multiagent modeling and simulation activities developed during the past 10 years by a group of researchers (Trébuil et al., 2008). Its methodologies rely on iterative coupling of role-playing games (RPG) and agent-based models (ABM), ComMod is an approach making use of evolving simulation models in a collaborative and integrative way to understand

211
complex systems and facilitate stakeholders collective decision-making processes when sharing a common resource (Bousquet et al., 2005). In recent years, four sites in Thailand (Mae Salaep, Mae Hae, and Nam Haen, upland catchments in Chiang Rai, Chiang Mai, and Nan provinces, respectively, and Lam Dome Yai in the rainfed lowlands of Ubon Ratchathani), and one in the highlands of west-central Bhutan (Bousquet et al., 2005) have been testing the use of the ComMod approach to examine different water management issues, and to develop methodologies to enhance adaptive management capacities of the community by inducing experiential and explorative learning (Barnaud et al., 2006). This paper presents a brief comparative analysis of ComMod effects on water management. Contexts The five sites provide a very strong contextual diversity for applying the ComMod approach (Barnaud et al., 2006). To give a better insight into the sites in relation to water management issues, a simple framework (Table 1) is used to compare and contrast the cases. The principal focus in all sites is associated with water management concerns from plot to catchment level, which has evolved over generations. The problems are legitimate, however demand to address the issues have not always come from farmers (or stakeholders). In two cases (Nam Haen and Lam Dome Yai) it has been researchers addressing the problems based on the opportunities and experiences from research. Table 1. Characterization of ComMod for water management contexts at the different sites. Topics/Sites Lingmuteychu (L) Mae Salaep (MS) Nam Haen (NH) Lam Dome Yai (LDY) Maehae (MH) Problem Irrigation water sharing
for rice cultivation Irrigation water sharing in cash cropping
Forest conservation in upper catchment
Water and labor management in rainfed lowland rice
Shortage and unequal access of water
Scale of the problem Seven villages One Akha village (48HH)
Two Mien villages Eleven households Fourteen Villages
Age and evolution of the problem
Since the settlement and increasing conflict
Recent / rising due to more cash cropping
Recent /establishment of new national park
Since the settlement & rising with mobility
Since 2005
Severity of the problem High for 7 villages Low to medium, rising Severe for small farms Low High Researchers-stakeholders linkage
Since 1987 Several years of on-farm research
No previous collaboration
Several years of on-farm research
Since 2002
Origin of demand and legitimacy
Downstream communities. Highly legitimate
Villagers after previous ComMod activities; good legitimacy
Researcher to local devpt. agency & village leaders; low legitimacy
Researchers, low legitimacy
Local watershed management officer & local dev. agency
Opportunities/incentives to act
Increased access to irrigation water
Decentralization policy & allocation of financial resources
New park: redefinition of rules for accessing NTFPs
New plan for more investments in water infrastructures
Emerging regulation to equitable water sharing
Potential of ComMod in these contexts
Approach for learning and communication
Villagers already aware of ComMod and ask for more
Poor communication & information sharing
To enhance a joint understanding of the water – labor issue
Weak communication & need to facilitate collective action
Key development question
Sharing irrigation water & foster community cooperation
Inequity in decision-making about water & power relations
Public awareness & communication about the new national park
Water availability and labor migration management
Strengthening of local institutions
Key research question Can ComMod facilitate better understanding and communication in resolving water sharing conflict?
Can ComMod facilitate the emergence of new equitable water sharing rules?
Can ComMod facilitate information sharing and consultation between stakeholders?
Can ComMod enhance understanding of the water management –labor migration interaction?
Can ComMod support improved water sharing & better understanding of resource management
Specific ComMod objectives
Understand decision-making in sharing irrigation water
Set up a consultation mechanism on irrigation water sharing
Improve communication among stakeholders
Integrate and produce new knowledge
Use ComMod & tools with different stakeholders
The diversity of stakeholders and their stake presents a challenge. Categorizing the stakeholders according to their relative influence (control on outcome of issues) and importance (need to resolve the issue) (Figure 1), indicates the position of farmers (small-majority) highest in importance and lowest in influence. Thus the actual control of the issue lies with other stakeholders for whom the issues may not be as pressing as it is to a farmer. It is the diversity of the stakeholders, power relations, and conflicting interests that provide a basis to establish key development objectives of awareness building, strengthening social capital, and networking; and key research objectives to test ComMod for better understanding, networking and institution building.

212
Figure 1. Diversity of stakeholders and their relative role in water issues at five sites. Process ComMod uses different tools such as RPGs, ABMs, geographical information system (GIS), participatory mapping, etc. Within a ComMod process, tools are used iteratively to build up learning their use in the proceedings. These tools can be used in different ways to associate them depending on the context, objectives, and dynamics of a given ComMod process (Trébuil et al., 2008). In five test sites, the processes have been adapted to suit the situation. As represented in Figure 2, the process started with problem identification and analysis, and sensitization of stakeholders about ComMod in all sites. Studies addressed complex ecosystem issues (soil erosion in Mae Hae and Mae Salep, hydrological dynamics in Lam Dome Yai, park-people interaction, and water sharing in Lingmuteychu). Conceptualization of RPGs was done in a participatory way by using real situations and simplifying the problem context. While the ABMs were conceptualized based on previous RPGs in all sites, except in Mae Salaep and Nam Haen, hybrid gaming ABMs were used. Conception and implementation of RPGs and ABMs were iteratively done in all sites and with no definitive order (Figure 2). In all cases CORMAS simulation platform was used to implement the ABMs and simulate scenarios that were presented and discussed with the stakeholders. Following the validation of scenarios, stakeholders make decisions for next steps, which often leads to the next cycle with a higher-level problem or a new problem altogether. For instance, farmers mobilized for a tea plantation in Mae Salaep from a simple water sharing problem of two villages in Lingmuteychu watershed. This led to the need for a watershed management committee, new NTFP harvesting rules, and livestock-forest interactions as the new issue in Nam Haen, and forest-arable land management to water conflict in Mae Hae from an initial issue of land use change. The process promotes stakeholders to develop common action plans benefiting the community as in Lingmuteychu and Mae Hae as an off-shoot from the usual loop. Implementing the common action plan has lessened the tension on water sharing, instituted watershed management committees, and acquired donor funds to implement collective plans in Lingmuteychu. The spiral within the RPG and ABM network represents continuous iteration between model and reality-enhanced incremental advances in collective understanding of the different viewpoints (D’Aquino et al., 2002). Such iterations used in all sites efficiently promoted knowledge integration in a collective learning process. Thus in all sites 2-3 cycles have been completed with every cycle opening up new frontiers and learning experiences.

213
Figure 2. Schematic representation of a companion modeling process. Diversity of effects The effects of ComMod process in all sites have been diverse and tangible. To analyze effects over five sites, a simple framework based on experiences of the researchers is used (Figure 3). The foremost effect has been the acquisition of new knowledge on discovering farm dynamics in Mae Salaep and Lam Dome Yai, resource sharing as a key to community cooperation in Lingmutychu, and ecological dynamics in Mae Hae and Nam Haen. It is also evident that knowledge acquisition is at individual, collective, and institutional levels, which leads to subsequent changes. Acquired knowledge helped in better collective understanding and awareness of the situations. For instance, severity of complexity became clearer in Lingmuteychu, Nam Haen, and Lam Dome Yai, while people became aware of opportunities for collective management in Mae Hae and Mae Salaep. Such awareness at individual and collective level engages people to collective learning leading to a series of changes. Individual interviews of players in all case studies and monitoring of ComMod process using Most Significant Change approach and Logbook method revealed that in all the cases there was a distinct display of changes in perception, behavior, decision-making, and practices. Change in perception from neglect and isolated in dwindling resource situation changed with new knowledge and understanding, to confident, well connected and confidence to negotiate resource management. People in Lingmuteychu started discussions on water issues openly beyond the village. Solidarity extended from kinship to community level, and resource-poor voices were heard in Mae Salaep. A contrasting behavior was observed, however, as people in Mae Hae participated in the consultative process, whereas in Nam Haen people who freely accessed forest chose to stay away from the process. Behavior change was broadly in terms of communication, networking, and engagement. Change in decision-making and practices from individualistic to collective mode supported emergence of adaptive mechanisms in most cases, except in Nam Haen. Overall the effect of these changes was on the evolution of the initial problem from simple to complex and more legitimate, that impacted their livelihood.

214
Figure 3. Diversity of effects and impacts generated by ComMod process. Discussion The five case studies in diverse socioeconomic and agroecological situations offer a wealth of experiences in using companion modeling approach. Some of the potentials and limitations of the approach are illustrated below: Potentials: • In a situation where communities lack knowledge to appreciate effects of their actions, ComMod process
provides a suitable methodological approach to support knowledge acquisition at individual, collective, and institutional levels. It also facilitates behavioral changes leading to adaptive mechanism, a principal strategy to adjust in a dynamic ecosystem. The model and scenarios allowed people to step out of their real setting thereby enabling stakeholders to realize the problems. While it takes time (multiple cycles in case studies) ComMod creates space for integrating knowledge and viewpoints leading to trust in relationships between stakeholders.
• RPG in all five cases was confirmed to be a neutral communication platform that allows heterogeneous groups of stakeholders to participate in the process without comprehending their social status. RPG in conjunction with MAS modeling opens up pathways to networks of reciprocity and collective management, thus leading to construction of social capital.
• The use of different tools, agrarian system analysis (Trébuil and Dufumier, 1993), RPG and MAS Modeling (Bousquet et al., 2002), GIS (Trébuil et al., 2005), RPG (Gurung, 2005) in different case studies with no definitive structure shows its flexibility to apply. Particularly the use of RPG and ABM alternatively displays the adaptability of approach depending on the context.
Limitations: Whilst ComMod promotes a neutral platform for knowledge integration, communication, and exploration of adaptive mechanisms, there are some weaknesses that can be improved during the process: • The effects of ComMod processes are sequential, as it opens areas of understanding and or intervention
from small to bigger. Further, the indifferences (social inequities, exclusion, sanctions) that may be induced by opening up the hidden rules of society and experiential learning, a mechanism to closely monitor the change process, will help in explaining the dynamics of change. The use of most significant change (MSC) technique and logbook in many sites proves to be useful tool to monitor.
• As ComMod process empowers people with information and knowledge, people (small proportion of population) who become involved in the process think and act collectively, which does not correspond to

215
the bigger group who did not participate in the process. This fragmentation undermines the strength of the ComMod process. Thus a method to up/out-scale the effects is a prerequisite.
• ComMod, as any participatory process, generates ideas and plans to improve, however, without a commensurate policy and institutional environment to implement the action plans, aspirations quickly die and further breaks down the social trust and fabrics. Lingmuteychu case is a good example where policy and institutional environment supported the outcome of process, making a difference to people’s livelihood, while this did not occur in Thailand. Thus local groups need support from legal structures for entitlements and legitimizing the change.
• In all cases, there is no demonstration of how institutions at different levels can be linked for dialogue. The inability to link grassroot to higher level institutions often has become a critical hurdle in four sites in Thailand.
Conclusion In five diverse case studies representing a complex socioecological-political domain where natural resource is highly contested, an iterative process supporting integration of stakeholder perspectives for collective learning and exploration of future strategies become a pragmatic methodological approach. The iterative process with flexibility in application facilitated collective learning and negotiation for resource sharing and management. With the ability to integrate viewpoints of heterogeneous stakeholders, ComMod opens several windows for interventions. Rather than conceiving it as a temporary and merely exploratory process, the principal challenge is how to enhance the ownership of the development process and legitimacy by local stakeholders. Furthermore, the involvement of stakeholders having greater influence on the issue from the initial stage still remains a challenge. While the process can empower voices less influential, the outcome has minimum impact on the governance system and institutions. A challenge remains on how the process can motivate people and institutions to partake in the process and legitimize the outcome. The approach working with small groups of RPG players heightens the understanding and expectation of small groups, leaving them as a privileged few in a majority of those who do not believe in the predictions of those who participated in the process. Thus the use of hybrid gaming ABM of Nam Haen promotes involvement of more stakeholders and communication at a higher social hierarchy. At the same time, it is imperative to institute monitoring procedures that can keep track of evolutions at different levels. Acknowledgments This paper presents findings from PN25, Effects of Companion Modeling on Water Management: Comparative analysis across five sites in Bhutan and Thailand, a project of the CGIAR Challenge Program on Water and Food and the Ecole-ComMod project of the Asia IT&C Initiative of the European Union. References Barnaud, C., P. Promburom, Raj T. Gurung, C. Le Page, and G. Trébuil. 2006. Companion Modelling for Collective
Learning & Action in Water Management: Lessons learned from three case studies in northern Thailand and Bhutan. Proceedings of the International Symposium 'Towards Sustainable Livelihoods and Ecosystems in Mountainous Regions,' 7-9 March 2006, Chiang Mai, Thailand. 13 p.
Bousquet, F., O. Barreteau, P. D’Aquino, M. Etienne, S. Boissau, S. Aubert, C. Le Page, D. Babin, and J.-C.
Castella. 2002. Multi-Agent systems and Role games: collective learning processes for ecosystem management. Pages 248-285. In M.A. Janssen (eds.) Complexity and ecosystem management. The theory and practice of multi-agent systems, Edward Elgar Publishing.
Bousquet, F., G. Trébuil, and B. Hardy (eds.) 2005. Companion Modeling and Multi-Agent Systems for Integrated
Natural Resource Management in Asia. CIRAD & International Rice Research Institute, Los Baños, Laguna, Philippines. 360 p.
D'Aquino, P., O. Barreteau, M. Etienne, S. Boissau, F. Bousquet, C. Le Page, S. Aubert, and W. Daré. 2002. The
role playing games in an ABM participatory modeling process: outcomes from five different experiments carried out in the last five years. In: A.E. Rizzoli and A.J. Jakeman (eds.) Integrated assessment and decision support. iEMSs. 1st biennial meeting of the International Environmental Modelling and Software Society, Lugano, Switzerland, 24-27 June. Pp: 275-80.

216
Gurung, T.R. 2005. Companion modeling to examine water sharing arrangement among rice-growing villages in west-central Bhutan. Pages 101-120. In: F. Bousquest, G. Trebuil, and B. Hardy (eds.) Companion modeling and multi-agent systems for integrated natural resource management in Asia. Los Baños, Philippines: IRRI.
Trébuil, G., on behalf of the ComMod Group. 2008. Companion Modelling for Resilient and Adaptive Social Agro-
Ecological Systems in Asia. Proceedings of the Fourth National Agricultural Systems Conference 'Agriculture for Community and Environment Ready to Handle Climate Change,' 27-28 May 2008, Empress Hotel, Chiang Mai, Thailand. 90-104.
Trébuil, G., and M. Dufumier. 1993. Regional Agrarian Systems and Sustainability of Agricultural Production
Systems in Thailand. J. Asian Farm. Syst. Assoc. 1(4): 557-68. Trébuil, G., F. Bousquet, B. Ekasingh, C. Baron, and C. Le Page. 2005. A multi-agent model linked to GIS to
explore the relationship between crop diversification and the risk of land degradation in north Thailand. Pages 167-191. In F. Bousquest, G. Trebuil, and B. Hardy (eds.) Companion modeling and multi-agent systems for integrated natural resource management in Asia. Los Baños, Philippines: IRRI.

217
Community-level multiple-use water services: MUS to climb the water ladder
B. van Koppen1, S. Smits2, P. Moriarty2, and F. Penning de Vries3
1IWMI, Pretoria, South Africa [email protected] 2IRC International Water and Sanitation Center, The Netherlands, and 3Consultant
Abstract The Challenge Program on Water and Food (CPWF) project PN28 developed and tested ‘multiple-use water services’ (‘MUS’). This approach to water services takes multiple water needs of rural and periurban communities as the starting point for planning and designing new systems or rehabilitations. By overcoming the administrative boundaries between single-use sectors, MUS contributes more sustainably to more dimensions of well-being than single-use approaches: health, freedom from drudgery, food, and income. The action-research took place in 25 study areas in eight countries in five basins. The project brought global, national, intermediate level, and local partners together who were champions of MUS at the time. At the community level, the project identified generic models for implementing MUS. This was done through pilot-implementation of innovative multiple-use water services, and by analyzing de facto multiple uses of single-use planned systems. At the intermediate, national, and global level, the project’s ‘learning alliances’ engaged in the wide upscaling of these community-level MUS models, with the aim of establishing an enabling environment to provide every rural and periurban water user with water for multiple uses. This paper presents some of the project findings. Media grab Multiple use water services (MUS) improve health, freedom from drudgery, food, and income considerably more effectively and sustainably than conventional single-use ‘domestic’ or ‘irrigation’ water services. Introduction Multiple users take water from multiple sources and use and reuse it for multiple purposes. This reality is obvious for rural and periurban water users at the local level. When they develop water themselves, they do so for multiple uses. Moreover, infrastructure that is designed for a single use, e.g., ‘domestic water’ or ‘irrigation water’ is de facto used for multiple purposes by communities. Similarly, at the highest levels, water professionals who provide bulk water supplies or manage national or basin-level water resources are well aware of the integrated nature of water resources and their multiple sources, uses, and users. This straightforward insight, however, is lacking at the community and household level. At this level, water professionals from each water sector carve out one particular end-use, which becomes the mandate and structuring principle of the entire sector. Other water uses, even by the same user taking water on the same site from the same source, are ignored. In externally supported water development and storage, this blindness is strongest for storage, conveyance, and use at homesteads and at the community or sub-basin level. This is the gap that the ‘multiple-use water services’ or MUS project attempted to fill. The project developed, tested, and upscaled an alternative approach to water services at the household and community level. MUS is defined as water services planning and design of new systems or rehabilitations that start with people’s multiple water uses and reuses and needs at their preferred sites within communities. By accommodating for multiple uses, multiple livelihoods benefits are achieved, in particular freedom from drudgery, health, food, and income. These benefits contribute directly or indirectly to all Millennium Development Goals. Hence, compared to conventional single-use water services approaches, MUS contributes more effectively to rural development, gender equity, and, if well targeted, poverty alleviation. Methods At its start in 2004, the MUS project brought those partners together who were pioneering MUS approaches at the time. Encouraged by CPWF’s call for innovative partnerships, the project included representatives from the domestic and productive water sectors, and scientists and implementers. Working in five CPWF benchmark basins, each of the global lead partners chose their national and intermediate-level partners and selected sites for case studies, again according to the criterion of being a MUS innovator. Thus, IRC International Water and Sanitation Center became the basin coordinator for the Andean (Bolivia and Colombia) and Limpopo basins (South Africa and Zimbabwe); IDE International Development Enterprise coordinated MUS project activities in the Indus-Ganges Basin (India and Nepal); Khon Kaen University and the Farmer Wisdom Network led the MUS project in the Mekong Basin (Thailand); and IWMI led the project in Ethiopia in the Nile Basin, and was the lead partner. Twenty-five

218
study areas were selected (either one or more communities or a group of adopters of a similar technology). This selection process gave a wide diversity in partners and contexts, which allowed exploring diverse perspectives on MUS. In 19 study areas, ‘MUS by design’ was piloted. In six sites (all from the domestic sector), de facto multiple-use systems were studied. The project partners encompassed all four main categories of water services providers: water users with self-supply, private providers, NGOs, and governments. Also, the three main technology groups were covered: private homestead-based technologies; communal systems with single-access points; and communal systems with distribution networks to public standpipes or homesteads. Socioeconomic conditions varied from low-income Ethiopia to middle-income South Africa. Hydrological contexts ranged from 300 mm average annual rainfall in Maharasthra to up to 2200 mm in Nepal. Across all sites, the first objective was to establish generic, field-tested, and convincing models of MUS at household and community levels. The second objective was to widely upscale these models in order to reach, ultimately, all rural and periurban people with water services that meet both domestic and productive water needs. So the challenge was to create an enabling environment at intermediate, national, and global levels that responds adequately to communities’ multiple water needs. This institutional innovation was taken up by ‘learning alliances.’ In each country the national MUS partner forged horizontal and vertical exchange with other water service providers in the local study area and at the intermediate, national, and global levels. These learning alliances raised awareness about community-level MUS models and through ‘learning by doing’ they induced institutional changes toward an enabling environment, which continued beyond the project life. As the MUS partners driving this process encompassed all four categories of service providers, insights in upscaling were generated from these different perspectives. In order to structure the action-research and allow for global comparison and generic conclusions, a ‘MUS conceptual framework’ was developed at the start. For this, the team identified the conditions, or principles, that should be in place if MUS were to work at the community level and if MUS were to be upscaled at intermediate, national, and global levels (Van Koppen et al., 2006). Learning how to realize those conditions was the focus of research. At community level, the principles were: livelihood-based planning and design of water services, appropriate technologies, adequate financing, equitable institutions, and sustainable water resources. At the intermediate level, these were: participatory approaches, coordinated long-term support, and strategic planning for further MUS innovation. At the national level, the principles were: decentralization of support and enabling policies and laws. This paper synthesizes some findings, conclusions, and recommendations. Over 100 of the project’s national outputs, international publications, and two books are available and forthcoming at www.musproject,net. Results Models for community-level MUS Table 1. Relationship between technologies and water use in selected study areas. Country Technology Range of average daily
water use (lpcd) Levels
Ethiopia
Communal piped systems with very scattered standpipes
8-17 Basic domestic
South Africa
Communal piped systems with scattered standpipes
30 Basic MUS
India
Communal piped systems with frequent standpipes
40 (design supply) Basic MUS
Zimbabwe a. communal boreholes with hand pumps b. individual shallow wells with windlass and buckets c. individual shallow wells with rope-and-washer pumps
a. 10-15 b. 60-70 c. 80-90
a. basic domestic b, c. intermediate MUS
Bolivia
a. tankers b. piped distribution systems with household connections
a. 30 - 40 b. 60 – 80, with exceptions up to 140
a. basic MUS b. intermediate MUS
Nepal
Communal piped systems with frequent standpipes
137-225 (design supplies) high MUS
Colombia
a. Communal piped systems with household connections (rural communities) b. Communal piped systems with household connections (periurban communities)
a.190 - 250, with some cases much higher b.76-118
a. High MUS b. intermediate MUS
Thailand
Farms with ponds and other sources
80-1,000
Intermediate – high MUS
219
With regard to the principles of livelihood-based services and affordable technologies, a strong link was found between people’s multiple water uses for livelihoods at and around homesteads and water availability as captured, conveyed, and stored through technologies. This link is shown in Table 1. Water-dependent productive activities that increase in number and size with higher water availability included small and large livestock keeping, trees, crops and vegetable irrigation, crafts, and small-scale food and other enterprises. This finding confirmed the project’s hypothesized ‘multiple-use water ladder.’ This is a critique on the conventional ‘service ladder’ in the domestic sector, which assumes that when water quantities available at or near homesteads increase up to 100 liters per capita or more per day (lpcd), this is only used for more drinking, sanitation, cooking, cleaning, bathing, and laundry. Instead, the MUS project proposed a ladder that reflected all water uses for livelihoods, distinguishing basic domestic (less than 20 lpcd), basic MUS (20-50 lpcd), intermediate MUS (50-100 lpcd), and high-level MUS (more than 100 lpcd) (Van Koppen and Hussain, 2007). The far-reaching policy implication of this finding is that water services that aim at meeting people’s livelihoods needs at and around homesteads should double or triple the conventional design norms in the domestic sector of 20-30 lpcd for domestic uses only (for Sub-Saharan Africa or South Asia). Instead, 50-100 lpcd or more is required to ensure that services meet people’s livelihood needs so they can ‘climb the multiple-use water ladder.’ Increasing water availability requires incremental expansion of one type of technology (e.g. through better lifting devices), jumps from one type to another, or further combinations. Such incremental investments make economic sense, especially for intermediate-level MUS (50-100 lpcd). Systematic cost-benefit analyses of various case studies of the MUS project and other cases were conducted by Winrock, IRC and IWMI and sponsored by the Bill and Melinda Gates Foundation. They showed that total incremental investments in hard- and software to ‘climb the water ladder’ can be repaid in 6-36 months (Renwick, 2007). With regard to the other principles (financing arrangements, equitable institutions and water resource availability), many challenges were similar to those in conventional domestic or productive water services. One unique feature of MUS, however, concerned equity notions for water sharing under scarcity. Homestead-based multiple uses were small-scale compared to a relatively few large users, most of whom use water beyond homesteads. Under scarcity, basic domestic needs were prioritized and, after that, minimum water supplies for both domestic and small-scale productive uses for all. Thus, within communal systems, the risk of overuse by the few was mitigated by pricing, institutional, and technical measures. Within areas with limited water resources, for example in water-scarce Maharasthra, homestead-based multiple uses by all were seen as higher priority than sugarcane farming by the few. In national water legislation, as in Thailand, the MUS project partners ensured that small-scale multiple uses were better prioritized over commercial users. When moving from homestead-to community-level water development, another typical MUS finding was that synergies can be forged if river intakes, storage, and conveyance structures are holistically designed and incrementally improved for shared water provision, whether to homesteads or fields. Failing to build upon prior community-level abstraction, storage, and conveyance infrastructure for any use leaves unmanageable ‘spaghettis’ of layers of infrastructure. Innovation and upscaling: creating a supportive environment for MUS At intermediate, national, and global levels, project partners initiated learning alliances that started creating an enabling environment for MUS at intermediate, national and global levels. In all countries, the visible and documented successful performance of community-level MUS in sufficient cases to allow for some generic validity appeared vital for awareness creation. There were also many differences between the learning alliance processes in the respective countries. They were primarily related to the different starting points of each category of water service providers that drove the upscaling process. The strengths and weaknesses in realizing the three principles for upscaling MUS at the intermediate level, from the angle of the each of water service provider categories, are given in Table 2. These findings show that the different water service providers brought different strengths to upscaling MUS at the intermediate level. Collaboration according to those strengths appeared effective and most sustainable and upscalable through local government. Highest-level policymakers were approached and appeared receptive in Nepal, Thailand, South Africa, and to some extent in Colombia and Zimbabwe. They started supporting community-level MUS through policymaking and providing direct support without strings. At the global level, a dozen of domestic and productive water sector organizations and IWRM agencies increasingly recognize the merits of MUS and strengthen collaboration, for example during the World Water Forums of 2006 and 2009. Table 2. Strengths and weaknesses in realizing principles for upscaling MUS by category of water service provider
Category of water service provider
Principles for upscaling at intermediate level
Participatory planning Coordinated
long-term support Strategic planning
for upscaling

220
Self-supply Thailand (Farmer wisdom network) South Africa (Water for Food Movement)
Multiple water needs obvious; High own contributions in cash and kind; Own experimenting, mutual learning and knowledge generation.
Expansion based on mutual help with limited resources; Needs-based soliciting of external support; Sustainability of movement uncertain.
Strategic alliances at highest policy levels for influencing policy and support for roll-out.
Private service provider Bolivia (Agua Tuya)
Multiple water needs obvious; Market-driven.
Providing holistic support for higher sales; private business’ outlook of medium-term growth.
Market-driven roll-out limited; linking with municipality.
NGOs Ethiopia (CRS) Nepal (IDE) Zimbabwe (various)
Responsive to multiple water needs; High own contributions in market-driven technological innovation, but otherwise limited.
Poverty relief or technological innovation driving coordinated support for multiple water uses; Short-term, project-bound.
Strategic alliances with local service providers and government at all levels for uptake of innovations and sustainable after-care of technologies.
Local government Bolivia Nepal, South Africa (with NGOs)
Responsive to multiple water needs; Elected representatives, but possibly politicized. Some own contributions.
Balancing between top-down sector-based frames and bottom-up needs-based integrated funding and service delivery; Permanent presence.
Developing generic methodology for integrating multiple water needs in local planning; Influencing national policy and guidelines.
Government/ parastatal domestic sector Colombia (with university) India (with NGO)
Top-down single-use and single-site planning; unable to prevent de facto multiple uses; limited contributions by users.
Supporting a single use at homesteads only; Short-term, project bound.
Lobbying at national level to increase design norms and address water quality issues; Awareness raising about livelihoods benefits of de facto multiple uses; Promoting immediate multiple uses of ‘domestic’ services planned for future expansion.
Government productive sector Learning alliance members
Top-down single-use planning biased to large-scale systems; Unable to prevent de facto multiple uses; limited contributions by users.
Prioritizing a single use or productive uses in agricultural zones, with ‘add-ons’ for better access (e.g. washing steps) Short-term, project-bound.
Lobbying at national level to support small-scale productive uses, also at homesteads; Awareness raising about livelihoods benefits of de facto multiple uses; Promoting efficient productive water use (drip kits)
Conclusions and recommendations The MUS project identified and tested new models for meeting the multiple water needs of people in rural and periurban areas. These multiple-use water services improve health, freedom from drudgery, food, and income more effectively than conventional single-use water development. Counter-productive bureaucratic water sector boundaries are dissolved into one common agenda: to plan and design new systems or rehabilitations according to people’s multiple water needs at preferred sites, starting with providing 50-100 lpcd to homesteads. At the level of one or more communities, communal abstraction, conveyance, and storage is embedded in holistic spatial layout. Specialization remains needed on health impacts, point of use water treatment, synergies, and conflicts regarding use-specific water requirements, for example, increasing productivity of water, or market linkages. Such use-specific specialist knowledge, however, is to support this common agenda instead of replacing it by systems designed for one single-end use at one specific site only. This agenda appeared evident for water users’ self-supply and private service providers. MUS project partners found NGOs and local government at the direct interface with communities also increasingly responsive to their integrated water needs. The same holds for a number of highest-level policymakers and global organizations. Indeed, proponents agree that this agenda is not rocket science but people’s logic. Hence, the most relevant question for further upscaling to reach, ultimately, every citizen with appropriate services is: why do sector-based services, in particular in government and its related education systems, continue? Acknowledgments This paper presents findings from PN28 ‘Multiple-use Water Services,’ a project of the CGIAR Challenge Program on Water and Food. We thank Rocío Bustamante, Alfredo Durán, Gustavo Heredia, Franz Quiroz, and Lourdes

221
Valenzuela in Bolivia; Silvia Corrales, Isabel Domínguez, and Inés Restrepo in Colombia; Eline Boelee, Michiko Ebato, Behailu Mintesinot, Samuel Simachew, and Samuel Yehdogo in Ethiopia; Sudarshan Suryawanshi in India; Deepak Adhikhari and Dhruba Pant in Nepal; Tessa Cousins, Vusi Dlamini, Philippa Kanyoka, Sylvie Morardet and Nyeleti Maluleke in South Africa; Sawaeng Ruaysoongnern in Thailand; Edward Guzha, Fungai Makoni, Cleophas Musara, and Innocent Shoshore in Zimbabwe; and John Butterworth, Jürgen Hagmann, Monique Mikhail, and Bob Yoder from the global team. References Van Koppen, Barbara, Patrick Moriarty, and Eline Boelee. 2006. Multiple-use water services to advance the
Millennium Development Goals. IWMI Research Report 98. Colombo, Sri Lanka: International Water Management Institute, Challenge Program on Water and Food, and International Water and Sanitation Center (IRC).
Van Koppen, Barbara, and Intizar Hussain. 2007. Irrigation, Gender, and Poverty: Overview of Issues and Options.
Special Issue Irrigation and Poverty Alleviation: Pro-poor Intervention Strategies in Irrigated Agriculture. Edited by I. Hussain. Journal of Irrigation and Drainage, Vol. 56, issues 2-3, January. John Wiley & Sons Ltd. (IF 0.598), p. 289-98.
Renwick, M. 2007. Multiple use water services for the poor: assessing the state of knowledge. Winrock
International, IRC Water and Sanitation Centre, International Water Management Institute www.winrockwater.org

222
Collective action in water management through regional networks: Critical reflections from M-POWER
experiences
R.C. Bastakoti1, L. Lebel1, J. Dore1, A. Contreras2, and X. Jianchu3
1Unit for Social and Environmental Research, Chiang Mai University, Thailand [email protected]
2De La Salle University, Philippines 3ICRAF, China
ABSTRACT Disputes and contests over allocation of benefits and burdens from multiple users and uses of water often persist because of difficulties in finding ways to get different social actors to recognize each other’s rights and responsibilities. In the regional and trans-boundary settings like the Mekong region, state interests, diplomatic norms, weak regional institutions, and partial democratization, can make collective action dependent solely on state-led initiatives especially problematic. This paper critically reflects on the experiences of a regional network of organizations and individuals contributing to the Mekong Program on Water Environment and Resilience (M-POWER). M-POWER focuses on the added-value and limitations of a network for collective action at regional as well as more local levels. We identify several different mechanisms that may be of wider significance to evaluating the policy and practice influence of networks in water resources development and management, such as regionalizing an issue for individuals to raise concerns about trans-boundary impacts. Networks are also important for rapid mobilization of knowledge inputs as well as the more reflective sharing of experiences and tactics. Finally, networks also have some major limitations, in particular, the efforts needed to maintain them while not detracting from the effectiveness of contributing members.
MEDIA GRAB Organized but informal networks play a vital role in the governance of water in the Mekong Region complementing, informing, and challenging intergovernmental processes.
INTRODUCTION The existence of international agreements, water regulations, and policies alone does not ensure that water governance is transparent, accountable, and fair. Just because the Mekong River has an organization, the Mekong River Commission, which looks specifically after the lower part of the basin, does not imply that everything is 'taken care of.' Some consider the MRC as the place to take all transboundary water governance issues; experiences elsewhere suggest it is unwise to look for panaceas in water institutions (Meinzen-Dick, 2007). National interests, political and economic factors, have sometimes sidelined the MRC (Dore, 2003). International institutions are important for cooperation (Keohane et al., 1994), but they are not sufficient. International agreements are often disconnected from national legislation and procedures. National water regulations and policies on paper may not reflect actual practices when it comes to evaluating, deciding, and implementing new water resources development projects. Multilateral and bilateral banks and foreign investors often have better access to national governments than the citizens of the countries that could benefit or otherwise be affected by water projects. Public monitoring and scrutiny are needed. Informed critiques and analysis of alternatives need to be forwarded and discussed in the public domain (Conca, 2006). This is not always simple for individuals in a region where democratic institutions are in 'the making' without peer support and encouragement. One way forward is through regional networks. Sometimes it takes initiatives and interventions from a third party to move polarized situations forward. In the regional and transboundary settings like the Mekong region, state interests, diplomatic norms, the weak regional institutions, and partial democratization, can make collective action dependent solely on state-led initiatives especially problematic. This paper is based on the experiences of M-POWER (www.mpowernet.org) (Mekong Program on Water, Environment and Resilience), a regional network that sits at the boundary between research and action. As an epistemic community (Haas, 1992) it is helping develop capacity within the region to conduct scholarly research on

223
governance problems. As an actor engaged in facilitating dialogue activities, policy analysis, and public commentary, its members are often drawn into the political process as well. Networks are thought to have value in building relationships, fostering trust, and coordination of activities. But they also place time and resource demands on members and can raise questions about identity and representation. Not enough is known about their functions and influence in water governance; this paper is a contribution to improving such understanding. METHODS This paper reflects on the ways M-POWER has engaged with water politics in the Mekong region. Information comes from annual meeting reports, previous technical progress reports, and scholarly publications of the network people. All five authors are members of networks and cannot be considered independent researchers. This has the advantage of insider knowledge and the limitation of possible biases. Some findings draw on a survey of M-POWER stakeholders conducted by one of us (AC). RESULTS AND DISCUSSION M-POWER network: Collective engagement and collaboration Over the past few years, a substantial network of individuals and organizations has contributed to the development of M-POWER program. It was started around 2004 as a loosely organized network of like-minded scholars working on water governance issues in the Mekong region. Over the period it turned out as a regional research network actively engaged in water governance related research, organizing and facilitating dialogues, and lobbying for influencing policy decisions through collective efforts of the various actors. The ultimate goal of M-POWER is improved livelihood security, and human and ecosystem health in the Mekong region through democratizing water governance. M-POWER Steering Committee (SC) governs overall development of the program by providing strategic advice to the coordination unit. SC is the cohort of researchers actively engaged in water governance issues in the Mekong region in various ways. Collective decisions of SC are crucial for the functioning of M-POWER and having overall policy impact in the region. The action research program is organized around empirical comparative studies and cross-cutting governance themes (Figure 1). Detailed distribution of ongoing research, especially under fellowship program, is given in Table 1.

224
Figure 1. M-POWER framework–sectoral and cross-cutting themes. The comparative studies and themes are all regional. Synthetic activities are guided by research leaders that build up multicountry and multiorganization teams. The 11 research leaders include academics, researchers, and international experts and help bring together the individual experiences of partner organizations. M-POWER network has been joined by 29 partner organizations working in the region; including eight academic institutions, 11 NGOs, seven international organizations, and 3 others; national policy institute, regional media and environmental consulting firm. Partner organizations are the main source of effort to M-POWER and working with M-POWER they enhance the impact of their organization in implementing their own agenda, plus add greater regional value and experience. Capacity building and sharing are important goals of the network, and are supported by a fellowship program. Thirty fellowship research projects have been provided to 35 researchers; including five Cambodian, five Chinese, 10 Thai, 10 Vietnamese, and the remainder from outside the Mekong region. The fellowship research focuses on various comparative studies areas presented in the research framework, and they often concentrate on more than one cross-cutting governance theme (Table 1). The distribution shows that comparative study areas such as water works and cross-cutting themes such as social justice are less integrated than others. The situation calls for more efforts in those areas in future. Table 1. M-POWER fellowship research by comparative study areas and governance themes.
Comparative study Governance themes
Total Dialogue Social justice Knowledge Policies
Fisheries 0.67 0.33 1.83 1.17 4.00 Floods 0.83 0.50 0.83 0.83 3.00 Irrigation 1.67 0.00 0.67 4.67 7.00 Hydropower 3.08 0.75 0.58 0.58 5.00 Watersheds 2.83 0.83 1.00 1.33 6.00 Waterworks 0.33 0.83 0.00 0.83 2.00 Multiple 0.50 0.33 1.83 0.33 3.00 Total 9.92 3.58 6.75 9.75 30.00

225
Note: The total column at far right of the table indicates the number of research activities under each comparative study area. The four columns under governance themes indicate relative weight assigned to each theme based on focus of each fellowship research. The value-added of M-POWER derives from the extent to which it facilitates working together across organizations and countries. There have been several outstanding individual efforts as analyses, events, or other kinds of activities. For example, during last year, M-POWER coordinated a visit of Chinese delegates to Tonle Sap Lake. What was possible through a network would have been very hard to arrange via formal state channels. But there are still many significant untapped opportunities for members to work even more closely together on some of their activities, and we are exploring collaborative efforts already underway or proposed to see how they can be strengthened. Creating space for dialogue and deliberation Mekong countries represent diverse political settings. Some of them are under centralized political systems and in some the political decisions are mostly influenced by a military junta. The political ideology and their relative closeness hinder the researchers’ ability to raise various governance-related issues. But, regionalizing an issue can provide secure spaces for individuals to raise concerns about trans-boundary impacts and fairness, which would otherwise be exceedingly difficult to do. M-POWER has been involved in organizing dialogues at various levels. M-POWER, with other partners, organized ‘Mekong Region Water Dialogue’ which was a regional multistakeholder platform, and provided the opportunity for debate and learning that contribute in improving water governance in the Mekong region (IUCN, TEI, IWMI, M-POWER, 2007). This event was made possible by an informal but organized network which could avoid bureaucratic hassles associated with formal state authorities, and bring together different stakeholders who otherwise would be unlikely to ever sit at the same table. M-POWER aims to ensure that significant policies and projects are examined at public forums. Considering this fact, M-POWER researchers are involved in the process of dialogue and policy advocacy of various large-scale infrastructure projects that have negative environmental and social consequences. For example, scholarly output of M-POWER researchers support informed multistakeholder dialogue on electricity and water resources planning at national and regional levels. Working as a knowledge hub: policy inputs Networks are also important for rapid mobilization of knowledge inputs for collective actions as well as the more reflective sharing of experiences and tactics. M-POWER has put organized effort to manage the role of knowledge and research on water governance-related issues, and most importantly transform them to policy and action. M-POWER is an epistemic community as it is a 'knowledge-based group of experts and specialists who share common beliefs about cause-and-effect relationships in the world and some political values concerning the ends to which policies should be addressed '(Haas, 1992). The findings of a survey of M-POWER stakeholders (conducted by Dr. A. Contreras, leader for the ‘Knowledge’ Theme) showed that most of the network members strongly agree on the fact that M-POWER should work to influence policy, and simple correlation analysis showed these members also agree that research conducted by M-POWER should be directed at changing policy and practice. Those who agree M-POWER harnesses its knowledge resources toward activities that enable it to influence policy also agree that the way M-POWER is structured and managed enables them to link their work to the policy process. They also agree that the policy context in which they operate in the country where they work enables them to link their work to the policy process. M-POWER has been instrumental in bringing researchers together and contributes to the knowledge-base that ultimately feeds the policy process. In the Mekong region floods and flood-related disasters are normally understood as a technical problem. M-POWER researchers across the region have dispelled that myth and suggested that floods and disaster management require attention to institutional and political issues (Lebel et al., 2007). Some scholarly outputs such as the information on linkages of land and water resources development on a river basin scale are helpful in making policy decisions regarding investments on water resources, mainly for irrigation (Molle and Floch, 2008). Sharing of knowledge based on research within the M-POWER network has been effective in informing local policy. Sharing the outcomes of the research activities is a major component of M-POWER. Regular interaction with the stakeholders through dialogues, international forums, and conferences are tools used. The various communication products of the network and contemporary developments on water governance issues are shared with the wider audience using listserv. It is effective in maintaining a cohort of researchers, a social capital that can be mobilized when the need arises.

226
Some limitations: identity and coordination It is often noted that coordinating the scientific community is like herding cats. M-POWER is no exception to this. M-POWER, through partner organizations, theme leaders, and fellowship, believes in collective engagement and effective collaboration in order to facilitate research, dialogue, and consultation process to help democratize water governance in the Mekong region. But the activities of stakeholders are going at different speeds. We must note some important issues: the diversity in working environment and interest of stakeholders involved, and variation in compliance to the requirements of coordination node. The multiple actors involved in the network have their own interests and they operate at diverse political settings. As a network, working collectively while maintaining this diverse interest of the actors has been a challenge. The members of the network differ greatly in approaches they take (due to different backgrounds as discussed in the first subsection), the emphasis they place on analysis versus advocacy for particular positions or changes, and in the special skills and contributions they could, and want to, make. The diversity of network members sometimes has created difficulty in coordination.
CONCLUSION AND RECOMMENDATIONS
In recent years, various regional networks have been engaged in governance of environment and natural resources. At the transnational level, the network of like-minded organizations and scholars is important to achieve the desired outcome, in the form of collective action. The critical reflections showed that as a regional action research network, M-POWER has been successful in bringing together researchers and organizations with expertise and interest in water governance issues in the Mekong region. Regionalizing the context of such issues, this network has provided the safe space for the researchers to raise their concern on such transboundary and political aspects of water governance. The experiences show the success of the regional network especially in terms of putting the water governance issues collectively. However, efforts are needed to maintain the individual identity of the actors and effective management coordination . Regional networks are crucial to facilitate the collective action in water governance. But this is not the panacea for all.
ACKNOWLEDGMENTS
This paper presents findings from PN50 ‘Enhancing multi-scale Mekong water governance,’ a project of the CGIAR Challenge Program on Water and Food. We duly acknowledge all the findings and experiences of the M-POWER members used in this paper.
REFERENCES
Conca, K. 2006. Governing water: contentious transnational politics and global institution building. MIT Press,
Cambridge, Massachusetts. Dore, J. 2003. The governance of increasing Mekong regionalism. Pages 405-440 in: Mingsarn Kaosa-ard, and J.
Dore (eds.) Social Challenges for the Mekong Region. White Lotus, Bangkok. Haas, P.M. 1992. Introduction: Epistemic Communities and International Policy Coordination. International
Organization, 46(1):1-37. IUCN, TEI, IWMI, and M-POWER, 2007. Exploring water futures together: Mekong Region Waters Dialogue. Report
from regional Dialogue, Vientiane, Lao PDR. IUCN, TEI, M-POWER. 75 pp. Keohane, R.O., P.M. Haas, and M.A. Levy. 1994. The effectiveness of international environmental institutions.
Pages 3-24 in: P.M. Haas, R.O. Keohane, and M.A. Levy (eds.) Institutions for the Earth: Sources of effective international environmental protection. The MIT Press, Cambridge, Massachusetts.
Level, L., B.T. Sinh, P. Garden, B.V. Hien, N. Subsin, L.A. Tuan, and N.T.P. Vinh. 2007. Risk reduction or redistribution? Flood management in the Mekong region M-POWER Working Paper MP-2007-06. Unit for Social Environmental Research: Chiang Mai University.
Meinzen-Dick, R. 2007. Beyond panaceas in water institutions. PNAS, 104(39): 15200–05. Molle, F, and P. Floch. 2008. Megaprojects and Social and Environmental Changes: The Case of the Thai 'Water
Grid.' Ambio, 37(3): 199-204.

227
MUS upscaling and outscaling: from household to community level and
national water law in Thailand
Sawaeng Ruaysoongnern Department of Plant Science and Agricultural Resources, Faculty of Agriculture, Khon Kaen University, Thailand
Abstract Multiple uses of water (MUS) have been traditionally practiced in Thailand for a long time, until the introduction of specific objectives of water use during the past 50 years. Single uses of water resources then became normalized according to the mandate of government sectors on water resource development. This was partly due to limited understanding and lack of information and knowledge about the specific purposes of the development projects of government agencies. Despite the severe reduction in the level of multiple uses in modern development programs, many leading villagers are still developing multiple-use practices at household and farm levels. They could achieve various objectives of integrated water resource management for a successful economy, improved livelihoods, and resource resilience. Successful developments often match previous local water resource management practices and actual water resource requirements, which follow the rhythm of natural water resource availability in different ecosystems.
Since the 1997 economic crisis, Thailand has reiterated former sustainable development objectives by emphasizing self-sufficiency for sustainable development. As a result, water resource management has been considered as a key basic parameter. As such, integration of local wisdom into integrated water resource management concepts became a vital ingredient from plot scales to watershed levels up to national policy and onto the national agenda. With local wisdom blending with government support, multiple uses of water resources has become a best practice for improving resources and livelihood of small farmers in most ecosystems with diverse water resource availability. From the successful cases at the farm level, the MUS principles of multiple sources, multiple uses, and multiple benefits for water use efficiency have been adopted as national policies, and a key guideline of a draft 2007 national water law and its regulations. The main aim of the law is sustainable water resource management at household and watershed levels. The Thailand case could demonstrate that MUS has played a major role in the successful integrated development of household, community, and watershed levels through group and network efforts for sustainable resource development. The key lesson learned is timely integration of the right organizations and stakeholders for the highest potential success. Media grab MUS is necessary for people's livelihoods and the MUS practices should be integrated into government programs and national policies. Introduction Multiple uses of water resources (MUS) have been a conventional livelihood practice for people in rural of Thailand for more than 100 years (Ruaysoongnern, 2006a). Developments during the past 50 years have changed the way projects used and managed water resources, from multiple use objectives to single use designs. Therefore, when the CPWF-MUS project began in 2004, it was a good opportunity to reiterate the traditional practices lost during nine National Development Plans that emphasized adopting single uses over multiple uses. Since the beginning of the project, numerous activities have progressed s a result of learning alliance approaches, knowledge management, policy intervention research, and integration of research results to budgeting systems and national legislation, especially national water law. Some activities were quite successful but some are still in the development phases (Penning de Vries and Ruaysoongnern, 2005). This paper demonstrates the processes and potential practices as lessons learned on how to integrate a research project into national policies and development programs, particularly for Thailand and the Mekong Basin. Background of MUS in Thailand and the northeast Before the age of national development plans, people in rural areas with water resource scarcity, particularly in the northeast (Mekong Basin), developed their own knowledge on multiple uses of existing water resources for their livelihood. The basic principles were utilization of water resources from multiple sources, with multiple uses for

228
each source according to quantity and quality, for multiple benefits to cover necessities of their life, and finally sharing benefits to multiple hierarchies within and across basins (Ruaysoongnern, 2006a). As a result, people could eventually have sufficient water for all their needs from drinking to domestic uses, from home garden to large-scale agricultural production, from households to community, and from community to environmental protection (Ruaysoongnern, 2006b). Environmental protection ensured basic resources and livelihood of local and regional people. Most developments are suitable and beneficial to their livelihood, but some could be beneficial only to the on-site users with potential hazards to other people living downstream. With previously low population pressure, however, the off-site damages were minimal. At the beginning of the water resource development in floodplain regions in Thailand more than 100 years ago, water resource development was primarily for travel routes, with potential development of agriculture along the waterways, which were somehow multiple uses of water resources for domestic, community development, and productive uses. When population pressures increased during the 1950s, national development plans were initiated. With the development plans, especially for the earlier ones, single uses of water resources were emphasized to solve specific problems with large reductions of multiple uses. This caused a number of problems for local people, and impacted water resources, the environment, and sustainable development. After environmental impact assessments were initiated, the damages were evident. Water resource development plans have been gradually altered to a combination of single uses and more recently multiple uses under recently integrated water resource management (Ruaysoongnern, 2006b). Development programs and constraints Single use development program During development planning of water resources, most of the plans were single use because of the mandates of sectoral government offices (e.g. domestic, agriculture, groundwater, watersheds, pollution, industrial, power generation, and other uses). The narrow objectives and practices were also due to education and information systems of specialization of various offices. With the mandates and emphasis on specialization, development plans were virtually single approaches and resulted in single use development with usually separated single benefits (Ruaysoongnern, 2005). Most water resource developments were either productive uses or domestic uses. Only with further experience on the part of users, were other single uses added. Even for domestic uses, they could be mostly for washing and cleaning rather than cooking and drinking. Evidence of failure of public drinking water development is the booming bottled drinking water industry throughout Thailand, even in the rural areas. Therefore, development of MUS under the single use mindset, we need integration of development plans, stemming from action plans, budgeting, project management, monitoring, and maintenance of the resource systems. Integrated plans have been continually developed for more than 10 years but success is relatively low due to bottlenecks in the budgeting system, impractical development plans, nonparticipation, insufficient knowledge on multiple uses at the household level, and political issues (Penning de Vries et al., 2005). Those constraints require policy intervention research and knowledge development for integrated sustainable development at the household, community, region, and basin scales. Multiple use practices Many empowered local households and communities have maintained and sometimes developed multiple uses of water resources at the farm and household levels for their own livelihood, applying primarily an indigenous multiple use concept. The multiple uses include drinking, cooking, washing, home garden, livestock, home industries, fisheries, agriculture, paddy, habitat, and environment in diverse ecosystems (Ruaysoongnern, 2004a), with some integration of appropriate scientific knowledge. The successful practices for livelihood and economics have become models of integrated water resource management, and multiple use of water (Ruaysoongnern, 2005). The successful cases leading to self-sufficiency have been the platforms for knowledge development and understanding of how to operate integrated water resource management, especially for appropriate planning, budgeting, and timely action plans for normal and special situations, and more recently national water laws. MUS project context and its development Reinstate MUS into development programs Since the beginning of the CPWF-MUS project, development plans have been analyzed through system approaches and analysis techniques by stakeholders of water resource uses. From the analysis of plans and practices on water resource development, it was determined that constraints of water resource management at all hierarchies from

229
plot to community watersheds had been due to single-use approaches without considering other co-existing uses. Even the irrigation systems, the main project targets, were only water collections and allocations for rice production without any water resource management. Target water users have rarely participated in planning and design of even the single use programs, nor in integrating multiple uses into existing single uses. Moreover, most of the development projects rarely emphasized the needs of people for multiple uses (Penning de Vries and Ruaysoongnern, 2005). Farmers and local communities have nevertheless tried very hard to divert existing designs for rice crop production to fisheries, domestic, livestock, tree, and home industries. A major task of the CPWF-MUS project is reinstating multiple uses into practice, policy, and budget systems to ease development at the local level (Ruaysoongnern 2004b). In fact, the project is focused on supporting development of learning alliances for multiple use approaches through knowledge sharing, action research for knowledge development, and policy intervention research. At a later stage, integration of the multiple uses has been applied to Thailand National Water Law through the hard work of learning alliances and beneficiary groups. Currently multiple uses is in the process of integration into practices of many government offices and budgeting systems, and integration into national water law and its subsidiaries. Integration of MUS into planning and practices Earlier, there were separate attempts at water resource development and integrated water resource management, even for the same target areas. With continuous development of learning alliances within the CPWF-MUS project, most government agencies and NGOs have been invited to join and blend their beneficial concepts and efforts for multiple uses into plans of each agency. The common objectives of development plans for water uses has gradually developed into integrated single uses, and finally to practices of multiple uses of water resources for livelihood and self-sufficiency of farmers and local people (Penning de Vries and Ruaysoongnern, 2005). One of the approaches used during learning alliance development is successful experience and knowledge sharing, exchange field visits, and counterpart development (Penning de Vries et al., 2005). All of the continuing approaches and development have developed into integrated, planned practices for multiple use water resource development at all levels. Integration MUS into budgeting and legislation During the research project period, there were occasions when researchers met with ministers and directors-general responsible for water resource management, including: the Minister of Agriculture and Cooperatives during the planning of 3 million multiple use ponds on 12 July 2004 at the Satuk farmer learning center; the Minister of Natural Resources and Environment during Megaproject development 9 November 2005 at Government House, Bangkok; the Prime Minister during water resource management for economic sufficiency on 15 May 2006 at Lamplaimas Farmer Learning Center; and the Deputy Prime Minister and Minister of Agriculture and Cooperatives at Kandong Farmer Learning Centers on 19 October 2007. In addition, many meetings were held with the DG of Land Development Department, the DG of Water Resources, and the DG of the Irrigation Department for MUS and other development plans. Responsible directors under these departments are also members of existing learning alliances. The learning alliances have greatly assisted in integrating MUS into planning, policy, budgeting, and finally into legislation of water laws. Lessons learned Learning alliances development The success of project activities can be largely attributed to learning alliances at community, regional, and national levels. Although the approach sounds simple, the practices were extremely delicate, requiring continuous goodwill at all levels. In particular, major limitations were placed on existing conflict resolutions of different organizations. At such meetings, organizers had to be highly sensitive to the mandate, regulation, working culture, and beliefs of their counterparts. Thereafter, blending of the idea and concept was extremely important prior to actual cooperation and continuing friendships outside the office. With delicate personal handling of learning alliances, the outcome of the project could be achieved even against 'impossible' odds.

230
Knowledge management With learning alliance development, the techniques used to encourage cooperation included knowledge sharing, exchanging site visits, and sharing views and ideas. Finally when sound understanding was established, the sharing of plans and resources of different offices were readily accepted. Development techniques for multiple uses, particularly approaches and practices, were usually lacking in original single use plans. Understanding existing knowledge was also important for sustainable development. Knowledge development was emphasized to central officials and field staff, rather than just supplying them with documentation. Comparative economic returns of MUS over single uses Economic analysis data (Ruaysoongnern, 2008) showed that poverty alleviation could be done more effectively through MUS than through single use or even combinations of single uses. Clear explanations were offered on overall lower costs of MUS practices and higher returns of MUS over single use or combinations of single uses. The reductionist’s view of development programs, however, usually considers that single use designs might be simpler and easier to manage with lower project cost. This reductionist evaluation procedure is still an obstacle to MUS development. Policy intervention research and policy development Knowledge sharing and development of learning alliances have led to voluntary development of resource sharing and official agreement to solve the existing constraints. There were joint attempts to tackle bottleneck policies to which most of the learning alliance members agreed (Ruaysoongnern, 2007). With this approach, joint policy intervention research was developed to verify integrated water resource management for further development and modeling (Ruaysoongnern, 2008). The MUS models and sites finally became research and learning sites for learning alliances and for everybody involved. As a result, policy development was eventually facilitated and achieved (Ruaysoongnern and Penning de Vries, 2005). Research and legislation procedures It was quite fortunate that during the life of the project, there were government and community efforts to develop better water law for Thailand. With continuous publicity of the research work and project activities, project staff and well-known learning alliances were invited to public hearings and, the drafting of water laws and its regulations. Multiple use concepts of water and water resources have been fully integrated into legislation. The most significant part is the right of people to use water resources for their livelihood (multiple uses), and not just activity-oriented allocations as before. Another important point in the law is water resource ownership: the water belongs to the people, not the nation or government, which is the crucial starting point for integrated water resource management by local committees for multiple uses. Conclusions and recommendations From the project activities, multiple use concepts were reinstated into national practice and policy, using a platform of learning alliances and through knowledge sharing and development. The objectives of the project were achieved at all levels. The key techniques on learning alliance development and knowledge sharing are prime principles of research for development of poor communities. The concepts and approaches can be applied with a clear understanding of the delicate balance of the role and power of each side. With continuous development of social capital under the learning alliance approach, other research programs and development initiatives could be done using similar practices. The lessons learned can be transferred to other working systems with a potentially high chance of success. Acknowledgments This paper presents findings of PN 28 ‘Multiple water uses,’ a project of the CGIAR Challenge Program on Water and Food. References Penning de Vries, F.W.T., and S. Ruaysoongnern. 2005. Learning Alliances for the broad implementation of an
integrated approach to multiple sources, multiple uses and multiple users of water. Manuscript prepared

231
for the International Conference on 'Integrated Assessment of Water Resources and Global Change: A North-South Analysis', 23-25 February 2005, Bonn, Germany (http://www.zef.de/watershed2005).
Penning de Vries, F.W.T, S. Ruaysoongnern, and S. Wongbhumiwatana. 2005. The optimal size of farm ponds in
N.E. Thailand with respect to farming style and multiple uses of water and under various biophysical and socio-economic conditions. Symposium on Sandy Soils, December, Khon Kaen, Thailand.
Ruaysoongnern, S. 2004a. Thai Local Wisdom for Sustainable Agricultural Development. Paper presented at Local
Wisdom for Development. Sirinthon Humanity Institute, Bangkok, March 23-25, 2004, (in Thai). Ruaysoongnern, S. 2004b. Self motivation of farmer networks in Thailand for ecoagriculture development and
national policy integration. Poster presentation ICRAF, Nairobi, Kenya, September 27-October, 1, 2004. Ruaysoongnern, S. 2005. Learning alliance development for scaling up multipurpose farm ponds in a semi-arid
region of Mekong basin. Paper Presentation at Learning Alliances Symposium. IRC, Delft, Netherlands, June 7-10, 2005.
Ruaysoongnern. S. 2006a. Local practices on multiple water use system in Mekong basin. World Water Forum,
Mexico City. March 18-22, 2006. Ruaysoongnern, S. 2006b. Multiple sources, multiple uses and multiple users of water: a learning alliance approach
to bring stakeholders together. SEA-watch Newsletter. Ruaysoongnern, S. 2007. Survey reports of technologies for multiple uses and multiple users of water in the
Northeast of Thailand. Research Report of Integrated water resource management center for the Northeast, Khon Kaen University. 342pp.
Ruaysoongnern, S. 2008. Verification of technologies for multiple uses of water among learning alliances in the
Northeast of Thailand. Research report of Integrated water resource management center for the Northeast, Khon Kaen University. 78 p.
Ruaysoongnern, S., and F. W.T. Penning de Vries. 2005. Learning Alliances development for scaling up of multi-
purpose farm ponds in a semi-arid region of the Mekong basin Symposium on Learning Alliances for scaling up innovative approaches in the water and sanitation sector, 7-9 June 2005, Delft, The Netherlands.

232
An evaluation of policy impacts in Thailand, South Africa, Zimbabwe and Ethiopia of the multiple use systems project
Douglas Merrey ([email protected]) and Lindiwe Sabanda
FANRPAN, South Africa
Abstract
Governments of Colombia, South Africa, Zimbabwe, and Thailand have taken up recommendations of the Multiple Use Systems Project and have adapted a national policy towards planning and implementation of multiple water uses. The government of South Africa has drafted national guidelines for multiple water use services and is testing these in pilot-projects with local governments. In Zimbabwe there is a proposed law incorporating MUS. This paper evaluates these claims. It describes the changes in policy that the MUS project has influences and identifies which project strategies and mechanisms worked, and how context influenced what worked where. Other contributing factors are described. The paper compares the originally conjectured project impact pathways with those that actually led to change. The reasons why MUS was less successful in Ethiopia, contrary to initial expectations, are examined. The actual and potential benefits and costs of the policy change are estimated, and compared to the investment in the project. An attempt is made to estimate the potential benefits and costs of the policy change.

233
Collective approaches to fish production
Fisheries and livelihoods in dispute around Pak Mun Dam, Thailand
T. Foran1
1Chiang Mai University-Unit for Social and Environmental Research, Thailand [email protected] Abstract This paper reviews livelihood and fisheries-related disputes following construction of a large run-of-river dam (located just above the confluence of the Mekong River and its largest tributary, the Mun) in Thailand. What role has local and expert knowledge played in decision-making, in a setting of ecological uncertainty and conflict? I focus on validity of knowledge claims made to support particular mitigation strategies. The study relied on field visits during 2001-05, with six weeks of intensive work in 2004. Written discourse analysis was used to explore policy narratives and to assess argumentation strategies. Approximately 30 interviews were conducted with farmers and policymakes. Farmers (predominately growing rice on rainfed plots of <7 ha) fell into two sets: one felt the dam, in operation since 1994, had damaged fisheries livelihoods. This group participated in multiple rounds of collective action for compensation. The second, larger group accepted official claims about the dam’s benefits. Socioeconomic differences between the two were slight. Two basic narratives for operations exist: (1) 'decommissioning restores migrating fisheries;' and (2) 'a four-month wet season opening allows migration and dry season storage.' Both solutions rely on inadequate knowledge: decommissioning may overestimate the importance of wild fisheries, in the context of increased off-farm labor. Seasonal-opening underestimates the difficulties farmers have accessing pumped river water and growing profitable crops. In the face of uncertain knowledge (e.g., about fisheries trends), both narratives invoke normative models, making the debate intensely political. Improving complex on- and off-farm livelihoods requires authentic deliberation and more holistic application of the sustainable livelihoods framework. Media grab Wild inland fisheries in the Mekong are difficult to quantify because they are diffuse, variable, and politicized. But they make meaningful contributions to livelihoods. Introduction Ever since its authorization in 1989, Pak Mun Dam has sparked controversy, linked on the one hand to resistance networks that have sought to defend, mitigate, and restore fisheries-dependent livelihoods, and opposed, on the other hand, by state-sponsored networks led by local authorities. Regardless of their participation in dam-related disputes, villagers in the lower Mun River basin pursue similar livelihood strategies. They are smallholder farmers who grow one main crop of rice during the May–October monsoon. Holdings are typically 5-7 ha, but soils near the dam are often poor. By Thai standards many households are income poor. Almost all households supplement their income by off-farm labor, with significant rates of seasonal and long-term out-migration, especially among younger people (Ubon Ratchatani University [UBU], 2002). This study’s objectives were to: (1) document competing policy narratives used to justify alternative policies for the operation of Pak Mun Dam in Thailand; and (2) to assess their credibility, in a highly politicized context. The study contributes to a case study on water allocation decision-making in the Mekong Region being prepared as part of PN67 of the CGIAR Challenge Program on Water and Food. Pak Mun Dam is located approximately 80 km downstream from the provincial centre of Ubon Ratchathani and 5.5 km upstream of the confluence of the Mun and the Mekong. Constructed by the Electricity Generating Authority of Thailand (EGAT) during 1990–94, the dam is 17 m high, 300 m wide, with eight hydraulic gates that can be fully opened to release water. The Mun’s living aquatic resources are noted for their high biodiversity and contribution to subsistence and trade (Roberts, 1993; Srettachau, 2002; Burawoy, 1998; Roberts, 2001). When the gates of Pak Mun Dam were opened in 2001-02 for a year-long experiment, two studies counted more than 150 species of fish (Srettachau, 2002; UBU, 2002). Fishermen use a variety of gear, including hook and line, traps, nets, and beach-haul seines. Total catch has not been estimated for a number of reasons, including the large number of landing

234
sites, subsistence consumption, and–most importantly for sustaining important fish populations–lack of a long-term fisheries assessment program. A concrete fish ladder was installed in 1996 but its design does not allow significant upstream migration (Roberts, 2001). Instead, in a 2003 Cabinet decision, EGAT is requested to fully open the dam’s gates during the annual wet season, nominally for 4 months beginning June (Foran 2006). Because it is a run-of-river dam operated for power generation, Pak Mun cannot also be used to store significant amounts of water. Yet since the early 2000s–partly as a result of populist development policy–the state has expanded small pumped irrigation systems near and upstream from the dam. Critics view this initiative as a justification for not opening Pak Mun’s gates beyond four months (Foran, 2006: Ch. 8), reserving the dam instead for power generation at least eight months of the year, including during Thailand’s peak power demand hot season. The dam’s installed capacity is 136 MW. Prior to the four-month seasonal opening, its actual energy output was approximately 300 million kWh per year. With the gates opened during June-September, energy output declines to approximately 150 million kWh. Methods The study was informed by discourse-oriented theories of politics. Politics can be explored using a conceptual framework consisting of actors’ interests, prevalent discourses, and institutions (Hajer, 1995; Lichbach and Zuckerman, 1997; Foran, 2006). Interests and discourses drive politics, but in a manner shaped by institutions. Interests are objectives and preferences. Institutions are enduring ideas, formal and informal, about how to achieve desired social outcomes (Foran, 2006, p31). Discourse is 'written and spoken communication and the thinking that underlies it' (Johnson, 2000). An important component of discourse is ideas: broad worldviews, and more specific normative or causal beliefs. The author used written discourse analysis to explore narratives and argumentation strategies. These were tracked historically and politically (i.e., in terms of possible influence on decision-making) from the dam’s approval in 1989, to an influential decision in 2003 to open Pak Mun’s gates four months a year. In particular, the author focused on assessing the knowledge claims in scientific narratives commissioned by the government to inform decision-making. The scientific studies were produced in the context of a remarkable decision to suspend hydropower production and fully open the gates of the dam (2001–02) to allow study of fisheries and livelihood impacts. The study also relied on field visits in 2001–05, with six weeks of intensive work in 2004. Approximately 30 interviews related to livelihood issues were conducted with farmers and policymakers. Results and discussion Discourse analysis revealed two general policy narratives for the continued operations of Pak Mun Dam: (1) 'decommissioning restores migrating fisheries;' and (2) 'a four-month wet season opening allows migration and dry season storage.' The narratives were deployed by two broad clusters of actors: a mainstream cluster and a critical cluster. Local farmers belonged to both. Opponents felt the dam, in operation since 1994, had damaged fisheries livelihoods. This group participated in multiple rounds of civil disobedience for livelihoods compensation. The second, larger group accepted official claims about the dam’s benefits. They were also 'free rider' beneficiaries of successful campaigns for enhanced compensation waged by dam opponents (Foran, 2006: Ch. 6-7). Expert knowledge commissioned by the Thai government (under PM Thaksin Shinawatra) to inform its decision-making provided conflicting knowledge claims. A multidisciplinary study by Ubon Ratchathani University (UBU, 2002) reported that although households interviewed wanted irrigation water in the dry-season, new river-pumped irrigation systems would have a minimal positive impact. Soils were poor, pumping costs were high, and farmers lacked capital inputs needed to grow high-value dry-season crops. Similarly, farmers near the dam told me in 2004 that the main benefit of pumped-water irrigation is to safeguard the wet season rice crop from punitive yield losses because of poor rains (cf. UBU, 2002: Ch. 3, p.32). A secondary benefit is the ability to control the timing of rice seedling production and transplanting, allowing farmers to more reliably commit to off-farm work. The university study argued that for at least another 5 years, the dam’s primary benefit–improving electric power reliability in the lower Northeast–could be substituted by increasing imports of electricity. Technical substitutes existed for the electricity, but no technical solution existed for improving the security of community-based livelihoods (UBU, 2002).

235
In late 2002, however, the government challenged the university’s findings, by ordering the National Statistics Office (NSO) to survey occupations and attitudes of residents in the lower Mun basin toward dam management. NSO reported that among 3750 householders sampled from 150 villages, the least disruptive and most favored option was a 4-month dam opening. Only 4% of respondents stated that fishing was their primary 'occupation' (achip); less than 7% stated it was their secondary occupation (National Statistics Office, 2003). Several weeks after the poll, NSO held a public meeting about its survey. Dam opponents argued that in the context of rural livelihoods, it would have been more accurate to ask villagers about their fishing activities, not if they regarded fishing as their 'occupation.' One villager asked: 'Why didn't you gather information using wording such as ‘Pho Yai [grandfather], do you have children or grandchildren that fish?’'–indicating that the response to this question would have been different than to questions based on 'achip.' Concepts such as occupation, fisher, and farmer were contested by experts using different methods. NSO used an extensive, single-encounter method, whereas Ubon Ratchathani University deployed researchers for more intensive fieldwork. The NSO poll took place several months after the government had announced its support for a 4-month dam opening policy. More than half of the NSO officials were from Bangkok, and each surveyor collected approximately 30 samples per day. Encounters were brief, constrained by the large sample size (N=3750) and the government's request for results in several days. In such a context, interviewees may have given responses calculated to be conciliatory (Burawoy, 1998). Respondents could also have interpreted the poll as an implicit request from the Thaksin administration for a show of support for its handling of the case. NSO asked for a yes/no response to the following: 'If there were to be an opening-closing of the Pak Mun Dam sluice gates in the following cases, would your household be troubled (dueat ron) or not?' If respondents answered yes, they were asked to state their reasons (NSO, 2003). The phrase dueat ron (troubled) is ambiguous, however. By contrast, UBU asked a series of questions about food security, including 'How has the construction and trial opening of Pak Mun Dam affected the convenience of obtaining food for your household?' The choices were: no change; improved; much improved; worsened; much worsened (UBU, 2002: Ch. 6, p.47). The UBU question occurred in the context of a much more extended questionnaire about incomes, assets, and livelihood strategies. The use of multiple thematically related questions would, other things being equal, reduce bias in survey design or administration. It may also have increased the odds of obtaining a reliable answer. Upon scrutiny, the results of the NSO poll are uncertain and ambiguous (Foran, 2006, ch. 8). The poll’s political effect was clear, however. It gave voice to what the government claimed was a hitherto silent majority of local farmers. These farmers, according to the poll, wanted the dam closed 8 months a year. In early 2003, the government justified its 4-month operating rule based on the preferences of this majority. Conclusions and recommendations In the lower reaches of the Mekong’s largest tributary, the degree to which local people derive benefit from living aquatic resources, especially wild fisheries, has been a topic of multiple rounds of dispute. Although marginalized in state-sponsored livelihood surveys, and difficult to quantify because diffuse, variable, and politicized, living aquatic resources make meaningful contributions to livelihoods (Srettachau, 2002; UBU, 2002; Foran, 2006, Ch. 8). This is especially true for land-poor farmers. In the context of increased off-farm labor, calls to suspend power production at Pak Mun may overestimate the importance of wild fisheries. A policy of a 4-month seasonal opening, however, underestimates the difficulties farmers have accessing pumped river water and growing profitable crops. In the face of uncertain knowledge (e.g., about fisheries trends), both policy narratives invoke normative models, making the debate intensely political. Improving complex on- and off-farm livelihoods requires authentic deliberation and more holistic application of sustainable livelihood approaches. The case offers sobering lessons about the politics of knowledge. Concepts such as occupation, fisher, and farmer were contested by laypeople and by experts using different methodologies. Nuances of smallholder livelihood strategies were ignored by contending experts, who needed simple conclusions on key issues such as the importance of wild-capture fisheries to local livelihoods. With authority highly concentrated in the state’s executive branch, knowledge production was manipulated.

236
I conclude by recommending that livelihood research focus on the following questions: • Will viable populations of key migratory species (Roberts, 2001a, b; Jutagate et al., 2003) persist in the
lower Mun if they cannot complete their downstream migration? • Is fishing effort on key species sustainable? If not, what are the most appropriate stock conservation
measures, given their trans-boundary nature and possibly high levels of fishing effort throughout the river basin? Will government sponsored artificial breeding and release programs make any difference?
• Is fingerling stocking an efficient and effective means of sustaining fisheries? • Will new irrigation canals make any significant impact on intensification or reduce vulnerability among
recipient farmers? • What interventions–e.g., occupational health and safety interventions, wages, and benefits packages–will
most benefit the well-being of household members who work away from the lower Mun? In order to begin addressing these topics in the near-term, debate over livelihoods need to be partly recontextualized. Attention to the above issues may reframe the polarized debate over the management of Pak Mun Dam. Basic concerns include understanding the coping strategies of most vulnerable households in the context of the 4-month opening, and evaluating the state’s new intensification programs. Acknowledgments This paper presents initial findings from PN67 'Improving Mekong Water Allocation,' a project of the CGIAR Challenge Program on Water and Food. References Burawoy, Michael. 1998. The Extended Case Method. Sociological Theory, 16(1):4-33. Foran, Tira. 2006. Rivers of Contention: Pak Mun Dam, Electricity Planning, and State–Society Relations in
Thailand, 1932–2004. PhD Thesis, Division of Geography, Department of Geosciences, University of Sydney. http://hdl.handle.net/2123/1984.
Hajer, Maarten A. 1995. The Politics of Environmental Discourse: Ecological Modernization and the Policy Process.
Oxford: Clarendon Press. Johnson, Allan G. 2000. The Blackwell Dictionary of Sociology: A User's Guide to Sociological Language. 2nd ed.
Malden, MA: Blackwell Publishers. Jutagate, Tuantong, Chaiwut Krudpan, Praneet Ngamsnae, Kanjana Payooha, and Thanatip Lamkom. 2003.
Fisheries in the Mun River: A One-Year Trial of Opening the Sluice Gates of Pak Mun Dam, Thailand. Kasetsart Journal of Natural Science, 37:101-16.
Lichbach, Mark I., and Alan S. Zuckerman (eds.) 1997. Comparative Politics: Rationality, Culture, and Structure.
Cambridge: Cambridge University Press. National Statistics Office. 2003. Rai ngan phon kan samruat khwam kit hen khong prachachon kiew kap khuean
pak mun nai amphoe phibhunmangsahan khongjiam sirindhorn changwat ubon ratchathani. [Report of public opinion survey about Pak Mun Dam in Phibun Mangsahan, Khong Jiam, and Sirindhorn Districts, Ubon Ratchathani Province] ISBN 974-060-923-6. Bangkok: National Statistics Office, Ministry of Information and Communications Technology.
Roberts, T. 2001. On the River of No Returns: Thailand's Pak Mun Dam and Its Fish Ladder. Natural History Bulletin
of the Siam Society, 49:189-230. Roberts, Tyson Royal. 1993. Just another dammed river? Negative Impacts of Pak Mun Dam on Fishes of the
Mekong Basin. Natural History Bulletin of the Siam Society, 41:105-33. Srettachau, Chainarong. 2002. Mae Mun Kan Klup Keun Ma Khong Kon Ha Pla. Bot Sarup Lae Khwam Ru Rueang
Pla Khong Kon Pak Mun [Moon River. Return of the Fishers: Summary and Fisheries Knowledge of Pak Mun People]. Tai Ban Research Project. Chiang Mai: Southeast Asia Rivers Network–Thailand.
Ubon Ratchatani University [UBU]. 2002. Khrong kan sueksa naew tang fuen fu rabop niwet withi chiwit lae
chumchon thi dai rap phon krathop chak kan sang khuean pak mun [Project to Study Approaches to Restoration of the Ecology, Livelihood, and Communities Receiving Impacts from Construction of Pak Mun Dam]. Ubon Ratchatani: Ubon Ratchatani University.

237
Managing resilience in West African small-scale fisheries
C. Béné1, N. Andrew2, A. Russell1, F. Sinaba3, S. Ovie4, P. Morand5, and J. Lemoalle6
1WorldFish Center, Regional Office for Africa, Cairo, Egypt [email protected] 2WorldFish Center, Headquarters, Penang, Malaysia
3IER, Mopti, Mali 4NIFFR, New Bussa, Nigeria
5IRD, Dakar, Senegal 6UMR G-Eau IRD, Montpellier, France
Abstract The central hypothesis of this research is that the concept of resilience, revisited from a socioecological and adaptive management perspective, can reduce the vulnerability of fishing communities and lead to improved resource management and water productivity. In order to test this hypothesis, the project described in this paper seeks to operationalize the concept of ‘resilience management.’ A range of participatory assessment and adaptive management tools are used to develop and evaluate management interventions to reduce vulnerability to external processes and promote durable decision-making. The methodology of this approach is implemented in two pilot fishery systems in the Niger River Basin and presented together with the first results obtained by the project. Media grab Faced with uncertainty and variability, small-scale fisheries in developing countries need a new management approach. Resilience provides a promising alternative that now needs to be operationalized. Introduction In many developing countries, small-scale inland fisheries are important to the livelihoods of the poor, contributing both income (through capture and postharvest activities) and food security (Béné et al., 2006). This is particularly true for river fisheries, and especially so in Africa, which has important inland and de facto unregulated open access fisheries, on which millions of poor households depend. These inland fisheries are characterized by complex multi-species, multi-gear exploitation systems, and large numbers of fishers operating completely within the informal sector. This makes small-scale inland fisheries extremely difficult to assess and manage, thus contributing to livelihood uncertainty and vulnerability. Even more importantly in the context of water management, small-scale fisheries are significantly affected by processes outside their control. In particular, water allocation policy and investments (e.g. dams and irrigation schemes) are dominant factors driving many inland fishery dynamics. Additionally, the unpredictable institutional and policy environment typical of many countries in sub-Saharan Africa is a source of great uncertainty and potential threat. Further, the uncertainty induced by climate changes will in the future increase the unpredictability of fishery systems and competition for water, thereby impacting severely on the capacity of the local populations to rely on those resources to sustain their livelihoods. Faced with such constraints and multiple uncertainties, conventional management has, by and large, failed to provide a basis for sustainable development of aquatic resources. The project ‘Managing resilience in West African small-scale fisheries’ has been designed to initiate and guide major changes in the way small-scale fisheries in sub-Saharan Africa are assessed and managed. The project, which has a strong ‘action research’ orientation, aims to strengthen the resilience of fishing communities through the field-testing and application of an innovative framework for participatory diagnosis and adaptive management. Where effectively adopted, this new resilience management approach is expected to reduce the vulnerability of these fishing communities to external threats and changes, thus enhancing their capacity to contribute more actively to the process of economic development and poverty alleviation. Two pilot sites have been chosen in the Niger River Basin to try this new approach, one in Mali in the Inner Delta of Niger and one in Nigeria on the shore of Lake Kainji. The concept of resilience For the prospects of fisheries to improve, established theory, approaches, definitions of sustainability, and indicators of management performance have to be reconsidered (Andrew et al., 2007). The last decade or so has seen fisheries research and management broaden considerably in the search for better ways of addressing fisheries problems. New approaches, concepts, and methods, have been proposed such as the precautionary principle (FAO, 1995), ecosystem approach (FAO, 2003), sustainable livelihoods framework (Allison and Ellis, 2001), participatory methods and co-management (Pomeroy and Riveira-Guieb, 2006). More broadly, recent developments in socioecological theory have provided new concepts and approaches to move these issues forward (e.g. Folke et al.,

238
2002). In particular, a consensus has now emerged across disciplines (ecology, social sciences), that emphasizes the necessity to build management around the concepts of resilience and adaptive management (Carpenter et al., 2001; Walker et al., 2002). In a broad sense, analysis of ‘resilience’ is about the capacity of systems to adapt to shocks, recognizing that disturbance and change are integral components of complex systems. More formally, resilience analysis proposes to focus on mechanisms and processes that help systems absorb perturbations and shocks, and cope with uncertainty and risks. Defined in such a way, the concept of resilience thus appears particularly useful for the management of small-scale fisheries. While the resilience concept is appealing, however, particularly in the face of the failure of current management approaches, the danger is that it remains largely academic and theoretical, and not of great help in effectively improving the way natural resources are managed on the ground. The challenge, therefore, lies in a pragmatic approach to operationalizing the concept of resilience and making its implementation on the ground practical and meaningful. We propose a framework aimed at this objective. We illustrate it in the specific context of small-scale fisheries in the Niger River Basin. A framework to manage resilience In practical terms, the goal of resilience management is to ensure that the socioecological system under consideration will remain within a set of ecological and socially desirable configurations (Carpenter et al., 2001). One needs therefore to identify indicators and thresholds that define these desired configurations. This is the role of the first component of the framework: the participatory diagnosis. More formally, the objective of this participatory diagnosis is to identify key threats and resilience indicators specific to the system (in the present case a fishery). This participatory diagnostic can be implemented using various techniques. In our case, we use a 360° integrated assessment map -see also Garcia et al. (in press). The idea of this integrated assessment tool is to ‘scan’ in a systematic and comprehensive manner the system in order to gain a better appreciation of the true nature of drivers and processes that affect its dynamics. Four domains are considered: (a) natural system, (b) livelihood and people, (c) institutions and governance, and (d) external drivers (Fig.1).
Figure1. The 360° integrated assessment map. In each of those four domains, resilience indicators are identified, and the current conditions of the system assessed against those indicators, using a combination of quantitative variables and thresholds. One example is used here to illustrate the process. In the case of the indicator ’Asset and Income poverty‘ in the domain ’People and Livelihood‘, stakeholders (say, the fishing households) will be asked to assess their situation in terms of income by identifying two thresholds; one distinguishing what those households consider as a 'desirable' situation from an 'undesirable' one. Above, say, US$4 per household per day, the fisherfolk consider that their situation is satisfactory ('desirable'), while below that same US$4 threshold the situation is considered as unsatisfactory ('undesirable'). Finally, under a lower threshold of US$2 per day the households regard the situation as a ‘crisis.’ Over time (season, life), the households income varies, passing above or below the thresholds (Fig.2). The objective of resilience management is to ensure that household income remains in the 'desirable' zone.
Institution & governance
External drivers
Natural system
People & Livelihood
Fisheries and development policies Organizational and Institutional capacities
Access to markets and financial services
Collective action abilit ies
Legal framework
Governance performance and rights
Infrastructure
Land use and population pressure
Conflicts w/ other sectors / users
Macroeconomic instability
Climate change and environmental uncertainty
Fishing practices Aquatic ecos ystem conditions
Stock status and trends
Biodiversity
Competition
Living conditions
Diversification / income dependence
Asset and income poverty
Human capability

239
Figure 2. Assessing the conditions of the system against thresholds. Applying this approach to each of the indicators considered critical by the stakeholders, a dashboard can be constructed, which reflects, for each indicator, the perception of the stakeholders about the conditions of the system. Different stakeholders can contribute to the evaluation of different indicators (or even domains) of the system. One may, for instance, request a panel of experts to assess the situation of the system for the ‘external drivers’ domain, while the local community may be asked to express their views about the ‘people & livelihood’ or the ‘natural system’ domains. An abridged example of a dashboard is given below in Table 1, which was produced by key-stakeholders assessing the situation of the artisanal fisheries of Lake Kainji in Nigeria. Table 1. Example of dashboard –with one indicator per domain extracted from a full dashboard completed for Lake Kainji fisheries (Nigeria).
DOMAIN INDICATOR JUSTIFICATION VARIABLE THRESHOLD STATUS Natural System
Fish Biodiversity
Maintaining a high and stable biodiversity is crucial to fisheries and fisheries dependent communities. The sustainability of the fisheries is dependent on maintaining the ecological integrity of the natural resources.
Number of species available
- Desirable: > 130 species in the system
- Crisis: < 90 species
> 120 species (stable)
People and livelihoods
Health centers
Health facilities (e.g. hospitals, clinics, dispensaries, pharmacy) are vital to human capital and the sustainability of livelihoods. Health has implications for household and community productivity, poverty reduction and food security.
Distance to health facilities
- Desirable: < 5 km to health centers
- Crisis: > 10 km to health centers
> 10 km to health care centers (crisis)
Institutions and governance
Accountability of traditional institutions
Accountability and responsiveness of traditional institution is vital to providing a basis for measuring the confidence and cohesiveness of rural fishing communities.
Approval rating amongst community members
- Desirable: > 70% approval (accountable)
- Crisis: < 50% approval (low accountability)
> 80% (getting better)
External drivers
Infrastructure (roads)
Access road is important for easy movement of fish and other agricultural products to market
Percentage of feeder roads in motorable condition during the rainy season
- Desirable: > 70% in motorable condition
- Crisis: < 30%
< 10% (crisis)
The completion of the dashboard allows the identification of site-specific indicators for which the system is considered in crisis–in the present case the access to health services and the conditions of infrastructures–and for which immediate actions are requested. For those indicators, management actions will be identified and implemented by the stakeholders (with the support of the project) with the objective of bringing back the variables to levels considered as ‘acceptable.’ At the time of writing this article, the fishing communities of the two sites selected by the project in Mali and Nigeria are yet to identify the specific management actions they wish to pursue. Once those are identified, a continuous cycle of adaptive learning will be established. The project will help
US$ per day
7
6
5
4
“desirable”
“undesirable”
“crisis” time
Status at the time of the diagnosis: “undesirable” diagnosis
Households income –evolving over time

240
stakeholders to progressively enhance their ability to diagnose and respond to the various changes or shocks that affect the fishery. The improved managerial capacities that will result from this process will lead to better informed and more appropriate decision-making processes in the fishery. This adaptive process is expected to lead in the long-term to a more resilient management system and the reduction of the overall vulnerability of the households who depend on the fishery viability for their livelihoods. Discussion Because the dashboard allows presentation of indicators of any nature, it provides a powerful way to integrate the combinations of economic, environmental, and social dynamics which characterize the realm of fisheries management. In this sense, it is an effective tool for multi-criteria assessment. The main merit of using the dashboard, however, is in its capacity to initiate and then strengthen the resilience management process. First it helps all those involved in the process realizing that there is no one unique management target. This aspect is critical in the sense that it clearly distinguishes this approach from the perception that the large majority of practitioners and researchers still have about fisheries management: under the resilience approach, management is not about looking for the unique, or ‘fair’ solution, it is about negotiating a set of acceptable configurations, and agreeing on interventions, incentives, or constraints to stakeholder behaviors to ensure that the system stays within these negotiated and accepted configurations. By so doing the dashboard also helps stakeholders to realize that the management process is bound to rely on trade-offs between ecological, social, and economic indicators of management performance. A vivid example of these trade-offs could be a situation where catching ‘too many’ fish is a short-term objective that might be ‘acceptable.’ Indeed when small-scale fisheries are set within the reality of societies with great poverty, insecure food supplies, and/or variable fisheries resources, such levels of harvest may be necessary and unavoidable for a while as long as the overall system is not irreversibly affected. If run through a participatory process that involves a large range of stakeholders, the dashboard assessment exercise can easily create the preliminary conditions that facilitate the adoption, comprehension, and acceptance of the concept of resilience management amongst stakeholder groups that are not necessarily familiar with this rather abstract concept. The simplicity of the criteria (‘undesirable’ versus ‘desirable’ configurations) captures in a straightforward and clear manner the configurations of the system and management objectives. The dashboard can facilitate communication and knowledge exchanges between the different groups of stakeholders, thus making the negotiation process easier, and sets the stage for rules and patterns of social interactions between stakeholders during the following adaptive learning process. In particular it can facilitate the identification of mechanisms and options that allow the fishery to move away from undesirable states. The identified resilience indicators will then be used during the implementation of the adaptive management phase to monitor the ‘health’ and evolution of the system under a resilience management approach. Acknowledgments This paper presents findings from PN-CP72 ‘Participatory Diagnosis and Adaptive Management of Fisheries in the Niger River Basin,’ a project of the CGIAR Challenge Program on Water and Food, with additional support from WorldFish Center. References Allison, E.H., and F. Ellis. 2001. The livelihoods approach and management of small-scale fisheries. Marine Policy
25(5): 377-88. Andrew N., C. Béné, S. Hall, E. Allison, S. Heck, and B. Ratner. 2007. Diagnosis and management of small-scale
fisheries in developing countries. Fish and Fisheries 8(3): 227-40 Béné C., G. Macfadyen, and E. Allison. 2007. Increasing the contribution of small-scale fisheries to poverty
alleviation and food security. FAO Fisheries Technical Paper. No. 481. Rome, FAO, 125 p. Carpenter, S., B. Walker, M. Anderies, and N. Abel. 2001. From metaphor to measurement: Resilience of what to
what? Ecosystems 4: 765-81. FAO. 1995. Precautionary Approach to Fishing. Part 1. Guidelines on the Precautionary Approach to Capture
Fisheries and Species Introductions. FAO Technical Paper No. 250/1. FAO, Rome. 52 p. FAO. 2003. The ecosystem approach to fisheries. FAO Technical guidelines for responsible fisheries, 112 p. Folke, C., S. Carpenter, T. Elmqvist, et al. 2002. Resilience and sustainable development: Building adaptive
capacity in a world of transformations. Scientific Background Paper on Resilience for The World Summit on Sustainable Development on behalf of The Environmental Advisory Council to the Swedish Government. 33 p.
Garcia S., E.H. Allison, et al. (in press) Towards integrated assessment and advice in small-scale fisheries:
principles and processes. FAO Technical Paper FAO, Rome. 98 p. Pomeroy, R.S., and R. Riveira-Guieb. 2006. Fishery co-management: A practical handbook. CABI Publishing in
collaboration with IDRC (Canada): 264 p. Walker, B., S. Carpenter, J. Anderies, et al. 2002. Resilience management in social-ecological systems: a working
hypothesis for a participatory approach. Conservation Ecology 6, 14 p.

241
Enhancements and institutional arrangements for scaling-up fish productivity of
tropical reservoirs in Indo-Gangetic Basin
K.K. Vass, Pradeep K. Katiha, N.P. Shrivastava, and A.K. Das
Central Inland Fisheries Research Institute, Barrackpore–700 120 West Bengal, India [email protected]
Abstract In India, reservoirs are recognized as sleeping giants for fisheries development, with their large expanse (3.15 million ha) and vast untapped production potential. The project CP34 (of the CGIAR Challenge Program on Water and Food) is aimed at improving fisheries productivity and management in tropical reservoirs. In the Indo-Gangetic Basin, two reservoirs, Dahod (460 ha) and Pahuj (518 ha), were undertaken for fisheries development. Major interventions included: (1) enhancement through stocking of fish seed; and (2) improvement of the institutional arrangements for fish catching and marketing. Based on limnological parameters and biological productivity of the reservoirs, the fish seed stocking rate was estimated at 400 fingerling/ha. The experiments on in situ fish seed raising in enclosures (cages) recorded growth of common carp from 20 to 98 mm and grass carp from 19 to 83 mm in 105 days. The survival rate was over 50%. The fish seed thus raised was directly stocked in the reservoirs. The fishers were provided with cycles fitted with ice-boxes for transportation of fresh fish to nearby markets fetch better prices. Both the interventions yielded very encouraging results in one year of the project. The impact of the interventions led to increased fish landings by over 60%. The share of commercially important fishes in the catch also increased significantly. The fishing intensity increased both in terms of average number of monthly fishing days (16 to19) and number of fishers fishing per day (8.6 to 14). The project is targeted for a three-fold increase in fish productivity of reservoirs. These case studies are helpful to formulate strategies for reservoir fisheries development in the Indo-Gangetic Basin. Introduction In India, with its large number of river valley projects, a chain of impoundments has been created during the post independence period, with the primary objective of storing river water for irrigation, power generation, and public uses. The Indo-Gangetic Basin has 1.16 million ha reservoir area (37% of total Indian reservoirs). The maximum reservoir area is in the state of Madhya Pradesh followed by Uttar Pradesh and Rajasthan. The exploitation level of these waters is much below potential because of traditional methods of fishing and nonadoption of methods for improving production (Sugunan, 1995). Fish yield enhancement in these reservoirs is possible with low capital investment and practically negligible environmental degradation through culture-based fisheries interventions. Enhancement options include stocking species of commercial value, and habitat enhancements. Such enhancements will directly benefit poor traditional fisher communities, especially in the surroundings of the reservoir. With this background, project CP34 was implemented with the goal of improving fisheries productivity and management based on the assessment of socioinstitutional settings, limnological characteristics, and fish stocks. The interventions were made through enhancing tools (fish seed stocking and improving the habitat) and institutional arrangements (leasing policy and marketing). This paper briefly discusses the results of these interventions and the suggestions for overall reservoir fisheries development. Methods After the desk review and survey of Indian IGB reservoirs, Dahod (460 ha) in Madhya Pradesh and Pahuj (518 ha) in Uttar Pradesh were chosen by the project for fisheries development. The selected reservoirs are representative of small reservoirs of IGB. Physical, chemical, and biological analyses were conducted along with fish and fisheries, socioinstitutional environment, and potential markets for reservoir fish production. The physicochemical characteristics of reservoir water and sediment were analyzed by the methods of APHA, AWWA, WPCF (1992). The quality and quantitative estimation of food-chain was done by following standard methodology. The potential production of each water body was estimated on the basis of biophysical data and information generated on primary and secondary production. Results and discussion Physical features Dahod is an irrigation impoundment near Dahod village in Goharganj Tehsil of district Raisen in Madhya Pradesh. The impoundment was constructed in 1958 and has a surface area of 460 ha, with maximum depth of 9.2 m and mean at 3.4 m. Pahuj reservoir is near Jhansi in Uttar Pradesh. It was constructed in 1909 with an area of 518 ha,

242
maximum depth at 10 m and mean depth at 3.5 m. The volume of Dahod and Pahuj reservoirs was estimated at 27.75 and 18.25 million m3. Limnological profile Observations on limno-chemistry of water in Dahod reservoir revealed that water was moderately alkaline with water pH values of 7.3-8.6, alkalinity, 34-86 ppm, and hardness, 32-84 ppm. The concentrations of dissolved nutrients were in the range: nitrate-N: trace-280 ppb, phosphate-P: trace-220 ppb, and silicate-Si: 2.5-9.2 ppm. In Dahod 30 species of fish, 44 species of plankton, 31 species of macrobenthos, and 10 species of macrophytes were recorded. Macrophytes were dominant in the littoral zone. Phytoplankton dominated over zooplankton in all seasons, and among benthos, gastropods dominated followed by dipterans. In Pahuj reservoir, the limno-chemical profile of water revealed moderately alkaline water with pH values ranging between 7.4 and 8.7, total alkalinity was 80-220 ppm, and hardness 82-178 ppm. Dissolved nutrient concentration was nitrate-N: trace-210 ppb, phosphate-P: trace-180 ppb and silicate-Si, 2.9-6.2 ppm. In Pahuj reservoir 25 species of fish, 54 species of plankton, 12 species of macrobenthos, and 24 species of macrophytes were recorded. The zonation of macrophytes and distribution of benthos was closely related. A higher density of molluscs was recorded in the littoral zone. Phytoplankton were dominant at all six sampling sites of Pahuj recording blooms at times. Estimation of fish production potential The fish production potential on the basis of biophysical parameters was estimated at 290 kg/ha/year for Dahod and 300 kg/ha/year for Pahuj, reservoir, but the actual yield was only 40 and 78 kg/ha, respectively. The project targeted a fish yield of 125 kg/ha/year for both reservoirs. Enhancement strategies To achieve the targeted fish yield, strategies on habitat, stock, and species enhancements were formulated in consultation with all stakeholders. Habitat enhancement Both reservoirs were infested with weeds, which impacted negatively on the fish yield. In Dahod reservoir, stocking of C. idella (grass carp) was suggested to reduce the weed infestation. The fishing activities were suspended in Pahuj reservoir during the preproject period (2005-06 and 2006-07) as the reservoir could not be leased out due to drastic reduction in water level and inflow of domestic sewage and deterioration of the aquatic environment of the reservoir. The reservoir was weed-choked and contained a significant proportion of minnows. To provide a congenial environment for the commercially important fish species, planned fishing of minnows and weed clearance were implemented for habitat improvement. These interventions resulted in bulk harvest of minnows and considerable clearance of macrophytes. This resulted in development of carp fishery and shift in fish catch in favor of commercially important fishes. Stock enhancement As mentioned above, potential productivity of the reservoirs was estimated at 290 and 300 kg/ha/year for Dahod and Pahuj, respectively. The existing fish yield was much lower than the potential, which demanded stock enhancement in both reservoirs. Based on the gap between the actual and targeted fish yield, the stocking rate was estimated at 435 and 386 advanced fingerlings/ha for Dahod and Pahuj reservoir, respectively. The stocking protocol implemented involved direct seeding of fingerlings and fry raised in cages up to advanced fingerling stage, followed by stocking. In Dahod reservoir, out of 0.17 million fingerlings stocked, 60% fingerlings were directly stocked and 40% were raised in the cages. For Pahuj reservoir, out of 0.2 million fingerlings, 70% fingerlings were directly stocked and the remainder raised in cages. Species enhancement Another way of improving the productivity is through increasing the share of commercially important fish species in the total catch through species enhancements. The share of major carps in total fish production was 36 and 7% in Dahod and Pahuj reservoirs during the preproject period. These fish species fetch very good prices. An increase in their share would enhance the fishers’ income. Therefore, another intervention was through species enhancement. The species composition of stocked fingerlings was 45% C. idella, 10% C. carpio (common carp), and 45% Indian major carps in Dahod, while the composition of stocked fingerlings was 25, 10, and 65% of the same species in Pahuj reservoir. Raising of fingerlings in cages Availability of appropriate fish seed in time and space is the main constraint in reservoir fishery development. To overcome this problem, fingerlings were raised from fry (18 mm average length) in situ in enclosures at both the reservoirs. The results are highlighted below: Cage experiment in Dahod

243
In the first phase, one battery of eight cages was installed in the reservoir with each cage 5 m x 3 m x 3 m. The cages were stocked with 90,000 (C. idella–54,000, C. carpio–36,000) fish fry (20-22 mm size). After a rearing period of 105 days 45,240 fingerlings (survival–50%) were released into the reservoir. The stocking size and weight of C. idella was 70-96 mm and 5.0-11.0 g, respectively, while for C. carpio, it was 85-112 mm and 19-26 g, respectively. In the second phase, two batteries of eight cages each were installed. In three cages 36,000 Indian Major Carp fry of 30-34 mm size (L. rohita: C. catla: C. mrigala = 5: 2: 3) were released. After a rearing period of 150 days, 23,322 fingerlings (survival–64.7%) were recovered and stocked in the reservoir. The stocking size and weight for different species was: C. catla: 90-150 mm and 19-32 g, L. rohita: 88-160 mm and 15-28 g and C. mrigala 82-130 mm and 12-23 g. In the remaining 13 cages 140,000 fry of C. idella (40%) and C. carpio (60%) were raised to fingerlings. After a rearing period of 160 days, 107,693 fingerlings (survival–77%) were released into the reservoir. The stocking size of C. idella was 98 mm in length and 3-10 g in weight as compared to C. carpio 72-110 mm in length and 10-21 g in weight. Cage experiment at Pahuj In Pahuj reservoir one battery of eight cages (each cage size 5 m x 3 m x 3 m) was installed and 100,000 fry (C. idella 74% and C. carpio 26%) were released. The length of fry at release was 16-28 mm. After a growing period of 145 days 62,400 (survival–62.4%) fingerlings were released into the reservoir. The stocking size for C. idella was 65-96 mm in length and 4-12 g in weight. For C. carpio stocking size in length was 74-115 mm and in weight was 12-22 g. Institutional arrangements The policy documents and Fisheries Acts of State Department of Fisheries (DoF) of both States were procured to have details of institutional issues related to fishing regimes and leasing systems. Both the reservoirs are under the ownership of the irrigation department. For fisheries purpose, the reservoirs are controlled by respective DoF. At Dahod reservoir, DoF was responsible for fisheries management including fish seed stocking, and monitoring of fish catch. Besides fisheries, the reservoirs were used for irrigation to agriculture, domestic potable water supply, flood control, and day to day domestic uses for the littoral population. Dahod The fishing rights of Dahod reservoir are with the three cooperative societies. The fishers of these societies are fishing in the reservoir on royalty basis @ Rs. 15/ kg for major carps and Rs. 8/ kg for minor carps. The fishers pay the royalty to DoF and dispose the catch either by themselves or to a local dealer or wholesaler. The disposal pattern depends upon its quantum. Small quantity is either pooled by the fishers or disposed off locally, and in case of a larger quantity, it is disposed of at wholesale market at Bhopal. Pahuj Pahuj reservoir witnessed different fishing rights since its adoption for fisheries. The fishermen cooperative had the fishing rights with a royalty system during 1961-81, followed by fixed quota during 1982-92 and free quota during 1994-2005. After 2005, the fishing was suspended for 2 years as the fishing rights of reservoir could not be auctioned because minimum lease amount fixed by DoF was very high. During 2007 the reservoir was leased out to the contractor for a period of 3 years at INR 0.8 million/year with 10% annual increase. Across different systems, the highest yield was under free quota 75 kg/ha and the minimum in fixed quota 33 kg/ha. The lease of the reservoir has been transferred to a contractor since 2007-08. He was a member of the earlier lessee fisher cooperative society. The contractor and his associates are responsible for fisheries management, monitoring, and fish seed stocking in the reservoir. The contractor engages the fisher parties/ local fishers for fishing in the reservoir. The fisher/fishing party hands over the fish catch to the contractor. The remuneration for fishers depends on the negotiations between the fishers and the lessee. Similar to Dahod, disposal of catch at Pahuj reservoir depends upon its quantum. The contractor collects the catch from fishers/fishing party and disposes of it either for auction at the wholesale market for local consumption or to terminal markets (Kolkata, Delhi, Amritsar, Lucknow, Gorakhpur) in case of higher catch. The irrigation was the priority activity with fishing as the secondary. The constraints of multiple use were primarily due to escape of fish from the sluice gates during release of water for irrigation and maintenance of minimum water level for fish. The latter was generally not common as water at the dead storage level of the reservoir is sufficient for requirements of fish. Regarding escapement of fish, the loss was estimated at 5-15%. To minimize this loss, the irrigation department would inform the dates and time of opening of gates, so that fishers can take care of this loss at a barrage downstream. Furthermore, demonstration of improved fish productivity and increase in revenue from fisheries would highlight fishing as one of the major activities, and emphasize the holistic approach for reservoir water use favoring or promoting fisheries. These efforts may be supplemented with measures for improving the efficiency of postharvest operations including marketing.

244
Impact of the interventions The impact of interventions made was assessed in terms of increase in fish production and fishing intensity (number of fishers and fishing days). The information on fish landings and fishing efforts was gathered from landing sites and records of respective DoF of Madhya Pradesh and Uttar Pradesh. To assess the impact these parameters were compared for pre- and post-project period. Dahod It is the second year of the fisheries enhancements under the project and the impact is thus only available for one year of interventions. The interventions have increased the fish production of the reservoir from 20 to 22 t (Table 1). The maximum increase was for major carps (51%), while the catch for other categories of fish had declined. The composition of fish catch of the reservoir was changed in favor of stocked fishes, the major carps. It indicated a positive impact of fisheries enhancements on the reservoir productivity. The outcomes of interventions will be more pronounced with time, as impact of regular stocking, species, and habitat enhancements will be visible through better fish harvests in future. The result promises immense scope for fisheries enhancement and other institutional interventions for scaling-up and scaling-out. Recognizing the impact of the project, state DoF put forward a massive plan for implementation of these interventions in most of the reservoirs of the state. Table 1. Impact of interventions on fish catch of Dahod reservoir. Fish category Fish catch(in t) %
increase Fish catch (in %)
Pre Post Pre Post Major carps 7.36 11.14 51.47 36.31 50.52 Catfishes 5.98 4.98 -16.80 29.52 22.56 Miscellaneous 7.02 5.93 -15.65 34.66 26.86 Total 20.26 22.06 8.86 100.00 100.00 The fishing effort per month of one of the lessee fisher societies was compared for pre- and post-project implementation period (Table 2). An increase in fishing effort in terms of average number of fishing days/month and number of fishers/day was noted. The average fishing effort reached over 263 fishing days/month, up from 138 indicating that fishing effort was nearly doubled after implementation of the project. Table 2. Impact of intervention on fishing effort at Dahod reservoir. Period Fishing
days/month No. of fishers/day
Effort/month
Pre 16.00 8.65 138.40 Post 18.50 14.23 263.26 % change 15.63 64.51 90.21
One of the major problems in fish disposal is access to the reservoir and maintaining quality of fish before its disposal. To solve these problems market and transportation support was provided to the Fisherman Cooperative Societies in the form of six bicycles fitted with iceboxes. The market survey and opinions of fishers and market intermediaries revealed good impact of the intervention. The fishers were also encouraged to operate collectively to reduce cost of transportation, storage, and marketing and better bargaining for price negotiations with the local dealers. The fishers are now able to transport their catch promptly and in good condition, which increases the remuneration of their catch. The provision was also made under the project for one boat for prompt assembling and monitoring of catch. These interventions are expected to result in better remuneration and income of fish catch for the fishers in the coming years. It was suggested that the fishers establish a separate shop at the local or primary wholesale fish market with a freezer for the storage and maintenance of better quality fish. It is expected that this will help fishers to fetch better prices for their produce. Pahuj Impact of interventions on the fish production and composition were analyzed and an evident positive impact was noticed for both the production and composition of fish catch. As mentioned earlier, fishing was suspended in the reservoir for 2 years prior to its adoption under the project. Habitat enhancement in terms of harvesting of minnows resulted in 300 t of fish, which were dried and sold at a very good price. After the clearance of weeds and minnows, the reservoir became favorable for commercial fisheries. The fish catch for only 3 months during project implementation period was more than fish production for whole the year during preproject period. The total production increased from 26 to about 42 t (Table 3).

245
Table 3. Impact of interventions on fish catch of Pahuj reservoir. Fish category Fish catch (t) %
increase Fish catch (in %)
Pre Post* Pre Post* Major carp 6.62 8.97 35.50 25.40 21.50 Minor carp 4.97 3.24 -34.81 19.07 7.76 Catfish 2.49 13.32 434.94 9.55 31.92 Weed fish 11.98 16.2 35.23 45.97 38.82 Total production 26.06 41.73 60.13 100.00 100.00 *Catch only for March-June. This indicated an increment of over 60% in catch. The maximum percentage increase was for catfishes followed by major carps and weed fishes. The fisheries favored catfishes due to easy availability of food, but they were difficult to harvest during pre-project period. Clearance of weeds and minnows during the project period made their fishing easy and led to a four-fold increase in their catch. The increment in catch of major carps was over 35%. Considering the wide gap between existing and potential fish production in the reservoir, regular stocking of carps is expected to improve their production and contribution in total catch significantly. This statement may be supported by the first year results of the project. The results also indicated that stocking and species enhancements had changed the catch composition in favor of stocked fishes, the desired outcome. The reservoir is located near Jhansi city and has good fish demand. Considering this demand for fish, it was suggested to have a separate shop of the contractor/fishers at the primary wholesale fish market at Jhansi with a deep freezer for the storage and maintenance of better quality fish to fetch higher prices. The fishers have given consent to implement this intervention. Further, involvement of reservoir fishers and their family members for direct disposal of fish catch in retail market as vendor to the consumers was also suggested. Potential local markets were identified for direct sale of fish. The fishers received better prices and returns after following this intervention. Institutional interventions for scaling up and scaling out The results of the project regarding fisheries enhancements, change in institutional arrangements and postharvest operations were regularly discussed with senior officials from fisheries development agencies: Ministry of Agriculture, Government of India, State Department of Fisheries, National Fisheries Development Board, Fishermen organizations. The agencies are convinced about the positive impact of project outputs and agreeing for their scaling-up and -out. They are willing to implement the project outputs in a phased manner with stakeholders’ participation. The State of Madhya Pradesh has already initiated to implement the project outputs in 50 reservoirs under the supervision of our institute (CIFRI, Barrackpoore) to improve fish productivity. Conclusions Most of the Indo-Gangetic Basin reservoirs have a wide gap between the actual and potential fish production and productivity. The major reasons for this gap are traditional fisheries management practices and the institutional environment. The project documented two reservoir fisheries management success stories. Fisheries enhancement results in increased fish productivity. Regarding institutional environment, two major constraints of multiple use with priority for irrigation, were escape of fish during release of water for irrigation, and maintenance of minimum water level for fish. Improved fish productivity in the reservoirs established fisheries as one of the major activities. It has put more emphasis on a holistic approach for reservoir water use favoring or promoting fisheries. These efforts are supplemented by providing the institutional and physical support for efficient fish marketing practices. Scaling-up of these fisheries management norms through their refinement at different sites and conditions and their scaling-out with stakeholders (DoF and fishers) participation would enhance reservoir fish productivity of Indian small reservoirs, and uplift the socioeconomic status of poor fisher communities operating in these reservoirs. Acknowledgments This paper presents findings from PN34, 'Improved fisheries productivity and management in tropical reservoirs,' a project of the CPWF Challenge Program on Water and Food, implemented in the Indo-Gangetic Basin. References APHA, AWWA, and WPCF. 1992. Standard Methods for Water and Waste Water Analysis. American Public Health
Association, 1130 pp. Sugunan, V.V. 1995. Reservoir Fisheries in India. Rome. FAO Fisheries Technical Paper No. 345, Food and
Agriculture Organisation, p 6.

246
Community-based fish culture in seasonal floodplains and irrigation systems
Natasja Sheriff1, Robert Arthur2, Benoy Barman3, and Meen Chee Hong1
1WorldFish Center, Penang, Malaysia [email protected]
2WorldFish Center, Phnom Penh, Cambodia 3WorldFish Center, Dhaka 123, Bangladesh
Abstract The Challenge Program on Water and Food project ‘Community-based Fish Culture in Seasonal Floodplains’ is a 5-year interdisciplinary action research project with an overall aim of enhancing fish production in seasonal floodplains to improve and sustain rural livelihoods. The research is being carried out in seasonally flooded areas where rice is cultivated on individual household plots during the dry season. During the flood season, the same land is inundated, creating an open access waterbody, subject to multiple uses including the capture of wild fish. The project has sought to develop technologies and institutional arrangements to support collective fish culture in the flood season appropriate to a variety of environmental and sociocultural settings represented by Bangladesh, Cambodia, Vietnam, China, and Mali. In the fourth year of implementation, the development of collective approaches to fish culture with local stakeholders has met with varying degrees of success. Negotiating access, the development of community-based management institutions, and benefit-sharing arrangements within a system where rights are dynamic, overlapping, and heterogeneous has created particular challenges for the development of the project. The variable success of the community-based fish culture activities in the project countries has led to a deeper consideration of context and its contribution to the success or failure of collective action under differing socioecological conditions. Media grab WorldFish initiative supports learning and adaptation to encourage rural households to innovate and develop locally appropriate technology for fish culture in seasonal floodplains. Introduction Seasonal flooding in many parts of Asia and Africa creates a dramatic shift in livelihoods and resource production for many households in floodplain areas (IIRR, IDRC, FAO, NACA, and ICLARM, 2001). During the dry season, agricultural production dominates, with cropping of rice and other commodities for sale and domestic consumption. Boundaries between private and commonly owned land are clear, and households focus on production from their individual homesteads or by providing labor to other households. In the flood season, land boundaries in deep-flooding areas become indistinct, and many areas revert to common ownership. Water resources become subject to multiple uses by multiple users. Fish production in these areas is based on the capture of wild fish. The community-based fish culture project is based on the premise that production from these water bodies could be enhanced by stocking locally important fish species, providing local communities with an additional source of income and an increased supply of affordable fish for sale or consumption (Dey and Prein 2003; WorldFish 2002; IIRR, 2000; Sinhababu et al., 1984). The added investment, however, required by resource users to sustain this intervention has important implications for access arrangements to waterbodies as well as their potential productivity. This concern is echoed by Haylor et al. (1997) who note that if the owners of rice fields suitable for fish production fence off their fields (converting access from open to private), this could affect access to fish by the poorest. Intervention therefore requires the participation and support of multiple resource users. With stakeholder support, the project is testing a range of models for collective approaches to aquaculture in the five project countries. Methods The project is being implemented in selected sites in five countries: Bangladesh, Vietnam, Cambodia, China, and Mali. Sites were selected based on hydrological conditions (height, extent, and duration of flooding), existing infrastructure (dikes, irrigation canals), and willingness of local communities to participate in the project, and support from local authorities. Although the exact nature of participation varies between countries, membership of a fish culture group, convened to undertake fish culture activities and to share the benefits of fish production, is open to all members of the community who wish to join. A management committee is elected from within the group to provide leadership and to oversee the coordination of fish culture activities. The creation of fish culture groups is supported by field staff from within the national partner institutions, who visit the groups regularly to provide guidance to farmers and, occasionally, to assist in conflict resolution. Fish stocking has been carried out at each of the project sites under the guidance of national partners with expertise in local aquaculture systems. Locally preferred species have been stocked in polyculture systems, with stocking densities and proportions varying from year to year as the culture systems have evolved. Enclosure designs have similarly been locally adapted and modified.

247
Results Implementation of the project has lead to a range of outcomes, both anticipated and unanticipated. Collective approaches to aquaculture have met with variable success in each of the project countries, with the project delivering different levels of benefits both within and between countries. Negotiating access, management institutions and benefit sharing arrangements within a system where rights are dynamic, overlapping, and heterogeneous has created particular challenges for the development of the project. In Bangladesh, successes have been substantial at some project sites, whereas disputes, conflicts, and ultimately discontinuance have arisen at others. Building on previous community-based fisheries management experience in the country, community-based fish culture has been introduced in floodplains subject to a complex array of administrative arrangements. The project is currently being implemented in government khas lands, or land reserved for distribution to the landless, and in areas with public and private ownership with no leasing arrangements. In each system, enclosures have been created within floodplain depressions. Fish culture is managed by a Floodplain Management Committee made up of representatives from all communities surrounding the floodplain, with participation of landowners and landless. As described by Haque et al. (2008), however, the complexities of access and ownership to land, water, and fishing rights have created serious challenges to the project. Despite these challenges, the community fishers’ society at Beel Mail, Rajshahi District, with the support of local authorities, has secured an extension to their current leasing arrangement allowing them to continue fish culture until 2013. Fish culture is now financed by savings from successful fish culture during previous years. Fish culture activities in southern Vietnam have been introduced on a collective basis in flooded rice fields of the Mekong Delta. In contrast to Bangladesh, the flooded land is entirely under private ownership, with members of the fish culture group drawn from households whose land is situated within the flooded area. Where annual flood height is low enough to permit the creation of enclosures around individual household plots, there has been a general preference toward fish culture on an individual basis, or a third rice crop, and insufficient incentive for farmers to work together collaboratively to raise fish. Consequently, there have been high levels of discontinuance of community-based fish culture in these areas, although approaches to collective fish culture are now evolving amongst groups of households who favor fish culture in a small number of enclosed rice fields. In the provinces of the Mekong Delta that border Cambodia, flood waters are deep, permitting only two rice crops each year. In these areas, the cost of creating individual enclosures, using fences of sufficient height to contain stocked fish, is prohibitive, making collective fish culture a more viable option. Benefit-sharing arrangements, management, and leadership of fish culture in community groups and fish marketing present significant challenges to the success of the approach. In Cambodia, establishing community groups to successfully manage fish culture within flooded areas has proved problematic. Fish culture activities have been introduced in open access reservoirs and flooded rice fields. Initially, households were keen to participate in the project. Farmers have since demonstrated a preference for fish culture on an individual basis, introducing the technology instead on their own homesteads and private plots. As in Vietnam, in some areas there has been a move toward collective fish culture amongst smaller fish culture groups of 10-12 households who practice fish culture in 3-4 enclosed rice fields. Members of these fish culture groups are currently improving the rice field environment for fish culture by creating ditches along the rice field perimeter to act as refuges when waters are shallow. Fish culture activities have only continued in Takeo province, a fish-deficit area. The approach has met with less success in Prey Veng province. Although the reasons for this failure are not yet clear, it is possible that incentives to participate may be lower due to the presence of support from numerous international organizations and NGOs. During the next phase of project development, community-based management of dry-season fish refuges will be introduced. Farmers in China have adopted a different approach to collective fish culture than their counterparts in other project countries. The project is being implemented in two provinces, Yunnan and Jiangsu. In Jiangsu province, fish culture has been introduced into irrigation canals. In Yunnan, fish have been stocked in flooded rice nurseries that are also used for the production of lotus. In both cases, management of fish culture has been entrusted to an individual who acts as a caretaker, feeding and guarding the stocked fish. In return, they receive a larger proportion of the benefit from production, with the remainder shared amongst project participants and local community funds. Fish culture is a new activity in Mali, creating a new set of challenges in addition to those faced in the Asian countries. Fish will be stocked into mares or floodplain depressions, which are generally managed by one community. Caution is needed to ensure that the introduction of fish culture does not undermine traditional access to the water, subject to multiple uses by a variety of resource users, or that the change in value of both the water resource and fish production transforms the management and allocation of rights to water and fishing. A detailed analysis of access rights and institutions forms the basis of the research in this area. The variable success of the community-based fish culture activities in the project countries has led to a deeper consideration of context and its contribution to the success or failure of collective action under differing socioecological conditions, recognizing that the results of stocking are often unexpected (e.g. Lorenzen and Garaway, 1998; Garaway, 2006; Garaway et al., 2006). Socio-political history, in particular, is likely to have had a strong influence on project success. For example, the suggestion that private property, although no longer recognized as privately owned during the flood season, should revert to collective management for the purposes of fish culture has important implications in countries such as Cambodia and Vietnam, where recent history makes collectivization socially sensitive. At the local level, an additional range of factors can be said to influence the sustainability of community-based institutions, including social context and motivation for collective action, group

248
leadership, local markets, ecological context, and the role of the implementation process itself. Recognizing the broad influence of context on project success, a framework was developed to guide the research during the final phase of the project (Figure1). The framework provides a basis for the comprehensive analysis of the many factors that make up the complex socioecological context in which the project sites are embedded. Adopting a political ecology perspective, the framework addresses issues of historical, political, socioeconomic and cultural context, placing them firmly within an understanding of the socioecological linkages occurring at the landscape level. The application of the research framework in each of the project countries will help to generate a deeper understanding of the factors that have led to the success and discontinuance of collective fish culture, and to assess the potential role of collective fish culture as a multiple use, floodplain system.
Figure 1. Framework for understanding socioecological factors supporting or constraining collective approaches to aquaculture, and the potential contribution of collective aquaculture to the multiple use of floodplain resources. Discussion The introduction of collective approaches to fish culture in a group of countries that are culturally, politically, and geographically diverse has created a number of challenges to the implementation of project activities (addressing sensitivities to collective action, negotiating benefit sharing with a range of stakeholders, ensuring equitable access to resources amongst multiple users, promoting participatory decision-making in the identification and implementation of technical and institutional options for fish culture). It has also provided an important opportunity for developing a greater understanding of a range of issues of increasing significance to the allocation and management of natural resources. Water, and the aquatic resources it supports, is often subject to multiple use and overlapping access and use rights (Bene, 2003; Benda-Beckmann et al., 1996; Meinzen-Dick and Knox, 1991). Seasonal floodplains are a particularly dynamic example of these changes in rights, at the interface of both land and water resource use. This creates a particular set of social and ecological challenges for resource management. Within the context of the community-based fish culture, the dynamic nature of property rights is a significant factor. Dry season private property is submerged during the flood season, creating open access water bodies available for use by multiple resource users. In addition to this complex set of rights to both water and land are the rights associated with the capture of wild fish. Despite the private ownership of the flooded land, the capture of wild fish is generally not restricted, and landowners accept open access conditions on otherwise private land. Numerous overlapping rights, coupled with issues of enclosure and fisheries enhancements, introduce additional layers of interest to the management of land, water, and fish resources. However, integrating aquaculture into existing water systems can change this dynamic (e.g. Lorenzen and Garaway, 1998; Garaway, 2006).

249
Conclusions and recommendations It is clear from experiences to date that the socioecological context plays a major role in the success or failure of collective action. The historical and social context into which any intervention is introduced is likely to influence the success and outcomes of collective action. The Community-Based Fish Culture project aims to contribute to the growing body of knowledge on collective action in multiple-use systems where property rights are dynamic. At this stage, the Community-Based Fish Culture project has introduced collective approaches to fish culture in five socially, politically, and geographically diverse countries where it has the potential to increase the production of living aquatic resources from floodplains. Despite the processes of adaptation and evolution of collective fish culture systems to fit local needs, the approach has had variable success within and between countries, suggesting that the conditions under which collective fish culture is appropriate must be better understood. The conditions that support and constrain collective approaches to fish culture in different socioecological contexts will be explored using a detailed framework of analysis during the final phases of the project. Introducing community-based or co-management approaches to resource management must respond to local complexities, and acknowledge that the associated incentives to adopt collective approaches may not always be sufficient to support sustainable community-based institutions. The complexity of rights and access encountered in the floodplain context add an extra dimension to current knowledge and experience regarding collective action. It is, therefore, essential to understand the local context, and to evaluate the potential impacts of intervention on existing access and ownership dynamics prior to the introduction of any new technology. Acknowledgments The authors would like to acknowledge the contribution of Benoy Barman, Hong Meen Chee, Aaron Russell and partner institutions in the project countries to the development of the ideas in this paper. Thanks to Sophie Nguyen-Khoa, Martin van Brakel and Louisa Evans for reviewing the paper. This paper presents findings from PN35 ‘Community-based Fish Culture,’ a project of the CGIAR Challenge Program on Water and Food. References Benda-Beckmann, F. von, K. von Benda-Beckmann, and H.L.J. Spiertz. 1996. Water rights and policy. In H.L.J.
Spiertz and M.G. Wiber (eds.) The Role of Law in Natural Resource Management. VUGA, Netherlands. Bene, C. 2003. When Fishery Rhymes with Poverty: A first step beyond the old paradigm on poverty in small-scale
fisheries. World Development, V 31(6) 949-75. Dey, M.M., and M. Prein. 2003. Participatory research at landscape level: flood-prone ecosystems in Bangladesh
and Vietnam. In: Managing Natural Resources for Sustainable Livelihoods: Uniting Science and Participation. B. Pound, S. Snapp, C. McDougall, and A. Braun (eds.) Earthscan, London 252p.
Garaway, C.J. 2006. Enhancement and Entitlement–the Impact of Stocking on Rural Households Command over
Living Aquatic Resources: A Case Study from the Lao PDR. Human Ecology, 34: 655-76. Garaway, C.J., R.I. Arthur, B. Chamsingh, P. Homekingkeo, K. Lorenzen, B. Saengvilaikham, and K. Sidavong.
2006. A social science perspective on stock enhancement outcomes: lessons learned from inland fisheries in southern Lao PDR. Fisheries Research, 80: 37–45.
Haylor G., A. Lawrence, and E. Meusch. 1997. Identification of technical, social and economic constraints to the
rearing of fish in rice fields in Lao PDR. Project Report, 3 volumes for DFID, NRSP Project R6380CB. DFID: London.
IIRR. 2000. Rice-fish culture in deepwater rice farming system. Report of the International Institute of Rural
Reconstruction. IIRR, IDRC, FAO, NACA, and ICLARM. 2001. Utilising different aquatic resources for livelihoods in Asia: a resource
book. International Institute of Rural Reconstruction, International Development Research Centre, Food and Agriculture Organization of the United Nations, Network of Aquaculture Centers in Asia-Pacific, and International Center for Living Aquatic Resource Management. 416p.
Lorenzen, K., and C.J. Garaway. 1998b. How predictable is the outcome of stocking? In: Inland fishery
enhancements. (ed. T. Petr). Rome, FAO Fisheries Technical Paper 374: 133-52. Meinzen-Dick, R., and A. Knox. 1991. Collective action, property rights, and devolution of natural resource
management: a conceptual framework. In: Meinzen-Dick, A. Knox, and M. Di Gregorio. Collective action, property rights and devolution of natural resource management. CGIAR.
Sinhababu, D.P., B.C. Ghosh, M.M. Panda, and B.B. Reddy. 1984. Some preliminary observations on physico-
chemical characteristics of soil and water under rice-cum-fish culture. Journal of the Inland Fisheries Society of India, 16(1 and 2): 58-61.
WorldFish. 2002. Increasing and sustaining the productivity of fish and rice in flood-prone ecosystems in South and
Southeast Asia. Final Report to IFAD prepared by WorldFish Center, Penang, Malaysia.

250
Institutional issues on management of seasonal floodplains under community-based aquaculture to benefit the poor in Bangladesh
A.B.M.M. Haque1, Benoy Barman2, and Madan Mohan Dey3
1PhD Fellow, WorldFish Center, Bangladesh and South Asia Office, [email protected]
2Worldfish Center, Bangladesh and South Asia Office 3University of Arkansas, USA
Abstract Bangladesh is endowed with large numbers of common pool aquatic resources. Sound institutional arrangements are important for sustainable management and uses of those resources. Our analysis of formal and informal institutions governing community-based fish culture in seasonal floodplains was carried out in three floodplains of the Indo-Gangetic River Basin, located in different regions of Bangladesh. The present study was carried out in 2006-07 to understand the complex institutional relations that govern ownership, access, and control of the floodplains brought under community-based fish culture with a goal to increase fish production, income, and overall livelihood gains of the poor. This study makes use of participatory approaches and involved diverse stakeholders from formal and informal institutions. The important institutions identified were: Department of Fisheries (DoF), Department of Land (DoL), and Local Fisheries Society. Important stakeholders included were lease holders of public water bodies in the floodplains, private landowners, seasonal and professional fishers, and poor people living in communities adjacent to floodplains. The outcomes of the study revealed important similarities as well as differences in institutional arrangements between the floodplains under study. This constitutes a vital part of the institutional analysis of the project and is of importance to develop institutional options for effective management of community-based fish culture in seasonal floodplains in Bangladesh. Media grab This paper identifies effective mechanisms and institutional arrangements for involvement of different stakeholders in community-based fish culture in seasonal floodplains. Introduction Seasonal floodplains are water bodies that retain water for 5-6 months during which they are suitable to grow fish and other aquatic animals. During dry months they are largely used for rice production. There are 3.0 million ha of floodplains in Bangladesh. A large proportion of these are suitable for fish culture (Dey and Prein, 2004; WorldFish Center, 2007). The floodplains differ largely in physical features, size, ownership and location. Previously, irrespective of ownership regimes, most of the floodplains were used as common pool resources for harvest of fish and other aquatic animals and plants during the monsoon. In recent years the demand for floodplain fish production has increased largely due to decreasing trends in capture fish production from the floodplains. It was also realized that floodplains offer a high potential for increased production through fish culture during monsoon. Attempts to bring the floodplains under fish culture to increase production and include the poor in sharing the benefits are surrounded with complexities, however. Institutional issues are amongst the most important challenges for achieving success. Ownership regimes of the floodplains in Bangladesh are diverse and complex with some floodplains being completely under public ownership, some public but surrounded by private lands, and some under completely private ownership. Floodplains with public ownership are normally leased out by the DoL in auction, with a priority to get leased by registered fishers’ society. In most cases it is the moneyed and politically influential people who paid lease money and took control over the floodplains to use it for fish culture. There are initiatives to bring privately owned floodplains under fish culture by contract between the owners and individual entrepreneurs. Initiatives to bring public and privately owned floodplains under community-based systems with multiple beneficiaries are less common, however. The present study improves our understanding of the complex institutional relations governing community-based fish culture in seasonal floodplains. The purpose of the study is to identify appropriate institutional options for the sustainable use of floodplains and maximize their benefit to large numbers of people, including the poor in Bangladesh. Methods Three floodplains of Brahamaputra, Padma, and Teesta river basins located in different areas of Bangladesh were selected for the studies by the researchers in collaboration with DoF. The floodplain ‘Beel Mail’ at Mohanpur in Rajshahi is located in the Padma River Basin. The floodplain ‘Angrar Beel’ in Pirgonj, Rangpur, is located at Teesta River Basin, and ‘Kalmina Beel’ in Fulbaria, Mymensingh, located at the Brahamaputra River Basin of Bangladesh.

251
All three floodplains selected for the studies were large under two types of ownership categories: ‘public and private’ and ‘private.’ The floodplain Beel Mail (40 ha) is under public ownership with public water bodies (15.2 ha) surrounded by privately owned land (24.8 ha). The two other floodplains, Angrar Beel (31 ha) and Kalmina Beel (33 ha), were under private ownership. In selecting floodplains, the feasibility of putting fencing in some of the outlets with minimum investment to prevent the escape of stocked fish was an important criterion. The presence of solidarity among the people in the communities surrounding the floodplains, and their interest in implementing the project, was taken into account (Dey et al., 2005). The communities surrounding the floodplains were visited and the lists of beneficiaries with basic information were collected. The specific details of different types of beneficiaries were collected through further visits and by arranging focus group discussion (FGD) with them. For each floodplain a floodplain management committee (FMC) was formed from the representatives of different types of beneficiaries in a participatory way. With support from DoF and the research team the FMC developed an annual work plan, budget, and implementation of activities of community-based fish culture in the floodplains. They played a role in the resolution of conflicts and took part in the distribution of income among the beneficiaries of the project. In addition a project implementation committee (PIC) was formed at the local level with representation from DoF, other related government departments, the representative of the research team, and the leaders of the FMC (the president and the secretary). The PIC was formed to encourage establishment of comanagement strategies in the use of floodplains for fish culture for its effectiveness and greater sustainability. Several authors emphasize the importance of comanagement of common resources (Ostrom, 1990; Pinkerton, 2003). In the use of community resource for the benefits of diverse groups of stakeholders, it is important to establish norms and rules through establishing comanagement strategies. As an action research process, initiatives were taken to empower the poor fishers by different measures (advocacy, awareness workshop, and exchange visit). During the studies, specific details on involvement of institutions (formal and informal) and their roles were recorded. Results and discussion Ownership of floodplains and beneficiaries Floodplains completely under private ownership (Angrar Beel and Kalmina Beel) were similar in size, with similar numbers of beneficiaries and similar proportions of different types of beneficiaries (landless, fishers, and landowners) with similar numbers of communities surrounding the floodplains. For the floodplain with public ownership and surrounded by private lands (Beel Mail), the public land was leased out. For this floodplain it was the fishers’ group that constituted the majority (55%) among the beneficiaries. The area of the floodplain was larger than that in Angrar Beel and Kalmina Beel, but the total number of beneficiaries was lower (Table 1). The higher proportion of fishers among the beneficiaries in Beel Mail was related to the fact that they were the leaseholders of the floodplain. In floodplains under public lease normally the lessees took control over the floodplains (including the private lands) during monsoon. Landowners involved as beneficiaries, in this case, were politically influential and solvent people. They earned income from the floodplain through returns on their financial investment in the scheme (they paid the lease value, management cost, and security), rather than as landowners (DoF, personal communication). In privately owned floodplains brought under community-based fish culture, landowners were the major stakeholders. The inclusion of landless and fishers, however, who get benefits from the system, was also given importance. Table 1. Numbers of different beneficiaries in floodplains brought under community-based fish culture. Floodplain Area (ha) Number of
communities Number of beneficiaries (%)
Landless Fishers Landowner Total
Angrar Beel 31 5 38 (22) 23 (13) 110 (65) 171
Kalmina Beel 33 5 52 (29) 25 (14) 97 (57) 174
Beel Mail 40 5 22 (18) 68 (55) 34 (27) 124
Total 104 11 112 (24) 116(25) 241 (51) 469 Dey et al. (2005) carried out pilot studies on community-based fish culture in privately owned small (1.3 to 18.3 ha) seasonal floodplains in Bangladesh, with an average of 38 beneficiaries. Overall, they demonstrated success in fish production and income earning. But flooding and escapes of fish, social conflicts within the community, and conflicts resulting from inclusion of people from outside the community caused poor performance and discontinuation of the activities. Social harmony among the group members is important in the success of community-based fish culture in the floodplains. Institutions and their roles Formal and informal institutions played their role in bringing the floodplains under community-based fish culture. Institutional linkages between DoF, WorldFish Center and Bangladesh Agricultural Research Council (BARC) played a key role in ensuring success. DoF is a government institution with establishments at different levels. Through its linkages with other institutions and collaboration with the research team, DoF played an active and strong role in
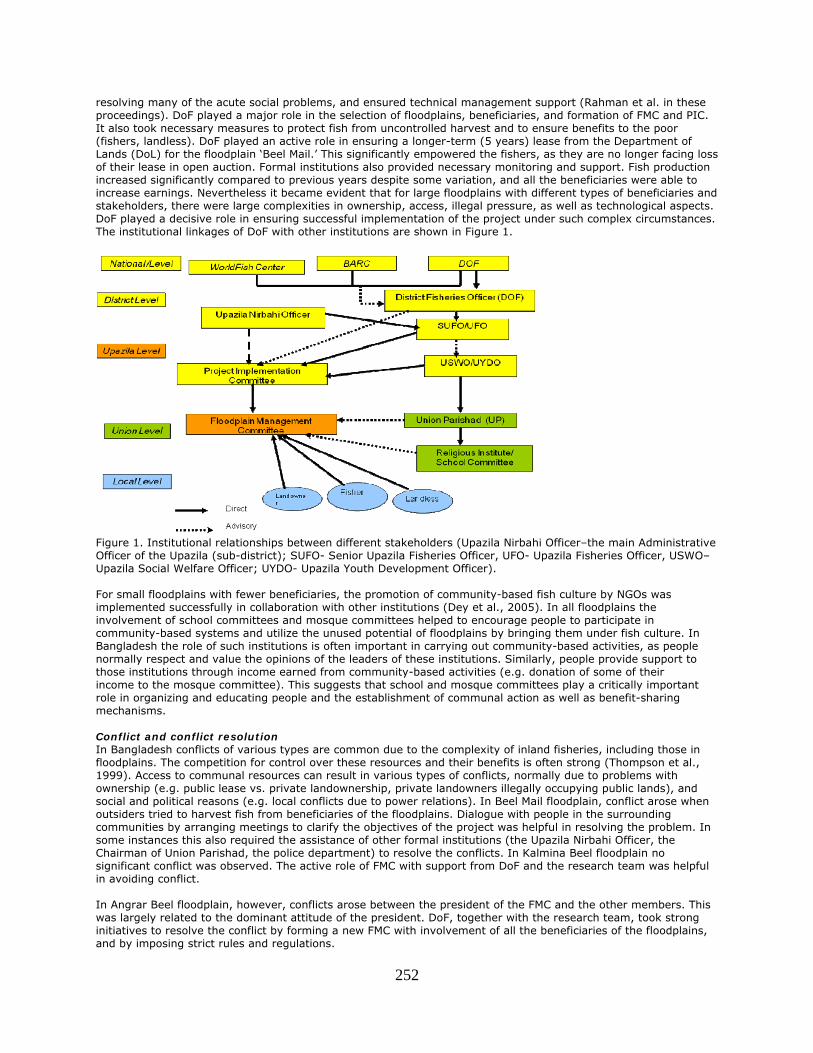
252
resolving many of the acute social problems, and ensured technical management support (Rahman et al. in these proceedings). DoF played a major role in the selection of floodplains, beneficiaries, and formation of FMC and PIC. It also took necessary measures to protect fish from uncontrolled harvest and to ensure benefits to the poor (fishers, landless). DoF played an active role in ensuring a longer-term (5 years) lease from the Department of Lands (DoL) for the floodplain ‘Beel Mail.’ This significantly empowered the fishers, as they are no longer facing loss of their lease in open auction. Formal institutions also provided necessary monitoring and support. Fish production increased significantly compared to previous years despite some variation, and all the beneficiaries were able to increase earnings. Nevertheless it became evident that for large floodplains with different types of beneficiaries and stakeholders, there were large complexities in ownership, access, illegal pressure, as well as technological aspects. DoF played a decisive role in ensuring successful implementation of the project under such complex circumstances. The institutional linkages of DoF with other institutions are shown in Figure 1.
Figure 1. Institutional relationships between different stakeholders (Upazila Nirbahi Officer–the main Administrative Officer of the Upazila (sub-district); SUFO- Senior Upazila Fisheries Officer, UFO- Upazila Fisheries Officer, USWO–Upazila Social Welfare Officer; UYDO- Upazila Youth Development Officer). For small floodplains with fewer beneficiaries, the promotion of community-based fish culture by NGOs was implemented successfully in collaboration with other institutions (Dey et al., 2005). In all floodplains the involvement of school committees and mosque committees helped to encourage people to participate in community-based systems and utilize the unused potential of floodplains by bringing them under fish culture. In Bangladesh the role of such institutions is often important in carrying out community-based activities, as people normally respect and value the opinions of the leaders of these institutions. Similarly, people provide support to those institutions through income earned from community-based activities (e.g. donation of some of their income to the mosque committee). This suggests that school and mosque committees play a critically important role in organizing and educating people and the establishment of communal action as well as benefit-sharing mechanisms. Conflict and conflict resolution In Bangladesh conflicts of various types are common due to the complexity of inland fisheries, including those in floodplains. The competition for control over these resources and their benefits is often strong (Thompson et al., 1999). Access to communal resources can result in various types of conflicts, normally due to problems with ownership (e.g. public lease vs. private landownership, private landowners illegally occupying public lands), and social and political reasons (e.g. local conflicts due to power relations). In Beel Mail floodplain, conflict arose when outsiders tried to harvest fish from beneficiaries of the floodplains. Dialogue with people in the surrounding communities by arranging meetings to clarify the objectives of the project was helpful in resolving the problem. In some instances this also required the assistance of other formal institutions (the Upazila Nirbahi Officer, the Chairman of Union Parishad, the police department) to resolve the conflicts. In Kalmina Beel floodplain no significant conflict was observed. The active role of FMC with support from DoF and the research team was helpful in avoiding conflict. In Angrar Beel floodplain, however, conflicts arose between the president of the FMC and the other members. This was largely related to the dominant attitude of the president. DoF, together with the research team, took strong initiatives to resolve the conflict by forming a new FMC with involvement of all the beneficiaries of the floodplains, and by imposing strict rules and regulations.

253
Benefits from fish culture and arrangements for sharing of benefits The share of net profit from fish production from the floodplains, agreed at the start of project activities, varied according to types of beneficiaries, and across floodplains. Benefit sharing was decided and agreed upon by the beneficiaries and finally by the FMC (Table 2). For the Beel Mail floodplain, the fishers received around 15% of net profits and the landowners received almost 50% of net benefits, as they paid the lease money for the floodplain. The fishers in the floodplain, however, received considerable benefits by taking control of fish harvest from the floodplain. They received 50% of the price of the harvest of nonstocked fish and 10-15% of the stocked fish. Furthermore, access of landless and seasonal fishers from communities surrounding the floodplain using local gear was allowed throughout the season. In the Kalmina Beel floodplain all stakeholders (fishers, landowners, and landless seasonal fishers) deposited around 30% of their net profit in a revolving fund. As in Beel Mail, the landless seasonal fishers were allowed to harvest fish for their subsistence throughout the season. The professional fishers group got their income through commercial harvest of fish. In Angrar Beel floodplain, the landless seasonal fishers had open access to harvest the nonstocked fish during monsoon. Because of the lower than expected profit from the harvest of stocked fish, it was not possible for them to deposit into the revolving fund. Table 2. Plan on arrangement of sharing of benefits of floodplains under community-based fish culture.
Source of benefit to distribute
Distribution of net profits by floodplain (%)
Beel Mail Kalmina Beel Angrar Beel
Fishers 30 5 10
Landowner 45 50 45
Landless 5 5 5
Deposit to use as revolving fund
20 40 40
Conclusions and recommendations In seasonal floodplains under community-based fish culture, better outcomes and sharing of benefits is vital for sustenance of the community-based systems (Dey et al., 2005). It is technologically feasible to bring large floodplains under public and private ownership successfully under community-based fish culture. Involvement of DoF as implementing institution is important. Large numbers of people, including landless, poor seasonal fishers, professional fishers, and landowners, benefited from the success in implementation of activities in all the floodplains. The outcomes demonstrated a significant increase of benefits to different stakeholders through sharing of benefits derived from their involvement. Despite the conflicts that arose, an environment with a win-win situation was created for large numbers of people, with active participation of DoF in implementing and strategic roles. The outcomes of the present study in large public and privately owned floodplains, together with similar studies carried out on privately owned seasonal floodplains, demonstrate that community-based fish culture in seasonal floodplains can be successful if supported by effective institutional arrangements. Acknowledgments This paper presents findings from PN35 'Community-based Fish Culture in Irrigation Systems and Seasonal Floodplains,' a project of the CGIAR Challenge Program on Water and Food. References Dey M., and M. Prein. 2004. Community-based Fish Culture in Irrigation Systems and Seasonal Floodplains. CGIAR
Challenge Program on Water and Food-Grant Start-Up Document. Dey, Madan M., M. Prein, A.B.M.M. Haque, P. Sultana, Cong Dan Nguyen, and Van Hao Nguyen. 2005. Economic
Feasibility of Community-based Fish Culture in Seasonally Flooded Rice Fields in Bangladesh and Vietnam. Official Journal of the International Association of Aqauculture Economics and Management, 9(1,2).
Ostrom, E. 1990. Governing the Commons: the Evolution of Institutions for Collective Action. Cambridge University Press, Toronto.
Pinkerton, E. 2003. Towards specificity in complexity: understanding co-management from a social science perspective, p. 61-77. In D.C. Wilson, J.R. Nielsen, and P. Degnbol (eds.) The Fisheries Comanagement Experience: Accomplishments, Challenges and Prospects. Kluwer Academic Publishers, The Netherlands.
Thompson, P.M., P. Sultana, M.N. Islam, M.M. Kabir, M.M. Hossain, and M.S. Kabir. 1999. An assessment of comanagement arrangements developed by the Community-based Fisheries Management Project in Bangladesh. Paper presented at the International Workshop on Fisheries Comanagement, 23-28 August 1999, Penang, Malaysia.
WorldFish Center. 2007. Floodplain aquaculture. Booklet no. 8. The WorldFish Center, Bangladesh and South Asia
Office, Dhaka. 12 p.

254
Fisheries productivity and its contribution to overall agricultural production in the Lower Mekong River Basin
Mohammed Mainuddin1 and Mac Kirby1
1CSIRO Land and Water, Australia, [email protected]
Abstract We examined the spatial and temporal trends in capture fisheries and aquaculture production and value in the Lower Mekong River Basin. We compared fishery contribution with crop and livestock sector contributions, and discuss the level of likely future demand and the prospects for the fisheries of the Basin meeting the demand. The overall production of fish is 2.5-3 million t. Production is dominated by capture fisheries in Cambodia, Laos, and Thailand, and by aquaculture in the delta in Vietnam. Production from capture fisheries increased relatively little from about 1995 to 2005 in all four Lower Mekong countries. The greatest estimate of value was about US$3 billion, mainly from the capture fisheries. Aquaculture in Vietnam is rapidly increasing in value, to match the increase in production, and in 2005 was worth over US$1 billion. The contribution of the fisheries sector to overall agricultural production is significant in Laos and Thailand, and large and growing in Cambodia and Vietnam. The Lower Mekong fisheries face threats to production from changed water availability, quality, and barriers to fish migration and overfishing. If the increased demand is to be met, these threats must be managed such that developments do not reduce the production of fisheries, especially capture fisheries. Media grab Is the production of fisheries enough to meet the growing demand in the Lower Mekong? Introduction The Mekong River has one of the most diverse and abundant fisheries in the world. The fisheries are a major factor in the well-being and livelihoods of the 60 million people who live in the Lower Mekong Basin. Some 40 million people or two-thirds of the Basin’s population are involved in Mekong fisheries, at least part-time or seasonally. Not only do they derive their livelihood from the fishery, they also depend on fish and other aquatic animals for food security. Fish and other aquatic animals are the most important sources of animal protein, and thus a major support to food security, in particular of the rural population in the Lower Mekong Basin (van Zalinge et al., 2003). There are many studies of fisheries of the Mekong, however, precise estimates of the total fisheries production are lacking (Rab et al., 2005). There are no studies on fisheries productivity for the whole Lower Mekong Basin below the country level, none that compare the contribution of this sector to overall agricultural production, and few that give trends (none for the whole of the Lower Basin). Most of the studies provide aggregated country level information for a season or a year. We analyzed the fisheries productivity of the Basin both spatially and temporally. We compare its contribution to the overall agricultural production to those of the crop and livestock sectors, and discuss the level of likely future demand and the prospects for the fisheries of the Basin meeting the demand. Methods We defined the fisheries productivity in terms of production and gross value of production per capita. Gross value of production (GVP) can be defined as: GVP (US$) = Production of fisheries (tonne) x Landing price of fisheries (US$/tonne) (1) The fisheries comprise inland capture fisheries and aquaculture. We have estimated GVP of both capture river fisheries and aquaculture. Estimates of fisheries production in the countries of the Lower Mekong Basin are found in statistical databases and in various reports and papers. The former give production statistics and often economic information. In the case of Cambodia and Vietnam, they also give a provincial breakdown of the data. The papers and reports, particularly the more recent ones, tend to use different methods of estimation, and give different and often much higher values of production. They generally have fewer temporal and spatial trend data (usually a single production figure for a whole country for one year), and often give production with less attention to economic data. Therefore, aiming to combine the better estimates of the recent literature with the trend and other information from the statistics, we present data from both sources. It must be emphasized, however, that the statistics are regarded as low and unreliable estimates of fish production. The literature sources of data are mainly the papers and reports available on the MRC website (www.mrcmekong.org) and the CD ‘Fisheries Information in the Lower Mekong Basin Version 1’ published by the

255
MRC. Statistical sources of data are the FAOSTAT database faostat.fao.org and the official statistical website of the respective riparian countries. Mainuddin et al. (2008a) estimated detailed province-wise crop and livestock productivity for the Lower Mekong Basin. We used the results from that report to compare here with the fisheries productivity. We have estimated productivity by province where data were available, however, we present only the country-level results. The details of the data sources, the method of analysis, and the provincial productivity can be found in Mainuddin et al. (2008b). Results and discussion Production per capita and GVP per capita of fisheries (both inland capture fisheries and aquaculture) based on the statistical data are given in Table 1. Aquaculture data were not available for Laos and Thailand, therefore, Table 1 shows only the inland capture fisheries for these two countries. Production and GVP per capita for Thailand is also for the whole country, though only about one-third of the country is in the Basin. Per capita production for Laos and Thailand remained the same due to the increase in population, although the total production gradually increased over the years. Total production for Laos increased from 19,500 t in 1993 to 29,800 t in 2004. For Thailand, production increased from 175,140 t to 201,700 t during 1993 to 2004. The GVP per capita gradually decreased for Laos, mainly because the US dollar increased in value against the local currency. The GVP per capita for Thailand remained static around US$3 per capita. Recent consumption-based estimates for Laos yield much higher values of around 42 kg/person/year, which in turn give much higher estimates of total fish production of around 183,000 t/year (Hortle and Bush, 2003; van Zalinge et al., 2003). The gross value of production implied by the higher estimate is perhaps in the order of US$200 million per year. van Zalinge et al. (2003) reported that among the four riparian countries, Thailand has the highest capture fisheries production, estimated at 932,300 t, based on per capita consumption of 52.7 kg. Mahasarakarm (2007) reported that annual consumption of fish and fish products in the Mekong Basin of Thailand amounts to 30-35 kg/capita, equating to an estimated total consumption of inland fish of 795,000 t. At a conservative first sale price of about US$1/kg, the freshwater fisheries (capture fisheries and aquaculture) of the Mekong in Thailand are worth about US$700 million per year (Mahasarakarm, 2007). Production and GVP per capita for Cambodia appears, according to the statistics, to have increased over the years, with a particularly marked increase in 2002-04 (Table 1 and Figure 1). This is mostly because of revised estimates of capture fisheries post 1998, including small-scale fishing (Figure 1). Aquaculture production also increased gradually from 7336 t in 1993 to 20,050 t in 2004. The fisheries production, however, is dominated (over 90% of the total) by inland capture fisheries (Fig. 1). Aquaculture production is much Lower than the capture fish production in Cambodia with average production of 1-2 kg/capita. Other estimates of fisheries production range from similar to, to higher than, the official statistics in recent years. The highest of these is published by van Zalinge et al. (2003) based on consumption survey, which estimates the total production as 719,000 t (shown by the single point in Figure 1) (65 kg/capita) with total GVP of US680 million (US$61/capita). Table 1. Production and GVP of fisheries per capita based on statistical data.
Year Laos Thailand Cambodia Vietnam Producti-on (kg / capita)
GVP (US$ / capita)
Producti-on (kg / capita)
GVP (US$ / capita)
Producti-on (kg / capita)
GVP (US$ / capita)
Producti-on (kg / capita)
GVP (US$ / capita)
1993 4.3 9.4 3.1 4.6 7.9 10.9 1994 5.2 11.2 3.4 3.0 7.4 10.2 1995 5.9 12.8 3.2 5.3 8.2 11.2 22.5 20.6 1996 5.0 10.8 3.5 5.9 7.1 9.7 24.3 21.7 1997 3.9 8.4 3.4 4.7 8.1 9.9 23.5 23.2 1998 4.0 5.5 3.4 3.6 8.3 10.2 22.9 22.5 1999 5.9 8.2 3.4 3.8 7.8 7.3 24.1 21.9 2000 5.6 7.8 3.3 3.4 8.9 8.4 29.1 29.3 2001 5.8 7.2 3.3 3.1 12.5 11.5 32.1 40.5 2002 6.1 7.2 3.2 3.1 28.0 25.0 35.7 42.4 2003 5.2 6.2 3.2 3.1 24.5 21.8 39.2 48.5 2004 5.1 6.8 3.2 3.2 19.2 19.9 44.5 56.6
Among the four riparian countries, Vietnam has the highest per capita production and GVP (Table 1). Per capita production has increased two-fold during 1995 to 2004, despite the increase in population. In Vietnam, aquaculture is well developed and unlike Cambodia the production is significantly higher than capture inland fisheries production. Aquaculture production was 71% of the total in 1995; in 2004 it was 91%. Inland fisheries production remained static over the years (Fig. 2). Both capture fisheries production and aquaculture dominate in the Mekong Delta. The Central Highlands produce only around 1% of the total fisheries production. Other estimates of fisheries productivity diverge from official statistics to a degree similar to that shown in Laos, Thailand, and Cambodia. van Zalinge et al. (2003) reported capture fishery production of about 845,000 t in 2000

256
based on consumption surveys. Aquaculture production was put at 171,600 t, and the total fish production of just over 1 million t was equivalent to the consumption of 60 kg/person/year. The total fish production according to this estimate, which excludes marine fish, is just short of the total production including marine fish in the official statistics, as shown in Fig. 2. Being located along the coastline, the Mekong Delta of Vietnam has an additional source of fisheries, that is, marine fisheries. The Mekong Delta is one of the major sources of marine fisheries in Vietnam. In the analysis of fisheries productivity described above, however, we did not consider the capture marine fisheries. To show the importance of the marine fisheries in the Mekong Delta part of Vietnam, it was included in Figure 2. In 1995 it was the most important part of the fishery, but by 2005 marine production had been superseded by that of the rapidly growing aquaculture sector.
0
500
1000
1500
2000
1995 1996 1997 1998 1999 2000 2001 2002 2003 2004 2005Year
Pro
duct
ion,
000
ton
Capture Inland fisheries Marine fisheries Farmed fish Farmed shrimp Other farmed product Figure 1. Production of fish in Cambodia, according to official statistics, with the high estimate from van Zalinge et al. (2003).
Figure 2. Production from different fisheries sectors in Vietnam. The Lower dark blue point is the total production estimate, excluding marine fisheries, of van Zalinge et al. (2003), while the upper dark blue point is the van Zalinge et al. (2003) estimate added to the official marine production value.
The comparison of GVP for different sectors is shown in Figure 3. The value of fisheries in the Lower Mekong is at least as important as that of livestock even if the Lower catch-based estimates are used. The consumption-based estimates lead to estimates of the value of fisheries considerably greater than that of livestock. The overall production is dominated by the crop production in Laos, Thailand, and Cambodia, however. In Vietnam, due to rapid increases in aquaculture production, the contribution of crop sector to overall production is decreasing though the total production remains almost static.
0
200
400
600
800
1,000
1993 1994 1995 1996 1997 1998 1999 2000 2001 2002 2003 2004
GV
P, m
illio
n $
Crop Livestock Fish low estimate
Laos
0
1000
2000
3000
4000
5000
1995 1996 1997 1998 1999 2000 2001 2002 2003
GVP
, milli
on $
Crop Livestock Fish low estimate
Thailand
0
500
1000
1500
1993 1994 1995 1996 1997 1998 1999 2000 2001 2002 2003
GV
P, m
illio
n $
Crop Livestock Fisheries Fish - high estimate
Cambodia
0
1000
2000
3000
4000
5000
1995 1996 1997 1998 1999 2000 2001 2002 2003 2004Year
GV
P, m
illio
n $
Crop Livestock Inland fisheries
Vietnam
Figure 3. Agriculture and fisheries gross value of production in the Lower Mekong Basin. The blue point shows the high estimate of van Zalinge et al. (2003). Threats and Opportunities in Fisheries Production The population of the Lower Mekong Basin is likely to rise from the present 60 million or so to perhaps 80 million or more by 2020, and more than 100 million by 2050. Delgado et al. (2007) suggested that fish consumption in Southeast Asia to 2020 will grow at 1.4-1.7% per year, partly because of rising population and partly because of improving diets with increasing development. Sokhem and Sunada (2006) suggested that an increase of 0.4-1.6
0 200 400 600 800
1993 1994 1995 1996 1997 1998 1999 2000 2001 2002 2003Year
Production, 000 tonnes
Total Capture Aquaculture Total - high estimate

257
million t will be required by 2050, based on a production of 3.1 million t in 2003. These increases are roughly proportional to the expected increase in population, and therefore appear not to be associated with an increase of fish in the diet. A growth rate of 1.4% per year, as suggested by Delgado et al. (2007), from the 3.1 million t base figure, would lead to an increase of 0.8 and 2.9 million t to 2020 and 2050, respectively, and a growth rate of 1.7% per year would lead to increases of 1.0 and 3.7 million t. There is some evidence of overfishing in the Mekong: combined with the apparent low growth of capture fisheries (albeit based on unreliable statistics), it appears reasonable to suggest that capture fisheries are unlikely to meet this demand. At the same time, there are concerns about several threats to the capture fisheries of the Lower Mekong Basin as a result of dam construction, increased diversions, and increased sediment load due to deforestation (Sverdrup-Jensen, 2002). Although growth appears unlikely, capture fisheries are the greatest source of fish in the Mekong, and efforts to maintain the production and minimize impacts from these threats, are clearly crucial. There has been considerable growth in aquaculture in the Lower Mekong Basin, particularly in the Mekong Delta in Vietnam. This, however, appears to be largely for the export market. It is reasonable to suppose that further growth is likely. Rice-fish farming systems also offer prospects for improved production and livelihoods, but they must be managed with considerable care as integrated systems so that rice farming and pesticide use do not affect the fish production (Frei and Becker, 2005). External impacts such as river pollution from aquaculture must also be managed. Whether these systems can meet future demand is unclear. Conclusions Fisheries production is a major source of animal protein in the Mekong, mostly from capture fisheries. Production and production trends are difficult to estimate; however, it appears that capture fisheries production is not increasing greatly, whereas aquaculture production in the delta is increasing rapidly. The contribution of fisheries to overall agricultural production is, perhaps, greater than the contribution of livestock, but crop production dominates overall production. Fisheries production is threatened by changed flows due to upstream development and climate change, but the extent of the threats cannot be quantified with current information. It would appear that the greatest prospects for growth are from aquaculture and perhaps also rice-fish production systems. There will be trade-offs between fisheries production and upstream development, including the development of irrigated agriculture, but the extent of the trade-off has not been quantified. Acknowledgment The paper presents findings from the Mekong Basin Focal Project, under the Challenge Program on Water and Food (CPWF). References Delgado, C.L., N. Wada, M.W. Rosegrant, S. Meijer, and M. Ahmed. 2007. Fish to 2020: Supply and Demand in
Changing Global Markets. International Food Policy Research Institute, Washington, DC, and WorldFish Center, Penang, Malaysia.
Frei, M., and K. Becker. 2005. Integrated rice-fish culture: Coupled production saves resources. Natural Resources Forum, 29: 135-43.
Hortle, K.G., S.R. and Bush. 2003. Consumption of fish and other aquatic animals in the Lower Mekong Basin. MRC Technical Series.
Mahasarakarm, O.P.N. 2007. An Introduction to the Mekong Fisheries of Thailand. Mekong Development Series No.5, Mekong River Commission, Vientiane, Lao PDR. 54 pp.
Mainuddin, M., M. Kirby, and Y. Chen. 2008a. Spatial and Temporal Pattern of Land and Water Productivity in the Lower Mekong River Basin. Basin Focal Project Working Paper No. 5, CGIAR Challenge Program on Water and Food. http://www.waterandfood.org/fileadmin/CPWF_Documents/Documents/Basin_Focal_Projects/BFP_Publications/Spatial_Temporal_Pattern_Land_Water_Productivity_Mekong_BFPWP5_pgs1-21.pdf
Mainuddin, M., M. Kirby, and Y. Chen, 2008b. Fisheries productivity and its Contribution to Overall Agricultural production in the Lower Mekong River Basin. Basin Focal Working Paper, Challenge Program on Water and Food, International Water Management Institute, Colombo, Sri Lanka (in review).
Rab, M.A., N. Hap, M. Ahmed, S.L. Keang, and K. Viner. 2005. Socioeconomics and Values of Resources in Great Lake, Tonle Sap and Mekong-Bassac Area: Results from a Sample Survey in Kampong Chhnang, Siem Reap and Kandal Provinces. WorldFish Center, Penang, Malaysia. (Available at www.ifredi.org).
Sokhem, P., and K. Sunada. 2006. Key Fisheries Issues in the Mekong Region Draft Paper for Mekong Region Waters Dialogues, Fisheries Session 230606 Available at: http://www.sea-user.org/UserFiles/File/docs/Sokhem&Sunada_Fisheries_Session_draft_270606(1).pdf
Sverdrup-Jensen, S. 2002. Fisheries in the Lower Mekong Basin: Status and Perspectives. MRC Technical Paper No. 6, Mekong River Commission, Phnom Penh. 103 pp.
Van Zalinge, N., P. Degen, C. Pongsri, S. Nuov, J.G. Jensen, V.H. Nguyen, and X. Choulamany. 2003. The Mekong River System. In. R.L. Welcomme, and TPetr (Eds.) Proceedings of the Second International Symposium on the Management of Large Rivers for Fisheries: Sustaining Livelihoods and Biodiversity in the New Millennium, 11-14 February, 2003, Phnom Penh, Cambodia.

258
Technical issues on management of seasonal floodplains under community-based
fish culture in Bangladesh
Md. Fazlur Rahman1, Benoy Kumar Barman2, Md. Khabir Ahmed3, and Somen Dewan1
1Bangladesh Agricultural University, Mymensingh, Bangladesh; [email protected] 2The WorldFish Center, Bangladesh and South Asia Office, Dhaka, Bangladesh
3Bangladesh Agricultural Research Council, Dhaka, Bangladesh
Abstract The Indo-Gangetic Basin of Bangladesh has large numbers of seasonal floodplains that offer great potential for promotion of fish culture to benefit the poor. Since 2006 studies carried out under the WorldFish Center managed Community-Based Fish Culture project, in collaboration with the Department of Fisheries (DoF) and Bangladesh Agricultural Research Council (BARC), looked at the technical aspects of management of seasonal floodplains in Bangladesh. Three floodplains located at three different regions of the country, were selected for fish culture. The floodplains hold water for 6-7 months and cover an area of 30-40 ha during monsoon. Suitable technical aspects for the purpose of holding water and fish by management of inlets and outlets of the floodplains were studied. In addition to existing structures, these inlets and outlets were largely managed by setting locally available low-cost bamboo fencing. The mesh size of bamboo fencing allowed the entrance of nonstocked small indigenous fish in the floodplains from outside sources. Fish fingerling stocking strategies varied, depending on availability, size, and the performance of fish species stocked in the floodplains. The technical measures resulted in production of 441 kg/ha (291 kg stocked and 150 kg nonstocked) fish, generating a net income of Bangladeshi Taka (BDT) 15,000/ha (US$220/ha) and 50 person-days/ha employment for poor fishers. The poor people in surrounding areas of the floodplains using local gear harvested at least 10% of the nonstocked fish for sale and for household consumption. Media grab Fish culture in seasonal floodplains in Bangladesh benefits the rural poor. Introduction Bangladesh has rich freshwater resources, and a huge potential for fisheries development. There are 4.58 million ha of inland waters, 62% of which are floodplains (FRSS, 2007). During monsoon almost half of country is inundated, and these areas are reported as floodplains. In years during which the water in the floodplains lasts for several months, a large proportion of the land is unavailable for crop production (Ahmed, 2005; DoF, 2005). If properly managed, these water resources can play a pivotal role in boosting fish production, generating income, and creating employment opportunities. Culture of fish in the seasonal floodplains can be an important tool for strengthening the rural economy of the country (Rahman et al., 1999; Dey and Prein, 2006). Floodplains were the major sources of natural fish production in the past, but present fish yields are declining. Typical capture fish yield usually ranges from 150 to 350 kg/ha (WorldFish, 2007). Recent studies indicate that there are good prospects for enhancement of fish production in the floodplains through improved management. There are opportunities to use floodplains for fish culture by providing enclosures in parts of this floodwater, and stocking fingerlings in addition to the nonstocked fish. Fish culture in seasonal floodplains, by stocking of fingerlings and application of feeds and fertilizers on a regular basis, has been established in the central part of Bangladesh. In Daudkandi, Comilla district, increases in fish production and income earnings have been achieved. These activities, however, were not community-based and were largely implemented by a company that sold shares to the beneficiaries. Our study is based upon earlier research carried out under community-based fish culture in seasonal floodplains in a limited scale in Bangladesh and Vietnam, which showed increased production and income earnings (Dey et al., 2005). The studies showed that although there were positive outcomes, benefits but it may vary from country to country and between locations within the same country. Further studies have been carried out on technical issues to develop appropriate technical options for the promotion of fish culture in seasonal floodplains to benefit primarily the poor. Methods Selection of study areas, beneficiaries, and institutions This study was conducted in three seasonal floodplains located in the northwest and northern part of Bangladesh in three large river basins: Padma, Teesta, and Brahamaputra (Table 1). The floodplains varied in size, ownership arrangements, and physical setup. Other variables included the number of users/beneficiaries and differences in existing institutional setup (Table 2). The floodplains were selected for implementation of fish culture under a CGIAR-supported Challenge Program on Water and Food collaborative action research project of the Bangladesh Agricultural Research Council (BARC), Department of Fisheries (DoF), and the WorldFish Center.

259
The beneficiaries consisted of landowners, fishers, and landless people but their proportions differ across the floodplains. In the ‘Beel Mail’ floodplain fishers dominated as beneficiaries. They are legal leaseholders of the government Khas lands. In the two other floodplains of ‘Kalmina Beel’ and ‘Angrar Beel’ private landowners dominated as beneficiaries. An important outcome is that community-based fish culture in seasonal floodplains also benefits stakeholders without land ownership. Table 1. Descriptions of the floodplains of different river basins located in different areas of Bangladesh. Floodplains Area (ha) Ownership River basin Project intervention (year) Beel Mail, Mohanpur, Rajshahi
40 (public 15.2 ha, private 24.8 ha)
Public and private
Padma 2006, 2007
Kalmina Beel, Fulbaria, Mymensingh
33 Private Brahamaputra 2007
Angrar Beel, Pirganj, Rangpur
31 Private Teesta 2007
Table 2. Number of beneficiaries selected in three floodplains under the study (figure in parentheses are percentages). Floodplain/ownership
Area (ha)
Number of villages
Number of beneficiaries Landless Fishers Landowner Total
Beel Mail 40 5 22 (18) 68 (55) 34 (27) 124 Kalmina Beel 33 1 52 (29) 25 (14) 97 (57) 174 Angrar Beel 31 5 38 (22) 23 (13) 110 (65) 171 Total 104 11 112 (24) 116 (25) 241 (51) 469
The beneficiaries of the floodplains were actively involved in planning, implementation, stocking of fingerling, monitoring, fish harvesting, marketing, and profit-sharing activities. The institutions involved in implementation of activities of floodplain aquaculture were: the local fishers society, the floodplain management committee (FMC), and the project implementation committee (PIC). The Department of Fisheries at the local and central level, Bangladesh Agricultural Research Council, and the WorldFish Center provided necessary support. Technological interventions Technological interventions included: (1) Management of the water inlets and outlets and the embankments of the floodplains by constructing bamboo fences at inlets and outlets and raising of the dykes. This varied largely by floodplain; (2) Maintenance of water levels and area coverage appropriate for fish culture in the floodplains, affecting the outcomes; (3) Manipulation of species combinations, ratios, and stocking densities of fish fingerlings. These also differed between floodplains and were based on local level information sharing and empirical knowledge about the performance of various fish species; and (4) Harvesting of stocked and nonstocked fish from the floodplains for sale and for household consumption. Records of fingerling stocked were taken on a sample basis. The individual length of fish species stocked was measured and the average weight was recorded by taking a bulk sample of 1 kg, divided by the total number of fingerlings in the sample. The same was done at harvest. The harvesting of fish was started after 4 months of stocking and continued up to 6 months after stocking. In some cases fish were harvested over a 2-3-month period as decided by the beneficiaries. At harvesting time, length (cm) and weight (g) of each fish were recorded. Numbers per species in the harvest were counted. Production and sale records were maintained. Results and discussion Management of waters by fencing The three floodplains brought under community-based fish culture differed largely with respect to their physical features. This resulted in differences in management of the water structures. Bamboo fencing was used in all the floodplains as measures to confine the fish while allowing the water to pass and maintain appropriate levels. In Beel Mail and Angrar Beel more investment was required to protect fencing or dykes compared to Kalmina Beel, where minimal use of bamboo fencing was required. An important advantage of the bamboo fencing used was that it allowed the small indigenous species of fish to enter into the floodplains, while preventing the stocked fingerlings from escaping. The investment is lower compared to building a solid structure, and the fencing can be used for two seasons with minimal repair. The cost of fencing ranges from 7-15% of total investment costs for floodplain aquaculture. Fingerling stocking strategies In 2007 community-based fish culture was started in the three floodplains. Fingerlings of different species of fish, largely from local sources, were stocked in all three floodplains during June-July. The stocking density was: 41 kg/ha, 31 kg/ha, and 42 kg/ha for Beel Mail, Kalmina Beel, and Angrar Beel floodplain, respectively (Table 3).

260
Table 3. Different species of fingerlings stocked in the floodplains under the project intervention in 2007 Area
(ha) Fingerlings stocked (kg)
Silver carp
Catla Bighead Rohu Mrigal Common carp
Total
Beel Mail 40 100 82 1099 50 50 251 1632 Kalmina Beel 33 212 267 - 20 30 497 1026 Angrar Beel 31 430 133 235 188 - 316 1302 Total 104 742 482 1334 258 80 1064 3960
The fingerlings stocked in 2007 were large (mean of total length 14±2 - 22±2 cm for Beel Mail; 16±1.5 - 18±1.5 cm for Kalmina Beel; and 16±1.5 - 18±1.8 cm for Angrar Beel). In Kalmina Beel and Angrar Beel, fingerlings were stocked for the first time in 2007 under project intervention. In Beel Mail floodplain, however, the fingerling stocking was started in 2005 by the initiative of the beneficiaries. In 2006 Beel Mail was stocked as part of the project intervention (Table 4). Table 4. Description of fish fingerlings stocking in Beel Mail floodplain in the first year of intervention in 2006 (US1$ = 69.8 BDT).
Fish harvests and production The comparative analysis of the fish production of the three floodplains brought under fish culture in 2007 showed significant variations in terms of production of fish (for stocked and nonstocked fish). Beel Mail floodplains showed the highest level of production of 625 kg/ha (total production 24,989 kg); for Kalmina Beel and Angrar Beel the corresponding production levels were 196 kg/ha (total 6469 kg), and 215 kg/ha (total 6663 kg), respectively. Compared to the year before project intervention, fish production in Beel Mail (282 kg/ha), Kalmina (46 kg/ha), and Angrar Beel (43 kg/ha) increased significantly (Table 5). Table 5. Production of stocked and nonstocked fish from the floodplains under the studies in 2007 (the figures in parentheses are the yield in kg per ha). Floodplain Area (ha) Total stocked
fish (kg) Nonstocked fish
(kg) Total (kg)
Beel Mail 40 13174 (329) 11815 (295) 24989 (625) Kalmina Beel 33 4943 (150) 1526 (46) 6469 (196) Angrar Beel 31 5345 (172) 1318 (43) 6663 (215) Total 104 23462 (226) 14659 (141) 38121 (367)
In Beel Mail the production of fish in 2006 and 2007 was similar: in 2006, 25,429 kg (stocked 18,446 and nonstocked 6983 kg), and in 2007 24,989 kg (stocked 13,174 kg and nonstocked 11,815, kg). The production of stocked fish was significantly lower in 2007, and the production of nonstocked fish was significantly higher. This variation was largely related to the lower amount of fingerlings stocked in 2007 compared to the previous year. In 2007 the floodplains flooded twice. This may have resulted in the loss of some of the stocked fish, while facilitating the entrance and production of nonstocked fish. The results showed that flooding did not hamper production and income-earning from the floodplains brought under community-based systems. Measures were also taken not to harvest fish by using large net gear for a certain period of time during the flooding. This encourages the nonstocked fish to enter the floodplains from the nearby water bodies. The presence of a connecting channel between Beel Mail floodplains and the nearby river, where sanctuaries are established, also facilitates the entrance of nonstocked fish into the floodplains during the period of flooding. The production of fish in Beel Mail after intervention of the project (2006 and 2007) was significantly higher than the year before the project intervention, even though the Beel was brought under fish culture under the community’s own initiative. The production of fish in Beel Mail in 2005 was 11,285 kg (stocked 4273 kg and nonstocked 7012 kg). The outcomes showed that the implementation of the technical strategies is helpful in increasing fish production in the floodplains under the community-based approach. In floodplain aquaculture the exotic species of fish showed the highest contribution in total fish production. Of the exotic fish species stocked the contribution of bighead carp (32%) was the highest, followed by common carp (27%), and silver carp (17%). Among the native fish species catla showed a modest contribution (18%) and the contribution of the other two native species, rohu (4%) and
Species Mean length (cm)
Mean weight (g)
Total weight (kg)
Total number Rate (BDT/kg) Total cost
(BDT) Catla 16 64 556 8688 110 61160 Bighead 15 38 1557 40973 70 108990 Ruhu 12 46 509 11065 100 50900 Mrigal 12 42 308 7333 90 27720 Common carp 12 35 553 15800 100 55300 Total 3483 83859 304070

261
mrigal (2%), was the lowest. The fixed costs (bana fencing, boat, dyke repairing, pump) of aquaculture in the floodplains varied from BDT1212 to BDT3584/ha. The variable cost (lease money, fingerling, guarding) for the floodplains varied from BDT3675 to BDT999/ha. The gross income from production from the floodplains was BDT10,742 to BDT28,543/ha with a net income of BDT5226 to BDT16,314/ha . The benefit cost ratio (BCR) for Beel Mail was 2.65, Kalmina Beel 2.78, and Angraer Beel 1.71. Fish culture in all the seasonal floodplains is profitable under the present set of management arrangements. The mean fish production as achieved from the floodplains under the project is higher than the national average of 254 kg/ha from the floodplains (FRSS, 2007). This is largely due to the implications of community-based management practices including technical interventions of fish culture in the floodplains. Among the various factors that influence the wetland ecosystem are depth, coverage of catchment, area or river basin, precipitation, and duration of connection to the river. Macrophyte plant material as well as paddy straw residue settles at the bottom of the Beel upon decay and decomposition, resulting in a huge amount of organic detritus that forms a substrate for heterotrophic bacteria and fungi. Under such circumstances detritivorous fish flourish and contribute to the fishery yield. Detritivorous fishes like bighead carp and common carp are well recognized as fast-growing species (Jhingran, 1983). Silver carp benefits from primary production resulting from inorganic and organic nutrient enrichment from bioturbation and browsing activities of the detritivorous fishes. The results of the present investigation indicate that among the species stocked, bighead carp, common carp, silver carp, and catla had higher growth rates than other species. The higher growth rate and production of these species are likely due to adequate availability of natural feeds available in the floodplains. Conclusions and recommendations Technical interventions for fish culture in seasonal floodplains lead to significant improvement in the production of stocked and nonstocked fish. The productivity of stocked fish and nonstocked fish is affected by flooding. The connection of floodplains to rivers and other perennial sources of water results in a significant increase in the production of nonstocked fish at the time of flooding. The stocking of the exotic species (bighead, common carp, and silver carp) showed better performance in production compared to the native species (catla, rohu, and mrigal), without hampering the production of the nonstocked fish. The use of bamboo fencing is effective in creating enclosures for culture. Mesh in the bamboo fencing allows water to pass through and provides entry of nonstocked small fish into the floodplains. Acknowledgments We are very grateful to the community people who worked with us to achieve the project goal. Special thanks go to the officials of Department of Fisheries (DoF), Bangladesh, Bangladesh Agricultural Research Council (BARC), and WorldFish Center, Bangladesh and South Asia Office, for their full cooperation. Thanks also go to Mr. Md. Rafiqul Islam, Director General, DoF, Bangladesh, for his continuous inspiration to improve the project activities. Particular thanks go to the CGIAR Challenge Program on Water and Food and the WorldFish Center for financial assistance in conducting this research. References Ahmed, M.N U. 2005. Status and potential of fisheries. Department of Fisheries, Bangladesh. 47 p. Dey, M.M. and M. Prein. 2006. Community-based fish culture in seasonal floodplains. NAGA, 29(1&2): 21-7. Dey, M.M., M. Prein, A.B.M.M. Haque, P. Sultana, N.C. Dan, and N.V. Hao. 2005. Economic feasibility of
community-based fish culture in seasonally flooded rice fields in Bangladesh and Vietnam. Aquaculture Economics and Management, 9 (1&2): 65-88.
DoF (Department of Fisheries). 2005. Inland capture fisheries strategy. Department of Fisheries, Dhaka.
Bangladesh. pp. 1-17. FRSS (Fisheries Resources Survey System). 2007. Fishery statistical yearbook of Bangladesh 2005-2006. Fisheries
Resources Survey System (FRSS), Department of Fisheries, Bangladesh. 42 p. Jhingran, V.G. 1983. Fish and Fisheries of India. Hindustan Publishing Company. New Delhi, India. Rahman, M., D.A. Capristrano, S.F. Minkin, A. Islam, and S. Halder. 1999. Experience of community managed
wetland habitat restoration. In: Sustainable Inland Fisheries Management in Bangladesh, H.A.J. Middendorp, P.M. Thompson, and R.S. Pomeroy (eds.) ICLARM Conf. Proc. 58, pp. 111-21.
WorldFish Center. 2007. Floodplain aquaculture. Booklet No. 8. The WorldFish Center, Bangladesh and South Asia
Office, Dhaka. 12 p.

262
Tools for understanding collective action around water management
Agent-based modeling and simulation of integrated rice-shrimp farming in Bac Lieu Province, Mekong Delta, Vietnam
Le Canh Dung1, Chu Thai Hoanh2, Christophe Le Page3, and Nantana Gajaseni4
1Mekong Delta Development Research Institute, Can Tho University, Vietnam ([email protected]) Currently a PhD
student at Faculty of Science, Chulalongkorn University, Thailand 2International Water Management Institute (IWMI), Regional Office for Southeast Asia, Penang, Malaysia
3Centre de coopération internationale en recherche agronomique pour le development (CIRAD), CU-CIRAD Unit, Faculty of Science, Chulalongkorn University, Thailand 4Faculty of Science, Chulalongkorn University, Thailand
Abstract Shrimp aquaculture is economically profitable to coastal people in the Mekong Delta, Vietnam. Nevertheless, conflicts are arising between shrimp and rice farmers from environmental and socioeconomic impacts of shrimp aquaculture. For example, shrimp farming encroaches upon land previously devoted to rice cultivation. This study aims at integrating and sharing knowledge about the rice-shrimp farming system in Bac Lieu Province. Companion modeling (ComMod) was used to involve stakeholders in the construction of a simulation model and discuss its outputs. The first stage of the modeling process consisted of a role-playing game (RPG) in which farmers from two villages in the province recreated their farming decisions. The process revealed diverse water and land-use strategies. In the second stage, agent-based modeling (ABM) used a subset of individual farming decisions to parameterize a generic model of integrated rice-shrimp farming. The initial ABM scenario spatially generated production areas and water salinity patterns similar to the ones used during the RPG sessions. This similarity is expected to convince farmers of the accuracy and value the ABM analysis, and help create continued interest when requested to 'validate' it by providing user feedback on its features and rules. Additional scenarios based on different sluice operators decisions, risk, and economic conditions were collectively simulated and assessed. Media grab Farmers and scientists can use ABM to understand better the complexity of rice and shrimp production systems, and accelerate the collective improvements in their design and management. Introduction Asian and Pacific region shrimp aquaculture contributes about 87.4% of cultured penaeid shrimp to the global market (FAO, 2004). During the past decade, coastal zones of several Asian countries have experienced significant conversions from rice to shrimp farms, including the Mekong Delta in Vietnam. As a consequence, traditional rice-farming area in this delta decreased from 757,300 ha in 1995 to 363,400 ha in 2006, whereas shrimp farming area increased from 289,400 ha to 699,200 ha in the same period (GSO, 2006). Bac Lieu Province has experienced similar land conversion pressures. Rice and shrimp are concurrently produced as main sources of local people’s income generation (Hoanh et al., 2003). The degree of integration between rice and shrimp farming relies on farmer decisions based on interactions among biophysical and socioeconomic factors. These interactions are often complex and difficult to understand. The research objectives are: (1) to understand better the land-use decisions based on interactions among water quality, risk perception, and market price factors; (2) to provide a research process for analyzing decision-making in land-use that can be used for modeling and policy analysis. A participatory modeling approach (ComMod) (Bousquet and Trebuil, 2005) is applied. In the ComMod approach, all key stakeholders who are directly or indirectly using common resources are involved in the research process through participating in the RPG. Participants contribute to the collective design of the model and discuss scenarios for exploring the use of common resources and associated environmental and economic impacts. ABM helps to analyze the interactions among numerous biophysical and socioeconomic factors that affect land-use decisions. Moreover, the research process helps support all stakeholders to share experiences in land-use decisions and strengthen the adaptive management capacity of local communities. Model description A conceptual model was collectively built based on available knowledge learnt from previous studies on land-use changes in Bac Lieu Province, and a series of RPGs conducted in 2006 and 2007 (Dung et al., 2007). The ABM was developed using the Common-pool Resource and Multi-Agent System (CORMAS) platform (Le Page et al., 2000) as presented in the following sections.

263
Spatial-temporal setting The model is to involve households that are representative of farmers in the province. These include 5 households in upstream and 8 households in downstream villages. Household size varies from 4 to 7 members, and the farm plots range from 1-4 ha. Diversed patterns of rice-shrimp integrated and rice-shrimp integrated combined with fish and crab, are main farming systems in the study site. These elements are created as spatial settings in the model. Spatial setting is made up of aggregated cells that represent different types of land-uses as rice-shrimp plots, farm composing of plots, and canal at the two villages (Figure 1). Cell is the smallest unit that equals 0.5 ha. A number of cells are aggregated into a plot. A farm comprises of one to eight cells and covers from 0.5 to 4 ha of land. The weekly time step is applied in this study, and the simulation period can be run from 1 to 5 years. Each year is from 1 January to 31 December. Figure 1. Spatial setting represents different land-use types at two villages, downstream (left), and upstream (right) in the study area. Overview of model structure Three components of the model, the water, production, and social modules, and their relationships are presented in a class diagram using unified modeling language (UML) (Wuyts, 2004/2005) (Figure 2). The water module is the core component of the model since it links the farm activities that are managed by the household in the social module with the plot that is occupied by the crop in the production module.
Figure 2. Class diagram of model’s structure in UML. Water module Water is a key factor to provide salinity seasonally for rice and other aquatic species to be grown in the farms. It is built into a separate module in which a super class entitled SpacePortion aggregates four classes of canal, village, farm, and plot. The functions of these classes are:

264
• Canal: carry water for rice crop and other aquatic species’ requirements. An important attribute of the canal is the state (opened or closed) of sluice connected to the canal that controls the salinity in the farm.
• Village: contain the farm and the canal, two main spatial entities of the model. • Plot: where rice and other aquatic species are cultivated. • Farm: aggregated by plots, the farm can be considered as a core class where the crops in the production
module are produced and the household in the social module can implement its management strategy. Production module The production module is composed of four classes: shrimp, rice, fish, and crab. These are the products for income generation. Their key attributes and operation method are briefly described as follows: • Shrimp: the highest value product. Its main attributes are shrimp stock, risk of shrimp disease, harvesting
time, harvesting method (partial or full harvest). Shrimp attributes are affected by water quality regarding timing and degree of salinity.
• Rice: the second product in terms of importance in the study area. Its main attributes are growing duration and yield response to degree of salinization of the soil where saline water has been kept in the dry season for shrimp culture.
• Fish: can be combined into shrimp or rice crops as an additional income source. Its main attributes are fish stock and weight of individuals to be harvested. It can be stocked with a wide range of salinity levels, either in dry or rainy seasons.
• Crab: crab can be combined into shrimp crop in brackish or fresh water. Crab is more preferred for raising in the downstream village of Phong Thanh. Similar to fish, its main attributes are crab stock and weight of individuals to be harvested.
Social module The module is composed of one single class of household, an active agent that would have a number of attributes and do several operation methods. Its main attributes are village code, farm size, income, and cost for production. Other attributes to present inputs of labor and fertilizer in rice and shrimp production can be temporarily ignored due to its minor contributions in decision-making regarding salinity change in the model. Three key operation methods of the farm are to initiate household income status, to produce crops, and to harvest products. Sequence of activities At present the model simply includes only one active agent (the household) that can make decisions on crop production, but more active agents as sluice operator, middleperson to buy products will be added. The sequence of activities performed in the model are as follows: • Setting salinity of water in the canal: monthly salinity is dependent on the sluice operation. In the model
there are three patterns of salinity variations corresponding to three sluice operation schedules selected by the sluice operator and villagers living in the two villages (Figure 3).
Figure 3. Saline water schemes by scenarios of three different sluice operators. Producing crops: four major products and their timing are presented in the followings: • Shrimp is the first crop started at the beginning of the year. Whenever salinity is higher than 5 ppt,
usually in November in the previous year, shrimp seed can be stocked. Since intensive shrimp farming with high inputs is not sustainable, hence not encouraged, extensive or improved extensive shrimp farming with maximum density of 4 seeds/m2 is practiced.
• Crab is the second crop started in a year, but only at Phong Thanh village near the sluice, because salinity of at least 5 ppt from 4-6 months is needed for crab growth.
• Fish is the third crop to be considered in a year. Fish can be grown in low salinity or in fresh water conditions, which is available mostly from June to December in both Phong Thanh and Vinh Loc villages.
Phong Thanh village
05
101520253035
Jan
Feb Mar AprMay Ju
n Jul
Aug Sep OctNov Dec
Salin
ity (p
pt)
Scenario 1 Scenario 2 Scenario 3
Vinh Loc village
05
101520253035
Jan
Feb Mar AprMay Ju
n Jul
Aug Sep OctNov Dec
Salin
ity (p
pt)
Scenario 1 Scenario 2 Scenario 3

265
• Rice crop is started after September when salinity is lower than 4 ppt. Rice is produced in the entire upstream village (Vinh Loc), whereas it is seldom practiced in the downstream village (Phong Thanh).
Phong Thanh village Vinh Loc village J
an
Feb
Ma r
Apr
May
Jun
Jul
Aug
Sep
Oct
Nov
Dec
Jan
Feb
Ma r
Apr
May
Jun
Jul
Aug
Sep
Oct
Nov
Dec
S1
S2
S3
Figure 4. Farming calendar in two villages by three different scenarios. Table 1. Values and source of parameters used in the modules of ABM model.
Module Attri-butes
Explanation Range of values Unit Source
Spatial
Salinity Water salinity 0 - 29 ppt CPWF PN#10
Area Farm size of a household 0.5 - 4 ha Gallop et al., 2003
Production
Stock amount
Shrimp density 10,000 – 40,000 Seeds /ha Interview with farmers
(2006) Crab density 200 – 1,000
Seeds /ha
Risk Shrimp dead due to disease
30 - 80 % Key Informant Interview (2006) Survival
rate Rate of shrimp survived 65 - 72 % Rate of crab survived 50 - 80 %
Weight Weight of harvested shrimp
0.022 – 0.067 Kg Interview with farmers (2007)
Weight of harvested crab 0.3 – 0.5 Kg
Yield Rice yield/ha 3,000 – 5,500 Kg Fish yield/ha 500 – 1,000 Kg
Price
Market price of shrimp 50,000 – 120,000 VND/kg http://www.vneconomy.vn (26/09/2006)
Market price of rice 2,250 – 3,500 VND/kg http://www.vneconomy.vn (17/11/2006)
Market price of fish 4,000 – 6,000 VND/kg Interview with farmers (2007)
Market price of crab 120,000 – 200,000 VND/kg Interview with farmers (2007)
Note: US$1is approximately equivalent to 16,000 VN (2008). Harvesting crops: • Shrimp can be harvested after 14 weeks from stocking date. Shrimp survival rate ranges from 65 to 72%
of initial population at harvesting time. There is a risk of 30 to 80% of shrimp dying due to disease. There are two harvesting methods: (1) full harvesting (all shrimp are harvested at one time), and (2) partial harvesting (only big shrimp are harvested). The full harvesting is applied by 20% of households. Shrimp is a most valuable product in the study area with the price ranging from 50,000 to 120,000 VND/kg.
• Crab can be harvested after 4-6 months from stocking date. Survival rate of crab is high, from 50 to 80% of initial population. Depending on harvesting time, farmers can sell crab at a price of 200,000 VND/kg.
• Fish crop can last from 18 to 22 weeks. Risk due to disease is minor. Fish yield can be varied from 500 to 1,000 kg/ha, but price is not high, from 4,000 to 6,000 VND/kg. So, fish is a popular crop to provide additional income to other crops.
• Rice in Phong Thanh is harvested in December, 3.5 months after sowing. However, in Vinh Loc rice can be harvested later, up to January. Market price of rice is relatively stable, from 3,000 to 5,500 VND/kg, depending on variety and quality.
shrimp rice fish crab S: scenario

266
The model has been collectively built based on available knowledge collected from secondary data, group meetings with local stakeholders, and RPGs with farmers. At each time step land-use change in each farm is displayed in the spatial interface (Figure 1). These changes are consistent with results of land-use patterns under the two scenarios of early and late salinity intake into the system selected by players at the RPGs in 2006 and 2007. At present more technical parameters such as production cost, price of product return, and risk of shrimp disease, and new operation methods attributed to the new active agents (sluice operator, middleperson or intermediary) are included in the model. These will be tested for analyzing more complex land-use decisions under various scenarios, such as variation in prices of products and of inputs for production. Conclusions This ABM prototype can display the spatial settings and present the impacts on production due to changes in water salinity, similar to what farmers were practicing during the RPG sessions. Various scenarios based on different sluice operations, risk perception, and economic conditions could be collectively simulated and assessed by stakeholders. More active agents will be added to reflect the complexity in land-use decisions in selecting production systems at two extremes of the canal with different salinity conditions. ACKNOWLEDGMENTS This paper presents findings from PN25, a project of the CGIAR Challenge Program on Water and Food. Our sincere thanks are expressed to CPWF, and local people and authorities in Bac Lieu Province, Vietnam, who have contributed significantly to the success of this research. References Bousquet, F., and G. Trebuil. 2005. Introduction to companion modeling and multi-agent systems for integrated
natural resource management in Asia. In: Companion Modeling and Multi-Agent Systems for Integrated Natural Resource Management in Asia: F. Bousquet, G. Trebuil, and B. Hardy (eds.) 1-20. IRRI (International Rice Research Institute), Los Baños, Philippines.
Hoanh, C.T., T.P. Tuong, K.M. Gallop, J.W. Gowing, S.P. Kam, N.T. Khiem, and N.D. Phong. 2003. Livelihood
impacts of water policy changes: evidence from a coastal area of the Mekong River Delta. Water Policy, 5 (5): 475-88.
Dung, L., C. Le Page, and C.T. Hoanh. 2007. Participatory simulations of competing aquacultural and agricultural
land-uses in Bac Lieu Province, Mekong Delta, Vietnam. In: Towards sustainable livelihood and environment, P.S. Ekasingh (ed.) 313-18. Proceedings of Asian Simulation and Modeling (ASIMMOD 2007) Chiang Mai, Thailand.
Gallop, K., N. Khiem, L. Dung, and J. Gowing. 2003. Changes in farmer livelihoods and land-use strategies during
the project period 2000-2003: Rep. No. R7467C. DFID-CRF Project: Accelerating poverty elimination through sustainable resource management in coastal lands protected from salinity intrusion: a case study in Vietnam.
GSO. 2006. Statistical Publishing House, Hanoi, Vietnam. Le Page, C., F. Bousquet, I. Bakam, A. Bah, and C. Baron. 2000. CORMAS: A multiagent simulation toolkit to model
natural and social dynamics at multiple scales. (W. t. N. The ecology of scales, June 27–30. Wuyts, Roel. 2004/2005. UML:History and Overview. http://www.ulb.ac.be/di/rwuyts/INFO139_2004/ World
Review of Fisheries and Aquaculture. http://www.fao.org.

267
Agent-based modeling of the interaction between water and labor availability
in the rainfed rice ecosystem of northeast Thailand
W. Naivinit1, C. Le Page2, M. Thongnoi3, and G. Trébuil2
1Faculty of Agriculture, Ubon Rajathanee University, Thailand & Ph.D. student at Chulalongkorn University, Thailand, and Paris X University, France ([email protected])
2CIRAD, UPR GREEN, Montpellier, F-34398 & CU–CIRAD ComMod Project, Chulalongkorn University, Bangkok, Thailand
3M.Sc. student, Faculty of Agriculture, Ubon Rajathanee University, Thailand Abstract An Agent-Based Model (ABM) was co-constructed with local rice farmers to represent the human-environment interactions between land/water use and labor management. A rainfed area located South of Ubon Ratchathani Province in lower northeast Thailand was the study site. This ABM evolved along a Companion Modeling (ComMod) process to integrate the research team’s scientific point of view with the local farmers’ desired development outcomes. The model consists of four interacting components: climate, hydrology, household, and rice. The 'household' module is a rule-based agent that makes daily decisions on the different stages of rice production depending on water and labor availability. Four main rice decision-making processes are modeled: (1) nursery establishment, (2) transplanting, (3) harvesting, and (4) postharvest decisions including labor migration. The toposequence of lower to upper paddies and types of land-use (water bodies, human settlement, paddy fields) are defined in the spatial settings. The paper describes the structure of key decision-making algorithms implemented in this ABM. The participatory use of this model to facilitate the discovery and assessment of different water and labor availability scenarios is also explained. The impact of different scenarios on farming practices and labor management is also analyzed and discussed. Media grab An agent-based model was co-constructed with rice farmers to integrate indigenous and academic knowledge into a shared representation of the interaction between water and labor availability in northeast Thailand. Introduction The northeast region of Thailand is known as the poorest in the country. Most of its inhabitants are resource-poor workers in the agricultural sector (NSO, 2007). Rice is extensively grown in rainfed lowland areas but productivity is low because of erratic rainfall distribution and coarse-textured infertile soils. To escape from poverty, many 20-35-year-old-northeast farmers out-migrate to urban areas searching for more profitable employment in the industrial and service sectors. Northeast Thailand has the largest percentage of out-migration–more than a third of all interregional migration originated from this region (Santiphop, 2000). Therefore, labor migration is a key adaptive strategy adopted by poor farmers to cope with severe agro-ecological constraints. An improved understanding of the interaction between land and water use and labor migration is urgently needed as the construction of major new water infrastructures in this region is under study. Toward this goal, in this study researchers and farmers worked together in a ComMod process to co-design and construct an ABM (Bousquet and Trébuil, 2005) based on a shared representation of the rice ecosystem and farmers’ decision-making processes. ABM is a tool for the analysis of a complex system, in which the human decision-making process is an integral part (Gilbert, 2008). This co-designed ABM is used with local farmers to simulate and explore the outcomes of land, water, and labor use scenarios. The study site is located in Det Udom district, the largest district of Ubon Ratchathani Province covering around 1400 km2 with moderate population density of 119 persons/km. Twenty-two farmers from Ban Mak Mai village in this district participated in the modeling process. The village is a typical rainfed lowland rice-producing area of lower northeast Thailand, with a comparably high average annual rainfall of 1600 mm, but unpredictable distribution. Farming households are diverse with different living conditions ranging from very small at an average of 3.2 ha to large farm holders averaging 6.4 ha (Naivinit et al., 2007). This social differentiation among rice farmers needs to be represented in the model. This paper describes the Ban Mak Mai (BMM) model (BMM after the name of the village where we conducted this study), its spatial, temporal, social settings, and three key interacting modules, as well as the sequence of farm and non-farm activities operating in the model within a crop year. Later, the results of the model validation and the identification of scenarios with local farmers are discussed. Methods The BMM model is spatial-explicit, composed of three interacting modules situated and operated in a defined spatial interface representing rice farming under rainfed conditions. The BMM model is also a discrete event-driven model with heterogeneous agents differently reacting to the consequence of interactions between modules. Spatial and temporal settings The BMM model spatial configuration has field, farm, and community levels representing three land-use types: paddy fields, water bodies such as farm ponds and streams, and human settlements including houses, villages, and roads (Figure 1). The smallest spatial unit, or cell, is equal to 0.04 ha (1 ngan in Thai area unit). Elevation ranges from 97 to 133 m to represent upper and lower paddies. The sandy Korat soil series typically found in this area

268
(Aumsamut and Boonsomphonphan, 1999) is applied to each cell. A paddy field is an aggregation of cells, and a farm is an aggregation of paddy fields. To represent the heterogeneity of farm size and water availability, two small farms (3.3 ha) and two large farms (6.5 ha) with different farm pond sizes were created. A simulated crop year starts at the end of the dry season on April 1. A daily time step is used to model farmers' rice production management decisions. The BMM model is designed to run up to 10-year-long simulations.
Figure 1. Spatial configuration of the BMM model representing two small farms (A and B) and two large farms (C and D) during rice transplanting.
Figure 2. The BMM conceptual model in a UML class diagram representing key entities and their relationships. Overview of the model structure The BMM model structure consists of three key interacting hydroclimatic (hydrology and climate), rice and household modules (Figure 2). Hydroclimatic module This module is embedded in the spatial units to calculate water availability. Four virtual hydrological tanks for ponding, root zone, subsoil, and water storage are superimposed vertically depending on land-use type. For instance, a paddy field is composed of a ponding tank on the top, a root zone tank in the middle and a subsoil tank at the bottom, while a single water storage tank corresponds to a pond. Data on daily rainfall and potential evapotranspiration from the regional meteorological center located in Ubon Ratchathani Province are used and 10 years of different actual climatic years are used in simulation runs. The hydrological processes depending on daily rainfall patterns previously developed to simulate the availability of water in paddy fields and ponds were integrated in the BMM model (Lacombe and Naivinit, 2005). Rice module This module provides information to the household regarding the rice growth stage at any given time. Information from this module prompts the household to make corresponding actions relevant to the current rice growth stage. The climatic conditions (wet or dry spells), however, also determine whether such actions are possible or not. Household module

269
This module integrates three social levels: individual member, household, and village. It has six interacting entities: household, member, role, farmer, migrant, and dependent (Figure 2). A household is a group of members whose roles can change over time, depending on the activity at a given moment. The member is in charge of migration decisions, thus the location of a member determines his/her role. For instance, in a city the member is in a migrant; in a paddy field he/she is a farmer. Two types of farmers are identified. One is an active farmer working in paddy fields, while the other is an inactive farmer in the village waiting for employment (Figure 1). To integrate diverse farming households into the BMM model, households were created with different size, assets, and number of workers. Small farming households A and B have six members, but household A has three laborers and three dependents while household B has four laborers and two dependents. Meanwhile, large farming households C and D have two laborers and one dependent, and three laborers and four dependents, respectively (Figure 1). Sequence of key activities throughout a crop year The household performs a sequence of farming activities driven by interactions between changing climatic conditions and rice-growing stages, except for the migration decision which is individually controlled by a member. The key successive activities are as follows: nursery establishment, transplanting, harvesting, postharvest phase, and labor migration. Nursery establishment Water availability provided by the hydroclimatic module triggers this activity. This depends on the farm pond’s water volume or the rainfall threshold to establish nurseries (Table 1). Water is pumped from a pond by a farmer agent during this period if there are 12 successive days without daily rainfall higher than 20 mm in order to alleviate water stress (Table 1). Rice seedlings belonging to farmer agent without possession of ponds or with inadequate water in ponds can be damaged by a long water-stress period. The rice module is responsible for the growth of rice seedlings, which are ready for transplanting once the seedlings are 30 days old. Transplanting All households wait for a daily rainfall higher than the threshold to start transplanting (Table 1). Once transplanting starts, all members with seasonal migrant role return home to help household workers. When a household cannot complete transplanting on their own in the specified period, additional laborers are hired. Water in farm ponds is not used for this activity. Table 1. Default values, units and sources of key parameters for each module of the BMM model.
Harvesting Two harvesting dates are used for early- and late-maturing rice varieties (Table 1). Households start to harvest rice on the harvesting date defined in the Rice module in relation to 'rainfall threshold to harvest' in the Hydroclimatic module. The availability of enough laborers is critical because a fast harvest yields a higher quality paddy to be sold at a higher market price (Table 1). This algorithm states that all farms get high quality paddy before December 1, or fair quality paddy until December 9. After December 10, additional laborers are no longer needed to secure a high quality product. Postharvest phase and labor migration Once rice production activities are completed, households compute their net incomes. Sources of income are rice sales, wages, and remittances. Expenses are farm inputs, cost of hired labor, and other household expenses. Afterwards, the demographic characteristics of member entities, which are important to determine potential migrants and migration patterns, are updated. The criteria to become a potential migrant are based on the combination of two factors–the member’s demographic characteristics; and the social and economic status of its
Module Parameter Default value Unit Source Water quantity need to supply a 0.04 ha nursery 40 m3 RPG 2 Percent of minimum water level needed to be kept in pond to the depth of pond 10 % RPG 1 Maximum age for villagers to migrate 45 year old PS2 Average annual household net income 20,000 baht NSO , 2007 Average farm input cost excluding labor cost 3,750 baht/ha OAE, 2005 Amount of paddy needed for self consumption 350 kg/person/year Farm survey , 2004 Price of high quality paddy 18 baht/kgPrice of fair quality paddy 12 baht/kgPrice of poor quality paddy 9 baht/kgWage offer during transplanting period 120 baht/person/day Wage offer during harvesting period 150 baht/person/day Rainfall threshold to establish nurseries 30 mm/dayRainfall threshold to start transplanting 20 mm/dayRainfall threshold to harvest 10 mm/dayRainfall threshold for seedlings related to water stress 20 mm/dayPeriod duration for seedlings related to water stress 12 days PS1 Maximum paddy yield 2,250 kg/haMinimum paddy yield 938 kg/haDuration needed for rice seedlings to be mature 30 dayDuration needed to complete transplanting after rice seedlings are 30 days old 21 dayLimited date to establish nurseries 115 (3rd week of July ) dayLimited date for transplanting activity 168 (2nd week of September ) dayLimited days for harvesting high quality paddy 10 dayDate to harvest early maturing rice 224 (10th November ) dayDate to harvest late maturing rice 235 (21st November ) day
Notes: RPG1: Role-Playing Game Session on 9-10 July 2005 PS1: Participatory Simulation on 5-6 February 2008 RPG2: Role-Playing Game Session on 10-11 October 2006 PS2: Participatory Simulation on19-20 March 2008
Bureau of Rice Research and Development , 1999
Hydroclimatic
Rice
RPG 2
Thai Rice Mills Association , 2008
PS2
RPG 1
PS1

270
household (De Jong, 1997). Meanwhile, two kinds of migration are taken into account. A seasonal migrant always returns home to help in rice production, while the more-permanent migrant is removed from the list of family laborers. At the end of the activity, members can decide to move to the city or stay in the village over the dry season. Results and discussion The BMM model was used with farmers in two steps. Scenarios to simulate were first identified with them before their participation in the assessment of their simulations. During a participatory workshop through a simulation of baseline scenario defined as mentioned in spatial and temporal setting and household characteristics, scenarios regarding water and labor availability were collectively identified. Unlimited water availability, for instance an access to irrigation canal, and an increasing number of cheap foreign laborers during rice-growing season from Lao PDR and Cambodia were specifically addressed by participating farmers. In a first scenario based on no water constraint, the synchronization of rice farming activities (all farms are able to start producing rice at the same time) induced problems for larger farms due to lack of hired labor for transplanting. Furthermore, there was a higher risk of rice production failure as well as higher farm input costs as agents started nursery establishment sooner to take advantage of the available water. One virtual farm could not complete transplanting when the heavy rains came late, and by then some rice seedlings were too old to be used. In a second scenario characterized by the presence of abundant cheaper hired laborers, the simulation showed high income differentials across farm types. Smallholdings A and B lost some income from wages received from households C and D. In contrast, without labor constraint, large farming households C and D earned higher incomes from selling high quality paddy because of faster harvest despite high labor costs. Conclusions Based on the results of monitoring and evaluation activities carried out with participating farmers, the BMM model sufficiently represents the interactions between water and labor availability of their community. As a consequence of the collaborative modeling process, researchers and local farmers gained better understanding of this interaction through the simulation analysis of changes in farming practices, and migration behavior. The BMM model is gradually developed based on this common understanding. As an integrated knowledge tool, the BMM model is now being used in a series of participatory simulation workshops. This model will be used further in the field to assess more scenarios regarding water and labor availability, and to stimulate collective knowledge-sharing and learning among local famers. Acknowledgments The paper presents findings from PN 25 'Companion modeling for resilient water management,' a project of the CGIAR Challenge Program on Water and Food, and Echel-Eau Project. References Aumsamut, S., and B. Boonsomphonphan. 1999. Established soil series in the Northeast Thailand reclassified
according to Soil Taxonomy 1998. Bangkok: Land Development Department, Ministry of Agriculture and Co-operatives, p. 154.
Bousquet, F., and G. Trébuil. 2005. Introduction to companion modeling and multi-agent systems for integrated
natural resource management in Asia. In: F. Bousquet, G. Trébuil, and B. Hardy (eds.) Companion Modeling and Multi-Agent Systems for Integrated Natural Resource Management in Asia. Los Baños, the Philippines: IRRI, pp. 1-20.
De Jong, G.F. 1997. Temporary and more permanent rural-urban migration in Thailand. Population Association of
America Annual Meeting. Washington, D.C., pp. 23-32. Gilbert, N. 2008. Agent-Based Models. In: T.F. Liao (ed.) Quantitative Applications in the Social Sciences. Vol. 153:
Sage Publications, p. 98. Lacombe, G., and W. Naivinit. 2005. Modeling a biophysical environment to better understand the decision-making
rules for water use in the rainfed lowland rice ecosystem. In: G. Trébuil, F. Bousquet, and B. Hardy (eds.) Companion Modeling and Multi-agent system for Integrated Natural Resource Management in Asia. Los Baños, Philippines: IRRI, pp. 191-210.
Naivinit, W., C. Le Page, M. Thongnoi, G. Trébuil, and N. Sribombat. 2007. Use participatory modelling to validate
and build Multi-Agent System model regarding rainfed lowland rice and labour management in lower northeast Thailand. 2nd International Conference on Asian Simulation and Modeling 2007: Towards sustainable livelihood and environment. Sheraton Hotel, Chiang Mai, Thailand, p. 6.
NSO. 2007. Statistical Yearbook of Thailand. Bangkok: National Statistical Office, Ministry of Information and
Communication Technology, p. 661. Santiphop, T. 2000. The relevant population dynamics to land degradation in the northeast region. Journal of
Population and Social Studies 8: 67-89.

271
Agent-based modeling to facilitate resilient water management in Southeast and South Asia
C.T. Hoanh1, C. Le Page2, O. Barreteau3, G. Trébuil2, F. Bousquet2, F. Cernesson4, C. Barnaud5,
T.R. Gurung5, P. Promburom5, W. Naivinit5, L.C. Dung5, P. Dumrongrojwatthana5, and M. Thongnoi6
1International Water Management Institute (IWMI), Regional Office for Southeast Asia, Penang, Malaysia, [email protected]
2CIRAD, UPR GREEN, Montpellier, F-34398 France & CU-CIRAD ComMod Project, Chulalongkorn University, Bangkok, Thailand
3Cemagref, Montpellier, France 4Engref-AgroParisTech, Montpellier, France
5PhD candidate, PN25-CPWF and Echel Eau projects 6Master student, PN25-CPWF and Echel Eau projects
Abstract Water is used and managed by stakeholders at different levels for diverse objectives, therefore understanding decision-making and supporting coordination is crucial in achieving resilient water management. Companion Modeling (ComMod) is an interactive process facilitated by evolutionary models for knowledge generation and exchange, and for supporting collective decision-making. Role-playing games and computerized agent-based simulations for focused group debates are complementary tools combined in a ComMod cycle and used at the field workshops. Agent-based modeling is used to understand how different processes in direct competition are coordinated, and to mediate the collective search for acceptable solutions to conflicting parties facilitated through exchanges. This paper compares the process of agent-based modeling applied in eight case studies with diverse natural and socioeconomic conditions and different resource management problems in Bhutan, Thailand, and Vietnam, to show the creative thinking in developing and applying flexible ComMod modeling tools and provide lessons for their use in other situations. Media grab Even under diverse conflicting water management situations with very different biophysical and socioeconomic conditions, agent-based modeling can be flexibly applied for generating and exchanging knowledge and to facilitate collective decision-making. Introduction Water is a resource used for diverse purposes such as agricultural production, fisheries and aquaculture, transport, tourism, and drinking. It is widely recognized that inadequate coordination among stakeholders leads to inefficient water use, economic and environmental damage, negative externalities, and social conflicts. ComMod is an interactive process facilitated by evolutionary models to support dialogue, shared learning, and collective decision-making in resilient water management (Bousquet et al., 2006). Key complementary analytical tools combined in a ComMod cycle and used during field workshops are conceptual models, role-playing games (RPG), and computerized agent-based models (ABM) with focused group debates. The modeling approach is applied for two objectives: (1) to integrate knowledge for understanding how different processes in direct competition are implemented by different stakeholders; and (2) to provide tools for mediating the collective search for acceptable solutions to conflicting parties facilitated through exchanges. Eight case studies (Figure 1 and Table 1) are being implemented under the PN25 project of the CPWF, which deals with conflicts regarding water sharing and social tensions over water use in Bhutan and northern Thailand (Gurung et al., 2006; Barnaud et al., 2006, 2007; Dumrongrojwatthana et al., 2007), conflict between agricultural intensification and labor migration in northeast Thailand (Naivinit et al., 2007), and conflict between rice and shrimp producers in the Mekong Delta, Vietnam (Dung et al., 2007). This paper compares the agent-based modeling processes developed in these case studies to illustrate how they are flexibly applied in diverse ecological and sociocultural conditions for different land and water management problems.
Figure 1. Location of the
i ht t di

272
Methods ComMod is an approach to improve coordination processes at the watershed level among an increasing number of diverse stakeholders using common water resources (Bousquet et al., 2006). It uses various tools in a participatory way to generate a common vision of optimal resource use among stakeholders, and to identify and examine new resource-sharing scenarios. Two key tools used in ComMod are Role Playing Games (RPGs) and Agent-Based Model (ABM). RPG and ABM are usually coupled in agent-based participatory simulations, but they can also be applied separately (Barreteau, 2003). Table 1. Characteristics of the eight study sites.
Site Location Catchment/
Basin Area (km2)
Population density
(persons/km2)
Main land use types
Main research objectives*
1. Lingmu-teychu
Punakha, Bhutan
Punatshang Chu, Bhramaputra 34 24 Irrigated
wetland Improve irrigation water sharing for rice cultivation
2. Radi Trashigang, Bhutan
Gamri Chu, Bhramaputra 54 111 Rice, yak &
cattle herders Develop strategies to address grazing land conflict
3. Kengkhar Mongar, Bhutan
Kurichu, Bhramaputra 156 12 Dryland
farming Promote sharing water from spring ponds
4. Mae Salaep Chiang Rai, Thailand
Mae Chan, Chao Phraya 3 83 Maize, lychee,
green tea Promote sharing irrigation water
5. Nam Haen Nan, Thailand Nam Yao, Nan, Chao Phraya 106 7
Maize, orchards & forestry
Facilitate communication among villagers and Nanthaburi National Park
6. Maehae Chiang Mai, Thailand
Ping, Chao Phraya 32 94
Rice, vegetable, orchards
Stimulate collective learning for land and water allocation
7. Ban Mak Mai Ubon Ratcha-thani,Thailand
Lam Dom Yai, Mun, Mekong 1,680 119 Rainfed
lowland rice Understand interactions between land-water use and labor migration
8. Bac Lieu Bac Lieu, Vietnam Mekong Delta 2,600 269 Rice, shrimp,
fish, crab Analyze farmers’ decision-making in rice & shrimp production
*More details and results from some case studies are presented in other papers at this conference. In a RPG, participants are assumed to represent 'fictional characters' and collaboratively create the stories close to their actual situation on the farm. Participants determine their actions based on their characterization, and these actions succeed or fail according to a formal system of rules and guidelines. Under this PN25 project, RPG is used as a social learning tool for researchers and players to exchange information for better knowledge on the ecological system and human behavior, and also to facilitate discussions, dialogues, and negotiation in water resource management. In an ABM, a system is modeled as a collection of computerized autonomous decision-making entities called agents. Each agent individually assesses its situation and makes decisions on the basis of a set of rules, for example, producing certain crops or selling certain products based on expected incomes. An important characteristic of ABM is the potential asynchrony of the interactions among agents and between agents and their common environment having its own ecological dynamics. For example, in the Bac Lieu case, rice farmers and shrimp growers are interacting in a coastal area affected by tide and different weather conditions in each year. With the help of a computer, interactions between agents can be repeated to explore the dynamics of the system. Although RPG is a useful tool that allows multiple stakeholders to interactively examine the complexity of the systems that they are part of, in operation it is costly and time consuming, cumbersome setting up, slow in simulating new scenarios, and difficult to analyze its results. To overcome these constraints, a hybrid ABM-RPG can run interactive simulations in which some of the decisions are taken by real participants, while others are taken by artificial agents (Barnaud et al., 2007). This combination enables the stakeholders to easier understand what the ABM will simulate. Discussions The following discussions are based on the agent-based modeling processes in eight case studies summarized and compared in Table 2. In all cases, there is production of knowledge through the interaction among researchers and local stakeholders. But in the last two cases, gaining a better understanding of complex environments and decision-making process (K) for researchers or for local stakeholders through training activities is the main objective, while in the first six cases it is a methodological requirement to support collective decision-making processes (C) in complex situations. RPG (G) were used in all eight cases. In the Radi and more recent Kengkhar cases, however, neither ABM (A) nor hybrid model (H) were applied yet. In Radi, the process is temporarily stopped after the RPG because of the legal and institutional complications in dealing with conflicts in using grazing land between rice growers and herders living in two parts of the watershed. In Kengkhar, where coordination for sharing water is needed, the process is

273
just starting, and an ABM will be developed. ABM (A) and/or hybrid model (H) were applied in six cases to explore scenarios in participatory simulation sessions. In the Mae Salaep case a hybrid model (H) was used after the RPG (G) to explore the effects of new water allocation rules on lychee and tea farms. When using the hybrid model, each player was a farmer interacting with a computer artefact that made all decisions in land use except one about water allocation decided by the player. In the Nam Haen case a hybrid model (H) was developed to communicate the outputs of the gaming sessions to more villagers and the national park officers. In this case, some players were autonomous computer agents while the others were farmers, except at the final workshop the model was run with only computer agents (corresponding to the 'A' of this case in Table 2) in several scenarios identified and discussed by participants who had played the RPG before. Table 2. Agent-based modeling tools applied in the eight case studies.
Site Main objec-tive
Tools Spatial dimension
Temporal dimension
Decision-making entities
Interac-tions
Model components No. of sessions
1. Lingmuteychu C G A Fi, Fa, Vi, Ca
G: Annual, 3 years A: Annual, 10 years
Farmers, Village administrators E C
Water flow Rice production Information exchange
G: 3 + 1 training A: 8
2. Radi C G Fa, Vi, Ca G: Annual, 5 years Farmers E C Livestock
Land degradation G:1+ several with small groups
3. Kengkhar C G Fa, Vi G: Annual, 6 years Farmers E I C
Water tank Household water use
G: 1
4. Mae Salaep C G H Fi, Fa, Vi, Ca
G, H: Annual, 5 years
Farmers Village representative Religious leader
E I C Crop, farm, slope Irrigation channels Small reservoirs
G: 2 H: 1 + several with small groups
5. Nam Haen C G H A Fi, Fa, Vi
G, H: Annual, 2-5 years
Farmers Village leader National Park Royal Forest Depart.
E Crop Non timber forest products
G: 2 H: 2 G+ A: 1 + teaching tool
6. Maehae C G A Fi, Fa, Vi, Ca
G: Seasonal, 4 years A: Monthly, 9 years
Farmers Foresters Community Network
E I C Forest Crop Water
G: 4 A: not yet.
7. Ban Mak Mai K G A Fi, Fa, Vi G: Daily , 1-2 years A: Daily , 10 years
Farmers Village E I C
Hydroclimatic module Household module Rice module
G: 3 A: 3
8. Bac Lieu K G A Fi, Fa, Vi, Ca
G: Monthly, 2 years A: Weekly, 5 years
Farmers Water manager Middleman Seed provider
E C
Rice, shrimp Water salinity Household budgeting
G: 4 A: 2 (planned)
Notes for columns: • Objectives: K = knowledge generation and exchange, C = collective decision (communication, negotiation). • Tools: G = Role playing games, A = Agent-based model, H = Hybrid (combined G and A). • Spatial dimension: Fi = Field, Fa = Farm, Vi = Village, Ca = Catchment. • Temporal dimension: time step (annual, seasonal, monthly, weekly, daily) and time horizon (no. years). • Interactions: E = via environmental factors, I = peer to peer interaction, C: collective within group. • Number of sessions that were organized with local stakeholders or for other purposes (training, teaching). In the spatial dimension, the farm (Fa) and village (Vi) levels were considered as important in all eight cases. The lower and higher levels, field (Fi) and catchment (Ca), were included in six and five cases, respectively. So, under this PN25 project, the applications of agent-based modeling are focusing on water use conflicts among farmers at the village level, but when needed they also include lower or higher levels. In the temporal dimension, five cases applied the time step of one year, but the time step in the three other cases were shorter, from daily in the Ban Mak Mai case to reflect the detailed crop calendar, to monthly/weekly in the Bac Lieu case to simulate the salinity variation, and to seasonal/monthly in Mae Hae to describe the forest management. In most of the cases, the same time step was applied in both RPG and ABM or Hybrid, except in the Maehae and Bac Lieu cases where time step in the ABM is shorter. As simulation scenarios are run much faster with ABM, longer time horizons than that of the RPG were used in most of the cases. This advantage allows the model user to analyze the long-term impacts that could not be found during the RPG. However, when it was combined into the hybrid model, the time horizon was only equal to that of the RPG, as in the Mae Salaep and Nam Haen cases. The farmer is the main decision-making entity that existed in all cases. The other ones are diverse and vary by case. A representation of the community management is included in four cases, whereas religious leader, national park, government officers and local administrators, foresters, and water managers found in different cases show the diversity of stakeholders concerned and to be involved in the search for resilient water management. The collective interactions (C) within agent groups in six cases show that a collaborative management of water resources has been stimulated at these sites. Also in six cases (not the same with C), the interactions were through environmental factors (E), for example, water flow from upstream to downstream villages as in Lingmuteychu, Kengkhar and Maehae cases, or soil erosion at Radi and Mae Salaep sites, or canal water salinity in Bac Lieu. Peer

274
to peer interactions (I), i.e. discussion between two individual agents without participation of the group, were also recorded in four case studies. Different model components were identified and developed in different cases. These components were based on the nature of conflicts, the related resources and products, and the agents involved and varied in a wide range from physical entities as water and climate, production systems as crop or livestock, to management as irrigation or economic as household finance. Similarly to the decision-making entities, these components were not fixed during modeling, but could be modified or added as needed. A relevant example for this dynamic in modeling is the Mae Salaep case with two ComMod cycles (Barnaud et al., 2007). In the first cycle, the researchers’ model MAE SALAEP 1 was developed by integration of scientific and indigenous knowledge on farming systems and soil erosion to focus on land use and land degradation. The model was then translated into an initial RPG that could be described as a simplified and noncomputerized version so that farmers could validate it. With knowledge on farmers’ land-use strategies acquired during the MAE SALAEP 1 gaming sessions, a simpler MAE SALAEP 2.1 ABM with rules and features similar to the RPG was developed. The second cycle was to set up a collective learning process on the socioeconomic conditions for adoption of perennial crops by different farm types. A new model version, the MAE SALAEP 2.2, was developed based on the previous version to represent the interactions between investment in perennial crops, formal and informal credit, and off-farm activities; to explore the interactions between decision-making processes at household level and the resultant collective dynamics at community level; and to support the exploration of scenarios with all stakeholders. Similar dynamic processes have been also applied in other case studies. The number of RPG or ABM or hybrid sessions with the participation of stakeholders also varied by case study. In general, organizing RPG or hybrid sessions took a lot of time and effort compared to participatory ABM ones. Therefore the maximum number of RPG sessions was only four (in Maehae and Bac Lieu), but the maximum of ABM sessions was eight (at Lingmuteychu site). The agent-based modeling tools used in Lingmuteychu, Mae Salaep, and Nam Haen have also been used for training purposes at several universities in Bhutan, Thailand, France, and Japan. Ban Mak Mai case is a special one with many sessions organized for a group of 10-15 participants or small groups of 3-4 participants to emphasize the co-designing and testing characteristics of the ABMs. In this case, the co-designer farmers are already involved in the presentation of 'their' ABM to master students at the regional university. Conclusion With two objectives, knowledge generation and exchange, and collective decision-making, these eight case studies showed that the agent-based modeling approach could be applied for diverse conflicting problems in water management under different biophysical and socioeconomic conditions. Although only two key tools, RPG and ABM, were used either separately or integrated into hybrid gaming ABM models, creative thinking and flexibility was required in tailoring them to specific needs and using them in each different case. Acknowledgments This paper presents findings from PN25 ‘Coastal Companion modelling and water dynamics,’ a project of the CGIAR Challenge Program on Water and Food (CPWF), and the Ecole-ComMod project of the Asia IT&C Initiative of the European Union. The authors would like to express their sincere thanks to the CPWF, the Asia IT&C Initiative, and stakeholders in Bhutan, Thailand, and Vietnam for their support in these studies. References Barnaud, C., P. Promburom, T.R. Gurung, C. Le Page, and G. Trébuil. 2006. Companion modelling for collective
learning & action in water management: lessons learned from three case studies in northern Thailand and Bhutan. Proceedings of the International Symposium 'Towards Sustainable Livelihoods and Ecosystems in Mountainous Regions,' 7-9 March 2006, Chiang Mai, Thailand. 13p.
Barnaud, C., T. Promburom, G. Trébuil, and F. Bousquet. 2007. An evolving simulation/gaming process to facilitate adaptive watershed management in northern mountainous Thailand. Simulation Gaming, 38: 398-420.
Barreteau, O. 2003. The joint use of role-playing games and models regarding negotiation processes: characterization of associations. Journal of Artificial Societies and Social Simulation, 6(2). <http://jasss.soc.surrey.ac.uk/6/2/3.html>
Bousquet, F., et al. 2006. Companion modeling for resilient water management: Stakeholders’ perceptions of water dynamics and collective learning at the catchment scale. In: D. Rocchi (ed.) 'France and the CGIAR: Delivering scientific results for agriculture development.' CGIAR Publication. 98-101.
Dumrongrojwatthana, P., C. Barnaud, N. Gajaseni, and G. Trébuil. 2007. Companion modeling to facilitate adaptive forest management in Nam Haen sub-watershed, Nan Province, Northern Thailand. In: B. Ekasingh, A. Jintrawet, and S. Pratummintra (eds.) Proceedings of the 2nd International Conference on Asian Simulation and Modeling (ASIMMOD), January 9-11, 2007, Chiang Mai, Thailand. 327-33.
Dung, L.C., C. Le Page, and C.T. Hoanh. 2007. Participatory simulations of competing aquacultural and agricultural land uses in Bac Lieu Province, Mekong Delta, Vietnam. In: B. Ekasingh, A. Jintrawet, and S. Pratummintra (eds.) Proceedings of the 2nd International Conference on Asian Simulation and Modeling (ASIMMOD), January 9-11, 2007. Chiang Mai, Thailand. 313-8.
Gurung T.R., Bousquet F., and G. Trébuil. 2006. Companion modeling, conflict resolution and institution building: sharing irrigation water in the Lingmuteychu Watershed, Bhutan. Ecology & Society, 11(2): 36.
Naivinit, W., C. Le Page, M. Thongnoi, G. Trébuil, and N. Srisombat. 2007. Using companion modelling to build and validate a multi-agent model on rainfed lowland rice and labour migrations in lower northeast Thailand. Proceedings of the International Conference on Asian Simulation and Modelling 2007 (ASIMMOD2007), 9-11 January 2007. Chiang Mai, Thailand. 306-12.

275
Monitoring use increases cooperation among water users in the Mekong Delta of
Cambodia and Vietnam
C. Werthmann1, A. Weingart1, and M. Kirk1
1Philipps-Universität Marburg, Faculty of Business Administration & Economics, Institute for Co-operation in Developing Countries (ICDC), Am Plan 2, D-35032 Marburg, Germany [email protected]
Abstract We used field experiments as a method to study underlying strategic actions Cambodian and Vietnamese natural resource users take in regard to the appropriation of common-pool resources. A common-pool resource (CPR) game was implemented in the two countries, investigating the importance of monitoring natural resources on the users’ strategies. We found that users’ cooperation rises significantly when monitoring is introduced into the game, representing an external agency that monitors and sanctions offenders. Other field experiments and qualitative research, however, showed that other key factors also significantly influence the likelihood of collective action and that cooperation in the field was dependent on many more factors. This paper presents findings about monitoring and the cooperation levels of players in eight villages in Cambodia and Vietnam. We compare results between the countries, draw conclusions from the experimental outcomes, and make suggestions for further research. Media grab Water users in the Mekong Delta of Cambodia and Vietnam face severe challenges in regard to the collective management and sustainable use of water resources. Introduction A functioning and resilient natural resource base plays a significant role in the livelihoods of people in Cambodia and Vietnam, as people living in the Lower Mekong Delta rely heavily on agriculture and fishing. Sustainable resource management in Cambodia and Vietnam faces severe challenges, however. Significant parts of the natural resource base are confronted with open access situations. Thus, these resources are rapidly degrading, threatening income streams of local users, and affecting the region’s ecosystem. Water and land resources are mainly shared by different neighboring communities with a tendency of overuse because limiting appropriation rights of existing users is difficult to enforce. In both countries, decentralization efforts are under way to empower communities and improve the management of resources. This is done although the underlying patterns of resource users’ interaction, and the effects of external intervention, have not yet been fully understood in the policy arena. In order to understand better users’ strategies and interaction in natural resource management settings, game theory analyses and described actions of individuals in a situation where the outcome for each individual is not only dependent on his or her own decisions but also the decisions of other players. We present the field context and explain the assumptions about the players’ behavior, and the experimental design of the game is described. Research activities were implemented in six Cambodian and two Vietnamese villages. The target provinces in Cambodia were Kampong Thom, Kampong Cham, Prey Veng, and Takeo. In Vietnam, both villages are in Can Tho province. Problems of resource degradation and overexploitation are well known in the research sites. Thirty-eight percent of the participants reported that natural resources in their village are in poor condition. Coordination problems are found in most public good and common-pool resource settings worldwide. They are often complex and interrelated (Ostrom et al., 1994; Steins and Edwards, 1999). Within this study, we use game theory to focus on specific aspects of the complex situation. In this paper, we present the effects of punishment on appropriation of common-pool resources. Many analysts would describe the situation of resource management in the research villages as a common-pool resource dilemma, as individuals are jointly appropriating from their limited natural resource base without being able to prevent free-riding. Hardin (1968), with his highly controversial hypotheses, states that self-interested individual behavior will lead to the 'tragedy of the commons' and that local users are not able to manage their natural resources sustainably. According to this and other theories, it is assumed that there is no solution to prevent the dilemma, and that individual rationality leads to an outcome that is not rational for the group. This corresponds to the assumptions of standard game theory. Here it is stated that players are self-interested and that the individual will always favor the private account over the public account. This does not explain, however, cooperative behavior observed in many experiments, and yet there is no consensus on what is really happening in common-pool resource games (Schlager et al., 1994). Many scholars found, contradicting noncooperative game theory, that various communities are able to adopt strategies that prevent the dilemma and enable sustainable natural resources management (Ostrom et al., 1994; Keser and Gardner, 1999). Ostrom (1990) developed eight design principles that are relevant to natural resource users to

276
prevent the dilemma. Communication as well as monitoring and sanction systems are, according to Ostrom (1990), essential measures to reduce resource exploitation. Experiments undertaken by other scholars find that monitoring and sanctioning decreases free-riding substantially, and that these measures lead to socially more profitable outcomes, even when punishment is costly for players (Ostrom et al., 1994; Fehr and Gächter, 2000; Masclet et al., 2003). In this study we used framed field experiments instead of lab experiments. Our aim was to adapt the decision situation in the experiment to decision situations the Cambodian and Vietnamese participants already know from their real life experience. According to the results presented by experimentalists and game theorists, we formulate the following hypotheses for the results from the two games: • Extractions will neither be at Nash equilibrium nor at social optimum. A substantial amount will be left on
the public account. Over time, extractions will increase. • Monitoring and sanctioning will significantly decrease free-riding, and thus increase group outcomes. Methods The extraction game was played with 128 players (16 participants per village divided into four games). Players were chosen by village representatives and from all wealth groups. Each game consisted of 20 rounds, where appropriations as group totals only were announced after every round. After ten rounds, monitoring was introduced, whereby the subjects were unaware of any rule change before they were introduced. They were informed, however, that the game would last about 2 hours. Participants were aware of the identity of the other group members, and they knew each other as players were all selected within the village. In both games, however, decisions were made in private, individually, and were kept confidential even after the game ended, although in reality decisions of villagers were often known by other villagers. To keep decisions confidential, however, reduces individual behavior to the economic decision alone, which we wanted to test. Each experiment lasted 1-2 hours. Experiment instructions were presented orally in Khmer or in Vietnamese. The facilitators in Cambodia and Vietnam remained the same for all sessions. Players knew the number of people attending the session, as well as the incentives from investing the token in the private account or in the group account. The instructions included examples of possible actions and outcomes. The games were framed according to the local situation. This was to assure that (a) confusion about subjects and intentions within participants was minimized, and that (b) illiterate participants had equal opportunities to participate. Additionally, all games were arranged in a manner that reading and writing was not necessary for participation. We used a common-pool resource game ('Extraction Game' hereafter) (Ruffle and Sosis, 2002), whereby people extracted fish from a common pond. Each round the pond was endowed with 40 units of fish and players decided to extract units of fish to the private account or leave it to the public account. Tokens extracted into the private account were immediately private gains, whereby fish units left in the common pond also yielded a return to each group member. Regardless of extraction levels of individual players each fish unit left was rewarded by the amount of 0.5 token. If the group total extraction was more than 40 units of fish, no player received any reward. Accordingly, the individual payoff function in the Extraction Game is:
40,0)(
40,)40(2
)(
1
1
1
>=
<+−−
=
∑
∑∑
=
=
−
≠
n
iii
n
iii
i
n
ijj
i
xifxg
xifxn
xxxg
In this experimental setting, free-riding is the dominant strategy. Because the private rewards of extracting from the public good is higher than the private rewards from the public good, individual (Nash) incentives to extract dominate. At the social optimum, however, all players would be better off if none of the players extracts any unit. This rule was introduced as villagers were involved in an aquaculture project, whereby benefits to the whole group were maximized when no fish was extracted until the common harvest. Fish were then fully grown and yielded more benefits. The common harvest is then displayed through the equal distribution of all fish to the group members at the end of the round.

277
After ten rounds, a monitoring system was introduced. Players were told that the new rule is to extract zero units, because this is the best strategy for the group as a whole in order to reach highest benefits at the common harvest. After each decision and the announcement of the group total, a dice was thrown and with the probability of one to six an external monitoring of all players occurred. Every player who extracted more than zero units from the common pond received a fine of four times the units he or she extracted. These units were then subtracted from the players’ total payoffs. Sanctioned players also did not receive shares from the common pond in the respective round. One unit extracted thus was punished by four units, two units by eight units of fish and so on. After 20 rounds, the end of the game was announced and players received money for each token they gained during the game, whereby one unit of fish was equal to 100 Riel or 1.000 Vietnamese Dong. Results We compared results from Cambodia and Vietnam and investigated how the introduced monitoring changed the strategic behavior of the participants. We tested each hypothesis introduced with our data. Payoffs in each round were calculated according to the daily income of a rural family. A game lasted around 2 hours with an additional 30 minutes interview after. For each player it was possible to earn 20 times a daily income, when social optimum would have been played all the time. In each round, players decided about a fourth of their daily income. For the Extraction Game, total payoff of all participants was US$1374, whereby the Cambodians earned US$6.70 on average, and the Vietnamese US$22.80 on average.
Mean extractions by country
0
2
4
6
8
10
1 2 3 4 5 6 7 8 9 10 11 12 13 14 15 16 17 18 19 20
Round numbers
Mea
n ex
tract
ions
Mean extractions Mean extractions Cambodia Mean extractions Vietnam
Figure 6. Mean extractions by country. The mean extraction of all players for both countries and separately for Cambodia and Vietnam is shown in Figure 1. The mean extractions are between the Nash equilibrium (10 tokens) and the social optimum (0 tokens) and are 3.9 tokens. The standard deviations are 4.47 (both countries), 4.56 (Cambodia), and 2.75 (Vietnam). The cases when social optimum, Nash equilibrium and over-extraction occurred within the groups is summarized in Table 1. In 10% of all rounds (n= 640 rounds) a social optimum was reached. On the other side, the Nash equilibrium resulted in only 2.7% of all rounds. Overextraction (more than 40 tokens played as group) occurred nine times in all games, and thus represents only 1.4% of the total rounds. Table 2. Totals and percent of rounds social optimum, Nash and overextraction played in Ext. game. Social optimum Nash equilibrium Overextraction Total % Total % Total % Cambodia 9 1.9 17 3.5 8 1.7 Vietnam 55 34.4 0 0 1 0.6 Total 64 10 17 2.7 9 1.4 In Figure 2 the frequencies of tokens played are shown. Individuals extracted more often at the social optimum level than at the Nash equilibrium. Only five players (out of 128 players), however, never extracted any tokens from the common good, and thus played continuously at the social optimum. However, free-riding occurred, and on 179 occasions (in 2560 decisions) people extracted even more than 10 tokens.
Nash Equilibrium = 10
Social Optimum = 0
Introduction of monitoring and sanctioning

278
Frequencies of extractions by country
050
100150200250300350400450
0tokens
1-2tokens
3-4tokens
5-6tokens
7-8tokens
9-10tokens
> 11tokens
Tokens
Wei
ghte
d fr
eque
ncie
s of
de
cisi
ons Cambodia
VietnamTotal
Figure 7. Frequencies of extractions by country. We find significant differences between the extraction levels in all rounds when comparing Cambodia and Vietnam (Kruskal-Wallis test 0.0001). The Vietnamese participants play much closer to the social optimum (1.15 tokens on average) and extracted 3.67 tokens less on average than the Cambodian players (4.82 tokens on average). Also, the frequency of zero tokens played is much higher in Vietnam than in Cambodia. In Figure 3, the change in extractions between round 10 and 11 already shows how much monitoring affects people’s extractions level. The means of tokens extracted before monitoring has been introduced are 4.76 for both countries, 5.7 tokens for Cambodia and 1.94 tokens for Vietnam. The respective means after monitoring was implemented are as follows: 3.05 tokens (both countries), 3.94 tokens (Cambodia), and 0.37 tokens (Vietnam). In Vietnam, the mean contributions after introduction of monitoring move very close to the social optimum. Also, the Wilcoxon signed ranks test comes to the conclusion that the effect of monitoring to extractions is significant. The differences in the distribution, the shift of the mean, and the reduction of the variance are shown in Figure 3.
Figure 8. Frequencies of mean extractions in round 1‐10 compared to round 11‐20. The assumptions made in the beginning were tested against our results. Extractions are neither at Nash nor at social optimum. We could not find, however, that extractions increased over time as suggested by other studies. The introduced monitoring had significant effect on cooperation and significantly decreased extractions. Vietnamese players played more cooperative from the very beginning of the Extraction Game, but especially after the introduction of monitoring measures with penalties. Discussion and conclusions Being a local user of natural resources in Cambodia and Vietnam, ones’ own decision always influences fellow villagers. In return, the decisions of others always influence one's own livelihood. Cooperation in natural resource management is thus essential, especially within the local village context, where livelihoods are almost exclusively assured from the daily use of natural resources. The findings of our research show results that are in line with earlier research on common-pool resources and public goods. Our hypotheses were all supported by the analysis, except for the surprising fact that free-riding did

279
not increase over time. This leads to the assumption that our groups were learning how to reach a higher group and thus a higher individual outcome, and improved their cooperation over time. The results concerning the impact of introduced monitoring measures into the game are noteworthy. Players reacted sensitively to the threat of being punished. In both countries, reactions might be related to the recent history of (civil) war, as most people are still traumatized and fear punishment. On the other hand, monitoring and sanctioning are rather random and insufficiently enforced, and people are not really used to getting punished for offending behavior in regard to natural resources. This is more evident in Cambodia as current natural resource management government structures in Cambodia often are not able to address negative natural resource management practices. Further research in the region concerning the users’ behavior is necessary in regard to different monitoring regulations, also including whether people would be willing to contribute money to monitoring activities. It would also be appealing to investigate what institution people would prefer, if they could choose. As appropriations as well as voluntary contributions usually include larger numbers of individuals, further research in the Lower Mekong area could also take into account how group size influences people's willingness to cooperate. The Cambodian as well as the Vietnamese government aims at decentralizing natural resource management to lower jurisdictional levels to provide more effective and sustainable governance. New institutional arrangements, such as community-based forestry or fisheries, are now being promoted by the governments with the aim to give decision power and fiscal means to the local communities that live with and from the natural resources. To ensure that these measures contribute to a better and more sustainable resource management, it is required to understand people’s behavior toward natural resources. It is necessary to understand the challenges natural resource users face in regard to the management to adjust policies and give essential support from higher jurisdictions when needed. With this research we hoped to improve our understanding of people’s strategies, to more effectively evaluate planned and implemented policies in the region. We found that cooperation in the communities is definitely present, and that community-based management is promising. It became obvious, however, that different institutional measures or rules can increase cooperation levels. This should be taken into consideration when planning decentralization measures in order to support communities in their rather difficult task of sustainable resource management. Acknowledgments This paper presents findings from CP35, Community Based Fish Culture in Irrigation Systems and Seasonal Floodplains. The research is part of PhD research financed by CAPRi and supervised by the University of Marburg, Germany (Prof. M. Kirk), and the WorldFish Center, Malaysia (N. Sheriff, PhD). 2 REFERENCES Fehr, E., and S. Gächter. 2000. Cooperation and Punishment in Public Goods Experiments. American Economic
Review, 90(4): 980-94. Hardin, G. 1968. The Tragedy of the Commons. Science, 162: 1243-48. Keser, K., and R. Gardner. 1999. Strategic Behavior of Experienced Subjects in a Common Pool Resource Game.
International Journal of Game Theory, 28(2): 241-52. Masclet, D., C. Noussair, S. Tucker, and M.-C. Villeval. 2003. Monetary and Non-Monetary Punishment in the
Voluntary Contribution Mechanism. American Economic Review, 93(1): 366-80. Ostrom, E. 1990. Governing the Commons: The Evolution of Institutions for Collective Action. New York,
Cambridge University Press. Ostrom, E., R. Gardner, and J. Walker. 1994. Rules, Games, and Common-Pool Resources. Ann Arbor, Michigan,
University of Michigan Press. Ruffle, B.J., and R.H. Sosis. 2002. Just How Cooperative are Kibbutz Members? Field Experiments on Israeli
Kibbutzim and in Israeli Cities. Available at SSRN:http://ssrn.com/abstract=311962. Schlager, E., W. Blomquist, and S.Y. Tang. 1994. Mobile Flows, Storage, and Self-Organized Institutions for
Governing Common-Pool Resources. Land Economics, 70(3): 294-317. Steins, N., and V. Edwards. 1999. Collective Action in Common-Pool Resource Management: The Contribution of a
Social Constructivist Perspective to Existing Theory. Society & Natural Resources 12(6): 539-57.

280
Enhancing stakeholder participation in regulation studies of the equatorial lakes
B. Zaake1 and M. McCartney2
1Directorate of Water Resources Management, Entebbe [email protected] 2International Water Management Institute (IWMI), Ethiopia
Abstract Over the past decade, the application of systems analysis techniques and decision support systems to support the operation of existing and planned dams in the Nile Equatorial Lakes Basin have been recognized as important steps in the quantification of the costs and benefits of different operating options. There has been very limited progress, however, toward implementation of the regulation regimes proposed by such DSS. This is partly because: (1) there is no basin-wide framework to support consideration and adoption of new regulation strategies; and (2) social and environmental concerns have not been considered. This paper presents the findings of a consultative exercise designed to agree upon broad management objectives for regulating the Equatorial Lakes within a participatory problem-structuring framework. Representatives of different stakeholder groups were able to rank decision criteria and agree on priority concerns. The process was facilitated through the use of an objectives hierarchy methodology, commonly referred to as value trees. The findings provide a sound foundation on which to base further development of a decision support system for this basin. Media grab Large dams remain highly controversial. Involvement of all stakeholders is a prerequisite for better decisions related to their operation. Introduction The operation of dams and large reservoir systems is often complicated by a multiplicity of conflicting project uses and purposes that ultimately affect different groups of people or interests. Resolving the dam operation problem is compounded by system managers who do not easily perceive the trade-offs and often resort to assigning priority to objectives that realize the greatest monetary benefit. For example, between 2000 and 2005, in the Upper Nile Equatorial Lakes Basin (Figure 1), hydropower plants at the outlet of Lake Victoria increased power generation, by releasing greater volumes of water through their turbines than is consistent with the Agreed Curve (i.e., an internationally agreed release regime, based on the relationship between outflow and Lake Victoria level that existed prior to construction of the Owen Falls Dam. Over the same period Lake Victoria levels dropped close to unprecedented lows. The role of hydropower production in this decline is not clear and has been much debated (EAC, 2006). Nevertheless it is clear that low lake levels had an adverse impact on landing sites, navigation facilities, and shoreline industries and settlements, leading to a range of mostly negative socioeconomic and ecosystem impacts. Several recent studies have utilized DSS to assess the impact of different regulation rules on hydropower production (e.g. Mott MacDonald, 1998; Georgakakos, 2004; Wardlaw et al., 2005). To date, however, no progress has been made in implementing any of the identified plans. It is probable that failure to consider environmental impacts and the lack of a framework to support consideration and adoption of new regulation strategies has impeded progress. In this paper, the findings of a consultative exercise designed to clarify different stakeholder opinions, and agree upon broad management objectives, are presented. Methods A two-day stakeholder meeting was organized and held in Entebbe in Uganda in July 2007. The meeting attracted participation from representatives of a wide range of stakeholders from the three riparian countries of Lake Victoria (Table 1). The aim of the meeting was to achieve a common understanding of stakeholders’ interests and desired goals. A number of presentations were made to facilitate discussion around different stakeholder positions. Key amongst these was a presentation made by ESKOM (the operator of the dams), which illustrated the challenges facing the company in resolving water-sharing issues within a framework of cascading hydropower plants along the Victoria Nile. Presentations were also made on the legal aspects of public participation in the planning and management of large dams.. Extracts of relevant literature were presented to the participants to facilitate their examination of problems similar to the one under consideration (e.g. Hämäläinen et al., 1999; Soncini-Sessa et al., 2002; Castelleti et al., 2004; Marttunen and Suomalainen, 2006). These illustrated stakeholder participation methodologies, processes, and techniques in DSS frameworks. During break-out sessions, stakeholders formed two broad groups influenced by similar concerns (e.g. 'Fisheries and Environment' vs 'Economics') and were accordingly asked to articulate their preferences and identify criteria to be used in the evaluation of a proposed regulation policy. Eliciting preferences was not straightforward as many of the participants were not aware of, or sure about, their preferences amongst several management objectives. Consequently they were not able to state them exactly. Hence, they were asked to initially define a wide range of

281
objectives from their perspective and rank them in order of importance based on their own interests. These were then presented to a plenary session for discussion.
Figure 1. Equatorial Lakes Basin (Sutcliffe and Parks, 1999). Table 1. Stakeholders that participated in the priority setting workshop (July 2007). Stakeholder Category+ Secretariat of the East African Community (EAC)
Decision maker Uganda Water Policy Committee National Association of Professional Environmentalists (NAPE)
Civil Society forums and Environmentalists
Uganda Dams Dialogue Nile Basin Discourse Forum Confidence Building and Stakeholder Involvement Project of the Nile Basin Initiative Directorate of Water Resources Management in Uganda
Water resources, fisheries & energy resource managers
Ministry of Energy and Minerals Development in Uganda Water Resources Management Authority in Kenya Lake Kyoga Integrated Management Organisation (LAKIMO) Lake Victoria Research Initiative (VICRES)
Research institutes Fisheries Research Institute (FIRRI) University of Dar Es Salaam, Tanzania Moi University, Kenya ESKOM Uganda, the dam operator Power Company +It is recognized that in relation to decision-making the various stakeholders are empowered differently. It is not, however, currently possible to quantify this power, even in relative terms.
An objectives hierarchy or decision hierarchy method commonly referred to as 'Value Trees' (Martunen and Hämäläinen, 1995; Rogers and Bestbier, 1997) was utilized to support the ranking process. The method begins with formulation of a broad management vision and specific management goals that give better definition to the vision, and is ultimately underpinned by a set of specific, quantified objectives that provide managers with management targets. Quantified objectives can include proposed levels of hydropower generation, desired range of lake levels, flood control, damage or targets of ecosystem integrity.

282
Results Each of the stakeholders articulated their own priorities. Representatives from NAPE sought to define management objectives that take into account issues related to cultural, spiritual, and ethical values. They were, however, urged to be prepared to make some concessions due to the difficulty of incorporating such non-tangible considerations within a DSS framework. Representatives from ESKOM argued that the underlying seasonality in annual Lake Victoria Levels implies that alternatives to the Agreed Curve should take into account the fact that more water is available between April and September each year. ESKOM also indicated that additional challenges in dam operation would arise once downstream power plants along the Victoria Nile were completed and expressed concern that, over the long term, large-scale withdrawal of water from Lake Victoria by upstream riparian countries would impact negatively on hydropower production. FIRRI focused on the need to maintain both upstream water levels as well as downstream flows to maintain important fisheries production in wetland areas. LAKIMO emphasized the importance of Lake Kyoga for the maintenance of many rural livelihoods and the need for timely inflows from the Victoria Nile to safeguard these livelihoods. Representatives from Kenya and Tanzania highlighted the importance of Lake Victoria for many of their citizens and the problems of excessive drawdown on the water supply to several large towns. An agreed value tree for regulation of Lake Victoria is shown in Figure 2, where the decision criteria were divided into four main objectives: i.e. economic, social, ecological, and institutional. Figure 2. Value tree developed to highlight key issues to be considered in the regulation of outflows from Lake Victoria. Institutional management objectives in this context are taken to be constraints imposed on regulation strategies. The priorities were validated in the plenary session by a method of public vote ranking. The results are a prioritized cardinal list of stakeholder objectives/preferences rather than an exhaustive ordinal list of regulation alternatives. Additional work will be required to support the generation, comparison, and choice of alternatives. The final choice usually occurs at the end of the decision-making process but, as demonstrated in this meeting, the process can be assisted with the early use of Multi-Criteria Decision Making (MCDM) tools that improve communication between stakeholders and facilitate the gathering of values seen to be important. The magnitudes of potential trade-offs will be derived after application of a multiobjective optimization algorithm and the use of multicriterion decision analysis techniques. This is beyond the scope of this paper, but is the subject of future work. Trade-off analysis that may be considered could include: • Demonstrating ways of meeting hydropower demand targets while sustaining the necessary volume,
levels, and timing of water flows to support important freshwater ecosystems. • Striking a balance between upstream use of water for irrigation and downstream hydropower production. • Minimizing damage to shoreline settlements, disruption to navigation, and water abstraction facilities by
limiting the range of water level variation but also ensuring that legal commitments are not violated.
Economic
Development of a Regulation Policy for Lake Victoria
1. Fisheries 2. Water supply3. Hydropower 4. Irrigation5. Transportation6. Tourism7. Flooding8. Livestock
1. Land use/Catchments mgt2. Other shoreline actives3. Wetlands4. Water quality5. Floods6. Biodiversity
1. Public health2. Cultural Values3. Floods4. Aesthetic values5. Displacement
1. Regional & international Issues2. Central Governments3. Local government4. Water Authorities5. Lake mgt org6. Civil society
Social
Ecological
Institutional

283
Discussion The workshop underscored the diversity of concerns and the wide range of stakeholders with interests in how the waters of the Equatorial Lakes Basin are regulated. It proved to be a useful forum for discussion of concerns and, facilitated by the use of value trees, enabled the development of a broad consensus on the range of priority issues related to the operation of dams. Ideally dam-operating regimes need to be tailored to ensure that, as far as possible, all these objectives are met. It is clear, however, that pragmatically some trade-offs will be required. A strength of modern DSS is being able to predict the implications of different operating regimes for a range of objectives. The workshop did not succeed in developing quantitative objectives and with hindsight, it is recognized that this was too ambitious an objective for such a short meeting. Nevertheless, the consensus on priority issues provides a useful basis for determining the focus for DSS development currently underway. Conclusions and recommendations The workshop highlighted the fact that decision-making related to dams is not simply an intellectual exercise related to optimizing benefits, but is in fact highly emotive. In such complex situations, where the potential for conflict is high, the decision-making process is as important as the final outcome. It is difficult to compare the findings of this study with others as it only covers the initial stage of problem structuring. Similar lessons learnt at this stage, however, and noted in many other studies, are that the methodology needs to be kept simple to be understandable to nontechnical stakeholders. Although the impacts of the workshop itself are difficult to evaluate it certainly promoted better mutual understanding of different stakeholder concerns. It also contributed to transparency in decision-making and fulfilled the objective of providing a firm foundation for further development of a DSS for dam operation in the basin. Acknowledgments This paper presents findings from PN 36: Improved planning of large dam operation: using decision support systems to optimize livelihood benefits, safeguard health and protect the environment, a project of the CGIAR Challenge Program on Water and Food. References Castelletti, A., R. Soncini-Sessa, F. Cellina, and E. Weber. 2004. The PIP procedure in the planning of lake Verbano,
In: IFAC Workshop on Modelling and Control for Participatory Planning and Managing Water Systems, Venezia, Italy.
Georgakakos, A.P. 2004. Decison support systems for integrated water resources management with an application
to the Nile Basin, In: IFAC Workshop on Modelling and Control for Participatory Planning and Managing Water Systems. International Federation of Automotive Control, Venice.
Hämäläinen, R.P., E. Kettunen, M. Marttunen, and H. Ehtamo. 1999. Towards decision and negotiation support in
multi-stakeholder development of lake regulation policy. Proceedings of the 32nd Annual Hawaii International Conference on Systems Analysis. Systems Sciences, Maui, HI, USA.
Marttunen, M., and R.P.Hämaläinen. 1995. Decision Analysis Interviews in Environmental Impact Assessment. Eur.
J. Oper. Res., 87: 551-63. Marttunen, M., and M. Suomalainen. 2006. Participatory and multi-objective development of water course
regulation–creation of regulation alternatives from stakeholder's preferences. Journal of Multi-Criteria Decision Analysis, 13(1): 29-49.
Mott MacDonald. 1998. Lake Victoria regulation studies. WRAP Report No WRA03, Water Resources Assessment
Project, Entebbe, Uganda. Rogers, K., and R. Bestbier. 1997. Development of a protocol for the definition of the desired state of riverine
systems in South Africa. Pretoria (S. Africa): South African Wetlands Conservation Programme, Dept. of Environmental Affairs and Tourism.
Soncini-Sessa, R., A. Castelletti, and E. Weber. 2002. Participatory decision making in reservoir planning, In:
Proceedings from iEMSs Integrated Assessment and Decision Support. Elservier, Lugano, Switzerland, pp. 34-44.
Sutcliffe, J.V., and Y.P. Parks. 1999. The hydrology of the Nile. IAHS Special Publication No. 5, IAHS Press,
Wallingford, UK. Wardlaw, R., M. Sharif, and F. Kimaite. 2005. Real-time hydro-power forecasting on the Victoria Nile. Water
Managementm 158: 45-54.

284
Vertical asymmetries and collective action in watershed management
Juan Camilo Cardenas1, Nancy Johnson2, and Luz Angela Rodriguez3
1Facultad de Economía–CEDE, Universidad de Los Andes, Bogotá, Colombia, [email protected]
2CIAT (International Center for Tropical Agriculture), Cali, Colombia [email protected] 3Universidad de Los Andes, Bogotá, Colombia, [email protected]
Abstract Watersheds have the characteristic of connecting people vertically by water flows, making relationships among users of water more complex. The location of the people along the watershed defines their roles in the provision and appropriation of water. Verticality in watersheds thus imposes a challenge to collective action. This paper presents the results of field experiments conducted in four watersheds in Colombia and Kenya. We recruited 639 watershed inhabitants from upstream, midstream, and downstream locations in these basins, and conducted field experiments to study the role that location and verticality plays in affecting cooperative decisions on provision and appropriation. Two field experiments were conducted: the 'Irrigation Game,' a new experimental design that includes the provision and appropriation nature of the resource, and the 'Water Trust Game,' an adaptation of the Trust Game where we explicitly announce the actual location upstream or downstream of the two players. The results show that reciprocity and trust are very important motivations for upstream-downstream cooperation, and that the role of upstream players has important implications in water provision decisions. Results from both experiments suggest that the lack of trust from downstream players toward upstream players restricts the possibilities of cooperation among the watershed users. Media grab Group communication can be better than regulation for increasing collective action around water management; upstream residents have a key role to play in initiating catchment-level processes. Introduction Watersheds connect people vertically by water flows, creating complex relationships among users of the resource. The social and biophysical interdependency among users of the watershed generates challenges to water and watershed management. The location of the people along the watershed defines their role in the provision and appropriation of water, so verticality in watersheds imposes a challenge to collective action. Watersheds are characterized by an important biophysical and socioeconomic heterogeneity that generates a variety of actors. These actors face different economic and environmental challenges, such as access to the resources, especially in terms of its quantity and quality. 'Watersheds may include grazing land, agricultural land, residential areas, forests, wetlands, common waterways, and water-storage structures, each of which may be used by a variety of resource users. Lateral flows of water, soil, and nutrients between source and destination areas may link those resource users to other stakeholders, some of whom live outside the watershed. Effective watershed management requires coordination in the way that various stakeholders use and invest in the resources' (Knox et al., 2001). The connection among actors in a watershed involves coordination and cooperation in the management of natural resources to improve their collective actions. Trust and reciprocity are important in a relationship that involves externalities and coordination failures, and these factors are enhanced by the awareness of dependence among participants (Ostrom, 1998; Ostrom and Gardner, 1993). We conducted experimental designs in the field with the participation of residents of four watersheds in two countries: Colombia and Kenya. Through these experiments we expected to observe the factors that can enhance trust and collective action in a context of dependence among people in different locations along a watershed. We recruited 639 watershed inhabitants from upstream, midstream, and downstream locations of Coello River and Fuquene Lake watersheds in Colombia and Awach and Kapchorean rivers in Kenya. The Irrigation Game was conducted with a sample of 355, participants and the Water Trust Game with a sample of 284 participants. The gender composition of the sample was of 48% for the irrigation game and 51% for the water trust game. The sample distribution across basins, games, and treatments is shown in Table 1. Not all cells were sampled due to budget and time restrictions. We guaranteed, however, that both games were conducted in both countries, and within each country we obtained data for all treatments of the irrigation game.

285
Table 1. Distribution of the participants across watersheds, games and treatments. Participants in Irrigation Game (1 session = 5 players, 20 rounds) Participants in
Water Trust Game (1 Session = 2 players, 1 round)
Basins Base Line Communication High
Fine Low Fine Total
Irrigation Game
Total Basin
Awach (Kenya)
20 20 20 -- 60 124 184
Kapchorean (Kenya)
20 20 -- 20 60 -- 60
Coello (Colombia)
20 30 20 30 100 -- 100
Fuquene (Colombia)
35 35 35 30 135 160 295
Total 95 105 75 80 355 284 639 The field experiment approach was used to achieve a better understanding of the effect of participants’ location on water systems and the factors that influence provision decisions in this context. Two field experiments were conducted: the 'Irrigation Game,' a new experimental design (Cardenas et.al., 2008a) that includes the provision and appropriation nature of the resource, and the 'Water Trust Game,' an adapted version of the Trust Game, framed around water that presents the dependence among players related to water and compensation (reverse) flows. In all games the participants received monetary incentives based on the tokens earned during the games. The average payment received by players ranged between 1 and 1.5 days of work paid at the minimum wage rate. Methods Irrigation game This game introduces the asymmetries in the water provision and access to the resource among players. In this game five players make two decisions in each round, one of contributing to a public project to produce water for the group, and another of extracting water for individual gains from irrigation. In the first part of the game, players make decisions on how many tokens to invest in a public fund to maintain water canals, from an initial endowment of ten tokens in each round. The amount of available water for the group is increasing as the group contributions increase. Noncontributed tokens are kept in a private account. These tokens are paid at the same monetary rate as the water units to be extracted in the second stage of each round. The second decision of the players is the individual water extraction from the total water produced. This decision is taken according to the location of the players along the water canal, which is defined randomly for the entire sequence of rounds, and is represented by a letter: A for the player in the first position and E for the player in the last position. The water is allocated, therefore, according to the location in the following manner. Player A first receives all the water produced by the group project, and decides how much water to extract. The remaining water is then shown to player located in B who then decides how much to extract and how much to leave to the remaining players downstream, and so on for players C, D, and E. This sequence is conducted for 10 rounds. After the first ten rounds of baseline treatment, rules changed for some groups and this change is announced aloud to the players. Some groups were permitted to communicate, others face external regulation treatments, and other groups continued playing with the baseline conditions. In the face-to-face communication treatment, players were allowed to communicate with the other players in the group before returning to their places to make their own private decisions. Likewise in the baseline, they know the aggregate decision but not the individual decisions after each decision round. In the external regulation or penalty treatments players were told that there would be a chance of being monitored each round. The experimenter rolled a dice in front of the participants each round and if the number obtained was 6, all the participants would be inspected. Thus, with a probability of 1/6 of being inspected, the monitor would verify if the player had extracted more than the allowed water amount, namely, 20% of the produced water by the group in the provision stage, and if so, they would pay a fine. In the high penalty treatment, the fine was the extra water in excess extracted plus six units from the earnings; in the low penalty treatment the fine was just the extra amount taken. Water trust game Based on the standard trust game (Berg et al., 1995), we adapted the basic incentives structure as a water trust game (WTG) framed around water production and distribution between two people located in different positions of a watershed. At the beginning of the game both players are endowed with 8 tokens. Player 1 (the proposer) can send any fraction from 0 to 8 tokens of her initial endowment to player 2 (the responder). As in the canonical version of the trust or investment game, the amount sent by player 1 is tripled before it reaches player 2 who then decides how to split the tripled amount plus her initial endowment between herself and player 1. This increase in the amount being sent reflects how a decision in favor of watershed conservation would increase the possibilities of a greater social outcome to be distributed along the watershed members. In our framing we explicitly framed the decision of player 1, if upstream, as the quantity of clean water sent to player 2 downstream, and player 2’s

286
decision as an economic compensation for the water provided by player 1. If the game started with a downstream player, also such decision was framed as an economic compensation for the water provided by player 1. We implemented the trust game using the strategy method, that is, player 2 was asked the complete strategy of responses to each possible offer by player 1. Therefore player 2 had to respond, without knowing yet the amount offered by player 1, how many tokens she would return to player 1 for each possible offer by player 1 (0, 2, 4, 6, 8 units). During each session we also asked each of the players the amount they expected from the other player. A typical experimental session lasted between 2 and 3 hours, including the time of explaining the rules and practice rounds to make sure every participant had understood the incentives and rules of the game. Results and discussion Irrigation game The Social Optimum or Maximum Social Efficiency is a contribution of 100 units of water that means an individual contribution of 45-50 tokens. Nash Equilibrium is zero-contribution obtaining a suboptimal result of 50% of the maximum social efficiency possible. The overall results replicated the patterns of previous public goods or CPR games where predictions of noncooperative game theory were not a common result and communication improved cooperation.
20%
30%
40%
50%
60%
70%
80%
1 2 3 4 5 6 7 8 9 10 11 12 13 14 15 16 17 18 19 20
Average
Con
tribution
Round
Base Line
Coello Fuquene Awach Kapchorean
20%
30%
40%
50%
60%
70%
80%
1 2 3 4 5 6 7 8 9 10 11 12 13 14 15 16 17 18 19 20
Average
Con
tribution
Round
Communication
Coello Fuquene Awach Kapchorean
20%
30%
40%
50%
60%
70%
80%
1 2 3 4 5 6 7 8 9 10 11 12 13 14 15 16 17 18 19 20
Average
Con
tribution
Round
High Penalty
Coello Fuquene Awach
20%
30%
40%
50%
60%
70%
80%
1 2 3 4 5 6 7 8 9 10 11 12 13 14 15 16 17 18 19 20
Average
Con
tribution
Round
Low Penalty
Coello Fuquene Kapchorian
Figure 1. Irrigation Game contribution by treatment (Baseline, Communication, High Penalty, and Low Penalty). The four panels in Figure 1 show the average contributions in the first stage of the game as a percentage of the endowment in each round. The contribution was on average 4.82 tokens, i.e. 48.2% of players’ endowment, for the 10 initial rounds. For the second stage of the game (rounds 11-20), the groups that continued playing under the baseline condition continued a similar pattern (47.1% of their endowment), whereas the groups that could communicate reached a contribution of 5.9 tokens on average. The penalty treatment groups obtained an average contribution of 4.83 for high penalty and 3.96 for the low penalty groups. The variance of the contributions behavior was rather constant and similar across the four treatments or across the watersheds. The standard deviation of the contributions ranged between 2.5 and 3 units and remained constant over rounds. We did observe a slightly higher variance for the communication data (sd=2.05 units for rounds 11 to 20 compared to 2.83, 2.64 and 2.88 for the baseline, high and low penalty treatments, respectively). This higher variance in the communication treatments is expected as the dynamic of a group conversation induces a significant number of players to contribute their entire endowment while other players remain in the low contributions,
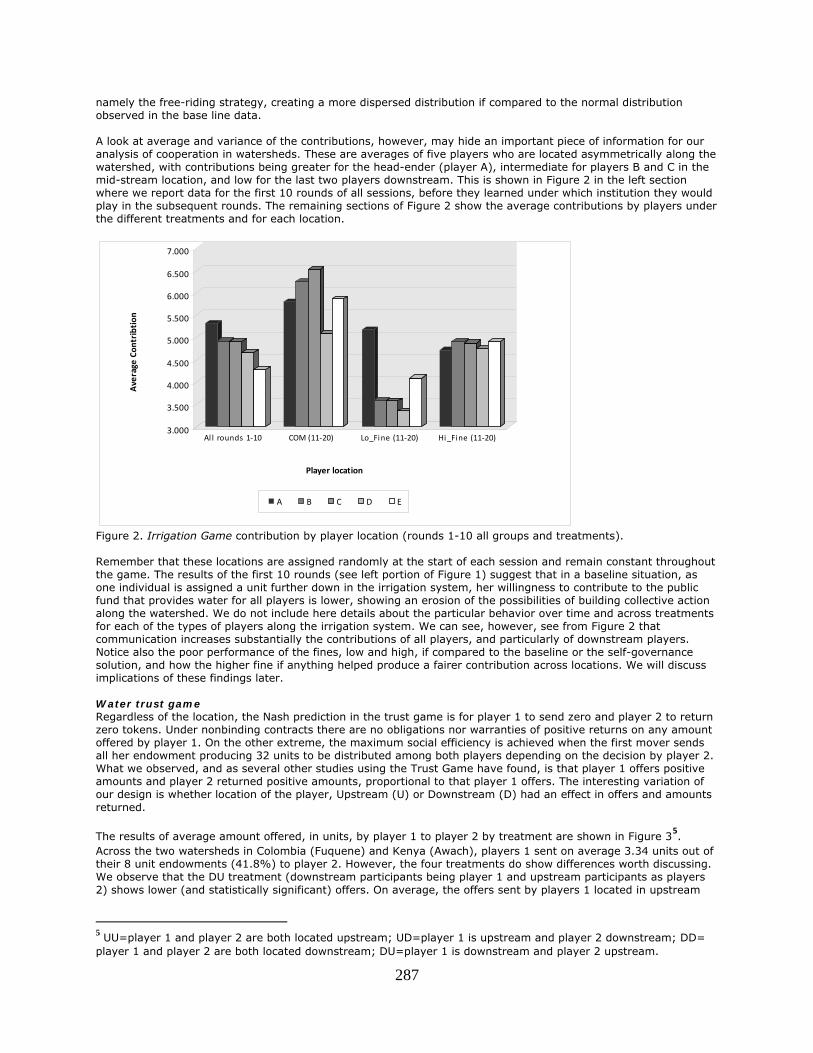
287
namely the free-riding strategy, creating a more dispersed distribution if compared to the normal distribution observed in the base line data. A look at average and variance of the contributions, however, may hide an important piece of information for our analysis of cooperation in watersheds. These are averages of five players who are located asymmetrically along the watershed, with contributions being greater for the head-ender (player A), intermediate for players B and C in the mid-stream location, and low for the last two players downstream. This is shown in Figure 2 in the left section where we report data for the first 10 rounds of all sessions, before they learned under which institution they would play in the subsequent rounds. The remaining sections of Figure 2 show the average contributions by players under the different treatments and for each location.
3.000
3.500
4.000
4.500
5.000
5.500
6.000
6.500
7.000
Average
Con
tribtion
Al l rounds 1‐10 COM (11‐20) Lo_Fine (11‐20) Hi_Fine (11‐20)
Player location
A B C D E
Figure 2. Irrigation Game contribution by player location (rounds 1-10 all groups and treatments). Remember that these locations are assigned randomly at the start of each session and remain constant throughout the game. The results of the first 10 rounds (see left portion of Figure 1) suggest that in a baseline situation, as one individual is assigned a unit further down in the irrigation system, her willingness to contribute to the public fund that provides water for all players is lower, showing an erosion of the possibilities of building collective action along the watershed. We do not include here details about the particular behavior over time and across treatments for each of the types of players along the irrigation system. We can see, however, see from Figure 2 that communication increases substantially the contributions of all players, and particularly of downstream players. Notice also the poor performance of the fines, low and high, if compared to the baseline or the self-governance solution, and how the higher fine if anything helped produce a fairer contribution across locations. We will discuss implications of these findings later. Water trust game Regardless of the location, the Nash prediction in the trust game is for player 1 to send zero and player 2 to return zero tokens. Under nonbinding contracts there are no obligations nor warranties of positive returns on any amount offered by player 1. On the other extreme, the maximum social efficiency is achieved when the first mover sends all her endowment producing 32 units to be distributed among both players depending on the decision by player 2. What we observed, and as several other studies using the Trust Game have found, is that player 1 offers positive amounts and player 2 returned positive amounts, proportional to that player 1 offers. The interesting variation of our design is whether location of the player, Upstream (U) or Downstream (D) had an effect in offers and amounts returned.
The results of average amount offered, in units, by player 1 to player 2 by treatment are shown in Figure 35.
Across the two watersheds in Colombia (Fuquene) and Kenya (Awach), players 1 sent on average 3.34 units out of their 8 unit endowments (41.8%) to player 2. However, the four treatments do show differences worth discussing. We observe that the DU treatment (downstream participants being player 1 and upstream participants as players 2) shows lower (and statistically significant) offers. On average, the offers sent by players 1 located in upstream
5 UU=player 1 and player 2 are both located upstream; UD=player 1 is upstream and player 2 downstream; DD= player 1 and player 2 are both located downstream; DU=player 1 is downstream and player 2 upstream.

288
positions were higher than when players 1 were located downstream. In all treatments both players were informed of the actual location of the other player in the watershed.
Figure 3. Average amount of units sent by player 1 to player 2. The more striking difference appears when players 1 are located downstream and must send their offers to players 2 located upstream. This phenomenon is observed in the Kenya and Colombia samples. Turn our attention to players 2 behavior, Figure 4 shows the average amounts, in tokens, returned by player 2 as a response to each of possible options that player 1 could offer to player 2 in our design. We are able to capture this information because we use the strategy method in the trust game, that is, we ask players 2 to elicit their responses to all possible offers by player 1, before they realized the actual offer. The results show that more trust is responded reciprocally, consistent with much of the literature using the trust game. For a survey of field and lab
experiments using the canonical version of trust game see Cardenas and Carpenter, 2008c6. It is worth noting that
players 1 received on average positive returns on their investment, that is, the average unit sent to player 2 generated a >1 return, although the returns were much higher for lower contributions, including getting on average 2.08 units for a zero offer.
Figure 4. Amount sent by player 1 and returned by player 2. These two phenomena, that downstream players seem to be less trusting, and that individuals in general include reciprocity in their strategic behavior, could explain in part why we observed in the irrigation game such lower contributions by players downstream; players D and E suffer more explicitly the negative effects of water over
6 The variation of the two observed decision variables, offers by players 1 and responses by players 2, showed a
standard deviation of 2.04 units for offers by players 1. With respect to responses by players 2 we need to calculate the standard deviation for each possible response with standard deviation values of 2.17, 2.81, 3.52, 4.50 and 6.05 units for 0, 2, 4, 6 and 8 offers by player 1, respectively.

289
extraction by players upstream and therefore are more sensitive to such unidirectional externalities. Experience with such externalities can drive a reduction of trust among downstream inhabitants toward the rest of watershed users, and it is well reflected with the experimental and actual location of the players in both games. Contextual analysis There are several types of variables at the individual, experimental session, and regional level, that can also help explain the variation of the behavioral variables by our participants in the two games, beyond the experimental design and treatments. Due to lack of space, we cannot report here a regression analysis to explain the contributions by players in the provision stage of the irrigation game, and the offers levels by players 1 in the water trust game. The data confirm our hypothesis of a downstream erosion of cooperation in the vertical collective action problem because of decreased trust by the downstream players in the game. The econometric analysis is discussed in detail in Cardenas et al. (2008b), where we explored the individual contributions in the irrigation game as a function of the experimental conditions, including the round, the location in the irrigation system, and the institutional treatment (baseline, communication, high fines, and low fines). We then continue with the individual characteristics given the richness of the demographics we were able to sample in the field. We included several context controls such as dummy variables for the watersheds and also for the particular five players context. We chose, therefore, to run a robust standard errors fixed effects model where the fixed effects were captured by each of the particular 71 sessions conducted in the four watersheds. We test several formulations of the estimator, including a pooled data model, a semi-pooled model with dummies for the watersheds, and an unpooled model where we estimate one separate regression for each of the watersheds. We also tested different institutional changes in round 11 for these sessions and compared them to the baseline treatment where players continued after round 11 under the same rules and incentives. Confirming our basic results reported here, we find that that the location in the irrigation system (A,B,C,D,E) does play a significant role in the level of contributions; in the unpooled model for each of the watersheds, we found that only for the case of Awach such effect is not significant under the baseline treatment, although it is statistically significant for the communication treatment7. Also, we observe the powerful effect of the communication treatment in increasing contributions for all estimated models. The introduction of high and low fines, however, seems to have a poorer effect on the contributions; if anything, some of the estimated models show a positive effect of the high fine, and for the case of low fines all coefficients are negative and not significant (Cardenas, 2004, 2005) for similar results comparing these type of regulations with face-to-face communication treatments in common-pool resource experiments conducted in the field. We also found that the contributions by the other people in the group in the previous round helped explain contributions with a negative effect: the higher the contribution by the other four players the smaller the contribution by the average player in the next round. This contradicts the reciprocity effect but the size of the coefficient is rather small. It could be, as a reviewer wisely suggested, that players would perceive that the group was making a sufficiently high effort, and therefore they could save some of the tokens for their own income, but also that when contributions were substantially low, they felt that an extra effort should be made to increase the group contributions. This effect changes substantially, however, if we study separately the institutional context of the regulation in the second stage, that is, this coefficient varies with the treatment. We found that lower levels of contributions for the two Kenyan watersheds and the effect of the 'other contributions lagged' turns out to be positive and significant for the Colombian basins, and negative for the Kenyan ones. We had already shown the much stronger effect of communication for the Colombian cases. With respect to demographic characteristics of the participants, we found that more educated, older people, living in larger households seem to contribute more to the provision stage of the game. Other factors do not seem to present a robust effect across the different subsample models estimated. The analysis of the role of the different regulatory treatments shows that the asymmetry in the coefficients for the player location is decreased for the case of the communication treatment. One of the major effects we observed of the self-governed solutions generated in the face-to-face communication within the groups is that players began to contribute in a more homogeneous manner as well as distributing better the water along the sequence. The watershed effects remain robust, with the Colombian watersheds showing higher levels of contributions for all treatments and with the Coello watershed showing a substantially higher level of contributions in all treatments. As for the case of the water trust game, we conducted an equivalent regression analysis. In this case we have 142 observations (pairs) for 284 participants in this game, and sampled from different locations in two of the watersheds (Fuquene of Colombia and Kapchorean of Kenya). We conducted all possible permutations of pairs for upstream and downstream locations of the players with the purpose of studying if there is, in fact, an effect of the actual location of the people in the watershed on the level of trust, a key element of collective action. We estimate the amount offered by player 1 to player 2 as a function of the same kind of explanatory variables used in the previous analysis. Model (1) considers the pooled data set, whereas model (2) includes a dummy for
7 We do not think it is a country effect or an experimenter effect, because the Kapchorean watershed did show statistically significant effects for the location of the players in the game, and the experimenters were the same in both Kenyan locations.

290
the Fuquene watershed that turned out to be significant (also consistent with the higher levels of contributions in the irrigation game for the Colombian samples). Models (3) and (4) consider the separate samples for each of the watersheds. Some robust results are worth mentioning. Reciprocal behavior drives trust by players 1. Those expecting more are sending greater amounts to players 2. This is consistent across the estimated models. Older and more educated people and females have a slight but not significant tendency to offer less. The more time the player has lived in the community the higher the offers with a significant effect, however. Let us now turn to the verticality effect. We had already in our descriptive analysis of offers (Figure 3) that the actual location of the player in the watershed might be playing a role. We do find that Player 2’s location is significant and negative for all estimated models, meaning that when the offers come from downstream players and player 2 is upstream, such offers decrease. Downstream players trust upstream players less, and that has a significant effect on trust and social efficiency since each token not sent represents three fewer tokens not generated for the social efficiency of the pair of players. Conclusions The challenge of vertical collective action emerges from the asymmetry in the location of players along the irrigation system. Head-enders or upstream players have better opportunities to capture the benefits of a public project that maintains or produces water because they have an earlier access to the resource. On the other hand, their actions cause direct externalities to those downstream. Therefore, tail-enders or downstream players notice two effects on their well-being: those upstream have better chances to benefit from the resource, and their appropriation actions affect them directly. Further, the appropriation by those downstream has no direct effect on players upstream and therefore the possibility of signaling through reciprocal responses is less available for downstream players. In our irrigation game this mechanism seems to operate through the contribution stage. Players downstream are willing to contribute less than upstream players to the public project; it seems that the effect is, if anything, of negative reciprocity that triggers even more the vicious cycle of reciprocity, trust, and reputation described by Ostrom (1998). These effects can create a similar negative effect to that of heterogeneity in collective action, in this case because of location. The distance created by these asymmetries (i.e. better resource availability and unidirectional externalities) from those upstream seems to reduce the level of trust and cooperativeness of downstream players. It seems that one major challenge to solve the vertical challenge is to address the asymmetries in a manner that players perceive a more fair allocation of the resource, and of the effort contributed to provide the resource. Remember, irrigation and water systems require solving both the provision and the appropriation problems, and proportionality between contributions and appropriation is part of the challenge. 'When rules are based on a clear principle of proportionality and all participants recognized that the rules enable them to reach better outcomes than feasible in the 'state of nature' game, and all are prepared to punish rule breakers, more productive equilibria are reached and sustained over time' (Ostrom and Gardner, 1993). The challenge is to bring downstream players to the group-oriented outcome of the game by creating better allocations of effort and resource extraction along the watershed. This is what the face-to-face communication treatment achieved in our results. It balanced the effort between upstream and downstream contributions and therefore increased substantially the water produced by the irrigation system, providing better chances for the downstream players (D and E) to obtain water in each round. 'Asymmetries among participants facing common-pool resource provision and appropriation problems can present substantial barriers to overcoming the disincentives of the 'state of nature' game between head-end and tail-end farmers. However, these asymmetries are frequently overcome in settings where farmers are made aware of their mutual dependencies; after all, head-enders and tail-enders may need the resources provided by tail-enders when it comes to maintaining the system over time' (Ostrom and Gardner, 1993). The lack of trust among the two ends of the watershed, and in particular of players downstream who suffer the most effects of the decisions and better location by those upstream, imposes a major challenge here. Further research is needed to explore the impacts of simply informing better about the expectations and intentions of both players upstream and downstream, and how different government and nongovernment actors can play in decreasing this lack of trust that we observed both because of the experimental location or the actual locations of

291
our hundreds of participants in Colombia and Kenya. Acknowledging these asymmetries, and addressing them to increase trust among head- and tail-enders could provide better foundations for the implementation of self-governed solutions for watershed management. On the methodological side, combining these experimental methods with other tools in the field can offer reflection spaces for communities as well as deeper understanding of the dynamics of behavior and rules. In fact the design of the irrigation game reported in this paper emerged from a National Science Foundation-funded project where collaborators from these different approaches have been applying lab and field experiments as well as role games (See http://www.public.asu.edu/~majansse/dor/nsfhsd.htm for details.) Acknowledgments This paper presents findings from PN20, 'Scales,' a project of the CGIAR Challenge Program on Water and Food. Field work in Colombia was possible because of the help from WWF-Colombia, Semillas de Agua and Fundación Humedales. In Kenya we received great assistance from Kelsey Jack, Nicholas Ndiwa, and Leah Onyango, and the rest of the ICRAF team. References Berg, J., J. Dickhaut, and K. McCabe. 1995. Trust, reciprocity and social history. Games and Economic Behavior,
10: 122-42. Cardenas, J.-C. 2004. Norms from outside and from inside: an experimental analysis on the governance of local
ecosystems. Forest Policy and Economics, 6: 229-41. Elsevier Press. Cardenas, J.-C. 2005. Groups, commons and regulations: experiments with villagers and students in Colombia. In:
Psychology, Rationality and Economic Behaviour: Challenging Standard Assumptions. International Economics Association. Bina Agarwal and Alessandro Vercelli (eds.).
Cardenas, J.-C., M.A. Janssen, and F. Bousquet. 2008a. Dynamics of rules and resources: three new field
experiments on water, forests and fisheries. Available at: http://www.public.asu.edu/~majansse/dor/Cardenas%20Janssen%20Bousquet%20Env.Exp.Econ.Handbook.pdf
Cardenas, J.-C., Luz Angela Rodriguez, and Nancy Johnson. 2008b. Vertical collective action: addressing vertical
asymmetries in watershed management. Mimeo. Cardenas, J.-C., and J. Carpenter. 2008. Behavioural development economics: lessons from field labs in the
developing world. Journal of Development Studies. V. 44(3): 337-64. Knox, A., B. Swallow, and N. Johnson. 2001. Conceptual and methodological framework lessons for improving
watershed management and research. Policy Brief Number 3, CGiAR SystemWide Program on Collective Action and Property Rights.
Ostrom, E. 1998. A behavioral approach to the rational choice theory of collective action. American Political Science
Review, 92: 1-22. Ostrom, E., and R. Gardner. 1993. Coping with asymmetries in the commons: self-governing irrigation systems can
work. The Journal of Economic Perspectives, V. 7, (4): 93-112.
292
Interactive models to catalyze collective water management:
a companion modeling approach in northern Thailand
Cécile Barnaud1, Panomsak Promburom2, Guy Trébuil3, and François Bousquet4
1Paris X University, France; CIRAD, UPR GREEN, Montpellier, F-34398 & CU-CIRAD ComMod Project, Chulalongkorn
University, Bangkok, Thailand 2Doctoral Candidate in Modeling, Lyon I University & Multiple Cropping Center, Chiang Mai University, Thailand
3CIRAD, UPR GREEN, Montpellier, F-34398 France & CU-CIRAD ComMod Project, Chulalongkorn University, Bangkok, Thailand
4CIRAD, UPR GREEN, Montpellier, F-34398, France Abstract How can simple interactive models catalyze collective learning and action about local water management? This paper aims at providing an answer to this question by drawing on a Companion Modeling (ComMod) experiment on irrigation water sharing in a highland community of northern Thailand. In a ComMod process, simulation models integrating different stakeholders’ points of view on the problem at stake are developed and used as communication platforms to facilitate the collective exploration and assessment of various possible future scenarios. In this case study, the ComMod process combined a preliminary diagnostic-analysis of the heterogeneous sociopolitical context, a role playing game (RPG), and an associated simple agent based model (ABM). An ABM was used to run simulations to stimulate a plenary debate and, later on, to facilitate discussions within small homogeneous groups of farmers. The various effects of the process on the participants in term of learning, communication, behavior change, and new practices were evaluated through a series of individual interviews. This ComMod process stimulated individual and collective learning and coordination among multiple stakeholders exploring pathways to solve their common irrigation water use problem. We show that in participatory modeling, simple models can be useful to mediate water use conflicts and accommodate multiple interests among stakeholders. To do so the participatory aspects of the modeling and simulation process must be carefully managed. In particular, much attention needs to be paid to the initial sociopolitical context and its power inequities to ensure the genuine involvement of all concerned stakeholders, including the usually voiceless and resource-poor ones. Introduction In the highlands of northern Thailand as in several upper watersheds around the world, water management issues are more and more complex and uncertain, involving an increasing number of stakeholders and combining more and more interacting agroecological and socioeconomic dynamics (Johnson et al., 2001). To tackle such a complexity, researchers have built a wide range of models aimed at better understanding these issues and/or facilitating decision-making processes in these complex systems (Costanza and Ruth, 1998). Box and Draper (1987) wrote that 'all models are wrong, but some are useful.' Building upon this idea, we wondered how can we produce useful models. More precisely, we wondered how simple models can catalyze collective learning and action about local water management. This paper aims at providing an answer to this question by drawing on a companion modeling (ComMod) experiment on irrigation water-sharing in a highland community of northern Thailand. In a ComMod process (which is participatory by its very nature), simulation models integrating different stakeholders’ points of view on the problem at hand are developed and used as communication platforms to facilitate the collective exploration and assessment of various possible future scenarios (Bousquet et al., 1999). In the ComMod process presented in this paper, we adopted a critical perspective, i.e. much attention was paid to the initial sociopolitical context and its power inequities to ensure the genuine involvement of all concerned stakeholders, including the usually voiceless and resource-poor ones. After a presentation of the context, methods and tools of the ComMod process conducted in the Akha community of Mae Salaep, this paper analyzes the main effects of this process in terms of collective learning and action about local water management. To conclude, we present the main lessons drawn from this experiment. A ComMod approach ComMod is a continuous and iterative modeling process alternating field and laboratory activities in a cyclical way, its main successive phases being as follows: (1) Characterization of the problem; (2) Modeling, i.e converting knowledge into a formal tool to be used as a simulator; and (3) Simulations to explore various scenarios (Bousquet et al., 2005). Two kinds of simulation tools were used: ABM and RPG. According to Duke (1974), RPG is an excellent mode of communication to convey complexity, as it allows multiple stakeholders to interactively examine the complex systems of which they are part. Players can test alternative scenarios, but quickly this becomes costly and time-consuming, and the number of participants remains limited. To alleviate these constraints, it is possible to build a simple computerized ABM, very similar to the RPG in its features and rules, but far more time-efficient to

293
simulate scenarios and allowing a higher number of participants. Moreover, the RPG allows the players to understand the ABM model, to validate and criticize it, and later on to easily follow ABM simulations. Discussions about a specific problem in a ComMod cycle might raise new questions, which can then be examined in a following one. This is what happened in the ComMod process conducted in the village of Mae Salaep (Figure 1).
Figure 1. Successive ComMod cycles conducted in Mae Salaep, Chiang Rai Province, 2002-2007. Context of Mae Salaep catchment In this village located in a highland catchment of Chiang Rai Province, small-scale poor farmers are being rapidly integrated into the market economy. Over the past 20 years, their former agrarian system based on swiddening was replaced by permanent cash crop-based agriculture. In the meanwhile, these changes led to an extensive socioeconomic differentiation among farming households, characterized by different availability of productive resources, and different socioeconomic and land-use strategies. Type A farmers are smallholders growing mainly maize for cash, while type B farmers hold self-sufficient medium-sized farms and grow upland rice for self consumption in addition to maize. Some of these type A and B farmers have small nonirrigated plantations of lychee or Assam tea. Type C farmers have relatively large and diversified farms, grow paddy rice and maize, and have extensive irrigated plantations of lychee or Oolong tea. In this context, after an initial ComMod cycle focusing on the interactions between soil erosion and crop diversification (Trébuil et al., 2002), the participants asked to focus the second cycle on the credit constraints to the adoption of nonerosive perennial crops such as tea and lychee (Barnaud et al., 2007, 2008). In a subsequent third cycle, which is presented in this article, the villagers requested a focus on water management at the catchment scale because these perennial crops require irrigation and their expansion in the catchment creates conflicts over water in the community. Presently, only a minority of relatively well-off farms have access to water to irrigate their plantations because of the first-come-first-served rule stipulating that once a farmer has set up irrigation pipes to draw water from a creek, other villagers cannot get water from its upstream section. Villagers also requested the participation to this ComMod cycle of the Tambon (sub-district) Administrative Organization (TAO) which is funding local projects such as the construction of small-scale water infrastructures. The initial sociopolitical context related to this water management problem involved several types of stakeholders with their own interests and perceptions of the issue at stake. A matrix illustrating the relative influence and importance of these stakeholders is given in Figure 2.

294
Figure 2. Matrix showing the relative influence and importance of the main stakeholders regarding the water management issue in Mae Salaep, northern Thailand. Type C farmers are well-off, belonging to influential clans of first settlers. Fifteen years ago, they started to irrigate their orchards and claimed that the first-come-first-served rule was an ancestral custom to regulate access to water. Using their high economic status and their traditional authority to exert power, they reinforced this rule when more villagers sought access to water. As a result, most of type A and B farmers do not have access to irrigation water. Some of them do not feel concerned by this issue since their plots are located above the streams and could not benefit from gravity irrigation anyway. But some others start to complain about the 'lack of water' in the catchment, especially the farmers with small lychee plantations who could increase their production if they had access to irrigation water during the dry season. Most of them, however, do not question the first-come-first-served rule, since they are usually in a relation of dependence (or patronage) with the powerful type C clans from whom they borrow money when needed or work as daily hired laborers on their farms. Two opposing leaders played a key role in this ComMod cycle about water. The first one is one of the two elected villagers sitting on the TAO council. He recently concluded a deal with an external investor who bought a very large piece of land in the village catchment to plant Oolong tea in the future. As such a plantation would require a lot of irrigation water, he had a strong personal interest in participating in this ComMod process. Another key stakeholder of the process is the religious leader of the village Christian community (60% of the village population). He is a respected person in the village, not only as a religious leader but also as a leading innovator and a knowledgeable person on agricultural matters, actively supporting poor households facing difficulties (by providing technical advice, through free distribution of tea seedlings, for example). He was the first one who suggested to the research team to use the ComMod tools to discuss water management issues in the community. Methods This ComMod cycle started with field interviews about the water problem in the community and its related sociopolitical context. The RPG and the associated ABM used in the previous cycle were modified to address the irrigation water-sharing issue and used in a three-day participatory workshop. On the first day, gaming sessions were organized with 12 villagers-players (Box 1 and Figure 3.b). After a first session played with rules corresponding to the current water-use situation, a collective debriefing was organized for the participants to discuss the problems encountered in this gaming session and their possible solutions. A second gaming session allowed them to test these potential solutions by modifying the initial rules of the game. On the second day, individual interviews were conducted to understand better the players’ behaviors during the game and the plenary discussions, to validate the model of the game, and to assess its learning effects. On the third day, participatory ABM simulations were conducted to support plenary discussions about possible future scenarios (Figure 3.a). An original feature of this semi-autonomous or hybrid ABM was the possibility to run very interactive simulations in which some of the decisions were taken by the villagers, while others were taken by artificial agents. At each time step, the simulation stopped when it was time to allocate water among the farmers, and the 12 participants in the game (corresponding to 12 'Farmer' agents in the model) had to decide together how they would allocate the water among them. Three weeks later, new simulations were conducted within smaller and more homogeneous groups of farmers to accompany the evolution of discussions about water allocation in the village. To assess the short-term and mid-term effects of the ComMod process, individual interviews were conducted 3 weeks, 3 months, and 10 months after the workshop.
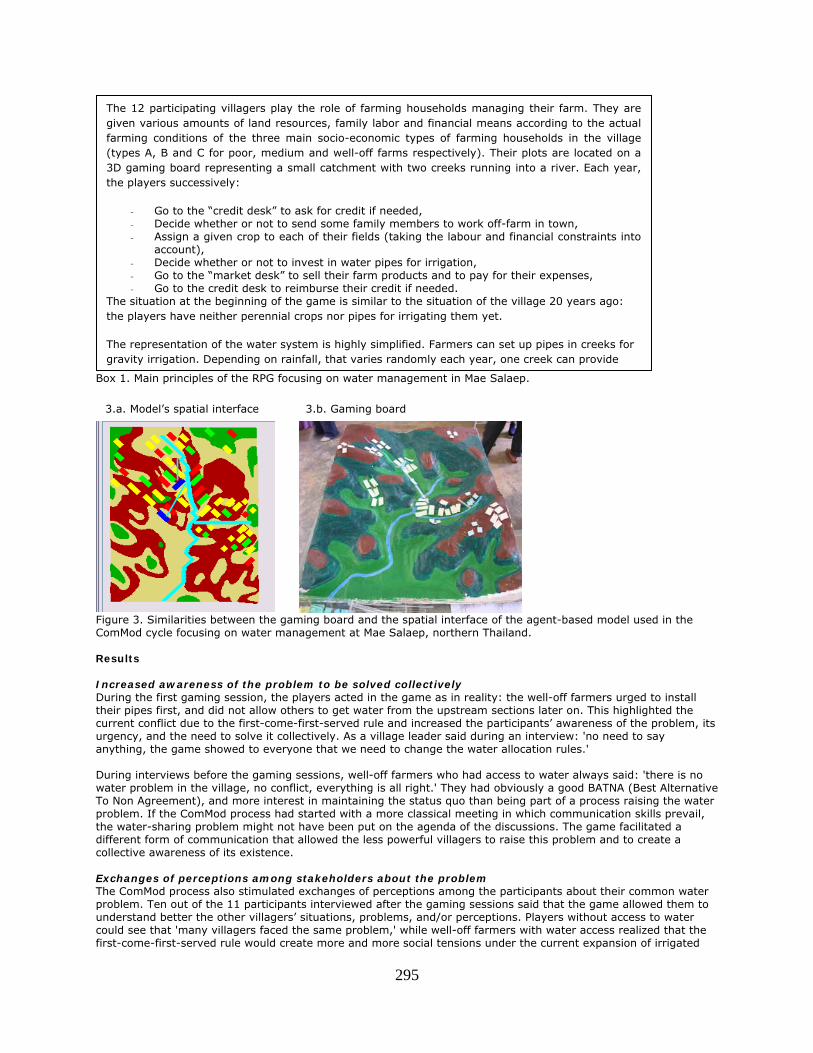
295
Box 1. Main principles of the RPG focusing on water management in Mae Salaep.
Figure 3. Similarities between the gaming board and the spatial interface of the agent-based model used in the ComMod cycle focusing on water management at Mae Salaep, northern Thailand. Results Increased awareness of the problem to be solved collectively During the first gaming session, the players acted in the game as in reality: the well-off farmers urged to install their pipes first, and did not allow others to get water from the upstream sections later on. This highlighted the current conflict due to the first-come-first-served rule and increased the participants’ awareness of the problem, its urgency, and the need to solve it collectively. As a village leader said during an interview: 'no need to say anything, the game showed to everyone that we need to change the water allocation rules.' During interviews before the gaming sessions, well-off farmers who had access to water always said: 'there is no water problem in the village, no conflict, everything is all right.' They had obviously a good BATNA (Best Alternative To Non Agreement), and more interest in maintaining the status quo than being part of a process raising the water problem. If the ComMod process had started with a more classical meeting in which communication skills prevail, the water-sharing problem might not have been put on the agenda of the discussions. The game facilitated a different form of communication that allowed the less powerful villagers to raise this problem and to create a collective awareness of its existence. Exchanges of perceptions among stakeholders about the problem The ComMod process also stimulated exchanges of perceptions among the participants about their common water problem. Ten out of the 11 participants interviewed after the gaming sessions said that the game allowed them to understand better the other villagers’ situations, problems, and/or perceptions. Players without access to water could see that 'many villagers faced the same problem,' while well-off farmers with water access realized that the first-come-first-served rule would create more and more social tensions under the current expansion of irrigated
3.a. Model’s spatial interface 3.b. Gaming board
The 12 participating villagers play the role of farming households managing their farm. They are given various amounts of land resources, family labor and financial means according to the actual farming conditions of the three main socio-economic types of farming households in the village (types A, B and C for poor, medium and well-off farms respectively). Their plots are located on a 3D gaming board representing a small catchment with two creeks running into a river. Each year, the players successively:
- Go to the “credit desk” to ask for credit if needed, - Decide whether or not to send some family members to work off-farm in town, - Assign a given crop to each of their fields (taking the labour and financial constraints into
account), - Decide whether or not to invest in water pipes for irrigation, - Go to the “market desk” to sell their farm products and to pay for their expenses, - Go to the credit desk to reimburse their credit if needed.
The situation at the beginning of the game is similar to the situation of the village 20 years ago: the players have neither perennial crops nor pipes for irrigating them yet.
The representation of the water system is highly simplified. Farmers can set up pipes in creeks for gravity irrigation. Depending on rainfall, that varies randomly each year, one creek can provide

296
plantations. Such a result might be surprising at first sight, since these villagers belong to a small community in which they all know each other, but as a participant said: 'in everyday life, every one goes to his fields; we do not have such opportunities to discuss together.' Problem reframing and integrative negotiation of possible solutions Once the problem was identified, the ComMod activities facilitated a collective process of problem reframing and integrative (or win-win) negotiation. First, the TAO representative suggested building a single reservoir for the village. This idea was rejected by the other players who feared that this would benefit only a minority of households. Later on the religious leader suggested building small weirs on each creek, and sharing water among small groups of households. This idea was accepted by the majority by vote. It is interesting to notice that this leader did not openly put into question the first-come-first-served rule because he knew that the well-off clans would not accept it. He suggested instead a more integrative solution which was acceptable to them: he said the problem was the lack of water, therefore new water storage infrastructure was needed to increase the volume of water available at the village level. Then, when such infrastructures would be built, farmers would have to discuss again the water allocation rules. As several players stated, 'new infrastructures are the only way to change the rules.' This was a typical integrative negotiation process in which stakeholders looked for solutions to 'increase the size of the cake' instead of fighting about the way to 'divide the cake.' Collective evaluation of solutions through interactive simulations The small weirs solution was collectively tested in the second gaming session. It stimulated discussions among players regarding the way to share water among beneficiaries of the weirs facilitated by the hybrid ABM. During the first set of participatory simulations in plenary session, the member of the sub-district administration (a well-off farmer) imposed sharing water proportionally to the farmers’ plantation size. But three weeks later, the participants had continued to discuss this point, and during the simulations, within each small group, they collectively decided to simulate the sharing of equal volumes of water among them, adding that there should be a possibility to lend, temporarily, water rights to other farmers in case the volume of water available exceeded ones needs. This illustrates the importance of discussions occurring between field workshops and the necessity to monitor them and take them into account. Discussion Empowerment of the resource-poor stakeholders: a levelled playing field Aware of the fact that power inequities express themselves in a participatory process, and of the subsequent risk of increasing social inequities, much attention was paid to the initial sociopolitical context to ensure the genuine involvement of all concerned stakeholders, including the usually voiceless ones. This ComMod process successfully empowered them in the negociation arena and allowed them to voice and assert their interests. This was achieved through a process of both personal and collective empowerment. The ComMod activities improved the participants’ self-confidence and supported the development of their capacity to understand the situation and imagine new solutions: "I am so proud. I did not know that I would be able to play the game, to think by myself about solutions," said a female participant. As for collective empowerment, 7 out of the 11 interviewed participants claimed that the game made them realize that they were collectively ‘stronger’ or ‘more intelligent’ (in their own words) than individually. This ComMod process also triggered a process of collective empowerment through the creation of alliances allowing the reinforcement of a counter power as the less powerful stakeholders realized that they could join a charismatic leader (the Christian leader) to make their voice louder. "If I think alone, I do not have good ideas. But if we think all together, we can all benefit from the good ideas of people like the Christian leader," said a woman. Negotiation with higher level institutions: the main limit of the process Ten months after the last workshop, the villagers had prepared a document to request funding from their TAO to build new water infrastructure. Unfortunately, the president of this administration rejected their proposition, in spite of her previous discourses about the importance of villager’s participation in local politics and management of renewable resources. This was the main limit faced by this ComMod process and one of the key future challenges. Conclusion How can simple models catalyze collective learning and action about local water management? This paper demonstrates that a model’s usefulness relies much more on the modeling process than on the model itself. Moreover, although water management issues are complex, when the model aims at facilitating collective learning and communication, there is no need for exhaustive models computing a large amount of data. Very simple models can be very useful. Their simplicity is even an advantage, as it facilitates the understanding and appropriation of this model by local stakeholders. Such simple models also have the advantage to be highly adaptive, and can be easily modified to accompany evolving local stakeholders’ representations and preoccupations. The modeling process itself, however, should not be 'quick and simple,' but carefully participatory to ensure the genuine involvement of the concerned stakeholders. To sum up, what we call a carefully participatory process or a critical companion modelling process includes:

297
• An initial analysis of the sociopolitical context to identify constraints to an equitable outcome of the
process and to mitigate them by adapting the tools and methods used; • The careful selection of participants to ensure that all participants are able to defend their interests and,
eventually, to empower some of them through increased self-confidence and creation of alliances; • The use of tools that are accessible to all kinds of stakeholders, whatever their level of formal education; • The use of tools and methods highlighting the diversity of interests so that all interests are taken into
account during the debates, even the usually voiceless ones; • The use of tools and methods favoring integrative or win-win negotiation processes that are acceptable to
influential and more marginal stakeholders; • Alternating plenary discussions, small group debates, and individual interviews, to ensure that all
stakeholders feel free to express themselves (sometimes not in the presence of the most powerful stakeholders);
• Not to stop at the first apparent consensus as it often reflects the most powerful stakeholders’ opinion; • A continuous and iterative process to favor and accompany discussions behind the scene, where most of
negotiation processes finally take place; and • The need for a specific monitoring and evaluation system to know what happens between two gaming and
simulation field workshops. Acknowledgments The authors acknowledge the financial support received from PN25 project 'Companion Modeling for resilient water management' of the Challenge Program Water for Food (CPWF) of the CGIAR, and the Asia IT&C initiative of the European Union. References Barnaud, C., T. Promburom, G. Trébuil, and F. Bousquet. 2007. An evolving simulation and gaming to facilitate
adaptive watershed management in mountainous northern Thailand. Simulation and Gaming, 38: 398-420.
Barnaud, C., F. Bousquet, and G. Trébuil. 2008. Multi-Agent Simulations to Explore Rules for Rural Credit
Management in a Highland Farming Community of northern Thailand. Ecological Economics, 66(4): 615-27.
Bousquet, F., O. Barreteau, C. Le Page, C. Mullon, and J. Weber. 1999. An environmental modelling approach. The
use of multi-agents simulations. In F. Blasco and A. Weill (eds.) Advances in Environmental and Ecological Modelling, pp. 113-22. Paris: Elsevier.
Bousquet, F., G. Trébuil, and B.E. Hardy. 2005. Companion Modeling and Multi-Agent Systems for Integrated
Natural Resource Management in Asia. CIRAD & International Rice Research Institute, Los Baños, Philippines. 360p.
Box, G.E.P., and N.R. Draper. 1987. Empirical Model-Building and Response Surfaces. New York: John Wiley &
Sons. Costanza, R., and M. Ruth. 1998. Using dynamic modelling to scope environmental problems and build consensus.
Environmental Management, 22(2): 183-95. Duke, R.D. 1974. Gaming: the future's language. New York: SAGE Publications, Halsted Press. Johnson, N., H.M. Ravnborg, O. Westermann, and K. Probst. 2001. User participation in watershed management
and research. Water Policy, 3: 507-20. Trébuil, G., F. Bousquet, C. Baron, and B. Shinawatra-Ekasingh. 2002. Collective Creation of Artificial Worlds Can
Help Govern Concrete Natural Resource Management Problems: A Northern Thailand Experience. Proc. International Symposium on Sustaining Food Security and Managing Natural Resources in Southeast Asia, 8-11 January 2002, Chiang Mai, Thailand.a