26 March 2020 PHILIPPINE STOCK EXCHANGE, INC ...
257
26 March 2020 PHILIPPINE STOCK EXCHANGE, INC. Disclosure Department 6F PSE Tower One Bonifacio High Street 28 th Street corner 5 th Avenue, Bonifacio Global City Taguig City ATTENTION: MS. JANET A. ENCARNACION Head – Disclosure Department PHILIPPINE DEALING & EXCHANGE CORP. Phlippine Dealing System Holdings Corp. & Subsidiaries 29 th Floor, BDO Equitable Tower 8751 Paseo de Roxas, Makati City Telephone Number: 8884-4446 ATTENTION: ATTY. MARIE ROSE M. MAGALLEN-LIRIO Head – Issuer Compliance and Disclosure Department Mesdames: We are pleased to furnish your good office with a copy of our SEC 20 Information Statement Preliminary (pursuant to section 20 of the Securities Regulation Code) filed with the Securities and Exchange Commission (SEC). For your information and guidance. Thank you. Respectfully yours, ALEXANDER C. ESCUCHA Corporate Information Officer
-
Upload
khangminh22 -
Category
Documents
-
view
0 -
download
0
Transcript of 26 March 2020 PHILIPPINE STOCK EXCHANGE, INC ...

26 March 2020 PHILIPPINE STOCK EXCHANGE, INC. Disclosure Department 6F PSE Tower One Bonifacio High Street 28
th Street corner 5
th Avenue, Bonifacio Global City
Taguig City ATTENTION: MS. JANET A. ENCARNACION Head – Disclosure Department PHILIPPINE DEALING & EXCHANGE CORP. Phlippine Dealing System Holdings Corp. & Subsidiaries 29
th Floor, BDO Equitable Tower
8751 Paseo de Roxas, Makati City Telephone Number: 8884-4446 ATTENTION: ATTY. MARIE ROSE M. MAGALLEN-LIRIO Head – Issuer Compliance and Disclosure Department Mesdames: We are pleased to furnish your good office with a copy of our SEC 20 Information Statement Preliminary
(pursuant to section 20 of the Securities Regulation Code) filed with the Securities and Exchange
Commission (SEC).
For your information and guidance. Thank you. Respectfully yours,
ALEXANDER C. ESCUCHA Corporate Information Officer

4 4 3
SEC Registration Number
C H I N A B A N K I N G C O R P O R A T I O N
(Company’s Full Name)
1 1 F C H I N A B A N K B L D G 8 7 4 5 P A S E O
D E R O X A S C O R V I L L A R S T M A K A T I
(Business Address: No., Street City/ Town / Province)
ATTY. LEILANI B. ELARMO 885-5145
Contact Person Company Telephone Number Preliminary Information Statement
0 3 2 6 2 0 - I S 0 5 0 2
Month Day FORM TYPE Month Day Annual Meeting
Secondary License Type, If Applicable
C F D
Dept. Requiring this Doc. Amended Articles Number / Section Total Amount of Borrowings
1,894
Total No. of Stockholders Domestic Foreign
To be accomplished by SEC Personnel concerned
File Number LCU
Document ID Cashier Enclosures: China Bank MC No. 516066 for P7,575.00 dated March 12, 2020 Notice of Annual Stockholders’ Meeting with Explanation (Annex “A)
Annexes “A” to “F” to the Information Statement
S T A M P S Remarks: Please use BLACK ink for scanning purposes


Annex “A”
EXPLANATION OF AGENDA ITEMS
1. Call to Order Chairman Hans T. Sy will welcome the stockholders and guests and formally begin the 2020 annual meeting of stockholders of China Bank. He will also highlight that stockholders will be given the opportunity to ask questions or raise their comments prior to submitting each agenda item for their action.
2. Proof of Notice of Meeting
Atty. Corazon I. Morando, Corporate Secretary, will certify the date the notice of meeting with the information statement was sent to stockholders of record as of March 20, 2020 and to the Securities and Exchange Commission (SEC) and the Philippine Stock Exchange (PSE), in accordance with the China Bank by-laws and the SEC and PSE rules and regulations, and the date such notice was published in a newspaper of general circulation.
3. Certification of Quorum Atty. Morando will certify the existence of quorum. A meeting where the stockholders holding a majority of the outstanding capital stock of China Bank are present either in person, by proxy, through remote communication or in absentia shall constitute a quorum and be competent to transact business.
4. Approval of the Minutes of the Annual Meeting of Stockholders on May 2, 2019
Stockholders will be asked to approve the minutes of the stockholders' meeting held on May 2, 2019, which contain, among others, the annual report to stockholders and approval of financial statements, ratification of all acts of the Board of Directors, Executive Committee, other committees and Management, during the fiscal year 2018 and immediately preceding the meeting, election of the Board of Directors, appointment of external auditor, delegation to the Board of Directors of power to amend by-laws, and announcement of the declaration of cash dividends. The minutes may be accessed through China Bank website, www.chinabank.ph. Copies of the minutes will also be provided to the stockholders before the meeting.
5. Annual Report to Stockholders
Stockholders will be provided information about the Bank‟s activities, business and financial performance, and other relevant data for the year 2019. Copies of the annual report will be provided to the stockholders before the meeting.
6. Approval of the Audited Financial Statements for the year ended December 31, 2019
Stockholders will be provided information about the financial position, performance and changes in financial position of the Bank. The financial statements will be included in the Information Statement to be sent to the stockholders prior to the meeting.
7. Ratification of all acts of the Board of Directors, Executive Committee, other Committees,
and Management during the year 2019, including the ratification of related party transactions All acts of the Board of Directors, Executive Committee, other Committees, and Management during the year 2019, including the ratification of related party transactions, will be presented to the stockholders for their approval and ratification.
8. Election of the Directors
The Chairman of the Nominations Committee and/or Corporate Governance Committee will present the nominees for election as members of the Board of Directors, including the independent directors. The list of nominees, with their profiles, will be provided in the Information Statement to be sent to the stockholders prior to the meeting.

9. Appointment of External Auditor
The stockholders will be asked to ratify the selection by the Audit Committee and Board of the auditors of the China Bank.
10. Amendment of By-laws
The Board resolution of March 25, 2020 amending the By-laws in order to update and clarify processes and practices of the business and comply with the requirements of the Revised Corporation Code of the Philippines and the Bangko Sentral ng Pilipinas‟ Manual of Regulations for Banks, will be presented to the stockholders for their approval.
11. Other Matters
All matters that arise after the notice, agenda, and information statement have been sent out may be presented for the consideration of the stockholders. Other businesses as may properly come before the stockholders may also be raised.
12. Adjournment
The Chairman will adjourn the meeting when the scheduled order of business is completed and no further business or matter is considered or raised.

P R O X Y The undersigned stockholder of CHINA BANKING CORPORATION (“China Bank”) hereby appoints ____________________________________________ or in his absence, the Chairman of the meeting, as proxy, to present and vote all shares of stocks registered in his/her/its name as proxy of the undersigned stockholder, at the Annual Meeting of Stockholders of China Bank on May 7, 2020, Thursday, and at any of the adjournments and postponements thereof, for the purpose of acting on the following matters:
1. Election of Directors ___ Vote for all nominees listed below: Hans T. Sy Harley T. Sy Gilbert U. Dee Jose T. Sio William C. Whang Alberto S. Yao* Peter S. Dee Margarita L. San Juan*
Joaquin T. Dee Philip S.L. Tsai* Herbert T. Sy Angeline Ann H. Hwang* *Independent ___ Withhold authority for all nominees listed above
___ Withhold authority to vote for the nominee/s listed below: ____________________ ____________________ ____________________ ____________________ ____________________ ____________________
2. Approval of Minutes of the May 2, 2019 Annual Meeting of Stockholders
___ Yes ___ No ___ Abstain
3. Approval of Annual Report ___ Yes ___ No ___ Abstain
4. Approval of audited financial statements for the year Ended December 31, 2019 ___ Yes ___ No ___Abstain 5. Ratification of all acts of the Board of Directors,
Executive Committee, other Committees, and Management, including ratification of related party transactions
___ Yes ___ No ___Abstain 6. Appointment of SyCipGorresVelayo& Co. as external
auditor ___ Yes ___ No ___ Abstain
7. Amendment of By-laws ___ Yes ___ No ___ Abstain
8. Such other matters as may properly come before the meeting
___ Yes ___ No ___ Abstain
This proxy should be received by the Corporate Secretary on or before April 30, 2020, the deadline for submission of proxies. This proxy shall continue until such time as the same is withdrawn by the stockholder through notice in writing, or superseded by subsequent proxy, delivered to the Secretary at least three (3) business days before any scheduled meeting, but shall not apply in instances where the stockholder personally attends the meeting in person and expresses his/her intention to vote in person. No proxy shall be valid and be effective beyond five (5) years from date hereof. This proxy is not required to be notarized, and when properly executed, will be voted in the manner as directed herein. If no direction is made, this proxy will be voted “for” the election of all nominees and “for” the approval of the matters stated above and “for” such other matters as may properly come before the meeting in the manner described in the information statement and/or as recommended by Management or the Board of Directors. SIGNED IN THE PRESENCE OF: __________________________________ ______________________________________ Signature of Stockholder/ Authorized Signatory __________________________________ ___________________________________
Printed Name of Stockholder
_____________________________________ Date

1
SECURITIES AND EXCHANGE COMMISSION
SEC FORM 20-IS
INFORMATION STATEMENT PURSUANT TO SECTION 20 OF THE SECURITIES REGULATION CODE
1. Check the appropriate box:
[ ] Preliminary Information Statement [ ] Definitive Information Statement 2. Name of Registrant as specified in its charter: China Banking Corporation 3. Province, country or other jurisdiction of incorporation or organization: Philippines 4. SEC Identification Number: 443 5. BIR Tax Identification Code: 000-444-210-000 6. Address of principal office: China Bank Bldg., 8745 Paseo de RoxasPostal Code: 1226
cor. Villar St., Makati City 7. Registrant‟s telephone number, including area code: (632) 888-55555 8. Date, time and place of the meeting of security holders:
Date: May 7, 2020 Time: 4:00 p.m. Place: Penthouse, China Bank Bldg., 8745 Paseo de Roxas cor. Villar St., Makati City 9. Approximate date on which the Information Statement is first to be sent or given to security holders:
April 6, 2020 10. Securities registered pursuant to Sections 8 and 12 of the Code or Sections 4 and 8 of the RSA:
Title of Each Class Number of Shares Outstanding
Common 2,685,899,812
11. Are any or all of registrant‟s securities listed in a Stock Exchange? Yes [ ] No [ ]
The above common shares are listed in the Philippine Stock Exchange.

A. GENERAL INFORMATION
1. Date, Time and Place of Meeting of Security Holders
Date : May 7, 2020 Time : 4:00 P.M. Place : Penthouse, China Bank Bldg.
8745 Paseo de Roxas cor. Villar St., Makati City
Mailing address of principal office: China Bank Bldg., 8745 Paseo de Roxas cor. Villar St., Makati City
Approximate date on which copies of the Information Statement are first to be sent or given to security holders : April 6, 2020
We are not asking you for a proxy and you are requested not to send us a proxy.
2. Dissenter’s Right of Appraisal
A stockholder has a right to dissent and demand payment of the fair value of his shares in any of the following instances under Section 80 of the Revised Corporation Code of the Philippines (Republic Act No. 11232): (a) in case an amendment to the articles of incorporation has the effect of changing or restricting the rights of any stockholder or class of shares, or of authorizing preferences in any respect superior to those of outstanding shares of any class, or of extending or shortening the term of corporate existence; (b) in case of sale, lease, exchange, transfer, mortgage, pledge or other disposition of all or substantially all of the corporate property and assets; (c) in case of merger or consolidation; and (d) in case of investment of corporate funds for any purpose other than the primary purpose of the corporation. There are no matters or proposed corporate actions included in the agenda of the meeting which may give rise to the exercise by a security holder of the right of appraisal. Should any proposed corporate action be passed upon at the meeting which may give rise to the right of appraisal, any stockholder who votes against the proposed corporate action may avail himself of the right of appraisal by making a written demand on the Bank for the payment of the fair value of shares held within thirty (30) days from the date on which the vote was taken. In order to perfect such right, the stockholder shall follow the procedures as described under Sections 81 to 85 of the Revised Corporation Code.
3. Interest of Certain Persons in or Opposition to Matters to be Acted Upon
No director, officer, nominee for election as director, or any associate of the foregoing persons, has any substantial interest, direct or indirect, by security holdings or otherwise, in any matter to be acted upon as contained in the agenda of the meeting other than election to office. No director has informed the Bank in writing that he intends to oppose any action to be taken as contained in the agenda of the meeting. B. CONTROL AND COMPENSATION INFORMATION
4. Voting Securities and Principal Holders Thereof
(a) Class of Voting Securities: 2,685,899,812 common shares entitled to vote as of February 29, 2020 (b) Record Date: Stockholders of record as of March 20, 2020 are entitled to notice of and vote at the meeting (c) Nomination and Election of Directors and Independent Directors and Manner of Voting:
In accordance with Sections 22 and 26 of the Revised Corporation Code, Section 15 of The General Banking Law (R.A. No. 8791), Section 38 of The Securities Regulation Code, and its Amended Implementing Rules and

Regulations of the Securities Regulation Code, and Sections 131, 132, and 138 of the Manual of Regulations for Banks, and relevant circulars or memoranda, the Bank‟s Nominations and Corporate Governance Committees adopted rules governing the nomination and election of directors. The rules pertinently state that the nomination forms shall be submitted to the Office of the Corporate Secretary on or before March 3, 2020 and thereafter referred to the Committee for evaluation and action. The rules likewise state that the Committees shall pre-screen the qualifications of the nominees and prepare a final list of candidates, indicating the nominees for independent directors. As to the manner of voting, Article III, Section 7 of the Bank‟s By-Laws specifies that any stockholder who is not delinquent in his subscription shall be allowed to vote either in person or by proxy executed in writing by the stockholder or his duly authorized attorney-in-fact in accordance with the requirements of existing rules and regulations. Following Section 23 of the Revised Corporation Code, a stockholder may vote such number of shares for as many persons as there are directors to be elected, or cumulate said shares and give one (1) candidate as many votes as the number of directors to be elected multiplied by the number of the shares owned, or distribute them on the same principle among as many candidates as may be seen fit, provided that the total number of votes cast shall not exceed the number of shares owned by the stockholder as shown in the books of the Bank multiplied by the whole number of directors to be elected. Item D.19 of the Information Statement further discusses the voting and tabulation procedures of the Bank.
(d) Security Ownership of Certain Record and Beneficial Owners and Management (i) Record and beneficial owners holding 5% or more of voting securities as of February 29, 2020:
* Based on the list provided by the Philippine Depository & Trust Corporation to the Bank‟s transfer agent, Stock
Transfer Service, Inc., as of February 29, 2020, The Hongkong and Shanghai Banking Corporation Limited (396,732,386 shares or 14.77%) and BDO Securities Corporation (186,897,025 shares or 6.96%) hold 5% or more of the Bank‟s securities. The beneficial owners, such as the clients of PCD Nominee Corporation, have the power to decide how their shares are to be voted.
Title of Class
Name, Address of Record Owner & Relationship with Issuer
Name of Beneficial Owner & Relationship with
Record Owner Citizenship
No. of Shares Held
Percentage
Common
PCD Nominee Corporation * 37
th Floor Tower I, The Enterprise
Center, 6766 Ayala Ave. corner Paseo de Roxas, Makati City Stockholder
Various stockholders/clients
Non-Filipino 716,587,345 26.68%
Common
PCD Nominee Corporation * 37
th Floor Tower I, The Enterprise
Center, 6766 Ayala Ave. corner Paseo de Roxas, Makati City Stockholder
Various stockholders/clients
Filipino 565,577,627 21.06%
Common
SM Investments Corporation 10
th Floor L.V. Locsin Bldg.,
6752 Ayala Avenue, Makati City Stockholder
Sy Family PCD Nominee Corporation Stockholders
Filipino 461,975,661 17.20 %
Common
Sysmart Corporation 10
th Floor L.V. Locsin Bldg.,
6752 Ayala Avenue, Makati City Stockholder
Sy Family Sycamore Pacific Corporation Stockholders
Filipino 415,995,323 15.49%

Mr. Henry Sy Sr.‟s (+) family is known to have substantial holdings in SM Investments Corporation and Sysmart Corporation and, as such, could direct the voting or disposition of the shares of said companies. Except as stated above, the Bank has no knowledge of any person holding more than 5% of the Bank‟s outstanding shares under a voting trust or similar agreement. The Bank is likewise not aware of any arrangement which may result in a change in control of the Bank, or of any additional shares which the above-listed beneficial or record owners have the right to acquire within thirty (30) days, from options, warrants, rights, conversion privilege or similar obligation, or otherwise.
(ii) Directors and Management as of February 29, 2020:
Title of Class
Name Position Citizenship Amount & Nature of
Beneficial / Record
Ownership
Percentage
(a) Directors
Common Hans T. Sy Chairman of the Board Filipino 4,226,761 0.157%
Common Gilbert U. Dee Vice Chairman Filipino 12,832,906 0.478%
Common William C. Whang Director and President Filipino 17,518 0.001%
Common Peter S. Dee Director Filipino 301,305 0.011%
Common Joaquin T. Dee Director Filipino 51,686,912 1.924%
Common Herbert T. Sy Director Filipino 578,730 0.022%
Common Harley T. Sy Director Filipino 740,553 0.028%
Common Jose T. Sio Director Filipino 3,517 0.000%
Common Alberto S. Yao Independent Director Filipino 548,876 0.020%
Common Margarita L. San Juan
Independent Director Filipino 95,238 0.004%
Common Philip S.L. Tsai Independent Director Filipino 2,000 0.000%
Common Angeline Ann H. Hwang Independent Director Filipino 100 0.000%
Total 71,034,416 2.645%
(b)
Common Rosemarie C. Gan Executive Vice President Filipino 130,032 0.005%
Common Patrick D. Cheng Executive Vice President & CFO Filipino 617,756 0.023%
Common Alexander C. Escucha Senior Vice President Filipino 83,886 0.003%
Common Benedict L. Chan First Vice President II Filipino 15,678 0.001%
Common Renato K. De Borja, Jr. First Vice President II Filipino 20,169 0.001%
Common Gerard T. Dee First Vice President II Filipino 277,864 0.010%
Common Shirley G.K.T. Tan First Vice President II Filipino 12,863 0.000%
Common Delia Marquez First Vice President II Filipino 23,560 0.001%
Common Lilibeth R. Cariño First Vice President Filipino 4,167 0.000%
Common Angela D. Cruz First Vice President Filipino 1,639,876 0.061%
Common Elizabeth C. Say First Vice President Filipino 3,433 0.000%
Common Maria Rosanna Catherina L. Testa
First Vice President Filipino 6,340
0.000%
Common Stephen Y. Tan First Vice President Filipino 2,746 0.000%
Common Marisol M. Teodoro First Vice President Filipino 21,323 0.001%
Common Layne Y. Arpon First Vice President Filipino 10,732 0.000%
Common Belenette C. Tan First Vice President Filipino 5,008 0.000%
Common Manuel M. Te First Vice President Filipino 3,199 0.000%
Common Clara C. Sy First Vice President Filipino 1,799,804 0.067%
Total 4,678,436 0.174%
GRAND TOTAL 75,712,852 2.819%

5. Directors and Principal Officers
(a) Incumbent Directors and Advisor Hans T. Sy, 64, Filipino, is the Chairman of the Board since May 5, 2011. He became a member of the China Bank Board on May 21, 1986, and was elected Vice Chairman in 1989. Chairman Sy also serves as Director and Chairman of the Executive Committee in SM Prime Holdings, Inc (SMPH) and Adviser to the Board of SM Investments Corporation (SMIC); SMPH and SMIC are both listed on the Philippine Stock Exchange (PSE). He is also the Chairman of the Board of Trustees of National University. He holds other key positions in several companies within the SM Group. He graduated from De la Salle University with a Bachelor of Science degree in Mechanical Engineering. He attends and participates in various trainings and seminars, the latest of which is on Anti-Money Laundering (AML) and corporate governance conducted by the Institute of Corporate Directors (ICD) in August 2019. Gilbert U. Dee, 84, Filipino, is the Vice Chairman of the Board since May 5, 2011. He has been a member of the China Bank Board since March 6, 1969, serving as Board Chairman from 1989 to 2011. He currently sits in the boards of other companies not listed in the PSE, namely, as Chairman of Union Motor Corporation and China Bank subsidiary CBC Properties and Computer Center, Inc. (CBC-PCCI). In the past, he was a director in Philippine Pacific Capital Corporation, Philex Mining Corporation, CBC Finance Corporation, and Super Industrial Corporation. Vice Chairman Dee holds a Bachelor of Science degree in Banking from the De La Salle University and a Master‟s in Business Administration (MBA) degree in Finance from the University of Southern California. Among the numerous trainings in banking he has attended over the years are ICD‟s Advanced Corporate Governance Training and AML Modules in 2019. William C. Whang, 61, Filipino, is Director and President of the Bank since November 1, 2017. Aside from China Bank, he does not hold any directorship position in any other PSE-listed company. He also sits in the boards of Bank subsidiaries China Bank Savings, Inc. (CBSI), China Bank Insurance Brokers, Inc. (CBC-IBI), CBC-PCCI, China Bank Capital Corporation (CBCC), and China Bank Securities Corporation (CBSC), and is actively involved in the boards of BancNet, Inc., Banker‟s Association of the Philippines, Philippine Payments Management Inc., and Manulife China Bank Life Assurance Corporation (MCBLife). He has almost 40 years of banking experience, previously holding key positions in local and international financial institutions, including Metrobank, Republic National Bank of New York, International Exchange Bank, Security Bank, and Sterling Bank of Asia. Director and President Whang earned his Bachelor of Science degree in Commerce, Major in Business Management, from the De La Salle University. He underwent various trainings in banking and other related fields such as corporate governance, AML, branch based marketing, quality service management, sales management, principle centered leadership, and corporate strategy. Peter S. Dee, 78, Filipino, has been on the China Bank Board since April 14, 1977, serving as President and Chief Executive Officer from 1985 to 2014. He is an independent director in PSE-listed companies City & Land Developers, Inc. and Cityland Development Corporation. He is also a member of the boards of other non-listed companies including China Bank subsidiary CBC-PCCI, Hydee Management & Resources Corporation, Commonwealth Foods, Inc., and GDSK Development Corporation. He was previously a director of Sinclair (Phils.) Inc., Can Lacquer, Inc., CBC Forex Corporation, and CBC-IBI. Director Dee obtained a Bachelor of Science degree, Major in Commerce, from the De La Salle University/University of the East, and attended a Special Banking Course at the American Institute of Banking. He attended extensive trainings in AML in December 2017 and August 2019, and corporate governance in November 2018 and August 2019, among others. Joaquin T. Dee, 84, Filipino, is a member of the China Bank Board since May 10, 1984. He does not hold directorship position in any PSE-listed company other than China Bank. He is presently the Director/Chairman of JJACCIS Development Corporation, Director/President of Enterprise Realty Corporation, and Director/Treasurer of Suntree Holdings Corporation. He was Vice President for Sales and Administration of Wellington Flour Mills from 1964 to 1994. Director Dee is a graduate of the Letran College with a Bachelor of Science degree in Commerce. He attended trainings and seminars related to banking, the most recent of which are the Corporate Governance and AML Trainings conducted by the ICD in August 2019. Herbert T. Sy, 63, Filipino, was first elected to the China Bank Board on January 7, 1993. He also serves in PSE-listed SM Prime Holdings, Inc. as Director, and in various non-listed companies including Supervalue, Inc., Super Shopping Market, Inc., Sondrik, Inc., and Sanford Marketing Corp. as Chairman, and in the National University as
Director. He has been involved in companies engaged in food retailing, investment, real estate development and mall operations. Director Sy obtained his Bachelor of Science degree in Management from the De La Salle University. His numerous banking-related trainings include those on corporate governance and AML in 2019. Harley T. Sy, 60, Filipino, has been a member of the China Bank Board since May 24, 2001. He also serves as the Executive Director of SM Investments Corporation, one of the largest publicly listed companies in the Philippines, and holds various positions in other non-listed companies in the SM group. Director Sy graduated with a Bachelor of Science degree in Commerce, Major in Finance, from the De La Salle University. He participated in extensive trainings on enhancing his banking skills, including programs on enterprise risk management, AML, corporate governance and data privacy. Jose T. Sio, 80, Filipino, was first elected to the China Bank Board on November 7, 2007. He is presently in the boards of the following PSE-listed companies: (1) SM Investments Corporation, as Chairman of the Board; (2) Atlas Consolidated Mining and Development Corporation, as Director; (3) Belle Corporation, as Director; and (4) Far Eastern University, Incorporated, as Independent Director. He also serves in other capacities in the following PSE-listed companies: SM Prime Holdings, Inc., as Adviser of Audit Committee/Risk Oversight Committee; BDO Unibank, Inc., as Adviser to the Board; and Premium Leisure Corporation, as Adviser to the Board. In addition, Mr. Sio is in the boards of non-listed companies, including NLEX Corporation, First Asia Realty Development Corporation, and Ortigas Land Corporation. He is the Chairman and President of SM Foundation, Inc. He previously worked as Senior Partner of SyCip Gorres Velayo & Co. (SGV). He was voted as CFO of the Year in 2009 by the Financial Executives of the Philippines (FINEX); and in various years, he was awarded as Best CFO (Philippines) by Hong Kong-based business publications such as Alpha Southeast Asia, Corporate Governance Asia, Finance Asia and The Asset. Director Sio is a Certified Public Accountant, graduating with a Bachelor of Science degree in Commerce, Major in Accounting, from the University of San Agustin. He obtained his Master‟s degree in Business Administration from the New York University, U.S.A. He is actively engaged in continuous trainings, having attended seminars/trainings on investments, loans and financial instruments, debt and equity financing during the Euromoney Conference in China in 2005, AML and Advanced Corporate Governance in 2019. Alberto S. Yao, 73, Filipino, is the Lead Independent Director of the Bank. He was elected to the China Bank Board on July 7, 2004. He does not serve in any listed PSE-listed company other than China Bank. He is the President & CEO of Richwell Philippines, Inc. and Internationale Globale Marques, Inc.; President of Richphil House Incorporated; and a Member of` the Philippine Constitution Association. He is also an Independent Director in the following Bank subsidiaries: CBSI, CBCC, and CBSC. He was previously a Director of Planters Development Bank, President and CEO of Richwell Trading Corporation and Europlay Distributor Co., Inc., President of Megarich Property Ventures Corporation, and Vice President for Merchandising of Zenco Sales, Inc. He holds a Bachelor of Science degree in Business Administration, Minor in Accounting, from the Mapua Institute of Technology. Director Yao‟s seminars include ICD‟s Corporate Governance and AML Training Programs in 2019. Margarita L. San Juan, 66, Filipino, is an Independent Director of the Bank. She was first elected to the China Bank Board on May 4, 2017. She is likewise an Independent Director in Bank subsidiaries CBSI, CBCC, and CBC-IBI. She does not hold directorship position in any other PSE-listed company. In the past, she worked with Ayala Investment and Development Corporation, Commercial Bank and Trust Co., and in the Bank‟s Account Management Group as Senior Vice President and Group Head until her retirement in 2012. Director San Juan earned her Bachelor of Science degree in Business Administration, Major in Financial Management, from the University of the Philippines, and completed the Advance Bank Management Program of the Asian Institute of Management (AIM). She participated in various trainings including development financing, international banking operations, marketing, financial analysis and control, credit and risk management, and the latest on AML and corporate governance in 2019. Philip S.L. Tsai,69, Filipino, was first elected as Independent Director on November 7, 2018. Aside from the Bank, he does not hold any position in other PSE-listed companies. He also serves as Independent Director in the Bank subsidiaries CBSI, CBCC, CBC-IBI. He has had more than 35 years of banking experience, previously holding key positions in First CBC Capital (Asia) Limited, Midwest Medical Management, Fortune Paper Inc., Chemical Bank New York, Consolidated Can Corp., Plastic Container Packaging, and in the Bank‟s Retail Banking Business until his retirement in 2015. Director Tsai obtained his Bachelor of Science degree in Business Administration from the University of the Philippines, and pursued his Master‟s degree in Business Administration from the Roosevelt University in Chicago, Illinois. He has had several trainings on corporate governance, bank protection, AML, and branch-based marketing, among others.

Angeline Ann H. Hwang, 69, Filipino, was elected as independent director of the Bank in 2019. She does not hold directorship position in any other PSE-listed company. She is currently the President of Wingsan Properties Corporation and Oxleyrise Properties Inc., which are both private family-owned corporations. She is also independent director of Bank subsidiaries CBSI and CBSC. She has more than 45 years of experience in Philippine banking, ranging from international trade finance to account management/relationship management for SME and middle market segments as well as branch banking, branch administration and branch expansion. In the past, she held various positions in Philippine Business Bank, Solidbank Corporation, Far East Bank & Trust Company and Bank of the Philippine Islands. Director Hwang earned her Bachelor of Science degree in Business Administration, Major in Banking and Finance, from the University of the Philippines. She has had various trainings on International Financing Reporting Standards (IFRS), financing, related party transactions, data privacy, SME, credit risk management, AML and corporate governance. Ricardo R. Chua, 68, Filipino, is Advisor to the Board since November 1, 2017. He previously held several key positions in the Bank: as Director from 2008 up to October 2017, President and Chief Executive Officer from September 2014 up to October 2017, and Chief Operating Officer from 2012 to 2014. He is the Advisor of the Bank‟s Technology Steering Committee, and sits in the boards of the following Bank subsidiaries: Chairman of CBSI and CBCC and Director of CBC-PCCI. A Certified Public Accountant, Mr. Chua graduated with a Bachelor of Science degree in Business Administration, Major in Accounting, cum laude, from the University of the East, and completed his Master‟s in Business Management (MBM) from the AIM. He has had trainings in banking operations and corporate directorship, and attended AML and corporate governance seminars, among others. Note: Messrs. Gilbert U. Dee and Peter S. Dee are related within the fifth civil degree of consanguinity. Messrs. Hans T. Sy, Herbert T. Sy, and Harley T. Sy are related within the second civil degree of consanguinity. For the period January to December 2019, the Board had 16 meetings, including the organizational meeting. The incumbent directors attended/participated in more than 50% of all the meetings, as follows:
Director Attendance
Hans T. Sy 15 Gilbert U. Dee 16 William C. Whang 16
Peter S. Dee 16 Joaquin T. Dee 16 Herbert T. Sy 14 Harley T. Sy 16 Alberto S. Yao 15 Jose T. Sio 16 Margarita L. San Juan 16 Philip S.L. Tsai 16 Angeline Ann H. Hwang 9
(a)
(a)
from her election effective May 2, 2019
(b) Principal Officers
Romeo D. Uyan, Jr., 57, Filipino, Executive Vice President, is the Chief Operating Officer of the Bank. He also serves as Vice Chairman in the Boards of Bank subsidiaries China Bank Capital Corporation (CBCC) and China Bank Securities Corporation (CBSC). He was an investment banker with more than two decades of experience in trading, financing, and structuring in the Asia Pacific region with various foreign investment houses. Before he joined the Bank, Mr. Uyan was Managing Director and Co-Head of Special Situations and Leveraged Capital Markets at UBS AG-Singapore Branch, and he also worked as Managing Director and Head of Asia Credit Products in Barclays Capital, where he was member of the Asia Pacific Executive Committee as well as Global Emerging Markets Committee. He graduated with a Bachelor of Science degree in Management Engineering from the Ateneo de Manila University, cum laude, and obtained his Master‟s degree in Business Administration (MBA), graduating with distinction, at the Johnson Graduate School of Management in Cornell University, New York. He participated in

numerous trainings in banking, including anti-money laundering (AML) and corporate governance trainings held in 2019. Rosemarie C. Gan, 62, Filipino, Executive Vice President, is the Segment Head of Retail Banking Business (RBB). She also serves as Director in the Bank subsidiaries China Bank Savings, Inc. (CBSI) and CBC Properties and Computer Center, Inc. (CBC-PCCI). With more than 40 years of experience with the Bank, her exposure and training in banking include marketing, financial analysis, credit portfolio management, strategic planning and corporate governance. Ms. Gan obtained her Bachelor of Science degree in Business Administration, Major in Management, from the University of Santo Tomas, where she graduated magna cum laude and received the distinguished Rector„s Award. She attended the Asian Institute of Management‟s (AIM) Advanced Bank Management Program in 2013. She also attended the BAI Retail Delivery Conference conducted by the Bank Administration Institute in 2012, and Corporate Governance workshops/seminars conducted by the Institute of Corporate Directors (ICD) from 2014 to 2019, and AMLA seminar conducted by ICD in 2019, among others. Patrick D. Cheng, 57, Filipino, Executive Vice President, is the Chief Finance Officer of the Bank. He also sits in the boards of Bank subsidiaries - in China Bank Insurance Brokers, Inc. (CBC-IBI) as Chairman, and in CBSI as Director, and in Manulife Chinabank Life Assurance Corporation (a bank affiliate) as Director. He is also Director of Manila Overseas Commercial Inc. and SR Holdings Corporation. Before joining the Bank, he held various key positions at the Philippine Bank of Communications, HSBC Savings Bank (Philippines), HSBC (Philippine Branch), Citibank N.A. (Philippine Branch), and Citicenter Condominium Corp. From 2008 to 2013, he was the President and Chief Executive Officer of HSBC Savings Bank (Philippines), and from 2011 to 2012, he was a two-term President of the Chamber of Thrift Banks. A Certified Public Accountant placing 7
th in the National Exams, Mr. Cheng graduated
magna cum laude from the University of the Philippines with a Bachelor of Science degree in Business Administration and Accountancy. He pursued his Master‟s in Management degree, with Distinction, from the Hult International Business School in Cambridge, Massachusetts, and completed the Trust Operations and Investment Management course, also with Distinction, from the Trust Institute of the Philippines. In 2010, he received the Distinguished Alumnus Award from the Virata School of Business of the University of the Philippines – Diliman. His extensive trainings include corporate governance, AML, asset liability management, operational risk, and information security. Alexander C. Escucha, 63, Filipino, Senior Vice President, is the Head of the Investor and Corporate Relations Group. He also serves as a Director in Bank subsidiary CBSI and Chairman of the UP Visayas Foundation, Inc. Board of Trustees. He is a fellow of the Foundation for Economic Freedom (FEF) and a member of the Shareholders Association of the Philippines (SharePhil). In the past, he was the president of the Philippine Economic Society (PES) and concurrent Chairman of the Federation of ASEAN Economic Associations (FAEA), and president of the Corporate Planning Society of the Philippines (CPSP) and Bank Marketing Association of the Philippines (BMAP). As an international resource person, he chaired the Technology Conferences at the Asian Banker Summit from 2006 to 2016 and chaired its Technology awards from 2007 to 2011. He was Vice President of International Corporate Bank (InterBank) before joining the Bank. Mr. Escucha earned his Bachelor of Arts degree in Economics, cum laude, from the University of the Philippines and was the G.P. Sicat awardee for Most Outstanding Undergraduate Thesis. Over the years, he attended seminars such as the BSP/IFC Sustainable Finance Forum, Moody‟s ASEAN Briefing, the CFA Society Training on ETHICS, the SEC-PSE Corporate Governance Summit, Microsoft CEO Forum, Investment Conferences of CFA Society Philippines and The Asset, GRI Sustainability Summit, the Annual conventions of the PES and FAEA, BSP Financial Education Forum and Expo and the UN ARISE Disaster Resilience Summit. Magnolia Luisa N. Palanca, 50, Filipino, Senior Vice President, is the Head of Financial Markets Segment. She has around 30 years of banking experience, having worked with several financial institutions before joining the Bank, such as J.P. Morgan (S.E.A. Limited) and J.P. Morgan Chase Bank, N.A., as Executive Director; Standard Chartered Bank Manila as Director; ING Bank NV Manila Branch, Solidbank Corporation and Metropolitan Bank and Trust Company as officer. She obtained her Bachelor of Science degree in Business Economics from the University of the Philippines. She is also an SEC Fixed Income License Salesman, Ateneo-BAP Certified Treasury Professional, and was an Appointed Representative by the Monetary Authority of Singapore. Her trainings and seminars focused on technical, soft and leadership, capital markets and corporate governance. Lilian Yu, 54, Filipino, Senior Vice President, is the Head of Institutional Banking Group. She also currently sits as Director in the boards of Bank subsidiaries CBSC and CBCC. Her more than 30 years of experience in the financial

industry spans the areas of credit, project and structured finance, and debt capital markets. Prior to joining the Bank, she was an International Consultant for the Asian Development Bank. She worked for international financial institutions abroad such as Barclays Capital, ABN Amro Bank, Deutsche Bank and the International Finance Corporation (IFC) of the World Bank Group. A Certified Public Accountant (CPA), Ms. Yu holds Bachelor of Science degree in Business Administration and Accountancy, magna cum laude, from the University of the Philippines. She obtained her MBA degree from the Wharton School of the University of Pennsylvania. She was also conferred the Certified Financial Analyst (CFA) designation by the CFA Institute. Christopher Ma. Carmelo Y. Salazar, 46, Filipino, First Vice President II, is the Treasurer and Treasury Group Head. He has gained around 25 years of financial markets experience held various senior roles from different institutions including ING Bank-Manila, Standard Chartered – Manila, Thailand, and U.A.E., Landbank of the Philippines and First Metro Investment Corporation. He is a graduate of Bachelor of Science in Management Engineering from the Ateneo de Manila University. He took up the Treasury Certification Program of the Ateneo-BAP. He participated in numerous trainings and seminars including corporate governance, AML, operational risk, information security, data privacy, bank marketing management, risk management, and leadership. Benedict L. Chan, 43, Filipino, First Vice President II, is the Bank‟s Chief Dealer. He has over 20 years of experience on trading and portfolio management gained from financial institutions including Trinitus Asset Management, BNP Paribas Singapore and London, and ING Bank Singapore, Hongkong, and Manila. Mr. Chan obtained his Bachelor of Science degree in Management Engineering from the Ateneo de Manila University. He is a recipient of Financial Markets Regulatory and Practice Certificate from the Singapore‟s Institute of Banking and Finance. He also successfully passed the Hongkong Securities Paper Exam 1 conducted by the HK FEC (Hongkong). Ananias S. Cornelio III, 44, Filipino, First Vice President II, is the Chief Risk Officer of the Bank. He has more than 20 years of banking experience, handling risk, treasury or audit functions at the Development Bank of the Philippines, Rizal Commercial Banking Corporation, First Metro Investment Corporation, and Solidbank Corporation. Mr. Cornelio earned his Bachelor of Science degree in Commerce, with academic distinction, from the San Beda College, and a Master‟s degree in Public Administration, academic scholar, from the National University of Singapore. He also took up the AIM‟s Bank Management Course. He participated in extensive trainings on corporate governance, macro prudential supervision and regulatory change, risk management, Basel Standards, fixed income, credit derivatives and structured products, interest rate and currency derivatives, ISDA documentation, and economic forecasting, among others. He has been a panelist/speaker in major events in the region which include The Asian Banker Summit, ASEAN Risk Forum, Risk Minds Asia, and ADB Regional Forum on Financial Asset and Liability, and a resource person/lecturer for the Bankers Institute of the Philippines (BAIPHIL), and the Association of Development Financing Institutions in Asia and the Pacific (ADFIAP). He is the Sub-Committee Chairman on Basel Standards Implementation of the Bankers Association of the Philippines. Renato K. De Borja, Jr., 48, Filipino, First Vice President II, is the Head of the Remittance and Cards Business Group and also oversees the Bank‟s Customer Contact Center. He also serves as member of the Bank‟s Operations Committee. He has exposure to banking and finance for more than 27 years, holding key positions in the past in East West Rural Bank (formerly Green Bank (a Rural Bank)) as non-Executive Director, Chief Finance Officer (CFO) of East West Banking Corporation, Citigroup Business Process Solutions and ROHQ, and Metrobank Card Corporation, various finance and accounting roles in Standard Chartered Bank and Far East Bank and Trust Co. Mr. De Borja is a graduate of Bachelor of Science in Commerce, Major in Accounting, from the University of Santo Tomas. He earned his Global Executive MBA from the IE Business School. He is a Certified Public Accountant (CPA) and BAP Certified Treasury Professional for money markets and foreign exchange. He participated in numerous trainings, seminars and workshops on profitability card management, corporate governance, AML, risk management, and other relevant banking subjects. Gerard T. Dee, 56, Filipino, First Vice President II, is the Head of Institutional Banking Group – Commercial Banking Division II. Before joining the Bank, he held key positions at Security Bank Corporation, TA Bank of the Philippines, and Banco de Oro. Mr. Dee graduated with a Bachelor of Science degree in Marketing from the De La Salle University and an MBA degree from the New Hampshire College. He attended banking-related trainings on core credit, remedial management and relationship marketing, among others. He is related within the first civil degree of consanguinity to Mr. Gilbert U. Dee, Vice Chairman of the Board.

Antonio Jose S. Dominguez, 52, Filipino, First Vice President II, is the Head of the Multi-Purpose Loans Division. He has more than 30 years‟ experience in the financial industry primarily in the key areas of Sales Management and Business Development. Most of his experience was gained in HSBC Philippines, under its two management training programs that led to holding varioussenior roles in Consumer Loans, Cards, Corporate Banking, Global Custody, Retail Banking and Wealth Management. Prior to joining the Bank, he headed the Sales and Marketing Groups of City Savings Bank and Rosehill Memorial Management, Inc. Earlier in his career, he worked in All Asia Capital and Trust Corporation, All Asia Securities Management Corporation, DMT Securities Inc. and AGJ Securities Corporation. His professional training includes various leadership skills, sales management, performance management, and digital marketing. He is a graduate of Bachelor of Science degree in Commerce, Major in Management, from the Colegio de San Juan de Letran. Delia Marquez, 58, Filipino, First Vice President II, is the Head of the Centralized Operations Group and concurrent Head of Business Process Management Division. She previously worked as Auditor at SGV & Co. and Transunion Corporation. A Certified Public Accountant, she graduated with a Bachelor of Science degree in Commerce, Major in Accounting, cum laude, from the University of Santo Tomas. She attended various seminars on corporate governance, Internal Capital Adequacy Assessment Process (ICAAP), risk model validation, Internal Credit Risk Rating System (ICRRS), Philippine Financial Reporting Standards (PFRS), The Asian Banker‟s Future of Finance Summit 2017, SAS Management, Inc.‟s Intro to Agile Project Management, GGAPP and PWC Phils.‟s Annual GGAPP Forum on Good Governance, Ethics and Compliance, and ICD‟s Corporate Governance Training Program. Jose L. Osmeña, Jr., 60, Filipino, First Vice President II, is the Deputy Group Head of RBB. He has been with the Bank for more than 28 years and serves as Excom member of Bank subsidiary CBSI. He worked at Insular Bank of Asia and America and at Producers Bank prior to joining China Bank. Mr. Osmeña is a Bachelor of Science degree holder in Commerce, Major in Accounting, from the University of San Carlos, and he earned his Masters of Science degree in Business Administration also from the same university. He also completed the AIM‟s Advance Bank Management Program. He participated in several trainings on export financing, loan documentation, money market, corporate governance, and AML. Shirley G.K.T. Tan, 64, Filipino, First Vice President II, is the Region Head of RBB - Metro Manila West Region. She spent about 40 years of her professional career with the Bank. A Certified Public Accountant, Ms. Tan holds a Bachelor of Science degree in Business Administration, Major in Accounting, from the Philippine School of Business Administration in Manila. She had professional trainings and seminars on sales management and leadership skills, among others. Cristina P. Arceo,51, Filipino, First Vice President, is the Head of Treasury Fixed Income Division. She has almost 30 years of banking and asset management experience, formerly holding officership positions at Philam Asset Management Inc. and Philippine National Bank. Ms. Arceo obtained her Bachelor of Science degree in Economics from the University of the Philippines and completed her MBA studies from the De La Salle University. She also successfully passed the SEC‟s Fixed Income Salesman Licensing Exam. She attended trainings on strategic systems thinking, foreign exchange, money and capital markets, interest rate swaps and options, market reading, derivatives documentation and portfolio management, among others. She received awards for “Best in Bond Trading” from The Asset for six (6) years. She earned her CFA charter in 2011 and was the former Chairman of the Board of Trustees of the CFA Society Philippines (CFAP). She still sits as member of the Board of Trustees of CFAP. Layne Y. Arpon,59, Filipino, First Vice President, is the Head of Institutional Banking Group-Corporate Banking Division I. She worked in financial institutions including BDO Unibank, The Manila Banking Corporation, Security Banking Corporation, and Land Bank of the Philippines, with exposure in commercial banking, corporate banking, investment banking, credit review and underwriting, project finance and audit. A Certified Public Accountant (CPA), Ms. Arpon took up Bachelor of Science in Commerce, Major in Accounting, from the Far Eastern University. She attended various trainings on trade finance, core credit, financial analysis, project financing, and credit investigation and property appraisal, among others. Lilibeth R. Cariño, 63, Filipino, First Vice President, is the Head of Consumer Banking Group. She spent her career with the Bank for over 41 years, and had extensive exposure and training in consumer banking, real estate, corporate planning, treasury, credit, project finance, and branch based marketing, among others. Ms. Cariño took up her Bachelor of Science degree in Statistics from the University of the Philippines, and earned her MBA units from

the Ateneo Graduate School of Business. She also participated in the Asian Development Bank‟s seminar on institutional strengthening of financial institution, Allen Management Program‟s Professional Management seminar/workshop, and ICD‟s training programs on corporate governance and AML. Amelia Caridad C. Castelo, 56, First Vice President, is the Head for Enterprise Business Intelligence Division. With extensive experience in the use of analytics tools and methodologies, quantitative modelling, and data-driven decision management support, she has worked in various banking roles under the Risk, marketing, and Finance groups. She previously worked with Standard Chartered Bank (Phils. and Hongkong), HSBC Manila, East West Banking Corporation, and BDO Unibank and has handled roles related to Risk Analytics, Marketing Analytics, Business Intelligence, Credit Policy and MIS. Ms. Castelo graduated with a Bachelor of Science degree in Statistics from the University of the Philippines – Diliman and took post-graduate units in Industrial Engineering from the same university. She recently completed the Executive Program in Data Science and Analytics from the University of California-Berkeley. She participated in various trainings on Credit Risk and Operational Risk Management, Basel Standard, Risk model development and validation, PFRS, Financial Consumer Protection, and AML. Melissa F. Corpus, 51, Filipino, First Vice President, is the Credit Management Group Head. She has 31 years of experience in banking and finance, having worked with various financial institutions such as Far East Bank and Trust Co., The Hongkong and Shanghai Banking Corporation, and Citibank, N.A. She has gained a wide span of banking exposure in the areas of credit analysis, credit risk management, relationship management of corporate and financial institutions, loan syndications, project finance, credit policy formulation and documentation management. She was an academic scholar at the Ateneo de Manila University where she graduated with a Bachelor of Science in Management degree. Apart from having engaged in different trainings on credit, risk management, treasury, derivatives, international trade, property appraisal, and various external regulations, she also finished her comprehensive Executive Training Program at the HSBC Group Management Training College in Bricket Wood, United Kingdom. Angela D. Cruz, 60, Filipino, First Vice President, is the Head of Market Sales Group under the Financial Markets Segment. She also presently serves as Director of Wellington Investment and Manufacturing Corporation and holds key positions in Suntree Holdings Corporation and JJACCIS Development Corporation. Prior to joining the Bank, she held executive positions at Citibank N.A., Far East Bank and Trust Company, and Equitable PCI Bank. Ms. Cruz earned her Bachelor of Science degree in Commerce, Major in Management of Financial Institutions, from the De La Salle University. Her professional trainings related to banking operations include Bourse Game, account management, and customer service. She is related within the first civil degree of consanguinity to Bank Director Joaquin T. Dee. Maria Luz B. Favis, 59, Filipino, First Vice President, is the Head of Asset Quality and Recovery Management Division. In the past, she held key positions in Philippine Commercial International Bank (PCIBank) and Planters Development Bank with exposure on account management, commercial lending and credit. Her extensive trainings covered loan evaluation and marketing, financial analysis and credit risk management supplemented by seminars on mergers and acquisitions, bank sales and marketing strategies and real estate management. Ms. Favis is a Bachelor of Arts degree holder in Economics from the De La Salle University and obtained her Master‟s degree in Business Management from the AIM. Madelyn V. Fontanilla, 57, Filipino, First Vice President is the Head of RBB‟s Branch Operations Division. She has more than 25 years of banking experience, with focus on retail banking and branch operations, gained from Equitable PCI Bank and PCI Bank. She is a graduate of Bachelor of Science in Business Administration, Major in Accounting, from the University of the East. She participated in various trainings such as on branch automation, leadership, financial planning, and operations control enhancement, among others. Jerry Ron T. Hao, 39, Filipino, First Vice President, is the Head of Foreign Exchange and Derivatives Division. Prior to joining the Bank, he gained his professional experience from ING Bank and International Exchange Bank. He graduated with a Bachelor of Science in Management Engineering degree from the Ateneo de Manila University. He is actively involved in several trainings such as on credit derivatives and structured products. Elizabeth C. Say, 61, Filipino, First Vice President, is the Head of the Branches Administration Division of RBB. She has been with the Bank for 32 years. She was an internal auditor at Morrison Forwarding Corporation and a money market trader at State Investment House, Inc. before she joined the Bank. Ms. Say is a graduate of Bachelor of

Science in Commerce, Major in Accounting, from the University of Santo Tomas. She participated in trainings on corporate governance, integrated risk management, credit risk management, foreign exchange, loan review and classification and AML, among others. Clara C. Sy, 60, Filipino, First Vice President, is the Region Head of RBB- Metro Manila East Region. She also holds officership positions in New Golden City Builders & Development Corp. and Citigold Resources & Development Corporation. She has been with the Bank for 38 years handling retail banking and branches administration. A CPA, she holds a Bachelor of Science degree in Commerce, Major in Accounting, from the University of Santo Tomas. She attended several trainings on enhancing managerial skills and branch management. Belenette C. Tan, 55, Filipino, First Vice President, is the Bank‟s Chief Legal Counsel and Head of Legal and Collections Group. She is also the concurrent Corporate Secretary of Bank subsidiary CBC-IBI. She has been with the Bank for more than 25 years. Atty. Tan previously worked with Yap, Apostol, Gumaru and Balgua Law Offices, prior to joining the Bank. She is a Bachelor of Laws degree holder from the University of Santo Tomas, after taking up Bachelor of Arts in Political Science from the University of the Philippines. She has had several trainings and seminars, including on the mandatory continuing legal education, AML and various aspects of commercial, criminal, and civil law. Stephen Y. Tan, 53, Filipino, First Vice President, is the Region Head of RBB-Visayas Region. He has more than 30 years of banking experience, having handled various positions at Metropolitan Bank & Trust Co., Far East Bank & Trust Co., Equitable PCI Bank, and International Exchange Bank, prior to joining the Bank. A CPA, Mr. Tan earned his Bachelor of Science degree in Commerce, Major in Accounting, from the University of San Carlos. He attended several trainings on account management strategies and other trainings in banking and other related fields. Manuel M. Te, 65, Filipino, First Vice President, is the Region Head of RBB – Metro Manila South Region, and also the head of National Marketing Unit. He joined the Bank in 1976 up to 1996 and was rehired in 1997. He has extensive exposure and training on retail banking. Mr. Te is a graduate of Bachelor of Science in Commerce, Major in Accounting, from the University of Mindanao Digos City and went on to take his post-graduate units in the MBA program of the Ateneo de Davao University. He participated in trainings on AML, forgery detection, credit management, position planning, branch-based marketing, and Leadership Training under Allen Management, among others. Marisol M. Teodoro,58, Filipino, First Vice President, is the Director, President and Chief Executive Officer of Bank subsidiary, CBSC, since her secondment in 2017. She previously worked in other financial institutions such as Security Bank and International Corporate Bank/Union Bank of the Philippines. She holds a Bachelor of Science degree in Business Economics and an MBA degree, both from the University of the Philippines-Diliman. She also participated in several trainings on trust, financial planning, and treasury. Maria Rosanna Catherina L. Testa, 60, Filipino, First Vice President, is the Head of Human Resources Group. She spent more than 30 years of her career in human resource management. She previously held key positions at Goodyear Phils., Equitable-PCI Bank, Far East Bank and Trust Company, The Manila Banking Corporation, and John Clements Consultants, among others. Ms. Testa is a graduate of Bachelor of Arts, Major in Business Administration, from the Assumption College, and completed her Master‟s degree in Business Administration from the Ateneo Business School. She participated in trainings on corporate governance, AML, leadership, and trends and challenges in human resource management. Geoffrey D. Uy, 54, Filipino, First Vice President, is the Head of Market and Liquidity Risk. Prior to joining the Bank, he was Treasurer, Risk Analytics Head, Funds Management Head, and Corporate Auditor at Citibank. Mr. Uy took up his Bachelor of Science degree in Mechanical Engineering from the De La Salle University and pursued his MBA from the New Hampshire College. His professional trainings include risk management, ICAAP, and financial derivatives, among others. Noemi Uy, 63, Filipino, First Vice President, is the Region Head of RBB-Metro Manila North Region. Ms. Uy spent her career with the Bank for over 25 years with focus on retail and branch banking. In the past, she worked with Associated Bank, United Coconut Planters Bank, Permanent Savings Bank, and Producers Bank of the Philippines. She graduated with a Bachelor of Science degree in Business Administration from the University of Santo Tomas.

She completed numerous trainings on AML, information security, foreign exchange, stock investments, and organization transformation, among others. Corazon I. Morando, Filipino, is the Vice President and Corporate Secretary of the Bank. She is also a Consultant on Legal and Corporate Affairs of the SM Group. She is a recipient of “Asian Company Secretary of the Year” award by the Corporate Governance Asia in Hongkong, recognizing her vital role in promoting and upholding corporate governance in the Bank. Atty. Morando was previously a Director of the Corporate Legal Department of the Securities and Exchange Commission of the Philippines. She took up her Bachelor of Laws from the University of the Philippines, and obtained her graduate studies under the MBA-Senior Executive Program from the Ateneo de Manila University. She is continuously involved in the development of her competence. She attended numerous trainings which include seminars on non-bank financial intermediaries, and the most recent on AML and corporate governance in 2019, among others. Note 1: All the foregoing officers have been involved in the banking industry for more than five (5) years. Note 2: None of the above-mentioned directors and officers works with the government.

(c) Nominees for election as Directors and Independent Directors
Nominee as Director Person who nominated Nominee as
Independent Director Person who nominated and Relationship with Nominee
Hans T. Sy Sysmart Corporation Alberto S. Yao Lucky Securities, Inc., no relation
Gilbert U. Dee Linda Susan T. Mendoza Margarita L. San Juan Zenaida C. Milan, no relation
William C. Whang George C. Yap Philip S.L. Tsai Alvin A. Quintanilla, no relation
Peter S. Dee Nancy D. Yang Angeline Ann H. Hwang Regina Capital Development Corporation, no relation
Joaquin T. Dee Christopher T. Dee
Herbert T. Sy Sysmart Corporation
Harley T. Sy SM Investments Corporation
Jose T. Sio SM Investments Corporation
All the above-mentioned nominees are incumbent members of the Board. The Certifications of the nominees for independent directors, in accordance with SEC Memorandum Circular No. 5, Series of 2017, are attached as Exhibits “A” to “D”. Upon initial determination, based on the Nomination Forms and attachments submitted to the Nominations and Corporate Governance Committees, the nominees for directors and independent directors were found to be fit and proper for the position they were nominated to and possess all the qualifications and none of the disqualifications of a director or independent director, and their qualities are aligned with the Bank‟s strategic directions. The Nominations Committee is currently composed of Ms. Angeline Ann H. Hwang (Chairman), Mr. Philip S.L. Tsai, Mr. Alberto S. Yao and Ms. Margarita L. San Juan.

(d) Involvement in Legal Proceedings To the knowledge and information of the Bank, none of the above-named directors, nominees, and executive officers have been involved in any of the following events during the past five (5) years: (i) any bankruptcy petition filed by or against any business of which such person was a general partner or executive officer either at the time of the bankruptcy or within two (2) years prior to that time; (ii) any conviction by final judgment, including the nature of the offense, in a criminal proceeding, domestic or foreign, or being subject to a pending criminal proceeding, domestic or foreign, excluding traffic violations and other minor offenses; (iii) being subject to any order, judgment, or decree, not subsequently reversed, suspended or vacated, of any court of competent jurisdiction, domestic or foreign, permanently or temporarily enjoining, barring, suspending or otherwise limiting his involvement in any type of business, securities, commodities or banking activities; and (iv) being found by a domestic or foreign court of competent jurisdiction (in a civil action), the Commission or comparable foreign body, or a domestic or foreign exchange or other organized trading market or self-regulatory organization, to have violated a securities or commodities law or regulation and the judgment has not been reversed, suspended, or vacated. For the past five (5) years, the Bank, its affiliates, subsidiaries, directors and officers have not been involved in any legal proceedings that would affect their ability, competence or integrity, and/or would involve a material or substantial portion of their property before any court of law, quasi-judicial body or administrative body in the Philippines or elsewhere, except in the usual routine cases directed against the Bank, arising from the ordinary conduct of its business. All legal proceedings involving the Bank are efficiently and competently attended to and managed by a group of eighteen (18) in-house lawyers who are graduates of reputable law schools in the country. For its external counsels, the Bank retains the services of respected law firms, among which are Medialdea Bello Guevarra & Suarez Law Offices, ACCRA Law Office, Britanico Sarmiento & Ringler Law Offices, Divina Law Office, Tagayuna Panopio & Escober Law Firm, Atty. Omar D. Vigilia, The Law Firm of Hermosisima Hermosisima & Hermosisima, and Catabay-Lauigan Law Office.
(e) Significant Employees The Bank highly values its human resources. It expects each employee to do his share in achieving the Bank‟s set goals; in return, the Bank has in place policies and programs for the protection and growth of employees.
(f) Relationships and Related Transactions In the ordinary course of business, the Bank has loans and other transactions with its directors, officers, stockholders, and related interests (DOSRI), which were made substantially on fair terms or at an arm‟s length basis, that is, terms not less favorable to the Bank than those offered to others. Full disclosures for these transactions were made through reports with the appropriate regulatory agency. The Bank has the following subsidiaries or affiliates/associates: i. China Bank Savings, Inc. (CBSI) – formerly known as The Manila Banking Corporation (TMBC),CBSI was
acquired by China Bank in June 2007. It was incorporated on May 23, 1960 and was formed to carry on, engage in the business of, and exercise the general powers of a commercial bank as provided by law. On June 23, 1999, the Bangko Sentral ng Pilipinas (BSP) granted TMBC authority to operate as a thrift bank. In 2008, in pursuance of the Bank‟s acquisition of TMBC, the BSP and the Securities and Exchange Commission (SEC) approved the change of name to CBSI. Further, the Monetary Board and SEC gave their approvals on November 21, 2013 and January 20, 2014, respectively, to the merger with Unity Bank, A Rural Bank, Inc. (Unity Bank), a Pampanga-based rural bank, with CBSI as the surviving bank. On August 14, 2014, the stockholders owning at least 2/3 of the outstanding capital stock of CBSI approved the Plan of Merger of Planters Development Bank and CBSI, with the latter as the surviving bank. BSP approved the merger on November 6, 2015 and SEC registered/approved the merger on December 17, 2015. China Bank now owns 98.29% of the total outstanding capital stock of CBSI. Sitting as directors and/or officers of CBSI are the following: Mr. Ricardo R. Chua as Chairman, Ms. Nancy D. Yang as Vice Chairman, and the rest of the Board members are Messrs. William C. Whang, Alexander C. Escucha, Alberto S. Yao, Philip S.L. Tsai, and Patrick D. Cheng, and Mesdames Rosemarie C. Gan, Angeline Ann H. Hwang, and Margarita L. San Juan.

ii. China Bank Capital Corporation (CBCC) – was incorporated on November 27, 2015 as a full-service investment
house with broker/dealer of securities functions. CBCC is also licensed to deal with government securities. It is 100% owned by the Bank. CBCC's Board of Directors is composed of: Messrs. Ricardo R. Chua (Chairman), Romeo D. Uyan, Jr. (Vice Chairman), Ryan Martin L. Tapia (President), William C. Whang, Philip S.L. Tsai, Alberto S. Yao, Juan Paulo E. Colet, and Mesdames Lilian Yu and Margarita L. San Juan. CBCC‟s business is supplemented by its wholly-owned subsidiaries: a) China Bank Securities Corporation (formerly ATC Securities, Inc.), an equity broker-dealer; and b) CBC Assets One (SPC) Inc., a special purpose corporation.
iii. CBC Assets One (SPC) Inc. (CBC Assets) – is a special purpose subsidiary of CBCC. It was incorporated on
June 15, 2016, with the primary purpose of securitization of assets which include receivables, mortgage loans and other debt instruments. CBC Assets is 100% owned by CBCC, with the following Board members: Messrs. Ryan Martin L. Tapia (Chairman/President/CEO), Juan Paolo E. Colet (Legal Director/Corporate Secretary), and Ariel A. Soner, and Ms. Marjorie T. Esplana and Ms. Emmelyn S. Chua (CFO/Treasurer/HR Director).
iv. China Bank Securities Corporation (CBSC) – formerly known as ATC Securities, Inc. (ATC), it is a wholly-owned
subsidiary of CBCC. CBSC operates as a stock brokerage licensed by the SEC to engage in dealing, for its own and its customers‟ accounts, securities listed in the PSE as well as providing securities research and analysis services. On April 19 2018, CBSC became one of the PSE Trading Participants eligible to trade dollar-denominated securities or DDS. ATC originally started out as Cathay Asia Securities, Inc. which was incorporated on December 13, 1978. On April 12, 1984, Cathay Asia Securities changed its name to ATC Securities, Inc. On June 29, 2016, CBCC and the stockholders of ATC executed a Share Purchase Agreement for the purchase by CBCC of 100% shares in ATC. The SEC approved CBCC's intended purchase of ATC on August 23, 2016, subject to certain documentary filing. The acquisition of ATC was eventually approved by the PSE on February 22, 2017 and the closing of the purchase of ATC was completed on March 6, 2017. On July 6, 2017, the SEC approved CBSC‟s amended articles of incorporation, including its change in corporate name from ATC Securities, Inc. to China Bank Securities Corporation. The company's Board of Directors is comprised of: Messrs. William C. Whang (Chairman), Romeo D. Uyan, Jr. (Vice Chairman), Ryan Martin L. Tapia, and Alberto S. Yao, and Mesdames Angeline Ann H. Hwang, Marisol M. Teodoro (President & CEO) and Lilian Yu.
v. CBC Properties and Computer Center, Inc. (CBC PCCI) – incorporated on April 14, 1982 to render general
services of computer and other computer-related products and services solely to the Bank and its business group. CBC PCCI is 100% owned by the Bank, with the following Board members: Messrs. Gilbert U. Dee (Chairman), Peter S. Dee (President), Ricardo R. Chua, and William C. Whang (Treasurer), and Ms. Rosemarie C. Gan.
vi. Chinabank Insurance Brokers, Inc. (CIBI)– incorporated on November 3, 1998 as a full service insurance broker,
providing direct insurance brokerage for retail and corporate customers, with a wide and comprehensive range of plans for non-life and life insurance. For non-life insurance, CIBI offers Property, Motor, Marine, Accident, Bonds, Construction All Risk and Liability for the Bank clients. CIBI is 100% owned by the Bank, with the following Board members: Messrs. Patrick D. Cheng (Chairman), William C. Whang (Director), and Philip S.L.Tsai (Independent Director), and Mesdames Rosa Maria L. Musico (President) and Margarita L. San Juan (Independent Director).
vii. ManulifeChinabank Life Assurance Corporation (MCBLife) – the Board approved on August 2, 2006 the joint project proposal of the Bank with The Manufacturers Life Insurance Company (Manulife). In September 2007, the BSP approved the Bank‟s request to invest in Manulife-owned insurance company that would offer innovative insurance and financial products for health, wealth and education through the branch network and bank offices. The life insurance company was initially incorporated as The Pramerica Life Insurance Company, Inc. in 1998 but the name was changed to Manulife China Bank Life Assurance Corporation (MCBLife) on March 23, 2007. The Bank initially held a 5% interest in MCBLIfe, the minimum stake required by the BSP. On September 12, 2014, the BSP approved the increase of the Bank‟s capital investment in the venture to 40%, giving the Bank better opportunities to expand its fee-based business. The following are MCBLife‟s Board members: Messrs. Joachim Wessling (Chairman), Sandeep Deobhakta (Director/President & CEO), Richard Bates, William Whang, Patrick Cheng, Matthew Lawrence, Janette Pena, Rhoda Regina Rara and Conrado Favorito.
Further, the Bank has business relationships with related parties. Transactions with such parties are thoroughly reviewed and verified as having been entered into in the best interest of the Bank, in the ordinary course of business

and on substantially same terms as those prevailing at the time for comparable transactions with other parties. The table below shows the Bank‟s material related party transactions and outstanding balances for the year 2019:
Related Party Total Amount /1 Total Outstanding Balance
/2
CBC Group ₱ 19.8 B $ 1.4 B
₱ 9.0 M
SM Group ₱ 134.5 B $ 224.5 M
₱ 13.7 B $ 170 M
Other Related Parties ₱ 37.7 B $ 8.9 M
₱ 11.5 B
1/ Covers all transactions 2/ For loan transactions approved in 2019
Related party transactions are also discussed in Note 30 and 37 of the Audited Financial Statements as presented in Annex F.
6. Compensation of Directors and Executive Officers
Name
Year
Salary
Bonuses & Other
Compensation
TOTAL
Total for the 5 most highly compensated executive officers*
2020 (estimates) 2019 (actual) 2018 (actual)
59,322,826.00 54,416,702.00 46,747,440.00
50,856,250.00 43,245,548.00 40,084,898.00
110,179,076.00 97,662,250.00 86,832,338.00
Total for all officers and directors
2020 (estimates) 2019 (actual) 2018 (actual)
1,804,237,142.00 1,684,491,110.00 1,454,423,412.00
955,827,401.00 926,954,259.00 859,813,381.00
2,760,064,543.00 2,611,445,369.00 2,314,236,793.00
* Messrs. Gilbert U. Dee, William C. Whang, Romeo D. Uyan, Jr., Patrick D. Cheng, and Ms. Rosemarie C. Gan Other than those relating to the foregoing figures, there are no actions to be taken as regards any bonus, profit sharing, pension or retirement plan, granting or extension of any option warrant or right to purchase any securities between the Bank and its directors and officers. The officers receive compensation based on their performance, banking experience, employment status, position and rank in the Bank. On the other hand, the directors are entitled to a per diem of P500.00 for attendance at each meeting of the Board or of any committee and to 4% of the Bank‟s net earnings, in accordance with Article IV, Section 11, and Article VIII, Section 1 (a) of the Bank‟s Amended By-Laws. The directors and officers have no other compensatory arrangement with the Bank.

7. Independent Public Accountants
SyCip Gorres Velayo & Co. (SGV & Co.) has been the Bank's independent auditor for more than 20 years and is again recommended for appointment at the scheduled annual stockholders' meeting. In compliance with SEC Memorandum Circular No. 8, Series of 2003, and Amendments to SRC Rule 68 on the rotation of external auditors or signing partners of a firm every after five (5) years of engagement, Mr. Ray Francis C. Balagtas was assigned since 2016 as SGV & Co. partner-in-charge for the Bank. None of the Bank's external auditors have resigned during the two (2) most recent fiscal years (2019 and 2018) or any interim period. Representatives of SGV & Co. are expected to be present at the stockholders‟ meeting to respond to any matter that may be pertinently raised during the meeting. Their representative will be given the opportunity to make a statement if they so desire. Fiscal Year Audit and Audit-Related Fees All Other Fees 2019 P8,377,600 P855,520 2018 P7,766,528 P6,312,320 Audit and Audit-Related Fees cover services rendered for the performance of the audit or review of the Bank's financial statements including the combined financial statements of Trust Group, and the issuance of comfort letters relative to the Bank‟s P30 billion bond issuance in 2019 and long term negotiable certificate of deposits offering in 2018. The 2019 and 2018 audit fees were taken up and approved by the Audit Committee at its regular meetings on March 25, 2020 and February 27, 2019, respectively. Tax fees related to the audit of tax accounting and compliance are already incorporated in the year-end audit fees under Audit and Audit-Related Fees category as this is part of the audit process conducted by the external auditors. The Board/Audit Committee likewise discussed, approved, and authorized to engage the services of SGV & Co in non-audit work for the independent Third Party Vulnerability Assessment and Penetration Testing in 2019, independent review of PFRS 9 expected credit loss model in 2018 and independent validation of votes in the annual stockholders„ meeting. Payment for these services are included under All Other Fees. The Bank's Audit Committee, which is composed of Messrs. Alberto S. Yao (Chairman), Joaquin T. Dee, and Philip S.L. Tsai, approves the audit fees and fees for non-audit services of external auditors, as emphasized in Article H.3.b.b of the Audit Committee Charter. SGV & Co. also confirmed that they did not have any disagreement with Management that could be significant to the Bank‟s financial statements or their auditor‟s report. Further, there are no matters that in their professional judgment may reasonably be thought to bear on their independence or that they gave significant consideration to in reaching the conclusion that independence has not been impaired. 8. Compensation Plans – Not applicable

C. ISSUANCE AND EXCHANGE OF SECURITIES 9. Authorization or Issuance of Securities Other than for Exchange – Not applicable
Dividend
The Bank is allowed to declare dividends out of its unrestricted retained earnings at such times and in such percentages based on the recommendation of the Board of Directors. Such recommendation will take into consideration factors such as debt service requirements, the implementation of business plans, operating expenses, budgets, funding for new investments, appropriate reserves and working capital, among other things. The Bank‟s Board of Directors is authorized to declare dividends. A cash dividend declaration does not require any further approval from the shareholders. A stock dividend declaration requires the further approval of shareholders holding or representing not less than two-thirds of the Bank‟s outstanding capital stock. The Revised Corporation Code defines the term “outstanding capital stock” to mean the “total shares of stock issued under binding subscription contracts to subscribers or stockholders, whether fully or partially paid, except treasury shares”. Such shareholders‟ approval may be given at a general or special meeting duly called for such purpose. See “Dividend Policy”.
Voting
Each Common Share entitles the holder to one vote. At each meeting of the shareholders, every stockholder entitled to vote on a particular question or matter involved shall be entitled to one vote for each share of stock standing in his name in the books of the Bank at the time of the closing of the transfer books for such meeting,
In accordance with Section 23 of the Revised Corporation Code, at each election of directors, every stockholder entitled to vote at such election shall have the right to vote, in person or by proxy, the number of shares owned by him as of the relevant record date for as many persons as there are directors to be elected and for whose election he has right to vote, or to cumulate his votes by giving one candidate the number of votes equal to the number of directors to be elected multiplied by the number his shares shall equal or by distributing such votes on the same principle among any number of candidates as the stockholder shall see fit.
Pre-emptive Rights
The Revised Corporation Code confers pre-emptive rights on shareholders of a Philippine corporation, which entitle them to subscribe to all issues or other disposition of shares of any class by the corporation in proportion to their respective shareholdings, subject to certain exceptions. A Philippine corporation may provide for the exclusion of these pre-emptive rights in its articles of incorporation. The Board has proposed and the stockholders of the Bank approved on May 8, 2014 to amend the Articles of Incorporation to include a waiver of such pre-emptive rights. The Articles of Incorporation of the Bank provides that stockholders shall have no pre-emptive rights to subscribe to any or all issues or dispositions of any class of shares.
10. Modification or Exchange of Securities– Not applicable
11. Financial and Other Information
(a) Brief Description of the general nature and scope of the business of the Bank, attached as Annex “A” (b) Market Information, Dividends, and Top 20 Stockholders, attached as Annex “B” (c) Discussion of Compliance with leading practice on Corporate Governance, attached as Annex “C” (d) Management‟s Discussion and Analysis or Plan of Operation, attached as Annex “D” (e) Statement of Management Responsibility for Financial Statements, attached as Annex “E” (f) Audited Financial Statements, attached as Annex “F”
12. Mergers, Consolidations, Acquisitions and Similar Matters – Not applicable
13. Acquisition or Disposition of Property– Not applicable
14. Restatement of Accounts– Not applicable
D. OTHER MATTERS
15. Action with Respect to Reports The following are to be submitted for approval during the stockholders' meeting:
a. Minutes of the Stockholders' Meeting held on May 2, 2019, which contain, among others, the: (i) annual report to stockholders; (ii) approval of financial statements; (iii) ratification of all acts of the Board of Directors, including the approval of additional capital infusion of P500 Million to China Bank Savings, Inc. and P40 Million to Manulife Bank Assurance Corporation and related party transactions and all the acts of the Executive Committee and of the various committees of the Bank and Management, during the fiscal
b. year 2018 and immediately preceding the stockholders‟ meeting; (iv) election of the Board of Directors; (v) appointment of external auditor; (vi) delegation to the Board of Director of the power to amend by-laws; and (vii) announcement of the declaration of P0.88/per share cash dividend;
c. Annual Report to Stockholders – to provide information about the Bank‟s activities, business and financial
performance, and other relevant data for the preceding year; d. Approval of the Audited Financial Statements for the year ended December 31, 2019 – to provide
information about the financial position, performance and changes in financial position of the Bank; e. Ratification of all acts of the Board of Directors, Executive Committee, other Committees, and Management,
including the ratification of related party transactions, fund raising exercise of up to P75 Billion in several tranches for the next three (3) years which maybe in the form of Retail bonds and/or Commercial Papers conduct of capital raising exercise of up to P15 Billion in the form of PHP-denominated Tier 2 capital notes and issuance of long term negotiable certificates of time deposit of up to P20.0 Billion - to further bind the Bank of the actions made for the covered period;
f. Election of Directors who will serve as such for the ensuing year; g. Appointment of external auditor – for the stockholders to ratify the Audit Committee‟s and Board‟s selection
of auditors;
h. Amendment of By-laws for the stockholders to approve, confirm and ratify the Board resolution of March 25, 2020 on the amendment of By-laws order to update and clarify the processes and practices of the business and to comply with the requirements under the revised Corporation Code and the Bangko Sentral ng Pilipinas (See schedule A for the comparative table of amendments);
i. All matters as contained in the agenda of the meeting, and other businesses as may properly come before
the stockholders.

16. Matters Not Required to be Submitted– Not applicable
17. Amendment of Charter, By-laws or Other Documents During the duly constituted regular annual meeting held on May 2, 2019, such stockholders owning or representing more than 2/3 of the subscribed capital stock of the Bank approved the delegation to the Board of Directors of the power to amend or repeal or adopt new by-laws.
For 2020, the March 25, 2020 Board resolution amending the By-laws will be presented to the stockholders for their approval and ratification. Please see schedule A for the comparative table of amendments.
18. Other Proposed Action– Not applicable 19. Voting Procedures
In accordance with Article III, Section 6 of the Bank's Amended By-Laws, no meeting of stockholders shall be competent to transact business unless a majority of the outstanding capital stock is represented. Unless the Revised Corporation Code of the Philippines requires otherwise, the majority vote of the shares present or represented at the stockholders‟ meeting, provided there is a quorum, shall be required to carry a stockholders‟ action on any matter taken up during the meeting. Stockholders as of record date of March 20, 2020 shall be entitled to vote at the annual stockholders‟ meeting. Voting will be by ballot. Upon registration and after verification, the registrant (stockholder or representative) shall be issued a ballot, indicating the number of shares represented for purposes of the meeting. The registrant shall indicate in the ballot his voting position for each item in the agenda. Each common share of stock entitles its holder as of record date to one vote. However, with respect to the election of the members of the Board of Directors, Article III, Section 7 of the Bank's Amended By-Laws specifies that any stockholder who is not delinquent in his subscription shall be allowed to vote either in person or by proxy executed in writing by the stockholder or his duly authorized attorney-in-fact in accordance with the requirements under existing rules and regulations. Following Section 23 of the Revised Corporation Code, a stockholder may vote such number of shares for as many persons as there are directors to be elected or he may cumulate said shares and give one (1) candidate as many votes as the number of directors to be elected multiplied by the number of the shares owned, or distribute them on the same principle among as many candidates as may be seen fit, provided that the total number of votes cast shall not exceed the number of shares owned by the stockholders as shown in the books of the Bank multiplied by the whole number of directors to be elected. Twelve (12) nominees receiving the highest number of votes shall be elected directors. For the amendment of by-laws, the affirmative vote by the stockholders representing at least a majority of the outstanding capital stock shall be required, in accordance with Section 47 of the Revised Corporation Code. All votes will be counted and tabulated by the Office of the Corporate Secretary, to be assisted by the transfer agent, Stock Transfer Service, Inc., and the results are set to be validated by the external auditor, SGV & Co.


Exhibit "A"

Exhibit "B"
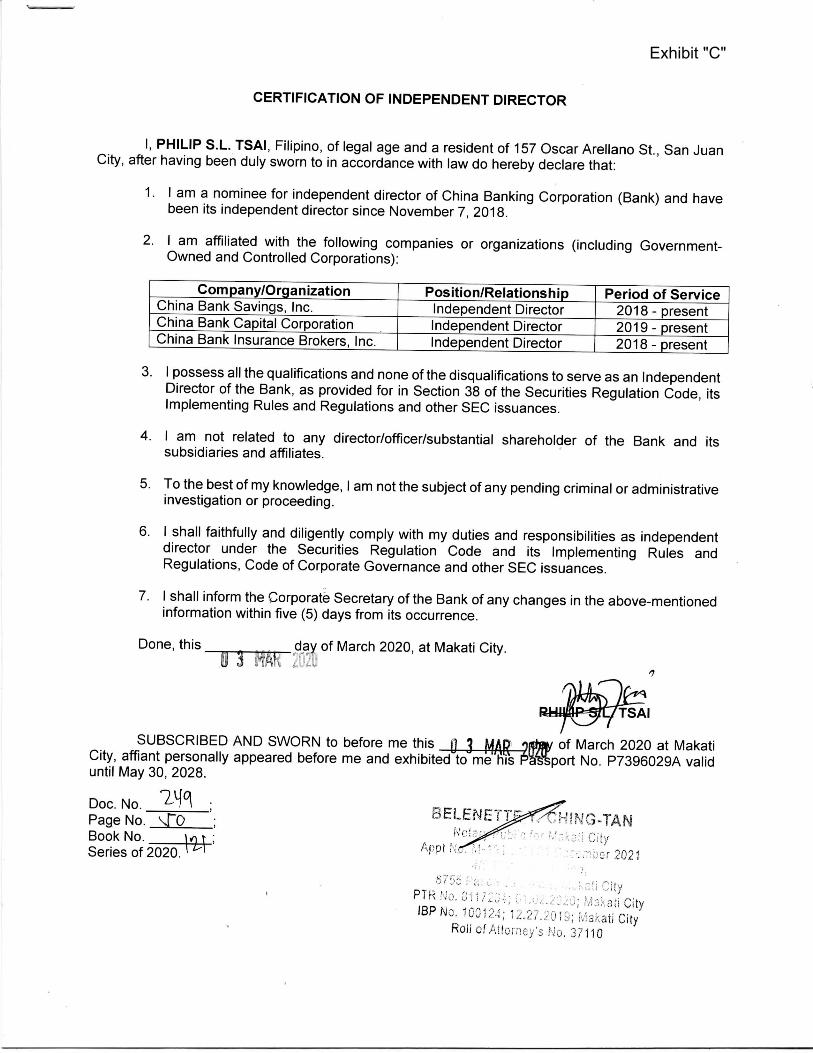
Exhibit "C"

Exhibit "D"

1
ANNEX “A” BUSINESS AND GENERAL INFORMATION 1. Description of Business China Banking Corporation (China Bank) is one of the leading private universal banks in the Philippines that offers a full range of banking products and services to institutional and individual customers, as well as thrift banking, investment banking, insurance brokerage, and bancassurance through our subsidiaries, China Bank Savings, China Bank Capital, China Bank Securities, Chinabank Insurance Brokers (CBC-IB), and Manulife China Bank Life Assurance Corp (MCBLife). The Bank started by mainly catering to the Chinese-Filipino commercial sector, but has since expanded its market scope to include the retail and consumer segments. Its core banking franchise stems mainly from its 99-year history in the Philippines, a factor that has enabled it to become deeply entrenched within the socioeconomic fabric of the Chinese-Filipino community. China Bank was incorporated on July 20, 1920 and commenced business on August 16 of the same year. It was listed on the local stock exchange in September 1927 and acquired its universal banking license in 1991. It played a key role in the post-war reconstruction and economic recovery by providing financial support to businesses and entrepreneurs. In 2007, the Bank acquired Manila Banking Corporation, the oldest savings bank in the country, and established the thrift bank arm, China Bank Savings (CBSI), the following year. To fast-track the savings bank‘s expansion program, the Bank acquired Pampanga-based rural bank Unity Bank under the BSP‘s Strengthening Program for Rural Banks Plus. Also in 2007, the Bank entered into a bancassurance joint venture with Manulife to establish MCBLife. In 2014, the Parent increased its equity stake in MCBLife to 40%. In 2014, the Bank acquired Planters Development Bank, the country‘s largest private development bank, which helped grow China Bank‘s middle market & SME portfolio and distribution network. The following year, CBS and Plantersbank completed its merger, with the former as the surviving entity. In 2015, China Bank established its investment house, China Bank Capital Corporation (CBCC), as a spin off of its former investment banking group. The incorporation of the stock brokerage subsidiary, China Bank Securities Corp, followed suit, together with the special purpose company, CBC Assets Once (SPC), Inc. In the same year, the China Bank MasterCard was launched, with three different variants – 1) China Bank Prime, the ―go-to‖ card for everyday expenses; 2) China Bank Platinum MasterCard, the ultimate privilege lifestyle card; and 3) China Bank World MasterCard, the card that gives world-class privileges, taking luxury to a whole new level. In August 2019, two new credit card variants were launched— China Bank Cash Rewards MasterCard and China Bank Freedom Card. In 2017, China Bank completed its stock rights offer in the second quarter, with the full subscription of 484 million additional common shares worth P15 billion, as part of its proactive capital management strategy to enhance financial flexibility to support strategic business expansion. This follows the Bank‘s P8-billion stock rights offer in 2014. In 2019, the Bank marked a successful return to the market with the USD 150-million Green Bond issue to the International Finance Corporation in June and the P30 billion Peso fixed-rate retail bond issue in July. China Bank continues to champion good corporate governance. In November 2018, the Bank was recognized at the ASEAN Corporate Governance Awards as one of the Top 50 ASEAN Publicly Listed Companies (PLCs) and among the Top 3 PLCs in the Philippines. In 2019, it also received a Four-Arrow Recognition for Good Governance from the Institute of Corporate Directors and the Best Corporate Governance Disclosure and Transparency award from the Bangko Sentral ng Pilipinas.

China Bank‘s main business include corporate and SME lending, retail loans (e.g. credit cards, housing, auto, personal (e.g. automatic payroll deduction), treasury & foreign exchange trading, trust & asset management, investment banking & advisory services, wealth management, cash management, insurance products through CBC-IB and MCBLife, internet & mobile banking, and remittances through tie-ups in the Middle East, Asia, and major US cities. The Bank also offers foreign currency deposits in four currencies, USD, EUR, CNY, and JPY. China Bank offers a comprehensive suite of products and services through its 631 branches complemented by convenient and secure electronic banking channels which are available 24/7 — 1,002 ATMs, Cash Accept Machine, China Bank TellerPhone (phone banking), China Bank Online, and China Bank Mobile App.
Subsidiary
Effective Percentages of Ownership Country of
Incorporation Principal Activities 2019 2018
Chinabank Insurance Brokers, Inc.
100.00%
100.00%
Philippines
Insurance brokerage
CBC Properties and Computer Center, Inc.
100.00%
100.00%
Philippines
Computer services
China Bank Savings, Inc. 98.29% 98.29% Philippines Retail and consumer banking
China Bank Capital Corporation 100.00% 100.00% Philippines Investment house CBC Assets One, Inc. 100.00% 100.00% Philippines Special purpose
corporation China Bank Securities Corporation 100.00% 100.00% Philippines Stock Brokerage
The Parent Company has no ultimate parent company. SM Investments Corporation, its significant investor, has effective ownership in the Parent Company of 22.55% and 20.30% as of December 31, 2019 and 2018, respectively. The Parent Company‘s principal place of business is at 8745 Paseo de Roxas cor. Villar St., Makati City.

2. Business of Issuer (a) Principal Products and Services
China Bank‘s main businesses include deposit taking, corporate and middle market lending, retail loans including mortgage and auto loans & automatic payroll deduction, investment banking, insurance products through its subsidiaries, treasury and foreign exchange trading, trust and investment management, wealth management, cash management, internet banking and mobile banking services, inward remittances through tie-ups with remittance companies and exchange houses in the Middle East, Asia and major US cities. The income from these products/services is divided into two categories, namely (1) interest income from the Bank‘s deposit taking and lending/investment activities which accounts for 85 % of revenues and (2) other income (includes service charges, fees & commissions, trading gain, foreign exchange gain, trust fees, income from sale of acquired assets and other miscellaneous income) which account for 15% of revenues. Percentage of sales or revenues and net income contribution from foreign sales (broken down into major markets such as Western Europe, Southeast Asia, etc.) for each of the last three years. Not applicable. DEPOSITS & RELATED SERVICES Peso Deposits: Checking - ChinaCheck Plus; Savings - Passbook Savings, ATM Savings, MoneyPlus Savings; SSS Pensioner’s Account; Premium Savings Account; Time - Regular Time Deposit, Special Time Deposit, Diamond Savings, Money Lift Plus; Foreign Currency Deposits – (USD, Euro, RMB and JPY) - Savings,Time; Cash Card; Manager’s/Gift Check/Demand Draft; Safety Deposit Box; Night Depository Services; Cash Delivery and Deposit Pick-up Services; Out-of-town Checks
LOANS & CREDIT FACILITIES
Corporate Notes and Loans; Commercial Loans; Loan Syndications; Project Finance Facilities; Structured Financing,Trade Financing, Working Capital and Revolving Credit Facilities; Receivable Factoring Consumer Loans - HomePlus Real Estate Loan, AutoPlus Vehicle Loan, Contract to Sell Facility; Credit Cards
INTERNATIONAL BANKING PRODUCTS & SERVICES
Letters of Credit; Standby Letters of Credit; Shipping Guarantee; Documents against Payment; Documents against Acceptance; Open Account;Advance Payments; Trust Receipt Loans Facility; Negotiation of Exports Letter of Credit; Export Bills Discounting, Export Collections, Customs and Duties Tax Payments, Advising of Letters of Credit and Standby Letters of Credit; Telegraphic Transfer (Domestic and International); Foreign Currency Accounts (Time Deposit, Savings and Checking Accounts); Foreign Currency Loans; Foreign Currency Bank Drafts, Foreign Purchase and Sale of Foreign Exchange; Inward and Outward Remittance Service -Domestic and International
INVESTMENT BANKING SERVICES
Bonds, Syndicated Loans, Corporate Notes, Structured Loan, Project Finance, Long_term Negotiable Certificate of Deposit (LTNCD), Enrolled Notes (Short Dated Notes/QB Notes, Initial Public Offering (Common Shares), Follow On Offering (Common Shares), Preferred Shares, Convertible/Exchangeable Shares; Mergers & Acquisition Advisory, Valuation, Securitization
OVERSEAS KABABAYAN SERVICES China Bank Remittance; Overseas Kababayan Savings (OKS) Account (PHP and USD)
TRUST SERVICES
Unit Investment Trust Fund (UITF) - China Bank Money Market Fund, China Bank Cash Fund, China Bank Short- Term Fund, China Bank
Intermediate Fixed Income Fund, China Bank Fixed-Income Fund, China Bank Balanced Fund, China Bank Equity Fund, China Bank High
Dividend Equity Fund, China Bank Dollar Fund, China Bank Dollar Money Market Fund; Wealth Management - Investment Management
Arrangement, Personal Management Trust; Corporate Trust Services - Escrow Services Arrangement, Employee Benefit Fund Management,
Corporate Fund Management, Facility Agency Arrangement, Security Trusteeship Arrangement, Collecting and Paying Agency Arrangement
TREASURY SERVICES
Investments - Local currency denominated Government and Corporate Bond Issues and Perpetual Notes, Foreign currency denominated
Government and Corporate Bond Issues and Perpetual Notes, China Bank Bond; Deposit and Deposit Substitutes – Long-Term Negotiable
Certificate of Deposit (LTNCD), Treasury Certificate of Deposit (TCD), Promissory Note; Foreign Exchange & Derivatives – Foreign Exchange:
Spot, Forward and FX Swaps, Derivatives: Interest Rate and Cross Currency Swaps
INSURANCE PRODUCTS Bancassurance: Wealth Retirement - Platinum Invest Elite, Enrich Max, MCBL Affluence Income, MCBL Affluence Max Elite; Protection Retirement - MCBL Enrich; Protection Education Retirement- MCBL Invest; Protection - Base Protect Plus; Protectio with VL component - LifeBuilder; Group Life Insurance - Group Yearly Renewable Term, Group Personal Accident, Group Credit Life Non-Life Insurance: Fire and Allied Perils - Residential, Commercial (Industrial All- Risk Insurance, Commercial All- Risk Insurance, Condominium Insurance), Trust Receipts; Motor Car Insurance - Individual, Fleet Program; Marine Insurance - Hull Insurance, Cargo Insurance; Engineering Insurance - Contractors ALL-Risk Insurance, Electronic Equipment Insurance, Erectors All- Risk Insurance, Machinery Breakdown Insurance, Equipment Floater; Liability Insurance - Comprehensive General Liability Insurance, Product Liability Insurance, Professional Indemnity Insurance, Directors and Officers Liability Insurance; Crime Insurance - Money, Security & Payroll Insurance, Fidelity Insurance, Cyber Crime Insurance, Kidnap and Ransom Insurance; Bonds: Surety Bonds - Bidder Bond, Surety / Downpayment Bond, Performance Bond, Warranty Bond, Heirs Bond; Fidelity Bonds; Employee Benefit - Group Personal Accident Insurance, Group Life Insurance, HMO, Travel Insurance, Mortgaged Redemption Insurance, Terrorism and Sabotage, Trade Credit and Business Interruption following Material Damage
PAYMENT & SETTLEMENT SERVICES
Electronic Banking Channels: China Bank Automated Teller Machine (ATM); China Bank TellerPhone; China Bank Online; China Bank Mobile Banking App; Cash Accept Machine; Point-of-Sale (POS)
CASH MANAGEMENT SOLUTIONS Account Management via China Bank Online Corporate –Basic Services: Balance Inquiry and Transaction Reporting, Intra & inter-bank transfer of funds to own &/or third Party account(s); Buy &/or sell foreign currency, Sure Sweep, Bills payment, Collection Arrangement Report Self-Service Functionalities: Forgotten credentials, Bank Certificate, Checkbook Reorder, Stop Payment Order (Available Soon) Cash Management Solutions: Liquidity, Receivables, Payables, POS Solutions, Government Payments and Collection Liquidity Management via China Bank Online Corporate - Multi-Bank SOA Concentration, Sure Sweep – Funds Consolidation, Funds Distribution; Corporate Inter-Bank Fund Transfer Receivables Management - Automatic Debit Arrangement (ADA); Check Depot; Bills Pay Plus; Referenced Deposit Solution; Smart Cash Safe Solution; Check Pay Solution Payables Management – Direct Debit Arrangement; Auto Credit Arrangement (ACA); Check Writing Services – Check Write Plus Software, Check Write Plus Outsourcing, Check Write Plus Self-Service; Payroll Services – Payroll Crediting, China Pay Software, Payroll Processing POS Solutions - ChinaBank Debit POS; ChinaBank POS Cash Out Trade and Settlement Solutions – Electronic Invoicing & Payment Solution; (Settle stock transactions with the Securities Corporation of the Philippines (SCCP) Broker’s Solution Government Payments and Collections – Easy Tax Filing and Payment Solution; BIR eTax Payments; eGov Payment - Social Security System (SSS), Philippine Health Insurance Corporation (PhilHealth), Pag-IBIG; SSS Sickness Maternity and Employee Compensation (SSS SMEC) CHINA BANK SECURITIES Stock Brokerage; Research Services
(b) Distribution Methods of Products and Services: China Bank‘s products and services are made available across multiple distribution and delivery channels: 631 branch network (of which 473 are China Bank branches, 158 ChinaBank Savings branches; 1,002 ATM network (622 in-branch and 380 off-site ATMs nationwide; founding member of the BancNet consortium, access to more than 15,000 ATMs nationwide of BancNet networks; online banking (through the Bank‘s e-portal www.chinabank.ph); China Bank EZPay Kiosk (tax payment); TellerPhone (phone banking) and Mobile Banking. Its head office is located at 8745 Paseo de Roxas corner Villar Streets, Makati City. Metro Manila Branches 1. MAKATI MAIN BRANCH (Head Office) - CBC Bldg., 8745 Paseo de Roxas cor. Villar Sts., Makati City*** 2. BINONDO BUSINESS CENTER - CBC Bldg., Dasmariñas cor. Juan Luna Sts. Binondo, Manila* 3. 999 MALL BRANCH – Unit 3D-5 & 3D-7 999 Shopping Mall, Bldg. 2, Recto – Soler Sts., Binondo, Manila* 4. A. BONIFACIO - MAUBAN BRANCH - G/F Urban Oasis Residences, 423-431., A. Bonifacio Ave., Brgy. San Jose, QC* 5. ALABANG HILLS BRANCH - G/F RBC-MDC Corporate Center, Don Jesus Blvd., Alabang Hills Village, Brgy. Cupang, Muntinlupa City* 6. ALVARADO BRANCH - HS Commercial Tower, 854 Alvarado St. Binondo, Manila 7. ANONAS BRANCH – Anonas corner Marang Streets, Brgy. Quirino, Project 2, Quezon City* 8. ANTIPOLO CITY BRANCH - G/F Budget Lane Arcade, No. 6, Provincial Road, Brgy. San Jose, Antipolo City, Rizal* 9. ANTIPOLO - SUMULONG HIGHWAY BRANCH - No. 219 Sumulong Highway, Bgry. Mambugan, Antipolo City, Rizal* 10. ANTIPOLO CITY-TAKTAK BRANCH - Sumulong Highway corner Taktak Road, Brgy. Dela Paz, Antipolo City, Rizal* 11. ARANETA AVE. BRANCH - Philippine Whithasco Bldg., 420 Araneta Ave., cor. Bayani St., Quezon City* 12. ARNAIZ AVE. BRANCH – United Life Assurance Building, A. Arnaiz Ave. (Pasay Road), Makati City* 13. ARRANQUE BRANCH – Don Felipe Bldg., 675 Tomas Mapua St., Brgy. 301 Sta. Cruz, Manila* 14. ASUNCION BRANCH – Units G6 & G7 Chinatown Steel Towers, 531 Asuncion St., San Nicolas, Manila* 15. AURORA BLVD. – NEW MANILA BRANCH - Aurora Blvd., Brgy. Valencia, Quezon City* 16. AYALA-ALABANG BRANCH - CBC Bldg., Acacia Ave., Madrigal Business Park, Ayala Alabang, Muntinlupa City* 17. AYALA AVE. – AMORSOLO BRANCH - G/F Teleperformance Bldg., Ayala Ave., Legaspi Village, Makati City* 18. AYALA - COLUMNS BRANCH – G/F The Columns Tower 3, Ayala Ave cor. Sen. Gil Puyat Ave., Brgy. Bel-Air., Makati City* 19. AYALA MALLS – MANILA BAY BRANCH - Level 2 Ayala Malls Manila Bay, D. Macapagal Ave., Parañaque City 20. BACLARAN - FB HARRISON BRANCH- BAGPI Main Bldg., 2935 Ortigas St. near cor. F.B. Harrison St., Pasay City* 21. BALINTAWAK - BONIFACIO BRANCH - 657 A. Bonifacio Ave., Balintawak, Quezon City* 22. BALUT BRANCH - North Bay Shopping Center, Honorio Lopez Boulevard, Balut, Tondo, Manila* 23. BANAWE BRANCH – CBC Bldg., 680 Banawe Ave., Sta.Mesa Heights, District I, Quezon City* 24. BANAWE - CALAMBA BRANCH - G/F One Banawe Complex Bldg., #119 Banawe St. cor Calamba St., Brgy. Sto. Domingo, QC* 25. BEL - AIR BRANCH - 2/F Saville Bldg., 8728 Paseo de Roxas, Makati City* 26. BEL - AIR – JUPITER BRANCH – Buendia Car Exchange, Jupiter Street, Makati City* 27. BETTER LIVING SUBD. BRANCH – 128 Doña Soledad Ave., Better Living, Brgy. Don Bosco, Parañaque City* 28. BF HOMES BRANCH - Aguirre cor. El Grande Aves., United BF Homes, Parañaque City* 29. BF HOMES - AGUIRRE BRANCH – Margarita Centre, Aguirre Ave. cor. Elsie Gaches St., BF Homes, Parañaque City* 30. BF RESORT VILLAGE BRANCH - BF Resort Drive cor. Gloria Diaz St., BF Resort Village, Talon Dos, Las Piñas City* 31. BGC - ICON PLAZA BRANCH - G/F Icon Plaza Bldg., 25th cor 5th Sts. Bonifacio South, Fort Bonifacio Global City, Taguig City* 32. BGC - ONE WORLD PLACE BRANCH - G/F One World Place, 32nd Avenue, Fort Bonifacio Global City, Taguig City* 33. BGC - WORLD PLAZA BRANCH- G/F World Plaza, L4B5 E-Square Information Technology Park, Crescent Park West, 5th Avenue, Bonifacio Global City, Taguig City * 34. BGC – W TOWER - G/F W Tower, 39th St., North Bonifacio Triangle, Fort Bonifacio Global City, Taguig City,1634* 35. BINANGONAN BRANCH - National Highway, Bo. Tagpos, Binangonan, Rizal* 36. BLUMENTRITT BRANCH - 1777-1781 Cavite cor. Leonor Rivera St., Blumentritt, Sta. Cruz, Manila* 37. BO. KAPITOLYO BRANCH - G/F P&E Bldg., 12 United cor. First Sts., Bo. Kapitolyo, Pasig City* 38. BONNY SERRANO BRANCH – G/F Greenhills Garden Square, 297 Col. Bonny Serrano Ave., Bagong Lipunan ng Crame, QC* 39. CAINTA BRANCH - CBC Bldg, F.P. Felix Ave., Brgy. San Isidro, Cainta, Rizal* 40. CAINTA - POBLACION BRANCH- A. Bonifacio Ave., Poblacion, Brgy. Sto. Domingo, Cainta, Rizal* 41. CAPITOL HILLS BRANCH - G/F Design Pro Bldg., Capitol Hills, Old Balara, Quezon City* 42. CENTURY CITY – KNIGHTS BRIDGE BRANCH - Unit 17 & 18 Knightsbridge Residences, Century City, Kalayaan Ave. Makati City* 43. CIRCUIT MAKATI BRANCH – Level 3, Ayala Mall, Circuit Makati, Hippodromo St., Brgy. Carmona, Makati City* 44. COMMONWEALTH AVE. BRANCH - LGF Ever Gotesco Mall, Commonwealth Ave. cor. Don Antonio Road, QC* 45. COMMONWEALTH AVE. EXTENSION – CASA MILAN BRANCH- ALX Center Building, Commonwealth Ave. Ext., Brgy. North Fairview, Quezon City*

46. CONGRESSIONAL AVENUE BRANCH – G/F Unit C, The Arete Square, Congressional Ave., Project 8, Quezon City* 47. CONGRESSIONAL AVE. EXTENSION – MIRA NILA BRANCH - CBC Building, #71 Lot 28 Blk 2 Mira Nila Homes, Congressional Ave. Ext., Quezon City* 48. CONGRESSIONAL AVE. – PROJECT 8 BRANCH - 159 Congressional Ave., Brgy. Bahay Toro, Project 8, Quezon City 49. CORINTHIAN HILLS BRANCH - G/F The Clubhouse, Corinthian Hills, Temple Drive, Brgy. Ugong Norte, Quezon City* 50. CUBAO - ARANETA BRANCH – Level 2, Ali Mall, Araneta Center, Cubao, Quezon City* 51. CUBAO - AURORA BRANCH - 911 Aurora Boulevard Extension cor. Miami St., Cubao, Quezon City 52. CUBAO - P. TUAZON BRANCH - No. 287 P. Tuazon Ave. near corner 18th Avenue, Brgy. San Roque, Cubao, Quezon City* 53. CULIAT- TANDANG SORA BRANCH - G/F Royal Midway Plaza, No. 419, Tandang Sora Ave. Brgy. Culiat, 1128 QC* 54. D. TUAZON BRANCH - 148 D. Tuazon St., Brgy. Lourdes, Sta. Mesa Heights, Quezon City* 55. DAMAR VILLAGE BRANCH – The Clubhouse, Damar Loop, Damar Village, Quezon City* 56. DASMARIÑAS VILLAGE BRANCH – 2283 Pasong Tamo Ext. cor. Lumbang St., Makati City* 57. DEL MONTE AVENUE BRANCH – No. 497 Del Monte Ave., Brgy. Manresa, Quezon City* 58. DEL MONTE - MATUTUM BRANCH – No. 202 Del Monte Ave. near cor. Matutum St., Brgy. St. Peter, Quezon City* 59. DILIMAN – MATALINO BRANCH – J&L Building, #23 Matalino Street, Brgy. Central, Diliman, Quezon City* 60. DIVISORIA - STA. ELENA BRANCH - Unit G22 New Divisoria Condominium Ctr., 632 Sta. Elena St., Binondo, Manila 61. DON ANTONIO BRANCH - G/F Royale Place, Don Antonio Ave., Old Balara, Quezon City* 62. EASTWOOD CITY BRANCH – Unit D, Techno Plaza One, Eastwood City Cyberpark, E. Rodriguez Jr. Ave., (C-5) Bagumbayan, QC* 63. EASTWOOD CITY FELINA CORPORATE PLAZA BRANCH - G/F Felina Corporate Plaza, #5 Eastwood Ave., Eastwood City, QC* 64. EDSA - KALOOKAN BRANCH - No. 531 EDSA near cor. Biglang Awa St., Kalookan City* 65. EDSA - PHILAM BRANCH - 917 EDSA, Brgy. Philam, Quezon City* 66. EDSA - TIMOG AVE. BRANCH - G/F Richwell Corporate Center, 102 Timog Ave., Brgy. Sacred Heart, Quezon City* 67. ELCANO BRANCH – G/F Elcano Tower, Elcano St., San Nicolas, Manila 68. E. RODRIGUEZ - ACROPOLIS BRANCH - G/F Suncrest Building, 82 E. Rodriguez Jr. Ave., Bagumbayan, Quezon City* 69. E. RODRIGUEZ - CORDILLERA BRANCH - 291 E. Rodriguez Sr. Blvd., Brgy. Doña Josefa, Quezon City* 70. E. RODRIGUEZ - HILLCREST BRANCH – No. 402 E. Rodriguez Sr. Blvd., Cubao, Quezon City* 71. E. RODRIGUEZ SR. BLVD. BRANCH - CBC Bldg., #286 E. Rodriguez Sr. Blvd., Brgy. Damayang Lagi, Quezon City* 72. ERMITA BRANCH – G/F Ma. Natividad Bldg., #470 T. M. Kalaw cor. Cortada Sts., Brgy. 666, Ermita, Manila* 73. ESCOLTA BRANCH - Burke Building, Escolta corner Burke Streets, Binondo, Manila 74. ESPAÑA BRANCH - España cor. Valencia Sts., Sampaloc, Manila* 75. EVANGELISTA BRANCH – 1748 AMV Building, Evangelista cor. Gen Estrella Sts., Bangkal, Makati City* 76. EXAMINER BRANCH - No. 1525 Quezon Ave. cor. Examiner St., West Triangle, Quezon City* 77. FAIRVIEW BRANCH - G/F Angelenix House, Commonwealth Ave. cor. Camaro Sts., Fairview Park Subdivision, Fairview, Quezon City* 78. FAIRVIEW TERRACES BRANCH - LGF Fairview Terraces, Quirino Hiway cor. Maligaya Drive, Brgy. Pasong Putik, Novaliches, QC* 79. FILINVEST CORPORATE CITY BRANCH - G/F Wilcon Depot, Alabang- Zapote Rd cor. Bridgeway Ave., Filinvest Corp City, Alabang, Muntinlupa City* 80. FILINVEST CORP. CITY – COMMERCENTER BRANCH - G/F Commercenter Bldg., Commerce Ave. cor. Filinvest Ave., Filinvest Corp City, Alabang, Muntinlupa City 81. FILINVEST CORP. CITY - NORTHGATE BRANCH - G/F Aeon Centre Building, Northgate Cyberzone, Filinvest Corporate City, Alabang, Muntinlupa City* 82. FIVE E - COM CENTER BRANCH - G/F Five E-com Center, Harbor Drive, MOA Complex, Pasay City* 83. FORT BONIFACIO GLOBAL CITY BRANCH – G/F Marajo Tower, 26th St. cor. 4th Avenue, Fort Bonifacio Global City, Taguig City* 84. GEN. LUIS - KATIPUNAN-CBC Building, Gen. Luis St. corner Katipunan SB Road, Brgy. Nagkaisang Nayon, Novaliches, Quezon City* 85. GIL PUYAT AVENUE BRANCH - Mitsu Bldg., No. 65 Sen. Gil Puyat Ave., Brgy. Palanan, Makati City* 86. GIL PUYAT - ELIZABETH PLACE BRANCH - G/F Elizabeth Place Condominium, 322 H.V. Dela Costa St., Brgy. Bel-Air, Makati City* 87. GIL PUYAT - REPOSO BRANCH - 331 Sen. Gil Puyat Ave., Brgy. Bel-Air, Makati City* 88. GREENBELT 1 BRANCH - G/F Greenbelt 1, Legaspi St. near cor. Paseo de Roxas, San Lorenzo, Makati City* 89. GREENHILLS BRANCH - G/F Gift Gate Bldg., Greenhills Shopping Center, San Juan City, Metro Manila** 90. GREENHILLS – ANNAPOLIS BRANCH – Mercedes 1 Condominium, Annapolis St., Greenhills, San Juan City* 91. GREENHILLS - CONNECTICUT BRANCH - 101 Missouri Square Bldg., Missouri cor. Connecticut St., Northeast Greenhills, San Juan City* 92. GREENHILLS - ORTIGAS BRANCH – CBC Bldg., 14 Ortigas Ave. Greenhills, San Juan City, Metro Manila* 93. HEROES HILLS BRANCH – Quezon Ave. cor. J. Abad Santos St., Heroes Hills, Brgy. Sta. Cruz, Quezon City* 94. HOLY SPIRIT DRIVE BRANCH - CBC Building Lot 18 Block 6 Holy Spirit Drive, Don Antonio Heights, Brgy. Holy Spirit, Quezon City* 95. ILAYA BRANCH - #947 APL-YSL Bldg., Ilaya, Tondo, Manila 96. INTRAMUROS BRANCH - Sitio Grande, No. 409 A. Soriano Ave., Intramuros, Manila* 97. J. ABAD SANTOS AVENUE BRANCH - 2159 J. Abad Santos Ave. cor. Batangas St., Tondo, Manila*

98. J. ABAD SANTOS AVE. – QUIRICADA BRANCH - #1714 J. Abad Santos Ave. near corner Quiricada Street, Brgy. 252, Tondo, Manila* 99. JUAN LUNA BRANCH – G/F Aclem Bldg., 501 Juan Luna St., Binondo, Manila* 100. KALAYAAN AVE. BRANCH – G/F PPS Bldg., Kalayaan Ave., Quezon City* 101. KALOOKAN - 8TH AVE.BRANCH - No. 279 Rizal Ave. cor, 8th Ave., Grace Park, Kalookan City* 102. KALOOKAN - 10TH AVE. BRANCH - No. 275 10th Ave. corner 3rd Street, Grace Park, Kalookan City* 103. KALOOKAN BRANCH - CBC Bldg., 167 Rizal Ave. Extension, Grace Park, Kalookan City* 104. KALOOKAN - CAMARIN BRANCH – L8B4 La Forteza Subd., Brgy. 175, Camarin, Kalookan City* 105. KALOOKAN - MONUMENTO BRANCH – CBC Bldg., 779 McArthur Highway, District 2, Brgy. 78. Kalookan City* 106. KAMIAS BRANCH – G/F CRM Bldg., 116 Kamias Road cor. Kasing-Kasing St., Quezon City* 107. KAMUNING BRANCH - SKY47 Bldg., #47 Kamuning Road, Quezon City* 108. KANLAON BRANCH - Kanlaon near corner N. Roxas Streets,Quezon City 109. KARUHATAN BRANCH – No. 253-B McArthur Highway cor, Bizotte St., Karuhatan, Valenzuela City* 110. KATIPUNAN AVE. – LOYOLA HEIGHTS BRANCH – GF Elizabeth Hall Bldg., Katipunan Ave., Loyola Heights, QC* 111. KATIPUNAN AVE.- ST. IGNATIUS BRANCH – CBC Bldg., No. 121 Katipunan Ave., Brgy. St. Ignatius, Quezon City* 112. LAGRO BRANCH - CBC Building, Lot 32 Blk 125, Quirino Highway, Greater Lagro, Quezon City* 113. LAS PIÑAS BRANCH - CBC Bldg., Alabang-Zapote Road cor. Aries St., Pamplona Park Subd., Las Piñas City* 114. LAS PIÑAS - MANUELA BRANCH – CBC Bldg., Alabang-Zapote Road cor. Philamlife Ave., Pamplona Dos, Las Piñas City* 115. LAS PIÑAS - MARCOS ALVAREZ BRANCH - Metro Towne Center, 2020 Marcos Alvarez Ave., Talon V, Moonwalk, Las Piñas City* 116. LAS PIÑAS – NAGA ROAD BRANCH - Lot 3, Naga Road, Pulanglupa2, Las Piñas City* 117. LAVEZARES BRANCH - 412 Lavezares Street, San Nicolas, Manila* 118. LEGASPI VILLAGE - AIM BRANCH - G/F Cacho-Gonzales Bldg, 101 Aguirre cor. Trasierra Sts., Legaspi Vill., Makati City* 119. LEGASPI VILLAGE - AMORSOLO BRANCH - G/F CAP Bldg., Herrera cor. Amorsolo Sts., Legaspi Village, Makati City* 120. LEGASPI VILLAGE - C. PALANCA BRANCH - Suite A, G/F Basic Petroleum Bldg., 104 C. Palanca Jr. St., Legaspi Village, Makati City* 121. LEGASPI VILLAGE – ESTEBAN BRANCH - G/F PPI Bldg., No. 109 Esteban St., Legaspi Village, Makati City* 122. LEGASPI VILLAGE - PEREA BRANCH - G/F Greenbelt Mansion, 106 Perea St., Legaspi Village, Makati City* 123. LEGASPI VILLAGE - SALCEDO BRANCH - G/F Fedman Suites, 199 Salcedo St., Legaspi Village, Makati City* 124. M. DELA FUENTE – TRABAJO MARKET BRANCH – #771 M. Dela Fuente St., Sampaloc, Manila* 125. MACAPAGAL AVE. – ASEANA SQUARE BRANCH - Aseana Square (Caltex Area), D. Macapagal Ave., Aseana City, Brgy. Tambo, Parañaque City* 126. MACAPAGAL AVE. – BIOPOLIS BRANCH - G/F The Biopolis, Central Business Park, 1-A Diosdado Macapagal Avenue, Pasay City* 127. MACAPAGAL AVE. – DOUBLE DRAGON BRANCH – G/F Phase 1, DD Meridian Park Plaza, Macapagal Ave. cor. EDSA Ext., Pasay City* 128. MAGALLANES VILLAGE BRANCH – G/F DHI Bldg., No. 2 Lapu-Lapu Ave. cor. EDSA, Magallanes Village, Magallanes, Makati City* 129. MAKATI AVENUE BRANCH - G/F CBC Bldg., Makati Ave. cor. Hercules St., Bel-Air Village, Brgy. Bel-Air, Makati City* 130. MAKATI – COMEMBO BRANCH – F & V Bldg., No. 46 JP Rizal Ext., Brgy. Comembo, Makati City* 131. MAKATI - JP RIZAL BRANCH – GF Casa Catalina Bldg., JP Rizal corner Honradez Streets, Brgy. Olympia, Makati City* 132. MAKATI - KALAYAAN AVE. BRANCH –GF Zentro Bldg., 8445 Mercedes St. cor. Buntal St., Brgy. Poblacion, Makati City* 133. MAKATI – YAKAL BRANCH - 173 Yakal St. near corner Ayala Ave. Ext., Makati City 134. MALABON - CONCEPCION BRANCH - Gen. Luna cor. Paez Sts., Concepcion, Malabon City* 135. MALABON - GOV. PASCUAL BRANCH – CBC Bldg., Gov. Pascual Ave., Brgy. Acacia, Malabon City* 136. MALABON - POTRERO BRANCH - CBC Bldg., McArthur Highway, Potrero, Malabon* 137. MALANDAY BRANCH - CBC Bldg. McArthur Highway, Malanday, Valenzuela City* 138. MANDALUYONG - BONI AVE. BRANCH - G/F VOS Bldg. Boni Ave. cor. San Rafael St., Plain View, Mandaluyong City* 139. MANDALUYONG BONI – SAN ROQUE BRANCH - #768 Bonifacio Ave. cor. San Roque St., Brgy. Barangka Ilaya, Mandaluyong City* 140. MANDALUYONG - D. GUEVARA BRANCH - Libertad Plaza, #19 Domingo Guevara St., Highway Hills, Mandaluyong City* 141. MANDALUYONG - PIONEER BRANCH - UG-05 Globe Telecom Plaza Tower I, Pioneer St., Brgy. Ilaya, Mandaluyong City* 142. MANILA - MACEDA BRANCH – M. Daguman Bldg., A. Maceda St., Sampaloc Manila* 143. MARIKINA - FAIRLANE BRANCH – G/F E & L Patricio Bldg., No. 809 J.P. Rizal Ave., Concepcion Uno, Marikina City* 144. MARIKINA - GIL FERNANDO BRANCH - Block 9 Lot 14 Gil Fernando Ave., Marikina City* 145. MARIKINA - SSS VILLAGE BRANCH - Lilac corner Rainbow Sts., Rancho Estate IV, Concepcion Dos, Marikina City* 146. MARIKINA - STA. ELENA BRANCH - 250 J.P. Rizal St., Sta. Elena, Marikina City* 147. MASANGKAY BRANCH - 959-961 G. Masangkay St., Binondo, Manila* 148. MASANGKAY MAYHALIGUE BRANCH No. 1417-1419 G. Masangkay St., Sta. Cruz, Manila* 149. MAYON BRANCH – 480 Mayon St., Sta. Mesa Heights, Quezon City * 150. MAYON – ROTONDA BRANCH - G/F One Mayon Place, #68 Mayon Street, Brgy. Sta. Teresita, Quezon City 151. MINDANAO AVE. BRANCH -30 Mindanao Avenue, Brgy. Tandang Sora, Quezon City*

152. MUNTINLUPA - PUTATAN BRANCH - G/F Teknikos Bldg., National Highway, Brgy. Putatan, Muntinlupa City* 153. N. DOMINGO BRANCH – G/F The Main Place, No.1 Pinaglabanan cor. N. Domingo Sts., San Juan City* 154. NAVOTAS BRANCH - No. 500 M. Naval St. near cor. Lacson St. Brgy. North Bay Blvd. North (NBBN), Navotas City* 155. NOVALICHES – BAGBAG BRANCH - No. 658 Quirino Highway, Bagbag, Novaliches, Quezon City 156. NOVALICHES - GULOD BRANCH – 858 Krystle Building, Quirino Highway, Gulod, Novaliches, Quezon City* 157. NOVALICHES - SANGANDAAN BRANCH – CBC Bldg., Quirino Highway cor. Tandang Sora Ave., Brgy. Sangandaan, Novaliches, QC* 158. NOVALICHES - STA. MONICA BRANCH - G/F E & V Bldg., Quirino Highway corner Dumalay St., Novaliches, Quezon City* 159. NOVALICHES - TALIPAPA BRANCH - 528 Copengco Bldg., Quirino Highway, Talipapa, Novaliches, Quezon City* 160. NOVALICHES - ZABARTE – G/F C.I. Bldg 1151 Quirino Highway cor. Zabarte Road, Brgy. Kaligayahan, Novaliches, Quezon City* 161. NUEVA BRANCH – Unit Nos. 557 & 559 G/F Ayson Bldg., Yuchengco St., Binondo, Manila* 162. ONGPIN BRANCH - G/F Se Jo Tong Bldg., 814 & 816 Ongpin St., Brgy. 297, Sta. Cruz, Manila* 163. OROQUIETA BRANCH – No. 1225 Oroquieta St., Sta. Cruz, Manila* 164. ORTIGAS - ADB AVE. BRANCH - LGF Cityland Mega Plaza Bldg., ADB Ave. cor. Garnet Road, Ortigas Center, Brgy. San Antonio, Pasig City* 165. ORTIGAS AVE. EXT. - RIVERSIDE BRANCH – Unit 2-3 Riverside Arcade, Ortigas Ave Ext. cor. Riverside Drive, Brgy. Sta. Lucia, Pasig City* 166. ORTIGAS CENTER BRANCH - Unit 101 Parc Chateau Condominium Onyx cor. Sapphire Sts, Ortigas Center, Pasig City* 167. ORTIGAS COMPLEX BRANCH - G/F Padilla Bldg., F. Ortigas Jr. Road, Ortigas Center, Brgy. San Antonio, Pasig City* 168. ORTIGAS - JADE DRIVE BRANCH - Unit G-03, Antel - Global Corporate Center, Jade Drive, Ortigas Center, Brgy. San Antonio, Pasig* 169. ORTIGAS - TEKTITE BRANCH- Unit EC-06B PSE Center (Tektite), Exchange Road, Ortigas Center, Pasig City* 170. PACO BRANCH – Gen. Luna cor. Escoda St., Paco, Manila* 171. PACO - ANGEL LINAO BRANCH - Unit 1636 & 1638 Angel Linao St. Paco, Manila* 172. PACO - OTIS BRANCH – G/F Union Motor Corporation Bldg., 1760 Dra. Paz Guanzon St., Paco, Manila* 173. PADRE FAURA BRANCH - G/F Regal Shopping Center, A. Mabini cor. Padre Faura Sts., Ermita, Manila* 174. PADRE RADA BRANCH - G/F Gosiupo Bldg., Padre Rada corner Elcano Sts., Tondo, Manila 175. PARAÑAQUE - BACLARAN BRANCH - Quirino Avenue cor. Aragon St., Baclaran, Parañaque City* 176. PARAÑAQUE - MOONWALK BRANCH – Milky Way St. cor. Armstrong Avenue, Moonwalk Village, Brgy. Moonwalk, Parañaque City* 177. PARAÑAQUE - NAIA BRANCH- Ninoy Aquino Ave., Brgy. San Dionisio, Parañaque City* 178. PARAÑAQUE - SAN ANTONIO VALLEY BRANCH - San Antonio Shopping Center, San Antonio Road, Brgy. San Antonio Valley 1, Parañaque City* 179. PARAÑAQUE - SUCAT BRANCH - No. 8260 Dr. A. Santos Ave., Brgy. San Isidro, Parañaque City* 180. PASAY - LIBERTAD BRANCH – CBC Bldg., 184 Libertad St., Antonio Arnaiz Ave., Pasay City* 181. PASAY - ROXAS BLVD. BRANCH - GF Unit G-01 Antel Seaview Towers, 2626 Roxas Blvd., Pasay City* 182. PASIG - A. MABINI BRANCH - A. Mabini Street, Brgy. Kapasigan, Pasig City* 183. PASIG - C. RAYMUNDO BRANCH – G/F MicMar Apartments No. 6353 C. Raymundo Ave., Brgy. Rosario, Pasig City* 184. PASIG - DELA PAZ BRANCH- Amang Rodriguez Avenue, Brgy. Dela Paz, Pasig City* 185. PASIG – ESTANCIA BRANCH - LGF Estancia (Expansion) Capitol Commons, Meralco Ave., Pasig City 186. PASIG - MERCEDES BRANCH - Commercial Motors Corp. Compound., Mercedes Ave., Brgy. San Miguel, Pasig City** 187. PASIG – ROSARIO BRANCH - 1864 Ortigas Ave. Ext., Rosario, Pasig City 188. PASIG - SAN JOAQUIN BRANCH - No. 43 M. Concepcion Ave., San Joaquin, Pasig City* 189. PASIG - SANTOLAN BRANCH - G/F Felmarc Business Center, Amang Rodriguez Ave., Santolan, Pasig City* 190. PASIG - SM SUPERCENTER BRANCH – G/F SM Supercenter Pasig, Frontera Drive, C-5, Brgy. Ugong, Pasig City* 191. PASIG - VALLE VERDE BRANCH - G/F Reliance IT Center, E. Rodriguez Jr. Ave., Ugong, Pasig City* 192. PASO DE BLAS BRANCH – G/F CYT Bldg., No 178 Paseo de Blas, Valenzuela City* 193. PASONG TAMO - BAGTIKAN BRANCH – G/F Trans-Phil House, 1177 Chino Roces Ave. cor. Bagtikan St., Makati City* 194. PASONG TAMO - CITYLAND BRANCH - Units UG29-UG32 Cityland Pasong Tamo Tower, 2210 Pasong Tamo St., Makati City* 195. PASONG TAMO - LA FUERZA- La Fuerza Plaza 1, Chino Roces Ave., Makati City* 196. PATEROS BRANCH - G/F Adela Bldg., M. Almeda St., Brgy. San Roque, Pateros* 197. PHILAM BRANCH - #8 East Lawin Drive, Philam Homes, Quezon City* 198. PROJECT 8 - SHORTHORN – CBC Bldg., 43 Shorthorn Street, Bahay Toro, Project 8, Quezon City* 199. PUREZA BRANCH – G/F Solicarel Building, Ramon Magsaysay Blvd. near corner Pureza St., Sta. Mesa, Manila 200. QUEZON AVE. BRANCH - G/F G&D Bldg., No. 18 Quezon Ave. cor. D. Tuazon St., Brgy. Doña Josefa, Quezon City* 201. QUIAPO BRANCH - 216-220 Villalobos St., Quiapo, Manila 202. REGALADO AVE. - CBC Building, #34 Regalado Ave., North Fairview, Quezon City* 203. REGALADO AVE. – WEST FAIRVIEW – CBC Building, Regalado Ave. corner Bulova St., Quezon City* 204. RIZAL - ANGONO - Lot 3 Blk. 4 M.L Quezon Ave., Richmond Subd., Angono, Rizal* 205. RIZAL - SAN MATEO BRANCH - #63 Gen. Luna corner Simon St., Banaba, San Mateo, Rizal*

206. ROCKWELL – ORTIGAS BRANCH - G/F Tower 1, Rockwell Business Center, Ortigas Avenue, Pasig City 207. ROOSEVELT AVE. BRANCH - CBC Bldg., #293 Roosevelt Ave., San Francisco Del Monte, Quezon City* 208. ROOSEVELT AVE. – FRISCO BRANCH - G/F Norita Bldg., #51 H. Francisco St. corner Roosevelt Ave., Brgy. Paraiso, QC* 209. SALCEDO VILLAGE - LP LEVISTE BRANCH - Unit 1-B G/F The Athenaeum – #160 LP Leviste St., Salcedo Village, Brgy. Bel-Air, Makati City* 210. SALCEDO VILLAGE - TORDESILLAS BRANCH - G/F Prince Tower Condominium, 14 Tordesillas St., Salcedo Village, Makati City* 211. SALCEDO VILLAGE - VALERO BRANCH - G/F Valero Tower, 122 Valero St., Salcedo Village, Makati City* 212. SALES - RAON BRANCH – 611 Sales St., Quiapo, Manila* 213. SAN ANTONIO VILLAGE - KAMAGONG BRANCH - Kamagong near corner St. Paul Streets, San Antonio Vill., Makati City* 214. SAN ANTONIO VILLAGE - P. OCAMPO BRANCH - JM Macalino Auto Center, P. Ocampo Street cor. Dungon St., San Antonio Village, Makati* 215. SAN JUAN - J. ABAD SANTOS BRANCH - Unit 3 Citiplace Bldg., 8001 Jose Abad Santos St., Little Baguio, San Juan City* 216. SAN JUAN BRANCH 17 F. Blumentritt St., San Juan, Metro Manila* 217. SCT. BORROMEO BRANCH - G/F The Forum Building, 71- A Sct. Borromeo St., Diliman, Quezon City* 218. SCT. CHUATOCO BRANCH -Estuar Building, No.880 Quezon Ave., Brgy. Paligsahan, Quezon City 219. SHAW – GOMEZVILLE BRANCH -Gomezville Street cor. Shaw Blvd., Mandaluyong City
220. SHAW - HAIG BRANCH – G/F First of Shaw Bldg, Shaw Blvd, cor. Haig St, Mandaluyong City* 221. SHAW-PASIG BRANCH - G/F RCC Center, No. 104 Shaw Boulevard, Pasig City* 222. SHAW-SUMMIT ONE BRANCH - Unit 102 Summit One Office Tower, 530 Shaw Boulevard, Mandaluyong City* 223. SM AURA PREMIER BRANCH – LGF SM Aura Premier, McKinley Parkway, Fort Bonifacio Global City, Taguig City* 224. SM CITY BF PARAÑAQUE BRANCH - G/F SM City BF Parañaque, Dr. A. Santos Ave. cor. President’s Ave., BF Homes, Parañaque City* 225. SM CITY BICUTAN BRANCH - LGF Bldg. B, SM City Bicutan Doña Soledad Ave. cor. West Service Road, Parañaque City** 226. SM CITY FAIRVIEW BRANCH – LGF SM City Fairview, Quirino Ave. cor. Regalado Ave. Fairview, Quezon City* 227. SM CITY MARIKINA BRANCH – G/F SM City Marikina, Marcos Highway, Brgy. Calumpang, Marikina City* 228. SM CITY MASINAG BRANCH – LGF SM City Masinag, Marcos Highway, Brgy. Mayamot Antipolo City, Rizal* 229. SM CITY SAN LAZARO BRANCH - UGF (Units 164-166) SM City San Lazaro, Felix Huertas St. cor. A.H. Lacson Ext., Sta. Cruz, Manila* 230. SM CITY TAYTAY BRANCH - Unit 147 Bldg. B, SM City Taytay, Manila East Road, Brgy. Dolores, Taytay, Rizal* 231. SM MALL OF ASIA BRANCH - G/F Main Mall Arcade, SM Mall of Asia, Bay Blvd., Pasay City** 232. SM MEGAMALL BRANCH - LGF Bldg. A, SM Megamall, E. delos Santos Ave. cor. Julia Vargas St., Mandaluyong City* 233. SM NORTH EDSA BRANCH – GF Cyberzone Carpark Bldg., SM City North Ave cor. EDSA, Quezon City* 234. SM NORTH TOWERS BRANCH – SM City North EDSA North Towers, SM City North EDSA Complex, Quezon City* 235. SM SOUTHMALL BRANCH – UGF SM Southmall, Alabang-Zapote Road, Almanza Uno, Las Piñas City * 236. SOLEMARE BRANCH - G-11 Solemare Parksuites, 5A Bradco Avenue, Aseana Business Park, Parañaque City* 237. SOLER – ARRANQUE BRANCH - #715 T. Alonzo St. near corner CM Recto Avenue, Sta. Cruz, Manila 238. SOLER - 168 BRANCH – G/F R&S Bldg., Soler St., Binondo, Manila* 239. SOUTH TRIANGLE BRANCH - G/F Sunshine Blvd. Plaza, Quezon Ave. cor. Sct. Santiago and Panay Ave., Bgry. South Triangle, QC* 240. STA. MESA BRANCH - 1-B G. Araneta Avenue, Brgy.Doña Imelda, Quezon City* 241. STO. CRISTO BRANCH – E-Square Bldg., 622 Sto. Cristo St. Binondo, Manila 242. STO. CRISTO – CM RECTO BRANCH – 858 Sto. Cristo Street, San Nicolas, Manila 243. STO. DOMINGO AVE. BRANCH – GF JRich Holdings Bldg., Sto. Domingo Ave., Brgy. Sto. Domingo, Quezon City* 244. T. ALONZO BRANCH – Anttan Residences, 908 T. Alonzo cor. Espeleta Sts., Brgy. 298, Sta. Cruz, Manila* 245. TAFT AVE. - NAKPIL BRANCH – G Square Taft Ave. corner Nakpil St., Malate, Manila* 246. TAFT AVE. - QUIRINO BRANCH – The Gregorian Bldg., 2178 Taft Ave. near cor. Quirino Ave., Malate, Manila* 247. TANDANG SORA - VISAYAS AVE. BRANCH - #250 Tandang Sora Ave., Brgy. Tandang Sora, Quezon City* 248. TAYTAY - ORTIGAS EXTENSION BRANCH- The Gate, Baltao Compound, Ortigas Ave. Ext., San Isidro Taytay, Rizal* 249. TAYTAY - SAN JUAN BRANCH - Velasquez St., Sitio Bangiad, Brgy. San Juan, Taytay, Rizal* 250. THE MEDICAL CITY BRANCH - 2/F Medical Arts Building, The Medical City, Ortigas Ave., Pasig City 251. TIMOG AVE. BRANCH - G/F Prince Jun Condominium, 42 Timog Ave., Quezon City* 252. TOMAS MAPUA - LAGUNA BRANCH - CBC Building, Tomas Mapua St., Sta. Cruz, Manila* 253. TOMAS MORATO - E. RODRIGUEZ BRANCH – #42 Metrofocus Bldg., Tomas Morato Avenue, Brgy. Kristong Hari, Quezon City* 254. TOMAS MORATO EXTENSION BRANCH – G/F QY Bldg., Tomas Morato Avenue, Brgy. South Triangle, Quezon City* 255. TRINOMA BRANCH - Unit P002, Level P1, Triangle North of Manila, North Ave. cor. EDSA, Brgy. Pag-asa, Quezon City* 256. TUTUBAN PRIME BLOCK BRANCH - Rivera Shophouse, Podium Area, Tutuban Center Prime Block, C.M. Recto Ave. cor. Rivera St., Manila* 257. UP TECHNO HUB BRANCH – UP Ayala Land Techno Hub, Commonwealth Ave., Quezon City* 258. UP VILLAGE – MAGINHAWA BRANCH - LTR Bldg, No. 46 Maginhawa St., UP Village, Quezon City*

259. V. LUNA BRANCH - G/F AGGCT Bldg. No. 32 V. Luna cor Matapat Sts., Brgy. Pinyahan, Quezon City** 260. VALENZUELA BRANCH – CBC Bldg., McArthur Highway cor. V. Cordero St., Marulas, Valenzuela City* 261. VALENZUELA - GEN. LUIS BRANCH – AGT Bldg., 425 Gen. Luis St., Paso de Blas, Valenzuela City* 262. VALENZUELA - MALINTA BRANCH – Jeep Center Bldg., MacArthur Highway, Brgy. Malinta, Valenzuela City* 263. VISAYAS AVE. BRANCH – CBC Bldg., Visayas Ave. cor. Congressional Ave. Ext., Quezon City* 264. WEST AVE. BRANCH - 82 West Ave., Brgy. Philam, Quezon City* 265. XAVIERVILLE BRANCH – G/F Lexington Condominium, 65 Xavierville Ave., Loyola Heights, Quezon City* 266. ZOBEL ROXAS BRANCH - 1247 Zobel Roxas Ave. corner Taal Street, Malate, Manila
Provincial Branches 1. ALBAY BRANCH - Rizal St. cor. Gov. Reynold Street, Old Albay District, Legazpi City, Albay* 2. ANGELES CITY BRANCH – CBC Bldg., 949 Henson St., Angeles City, Pampanga* 3. ANGELES CITY – BALIBAGO BRANCH - Diamond Square Bldg., Service Road McArthur Highway cor. Charlotte St., Balibago, Angeles City, Pampanga* 4. ANGELES CITY - MARQUEE MALL BRANCH – G/F Marquee Mall, Angeles City, Pampanga* 5. ANGELES - MCARTHUR HIGHWAY BRANCH – CBC Bldg., San Pablo St. cor. McArthur Highway, Brgy. CM Recto, Angeles City, Pampanga* 6. ANGELES - STO. ROSARIO BRANCH – Angeles Business Center Bldg., Teresa Ave., Nepo Mart Complex, Angeles City, Pampanga* 7. ANTIQUE - SAN JOSE BRANCH - Felrosa Bldg., Gen. Fullon St. cor. Cerdena St., San Jose, Antique* 8. APALIT BRANCH – CBC Bldg., McArthur Highway, San Vicente, Apalit, Pampanga* 9. BACOLOD - ARANETA BRANCH - CBC Bldg., Araneta cor. San Sebastian Sts., Bacolod City, Negros Occidental* 10. BACOLOD - LACSON BRANCH- GF Soliman Bldg., Lacson corner Luzuriaga Sts., Brgy. 29, Bacolod City, Negros Occidental* 11. BACOLOD - LIBERTAD BRANCH - Libertad St., Brgy. 40, Bacolod City, Negros Occidental* 12. BACOLOD – MANDALAGAN BRANCH – Azotea Bldg., Lacson St., Mandalagan, Bacolod City, Negros Occidental* 13. BACOLOD - NORTH DRIVE BRANCH – Unit 1, Anesa Bldg., B.S. Aquino Drive, Brgy. Villamonte, Bacolod City, Negros Occidental* 14. BAGUIO CITY BRANCH - G/F Juniper Bldg., A. Bonifacio St., Brgy. ACBR, Baguio City, Benguet* 15. BAGUIO CITY - ABANAO BRANCH – G/F Paladin Hotel, No. 136 Abanao Ext. cor. Cariño St., Baguio City, Benguet* 16. BALANGA CITY BRANCH - G/F Dilig Bldg., Don Manuel Banzon St., Balanga City, Bataan* 17. BALER BRANCH – Quezon St., Barrio Suklayain, Baler, Aurora** 18. BALIWAG BRANCH – Km. 51, Doña Remedios Trinidad (DRT) Highway, Baliwag Bulacan* 19. BATAAN - DINALUPIHAN BRANCH – GNI Building, San Ramon Highway corner Doña Rosa Street and Mabini Ext., Dinalupihan, Bataan* 20. BATANGAS CITY BRANCH - P. Burgos St., Brgy. 10, Poblacion, Batangas City, Batangas* 21. BATANGAS CITY – KUMINTANG ILAYA BRANCH – CBC Building, Brgy. Kumintang Ilaya, Batangas City, Batangas* 22. BATANGAS - BALAYAN BRANCH - CBC Building, Barrio Ermita, Balayan, Batangas* 23. BATANGAS - BAUAN BRANCH - 62 Kapitan Ponso St., Bauan, Batangas* 24. BATANGAS – LEMERY BRANCH – Miranda Bldg., Ilustre Ave. Lemery, Batangas* 25. BATANGAS - ROSARIO BRANCH - Dr. Gualberto Ave., Brgy. Namunga, Rosario, Batangas* 26. BATANGAS – SAN JUAN BRANCH – Rizal St. near corner Gen. Luna St., Poblacion, San Juan, Batangas* 27. BATANGAS - TANAUAN BRANCH - J.P Laurel Highway, Tanauan City, Batangas* 28. BAYBAY CITY BRANCH – Magsaysay Ave., Baybay City, Leyte* 29. BORONGAN BRANCH – Balud II, Poblacion Borongan, Eastern Samar* 30. BULACAN - BALAGTAS BRANCH – G/F D&A Bldg. II, McArthur Highway, Brgy. San Juan, Balagtas, Bulacan* 31. BULACAN – GUIGUINTO BRANCH – CBC Building, Cagayan Valley Road, Brgy. Sta. Rita, Guiguinto, Bulacan* 32. BULACAN - PLARIDEL BRANCH - CBC Building, Cagayan Valley Road, Plaridel, Bulacan* 33. BULACAN - STA. MARIA BRANCH - J.P Rizal cor. C. De Guzman St., Poblacion, Sta. Maria, Bulacan* 34. BUTUAN CITY BRANCH - CBC Building, J.C. Aquino Avenue, Butuan City, Agusan del Norte* 35. CABANATUAN CITY BRANCH - Melencio cor. Sanciangco Sts. Cabanatuan City, Nueva Ecija* 36. CABANATUAN - MAHARLIKA BRANCH – CBC Bldg., Maharlika Highway, Brgy. Dicarma, Cabanatuan City, Nueva Ecija* 37. CAGAYAN DE ORO - CARMEN BRANCH - G/F GT Realty Bldg., Max Suniel St. cor. Yakal St., Carmen, Cagayan De Oro City, Misamis Oriental* 38. CAGAYAN DE ORO - DIVISORIA BRANCH - RN Abejuela St., South Divisoria, Cagayan de Oro City, Misamis Oriental* 39. CAGAYAN DE ORO - GAISANO CITY MALL BRANCH - G/F Gaisano City Mall, C. M. Recto Ave. cor. Corrales Ext., Cagayan De Oro City, Misamis Oriental* 40. CAGAYAN DE ORO - LAPASAN BRANCH - CBC Bldg, Claro M. Recto Ave., Lapasan, Cagayan de Oro City, Misamis Oriental*

41. CAGAYAN DE ORO - PUERTO BRANCH - Luis A.S. Yap Building, Sayre Highway, Zone 6, Brgy. Puerto, Cagayan De Oro City, Misamis Oriental* 42. CALAPAN BRANCH – J.P. Rizal St., San Vicente, Calapan City, Oriental Mindoro* 43. CALBAYOG BRANCH - Cajurao cor. Gomez Sts., Balud, Calbayog Dist., Calbayog City, Samar* 44. CAMALANIUGAN BRANCH - CBC Building, National Highway, Brgy. Dugo, Camalaniugan, Cagayan* 45. CANDON CITY BRANCH - CBC Bldg., National Road, San Isidro, Candon City, Ilocos Sur* 46. CARMONA BRANCH – CBC Bldg, Paseo de Carmona, Brgy. Maduya, Carmona, Cavite* 47. CATARMAN BRANCH – Cor. Rizal & Quirino Sts, Brgy. Jose P. Rizal, Catarman, Northern Samar* 48. CATBALOGAN BRANCH - CBC Bldg. Del Rosario St. cor. Taft Ave., Catbalogan City, Samar* 49. CAUAYAN CITY BRANCH - G/F Prince Christopher Bldg. Maharlika Highway, Cauayan City, Isabela* 50. CAVITE - DASMARIÑAS BRANCH - G/F CBC Bldg., Gen. E. Aguinaldo Highway, Dasmariñas, Cavite** 51. CAVITE – GEN. TRIAS BRANCH – Lot 12 Brookeside Lane 5 Arnaldo Highway, Brgy. San Francisco, Gen. Trias City, Cavite* 52. CAVITE - IMUS BRANCH - G/F CBC Bldg., Nueno Ave., Tanzang Luma, Imus, Cavite* 53. CAVITE - MOLINO BRANCH - Patio Jacinto, Molino Road, Molino 3, Bacoor, Cavite* 54. CAVITE - ROSARIO BRANCH - G/F CBC Bldg., Gen Trias Drive, Rosario, Cavite* 55. CAVITE - SILANG BRANCH - CBC Building, J.P Rizal St., Poblacion, Silang, Cavite* 56. CAVITE - SM CITY BACOOR BRANCH - LGF SM City Bacoor Tirona Highway cor. Aguinaldo Highway Bacoor, Cavite* 57. CEBU - AYALA BRANCH - Unit 101 G/F Insular Life Cebu Business Center, Mindanao Ave. cor. Biliran Road, Cebu Business Park, Cebu City, Cebu* 58. CEBU - BANAWA BRANCH - G/F The J Block, Duterte St., Banawa, Guadalupe, Cebu City, Cebu* 59. CEBU - BANILAD BRANCH - CBC Bldg., A.S. Fortuna St., Banilad, Cebu City, Cebu* 60. CEBU – BASAK - SAN NICOLAS BRANCH – Bai Center, N. Bacalso Ave., Brgy. Basak San Nicolas, Cebu City, Cebu* 61. CEBU - BOGO BRANCH – G/F SIM Bldg., P. Rodriguez St., Bogo City Cebu* 62. CEBU BUSINESS CENTER BRANCH – G/F Chinabank Corporate Center, Samar Loop cor. Panay Road, Cebu Business Park, Cebu City, Cebu* 63. CEBU - CARCAR BRANCH – Dr. Jose Rizal St, Poblacion I, Carcar, Cebu City, Cebu* 64. CEBU - CONSOLACION BRANCH – G/F SM City Consolacion, Brgy. Lamac, Consolacion, Cebu* 65. CEBU - ESCARIO BRANCH - Units 3 & 5, Escario Central, Escario Road, Cebu City, Cebu* 66. CEBU - F. RAMOS BRANCH – G/F Cebu Velez Hospital, 41-3 F. Ramos St., Brgy. Cogon, Cebu City, Cebu* 67. CEBU - GORORDO BRANCH – No 424, Gorordo Ave., Bo. Kamputhaw, Cebu City, Cebu* 68. CEBU - GUADALUPE BRANCH – CBC Bldg., M. Velez St., cor. V. Rama Ave., Guadalupe, Cebu City, Cebu* 69. CEBU - IT PARK BRANCH – G/F, The Link, Cebu IT Park, Apas, Cebu City, Cebu* 70. CEBU - LAHUG BRANCH - JY Square Mall, No. 1 Salinas Dr., Lahug, Cebu City, Cebu* 71. CEBU - LAPU LAPU PUSOK BRANCH - G/F Goldberry Suites, President Quezon National Highway, Pusok, Lapu-Lapu City, Cebu* 72. CEBU - LAPU LAPU CENTRO BRANCH – A. Geson Bldg., G.Y Dela Serna St., Poblacion, Lapu Lapu City, Cebu* 73. CEBU - MAGALLANES BRANCH - CBC Bldg., Magallanes cor. Jakosalem Sts., Brgy. Sto. Niño, Cebu City, Cebu* 74. CEBU - MANDAUE BRANCH – SV Cabahug Bldg., 155-B SB Cabahug St., Brgy. Centro, Mandaue City, Cebu* 75. CEBU - MANDAUE CABANCALAN BRANCH – G/F A. Geson Bldg., M.L. Quezon St., Cabancalan, Mandaue City, Cebu* 76. CEBU - MANDAUE – J. CENTRE MALL BRANCH – LGF J Centre Mall, A.S. Fortuna Ave., Bakilid Mandaue City, Cebu* 77. CEBU - MANDAUE NORTH ROAD BRANCH - G/F Basak Commercial Bldg., North Road, Tabok, Mandaue City, Cebu* 78. CEBU - MANDAUE NRA BRANCH - G/F Bai Hotel Cebu, Ouano Ave. cor. Seno Blvd, North Reclamation Area, Mandaue City, Cebu* 79. CEBU - MINGLANILLA BRANCH – Unit 9 Plaza Margarita, Lipata, Minglanilla, Cebu* 80. CEBU - NAGA BRANCH - Leah’s Square, National South Highway, East Poblacion, Naga City, Cebu* 81. CEBU - SM CITY BRANCH - UGF SM City Cebu, Juan Luna cor. A. Soriano Ave., North Reclamation Area, Brgy. Mabolo, Cebu City, Cebu** 82. CEBU - SM SEASIDE CITY BRANCH - LGF SM Seaside City, Cebu South Road Properties, Mambaling, Cebu City, Cebu* 83. CEBU - SUBANGDAKU BRANCH - G/F A.D. Gothong I.T. Center, Subangdaku, Mandaue City, Cebu* 84. CEBU - TALAMBAN BRANCH - Unit UG-7 Gaisano Grand Mall Talamban, Gov. Cuenco Ave., Brgy. Talamban, Cebu City, Cebu* 85. CEBU - TALISAY BRANCH - CBC Bldg., 1055 Cebu South National Road Bulacao, Talisay City, Cebu* 86. CLARK FREEPORT ZONE BRANCH – G/F Stotsenberg Lifestyle Center, N. Aquino corner S. Osmeña & E. Jacinto Sts., , Clark Freeport Zone, Angeles City, Pampanga* 87. COTABATO CITY BRANCH - No. 76 S.K. Pendatun Ave., Cotabato City, Maguindanao* 88. DAET BRANCH – Vinzons Ave., Daet, Camarines Norte* 89. DAGUPAN - M.H.DEL PILAR BRANCH – Carried Realty Bldg., No. 28 M.H. del Pilar St., Dagupan City, Pangasinan* 90. DAGUPAN - PEREZ BRANCH – GF Siapno Bldg., Perez Boulevard, Brgy. Pogo Chico, Dagupan City, Pangasinan* 91. DAVAO - BAJADA BRANCH – B.I. Zone Bldg., J.P. Laurel Ave., Bajada, Davao City, Davao del Sur*

92. DAVAO - BUHANGIN BRANCH – Buhangin Road, Davao City, Davao del Sur* 93. DAVAO – CALINAN BRANCH - Davao-Bukidnon National Hway – Riverside, Calinan Proper, Davao City, Davao del Sur** 94. DAVAO - INSULAR VILLAGE BRANCH – Km. 8, Insular Village I, Lanang, Davao City, Davao del Sur* 95. DAVAO - MA-A BRANCH - G/F Lapeña Bldg., Mac Arthur Highway, Matina, Davao City, Davao del Sur* 96. DAVAO - MATINA BRANCH – Km. 4 McArthur Highway, Matina, Davao City, Davao del Sur* 97. DAVAO - MONTEVERDE BRANCH - Doors 1 & 2, Sunbright Bldg., Monteverde St., Brgy. 27-C, Poblacion District, Davao City, Davao del Sur* 98. DAVAO – PANABO BRANCH –Grajeda Bldg (Major Building),Quezon St., Brgy New Pandan, Panabo City, Davao del Norte
99. DAVAO - RECTO BRANCH - CBC Bldg., C.M. Recto Ave. cor. J. Rizal St. Davao City, Davao del Sur* 100. DAVAO - SM LANANG BRANCH - G/F SM Lanang Premier, J.P. Laurel Ave., Davao City, Davao del Sur* 101. DAVAO - STA. ANA BRANCH - R. Magsaysay Ave. cor. F. Bangoy St., Sta. Ana District, Davao City, Davao del Sur* 102. DAVAO - TAGUM BRANCH - 153 Pioneer Ave., Tagum, Davao del Norte* 103. DAVAO – TORIL BRANCH – JFI Building, Mc Arthur Highway cor. St. Peter St., Crossing Bayabas, Toril, Davao City, Davao del Sur* 104. DIPOLOG CITY BRANCH – CBC Bldg., Gen Luna cor. Gonzales Sts. Dipolog City, Zamboanga del Norte* 105. DOLORES BRANCH - CBC Bldg., McArthur Highway, Dolores, City of San Fernando, Pampanga* 106. DUMAGUETE CITY BRANCH – CBC Bldg., Real St.,Dumaguete City, Negros Oriental* 107. GAPAN BRANCH – G/F Walter Mart Center - Gapan, Maharlika Highway, Brgy. Bayanihan, Gapan, Nueva Ecija* 108. GEN. SANTOS CITY BRANCH - CBC Bldg., I. Santiago Blvd., Gen. Santos City South Cotabato* 109. GEN. SANTOS CITY – DADIANGAS BRANCH - M. Roxas Ave. corner Lapu-Lapu Street, Brgy. Dadiangas East, General Santos City, South Cotabato* 110. GUAGUA BRANCH – Yabut Bldg., Plaza Burgos, Guagua, Pampanga* 111. ILIGAN CITY BRANCH – Lai Bldg., Quezon Ave. Extension, Pala-o, Iligan City, Lanao del Norte* 112. ILIGAN CITY - SOLANA DISTRICT BRANCH Andres Bonifacio Highway, Brgy. San Miguel, Iligan City, Lanao del Norte* 113. ILOCOS NORTE - SAN NICOLAS BRANCH - National Highway, Brgy. 2, San Baltazar, San Nicolas, Ilocos Norte* 114. ILOILO - IZNART BRANCH - G/F John A. Tan Bldg., Iznart St., Iloilo City, Iloilo* 115. ILOILO – JARO BRANCH – CBC Bldg., E. Lopez St., Iloilo City, Iloilo* 116. ILOILO - MABINI BRANCH – A. Mabini St., Iloilo City, Iloilo* 117. ILOILO - MANDURRIAO BRANCH – Injap Bldg., Benigno Aquino Ave., Brgy, San Rafael, Mandurriao, Iloilo City, Iloilo* 118. ILOILO - RIZAL BRANCH – CBC Bldg., Rizal cor. Gomez Sts., Brgy. Ortiz, Iloilo City, Iloilo* 119. IRIGA CITY BRANCH Highway 1, JP Rizal St., San Roque, Iriga City, Camarines Sur* 120. ISABELA - ILAGAN BRANCH - G/F North Star Mall, Maharlika Highway, Brgy. Alibagu, Ilagan, Isabela* 121. ISABELA – ROXAS BRANCH – National Road, Brgy. Bantug, Roxas, Isabela* 122. KALIBO BRANCH - Aklan Catholic College, Arch. Gabriel M. Reyes St., 5600,Kalibo, Aklan* 123. KIDAPAWAN CITY BRANCH - G/F EVA Bldg., Quezon Blvd. cor. Tomas Claudio St., National Highway, Kidapawan City, Cotabato* 124. KORONADALCITY BRANCH – G/F LBU Bldg., Gen. Santos Drive cor. Aquino St. Koronadal City, South Cotabato* 125. LA TRINIDAD BRANCH - G/F SJV Bulasao Bldg., Km. 4, La Trinidad, Benguet* 126. LA UNION - AGOO BRANCH - National Highway, San Jose Norte, Agoo, La Union* 127. LA UNION - SAN FERNANDO BRANCH – Roger Pua Phee Bldg., National Highway, Brgy. 3, San Fernando, La Union* 128. LAGUNA - BIÑAN BRANCH - G/F Raja Cordelle Bldg, National Highway, Brgy. San Vicente, Biñan, Laguna* 129. LAGUNA - CABUYAO BRANCH - G/F Centro Mall, Pulo, Cabuyao City, Laguna* 130. LAGUNA - CALAMBA BRANCH – CBC Bldg., National Highway, Crossing, Calamba, Laguna* 131. LAGUNA - LOS BAÑOS BRANCH - National Road, San Antonio, Los Baños, Laguna* 132. LAGUNA - SAN PEDRO BRANCH - No. 365 National Highway, Brgy. Nueva, San Pedro City, Laguna* 133. LAGUNA - STA. CRUZ BRANCH - A. Regidor St., Sta. Cruz, Laguna* 134. LAOAG CITY BRANCH - Liberato Abadilla St., Brgy 17, San Francisco, Laoag City, Ilocos Norte* 135. LEGAZPI CITY BRANCH - G/F Emma Chan Bldg., F. Imperial St., Legazpi City, Albay* 136. LIPA CITY - TAMBO BRANCH - President Jose P. Laurel Highway,Tambo, Lipa City, Batangas* 137. LUCENA CITY BRANCH – 223 Quezon Ave., Lucena City, Quezon* 138. MAASIN CITY BRANCH - G/F SJC Bldg., Tomas Oppus St., Brgy. Tunga-Tunga, Maasin City, Southern Leyte* 139. MABALACAT - DAU BRANCH - R.D. Policarpio Bldg., McArthur Highway, Dau, Mabalacat, Pampanga* 140. MALAYBALAY CITY BRANCH – Bethelda Bldg., Sayre Highway, Malaybalay City, Bukidnon* 141. MALOLOS CITY BRANCH - G/F Graceland Mall, BSU Grounds, McArthur Highway, Guinhawa, Malolos City, Bulacan 142. MARILAO BRANCH - G/F, SM City Marilao Km. 21, Brgy. Ibayo, Marilao, Bulacan* 143. MARIVELES - FAB BRANCH – GF Tamayo’s Building, Avenue of the Phils., Brgy. Malaya, Freeport Area of Bataan (FAB), Mariveles, Bataan* 144. MASBATE BRANCH – Espinosa Bldg., Zurbito St., Masbate City, Masbate*

145. MEYCAUAYAN BRANCH - CBC Bldg., Malhacan Road, Meycauayan, Bulacan* 146. MIDSAYAP BRANCH - CBC Building, Quezon Ave., Poblacion 2, Midsayap, Cotabato* 147. NAGA CITY BRANCH – CBC Building, Penafrancia St., Naga City, Camarines Sur* 148. NEGROS OCCIDENTAL - KABANKALAN BRANCH - CBC Bldg., National Hway, Brgy. 1, Kabankalan, Negros Occidental* 149. NEGROS OCCIDENTAL – SAN CARLOS BRANCH – Rizal cor. Carmona Sts., San Carlos City, Negros Occidental* 150. NUEVA ECIJA – STA ROSA BRANCH - CBC Bldg., Maharlika Highway, Poblacion, Sta Rosa, Nueva Ecija* 151. OCCIDENTAL MINDORO - SAN JOSE BRANCH - Liboro cor. Rizal St., San Jose, Occidental Mindoro* 152. OLONGAPO – DOWNTOWN BRANCH – CBC Building, No. 2 corner 20th St., East Bajac-Bajac, Olongapo City, Zambales* 153. ORMOC CITY BRANCH – CBC Bldg., Real cor. Lopez Jaena Sts., Ormoc City, Leyte* 154. OZAMIZ CITY BRANCH - Gomez corner Kaamino Streets, Ozamiz City, Misamis Oriental* 155. PAGADIAN CITY BRANCH – Marasigan Bldg., F.S. Pajares Ave., Pagadian City, Zamboanga del Sur* 156. PANGASINAN - ALAMINOS CITY BRANCH – Marcos Ave., Brgy, Palamis, Alaminos City, Pangasinan* 157. PANGASINAN - BAYAMBANG BRANCH - CBC Bldg., No. 91, Poblacion Sur, Bayambang, Pangasinan* 158. PANGASINAN - ROSALES BRANCH - CBC Building, Calle Dewey, Rosales, Pangasinan* 159. PANGASINAN - URDANETA BRANCH – EF Square Bldg., MacArthur Highway, Poblacion, Urdaneta City, Pangasinan* 160. PASEO DE STA. ROSA BRANCH - Unit 3, Paseo 5, Paseo de Sta. Rosa, Sta. Rosa City, Laguna* 161. PUERTO PRINCESA CITY BRANCH – Malvar St. near cor. Valencia St., Puerto Princesa City, Palawan* 162. QUEZON - CANDELARIA BRANCH - Pan Philippine Highway cor. Del Valle Street, Poblacion, Candelaria, Quezon* 163. ROXAS CITY BRANCH - 1063 Roxas Ave. cor. Bayot Drive, Roxas City, Capiz* 164. SAN FERNANDO BRANCH - CBC Bldg., V. Tiomico St. City of San Fernando, Pampanga* 165. SAN FERNANDO - SINDALAN BRANCH – Jumbo Jenra Sindalan, Brgy. Sindalan, San Fernando City, Pampanga* 166. SAN JOSE CITY BRANCH – Maharlika Highway, Brgy. Malasin, San Jose City, Nueva Ecija* 167. SAN PABLO CITY BRANCH – M. Paulino St., San Pablo City, Laguna* 168. SANTIAGO CITY BRANCH - Navarro Bldg., Maharlika Highway near cor. Bayaua St., Santiago City, Isabela* 169. SILAY CITY BRANCH – Rizal St., Silay City, Negros Occidental* 170. SM CITY CABANATUAN – UGF SM City Cabanatuan, Maharlika Highway, Brgy. H. Concepcion, Cabanatuan City, Nueva Ecija* 171. SM CDO DOWNTOWN PREMIER BRANCH - G/F SM CDO Downtown Premier, Claro M. Recto Ave., , Cagayan de Oro City, Misamis Oriental* 172. SM CITY CLARK BRANCH - G/F SM City Clark, M. Roxas St., CSEZ, Angeles City, Pampanga** 173. SM CITY DASMARIÑAS BRANCH – LGF SM City Dasmariñas, Gov Drive, Pala-Pala, City of Dasmariñas, Cavite* 174. SM CITY LIPA BRANCH - G/F SM City Lipa, J.P. Laurel Highway, Brgy. Maraouy, Lipa City, Batangas* 175. SM CITY NAGA BRANCH - SM City Naga, CBD II, Brgy. Triangulo, Naga City, Camarines Sur* 176. SM CITY OLONGAPO CENTRAL BRANCH - G/F SM City Olongapo Central, East Tapinac, Olongapo City, Zambales* 177. SM CITY PAMPANGA BRANCH - Unit AX3 102, Bldg. 4, SM City Pampanga, Mexico, Pampanga* 178. SM CITY SAN JOSE DEL MONTE BRANCH - UGF SM City San Jose Del Monte, Quirino Highway, Brgy. Tungkong Mangga, San Jose Del Monte City, Bulacan* 179. SM CITY SAN PABLO BRANCH - G/F SM City San Pablo, National Highway, Brgy. San Rafael, San Pablo City, Laguna* 180. SM CITY STA. ROSA BRANCH - G/F SM City Sta. Rosa, Bo. Tagapo, Sta. Rosa, Laguna* 181. SM CITY TELABASTAGAN BRANCH – G/F SM City Telabastagan, San Fernando City, Pampanga* 182. SOLANO BRANCH – National Highway, Brgy. Quirino, Solano, Nueva Vizcaya* 183. SORSOGON BRANCH - CBC Bldg., Ramon Magsaysay Ave., Sorsogon City, Sorsogon* 184. SUBIC BAY FREEPORT ZONE BRANCH – CBC Bldg, Rizal Highway, Subic Bay Gateway Park, Subic Bay Freeport Zone, Zambales* 185. SURIGAO CITY BRANCH – CBC Bldg., Amat St., Barrio Washington, Surigao City, Surigao Del Norte* 186. TABACO CITY BRANCH – Ziga Ave. cor. Berces St., Tabaco City, Albay* 187. TACLOBAN CITY BRANCH – Uytingkoc Bldg., Avenida Veteranos,Tacloban City, Leyte* 188. TAGAYTAY CITY BRANCH – Foggy Heights Subdivision, E. Aguinaldo Highway, Tagaytay City, Cavite* 189. TAGBILARAN CITY BRANCH - G/F Melrose Bldg., Carlos P. Garcia Ave.,Tagbilaran City, Bohol* 190. TALAVERA BRANCH – CBC Bldg., Maharlika Highway, Marcos District, Talavera, Nueva Ecija* 191. TARLAC - BAMBAN BRANCH - National Road, Bgry. Anupul, Bamban, Tarlac* 192. TARLAC - CAMILING BRANCH - Sun Plaza, Romulo St., Poblacion, Camiling Tarlac* 193. TARLAC - CONCEPCION BRANCH - G/F Descanzo Bldg., F. Timbol St., San Nicolas, Poblacion, Concepcion, Tarlac* 194. TARLAC - PANIQUI BRANCH – G/F Cedasco Bldg., M. H del Pilar St., Poblacion, Paniqui, Tarlac* 195. TARLAC BRANCH – CBC Bldg., Panganiban near cor. F. Tañedo St., Tarlac City, Tarlac* 196. TARLAC - SAN RAFAEL BRANCH - CBC Building, MacArthur Highway, San Rafael, Tarlac City, Tarlac* 197. THE DISTRICT IMUS BRANCH - G/F The District Imus, Emilio Aguinaldo Highway, Anabu II, Imus, Cavite* 198. TRECE MARTIRES BRANCH - G/F Walter Mart, Governor’s Drive cor. City Hall Road, Brgy. San Agustin, Trece Martires City, Cavite* 199. TUGUEGARAO - BALZAIN BRANCH – Balzain Highway, Tuguegarao City, Cagayan*

200. TUGUEGARAO CITY BRANCH - A. Bonifacio St., Tuguegarao, Cagayan * 201. VALENCIA BRANCH – A. Mabini St., Valencia, Bukidnon* 202. VIGAN CITY BRANCH – Burgos St. near cor. Rizal St., Vigan City, Ilocos Sur* 203. VIRAC BRANCH – Quezon Avenue, Brgy. Salvacion, Virac, Catanduanes* 204. ZAMBALES - BOTOLAN BRANCH – National Highway, Brgy. Batonlapoc, Botolan, Zambales* 205. ZAMBOANGA CITY BRANCH – CBC Bldg., Gov. Lim Ave. cor. Nuñez St., Zone III, Zamboanga City, Zamboanga del Sur* 206. ZAMBOANGA - GUIWAN BRANCH - G/F Yang’s Tower, Ma. Clara Lorenzo Lobregat National Highway, Guiwan, Zamboanga City, Zamboanga del Sur* 207. ZAMBOANGA - SAN JOSE GUSU BRANCH - Yubenco Star Mall, San Jose Gusu, Zamboanga City, Zamboanga del Sur**
CHINA BANK SAVINGS, INC. Metro Manila Branches 1. ACACIA ESTATES -SAVEMORE BRANCH - Acacia Town Center, Acacia Estates, Ususan, Taguig City* 2. AYALA BRANCH - 6772 Ayala Ave., Makati City** 3. ADRIATICO -SM HYPERMARKET BRANCH – Adriatico St., Malate, Manila* 4. ALABANG- GF / Common Goal Bldg., Finance cor. Industry Sts., Madrigal Business Park, Ayala Alabang, Muntinlupa City* 5. AMANG RODRIGUEZ- SAVEMORE BRANCH – G/F GBU Bldg. Amang Rodriguez Ave cor. Evangelista St.
Santolan, Pasig City* 6. AMORANTO AVENUE – Unit 101 R. Place Building, 255 N.S Amoranto Sr. Avenue, Quezon City* 7. ANONAS - SAVEMORE BRANCH - V. Luna St. corner Anonas Extension, Sikatuna Village, Quezon City* 8. ARANETA CENTER COD - SAVEMORE BRANCH - Gen. Romulo St., Araneta Center, Cubao, Quezon City* 9. BACLARAN – 3751 Quirino Avenue cor. Sta. Rita St., Baclaran, Parañaque City* 10. BANAWE- Nos. 247-249 Banawe St., Sta. Mesa Heights, Brgy. Lourdes, Quezon City* 11. BANGKAL- GF / Amara Bldg., 1661 Evangelista St., Bangkal, Makati City* 12. BLUMENTRITT - Blumentritt St. near Oroquieta St. Sta. Cruz, Manila* 13. BINONDO – JUAN LUNA – 694-696 Juan Luna St., Binondo, Manila 14. BONI AVENUE – Raymond Tower Boni, 615 Boni Avenue, Plainview, Mandaluyong City* 15. BUENDIA- Main Branch, 314 Sen. Gil J. Puyat Ave., Makati City** 16. COMMONWEALTH AVENUE - JocFer Building, Commonwealth Avenue, Brgy. Holy Spirit, Quezon City * 17. CUBAO- Fernandina 88 Suites, 222 P. Tuazon Boulevard, Cubao, Quezon City* 18. DEL MONTE- 392 Del Monte Ave., Brgy. Sienna, Quezon City* 19. DIVISORIA – 3/F Dragon 8 Shopping Center, C.M Recto Avenue cor. Dagupan St., Divisoria Manila* 20. E. RODRIGUEZ SR. - HEMADY - E. Rodriguez, Sr. cor Hemady St., Quezon City * 21. ESPAÑA - SUNMALL, Espana Boulevard corner Mayon St., Manila * 22. FELIX HUERTAS - JT Centrale Mall, 1686 V. Fugoso St. corner Felix Huertas St., Sta. Cruz, Manila * 23. FILINVEST CORPORATE CITY BR - BC Group Bldg., East Asia Drive near cor. Comm. Ave., Filinvest Corp City, Alabang, Muntinlupa City* 24. FTI-TAGUIG -SM HYPERMARKET BRANCH - DBP Avenue, Food Terminal Inc., Western Bicutan, Taguig* 25. G. ARANETA AVENUE – 195 G. Araneta Avenue, Quezon City* 26. GIL PUYAT-BAUTISTA – Lot 25 Blk 74 Bautista St. cor. Buendia Avenue, Makati City* 27. GREENHILLS-ORTIGAS AVENUE - VAG Bldg., Ortigas Ave., Greenhills, San Juan, Metro Manila* 28. GREENHILLS-WILSON BRANCH - 219 Wilson St., Greenhills, San Juan* 29. GUIGUINTO-RIS - RIS-5 Industrial Complex, 68 Mercado St., Tabe, Guiguinto, Bulacan 30. KALOOKAN BRANCH - Augusto Bldg., Rizal Ave., Grace Park, Kalookan City* 31. KALOOKAN-A. MABINI- AJ Bldg., 353 A. Mabini St., Kalookan City* 32. KATIPUNAN – One Burgundy Condominium, Katipunan Avenue, Quezon City* 33. LAGRO- Bonanza Bldg., Quirino Highway, Greater Lagro, Novaliches, Quezon City* 34. LAS PIÑAS – ALMANZA UNO BRANCH - Alabang Zapote Road, Almanza Uno, Las Piñas City* 35. MAKATI-CHINO ROCES BRANCH - 2176 Chino Roces Ave., Makati City* 36. MAKATI-J.P. RIZAL BRANCH - 882 J.P. Rizal St., Makati City* 37. MALABON -SAVEMORE - Francis Market, Governor Pascual corner M.H. Del Pilar Sts., Malabon* 38. MANDALUYONG- Paterno’s Bldg., 572 New Panaderos St., Brgy. Pag-asa, Mandaluyong City* 39. MANDALUYONG-SHAW BOULEVARD BRANCH – 500 Shaw Tower, 500 Shaw Boulevard, Mandaluyong City* 40. MANILA - STA.ANA - SAVEMORE BRANCH - Savemore, Pedro Gil St., Sta. Ana, Manila * 41. MARIKINA BRANCH - 33 Bayan-Bayanan Ave., Brgy. Concepcion 1, Marikina City*

42. MARIKINA-GIL FERNANDO AVENUE - CTP Bldg., Gil Fernando Ave., Brgy. San Roque, Marikina City* 43. MUÑOZ – JACKMAN BRANCH - Jackman Plaza, Lower Ground Floor, EDSA-Munoz, Quezon City* 44. NEPA-Q-MART -SAVEMORE BRANCH - Rose Bldg., 770 St. EDSA and K-G St., West Kamias, Quezon City* 45. NINOY AQUINO AVENUE- Ground Floor Skyfreight Bldg., Ninoy Aquino Ave. cor. Pascor Drive, Parañaque City* 46. ORTIGAS BRANCH - Ground Floor, Hanston Square, San Miguel Ave., Ortigas Center, Pasig City* 47. PARAÑAQUE - BETTER LIVING - 90 Dona Soledad Avenue, Better Living Subdivision, Parañaque* 48. PARAÑAQUE - BF HOMES BRANCH - 284 Aguirre Ave., B.F. Homes, Paranaque* 49. PARAÑAQUE-JAKA - Jaka Plaza Center, Dr. A. Santos Ave. (Sucat Road), Brgy. San Isidro, Parañaque City* 50. PARAÑAQUE - LA HUERTA – 1070 Quirino Ave., La Huerta, Paranaque City* 51. PARAÑAQUE – MOONWALK – Kassel Residence Building, E. Rodriguez Avenue, Moonwalk Parañaque City* 52. PASAY-LIBERTAD – 533 Cementina St. Libertad, Pasay City* 53. PASIG CANIOGAN - KSN Building, C. Raymundo Avenue, Caniogan, Pasig City * 54. PASIG-MUTYA – Richcrest Building, Caruncho corner Market Avenue, San Nicolas, Pasig City* 55. PASIG – PADRE BURGOS BRANCH - 114 Padre Burgos St., Kapasigan, Pasig City* 56. PASO DE BLAS- Andok’s Bldg., 629 General Luis St., Malinta Interchange-NLEX, Paso de Blas, Valenzuela City* 57. PATEROS BRANCH - 500 Elisco Rd., Sto. Rosario, Pateros* 58. PATEROS-ALMEDA - 120 Almeda St., Pateros, Metro Manila* 59. PEDRO GIL - LKE Bldg. Pedro Gil corner Pasaje, Rosario st. Paco, Manila 60. PLAZA STA. CRUZ BRANCH – MBI Building, Unit 103, Plaza Sta. Cruz, Sta. Cruz, Manila* 61. QUEZON AVENUE BRANCH - G/F GJ Bldg., 385 Quezon Ave., Quezon City* 62. QUEZON AVENUE-PALIGSAHAN - 1184-A Ben-Lor Bldg., Quezon Ave., Brgy. Paligsahan, Quezon City* 63. QUIAPO – ECHAGUE - Palanca corner P. Gomez streets, Echague, Quiapo, City of Manila 64. QUIAPO – QUEZON BLVD. – 416 Quezon Boulevard, Quiapo Manila* 65. RADA- LEGASPI - HRC Center , 104 Rada St., Legaspi Village, Makati City* 66. ROOSEVELT – 342 Roosevelt Avenue, Quezon City* 67. SAN JUAN - Madison Square, 264 N. Domingo St., Barangay Pasadena, San Juan* 68. SOUTH TRIANGLE - Ground Floor, SUNNYMEDE IT CENTER, Brgy. South Triangle, Quezon Ave., QC 69. STA. MESA - 4128 Ramon Magsaysay Blvd., Sta. Mesa Manila* 70. TANDANG SORA – Cecileville Bldg. III, 670 Tandang Sora Ave. corner General Ave., Tandang Sora, Quezon City* 71. TAYUMAN – 1925-1929 Rizal Avenue near corner Tayuman St., Sta. Cruz, Manila* 72. TIMOG- Jenkinsen Towers, 80 Timog Ave., Brgy. Sacred Heart, Quezon City* 73. TWO E-COM – Two E-Com Center Tower B, Ocean Drive near cor. Bayshore Ave., Mall of Asia Complex, Pasay City* 74. UN AVENUE- 552 U.N. Ave., Ermita, Manila* 75. VALENZUELA-MARULAS- Ong-Juanco Bldg., 92 - J McArthur Highway, Marulas, Valenzuela City* 76. VISAYAS AVENUE- Wilcon City Center Mall, Visayas Ave., Quezon City* 77. ANTIPOLO- EMS Bldg., M.L. Quezon St. cor. F. Dimanlig St., Antipolo City, Rizal* 78. ANGONO- Manila East Road cor. Don Benito St., Brgy. San Roque, Angono, Rizal* 79. TAYTAY BRANCH - C. Gonzaga Bldg. II, Manila East Road, Taytay, Rizal* Provincial Branches 1. ANGELES-RIZAL AVENUE - 639 Rizal St., Angeles City* 2. ARAYAT BRANCH - Cacutud, Arayat, Pampanga* 3. BACOLOD BRANCH - SKT Saturn Bldg., Lacson cor. Rizal Sts., Bacolod City* 4. BACOOR - TALABA - Coastal Road cor. Aguinaldo Highway, Brgy. Talaba VII, Bacoor City, Cavite* 5. BAGUIO - SESSION - B108 Lopez Bldg., Session Road, Baguio City* 6. BALAGTAS- McArthur Highway, Wawa, Balagtas, Bulacan* 7. BALANGA - DM BANZON - D.M. Banzon St., Balanga City* 8. BALIBAGO- JEV Bldg., McArthur Highway, Balibago, Angeles City* 9. BALIUAG- Plaza Naning, Poblacion, Baliuag, Bulacan* 10. BATANGAS - P. BURGOS - No. 3 P. Burgos St., Batangas City* 11. BIÑAN- Nepa Highway, San Vicente, Biñan, Laguna* 12. CABANATUAN-BAYAN - Burgos Ave., Cabanatuan City, Nueva Ecija* 13. CAGAYAN DE ORO BRANCH - Sergio Osmeña St., Cogon District, Cagayan de Oro City* 14. CALAMBA BRANCH - HK Bldg II, National Highway, Brgy. Halang, Calamba, Laguna* 15. CAVITE CITY - 485 P. Burgos St., Brgy. 34, Caridad, Cavite City* 16. CEBU – MANDAUE BRANCH - A. Del Rosario Ave., Mantuyong, Mandaue City, Cebu*

17. CEBU – MANGO AVENUE, JSP Mango Plaza, Gen. Maxilom Ave. cor. Echavez St., Cebu City* 18. CEBU-LAHUG BRANCH - G/F Skyrise IT Bldg., Brgy. Apas, Lahug, Cebu City* 19. CEBU-MANDAUE BASAK - Co Tiao King Bldg., Cebu North Road Basak, Mandaue City* 20. DAGUPAN BRANCH - G/F Lyceum-Northwestern University, Tapuac District, Dagupan City* 21. DARAGA BRANCH - Rizal St., Brgy. San Roque, Daraga, Albay, Bicol* 22. DASMARIÑAS- Veluz Plaza Bldg., Zone I, Aguinaldo Highway, Dasmariñas City, Cavite* 23. DAU BRANCH - MacArthur Highway, Dau, Mabalacat, Pampanga* 24. DAVAO – RECTO- C. M Ville Abrille Bldg., C. M. Recto St. Davao City* 25. DAVAO BRANCH - G/F 8990 Corporate Center, Quirino Ave., Davao City* 26. DOLORES- STCI Bldg., McArthur Highway, San Agustin, City of San Fernando, Pampanga* 27. GENERAL SANTOS- I. Santiago Boulevard General, Santos City* 28. GUAGUA BRANCH - Plaza Burgos, Guagua, Pampanga* 29. ILOILO – JARO BRANCH - Lopez Jaena cor. EL 98 Sts., Jaro, Iloilo* 30. ILOILO – IZNART - Golden Commercial Center Bldg, Iznart St. Iloilo City* 31. IMUS- TANZANG LUMA - Tanzang Luma, Aguinaldo Highway, Imus City, Cavite* 32. KALIBO-CITYMALL – F. Quimpo St. connecting Mabini and Toting Reyes Streets, Kalibo, Aklan* 33. LA UNION- AG Zambrano Bldg., Quezon Ave., San Fernando City, La Union* 34. LAGUNA-STA. CRUZ - E & E Building, Pedro Guevarra St., Sta. Cruz, Laguna.* 35. LAOAG - J.P Rizal St. corner Balintawak St. Laoag City, Ilocos Norte* 36. LEGAZPI CITY - F. Imperial Street, Barangay Bitano, Legazpi City* 37. LINGAYEN - Unit 5-6, The Hub - Lingayen Building , National Road, Poblacion, Lingayen, Pangasinan 38. LIPA - CM RECTO - C.M. Recto Ave., Lipa City* 39. LOS BAÑOS-CROSSING- Lopez Ave., Batong Malaki, Los Baños, Laguna* 40. LUCENA- Merchan cor., Evangelista St., Lucena City* 41. MACABEBE BRANCH - Poblacion, Macabebe, Pampanga* 42. MALOLOS BRANCH - Canlapan St., Sto. Rosario, Malolos City, Bulacan* 43. MALOLOS-CATMON - Paseo del Congreso, Catmon, City of Malolos, Bulacan* 44. MEYCAUAYAN- Mancon Bldg., McArthur Highway, Calvario, Meycauayan, Bulacan* 45. MOLINO-BACOOR - 817 Molino Road Molino III, Bacoor, Cavite* 46. MOUNT CARMEL- AMB Bldg., Km. 78 McArthur Highway, Brgy. Saguin, City of San Fernando, Pampanga* 47. NAGA BRANCH - RL Bldg., Panganiban St., Lerma, Naga City* 48. OLONGAPO BRANCH - Ground Floor, City View Hotel, 25 Magsaysay Drive, New Asinan, Olongapo City* 49. ORANI BRANCH - Brgy. Balut, Orani, Bataan** 50. PLARIDEL- 0226 Cagayan Valley Road, Banga 1st, Plaridel, Bulacan* 51. PORAC BRANCH - Cangatba, Porac, Pampanga* 52. ROXAS AVE.-CAPIZ CITYMALL - Roxas Ave, brgy VI, Roxas City, Capiz 53. SAN FERNANDO BRANCH - KHY Trading Bldg., San Fernando-Gapan Rd., San Fernando City, Pampanga* 54. SAN FERNANDO – BAYAN BRANCH - JSL Building, Consunji St., San Fernando, Pampanga* 55. SAN JOSE DEL MONTE BRANCH - Ground Floor, Giron Bldg., Gov. Halili Ave., Tungkong Mangga, City of San Jose Del Monte, Bulacan* 56. SAN MIGUEL- Norberto St., San Jose, San Miguel, Bulacan* 57. SAN NARCISO BRANCH - Brgy. Libertad, San Narciso, Zambales* 58. SAN PABLO-RIZAL AVE. BRANCH – Rizal Avenue cor. Lopez Jaena St. San Pablo City, Laguna* 59. SAN PEDRO BRANCH - Gen - Ber Bldg. National Highway Landayan, San Pedro Laguna* 60. SAN RAFAEL BRANCH - Cagayan Valley cor. Cruz na Daan Roads, San Rafael, Bulacan* 61. SANTIAGO - VICTORY NORTE - JECO Bldg., Maharlika Highway cor. Quezon St., Victory Norte, Santiago City* 62. SAVEMORE SAN ILDEFONSO BRANCH - Savemore San Ildefonso, Poblacion, San Ildefonso, Bulacan* 63. SAVEMORE TAGAYTAY-MENDEZ - Mendez Crossing West, Tagaytay-Nasugbu Highway corner Mendez - Tagaytay Rd, Tagaytay City* 64. SAVEMORE TALISAY-NEGROS BRANCH – Talisay, Mabini St., Zone 12 Paseo Mabini Talisay City Negros Occidental* 65. STA. ANA BRANCH - Poblacion, Sta. Ana, Pampanga* 66. STA. MARIA- JC De Jesus cor. M. De Leon, Poblacion, Sta. Maria, Bulacan* 67. STA. RITA BRANCH - San Vicente, Sta. Rita, Pampanga* 68. STA. ROSA BRANCH - Sta. Rosa-Tagaytay Highway, Sta. Rosa, Laguna* 69. STA. ROSA-BALIBAGO - National Highway cor. Lazaga St. Balibago, Sta. Rosa, Laguna* 70. STO. TOMAS- MAHARLIKA - Agojo Bldg., Maharlika Highway, Sto. Tomas, Batangas* 71. SUBIC BRANCH - Baraca, Subic, Zambales* 72. TACLOBAN CITY – GF,YVI Center, Bldg A, Fatima Village, Tacloban City, Leyte

73. TAGUM-CITYMALL – Maharlika Highway cor. Lapu-Lapu Extension, Brgy. Magugpo Tagum City* 74. TANAUAN CITY - Jose P. Laurel National Highway, Darasa, Tanauan City, Batangas 75. TARLAC - MAC ARTHUR - McArthur Highway, San Nicolas, Tarlac City* 76. TUGUEGARAO- Metropolitan Cathedral Parish, Rectory Complex, Rizal St., Tuguegarao City* 77. URDANETA- MacArthur Highway, Nancayasan, Urdaneta City, Pangasinan* 78. VIGAN- Plaza Maestro Convention Center, Florentino St. and Burgos St. Vigan City, Ilocos Sur* 79. ZAMBOANGA-CITYMALL BRANCH – CityMall, Don Alfaro St., Tetuan, Zamboanga* * One (1) ATM ** Two (2) ATMs *** Three (3) ATMs China Bank - Off Branch ATM Directory Metro Manila 1. 168 MALL – 3F Food Court, 168 Mall, Sta. Elena St., Binondo, Manila 2. 999 SHOPPING MALL – Basement Lobby 999 Shopping Mall, 1002-1062 Soler St., Brgy. 293, Zone 28, District 3, Binondo, Manila 3. 999 SHOPPING MALL 2 – Basement, 999 Shopping Mall Bldg. 2, Recto - Soler Sts., Binondo, Manila 4. ALABANG MALL – Alabang Town Center, Alabang - Zapote Road cor. Madrigal Ave., Muntinlupa City 5. ALFAMART A. MABINI MANGGAHAN – A. Mabini Street, Manggahan, Pasig City 6. ALFAMART DAEZ CAMARIN CALOOCAN – Daez Commercial Bldg., Susano Road, Bagumbong, Caloocan City 7. ALFAMART F.B. HARRISON – GF F.B. Harrison St., Brgy. San Rafael, Pasay City 8. ALFAMART JHOCSON SAMPALOC – 534-548 M.F. Jhocson St., Zone 042, Brgy. 408, Sampaloc, Manila 9. ALFAMART MAAX – Unit 111 Mall of Asia Annex Bldg. (MAAX), Seaside Blvd., San Rafael, Pasay City 10. ALFAMART NAGA ROAD LAS PIÑAS – Alfamart, Naga Road, Pulang Lupa 2, Las Piñas City 11. ALFAMART SAN LAZARO – Units 108B-113B SM City San Lazaro, A.H. Lacson Ext., Sta. Cruz, Manila 12. ALI MALL – ATM Booth #1 UGF Ali Mall, P.Tuazon Blvd., Araneta Center, Quezon City 13. ALI MALL 2 – LGF Times Square Entrance, Ali Mall, P. Tuazon Blvd., Araneta Center, Quezon City 14. ARMSCOR MARIKINA – 2 Armscor Avenue, Brgy. Fortune, Marikina City 15. ATENEO DE MANILA UNIVERSITY – G/F Kostka Hall, Ateneo De Manila University, Katipunan Ave., Loyola Heights, Quezon City 16. CASH AND CARRY – 2/F Cash and Carry Mall, between South Super Highway & Filmore St., Brgy. Palanan, Makati City 17. CBS HEAD OFFICE LOBBY – CBS Lobby, 314 Sen. Gil J. Puyat Avenue, Makati City 18. CHIANG-KAI-SHEK – Chiang Kai Shek College, 1274 P. Algue St., Tondo, Manila 19. CENTURY CITY MALL – 3F Century City Mall, Kalayaan Ave. cor. Salamanca St., Brgy. Pobalcion, Makati City 20. COMEMBO COMMERCIAL COMPLEX – Comembo Commercial Complex, J.P. Rizal Ext. cor. Sampaguita St., Comembo, Makati City 21. COMMERCE CENTER – Commerce Ave. cor. Filinvest Ave., Alabang, Muntinlupa City 22. CONRAD S MAISON MALL – 2F Conrad Hotel, Coral Ave., SM MOA Complex, Pasay City 23. CYBER PARK TOWER 1 CUBAO – Lobby Tower 1, Araneta Center, Cubao, Quezon City 24. CYBER PARK TOWER 2 CUBAO – Lobby Tower 2, Araneta Center, Cubao, Quezon City 25. DASMARIÑAS VILLAGE ASSOCIATION OFFICE – 1417 Campanilla St., Brgy. Dasmariñas Village, Makati City 26. EASTWOOD CITY WALK 2 – G/F ATM 1 Eastwood City Walk Ph. 2, Eastwood City Cyberpark, 188 E. Rodriguez Jr. Ave., Bagumbayan, Quezon City 27. EASTWOOD CYBERMALL – 2F Eastwood Cybermall, Eastwood Ave., Eastwood City Cyberpark, Bagumbayan, Quezon City 27. EASTWOOD MALL – Level 1 ATM 2 Ph.2, Eastwood Mall, E. Rodriguez Jr. Ave., Bagumbayan, Quezon City 28. FAMILY MART PARK SQUARE – Park Square Bldg., South Drive cor. Theater Drive, Ayala Center, Makati City 29. FAMILY MART UP TECHNOHUB – Space 132 GF UP Technohub, Quezon City 30. GATEWAY MALL – Booth 4 Level 2 Gateway Mall, Cubao, Quezon City 31. GLORIETTA 4 – Glorietta 4, Ayala Center, Makati City 32. GLORIETTA 5 – G/F Glorietta 5, Ayala Center, Makati City 33. GREENBELT 3 – Greenbelt 3 Drop-off Area, Makati Ave., Makati City 34. GREENHILLS THEATER MALL – Main Entrance Greenhills Theater Mall, San Juan City 35. GREENMEADOWS CLUBHOUSE – Lovebird St., Green Meadows Subdivision, Brgy. Ugong Norte, Quezon City 36. HIGH POINTE MEDICAL HUB – 241 Shaw Blvd, Mandaluyong City 37. HOLIDAY ISLAND CALOOCAN – G/F Phase 2, Commercial Site Dutong St. cor. Kanlaon St., Bagong Silang, Caloocan City 38. IACADEMY BUENDIA – G/F iAcademy Plaza, H.V. Dela Costa St., Makati City 39. JACKMAN EMPORIUM – Jackman Emporium Department Store Bldg., Grace Park, Kalookan City 40. JACKMAN PLAZA - MUÑOZ – Jackman Plaza Muñoz, EDSA, Muñoz, Quezon City

41. JGC ALABANG – JGC PHILS. Bldg., 2109 Prime St., Madrigal Business Park Ph III, Ayala Alabang, Muntinlupa City 42. KATARUNGAN VILLAGE – Katarungan Village Admin Office, F. Reria cor. University Road, Muntinlupa City 43. KIMSTON PLAZA – Kimston Plaza, P. Victor St. cor. P. Burgos St., Guadalupe Nuevo, Makati City 44. LAKEVIEW BINANGONAN – Manila East Road, Tagpos, Binangonan, Rizal 45. LANDMARK - MAKATI – G/F The Landmark Bldg., Makati Ave., Ayala Center, Makati City 46. LANDMARK - TRINOMA – ATM Slot 4, 2F Landmark Trinoma, North Ave. cor. EDSA, Quezon City 47. LIANA'S SAMPALOC – 537 Earnshaw St., Sampaloc, Manila 48. LOYOLA GRAND VILLAS – Loyola Grand Villas Lifeline, Soliven Ave., Quezon City 49. LRT 2 KATIPUNAN – Westbound, LRT 2 Katipunan Station, Aurora Blvd., Loyola Heights, Quezon City 50. LRT 2 PUREZA – Westbound, LRT 2 Pureza Station, R. Magsaysay Blvd., Sta. Mesa, Manila 51. LRT 2 RECTO EAST – East Side, LRT 2 Recto Station, Recto Avenue, Sta. Cruz, Manila 52. LRT 2 RECTO WEST – West Side, LRT 2 Recto Station, Recto Avenue, Sta. Cruz, Manila 53. LRT 2 V. MAPA – Westbound, LRT 2 V. Mapa Station, R. Magsaysay Blvd., Sta. Mesa, Manila 54. MALABON CITISQUARE – G/F Malabon Citisquare, C-4 Road cor. Dagat-dagatan Ave., Malabon City 55. MARKET! MARKET! 1 – Market! Market!, Fort Bonifacio Global City, Taguig City 56. MARKET! MARKET! 2 – 2F Market! Market!, Fort Bonifacio Global City, Taguig City 57. MARKET! MARKET! 3 – G/F ATM Center in Fiesta Market, Market! Market!, Fort Bonifacio Global City, Taguig City 58. MEDICAL CITY – Medical City, Ortigas Ave., Pasig City 59. METRO POINT MALL – 3F Metro Point Mall, EDSA cor. Taft Ave., Pasay City 60. METROWALK – ATM 1 Bldg C, G/F Metrowalk Commercial Complex, Meralco Ave., Pasig City 61. MIDAS HOTEL – Midas Hotel, 2702 Roxas Blvd., Pasay City 62. MRT - BONI STATION – MRT - Boni Station, EDSA, Mandaluyong 63. MRT - CUBAO STATION – MRT - Cubao Station, EDSA, Quezon City 64. MRT - NORTH AVE. – MRT - North Avenue Station, EDSA, Quezon City 65. MRT - SHAW – MRT - Shaw Station, EDSA, Mandaluyong City 66. MULTINATIONAL CLUBHOUSE – Clubhouse, Nazareth cor. Judea St., Multinational Village, Parañaque City 67. NEWPORT MALL 4F – 4F Newport Mall, Resorts World, Newport City, Pasay City 68. NOVA SQUARE – G/F Nova Square, Quirino Highway, Brgy. San Bartolome, Novaliches, Quezon City 69. ONE E - COM CENTER – G/F One E-Com Center, Palm Coast Ave., SM MOA Complex, Pasay City 70. ONE MALL VALENZUELA – Gen. T. De Leon, Valenzuela City 71. PROMENADE GREENHILLS – Missouri Entrance, Promenade Mall, Greenhills Shopping Center, San Juan City 72. PUREGOLD - BLUMENTRITT – 286 Blumentritt St., Sta Cruz, Manila 73. PUREGOLD - E. RODRIGUEZ – ATM #1 Puregold E. Rodriguez, Cosco Bldg., E. Rodriguez Ave. cor. G. Araneta Ave., Quezon City 74. PUREGOLD - LAKEFRONT – Puregold Lakefront, Presidio Subdivision, Lakefront, Muntinlupa City 75. PUREGOLD - PASO DE BLAS – LGF Puregold Plaso de Blas, Plaso de Blas cor. Gen. Luis St., Malinta Ex, Valenzuela City 76. PUREGOLD JR. - PANDACAN – Puregold Jr. Pandacan, West J. Zamora St., Pandacan, Manila 77. PUREGOLD MAYPAJO KALOOKAN – Puregold Maypajo, J.P. Rizal St., Brgy. Maypajo, Caloocan City 78. QUICKLEAN MAYBUNGA – 369 Dr. Sixto Antonio Avenue, Maybunga, Pasig City 79. REGALIA PARK TOWER – 150 P. Tuazon Blvd., Cubao, Quezon City 80. RESORTS WORLD GAMING AREA – G/F Casino Gaming Area, Resorts World, Pasay City 81. ROBINSONS FORUM PIONEER – ATM Center Pioneer Side, Forum Robinsons, Pioneer St. cor. EDSA, Mandaluyong City 82. ROBINSONS GALLERIA – Robinsons Galleria, EDSA cor. Ortigas Ave., Pasig City 83. ROBINSONS GALLERIA 2 – Robinsons Galleria, EDSA cor. Ortigas Ave., Pasig City 84. ROBINSONS GALLERIA 3 – West Wing, Robinsons Galleria, EDSA cor. Ortigas Ave., Pasig City 85. ROBINSONS PLACE - MANILA – G/F Padre Faura Entrance, Robinsons Place Manila, Pedro Gil cor. Adriatico St., Ermita, Manila 86. ROCKWELL BUSINESS CENTER – Rockwell Business Center, Ortigas Ave., Pasig City 87. ROCKWELL POWER PLANT – Stall No. 060 Ground Level, Power Plant Mall, Makati City 88. SAVERS CENTER – G/F Savers Center (right side of Main Entrance), along EDSA cor. Taft Ave., Pasay City 89. SHOP AND RIDE – 248 Gen. Luis St., Brgy. Nova Proper, Novaliches, Quezon City 90. SHOP AND RIDE STA. MONICA – Shop & Ride Sta. Monica, 1004 Quirino Highway, Dumalay Street, Novaliches, Quezon City 91. SHOPWISE - ANTIPOLO – Shopwise Bldg., M.L. Quezon St. cor. Circumferential Road, San Roque, Antipolo City 92. SHOPWISE - COMMONWEALTH – Shopwise, Blk 17, Commonwealth Ave., Quezon City 93. SHOPWISE MARKETPLACE EAST BAY – Marketplace East Bay, East Service Road, Muntinlupa City 94. SHOPWISE METLIVE PASAY – Blue Wave Mall, Diosdado Macapagal cor. EDSA, Metropolitan Park Bay City, Pasay 95. SHOPWISE SUCAT – Shopwise Sucat, Dr. A. Santos Avenue corner Soreena Avenue, Paranaque City 96. SM CENTER ANGONO – SM Center Angono, Quezon Ave. Angono, Rizal 97. SM CENTER LAS PIÑAS – G/F SM Center Las Piñas, Alabang - Zapote Road, Las Piñas City
98. SM CITY THE BLOCK – GF Hypermarket - The Block, SM City North Edsa, North Avenue corner EDSA, Quezon City 99. SM HYPERMARKET - MANDALUYONG – SM Hypermarket Mandaluyong, 121 Shaw Blvd. cor. E.Magalona St., Brgy. Bagong Silang, Mandaluyong City 100. SM MANILA – UGF SM Manila Main Entrance, Natividad A. Lopez cor. Antonio Villegas St., Ermita, Manila 101. SM MEGAMALL BLDG. B – Level 2 Bldg. B, SM Megamall, EDSA cor. Julia Vargas St., Mandaluyong City 102. SM MOA HYPERMARKET – G/F SM Hypermarket, SM Mall of Asia, Pasay City 103. SM MOA SEASIDE FERRY TERMINAL – SM MOA Seaside Blvd. near Esplanade, Pasay City 104. SM MUNTINLUPA – ATM 2 G/F (beside Rear Entrance) SM Muntinlupa, National Road, Brgy. Tunasan, Muntinlupa City 105. SM TAYTAY OFF-BRANCH – 2F Bldg. A, SM Taytay, Manila East Road, Brgy. Dolores, Taytay, Rizal 106. SOLAIRE MANILA 2 – Entertainment City, Aseana Ave., Tambo, Parañaque City 107. SOLAIRE RESORT & CASINO – Entertainment City, Aseana Ave., Tambo, Parañaque City 108. SOUTHGATE MALL – Alphaland Southgate Mall, EDSA cor. Chino Roces Ave., Makati City 109. ST. FRANCIS SQUARE – Basement 1 St. Francis Square, Doña Julia Vargas Ave. cor. Bank Drive, Ortigas Center, Mandaluyong City 110. ST. JUDE COLLEGE – Dimasalang St. cor. Don Quijote St., Sampaloc, Manila 111. ST. LUKE'S - THE FORT – Basement, St. Luke's Medical Center, 5th Ave., Fort Bonifacio Global City, Taguig City 112. ST. LUKE'S - THE FORT 2 – Basement, St. Luke's Medical Center, 5th Ave., Fort Bonifacio Global City, Taguig City 113. STI - DELOS SANTOS MEDICAL CENTER – 201 E.Rodriguez Sr. Blvd., Quezon City 114. TAFT - U.N. – G/F Times Plaza, T.M Kalaw cor. Gen. Luna St., Ermita, Manila 115. TIENDESITAS – Tiendesitas, Ortigas Ave. cor E. Rodriquez Ave., Pasig City 116. TRINOMA OFF-BRANCH 1 – Level 1 Trinoma, North Ave. cor. EDSA, Quezon City 117. TRINOMA OFF-BRANCH 2 – Level 1 Trinoma, North Ave. cor. EDSA, Quezon City 118. TWO SHOPPING CENTER – Two Shopping Center, Taft Ave. Ext., 026 Zone 10, Pasay City 119. UNIMART GREENHILLS – B1 Unimart Greenhills Shopping Center, Ortigas Ave., San Juan City 120. UP TOWN CENTER – 2F UP Town Center, Katipunan Ave., Brgy. UP Campus Diliman, Quezon City 121. UPM - PGH – Faculty Medical Arts Bldg., PGH Compound, Taft Ave., Ermita, Manila 122. URDANETA VILLAGE - Urdaneta Village Clubhouse, Urdaneta Ave., Makati City 123. UST - DOCTOR'S CLINIC – University of Sto. Tomas Hospital, Vestibule and New Doctor's Clinic, A.H. Lacson Ave., Sampaloc, Manila 124. UST HOSPITAL – University of Sto. Tomas Hospital, A.H. Lacson Ave., Sampaloc, Manila 125. UST HOSPITAL 3 – G/F Clinical Division, University of Sto. Tomas Hospital, A.H. Lacson Ave., Sampaloc, Manila 126. VICTORY CENTRAL MALL – ATM 2 G/F Victory Central Mall, #717 Old Victory Compound, Rizal Ave., Monumento, Caloocan City 127. VICTORY FOOD MARKET BACLARAN – Victory Food Market, Redemptorist Road, Baclaran, Parañaque City 128. VICTORY PASAY MALL – Victory Pasay Mall, Antonio S. Arnaiz Ave, Pasay City 129. WACK WACK GOLF & COUNTRY CLUB – Main Lobby Clubhouse, Wack Wack Golf & Country Club, Shaw Blvd., Mandaluyong City 130. WALTER MART - MAKATI – G/F Waltermart Makati, 790 Chino Roces Ave. cor. Antonio Arnaiz, Makati City 131. WALTER MART - NORTH EDSA – Walter Mart Bldg., EDSA, Quezon City 132. WALTER MART - SUCAT – Walter Mart Sucat, Dr. A. Santos Ave., Brgy. San Isidro, Sucat, Parañaque City 133. WHITE PLAINS CLUBHOUSE – 10 Natabo Rd., White Plains Clubhouse Area, Quezon City 134. WORLD CITI MEDICAL ANONAS – Lobby Entrance, 960 Aurora Blvd. corner Anonas St., Quezon City 135. ZABARTE TOWN CENTER – Basement Zabarte Town Center, 588 Camarin Road corner Zabarte Road, Caloocan City
Provincial 1. 2 MANGO AVENUE – 2 Mango Ave. - Solara Bldg., General Maxilom Ave, Cebu City 2. 7-11 IMUS BAYAN LUMA – Aguinaldo Highway cor. Patindig Araw Road, Bayan Luma VIII, Imus, Cavite 3. 7-11 IMUS TANZANG LUMA – Aguinaldo Highway cor. Captain B. Paredes St., Tanzang Luma 1, Imus, Cavite 4. A. BONIFACIO - MCDONALD'S BAGUIO – Villanueva Bldg., Lower Bonifacio St., Baguio City 5. ABREEZA MALL – Abreeza Mall, J.P. Laurel Ave., Bajada, Davao City, Davao del Sur 6. ACC HYPERMART SAN ANDRES – San Andres, Catanduanes 7. ACIENDA DESIGNER OUTLET SILANG – G/F Acienda Designer Outlet, E. Aguinaldo Highway, Silang, Cavite 8. ADVENTIST UNIVERSITY OF THE PHILIPPINES – Adventist University of the Philippines, Sta. Rosa - Tagaytay Road, Puting Kahoy, Silang, Cavite 9. AG&P – Atlantic, Gulf & Pacific Company of Manila Inc., Brgy. San Roque, Bauan, Batangas 10. ALFAMART - LUMINA – Alfamart Lumina, Aguinaldo Highway cor. Nueno Ave., Imus, Cavite 11. ALFAMART - TRECE MARTIRES – CPC Bldg., Governor's Drive cor. Hugo Perez, Trece Martires, Cavite 12. ALFAMART FILINVEST TANZA – Alfamart Filinvest Tanza, Filinvest Ave., Westwood Place Subd. Ph. 2, Brgy. Paradahan, Tanza, Cavite 13. ALFAMART GOLDEN CITY – Molino-Paliparan Road, Salawag, Dasmariñas City, Cavite 14. ALFAMART ILANG-ILANG TANZA – Alfamart Ilang-Ilang Tanza, Ilang-ilang St., De Roman Subd., Daang Amaya 1, Tanza, Cavite

15. ALFAMART LANCASTER – Alfamart Lancaster, MCS Bldg., Advincula Ave., Alapan II-A, Imus, Cavite 16. ALFAMART L'PASEO ARCADE INDANG – LGF L'Paseo Building, Indang-Trece Martires Road, Indang, Cavite 17. ALFAMART PACITA COMPLEX – Alfamart, Block 3 Phase 3A Pacita Complex, San Pedro, Laguna 18. ALFAMART POBLACION 4 CALACA – #149 Marasigan St., Poblacion 4, Calaca, Batangas 19. ALFAMART POBLACION ROSARIO – Alfamart Poblacion Rosario, 153 Gen. Trias Drive, Brgy. Poblacion, Rosario, Cavite 20. ALFAMART VILLA CATALINA DASMARIÑAS – Lot 6123 Don Placido Campos Avenue, San Agustin, Dasmariñas City, Cavite 21. ALFAMART YAKAL SILANG CAVITE – G/F Alfamart Yakal Silang Cavite, 137 Pedro Montoya St. cor. Yakal, Silang, Cavite 22. ALLEN AVENUE CATBALOGAN – Centro Mall, Allen Ave., Brgy. 04, Catbalogan City, Samar 23. ALWANA BUSINESS PARK – National Highway, Brgy. Cugman, Cagayan de Oro City, Misamis Oriental 24. ANGEL SUPERMARKET – Luna St. cor. Burgos St., Brgy. Quirino, Solano, Nueva Vizcaya 25. ANGELES UNIVERSITY FOUNDATION MEDICAL CENTER – Basement, Angeles University Foundation Medical Center, McArthur Highway cor. Diego Silang St., Angeles City, Pampanga 26. AQUATIC CENTER - New Clark City Aquatic Center, Capas, Tarlac 27. ARAULLO UNIVERSITY – Araullo University, Maharlika Highway, Brgy. Bitas, Cabanatuan City, Nueva Ecija 28. ATENEO DE DAVAO UNIVERSITY – Ateneo de Davao University, Roxas Ave, Poblacion Dist., Davao City, Davao del Sur 29. ATHLETES VILLAGE BLDG. 2 – New Clark City Registration Center, Capas, Tarlac 30. ATHLETES VILLAGE BLDG. A – New Clark City Athletes' Village Bldg. A, Capas, Tarlac 31. ATHLETES VILLAGE BLDG. B – New Clark City Athletes' Village Bldg. B Lobby, Capas, Tarlac 32. ATHLETIC STADIUM 1 – New Clark City Athletic Stadium 1, Capas, Tarlac 33. ATHLETIC STADIUM 2 – New Clark City Athletic Stadium 1, Capas, Tarlac 34. AVENUE HOTEL BACOLOD – Avenue Suites Hotel and Spa, 12th St. cor Lacson St., Bacolod City, Negros Occidental 35. AYALA CENTER CEBU – Level 3 ATM 1 Ayala Center Cebu, Cebu Business Park, Cebu City 36. BRENT INTERNATIONAL SCHOOL MANILA – Brentville Subdivision, Mamplasan, Biñan, Laguna 37. BU DGET WISE SUPERMARKET – Budget Wise Supermarket, Veterans Ave., Zamboanga City, Zamboanga del Sur 38. CALTEX - SLEX 1 – South Luzon Expressway-Northbound, Brgy. San Antonio, San Pedro, Laguna 39. CB MALL URDANETA – CB Mall, McArthur Highway, Brgy. Nancayasan, Urdaneta City, Pangasinan 40. CDO MEDICAL CENTER – CDO Medical Center Bldg. 2, Tiano Brothers cor. Nacalaban St., Cagayan de Oro City, Misamis Oriental 41. CEBU DOCTORS' HOSPITAL – Cebu Doctors' University Hospital, Osmeña Blvd., Cebu City, Cebu 42. CEBU DOCTORS' UNIVERSITY – Cebu Doctors' University Hospital, #1 Potenciano Larrazabal Ave., North Reclamation Area, Mandaue City, Cebu 43. CELEBES COCONUT BUTUAN – Km 9, Brgy. Taguibo, Butuan City, Agusan Del Norte 44. CENTRIO MALL – G/F Centrio Mall, CM Recto cor. Corrales St., Cagayan de Oro, Misamis Oriental 45. CLARK GATEWAY – Clark Gateway Commercial Complex, Gil Puyat Ave., Brgy. San Francisco, Mabalacat, Pampanga 46. CORPUS CHRISTI – Corpus Christi School, Tomas Saco St., Macasandig, Cagayan de Oro City, Misamis Oriental 47. DAGUPAN - NEPO MALL – G/F Nepo Mall Dagupan, Arellano St., Dagupan City, Pangasinan 48. DAVAO ADVENTIST HOSPITAL – Davao Adventist Hospital, Km. 7 McArthur Highway, Bangkal, Davao City, Davao del Sur 49. DAVAO METRO SHUTTLE – Pereyras Terminal 1, Magugpo West, Tagum City, Davao del Norte 50. DIPOLOG CENTER MALL – Dipolog Center Mall, 138 Rizal Ave., Dipolog City, Zamboanga del Norte 51. DIPSSCOR – Davao Integrated Port And Stevedoring Services Corporation Bldg., International Port of Davao, Sasa Wharf, Davao City, Davao del Sur 52. DLSU - DASMARIÑAS – College of Engineering, DLSU Dasmariñas, Dasmariñas City, Cavite 53. DLSU - HEALTH SCIENCE CAMPUS – De La Salle University Health Science Campus Inc., Congressional Road, Dasmariñas City, Cavite 54. DLSU MAC – G/F Medical Arts Centre Bldg., DLSU Medical Center Compound, Congressional Road, Dasmariñas City, Cavite 55. DUSIT THANI D2 DAVAO – Stella Hizon Reyes Drive, Bo. Pampanga, Davao City, Davao del Sur 56. EAGLE RIDGE COUNTRY CLUB – Club House, Eagle Ridge and Country Club, Brgy. Javalera, Gen. Trias, Cavite 57. ECCO BUILDING – G/F ECCO Bldg. (beside unit A), Fil-Am Friendship Highway, Brgy. Anunas, Angeles City, Pampanga 58. FAMILY MART BALITI PAMPANGA – McArthur Hiway cor. Baliti Road, San Fernando, Pampanga 59. FAMILY MART ONE NORTHMALL – McArthur Hiway, Dau, Mabalacat, Pampanga 60. FESTIVE WALK - ANNEX BLDG. – Annex Bldg., Iloilo Festive Walk, Megaworld Blvd., Iloilo Business Park, Mandurriao, Iloilo City 61. FESTIVE WALK - FOOD HALL – Food Hall, Iloilo Festive Walk, Megaworld Blvd., Iloilo Business Park, Mandurriao, Iloilo City 62. FESTIVE WALK - OUTDOOR – Outdoor Area, Iloilo Festive Walk, Megaworld Blvd., Iloilo Business Park, Mandurriao, Iloilo City 63. FESTIVE WALK - WILCON – Wilcon Area, Iloilo Festive Walk, Megaworld Blvd., Iloilo Business Park, Mandurriao, Iloilo City 64. FRIENDSHIP SUPERMARKET MUÑOZ NE – D. Delos Santos St., Science City of Muñoz, Nueva Ecija 65. GAISANO - BULUA – Gaisano Bulua Mall, Bulua St., Cagayan de Oro City, Misamis Oriental 66. GAISANO - ILIGAN – G/F Gaisano Citi Super Mall, Iligan City, Lanao del Norte 67. GAISANO - LAPU-LAPU CITY – Gaisano Mactan Island Mall, Pusok, Lapu-Lapu City, Cebu

68. GAISANO - MASBATE – Gaisano Capital Masbate, Quezon St., Crossing, Masbate City, Masbate 69. GAISANO - PUERTO – Unit #1 ATM - 2nd Level Gaisano Puerto, Sayre Highway, Puerto, Cagayan de Oro City, Misamis Oriental 70. GAISANO MALL - BAJADA DAVAO – Gaisano Mall of Davao, J.P. Laurel Ave., Bajada, Davao City, Davao del Sur 71. GAISANO MALL - CAGAYAN DE ORO – Unit #3 Level 2 Atrium Gaisano Mall, Corrales Extension cor. CM Recto Ave., Cagayan de Oro City, Misamis Oriental 72. GOLDEN PRINCE HOTEL – Golden Prince Hotel & Suites, Acacia St. cor. Archbishop Reyes Ave., Cebu City, Cebu 73. GOOD SAMARITAN HOSPITAL – Good Samaritan Compound, Burgos Ave., Cabanatuan City, Nueva Ecija 74. GREEN CITY MEDICAL CENTER DOLORES – Gapan Olongapo Road, San Fernando, Pampanga 75. GROSVENOR SQUARE – Grosvenor Square, Josefa St., Angeles City, Pampanga 76. HOLY ANGEL UNIVERSITY 2 – G/F Holy Angel University Student's Center, Sto. Rosario St., Angeles City, Pampanga 77. JENRA JUMBO DOLORES – Olongapo-Gapan Road, Dolores, San Fernando, Pampanga 78. JENRA MALL – JENRA Grand Mall, Sto. Rosario St., Angeles City, Pampanga 79. JOLLIBEE - MABALACAT – ATM 2 ATM Center (beside Jollibee), McArthur Highway, Brgy. San Francisco, Mabalacat City, Pampanga 80. JOLLIBEE FLORIDABLANCA – Macabulos St., Floridablanca, Pampanga 81. JOLLIBEE FLORIDABLANCA 2 – Macabulos St., Floridablanca, Pampanga 82. JOLIIBEE GUAGUA – Jollibee Compound, Jose Abad Santos Avenue, Guagua, Pampanga 83. JOLLIBEE MONCADA – McArthur Highway, Poblacion 1, Moncada, Tarlac 84. KCC MALL - GENSAN – G/F KCC Mall GenSan, J. Catolico Sr. Ave., Gen. Santos City, South Cotabato 85. KCC MALL DE ZAMBOANGA – KCC Mall de Zamboanga, Gov. Camins Rd., Camino Nuevo, Zamboanga City, Zamboanga del Sur 86. KMSCI – Kidapawan Medical Specialist Center Inc., Sudapin, Kidapawan City, North Cotabato 87. LA NUEVA MINGLANILLA – La Nueva Supermart Inc., Poblacion, Minglanilla, Cebu 88. LA NUEVA SUPERMART – La Nueva Supermart Inc., G.Y. Dela Serna St., Lapu-Lapu, Cebu City, Cebu 89. LCC PEÑARANDA – LCC Supermarket, Peñaranda cor. Rizal St., Legazpi City, Albay 90. LCC SUPERMAKET AYALA LEGAZPI – Liberty Center, Quezon Ave., Capantawan, Legazpi City, Albay 91. LEE HYPERMARKET – G/F Lee Hypermart, Jose E. Romero Sr. Ave., Bagacay, Dumaguete City, Negros Oriental 92. LEE SUPER PLAZA – G/F Lee Super Plaza, M. Perdices cor. San Jose St., Dumaguete City, Negros Oriental 93. LEGAZPI INTERNATIONAL AIRPORT – Magayon Dr., Legazpi City International Airport, Legazpi City, Albay 94. LIM KET KAI MALL – M4-193B LIMKETKAI Mall, Lim Ket Kai Drive, Cagayan de Oro City, Misamis Oriental 95. LITE PORT TAGBILARAN – Celestino Gallares St., Poblacion 2, Tagbilaran City, Bohol 96. LOPUE'S EAST CENTRE – Lopue's East Centre, Burgos St. cor. Carlos Hilado National Highway, Bacolod City, Negros Occidental 97. LORMA HOSPITAL – Lorma Medical Center, San Fernando, La Union 98. LOTRIM DAVAO CITY – GF LCI Building 2, 100 Roxas Avenue, Barangay 32-D Poblacion, Davao City, Davao del Sur 99. LOTUS CENTRAL MALL – G/F Lotus Central Mall, Nueno Ave., Imus, Cavite 100. LVGH VALENCIA – La Viña General Hospital, ML Quezon St., Poblacion, Valencia City 101. MAAP – Maritime Academy of Asia and the Pacific, Kamaya Point Road, Mariveles, Bataan 102. MACTAN ISLA RESORT – Agus Road, Ibabao, Marigondon, Lapu Lapu City, Cebu 103. MACTAN MARINA MALL – G/F Mactan Marina Mall, MEPZ 1, Lapu-Lapu City, Cebu 104. MAGIC MALL – G/F Magic Mall, Alexander St., Poblacion, Urdaneta City, Pangasinan 105. MAGIC STARMALL – UGF Magic Star Mall, Romulo Blvd., Brgy. Cut-Cut 1, Tarlac City, Tarlac 106. MALOLOS OFF-BRANCH – G/F Graceland Mall, Bulacan State University Grounds, McArthur Highway, Guinhawa, Malolos City, Bulacan 107. MALTA HOSPITAL TORIL – Malta Hospital Toril, McArthur Highway, Toril, Davao City, Davao del Sur 108. MARIA REYNA HOSPITAL – Beside Hospital Entrance/Exit, Maria Reyna Hospital, T.J. Hayes St., Cagayan De Oro City, Misamis Oriental 109. MARITON GROCERY DON DOMINGO – Mariton Grocery, Don Domingo, Tuguegarao City, Cagayan 110. MARKET CITY – Market City Bldg., Bus Terminal, Agora, Cagayan De Oro, Misamis Oriental 111. MARQUEE MALL 1 – G/F Activity Center, Marquee Mall, Aniceto Gueco St. , Angeles City, Pampanga 112. MATINA TOWN SQUARE – G/F Strip Bldg., Matina Town Center, along McArthur Highway, Matina, Davao City, Davao del Sur 113. MCIA - DOMESTIC CHECK-IN AREA – Mactan Cebu International Airport, Lapu-Lapu Airport Road, Lapu-Lapu City, Cebu 114. MCIA - DOMESTIC DEPARTURE HALL – Mactan Cebu International Airport, Lapu-Lapu Airport Road, Lapu-Lapu City, Cebu 115. MCIA DEPARTURE CHECK-IN SOUTHWING – Mactan Cebu International Airport, Lapu-Lapu Airport Road, Lapu Lapu City, Cebu 116. MCIA DOMESTIC ARRIVAL – Mactan Cebu International Airport, Lapu Lapu Airport Road, Lapu Lapu City, Cebu 117. MERCY HOSPITAL ILIGAN – Sister of Mercy Road, Iligan City, Lanao del Norte 118. MHAM CEBU – Entrance Matias H. Aznar, Memorial College, R. Duterte St., Cebu City, Cebu 119. MINDANAO SANITARIUM AND HOSPITAL – Mindanao Sanitarium and Hospital, Tibanga Highway, Iligan City, Lanao del Norte 120. MJS HOSPITAL – Manuel J. Santos Hospital, 554 Montilla Blvd., Butuan City, Agusan del Norte

121. MOTHER TERESA HOSPITAL – Mother Teresa of Calcutta Medical Center, McArthur Highway, Brgy. Maimpis, City of San Fernando, Pampanga 122. MUZON UPTOWN – G/F Muzon Uptown, Brgy. Muzon, San Jose Del Monte, Bulacan 123. NAGALAND E-MALL – P.Diaz cor. Elias Angeles St., San Francisco, Naga City, Cebu 124. NAKASHIN DAVAO INTERNATIONAL – Malagamot Road, Kilometer 14, Panacan, Davao City 125. NEPO MALL - ANGELES – Nepo Mall Angeles, Doña Teresa Ave. cor. St. Joseph St., Nepo Mart Complex, Angeles, Pampanga 126. NEWPOINT ANGELES – GF ATM Center Newpoint Mall, Plaridel St., Sto. Rosario, Angeles City, Pampanga 127. NORTHSIDE DOCTORS HOSPITAL – Northside Doctors Hospital, Guimod, Bantay, Vigan City, Ilocos Sur 128. NOTRE DAME DE CHARTRES HOSPITAL – Notre Dame De Chartres Hospital, #25 Gen. Luna Road, Baguio City, Benguet 129. NUEVA ECIJA DOCTORS HOSPITAL – Nueva Ecija Doctors Hospital, Maharlika Highway, Cabanatuan City, Nueva Ecija 130. NUVALI SOLENAD 2 – G/F Solenad 2 Nuvali, Sta. Rosa-Tagaytay Road, Don Jose, Sta. Rosa, Laguna 131. NUVALI SOLENAD 3 BLDG. B – G/F Bldg. B Solenad 3 Nuvali, Sta. Rosa-Tagaytay Road, Don Jose, Sta. Rosa, Laguna 132. NUVALI SOLENAD HAWKERS MARKET – Hawkers Market, Solenad 3 Nuvali, Sta. Rosa-Tagaytay Road, Don Jose, Sta. Rosa, Laguna 133. ORCHARD GOLF AND COUNTRY CLUB – Gate 2, The Orchard Golf and Country Club Inc., Jose Abad Santos, Dasmariñas City, Cavite 134. OSPA - FARMERS' MEDICAL CENTER – Ormoc Sugarcane Planters Association - Farmers Medical Center, Carlota Hills, Brgy. Can-Adieng, Ormoc City, Leyte 135. OUR LADY OF THE PILLAR – G/F Our Lady of the Pillar Medical Center (near Emergency Room), Tamsui Ave., Bayan Luma II, Imus, Cavite 136. PACIFIC MALL 2 – Pacific Mall Bldg., Landco Business Park, F. Imperial St., Legazpi Port District, Legazpi City 137. PANGASINAN MEDICAL CENTER – Pangasinan Medical Center, Nable St., Dagupan City, Pangasinan 138. PAVILION MALL – G/F Bldg. A, Pavilion Mall, KM. 35 Brgy. San Antonio, Biñan, Laguna 139. PELCO 1 MEXICO – Jose Abad Santos Ave., Mexico, Pampanga 140. PELCO III APALIT – PELCO III, Mc Arthur Highway, Sampaloc, Apalit, Pampanga 141. PLAZA FINA MAGALANG – Plaza Fina, Don Andres Luciano St., Magalang, Pampanga 142. PLG ECOZONE HERMOSA BATAAN – PLG Prime Global, FTI Group Bldg., GF Ecozone, Hermosa, Bataan 143. PORTA VAGA MALL – Porta Vaga Mall, Along Session Road, Baguio City 144. PPL MCDONALD'S ORMOC – G/F IAL Building, Burgos St. cor. Rizal St., Ormoc City, Leyte 145. PRINCE HYPERMART BAGO – Poblacion, Bago City, Negros Occidental 146. PRINCE HYPERMART DAANBANTAYAN – Prince Hypermart, Poblacion, Daanbantayan, Cebu 147. PRINCE HYPERMART HIMAMAYLAN – Brgy. Poblacion, Himamaylan City, Negros Occidental 148. PRINCE HYPERMART MANOLO FORTICH – Prince Hypermart, Sayre Highway, Manolo Fortich, Bukidnon 149. PRINCE HYPERMART TALISAY – Poblacion, Talisay City, Negros Occidental 150. PRINCE MALL OF BAYBAY – Prince Town Baybay, Andres Bonifacio & Manuel L. Quezon St., Baybay, Leyte 151. PUREGOLD - DAU – Lot 9 Blk 19 Cosco Building, McArthur Highway, Dau, Mabalacat, Pampanga 152. PUREGOLD LUCENA – Brgy. Gulang Gulang, Quezon Ave., Lucena 153. PUREGOLD OBANDO – Puregold Obando, P. Sevilla St., Brgy. Catanghalan, Obando, Bulacan 154. QUICKMART DARAGA – Quickmart Bldg., Rizal St., Daraga, Albay 155. RIVERA HOSPITAL PANABO – Rivera Medical Center, National Highway, 7302 Brgy. San Francisco, Panabo City, Davao Del Norte 156. ROBINSONS CALASIAO – Robinsons Place Pangasinan, Brgy. San Miguel, Calasiao, Pangasinan 157. ROBINSONS GENSAN – G/F Robinsons Gensan, Jose Catolico Sr. Ave., Brgy. Lagao, General Santos City, South Cotabato 158. ROBINSONS TAGUM – National Highway, Tagum, Davao del Norte 159. ROYAL DUTY FREE 2 – Bldg. 1109, Palm St., Subic Gateway District, Subic Bay Freeport Zone. X City, Zambales 160. ROYCE HOTEL – Royce Hotel, Manuel A. Roxas Highway cor. Ninoy Aquino Avenue, Clark Freeport Zone, Mabalacat, Pampanga 161. ROYCE HOTEL 2 – Royce Hotel, Manuel A. Roxas Highway cor. Ninoy Aquino Avenue, Clark Freeport Zone, Mabalacat, Pampanga 162. ROYCE HOTEL 3 – Royce Hotel, Manuel A. Roxas Highway cor. Ninoy Aquino Avenue, Clark Freeport Zone, Mabalacat, Pampanga 163. RPGMC TUGUEGARAO – Ronald P. Guzman Medical Center, Enrile Blvd., Carig, Tuguegarao City, Cagayan 164. SAMULCO – Sta. Ana Multi-Purpose Cooperative, Bldg. 1, Monteverde St., Davao City, Davao del Sur 165. SAN FERNANDINO HOSPITAL – San Fernandino Hospital, McArthur Highway, Bo. Dolores, San Fernando, Pampanga 166. SAVEWISE - POZORRUBIO – Savewise Bldg., Caballero St., Brgy. Cablong, Pozorrubio, Pangasinan 167. SHOPWISE - CEBU – Shopwise Bldg., N. Bacalso Ave., Basak, San Nicolas, Cebu City, Cebu 168. SHOPWISE - SAN PEDRO – Shopwise, National Highway, Brgy. Landayan, San Pedro, Laguna 169. SHOPWISE BUHAY NA TUBIG IMUS – Brgy. Buhay na Tubig, Imus, Cavite 170. SHOPWISE GRAND TERMINAL BATANGAS – Diversion Road, Brgy. Alangilan, Batangas City, Batangas 171. SHOPWISE LANCASTER IMUS – G/F Shopwise Lancaster City, Advincula Avenue, Imus City, Cavite 172. SIBALOM MUNICIPAL ANTIQUE – G/F Sibalom Municipal Hall, Sibalom, Antique

173. SKYRISE REALTY – G/F Skyrise IT Bldg., Gorordo Ave. cor. N. Escario St., Cebu City, Cebu 174. SM BAGUIO – SM Baguio, Luneta Hill, Upper Session Road, Baguio City, Benguet 175. SM CENTER DAGUPAN – 2F SM Center Dagupan, M.H. del Pilar, Dagupan City 176. SM CENTER IMUS – N.I.A Road, Barangay Bucandala III, Imus, Cavite 177. SM CENTER TUGUEGARAO – 2F SM Center Tuguegarao Downtown, Luna St. cor Mabinit St., Tuguegarao City 178. SM CITY BACOLOD – G/F Bldg. A, ATM #3 SM City Bacolod, Reclamation Area, Bacolod City, Negros Occidental 179. SM CITY BALIWAG – G/F SM City Baliwag, Doña Remedios Trinidad Highway, Brgy. Pagala, Baliwag, Bulacan 180. SM CITY BATANGAS – SM City Batangas, M. Pastor Ave., Pastor Village, Brgy. Pallocan Kanluran, Batangas City, Batangas 181. SM CITY BATANGAS 2 – SM City Batangas, M. Pastor Ave, Pastor Village, Brgy. Pallocan Kanluran, Batangas City, Batangas 182. SM CITY CABANATUAN – ATM Center, SM City Cabanatuan, Maharlika Highway, Brgy. H. Concepcion, Cabanatuan City, Nueva Ecija 183. SM CITY CAGAYAN DE ORO – ATM Center 2, Main Entrance, SM City Cagayan de Oro, Masterson Ave., Cagayan De Oro , Misamis Oriental 184. SM CITY CALAMBA – G/F SM City Calamba, National Road, Brgy. Real, Calamba City, Laguna 185. SM CITY CALAMBA 2 – 2F SM City Calamba, National Road, Brgy. Real, Calamba City, Laguna 186. SM CITY CALAMBA 3 – SM City Calamba, National Road, Brgy. Real, Calamba City, Laguna 187. SM CITY CAUAYAN – Maharlika Highway, Brgy. District II, Cauayan City, Isabela 188. SM CITY CLARK OFF-BRANCH – ATM #1 SM City Clark (in-front of transport terminal), M. Roxas Highway, CSEZ, Angeles City, Pampanga 189. SM CITY DASMARIÑAS 2 – G/F SM City Dasmariñas, Governor's Drive cor. Aguinaldo Hiway, Brgy. Sampaloc 1, Dasmariñas, Cavite 190. SM CITY GENERAL SANTOS – SM City Gen Santos, Santiago Blvd. cor. San Miguel St., Brgy. Lagao, Gen. Santos City, South Cotabato 191. SM CITY LIPA OFF-BRANCH – ATM 2, SM City Lipa, Ayala Highway, Brgy. Maraouy, Lipa City, Batangas 192. SM CITY OLONGAPO CENTRAL 2F – 2F East Tapinac, Olongapo City, Zambales 193. SM CITY ROSALES – SM City Rosales, MacArthur Highway, Carmen East, Rosales, Pangasinan 194. SM CITY TARLAC – G/F SM City Tarlac, McArthur Highway, Brgy. San Roque, Tarlac City, Tarlac 195. SM CITY URDANETA – McArthur Highway, Urdaneta, Pangasinan 196. SM DAVAO – ATM Center 1, SM City Davao, Quimpo Blvd. cor. Tulip Drive, Ecoland Subd., Brgy. Matina, Davao City, Davao del Sur 197. SM LANANG PREMIER OFF-BRANCH – UGF SM Lanang Premier, J.P. Laurel Ave., Brgy. San Antonio, Davao City, Davao del Sur 198. SM LEMERY – SM Center Lemery, Ilustre Avenue, Lemery, Batangas 199. SM MARILAO OFF-BRANCH – G/F SM City Marilao, MacArthur Highway, Marilao, Bulacan 200. SM MARKET MALL – ATM 3 SM Market Mall Dasmariñas, Congressional Ave., Dasmariñas Bagong Bayan, Dasmariñas, Cavite 201. SM SUPERCENTER MOLINO – G/F SM Supercenter Molino, Molino Road, Brgy. Molino 4, Bacoor, Cavite 202. SOCSARGEN COUNTY HOSPITAL – Socsargen County Hospital, Arradaza St., General Santos City, South Cotabato 203. SOUTH TOWN CENTRE TALISAY – South Gate Mall, Tabunok, Talisay, Cebu 204. SOUTHWAY MALL – The Southway Square Mall, Gov. Lim Ave. cor. La Purisima St., Zamboanga City, Zamboanga del Sur 205. ST. ELIZABETH HOSPITAL – L. Santiago Blvd. corner National Highway, General Santos City 206. STA. ROSA HOSPITAL – Sta. Rosa Hospital and Medical Center, San Lorenzo Road, Brgy. Balibago, Sta. Rosa, Laguna 207. SUPER METRO CARCAR – Natalio B. Bacalso National Highway, Carcar City, Cebu 208. SUPERL PHILS BACOLOR – Angeles Industrial Park, PEZA, Brgy. Calibutbut, Bacolor, Pampanga 209. TARGET MALL 1 – G/F Target Mall, Sta. Rosa Commercial Complex, Brgy. Balibago, Sta. Rosa, Laguna 210. TARGET MALL 2 – ATM 4 Canopy Area, Target Mall, Sta. Rosa Commercial Complex, Brgy. Balibago, Sta. Rosa, Laguna 211. THE DISTRICT - DASMARIÑAS – G/F The District - Dasmariñas, Molino-Paliparan Road, Dasmariñas City, Cavite 212. THE DISTRICT - IMUS – The District Imus, Aguinaldo Highway cor. Daang Hari Road, Brgy. Anabu II-D, Imus, Cavite 213. TOYOTA SAN NICOLAS – Brgy.16 San Marcos, San Nicolas, Ilocos Norte 214. UNION CHRISTIAN COLLEGE – Union Christian College, Widdoes St., Brgy. II, San Fernando, La Union 215. UNIVERSITY OF BAGUIO – University of Baguio, Assumption Road, Baguio City, Benguet 216. UNIVERSITY OF BOHOL – University of Bohol, Ma. Clara St., Tagbiliran City, Bohol 217. UNIVERSITY OF PERPETUAL HELP - BIÑAN – Dr. Jose Tamayo Medical Bldg., University of Perpetual Help System Laguna, Brgy. Sto. Niño, Biñan, Laguna 218. UNIVERSITY OF SAN CARLOS – University of San Carlos Main University Bldg., Pantaleon del Rosario St., Cebu City, Cebu 219. USC - TALAMBAN – USC Talamban Campus, Gov. M. Cuenco Ave., Brgy. Nasipit, Talamban, Cebu City, Cebu 220. USJR BASAK CEBU – University of San Jose Recoletos Basak, N. Bacalso Ave., Basak Pardo, Cebu City, Cebu 221. VIRAC TOWN CENTER – Catanduanes Circumferential Road, Virac, Catanduanes 222. VISION FEEDMILLS ROSARIO – Rosario - San Juan - Candelaria Road, Rosario, Batangas 223. WALTER MART - CABANATUAN – Maharlika Highway, Brgy. Dicarma, Cabanatuan City, Nueva Ecija 224. WALTER MART - CALAMBA – G/F Waltermart Calamba, Real St., Brgy. Real, Calamba City, Laguna 225. WALTER MART - CARMONA – G/F Walter Mart Carmona, Macaria Business Center, Governor's Drive, Carmona, Cavite
226. WALTER MART - DASMARIÑAS – G/F Walter Mart Dasmariñas, Barrio Burol Aguinaldo Highway, Dasmariñas City,Cavite 227. WALTER MART - GEN. TRIAS – G/F Waltermart General Trias, Governors Drive, Barrio Mangahan, General Trias, Cavite 228. WALTER MART - SAN FERNANDO – Walter Mart San Fernando, McArthur Highway, Brgy. San Agustin, San Fernando, Pampanga 229. WALTER MART - STA. ROSA 1 – UGF Waltermart Sta. Rosa, San Lorenzo Village, Balibago Road, Brgy. Balibago, Sta. Rosa, Laguna 230. WALTER MART - STA. ROSA 2 – UGF Waltermart Sta. Rosa, San Lorenzo Village, Balibago Road, Brgy. Balibago, Sta. Rosa, Laguna 231. WALTER MART - STA. ROSA BEL-AIR – Walter Mart Bel-Air, Sta. Rosa Tagaytay Road, Pulong Sta. Cruz, Sta. Rosa, Laguna 232. WALTER MART - TAGAYTAY – G/F Ayala Mall Serin, Tagaytay-Nasugbu Highway, Silang Junction South, Tagaytay City, Cavite 233. WALTER MART - TANAUAN – Walter Mart Tanauan, J. P. Laurel National Highway, Brgy. Darasa, Tanauan, Batangas 234. WELLCOME MINIMART BASISTA – National highway, Basista, Pangasinan 235. WESLEYAN UNIVERSITY – Wesleyan University of the Philippines, Mabini St. Extension, Cabanatuan City, Nueva Ecija 236. WNU STI UNIVERSITY – STI West Negros University, Burgos cor. Hilado St., Bacolod City, Negros Occidental 237. XAVIER UNIVERSITY – G/F Library Annex, Xavier University, Corrales Ave., Cagayan De Oro City, Misamis Oriental 238. YASHANO MALL LEGAZPI – Yashano Mall, F. Imperial St. cor. Terminal Rd. 1, Legazpi Port District, Legazpi City, Albay 239. YUBENCO STARMALL – Yubenco Starmall, Maria Clara Lorenzo Lobregat Highway, Putik, Zamboanga City, Zamboanga del Sur 240. YU-YU CAFÉ & DESSERT SHOPPE TAGUM – National Hiway cor. Quirante II St., Magugpo Poblacion, Tagum City, Davao del Norte 241. ZAMBOANGA PENINSULA MEDICAL CENTER – Zamboanga Peninsula Medical Center, Maria Clara Lorenzo Lobregat Highway, Putik, Zamboanga City, Zamboanga del Sur China Bank Savings - Off Branch ATM Directory 1. Calamba Hospital - KM. 49 National Highway, Parian, Calamba City, Laguna 2. RIS - RIS DEVELOPMENT CORPORATION - 168 Mercado St Tabe, Guiguinto, Bulacan 03015 (Balagtas Branch) 3. ZAMECO - ZAMECO II Head Office Compound, National Road, Brgy. Magsaysay, Castillejos, Zambales (Olongapo Branch) 3. Status of Publicly Announced New Products and Services
Product Status
Deposit Products
Money Lift Plus Fully operational
4. Competition The combined assets of the UK/B & TB industries, based on their published statements of condition as of December 2019, expanded by 8% or P1.4 trillion year-on-year to P17.9 trillion, with the top 10 banks accounting for 84% of the industry‘s resources. China Bank maintained its position as the fifth largest private commercial bank, growing by 11% or P96 billion to P962 billion. Total deposits growth slowed to 7% (+P866 billion) to P13.3 trillion, while bank borrowings increased 13% to P1.6 trillion with the issuance of P176-billion Peso-denominated bonds of major banks. On the other hand, gross loans expanded by 9% (+P875 billion) to P10.2 trillion, with loans-to-deposits ratio at 76%. Gross non-performing loans increased by 38% to P157 billion, resulting in an uptick in gross NPL ratio to 1.57% from 1.26% and a decline in NPL coverage ratio to 109% from 130%. The general deterioration in asset quality may be attributed to the loan exposures (about US$412 Mn) of several banks to Hanjin Heavy Industries and Construction Philippines which is undergoing corporate rehabilitation. Combined equity of the UK/B & TB industries went up by 13% or P239 billion to P2.1 trillion. UK/B industry CAR as of September 2019 improved to 15.61% on a solo basis and 15.95% on a consolidated basis. As of February 2020, there were 45 universal and commercial domestic banks – 17 private domestic banks, 23 foreign bank branches, three government banks, and two foreign bank subsidiaries.

5. Transactions with and/or dependence on related parties In the ordinary course of business, the Bank has loans and other transactions with its subsidiaries and affiliates, and with certain directors, officers, stockholders and their related interest (DOSRI). These loans and other transactions are in accordance with the Bank's policy should be reviewed by the Related Party Transaction Committee to ensure that they are conducted at arm's length basis at fair market prices and upon terms not less favorable to Bank than those offered to others and in compliance with all regulatory requirements. Related party transactions are presented to the stockholders during the annual stockholders' meeting for ratification. 6. Trademarks, Licenses, Franchises, etc. China Bank is operating under a universal banking license obtained in 1991. Over the years, China Bank has registered its corporate brand, slogan and product trademarks with the Intellectual Property Office (IPO) of the Philippines – Bureau of Trademarks, as follows:
China Bank - Your Success Is Our Business. China Bank Check Depot More Than Your Banker, The Right Partner China Bank Sure Sweep
China Bank Treasury Investments China Bank Sure Collect China Bank GS Fund China Bank Bills Pay Plus China Bank Online China Bank ACA Auto-Credit Arrangement China Bank Diamond Savings Account China Bank ADA Auto-Debit Arrangement China Bank Dollar Fund China Bank EGOV China Bank Check Plus China Bank Corporate Bills Payment China Bank HomePlus China Bank Escrow Agency Service POEA China Bank AutoPlus China Bank Partnership Banking China Bank Platinum China Bank EIPS Electronic Invoicing and Payment Solution China Bank Prime China Bank World China Bank Money Plus China Bank Cash Management China Bank Check Write Plus
All the Bank‘s trademark registrations are valid for 10 years with expiration dates varying from 2020 to 2025. The Bank closely monitors the expiry and renewal dates of these trademark names to protect the Bank‘s brand equity. 7. Sources and Availability of raw materials and the names of principal suppliers. Not applicable.
8. Disclose how dependent the business is upon a single customer or a few customers. Not applicable. 9. Need for any government approval of principal products or services. The Bank secures regulatory approval of all its products and services, as required. 10. Effect of existing or probable governmental regulations on the business. The Bank strictly complied with the Bangko Sentral ng Pilipinas (BSP) requirements in terms of reserves, liquidity position, capital adequacy, limits on loan exposure, cap on foreign exchange holdings, provision for losses, anti-money laundering provisions and other reportorial requirements. 11. Amount spent on research and development activities
(In‘000) 2019 2018 2017
Education & Training 60,127 50,839 51,031
Advertising Expenses 49,551 32,729 54,759
Technology 871,137 892,431 913,049
12. Cost and effect of compliance with environmental laws. Not applicable.

13. Total number of employees Below is the breakdown of the manpower complement in 2019 as well as the projected headcount for 2020:
2020 2019
Officers 3,837 3,632
Staff 6,493 6,181
Total 10,330 9,813
The CBC Employees Association (CBCEA) members have an existing Collective Bargaining Agreement with the Bank for the period 01 August 2017 to 31 July 2020.

ANNEX “B”
MARKET INFORMATION AND RELATED MATTERS (1) Market Information
Principal market where the equity is traded – Philippine Stock Exchange, Inc. (PSE) Market Value
Actual Prices*
2019 HIGH LOW CLOSE
Jan - Mar 29.40 26.80 26.85
April - Jun 28.70 26.10 27.45
Jul – Sept 28.00 24.90 25.00
Oct – Dec 26.20 24.75 25.05
Actual Prices: *
2018 HIGH LOW CLOSE
Jan - Mar 37.50 33.20 35.20
April - Jun 35.55 33.00 33.60
Jul – Sept 33.60 28.85 28.85
Oct – Dec 29.95 26.75 27.10
* No adjusted prices as no stock rights or stock dividends were issued in 2018 and 2019. Market value as of December 27, 2019 (last trading day): P25.05 Price Information as of February 28, 2020 (latest practicable trading date): P24.75

(2) Holders Top 20 Stockholders
(As of February 29, 2020)
Name of Stockholder Number of Shares Percentage
1. PCD Nominee Corporation (Non-Filipino) 716,587,345 26.680%
2. PCD Nominee Corporation (Filipino) 565,577,627 21.057% 3. SM Investments Corporation 461,975,661 17.200% 4. Sysmart Corporation 415,995,323 15.488% 5. JJACCIS Development Corporation 56,949,897 2.120% 6. CBC Employees Retirement Plan 53,278,951 1.984% 7. Joaquin T. Dee &/or Family 45,705,005 1.702% 8. GDSK Development Corporation 31,458,583 1.171% 9. Syntrix Holdings, Inc. 21,552,649 0.802% 10. Suntree Holdings Corporation 20,138,332 0.750% 11. Hydee Management & Resource Corporation 14,334,603 0.534% 12. The First Resources Mgt. and Sec. Corp. 5,964,229 0.222% 13. Kuan Yan Tan‘s Charity (Phil.), Inc. 5,941,277 0.221% 14. Reliance Commodities, Inc 5,662,648 0.211% 15. Robert Y. Dee, Jr. 5,569,499 0.207% 16. Ansaldo, Godinez & Co., Inc. 5,037,498 0.188% 17. Michael John G. Dee 3,963,468 0.148% 18. Cheng Siok Tuan 3,864,332 0.144% 19. Rosario Chua Siu Choe 3,631,816 0.135% 20. Kristin Dee Belamide 3,520,559 0.131%
TOTAL 2,446,709,302 91.095%
Total number of shareholders (as of February 29, 2020) – 1,894 Summary of Filipino and Non-Filipino Holdings (as of February 29, 2020)
Nationality Number of Stockholders
Number of Shares
Percentage
Filipino 1,820 1,961,941,331 73.046% Non-FilipinoPCD) 1 716,587,345 26.680% Chinese 50 3,623,866 0.135% American 12 2,403,317 0.089% Australian 2 4,513 0.000% British 2 97,631 0.004% Canadian 2 450,163 0.017% Dutch 1 62,198 0.002% Spanish 1 107 0.000% Taiwanese 3 729,341 0.027%
TOTAL 1,894 2,685,899,812 100.0%
(3) Dividend History
2019 2018 2017 2016 2015
Stock Dividend -- -- 8% 8% 8%
Cash Dividend 8.8% 8.3% 8% 10% 10%

Authorized and Issued Capital
Authorized Capital - P33.0 Billion divided into 3.3 Billion shares with a par value of P10.00 per share Issued Shares - 2,685,899,812 common shares There is no restriction that limits the ability of the Bank to pay dividends other than what is required under the Revised Corporation Code and pertinent Bangko Sentral ng Pilipinas (BSP) regulations that prescribe minimum levels and ratios of capital adequacy. However, any dividends declared by the Bank are subject to notice to/approval by the BSP, Philippine Stock Exchange (PSE), and/or Securities and Exchange Commission (SEC). The Dividend Policy of the Bank is discussed under Annex C of the Information Statement. (4) Unregistered Securities There were no unregistered securities sold by the Bank for the past three (3) years. However, there were new securities issued resulting from the stock rights offering of 483,870,967 common shares in 2017, and declaration of 8% stock dividend in 2017 to come from the Bank‘s unissued shares. These securities distributions were exempt from registration requirement under Section 10.1 of the Securities Regulation Code. (5) Free Float Level Based on the Public Ownership Report of the Bank as of December 31, 2019, 57.168% of the total outstanding shares are owned by the public.

ANNEX “C” COMPLIANCE WITH LEADING PRACTICE ON CORPORATE GOVERNANCE Embracing a Sustainable Future through Principled Leadership Over the years, good governance is the foundation upon which China Bank‗s commitment to be a reliable institution in the industry, is built. The principles of Fairness, Accountability, Transparency and Integrity are channeled through the decisions and actions made and executed across all levels of the organization. The Bank is driven to continuously improve and uphold the highest standards of corporate governance to remain strongly positioned for value creation amidst the evolving global environment, in a manner consistent with its fiduciary responsibility. The Board and Management endeavor to completely exercise and uphold these core principles in all financial and business dealings of the Bank. At the helm of the Bank‘s governance is the Board of Directors which is responsible for its corporate philosophy and overall strategic direction; and leads in the ethical conduct of business. The Board sets the tone and provides oversight, insight and foresight. In steering the Bank forward and making plans for its future, the Board monitors the performance and develops strategies to improve business and risk strategies, financial soundness and regulatory compliance. The Board also sets the pace for the Bank‘s current operations and future directions, and ensures that all obligations to stakeholders are met. The Bank recognizes good corporate governance as a critical factor for its continued success and sustainability. It is committed to doing business the right way—in accordance with the rules, best practices, and best interest of all stakeholders. Its robust governance, compliance, and risk management systems enable the Bank to be a dependable partner for its customers, employees and shareholders in the creation of wealth for a more resilient and secured future. To further strengthen our position as one of the best governed companies in the region, we have implemented new initiatives and maintained best practices, as follows:
Amendment of the Bank‘s By-Laws, increasing the number of directors from eleven (11) to twelve (12).
Enhancement of the Corporate Governance Manual to align with recent rules, regulations and international practices.
Enhancement of the Board Committee Charters and Board Self-Assessment Forms, and preparation of a new Self-Assessment Form for Independent Directors.
Updating of the RPT Framework to harmonize the Bank‘s compliance with the rules of the Bangko Sentral ng Pilipinas (BSP) and Securities and Exchange Commission (SEC).
Conduct of the annual assessment of the Board, all Board-level committees, Compliance Division, External Auditor and the President.
Enhancement of the Board performance evaluation process through a third party validation by an external / independent entity to ensure its objectivity.
Election of the Bank‘s second female independent director during the Annual Stockholders‘ Meeting.
Conduct by the Institute of Corporate Directors of the corporate governance training on the Bank‘s directors and key officers.

Organizational Structure The Board of Directors being at the core of the Bank‘s corporate governance structure continues to foster a culture of a proactive Board that is accountable and responsible for the affairs and performance of the Bank supported by proactive and competent personnel in achieving its goal of governance of going beyond best practice compliance.
Board of Directors The Bank has twelve (12) directors and one (1) advisor. Two (2) of the directors are executive directors and the rest are non-executive directors. The Bank has a rigorous and transparent procedure for the nomination and election of new directors to the Board, to ensure a diverse and well-balanced composition. In accordance with the Bank‘s Manual on Corporate Governance aligned with laws, rules and regulations, the members of the Board are selected from a pool of qualified candidates after considering, among other things, their integrity, competence, independence, leadership, ability to exercise sound judgment, and experience at policy-making levels involving issues affecting business, government, and other areas relevant to banking operations. The Board may use professional search firms or other external sources when searching for candidates for the Board. Acknowledging the significant and crucial roles of Independent Directors, the Bank has four (4) Independent (non-executive) Directors in the Board to ensure a strong element of independence. The Bank‘s Independent Directors are independent of management and major/substantial shareholders, and free from any business, family or any other relationship with the Bank, which could affect their judgment. The members of the Board are given a copy of their general and specific duties and responsibilities as prescribed by the Manual of Regulations for Banks (MORB); the directors acknowledge that they have received and certify that

they read and fully understood the same. Copies of the Acknowledgement Receipt and Certification are submitted to the BSP within the prescribed period. Moreover, the Directors also individually submit a Sworn Certification that they possess all the qualifications as enumerated in the MORB. These certifications are submitted to BSP after their election. Additional certifications are executed by Independent Directors to comply with Securities Regulation Code and BSP rules which are then submitted to the SEC. Board Committees In order to effectively carry out its mandate of good corporate governance through compliance with laws, rules, regulations and best practices, the Bank‘s Board is supported by various committees, as follows:
Executive Committee has the powers of the Board, when the latter is not in session, in the management of the business and affairs of the Bank to the fullest extent permitted under its By-Laws and Philippine laws. The Executive Committee had 38 meetings in 2019, including 1 joint meeting with the Risk Oversight Committee.
Director Attendance
Hans T. Sy (Chairman) 35
Gilbert U. Dee 38
Peter S. Dee 35
Joaquin T. Dee 36
William C. Whang 36
Corporate Governance Committee is responsible for ensuring that the Bank‘s Corporate Governance
framework is regularly reviewed, updated, and implemented accordingly at all times. It provides assistance to the Board in fulfilling its responsibilities by ensuring compliance with, and proper observance of governance laws, rules, principles, and best practices, including the continuing education program for the directors and conduct of the Board assessment, among others.The Corporate Governance Committee had 30 meetings in 2019, including 11 joint meetings with Compliance Committee and 18 joint with Nominations Committee.
Director Attendance
Philip S.L. Tsai (Chairman) 29
Alberto S. Yao 29
Margarita L. San Juan 29
Angeline Ann H. Hwang (a)
15
(a) Member from May 2, 2019; attended 15 out of 19 joint meetings of Compliance/Nominations and Corporate Governance Committees
Audit Committee primarily oversees all matters pertaining to audit – mainly the evaluation of the adequacy and effectiveness of the Bank‘s internal control system, as well as the integrity of its financial statements.It appoints, reviews and concurs in the appointment or replacement of the Chief Audit Executive (CAE), and is responsible for ensuring that the CAE and internal audit function are free from interference by outside parties. It also ensures that an annual review is performed with regard to the effectiveness of the internal audit mechanism, including compliance with the Institute of Internal Auditors‘ International Standards for the Professional Practice of Internal Auditing and Code of Ethics.It provides oversight of Management‘s activities in maintaining an adequate internal control framework, managing credit, market, liquidity, operational, legal and other risks of the Bank, including regular receipts from management of information on risk exposures and risk management activities. It likewise ensures that internal and external auditors remain independent and are given unrestricted access to records, properties and personnel, to enable them to perform their respective audit functions. It has the explicit authority to investigate any matter within its terms of reference, in order to ensure the effectiveness and efficiency of the Bank‘s internal controls. The Audit Committee had 15 meetings in 2019.
Director Attendance
Alberto S. Yao (Chairman) 14

Joaquin T. Dee 15
Philip S.L. Tsai 15
Compliance Compliance Committeeis tasked to monitor compliance with established bank laws, rules and
regulations specifically in creating a dynamic and responsive compliance risk management system for identifying and mitigating risks that may erode the franchise value of the Bank, and ensuring that management is doing business in accordance with the said prescribed laws, rules and regulations including policies, procedures, guidelines and best practices. The Compliance Committee had 12 meetings in 2019, including 11 joint meetings with the Corporate Governance Committee.
Director Attendance
Hans T. Sy (Chairman) 10
Joaquin T. Dee 12
Alberto S. Yao 11
Risk Oversight Committee is responsible for the development and oversight of the Bank‘s risk
management functions, including the evaluation of the effectiveness of the enterprise risk management framework and ensuring that corrective actions are in place to address concerns in a timely manner. It oversees the risk taking activities of the Bank and warrants the continued relevance, comprehensiveness and overall value of the institutional risk management plan. The Risk Oversight Committee had 11 meetings in 2019, including 1 joint meetings with the Executive Commitee.
Director Attendance
Margarita L. San Juan (Chairman) 11
Hans T. Sy 11
Alberto S. Yao 11
Nominations Committee is responsible for reviewing and evaluating the qualifications of all persons
nominated to the Board and other appointments that require Board approval, including promotions favorably endorsed by the Promotions Review Committee. It is also tasked to review the qualifications of the candidates, to ensure that their qualities and/or skills are appropriate for leading and assisting the Bank in achieving its vision and corporate goals. The Committee is composed entirely of Independent Directors. The Nominations Committee had 18 meetings in 2019, including 11 jointly with the Corporate Governance Committee.
Director Attendance
Angeline Ann H. Hwang (a)
(Chairman)
9
Alberto S. Yao 17
Margarita L. San Juan 18
Philip S.L. Tsai(b)
17
(a) Chairman from May 2, 2019; attended 9 out of 11 joint meetings (b) Chairman up to May 1, 2019
Remuneration Committee provides oversight over the remuneration of senior management and other key
personnel, ensuring that compensation is consistent with the interest of all stakeholders and the Bank‘s culture, strategy and control environment. The Remuneration Committee had 2 meetings in 2019.
Director Attendance
Philip S.L. Tsai (Chairman) 2
Hans T. Sy 2
Alberto S. Yao 2
Harley T. Sy 2
Margarita L. San Juan 2

Related Party Transactions Committee is responsible for reviewing all material related party transactions (RPTs) to ensure that they are conducted at an arm's length. Composed entirely of Independent Directors, the committee oversees the proper implementation of the RPT Policy and ensures that corresponding transactions are duly identified, measured, monitored, controlled and reported. The Related Party Transaction Committee had 12 meetings in 2019.
Director Attendance
Philip S.L. Tsai (Chairman) 12
Alberto S. Yao 10
Margarita L. San Juan 12
Angeline Ann H. Hwang(a)
7
(a) Member from May 2, 2019; attended 7 out of 7 meetings
Trust Investment Committee provides oversight functions, overall strategic business development and financial policy directions to the Trust and Asset Management Group. It oversees the trust, investment management and fiduciary activities of the Bank, and ensures that they are conducted in accordance with applicable rules and regulations, and judicious practices. Moreover, it ensures that prudent operating standards and internal controls are in place and that the Board‗s objectives are clearly understood and duly implemented by the concerned units and personnel. The Trust Investment Committee convened 11 times in 2019.
Director Attendance
Herbert T. Sy (Chairman) 11
Jose T. Sio 11
Peter S. Dee 11
William C. Whang 11
Mary Ann T. Lim 11
Additional details on the Committees and their charters can be accessed through the Bank‘s website at www.chinabank.ph.
Corporate Secretary
Assisting the Board of Directors in the effective and efficient discharge of their duties is the Corporate Secretary. Our Corporate Secretary, Atty. Corazon I. Morando, reports operationally to the Chairman and is accountable to the Board. Her duties and responsibilities are clearly stated in the Bank‘s Corporate Governance Manual.
The Corporate Secretary is a senior, strategic-level corporate officer who has the vital role of official record keeper responsible for the administrative side of Board and committee meetings; corporate governance gatekeeper responsible for overseeing sound board practices; and Board liaison who works and deals fairly and objectively with the Board, Management, stockholders and other stakeholders. Board Training and Orientation Program In compliance with existing rules and regulations and as part of the continuing education program, the Board undergoes an annual training. Last August 7, 2019, the directors and members of the Management Committee, together with key officers of the Bank, have attended the Bank‘s exclusive advanced Corporate Governance training facilitated by the Institute of Corporate Directors (ICD). The said training focused on the revised Corporation Code; Anti-Money Laundering (AML) in the age of technology; and other AML updates. A new member of the Board is briefed on his duties and responsibilities and is given an orientation kit, containing: (1) Specific Duties and Responsibilities of Directors, (2) Corporate Governance Manual and (3) applicable Board Committee Charters. A new member is also required to attend an orientation program from accredited training providers.

Performance Evaluation for the Board, Individual Directors, Board Committees and President The Bank has an annual performance assessment to determine the level of compliance of the Board, individual Directors, all Board-level Committees, and the President with leading practices and principles on good governance and to identify areas for improvement. The evaluation seeks to assess the effectiveness and collective performance of the Board through a self-assessment. The Compliance Division summarizes the results of the evaluation and reports it to the Board through the Corporate Governance Committee. The Board reviews the results and evaluates the enhancements needed in order to improve the performance of the Board collectively, the individual directors, and the various committees. The assessment shall be validated by an external facilitator every three (3) years.
In 2019, there are no significant deviations and in general, the Bank has fully complied with the provisions and requirements of the Corporate Governance Manual. Compliance System The Compliance Division plays a crucial role in fostering a culture of group-wide compliance in all facets of the Bank, assists the Board in the discharge of its governance function to protect the Bank‘s reputation and its stakeholders‘ interests. In place is a compliance risk management system that is designed to identify and mitigate risks, and ensure the Bank‘s safety and soundness. Moreover, the division ensures that employees at all levels are aware of and comply with all applicable laws, rules and regulations, by cascading the compliance plan to them and in disseminating all latest issuances, advisories, notices, and other regulatory matters.
Compliance Division is headed by the Chief Compliance Officer (CCO), Atty. Aileen Paulette S. De Jesus, who reports functionally to the Compliance and the Corporate Governance Committees and administratively to the Bank‘s President. The Compliance function is supported by a duly approved Compliance Charter that defines the duties and responsibilities, mandate, independence, and manner on which compliance is implemented. At the helm of this function is the Regulatory Compliance Department, which ensures that the compliance system is updated and implemented accordingly. The Corporate Governance Department carries out and manages the implementation of the corporate governance mandates. On the other hand, the IT Compliance Department provides the necessary IT support to the AML Compliance Department in the administration of the Bank‘s AML system, the Base60. The Associated Person is responsible for the Bank‘s compliance with the Securities Regulations Code, including relevant laws and issuances related thereto. All units in the Bank have Compliance Coordinators to ensure that all risks associated with the operations and business of the individual units are identified, monitored, and mitigated. To enhance regulatory, compliance and good governance awareness and continuously strengthen the implementation of our compliance culture within the Bank, the Compliance Division:
1. Cascades all recent laws, rules, and regulations to all concerned;
2. Acts as liaison for the Board and Management on regulatory compliance matters, with the regulatory agencies;
3. Provides advisory services, including reviewing proposed Bank products and services;
4. Reviews and updates the Compliance Manual, Money Laundering and Terrorist Financing Prevention Program and Corporate Governance Manual annually, to align with recent regulatory requirements;
5. Continuously educates Bank employees about compliance, anti-money laundering, good governance and its benefits, the Bank‘s Code of Ethics, the policy on avoidance of conflict of interest, among others, to ensure that everyone in the institution is in the same direction towards good governance and to develop a culture of trust and integrity and to enable the employees of the Bank embrace the principles set forth by the Board;
6. Conducts briefings for Compliance Coordinators in the branches and Head Office to raise the level of awareness and understanding of the principles, concepts, and elements of good corporate governance and compliance. The Compliance Coordinators are required to cascade their learnings to their respective areas; and
7. Conducts lectures to all new employees of the Bank for the basic orientation on Compliance System, AML, Whistleblowing, and Corporate Governance giving them an overview of the Bank‘s Compliance Risk Management

System. Compliance Division also conducts lectures during the Junior Executive Development (JED) and Supervisory Development Program (SDP), among others.
Governance Policies
Corporate Governance Manual In place is an extensive Corporate Governance Manual that contains the Bank‘s corporate governance
policies, structure, and principles, as well as the general and specific duties and responsibilities of the Board
and the individual directors. The Manual is kept updated to ensure that it is aligned with latest regulatory
issuances. To enjoin Bank-wide compliance and for easy access, a copy of the Manual is available in the
Bank‘s intranet facility, under the Compliance Office Public Folder. The CCO is primarily tasked to monitor
compliance with the Manual, and is always available to respond to inquiries from Bank officials and personnel
regarding good corporate governance policies and practices.
In 2019, the Bank has fully complied with the provisions of the Corporate Governance Manual.
Board Remuneration
The directors are entitled to a per diem of five hundred pesos (P500.00) for attendance at each meeting of the
Board of Directors or of any Committee, or as may be determined from time to time by stockholders owning or
representing a majority of the subscribed capital stock, at any regular or special meeting. In accordance with
Article VIII of the Bank‘s By-Laws, a portion of the net earnings shall be given to the members of the Board.
Dividend Policy The Bank, as a matter of policy, will declare cash dividends at a payout ratio of approximately thirty percent
(30%) of the net income of the prior year, subject to the conditions and limitations set forth in this policy
statement. The Bank‘s Dividend Policy is an integral component of its Capital Management Policy and
Process. Its fundamental and overriding philosophy is sustainability.
Dividend payouts are reviewed annually. These are referenced against the Bank‘s Capital Management
Process. Dividend payouts are calibrated based on the prior year‘s earnings while taking into consideration
dividend yields, future earnings streams and future business opportunities.
In declaring dividend payouts, the Bank uses a combination of cash or stock dividends as follows: 1. The dividend is increased in response to the Bank‘s achieving a higher level of sustainable earnings.
2. Dividends may be increased for a specific year to plow back to shareholders a commensurate share of
unusually high earnings for a given year.
The Bank‘s capital management philosophy and process, and consequently its Dividend Policy which comprises an integral component of this undertaking, are driven by the following primary objectives: 1. Ensuring compliance with externally imposed regulatory capital requirements. 2. Maintaining strong credit ratings. 3. Maintaining healthy capital ratios to support its business and maximize shareholder value.
Moreover, the Bank manages its capital structure and makes adjustments to it in the light of: 1. Changes in economic conditions. 2. The risk characteristics of its activities. 3. The assessment of prospective business requirements or directions.

Whistleblowing The Bank does not and will not tolerate unethical conduct. Hence, a whistle-blowing policy is in place, wherein employees, customers, shareholders, and third party service providers are encouraged to report questionable activity, unethical conduct, fraud or any other malpractice by mail, phone or e-mail, without fear of reprisal or retaliation as the identity of the whistle blower is kept confidential. The Bank‘s CCO determines the substance and validity of all whistle-blower reports. Reports can also be disclosed to any officer of the Bank, the Risk Management Group, Internal Audit Division and the Human Relations Group (HRG).
Code of Ethics The Bank is committed to conduct its business in an honest and ethical manner, well guided by its core values, namely: integrity, high performance standards, commitment to quality, customer service focus, concern for people, efficiency and resourcefulness, and initiative in carrying out its functions and in dealing with its clients. These core values are also the foundation of the Bank‘s Code of Ethics.
Setting the tone from the top, our Board of Directors is fully committed to principled conduct of business. Just as it expects full compliance to the Code of Ethics from all Bank employees, the body believes that its members should also uphold the principles of integrity, fairness, accountability and transparency at all times.
The Code of Ethics for Directors articulates the acceptable practices in relation to both internal and external dealings (i.e., investors, creditors, customers, depositors, contractors, suppliers, regulators, and the general public) of the members of the Board. It also provides the guiding principles on the performance of their duties in accordance with the fit and proper rules; and establishes standards for professional and ethical conduct. All new directors are given a copy of the Code, which they acknowledge receipt of the same.
To ensure that business is carried out in compliance with relevant laws and in the protection of the interest of the Bank‘s customers, shareholders and other stakeholders, the Bank‘s HRG has disseminated the Bank‘s Code of Ethics to all employees, including new hires. Employees are required to sign an acknowledgement receipt that they have received a copy of the Code of Ethics.
Copies of the Codes are also made available in the Bank‘s intranet to be readily accessible to all employees, and are also available on the Bank‘s website. A comprehensive discussion on the Code of Ethics is conducted with new employees of the Bank to foster a culture of awareness on the Bank‘s core values. Such discussion also highlights the behavioral standards, business conduct, and corresponding sanctions for violations of the Code of Ethics.
Policy on Conflict of Interest
In accordance with the Bank‘s Code of Ethics, conflict of interest between the Bank and its employees should
be avoided at all times. However, should a conflict arise, the interest of the Bank must prevail. Employees are
not permitted to have or be involved in any financial interests that are in conflict or appear to be in conflict with
their duties and responsibilities to the Bank. They are likewise barred from engaging in work outside of the
Bank unless with duly-approved permission, as well as work that lies in direct competition with the Bank.
Disclosure and Transparency
The Bank is committed to a high standard of disclosure and transparency to facilitate understanding of the Bank‘s true financial condition and the quality of its corporate governance. All material information about the Bank is disclosed in a timely manner, in accordance with the disclosure rules of the SEC and the PSE. In addition to compliance with the reportorial requirements like publishing quarterly financial statements in leading newspapers and producing a comprehensive annual report for the Bank‘s annual stockholders‘

meeting, the Bank promptly discloses major and market-sensitive information like dividend declarations, joint ventures and acquisitions, sale and disposition of significant assets, as well as financial and non-financial information that may affect or influence the decision of the investing public, in the form of press releases in newspapers and reports in our internal publications. We also electronically file our disclosures through EDGE which are then posted on the PSE‘s website. The Bank‘s corporate website is likewise regularly updated to include the latest news and current information about the Bank. The Bank aims to ensure that information about its products and services are clear, understandable,
accurate, and accessible. We give all necessary and relevant information to our customers so that they can
make informed decisions when transacting with us. The information is communicated to our customers
through the use of different media and channels such as printed materials that are prominently displayed in
our branches or directly sent to customers—TV, print, radio and other forms of advertisements; our website
and social media channels such as Twitter and Facebook; and our Customer Contact Center. All consumer
information required by the BSP are likewise openly displayed at our branches. Our branch personnel are
trained to handle inquiries about any information in a professional manner to explain risks relating to our
products and services and to provide advice on financial matters.

ANNEX “D”
Item 6. Management Discussion and Analysis or Plan of Operation (Last Three Years 2019, 2018, and 2017)
(a) Financial and Operating Highlights
Balance Sheet
in Million Pesos
Dec 31, 2019
Audited
Dec 31, 2018
Audited
Dec 31, 2017
Audited
Assets 962,226 866,072 751,448
Investment Securities 212,836 190,235 127,971
Loan Portfolio (Net) 568,919 505,805 448,971
Total Deposits 775,428 722,123 635,093
Equity 96,176 87,857 83,655
Balance Sheet – 2019 vs. 2018 Assets grew by 11.1% to P962.2 billion from P866.1 billion mainly from the build-up in loans and liquid assets. Cash and other cash items increased by 7.7% to P16.8 billion from P15.6 billion due to the higher cash requirements from the branch network expansion. Interbank loans receivable and securities purchased under resale agreements rose 42.0% to P17.0 billion from higher overnight placements with the BSP. Total investment securities amounted to P212.8 billion, up 11.9%. The build-up in securities volume raised the portfolio of financial assets at fair value through profit or loss (FVPL) by P10.9 billion to P18.5 billion and financial assets at fair value other comprehensive income (FVOCI) by P16.0 billion to P26.1 billion.The Bank‘s securities portfolio remained at 22.0% level of consolidated resources. The Bank‘s liquidity ratio stood at 37%, slightly lower than last year‘s 38%. Gross loan portfolio was at P577.8 billion, 12.7% higher year-on-year, while net loans stood at P568.9 billion, up P63.1 billion or 12.5% as the demand across market segments steadily increased. Accrued interest receivable amounted to P7.2 billion, up P1.5 billion from P5.7 billion because of the increase in earning assets. Investment in associates saw a P369.1 million increase to P704.2 million because of additional capital infused to the Bank‘s affiliate, MCBLife, as well as its higher income contribution. Bank premises, furniture, fixture, and equipment and right-of-use assets grew by P2.7 billion or 41.9% to P9.2 billion from PFRS-16 related adjustments. Investment properties dropped 9.4% to P4.4 billion due to the sale and disposal of foreclosed properties. The booking of additional allowance for credit losses raised deferred tax assets by P856.1 million to P3.4 billion. Other assets grew by 10.7% to P6.9 billion from higher miscellaneous items such as creditable withholding taxes and returned checks and other cash items (RCOCI). On the liabilities side, total deposits increased by 7.4% to P775.4 billion from P722.1 billion, of which CASA (demand and savings deposits) totaled P411.8 billion. Bills payable dropped P6.5 billion or 16.2% to P33.3 billion from lower interbank borrowings and BSP rediscounted loans. The Bank booked P37.4 billion in bonds payable comprised of the P30-billion Peso fixed-rate retail bond and USD 150-million Green bond issuance to the International Finance Corporation (IFC). Manager’s checks dropped by 22.5% to P2.0 billion from P2.6 billion because of lower customer demand. Income tax payable amounted to P540.7 million, up P63.1 million or 13.2% due to additional regular corporate income taxes payable for the year. Accrued interest and other expenses were up by 7.3% to P4.1 billion because of the booking

of accruals and payroll expenses. Derivative liabilities increased to P1.0 billion from P455.1 million from higher volume of currency swaps during the period. The 12.0% drop in deferred tax liabilities was attributable to the savings bank subsidiary. Other liabilities increased P3.3 billion to P11.0 billion mainly from lease-related liabilities from PFRS-16 related adjustments.
Total equity reached P96.2 billion, 9.5% higher than last year‘s P87.9 billion mainly from the 19.9% increase in surplus and the P1.1 billion improvement of net unrealized gain on financial assets on FVOCI. Remeasurement gain on defined benefit asset recorded a P485.6 million decline resulting from actuarial changes arising from changes in demographic assumptions. Cumulative translation adjustment totaled P6.8 million, up from (P91.7) million arising from the conversion of income and expenses related to foreign currency-denominated positions to base currency. The Bank‘s Common Equity Tier 1 (CET 1 / Tier 1) ratio and total CAR were computed at 12.76% and 13.67%, respectively, well above the minimum regulatory requirement. Balance Sheet – 2018 vs. 2017 Total assets expanded by 15.3% to P866.1 billion from P751.4 billion mainly from the build-up in loans and liquid assets. Cash and other cash item increased by 23.3% to P15.6 billion from P12.7 billion due to the higher cash requirements from the branch network expansion. Due from other banks decreased 39.5% to P9.5 billion from the drop in placements with correspondent banks. The Bank also reduced interbank loans receivable and securities purchased under resale agreements to P12.0 billion from lower overnight placements with the BSP. Investment securities amounted to P190.2 billion, up by 48.7% from P128.0 billion. Financial assets at fair value through profit or loss (FVPL) decreased P8.6 billion or 53.2% to P7.6 billion. Financial Assets at fair value through other comprehensive income (FVOCI), formerly available-for-sale financial assets (AFS), declined P36.3 billion to P10.1 billion due to the sale of securities and PFRS-9 related adjustments. Investment securities at amortized cost, formerly held-to-maturity financial assets (HTM), climbed P107.3 billion to P172.5 billion with the build-up in fixed income assets and reclassification related to PFRS-9 implementation. The Bank‗s securities portfolio accounted for 22% of consolidated resources, higher than the 17% at year-end 2017. The Bank‗s liquidity ratio stood at 38%, slightly higher than last year‗s 36%. The Bank‗s gross loan portfolio expanded to P512.9 billion, 12.6% higher from last year‗s P455.6 billion with the growth in corporate and consumer loans, while loans and receivables (net) stood at P505.8 billion, up P56.8 billion or 12.7%. Accrued interest receivables grew by 53.2% to P5.7 billion from P3.7 billion due to larger receivables from investment securities and uptick in loans. Investment properties dropped 5.6% to P4.8 billion due to the sale and disposal of foreclosed properties. The booking of additional provision for impairment and credit losses raised deferred tax assets by P736.8 million to P2.5 billion. On the liabilities side, total deposits increased by 13.7% to P722.1 billion from P635.1 billion, of which CASA (demand and savings deposits) totaled P400.8 billion. CASA ratio of 56% exceeded the 2017-end ratio of 54%. The Bank also issued Long-Term Negotiable Certificates of Time Deposit (LTNCDs) amounting to P10.25 billion in July 2018. Bills payable grew by 98.0% to P39.8 billion from the increase in alternative fund sources (interbank borrowings and BSP rediscounting). Manager’s checks also went up by 5.6% to P2.6 billion from P2.4 billion because of higher customer demand. Income tax payable worth P477.6 million recorded a P115.5 million or 31.9% increase due to additional regular corporate income taxes payable for the year. Accrued interest and other expenses were up by 46.2% to P3.8 billion from the setup of interest accruals and payroll expenses. Derivative liabilities also expanded by P187.6 million or 70.1% to P455.1 million because of higher currency swaps volume. Deferred tax liabilities increased by 6.0% to P1.2 billion because of foreclosure gains. Other liabilities increased

by P2.0 billion to P7.7 billion with the booking of expected credit losses (ECL) on off-balance sheet exposures amounting to P1.6 billion. Total equity reached to P87.9 billion, 5.0% higher than last year‗s P83.7 billion. Surplus reserves went up by P3.1billion to P4.0 billion from the impact of PFRS-9 adoption. Net unrealized loss on financial assets at FVOCI improved P1.1 billion to (P702.5) million from (P1.8) billion arising from the mark-to-market revaluation of the Bank‗s unsold securities. Remeasurement gain on defined benefit asset registered a P166.7 million or 58.8% decrease to P117.0 million because of actuarial adjustments in the valuations of retirement plans last year. Cumulative translation adjustment fell to (P91.7) million from (P38.7) million due to exchange rate difference. The Bank‗s Common Equity Tier 1 (CET 1) and total CAR were computed at 12.16% and 13.09%, respectively. The difference was accounted by the general loan loss provision limited to 1% of credit risk weighted assets as buffer for potential losses.

Income Statement
In Million Pesos 2019 Audited
2018 Audited
2017 Audited
Interest Income 47,685 35,213 26,539
Interest Expense 21,634 12,286 6,913
Net Interest Income 26,051 22,926 19,626
Non-Interest Income 8,431 5,658 6,102
Provision for Impairment & Credit Losses 2,570 141 754
Operating Expenses 20,324 18,056 15,962
Net Income 10,075 8,116 7,523
Income Statement – For the years ended December 31, 2019 and 2018 For 2019, the Bank recorded a net income of P10.1 billion, 24.1% higher than P8.1 billion in 2018 due to higher operating income, resulting in a return on equity of 11.04% and return on assets of 1.10%. Total interest income climbed 35.4% to P47.7 billion from P35.2 billion with the growth in earning assets. Interest income from loans and receivables was up 27.9% to P36.1 billion from P28.2 billion on the back of robust year-on-year loan portfolio expansion. Interest income from investment securities at amortized cost and at FVOCI and financial assets at FVPL recorded increases at 67.3% and 67.5%, respectively, from the build-up in securities holdings. Furthermore, interest income from due from BSP and other banks and SPURA registered a 53.1% increase to P1.1 billion from P727.3 million with the growth in placements with BSP and other banks. Total interest expense amounted to P21.6 billion, P9.3 billion or 76.1% higher than last year due to fund build-up. Interest expense on deposit liabilities increased 59.8% to P18.6 billion arising from the deposit expansion. Interest expense on bonds payable, bills payable and other borrowings was P2.1 billion higher due to volume-related growth including the Bank‘s P30-billion Peso retail bond and USD 150-million Green bond. There was a P264.2 million lease payable that the Bank incurred from PFRS-16 related adjustments. Net Interest income rose 13.6% or P3.1 billion to P26.1 billion. The Bank‘ reported consolidated net interest margin of 3.39% from last year‘s 3.56%. Provision for impairment and credit losses grew by P2.4 billion to P2.6 billion because of the growth in loan portfolio and low-base on impact from the lower first year provisions on the PFRS-9 implementation. Total non-interest income surged 49.0% to P8.4 billion mainly driven by improvements in service charges, fees and commissions, as well as trading and securities gains. Service charges, fees, and commissions increased by 18.7% to P3.3 billion from the upswing in commissions and transactional fee income. Trading opportunities boosted the Bank‘s profitability as trading and securities gain and Gain on disposal of investment securities at amortized cost jumped to P884.5 million and P1.4 billion, respectively. Lower sales of foreclosed assets resulted in a 14.9% drop in gain on sale of investment properties to P864.4 million and 81.2% decrease in gain on asset foreclosure and dacion transactions to P47.5 million. Trust fee income increased by P51.3 million or 16.8% to reach P357.1 million with the steady growth in trust assets under management. Share in net income of an associate recorded an P83.7 million increase to P184.7 million from P101.0 million because of the improved profitability of the bancassurance joint venture, MCBLife. Miscellaneous income decreased by 5.4% to P1.2 billion with the booking of one-off gains last year. Meanwhile, the ongoing upgrading of systems, processes, infrastructure, and manpower resulted in the 12.6% increase in operating expenses to P20.3 billion.Nevertheless, the significant year-on-year increase in operating income improved cost-to-income ratio to 59% from last year‘s 63%. Compensation and fringe benefits increased 7.9% to P6.6 billion from the growth in manpower complement. Taxes and licenses increased by 32.8% to P3.9

billion from higher documentary stamp, gross receipts, and business volume related taxes. Occupancy costs fell by 22.9% to P1.8 billion due to PFRS-16 related adjustments. Insurance, which includes PDIC premium payments, grew 12.4% to P1.9 billion with the expansion in deposits. Depreciation and amortization recorded an increase of 49.7% due to the capitalization of depreciable Right-of-use Assets upon the implementation of PFRS 16. Repairs and maintenance increased by 21.8% due to the continued investments in our distribution channel and technology upgrades.‘ Professional fees, marketing, and other related services; entertainment, amusement and recreation; and transportation and traveling likewise rose by 17.0%, 25.7%, 16.9% respectively, with the ramp-up in business development and marketing efforts. Miscellaneous expenses rose by 13.1% to P2.3 billion mainly from increases in information technology-related expenses, litigation and provision for year-end expenses. Income Statement – For the years ended December 31, 2018 and 2017 The Bank recorded a 7.9% improvement in net income to P8.1 billion, which translated to a 9.54% return on equity (ROE) and 1.04% return on assets (ROA). Total interest income increased 32.7% to P35.2 billion from P26.5 billion in the same period last year. Interest income from loans and receivables was up 29.6% to P28.2 billion from P21.75 billion on the back of robust year-on- year loan portfolio expansion. Interest income from investment securities at amortized cost and at FVOCI was 65.2%. higher at P5.9 billion from the year-on-year growth in securities holdings. Interest income from due from BSP and other banks and securities purchased under resale agreements registered an 11.4% drop to P727.3 million from P820.7 million because of lower BSP and interbank placements. Total interest expense amounted to P12.3 billion, P5.4 billion or 77.7% larger than last year due to the build-up in funds which include the P10.25 billion LTNCD issue in the third quarter. Interest expenses on deposit liabilities increased 78.2% to P11.6 billion arising from the deposit expansion and higher funding costs. Interest expenses on bills payable and other borrowings was 70.1% higher at P665.3 million due to higher foreign currency denominated liabilities. Net Interest income increased P3.3 billion or 16.8% to P22.9 billion. The Bank‗s consolidated net interest margin was recorded at 3.56% from 3.60% last year as higher interest revenues were offset by higher funding cost. Provision for impairment and credit losses, computed under PFRS-9, totaled P141.1 million, down P613.1 million or 81.3%. Inclusive of appropriated retained earnings, total provisions would amount to P481.5 million. Total non-interest income declined P443.4 million or 7.3% mostly from the drop in trading and securities gain to (P271.6) million from P480.0 million arising from rate volatility that affected both the dealership business and returns on tradable securities. Service charges, fees, and commissions increased by 13.7% to P2.8 billion from the upswing in investment banking fees and transactional fee revenues. Gain on sale of investment properties was up by 51.4% to P1.0 billion due to robust sales of foreclosed assets. Gain on asset foreclosure and dacion transactions also improved by 60.4% to P 252.5 million because of the upside revaluation on foreclosed assets. Foreign exchange gain decreased 44.1% to P216.0 million from P386.0 million because of the month-to-month movement in the Peso-Dollar exchange rate. Trust fee income likewise dropped by P70.6 million or 18.8% to reach P305.8 million due to the drop in related fees. Share in net income of associates recorded a P27.9 million increase to P101.0 million from P73.1 million because of the improved profitability of bancassurance joint venture MCBLife. Miscellaneous income decreased by 16.8% to P1.3 billion with the booking of one-off gains last year. Operating expenses (excluding provision for impairment and credit losses) increased 13.1% to P18.1 billion as the Bank carried out its expansion by investing in new branches, more people, and up-to-date technology to support the growth of new businesses. Cost-to-income ratio slightly climbed to 63% from 62% last year. Compensation and fringe benefits increased 7.5% to P6.1 billion from the increase in human resource complement. Taxes and licenses increased by 29.2% to P2.9 billion from higher documentary stamp (as a result of the implementation of the Tax Refom for Acceleration and Inclusion Act), gross receipts, and other business taxes. Meanwhile, the continued outlay and investments related to the network & business expansion increased occupancy costs by 10.6% to P2.3 billion, as well as depreciation and amortization by 6.6% to P1.3 billion. Insurance, which includes PDIC premium payments, grew 15.9% to P1.7 billion with the expansion in deposits. Professional fees, marketing, and other related services; entertainment, amusement and recreation; and transportation and traveling likewise rose by 12.9%, 32.4%, 27.9% respectively, with the ramp-up in business development and marketing efforts. Also, the

Bank‗s repairs and maintenance was 25.8% higher at P131.2 million mainly due to technology upgrade. Miscellaneous expenses went up by 10.0% or P187.1 million primarily from increases in information technology related expenses, litigation, and transactional costs. Total Comprehensive Income For the years ended December 31, 2019, 2018, and 2017 The Bank recorded total comprehensive income of P10.7 billion for 2019, a P3.3 billion or 45.2% increase from the P7.4 billion recorded in the same period last year mainly from the growth in net income and the P1.3 billion increase in net unrealized gain on FVOCI. Meanwhile, total comprehensive income for 2018 and 2017 stood at P 7.4 billion and P7.3 billion respectively, mainly from higher net income and improvement in the fair value of financial assets on FVOCI.

(b) Key Performance Indicators
Definition of Ratios Profitability Ratios: Return on Average Equity - Net Income after Income Tax
Average Total Equity
Return on Average Assets - Net Income after Income Tax Average Total Assets
Cost-to-Income Ratio - Operating Expenses excl Provision for Impairment & Credit Losses Total Operating Income
Net Interest Margin - Net Interest Income Average Interest Earning Assets
Liquidity Ratios: Liquid Assets to Total Assets - Total Liquid Assets
Total Assets
Loans to Deposit Ratio - Loans (Net) Deposit Liabilities
Asset Quality Ratios: Gross NL Ratio - Gross Non-Performing Loans
Gross Loans
NPL Cover - Total Allowance for Impairment & Credit Losses on Receivables from
Customers plus Retained Earnings Appropriated for Gen. Loan Loss Provision. Gross Non-Performing Loans
Solvency Ratios: Debt to Equity Ratio - Total Liabilities
Total Equity
Asset to Equity Ratio - Total Assets Total Equity
Interest Coverage Ratio - Net Income Before Tax and Interest Expense Interest Expense
Capital Adequacy Ratio: Capital to Risk Assets Ratio - BSP prescribed formula:
CET 1/Tier 1 CAR - CET 1 / Tier 1 Capital
Total Risk Weighted Assets
Total CAR - Total Qualifying Capital Total Risk Weighted Assets

2019 2018 2017
PROFITABILITY (%) Return on Assets 1.10 1.04 1.12 Return on Equity 11.04 9.54 10.01 Net Interest Margin 3.39 3.56 3.60 Cost-to-Income Ratio 59 63 62 LIQUIDITY (%) Liquid Assets to Total Assets 37 38 36 Loans to Deposit Ratio 73 70 71 ASSET QUALITY (%) Gross Non-Performing Loans Ratio 1.5 1.2 1.4 Non-performing Loan (NPL) Cover 129 167 99 SOLVENCY RATIOS
Debt-to-Equity Ratio 9.0 8.9 8.0 Asset-to-Equity Ratio 10.0 9.9 9.0 Interest Rate Coverage Ratio 1.5 1.8 2.3 CAPITAL ADEQUACY (%) CET 1 / Tier 1 12.76 12.16 13.47 Total CAR 13.67 13.09 14.22
Profitability
CHIB‘s net income of P10.1 billion translated to an ROE of 11.04%, the highest over the last three years and a ROA of 1.10%. Cost-to-income ratio was lower at 59% from the 63% in 2018 and 62% in 2017, even as the Bank continued to invest heavily in the needed improvements to provide the best service to customers. Net interest margin was lower at 3.39% from 3.56% in 2018 and 3.60% in 2017 due to fund build-up.
Liquidity The Bank‘s liquidity ratio was steady at 37%, 38% and 36% in 2019, 2018 and 2017, respectively. Asset Quality Asset quality remained healthy amid the loans year-on-year expansion. Gross NPL ratio slightly increased to 1.5% from 1.2% in 2018 and 1.4% in 2017. NPL cover was registered at 129% in December 2019, 167% in 2018, and 99% in 2017; the Parent Bank‘s was at 190% as of 2019. Solvency Ratios Debt-to-equity ratio was recorded at 9.0 in December 2019 versus 8.9 in December 2018 and 8.0 in December 2017; asset-to-equity ratio was at 10.0 versus 9.9 from year-end. Interest coverage ratio for the period stood at 1.5 as against 1.8 for 2018 and 2.3 in 2017. Capitalization
China Bank‘s CET 1 / Tier 1 CAR and total CAR ratios were computed at 12.76% and 13.67%, respectively. The Bank‘ capital is largely comprised of CET 1 (core) capital.

(c) Past Financial Conditions and Results of Operations US GDP growth figured at 2.3% in 2019, the slowest since Trump‘s presidency in 2017, due to the deceleration in consumer spending & private investments and downturn in exports. This, together with below-target inflation of 1.4%, has prompted the US Fed to trim policy rates thrice in 2019, in increments of 25 bps, to 1.50% - 1.75% range. In March 2020, the Fed administered two emergency rate cuts (-150bps) to 0.00% - 0.25% and announced plans of buying at least US$ 500 billion in Treasury securities and $200 billion in mortgage-backed securities as cushion against the economic spillovers from the Corona Virus Disease (COVID-19) outbreak. Meanwhile, the US and China struck a trade deal in January, reducing US tariff on Chinese goods and increasing China‘s purchases of American goods. On the other hand, the Philippine GDP growth slid to an eight-year low of 5.9% due to the contraction in capital formation and delayed fiscal disbursements which decreased infrastructure spending by 2.6% to P709 billion from January to November 2019. On the upside, balance of payments logged a surplus of US$5.6 billion during the first three quarters with the 4.1% improvement in exports. Consumer spending remained the major economic driver, as inflation rate averaged 2.5% for full-year 2019. In an attempt to spur economic activity and manage inflation, the BSP cut policy rate thrice (75 bps) to 4.0%. In March 2020, the regulator also reduced the reserve requirement from 14% to 12%, effective at the end of the same month. China Bank recorded net profits of P10.1 billion for full-year 2019, up 24.1% from 2018, primarily due to the robust growth in operating income. This resulted in a return on equity of 11.04% and return on assets of 1.10%. Net interest income was up 13.6% or P3.1 billion to P26.1 billion mainly from the build-up in earning assets. Fee-based revenues also recorded a 49.0% increase to P8.4 billion due to significant improvements in trading gains and service charges, fees, and commissions. Total assets expanded 11.1% or P96.2 billion to P962.2 billion mainly from the P63.1 billion loans growth across all market segments. Deposits were up P53.3 billion to P775.4 billion, of which 53% were in demand and savings accounts. The Bank also marked a successful return to the market with the USD 150-million Green Bond issue to the International Finance Corporation in June, as well as the P30-billion Peso fixed-rate retail bond issue in July. Total equity ended at P96.2 billion, up 9.5% from 2018. CET 1/ Tier 1 and total CAR were at 12.76% and 13.67%, respectively. At end-2019, the Bank‘s distribution network comprised of 631 branches, 1,002 ATMs, and a suite of alternative channels including phone, internet, and mobile banking. In 2019, China Bank received the Golden Arrow award at the ASEAN Corporate Governance Scorecard (ACGS) Golden Arrow Recognition Ceremony 2019; Best Corporate Governance Disclosure and Transparency Award and The Pagtugon Award for Universal and Commercial Banks at the BSP Stakeholder Awards; Best Managed Fund of the Year Award - Dollar Long-Term Bond Category at the Chartered Financial Analyst Society Philippines (CFA) 2019 Charter Awards; Top Corporate Securities Market Makers and Top Fixed-income Brokering participants at the 2019 PDS Annual Awards Night; Most Innovative Public Sector System for its Autotax Payment Facility at the 2019 Triple A Awards.

(d) Future Prospects
Global economic growth could likely decelerate in the near-term owing to the effects of COVID-19 outbreak, together with the subsequent restrictions in the movement of people and commerce across major cities. Meanwhile, in March, the US stock market recorded its biggest one-day sell-off (-7.6%) since 2011, which triggered a temporary trading halt and wiped off US$5 trillion from the S&P 500 market capitalization. The stock market crash was mainly caused by the abrupt drop in oil prices as the OPEC and Russia failed to reach an agreement on supply cuts, which further heightened fears of a global economic slowdown. The bleak outlook of the US economy could weigh down on Trump‘s re-election bid, fuelling uncertainties relative on the upcoming midterm elections. On the domestic front, growth could be tempered by the prolonged effects of the COVID-19 on market outlook and overall economic activity. Nevertheless, the timely roll-out of government infrastructure projects and sustained domestic demand remain as key drivers of economic growth. In step with the US Fed, the BSP delivered rate cuts in February (-25 bps) and March 2020 (-50 bps), bringing the policy rate to 3.25%. The regulator is expected to maintain an accommodative stance to buffer against external headwinds. In March, it further cut reserve requirement from 14% to 12%, effective at the end of the same month. At its centennial year, China Bank remains committed to providing the highest quality of banking experience, and to becoming the top choice for its multi-generational customers. The Bank aims to be on the best financial institutions in terms of profitability and shareholder value over the next five years. To do so, the Bank will focus on four key goals: 1) growth in revenues and size of business; 2) operational excellence; 3) a customer-centric approach to doing business; and 4) higher level of engagement from the employees. Depending on the economic effects of COVID-19 and the Enhanced Community Quarantine in the island of Luzon, the Bank will maintain a prudent stance in its business operations. Core business expansion strategy is anchored on growing customer relationship while strengthening ties with existing ones. Our funds build-up strategy will be driven by our client acquisition & retention programs, the launch of new products and services suited to the requirements of the retail and emerging sectors. The synergy between branches and other sales desks will be strengthened to drive internal client sourcing, cross-selling, and leads generation programs, while maintaining prudent credit standards. The Bank will expand in the consumer sector, with the launch of new retail loan products while repackaging and improving the product features of existing ones. This will be complemented by a suite of fee-based products & services, such as non-life insurance, trust, bancassurance, wealth management, and securities brokering, as well as credit cards in order to achieve comprehensive product coverage. CBS will further ramp up its Automatic Payroll Deduction (APD) portfolio by setting up additional sales offices and customer touchpoints for easier loan application and transaction. The Bank‘s insurance brokerage, China Bank Insurance Brokers, Inc., and bancassurance arm, Manulife China Bank Life Assurance Corporation, will further deepen market penetration through active leads generation in the various customer segments of the Bank; widen branch network coverage; and solidify existing relationships through the distinctive China Bank customer experience. Our investment house subsidiary, China Bank Capital, together with China Bank Securities, will sustain its momentum in the capital markets by actively participating in more underwriting deals, loan syndications, preferred shares issuance, project finance, advisory services, and stock brokerage. In 2020, the Bank will continue to invest in its digital capabilities. Last year, it engaged Microsoft for digital advisory services which entails developing the Bank‘s digital transformation strategy and roadmap for delivering enhanced customer experience and for future-proofing its operations. On top of this, the Bank will continue to streamline key processes related to the rolling growth mandate, cut redundancies, and automate manual procedures even as it institutionalizes inter-departmental service level agreements to generate operational efficiencies and provide superior customer experience.
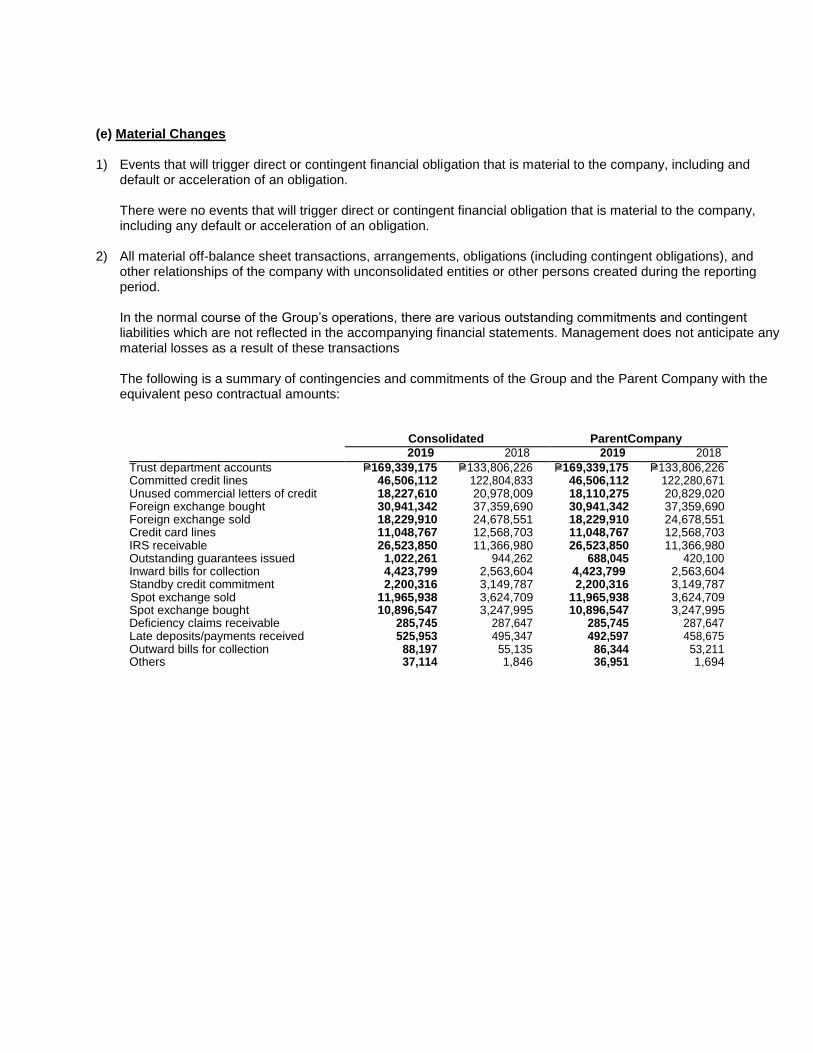
(e) Material Changes 1) Events that will trigger direct or contingent financial obligation that is material to the company, including and
default or acceleration of an obligation. There were no events that will trigger direct or contingent financial obligation that is material to the company, including any default or acceleration of an obligation.
2) All material off-balance sheet transactions, arrangements, obligations (including contingent obligations), and
other relationships of the company with unconsolidated entities or other persons created during the reporting period. In the normal course of the Group‘s operations, there are various outstanding commitments and contingent liabilities which are not reflected in the accompanying financial statements. Management does not anticipate any material losses as a result of these transactions The following is a summary of contingencies and commitments of the Group and the Parent Company with the equivalent peso contractual amounts:
Consolidated ParentCompany
2019 2018 2019 2018
Trust department accounts P=169,339,175 P=133,806,226 P=169,339,175 P=133,806,226 Committed credit lines 46,506,112 122,804,833 46,506,112 122,280,671 Unused commercial letters of credit 18,227,610 20,978,009 18,110,275 20,829,020 Foreign exchange bought 30,941,342 37,359,690 30,941,342 37,359,690 Foreign exchange sold 18,229,910 24,678,551 18,229,910 24,678,551 Credit card lines 11,048,767 12,568,703 11,048,767 12,568,703 IRS receivable 26,523,850 11,366,980 26,523,850 11,366,980 Outstanding guarantees issued 1,022,261 944,262 688,045 420,100 Inward bills for collection 4,423,799 2,563,604 4,423,799 2,563,604 Standby credit commitment 2,200,316 3,149,787 2,200,316 3,149,787 Spot exchange sold 11,965,938 3,624,709 11,965,938 3,624,709 Spot exchange bought 10,896,547 3,247,995 10,896,547 3,247,995 Deficiency claims receivable 285,745 287,647 285,745 287,647 Late deposits/payments received 525,953 495,347 492,597 458,675 Outward bills for collection 88,197 55,135 86,344 53,211 Others 37,114 1,846 36,951 1,694

Annex "E"

China Banking Corporationand Subsidiaries
Financial StatementsDecember 31, 2019 and 2018and for the years ended December 31, 2019,2018 and 2017
and
Independent Auditor’s Report

*SGVFS039096*
INDEPENDENT AUDITOR’S REPORT
The Board of Directors and StockholdersChina Banking Corporation
Report on the Consolidated and Parent Company Financial Statements
Opinion
We have audited the consolidated financial statements of China Banking Corporation and its subsidiaries(the Group) and the parent company financial statements of China Banking Corporation, which comprisethe consolidated and parent company balance sheets as at December 31, 2019 and 2018, and theconsolidated and parent company statements of income, consolidated and parent company statements ofcomprehensive income, consolidated and parent company statements of changes in equity andconsolidated and parent company statements of cash flows for each of the three years in the period endedDecember 31, 2019, and notes to the consolidated and parent company financial statements, including asummary of significant accounting policies.
In our opinion, the accompanying consolidated and parent company financial statements present fairly, inall material respects, the financial position of the Group and the Parent Company as atDecember 31, 2019 and 2018, and their financial performance and their cash flows for each of the threeyears in the period ended December 31, 2019 in accordance with Philippine Financial ReportingStandards (PFRSs).
Basis for Opinion
We conducted our audits in accordance with Philippine Standards on Auditing (PSAs). Ourresponsibilities under those standards are further described in the Auditor’s Responsibilities for the Auditof the Consolidated and Parent Company Financial Statements section of our report. We are independentof the Group and the Parent Company in accordance with the Code of Ethics for ProfessionalAccountants in the Philippines (Code of Ethics) together with the ethical requirements that are relevant toour audit of the consolidated and parent company financial statements in the Philippines, and we havefulfilled our other ethical responsibilities in accordance with these requirements and the Code of Ethics.We believe that the audit evidence we have obtained is sufficient and appropriate to provide a basis forour opinion.
Key Audit Matters
Key audit matters are those matters that, in our professional judgment, were of most significance in ouraudit of the consolidated and parent company financial statements of the current period. These matterswere addressed in the context of our audit of the consolidated and parent company financial statements asa whole, and in forming our opinion thereon, and we do not provide a separate opinion on these matters.For each matter below, our description of how our audit addressed the matter is provided in that context.
SyCip Gorres Velayo & Co.6760 Ayala Avenue1226 Makati CityPhilippines
Tel: (632) 891 0307Fax: (632) 819 0872ey.com/ph
BOA/PRC Reg. No. 0001, October 4, 2018, valid until August 24, 2021SEC Accreditation No. 0012-FR-5 (Group A), November 6, 2018, valid until November 5, 2021
A member firm of Ernst & Young Global Limited

*SGVFS039096*
- 2 -
We have fulfilled the responsibilities described in the Auditor’s Responsibilities for the Audit of theConsolidated and Parent Company Financial Statements section of our report, including in relation tothese matters. Accordingly, our audit included the performance of procedures designed to respond to ourassessment of the risks of material misstatement of the consolidated and parent company financialstatements. The results of our audit procedures, including the procedures performed to address thematters below, provide the basis for our audit opinion on the accompanying consolidated and parentcompany financial statements.
Applicable to the audit of the Consolidated and Parent Company Financial Statements
Recognition of Expected Credit Losses (ECL) on loans and receivables
The Group’s and the Parent Company’s adoption of the ECL model is significant to our audit as itinvolves the exercise of significant management judgment. Key areas of judgment include: segmentingthe Group’s and the Parent Company’s credit risk exposures; determining the method to estimate ECL;defining default; identifying exposures with significant deterioration in credit quality; determiningassumptions to be used in the ECL model such as the counterparty credit risk rating, the expected life ofthe financial asset and expected recoveries from defaulted accounts; and incorporating forward-lookinginformation (called overlays) in calculating ECL.
Allowance for credit losses for loans and receivables as of December 31, 2019 for the Group and theParent Company amounted to P=8.56 billion and P=6.94 billion, respectively. Provision for credit losses ofthe Group and the Parent Company in 2019 amounted to P=2.57 billion and P=2.21 billion, respectively.
Refer to Note 16 of the financial statements for the details of the allowance for credit losses using theECL model.
Audit Response
We obtained an understanding of the board approved methodologies and models used for the Group’s andthe Parent Company’s different credit exposures and assessed whether these considered the requirementsof PFRS 9 to reflect an unbiased and probability-weighted outcome, and to consider time value of moneyand the best available forward-looking information.
We (a) assessed the Group’s and the Parent Company’s segmentation of its credit risk exposures based onhomogeneity of credit risk characteristics; (b) verified the definition of default and significant increase incredit risk criteria against historical analysis of accounts and credit risk management policies andpractices in place, (c) tested the Group’s and the Parent Company’s application of internal credit riskrating system by reviewing the ratings of sample credit exposures; (d) assessed whether expected life isdifferent from the contractual life by testing the maturity dates reflected in the system of record andconsidering management’s assumptions regarding future payments, advances, extensions, renewals andmodifications; (e) inspected financial information used to derive baseline probability of default; (f)performed simulation of baseline probability of default and tested its conversion to forward-lookingprobability of default; (g) performed trend analysis of expected default generated by third-party serviceproviders and compared trend with the resulting expected credit loss (h) tested loss given default byinspecting historical recoveries and related costs, write-offs and collateral valuations; (i) verified exposureat default considering outstanding commitments and repayment scheme; and (j) tested the effectiveinterest rate used in discounting the expected loss.
A member firm of Ernst & Young Global Limited

*SGVFS039096*
- 3 -
We recalculated impairment provisions on a sample basis. We reviewed the completeness of thedisclosures made in the financial statements.
Impairment testing of goodwill
Under PFRS, the Group and the Parent Company are required to annually test the amount of goodwill forimpairment. As of December 31, 2019, the goodwill recognized in the consolidated and parent companyfinancial statements amounting to P=222.84 million is attributed to the Parent Company’s Retail BankingBusiness (RBB) segment, while goodwill of P=616.91 million in the consolidated financial statements isattributed to the subsidiary bank, China Bank Savings, Inc. (CBSI). The impairment assessment processrequires significant judgment and is based on assumptions, specifically loan and deposit growth rates,discount rate and the long-term growth rate.
The Group’s disclosures about goodwill are included in Notes 3 and 14 to the financial statements.
Audit Response
We involved our internal specialist in evaluating the methodologies and the assumptions used. Theseassumptions include loan and deposit growth rates, discount rate and the long-term growth rate. Wecompared the key assumptions used, such as loan and deposit growth and long-term growth rates againstthe historical performance of the RBB and CBSI, industry/market outlook and other relevant externaldata. We tested the parameters used in the determination of the discount rate against market data. Wealso reviewed the Group’s disclosures about those assumptions to which the outcome of the impairmenttest is most sensitive; specifically those that have the most significant effect on the determination of therecoverable amount of goodwill.
Accounting for disposals of investment securities under a hold-to-collect business model
In 2019, the Group and the Parent Company disposed investment securities managed under the hold-to-collect (HTC) business model with aggregate carrying amount of P=18.62 billion and P=13.32 billion,respectively. The disposals resulted to a gain of P=1.38 billion for the Group and P=1.30 billion for theParent Company. Investment securities held under a hold-to-collect business model, which are classifiedas ‘Investment securities at amortized cost’, are managed to realize cash flows by collecting contractualpayments over the life of the instrument.
The accounting for the disposals is significant to our audit because the amounts involved are material(9.97% and 7.50% of the total investment securities at amortized cost of the Group and the ParentCompany, respectively and 4.00% and 4.35% of the total operating income of the Group and ParentCompany, respectively). Moreover, it involves the exercise of significant judgment by management inassessing that the disposals are consistent with the HTC business model and that it would not impact themeasurement of the remaining securities in the affected portfolios.
The disclosures related to the disposals of investment securities are included in Notes 3 and 9 to the financialstatements.
A member firm of Ernst & Young Global Limited

*SGVFS039096*
- 4 -
Audit response
We obtained an understanding of the Group’s and Parent Company’s objectives for disposals ofinvestment securities at amortized cost through inquiries with management and review of approvedinternal documentations, including governance over the disposals. We evaluated management’sassessment of the impact of the disposals in reference to the Group’s and the Parent Company’s businessmodels and the provisions of the relevant accounting standards and regulatory issuances. We alsoreviewed the calculation of the gains on the disposals and the measurement of the remaining securities inthe affected portfolios.
We reviewed the disclosures related to the disposals based on the requirements of PFRS 7, FinancialInstruments: Disclosures and Philippine Accounting Standard (PAS 1), Presentation of FinancialStatements.
Adoption of PFRS 16, Leases
Effective January 1, 2019, the Group adopted PFRS 16, Leases, under the modified retrospectiveapproach which resulted in significant changes in the Group’s accounting policy for leases. The Group’sadoption of PFRS 16 is significant to our audit because the Group has high volume of lease agreements;the recorded amounts are material to the financial statements; and adoption involves application ofsignificant judgment and estimation in determining the lease term, including evaluating whether theGroup is reasonably certain to exercise options to extend or terminate the lease, and in determining theincremental borrowing rate. This resulted in the recognition of right of use assets amounting toP=3.43 billion and P=2.73 billion for the Group and the Parent Company, respectively, and lease liabilityamounting to Php3.67 billion and P=2.92 billion, for the Group and the Parent Company, respectively, asof January 1, 2019, and the recognition of depreciation expense of P=670.78 million and P=505.53 million,for the Group and the Parent Company, respectively, and interest expense of P=265.54 million andP=207.74 million, for the Group and the Parent Company, respectively, for the year endedDecember 31, 2019.
The disclosures related to the adoption of PFRS 16 are included in Note 2 to the financial statements.
Audit response
We obtained an understanding of the Group’s process in implementing the new standard on leases,including the determination of the population of the lease contracts covered by PFRS 16, the applicationof the short-term and low value assets exemption, the selection of the transition approach and any electionof available practical expedients.
We tested the completeness of the population of lease agreements by comparing the number of leases peroperational report against the database. On a test basis, we inspected lease agreements (i.e., leaseagreements existing prior to the adoption of PFRS 16 and new lease agreements), identified theircontractual terms and conditions, and traced these contractual terms and conditions to the leasecalculation prepared by management, which covers the calculation of financial impact of PFRS 16,including the transition adjustments.
A member firm of Ernst & Young Global Limited

*SGVFS039096*
- 5 -
For selected lease contracts with renewal and/or termination option, we reviewed the management’sassessment of whether it is reasonably certain that the Group will exercise the option to renew or notexercise the option to terminate.
We tested the parameters used in the determination of the incremental borrowing rate by reference tomarket data. We test computed the lease calculation prepared by management on a sample basis,including the transition adjustments.
We reviewed the disclosures related to the transition adjustments based on the requirements of PFRS 16and PAS 8, Accounting Policies, Changes in Accounting Estimates and Errors.
Applicable to the audit of the Consolidated Financial Statements
Recoverability of deferred tax assets
The Group has recognized and unrecognized deferred tax assets. The recoverability of deferred tax assetsrecognized depends on the Group’s ability to continuously generate sufficient future taxable income. Theanalysis of the recoverability of deferred tax assets was significant to our audit because the assessmentprocess is complex and judgmental, and is based on assumptions that are affected by expected futuremarket or economic conditions and the expected performance of the Group.
The disclosures in relation to deferred income taxes are included in Notes 3 and 28 to the financialstatements.
Audit Response
We reviewed the management’s assessment on the availability of future taxable income in reference tofinancial forecast and tax strategies. We evaluated management’s forecast by comparing the loanportfolio and deposit growth rates with that of the industry and the historical performance of the Group.We also reviewed the timing of the reversal of future taxable and deductible temporary differences.
Other Information
Management is responsible for the other information. The other information comprises the informationincluded in the SEC Form 20-IS (Definitive Information Statement), SEC Form 17-A and Annual Reportfor the year ended December 31, 2019, but does not include the consolidated and parent companyfinancial statements and our auditor’s report thereon. The SEC Form 20-IS (Definitive InformationStatement), SEC Form 17-A and Annual Report for the year ended December 31, 2019 are expected to bemade available to us after the date of this auditor’s report.
Our opinion on the consolidated and parent company financial statements does not cover the otherinformation and we will not express any form of assurance conclusion thereon.
In connection with our audits of the consolidated and parent company financial statements, ourresponsibility is to read the other information identified above when it becomes available and, in doingso, consider whether the other information is materially inconsistent with the consolidated and parentcompany financial statements or our knowledge obtained in the audits, or otherwise appears to bematerially misstated.
A member firm of Ernst & Young Global Limited

*SGVFS039096*
- 6 -
Responsibilities of Management and Those Charged with Governance for the Consolidated andParent Company Financial Statements
Management is responsible for the preparation and fair presentation of the consolidated and parentcompany financial statements in accordance with PFRSs, and for such internal control as managementdetermines is necessary to enable the preparation of consolidated and parent company financialstatements that are free from material misstatement, whether due to fraud or error.
In preparing the consolidated and parent company financial statements, management is responsible forassessing the Group’s and Parent Company’s ability to continue as a going concern, disclosing, asapplicable, matters related to going concern and using the going concern basis of accounting unlessmanagement either intends to liquidate the Group and the Parent Company or to cease operations, or hasno realistic alternative but to do so.
Those charged with governance are responsible for overseeing the Group’s and Parent Company’sfinancial reporting process.
Auditor’s Responsibilities for the Audit of the Consolidated and Parent Company FinancialStatements
Our objectives are to obtain reasonable assurance about whether the consolidated and parent companyfinancial statements as a whole are free from material misstatement, whether due to fraud or error, and toissue an auditor’s report that includes our opinion. Reasonable assurance is a high level of assurance, butis not a guarantee that an audit conducted in accordance with PSAs will always detect a materialmisstatement when it exists. Misstatements can arise from fraud or error and are considered material if,individually or in the aggregate, they could reasonably be expected to influence the economic decisions ofusers taken on the basis of these consolidated and parent company financial statements.
As part of an audit in accordance with PSAs, we exercise professional judgment and maintainprofessional skepticism throughout the audit. We also:
· Identify and assess the risks of material misstatement of the consolidated and parent companyfinancial statements, whether due to fraud or error, design and perform audit procedures responsive tothose risks, and obtain audit evidence that is sufficient and appropriate to provide a basis for ouropinion. The risk of not detecting a material misstatement resulting from fraud is higher than for oneresulting from error, as fraud may involve collusion, forgery, intentional omissions,misrepresentations, or the override of internal control.
· Obtain an understanding of internal control relevant to the audit in order to design audit proceduresthat are appropriate in the circumstances, but not for the purpose of expressing an opinion on theeffectiveness of the Group’s and Parent Company’s internal control.
· Evaluate the appropriateness of accounting policies used and the reasonableness of accountingestimates and related disclosures made by management.
· Conclude on the appropriateness of management’s use of the going concern basis of accounting and,based on the audit evidence obtained, whether a material uncertainty exists related to events or
A member firm of Ernst & Young Global Limited
*SGVFS039096*
- 7 -
conditions that may cast significant doubt on the Group’s and Parent Company’s ability to continueas a going concern. If we conclude that a material uncertainty exists, we are required to drawattention in our auditor’s report to the related disclosures in the consolidated and parent companyfinancial statements or, if such disclosures are inadequate, to modify our opinion. Our conclusionsare based on the audit evidence obtained up to the date of our auditor’s report. However, futureevents or conditions may cause the Group and the Parent Company to cease to continue as a goingconcern.
· Evaluate the overall presentation, structure and content of the consolidated and parent companyfinancial statements, including the disclosures, and whether the consolidated and parent companyfinancial statements represent the underlying transactions and events in a manner that achieves fairpresentation.
· Obtain sufficient appropriate audit evidence regarding the financial information of the entities orbusiness activities within the Group to express an opinion on the consolidated financial statements.We are responsible for the direction, supervision and performance of the audit. We remain solelyresponsible for our audit opinion.
We communicate with those charged with governance regarding, among other matters, the planned scopeand timing of the audit and significant audit findings, including any significant deficiencies in internalcontrol that we identify during our audit.
We also provide those charged with governance with a statement that we have complied with relevantethical requirements regarding independence, and to communicate with them all relationships and othermatters that may reasonably be thought to bear on our independence, and where applicable, relatedsafeguards.
From the matters communicated with those charged with governance, we determine those matters thatwere of most significance in the audit of the consolidated and parent company financial statements of thecurrent period and are therefore the key audit matters. We describe these matters in our auditor’s reportunless law or regulation precludes public disclosure about the matter or when, in extremely rarecircumstances, we determine that a matter should not be communicated in our report because the adverseconsequences of doing so would reasonably be expected to outweigh the public interest benefits of suchcommunication.
Report on the Supplementary Information Required Under Bangko Sentral ng Pilipinas (BSP)Circular No. 1074 and Revenue Regulations 15-2010
Our audits were conducted for the purpose of forming an opinion on the basic financial statements takenas a whole. The supplementary information required under BSP Circular No. 1074 in Note 37 andRevenue Regulations 15-2010 in Note 38 to the financial statements is presented for purposes of filingwith the BSP and Bureau of Internal Revenue, respectively, and is not a required part of the basicfinancial statements. Such information is the responsibility of the management of China BankingCorporation. The information has been subjected to the auditing procedures applied in our audit of thebasic financial statements. In our opinion, the information is fairly stated, in all material respects, inrelation to the basic financial statements taken as a whole.
A member firm of Ernst & Young Global Limited

*SGVFS039096*
- 8 -
The engagement partner on the audit resulting in this independent auditor’s report isRay Francis C. Balagtas.
SYCIP GORRES VELAYO & CO.
Ray Francis C. BalagtasPartnerCPA Certificate No. 108795SEC Accreditation No. 1510-AR-1 (Group A), September 18, 2019, valid until September 17, 2021Tax Identification No. 216-950-288BIR Accreditation No. 08-001998-107-2018, February 14, 2018, valid until February 13, 2021PTR No. 8125208, January 7, 2020, Makati City
February 26, 2020
A member firm of Ernst & Young Global Limited

*SGVFS039096*
CHINA BANKING CORPORATION AND SUBSIDIARIESBALANCE SHEETS(Amounts in Thousands)
Consolidated Parent CompanyDecember 31
2019 2018 2019 2018ASSETSCash and Other Cash Items P=16,839,755 P=15,639,474 P=14,856,844 P=13,705,304Due from Bangko Sentral ng Pilipinas
(Notes 7 and 17) 100,174,398 101,889,773 88,109,650 95,092,944Due from Other Banks (Note 7) 9,900,642 9,455,447 8,645,547 7,837,894Interbank Loans Receivable and Securities Purchased
under Resale Agreements (Note 8) 17,036,460 11,998,040 10,027,609 8,998,040Financial Assets at Fair Value through Profit or Loss
(Note 9) 18,500,111 7,596,261 18,444,101 6,689,796Financial Assets at Fair Value through Other
Comprehensive Income (Note 9) 26,133,360 10,101,527 24,170,629 8,213,010Investment Securities at Amortized Cost (Note 9) 168,202,728 172,537,036 164,231,583 163,824,466Loans and Receivables (Notes 10 and 29) 568,919,164 505,804,955 502,930,197 441,432,156Accrued Interest Receivable 7,158,494 5,697,181 6,526,475 5,126,127Investment in Subsidiaries (Notes 11 and 30) – – 15,129,118 14,333,567Investment in Associates (Note 11) 704,169 335,092 704,169 335,092Bank Premises, Furniture, Fixtures and
Equipment and Right-of-use Assets (Note 12) 9,155,234 6,450,458 7,468,646 5,265,386Investment Properties (Note 13) 4,337,184 4,789,602 1,496,987 1,188,797Deferred Tax Assets (Note 28) 3,370,949 2,514,889 2,287,956 1,739,219Intangible Assets (Note 14) 4,066,078 4,202,599 945,916 915,531Goodwill (Note 14) 839,748 839,748 222,841 222,841Other Assets (Note 15) 6,887,505 6,219,558 3,982,129 3,332,763
P=962,225,979 P=866,071,640 P=870,180,397 P=778,252,933
LIABILITIES AND EQUITYLiabilitiesDeposit Liabilities (Notes 17 and 30)Demand P=186,955,056 P=161,239,669 P=170,279,879 P=145,559,564Savings 224,872,421 239,539,817 210,191,063 226,943,962Time 363,600,383 321,343,811 307,293,511 265,739,836
775,427,860 722,123,297 687,764,453 638,243,362Bills Payable (Note 19) 33,381,406 39,826,532 33,381,406 39,826,532Manager’s Checks 1,998,678 2,577,175 1,535,936 2,069,812Income Tax Payable 540,662 477,585 479,923 414,233Accrued Interest and Other Expenses (Note 20) 4,121,302 3,842,525 3,650,339 3,342,152Bonds Payable (Note 18) 37,394,398 – 37,394,398 –Derivative Liabilities (Note 26) 1,036,052 455,150 1,036,052 455,150Derivative Contracts Designated as Hedges (Note 26) 51,949 – 51,949 –Deferred Tax Liabilities (Note 28) 1,083,378 1,231,145 – –Other Liabilities (Notes 21 and 24) 11,014,701 7,681,644 8,722,696 6,049,812
866,050,386 778,215,053 774,017,153 690,401,053EquityEquity Attributable to Equity Holders of the
Parent CompanyCapital stock (Note 24) 26,858,998 26,858,998 26,858,998 26,858,998Capital paid in excess of par value (Note 24) 17,122,625 17,122,625 17,122,626 17,122,625Surplus reserves (Notes 24 and 29) 3,598,274 4,031,008 3,598,275 4,031,008Surplus (Notes 24 and 29) 48,558,760 40,497,256 48,558,760 40,497,256Net unrealized gain (loss) on financial assets at fair value
through other comprehensive income (Note 9) 417,576 (702,509) 417,576 (702,509)Remeasurement gain (loss) on defined benefit asset
(Note 25) (368,531) 117,047 (368,531) 117,047Cumulative translation adjustment 6,835 (91,699) 6,835 (91,699)Remeasurement gain on life insurance reserves 20,655 19,154 20,655 19,154Cash flow hedge reserve (51,949) – (51,949) –
96,163,243 87,851,880 96,163,244 87,851,880Non-controlling Interest 12,350 4,707 –
96,175,593 87,856,587 96,163,244 87,851,880P=962,225,979 P=866,071,640 P=870,180,397 P=778,252,933
See accompanying Notes to Financial Statements.

*SGVFS039096*
CHINA BANKING CORPORATION AND SUBSIDIARIESSTATEMENTS OF INCOME(Amounts in Thousands)
Consolidated Parent CompanyYears Ended December 31
2019 2018 2017 2019 2018 2017
INTEREST INCOMELoans and receivables (Notes 10 and 30) P=36,051,051 P=28,195,915 P=21,751,647 P=30,824,138 P=23,488,872 P=17,537,017Investment securities at amortized costs and at
FVOCI (Note 9) 9,828,076 5,875,928 3,556,110 9,362,427 5,559,557 3,275,025Financial assets at FVPL 692,482 413,323 410,889 692,482 413,323 398,777Due from Bangko Sentral ng Pilipinas and
other banks and securities purchased underresale agreements (Notes 7 and 8) 1,113,206 727,337 820,699 702,422 516,645 634,906
47,684,814 35,212,503 26,539,345 41,581,468 29,978,697 21,845,725INTEREST EXPENSEDeposit liabilities (Notes 17 and 29) 18,567,168 11,621,063 6,521,935 15,915,107 9,736,014 5,210,803Bonds payable, bills payable and other
borrowings(Note 18 and 19) 2,802,104 665,254 391,007 2,800,843 665,254 391,007
Lease payable (Note 21) 264,246 – – 207,744 – –21,633,519 12,286,317 6,912,942 18,923,694 10,401,268 5,601,810
NET INTEREST INCOME 26,051,295 22,926,186 19,626,403 22,657,774 19,577,428 16,243,915Service charges, fees and commissions
(Note 22) 3,296,673 2,777,283 2,441,724 1,624,703 1,529,727 1,394,998Gain on disposal of investment securities at
amortized cost (Note 9) 1,381,871 – – 1,299,360 – –Trading and securities gain (loss) - net
(Notes 9 and 22) 884,482 (271,552) 479,960 837,875 (275,964) 399,760Gain on sale of investment properties 864,383 1,015,622 670,612 721,893 925,831 614,587Trust fee income (Note 29) 357,080 305,753 376,312 357,080 305,338 371,947Foreign exchange gain - net (Note 26) 221,104 215,963 386,015 243,764 187,064 389,692Share in net income of an associate (Note 11) 184,661 101,009 73,133 184,661 101,009 73,133Gain on asset foreclosure and dacion
transactions (Note 13) 47,479 252,477 157,415 81,294 57,676 71,888Share in net income of subsidiaries (Note 11) – – – 770,628 695,356 836,004Miscellaneous (Notes 22 and 30) 1,193,056 1,261,741 1,516,523 1,062,795 1,130,134 1,391,657TOTAL OPERATING INCOME 34,482,085 28,584,482 25,728,097 29,841,828 24,233,599 21,787,581Compensation and fringe benefits
(Notes 25 and 30) 6,622,664 6,139,001 5,708,948 5,029,191 4,610,265 4,288,096Taxes and licenses 3,884,183 2,925,870 2,264,025 3,155,849 2,307,948 1,819,331Provision for impairment and credit losses
(Note 16) 2,570,168 141,076 754,171 2,205,062 (1,957) 423,922Depreciation and amortization
(Notes 12, 13 and 14) 1,942,660 1,297,685 1,217,489 1,463,092 947,908 877,240Insurance 1,875,977 1,669,618 1,440,153 1,624,065 1,447,890 1,241,575Occupancy cost (Notes 27 and 30) 1,801,154 2,336,639 2,112,602 1,308,482 1,713,888 1,528,876Transportation and traveling 566,572 484,514 378,703 432,157 370,980 289,903Entertainment, amusement and recreation 477,761 380,166 287,105 342,034 262,489 182,172Professional fees, marketing and other related
services 412,146 352,159 312,042 329,959 261,931 222,509Stationery, supplies and postage 258,425 284,436 268,901 194,990 220,651 197,567Repairs and maintenance 159,814 131,158 104,298 120,242 102,834 69,276Miscellaneous (Notes 22 and 30) 2,322,938 2,054,634 1,867,552 1,890,022 1,619,159 1,490,658TOTAL OPERATING EXPENSES 22,894,462 18,196,956 16,715,989 18,095,147 13,863,986 12,631,125INCOME BEFORE INCOME TAX 11,587,621 10,387,526 9,012,108 11,746,680 10,369,613 9,156,456PROVISION FOR INCOME TAX
(Note 28) 1,512,650 2,271,422 1,489,177 1,677,720 2,259,233 1,642,484NET INCOME P=10,074,972 P=8,116,104 P=7,522,931 P=10,068,960 P=8,110,380 P=7,513,972Attributable to: Equity holders of the Parent Company
(Note 33) P=10,068,960 P=8,110,379 P=7,513,972 Non-controlling interest 6,012 5,725 8,959
P=10,074,972 P=8,116,104 P=7,522,931Basic/Diluted Earnings Per Share (Note 32) P=3.75 P=3.02 P=2.91

*SGVFS039096*
CHINA BANKING CORPORATION AND SUBSIDIARIESSTATEMENTS OF COMPREHENSIVE INCOME(Amounts in Thousands)
Consolidated Parent CompanyYears Ended December 31
2019 2018 2017 2019 2018 2017
NET INCOME P=10,074,972 P=8,116,104 P=7,522,931 P=10,068,960 P=8,110,380 P=7,513,972
OTHER COMPREHENSIVE INCOME(LOSS)
Items that recycle to profit or loss in subsequentperiods:
Changes in fair value of:Financial assets at fair value through other
comprehensive income:Fair value gain (loss) for the year, net of
tax 1,163,009 (451,866)–
940,851 (381,791)–
Loss (gain) taken to profit or loss (Note22) (269,478) 2,104
–(240,310) 2,451
–
Available-for-sale financial assets:Fair value gain for the year, net of tax – – 158,946 – – 113,020
Gains taken to profit or loss (Note 22) – – (365,145) – – (342,146) Share in changes in other comprehensive
income of an associate (Note 11) 152,452 (126,713) (8,049) 152,452 (126,713) (8,049)Share in changes in other comprehensive
income of subsidiaries (Note 11) – – 207,510 (64,109) 35,552 Cumulative translation adjustment 98,830 (52,900) (15,972) 81,518 (58,792) (29,255)
Loss on cash flow hedges (51,949) – – (51,949) – –Items that do not recycle to profit or loss in
subsequent periods: Share in changes in other comprehensive
income of subsidiaries (Note 11) – – – (56,353) 88,642 20,140Share in changes in other comprehensive
income of associate (Note 11) 4,486 31,374 (12,221) 4,486 31,374 (12,221) Remeasurement gain (loss) on defined benefit
asset, net of tax (Note 25) (489,722) (165,213) 30,149 (432,210) (255,359) 9,678
OTHER COMPREHENSIVE INCOME(LOSS) FOR THE YEAR, NET OF TAX 607,627 (763,214) (212,292) 605,996 (764,297) (213,281)
TOTAL COMPREHENSIVE INCOME FORTHE YEAR P=10,682,599 P=7,352,890 P=7,310,639 P=10,674,956 P=7,346,083 P=7,300,691
Total comprehensive income attributable to: Equity holders of the Parent Company P=10,674,956 P=7,346,083 P=7,300,691 Non-controlling interest 7,643 6,807 9,948
P=10,682,599 P=7,352,890 P=7,310,639
See accompanying Notes to Financial Statements.

*SGVFS039096*
CHINA BANKING CORPORATION AND SUBSIDIARIESSTATEMENTS OF CHANGES IN EQUITY(Amounts in Thousands)
ConsolidatedEquity Attributable to Equity Holders of the Parent Company
Capital Stock(Note 23)
Capital Paidin Excess ofPar Value
(Note 23)
SurplusReserves
(Notes 23 and28)
Surplus(Notes 23 and
28)
Net Unrealized (Losses) on
FinancialAssets at Fair
Value throughOther
ComprehensiveIncome(Note 9)
Net Unrealized Gains
(Losses) on Available-
for-SaleFinancial
Assets(Note 9)
RemeasurementGain on Defined
Benefit Asset or Liability
(Note 24)
Cumulative Translation Adjustment
RemeasurementLoss on
Life Insurance Reserve
Cash FlowHedge
Reserve Total Equity
Non-Controlling
Interest(Note 11) Total Equity
Balance at January 1, 2019 P=26,858,998 P=17,122,625 P=4,031,008 P=40,497,256 (P=702,509) P=– P=117,047 (P=91,699) P=19,154 P=– P=87,851,880 P=4,707 P=87,856,587Total comprehensive income (loss) for the year – – – 10,068,960 1,043,488 – (485,578) 98,534 1,501 (51,949) 10,674,956 7,643 10,682,599Transfer from surplus to surplus reserves – – 35,708 (35,708) – – – – – – – – –Appropriation of retained earnings (Note 16) – – (468,442) 468,442 – – – – – – – – –Realized loss on sale of equity securities at
FVOCI– – – (76,597) 76,597 – – – – – – – –
Cash dividends - P=0.88 per share – – – (2,363,592) – – – – – – (2,363,592) – (2,363,592)Balance at December 31, 2019 P=26,858,998 P=17,122,625 P=3,598,275 P=48,558,760 P=417,576 P=– (P=368,531) P=6,835 P=20,655 (P=51,949) P=96,163,244 P=12,351 P=96,175,595Balance at January 1, 2018 P=26,847,717 P=17,096,228 P=926,689 P=40,360,563 P=– (P=1,813,280) P=283,763 (P=38,698) (P=12,221) – P= 83,650,761 P=4,736 83,655,497Effect of initial application of PFRS 9 (Note 2) – – 2,732,628 (5,372,699) (126,556) 1,813,280 – – – – (953,346) (6,835) (960,181)Balance at January 1, 2018, as restated 26,847,717 17,096,228 3,659,317 34,987,864 (126,556) – 283,763 (38,698) (12,221) – 82,697,415 (2,099) 82,695,316Total comprehensive income (loss) for the year – – – 8,110,379 (575,953) – (166,716) (53,001) 31,375 – 7,346,084 6,806 7,352,890Transfer from surplus to surplus reserves – – 371,691 (371,691) – – – – – – – – –Issuance of common shares (P=31.00 per share) 11,281 26,397 – – – – – – – – 37,678 – 37,678Transaction cost on the issuance of commonshares
– (52,089) – – – – – – – – (52,089) – (52,089)
Cash dividends - P=0.83 per share – – – (2,229,297) – – – – – – (2,229,297) – (2,229,297)Balance at December 31, 2018 P=26,858,998 P=17,122,625 P=4,031,008 P=40,497,256 (P=702,509) P=– P=117,047 (P=91,699) P=19,154 – P=87,851,880 P=4,707 P=87,856,587Balance at January 1, 2017 P=20,020,278 P=6,987,564 P=861,630 P=36,889,099 – (P=1,598,600) P=253,945 (P=22,500) P=– – P=63,391,416 (P=5,212) P=63,386,204Transfer from surplus to surplus reserves – – 65,059 (65,059) – – – – – – – – –Total comprehensive income (loss) for the year – – – 7,513,972 – (214,680) 29,818 (16,198) (12,221) – 7,300,691 9,948 7,310,639Issuance of common shares (P=31.00 per share) 4,838,710 10,160,753 – – – – – – – – 14,999,463 – 14,999,463Transaction cost on the issuance of commonshares
– (52,089) – – – – – – – – (52,089) – (52,089)
Stock dividends - 8.00% 1,988,729 – – (1,988,729) – – – – – – – – –Cash dividends - P=0.80 per share – – – (1,988,720) – – – – – – (1,988,720) – (1,988,720)Balance at December 31, 2017 P=26,847,717 P=17,096,228 P=926,689 P=40,360,563 – (P=1,813,280) P=283,763 (P=38,698) (P=12,221) – P=83,650,761 P=4,736 P=83,655,497
See accompanying Notes to Financial Statements.

*SGVFS039096*
CHINA BANKING CORPORATION AND SUBSIDIARIESSTATEMENTS OF CHANGES IN EQUITY(Amounts in Thousands)
Parent Company
Capital Stock(Note 23)
Capital Paid inExcess of
Par Value(Note 23)
SurplusReserves
(Notes 23 and 28)Surplus
(Notes 23 and 28)
Net Unrealized(Losses) on
FinancialAssets at Fair
Value throughOther
ComprehensiveIncome (Note 9)
Net UnrealizedGains
(Losses) onAvailable-for-Sale FinancialAssets (Note 9)
RemeasurementGain on DefinedBenefit Asset or
Liability(Note 24)
CumulativeTranslationAdjustment
RemeasurementLoss on Life
InsuranceReserve
Cash FlowHedge
Reserve Total EquityBalance at January 1, 2019 P=26,858,998 P=17,122,626 P=4,031,008 P=40,497,256 (P=702,510) P=– P=117,047 (P=91,699) P=19,153 P=– P=87,851,880Total comprehensive income (loss) for the year – – – 10,068,960 1,043,488 – (485,578) 98,534 1,501 (51,949) 10,674,956Transfer from surplus to surplus reserves – – 35,708 (35,708) – – – – – – –Appropriation of retained earnings (Note 16) – – (468,442) 468,442 – – – – – – –Realized loss on sale of equity securities at FVOCI – – – (76,597) 76,597 – – – – – –Cash dividends - P=0.88 per share – – – (2,363,592) – – – – – – (2,363,592)Balance at December 31, 2019 P=26,858,998 P=17,122,626 P=3,598,275 P=48,558,760 P=417,576 P=– (P=368,531) P=6,835 P=20,655 (P=51,949) P=96,163,244Balance at January 1, 2018 P=26,847,717 P=17,096,228 P=926,689 P=40,360,563 P=– (P=1,813,280) P=283,763 (P=38,698) (P=12,221) – P=83,650,761Effect of initial application of PFRS 9 (Note 2) – – 2,732,628 (5,372,699) (126,556) 1,813,280 – – – (953,346)Balance at January 1, 2019, as restated P=26,847,717 P=17,096,228 3,659,317 34,987,864 (126,556) – P=283,763 (P=38,698) (P=12,221) – 82,697,417Total comprehensive income (loss) for the year – – – 8,110,379 (575,954) – (166,716) (53,001) 31,374 – 7,346,081Transfer from surplus to surplus reserves – – 371,691 (371,691) – – – – – –Issuance of common shares (P=31.00 per share) 11,281 26,397 – – – – – – – – 37,678Cash dividends - P=0.83 per share – – (2,229,297) – – – – – – (2,229,297)Balance at December 31, 2018 P=26,858,998 P=17,122,626 P=4,031,008 P=40,497,256 (P=702,510) P=– P=117,047 (P=91,699) P=19,153 – P=87,851,880Balance at January 1, 2017 P=20,020,278 P=6,987,564 P=861,630 P=36,889,099 – (P=1,598,600) P=253,945 (P=22,500) P=– – P=63,391,416Transfer from surplus to surplus reserves – – 65,059 (65,059) – – – – – – –Total comprehensive income (loss) for the year – – – 7,513,972 – (214,680) 29,818 (16,198) (12,221) – 7,300,691Issuance of common shares (P=31.00 per share) 4,838,710 10,160,753 – – – – – – – – 14,999,463Transaction cost on the issuance of common shares – (52,089) – – – – – – – – (52,089)Stock dividends - 8.00% 1,988,729 – – (1,988,729) – – – – – – –Cash dividends - P=0.80 per share – – – (1,988,720) – – – – – – (1,988,720)Balance at December 31, 2017 P=26,847,717 P=17,096,228 P=926,689 P=40,360,563 – (P=1,813,280) P=283,763 (P=38,698) (P=12,221) – P=83,650,761
See accompanying Notes to Financial Statements.

*SGVFS039096*
CHINA BANKING CORPORATION AND SUBSIDIARIESSTATEMENTS OF CASH FLOWS(Amounts in Thousands)
Consolidated Parent CompanyYears Ended December 31
2019 2018 2017 2019 2018 2017CASH FLOWS FROM OPERATING ACTIVITIESIncome before income tax
P=11,587,621 P=10,387,526 P=9,012,108 P=11,746,680 P=10,369,613 P=9,156,456Adjustments for:
Depreciation and amortization(Notes 12, 13 and 14) 1,942,661 1,297,685 1,217,489 1,463,092 947,908 877,240
Provision for impairment and credit losses (Note 16) 2,570,168 141,076 754,171 2,205,062 (1,957) 423,922
Amortization of transaction costs on bonds payable 200,852 – – 200,852 – –Securities gain on financial assets at fair value
through other comprehensive income andinvestment securities at amortized cost(Note 21) (1,651,349) (9,624) – (1,539,670) (9,277) –
Trading and securities gain on available-for-sale andheld-to-maturity financial assets (Note 21) – – (365,145) – – (342,146)
Gain on sale of investment properties (864,383) (1,015,622) (670,612) (721,893) (925,831) (614,587)Gain on asset foreclosure and dacion transactions
(Note 13) (47,479) (252,477) (157,415) (81,294) (57,676) (71,888)Share in net losses (income) of an associate
(Notes 2 and 11) (184,661) (101,009) (73,133) (184,661) (101,009) (73,133)Share in net (income) of subsidiaries
(Notes 2 and 11) – – – (770,628) (695,356) (836,004) Changes in operating assets and liabilities: Decrease (increase) in the amounts of: Financial assets at FVPL (10,322,948) 8,830,244 (8,510,654) (14,085,388) 9,554,643 (8,799,606) Loans and receivables (64,140,453) (60,828,559) (63,393,487) (64,112,157) (57,994,624) (57,873,074) Other assets (3,844,834) (1,263,617) 6,159 (2,708,132) (2,544,975) 275,322 Increase (decrease) in the amounts of: Deposit liabilities 53,304,563 87,029,904 93,510,375 49,521,091 79,007,383 88,273,987 Manager’s checks (578,497) 136,133 411,264 (533,876) 360,564 263,663 Accrued interest and other expenses 278,777 1,214,906 759,429 308,187 1,058,204 722,597 Other liabilities 433,649 1,960,943 177,618 3,262,497 2,393,869 (540,630)Net cash generated from operations (11,316,313) 47,527,509 32,678,167 (16,030,238) 41,361,482 30,842,119Income taxes paid (2,143,644) (1,732,819) (1,554,045) (1,840,519) (1,511,638) (1,274,667)Net cash provided by operating activities (13,459,957) 45,794,690 31,124,122 (17,870,757) 39,849,844 29,567,452CASH FLOWS FROM INVESTING ACTIVITIESAcquisitions of/Additions to:
Bank premises, furniture, fixtures and equipment(Note 12) (873,688) (1,058,002) (1,752,173) (709,808) (825,096) (1,387,684)
Equity investments (Note 11) (40,000) – – (40,363) (500,000) (500,000)
Investment securities at amortized cost (24,382,774) (172,348,552) – (23,616,210) (167,337,112) –Financial assets at fair value through other
comprehensive income (27,081,539) (44,399,340) – (27,081,539) (44,477,104) –Held-to-maturity financial assets – – (23,618,560) – – (23,599,743)
Available-for-sale financial assets – – (54,304,672) – – (53,171,027)Proceeds from sale of:
Investment securities at amortized cost 18,616,553 – – 13,324,227 – –Financial assets at fair value through other
comprehensive income 10,972,736 80,729,853 – 12,141,368 – Available-for-sale financial assets – – 41,891,950 – – 41,500,714
Investment properties 2,074,400 1,810,112 1,335,946 802,118 1,458,379 846,974 Bank premises, furniture, fixtures and equipment 62,943 258,136 275,109 26,990 51,642 242,202
Proceeds from maturity of:Investment securities at amortized cost 11,482,400 65,109,637 – 11,184,226 65,060,529 –Held-to-maturity financial assets – – 15,737,093 – – 16,135,271
Cash dividends from a subsidiary (Note 11) – 50,000 – 50,000 50,000 –Net cash used in investing activities (9,168,969) (69,898,150) (20,435,307) (13,918,991) (66,023,900) (19,933,293)CASH FLOWS FROM FINANCING ACTIVITIESProceeds from bills payable 180,468,980 184,568,424 252,268,556 180,468,980 184,568,424 252,268,556Settlement of bills payable (186,914,106) (164,859,923) (249,105,524) (186,914,106) (164,859,923) (249,105,524)Proceeds from issuance of bonds payable 37,193,546 – – 37,193,546 – –Payments of cash dividends (Note 23) (2,363,592) (2,229,297) (1,988,720) (2,363,592) (2,229,297) (1,988,720)Proceeds from issuance of common shares (Note 23) – 37,678 14,999,463 – 37,678 14,999,463Transaction cost on the issuance of common shares
(Note 23) – – (52,089) – – (52,089)Payments of principal portion lease liabilities (787,381) – – (589,613) – –Net cash provided by (used in) financing activities 27,597,447 17,516,882 16,121,687 27,795,215 17,516,882 16,121,687NET INCREASE (DECREASE) IN CASH AND
CASH EQUIVALENTS 4,968,521 (6,586,585) 26,810,502 (3,994,533) (8,657,174) 25,755,846

*SGVFS039096*
- 2 -
Consolidated Parent CompanyYears Ended December 31
2019 2018 2017 2019 2018 2017NET INCREASE (DECREASE) IN CASH AND
CASH EQUIVALENTS P=15,639,474 (P=6,586,585) P=26,810,502 (P=3,994,533) (P=8,657,174) P=25,755,846CASH AND CASH EQUIVALENTS AT
BEGINNING OF YEARCash and other cash items 15,639,474 12,685,984 12,010,543 13,705,304 11,160,173 10,580,748Due from Bangko Sentral ng Pilipinas (Note 7) 101,889,773 98,490,014 91,964,495 95,092,944 91,717,037 85,307,128Due from other banks (Note 7) 9,455,447 15,641,476 11,332,236 7,837,894 14,066,620 9,689,165Interbank Loans Receivable and SPURA (Note 8) 11,998,040 18,751,845 3,451,543 8,998,040 17,347,522 2,958,465
138,982,734 145,569,319 118,758,817 P=125,634,182 134,291,352 108,535,506CASH AND CASH EQUIVALENTS AT END
OF YEARCash and other cash items 16,839,755 15,639,474 12,685,984 14,856,844 13,705,304 11,160,173Due from Bangko Sentral ng Pilipinas (Note 7) 100,174,398 101,889,773 98,490,014 88,109,650 95,092,944 91,717,037Due from other banks (Note 7) 9,900,642 9,455,447 15,641,476 8,645,547 7,837,894 14,066,620Securities purchased under resale agreements (Note 8) 17,036,460 11,998,040 18,751,845 10,027,609 8,998,040 17,347,522
P=143,951,255 P=138,982,734 P=145,569,319 P=121,639,650 P=125,634,182 P=134,291,352
OPERATING CASH FLOWS FROM INTEREST
Consolidated Parent CompanyAs of December 31
2019 2018 2017 2019 2018 2017Interest paid P=20,557,295 P=11,361,726 P=6,652,755 P=17,928,838 P=9,595,463 P=5,359,209Interest received 46,223,502 33,233,827 25,835,369 40,181,121 28,041,653 21,322,995
See accompanying Notes to Financial Statements.

*SGVFS039096*
CHINA BANKING CORPORATION AND SUBSIDIARIESNOTES TO FINANCIAL STATEMENTS
1. Corporate Information
China Banking Corporation (the Parent Company) is a publicly listed universal bank incorporated inthe Philippines. The Parent Company acquired its universal banking license in 1991. It providesexpanded commercial banking products and services such as deposit products, loans and trade finance,domestic and foreign fund transfers, treasury products, trust products, foreign exchange, corporatefinance and other investment banking services through a network of 473 and 458 local branches as ofDecember 31, 2019 and 2018, respectively.
The Parent Company acquired its original Certification of Incorporation issued by the Securities andExchange Commission (SEC) on July 20, 1920. On December 4, 1963, the Board of Directors (BOD)of the Parent Company approved the Amended Articles of Incorporation to extend the corporate termof the Parent Company for another 50 years or until July 20, 2020, which was confirmed by thestockholders on December 23, 1963, and approved by the SEC on October 5, 1964. On March 2, 2016,the BOD approved the amendment of the Third Article of the Parent Company's Articles ofIncorporation, to further extend the corporate term for another 50 years from and after July 20, 2020,the expiry date of its extended term. The approval was ratified by the stockholders during theirscheduled annual meeting on May 5, 2016. On November 7, 2016, the SEC issued the Certificate ofFiling of Amended Articles of Incorporation, amending the Third Article thereof to extend the term ofcorporate existence of the Parent Company.
The Parent Company has the following subsidiaries:
Subsidiary
Effective Percentages ofOwnership Country of
Incorporation Principal Activities2019 2018Chinabank Insurance Brokers, Inc.
(CIBI) 100.00% 100.00% Philippines Insurance brokerageCBC Properties and Computer Center,
Inc. (CBC-PCCI) 100.00% 100.00% Philippines Computer servicesChina Bank Savings, Inc. (CBSI) 98.29% 98.29% Philippines Retail and consumer
bankingChina Bank Capital Corporation
(CBCC)100.00% 100.00% Philippines Investment house
CBC Assets One (SPC) Inc. 100.00% 100.00% Philippines Special purposecorporation
China Bank Securities Corporation(CBCSec)
100.00% 100.00% Philippines Stock brokerage
The Parent Company has no ultimate parent company. SM Investments Corporation, its significantinvestor, has effective ownership in the Parent Company of 22.55%and 20.30% as of December 31,2019 and 2018, respectively.
The Parent Company’s principal place of business is at 8745 Paseo de Roxas cor. Villar St., MakatiCity.
- 2 -
*SGVFS039096*
2. Summary of Significant Accounting Policies
Basis of PreparationThe accompanying consolidated financial statements include the financial statements of the ParentCompany and its subsidiaries (collectively referred to as “the Group”).
The accompanying financial statements have been prepared on a historical cost basis except forfinancial instruments at fair value through profit or loss (FVTPL) and financial assets at fair valuethrough other comprehensive income (FVOCI). The financial statements are presented in Philippinepeso, and all values are rounded to the nearest thousand except when otherwise indicated.
The financial statements of the Parent Company reflect the accounts maintained in the Regular BankingUnit (RBU) and Foreign Currency Deposit Unit (FCDU). The financial statements of these units arecombined after eliminating inter-unit accounts.
Each entity in the Group determines its own functional currency and items included in the financialstatements of each entity are measured using that functional currency. The functional currency of theParent Company’s subsidiaries is the Philippine peso.
Statement of ComplianceThe financial statements of the Group and the Parent Company have been prepared in compliance withPhilippine Financial Reporting Standards (PFRS).
Presentation of Financial StatementsThe balance sheets of the Group and of the Parent Company are presented in order of liquidity. Ananalysis regarding recovery of assets or settlement of liabilities within 12 months after the reportingdate (current) and more than 12 months after the reporting date (non-current) is presented in Note 23.
Financial assets and financial liabilities are offset and the net amount reported in the balance sheetsonly when there is a legally enforceable right to offset the recognized amounts and there is an intentionto settle on a net basis, or to realize the assets and settle the liability simultaneously. The Group andthe Parent Company assess that they have currently enforceable right of offset if the right is notcontingent on a future event, and is legally enforceable in the normal course of business, event ofdefault, and event of insolvency or bankruptcy of the Group, the Parent Company and all of thecounterparties.
Income and expenses are not offset in the statement of income unless required or permitted by anyaccounting standard or interpretation, and as specifically disclosed in the accounting policies of theGroup and the Parent Company.
Basis of Consolidation and Investments in SubsidiariesThe consolidated financial statements of the Group are prepared for the same reporting year as theParent Company, using consistent accounting policies. All significant intra-group balances,transactions and income and expenses resulting from intra-group transactions are eliminated in full.
Subsidiaries are consolidated from the date on which control is transferred to the Parent Company.The Group controls an investee if and only if the Group has:
· power over the investee (i.e., existing rights that give it the current ability to direct the relevantactivities of the investee);
· exposure, or rights, to variable returns from its involvement with the investee, and

- 3 -
*SGVFS039096*
· the ability to use its power over the investee to affect its returns.
When the Group has less than a majority of the voting or similar rights of an investee, the Groupconsiders all relevant facts and circumstances in assessing whether it has power over an investee,including:
· the contractual arrangement with the other vote holders of the investee· rights arising from other contractual arrangements· the Group’s voting rights and potential voting rights.
The Group re-assesses whether or not it controls an investee if facts and circumstances indicate thatthere are changes to one or more of the three elements of control. Consolidation of a subsidiary beginswhen the Group obtains control over the subsidiary and ceases when the Group loses control of thesubsidiary. Assets, liabilities, income and expenses of a subsidiary acquired or disposed of during theyear are included in the statement of comprehensive income from the date the Group gains control untilthe date the Group ceases to control the subsidiary. Profit or loss and each component of othercomprehensive income (OCI) are attributed to the equity holders of the Group and to the non-controlling interests. When necessary, adjustments are made to the financial statements of thesubsidiary to bring its accounting policies into line with the Group’s accounting policies. All intra-group assets and liabilities, equity, income, expenses and cash flows relating to transactions betweenmembers of the Group are eliminated in full on consolidation.
A change in the ownership interest of a subsidiary, without a loss of control, is accounted for as anequity transaction. If the Group loses control over a subsidiary, it:
· Derecognizes the assets (including goodwill) and liabilities of the subsidiary· Derecognizes the carrying amount of any non-controlling interest· Derecognizes the related OCI recorded in equity and recycle the same to profit or loss or surplus· Recognizes the fair value of the consideration received· Recognizes the fair value of any investment retained· Recognizes the remaining difference in profit or loss· Reclassifies the parent’s share of components previously recognized in OCI to profit or loss or
retained earnings, as appropriate, as would be recognized if the Group had directly disposed of therelated assets or liabilities
Non-Controlling InterestNon-controlling interest represents the portion of profit or loss and net assets not owned, directly orindirectly, by the Parent Company.
Non-controlling interest is presented separately in the consolidated statement of income, consolidatedstatement of comprehensive income, and within equity in the consolidated balance sheet, separatelyfrom parent shareholders' equity. Any losses applicable to the non-controlling interest are allocatedagainst the interests of the non-controlling interest even if this results in the non-controlling interesthaving a deficit balance.

- 4 -
*SGVFS039096*
Changes in Accounting Policies and Disclosures
The accounting policies adopted are consistent with those of the previous financial year except for thefollowing new, amendments and improvements to PFRS, Philippine Accounting Standards (PAS) andPhilippine Interpretation which became effective as of January 1, 2019. Except as otherwise indicated,these changes in the accounting policies did not have any significant impact on the financial positionor performance of the Group:
· Amendments· PFRS 9 (Amendment), Prepayment Features with Negative Compensation· PAS 19 (Amendments), Employee Benefits, Plan Amendment, Curtailment or Settlement· PAS 28 (Amendments), Long-term Interests in Associates and Joint Ventures
· Annual Improvements to PFRS 2015-2018 Cycle· Amendments to PFRS 3, Business Combinations, and PFRS 11, Joint Arrangements,
Previously Held Interest in a Joint Operation· Amendments to PAS 12, Income Tax Consequences of Payments on Financial Instruments· Amendments to PAS 23, Borrowing Costs, Borrowing Costs Eligible for Capitalization
· Interpretation· IFRIC 23, Uncertainty over Income Tax Treatments
The Interpretation addresses the accounting for income taxes when tax treatments involveuncertainty that affects the application of PAS 12, Income Taxes. It does not apply to taxes orlevies outside the scope of PAS 12, nor does it specifically include requirements relating tointerest and penalties associated with uncertain tax treatments. The Interpretation specificallyaddresses the following:
· Whether an entity considers uncertain tax treatments separately· The assumptions an entity makes about the examination of tax treatments by taxation
authorities· How an entity determines taxable profit (tax loss), tax bases, unused tax losses, unused
tax credits and tax rates· How an entity considers changes in facts and circumstances
The entity is required to determine whether to consider each uncertain tax treatment separately ortogether with one or more other uncertain tax treatments and use the approach that better predicts theresolution of the uncertainty. The entity shall assume that the taxation authority will examine amountsthat it has a right to examine and have full knowledge of all related information when making thoseexaminations. If an entity concludes that it is not probable that the taxation authority will accept anuncertain tax treatment, it shall reflect the effect of the uncertainty for each uncertain tax treatmentusing the method the entity expects to better predict the resolution of the uncertainty.
The Group applies significant judgment in assessing whether it has uncertain tax position over itsincome tax treatments. Based on the assessment made, the Group determined that it has no uncertaintax position and the Interpretation did not have an impact on the consolidated financial statement.
Standard that has been adopted and that is deemed to have significant impact on the financial statementsor performance of the Group is described below:

- 5 -
*SGVFS039096*
PFRS 16, LeasesPFRS 16 supersedes PAS 17, Leases, Philippine Interpretation IFRIC 4, Determining whether anArrangement contains a Lease, Philippine Interpretation SIC-15, Operating Leases-Incentives andPhilippine Interpretation SIC-27, Evaluating the Substance of Transactions Involving the Legal Formof a Lease. The standard sets out the principles for the recognition, measurement, presentation anddisclosure of leases and requires lessees to recognize most leases on the balance sheet.
Lessor accounting under PFRS 16 is substantially unchanged from the accounting under PAS 17.Lessors will continue to classify all leases using the same classification principle as in PAS 17 anddistinguish between two types of leases: operating and finance leases.
On January 1, 2019, the Group adopted PFRS 16 following the modified retrospective approach.Under the modified retrospective approach, the Group did not restate prior-period comparativefinancial statements which remain to be reported under PAS 17. Therefore, some accounts in thecomparative financial statements are not comparable to the information presented for 2019. The Groupelected to use the following transition practical expedients:
· Non-recognition of lease liability and right-of-use asset for low-value leases and leases endingwithin 12 months of the date of initial application; and
· Exclusion of initial direct costs from the measurement of the right-of-use asset at the date ofinitial application.
As of January 1, 2019, the weighted average incremental borrowing rate applied to lease commitmentsranges from 5% to 8.17% for the Group and 7.38% for the Parent Company. The reconciliation of theoperating lease commitments to the total gross lease payments used in the measurement of the openinglease liabilities follows:
Consolidated Parent CompanyGross lease payments as of December 31, 2018 P=4,724,577 P=3,853,894Gross lease payments pertaining to short-term or
low-value leases (557,275) (543,366)Total gross lease payments as of December 31, 2018 4,167,302 3,310,528Weighted average incremental borrowing rate 5.00%-8.17% 7.38%Lease liability as of January 1, 2019 P=3,669,457 P=2,915,844
The right-of-use assets are presented under bank premises, furniture, fixtures and equipment and thelease liabilities under other liabilities.
As a result of the adoption of PFRS 16, as at January 1, 2019:a) total assets and total liabilities increased resulting from the recognition of right-of use assets and
lease liability in the balance sheet amounting to P=3.67 billion for the Group and P=2.92 billion forthe Parent Company; and
b) accrued rent payable relating to previous operating leases was recorded as an adjustment to right-of-use assets amounting to P=238.18 million and P=186.76 million for the Group and the ParentCompany, respectively.

- 6 -
*SGVFS039096*
The adoption of PFRS 16 did not have an impact on equity on January 1, 2019, since the Groupelected to measure the right-of-use assets at an amount equal to the lease liability, adjusted by theamount of any prepaid or accrued lease payments relating to that lease recognized in the balance sheetimmediately before the date of initial application
Significant Accounting Policies
Foreign Currency TranslationThe consolidated financial statements are presented in Philippine peso, which is the Parent Company’sfunctional currency.
Transactions and balancesThe books of accounts of the RBU are maintained in Philippine peso, the RBU’s functional currency,while those of the FCDU are maintained in United States (US) dollars (USD), the FCDU’s functionalcurrency. For financial reporting purposes, the foreign currency-denominated monetary assets andliabilities in the RBU are translated in Philippine peso based on the Bankers Association of thePhilippines (BAP) closing rate (for 2019 and 2018) and the Philippine Dealing System (PDS) closingrate prevailing (for 2017) at end of the year, and foreign currency-denominated income and expenses,at the exchange rates on transaction dates. Foreign exchange differences arising from restatements offoreign currency-denominated assets and liabilities are credited to or charged against operations in theperiod in which the rates change. Non-monetary items that are measured in terms of historical cost ina foreign currency are translated using the exchange rates as at the dates of the initial transactions. Non-monetary items measured at fair value in a foreign currency are translated using the exchange rates atthe date when the fair value was determined.
FCDUAs at the reporting date, the assets and liabilities of the FCDU are translated into the Parent Company’spresentation currency (the Philippine Peso) at the BAP closing rate (for 2019 and 2018) and the PDSclosing rate prevailing (for 2017) at the reporting date, and its income and expenses are translated atthe BAP weighted average rate for 2019 and 2018 while in 2017, the basis was PDSWAR for the year.Exchange differences arising on translation are taken directly to the statement of comprehensive incomeunder ‘Cumulative translation adjustment’. Upon actual remittance or transfer of the FCDU income toRBU, the related exchange difference arising from translation lodged under 'Cumulative translationadjustment' is recognized in the statement of income of the RBU books.
Fair Value MeasurementThe Group measures financial instruments, such as financial instruments at FVPL and financial assetsat FVOCI at fair value at each reporting date. Also, fair values of financial instruments measured atamortized cost are disclosed in Note 5.
Fair value is the price that would be received to sell an asset or paid to transfer a liability in an orderlytransaction between market participants at the measurement date. The fair value measurement is basedon the presumption that the transaction to sell the asset or transfer the liability takes place either:
· in the principal market for the asset or liability, or· in the absence of a principal market, in the most advantageous market for the asset or liability.
The principal or the most advantageous market must be accessible by the Group. The fair value of anasset or a liability is measured using the assumptions that market participants would use when pricingthe asset or liability, assuming that market participants act in their economic best interest.

- 7 -
*SGVFS039096*
If an asset or a liability measured at fair value has a bid price and an ask price, the price within thebid - ask spread that is most representative of fair value in the circumstances shall be used to measurefair value regardless of where the input is categorized within the fair value hierarchy.
A fair value measurement of a non-financial asset takes into account a market participant's ability togenerate economic benefits by using the asset in its highest and best use or by selling it to anothermarket participant that would use the asset in its highest and best use.
The Group uses valuation techniques that are appropriate in the circumstances and for which sufficientdata are available to measure fair value, maximizing the use of relevant observable inputs andminimizing the use of unobservable inputs.
All assets and liabilities for which fair value is measured or disclosed in the financial statements arecategorized within the fair value hierarchy, described as follows, based on the lowest level input that issignificant to the fair value measurement as a whole:
· Level 1 - Quoted (unadjusted) market prices in active markets for identical assets or liabilities· Level 2 - Valuation techniques for which the lowest level input that is significant to the fair value
measurement is directly or indirectly observable· Level 3 - Valuation techniques for which the lowest level input that is significant to the fair value
measurement is unobservable
For assets and liabilities that are recognized in the financial statements on a recurring basis, the Groupdetermines whether transfers have occurred between Levels in the hierarchy by re-assessingcategorization (based on the lowest level input that is significant to the fair value measurement as awhole) at the end of each reporting period.
Cash and Cash EquivalentsFor purposes of reporting cash flows, cash and cash equivalents include cash and other cash items, duefrom BSP and other banks, interbank loans receivables and securities purchased under resale agreement(SPURA) that are convertible to known amounts of cash which have original maturities of three monthsor less from dates of placements and that are subject to an insignificant risk of changes in value. Duefrom BSP includes the statutory reserves required by the BSP which the Group considers as cashequivalents wherein withdrawals can be made to meet the Group’s cash requirements as allowed by theBSP.
SPURASecurities purchased under agreements to resell at a specified future date (‘reverse repos’) are notrecognized in the balance sheet. The corresponding cash paid including accrued interest, is recognizedin the balance sheet as SPURA. The difference between the purchase price and resale price is treatedas interest income and is accrued over the life of the agreement using the EIR method.
Financial Instruments - Initial RecognitionDate of recognitionPurchases or sales of financial assets, except for derivative instruments, that require delivery of assetswithin the time frame established by regulation or convention in the marketplace are recognized on thesettlement date. Settlement date accounting refers to (a) the recognition of an asset on the day it isreceived by the Group, and (b) the derecognition of an asset and recognition of any gain or loss ondisposal on the day that such asset is delivered by the Group. Any change in fair value of a financialasset is recognized in the statement of income for assets classified as financial assets at FVPL, and inequity for assets classified as financial assets at FVOCI. Derivatives are recognized on a trade date

- 8 -
*SGVFS039096*
basis. Deposits, amounts due to banks and customers loans and receivables are recognized when cashis received by the Group or advanced to the borrowers.
Initial recognition of financial instrumentsAll financial instruments are initially recognized at fair value. Except for financial assets and financialliabilities at FVPL, the initial measurement of financial instruments includes transaction costs.
‘Day 1’ differenceWhere the transaction price in a non-active market is different with the fair value from other observablecurrent market transactions in the same instrument or based on a valuation technique whose variablesinclude only data from observable market, the Group recognizes the difference between the transactionprice and fair value (a ‘Day 1’ difference) in the statement of income. In cases where the transactionprice used is made of data which is not observable, the difference between the transaction price andmodel value is only recognized in the statement of income when the inputs become observable or whenthe instrument is derecognized. For each transaction, the Group determines the appropriate method ofrecognizing the ‘Day 1’ difference amount.
Classification and measurementUnder PFRS 9, the classification and measurement of financial assets is driven by the contractual cashflow characteristics of the financial assets and the entity’s business model for managing the financialassets.
As part of its classification process, the Group assesses the contractual terms of financial assets toidentify whether they meet the ‘solely payments of principal and interest’ (SPPI) test. ‘Principal’ forthe purpose of this test is defined as the fair value of the financial asset at initial recognition and maychange over the life of the financial asset (e.g., if there are repayments of principal or amortization ofthe premium or discount).
The most significant elements of interest within a lending arrangement are typically the considerationfor the time value of money and credit risk. To make the SPPI assessment, the Bank applies judgementand considers relevant factors such as the currency in which the financial asset is denominated, and theperiod for which the interest rate is set. In contrast, contractual terms that introduce a more than deminimis exposure to risks or volatility in the contractual cash flows that are unrelated to a basic lendingarrangement do not give rise to contractual cash flows that are solely payments of principal and intereston the amount outstanding. In such cases, the financial asset is required to be measured at FVTPL.
The Group determines its business model at the level that best reflects how it manages groups offinancial assets to achieve its business objective.
The Bank's business model is not assessed on an instrument-by-instrument basis, but at a higher levelof aggregated portfolios and is based on observable factors such as:· how the performance of the business model and the financial assets held within that business model
are evaluated and reported to the entity's key management personnel· the risks that affect the performance of the business model (and the financial assets held within that
business model) and, in particular, the way those risks are managed· how managers of the business are compensated (for example, whether the compensation is based
on the fair value of the assets managed or on the contractual cash flows collected)· the expected frequency, value and timing of sales are also important aspects of the Group’s
assessment

- 9 -
*SGVFS039096*
The business model assessment is based on reasonably expected scenarios without taking 'worst case'or 'stress case’ scenarios into account. If cash flows after initial recognition are realized in a way that isdifferent from the Group's original expectations, the Group does not change the classification of theremaining financial assets held in that business model, but incorporates such information whenassessing newly originated or newly purchased financial assets going forward.
The Group’s measurement categories are described below:
Financial assets at Amortized CostFinancial assets are measured at amortized cost if both of the following conditions are met:· the asset is held within the Group’s business model whose objective is to hold financial assets in
order to collect contractual cash flows; and,· the contractual terms of the instrument give rise, on specified dates, to cash flows that are SPPI on
the principal amount outstanding.
Financial assets meeting these criteria are measured initially at fair value plus transaction costs. Theyare subsequently measured at amortized cost using the effective interest method, less any impairmentin value. The amortization is included in ‘Interest income’ in the statement of income. Gains or lossesare recognized in statement of income when these investments are derecognized or impaired, as well asthrough the amortization process. The ECL are recognized in the statement of income under provisionfor impairment and credit losses: The effects of revaluation or foreign currency-denominatedinvestments are recognized in the statement of income. Gains or losses arising from disposals of theseinstruments are included in ‘Gains (losses) on disposal of investment securities at amortized cost’ inthe statement of income.
The Group’s financial assets at amortized cost are presented in the statement of financial position asDue from BSP, Due from other banks, Interbank loans receivable and SPURA, Investment securitiesat amortized cost, Loans and receivables, Accrued interest receivables and certain financial assets underOther assets.
The Group may irrevocably elect at initial recognition to classify a financial asset that meets theamortized cost criteria above as at FVTPL if that designation eliminates or significantly reduces anaccounting mismatch had the financial asset been measured at amortized cost.
Financial Assets at FVTPLDebt instruments that neither meet the amortized cost nor the FVOCI criteria, or that meet the criteriabut the Group has chosen to designate as at FVTPL at initial recognition, are classified as financialassets at FVTPL. Equity investments are classified as financial assets at FVTPL, unless the Groupirrevocably designates an equity investment that is not held for trading as at FVOCI at initialrecognition. The Group’s financial assets at FVTPL include government securities, corporate bondsand equity securities which are held for trading purposes and derivatives.
A financial asset is considered as held for trading if:· it has been acquired principally for the purpose of selling it in the near term;· on initial recognition, it is part of a portfolio of identified financial instruments that the Group
manages together and has evidence of a recent actual pattern of short-term profit-taking; or,· it is a derivative that is not designated and effective as a hedging instrument or financial guarantee.
Gains and losses arising from changes (mark-to-market) in the fair value of the financial assets atFVTPL and gains or losses arising from disposals of these instruments are included in ‘Gains (losses)on trading and investment securities’ account in the statement of income.

- 10 -
*SGVFS039096*
Interest recognized based on the modified effective interest rate of these investments is reported instatement of income under ‘Interest income’ account while dividend income is reported in statement ofincome under ‘Miscellaneous income’ account when the right of payment has been established.
Derivative instrumentsThe Parent Company is a party to derivative instruments, particularly, forward exchange contracts,interest rate swaps (IRS) and warrants. These contracts are entered into as a service to customers andas a means of reducing and managing the Parent Company’s foreign exchange risk, and interest raterisk as well as for trading purposes, but are not designated as hedges. Such derivative financialinstruments are stated at fair value through profit or loss.
Any gains or losses arising from changes in fair value of derivative instruments that do not qualify forhedge accounting are taken directly to the statement of income under 'Foreign exchange gain (loss) -net’ for forward exchange contracts and ‘Trading and securities gain-net’ for IRS and warrants.
Embedded derivatives that are bifurcated from the host financial and non-financial contracts are alsoaccounted for as financial instruments at FVPL.
An embedded derivative is separated from the host contract and accounted for as a derivative if all ofthe following conditions are met: (a) the economic characteristics and risks of the embedded derivativeare not closely related to the economic characteristic of the host contract; (b) a separate instrument withthe same terms as the embedded derivative would meet the definition of a derivative; and (c) the hybridor combined instrument is not recognized at fair value through profit or loss.
The Group assesses whether embedded derivatives are required to be separated from the host contractswhen the Group first becomes a party to the contract. Reassessment of embedded derivatives is onlydone when there are changes in the contract that significantly modifies the contractual cash flows thatwould otherwise be required.
Financial Assets at FVOCI - Equity InvestmentsAt initial recognition, the Group can make an irrevocable election (on an instrument-by-instrumentbasis) to designate equity investments as at FVOCI; however, such designation is not permitted if theequity investment is held by the Group for trading. The Group has designated certain equity instrumentsas at FVOCI on January 1, 2018.
Financial assets at FVOCI are initially measured at fair value plus transaction costs. Subsequently, theyare measured at fair value, with no deduction for any disposal costs. Gains and losses arising fromchanges in fair value are recognized in other comprehensive income and accumulated in Net unrealizedfair value gain (loss) on financial assets at FVOCI in the balance sheet. When the asset is disposed of,the cumulative gain or loss previously recognized in the Net unrealized fair value gains (losses) oninvestment securities account is not reclassified to profit or loss, but is reclassified directly to Surplusaccount. Any dividends earned on holding these equity instruments are recognized in profit or lossunder ‘Miscellaneous Income’ account.
Financial Assets at FVOCI - Debt InvestmentsThe Group applies the category of debt instruments measured at FVOCI when both of the followingconditions are met:· the instrument is held within a business model, the objective of which is achieved by both collecting
contractual cash flows and selling financial assets, and· the contractual terms of the financial asset meet the SPPI test.

- 11 -
*SGVFS039096*
FVOCI debt instruments are subsequently measured at fair value with gains and losses arising due tochanges in fair value being recognized in OCI. Interest income and foreign exchange gains and lossesare recognized in profit or loss. Provision for credit and impairment losses is recognized in profit orloss with the corresponding ECL recognized in OCI.
On derecognition, ECL and cumulative gains or losses previously recognized in OCI are reclassifiedfrom OCI to profit or loss.
ReclassificationThe Group can only reclassify financial assets if the objective of its business model for managing thosefinancial assets changes. Accordingly, the Group is required to reclassify financial assets:(i) from amortized cost to fair value, if the objective of the business model changes so that the amortizedcost criteria are no longer met; and, (ii) from fair value to amortized cost, if the objective of the businessmodel changes so that the amortized cost criteria start to be met and the characteristic of theinstrument’s contractual cash flows meet the amortized cost criteria.
A change in business model occurs when the Group either begins or ceases to perform an activity thatis significant to its operations. A change in the objective of the Group’s business model will be effectedonly at the beginning of the next reporting period following the change in the business model.
Impairment of financial assetsECL represent credit losses that reflect an unbiased and probability-weighted measure of expected cashshortfalls, discounted at an approximation to the EIR which is determined by evaluating a range ofpossible outcomes, the time value of money and reasonable and supportable information about pastevents, current conditions and forecasts of future economic conditions. A cash shortfall is the differencebetween the cash flows that are due to an entity in accordance with the contract and the cash flows thatthe entity expects to receive. ECL allowances are measured at amounts equal to either (i) 12-monthECL or (ii) lifetime ECL for those financial instruments which have experienced a significant increasein credit risk (SICR) since initial recognition (General Approach). The 12-month ECL is the portion oflifetime ECL that results from default events on a financial instrument that are possible within the 12months after the reporting date. Lifetime ECL are credit losses that results from all possible defaultevents over the expected life of a financial instrument.
For non-credit-impaired financial instruments:· Stage 1 consists of all non-impaired financial instruments which have not experienced a SICR since
initial recognition. The Group and the Parent Company recognizes a 12-month ECL for Stage 1financial instruments.
· Stage 2 consists of all non-impaired financial instruments which have experienced a SICR sinceinitial recognition. The Group and the Parent Company recognizes a lifetime ECL for Stage 2financial instruments.
For credit-impaired financial instruments:· Financial instruments are classified as Stage 3 when there is objective evidence of impairment as a
result of one or more loss events that have occurred after initial recognition with a negative impacton the estimated future cash flows of a loan or a portfolio of loans. The ECL model requires thatlifetime ECL be recognized for impaired financial instruments.
The Group uses internal credit assessment and approvals at various levels to determine the credit riskof exposures at initial recognition. Assessment can be quantitative or qualitative and depends on themateriality of the facility or the complexity of the portfolio to be assessed.

- 12 -
*SGVFS039096*
ECL is a function of the probability of default (PD), exposure at default (EAD), and loss given default(LGD), with the timing of the loss also considered, and is estimated by incorporating forward-lookingeconomic information and through the use of experienced credit judgment.
The PD represents the likelihood that a credit exposure will not be repaid and will go into default ineither a 12-month horizon for Stage 1 or lifetime horizon for Stage 2. EAD represents an estimate ofthe outstanding amount of credit exposure at the time a default may occur. For off-balance sheet andundrawn amounts, EAD includes an estimate of any further amounts to be drawn within the contractualavailability period of the irrevocable commitments. LGD is the amount that may not be recovered inthe event of default. LGD takes into consideration the amount and quality of any collateral held. Pleaserefer to Note 6 for other information related to the Bank’s models for PD, EAD, and LGD.
The calculation of ECLs, including the estimation of PD, EAD, LGD and discount rate, is made on anindividual basis for most of the Group’s financial assets, and on a collective basis for retail productssuch as credit card receivables. The collective assessments are made separately for portfolios offacilities with similar credit risk characteristics.
In certain circumstances, the Bank modifies the original terms and conditions of a credit exposure toform a new loan agreement or payment schedule. The modifications can be given depending on theborrower’s or counterparty’s current or expected financial difficulty. The modifications may include,but are not limited to, change in interest rate and terms, principal amount, maturity date, date andamount of periodic payments and accrual of interest and charges. Distressed restructuring withindications of unlikeliness to pay are categorized as impaired accounts and are moved to Stage 3.
Hedge AccountingFor the purpose of hedge accounting, hedges are classified as:
· Fair value hedges when the risk being hedged is the exposure to changes in the fair value of arecognized asset or liability or an unrecognized firm commitment.
· Cash flow hedges when the risk being hedged is the exposure to variability in cash flows that iseither attributable to a particular risk associated with a recognized asset or liability or a highlyprobable forecast transaction or the foreign currency risk in an unrecognized firm commitment
· Hedges of a net investment in a foreign operation
At the inception of a hedge relationship, the Parent Company formally designates and documents thehedge relationship to which it wishes to apply hedge accounting and the risk management objectiveand strategy for undertaking the hedge.
The documentation includes identification of the hedging instrument, the hedged item, the nature of therisk being hedged and how the Parent Company will assess whether the hedging relationship meets thehedge effectiveness requirements (including the analysis of sources of hedge ineffectiveness and howthe hedge ratio is determined).
A hedging relationship qualifies for hedge accounting if it meets all of the following effectivenessrequirements:
· There is an economic relationship between the hedged item and the hedging instrument.· The effect of credit risk does not dominate the value changes that result from that economic
relationship.

- 13 -
*SGVFS039096*
· The hedge ratio of the hedging relationship is the same as that resulting from the quantity of thehedged item that the Parent Company actually hedges and the quantity of the hedging instrumentthat the Parent Company actually uses to hedge that quantity of hedged item.
An economic relationship exists when the hedging instrument and the hedged item have values thatgenerally move in opposite directions in response to movements in the same risk (hedged risk). TheParent Company assesses economic relationship by performing prospective qualitative or quantitativehedge effectiveness assessment at each reporting date. In addition, the Parent Company measuresineffectiveness by comparing the cumulative change in the fair value of the hedging instrument withthe cumulative change in the fair value of the hedged item.
Cash flow hedgesThe effective portion of the gain or loss on the hedging instrument is recognized in OCI in the cashflow hedge reserve, while any ineffective portion is recognized immediately in the statement of income.The cash flow hedge reserve is adjusted to the lower of the cumulative gain or loss on the hedginginstrument and the cumulative change in fair value of the hedged item.
As of December 31, 2019, the Parent Company has outstanding interest rate swaps designated aseffective hedging instruments in a cash flow hedge (Note 26).
Impairment of Financial Assets (Policies applicable prior to January 1, 2018)The Group assesses at each reporting date whether there is objective evidence that a financial asset orgroup of financial assets is impaired. A financial asset or a group of financial assets is deemed to beimpaired if, and only if, there is objective evidence of impairment as a result of one or more events thathas occurred after the initial recognition of the asset (an incurred ‘loss event’) and that loss event (orevents) has an impact on the estimated future cash flows of the financial asset or the group of financialassets that can be reliably estimated. Evidence of impairment may include indications that the borroweror a group of borrowers is experiencing significant financial difficulty, default or delinquency in interestor principal payments, the probability that they will enter bankruptcy or other financial reorganizationand where observable data indicate that there is measurable decrease in the estimated future cash flows,such as changes in arrears or economic conditions that correlate with defaults.
Financial assets carried at amortized costFor financial assets carried at amortized cost, the Group first assesses whether objective evidence ofimpairment exists individually for financial assets that are individually significant, or collectively forfinancial assets that are not individually significant.
If there is objective evidence that an impairment loss has been incurred, the amount of the loss ismeasured as the difference between the asset’s carrying amount and the present value of the estimatedfuture cash flows (excluding future credit losses that have not been incurred). The present value of theestimated future cash flows is discounted at the financial asset’s original EIR.
If a loan has a variable interest rate, the discount rate for measuring any impairment loss is the currentEIR, adjusted for the original credit risk premium. The calculation of the present value of the estimatedfuture cash flows of a collateralized financial asset reflects the cash flows that may result fromforeclosure less costs for obtaining and selling the collateral, whether or not foreclosure is probable.
The carrying amount of the asset is reduced through use of an allowance account and the amount ofloss is charged to the statement of income. Interest income continues to be recognized based on theoriginal EIR of the asset. The financial assets, together with the associated allowance accounts, arewritten off when there is no realistic prospect of future recovery and all collateral has been realized.

- 14 -
*SGVFS039096*
If the Group determines that no objective evidence of impairment exists for individually assessedfinancial asset, whether significant or not, it includes the asset in a group of financial assets with similarcredit risk characteristics and collectively assesses for impairment. Those characteristics are relevantto the estimation of future cash flows for groups of such assets by being indicative of the debtors’ abilityto pay all amounts due according to the contractual terms of the assets being evaluated. Assets that areindividually assessed for impairment and for which an impairment loss is, or continues to be, recognizedare not included in a collective assessment for impairment.
For the purpose of a collective evaluation of impairment, financial assets are grouped on the basis ofsuch credit risk characteristics as industry, collateral type, past-due status and term. Future cash flowsin a group of financial assets that are collectively evaluated for impairment are estimated on the basisof historical loss experience for assets with credit risk characteristics similar to those in the group.Historical loss experience is adjusted on the basis of current observable data to reflect the effects ofcurrent conditions that did not affect the period on which the historical loss experience is based and toremove the effects of conditions in the historical period that do not exist currently. Estimates of changesin future cash flows reflect, and are directionally consistent with changes in related observable datafrom period to period (such as changes in unemployment rates, property prices, commodity prices,payment status, or other factors that are indicative of incurred losses in the Group and their magnitude).The methodology and assumptions used for estimating future cash flows are reviewed regularly by theGroup to reduce any differences between loss estimates and actual loss experience.
If, in a subsequent year, the amount of the estimated impairment loss decreases because of an eventoccurring after the impairment was recognized, the previously recognized impairment loss is reducedby adjusting the allowance account. If a future write-off is later recovered, the recovery is credited to‘Miscellaneous income’.
Financial assets carried at costIf there is objective evidence that an impairment loss on an unquoted equity instrument that is notcarried at fair value because its fair value cannot be reliably measured, or on a derivative asset that islinked to and must be settled by delivery of such an unquoted equity instrument has been incurred, theamount of loss is measured as the difference between the asset’s carrying amount and the present valueof estimated future cash flows discounted at the current market rate of return for a similar financialasset.
Available-for-sale financial assetsFor AFS financial assets, the Group assesses at each reporting date whether there is objective evidencethat a financial asset or group of financial assets is impaired.
In the case of equity investments classified as AFS financial assets, this would include a significant orprolonged decline in the fair value of the investments below its cost. Where there is evidence ofimpairment, the cumulative loss - measured as the difference between the acquisition cost and thecurrent fair value, less any impairment loss on that financial asset previously recognized in thestatement of income - is removed from OCI and recognized in the statement of income. Impairmentlosses on equity investments are not reversed through the statement of income. Increases in fair valueafter impairment are recognized directly in OCI.
In the case of debt instruments classified as AFS financial assets, impairment is assessed based on thesame criteria as financial assets carried at amortized cost. However, the amount recorded forimpairment is the cumulative loss measured as the difference between the amortized cost and the currentfair value, less any impairment loss on that investment previously recognized in profit or loss. Futureinterest income is based on the reduced carrying amount and is accrued based on the rate of interestused to discount future cash flows for the purpose of measuring impairment loss. Such accrual is

- 15 -
*SGVFS039096*
recorded as part of ‘Interest income’ in the statement of income. If, in subsequent years, the fair valueof a debt instrument increased and the increase can be objectively related to an event occurring afterthe impairment loss was recognized in the statement of income, the impairment loss is reversed throughthe statement of income.
Restructured loansWhere possible, the Group seeks to restructure loans rather than to take possession of collateral. Thismay involve extending the payment arrangements and the agreement of new loan conditions. Once theterms have been renegotiated, the loan is no longer considered past due. Management continuouslyreviews restructured loans to ensure that all criteria are met and that future payments are likely to occur.The loans continue to be subject to an individual or collective impairment assessment, calculated usingthe loan’s original EIR. The difference between the recorded value of the original loan and the presentvalue of the restructured cash flows, discounted at the original EIR, is recognized in ‘Provision forimpairment and credit losses’ in the statement of income.
When the loan has been restructured but not derecognized, the Group also reassesses whether there hasbeen a SICR and considers whether the assets should be classified as Stage 3. If the restructuring termsare substantially different, the loan is derecognized and a new ‘asset’ is recognized at fair value usingthe revised EIR.
Financial LiabilitiesFinancial liabilities which include deposit liabilities, bills payable, notes and bonds payable, and otherliabilities (except tax-related payables, pre-need reserves and post-employment defined benefitobligation) are recognized when the Group becomes a party to the contractual terms of the instrument.
Financial liabilities are recognized initially at their fair value and subsequently measured at amortizedcost using the effective interest method, for those with maturities beyond one year, less settlementpayments. All interest-related charges incurred on financial liabilities are recognized as an expense inthe statements of income under the caption Interest expense.
Deposit liabilities are stated at amounts in which they are to be paid. Interest is accrued periodicallyand recognized in a separate liability account before recognizing as part of deposit liabilities.
Bills payable and Notes and bonds payable are recognized initially at fair value, which is the issueproceeds (fair value of consideration received) less any issuance costs. These are subsequentlymeasured at amortized cost; any difference between the proceeds net of transaction costs and theredemption value is recognized in the statements of income over the period of the borrowings using theeffective interest method.
Derivative liabilities are recognized initially and subsequently measured at fair value with changes infair value recognized in the statements of income.
Other liabilities, apart from derivative liabilities, are recognized initially at their fair value andsubsequently measured at amortized cost, using effective interest method for maturities beyond oneyear, less settlement payments.
Derecognition of Financial Assets and LiabilitiesFinancial assetsA financial asset (or, where applicable a part of a financial asset or part of a group of financial assets)is derecognized when:
· the rights to receive cash flows from the asset have expired; or

- 16 -
*SGVFS039096*
· the Group retains the right to receive cash flows from the asset, but has assumed an obligation topay them in full without material delay to a third party under a “pass-through” arrangement; or
· the Group has transferred its rights to receive cash flows from the asset and either (a) has transferredsubstantially all the risks and rewards of the asset, or (b) has neither transferred nor retained therisks and rewards of the asset but has transferred control of the asset.
Where the Group has transferred its rights to receive cash flows from an asset or has entered into apass-through arrangement, and has neither transferred nor retained substantially all the risks andrewards of the asset nor transferred control of the asset, the asset is recognized to the extent of theGroup’s continuing involvement in the asset. Continuing involvement that takes the form of aguarantee over the transferred asset is measured at the lower of the original carrying amount of the assetand the maximum amount of consideration that the Group could be required to repay.
Financial liabilitiesA financial liability is derecognized when the obligation under the liability is discharged, cancelled orhas expired. Where an existing financial liability is replaced by another from the same lender onsubstantially different terms, or the terms of an existing liability are substantially modified, such anexchange or modification is treated as a derecognition of the original liability and the recognition of anew liability, and the difference in the respective carrying amounts is recognized in the statement ofincome.
Financial Guarantees and Undrawn Loan CommitmentsThe Group issues financial guarantees and loan commitments. Financial guarantees are those issued bythe Group to creditors as allowed under existing rules and regulations whereby it guarantees third partyobligations by signing as guarantor in the contract/agreement. Undrawn loan commitments and lettersof credit are commitments under which over the duration of the commitment, the Group is required toprovide a loan with pre-specified terms to the customer. The nominal contractual value of financialguarantees and undrawn loan commitments, where the loan agreed to be provided is on market terms,are not recorded in the statement of financial position. Starting January 1, 2018, these contracts are inthe scope of the ECL requirements where the Group estimates the expected portion of the undrawn loancommitments that will be drawn over their expected life. The ECL related to loan commitments isrecognized in ‘Miscellaneous liabilities’.
Write-offsFinancial assets are written off either partially or in their entirety when the Group no longer expectscollections or recoveries within a foreseeable future. If the amount to be written off is greater than theaccumulated loss allowance, the difference is first treated as an addition to the allowance that is thenapplied against the gross carrying amount. Any subsequent recoveries are credited to credit lossexpense.
Investment in AssociatesAssociates pertain to all entities over which the Group has significant influence but not control,generally accompanying a shareholding of between 20.00% and 50.00% of the voting rights. In theconsolidated and parent company financial statements, investments in associates are accounted forunder the equity method of accounting.
Under the equity method, an investment in an associate is carried in the balance sheet at cost plus post-acquisition changes in the Group’s share of the net assets of the associates. Goodwill, if any, relatingto an associate is included in the carrying value of the investment and is not amortized. The statementof income reflects the share of the results of operations of the associate. Where there has been a changerecognized directly in the equity of the associate, the Group recognizes its share of any changes anddiscloses this, when applicable, in the statement of changes in equity.

- 17 -
*SGVFS039096*
When the Group’s share of losses in an associate equals or exceeds its interest in the associate, includingany other unsecured receivables, the Group does not recognize further losses, unless it has incurredobligations or made payments on behalf of the associate. Profits or losses resulting from transactionsbetween the Group and an associate are eliminated to the extent of the interest in the associate.
Dividends earned on this investment are recognized in the Parent Company’s statement of income as areduction from the carrying value of the investment.
The financial statements of the associate are prepared for the same reporting period as the ParentCompany. Where necessary, adjustments are made to bring the accounting policies in line with thoseof the Group.
Upon loss of significant influence over the associate, the Group measures and recognizes any retainedinvestment at its fair value. Any difference between the carrying amount of the associate upon loss ofsignificant influence and the fair value of the retained investment and proceeds from disposal isrecognized in profit or loss.
Investment in SubsidiariesIn the parent company financial statements, investment in subsidiaries is accounted for under the equitymethod of accounting similar to the investment in associates.
Business Combinations and GoodwillBusiness combinations are accounted for using the acquisition method. The cost of an acquisition ismeasured as the aggregate of the consideration transferred, measured at acquisition date fair value andthe amount of any non-controlling interest in the acquiree. For each business combination, the acquirermeasures the non-controlling interest in the acquiree either at fair value or at the proportionate share ofthe acquiree’ s identifiable net assets. Acquisition costs incurred are charged to profit or loss.
When the Group acquires a business, it assesses the financial assets and liabilities assumed forappropriate classification and designation in accordance with the contractual terms, economiccircumstances and pertinent conditions as at the acquisition date. This includes the separation ofembedded derivatives in host contracts by the acquiree.
If the business combination is achieved in stages, the acquisition date fair value of the acquirer’spreviously held equity interest in the acquiree is remeasured to fair value at the acquisition date throughprofit or loss.
Any contingent consideration to be transferred by the acquirer will be recognized at fair value at theacquisition date. Subsequent changes to the fair value of the contingent consideration which is deemedto be an asset or liability, will be recognized in accordance with PFRS 9, either in profit or loss or as acharge to OCI. If the contingent consideration is classified as equity, it should not be remeasured untilit is finally settled within equity.
Goodwill is initially measured at cost being the excess of the aggregate of fair value of the considerationtransferred and the amount recognized for non-controlling interest over the net identifiable assetsacquired and liabilities assumed. If this consideration is lower than the fair value of the net assets ofthe subsidiary acquired, the difference is recognized in profit or loss as gain on bargain purchase under‘Miscellaneous income’.
After initial recognition, goodwill is measured at cost less any accumulated impairment losses.

- 18 -
*SGVFS039096*
Goodwill is tested for impairment annually or more frequently if events or changes in circumstancesindicate the carrying value may be impaired. For the purpose of impairment testing, goodwill acquiredin a business combination is, from the date of acquisition, allocated to each of the Group’s CGUs, orgroups of CGUs, that are expected to benefit from the synergies of the combination, irrespective ofwhether other assets or liabilities of the acquiree are assigned to those units or group of units. Eachunit or group of units to which the goodwill is allocated:
· represents the lowest level within the Group at which the goodwill is monitored for internalmanagement purposes; and
· is not larger than an operating segment identified for segment reporting purposes.
Where goodwill forms part of a CGU (or group of CGUs) and part of the operation within that unit isdisposed of, the goodwill associated with the operation disposed of is included in the carrying amountof the operation when determining the gain or loss on disposal of the operation. Goodwill disposed ofin this circumstance is measured based on the relative values of the operation disposed of and theportion of the CGU retained.
Cash Dividend and Non-cash Distribution to Equity Holders of the Parent CompanyThe Group recognizes a liability to make cash or non-cash distributions to equity holders of the ParentCompany when the distribution is authorized and the distribution is no longer at the discretion of theGroup. A corresponding amount is recognized directly in equity.
Non-cash distributions are measured at the fair value of the assets to be distributed with fair valueremeasurement recognized directly in equity.
Upon distribution of non-cash assets, any difference between the carrying amount of the liabilityand the carrying amount of the assets distributed is recognized in the statement of income.
Bank Premises, Furniture, Fixtures and EquipmentLand is stated at cost less any impairment in value while depreciable properties such as buildings,leasehold improvements, and furniture, fixtures and equipment are stated at cost less accumulateddepreciation and amortization, and any impairment in value. Such cost includes the cost of replacingpart of the bank premises, furniture, fixtures and equipment when that cost is incurred and if therecognition criteria are met, but excluding repairs and maintenance costs.
Construction-in-progress is stated at cost less any impairment in value. The initial cost comprises itsconstruction cost and any directly attributable costs of bringing the asset to its working condition andlocation for its intended use, including borrowing costs. Construction-in-progress is not depreciateduntil such time that the relevant assets are completed and put into operational use.
Depreciation and amortization is calculated using the straight-line method over the estimated usefullife (EUL) of the depreciable assets as follows:
EULBuildings 50 yearsFurniture, fixtures and equipment 3 to 5 yearsLeasehold improvements Shorter of 6 years or the
related lease terms
The depreciation and amortization method and useful life are reviewed periodically to ensure that themethod and period of depreciation and amortization are consistent with the expected pattern of

- 19 -
*SGVFS039096*
economic benefits from items of bank premises, furniture, fixtures and equipment and leaseholdimprovements.
An item of bank premises, furniture, fixtures and equipment is derecognized upon disposal or when nofuture economic benefits are expected from its use or disposal. Any gain or loss arising onderecognition of the asset (calculated as the difference between the net disposal proceeds and thecarrying amount of the asset) is included in the statement of income in the year the asset is derecognized.
Investment PropertiesInvestment properties include real properties acquired in settlement of loans and receivables which aremeasured initially at cost, including certain transaction costs. Investment properties acquired througha nonmonetary asset exchange is measured initially at fair value unless (a) the exchange lackscommercial substance or (b) the fair value of neither the asset received nor the asset given up is reliablymeasurable. The difference between the fair value of the investment property upon foreclosure and thecarrying value of the loan is recognized under ‘Gain on asset foreclosure and dacion transactions’ inthe statement of income. Subsequent to initial recognition, depreciable investment properties are statedat cost less accumulated depreciation and any accumulated impairment in value except for land whichis stated at cost less impairment in value.
Expenditures incurred after the investment properties have been put into operation, such as repairs andmaintenance costs, are normally charged to income in the period in which the costs are incurred.
Depreciation is calculated on a straight-line basis using the remaining EUL of the building andimprovement components of investment properties which ranged from 10 to 33 years from the time ofacquisition of the investment properties.
Investment properties are derecognized when they have either been disposed of or when the investmentproperties are permanently withdrawn from use and no future benefit is expected from their disposal.Any gains or losses on the derecognition of an investment property are recognized as ‘Gain on sale ofinvestment properties’ in the statement of income in the year of derecognition.
Transfers are made to investment properties when, and only when, there is a change in use evidencedby ending of owner occupation, commencement of an operating lease to another party or ending ofconstruction or development. Transfers are made from investment properties when, and only when,there is a change in use evidenced by commencement of owner occupation or commencement ofdevelopment with a view to sale.
Intangible AssetsIntangible assets include software cost and branch licenses resulting from the Parent Company’sacquisition of CBSI, Unity Bank and PDB (Notes 11 and 14).
Software costs Costs related to software purchased by the Group for use in operations are amortized on a straight-linebasis over 3 to 10 years. The amortization method and useful life are reviewed periodically to ensurethat the method and period of amortization are consistent with the expected pattern of economic benefitsembodied in the asset.
Branch licensesThe branch licenses are initially measured at fair value as of the date of acquisition and are deemed tohave an indefinite useful life as there is no foreseeable limit to the period over which they are expectedto generate net cash inflows for the Group.

- 20 -
*SGVFS039096*
Such intangible assets are not amortized, instead they are tested for impairment annually eitherindividually or at the CGU level. Impairment is determined by assessing the recoverable amount ofeach CGU (or group of CGUs) to which the intangible asset relates. Recoverable amount representsthe CGU’s value in use. Where the recoverable amount of the CGU is less than its carrying amount,an impairment loss is recognized.
Gains and losses arising from derecognition of an intangible asset are measured as the differencebetween the net disposal proceeds and the carrying amount of the asset and are recognized in earningswhen the asset is derecognized.
Impairment of Nonfinancial AssetsAt each reporting date, the Group assesses whether there is any indication that its nonfinancial assets(e.g., investment in associates, investment properties, bank premises, furniture, fixtures and equipment,goodwill and intangible assets) may be impaired. When an indicator of impairment exists or when anannual impairment testing for an asset is required, the Group makes a formal estimate of recoverableamount.
Recoverable amount is the higher of an asset’s (or CGU’s) fair value less costs to sell and its value inuse and is determined for an individual asset, unless the asset does not generate cash inflows that arelargely independent of those from other assets or groups of assets, in which case the recoverable amountis assessed as part of the CGU to which it belongs. Where the carrying amount of an asset (or CGU)exceeds its recoverable amount, the asset (or CGU) is considered impaired and is written down to itsrecoverable amount. In assessing value in use, the estimated future cash flows are discounted to theirpresent value using a pre-tax discount rate that reflects current market assessments of the time value ofmoney and the risks specific to the asset (or CGU).
An impairment loss is charged to operations in the year in which it arises.
For nonfinancial assets, excluding goodwill and branch licenses, an assessment is made at eachreporting date as to whether there is any indication that previously recognized impairment losses mayno longer exist or may have decreased. If such indication exists, the recoverable amount is estimated.A previously recognized impairment loss is reversed, except for goodwill, only if there has been achange in the estimates used to determine the asset’s recoverable amount since the last impairment losswas recognized. If that is the case, the carrying amount of the asset is increased to its recoverableamount. That increased amount cannot exceed the carrying amount that would have been determined,net of depreciation, had no impairment loss been recognized for the asset in prior years. Such reversalis recognized in the statement of income. After such a reversal, the depreciation expense is adjusted infuture years to allocate the asset’s revised carrying amount, less any residual value, on a systematicbasis over its remaining life.
Accounting policy on Leases effective January 1, 2019The Group assesses at contract inception whether a contract is, or contains, a lease. That is, if thecontract conveys the right to control the use of an identified asset for a period of time in exchange forconsideration.
Group as a lesseeThe Group applies a single recognition and measurement approach for all leases, except for short-termleases and leases of low-value assets. The Group recognizes lease liabilities to make lease paymentsand right-of-use assets representing the right to use the underlying assets.

- 21 -
*SGVFS039096*
i) Right-of-use assetsThe Group recognizes right-of-use assets at the commencement date of the lease (i.e., the date theunderlying asset is available for use). Right-of-use assets are measured at cost, less any accumulateddepreciation and impairment losses, and adjusted for any remeasurement of lease liabilities. The costof right-of-use assets includes the amount of lease liabilities recognized adjusted by lease paymentsmade at or before the commencement date and lease incentives received. Right-of-use assets aredepreciated on a straight-line basis over the shorter of the lease term and the estimated useful lives ofthe depreciable assets. The depreciation expense is presented under ‘Depreciation and Amortization’in the statement of income.
If ownership of the leased asset transfers to the Group at the end of the lease term or the cost reflectsthe exercise of a purchase option, depreciation is calculated using the estimated useful life of the asset.
The right-of-use assets are also subject to impairment. Refer to the accounting policies in Impairmentof Nonfinancial Assets.
ii) Lease liabilitiesAt the commencement date of the lease, the Group recognizes lease liabilities measured at the presentvalue of lease payments to be made over the lease term. The lease payments include fixed payments(including in-substance fixed payments) less any lease incentives receivable, variable lease paymentsthat depend on an index or a rate, and amounts expected to be paid under residual value guarantees.The lease payments also include the exercise price of a purchase option reasonably certain to beexercised by the Group and payments of penalties for terminating the lease, if the lease term reflectsthe Group exercising the option to terminate. Variable lease payments that do not depend on an indexor a rate are recognized as expenses in the period in which the event or condition that triggers thepayment occurs. In calculating the present value of lease payments, the Group uses its incrementalborrowing rate at the lease commencement date because the interest rate implicit in the lease is notreadily determinable. After the commencement date, the amount of lease liabilities is increased toreflect the accretion of interest and reduced for the lease payments made. In addition, the carryingamount of lease liabilities is remeasured if there is a modification, a change in the lease term, a changein the lease payments (e.g., changes to future payments resulting from a change in an index or rate usedto determine such lease payments) or a change in the assessment of an option to purchase the underlyingasset.
iii) Short-term leases and leases of low-value assetsThe Group applies the short-term lease recognition exemption to its short-term leases of ATM sites(i.e., those leases that have a lease term of 12 months or less from the commencement date and do notcontain a purchase option). It also applies the lease of low-value assets recognition exemption to leasesof ATM sites that are considered to be low value. Lease payments on short-term leases and leases oflow value assets are recognized as expense on a straight-line basis over the lease term.
Group as a lessorLeases in which the Group does not transfer substantially all the risks and rewards incidental toownership of an asset are classified as operating leases. Rental income arising from leased propertiesis accounted for on a straight-line basis over the lease terms and is included in revenue in the statementof income due to its operating nature. Initial direct costs incurred in negotiating and arranging anoperating lease are added to the carrying amount of the leased asset and recognized over the lease termon the same basis as rental income. Contingent rents are recognized as revenue in the period in whichthey are earned.

- 22 -
*SGVFS039096*
Leases (Prior to January 1, 2019)The determination of whether an arrangement is, or contains a lease is based on the substance of thearrangement and requires an assessment of whether the fulfillment of the arrangement is dependent onthe use of a specific asset or assets and the arrangement conveys a right to use the asset. A reassessmentis made after inception of the lease only if one of the following applies:
(a) there is a change in contractual terms, other than a renewal or extension of the arrangement; or(b) a renewal option is exercised or extension granted, unless that term of the renewal or extension was
initially included in the lease term; or(c) there is a change in the determination of whether fulfillment is dependent on a specified asset; or(d) there is a substantial change to the asset.
Where a reassessment is made, lease accounting shall commence or cease from the date when thechange in circumstances gave rise to the reassessment for scenarios (a), (c), or (d) above, and at thedate of renewal or extension period for scenario (b).
Group as a lesseeLeases where the lessor retains substantially all the risks and benefits of ownership of the asset areclassified as operating leases. Operating lease payments are recognized as an expense in the statementof income on a straight-line basis over the lease term and included in ‘Occupancy cost’ in the statementof income.
Group as a lessorLeases where the Group does not transfer substantially all the risks and benefits of ownership of theassets are classified as operating leases. Initial direct costs incurred in negotiating operating leases areadded to the carrying amount of the leased asset and recognized over the lease term on the same basisas the rental income. Contingent rents are recognized as revenue in the period in which they are earned.
Capital StockCapital stocks are recorded at par. Proceeds in excess of par value are recognized under equity as‘Capital paid in excess of par value’ in the balance sheet. Incremental costs incurred which are directlyattributable to the issuance of new shares are shown in equity as a deduction from proceeds, net of tax.
Revenue Recognition
Revenues within the scope of PFRS 15, Revenue from Contracts with CustomersRevenue from contract with customers is recognized upon transfer of promised goods or services tocustomers at an amount that reflects the consideration to which an entity expects to be entitled inexchange for transferring goods or services to a customer. The Group and the Parent Company exercisejudgement, taking into consideration all of the relevant facts and circumstances when applying each stepof the five-step model to contracts with customers.
The following specific recognition criteria must be met before revenue is recognized for contracts withinthe scope of PFRS 15:
Fee and commission incomeThe Group earns fee and commission income from a diverse range of services it provides to itscustomers. Fee income can be divided into the following two categories:

- 23 -
*SGVFS039096*
a. Fee income earned from services that are provided over a certain period of timeFees earned for the provision of services over a period of time are accrued over that period. Thesefees include investment fund fees, custodian fees, fiduciary fees, commission income, credit relatedfees, asset management fees, portfolio and other management fees, and advisory fees.
b. Fee income from providing transactions servicesFees arising from negotiating or participating in the negotiation of a transaction for a third party -such as underwriting fees, corporate finance fees and brokerage fees for the arrangement of theacquisition of shares or other securities or the purchase or sale of businesses - are recognized oncompletion of the underlying transaction. Fees or components of fees that are linked to a certainperformance are recognized after fulfilling the corresponding criteria.
Loan syndication fees are recognized in the statement of income when the syndication has beencompleted and the Group retains no part of the loans for itself or retains part at the same EIR as for theother participants.
Service charges and penaltiesService charges and penalties are recognized only upon collection or accrued where there is areasonable degree of certainty as to their collectability.
Other incomeIncome from sale of service is recognized upon rendition of the service. Income from sale of propertiesis recognized when control has been transferred to the customer and when the collectability of the salesprice is reasonably assured.
Revenues outside the scope of PFRS 15Interest incomeFor all interest-bearing financial assets, interest income is recorded at either EIR, which is the rate thatexactly discounts estimated future cash payments or receipts through the expected life of the financialinstrument or a shorter period, where appropriate, to the net carrying amount of the financial asset orfinancial liability, or at rate stated in the contract. The calculation takes into account all contractualterms of the financial instrument (for example, prepayment options), includes any fees or incrementalcosts that are directly attributable to the instrument and are an integral part of the EIR, as applicable,but not future credit losses. The adjusted carrying amount is calculated based on the original EIR. Thechange in carrying amount is recorded as ‘Interest income’. Loan commitment fees for loans that arelikely to be drawn down are deferred (together with any incremental costs) and recognized as anadjustment to the EIR on the loan. If the commitment expires without the Group making the loan, thecommitment fees are recognized as other income on expiry.
Once the recorded value of a financial asset or group of similar financial assets has been reduced dueto an impairment loss, interest income continues to be recognized using the original EIR applied to thenew carrying amount.
Dividend incomeDividend income is recognized when the Group’s right to receive payment is established.
Trading and securities gainThis represents results arising from trading activities and sale of AFS financial assets or FVOCI debtassets.
Gain on disposal of investment securities at amortized costThis represents results arising from sale of investment securities measured at amortized cost.

- 24 -
*SGVFS039096*
Expense RecognitionExpense is recognized when it is probable that a decrease in future economic benefits related to adecrease in an asset or an increase in liability has occurred and the decrease in economic benefits canbe measured reliably. Revenues and expenses that relate to the same transaction or other event arerecognized simultaneously.
Interest expenseInterest expense for all interest-bearing financial liabilities are recognized in ‘Interest expense’ in thestatement of income using the EIR of the financial liabilities to which they relate.
Other expensesExpenses encompass losses as well as those expenses that arise in the ordinary course of business ofthe Group. Expenses are recognized when incurred.
Retirement BenefitsDefined benefit planThe net defined benefit liability or asset is the aggregate of the present value of the defined benefitobligation at the end of the reporting period reduced by the fair value of plan assets and adjusted forany effect of limiting a net defined benefit asset to the asset ceiling. The defined benefit obligation iscalculated annually by an independent actuary. The present value of the defined benefit obligation isdetermined by discounting the estimated future cash outflows using interest rates on government bondsthat have terms to maturity approximating the terms of the related retirement liability. The asset ceilingis the present value of any economic benefits available in the form of refunds from the plan orreductions in future contributions to the plan.
The cost of providing benefits under the defined benefit plans is actuarially determined using theprojected unit credit method.
Defined benefit costs comprise the following:(a) service cost;(b) net interest on the net defined benefit liability or asset; and(c) remeasurements of net defined benefit liability or asset.
Service costs which include current service costs, past service costs and gains or losses on non-routinesettlements are recognized as expense in profit or loss. Past service costs are recognized when planamendment or curtailment occurs.
Net interest on the net defined benefit liability or asset is the change during the period in the net definedbenefit liability or asset that arises from the passage of time which is determined by applying thediscount rate based on Philippine government bonds to the net defined benefit liability or asset. Netinterest on the net defined benefit liability or asset is recognized as expense or income in profit or loss.
Remeasurements comprising actuarial gains and losses, return on plan assets and any change in theeffect of the asset ceiling (excluding net interest on defined benefit liability) are recognized immediatelyin OCI in the period in which they arise. Remeasurements are not reclassified to profit or loss insubsequent periods.
Plan assets are assets that are held by a long-term employee benefit fund. Plan assets are not availableto the creditors of the Group, nor can they be paid directly to the Group. The fair value of plan assetsis based on market price information. When no market price is available, the fair value of plan assetsis estimated by discounting expected future cash flows using a discount rate that reflects both the riskassociated with the plan assets and the maturity or expected disposal date of those assets (or, if they

- 25 -
*SGVFS039096*
have no maturity, the expected period until the settlement of the related obligations).
The Group’s right to be reimbursed of some or all of the expenditure required to settle a defined benefitobligation is recognized as a separate asset at fair value when and only when reimbursement is virtuallycertain. If the fair value of the plan assets is higher than the present value of the defined benefitobligation, the measurement of the resulting defined benefit asset is limited to the present value ofeconomic benefits available in the form of refunds from the plan or reductions in future contributionsto the plan.
Employee leave entitlementEmployee entitlements to annual leave are recognized as a liability when they are accrued to theemployees. The undiscounted liability for leave expected to be settled after the end of the annualreporting period is recognized for services rendered by employees up to the end of the reporting period.
Provisions and ContingenciesProvisions are recognized when the Group has a present obligation (legal or constructive) as a result ofa past event and it is probable that an outflow of resources embodying economic benefits will berequired to settle the obligation and a reliable estimate can be made of the amount of the obligation.Where the Group expects some or all of a provision to be reimbursed, for example, under an insurancecontract, the reimbursement is recognized as a separate asset but only when the reimbursement isvirtually certain. The expense relating to any provision is presented in the statement of income, net ofany reimbursement. If the effect of the time value of money is material, provisions are determined bydiscounting the expected future cash flows at a pre-tax rate that reflects current market assessments ofthe time value of money and, where appropriate, the risks specific to the liability. Where discountingis used, the increase in the provision due to the passage of time is recognized as an interest expense.
Contingent liabilities are not recognized in the financial statements but are disclosed unless thepossibility of an outflow of resources embodying economic benefits is remote. Contingent assets arenot recognized but are disclosed in the financial statements when an inflow of economic benefits isprobable.
Income TaxesCurrent taxCurrent tax assets and liabilities for the current and prior periods are measured at the amount expectedto be recovered from or paid to the taxation authorities. The tax rates and tax laws used to compute theamount are those that are enacted or substantively enacted as of the reporting date.
Deferred taxDeferred tax is provided, using the balance sheet liability method, on all temporary differences at thereporting date between the tax bases of assets and liabilities and their carrying amounts for financialreporting purposes.
Deferred tax liabilities are recognized for all taxable temporary differences. Deferred tax assets arerecognized for all deductible temporary differences, carry forward of unused tax credits from the excessof minimum corporate income tax (MCIT) over the regular corporate income tax (RCIT), and unusednet operating loss carryover (NOLCO), to the extent that it is probable that sufficient taxable profit willbe available against which the deductible temporary differences and carry forward of unused tax creditsfrom MCIT and unused NOLCO can be utilized. Deferred tax, however, is not recognized on temporarydifferences that arise from the initial recognition of an asset or liability in a transaction that is not abusiness combination and, at the time of the transaction, affects neither the accounting income nortaxable income.

- 26 -
*SGVFS039096*
Deferred tax liabilities are not provided on non-taxable temporary differences associated withinvestments in domestic subsidiaries and associates.
The carrying amount of deferred tax assets is reviewed at each reporting date and reduced to the extentthat it is no longer probable that sufficient taxable profit will be available to allow all or part of thedeferred tax asset to be utilized. Unrecognized deferred tax assets are reassessed at each reporting dateand are recognized to the extent that it has become probable that future taxable profit will allow thedeferred tax asset to be recovered.
Deferred tax assets and liabilities are measured at the tax rates that are applicable to the period whenthe asset is realized or the liability is settled, based on tax rates (and tax laws) that have been enactedor substantively enacted at the reporting date.
Current tax and deferred tax relating to items recognized directly in equity is also recognized in equityand not in the statement of income.
Deferred tax assets and deferred tax liabilities are offset if a legally enforceable right exists to set offcurrent tax assets against current tax liabilities and deferred taxes relate to the same taxable entity andthe same taxation authority.
Earnings per ShareBasic earnings per share (EPS) is computed by dividing net income for the year by the weighted averagenumber of common shares outstanding during the year after giving retroactive effect to stock splits,stock dividends declared and stock rights exercised during the year, if any.
The Parent Company has no outstanding dilutive potential common shares.
Dividends on Common SharesDividends on common shares are recognized as a liability and deducted from equity when approved bythe respective shareholders of the Parent Company and its subsidiaries. Dividends declared during theyear that are approved after the reporting date are dealt with as an event after the reporting date.
Segment ReportingThe Group’s operating businesses are organized and managed separately according to the nature of theproducts and services provided, with each segment representing a strategic business unit that offersdifferent products and serves different markets. Financial information on business segments ispresented in Note 32. The Group’s revenue producing assets are located in the Philippines (i.e., onegeographical location). Therefore, geographical segment information is no longer presented.
Fiduciary ActivitiesAssets and income arising from fiduciary activities together with related undertakings to return suchassets to customers are excluded from the financial statements where the Parent Company acts in afiduciary capacity such as nominee, trustee or agent.
Events after the Reporting PeriodAny post year-end events that provide additional information about the Group’s position at the reportingdate (adjusting event) are reflected in the Group’s financial statements. Post year-end events that arenot adjusting events, if any, are disclosed when material to the financial statements.

- 27 -
*SGVFS039096*
Standards Issued but Not Yet EffectiveThere are new PFRSs, amendments, interpretation and annual improvements, to existingstandards effective for annual periods subsequent to 2019, which are adopted by the FRSC.Management will adopt the following relevant pronouncements in accordance with theirtransitional provisions; and, unless otherwise stated, none of these are expected to havesignificant impact on the Group’s financial statements:
Effective beginning on or after January 1, 2020· Amendments to PFRS 3, Definition of a Business.
The amendments to PFRS 3 clarify the minimum requirements to be a business, remove theassessment of a market participant’s ability to replace missing elements, and narrow the definitionof outputs. The amendments also add guidance to assess whether an acquired process is substantiveand add illustrative examples. An optional fair value concentration test is introduced which permitsa simplified assessment of whether an acquired set of activities and assets is not a business.
An entity applies those amendments prospectively with earlier application permitted.
These amendments will apply on future business combinations of the Group.
· Amendments to PAS 1, Presentation of Financial Statements, and PAS 8, Accounting Policies,Changes in Accounting Estimates and Errors, Definition of MaterialThe amendments refine the definition of material in PAS 1 and align the definitions used acrossPFRSs and other pronouncements. They are intended to improve the understanding of the existingrequirements rather than to significantly impact an entity’s materiality judgements.
An entity applies those amendments prospectively with earlier application permitted.
Effective beginning on or after January 1, 2021· PFRS 17, Insurance Contracts
The standard is a comprehensive new accounting standard for insurance contracts coveringrecognition and measurement, presentation and disclosure. Once effective, PFRS 17 will replacePFRS 4, Insurance Contracts. This new standard on insurance contracts applies to all types ofinsurance contracts (i.e., life, non-life, direct insurance and re-insurance), regardless of the type ofentities that issue them, as well as to certain guarantees and financial instruments with discretionaryparticipation features. A few scope exceptions will apply.
The overall objective of PFRS 17 is to provide an accounting model for insurance contracts thatis more useful and consistent for insurers. In contrast to the requirements in PFRS 4, which arelargely based on grandfathering previous local accounting policies, PFRS 17 provides acomprehensive model for insurance contracts, covering all relevant accounting aspects. The coreof PFRS 17 is the general model, supplemented by:
· A specific adaptation for contracts with direct participation features (the variable feeapproach)
· A simplified approach (the premium allocation approach) mainly for short-durationcontracts
Early application is permitted.

- 28 -
*SGVFS039096*
Deferred effectivity· Amendments to PFRS 10, Consolidated Financial Statements, and PAS 28, Sale or Contribution
of Assets between an Investor and its Associate or Joint Venture. The amendments address theconflict between PFRS 10 and PAS 28 in dealing with the loss of control of a subsidiary that issold or contributed to an associate or joint venture. The amendments clarify that a full gain or lossis recognized when a transfer to an associate or joint venture involves a business as defined inPFRS 3. Any gain or loss resulting from the sale or contribution of assets that does not constitutea business, however, is recognized only to the extent of unrelated investors’ interests in theassociate or joint venture.
On January 13, 2016, the Financial Reporting Standards Council deferred the original effectivedate of January 1, 2016 of the said amendments until the International Accounting Standards Boardcompletes its broader review of the research project on equity accounting that may result in thesimplification of accounting for such transactions and of other aspects of accounting for associatesand joint ventures.
3. Significant Accounting Judgments and Estimates
The preparation of the financial statements in accordance with PFRS requires the Group to makejudgments and estimates that affect the reported amounts of assets, liabilities, income and expenses anddisclosure of contingent assets and contingent liabilities at reporting date. Future events may occurwhich will cause the judgments and assumptions used in arriving at the estimates to change. The effectsof any change in judgments and estimates are reflected in the financial statements as they becomereasonably determinable.
Judgments and estimates are continually evaluated and are based on historical experience and otherfactors, including expectations of future events that are believed to be reasonable under thecircumstances.
Judgmentsa. Financial instruments
Where the fair values of financial assets and financial liabilities recorded on the balance sheet ordisclosed in the notes cannot be derived from active markets, they are determined using discountedcash flow model, incorporating inputs such as current market rates of comparable instruments. Thecarrying values and corresponding fair values of financial instruments, as well as the manner inwhich fair values were determined, are discussed in more detail in Note 5.
b. ContingenciesThe Group is currently involved in various legal proceedings. The estimate of the probable costsfor the resolution of these claims has been developed in consultation with outside counsel handlingthe Group’s defense in these matters and is based upon an analysis of potential results. The Groupcurrently does not believe that these proceedings will have a material adverse effect on the financialstatements (Note 31). It is possible, however, that future results of operations could be materiallyaffected by changes in the estimates or in the effectiveness of the strategies relating to theseproceedings.
c. Evaluation of business model in managing financial assets (PFRS 9)The Group manages its financial assets based on business models that maintain an adequate levelof financial assets to match its expected cash outflows, largely arising from customers’ withdrawals

- 29 -
*SGVFS039096*
and continuing loan disbursements to borrowers, while maintaining a strategic portfolio of financialassets for investment and trading activities consistent with its risk appetite.
The Group developed business models which reflect how it manages its portfolio of financialinstruments. The Group’s business models need not be assessed at entity level or as a whole butapplied at the level of a portfolio of financial instruments (i.e., group of financial instruments thatare managed together by the Group) and not on an instrument-by-instrument basis (i.e., not basedon intention or specific characteristics of individual financial instrument).
In determining the classification of a financial instrument under PFRS 9, the Group evaluates inwhich business model a financial asset or a portfolio of financial assets belong to taking intoconsideration the objectives of each business model established by the Group, various risks andkey performance indicators being reviewed and monitored by responsible officers, as well as themanner of compensation for them. The Group also considers the frequency, value, reasons andtiming of past sales and expectation of future sales activity in this evaluation.
In addition, PFRS 9 emphasizes that if more than an infrequent and more than an insignificant saleis made out of a portfolio of financial assets carried at amortized cost, an entity should assesswhether and how such sales are consistent with the objective of collecting contractual cash flows.In making this judgment, the Group considers certain circumstances to assess that an increase inthe frequency or value of sales of financial instruments in a particular period is not necessarilyinconsistent with a held-to-collect business model if the Group can explain the reasons for thosesales and why those sales do not reflect a change in the Group’s objective for the business model.
The business model assessment is based on reasonably expected scenarios without taking worstcase or stress case scenarios into account. If cash flows, after initial recognition are realized in away that is different from the Group’s and the Parent Company’s original expectations, the Groupand the Parent Company does not change the classification of the remaining financial assets heldin that business model but incorporates such information when assessing newly originated or newlypurchased financial assets going forward.
In 2019, the Parent Company sold investment securities at amortized cost whose carrying valuesprior to the sale amounted P=13.32 billion. Such disposals were made due to the followingconditions and reasons:· An increase in the financial assets’ credit risk due to political uncertainty affecting the
sovereign issuer’s environment· A change in the funding profile of the Parent Company;· A potential breach in the regulatory or internal limits of the Parent Company;· A highly probable change in regulations with a potentially adverse impact to the financial
assets’ contractual cash flows
The disposals resulted in gains amounting to P=1.30 billion for the Parent Company.
Also, CBS sold investment securities at amortized cost amounting to P=5.29 billion to comply withregulatory limits. The sold investments included securities with carrying amount of P=1.93 billionthat are nearing their maturity dates and where the selling price approximated amortized cost. Thedisposals resulted in gains amounting to P=82.51 million for CBS.
These disposals in the investment securities at amortized cost are consistent with the portfolios’business models with respect to the conditions and reasons for which the disposals were made as

- 30 -
*SGVFS039096*
discussed above. Further, these disposals did not result in a change in business model and theremaining portfolio after the sale remains to be accounted for at amortized cost (see Note 9).
d. Testing the cash flow characteristics of financial assets (PFRS 9)In determining the classification of financial assets under PFRS 9, the Group assesses whether thecontractual terms of the financial assets give rise on specified dates to cash flows that are SPPI onthe principal amount outstanding, with interest representing time value of money and credit riskassociated with the principal amount outstanding. The assessment as to whether the cash flows meetthe test is made in the currency in which the financial asset is denominated. Any other contractualterm that changes the timing or amount of cash flows (unless it is a variable interest rate thatrepresents time value of money and credit risk), i.e., cash flows that are non-SPPI, does not meetthe amortized cost criteria. In cases where the relationship between the passage of time and theinterest rate of the financial instrument may be imperfect, known as modified time value of money,the Group assesses the modified time value of money feature to determine whether the financialinstrument still meets the SPPI criterion. The objective of the assessment is to determine howdifferent the undiscounted contractual cash flows could be from the undiscounted cash flows thatwould arise if the time value of money element was not modified (the benchmark cash flows). Ifthe resulting difference is significant, the SPPI criterion is not met. In view of this, the Groupconsiders the effect of the modified time value of money element in each reporting period andcumulatively over the life of the financial instrument.
e. Incremental borrowing rate used for lease liabilitiesIf the Group cannot readily determine the interest rate implicit in the lease, it uses its incrementalborrowing rate in measuring its lease liabilities. The incremental borrowing rate is the rate ofinterest that the Group would have to pay to borrow over a similar term, and with a similar security,the funds necessary to obtain an asset of a similar value in a similar economic environment. TheGroup estimates the incremental borrowing rate using observable inputs (prevailing risk-freemarket rates) adjusted by the credit risk of the Group (i.e., credit spread).
f. Hedge accountingThe Bank has designated the hedge relationship between its floating rate bond payable (Note 18)and an interest rate swap as cash flow hedge. The Bank’s hedge accounting policies include anelement of judgement and estimation, in particular, in respect of the existence of highly probablecash flows for inclusion within the cash flow hedge. Estimates of future interest rates and thegeneral economic environment will influence the availability and timing of suitable hedged items,with an impact on the effectiveness of the hedge relationships. Details of the Bank’s hedgeaccounting policies are described in Note 26.
Estimatesa. Expected credit losses on financial assets and commitments (PFRS 9)
The Group reviews its financial assets and commitments at each reporting date to determine theamount of expected credit losses to be recognized in the balance sheet and any changes thereto inthe statement of income. In particular, judgments and estimates by management are required indetermining the following:
· whether a financial asset has had a significant increase in credit risk since initial recognition;· whether default has taken place and what comprises a default;· macro-economic factors that are relevant in measuring a financial asset’s probability of default
as well as the Group’s forecast of these macro-economic factors;· probability weights applied over a range of possible outcomes;

- 31 -
*SGVFS039096*
· sufficiency and appropriateness of data used and relationships assumed in building thecomponents of the Group’s expected credit loss models;
· measuring the exposure at default for unused commitments on which an expected credit lossshould be recognized and the applicable loss rate
The related allowance for credit losses of financial assets and commitments of the Group and theParent Company are disclosed in Notes 16 and 21.
b. Impairment of goodwillGoodwill is reviewed for impairment, annually or more frequently if events or changes incircumstances indicate that the carrying value may be impaired. Impairment is determined forgoodwill by assessing the recoverable amount of the cash generating unit (CGU) to which thegoodwill relates. The recoverable amount of the CGU is determined based on a VIU calculationusing cash flow projections from financial budgets approved by senior management covering afive-year period. For VIU, the Group estimates the discount rate used for the computation of thenet present value by reference to industry cost of capital. Impairment assessment process requiressignificant judgement and based on assumptions, specifically loan and deposit growth rates,discount rate and the long-term growth rates.
Where the recoverable amount is less than the carrying amount of the CGU to which goodwill hasbeen allocated, an impairment loss is recognized immediately in the statement of income.Impairment losses relating to goodwill cannot be reversed for subsequent increases in itsrecoverable amount in future periods. The carrying values of the Group’s goodwill are disclosed inNote 14.
c. Impairment of branch licensesThe Group conducts an annual review for any impairment in the value of branch licenses. Branchlicenses are written down for impairment where the recoverable value is insufficient to support thecarrying value. The recoverable amount of branch licenses is determined based on a VIUcalculation using cash flow projections from financial budgets approved by senior managementcovering a five-year period. For VIU, the Group estimates the discount rate used for thecomputation of the net present value by reference to industry cost of capital. Impairmentassessment process requires significant judgement and based on assumptions, specifically loan anddeposit growth rates, discount rate and the long-term growth rates.
The carrying values of the Group’s branch licenses are disclosed in Note 14.
d. Net plan assets and retirement expenseThe determination of the Group’s net plan assets and annual retirement expense is dependent onthe selection of certain assumptions used in calculating such amounts. These assumptions include,among others, discount rates and salary rates.
The assumed discount rates were determined using the market yields on Philippine governmentbonds with terms consistent with the expected employee benefit payout as of the reporting date.
The present value of the retirement obligation and fair value of plan assets, including the details ofthe assumptions used in the calculation are disclosed in Note 25.
e. Recognition of deferred income taxesDeferred tax assets are recognized for deductible temporary differences to the extent that it isprobable that taxable profit will be available against which the losses can be utilized. Managementdiscretion is required to determine the amount of deferred tax assets that can be recognized, based

- 32 -
*SGVFS039096*
on the forecasted level of future taxable profits and the related future tax planning strategies. Keyassumptions used in forecast of future taxable income include loan portfolio and deposit growthrates.
The Group believes it will be able to generate sufficient taxable income in the future to utilize itsrecorded deferred tax assets. Taxable income is sourced mainly from interest income from lendingactivities and earnings from service charge, fees, commissions and trust activities.
The recognized and unrecognized deferred tax assets are disclosed in Note 28.
f. Impairment on non-financial assetsThe Group assesses impairment on its nonfinancial assets (e.g., investment properties and bankpremises, furniture, fixtures and equipment) and considers the following impairment indicators:· significant underperformance relative to expected historical or projected future operating
results;· significant changes in the manner of use of the acquired assets or the strategy for overall
business; and· significant negative industry or economic trends.
An impairment loss is recognized whenever the carrying amount of an asset exceeds its recoverableamount. Except for investment properties where recoverable amount is determined based on fairvalue less cost to sell, the recoverable amount of all other nonfinancial assets is determined basedon the asset’s value in use computation which considers the present value of estimated future cashflows expected to be generated from the continued use of the asset. The Group is required to makeestimates and assumptions that can materially affect the carrying amount of the asset beingassessed.
The carrying values of the Group’s nonfinancial assets are disclosed in Notes 12 and 13.
4. Financial Instrument Categories
The following table presents the total carrying amount of the Group’s and the Parent Company’sfinancial instruments per category:
Consolidated Parent Company2019 2018 2019 2018
Financial assetsCash and other cash items P=16,839,755 P=15,639,474 P=14,856,844 P=13,705,304Financial assets at FVTPL 18,500,111 7,596,261 18,444,101 6,689,796Financial assets at FVOCI 26,133,360 10,101,527 24,170,629 8,213,010Financial assets at amortized cost
Due from BSP 100,174,398 101,889,773 88,109,650 95,092,944Due from other banks 9,900,642 9,455,447 8,645,547 7,837,894Interbank loans receivables and 17,036,460 11,998,040 10,027,609 8,998,040Investment securities at amortized cost 168,202,728 172,537,036 164,231,583 163,824,466Loans and receivables 568,919,164 505,804,955 502,930,197 441,432,156Accrued interest receivable 7,158,494 5,697,181 6,526,475 5,126,127Other assets* 4,382,441 3,577,270 2,077,459 1,520,108
707,571,599 810,959,702 618,316,937 723,831,735Total financial assets P=937,247,553 P=844,296,964 P=840,020,094 P=752,439,845*Other assets include accounts receivables, SCR, RCOCI and miscellaneous financial assets (Note 15).

- 33 -
*SGVFS039096*
Consolidated Parent Company2019 2018 2019 2018
Financial liabilitiesOther financial liabilities:
Deposit liabilities P=775,427,861 P=722,123,297 P=687,764,453 P=638,243,362Bills payable 33,381,406 39,826,532 33,381,406 39,826,532Manager’s checks 1,998,678 2,577,175 1,535,936 2,069,812Accrued interest and other expenses * 2,153,496 2,456,064 1,803,090 2,035,662Bonds payable 37,394,398 – 37,394,398 –Other liabilities** 10,532,784 7,347,450 8,426,083 5,779,466
860,888,623 774,330,518 770,305,366 687,954,834Financial liabilities at FVPL:
Derivative liabilities P=1,036,052 P=455,150 P=1,036,052 P=455,150Derivative contracts designated as hedges 51,949 – 51,949 –Total financial liabilities P=861,976,624 P=774,785,668 P=771,393,367 P=688,409,984
*Accrued interest and other expenses includes accrued interest payable and accrued other expenses payable (Note 20).**Other liabilities exclude withholding taxes payable and retirement liabilities (Note 21)
5. Fair Value Measurement
The Group has assets and liabilities in the consolidated and Parent Company balance sheets that aremeasured at fair value on a recurring and non-recurring basis after initial recognition. Recurring fairvalue measurements are those that another PFRS requires or permits to be recognized in the balancesheet at the end of each financial reporting period. These include financial assets and liabilities at FVPLand financial assets at FVOCI.
As of December 31, 2019 and 2018, except for the following financial instruments, the carrying valuesof the Group’s and the Parent Company’s financial assets and liabilities as reflected in the balancesheets and related notes approximate their respective fair values:
2019Consolidated Parent Company
Carrying Value Fair Value Carrying Value Fair ValueFinancial AssetsInvestment securities at amortized cost
Investment securities (Note 9)Government bonds P=116,859,352 P=115,600,451 P=114,157,458 P=113,070,656Private bonds 51,343,376 52,569,793 50,074,125 51,304,523
Loans and receivables (Note 10)Corporate and commercial lending 458,007,221 449,343,219 433,716,968 423,191,284Consumer lending 100,104,341 105,846,151 58,707,050 59,188,709Trade-related lending 10,766,453 11,267,769 10,472,182 10,819,193Others 41,148 47,780 33,997 39,177
Sales contracts receivable (Note 15) 1,124,275 1,200,426 210,706 224,080Investment properties
Land 2,770,799 5,199,926 615,253.00 2,516,447Buildings and improvements 1,603,958 2,819,400 881,734.00 1,455,041
Financial LiabilitiesDeposit liabilities (Note 17) 363,600,383 358,540,409 307,293,511 302,112,818Bonds payable 37,394,398 37,980,269 37,394,398 37,980,269
2018Consolidated Parent Company
Carrying Value Fair Value Carrying Value Fair ValueFinancial AssetsHTM financial assets (Note 9)
Government bonds P=117,260,018 P=108,886,906 P=110,220,634 P=102,006,641Private bonds 55,277,018 54,077,408 53,603,832 52,509,703
Loans and receivables (Note 10)Corporate and commercial lending 406,403,070 389,177,803 376,793,349 357,613,633Consumer lending 85,688,187 85,222,099 51,816,708 46,749,579Trade-related lending 13,662,914 13,283,538 12,782,734 12,772,774Others 50,785 56,603 39,365 45,185
Sales contracts receivable (Note 15) 1,040,939 1,101,941 199,692 178,486Financial LiabilitiesDeposit liabilities (Note 17) 321,343,811 299,666,264 265,739,836 243,898,397

- 34 -
*SGVFS039096*
The methods and assumptions used by the Group and Parent Company in estimating the fair values ofthe financial instruments follow:
Cash and other cash items, due from BSP and other banks, interbank loans receivable and SPURA andaccrued interest receivable - The carrying amounts approximate their fair values in view of therelatively short-term maturities of these instruments.
Debt securities - Fair values are generally based on quoted market prices. If the market prices are notreadily available, fair values are estimated using either values obtained from independent partiesoffering pricing services or adjusted quoted market prices of comparable investments or using thediscounted cash flow methodology.
Equity securities - For publicly traded equity securities, fair values are based on quoted prices. Forunquoted equity securities, remeasurement to their fair values is not material to the financial statements.
Loans and receivables and sales contracts receivable (SCR) included in other assets - Fair values ofloans and receivables and SCR are estimated using the discounted cash flow methodology, where futurecash flows are discounted using the Group’s current incremental lending rates for similar types of loansand receivables.
Accounts receivable, RCOCI and other financial assets included in other assets - Quoted market pricesare not readily available for these assets. These are reported at cost and are not significant in relationto the Group’s total portfolio of securities.
Derivative instruments (included under FVPL) - Fair values are estimated based on discounted cashflows, using prevailing interest rate differential and spot exchange rates.
Deposit liabilities (time, demand and savings deposits) - Fair values of time deposits are estimatedusing the discounted cash flow methodology, where future cash flows are discounted using the Group’scurrent incremental borrowing rates for similar borrowings and with maturities consistent with thoseremaining for the liability being valued. For demand and savings deposits, carrying amountsapproximate fair values considering that these are currently due and demandable.
Bonds payable and Bills payable – Unless quoted market prices are not readily available, fair valuesare estimated using the discounted cash flow methodology, where future cash flows are discountedusing the current incremental borrowing rates for similar borrowings and with maturities consistentwith those remaining for the liability being valued.
Manager’s checks and accrued interest and other expenses - Carrying amounts approximate fair valuesdue to the short-term nature of the accounts.
Other liabilities - Quoted market prices are not readily available for these liabilities. These are reportedat cost and are not significant in relation to the Group’s total portfolio.
Fair Value HierarchyThe Group uses the following hierarchy for determining and disclosing the fair value of assets andliabilities by valuation technique:
Level 1: quoted prices in active markets for identical assets or liabilities;Level 2: inputs other than quoted prices included in Level 1 that are observable for the asset or liability,
either directly (as prices) or indirectly (derived from prices); andLevel 3: inputs that are not based on observable market data or unobservable inputs.

- 35 -
*SGVFS039096*
As of December 31, 2019 and 2018, the fair value hierarchy of the Group’s and the Parent Company’sassets and liabilities are presented below:
Consolidated2019
Level 1 Level 2 Level 3 TotalRecurring fair value measurements(a)
Financial assets at FVPLHeld-for-trading
Government bonds P=5,087,179 P=3,363,947 P=– P=8,451,126 Treasury notes – 2,386,226 – 2,386,226
Treasury bills – 1,378,137 – 1,378,137Private bonds 4,372,734 – – 4,372,734Quoted equity shares 1,243,938 – – 1,243,938
Derivative assets – 667,950 – 667,950FVOCI financial assets Government bonds 3,977,446 18,563,070 – 22,540,516
Quoted private bonds 2,953,271 – – 2,953,271Quoted equity shares 621,208 – – 621,208
P=18,255,776 P=26,359,330 P=– P=44,615,106Financial liabilities at FVPL Derivative liabilities P=– P=1,036,052 P=– P=1,036,052
Derivative contracts designated as hedges – 51,949 – 51,949P=– P=1,088,001 P=– P=1,088,001
Fair values of assets carried at amortized cost/cost(a)
Investment securities at amortized costGovernment bonds P=115,600,451 P=– P=– P=115,600,451Private bonds 52,569,793 – – 52,569,793
Loans and receivablesCorporate and commercial loans – – 449,343,219 449,343,219Consumer loans – – 105,846,151 105,846,151
Trade-related loans – – 11,267,769 11,267,769Others – – 47,780 47,780
Sales contracts receivable – – 1,200,426 1,200,426Investment properties(b)
Land – – 5,199,926 5,199,926Buildings and improvements – – 2,819,400 2,819,400
P=168,170,244 P=– P=575,724,671 P=743,894,915Fair values of liabilities carried at amortized cost(a)
Deposit liabilities P=– P=– P=358,540,409 P=358,540,409Bonds payable – – 37,980,269 37,980,269
– – P=432,151,557 P=432,151,557(a) valued as of December 31, 2019
Consolidated2018
Level 1 Level 2 Level 3 TotalRecurring fair value measurements(a)
Financial assets at FVPL Held-for-trading
Government bonds P=492,521 P=141,372 P=− P=633,893Treasury notes − 838,662 − 838,662
Treasury bills − 1,214,170 − 1,214,170Private bonds 3,189,063 − − 3,189,063Quoted equity shares 1,312,625 − − 1,312,625
Derivative assets − 407,848 − 407848Financial assets at FVOCI −
Government bonds 4,859,716 5,107,673 − 9,967,389 Quoted private bonds 35,370 − − 35,370
Quoted equity shares 80,403 − − 80,403P=9,969,698 P=7,709,725 P=− P=17,679,423
Financial liabilities at FVPLDerivative liabilities P=− 455,150 P=− 455,150
P=− 455,150 P=− 455,150

- 36 -
*SGVFS039096*
Consolidated2018
Level 1 Level 2 Level 3 TotalFair values of assets carried at amortized cost/cost(a)
HTM financial assetsGovernment bonds P=108,886,906 P=− P=− P=108,886,906Private bonds 54,077,408 − − 54,077,408
Loans and receivablesCorporate and commercial loans − − 389,177,803 389,177,803Consumer loans − − 85,222,099 85,222,099
Trade-related loans − − 13,283,538 13,283,538Others − − 56,603 56,603
Sales contracts receivable − − 1,101,941 1,101,941Investment properties(b) −
Land − − 8,696,956 8,696,956Buildings and improvements − − 1,371,972 1,371,972
P=162,964,314 P=− P=498,910,912 P=661,875,226Fair values of liabilities carried at amortized cost(a)
Deposit liabilities P=− P=− P=299,666,264 P=299,666,264(a) valued as of December 31,2018
Parent Company2019
Level 1 Level 2 Level 3 TotalRecurring fair value measurements(a)
Financial assets at FVPLHeld-for-trading
Government bonds P=5,087,179 P=3,363,947 P=– P= 8,451,126Treasury notes – 2,386,226 – 2,386,226Treasury bills – 1,378,137 – 1,378,137
Private bondsQuoted equity shares
4,372,734 ––
– 4,372,7341,187,928 – 1,187,928
Derivative assets – 667,950 – 667,950FVOCI financial assets
Government bonds 2,489,563 18,563,070 – 21,052,633Quoted private bonds 2,512,588 – – 2,512,588Quoted equity shares 587,043 – – 587,043
P=16,237,035 P=26,359,330 P=– P=42,596,365Financial liabilities at FVPL
Derivative liabilities P=– P=1,036,052 P=– P=1,036,052Derivative contracts designated as hedges 51,949 51,949
P=– P=1,088,001 P=– P=1,088,001Fair values of assets carried at amortized cost/cost(a)
Investment securities at amortized costGovernment bonds P=113,070,656 P=– P=– P=113,070,656
Private bonds 51,304,523 – – 51,304,523Loans and receivables
Corporate and commercial loans – – 423,191,284 423,191,284 Consumer loans – – 59,188,709 59,188,709
Trade-related loans – – 10,819,193 10,819,193Others – – 39,177 39,177
Sales contracts receivable – – 224,080 224,080Investment properties(b)
Land – – 2,516,447 2,516,447 Buildings and improvements – – 1,455,041 1,455,041
P=164,375,179 P=– P=497,433,931 P=661,809,110Fair values of liabilities carried at amortized cost(a)
Deposit liabilities P=– P=– P=302,112,818 P=302,112,818Bills payable – – 35,630,879 35,630,879Bonds payable – – 37,980,269 37,980,269
– – 375,723,966 375,723,966P=164,375,179 P=– P=121,709,965 P=286,085,144
(a) valued as of December 31, 2019

- 37 -
*SGVFS039096*
Parent Company2018
Level 1 Level 2 Level 3 TotalRecurring fair value measurements(a)
Financial assets at FVPLHeld-for-trading
Government bonds P=492,521 P=141,372 P=− P=633,893Treasury notes − 838,662 − 838,662Treasury bills − 1,214,170 − 1,214,170
Private bonds 2,282,598 − − 2,282,598Quoted equity shares 1,312,625 − − 1,312,625
Derivative assets − 407,848 − 407,848Financial assets at FVOCI
Government bonds 3,033,686 5,107,673 − 8,141,359Quoted private bonds 1,676 − − 1,676
Quoted equity shares 51,610 − − 51,610P=7,174,716 P=7,709,725 P=− P=14,884,441
Financial liabilities at FVPLDerivative liabilities P=− P=455,150 P=− P=455,150
P=− P=455,150 P=− P=455,150Fair values of assets carried at
amortized cost/cost(a)
HTM financial assetsGovernment bonds P=102,006,641 P=− P=− P=102,006,641Private bonds 52,509,703 − − 52,509,703
Loans and receivablesCorporate and commercial loans − − 357,613,633 357,613,633Consumer loans − − 46,749,579 46,749,579
Trade-related loans − − 12,772,774 12,772,774Others − − 45,185 45,185
Sales contracts receivable − − 178,486 178,486Investment properties(b)
Land − − 4,225,706 4,225,706Buildings and improvements − − 974,119 974,119
P=154,516,344 P=− P=422,559,482 P=577,075,826Fair values of liabilities carried at
amortized costDeposit liabilities P=− P=− P=243,898,397 P=243,898,397(a) valued as of December 31, 2018
There were no transfers between Level 1 and Level 2 fair value measurements and no transfers into andout of Level 3 fair value measurements in 2019 and 2018.
The inputs used in the fair value measurement based on Level 2 are as follows:
Government securities - interpolated rates based on market rates of benchmark securities as of reportingdate.
Private bonds and commercial papers - quoted market price of comparable investments with credit riskpremium that is insignificant to the entire fair value measurement.
Derivative assets and liabilities - fair values are calculated by reference to the prevailing interestdifferential and spot exchange rate as of the reporting date, taking into account the remaining term tomaturity of the derivative assets and liabilities.
Inputs used in estimating fair values of financial instruments carried at cost and categorized under Level3 include risk-free rates and applicable risk premium.
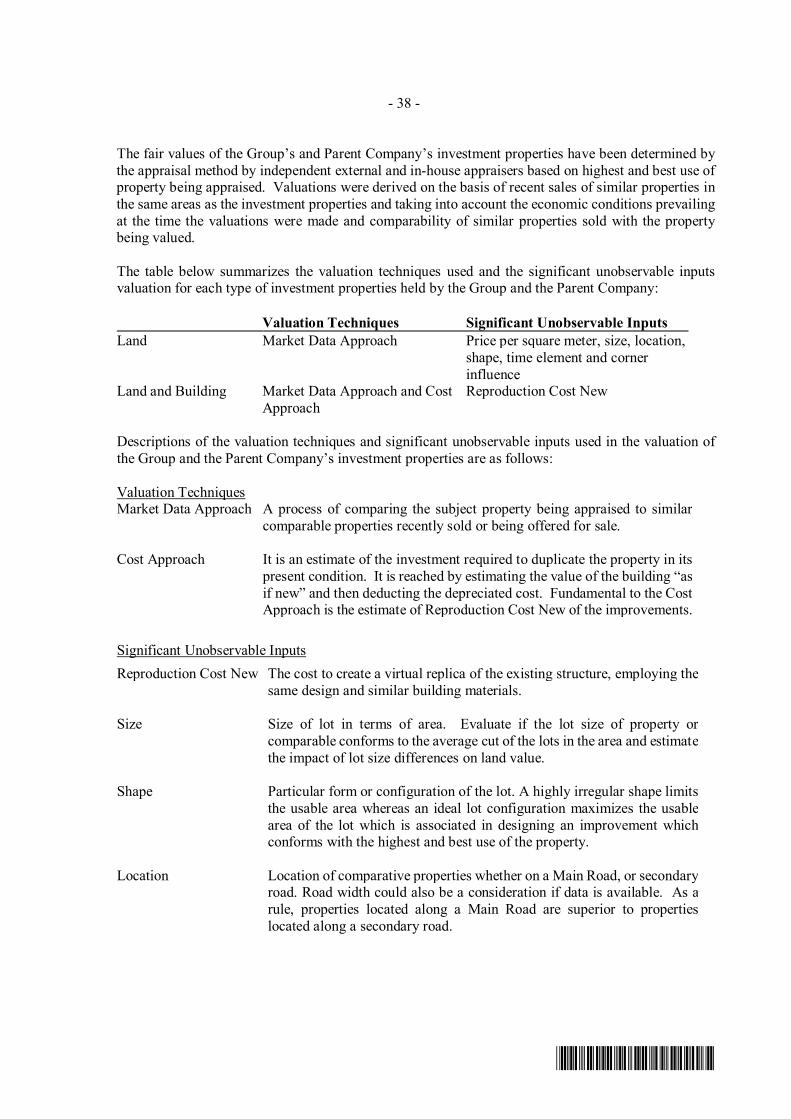
- 38 -
*SGVFS039096*
The fair values of the Group’s and Parent Company’s investment properties have been determined bythe appraisal method by independent external and in-house appraisers based on highest and best use ofproperty being appraised. Valuations were derived on the basis of recent sales of similar properties inthe same areas as the investment properties and taking into account the economic conditions prevailingat the time the valuations were made and comparability of similar properties sold with the propertybeing valued.
The table below summarizes the valuation techniques used and the significant unobservable inputsvaluation for each type of investment properties held by the Group and the Parent Company:
Valuation Techniques Significant Unobservable InputsLand Market Data Approach Price per square meter, size, location,
shape, time element and cornerinfluence
Land and Building Market Data Approach and CostApproach
Reproduction Cost New
Descriptions of the valuation techniques and significant unobservable inputs used in the valuation ofthe Group and the Parent Company’s investment properties are as follows:
Valuation TechniquesMarket Data Approach A process of comparing the subject property being appraised to similar
comparable properties recently sold or being offered for sale.
Cost Approach It is an estimate of the investment required to duplicate the property in itspresent condition. It is reached by estimating the value of the building “asif new” and then deducting the depreciated cost. Fundamental to the CostApproach is the estimate of Reproduction Cost New of the improvements.
Significant Unobservable InputsReproduction Cost New The cost to create a virtual replica of the existing structure, employing the
same design and similar building materials.
Size Size of lot in terms of area. Evaluate if the lot size of property orcomparable conforms to the average cut of the lots in the area and estimatethe impact of lot size differences on land value.
Shape Particular form or configuration of the lot. A highly irregular shape limitsthe usable area whereas an ideal lot configuration maximizes the usablearea of the lot which is associated in designing an improvement whichconforms with the highest and best use of the property.
Location Location of comparative properties whether on a Main Road, or secondaryroad. Road width could also be a consideration if data is available. As arule, properties located along a Main Road are superior to propertieslocated along a secondary road.

- 39 -
*SGVFS039096*
Significant Unobservable InputsTime Element “An adjustment for market conditions is made if general property values
have appreciated or depreciated since the transaction dates due to inflationor deflation or a change in investors’ perceptions of the market over time”.In which case, the current data is superior to historic data.
Discount Generally, asking prices in ads posted for sale are negotiable. Discount isthe amount the seller or developer is willing to deduct from the postedselling price if the transaction will be in cash or equivalent.
Corner influence Bounded by two (2) roads.
6. Financial Risk Management Objectives and Policies
The Group’s activities are principally related to the profitable use of financial instruments. Risks areinherent in these activities but are managed by the Group through a rigorous, comprehensive andcontinuous process of identification, measurement, monitoring and mitigation of these risks, partlythrough the effective use of risk and authority limits and thresholds, process controls and monitoring,and independent controls. As reflected in its corporate actions and organizational improvements, theGroup has placed due importance on expanding and strengthening its risk management process andconsiders it as a vital component to the Group’s continuing profitability and financial stability. Centralto the Group’s risk management process is its adoption of a risk management program intended to avoidunnecessary risks, manage and mitigate inherent risks and maximize returns from taking acceptablerisks necessary to sustain its business viability and good financial position in the market.
The key financial risks that the Group faces are: credit risk, market risk and liquidity risk. The Group’srisk management objective is primarily focused on controlling and mitigating these risks. The ParentCompany and its subsidiaries manage their respective financial risks separately. The subsidiaries,particularly CBSI, have their own risk management processes but are structured similar to that of theParent Company. To a large extent, the respective risk management programs and objectives are thesame across the Group. The severity of risk, materiality, and regulations are primary considerations indetermining the scope and extent of the risk management processes put in place for the subsidiaries.
Risk Management StructureThe BOD of the Parent Company is ultimately responsible for the oversight of the Parent Company’srisk management processes. On the other hand, the risk management processes of the subsidiaries arethe separate responsibilities of their respective BODs. The BOD of the Parent Company created aseparate board-level independent committee with explicit authority and responsibility for managingand monitoring risks.
The BOD has delegated to the Risk Oversight Committee (ROC) the implementation of the riskmanagement process which includes, among others, determining the appropriate risk mitigatingstrategies and operating principles, adoption of industry standards, development of risk metrics,monitoring of key risk indicators, and the imposition of risk parameters. The ROC is composed of threemembers of the BOD, two of whom are independent directors.

- 40 -
*SGVFS039096*
The Risk Management Group (RMG) is the operating unit of the ROC primarily responsible for theimplementation of the risk management strategies approved by the Board of Directors. Theimplementation cuts across all departments of the Parent Company and involves all of the ParentCompany’s financial instruments, whether “on-books” or “off-books.” The RMG is likewiseresponsible for monitoring the implementation of specific risk control procedures and enforcingcompliance thereto. The RMG is also directly involved in the day-to-day monitoring of material risksensuring that the Parent Company, in its transactions and dealings, engages only in risk taking activitiesduly approved by the ROC. The RMG also ensures that relevant information are accurately andcompletely captured on a timely basis in the management reporting system of the Parent Company.The RMG regularly reports the results of the risk measurements to the ROC. The RMG is headed bythe Chief Risk Officer (CRO).
Apart from RMG, each business unit has created and put in place various process controls which ensurethat all the external and internal transactions and dealings of the unit are in compliance with the unit’srisk management objectives.
The Internal Audit Division also plays a crucial role in risk management primarily because it isindependent of the business units and reports exclusively to the Audit Committee which, in turn, iscomprised of independent directors. The Internal Audit Division focuses on ensuring that adequatecontrols are in place and on monitoring compliance to controls. The regular audit covers all processesand controls, including those under the risk management framework handled by the RMG. The auditof these processes and controls is undertaken at least annually. The audit results and exceptions,including recommendations for their resolution or improvement, are discussed initially with thebusiness units concerned before these are presented to the Audit Committee.
Risk Management ReportingThe CRO reports to the ROC and is a resource to the Management Committee (ManCom) and theCredit Committee (CreCom). The CRO reports on key risk indicators and specific risk managementissues that would need resolution from top management. This is undertaken after the risk issues andkey risk indicators have been discussed with the business units concerned. The RMG’s function,particularly, that of the CRO, as well as the Board’s risk oversight responsibilities are articulated underBSP Circular No. 971, Guidelines on Risk Governance.
The key risk indicators were formulated on the basis of the financial risks faced by the Parent Company.These indicators contain information from all business units that provide measurements on the level ofthe risks taken by the Parent Company in its products, transactions and financial structure. Amongothers, the report on key risk indicators includes information on the Parent Company’s aggregate creditexposure, credit metric forecasts, hold limit exceptions, Value-at-Risk (VaR), Maximum CumulativeOutflow (MCO) and Earnings-at-Risk (EAR) analysis, utilization of market and credit limits andthresholds, liquidity risk limits and ratios, overall loan loss provisioning and risk profile changes. Loanloss provisioning and credit limit utilization are, however, discussed in more detail in the CreditCommittee. On a monthly basis, detailed reporting of industry, customer and geographic risks isincluded in the discussion with the ROC. A comprehensive risk report is presented to the BOD on aperiodic basis for an overall assessment of the level of risks taken by the Bank. On the other hand, theChief Audit Executive reports to the Audit Committee on a monthly basis on the results of branch orbusiness unit audits and for the resolution of pending but important internal audit issues.
Risk MitigationThe Parent Company uses derivatives to manage exposures in its financial instruments resulting fromchanges in interest rates and foreign currencies exposures. However, the nature and extent of use ofthese financial instruments to mitigate risks are limited to those allowed by the BSP for the ParentCompany and its subsidiaries. For interest rate risk from the bonds payable to IFC (Note 18), the Parent

- 41 -
*SGVFS039096*
Company entered into a pay-fixed, receive-floating interest rate swap (Note 26) with the same principalterms to hedge the exposure to variable cash flow payments. The hedge relationship would eliminatethe risk that variability in the floating rates will compress the net interest margin. The IRS designatedas hedge shall be reflected in the Earnings-at-Risk report of RMG.
To further mitigate risks throughout its different business units, the Parent Company formulates riskmanagement policies and continues to improve its existing policies. These policies further serve as theframework and set of guidelines in the creation or revisions of operating policies and manuals for eachbusiness unit. In the process design and implementation, preventive controls are preferred overdetection controls. Clear delineation of responsibilities and separation of incompatible duties amongofficers and staff, as well as, among business units are reiterated in these policies. To the extentpossible, reporting and accounting responsibilities are segregated from units directly involved inoperations and front line activities (i.e., players must not be scorers). This is to improve the credibilityand accuracy of management information. Any inconsistencies in the operating policies and manualswith the risk framework created by the RMG are taken up and resolved in the ROC and ManCom.
Based on the approved Operational Risk Assessment Program, RMG spearheaded the bankwide (allHead Office units and branches) risk identification and self-assessment process. This would enabledetermination of priority risk areas, assessment of mitigating controls in place, and institutionalizationof additional measures to ensure a controlled operating environment. RMG was also mandated tomaintain and update the Parent Company’s Centralized Loss Database wherein all reported incidentsof losses shall be encoded to enable assessment of weaknesses in the processes and come up with viableimprovements to avoid recurrence.
Monitoring and controlling risks are primarily performed based on various limits and thresholdsestablished by the top management covering the Group’s transactions and dealings. These limits andthresholds reflect the Group’s business strategies and market environment, as well as, the levels of risksthat the Group is willing to tolerate, with additional emphasis on selected industries. In addition, theParent Company monitors and measures the overall risk-bearing capacity in relation to the aggregaterisk exposure across all risk types and activities.
Liquidity and interest rate risk exposures are measured and monitored through the MaximumCumulative Outflow and Earnings-at-Risk reports from the Asset and Liability Management (ALM)system. It was implemented in 2013 and was upgraded in 2018 to a new version which include modulesfor calculating Liquidity Coverage Ratio (LCR) and Net Stable Funding Ratio (NSFR). The systemalso has a Funds Transfer Pricing module used by the Treasury Group and Corporate Planning Group.
For the measurement of market risk exposures, the Bank uses Historical Simulation VaR approach forall treasury traded instruments, including fixed income bonds, foreign exchange swaps and forwards,interest rate swaps and equity securities. Market risk exposures are measured and monitored throughreports from the Market Risk Management System which has been implemented in 2018 to enhancerisk measurement and automate daily reporting.
BSP issued Circular No. 639 dated January 15, 2009 which mandated the use of the Internal CapitalAdequacy Assessment Process (ICAAP) by all universal and commercials banks to determine theirminimum required capital relative to their business risk exposures. In this regard, the Board approvedthe engagement of the services of a consultant to assist in the bank-wide implementation and embeddingof the ICAAP, as provided for under Pillar 2 of Basel II and BSP Circular No. 639.

- 42 -
*SGVFS039096*
On April 3, 2019, the BOD approved the changes in the trigger events for the review of Capital RatiosMAT and the methodology for the CET1 ratio limit and the Management Action Trigger (MAT) oncapital ratios. There were no changes made in the Priority Risk Areas of the Parent Company and theapproved trigger events for the review of Priority Risks.
The Parent Company submitted its annually updated ICAAP document, in compliance with BSPrequirements on March 29, 2019. The document disclosed that the Parent Company has an appropriatelevel of internal capital relative to the Group’s risk profile.
For this submission, the Parent Company retained the Pillar 1 Plus approach using the Pillar 1 capitalas the baseline. The process of allocating capital for all types of risks above the Pillar 1 capital levelsincludes quantification of capital buffer for Pillar 2 risks under normal business cycle/condition, inaddition to the quantification based on the results of the Integrated Stress Test (IST). The adoption ofthe IST allows the Parent Company to quantify its overall vulnerability to market shocks andoperational losses in a collective manner driven by events rather than in silo. The capital assessment inthe document discloses that the Group and the Parent Company has appropriate and sufficient level ofinternal capital.
Credit Risk
Credit Risk and Concentration of Assets and Liabilities and Off-Balance Sheet ItemsCredit risk is the risk of financial loss on account of a counterparty to a financial product failing tohonor its obligation. The Group faces potential credit risks every time it extends funds to borrowers,commits funds to counterparties, guarantees the paying performance of its clients, invests funds toissuers (i.e., investment securities issued by either sovereign or corporate entities) or enters into eithermarket-traded or over-the-counter derivatives, through implied or actual contractual agreements (i.e.,on or off-balance sheet exposures). The Group manages its credit risk at various levels (i.e., strategiclevel, portfolio level down to individual credit or transaction).
The Group established risk limits and thresholds for purposes of monitoring and managing credit riskfrom individual counterparties and/or groups of counterparties, major industries, as well as countries.It also conducts periodical assessment of the creditworthiness of its counterparties. In addition, theGroup obtains collateral where appropriate, enters into master netting agreements and collateralarrangements with counterparties, and limits the duration of exposures.
The Parent Company has four credit risk rating models in place: for corporate borrowers, for non-consumer individual borrowers and small & medium enterprises (SMEs), for financial institutions, forsovereign / country exposures. In addition, it also has three scoring models: for auto and housing loanapplicants, and for credit card applicants.
In compliance with BSP requirements, the Parent Company established an internal Credit Risk RatingSystem (ICRRS) for the purpose of measuring credit risk for corporate borrowers in a consistentmanner, as accurately as possible, and thereafter uses the risk information for business and financialdecision making. The ICRRS covers corporate borrowers with total assets, total facilities, or total creditexposures amounting to P=15.00 million and above.
Further, the ICRRS was designed within the technical requirements defined under BSP CircularNo. 439. It has two components, namely: a) Borrower Risk Rating which provides an assessment ofthe creditworthiness of the borrower, without considering the proposed facility and securityarrangements, and b) Loan Exposure Ratio which provides an assessment of the proposed facilities asmitigated or enhanced by security arrangements.

- 43 -
*SGVFS039096*
On February 6, 2019, the Board of Directors approved the recalibrated ICRRS model. Among thechanges made was in the rating scale which was expanded from ten to fourteen rating grades, ten ofwhich fall under unclassified accounts, with the remaining four falling under classified accounts inaccordance with regulatory provisioning guidelines.
The Parent Company launched in 2011 the Borrower Credit Score (BCS), a credit scoring systemdesigned for retail small and medium entities and individual loan accounts. In 2018, RMG completedthe statistical validation of the BCS using the same methodology applied to the validation of thecorporate risk rating model. The validation process was conducted with the assistance of Teradata whichprovided the analytics platform, tools and technical guidance for both credit model performanceassessment and recalibration.
The CAMELOT rating system was approved by the BOD in 2006 to specifically assess Philippineuniversal, commercial and thrift banks. In 2009, the Parent Company implemented the rating systemfor rural and cooperative banks as well as the rating system for foreign financial institutions.
The Parent Company also developed a Sovereign Risk Rating Model, which provided the tool for theParent Company to assess the strength of the country rated in reference to its economic fundamentals,fiscal policy, institutional strength, and vulnerability to extreme events. The Model was approved bythe Board on September 7, 2018.
The scorecards for auto and housing loans were officially launched in November 2016, adopting themodels developed by CBS with a third-party consultant, and utilizing internally developed softwareinterfaces for their implementation.
For the Bank’s credit cards, starting September 2017, Transunion score is being used in lieu of anacquisition scorecard to determine application acceptance in conjunction with other credit acceptancecriteria.
Excessive Risk ConcentrationConcentrations arise when a number of counterparties are engaged in similar business activities, oractivities in the same geographic region, or have similar economic features that would cause their abilityto meet contractual obligations to be similarly affected by changes in economic, political or otherconditions. Concentrations indicate the relative sensitivity of the Parent Company's performance todevelopments affecting a particular industry or geographical location.
In order to avoid excessive concentrations of risk, the Parent Company's policies and proceduresinclude specific guidelines focusing on maintaining a diversified portfolio. Identified concentrationsof credit risks are controlled and managed accordingly.
The distribution of the Group’s and Parent Company’s assets and liabilities, and credit commitmentitems by geographic region as of December 31, 2019 and 2018 (in millions) follows:
Consolidated2019 2018
Assets Liabilities Commitment Assets Liabilities CommitmentGeographic Region
Philippines P= 871,434 P=839,979 P=139,879 P=741,331 P=743,613 P=87,789Asia 15,110 6,717 8,658 14,965 1,386 27,313Europe 39,071 10,116 27,978 18,411 2,859 3,634United States 10,185 321 7,483 68,277 21,107 2,548Others 1,447 4,844 87 1,313 5,821 38
P=937,247 P=861,977 P=184,085 P=844,297 P=774,786 P=121,322

- 44 -
*SGVFS039096*
Parent Company2019 2018
Assets Liabilities Commitment Assets Liabilities CommitmentGeographic Region
Philippines P=774,207 P=749,395 P=139,392 P=689,382 P=660,706 P=87,077Asia 15,110 6,717 8,658 14,965 1,386 27,313Europe 39,071 10,116 27,978 18,411 2,859 3,634United States 10,185 321 7,483 28,369 17,638 2,548Others 1,447 4,844 87 1,313 5,821 38
P=840,020 P=771,393 P=183,598 P= 752,440 P=688,410 P=120,610
Information on credit concentration as to industry of loans and receivables is presented in Note 10 tothe financial statements.
Maximum exposure to credit riskThe tables below provide the analysis of the maximum exposure to credit risk of the Group and theParent Company’s financial instruments, excluding those where the carrying values as reflected in thebalance sheets and related notes already represent the financial instrument’s maximum exposure tocredit risk, before and after taking into account collateral held or other credit enhancements:
Consolidated2019
Gross maximumexposure Net exposure
Financial effectof collateral or
creditenhancement
Credit risk exposure relating to on-balancesheet items are as followsLoans and receivables P=568,919,164 P=319,163,000 P=249,756,164Interbank loans receivable and SPURA 17,036,460 – 17,036,460Sales contracts receivable 1,162,106 – 1,162,106
P=587,117,730 P=319,163,000 P=267,954,730
Consolidated2018
Gross maximumexposure Net exposure
Financial effectof collateral or
creditenhancement
Credit risk exposure relating to on-balancesheet items are as followsLoans and receivables P=505,804,955 P=275,165,316 P=230,639,639Interbank loans receivable and SPURA 10,000,000 – 10,000,000Sales contracts receivable 1,040,939 – 1,040,939
P=516,845,894 P=275,165,316 P=241,680,578
Parent Company2019
Gross maximumexposure Net exposure
Financial effectof collateral or
creditenhancement
Credit risk exposure relating to on-balancesheet items are as followsLoans and receivables P=502,930,197 P=289,396,593 P=213,533,604Interbank loans receivable and SPURA 10,027,609 – 10,027,609Sales contracts receivable 235,049 – 235,049
P=513,192,855 P=289,396,593 P=223,796,262

- 45 -
*SGVFS039096*
Parent Company2018
Gross maximumexposure Net exposure
Financial effectof collateral or
creditenhancement
Credit risk exposure relating to on-balancesheet items are as follows
Loans and receivables P=441,432,156 P=249,012,090 P=192,420,066Interbank loans receivable and SPURA 7,000,000 – 7,000,000Sales contracts receivable 199,692 – 199,962
P=448,631,848 P=249,012,090 P=199,619,758
For the Group, the fair values of collateral held for loans and receivables and sales contracts receivableamounted to P=281.92 billion and P=2.38 billion, respectively, as of December 31, 2019 andP=330.43 billion and P=1.60 billion, respectively, as of December 31, 2018.
For the Parent Company, the fair values of collateral held for loans and receivables and sales contractsreceivable amounted to P=245.70 billion and P=0.91 billion, respectively, as of December 31, 2019 andP=302.16 billion and P=1.47 billion, respectively, as of December 31, 2018.
Credit risk, in respect of derivative financial products, is limited to those with positive fair values,which are included under financial assets at FVPL (Note 9). As a result, the maximum credit risk,without taking into account the fair value of any collateral and netting agreements, is limited to theamounts on the balance sheet plus commitments to customers such as unused commercial letters ofcredit, outstanding guarantees and others as disclosed in Note 31 to the financial statements.
Collateral and other credit enhancementsThe amount and type of collateral required depends on an assessment of the credit risk of thecounterparty. Guidelines are implemented with regard to the acceptability of types of collateral andvaluation parameters.
The main types of collateral obtained are as follows:· For securities lending and reverse repurchase transactions - cash or securities· For consumer lending - real estate and chattel over vehicle· For corporate lending and commercial lending- real estate, chattel over properties, assignment of
deposits, shares of stocks, bonds, and guarantees
Management requests additional collateral in accordance with the underlying agreement and takes intoconsideration the market value of collateral during its review of the adequacy of allowance for creditlosses.
It is the Group's policy to dispose of repossessed properties in an orderly fashion. The proceeds areused to reduce or repay the outstanding claim. In most cases, the Parent Company does not occupyrepossessed properties for business use.
Collateral valuationTo mitigate its credit risks on financial assets, the Group seeks to use collateral, where possible. Thecollateral comes in various forms, such as cash, securities, letters of credit/guarantees, real estate,receivables, inventories, other non-financial assets and credit enhancements such as netting agreements.Collateral, unless repossessed, is not recorded on the Group’s balance sheet. However, the fair value ofcollateral affects the calculation of loss allowances. It is generally assessed, at a minimum, at inceptionand re-assessed on an annual basis. To the extent possible, the Group uses active market data for

- 46 -
*SGVFS039096*
valuing financial assets held as collateral. Other financial assets which do not have readily determinablemarket values are valued using models. Non-financial collateral, such as real estate, is valued based ondata provided by internal or external appraisers.
Credit quality per class of financial assetsThe credit quality of financial assets is managed by the Group using an internal credit rating system forthe purpose of measuring credit risk in a consistent manner as accurately as possible. The model onrisk ratings is assessed regularly because the Group uses this information as a tool for business andfinancial decision making. Aside from the periodic review by the Bank’s Internal Audit Group, theBank likewise engaged the services of third-party consultants in 2014, 2015, and 2017 for purposes ofconducting an independent validation of the credit risk rating model.
It is the Parent Company’s policy to maintain accurate and consistent risk ratings across the creditportfolio. This facilitates focused management of the applicable risks and the comparison of creditexposures across all lines of business, geographic regions and products. The rating system is supportedby a variety of financial analytics, combined with processed market information to provide the maininputs for the measurement of counterparty risk. All internal risk ratings are tailored to the variouscategories and are derived in accordance with the Parent Company’s rating policy. The attributablerisk ratings are assessed and monitored regularly.
The rating categories are further described below.
Neither Past Due nor Impaired
High Grade
This includes all borrowers whose ratings are considered as Low Risk and/or those where the exposuresare covered by Government Guarantee. Thus, these borrowers have a very low probability of going intodefault in the coming year.
In terms of borrower credit ratings, these include the following:A. ICRRS-Covered· Borrower Risk Rating (BRR) 1 (Exceptional)· BRR 2 (Excellent)· BRR 3 (Strong)· BRR 4 (Good)B. BCS-Covered· Strong
Generally, a Low Risk (High Grade) rating is indicative of a high capacity to fulfill its obligationssupported by robust financials (i.e., profitable, with returns considerably higher than the industry,elevated capacities to service its liabilities), gainful positioning in growing industries (i.e., participationin industries where conditions are very favorable and in which they are able to get a good share of themarket), and very strong leadership providing clear strategic direction and/or excellent training anddevelopment programs.
Standard Grade
This includes all borrowers whose ratings are considered as Moderate Risk and are seen to withstandtypical swings in the economic cycle without going into default. However, any prolonged unfavorableeconomic period would create deterioration that may already be beyond acceptable levels.

- 47 -
*SGVFS039096*
In terms of borrower credit ratings, these include the following:A. ICRRS-Covered· BRR 5 (Satisfactory)· BRR 6 (Acceptable)· BRR 7 (Fair)B. BCS-Covered· Satisfactory· Acceptable
Generally, a Moderate Risk (Standard Grade) rating signifies a borrower whose financial performanceis sufficient to service obligations and is at par with competitors in the industry. In terms ofmanagement, it is run by executives with adequate personal and professional qualifications andsufficient experience in similar companies. In terms of growth potential, it is engaged in an industrywith stable outlook, supportive of continuing operations.
Sub-Standard Grade
This includes all borrowers whose ratings are considered as High Risk and show an elevated risk fordefault in the next year.
In terms of borrower credit ratings, these includes the following:
UnclassifiedA. ICRRS-Covered· BRR 8 (Watchlist)· BRR 9 (Speculative)· BRR 10 (Highly Speculative)B. BCS-Covered· Watchlist
Adversely ClassifiedA. ICRRS and BCS--Covered· BRR 11 (Especially Mentioned)· BRR 12 (Substandard)· BRR 13 (Doubtful)· BRR 14 (Loss)
For accounts that are Unclassified, a High Risk (Sub-Standard Grade) rating is indicative of borrowerswhere there are unfavorable industry or company-specific factors. This may be financial in nature (i.e.marginal operating performance, returns that are lower than those of the industry, and/or diminishedcapacity to pay off obligations that are due), related to management quality (including negativeinformation regarding the company or specific executives) and/or unfavorable industry conditions. Theborrower might find it very hard to cope with any significant economic downturn and a default in sucha case is more than a possibility. These accounts require a closer monitoring for any signs of furtherdeterioration, warranting adverse classification.

- 48 -
*SGVFS039096*
Adversely Classified accounts are automatically considered as high-risk and generally includes pastdue accounts. However, in some cases, even accounts that are neither past due nor impaired, qualifiesfor adverse classification. Reasons for this include among others the following: consecutive net losses,emerging weaknesses in terms of cash flow, negative equity, and/or breach in the covenants per termloan agreement.
For consumer loans (i.e., auto, housing, credit card) that are covered by application scorecards whichprovide either a pass/fail score, the basis for credit quality rating is the BSP classification for those thatare booked as Current (i.e. Standard Grade if Unclassified and Sub Standard Grade if Classified andimpairment status for those that are booked as Past Due / ITL.
The financial assets are also grouped according to stage whose description is explained as follows:
Stage 1 - those that are considered current and up to 30 days past due, and based on change in rating,delinquencies and payment history, do not demonstrate significant increase in credit risk.
Stage 2 - those that, based on change in rating, delinquencies and payment history, demonstratesignificant increase in credit risk, and/or are considered more than 30 days past due but does notdemonstrate objective evidence of impairment as of reporting date.
Stage 3 - those that are considered in default or demonstrate objective evidence of impairment as ofreporting date.
The following tables illustrate the Group’s and the Parent Company’s credit exposures.
Consolidated 2019 ECL Staging
Corporate and commercial lending Stage 1 Stage 2 Stage 312-month ECL Lifetime ECL Lifetime ECL Total
Neither past due nor impairedHigh grade 50,587 4,271 - 54,858Standard grade 295,112 5,899 - 301,011Sub-Standard 88,999 8,542 - 97,541Unrated 724 1 - 725
Past due but not impaired 13 725 - 738Past due and impaired - - 4,784 4,784
Gross carrying amount 435,435 19,438 4,784 459,657
Consolidated 2019 ECL Staging
Consumer Lending Stage 1 Stage 2 Stage 3
12-month ECL Lifetime ECL Lifetime ECL TotalNeither past due nor impaired
High grade 40,542 - - 40,542Standard grade 48,761 744 - 49,505Sub-Standard 7,433 435 - 7,868Unrated 2,280 1,862 - 4,142
Past due but not impaired 106 1,562 - 1,668Past due and impaired - - 3,497 3,497
Gross carrying amount 99,122 4,603 3,497 107,222

- 49 -
*SGVFS039096*
Consolidated 2019 ECL Staging
Trade-related Lending Stage 1 Stage 2 Stage 3
12-month ECL Lifetime ECL Lifetime ECL TotalNeither past due nor impaired
High grade 250 - - 250Standard grade 8,142 37 - 8,179Sub-Standard 2,169 37 - 2,206Unrated - - - -
Past due but not impaired 32 - - 32Past due and impaired - - 236 236
Gross carrying amount 10,593 74 236 10,903
Consolidated 2019 ECL Staging
Others Stage 1 Stage 2 Stage 3
12-month ECL Lifetime ECL Lifetime ECL TotalNeither past due nor impaired
High grade 8 - - 8Standard grade - - - -Sub-Standard - - - -Unrated 34 - - 34
Past due but not impaired - - - -Past due and impaired - - 5 5
Gross carrying amount 42 - 5 47
Consolidated 2018ECL Staging
Corporate and commercial lending Stage 1 Stage 2 Stage 3 Total12-month ECL Lifetime ECL Lifetime ECL
Neither past due nor impairedHigh grade P=65,022 P=- P=- P=65,022Standard grade 234,159 2,341 - 236,500Sub-Standard 90,877 14,428 - 105,305Unrated 438 8 - 446
Past due but not impaired 44 648 - 692Past due and impaired - - 3,835 3,835
Gross carrying amount P=390,540 P=17,425 P=3,835 P=411,800
Consolidated 2018 ECL Staging
Consumer LendingStage 1 Stage 2 Stage 3 Total
12-month ECL Lifetime ECL Lifetime ECLNeither past due nor impaired
High grade P=32,661 P=- P=- P=32,661Standard grade 44,389 600 - 44,989Sub-Standard 1,309 563 - 1,872Unrated 1,782 1,613 - 3,395
Past due but not impaired 551 435 - 986Past due and impaired - - 3,313 3,313
Gross carrying amount P=80,692 P=3,211 P=3,313 P=87,216
Consolidated 2018ECL Staging
Trade-related LendingStage 1 Stage 2 Stage 3 Total
12-month ECL Lifetime ECL Lifetime ECLNeither past due nor impaired
High grade P=1,239 P=- P=- P=1,239Standard grade 9,371 9 - 9,380Sub-Standard 1,500 1,675 - 3,175Unrated - - - -
Past due but not impaired 0 - - 0Past due and impaired - - 23 23
Gross carrying amount P=12,110 P=1,684 P=23 P=13,817

- 50 -
*SGVFS039096*
Consolidated 2018ECL Staging
OthersStage 1 Stage 2 Stage 3 Total
12-month ECL Lifetime ECL Lifetime ECLNeither past due nor impaired
High grade P=12 P=- P=- P=12Standard grade 0 - - 0Sub-Standard 0 - - 0Unrated 39 - - 39
Past due but not impaired 1 5 - 6Past due and impaired - - - -
Gross carrying amount P=52 P=5 P=- P= 57
Parent Company 2019 ECL Staging
Corporate and commercial lending Stage 1 Stage 2 Stage 312-month ECL Lifetime ECL Lifetime ECL Total
Neither past due nor impairedHigh grade 29,392 4,271 - 33,663Standard grade 295,112 5,155 - 300,267Sub-Standard 88,999 8,528 - 97,527Unrated 724 1 - 725
Past due but not impaired 12 50 - 62Past due and impaired - - 2,229 2,229
Gross carrying amount 414,239 18,005 2,229 434,473
Parent Company 2019 ECL Staging
Consumer Lending Stage 1 Stage 2 Stage 3
12-month ECL Lifetime ECL Lifetime ECL TotalNeither past due nor impaired
High grade 224 - - 224Standard grade 48,761 714 - 49,475Sub-Standard 7,433 430 - 7,863Unrated 2,280 1,862 - 4,142
Past due but not impaired - 624 - 624Past due and impaired - - 2,421 2,421
Gross carrying amount 58,698 3,630 2,421 64,749
Parent Company 2019 ECL Staging
Trade−related Lending Stage 1 Stage 2 Stage 3
12-month ECL Lifetime ECL Lifetime ECL TotalNeither past due nor impaired
High grade 250 - - 250Standard grade 8,142 37 - 8,179Sub-Standard 2,169 37 - 2,206Unrated - - - -
Past due but not impaired 32 - - 32Past due and impaired - - 236 236
Gross carrying amount 10,593 74 236 10,903
Parent Company 2019 ECL Staging
Others Stage 1 Stage 2 Stage 3 Total
12-month ECL Lifetime ECL Lifetime ECLNeither past due nor impaired
High grade - - - -Standard grade - - - -Sub-Standard - - - -Unrated 34 - - 34
Past due but not impaired - - - -Past due and impaired - - - -
Gross carrying amount 34 - - 34

- 51 -
*SGVFS039096*
Parent Company 2018ECL Staging
Corporate and commercial lending Stage 1 Stage 2 Stage 3 Total 12-month ECL Lifetime ECL Lifetime ECL
Neither past due nor impairedHigh grade P=38,025 P=- P=- P=38,025Standard grade 234,159 2,341 - 236,500Sub-Standard 90,869 14,428 - 105,297Unrated 438 8 - 446
Past due but not impaired 44 25 - 69Past due and impaired - - 1,068 1,068
Gross carrying amount P=363,535 P=16,802 P=1,068 P= 381,405
Parent Company 2018ECL Staging
Consumer LendingStage 1 Stage 2 Stage 3 Total
12-month ECL Lifetime ECL Lifetime ECLNeither past due nor impaired
High grade P=18 P=- P=- P=18Standard grade 44,287 600 - 44,887Sub-Standard 1,271 563 - 1,834Unrated 1,782 1,613 - 3,395
Past due but not impaired 551 49 - 600Past due and impaired - - 1,952 1,952
Gross carrying amount P=47,909 P=2,825 P=1,952 P=52,686
Parent Company 2018ECL Staging
Trade−related Lending Stage 1 Stage 2 Stage 3 Total
12-month ECL Lifetime ECL Lifetime ECLNeither past due nor impaired
High grade P=359 P=- P=- P=359Standard grade 9,371 9 - 9,380Sub-Standard 1,500 1,675 - 3,175Unrated - - - -
Past due but not impaired 0 - - 0Past due and impaired - - 23 23
Gross carrying amount P=11,230 P=1,684 P=23 P=12,937
Parent Company 2018 ECL Staging
OthersStage 1 Stage 2 Stage 3 Total
12-month ECL Lifetime ECL Lifetime ECLNeither past due nor impaired
High grade P=- P=- P=- P=-Standard grade - - - -Sub-Standard - - - -Unrated 39 - - 39
Past due but not impaired 1 - 1Past due and impaired - -
Gross carrying amount P=40 P=- P=- P=40
Depository accounts with the BSP and counterparty banks, Trading and Investment SecuritiesFor these financial assets, outstanding exposure is rated primarily based on external risk rating(i.e. Standard and Poor’s (S&P), otherwise, rating is based on risk grades by a local rating agency orincluded under “Unrated”, when the counterparty has no available risk grade.

- 52 -
*SGVFS039096*
The external risk rating of the Group’s depository accounts with the BSP and counterparty banks,trading and investment securities, is grouped as follows:
Credit Quality Rating External Credit Risk Rating Credit Rating AgencyHigh grade AAA, AA+, AA, AA− S&P
Aaa, Aa1, Aa2, Aa3 Moody’sAAA, AA+, AA, AA− Fitch
Standard grade A+, A, A−, BBB+, BBB, BBB− S&PA1, A2, A3, Baa1, Baa2, Baa3 Moody’sA+, A, A−, BBB+, BBB, BBB− Fitch
Substandard grade BB+, BB, BB−, B/B+, CCC, R, SD & D S&PBa1, Ba2, Ba3, B1, B2, R, SD & D Moody’sBB+, BB, BB−, B/B+, CCC, R, SD & D Fitch
Following is the credit rating scale applicable for foreign banks, and government securities (alignedwith S&P ratings):
AAA − An obligor has extremely strong capacity to meet its financial commitments.
AA − An obligor has very strong capacity to meet its financial commitments. It differs from thehighest−rated obligors at a minimal degree.
A − An obligor has strong capacity to meet its financial commitments but is somewhat more susceptibleto the adverse effects of changes in circumstances and economic conditions than obligors inhigher−rated categories.
BBB and below:
BBB − An obligor has adequate capacity to meet its financial commitments. However, adverseeconomic conditions or changing circumstances are more likely to lead to a weakened capacity of theobligor to meet its financial commitments.
BB − An obligor is less vulnerable in the near term than other lower−rated obligors. However, it facesmajor ongoing uncertainties and exposure to adverse business, financial, or economic conditions whichcould lead to the obligor's inadequate capacity to meet its financial commitments.
B − An obligor is more vulnerable than the obligors rated ‘BB’, but the obligor currently has thecapacity to meet its financial commitments. Adverse business, financial, or economic conditions willlikely impair the obligor's capacity or willingness to meet its financial commitments.
CCC − An obligor is currently vulnerable and is dependent upon favorable business, financial, andeconomic conditions for the obligor to meet its financial commitments.
CC − An obligor is currently vulnerable. The rating is used when a default has not yet occurred, butexpects default to be a virtual certainty, regardless of the anticipated time to default.
R − An obligor is under regulatory supervision owing to its financial condition. During the pendencyof the regulatory supervision, the regulators may have the power to favor one class of obligations overothers or pay some obligations and not others.

- 53 -
*SGVFS039096*
SD and D − An obligor is in default on one or more of its financial obligations including rated andunrated financial obligations but excluding hybrid instruments classified as regulatory capital or innon−payment according to terms.
Due from other banks and government securitiesThe external risk rating of the Group’s depository accounts with counterparty banks, trading andinvestment securities, is grouped as follows (aligned with the Philippine Ratings System):
Credit Quality Rating External Credit Risk RatingHigh grade PRSAAA, PRSAa+, PRSAa, PRSAa−Standard grade PRSA+, PRSA, PRSA−, PRSBaa+, PRSBaa, PRSBaa−Substandard grade PRSBa+, PRSBa, PRSBa−, PRSB+, PRSB, PRSB−,
PRSCaa+, PRSCaa, PRSCaa−, PRSCa+, PRSCa, PRSCa−,PRSC+, PRSC, PRSC−
PRSAaa − The obligor’s capacity to meet its financial commitment on the obligation is extremelystrong.
PRSAa − The obligor’s capacity to meet its financial commitment on the obligation is very strong.
PRSA − With favorable investment attributes and are considered as upper−medium grade obligations.Although obligations rated ‘PRSA’ are somewhat more susceptible to the adverse effects of changes ineconomic conditions, the obligor’s capacity to meet its financial commitments on the obligation is stillstrong.
PRSBaa − An obligation rated ‘PRS Baa’ exhibits adequate protection parameters. However, adverseeconomic conditions and changing circumstances are more likely to lead to a weakened capacity of theobligor to meet its financial commitment on the obligation. PRSBaa−rated issues may possess certainspeculative characteristics.
PRSBa − An obligation rated ‘PRSBa’ is less vulnerable to nonpayment than other speculative issues.However, it faces major ongoing uncertainties relating to business, financial or economic conditions,which could lead to the obligor’s inadequate capacity to meet its financial commitment on theobligation.
PRSB − An obligation rated ‘PRSB’ is more vulnerable to nonpayment than obligations rated ‘PRSBa’,but the obligor currently has the capacity to meet its financial commitment on the obligation. Adverseeconomic conditions will likely impair the obligor’s capacity to meet its financial commitment on theobligation. The issue is characterized by high credit risk.
PRSCaa − An obligation rated ‘PRSCaa’ is presently vulnerable to nonpayment and is dependent uponfavorable business, financial and economic conditions for the obligor to meet its financial commitmentson the obligation. In the event of adverse economic conditions, the obligor is not likely to have thecapacity to meet its financial commitment on the obligation. The issue is considered to be of poorstanding and is subject to very high credit risk.
PRSCa − An obligation rated “PRSCa” is presently highly vulnerable to nonpayment. Likely alreadyin or very near default with some prospect for partial recovery of principal or interest.
PRSC − An obligation is already in default with very little prospect for any recovery of principal orinterest.

- 54 -
*SGVFS039096*
The succeeding tables show the credit exposure of the Group and the Parent Company related to thesefinancial assets.
Consolidated 2019 ECL Staging
Investment securities atamortized cost
Stage 1 Stage 2 Stage 3 Total 12-month ECL Lifetime ECL Lifetime ECL
Neither past due nor impairedHigh grade 25,859 - - 25,859Standard grade 108,989 336 - 109,325Sub-Standard 1,183 - - 1,183Unrated 15,721 8,302 - 24,023Past due but not impaired - - - -Impaired - - - -
Gross carrying amount 151,752 8,638 - 160,390
Consolidated 2019 ECL Staging
Financial assets at FVOCI Stage 1 Stage 2 Stage 3 Total
12-month ECL Lifetime ECL Lifetime ECLNeither past due nor impaired
High grade 1,205 - - 1,205Standard grade 22,822 - - 22,822Sub-Standard 107 - - 107Unrated 1,980 - - 1,980
Past due but not impaired - - - -Impaired - - 19 19
Gross carrying amount 26,114 - 19 26,133
Consolidated 2018 ECL Staging
Investment securities atamortized cost
Stage 1 Stage 2 Stage 3 Total12-month ECL Lifetime ECL Lifetime ECL
Neither past due nor impairedHigh grade P=7,913 P=108 P=- P=8,021Standard grade 111,072 - - 111,072Sub-Standard 1,703 - - 1,703Unrated 40,765 1,396 152 42,313
Gross carrying amount P=161,453 P=1,504 P=152 P=163,109
Consolidated 2018 ECL Staging
Financial assets at FVOCI Stage 1 Stage 2 Stage 3 Total
12-month ECL Lifetime ECL Lifetime ECLNeither past due nor impaired
High grade P=674 P=- - P=674Standard grade 9,371 - - 9,371Sub-Standard - - - -Unrated 55 2 - 57
Past due but not impaired - - - -Past due and impaired - - - -
Gross carrying amount P=10,100 P=2 P= - P=10,102
Parent Company 2019 ECL Staging
Investment securities atamortized cost
Stage 1 Stage 2 Stage 3 Total12-month ECL Lifetime ECL Lifetime ECL
Neither past due nor impairedHigh grade 24,491 - - 24,491Standard grade 106,682 336 - 107,018Sub-Standard 1,183 - - 1,183Unrated 15,721 8,302 - 24,023Past due but not impaired - - - -Impaired - - - -
Gross carrying amount 148,077 8,638 - 156,715

- 55 -
*SGVFS039096*
Parent Company 2019 ECL Staging
Financial assets at FVOCI Stage 1 Stage 2 Stage 3 Total
12-month ECL Lifetime ECL Lifetime ECLNeither past due nor impaired
High grade 555 - - 555Standard grade 21,528 - - 21,528Sub-Standard 107 - - 107Unrated 1,980 - - 1,980
Past due but not impaired - - - -Impaired - - - -
Gross carrying amount 24,170 - - 24,170
Parent Company 2018 ECL Staging
Investment securities atamortized cost
Stage 1 Stage 2 Stage 3 Total12-month ECL Lifetime ECL Lifetime ECL
Neither past due nor impairedHigh grade P=7,235 P=108 P=- P=7,343Standard grade 103,873 - - 103,873Sub-Standard 1,303 - - 1,303Unrated 40,765 1,396 - 42,161
Gross carrying amount P=153,176 P=1,504 P=- P=154,680
Parent Company 2018 ECL Staging
Financial assets at FVOCI Stage 1 Stage 2 Stage 3 Total
12-month ECL Lifetime ECL Lifetime ECLNeither past due nor impaired
High grade P=15 P=- P=- P=15Standard grade 8,141 - - 8,141Sub-Standard - - - -Unrated 55 2 - 57
Past due but not impaired - - - -Past due and impaired - - - -
Gross carrying amount P=8,211 P=2 P=- P=8,213
Parent Company 2019High
GradeStandard
GradeSubstandard
Grade Unrated Total
Due from BSP P=− P=88,110 P=− P=− P=88,110Due from other banks 374 8,249 3 20 8,646Interbank loans receivable and SPURA − 10,028 − − 10,028Financial assets at FVPL 3,510 11,580 483 2,871 18,444
P=3,884 P=117,967 P=486 P=2,891 P=125,228
Parent Company 2018High
GradeStandard
GradeSubstandard
Grade Unrated Total
Due from BSP P=− P=95,093 P=− P=− P=95,093Due from other banks 696 7,119 17 7 7,839Interbank loans receivable and SPURA − 7,000 − − 7,000Financial assets at FVPL 1,447 4,100 − 1,143 6,690
P=2,143 P=113,312 P=17 P=1,150 P=116,622

- 56 -
*SGVFS039096*
The following table presents the carrying amount of financial assets of the Group and Parent Companyas of December 31, 2019 and 2018 that would have been considered past due or impaired if notrenegotiated:
Consolidated Parent Company2019 2018 2019 2018
Loans and advances to customersCorporate and commercial lending P=312,787 P=507,921 P=35,673 P=40,029Consumer lending 115,370 110,885 114,185 110,885
Total renegotiated financial assets P=428,157 P=618,806 P=149,858 P=150,914
Impairment assessmentThe Group recognizes a credit loss allowance on a financial asset based on whether it has had asignificant increase in credit risk since initial recognition. Accordingly, the Group categorizes itsfinancial assets into three categories: stage 1 – financial asset that has not had a significant increase incredit risk; stage 2 – financial asset that has had a significant increase in credit risk; and stage 3 –financial asset in default.
Generally, the Group assesses the presence of a significant increase in credit risk based on the numberof notches that a financial asset’s credit risk rating has declined. When applicable, the Group alsoapplies a rebuttable presumption that the credit risk on a financial asset has increased significantlysince initial recognition when contractual payments are more than 30 days past due.
The Group defines a financial instrument as in default, which is fully aligned with the definition ofcredit impaired, in all cases when the borrower becomes at least 90 days past due on its contractualpayments. As a part of a qualitative assessment of whether a customer is in default, the Group alsoconsiders a variety of instances that may indicate unlikeliness to pay. When such events occur, theGroup carefully considers whether the event should result in treating the customer as defaulted. Aninstrument is considered to be no longer in default (i.e., to have cured) when it no longer meets any ofthe default criteria for a consecutive period of 180 days (i.e. consecutive payments from the borrowersfor 180 days).
The criteria for determining whether credit risk has increased significantly vary by portfolio and includequantitative changes in probabilities of default and qualitative factors such as downgrade in the creditrating of the borrowers and a backstop based on delinquency. The credit risk of a particular exposureis deemed to have increased significantly since initial recognition if, based on the Group’s internalcredit assessment, the borrower or counterparty is determined to require close monitoring or with well-defined credit weaknesses. For exposures without internal credit grades, if contractual payments aremore than a specified days past due threshold (i.e. 30 days), the credit risk is deemed to have increasedsignificantly since initial recognition. Days past due are determined by counting the number of dayssince the earliest elapsed due date in respect of which full payment has not been received. In subsequentreporting periods, if the credit risk of the financial instrument improves such that there is no longer aSICR since initial recognition, the Bank shall revert to recognizing a 12-month ECL.
Further, the Group considers a financial asset as in default when (a) as a result of one or more lossevents, there is objective evidence that its recoverable value is less than its carrying amount; (b) it isclassified as doubtful or loss under prudential reporting; (c) it is in litigation; and/or (d) full repaymentof principal and interest is unlikely without foreclosure of collateral, if any. When applicable, theGroup also applies a rebuttable presumption that default does not occur later than when a financial assetis 90 days past due unless the Group has reasonable and supportable information to demonstrate that amore lagging default criterion is more appropriate.

- 57 -
*SGVFS039096*
The Group then measures the credit loss allowance on a financial instrument at an amount equal to 12-month expected credit losses for items categorized as stage 1 and lifetime credit losses to itemscategorized as stage 2 and stage 3.
The Group modeled the following inputs to the expected credit loss formula separately. The formulais applied to each financial asset, with certain exceptions wherein a collective or other general approachis applied:
Exposure at Default (EAD)The Group defines EAD as the principal and interests that would not be collected assuming theborrower’s defaults during a future point in time. The Bank computes for a financial asset’s EAD usingthe expected contractual cash flows during the contractual life of the financial instrument. A financialasset’s EAD is defined as the sum of EAD from principal and EAD from interest.
Probability of default (PD)The Group uses forward-looking PD estimates that are unbiased and probability-weighted using a rangeof possible outcomes. The PD for each individual instrument is modelled based on historical data andis estimated based on current market conditions and reasonable and supportable information aboutfuture economic conditions. The Bank segmented its credit exposures based on homogenous riskcharacteristics and developed a corresponding PD methodology for each portfolio. The PDmethodology for each relevant portfolio is determined based on the underlying nature or characteristicof the portfolio, behavior of the accounts and materiality of the segment as compared to the totalportfolio. The Group’s PDs are mainly categorized into three: (a) corporate; (b) sovereign; and (c)retail.
Loss given default (LGD)The Group’s LGD model considers certain factors such as the historical cash flow recovery andreasonable and supportable information about future economic conditions, where appropriate.Generally, the model utilizes the Bank’s existing loan exposure rating system which is designed tocapture these factors as well as the characteristics of collaterals related to an exposure. In cases whereinthis does not apply, the Group looks into the standard characteristics of collaterals (e.g., car and housingloans) in order to estimate an LGD factor. In the case of exposures without collaterals (e.g., securities),the Group uses internationally-accepted standard LGD factors.
Credit ReviewIn accordance with BSP Circular 855, credit reviews are conducted on loan accounts to evaluatewhether loans are granted in accordance with the Bank’s policies, to assess loan quality andappropriateness of classification and adequacy of loan loss provisioning. Results of credit reviews arepromptly reported to management to apprise them of any significant findings for proper correctiveactions.
Market RiskMarket risk is the risk of loss that may result from changes in the value of a financial product. TheParent Company’s market risk originates from its holdings of domestic and foreign−denominated debtsecurities, foreign exchange instruments, equities, foreign exchange derivatives and interest ratederivatives.
The RMG of the Parent Company is responsible for assisting the ROC with its responsibility foridentifying, measuring, managing and controlling market risk. Market risk management measures theParent Company market risk exposures through the use of VaR. VaR is a statistical measure thatestimates the maximum potential loss from a portfolio over a holding period, within a given confidencelevel.

- 58 -
*SGVFS039096*
VaR assumptionsThe Parent Company calculates the VaR in trading activities. The Parent Company uses the HistoricalSimulation Full Valuation approach to measure VaR for all treasury traded instruments, using a 99.00%confidence level and a 1−day holding period.
The use of a 99.00% confidence level means that, within a one day horizon, losses exceeding the VaRfigure should occur, on average, not more than once every hundred days. The validity of the VaRmodel is verified through back testing, which examines how frequently actual and hypothetical dailylosses exceeds daily VaR. The Parent Company measures and monitors the VaR and profit and loss ona daily basis.
Since VaR is an integral part of the Parent Company’s market risk management, VaR limits have beenestablished for all trading positions and exposures are reviewed daily against the limits by management.Further, stress testing is performed for monitoring extreme events.
Limitations of the VaR MethodologyThe VaR models are designed to measure market risk in a normal market environment using equallyweighted historical data. The use of VaR has limitations because it is based on historical correlationsand volatilities in market prices and assumes that future price movements will follow the samedistribution. Due to the fact that VaR relies heavily on historical data to provide information and maynot clearly predict the future changes and modifications of the risk factors, the probability of largemarket moves may be underestimated if changes in risk factors fail to align with the assumptions. VaRmay also be under− or over−estimated due to the assumptions placed on risk factors and the relationshipbetween such factors for specific instruments. Even though positions may change throughout the day,the VaR only represents the risk of the portfolios at the close of each business day, and it does notaccount for any losses that may occur beyond the 99.00% confidence level.
In practice, the actual trading results will differ from the VaR calculation and, in particular, thecalculation does not provide a meaningful indication of profits and losses in stressed market conditions.To determine the reliability of the VaR models, actual outcomes are monitored regularly to test thevalidity of the assumptions and the parameters used in the VaR calculation. Market risk positions arealso subject to regular stress tests to ensure that the Group would withstand an extreme market event.
A summary of the VaR position of the trading portfolio of the Parent Company is as follows:
Interest Rate1Foreign
Exchange2 Price3 Interest Rate4 Interest Rate5
(In Millions)201931 December P=69.41 P=21.89 P=17.85 P=12.53 P=5.54Average daily 82.81 25.42 23.89 8.75 7.78Highest 134.67 73.41 42.90 14.60 16.15Lowest 44.49 1.84 17.29 3.36 5.22
201831 December P=43.62 P=4.54 P=21.78 P=13.78 P=10.65Average daily 52.11 18.69 30.17 6.35 4.40Highest 121.89 63.74 56.30 13.78 19.03Lowest 21.47 2.53 18.29 3.18 0.60
1 Interest rate VaR for debt securities (Interest rate VaR for foreign currency denominated debt securities are translated to PHP using dailyclosing rate)
2 FX VaR is the bankwide foreign exchange risk3 Price VaR for equity securities and futures4 Interest rate VaR for FX swaps and FX forwards5 Interest rate VaR for IRS

- 59 -
*SGVFS039096*
Interest Rate RiskThe Group’s interest rate risk originates from its holdings of interest rate sensitive assets and interestrate sensitive liabilities. The Parent Company follows prudent policies in managing its exposures tointerest rate fluctuations, and constantly monitors and discusses its exposure in Asset and LiabilityCommittee (ALCO) meetings held every week.
As of December 31, 2019 and 2018, 72.55% and 64.57% of the Group’s total loan portfolio,respectively, comprised of floating rate loans which are repriced periodically by reference to thetransfer pool rate which reflects the Group’s internal cost of funds. In keeping with banking industrypractice, the Group aims to achieve stability and lengthen the term structure of its deposit base, whileproviding adequate liquidity to cover transactional banking requirements of customers.
Interest is paid on demand accounts, which constituted 24.76% and 22.81% of total deposits of theParent Company as of December 31, 2019 and 2018, respectively.
Interest is paid on savings accounts and time deposits accounts, which constitute 30.56% and 44.68%,respectively, of total deposits of the Parent Company as of December 31, 2019, and 35.56% and41.64%, respectively, as of December 31, 2018.
Savings account interest rates are set by reference to prevailing market rates, while interest rates ontime deposits and special savings accounts are usually priced by reference to prevailing rates ofshort-term government bonds and other money market instruments, or, in the case of foreign currencydeposits, inter-bank deposit rates and other benchmark deposit rates in international money marketswith similar maturities.
The Group is likewise exposed to fair value interest rate risk due to its holdings of fixed rate governmentbonds as part of its financial assets at FVOCI and FVTPL portfolios. Market values of theseinvestments are sensitive to fluctuations in interest rates. The following table provides for the averageeffective interest rates of the Group and of the Parent Company as of December 31, 2019 and 2018:
Consolidated Parent Company2019 2018 2019 2018
PesoAssetsDue from BSP 0.29% 0.17% 0.07% 0.06%Due from banks 0.22% 0.26% 0.11% 0.11%Investment securities* 5.47% 4.52% 5.47% 4.36%Loans and receivables 7.09% 7.26% 6.89% 6.18%
LiabilitiesDeposit liabilities 2.63% 1.96% 2.54% 1.71%Bills payable 4.86% 3.59% 4.86% 3.59%Bonds payable 3.02% – 3.02% –
USDAssetsDue from banks 0.99% 0.75% 1.02% 0.61%Investment securities* 3.58% 4.16% 3.56% 3.88%Loans and receivables 4.13% 4.07% 4.07% 3.93%
LiabilitiesDeposit liabilities 1.66% 1.48% 1.66% 1.45%Bills payable 4.99% 2.89% 4.00% 2.86%Bonds payable 1.71% – 1.71% –* Consisting of financial assets at FVPL, Financial assets at FVOCI and Investment securities at amortized cost.

- 60 -
*SGVFS039096*
The repricing gap analysis method is used by the Group to measure the sensitivity of its assets andliabilities to interest rate fluctuations. This analysis measures the Group’s susceptibility to changes ininterest rates. The repricing gap is calculated by first distributing the assets and liabilities contained inthe Group’s balance sheet into tenor buckets according to the time remaining to the next repricing date(or the time remaining to maturity if there is no repricing), and then obtaining the difference betweenthe total of the repricing (interest rate sensitive) assets and the total of repricing (interest rate sensitive)liabilities.
A gap is considered negative when the amount of interest rate sensitive liabilities exceeds the amountof interest rate sensitive assets. A gap is considered positive when the amount of interest rate sensitiveassets exceeds the amount of interest rate sensitive liabilities.
Accordingly, during a period of rising interest rates, a bank with a positive gap would be in a positionto invest in higher yielding assets earlier than it would need to refinance its interest rate sensitiveliabilities. During a period of falling interest rates, a bank with a positive gap would tend to see itsinterest rate sensitive assets repricing earlier than its interest rate sensitive liabilities, restraining thegrowth of its net income or resulting in a decline in net interest income.
The following tables set forth the repricing gap position of the Group and Parent Company as ofDecember 31, 2019 and 2018 (in millions):
Consolidated2019
Up to 3Months
>3 to 12Months
>12Months Total
Financial AssetsDue from BSP P=96,254 P=− P=3,921 P=100,175Due from other banks 9,901 − − 9,901Investment securities 3,815 6,637 202,384 212,836Loans and receivables 257,385 111,758 199,776 568,919Total financial assets 367,355 118,395 406,081 891,831Financial LiabilitiesDeposit liabilities 313,164 37,636 424,628 775,428Bills payable 18,409 14,972 − 33,381Bonds payable − 7,394 30,000 37,394Total financial liabilities 331,573 60,002 454,628 846,203Repricing gap P=35,782 P=58,393 (P=48,547) P=45,628
Consolidated2018
Up to 3Months
>3 to 12Months
>12Months Total
Financial AssetsDue from BSP P=101,890 P=− P=− P=101,890Due from other banks 9,455 − − 9,455Investment securities 12,301 3,432 174,500 190,233Loans and receivables 255,491 38,683 211,634 505,808Total financial assets 379,137 42,115 386,134 807,386Financial LiabilitiesDeposit liabilities 291,698 17,893 412,532 722,123Bills payable 34,505 4,507 815 39,827Total financial liabilities 326,203 22,400 413,347 761,950Repricing gap P=52,934 P=19,715 (P=27,213) P=45,436

- 61 -
*SGVFS039096*
Parent Company2019
Up to 3Months
>3 to 12Months
>12Months Total
Financial AssetsDue from BSP P=88,110 P=– P=– P=88,110Due from other banks 8,646 – – 8,646Investment securities 3,815 4,671 198,360 206,846Loans and receivables 248,190 81,756 172,984 502,930Total financial assets 348,761 86,427 371,344 806,532
Financial LiabilitiesDeposit liabilities 288,787 16,873 382,105 687,765Bills payable 18,409 14,972 – 33,381Bonds payable – 7,394 30,000 37,394Total financial liabilities 307,196 39,239 412,105 758,540Repricing gap P=41,565 P=47,188 (P=40,761) P=47,992
Parent Company2018
Up to 3Months
>3 to 12Months
>12Months Total
Financial AssetsDue from BSP P=95,093 P=– P=– P=95,093Due from other banks 7,838 – – 7,838Investment securities 5,782 3,355 169,588 178,725Loans and receivables 232,067 26,695 182,672 441,434Total financial assets 340,780 30,050 352,260 723,090
Financial LiabilitiesDeposit liabilities 241,100 14,877 382,266 638,243Bills payable 34,505 4,507 815 39,827Total financial liabilities 275,605 19,384 383,081 678,070Repricing gap P=65,175 P=10,666 (P=30,821) P=45,020
The Group monitors its exposure to fluctuations in interest rates by using scenario analysis to estimatethe impact of interest rate movements on its interest income. This is done by modeling the impact tothe Group’s interest income and interest expenses to parallel changes in the interest rate curve in a given12-month period. Interest rate risk exposure is managed through approved limits.
The following tables set forth the estimated change in the Group’s and Parent Company’s annualizednet interest income due to a parallel change in the interest rate curve as of December 31, 2019and 2018:
Consolidated2019
Change in interest rates (in basis points)100bp rise 50bp rise 50bp fall 100bp fall
Change in annualized net interestincome P=796 P=398 (P=398) (P=796)
As a percentage of the Group’s netinterest income for the year endedDecember 31, 2019 2.95% 1.48% (1.48%) (2.95%)

- 62 -
*SGVFS039096*
Consolidated2018
Change in interest rates (in basis points)100bp rise 50bp rise 50bp fall 100bp fall
Change in annualized net interestincome P=645 P=322 (P=322) (P=645)
As a percentage of the Group’s netinterest income for the year endedDecember 31, 2018 2.80% 1.40% (1.40%) (2.80%)
Parent Company2019
Change in interest rates (in basis points)100bp rise 50bp rise 50bp fall 100bp fall
Change in annualized net interestincome P=770 P=385 (P=385) (P=770)
As a percentage of the ParentCompany’s net interest incomefor the year endedDecember 31, 2019 3.25% 1.63%% (1.63%) (3.25%)
Parent Company2018
Change in interest rates (in basis points)100bp rise 50bp rise 50bp fall 100bp fall
Change in annualized net interestincome P=996 P=498 (P=498) (P=996)
As a percentage of the ParentCompany’s net interest incomefor the year endedDecember 31, 2018 4.95% 2.48% (2.48%) (4.95%)
The following tables set forth the estimated change in the Group’s and Parent Company’s incomebefore tax and equity due to a reasonably possible change in the market prices of quoted bonds classifiedunder financial assets at FVPL and financial assets at FVOCI, brought about by movement in theinterest rate curve as of December 31, 2019 and 2018 (in millions):
Consolidated2019
Change in interest rates (in basis points)25bp rise 10bp rise 10bp fall 25bp fall
Change in income before tax (P=183) (P=73) P=73 P=183Change in equity (369) (148) 148 369
Consolidated2018
Change in interest rates (in basis points)25bp rise 10bp rise 10bp fall 25bp fall
Change in income before tax (P=51) (P=20) P=20 P=51Change in equity (113) (45) 45 113

- 63 -
*SGVFS039096*
Parent Company2019
Change in interest rates (in basis points)25bp rise 10bp rise 10bp fall 25bp fall
Change in income before tax (P=183) (P=73) P=73 P=183Change in equity (356) (142) 142 356
Parent Company2018
Change in interest rates (in basis points)25bp rise 10bp rise 10bp fall 25bp fall
Change in income before tax (P=51) (P=20) P=20 P=51Change in equity (103) (41) 41 103
Foreign Currency RiskThe Group’s foreign exchange risk originates from its holdings of foreign currency-denominated assets(foreign exchange assets) and foreign currency-denominated liabilities (foreign exchange liabilities).
Foreign exchange liabilities generally consist of foreign currency-denominated deposits in the Group’sFCDU account made in the Philippines or generated from remittances to the Philippines by personsoverseas who retain for their own benefit or for the benefit of a third party, foreign currency depositaccounts with the Group.
Foreign currency liabilities are generally used to fund the Group’s foreign exchange assets whichgenerally consist of foreign currency-denominated loans and investments in the FCDU. Banks arerequired by the BSP to match the foreign currency-denominated assets with liabilities held in the FCDUthat are denominated in the same foreign currency. In addition, the BSP requires a 30.00% liquidityreserve on all foreign currency-denominated liabilities held in the FCDU.
The Group’s policy is to maintain foreign currency exposure within existing regulations, and withinacceptable risk limits. The Group believes in ensuring its foreign currency is at all times within limitsprescribed for financial institutions who are engaged in the same types of businesses in which the Groupand its subsidiaries are engaged.
The table below summarizes the Group’s and Parent Company’s exposure to foreign exchange risk.Included in the table are the Group’s and Parent Company’s assets and liabilities at carrying amounts(stated in US Dollars), categorized by currency with its PHP equivalent:
Consolidated2019 2018
USDOther
Currencies* Total PHP USDOther
Currencies* Total PHPAssetsCash and other cash items $2,258 2,377 4,635 P=234,704 $2,204 2,095 4,299 P=226,044Due from other banks 118,692 4,983 123,675 6,262,264 42,189 7,705 49,894 2,623,437Financial assets at FVPLFinancial assets at FVOCI
15,396 34,582 49,978 2,530,668 15,98814,640
––
15,98814,640
840,625769,77113,543 2,284 15,827 801,358
Investment securities at amortizedcost 25,838 – 25,838 1,308,285 116,716 – 116,716 6,136,946
Loans and receivables 31,901 39,692 71,593 3,625,127 42,471 12,985 55,456 2,915,835Accrued interest receivable 654 287 941 47,644 1,038 19 1,057 55,562Other assets 1,156 2 1,158 58,661 753 18 771 40,523
$209,438 84,207 293,645 P=14,868,711 $235,999 22,822 258,821 P=13,608,743LiabilitiesDeposit liabilities 64,221 32,506 96,727 4,897,774 66,162 109,191 175,353 9,220,065Bills payables 388,225 62,731 450,956 22,834,146 354,416 57,130 411,546 21,639,069Accrued interest and other expenses 2,227 1 2,228 112,788 1,554 7 1,561 82,090Other liabilities 7,790 793 8,583 434,593 8,710 1,466 10,176 535,013
462,463 96,031 558,494 28,279,301 430,842 167,794 598,636 31,476,237Currency spot (21,103) 103 (21,000) (1,063,314) (6,789) (316) (7,105) (373,621)Currency forwards 284,866 32,397 317,263 16,064,529 185,313 145,250 330,563 17,380,980Net Exposure $10,738 20,676 31,414 P=1,590,625 ($16,319) (38) (16,357) (P=860,135)*Other currencies include EUR, CNY, JPY, GBP, AUD, SGD, CHF, CAD, NZD, AED, HKD.

- 64 -
*SGVFS039096*
Parent Company2019 2018
USDOther
Currencies* Total PHP USDOther
Currencies* Total PHPAssetsCash and other cash items $148 2,377 2,525 P=127,857 $123 2,095 2,218 P=116,611Due from other banks 98,334 4,983 103,317 5,231,428 38,240 7,705 45,945 2,415,755Financial assets at FVPLFinancial assets at FVOCI
15,396 34,582 49,978 2,530,668 15,988–
––
15,988–
840,625–– 2,284 2,284 115,629
Investment securities at amortizedcost – – – – 69,961 – 69,961 3,678,571
Loans and receivables 24,445 39,692 64,137 3,247,606 35,151 12,985 48,136 2,530,985Accrued interest receivable 103 287 390 19,737 75 19 94 4,967Other assets 1,137 2 1,139 57,691 560 18 578 30,411
$139,563 84,207 223,770 P=11,330,616 $160,098 22,822 182,920 P=9,617,925LiabilitiesDeposit liabilities 140 32,506 32,646 1,653,048 402 109,191 109,593 5,762,373Bills payables 388,225 62,731 450,956 22,834,146 354,416 57,130 411,546 21,639,069Accrued interest and other expenses 2,126 1 2,127 107,687 1,433 7 1,440 75,729Other liabilities 7,597 793 8,390 424,785 8,611 1,466 10,077 529,836
398,088 96,031 494,119 25,019,666 364,862 167,794 532,656 28,007,007Currency spot (21,103) 103 (21,000) (1,063,314) (6,789) (316) (7,105) (373,621)Currency forwards 284,866 32,397 317,263 16,064,529 185,313 145,250 330,563 17,380,980Net Exposure $5,238 20,676 25,914 P=1,312,165 ($26,240) (38) (26,278) (P=1,381,723)*Other currencies include EUR, CNY, JPY, GBP, AUD, SGD, CHF, CAD, NZD, AED, HKD.
The following table sets forth, for the period indicated, the impact of the range of reasonably possiblechanges in the US$ exchange rate and other currencies per Philippine peso on the pre-tax income andequity (in millions).
ConsolidatedChange in
ForeignExchange Rate
Sensitivity ofPretax Income
Sensitivity ofEquity
2019USD 2% P=126 P=238Other 1% – 1USD (2%) (126) (238)Other (1%) – (1)
2018USD 2% P=33 P=110Other 1% – –USD (2%) (33) (110)Other (1%) – –
Parent CompanyChange in
ForeignExchange Rate
Sensitivity ofPretax Income
Sensitivity ofEquity
2019USD 2% P=126 P=225Other 1% – 1USD (2%) (126) (225)Other (1%) – (1)
2018USD 2% P=33 P=95Other 1% – –USD (2%) (33) (95)Other (1%) – –

- 65 -
*SGVFS039096*
The impact in pre−tax income and equity is due to the effect of foreign currency behaviour to Philippinepeso.
Equity Price RiskEquity price risk is the risk that the fair values of equities change as a result of movements in both thelevel of equity indices and the value of individual stocks. The non−trading equity price risk exposurearises from the Group’s investment portfolio.
The effect on the Group and Parent Company’s equity as a result of a change in the fair value of equityinstruments held as FVOCI due to a reasonably possible change in equity indices, with all othervariables held constant, is as follows (in millions):
ConsolidatedChange in
equity indexEffect on
Equity2019 +10% P=9.7
−10% (0.3)2018 +10% 6.8
−10% 1.2
Parent CompanyChange in
equity indexEffect on
Equity2019 +10% P=10.0
−10% (2.5)2018 +10% 7.7
−10% 0.2
Liquidity Risk and Funding ManagementLiquidity risk is generally defined as the current and prospective risk to earnings or capital arising fromthe Parent Company’s inability to meet its obligations when they become due without incurringunacceptable losses or costs.
The Parent Company’s liquidity management involves maintaining funding capacity to accommodatefluctuations in asset and liability levels due to changes in the Parent Company’s business operations orunanticipated events created by customer behavior or capital market conditions. The Parent Companyseeks to ensure liquidity through a combination of active management of liabilities, a liquid assetportfolio composed of deposits reserves and high quality securities, the securing of money market lines,and the maintenance of repurchase facilities to address any unexpected liquidity situations.
The tables below show the maturity profile of the Parent Company’s assets and liabilities, based oncontractual undiscounted cash flows (in millions):
December 31, 2019
On demandLess than
1 year 1 to 2 years 2 to 3 years 3 to 5 years TotalFinancial AssetsCash and other cash items P=14,857 P=– P=– P=– P=– P=14,857Due from BSP 88,110 – – – – 88,110Due from other banks 8,646 – – – – 8,646SPURA – 10,028 – – – 10,028Financial assets at FVPL – 1,971 1,795 3,564 15,642 22,972Financial assets at FVOCI – 993 4,517 523 26,443 32,476Loans and receivables – 144,745 25,030 45,970 337,036 552,781
111,613 157,737 31,342 50,057 379,121 729,870(Forward)

- 66 -
*SGVFS039096*
December 31, 2019
On demandLess than
1 year 1 to 2 years 2 to 3 years 3 to 5 years TotalFinancial LiabilitiesDeposit liabilities
Demand P=170,280 P=– P=– P=– P=– P=170,280 Savings 210,191 – – – – 210,191
Time – 308,305 253 6 4 308,568Bills payable – 33,381 – – – 33,381Manager’s checks – 1,536 – – – 1,536Accrued interest and other expenses – 3,600 – – – 3,600Derivative liabilities – 1,036 – – – 1,036Bonds payable – 29,828 – – 7,566 37,394Other liabilities:Lease payable – 543 – 1,899 714 3,156 Accounts payable – 2,179 – – – 2,179
Acceptances payable – 413 – – – 413Due to PDIC – 692 – – – 692
Margin deposits – 6 – – – 6Other credits − dormant – 447 – – – 447
Due to the Treasurer of thePhilippines
– 417 – – – 417
Miscellaneous – 323 – – – 323Total liabilities 380,471 382,706 253 1,905 8,284 773,618Net Position (P=268,858) (P=225,969) P=31,089 P=48,152 P=370,838 (P=43,747)
December 31, 2018
On demandLess than
1 year 1 to 2 years 2 to 3 years 3 to 5 years TotalFinancial AssetsCash and other cash items P=13,705 P=– P=– P=– P=– P=13,705Due from BSP 95,093 – – – – 95,093Due from other banks 7,838 – – – – 7,838SPURA – 8,998 – – – 8,998Financial assets at FVPL – 1,700 378 1,079 4,296 7,453Financial assets at FVOCI – 1,382 389 3,258 4,502 9,531Loans and receivables – 166,040 30,097 45,970 337,036 579,143
P=116,636 P=178,120 P=30,864 P=50,307 P=345,834 P=721,761Financial LiabilitiesDeposit liabilities
Demand 145,560 – – – – 145,560 Savings 226,944 – – – – 226,944
Time – 235,885 4,764 16,552 16,102 273,303Bills payable – 40,108 – – – 40,108Manager’s checks – 2,070 – – – 2,070Accrued interest and other expenses – 3,279 – – – 3,279Derivative liabilities – 455 – – – 455Other liabilities:
Accounts payable – 2,249 – – – 2,249Acceptances payable – 358 – – – 358
Due to PDIC – 628 – – – 628Margin deposits – 3 – – – 3Other credits − dormant – 242 – – – 242
Due to the Treasurer of thePhilippines
– 379 – – – 379
Miscellaneous – 1,922 – – – 1,922Total liabilities P=372,504 P=287,578 P=4,764 P=16,552 P=16,102 P=697,500Net Position (P=255,868) (P=109,458) P=26,100 P=33,755 P=329,732 P=24,261
Liquidity risk is monitored and controlled primarily by a gap analysis of maturities of relevant assetsand liabilities reflected in the MCO report, as well as an analysis of available liquid assets. Instead ofrelying solely on contractual maturities profile, the Parent Company uses Behavioral MCO to capturea going concern view. Furthermore, internal liquidity ratios and monitoring of large fund providershave been set to determine sufficiency of liquid assets over deposit liabilities. The Bank startedmonitoring and reporting to the BSP the Liquidity Coverage Ratio in 2017 and the Net Stable Funding

- 67 -
*SGVFS039096*
Ratio in 2019. Liquidity is managed by the Parent and its subsidiaries on a daily basis, while scenariostress tests and sensitivity analysis are conducted periodically.
7. Due From BSP and Other Banks
Due from BSPThis account consists of:
Consolidated Parent Company2019 2018 2019 2018
Demand deposit account (Note 17) P=92,674,383 P=99,889,758 P=80,609,635 P=93,092,929Special deposit account 7,500,000 2,000,000 7,500,000 2,000,000Others 15 15 15 15
P=100,174,398 P=101,889,773 P=88,109,650 P=95,092,944
Due from Other BanksThis comprises of deposit accounts with:
Consolidated Parent Company2019 2018 2019 2018
Local banks P=3,067,833 P=5,284,825 P=2,224,644 P=4,140,002 Foreign banks 6,832,809 4,170,622 6,420,903 3,697,892
P=9,900,642 P=9,455,447 P=8,645,547 P=7,837,894
Interest Income on Due from BSP and Other Banks
This account consists of:
Consolidated Parent Company2019 2018 2017 2019 2018 2017
Due from BSP P=884,009 P=124,557 P=213,879 P=539,713 P=67,039 P=112,851Due from other banks 229,197 135,818 138,850 162,709 101,994 50,296
P=1,113,206 P=260,375 P=352,729 P=702,422 P=169,033 P=163,147
8. Interbank Loans Receivable and Securities Purchased Under Resale Agreement
Consolidated Parent Company2019 2018 2019 2018
Interbank loans receivable P=4,580,316 P=1,998,040 P=4,580,316 P=1,998,040SPURA 12,456,144 10,000,000 5,447,293 7,000,000
P=17,036,460 P=11,998,040 P=10,027,609 P=8,998,040
Interbank Loans ReceivableAs of December 31, 2019 and 2018, interbank loans receivable consists of short-term foreign currency-denominated loans granted to other banks with annual interest rates ranging from 1.9% to 2.1% and2.2%, respectively.
Securities Purchased Under Resale AgreementThis account represents overnight placements with the BSP where the underlying securities cannot besold or repledged to parties other than the BSP.
In 2019, 2018 and 2017, the interest rates of SPURA equals to 4.00%, 4.75%, and 3.50%, respectively,for the Group and Parent Company.

- 68 -
*SGVFS039096*
9. Trading and Investment Securities
Financial Assets at FVPLThis account consists of:
Consolidated Parent Company2019 2018 2019 2018
Held for trading Government bonds (Note 28) P=8,451,126 P=633,893 P=8,451,126 P=633,893 Treasury notes 2,386,226 838,662 2,386,226 838,662 Treasury bills 1,378,137 1,214,170 1,378,137 1,214,170 Private bonds
Quoted equity shares4,372,734 3,189,063
1,312,6254,372,734 2,282,598
1,312,6251,243,938 1,187,92817,832,161 7,188,413 17,776,151 6,281,948
Derivative assets (Note 25) 667,950 407,848 667,950 407,848Total P=18,500,111 P=7,596,261 P=18,444,101 P=6,689,796
As of December 31, 2019 and 2018, HFT securities include fair value loss of P=22.14 million andP=55.35 million, respectively, for the Group and Parent Company.
Effective interest rates for peso−denominated financial assets at FVPL for both the Group and theParent Company range from 1.41% to 7.26% in 2019 and from 0.06% to 7.11% in 2018. Effectiveinterest rates for foreign currency−denominated financial assets at FVPL for the Group range from0.71% to 5.81% in 2019 and from 0.71% to 6.28% in 2018. Effective interest rates for foreigncurrency−denominated financial assets at FVTPL for the Parent Company range from 0.71% to 5.81%in 2019 and from 0.71% to 6.28% in 2018.
Financial Assets at FVOCIThis account consists of:
Consolidated Parent Company2019 2018 2019 2018
QuotedGovernment bonds (Notes 18 and 28) P=22,540,516 P=9,944,507 P=21,052,633 P=8,141,359Private bonds 2,953,271 35,370 2,512,588 1,676Equities 621,208 103,285 587,043 51,610
26,114,995 10,083,162 24,152,264 8,194,645Unquoted
Equities - net * 18,365 18,365 18,365 18,36518,365 18,365 18,365 18,365
Total P=26,133,360 P=10,101,527 P=24,170,629 P=8,213,010
Unquoted equity securitiesThis account comprises of shares of stocks of various unlisted private corporations. The Group hasdesignated these equity securities as at FVOCI because they will not be sold in the foreseeable future.
Net unrealized gains (losses)Financial assets at FVOCI include fair value gains of P=417.58 million for the Group and ParentCompany as of December 31, 2019 and fair value losses of P=702.51 million for the Group and ParentCompany as of December 31, 2018. The fair value gains or losses are recognized under OCI.Impairment loss on debt financial assets at FVOCI of the Group and the Parent Company amounted toP=18.52 million and P=18.47 million in 2019, respectively and P=9.82 million for the Parent Company in2018.

- 69 -
*SGVFS039096*
Effective interest rates for peso−denominated financial assets at FVOCI for both the Group and ParentCompany range from 3.94% to 6.87% in 2019, from 4.25% to 5.58% in 2018 and 2.95% to 8.92% in2017.
Effective interest rates for foreign currency−denominated financial assets at FVOCI for both the Groupand Parent Company range from 0.83% to 5.65% in 2019, from 2.33% to 8.48% in 2018 and from0.99% to 5.75% in 2017.
Investment Securities at Amortized CostThis account consists of:
Consolidated Parent Company2019 2018 2019 2018
Government bonds (Note 18) P=108,061,363 P=107,986,234 P=105,602,176 P=101,388,184Private bonds 52,381,323 55,122,532 51,112,073 53,291,150
160,442,686 163,108,766 156,714,249 154,679,334Unamortized premium − net 8,848,025 9,803,371 8,600,024 9,360,070Allowance (1,087,983) (375,101) (1,082,690) (214,938)
P=168,202,728 P=172,537,036 P=164,231,583 P=163,824,466
Effective interest rates for peso−denominated investment securities at amortized cost for the Grouprange from 1.06% to 8.92% in 2019, 1.06% to 8.92% in 2018, and from 2.82% to 7.75% in 2017.Effective interest rates for foreign currency−denominated investment securities at amortized cost rangefrom 1.82% to 6.97% in 2019, 0.58% to 7.37% in 2018, and from 8.50% to 8.93% in 2017.
Sale of Investment Securities at Amortized CostThe Group and the Parent Company sold the following investment securities at amortized cost in2019 (figures in P= millions):
Group Parent Company
Reason for selling Carryingamount
Gain onsale
Carryingamount
Gain onsale
An increase in the financial assets’ credit risk due topolitical uncertainty affecting the sovereign issuer’senvironment P=1,169 P=43 P=1,169 P=43
A change in the funding profile of the Parent Company 10,445 1,156 10,445 1,156A potential breach in the regulatory or internal limits of
the Group and the Parent Company 6,275 168 982 86A highly probable change in regulations with a
potentially adverse impact to the financial assets’contractual cash flows 729 14 729 14
Total P=18,618 P=1,381 P=13,325 P=1,299
These disposals in the investment securities at amortized cost are consistent with the portfolios’business models with respect to the conditions and reasons for which the disposals were made asdiscussed above (see Note 3).
Interest Income on Investment SecuritiesThis account consists of:
Consolidated Parent Company2019 2018 2017 2019 2018 2017
Financial assets at FVOCI P=665,379 P=596,864 P=– P=600,160 P=525,774 P=–AFS financial assets – – 1,309,755 – – 1,176,831Investment securities at
amortized cost 9,162,697 5,279,064 – 8,762,267 5,034,083 –HTM financial assets – – 2,246,355 – – 2,098,194
P=9,828,076 P=5,875,928 P=3,556,110 P=9,362,427 P=5,559,857 P=3,275,025
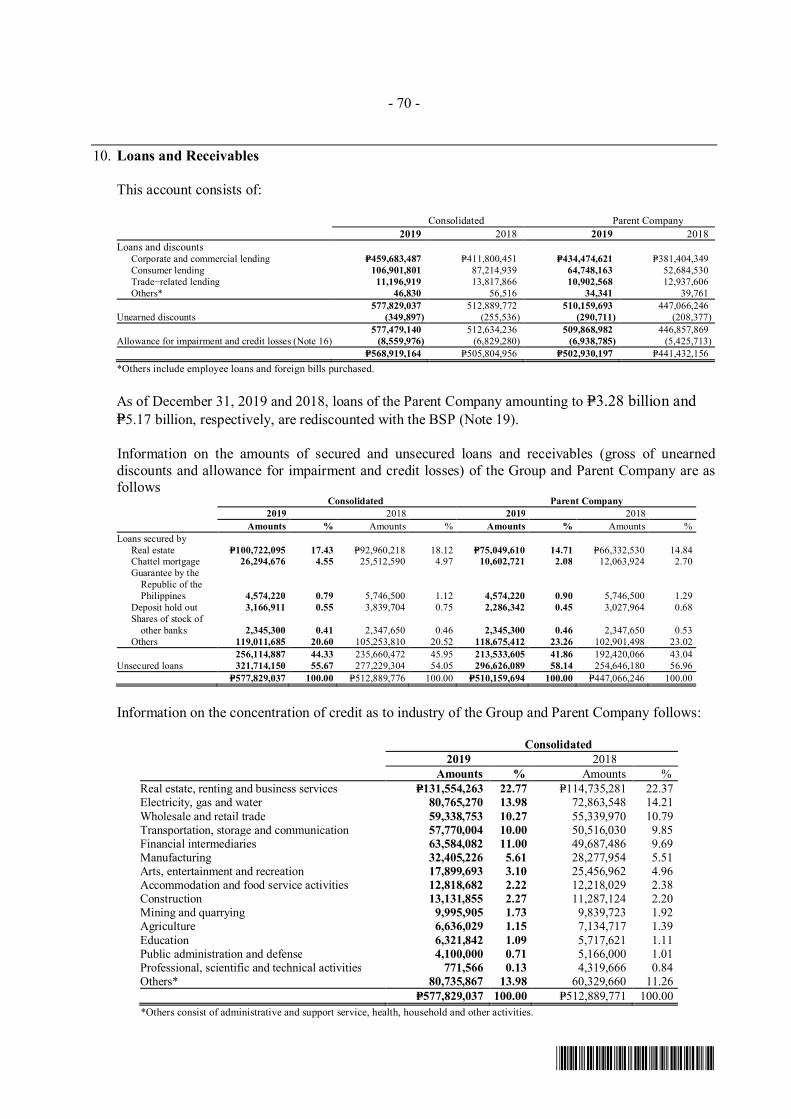
- 70 -
*SGVFS039096*
10. Loans and Receivables
This account consists of:
Consolidated Parent Company2019 2018 2019 2018
Loans and discounts Corporate and commercial lending P=459,683,487 P=411,800,451 P=434,474,621 P=381,404,349 Consumer lending 106,901,801 87,214,939 64,748,163 52,684,530
Trade−related lending 11,196,919 13,817,866 10,902,568 12,937,606 Others* 46,830 56,516 34,341 39,761
577,829,037 512,889,772 510,159,693 447,066,246Unearned discounts (349,897) (255,536) (290,711) (208,377)
577,479,140 512,634,236 509,868,982 446,857,869Allowance for impairment and credit losses (Note 16) (8,559,976) (6,829,280) (6,938,785) (5,425,713)
P=568,919,164 P=505,804,956 P=502,930,197 P=441,432,156*Others include employee loans and foreign bills purchased.
As of December 31, 2019 and 2018, loans of the Parent Company amounting to P=3.28 billion andP=5.17 billion, respectively, are rediscounted with the BSP (Note 19).
Information on the amounts of secured and unsecured loans and receivables (gross of unearneddiscounts and allowance for impairment and credit losses) of the Group and Parent Company are asfollows
Consolidated Parent Company2019 2018 2019 2018
Amounts % Amounts % Amounts % Amounts %Loans secured by Real estate P=100,722,095 17.43 P=92,960,218 18.12 P=75,049,610 14.71 P=66,332,530 14.84 Chattel mortgage 26,294,676 4.55 25,512,590 4.97 10,602,721 2.08 12,063,924 2.70 Guarantee by the
Republic of the Philippines 4,574,220 0.79 5,746,500 1.12 4,574,220 0.90 5,746,500 1.29
Deposit hold out 3,166,911 0.55 3,839,704 0.75 2,286,342 0.45 3,027,964 0.68 Shares of stock of
other banks 2,345,300 0.41 2,347,650 0.46 2,345,300 0.46 2,347,650 0.53 Others 119,011,685 20.60 105,253,810 20.52 118,675,412 23.26 102,901,498 23.02
256,114,887 44.33 235,660,472 45.95 213,533,605 41.86 192,420,066 43.04Unsecured loans 321,714,150 55.67 277,229,304 54.05 296,626,089 58.14 254,646,180 56.96
P=577,829,037 100.00 P=512,889,776 100.00 P=510,159,694 100.00 P=447,066,246 100.00
Information on the concentration of credit as to industry of the Group and Parent Company follows:
Consolidated2019 2018
Amounts % Amounts %Real estate, renting and business services P=131,554,263 22.77 P=114,735,281 22.37Electricity, gas and water 80,765,270 13.98 72,863,548 14.21Wholesale and retail trade 59,338,753 10.27 55,339,970 10.79Transportation, storage and communication 57,770,004 10.00 50,516,030 9.85Financial intermediaries 63,584,082 11.00 49,687,486 9.69Manufacturing 32,405,226 5.61 28,277,954 5.51Arts, entertainment and recreation 17,899,693 3.10 25,456,962 4.96Accommodation and food service activities 12,818,682 2.22 12,218,029 2.38Construction 13,131,855 2.27 11,287,124 2.20Mining and quarrying 9,995,905 1.73 9,839,723 1.92Agriculture 6,636,029 1.15 7,134,717 1.39Education 6,321,842 1.09 5,717,621 1.11Public administration and defense 4,100,000 0.71 5,166,000 1.01Professional, scientific and technical activities 771,566 0.13 4,319,666 0.84Others* 80,735,867 13.98 60,329,660 11.26
P=577,829,037 100.00 P=512,889,771 100.00*Others consist of administrative and support service, health, household and other activities.

- 71 -
*SGVFS039096*
Parent Company2019 2018
Amounts % Amounts %Real estate, renting and business services P=108,067,826 21.18 P=90,654,316 20.28Electricity, gas and water 78,802,898 15.45 70,798,136 11.04Financial intermediaries 62,178,902 12.19 48,096,511 10.76Wholesale and retail trade 55,222,983 10.82 49,365,453 11.04Transportation, storage and communication 55,429,738 10.86 47,756,466 10.68Manufacturing 29,757,318 5.83 25,115,956 5.62Arts, entertainment and recreation 17,799,562 3.49 25,318,150 5.66Accommodation and food service activities 11,591,121 2.27 10,563,067 2.36Construction 11,985,485 2.35 9,965,323 2.23Mining and quarrying 9,991,633 1.96 9,835,453 2.20Agriculture 5,076,970 1.00 5,321,124 1.19Public administration and defense 4,100,000 0.80 5,166,000 1.16Education 5,667,447 1.11 4,872,451 1.09Professional, scientific and technical activities 685,031 0.13 4,221,842 0.94Others* 53,806,348 10.55 40,015,998 8.95
P=510,163,262 100.00 P=447,066,246 100.00*Others consist of administrative and support service, health, household and other activities.
As of December 31, 2019 and 2018, the Parent Company does not have credit concentration in anyparticular industry.
Interest Income on Loans and ReceivablesThis account consists of:
Consolidated Parent Company2019 2018 2017 2019 2018 2017
Receivables from customers P=36,051,051 P=28,195,915 P=21,663,571 P=30,824,138 P=23,488,872 P=17,455,018Unquoted debt securities – – 88,076 – – 81,999
P=36,051,051 P=28,195,915 P=21,751,647 P=30,824,138 P=23,488,872 P=17,537,017
As of December 31, 2019 and 2018, 72.55% and 67.40%, respectively, of the total receivables fromcustomers of the Group were subject to interest repricing. As of December 31, 2019 and 2018, 75.54%and 71.76%, respectively, of the total receivables from customers of the Parent Company were subjectto interest repricing. Remaining receivables carry annual fixed interest rates ranging from 1.66% to10.50% in 2019, from 1.65% to 10.50% in 2018, and from 2.08% to 10.50% in 2017 for foreigncurrency−denominated receivables and from 0.95% to 30.00% in 2019 and from 0.95% to 30.00% in2018, and from 0.95% to 30.00% in 2017 for peso−denominated receivables.
11. Equity Investments
This account consists of investments in:
A. Subsidiaries2019 2018
Equity Method:Balance at beginning of the year
CBSI P=12,117,074 P=11,618,713CBCC 1,846,455 1,512,899CBC−PCCI 42,739 27,905
CIBI 327,299 401,21514,333,567 13,560,732
(Forward)

- 72 -
*SGVFS039096*
2019 2018Share in net income
CBSI P=345,165 P=328,663CBCC 350,421 358,796CBC−PCCI 18,061 14,834CIBI 56,981 (6,938)
770,628 695,355Share in Other Comprehensive IncomeItems that recycle to profit or loss in subsequent periods:
Net unrealized gain (loss) on FVOCICBSI 143,236 (25,338)CBCC 34,527 (27,584)CIBI 12,732 (16,978)
190,495 (69,900)Cumulative translation adjustments
CBSI 17,015 5,79117,015 5,791
Items that do not recycle to profit or loss in subsequentperiods:
Remeasurement gain on defined benefit assetsCBSI (66,609) 86,299CBCC 5,499 2,344
CIBI 4,758 – (56,352) 88,643
Realized loss on sale of equity securities at FVOCI (76,597) (397,055) (76,597) (397,055)
Additional Investments CBSI 363 500,000
363 500,000Cash Dividends
CBSI – 86,299 CIBI (50,000) (50,000)
(50,000) 36,299Balance at end of the year
CBSI 12,479,647 12,117,074CBCC 2,236,902 1,846,455CBC−PCCI 60,800 42,739CIBI 351,769 327,299
P=15,129,118 P=14,333,567
B. Associates:
2019 2018Equity Method:Balance at beginning of the year P=335,092 P=329,422Share in net income 184,661 101,009Share in OCI:Items that do not recycle to profit or loss in subsequent periods
Remeasurement gain (loss) on life insurance reserves (11,021) 31,374Items that recycle to profit or loss in subsequent periods:
Net unrealized gain (loss) on FVOCI 152,452 (126,713)Remeasurement on defined benefit plan 2,985 –
Additional investments 40,000 –Balance at end of the year P=704,169 P=335,092

- 73 -
*SGVFS039096*
CBSICost of investment includes the original amount incurred by the Parent Company from its acquisitionofCBSI in 2007 amounting to P=1.07 billion. The capital infusion to CBSI in 2018 amounting toP=500 million was approved by the Parent Company’s BOD on June 6, 2018.
Merger of CBSI with PDBThe BOD of both CBSI and PDB, in their meeting held on June 26, 2014, approved the proposed mergerof PDB with CBSI, with the latter as the surviving bank. On November 6, 2015, the BSP issued theCertificate of Authority on the Articles of Merger and the Plan of Merger, as amended, of CBSI andPDB. On December 17, 2015, CBSI obtained SEC’s approval of its merger with PDB, whereby theentire assets and liabilities of PDB shall be transferred to and absorbed by CBSI.
Acquisition of PDBIn 2014, the Parent Company made tender offers to non−controlling stockholders of PDB. As ofDecember 31, 2014, the Parent Company owns 99.85% and 100.00% of PDB’s outstanding commonand preferred stocks, respectively.
As of December 31, 2014, the Parent Company’s cost of investment in PDB consists of:
Acquisition of majority of PDB’s capital stock P=1,421,346Additional capital infusion 1,300,000Tender offers 255,354
P=2,976,700
On March 31, 2015, the Parent Company made additional capital infusion to PDB amounting toP=1.70 billion. Of the total cost of investment, the consideration transferred for the acquisition of PDBfollows:
Acquisition of majority of PDB’s capital stock P=1,421,346Tender offers 255,354
P=1,676,700
In 2015, the MB of the BSP granted to the Group investment and merger incentives in the form ofwaiver of special licensing fees for 67 additional branch licenses in restricted areas. This is in additionto the initial investment and merger incentives of 30 new branches in restricted areas and 35 branchesto be transferred from unrestricted to restricted areas granted to the Parent Company by the MB in 2014.These branch licenses were granted under the Strengthening Program for Rural Bank (SPRB) PlusFramework.
The branch licenses have the following fair values:
114 Commercial Bank branch licenses P=2,280,00018 Thrift Bank branch licenses 270,000
2,550,000Deferred tax liability 765,000
P=1,785,000
On April 6, 2016, the Parent Company’s BOD has approved the allocation of the 67 additional branchlicenses in restricted areas as follows: 49 to the Parent Company and 18 to CBSI. Pursuant to amemorandum dated March 18, 2017, the 67 branch licenses were awarded as incentives by theMonetary Board as a result of the Parent Company’s acquisition of PDB. Goodwill from acquisition ofPDB is computed as follows:

- 74 -
*SGVFS039096*
Consideration transferred P=1,676,700Less: Fair value of identifiable assets and liabilities
acquired (Note 15)Net liabilities of PDB (P=725,207)Branch licenses, net of deferred tax liability
(Note 13) 1,785,000 1,059,793P=616,907
CIBIOn October 16, 2019, the BOD declared and approved cash dividend of P=50 million forstockholders on record as of declaration date, payable on December 19, 2019.
On December 7, 2018, the BOD of CIBI approved the declaration of the cash dividends of P=50 millionfrom the CIBI’s unrestricted retained earnings for Stockholders on record as of December 15, 2018 andpayable on December 26, 2018.
CBCCOn April 1, 2015, the BOD approved the investment of the Parent Company in an investment housesubsidiary, CBCC, up to the amount of P=500.00 million, subject to the requirements of relevantregulatory agencies. On April 30, 2015, the BSP approved the request of the Parent Company to investup to 100% or up to P=500.00 million common shares in CBCC, subject to certain conditions. OnNovember 27, 2015, the SEC approved the Articles of Incorporation and By−Laws of CBCC. It alsogranted CBCC the license to operate as an investment house. Actual capital infusion to CBCCamounted to P=200.00 million and P=300.00 million in 2016 capital stock of CBCC from P=500.00 millionto P=2.00 billion to enable CBCC to handle bigger and 2015, respectively.
On January 19, 2017, the BOD of CBCC approved the increase in authorized deals. The approval wasratified by the BOD of the Parent Company on February 1, 2017. On April 27, 2017, the ParentCompany paid CBCC P=500.00 million for additional subscription of 50,000,000 shares.
CBCC acquisition of CBCSec (formerly ATC Securities, Inc.)On May 19, 2016, the BOD of CBCC approved the acquisition of ATC Securities, Inc. (ATC).
On June 29, 2016, CBCC and the shareholders of ATC (the Original Shareholders) entered into anAgreement for the Purchase of Shares (Agreement), whereby CBCC agreed to buy, and the OriginalShareholders agreed to sell, 3,800,000 shares representing 100% of the issued and outstanding sharesof ATC.
On July 6, 2017, the SEC approved the change of name from ATC Securities, Inc. to China BankSecurities Corporation.
CBC Assets One (SPC) Inc.CBC Assets One (SPC) Inc. was incorporated on June 15, 2016 as a wholly−owned special purposecompany of CBCC for asset−backed securitization. It has not yet commenced commercial operations.
Investment in AssociatesInvestment in associates in the consolidated and Parent Company’s financial statements pertain toinvestment in MCB Life and CBC−PCCI’s investment in Urban Shelters (accounted for by CBC−PCCIin its financial statements as an investment in an associate). Investment in Urban Shelters is carried atnil amount as of December 31, 2019 and 2018.
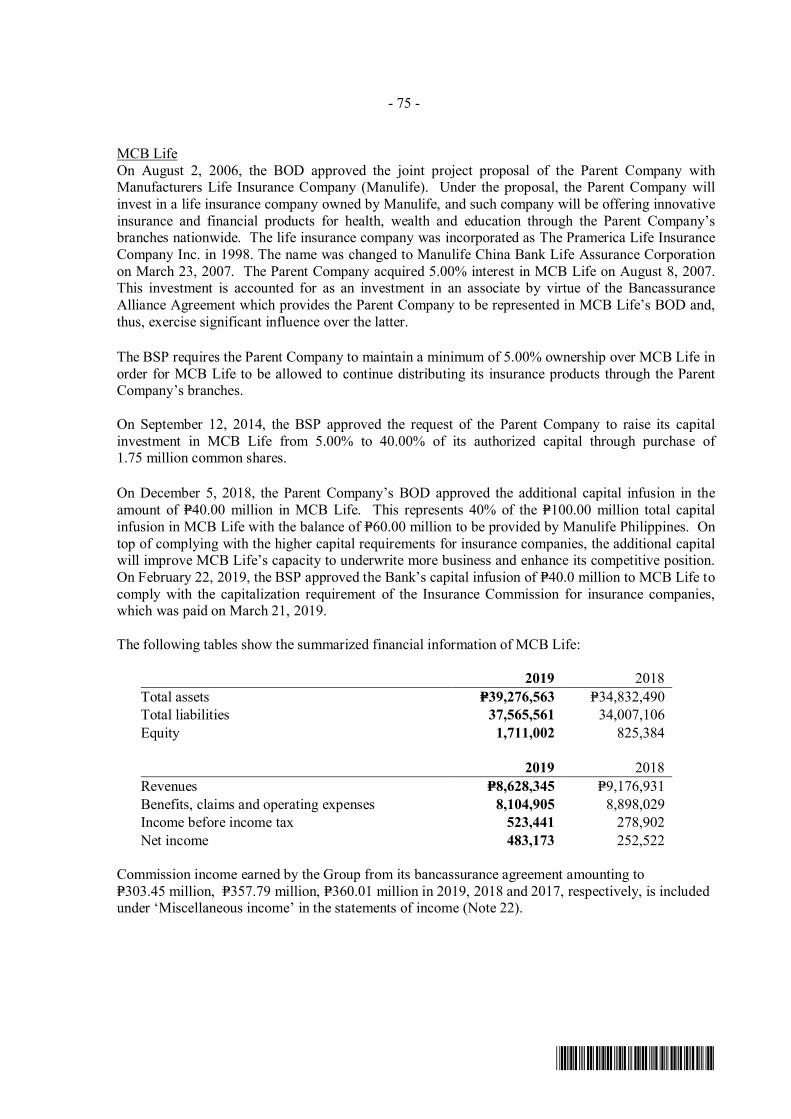
- 75 -
*SGVFS039096*
MCB LifeOn August 2, 2006, the BOD approved the joint project proposal of the Parent Company withManufacturers Life Insurance Company (Manulife). Under the proposal, the Parent Company willinvest in a life insurance company owned by Manulife, and such company will be offering innovativeinsurance and financial products for health, wealth and education through the Parent Company’sbranches nationwide. The life insurance company was incorporated as The Pramerica Life InsuranceCompany Inc. in 1998. The name was changed to Manulife China Bank Life Assurance Corporationon March 23, 2007. The Parent Company acquired 5.00% interest in MCB Life on August 8, 2007.This investment is accounted for as an investment in an associate by virtue of the BancassuranceAlliance Agreement which provides the Parent Company to be represented in MCB Life’s BOD and,thus, exercise significant influence over the latter.
The BSP requires the Parent Company to maintain a minimum of 5.00% ownership over MCB Life inorder for MCB Life to be allowed to continue distributing its insurance products through the ParentCompany’s branches.
On September 12, 2014, the BSP approved the request of the Parent Company to raise its capitalinvestment in MCB Life from 5.00% to 40.00% of its authorized capital through purchase of1.75 million common shares.
On December 5, 2018, the Parent Company’s BOD approved the additional capital infusion in theamount of P=40.00 million in MCB Life. This represents 40% of the P=100.00 million total capitalinfusion in MCB Life with the balance of P=60.00 million to be provided by Manulife Philippines. Ontop of complying with the higher capital requirements for insurance companies, the additional capitalwill improve MCB Life’s capacity to underwrite more business and enhance its competitive position.On February 22, 2019, the BSP approved the Bank’s capital infusion of P=40.0 million to MCB Life tocomply with the capitalization requirement of the Insurance Commission for insurance companies,which was paid on March 21, 2019.
The following tables show the summarized financial information of MCB Life:
2019 2018Total assets P=39,276,563 P=34,832,490Total liabilities 37,565,561 34,007,106Equity 1,711,002 825,384
2019 2018Revenues P=8,628,345 P=9,176,931Benefits, claims and operating expenses 8,104,905 8,898,029Income before income tax 523,441 278,902Net income 483,173 252,522
Commission income earned by the Group from its bancassurance agreement amounting toP=303.45 million, P=357.79 million, P=360.01 million in 2019, 2018 and 2017, respectively, is includedunder ‘Miscellaneous income’ in the statements of income (Note 22).

- 76 -
*SGVFS039096*
12. Bank Premises, Furniture, Fixtures and Equipment and Right-of-use Assets
The composition of and movements in this account follow:
Consolidated
Land(Note 23)
Furniture,Fixtures and
Equipment BuildingsLeasehold
ImprovementsConstruction−
in−Progress
Right-of-use AssetsLand
(Note 2)
Right-of-useAssets Bldg.
(Note 2)2019
TotalCostBalance at beginning of year P=3,218,263 P=7,909,078 P=1,789,412 P=2,189,884 P=24,727 P=181,451 P=3,260,478 P=18,573,293Additions – 388,704 95,138 108,863 82,649 – 247,311 922,665Disposals/transfers (Note 14)* 18,732 (1,315,540) 77,268 27,824 (47,937) – (1,396) (1,241,049)Balance at end of year 3,236,995 6,982,242 1,961,818 2,326,571 59,439 181,451 3,506,393 18,254,909Accumulated Depreciation
and AmortizationBalance at beginning of year – 6,360,109 1,063,973 1,256,824 – – – 8,680,906Depreciation and amortization – 581,985 108,578 233,081 – 13,556 657,228 1,594,428Disposals/transfers (Note 14)* – (1,139,495) (14,911) (22,304) – – 1,052 (1,175,658)Balance at end of year – 5,802,599 1,157,640 1,467,601 – 13,556 658,280 9,099,676Net Book Value at End of Year P=3,236,995 P=1,179,643 P=804,179 P=858,970 P=59,439 P=167,895 P=2,848,113 P=9,155,233*Includes transfers from investment properties amounting to P=28.90 million.
Consolidated
Land(Note 23)
Furniture,Fixtures and
Equipment BuildingsLeasehold
ImprovementsConstruction−
in−Progress2018Total
CostBalance at beginning of year P=`3,345,404 P=7,893,528 P=1,941,742 P=1,855,565 P=61,489 P=15,097,728Additions 631,734 23,978 315,486 86,804 1,058,002Disposals/transfers* (127,141) (616,184) (176,307) 18,832 (123,565) (1,024,365)Balance at end of year 3,218,263 7,909,078 1,789,413 2,189,883 24,728 15,131,365Accumulated Depreciation and AmortizationBalance at beginning of year − 6,079,049 1,103,650 1,038,017 − 8,220,716Depreciation and amortization − 704,124 94,836 211,907 − 1,010,867Disposals/transfers* − (423,065) (134,512) 6,901 − (550,676)Balance at end of year − 6,360,108 1,063,974 1,256,825 − 8,680,907Allowance for Impairment Losses (Note 16)Balance at beginning of year − − 1,148 − − 1,148Reclassification − − (1,148) − − (1,148)Balance at end of year − − − − − −Net Book Value at End of Year P=3,218,263 P=1,548,970 P=725,439 P=933,058 P=24,728 P=6,450,458*Includes transfers from investment properties amounting to P= 20.13 million.
Parent Company
Land(Note 23)
Furniture,Fixtures and
Equipment BuildingsLeasehold
ImprovementsConstruction−
in−Progress
Right-of-useAssets Land
(Note 2)
Right-of-useAssets Bldg.
(Note 2)2019
TotalCostBalance at beginning of year P=2,786,310 P=6,628,787 P=1,104,030 P=1,536,024 P=24,727 P=181,451 P=2,544,985 P=14,806,314Additions - 292,340 90,988 80,222 42,494 – 185,549 691,593Disposals/transfers (Note 14)* 103,395 (1,256,060) 40,672 26,633 (47,851) – – (1,133,211)Balance at end of year 2,889,705 5,665,067 1,235,690 1,642,879 19,370 181,451 2,730,534 14,364,696Accumulated Depreciation
and AmortizationBalance at beginning of year – 5,381,253 580,504 852,735 – – – 6,814,492Depreciation and amortization – 455,240 61,486 165,524 – 13,556 491,975 1,187,781Disposals/transfers (Note 14)* – (1,087,258) 3,610 (22,573) – – – (1,106,221)Balance at end of year – 4,749,235 645,600 995,686 – 13,556 491,975 6,896,052Net Book Value at End of Year P=2,889,705 P=915,832 P=590,090 P=647,193 P=19,370 P=167,895 P=2,238,559 P=7,468,644*Includes transfers from investment properties amounting to P=28.90 million
Parent Company
Land(Note 23)
Furniture,Fixtures and
Equipment BuildingsLeasehold
ImprovementsConstruction−
in−Progress2018Total
CostBalance at beginning of year P=2,786,310 P=6,668,301 P=1,085,668 P=1,351,869 P=61,486 P=11,953,634Additions − 498,101 16,235 223,957 86,804 825,097Disposals/transfers* − (537,615) 2,127 (39,802) (123,565) (698,855)Balance at end of year 2,786,310 6,628,787 1,104,030 1,536,024 24,725 12,079,876Accumulated Depreciation
and AmortizationBalance at beginning of year − 5,189,416 543,875 755,761 − 6,489,052Depreciation and amortization − 557,586 36,010 148,934 − 742,530Disposals/transfers* − (365,749) 618 (51,961) − (417,092)Balance at end of year − 5,381,253 580,503 852,734 − 6,814,490Net Book Value at End of Year P=2,786,310 P=1,247,534 P=523,527 P=683,290 P=24,725 P=5,265,386*Includes transfers from investment properties amounting to P=20.13 million.
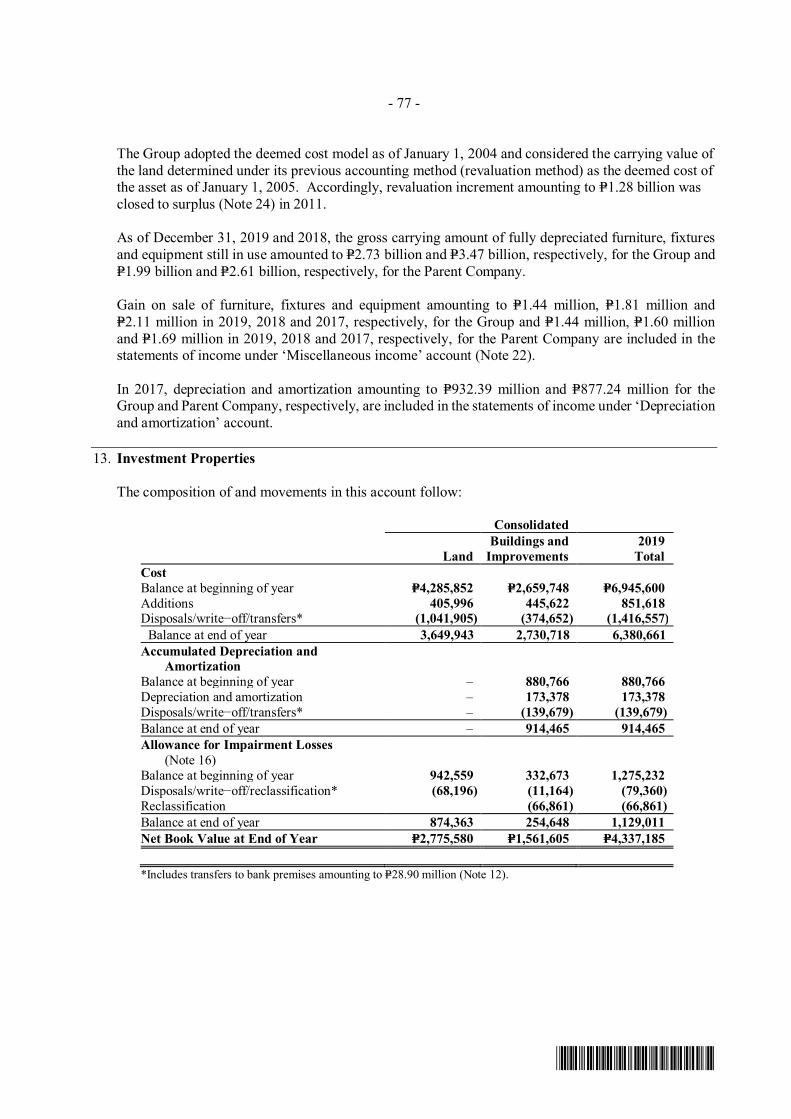
- 77 -
*SGVFS039096*
The Group adopted the deemed cost model as of January 1, 2004 and considered the carrying value ofthe land determined under its previous accounting method (revaluation method) as the deemed cost ofthe asset as of January 1, 2005. Accordingly, revaluation increment amounting to P=1.28 billion wasclosed to surplus (Note 24) in 2011.
As of December 31, 2019 and 2018, the gross carrying amount of fully depreciated furniture, fixturesand equipment still in use amounted to P=2.73 billion and P=3.47 billion, respectively, for the Group andP=1.99 billion and P=2.61 billion, respectively, for the Parent Company.
Gain on sale of furniture, fixtures and equipment amounting to P=1.44 million, P=1.81 million andP=2.11 million in 2019, 2018 and 2017, respectively, for the Group and P=1.44 million, P=1.60 millionand P=1.69 million in 2019, 2018 and 2017, respectively, for the Parent Company are included in thestatements of income under ‘Miscellaneous income’ account (Note 22).
In 2017, depreciation and amortization amounting to P=932.39 million and P=877.24 million for theGroup and Parent Company, respectively, are included in the statements of income under ‘Depreciationand amortization’ account.
13. Investment Properties
The composition of and movements in this account follow:
Consolidated
LandBuildings and
Improvements2019
TotalCostBalance at beginning of year P=4,285,852 P=2,659,748 P=6,945,600Additions 405,996 445,622 851,618Disposals/write−off/transfers* (1,041,905) (374,652) (1,416,557)
Balance at end of year 3,649,943 2,730,718 6,380,661Accumulated Depreciation and
AmortizationBalance at beginning of year – 880,766 880,766Depreciation and amortization – 173,378 173,378Disposals/write−off/transfers* – (139,679) (139,679)Balance at end of year – 914,465 914,465Allowance for Impairment Losses
(Note 16)Balance at beginning of year 942,559 332,673 1,275,232Disposals/write−off/reclassification* (68,196) (11,164) (79,360)Reclassification (66,861) (66,861)Balance at end of year 874,363 254,648 1,129,011Net Book Value at End of Year P=2,775,580 P=1,561,605 P=4,337,185
*Includes transfers to bank premises amounting to P=28.90 million (Note 12).

- 78 -
*SGVFS039096*
Consolidated
LandBuildings andImprovements
2018Total
CostBalance at beginning of year P=4,605,061 P=2,646,549 P=7,251,610Additions 135,099 408,334 543,433Disposals/write−off/transfers* (454,309) (395,136) (849,445)Balance at end of year 4,285,851 2,659,747 6,945,598Accumulated Depreciation and
AmortizationBalance at beginning of year – 742,071 742,071Depreciation and amortization – 170,978 170,978Disposals/write−off/transfers* – (32,285) (32,285)Balance at end of year – 880,764 880,764Allowance for Impairment Losses
(Note 16)Balance at beginning of year 1,028,013 409,370 1,437,383Disposals/write−off/reclassification* (85,454) (76,697) (162,151)Balance at end of year P=942,559 P=332,673 P=1,275,232Net Book Value at End of Year P=3,343,292 P=1,446,310 P=4,789,602*Includes transfers to bank premises amounting to P=20.13 million (Note 12).
Parent Company
LandBuildings and
Improvements2019
TotalCostBalance at beginning of year P=1,420,279 P=1,329,938 P=2,750,217Additions 174,610 315,738 490,348Disposals/write−off/transfers* (66,810) (106,911) (173,721)Balance at end of year 1,528,079 1,538,765 3,066,844Accumulated Depreciation and
AmortizationBalance at beginning of year – 440,455 440,455Depreciation and amortization – 101,933 101,933Disposals/write−off/transfers* – (87,046) (87,046)Balance at end of year – 455,342 455,342Allowance for Impairment Losses
(Note 16)Balance at beginning and end of year 919,276 201,689 1,120,965Disposals/write−off/reclassification* (6,450) – (6,450)Balance at end of year 912,826 201,689 1,114,515
Net Book Value at End of Year P=615,253 P=881,734 P=1,496,987*Includes transfers to bank premises amounting to P=28.90 (Note 12).

- 79 -
*SGVFS039096*
Parent Company
LandBuildings andImprovements
2018Total
CostBalance at beginning of year P=1,859,355 P=1,397,668 P=3,257,023Additions 135,099 125,671 260,770Disposals/write−off/transfers* (574,177) (193,400) (767,577)Balance at end of year 1,420,277 1,329,939 2,750,216Accumulated Depreciation and
AmortizationBalance at beginning of year – 500,102 500,102Depreciation and amortization – 89,928 89,928Disposals/write−off/transfers* – (149,575) (149,575)Balance at end of year – 440,455 440,455Allowance for Impairment Losses
(Note 16)Balance at beginning and end of year 1,004,729 201,689 1,206,418Disposals/write−off/reclassification* (85,454) – (85,454)Balance at end of year 919,275 201,689 1,120,964Net Book Value at End of Year P=501,002 P=687,795 P=1,188,797*Includes transfers to bank premises amounting to P=20.13 million (Note 12).
The Group’s investment properties consist entirely of real estate properties acquired in settlement ofloans and receivables. The difference between the fair value of the investment property uponforeclosure and the carrying value of the loan is recognized under ‘Gain on asset foreclosure anddacion transactions’ in the statements of income.
In 2017, depreciation and amortization amounting to P=191.34 million and P=104.64 million for theGroup and Parent Company, respectively, are included in the statements of income under ‘Depreciationand amortization’ account.
In 2019, expense relating to short-term leases amounting to P=523.71 million and P=388.83 million forthe Group and Parent Company, respectively, are included in the ‘Occupancy cost’ account. Total cashoutflows for leases amount to P=1.51 billion and P=1.18 billion for the Group and Parent Company,respectively.
Details of rental income earned and direct operating expenses incurred on investment properties follow:
Consolidated2019 2018 2017
Rent income on investment properties P=38,288 P=35,323 P=32,499Direct operating expenses on investment
properties generating rent income 12,952 1,451 924Direct operating expenses on investment
properties not generating rent income 55,424 66,011 52,029
Parent Company2019 2018 2017
Rent income on investment properties P=8,460 P=10,994 P=8,250Direct operating expenses on investment
properties generating rent income 12,150 649 799Direct operating expenses on investment
properties not generating rent income 20,503 29,584 33,405

- 80 -
*SGVFS039096*
Rent income earned from leasing out investment properties is included under ‘Miscellaneous income’in the statements of income (Note 22).
On August 26, 2011, the Parent Company was registered as an Economic Zone Information Technology(IT) Facilities Enterprise with the Philippine Economic Zone Authority (PEZA) to operate and maintaina proposed 17−storey building located inside the CBP−IT Park in Barangays Mabolo, Luz, Hipodromo,Carreta, and Kamputhaw, Cebu City, for lease to PEZA−registered IT enterprises, and to be known asChinabank Corporate Center. This registration is under PEZA Registration Certificate No. 11−03−F.
Under this registration, the Parent Company is entitled to five percent (5.00%) final tax on gross incomeearned from locator IT enterprises and related operations in accordance with existing PEZA rules. TheParent Company shall also be exempted from the payment of all national and local taxes in relation tothis registered activity.
14. Goodwill and Intangible Assets
GoodwillGoodwill represents the excess of the acquisition costs over the fair value of the identifiable assets andliabilities of companies acquired by the Group.
The Group attributed the goodwill arising from its acquisition of CBSI and PDB to factors such asincrease in geographical presence and customer base due to the branches acquired. None of thegoodwill recognized is expected to be deductible for income tax purposes. CBSI as surviving entityfrom the merger with PDB, is the identified CGU for this goodwill. The Parent Company’s RetailBanking Business (RBB) has been identified as the CGU for impairment testing of the goodwill fromits acquisition of CBSI.
As of December 31, 2019 and 2018, amount of goodwill per CGU follows:
Consolidated Parent CompanyRBB P=222,841 P=222,841CBSI 616,907 –Total P=839,748 P=222,841
The recoverable amount of the CGUs have been determined based on a value−in−use calculation usingcash flow projections from financial budgets approved by senior management covering a five−yearperiod, which do not include restructuring activities that the Group is not yet committed to or significantfuture investments that will enhance the asset base of the CGU being tested. Other than loans anddeposits growth rates, the significant assumptions, and the most sensitive, used in computing for therecoverable values of the CGUs follow:
2019 2018RBB CBSI RBB CBSI
Discount rate 6.29% 10.19% 7.12% 9.81%Long-term growth rate 1.00% 1.00% 1.00% 1.00%
With regard to the assessment of value−in−use of the CGU, management believes that no reasonablypossible change in any of the above key assumptions would cause the carrying value of the goodwill tomaterially exceed its recoverable amount as of December 31, 2019 and 2018.

- 81 -
*SGVFS039096*
Branch LicensesBranch licenses of the Group arose from the acquisitions of CBSI, Unity Bank, and PDB. As ofDecember 31, 2019 and 2018, details of branch licenses (gross of allowance for impairment) in theGroup’s and Parent Company’s financial statements follow:
Consolidated Parent CompanyBranch license from CBSI acquisition P=420,600 P=398,000Branch license from Unity Bank acquisition 347,400 –Branch license from PDB acquisition* 2,839,500 –Total P=3,607,500 P=398,000*mostly attributable to the Parent Company
The calculation of the value−in−use of the CGU is most sensitive to the following assumptions:
· Discount rates· Long-term growth rate used to extrapolate cash flows beyond the budget period
As of December 31, 2019, the Group provided allowance for probable losses amounting to P=160 millionrelated to certain branch licenses granted by the BSP in restricted areas arising from the acquisition ofCBSI.
Capitalized software costs
The movements in the account follow:
Consolidated Parent Company2019 2018 2019 2018
CostBalance at beginning of year P=1,000,739 P=714,230 P=895,105 P=591,256Additions 96,460 144,123 79,070 154,055Disposals/Write-off/Reclass (Note 12) 794,174 142,386 811,256 149,794Balance at end of year 1,891,373 1,000,739 P=1,785,431 895,105Accumulated Depreciation
and AmortizationBalance at beginning of year 407,277 217,697 377,574 188,395Depreciation and amortization 174,855 115,840 173,378 115,450Disposals/Write-off/Reclass (Note 12) 686,563 73,740 686,563 73,729Balance at end of year 1,268,695 407,277 1,237,514 377,574Net Book Value at End of Year P=622,678 593,462 P=547,917 P=517,531

- 82 -
*SGVFS039096*
15. Other Assets
This account consists of:
Consolidated Parent Company2019 2018 2019 2018
Financial assetsAccounts receivable P=2,394,849 P=2,595,023 P=1,464,942 P=1,480,760SCR 1,162,106 1,121,035 235,049 224,035RCOCI 424,364 129,142 342,018 117,227Others 966,441 491,475 330,363 175,540
4,947,760 4,336,675 2,372,372 1,997,562Nonfinancial assetsNet plan assets (Note 25) 543,471 777,827 499,711 756,160Prepaid expenses 338,754 246,053 303,794 208,632Creditable withholding taxes 544,634 338,618 476,107 338,618Security deposit 268,602 272,541 189,277 193,216Documentary stamps 198,093 215,696 157,020 149,078Sundry debits 278,761 358,051 278,761 166,951Miscellaneous 332,751 433,502 – –
2,505,066 2,642,288 1,904,670 1,812,6557,452,826 6,978,963 4,277,042 3,810,217
Allowance for impairment and credit losses(Note 16) (565,319) (759,404) (294,913) (477,454)
P=6,887,507 P=6,219,559 P=3,982,129 P=3,332,763
Accounts receivableAccounts receivable also includes non−interest bearing advances to officers and employees, with termsranging from 1 to 30 days and receivables of the Parent Company from automated teller machine(ATM) transactions of clients of other banks that transacted through any of the Parent Company’s ATMterminals.
Sales Contract ReceivableThis refers to the amortized cost of assets acquired in settlement of loans through foreclosure or dationin payment and subsequently sold on installment basis whereby the title to the said property istransferred to the buyers only upon full payment of the agreed selling price.
SCR bears fixed interest rate per annum in 2019 and 2018 ranging from 5% to 10.25% and 5.00% to10.00%, respectively.
MiscellaneousMiscellaneous consists mainly of unissued stationery and supplies, inter−office float items, anddeposits for various services.

- 83 -
*SGVFS039096*
16. Allowance for Impairment and Credit Losses
Changes in the allowance for impairment and credit losses are as follows:
Consolidated Parent Company2019 2018 2019 2018
Balances at beginning of yearLoans and receivables P=6,829,280 P=8,121,175 P=5,425,713 P=6,500,542Investment properties 1,275,232 1,437,383 1,120,965 1,206,418Accrued interest receivable 303,555 201,647 45,247 58,269Financial Assets at FVOCI (4,023) 128,171 – 6,323Investment securities at amortized cost 375,102 – 214,938 83,618Bank premises, furniture, fixtures and
equipment – 1,148 – –Other assets 772,004 781,424 477,454 540,960
9,551,150 10,670,948 7,284,317 8,396,130Provisions charged to operations 2,570,168 141,076 2,205,062 (1,957)Accounts charged off and others (305,722) (1,260,874) (746) (1,109,856)
2,264,446 (1,119,798) 2,204,316 (1,111,813)Balances at end of year
Loans and receivables (Note 10) 8,559,976 6,829,280 6,938,785 5,425,713Investment properties (Note 13) 1,129,012 1,275,232 1,114,514 1,120,965Accrued interest receivable 275,888 303,555 39,261 45,247Financial Assets at FVPL 6,297 – – –
Financial Assets at FVOCI (Note 9) 18,521 (4,023) 18,471 –Investment securities at amortized cost 1,087,983 375,102 1,082,690 214,938Intangible assets 172,600 – – –Other assets (Note 15) 565,319 772,004 294,912 477,454
P=11,815,596 P=9,551,150 P=9,488,633 P=7,284,317
At the current level of allowance for impairment and credit losses, management believes that theGroup has sufficient allowance to cover any losses that may be incurred from the non−collection ornon−realization of its loans and receivables and other risk assets.
The separate valuation allowance of acquired loans and receivables from PDB amounting toP=1.59 billion was not recognized by the Group on the effectivity date of acquisition as these receivableswere measured at fair value at acquisition date. Any uncertainties about future cash flows of thesereceivables were included in their fair value measurement (Note 11). Also, the separate valuationallowance of acquired investment properties from PDB amounting to P=199.15 million was notrecognized by the Group on the effectivity date of acquisition as these properties were measured at fairvalue on acquisition date.
The tables below illustrate the movements of the allowance for impairment and credit losses during theyear (effect of movements in ECL due to transfers between stages are shown in the total column):
Consolidated ECL Staging
Stage 1 Stage 2 Stage 3 TotalCorporate and commercial lending 12-month ECL Lifetime ECL Lifetime ECL
Loss allowance at January 1, 2019 2,775,127 983,660 1,590,107 5,348,894Movements with P&L impactTransfers:
Transfer from Stage 1 to Stage 2 (52,828) 117,697 - 64,869Transfer from Stage 1 to Stage 3 (1,359) - 128,216 126,857Transfer from Stage 2 to Stage 1 161,584 (806,673) - (645,089)Transfer from Stage 2 to Stage 3 - (35,349) 466,611 431,262Transfer from Stage 3 to Stage 1 11,821 - (18,807) (6,986)Transfer from Stage 3 to Stage 2 - 207 (207) -
(Forward)

- 84 -
*SGVFS039096*
Consolidated ECL Staging
Stage 1 Stage 2 Stage 3 TotalCorporate and commercial lending 12-month ECL Lifetime ECL Lifetime ECL
New financial assets originated * 1,653,940 153,502 654,294 2,461,736Changes in PDs/LGDs/EADs (173,129) 119,883 518,155 464,909Financial assets derecognized during the period (968,397) (39,618) (205,387) (1,213,402)Fx and other movements 17,673 20 12,192 29,885Total net P&L charge during the period 649,305 (490,331) 1,555,067 1,714,041Other movements without P&L impactWrite-offs, Foreclosures and other movements (17,716) (17) (127,758) (145,491)Total movements without P&L impact (17,716) (17) (127,758) (145,491)
Loss allowance at December 31, 2019 3,406,716 493,312 3,017,416 6,917,444* Stage classification of new financial assets originated pertains to the stage as of end of year
Consolidated ECL Staging
Stage 1 Stage 2 Stage 3 TotalConsumer lending 12-month ECL Lifetime ECL Lifetime ECL
Loss allowance at January 1, 2019 223,382 16,576 1,141,577 1,381,535Movements with P&L impactTransfers:
Transfer from Stage 1 to Stage 2 (5,909) 11,613 - 5,704Transfer from Stage 1 to Stage 3 (3,345) - 74,421 71,076Transfer from Stage 2 to Stage 1 2,134 (2,300) - (166)Transfer from Stage 2 to Stage 3 - (7,011) 17,168 10,157Transfer from Stage 3 to Stage 1 12,565 - (32,749) (20,184)Transfer from Stage 3 to Stage 2 - 3,004 (10,610) (7,606)
New financial assets originated* 80,141 8,549 102,033 190,723Changes in PDs/LGDs/EADs (59,675) 4,088 (127,824) (183,411)Financial assets derecognized during the period (22,734) (3,584) (86,203) (112,521)Fx and other movements (15) - 2,016 2,001Total net P&L charge during the period 3,162 14,359 (61,748) (44,227)Other movements without P&L impactWrite-offs, Foreclosures and other movements - - (31,668) (31,668)Total movements without P&L impact - - (31,668) (31,668)
Loss allowance at December 31, 2019 226,544 30,935 1,048,161 1,305,640* Stage classification of new financial assets originated pertains to the stage as of end of year
Consolidated ECL Staging
Stage 1 Stage 2 Stage 3 TotalTrade-related lending 12-month ECL Lifetime ECL Lifetime ECL
Loss allowance at January 1, 2019 53,678 25,774 19,400 98,852Movements with P&L impactTransfers:
Transfer from Stage 1 to Stage 2 (14) 88 - 74Transfer from Stage 1 to Stage 3 (242) - 46,387 46,145Transfer from Stage 2 to Stage 1 - - - -Transfer from Stage 2 to Stage 3 - - - -Transfer from Stage 3 to Stage 1 - - - -Transfer from Stage 3 to Stage 2 - - - -
New financial assets originated* 127,018 341 141,229 268,588Changes in PDs/LGDs/EADs 17 - (1) 16Financial assets derecognized during the
period(53,384) (25,774) - (79,158)
Fx and other movements 297 - - 297Total net P&L charge during the period 73,692 (25,345) 187,615 235,962Other movements without P&L impactWrite-offs, foreclosures and other movements (297) - - (297)Total movements without P&L impact (297) - - (297)
Loss allowance at December 31, 2019 127,073 429 207,015 334,517* Stage classification of new financial assets originated pertains to the stage as of end of year

- 85 -
*SGVFS039096*
Consolidated ECL Staging
Stage 1 Stage 2 Stage 3 TotalInvestments measured at Amortized Cost 12-month ECL Lifetime ECL Lifetime ECL
Loss allowance at January 1, 2019 208,949 14,317 151,836 375,102Movements with P&L impactTransfers:
Transfer from Stage 1 to Stage 2 (12,351) 697,085 - 684,734Transfer from Stage 1 to Stage 3 - - - -Transfer from Stage 2 to Stage 1 29 (486) - (457)Transfer from Stage 2 to Stage 3 - - - -Transfer from Stage 3 to Stage 1 - - - -Transfer from Stage 3 to Stage 2 - - - -
New financial assets originated or purchased* 14,762 101,535 - 116,297Changes in PDs/LGDs/EADs 78,542 4,099 - 82,641Financial assets derecognized during
the period(18,712) (4,722) (151,836) (175,270)
Fx and other movements 23,248 1,681 - 24,929Total net P&L charge during the period 85,518 799,192 (151,836) 732,874Other movements without P&L impactWrite-offs, foreclosures and other movements (18,379) (1,681) - (20,060)Total movements without P&L impact (18,379) (1,681) - (20,060)
Loss allowance at December 31, 2019 276,088 811,828 - 1,087,916* Stage classification of new financial assets originated or purchased pertains to the stage as of end of year
Consolidated ECL Staging
Stage 1 Stage 2 Stage 3 TotalInvestments measured at FVOCI (Debt) 12-month ECL Lifetime ECL Lifetime ECL
Loss allowance at January 1, 2019 3,496 2 - 3,498Movements with P&L impactTransfers:
Transfer from Stage 1 to Stage 2 - - - -Transfer from Stage 1 to Stage 3 - - - -Transfer from Stage 2 to Stage 1 19 (2) - 17Transfer from Stage 2 to Stage 3 - - - -Transfer from Stage 3 to Stage 1 - - - -Transfer from Stage 3 to Stage 2 - - - -
New financial assets originated or purchased* 9,688 - - 9,688Changes in PDs/LGDs/EADs (96) - - (96)Financial assets derecognized during the period
(909) - - (909)
Fx and other movements 1,637 - - 1,637Total net P&L charge during the period 10,339 (2) - 10,337Other movements without P&L impactWrite-offs, foreclosures and other movements (1,637) - - (1,637)Total movements without P&L impact (1,637) - - (1,637)
Loss allowance at December 31, 2019 12,198 - - 12,198* Stage classification of new financial assets originated or purchased pertains to the stage as of end of year
Parent ECL Staging
Stage 1 Stage 2 Stage 3 TotalCorporate and commercial lending 12-month ECL Lifetime ECL Lifetime ECL
Loss allowance at January 1, 2019 2,646,168 961,778 909,762 4,517,708Movements with P&L impactTransfers:
Transfer from Stage 1 to Stage 2 (51,341) 116,210 – 64,869Transfer from Stage 1 to Stage 3 (862) – 127,719 126,857Transfer from Stage 2 to Stage 1 161,245 (806,334) – (645,089)Transfer from Stage 2 to Stage 3 – (33,631) 464,893 431,262Transfer from Stage 3 to Stage 1 10 – (6,996) (6,986)Transfer from Stage 3 to Stage 2 – – – –
New financial assets originated * 1,625,381 153,094 633,358 2,411,833Changes in PDs/LGDs/EADs (161,930) 116,189 (9,589) (55,330)
(Forward)

- 86 -
*SGVFS039096*
Parent ECL Staging
Stage 1 Stage 2 Stage 3 TotalCorporate and commercial lending 12-month ECL Lifetime ECL Lifetime ECL
Financial assets derecognized during the period (901,968) (21,640) (64,352) (987,960)Fx and other movements 17,673 17 12,193 29,883Total net P&L charge during the period 688,208 (476,095) 1,157,226 1,369,339Other movements without P&L impactWrite-offs, foreclosures and other movements (17,716) (17) (127,758) (145,491)Total movements without P&L impact (17,716) (17) (127,758) (145,491)
Loss allowance at December 31, 2019 3,316,660 485,666 1,939,230 5,741,556* Stage classification of new financial assets originated pertains to the stage as of end of year
Parent ECL Staging
Stage 1 Stage 2 Stage 3 TotalConsumer lending 12-month ECL Lifetime ECL Lifetime ECL
Loss allowance at January 1, 2019 94,166 5,721 714,022 813,909Movements with P&L impactTransfers:
Transfer from Stage 1 to Stage 2 (1,968) 7,672 – 5,704Transfer from Stage 1 to Stage 3 (2,068) – 73,144 71,076Transfer from Stage 2 to Stage 1 599 (765) – (166)Transfer from Stage 2 to Stage 3 – (621) 10,778 10,157Transfer from Stage 3 to Stage 1 192 – (20,376) (20,184)Transfer from Stage 3 to Stage 2 – 94 (7,700) (7,606)
New financial assets originated* 67,474 2,365 83,338 153,177Changes in PDs/LGDs/EADs (3,877) (342) (32,708) (36,927)Financial assets derecognized during the period (9,452) (1,701) (86,110) (97,263)Fx and other movements (15) – 2,016 2,001Total net P&L charge during the period 50,885 6,702 22,382 79,969Other movements without P&L impactWrite-offs, foreclosures and other movements – – (31,668) (31,668)Total movements without P&L impact – – (31,668) (31,668)
Loss allowance at December 31, 2019 145,051 12,423 704,736 862,210* Stage classification of new financial assets originated pertains to the stage as of end of year
Parent ECL Staging
Stage 1 Stage 2 Stage 3 TotalTrade-related lending 12-month
ECL Lifetime ECL Lifetime ECL
Loss allowance at January 1, 2019 48,922 25,774 19,400 94,096Movements with P&L impactTransfers:
Transfer from Stage 1 to Stage 2 (14) 88 – 74Transfer from Stage 1 to Stage 3 (242) – 46,387 46,145Transfer from Stage 2 to Stage 1 – – – –Transfer from Stage 2 to Stage 3 – – – –Transfer from Stage 3 to Stage 1 – – – –Transfer from Stage 3 to Stage 2 – – – –
New financial assets originated* 127,018 341 141,229 268,588Changes in PDs/LGDs/EADs 17 – (1) 16Financial assets derecognized during the period (48,628) (25,774) – (74,402)Fx and other movements 297 – – 297Total net P&L charge during the period 78,448 (25,345) 187,615 240,718Other movements without P&L impactWrite-offs, foreclosures and other movements (297) – – (297)Total movements without P&L impact (297) – – (297)
Loss allowance at December 31, 2019 127,073 429 207,015 334,517

- 87 -
*SGVFS039096*
Parent ECL Staging
Stage 1 Stage 2 Stage 3 Total 12-month ECL Lifetime ECL Lifetime ECL
Investments in debt instruments (AC)Loss allowance at January 1, 2019 200,622 14,317 – 214,939Movements with P&L impactTransfers:
Transfer from Stage 1 to Stage 2 (12,351) 697,085 – 684,734Transfer from Stage 1 to Stage 3 – – – –Transfer from Stage 2 to Stage 1 29 (486) – (457)Transfer from Stage 2 to Stage 3 – – – –Transfer from Stage 3 to Stage 1 – – – –Transfer from Stage 3 to Stage 2 – – – –
New financial assets originated or purchased* 13,489 101,535 – 115,024Changes in PDs/LGDs/EADs 78,542 4,099 – 82,641Financial assets derecognized during the period (9,536) (4,721) – (14,257)Fx and other movements 18,379 1,681 – 20,060Total net P&L charge during the period 88,552 799,193 – 887,745Write-offs, foreclosures and other movements (18,379) (1,681) – (20,060)Total movements without P&L impact (18,379) (1,681) – (20,060)
Loss allowance at December 31, 2019 270,795 811,829 – 1,082,624* Stage classification of new financial assets originated or purchased pertains to the stage as of end of year
Parent ECL Staging
Stage 1 Stage 2 Stage 3 Total 12-month ECL Lifetime ECL Lifetime ECL
Investments in debt instruments (FVOCI)Loss allowance at January 1, 2019 3,496 2 – 3,498Movements with P&L impactTransfers:
Transfer from Stage 1 to Stage 2 – – – –Transfer from Stage 1 to Stage 3 – – – –Transfer from Stage 2 to Stage 1 19 (2) – 17Transfer from Stage 2 to Stage 3Transfer from Stage 3 to Stage 1Transfer from Stage 3 to Stage 2
New financial assets originated or purchased* 9,638 – – 9,638Changes in PDs/LGDs/EADs (96) – – (96)Financial assets derecognized during the period (909) – – (909)Fx and other movements 1,637 – – 1,637Total net P&L charge during the period 10,289 (2) - 10,287Write-offs, foreclosures and other movements (1,637) – – (1,637) Total movements without P&L impact (1,637) – – (1,637)
Loss allowance at December 31, 2019 12,148 – – 12,148* Stage classification of new financial assets originated or purchased pertains to the stage as of end of year
The corresponding movement of the gross carrying amount of the financial asset are shown below:
ConsolidatedECL Staging
Stage 1 Stage 2 Stage 3 TotalCorporate and commercial lending 12-month ECL Lifetime ECL Lifetime ECLGross carrying amount at January 1, 2019 390,540,527 17,424,690 3,835,233 411,800,450Movements with P&L impactTransfers:Transfer from Stage 1 to Stage 2 (9,834,545) 9,834,545 - -Transfer from Stage 1 to Stage 3 (718,875) - 718,875 -Transfer from Stage 2 to Stage 1 9,676,644 (9,676,644) - -Transfer from Stage 2 to Stage 3 - (138,087) 138,087 -Transfer from Stage 3 to Stage 1 76,817 - (76,817) -Transfer from Stage 3 to Stage 2 - 2,092 (2,092) -New financial assets originated* 210,489,202 6,683,212 979,440 218,151,854
(Forward)

- 88 -
*SGVFS039096*
ConsolidatedECL Staging
Stage 1 Stage 2 Stage 3 TotalCorporate and commercial lending 12-month ECL Lifetime ECL Lifetime ECLChanges in PDs/LGDs/EADs (18,208,483) (1,851,903) (156,935) (20,217,321)Financial assets derecognized during the period (146,536,480) (2,839,497) (473,862) (149,849,839)Fx and other movements (49,238) - 49,238 -Total movements with P&L impact 44,895,043 2,013,718 1,175,934 48,084,695Other movements without P&L impactWrite-offs, Foreclosures and other movements - - (226,471) (226,471)Total movements without P&L impact - - (226,471) (226,471)
Gross carrying amount at December 31, 2019 435,435,570 19,438,408 4,784,696 459,658,674* Stage classification of new financial assets originated pertains to the stage as of end of year
ConsolidatedECL Staging
Stage 1 Stage 2 Stage 3 TotalConsumer lending 12-month ECL Lifetime ECL Lifetime ECLGross carrying amount at January 1, 2019 80,691,641 3,210,598 3,312,700 87,214,939Movements with P&L impactTransfers:Transfer from Stage 1 to Stage 2 (2,665,015) 2,665,015 - -Transfer from Stage 1 to Stage 3 (1,116,995) - 1,116,995 -Transfer from Stage 2 to Stage 1 449,278 (449,278) - -Transfer from Stage 2 to Stage 3 - (147,540) 147,540 -Transfer from Stage 3 to Stage 1 174,723 - (197,297) -Transfer from Stage 3 to Stage 2 - 61,078 (61,078) -New financial assets originated* 39,667,155 649,833 206,737 40,523,725Changes in PDs/LGDs/EADs (6,141,036) (598,191) (254,693) (6,993,920)Financial assets derecognized during the period (11,957,718) (788,449) (676,052) (13,422,219)Fx and other movements (4,345) - 4,345 -Total movements w/ P&L impact during the period 18,428,622 1,392,468 286,497 20,107,587Other movements without P&L impactWrite-offs, Foreclosures and other movements - - (101,692) (101,692)Total movements without P&L impact - - (101,692) (101,692)
Gross carrying amount at December 31, 2019 99,120,263 4,603,066 3,497,505 107,220,834* Stage classification of new financial assets originated pertains to the stage as of end of year
ConsolidatedECL Staging
Stage 1 Stage 2 Stage 3 TotalTrade-related lending 12-month ECL Lifetime ECL Lifetime ECLGross carrying amount at January 1, 2019 12,110,169 1,684,378 23,319 13,817,866Movements with P&L impactTransfers:Transfer from Stage 1 to Stage 2 (11,355) 11,355 - -Transfer from Stage 1 to Stage 3 (57,565) - 57,565 -Transfer from Stage 2 to Stage 1 - - - -Transfer from Stage 2 to Stage 3 - - - -Transfer from Stage 3 to Stage 1 - - - -Transfer from Stage 3 to Stage 2 - - - -New financial assets originated* 10,583,215 64,584 160,927 10,808,726Changes in PDs/LGDs/EADs (3,548) (1,442) (5,905) (10,895)Financial assets derecognized during the period (12,028,751) (1,684,378) - (13,713,129)Fx and other movements - - - -Total movements w/ P&L impact during the period (1,518,004) (1,609,881) 212,587 (2,915,298)Other movements without P&L impactWrite-offs, Foreclosures and other movements - - - -Total movements without P&L impact - - - -
Gross carrying amount at December 31, 2019 10,592,165 74,497 235,906 10,902,568* Stage classification of new financial assets originated pertains to the stage as of end of year
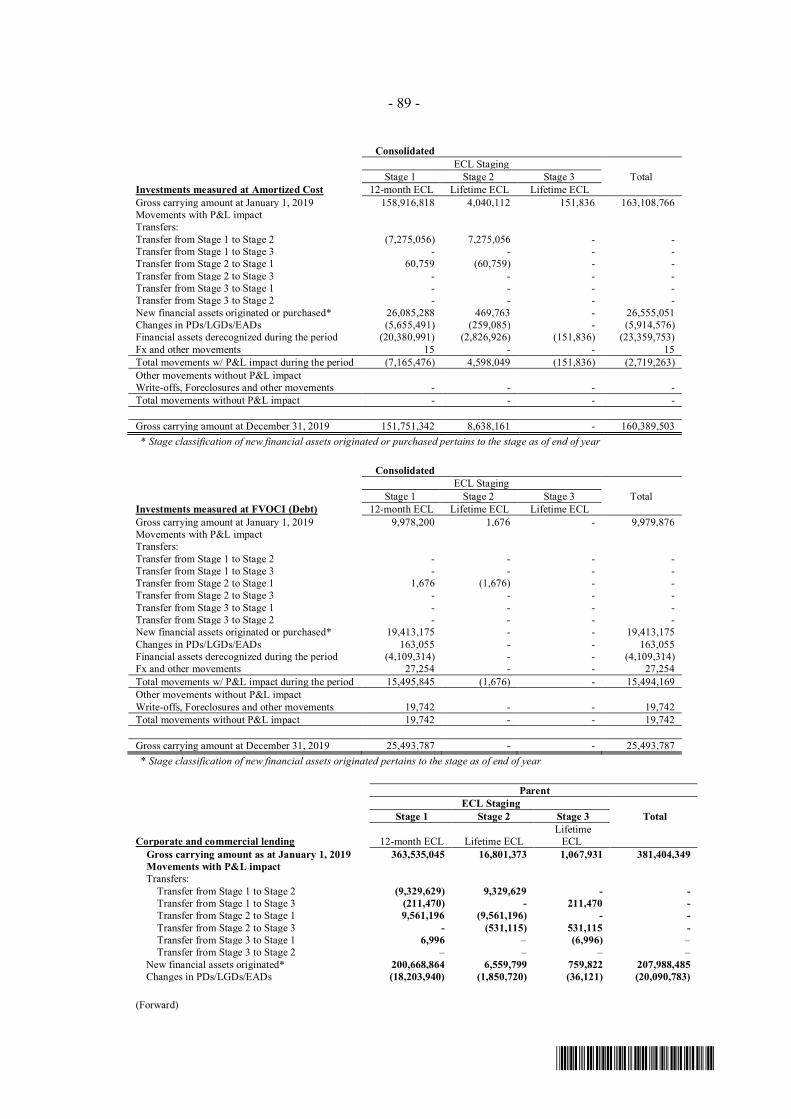
- 89 -
*SGVFS039096*
ConsolidatedECL Staging
Stage 1 Stage 2 Stage 3 TotalInvestments measured at Amortized Cost 12-month ECL Lifetime ECL Lifetime ECLGross carrying amount at January 1, 2019 158,916,818 4,040,112 151,836 163,108,766Movements with P&L impactTransfers:Transfer from Stage 1 to Stage 2 (7,275,056) 7,275,056 - -Transfer from Stage 1 to Stage 3 - - - -Transfer from Stage 2 to Stage 1 60,759 (60,759) - -Transfer from Stage 2 to Stage 3 - - - -Transfer from Stage 3 to Stage 1 - - - -Transfer from Stage 3 to Stage 2 - - - -New financial assets originated or purchased* 26,085,288 469,763 - 26,555,051Changes in PDs/LGDs/EADs (5,655,491) (259,085) - (5,914,576)Financial assets derecognized during the period (20,380,991) (2,826,926) (151,836) (23,359,753)Fx and other movements 15 - - 15Total movements w/ P&L impact during the period (7,165,476) 4,598,049 (151,836) (2,719,263)Other movements without P&L impactWrite-offs, Foreclosures and other movements - - - -Total movements without P&L impact - - - -
Gross carrying amount at December 31, 2019 151,751,342 8,638,161 - 160,389,503* Stage classification of new financial assets originated or purchased pertains to the stage as of end of year
ConsolidatedECL Staging
Stage 1 Stage 2 Stage 3 TotalInvestments measured at FVOCI (Debt) 12-month ECL Lifetime ECL Lifetime ECLGross carrying amount at January 1, 2019 9,978,200 1,676 - 9,979,876Movements with P&L impactTransfers:Transfer from Stage 1 to Stage 2 - - - -Transfer from Stage 1 to Stage 3 - - - -Transfer from Stage 2 to Stage 1 1,676 (1,676) - -Transfer from Stage 2 to Stage 3 - - - -Transfer from Stage 3 to Stage 1 - - - -Transfer from Stage 3 to Stage 2 - - - -New financial assets originated or purchased* 19,413,175 - - 19,413,175Changes in PDs/LGDs/EADs 163,055 - - 163,055Financial assets derecognized during the period (4,109,314) - - (4,109,314)Fx and other movements 27,254 - - 27,254Total movements w/ P&L impact during the period 15,495,845 (1,676) - 15,494,169Other movements without P&L impactWrite-offs, Foreclosures and other movements 19,742 - - 19,742Total movements without P&L impact 19,742 - - 19,742
Gross carrying amount at December 31, 2019 25,493,787 - - 25,493,787* Stage classification of new financial assets originated pertains to the stage as of end of year
Parent ECL Staging
Stage 1 Stage 2 Stage 3 Total
Corporate and commercial lending 12-month ECL Lifetime ECL Lifetime
ECLGross carrying amount as at January 1, 2019 363,535,045 16,801,373 1,067,931 381,404,349Movements with P&L impactTransfers:
Transfer from Stage 1 to Stage 2 (9,329,629) 9,329,629 - -Transfer from Stage 1 to Stage 3 (211,470) - 211,470 -Transfer from Stage 2 to Stage 1 9,561,196 (9,561,196) - -Transfer from Stage 2 to Stage 3 - (531,115) 531,115 -Transfer from Stage 3 to Stage 1 6,996 – (6,996) –Transfer from Stage 3 to Stage 2 – – – –
New financial assets originated* 200,668,864 6,559,799 759,822 207,988,485Changes in PDs/LGDs/EADs (18,203,940) (1,850,720) (36,121) (20,090,783)
(Forward)
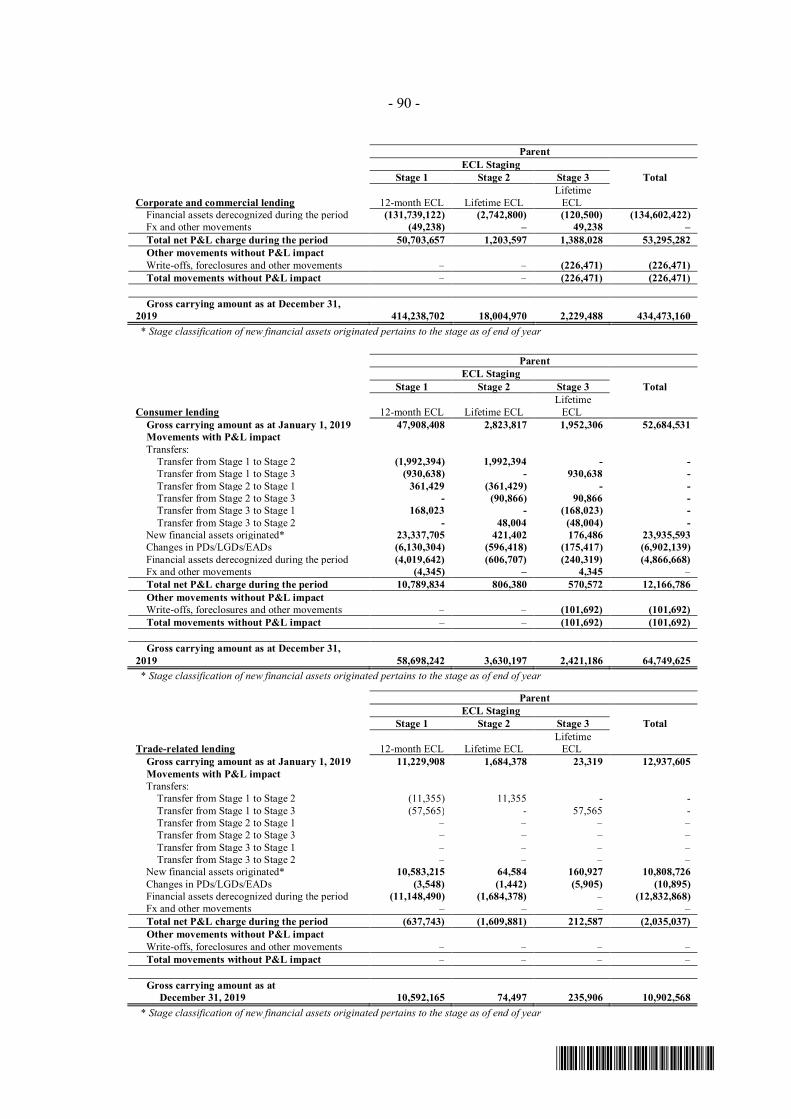
- 90 -
*SGVFS039096*
Parent ECL Staging
Stage 1 Stage 2 Stage 3 Total
Corporate and commercial lending 12-month ECL Lifetime ECL Lifetime
ECLFinancial assets derecognized during the period (131,739,122) (2,742,800) (120,500) (134,602,422)Fx and other movements (49,238) – 49,238 –Total net P&L charge during the period 50,703,657 1,203,597 1,388,028 53,295,282Other movements without P&L impactWrite-offs, foreclosures and other movements – – (226,471) (226,471)Total movements without P&L impact – – (226,471) (226,471)
Gross carrying amount as at December 31,2019 414,238,702 18,004,970 2,229,488 434,473,160* Stage classification of new financial assets originated pertains to the stage as of end of year
Parent ECL Staging
Stage 1 Stage 2 Stage 3 Total
Consumer lending 12-month ECL Lifetime ECL Lifetime
ECLGross carrying amount as at January 1, 2019 47,908,408 2,823,817 1,952,306 52,684,531Movements with P&L impactTransfers:
Transfer from Stage 1 to Stage 2 (1,992,394) 1,992,394 - -Transfer from Stage 1 to Stage 3 (930,638) - 930,638 -Transfer from Stage 2 to Stage 1 361,429 (361,429) - -Transfer from Stage 2 to Stage 3 - (90,866) 90,866 -Transfer from Stage 3 to Stage 1 168,023 - (168,023) -Transfer from Stage 3 to Stage 2 - 48,004 (48,004) -
New financial assets originated* 23,337,705 421,402 176,486 23,935,593Changes in PDs/LGDs/EADs (6,130,304) (596,418) (175,417) (6,902,139)Financial assets derecognized during the period (4,019,642) (606,707) (240,319) (4,866,668)Fx and other movements (4,345) – 4,345 –Total net P&L charge during the period 10,789,834 806,380 570,572 12,166,786Other movements without P&L impactWrite-offs, foreclosures and other movements – – (101,692) (101,692)Total movements without P&L impact – – (101,692) (101,692)
Gross carrying amount as at December 31,2019 58,698,242 3,630,197 2,421,186 64,749,625* Stage classification of new financial assets originated pertains to the stage as of end of year
Parent ECL Staging
Stage 1 Stage 2 Stage 3 Total
Trade-related lending 12-month ECL Lifetime ECL Lifetime
ECLGross carrying amount as at January 1, 2019 11,229,908 1,684,378 23,319 12,937,605Movements with P&L impactTransfers:
Transfer from Stage 1 to Stage 2 (11,355) 11,355 - -Transfer from Stage 1 to Stage 3 (57,565) - 57,565 -Transfer from Stage 2 to Stage 1 – – – –Transfer from Stage 2 to Stage 3 – – – –Transfer from Stage 3 to Stage 1 – – – –Transfer from Stage 3 to Stage 2 – – – –
New financial assets originated* 10,583,215 64,584 160,927 10,808,726Changes in PDs/LGDs/EADs (3,548) (1,442) (5,905) (10,895)Financial assets derecognized during the period (11,148,490) (1,684,378) – (12,832,868)Fx and other movements – – – –Total net P&L charge during the period (637,743) (1,609,881) 212,587 (2,035,037)Other movements without P&L impactWrite-offs, foreclosures and other movements – – – –Total movements without P&L impact – – – –
Gross carrying amount as atDecember 31, 2019 10,592,165 74,497 235,906 10,902,568
* Stage classification of new financial assets originated pertains to the stage as of end of year

- 91 -
*SGVFS039096*
Parent ECL Staging
Stage 1 Stage 2 Stage 3 Total
Investments in amortized cost 12-month ECL Lifetime ECL Lifetime
ECLGross carrying amount as at January 1, 2019 150,639,222 4,040,112 – 154,679,334Movements with P&L impactTransfers: –
Transfer from Stage 1 to Stage 2 (7,275,056) 7,275,056 – –Transfer from Stage 1 to Stage 3 - - – –Transfer from Stage 2 to Stage 1 60,759 (60,759) – –Transfer from Stage 2 to Stage 3 – – – –Transfer from Stage 3 to Stage 1 – – – –Transfer from Stage 3 to Stage 2 – – – –
New financial assets originated or purchased* 25,123,628 469,763 – 25,593,391Changes in PDs/LGDs/EADs (5,655,491) (259,085) - (5,914,576)Financial assets derecognized during the period (14,816,974) (2,826,926) – (17,643,900)Fx and other movements – – – –Total net P&L charge during the period (2,563,134) 4,598,049 – 2,034,915Other movements without P&L impactWrite-offs, foreclosures and other movements – – – –Total movements without P&L impact – – – –
Gross carrying amount as atDecember 31, 2019 148,076,088 8,638,161 – 156,714,249
* Stage classification of new financial assets originated pertains to the stage as of end of year
Parent ECL Staging
Stage 1 Stage 2 Stage 3 Total
Investments at FVOCI (debt) 12-month ECL Lifetime ECL Lifetime
ECLGross carrying amount as at January 1, 2019 8,141,359 1,676 – 8,143,035Movements with P&L impactTransfers: –
Transfer from Stage 1 to Stage 2 – – – –Transfer from Stage 1 to Stage 3 – – – –Transfer from Stage 2 to Stage 1 1,676 (1,676) – –Transfer from Stage 2 to Stage 3 – – – –Transfer from Stage 3 to Stage 1 – – – –Transfer from Stage 3 to Stage 2 – – – –
New financial assets originated or purchased* 18,997,616 – – 18,997,616Changes in PDs/LGDs/EADs 136,794 - - 136,794Financial assets derecognized during the period (3,712,224) – – (3,712,224)Fx and other movements – – – –Total net P&L charge during the period 15,423,862 (1,676) – 15,422,186Other movements without P&L impactWrite-offs, foreclosures and other movements – – – –Total movements without P&L impact – – – –
Gross carrying amount as atDecember 31, 2019 23,565,221 – – 23,565,221
* Stage classification of new financial assets originated pertains to the stage as of end of year
While the Group recognizes through the statement of income the movements in the expected creditlosses computed using the models, the Group also complies with BSP's regulatory requirement toappropriate a portion of its retained earnings at an amount necessary to bring to at least 1% theallowance for credit losses on loans (Note 24).
Consolidated Parent2019 2018 2017 2019 2018 2017
Provision for Impairmentand Credit Losses P=2,570,168 P=141,076 P=754,171 P=2,205,062 (P=1,957) P=423,922Retained Earnings,appropriated 468,442 340,409 – 468,442 340,409 –
P=3,038,610 P=481,485 P=754,171 P=2,673,504 P=338,452 P=423,922

- 92 -
*SGVFS039096*
17. Deposit Liabilities
As of December 31, 2019 and 2018, 38.34% and 33.64% respectively, of the total deposit liabilities ofthe Group and 40.85% and 37.56% of the Parent Company are subject to periodic interest repricing.The remaining deposit liabilities bear annual fixed interest rates ranging from 0.13% to 4.55% in 2019,0.13% to 4.55% in 2018 and 0.13% to 3.65% in 2017.
Interest Expense on Deposit LiabilitiesThis account consists of:
Consolidated Parent Company2019 2018 2017 2019 2018 2017
Demand P=242,838 P=257,380 P=233,984 P=189,776 P=182,521 P=163,524Savings 6,356,024 3,490,378 1,120,422 6,247,134 3,429,446 1,072,849Time 11,968,304 7,873,305 5,167,529 9,478,197 6,124,047 3,974,430
P=18,567,168 P=11,621,063 P=6,521,935 P=15,915,107 P=9,736,014 P=5,210,803
BSP Circular No. 830 requires reserves against deposit liabilities. As of December 31, 2019 and 2018,Due from BSP amounting to P=92.67 billion and P=99.89 billion, respectively, for the Group and P=80.61billion and P=93.09 billion, respectively, for the Parent Company were set aside as reserves for depositliabilities per latest report submitted BSP. As of December 31, 2019 and 2018, the Group is incompliance with such regulation.
Long Term Negotiable Certificates of Deposits (LTNCD)On August 3, 2016, the BOD of the Parent Company approved the issuance of Long Term NegotiableCertificates of Deposits (LTNCD) of up to P=20.00 billion in tranches of P=5.00 billion to P=10.00 billioneach and with tenors ranging from 5 to 7 years to support the Group’s strategic initiatives and businessgrowth. On October 27, 2016, the Monetary Board of the BSP approved the LTNCD issuances. OnNovember 18, 2016, the Parent Company issued the first tranche at par with aggregate principal amountof P=9.58 billion due May 18, 2022. The LTNCDs bear a fixed coupon rate of 3.65% per annum, payablequarterly in arrears. Subject to BSP rules, the Group has the option to pre−terminate the LTNCDs as awhole but not in part, prior to maturity and on any interest payment date at face value plus accruedinterest covering the accrued and unpaid interest.
On June 2, 2017, the Parent Company issued at par LTNCDs with aggregate principal amount ofP=6.35 billion due December 22, 2022, representing the second tranche of the P=20.00 billion.
On March 7, 2018, the Board of Directors approved the Bank’s Peso funding program of up toP=50 billion via a combination of Long−Term Negotiable Certificate of Time Deposit and/or RetailBonds and/or Commercial Papers.
On July 12, 2018, the Parent Company issued at par LTNCDs with aggregate principal amount ofP=10.25 billion due January 12, 2024, representing the first tranche of the P=20 billion LTNCD approvedby BSP on June 14, 2018. The LTNCDs bear a fixed coupon rate of 4.55% per annum, payable quarterlyin arrears. The P=20.00 billion LTNCD program is part of the Group’s funding program amounting toP50 billion.
The LTNCDs are included under the ‘Time deposit liabilities’ account.

- 93 -
*SGVFS039096*
18. Bonds Payable
P=30 Billion Peso Fixed Rate BondsOn July 10, 2019, the Parent Company issued P=30 billion peso fixed rate bonds, which bears a fixedcoupon rate of 5.70% per annum, payable monthly, and is due on January 2021. The Parent Companyincurred transaction costs amounting to P=257.73 million. In 2019, amortization of this transaction costsamounted to P=81.86 million.
$150 Million Bonds Payable to IFCOn June 18, 2019, the Parent Company issued a $150 million, seven-year bond to International FinanceCorporation. The bond carries an interest rate of 120 basis points over 6-month LIBOR.Shortly thereafter, the Parent Company entered into a seven-year pay-fixed, receive-floating interestrate swap (see Note 26) with the same principal terms to hedge the exposure to variable cash flowpayments on the floating-rate bonds payable attributable to interest rate risk (Note 6). The ParentCompany incurred transaction costs amounting to P=30.62 million. In 2019, amortization of thistransaction costs amounted to P=12.08 million.
The Bond Subscription Agreement contains certain financial covenants that the Parent Company shouldcomply during the term of the Bond, including the following:
· Risk Weighted Capital Adequacy Ratio of not less than ten per cent (10%);· Equity to Assets Ratio of not less than five per cent (5%);· Aggregate Large Exposures Ratio of not more than four hundred per cent (400%);· Open Credit Exposures Ratio of not more than twenty five per cent (25%);· Fixed Assets Plus Equity Participations Ratio of not more than thirty five per cent (35%);· Aggregate Foreign Exchange Risk Ratio of not more than twenty five per cent (25%);· Single Currency Foreign Exchange Risk Ratio of not more than ten per cent (10%);· Interest Rate Risk Ratio of not less than negative twenty five per cent (-25%) and not more than twenty five
per cent (25%);· Aggregate Interest Rate Risk Ratio of not less than negative fifty per cent (-50%) and not more than twenty
per cent (20%);· Open FX Position of not more than $50,000,000.
In addition, the Parent Company should also comply with the regulatory requirements related toEconomic Group Exposure and Related Party Exposure set by the BSP or the Bond SubscriptionAgreement, whichever is more stringent.
Noncompliance of these obligations may require the Parent Company to pay the bond immediately.As of December 31, 2019, the Parent Company is in compliance with these covenants and regulatoryrequirements.
Interest expense on bonds payable amounted to P=1.03 billion in 2019.
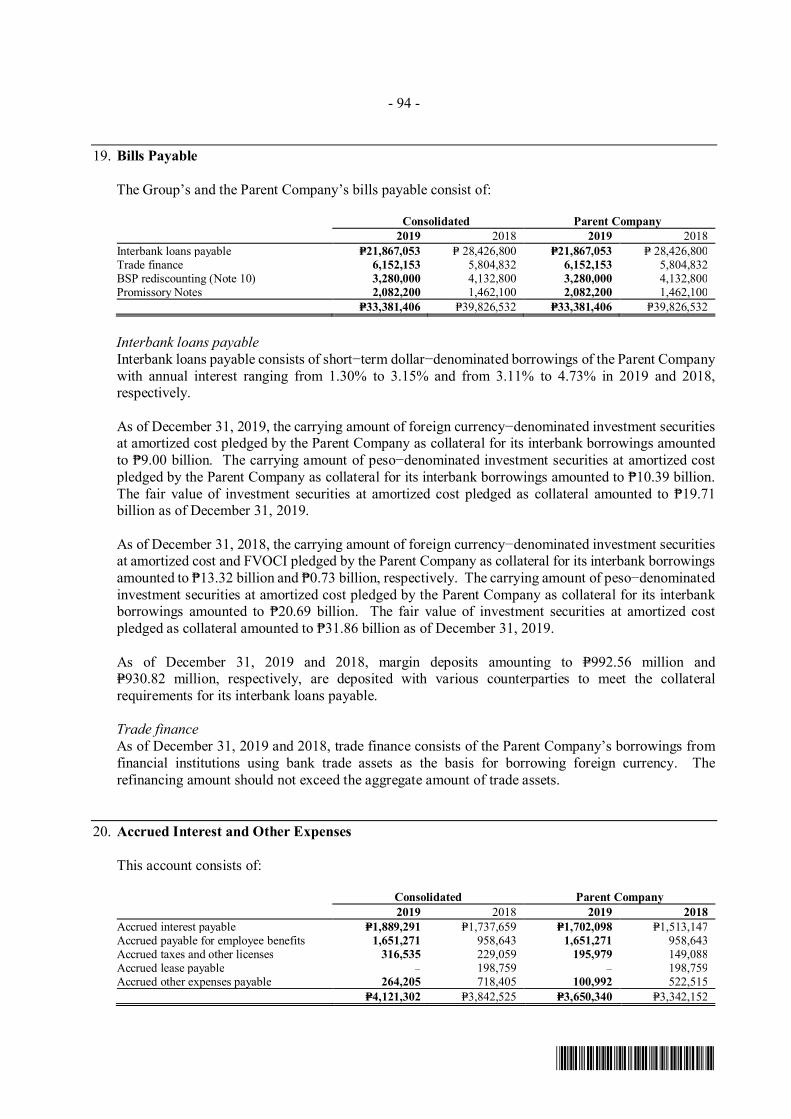
- 94 -
*SGVFS039096*
19. Bills Payable
The Group’s and the Parent Company’s bills payable consist of:
Consolidated Parent Company2019 2018 2019 2018
Interbank loans payable P=21,867,053 P= 28,426,800 P=21,867,053 P= 28,426,800Trade finance 6,152,153 5,804,832 6,152,153 5,804,832BSP rediscounting (Note 10) 3,280,000 4,132,800 3,280,000 4,132,800Promissory Notes 2,082,200 1,462,100 2,082,200 1,462,100
P=33,381,406 P=39,826,532 P=33,381,406 P=39,826,532
Interbank loans payableInterbank loans payable consists of short−term dollar−denominated borrowings of the Parent Companywith annual interest ranging from 1.30% to 3.15% and from 3.11% to 4.73% in 2019 and 2018,respectively.
As of December 31, 2019, the carrying amount of foreign currency−denominated investment securitiesat amortized cost pledged by the Parent Company as collateral for its interbank borrowings amountedto ₱9.00 billion. The carrying amount of peso−denominated investment securities at amortized costpledged by the Parent Company as collateral for its interbank borrowings amounted to ₱10.39 billion.The fair value of investment securities at amortized cost pledged as collateral amounted to ₱19.71billion as of December 31, 2019.
As of December 31, 2018, the carrying amount of foreign currency−denominated investment securitiesat amortized cost and FVOCI pledged by the Parent Company as collateral for its interbank borrowingsamounted to ₱13.32 billion and ₱0.73 billion, respectively. The carrying amount of peso−denominatedinvestment securities at amortized cost pledged by the Parent Company as collateral for its interbankborrowings amounted to ₱20.69 billion. The fair value of investment securities at amortized costpledged as collateral amounted to ₱31.86 billion as of December 31, 2019.
As of December 31, 2019 and 2018, margin deposits amounting to P=992.56 million andP=930.82 million, respectively, are deposited with various counterparties to meet the collateralrequirements for its interbank loans payable.
Trade financeAs of December 31, 2019 and 2018, trade finance consists of the Parent Company’s borrowings fromfinancial institutions using bank trade assets as the basis for borrowing foreign currency. Therefinancing amount should not exceed the aggregate amount of trade assets.
20. Accrued Interest and Other Expenses
This account consists of:
Consolidated Parent Company2019 2018 2019 2018
Accrued interest payable P=1,889,291 P=1,737,659 P=1,702,098 P=1,513,147Accrued payable for employee benefits 1,651,271 958,643 1,651,271 958,643Accrued taxes and other licenses 316,535 229,059 195,979 149,088Accrued lease payable – 198,759 – 198,759Accrued other expenses payable 264,205 718,405 100,992 522,515
P=4,121,302 P=3,842,525 P=3,650,340 P=3,342,152

- 95 -
*SGVFS039096*
21. Other Liabilities
This account consists of:
Consolidated Parent Company2019 2018 2019 2018
Financial liabilities
Lease liabilities P=3,394,925 P=– P=2,719,524 P=–
Accounts payable 3,221,353 3,426,924 2,178,540 2,248,710Expected credit losses on off−balance sheetexposures 1,239,967 1,629,150 1,229,949 1,619,131Due to PDIC 692,262 628,142 692,262 628,142Other credits−dormant 447,346 241,720 447,346 241,720Due to the Treasurer of the Philippines 435,287 386,930 416,444 378,871Acceptances payable 413,149 348,738 413,149 357,832Margin deposits 5,586 3,359 5,586 3,359Miscellaneous (Note 23) 807,734 682,487 323,284 301,701
10,657,609 7,347,450 8,426,084 5,779,466Nonfinancial liabilitiesWithholding taxes payable 341,901 325,508 296,613 270,346Retirement liabilities (Note 25) 15,191 8,686 - –
357,092 334,194 296,613 270,346P=11,014,701 P=7,681,644 P=8,722,696 P=6,049,812
Movements in the lease liabilities account follows:
2019Consolidated Parent Company
As of January 1, 2019 P=3,669,457 P=2,915,844Additions 247,311 185,549Interest expenses 265,539 207,744Payments (787,381) (589,613)Ending Balance P=3,394,925 P=2,719,524
Accounts payable includes payables to suppliers and service providers, and loan payments and othercharges received from customers in advance.
Off-balance sheet exposures (see Note 31) subject to ECL include syndicated and long-term lines. ECLfor these exposures that was recognized on January 1, 2018 amounted to P=1.67 billion for the Groupand P=1.61 billion for the Parent Company.
Miscellaneous mainly includes sundry credits, inter−office float items, and dormant deposit accounts.

- 96 -
*SGVFS039096*
22. Other Operating Income and Miscellaneous Expenses
Service Charges, Fees and CommissionsDetails of this account are as follows:
Consolidated Parent Company2019 2018 2017 2019 2018 2017
Service and collection charges:Deposits P=510,517 P=606,051 P=540,323 P=510,517 P=606,051 P=539,941Loans 806,509 303,817 276,054 46,967 47,397 34,758Remittances 315,050 330,520 311,768 315,050 330,520 311,768Others 252,254 109,290 112,725 228,734 107,652 99,116
1,884,320 1,349,677 1,240,870 1,101,268 1,091,620 985,583Fees and commissions 1,412,344 1,427,607 1,200,854 523,435 438,107 409,415
P=3,296,674 P=2,777,283 P=2,441,724 P=1,624,703 P=1,529,727 P=1,394,998
Trading and Securities Gain – NetThis account consists of:
Consolidated Parent Company2019 2018 2017 2019 2018 2017
Financial assets at FVOCI P=269,478 (P=2,104) P=– P=240,310 (P=2,451) P=–AFS financial assets – – 363,350 – – 342,146Financial assets designated at FVPL
(Note 9) – (36,766) 170,352 – (40,831) 170,352Held−for−trading (Note 9) 703,982 (224,583) (55,257) 712,910 (224,583) (112,458)Derivative assets (Note 25) (88,978) (19,827) (3,510) (115,346) (19,827) (3,510)Investment securities at amortizedcost – 11,728 – – 11,728 –
HTM financial assets – 5,025 – – 5,025P=884,482 (P=271,552) P=479,960 P=837,874 P=(275,964) P=399,760
Miscellaneous IncomeDetails of this account are as follows:
Consolidated Parent Company2019 2018 2017 2019 2018 2017
Bancassurance (Note 11) P=303,454 P=357,786 P=360,009 P=300,664 P=357,786 360,009Recovery of charged off assets 244,947 144,924 199,014 219,055 100,517 184,272Rental on bank premises 121,507 111,572 111,651 88,848 80,388 83,911Dividends (Note 9) 107,969 127,084 91,073 107,050 126,386 91,073Fund transfer fees 52,976 49,171 59,682 52,976 49,171 59,682Rental safety deposit boxes 28,987 26,341 24,933 28,987 26,341 24,825Miscellaneous income
(Notes 12, 13 and 15) 333,217 444,863 670,161 265,215 389,545 587,884
P=1,193,057 P=1,261,741 P=1,516,523 P=1,062,795 P=1,130,134 P=1,391,657
On April 11, 2017, the BTr paid the Group the final tax withheld (FWT) from the proceeds of thePoverty Eradication and Alleviation Certificates (PEACe) bonds last October 18, 2011, plus 4.00%interest per annum from October 19, 2011 to April 10, 2017. Total settlement amount were paid in theform of 3−year Retail Treasury Bonds with interest of 4.25% per annum. The settlement resulted ingain amounting to P=381.65 million and P=356.77 million for the Group and Parent Company,respectively, which is presented under ‘Miscellaneous income’ in 2017.
Miscellaneous ExpensesDetails of this account are as follows:
Consolidated Parent Company2019 2018 2017 2019 2018 2017
Information technology P=635,422 P=500,459 P=402,314 P=575,316 P=452,540 P=339,214Service charges 207,782 231,895 219,430 206,754 231,895 219,430Litigations 243,124 198,011 176,602 60,811 65,157 22,815Freight 58,397 37,593 38,909 38,911 24,352 27,953Broker’s fee 27,370 35,843 39,129 27,370 31,891 39,128Clearing and processing fee 15,331 22,024 21,252 15,331 17,355 16,320Membership fees and dues 21,525 17,756 18,642 17,369 16,260 17,160Miscellaneous expense 1,113,988 1,011,053 951,274 948,159 779,702 808,638
P=2,322,939 P=2,054,634 P=1,867,552 P=1,890,021 P=1,619,152 P=1,490,658

- 97 -
*SGVFS039096*
23. Maturity Analysis of Assets and Liabilities
The following tables present both the Group’s and Parent Company’s assets and liabilities as ofDecember 31, 2019 and 2018 analyzed according to when they are expected to be recovered or settledwithin one year and beyond one year from the respective reporting date:
Consolidated2019 2018
WithinTwelve Months
OverTwelve Months Total
WithinTwelve Months
OverTwelve Months Total
Financial assetsCash and other cash items P=16,839,755 P=– P=16,839,755 P=15,639,474 P=– P=15,639,474Due from BSP 100,174,398 – 100,174,398 101,889,773 – 101,889,773Due from other banks 9,900,642 – 9,900,642 9,455,447 – 9,455,447Interbank loans receivable and SPURA 17,036,460 – 17,036,460 11,998,040 – 11,998,040Financial assets at FVPL 17,302,294 1,197,817 18,500,111 6,273,368 1,322,894 7,596,262Financial assets at FVOCI 894,386 25,238,974 26,133,360 1,364,962 8,732,542 10,097,504Investment securities at amortized cost 5,173,756 164,116,954 169,290,710 9,893,261 163,018,876 172,912,137Loans and receivables – gross 167,801,401 410,027,636 577,829,037 166,260,382 346,629,390 512,889,772Accrued interest receivable – gross 7,434,382 – 7,434,382 6,000,736 – 6,000,736Other assets – gross 3,744,259 1,203,502 4,947,761 3,294,964 1,121,036 4,416,000
346,301,733 601,784,883 948,086,616 332,070,407 520,824,738 852,895,145Nonfinancial assetsBank premises, furniture, fixtures
and equipment − net ofaccumulated depreciation andamortization – 9,155,234 9,155,234 – 6,450,458 6,450,458
Investment properties − net ofaccumulated depreciation – 5,466,196 5,466,196 – 6,064,835 6,064,835
Deferred tax assets – 3,370,949 3,370,949 – 2,514,889 2,514,889Investments in associates – 704,169 704,169 – 335,092 335,092Intangible assets – 4,078,678 4,078,678 – 4,215,199 4,215,199Goodwill – 839,748 839,748 – 839,748 839,748Other assets – gross 1,628,844 876,221 2,505,065 1,351,634 1,211,331 2,562,965
1,628,844 24,491,195 26,120,039 1,351,634 21,631,552 22,983,186Allowance for impairment and credit losses (Note 16) (11,630,778) (9,551,150)Unearned discounts (Note 10) (349,896) (255,535)
(11,980,674) (9,806,685)P=962,225,981 P=866,071,646
Financial liabilitiesDeposit liabilities 764,810,192 10,617,669 775,427,861 682,760,286 39,363,010 722,123,296Bills payable 33,381,406 – 33,381,406 39,826,532 – 39,826,532Bonds payable 29,828,359 7,566,039 37,394,398Manager’s checks 1,998,678 – 1,998,678 2,577,175 – 2,577,175Accrued interest and other expenses* 2,153,496 – 2,153,496 2,098,994 352,335 2,451,329Derivative liabilities 1,036,052 – 1,036,052 455,150 – 455,150Derivative Contracts Designated as
Hedges 51,949 – 51,949Other liabilities 10,657,609 – 10,657,609 6,110,225 1,213,812 7,324,037
843,917,741 18,183,708 862,101,449 733,828,362 40,929,157 774,757,519Nonfinancial liabilitiesAccrued interest and other expenses 316,535 1,651,271 1,967,806 161,542 1,229,654 1,391,196Deferred tax liabilities – 1,083,378 1,083,378 – 1,231,145 1,231,145Income tax payable 540,662 – 540,662 477,585 – 477,585Other liabilities 217,076 140,016 357,092 325,508 32,102 357,610
P=844,992,014 P=21,058,373 P=866,050,387 P=734,792,997 P=43,422,058 P=778,215,055*Accrued interest and other expenses include accrued interest payable and accrued other expenses payable (Note 19).
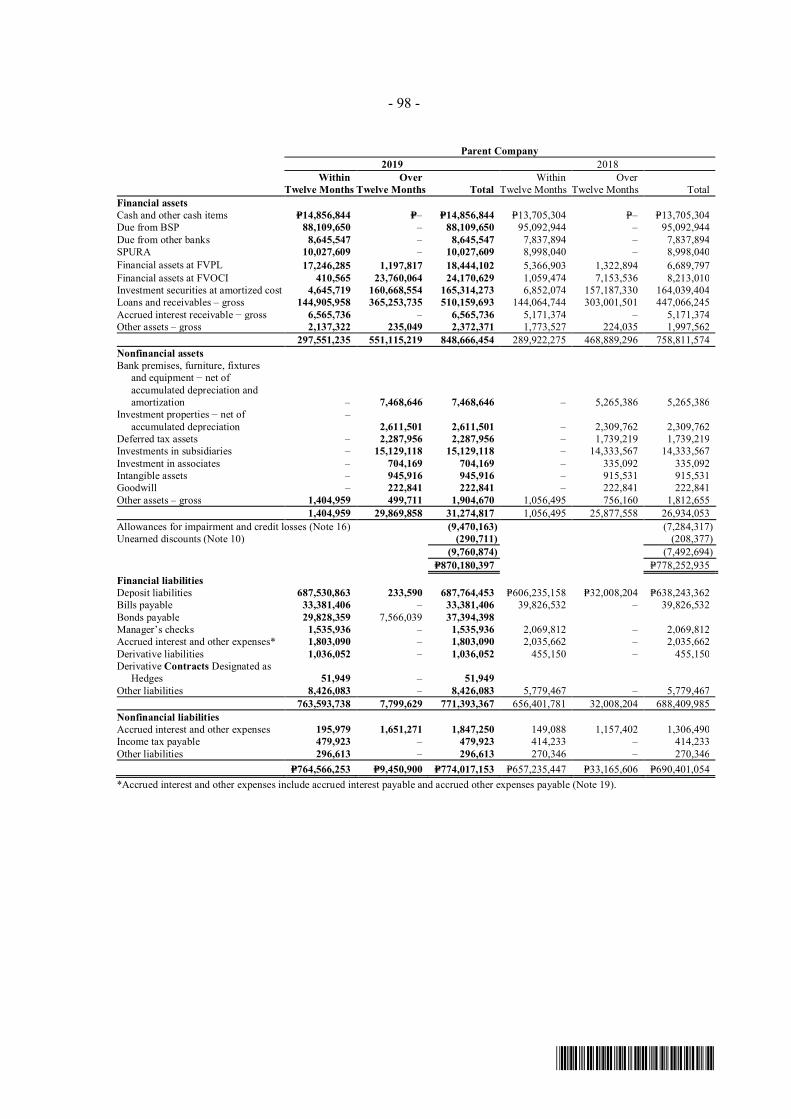
- 98 -
*SGVFS039096*
Parent Company2019 2018
WithinTwelve Months
OverTwelve Months Total
WithinTwelve Months
OverTwelve Months Total
Financial assetsCash and other cash items P=14,856,844 P=– P=14,856,844 P=13,705,304 P=– P=13,705,304Due from BSP 88,109,650 – 88,109,650 95,092,944 – 95,092,944Due from other banks 8,645,547 – 8,645,547 7,837,894 – 7,837,894SPURA 10,027,609 – 10,027,609 8,998,040 – 8,998,040Financial assets at FVPL 17,246,285 1,197,817 18,444,102 5,366,903 1,322,894 6,689,797Financial assets at FVOCI 410,565 23,760,064 24,170,629 1,059,474 7,153,536 8,213,010Investment securities at amortized cost 4,645,719 160,668,554 165,314,273 6,852,074 157,187,330 164,039,404Loans and receivables – gross 144,905,958 365,253,735 510,159,693 144,064,744 303,001,501 447,066,245Accrued interest receivable − gross 6,565,736 – 6,565,736 5,171,374 – 5,171,374Other assets – gross 2,137,322 235,049 2,372,371 1,773,527 224,035 1,997,562
297,551,235 551,115,219 848,666,454 289,922,275 468,889,296 758,811,574Nonfinancial assetsBank premises, furniture, fixtures
and equipment − net ofaccumulated depreciation andamortization – 7,468,646 7,468,646 – 5,265,386 5,265,386
Investment properties − net ofaccumulated depreciation
–2,611,501 2,611,501 – 2,309,762 2,309,762
Deferred tax assets – 2,287,956 2,287,956 – 1,739,219 1,739,219Investments in subsidiaries – 15,129,118 15,129,118 – 14,333,567 14,333,567Investment in associates – 704,169 704,169 – 335,092 335,092Intangible assets – 945,916 945,916 – 915,531 915,531Goodwill – 222,841 222,841 – 222,841 222,841Other assets – gross 1,404,959 499,711 1,904,670 1,056,495 756,160 1,812,655
1,404,959 29,869,858 31,274,817 1,056,495 25,877,558 26,934,053Allowances for impairment and credit losses (Note 16) (9,470,163) (7,284,317)Unearned discounts (Note 10) (290,711) (208,377)
(9,760,874) (7,492,694) P=870,180,397 P=778,252,935
Financial liabilitiesDeposit liabilities 687,530,863 233,590 687,764,453 P=606,235,158 P=32,008,204 P=638,243,362Bills payable 33,381,406 – 33,381,406 39,826,532 – 39,826,532Bonds payable 29,828,359 7,566,039 37,394,398Manager’s checks 1,535,936 – 1,535,936 2,069,812 – 2,069,812Accrued interest and other expenses* 1,803,090 – 1,803,090 2,035,662 – 2,035,662Derivative liabilities 1,036,052 – 1,036,052 455,150 – 455,150Derivative Contracts Designated as
Hedges 51,949 – 51,949Other liabilities 8,426,083 – 8,426,083 5,779,467 – 5,779,467
763,593,738 7,799,629 771,393,367 656,401,781 32,008,204 688,409,985Nonfinancial liabilitiesAccrued interest and other expenses 195,979 1,651,271 1,847,250 149,088 1,157,402 1,306,490Income tax payable 479,923 – 479,923 414,233 – 414,233Other liabilities 296,613 – 296,613 270,346 – 270,346
P=764,566,253 P=9,450,900 P=774,017,153 P=657,235,447 P=33,165,606 P=690,401,054*Accrued interest and other expenses include accrued interest payable and accrued other expenses payable (Note 19).
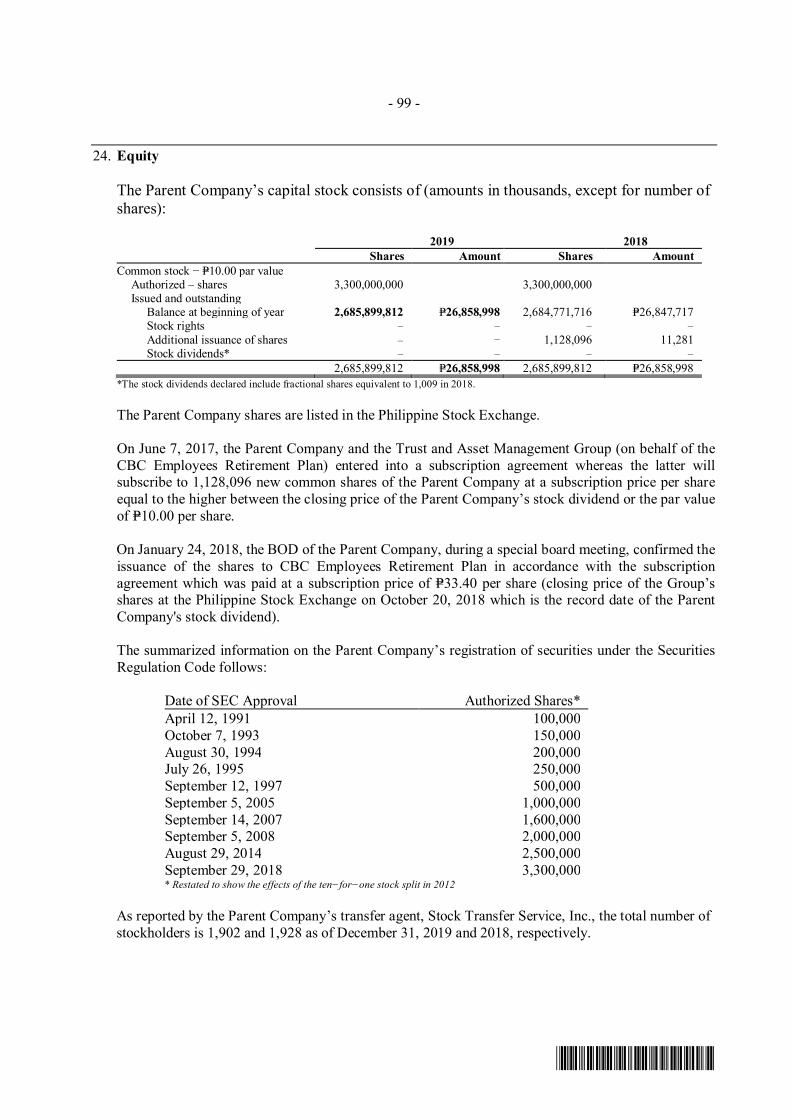
- 99 -
*SGVFS039096*
24. Equity
The Parent Company’s capital stock consists of (amounts in thousands, except for number ofshares):
2019 2018Shares Amount Shares Amount
Common stock − P=10.00 par valueAuthorized – shares 3,300,000,000 3,300,000,000Issued and outstanding
Balance at beginning of year 2,685,899,812 P=26,858,998 2,684,771,716 P=26,847,717Stock rights – – – –Additional issuance of shares – – 1,128,096 11,281Stock dividends* – – – –
2,685,899,812 P=26,858,998 2,685,899,812 P=26,858,998*The stock dividends declared include fractional shares equivalent to 1,009 in 2018.
The Parent Company shares are listed in the Philippine Stock Exchange.
On June 7, 2017, the Parent Company and the Trust and Asset Management Group (on behalf of theCBC Employees Retirement Plan) entered into a subscription agreement whereas the latter willsubscribe to 1,128,096 new common shares of the Parent Company at a subscription price per shareequal to the higher between the closing price of the Parent Company’s stock dividend or the par valueof P=10.00 per share.
On January 24, 2018, the BOD of the Parent Company, during a special board meeting, confirmed theissuance of the shares to CBC Employees Retirement Plan in accordance with the subscriptionagreement which was paid at a subscription price of P=33.40 per share (closing price of the Group’sshares at the Philippine Stock Exchange on October 20, 2018 which is the record date of the ParentCompany's stock dividend).
The summarized information on the Parent Company’s registration of securities under the SecuritiesRegulation Code follows:
Date of SEC Approval Authorized Shares*April 12, 1991 100,000October 7, 1993 150,000August 30, 1994 200,000July 26, 1995 250,000September 12, 1997 500,000September 5, 2005 1,000,000September 14, 2007 1,600,000September 5, 2008 2,000,000August 29, 2014 2,500,000September 29, 2018 3,300,000* Restated to show the effects of the ten−for−one stock split in 2012
As reported by the Parent Company’s transfer agent, Stock Transfer Service, Inc., the total number ofstockholders is 1,902 and 1,928 as of December 31, 2019 and 2018, respectively.

- 100 -
*SGVFS039096*
DividendsDetails of the Parent Company’s cash dividend payments follow:
Cash Dividends
Date of Date of Date of Cash DividendDeclaration Record Payment Per ShareMay 02, 2019 May 17, 2019 May 31, 2019 0.88May 03, 2018 May 17, 2018 June 01, 2018 0.83May 04, 2017 May 18, 2017 June 02, 2017 0.80May 05, 2016 May 23, 2016 June 03, 2016 1.00May 07, 2015 August 12, 2015 September 09, 2015 1.00May 08, 2014 September 19, 2014 October 15, 2014 1.00May 02, 2013 July 19, 2013 August 14, 2013 1.20
Stock Dividends
Date of Date of Date of Stock DividendDeclaration Record Payment Per ShareMarch 15, 2017 October 20, 2017 November 03, 2017 8%May 05, 2016 May 23, 2016 June 03, 2016 8%May 07, 2015 August 12, 2015 September 09, 2015 8%May 08, 2014 September 19, 2014 October 15, 2014 8%May 02, 2013 July 19, 2013 August 14, 2013 10%
SurplusThe computation of surplus available for dividend declaration in accordance with SEC MemorandumCircular No. 11 issued in December 2008 differs to a certain extent from the computation followingBSP guidelines.
As of December 31, 2019 and 2018, surplus includes the amount of P=1.28 billion, net of deferred taxliability of P=547.40 million, representing transfer of revaluation increment on land which was carriedat deemed cost when the Group transitioned to PFRS in 2005 (Note 12). This amount will be availableto be declared as dividends upon sale of the underlying land.
In the consolidated financial statements, a portion of the Group’s surplus corresponding to the netearnings of the subsidiaries and associates amounting to P=1.02 billion and P=1.64 billion as of December31, 2019 and 2018, respectively, is not available for dividend declaration. The accumulated equity innet earnings becomes available for dividends upon declaration and receipt of cash dividends from theinvestees.
ReservesIn compliance with BSP regulations, 10.00% of the Parent Company’s profit from trust business isappropriated to surplus reserve. This annual appropriation is required until the surplus reserves for trustbusiness equals 20.00% of the Parent Company’s authorized capital stock.
Upon adoption of PFRS 9, BSP requires appropriation of a portion of the Group’s Retained Earningsat an amount necessary to bring to at least 1% the allowance for credit losses on loans (Note 16).
Capital ManagementThe primary objectives of the Group’s capital management are to ensure that it complies with externallyimposed capital requirements and that it maintains strong credit ratings and healthy capital ratios inorder to support its business and to maximize shareholders’ value.

- 101 -
*SGVFS039096*
The Group manages its capital structure and makes adjustments to it in light of changes in economicconditions and the risk characteristics of its activities. In order to maintain or adjust the capitalstructure, the Group may adjust the amount of dividend payment to shareholders, return capital toshareholders or issue capital securities. No changes were made in the objectives, policies and processesas of December 31, 2019 and 2018.
Regulatory Qualifying CapitalUnder existing BSP regulations, the determination of the Parent Company’s compliance with regulatoryrequirements and ratios is based on the amount of the Parent Company’s unimpaired capital (regulatorycapital) as reported to the BSP. This is determined on the basis of regulatory accounting policies whichdiffer from PFRS in some respects.
In addition, the risk−based capital ratio of a bank, expressed as a percentage of qualifying capital torisk−weighted assets (RWA), should not be less than 10.00% for both solo basis (head office andbranches) and consolidated basis (Parent Company and subsidiaries engaged in financial alliedundertakings but excluding insurance companies). Qualifying capital and RWA are computed basedon BSP regulations. RWA consists of total assets less cash on hand, due from BSP, loans covered byhold−out on or assignment of deposits, loans or acceptances under letters of credit to the extent coveredby margin deposits and other non−risk items determined by the Monetary Board of the BSP.
On August 4, 2006, the BSP, under BSP Circular No. 538, issued the prescribed guidelinesimplementing the revised risk−based capital adequacy framework for the Philippine banking system toconform to Basel II capital adequacy framework. The BSP guidelines took effect on July 1, 2007.Thereafter, banks were required to compute their CAR using these guidelines.
Standardized credit risk weights were used in the credit assessment of asset exposures. Third partycredit assessments were based on ratings by Standard & Poor's, Moody's and Fitch, while PhilRatingswere used on peso−denominated exposures to Sovereigns, MDBs, Banks, LGUs, GovernmentCorporations, Corporates.
On January 15, 2013, the BSP issued Circular No. 781, Basel III Implementing Guidelines on MinimumCapital Requirements, which provides the implementing guidelines on the revisedrisk−based capital adequacy framework particularly on the minimum capital and disclosurerequirements for universal banks and commercial banks, as well as their subsidiary banks andquasi−banks, in accordance with the Basel III standards. The circular took effect on January 1, 2014.
The Circular sets out a minimum Common Equity Tier 1 (CET1) ratio of 6.00% and Tier 1 capital ratioof 7.50%. It also introduces a capital conservation buffer of 2.50% comprised of CET1 capital. TheBSP’s existing requirement for Total CAR remains unchanged at 10.00% and this ratio shall bemaintained at all times.
Further, existing capital instruments as of December 31, 2010 which do not meet the eligibility criteriafor capital instruments under the revised capital framework shall no longer be recognized as capitalupon the effectivity of Basel III. Capital instruments issued under BSP Circular Nos. 709 and 716 (thecirculars amending the definition of qualifying capital particularly on Hybrid Tier 1 and Lower Tier 2capitals), starting January 1, 2011 and before the effectivity of BSP Circular No. 781, shall berecognized as qualifying capital until December 31, 2017. In addition to changes in minimum capitalrequirements, this Circular also requires various regulatory adjustments in the calculation of qualifyingcapital.

- 102 -
*SGVFS039096*
The CAR of the Group and the Parent Company as of December 31, 2019 as reported to the BSP areshown in the table below.
Consolidated Parent Company2019 2018 2019 2018
(Amounts in Million Pesos)CET 1 Capital P=92,758 P=84,726 P=89,999 P=81,957Less: Regulatory Adjustments 11,492 10,492 19,496 17,208
81,266 74,234 70,503 64,749Additional Tier 1 Capital − − − −Less: Regulatory Adjustments − − − −
− − − −Net Tier 1 Capital 81,266 74,234 70,503 64,749Tier 2 Capital 5,799 5,659 5,118 4,982Less: Regulatory Adjustments − − − −Net Tier 2 Capital 5,799 5,659 5,118 4,982Total Qualifying Capital P=87,067 P=79,893 P=75,621 P=69,731
Consolidated Parent Company2019 2018 2019 2018
(Amounts in Million Pesos)Credit RWA P=579,653 P=565,777 P=511,015 P=498,030Market RWA 11,433 5,154 11,434 5,204Operational RWA 45,623 39,470 36,385 31,877Total RWA P=636,709 P=610,401 P=558,834 P=535,111
CET 1 capital ratio 12.76% 12.16% 12.62% 12.10%Tier 1 capital ratio 12.76% 12.16% 12.62% 12.10%Total capital ratio 13.67% 13.09% 13.53% 13.03%
The Parent Company has complied with all externally imposed capital requirements throughout theperiod.
The issuance of BSP Circular No. 639 covering the ICAAP in 2009 supplements the BSP’s risk−basedcapital adequacy framework under Circular No. 538. In compliance with this circular, the ParentCompany has adopted and developed its ICAAP framework to ensure that appropriate level and qualityof capital are maintained by the Group. Under this framework, the assessment of risks extends beyondthe Pillar 1 set of credit, market and operational risks and onto other risks deemed material by the ParentCompany. The level and structure of capital are assessed and determined in light of the ParentCompany’s business environment, plans, performance, risks and budget, as well as regulatory edicts.BSP requires submission of an ICAAP document every March 31. The Group has complied with thisrequirement.
Leverage RatioOn June 9, 2015, BSP issued circular No. 881, which approved the guidelines for the implementationof the Basel 3 Leverage Ratio in the Philippines. The Basel III Leverage Ratio is designed to act as asupplementary measure to the risk-based capital requirements. The leverage ratio intends to restrict thebuild-up of leverage in the banking sector to avoid destabilizing deleveraging processes which candamage the broader financial system and the economy. Likewise, it reinforces the risk-basedrequirements with a simple, non-risk based “backstop” measure. The Basel III leverage ratio is definedas the capital measure (the numerator) divided by the exposure measure (the denominator). Themonitoring of the leverage ratio shall be implemented as a Pillar 1 minimum requirement effective on1 July 2018.

- 103 -
*SGVFS039096*
The BLR of the Group and the Parent Company as of December 31, 2019 as reported to the BSP areshown in the table below.
Consolidated Parent Company2019 2018 2019 2018
(Amounts in Million Pesos)Tier 1 Capital P=81,266 P=74,234 P=70,503 P=64,749Exposure Measure 975,329 842,549 871,678 744,599Leverage Ratio 8.33% 8.81% 8.09% 8.70%
Liquidity Coverage RatioOn 18 February 2016, BSP issued circular no. 905 which approved the attached liquidity standards,which include guidelines on liquidity coverage ratio (LCR), and LCR disclosure standards that areconsistent with the Basel III framework. Banks are required to adopt Basel III's Liquidity CoverageRatio (LCR) aimed at strengthening the short-term liquidity position of banks. This requires banks tohave available High Quality Liquid Assets (HQLA) to meet anticipated net cash outflow for a 30-dayperiod under stress conditions. The standard prescribes that, under a normal situation, the value of theliquidity ratio be no lower than 100% on a daily basis because the stock of unencumbered HQLA isintended to serve as a defense against potential onset of liquidity stress. As of December 31, 2019 and2018, the LCR in single currency is 127.65% and 111.73%, respectively, for the Group and 126.29%and 112.79%, respectively, for the Parent Company.
Net Stable Funding RatioOn 24 May 2018, BSP issued circular no. 1007 which approved the implementing guidelines on theadoption of the Basel III Framework on Liquidity Standards - Net Stable Funding Ratio (NSFR). Banksare required to adopt Basel III's Net Stable Funding Ratio (NSFR) aimed to promote long-termresilience of banks against liquidity risk. Banks shall maintain a stable funding profile in relation tothe composition of its assets and off-balance sheet activities. The NSFR complements the LiquidityCoverage Ratio (LCR), which promotes short-term resilience of a Bank’s liquidity profile. As ofDecember 31, 2019 and 2018, the NSFR is 121.31% and 117.43%, respectively, for the Group and120.01% and 116.08%, respectively, for the Parent Company.
25. Retirement Plan
The Group has separate funded noncontributory defined benefit retirement plans covering substantiallyall its officers and regular employees. The retirement plans are administered by the Parent Company’sTrust Group which acts as the trustee of the plans. Under these retirement plans, all covered officersand employees are entitled to cash benefits after satisfying certain age and service requirements. Thelatest actuarial valuation studies of the retirement plans were made as of December 31, 2019.
The Group’s annual contribution to the retirement plan consists of a payment covering the currentservice cost, unfunded actuarial accrued liability and interest on such unfunded actuarial liability.
The amounts of net defined benefit asset in the balance sheets follow:
Consolidated Parent Company2019 2018 2019 2018
Net plan assets (Note 15) P=543,471 P=777,827 P=499,711 P=756,159Retirement liabilities (Note 21) (15,191) (8,686) – –
P=528,280 P=769,141 P=499,711 P=756,159

- 104 -
*SGVFS039096*
The movements in the defined benefit asset, present value of defined benefit obligation and fair value of plan assets follow:
Consolidated2019
Remeasurements in OCI
January 1,2019
Net benefit cost
Benefitspaid
Return onplan assets(excluding
amountincluded
in net interest)
Actuarialchanges arising
fromexperience
adjustments
Actuarialchanges arising
from changesin financial
assumptions
Changes inremeasurement
gains (losses)Contributionby employer
December 31,2019
Currentservice cost Net interest
Net pensionexpense*
Actuarialchanges arising
from changesin demographic
assumptions
(a) (c) (d) (e) = c + d (f) (g) (h) (i) (j) = g + h + i (k)(l) = a + b + e +
f + j + kFair value of plan assets P=4,859,249 P=- P=347,965 P=347,965 (P=307,702) (P=188,983) P=– P=– P=– (P=188,983) P=629,871 P=5,340,401Present value of defined
benefit obligation 4,090,108 398,065 292,955 691,020 (307,702) – (48,548) 830,609 (443,366) 338,695 – 4,812,121Net defined benefit asset P=769,141 (P=398,065) P=55,010 (P=343,055) – (P=188,983) P=48,548 (P=830,609) P=443,366 (P=527,678) P=629,871 528,280*Presented under Compensation and fringe benefits in the statements of income.
Consolidated2018
Remeasurements in OCI
January 1,2019
Net benefit cost
Benefitspaid
Return onplan assets(excluding
amountincluded
in net interest)
Actuarialchanges arising
fromexperience
adjustments
Actuarialchanges arising
from changesin financial
assumptions
Changes inremeasurement
gains (losses)Contributionby employer
December 31,2019
Currentservice cost Net interest
Net pensionexpense*
Actuarialchanges arising
from changesin demographic
assumptions
(a) (c) (d) (e) = c + d (f) (g) (h) (i) (j) = g + h + i (k)(l) = a + b + e +
f + j + kFair value of plan assets P=4,868,423 P=− P=272,914 P=272,914 P= (275,805) P= (619,071) P=− P=− P= (619,071) P=612,788 P=4,859,249Present value of defined
benefit obligation 3,992,824 431,972 223,936 655,907 (275,805) − 38,390 P= (321,209) (282,819) 4,090,108Net defined benefit asset P=875,599 P= (431,972) P=382,993 P= (382,994) − P= (619,071) P= (38,390) P=321,209 P= (336,252) P=612,788 P=769,141*Presented under Compensation and fringe benefits in the statements of income.

- 105 -
*SGVFS039096*
Parent Company2019
Remeasurements in OCI
January 1,2019
Net benefit costBenefits
paid
Return onplan assets(excluding
amountincluded
in net interest)
Actuarialchanges
arisingfrom
experienceadjustments
Actuarialchanges
arisingfrom changes
in financialassumptions
Actuarialchanges
arising fromchanges in
demographicAssumptions
Changes inremeasureme
ntgains (losses)
Contributionby employer
December 31,2019
Currentservice cost Net interest
Net pensionexpense*
Transfer fromAffiliates
(a) (c) (d) (e) = c + d (f) (g) (h) (i) (j) (k) =f+g+h+i (l)
(m) = a + b + e+ f
+ j + kFair value of plan assets P=4,467,637 P=– P=319,436 P=319,436 P=– (P=286,575) (P=196,884) P=– P= P=– (P=196,884) P=480,000 P=4,783,615Present value of defined
benefit obligation 3,711,477 311,538 265,378 576,916 260 (286,575) – (29,515) 650,700 (339,360) 281,826 4,283,904Net defined benefit asset P=756,160 (P=311,538) P=54,058 (P=257,480) (P=260) P=– (P=196,884) P=29,515 (P=650,700) P=339,360 (P=478,710) P=480,000 P=499,711*Presented under Compensation and fringe benefits in the statements of income.
Parent Company2018
Remeasurements in OCI
January 1,2019
Net benefit costBenefits
paid
Return onplan assets(excluding
amountincluded
in net interest)
Actuarialchanges arising
fromexperience
adjustments
Actuarialchanges arising
from changesin financial
assumptions
Changes inremeasurement
gains (losses)Contributionby employer
December 31,2019
Currentservice cost Net interest
Net pensionexpense*
(a) (c) (d) (e) = c + d (f) (g) (h) (i) (j) = g + h + i (k)(l) = a + b + e + f
+ j + kFair value of plan assets P=4,558,199 P=− P=255,259 P=255,259 P= (235,193) P= (590,629) P=− P=− P= (590,629) P=480,000 P=4,467,637Present value of defined
benefit obligation 3,566,814 324,756 199,742 324,956 (235,193) − 97,785 (245,646) (147,861) − 3,711,477Net defined benefit asset P=991,386 P= (324,756) P=55,517 P= (69,697) P=− P= (590,629) P=97,785 P=245,646 P= (442,768) P=480,000 P=756,160*Presented under Compensation and fringe benefits in the statements of income.

- 106 -
*SGVFS039096*
The Group and the Parent Company is recommended to contribute to its defined benefit pension planin 2020 amounting to P=134.13 million and P=30.15 million, respectively.
In 2019 and 2018, the major categories of plan assets as a percentage of the fair value of total planassets are as follows:
Consolidated Parent Company2019 2018 2019 2018
Parent Company shares (Note 30) 25.06% 31.54% 28.58% 33.76%Equity instruments 3.85% 23.83% 3.21% 21.76%Cash and cash equivalents 0.99% 10.17% 0.82% 9.07%Debt instruments 61.76% 19.39% 63.48% 19.39%Other assets 7.80% 15.08% 3.91% 16.03%
100.00% 100.00% 100.00% 100.00%
The following table shows the breakdown of fair value of the plan assets:
Consolidated Parent Company
2019 2018 2019 2018Deposits in banks P=52,757 P=560,672 P=39,407 P=399,395Financial assets at FVPL
Quoted debt securities 2,981,233 – 2,754,412 –Quoted equity securities 205,620 868,381 153,330 839,145Parent Company shares 1,367,210 – 1,367,210 –Investments in unit investment
trust fund316,929 – 282,059 –
Financial assets at FVOCIQuoted debt securities – 977,735 – 832,834Quoted equity securities – 46,101 – 15,023Parent Company shares – 1,487,360 – 1,487,360
Investments in unit investmenttrust fund
– 160,762 – 117,097
Corporate bonds – 8,750 – 8,750Loans and receivable 1,921 523,483 1,921 520,663Investment properties* 162,323 162,323 162,323 162,323Other assets 252,409 63,144 22,952 23,019
P=5,340,402 P=4,858,711 P=4,783,614 P=4,405,609 * Investment properties comprise properties located in Manila.
The carrying value of the plan assets of the Group and Parent Company amounted toP=5.34 billion and P=4.81 billion, respectively, as of December 31, 2019, and P=4.78 billion andP=4.41 billion, respectively, as of December 31, 2019
The principal actuarial assumptions used in 2019 and 2018 in determining the retirement asset (liability)for the Group’s and Parent Company’s retirement plans are shown below:
2019
Parent CBSI CIBI CBC−PCCI CBCC CBSC
Discount rate:January 1 7.15% 7.27% 7.33% 7.33% 7.38% 7.40%December 31 4.36% 4.47% 4.47% 4.76% 4.30% 4.24%
Salary increase rate 6.00% 6.00% 6.00% 6.00% 6.00% 6.00%
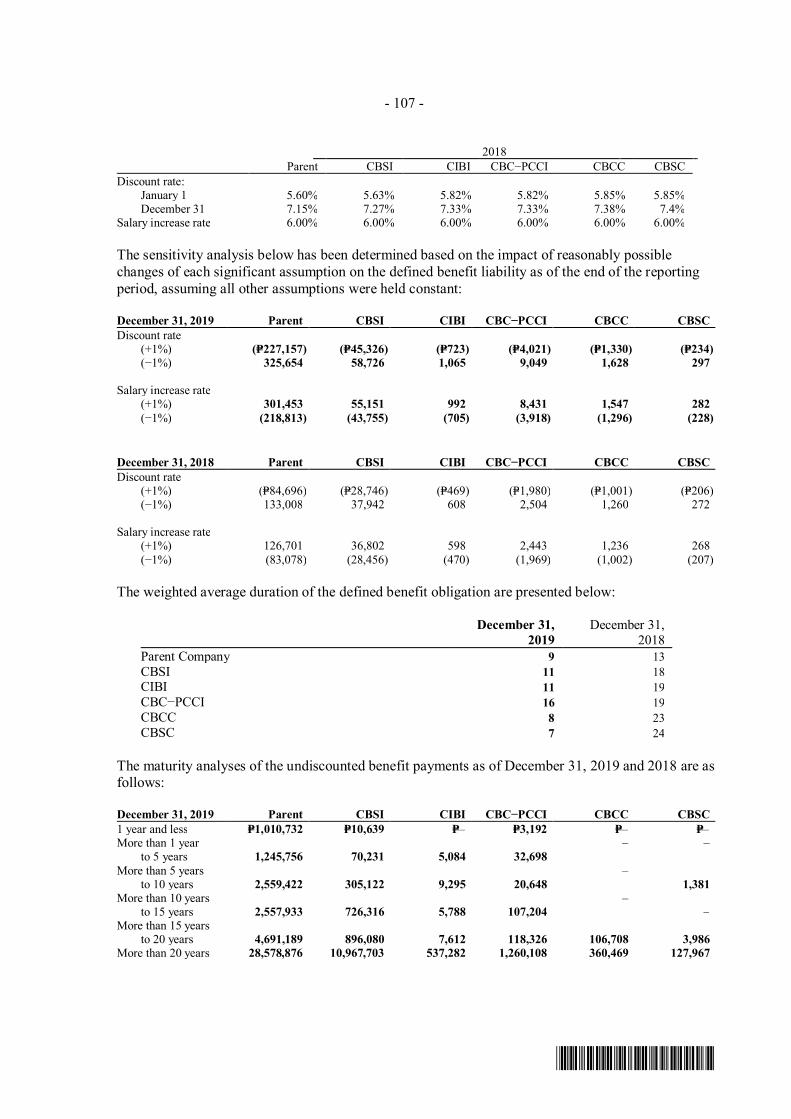
- 107 -
*SGVFS039096*
2018Parent CBSI CIBI CBC−PCCI CBCC CBSC
Discount rate:January 1 5.60% 5.63% 5.82% 5.82% 5.85% 5.85%December 31 7.15% 7.27% 7.33% 7.33% 7.38% 7.4%
Salary increase rate 6.00% 6.00% 6.00% 6.00% 6.00% 6.00%
The sensitivity analysis below has been determined based on the impact of reasonably possiblechanges of each significant assumption on the defined benefit liability as of the end of the reportingperiod, assuming all other assumptions were held constant:
December 31, 2019 Parent CBSI CIBI CBC−PCCI CBCC CBSCDiscount rate
(+1%) (P=227,157) (P=45,326) (P=723) (P=4,021) (P=1,330) (P=234)(−1%) 325,654 58,726 1,065 9,049 1,628 297
Salary increase rate (+1%) 301,453 55,151 992 8,431 1,547 282
(−1%) (218,813) (43,755) (705) (3,918) (1,296) (228)
December 31, 2018 Parent CBSI CIBI CBC−PCCI CBCC CBSCDiscount rate
(+1%) (P=84,696) (P=28,746) (P=469) (P=1,980) (P=1,001) (P=206)(−1%) 133,008 37,942 608 2,504 1,260 272
Salary increase rate (+1%) 126,701 36,802 598 2,443 1,236 268
(−1%) (83,078) (28,456) (470) (1,969) (1,002) (207)
The weighted average duration of the defined benefit obligation are presented below:
December 31,2019
December 31,2018
Parent Company 9 13CBSI 11 18CIBI 11 19CBC−PCCI 16 19CBCC 8 23CBSC 7 24
The maturity analyses of the undiscounted benefit payments as of December 31, 2019 and 2018 are asfollows:
December 31, 2019 Parent CBSI CIBI CBC−PCCI CBCC CBSC1 year and less P=1,010,732 P=10,639 P=– P=3,192 P=– P=–More than 1 year
to 5 years 1,245,756 70,231 5,084 32,698– –
More than 5 yearsto 10 years 2,559,422 305,122 9,295 20,648
–1,381
More than 10 yearsto 15 years 2,557,933 726,316 5,788 107,204
––
More than 15 yearsto 20 years 4,691,189 896,080 7,612 118,326 106,708 3,986
More than 20 years 28,578,876 10,967,703 537,282 1,260,108 360,469 127,967

- 108 -
*SGVFS039096*
December 31, 2018 Parent CBSI CIBI CBC−PCCI CBCC CBSC1 year and less P=1,020,830 P=9,552 P=1,578 P=538 P=– P=–More than 1 year
to 5 years 1,112,345 81,367 1,306 17,652 – –More than 5 years
to 10 years 2,349,644 210,666 10,410 36,531 5,015 –More than 10 years
to 15 years 2,537,302 715,066 5,796 54,937 – –More than 15 years
to 20 years 4,117,126 972,734 – 141,549 103,091 3,741More than 20 years 27,553,459 11,606,160 455,722 1,097,718 381,490 182,074
26. Derivative Financial Instruments
Occasionally, the Parent Company enters into forward exchange contracts as an accommodation to itsclients. These derivatives are not designated as accounting hedges.
As of December 31, 2019 and 2018, the aggregate notional amount of outstanding forwards and itsweighted average rate are as follows:
2019 2018 NotionalAmount
WeightedAverage Rate
NotionalAmount
WeightedAverage Rate
US DollarBuy $548,790 ₱51.52 $515,771 ₱53.52Sell $297,009 ₱51.10 $313,379 ₱51.41
EuroBuy €29,000 ₱56.56 €127,100 ₱59.95Sell €17,709 ₱55.88 – –
Japanese YenBuy ¥2,189,180 ₱0.46 – –
Singapore DollarSell SGD541 ₱37.66 – –
The aggregate notional amounts of the outstanding buy US Dollar NDF as of December 31, 2019 and2018 amounted to nil and US$40.00 million, respectively. The weighted average buy NDF rate as ofDecember 31, 2018 is P=52.93.
The aggregate notional amounts of the outstanding Futures as of December 31, 2019 and December 31,2018 amounted to US$40 million and US$5 million, respectively.
The aggregate notional amounts of the outstanding IRS as of December 31, 2019 and 2018 amountedto P=26.524 billion and P=11.366 billion, respectively.
As of December 31, 2019 and 2018, the fair values of derivatives follow:
2019 2018Derivative
AssetDerivative
LiabilityDerivative
AssetDerivative
LiabilityCurrency forwards P=113,384 P=425,976 P=339,190 P=362,689IRS 528,238 610,077 58,390 90,530Futures 16,439 – – 1,931Warrants 9,889 – 10,268 –
P=667,950 P=1,036,053 P=407,848 P=455,150

- 109 -
*SGVFS039096*
Fair Value Changes of DerivativesThe net movements in fair value changes of derivative instruments are as follows:
2019 2018Balance at beginning of year (P=47,303) P=66,053Fair value changes during the year 326,366 (288,211)Settled transactions (647,167) 174,855Balance at end of year (P=368,104) (P=47,303)
The net movements in the value of the derivatives are presented in the statements of income under thefollowing accounts:
2019 2018 2017Foreign exchange gain (loss) (P=289,093) (P=82,585) P=96,401
Trading and securities gain (loss)* (Note 21) (31,708)(30,771) (3,437)
P=(320,801) P=(113,356) P=92,964*Net movements in the value related to embedded credit derivatives and IRS.
In 2019, the Parent Company established a monitoring process to properly account for the netmovements in the value of foreign exchange contracts which pertain to funding and trading activities.
Funding activities pertain to activities undertaken by the Parent Company to obtain funds in onecurrency in exchange of another currency through the use of foreign exchange derivatives. For the yearended December 31, 2019, the account "Foreign exchange gains (losses)" in the statement of incomeconsisted of the net movements in the value of foreign exchange contracts amounting toP=402.93 million loss and P=646.69 million gain for funding and trading activities, respectively.
Derivative contracts designated as hedgesIn 2019, the Parent Company designated an interest rate swap contract (IRS) to hedge the cash flowvariability of its floating rate bonds payable As of December 31, 2019, the fair value of the IRSdesignated as a hedging instrument amounted to P=51.95 million with a notional amount of US$150.00million.
The IRS designated as cash flow hedges has the same principal terms as the hedged bonds payable(Note 18). Accordingly, as of December 31, 2019, the Parent Company assessed that the hedgingrelationship is expected to be highly effective and no ineffective portion was recognized in profit orloss.
Net interest income on the derivative liabilities designated as hedges amounted to P=14.27 million in2019. Also, in 2019, the amount of gain or loss reclassified from the cash flow hedge reserve to profitor loss under net interest income amounted to P=0.50 million.
27. Lease Contracts
The lease contracts are for periods ranging from one to 25 years from the dates of contracts and arerenewable under certain terms and conditions. Various lease contracts include escalation clauses, mostof which bear an annual rent increase of 5.00% to 10.00%.

- 110 -
*SGVFS039096*
Annual rentals on these lease contracts included in ‘Occupancy cost’ in the statements of income in2018 and 2017 amounted to P=844.24 million and P=782.30 million, respectively, for the Group, andP=541.24 million and P=518.47 million, respectively, for the Parent Company.
As of December 31, 2018, future minimum rentals payable of the Group and the Parent Company undernon−cancelable operating leases follow:
Consolidated Parent CompanyWithin one year P=578,761 P=564,852After one year but not more than five years 2,402,298 1,951,017After five years 1,743,518 1,338,024
P=4,724,577 P=3,853,894
The Group and the Parent Company have also entered into commercial property leases on its investmentproperties (Note 13).
Future minimum rentals receivable under noncancellable operating leases follow:
Consolidated Parent Company2019 2018 2019 2018
Within one year P=6,146 P=10,906 P=6,146 P=9,068After one year but not more
than five years 12,705 19,688 8,162 13,202After more than five years 13,518 15,466 − −
P=32,369 P=46,060 P=14,308 P=22,270
28. Income and Other Taxes
Income taxes include corporate income tax and FCDU final taxes, as discussed below, and final taxpaid at the rate of 20.00% on gross interest income from government securities and other depositsubstitutes. These income taxes, as well as the deferred tax benefits and provisions, are presented as‘Provision for income tax’ in the statements of income.
Republic Act (RA) No. 9337, An Act Amending National Internal Revenue Code, provides that RCITrate shall be 30.00% while interest expense allowed as a deductible expense is reduced to 33.00% ofinterest income subject to final tax.
An MCIT of 2.00% on modified gross income is computed and compared with the RCIT. Any excessMCIT over RCIT is deferred and can be used as a tax credit against future income tax liability forthe next three years. In addition, the NOLCO is allowed as a deduction from taxable income in thenext three years from the year of inception.
Effective in May 2004, RA No. 9294 restored the tax exemption of FCDUs and offshore banking units(OBUs). Under such law, the income derived by the FCDU from foreign currency transactions withnonresidents, OBUs, local commercial banks including branches of foreign banks is tax−exempt whileinterest income on foreign currency loans from residents other than OBUs or other depository banksunder the expanded system is subject to 10.00% gross income tax.
Interest income on deposit placements with other FCDUs and OBUs is taxed at 7.50% (now 15%effective January 1, 2018), while all other income of the FCDU is subject to the 30.00% corporate tax.

- 111 -
*SGVFS039096*
Relevant Tax UpdatesRepublic Act 10963, The Tax Reform for Acceleration and Inclusion (TRAIN), is first package of thecomprehensive tax reform program of the government. The bill was signed into law onDecember 19, 2018 and took effect on January 1, 2018, amending some provisions of the old Philippinetax system.
Except for resident foreign corporations, which is still subject to the existing rate of 7.5%, tax on interestincome of foreign currency deposit was increased to 15% under TRAIN. Documentary stamp tax onbank checks, drafts, certificate of deposit not bearing interest, all debt instruments, bills of exchange,letters of credit, mortgages, deeds and others are now subjected to a higher rate.
RR 4-2011On March 15, 2011, the Bureau of Internal Revenue (BIR) issued Revenue Regulations (RR) No.4−2011 which prescribed the attribution and allocation of expenses between FCDUs/EFCDUs or OBUand RBU and within RBU.
On April 6, 2015, the Bank and other member banks of the Bankers Association of the Philippines(BAP), filed a Petition for Declaratory Relief with Application for Temporary Restraining Order (TRO)and/or Writ of Preliminary Injunction with the Regional Trial Court of Makati (Makati Trial Court).Further, in Civil Case No. 15-287, the Bank and other BAP member banks assailed the validity of RR4-2011 on the ground, among others, that (a) the RR violates the petitioner-banks substantive dueprocess rights; (b) it is not only illegal but also unfair; (c) that it serves as a deterrent to banks to investin capital market transactions to the prejudice of the economy; (d) it sets a dangerous precedent for thedisallowance of full deductions due to the prescribes method of allocation; and (e) it violates the equalprotection clause of the Constitution.
On April 8, 2015, the Makati Trial Court issued a TRO enjoining the BIR from enforcing RR 4-2011.Also, on April 25, 2015, Makati Trial Court issued a Writ of Preliminary Injunction enjoining the BIRfrom enforcing, carrying out, or implementing in any way or manner RR 4-2011 against the Bank andother BAP member banks, including issuing Preliminary Assessment Notice or Final AssessmentNotice against them during the pendency of the litigation, unless sooner dissolved.
On June 10, 2015, the Makati Trial Court issued a Confirmatory Order stating that the TRO and Writof Preliminary Injunction also prohibits the BIR from ruling or deciding on any administrative matterpending before it in relation to the subject revenue regulations and insofar as the Bank and other BAPmember banks are concerned.
On May 25, 2019, the Makati Trial Court issued a decision annulling RR 4-2011 and making the Writof Preliminary Injunction permanent.
Current tax regulations also provide for the ceiling on the amount of entertainment, amusement andrecreation (EAR) expense that can be claimed as a deduction against taxable income. Under theregulations, EAR expense allowed as a deductible expense is limited to the actual EAR paid or incurredbut not to exceed 1.00% of the Parent Company’s net revenue.

- 112 -
*SGVFS039096*
The provision for income tax consists of:
Consolidated Parent Company2019 2018 2017 2019 2018 2017
CurrentFinal tax P=1,420,644 P=908,756 P=677,450 1,402,657 P=836,560 P=607,136RCIT 962,712 1,070,191 977,968 680,187 926,792 829,109
MCIT − 46,051 − − − −2,383,356 2,024,998 1,655,418 2,082,844 1,763,352 1,436,245
Deferred (870,707) 246,424 (166,241) (405,124) 495,882 206,239P=1,512,649 P=2,271,422 P=1,489,177 P=1,677,720 P=2,259,234 P=1,642,484
The details of net deferred tax assets (liabilities) follow:
Consolidated Parent Company2019 2018 2019 2018
Net deferred tax assets on:Allowance for impairment and
credit losses P=3,670,628 P=2,806,637 P=2,845,003 P=2,340,436Revaluation Increment on land
(Notes 11 and 22) (547,405) (547,405) (547,405) (547,405)Fair value adjustments on asset
foreclosure and daciontransactions - net of depreciatedportion 271,947 346,238 23,376 25,437
Net defined benefit asset (166,955) (243,812) (151,420) (228,277)Others 142,734 151,231 118,402 149,029
P=3,370,949 P=2,514,889 P=2,287,956 P=1,739,220
Deferred tax liabilities of the Group arose mainly from fair value adjustments related to theacquisition of PDB and Unity Bank.
The Group did not set up deferred tax assets on the following temporary differences as it believes thatit is highly probable that these temporary differences will not be realized in the near foreseeablefuture:
Consolidated Parent Company2019 2018 2019 2018
Allowance for impairment and creditlosses P=1,684,183 P=2,809,469 P=− P=163,062
Accrued compensated absences 57,182 − − −NOLCO − 329,959 − −Excess of MCIT over RCIT 83,204 46,122 − −Others 34,065 34,572 − −
P=1,858,634 P=3,220,122 P=− P=163,062

- 113 -
*SGVFS039096*
As of December 31, 2019, details of the Subsidiary’s NOLCO are as follows:
Inception YearOriginalAmount
UsedAmount
ExpiredAmount
RemainingBalance
ExpiryYear
2016 P=− P=− P=− P=− 20162017 − − − − 20172018 288,559 288,559 − − 20182019 − − − − 2019
P=288,559 P=288,559 P=− P=−
As of December 31, 2019, details of the excess of MCIT over RCIT of the Subsidiary follow:
InceptionYear
OriginalAmount
UsedAmount
ExpiredAmount
RemainingBalance
ExpiryYear
2016 P=35,414 P=35,313 P=101 P=− 20162017 − − − − 20172018 46,643 − − 46,643 20182019 36,560 − − 36,560 2019
P=118,618 P=35,313 P=101 P=83,204
The reconciliation of the statutory income tax to the provision for income tax follows:
Consolidated Parent Company2019 2018 2017 2019 2018 2017
Statutory income tax P=3,476,286 P=3,116,258 P=2,703,632 P=3,524,004 P=3,110,883 P=2,746,937Tax effects of FCDU income (730,776) (250,305) (498,029) (714,703) (252,809) (496,062)
Non−taxable income (690,059) (984,372) (939,179) (1,458,268) (895,392) (837,850) Interest income
subjected to final tax (1,609,292) (318,857) (279,914) (622,878) (276,675) (266,103)
Nondeductible expenses 1,439,020 827,904 771,915 1,244,697 676,253 612,065Others (372,530) (119,204) (269,248) (295,132) (103,027) (116,503)
Provision for income tax P=1,512,649 P=2,271,424 P=1,489,177 P=1,677,720 P=2,259,223 P=1,642,484
29. Trust Operations
Securities and other properties (other than deposits) held by the Parent Company in fiduciary or agencycapacities for clients and beneficiaries are not included in the accompanying balance sheets since theseare not assets of the Parent Company (Note 31).
In compliance with the requirements of current banking regulations relative to the Parent Company’strust functions : (a) government bonds included under HFT financial assets and financial assets atFVOCI with total face value of P=1.87 billion and P=1.78 billion as of December 31, 2019 and 2018,respectively, are deposited with the BSP as security for the Parent Company’s faithful compliance withits fiduciary obligations (Note 9); and (b) a certain percentage of the Parent Company’s trust fee incomeis transferred to surplus reserve. This yearly transfer is required until the surplus reserve for trustfunction equals 20.00% of the Parent Company’s authorized capital stock.
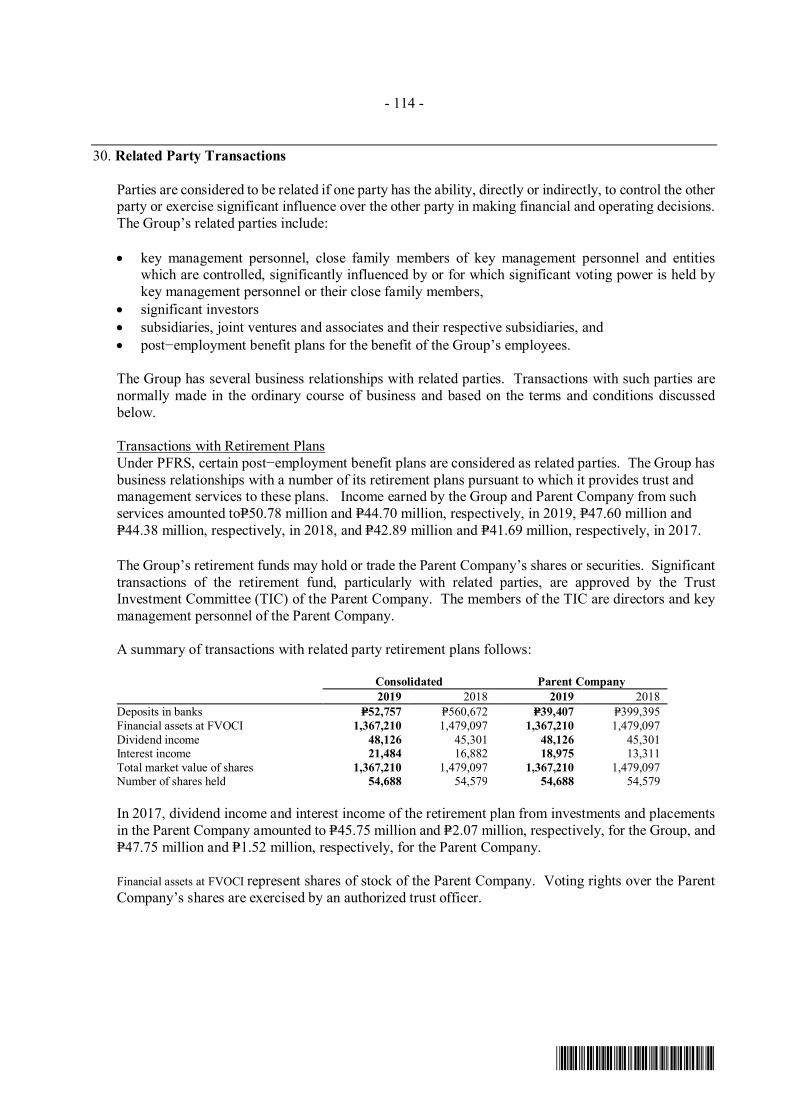
- 114 -
*SGVFS039096*
30. Related Party Transactions
Parties are considered to be related if one party has the ability, directly or indirectly, to control the otherparty or exercise significant influence over the other party in making financial and operating decisions.The Group’s related parties include:
· key management personnel, close family members of key management personnel and entitieswhich are controlled, significantly influenced by or for which significant voting power is held bykey management personnel or their close family members,
· significant investors· subsidiaries, joint ventures and associates and their respective subsidiaries, and· post−employment benefit plans for the benefit of the Group’s employees.
The Group has several business relationships with related parties. Transactions with such parties arenormally made in the ordinary course of business and based on the terms and conditions discussedbelow.
Transactions with Retirement PlansUnder PFRS, certain post−employment benefit plans are considered as related parties. The Group hasbusiness relationships with a number of its retirement plans pursuant to which it provides trust andmanagement services to these plans. Income earned by the Group and Parent Company from suchservices amounted toP=50.78 million and P=44.70 million, respectively, in 2019, P=47.60 million andP=44.38 million, respectively, in 2018, and P=42.89 million and P=41.69 million, respectively, in 2017.
The Group’s retirement funds may hold or trade the Parent Company’s shares or securities. Significanttransactions of the retirement fund, particularly with related parties, are approved by the TrustInvestment Committee (TIC) of the Parent Company. The members of the TIC are directors and keymanagement personnel of the Parent Company.
A summary of transactions with related party retirement plans follows:
Consolidated Parent Company2019 2018 2019 2018
Deposits in banks P=52,757 P=560,672 P=39,407 P=399,395Financial assets at FVOCI 1,367,210 1,479,097 1,367,210 1,479,097Dividend income 48,126 45,301 48,126 45,301Interest income 21,484 16,882 18,975 13,311Total market value of shares 1,367,210 1,479,097 1,367,210 1,479,097Number of shares held 54,688 54,579 54,688 54,579
In 2017, dividend income and interest income of the retirement plan from investments and placementsin the Parent Company amounted to P=45.75 million and P=2.07 million, respectively, for the Group, andP=47.75 million and P=1.52 million, respectively, for the Parent Company.
Financial assets at FVOCI represent shares of stock of the Parent Company. Voting rights over the ParentCompany’s shares are exercised by an authorized trust officer.

- 115 -
*SGVFS039096*
Remunerations of Directors and other Key Management PersonnelKey management personnel are those persons having authority and responsibility for planning,directing and controlling the activities of the Group, directly or indirectly. The Group considers themembers of the ManCom to constitute key management personnel for purposes of PAS 24.
Total remunerations of key management personnel are as follows:
Consolidated Parent Company2019 2018 2017 2019 2018 2017
Short−term employee benefits P=550,767 P=533,995 P=482,345 P=468,271 P=441,361 P=408,311Post−employment benefits 5,395 5,064 2,501 4,718 4,418 2,501
P=556,162 P=539,059 P=484,846 P=472,989 P=445,779 P=410,812
Members of the BOD are entitled to a per diem of P=500.00 for attendance at each meeting of the Boardor of any committees and to four percent (4.00%) of the Parent Company’s net earnings, with certaindeductions in accordance with BSP regulation. Non−executive directors do not receive anyperformance−related compensation. Directors’ remuneration covers all Parent Company’s Boardactivities and membership of committees and subsidiary companies.
The Group also provides banking services to directors and other key management personnel andpersons connected to them. These transactions are presented in the tables below.
Other Related Party TransactionsTransactions between the Parent Company and its subsidiaries meet the definition of related partytransactions. Transactions between the Group and its associated companies also qualify as related partytransactions. Details of the Parent Company’s subsidiaries and associate are disclosed inNotes 1 and 10.
GroupRelated party transactions of the Group by category of related party are presented below.
December 31, 2019Category Amount / Volume Outstanding Balance Terms and ConditionsSignificant InvestorLoans and receivables P=– P=2,345,300 Partially secured Loans with interest rate
of 2 − 5.12% and maturity of two toseven years.
Issuances – –Repayments (4,421,200) –
Deposit liabilities – 1,496 These are checking accounts with annualaverage rate of 0.13%.Deposits 1,123 –
Withdrawals – –AssociateDeposit liabilities – 300,620 These are savings accounts with annual
average interest rates ranging from0.25% to 1.00%.
Deposits 666,996 –Withdrawals (532,748) –
Key Management PersonnelLoans and receivables – 427 Unsecured Officer's accounts from
Credit card with interest of 3% andcurrently maturing and Fully securedOEL accounts with interest of6%;Secured; no impairment; withannual fixed interest rates rangingfrom 0% to 5.50%
Issuances – –Repayments (61) –
Deposit liabilities – 78,763 These are checking, savings and timedeposits with annual average interestrates ranging from 0.25% to 1.00%.
Deposits 255,582 –Withdrawals (257,836) –
Other Related PartiesDeposit liabilities – 389,714 These are checking and savings accounts
with annual average interest ratesranging from 0.13% to 1.00%.
Deposits 22,632,109 –Withdrawals (22,523,755) –

- 116 -
*SGVFS039096*
December 31, 2018Category Amount / Volume Outstanding Balance Terms and ConditionsSignificant InvestorLoans and receivables P=6,766,500 Partially secured Loans with interest rate
of 2 − 5.12% and maturity of two toseven years.
Issuances P=86,125,000Repayments (2,350,000)
Deposit liabilities 374 These are checking accounts with annualaverage rate of 0.13%.Deposits 2,532,609
Withdrawals (2,532,493)AssociateDeposit liabilities 166,372 These are savings accounts with annual
average interest rates ranging from0.25% to 1.00%.
Deposits 487,691Withdrawals (399,123)
Key Management PersonnelLoans and receivables 488 Unsecured Officer's accounts from
Credit card with interest of 3% andcurrently maturing and Fully securedOEL accounts with interest of6%;Secured; no impairment; withannual fixed interest rates rangingfrom 0% to 5.50%
Issuances 388Repayments (39,213)
Deposit liabilities 79,241 These are checking, savings and timedeposits with annual average interestrates ranging from 0.25% to 1.00%.
Deposits 406,225Withdrawals (350,120)
Other Related PartiesDeposit liabilities 238,933 These are checking and savings accounts
with annual average interest ratesranging from 0.13% to 1.00%.
Deposits 35,337,503Withdrawals (35,165,054)
Interest income earned and interest expense incurred from the above loans and deposit liabilities in2019, 2018, and 2017 follow:
Significant Investor Associate2019 2018 2017 2019 2018 2017
Interest income P=46,906 P=42,601 P=169,706 P=– P=– P=–Interest expense 2 3 61 655 168 1,849
Key Management Personnel Other Related Parties2019 2018 2017 2019 2018 2017
Interest income P=26 P=7,921 P=17,102 P=– P=– P=–
Interest expense 1,952 2,121 47 2,376 2,129 69
Related party transactions of the Group with significant investor, associate and other related partiespertain to transactions of the Parent Company with these related parties.
Parent CompanyRelated party transactions of the Parent Company by category of related party, except those alreadypresented in the Group disclosures, are presented below.
December 31, 2019Category Amount / Volume Outstanding Balance Nature, Terms and ConditionsSignificant InvestorLoans and receivables 2,345,300.00Partially secured Loans with interest rate of 2 - 5.25%
and maturity of two to seven years.IssuancesRepayments (4,421,200.00)
Deposit liabilities P=1.496These are checking accounts with annual average rateof 0.13%.Deposits P=1,123
WithdrawalsSubsidiariesDeposit liabilities 481,247 These are checking and savings accounts with annual
average interest rates ranging from 0.13% to 1.00%.Deposits 3,673,806Withdrawals (3,306,898)
AssociateDeposit liabilities 300,538 These are savings accounts with annual
average interest rates ranging from0.25% to 1.00%.Deposits 666,995Withdrawals (532,748)
(Forward)

- 117 -
*SGVFS039096*
December 31, 2019Category Amount / Volume Outstanding Balance Nature, Terms and ConditionsKey Management PersonnelLoans and receivables 426.50Unsecured Officer's accounts from Credit card with
interest of 3% and currently maturing and Fullysecured OEL accounts with interest of 6%
IssuancesRepayments (61.14)
Deposit liabilities 27,009 These are savings account with annual average interestrates ranging from 0.25% to 1.00%.Deposits 229,243
Withdrawals (216,803)Other Related PartiesDeposit liabilities 168,085 These are checking and savings accounts with annual
average interest rates ranging from 0.13% to1.00%.
Deposits 22,528,359Withdrawals (22,474,211)
December 31, 2018Category Amount / Volume Outstanding Balance Nature, Terms and ConditionsSignificant InvestorLoans and receivables P=6,766,500 These are secured loans with interest rate of 5.13% and
maturity of four years; collateral includes sharesof stocks with fair value of P=28.44 billion
Issuances P=86,125,000Repayments (2,350,000)
Deposit liabilities 374 These are checking accounts with annual average rateof 0.13%.Deposits 2,532,609
Withdrawals (2,532,493)SubsidiariesDeposit liabilities 114,339 These are checking and savings accounts with annual
average interest rates ranging from 0.13% to 1.00%.Deposits 3,668,567Withdrawals (3,587,029)
AssociateDeposit liabilities P=166,291 These are savings accounts with annual
average interest rates ranging from0.25% to 1.00%.Deposits P=487,691Withdrawals (399,123)
Key Management PersonnelLoans and receivables 488 Unsecured Officer's accounts from Credit card with
interest of 3% and currently maturing and Fullysecured OEL accounts with interest of 6%
Issuances 388Repayments (39,213)
Deposit liabilities 14,569 These are savings account with annual average interestrates ranging from 0.25% to 1.00%.Deposits 365,236
Withdrawals (369,439)Other Related PartiesDeposit liabilities These are checking and savings accounts with annual
average interest rates ranging from 0.13% to1.00%.
Deposits 35,229,849 113,937Withdrawals (35,167,475)
In 2019 and 2017, the Parent Company sold its investment property to a related party for a total cashselling price of P=382.33 million and P=161.58 million, respectively, and recognized gain ofP=377.18 million and P=142.61 million, respectively.
The related party transactions shall be settled in cash. There are no provisions for credit losses in 2019,2018 and 2017 in relation to amounts due from related parties.
Interest income earned and interest expense incurred from the above loans and deposit liabilities in2019, 2018 and 2017 follow:
Subsidiaries Associate2019 2018 2017 2019 2018 2017
Interest expense P=743 P=375 P=46 P=654 P=168 P=1,849
Key Management Personnel Other Related Parties2019 2018 2017 2019 2018 2017
Interest income P=26 P=11,277 P=46 P=– P=– P=–
Interest expense 36 19 47 210 131 69
Significant Investor2019 2018 2017
Interest income P=46,906 P=42,601 P=169,706Interest expense 2 3 61

- 118 -
*SGVFS039096*
Outright purchases and outright sale of debt securities of the Parent Company with its subsidiaries in2019 and 2018 follow:
Subsidiaries2019 2018
Peso−denominatedOutright purchase P=3,390,547 P=817,030Outright sale 854,135 4,246,628
Dollar – denominated (equity)Outright purchase 6,550 5,117Outright sale 450 41,400
The following table shows the amount and outstanding balance of other related party transactionsincluded in the financial statements:
Subsidiaries2019 2018 Nature, Terms and Conditions
Balance SheetAccounts receivable P=1,144 P=1,242 This pertains to various expenses advanced by CBC in behalf of
CBSISecurity deposits 2,270 2,270 This pertains to the rental deposits with CBSI for office space
leased out to the Parent CompanyAccounts payable 12,941 4,858 This pertains to various unpaid rental to CBSI
Subsidiaries2019 2018 2017 Nature, Terms and Conditions
Income StatementMiscellaneous income P=1,800 P=1,800 P=1,800 Human resources functions provided by the
Parent Company to its subsidiaries (exceptCBC Forex and Unity Bank) such asrecruitment and placement, training anddevelopment, salary and benefitsdevelopment, systems and research, andemployee benefits. Under the agreementbetween the Parent Company and itssubsidiaries, the subsidiaries shall pay theParent Company an annual fee
Occupancy cost 20,067 19,937 24,532 Certain units of the condominium owned byCBSI are being leased to the ParentCompany for a term of five years, with noescalation clause
Miscellaneous expense 222,414 204,749 193,651 This pertains to the computer and generalbanking services provided by CBC−PCCIto the Parent Company to support itsreporting requirements
31. Commitments and Contingent Assets and Liabilities
In the normal course of the Group’s operations, there are various outstanding commitments andcontingent liabilities which are not reflected in the accompanying financial statements. Managementdoes not anticipate any material losses as a result of these transactions.
There are several suits, assessments or notices and claims that remain contested. Management believes,based on the opinion of its legal counsels, that the ultimate outcome of such suits, assessments andclaims will not have a material effect on the Group’s and the Parent Bank’s financial position andresults of operations.
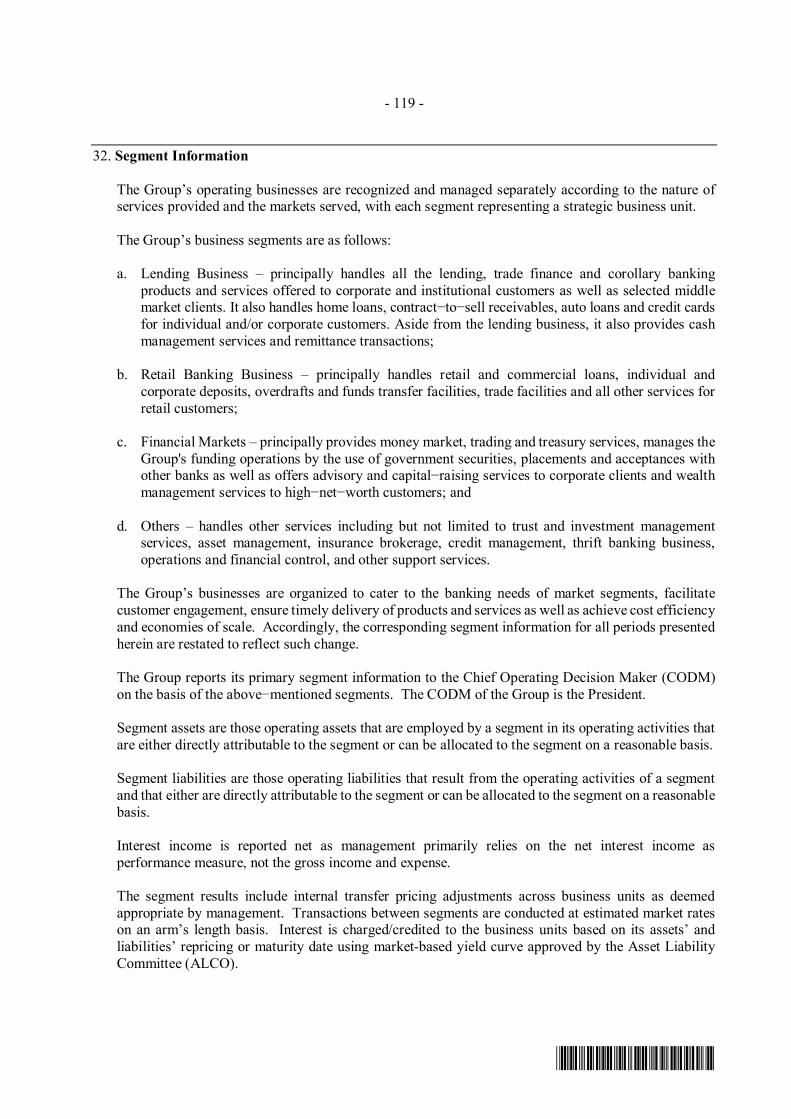
- 119 -
*SGVFS039096*
32. Segment Information
The Group’s operating businesses are recognized and managed separately according to the nature ofservices provided and the markets served, with each segment representing a strategic business unit.
The Group’s business segments are as follows:
a. Lending Business – principally handles all the lending, trade finance and corollary bankingproducts and services offered to corporate and institutional customers as well as selected middlemarket clients. It also handles home loans, contract−to−sell receivables, auto loans and credit cardsfor individual and/or corporate customers. Aside from the lending business, it also provides cashmanagement services and remittance transactions;
b. Retail Banking Business – principally handles retail and commercial loans, individual andcorporate deposits, overdrafts and funds transfer facilities, trade facilities and all other services forretail customers;
c. Financial Markets – principally provides money market, trading and treasury services, manages theGroup's funding operations by the use of government securities, placements and acceptances withother banks as well as offers advisory and capital−raising services to corporate clients and wealthmanagement services to high−net−worth customers; and
d. Others – handles other services including but not limited to trust and investment managementservices, asset management, insurance brokerage, credit management, thrift banking business,operations and financial control, and other support services.
The Group’s businesses are organized to cater to the banking needs of market segments, facilitatecustomer engagement, ensure timely delivery of products and services as well as achieve cost efficiencyand economies of scale. Accordingly, the corresponding segment information for all periods presentedherein are restated to reflect such change.
The Group reports its primary segment information to the Chief Operating Decision Maker (CODM)on the basis of the above−mentioned segments. The CODM of the Group is the President.
Segment assets are those operating assets that are employed by a segment in its operating activities thatare either directly attributable to the segment or can be allocated to the segment on a reasonable basis.
Segment liabilities are those operating liabilities that result from the operating activities of a segmentand that either are directly attributable to the segment or can be allocated to the segment on a reasonablebasis.
Interest income is reported net as management primarily relies on the net interest income asperformance measure, not the gross income and expense.
The segment results include internal transfer pricing adjustments across business units as deemedappropriate by management. Transactions between segments are conducted at estimated market rateson an arm’s length basis. Interest is charged/credited to the business units based on its assets’ andliabilities’ repricing or maturity date using market-based yield curve approved by the Asset LiabilityCommittee (ALCO).

- 120 -
*SGVFS039096*
Other operating income mainly consists of trading and securities gain (loss) − net, service charges, feesand commissions, trust fee income and foreign exchange gain − net. Other operating expense mainlyconsists of compensation and fringe benefits, provision for impairment and credit losses, taxes andlicenses, occupancy, depreciation and amortization, stationery, supplies and postage and insurance.Other operating income and expense are allocated between segments based on equitable sharingarrangements.
The Group has no significant customers which contributes 10.00% or more of the consolidatedrevenues.
The Group’s asset producing revenues are located in the Philippines (i.e., one geographical location);therefore, geographical segment information is no longer presented.
The following tables present relevant financial information regarding business segments measured inaccordance with PFRS as of and for the years ended December 31, 2019, 2018 and 2017:
Lending Business Retail Banking Business2019 2018 2017 2019 2018 2017
Results of OperationsNet interest income Third party P=24,613,498 P=19,034,015 P=13,876,995 (P=5,338,849) (P=871,505) P=855,933 Intersegment (18,388,536) (12,956,205) (8,438,704) 18,020,023 11,763,393 7,915,744
6,224,962 6,077,810 5,438,291 12,681,174 10,891,888 8,771,677Other operating income 2,281,689 1,794,959 1,317,298 2,209,567 1,619,591 1,465,962Total revenue 8,506,651 7,872,769 6,755,589 14,890,741 12,511,479 10,237,639Other operating expense (5,608,740) (1,559,750) (2,294,490) (10,229,225) (7,138,661) (6,536,859)Income before income tax 2,897,911 6,313,019 4,461,099 4,661,516 5,372,818 3,700,780Provision for income tax (45,149) 210,176 236,856 (419,750) − −Net income P=2,852,762 P=6,523,195 P=4,697,955 P=4,241,766 P=5,372,818 P=3,700,780Total assets P=438,731,372 P=376,187,705 P=299,052,197 P=516,900,229 P=471,540,704 P=431,622,883Total liabilities 5,042,977 4,819,787 1,171,742 569,897,912 499,955,967 444,030,414Depreciation and amortization 54,477 73,475 61,988 1,185,539 437,201 378,597Provision for impairment and
credit losses P=1,836,780 P=(328,404) P=668,360 P=443,621 P=103,780 P=238,645Capital expenditures P=29,405 P=66,105 P=63,136 P=177,348 P=148,179 P=118,378
Financial Markets Other Business and Support Units2019 2018 2017 2019 2018 2017
Results of OperationsNet interest income Third party P=3,462,384 P=4,028,486 P=1,661,494 P=3,314,263 P=735,189 P=3,231,982 Intersegment 1,041,115 (434,176) 1,124,033 (672,603) 1,626,988 (601,073)
4,503,499 3,594,310 2,785,527 2,641,660 2,362,177 2,630,909Other operating income 1,994,224 522,523 879,737 1,945,308 1,721,223 2,438,697Total revenue 6,497,723 4,116,833 3,665,264 4,586,968 4,083,400 5,069,606Other operating expense (1,853,424) (916,021) (1,264,773) (5,203,075) (8,582,525) (6,619,869)Income before income tax 4,644,299 3,200,812 2,400,491 (616,107) (4,499,125) (1,550,263)Provision for income tax (1,240,335) (730,643) (547,624) 192,584 (1,750,956) (1,178,409)Net income P=3,403,964 P=2,470,169 P=1,852,867 (P=423,523) P=(6,250,081) (P=2,728,672)Total assets P=230,368,926 P=170,463,397 P=168,052,729 (P=223,774,545) (P=152,120,165) (P=147,280,299)Total liabilities P=118,786,174 P=88,040,610 P=140,321,883 P=172,323,324 P=185,398,690 P=82,267,974Depreciation and amortization P=52,328 P=49,433 P=41,852 P=650,317 P=737,576 P=735,052Provision for impairment and
credit losses P=92,689 P=51,689 P=– P=197,078 P=314,011 (P=152,834)Capital expenditures P=8,542 P=60,838 P=63,795 P=209,829 P=299,388 P=389,402

- 121 -
*SGVFS039096*
Total2019 2018 2017
Results of OperationsNet interest income
Third party P=26,051,296 P=22,926,185 P=19,626,404Intersegment − − −
26,051,296 22,926,185 19,626,404Other operating income 8,430,788 5,658,296 6,101,694Total revenue 34,482,083 28,584,481 25,728,098Other operating expense (22,894,464) (18,196,957) (16,715,991)Income before income tax 11,587,619 10,387,524 9,012,107Provision for income tax (1,512,650) (2,271,423) (1,489,177)Net income P=10,074,969 P=8,116,101 P=7,522,930Total assets P=962,225,982 P=866,071,641 P=751,447,510Total liabilities P=866,050,387 P=778,215,054 P=667,792,013Depreciation and amortization P=1,942,661 P=1,297,685 P=1,217,489Provision for impairment and credit losses P=2,570,168 P=141,076 P=754,171Capital expenditures P=425,124 P=574,510 P=634,711
The Group’s share in net income of an associate included in other operating income amounting toP=184.66 million , P=101.01 million and P=73.13 million in 2019, 2018 and 2017, respectively are reportedunder ‘Other Business and Support Units’.
33. Earnings Per Share
Basic EPS amounts are calculated by dividing the net income for the year by the weighted averagenumber of common shares outstanding during the year (adjusted for stock dividends).
The following reflects the income and share data used in the basic earnings per share computations:
2019 2018 2017a. Net income attributable to equity
holders of the parent P=10,068,960 P=8,110,379 P=7,513,972b. Weighted average number of
common shares outstanding (Note 23) 2,685,900 2,685,826 2,581,182c. EPS (a/b) P=3.75 P=3.02 P=2.91
As of December 31, 2019, 2018 and 2017, there were no outstanding dilutive potential commonshares.
34. Supplementary Information for Cash Flow Analysis
The following is a summary of certain non−cash investing activities that relate to the analysis of thestatements of cash flows:
Consolidated2019 2018 2017
Addition to investment propertiesfrom settlement of loans P=832,290 P=523,343 P=579,089
Fair value gain in AFS financialassets 892,644 (451,786) 158,946
Cumulative translation adjustment 98,830 (52,900) (15,970)Addition to chattel mortgage from
settlement of loans 618,298 626,182 559,283

- 122 -
*SGVFS039096*
Parent Company2019 2018 2017
Addition to investment propertiesfrom settlement of loans P=471,020 P=240,680 P=126,652
Fair value gain in AFS financialassets 670,487 (381,791) 113,020
Cumulative translation adjustment 81,518 (58,792) (16,197)Addition to chattel mortgage from
settlement of loans 10,332 20,135 10,824
The following table shows the reconciliation analysis of liabilities arising from financing activities forthe period ended December 31, 2019:
2019 2018Balance at beginning of year P=39,826,532 P=20,118,031Cash flows during the year
Proceeds 180,468,980 184,568,424Settlement (147,998,921) (171,215,735)
Non−cash changesForeign exchange movement (1,319,934) 4,132,800Amortization of transaction cost (200,852) 2,223,012
Balance at end of year P=70,775,804 P=39,826,532
35. Offsetting of Financial Assets and Liabilities
The amendments to PFRS 7 require the Group to disclose information about rights of offset and relatedarrangements (such as collateral posting requirements) for financial instruments under an enforceablemaster netting agreements or similar arrangements. The effects of these arrangements are disclosed inthe succeeding table.
December 31, 2019
Financial instrumentsrecognized at
end of reportingperiod by type
Gross carryingamounts (before
offsetting)
Gross amountsoffset in
accordance withthe offsetting
criteria
Net amountpresented instatements of
financialposition
[a−b]
Effects of remaining rights ofset−off (including rights to set
off financial collateral) thatdo not meet PAS 32 offsetting
criteria
Net exposure[c−d]
Financialinstruments
Fair value offinancialcollateral
[a] [b] [c] [d] [e]Financial assetsSPURA P=5,447,293 P=− P=5,447,293 P=5,447,293 P=5,447,293 P=−Currency forwards 101,067 − 101,067 10,786 − 90,281IRS 2,082 − 2,082 15 − 2,067
P=5,550,442 P=− P=5,550,442 P=5,458,094 P=5,447,293 P=92,348Financial liabilitiesBills payable P=21,867,053 P=− P=21,867,053 P=19,385,705 P=19,706,128 P=2,160,925Currency forwards 278,942 − 278,942 37,058 241,883IRS 44,355 − 44,355 10,786 − 33,569
P=22,190,350 P=− P=22,190,350 P=19,433,549 P=19,706,128 P=2,436,378

- 123 -
*SGVFS039096*
December 31, 2018
Financial instrumentsrecognized at
end of reportingperiod by type
Gross carryingamounts (before
offsetting)
Gross amountsoffset in
accordance withthe offsetting
criteria
Net amountpresented instatements of
financialposition
[a−b]
Effects of remaining rights ofset−off (including rights to set
off financial collateral) thatdo not meet PAS 32 offsetting
criteria
Net exposure[c−d]
Financialinstruments
Fair value offinancialcollateral
[a] [b] [c] [d] [e]Financial assetsSPURA P=7,000,000 P=− P=7,000,000 P=7,000,000 P=7,000,000 P=0Currency forwards 129,322 − 129,322 33,933 95,389IRS 28,198 − 28,198 3,481 24,717
P=7,157,525 P=− P=7,157,525 P=7,037,414 P=7,000,000 P=120,106Financial liabilitiesBills payable P=27,372,201 P=− P=27,372,201 P=34,689,129 P=32,547,479 P=0Currency forwards 52,249 - 52,249 33,933 18,316IRS 20,963 − 20,963 4,481 16,482
P=27,445,413 P=− P=27,445,413 P=34,727,543 P=32,547,479 P=35,798
The amounts disclosed in column (d) include those rights to set−off amounts that are only enforceableand exercisable in the event of default, insolvency or bankruptcy. These include amounts related tofinancial collateral both received and pledged, whether cash or non−cash collateral, excluding theextent of over−collateralization.
36. Approval of the Financial Statements
The accompanying consolidated and parent company financial statements were authorized for issueby the Parent Company’s BOD on February 26, 2020.
37. Supplementary Information Required Under BSP Circular 1074
Presented below is the supplementary information required by BSP under Appendix 55 of BSPCircular 1074 to be disclosed as part of the notes to financial statements. This supplementaryinformation is not a required disclosure under PFRS.
Basic quantitative indicators of financial performanceThe following basic ratios measure the financial performance of the Group and the Parent Company:
Consolidated Parent Company2019 2018 2017 2019 2018 2017
Return on average equity 11.04% 9.54% 10.01% 11.04% 9.54% 10.01%Return on average assets 1.10% 1.04% 1.12% 1.22% 1.17% 1.27%Net interest margin 3.39% 3.10% 3.11% 3.26% 2.97% 2.91%
Description of capital instruments issued
None to report.
Significant credit exposures
The BSP considers that loan concentration exists when the total loan exposure to a particular industryor economic sector exceeds 30.00% of total loan portfolio. As of December 31, 2019 and 2018, theParent Company does not have credit concentration in any particular industry.

- 124 -
*SGVFS039096*
Status of loans
Information on the amounts of performing and non-performing loans and receivables (gross ofallowance for impairment and credit losses) of the Group and Parent Company are as follows:
Consolidated2019 2018
Performing Non-Performing Total Performing Non-Performing TotalLoans and discounts
Corporate and commercial lending P=454,852,808 P=4,690,104 P=459,542,912 P=408,396,312 P=3,259,100 P=411,655,412Consumer lending:
Housing 69,504,381 2,427,211 71,931,592 57,632,786 1,650,827 59,283,613Auto 22,155,296 702,476 22,857,772 21,339,654 593,380 21,933,034Credit Card 1,209,616 304,222 1,513,838 1,178,929 269,362 1,448,291Others 10,061,522 327,756 10,389,278 4,299,580 139,926 4,439,506
Trade-related lending 10,954,527 242,392 11,196,919 13,794,546 23,319 13,817,865Others* 42,358 4,471 46,829 51,815 4,701 56,516
P=568,780,508 P=8,698,632 P=577,479,140 P=506,693,622 P=5,940,615 P=512,634,237
Parent Company2019 2018
Performing Non-Performing Total Performing Non-Performing TotalLoans and discounts
Corporate and commercial lending P= 432,104,596 P= 2,229,449 P= 434,334,045 P= 380,318,161 P= 1,086,188 P= 381,404,349Consumer lending:
Housing 53,033,152 1,908,416 54,941,568 41,893,098 1,147,000 43,040,098Auto 7,956,005 185,153 8,141,158 8,086,688 107,934 8,194,622Credit Card 1,209,616 304,222 1,513,838 1,178,928 269,361 1,448,289Others 1,463 - 1,463 1,521 1,521
Trade-related lending 10,666,662 235,906 10,902,568 12,914,287 23,319 12,937,606Others* 34,340 1 34,341 39,489 271 39,760
P= 505,005,834 P= 4,863,147 P= 509,868,981 P= 444,432,172 P= 2,634,073 P= 447,066,245
Loans per security
As of December 31, 2019 and 2018, secured and unsecured non−performing loans (NPLs) of the Groupand the Parent Company follow:
Consolidated Parent Company2019 2018 2019 2018
Secured P=3,177,507 P=2,771,745 P=935,742 P=493,929Unsecured 5,521,125 3,173,971 3,927,405 2,140,143
P=8,698,632 P=5,945,716 P=4,863,147 P=2,634,072
According to BSP Circular 941 Amendments to the Regulations on Past Due and Non−PerformingLoans effective January 1, 2018, loans shall be considered non−performing, even without any missedcontractual payments, when it is considered impaired under existing accounting standards, classified asdoubtful or loss, in litigation, and/or there is evidence that full repayment of principal and interest isunlikely without foreclosure of collateral, if any. All other loans, even if not considered impaired, shallbe considered non−performing if any principal and/or interest are unpaid for more than ninety (90) daysfrom contractual due date, or accrued interests for more than ninety (90) days have been capitalized,refinanced, or delayed by agreement.
Secured liability and assets pledged as security
As of December 31, 2019, the carrying amount of foreign currency−denominated investment securitiesat amortized cost pledged by the Parent Company as collateral for its interbank borrowings amountedto ₱9.00 billion. The carrying amount of peso−denominated investment securities at amortized costpledged by the Parent Company as collateral for its interbank borrowings amounted to ₱10.39 billion.
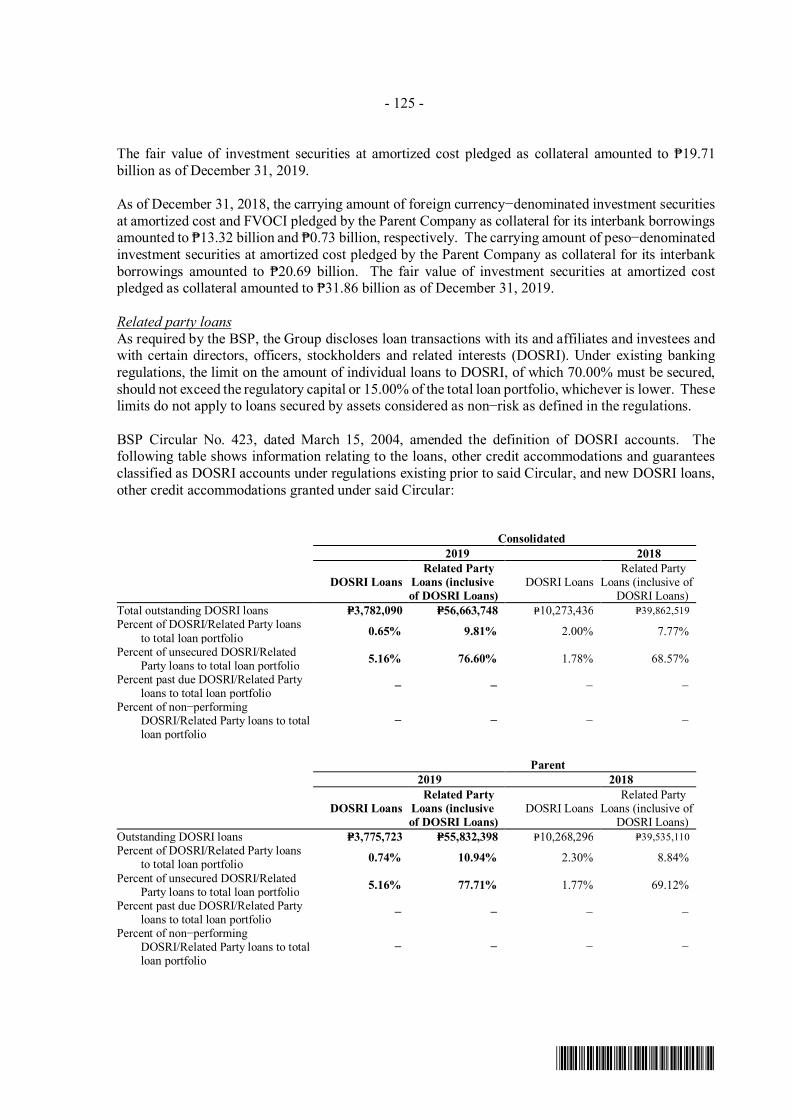
- 125 -
*SGVFS039096*
The fair value of investment securities at amortized cost pledged as collateral amounted to ₱19.71billion as of December 31, 2019.
As of December 31, 2018, the carrying amount of foreign currency−denominated investment securitiesat amortized cost and FVOCI pledged by the Parent Company as collateral for its interbank borrowingsamounted to ₱13.32 billion and ₱0.73 billion, respectively. The carrying amount of peso−denominatedinvestment securities at amortized cost pledged by the Parent Company as collateral for its interbankborrowings amounted to ₱20.69 billion. The fair value of investment securities at amortized costpledged as collateral amounted to ₱31.86 billion as of December 31, 2019.
Related party loansAs required by the BSP, the Group discloses loan transactions with its and affiliates and investees andwith certain directors, officers, stockholders and related interests (DOSRI). Under existing bankingregulations, the limit on the amount of individual loans to DOSRI, of which 70.00% must be secured,should not exceed the regulatory capital or 15.00% of the total loan portfolio, whichever is lower. Theselimits do not apply to loans secured by assets considered as non−risk as defined in the regulations.
BSP Circular No. 423, dated March 15, 2004, amended the definition of DOSRI accounts. Thefollowing table shows information relating to the loans, other credit accommodations and guaranteesclassified as DOSRI accounts under regulations existing prior to said Circular, and new DOSRI loans,other credit accommodations granted under said Circular:
Consolidated2019 2018
DOSRI LoansRelated Party
Loans (inclusiveof DOSRI Loans)
DOSRI LoansRelated Party
Loans (inclusive ofDOSRI Loans)
Total outstanding DOSRI loans P=3,782,090 P=56,663,748 P=10,273,436 P=39,862,519Percent of DOSRI/Related Party loans
to total loan portfolio 0.65% 9.81% 2.00% 7.77%
Percent of unsecured DOSRI/RelatedParty loans to total loan portfolio 5.16% 76.60% 1.78% 68.57%
Percent past due DOSRI/Related Partyloans to total loan portfolio − − − −
Percent of non−performingDOSRI/Related Party loans to totalloan portfolio
− − − −
Parent2019 2018
DOSRI LoansRelated Party
Loans (inclusiveof DOSRI Loans)
DOSRI LoansRelated Party
Loans (inclusive ofDOSRI Loans)
Outstanding DOSRI loans P=3,775,723 P=55,832,398 P=10,268,296 P=39,535,110Percent of DOSRI/Related Party loans
to total loan portfolio 0.74% 10.94% 2.30% 8.84%
Percent of unsecured DOSRI/RelatedParty loans to total loan portfolio 5.16% 77.71% 1.77% 69.12%
Percent past due DOSRI/Related Partyloans to total loan portfolio − − − −
Percent of non−performingDOSRI/Related Party loans to totalloan portfolio
− − − −

- 126 -
*SGVFS039096*
The amounts of loans disclosed for related parties above differ with the amounts disclosed for keymanagement personnel since the composition of DOSRI is more expansive than that of keymanagement personnel.
BSP Circular No. 560 provides that the total outstanding loans, other credit accommodation andguarantees to each of the bank’s/quasi−bank’s subsidiaries and affiliates shall not exceed 10.00% ofthe net worth of the lending bank/quasi−bank, provided that the unsecured portion of which shall notexceed 5.00% of such net worth. Further, the total outstanding loans, credit accommodations andguarantees to all subsidiaries and affiliates shall not exceed 20.00% of the net worth of the lendingbank/quasi−bank; and the subsidiaries and affiliates of the lending bank/quasi−bank are not related interest of any director, officer and/or stockholder of the lending institution, except where such director,officer or stockholder sits in the BOD or is appointed officer of such corporation as representative ofthe bank/quasi−bank.
On May 12, 2009, BSP issued Circular No. 654 allowing a separate individual limit of twenty−five(25.00%) of the net worth of the lending bank/quasi−bank to loans of banks/quasi−banks to theirsubsidiaries and affiliates engaged in energy and power generation.
Commitments and contingencies
The following is a summary of contingencies and commitments of the Group and the ParentCompany with the equivalent peso contractual amounts:
Consolidated Parent Company2019 2018 2019 2018
Trust department accounts (Note 28) P=169,339,175 P=133,806,226 P=169,339,175 P=133,806,226Committed credit lines 46,506,112 122,804,833 46,506,112 122,280,671Unused commercial letters of credit (Note 29) 18,227,610 20,978,009 18,110,275 20,829,020Foreign exchange bought 30,941,342 37,359,690 30,941,342 37,359,690Foreign exchange sold 18,229,910 24,678,551 18,229,910 24,678,551Credit card lines 11,048,767 12,568,703 11,048,767 12,568,703IRS receivable 26,523,850 11,366,980 26,523,850 11,366,980Outstanding guarantees issued 1,022,261 944,262 688,045 420,100Inward bills for collection 4,423,799 2,563,604 4,423,799 2,563,604Standby credit commitment 2,200,316 3,149,787 2,200,316 3,149,787Spot exchange sold 11,965,938 3,624,709 11,965,938 3,624,709Spot exchange bought 10,896,547 3,247,995 10,896,547 3,247,995Deficiency claims receivable 285,745 287,647 285,745 287,647Late deposits/payments received 525,953 495,347 492,597 458,675Outward bills for collection 88,197 55,135 86,344 53,211Others 37,114 1,846 36,951 1,694
38. Supplementary Information Required Under RR No. 15−2010
In compliance with the requirements set forth by RR No. 15−2010, hereunder are the details ofpercentage and other taxes paid or accrued by the Parent Company in 2019.
Gross receipts tax P=1,722,992Documentary stamps tax 1,322,819Local taxes 76,196Fringe benefit tax 13,669Others 20,173Balance at end of year P=3,155,849

- 127 -
*SGVFS039096*
Withholding TaxesDetails of total remittances of withholding taxes in 2019 and amounts outstanding as ofDecember 31, 2019 are as follows:
Totalremittances
Amountsoutstanding
Final withholding taxes P=3,362,053 P=261,612Withholding taxes on compensation and benefits 555,303 31,699Expanded withholding taxes 149,719 10,235
P=4,067,075 P=303,546

*SGVFS039096*
INDEPENDENT AUDITOR’S REPORT
The Stockholders and the Board of DirectorsChina Banking Corporation8745 Paseo de Roxas cor. Villar St.Makati City
We have audited in accordance with Philippine Standards on Auditing, the consolidated financialstatements of China Banking Corporation and Subsidiaries (the Group) and the financial statements ofChina Banking Corporation (the Parent Bank) as at December 31, 2019, included in this Form 17-A, andhave issued our report thereon dated February 26, 2020. Our audits were made for the purpose offorming an opinion on the basic financial statements taken as a whole. The schedules listed in the Indexto the Financial Statements and Supplementary Schedules are the responsibility of the Group’smanagement. These schedules are presented for purposes of complying with Revised SecuritiesRegulation Code Rule 68, and are not part of the basic financial statements. These schedules have beensubjected to the auditing procedures applied in the audit of the basic financial statements and, in ouropinion, fairly state in all material respects, the information required to be set forth therein in relation tothe basic financial statements taken as a whole.
SYCIP GORRES VELAYO & CO.
Ray Francis C. BalagtasPartnerCPA Certificate No. 108795SEC Accreditation No. 1510-AR-1 (Group A), September 18, 2018, valid until September 17, 2021Tax Identification No. 216-950-288BIR Accreditation No. 08-001998-107-2018, February 14, 2018, valid until February 13, 2021PTR No. 8125208, January 7, 2020, Makati City
February 26, 2020
SyCip Gorres Velayo & Co.6760 Ayala Avenue1226 Makati CityPhilippines
Tel: (632) 891 0307Fax: (632) 819 0872ey.com/ph
BOA/PRC Reg. No. 0001, October 4, 2018, valid until August 24, 2021SEC Accreditation No. 0012-FR-5 (Group A), November 6, 2018, valid until November 5, 2021
A member firm of Ernst & Young Global Limited

CHINA BANKING CORPORATIONINDEX TO THE FINANCIAL STATEMENTS AND SUPPLEMENTARY SCHEDULES
DECEMBER 31, 2019
Part ISchedule Content Page No.
I Reconciliation of retained earnings available for dividend declaration(Part 1 5B, Annex 68-D) 1
II Map showing relationships between and among parent, subsidiaries, an associate, andjoint venture(Part 1 5G) 2
Part IIA Financial Assets
Financial assets at fair value through profit or lossFinancial assets at fair value through other comprehensive incomeFinancial assets at amortized cost
(Part II 7D, Annex 68-J, A) 3B Amounts Receivable from Directors, Officers, Employees, Related Parties and
Principal Stockholders (Other than Related Parties)(Part II 7D, Annex 68-J, B) 4
C Amounts Receivable from Related Parties which are eliminated during theconsolidation of financial statements(Part II 7D, Annex 68-J, C) 5
D Long-Term Debt(Part II 7D, Annex 68-J, D) 6
E Indebtedness to Related Parties (included in the consolidated balance sheet)(Part II 7D, Annex 68-J, E) 7
F Guarantees of Securities of Other Issuers(Part II 7D, Annex 68-J, F) 8
G Capital Stock(Part II 7D, Annex 68-J, G) 9

1
CHINA BANKING CORPORATION8745 Paseo de Roxas corner Villar Street Makati City
SCHEDULE IRECONCILIATION OF RETAINED EARNINGSAVAILABLE FOR DIVIDEND DECLARATION
DECEMBER 31, 2019(Amounts in Thousands)
Unappropriated Retained Earnings, Beginning P=40,497,256
Adjustments:Prior years non-actual/unrealized income net of tax (2007-2018) (P=5,022,666)Transfer of revaluation increment to surplus (1,277,277)Prior years net earnings of subsidiaries not available for dividends (1,603,988)
(7,903,932)
Unappropriated Retained Earnings, As adjusted, Beginning 32,593,324
Add: Net income during the period 10,068,960
Less: Non-actual/unrealized income net of taxEquity in net income of associate 184,661Fair value adjustments (Mark-to-Market gains) 139,794Net earnings of subsidiaries not available for dividends 770,628Fair value adjustments of investment property resulting to gain 218,603Provision for deferred taxes (405,124)Sub-total 908,562
Add: Non-actual lossesLoss on fair value adjustment on investment property (after tax) 83,033
Net income actually earned/ realized during the period 9,243,432
Less: Cash dividend declared during the period 2,363,592Appropriation of Retained Earnings during the period (468,442)Transfer from surplus to Surplus Reserves 35,708Realized loss on sale of equity investments at FVOCI 76,597
(2,007,455)
Unappropriated Retained Earnings, Ending, Available for DividendDeclaration P=39,829,301

2
CHINA BANKING CORPORATION8745 Paseo de Roxas corner Villar Street Makati City
SCHEDULE IIMAP SHOWING RELATIONSHIPS BETWEEN AND AMONG PARENT
SUBSIDIARIES, AN ASSOCIATE, AND JOINT VENTURE

3
China Banking CorporationSchedule A – Financial Assets
December 31, 2019(Amounts in Thousands)
Name of issuing entity andassociation of each issue
Number of shares orprincipal amount of bonds
or notesAmount shown on the
balance sheet
Valued based on marketquotation at end ofreporting period Income accrued
Financial Assets at Fair Value through Profitor Loss
Treasury Notes P=2,274,755 P=2,386,226 P=2,386,226 P=44,461Government Bonds 7,870,979 8,451,126 8,451,126 59,574Treasury Bills 1,397,410 1,378,137 1,378,137 –Private Bonds 4,340,404 4,372,734 4,372,734 22,912
Equities 8,806 shares 466,445 466,445 –759,525 777,493 777,493 17,801
Derivative assets 658,061 658,061 658,061 44,88520 warrants 9,889 9,889 –
P=18,500,111 P=18,500,111 P=189,633Financial Assets at Fair Value through OtherComprehensive Income
Government Bonds P=20,263,512 P=22,540,516 P=22,540,516 P=184,607Private Bonds 2,923,953 2,953,271 2,953,271 21,615Equities 33,293 shares 639,573 639,573 –
P=26,133,360 P=26,133,360 P=206,222
Financial Assets at Amortized CostGovernment Bonds P=116,342,511 P=116,859,352 P=115,600,451 P=1,992,626Private Bonds 52,381,323 51,343,376 52,569,793 627,455
P=168,723,835 P=168,202,728 P=168,170,244 P=2,620,081

4
China Banking CorporationSchedule B - Amounts Receivable from Directors, Officers, Employees, Related Parties and
Principal Stockholders (Other than Related Parties)December 31, 2019
Name of Debtor
Balance atbeginning of
period Additions AmountsCollected
AmountsWritten-
off Current Non-
Current Balance at end
of period
The Group has no receivables from directors, officers, employees, related parties and principal stockholders that did not arise from ordinary course of business.

5
China Banking CorporationSchedule C - Amounts Receivable from Related Parties which are eliminated
during the consolidation of financial statementsDecember 31, 2019
(Amounts in Thousands)
Name of Debtor
Balance atbeginning of
period Additions Amounts Collected Amounts
Written-off Current Non- Current Balance at end
of periodChina Bank Savings P=1,242 P=1,144 P=1,242 P=− P=1,144 P=− P=1,144

6
China Banking CorporationSchedule D - Long-Term Debt
December 31, 2019(Amounts in Thousand)
Title of issue and type ofobligation
Amount authorized byindenture
Amount shown undercaption “Current portion
of long-term debt’ inrelated balance sheet
Amount shown undercaption “Long-Term
Debt” in relatedbalance sheet (
Interest Rate% Maturity Date
Bonds Payable- CHIB PHP30,000,000 PHP29,828,359 5.70% January 10, 2021Bonds Payable- IFC USD150,000 USD149,423 3.09% June 18, 2026

7
China Banking CorporationSchedule E - Indebtedness to Related Parties
(Long-term from Related Companies)December 31, 2019
Name of Related Parties (i) Balance at beginning of period Balance at end of period (ii)
None to Report
__________________________________________________(i) The related parties named shall be grouped as in Schedule D. The information called shall be stated for any persons whose investments shown separately in such related
schedule.(ii) For each affiliate named in the first column, explain in a note hereto the nature and purpose of any material increase during the period that is in excess of 10 percent of the
related balance at either the beginning or end of the period.
8
China Banking CorporationSchedule F - Guarantees of Securities of Other Issuers
December 31, 2019
Name of issuing entity ofsecurities guaranteed by the
company for which thisstatement is filed
Title of issue of each class ofsecurities guaranteed
Total amount of guaranteedand outstanding (i)
Amount owned by person ofwhich statement is filed Nature of guarantee (ii)
None to Report
_____________________________________________________(i) Indicate in a note any significant changes since the date of the last balance sheet file. If this schedule is filed in support of consolidated financial statements, there shall
be set forth guarantees by any person included in the consolidation except such guarantees of securities which are included in the consolidated balance sheet.(ii) There must be a brief statement of the nature of the guarantee, such as “Guarantee of principal and interest”, “Guarantee of Interest”, or “Guarantee of Dividends”. If the
guarantee is of interest, dividends, or both, state the annual aggregate amount of interest or dividends so guaranteed.

9
China Banking CorporationSchedule G - Capital Stock
December 31, 2019
(Absolute numbers of shares)
Title of Issue (i)Number of
sharesauthorized
Number of shares issued andoutstanding as shown under
the related balance sheetcaption
Number ofshares reserved
for options,warrants,
conversion andother rights
Number ofshares held byrelated parties
(ii)
Directors,officers andemployees
Others (iii)
Common stock - P=10 par valueAuthorized - shares 3,300,000,000Issued and outstanding 2,685,899,812 877,970,984 52,722,765 1,755,206,063
_________________________________________________
(i) Include in this column each type of issue authorized(ii) Related parties referred to include persons for which separate financial statements are filed and those included in the consolidated financial statements, other than theissuer of the particular security.(iii) Indicate in a note any significant changes since the date of the last balance sheet filed.

*SGVFS039096*
INDEPENDENT AUDITOR’S REPORT ONCOMPONENTS OF FINANCIAL SOUNDNESS INDICATORS
The Stockholders and the Board of DirectorsChina Banking Corporation8745 Paseo de Roxas cor. Villar St.Makati City
We have audited in accordance with Philippine Standards on Auditing, the consolidated financialstatements of China Banking Corporation and subsidiaries (the Group) and the financial statements ofChina Banking Corporation (the Parent Bank) as at December 31, 2019 and 2018 and for each of the threeyears in the period ended December 31, 2019 and have issued our report thereon dated February 26, 2020.Our audits were made for the purpose of forming an opinion on the basic financial statements taken as awhole. The Supplementary Schedule on Financial Soundness Indicators, including their definitions,formulas, calculation, and their appropriateness or usefulness to the intended users, are the responsibilityof the Group’s management. These financial soundness indicators are not measures of operatingperformance defined by Philippine Financial Reporting Standards (PFRS) and may not be comparable tosimilarly titled measures presented by other companies. This schedule is presented for the purpose ofcomplying with the Revised Securities Regulation Code Rule 68 issued by the Securities and ExchangeCommission and is not a required part of the basic financial statements prepared in accordance withPFRS. The components of these financial soundness indicators have been traced to the Group’s financialstatements as at December 31, 2019 and 2018 and for each of the three years in the period endedDecember 31, 2019 and no material exceptions were noted.
SYCIP GORRES VELAYO & CO.
Ray Francis C. BalagtasPartnerCPA Certificate No. 108795SEC Accreditation No. 1510-AR-1 (Group A), September 18, 2018, valid until September 17, 2021Tax Identification No. 216-950-288BIR Accreditation No. 08-001998-107-2018, February 14, 2018, valid until February 13, 2021PTR No. 8125208, January 7, 2020, Makati City
February 26, 2020
SyCip Gorres Velayo & Co.6760 Ayala Avenue1226 Makati CityPhilippines
Tel: (632) 891 0307Fax: (632) 819 0872ey.com/ph
BOA/PRC Reg. No. 0001, October 4, 2018, valid until August 24, 2021SEC Accreditation No. 0012-FR-5 (Group A), November 6, 2018, valid until November 5, 2021
A member firm of Ernst & Young Global Limited

CHINA BANKING CORPORATIONCOMPONENTS OF FINANCIAL SOUNDNESS INDICATORS
2019 2018 2017PROFITABILITY (%)Return on Assets1 1.10 1.04 1.12Return on Equity2 11.04 9.54 10.01Net Interest Margin3 3.39 3.56 3.60Cost to Income Ratio 59 63 62
LIQUIDITY (%)Liquid Assets to Total Assets 37 38 36Loans (net) to Deposit Ratio 73 70 71
ASSET QUALITY (%)Gross Non-Performing Loans Ratio 4 1.5 1.2 1.4Non-performing Loan (NPL) Cover5 129 167 99
SOLVENCY RATIOSDebt to Equity Ratio 9.0 8.9 8.0Asset to Equity Ratio 10.0 9.9 9.0Interest Rate Coverage Ratio6 1.5 1.9 2.3
CAPITALIZATION (%)Capital Adequacy RatioCET 1 / Tier 1 12.76 12.16 13.47Total CAR 13.67 13.09 14.22
Notes
1. Net income divided by average total assets for the period indicated. Average total assets is based on theaverage monthly balances for the respective periods indicated.
2. Net income divided by average total equity for the period indicated. Average total equity is based on theaverage monthly balances for the respective periods indicated.
3. Net interest income divided by average interest-earning assets which is based on the average monthly balancesfor the respective periods indicated. Interest-earning assets include due from other banks, due from BSP,securities purchased under resale agreement, financial assets at fair value through profit or loss, available-for-sale financial assets, held-to-maturity financial assets, and loans and receivables.
4. Total NPLs divided by loans and receivables, net of unearned discount and gross of allowance for credit andimpairment losses.
5. The sum of total allowance for impairment and credit losses on receivables from customers and retainedearnings appropriated for general loan loss provision divided by total NPLs.
6. Net Income before Tax and Interest Expense divided by Interest Expense

China Banking CorporationSCHEDULE FOR LISTED COMPANIES WITH A RECENT OFFERING OF SECURITIES TO THE
PUBLICDECEMBER 31, 2019
GrossProceeds asdisclosed in
the FinalProspectus
ExpenditureItems
Net Proceedsas disclosed in
the FinalProspectus
Actual GrossProceeds
Actual NetProceeds
Balance ofthe proceeds
as of thereporting
period
P=30 Billion Peso Fixed RateBonds
P=30,000,000 P=257,728 P=29,742,272 P=30,000,000 P=29,742,272 P=−
$150 Million Bonds Payableto IFC
$150,000 $605 $149,395 $150,000 $149,395 −

1
UNDERTAKING The Bank undertakes to furnish a copy of its Annual Report (SEC Form 17-A) exclusive of attachments, free of charge, upon the written request of the stockholder addressed to the Office of the Corporate Secretary, 11
th Floor
China Bank Building, 8745 Paseo de Roxas cor. Villar St., Makati City.

1
PROPOSED AMENDMENTS OF BY-LAWS CHINA BANKING CORPORATION
Schedule A
Changes From To Purpose
Article III (Meeting of Stockholders) Section 4. Notice of Regular Meeting
The regular meeting of stockholders shall be called by written or printed notice delivered personally or deposited in the post office, postage prepaid, addressed to each stockholder at the address appearing in the registry book of the Corporation, not less than fifteen (15) working days prior to the date of such meeting.
The regular meeting of stockholders shall be called by written or printed notice delivered personally, or deposited in the post office, postage prepaid, addressed to each stockholder at the address appearing in the registry book of the Corporation, or by electronic mail (e-mail), or by publication in a newspaper of general circulation, not less than fifteen (15) working days prior to the date of such meeting.
To comply with Section 49 of the Revised Corporation Code of the Philippines (RCCP) allowing notice via e-mail, and to align with the current practice of the Bank on publication of notice.
Article III (Meeting of Stockholders) Section 5. Notice of Special Meeting
Special meetings shall be called by written or printed notice delivered personally, or deposited in the post office, postage prepaid, addressed to each stockholder at the address appearing in the registry book of the Corporation, not less than fifteen (15) working days prior to the date of such meeting. In such notice there shall appear, in addition to the date, hour and place of meeting, a statement of the matters to be taken up at such meeting.
Special meetings shall be called by written or printed notice delivered personally, or deposited in the post office, postage prepaid, addressed to each stockholder at the address appearing in the registry book of the Corporation, or by electronic mail (e-mail), or by publication in a newspaper of general circulation, not less than fifteen (15) working days prior to the date of such meeting. In such notice there shall appear, in addition to the date, hour and place of meeting, a statement of the matters to be taken up at such meeting.
To comply with Section 49 of the RCCP allowing notice via e-mail, and to align with the current practice of the Bank on publication of notice.
Article III (Meeting of Stockholders) Section 6. Quorum
No meeting of stockholders shall be competent to transact business unless a majority of the outstanding capital stock, exclusive of treasury stock, is represented, except to adjourn from day to day, or until such time as may be deemed proper.
No meeting of stockholders shall be competent to transact business unless a majority of the outstanding capital stock, exclusive of treasury stock, is represented, except to adjourn from day to day, or until such time as may be deemed proper. Stockholders who participate through remote communication or in absentia, shall be deemed present for purposes of quorum.
To comply with Sections 23 and 57 of the RCCP allowing the counting of stockholders voting through remote communication or in absentia for purposes of quorum.
Article III (Meeting of Stockholders) Section 7. Manner of Voting
In all meetings of stockholders, any stockholder who is not delinquent in his subscription shall be allowed to vote either in person or by proxy executed
In all meetings of stockholders, any stockholder who is not delinquent in his subscription shall be allowed to vote in person, through remote
To comply with Section 23 of the RCCP, allowing voting through remote communication and

in writing by the stockholder or his duly authorized attorney-in-fact made in accordance with the requirements of existing rules and regulations.
communication, in absentia, or by proxy executed in writing by the stockholder or his duly authorized attorney-in-fact, subject to compliance with the requirements of existing rules and regulations.
electronic voting in absentia.
Article III (Meeting of Stockholders) Section 8. Proxies
Unless otherwise provided in the proxy, it shall be valid only for the meeting for which it is intended. No proxy, however, shall be valid and effective for a period longer than five (5) years at any one time. All proxies must be in the hands of the Secretary not later that three (3) banking days before the time set for the meeting. xxx
Unless otherwise provided in the proxy, it shall be valid only for the meeting for which it is intended. No proxy, however, shall be valid and effective for a period longer than five (5) years at any one time. All proxies must be in the hands of the Secretary not later than three (3) banking days before the time set for the meeting. xxx
To correct a clerical error.
Article III (Meeting of Stockholders) Section 9. Closing of Transfer Books or Fixing of Record Date
For the purpose of determining the stockholders entitled to notice of, or to vote at, any meeting of stockholders or any adjournment thereof, or to receive payment of any dividend, or of making a determination of stockholders for any other proper purpose, the Board of Directors may provide that the stock and transfer books be closed for a stated period of at least ten (10) banking days. If the stock and transfer books be closed for the purpose of determining stockholders entitled to notice of, or to vote at, a meeting of stockholders, such books shall be closed for at least ten (10) banking days immediately preceding such meeting. In lieu of closing the stock and transfer books, the Board of Directors may fix in advance a date as the record date for any such determination of stockholders. Such date shall in no case be less than ten (10) banking days prior to the date on which the particular action requiring such determination of stockholders is to be taken,
For the purpose of determining the stockholders entitled to notice of, or to vote at, any meeting of stockholders or any adjournment thereof, or to receive payment of any dividend, or of making a determination of stockholders for any other proper purpose, the stock and transfer books shall be closed for at least twenty (20) days for regular meetings and seven (7) days for special meetings before the scheduled date of the meeting. If the stock and transfer books be closed for the purpose of determining stockholders entitled to notice of, or to vote at, a meeting of stockholders, such books shall be closed for the same number of days immediately preceding such meeting, except in instances where applicable rules and regulations provide otherwise.
To comply with Section 49 of the RCCP on the closing of the stock and transfer book for regular and special meetings.
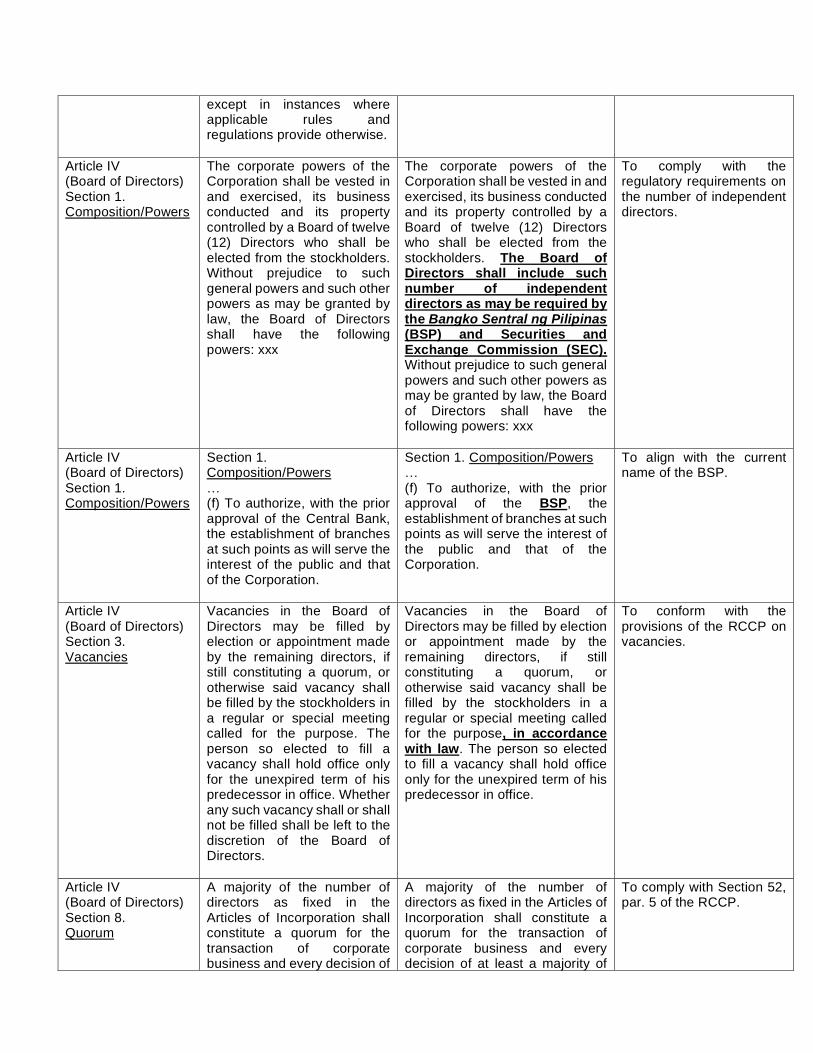
except in instances where applicable rules and regulations provide otherwise.
Article IV (Board of Directors) Section 1. Composition/Powers
The corporate powers of the Corporation shall be vested in and exercised, its business conducted and its property controlled by a Board of twelve (12) Directors who shall be elected from the stockholders. Without prejudice to such general powers and such other powers as may be granted by law, the Board of Directors shall have the following powers: xxx
The corporate powers of the Corporation shall be vested in and exercised, its business conducted and its property controlled by a Board of twelve (12) Directors who shall be elected from the stockholders. The Board of Directors shall include such number of independent directors as may be required by the Bangko Sentral ng Pilipinas (BSP) and Securities and Exchange Commission (SEC). Without prejudice to such general powers and such other powers as may be granted by law, the Board of Directors shall have the following powers: xxx
To comply with the regulatory requirements on the number of independent directors.
Article IV (Board of Directors) Section 1. Composition/Powers
Section 1. Composition/Powers … (f) To authorize, with the prior approval of the Central Bank, the establishment of branches at such points as will serve the interest of the public and that of the Corporation.
Section 1. Composition/Powers … (f) To authorize, with the prior approval of the BSP, the establishment of branches at such points as will serve the interest of the public and that of the Corporation.
To align with the current name of the BSP.
Article IV (Board of Directors) Section 3. Vacancies
Vacancies in the Board of Directors may be filled by election or appointment made by the remaining directors, if still constituting a quorum, or otherwise said vacancy shall be filled by the stockholders in a regular or special meeting called for the purpose. The person so elected to fill a vacancy shall hold office only for the unexpired term of his predecessor in office. Whether any such vacancy shall or shall not be filled shall be left to the discretion of the Board of Directors.
Vacancies in the Board of Directors may be filled by election or appointment made by the remaining directors, if still constituting a quorum, or otherwise said vacancy shall be filled by the stockholders in a regular or special meeting called for the purpose, in accordance with law. The person so elected to fill a vacancy shall hold office only for the unexpired term of his predecessor in office.
To conform with the provisions of the RCCP on vacancies.
Article IV (Board of Directors) Section 8. Quorum
A majority of the number of directors as fixed in the Articles of Incorporation shall constitute a quorum for the transaction of corporate business and every decision of
A majority of the number of directors as fixed in the Articles of Incorporation shall constitute a quorum for the transaction of corporate business and every decision of at least a majority of
To comply with Section 52, par. 5 of the RCCP.

at least a majority of the directors present at a meeting at which there is a quorum shall be valid as a corporate act, except for the election of officers which shall require the vote of a majority of all the members of the Board, and whenever required by existing laws and regulations.
the directors present at a meeting at which there is a quorum shall be valid as a corporate act, except for the election of officers which shall require the vote of a majority of all the members of the Board, and whenever required by existing laws and regulations. Directors who cannot physically attend or vote at Board or Committee meetings can participate and vote through remote communication such as videoconferencing, teleconferencing, or other alternative modes of communication that allow them reasonable opportunities to participate.
Article IV (Board of Directors) Section 11. Per Diems
In addition to the compensation determined in Article VIII, the directors shall receive a per diem of FIVE Hundred Pesos for attendance at each session of the Board of Directors or of any Committee.
In addition to the compensation determined in Article VIII, the directors shall receive a per diem of up to Ten Thousand Pesos for attendance at each session of the Board of Directors or of any Committee.
To align with current industry and standards.
Article VI.A. (Officers of the Corporation) Section 1. Officers
Section 1. Officers – The Officers of the Corporation shall be: a Chairman, a Vice-Chairman, a President and one or more Executive Vice-Presidents, Senior Vice-Presidents and Vice-Presidents as the Board of Directors may determine, a Secretary, a Treasurer, an Internal Auditor and such other officers as the Board of Directors may deem necessary.
Section 1. Corporate Officers – The Corporate Officers of the Corporation shall be a Chairman, a Vice-Chairman, a President, one or more Executive Vice-Presidents and Senior Vice-Presidents, a Corporate Secretary, a Treasurer, an Internal Auditor, a Compliance Officer and such other officers as the Board of Directors may deem necessary.
To align the provisions with the current practice of the Bank and with Section 24 of the RCCP on the election of Compliance Officer.
Article VI.A. (Officers of the Corporation) Section 6. President
The President, shall be the Chief Executive Officer of the Corporation. He shall be subject to the control of the Board of Directors, have direct charge of the business of the Corporation and general supervision of the business affairs and property of the Corporation. In the absence or inability of the Chairman and the Vice-Chairman, he shall preside over the meetings of the stockholders and of the
The President, shall be the Chief Executive Officer of the Corporation. He shall be subject to the control of the Board of Directors, have direct charge of the business of the Corporation and general supervision of the business affairs and property of the Corporation. In the absence, inability, or incapacity of the Chairman and the Vice-Chairman, the President shall preside over the meetings of the stockholders
To reflect minor and clerical corrections.

Board of Directors of the Corporation.
and of the Board of Directors of the Corporation.
Article VI.A. (Officers of the Corporation) Section 8. Secretary
Section 8. Secretary – The Secretary who shall be a resident and citizen of the Philippines, xxx
Section 8. Corporate Secretary – The Corporate Secretary who shall be a resident and citizen of the Philippines, xxx
To reflect the complete title of the position.
Article VI.A. (Officers of the Corporation) Section 10. Compliance Officer (new)
None Sec. 10. Compliance Officer – The Chief Compliance Officer, who shall be independent, shall report functionally to the Board through a duly designated Board-level Committee and administratively to the President. He shall oversee implementation of the Bank’s compliance risk management system to ensure compliance with the applicable laws, rules and regulations.
To align with the current practice of the Bank and with Section 24 of the RCCP on the election of a compliance officer for corporations vested with public interest.
Article VI.A. (Officers of the Corporation) Section 10. Other Officers
Sec. 10. Other Officers Sec. 11. Other Officers Renumbered
Article VI.B. (Trust and Asset Management Group)
B. Trust Group
B. Trust and Asset Management Group
To reflect the complete name of the Group.
Article VI.B. (Trust and Asset Management Group) Section 1. Organization
The trust and other fiduciary business of the Bank shall be carried out through the Trust Group which shall be organizationally, operationally, administratively and functionally separate and distinct from the other groups, departments, divisions and/or businesses of the Bank. The Bank’s investment management activities, shall be conducted through its Trust Group and/or the Treasury Division and/or similar group, department or division. The responsibilities of the Board of Directors, Trust Committee and the Trust Officer shall be construed to include the proper administration and management of investment management activities.
The trust and other fiduciary business of the Bank shall be carried out through the Trust and Asset Management Group which shall be organizationally, operationally, administratively and functionally separate and distinct from the other groups, departments, divisions and/or businesses of the Bank. The Bank’s investment management activities, shall be conducted through its Trust and Asset Management Group. The responsibilities of the Board of Directors, Trust Investment Committee and the Trust Officer shall be construed to include the proper administration and management of investment management activities. The Bank shall not undertake any of the trust and other fiduciary
To comply with the provisions under the Manual of Regulations for Banks.

The Bank shall not undertake any of the trust and other fiduciary business and investment management activities outside the direct control, authority and management of the Trust Group and/or through any group, department, division or office which is involved in the other businesses of the Bank, such as the Treasury Division, or any similar department or division, otherwise, any such business shall be considered part of the Bank’s real liabilities.
business and investment management activities outside the direct control, authority and management of the Trust and Asset Management Group or through any group, department, division or office which is involved in the other businesses of the Bank, such as the Treasury Group, or any similar department or division, otherwise, any such business shall be considered part of the Bank’s real liabilities. The Bank Proper and the Trust and Asset Management Group may share the following activities: (1) electronic data processing; (2) credit investigation; (3) collateral appraisal; and (4) messengerial, janitorial and security services.
Article VI.B. (Trust and Asset Management Group) Section 2. Accountability
The Trust Group, Trust Officer and other subordinate officers of the Group shall only be directly responsible to the Trust Committee which shall in turn be only directly responsible to the Board of Directors. No director, officer or employee taking part in the management of trust and other fiduciary accounts shall perform duties in other groups, departments, divisions or the Audit Committee of the Bank and vice versa. The organization structure and definition of duties and responsibilities of the trust committee, officers and employees of the trust group or department shall reflect adherence to the minimum internal control standards prescribed by the Central Bank. The Trust Officer who is a lawyer and/or the Legal group shall see to it that legal assistance is readily available in the review of proposed and/or existing trust and fiduciary agreements and
The Trust and Asset Management Group, Trust Officer and other subordinate officers of the Group shall only be directly responsible to the Trust Investment Committee which shall in turn be only directly responsible to the Board of Directors. No director, officer or employee taking part in the management of trust and other fiduciary accounts shall perform duties in other groups, departments, divisions or the Audit Committee of the Bank and vice versa. However, branch managers duly authorized by the Board of Directors may, for or on behalf of the Trust Officer, sign pre-drawn trust instruments such as UITFs. The organization structure and definition of duties and responsibilities of the Trust Investment Committee, officers and employees of the Trust and Asset Management Group shall reflect adherence to the minimum internal control standards prescribed by the BSP.
To comply with the provisions under the Manual of Regulations for Banks.

documents and in the handling of legal and tax matters related thereto.
Provisions shall be made by the Bank to have legal assistance readily available in the review of proposed and/or existing trust and fiduciary agreements and documents and in the handling of legal and tax matters related thereto.
Article VI.B. (Trust and Asset Management Group) Section 3. Composition of the Trust Investment Committee
The Trust Committee shall be composed of five [5] members: (a) three [3] directors who are appointed by the Board on a regular rotation basis and who are not operating officers of the institution; (b) the President; and (c) the Trust Officer. No member of the Audit Committee shall be concurrently designated as a member of the Trust Committee. The Board shall indicate in the Minutes the Committee Members and designate the Chairman who shall be one of the three (3) directors referred to in item “(a)” above.
The Trust Investment Committee shall be composed of five [5] members: (a) three [3] non-executive directors or independent directors who are not part of the Audit Committee; (b) the President; and (c) the Trust Officer. The Board shall indicate in the Minutes the Committee Members and designate the Chairman who shall be one of the three (3) directors referred to in item “(a)” above.
To comply with the provisions under the Manual of Regulations for Banks.
Article VI.B. (Trust and Asset Management Group) Section 4. Qualifications of Committee Members, Officers and Staff
The Trust Department shall be staffed by persons of competence, integrity and honesty. Directors, committee members and officers charged with the administration of trust and other fiduciary activities shall, in addition to meeting the qualification standards prescribed for directors and officers of financial institutions, possess the necessary technical expertise in such business: Provided, that trust officers who shall be appointed after October 16, 1990 shall have at least two (2) years of actual experience or training in trust operations.
The Trust and Asset Management Group shall be staffed by persons of competence, integrity and honesty. Directors, committee members and officers charged with the administration of trust and other fiduciary activities shall, in addition to meeting the qualification standards prescribed for directors and officers of banks, possess the necessary technical expertise and relevant experience in such business. A Trust Investment Committee member should be familiar with Philippine laws, rules and regulations on trust business, as well as uphold at all times ethical and good governance standards. The Trust Officer who shall be appointed shall possess any of the following: (a) at least five (5) years of actual experience in trust operations; (b) at least three (3) years of actual experience in trust
To comply with the provisions under the Manual of Regulations for Banks.
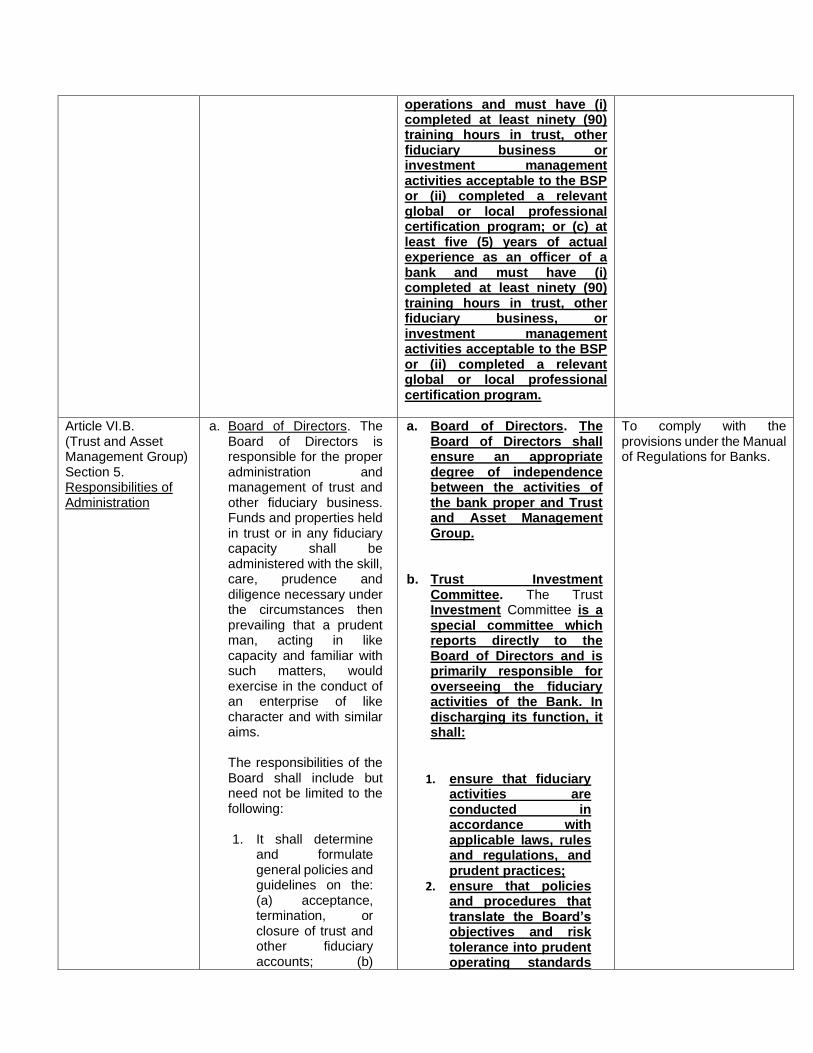
operations and must have (i) completed at least ninety (90) training hours in trust, other fiduciary business or investment management activities acceptable to the BSP or (ii) completed a relevant global or local professional certification program; or (c) at least five (5) years of actual experience as an officer of a bank and must have (i) completed at least ninety (90) training hours in trust, other fiduciary business, or investment management activities acceptable to the BSP or (ii) completed a relevant global or local professional certification program.
Article VI.B. (Trust and Asset Management Group) Section 5. Responsibilities of Administration
a. Board of Directors. The Board of Directors is responsible for the proper administration and management of trust and other fiduciary business. Funds and properties held in trust or in any fiduciary capacity shall be administered with the skill, care, prudence and diligence necessary under the circumstances then prevailing that a prudent man, acting in like capacity and familiar with such matters, would exercise in the conduct of an enterprise of like character and with similar aims.
The responsibilities of the Board shall include but need not be limited to the following:
1. It shall determine
and formulate general policies and guidelines on the: (a) acceptance, termination, or closure of trust and other fiduciary accounts; (b)
a. Board of Directors. The Board of Directors shall ensure an appropriate degree of independence between the activities of the bank proper and Trust and Asset Management Group.
b. Trust Investment Committee. The Trust Investment Committee is a special committee which reports directly to the Board of Directors and is primarily responsible for overseeing the fiduciary activities of the Bank. In discharging its function, it shall:
1. ensure that fiduciary activities are conducted in accordance with applicable laws, rules and regulations, and prudent practices;
2. ensure that policies and procedures that translate the Board’s objectives and risk tolerance into prudent operating standards
To comply with the provisions under the Manual of Regulations for Banks.

proper administration and management of each trust and other fiduciary accounts; and (c) investment, reinvestment and disposition of funds or property held by the Trust Group in its capacity as trustee or fiduciary;
2. It shall direct and
review the actions of the Trust Committee and all officers and employees designated to manage the trust and other fiduciary accounts, especially in the absence of specific agreements on investments, or in the case of discretionary accounts;
3. It shall approve or
confirm the acceptance, termination or closure of all trust and other fiduciary accounts and shall record such in its minutes;
4. Upon the
acceptance of an account, it shall immediately review all non-cash assets received for management. Likewise, it shall make a review of the trust and/or fiduciary assets at least once every twelve (12) months to determine the advisability of retaining or
are in place and continue to be relevant, comprehensive and effective;
3. oversee the implementation of the risk management framework and ensure that internal controls are in place relative to the fiduciary activities;
4. adopt an appropriate organizational structure/staffing pattern and operating budgets that shall enable the Trust and Asset Management Group to effectively carry out its functions;
5. oversee and evaluate the performance of the Trust Officer;
6. conduct regular meetings at least once every quarter, or more frequently as necessary, depending on the size and complexity of the fiduciary business; and
7. report regularly to the Board of Directors on matters arising from fiduciary activities.
c. Trust Officer. The management of day-to-day fiduciary activities shall be vested in the Trust Officer. In this regard, the Trust Officer shall:
1. ensure adherence to the basic standards in the administration of trust, other fiduciary and investment management accounts;
2. develop and implement relevant
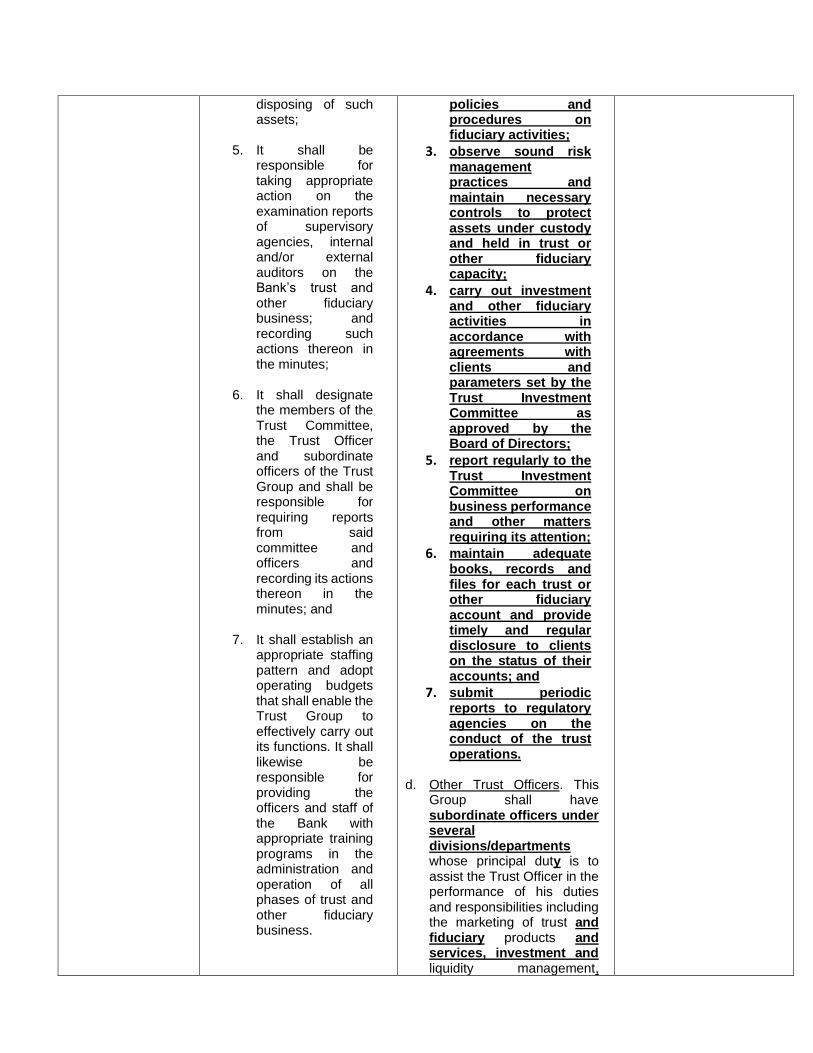
disposing of such assets;
5. It shall be
responsible for taking appropriate action on the examination reports of supervisory agencies, internal and/or external auditors on the Bank’s trust and other fiduciary business; and recording such actions thereon in the minutes;
6. It shall designate
the members of the Trust Committee, the Trust Officer and subordinate officers of the Trust Group and shall be responsible for requiring reports from said committee and officers and recording its actions thereon in the minutes; and
7. It shall establish an
appropriate staffing pattern and adopt operating budgets that shall enable the Trust Group to effectively carry out its functions. It shall likewise be responsible for providing the officers and staff of the Bank with appropriate training programs in the administration and operation of all phases of trust and other fiduciary business.
policies and procedures on fiduciary activities;
3. observe sound risk management practices and maintain necessary controls to protect assets under custody and held in trust or other fiduciary capacity;
4. carry out investment and other fiduciary activities in accordance with agreements with clients and parameters set by the Trust Investment Committee as approved by the Board of Directors;
5. report regularly to the Trust Investment Committee on business performance and other matters requiring its attention;
6. maintain adequate books, records and files for each trust or other fiduciary account and provide timely and regular disclosure to clients on the status of their accounts; and
7. submit periodic reports to regulatory agencies on the conduct of the trust operations.
d. Other Trust Officers. This
Group shall have subordinate officers under several divisions/departments whose principal duty is to assist the Trust Officer in the performance of his duties and responsibilities including the marketing of trust and fiduciary products and services, investment and liquidity management,

The Board of Directors may, by action duly entered in the minutes, delegate its authority for the acceptance, termination, closure or management of trust and other fiduciary accounts to the Trust Committee or to the Trust Officer subject to certain guidelines approved by the Board.
b. Trust Committee. The
Trust Committee duly constituted and authorized by the Board shall act within the sphere of authority which may be provided in the by-laws and/or as may be delegated by the Board, such as but not limited to the following:
1. The acceptance and closing of trust and other fiduciary accounts;
2. The initial review of assets placed under the trustee’s or fiduciary’s custody;
3. The investment, reinvestment and disposition of funds or property;
4. The review and approval of transactions between trust and/or fiduciary accounts; and
5. The review of trust and other fiduciary accounts at least once every twelve (12) months to determine the advisability of retaining or disposing of the trust or fiduciary assets, and/or whether the account is being managed in
business and product development, and operations of the Group.
The group may have such subordinate officer/s as the exigencies of the operations may require as determined by the Trust Officer and/or the Trust Investment Committee, the office/s or position/s of which is/are created by the Board of Directors, and whose principal functions shall be defined by the Board.

accordance with the instrument creating the trust or other fiduciary relationship.
For this purpose, the Trust Committee shall meet whenever necessary and keep minutes of its actions and make periodic reports thereon to the Board.
c. Trust Officer. The Trust
Officer designated by the Board as head of the Trust Group shall act and represent the institution in all trust and other fiduciary matters within the sphere of authority as may be provided in the By-Laws or as may be delegated by the Board. His responsibilities shall include, but need not be limited to the following:
1. The administration of
trust and other fiduciary account;
2. The implementation of
policies and instructions of the Board of Directors and the Trust Committee;
3. The submission of
reports on matters which require the attention of the Trust Committee and the Board of Directors;
4. The maintenance of
adequate books, records and files for each trust or other fiduciary account; and
5. The maintenance of necessary controls and measures to protect assets under his custody and held in trust or other fiduciary capacity.
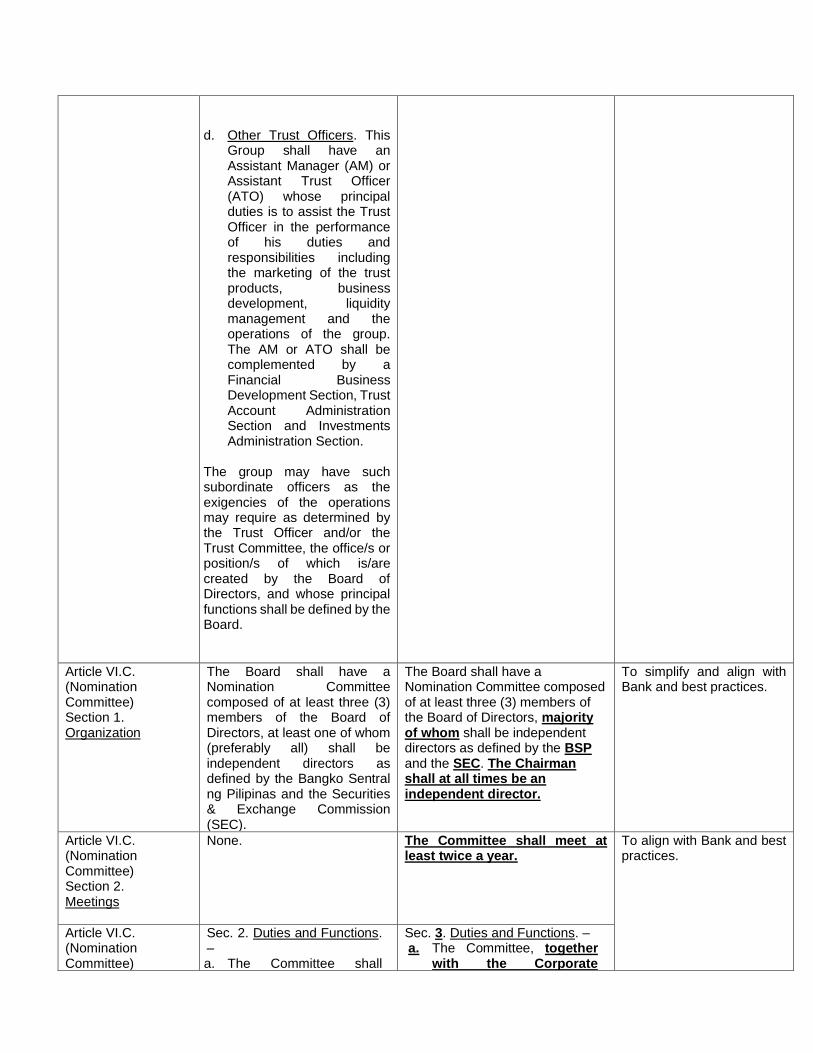
d. Other Trust Officers. This Group shall have an Assistant Manager (AM) or Assistant Trust Officer (ATO) whose principal duties is to assist the Trust Officer in the performance of his duties and responsibilities including the marketing of the trust products, business development, liquidity management and the operations of the group. The AM or ATO shall be complemented by a Financial Business Development Section, Trust Account Administration Section and Investments Administration Section.
The group may have such subordinate officers as the exigencies of the operations may require as determined by the Trust Officer and/or the Trust Committee, the office/s or position/s of which is/are created by the Board of Directors, and whose principal functions shall be defined by the Board.
Article VI.C. (Nomination Committee) Section 1. Organization
The Board shall have a Nomination Committee composed of at least three (3) members of the Board of Directors, at least one of whom (preferably all) shall be independent directors as defined by the Bangko Sentral ng Pilipinas and the Securities & Exchange Commission (SEC).
The Board shall have a Nomination Committee composed of at least three (3) members of the Board of Directors, majority of whom shall be independent directors as defined by the BSP and the SEC. The Chairman shall at all times be an independent director.
To simplify and align with Bank and best practices.
Article VI.C. (Nomination Committee) Section 2. Meetings
None. The Committee shall meet at least twice a year.
To align with Bank and best practices.
Article VI.C. (Nomination Committee)
Sec. 2. Duties and Functions. – a. The Committee shall
Sec. 3. Duties and Functions. – a. The Committee, together
with the Corporate

Section 3. Duties and Functions
review and evaluate the qualifications of all persons nominated to the Board, as well as those nominated to other positions requiring election / appointment by the Board of Directors and all promotions favorably endorsed by the Promotions Review Committee.
b. It shall promulgate the guidelines or criteria to govern the conduct of the nomination, and the same shall be properly disclosed in the company's information or proxy statement or such other reports required to be submitted to the SEC.
c. The nomination of all
director, more particularly of independent directors, shall be conducted by the Committee prior to a stockholders' meeting. All nominations or recommendations shall be signed by the nominating stockholders together with the acceptance and conformity of the nominees.
d. The Committee shall pre-
screen the qualifications and prepare a final list of all candidates and put in place screening policies and parameters that meet at least the minimum requirements of SEC Memorandum Circular No. 16 and BSP Circular No. 296 Series of 2001 to facilitate its task to effectively review the qualifications of the nominees for directors, more specifically for independent director/s.
Governance Committee, shall review and evaluate the qualifications of all persons nominated to the Board and of all persons appointed to positions beginning from Department and Division Head, as well as all promotions to any Bank Officer position.
b. It shall promulgate the guidelines or criteria to govern the conduct of the nomination, and the same shall be properly disclosed in the company’s information or proxy statement or such other reports required to be submitted to the SEC.
c. The nomination of all
directors, more particularly of independent director/s, shall be conducted by the Committee prior to a stockholders’ meeting. All nominations or recommendations shall be signed by the nominating stockholders together with the acceptance and conformity of the nominees.
d. The Committee shall pre-
screen the qualifications and prepare a final list of all candidates and put in place screening policies and parameters that meet at least the minimum requirements of relevant BSP and SEC circulars and issuances to facilitate its task to effectively review the qualifications of the nominees for directors, more specifically for independent director/s.
e. After the nomination, the
Committee shall prepare a Final List of Candidates which shall contain all the

e. After the nomination, the Committee shall prepare a Final List of Candidates which shall contain all the information about all the nominees for directors, more particularly for independent directors, as required under Part IV (A) and (C) of Annex "C" of SRC Rule 12, which list shall be made available to the SEC and to all stockholders through the filing and distribution of the Information Statement or Proxy Statement, in accordance with SRC Rule 17.1 (b) or SRC Rule 20, through the filing and distribution of the Information Statement or Proxy Statement, in accordance with SRC Rule 17.1 (b) or SRC Rule 20, respectively, or in such other reports the company is required to submit to the SEC. The name of the person or group of persons who recommended the nomination of the independent director/s shall be identified in such report including any relationship with the nominee.
f. Only nominees whose names appear on the Final List of Candidates shall be eligible for election as directors, more specifically for Independent Directors. No other nomination shall be entertained after the Final List of Candidates shall have been prepared. No further nomination shall be entertained or allowed on the floor during the actual annual stockholders' meeting, except in the unlikely event that a
information about all the nominees for directors, more particularly for independent directors, as required by existing laws and relevant circulars and issuances.
f. Only nominees whose
names appear on the Final List of Candidates shall be eligible for election as directors. No other nomination shall be entertained after the Final List of Candidates shall have been prepared. No further nomination shall be entertained or allowed on the floor during the actual annual stockholders’ meeting.

particular nominee/s make/s a last minute withdrawal of his/their acceptance and conformity, become/s incapacitated or otherwise no longer available for any reason whatsoever.
Article VI.C. (Nomination Committee) Section 4. Election of Independent Directors
Sec. 3 - Election of Independent Director/s a. Except as those required
under SEC Memorandum Circular No. 16, Series of 2002, and subject to pertinent existing laws, rules and regulations of the Commission, the conduct of the election of independent directors and the other directors shall be made in accordance with the standard election procedures of these By-Laws.
b. It shall be the responsibility of the Chairman of the Meeting to inform all stockholders in attendance of the mandatory requirement of electing independent directors. He shall ensure that independent directors are elected during the stockholders' meeting.
c. Specific slots for
independent directors shall not be filled-up by unqualified nominees.
d. In case of failure of
election for independent directors, the Chairman of the Meeting shall call a separate election during the same meeting to fill up the vacancy.
Sec. 4. Election of Independent Directors. – Except as those required under existing laws, rules, and regulations of the SEC, the conduct of the election of independent directors and the other directors shall be made in accordance with the standard election procedures of these By-Laws.
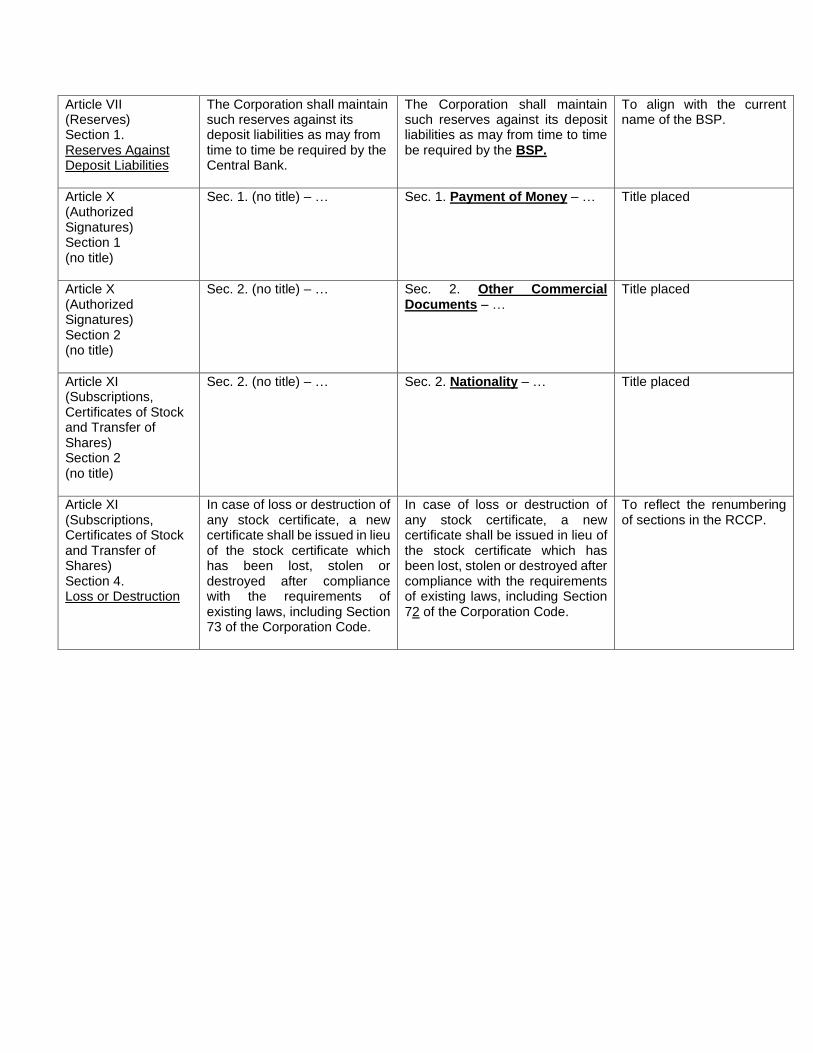
Article VII (Reserves) Section 1. Reserves Against Deposit Liabilities
The Corporation shall maintain such reserves against its deposit liabilities as may from time to time be required by the Central Bank.
The Corporation shall maintain such reserves against its deposit liabilities as may from time to time be required by the BSP.
To align with the current name of the BSP.
Article X (Authorized Signatures) Section 1 (no title)
Sec. 1. (no title) – … Sec. 1. Payment of Money – … Title placed
Article X (Authorized Signatures) Section 2 (no title)
Sec. 2. (no title) – … Sec. 2. Other Commercial Documents – …
Title placed
Article XI (Subscriptions, Certificates of Stock and Transfer of Shares) Section 2 (no title)
Sec. 2. (no title) – … Sec. 2. Nationality – … Title placed
Article XI (Subscriptions, Certificates of Stock and Transfer of Shares) Section 4. Loss or Destruction
In case of loss or destruction of any stock certificate, a new certificate shall be issued in lieu of the stock certificate which has been lost, stolen or destroyed after compliance with the requirements of existing laws, including Section 73 of the Corporation Code.
In case of loss or destruction of any stock certificate, a new certificate shall be issued in lieu of the stock certificate which has been lost, stolen or destroyed after compliance with the requirements of existing laws, including Section 72 of the Corporation Code.
To reflect the renumbering of sections in the RCCP.