Australian School Libraries Research Project: Australian teacher librarians
Upload
khangminh22Category
view
4download
0
Ombudsman review: https://www.asbfeo.gov.au/news/news-articles/ombudsman-releases-supply-chain-financing-review-position-paper Position paper: https://www.asbfeo.gov.au/sites/default/files/documents/ASBFEO-SCF-position-paper.pdf
Page 1
26 February 2020
Australian Small Business and Family Enterprise Ombudsman (ASBFEO) ANZ Building Level 2, 15 Moore Street CANBERRA ACT 2601 Dear Ms. Carnell, RE: FEEDBACK ON THE SUPPLY CHAIN FINANCE REVIEW - POSITION PAPER We have taken the time to appraise the Supply Chain Finance Review – Position Paper of February 2020, and as a current provider of invoice finance; trade finance and our embryonic launch of our Supply Chain Finance (“SCF”) funding solution into the Australian market, we thought it would be beneficial to provide our views, comments and feedback on the Position Paper, having done an extraordinary amount of global research into SCF over the last 2 years. TIM Finance is partnering with a highly regarded and leading global technology platform provider to provide SCF into the Australian market as a supplement to Invoice Finance, which, although having been around for many years has one of the lowest penetration rates and annual growth rates amongst its first world peers. Unlike the UK and USA, Australian small businesses continue to choose high cost non-bank funding, instead of invoice finance, to help with their working capital requirements, when in fact such expensive debt is causing more harm than good. We continue to educate the market about invoice finance and its benefits to small business, but we strongly feel that SCF, like in other countries, will exceed invoice finance and trade finance within a few years, due to its ease of use and the fact that if implemented correctly, is a win-win for both Buyers (big corporates) and Suppliers (big and small). SCF is a fantastic solution for Suppliers (big and small) that require it, as it allows quick and easy access to funding without the need to submit applications forms; get credit checks done; wait for credit approval; pay upfront application/establishment fees, as is normally charged on loans, nor is there ongoing serviceability requirements of principal and interest. Suppliers get to access funds at borrowing rates determined by the large Buyers credit rating, making it highly cost effective for the supplier. TIM Finance’s business philosophy is to ensure that small business thrives in Australia, being the backbone of the economy, we therefore take each and every point made in the Position Paper seriously, and whilst we agree with many of the findings, there are a few areas where we hold a different view mainly as a result of our solutions being different to what small businesses are currently experiencing with other SCF programs in place in Australia. We would like to contribute to achieving a better market perception of SCF in Australia by leveraging our experience in the field and our knowledge of what’s happening globally. As many comments made by journalists of late have not only been placed out of context but others are simply completely incorrect.
Ombudsman review: https://www.asbfeo.gov.au/news/news-articles/ombudsman-releases-supply-chain-financing-review-position-paper Position paper: https://www.asbfeo.gov.au/sites/default/files/documents/ASBFEO-SCF-position-paper.pdf
Page 2
TIM Finance intends to focus on our point of difference in the market by outlining why we hold a different view to what is currently being offered in the Australian market, as we are following the European and USA market principals, which is based on the principals that a SCF program must be beneficial to all Suppliers and the Buyer, in order to work and on top of this, no Supplier should be forced to participate in an SCF program if they do not wish to. It should be 100% voluntary. a. TIM Finance via its Supply Chain Finance (“SCF”) related entity, called Fintrade,
endorses the effort and purpose of the Australian Small Business and Family Enterprise Ombudsman’s (“ASBFEO”) review currently being undertaken and believe this will lead to a significantly more transparent and positive outcome for all Suppliers to large business, including small businesses. This is driven by the fundamental principal behind SCF which is to ensure that it is a win-win for ALL parties involved, and should a Supplier (large or small) feel that they are not benefiting from the terms being offered by the Buyer offering the SCF program, then the Supplier must be entitled to opt-out of the program, without penalties. No SCF program should be compulsory, forcing a Supplier to participate. Under a SCF program both Supplier and Buyer are meant to be able to thrive with the funding solution being offered in order to participate in a program.
b. SCF, when implemented and used properly, provides huge benefits to Suppliers as they are sourcing funding (by being paid early) by taking advantage of the cost of funds based on the Buyers credit rating. The annualised discounts that a Supplier ‘endures’ by accepting early payment needs to be equal to or less than the cost of funds of that Suppliers sourcing a funding facility (business loan) themselves from a bank or non-bank lender. If not then either the SCF program is not being offered and implemented correctly or the Supplier has an equal or better credit rating to the Buyer, which in this case the Supplier can source its owing working capital funding and opt-out of the SCF program. Without knowing the confidential details of the current programs underway in the market, from what has been reported in the media, it does appear that there has been misuse of this product or funding solution in the market, hence the need for this review, which we encourage. Any current SCF party that is taking advantage of small Suppliers, in our view, is not a complete surprise as the Australian SCF market is still nascent, when compared to the UK, Europe and the USA, with only one true provider currently, with the rest playing around the fringes (as they either do not have the tech platform and/or funding capabilities to implement SCF programs at the top end of town). As time goes on and SCF becomes more prevalent in Australia the “dust will settle”, pricing and terms will normalise (this is only natural in any environment where no true competitors exist, until market norms prevail). We are not against intervention by ASBFEO, in monitoring the situation but we do caution any rash legislation that might be under consideration, which may stifle the uptake of SCF in Australia as a result. ASBFEO is highly encouraged to undertake in-depth studies of the UK, EU and USA markets in terms of what laws exist in those jurisdictions, as SCF is thriving and is working for small Suppliers as well as big, to the point that SCF is now larger than trade finance and invoice finance in many overseas markets. It is inevitable that free market competition will, over time, normalise what is and isn’t acceptable, and hence we would encourage ASBFEO to refrain from making any rash changes to any laws, simply due to having very low penetration; very low competition and less than a dozen SCF programs currently running in Australia.
Ombudsman review: https://www.asbfeo.gov.au/news/news-articles/ombudsman-releases-supply-chain-financing-review-position-paper Position paper: https://www.asbfeo.gov.au/sites/default/files/documents/ASBFEO-SCF-position-paper.pdf
Page 3
c. While we agree with many of the findings and recommendations in the Position Paper,
we would like to comment under each of the key recommendations. We list the main headings as provided in the Position Paper below, with comments and views on each, for consideration:
Commentary on the Draft Recommendations:
i. Consistent Small Business Definition: As is the case in the UK, Europe and the United States of America, they all define business under two categories being number of employees and annual turnover (not either or). Therefore businesses with less than 20 employees and annual turnover of less than AUD10 million would be a fair definition of a business category and hence the definition cannot and should not be defined simply by number of employees, as this will lead to more business employing contractors in order to be defined as “small” and on the other hand there are very high turnover businesses in the IT sector with very few employees so such a simple definition in our view is too restrictive and will not represent small business size adequately. It should be noted that although the 20 employees and $10 million turnover is currently used as benchmarks, one should also consider Canada as another example as a small business in Canada is defined as a Canadian-based corporation with fewer than 100 employees and under $500,000 in annual income. In our view turnover should therefore be somewhere between $500,000 and the current $10 million.
ii. Enforceable Payment Times: We feel this would be going to far. It would be a very costly framework to set up and manage and whose costs will no doubt have to be borne by business (in taxes). At some point business should and would take responsibility for their actions around what payment times are considered fair in the industry in which they operate and often this is dictated by the market forces of supply and demand. It should be noted that although the federal government is moving towards 20 day payment terms for government contracts under $1.0 million this does no take into account the size of the Supplier (payment is based on contract size only) and many State and Federal government departments are not adhering to this proposed payment term, such is seen on the invoice finance side of our business whereby clients are waiting significantly longer than 20 days for the government to pay them for products and services rendered.
iii. 30-day payment standard: Government should not intervene with legislation on this regardless of Supplier size, not only would Australia be the first in the world to legislate on this, but it would be impractical as it automatically assumes that every Buyer (regardless of size) is able to pay ALL of its Suppliers (regardless of size) on 30 days, which is unfeasible. Payment terms should be negotiated between Buyer and Supplier like any other contract term, whilst maintaining reasonableness. Australia currently does not have DPO days (Days Payable Outstanding) that are longer than other countries, Buyers, in general, across the board are paying their Suppliers in a reasonable timeframe. 30 days is simply unrealistic, especially for bigger transactions: It is global norms that big transactions have more than 30-day payment terms, often with complex repayment structures. Why would Australia be any different? The Australian
Ombudsman review: https://www.asbfeo.gov.au/news/news-articles/ombudsman-releases-supply-chain-financing-review-position-paper Position paper: https://www.asbfeo.gov.au/sites/default/files/documents/ASBFEO-SCF-position-paper.pdf
Page 4
government would be naïve in thinking that by simply implementing legislation the problem will go away, as not only is the government themselves often a culprit of late payments but if one takes a simple metric like average Days Inventory Outstanding (DIO) – the amount of time companies hold inventory - in many case this is often greater than 30-days and in some sectors its >90-days, so a 30 day payment term for them is just not possible. This is just one or many reasons it is simply no workable. There is no country in the world that has been able to achieve this. Payment terms of 30 days to Suppliers who are small businesses is reasonable, however market forces and competition amongst other things should determine if payment days are 30, 60 or even 90 days to larger Suppliers. Also, it is important to recognise that the business sector that actually has the longest payment terms to their suppliers is actually other small businesses! (Refer to the Cash Flow Crisis Report attached, which was commissioned by The Invoice Market (now known as TIM Finance) in 2017 which substantiates these comments). Legislating 30-day payment terms will, in our view, only lead to an increase in small business failures.
iv. SCF as a real choice: Yes, SCF is a very real choice. It should be available to every small business that is wanting payment in under 30 days from a Buyer that has implemented a SCF programme. Saying this, if current payment terms are say 45 days and Suppliers have accepted this then early payment should not be limited to 30 day payment terms only. The Supplier is advanced payment on shorter payment days than is in their contract with the Buyer and if the Supplier does not wish to get early payment then they will still be paid in 45-days as per their agreed contract or payment terms. From what has been reported in the media and intimated in the Position Paper, it seems like some SCF programs are forcefully changing payment terms to all Suppliers from 30 days (if that is the current terms of payment) to 60 or even 90 days. In order for a Supplier to get an earlier payment, even if they want payment on 30 days (as they were receiving prior to the SCF program being implemented), they would need to agree to giving a discount on invoice value simply to enable them to get paid on what was their previous 30 day payment terms. This is not how SCF should be offered. A fair SCF program would be to offer all Suppliers the opportunity to participate in an SCF program, but as a result of them participating they then have a choice: get paid in 45 or 60 days (from the say the original 30 days); or get paid sooner at a discount. However, if a Supplier does not want to participate in a program then it should not be forced to and in that case the agreement with the Supplier will continue without change and be paid on the current agreed 30 days (without the ability to received payment any sooner). The revised ‘prolonged payment times’ should never be forced onto Suppliers, they are mutually agreed - with the Suppliers having the choice to then accept or reject them, in order to participate in the SCF program or not, and if not accepted then the Supplier continues to get paid on current terms (if a small Supplier then this could be in the 30- days). Having the option (and getting advanced payment using the Buyer’s credit rating) is almost always more beneficial, as the key principal behind the discount given by the Supplier to get paid early, is that this discount, when annualised should be
Ombudsman review: https://www.asbfeo.gov.au/news/news-articles/ombudsman-releases-supply-chain-financing-review-position-paper Position paper: https://www.asbfeo.gov.au/sites/default/files/documents/ASBFEO-SCF-position-paper.pdf
Page 5
lower than if the Supplier went to the bank itself to sources its own working capital funding (via a loan or invoice finance). This is due to the fact that the funding costs in an SCF program are determined by the credit rating of the Buyer, so even with a margin built-in (which is required to fill the gap between the time period of paying a Supplier earlier and the Buyer paying back the funder, see point (vii) below), the cost of funds to a Supplier should be lower. From what we are reading in the press and what is being implied in the Position Paper is that Buyers offering SCF are asking/demanding unreasonably high annualised discounts from Suppliers, in order to get paid early or they must accept extended payment terms The focus should be on ensuring reasonable rates are offered. An acceptable outcome is achieved when the advanced payment rate is between the Buyer’s and the Supplier’s credit rating. This is then a win-win for all and how SCF should be!
v. Appropriate Coverage by Accounting Standards: TIM supports the disclosure of the use of SCF in financial reporting. SCF should not be used to cover up or to manipulate the cash flow position of a business. Any changes in Accounting Standards and reporting should be governed by changes in global Accounting Standards and not simply a rule for Australian businesses only. Reporting and the need for such changes is and has been on the agenda for sometime in many countries, it is not something that should be spearheaded from Australia but rather adopted by Australia when the rest of the world legislate it.
vi. SCF using AI and algorithms to target small businesses: The use of Artificial Intelligence (AI) and algorithms is not being used (to our knowledge) to extract as much dollars from Suppliers as possible. Such technology is being used in an effort to mitigate risk as all lending or funding solutions no matter how big or small comes with risk, so by having appropriate pricing based on risk, it will assist funders in determining the price by which a Buyer can access its capital, in order to pay Suppliers early. High risk industries with high risk Suppliers will naturally result in a different risk/reward ratio than those in low risk, stable sectors with stable Buyers and Suppliers. No SCF program should be utlising AI to the detriment of any Supplier, big or small.
vii. SCF produces artificial benefits to big businesses: The comments on this on page 4 of the Position Paper, is in our view completely incorrect if an SCF program is implemented correctly.
i. An SCF program must benefit both Buyers and Suppliers, else it is flawed from the start;
ii. SCF does not artificially improve a Buyer (big business’) accounts. SCF genuinely does improve a Buyers working capital, by allowing a Buyer to pay its creditor (being the SCF programme funder) on an extended payment timeframe. Example: If a Buyer is currently paying its Suppliers (big and small) on average across its entire ledger on say 37 days EOM, an SCF program could allow the Buyer to pay its funder back for the funding it has used to pay Suppliers early, up to 90 days later. This is a true improvement in working capital and hence cash flow to the Buyer.
iii. Buyers should not receive the benefit of the discount on their invoices (funded by small businesses and shared with SCF providers). The difference in margin usually goes to the funder for wearing the cost (and risk) from the day they pay the Supplier (upfront/early payment), until the Buyer eventually pays them up to 90-days later, plus a portion goes to the
Ombudsman review: https://www.asbfeo.gov.au/news/news-articles/ombudsman-releases-supply-chain-financing-review-position-paper Position paper: https://www.asbfeo.gov.au/sites/default/files/documents/ASBFEO-SCF-position-paper.pdf
Page 6
SaaS technology platform provider that manages the whole SCF program. Should the Buyer receive any monetary benefits, the SCF program would then need to be classified as financial debt and be disclosed on the balance sheet of the Buyer.
We appreciate that SCF in Australia is in its infancy and we have no doubt that some providers might be pushing the boundaries, however this is not globally accepted norms. SCF has been a funding solution in the UK, Europe and the USA for several years now and growing faster than trade finance and invoice finance, and therefore hopefully our contribution to the Position Paper, as per above points will provide some insights into how SCF should be implemented, how it should work and how it should be beneficial to both small Suppliers (wishing to utilise it, voluntarily) and to the Buyers offering it. Should the you wish to gather further insights from us, we would welcome the opportunity to meet and discuss further. Kind regards,
STEVEN FURMAN DIRECTOR
January 2017
SME cash-flow crisis report
The Invoice Market | SME cash-flow crisis report 2
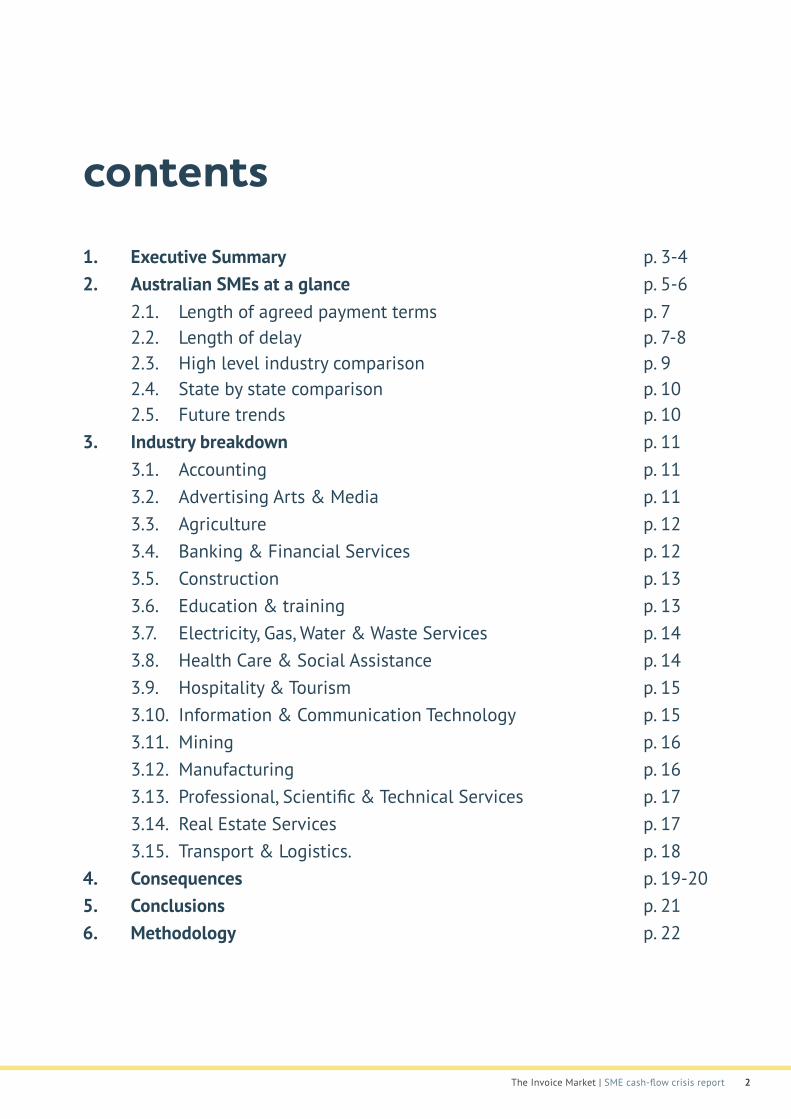
contents1. Executive Summary p. 3-42. Australian SMEs at a glance p. 5-6
2.1. Length of agreed payment terms p. 7 2.2. Length of delay p. 7-8 2.3. High level industry comparison p. 9 2.4. State by state comparison p. 10 2.5. Future trends p. 10
3. Industry breakdown p. 11 3.1. Accounting p. 11 3.2. Advertising Arts & Media p. 11 3.3. Agriculture p. 12 3.4. Banking & Financial Services p. 12 3.5. Construction p. 13 3.6. Education & training p. 13 3.7. Electricity, Gas, Water & Waste Services p. 14 3.8. Health Care & Social Assistance p. 14 3.9. Hospitality & Tourism p. 15 3.10. Information & Communication Technology p. 15 3.11. Mining p. 16 3.12. Manufacturing p. 16 3.13. Professional, Scientific & Technical Services p. 17 3.14. Real Estate Services p. 17 3.15. Transport & Logistics. p. 18
4. Consequences p. 19-205. Conclusions p. 216. Methodology p. 22
The Invoice Market | SME cash-flow crisis report 3
1
Australia’s two million small and medium size businesses are drowning in a sea of unpaid customer bills, with $76 billion in outstanding invoices at any one
time crippling their ability to grow.
On average, each Australian business is owed more than $38,000, with corporate customer excuses ranging from ‘lost in the system’, ‘in dispute’ to ‘being reviewed internally’ or ‘being processed offshore’.
The Invoice Market’s ‘Cash Flow Crisis report’ has important implications for all Australians. Small business is the engine room of the national economy, employing seven million Australian workers, or 70 per cent of the entire workforce. As such, it is the incubator of our national prosperity.
However, cash flow is so dire for 38 per cent of small and medium sized Australian businesses that owners have to dip into their personal savings to manage their company cash flow, which impacts their ability to pay their housing and other living expenses.
This in turn creates a disincentive to hire new staff, and makes it harder to pay existing workers.
executive summary
The Invoice Market | SME cash-flow crisis report 4
While Australians are renowned for their laid-back attitude, this report shows that small business, rather than big corporates, are the tardiest in paying their bills to other SMEs.This growing culture is producing a self-inflicted cash flow crisis, which is often cited as one of the key reasons why small businesses go out of business, particularly in the first five years of operation.
• Almost half a million Australian companies would employ more people if they could improve their cash flow position. In doing so, unemployment would be largely eliminated in this country.
• Culturally Australian businesses are prepared to break their word with suppliers to assist their own business.
• Schools have the lowest rate of delinquent debts of any industry in the country, suggesting that teachers are significantly more commercial, and better at managing their debtors, than other industries. Other winners include the health sector and banking.
• Companies in IT, Electricity and Mining suffer the longest wait before their bills are paid.
• Four in five businesses ask to be paid within one month, but three-quarters do not get paid until up to a month beyond the agreed terms, and an unlucky 3% have to wait more than three months after the due date.
• Contrary to popular belief that big business and multi-nationals treat small business poorly, 85% of debtors to Australian SMEs are actually other SMEs.
• More than 40% of SMEs typically have more than 11 invoices outstanding, collectively worth an average $38,000. Extended across the economy, this amounts to a $76 billion ‘cash flow handbreak’.
Key findings of this report include:
The Invoice Market | SME cash-flow crisis report 5
australian SMEs at a glance2
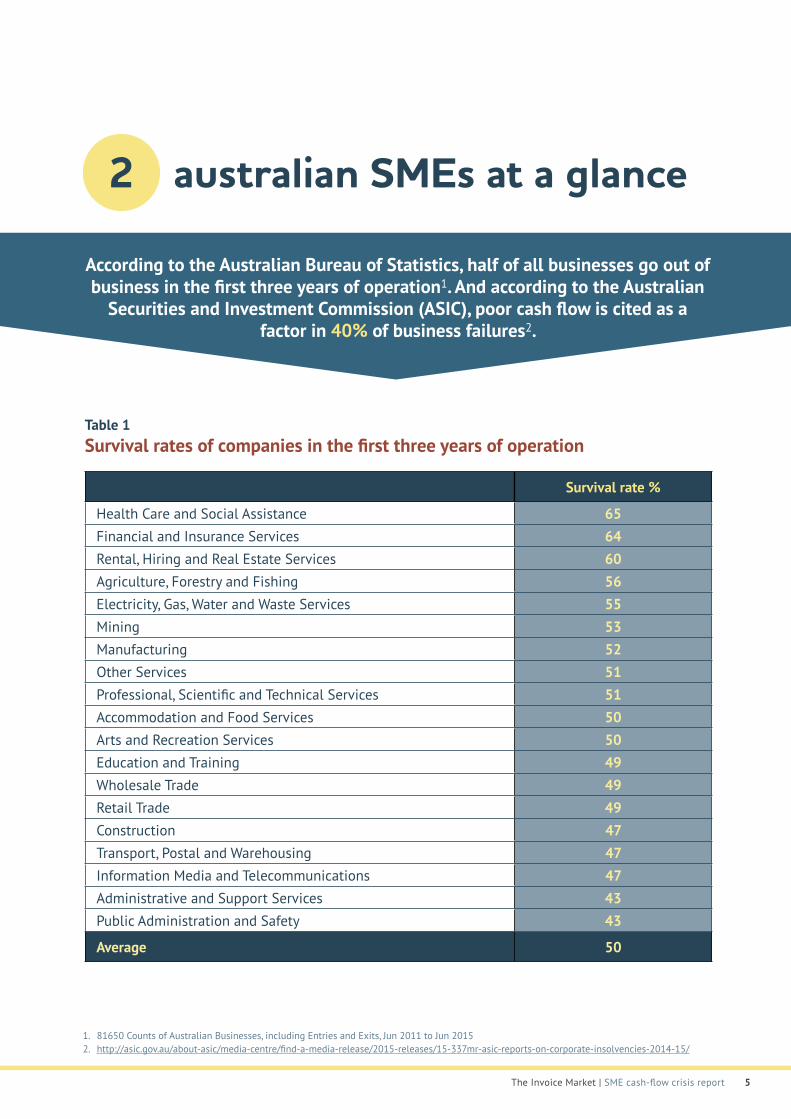
Table 1 Survival rates of companies in the first three years of operation
According to the Australian Bureau of Statistics, half of all businesses go out of business in the first three years of operation1. And according to the Australian
Securities and Investment Commission (ASIC), poor cash flow is cited as a factor in 40% of business failures2.
Survival rate %
Health Care and Social Assistance 65Financial and Insurance Services 64Rental, Hiring and Real Estate Services 60Agriculture, Forestry and Fishing 56Electricity, Gas, Water and Waste Services 55Mining 53Manufacturing 52Other Services 51Professional, Scientific and Technical Services 51Accommodation and Food Services 50Arts and Recreation Services 50Education and Training 49Wholesale Trade 49Retail Trade 49Construction 47Transport, Postal and Warehousing 47Information Media and Telecommunications 47Administrative and Support Services 43Public Administration and Safety 43
Average 50
1. 81650 Counts of Australian Businesses, including Entries and Exits, Jun 2011 to Jun 20152. http://asic.gov.au/about-asic/media-centre/find-a-media-release/2015-releases/15-337mr-asic-reports-on-corporate-insolvencies-2014-15/
The Invoice Market | SME cash-flow crisis report 6
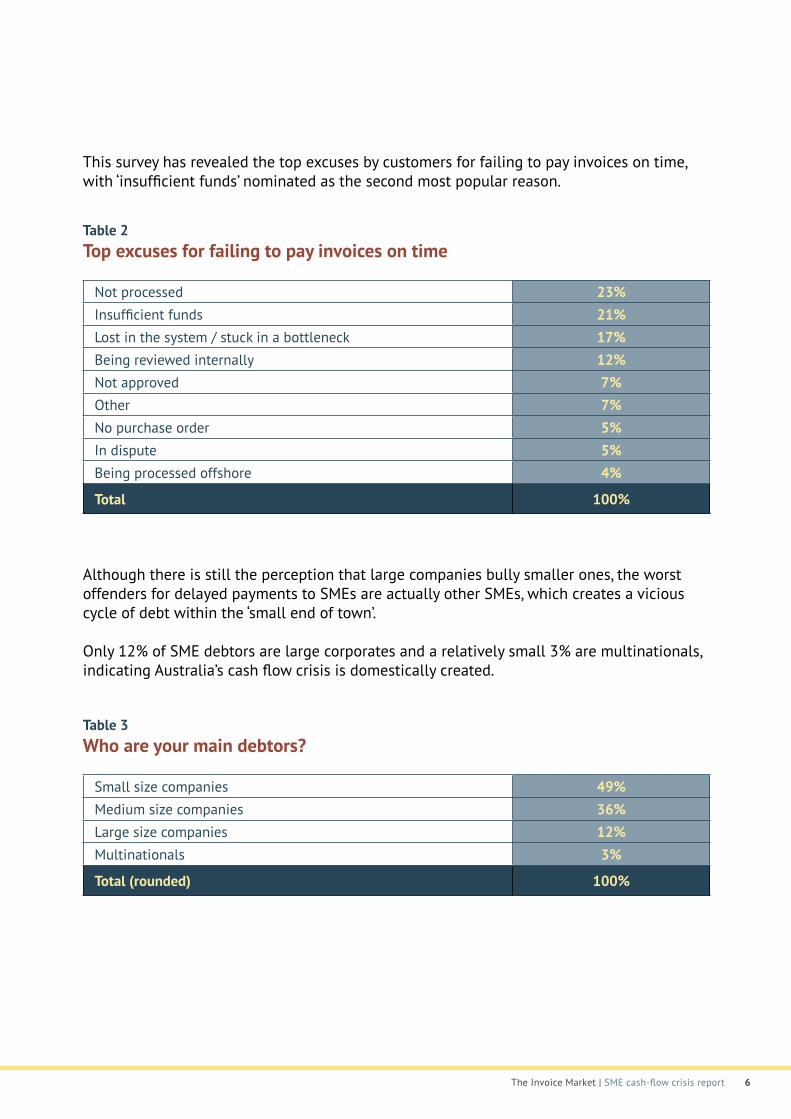
This survey has revealed the top excuses by customers for failing to pay invoices on time, with ‘insufficient funds’ nominated as the second most popular reason.
Table 2 Top excuses for failing to pay invoices on time
Not processed 23%Insufficient funds 21%Lost in the system / stuck in a bottleneck 17%Being reviewed internally 12%Not approved 7%Other 7%No purchase order 5%In dispute 5%Being processed offshore 4%
Total 100%
Although there is still the perception that large companies bully smaller ones, the worst offenders for delayed payments to SMEs are actually other SMEs, which creates a vicious cycle of debt within the ‘small end of town’.
Only 12% of SME debtors are large corporates and a relatively small 3% are multinationals, indicating Australia’s cash flow crisis is domestically created.
Table 3 Who are your main debtors?
Small size companies 49%Medium size companies 36%Large size companies 12%Multinationals 3%
Total (rounded) 100%
The Invoice Market | SME cash-flow crisis report 7
length of delay2.2
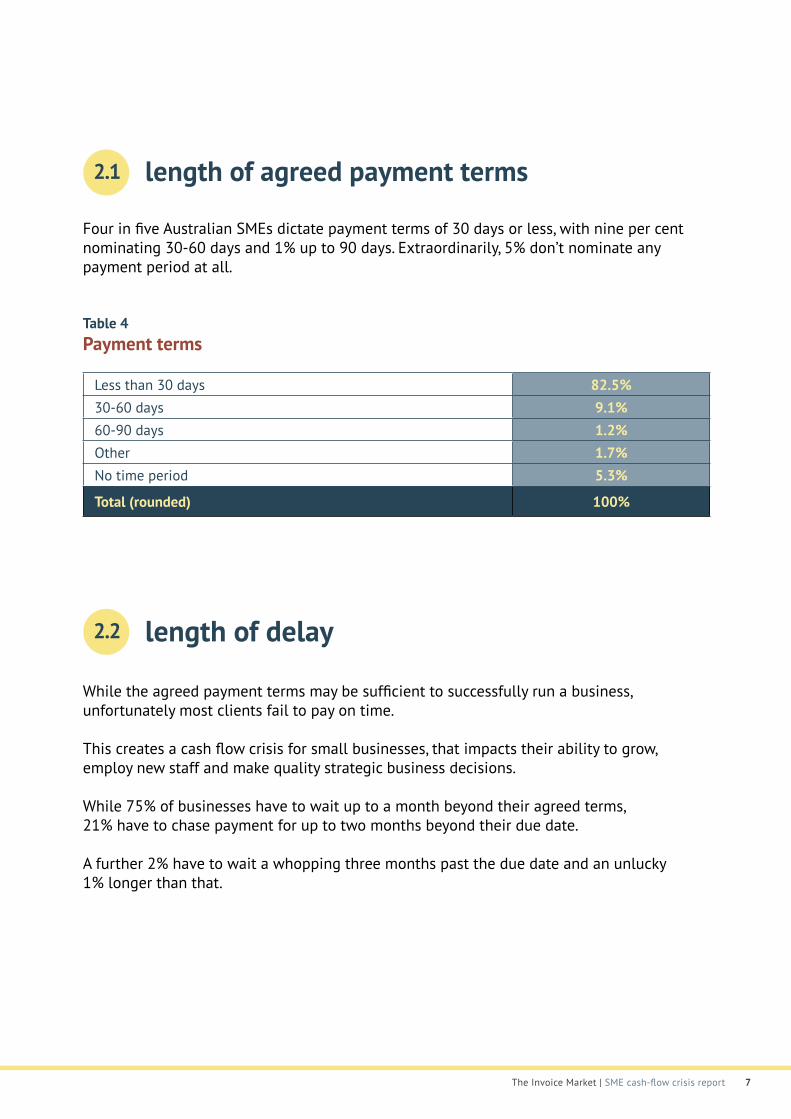
Four in five Australian SMEs dictate payment terms of 30 days or less, with nine per cent nominating 30-60 days and 1% up to 90 days. Extraordinarily, 5% don’t nominate any payment period at all.
Table 4 Payment terms
Less than 30 days 82.5%30-60 days 9.1%60-90 days 1.2%Other 1.7%No time period 5.3%
Total (rounded) 100%
While the agreed payment terms may be sufficient to successfully run a business, unfortunately most clients fail to pay on time.
This creates a cash flow crisis for small businesses, that impacts their ability to grow, employ new staff and make quality strategic business decisions.
While 75% of businesses have to wait up to a month beyond their agreed terms, 21% have to chase payment for up to two months beyond their due date.
A further 2% have to wait a whopping three months past the due date and an unlucky 1% longer than that.
length of agreed payment terms2.1

The Invoice Market | SME cash-flow crisis report 8
Table 5 How late are payments made to payment terms?
Always get paid on time 0%1-13 days 37%14-30 days 39%31-45 days 15%46-60 days 6%61-90 days 2%More than 90 days 1%
Total (rounded) 100%
One of the most striking findings of this report is that while late payments cost companies money, it is the hidden cost in time that is the most revealing.
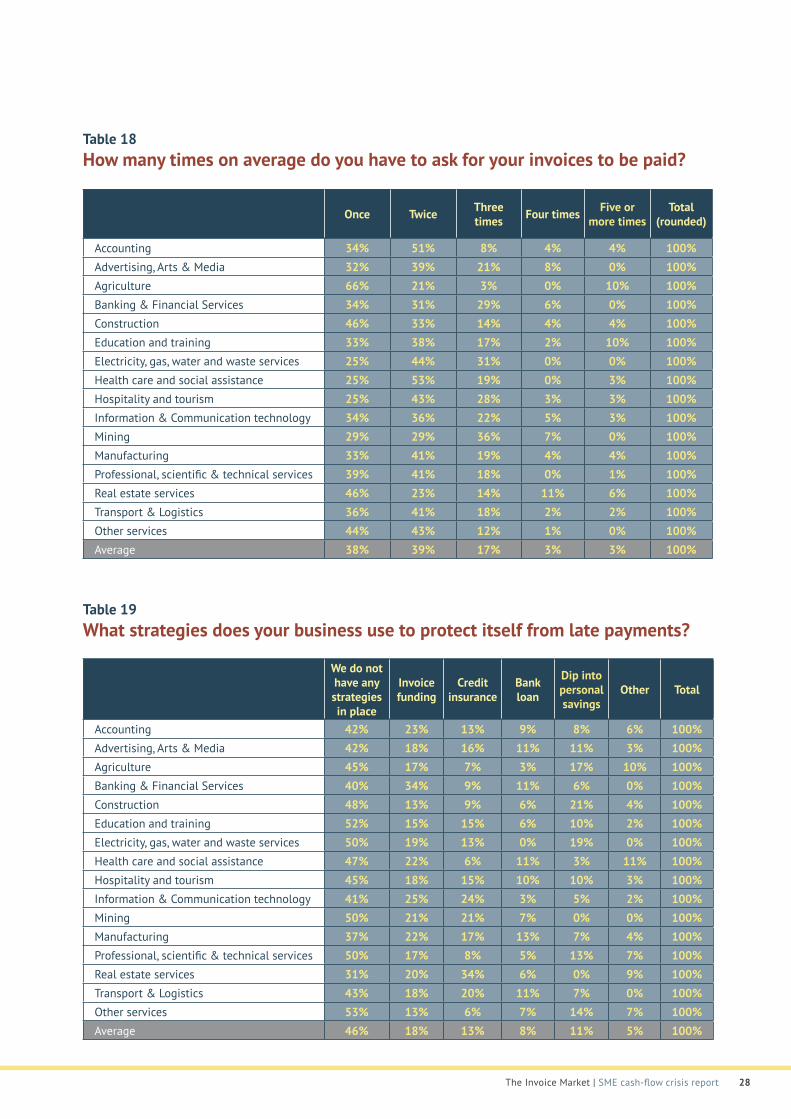
On average, 46% of companies have to ask twice or three times for their bills to be paid by errant corporate customers.
Extraordinarily, in 3% of cases companies are forced to demand payment five or more times.This suggests that culturally Australian businesses are prepared to break their word with suppliers to assist their own business.
This raises questions about how long peer-to-peer business relationships can last before they begin breaking down.
The trend helps explain why Australia’s two million SMEs have on average $38,000 in outstanding invoices waiting to be paid.
Collectively this is $76 billion that is stalling the economy in frozen liquidity at any one time.
Table 6 Number of times client needs to be reminded to pay their bills
Once 38%Twice 39%Three times 17%Four times 3%Five or more times 3%
Total (rounded) 100%
The Invoice Market | SME cash-flow crisis report 9
industry comparison2.3
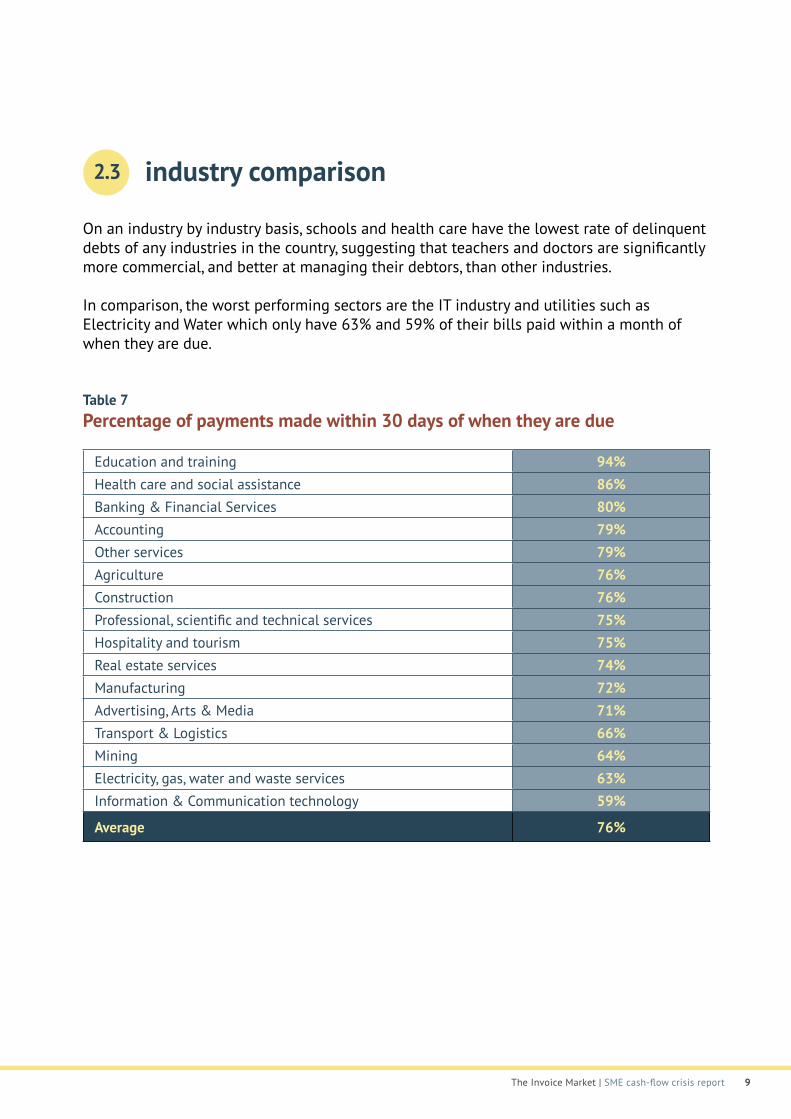
On an industry by industry basis, schools and health care have the lowest rate of delinquent debts of any industries in the country, suggesting that teachers and doctors are significantly more commercial, and better at managing their debtors, than other industries.
In comparison, the worst performing sectors are the IT industry and utilities such as Electricity and Water which only have 63% and 59% of their bills paid within a month of when they are due.
Table 7 Percentage of payments made within 30 days of when they are due
Education and training 94%Health care and social assistance 86%Banking & Financial Services 80%Accounting 79%Other services 79%Agriculture 76%Construction 76%Professional, scientific and technical services 75%Hospitality and tourism 75%Real estate services 74%Manufacturing 72%Advertising, Arts & Media 71%Transport & Logistics 66%Mining 64%Electricity, gas, water and waste services 63%Information & Communication technology 59%
Average 76%
The Invoice Market | SME cash-flow crisis report 10
state by state comparison2.4
On a national basis, the larger states not surprisingly also were over-represented with larger SMEs.
Nationally 15% of the surveyed companies had annual revenue between $5-$10 million. However in NSW this rose to 20% and in Victoria it climbed to 18%.
By comparison, while half of all SMEs nationally had annual turnover of less than $1 million, 63% of those in Tasmania and 59% of those in Western Australia fell into this category.
Western Australia is the standout state for laggard payments, with 8% of all invoices paid more than two months late, against a national average of 3%.
At the other end of the scale, South Australian businesses fare best in the nation with 78% of all payments made within 30 days of their due date, compared to a national average of 76%.
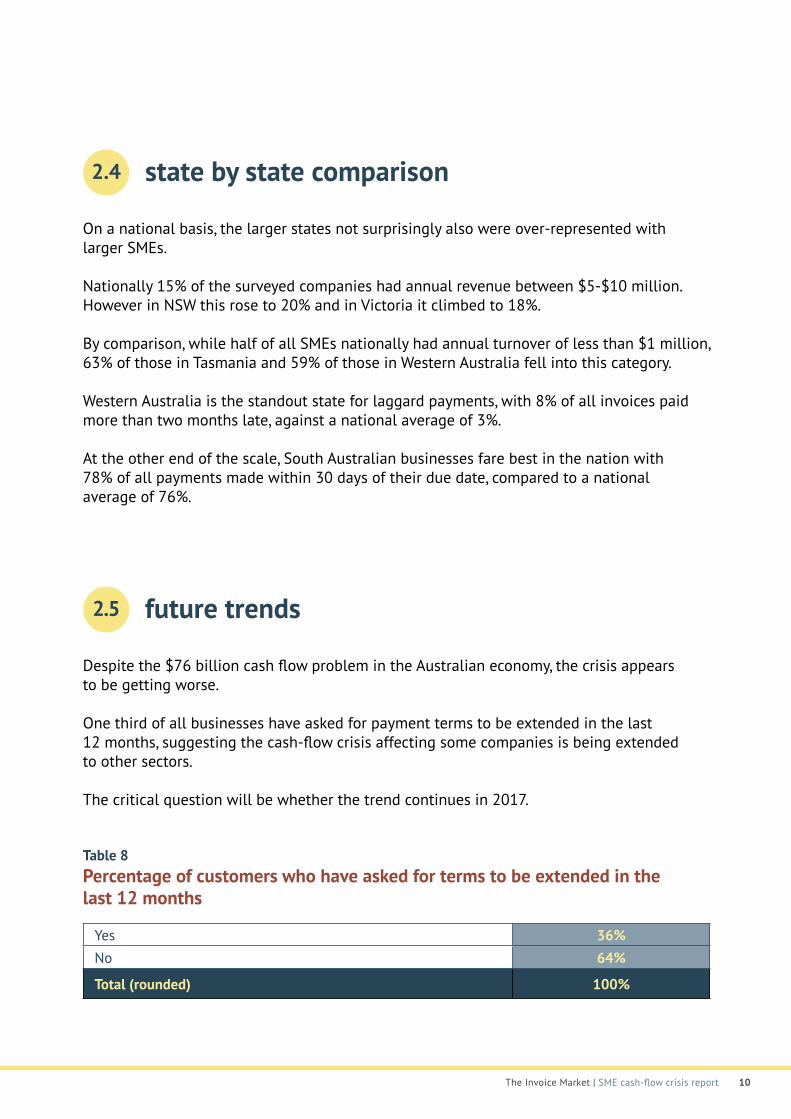
future trends 2.5
Despite the $76 billion cash flow problem in the Australian economy, the crisis appears to be getting worse.
One third of all businesses have asked for payment terms to be extended in the last 12 months, suggesting the cash-flow crisis affecting some companies is being extended to other sectors.
The critical question will be whether the trend continues in 2017.
Table 8 Percentage of customers who have asked for terms to be extended in the last 12 months
Yes 36%No 64%
Total (rounded) 100%
The Invoice Market | SME cash-flow crisis report 11
industry breakdown3
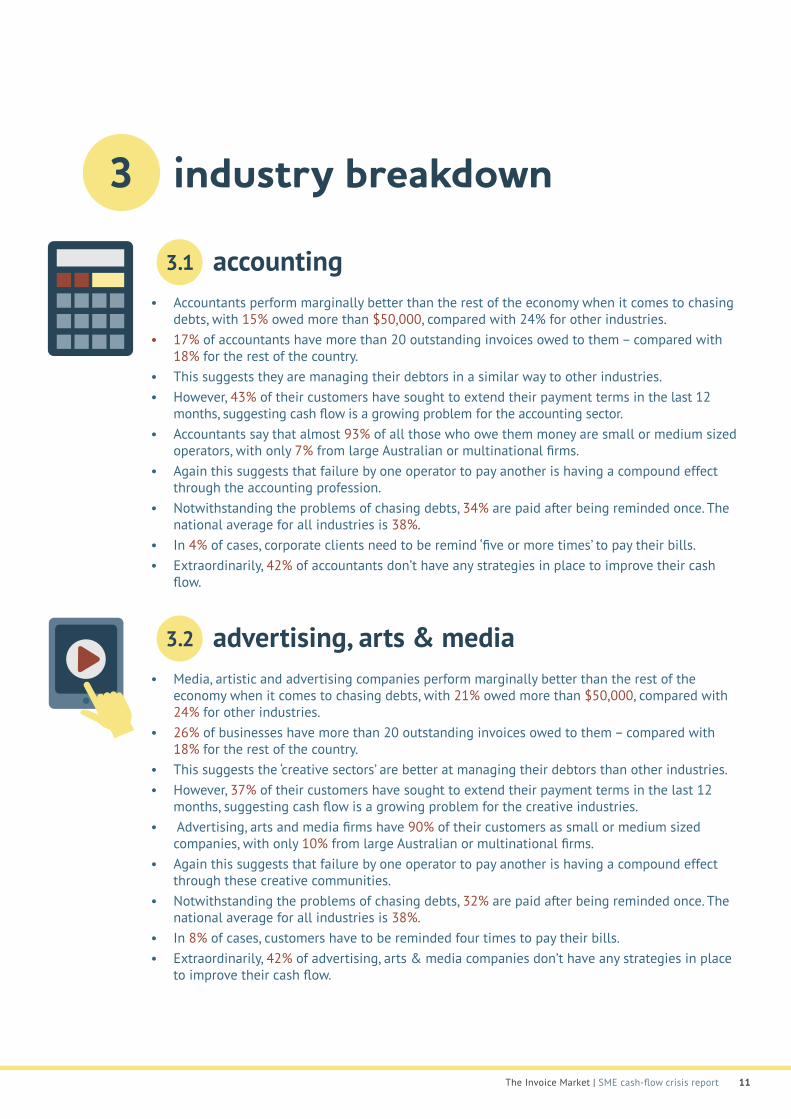
accounting3.1
• Accountants perform marginally better than the rest of the economy when it comes to chasing debts, with 15% owed more than $50,000, compared with 24% for other industries.
• 17% of accountants have more than 20 outstanding invoices owed to them – compared with 18% for the rest of the country.
• This suggests they are managing their debtors in a similar way to other industries. • However, 43% of their customers have sought to extend their payment terms in the last 12
months, suggesting cash flow is a growing problem for the accounting sector.• Accountants say that almost 93% of all those who owe them money are small or medium sized
operators, with only 7% from large Australian or multinational firms.• Again this suggests that failure by one operator to pay another is having a compound effect
through the accounting profession.• Notwithstanding the problems of chasing debts, 34% are paid after being reminded once. The
national average for all industries is 38%.• In 4% of cases, corporate clients need to be remind ‘five or more times’ to pay their bills.• Extraordinarily, 42% of accountants don’t have any strategies in place to improve their cash
flow.
advertising, arts & media3.2
• Media, artistic and advertising companies perform marginally better than the rest of the economy when it comes to chasing debts, with 21% owed more than $50,000, compared with 24% for other industries.
• 26% of businesses have more than 20 outstanding invoices owed to them – compared with 18% for the rest of the country.
• This suggests the ‘creative sectors’ are better at managing their debtors than other industries. • However, 37% of their customers have sought to extend their payment terms in the last 12
months, suggesting cash flow is a growing problem for the creative industries.• Advertising, arts and media firms have 90% of their customers as small or medium sized
companies, with only 10% from large Australian or multinational firms.• Again this suggests that failure by one operator to pay another is having a compound effect
through these creative communities.• Notwithstanding the problems of chasing debts, 32% are paid after being reminded once. The
national average for all industries is 38%.• In 8% of cases, customers have to be reminded four times to pay their bills.• Extraordinarily, 42% of advertising, arts & media companies don’t have any strategies in place
to improve their cash flow.

The Invoice Market | SME cash-flow crisis report 12
agriculture3.3
• Agriculture employs about 477,000 Australians and has annual sales of about $85 billion3.• Agriculture performs marginally better than the rest of the economy when it comes to chasing
debts, with 17% of farmers owed more than $50,000, compared with 24% for other industries.• 21% of farms have more than 20 outstanding invoices owed to them – compared with 18% for
the rest of the country.• This suggests that farmers are struggling to manage their debtors in a better way than other
industries. • However, more than a quarter of all suppliers have sought to extend their payment terms in the
last 12 months, suggesting cash flow is a growing problem in rural areas.• Farmers say that almost 95% of all those who owe them money are small or medium sized
operators, with only 5% from large Australian or multinational firms.• Again this suggests that failure by one operator in the bush to pay another is having a
compound effect through regional communities.• Notwithstanding the problems of chasing debts, farmers are the only industry where a majority
of invoices (65%) are paid after being reminded once. The national average for all industries is38%.
• In 10% of cases, farmers have to remind those who owe them money ‘five or more times’.• Extraordinarily, 45% of operators in the agriculture sector don’t have any strategies in place to
improve their cash flow.
banking & financial services3.4
• According to the Australian Parliament, banking and financial services employs about400,000 people4.
• Bankers perform marginally worse than the rest of the economy when it comes to chasingdebts, with 29% owed more than $50,000, compared with 24% for other industries.
• 26% of banks have more than 20 outstanding invoices owed to them – compared with 18% forthe rest of the country.
• However, owing to the size of most financial institutions, negative conclusions are difficult toreach about the performance of each of their accounts departments.
• This suggests that xxx are managing their creditors in a better/worse way than other industries. • A majority of customers (52%) have sought to extend their payment terms in the last 12
months, suggesting cash flow is a growing problem for financial services companies.• Bankers say that 74% of all those who owe them money are small or medium sized operators,
with only 26% from large Australian or multinational firms.• Notwithstanding the problems of chasing debts, 34% are paid after being reminded once. The
national average for all industries is 38%.• In 6% of cases, bankers have to remind their customers four times to pay their bills.• Extraordinarily, 40% of financial services companies don’t have any strategies in place to
improve their cash flow.
3. Aust Bureau of Statistics – 8155.0 Australian Industry 2014-154. www.aph.gov.au/About_Parliament/Parliamentary_Departments/Parliamentary_Library/FlagPost/2014/February/Employment-by-industry-2012-13
The Invoice Market | SME cash-flow crisis report 13
construction3.5
• According to the Australian Bureau of Statistics, construction employs 1,038,000 people, with annual sales of $382 billion5.
• Building companies perform marginally worse than the rest of the economy when it comes to chasing debts, with 30% owed more than $50,000, compared with 24% for other industries.
• 11% of builders have more than 20 outstanding invoices owed to them – compared with 18% for the rest of the country.
• This suggests that builders are managing their debtors in a better way than other industries. • However, 36% of all customers have sought to extend their payment terms in the last 12
months, suggesting cash flow is a growing problem for builders.• Builders say that almost 80% of all those who owe them money are small or medium sized
operators, with only 20% from large Australian or multinational firms.• Again this suggests that failure by one small operator to pay another is having a compound
effect throughout the construction sector.• Notwithstanding the problems of chasing debts, 46% are paid after being reminded once. The
national average for all industries is 38%.• In 4% of cases, builders have to remind those who owe them money ‘five or more times’.• Extraordinarily, 48% of those in the construction industry don’t have any strategies in place to
improve their cash flow.
education & training3.6
• According to the Australian Bureau of Statistics, the education and training (private) sector employs 399,000 people, with annual sales of $21 billion6.
• Schools have the lowest rate of delinquent debts of any industry in the country, suggesting that teachers are significantly more commercial, and better at managing their debtors, than other industries.
• Only 19% of schools and colleges have unpaid sales of more than $50,000, compared to 24% of companies in other industries.
• And 6% of schools and colleges have more than 20 outstanding invoices owed to them – compared with 18% of companies for the rest of the country.
• However, 31% of customers have sought to extend their payment terms in the last 12 months, suggesting cash flow is an emerging problem for schools and training organisations.
• Educators say that 96% of all those businesses who owe them money are small or medium sized, with only 4% from large Australian or multinational firms.
• Again this suggests that failure by one operator to pay another is having a compound effect through the education system.
• Notwithstanding the problems of chasing debts, 33% of invoices are paid after being reminded once. The national average for all industries is 38%.
• In 10% of cases, educators have to remind those who owe them money ‘five or more times’.• Extraordinarily, 52% of those companies in the education and training sector don’t have any
strategies in place to improve their cash flow.
5. Aust Bureau of Statistics – 8155.0 Australian Industry 2014-15; 6. Aust Bureau of Statistics – 8155.0 Australian Industry 2014-15

The Invoice Market | SME cash-flow crisis report 14
• According to the Australian Bureau of Statistics, electricity, gas, water and waste services employs 112,000 people and has annual sales of $113 billion7.
• Utility providers perform marginally better than the rest of the economy when it comes to chasing debts, with 19% owed more than $50,000, compared with 24% for other industries.
• 25% of utility businesses have more than 20 outstanding invoices owed to them – compared with 18% for the rest of the country.
• However, owing to their size, the sheer volume of customers would explain this outcome.• 38% of all suppliers have sought to extend their payment terms in the last 12 months,
suggesting cash flow remains a problem for utilities.• Utility operators say that almost 94% of all those who owe them money are small or medium
sized operators, with only 6% from large Australian or multinational firms.• Again this suggests that failure by one small operator to pay another is having a compound
effect through the electricity, gas, water and waste sectors.• Notwithstanding the problems of chasing debts, one quarter are paid after being reminded
once. The national average for all industries is 38%.• In 31% of cases, utilities have to remind those who owe them money three times. It is the only
sector that does not have to chase suppliers a fourth or fifth occasion, reflecting their market power relative to other industries that may be more fragmented.
• Extraordinarily, 50% of electricity, gas, water and waste services companies don’t have any strategies in place to improve their cash flow.
electricity, gas, water & waste services3.7
health care & social assistance3.8
• According to the Australian Bureau of Statistics, the health care and social assistance sectors employs 1,079,000 people, with annual sales of $84 billion8.
• Doctors, hospitals and charities have the second lowest rate of delinquest debts of any industry in the country, after education. This suggests that doctors are significantly more commercial, and better at managing their debtors, than other industries.
• 22% of health providers have more than $50,000 owed to them, compared with 24% for other industries.
• Likewise, 17% of health businesses have more than 20 outstanding invoices owed to them – compared with 18% for the rest of the country.
• However, 22% of business customers have sought to extend their payment terms in the last 12 months, suggesting cash flow is a growing problem for the health sector.
• Health and social care professional say that 92% of all those who owe them money are small or medium sized operators, with only 8% from large Australian or multinational firms.
• Again this suggests that failure by one small operator to pay another is having a compound effect through the health and caring communities.
• Notwithstanding the problems of chasing debts, one quarter of invoices are paid after being reminded once. The national average for all industries is 38%.
• In 3% of cases, corporate customers have to be reminded ‘five or more times’ to pay their bills.• Extraordinarily, 47% of health care & social assistance operators don’t have any strategies in
place to improve their cash flow.
7. Aust Bureau of Statistics – 8155.0 Australian Industry 2014-15; 8. Aust Bureau of Statistics – 8155.0 Australian Industry 2014-15
The Invoice Market | SME cash-flow crisis report 15
hospitality & tourism3.9
• According to the Australian Bureau of Statistics, accommodation and food services employs 963,000 people and has annual sales of $92 billion9.
• Tourism operators perform marginally better than the rest of the economy when it comes to chasing debts, with 23% of hotels, resorts and other hospitality providers owed more than $50,000, compared with 24% for other industries.
• 25% of hospitality and tourism businesses have more than 20 outstanding invoices owed to them – compared with 18% for the rest of the country.
• However, 45% of all customers have sought to extend their payment terms in the last 12 months, suggesting cash flow is a growing problem for the lucrative tourism sector.
• Hospitality and tourism providers say that 95% of those who owe them money are small or medium sized operators, with only 5% from large Australian or multinational firms.
• Again this suggests that failure by one small operator to pay another is having a compound effect throughout the hospitality sector.
• Notwithstanding the problems of chasing debts, a quarter are paid after being reminded once. The national average for all industries is 38%.
• In 3% of cases, tourism and hospitality providers have to remind those who owe them money to pay ‘five or more times’.
• Extraordinarily, 45% of hospitality and tourism operators don’t have any strategies in place to improve their cash flow.
information & communication technology3.10
• IT companies are significantly worse than the rest of the economy when it comes to chasing debts, with 39% having more than $50,000 owed to them, compared with 24% for other industries.
• 22% of IT businesses have more than 20 outstanding invoices owed to them – compared with 18% for the rest of the country.
• This could partly be explained by the relatively large size of many IT companies, with a commensurate rise in customer numbers.
• However, 44% of all customers have sought to extend their payment terms in the last 12 months, suggesting cash flow is a growing problem for the IT sector.
• It companies say that four in five companies who owe them money are small or medium sized operators, with only 19% from large Australian or multinational firms.
• Again this suggests that failure by one small operator to pay another is having a compound effect through the IT sector.
• Notwithstanding the problems of chasing debts, 34% of bills are paid after being reminded once. The national average for all industries is 38%.
• In 3% of cases, customers have to be reminded to pay their bills ‘five or more times’.• Extraordinarily, 41% of IT companies don’t have any strategies in place to improve their cash
flow.
9. Aust Bureau of Statistics – 8155.0 Australian Industry 2014-15
The Invoice Market | SME cash-flow crisis report 16
mining• According to the Australian Bureau of Statistics, mining employs 173,000 people and has
annual sales of $211 billion11.• Miners are the worst performing industry in Australia for chasing debts, with 57% of resources
companies owed more than $50,000, compared with 24% for other industries. • However, this may be explained by the heavy capital nature of the industry, with large
inventories and supply chains required to operate.• 36% of mining businesses have more than 20 outstanding invoices owed to them – compared
with 18% for the rest of the country.• However, 57% of all suppliers have sought to extend their payment terms in the last 12 months,
the most of any industry in Australia.• This suggests that as mining boom continues to fade, customers within the resources sector are
struggling to adjust.• Miners say that 79% of all those who owe them money are small or medium sized operators,
with only 21% from large Australian or multinational firms.• Again this suggests that failure by one small operator to pay another is having a compound
effect throughout the resources sector.• Notwithstanding the problems of chasing debts, 29% of debts are paid after being reminded
once. The national average for all industries is 38%.• In 7% of cases, miners have to remind customers to pay their bills four times.• Extraordinarily, 50% of mining companies don’t have any strategies in place to improve their
cash flow.
manufacturing3.12
• According to the Australian Bureau of Statistics manufacturing employs 850,000 people, and has annual sales of $377 billion12.
• Manufacturers dealing with tight profit margins and fierce international competition are better than the rest of the economy when it comes to chasing debts, with 18% owed more than $50,000, compared with 24% for other industries.
• 20% of manufacturing businesses have more than 20 outstanding invoices owed to them – compared with 18% for the rest of the country.
• This may be explained by the heavy capital nature of the industry, with large inventories and supply chains.
• However, 44% of all customers have sought to extend their payment terms in the last 12 months, suggesting cash flow is a growing problem for the manufacturing sector.
• Manufacturers say that four in five of all those who owe them money are small or medium sized operators, with only 20% from large Australian or multinational firms.
• Again this suggests that failure by one small operator to pay another is having a compound effect throughout the manufacturing sector.
• Notwithstanding the problems of chasing debts, a third of invoices are paid after being reminded once. The national average for all industries is 38%.
• In 4% of cases, manufacturers have to remind clients to pay them ‘five or more times’.• Extraordinarily, 37% of manufacturers don’t have any strategies in place to improve their cash
flow.
3.11
11. Aust Bureau of Statistics – 8155.0 Australian Industry 2014-15; 12. Aust Bureau of Statistics – 8155.0 Australian Industry 2014-15
The Invoice Market | SME cash-flow crisis report 17
professional, scientific & technical services• According to the Australian Bureau of Statistics, professional, scientific and technical services
employs 964,000 people, with annual sales of $194 billion13.• Professional white collar service industries are worse than the rest of the economy when it
comes to chasing debts, with 26% of companies owed more than $50,000, compared with 24% for other industries.
• Only 9% of businesses have more than 20 outstanding invoices owed to them – compared with 18% for the rest of the country.
• This could partly be explained because many professional services companies are smaller in size than the rest of the economy, which means they issue fewer invoices annually.
• However, almost a third of all customers have sought to vary their payment terms in the last 12 months, suggesting cash flow remains a problem for white collar professionals.
• Almost 87% of all those who owe them money are small or medium sized operators, with only 13% from large Australian or multinational firms.
• Again this suggests that failure by one operator to pay another is having a compound effect throughout the professional, scientific and technical services communities.
• Notwithstanding the problems of chasing debts, 40% of bills are paid after customers are reminded once. The national average for all industries is 38%.
• In 1% of cases, customers have to be reminded ‘five or more times’.• Extraordinarily, half of all professional services firms don’t have any strategies in place to
improve their cash flow.
real estate services3.14
• According to the Australian Bureau of Statistics, rental, hiring and real estate services employ 403,000 people, with annual sales of $121 billion14.
• Real estate agents are significantly worse than the rest of the economy when it comes to chasing debts, with 37% owed more than $50,000, compared with 24% for other industries.
• Agents rely on inconsistent cash flow, owing to a small number of property sales per month, so chasing up outstanding bills should be a priority.
• 29% of real estate businesses have more than 20 outstanding invoices owed to them – compared with 18% for the rest of the country.
• This is puzzling, as many real estate agents are relatively small businesses, and reinforces the notion that the sector can improve its management of its debtors.
• This comes at a time when a quarter of customers have sought to extend their payment terms in the last 12 months.
• Real estate service operators say that almost 69% of all those who owe them money are small or medium sized operators, with only 31% from large Australian or multinational firms.
• Again this suggests that failure by one small operator to pay another is having a compound effect throughout the property sector.
• Notwithstanding the problems of chasing debts, 46% of bills are paid after customers are reminded once. The national average for all industries is 38%.
• In a whopping 6% of cases, agents have to remind those who owe them money to pay ‘five or more times’.
• Extraordinarily, 31% of those in the real estate services sector don’t have any strategies in place
3.13
13. Aust Bureau of Statistics – 8155.0 Australian Industry 2014-15; 14. Aust Bureau of Statistics – 8155.0 Australian Industry 2014-15
The Invoice Market | SME cash-flow crisis report 18
transport & logistics• According to the Australian Bureau of Statistics, the transport, postal and warehousing sectors
employ 574,000 people with annual sales of $154 billion.• Trucking and logistics companies are worse than the rest of the economy when it comes to
chasing debts, with 32% owed more than $50,000, compared with 24% for other industries. • 25% of transport and logistics businesses have more than 20 outstanding invoices owed to
them – compared with 18% for the rest of the country.• Given the fragmented nature of the sector, this result suggests they are failing to manage their
debtors as well as other industries. • This comes at a time when 41% of corporate customers have sought to extend their payment
terms in the last 12 months, suggesting cash flow remains a problem in the transport sector.• Operators say that 77% of all those who owe them money are small or medium sized operators,
with only 23% from large Australian or multinational firms.• Again this suggests that failure by one operator to pay another is having a compound effect
throughout the transport and logistics supply chain.• Notwithstanding the problems of chasing debts, 36% of customers need to be reminded once
before paying. The national average for all industries is 38%.• In 2% of cases, they need to be reminded ‘five or more times’.• Extraordinarily, 42% of transport and logistics companies don’t have any strategies in place to
improve their cash flow.
3.15

The Invoice Market | SME cash-flow crisis report 19
4 consequences
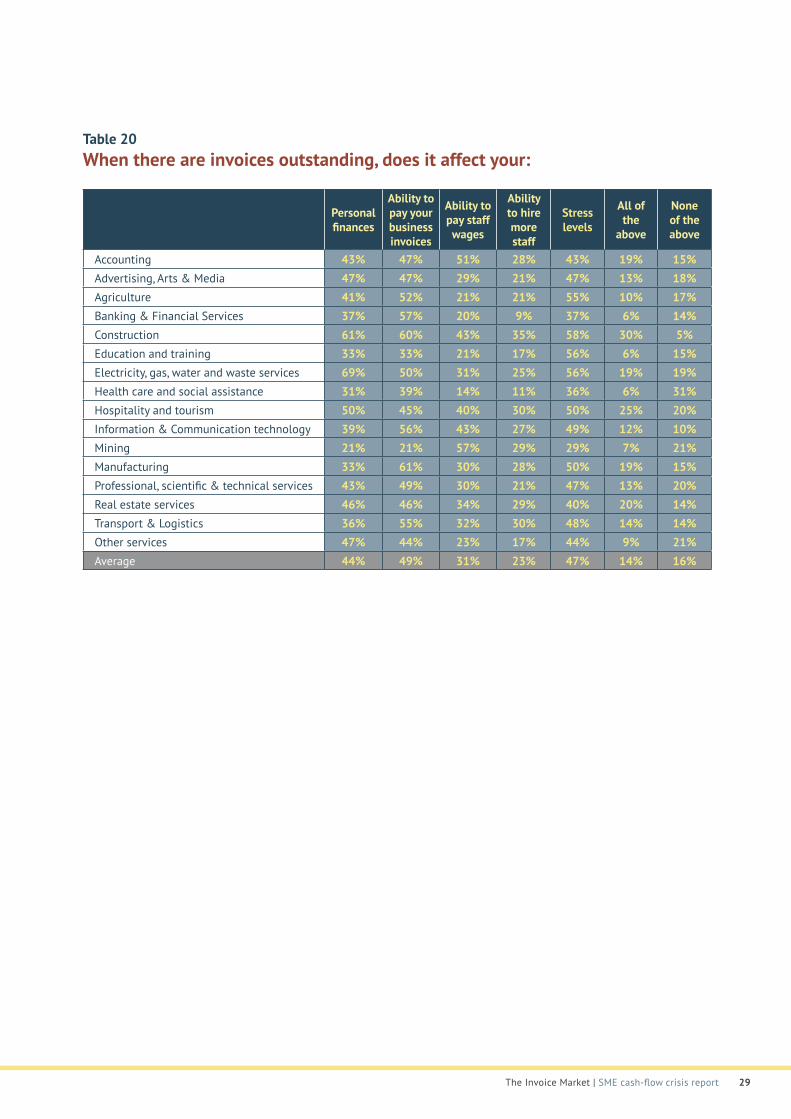
Top 5 Pain Points caused by late payments:
stress
#1 pain point: ability to pay invoices
#2 pain point: stress levels
#3 pain point: personal finances
#4 pain point: ability to pay staff wages
#5 pain point: ability to hire more staff
The Invoice Market | SME cash-flow crisis report 20
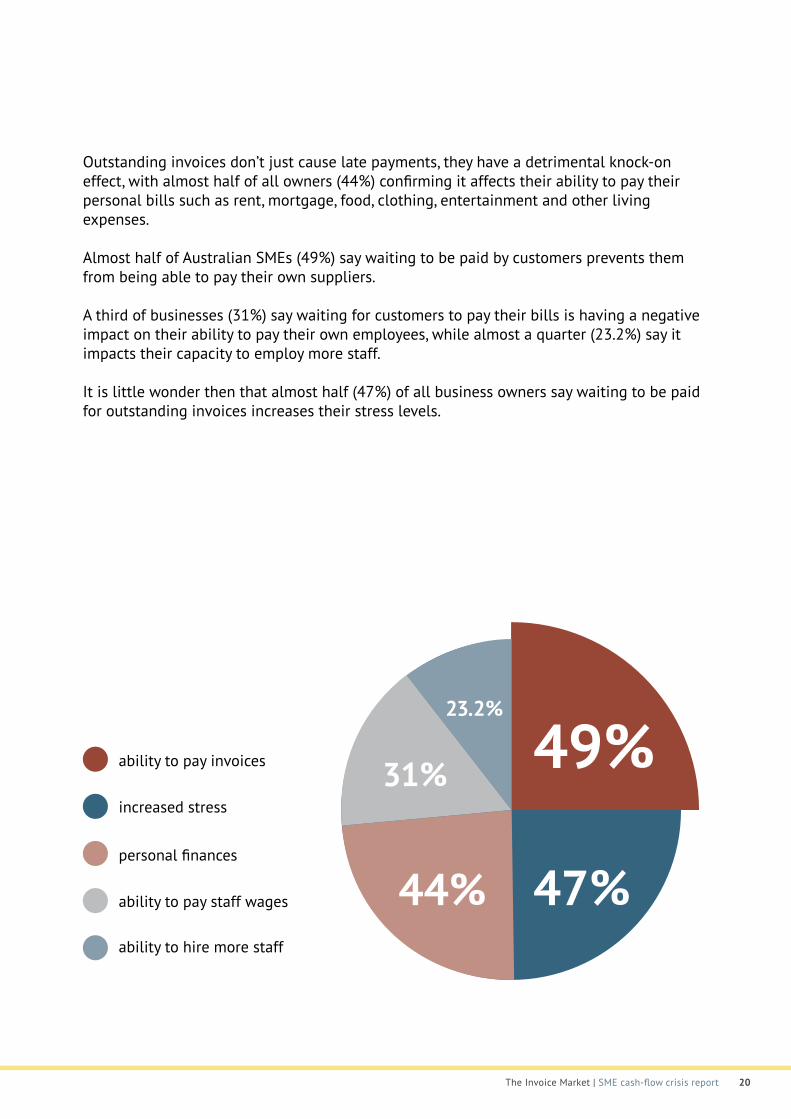
Outstanding invoices don’t just cause late payments, they have a detrimental knock-on effect, with almost half of all owners (44%) confirming it affects their ability to pay their personal bills such as rent, mortgage, food, clothing, entertainment and other living expenses.
Almost half of Australian SMEs (49%) say waiting to be paid by customers prevents them from being able to pay their own suppliers.
A third of businesses (31%) say waiting for customers to pay their bills is having a negative impact on their ability to pay their own employees, while almost a quarter (23.2%) say it impacts their capacity to employ more staff.
It is little wonder then that almost half (47%) of all business owners say waiting to be paid for outstanding invoices increases their stress levels.
49%23.2%
31%
44% 47%
ability to pay invoices
increased stress
personal finances
ability to pay staff wages
ability to hire more staff
The Invoice Market | SME cash-flow crisis report 21
5
What this report shows is that Australia’s two million small and medium size businesses are drowning in a sea of unpaid customer bills, with $76 billion in
outstanding invoices at any one time crippling their ability to grow.
On average, each Australian business is owed more than $38,000.
This creates unnecessary stress and impinges on owners’ personal lifestyles and their ability to grow their businesses.
Alarmingly, almost half of all SMEs have no strategies in place to protect themselves from late payments, which are contributing to this growing crisis.
It doesn’t have to be this way.
If SMEs can free up their cash flow, it will not only help their own enterprises, but it will have profound benefits for national economic growth and job creation.
For example, the country’s unemployment rate currently stands at 5.6%15, with 714,000 people out of work.
This report shows that 23% of Australian businesses, or 464,000 companies, would employ more people if they could improve their cash flow position.
Therefore, unemployment could be effectively eliminated in Australia, taking pressure off Federal public spending and ushering in a new era of national productivity growth.
This in turn would take pressure off the Australian Government budget and put the country on the path to a more sustainable fiscal future.
conclusions
15. http://www.abs.gov.au/ausstats/[email protected]/mf/6202.0
The Invoice Market | SME cash-flow crisis report 22
6
The Invoice Market commissioned research company, Pure Profile, in November 2016 to seek a nationally representative sample of 800 companies defined
as either a Small or Medium Sized Business, according to the Australian Bureau of Statistics criteria.
Responses were grouped into the ABS classifications of Accounting, Advertising Arts & Media, Agriculture, Banking & Financial Services, Construction, Education & training, Electricity, Gas, Water & Waste Services; Health Care & Social Assistance; Hospitality & Tourism, Information & Communication Technology; Mining; Manufacturing; Professional, Scientific & Technical Services; Real Estate Services; Transport & Logistics; and Other.
methodology
The Invoice Market | SME cash-flow crisis report 23
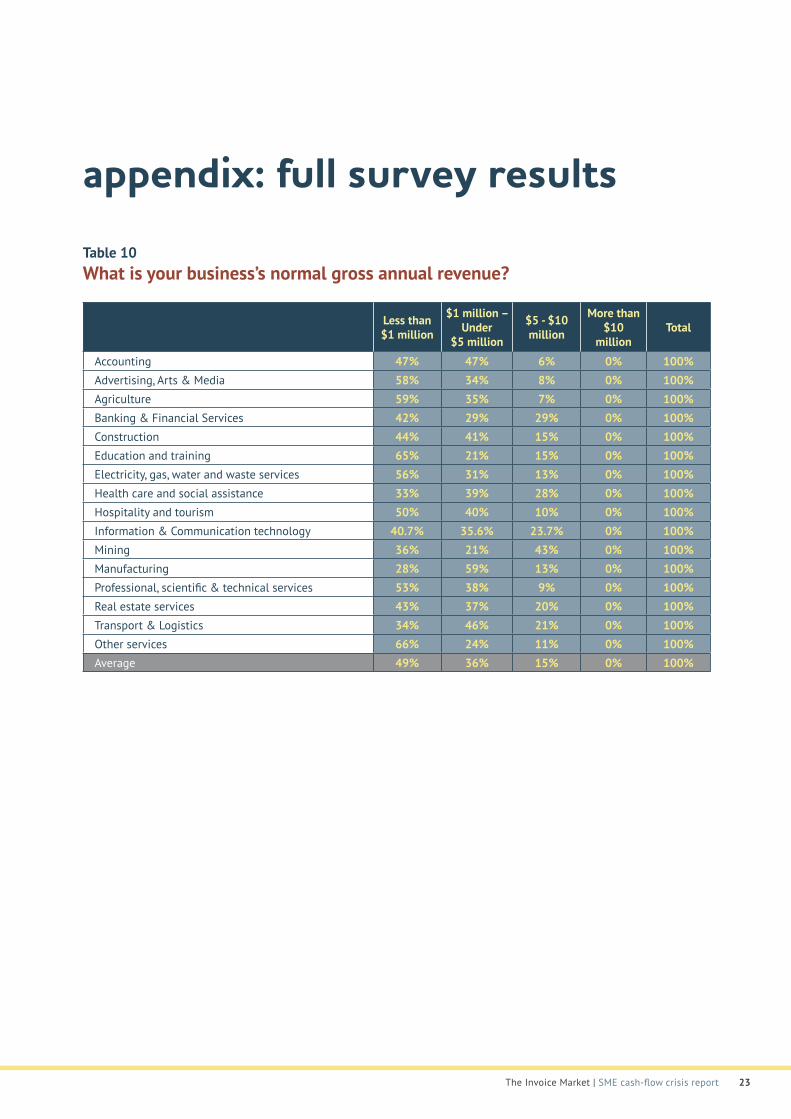
appendix: full survey resultsTable 10 What is your business’s normal gross annual revenue?
Not processed Less than $1 million
$1 million – Under
$5 million
$5 - $10 million
More than $10
million Total
Accounting 47% 47% 6% 0% 100%Advertising, Arts & Media 58% 34% 8% 0% 100%Agriculture 59% 35% 7% 0% 100%Banking & Financial Services 42% 29% 29% 0% 100%Construction 44% 41% 15% 0% 100%Education and training 65% 21% 15% 0% 100%Electricity, gas, water and waste services 56% 31% 13% 0% 100%Health care and social assistance 33% 39% 28% 0% 100%Hospitality and tourism 50% 40% 10% 0% 100%Information & Communication technology 40.7% 35.6% 23.7% 0% 100%Mining 36% 21% 43% 0% 100%Manufacturing 28% 59% 13% 0% 100%Professional, scientific & technical services 53% 38% 9% 0% 100%Real estate services 43% 37% 20% 0% 100%Transport & Logistics 34% 46% 21% 0% 100%Other services 66% 24% 11% 0% 100%Average 49% 36% 15% 0% 100%
The Invoice Market | SME cash-flow crisis report 24
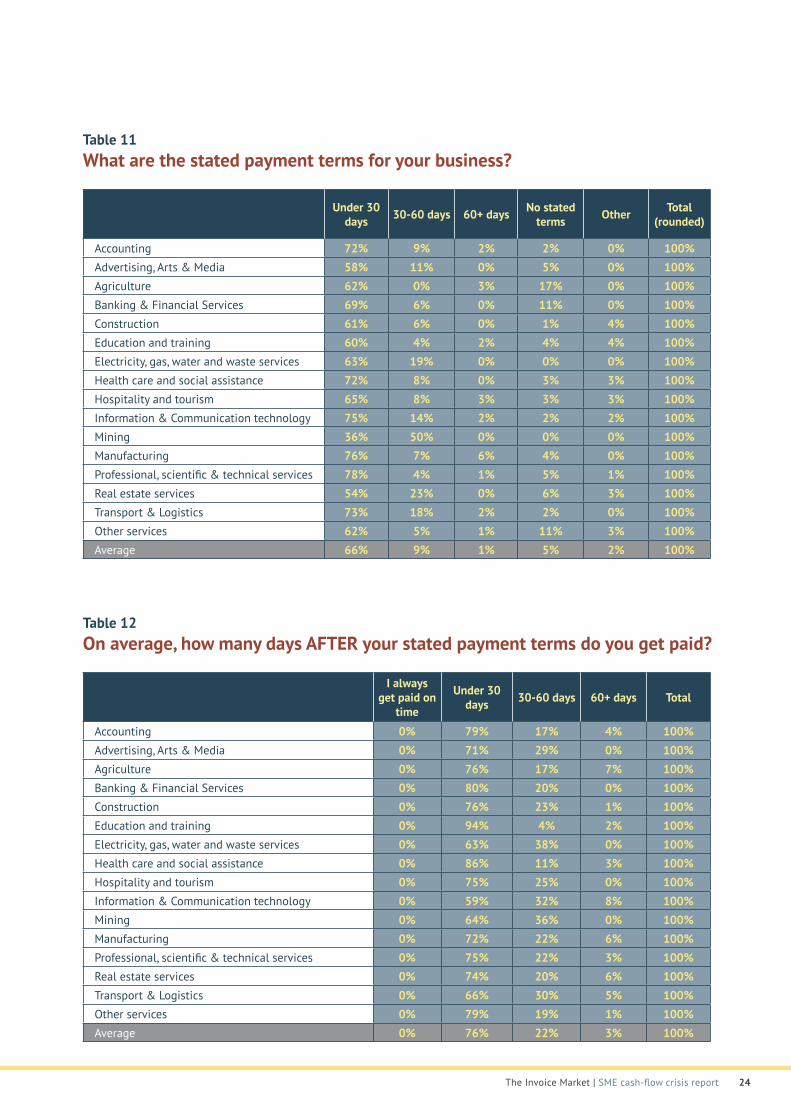
Table 11 What are the stated payment terms for your business?
Not processed Under 30 days 30-60 days 60+ days No stated
terms Other Total (rounded)
Accounting 72% 9% 2% 2% 0% 100%Advertising, Arts & Media 58% 11% 0% 5% 0% 100%Agriculture 62% 0% 3% 17% 0% 100%Banking & Financial Services 69% 6% 0% 11% 0% 100%Construction 61% 6% 0% 1% 4% 100%Education and training 60% 4% 2% 4% 4% 100%Electricity, gas, water and waste services 63% 19% 0% 0% 0% 100%Health care and social assistance 72% 8% 0% 3% 3% 100%Hospitality and tourism 65% 8% 3% 3% 3% 100%Information & Communication technology 75% 14% 2% 2% 2% 100%Mining 36% 50% 0% 0% 0% 100%Manufacturing 76% 7% 6% 4% 0% 100%Professional, scientific & technical services 78% 4% 1% 5% 1% 100%Real estate services 54% 23% 0% 6% 3% 100%Transport & Logistics 73% 18% 2% 2% 0% 100%Other services 62% 5% 1% 11% 3% 100%Average 66% 9% 1% 5% 2% 100%
Table 12 On average, how many days AFTER your stated payment terms do you get paid?
Not processed I always
get paid on time
Under 30 days 30-60 days 60+ days Total
Accounting 0% 79% 17% 4% 100%Advertising, Arts & Media 0% 71% 29% 0% 100%Agriculture 0% 76% 17% 7% 100%Banking & Financial Services 0% 80% 20% 0% 100%Construction 0% 76% 23% 1% 100%Education and training 0% 94% 4% 2% 100%Electricity, gas, water and waste services 0% 63% 38% 0% 100%Health care and social assistance 0% 86% 11% 3% 100%Hospitality and tourism 0% 75% 25% 0% 100%Information & Communication technology 0% 59% 32% 8% 100%Mining 0% 64% 36% 0% 100%Manufacturing 0% 72% 22% 6% 100%Professional, scientific & technical services 0% 75% 22% 3% 100%Real estate services 0% 74% 20% 6% 100%Transport & Logistics 0% 66% 30% 5% 100%Other services 0% 79% 19% 1% 100%Average 0% 76% 22% 3% 100%
The Invoice Market | SME cash-flow crisis report 25
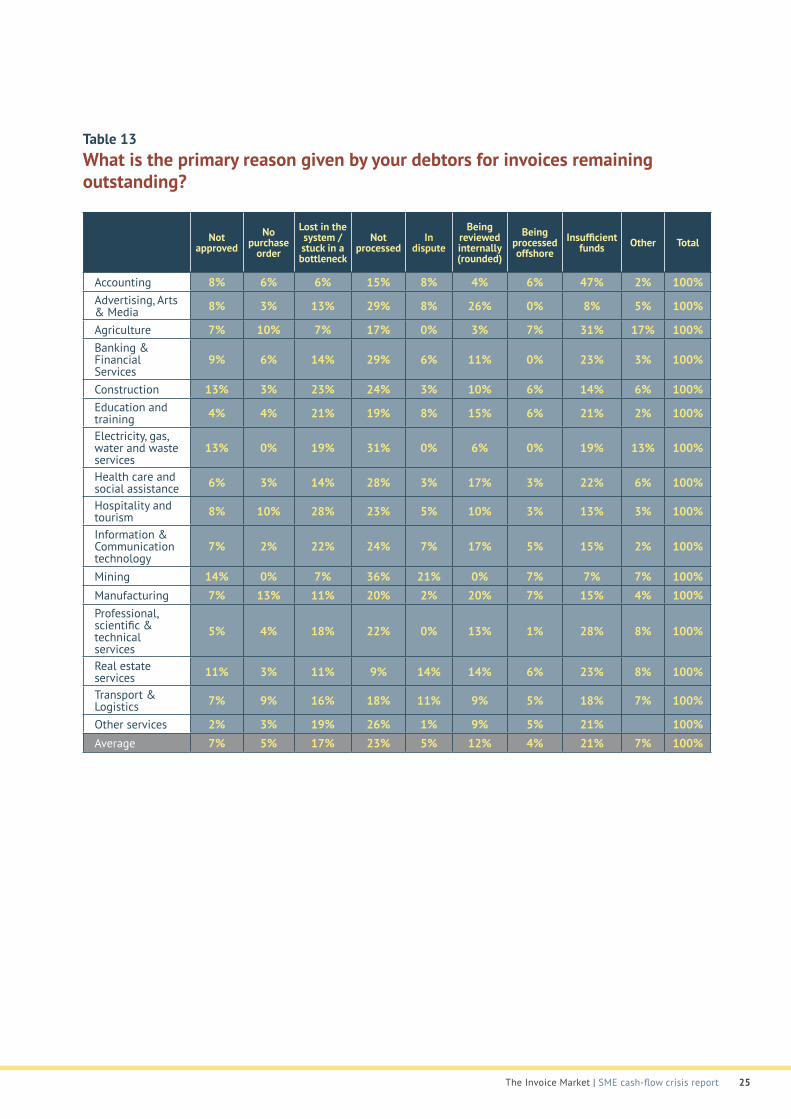
Table 13 What is the primary reason given by your debtors for invoices remaining outstanding?
Not processed
Not approved
No purchase
order
Lost in the system / stuck in a bottleneck
Not processed
In dispute
Being reviewed internally (rounded)
Being processed offshore
Insufficient funds Other Total
Accounting 8% 6% 6% 15% 8% 4% 6% 47% 2% 100%Advertising, Arts & Media 8% 3% 13% 29% 8% 26% 0% 8% 5% 100%
Agriculture 7% 10% 7% 17% 0% 3% 7% 31% 17% 100%Banking & Financial Services
9% 6% 14% 29% 6% 11% 0% 23% 3% 100%
Construction 13% 3% 23% 24% 3% 10% 6% 14% 6% 100%Education and training 4% 4% 21% 19% 8% 15% 6% 21% 2% 100%
Electricity, gas, water and waste services
13% 0% 19% 31% 0% 6% 0% 19% 13% 100%
Health care and social assistance 6% 3% 14% 28% 3% 17% 3% 22% 6% 100%
Hospitality and tourism 8% 10% 28% 23% 5% 10% 3% 13% 3% 100%
Information & Communication technology
7% 2% 22% 24% 7% 17% 5% 15% 2% 100%
Mining 14% 0% 7% 36% 21% 0% 7% 7% 7% 100%Manufacturing 7% 13% 11% 20% 2% 20% 7% 15% 4% 100%Professional, scientific & technical services
5% 4% 18% 22% 0% 13% 1% 28% 8% 100%
Real estate services 11% 3% 11% 9% 14% 14% 6% 23% 8% 100%
Transport & Logistics 7% 9% 16% 18% 11% 9% 5% 18% 7% 100%
Other services 2% 3% 19% 26% 1% 9% 5% 21% 100%Average 7% 5% 17% 23% 5% 12% 4% 21% 7% 100%

The Invoice Market | SME cash-flow crisis report 26
Table 14 How many invoices do you typically have outstanding?
Not processed Under 20 invoices More than 20 invoices Total
Accounting 83% 17% 100%Advertising, Arts & Media 74% 26% 100%Agriculture 79% 21% 100%Banking & Financial Services 74% 26% 100%Construction 89% 11% 100%Education and training 94% 6% 100%Electricity, gas, water and waste services 75% 25% 100%Health care and social assistance 83% 17% 100%Hospitality and tourism 75% 25% 100%Information & Communication technology 78% 22% 100%Mining 64% 36% 100%Manufacturing 80% 20% 100%Professional, scientific & technical services 91% 9% 100%Real estate services 71% 29% 100%Transport & Logistics 75% 25% 100%Other services 87% 13% 100%Average 82% 18% 100%
Table 15 What is the value, on average, of all your outstanding invoices?
Not processed Less than $50,000
$50,000-$99,999
$100,000-$150,000
More than $150,000 Total
Accounting 85% 8% 8% 0% 100%Advertising, Arts & Media 79% 8% 11% 3% 100%Agriculture 83% 10% 3% 3% 100%Banking & Financial Services 71% 20% 9% 0% 100%Construction 70% 15% 10% 5% 100%Education and training 81% 13% 6% 0% 100%Electricity, gas, water and waste services 81% 6% 6% 6% 100%Health care and social assistance 78% 8% 6% 8% 100%Hospitality and tourism 78% 10% 10% 3% 100%Information & Communication technology 61% 15% 10% 14% 100%Mining 43% 0% 57% 0% 100%Manufacturing 81% 7% 6% 6% 100%Professional, scientific & technical services 74% 16% 7% 4% 100%Real estate services 63% 11% 14% 11% 100%Transport & Logistics 68% 18% 5% 9% 100%Other services 85% 5% 5% 5% 100%Average 76% 11% 8% 5% 100%
The Invoice Market | SME cash-flow crisis report 27
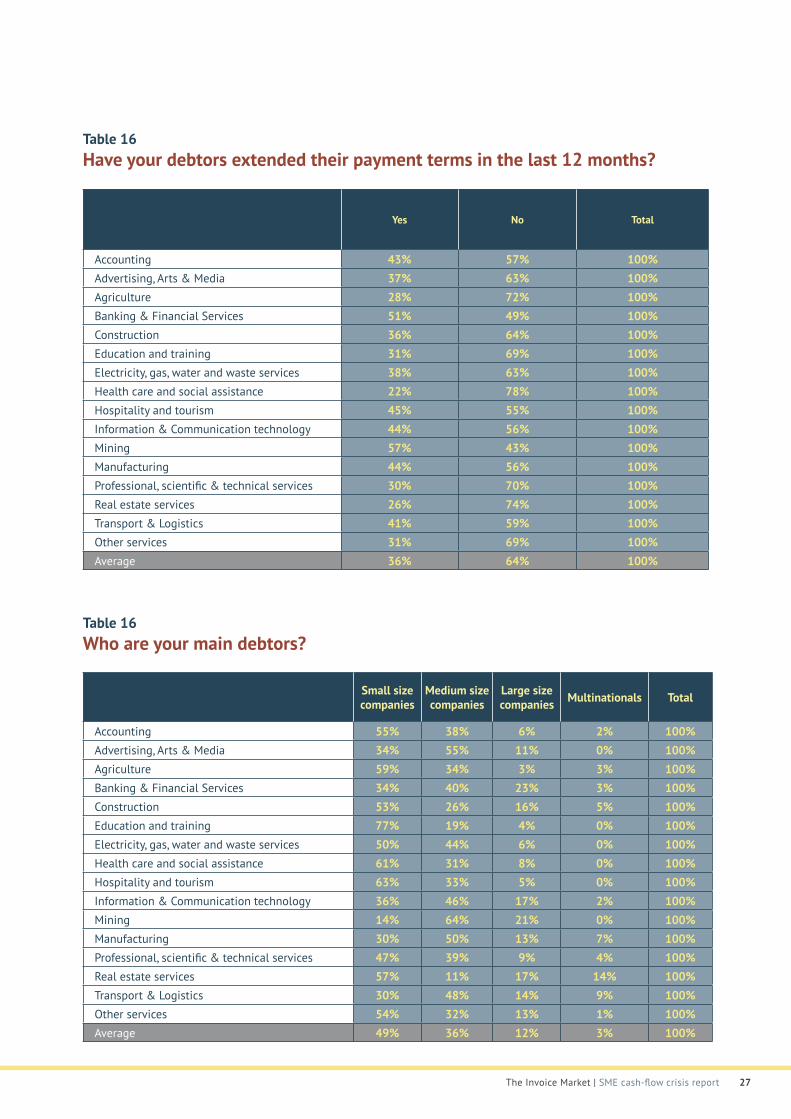
Table 16 Have your debtors extended their payment terms in the last 12 months?
Not processed Yes No Total
Accounting 43% 57% 100%Advertising, Arts & Media 37% 63% 100%Agriculture 28% 72% 100%Banking & Financial Services 51% 49% 100%Construction 36% 64% 100%Education and training 31% 69% 100%Electricity, gas, water and waste services 38% 63% 100%Health care and social assistance 22% 78% 100%Hospitality and tourism 45% 55% 100%Information & Communication technology 44% 56% 100%Mining 57% 43% 100%Manufacturing 44% 56% 100%Professional, scientific & technical services 30% 70% 100%Real estate services 26% 74% 100%Transport & Logistics 41% 59% 100%Other services 31% 69% 100%Average 36% 64% 100%
Table 16 Who are your main debtors?
Not processed Small size companies
Medium size companies
Large size companies Multinationals Total
Accounting 55% 38% 6% 2% 100%Advertising, Arts & Media 34% 55% 11% 0% 100%Agriculture 59% 34% 3% 3% 100%Banking & Financial Services 34% 40% 23% 3% 100%Construction 53% 26% 16% 5% 100%Education and training 77% 19% 4% 0% 100%Electricity, gas, water and waste services 50% 44% 6% 0% 100%Health care and social assistance 61% 31% 8% 0% 100%Hospitality and tourism 63% 33% 5% 0% 100%Information & Communication technology 36% 46% 17% 2% 100%Mining 14% 64% 21% 0% 100%Manufacturing 30% 50% 13% 7% 100%Professional, scientific & technical services 47% 39% 9% 4% 100%Real estate services 57% 11% 17% 14% 100%Transport & Logistics 30% 48% 14% 9% 100%Other services 54% 32% 13% 1% 100%Average 49% 36% 12% 3% 100%
The Invoice Market | SME cash-flow crisis report 28
Not processed We do not have any strategies in place
Invoice funding
Credit insurance
Bank loan
Dip into personal savings
Other Total
Accounting 42% 23% 13% 9% 8% 6% 100% Advertising, Arts & Media 42% 18% 16% 11% 11% 3% 100%Agriculture 45% 17% 7% 3% 17% 10% 100%Banking & Financial Services 40% 34% 9% 11% 6% 0% 100%Construction 48% 13% 9% 6% 21% 4% 100% Education and training 52% 15% 15% 6% 10% 2% 100%Electricity, gas, water and waste services 50% 19% 13% 0% 19% 0% 100%Health care and social assistance 47% 22% 6% 11% 3% 11% 100%Hospitality and tourism 45% 18% 15% 10% 10% 3% 100%Information & Communication technology 41% 25% 24% 3% 5% 2% 100%Mining 50% 21% 21% 7% 0% 0% 100%Manufacturing 37% 22% 17% 13% 7% 4% 100%Professional, scientific & technical services 50% 17% 8% 5% 13% 7% 100%Real estate services 31% 20% 34% 6% 0% 9% 100%Transport & Logistics 43% 18% 20% 11% 7% 0% 100%Other services 53% 13% 6% 7% 14% 7% 100%Average 46% 18% 13% 8% 11% 5% 100%
Table 18 How many times on average do you have to ask for your invoices to be paid?
Table 19 What strategies does your business use to protect itself from late payments?
Not processed Once Twice Three times Four times Five or
more timesTotal
(rounded)
Accounting 34% 51% 8% 4% 4% 100%Advertising, Arts & Media 32% 39% 21% 8% 0% 100%Agriculture 66% 21% 3% 0% 10% 100%Banking & Financial Services 34% 31% 29% 6% 0% 100%Construction 46% 33% 14% 4% 4% 100%Education and training 33% 38% 17% 2% 10% 100%Electricity, gas, water and waste services 25% 44% 31% 0% 0% 100%Health care and social assistance 25% 53% 19% 0% 3% 100%Hospitality and tourism 25% 43% 28% 3% 3% 100%Information & Communication technology 34% 36% 22% 5% 3% 100%Mining 29% 29% 36% 7% 0% 100%Manufacturing 33% 41% 19% 4% 4% 100%Professional, scientific & technical services 39% 41% 18% 0% 1% 100%Real estate services 46% 23% 14% 11% 6% 100%Transport & Logistics 36% 41% 18% 2% 2% 100%Other services 44% 43% 12% 1% 0% 100%Average 38% 39% 17% 3% 3% 100%
The Invoice Market | SME cash-flow crisis report 29
Not processed Personal finances
Ability to pay your business invoices
Ability to pay staff wages
Ability to hire more staff
Stress levels
All of the
above
None of the above
Accounting 43% 47% 51% 28% 43% 19% 15%Advertising, Arts & Media 47% 47% 29% 21% 47% 13% 18%Agriculture 41% 52% 21% 21% 55% 10% 17%Banking & Financial Services 37% 57% 20% 9% 37% 6% 14%Construction 61% 60% 43% 35% 58% 30% 5%Education and training 33% 33% 21% 17% 56% 6% 15%Electricity, gas, water and waste services 69% 50% 31% 25% 56% 19% 19%Health care and social assistance 31% 39% 14% 11% 36% 6% 31%Hospitality and tourism 50% 45% 40% 30% 50% 25% 20%Information & Communication technology 39% 56% 43% 27% 49% 12% 10%Mining 21% 21% 57% 29% 29% 7% 21%Manufacturing 33% 61% 30% 28% 50% 19% 15%Professional, scientific & technical services 43% 49% 30% 21% 47% 13% 20%Real estate services 46% 46% 34% 29% 40% 20% 14%Transport & Logistics 36% 55% 32% 30% 48% 14% 14%Other services 47% 44% 23% 17% 44% 9% 21%Average 44% 49% 31% 23% 47% 14% 16%
Table 20 When there are invoices outstanding, does it affect your:
Copyright © 2022 FDOKUMEN