
25 YEARS OF DUTCH IPOS: AN EXAMINATION OF FREQUENTLY CITED IPO ANOMALIES WITHIN MAIN SECTORS AND...
23
De Economist (2006) 154:405–427 © Springer 2006 DOI 10.1007/s10645-006-9017-y DE ECONOMIST 154, NO. 3, 2006 25 YEARS OF DUTCH IPOS: AN EXAMINATION OF FREQUENTLY CITED IPO ANOMALIES WITHIN MAIN SECTORS AND DURING HOT- AND COLD-ISSUE PERIODS BY R.Q. DOESWIJK ∗ , H.S.K. HEMMES ∗∗ AND R.H. VENEKAMP ∗∗∗ Summary This study examines the existence of the initial underpricing and the long-term underperformance anomalies in the Dutch IPO market between 1977 and 2001. We found an average initial under- pricing level of 17.6%, measured relative to a sector-specific benchmark. The median initial return was 5.0%, while there were negative initial returns in only 17% of the IPOs. During their first 3years of listing, IPOs on average underperformed their benchmark by a cumulative 10.0%, but this result is statistically insignificant. The period 1997—beginning of 2000 was a true hot-issue period for growth stocks: their level of initial underpricing was 35.8%, compared to 9.2% dur- ing cold-issue periods. These growth IPOs also significantly underperformed their benchmark by 38.4% after 3 years. Key words: Dutch stock market, IPO, hot- and cold-issue periods, initial underpricing, long-term underperformance JEL Code(s): G12, G14, G24 1 INTRODUCTION This paper presents the results of a study into the existence of the initial underpricing and the long-term underperformance anomalies in the Dutch initial public offering (IPO) market between 1977 and 2001. The study also examined whether the strength of these patterns differs during hot- issue and cold-issue periods. The difference between this study and previous research on Dutch IPOs is that we compared the performance of each IPO with its sector-specific benchmark to ensure a benchmark portfolio that has The authors are grateful to Nico van der Sar for his constructive comments and to two anony- mous referees for their useful suggestions. ∗ Institute for Research and Investment Services (IRIS), research enterprise of Rabobank and Robeco, P.O. Box 1296, 3000 BG Rotterdam, The Netherlands, e-mail: [email protected]. ∗∗ Fortis Meespierson, P.O. Box 293, 1000 AG Amsterdam, The Netherlands, e-mail: [email protected] ∗∗∗ Robeco, P.O. Box 973, 3000 AZ, Rotterdam, The Netherlands, e-mail: [email protected]
Transcript of 25 YEARS OF DUTCH IPOS: AN EXAMINATION OF FREQUENTLY CITED IPO ANOMALIES WITHIN MAIN SECTORS AND...
De Economist (2006) 154:405–427© Springer 2006DOI 10.1007/s10645-006-9017-y
DE ECONOMIST 154, NO. 3, 2006
25 YEARS OF DUTCH IPOS:AN EXAMINATION OF FREQUENTLY CITED IPO ANOMALIES
WITHIN MAIN SECTORS AND DURING HOT- AND COLD-ISSUEPERIODS
BY
R.Q. DOESWIJK∗, H.S.K. HEMMES∗∗ AND R.H. VENEKAMP∗∗∗
Summary
This study examines the existence of the initial underpricing and the long-term underperformanceanomalies in the Dutch IPO market between 1977 and 2001. We found an average initial under-pricing level of 17.6%, measured relative to a sector-specific benchmark. The median initial returnwas 5.0%, while there were negative initial returns in only 17% of the IPOs. During their first3 years of listing, IPOs on average underperformed their benchmark by a cumulative 10.0%, butthis result is statistically insignificant. The period 1997—beginning of 2000 was a true hot-issueperiod for growth stocks: their level of initial underpricing was 35.8%, compared to 9.2% dur-ing cold-issue periods. These growth IPOs also significantly underperformed their benchmark by38.4% after 3 years.
Key words: Dutch stock market, IPO, hot- and cold-issue periods, initial underpricing, long-termunderperformance
JEL Code(s): G12, G14, G24
1 INTRODUCTION
This paper presents the results of a study into the existence of the initialunderpricing and the long-term underperformance anomalies in the Dutchinitial public offering (IPO) market between 1977 and 2001. The studyalso examined whether the strength of these patterns differs during hot-issue and cold-issue periods. The difference between this study and previousresearch on Dutch IPOs is that we compared the performance of each IPOwith its sector-specific benchmark to ensure a benchmark portfolio that has
The authors are grateful to Nico van der Sar for his constructive comments and to two anony-mous referees for their useful suggestions.∗ Institute for Research and Investment Services (IRIS), research enterprise of Rabobank andRobeco, P.O. Box 1296, 3000 BG Rotterdam, The Netherlands, e-mail: [email protected].∗∗ Fortis Meespierson, P.O. Box 293, 1000 AG Amsterdam, The Netherlands, e-mail:[email protected]∗∗∗ Robeco, P.O. Box 973, 3000 AZ, Rotterdam, The Netherlands, e-mail: [email protected]

406 R.Q. DOESWIJK, H.S.K. HEMMES AND R.H. VENEKAMP
return characteristics close to the IPO itself. We identified four main sec-tors, that is, growth stocks, cyclicals, defensives and interest rate sensitivestocks.
The division of IPOs into these four main sectors also enabled us to exam-ine the difference between each group in the extent of the initial underpric-ing and the long-term underperformance. Recent research on hot-issue andcold-issue periods led us to identify these main sectors. Already in 1984,Ritter showed that most of the underpricing in the hot-issue market of1980–1981 in the USA could be attributed to IPOs in the natural resourcessector. Recently, Helwege and Liang (2004) examined IPO firms in hot-issueand cold-issue periods to determine whether the firms that launched IPOs inthese periods were very different in terms of the nature of their business orthe newness of their industry. A study by Lowry (2003) reports that industrydynamics play an important role in the decision by firms to go public.
These findings suggest that hot-issue markets might be characterized byIPOs from specific industries. This particularly applies to our IPO sample,in which more than 60% of the issues launched in the two hot-issue periodsthat we distinguish came from one specific main sector. By dividing IPOs intosector groups, we were able to examine whether the extreme levels of initialunderpricing and long-term underperformance during hot-issue periods par-ticularly applied to the sector that dominated the hot-issue period. Hence,we examine whether frequently cited anomalies in the IPO market were gen-eral or whether they were limited to sector-specific and period-specific circum-stances for IPOs on the Dutch stock market from 1977 to 2001.
We tested the following five hypotheses:
H1: The initial underpricing anomaly did not exist in the Dutch IPO marketbetween 1977 and 2001.
H2: Between 1977 and 2001, Dutch IPOs did not underperform their bench-mark in the long run.
H3: There is no relation between initial return and long-term underperfor-mance that suggests initial over-optimism among investors.
H4: The level of initial underpricing for Dutch IPOs between 1977 and 2001during hot-issue periods and cold-issue periods was the same.
H5: The performance in the long run of Dutch IPOs in hot-issue periodsbetween 1977 and 2001 was no worse than the long-run performance ofIPOs in a cold-issue period.
In the following, we discuss previous research, present the data and meth-odology we used in our study, and provide the empirical results. We closewith a summary and our conclusions.
25 YEARS OF DUTCH IPOS 407
2 LITERATURE
2.1 Underpricing
Underpricing is the difference between the offer price and the closing price onthe first day an IPO trades. Underpricing is a subject that has been regularlycovered in previous research. Ibbotson et al. (1994) found an underpricinglevel of 15.3% for the US market in the period 1960–1992. In an updated ver-sion (2001), this had risen to a level of 18.6% for firms that had gone publicbetween 1960 and 2000. For the Dutch IPO market between 1980 and 1996,Hoeijen and van der Sar (1999) found an underpricing level of 7.8%.
Many of the early theories developed to explain this underpricing phenom-enon state that the underpricing is either deliberate or a result of informationasymmetry between the parties involved during the process of going public,1
resulting in ex-ante uncertainty for some of those parties. These theories—among which are the winner’s curse hypothesis, the market feedback hypoth-esis, the signalling hypothesis and the ownership dispersion hypothesis—givedifferent reasons why underpricing is done deliberately. For interested readers,we refer to an extensive overview by Ritter (1998).
Aggarwal (2000) found support for an alternative explanation: price sup-port by the underwriter causes an average high level of first-day returns forIPOs. IPOs that would have shown a negative first-day return in normal trad-ing are supported by the underwriter, which results in a positive first-dayreturn.
Another possible explanation for the initial underpricing is irrationalbehaviour on the part of over-optimistic investors. Tinic (1988) examined thepossibility of a speculative bubble in the IPO market. He states that the excessinitial returns on IPOs occur because of the speculative appetite of investorswho could not get shares at the offering due to oversubscription of the IPO.The irrational over-optimism in the early trading days of the IPO implies thatthis bubble will eventually burst, leading to negative excess returns in the longrun. However, Tinic (1988) found no empirical support for this pattern. Ritter(1991), on the other hand, did find such support. He concluded that the IPOsin his data set significantly underperformed three years after going public.
2.2 Long-term Underperformance
Ritter (1991) found that firms that went public between 1975 and 1984 in theUnited States performed significantly worse in the 3 years following their firsttrading day than did a set of comparable firms matched by size and indus-try. He found that the performance of the offerings over 3 years was 34.5%
1 The parties involved are the issuer, the underwriter and the investors. Many theories arebased on information asymmetry between two of these parties.
408 R.Q. DOESWIJK, H.S.K. HEMMES AND R.H. VENEKAMP
compared to a return of 61.9% for the group of similar firms that had nothad an IPO. The underperformance was measured based on the closing priceon the first trading day. Loughran and Ritter (1995) found that underperfor-mance in the long term occurred primarily in the stocks of firms that hadgone public during a hot-issue period. Firms that had gone public duringyears when there was little issuing activity did not underperform at all. Thisfinding suggests that issuers use windows of opportunity.
A recent paper by Schultz (2003) presents a different view on the timingabilities of issuing firms. Schultz refers to it as ‘pseudo market timing’. Heshows that underperformance is likely to be observed ex-post in an efficientmarket. The premise is that more firms go public when they can receive ahigher price for their shares. When examining IPO activity, he states that ex-post issuers seem to time the market because IPOs cluster at market peaks.The issuing companies did not know prices were at a peak when they issuedstock. If prices had kept rising, even more companies would have issuedequity until prices eventually fell and offerings dried up. In a simulationbased on 1973 through 1997, he reveals that when ex-ante expected abnor-mal returns are zero, median ex-post underperformance is significantly neg-ative in event time. The solution he gives for this ‘pseudo market timing bias’is to use calendar-time returns instead of event-time returns. Calendar-timereturns average the average return by calendar year while event-returns aver-age returns from all individual events. So, calendar-time returns are basedon an IPO portfolio with an equal amount invested in an annual equallyweighted basket of all IPOs in a year. Both calculations would deliver thesame result if the number of IPOs is equal for each year. His simulationshows that excess returns are zero in calendar-time.
Brav and Gompers (1997) argue that the underperformance is not an IPOeffect. The underperformance documented in Ritter (1991) and Loughran andRitter (1995) comes primarily from small, non-venture-backed IPOs. Theirresults indicate that the underperformance is not unique to firms issuingequity, but is a small, low book-to-market effect. Several studies show supe-rior returns for “value stocks” with favourable valuation multiples such as thebook-to-market equity ratio, see for instance Fama and French (1992), as wellas superior returns for “small stocks” with low market capitalizations, firstdocumented by Banz (1981). Brav and Gompers (1997) report that, using theFama and French (1993) three factor asset pricing model, only the smallestnon-venture-backed firms underperform within their IPO sample. However, asthey argue, this is not an IPO-effect. Similar size and book-to-market firmsthat have not issued equity perform as poorly as IPOs. This would mean thatone should look more broadly at types of firms that underperform and nottreat IPO firms as a different group.
Next, Miller (1977) argues that the most optimistic investors in an IPOare the buyers. When the value of an IPO is shrouded in uncertainty, the
25 YEARS OF DUTCH IPOS 409
valuation of optimistic investors is higher than that of pessimistic investors.In the long run, the divergence of opinion between optimistic and pessimis-tic investors narrows, as more information about the IPO becomes available.Consequently, the market price drops.
2.3 Hot-issue Markets
In the IPO market there is a distinct cyclical pattern in the returns of IPOsand in the number of IPOs brought to the market. Periods of rising initialreturns and increasing numbers of IPOs can be defined as hot-issue markets.Ritter (1998) explains that both in the US and in other countries the vol-ume of IPOs shows a strong tendency to be high following periods of highstock market returns. Ritter (1984) found that 1980 was a hot-issue market inthe United States. The average initial return on IPOs in the 15-month periodstarting in January 1980 was 48.4%. This is much higher than the returns inother (‘normal’) IPO periods.
Lowry (2003) also examined the causes of fluctuations in the number ofIPOs. She found two reasons that are of importance in explaining when firmschoose to issue their stock. First, she found that IPO volume is higher whenthe economy is strong and the possibility for real investment opportunities isgreater. The second reason Lowry found is that of investor demand. A dis-proportionate number of firms issue stock when stocks are especially highlyvalued by the market. Furthermore, she found that firms that issue stock dur-ing a hot market do not seem to be overvalued relative to other comparablefirms. The firms issue stock at a time when their whole sector is overvalued.These factors may explain the existence of the hot-issue market phenomenon.
If one expects underpricing to take place especially in hot-issue markets,more underperformance should occur in the long run. Both Ritter (1991) andLoughran and Ritter (1995) argue that companies that went public in a hotmarket perform worse in the long run than do IPOs that went public duringa normal period.
2.4 Previous Research into the Dutch IPO Market
Numerous studies have found support for the existence of the underpricinganomaly in the Dutch IPO market. For example, Eijgenhuijsen (1989) reportsan average level of underpricing of 7.9% for 53 IPOs between 1982 and 1987.Huygen and Tourani (1993) document an average underpricing of 2.2% for34 IPOs in the 1987–1992 period. Van Hoeijen and van der Sar (1999) report7.8% underpricing for their sample of 81 IPOs in the period 1980–1996.
One of the first Dutch papers to discus the longer-term aftermarket perfor-mance of IPOs is that by Buijs and Eijgenhuijsen (1992). They examined thelong-term performance after 1, 12 and 24 months and found an insignificant

410 R.Q. DOESWIJK, H.S.K. HEMMES AND R.H. VENEKAMP
negative performance after 1 and 12 months, and no underperformance after24 months. Van Hoeijen and van der Sar (1999) examined the performanceafter longer periods of 3 and 5 years. They found an outperformance of 17.1%after 3 years, but an underperformance of 17.9% after 5 years. Although thesefigures are quite large, they are statistically insignificant.
Not all previous research has labelled the same period as a hot-issueperiod. Buijs and Eijgenhuijsen (1992) label the years 1985 and 1986 as a hot-issue market, while Huygen and Tourani (1993) suggest that 1989 had someof the characteristics of a hot-issue period, with above average initial returns.Van der Goot (1997) states that the year 1986 and the first half of 1987 canbe considered a hot-issue period. He notes that the stock market boom of1982–1985 can be viewed as the reason for it.
3 DATA AND METHODOLOGY
3.1 Data
We collected data on the IPO date, offering price and the first day closingprice from the Officiele Prijscourant van de Amsterdamse Effectenbeurs (Offi-cial Price Journal of the Amsterdam Stock Exchange) and the annual Gidsbij de Officiele Prijscourant van de Amsterdamse Effectenbeurs (Guide to theOfficial Price Journal of the Amsterdam Stock Exchange). Both are availablein the Royal Library in The Hague. For more recent years, we used Thom-son Financial Datastream (TFD) and Bloomberg. We found 183 companiesthat started trading on the Dutch stock exchange between 1977 and 2001.2
A filtering3 of these IPOs resulted in a data set comprising 154 IPOs, 22 ofwhich were introduced via claim. This sample of 154 IPOs is the sample thatwe used in this study. For the construction of the benchmarks, we collectedtotal return data for all stocks that traded on the Dutch stock market duringthe examination period.
Figure 1 shows the number of IPOs per year. TFD was the source for thetime series total return data. We limited ourselves to this sample period aswe have no reliable IPO data in combination with daily electronic price dataavailable before 1977. After 2000, the Dutch IPO market became quiet, simi-lar to that in other countries, due to a lacklustre stock market climate. Evenin 2005, there were no more than three IPOs in Amsterdam.
2 This covers IPOs on the official market, the parallel market (which existed between 1982and 1993 and then merged with the official market) and the NMAX (New Market AmsterdamExchange), which started in 1996.3 The 183 IPOs were filtered to remove IPOs for which the data are incomplete and couldnot be found, IPOs that were introduced with a warrant and IPOs that were introduced viatrading.
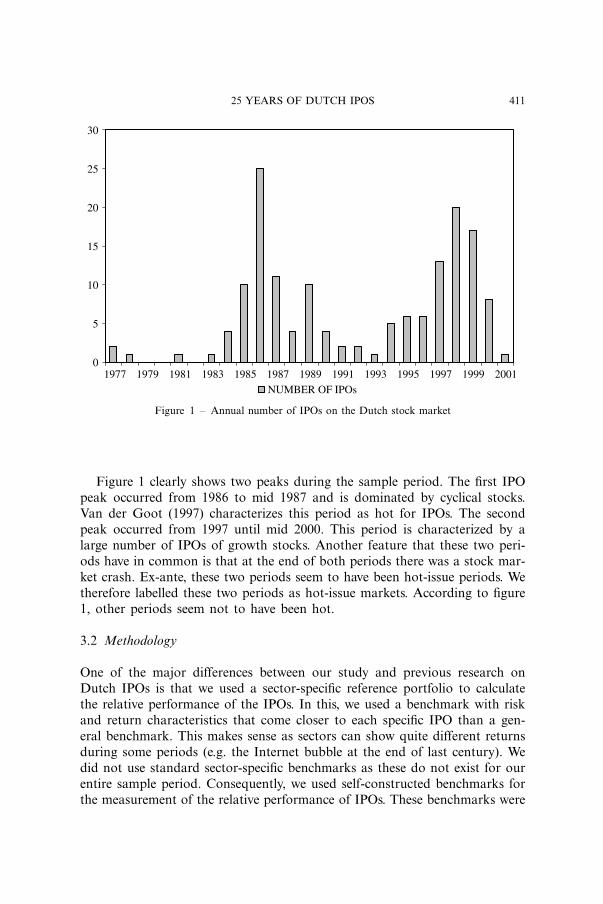
25 YEARS OF DUTCH IPOS 411
0
5
10
15
20
25
30
1977 1979 1981 1983 1985 1987 1989 1991 1993 1995 1997 1999 2001NUMBER OF IPOs
Figure 1 – Annual number of IPOs on the Dutch stock market
Figure 1 clearly shows two peaks during the sample period. The first IPOpeak occurred from 1986 to mid 1987 and is dominated by cyclical stocks.Van der Goot (1997) characterizes this period as hot for IPOs. The secondpeak occurred from 1997 until mid 2000. This period is characterized by alarge number of IPOs of growth stocks. Another feature that these two peri-ods have in common is that at the end of both periods there was a stock mar-ket crash. Ex-ante, these two periods seem to have been hot-issue periods. Wetherefore labelled these two periods as hot-issue markets. According to figure1, other periods seem not to have been hot.
3.2 Methodology
One of the major differences between our study and previous research onDutch IPOs is that we used a sector-specific reference portfolio to calculatethe relative performance of the IPOs. In this, we used a benchmark with riskand return characteristics that come closer to each specific IPO than a gen-eral benchmark. This makes sense as sectors can show quite different returnsduring some periods (e.g. the Internet bubble at the end of last century). Wedid not use standard sector-specific benchmarks as these do not exist for ourentire sample period. Consequently, we used self-constructed benchmarks forthe measurement of the relative performance of IPOs. These benchmarks were
412 R.Q. DOESWIJK, H.S.K. HEMMES AND R.H. VENEKAMP
equally weighted; otherwise they would have been dominated by a few largecaps.
In our study, we classified all 24 industry groups of the Global IndustryClassification Standard (GICS) into four main sectors to ensure that eachof the corresponding benchmarks was made up of enough individual stocks.These four main sectors are growth stocks, cyclicals, defensives and inter-est rate sensitive stocks.4 Within the ‘growth’ sector, we included informa-tion-related industries (content and processing), such as telecom, media andinformation technology. Cyclicals is made up of energy, raw materials, capitalgoods (excluding information technology), business services and cyclical con-sumer goods. Defensives are defensive consumer goods and utilities. Finally,the interest rate sensitive group contains financials like banks and insurers,and real estate. We applied this classification to both the constructed bench-marks and our IPO sample.
Previous research shows the existence of biases in the calculation of thereturn of reference portfolios and in the measurement of relative performances.The first bias is the rebalancing bias (Blume and Stambaugh (1983)), which —as Barber and Lyon (1997) explain — arises because the returns of a refer-ence portfolio assume a frequent portfolio rebalancing (e.g. once a month),5
while the returns of the sample IPOs are compounded without rebalancing.Frequent rebalancing introduces an upward bias into the measured returns ofthe benchmarks. The upward bias is due to short-term negative autocorrelationin individual stock returns, which can likely be attributed to bid-ask bounceand non-synchronous trading. This gives the measured abnormal returns ofIPOs a downward bias. The second bias that arises is the new listing bias (seeLyon et al. (1999)), which arises because the sample IPOs are compared to abenchmark that typically includes firms that begin trading subsequent to theIPO date of each IPO in the sample. Third, the survivorship bias arises becausein the case of a bankruptcy, takeover or merger, firms become hard to trackin databases. Without bankrupt companies, benchmark returns get an upwardbias. The fourth and final bias is the skewness bias (again, see Lyon et al.(1999)). This bias arises because the distribution of long-run abnormal stockreturns is positively skewed. Although this does not affect the calculation ofreturns, it does contribute to a misspecification of standard test statistics.
In this paper, we evaluate the relative performance of IPOs using anapproach that controls for most of these biases. The benchmarks we used tocalculate the abnormal returns were constructed with annual rebalancing to
4 The categorization into cyclicals, defensives, growth stocks and interest rate sensitive is notuncommon in daily investment practice. A practitioner’s book like Taylor (1998) also containsa categorization like this.5 At the rebalancing date, all portfolio weights are reset and all stocks get an equal weight.Due to performance differences, portfolio weights will start to differ, until the next rebalancingdate.
25 YEARS OF DUTCH IPOS 413
reduce the rebalancing bias. Controlling for the new listing bias introduces anumber of complications. First of all, this means that each IPO, seen as aseparate event, must be compared with a specially constructed benchmark foreach specific IPO. This means that 154 separate benchmarks must be created.Second, for each IPO we examined the abnormal return in the long run overdifferent horizons. This creates a further need for specific benchmarks, mul-tiplying the number of benchmarks needed already. Hence, we did not con-trol for the new listing bias, nor has any research of which we are aware.The implication that this bias might cause is a downward estimate of thebenchmark returns, as most of the new listings are IPOs. Earlier research—such as that by Ritter (1991) and that by Loughran and Ritter (1995)—sug-gests that IPOs (hence a great part of the new listings) underperform anequally weighted market index. However, Brav and Gompers (1997) reportthat underperformance is not an IPO effect. By comparing IPOs with simi-lar non-IPO firms, their results show no significant difference in performance.Therefore, it might be that IPOs create no new listing bias at all. But, shoulda new listing bias exist, it would depress benchmark returns. When examiningthe long-term abnormal performance of IPOs this might create a positive biasin the long-term abnormal performances (only in the case of depressed bench-mark returns). For the construction of the benchmark returns, we did correctfor a survivorship bias, as we took all previously listed firms into account. Wealso corrected for the skewness bias by using significance tests that correct forthis bias.
Before constructing the benchmark, we screened all stocks that were tradedon the Dutch stock market during the examination period. The stocks usedfor the benchmarks were filtered for the following criteria in the same order asthey are stated. First, we corrected the delisting date after bankruptcy, take-over or merger. Mostly, these stocks had been deleted from TFD much laterthan the date that the bankruptcy, takeover or merger took place. In thesecases, the delisting date was corrected. We then deleted penny stocks beforedelisting. To prevent penny stocks from having a great, not beneficial, influ-ence on the benchmark return, they were not taken into account. Finally, wedeleted highly illiquid stocks. If after the first two corrections stocks showedzero returns in (on average) three or more out of five trading days, they werenot taken into account. All stocks traded at the beginning of each calendaryear were taken into account for the formation of a benchmark for that year.
In short, all benchmarks were carefully constructed and corrected as muchas possible for possible biases that might arise when determining benchmarkreturns. The final result was five equally weighted total return indices, withannual rebalancing, for each of the four main sectors as well as for the marketas a whole. If stocks were deleted during a year, the daily benchmark returnswere used for the remaining days of that year. The four main sector bench-marks we constructed show very different returns. Defensives had the best
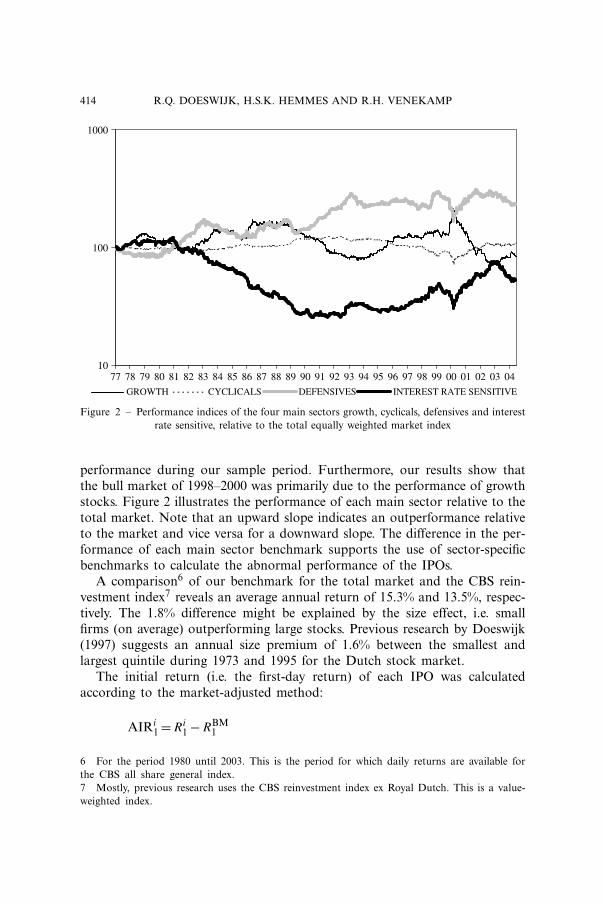
414 R.Q. DOESWIJK, H.S.K. HEMMES AND R.H. VENEKAMP
10
100
1000
77 78 79 80 81 82 83 84 85 86 87 88 89 90 91 92 93 94 95 96 97 98 99 00 01 02 03 04
GROWTH CYCLICALS DEFENSIVES INTEREST RATE SENSITIVE
Figure 2 – Performance indices of the four main sectors growth, cyclicals, defensives and interestrate sensitive, relative to the total equally weighted market index
performance during our sample period. Furthermore, our results show thatthe bull market of 1998–2000 was primarily due to the performance of growthstocks. Figure 2 illustrates the performance of each main sector relative to thetotal market. Note that an upward slope indicates an outperformance relativeto the market and vice versa for a downward slope. The difference in the per-formance of each main sector benchmark supports the use of sector-specificbenchmarks to calculate the abnormal performance of the IPOs.
A comparison6 of our benchmark for the total market and the CBS rein-vestment index7 reveals an average annual return of 15.3% and 13.5%, respec-tively. The 1.8% difference might be explained by the size effect, i.e. smallfirms (on average) outperforming large stocks. Previous research by Doeswijk(1997) suggests an annual size premium of 1.6% between the smallest andlargest quintile during 1973 and 1995 for the Dutch stock market.
The initial return (i.e. the first-day return) of each IPO was calculatedaccording to the market-adjusted method:
AIRi1 =Ri
1 −RBM1
6 For the period 1980 until 2003. This is the period for which daily returns are available forthe CBS all share general index.7 Mostly, previous research uses the CBS reinvestment index ex Royal Dutch. This is a value-weighted index.
25 YEARS OF DUTCH IPOS 415
In this equation AIRi1 is the initial market-adjusted return for IPO i on the
first trading day. Ri1 is the return on IPO i of the first trading day. Here the
first day return of an IPO is calculated as the difference between the first dayclosing price of the IPO and the offer price. RBM
1 is the return of the bench-mark on the first trading day of IPO i.
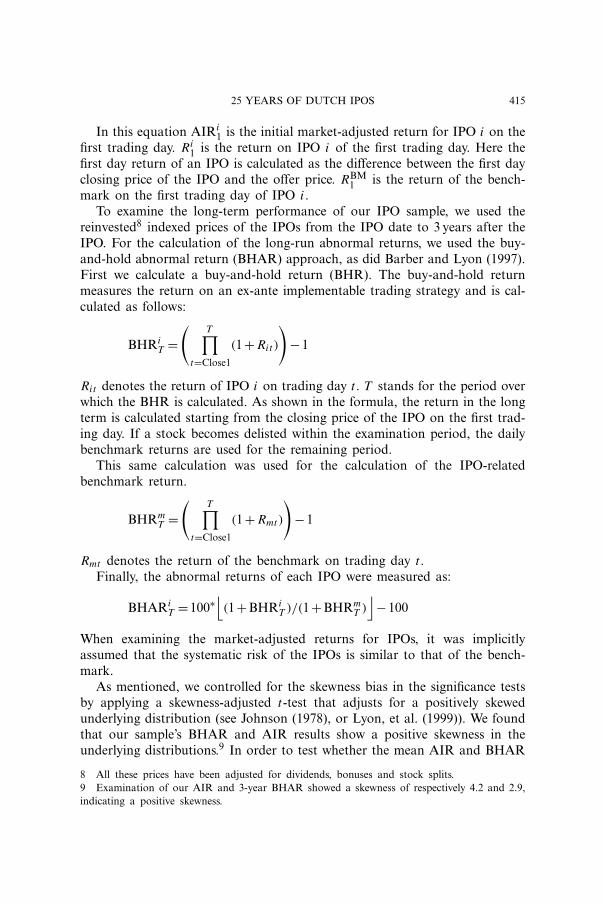
To examine the long-term performance of our IPO sample, we used thereinvested8 indexed prices of the IPOs from the IPO date to 3 years after theIPO. For the calculation of the long-run abnormal returns, we used the buy-and-hold abnormal return (BHAR) approach, as did Barber and Lyon (1997).First we calculate a buy-and-hold return (BHR). The buy-and-hold returnmeasures the return on an ex-ante implementable trading strategy and is cal-culated as follows:
BHRiT =
(T∏
t=Close1
(1+Rit )
)−1
Rit denotes the return of IPO i on trading day t . T stands for the period overwhich the BHR is calculated. As shown in the formula, the return in the longterm is calculated starting from the closing price of the IPO on the first trad-ing day. If a stock becomes delisted within the examination period, the dailybenchmark returns are used for the remaining period.
This same calculation was used for the calculation of the IPO-relatedbenchmark return.
BHRmT =
(T∏
t=Close1
(1+Rmt)
)−1
Rmt denotes the return of the benchmark on trading day t .Finally, the abnormal returns of each IPO were measured as:
BHARiT =100∗
⌊(1+BHRi
T )/(1+BHRmT )⌋
−100
When examining the market-adjusted returns for IPOs, it was implicitlyassumed that the systematic risk of the IPOs is similar to that of the bench-mark.
As mentioned, we controlled for the skewness bias in the significance testsby applying a skewness-adjusted t-test that adjusts for a positively skewedunderlying distribution (see Johnson (1978), or Lyon, et al. (1999)). We foundthat our sample’s BHAR and AIR results show a positive skewness in theunderlying distributions.9 In order to test whether the mean AIR and BHAR
8 All these prices have been adjusted for dividends, bonuses and stock splits.9 Examination of our AIR and 3-year BHAR showed a skewness of respectively 4.2 and 2.9,indicating a positive skewness.
416 R.Q. DOESWIJK, H.S.K. HEMMES AND R.H. VENEKAMP
differs significantly from zero, we calculated the following skewness-adjustedt-statistic:
tsa =√
N
(S + 1
3γ S2 + 1
6Nγ
)
where
S = AIRσAIR
and γ =∑N
i=1 (AIRi −AIR)3
(N −1)∗σ 3AIR
Here, γ is an estimate of the coefficient of skewness and σAIR is the stan-dard deviation. N is the number of IPOs in the sample or sample group. Thesame method was applied for BHAR, except that the AIR in the calculationsabove was replaced by BHAR.
4 EMPIRICAL RESULTS
4.1 Initial Underpricing
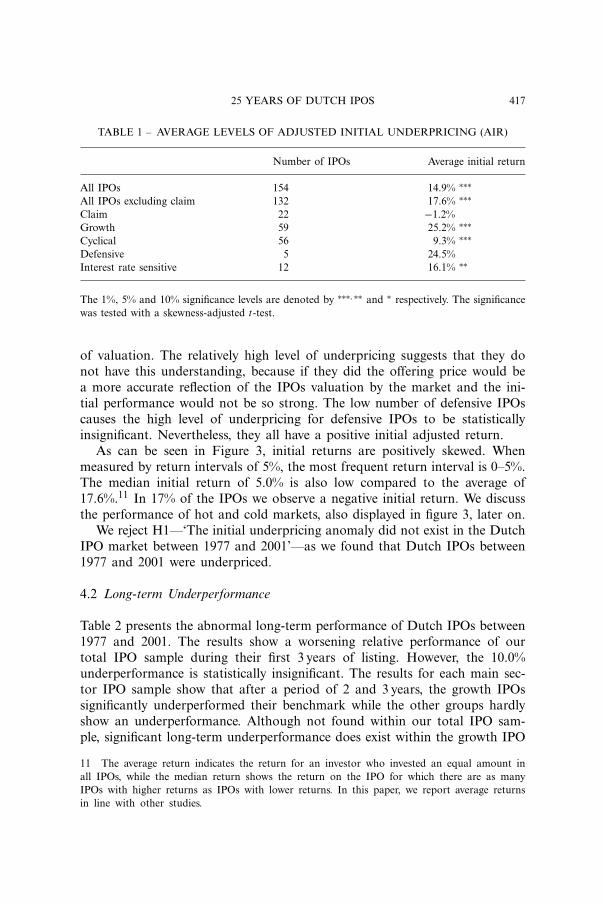
Table 1 shows the average benchmark-adjusted underpricing in the Dutchmarket between 1977 and 2001. Our results confirm the presence of under-pricing in the Dutch IPO market, with an average initial return of 17.6%(excluding claims). We note that the average first-day return might be over-estimated due to the rationing of the most successful IPOs, in line with thewinner’s curse hypothesis (see Rock, 1986). There is a large difference in un-derpricing for introductions via the claim method10 compared to non-claimintroductions. A problem associated with the claim method is that of estimat-ing the exact offering price. This causes the difference. Therefore, we excludedthe claim IPOs from the calculation of the average initial return per mainsector. The average underpricing is in line with results from Ibbotson et al.(1994/2001), who report an average underpricing of 18.6% between 1960 and2000 for IPOs in the United States. Compared to previous research intoDutch IPOs, our initial returns seem rather high. But, when we limit our sam-ple period from 1980 to 1996, the same as in van Hoeijen and van der Sar(1999), we find an average underpricing of 7.7%, similar to their 7.8%.
The underpricing levels differ between the four groups of IPOs. GrowthIPOs show the highest level of underpricing. The level of underpricing forinterest rate sensitive IPOs is in line with the level of underpricing for allIPOs. This is quite remarkable, considering that most of these IPOs were forfinancial companies, which one would expect to have a better understanding
10 In this method, shares are offered for a fixed price. However, only investors that ownrights (i.e. claims) are entitled to subscribe. These rights or claims may originate from the issu-ing company or from existing shareholders and are traded a few weeks before the introductiondate.
25 YEARS OF DUTCH IPOS 417
TABLE 1 – AVERAGE LEVELS OF ADJUSTED INITIAL UNDERPRICING (AIR)
Number of IPOs Average initial return
All IPOs 154 14.9% ∗∗∗All IPOs excluding claim 132 17.6% ∗∗∗Claim 22 −1.2%Growth 59 25.2% ∗∗∗Cyclical 56 9.3% ∗∗∗Defensive 5 24.5%Interest rate sensitive 12 16.1% ∗∗
The 1%, 5% and 10% significance levels are denoted by ∗∗∗,∗∗ and ∗ respectively. The significancewas tested with a skewness-adjusted t-test.
of valuation. The relatively high level of underpricing suggests that they donot have this understanding, because if they did the offering price would bea more accurate reflection of the IPOs valuation by the market and the ini-tial performance would not be so strong. The low number of defensive IPOscauses the high level of underpricing for defensive IPOs to be statisticallyinsignificant. Nevertheless, they all have a positive initial adjusted return.
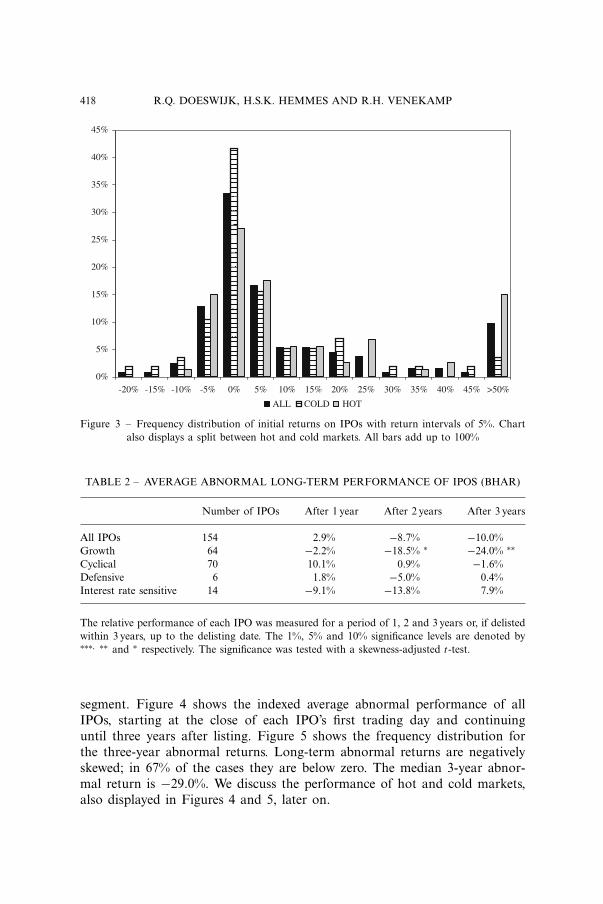
As can be seen in Figure 3, initial returns are positively skewed. Whenmeasured by return intervals of 5%, the most frequent return interval is 0–5%.The median initial return of 5.0% is also low compared to the average of17.6%.11 In 17% of the IPOs we observe a negative initial return. We discussthe performance of hot and cold markets, also displayed in figure 3, later on.
We reject H1—‘The initial underpricing anomaly did not exist in the DutchIPO market between 1977 and 2001’—as we found that Dutch IPOs between1977 and 2001 were underpriced.
4.2 Long-term Underperformance
Table 2 presents the abnormal long-term performance of Dutch IPOs between1977 and 2001. The results show a worsening relative performance of ourtotal IPO sample during their first 3 years of listing. However, the 10.0%underperformance is statistically insignificant. The results for each main sec-tor IPO sample show that after a period of 2 and 3 years, the growth IPOssignificantly underperformed their benchmark while the other groups hardlyshow an underperformance. Although not found within our total IPO sam-ple, significant long-term underperformance does exist within the growth IPO
11 The average return indicates the return for an investor who invested an equal amount inall IPOs, while the median return shows the return on the IPO for which there are as manyIPOs with higher returns as IPOs with lower returns. In this paper, we report average returnsin line with other studies.
418 R.Q. DOESWIJK, H.S.K. HEMMES AND R.H. VENEKAMP
0%
5%
10%
15%
20%
25%
30%
35%
40%
45%
-20% -15% -10% -5% 0% 5% 10% 15% 20% 25% 30% 35% 40% 45% >50%
ALL COLD HOT
Figure 3 – Frequency distribution of initial returns on IPOs with return intervals of 5%. Chartalso displays a split between hot and cold markets. All bars add up to 100%
TABLE 2 – AVERAGE ABNORMAL LONG-TERM PERFORMANCE OF IPOS (BHAR)
Number of IPOs After 1 year After 2 years After 3 years
All IPOs 154 2.9% −8.7% −10.0%Growth 64 −2.2% −18.5% ∗ −24.0% ∗∗Cyclical 70 10.1% 0.9% −1.6%Defensive 6 1.8% −5.0% 0.4%Interest rate sensitive 14 −9.1% −13.8% 7.9%
The relative performance of each IPO was measured for a period of 1, 2 and 3 years or, if delistedwithin 3 years, up to the delisting date. The 1%, 5% and 10% significance levels are denoted by∗∗∗, ∗∗ and ∗ respectively. The significance was tested with a skewness-adjusted t-test.
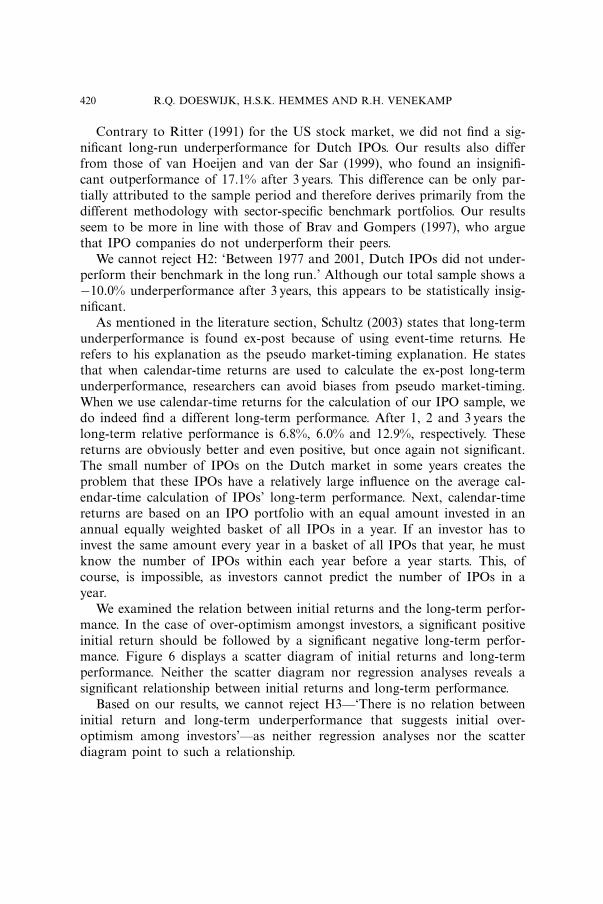
segment. Figure 4 shows the indexed average abnormal performance of allIPOs, starting at the close of each IPO’s first trading day and continuinguntil three years after listing. Figure 5 shows the frequency distribution forthe three-year abnormal returns. Long-term abnormal returns are negativelyskewed; in 67% of the cases they are below zero. The median 3-year abnor-mal return is −29.0%. We discuss the performance of hot and cold markets,also displayed in Figures 4 and 5, later on.
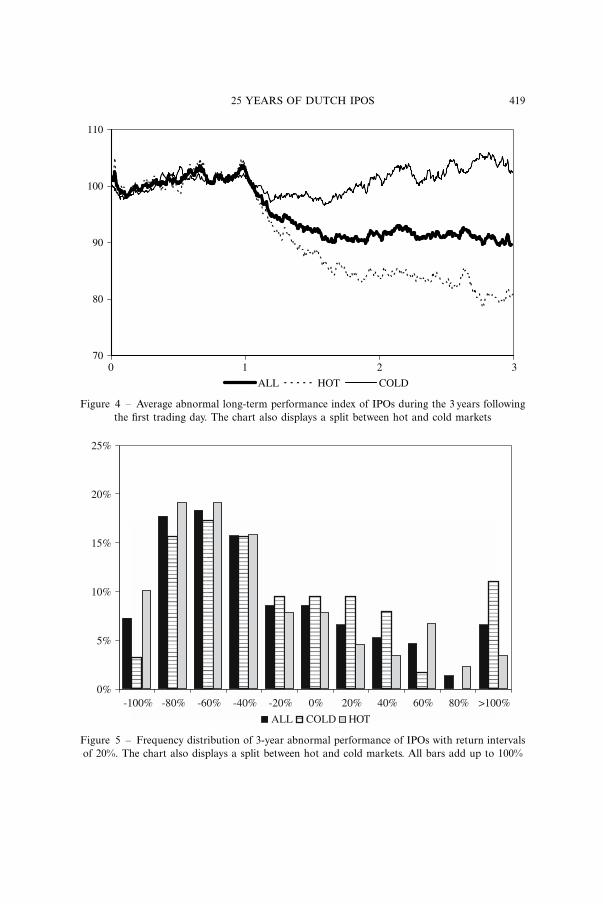
25 YEARS OF DUTCH IPOS 419
70
80
90
100
110
ALL HOT COLD
10 2 3
Figure 4 – Average abnormal long-term performance index of IPOs during the 3 years followingthe first trading day. The chart also displays a split between hot and cold markets
0%
5%
10%
15%
20%
25%
-100% -80% -60% -40% -20% 0% 20% 40% 60% 80% >100%
ALL COLD HOT
Figure 5 – Frequency distribution of 3-year abnormal performance of IPOs with return intervalsof 20%. The chart also displays a split between hot and cold markets. All bars add up to 100%
420 R.Q. DOESWIJK, H.S.K. HEMMES AND R.H. VENEKAMP
Contrary to Ritter (1991) for the US stock market, we did not find a sig-nificant long-run underperformance for Dutch IPOs. Our results also differfrom those of van Hoeijen and van der Sar (1999), who found an insignifi-cant outperformance of 17.1% after 3 years. This difference can be only par-tially attributed to the sample period and therefore derives primarily from thedifferent methodology with sector-specific benchmark portfolios. Our resultsseem to be more in line with those of Brav and Gompers (1997), who arguethat IPO companies do not underperform their peers.
We cannot reject H2: ‘Between 1977 and 2001, Dutch IPOs did not under-perform their benchmark in the long run.’ Although our total sample shows a−10.0% underperformance after 3 years, this appears to be statistically insig-nificant.
As mentioned in the literature section, Schultz (2003) states that long-termunderperformance is found ex-post because of using event-time returns. Herefers to his explanation as the pseudo market-timing explanation. He statesthat when calendar-time returns are used to calculate the ex-post long-termunderperformance, researchers can avoid biases from pseudo market-timing.When we use calendar-time returns for the calculation of our IPO sample, wedo indeed find a different long-term performance. After 1, 2 and 3 years thelong-term relative performance is 6.8%, 6.0% and 12.9%, respectively. Thesereturns are obviously better and even positive, but once again not significant.The small number of IPOs on the Dutch market in some years creates theproblem that these IPOs have a relatively large influence on the average cal-endar-time calculation of IPOs’ long-term performance. Next, calendar-timereturns are based on an IPO portfolio with an equal amount invested in anannual equally weighted basket of all IPOs in a year. If an investor has toinvest the same amount every year in a basket of all IPOs that year, he mustknow the number of IPOs within each year before a year starts. This, ofcourse, is impossible, as investors cannot predict the number of IPOs in ayear.
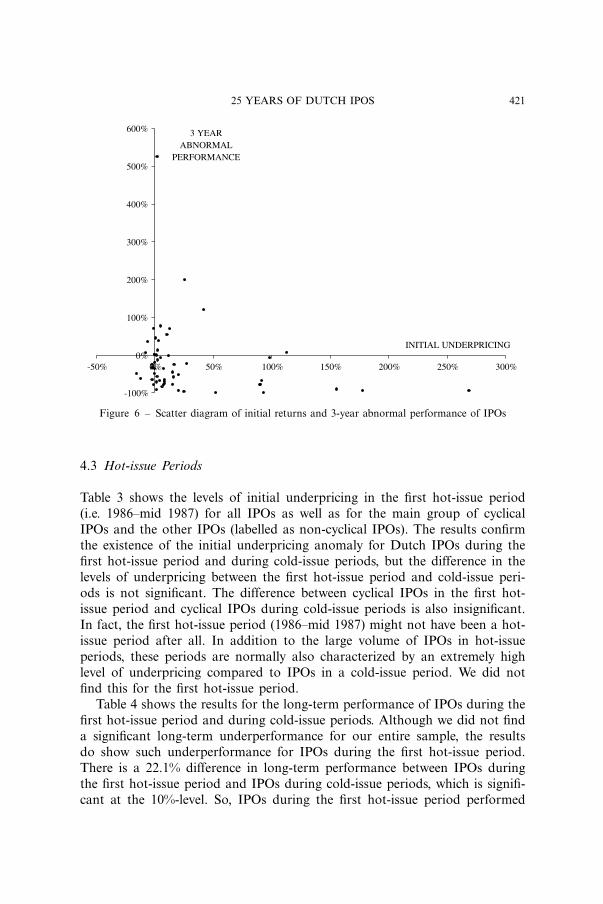
We examined the relation between initial returns and the long-term perfor-mance. In the case of over-optimism amongst investors, a significant positiveinitial return should be followed by a significant negative long-term perfor-mance. Figure 6 displays a scatter diagram of initial returns and long-termperformance. Neither the scatter diagram nor regression analyses reveals asignificant relationship between initial returns and long-term performance.
Based on our results, we cannot reject H3—‘There is no relation betweeninitial return and long-term underperformance that suggests initial over-optimism among investors’—as neither regression analyses nor the scatterdiagram point to such a relationship.
25 YEARS OF DUTCH IPOS 421
-100%
0%
100%
200%
300%
400%
500%
600%
-50% 0% 50% 100% 150% 200% 250% 300%
INITIAL UNDERPRICING
3 YEAR ABNORMAL
PERFORMANCE
Figure 6 – Scatter diagram of initial returns and 3-year abnormal performance of IPOs
4.3 Hot-issue Periods
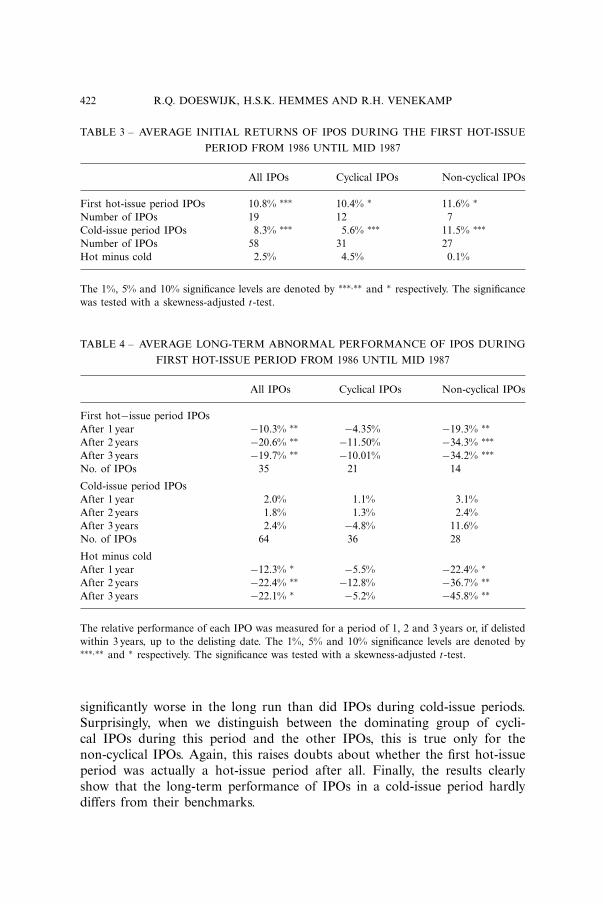
Table 3 shows the levels of initial underpricing in the first hot-issue period(i.e. 1986–mid 1987) for all IPOs as well as for the main group of cyclicalIPOs and the other IPOs (labelled as non-cyclical IPOs). The results confirmthe existence of the initial underpricing anomaly for Dutch IPOs during thefirst hot-issue period and during cold-issue periods, but the difference in thelevels of underpricing between the first hot-issue period and cold-issue peri-ods is not significant. The difference between cyclical IPOs in the first hot-issue period and cyclical IPOs during cold-issue periods is also insignificant.In fact, the first hot-issue period (1986–mid 1987) might not have been a hot-issue period after all. In addition to the large volume of IPOs in hot-issueperiods, these periods are normally also characterized by an extremely highlevel of underpricing compared to IPOs in a cold-issue period. We did notfind this for the first hot-issue period.
Table 4 shows the results for the long-term performance of IPOs during thefirst hot-issue period and during cold-issue periods. Although we did not finda significant long-term underperformance for our entire sample, the resultsdo show such underperformance for IPOs during the first hot-issue period.There is a 22.1% difference in long-term performance between IPOs duringthe first hot-issue period and IPOs during cold-issue periods, which is signifi-cant at the 10%-level. So, IPOs during the first hot-issue period performed
422 R.Q. DOESWIJK, H.S.K. HEMMES AND R.H. VENEKAMP
TABLE 3 – AVERAGE INITIAL RETURNS OF IPOS DURING THE FIRST HOT-ISSUE
PERIOD FROM 1986 UNTIL MID 1987
All IPOs Cyclical IPOs Non-cyclical IPOs
First hot-issue period IPOs 10.8% ∗∗∗ 10.4% ∗ 11.6% ∗Number of IPOs 19 12 7Cold-issue period IPOs 8.3% ∗∗∗ 5.6% ∗∗∗ 11.5% ∗∗∗Number of IPOs 58 31 27Hot minus cold 2.5% 4.5% 0.1%
The 1%, 5% and 10% significance levels are denoted by ∗∗∗,∗∗ and ∗ respectively. The significancewas tested with a skewness-adjusted t-test.
TABLE 4 – AVERAGE LONG-TERM ABNORMAL PERFORMANCE OF IPOS DURING
FIRST HOT-ISSUE PERIOD FROM 1986 UNTIL MID 1987
All IPOs Cyclical IPOs Non-cyclical IPOs
First hot−issue period IPOsAfter 1 year −10.3% ∗∗ −4.35% −19.3% ∗∗After 2 years −20.6% ∗∗ −11.50% −34.3% ∗∗∗After 3 years −19.7% ∗∗ −10.01% −34.2% ∗∗∗No. of IPOs 35 21 14
Cold-issue period IPOsAfter 1 year 2.0% 1.1% 3.1%After 2 years 1.8% 1.3% 2.4%After 3 years 2.4% −4.8% 11.6%No. of IPOs 64 36 28
Hot minus coldAfter 1 year −12.3% ∗ −5.5% −22.4% ∗After 2 years −22.4% ∗∗ −12.8% −36.7% ∗∗After 3 years −22.1% ∗ −5.2% −45.8% ∗∗
The relative performance of each IPO was measured for a period of 1, 2 and 3 years or, if delistedwithin 3 years, up to the delisting date. The 1%, 5% and 10% significance levels are denoted by∗∗∗,∗∗ and ∗ respectively. The significance was tested with a skewness-adjusted t-test.
significantly worse in the long run than did IPOs during cold-issue periods.Surprisingly, when we distinguish between the dominating group of cycli-cal IPOs during this period and the other IPOs, this is true only for thenon-cyclical IPOs. Again, this raises doubts about whether the first hot-issueperiod was actually a hot-issue period after all. Finally, the results clearlyshow that the long-term performance of IPOs in a cold-issue period hardlydiffers from their benchmarks.

25 YEARS OF DUTCH IPOS 423
TABLE 5 – AVERAGE INITIAL RETURNS OF IPOS DURING THE SECOND HOT-
ISSUE PERIOD FROM 1997 UNTIL MID 2000
All IPOs Growth IPOs Non-growth IPOs
Second hot-issue period IPOs 29.5% ∗∗∗ 35.8% ∗∗∗ 17.4% ∗∗∗Number of IPOs 55 36 19Cold-issue period IPOs 8.3% ∗∗∗ 9.2% ∗∗ 7.8% ∗∗∗Number of IPOs 58 21 37Hot minus cold 21.2% ∗∗∗ 26.6% ∗∗ 9.6%
The 1%, 5% and 10% significance levels are denoted by ∗∗∗,∗∗ and ∗ respectively. The significancewas tested with a skewness-adjusted t-test.
Table 5 presents the results for the second hot-issue period. This periodwas dominated by growth IPOs. The results show that, as opposed to IPOs inthe first hot-issue period, IPOs during the second hot-issue period did indeedhave a significantly higher initial return than did IPOs during cold-issue peri-ods. Differentiation between the dominant group of growth IPOs and otherIPOs reveals that this is true only for the dominant group of growth IPOs.During this period, the initial return of growth IPOs was a staggering 35.8%on average. So, besides the fact that there was a large volume of growth IPOsduring this hot-issue period, these growth IPOs were also characterized by anextremely high level of underpricing compared to growth IPOs in a cold-issueperiod.
We refer again to Figure 3—the frequency distribution of initial returns. Itshows that cold-issue IPOs are over-represented in the left-hand part of thefrequency distribution, while hot-issue IPOs are over-represented in the right-hand part. This basically illustrates the results of table 5, which shows extrahigh initial returns for hot-issue IPOs in the period 1997–mid 2000.
We can reject H4—‘The level of initial underpricing for Dutch IPOsbetween 1977 and 2001 during hot-issue periods and cold-issue periods wasthe same’—for the hot-issue period 1997–mid 2000. IPOs issued in this perioddelivered an average initial return of 29.5% compared to 8.3% in cold-issueperiods. The difference (21.2%) is highly significant. The dominating groupof IPOs from the main sector growth even yielded an initial return of 35.8%compared to 9.2% for growth IPOs in cold-issue periods, a difference (26.6%)that is also highly significant.
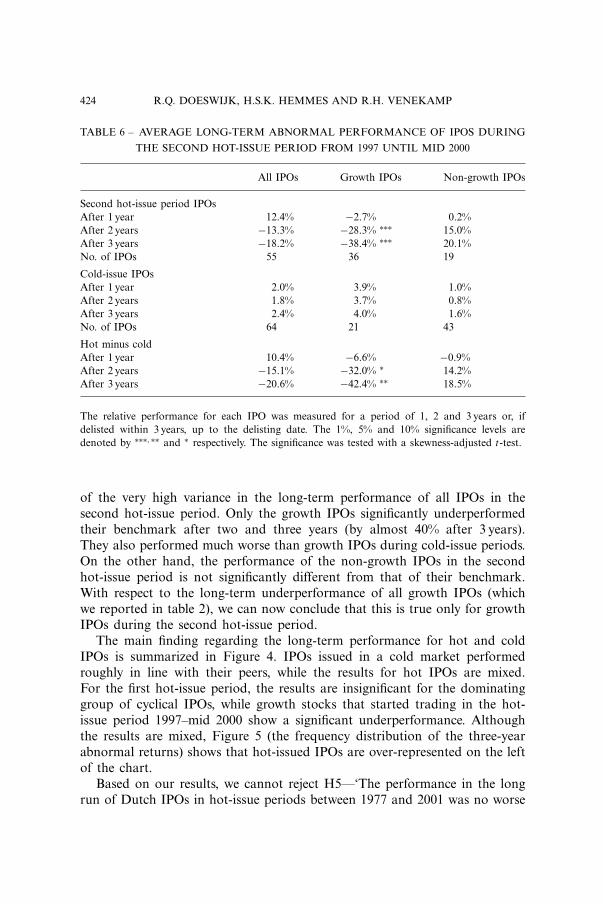
Table 6 presents our findings for the long-term performance of IPOs dur-ing the second hot-issue period compared to IPOs during cold-issue periods.Although there is a large difference (20.6%) in the long-term performanceafter three years between all IPOs during the second hot-issue period andduring cold-issue periods, this difference is statistically insignificant because
424 R.Q. DOESWIJK, H.S.K. HEMMES AND R.H. VENEKAMP
TABLE 6 – AVERAGE LONG-TERM ABNORMAL PERFORMANCE OF IPOS DURING
THE SECOND HOT-ISSUE PERIOD FROM 1997 UNTIL MID 2000
All IPOs Growth IPOs Non-growth IPOs
Second hot-issue period IPOsAfter 1 year 12.4% −2.7% 0.2%After 2 years −13.3% −28.3% ∗∗∗ 15.0%After 3 years −18.2% −38.4% ∗∗∗ 20.1%No. of IPOs 55 36 19
Cold-issue IPOsAfter 1 year 2.0% 3.9% 1.0%After 2 years 1.8% 3.7% 0.8%After 3 years 2.4% 4.0% 1.6%No. of IPOs 64 21 43
Hot minus coldAfter 1 year 10.4% −6.6% −0.9%After 2 years −15.1% −32.0% ∗ 14.2%After 3 years −20.6% −42.4% ∗∗ 18.5%
The relative performance for each IPO was measured for a period of 1, 2 and 3 years or, ifdelisted within 3 years, up to the delisting date. The 1%, 5% and 10% significance levels aredenoted by ∗∗∗,∗∗ and ∗ respectively. The significance was tested with a skewness-adjusted t-test.
of the very high variance in the long-term performance of all IPOs in thesecond hot-issue period. Only the growth IPOs significantly underperformedtheir benchmark after two and three years (by almost 40% after 3 years).They also performed much worse than growth IPOs during cold-issue periods.On the other hand, the performance of the non-growth IPOs in the secondhot-issue period is not significantly different from that of their benchmark.With respect to the long-term underperformance of all growth IPOs (whichwe reported in table 2), we can now conclude that this is true only for growthIPOs during the second hot-issue period.
The main finding regarding the long-term performance for hot and coldIPOs is summarized in Figure 4. IPOs issued in a cold market performedroughly in line with their peers, while the results for hot IPOs are mixed.For the first hot-issue period, the results are insignificant for the dominatinggroup of cyclical IPOs, while growth stocks that started trading in the hot-issue period 1997–mid 2000 show a significant underperformance. Althoughthe results are mixed, Figure 5 (the frequency distribution of the three-yearabnormal returns) shows that hot-issued IPOs are over-represented on the leftof the chart.
Based on our results, we cannot reject H5—‘The performance in the longrun of Dutch IPOs in hot-issue periods between 1977 and 2001 was no worse

25 YEARS OF DUTCH IPOS 425
than the long-run performance of IPOs in a cold-issue period’—as our resultsregarding the long-term performance of hot and cold IPOs are mixed. Forthe first hot-issue period abnormal returns were significantly negative for allhot IPOs together, but not for the dominating group of cyclicals. For the sec-ond hot issue period abnormal returns were insignificant for all IPOs, but forthe dominating group of growth stocks abnormal returns were significantlynegative.
5 SUMMARY AND CONCLUSIONS
This study focused on the existence of the initial underpricing and the long-term underperformance anomalies in the Dutch Initial Public Offering (IPO)market between 1977 and 2001. The difference between our study and pre-vious research on Dutch IPOs is that we compared the performance ofeach IPO with its sector-specific benchmark to ensure a benchmark portfo-lio that has return characteristics close to the IPO itself. For this purpose,we identified four main sectors – namely growth stocks, cyclicals, defensivesand interest rate sensitive stocks – for which we calculated equally weightedbenchmarks.
This paper documents the existence of the underpricing anomaly in theDutch IPO market. We found an average initial underpricing level of 17.6%,measured relative to a sector-specific benchmark. The median initial returnwas 5.0%, while we observe negative initial returns in only 17% of the IPOs.The level of underpricing for IPOs is in line with the results of Ibbotsonet al. (1994/2001), who report an average underpricing of 18.6% between 1960and 2000 for IPOs in the United States. Compared to previous research intoDutch IPOs, our initial returns seem rather high. This is due to the fact thatwe used an extensive sample that includes the late 1990s. In those years, ini-tial returns were extraordinary high.
During their first 3 years of listing, IPOs on average underperformed theirbenchmark by a cumulative 10.0%, but this result is statistically insignifi-cant. The frequency distribution for the 3-year abnormal returns is negativelyskewed; in 67% of the cases they are below zero. But, the long-term abnormalperformance does not significantly differ from zero, our results are more sup-portive of the findings of Brav and Gompers (1997)—who suggested that IPOcompanies do not underperform their peers—than of those of Ritter (1991),who found a significant long-term underperformance.
We also examined the performance of IPOs during hot- and cold-issueperiods. Ex-ante, we labelled two periods as hot-issue periods. The first periodis 1986–mid 1987, and the second is 1997–mid 2000. Both periods show alarge number of IPOs and both end with a stock market crash. Next, wefound that each period was dominated (by 60% or more) by one single mainsector. The first period was dominated by cyclical IPOs, and the second by
426 R.Q. DOESWIJK, H.S.K. HEMMES AND R.H. VENEKAMP
growth IPOs. Our results for the first hot-issue period raise doubts aboutwhether the first hot-issue period was actually a hot-issue period. The levelof underpricing was not significantly higher than in cold-issue periods. In thesecond hot-issue period, we observe an average initial return of 29.5%, whichis significantly higher than the 8.3% in cold-issue periods. During this period,the initial return of the dominating group of growth IPOs was, on average,a staggering 35.8%. Regarding the long-term performance, IPOs issued in acold market performed roughly in line with their peers, while the results forhot IPOs were mixed. For the first hot-issue period, the results are insig-nificant for the dominating group of cyclical IPOs. However, the dominatinggroup of growth stocks that started trading in the hot-issue period 1997–mid2000 underperformed significantly, showing some support for the hypothesisthat issuers use windows of opportunity.
We did not find a significant link between the initial returns and the long-term performance of IPOs. Therefore, our study does not provide support forthe over-optimism hypothesis of Tinic (1988), which states that the optimismat early trading of IPOs should be corrected by a negative long-term relativeperformance.
Our results suggest that investors should always subscribe to an IPO. Forthe Dutch stock market, we found an 83% chance of a positive initial return.We found an average initial return of 17.6% and a median of 5.0%. Notethat the average of 17.6% might be an overestimation due to the rationingof the most successful IPOs, in line with the winner’s curse hypothesis (seeRock (1986)). For the long-term perspective, we lack evidence to support thehypothesis that IPOs perform worse than their peers. Therefore, our resultssuggest that there is no need for investors to sell immediately after listing.
REFERENCES
Aggarwal, R. (2000), ‘Stabilization Activities by Underwriters after IPOs,’ Journal of Finance, 55,pp. 1075–1103.
Banz, R.W. (1981), ‘The Relationship between Returns and Market Value of Common Stocks,’Journal of Financial Economics, 21, pp. 3–18.
Barber, B.M. and J.D. Lyon (1997), ‘Detecting Long-Run Abnormal Stock Returns: The Empiri-cal Power and Specification of Test Statistics,’ Journal of Financial Economics, 43, pp. 341–372.
Blume, M. and R.F. Stambaugh (1983), ‘Biases in Computed Returns: An Application to the SizeEffect,’ Journal of Financial Economics, 12, pp. 387–404.
Brav, A. and P. Gompers (1997), ‘Myth or reality? The Long-Run Underperformance of InitialPublic Offerings: Evidence from Venture and Nonventure Capital-backed Companies,’ Journalof Finance, 52, pp. 1791–1821.
Buijs, A. and H.G Eijgenhuijsen (1992), ‘IPOs in Amsterdam: An Analysis of UnseasonedIssues of Common Stock in the Netherlands 1982–1991,’ Faculty Research Paper Series No. 2,Nijenrode University.

25 YEARS OF DUTCH IPOS 427
Doeswijk, R.Q. (1997), ‘Contrarian investment in the Dutch stock market,’ De Economist, 145,pp. 573–598.
Eijgenhuijsen, H. (1989), ‘Aandelenintroducties op de Amsterdamse Effectenbeurs en het Vers-chijnsel ‘Underpricing’ (IPOs at the Amsterdam Stock Exchange and Underpricing), Maand-blad voor Accountancy & Bedrijfseconomie, 63, pp. 119–127.
Fama, E.F. and K.R. French (1992), ‘The Cross Section of Expected Returns,’ Journal of Finance,47, pp. 427–465.
Fama, E.F. and K.R. French (1993), ‘Common Risk Factors in the Returns of Stocks andBonds,’ Journal of Financial Economics, 33, pp. 3–55.
Gids bij de Officiele Prijscourant van de Amsterdamse Effectenbeurs (Guide to the Official PriceJournal of the Amsterdam Stock Exchange), editions 1973–1995, Amsterdam, J.H. de Bussy.
Goot, van der, L.R.T. (1997), ‘Valuing New Issues: Information Quality of Initial Public Offer-ings at the Amsterdam Stock Exchange,’ dissertation, Thesis Publishers.
Helwege, J. and N. Liang (2004), ‘Initial Public Offerings in Hot and Cold Markets,’ Journal ofFinancial and Quantitative Analysis, 39, pp. 541–569.
Hoeijen, van H.J. and N.L. Van der Sar (1999), ‘De Performance van Aandelenintroducties opde Amsterdamse Effectenbeurs’ (The Performance of IPOs at the Amsterdam Stock Exchange),Maandblad voor Accountancy & Bedrijfseconomie, 73, pp. 120–132.
Huygen, T.G. and A. Tourani (1993), ‘Beursintroducties op de Nederlandse Aandelenmarkt’(IPOs in the Dutch Stock Market), Economisch Statistische Berichten (ESB), 78, pp. 428–431.
Ibbotson, R.G., J. Sindelar and J. Ritter (1994, updated in 2001), ‘The Market’s Problem with thePricing of Initial Public Offerings,’ Journal of Applied Corporate Finance, 7, pp. 66–74.
Johnson, N.J. (1978), ‘Modified T Tests and Confidence Intervals for Asymmetrical Populations,’Journal of the American Statistical Association, 73, pp. 536–544.
Loughran, T. and J.R. Ritter (1995), ‘The New Issues Puzzle,’ Journal of Finance, 50, 23–51.Lowry, M. (2003), ‘Why Does IPO Volume Fluctuate so Much?’ Journal of Financial Economics,
67, pp. 3–40.Lyon, J.D., B.M. Barber, and C.L. Tsai (1999), ‘Improved Methods for Tests of Long-Run
Abnormal Stock Performance,’ Journal of Finance, 54, pp. 165–186.Miller, E. (1977), ‘Risk, Uncertainty and Divergence of Opinion,’ Journal of Finance, 32, pp.
1151–1168.Officiele Prijscourant van de Amsterdamse Effectenbeurs (Official Price Journal of the Amster-
dam Stock Exchange), daily editions 1977 to 1997.Ritter, J.R. (1984), ‘The Hot Issue Market of 1980,’ Journal of Business, 57, pp. 215–240.Ritter, J.R. (1991), ‘The Long-Run Performance of Initial Public Offerings,’ Journal of Finance,
46, pp. 3–27.Ritter, J.R. (1998), ‘Initial Public Offerings,’ Contemporary Finance Digest, 2, pp. 5–30.Rock, K. (1986), ‘Why New Issues are Underpriced,’ Journal of Financial Economics, 15, pp. 187–
212.Schultz, P. (2003), ‘Pseudo Market Timing and the Long-Run Underperformance of IPOs,’
Journal of Finance, 58(2), pp. 483–517.Taylor, J.G. (1998), Investment Timing and the Business Cycle (Wiley Frontiers in Finance),
Canada, John Wiley & Sons.Tinic, S. (1988), ‘Anatomy of initial public offerings of common stock,’ Journal of Finance, 43,
pp. 789–822.