232918 - University of Bristol Research Portal
408
This electronic thesis or dissertation has been downloaded from Explore Bristol Research, http://research-information.bristol.ac.uk Author: Faulkner, Thomas Joseph Title: Carbonate facies on a Lower Carboniferous storm influenced ramp in SW Britain General rights Access to the thesis is subject to the Creative Commons Attribution - NonCommercial-No Derivatives 4.0 International Public License. A copy of this may be found at https://creativecommons.org/licenses/by-nc-nd/4.0/legalcode This license sets out your rights and the restrictions that apply to your access to the thesis so it is important you read this before proceeding. Take down policy Some pages of this thesis may have been removed for copyright restrictions prior to having it been deposited in Explore Bristol Research. However, if you have discovered material within the thesis that you consider to be unlawful e.g. breaches of copyright (either yours or that of a third party) or any other law, including but not limited to those relating to patent, trademark, confidentiality, data protection, obscenity, defamation, libel, then please contact [email protected] and include the following information in your message: • Your contact details • Bibliographic details for the item, including a URL • An outline nature of the complaint Your claim will be investigated and, where appropriate, the item in question will be removed from public view as soon as possible.
-
Upload
khangminh22 -
Category
Documents
-
view
1 -
download
0
Transcript of 232918 - University of Bristol Research Portal

This electronic thesis or dissertation has beendownloaded from Explore Bristol Research,http://research-information.bristol.ac.uk
Author:Faulkner, Thomas Joseph
Title:Carbonate facies on a Lower Carboniferous storm influenced ramp in SW Britain
General rightsAccess to the thesis is subject to the Creative Commons Attribution - NonCommercial-No Derivatives 4.0 International Public License. Acopy of this may be found at https://creativecommons.org/licenses/by-nc-nd/4.0/legalcode This license sets out your rights and therestrictions that apply to your access to the thesis so it is important you read this before proceeding.
Take down policySome pages of this thesis may have been removed for copyright restrictions prior to having it been deposited in Explore Bristol Research.However, if you have discovered material within the thesis that you consider to be unlawful e.g. breaches of copyright (either yours or that ofa third party) or any other law, including but not limited to those relating to patent, trademark, confidentiality, data protection, obscenity,defamation, libel, then please contact [email protected] and include the following information in your message:
•Your contact details•Bibliographic details for the item, including a URL•An outline nature of the complaint
Your claim will be investigated and, where appropriate, the item in question will be removed from public view as soon as possible.
Carbonate facies on a Lower Carboniferous storm influenced ramp
in SW Britain
Thomas Joseph Faulkner B. A.
A thesis submitted to the University of Bristol in accordance with the requirements for the degree of Doctor of Philosophy (Ph. D. ) in
the Faculty of Science (Geology). May 1989.

BEST COPY
AVAILABLE Poor text in the original thesis.
Abstract
The Lower Carboniferous ('mid'-Courceyan to early Chadian) Black Rock Limestone ramp succession of SW Britain, accumulated along the southern margin of the Welsh-Brabant Massif during the early stage of development of the SW European foreland basin. Two depositional cycles are recognized which culminate in the subaerial exposure of those sequences in a more landward setting.
The lower depositional cycle includes the Barry Harbour Limestone Formation, which contains a variety of storm-related sedimentary structures including hummocky cross-stratification. This is conformably overlain by the tidally influenced, cross-stratified Brofiscin Oolite Formation which locally displays evidence of subaerial exposure. Seven sedimentary lithofacies are identified in these two formations, which record a distal to proximal, shallowing-upward trend that passes from beneath mean wave-base to above fairweather wave-base.
The upper depositional cycle of the Friars Point Limestone Formation includes the volcanics at Middle Hope, the Waulsortian facies at Castlemartin and Cannington Park, and is capped by the (herein named) Portishead Paleosol Beds (near Bristol). Above the basal transgressive sequence, the Friars Point Limestone consists of two distinct offshore ramp facies belts. The more proximal inner ramp facies belt was more strongly influenced by storm-related currents and exhibits tubular tempestites (storm sediment-filled burrows). The finer-grained, outer ramp facies belt is extensively bioturbated and preserves few features indicative of deposition from storm-related currents. The effects and relative timing of differential subsidence was elucidated by using the well documented biostratigraphy to
separate the succession into isochronous units. The onset of pronounced differential subsidence was signified by volcanic activity at Middle Hope (Weston-super-Mare). The volcanic tuffs form a coarsening- and shallowing-upward sequence which records the development of a localised, probably non-emergent, offshore-volcanic high. Recognition of a major eustatic sea level fall at the end of the Courceyan and during the early part of the Chadian, is revealed by
studying the decline of the Waulsortian reefs in an offshore ramp setting and evaluating the regional significance of the Portishead Paleosol Beds.
Overall, the development of the Black Rock Limestone ramp was the result of the interplay between eustacy and tectonism.
A full petrographic and geochemical analysis of the Waulsortian dolomites at Castlemartin, including the use of stable isotopes
revealed that dolomitization occurred during burial, most probably as a result of basin dewatering.

Acknowledgements
Firstly, I am extremely grateful to Dr V. P. Wright & D. Tucker
(ARC), for continual support and expert advice throughout my period of
research.
Secondly, I am indebted to Susan Forson for encouragement, and
assistance with field logging and editing the text.
Thirdly, I wish to thank the following for help and advice:
John Miller, Dick Waters, Jerry Davies, Neil Pickard, Peter Hardy,
Trevor Burchette, Alan Lees, Peter Gutteridge, Nigel Hughes, and Shoa
Sun.
Fourthly, I thank the technical staff at Bristol, in particular
Tony Kemp (geochemistry), Simon Powell (photography) and Gary Webber
(preparation of thin-sections).
Lastly, I am grateful for the receipt of a N. E. R. C grant and an
Amey Roadstone Case award.

Declaration
I declare that the work contained in this thesis was my own work except where otherwise stated.
............ ................. Signed
T. J. Faulkner
May 19th, 1989.
iv
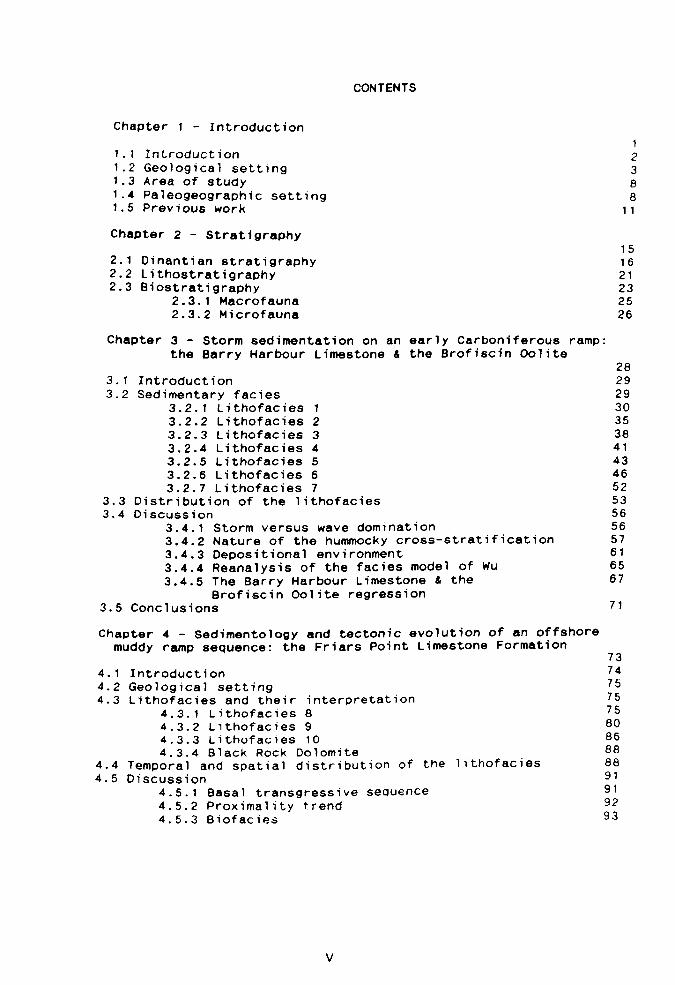
CONTENTS
Chapter 1- Introduction
1.1 Introduction 2 1.2 Geological setting 3 1.3 Area of study 8 1.4 Paleogeographic setting 8 1.5 Previous work 11
Chapter 2- Stratigraphy 15
2.1 Dinantian stratigraphy 16 2.2 Lithostratigraphy 21 2.3 Biostratigraphy 23
2.3.1 Macrofauna 25 2.3.2 Microfauna 26
Chapter 3- Storm sedimentation on an early Carboniferous ramp: the Barry Harbour Limestone & the Brofiscin Oolite
28 3.1 Introduction 29 3.2 Sedimentary facies 29
3.2.1 Lithofacies 1 30 3.2.2 Lithofacies 2 35 3.2.3 Lithofacies 3 38 3.2.4 Lithofacies 4 41 3.2.5 Lithofacies 5 43 3.2.6 Lithofacies 6 46 3.2.7 Lithofacies 7 52
3.3 Distribution of the lithofacies 53 3.4 Discussion 56
3.4.1 Storm versus wave domination 56 3.4.2 Nature of the hummocky cross-stratification 57 3.4.3 Depositional environment 61 3.4.4 Reanalysis of the facies model of Wu 65 3.4.5 The Barry Harbour Limestone & the 67
Brofiscin Oolite regression 3.5 Conclusions 71
Chapter 4- Sedimentology and tectonic evolution of an offshore muddy ramp sequence: the Friars Point Limestone Formation
73 4.1 Introduction 74 4.2 Geological setting 75 4.3 Lithofacies and their interpretation 75
4.3.1 Lithofacies 8 75 4.3.2 Lithofacies 9 80 4.3.3 Lithofacies 10 86 4.3.4 Black Rock Dolomite 88
4.4 Temporal and spatial distribution of the lithofacies 88 4.5 Discussion 91
4.5.1 Basal transgressive sequence 91
4.5.2 Proximality trend 92 4.5.3 Biofacies 93
V
4.5.4 Biostratigraphic time-lines 97 4.5.5 Sedimentation and tectonics 101
4.6 Conclusions 103
Chapter 5- The Middle Hope volcanics of Weston-super-Mare: Development and demise of an offshore volcanic high
104 5.1 Introduction 105 5.2 Background 105 5.3 Correlation 107 5.4 Sedimentary facies description and interpretation 110
5.4.1 Facies association A 110 5.4.2 Facies association B 110 5.4.3 Facies association C 114 5.4.4 Facies association D 120
5.5 Discussion 124 5.6 Geochemistry of the pillow basalt 128
5.6.1 Pillow basalt 129 5.6.2 Methods 129 5.6.3 Geochemistry 132
5.7 Conclusions 136
Chapter 6- Facies and dolomite geochemistry of the Castlemar tin Waulsortian buildups
137 6.1 Introduction 138 6.2 Waulsortian buildups of Castlemartin 141
6.2.1 The Berry Slade and the Wind Bay mounds 141 6.2.2 The Hanging Tar mound 145
6.3 Sedimentary phases 150 6.3.1 Sedimentary phases at Castlemartin 151
6.4 Discussion 155 6.5 Petrography and geochemistry of the Castlemartin 161
Waulsortian dolomites 6.6 Burial history 162 6.7 Methods 162
6.8 Diagenetic relationships 164 6.9 Dolomite types & their geochemistry 166
6.9.1 Type 1-Mosaic dolomite 166
6.9.2 Type 2-Saddle dolomite 167 6.9.3 Geochemistry 169
6.10 Other Dinantian dolomites of South Wales 173 6.11 Discussion 174 6.12 Conclusions 180
Chapter 7- Cryptic exposure horizons in the Carboniferous Limestone of Portishead
181 7.1 Introduction 182 7.2 Succession 182
7.2.1 The Black Rock Dolomite 182 7.2.2 The Sub-Oolite Bed 184 7.2.3 The Gully Oolite 185
7.3 The Portishead Paleosol Beds 186
7.3.1 Carbonate nodules 186
7.3.2 Columnar calcite crystals 189
vi
7.3.3 Clays & siltstones 192 7.4 Other columnar calcites 195 7.5 Discussion 201 7.6 Conclusions 207
Chapter 8- Ramp longevity & summary 209
8.1 Introduction 210 8.2 Ramp to shelf evolution 210
8.2.1 Stage I Clastic sedime ntation 213 8.2.2 Stage II Establishment of ramps 213 8.2.3 Stage III Differential subsidence 216 8.2.4 Stage IV Ramp-to-shelf transition 218 8.2.5 Stage V Shelf/rimmed shelf 220
8.3 Discussion 220 8.3.1 Sediment supply 221 8.3.2 Sea level changes 221
8.4 Conclusions 225
8.5 Summary 225
References 228 Appendices Key for appendices 248
Key for sedimentary logs 249 Appendices A-R Locality maps and sedimentary logs 250 Appendices S-V Laboratory techniques 313
LIST OF FIGURES & TABLES
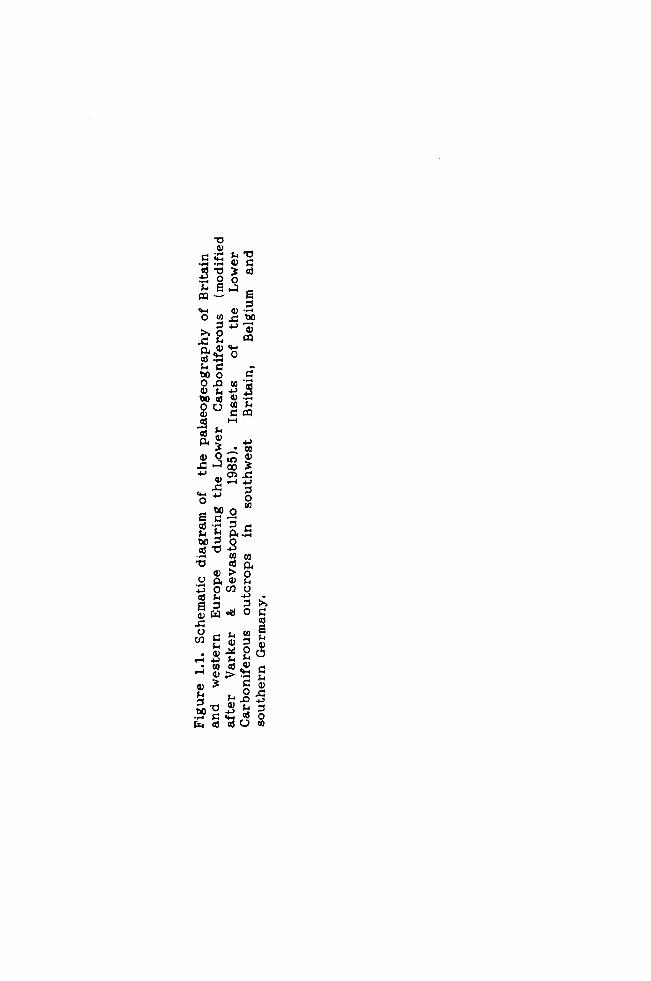
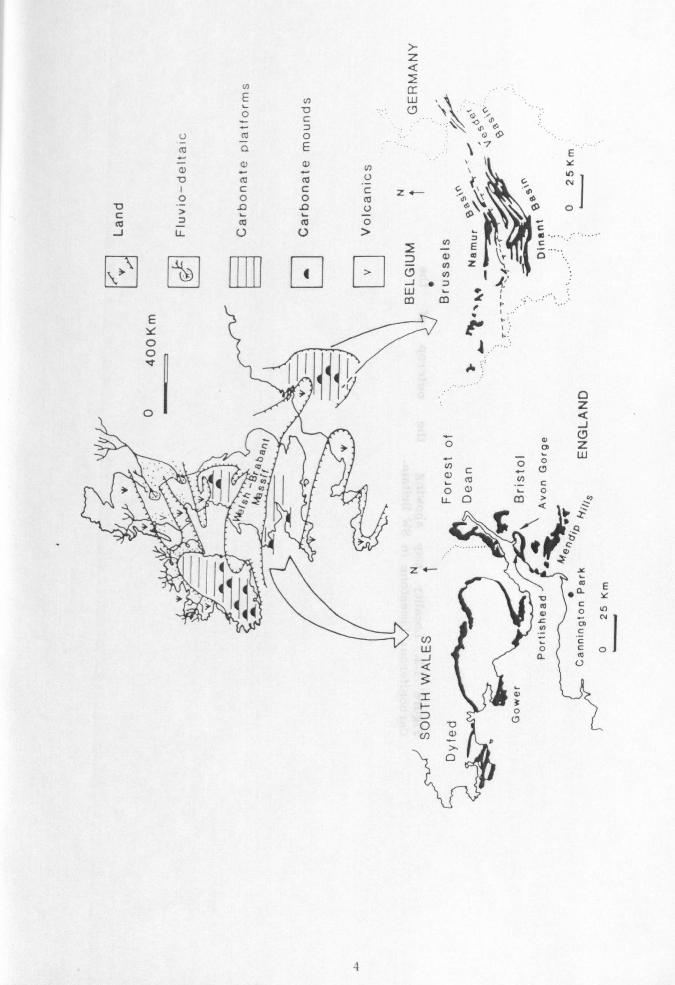
Chapter 1 Fig. 1.1 Palaeogeography of western Europe during the 4
lower Dinantian Fig. 1.2 Locality map 5 Fig. 1.3 Cross-section across South Wales & SW England 7 Fig. 1.4 Palaeotectonic setting 9
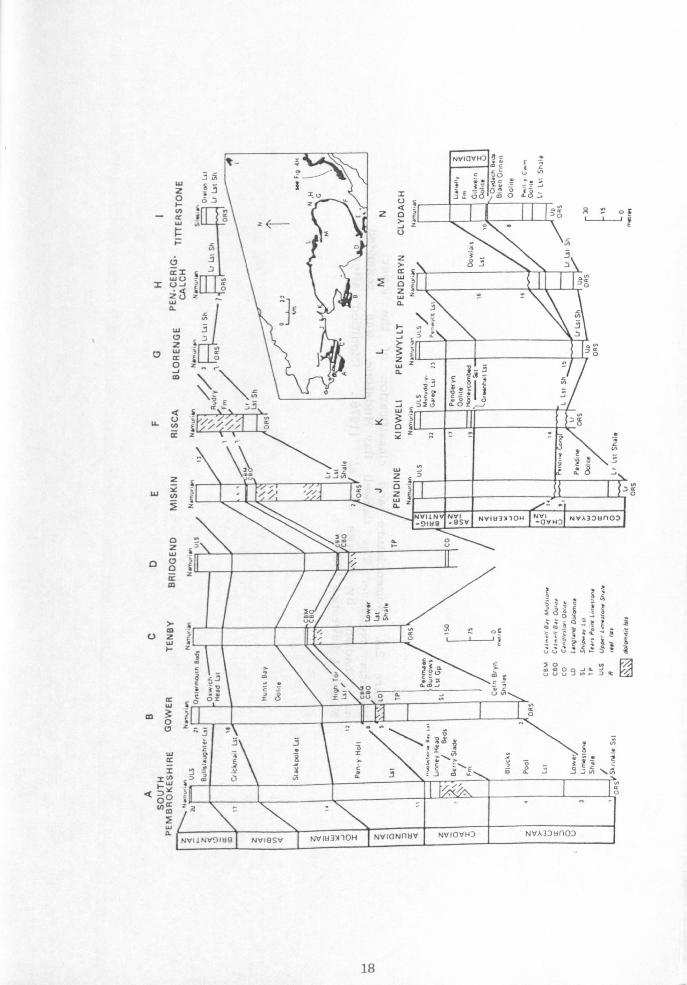
Chap ter 2 Fig. 2.1 Dinantian stratigraphy of Bristol & the Mendips 17 Fig. 2.2 Dinantian stratigraphy of South Wales 18 Fig. 2.3 Nomenclature and classification of lower Dinantian 19
sequence Fig. 2.4 Correlation of some pre-Holkerian sections across 20
SW Britain Fig. 2.5 Depth-related Dinantian facies sequence 22
recognized by Ramsbottom Fig. 2.6 Correlation of Vaughan's zones with Ramsbottom's 22
sedimentary cycles Fig. 2.7 Relationship between the conodont zones, the coral 24
assemblage biozones and the formations in the Black Rock Limestone
Chapter 3 Fig. 3.1 Sedimentary features of Lithofacies 1,2 &3 31 Fig. 3.2 (A) Lithofacies 1 32
(B) Lithofacies 2
vii
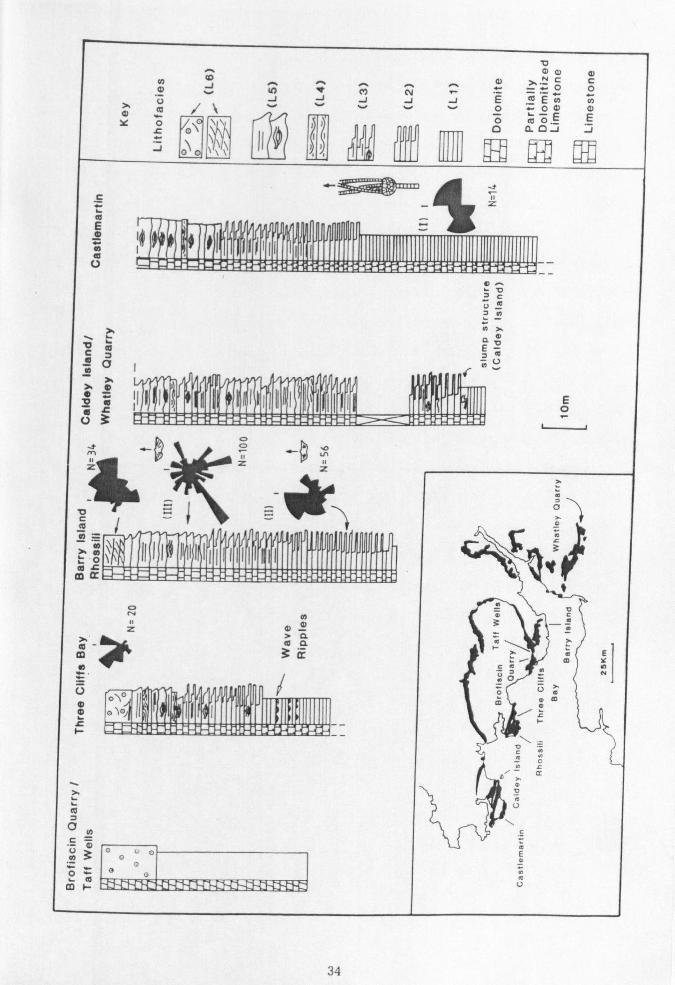
(C) Zoophycos Fig. 3.3 Sedimentary logs of the Barry Harbour Limestone & 34
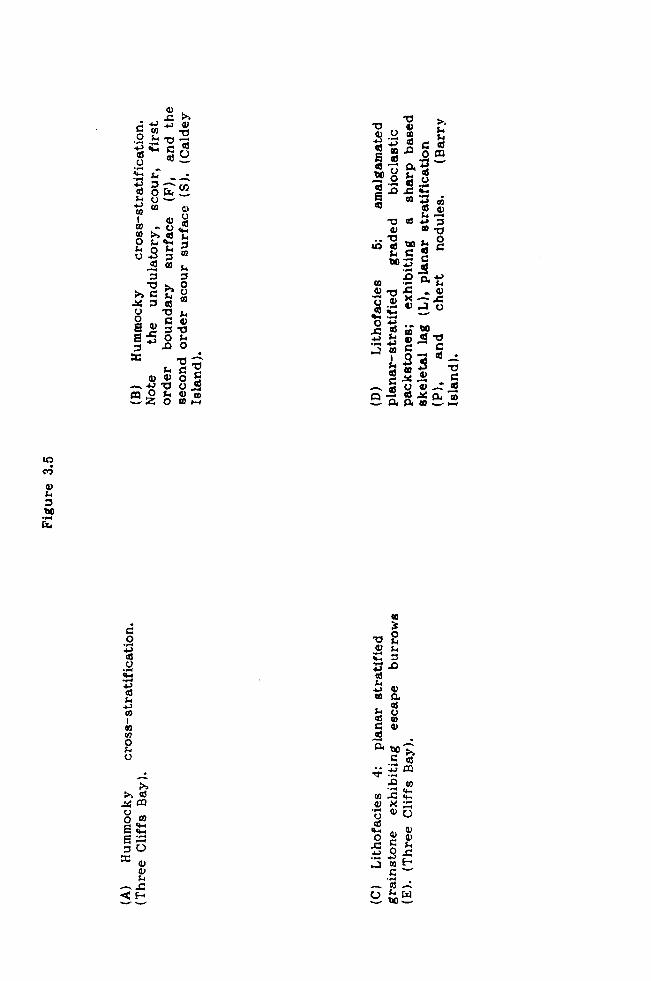
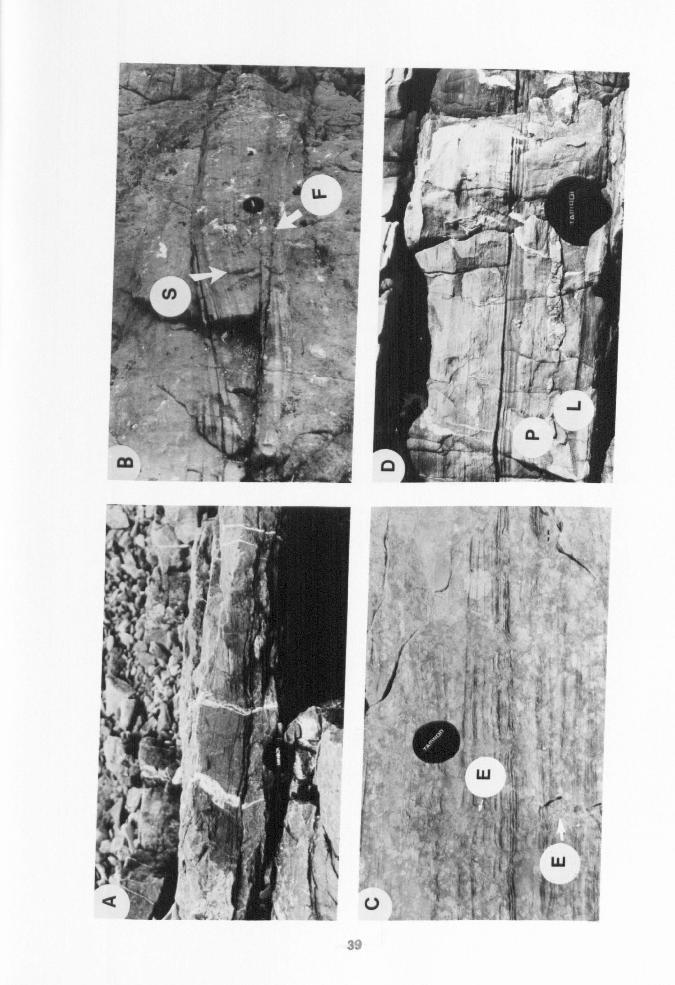
the Brofiscin Oolite in South Wales Fig. 3.4 Rose diagram of the orientation of spiriferiods 37 Fig. 3.5 (A) Hummocky cross-stratification 39
(B) Hummocky cross-stratification (C) Lithofacies 4 (0) Lithofacies 5
Fig. 3.6 Sedimentary features of Lithofacies 4,5 &6 42 Fig. 3.7 Hummocky cross-stratification 45 Fig. 3.8 Lateral profile of hummocky cross-stratification 47 Fig. 3.9 (A) Lithofacies 6 48
(B) Low-angle lateral accretion surface (C) Lithofacies 7
Fig. 3.10 Yorke Rock Bed 50 Fig. 3.11 Palaeogeography and distribution of the Brofiscin 51
Oolite Fig. 3.12 Sedimentary logs of the Barry Harbour Limestone & 54
the Brofiscin Oolite in SW England Fig. 3.13 Depositional model of the Barry Harbour Limestone & 55
the Brofiscin Oolite Fig. 3.14 Storm beds of the Barry Harbour Limestone 62 Fig. 3.15 Zonation of depositional types (Wu 1982) 66 Fig. 3.16 Slump structure 70
Chapter 4 Fig. 4.1 Sedimentary features of Lithofacies 8,9 & 10 76 Fig. 4.2 (A) Lithofacies 8 77
(B) Parallel orientated crinoid stems (C) Tubular tempestite connected to a skeletal lag
Fig. 4.3 Sedimentary logs of the Friars Point Limestone in 79 South Wales
Fig. 4.4 Proximality trend of lithofacies 81 Fig. 4.5 (A) Lithofacies 9 82
(B) Overturned Syringopora (C) Thalassinoides- type burrows (D) Tubular tempestite
Fig. 4.6 Sedimentary logs of the Friars Point Limestone in 84 SW England
Fig. 4.7 (A) Lithofacies 10 87 (B) Stacked convex-upward brachiopod valves (C) Lithofacies 6
Fig. 4.8 Distribution of the lithofacies in the Friars 89 Point Limestone
Fig. 4.9 Sedimentary lithofacies and coral zones 94 Fig. 4.10 Sedimentary lithofacies and conodont zones 95 Fig. 4.11 Thickness variation of the Friars Point Limestone 99
within the Ps. multistriatus Zone Fig. 4.12 Thickness variation of the Friars Point Limestone 100
within the P. meh 1i and M. beckmann i Zone
Chapt er 5 Fig. 5.1 Correlation of the lower Dinantian in the Bristol- 106
Weston-super-Mare district Fig. 5.2 Locality map at Middle Hope 108
viii
Fig. 5.3 Sedimentary logs at Middle Hope 109 Fig. 5.4 Sedimentary log at exposure 1 111 Fig. 5.5 (A) Facies association A 112
(B) Facies association Bb Fig. 5.6 (A) Facies association Cc: cross-bedding 115
(B) Facies association Ca: paraconglomerate (C) Photomicrograph of ooids
Fig. 5.7 (A) Facies association Cc: 'pipe-rock' 119 (B) Facies association Cc: wave-ripples
Fig. 5.8 (A) Facies association D: basal conglomerate 122 (B) Pillow basalt
Fig. 5.9 Composite model of the volcanic high 125 Fig. 5.10 Tectonic discrimination diagram 130 Fig. 5.11 Geochemical patterns of within plate basalts & 131
calc-alkali basalts Fig. 5.12 Geochemical pattern of the Middle Hope basalt 134 Table 5.1 Geochemistry of the pillow basalt at Middle Hope 133
Chapter 6 Fig. 6.1 Stratigraphy along the Castlemartin coastline 139 Fig. 6.2 (A) Wind Bay mound 140
(B) Hanging Tar mound Fig. 6.3 Sedimentary phases within the Castlemartin mounds 142 Fig. 6.4 Profile of the Hanging Tar mound 143 Fig. 6.5 (A) Polished specimen of the Hanging Tar mound 144
(B) Syringopora in growth position (C) Photomicrograph of stromatactis
Fig. 6.6 Microfacies of the Hanging Tar mound 146 Fig. 6.7 (A) Photomicrograph of plurilocular foraminfera 147
(B) Photomicrograph of cryptalgal coating (C) Micrite lens (D) Micritic intraclasts
Fig. 6.8 Schematic representation of the composition of 152 the sediments associated with the four Waulsortian phases
Fig. 6.9 Lower depth limits of significant components 153 in the bathymetric phases
Fig. 6.10 Schematic cross-sectional model of the carbonate 156 ramp of SW Britain and the Waulsortian facies of Belgium
Fig. 6.11 Time/water depth reconstruction of the 'middle' 157 Courceyan to early Chadian of SW Britain, Belgium & Ireland
Fig. 6.12 Time-depth reconstruction to show the history of 163 South Wales
Fig. 6.13 (A) Stratabound dolomites 165 (B) Photomicrograph of void filling cement (C) Photomicrograph of dolomite replacing the
Stage III void filling cement Fig. 6.14 (A) Photomicrograph of xenotopic dolomite 168
(B) Photomicrograph of Type-1A and Type-1B dolomite under cathodoluminescence (CL)
(C) Photomicrograph of saddle dolomite under (CL) Fig. 6.15 Isotopic composition of the Waulsortian dolomites 172 Fig. 6.16 Isotopic composition of the four main dolomite 175
types in the Dinantian of South Wales
ix
Fig. 6.17 Models of dolomitization within the subsurface 177 Table 6. 1 Geochemistry of the Waulsortian dolomites 170 Chapter 7 Fig. 7.1 Sedimentary log of the uppermost Black Rock 183
Dolomite, Sub-Oolite Bed and Gully Oolite Fig. 7.2 Schematic diagram of a nodule encrusted with 187
columnar calcite crystals Fig. 7.3 (A) Photomicrograph of a non-ferroan rhombic 188
microspar under cathodoluminescence (B) Section through a limestone nodule encrusted
with columnar calcite crystals Fig. 7.4 Schematic diagram through a sperulite 190 Fig. 7.5 (A) Photomicrograph of the fibrous columnar 191
calcite crystals (8) Photomicrograph of the fascicular 'grains'
Fig. 7.6 Sedimentary logs of the columnar calcites at 196 Daren Cilau, Portishead, and equivalent clay paleosol at Taff's Wells
Fig. 7.7 (A) Outcrop of the Daren Ddu Beds 197 (8) Photomicrograph of the fibrous columnar calcites from the baren Ddu Beds (C) Outcrop of the elongate crystals of Palisade
Calcite at Engihoul (Belgium) Fig. 7.8 Stratigraphic log of the uppermost Tournaisian and 200
lower Visean sequences of E-Namur, Vesder & Aachen Fig. 7.9 A model of the sediment cycles within the palisade 202
calcites of Belgium Fig. 7.10 Sea level curves for the lower part of the Dinantian 204 Fig. 7.11 Idealized block models of the evolution of SW 206
Britain during the late Courceyan to late Chadian
Chapter 8 Fig. 8.1 The three major geomorphological settings of 211
carbonates Fig. 8.2 The five stage development of the Courceyan to 212
Asbian successions of England, Ireland & Wales Fig. 8.3 Summary of the eustatic and tectonic evolution 214
of the Lower Limestone Shale, the Black Rock Limestone and the Gully Oolite
Fig. 8.4 (A) Ramp-to-shelf development 222 (B) Persistence of ramps during eustacy (C) Persistence of ramps during subsidence
Appen dices Table S. 1 Operating conditions and count times of the XRF 306 Table S. 2 Limits of determination of XRF results 307
x

Chapter 1- Introduction
1.1 Introduction
1.2 Geological setting
1.3 Area of study
1.4 Paleogeographic setting
1.5 Previous work
1.1 Introduction
In carbonate sedimentology, the term shelf has become synonymous with the
very shallow (less than 10m) flat-topped, and rimmed shelves such as that
of southern Florida. Carbonate settings which show a progressive
deepening seaward to well below wave-base are referred to as ramps (Ahr
1973) or open shelves (Ginsburg & James 1974). Typically, they
exhibit a shallow-water, nearshore sand belt and an offshore, deeper-water
region of finer grained sediments. Since there is a general lack of well
documented modern analogues (e. g. Persian Gulf, Wilson & Jordan 1983)
refinement of the model is dependent upon studies of well exposed ancient
successions. Overall, there have been few comprehensive studies of
carbonate ramps. Notable exceptions include the work on the
Muschelkalk by Aigner (1984 & 1985), Calvet & Tucker (1988), and studies
of Palaeozoic ramps by Brett (1983), Markello & Read (1981), Handford
(1986), Wright (1986) and Chatellier (1988). In particular, there have
been few detailed descriptions of offshore ramp facies types (e. g Calvet &
Tucker 1988).
The Lower Carboniferous Black Rock Limestone Group of SW Britain
has traditionally been regarded as a monotonous sequence of muddy
bioclastic limestones which provide little information on palaeogeography
or sea level changes. The main aim of this thesis is to detail the
different ramp facies types occurring within the Black Rock Limestone
Group and evaluate the evolution of the carbonate province of SW Britain
during the mid-Courceyan to early Chadian period. This mainly
involves detailed facies analyses of the Black Rock Limestone Group
including the Middle Hope volcanics (Weston-super-Mare). In
addition, this thesis includes a microfacies and diagenetic study of the
Waulsortian mudmounds at Castlemartin and an assessment of the
significance of two subaerial exposure units, containing columnar
2

calcites, immediately above the Black Rock Limestone Group at Portishead
(Bristol district).
1.2 Geological setting
In SW Britain, the Lower Carboniferous succession forms a 100Km
wide sedimentary wedge (ca. 1500m thick in the south and west) tapering
(to 150m) towards the north onto the ancient landmass, the
Welsh-Brabant Massif (St George's Land) (Figures 1.1,1.2 & 1.3). As a
result of an early Carboniferous eustatic sea level rise (Johnson 1982)
the (Devonian) Old Red Sandstone alluvial plains of southern Britain were
drowned to form a southward deepening ramp. The siliciclastic-dominated
Lower Limestone Shale Group (Courceyan) records the transgression, at the
peak of which it passes transitionally upward into the overlying,
mid-Courceyan to early Chadian, Black Rock Limestone Group (Rams bottom
1984). The latter records the first major phase of carbonate production
and establishment of a carbonate ramp (Wright 1986).
As well as sea level changes, differential subsidence played an
important role in the development of the pre-Holkerian ramp
succession (Wright 1986; Wilson et aL 1988). This is reflected in the
distribution of the three depth-related ramp facies identifed by Wright
(1986) which broadly conform to three distinct tectonic zones (Figure
1.3).
The inner ramp facies, laid-down above fairweather wave-base,
include oolitic and peritidal limestones representing shoal and back-shoal
environments. Such facies tend to concentrate in the northern zone, that
underwent little or no subsidence and contain an attenuated succession
with numerous subaerial breaks (Figure 1.3)
I
b3 ci
4. 0 °1öa
pa wÖ
mÖ
re *14 4) s
ue , 41 ÖÜ Co 4) - w .4
a3 41 äö
0 0 to o r= 4 94
býro rh o p, 0
sg. 0 c' Wa30r.
0
Lr. ý Co
m0
10 c tu J
7111. >
U
c0
LL
N
E 0 ro
n
c 0 I- U
0 E
a)
c 0
cv U
V) U
O
rIT-ý Z [-tý F] Lioi
Z3
9 co
o0 LLo
w J Q >
F-- D
0 cn
T
} Z
W
-7 E
Z,
IY N r 0
ý ýn Ec
NZ 0 J" W co
N 7
ý'
m
"1.
1 .'
L 4
0 Z
J a z w
Oöa
c 0
CD > º?
1ý
°0 E c "a Y
0N
NC
OO a to
U
0 0
4
0
0 v
0
(1)
o m3
U) ar,
o
äa
C's ö
W
yC O
b0 'm
54 L)
24-
W O ti y W a 0 U.
T
0 Y O O
D T
O
0 w LL 0
c0
Q
A7 T7ý
OD
m A Ora
cEc 0od, rn Ünn cm CÜOF.
CI V tcQ
>
AAL
D m
W
_m tu
3
0 0
N m
3 _d C C
Y lC V7
oQd m 'D 9_ n ýO
O L
di t
T
0!
QC
U h
0O
Ur m
dm d
L rr
ec W
y C9
O VL CQ
/N
r V
'- O
U C 10
E
U
cv 0 T
D E
cu D
op U yT
E 0
U
ö
= c
m v
L. r
C N
T
l9
0
a c 0
CC C C A
0
E
N
0
00 cz? G0
5
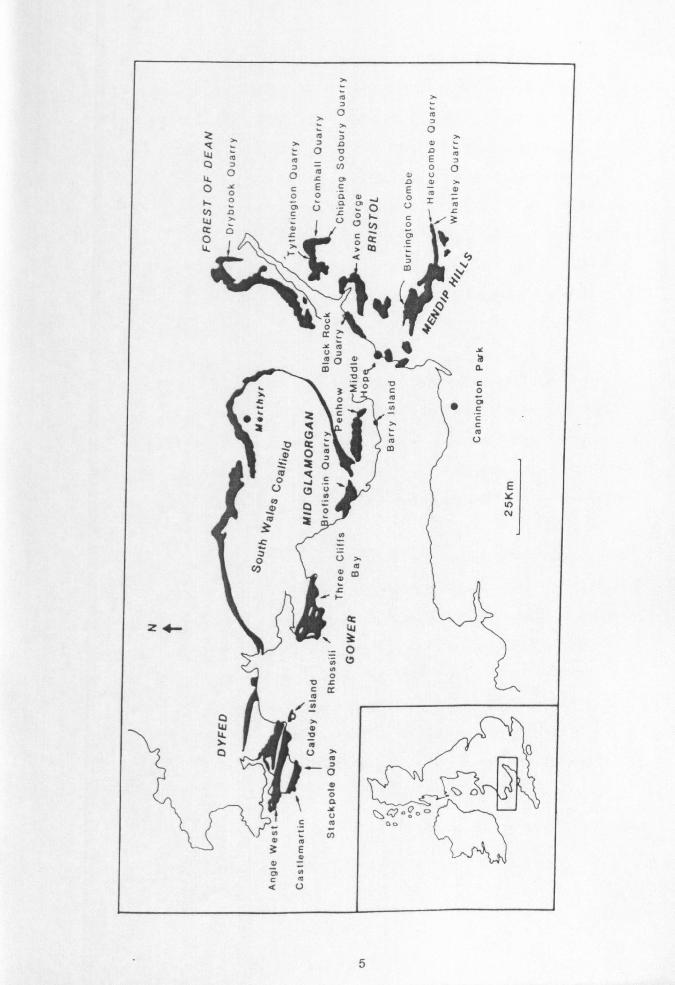
The mid-ramp facies, laid-down between fairweather and storm
wave-base, are represented by a variety of event-beds including hummocky
cross-stratification (Wu 1982; Junghanss et al. 1984; Wright 1986; Waters
& Lawrence 1987; Faulkner 1988). Such facies are prominent in the central
zone (Bristol, Gower, Caldey Island and Angle West) which underwent a
moderate degree of subsidence (Figures 1.2 & 1.3). Here, the
succession mainly consists of bioclastic and oolitic limestones
representing a shallow-marine setting predominantly beneath fairweather
wave-base, but occasionally influenced by oolite shoal progradation and
apparent sea-level falls (Wright 1986; Waters & Lawrence 1987; Faulkner
1988).
The outer ramp facies, deposited beneath storm wave-base
include slightly argillaceous, extensively-bioturbated limestones and
Waulsortian mounds. Such fades dominate the southern zone of the
eastern Mendip Hills, Cannington Park and Castlemartin. These areas
underwent a high degree of subsidence and exhibit an expanded succession
(Figures 1.2 & 1.3).
The burial history of the Dinantian succession of Gower has been
documented by Dickson (1985). The limestones and dolomites were buried
to considerable depths (at least 7Kms) by the end of the Carboniferous and
were subsequently uplifted and eroded during the Triassic. Subsequent
shallow burial (possibly about 2Km) occurred during the Mesozoic and
Tertiary. The Dinantian succession has been considerably affected by the
Hercynian Orogeny (Donato 1988; Dunne 1983; Hancock et al. 1981; Williams
& Chapman 1986; Wilson et a1.1988) and to a lesser extent by the Alpine
Orogeny.
6

Figure 1.3. Stratigraphic cross-section across South Wales and SW England. For localities see Figure 1.2.
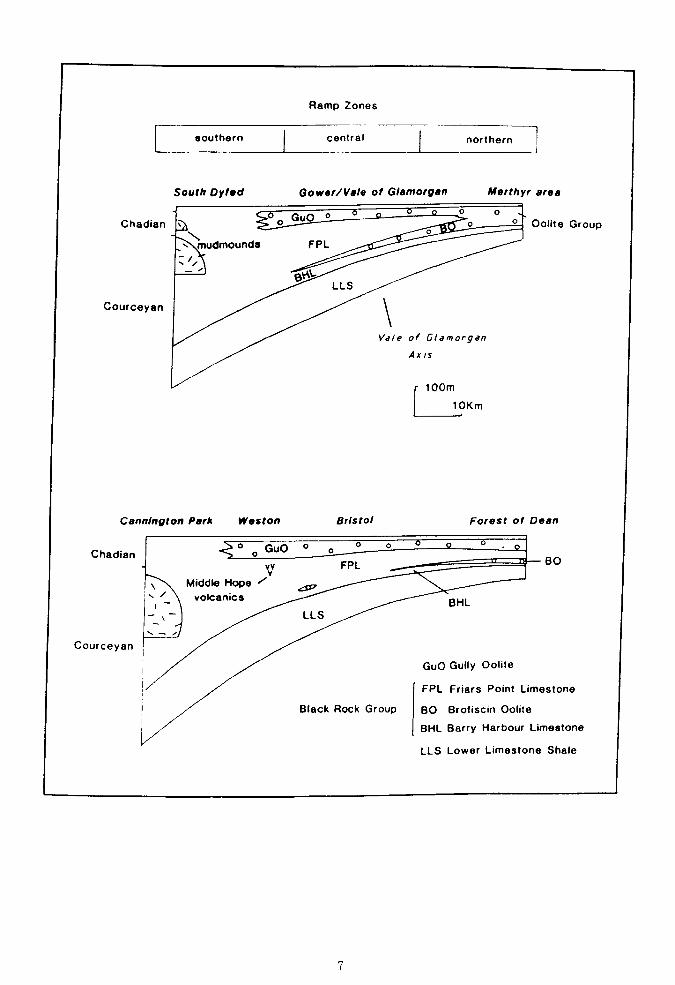
Ramp Zones
L southern central northern 1
South Dyed Gower/Vale of Glamorgan Merthyr area
Chadian
Courceyan
Oolite Group
10Km
Cannington Park Weston Bristol Forest of Dean
0 Chadian
°o GuO oo00 BO
v FPL
Middle Hope "
volcanics BHL -, - LLS
Courceyan
GuO Gully Oolite
FPL Friars Point Limestone
Black Rock Group BO Brofiscin Oolite
BHL Barry Harbour Limestone
LLS Lower Limestone Shale

1.3 Area of study
Outcrop of the Black Rock Limestone Group in the South Wales Coalfield is
confined to the South Crop of the Carboniferous Limestone (South Dyfed,
Gower, and the Cardiff area) (George et al. 1976) (Figure 1.2).
Developments in SW England occur within the Forest of Dean area, the
Bristol district, and in the Mendip Hills. To the south of the
Mendip Hills a borehole has been drilled at (Knap Farm) Cannington Park
by the British Geological Survey (Whittaker & Green 1983) (Figure 1.2).
Those sections logged in detail (Appendices A-R) include: West
Angle Bay, Castlemartin, Stackpole Quay, and Caldey Island (Dyfed);
Rhossili, and Three Cliffs Bay (Gower); Barry Island and a borehole
drilled by ARC at Penhow (Vale of Glamorgan); Drybrook Quarry (Forest of
Dean); Tytherington Quarry, Cromhall Quarry, Chipping So dbury Quarry, the
Avon Gorge section, Black Rock Quarry, and Middle Hope (Bristol
district); Burrington Combe, Halecombe Quarry, and Whatley Quarry
(Mendip Hills). These provide a good spread of sections arranged both
parallel and normal to depositional strike (Figures 1.2 & 1.3).
Information from the Knap Farm borehole is taken from the British
Geological Survey memoir by Whittaker & Green (1983).
1.4 Palaeogeographic setting
Reconstructions of the early Carboniferous period, depict two major
landmasses Gondwanaland and Euramerica (Laurussia) separated by a seaway
known as the Mid-European Ocean (Smith et al. 1973; Scotese et
a]. 1979; Turner & Tarling 1975; Rowley et al. 1985; Raymond
et al. 1985; Van der Zwan et al. 1985; Leeder
1987). Britain was positioned on the southern border of Euramerica and
just to the north of the Mid-European Ocean which was an active subduction
zone (Figure 1.4A). Recent palaeomagnetic studies suggest the
palaeolatitude of Britain was close to the south of the equator
14 14
IM w
aý ro _Z
ON
3äm= od
_C 0) 4)
E `n , -) Z: 4. to
Vb4 4)
Co. - EV°e
.ýý mpq-0
OO a- rZ 9-4 w m
cd 0
WC cd
Co -, ý 10
.. O0 to 0 Z aao X
m 94 wöý
O ä: 0 ýb 0.4 ce E- 41 0
q0,00
it O to 0 a) 0 lbo :1 UÖ
9+ A
a: * 4) "-
all O)
3ý äöö
dý 0' a0i
ýý aua
Uy
Co
o 'd Z +U' 4.3 s. 4 gi 9)
41 Co j
4-4 O
. 11 a+ý O cd b 10 0.4)
jl. r. 4-4
O
f11 QUO to
-Z 02 O U ýý 0
CD C co O
N
C Ca0
0v NCrC
lý0 Cn
11 -U 1 \E-
_0mc CC
UY iCC
ºv Jý öwE
r h> ßc0 "'° e? q
0rEa .e
.rr> ý0
`4 Nº>O
o o as
a
Ndý `c
h,
E
ao 5 ýe o Um
Q
C
O
C C 0
C
CD
N
C
V
Y U m
C
C Tw
vc ii
e 0 s
co z
p \ý
no. /
000 0 Nm
-1
U
.ý1 C
UI
Hn \` r
Oo
O
T 'ýJ 0 Uý
7m
m
co 2- C cfl, n -_ _
to _- -
9
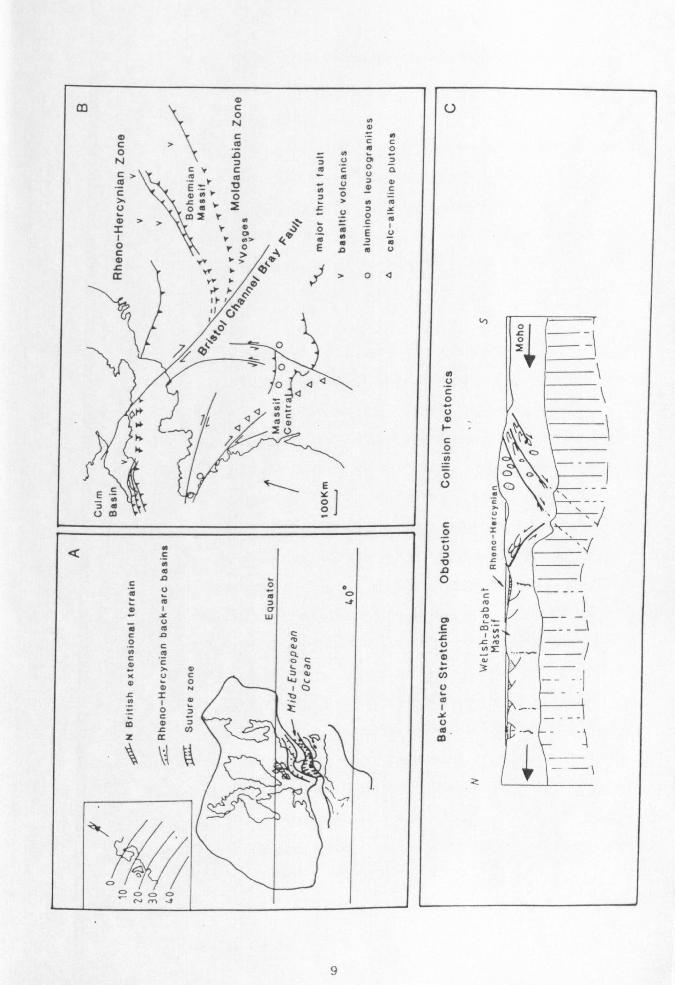
(Figure 1.4A) and Britain moved progressively northward, between 15-200,
during the late Devonian to mid-Carboniferous period (Duff 1980; Smith
1981; Van der Zwan et al. 1985).
Throughout the Lower Carboniferous northern Britain was subdivided
into a series of basins and tectonic highs (platforms) (Leeder
1976; Leeder 1982; Leeder 1987; Bott 1987) (Figures 1.1 & 1.4C). The most
southerly emergent area is known as the Welsh-Brabant Massif
(Kent 1975; otherwise known as St George's Land, George et al.
1976; St George's Platform, Leeder 1976) which formed a low relief
'platform' (Figure 1.1).
The relationship between the southern margin of the carbonate
province with the SW England Culm Basin (otherwise known as the Cornubian
Basin, George et al. 1976) is problematic because the transition is not
exposed. In addition, major tectonic displacement has been inferred along
the Bristol Channel-Bray Fault (Johnson 1984; Higgs 1986; Holder &
Leveridge 1986 & 1987) (Figure 1.4B). Holder & Leveridge (1986) proposed
that the Rhenohercynian-Variscides of Belgium, Germany and SW Britain were
in tectonic continuity prior to the mid- to late Carboniferous offset (up
to 400km) along the Bristol Channel-Bray Fault (Figure 1.4B).
Tectonically, Lower Carboniferous Europe was an active area
dominated along its southern margin by platelet collision, as a
result of subduction which created a compressional regime (Leeder 1987)
(Figure 1.4C). In contrast, an extensional ("stretching") regime dominated
NW Europe, causing widespread volcanic activity and subsidence (Leeder
1976; Anderton et al. 1979; Leeder 1982; Miller & Grayson 1982;
Leeder 1987; Bott 1987; Grayson & Oldham 1987; Gutteridge 1987) (Figure
1.4C). A major phase of subsidence occurred during the late Devonian to
early Carboniferous period. This subsidence is postulated as being
10
related to the progressive closure of the Mid-European Ocean (Leeder 1982
& 1987).
Subsidence was a major cause of the establishment of the Lower
Carboniferous block and basins of northern England (Leeder 1976;
Leeder 1982; Bott 1987), and the development of a back-arc basin (Reading
1973) along the Rheno-Hercynian zone (Leeder 1987) (Figure 1.4A & C). In
which the Culm Basin formed a 'bathyal lull' (Goldring 1962)
characteristed by slow, continuous, pelagic sedimentation, interrupted by
phases of volcanic activity (Anderton et a1.1979; Floyd 1982;
Leeder 1982).
Closure of the back-arc sea and platelet collision, occurring
during the late Lower Carboniferous period, resulted in the uplift of the
northern and southern parts of Europe. This was to set the scene for the
subsequent development of the extensive Upper Carboniferous
delta plains across central Europe (Leeder 1987). During this period the
Culm basin received an input of clastic material, prior to being
overridden by the northward migrating Variscan mountain front (Selwood
& Thomas 1987). To the north of the mountain front lay the foreland
basin of SW Britain (Gayer 1988; Kelling 1988). The onset of Variscan
deformation is recorded in South Wales by syn-sedimentary movements on
sub-basin structures, influencing subsidence and causing coal seam splits
(Gayer 1988). Subsequent thrusting and folding in South Wales and the
Bristol-Mendip area, records the progressive northward migration of the
Variscan front, telescoping the Palaeozoic sedimentary successions (Dunne
1983; Hancock et al. 1981; Williams & Chapman 1986).
1.5 Previous work
The foundations for modern research into the Dinantian succession of SW
Britain were laid down at the beginning of this century. Pioneering
11
palaeontological work by Vaughan (1903 & 1905) established a coral and
brachiopod zonal scheme that was shown to be more than of local
significance in SW Britain. Correlation of the Zaphrentis (Z) and lower
part of the Caninia (Cl) Zone permitted regional sedimentological
studies of what is now known as the Black Rock Limestone Group. Notable
contributions were from Sullivan (1960 & 1965) and George (1972) who
showed that the Z-C1 Zones formed a southerly deepening carbonate
'shelf'. Shallow water, oolite shoal and back-barrier facies dominate the
northern attenuated succession e. g. Oolite Group (Figure 1.3). To the
south, occur the mainly subtidal facies of bioclastic limestones and the
Waulsortian reef mounds at Castlemartin (Dixon 1921) and Cannington Park
(Whittaker & Green 1983). Controls upon the southward migration of the
nearshore facies belts (e. g. the tongues of southward wedging oolitic
limestone) were considered to be strongly influenced by pulses of tectonic
subsidence affecting the area to the south of St George's Land
(Welsh-Brabant Massif) (George 1972 & 1974).
In contrast, Ramsbottom (1973) proposed that eustatic sea level
changes were the major control upon the distribution of the facies
in the Dinantian succession. Transgressive phases were represented by
the subtidal bioclastic limestones; the regressive phases by oolitic
limestones and non-sequences in the more marginal (landward) areas. The
first Major Cycle (transgression-regression) in SW Britain includes the
Lower Limestone Shale Group and the Black Rock Limestone (Ramsbottom
1973). The regression is represented by a non-sequence (faunal break) at
the top of the Black Rock Limestone Group in the Avon Gorge (Mitchell 1971
& 1972; Rhodes et a1.1969). Ramsbottom (1984) and Wright (1986),
were later to show that sedimentation was not only controlled by eustatic
sea level changes but also by differential subsidence across SW Britain
(see Geological Setting 1.2). A tectonic "hinge", the Vale of Glamorgan
12
axis, perhaps a major fault at depth, is known to have centred about the
Vale of Glamorgan and eastern Gower (Wright 1984a; Waters 1984; Wright
1986; Waters & Lawrence 1987; Wilson et al. 1988) (Figure 1.3). To
the south of the axis the Black Rock Limestone and Gully Oolite show a
pronounced increase in thickness. Other evidence for tectonic activity is
recorded by the Middle Hope volcanics (Weston-super-Mare) (Speedyman 1977;
Jeffreys 1979; Jeffreys & Aigner 1982; Whittaker & Green 1983; Faulkner
1989).
Until this study, the only detailed facies studies of the Black
Rock Limestone Group have been undertaken upon the superb sections of
Gower (Wu 1982; Junghanss et al. 1984; Wright 1986; Ramsay 1987),
the Cardiff district (Waters & Lawrence 1987) and the borehole drilled at
Knap Farm, Cannington Park (Whittaker & Scrivener 1982; Lees &
Hennebert 1982). Overall, the outcrop studies have emphasised the
storm-generated sedimentary features in the lower part of the Black Rock
Limestone (Wu 1982; Junghanss et al. 1984; Ramsay 1987).
Only a limited amount of work has been undertaken on the upper part of
the Black Rock Limestone which consists of a monotonous succession of
thickly-bedded, slightly argillaceous, bioclastic limestones recording
sedimentation in a below storm wave-base environment (Wright 1986;
Ramsay 1987; Waters & Lawrence 1987). This interpretation confirms
a detailed microfacies analysis of the borehole at Cannington by Lees
& Hennebert (1982). The latter authors showed the mudmound complex cored
at Knap Farm to be comparable to the classic Waulsortian mounds of
Belgium, indicative of a deepwater, below storm wave-base environment.
Two main types of dolomite have been identified in the Black Rock
Limestone Group. Volumetrically the reddish-brown, pervasive strata]
dolomites are the most significant. They form the regionally extensive
13
Black Rock Dolomite which immediately underlies the Gully Oolite
(Whittaker & Green 1983; Wright 1986; Waters & Lawrence 1987; Hird
et al. 1987). In contrast, pale white Waulsortian reef dolomites
(Dixon 1921; Lees & Hennebdrt 1982) have a more limited distribution since
they are restricted to the southern ramp zone (Figure 1.3).
The variability of the trace element chemistry of the Black Rock
Dolomite was demonstrated by Bhatt (1973 & 1976). A subsequent, more
comprehensive, geochemical study using stable isotopes by Hird
et al. (1987) concluded dolomitization proceeded in a shallow-burial
mixing zone environment. Only a limited amount of petrographic work has
been undertaken upon the Waulsortian reef dolomites (Dixon 1921; Lees &
Hennebert 1982).
14

Chapter 2- Stratigraphy
2.1 Dinantian stratigraphy
2.2 Lithostratigraphy
2.3 Biostratigraphy
2.3.1 Macrofauna
2.3.2 Microfauna
15
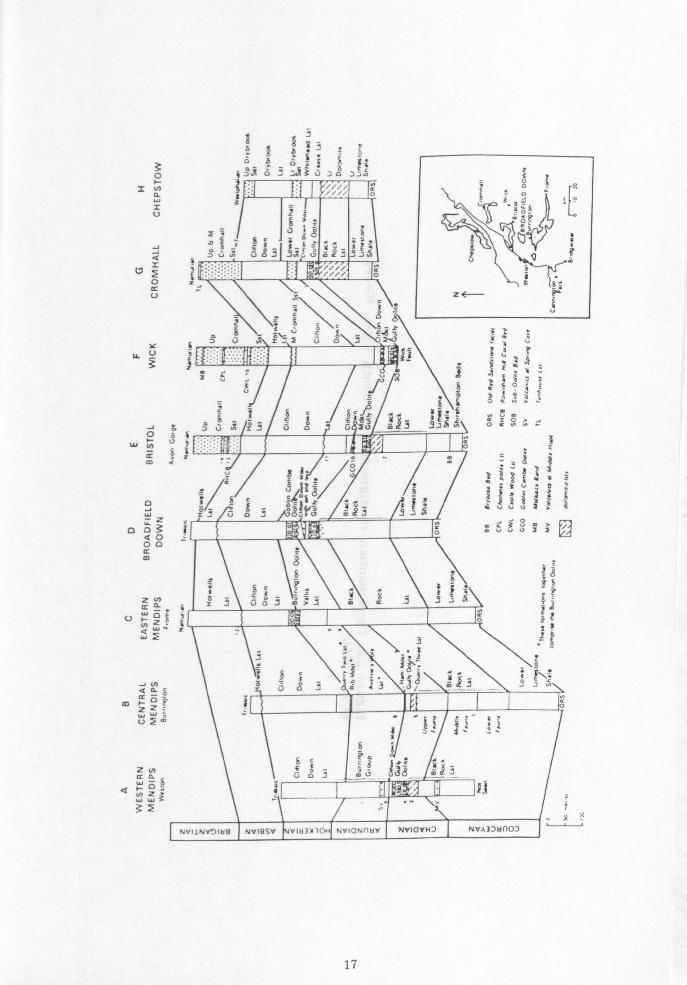
2.1 Dinantian stratigraphy
Dinantian stratigraphy of the British Isles is based upon the six regional
stages (chronostratigraphic divisions) of George et al. (1976) (Figures
2.1 & 2.2). It is still necessary, however, to identify the Tournaisain -
Visean subsystems which are still widely used abroad and represent the
only international standard of subdividing the Dinantian (Varker &
Sevastopulo 1985). Approximately, but not exactly, the Courceyan (the
lowest stage of George et al. 1976) is equivalent to the Tournaisian
(Mitchell et al. 1982; Mitchell et al. 1986; Waters & Lawrence 1987)
(Figure 2.3). The Black Rock Group is mid-Courceyan (mid-Tournaisian) to
early Chadian (Visean) in age (Figure 2.3) and includes: the Black Rock
Limestone, the Blucks Pool Limestone, the Waulsortian mounds at
Castlemartin and Cannington Park as well as the overlying Linney Head Beds
and lower part of the Cynwir Cherty Limestone (Figure 2.4).
The approach by George et al. (1976) is based on precisely defined
stratotype stages, each delineated at their base by the incoming of a
diagnostic fauna (George et al. 1976). The stratotype stages replaced
both the faunal zones of Vaughan (1905) and the sedimentary cycles of
Ramsbottom (1973 & 1979). Vaughan's coral and brachiopod zones were
finally abandoned after numerous stages of emendation and a plethora of
inconsistencies had arisen from their use (for a summary see George et
al. 1976, Table I).
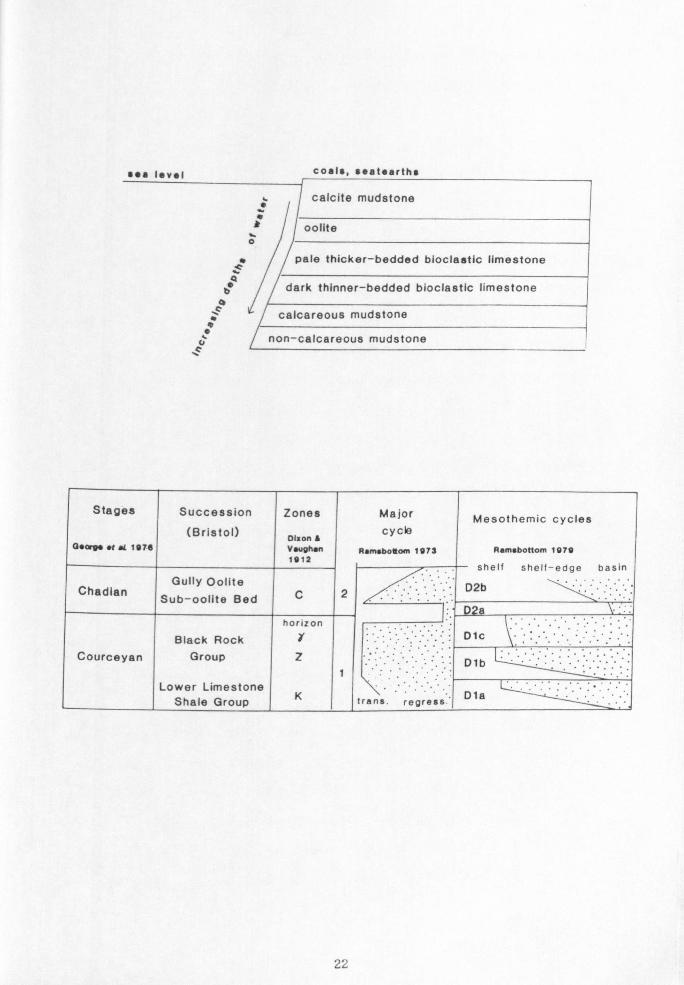
Ramsbottom (1973) interpreted the Dinantian succession of Britain
as comprising of six major transgressive-regressive cycles, each
correlatable within a given area using his idealised facies model
(Figures 2.5 & 2.6). Correlations between regions were based on the
incoming of distinctive faunas, at the base of each Major Cycle, which
were thought to have been synchronous and in response to eustatic rises in
sea level. This approach was extensively critised, in particular by
16
Figure 2.1. The Dinantian stratigraphy of Bristol and the Mendips. (George et al. 1976).
0 SN
2 U
a Fý o
ai
o =J .. G
Y LL U_ 1
) EI 3.
EýäSýýö oEE _z
Jý O ýý
VJON
3_
z
WyVS ýi
03 < -J
0 J W_
Z 003
40 00 cr co
i
2N ¢dt Wp2 UwzE N Wc "t
WC
rN a CL ö cc -m¢Zg WW'
Uým
ZN
WQ Qr
NZ W WC ;
2( ö? R ýo
"=öb : äP
i
Q$
ý; b:
3 =ý8 I äasý-
äJJu
oe,
eüüVýý
x
17

W 00 ö
ce
,
0^
v1
w 0
C ro C
C
F
N
N
. --4
7 ay LO
wy
A"_ m_ü G N
VQ
Z O W
6 G
: äS Ros n 2O
Ir W
Nö
-Z E-- >s
J
f U N
] 8J
>
wo ö
S U-+ ö z= w
d \{
N
]
W
N F
c, 2
J y
J ýö
w 3i
J
CO \T
Q
E
oi i> a' IZ
N
ýs YO
ui c.
a s 3 ýg Y K Z c
w gFS
J 2 ¬j /i ö
ý/i nä ö
W N
^ NVI1N NVI Ny1y 3710H
-9, He -BSV
NQb N. ý
NrA3Jtlý107
ým O O u z
fööä ýý
W =
ÜVV_. NJ
~ fi °J 1 ? 20' °
L öi = U) 0
0 CC,
w 4 8r sýýý 2 a; \ü
° p
JJJN ýN
N _S
V XQ
]m
XW ý
O 2 N cc co y
ä
N'�IH 3ýýOH NVIO Nf1HV NVIOVN7 NVA3JHn0: )
NVII NV`JIHB NV195b'
18
b a)
osýý V
; ti 00
o °0C
b rn
'C a) 0ý q)
C) U
Ü
c; cä a3
dnoJ9 euolsew(1
ýIOOEj ýIOBI8
Co Of
N º C,
G1 C
C O
r 0 d N " d
C 0
0 N
ö N E qä V
-0 T J
0 J
OO tÖ
VU C 7 J
C C7 c
0 c> N
0 .0
m m 0 ö 0
5 m
0 p m
S ö Vý J 5 T
º J
W N
Co 4 Y Y 0 º {0'r
V« p
Um OC OO Ög O
0 Q o ¢O 6ý
ins ým ýc ý Ym CO 0 _ pm m'
3 T 3
V
TO U
e . - E JE
i (3 m m -
ýj N Y
D m ýn a E O O O N
> O Jp O
00 vx se184S
euolsewfl uleyy ouolsewl1 . OMO1
m C, OUOlS8W1ý
v 0m O SMOJJne UeoWUed C, L- aä
0 N
mo Ei
T m m IW
cý T O = m 9OI
e OcI Co 0
a m
c p äQ I NmId
JI - A I
O bA pp C
C T N p d
0 V
o 0p U U cm 0ö
C9
NV3SIA ý ' N9ISIVNtlf101
19
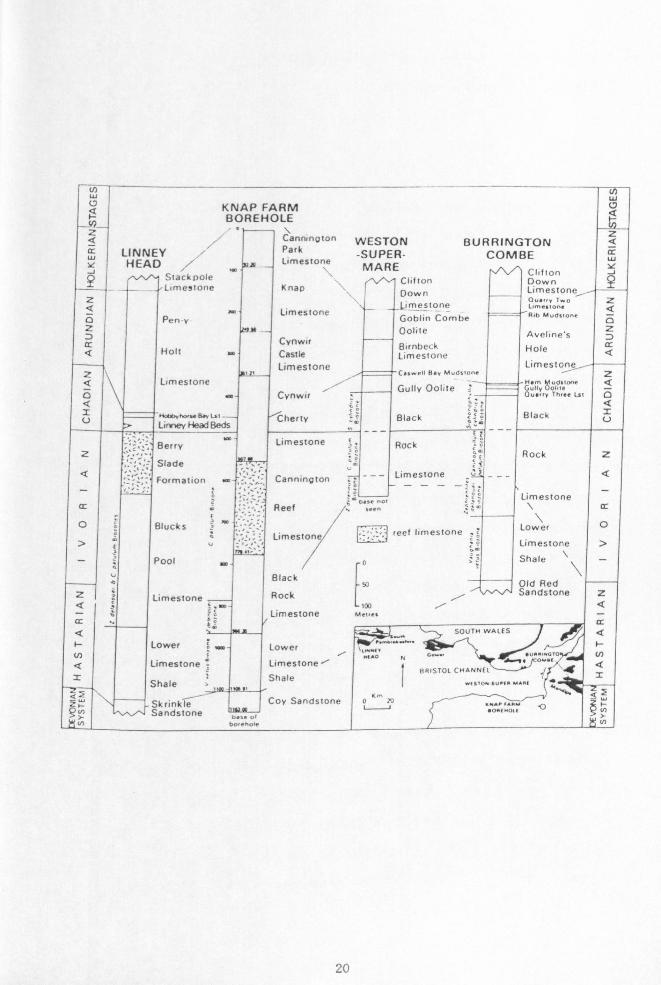
Figure 2.4. Correlation of some pre-Holkerian sections across SW Britain. (Mitchell et al. 1982).
W KNAP FARM w BOREHOLE
Q 1 Canninoton WESTON BURRINGTON z z
W Ir 1 LINNEY Park -SUPER- COMBS
HEAD Limestone MARE ui
2 Stackpole Clifton
Clifton Down g
_ -- - -Limestone Knap Down Limestone
Q o°.,, r Tw°
imestone -
z Q
O ý
Pen-v ^ Limestone - Goblin Combe - R, b M°aa, on,
z 0olite Aveline's z
Cynwir Birnbeck Hole
Q Holt Castle Limestone Q Limestone Limeston:
Z Catweil tlaý Mý°s, o°e z
Q Limestone / - H., n °o. Gully OOlite - p Th' . _- O e Cynwir - "Y u
.. Est O Q Q =
Ewm, rouewt., - Cherty Black Black =
Linney Head Beds
Berry Limestone Rock °r z ;F Rock z
Slade -
Formation Cannington - Limestone
limestone ä°a Q Reef sc \ ar
O Blucks Limestone
Lower reef limestone
O
> E - Limestone > \
- ö Pool o Shale
\
L
-
Black 5 Old Red
Z Limestone Rock Sandstone z Q .. ýo too Q
Limestone M.,,.. Cr ý cc Q SOUTH WAIE$ Q
~ Lower ö ,. e Lower ; TýýýM ~
Nea Q Limestone Limestone
CHANNEL
_ z Sh l HRISTO( =
f Shale
1100 I e a
w,:,,, sýa... w, " yý'V ý_-
V) Skrinkle S d
Coy Sandstone ox . ýw'MOif o N an stone °�ý °,
20
George (1978) who noted a number of major defects. It neglected the
possibility that the facies may be strongly influenced by tectonic
controls as well as eustacy.
2.2 Lithostratigraphy
The base of the Black Rock Limestone Group is transitional with the
underlying Lower Limestone Shale Group. The boundary is taken at that
horizon where the carbonate content becomes prevalent which is usually
quite distinct. Over the northern and central part of the study area the
Black Rock Limestone is immediately overlain by the Gully Oolite (Figure
2.1 & 2.2). In the eastern Mendip Hills, at Cannington Park and
Castlemartin, the Black Rock Limestone passes upward into the overlying
succession of crinoidal limestones (Figures 2.1 & 2.4).
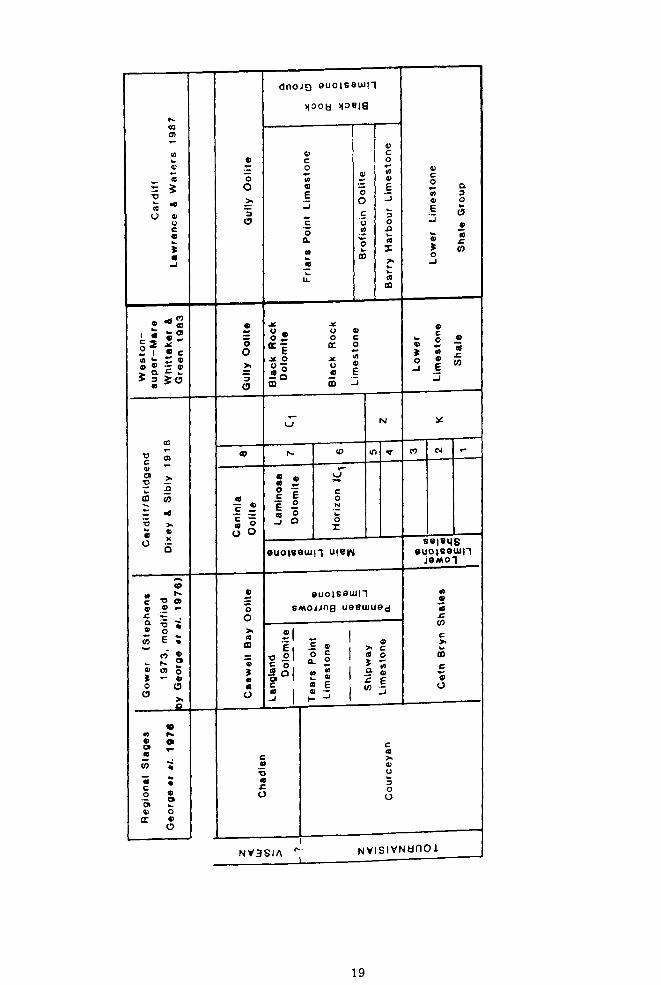
A summary of major developments in the lower Dinantian stratigraphy
of SW Britain since Dixey & Sibly (1918) is shown in Figure 2.3. The
most recent scheme for subdividing the Black Rock Group has been proposed
by Waters & Lawrence (1987) who recognized three lithostratigraphic
formations in the Cardiff district: the Barry Harbour Limestone, the
Brofiscin Oolite and the Friars Point Limestone which are readily
identifiable within the study area and form mappable units. They replace
the faunal assemblage zones of the Shipway Limestone Formation and Tears
Point Limestone Formation defined on Gower by Dixon & Vaughan 1911
(Figure 2.3)
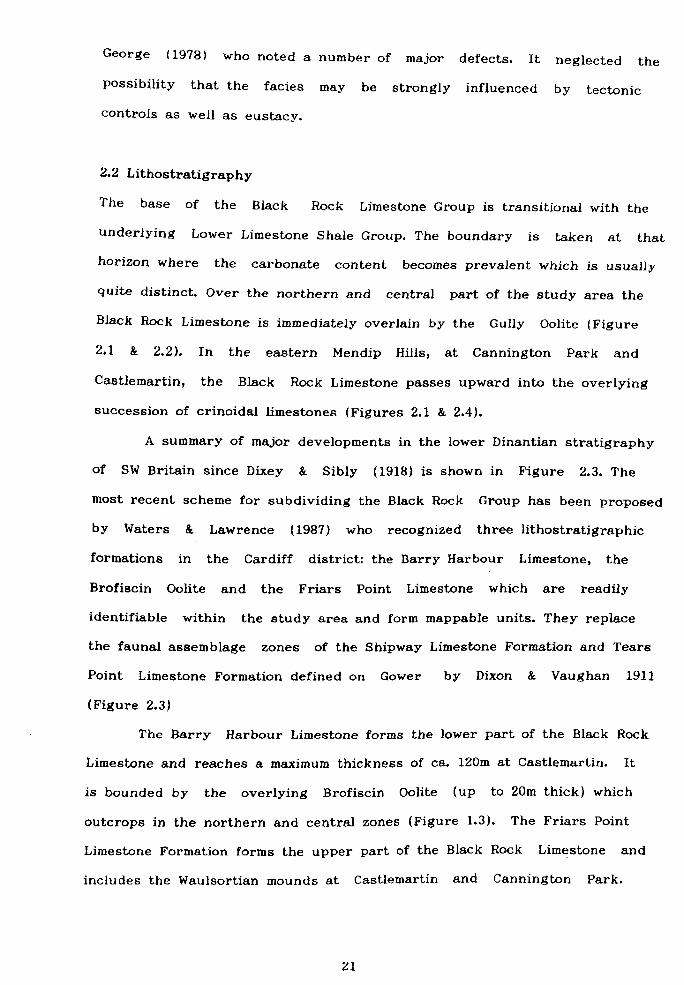
The Barry Harbour Limestone forms the lower part of the Black Rock
Limestone and reaches a maximum thickness of ca. 120m at Castlemartin. It
is bounded by the overlying Brofiscin Oolite (up to 20m thick) which
outcrops in the northern and central zones (Figure 1.3). The Friars Point
Limestone Formation forms the upper part of the Black Rock Limestone and
includes the Waulsortian mounds at Castlemartin and Cannington Park.
21
Figure 2.5. Depth-related Dinantian facies sequence recognized by Ramsbottom (1973).
Figure 2.6. Correlation of Ramsbottom's cycles with Vaughan's Zones. (After Ramsbottom 1973 & 1979).
sea Ievel coals, seatearths
4/
ýý IC calcareous mudstone " e U. non-calcareous mudstone
IC
Stages S Succession Zones Major Mesothemic cycles
E
(Bristol) cycle Dl: on A at al 1976 Vaughan Ramaboeom 1973 Ramebottom 1979
1914 lf basin h lf h d s e s e ge e
Gully Oolite D2b Chadian tite Bed S b- C 2
u oo horizon
Black Rock Y " D1c
Courceyan Group Z D1b
Lower Limestone K D18
Shale Group trans. regress
calcite mudstone
oollte 0
1*1 // I? dark thinner-bedded bioclastic limestone
pale thicker-bedded bioclaatic limestone
dark thinner-bedded bioclastic limestone
calcareous mudstone
non-calcareous mudstone
22
It also contains the Black Rock Dolomite (otherwise known as the Langland
Dolomite or Laminosa Dolomite) which occurs immediately beneath the Gully
Oolite (Figure 2.3).
The advantage of the lithostratigraphic formations of Waters &
Lawrence (1987) is that they are readily identifiable even within the
dolomitized sucessions that outcrop in the northern part of the study
area e. g Drybrook Quarry (Appendix I). Difficulties arise, however, in
distinguishing the boundary between the Barry Harbour Limestone and Friars
Point Limestone in those 'sections where the Brofiscin Oolite is absent.
This problem is resolved at Barry Island by the use of a cross-bedded
bioclastic unit (Yorke Rock Bed), that occurs at a similar stratigraphic
level to the Brofiscin Oolite (Waters & Lawrence 1987). A similar
approach has been adopted at Rhossili (Appendix E) on the Gower. In
the southern zone and at Chipping Sodbury (Appendix L), the boundary is
arbitarily placed in the transition between the thin-bedded bioclastic
limestones characteristic of the Barry Harbour Limestone and the more
thickly-bedded, bioturbated limestones characteristic of the Friars Point
Limestone (e. g. Castlemartin, Appendix B).
2.3 Biostratigraphy
Correlation within the Black Rock Limestone Group is mainly achieved using
corals and conodonts (Figure 2.7). The former are particularly
important, for inter-regional correlations with the rest of Britain,
Belgium and Ireland. Collections of corals and conodonts have mainly been
taken from the thickest developments of the Black Rock
Limestone Group (Butler 1973; Mitchell et al. 1982; Mitchell et al. 1986;
Waters & Lawrence 1987). Systematic work on the macrofaunas in the
thinner successions, towards the north, is extremely difficult owing to
the replacement of the corals by dolomite. Unfortunately, there have been
23
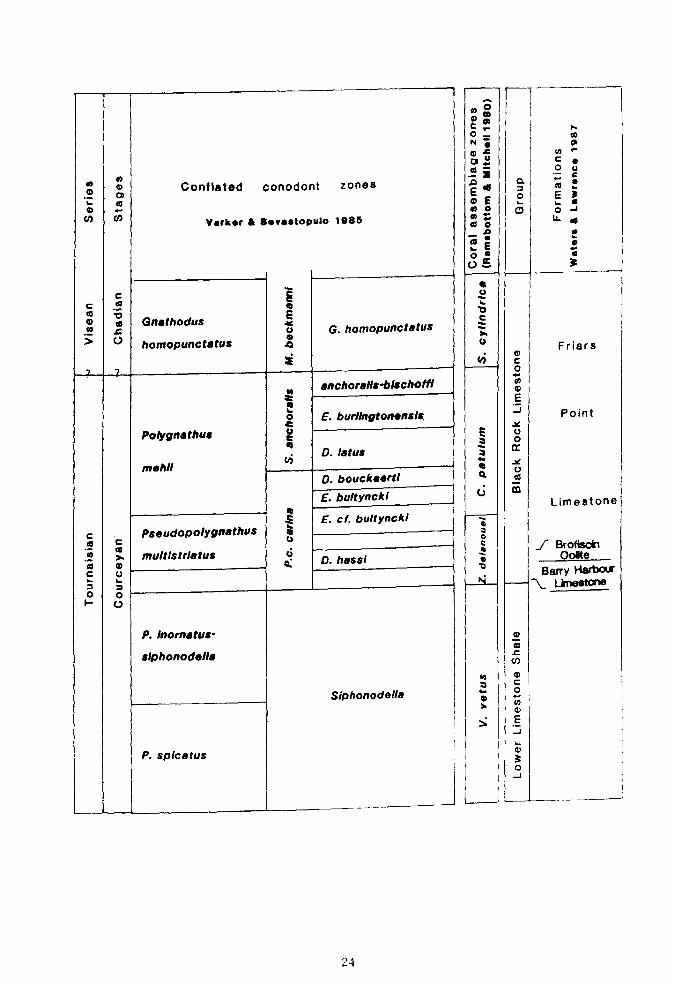
Figure 2.7. The relationship between the conflated conodont zones of Varker & Sevastopulo (1985), the coral assemblage biozones of Ramsbottom & Mitchell (1980) and the Black Rock Formations of Waters & Lawrence (1987). (Modified after Waters & Lawrence 1987).
m ID Conflated conodont zones m .. 0) N Varker & savastopulo 1985
ý C W W 1° m Ca
E Gnathodus °' 0 G. homopunctstus V homopunctstus 40
N anchoralls-blschoN!
E. burlingtonens/s, Polygnathus
W D. latus mehll y
D. bouckaertl E. bultynck!
S E. cf. bultynckl c Pseudopolypnathus y tp C
te V
b ,o
a . m mult/strlatus ci d D. hasst
C U
O O
P. Inornatus-
sphonodella
Slphonodella
P. splcatus
i
Ný p
Q ý C _
mE ° E ao a« c o Co ö U. r
w ° °
~ E ý 2
a U h. 0 C ti
V
H
E a V 0
Q
U
N a V
ýb
m Friars
c 0 q
E
'-j Point Y V 0
Limestone
f Brofisciti Ooie
Barry Hartwrr Limestone
m m t
03 m c 0 yI
E J
3 0 J
24
few conodont collections taken from the northern attenuated sequences (e. g. Rhodes et al. 1969). Only limited amounts of biostratigraphic work have
been undertaken using foraminifera, mainly in connection with the
determination of the position of the Tournaisian-Visean boundary (Austin et
al. 1973; Mitchell et al. 1986).
2.3.1 Macrofauna
Three distinctive coral faunas (Lower, Middle & Upper Fauna) were
identified at Burrington Combe by Mitchell & Green (1965). These are now
known as the Zaphrentites delanouei, Caninophvllum patulum and
Siphonophvilia c, vlindrica Assemblage Biozones respectively (Mitchell
1980; Ramsbottom & Mitchell 1980). These coral faunas have been used to
correlate across the carbonate province of SW Britain (Mitchell 1980;
Ramsbottom & Mitchell 1980; Mitchell et al. 1982; Mitchell et
al. 1986) (Figures 2.1 & 2.4). A recent study of the corals, conodonts
and foraminifera at the Tears Point section (Rhossili) has shown that the
base of the S. cvlindrica (Upper Fauna) Assemblage Biozone there is
approximately coincidental with the Tournaisian-Visean boundary and in
close proximity to the Courceyan-Chadian boundary (Mitchell et al.
1986).
The base of the Z. delanouei Biozone occurs in close
proximity to the contact between the Lower Limestone Shale and the
overlying Black Rock Limestone (Mitchell 1980). The Z. delanouei
Biozone includes the Barry Harbour Limestone, the Brofiscin Oolite and the
lower part of the Friars Point Limestone (Figure 2.7). The upper part
of the Friars Point Limestone contains the C. patulum and the
overlying S. cylindrica Assemblage Biozones (Figure 2.7).
The Z. delanouei Biozone has an almost consistent thickness
throughout the region (ca. lOOm). While the C. patulum
25
(up to 400m thick) and S. cylindrica (up to 50m thick) Biozones
show great thickness variations and a pronounced northward
attenuation. At Bristol (Avon Gorge & Portway Tunnel) the S.
cylindrica Biozone is conspicuously absent and the C. patulum
Biozone is considerably reduced in thickness in comparison to the
succession at Burrington Combe (Mitchell 1971,1972 & 1980).
2.3.2 Microfauna
The conodont biostratigraphical 'framework' used is based on the
conflated zonation proposed by Varker & Sevastopulo (1985).
This recent synthesis relates the multitude of different zonations which
emerged during the late sixties and seventies, to form a zonal scheme of
regional significance (Figure 2.7). It includes a synthesis of the 14
conodont zones identified by Rhodes et al. (1969) from the Avon Gorge
section.
The base of the Black Rock Limestone occurs within the interzone
between the Siphonodella Zone and the overlying Pseudopolygnathus
multistriatus Zone. Other zones occurring within the Black Rock Group
include the Polygnathus mehli Zone and the Gnathodus homopunctatus Zone
(Figure 2.7). The base of the Gnathodus homopunctatus Zone denotes
the base of the Visean and occurs in close proximity to the base of the
Chadian Stage (Mitchell et al. 1982; Mitchell et a1.1986; Waters &
Lawrence 1987).
The Barry Harbour Limestone occurs within the Siphonodella-Ps.
multistriatus interzone (Waters & Lawrence 1987; Mitchell et a1.
1982) (Figure 2.7). At Brofiscin Quarry, the base of the Ps. multistriatus
Zone occurs within the Brofiscin Oolite (Waters & Lawrence 1987). While at
Barry, it occurs at the base of the Yorke Rock Bed (Waters & Lawrence
26
1987). The Friars Point Limestone includes the upper part of the Ps.
multistriatus Zone, P. mehlf Zone and the Gnathodus homopunctatus Zone
(Figure 2.7).
Complete faunal successions have been documented in the thicker
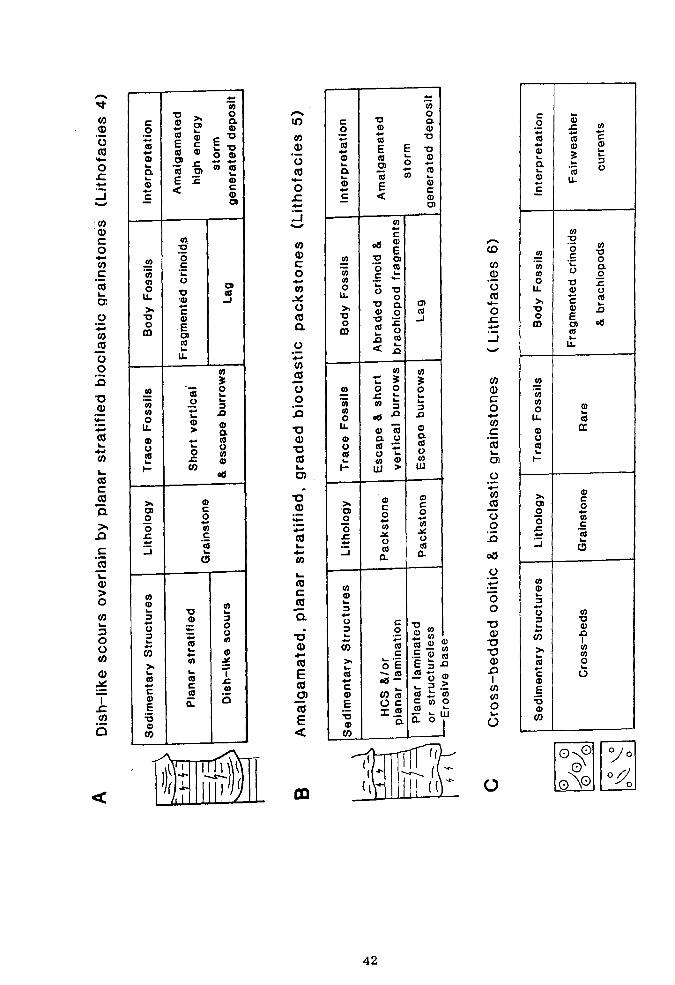
sequences in the Mendip Hills (Butler 1972 & 1973), at Cannington Park
(Mitchell et al. 1982), Weston-super-Mare (Whittaker & Green 1983), Tears
Point (Mitchell et al. 1986), and Barry Island (Waters & Lawrence 1987).
Notably absent in the attentuated succession of the Avon Gorge is the
conodont Scaliognathus anchoralis (Rhodes et al. 1969). Rhodes et
al. (1969) proposed that the absence of S. anchoralis could either be due
to factors influencing its distribution (e. g. facies control) or as a
result of a non-sequence at the top of the Black Rock Group. Subsequently,
S. arichoralis has been recorded in a laterally equivalent section
at Llanstrisant (Wales) by Waters & Lawrence (1987).
27
Chapter 3- Storm sedimentation on an early Carboniferous ramp:
the Barry Harbour Limestone & the Brofiscin Oolite
3.1 Introduction
3.2 Sedimentary fades
3.2.1 Lithofacies 1: Planar laminated facies containing minor scours
filled with Shelly lags
3.2.2 Lithofacies 2: Ungraded thin sedimentary couplets
3.2.3 Lithofacies 3: Graded beds containing planar stratification
and/or HCS
3.2.4 Lithofacies 4: Dish-like scours overlain by horizontal planar
stratified bioclastic grainstones
3.2.5 Lithofacies 5: Amalgamated graded bioclastic/oolitic packstones
3.2.6 Lithofacies 6: Cross-bedded grainstones
3.2.7 Lithofacies 7: Structureless, fine grained dolomites interbedded
with shales
3.3 Distribution of the lithofacies
3.4 Discussion
3.4.1 Storm versus wave domination
3.4.2 Nature of the hummocky cross-stratification
3.4.3 Depositional environment
3.4.4 Reanalysis of the facies model of Wu (1982)
3.4.5 The Barry Harbour Limestone & the Brofiscin Oolite regression
3.5 Conclusions
28
3.1 Introduction
The carbonate ramp model is increasingly being applied to ancient
carbonate sequences. A typical regressive sequence consists of thickening-
and coarsening-upward storm layers, overlain by a sandy unit
representative of deposition in a nearshore, shallow water
environment (Ahr 1973; Brett 1983; Aigner 1984 & 1985; Markello & Read
1981; Wu 1982; Read 1985; Handford 1986; Wright 1986; and Chatellier
1988). There have, however, been few regional (basin) studies of the
nature of regressive carbonate ramp sequences. Notable exceptions include
the work on the Muschelkalk of Germany by Aigner (1984 & 1985), the
Lower Carboniferous, Banff Formation of Canada by Chatellier (1988) and
the Upper Cambrian of Southwest Virginia by Markello & Read (1981).
The aim of this chapter is to describe and interpret the carbonate
facies of the lower part of the Black Rock Limestone Group (the Barry
Harbour Limestone Formation and the Brofiscin Oolite Formation) of SW
Britain. This regional study includes the detailed facies analysis
undertaken at Three Cliffs Bay (Gower) by Faulkner (1988). Here, the Barry
Harbour Limestone forms a shallow marine, predominantly subtidal,
shallowing-upward sequence which is capped by the subaerially exposed
Brofiscin Oolite (Hird 1986). Subsequent to an assessment of the spatial
and temporal distribution of the lithofacies, a general model is
offered for the environment of deposition.
3.2 Sedimentary facies
Six lithofacies have been identified in the Barry Harbour Limestone, the
Brofiscin Oolite and its probable cross-bedded bioclastic limestone
equivalents e. g. Yorke Rock Bed (Waters & Lawrence 1987). These are
similar to the lithofacies described by Faulkner (1988) from Three Cliffs
Bay. An additional, minor lithofacies 17) has been recognized immediately
29
beneath the Friars Point Limestone at Drybrook Quarry (Appendix 1). The
lithofacies are characterised using the following sedimentary features:
grain-size variation, sedimentary structures, trace fossil assemblages and
bedding thickness.
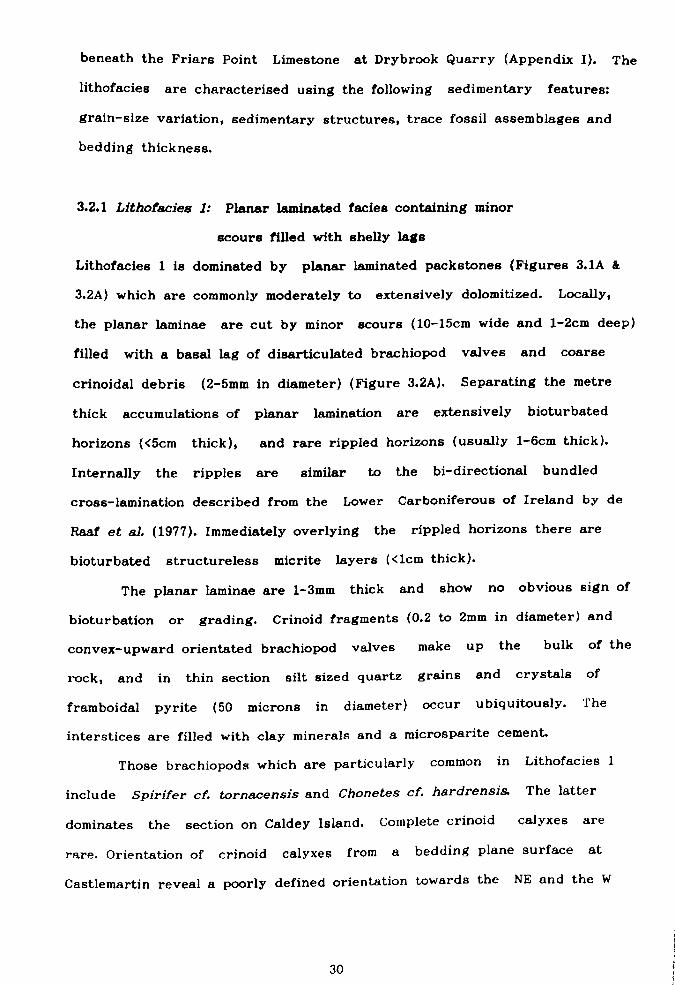
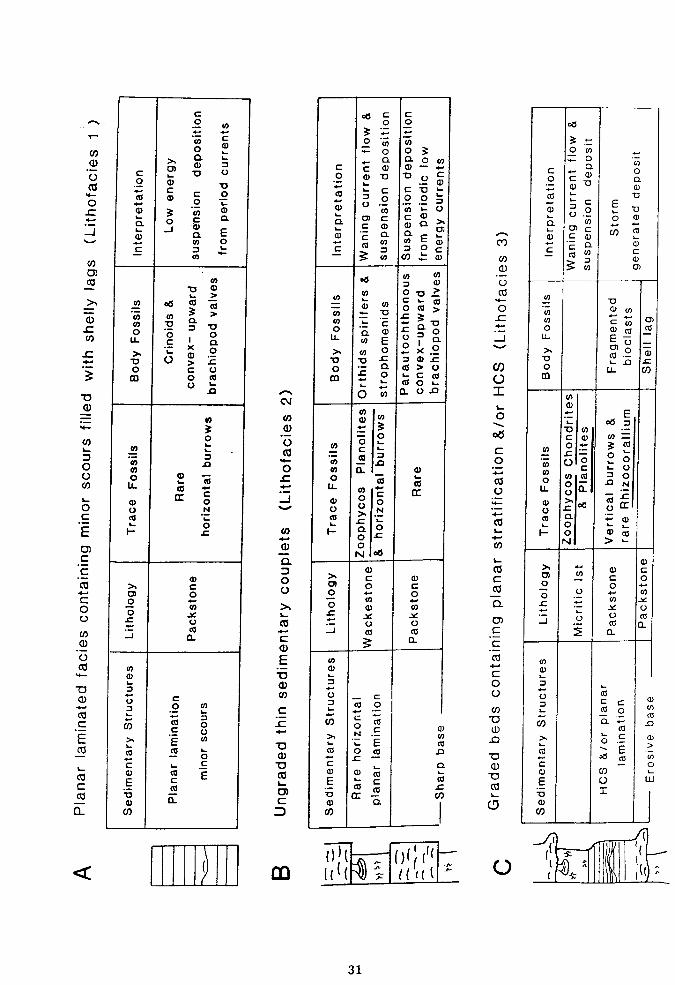
3.2.1 Lithofacies 1: Planar laminated fades containing minor
scours filed with shelly lags
Lithofacies 1 is dominated by planar laminated packstones (Figures 3.1A &
3.2A) which are commonly moderately to extensively dolomitized. Locally,
the planar laminae are cut by minor scours (10-15cm wide and 1-2cm deep)
filled with a basal lag of disarticulated brachiopod valves and coarse
crinoidal debris (2-5mm in diameter) (Figure 3.2A). Separating the metre
thick accumulations of planar lamination are extensively bioturbated
horizons (<5cm thick), and rare rippled horizons (usually 1-6cm thick).
Internally the ripples are similar to the bi-directional bundled
cross-lamination described from the Lower Carboniferous of Ireland by de
Raaf et al. (1977). Immediately overlying the rippled horizons there are
bioturbated structureless micrite layers (<1cm thick).
The planar laminae are 1-3mm thick and show no obvious sign of
bioturbation or grading. Crinoid fragments (0.2 to 2mm in diameter) and
convex-upward orientated brachiopod valves make up the bulk of the
rock, and in thin section silt sized quartz grains and crystals of
framboidal pyrite (50 microns in diameter) occur ubiquitously. The
interstices are filled with clay minerals and a microsparite cement.
Those brachiopods which are particularly common in Lithofacies 1
include Spirifer cf. tornacensis and Chonetes cf. hardrensis. The latter
dominates the section on Caldey Island. Complete crinoid calyxes are
rare. Orientation of crinoid calyxes from a bedding plane surface at
Castlemartin reveal a poorly defined orientation towards the NE and the W
30

.cc
co .ýw 3
rA w
.. a Co u
47 4J
C
O
COJý U
Sr _ 7Ü
it ww
Cp 'D OC
.1 -0 80 °4
LOQ U -C
D cý o
4 r- N
.v C�.
O
to 40 U
C, äw
OO C) ýJ y
. Ei CC -2
U,
U C13
J
U, rn
t
w
O U
0 C E
C_
C
O U
a_) U (0
ü O r- cti C E
Co
L Cu
C Co
a
Q
C O y y C
O ID
C p U O O
« C cC N
C O O `
3 y N 0 n a °ý J E O y
O C C w
Co
N O
N Co ,q y 3 > y a 0 :O O 0 O O O U C X a
O > O 0 > t 0 C U
m 0 Co
N 3 O
N
N L
O U. O r
C O O U N ca ý- O
I"' L
d > C O1 0
2 0 0 Y L U
O d
y N
C U O N L c O
O 0
T E N c
O C C N N - E C
aý Co
Coil
N
Co
U
O t ... J
0
U)
0 U
(0 C d) E_
d) U)
C_
V a)
V cö h- c3) C
m
C O
(U
N
fl
N
C
oc 0
O 'y w0
a Cd
NO `C OO ° *o 0C Cp C Co
7
C 0
to O3 a° ro O "" VUC
C '0 ` OO 0ZO COT pa cm 9)
EO OOC
NN 7d
T
._ O C CO OO>
y '
L Cl, O
C Qp
äa
t> O LL °E Q ö T UJ 0
0X2 -
V VL 7NL p a c0 >U
N ý 0 '- C cc W - Co O-
y 0 -0 . 92
=O
0 A2 0 a p
yC °
ir
N U
O TN Co L ti-
pO - O J-
0 N "6
T c aD 0) o C O O
_ O y O L Y Y
O p J Co (0
a
U
C
E V d U)
C (0
o Co Ny
E O Co
C (C ýL
Cr- QN
(lýl ý ()ý j III
C, )
U, U Cd
O t
J
U 2
0
0ö c 0 : - co U
U)
C
Q
0)
C_ C
4-
O U
O
0
0
00 ON
"- O U)
C 0
+- (D
C 0 Q
ro '- c E ÜO
O . 0) C U)
U CO
C U) O
C N
N .ý ON
N O
Cy
d 0)
_CC L U
T ro O
N G) ". E
C d N
y O
1
- 3c C
.y o L
0 o O
N cn
C cC
ýU =O
LL O N
O t o0 tr
V U O. Z (D
F- O O tU N >
O T
N N C
C 0
O 0 0 U . - Cl)
N Y
L " U
J U O a n.
N c) 7
U O cc a
v F
_(Co R a -c
C 4; E
D(f U
C G)
- (n C
E V u
a)
I, ,
I-1
1
31
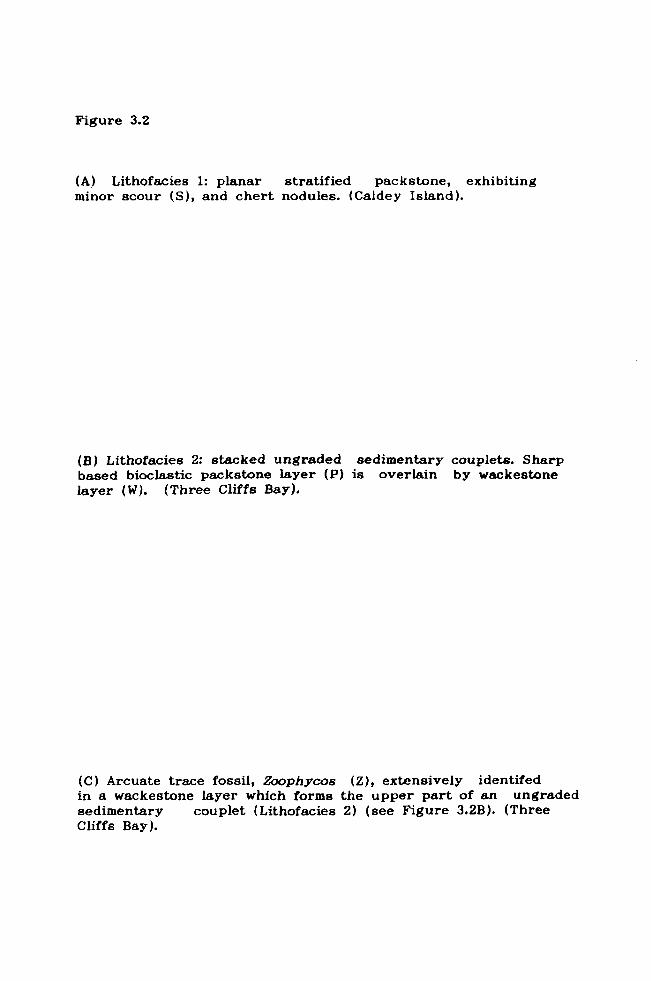
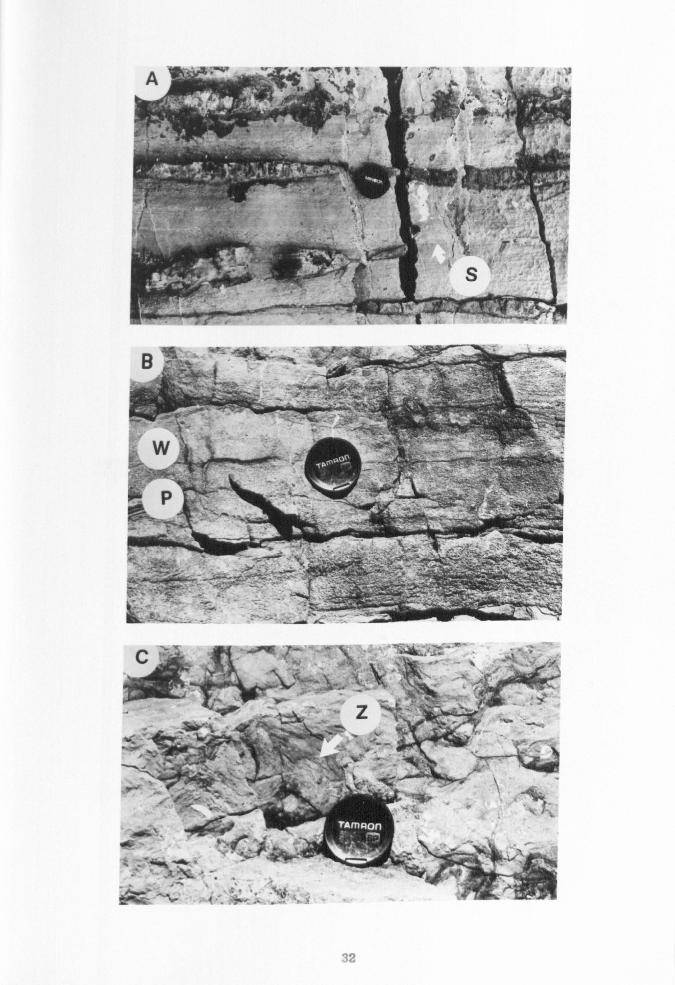
Figure 3.2
(A) Lithofacies 1: planar stratified packstone, exhibiting minor scour (S), and chert nodules. (Caldey Island).
(B) Lithofacies 2: stacked ungraded sedimentary couplets. Sharp based bioclastic packstone layer (P) is overlain by wackestone layer (W). (Three Cliffs Bay).
(C) Arcuate trace fossil, Zoophycos (Z), extensively identifed in a wackestone layer which forms the upper part of an ungraded sedimentary couplet (Lithofacies 2) (see Figure 3.2B). (Three Cliffs Bay).
A
-' ý,
,ý , r-ý
. t_ý- ý.
32
a
(Figure 3.3, denoted by I).
Interpretation: The fragmented brachiopod and crinoid allochems
were probably transported and disarticulated by marine currents which at
times were of sufficient energy to cause localised scouring prior to
deposition. The absence of primary current lineation and poor sorting in
the laminites suggests deposition from suspension and not from upper flow
regime conditions. The internal structure of the wave ripples is similar
to the wave generated structures described by de Raaf et al. (1977).
However, their minor occurrence in Lithofacies 1 suggests that they
represent rare sedimentary events. The distinct contact between the
ripples and the overlying micrite layer indicates a change in the
hydrological regime from the higher energy oscillatory currents to low
energy suspension deposition. The formation of the wave ripples is most
likely to be due to rare (storm? ) events, allowing oscillatory currents to
interact with the sea floor sediment at a greater depth than the mean
level of wave-base. Such an occurrence is not unusual, as wave-ripples
have been documented developing beneath mean wave-base (in water depths
exceeding 100m) during major storms, by Komar et al. (1972) and Channon &
Hamilton (1976).
Below wave-base, planar laminated turbidite-like (tempestite) storm
sandstones have been described from both the recent (Reineck & Singh 1972;
Nelson 1982; Aigner & Reineck 1982) and the ancient (Handford 1986;
Hamblin & Walker 1979; Soegaard & Eriksson 1985; Brenchley et al. 1979).
Observations from the North Sea, led Aigner & Reineck (1982) to interpret
the thin bedded, planar laminated sands as having been deposited from low
energy storm flows (distal tempestites). These low energy deposits are
lateral (down depositional dip) equivalents of the thicker bedded higher
energy tempestite flow deposits found accumulating nearer to shore at
shallower depths. There is some similarity between the laminates described
33
w U
0000 n
C) C y; ý >
c0 U, > WC f�
. äi ä
,c00 w3 ý' v
,C Co 0 r.
Or 10 mC
to
bOA U
CÖ 4)
VO
.C "ý UC
«-Cý. w Cý "
C7
.10 of aý rn
öEý 9) .1 ci
EO C_ wýý
v
2-- c m
. J. ýn r c)
_ CS1 JEEm in
. J.
. J.
. J. .-o0m C)
1 00 äöß m : °. %
noý ýS; ma= C
I- m E m ä 0
U
U 10
7N
NT
ýQm
4Q
-ya
st 1I1IýýE I1III1
Ü
orý ýo
u ýJ
Z
IIIIIIIlUll
C) co
>G T04 m 3¢
p- 6 ý ' U o1 mo lo
I i
II IIl
i--
ýa Oy c
wýo ö8 co f-
E 0
T
T m mý
L
3
r
C
R E
U
N
N
34
by Aigner & Reineck (1982) and Lithofacies 1. Both are dominated by planar lamination and there is a conspicuous lack of cross-lamination. However
the two differ because in Lithofacies 1 there is a paucity of bioturbated,
finer grained layers separating the storm-related deposits. These finer
grained layers are representative of fairweather, low energy, suspension
deposition between storm events. The absence of mud-rich layers could be
due to crinoidal material diluting the fine grained suspension input.
In conclusion it seems likely that the planar laminated Lithofacies
1 was deposited from low energy storm currents beneath the mean level of
wave-base. The absence of bioturbation, which is common in the other
overlying lithofacies is problematical. There are three important factors
that can affect bioturbation: these include the nature of the substrate,
the rate of sedimentation and the supply of oxygen. The episodic nature of
sedimentation as envisaged here would have been unlikely to inhibit
bioturbation altogether and more likely to concentrate it within layers.
Extensively bioturbated horizons are found in Lithofacies I but there is a
paucity of bioturbation in the metre thick accumulations of planar
lamination. There is no evidence to suggest that the nature of the
substrate was unsuitable for bioturbation, therefore anaerobic conditions
are the most likely cause for the preservation of the planar-lamination.
Framboidal pyrite is generally accepted as an early diagenetic product of
reducing conditions (Berner 1971; Hudson 1982). However, the sparse,
evenly disseminated pyrite within these rocks need not necessarily imply
totally anaerobic conditions. Overall, the combined sedimentary and
diagenetic evidence favours oxygen depleted sea floor sediments.
3.2.2 Lithofacies 2: Ungraded thin sedimentary couplets.
Lithofacies 2 consists of thinly bedded (5-10cm thick) sedimentary
couplets, of structureless or planar laminated bioclastic packstones,
35

overlain by bioturbated wackestones (Figures 3.1B & 3.2B). The bases of the couplets are usually sharp, although locally there are indications of
shallow scouring (invariably less 1cm deep). The fauna of the beds include
thin-shelled valves of orthids, strophomenids, spiriferoids, and crinoid
fragments which are 1-5mm in diameter. The majority of the allochems are
disarticulated and when inequidimensional the long axes are generally
concordant to bedding.
The junction between each packstone coquina layer and the overlying
wackestone is gradational and distinct. The wackestone layer is
predominantly extensively bioturbated, although occasional relict
horizontal lamination may be found. The diverse assemblage of biogenic
structures includes Zoophycos (Figure 3.2C), simple horizontal burrows and
shallow vertical burrows.
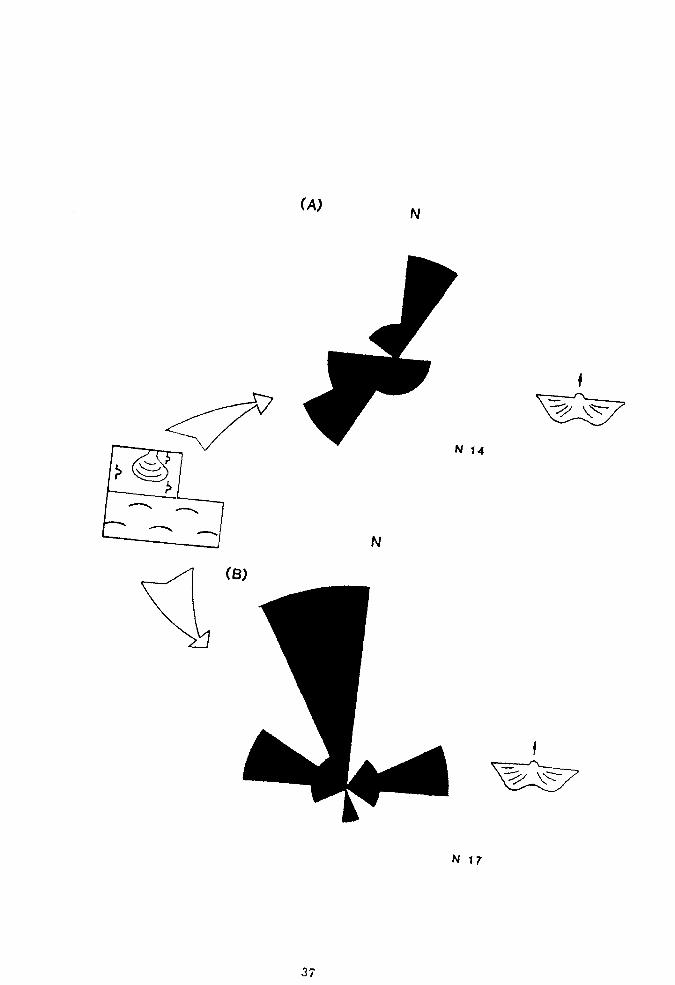
The orientations of spiriferoids have been recorded on bedding
plane surfaces at Barry. Results from two surfaces considered to be
representative of the sedimentary couplet, reveal a strong alignment of
the hinge-lines in the packstone layer towards the ENE and WSW
(Figure 3.4B). In the wackestone layer, the brachiopod hinge-lines show a
more poorly defined trend towards the NW-SE (Figure 3.4A). However, the
sample sizes were very small. The collation of composite results, taken
from numerous packstone bedding plane surfaces, confirms a preferred
orientation of the hinge-lines towards the ENE-WSW (Figure 3.3, denoted by
II).
Interpretation: The alternation of packstone layers and extensively
bioturbated wackestone layers is indicative of two contrasting energy
regimes. Episodic flows probably disarticulated and fragmented the
faunal constituents into packstone layers. This is reflected in the
prefered orientation of the brachiopods in the lags.
Wackestone layers accumulated from low energy suspension
36
Figure 3.4. Rose diagram plots of the orientation of spiriferoid valve umbones. The measurements were taken from two bedding plane surfaces, representative of the wackestone and packstone lithologies which comprise the ungraded sedimentary couplets (Lithofacies 2); A and B respectively.
(A) N
°, %ý' ýý
z---__ --ý ý
}
N 14
N
(B)
IZEý7 H 17
37
deposition. Since there is a similarity between the brachiopod content in
the packstone and the overlying wackestone layers, the faunal assemblage
was most likely locally derived and reworked into (parautochthonous)
packstone layers. The episodic nature of sedimentation was most likely
due to low energy storm flows operating beneath mean wave-base.
3.2.3 Lithofacies 3: Graded beds containing planar
stratification and/or HCS.
Lithofacies 3 is equivalent to type B bedding described and figured by Wu
(1982, page 194) from Three Cliffs Bay. This lithofacies is bedded on a
10-20cm scale and charcterized by its tripartite grain-size variation and
sedimentary structures (Figure 3.1C). The basal contact is sharp and
planar, but locally there are shallow scours (first order boundary
surfaces). The basal skeletal lag (2-3cm thick) is a coarse continuous
bioclastic pack/grainstone that increases in thickness into the scours.
The second layer is finely laminated (on a 2-5mm scale), and contains
isolated, coarser bioclastic lenses (1-2cm thick and 10-15cm wide).
Vertically, over a 5-10cm scale, the lamination diminishes in thickness.
Within the second layer, there are two distinct sedimentary structures:
horizontal planar lamination and, more rarely, hummocky
cross-stratification (HCS) (Figure 3.5A & B). The HCS consists of
lamination draping over a scoured topography (second order surfaces) of
convex-upward surfaces (hummocks), and convex downward surfaces (swales)
(Figure 3.5B). Laterally, the laminae expand noticeably in thickness from
the crest of the hummocks into the swales. The wavelength of the hummocks
is between 0.3 and 2m. A maximum vertical relief of 10cm was recorded for
the hummocks which invariably pass upward into planar horizontal
lamination although rarely wave ripples may be found. In the HCS in the
Barry Harbour Limestone there is commonly only one second order scour
38
aýý "q) 14
rA °d
V0 q) qi
f"'
2 13 r. ) 19 tu a 93 Ü0
4-4 to a 0 '-
a0ý aö Co
-4-) W i
4, u -0 45 41
Co ýz 1L4 il
;1 0 94
Z Z$ D +ý
X Z$ 95 VM 0 a q) :3
4l 10 c cd ;j° b0
9 0Ö 4C
4) 0) 0
.ý +ý "v o r.
. -. cß v 4)
to cl; a) c.
eo rzl
0 g 4-,
42 g
v., Z ý 12
c mä ci 9.4
02 0 ä, Ü 4j
^
00 Co wC4.
,q ca aý :ý U O
ýj U ci 464
aF V op
W
ý,;,:. ý'- >.
i ii'ý
r ýlk4
1
Wv ,
ý', ý, + :, º. :,
;, -ýýý y
1A
LLI ß,
_ F4 , q{
tA
fC r r_w1
39
surface (Figure 3.5B), although rarely two or more surfaces are found to
have scoured into each other.
The top layer consists of either a black micritic limestone or,
more rarely an argillaceous micrite. Both are commonly extensively
bioturbated, although scarce relict horizontal lamination may be found.
Generally, there is an upward increase in the intensity of bioturbation
from the base (Figure 3.1C). The base is usually poorly bioturbated, but
escape burrows can be found. The middle layer is usually poorly to
moderately bioturbated, but shows a high diversity of biogenic structures.
These include simple vertical burrows, Zoophycos,
Arenicolites, Diplocraterion, rare Rhizocorallium (Wu 1982) and
Planolites. The top layer is normally rich in the biogenic structures
mentioned above with the most obvious burrow system being Planolites.
Interpretation: High energy currents would be required to produce
the first order boundary surface and fragment and transport the allochems.
Overall, the upward decrease in grain size and the contrasting upward
increase in bioturbation, is indicative of a reduction in depositional
rate, a waning of current energy and recolonization of the upper sediment
surface.
Although there is great debate at the moment concerning the origin
of HCS, there is agreement that oscillatory currents, due to storm surface
gravity waves, play a part in its formation (Allen 1985; Brenchley
1985; Dott & Bourgeois 1982; Harms et al. 1975; Duke 1985 & 1987;
Greenwood & Sherman 1986; Klein & Marsaglia 1987; Leckie 1988; Nottvedt &
Kreisa 1987; Swift et al. 1983; Swift & Nummedal 1987; and Walker et. al.
1983). Unequivocally, HCS has been reported from a number of depositional
environments which include lacustrine (Duke 1985) and coastal sediments
(Greenwood & Sherman 1986) but it is most commonly reported in deposits in
40
ancient epicontinental seas (Brenchley 1985, Dott & Bourgeois 1982; Harms
et al. 1975; Duke 1985 & 1987; Swift & Nummedal 1987 and Wu 1982). The
top layer of each Lithofacies 3 bed was not reworked by currents, which
would suggest deposition from suspension probably below fairweather
wave-base (Figure 3.1C).
3.2.4 Lithotacies 4. Dish-like scours overlain by horizontal
planar stratified bioclastic grainstones
Lithofacies 4 is a parallel to sub-parallel, stratified, coarse bioclastic
grainstone, bedded on a 10-30cm scale (Figures 3.5C & 3.6A). The base of
each bed is sharp, and commonly undulatory due to scouring. It is
uncommon for the scours to cut-into each other. Generally they are
laterally spaced on a metre scale and cut-down (5-8cm) into the underlying
beds. Studying the sedimentary structures on perpendicular joint-set
faces, reveals a dish-like geometry. Solitary scour margins have also been
found which have inclined concave-upward surfaces that pass along their
lower margin into subhorizontal parallel stratification. At the base of
the dish-like scours there is commonly a shell-lag layer (less than 5cm
thick). This lag consists of abundant, broken and disarticulated crinoid
ossicles, brachiopod valves, and rare crinoid stems. Into the partially
filled scours, a finely laminated, bioclastic grainstone was deposited.
The alternately thick and thin layers are parallel to subparallel and at
the scour margins dip at less than 15 degress toward the centre of the
depression. It is noticeable that the scour depressions were infilled
before the deposition of overlying horizontally stratified blanket layers
(each layer is 3mm to 2cm thick). Locally there are signs of erosion
planing-off the swells between the scours before the deposition of the
blanket layers.
Constituents of both the inclined and blanket laminae include
41
-C c
r. ý m3
Zo
O
v
Co cj 4j
4) U w
12.
e cw. ý
CL) O as u 1.
vv., s tD
X73 wc 0 Co in
cp O ch
+j G) vc ocv_
v. ý U 4) 1.4 m0 i' a' EO
U) U (10
v- O
.h
C O 9) C
L 0,
U :r O c) U O_
.
c)
O
cC C U) ä L
C im
I- a) O
N
O U N
u)
Cl) 0
0) ö
bT
4- ..
ä
m m
m a 3
m Es 0 C a m
CI)
v
q 0
U 0
Co W
N J >` C
O O E
c9 w . U.
W
yJ H
U `
O LL
y O
y U
- O
Rf 0
0
T
O
0
O
O q C
m V
y
U C
O L
M
= C'
U 0
y Y T
C Co E ö
m
Il
Q l! ( J
y .. p tp c 'o a
OmN
m c° EEv
70 - Co c- a Co . "~ Ec CQ0 - rn
4-
y as N
N 'O E
C oNCN
to pVO LL
U >, 'ý aC 0 CO
p °. m Co UQ NNN
r
UNo0 C_ t'V NN>>
o
u' Q1 N0
Cl C. V O' V Co
(ý 4U1 0N L F- uJ > UJ
0T0CC
pO
-ONN 0
L-p cu 4- JOa. ya
N Cd
0 7p -0
C_ N m of ja E ýcý VN cý c °a
. >_
0O Co cm Co NO EUc w
E ° =ö -öL 12-
Q vý
m sty` (t
CD
U ca O
J
U)
O U) c
L
U 4- 0
U _O 3
od U
O O Z7 4)
a)
m O U
0
L y
d w
C
N
N N
O y ti' O. 0 V O 0 :2 Ii N U
,0 T C ö E
rn Cd
tL
N y
0) O
m U
H
O T M O
0 O C L - c0
m
U d1 7 C)
U T
cC 0 c 0 d E
Cl)
0
mg
42
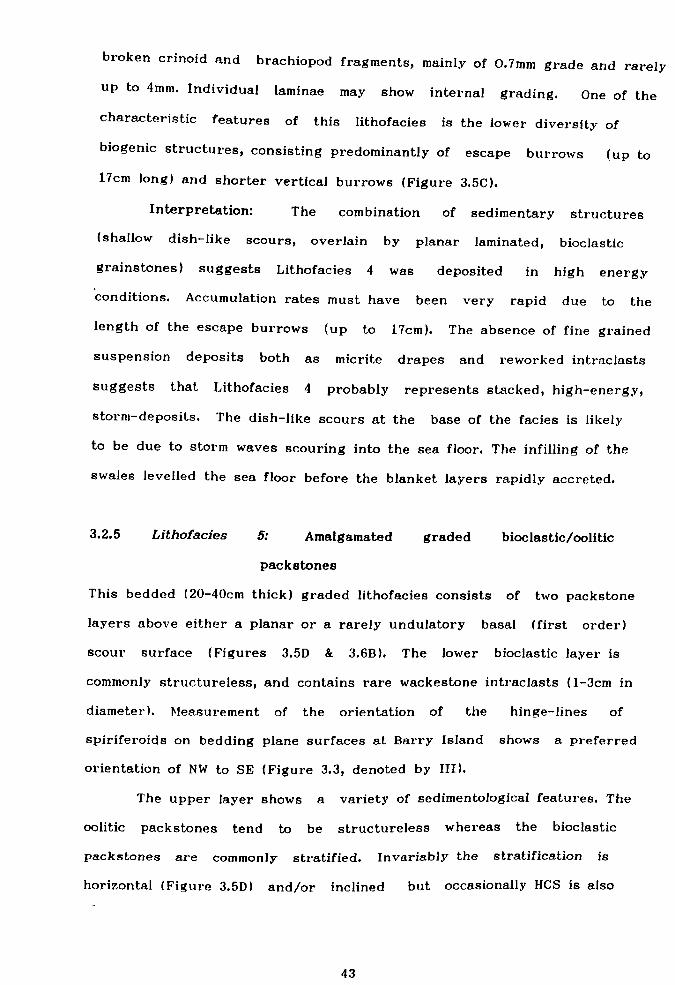
broken crinoid and brachiopod fragments, mainly of O. 7mm grade and rarely
up to 4mm. Individual laminae may show internal grading. One of the
characteristic features of this lithofacies is the lower diversity of
biogenic structures, consisting predominantly of escape burrows (up to
17cm long) and shorter vertical burrows (Figure 3.5C).
Interpretation: The combination of sedimentary structures
(shallow dish-like scours, overlain by planar laminated, bioclastic
grainstones) suggests Lithofacies 4 was deposited in high energy
conditions. Accumulation rates must have been very rapid due to the
length of the escape burrows (up to 17cm). The absence of fine grained
suspension deposits both as micrite drapes and reworked intraclasts
suggests that Lithofacies 4 probably represents stacked, high-energy,
storm-deposits. The dish-like scours at the base of the facies is likely
to be due to storm waves scouring into the sea floor. The infilling of the
swales levelled the sea floor before the blanket layers rapidly accreted.
3.2.5 Lithofacies 5: Amalgamated graded bioclastic/oolitic
packstones
This bedded (20-40cm thick) graded lithofacies consists of two packstone
layers above either a planar or a rarely undulatory basal (first order)
scour surface (Figures 3.5D & 3.6B). The lower bioclastic layer is
commonly structureless, and contains rare wackestone intraclasts (1-3cm in
diameter). Measurement of the orientation of the hinge-lines of
spiriferoids on bedding plane surfaces at Barry Island shows a preferred
orientation of NW to SE (Figure 3.3, denoted by 1II).
The upper layer shows a variety of sedimentological features. The
oolitic packstones tend to be structureless whereas the bioclastic
packstones are commonly stratified. Invariably the stratification is
horizontal (Figure 3.5D) and/or inclined but occasionally HCS is also
43
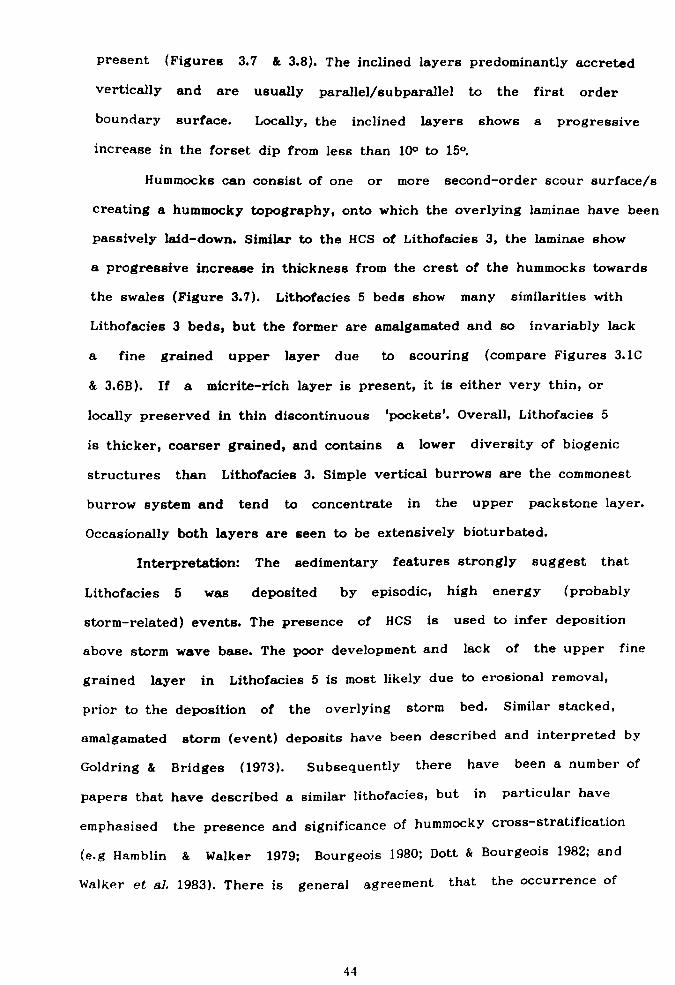
present (Figures 3.7 & 3.8). The inclined layers predominantly accreted
vertically and are usually parallel/subparallel to the first order
boundary surface. Locally, the inclined layers shows a progressive
increase in the forset dip from less than 100 to 15°.
Hummocks can consist of one or more second-order scour surface/s
creating a hummocky topography, onto which the overlying laminae have been
passively laid-down. Similar to the HCS of Lithofacies 3, the laminae show
a progressive increase in thickness from the crest of the hummocks towards
the swales (Figure 3.7). Lithofacies 5 beds show many similarities with
Lithofacies 3 beds, but the former are amalgamated and so invariably lack
a fine grained upper layer due to scouring (compare Figures 3.1C
& 3.6B). If a micrite-rich layer is present, it is either very thin, or
locally preserved in thin discontinuous 'pockets'. Overall, Lithofacies 5
is thicker, coarser grained, and contains a lower diversity of biogenic
structures than Lithofacies 3. Simple vertical burrows are the commonest
burrow system and tend to concentrate in the upper packstone layer.
Occasionally both layers are seen to be extensively bioturbated.
Interpretation: The sedimentary features strongly suggest that
Lithofacies 5 was deposited by episodic, high energy (probably
storm-related) events. The presence of HCS is used to infer deposition
above storm wave base. The poor development and lack of the upper fine
grained layer in Lithofacies 5 is most likely due to erosional removal,
prior to the deposition of the overlying storm bed. Similar stacked,
amalgamated storm (event) deposits have been described and interpreted by
Goldring & Bridges (1973). Subsequently there have been a number of
papers that have described a similar lithofacies, but in particular have
emphasised the presence and significance of hummocky cross-stratification
(e. g Hamblin & Walker 1979; Bourgeois 1980; Dott & Bourgeois 1982; and
Walker et al. 1983). There is general agreement that the occurrence of
44
O
U ^ E .ý
-O E
<-- .U O v) b aj C)
L,. 0ä cL) a) omt 8
.ý E-
4- -: .u0 LaU
pU C cß
a .c
ti U .D c) -. y
4.1 r! J ß.
th c
7 cn OO OG
[L U cC
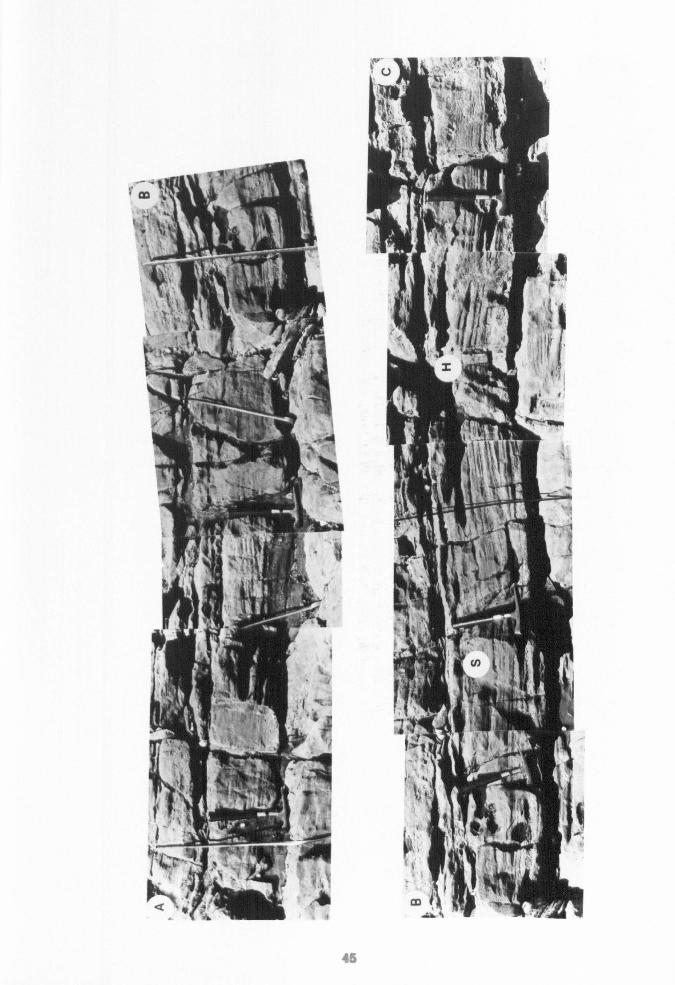
45
amalgamated HCS storm deposits indicate shallow water environments,
commonly in close-proximity to fairweather wave-base (Brenchley 1985).
Such an interpretation is consistent with Lithofacies 5. This
interpretation is supported by the presence of ooids within some of the
graded beds, which are likely to have been locally derived from active
shoal facies.
Wu (1982) interpreted the low angle inclined stratification, in his
proximal to shoreline facies type D, as megaripples. Ramsay (1987)
extended this interpretation and proposed that the inclined stratification
in the upper part of the Barry Harbour Limestone represents migratory
storm megaripples. Many of these layers are inclined because they are
parallel/subparallel to the inclined first order boundary scour surface
(as shown in Figure 14.3, page 270, Ramsay 1987). It is uncommon for the
inclined stratified layers to dip at angles greater than the first order
boundary scour surface. Vertical accretion was the dominant mode of
sedimentation during storms and a significant component of real lateral
accretion was rarely developed. It is important to distinguish between
accentuated lateral accretion due to an uneven or low angle inclined sea
floor surface and genuine migratory megaripples. There are, however,
several beds with a persistent inclination. These show a progressive
increase in the foreset dip from less than 10 degrees to 15 degrees; such
beds are interpreted as migratory megaripples. There is an absence of
reactivation surfaces and so it seems likely that migration only
presisted for single storm events.
3.2.6 Lithofacies 6: Cross-bedded grainstones
Lithofacies 6 includes cross-bedded, bioclastic (3-4m thick) and oolitic
grainstones (3-20m thick) (Figure 3.6C). The medium scale trough and
planar cross-beds (5-30cm thick) commonly have a sharp and erosive base
46
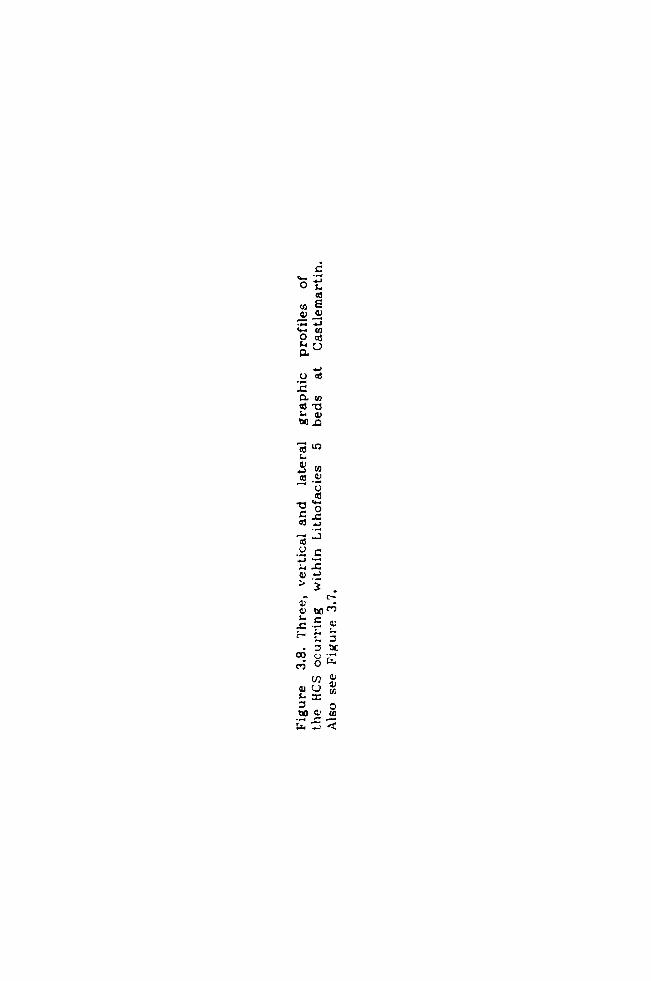
oý.
w tq 0
.ý U ýE
0o 0
ý-o s.
y 10 q5 W
U
bO
as
V
ýcy
a M0
LXU.
O
GcýýQ
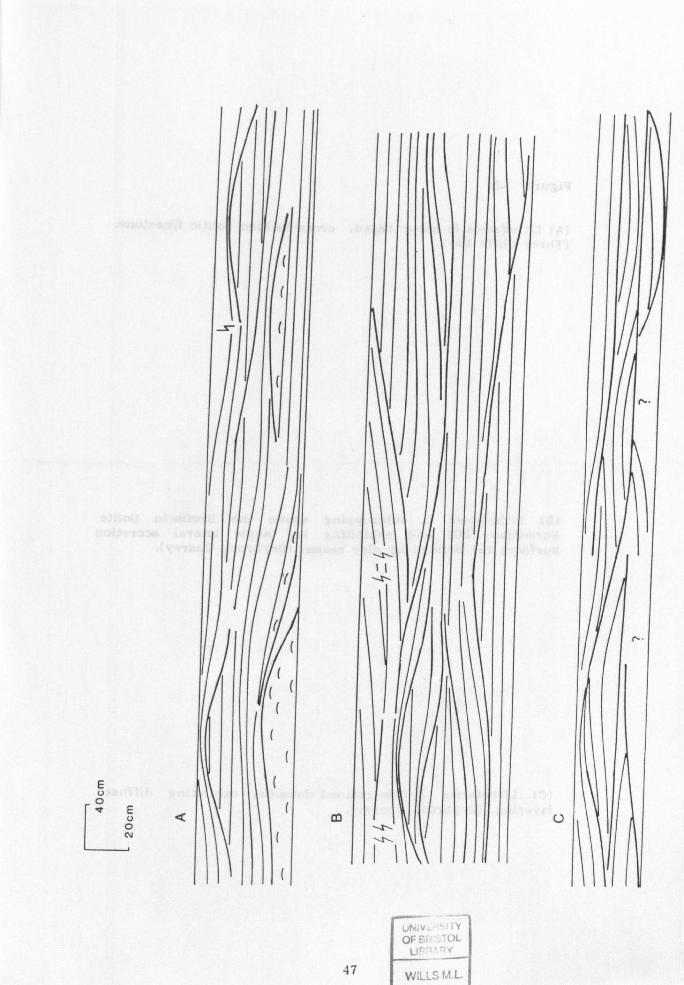
E U
O ýUQ
O N
m
Vfv VY OF E OL
U,
47 W LLS M. L.
U

Figure 3.9.
(A) Lithofacies 6: scour based, cross-bedded oolitic limestone. (Three Cliffs Bay).
(B) Lithofacies 7: outcropping above the Brofiscin Oolite Formation (BO) and exhibiting low angle lateral accretion surfaces (S) defined by clay seams. (Drybrook Quarry).
(C) Lithofacies 7: fine-grained dolomite, exhibiting diffuse layering. (Dry brook Quarry).
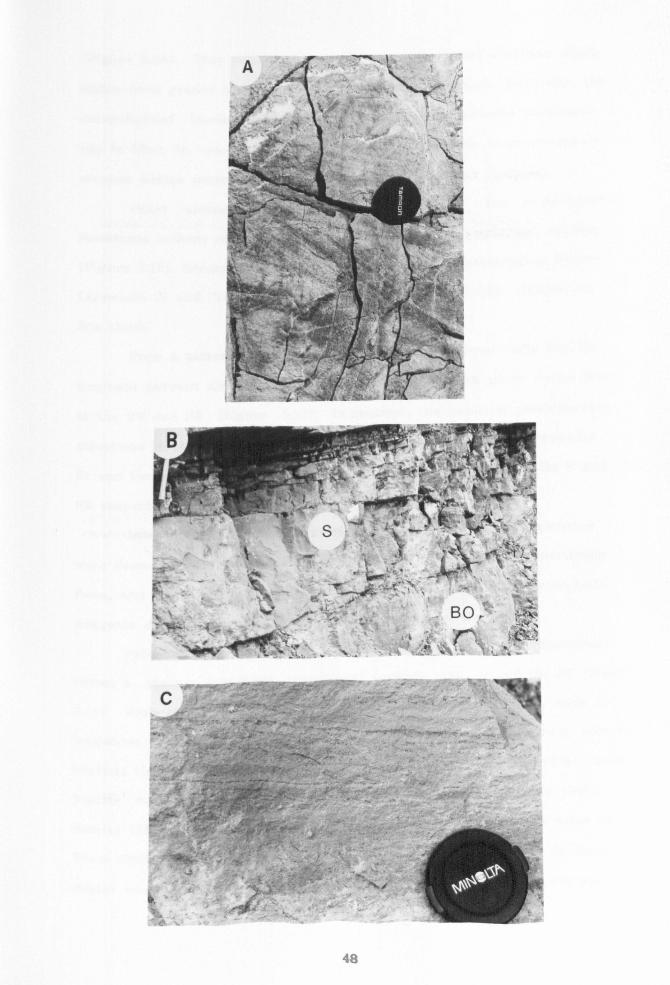
A ýE
ýý, i"":
ý, , ýý ý, ; -, ýy,, ý.
: r'
p i4
-, BO; ;
.., -wow
:
°' 1
fýyp gq`y
48
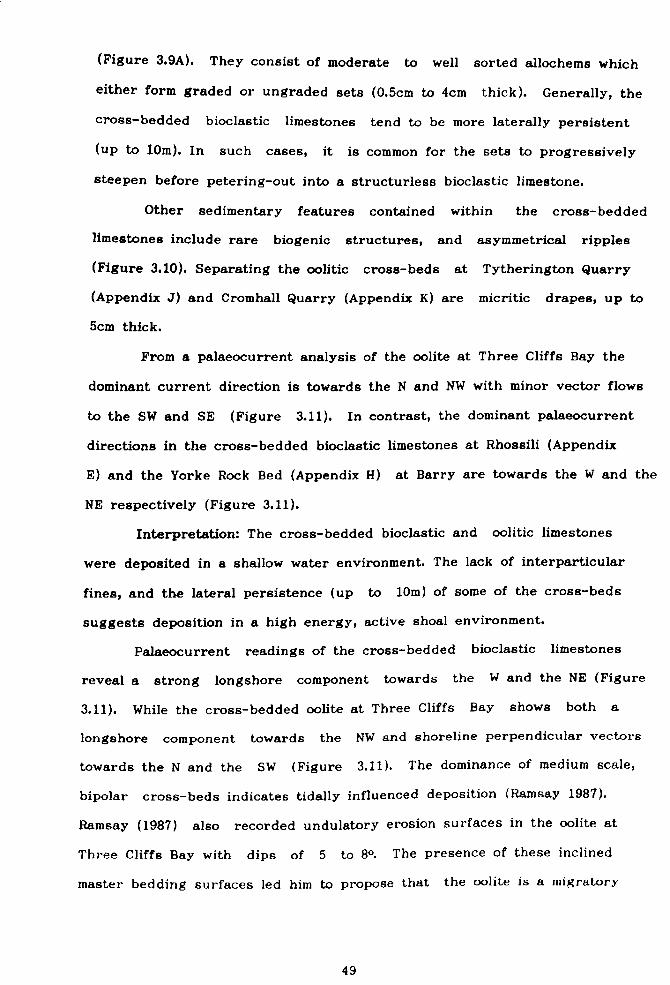
(Figure 3.9A). They consist of moderate to well sorted allochems which
either form graded or ungraded sets (0.5cm to 4cm thick). Generally, the
cross-bedded bioclastic limestones tend to be more laterally persistent
(up to 10m). In such cases, it is common for the sets to progressively
steepen before petering-out into a structurless bioclastic limestone.
Other sedimentary features contained within the cross-bedded
limestones include rare biogenic structures, and asymmetrical ripples
(Figure 3.10). Separating the oolitic cross-beds at Tytherington Quarry
(Appendix J) and Cromhall Quarry (Appendix K) are micritic drapes, up to
5cm thick.
From a palaeocurrent analysis of the oolite at Three Cliffs Bay the
dominant current direction is towards the N and NW with minor vector flows
to the SW and SE (Figure 3.11). In contrast, the dominant palaeocurrent
directions in the cross-bedded bioclastic limestones at Rhossili (Appendix
E) and the Yorke Rock Bed (Appendix H) at Barry are towards the W and the
NE respectively (Figure 3.11).
Interpretation: The cross-bedded bioclastic and oolitic limestones
were deposited in a shallow water environment. The lack of interparticular
fines, and the lateral persistence (up to 10m) of some of the cross-beds
suggests deposition in a high energy, active shoal environment.
Palaeocurrent readings of the cross-bedded bioclastic limestones
reveal a strong longshore component towards the W and the NE (Figure
3.11). While the cross-bedded oolite at Three Cliffs Bay shows both a
longshore component towards the NW and shoreline perpendicular vectors
towards the N and the SW (Figure 3.11). The dominance of medium scale,
bipolar cross-beds indicates tidally influenced deposition (Ramsay 1987).
Ramsay (1987) also recorded undulatory erosion surfaces in the oolite at
Three Cliffs Bay with dips of 5 to 8°. The presence of these inclined
master bedding surfaces led him to propose that the oolite is a migratory
49
0)
sO
y ch
O
a as
öc ý0 s. ýG. 12. _r2 c
siö
Co qCo
a0 to Co c
O
O a
ä Co ä
Q) ö $. d
91
öy Z: of 'cý
Q) (0 .0 to
oooý s. ý G. u ..
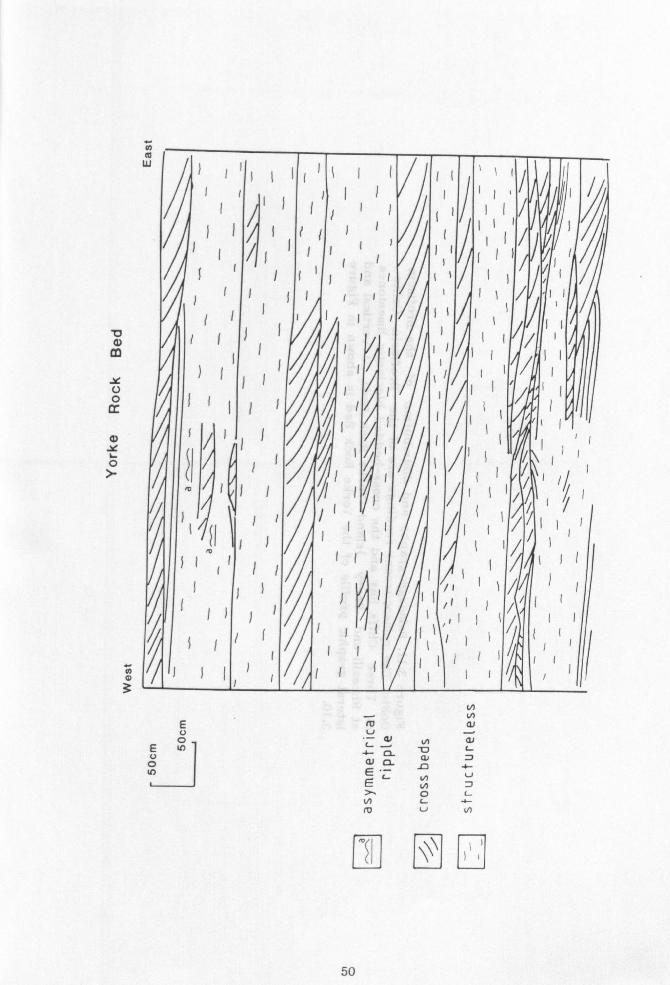
co
Y U 0
C,
0 }
m w
d, C) 3
N 0
E v U -y N G1
0 C-- -0 L- E In +- _ o a, Z U Gl O_ i o 'n E "L N E N ý
T O N u
u N
rZ -(ýI Z rý ý, ý Ll J
50
. Co cl ;3 40 =
-0r
'ý' "ý d0 ö
Co Co 113 Ob..,
4)3GOb OJa x' G1ý
79 %. O0ß: 0-2 U 9) 0
O f. Cý W0
-y 'U tin j� %0
C C)
of,. ) ''0""9- cC0
vwa
ýtl 'O U
Sr (JU
7ýýG: yp
is. Owxý c-ý
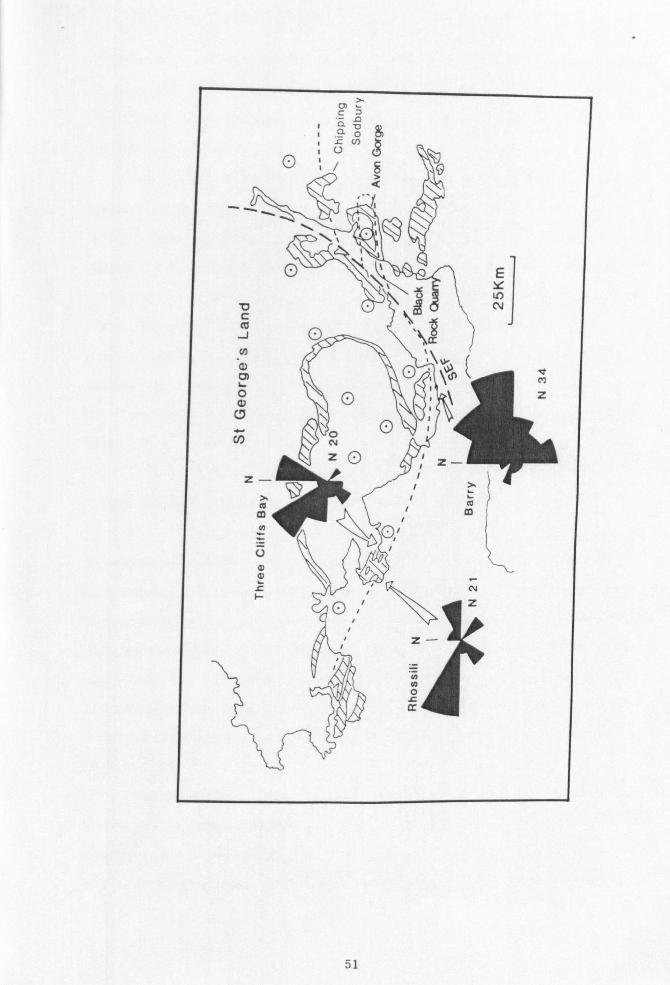
,ay O 01
L o, ýj
O"U üi 9
ýý YY U In
c
J0\ :a U) ý\
N
ZOZ-
Z-) /Tl
Co
U/
L ý'
N
O/Z
'Z-
O L cr
ý`ti
51
sandwave. Unfortunately, minimal sedimentary evidence can be obtained
from the more northerly outcrops of the Brofiscin Oolite to support the
tidal interpretation because the oolite is dolomitized and it is difficult
to see much detail.
Contained within the oolitic limestones of South Wales are vadose
cements, indicative of subaerial exposure (Hird 1986). In contrast, there
is a conspicuous absence of such features in the cross-bedded oolitic
limestones of the Bristol district (e. g. Tytherington, Cromhall, &
Chipping Sodbury) and in the cross-bedded bioclastic limestones of South
Wales (Rhossili & Barry Island). The latter pass transitionally upward
into the overlying Friars Point Limestone and probably occur in a slightly
deeper water environment and represent a more marginal, seaward part of
the shoal than the cross-bedded oolitic limestones of South Wales (Figure
3.11).
3.2.7 Lithofecies 7 Structureless fine grained dolomites
interbedded with shales
Invariably, immediately overlying the Brofiscin Oolite are the crinoidal
packstones of the Friars Point Limestone. Separating these lithologies at
Drybrook Quarry (Appendix I) is a non-fossiliferous, diffusely laminated
dolomite (ca. 120cm thick) (Figure 3.9B & C). Interbedded with the pale
tan dolomites (bedded on a 30-50cm scale) are thinly-bedded,
black/bluey-green shale layers (1-2cm thick). The latter define low angle
(<10°) lateral accretion surfaces which are convergent towards the west
(Figure 3.9B).
Interpretation: The association of interbedded, thin shale
layers and non-fossiliferous, fine grained dolomites is indicative of
deposition in a low energy, probably restricted (lagoonal? ) environment.
Similar lithologies have been recorded in the Clifton Down Mudstone
52
immediately overlying the Gully Oolite, and interpreted as back-barrier
deposits by Riding & Wright (1981), Wright (1986), Ramsay (1987) and Weedon (1988). The low angle, lateral accretions surfaces (Figure 3.9B)
are thought to represent migratory tidal channel bars. Such surfaces have
been recorded within the clastic tidal channel fills of the North Sea by
Weimer et al. (1982) and in a carbonate setting on Andros by Shinn et al.
(1969). Recognition of low angle accreting surfaces in back-barrier
deposits are considered by Wright (1984b), to be diagnostic of tidal
channels in ancient sequences.
3.3 Distribution of the lithofacies
This study concentrates upon the coastal sections in South Wales where the
lithofacies are readily identifiable. Recognition of the lithofacies was
hampered in the quarry sections due to the lack of detail in the 'fresh'
(unweathered) rock faces, particularly in the northern and central parts
of the area. Here, the succession has been extensively dolomitized.
Fortunately, the oolitic grainstones are readily identifiable mainly
because of secondary reddening of the ooliths.
From north to south the Barry Harbour Limestone
Formation forms a southerly thickening wedge. The measured thickness
increases from ca. 5m at Drybrook Quarry to over 90m at Castlemartin
(Figures 3.3 & 3.12). In contrast, the Brofiscin Oolite Formation (up to
16m thick at Brofiscin Quarry) forms a southerly thinning sedimentary
wedge which 'feathers-out' in the central ramp zone (Figures 3.3 & 3.12).
A summary of the distribution of the lithofacies is shown in Figure
3.13. The planar laminated facies (Lithofacies 1) forms the lower part of
the Barry Harbour Limestone in the central and southern ramp zones.
In stratigraphic order it is overlain by the ungraded sedimentary
couplets of Lithofacies 2, the graded beds of Lithofacies 3, and the
53
oýý g
c) n
cm
CJ bV Z0
47
-61 >
o3. CV to ., mC ý'
0 ö 4,
Ow Z. y
40
V Cn Q) .ý
12. (V V,
0
CSýwä
r> 0) w
Cd G,. aw aICD'
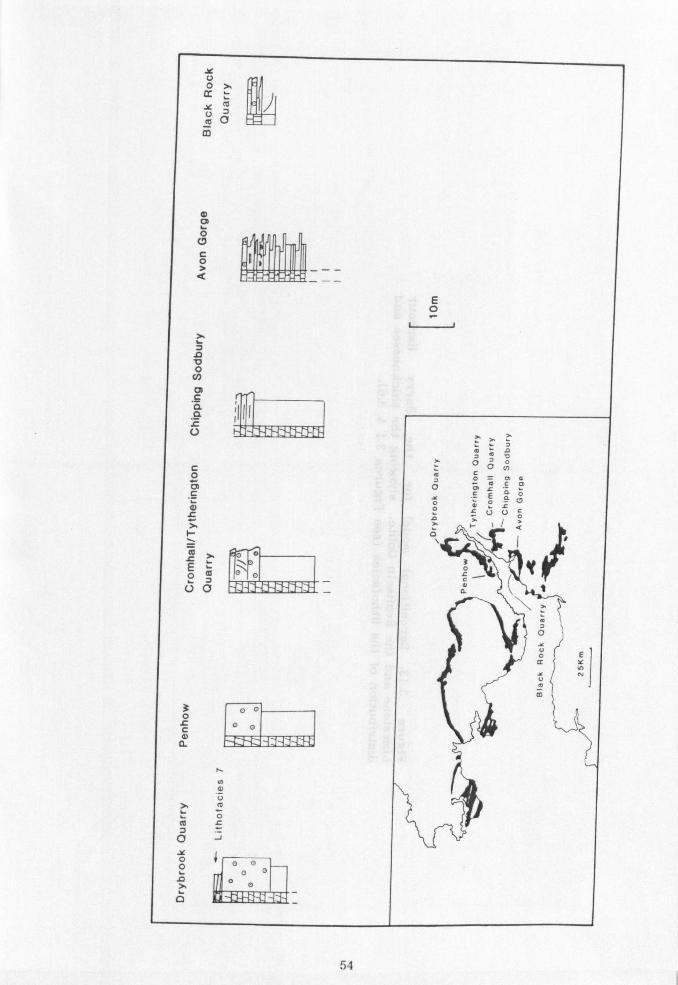
54
ý. b JC
O0
cd 9)
xw w
t., U S. . (0
ýotl
ýý rr
,ý pp ch
w U1 Lr.
v
c Co 0 (A
`r te 0 o
äßs
`a O
CO C C.,
0O
I ;ý DO8 ý
firs -Z
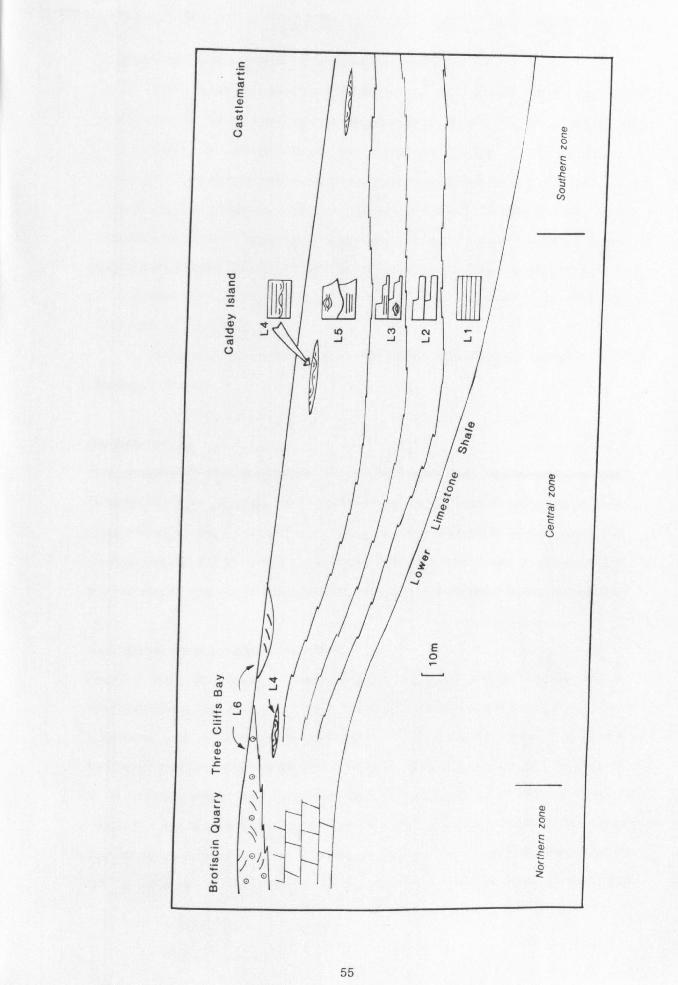
C
E w yý N U
cr
A
_'a J
U
cc m H CD
wJ
U
F-O
O d
C
ö00
G NN G
L
O Z
Q) NN C
O
m c 0 N
<O
C m 0
55
amalgamated graded beds of Lithofacies 4 and 5.
The northern and central parts of the study area are mainly
dominated by the cross-bedded limestones of Lithofacies 6 (Figures 3.3,
3.11 & 3.12). In South Wales the southern fringe of the Bandbody is
recorded by the cross-bedded bioclastic limestones at Rhossili and Barry
Island. In SW England the cross-bedded oolite 'feathers-out' before
Chipping Sod bury (Figures 3.11 & 3.12). However, graded oolitic limestone
units (Lithofacies 5) are found to the south of Chipping Sodbury: in the
Avon Gorge (1m thick unit) and at Black Rock Quarry (2m thick unit)
(Figures 3.11 & 3.12).
Lithofacies 7 has only been identified at Drybrook Quarry in the
Forest of Dean.
3.4 Discussion
The purpose of this discussion is to evaluate the significance of the
lithofacies and discuss the processes operating in the middle and inner
ramp environments. In addition, there is a re-evaluation of the idealized
shallow marine facies model described by Wu (1982) and an assessment of
the nature of the Barry Harbour Limestone and Brofiscin Oolite regression.
3.4.1 Storm versus wave domination
Within the literature there are two alternative sedimentary
interpretations offered for the Barry Harbour Limestone on Gower.
Junghanss et al. (1984) and Wright (1986) agree upon a storm
dominated interpretation with HCS, whereas Ramsay (1987) is in favour
of it being storm and wave-dominated without HCS. Wave generated
structures are present but they have a low abundance in comparison with
the storm generated sedimentary structures. The paucity of wave-ripples
and the absence of beach facies in the Brofiscin Oolite suggest deposition
56
under low wave-energy conditions. From the lithofacies descriptions in
this study it is apparent that the Barry Harbour Limestone is a
storm-dominated sequence with HCS (Figures 3.7 & 3.8).
3.4.2 Nature of the hummocky cross-stratification
Ramsay (1987) reinterpreted the hummocks at Three Cliffs Bay, as
symmetrical or possibly three dimensional ripples and uniformly dipping
low angle cross-lamination. This reappraisal of the sequence favours the
interpretation of Wu (1982) and Wright (1986). The HCS in the Barry
Harbour Limestone has been identified by several diagnostic
characteristics: - the lower erosional surface gently curves upwards with a
maximum slope of 20 degrees (Figures 3.5A & B, 3.7 & 3.8) and clearly
truncates the parallel laminae below; the laminae immediately above this
surface are subparallel to it; there are some intersections between
laminae, but the angles are generally less than 5-10 degrees; the
wavelength of the hummocks is between 0.3m and 3m.
The majority of examples of HCS in the Barry Harbour Limestone are
simple compared to the classical form of HCS as described by Dott &
Bourgeois (1982). The classical form consists of several scour and
depositional drape phases (Brenchley 1985) which is in contrast to the
single scour and drape phase commonly seen in the HCS of the Barry
Harbour Limestone (Figures 3.5B & 3.8A). The formation of HCS is dependent
upon the appropriate current type, current strength and suitable grain
size. Consequently the absence of HCS in many of the Lithofacies 3 and 5
beds could be due to one or more of the above factors being inappropriate
for its formation. It would seem that current intensity and grain size are
both related, since without scouring the HCS in the Barry Harbour
Limestone will not develop. Dott & Bourgeois (1982) noted that in
clastic sequences, HCS preferentially developed in silt to fine sand
57
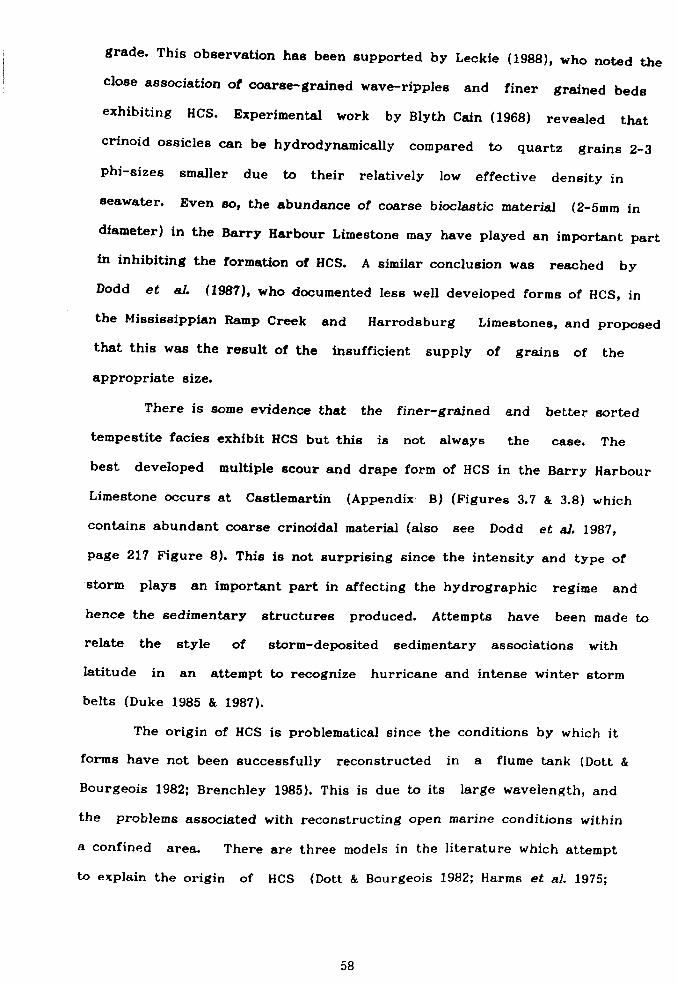
grade. This observation has been supported by Leckie (1988), who noted the
close association of coarse-grained wave-ripples and finer grained beds
exhibiting HCS. Experimental work by Blyth Cain (1968) revealed that
crinoid ossicles can be hydrodynamically compared to quartz grains 2-3
phi-sizes smaller due to their relatively low effective density in
seawater. Even so, the abundance of coarse bioclastic material (2-5mm in
diameter) in the Barry Harbour Limestone may have played an important part
in inhibiting the formation of HCS. A similar conclusion was reached by
Dodd et al. (1987), who documented less well developed forms of HCS, in
the Mississippian Ramp Creek and Harrodsburg Limestones, and proposed
that this was the result of the insufficient supply of grains of the
appropriate size.
There is some evidence that the finer-grained and better sorted
tempestite facies exhibit HCS but this is not always the case. The
best developed multiple scour and drape form of HCS in the Barry Harbour
Limestone occurs at Castlemartin (Appendix B) (Figures 3.7 & 3.8) which
contains abundant coarse crinoidal material (also see Dodd et al. 1987,
page 217 Figure 8). This is not surprising since the intensity and type of
storm plays an important part in affecting the hydrographic regime and
hence the sedimentary structures produced. Attempts have been made to
relate the style of storm-deposited sedimentary associations with
latitude in an attempt to recognize hurricane and intense winter storm
belts (Duke 1985 & 1987).
The origin of HCS is problematical since the conditions by which it
forms have not been successfully reconstructed in a flume tank (Dott &
Bourgeois 1982; Brenchley 1985). This is due to its large wavelength, and
the problems associated with reconstructing open marine conditions within
a confined area. There are three models in the literature which attempt
to explain the origin of HCS (Dott & Bourgeois 1982; Harms et al. 1975;
58
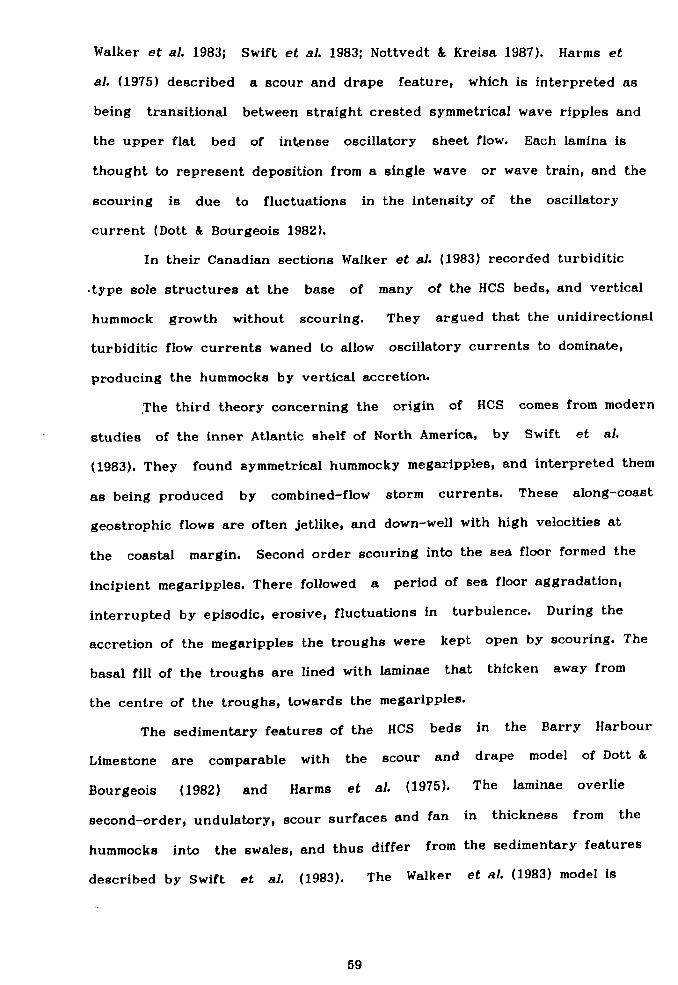
Walker et al. 1983; Swift et al. 1983; Nottvedt & Kreisa 1987). Harms et
al. (1975) described a scour and drape feature, which is interpreted as
being transitional between straight crested symmetrical wave ripples and
the upper flat bed of intense oscillatory sheet flow. Each lamina is
thought to represent deposition from a single wave or wave train, and the
scouring is due to fluctuations in the intensity of the oscillatory
current (Dott & Bourgeois 1982).
In their Canadian sections Walker et al. (1983) recorded turbiditic
-type sole structures at the base of many of the HCS beds, and vertical
hummock growth without scouring. They argued that the unidirectional
turbiditic flow currents waned to allow oscillatory currents to dominate,
producing the hummocks by vertical accretion.
The third theory concerning the origin of HCS comes from modern
studies of the inner Atlantic shelf of North America, by Swift et al.
(1983). They found symmetrical hummocky megaripples, and interpreted them
as being produced by combined-flow storm currents. These along-coast
geostrophic flows are often jetlike, and down-well with high velocities at
the coastal margin. Second order scouring into the sea floor formed the
incipient megaripples. There followed a period of sea floor aggradation,
interrupted by episodic, erosive, fluctuations in turbulence. During the
accretion of the megaripples the troughs were kept open by scouring. The
basal fill of the troughs are lined with laminae that thicken away from
the centre of the troughs, towards the megaripples.
The sedimentary features of the HCS beds in the Barry Harbour
Limestone are comparable with the scour and drape model of Dott &
Bourgeois (1982) and Harms et al. (1975). The laminae overlie
second-order, undulatory, scour surfaces and fan in thickness from the
hummocks into the swales, and thus differ from the sedimentary features
described by Swift et al. (1983). The Walker et al. (1983) model is
59
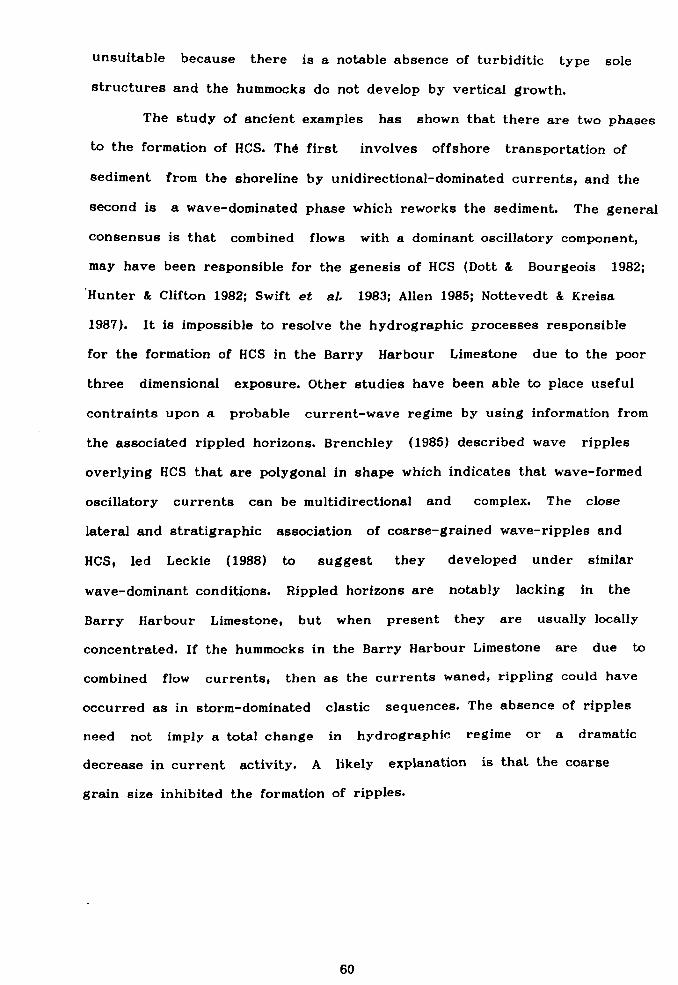
unsuitable because there is a notable absence of turbiditic type sole
structures and the hummocks do not develop by vertical growth.
The study of ancient examples has shown that there are two phases
to the formation of HCS. The first involves offshore transportation of
sediment from the shoreline by unidirectional-dominated currents, and the
second is a wave-dominated phase which reworks the sediment. The general
consensus is that combined flows with a dominant oscillatory component,
may have been responsible for the genesis of HCS (Dott & Bourgeois 1982;
Hunter & Clifton 1982; Swift et al. 1983; Allen 1985; Nottevedt & Kreisa
1987). It is impossible to resolve the hydrographic processes responsible
for the formation of HCS in the Barry Harbour Limestone due to the poor
three dimensional exposure. Other studies have been able to place useful
contraints upon a probable current-wave regime by using information from
the associated rippled horizons. Brenchley (1985) described wave ripples
overlying HCS that are polygonal in shape which indicates that wave-formed
oscillatory currents can be multidirectional and complex. The close
lateral and stratigraphic association of coarse-grained wave-ripples and
HCS, led Leckie (1988) to suggest they developed under similar
wave-dominant conditions. Rippled horizons are notably lacking in the
Barry Harbour Limestone, but when present they are usually locally
concentrated. If the hummocks in the Barry Harbour Limestone are due to
combined flow currents, then as the currents waned, rippling could have
occurred as in storm-dominated clastic sequences. The absence of ripples
need not imply a total change in hydrographic regime or a dramatic
decrease in current activity. A likely explanation is that the coarse
grain size inhibited the formation of ripples.
60
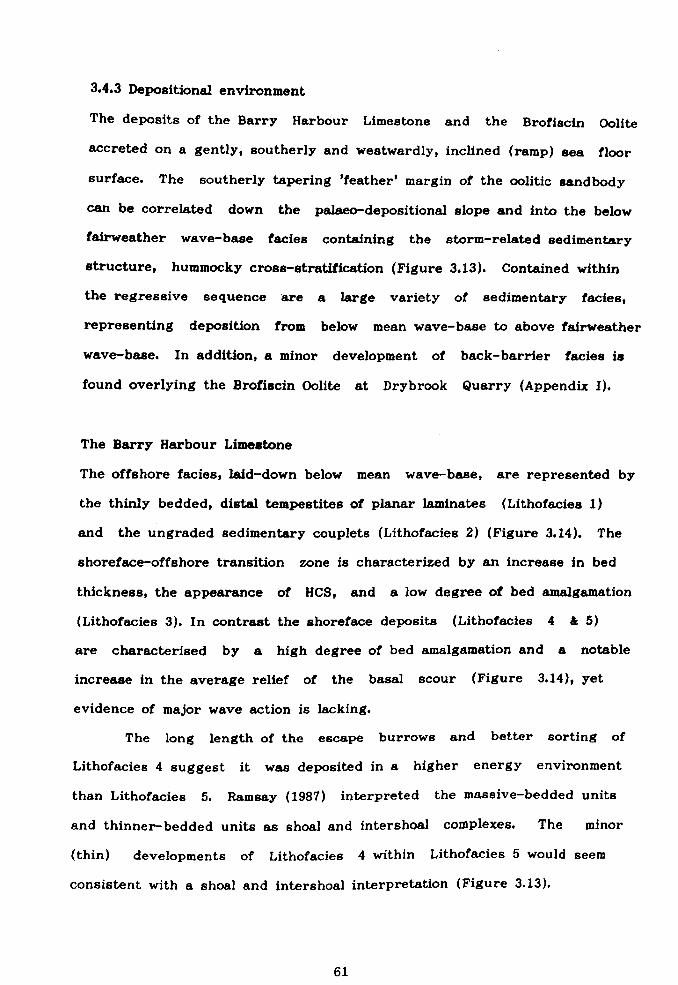
3.4.3 Depositional environment
The deposits of the Barry Harbour Limestone and the Brofiscin Oolite
accreted on a gently, southerly and westwardly, inclined (ramp) sea floor
surface. The southerly tapering 'feather' margin of the oolitic sandbody
can be correlated down the palaeo-depositional slope and into the below
fairweather wave-base facies containing the storm-related sedimentary
structure, hummocky cross-stratification (Figure 3.13). Contained within
the regressive sequence are a large variety of sedimentary facies,
representing deposition from below mean wave-base to above fairweather
wave-base. In addition, a minor development of back-barrier fades is
found overlying the Brofiscin Oolite at Drybrook Quarry (Appendix I).
The Barry Harbour Limestone
The offshore facies, laid-down below mean wave-base, are represented by
the thinly bedded, distal tempestites of planar laminates (Lithofacies 1)
and the ungraded sedimentary couplets (Lithofacies 2) (Figure 3.14). The
shoreface-offshore transition zone is characterized by an increase in bed
thickness, the appearance of HCS, and a low degree of bed amalgamation
(Lithofacies 3). In contrast the shoreface deposits (Lithofacies 4& 5)
are characterised by a high degree of bed amalgamation and a notable
increase in the average relief of the basal scour (Figure 3.14), yet
evidence of major wave action is lacking.
The long length of the escape burrows and better sorting of
Lithofacies 4 suggest it was deposited in a higher energy environment
than Lithofacies 5. Ramsay (1987) interpreted the massive-bedded units
and thinner-bedded units as shoal and intershoal complexes. The minor
(thin) developments of Lithofacies 4 within Lithofacies 5 would seem
consistent with a shoal and intershoal interpretation (Figure 3.13).
61
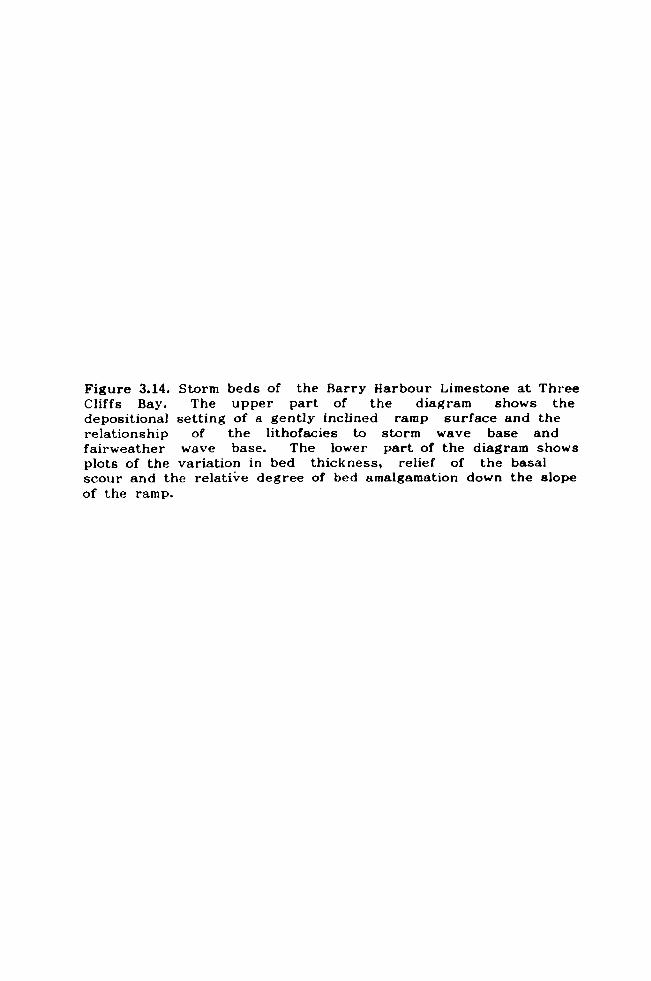
Figure 3.14. Storm beds of the Barry Harbour Limestone at Three Cliffs Bay. The upper part of the diagram shows the depositional setting of a gently inclined ramp surface and the relationship of the lithofacies to storm wave base and fairweather wave base. The lower part of the diagram shows plots of the variation in bed thickness, relief of the basal scour and the relative degree of bed amalgamation down the slope of the ramp.
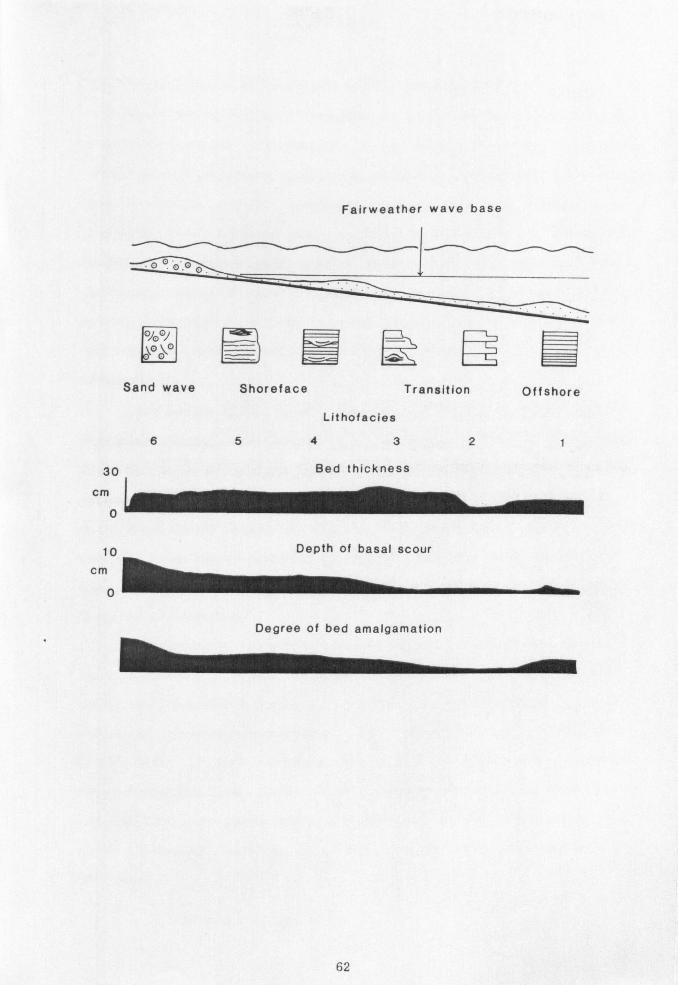
Fairweather wave base
Sand wave Shoreface Transition Offshore
Lithofacies
654321
30 Bed thickness
cm I-
lb, 0
10 Depth of basal scour
cm
0
Degree of bed amalgamation
62
The Brofiscin Oolite & its lateral cross-bedded equivalents
The cross-bedded Brofiscin Oolite and its lateral bioclastic cross-bedded
equivalents record sedimentation in an above fairweather wave-base
environment. The palaeocurrent readings show a strong longshore component
and a weaker shoreline perpendicular, tidal component (Figure 3.11).
Deposition of the Brofiscin Oolite in the Bristol district is interpreted
as being in a slightly lower energy regime than that in South Wales.
Separating many of the cross-beds at Cromhall Quarry (Appendix K) are
micrtic drapes (up to 5cm thick) which contain biogenic structures. Such
features are notably absent in the Brofiscin Oolite of Three Cliffs Bay
(Appendix F).
The nature of the contact between the Brofiscin Oolite and the
overlying Friars Point Limestone is variable. In South Wales the
Brofiscin Oolite has a sharp contact with the overlying beds and contains
meniscus cements which are indicative of subaerial exposure (Hird 1986).
At Cromhall Quarry (Appendix K) and Tytherington Quarry (Appendix J), the
Brofiscin Oolite passes transitionally upward into the overlying Friars
Point Limestone without any evidence of subaerial exposure or a major
break in sedimentation.
Unfortunately, there is insufficient evidence to determine whether
the back-barrier tidal deposits (Lithofacies 7) overlying the
extensively dolomitized oolite at Drybrook Quarry (Appendix I) were
laid-down penecontemporaneously. The alternative is that the
back-barrier facies developed landward of a shoreward migrating
shoal, during the basal Friars Point Limestone transgression. In such a
scenario, the shoal facies would be represented by the sheet deposit of
coarse crinoidal material (ca. 10cm) which immediately overlies
Lithofacies 7.
63
In conclusion, at the peak of the regression much of South Wales
was subaerially exposed whereas the palaeo-shoreline in SW England was
most probably located to the north of the Cromhall Quarry and Tytherington
Quarry (Figure 3.11). The Bristol area probably formed a marine
embayment, perhaps partially protected by the oolite shoal facies and the
emergence surface which developed in South Wales (Figure 3.11).
It is notable that there there is a paucity of re-sedimented ooids
in the more proximal tempestite facies. This is significant as it is well
established that barometric and wind effects during major hurricanes and
mid-latitude storms can cause the build-up of sea water against the
shoreline (Morton 1981; Leckie & Walker 1982; Swift et al. 1983;
Swift & Nummedal 1987; Swift et al. 1987). The build-up of a significant
head of water against the shore is counteracted by gravity which creates
downwelling currents that flow offshore. These returning currents are
capable of carrying sediment from the nearshore region offshore (Swift et
al. 1983). However, it is only the most intense storms which mobilise
large volumes of water that cause significant set-up along a coastline
(Swift et al. 1983) and are capable of transporting material
offshore. The less intense short-lived storms (e. g. Cyclone
Winifred) that affect only a relatively small area of coastline do not
cause significant set-up against the coastline (<1.6m) and create
high-energy downwelling currents (Gagan et al. 1988). These types
of storm events merely cause in situ resuspension of shelf sediment,
without significant net-transportation offshore (Gagan et al. 1988).
It is significant that the developments of graded oolitic limestone
in the Avon Gorge and at Black Rock Quarry are not attached to the main
part of the oolite shoal, located to the north of Chipping Sodbury (Figure
3.11). The absence of re-sedimented ooids at Chipping Sodbury (Figure
3.11) militates against the ooid supply being from the north by means of
64
storm-related relaxation currents.
The well developed ooids are likely to have originated in a
nearshore environment and were subsequently transported to below
fairweather wave-base. The two-fold westward thickening of the graded
oolite units indicates the most likely source of supply. Palaeocurrent
readings of the cross-bedded Yorke Rock Bed at Barry show a strong
prefered orientation towards the east (Figures 3.10 & 3.11). This would
support the proposal that longshore (fairweather) currents were
responsible for transporting the ooids offshore into the marine embayment
of the Bristol area.
Regardless of the mode of supply of the ooids, sedimentation of the
graded oolitic limestones was ultimately from high energy,
(storm-related? ) currents. The fairweather, offshore transportation of
the ooids may have been enhanced by storm processes. Alternatively, the
graded oolitic limestone beds may just represent in situ resuspension of
bioclastic and oolitic material without significant net-transportation
offshore (e. g. Gagan et al. 1988).
3.4.4 Reanalysis of the facies model of Wu (1982)
This re-analysis of the depositional environments of the Barry Harbour
Limestone at Three Cliffs Bay has resulted in a reappraisal of the four
distal to proximal, graded facies types described by Wu (1982) (Figure
3.15). His facies model was constructed from his analysis of two lower
Dinantian sequences in South Wales. Wu's "below storm wave base facies,
type A" is a thickly bedded, bioturbated packstone characterized by
reorientated horn corals in the basal lag. This facies is not
present in the Barry Harbour Limestone Formation. Types B and C contain
HCS, and are interpreted by Wu (1982) as representing deposition between
storm and fairweather wave-base (Figure 3.15). The former is analogous to
65

x v
.n
0 c x 0
s 9 s
co 0 I) 0
OC
03
1w
C7
yv
00
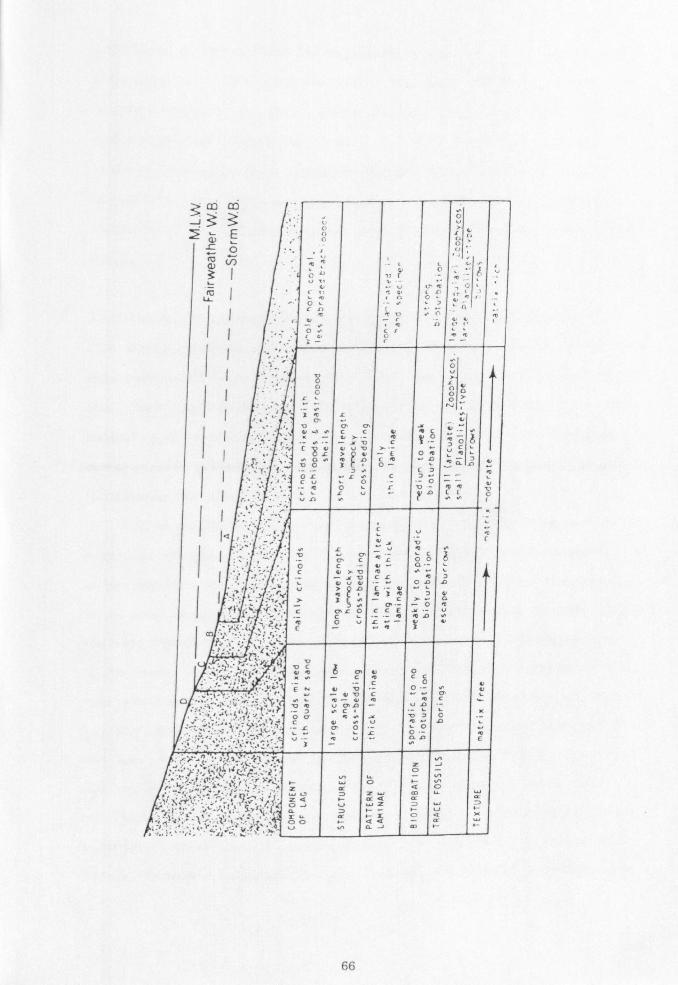
66
Lithofacies 3. Types C and the megaripple facies Type D are represented by
Lithofacies 5 which contains HCS. Important additional sedimentary
features found in the Barry Harbour Limestone include the two
distal-tempestite Lithofacies 1 and 2, and the subaerially exposed
cross-bedded oolite. It is suprising that the latter lithofacies was not
included in Wu's facies model because oolitic sandbodies are particularly
useful both as palaeobathymetric and environmental indicators (section
3.4.3).
3.4.5 The Barry Harbour Limestone & the Brofiscin Oolite regression
The Barry Harbour Limestone and the Brofiscin Oolite record the
establishment of a carbonate ramp and the first major regression in
the Dinantian succession of SW Britain. The regression in the
central and southern ramp zone is recorded by the sequence of
storm-related sedimentary structures in the Barry Harbour Limestone
(Lithofacies 1-5) (Figure 3.13).
It is significant that the depth-related facies show a high
degree of provinciality (Figure 3.13). The Brofiscin Oolite is thickest
in the northern ramp zone (Figure 3.12 & 3.13). In contrast the central
ramp zone contains an expanded sequence consisting mainly of the graded
beds of Lithofacies 3 and the amalgamated storm beds of Lithofacies 4 and
5. The above facies form an attenuated succession in the southern ramp
zone which is dominated by the distal tempestites of Lithofacies 1 and
2. The provinciality of the facies would suggest sediment aggradation
was the main process of sediment accumulation. The basinward
petering-out of the Brofiscin Oolite in the central ramp zone,
represents an unsuccessful, late stage attempt at progradation. For
sediment. aggradation to have dominated over lateral accretion, and
for the expanded sequence in the central ramp zone to have developed,
67
there must have been a relative rise in sea level.
Eustatic controls upon sedimentation
Ramsbottom (1977 & 1979) and later Ross & Ross (1985 & 1987) suggested
that there were three significant depositional (mesothemic) cycles during
the Courceyan and two during the Chadian. The three Courceyan mesothems
(Dla, Dlb & D1c) are part of Ramsbottom's (1973)
transgressive-regressive 'First Major Cycle' of which there are six during
the Carboniferous.
The first mesothemic cycle, Dla, includes the Lower Limestone
Shale Group. The start of the second cycle, Dib, occurs at the base of
the Black Rock Limestone. It includes the Barry Harbour Limestone, the
Brofi: scin Oolite and the lower part of the Friars Point Limestone. The
third mesothemic cycle, D1c, comprises the upper part of the Friars
Point Limestone and records the major sea level fall at the end of the
Courceyan (Ramsbottom 1973; Lees & Hennebert 1982; Ross & Ross 1985 &
1987).
A sea level fall at the base of the Barry Harbour Limestone is
difficult to detect, although it may well have prompted carbonate
production. According to the sea level curves of Ramsbottom (1977 &
1979) the Barry Harbour Limestone, the Brofiscin Oolite and the lower part
of the Friars Point Limestone accumulated during a eustatic rise in sea
level. However, the geometry of the Brofiscin Oolite is inconsistent with
that of an oolitic sandbody which developed during a eustatic rise in
sea level, such as the Castell Coch Limestone (Lower Limestone Shale
Group) (Burchette 1987).
Both the Brofiscin Oolite and the Castel] Coch Limestone were
laid-down in a storm and tide-dorninated regime (Burchette el al.
submitted) and under humid climatic conditions (fiird & fucker 1988;
(38
Burchette pers. comm. ). They both form an oolitic sand belt of tidal
shoals which pass seaward into below fairweather wave-base,
storm-dominated facies. The palaeocurrent readings show a strong
longshore component and a weaker shoreline perpendicular tidal component
(Figure 3.11; Burchette 1987, page 250, figure 13.6).
However, the geometries of the Castel] Coch Limestone and the
Brofiscin Oolite differ. The thickest development of the Castell Coch
Limestone occurs basinward along the southern fringe of the oolitic
sandbody. A shallow marine embayment/'lagoon' developed landward of the
sand belt and prograded basinward during the eustatic rise in sea level
(Burchette 1987). The southward thinning of the Brofiscin Oolite and poor
development of back-barrier facies (Lithofacies 7), if at all, suggests
the Brofiscin Oolite accumulated during a period of relative sea level
stasis.
In conclusion the Barry Harbour Limestone and the Brofiscin
Oolite depositional cycle is not equivalent to the depositional D1b cycle
of Ramsbottom (1977 & 1979). This _ would suggest the above regressive
sequence was a localised phenomenon in SW Britain.
Tectonic controls upon sedimentation
The Barry Harbour Limestone and the Brofiscin Oolite sequence shows over a
six fold thickness increase from Drybrook Quarry (Appendix 1) to
Castlemartin (Appendix B) (Figures 3.3 & 3.12). This would suggest that
sedimentation was influenced by differential subsidence. A progressive
increase in the rate of subsidence into the basin (flexure) would limit
the degree of lateral progradation and maintain the ramp facies belts. A
minor drop in sea level exposed the Brofiscin Oolite and caused a seaward
shift of the shoal facies belt into the central ramp zone (Figure 3.13).
The only direct evidence of tectonic activity upon sedimentation is
69
Figure 3.16. Slump structure occurring towards the base of the Barry Harbour Limestone, containing chert nodules. Stratigraphic position is shown in Figure 3.3. (Caldey Island).
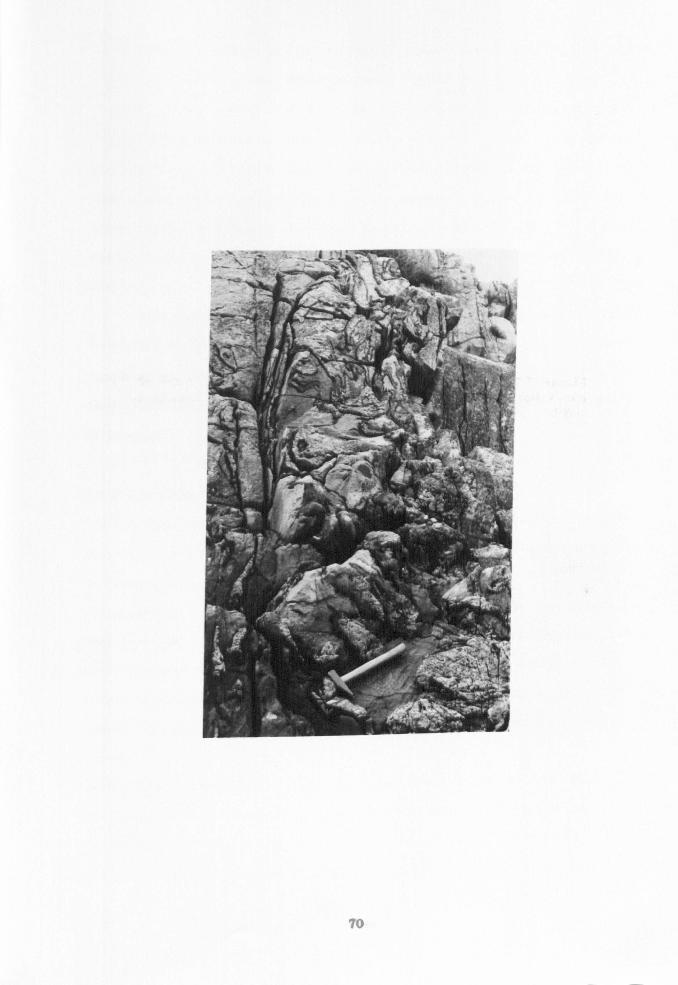
70
to be found at Caldey Island (Appendix D) where a slump structure occurs in the basal part of the Barry Harbour Limestone (Figures 3.3 & 3.16).
Similar slump structures have been documented in the Lower Limestone
Shale Group in sections located just to the south of the Ritec Fault
(Dyfed). These structures have been recorded at West Angle Bay, Skrinkle
Haven, and Caldey Island (Figure 1.2) by Kelling & Williams (1966). The
latter authors proposed that seismic activity along the Ritec Fault was
the most likely trigger for slumping. Such an origin is consistent with
the presence of slumping in the Barry Harbour Limestone at Caldey Island.
In conclusion the nature of the Barry Harbour Limestone and the
Brofiscin Oolite regression was as a result of carbonate production
'catching-up' with sea level. The persistence of the depth-related ramp
facies belts was probably assisted by differential subsidence as a result
of flexure.
3.5 Conclusions
1) The Barry Harbour Limestone and the Brofiscin Oolite form a shallow
marine, predominantly subtidal, shallowing-upward sequence which is capped
by a subaerially exposed oolite in South Wales.
2) Hummocky cross-stratification was identified within the succession.
Many of the HCS beds exhibit only one phase of second-order scour, onto
which the overlying laminae drape. The lack of successive scour and drape
events as seen as the classical form of HCS is thought to be due to the
coarse grain-size of the bioclasts, inhibiting the successive scour
events.
3) An assessment of the major controls affecting the sedimentation of
the Barry Harbour Limestone favours a storm-dominated interpretation.
4) Wu's (1982) distal to proximal facies trend model is modified to
include two additional distal tempestite lithofacies and a proximal oolite
71
sandbody.
5) The oolitic sandbody is a low wave energy, tidally influenced, sand
shoal deposit which prograded across the gently inclined ramp from the
north.
6) The area to the north of Bristol formed a marine embayment whose
southern limit is a subtidal bar containing re-sedimented ooids derived
from the west by longshore currents.
7) The Barry Harbour Limestone and the Brofiscin Oolite record the first
major basin-wide, shallowing-upward phase subsequent to the early
Carboniferous transgression.
72
Chapter 4- Sedimentology and tectonic evolution of an offshore muddy ramp
sequence: the Friars Point Limestone Formation
4.1 Introduction
4.2 Geological setting
4.3 Lithofacies and their interpretation
4.3.1 Lithofacies 8: Decimetre-bedded, bioturbated
packstone/wackestone beds with shell lags
4.3.2 Lithofacies 9: Thickly-bedded, bioturbated
wackestones/packstones separated by shaly layers
4.3.3 Lithofacies 10 : Crinoidal stem-rich packstone
4.3.4 Black Rock Dolomite
4.4 Temporal and spatial distribution of the lithofacies
4.5 Discussion
4.5.1 Basal transgressive sequence
4.5.2 Proximality trend
4.5.3 Biofacies
4.5.4 Biostratigraphic time-lines
4.5.5 Sedimentation and tectonics
4.6 Conclusions
73
4.1 Introduction
Considerable attention has been devoted to the study of above storm
wave-base facies in Carboniferous ramp successions (e. g. Wu 1982; Handford
1986; Wright 1986; Faulkner 1988; Dodd et al. 1987), whereas,
there have been few detailed accounts of those facies types which form the
deeper ramp sequences. Notable exceptions include work on the Arundian of
South Wales by Simpson (1987), and studies of the Muschelkalk in Germany
and NE Spain by Aigner (1984 & 1985) and Calvet & Tucker (1988),
respectively. This disparity of work is more acute in the knowledge
that below storm wave-base facies dominate the Lower Carboniferous ramp
succession of SW Britain. In particular, these facies form the thick
assemblages occurring in the southern ramp zone (Lees et al. 1977;
Wright 1986; Waters & Lawrence 1987).
The aim of this chapter is to describe and interpret the
moderately to extensively bioturbated succession of the Friars Point
Limestone Formation (up to 280m thick). Emphasis will be placed upon
distribution of the lithofacies and current indicators (e. g.
storm-sediment filled burrows). A model is offered for the environment
of deposition which consists of two broad depth-related offshore facies
belts. The timing of differential subsidence and its effect upon
sedimentation is assessed using established conodont biostratigraphy, in
order to identify seemingly isochronous sedimentary assemblages.
Also contained within the Friars Point Limestone are the Middle
Hope (Weston-super-Mare) volcanics and the Waulsortian buildups of
Castlemartin and Cannington Park, these topics are dealt with separately
in Chapters 5 and 6 respectively.
74
4.2 Geological Setting
The Friars Point Limestone Formation (Figure 1.3) overlies the regressive
sequence of the Barry Harbour Limestone and Brofiscin Oolite. The peak of
the regression culminated in the local emergence of the Brofiscin Oolite,
which can be correlated, southward and westward, down the palaeoslope into
the subtidal facies of the uppermost Barry Harbour Limestone. The Friars
Point Limestone commonly displays a sharp, truncated contact with the
immediately underlying Brofiscin Oolite but a gradational contact with the
Barry Harbour Limestone, in more distal settings.
4.3 Lithofacies and their interpretation
Three main lithofacies types are recognized (Figure 4.1) and their
numbering (Lithofacies 8-10) follows on from those described in Chapter 3.
Many of the lithofacies described from the Barry Harbour Limestone are
also present in the lower part of the Friars Point Limestone; where
necessary the reader is referred to Chapter 3.
Across much of the study area, the Black Rock Dolomite forms the
upper part of the Friars Point Limestone Formation (Figures 2.1,2.2 &
2.3). Unfortunately, the pervasive dolomite almost totally obscures the
sedimentary features, except for rare limestone pods in which the
precursor limestone may occasionally be identified. Only the latter
features are described in detail, since a full petrographic and
geochemical study of the Black Rock Dolomite has been documented elsewhere
by Hird (1986) and Hird et al. (1987).
4.3.1 Lithofacies 8. Decimetre-bedded, bioturbated
packstone/wackestone beds with shell lags
Lithofacies 8 forms decimetre-thick, bioturbated, pale grey
packstone/wackestone beds (Figures 4.1A & 4.2A). The base of each bed is
75
r. U uw
O
C cli . -
E3
C
1Z3 li w
is y, 1)
EUp,
O
ü
(n w O" m
Z (D 00ý
,e -0 sue. C3' cö
i..
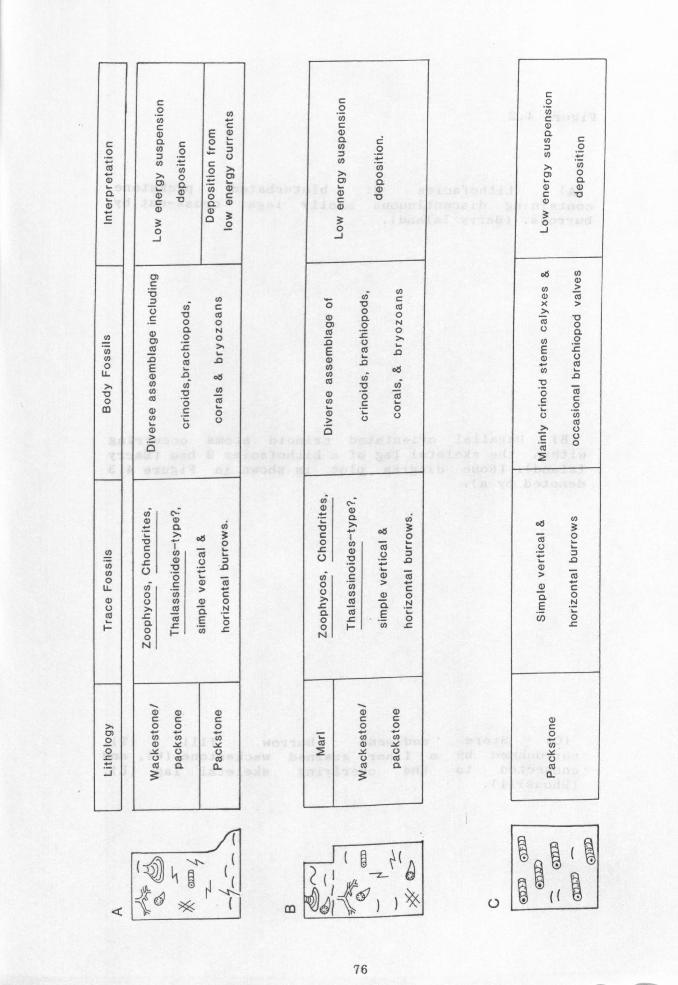
C O 0C
NE aC0 .
`. 0
Typ O C' :! Z `
". ym CV
CL C
C3
3p p- J
O)
Vy
VyC Cy
"- OO CL N
.20 T
Co m
E m 06 (! 1 y y
_y yOO
NCp
0
Ir aý C)
a 0ö 3
Oyý Uv .-0
c ÜydO
T l0 äN a Co Eö pý 'y t
dNN ccc 000 (d y0
YY YUU
cci 00
C O
a
C
N
y y 0
LL
T
0 m
y
U) N 0 LL
U c0
I-
0) 0 ö L
J
-fd Q1 C
C 0 0) C y CL c y O
Y N
N >. 0 O) p,
O d C d
O J
N N C
O O 0 0 y a N Cý
y 0
L O U
L
N N N
y O Co C
0- O U V
m C)
3 a ,0 o o O y c `
L 1 v
O 'y V y G>
C O
t N ä
CL Co E ý L N L
d) G) C C O o N N
Je 0 0 Co Co a
3
L
m ®11ý®1
76
C 0
Co C
yc O
N
Ty pý O
dN CV d
O J
oÖ y
N> d fC x> a
NV UO a N .2 EL yU
O Co Ec O U tq
fC >U
CU
OO
N 3 O
U
G) > lC
0C O N
0
d C O y
U Co
k

Figure 4.2
(A) Lithofacies 8: bioturbated packstone containing discontinuous shelly lags, cross-cut by burrows. (Barry Island).
(B) Parallel orientated crinoid stems within the skeletal lag of a Lithofacies 8 Island). (Rose diagram plot is shown in denoted by a).
occurring bed (Barry Figure 4.3
(C) Storm sediment burrow fill (T),
surrounded by a finer grained wackestone (W), and connected to the overlying skeletal lag (L). (Rhossili).
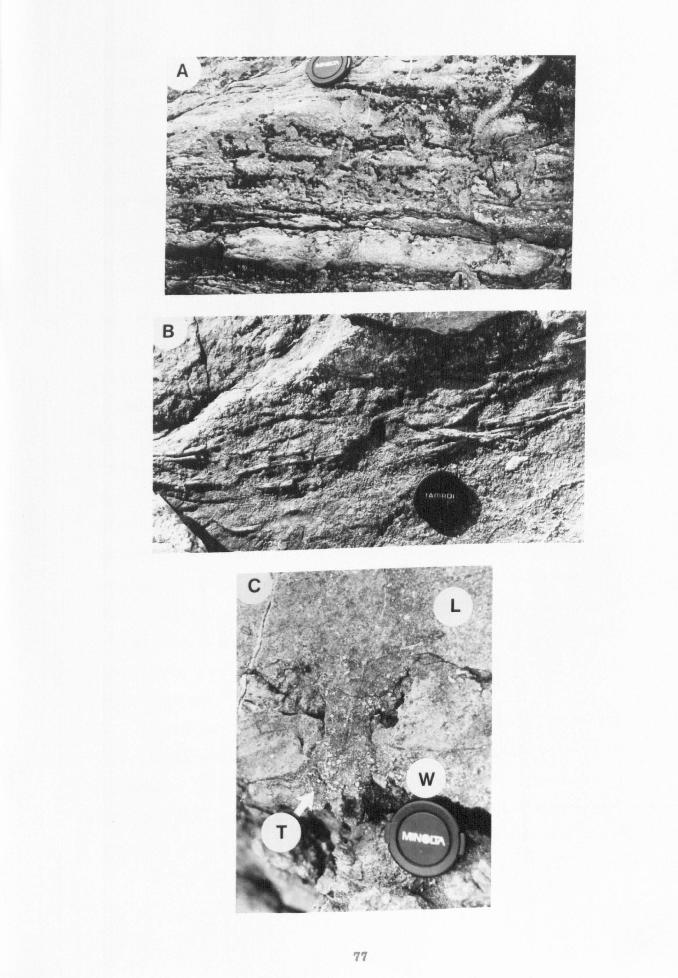
*61 0-
W. -,
77
7L
yý
delineated by a laterally-discontinuous skeletal lag (invariably less
than 5cm thick) which is traceable up to a maximum distance of 10m.
Disrupting the continuity of the lags are cross-cutting burrows (Figure
4.2A. ). The main constituents of the lags include convex-upward brachiopod
valves and crinoid debris including stems. Measurements of the
orientation of closely-packed crinoid stems (»15cm in length) (Figure
4.2B) on a bedding plane surface at Barry, revealed a strong preferred
NE-SW orientation (Figure 4.3 denoted by a). Composite results, taken from
numerous bedding plane surfaces confirmed the NE-SW trend, although it was
less well defined (Figure 4.3 denoted by b).
Lithofacies 8 contains a diverse fauna of crinoids, corals
(mainly zaphrentoids), brachiopods and bryozoans. The faunal
constituents are commonly disarticulated and apart from the bryozoans
there is a minimal amount of fragmentation. The skeletal elements occur
within a pale grey micrite which exhibits a diverse assemblage of trace
fossils including Thalassinoides-type burrows, Chondrites, Zoophycos, and
simple vertical and horizontal burrows. Two types of burrow fill
have been recorded: coarse bioclastic packstones, and wackestones. The
finer grained burrow fills are prevalent and include those burrows that
disrupt the continuity of the skeletal lags (Figure 4.2A). The coarser
grained burrow fills only occur immediately beneath the skeletal lags. The
coarse skeletal burrow infill is connected to the overlying skeletal lag
(Figure 4.2C).
Lithofacies 8 contains abundant dissolution seams, along which
black argillaceous material is concentrated. Locally they occur
immediately beneath the skeletal lags and exaggerate true
bedding. More commonly, however, they are observed occurring within beds,
giving the succession a 'pseudo-bedded' appearance (sensus Simpson 1985).
Chert nodules are present within Lithofacies 8, although
78
ö a) 0 Co
42 O aO
"o ý&Em
(P 4) le
ö
O 00
m- 0 Ö 10 r.
ce
Ü
a, 4, Co
äN 0ww
O O"0
c+i
IJ.. a 0 .0

C
E
U)
U
E LL
T d
,., O
Ror
ý«r ZZZo
Z-u
-ýZ
ýý1 II
Z2
z-
ý
Cam'
L/
ö I- I ýi II t
v C
n II II U
t0 co
m ýh ilý 1-'
1/1 m_
U A
O L
J
E 0 N
03 U
V c Z 0 E V E
ýýl
nB ,9 -p 2 f; N
i, m fl
C
ö
E s
0
I
r ý_,
79
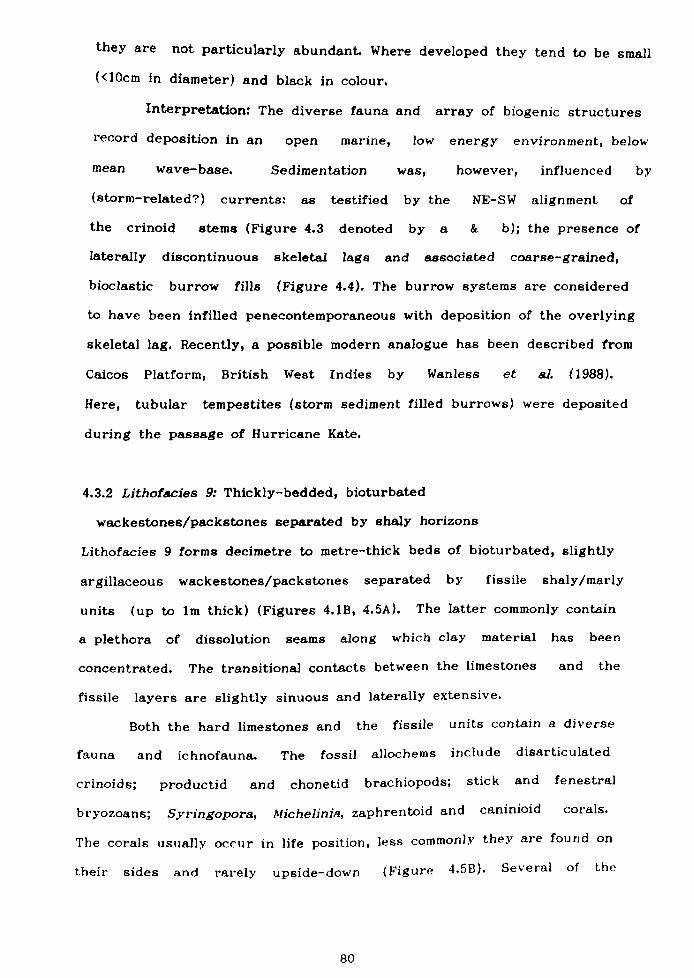
they are not particularly abundant. Where developed they tend to be small (<10cm in diameter) and black in colour.
Interpretation: The diverse fauna and array of biogenic structures
record deposition in an open marine, low energy environment, below
mean wave-base. Sedimentation was, however, influenced by
(storm-related? ) currents: as testified by the NE-SW alignment of
the crinoid stems (Figure 4.3 denoted by a& b); the presence of
laterally discontinuous skeletal lags and associated coarse-grained,
bioclastic burrow fills (Figure 4.4). The burrow systems are considered
to have been infilled penecontemporaneous with deposition of the overlying
skeletal lag. Recently, a possible modern analogue has been described from
Caicos Platform, British West Indies by Wanless et al. (1988).
Here, tubular tempestites (storm sediment filled burrows) were deposited
during the passage of Hurricane Kate.
4.3.2 Lithofacies 9: Thickly-bedded, bioturbated
wackestones/packstones separated by shaly horizons
Lithofacies 9 forms decimetre to metre-thick beds of bioturbated, slightly
argillaceous wackestones/packstones separated by fissile shaly/marly
units (up to lm thick) (Figures 4.1B, 4.5A). The latter commonly contain
a plethora of dissolution seams along which clay material has been
concentrated. The transitional contacts between the limestones and the
fissile layers are slightly sinuous and laterally extensive.
Both the hard limestones and the fissile units contain a diverse
fauna and ichnofauna. The fossil allochems include disarticulated
crinoids; productid and chonetid brachiopods; stick and fenestral
bryozoans; Syringopora, Afichelinia, zaphrentoid and caninioid corals.
The corals usually occur in life position, less commonly they are found on
their sides and rarely upside-down (Figure 4.5B). Several of the
80

.J
c^ ä3
ýv LA" U Uw
ýO
C
.ý ý3 w O
bw r 0 4 to z
o PU
°0. P C -^3
0) 0 Er C)
a: y
Z C) O_0 Ey
v G4 cJ

J n7 m
i C O
4 a
_ö v° rn m mNým mrm U
_C J
/Z Cl.
O Od E E ö ýJ m
Eö /'
Q:
Or ii
Eý >ö OjUb
W
CC
aýmE VOUb
m lC
NQ ý-U OV UyT
yý T D°
81
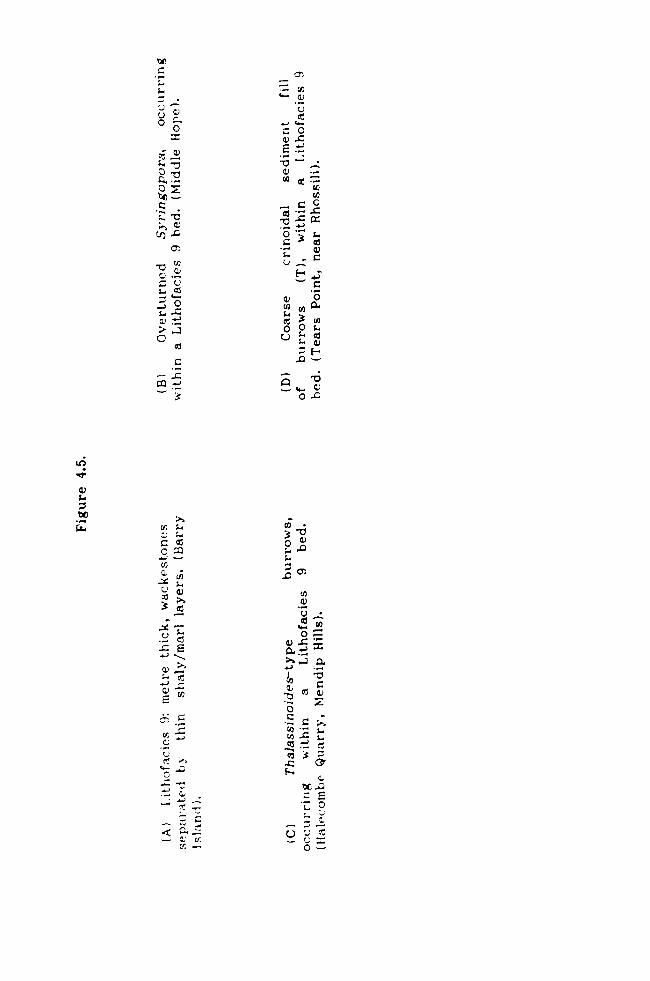
00 c o,
w y v
Z. -- O (n 2 w ön.., m C GO
y p G3 Q: Co
Z y) -C
nä c): ' (Z 30
O OO:.
cd
rF
Gp ý
Aý
ýci
to
c ä
U zu Z'
y
3x (V
x """' w U1
V O --
4-''. ' .a
C öL
CC C
¢7 G
O c
y 00ý
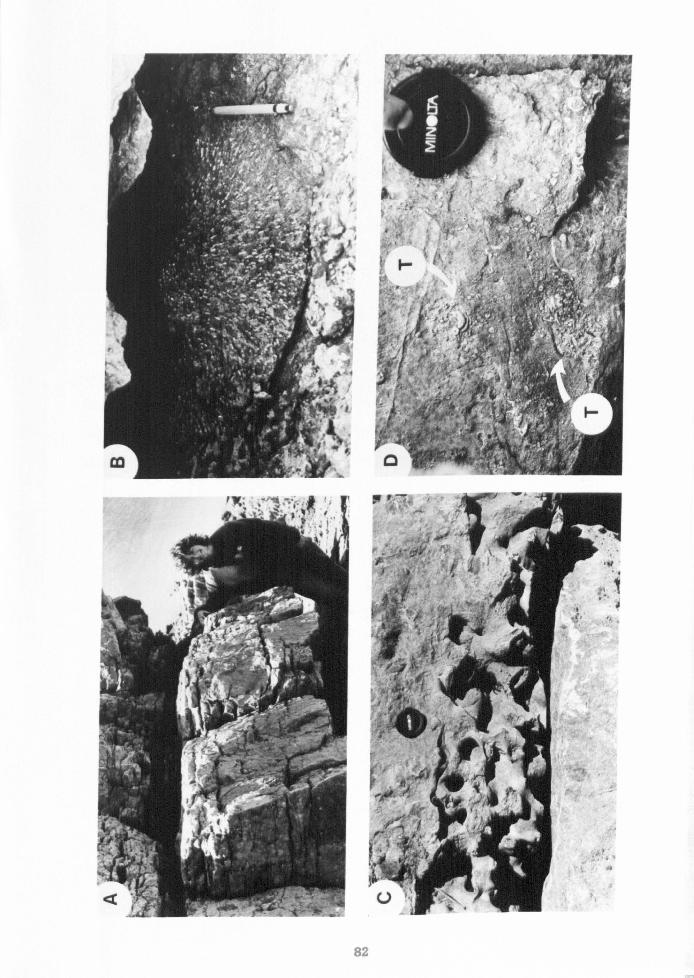
'N
overturned Syringopora colonies show notable inflexions in the growth
directions of the corallites, passing along their length from being
bedding-parallel to bedding-perpendicular. Overall, there is a tendency
for the crinoid stems to have a wider diameter (up to 1cm) than those seen
in the underlying facies (e. g. Lithofacies 8). Measurements of the
orientation of crinoid stems and zaphrentoid corals on bedding plane
surfaces at Barry Island, Rhossili and Middle Hope revealed either a
poorly defined N-S trend or random arrangement (Figures 4.3 & 4.6 denoted
by c).
Both the fissile units and the hard limestones are extensively
bioturbated. The majority of the burrow systems are either infilled
with micrite or fine grained crinoidal debris. Locally, coarser-grained
bioclastic burrow fills can be observed within the wackestone layers
(Figure 4.5D). The identification of such features was extremely
difficult in the compacted shale units. Where developed, the coarse
crinoidal burrow fills occur restricted within thin bands (<10cm thick)
which are laterally extensive and parallel to bedding (Figure 4.5D).
The trace fossils identified include simple horizontal and
vertical burrows, Zoophycos, Planolites, Chondrites, and
Thalassinoides-type burrows. Within the Halecombe quarry (Appendix
Q) in the Mendip Hills, Zoophycos is particularly prominent (up to
30cm across) and the intricate network of the Thalassinoides-type
burrows are locally preserved in their original three dimensional form by
chert (Figure 4.5C).
Chert is common in Lithofacies 9 and occurs both as discrete
nodules and bedding-parallel sheets. On bedding plane surfaces, the
latter commonly consists of a network of nodules (up to ten's of
centrimetres thick) joined by thin layers of chert (usually less than 3cm
in thickness).
83
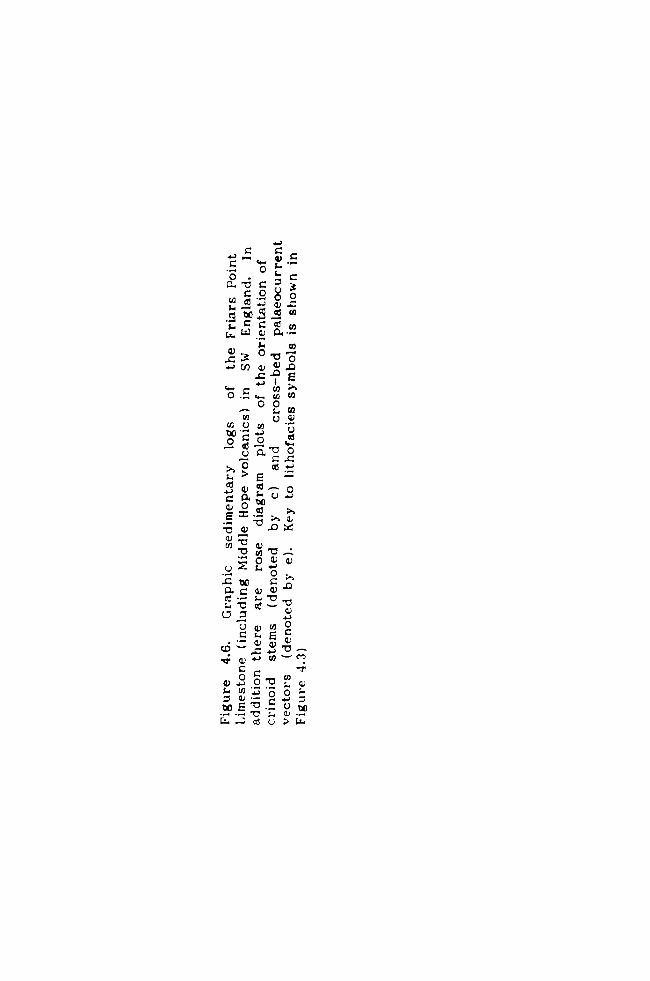
c". " c
ös c ý. "c
ä-vcc3 caý'o
cce
aý o .b can v jo
41 w. c v, %ý 4ý Co
oo VU U1
U"
oC0 qs Oow
cm
E Cd äUo
to ESa, i : vvow
`n v 0(Av-
o +) v 0 son cý
acv ce .- Co
° cD a 0)
C s' Co c
vv CD Z 13
0 41
9. (n v
,o t7 v
ooEý" o0
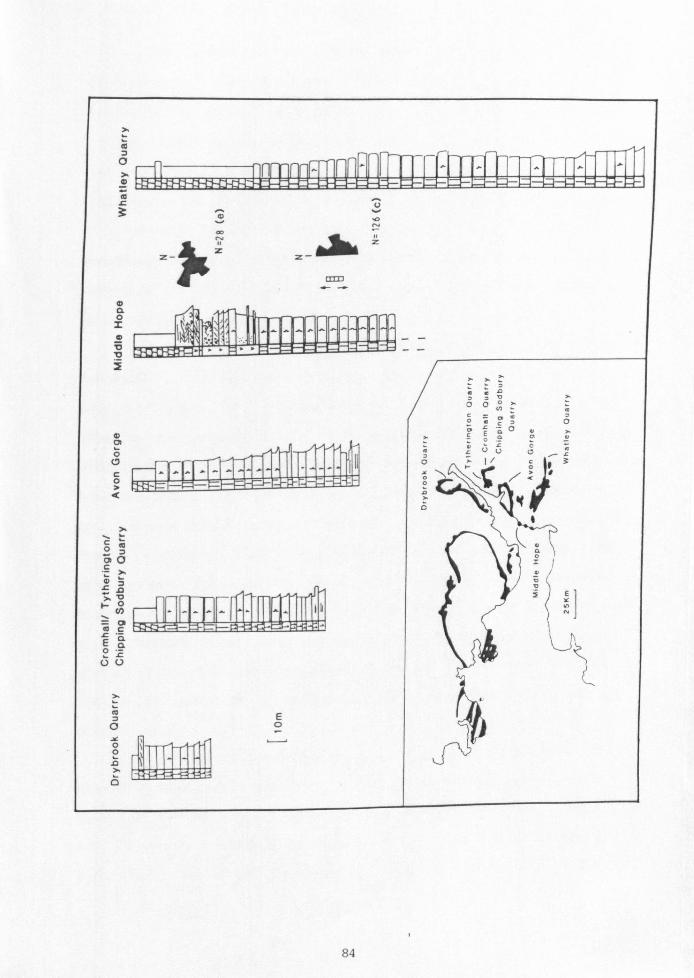
T
m v T m
t
3
W OL
U v d .o
m
Z. Z
10 FEM-A 1. 2
m rn ä ý o I 1 c -
EE
° o ý a
ö
T
C
m
T
E o O
O\ Oý D
T O
rt eä OO° Nm
o°O öLpQu
cEov_ o ._ `y LC
LUU cý _L ý/ c3
oý
°1 Z L/
ýE
N
Lýý 1
84
Interpretation: The diverse fauna, and array of biogenic
structures contained within this fine grained, extensively
bioturbated lithofacies is indicative of deposition in a low
energy, open marine, offshore environment. The formation of the shaly
layers containing abundant dissolution seams occurred as a result of
compaction. The alternation of hard limestones separated by shaly layers
is a common feature of slightly argillaceous platform and ramp
limestones (Bathurst 1987). Bathurst (1987) proposed that the early
cementation of the hard limestones caused the intense compaction of those
layers which are poorly cemented.
The paucity of storm-related sedimentary structures would suggest
deposition in an environment well beneath storm wave-base (Figure
4.4). The affects of (storm-related ?) currents operating below
wave-base are recorded by the rare tubular tempestites. The restricted
occurrence of the coarse-grained crinoidal burrow fills within
bedding-parallel bands would seem to support a storm-related origin,
rather than a biogenic process sorting the sediment such as described by
Rhoads & Stanley (1965), Rhoads (1967) and Tudhope & Scoffin (1984).
Other possible indicators of current activity include the overturned
Syringopora colonies (Figure 4.5B) and the poorly defined N-S trend shown
by the crinoid stems and zaphrentoid corals (Figures 4.3 & 4.6
denoted by c). The geniculate growth pattern in some of the Syringopora
colonies is indicative of corallites growing upwards after being
overturned.
The absence of event-beds is thought to be due to the homogenizing
process of bioturbation which both obliterates sedimentary structures and
mixes the deposits laid-down during 'foul-' and 'fair'-weather (Figure
4.4). In modern offshore shelf settings, the destruction of storm-related
sedimentary structures by biogenic processes can occur within it
85
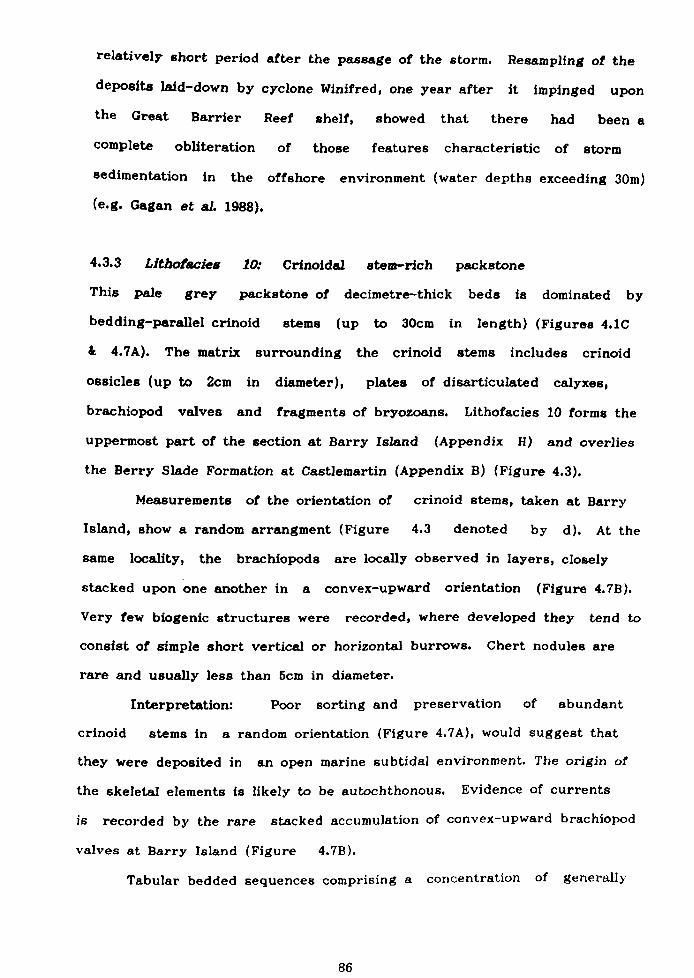
relatively short period after the passage of the storm. Resampling of the
deposits laid-down by cyclone Winifred, one year after it impinged upon
the Great Barrier Reef shelf, showed that there had been a
complete obliteration of those features characteristic of storm
sedimentation in the offshore environment (water depths exceeding 30m)
(e. g. Gagan et al. 1988).
4.3.3 Lithotacies 10: Crinoidal stem-rich packstone
This pale grey packst6ne of decimetre-thick beds is dominated by
bedding-parallel crinoid stems (up to 30cm in length) (Figures 4.1C
& 4.7A). The matrix surrounding the crinoid stems includes crinoid
ossicles (up to 2cm in diameter), plates of disarticulated calyxes,
brachiopod valves and fragments of bryozoans. Lithofacies 10 forms the
uppermost part of the section at Barry Island (Appendix H) and overlies
the Berry Slade Formation at Castlemartin (Appendix B) (Figure 4.3).
Measurements of the orientation of crinoid stems, taken at Barry
Island, show a random arrangment (Figure 4.3 denoted by d). At the
same locality, the brachiopods are locally observed in layers, closely
stacked upon one another in a convex-upward orientation (Figure 4.7B).
Very few biogenic structures were recorded, where developed they tend to
consist of simple short vertical or horizontal burrows. Chert nodules are
rare and usually less than 5cm in diameter.
Interpretation: Poor sorting and preservation of abundant
crinoid stems in a random orientation (Figure 4.7A), would suggest that
they were deposited in an open marine subtidal environment. The origin of
the skeletal elements is likely to be autochthonous. Evidence of currents
is recorded by the rare stacked accumulation of convex-upward brachiopod
valves at Barry Island (Figure 4.7B).
Tabular bedded sequences comprising a concentration of generally
86
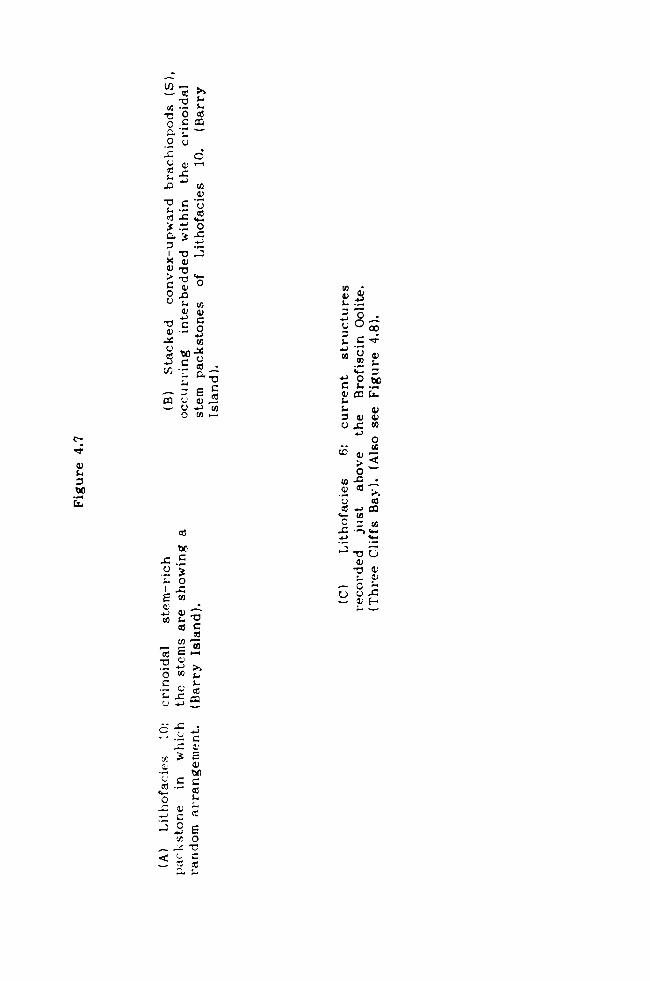
C-
to w
v g. 0 CJ
O_ U
s. ý 1. m
mC 'G t M .:. S0
a3
o0 4v Q)
.JG
x vý U
pý U
rn .ý 0
Cc 00
v3
8ý C
w Cd
cýý "ý c
s3 on wcýc
o ý- ý cc o fo
QMx
W n+
Ö
20,0
CL co
i. y 7 Cý Cý U .C CO
O m
O` L ol r
v a1 cd jCIO
4- Co
"'ý 'L7 U d te a;
VÜ
4%F
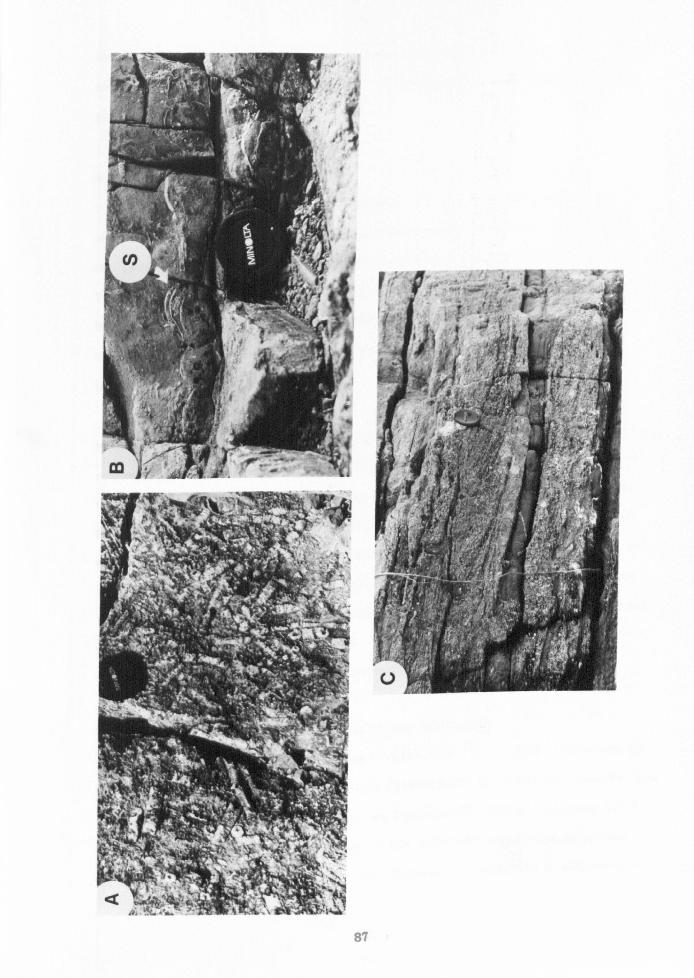
87
in-place carbonate skeletons are known as biostromes (James 1983). These
localised occurrences of abundant crinoid stems are interpreted as
crinoidal biostromes.
4.3.4 Black Rock Dolomite
Overall, the Black Rock Dolomite consists of massive, decimetre beds of
slightly argillaceous, reddish-brown, saccharoidal dolomite in which pods
of partially dolomitized crinoidal packstones and wackestones occur.
The latter consist of disarticulated crinoid ossicles and show signs of
bioturbation. The regular identification of burrow types is impossible
owing to the replacive dolomite which has only left isolated relics of
individual burrows.
Interpretation: Deposition of the bioturbated, crinoidal
packstones and wackestones is thought to have been in a low energy,
probably subtidal environment. Unfortunately, any further evaluation of
the depositional environment is hampered by the lack of relict sedimentary
features preserved within the replacive dolomite. However, the overall
appearance of the crinoidal pac kstone/wac ke stone pods is similar to
Lithofacies 9. In the absence of storm-related sedimentary structures
deposition beneath the storm-wave base is suggested. If such a comparison
between the above is valid then the environment of deposition was likely
to have been mainly subtidal, and probably beneath 'storm wave-base'.
4.4 Temporal and spatial distribution of the lithofacies
The Friars Point Limestone Formation shows ca. a7 fold increase in
thickness from the thinnest measured development at Drybrook Quarry (ca.
40m) to the thickest development at Castlemartin (280m) (Figures 4.3 &
4.6). A summary of the distribution of the different lithofacies is. shown
in Figure 4.8. The lower part of the succession comprises a sequence of
88

CO U
w 0
. c:
0
r. 0
41
. 1]
Fa
Co
'b
ai 0 41 012
6
0
Co $4 w
sý aý
v
04
F, 3
CO 'a d' N
G7 L" bO O
00 O 1Z4 fr
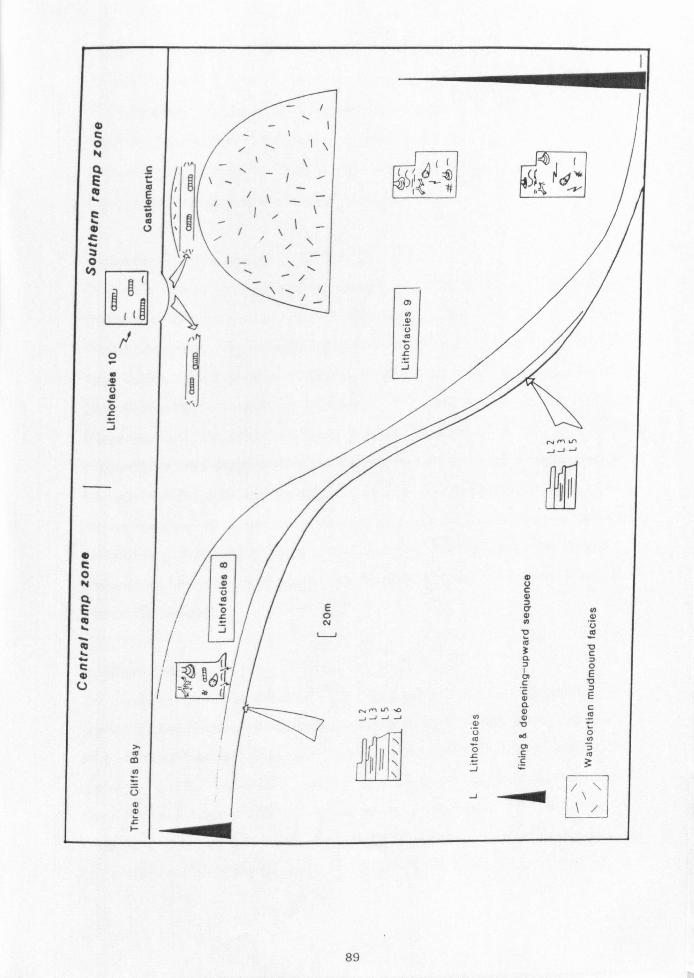
G-ý
Cp /- E i\\-\
m tý
öV/
U
_A L
OJ
m ö
ö
J ry m�+ JJJ
II II
O
G co m Nem U
ö EECH L0U
ca '2 A
N. J1Ä
C cc 0ý
0 r(I
'öE v ýý®
C UEE 10
nc ý, m u'i .ONWA
,ýJJJ-V
\ aO
_N 01 7
co -I-- E
-_ \
89
bioclastic limestones. In stratigraphic order they are represented by
Lithofacies 6,5,3 &2 (previously described in Chapter 3), above which
the thickest developments of Lithofacies 8 occur in the northern and
central ramp zones. Lithofacies 9 dominates the successions of the
southern ramp zone in which the minor Lithofacies 10 and the rare
Waulsortian mudwounds occur (Figure 4.8).
Northern & Central Zones
Decimetre bedded, bioturbated packstones and shelly lags (Lithofacies 8)
dominate the sections at Three Cliffs Bay (Appendix F) and Caldey
Island (Appendix D). Here, Lithofacies 8 can locally be found interbedded
with ungraded sedimentary couplets (Lithofacies 2) and rare, graded beds
(Lithofacies 3). In Tytherington Quarry (Appendix J), Cromhall Quarry
(Appendix K), Chipping Sodbury Quarry (Appendix L) and the Avon Gorge
(Appendix M) the skeletal lags of Lithofacies 8 can be identifed even
though the fresh fracture surfaces reveal few sedimentary features. Much
of the section at Drybrook Quarry (Appendix I) has been extensively
dolomitized but relict skeletal lags (up to 5cm thick) can be found.
Towards the top of the succession a low-angle cross-bed was identified
within the dolomite.
Southern Zone
The extensively bioturbated wackestones/packstones (Lithofacies 9)
dominate the sections at Middle Hope (Appendix 0), Barry Island (Appendix
H) and Castle martin (Appendix B). Unfortunately, very few sedimentary
features can be observed in the fresh fracture surfaces of the quarry
faces in the Mendip Hills at Halecombe (Appendix Q) and Whatley
(Appendix R). However, towards the uppermost part of both successions
there are rare crinoidal lags (up to 4cm thick). Occurring within the
90
uppermost parts of the Barry Island and Castlemartin successions are the
crinoidal stem-rich packstones of Lithofacies 10 (Figure 4.8).
4.5 Discussion
The main purpose of this discussion is to evaluate the
offshore, depth-related facies trend in the main part of the Friars Point
Limestone, overlying the basal transgressive sequence. In addition, the
subsidence history of the basin and its effect upon the distribution of
the lithofacies will be assessed using the biostratigraphic zones as
viable time-lines.
4.5.1 Basal Transgressive Sequence
The basal part of the Friars Point Limestone Formation forms a
fining- and deepening upward sequence (5-15m thick) (Figure 4.8). In the
central ramp zone, the sequence commences with cross-bedded bioclastic
limestones (Lithofacies 6, Figure 4.7C) representing deposition in above
fairweather-wave base environment. It passes transitionally upward into
the subtidal storm-dominated facies of amalgamated and graded storm beds
(Lithofacies 5& 3) which are overlain by the below mean wave base facies
of ungraded sedimentary couplets (Lithofacies 2) (Figure 4.8). The
transition upward into Lithofacies 8 is recorded by the decrease in the
abundance of the storm layers, partly as a result of their obliteration
by biogenic processes. The transgressive sequence in the southern zone is
comparable but commences from amalgamated and graded storm beds
(Lithofacies 5& 3) and passes upward, over a short vertical distance of
less than 20m, into the below storm-wave base facies of Lithofacies 9
(Figure 4.8).
The overall upward decrease in current energy as a result of the
transgression, is reflected in the alignment of the crinoid stems. Those
91
measurements taken from skeletal lags, where Lithofacies 8 occurs
interbedded with Lithofacies 2 and 3, show a prefered orientation towards
the NE-SW (Figures 4.3 denoted by a& b). Whereas in the main part of the
Friars Point Limestone succession in the southern ramp zone
(Lithofacies 9) the orientation of the crinoid stems is either random or
shows a poorly defined N-S alignment (Figures 4.3 & 4.6 denoted by c).
4.5.2 Proximality Trend
The three lithofacies types described, conspicuously lack those
sedimentary structures characteristic of sedimentation from tractional
currents, and record deposition in a below storm-wave base environment.
From an analysis of the distribution of the lithofacies two major ramp
facies belts can be recognized. The more proximal, inner facies
belt, includes those sequences of the northern and central ramp
zone which record the affects of storm-related currents operating in
the below wave base environment (i. e. Lithofacies 8). The outer facies
belt contains few current related features and consists of extensively
bioturbated limestones (Lithofacies 9), rare crinoidal biostromes
(Lithofacies 10) and Waulsortian mudmounds. The preservation of the
effects of current activity within Lithofacies 10 is thought to be due to
the low degree of biogenic activity. Presumably, the substrate of coarse
crinoidal debris was unsuitable for extensive infaunal colonization and
biogenic reworking.
The distribution and nature of the tubular tempestites also
conforms to the proximality trend (Figure 4.4). Within Lithofacies 8,
they are connected to a recognizable storm layer (Figure 4.2C). This is
in marked contrast to those found in the lower parts of of the sequence of
Lithofacies 9, where the tubular tempestites are not associated with any
recognizable skeletal lag (Figure 4.5D). This could either be due to an
92
insufficient supply of coarse skeletal material to produce a skeletal lag,
or the storm layers were thin enough to be subsequently obliterated by
biogenic reworking. Nevertheless, the presence of tubular tempestites
records the effects of current activity. Within the main part of the
Lithofacies 9 succession, there is a conspicuous absence of tubular
tempestites which is considered to represent deposition in a more
distal setting (Figure 4.4).
In conclusion, the dipartite distribution of Lithofacies 8 and 9
conforms to two depth-related facies belts (Figure 4.4) which were most
probably arranged parallel to the palaeo-shoreline, located further to the
north.
4.5.3 Biofacies
The environmental gradient across the ramp may well have had an effect
upon the distribution of the fauna. Basic field observations reveal that
the abundance of the corals is conspicuously greater in the southern
ramp sequences. A study of the stratigraphic distribution of corals and
conodonts against the sedimentary facies shows that the former is clearly
facies related whereas the latter is only partly facies controlled
(Figures 4.9 & 4.10).
Coral biozones
The base of the Zaphrentites delanouei Zone occurs in close-proximity to
the lithological contact between the Lower Limestone Shale and Black Rock
Limestone (Mitchell 1980). From a comparison of the coral assemblages with
the lithofacies assemblages, it is apparent that the zaphrentoid corals
have a wide facies distribution (Figure 4.9). They are present both within
the shallow water succession of the Barry Harbour Limestone and the deeper
water facies of the Friars Point Limestone (Figure 4.9). Whereas the
93
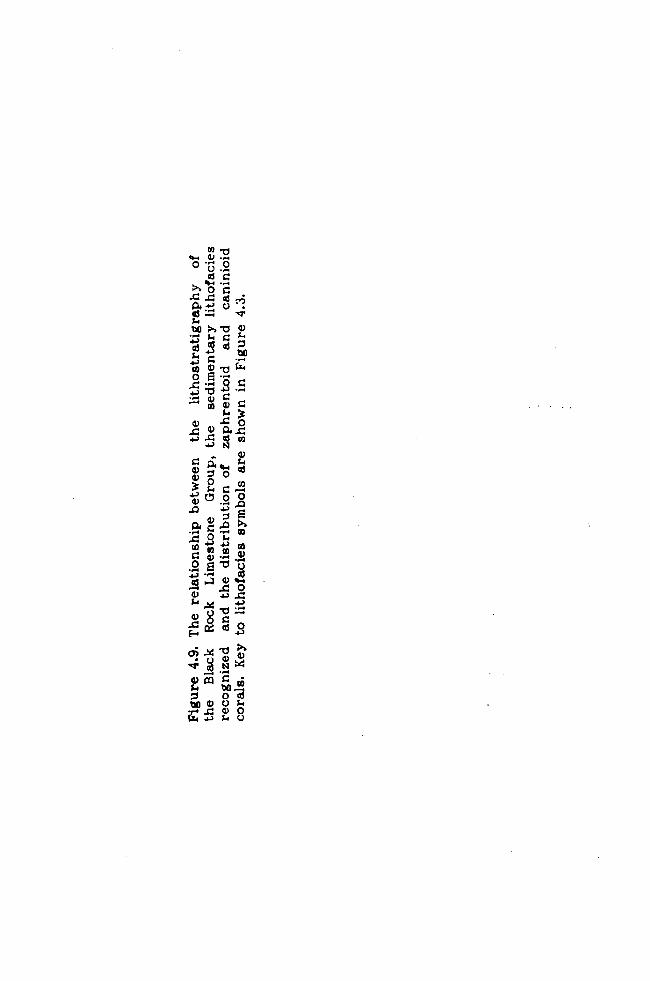
to . ti a. 0). - 00
w-
0 r.
Ra
Cd ca Lbw
4J 0
mý3
0a 4 CO m
m
ÖO0
m0O
Am
mmmm
O L! U 41 - rr. ' Ö a) 4-N 9.4 41
E- gz Co 2
0; 20a,
94 to 00U9.1
-. ý
0O G4 +. > %4 U
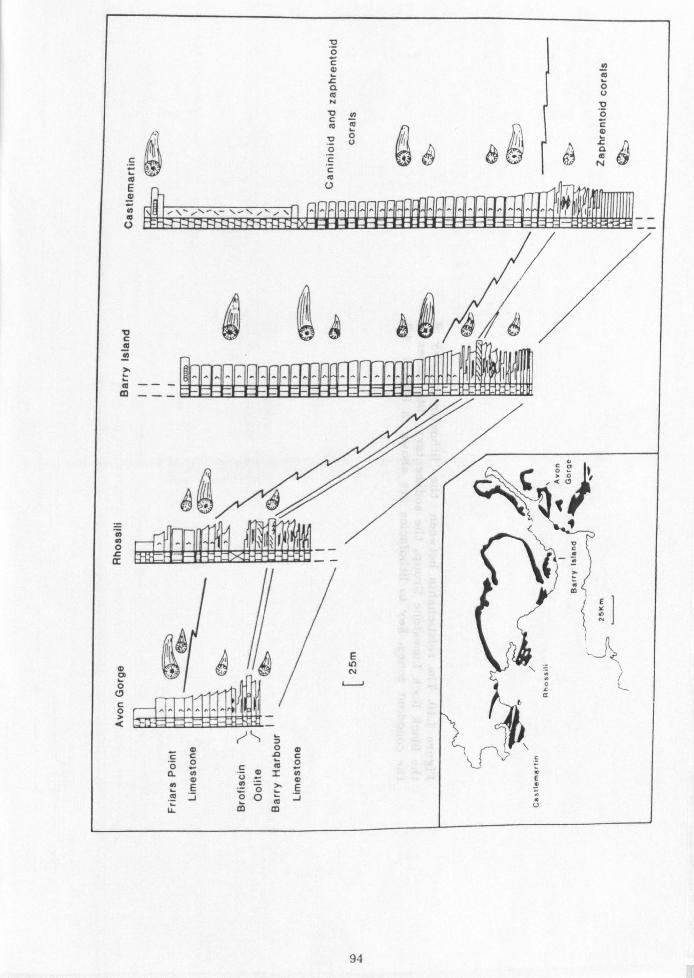
:2 0 C
1 ýp 0
E m q
U
V C
0, 0, 0 L
m ö c7 C 0 i t
LO 4O
N v_
10 %O CC OOm
O/L vh O Jý n COi aril
ý `ýI
ýN
C
a m = m m 49 E °-' ö E t0 ;j O Q
ýy m m
94

o Go
"r >, rA
s4
b0 ý°
c
c ö
W Go a) E a,
3 w, Q) ä
.0 :5cýr
0o0
0 üN
O
C
C
CO =' 4) Gz.
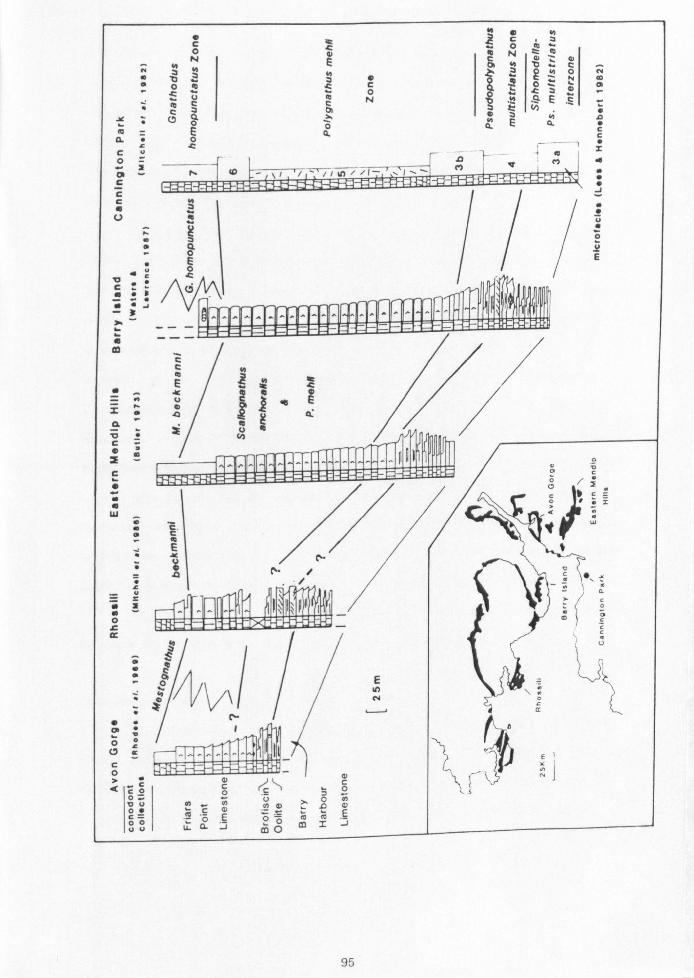
< O
< 4 C
N ý 7 v
- N
d E c' e 41) 2
Z 4) Z _ N Z ti 44 N
O p `
Q QQ y
ý ýo N ý w a E e ý N
G ý e ý O
ý y cri
ýc cý ö ö ä E a A - E a C r
V
-
Qr C9 a
q ý
I 7\ ý I 1
4y
y{ý
eQ
aýt
Cy y,
YyÖ
ii G
up_-
ýT1Tl^ nAY
O
"
"
C
Z
4 i
J
S u
O Y E
°ö ý ö° w//iV I/ °
e 4 W e
i
i
u
0
E/
A E
ö
do
It "c "Q
P"
O° C7 t
o CO
vu o" c= OO uu
ý_
E
CIC
o'o= t
W
c
( 11 A
95
c ö NN
SEöö ti aJnn co
ii!
caninioid corals (e. g. Caninophyllum patulum and Siphonophyllia
cylindrica) are restricted to the deeper water facies. The northward
migration of the caninioid corals, from the southern to central ramp
zone, was seemingly related to the prolonged Friars Point Limestone
transgression, causing the shoreward migration of the deeper water facies
belt of Lithofacies 9 (Figures 4.8 & 4.9).
A variety of depth-related fossil communities have been described
from the Lower Carboniferous of Britain by Ramsbottom (1978) and Beus
(1984). Unfortunately, none of the associations described by the above
authors are readily comparable to the shallow-water zaphrentoid and
brachiopod assemblages of the lower part of the Black Rock Group. The
shallow water communities of post-Courceyan age contain caninioid corals
(Ramsbottom 1978; Beus 1984). The caninioid corals that lived in
shallow water environments tended to be large to withstand the
turbulent waters (Ramsbottom 1978).
The faunal association in the upper part of the Black Rock Group
includes abundant small caninioids corals and smooth shelled brachiopods,
which are comparable to the deep water Rhipidomella association of Beus
(1984) and the brachiopod calcarenite community of Ramsbottom (1978).
In conclusion the incoming of the zaphrentoid and caninoid corals
appears to be strongly influenced by sedimentary facies.
Conodont biozones
A plot of the conodont zones against the lithological formations of the
Black Rock Group are shown in Figure 4.10. The base of the Ps.
multistriatus Zone does not appear to be facies controlled as it occurs in
a large variety of different ramp facies types, including: oolitic,
96
bioclastic and micritic limestones (Waters & Lawrence 1987; Mitchell et
W. 1982; Lees & Hennebert 1982). A regional study of the base of Ps.
multistriatus in Ireland and Britain by Sevastopulo & Nudds (1987)
concluded that it is not strongly facies controlled, and is a viable zone
with regard to time correlation.
The base of the Polygnathus mehli Zone does not appear to be facies
controlled. However, as the main part of the Friars Point Limestones
consists of deep water ramp facies it is extremely difficult to certify
such an interpretation solely from a study of its occurrence in SW
Britain. A regional investigation in Ireland by Sevastopulo & Nudds
(1987) noted that the base of the P. mehli Zone does not appear to be
associated with any consistent lithological change, and as a result it is
considered not to be facies controlled.
The uppermost part of the Friars Point Limestone contains two zones
which are clearly facies related. Mestognathus beckmanni tends to be
associated with shallow-water facies while Gnathodus homopunctatus is more
abundant in distal ramp facies (Austin & Davies 1984) (Figure 4.10).
4.5.4 Biostratigraphic Time-Lines
An assessment of the effect of differential subsidence across an area is
relient upon subdividing the succession into isochronous units. Ideally,
faunal zones are time equivalents. Regional plots of the thickness
variation of each zone should permit an evaluation as to the relative
timing and effects of differential subsidence.
A synthesis of the isochroneity of the upper Courceyan coral and
conodont zones of SW Britain and Ireland has been published by Sevastopulo
& Nudds (1987). This revealed that the bases of the coral zones do not
consistently appear at the same relative positions as the conodont zones.
For example, in those sections in a more distal setting the first
97
appearance of the caninioid corals is within the Ps. multistriatus Zone
(e. g. Cannington Park & Barry) (Lees & Hennebert 1982; Waters & Lawrence
1987). Whereas in the more proximal sections the caninioid corals first appear towards the end of the overlying P. mehli Zone (e. g.
Rhossili) (compare Figures 4.9 & 4.10). Sevastopulo & Nudds (1987)
went on to suggest that the conodont zones represent a more accurate
guide to time correlation because they are evolutionary lineages and are
not linked to lithology. The basis of the coral zones reflect the
occurrences of cryptogenic taxa (unknown phyletic origin), whose
distributions were judged by the above authors to be strongly controlled
by facies -a point which they did not elaborate upon.
It would seem that conodont zones offer the best means by which to
subdivide the Courceyan into seemingly isochronous biostratigraphic
units. Although it must be appreciated that those faunas
characteristic of a zone may well be partly facies controlled e. g.
Mestognathus beckmanni (Austin & Davies 1984).
Using the conodont zones and lithostratigraphy, the Friars Point
Limestone can be subdivided into three units. For convenience the lower
unit is taken as that part of the Ps. multistriatus Zone above the
Brofiscin Oolite and Barry Harbour Limestone (Figures 4.10 &
4.11). This seems a viable proposition, since the base of the Ps.
multfstriatus Zone consistently occurs in close-proximity to this
regionally significant facies boundary (Waters & Lawrence 1987). The
middle unit consists of the P. mehli Zone which is bounded
by the base of the overlying Mestognathus beckmanni Zone (Figures 4.10
& 4.12). The upper unit includes that part of the Mestognathus beckmanni
Zone beneath the Gully Oolite (Figures 4.10 & 4.12). Unfortunately, the
upper surface of this unit cannot be delineated in the southern ramp
zone, as the Black Rock Group passes transitionally upward into the
98
0 44 to ý
oQ
cu L'.
>
vm
.° coo .c
Co
a)
ö° aý a r, oar
°Coö o)
ýa aS' u2 ,o a) j4
94
Co r. Z
94 ci
.
to
rT.
°° C0 ä)
G4 +ý Nm
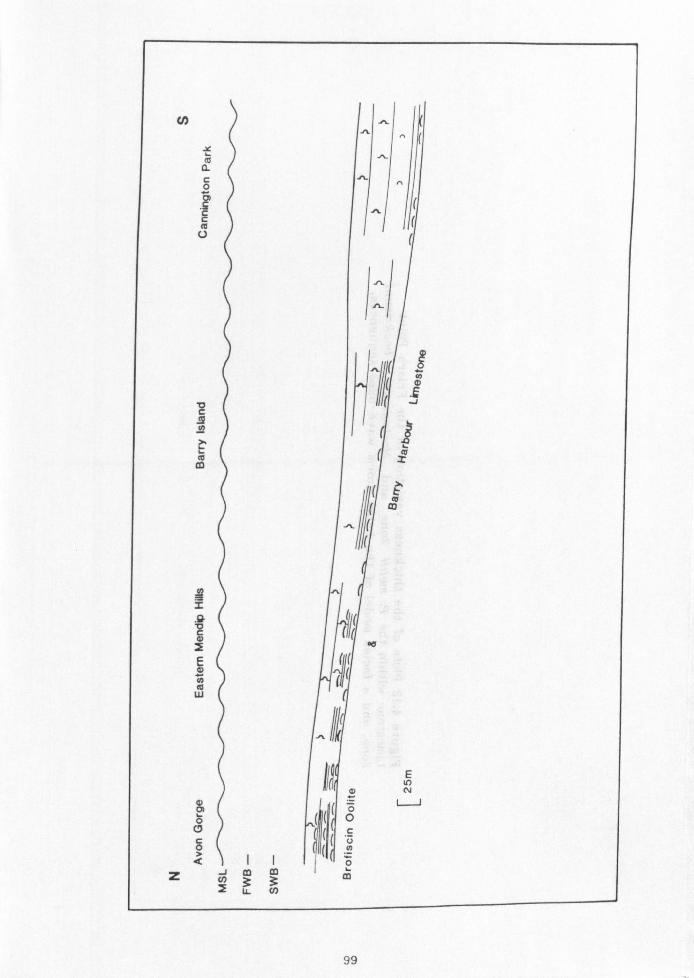
N
t0
c ^
c
( J I
ß
W
Co _
(
(
m
I( g ( Co W
II ( -. K
d N
- C 0
0 0
QII iÖ Z LD m m
99

Cc C
ri J
0ä1
-0 a L fr, 'A
to
cm Z
Q; C,
wý ow3
c`- E o0
MC t1, '
M3 yao
äc "=
U
aö
,c4v ". ' c waC or V. �C
C) _w
N
CGC C
OO C_
(L .-
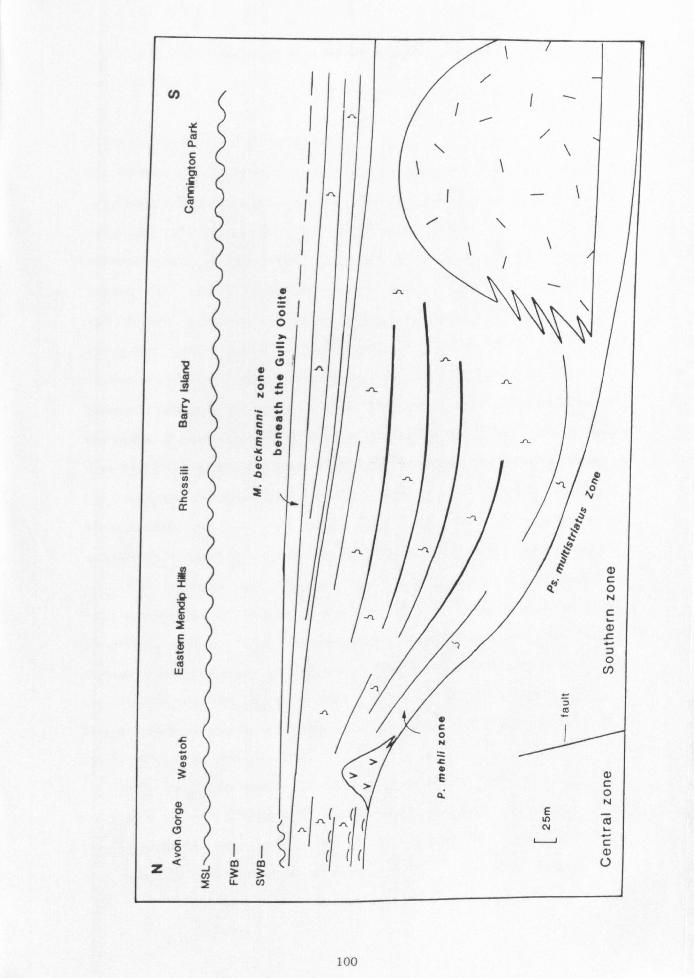
i
1 I i
to \ I
I1
I
O
O n
c o o t . ti N y
ýe `e ä m c o E m
_ d m
0 t y
ýQ
J F ý
C! E Qy
C O
= N
0 co
W
L O N
O N >t
m 3 >
c > 0
N E (( N ö
ý ( N
> I > I ( (( 0 co co 3: R., co
LL CO
100
overlying mid-Chadian succession of crinoidal limestones without a change in lithology.
4.5.5 Sedimentation and Tectonics
To develop a thick (>100m) succession of below wave base facies, requires
a relative rise in sea level to be greater or equal to the net rate of
carbonate production (Kendall & Schlager 1981). In addition to the
relative rise in sea level, carbonate sedimentation across SW Britain
during the upper Courceyan period was influenced by differential
subsidence. A marked increase in the thickness of the Friars Point
Limestone occurs to the south of an east-west line between
Weston-super-Mare, Cardiff, Cowbridge and Three Cliffs Bay (Waters 1984;
Waters & Lawrence 1987; Wilson et al. 1988; Wright 1984a; Wright 1986). To
the north of this line, the Friars Point Limestone of the central ramp
zone has a relatively uniform thickness, most probably forming part of
the stable Welsh-Brabant Massif (Figures 4.3 & 4.6). Overall,
sedimentation across the basin kept pace with the differential
subsidence to maintain a shallowly inclined carbonate ramp configuration.
To evaluate the relative timing and effect of differential
subsidence requires the use of the isochronous units established in the
preceding section 4.5.4. Contained within the lower unit is the basal
transgressive sequence of the Friars Point Limestone which culminates in
the establishment of below storm-wave base facies across the study area.
The geometry of this unit is that of a southerly thickening uniform wedge
(up to 90m thick) (Figure 4.11).
The overlying middle unit (P. mehli Zone) consists of a montonous
succession of thickly-bedded, bioturbated limestones (Lithofacies 9);
rare Waulsortian mudmounds (Mitchell et al. 1982) as well as the 'diddle
Hope volcanics - Weston-super-Mare (Whittaker & Green 1983) (Figure 4.12).
101

This middle unit also forms a southerly thickening wedge but shows a
pronounced thickening of the succession to the south of Caldey Island,
Rhossili, Cardiff-Cowbridge, and Weston-super-Mare (Figure 4.12). This
is considered to be in response to the vertical movement of a major
hinge-line, most probably a fault at depth, which is locally known as the
Vale of Glamorgan axis (Waters 1984; Waters & Lawrence 1987; Wilson et
al. 1988). The upper unit forms a uniformly southward thickening
wedge (Figure 4.12) consisting mainly of the Black Rock Dolomite and
Lithofacies 10 (Figure 4.10).
In conclusion, the timing for the main phase of differential
subsidence occurred early during the P. mehli Zone, the
onset of which was signified by volcanic activity in the
Weston-super-Mare area. The tectonic evolution of the Friars Point
Limestone is analogous to the structurally controlled block and basin
configuration that occurred north of the Welsh-Brabant Massif during
the Lower Carboniferous. Here, extensional faulting in the
underlying basement produced a series of NE to SW orientated blocks
separated by areas of high subsidence which formed the basins (Bott 1967 &
1987; Johnson 1967; Leeder 1976,1982 & 1987; Miller & Grayson 1982;
Grayson & Oldham 1987).
Differential subsidence played an important role in the
distribution of the facies within the main part of the Friars Point
Limestone. Those successions to the north of the tectonic hinge-line
typically contain sedimentary features indicative of storm-related
currents influencing sedimentation (e. g. Lithofacies 8). Whereas, the
thicker successions in the southern ramp zone, are dominated by the
deepest water facies (Lithofacies 9,10 and Waulsortian mudmounds) which
lack evidence of current activity.
102
4.6 Conclusions
1) The Friars Point Limestone records a basinwide transgression above
the the locally exposed Brofiscin Oolite and subtidal facies of the Barry
Harbour Limestone.
2) Two distinct offshore ramp facies belts are recognized. The more
proximal inner facies belt was influenced by storm-related currents. It
contains tubular tempestites (storm sediment-filled burrows) which are
connected to thin shelly lags. The finer-grained, outer facies belt
is extensively bioturbated and preserves fewer features indicative of
deposition from storm-related currents.
3) The pronounced differential subsidence to the south of the Vale of
Glamorgan axis commenced early during the P. mehli Zone, the onset of
which was signified by volcanic activity at Middle Hope
(Weston-s uper-Mare ).
4) Differential subsidence was instrumental in maintaining the
temporal and spatial configuration of the proximal (mid-ramp) and
distal (outer ramp) facies belts.
103
Chapter 5- The Middle Hope volcanics of Weston-super-Mare: Development
and demise of an offshore volcanic high
5.1 Introduction
5.2 Background
5.3 Correlation
5.4 Sedimentary facies description and interpretation
5.4.1 Facies association A Bioturbated argillaceous limestones
5.4.2 Facies association B Ash-tuff
5.4.3 Facies association C Lapilli tuffs
5.4.4 Facies association D: Cross-bedded bioclastic limestone
5.5 Discussion
5.6 Geochemistry of the pillow basalt
5.6.1 Pillow basalt
5.6.2 Methods
5.6.3 Geochemistry
5.7 Conclusions
104
5.1 Introduction
During the Dinantian there was a widespread and prolonged period of
volcanic activity over what is now Britain. Those areas which were
affected by volcanism include the Scottish Midland Valley, the
Northumberland Trough, the Isle of Man, the Derbyshire Block, the English
Midlands, SW Britain (Upton 1982). Generally, the vents from which the
tuffs and lavas erupted were relatively small and short-lived, even during
the period of maximum activity in the Courceyan (Upton 1982). The
lavas and pyroclastics lie interbedded with marine and non-marine
deposits. The sedimentary structures preserved in such deposits record the
buildup of the volcanic centres and their subsidence histories subsequent
to the cessation of volcanic activity.
The Lower Carboniferous Middle Hope volcanics, just north of
Weston-super-Mare, contains a diverse range of sedimentary structures
which record the aggradation of a volcanic high in an offshore setting,
on deposits of a carbonate ramp. Analysis of the sedimentary facies
allows the detailed nature of volcanic buildup to be determined. This
study of the Middle Hope volcanics forms the basis of Faulkner (1989). In
addition, this chapter contains a pilot geochemical study of pillow
basalt in an attempt to evaluate their tectonic significance.
5.2 Background
Extrusive igneous rocks have long been recognized in the Weston district
(see historical summary of Morgan & Reynolds 1904) and were shown to occur
at two distinct stratigraphic levels (Sibly 1905) (Figure 5.1). The older
volcanics occur within the Black Rock Limestone at Middle Hope
(Appendix 0), whereas the younger development occurs east of Birnbeck
Pier in the lower Birnbeck Limestone (Figure 5.1) at Spring Cove
105
0 as
41 to
a w
O 0 s.
U
v 3 C
a c
C) 3 0
v
w 0
C O to
3 r,, Co
c 0 v v w i co m 0 s. U
oc v mý
ýs
vý Cj
EO
1.4 L,
t3, s. a 00 w 3w
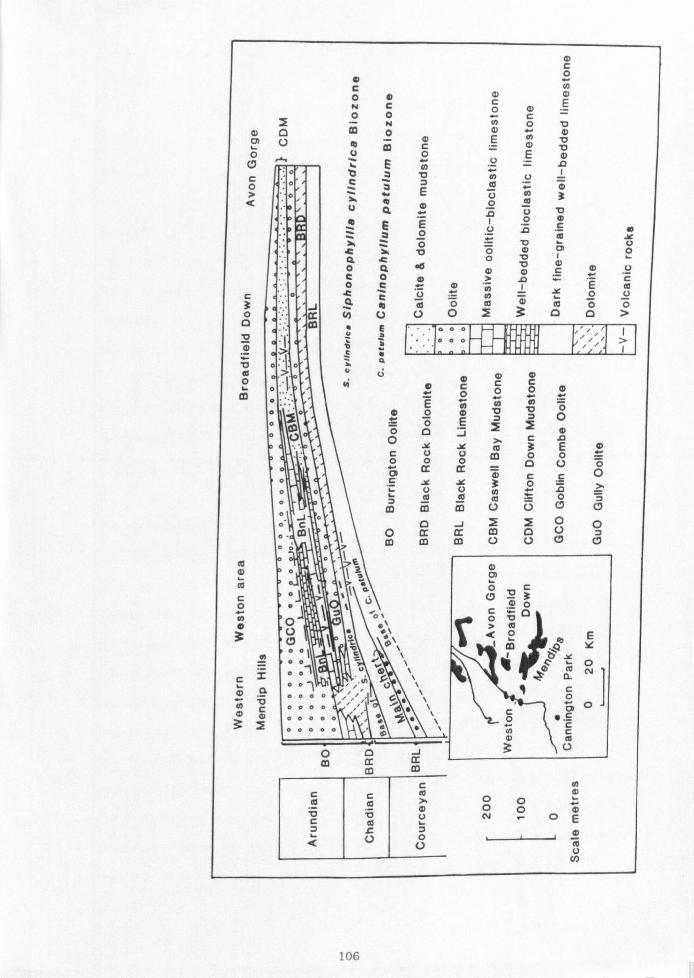
m C 0
m N C m m O m C E N C O O O C
N r
m 0 m 0
m d
E rn U eo M c
° E C7
_ C " 0 f0 «.
0 o ` E Z 0
° . v 4 ö m
E ö ° Y r ýc
T z _ O m Oý U O
4 3k 10 0
Q. -C so T) m
C (D U O a m m C
0 (D > E co O G !. Y d1 I Y p U C .. o ä G co m e0 O O
0 CLI 0 3 0 ö N C) U
0 m " E o00 /, / I
L O ý ý ä
o"I. o ý' m m
m >. v m O "I'
N O C p 0 m '
m o e
r E
p dl
r ý ö
o" e m 0 m > O ° O 0 J
C O
O ac Y cc 3 E « 0 0 cc
0 a U
cc 0 cl a
o C Y Y ; 0 70 _T V CO O 7
cc to Jo
im O
0 to o 7 o. co p) m U U ( C ooo
° 1
m
1 ` 1 O c ° % ü m
ö e ' c :p 1
U
öý
p c 0
' E 3 O1 = \ m
\ I m
.Q ý Y
0 oI c_ \ ý
C Y
O \ 0 ä N
0 °ý u y \ ý
I d1 0o0oe " \\ C C
m mo00o e j, " \ 0 C
3 " " \ N C 0000 0 m ca
_. 3 U O p J to (n co
m co ca
C
c c am� O O . ̀- co co O p m V N O E
c e0 O O -- - U ö
106
(Speedyman 1977; Jeffreys 1979; Jeffreys & Aigner 1982; Whittaker & Green
1983).
The volcanic deposits at Middle Hope are seen in four exposures
along the north coast of the peninsula (Figure 5.2) and were numbered 1 to
4 by Morgan & Reynolds (1904). Their lithostratigraphic position is above
the main cherts of the Black Rock Limestone and beneath the Black Rock
Dolomite (Figure 5.1). Situated in the Caninophyllum patulum Assemblage
Biozone (Mitchell 1980) and the P. mehli conodont Biozone. The Middle
Hope volcanics are immediately overlain by a cross-bedded bioclastic
limestone which is not seen in equivalent sections to the north (e. g. in
the Avon Gorge) and the south (e. g. in the western Mendip Hills).
The main phases of volcanic activity in the Cornubian Basin
occurred during Chadian to Arundian times (Selwood & Thomas 1987). This
postdates the first phase of volcanic activity in the Bristol district but
coincides with the second development.
5.3 Correlation
The Middle Hope volcanics thin from 37.5m in the west at exposure 1 to
less than 4m in the east at exposure 4 (Figure 5.3). Correlating horizons
within the volcanic series between exposures is made more difficult owing
to faulting and variation in lateral thickness and facies (Figure 5.3).
Three limestone marker bands are recognized but for the reasons above,
lithostratigraphic correlations are unfortunately only reliable between
exposures 1 and 2. The sequence at exposure 3 has been extensively folded
and faulted and is incomplete (Figure 5.3). The lower marker horizon, a
crinoidal packstone, is however thought to be correlateable from exposure
1 to 3 (Figure 5.3). The middle marker horizon is a 3m thick crinoidal
limestone containing zaphrentoid corals (Figure 5.3). The upper marker
horizon is a dark grey, bioturbated crinoidal limestone with lines of
107
aý a 0 x
O
00 O O
00
. fý
'd
a co 8
U O
Cla cri 4) to
rT,
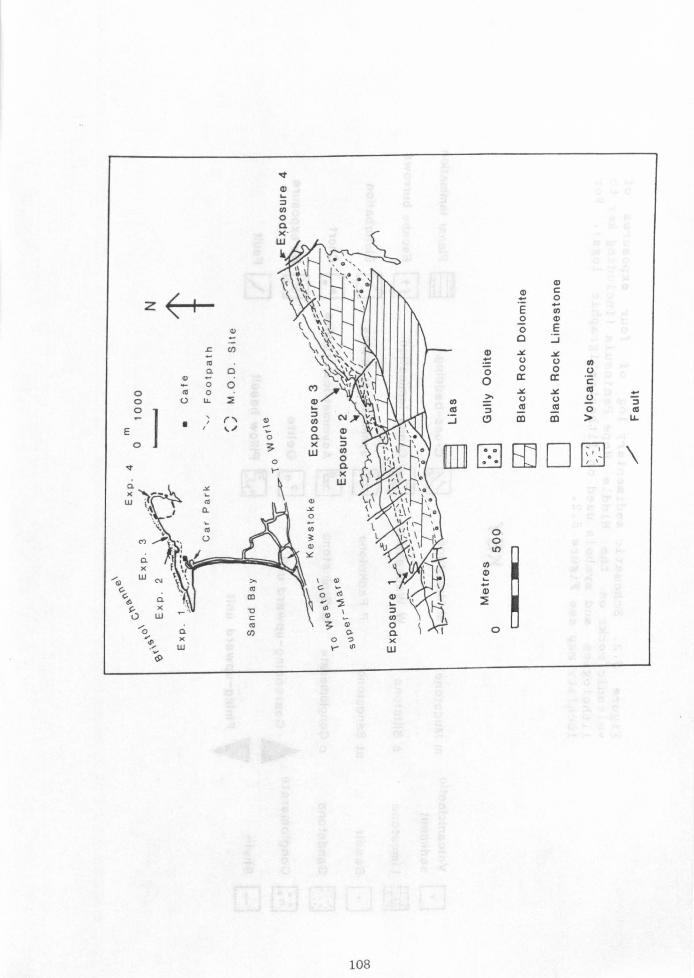
It
y 0 a x. w
O 1\
Zý
w
t` ý` a
0
o
OU LL m O
Nv %* -
o Om a
O x W(
a 0
r O a
X w
1, 0- 0
Cl) -Al U 3
a
WF T p
1d G
CL GIt
x U
O N
w n
c 0
10 x )
0 uJ rN
IP
% ,I
ýs
i i1 ýý
ýr lý
äS X
W
a, m c
E N o m ö E o _ J Y Y V V o
a 0 o 0
0 Y Y ý U U V
a) a fC lC 0
3 CD m m >
En m [Z r-1 EI
0 0 Lf)
N
0
_r 7
U-
\
108

C O
y 3
4-4 0 94 O+1 O
cti E j O
w
may
L
m r Co
m
ýf O a
O 00 to C6 y 0 L
x 0
= Co
N b0 OO ä w m U Z w
4) --1 [3 rýI n- 2 m r5111 UU
O -- a p
o ýa 4-4 CC 9+ C
m .
c. a
-a to O C« m +1 p r.
E V co
C_ =
öä CO Co Co
c ä
ýn ö
vý ö E
E EE
0 ;' p" Ü Ü Cl,
y <
o 0
_ ä
0x 4-1 Z:
ý\ re i I o Eýb
m ^4 O U .aO0i.
uJ C c m
C O
C r .
4m Co E "H
y Y U
Y
U C e0
7
9) .Z
Co b-
Co C
V) OC 10
O a C7 3 a O V
ö00 s. E
4- co
i C ;
a to
+ý O O C O 0 E 0
ä O p-4 "14 9.4 cß O -1 OU .Z cC
N O «. y
j _O O)
ß e0 O
C C
00 -I 41
., 4 OO cmd > -+ E
to m
to N
p
U U
U LL
..
U 4- ý+ Cl) O m
C C
Co
p
N C
U
r
m y
C
0 C _m
Co p > 0)
E J
Co m
Co O V
L
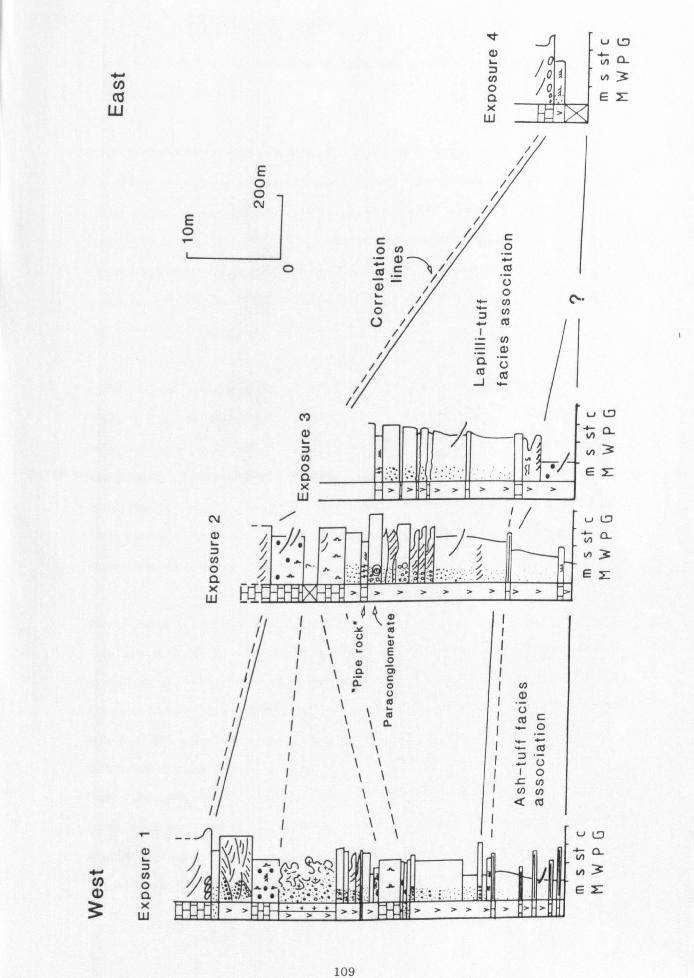
CO (0
W
k n-
Z /oý
N3
Q/E 7- xW
/
E/ O/ O
p/c y/0
O Co /U O/0
c-
(0 / 4- (C /I CO
/U
/J w-
Li LJ
}a N
'3 E
4-0
N a)
I- ti) I-
0 a x W
04 0
0
Lii -Z S
i
1
1
Ei oi ä
i\\'
i\`
Li L7
ýoý N3 /01 Q_E 7-
xW
Cl)
VC
0
as U
10 L (A w U)
Q co
Li lD
E
v Lo
N
EE
109
cherty nodules. It outcrops at exposure 1 immediately above the pillow basalts (Figure 5.3).
5.4 Sedimentary facies description and interpretation
To simplify the sedimentary descriptions, the succession can be separated
into four facies associations (A-D) (Faulkner 1989). In stratigraphic
order they are as follows: argillaceous bioturbated limestone, ash-tuff,
lapilli-tuff and cross-bedded bioclastic limestone (Figure 5.4). To save
repetition of facies descriptions where necessary the reader is referred
to relevant sections in Chapters 3&4.
5.4.1. Facies Association A: Bioturbated argillaceous limestone
This is exposed along the foreshore at Middle Hope and underlying the
volcanics is a 51w thick succession of decimetre-bedded,
extensively bioturbated, wackestones and packstones separated by
shaly/marl layers (Figure 5.5A). Such features are characteristic of
Lithofacies 9 which is described in section 4.3.2 and is interpreted as
below storm wave-base facies.
5.4.2. Facies Association B: Ash-tuft
The ash-tuff facies association dominates the lower part of the volcanic
series at the first three exposures but is not present at the fourth
(Figure 5.3). The dominant subfacies is an ash-tuff (Ba) which occurs
interbedded with thin-bedded limestones (Bb).
Subfacies Ba: Ash-tuff
The structureless, multi-coloured ash-tuff subfacies is slightly
calcareous and forms a broadly upward-coarsening unit, from coarse
ash to medium grained ash-tuff. Present within it are maroon and pale
green lapilli which tend to concentrate in layers (3-5cm thick). From the
110
Figure 5.4. Schematic sedimentary log of exposure 1 on the Middle Hope Peninsula. The lower rose diagram is a plot of crinoid stem orientations; the upper rose diagram is a plot of the accretion direction of the cross-bed foresets. Symbols as for Figure 5.3.
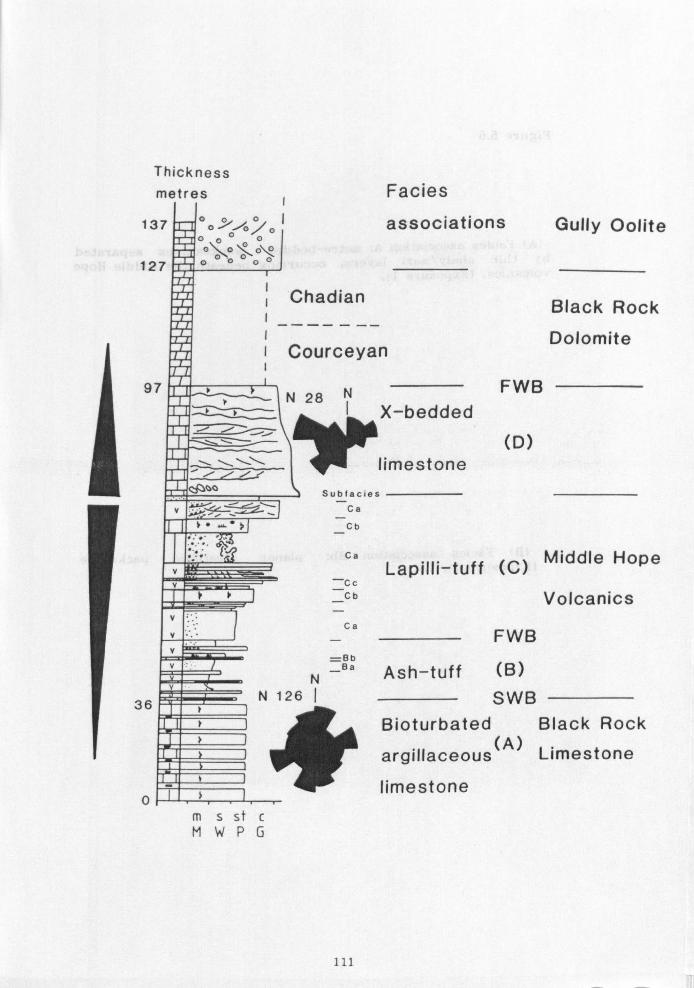
Thickness
metres
137 °o%%7o o00o
\\
o0 127 0
97
36
0
Facies
associations
Chadian
i Courceyan
ºN 28 N º X-bedded
limestone X00
Subfacies
Ca
º"-"> _Cb
"ýCa
-Cc /º Cb
Ca V '.
=Bb _Ba N
N 126 1
ms st c mWPG
FWB
(D)
Gully Oolite
Black Rock
Dolomite
Lapilli-tuff (C) Middle Hope
Volcanics
FWB
Ash-tuff (B)
SWB Bioturbated Black Rock
argillaceous(A) Limestone
limestone
111

Figure 5.5
(A) Facies association A: metre-bedded wackestones separated by thin shaly/marl layers, occurring beneath the Middle Hope volcanics. (Exposure 1).
(B) Facies association Bb: planar stratified pachstone (Exposure 1).

112
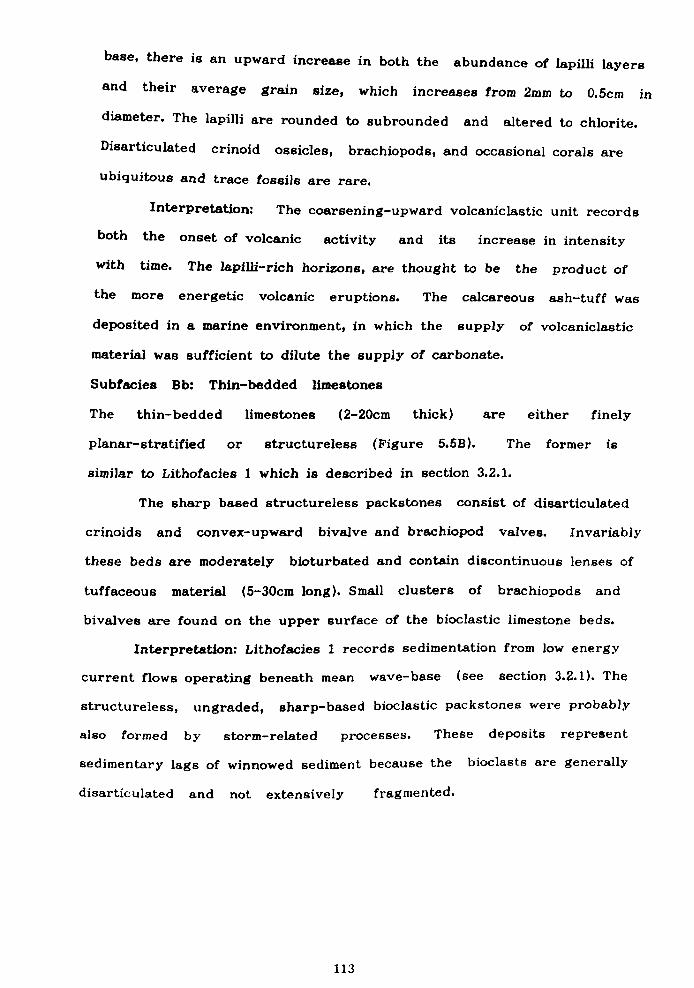
base, there is an upward increase in both the abundance of lapilli layers
and their average grain size, which increases from 2mm to 0.5cm in
diameter. The lapilli are rounded to subrounded and altered to chlorite.
Disarticulated crinoid ossicles, brachiopods, and occasional corals are
ubiquitous and trace fossils are rare.
Interpretation: The coarsening-upward volcaniclastic unit records
both the onset of volcanic activity and its increase in intensity
with time. The lapilli-rich horizons, are thought to be the product of
the more energetic volcanic eruptions. The calcareous ash-tuff was
deposited in a marine environment, in which the supply of volcaniclastic
material was sufficient to dilute the supply of carbonate.
Subfacies Bb: Thin-bedded limestones
The thin-bedded limestones (2-20cm thick) are either finely
planar-stratified or structureless (Figure 5.5B). The former is
similar to Lithofacies 1 which is described in section 3.2.1.
The sharp based structureless packstones consist of disarticulated
crinoids and convex-upward bivalve and brachiopod valves. Invariably
these beds are moderately bioturbated and contain discontinuous lenses of
tuffaceous material (5-30cm long). Small clusters of brachiopods and
bivalves are found on the upper surface of the bioclastic limestone beds.
Interpretation: Lithofacies 1 records sedimentation from low energy
current flows operating beneath mean wave-base (see section 3.2.1). The
structureless, ungraded, sharp-based bioclastic packstones were probably
also formed by storm-related processes. These deposits represent
sedimentary lags of winnowed sediment because the bioclasts are generally
disarticulated and not extensively fragmented.
113
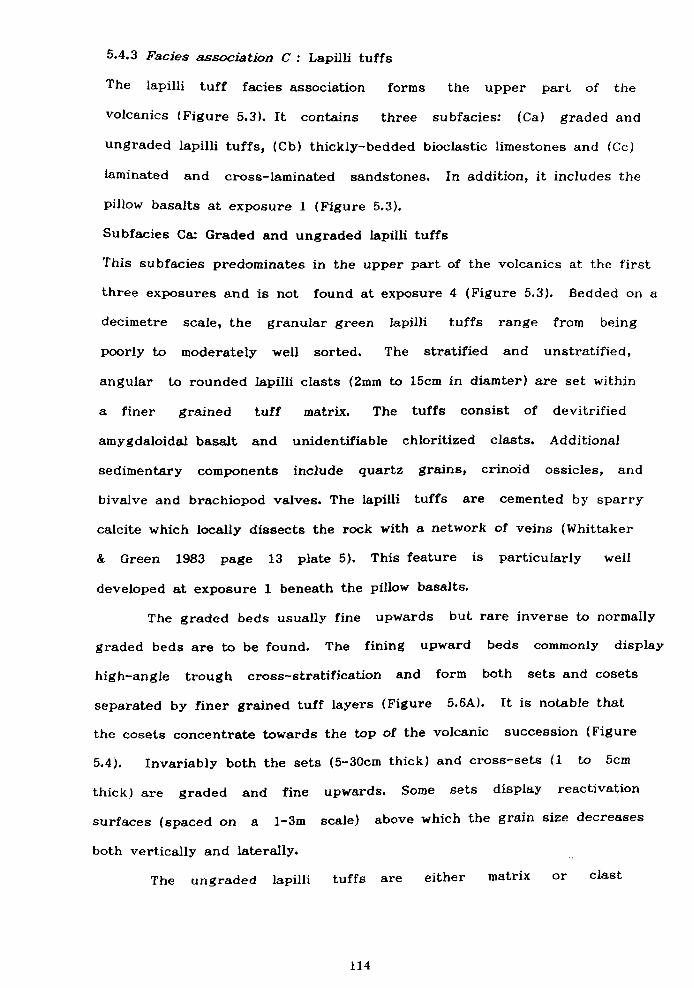
5.4.3 Facies association C: Lapilli tuffs
The lapilli tuff facies association forms the upper part of the
volcanics (Figure 5.3). It contains three subfacies: (Ca) graded and
ungraded lapilli tuffs, (Cb) thickly-bedded bioclastic limestones and (Cc)
laminated and cross-laminated sandstones. In addition, it includes the
pillow basalts at exposure I (Figure 5.3).
Subfacies Ca: Graded and ungraded lapilli tuffs
This subfacies predominates in the upper part of the volcanics at the first
three exposures and is not found at exposure 4 (Figure 5.3). Bedded on a
decimetre scale, the granular green lapilli tuffs range from being
poorly to moderately well sorted. The stratified and unstratified,
angular to rounded lapilli ciasts (2mm to 15cm in diamter) are set within
a finer grained tuff matrix. The tuffs consist of devitrified
amygdaloidal basalt and unidentifiable chloritized Glasts. Additional
sedimentary components include quartz grains, crinoid ossicles, and
bivalve and brachiopod valves. The lapilli tuffs are cemented by sparry
calcite which locally dissects the rock with a network of veins (Whittaker
& Green 1983 page 13 plate 5). This feature is particularly well
developed at exposure 1 beneath the pillow Basalts.
The graded beds usually fine upwards but rare inverse to normally
graded beds are to be found. The fining upward beds commonly display
high-angle trough cross-stratification and form both sets and cosets
separated by finer grained tuff layers (Figure 5.6A). It is notable that
the cosets concentrate towards the top of the volcanic succession (Figure
5.4). Invariably both the sets (5-30cm thick) and cross-sets (1 to 5cm
thick) are graded and fine upwards. Some sets display reactivation
surfaces (spaced on a 1-3m scale) above which the grain size decreases
both vertically and laterally.
The ungraded lapilli tuffs are either matrix or Glast
114
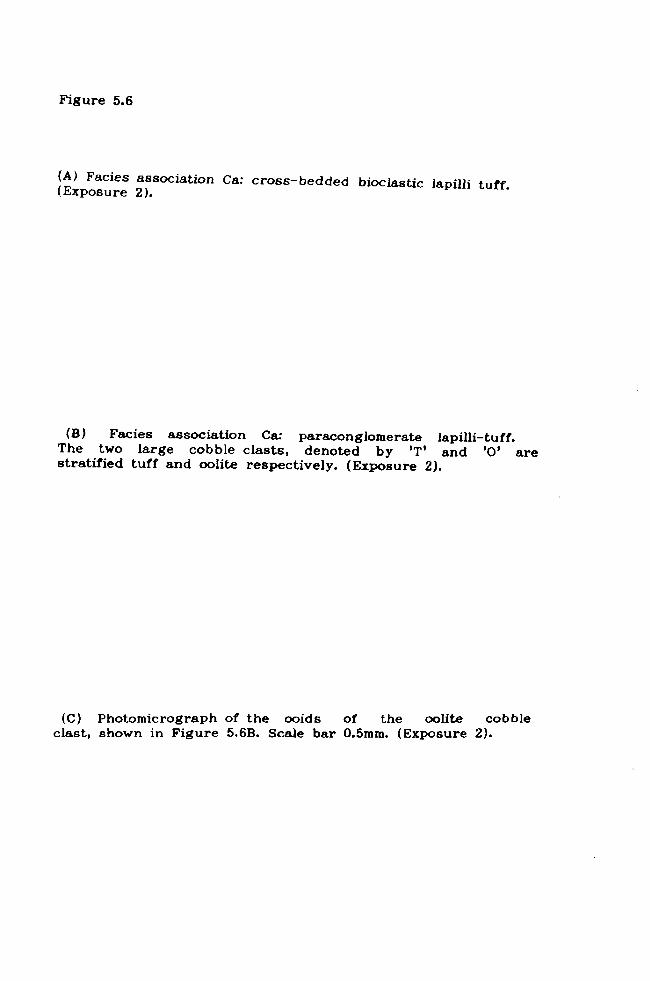
Figure 5.6
(A) Facies association Ca: cross-bedded bioclastic lapilli tuff. (Exposure 2).
(B) Facies association Ga paraconglomerate lapilli-tuff. The two large cobble clasts, denoted by 'T' and '0' are stratified tuff and oolite respectively. (Exposure 2).
(C) Photomicrograph of the ooids of the oolite cobble clast, shown in Figure 5.6B. Scale bar 0.5mm. (Exposure 2).
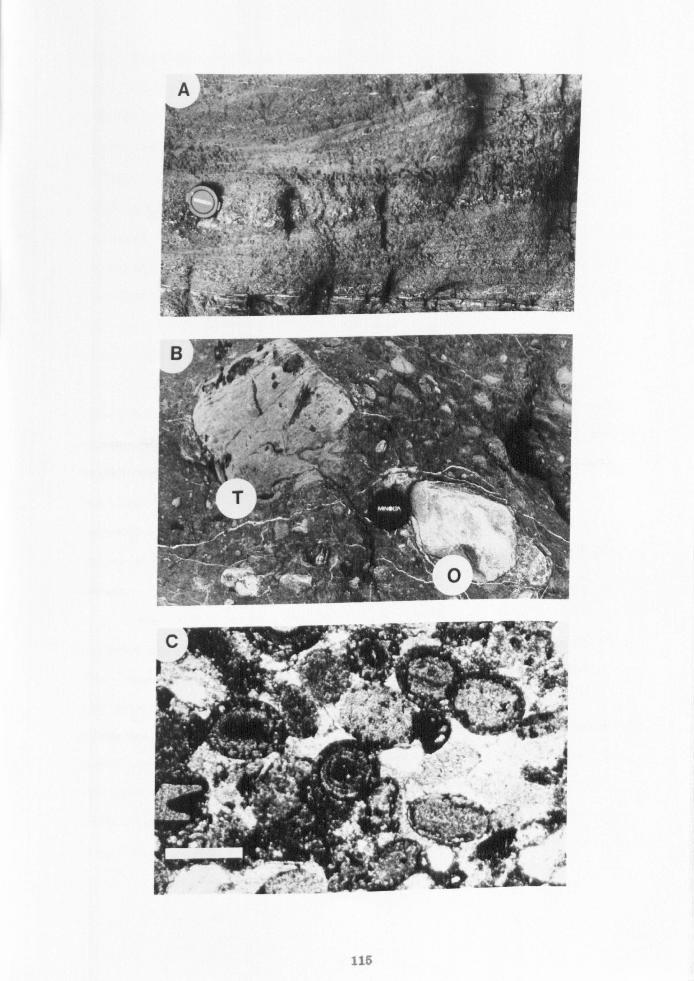
A s. N cq fý 4
*
ý{
116
supported, and the former is particularly well developed at exposure 2,
just beneath the 'pipe-rock' (Figures 5.3 & 5.6B). Additional clasts
identified in paraconglomerate beds include chert nodules and limestones
clasts containing the coral Michelinia. A single large cobble of
oolitic limestone which lacks internal stratification, also occurs
(Figure 5.6B). The ooid nuclei consist of subrounded echinoderm, bivalve
and coral bioclasts, and angular quartz grains (silt to medium sand sized
in diameter). Set within sparite cement, the ooids commonly show a poorly
developed concentric cortex due to their partial replacement by microspar
(Figure 5.6C) and more rarely by pyrite. The latter also occurs as
crystal aggregates within the microspar cement.
Interpretation: Since the lapilli tuffs contain crinoids and
brachiopods, it seems likely that deposition was in a shallow-marine
environment. The coarse grain size and sedimentary features of the
lapilli tuffs suggest deposition from high-energy currents. Grading
between reactivation surfaces, spaced on a metre scale, indicates
punctuated phases of deposition. The grading of the cross-sets is most
probably due to the episodic avalanching of ripples down the slip-face of
dunes.
The high-energy currents could either be due to subaqueous
eruption-related gravity flows and/or normal shallow-marine processes.
'Cold' pyroclastic flows are known to develop in subaqueous environments
and form non-welded turbidite-like sequences (Carey & Siguardsson 1980).
Owing to the dominance of medium-scale cross-bedding much of the Middle
Hope volcanics is interpreted as having been ultimately laid-down by
shallow-marine processes. The paraconglomerate containing intraformational
cobble clasts was interpreted, by Jeffreys (1979), as a pyroclastic
debris-flow or lahar. Moving down the palaeoslope the debris-flow
entrained intraformational clasts of chert, coralliferous limestone and
116
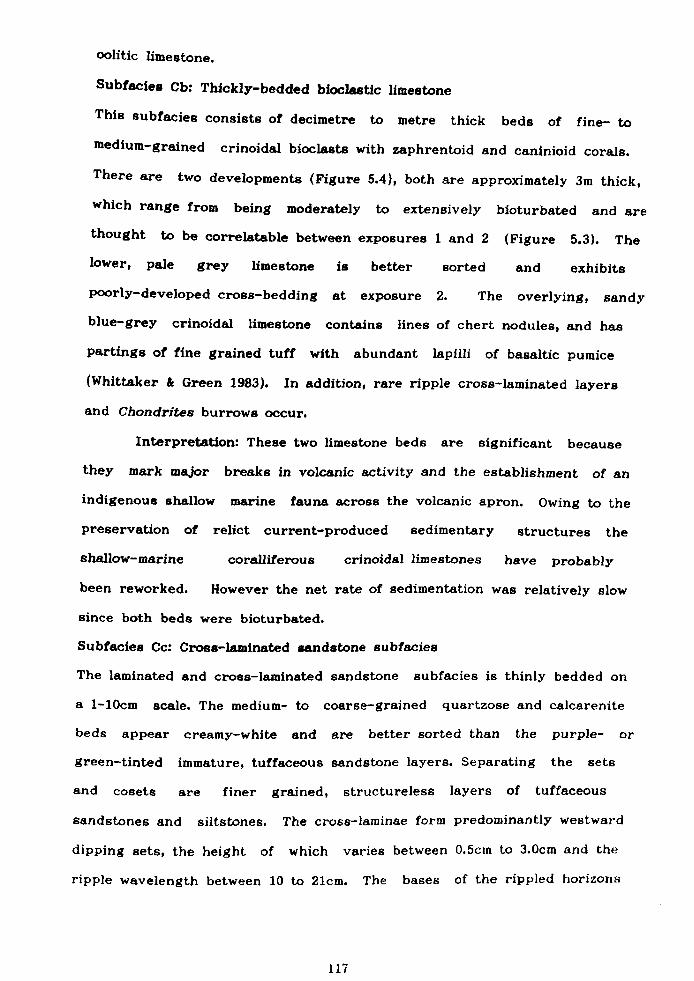
oolitic limestone.
Subfacies Cb: Thickly-bedded bioclastic limestone
This subfacies consists of decimetre to metre thick beds of fine- to
medium-grained crinoidal bioclasts with zaphrentoid and caninioid corals.
There are two developments (Figure 5.4), both are approximately 3m thick,
which range from being moderately to extensively bioturbated and are
thought to be correlatable between exposures 1 and 2 (Figure 5.3). The
lower, pale grey limestone is better sorted and exhibits
poorly-developed cross-bedding at exposure 2. The overlying, sandy
blue-grey crinoidal limestone contains lines of chert nodules, and has
partings of fine grained tuff with abundant lapilli of basaltic pumice
(Whittaker & Green 1983). In addition, rare ripple cross-laminated layers
and Chondrites burrows occur.
Interpretation: These two limestone beds are significant because
they mark major breaks in volcanic activity and the establishment of an
indigenous shallow marine fauna across the volcanic apron. Owing to the
preservation of relict current-produced sedimentary structures the
shallow-marine coralliferous crinoidal limestones have probably
been reworked. However the net rate of sedimentation was relatively slow
since both beds were bioturbated.
Subfacies Cc: Cross-laminated sandstone subfacies
The laminated and cross-laminated sandstone subfacies is thinly bedded on
a 1-10cm scale. The medium- to coarse-grained quartzose and calcarenite
beds appear creamy-white and are better sorted than the purple- or
green-tinted immature, tuffaceous sandstone layers. Separating the sets
and cosets are finer grained, structureless layers of tuffaceous
sandstones and siltstones. The cross-laminae form predominantly westward
dipping sets, the height of which varies between 0.5cm to 3.0cm and the
ripple wavelength between 10 to 21cm. The bases of the rippled horizons
117
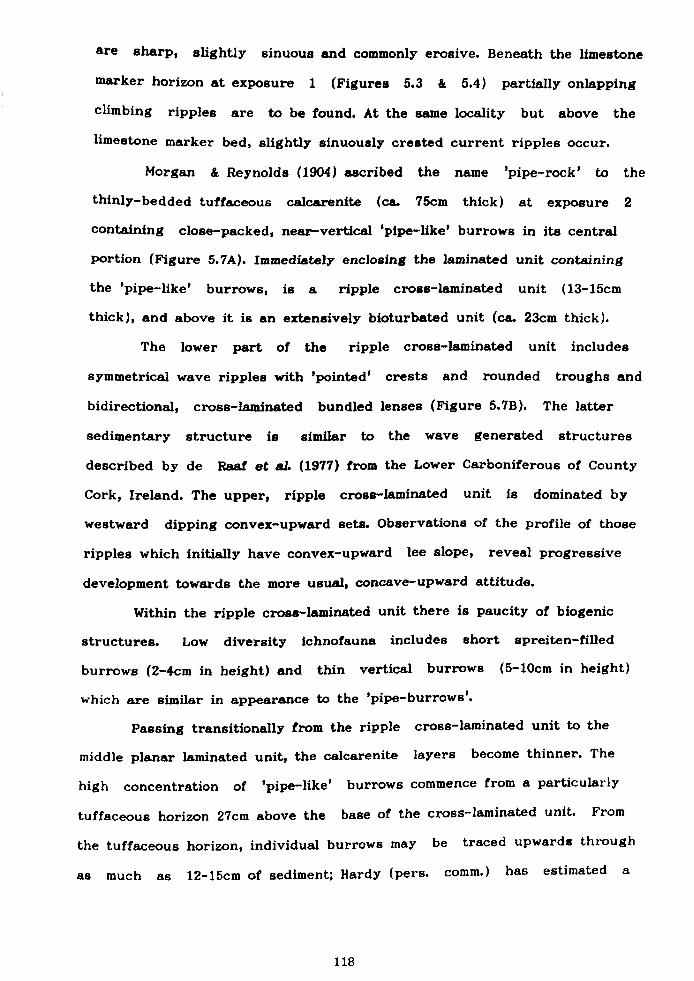
are sharp, slightly sinuous and commonly erosive. Beneath the limestone
marker horizon at exposure 1 (Figures 5.3 & 5.4) partially onlapping
climbing ripples are to be found. At the same locality but above the
limestone marker bed, slightly sinuously crested current ripples occur.
Morgan & Reynolds (1904) ascribed the name 'pipe-rock' to the
thinly-bedded tuffaceous calcarenite (ca. 75cm thick) at exposure 2
containing close-packed, near-vertical 'pipe-like' burrows in its central
portion (Figure 5.7A). Immediately enclosing the laminated unit containing
the 'pipe-like' burrows, is a ripple cross-laminated unit (13-15cm
thick), and above it is an extensively bioturbated unit (ca. 23cm thick).
The lower part of the ripple cross-laminated unit includes
symmetrical wave ripples with 'pointed' crests and rounded troughs and
bidirectional, cross-laminated bundled lenses (Figure 5.7B). The latter
sedimentary structure is similar to the wave generated structures
described by de Raaf et aL (1977) from the Lower Carboniferous of County
Cork, Ireland. The upper, ripple cross-laminated unit is dominated by
westward dipping convex-upward sets. Observations of the profile of those
ripples which initially have convex-upward lee slope, reveal progressive
development towards the more usual, concave-upward attitude.
Within the ripple cross-laminated unit there is paucity of biogenic
structures. Low diversity ichnofauna includes short spreiten-filled
burrows (2-4cm in height) and thin vertical burrows (5-10cm in height)
which are similar in appearance to the 'pipe-burrows'.
Passing transitionally from the ripple cross-laminated unit to the
middle planar laminated unit, the calcarenite layers become thinner. The
high concentration of 'pipe-like' burrows commence from a particularly
tuffaceous horizon 27cm above the base of the cross-laminated unit. From
the tuffaceous horizon, individual burrows may be traced upwards through
as much as 12-15cm of sediment; Hardy (pers. comm. ) has estimated a
118
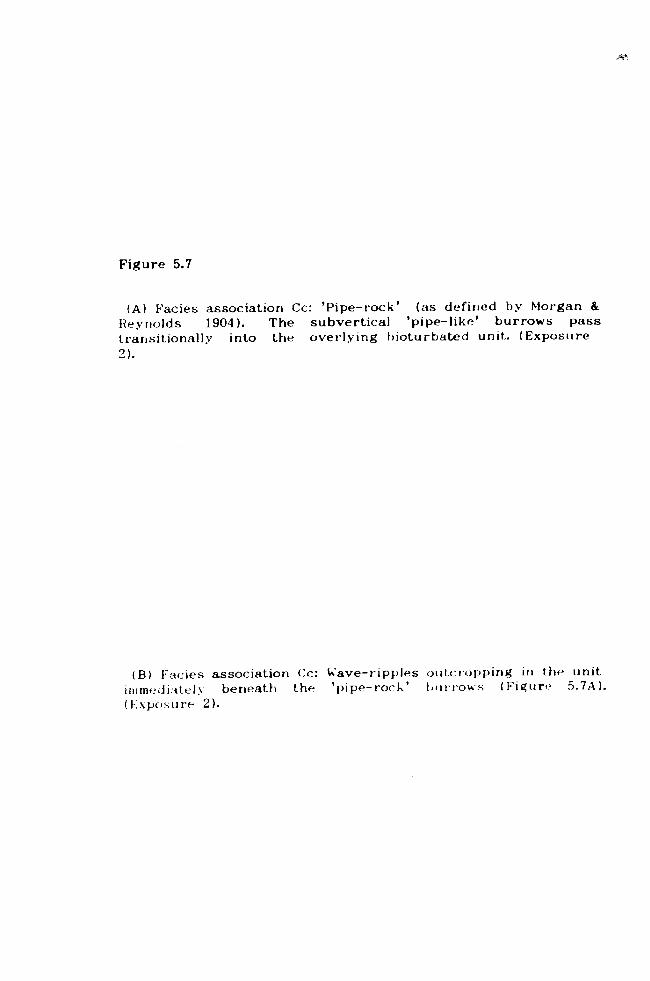
>ýý
Figure 5.7
(A) Facies association Cc: 'Pipe-rock' (as defined by Morgan & Reynolds 1904). The subvertical 'pipe-like' burrows pass transitionally into the overlying bioturbated unit. (Exposure 2).
(B) Facies association Cc: Wave-ripples outcropping in the unit inimcdi, itely beneath the 'pipe-rock' burrows (Figure 5.7A). (Exposure 2).
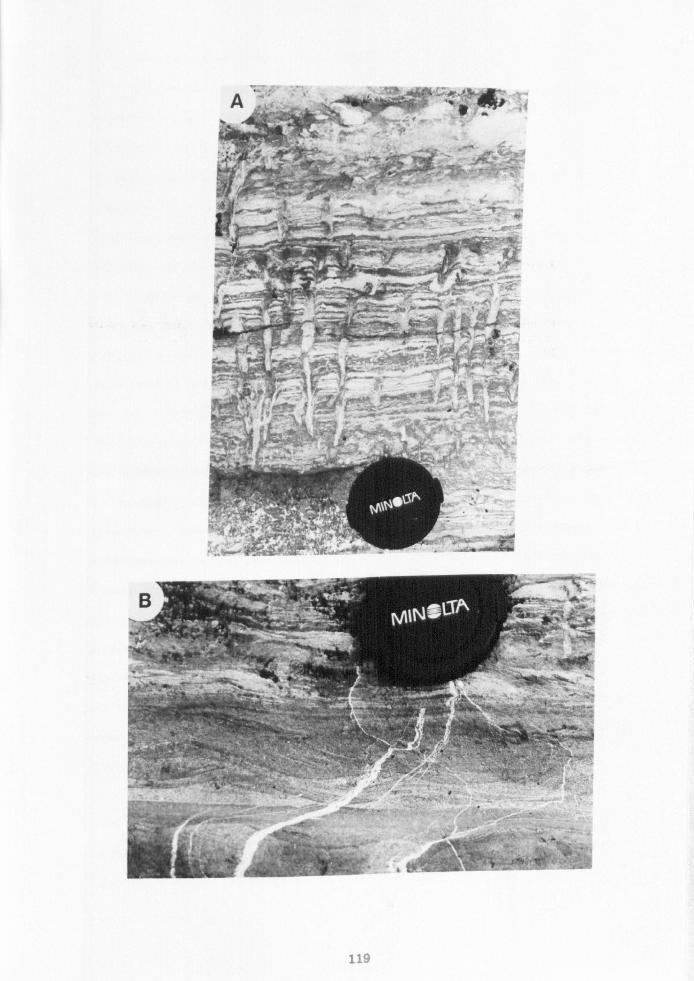
ý'
_ ý- - "_ ; wißt`ýý '"'^''ti
A.
v JOIN
_- lý .
119
4
. - ^. ....
ý..,,,. ,:
ý�ý,.. ýy, rý,
ý' ý-z
li-- .
.,,, ý
., ý ; u.. w` ar .
y x' a
Lr $`h. ýýT
wwý
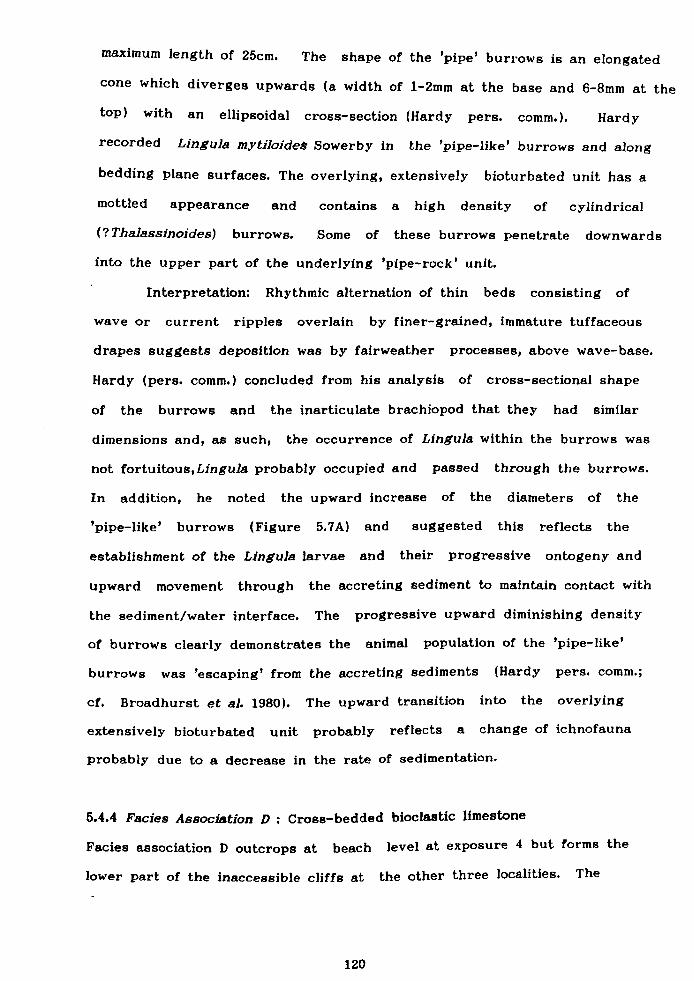
maximum length of 25cm. The shape of the 'pipe' burrows is an elongated
cone which diverges upwards (a width of 1-2mm at the base and 6-8mm at the
top) with an ellipsoidal cross-section (Hardy pers. comm. ). Hardy
recorded Lingula mytilofde. Sowerby in the 'pipe-like' burrows and along
bedding plane surfaces. The overlying, extensively bioturbated unit has a
mottled appearance and contains a high density of cylindrical
(? Thalassinoides) burrows. Some of these burrows penetrate downwards
into the upper part of the underlying 'pipe-rock' unit.
Interpretation: Rhythmic alternation of thin beds consisting of
wave or current ripples overlain by finer-grained, immature tuffaceous
drapes suggests deposition was by fairweather processes, above wave-base.
Hardy (pers. comm. ) concluded from his analysis of cross-sectional shape
of the burrows and the inarticulate brachiopod that they had similar
dimensions and, as such, the occurrence of Lingula within the burrows was
not fortuitous, Lingula probably occupied and passed through the burrows.
In addition, he noted the upward increase of the diameters of the
'pipe-like' burrows (Figure 5.7A) and suggested this reflects the
establishment of the Lingula larvae and their progressive ontogeny and
upward movement through the accreting sediment to maintain contact with
the sediment/water interface. The progressive upward diminishing density
of burrows clearly demonstrates the animal population of the 'pipe-like'
burrows was 'escaping' from the accreting sediments (Hardy pers. comm.;
cf. Broadhurst et al. 1980). The upward transition into the overlying
extensively bioturbated unit probably reflects a change of ichnofauna
probably due to a decrease in the rate of sedimentation.
5.4.4 Facies Association D: Cross-bedded bioclastic limestone
Facies association D outcrops at beach level at exposure 4 but forms the
lower part of the inaccessible cliffs at the other three localities. The
120
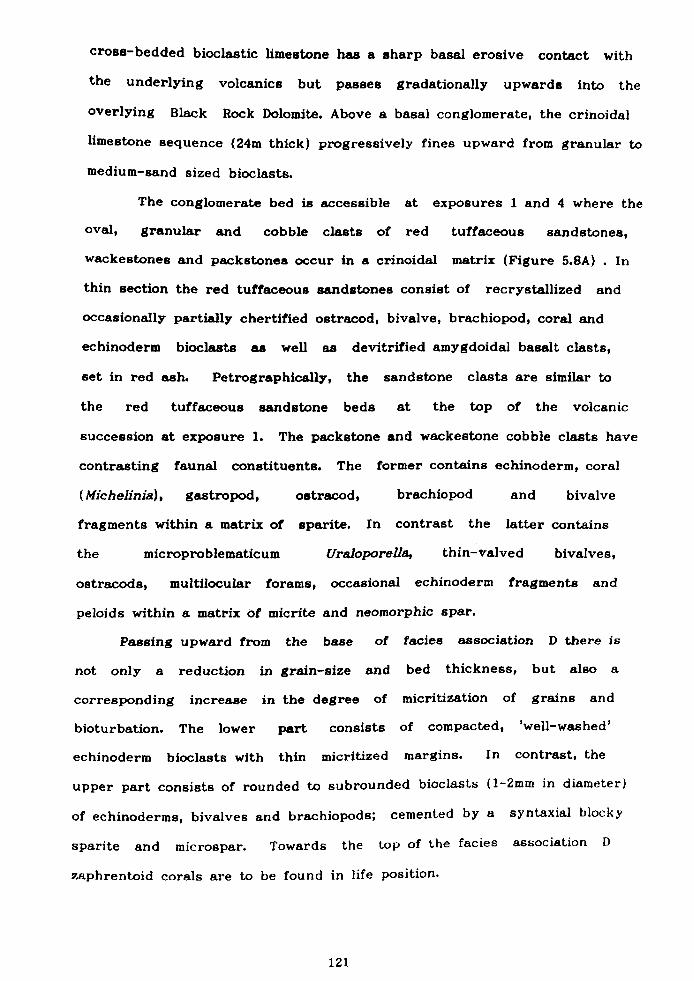
cross-bedded bioclastic limestone has a sharp basal erosive contact with
the underlying volcanics but passes gradationally upwards into the
overlying Black Rock Dolomite. Above a basal conglomerate, the crinoidal
limestone sequence (24m thick) progressively fines upward from granular to
medium-sand sized bioclasts.
The conglomerate bed is accessible at exposures 1 and 4 where the
oval, granular and cobble clasts of red tuffaceous sandstones,
wackestones and packstones occur in a crinoidal matrix (Figure 5.8A) . In
thin section the red tuffaceous sandstones consist of recrystallized and
occasionally partially chertified ostracod, bivalve, brachiopod, coral and
echinoderm bioclasts as well as devitrified amygdoidal basalt clasts,
set in red ash. Petrographically, the sandstone Glasts are similar to
the red tuffaceous sandstone beds at the top of the volcanic
succession at exposure 1. The packstone and wackestone cobble clasts have
contrasting faunal constituents. The former contains echinoderm, coral
(Michelinia), gastropod, ostracod, brachiopod and bivalve
fragments within a matrix of sparite. In contrast the latter contains
the microproblematicum Uraloporella, thin-valved bivalves,
ostracods, multilocular forams, occasional echinoderm fragments and
peloids within a matrix of micrite and neomorphic spar.
Passing upward from the base of facies association D there is
not only a reduction in grain-size and bed thickness, but also a
corresponding increase in the degree of micritization of grains and
bioturbation. The lower part consists of compacted, 'well-washed'
echinoderm bioclasts with thin micritized margins. In contrast, the
upper part consists of rounded to subrounded bioclasts (1-2mm in diameter)
of echinoderms, bivalves and brachiopods; cemented by a syntaxial blocky
sparite and microspar. Towards the top of the facies association D
zaphrentoid corals are to be found in life position.
121

. _; x
Figure 5.8
(A) Basal conglomerate of the Middle (lope Limestone; l acies assocation D. The letter 'R' denotes clasts of red tuff. wceous sandstone and 'W' the wackestone Glast containing the
microproblematicum Uraloporella. (Exposure 1).
(B) Pillow basalt. (Exposure I ).
{mot '_ z_. ý ý, t sp. F
.. ; t.. ý. ý,.. :.; _.
4, '. ý-
122
Jý 1. k
Bedded on a decimetre scale are the sharp, planar or undulatory
erosively-based crinoidal-limestones. Short crinoid stems, when present,
tend to concentrate along the base of the beds as a lag deposit. The
planar and trough cross-sets form both cosets and sets separated by
structureless crinoidal limestones. The latter exhibit rare reactivation
surfaces and erosive asymmetric dish-like troughs (5m wide and 25cm deep)
filled by the lateral accretion of sets. The dominant palaeocurrent vector
is toward the west with a corresponding reverse current now toward the
east (Figure 5.4).
Interpretation: The erosively-based crinoidal unit was laid-down
upon the poorly sorted, sedimentologically immature deposits of the
volcanics. The well-washed appearance of the cross-bedded crinoidal
grainstone records deposition in a shallow marine environment. High
energy currents are thought to be responsible for forming the
erosive-based granular crinoidal-limestone beds which exhibit dune-like
structures, reactiviation surfaces and large asymmetric (channel? )
scours. The east - west palaeocurrents parallel the inferred orientation
of palaeo-shoreline to the north (cf. Wright 1986). From the base of the
sequence, the upward decrease in bed-thickness, grain-size and
corresponding increase in degree of micritization, biogenic structures and
occurrence of zaphrentoids in growth position suggest an overall decrease
in current energy and the rate of sedimentation. Modern studies of
degree of grain micritization, by marine endolithic algae, show it
increases with residence time on the sea floor (Kobluk & Risk 1977).
Overall, sedimentary evidence suggests the cross-bedded limestone is a
transgressive sequence and records progressive deepening of the water
column above a crinoidal gravel sandbank.
The occurrence in the basal conglomerate of the wackestone clast
containing Uraloporella indicates localised development of low energy
123
(protected? ) environments on the upper surface of the volcanics, prior to
the establishment of the crinoidal sandbank.
5.5 Discussion
The aim of this discussion is to assess the significance of the facies
associations which record the evolution of a geologically transient,
offshore volcanic-high. The Middle Hope volcanics occur within the upper
part of the Black Rock Limestone offshore outer-ramp
facies. The coarsening- and shallowing- upward volcanic sequence (facies
association B& C) records the buildup of the localised volcanic
submarine-high (Figure 5.9). The source of the volcanic material is
thought to have been from the west, since the volcanic pile thins notably
towards the east (Whittaker & Green 1983). Thus the volcanic wedge
probably forms part of an apron which flanks a volcanic centre (Figure
5.9). Subsequent to the cessation of volcanic activity a crinoidal
sandbank developed upon the upper surface of the volcanic high. The
decline of the submarine-high to beneath wave-base is recorded by the
upward-fining, transgressive, bioclastic limestone (facies association D).
The four facies associations (A-D) were laid-down in a subaqueous
environment because there is a conspicuous absence of subaerial exposure
features (Jeffreys 1979). The volcanics were initially deposited over the
outer ramp facies of bioturbated, argillaceous limestones (facies
association A). The regressive sequence records deposition from below
storm wave-base to above fairweather wave-base. The ash-tuff facies
association B contains stratified, thin-bedded storm-related deposits
characteristic of a depositional environment above storm wave-base.
Facies association C consists of a diverse range of lithologies which
reflects the variability of above fairweather wave-base sedimentary
environments.
124
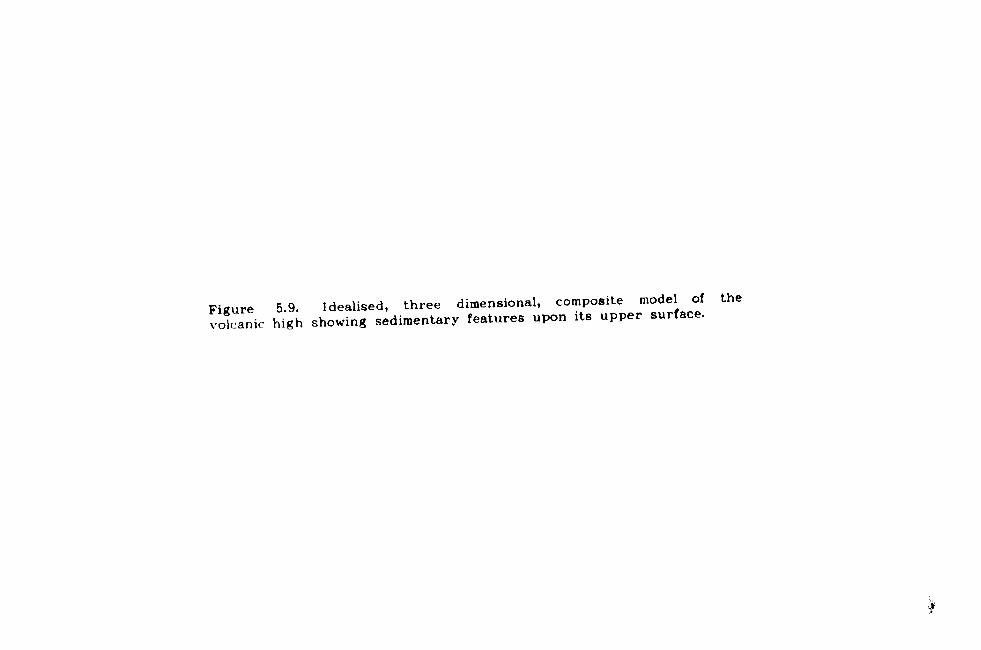
Figure 5.9. Idealised, three dimensional, composite model of the volcanic high showing sedimentary features upon its upper surface.

v
E Y 0
c
/o 1
+
125
Contained within facies association C are a number of
palaeontological and sedimentary palaeo-depth indicators which suggest
that the volcanic high shallowed to within close proximity of sea level.
They include clasts with the microproblematicum Uraloporella, the oolite
cobble clast and wave and current ripples associated with Lingula burrows.
Uraloporella occurs preferentially in restricted environments: such as
lagoonal deposits (Riding & Jansa 1974 & 1976; Kazmierczak & Goldring
1978; Faber & Riding 1979) and the surf zone deposits of the Lower
Carboniferous (Arundian? ) Llanelly Formation of South Wales (Wright 1982).
The low diversity fauna within the wackestone clast containing
Uraloporella suggests deposition in a protected marine environment.
The oolite cobble clast could have had three potential sources.
Firstly, it could be a volcanic bomb, derived from the underlying country
rock which was ejected onto the volcanic apron during an eruption.
Alternatively, it could have formed within a nearshore oolite shoal
complex, from which it was transported offshore onto the volcanic pile.
Thirdly, it could have formed in situ as part of the volcanic and
sedimentary offshore shoal complex.
Oolite sandbodies are to be found in the underlying Lower Limestone
Shale Group (Burchette 1987) and within the lower part of the Black
Rock Limestone in the region. These however, do not occur in the
Weston-super-Mare area, but predominate in the Forest of Dean area further
north. The absence of volcanic activity in those areas where the
oolite sandbodies developed, also militates against the oolite clast being
a volcanic bomb.
During the deposition of the Middle Hope volcanics the
palaeo-shoreline was situated at least 30-40km northward of the
Weston-super-Mare - Bristol exposures of the Carboniferous Limestone (cf.
Wright 1986). The bioturbated thickly-bedded deposits of the upper part
126
of the Black Rock Limestone record deposition beneath storm wave-base in
an offshore environment (Wright 1986). Thus it would seem unlikely that
the oolite cobble was derived from a nearshore environment, transported
across the ramp and onto the volcanic high. Therefore the most likely
origin for the oolite clast is from an oolite shoal which developed upon
the upper slopes of the volcanic high.
Oolite production is known to be significantly reduced at depths
greater than 10m. Thus, that part of the volcanic high from which the
oolite cobble was derived, seemingly shallowed to within close proximity
of sea level. There is no evidence that the oolite clast was subaerially
exposed and cemented in a vadose zone.
Recent lingulids commonly occur in intertidal sediments and are
usually found at depths of less than 40m (Craig 1952; Paine 1970) but they
have been recorded as deep as the bathyal and abyssal zones (Mileikovsky
1971). Fossil Iingulids, by analogy with modern forms, are often inferred
to have lived in shallow water but appear to have had a wide depth range
in the geological past (Cherns 1979). Boucot (1975) noted that the simple
occurrence of linguloids does' not unequivocally indicate shallow water
conditions, as it is necessary to have a knowledge of the associated
lithofacies before reaching this conclusion. The high density of Lingula
burrows passing through a series of wave and current ripples, interpreted
as being produced within fairweather wave-base, seems strong evidence in
favour of shallow marine conditions. The notable absence of subaerial
exposure features militates against deposition in an intertidal zone.
Following the cessation of volcanic activity, an open-marine
crinoidal sandbank (Facies association D) developed over the volcanic
apron. The upward-fining crinoidal-limestone sequence records the
progressive increase in depth of the water column above the volcanic
high, to beneath wave-base. The demise of the volcanic high could either
127
be due to eustatic rise in sea level and/or slow subsidence of the
extinct volcanic centre.
During the deposition of the Courceyan Black Rock Limestone there
was differential subsidence across SW Britain and the sea level is
thought to have risen until the end of the Courceyan when there was
a marked regression (Ramsbottom 1973; Lees & Hennebert 1982; Ross & Ross
1985). As yet, there is no evidence of a major basin-wide net change in
the rate of subsidence and/or sea level rise during the period of the
accumulation of the volcanics.
The geological processes capable of building a localised
volcanic high to within close proximity of sea level, include volcanic
updoming and aggradation of the sedimentary pile due to the supply of
pyroclastic material. Determining whether volcanic updoming or aggradation
was the major factor in the evolution of the volcanic high is dependent
upon separating the effect that sediment accretion had upon its
development. The Middle Hope volcanic sedimentary wedge thins from 37.5m
at exposure 1 to less than a postulated 4m at exposure 4 (Figure 5.3). At
exposure 4 the above fairweather wave-base deposits of facies association
C are seen to directly overlie the below storm wave-base deposits of
facies assocation A, without any deposits of the intervening facies
association B (Figure 5.3). Regardless of whether facies association B
accumulated and was then eroded or not, the incongruous juxtaposition of
depth-related facies and the thinness of the volcanic sediments suggest
updoming was a significant factor in the development of the volcanic high.
5.6 Geochemistry of the pillow basalts (locality 1)
In recent years sophisticated geochemical techniques have been developed
to identify ancient tectonic settings even when they cannot be deduced
from the field relationships. The principle is based upon the recognition
128
that there is a close link between the rare earth element composition of
modern basic rocks and their tectonic setting (Figures 5.10 & 5.11),
against which analyses of ancient rocks are readily comparable (Pearce &
Cann 1973; Pearce 1983).
The aim of this study is to characterise the geochemical traits of
the pillow basalts at Middle Hope, in order to evaluate their tectonic
significance. The results of the analyses were compared against more
comprehensive geochemical studies undertaken to the south, in
Rheno-Hercynian zone by Floyd (1982), and along the northern margin of
Welsh-Brabant Massif, by Macdonald et aI. (1984).
5.6.1 Pillow basalt
The greenish amygdaloidal basalt of exposure 1 exhibits a four fold
increase in thickness, over a lateral distance of 15m, from 2 metres in
the east to c. 8m in the west. Within the basal part of the flow there
are well developed pillows (c. 50cm in diameter) (Figure 5.8B).
The petrography of the basalt from Swallow Cliff (Locality 1) has
been described in considerable detail in the Geological Memoir (Whittaker
& Green 1983). The sparsely amygdaloidal, porphyritic, olivine-basalt has
undergone extensive alteration and apart from the texture, there are
very few relicts of the original minerals. Identifying the primary
mineralogical phases has mainly been achieved by identifying the
alteration products and utilising information of the form of the minerals
from their relict texture. The primary phases include olivine, albite,
K-feldspar, pyroxenes and opaque ore (Whittaker & Green 1983). The sparse
ovoid amygdales are lined with sparry calcite or opaque ore and are filled
with pale green clay.
5.6.2 Methods
Two samples of the basalt were taken for geochemical study of major and
trace elements (using X-ray fluorescence using U. S. G. S standard rocks).
129
Figure 5.10. Discrimination diagram using Ti, Zr and Y. (Pearce & ("Wann 1973).
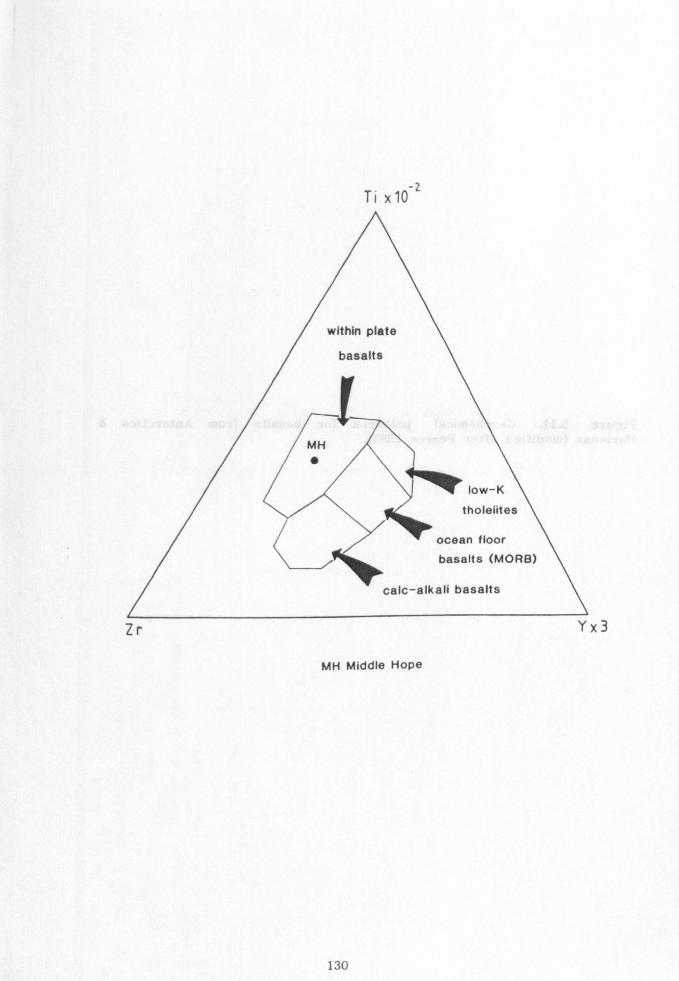
Ti x102
within plate
basalts
low-K
tholeiites
ocean floor
Basalts (MO RB)
calc-alkali basalts
Zr Yx3
MH Middle Hope
130
Figure 5.11. Geochemical patterns for basalts from Antarctica & Marianas (modified after Pearce 1983).
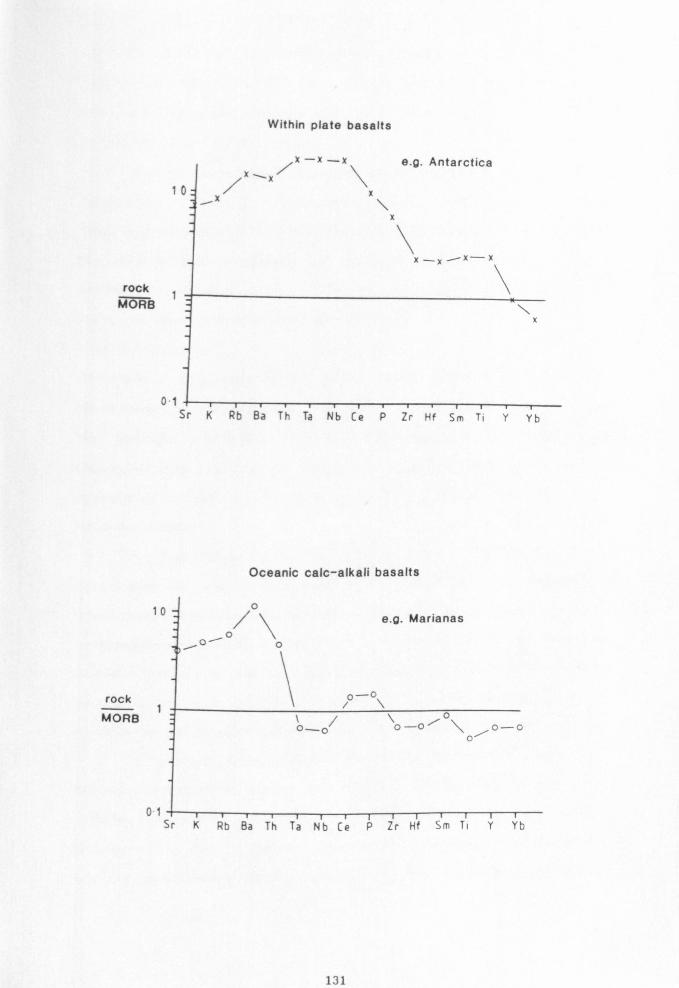
Within plate basalts
rock MORB
0'1 1- r--ITS-T .r Ti-T-
Sr K Rb Ba Th Ta Nb Ce p Zr Hf Sm Ti Y Yb
Oceanic calc-alkali basalts
10 ° /\e. g. Marianas
o °J0
rock / 0-O
MORE 1\/
°_0 0-0ý \ /0-0 0
o1 Sr K Rb Ba Th Ta Nb Ce P Zr Hf Sm Ti Y Yb
131
,x -x -x a. a. Antarctica
Both the preparation and analyses were undertaken by M. Widdowson (Oxford
University) (Appendix S). The former required the removal of the
amygdales, by slicing samples into thin slabs and breaking off the
secondary void filling phases.
Basalts are commonly classified solely upon their bulk chemical
composition into: silica-oversaturated, silica-saturated and
silica-undersaturated. This is achieved by calculating the C. I. P. W. norm:
the hypothetical assemblage of standard minerals (Cross et al. 1903;
modified by Cox et al. 1979). This was calculated on a volatile free
basis and with Fe203 arbitrarily set at 1.5wt%.
5.6.3 Geochemistry
The chemical composition of the pillow basalt is silica-undersaturated,
alkali basalt, as revealed from the norm calculation (Table 5.1). From
the available information, the bulk chemical composition of the rock
(Table 5.1) does not seem to have been notably changed, even though the
majority of the primary mineralogical phases are highly altered.
Magmatic affinity
Two trace element plots have been used to delimit the tectonic
environment of the pillow basalts: Ti, Zr and Y triangular diagram and
trace element geochemistry patterns (Figures 5.10 & 5.12). The stable
incompatible elements Ti, Zr and Y are particularly useful in assessing
magmatic affinity in that they are assumed to be unaffected by alteration
processes. The use of the Ti, Zr and Y triangular diagram is implicit
whereas the geochemical pattern diagram requires some explanation.
To produce smooth, readily comparable geochemical patterns the
samples are normalized against the trace element composition of an average
tholeiitic mid-ocean ridge basalt (MORB) (Pearce et al. 1981)
(Figure 5.11). The patterns characterisitic of calc-alkali basalts show
selective enrichment of Sr, K, Rb, Ba and Th; Ta, Nb, Zr, Hf, Ti, Y and Yb
132

Table 5.1. Geochemistry of the pillow basalt at Middle Hope. Or orthoclase, ab albite, an anorthite, ne nephline, di diopside (wo wollastonite, en enstatite, fs ferrosilite), of olivine (fo forsterite, fa fayalite), nit magnetite, cm cummingtonite, il illmenite.

wt% NORM Si02 45.86 or 25.41
Ti02 3.10 ab 5.55 A1203 13.95 an 17.28
Cr203 0.06 ne 5.24 Fe203 1070 di 18.52
((wo 9.6 0)
en 6.33) MnO 0.01 (t s 2.59) MgO 8.65 0( 15.47 (f o10,66)
Ca0 8.87 (fa 481)
Na20 1.80 mt 233
K20 4.30 cm 0.09
P205 0.57 il 5.89
T +ta
t 97.93 97.11
Zn L 189.8 Cu 39.0 Ni 236.5
Co 48.2 Cr 410.9 V 231.5 8a 524-6 Ga 197 Rb 54.4 Analysis of
Sr 2859 Middle Hope Basalt
Y 26.0 Zr 204-5 Nb 42.2 Pb 13.2
Th 28 U 1.4
133
cý a 0
a,
x
0
X
ö
v
L
v
0
4l
7
CT.
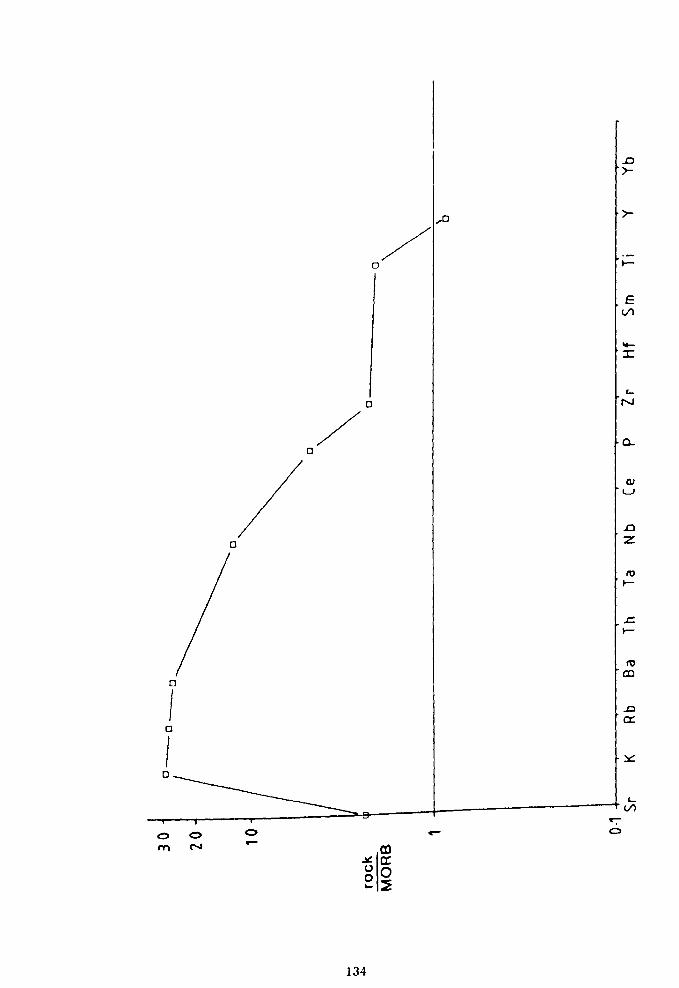
r
E
r--
N
a u
ro
r
a
N
134
C> C> CD MN co
Q 00
form a flat trend which lies parallel to the tholeiitic HORB pattern but
at a lower level (Pearce & Cann 1973). Apart from the least incompatible
elements Y and Yb, within plate basalts show enrichment relative to MORB.
The most incompatible elements, Ba, Th, Ta and Nb show the greatest
enrichment. As a result, the 'humped' pattern is characteristic for within
plate basalts.
The pillow basalt at Middle Hope shows the geochemical traits of a
within plate basalt by having "humped" geochemical pattern (compare
Figures 5.11 against 5.12) and plotting within the "within plate basalt"
field on the Ti, Zr and Y triangular diagram (Figure 5.10). Such
characteristics are consistent with the geochemical analyses of other
Hercynian basalts of the Rheno-Hercynian Zone (Floyd 1982) as well as
those just to the north of Welsh-Brabant Massif in the N Derbyshire area
(Macdonald et al. 1984). The above show a mild to moderate light rare
earth element enrichment and are of intra-plate in aspect. Their origin
is considered to be subsidence related (Leeder 1982; Macdonald et al.
1984). The cause of the tensional regime across Britain, is considered to
have been the result of northward subduction occurring some considerable
distance to the south of Welsh-Brabant Massif (Leeder 1974,1982 & 1987).
The geographical siting of Hercynian volcanic activity does in part
seem to have been influenced by the position of tectonic hinge lines
(Leeder 1974), particularly when coincidental with ancient (Caledonide)
lines of weakness which were most probably reactiviated e. g. the Midland
Valley (Upton 1982). These ancient basement lineaments most probably
facilitated easier access through the lithosphere for the melts (Upton
1982; Macdonald et al. 1984). The siting of volcanics in the
Weston-super-Mare region overlies the Mendip axis, interpreted as a
probable hinge-line at depth (Green & Welch 1965; Wilson et al. 1988). The
timing of the Middle Hope volcanics is seemingly related to movement
135
along a hinge-line, early during the P. mehli Zone, causing subsidence
to the south of the Mendip and Vale of Glamorgan axis (Figure 5.12).
Although in the vicinity of the area of volcanic activity localised
uplifted occurs (section 5.5).
5.7 Conclusions
1) The Dinantian (Courceyan) Middle Hope volcanics (near
Weston-super-Mare) form a coarsening- and shallowing-upward sequence which
records the buildup of a localised, offshore volcanic high upon the
below storm wave-base (outer carbonate ramp zone) deposits of the upper
Black Rock Limestone.
2) Combined palaeontological and sedimentary depth indicators suggest the
volcanic- high developed from below mean wave-base to above fairweather
wave-base and shallowed to within close proximity of sea level. No
subaerial exposure features were identified.
3) Comparative study of the sedimentary facies, developed down the
volcanic apron slope, revealed that volcanic updoming was a significant
factor in the development of the volcanic high.
4) The submergence of the topographic high, to below wave base, is
recorded by the succeeding erosively- based cross-bedded bioclastic
limestone which forms a fining- and deepening-upward sequence.
5) The geochemistry of the pillow basalt is of intra-plate character.
The timing for volcanic activity is seemingly related to major subsidence
to the south of the Vale of Glamorgan and Mendip axis, and as a
consequence of tensional regime set-up across Britain during the Lower
Carboniferous.
136
Chapter 6- Facies and dolomite geochemistry of the Castlemartin
Waulsortian buildups
6.1 Introduction
6.2 Waulsortian buildups of Castlemartin
6.2.1 The Berry Slade and the Wind Bay mounds
6.2.2 The Hanging Tar mound
6.3 Sedimentary phases
6.3.1 Sedimentary phases at Castlemartin
6.4 Discussion
6.5 Petrography and geochemistry of the Castlemartin Waulsortian dolomites
6.6 Burial history
6.7 Methods
6.8 Diagenetic relationships
6.9 Dolomite types & their geochemistry
6.9.1 Type 1-Mosaic dolomite
6.9.2 Type 2-Saddle dolomite
6.9.3 Geochemistry
6.10 Other Dinantian dolomites of South Wales
6.11 Discussion
6.12 Conclusions
137
6.1 Introduction
Mudmounds are typically large reef-like buildups dominated by a fine
grained matrix and lacking any prominent skeletal framework. They are a
special category of reef mound in which carbonate mud exceeds bioclastic
debris in volume (Wright 1989). Such reefs are common in the Palaeozoic.
The term Waulsortian was originally reserved for the sparry calcite
"veines bleues" lithology which makes up a considerable proportion of the
buildups of Waulsort, in Belgium (Lees at a]. 1977). The
present use of the term has been modified to include all those mudmounds
which show comparable faunal assemblages and sedimentary fabrics to the
Waulsortian buildups of Belgium (Miller & Grayson 1982; Lees et al. 1977).
The reef mounds described in this chapter are Waulsortian mounds, but
notably lack the "veines bleues" lithology.
Dixon (1921) was the first to describe the dolomitized mounds at
Berry Slade and Wind Bay (100-130m thick) as well as the undolomitized
mudmound at Hanging Tar (11m thick) (Figure 6.1). He proposed that these
mounds were of Waulsortian aspect; a conclusion later supported by
Sullivan (1960) and more recently confirmed by Lees & Hennebert (1982).
The aim of the first part of this chapter is to describe the
Castlemartin buildups and compare their evolution to other Waulsortian
mound complexes, situated along the southern margin of Welsh-Brabant
Massif, at Cannington Park (Lees & Hennebert 1982) and in Belgium (Lees at
al. 1985) (Figure 1.1).
In the second part of this chapter there is a full petrographic
description of the Waulsortian dolomites and their geochemistry, including
stable isotope analyses. Constraints from the geochemistry and
distribution of the dolomite permit an evaluation as to the most likely
subsurface hydrological system to have caused dolomitization.
138
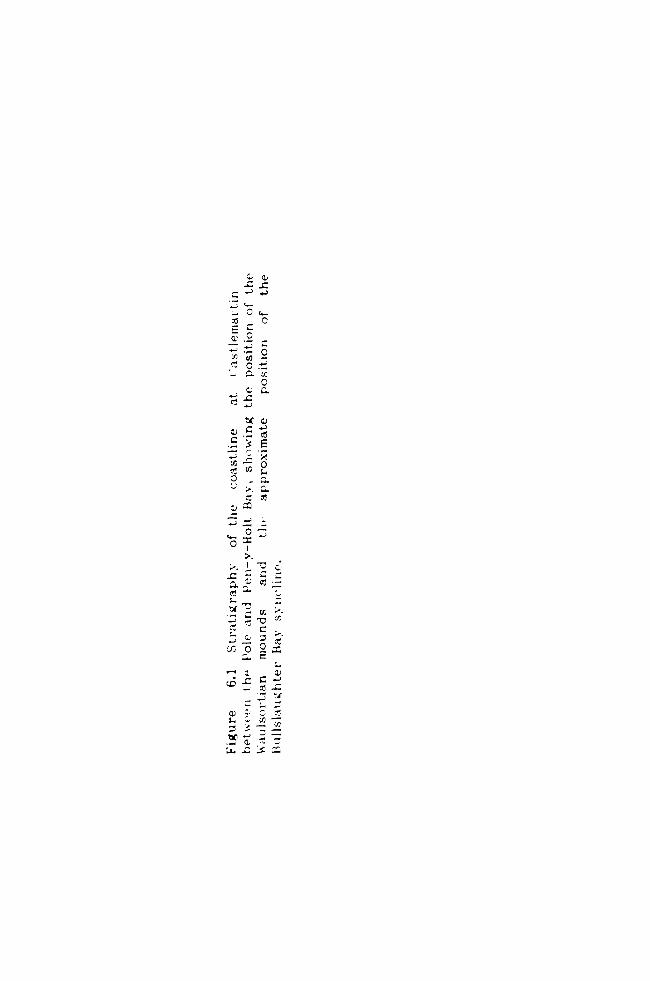
4.; a, -C s
zC Ec
ny ._
t
0 ý^ 4
oz
^l Tur.
'v s
räox
-"s :)
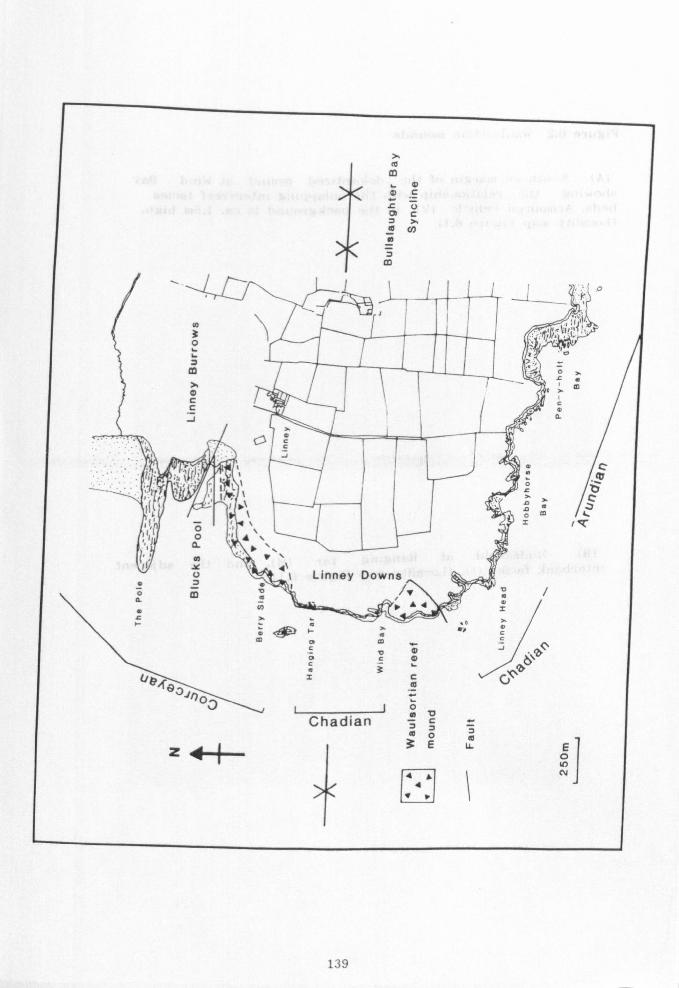
T
C
LU aC 7T
Ct) ä
co T 3 ö.
7 m
L ýaT
O m
m m
a
17- 0 c
'h
1
_ J I
"
I
-.
jIý. 1ºf'ý 1 1
1ý ý
ýý 1I
L T ne
C
J
I ,
Linney Downs v
IL f0 0
y / f4 S
L T
ö ý6l m
1e aY
c /ý
r G
Chadian 3E U. E
z N 1
1 I
139
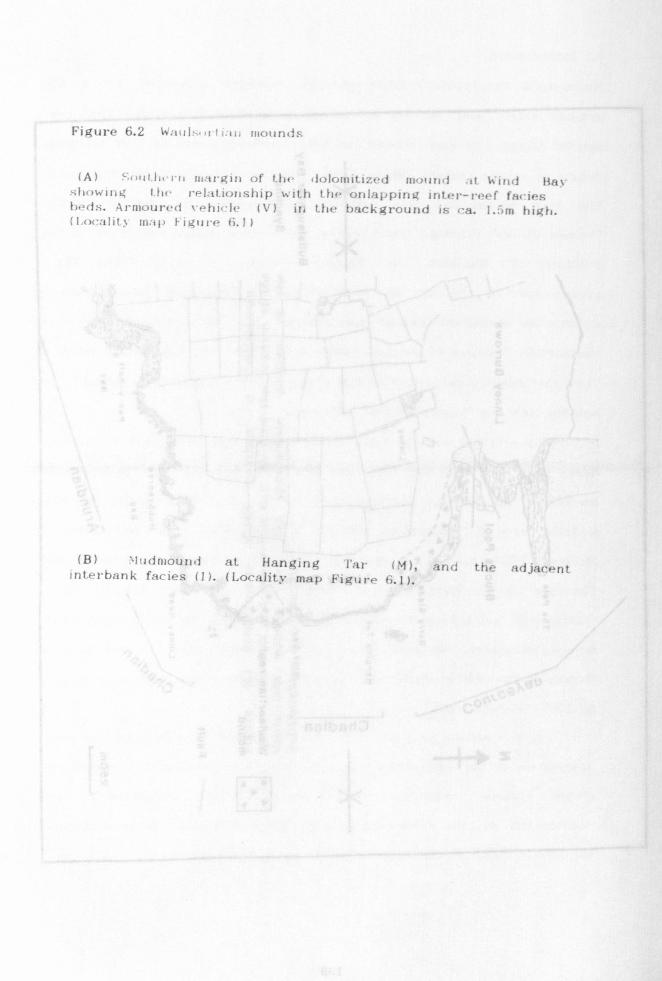
Figure 6.2 6mi k. iti: in nioiinds
(A) i"n mrirgiºi of t. t iiolomitized motind it Wind Ha
showing 1.114' relationship with the onlapping inter-reef fan es t. 1s. Armoured vehicle I V) in the background is ca. 1.: )m high. t I, cxraIit } uL't p I- ir; ººº"e ti. 11
ýý
3
S
9
... l1;
.ý ýý? ý
`ý
r
,,...., ..: -- Y.. . _-ý .. _ i- --
ý+vý; ed <
Sa
c'
(B) "Iudniouul1 at Hanging I'ai" (M), and the adjar, Pnt interbank facies (1). (Locality map Figure 6.1).
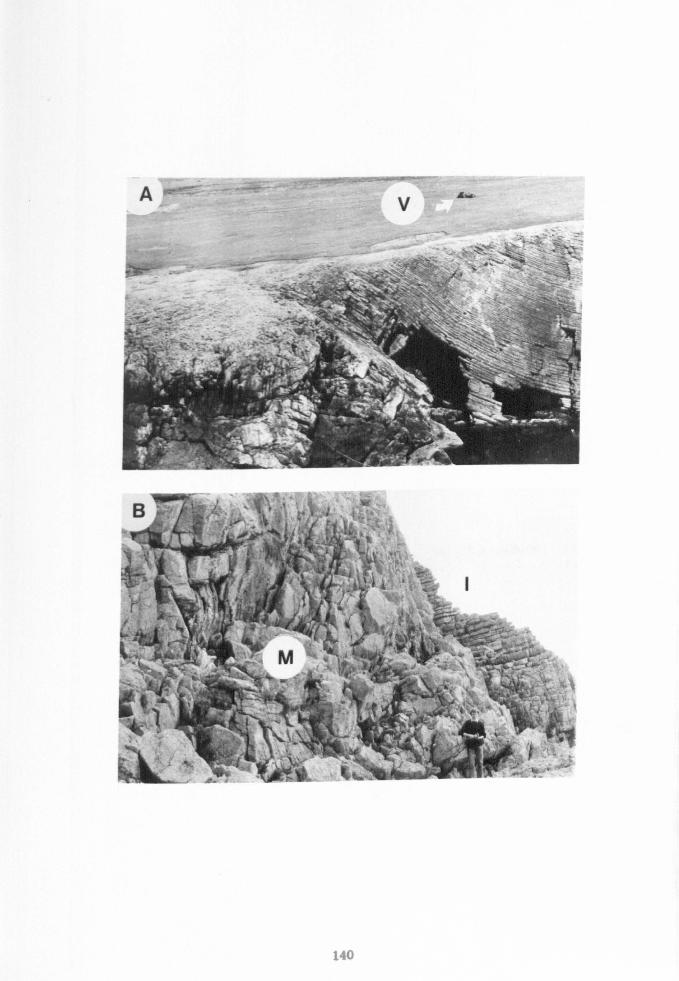
V `"_
Y""ý 'ý-'S
rý
T
ý. ký t';:
"-'
ýü f
140
6.2 Waulsortian buildups of Castlemartin
The two extensively dolomitized mounds at Berry Slade and Wind Bay
are thought to be lateral equivalents because they outcrop at a similar
stratigraphic position either side of the axis of the Bull Slaughter
Bay syncline (Dixon 1921) (Figures 6.1 & 6.2A). Stratigraphically, they
are overlain by the minor buildup at Hanging Tar (Figures 6.1 & 6.2B)
(Appendix B). All three developments occur within below storm wave-base
facies of late Courceyan to early Chadian age (see Chapter 4).
In SW Britain, the main period of the mudmound formation occurred
during upper Courceyan times within the S. anchoralis Zone (Mitchell et
al. 1982). The only development that has an early Chadian age is the
minor buildup at Hanging Tar which occurs within the Gnathodus
homopunctatus Zone (Mitchell et al. 1982) (Figure 6.3).
6.2.1 Berry Slade and Wind Bay Mounds
The Berry Slade and Wind Bay dolomite mounds are both ca. 100-130m thick
(Mitchell et al. 1982) and occur within a succession of pseudo-bedded
packstones separated by shaly/marly layers (Lithofacies 9; previously
described in Chapter 4) (Figure 6.2A). The Berry Slade mound has a
gradational contact with the underlying succession which consists of
abundant disarticulated crinoids, sponge spicules, and fenestellid
bryozoans, set within micrite. The junction between the mounds and the
overlying bedded limestones is sharp. The high angle dips (up to 55 0)
recorded in the inter-reef facies at Wind Bay, appear to have been
enhanced tectonically as well as by differential compaction (Figure 6.2A).
The pale white dolomite mounds are characterised by a striking lack
of recognizable bedding-planes (Figure 6.2A). Unfortunately, they contain
few calcite relics which consist of crinoid and bryozoan debris. Two ghost
plurilocular foraminifera were identified within the dolomite, towards the
141
3v
m m .co a4 w
4)
va 0
to
yý fA
o0 X11
El
ooý bE
1)U
Co N M-o Co
mWý w4j q)
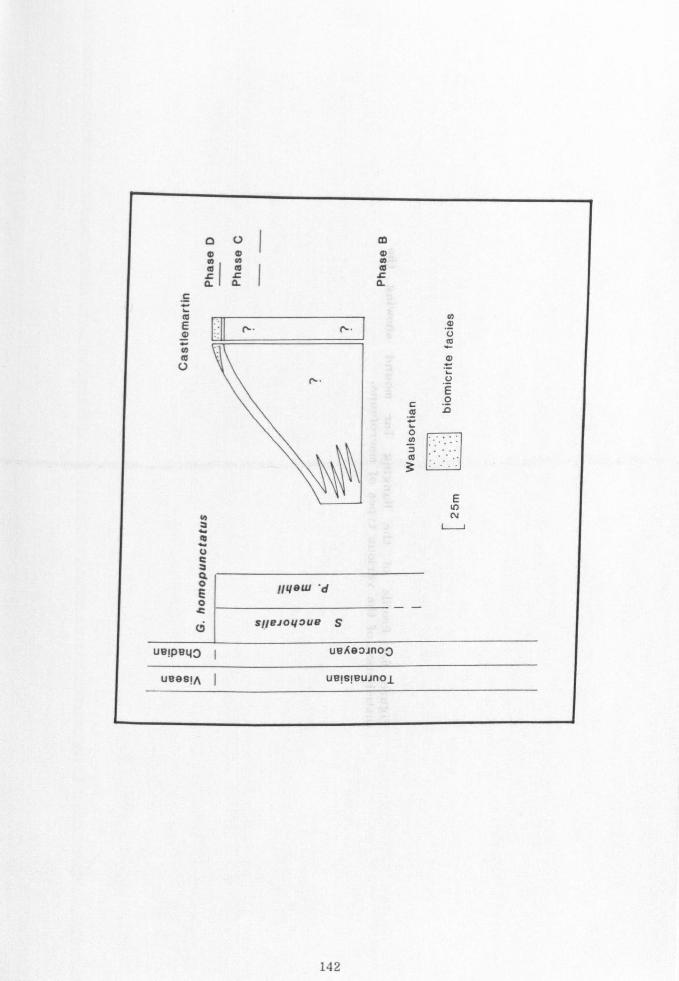
p U m
a m ý+ coo
LI t L a a a
c
E cý" r` U
2
0 E
E
N LJ
co
V C.
z
Q
E l�gew 'd o
siteioyoue S
ueiPe40 I ueAeoJnoO
ueesIA uetsieuinol
14 2
aV s
c_ 3 0 r U,
b c 0 Ec
J
Ly I^ ý
b
ýc o
zä
ý U.
O O
9 aý a ýý o .ý iw
0 ýc .ý ca },
aý -_ ý, .ý ý ,ý m ýn w71
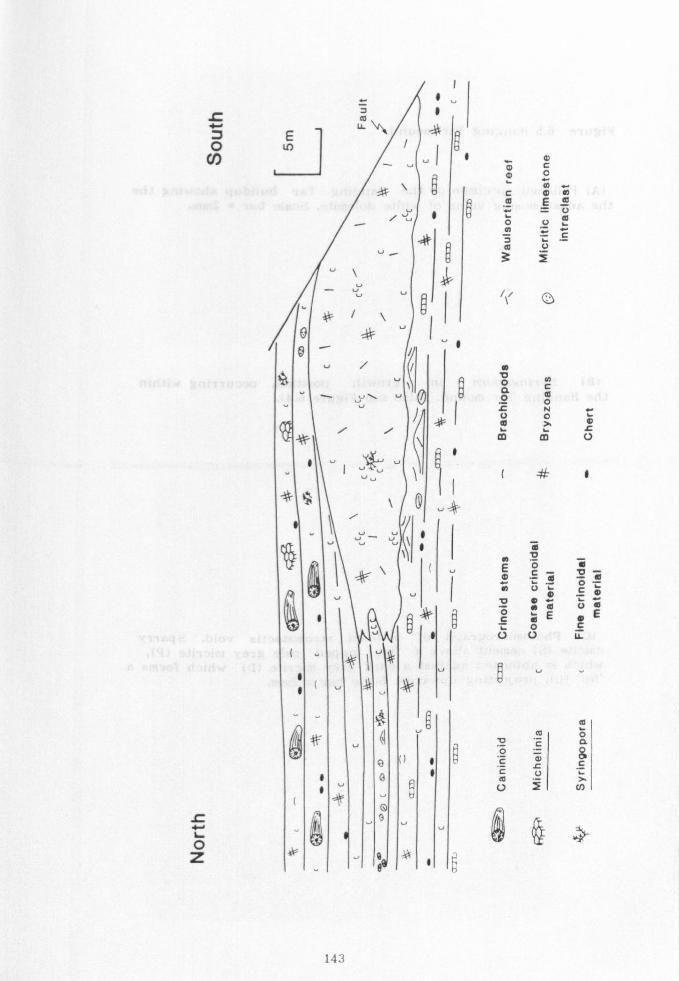
o LO _ u C
r `
ý
OJ r
E
/ü1 ö U ao _ M =C
V ý / p
O C
u\ u O a
O
:w L U
P N O
t
20-
to CD
E m
c m ýe
o ýp Uö C `m
u u I
ö ~E e
UO
oE / c /
Ü Ü ti
1v U I
V
e V
V cv ö
© f1 1 ý L
1 © ý ýj ý to
f
i
O
"V
143
Figure 6.5 flanging Tar mound.
(A) Polished specimen of the Hanging Far buildup showing the the anastomosing veins of white dolomite. Scale bar = 2mm.
(B) Syringopora in growth position, occurring within the Hanging Tar mound. (Also see Figure 6.4).
(C) Photomicrograph of inclined stromatactis void. Sparre
calcite (S) cement above a flat topped pale grey micrite (P),
which is abbutted against a dark grey micrite (D) which forms a 'lip)' (L), projecting upwards. Scale bar = 2mm.
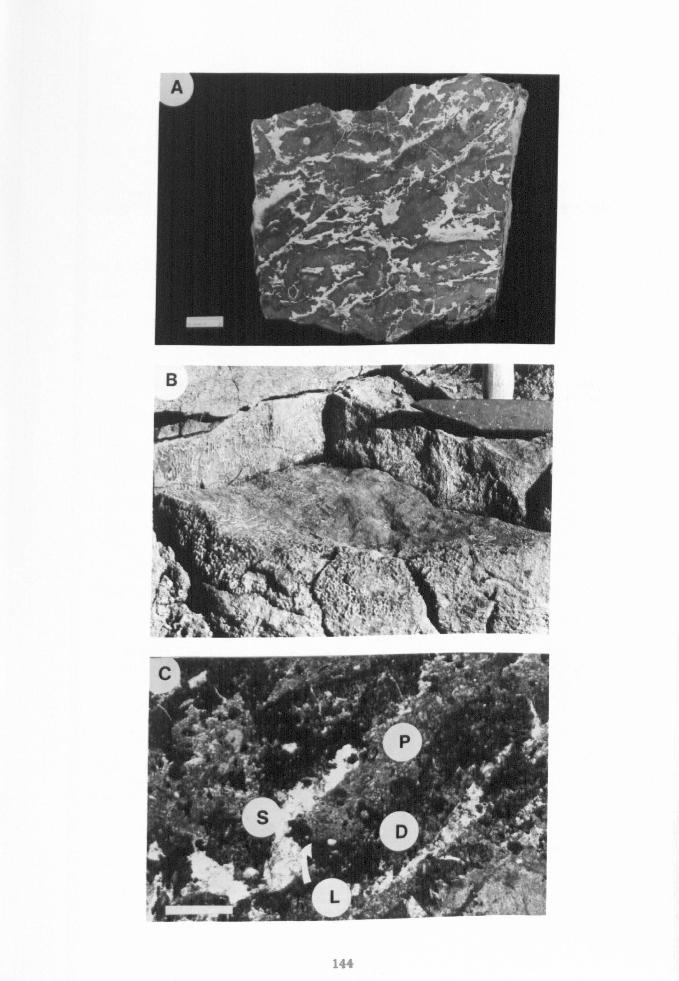
144
top of the Berry Slade mound.
Interpretation: The scarcity of relict primary features hampers any
meaningful interpretation of the development of the Berry Slade and Wind
Bay mounds. Even though they form sizeable buildups and are onlapped by
the surrounding bedded succession, there is no evidence as to the
topographic height developed above the surrounding sea floor surface.
6.2.2 Hanging Tar Mound
The mudmound at Hanging Tar is ca. 11m thick and bedded on a 0.5m-21n
scale (Figures 6.2B & 6.4). It possesses an irregular, gradational contact
with the underlying crinoidal stem-rich packstone (Lithofacies 10;
previously described in Chapter 4). The interdigitating of the reef and
inter-reef crinoidal packstones (bedded on 10-30cm scale) can be observed
along the northern margin of the buildup, as the southern margin is fault
bounded (Figure 6.4). The convex-upward mound exhibits a sharp boundary
with the overlying bioturbated packstones which contain large caninioid
corals.
The reef fades is dominated by a pale grey micrite (Figure 6.5A)
in which occurs a macrofauna of fenestellid bryozoans, crinoids, and
rare brachiopod valves (Figure 6.4). Fenestellid sheets are present but
not abundant. The crinoidal debris is locally clustered to form
packstone pods (up to 40cm in diameter) within which Syringopora can
be found in growth position (Figure 6.5B).
A microfacies analysis revealed that the reef contains a diverse
fauna in which two componental assemblages were recognized
(Figure 6.6). Contained within the lower part of the reef are crinoids,
fenestellid bryozoans, ostracods, unilocular and plurilocular foraminifera
(Figure 6.7A) (such as Earlandis and lituotubellids),
aoujgaliidas, sponge spicules (e. g. hyalosteliids), peloids and
145
4)
ooý 30 0
mýcD
V $4
F to
O 14 4J. -
E"ý "- O
Cam
o' Em
co
4. ) C co
ww O W CO Cc
aý 0E ý
Co 0
00 mý O
LOmw
rýbv
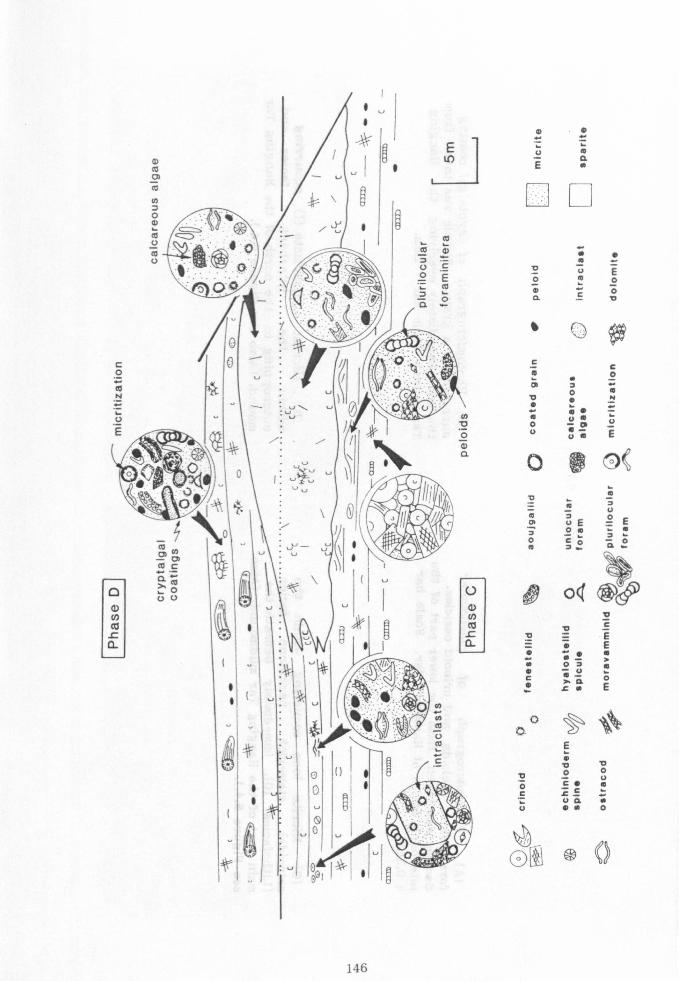
C O
e0 N
U
E
1)
co m a
ýiý ,ý ýý ýýýý ýý. ý ., ý. ý
/I s Iý
`
N V) Ol cm
(O C a
O UU
E
N
O
U a) (/) ß
L
a
ý}yý llU N
Iýý o0
v I
/I In
JýO-,
.4
\ ýý/ ýoI
v-V\IA jV I\
I\H
u I u
:I H1 \I.
146
00
_v o n E+
u
m a
"
C
Q
a e 0 U
0 'D
0 e
0
e r 0 c e
0
q E
._v
c M0
Oq
q"v OqU qp ueE
4ý vE°E oq cFQF
oQ *W E E
Oýq
a. CL ° L+E
E ö9
0 Vu 3cOO CLC
onw VOlO
CU ä) 73 V C_
_O E O
ä
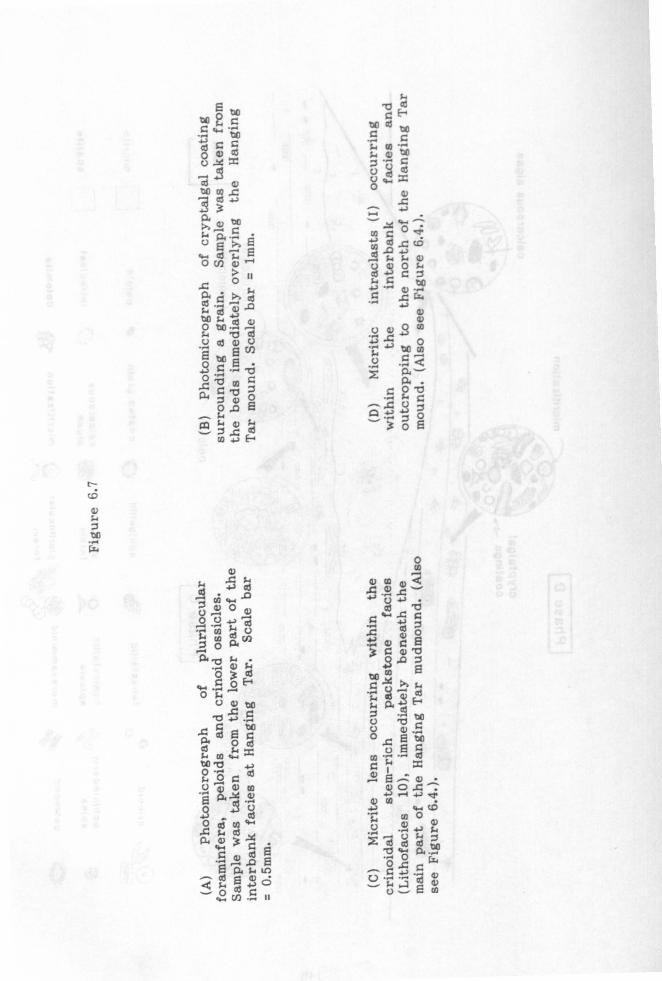
t-;
(V s. a 00 w
H um
00 C ". +
hd = s. g) to
cd U IX Co O
94 0 ': r Co r: P, u Ei 9 41 Co etc
4. Co
4) 0 O
.C Co
y r. c: [z' Cd
w di gp - to O 0010 0
m
U qý yV V! aý jD Ei ý 00 000
00 Z9 . :10 0,0 E 4r
'U q' 8: 1c: Co F
mm öE
CO 4.3
0 C, 4'cd
m x°a
CL) ö
-5 Co cj 0
A'CJ a
3rö
46.4 r. 0 E- oý
X
ýý 'd -
. -+ . r. Ibc J., cd 0C C)) 'C
to p Cl
ci 94 m: m co CO -CJ .. ) sý 0 r. Co
9.4 r r= -Z 0 Z -
Ei 2z 4) to 2 - Co 41 '4. (D o Co Co
s. Co m Ni
UCy 4)
44 r. 0 cd Cd o X06 -ý0r3ý8 0 mo
ö cý. CO Ci 4-)
'Z $4
ate ... 4)
-mZ CO 4) Co w 0 Co
C/] .- 11
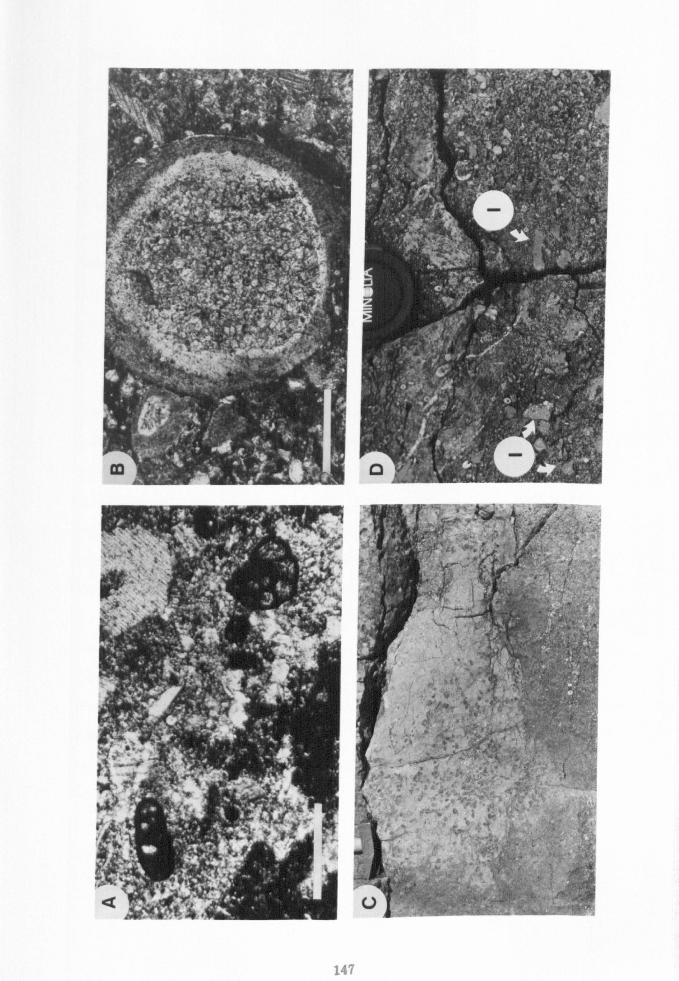
.ý
f
E 1tß
ýy ý'
tl 1-T
"r
ice" ,. '
ý;
14 f
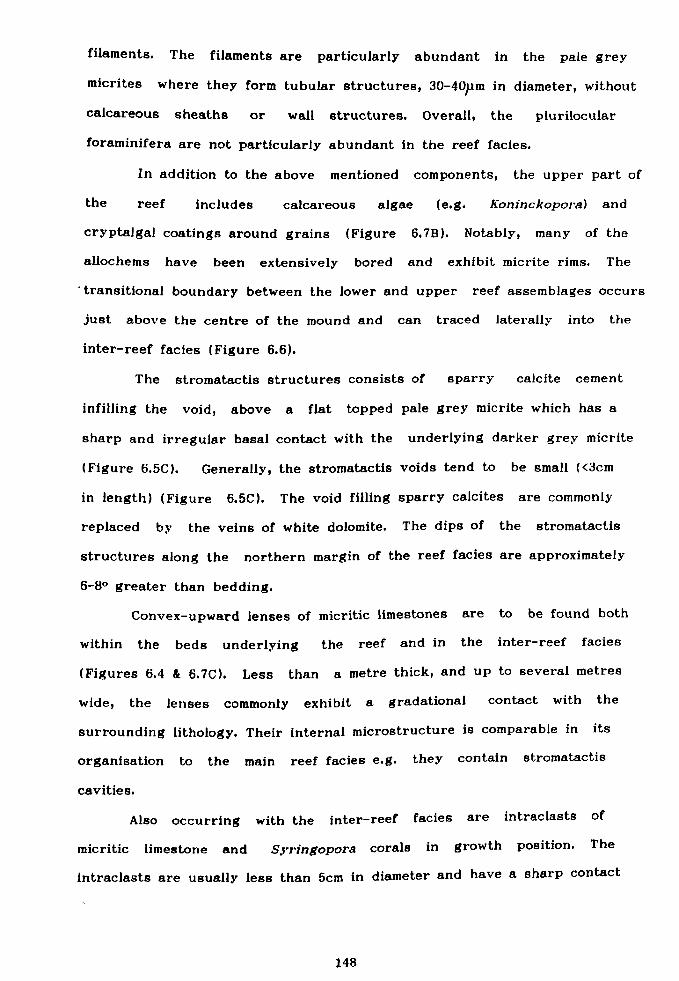
filaments. The filaments are particularly abundant in the pale grey
micrites where they form tubular structures, 30-40pm in diameter, without
calcareous sheaths or wall structures. Overall, the plurilocular
foraminifera are not particularly abundant in the reef facies.
In addition to the above mentioned components, the upper part of
the reef includes calcareous algae (e. g. Koninckopora) and
cryptalgal coatings around grains (Figure 6.7B). Notably, many of the
allochems have been extensively bored and exhibit micrite rims. The
'transitional boundary between the lower and upper reef assemblages occurs
just above the centre of the mound and can traced laterally into the
inter-reef facies (Figure 6.6).
The stromatactis structures consists of sparrt' calcite cement
infilling the void, above a flat topped pale grey micrite which has a
sharp and irregular basal contact with the underlying darker grey micrite
(Figure 6.5C). Generally, the stromatactis voids tend to be small (<3cm
in length) (Figure 6.5C). The void filling sparry calcites are commonly
replaced by the veins of white dolomite. The dips of the stromatactis
structures along the northern margin of the reef facies are approximately
6-8° greater than bedding.
Convex-upward lenses of micritic limestones are to be found both
within the beds underlying the reef and in the inter-reef facies
(Figures 6.4 & 6.7C). Less than a metre thick, and up to several metres
wide, the lenses commonly exhibit a gradational contact with the
surrounding lithology. Their internal microstructure is comparable in its
organisation to the main reef facies e. g. they contain stromatactis
cavities.
Also occurring with the inter-reef facies are intraclasts of
micritic limestone and Syringopora corals in growth position. The
intraclasts are usually less than 5cm in diameter and have a sharp contact
148
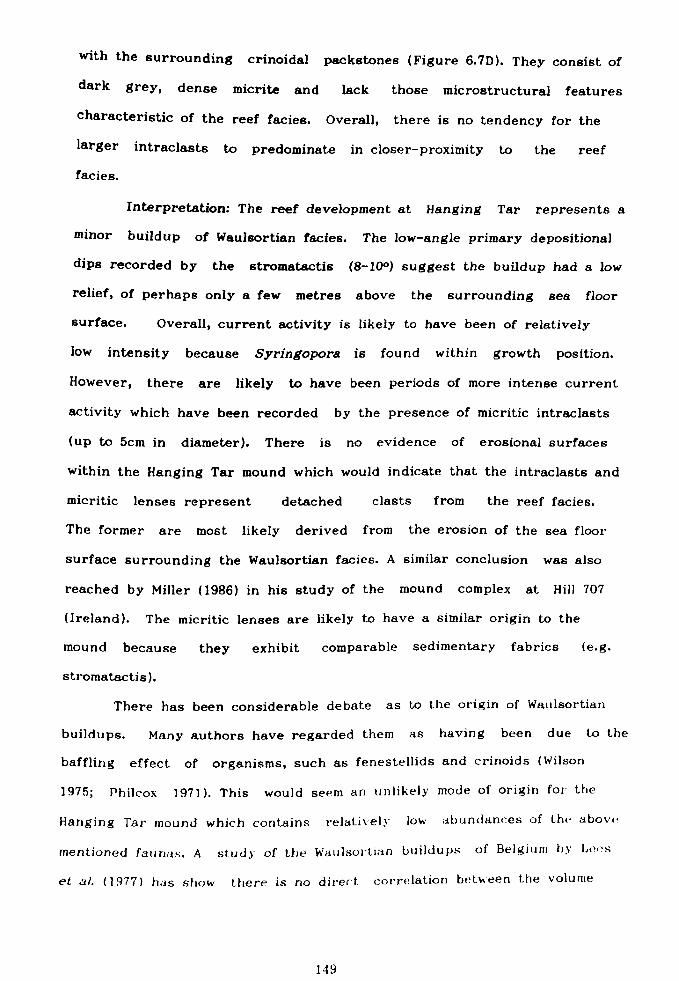
with the surrounding crinoidal packstones (Figure 6.7D). They consist of
dark grey, dense micrite and lack those microstructural features
characteristic of the reef facies. Overall, there is no tendency for the
larger intraclasts to predominate in closer-proximity to the reef
facies.
Interpretation: The reef development at Hanging Tar represents a
minor buildup of Waulsortian fades. The low-angle primary depositional
dips recorded by the stromatactis (8-100) suggest the buildup had a low
relief, of perhaps only a few metres above the surrounding sea floor
surface. Overall, current activity is likely to have been of relatively
low intensity because Syringopora is found within growth position.
However, there are likely to have been periods of more intense current
activity which have been recorded by the presence of micritic intraclasts
(up to 5cm in diameter). There is no evidence of erosional surfaces
within the Hanging Tar mound which would indicate that the intraclasts and
micritic lenses represent detached clasts from the reef facies.
The former are most likely derived from the erosion of the sea floor
surface surrounding the Waulsortian facies. A similar conclusion was also
reached by Miller (1986) in his study of the mound complex at Hill 707
(Ireland). The micritic lenses are likely to have a similar origin to the
mound because they exhibit comparable sedimentary fabrics (e. g.
stromatactis).
There has been considerable debate as to the origin of Waulsortian
buildups. Many authors have regarded them as having been due to the
baffling effect of organisms, such as fenestellids and crinoids (Wilson
1975; Philcox 1971). This would seem an unlikely mode of origin for the
Hanging Tar mound which contains relatively low abundances of the above
mentioned faunas. A study of the Waulsortian buildups of Belgium by Lees
et al. (1977) has show there is no direct correlation between the volume
149
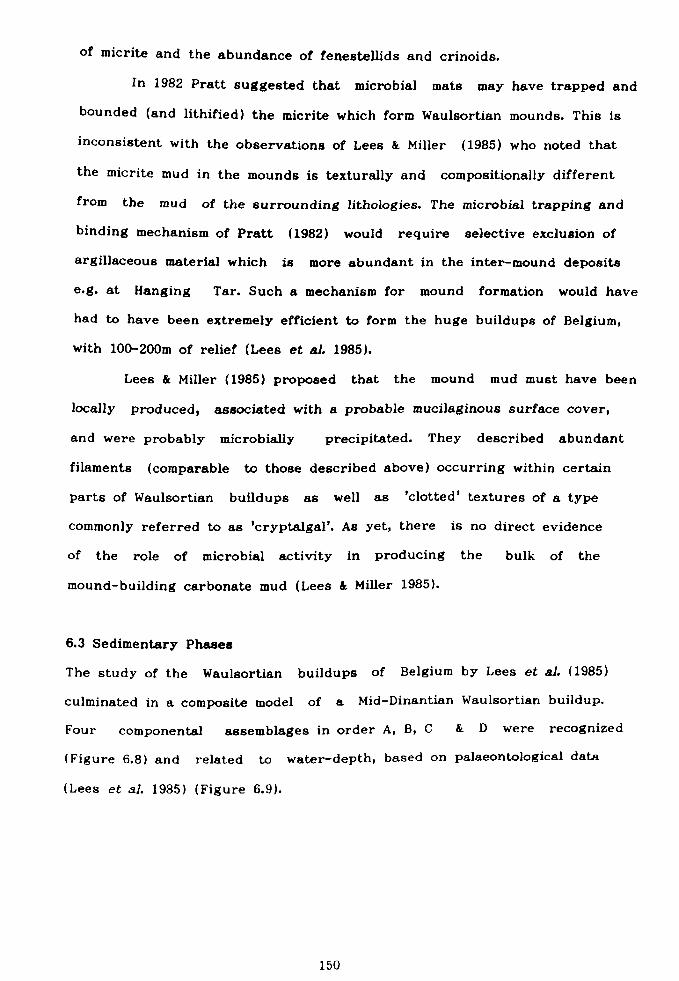
of micrite and the abundance of fenestellids and crinoids.
In 1982 Pratt suggested that microbial mats may have trapped and bounded (and lithified) the micrite which form Waulsortian mounds. This is
inconsistent with the observations of Lees & Miller (1985) who noted that
the micrite mud in the mounds is texturally and compositionally different
from the mud of the surrounding lithologies. The microbial trapping and
binding mechanism of Pratt (1982) would require selective exclusion of
argillaceous material which is more abundant in the inter-mound deposits
e. g. at Hanging Tar. Such a mechanism for mound formation would have
had to have been extremely efficient to form the huge buildups of Belgium,
with 100-200m of relief (Lees et el. 1985).
Lees & Miller (1985) proposed that the mound mud must have been
locally produced, associated with a probable mucilaginous surface cover,
and were probably microbially precipitated. They described abundant
filaments (comparable to those described above) occurring within certain
parts of Waulsortian buildups as well as 'clotted' textures of a type
commonly referred to as 'cryptalgal'. As yet, there is no direct evidence
of the role of microbial activity in producing the bulk of the
mound-building carbonate mud (Lees & Miller 1985).
6.3 Sedimentary Phases
The study of the Waulsortian buildups of Belgium by Lees et a/. (1985)
culminated in a composite model of a Mid-Dinantian Waulsortian buildup.
Four componental assemblages in order A, B, C&D were recognized
(Figure 6.8) and related to water-depth, based on palaeontological data
(Lees et al. 1985) (Figure 6.9).
150
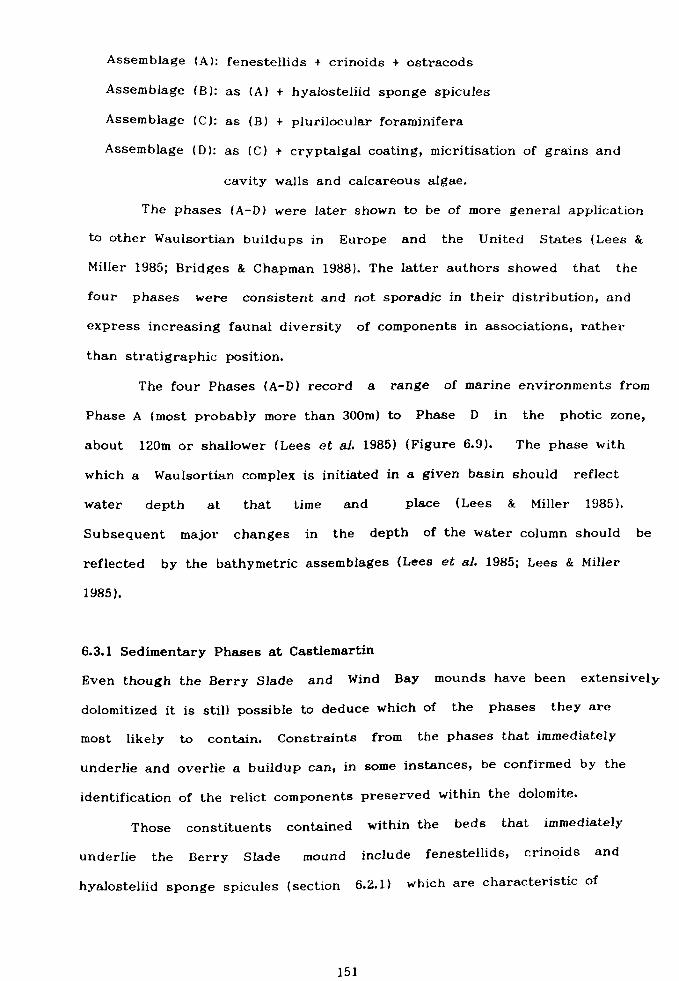
Assemblage (A): fenestellids + crinoids + ostracods
Assemblage (B): as (A) + hyalosteliid sponge spicules
Assemblage (C): as (B) + plurilocular foraminifera
Assemblage (D): as (C) + cryptalgal coating, micritisation of grains and
cavity walls and calcareous algae.
The phases (A-D) were later shown to be of more general application
to other Waulsortian buildups in Europe and the United States (Lees &
Miller 1985; Bridges & Chapman 1988). The latter authors showed that the
four phases were consistent and not sporadic in their distribution, and
express increasing faunal diversity of components in associations, rather
than stratigraphic position.
The four Phases (A-D) record a range of marine environments from
Phase A (most probably more than 300m) to Phase D in the photic zone,
about 120m or shallower (Lees et al. 1985) (Figure 6.9). The phase with
which a Waulsortian complex is initiated in a given basin should reflect
water depth at that time and place (Lees & Miller 1985).
Subsequent major changes in the depth of the water column should be
reflected by the bathymetric assemblages (Lees et al. 1985; Lees & Miller
1985).
6.3.1 Sedimentary Phases at Castlemartin
Even though the Berry Slade and Wind Bay mounds have been extensively
dolomitized it is still possible to deduce which of the phases they are
most likely to contain. Constraints from the phases that immediately
underlie and overlie a buildup can, in some instances, be confirmed by the
identification of the relict components preserved within the dolomite.
Those constituents contained within the beds that immediately
underlie the Berry Slade mound include fenestellids, crinoids and
hyalosteliid sponge spicules (section 6.2.1) which are characteristic of
151
.u
%. O0
O
O ý"O b .+O 0O O P. A
OC 3
o
0
W r.
ýOOa)
a) 94 ý. 0 a3 aý
co 'ti.. O
äöäcj Eo°E 4) 0
aCo a M0mO
00
a)'v x+ O
ate) co [z4 co 0 0Q
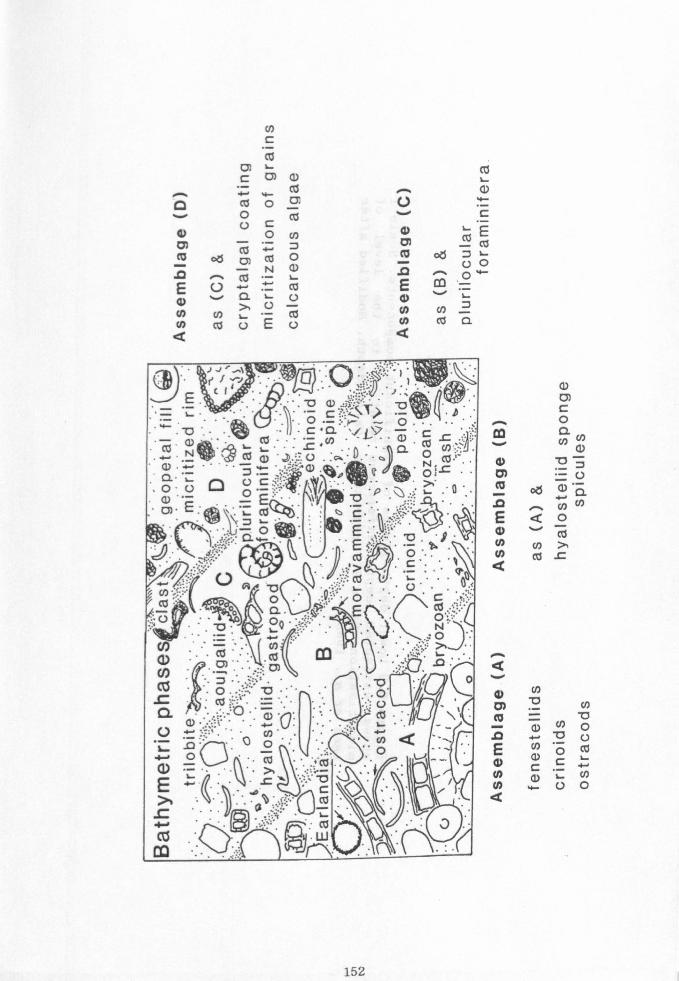
c
v d
E
O U C
O
_N
Co
Co
Co
N
im
. 92
E m
'-
O
C
Co
v-
N N
Co Cs U
U E Co
U
N N
Q cd d
OL
co N' ... .a co
E4.
U- "AO4
co co
Cl)
4-0 oJs cý - CD CO Q
o L
O 0) c
m aN
o Co oÖ U)
.a_yN EQ
_O N CO T Nc .C
U) aý Co 1: 3 o 0 7 - E Co 0 cZ N : cA y N . - U o
152
HW it O 0)
4) +-' -ý W
U C) Cl, >-0
4)a) - , -1 "4
Cn w +2 ". i 0 0) '0 4) a0 Gm 0
EOC o+'+) oa
4) C: > Cd "I $ýl
U +) 4) ". "+ cd +) 4r ". - 3 CN 00
". + o 0) m 4) +.
UC Wq 4) ON1
f4 Cl (A Q) to 4. )W a -. - 4« 4) e -1 $4
--4b L' H
a aas a, U-
$4 "U (n tn 0) O co 3 +) -rn 0 ad 0 -4
a8O
(D 41 4-) -m ad as
to 9) N "rl 4. ) 4-3 4)
3 F+ U) b0 OU C) -. i .9", 1 O) cz. Un 8a
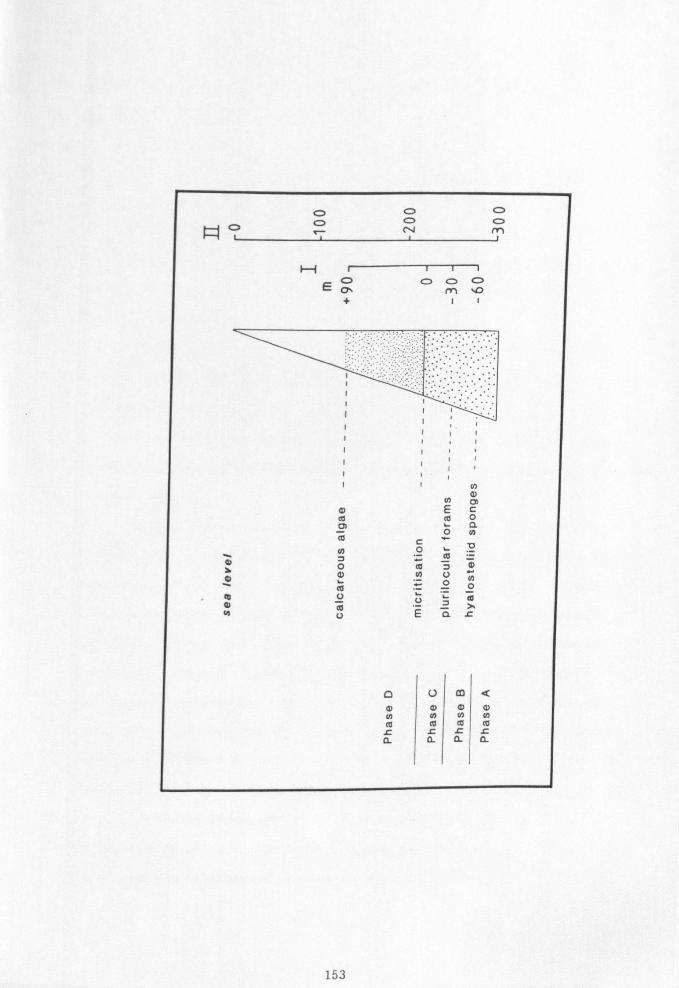
C) C) OO
HO°NM '
° E°o, m -0
0 pl
mEc mO
O
yOý-
O to 5 m d) Uy
OO
mo
yvEL
co Q mmmm yy to co
cc to l9 l0 tLLL
aaaa
153
Phase B. In addition, the beds that immediately overlie the Berry Slade
and Wind Bay mounds contain plurilocular foraminifera, which are
characteristic of Phase C.
Unfortunately, no relict hyalosteliid sponge spicules were
identified within the dolomite mounds. However, two relict ghost
plurilocular foraminifera (diagnostic of Phase C) were found in the upper
part of the Berry Slade mound. From the available evidence, it would seem
the dolomitized mound at Berry Slade, and its lateral equivalent at Wind
Bay, both contain Phases B and C, although the exact position of the
boundary is unknown.
Phases C and D are readily identifiable within the Hanging Tar
mound, where the boundary occurs within the upper part of the buildup
(Figure. 6.6). A similar conclusion was reached by Lees & Miller (1985).
The base of Phase D is denoted by the incoming of cryptalgal coatings,
calcareous algae and micritised grains all at approximately the same level
(Figure 6.6).
Interpretation: The initiation of the Berry Slade and Wind Bay
mounds was within Phase B, a subphotic environment, most probably
representative of water depths between 250m and 280m. Using the
depth-related scale of Lees et al. (1985) (Figure 6.9), the three phases
recognized within the Waulsortian mounds at Castlemartin record a
regression passing upward from Phases B to D (Figure 6.3). The
incoming of micritisation and calcareous algae together, most probably
represents a marked relative fall in sea level during early Chadian times
(compare Figures 6.6 & 6.9). In the absence of wave formed features, it
would seem that the southern ramp zone remained beneath storm wave-base.
The preservation of the effects of currents operating beneath wave-base
are not, however, conspicuous until the uppermost parts of Phase C, and
the appearance of abundant micritic intraclasts (up to 5cm in diameter) in
154
the inter-reef facies at Hanging Tar.
6.4 Discussion
The Waulsortian phases provide a new tool for basin analysis (Lees &
Miller 1985). A record of the phase changes within Waulsortian facies and
good biostratigraphic controls provide the means by which local tectonic
effects and regional eustatic events can be distinguished. The aim of the
first part of this discussion is to evaluate the significance of the phase
changes recorded within the Waulsortian mounds of SW Britain. A
comparison of the evolution of the buildups of SW Britain with those of
Belgium allows an assessment to be made of the effects of tectonics and
eustacy upon mound development along the southern margin of the
Welsh-Brabant Massif (Figure 1.1).
All four of the depth-related sedimentary Phases (A to D), as
described by Lees et sf. (1985) from the buildups in Belgium, are present
within the Waulsortian facies of SW Britain (Figures 6.10 & 6.11). The
deepest water assemblage of Phase A has only been identified at
Cannington Park (Lees & Hennebert 1982). Here, the lower part of the
mound complex consists of sparry calcite facies readily comparable to the
"veines bleues" of Belgium. The upper part of the Cannington Park mound
complex consists of a biomicrite facies which contains a Phase B
assemblage (Lees & Hennebert 1982). The incoming of plurilocular
foraminifera (Phase C) occurs within the uppermost part of the Cannington
Reef Limestone. The decline of the Cannington Park mound complex
occurred prior to the end of the Courceyan (Mitchell et aL 1982; Lees
& Hennebert 1982). Development of the Waulsortian facies during the
uppermost Courceyan and early Chadian times is recorded at
Castlemartin (Figures 6.3,6.10 & 6.11). Here, Phases B, C and D have been
155
c 0
13 0 ii g. C
-0 4-. Uön
6
ýO of Ü^ý
Go V oo c:
-0 9 WU 0v O
c 'v 4.1
Cd C+ 4OW
C 0 9.4 40E
Ü m+'. C pro
Co Co r. =M m3A
'~ äÖ eb. mO m
V9m 4) b G)
. Ur i". 0 0y Co 9: 8a o
'owo
CA 0b xo 03 jg 0o
cdý0 wU 'C tý y. 4) O
Co Pt scd 0m rr. s. oHa..
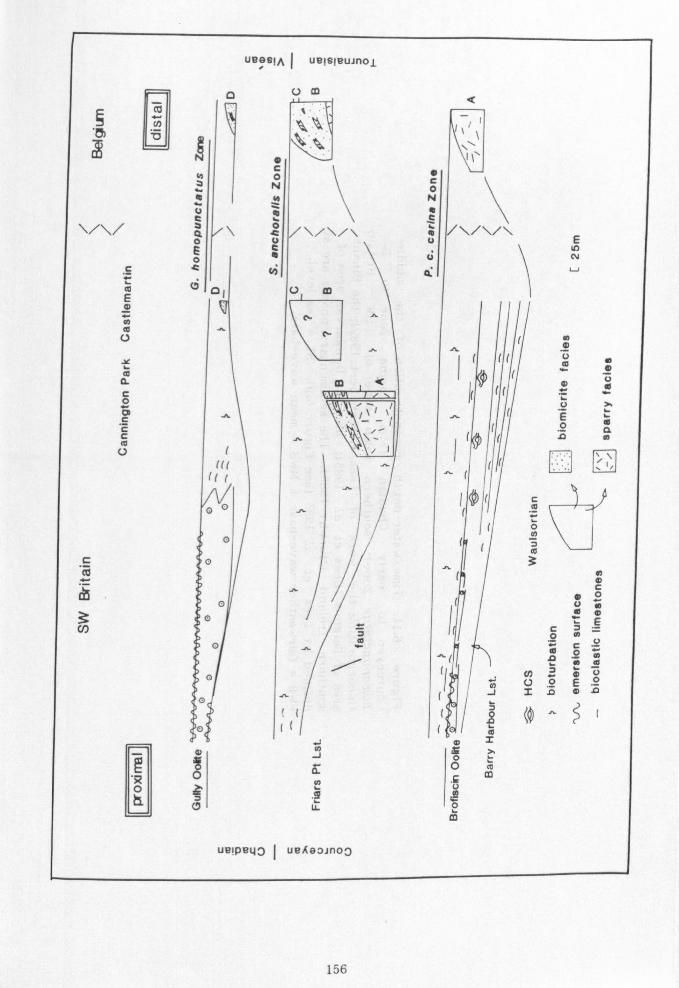
V
O
0
E m
U
Y
a c 0
c c U
C
r_
e
CO
C
USIA I ueisieuJnol
m
0 C 0 N. N O
ýt V G "
to
w
/\/\/\
Umý
A N
N
A
rrr i rr r
00
0
0
0 0
o
,o
0
_ aý Ö
öý
cý
w A
11 0, J
W I. I-
U.
uerpeuD 1 ueAeoJnoO
e c O N e
e u
U
Q
N /\/\/\ E
N
0
E a
(Y
(o ((
(o
(ue
oe V eO äp
(J) "' mÖ U°E
JIDmD
o
.ým fD
156
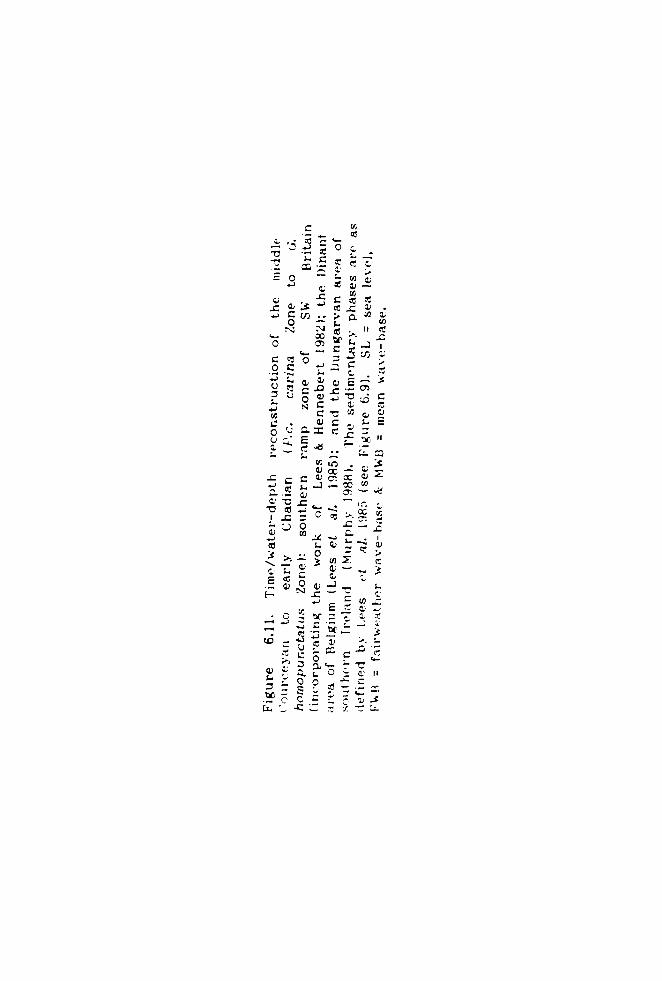
C_ v
_Oy1
L L 4ý :3 '' aC Ly .. ) c V7 .-+ß.
n va
V II iN
O
c°
0 na v yNC+. tUll UU
sy ýLC O, G2C: v
L II
OC C; U OC
X Lo cL
LUC S
^mFR
E- yV ']
yL
Me
c -. --y .ý=CL
_z x -- - ca
cLC, 4)
CILooc
to c c_ v3
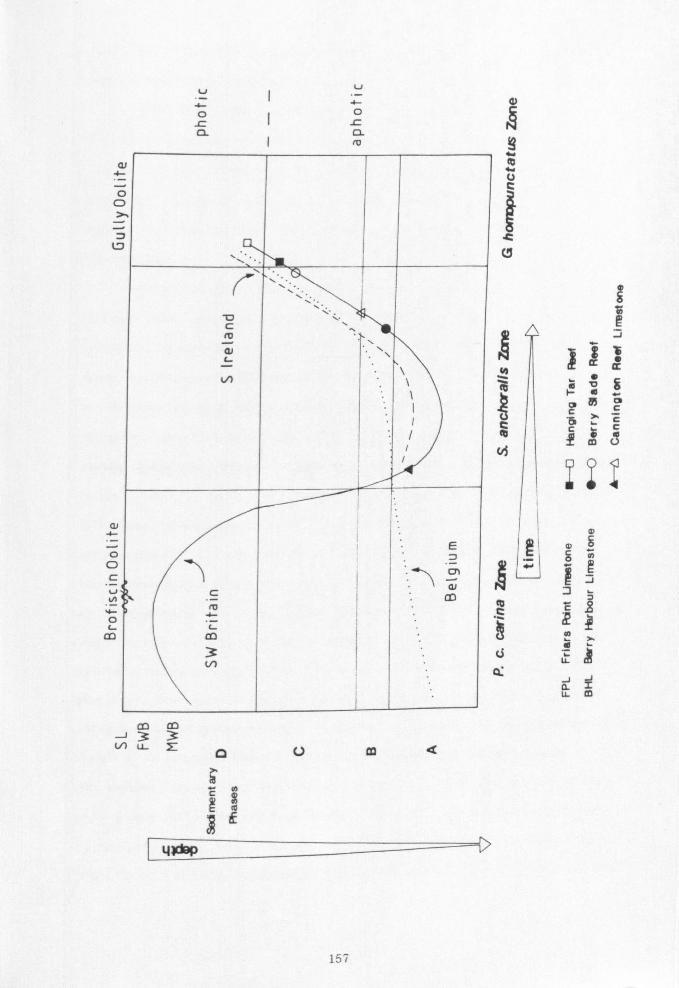
Li v_ 0
OIL
CL CL
9
t
rv
C, 65
c
ye
p
C c tý `° mv
4) C: CID cc IE .8
mä
äJ= U
a 4- ö 0
75
C) -4- 0 O c u CA
"4- 0 L
m
m m v
LL- o V m Q
c °ý
4
157
identified within the buildups (section 6.2.3). The incoming of Phase D
was during early Chadian times.
The four phases (A-D) record aa hallowin g- upward succession during
the late Courceyan to early Chadian times (Figures 6.9,6.10 & 6.11).
The presence of Phase A at Cannington Park represents water depths most
probably in excess of 300m. The subsequent relative fall of sea
level was likely to have been within close-proximity of 100m by early
Chadian times.
A comparison of the evolution of the Waulsortian buildups of SW
Britain with those of Belgium show that the initiation of the mound
complexes is strongly diachronous whereas their subsequent evolution is
more synchronous (Figures 6.10 & 6.11). The development of the
Waulsortian facies of Belgium commenced with the deepest water assemblage
(Phase A) near the base of the P. c. carina Zone. Throughout the P. c.
carina Zone, SW Britain was dominated by notably shallower water
facies, such as the Barry Harbour Limestone (Figures 6.10 &
6.11). The establishment of the Waulsortian facies of SW Britain did not
occur until the S. anchoralis Zone (Figures 6.10 & 6.11). Initation of the
Waulsortian facies commenced with Phase A at Cannington Park and Phase B
at Castlemartin. The formation of these deep water phases represents a
major relative rise in sea level above the shallow water facies of the
Brofiscin Oolite and the Barry Harbour Limestone (Figures 6.10 & 6.11).
The magnitude of this sea level rise is likely to be in the order of
several hundred metres. If such a facies change was as a result of eustacy
then it is highly likely to be represented by phase changes in the
Waulsortian mounds of Belgium. In actual fact, the buildups of Belgium
show a relative shallowing from Phase A to Phase B, from the uppermost P.
c. caring Zone to the lower part of the S. anchoralis Zone
(Figures 6.10 & 6.11). This would suggest that the main control upon the
158
establishment of Waulsortian facies in SW Britain was regional tectonic
subsidence.
The tectonic setting for the Waulsortian mounds of Castlemartin and
Cannington Park is within the southern ramp zone which underwent the
greatest subsidence (see Chapter 4). Their occurrence is comparable to
the Waulsortian developments of Northern England (Miller & Grayson 1982).
Here, the Waulsortian mounds occur in distal ramp settings in rapidly
subsiding basins, which contrast with the adjacent slowly subsiding
blocks, dominated by shallow water facies.
Subsequent to the initiation of Waulsortian mounds in SW
Britain, their evolution is comparable to the buildups of Belgium which
record a major change of environment during the upper Courceyan
(Tournaisian) times (Lees et al. 1985; Lees & Hennebert 1982). Throughout
the early part of this period, the Waulsortian buildups of both regions
continued to form and develop but then suffered a sharp decline from which
the mound complex at Cannington Park did not recover, while those in
Belgium (Lees & Hennebert 1982) and Castlemartin persisted only into the
early part of the Vis(; an (Chadian) (Figures 6.10 & 6.11).
Towards the end of the Courceyan (Tournaisian) period there was a
sharp, 'take-over' in the main faunal constituents of the buildups, from
crinoids and bryozoans to moravamminids and plurilocular foraminifera
(Lees & Hennebert 1982; Lees et al. 1985). This marked facies change
preceded the expansion of the area effected by micritisation. The
incoming of calcareous algae occurred during the late Courceyan
(Tournaisian) to early Chadian (Vis6an) times. These phenomenon have been
attributed by Lees et al. (1985) and Lees & Hennebert (1982) to the
passage of the buildups and their flanking beds up into the photic zone
and as a consequence of a marked fall in sea level (Figures 6.9,6.10 &
6.11). A study of the buildups of Castlemartin would support this
159
interpretation.
Correlative evidence for a sea level fall at the end of the
Courceyan has come from the study of the Waulsortian Limestone
Formation of the (Dungarvan Syncline) Munster Basin, southern Ireland by
Murphy (1988) (Figure 6.11). Initiation and growth of the reef commenced
with Phase A during the S. anchoralis Zone; the incoming of Phase D was
occurred during the late Courceyan; and the eventual demise of the
mound complex occurred during early Chadian times (Figure 6.11).
In conclusion, suitable conditions for the initiation of the
Waulsortian reefs of SW Britain developed after a major phase of
differential subsidence, following which relatively deep water
environments prevailed over the southern ramp zone. Three sedimentary
phases, comparable to the sedimentary Phases B-D of Lees et al., can
be identified within the Waulsortian mounds at Castlemartin. They support
the interpretation by Lees et W. (1985) for a pronounced change of
environment, most probably as a result of a marked eustatic sea level
fall, at the end of the Courceyan and during early Chadian times.
160
6.5 Petrography and (geochemistry of the Castlemartin Waulsortian
Dolomites
There is a marked contrast between the pale white, almost completely
dolomitized Waulsortian mounds of Berry Slade and Wind Bay, and the
surrounding dark grey, stratified inter-reef limestones (Figure 6.2A).
These "peculiar reef dolomites" lacking bedding, were proclaimed by Dixon
(1921) to be without analogue in SW Britain and comparable to
dolomites he observed in the Waulsortian buildups of northern England
(Clitheroe) and Belgium.
Even though many Waulsortian buildups have been partially to
extensively dolomitized (Dixon 1921; Cotter 1966; Miller 1986; Lees &
Hennebert 1982; Philcox 1971; Lees et aL 1977) there have been few
studies into the origin of the dolomite. Cotter (1966) proposed that the
buildups of central Montana (USA) were dolomitized by near-surface
hypersaline fluids, by means of seepage reflux. Whereas Miller (1986)
favoured a burial origin for the dolomites within the mound complex at
Hill 707 (Ireland).
Characterisation of the Waulsortian dolomites at Castlemartin is
aided by making comparisons with the other major dolomite types occurring
within the Dinantian of South Wales (Bhatt 1973 & 1976; Hird et a]. 1987;
Wright & Robinson 1988; Searl 1988). These mainly outcrop in the northern
and central ramp zones and include: penecontemporaneous peritidal and
pedogenic dolomicrites, pervasive strata) dolomites of shallow-burial
mixing zone origin, and cross-cutting 'vein' or 'dyke' dolomites of
burial origin.
161
6.6 Burial History
The buildups of Castlemartin underlie a thick limestone
succession, mainly consisting of below storm wave-base facies (Wright
1986; Simpson 1987). The post-Dinantian sediments are predominantly
sandstones, reflecting the establishment of fluvio-deltaic environments
within the Hercynian fore-deep of SW Britain (Kelling 1988). The
original thickness of the Namurian and Westphalian strata is unknown
because of uplift and erosion during the Stephanian(? ) and the Permian.
However, the thickness of Namurian and Westphalian sediments in the
adjacent area of Swansea indicates burial of the Dinantian sequence to a
depth of at least 7Km by late Carboniferous times (Dickson 1985, Jones
1974; Thomas 1974; George 1970) (Figure 6.12). The Hercynian orogeny
deformed and raised the Carboniferous Limestone which became subaerially
exposed. Subsequent burial occurred during the Mesozoic (Figure 6.12) and
up to 1.5Km of Jurassic and Cretaceous sediments were deposited but later
removed by the Oligocene (George 1974; Dickson 1985).
6.7 Methods
Twenty representative samples of the Waulsortian dolomites at Castlemartin
were taken for analysis. The thin sections and thirty acetate peels were
stained with Alizarin Red S and potasium ferricyanide using the modified
technique described by Dickson (1965). Cathodoluminescence (CL) was
undertaken using a Technosyn (Model 8200) MkII cold cathode luminescope.
The following elements were analysed using atomic absorption
spectrophotometer (AAS): Ca, Mg, Sr, Fe, Mn and Na (Appendix T).
Operation of the AA was undertaken by A. Kemp (Bristol University). Carbon
and oxygen stable isotope analyses were carried out by M. T. Burchell
(Oxford University) at BP Research Centre, Sunbury (Appendix U).
162
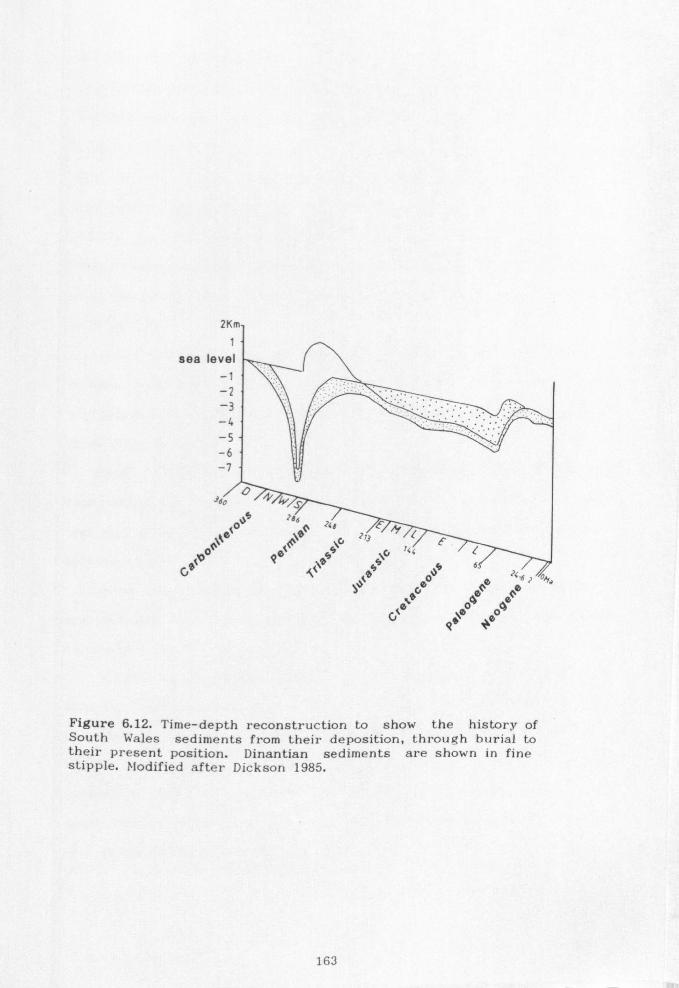
sea level
Figure 6.12. Time-depth reconstruction to show the history of South Wales sediments from their deposition, through burial to their present position. Dinantian sediments are shown in fine stipple. Modified after Dickson 1985.
163
6.8 Diagenetic relationships
In addition to replacing the mounds at Wind Bay and Berry Slade, the pale
dolomites also form rare stratabound units in the inter-reef facies at
Wind Bay (Figure 6.13A) and anastomosing veins in the buildup at Hanging
Tar (Figure 6.5A). Overall, dolomitization was a selective process, more
commonly replacing lime mud. Its timing postdated the void filling
calcite cements in the Hanging Tar mound, which it both replaced
(Figure 6.13B & C) and cross-cut in veins. Three void filling calcite
cement phases have been identified within the Hanging Tar mound
(Figure 6.13B).
Cement stage I consists of clear, non-ferroan, prismatic calcite
crystals which are non-luminescent under CL (Figure 6.13B). The crystals
are generally euhedral with rhombohedral terminations and are usually less
than 500jum in length.
Cement stage II comprises several alternating bright yellow-orange and
non-luminescent zones (Figure 6.13B). The individual zones are usually
less than 10pm thick. Cement stage II is syntaxial with the stage I prisms
(Figure 6.13B).
Cement stage III consists of blocky ferroan, calcite crystals which are
orange-brown to dull brown luminescent under CL. Cement stage III also
occurs in veins.
The cement stages I-III record precipitation in oxidising to
reducing conditions. This is thought to reflect the decreasing redox
potential of pore fluids with time and burial. A comparable sequence of
cements (Stages 2-4) has been described by Miller (1986) in the mound
complex at Hill 707 Co. Galway Ireland. The cement Stages 2-4 are also
interpreted as representing the progressive change in the chemistry of the
pore fluids during burial.
164
Figure 6.13
(A) Strat. abourrd t,; i1F doloruites ( 1)), approximatPI. -% -mu thick, within the interbank facies at. Wind Bay.
(B) Photumicrograph of a CL image of void cements, showing Stages I, II A [II. See text. Scale bar = 0.25mm
(C) L'liot(. nii"i . raph of a CL. iwagr, of a void infi)h d by 3 st ge 111 (111) a) it cement that has in part he ri r4-placed by :i ; iiid dotomit«- (/). Scale bar = l). Z: irnm.
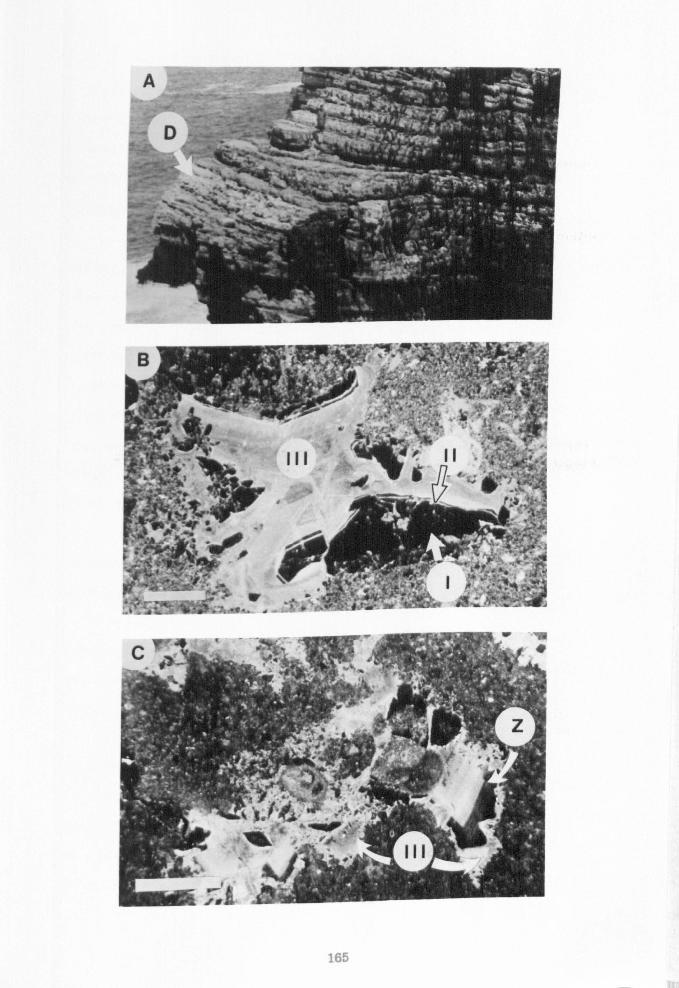
165
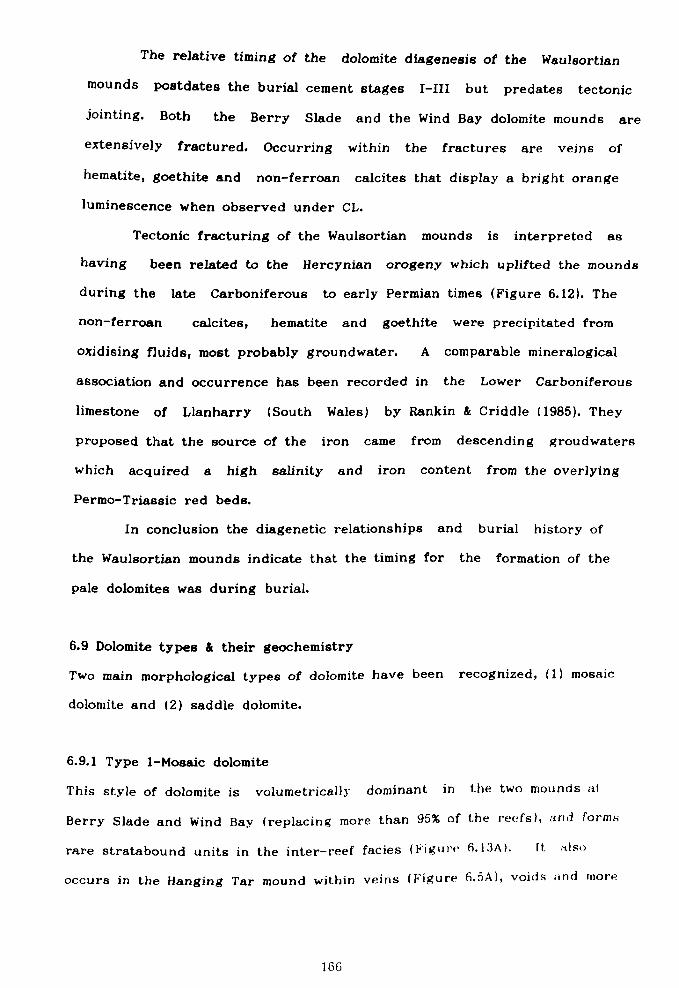
The relative timing of the dolomite diagenesis of the Waulsortian
mounds postdates the burial cement stages I-III but predates tectonic
jointing. Both the Berry Slade and the Wind Bay dolomite mounds are
extensively fractured. Occurring within the fractures are veins of
hematite, goethite and non-ferroan calcites that display a bright orange
luminescence when observed under CL.
Tectonic fracturing of the Waulsortian mounds is interpreted as
having been related to the Hercynian orogeny which uplifted the mounds
during the late Carboniferous to early Permian times (Figure 6.12). The
non-ferroan calcites, hematite and goethite were precipitated from
oxidising fluids, most probably groundwater. A comparable mineralogical
association and occurrence has been recorded in the Lower Carboniferous
limestone of Llanharry (South Wales) by Rankin & Criddle (1985). They
proposed that the source of the iron came from descending groudwaters
which acquired a high salinity and iron content from the overlying
Permo-Triassic red beds.
In conclusion the diagenetic relationships and burial history of
the Waulsortian mounds indicate that the timing for the formation of the
pale dolomites was during burial.
6.9 Dolomite types & their geochemistry
Two main morphological types of dolomite have been recognized, (1) mosaic
dolomite and (2) saddle dolomite.
6.9.1 Type 1-Mosaic dolomite
This style of dolomite is volumetrically dominant in the two mounds at
Berry Slade and Wind Bay (replacing more than 95% of the reefs), and forms
rare stratabound units in the inter-reef facies (Figure 6.13A). It nlso
occurs in the Hanging Tar mound within veins (Figure (i. 5A), voids and more
166
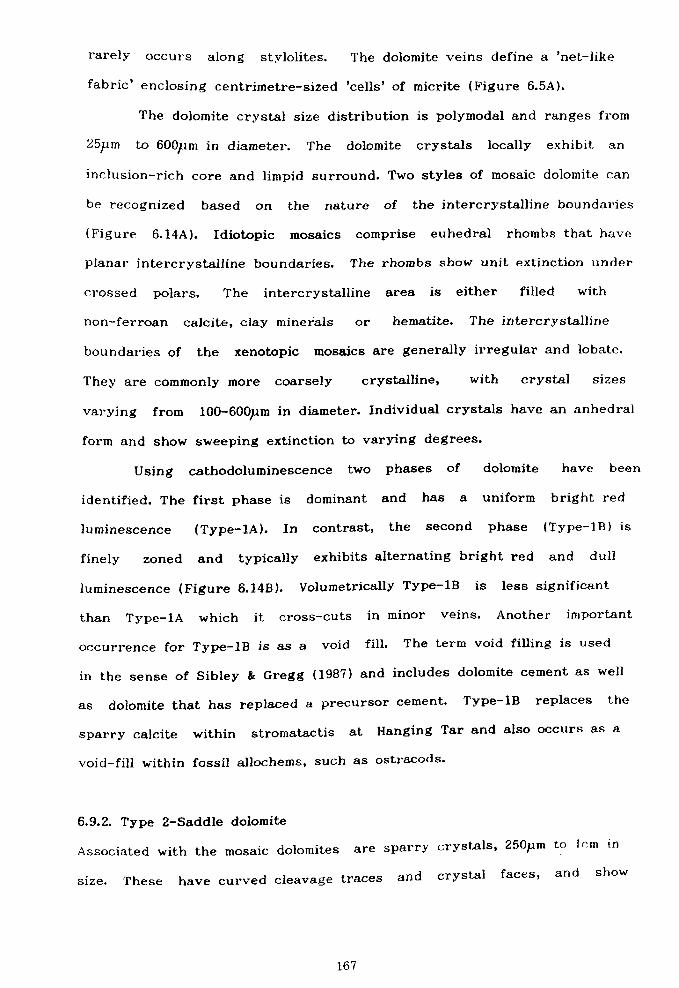
rarely occurs along stylolites. The dolomite veins define a 'net-like
fabric' enclosing centrimetre-sized 'cells' of micrite (Figure 6.5A).
The dolomite crystal size distribution is polymodal and ranges from
25pm to 600pm in diameter. The dolomite crystals locally exhibit an
inclusion-rich core and limpid surround. Two styles of mosaic dolomite can
be recognized based on the nature of the intercrystalline boundaries
(Figure 6.14A). Idiotopic mosaics comprise euhedral rhombs that have
planar intercrystalline boundaries. The rhombs show unit extinction under
crossed polars. The intercrystalline area is either filled with
non-ferroan calcite, clay minerals or hematite. The intercrystalline
boundaries of the xenotopic mosaics are generally irregular and lobate.
They are commonly more coarsely crystalline, with crystal sizes
varying from 100-600pm in diameter. Individual crystals have an anhedral
form and show sweeping extinction to varying degrees.
Using cathodoluminescence two phases of dolomite have been
identified. The first phase is dominant and has a uniform bright red
luminescence (Type-IA). In contrast, the second phase (Type-1B) is
finely zoned and typically exhibits alternating bright red and dull
luminescence (Figure 6.14B). Volumetrically Type-1B is less significant
than Type-1A which it cross-cuts in minor veins. Another important
occurrence for Type-1B is as a void fill. The term void filling is used
in the sense of Sibley & Gregg (1987) and includes dolomite cement as well
as dolomite that has replaced a precursor cement. Type-1B replaces the
sparry calcite within stromatactis at Hanging Tar and also occurs as a
void-fill within fossil allochems, such as ostracods.
6.9.2. Type 2-Saddle dolomite
Associated with the mosaic dolomites are sparry crystals, 25O Pm to Irm in
size. These have curved cleavage traces and crystal faces, and show
167
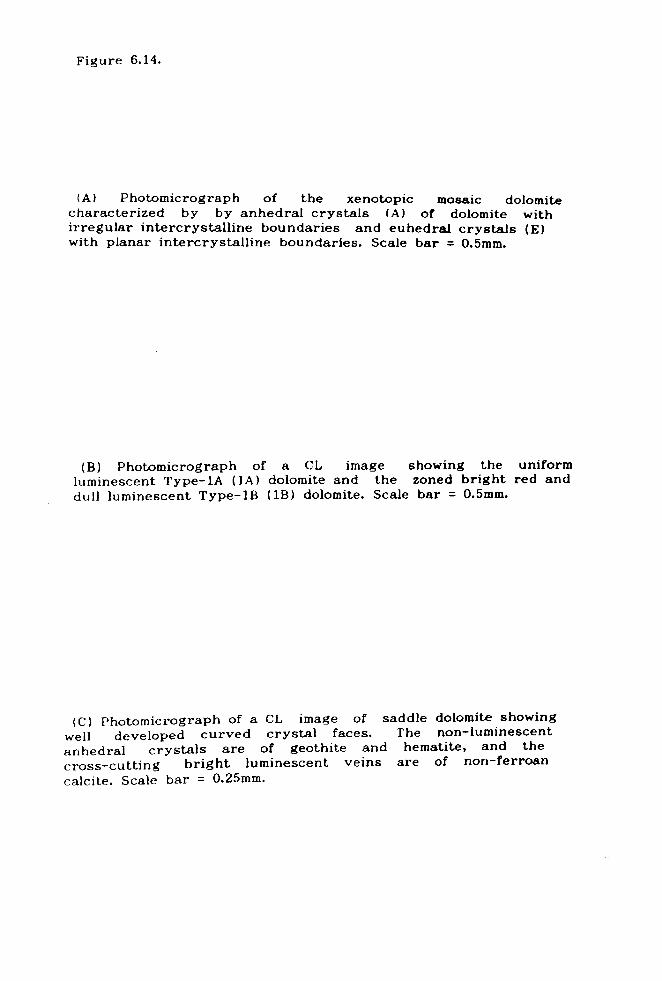
Figure 6.14.
(A) Photomicrograph of the xenotopic mosaic dolomite characterized by by anhedral crystals (A) of dolomite with irregular intercrystalline boundaries and euhedral crystals (E) with planar intercrystalline boundaries. Scale bar = 0.5mm.
(B) Photomicrograph of a CL image showing the uniform luminescent Type-IA (1A) dolomite and the zoned bright red and dull luminescent Type-1B (1B) dolomite. Scale bar = 0.5mm.
(C) Photomicrograph of a CL image of saddle dolomite showing
well developed curved crystal faces. The non-luminescent
anhedral crystals are of geothite and hematite, and the
cross-cutting bright luminescent veins are of non-ferroan
calcite. Scale bar = 0.25mm.

A'
ý`
F111 '
1 *0,04, 1A -,
Cis ,
ý- -V IIc" --w V's, -
. Al ;f"i, . '
r
i
168
sweeping extinction when viewed under crossed polars. Each crystal
commonly exhibits an inclusion-rich core and limpid surround (Figure
6.14C). This particular type of dolomite is mainly restricted to the
Berry Slade and Wind Bay mounds, where it occurs within veins. The
crystals commonly occur in a palisade arrangement orientated perpendicular
to the surface from which they grew; a feature described as 'laminae' by
Dixon (1921).
These pore-filling dolomites are saddle dolomites (in the sense of
Radke & Mathis 1980; or 'baroque dolomite' Zenger 1983; or 'white-sparry
dolomite' Beales 1971) and have an anhedral to euhedral form. Under CL
they exhibit a uniform red-brick luminescence. The saddle dolomite is
thought to postdate the Type-lA mosaic dolomite upon which they grew. The
relationship to the Type-1B mosaic dolomite is unclear.
6.9.3. Geochemistry
Only Type-1A (mosaic) dolomite and Type-2 (saddle) dolomite have
been analysed (Table 6.1). The occurrences of Type-1B dolomite are too
small to be extracted successfully.
The trace element compositions are remarkably consistent (Table
6.1). The Mg/Ca ratios are approximately 1: 2 and show a high degree of
ordering typically 49: 51, respectively. The average concentrations of Mn
(82ppm), Fe (165pprn) and Sr (76ppm) are low compared with many other
examples from the geologic record (summary see Mattes & Mountjoy 1980).
Similar values for Mn (35-95), Fe (200ppm) and Sr (50ppm) have been
recorded by Mattes & Mountjoy (1980) for the burial dolomites of the Upper
Devonian Miette reefs of Cananda.
Isotope data for the Waulsortian reef dolomites from 12 analyses is
presented in Table 6.1. Carbon and oxygen values are presented relative to
the PDB standard. The samples are bulk rock analyses since individual
169
c -- ö r-
Z: 0 b
o «ý pO
O
U-
ý
EÖ Ow0
rJ
.: OC
M
Cli f
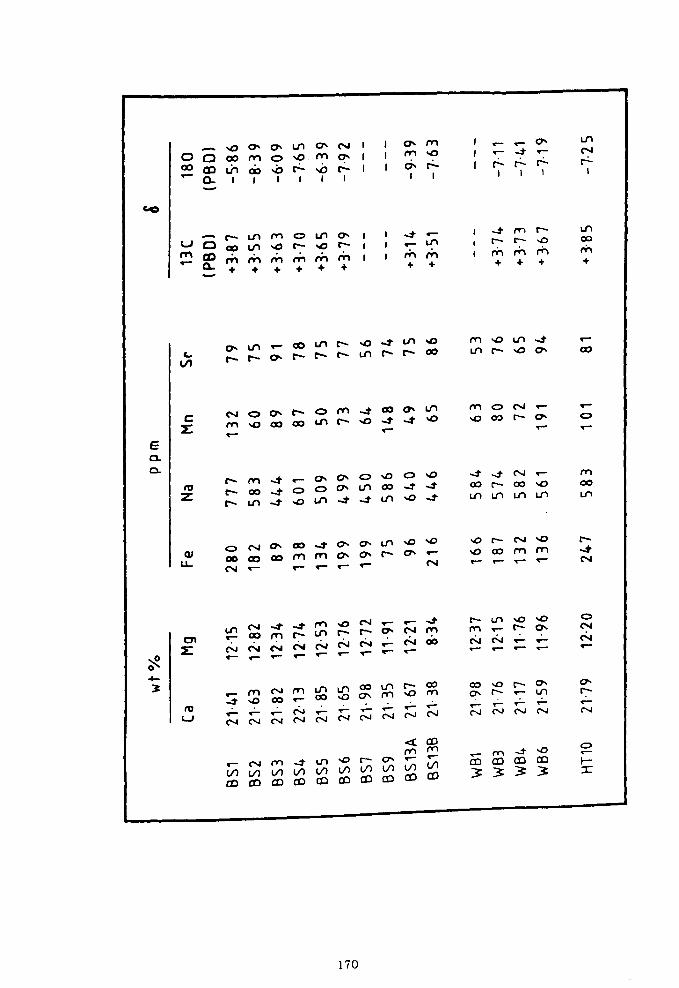
"0 o" v, Ln o" NI I o" m O p oo m o o" I I" `0 CO m
a Ln
1 ob 1
D 1 1 1
cý 1 1
1 c`
1 cý
1
COD
^- r- L! 1 MO LI1 O' I1 -t r- u
OD UIO r- %0 r- 11 a-- MMMMM n1 I1 Pß'1 nI
t444f+44 v
1 pý ß. l1
r .f e- N
1111
im r- Ln 10 00
i rn en rn (Ih
N P r-
U., t-
, Oý
C0 UI fý %0 Ill
-t fý
UI Cý
%0 00
M t! 1
%Q [
ßf1 ýD
-t P
'- 00
G Z
N m
O 'O
P C=
! '- 00
O UI
M r-
-4 %0
00 C7`
-t
UI NO
M
%0
O 07
N r-
r- P O
E CL c2-
Z
r- C- [ý
M 00 Lfl
-t -t t
, p
`0
P O 111
P P
-t
O UI
.f
'. D 00 UI
O
.. t
'. 0
%0 .? .t
-t OQ Ul
-! h UI
N o0 UI
i- %0 UI
M 00 UI
LL-
p pp (V
N Co
P
Co
Co M
.? M r
O' P r
O' P
UI t-
'D P
MD r" N
%0 NO r-
t- Co r
N m r-
'. D m Irl,
L-
-4 N
O
Z a- N
N Co
N en N
J r- N
M Ui
N
.O r- N
N r- c`4
r-- P
r
- N N
-3 M
tom- M N
Ln r- tV
-'0
Ir-
%0 P v-
p N cý4
. 4-
(n O
N M
en �-
U') CO
UI O
00 O_
U"1 M
t- Co m
Co p.
%0 [-
[- e-
P Ui
P
{ý N
c- N
r N
N N
r N
r C-J <'`J N N (4 N fV N (V CV
r N m
N to Co
M vi m
UI N Co
UI to Co
10 LA Co
r- to
m
c71 to
m
M ý-
UI
m
0
v 0 m
ca 3
m 3
Co 3
Co 3
º- =
170
individual crystals could not be isolated.
The S13C compositions of both the mosaic (Type-IA) and the saddle
(Type-2) dolomite fall within a narrow range (+3.14%. to +3.87%. ) (Table
6.1 & Figure 6.15). The Type-IA mosaic dolomite is uniformly enriched in
18O ranging from -5.86%.. to -7.63%.. Notably, it is the saddle dolomite
(BS13A; Table 6.1) which is the most 9180-depleted (Figure 6.15).
Interpretation: The types of dolomite and their geochemistry provide
constraints as to their origin. The warped crystal lattice of saddle
dolomites has been attributed to a number of factors (Radke & Mathis
1980), among which elevated temperature (>600C) appears to be one of the
most important. Integration of experimental data and field examples by
Gregg & Sibley (1984), suggests that xenotopic dolomite textures are the
result of growth at elevated temperatures in excess of 50°C. The
association of idiotopic and xenotopic mosaic dolomite within the
Waulsortian mounds can be explained in terms of increasing temperature
during progressive burial.
The 8160 composition of dolomite is influenced by 1) the
composition of the precursor carbonates and 2) the composition of the
dolomitizing fluids (Land 1980). At increased temperatures the
composition of the dolomitizing fluids is likely to alter as a result of
the fractionation of 180,
so that higher temperature dolomites are
relatively 180-depleted (Land 1980). The wide range of negative values
shown by the 9180 composition in the reef dolomites at Castlemartin would
support the petrographic evidence of increasing temperatures of dolomite
formation, most probably as a result of progressive burial. It is
significant that the most depleted 9Jb0 dolomite type is the saddle
dolomite (Figure 6.15; Table 6.1, sample BS13A) which most probably formed
171
T
7
O
s
S
a
0
ö a.. 1
J,
J
M
C
'l, c.
cis v s. J
m
i7/
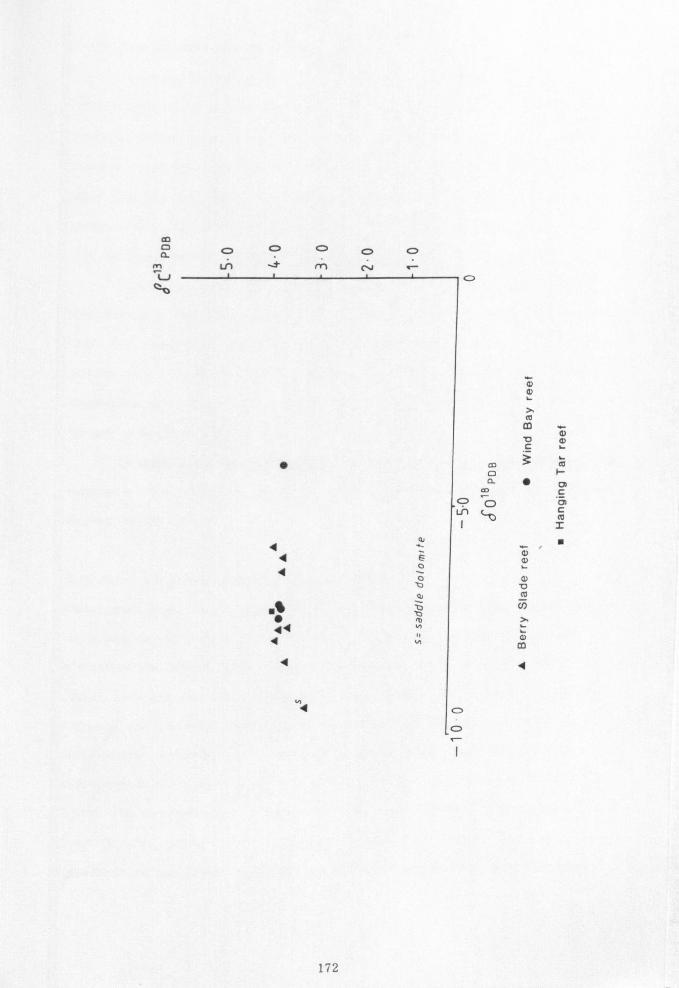
co 0 a
m L-)
11-1o 0
d d lC
d m
C
CID 00
O ~
a " pý m c p
Ln 1 =
a, a,
C, v co
T
d m
4
0 O
172
00 C) 00 .:,
m cv
under the highest temperatures.
Because of the relative insolubility of C02, it is very difficult
to markedly alter the carbon isotopic composition of carbonate sediment
from its initial value (Land 1980). The 813C of modern carbonate sediment
ranges between about +4.0%. and -2.0%. on the PDB scale (Gross 1964) and
most platform dolomites fall within this range (Land 1980). The narrow
isotopic composition of the Castlemartin reef dolomites falls within that
for marine dolomites (+4.0 to -2. OPDB) (Figure 6.15).
There are many difficulties in interpreting dolomite trace element
geochemistry data (Land 1980; Hardie 1987). However, it is significant
that the dolomites have a low iron content. A low total iron
concentration reflects the quantity of iron delivered to a site during
deposition and diagenesis. This can have important constraints upon the
nature of the dolomitizing fluids.
In conclusion the petrographic observations and geochemical data
suggests the dolomites formed under increasing temperature conditions,
during burial.
6.10 Other Dinantian dolomites of South Wales
Petrographically, the Waulsortian dolomites at Castlemartin show some
similarity to the burial 'vein' dolomites described from the Gully Oolite
(Chadian) and Hunts Bay Oolite (Holkerian) by Hird et a1. (1987). The
'vein' dolomites consist of dolomite mosaics, mainly of anhedral cloudy
crystals and saddle dolomite (Hird et al. 1987). Chemically, however, the
Waulsortian dolomites are distinct from the other major dolomite types
documented in the Dinantian of South Wales (Hird et al. 1987; Sear]
1988). The concentration of manganese and iron (average 88ppm and 165ppm
respectively) within the Waulsortian dolomites is notably less than the
results from the other dolomite types. For example, the 'vein' dolomites
173
show an average of 3074ppm for manganese and 1.81wt% for iron (Hird et al.
1987). Isotopically the Waulsortian dolomites define their own 'field',
showing no overlap with other dolomite types, as they have a significantly
higher 913C value (average +3.65) (Figure 6.16). The A180
value shows a
similar spread of data points to that of the 'vein' dolomites
which are also interpreted as having formed during burial (third et al.
1987).
6.11 Discussion
It is well established that Waulsortian mudmounds form in water depths
greater than loom and occur in distal ramp settings (Miller &
Grayson 1982; Lees et al. 1985; Lees & Miller 1985; op. cit. Bridges &
Chapman 1988). This places a major constraint upon dolomitization by
near-surface processes (the reflux of hypersaline brines and the mixing of
seawater and meteoric water) which require a marked fall in sea level to
allow the infilltration of near-surface fluids into the reef mounds.
Therefore, the fluids most likely to dolomitize Waulsortian facies are sea
water and burial connate water.
Important constraints on the origin of the pale dolomites at
Castlemartin include: (1) the relative timing of dolomitization, (2) the
dolomite types, (3) their distribution and (4) geochemistry. The
diagenetic relationships show the dolomites are of burial origin (section
6.8) and this is consistent with the types of dolomite identified and
their geochemistry (section 6.9). At elevated temperatures, there are
fewer thermodynamic and kinetic constraints on dolomite formation than
are required at surface temperatures (Usdowski 1968; Lovering 1969;
Lippmann 1973; Mattes & Mountjoy 1980; Zenger 1983; Hardie 1987; Machel &
Mountjoy 1986). This both hastens the reaction rates and permits
dolomitization at lower Mg/Ca ratios.
174
w v 11!
Co 0 4. )
:52 ö
00 Aw c .. (0 010 s.. c 0
.ýc
... aE 0, ' 0 ýc 4) 0
8ý cd 0 . - to -CJ CD -5
bo
Q6ä
-4 eo
.-X rn W0 a% . -+
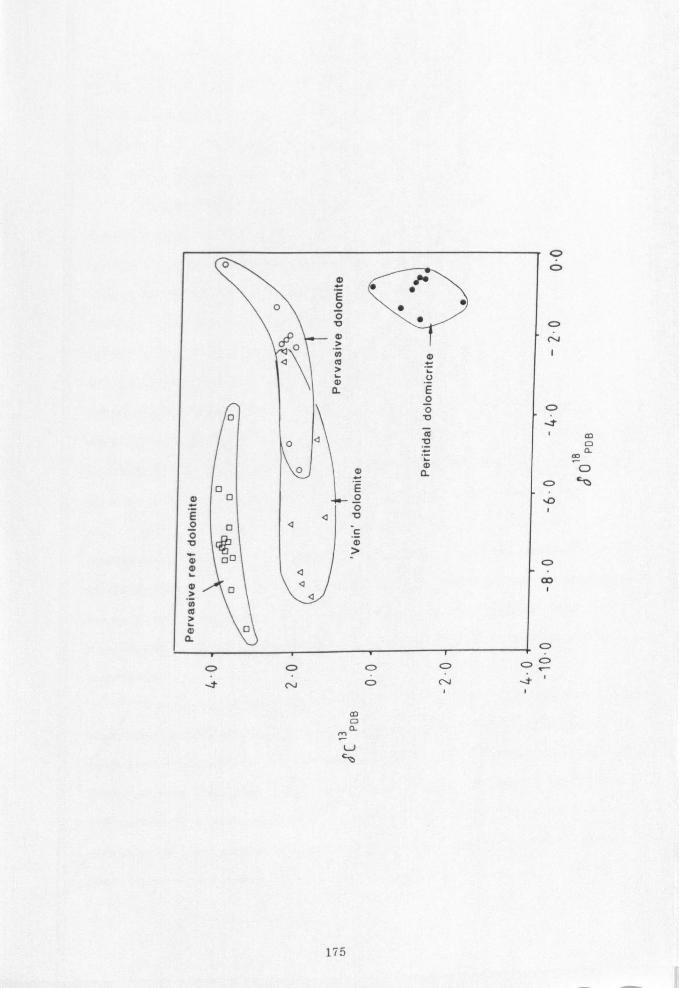
0 m" f'
" E" 0o"
o" V o
o> dl m a to I:
LE a0
OV
-Fo U4:
CD o aý a
o mo0 ö Ea 2oc oý 'm
o0 Od
O 0
o
C> ö
0
O
o
0 Co
ov ooi
(V }N
m 0 a
m u Co
175
In order to dolomitize the Waulsortian mounds at Castlemartin, two
basic conditions must have been fulfilled: 1) the source of ions must have
been sufficiently large to replace the mounds at Wind Bay and Berry
Slade; and 2) a mechanism for transporting the ions from their source to
the site of dolomitization must have existed.
There are three main models in the literature which explain
dolomitization in the subsurface. These include: cellular thermal
convection, regional topography- driven flow, and compactional flow (Figure
6.17). Thermal convection requires the establishment of a 'half-cell'
between the platform interior and seawater, which acts as an infinite
reservoir for magnesium (Kohout et al. 1977; Simms 1984). It is believed
to originate from the density gradient that exists between the warmer
(geothermally heated) waters of the platform interior and the cold
surrounding seawater (Simms 1984) (Figure 6.17A). Cellular thermal
convection has only been proven for the Florida platform where the supply
of sea water is from the adjacent cold, deep water straits (Kohout et
al. 1977; Simms 1984) (Figure 1.7A). The low angle
configuration shown by carbonate ramps is in marked contrast to the
platform geometries which are most likely to establish cellular thermal
convection. Therefore, it is considered highly unlikely that the
Waulsortian reefs at Castlemartin were dolomitized by cellular thermal
convection.
Topography-driven flow (Garven & Freeze 1984; Garven 1985),
otherwise known as gravity driven flow, of groundwater water is reliant
upon the hydraulic head established in a site of elevation, known as the
recharge area (e. g. hills and mountains) (Figure 6.17B). A topography
driven flow is a regional flow and its diagenetic effects are liable to be
recognizable throughtout a region, rather than localised within certain
facies type. As a result it is also considered to be an unlikely
176
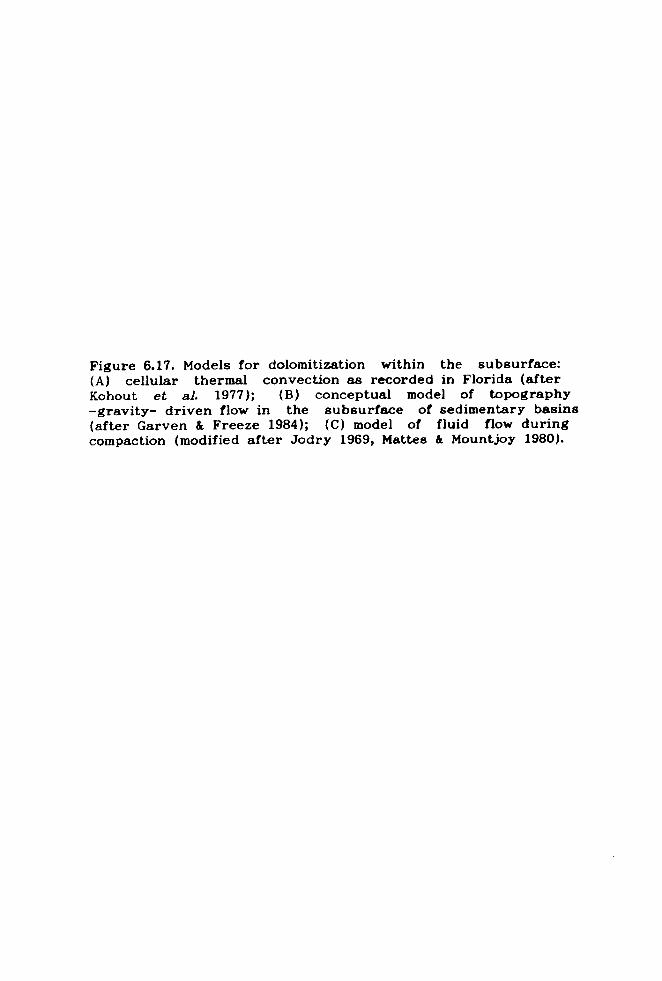
Figure 6.17. Models for dolomitization within the subsurface: (A) cellular thermal convection as recorded in Florida (after Kohout et al. 1977); (B) conceptual model of topography
-gravity- driven flow in the subsurface of sedimentary basins (after Garven & Freeze 1984); (C) model of fluid flow during
compaction (modified after Jodry 1969, Mattes & Mountjoy 1980).
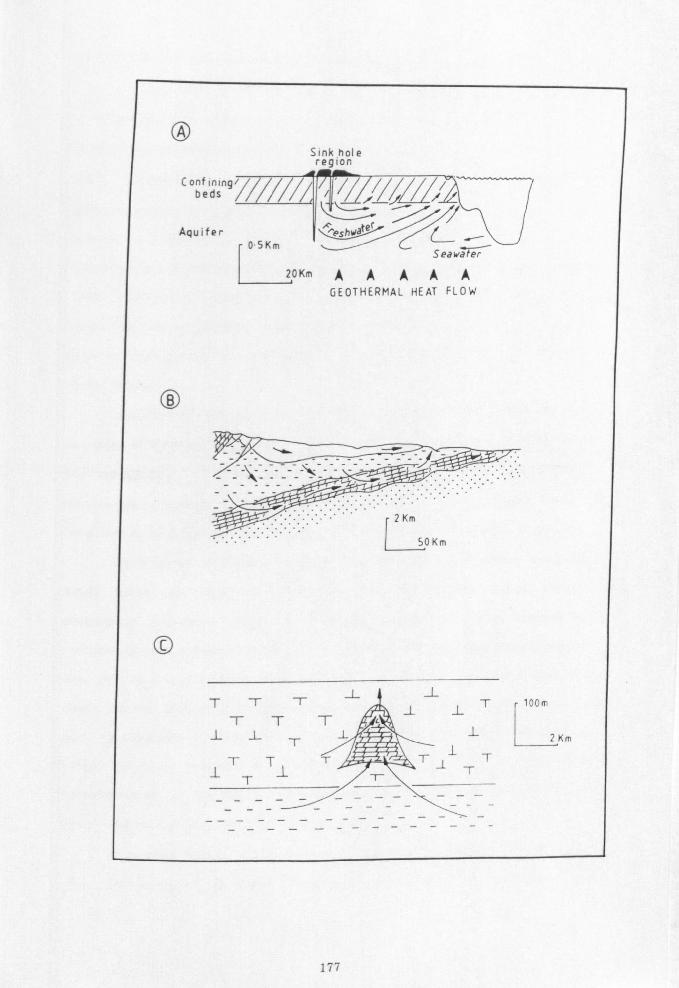
0 Sink hole region
C oldsng/ beds
Aquifer shwter 0"SKm I ----J Sea Wa I 20Km AAAAA
GEOTHERMAL HEAT FLOW
(E'ý k_D)
. ..
r 1Km
50Km
(C)
TTT1Tr 100m TTT
1 -ý- 1L
bm
1T T1 T T11T T
TT
177
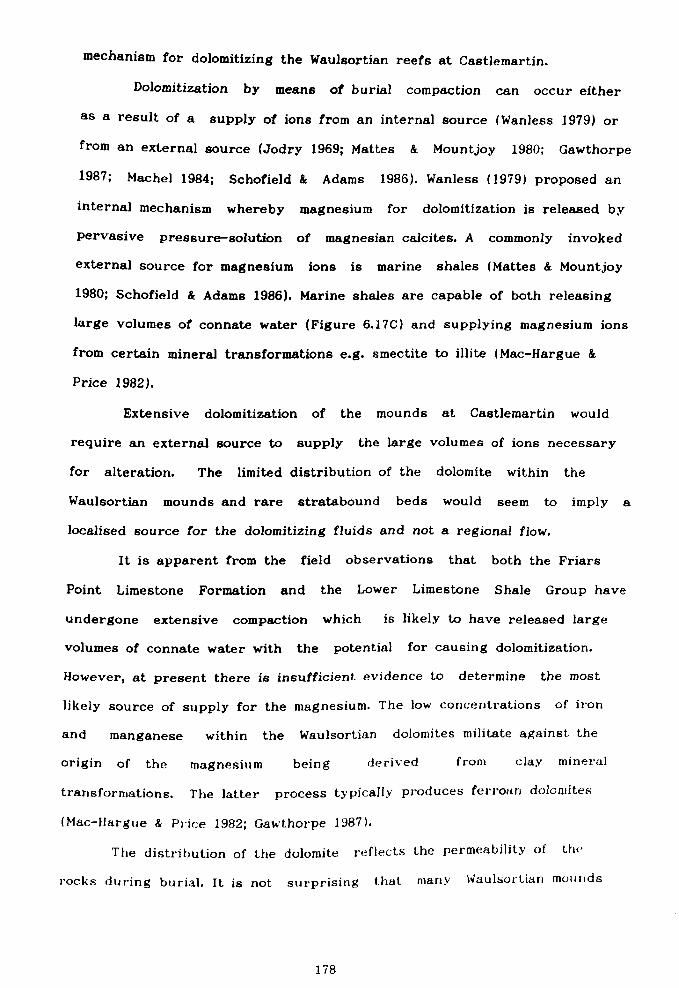
mechanism for dolomitizing the Waulsortian reefs at Castlemartin.
Dolomitization by means of burial compaction can occur either
as a result of a supply of ions from an internal source (Wanless 1979) or
from an external source (Jodry 1969; Mattes & Mountjoy 1980; Gawthorpe
1987; Machei 1984; Schofield & Adams 1986). Wanless (1979) proposed an
internal mechanism whereby magnesium for dolomitization is released by
pervasive pressure-solution of magnesian calcites. A commonly invoked
external source for magnesium ions is marine shales (Mattes & Mountjoy
1980; Schofield & Adams 1986). Marine shales are capable of both releasing
large volumes of connate water (Figure 6.17C) and supplying magnesium ions
from certain mineral transformations e. g. smectite to illite (Mac-Hargue &
Price 1982).
Extensive dolomitization of the mounds at Castlemartin would
require an external source to supply the large volumes of ions necessary
for alteration. The limited distribution of the dolomite within the
Waulsortian mounds and rare stratabound beds would seem to imply a
localised source for the dolomitizing fluids and not a regional flow.
It is apparent from the field observations that both the Friars
Point Limestone Formation and the Lower Limestone Shale Group have
undergone extensive compaction which is likely to have released large
volumes of connate water with the potential for causing dolomitization.
However, at present there is insufficient evidence to determine the most
likely source of supply for the magnesium. The low concentrations of iron
and manganese within the Waulsortian dolomites militate against the
origin of the magnesium being derived from clay mineral
transformations. The latter process typically produces ferroan dolomites
(Mac-Hargue & Price 1982; Gawthorpe 1987).
The distribution of the dolomite reflects the permeability of the
rocks during burial. It is not surprising that many Waulsortian mounds
178
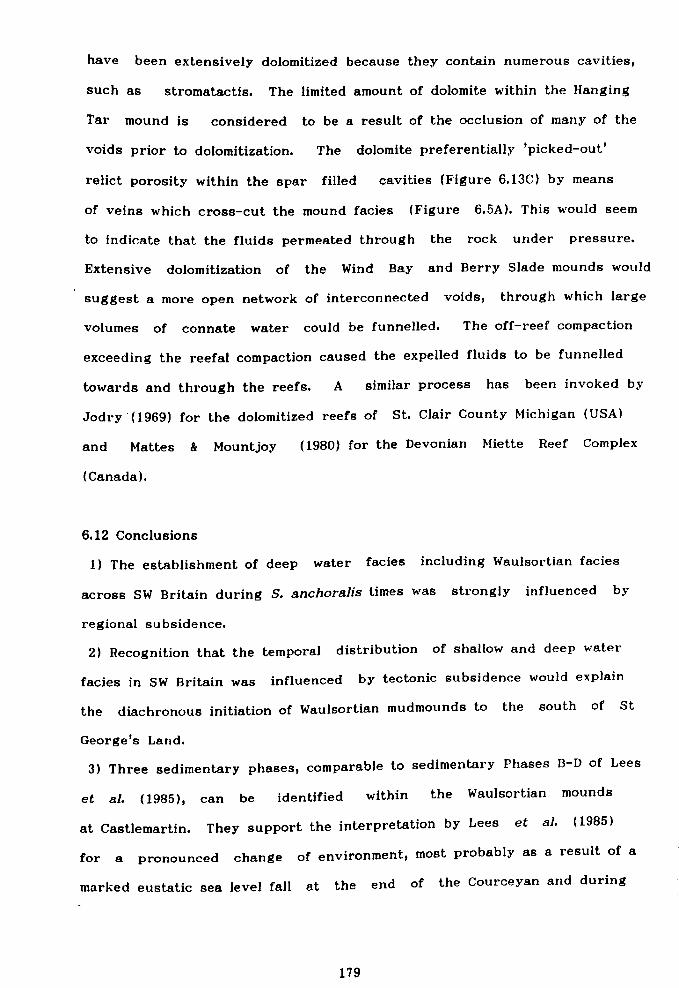
have been extensively dolomitized because they contain numerous cavities,
such as stromatactis. The limited amount of dolomite within the Hanging
Tar mound is considered to be a result of the occlusion of many of the
voids prior to dolomitization. The dolomite preferentially 'picked-out'
relict porosity within the spar filled cavities (Figure 6.13C) by means
of veins which cross-cut the mound facies (Figure 6.5A). This would seem
to indicate that the fluids permeated through the rock under pressure.
Extensive dolomitization of the Wind Bay and Berry Slade mounds would
suggest a more open network of interconnected voids, through which large
volumes of connate water could be funnelled. The off-reef compaction
exceeding the reefal compaction caused the expelled fluids to be funnelled
towards and through the reefs. A similar process has been invoked by
Jodry (1969) for the dolomitized reefs of St. Clair County Michigan (USA)
and Mattes & Mountjoy (1980) for the Devonian Miette Reef Complex
(Canada).
6.12 Conclusions
1) The establishment of deep water facies including Waulsortian facies
across SW Britain during S. anchoralis times was strongly influenced by
regional subsidence.
2) Recognition that the temporal distribution of shallow and deep water
facies in SW Britain was influenced by tectonic subsidence would explain
the diachronous initiation of Waulsortian mudmounds to the south of St
George's Land.
3) Three sedimentary phases, comparable to sedimentary Phases B-D of Lees
et al. (1985), can be identified within the Waulsortian mounds
at Castlemartin. They support the interpretation by Lees et al. (1985)
for a pronounced change of environment, most probably as a result of a
marked eustatic sea level fall at the end of the Courceyan and during
179

early Chadian times.
4) The Waulsortian dolomites of Castlemartin originated during burial
diagenesis.
5) The most likely source of magnesium was from connate waters from the
surrounding limestones and/or the underlying Lower Limestone Shale Group.
180
Chapter 7- Cryptic exposure horizons in the Carboniferous Limestone of
Portishead
7.1 Introduction
7.2 Succession
7.2.1 The Black Rock Dolomite
7.2.2 The Sub-Oolite Bed
7.2.3 The Gully Oolite
7.3 The Portiahead Paleosol Beds
7.3.1 Carbonate nodules
7.3.2 Columnar calcite crystals
7.3.3 Clays & siltstones
7.4 Other columnar calcites
7.5 Discussion
7.6 Conclusions
181
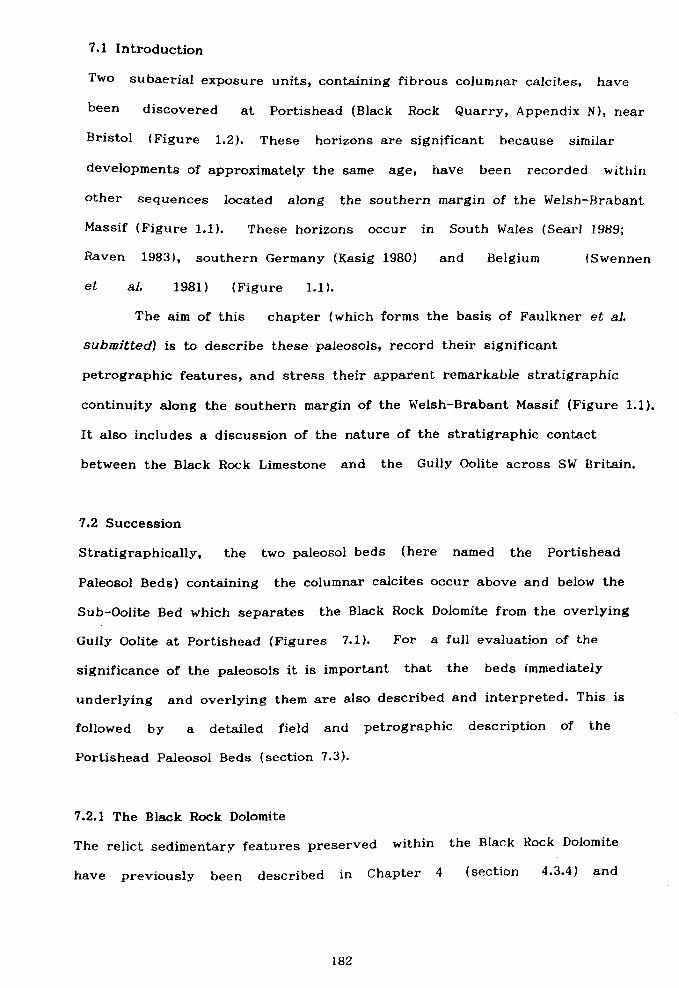
7.1 Introduction
Two subaerial exposure units, containing fibrous columnar calcites, have
been discovered at Portishead (Black Rock Quarry, Appendix N), near
Bristol (Figure 1.2). These horizons are significant because similar
developments of approximately the same age, have been recorded within
other sequences located along the southern margin of the Welsh-Brabant
Massif (Figure 1.1). These horizons occur in South Wales (Searl 1989;
Raven 1983), southern Germany (Kasig 1980) and Belgium (Swennen
et a1.1981) (Figure 1.1).
The aim of this chapter (which forms the basis of Faulkner et al.
submitted) is to describe these paleosols, record their significant
petrographic features, and stress their apparent remarkable stratigraphic
continuity along the southern margin of the Welsh-Brabant Massif (Figure 1.1).
It also includes a discussion of the nature of the stratigraphic contact
between the Black Rock Limestone and the Gully Oolite across SW Britain.
7.2 Succession
Stratigraphically, the two paleosol beds (here named the Portishead
Paleosol Beds) containing the columnar calcites occur above and below the
Sub-Oolite Bed which separates the Black Rock Dolomite from the overlying
Gully Oolite at Portishead (Figures 7.1). For a full evaluation of the
significance of the paleosols it is important that the beds immediately
underlying and overlying them are also described and interpreted. This is
followed by a detailed field and petrographic description of the
Portishead Paleosol Beds (section 7.3).
7.2.1 The Black Rock Dolomite
The relict sedimentary features preserved within the Black Rock Dolomite
have previously been described in Chapter 4 (section 4.3.4) and
182

Figure 7.1. Sedimentary log of the uppermost Black Rock Dolomite, the Portishead Paleosol Beds, the Sub-Oolite Bed and the Gully Oolite. (Black Rock Quarry; locality map is shown in Appendix N. )

9m
o o0 0--'0
0ö o^o
00
Qý "
""
""""
Q. ýO
CZ)
ýý 1
m äs 0, m I- 0
Gully Oolite
Upper Portishead Paleosol Bed
O
aý O m O I-
Sub-Oolite Q* 0
lip Bed cm U, C (Cl
Lower Portishead Paleosol Bed
Black Rock
Dolomite
aoi
grain stone
peloidal pack stone
bioclastic ckst packone /
grainstone
EI
crinoidal wackestone/ packstone
0 mottled nodular ýý limestone &
0
mudstone
F; I dolomite
columnar calcite concretions
Fýl cross-bedding
'pockets' of limeston
f1m
183
interpreted as having been laid-down in a subtidal, probably beneath storm
wave-base environment.
7.2.2 The Sub-Oolite Bed
The packstone/grainstone Sub-Oolite Bed (0.5m to 3. Om thick) has a sharp
planar contact with the Lower Portishead Paleosol Bed and a gradational
contact with Upper Portishead Paleosol Bed (Figure 7.1). Upward from the
base of the unit there is an overall grain size decrease from granular
grade to coarse sand-grade. The sedimentary features include graded beds
(5-10cm thick) and medium scale trough cross-sets, laterally persistent
for up to 2m. The base of the graded beds consists of a crinoidal lag
(1-2cm thick) overlain by a bioturbated, peloidal-rich layer of coarse
sand-grade. Biogenic structures are more noticeable in the upper part
of the unit and their appearance is similar to Thalassinoidea-type
burrows occurring as circular tubular burrows (ca. 3cm in diameter) both
parallel and perpendicular to bedding.
The Sub-Oolite Bed has a low diversity fauna, and consists of the
following constituents in decreasing order of abundance: - peloids;
disarticulated crinoid ossicles with thin micritized margins; composite
grains of micrite-coated bioclasts; disarticulated brachiopod valves;
angular silt to medium sand grade quartz grains; and rare microfossils
such as moravamminids. The ovoid peloids, 1-4mm in diameter, are
commonly amalgamated due to compaction prior to cementation.
Interpretation: Deposition of the Sub-Oolite Bed was mainly from
currents which reworked and deposited the allochems into graded beds and
laterally impersistent cross-beds. The dominance of coarse peloidal
allochems and a low diversity fauna suggest deposition not in an active
shoal environment but perhaps a more restricted, either back-shoal or
inter-shoal environment.
184
7.2.3 The Gully Oolite
At Black Rock Quarry, the Gully Oolite (ca. 30m thick) has a sharp
planar contact with the underlying Upper Portishead Paleosol Bed. The
basal lOm of the Gully Oolite consists of a poorly sorted,
granular-sized, peloidal and bioclastic packstone/grainstone that
passes gradationally into the overlying oolitic grainstone unit.
The peloidal limestone shows signs of bioturbation and include thin
layers (less than 5cm thick) of disarticulated, convex-upward brachiopod
valves. Overall, the relative abundance and types of allochems are
similar to that recorded in the Sub-Oolite Bed (section 7.2.2).
Above the peloidal limestone, the ooids have a well developed
concentric structure (up to 0.5mm in diameter) around a nucleus of
crinoid, brachiopod and echinoderm spine fragments. Locally observed
within the oolite grainstone are cosets of low angle, planar cross-beds
(5-10cm thick).
Interpretation: The similarity between the lower part of the Gully
Oolite and the Sub-Oolite Bed suggests that the latter was also deposited
in a subtidal environment. The thin layers of disarticulated,
convex-upward brachiopod valves are interpreted as representing deposition
from higher energy (storm-related? ) currents. The upward passage from the
subtidal peloidal packstone/grainstone into the overlying low angle
cross-bedded oolite grainstone is interpreted as a shadowing-upward
sequence, perhaps into an upper shoreface environment. Similar
shallowing-upward successions have been recorded in the Gully Oolite of
South Wales by Waters (1984), Wright (1986), Ramsay (1987), and Waters
& Lawrence (1987).
185
7.3 The Portishead Paleosol Beds
Lithologically the Portishead Palaeosol Beds (1-4m thick) consist of 1)
carbonate nodules, 2) columnar calcite crystals, 3) siltstones and 4)
variegated clays. The base of each paleosol bed is gradational with the
underlying beds, and exhibits a relief of 1-2m over a short lateral
distance of only a few metres. The top of the beds is sharp and planar.
7.3.1 Carbonate nodules
Both the paleosol beds have a strongly nodular appearance. The nodules
commonly either consist of crinoidal limestone (Figure 7.2) or dolomite
depending on which unit they overlie, the Sub-Oolite Bed or the Black Rock
Dolomite respectively. The nodules are round, irregular to ovoid, and
vary from 3cm to 40cm in diameter. Locally they exhibit irregular,
internal cavities (up to 1cm in diameter), and cuspate
embayments particularly on the upper surface (up to 5cm deep). Occluding
the intra-nodular cavities is a clear microspar which consists of rhombic
and sub-rhombic crystals (4pm in diameter). When viewed under
cathodoluminescence (CL) the latter comprises numerous thin alternating
bright orange and dull zones, outlining a rhombic shape, commonly
with internal crenulated crystal faces (Figure 7.3A).
The surface embayments are a dissolution feature because they
cross-cut fossil allochems (e. g. crinoid ossicles) and the matrix of
the rock (e. g. micrite and its neomorphic microspar replacement).
Locally, infilling the embayments are layered micrites which are either
sub-concordant or disconcordant to the cavity wall (Figure 7.2). It is
common for the layered micrites to be subsequently replaced by either a
fine grained (25-50 pm in diameter) xenotopic dolomite or neomorphic
microspar. Significantly, simple burrow forms have been observed within a
layered dolomite (Figure 7.2), just beneath the sharp contact with the
186
Co 7v ö
c;
r or 0
0 U 4)
w
L V
4)
J
U
U
L
C E 3
ö U
L_
3
L U
y
c 0 ;,, c; E
w 0
E
0 E v v
N N
it z MI
U4
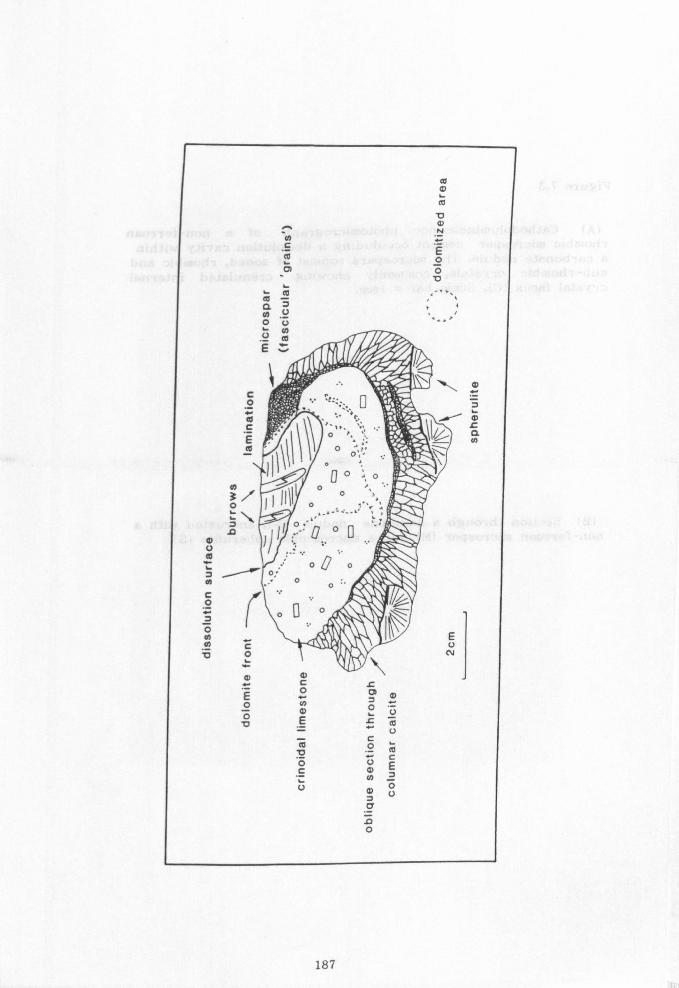
A V
E l9
_O
ä
y
cp 7 U
,
. O
U U q
E "
0
I
1 0 r
10'
\
%a l d
1' j o
e
1 1 00 O o
`ý
ýº poo o F ) i a
Iý E ý
ý C U
N
m O
O Co
'D
E
cd V
C O
U
c C
m N
E ý 0
187

Figure 7.3
(A) Cathodoluminescence photomicrograph of a non-ferroan rhombic microspar cement occuluding a dissolution cavity within a carbonate nodule. The microspars consist of zoned, rhombic and sub-rhombic crystals, commonly showing crenulated internal crystal faces (C). Scale bar = lmm.
(B) Section through a limestone nodule (N), encrusted with a non-ferroan microspar (M) and a macroscopic spherulite (S).
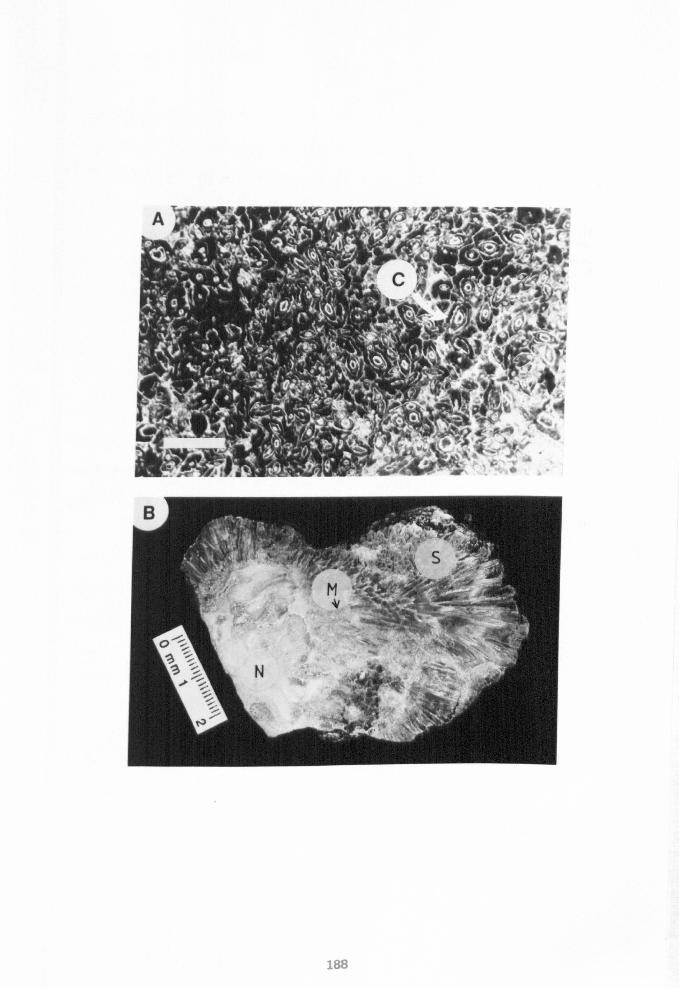
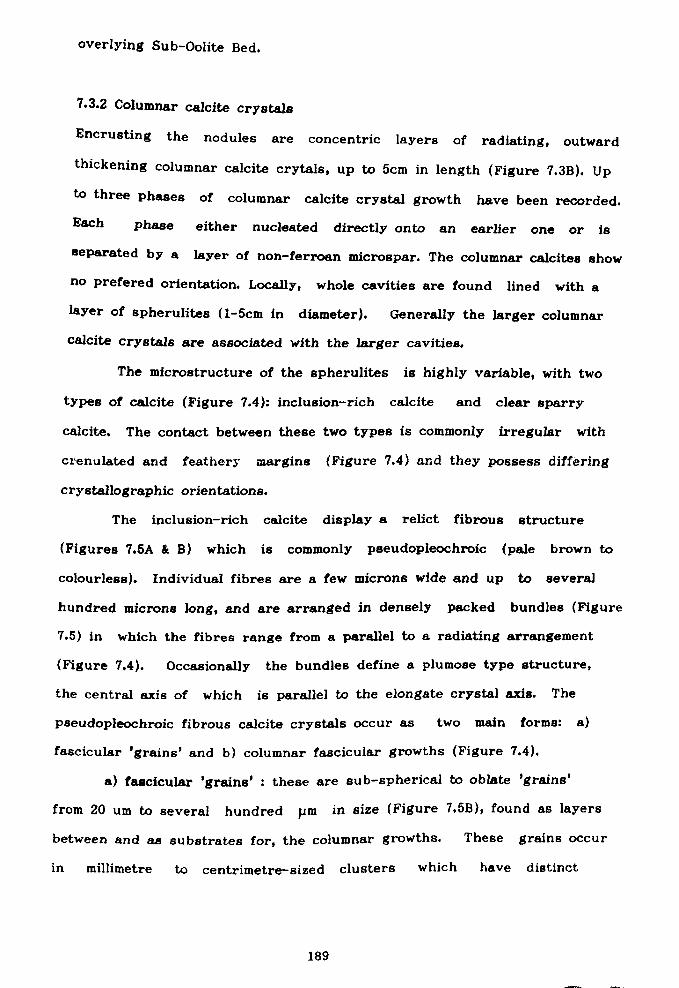
overlying Sub-Oolite Bed.
7.3.2 Columnar calcite crystals Encrusting the nodules are concentric layers of radiating, outward
thickening columnar calcite crytals, up to 5cm in length (Figure 7.3B). Up
to three phases of columnar calcite crystal growth have been recorded. Each phase either nucleated directly onto an earlier one or is
separated by a layer of non-ferroan microspar. The columnar calcites show
no prefered orientation. Locally, whole cavities are found lined with a
layer of spherulites (1-5cm in diameter). Generally the larger columnar
calcite crystals are associated with the larger cavities.
The microstructure of the spherulites is highly variable, with two
types of calcite (Figure 7.4): inclusion-rich calcite and clear sparry
calcite. The contact between these two types is commonly irregular with
crenulated and feathery margins (Figure 7.4) and they possess differing
crystallographic orientations.
The inclusion-rich calcite display a relict fibrous structure
(Figures 7.5A & B) which is commonly pseudopleochroic (pale brown to
colourless). Individual fibres are a few microns wide and up to several
hundred microns long, and are arranged in densely packed bundles (Figure
7.5) in which the fibres range from a parallel to a radiating arrangement
(Figure 7.4). Occasionally the bundles define a plumose type structure,
the central axis of which is parallel to the elongate crystal axis. The
pseudopleochroic fibrous calcite crystals occur as two main forms: a)
fascicular 'grains' and b) columnar fascicular growths (Figure 7.4).
a) fascicular 'grains' : these are sub-spherical to oblate 'grains'
from 20 um to several hundred µm in size (Figure 7.5B), found as layers
between and as substrates for, the columnar growths. These grains occur
in millimetre to centrimetre-sized clusters which have distinct
189

r' T
äy
(4 c
LC ar
,n C cc t-:
cy o W s `ä
w ý0
1
yO= r.
L
Of ct `w ý; 3y
sOr
yJ
Z 1, -C
LL 1y
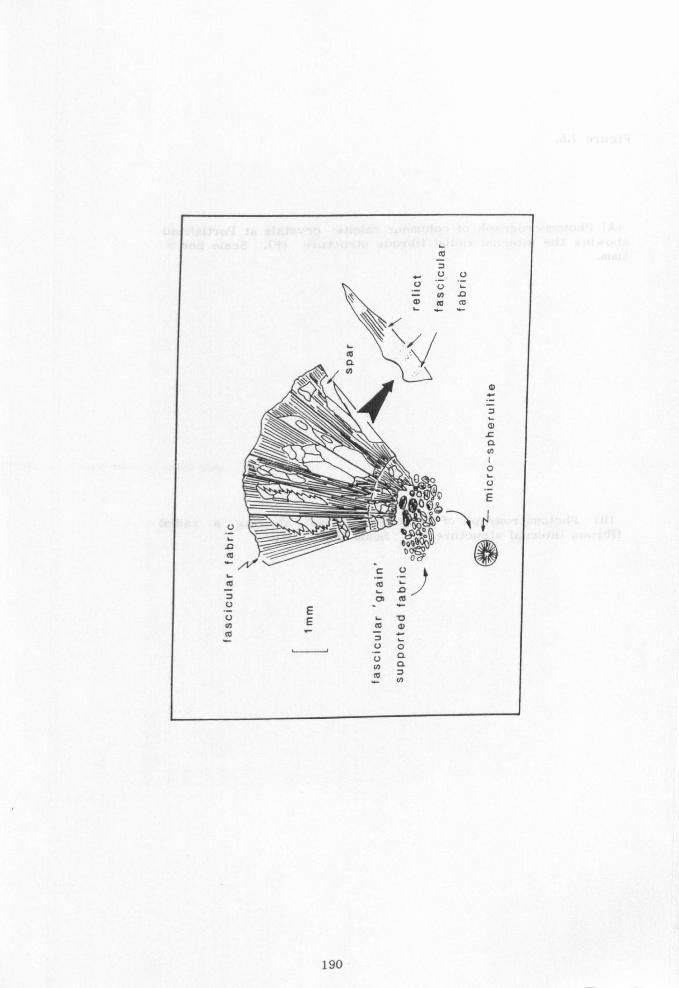
UU UUý
Nm m lp (6
\\ O
Oä
o mo ý_ oflQg E
ed cC
UE .ý
m co y
UO
Ua Na O f6
w0
190

Figure 7.5.
(A) Photomicrograph of columnar calcite crystals at ['ortishi-ad he intFrrnxl rridial fibrous structure- (F). Sca1o liar =
I num.
(B) Photomicrograph of fascicular 'grains' showing a radial fibrous internal structure (F). Scale bar = lmm.
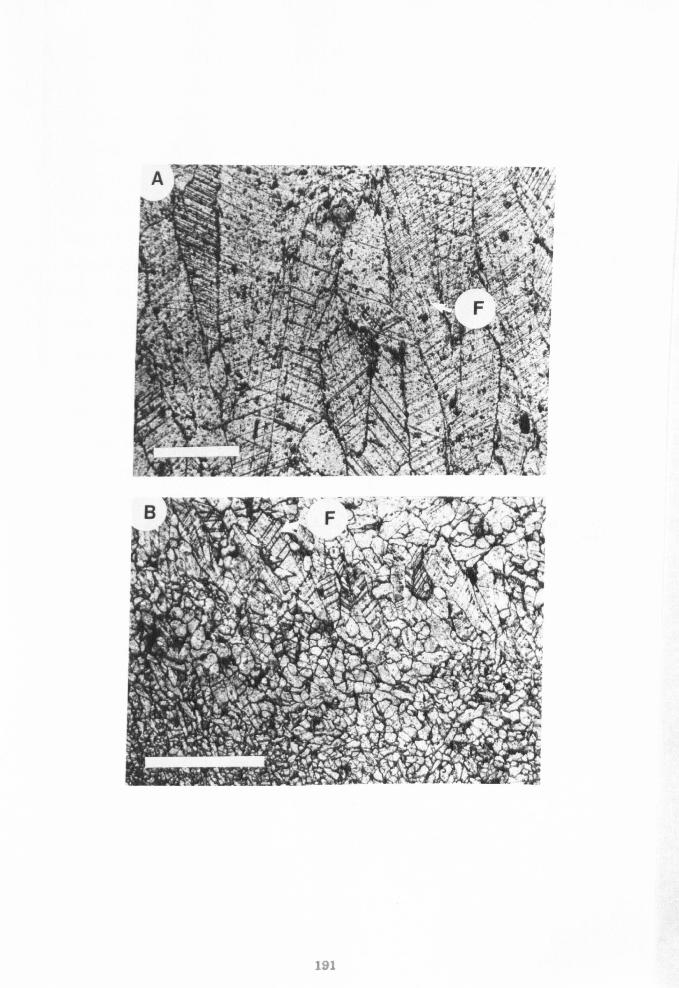
191
boundaries with adjacent populations of coarser or finer grains (Figure 7.5B). Thin veneers of argillaceous material (<1mm thick) are
commonly found enclosing individual crystals. There is no prefered
orientation to the component fibres between each grain, but within each
the fibres vary from a parallel to radial arrangement (Figure 7.4).
b) columnar fascicular growths : these are centimetre-long
crystals which form the macroscopic spherulites (Figure 7.3B) but also
include transitional forms with the fascicular oblate grains (Figure
7.4). The crystal terminations commonly consist of a series of pointed
fibres, particularly along the outer margin of the spherulites. The
crystals with relict fibres exhibit uniform extinction, straight
cleavage/twin planes and uniform dull luminescence under
cathodoluminescence. The optical properties of the fibrous spar are thus
not comparable with radiaxial fibrous or fascicular optic calcite (cf.
Kendall 1985), but are comparable to classical radial fibrous calcites
(cf. Bathurst 1975). The fibres are defined by lines of clay inclusions
(Figure 7.5). Etching and SEM examination has revealed neither
microdolomites or aragonite relicts, which suggests formation from either
high Mg calcite or aragonite precursors.
7.3.3 Clays and siltstones
Infilling the areas (up to 15cm in diameter) between the nodules and the
spherulites are quartz siltstones and mottled, variegated (typically
purple and green) clays. The quartz siltstones form bedding-parallel,
laterally discontinuous layers (0.3mm to 10mm thick) and lenses (0.5cm to
3cm wide) whose lower bounding surfaces are commonly convex-downward.
Layering is picked-out by colour variation: the thinner, pale white layers
(1-5mm thick) are more quartz-rich (up to 70%) than the pale orange layers
(1-2cm thick), in which the quartz grains occur floating in
192
micrite or neomorphic microspar.
Clay mineralogical determinations were undertaken by L. Garvie at
Bristol University (Appendix V). The clay mineralogy of the
two paleosol beds is essentially the same. The clay fraction is dominated,
in decreasing order of abundance, by: interstratified illite/smectite
(I/S), kaolinite, discrete illite and probably some chlorite. Comparison
of the observed I/S peaks with the computer calculated patterns for I/S
(Reynolds 1984) indicated that the interstratified I/S contains
approximately 80% illite with an ordering of R=1.
Interpretation: The crinoidal sediments of the Black Rock
Limestone and Sub-Oolite Bed were laid-down, cemented and underwent
neomorphic microspar replacement, prior to dissolution. The irregular,
gradational base of the nodular units, suggests that dissolution took
place in situ. It was within the dissolution cavities that the layered
micrites, the clays and the silts were deposited; and that the rhombic
calcites and the fibrous calcite crystals were precipitated.
The presence of biogenic structures in the layered micrites
suggests deposition occurred in close-proximity to the surface (Figure
7.2). Unfortunately, the clays do not possess any obvious pedogenic
signature (e. g. Robinson & Wright 1987). The estimated burial depth
from the clay mineralogy of the Portishead Paleosol Beds is not
incompatible with the known burial history of the region. The abundance of
interstratified illite/smectite and kaolinite, and the paucity of discrete
illite and chlorite indicates a relatively low grade of diagenesis (e. g.
depth of ca. 4000m, Temperature ca. 120°C) (Eslinger & Pevear 1988).
Robinson & Wright (1987) invoked a pedogenic explanation for the clays in
the Arundian paleosols of South Wales because of the discrepancy between
the high degree of illitisation and the shallow burial history of the
area.
193
The appearance of the rhombic calcites in the intra-nodular
cavities (Figure 7.3A) are comparable to calcrete fabrics described from
the Lower Carboniferous of South Wales by Wright (1982b). Rhombic habit is
a typical calcrete feature 'and the crenulated growth zones (Figure 7.3A)
indicate phases of dissolution between phases of precipitation (Wright &
Peeters submitted).
The origin of the columnar calcites is problematic. They show some
similarites with both speleothems (cf. Heckel 1983; Assereto & Folk 1976;
Kendall & Broughton 1978) and selenitic gypsum as described by Vai &
Ricci-Lucchi (1977) from the thick evaporites of the Mediterranean
Messinian. Similar columnar calcite horizons in the Lower Carboniferous
of Britain have been described by Dixon & Wright (1983) and Searl (1989)
and interpreted as speleothems. Swennen et al. (1981) suggested the
developments in the Vesder Basin (Belgium) represent replacement after
gypsum, owing to the dominant upward growth direction of the spherulites
and their occurrence beneath known evaporitic collapse breccias (Jacobs et
al. 1982). However, it is unlikely that the replacement of gypsum would
have resulted in the development of pseudomorph crystals with a regular
fabric. Similarily the very fine relict fibre bundles do not have an
obvious analogue in gypsum crystal fabrics.
Dixon & Wright (1983) described similar spherulites and palisade
fabrics from an Arundian paleosol in the Llanelly Formation of the
Tredegar area, South Wales. They interpreted the fibrous calcites as
probable fossil speleothems, because they only occur in association with
palaeokarsts and paleosols, and are absent from associated limestones
which lack clear evidence of subaerial exposure. Such an interpretation
is consistent with the developments at Portishead where the columnar
crystals grew within subaerial exposure horizons. The use of the term
speleothem seems inappropriate in the absence of a cave system. However,
194
the term is applied here because the columnar calcite crystals are known
to have grown into cavities and clearly show affinity with other known
speleothems in their mode of formation and petrographic attributes.
7.4 Other Columnar Calcites
Other subaerial exposure surfaces containing columnar calcites have
been documented at a similar stratigraphic level to the Portishead
development, along the southern margin of the Welsh-Brabant Massif (Figure
1.1). To date they have been recorded from South Wales (Raven 1983; Sear]
1989), Belgium (Swennen et a). 1981) and southern Germany (Kasig 1980).
Their occurrence in mainland Europe is consistent with Lees' (1982)
conclusions that there are striking geological similarities between the
two areas.
Two columnar calcite units (each ca. Im thick) have been
documented in the Daren Ddu Beds (ca. 5m thick) of the Oolite Group
which outcrops between Cwar-yr-Ystrad and Daren Cilau in South Wales
(Raven 1983; Searl 1989) (Figures 7.6 & 7.7A). They occur, separated by a
bioclastic peloidal and oolitic limestone (up to 3m thick),
stratigraphically sandwiched between the Pwll-y-Cwm Oolite (8m thick) and
the overlying Blaen Onnen Oolite (5-14m thick) (Figures 7.6 & 7.7A).
Unfortunately, the age of the Daren Ddu Beds and the position of
the Courceyan-Chadian boundary in the Oolite Group, has yet to be
accurately determined. On account of its stratigraphic position, the
Daren Ddu Beds are thought to have a late Courceyan to early Chadian age.
They occur sandwiched between the Courceyan Lower Limestone Shale Group,
and beneath the Arundian Coral Bed (George et al. 1976) which immediately
overlies the Blaen Onnen Oolite. However, it is still necessary to
verify the age of the columnar calcite beds as well as the position of
Courceyan-Chadian boundary.
195
Figure 7.6. Sedimentary logs showing the position of the columnar calcite developments at Daren Cilau (1) and Portishead (2), as well as the occurrence of a possible clay paleosol at. Taff's Well (3) separating the Black Rock Dolomite from the (Tully Oolite. Inset map shows the location of the sections and the approximate position of the Vale of Glamorgan axis.
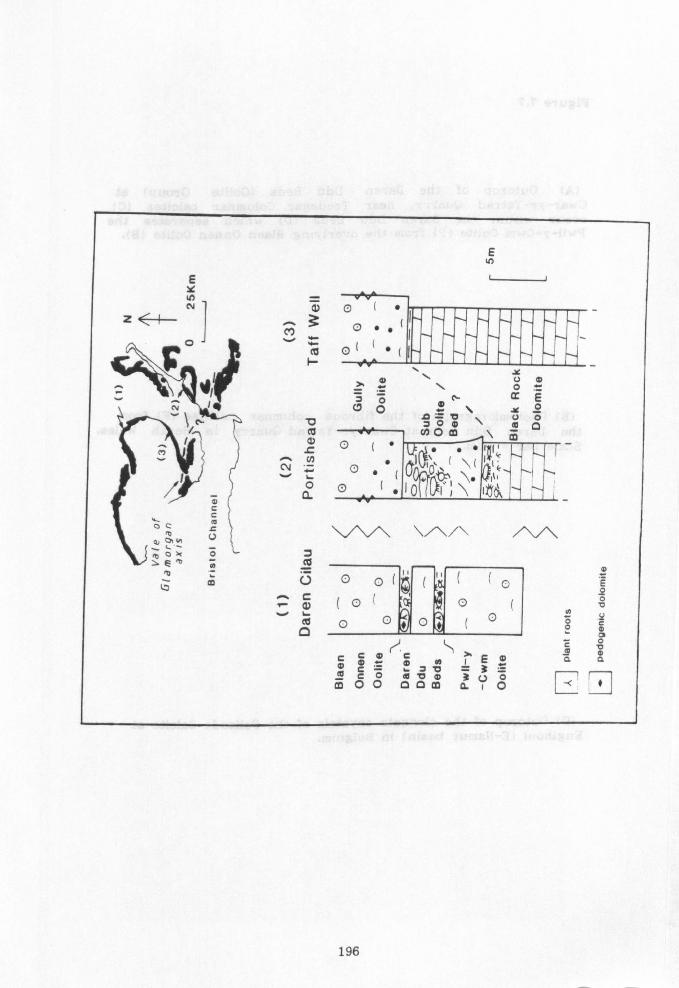
E
E 19 " _"- ull a0
CV)
,;
0 cC 0( (
"1I _ Y
\Uf
ÖmÖ
.. OO_\Y 0 v1 ,0 0ö mm o" Ili
:
(ý i-. y" /ý('ý VI
O( ý(IýE ýi tai
(D 10
OCL \\V v`
\/ ý/\ / ý/
U y O1 N
Ok _O
m JFb-i
Ü0 O( I((Oö cc - o r cc, (O
cis 0"ofo `2 m
O 0
c= m rý
Enn
(D OOa co aI0
196
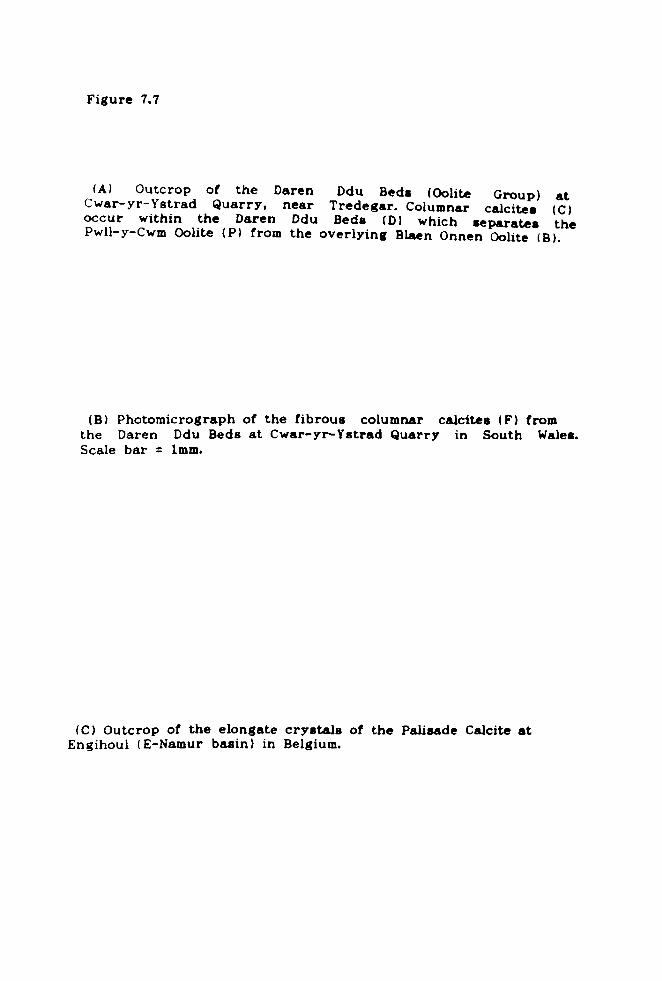
Figure 7.7
(A) Outcrop of the Daren Ddu Beds (Oolite Group) at Cwar-yr-Ystrad Quarry, near Tredegar. Columnar calcites (C) occur within the Daren Ddu Beds (D) which separates the Pwll-y-Cwm Oolite (P) from the overlying Blaen Onnen Oolite (B).
(B) Photomicrograph of the fibrous columnar calcites (F) from
the Daren Ddu Beds at Cwar-yr-Ystrad Quarry in South Wales.
Scale bar = lmm.
(C) Outcrop of the elongate crystals of the Palisade Calcite at Engihoul (E-Namur basin) in Belgium.
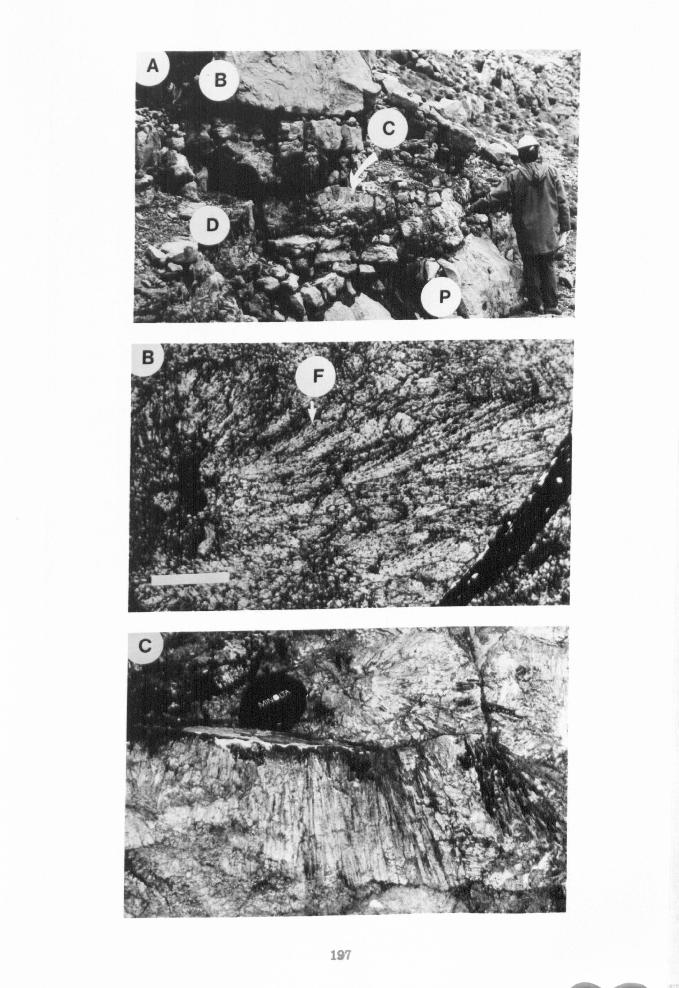
197

The overall appearance of the nodular units in the Daren Ddu Beds
is similar to the developments at Portishead. The skeletal limestone
nodules, upon which the columnar calcites nucleated and grew, occur
interbedded with a variety of different lithologies including clays and
silts as well as stratiform concretions of dolomite (Searl 1988)
(Figure 7.7A). Contained within the dolomite concretions (up to lm thick)
are thin coals, plant roots and organic-rich shales which locally pick-out
fine scale lamination and simple burrows (Searl 1988).
The columnar calcite crystals are fibrous, pseudopleochroic
and usually less than 10cm in length and taper towards their point of
nucleation (Figure 7.7B). Predominantly, they are non-luminsecent, unzoned
and exhibit straight extinction. The fibres are defined by clay
inclusions (Figure 7.7B) and locally the fibrous bundles have a plumose
appearance, the long axis of which is subparallel to that of the crystal.
The crystal terminations are commonly finely fibrous but locally they are
syntaxially overgrown by clear sparry calcites that exhibit well developed
rhombohedral form. The columnar calcites show no prefered orientation.
Locally, within the nodular beds, there are areas dominated by
elongate fence-like layers of (palisade) calcite up to 50cm in length.
Searl (1989) interprets the columnar calcite as speleothem deposits
owing to their similarity with such preciptates as described in the
literature (cf. Heckel 1983; Folk & Assereto 1976; and Kendall & Broughton
1978). The presence of fine scale primary crystal growth zones revealed
by cathodoluminescence precludes a secondary origin, such as the
replacement after evaporites (Searl pers comm. ). The stratiform dolomites
are thought to have a pedogenic origin (Searl 1988) and formed within
swamps by the replacement of calcite sediments, derived by washing in by
storms. Similar dolomites occur in the Llanelly Formation of South Wales
and have also been interpreted as marsh deposits (Wright & Robinson 1988).
198
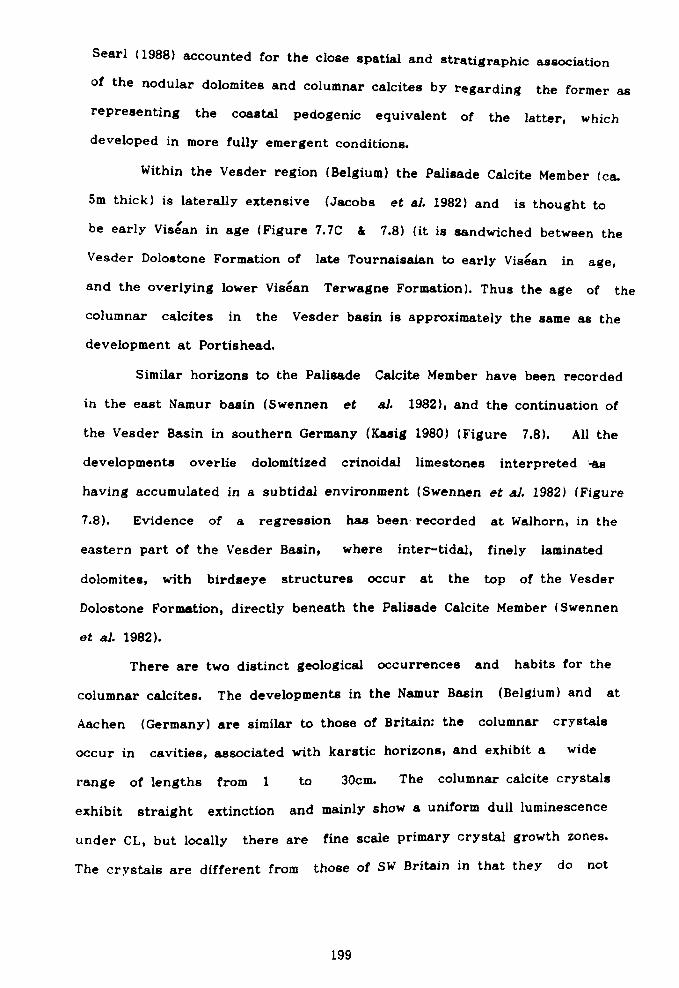
Searl (1988) accounted for the close spatial and stratigraphic association
of the nodular dolomites and columnar calcites by regarding the former as
representing the coastal pedogenic equivalent of the latter, which developed in more fully emergent conditions.
Within the Vesder region (Belgium) the Palisade Calcite Member (ca.
5m thick) is laterally extensive (Jacobs et al. 1982) and is thought to
be early Visean in age (Figure 7.7C & 7.8) (it is sandwiched between the
Vesder Dolostone Formation of late Tournaisaian to early Visean in age,
and the overlying lower Visean Terwagne Formation). Thus the age of the
columnar calcites in the Vesder basin is approximately the same as the
development at Portishead.
Similar horizons to the Palisade Calcite Member have been recorded
in the east Namur basin (Swennen et al. 1982), and the continuation of
the Vesder Basin in southern Germany (Kasig 1980) (Figure 7.8). All the
developments overlie dolomitized crinoidal limestones interpreted '-as
having accumulated in a subtidal environment (Swennen et al. 1982) (Figure
7.8). Evidence of a regression has been- recorded at Walhorn, in the
eastern part of the Vesder Basin, where inter-tidal, finely laminated
dolomites, with birdseye structures occur at the top of the Vesder
Dolostone Formation, directly beneath the Palisade Calcite Member (Swennen
et al. 1982).
There are two distinct geological occurrences and habits for the
columnar calcites. The developments in the Namur Basin (Belgium) and at
Aachen (Germany) are similar to those of Britain: the columnar crystals
occur in cavities, associated with karstic horizons, and exhibit a wide
range of lengths from 1 to 30cm. The columnar calcite crystals
exhibit straight extinction and mainly show a uniform dull luminescence
under CL, but locally there are fine scale primary crystal growth zones.
The crystals are different from those of SW Britain in that they do not
199

10 Z
möö cB
J'l 18 e
45 oýc
4) m >y
v. .c9J
oz;
m öw= O
_. ý
SmNý
Zm
. ý"i mvÜ
ýCmy C
CDÖ ' ?
bo 31 Z)
ro, _,
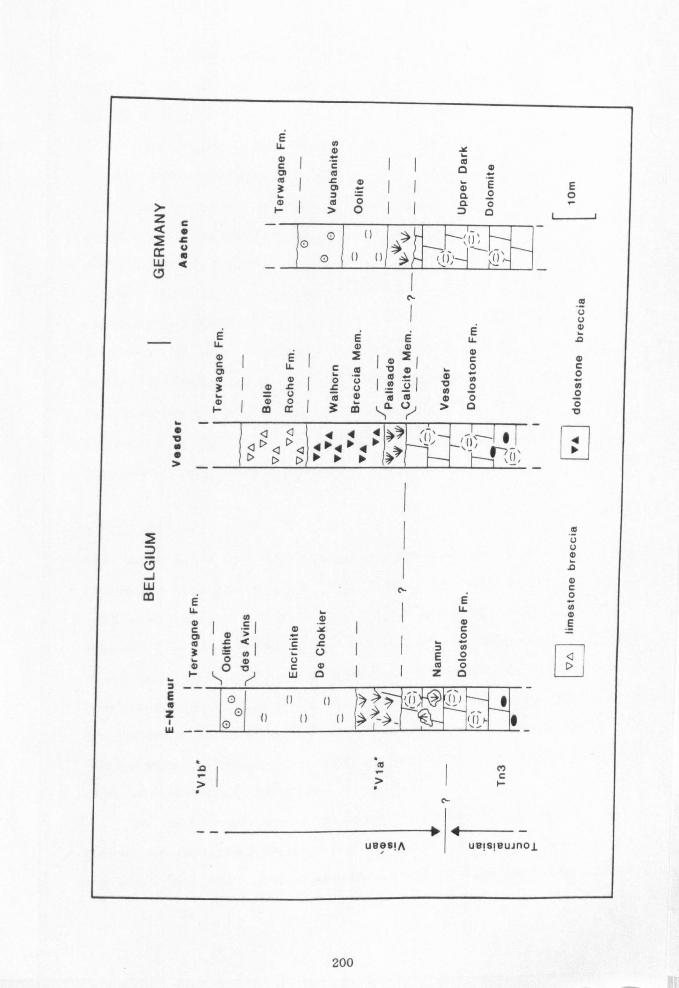
} z
W
LL E
y m
c I c A
I D
E ao > OO II Ö
r 11 ý `1 p ýi _ . Il. (1 ä
p I1 11 ;
c
mm
l
E LL c O
cc y I c 0
vm U
ýp r (ý
I - Q) y O
U m c0 0O
e D º º º º ýý
rll,
> _ D D D -
E 0
. 10 U
a
m C 0 a, 0 ö V
m
J c
W C. - o co E I U.
ý` w m m E m Im El ö 1 Q t< C L
I
I y l l v c a
m 0
ov m o I I z c w
- E o n 11 ; li, t i
ff
_ 11 1 1I I ýýý1_ 's 0 W --
cc CO) D ý C
H
- -- ueeS! A uelsieuInol
200
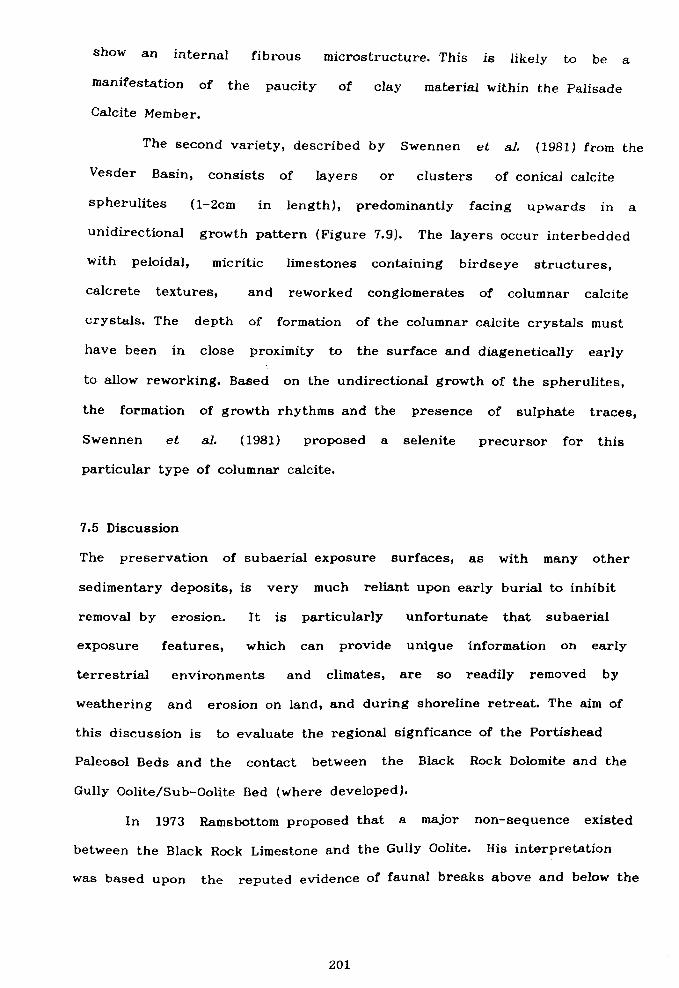
show an internal fibrous microstructure. This is likely to be a
manifestation of the paucity of clay material within the Palisade
Calcite Member.
The second variety, described by Swennen et aL (1981) from the
Vesder Basin, consists of layers or clusters of conical calcite
spherulites (1-2cm in length), predominantly facing upwards in a
unidirectional growth pattern (Figure 7.9). The layers occur interbedded
with peloidal, micritic limestones containing birdseye structures,
calcrete textures, and reworked conglomerates of columnar calcite
crystals. The depth of formation of the columnar calcite crystals must
have been in close proximity to the surface and diagenetically early
to allow reworking. Based on the undirectional growth of the spherulites,
the formation of growth rhythms and the presence of sulphate traces,
Swennen et al. (1981) proposed a selenite precursor for this
particular type of columnar calcite.
7.5 Discussion
The preservation of subaerial exposure surfaces, as with many other
sedimentary deposits, is very much reliant upon early burial to inhibit
removal by erosion. It is particularly unfortunate that subaerial
exposure features, which can provide unique information on early
terrestrial environments and climates, are so readily removed by
weathering and erosion on land, and during shoreline retreat. The aim of
this discussion is to evaluate the regional signficance of the Portishead
Paleosol Beds and the contact between the Black Rock Dolomite and the
Gully Oolite/Sub-Oolite Bed (where developed).
In 1973 Ramsbottom proposed that a major non-sequence existed
between the Black Rock Limestone and the Gully Oolite. His interpretation
was based upon the reputed evidence of faunal breaks above and below the
201
Figure 7.9 A model of the sediment cycles within the palisade calcites of Belgium. Modified after Swennen et al. 1981.
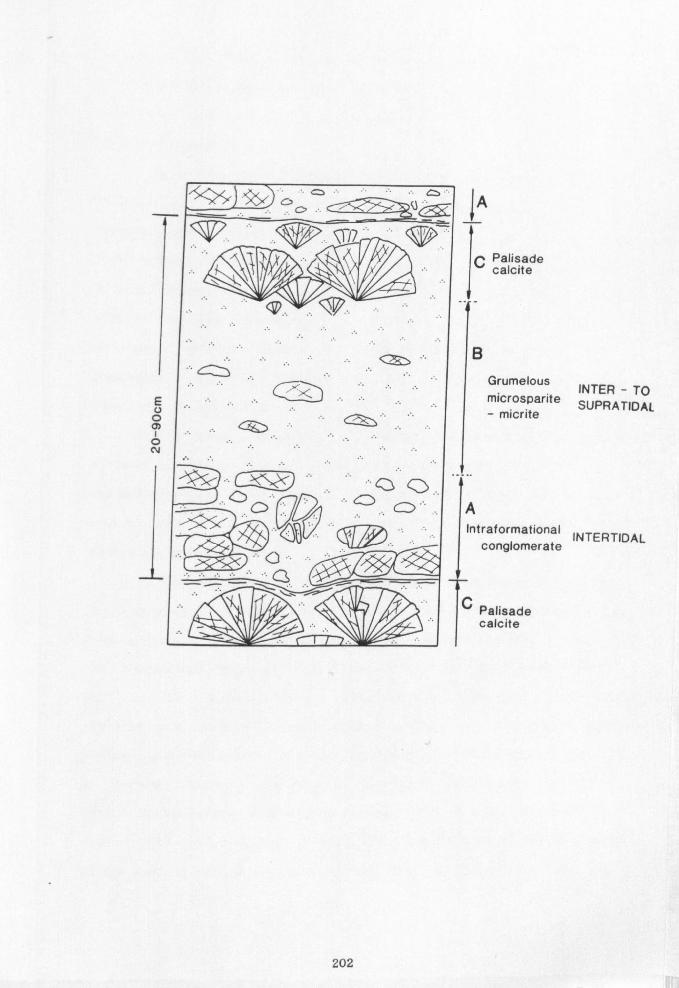
jA
C Palisade calcite
IB Grumelous INTER - TO microsparite SUPRATIDAL - micrite
A Intraformational
INTERTIDAL conglomerate
C Palisade calcite
202
Sub-Oolite Bed (Mitchell 1971 & 1972). More recently, the evidence for the faunal breaks has been called into doubt (Waters & Lawrence 1987) and as a result cannot be used to substantiate the sedimentary evidence for
this non-sequence.
Apart from the Portishead Paleosol Beds, the only other direct
evidence for a subaerial exposure surface separating the Black Rock
Limestone from the Gully Oolite has been recorded at Taff's Well in South
Wales (Figure 7.6). Here a possible clay paleosol (up to 15cm thick) and
a shallowing-upward sequence have been documented by Waters & Lawrence
(1987). The latter unit consists of shoreface facies of fine grained
dolomites, lacking crinoid debris, and exhibiting faint low-angle
lamination, overlying crinoidal limestones representing the below
wave-base facies (Waters & Lawrence 1987).
On a more regional scale, the widespread development of exposure
surfaces containing columnar calcite crystals along the southern margin of
the Welsh-Brabant Massif (section 7.4), supports the case for a major
eustatic fall in sea level at the end of the Courceyan (Tournaisian) and
during the early part of the Chadian (Visean).
In addition compelling evidence for a sea level fall at the end of
the Courceyan (Tournaisian) and during the early Chadian (Visean) has come
from a study of those sequences in a more basinward setting. Studies of
the Waulsortian facies of Belgium (Lees et al. 1977; Lees et al. 1985)
and in SW Britain (Lees 1982; Lees & Hennebert 1982) have
revealed much evidence to show that a change of environment occurred
during upper Courceyan (Tournaisian) times, most probably as a result of
a marked fall in sea level (v. Chapter 6). From a synthesis of the
Lower Carboniferous successions of northwest Europe, the Mississippi
Valley (USA) and the Russian Platform, Ross & Ross (1985 & 1987) concluded
there was a marked eustatic sea level fall at the end of the
203
m t .ý
0 4.1 L. a
a aP öi°
s o äi mm a
0 40 w
m
m1
0
10 V ný ..
Co 4) 92 co
r. Q
I
&d ao&d cU
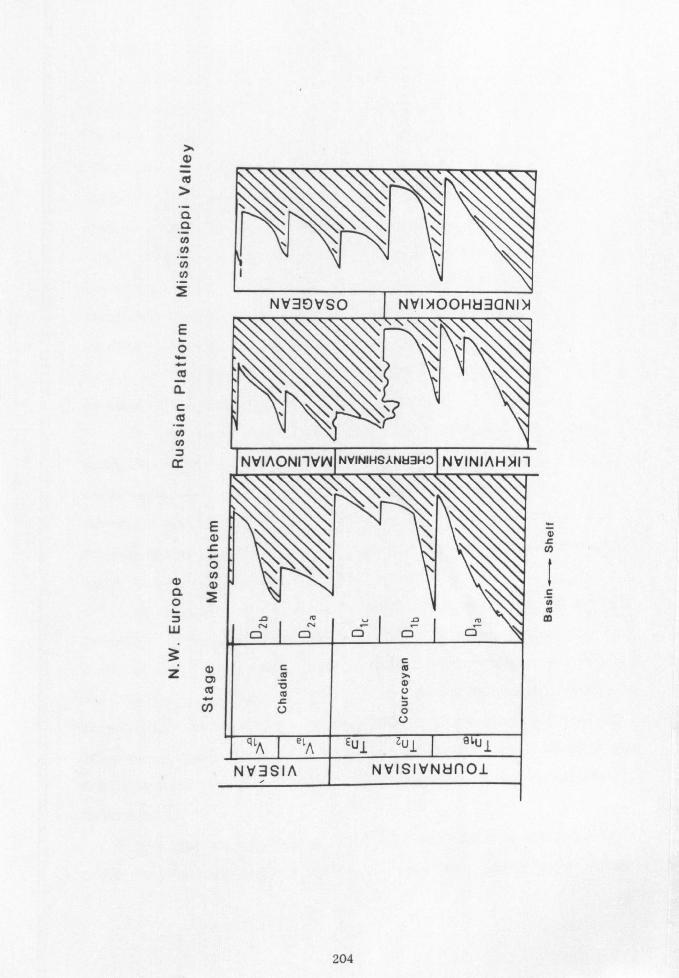
a y
N
CO
15
E 0 w cc ä c
co
cc
a, a 0
w
Z
\
NV3OVSO NVINOOH83GNI>I
NVIAONI1VINNYINIHSAN83HO NVINIAH>III
E
4- O co 2
. tz
pIp11610
a) m 4-
CW
U
U0 0
"A eLA Eul zul 9LUl
NV3SIA NVISIVN8f101
Co
I c 0 Co m
204
Courceyan (Tournaisian) (Figure 7.10).
If the sedimentary break beneath the Gully Oolite (Sub-Oolite Bed
in the Bristol district) represents a significant global sea level fall
then the apparent rarity of subaerial exposure features at the top of the
Black Rock Limestone requires an explanation. Within the Daren Ddu
Beds, a major control affecting the lateral extent of such horizons is
thought to have been local topography because westward (over a distance of
13Km) they can be correlated with thin-bedded dolomites displaying algal
lamination (Raven 1983). Other, more likely mechanisms by which
regionally significant exposure features could be destroyed include
erosional removal and obliteration of the textures by dolomite. However,
as yet, no occurrence of the reworked clasts of the subaerial exposure
horizons have been found in the overlying beds.
It is significant that the Black Rock Dolomite is regionally
extensive and contains few relict sedimentary features. However,
dolomitizing fluids are incapable of obliterating the non-carbonate
features associated with the paleosols e. g. siltstones and clays. It is
for this reason that the loss of the emergent features is thought to be a
result of both erosional and diagenetic processes.
In conclusion, the evidence strongly suggests that the Black Rock
Limestone at Portishead, and presumably also at Taff's Well, underwent a
period of subaerial exposure. It would seem highly unlikely that these
developments represent major isolated topographic highs whilst the
surrounding area remained submerged. Following this line of reasoning,
large areas along the southern flanks of the Welsh-Brabant Massif in SW
Britain, are likely to have become subaerially exposed during early
Chadian times.
It is tempting to correlate the southward extent of the subaerial
break with the outer limits of the central ramp zone which extends as far
205
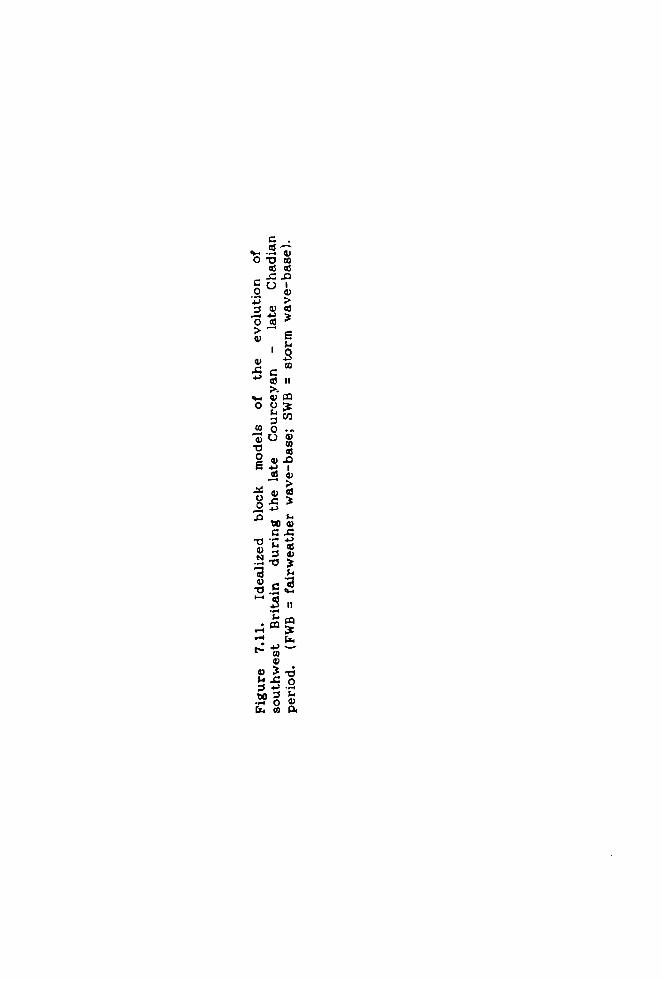
c. ö.,
z
Cd Cc > cd
0 cc
Cis u
oQ 00
o U 4)
> 3
. ..
4) CIS
~ Ali 14
r+0°3 -w V
oo wmä
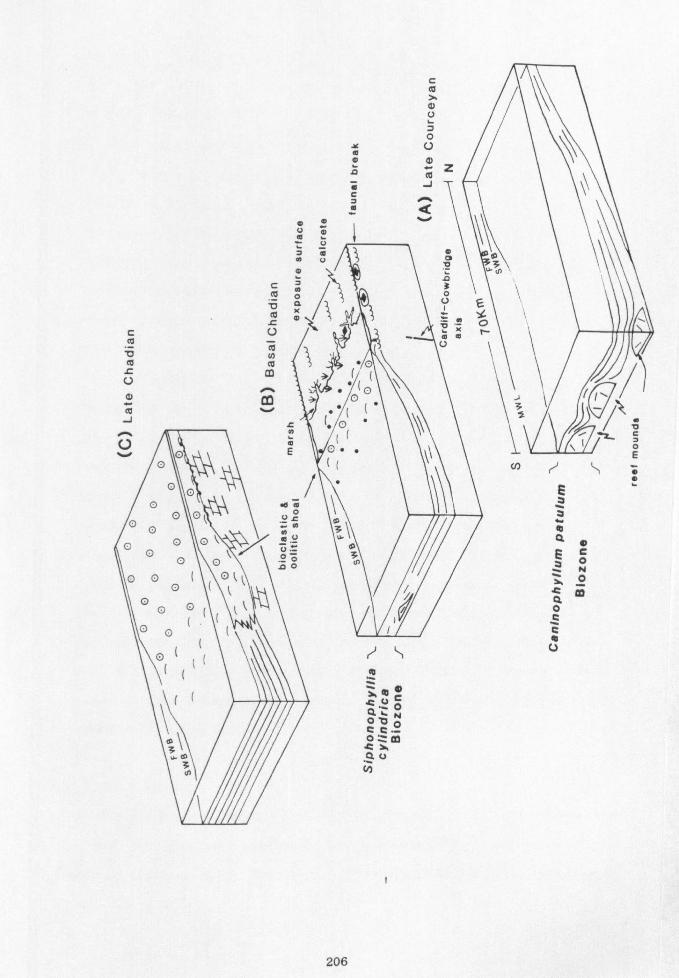
C c_0
U
cd
J
U
o" om
7m bU
U
C'\
d U
O
,cU
«ý Z
eJ öQ
206
0 ýý Ný. 3\ 0 U fG
°O
to to
3
r E
4 Qo EC o N
ZO tm
O
G
c)
/9 0 E
ýe e
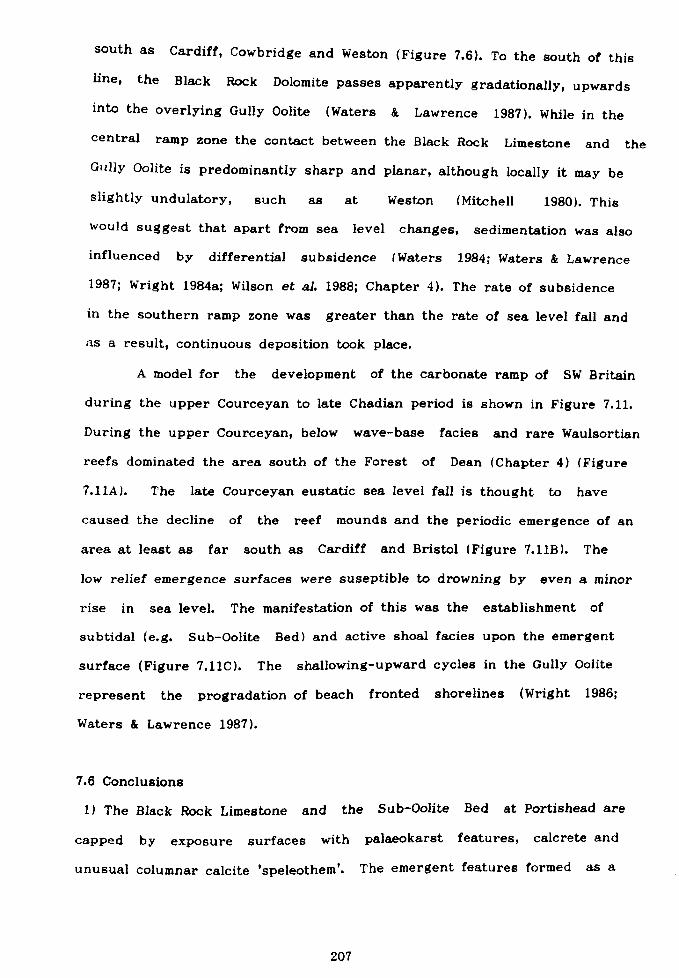
south as Cardiff, Cowbridge and Weston (Figure 7.6). To the south of this
line, the Black Rock Dolomite passes apparently gradationally, upwards into the overlying Gully Oolite (Waters & Lawrence 1987). While in the
central ramp zone the contact between the Black Rock Limestone and the
Gully Oolite is predominantly sharp and planar, although locally it may be
slightly undulatory, such as at Weston (Mitchell 1980). This
would suggest that apart from sea level changes, sedimentation was also
influenced by differential subsidence (Waters 1984; Waters & Lawrence
1987; Wright 1984a; Wilson et al. 1988; Chapter 4). The rate of subsidence
in the southern ramp zone was greater than the rate of sea level fall and
as a result, continuous deposition took place.
A model for the development of the carbonate ramp of SW Britain
during the upper Courceyan to late Chadian period is shown in Figure 7.11.
During the upper Courceyan, below wave-base facies and rare Waulsortian
reefs dominated the area south of the Forest of Dean (Chapter 4) (Figure
7.11A). The late Courceyan eustatic sea level fall is thought to have
caused the decline of the reef mounds and the periodic emergence of an
area at least as far south as Cardiff and Bristol (Figure 7.11B). The
low relief emergence surfaces were suseptible to drowning by even a minor
rise in sea level. The manifestation of this was the establishment of
subtidal (e. g. Sub-Oolite Bed) and active shoal facies upon the emergent
surface (Figure 7.11C). The shallowing- upward cycles in the Gully Oolite
represent the progradation of beach fronted shorelines (Wright 1986;
Waters & Lawrence 1987).
7.6 Conclusions
1) The Black Rock Limestone and the Sub-Oolite Bed at Portishead are
capped by exposure surfaces with palaeokarst features, calcrete and
unusual columnar calcite 'speleothem'. The emergent features formed as a
207

result of a major eustatic sea level fall at the end of the Courceyan and
during the early part of the Chadian.
2) Further confirmation of a eustatic sea level fall at the end of the
Courceyan has come from the recognition that other subaerial
exposure horizons containing columnar calcites documented in South Wales,
Belgium and Germany occur at a similar stratigraphic level to the
development at Portishead.
3) In SW Britain, the Black Rock Dolomite - Gully Oolite (Sub-Oolite
bed where developed) contact is interpreted as a subaerial
exposure horizon. Subsequent geological processes (erosion, removal and
dolomitization) are thought to have partly obscured the evidence for
exposure. This exposure surface probably reached as far south as the
present day Cowbridge, Cardiff and Weston areas. Its southerly extent is
thought to have been controlled by differential subsidence.
208

Chapter 8- Ramp longevity & summary
8.1 Introduction
8.2 Ramp to shelf evolution
8.2.1 Stage I - Clastic sedimentation
8.2.2 Stage II - Establishment of the muddy carbonate ramps
8.2.3 Stage III - Differential subsidence
8.2.4 Stage IV - Ramp-to-shelf transition
8.2.5 Stage V - shelf/rimmed shelf
8.3 Discussion
8.3.1 Sediment supply
8.3.2 Sea level changes
8.4 Conclusions
8.5 Summary
209
8.1 Introduction
The Black Rock Limestone forms a major component of the early Carboniferous to late Arundian ramp succession of SW Britain (Wright
1987). In this chapter the development of this ramp sequence is
discussed, especially the tectonic controls. The ramp history is compared
with other Dinantian ramp sequences. Those other basins under
consideration include: the Craven Basin, Northern England; the Munster
Basin, southern Ireland; the Shannon Basin, western Ireland; and the
Dublin Basin, eastern Ireland (Figure 8.1B).
Ramps are typical features of the early stages in the development
of carbonate build-ups and form soon after the drowning of the continental
areas (Wilson 1975; Read 1982 & 1985). They are considered to be
relatively short-lived phenomenon because they readily evolve into rimmed
carbonate shelves or platforms (Figure 8.1A) once carbonate
sedimentation is established (Read 1982 & 1985). Read (1985) proposed that
this process is a result of high carbonate production in the nearshore
environment and sediment starving of off-shelf environments. The
persistence of the Dinantian ramps of England, Ireland and Wales, from
the early Courceyan to Arundian period or later (up to 25 million years,
George et al. 1976) requires explanation.
8.2 Ramp to shelf evolution
Five stages of basin development are recognized (Figure 8.2). It is
important to note that the stages are not intended to represent regional
correlatable 'events'. They reflect the comparable evolution of each
basin: from a carbonate ramp to a shelf.
210
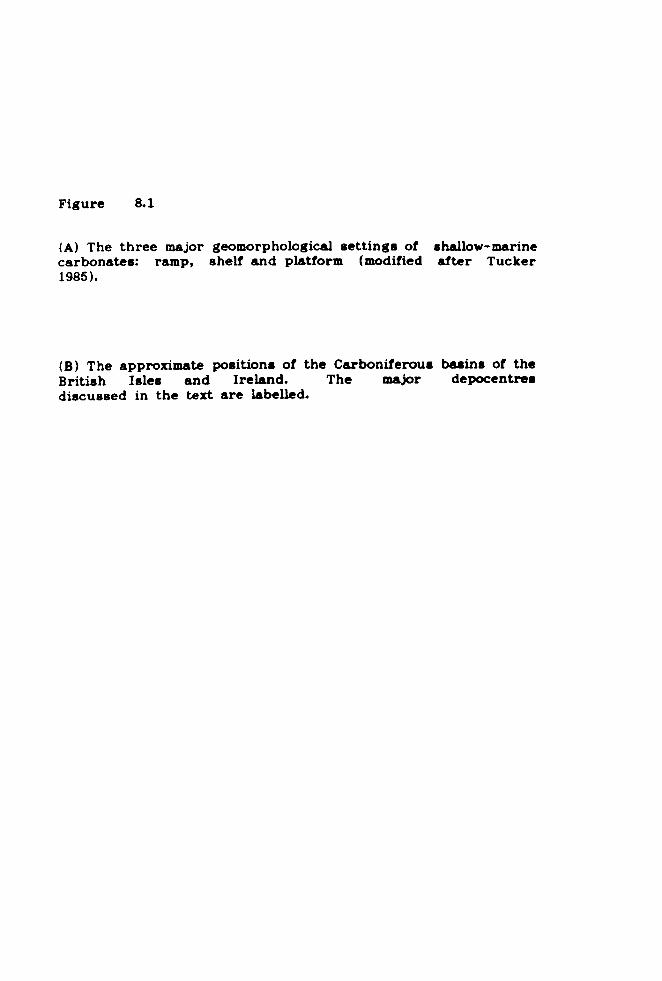
Figure 8.1
(A) The three major geomorphological settings of shallow-marine carbonates: ramp, shelf and platform (modified after Tucker 1985).
(B) The approximate positions of the Carboniferous basins of the British Isles and Ireland. The major depocentres discussed in the text are labelled.
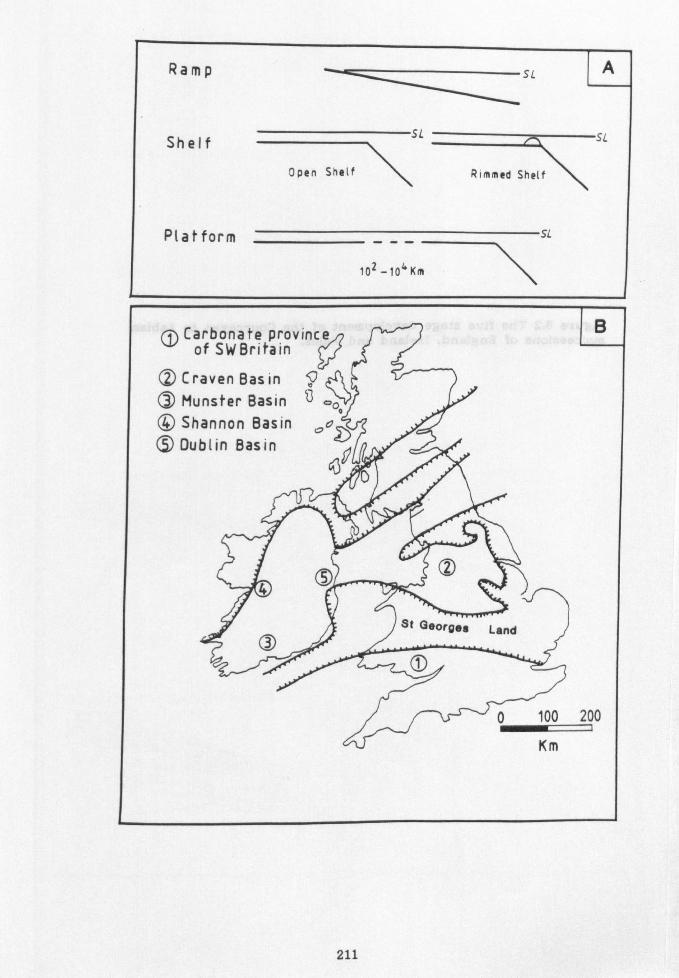
Ramp SL
SL SL Shelf
Open Shelf Rimmed Shelf
Ptafform
102 -104 Km
Carbonate prov ince of SW Britain
Q Craven Basin 4 Q Munster Basin do 4Q Shannon Basin
© Dublin Basin
° 4
St Georges Land 0
T
0 100 200
Km
211

Figure 8.2 The five stage development of the Courceyan to Asbian successions of England, Ireland and Wales.
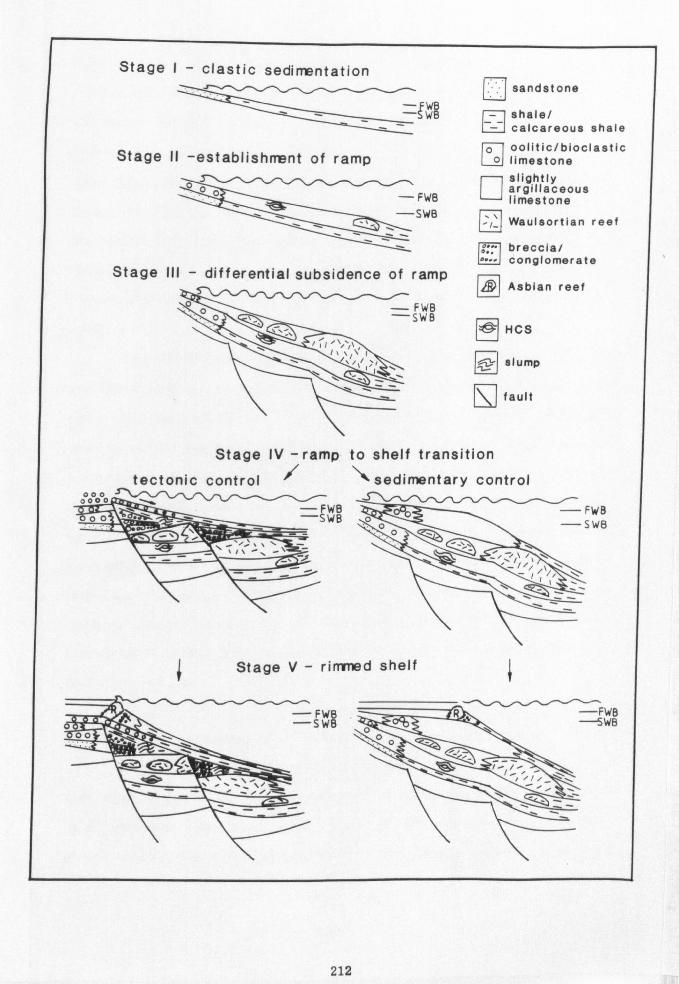
Stage I- clastic sedimentation
D sandstone - FWg
SWB shale/ a calcareous shale
o oolitic/bioclastic Stage I I -establishment of ramp 1 01 limestone
slightly 00 argillaceous ° FWB limestone
- SWB Waulsortian reef
g; O breccia/ - -- conglomerate
Stage I II - differential subsidence of ramp Asbian reef
- FWB SWB ® HCS
�v slump
fault
Stage IV -ramp to shelf transition
tectonic control /
sedimentary control
WB WB
i Stage V- rimmed shelf 1
FWB swe
- FWB - SW8
FWS ýý. --5WB
212
8.2.1 Stage I- Clastic sedimentation ('lower' Courceyan)
During the lower Dinantian a major transgression flooded the Old Red
Sandstone alluvial plains (Johnson 1982). The depositional units which
record this transgression include: the Lower Limestone Shale Group
(100-120m) of SW Britain (Burchette 1987) (Figure 8.3); the Kinsale
Formation (1600m) of the Munster Basin (MaCarthy & Gardiner 1987;
MacCarthy 1987); the Mellon House Formation (38m) and the Ringmoylan Shale
Formation (31m) of the Shannon Basin (Somerville & Jones 1985); and the
'Lower Limestone Shale' unit (>30m) of the Dublin Basin (Jones et al.
1988).
The above sequences mainly consist of shales/calcareous shales and
are interpreted as representing offshore muddy facies. The transgressive
units typically culminate in very extensive mudrock deposition
(George 1972; MacCarthy & Gardiner 1987; MacCarthy 1987). Detailed
sedimentary studies by Burchette (1987), MacCarthy & Gardiner (1987) and
MacCarthy (1987) reveal that the overall transgression was locally pulsed
by several minor, wave and storm dominated, coarsening and
shallowing-upward (progradational) sedimentary cycles. Overall, during
this stage the basins underwent a regional subsidence by flexure (a
gradual, linear increase in the rate of subsidence into the basin) but
there was no marked differential subsidence, along tectonic hinge-lines or
faults (Figure 8.2).
8.2.2 Stage II - Establishment of the muddy carbonate ramps
('middle' Courceyan)
This stage is marked by the predominance of carbonate sediments deposited
as a uniformly thickening wedge. Some of the sequences representative
of this stage of basin development include: the Barry Harbour Limestone
213
wy O:
O -d
O
Qý C
NE
b ýG
°d v .3v mm
ss
E ar EC
U1 aý
OO ti.. -] 0
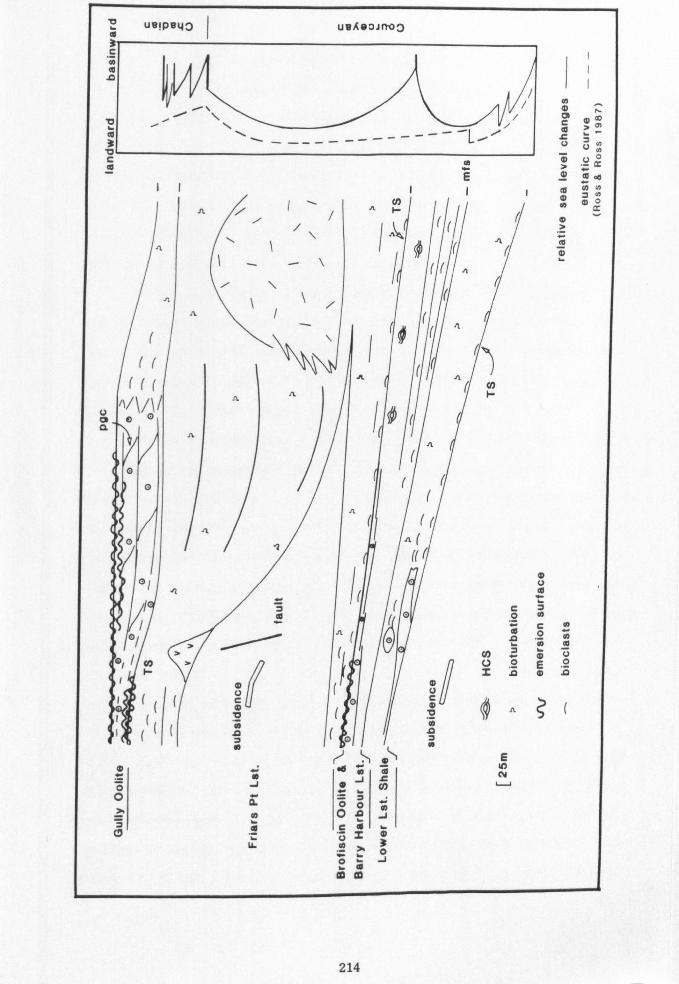
ueipey0
icc to
1c 0
V O
uA
m Z
CD c0 °E m7y
(UI
Co I
((
(((
m ö O
t7
N
a J
ä a a U.
(rY
.lý -6 ÖO
OJ V)
ÖÖ OaJ c=m
0J 4
mm
O 0)
ý O a aq 0 0 ý ` N . . m v
Z in m 2
v c m n
0
a E lb
214
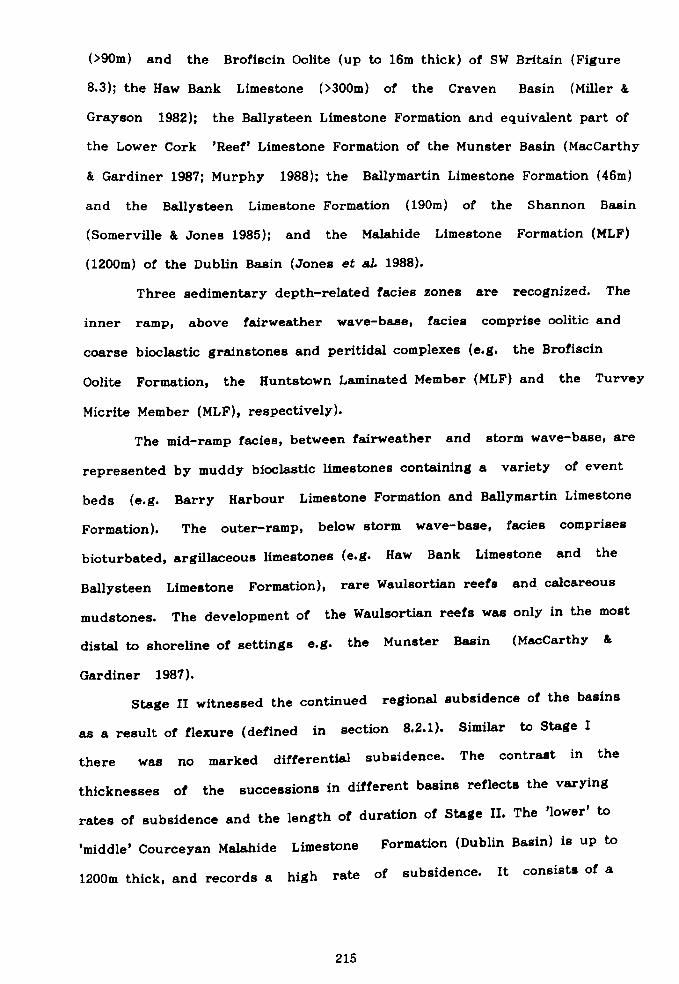
(>90m) and the Brofiscin Oolite (up to 16m thick) of SW Britain (Figure
8.3); the Haw Bank Limestone (>300m) of the Craven Basin (Miller &
Grayson 1982); the Ballysteen Limestone Formation and equivalent part of
the Lower Cork 'Reef' Limestone Formation of the Munster Basin (MacCarthy
& Gardiner 1987; Murphy 1988); the Ballymartin Limestone Formation (46m)
and the Ballysteen Limestone Formation (190m) of the Shannon Basin
(Somerville & Jones 1985); and the Malahide Limestone Formation (MLF)
(1200m) of the Dublin Basin (Jones et al. 1988).
Three sedimentary depth-related facies zones are recognized. The
inner ramp, above fairweather wave-base, facies comprise oolitic and
coarse bioclastic grainstones and peritidal complexes (e. g. the Brofiscin
Oolite Formation, the Huntstown Laminated Member (MLF) and the Turvey
Micrite Member (MLF), respectively).
The mid-ramp facies, between fairweather and storm wave-base, are
represented by muddy bioclastic limestones containing a variety of event
beds (e. g. Barry Harbour Limestone Formation and Ballymartin Limestone
Formation). The outer-ramp, below storm wave-base, facies comprises
bioturbated, argillaceous limestones (e. g. Haw Bank Limestone and the
Ballysteen Limestone Formation), rare Waulsortian reefs and calcareous
mudstones. The development of the Waulsortian reefs was only in the most
distal to shoreline of settings e. g. the Munster Basin (MacCarthy &
Gardiner 1987).
Stage II witnessed the continued regional subsidence of the basins
as a result of flexure (defined in section 8.2.1). Similar to Stage I
there was no marked differential subsidence. The contrast in the
thicknesses of the successions in different basins reflects the varying
rates of subsidence and the length of duration of Stage II. The 'lower' to
'middle' Courceyan Malahide Limestone Formation (Dublin Basin) is up to
1200m thick, and records a high rate of subsidence. It consists of a
215
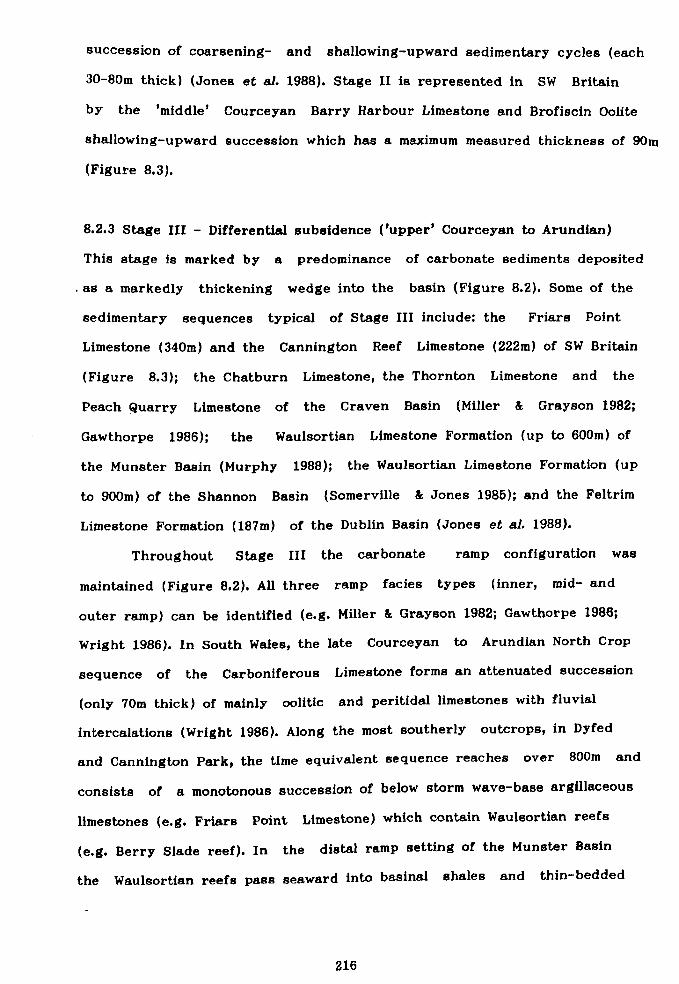
succession of coarsening- and shallowing-upward sedimentary cycles (each
30-80m thick) (Jones et a!. 1988). Stage II is represented in SW Britain
by the 'middle' Courceyan Barry Harbour Limestone and Brofiscin Oolite
shallowing-upward succession which has a maximum measured thickness of 90m
(Figure 8.3).
8.2.3 Stage III - Differential subsidence ('upper' Courceyan to Arundian)
This stage is marked by a predominance of carbonate sediments deposited
as a markedly thickening wedge into the basin (Figure 8.2). Some of the
sedimentary sequences typical of Stage III include: the Friars Point
Limestone (340m) and the Cannington Reef Limestone (222m) of SW Britain
(Figure 8.3); the Chatburn Limestone, the Thornton Limestone and the
Peach Quarry Limestone of the Craven Basin (Miller & Grayson 1982;
Gawthorpe 1986); the Waulsortian Limestone Formation (up to 600m) of
the Munster Basin (Murphy 1988); the Waulsortian Limestone Formation (up
to 900m) of the Shannon Basin (Somerville & Jones 1985); and the Feltrim
Limestone Formation (187m) of the Dublin Basin (Jones et al. 1988).
Throughout Stage III the carbonate ramp configuration was
maintained (Figure 8.2). All three ramp facies types (inner, mid- and
outer ramp) can be identified (e. g. Miller & Grayson 1982; Gawthorpe 1986;
Wright 1986). In South Wales, the late Courceyan to Arundian North Crop
sequence of the Carboniferous Limestone forms an attenuated succession
(only 70m thick) of mainly oolitic and peritidal limestones with fluvial
intercalations (Wright 1986). Along the most southerly outcrops, in Dyfed
and Cannington Park, the time equivalent sequence reaches over 800m and
consists of a monotonous succession of below storm wave-base argillaceous
limestones (e. g. Friars Point Limestone) which contain Waulsortian reefs
(e. g. Berry Slade reef). In the distal ramp setting of the Munster Basin
the Waulsortian reefs pass seaward into basinal shales and thin-bedded
216
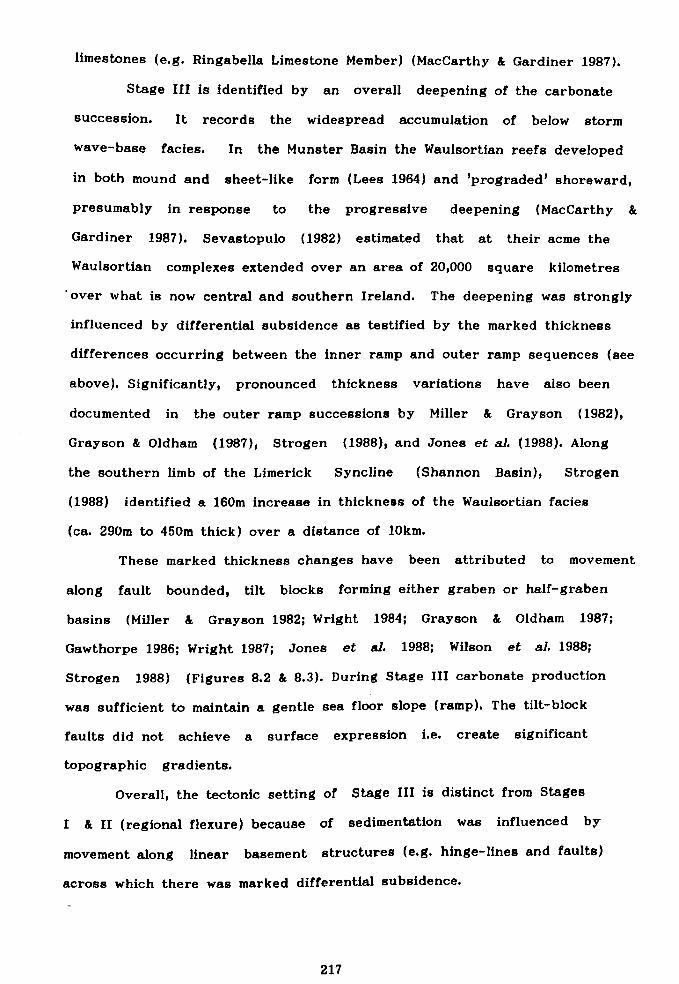
limestones (e. g. Ringabella Limestone Member) (MacCarthy & Gardiner 1987).
Stage III is identified by an overall deepening of the carbonate
succession. It records the widespread accumulation of below storm
wave-base facies. In the Munster Basin the Waulsortian reefs developed
in both mound and sheet-like form (Lees 1964) and 'prograded' shoreward,
presumably in response to the progressive deepening (MacCarthy &
Gardiner 1987). Sevastopulo (1982) estimated that at their acme the
Waulsortian complexes extended over an area of 20,000 square kilometres
over what is now central and southern Ireland. The deepening was strongly
influenced by differential subsidence as testified by the marked thickness
differences occurring between the inner ramp and outer ramp sequences (see
above). Significantly, pronounced thickness variations have also been
documented in the outer ramp successions by Miller & Grayson (1982),
Grayson & Oldham (1987), Strogen (1988), and Jones et al. (1988). Along
the southern limb of the Limerick Syncline (Shannon Basin), Strogen
(1988) identified a 160m increase in thickness of the Waulsortian facies
(ca. 290m to 450m thick) over a distance of 10km.
These marked thickness changes have been attributed to movement
along fault bounded, tilt blocks forming either graben or half-graben
basins (Miller & Grayson 1982; Wright 1984; Grayson & Oldham 1987;
Gawthorpe 1986; Wright 1987; Jones et al. 1988; Wilson et al. 1988;
Strogen 1988) (Figures 8.2 & 8.3). During Stage III carbonate production
was sufficient to maintain a gentle sea floor slope (ramp). The tilt-block
faults did not achieve a surface expression i. e. create significant
topographic gradients.
Overall, the tectonic setting of Stage III is distinct from Stages
I& II (regional flexure) because of sedimentation was influenced by
movement along linear basement structures (e. g. hinge-lines and faults)
across which there was marked differential subsidence.
217
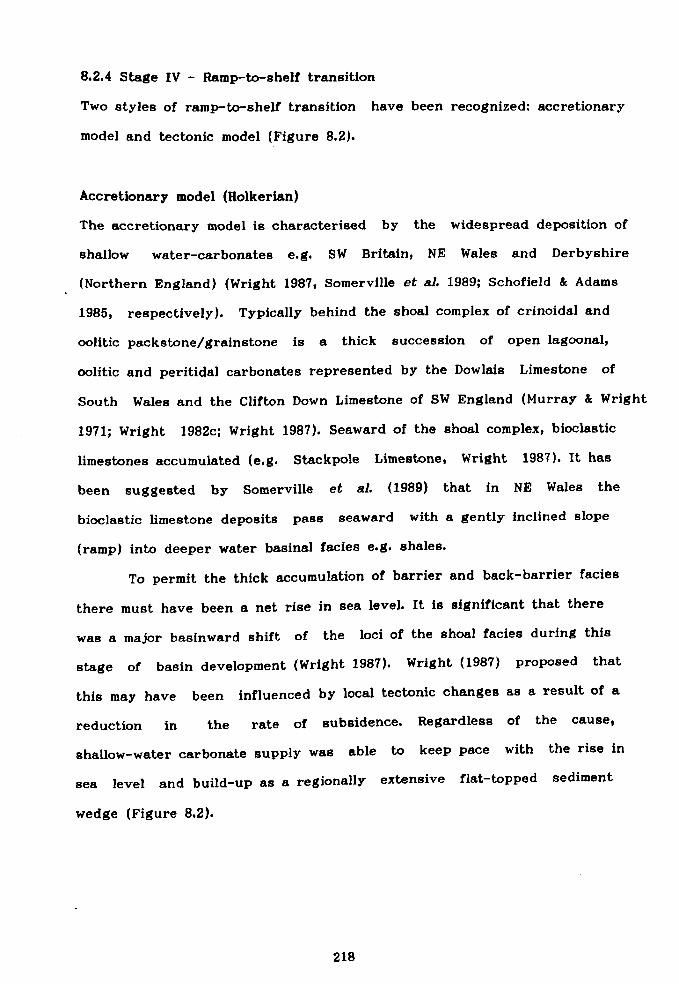
8.2.4 Stage IV - Ramp-to-shelf transition
Two styles of ramp-to-shelf transition have been recognized: accretionary
model and tectonic model (Figure 8.2).
Accretionary model (Holkerian)
The accretionary model is characterised by the widespread deposition of
shallow water-carbonates e. g. SW Britain, NE Wales and Derbyshire
(Northern England) (Wright 1987, Somerville et al. 1989; Schofield & Adams
1985, respectively). Typically behind the shoal complex of crinoidal and
oolitic packstone/grainstone is a thick succession of open lagoonal,
oolitic and peritidal carbonates represented by the Dowlais Limestone of
South Wales and the Clifton Down Limestone of SW England (Murray & Wright
1971; Wright 1982c; Wright 1987). Seaward of the shoal complex, bioclastic
limestones accumulated (e. g. Stackpole Limestone, Wright 1987). It has
been suggested by Somerville et al. (1989) that in NE Wales the
bioclastic limestone deposits pass seaward with a gently inclined slope
(ramp) into deeper water basinal facies e. g. shales.
To permit the thick accumulation of barrier and back-barrier facies
there must have been a net rise in sea level. It is significant that there
was a major basinward shift of the loci of the shoal facies during this
stage of basin development (Wright 1987). Wright (1987) proposed that
this may have been influenced by local tectonic changes as a result of a
reduction in the rate of subsidence. Regardless of the cause,
shallow-water carbonate supply was able to keep pace with the rise in
sea level and build-up as a regionally extensive flat-topped sediment
wedge (Figure 8.2).
218
Tectonic model (late Chadian to Holkerian)
During the late Chadian to Holkerian period, both the Craven Basin and the
Dublin Basin were dominated by terrigenous mudstones in which occur
beccia/conglomerates and fining-upward calcarenites (Miller & Grayson
1982; Gawthorpe 1986; Jones et aL 1988). The limestone
breccias/conglomerates (are up to tens of metres in diameter) are often of
reef facies (Miller & Grayson 1972; Gawthorpe 1986). Associated with the
breccias/conglomerates in the Craven Basin are sedimentary slide and slump
structures (Gawthorpe 1986).
The breccia/conglomerate horizons have been interpreted as debris
flow deposits and the fining-upward calcarenites as having a
turbiditic-type origin (Gawthorpe 1986; Jones et al. 1988). The
graded calcarenite beds suggest an offshore transport of carbonate
material by storm surges and turbidity flows from shelf areas into the
mud-dominated basins (Nolan 1987; Jones et al. 1988).
The cessation of local carbonate production was replaced by an
increased influx of terrigenous material. The reworking of the underlying
succession and the formation of slump and slide structures must have had a
tectonic origin, requiring steep gradients, suggesting the basin edge
faults were surfacing to have a significant topographic expression
(Gawthorpe 1986; Jones et al. 1988). The shallow water carbonates
accumulated landward of the developing shelf edge, most probably within
the hanging-wall dip-slope of a half-graben (Nolan 1987) (Figure 8.2).
Overall, tectonic controls played a major role In the development
of the shelf edge in the Dublin Basin and Craven Basin (Miller & Grayson
1982; Gawthorpe 1986; Jones et al. 1988).
In conclusion the Dinantian ramp-to-shelf transition occurred
either by 1) the progradation of shallow water carbonate facies to form a
flat-topped sediment wedge (accretionary model) or 2) the surfacing of
219
basement faults to create steep gradients and a shelf edge (tectonic
model) (Figure 8.2).
8.2.5 Stage V- shelf/rimmed shelf (Asbian)
The palaeogeography during the Asbian is characterised by shallow water
shelf facies, commonly delineated from the basin by reefs along the
shelf-edge (Broadhurst & Simpson 1973; Somerville 1979; Walkden 1987;
Miller & Grayson 1982; Gawthorpe 1986; Grayson & Oldham 1987). The
shallow water facies comprise decimetre-thick, fossiliferous, bioclastic
and peloidal limestones (Somerville 1979; Walkden 1974 & 1987; Wright
1987). The sequences are typically bounded by palaeokarstic surfaces,
or calcareous laminated crusts, or paleosols (Somerville 1979; Walkden
1974 & 1987). Each minor cycle suggests an alternation of transgressive
and regressive periods which culminates in widespread emergence
(Ramsbottom 1973 & 1979; Walkden 1974 & 1987; Somerville 1979). Overall,
the style of sedimentation suggests a uniform, shallow, relatively flat,
shelf configuration (Walkden 1987; Wright 1987).
The shelf edge reefs have rich and diverse faunas, often showing
depth-related ecological zonation (Ramsbottom 1978). They commonly have a
stromatolitic algal wall from which fore-reef talus slopes extend
basinwards, into deep water shales (Broadhurst & Simpson 1973; Ramsbottom
1978; Miller & Grayson 1982; Grayson & Oldham 1987).
8.3 Discussion
The aim of this discussion is to evaluate the factors which enabled the
Dinantian ramps to persist. Those parameters which affect the
geomorphology of carbonate settings include: (a) sediment supply and (b)
sea level changes.
220
8.3.1 Sediment supply
In modern carbonate settings the supply of sediment is highly localised,
mainly within shallow water environment (<30m) and typically negligible
in the aphotic zone (Kendall & Schlager 1981). Excess sediment supply in
the shallow-water environment and sediment starvation in the basin will
eventually cause the aggrading sedimentary pile to over-steepen along the
seaward margin (Read 1982 & 1985). On a seismic scale the low-angle ramp
clinoforms (few metres per kilometre, Chatellier 1988) progressively
steepen in the central ramp zone to form a 'shelf-like' configuration
(Figure 8.4A).
Significantly, carbonate supply during the the Dinantian was
locally produced and over a wide range of environments, including the
aphotic zone. The thick accumulations of aphotic deposits, locally in
excess of 1500m, comprise crinoids, bryozoans, hyalosteliid sponge
spicules, plurilocular foraminifera and Waulsortian reefs (Lees et al.
1985).
It was the nature of the supply of sediment during the Dinantian
which enabled the ramps to persist. During high sea level stands, a
plentiful supply of sediment in a wide range of environments results in
seafloor aggradation and inhibits lateral accretion (progradation).
Progradation represents an excess sediment supply, it causes a sedimentary
pile to locally over-steepen and ultimately results in the development of
a carbonate shelf or platform configuration (Figure 8.4A).
8.3.2 Sea level changes
A plentiful supply of sediment in a wide range of environments is a
necessary but insufficient criterion by which to maintain a carbonate ramp.
The supply of sediment needs to be accomodated by a rise in sea level
(e. g. eustatic rise in sea level or subsidence) otherwise progradation of
221
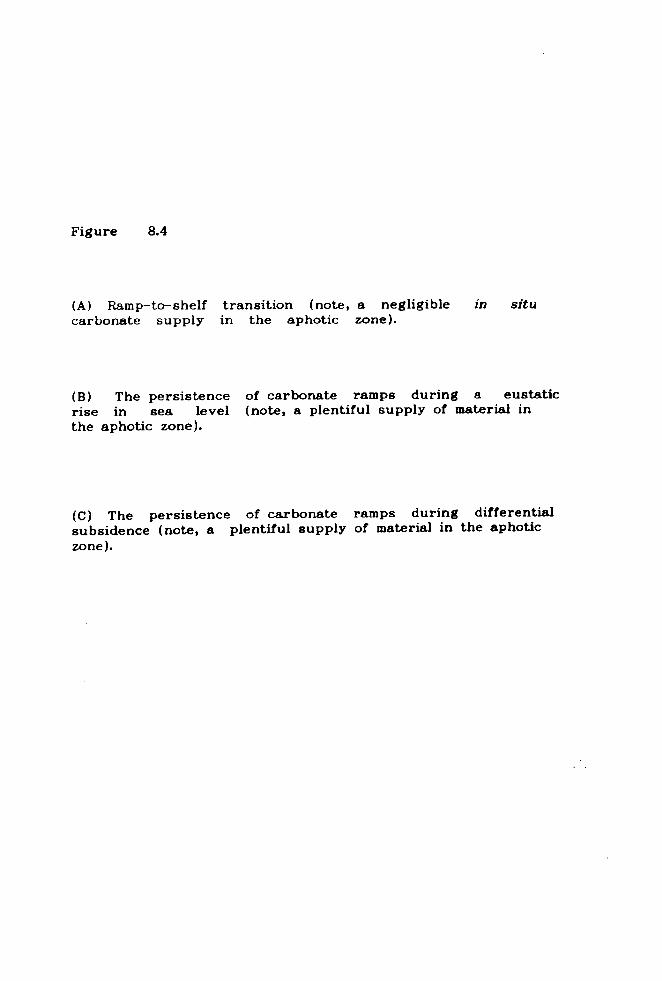
Figure 8.4
(A) Ramp-to-shelf transition (note, a negligible in situ carbonate supply in the aphotic zone).
(B) The persistence of carbonate ramps during a eustatic rise in sea level (note, a plentiful supply of material in the aphotic zone).
(C) The persistence of carbonate ramps during differential
subsidence (note, a plentiful supply of material in the aphotic zone).
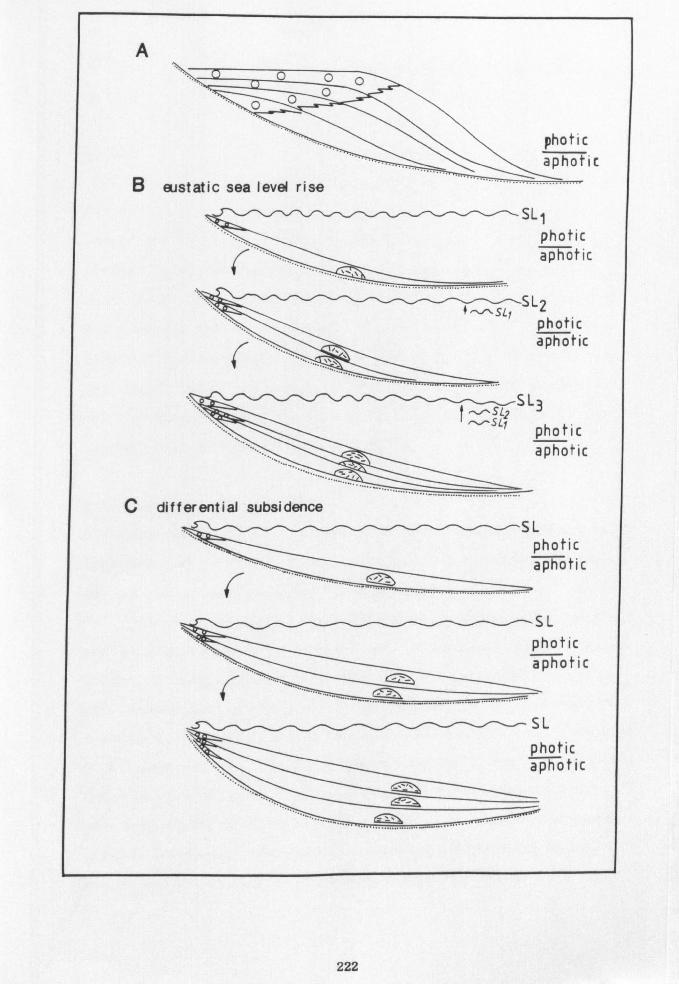
0
ic Ba ...........
SL1 photic aphotic
... 5L SL2
photic aphotic
c1 SL 3
photic aphotic
C differential subsidence SL
photic aphotic
..... ... "'- SL photic aphotic
SL
photic aphotic
.. "........
222
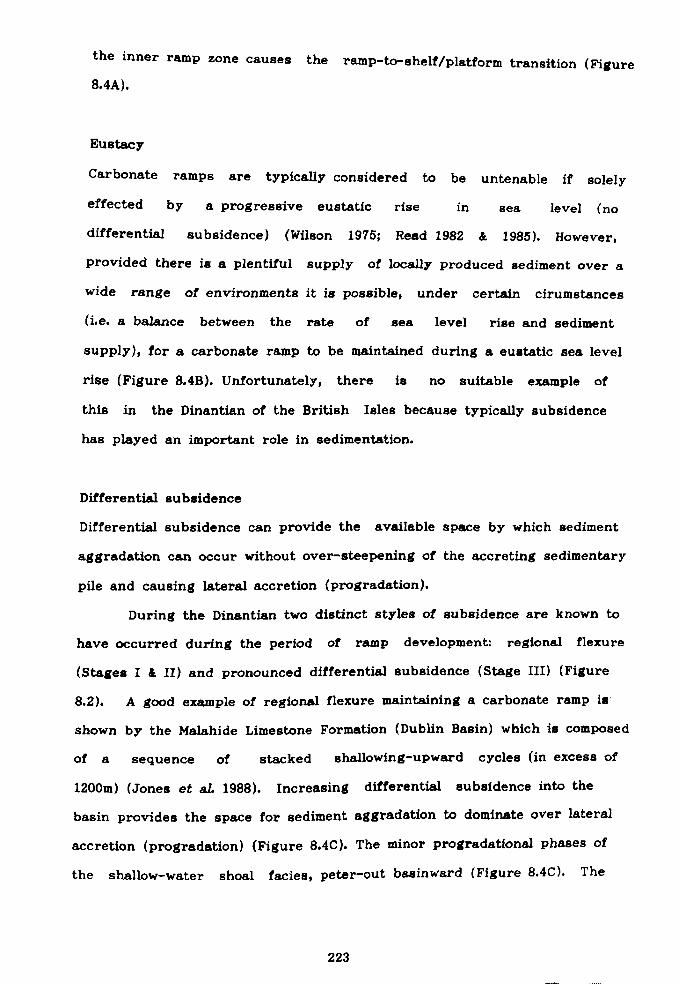
the inner ramp zone causes the ramp-to-shelf/platform transition (Figure
8.4A).
Eustacy
Carbonate ramps are typically considered to be untenable if solely
effected by a progressive eustatic rise in sea level (no
differential subsidence) (Wilson 1975; Read 1982 & 1985). However,
provided there is a plentiful supply of locally produced sediment over a
wide range of environments it is possible, under certain cirumstances
(i. e. a balance between the rate of sea level rise and sediment
supply), for a carbonate ramp to be maintained during a eustatic sea level
rise (Figure 8.4B). Unfortunately, there is no suitable example of
this in the Dinantian of the British Isles because typically subsidence
has played an important role in sedimentation.
Differential subsidence
Differential subsidence can provide the available space by which sediment
aggradation can occur without over-steepening of the accreting sedimentary
pile and causing lateral accretion (progradation).
During the Dinantian two distinct styles of subsidence are known to
have occurred during the period of ramp development: regional flexure
(Stages I& II) and pronounced differential subsidence (Stage III) (Figure
8.2). A good example of regional flexure maintaining a carbonate ramp is
shown by the Malahide Limestone Formation (Dublin Basin) which is composed
of a sequence of stacked shallowing-upward cycles (in excess of
1200m) (Jones et al. 1988). Increasing differential subsidence into the
basin provides the space for sediment aggradation to dominate over lateral
accretion (progradation) (Figure 8.4C). The minor progradational phases of
the shallow-water shoal facies, peter-out basinward (Figure 8.4C). The
223
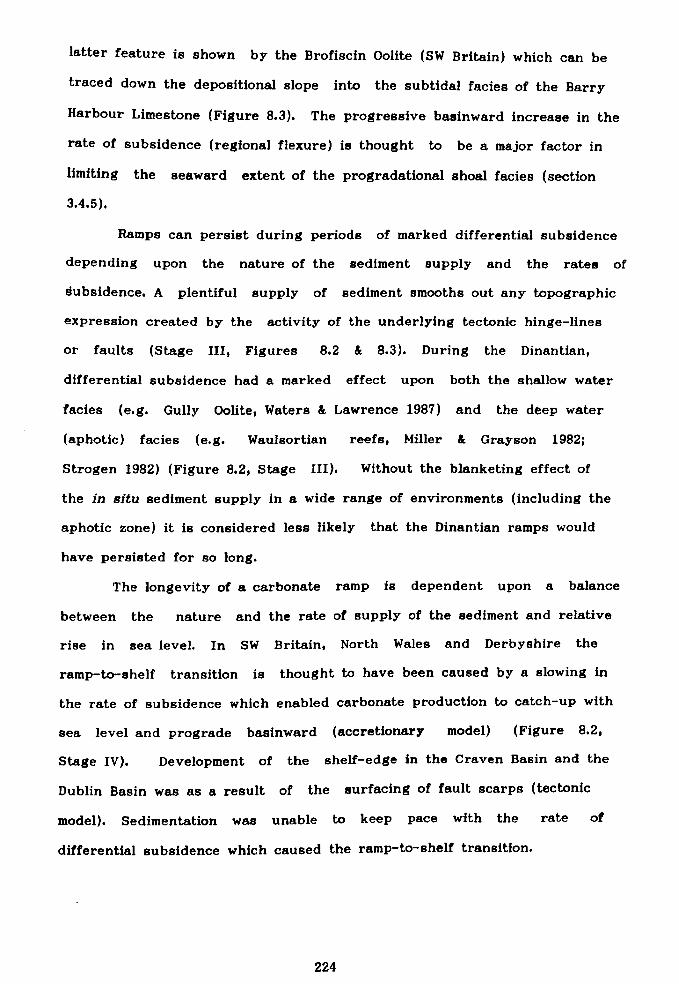
latter feature is shown by the Brofiscin Oolite (SW Britain) which can be
traced down the depositional slope into the subtidal facies of the Barry
Harbour Limestone (Figure 8.3). The progressive basinward increase in the
rate of subsidence (regional flexure) is thought to be a major factor in
limiting the seaward extent of the progradational shoal facies (section
3.4.5).
Ramps can persist during periods of marked differential subsidence
depending upon the nature of the sediment supply and the rates of
subsidence. A plentiful supply of sediment smooths out any topographic
expression created by the activity of the underlying tectonic hinge-lines
or faults (Stage 111, Figures 8.2 & 8.3). During the Dinantian,
differential subsidence had a marked effect upon both the shallow water
facies (e. g. Gully Oolite, Waters & Lawrence 1987) and the deep water
(aphotic) facies (e. g. Waulsortian reefs, Miller & Grayson 1982;
Strogen 1982) (Figure 8.2, Stage III). Without the blanketing effect of
the in situ sediment supply in a wide range of environments (including the
aphotic zone) it is considered less likely that the Dinantian ramps would
have persisted for so long.
The longevity of a carbonate ramp is dependent upon a balance
between the nature and the rate of supply of the sediment and relative
rise in sea level. In SW Britain, North Wales and Derbyshire the
ramp-to-shelf transition is thought to have been caused by a slowing in
the rate of subsidence which enabled carbonate production to catch-up with
sea level and prograde basinward (accretionary model) (Figure 8.2,
Stage IV). Development of the shelf-edge in the Craven Basin and the
Dublin Basin was as a result of the surfacing of fault scarps (tectonic
model). Sedimentation was unable to keep pace with the rate of
differential subsidence which caused the ramp-to-shelf transition.
224
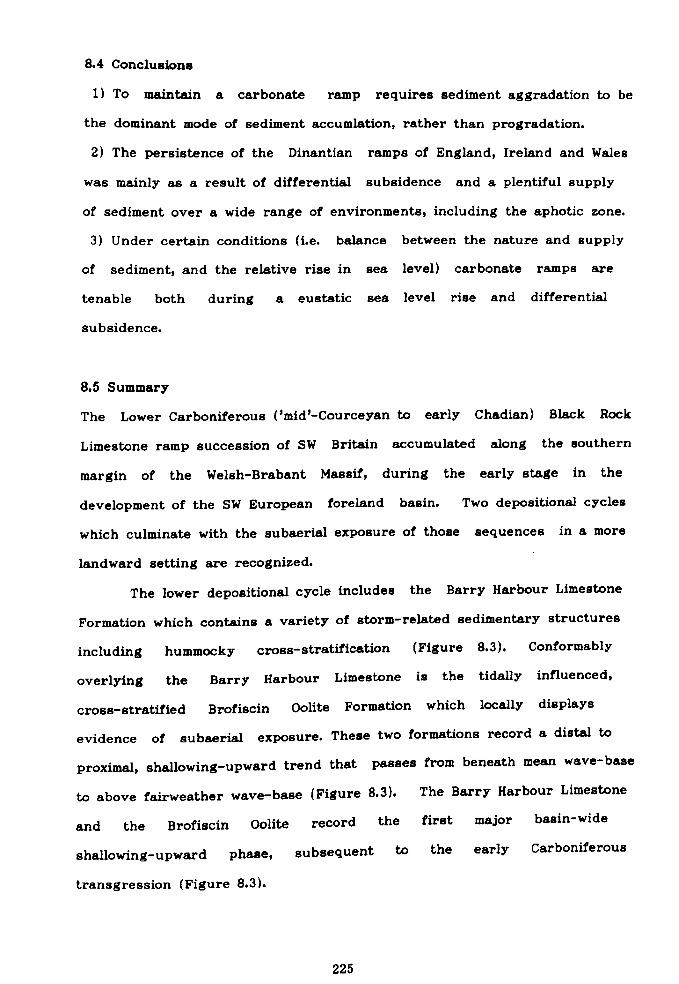
8.4 Conclusions
1) To maintain a carbonate ramp requires sediment aggradation to be
the dominant mode of sediment accumlation, rather than progradation.
2) The persistence of the Dinantian ramps of England, Ireland and Wales
was mainly as a result of differential subsidence and a plentiful supply
of sediment over a wide range of environments, including the aphotic zone.
3) Under certain conditions (i. e. balance between the nature and supply
of sediment, and the relative rise in sea level) carbonate ramps are
tenable both during a eustatic sea level rise and differential
subsidence.
8.5 Summary
The Lower Carboniferous ('mid'-Courceyan to early Chadian) Black Rock
Limestone ramp succession of SW Britain accumulated along the southern
margin of the Welsh-Brabant Massif, during the early stage in the
development of the SW European foreland basin. Two depositional cycles
which culminate with the subaerial exposure of those sequences in a more
landward setting are recognized.
The lower depositional cycle includes the Barry Harbour Limestone
Formation which contains a variety of storm-related sedimentary structures
including hummocky cross-stratification (Figure 8.3). Conformably
overlying the Barry Harbour Limestone is the tidally influenced,
cross-stratified Brofiscin Oolite Formation which locally displays
evidence of subaerial exposure. These two formations record a distal to
proximal, shallowing-upward trend that passes from beneath mean wave-base
to above fairweather wave-base (Figure 8.3). The Barry Harbour Limestone
and the Brofiscin Oolite record the first major basin-wide
shallowing-upward phase, subsequent to the early Carboniferous
transgression (Figure 8.3).
225
The upper depositional cycle of the Friars Point Limestone
Formation includes the volcanics at Middle Hope, the Waulsortian facies at
Castlemartin and Cannington Park, and is capped by the Portishead Paleosol
Beds (near Bristol) (Figure 8.3). Above the basal transgressive sequence,
the Friars Point Limestone consists of two distinct offshore ramp facies
belts. The more proximal inner ramp facies belt was more strongly
influenced by storm-related currents (Figure 8.3) and exhibits tubular
tempestites (storm sediment-filled burrows). The finer-grained, outer ramp
facies belt is extensively bioturbated and preserves few features
indicative of deposition from storm-related currents (Figure 8.3). The
effects and relative timing of differential subsidence was elucidated by
using the well documented biostratigraphy to separate the succession into
isochronous units. The onset of pronounced differential subsidence was
signified by volcanic activity at Middle Hope (Weston-super-Mare) (Figure
8.3). The volcanics form a coarsening and shallowing-upward sequence
which records the development of a localised, probably non-emergent,
offshore-volcanic high. Recognition of a major eustatic sea level fall at
the end of the Courceyan and during the early part of the Chadian is
revealed by studying the decline of the Waulsortian reefs in an offshore
ramp setting and evaluating the regional significance of the Portishead
Paleosol Beds.
The Barry Harbour Limestone and the Brofiscin Oolite represents a
classical shallowing-upward cycle during which time sediment supply was
able to catch-up with sea level (no eustatic fall in sea level) (Figure
8.3). In contrast, the identification of a eustatic sea level fall between
the deposition of the Friars Point Limestone and the overlying Gully
Oolite/Sub-Oolite Bed (where developed) is more cryptic in nature.
Evidence of subaerial exposure of the Black Rock Dolomite in the central
ramp zone has only been locally preserved. Significantly, only one well
226

defined shallowing-upward sequence has been identified in the uppermost
part of the Black Rock Limestone (Waters & Lawrence 1987).
This case study shows that the recognition of eustatic sea level
changes requires a good understanding of basin development to separate the
effects of subsidence and sediment supply from eustacy.
227

REFERENCES
Ahr, W. 1973. The carbonate ramp; an alternative to the shelf model. Transactions of the Gulf Coast Association of Geologists, Twenty-Third Annual Convention, 221-225.
Aigner, T. 1984. Dynamic stratigraphy of epicontinental carbonates, Upper Muschelkalk (M. Triassic) South-German Basin. Neues Jb. Geol. Paläont. Abhandlungen, 169,127-159.
Aigner, T. 1985. Storm depositional systems: dynamic stratigraphy in modern and ancient shallow marine sequences. In: Lecture notes in Earth Sciences (Eds G. M. Friedman, H. J. Neugebauer & A. Seilacher) 1-174. Springer-Verlag (Berlin).
Aigner, T. & Reineck, H. -E. 1982. Proximality trends in modern storm sands from the Helgoland Bight (North Sea) and their implications for basin analysis. Senckenbergiana Maritima, 14,183-215.
Allen, P. A. 1985. Hummocky cross-stratification is not produced purely under progressive gravity waves. Nature, 313,562-564.
Anderton, R., Bridges, P. H., Leeder, M. R. & Sellwood, B. W. 1979. A Dynamic Stratigraphy of the British Isles. George Allen & Unwin.
Assereto, R. A. M. & Folk, R. L. 1976. Brick-like texture and radial rays in Triassic Pisolites of Lombardy, Italy: a clue to distinguish ancient aragonite pisolites. Sedimentary Geology, 16, 295-322.
Austin, R. L. 1973. Modifications of the British Avonian conodont zonation and a reappraisal of European Dinantian conodont zonation and correlation. Extrait des Annales de la Societe Geologique de Belgique, 96,523-532.
Austin, R. L. & Davies, R. B. 1984. Problems of recognition and implications of Dinantian conodont biofacies in the British Isles. In: Conodont Biofacies and Provincialism (Ed. D. L. Clark). Special Paper Geological Society of America, 196,195-228.
Bathurst, R. G. C. 1975. Carbonate sediments and their diagenesis: second enlarged edition. Elsevier, Amsterdam.
Bathurst, R. G. C. 1987. Diagenetically enhanced bedding in argillaceous platform limestones: stratified cementation and selective compaction. Sedimentology, 34,749-778.
Beales, F. W. 1971. Cementation by white sparry dolomite. In: Carbonate cements (Ed. O. P. Bricker), 339-346. John Hopkins University Press, Baltimore, Maryland.
Berner, R. A. 1971. Diagenesis of iron minerals. In: Principles of chemical sedimentology. (Ed. R. A. Berner). International Series In Earth & Planetary Scieneces. McGraw-Hill.
Beus, S. S. 1984. Fossil associations in the High Tor Limestone (Lower Carboniferous) of South Wales. Journal of Paleontology, 58,651-667.
228
Bhatt, J. J. 1973. Ca/Mg ratio classification of Main Limestones (Mississippian) in South Wales, U. K. Sedimentary Geology, 10,225-231.
Bhatt, J. J. 1976. Geochemistry and petrology of the Main Limestone Series (Lower Carboniferous), South Wales, U. K. Sedimentary Geology, 15,55-86.
Blyth Cain, J. D. 1968. Aspects of the depositional environment and palaeoecology of crinoidal limestones. Scottish Journal Geology, 4,191-208.
Bott, M. P. 1967. Geophysical investigations of the northern Pennine basement rocks. Proceedings of the Yorkshire Geological Society, 36,139-168.
Bott, M. P. 1987. Subsidence mechanisms of Carboniferous basins in northern England. In: European Dinantian Environments (Eds J. Miller, A. E. Adams & V. P. Wright), 21-32. Geological Journal Special Issue No. 12. John-Wiley (Chicester).
Boucot, A. J. 1975. Evolution and extinction rate controls. In: Developments in Palaeontology and Stlatigraphy 1. Elsevier.
Bourgeois, J. 1980. A transgressive shelf sequence exhibiting hummocky
cross-stratification. The Cape Sebastian Sandstone (Upper Cretaceous), southwestern Oregon. Journal of Sedimentary Petrology, 50,681-702.
Brenchley, P. J. 1985. Storm influenced , sandstone beds. Modern
Geology, 9,369-396.
Brenchley, P. J., Newall, G. & Stanistreet, I. G. 1979. A storm surge origin for sandstone beds in an epicontinental platform sequence, Ordovician, Norway. Sedimentary Geology, 33,185-217.
Brett, C. E. 1983. Sedimentology, facies and depositional environments of the Rochester Shale (Silurian; Wenlockian) in western New York and Ontario. Journal of Sedimentary Petrology, 53,947-971.
Bridges, P. H. & Chapman A. J. 1988. The anatomy of a deep water mud-mound complex to the southwest of the Dinantian platform in Derbyshire, UK. Sedimentology, 35,139-162.
Brindley, G. W. & Brown, G. Crystal structures of clay minerals and their
x-ray identification. Mineralogical Society of London, Monograph 5.
Broadhurst, F. M., Simpson, I. M. & Hardy, P. G. 1980. Seasonal
sedimentation in the Upper Carboniferous of England. Journal of Geology, 88,639-651.
Broadhurst, F. M. & Simpson, I. M. 1973. Bathymetry on a Carboniferous reef. Lethaia, 6,367-381.
229

Burchette, T. P. 1987. Carbonate-barrier shorelines during the basal Carboniferous transgression: the Lower Limestone Shale Group, South Wales and Western England. In: European Dinantian Environments (Eds J. Miller A. E. Adams, and V. P. Wright), 239-263. Special Issue Geological Journal No. 12. John Wiley (Chichester).
Burchette, T. P., Wright, V. P. & Faulkner, T. J. submitted. Oolitic sandbody geometries and sequences, Mississippian of South West Britain: implications for petroleum exploration in carbonate ramp settings. Sedimentary Geology.
Butler, M. 1972. Conodont faunas and stratigraphy of certain Tournaisian sections in the Bristol-Mendip area. Unpublished thesis University of Bristol, England.
Butler, M. 1973. Lower Carboniferous conodont faunas from the Eastern Mendips, England. Palaeontology, 16,477-517.
Calvet, F. & Tucker, M. E. 1988. Outer ramp cycles in the Upper Muschelkalk of the Catalan Basin, northeast Spain. Sedimentary Geology, 57,185-198.
Carey, S. N. & Sigurdsson, H. 1980. The Roseau Ash: deep-sea tephra deposits from a major eruption on Dominica, Lesser Antilles Arc. Journal Volcanology Geotherm. Res., 7,67-86.
Channon, R. D. & Hamilton, D. 1976. Wave and tidal current sorting of shelf sediment southwest of England. Sedimentology, 23, 17-42.
Chatellier, J. Y. 1988. Carboniferous carbonate ramp, the Banff Formation, Alberta, Canada. Bulletin des Centres de Recherches Exploration-Production, Elf-Aquitaine, 12,569-599.
Cherns, L. 1979. The environmental significance of Lingula in the Ludlow Series of the Welsh Borderland and Wales. Lethaia, 12,35-46.
Cotter, E. 1966. Limestone diagenesis and dolomitization in Mississippian carbonate banks in Montana. Journal of Sedimentary Petrology, 36,764-774.
Cox, K. G., Bell, J. D. & Pankhurst, R. J. 1979. The interpretation of igneous rocks, 408-414. George Allen & Unwin.
Craig, G. Y. 1952. A comparative study of the ecology and palaeoecology of Lingula. Transactions of the Geological Society of London, 124,213-238.
Craig, M. 1957. Isotopic standards for carbon and oxygen and correction factors for mass spectrometric analysis of carbon dioxide. Geochim.
et Cosmochimica Acts, 12,133-149-
Cross, W., Iddings, J. P., Pirrson, L. V. & Washington, H. S. 1903. Quantitative classification of igneous rocks. University of Chicago Press.
230
Deines, P. 1970. Mass spectrometer correction factors for the determination of small isotopic composition variations of carbon and oxygen. Int. Journal Mass Spectrometry Ion. Phys., 4,283-295.
Devey, C. W. 1986. Stratigraphy and geochemistry of the Deccan Trap lavas, Western India Unpublished D. Phil. thesis University of Oxford.
Dickson, J. A. D. 1965. A modified staining technique for carbonates in thin section. Nature, 205,587.
Dickson, J. A. D. 1985. Diagenesis of shallow-marine carbonates. In: Sedimentology: Recent Developments and Applied Aspects, (Eds P. J. Brenchley & B. P. J. Williams) Geological Society Special Publication, 18,173-189. Blackwells.
Dixey, F. & Sibly, T. F. 1918. The Carboniferous Limestone Series on the south-eastern margin of the S. Wales Coalfield. Quarterly Journal of the Geological Society, London, 73,111-164.
Dixon, E. E. L. 1921. The Geology of the South Wales Coalfield. Part XIII. The country around Pembroke and Tenby. Memoir of the Geological Survey of Great Britain, Sheet 244,245. H. M. S. O. (London).
Dixon, E. E. L. & Vaughan, A. 1911. The Carboniferous succession in Gower. Quarterly Journal of the Geological Society of London, 67,477-571.
Dixon J. & Wright V. P. 1983. Burial diagenesis and crystal diminution. The origin of crystal diminution in some limestones from South Wales. Sedimentology, 30,537-546.
Dodd, R., Carter, P., Fara, D., Feldman, H., Hill, J., Malvia, R., Maples, C., Petricca, A. & Thompson, T. 1987. Ramp Creek and Harrodsburg Limestones: a shallowing-upward sequence with storm-produced features in southern Indiana, U. S. A.. Sedimentary Geology, 52,207-226.
Donato, J. A. 1988. Possible Variscan thrusting beneath the Somerton anticline, Somerset. Journal of the Geological Society of London, 145,431-438.
Dott, R. H. Jr & Bourgeois, J. 1982. Hummocky stratification: significance of its variable bedding sequences. Bulletin of the Geological Society America, 93,663-680.
Duff, B. 1980. The palaeomagnetism of Jersey volcanics and dykes, and the Lower Palaeozoic apparent polar wander path for Europe. Geophys. J. R. Astr. Soc., 60,355-375.
Duke, W. L. 1985. Hummocky cross-stratification, tropical hurricanes, and intense winter storms. Sedimentology, 32,167-194.
Duke, W. L. 1987. Hummocky cross-stratification, tropical hurricanes, and intense winter storms: reply. Sedimentology, 34,344-359.
Dunne, W. D. 1983. Tectonic evolution of SW Wales during the Upper Palaeozoic. Journal of Geological Society of London, 140,257-265.
231
Eslinger, E. & Peavear, D. 1988. Clay minerals for petroleum geologists and engineers. Society of Economic Paleontologists and Mineralogists Short course notes, 22,1-428.
Faber, P. & Riding, R. 1979. Uraloporella (microproblematicum) from the Middle Devonian . of Eifel (West Germany). Neues. Jb. Geol. Pa1äont. Mh., Stuttgart, 1979,139-146.
Faulkner, T. J. 1988. The Shipway Limestone of Gower: Sedimentation on a storm-dominated early Carboniferous ramp. Geological Journal, 23,85-100.
Faulkner, T. J. 1989. The early Carboniferous (Courceyan) Middle Hope volcancis of Weston-super-Mare (near Bristol): Development and demise of an offshore volcanic high. Proceedings of Geologists' Association, 100,93-106.
Floyd, P. A. 1982. Chemical variation in Hercynian basalts relative to plate tectonics. Journal of Geological Society, London, 139,505-520.
Folk, R. L. & Assereto, R. A. M. 1976. Comparative fabrics of length-slow and length-fast calcite and calcitised aragonite in a Holocene speleothem, Carlsbad Caver, New Mexico. Journal of Sedimentary Petrology, 46,486-496.
Gagan, M. K., Johnson, D. P., & Carter, R. M. 1988. The cyclone Winnifred storm bed, Central Great Barrier Reef shelf, Australia. Journal of Sedimentary Petrology, 58,845-856.
Garven, G. 1985. The role of regional fluid flow in the genesis of the Pine Point deposit, western Canada sedimentary basin. Economic Geology, 80,307-324.
Garven, G. & Freeze, R. A. 1984. Theoretical analysis of the role of groundwater flow in the genesis of stratabound ore deposits. American Journal of Science, 284,1085-1124.
Gawthorpe, R. L. 1986. Sedimentation during carbonate ramp-to-slope evolution in a tectonically active area: Bowland Basin (Dinantian), Derbyshire, England. Sedimentology, 33,185-206.
Gawthorpe, R. L. 1987. Burial dolomitization and porosity development in a mixed carbonate-clastic sequence: an examples from the Bowland Basin, northern England. Sedimentology, 34,533-558.
Gayer, R. 1988. Variscan deformation of the South Wales coalfield -a foreland basin model. Upper Palaeozoic basin evolution in South Wales. Meeting of the geological Society of London (abstract). University College Cardiff (University of Wales).
George, T. N. 1970. British Regional Geology: South Wales. 3rd ed. H. M. S. O. London.
George, T. N. 1972. The classification of Avonian limestones. Quarterly Journal of the Geological Society of London, 128,221-256.
232
George, T. N. 1974. The Cenozoic evolution of Wales. In: The Upper Palaeozoic and Post-Palaeozoic rocks of Wales (Ed. T. R. Owen) 85-115. University of Wales Press, Cardiff.
George, T. N. 1978. Eustasy and tectonics: Sedimentary rhythms and stratigraphical units in British Dinantian correlation. Proceedings of the Yorkshire Geological Society, 42, 229-262.
George, T. N., Johnson, G. A. L., Mitchell, M., Prentice, J. E., Ramsbottom, W. H. C. 9 Sevastopulo, G. & Wilson, R. B. 1976. A correlation of the Dinantfan rocks of the British Isles. Geol. Soc. London Special Report No. 7.
Ginsburg, R. N. & James, N. P. 1974. Holocene carbonate sediments of continental shelves. In: The Geology of Continental Margins (Eds C. A. Bank and C. L. Drake), 137-155. Springer-Verlag (Berlin).
Goldring, R. 1962. The Bathyal Lull: Upper Devonian and Lower Carboniferous sedimentation in the Variscan geosyncline. In., Some aspects of the Variscan Fold Belt (Ed. K. Coe) Manchester University Press, 75- 92.
Goldring, R. & Bridges, P. 1973. Sublittoral sheet sandstones. Journal of Sedimentary Petrology, 43,736-747.
Grayson, R. F. & Oldham, L. 1987. A new structural framework for the northern British Dinantian as a basis for oil, gas and mineral exploration. In: European Dinantian Environments (Eds J. Miller, A. E. Adams & V. P. Wright), 33-59. Geological Journal Special Issue No. 12. John-Wiley (Chichester).
Green, G. W. & Welch, F. B. A. 1965. Geology of the country around Wells and Cheddar. Memoir of the Geological Survey of Great Britain, Sheet 280.
Greenwood, B. & Sherman, D. J. 1986. Hummocky cross-stratification in the surf zone: flow parameters and bedding genesis. Sedimentology, 33,33-45.
Gregg, J. M. & Sibley, D. F. 1984. Epigenetic dolomitization and the origin of xenotopic dolomite texture. Journal of Sedimentary Petrology, 54,908-931.
Gross, M. G. 1964. Variations in the 018/016 and C13/C12 ratios of diagenetically altered limestones in the Bermuda Island. Journal of Geology, 72,170-194.
Gutteridge, P. 1987. Dinantian sedimentation and the basement structure of the Derbyshire Dome. Geological Journal, 22,25-41.
Hamblin, A. P. & Walker, R. G. 1979. Storm-dominated shallow marine deposits: the Fernie-Kootenay (Jurassic) transition, southern Rocky Mountains. Canadian Journal of Earth Sciences, 16, 1673-1690.
Hancock, P. L., Dunne, W. M. & Tringham, M. E. 1981. Variscan structures in southwest Wales. Geologie en Mijnbouw, 60,81-88.
233
Handford, C. J. 1986. Facies and bedding sequences in shelf-storm-deposited carbonates-Fayettevile Shale and Pitkin Limestone (Mississippian), Arkanas. Journal of Sedimentary Petrology, 56,123-137.
Hardie, L. A. 1987. Dolomitization: a critical view of some current views. Journal of Sedimentary Petrology, 57,166-183.
Harms, J. C., Southard, J. B., Spearing, D. R. & Walker, R. G. 1975. Depositional environments as interpreted from primary sedimentary structures and stratified sequences. Society of Economic Palaeontologists and Mineralogists, Short Course, 2,161.
Heckel, P. A. 1983. Diagenetic model for carbonate rocks in midcontinent Pennsylvanian eustatic cyclothems. Journal of Sedimentary Petrology, 53,733-759.
Higgs, R. 1986. The 'South British Fault': 200km of Stephanian-early Permian dextral wrenching on an E-W fault through the Bristol Channel. Conference Abstract: Controls of Upper Carboniferous Sedimentation, North-West Europe. University of Keele.
Hird, K. 1986. Petrography and geochemistry of some Carboniferous and Precambrian dolomites. Unpublished Ph. D. thesis, University of Durham.
Hird, K. & Tucker, M. E. 1988. Contrasting diagenesis of two Carboniferous oolites from South Wales; a tale of climatic influence. Sedimentology, 35,587-602.
Hird, K., Tucker, M. E. & Waters, R. A. 1987. Petrography, geochemistry and origin of Dinantian dolomites from South-east Wales. In: European Dinantian Environments (Eds J. Miller, A. E. Adams & V. P. Wright), 359-377. Geological Journal Special Issue No. 12. John-Wiley (Chichester).
Holder, M. T. & Leveridge, B. E. 1986. Correlation of the Rhenohercynian Variscides. Journal of the Geological Society of London, 143,141-147.
Holder, M. T. & Leveridge, B. E. 1987. Discussion on the correlation of Rhenohercynian Variscides: reply. Journal of the Geological
Society of London, 144,353-354.
Hudson, J. D. 1982. Pyrite in ammonite-bearing shales from the Jurassic of England and Germany. Sedimentology, 29,639-667.
Hunter, R. E. & Clifton, H. E. 1982. Cyclic deposits and hummocky
cross-stratification of probable storm origin in Upper Cretaceous
area, southwestern Oregon. Journal of Sedimentary Petrology, 52,127-146.
Jacobs, L., Swennen, R., Van Orsmael, J., Notebaert, L., & Viaene, W.
1982. Occurences of pseudomorphs after evaporitic minerals in the
Dinantian carbonate rocks of the eastern part of Belgium.
Bulletin de Is Societe beige de Geologie, 2,105-123.
234
James, N. P. 1983. Reefs. In: Carbonate Depositional Environments (Eds P. A. Scholle, D. G. Bebout & C. H. Moore), 345-462. America Association of Petroleum Geologists, Memoir, 33.
Jeffreys, D. H. 1979. Sedimentology of the Dinantian volcaniclastic and carbonate rocks of Middle Hope and Spring Cove, Weston-super-Mare. Unpublished MSc. thesis, University of Reading.
Jeffreys, D. H. & Aigner, T. 1982. Storm sedimentation in the Carboniferous Limestones near Weston-super-Mare (Dinantian, SW-England). In: Cyclic & Event Stratification (Ed. A. Seilacher) 240-247. Springer-Verlag (Berlin).
Jodry, R. L. 1969. Growth and dolomitization of Silurian Reefs. St. Clair County, Michigan. Bulletin of the American Association of Petroleum Geologists, 53,957-981.
Johnson, G. A. L. 1967. Basement control of Carboniferous sedimentation in northern England. Proceedings of the Yorkshire geological Society, 36,175-194.
Johnson, G. A. L. 1982. Geographical changes in Britain during the Carboniferous period. Proceedings of the Yorkshire Geological Society, 44,181-212.
Johnson, G. A. L. 1984. Precision in Dinantian geography. European Dinantian Environments, First Meeting 1984, Abstracts, 64-65. Department of Earth Sciences, Open University, Milton Keynes, U. K.
Jones, D. G. 1974. The Namurian Series in South Wales. In: The Upper Palaeozic Rocks of Wales, (Ed. T. R. Owen), 117-132. University of Wales Press, Cardiff.
Jones, G. L., Somerville, I. D. & Strogen, P. 1988. The Lower Carboniferous (Dinantian) of the Swords area: Sedimentation and tectonics in the Dublin Basin, Ireland. Geological Journal, 23,221-248.
Junghanse, T., Goldring, R. & Simpson, J. 1984. The Dinantian between Rhosilli and Port Eynon (Gower, South Wales). In: European Dinantian Environments, First Meeting, 1984, Abstracts, 61-63. Department of Earth Sciences, Open University, U. K.
Kasig, W. 1980. Dinantian carbonates in the Aachen region. F. R. G. Med. Rijka Geol. Dienst., 32-6,44-52.
Kazmierczak, J. & Goldring, R. 1978. Subtidal flat-pebble conglomerate from the Upper Devonian of Poland: a multiprovenant high energy product. Geological Magazine, 115,359-366.
Kelling, G. 1988. Silesian sedimentation and tectonics in the South Wales Basin: a brief review. In: Sedimentation in a Synorogenic Basin Complex: the Upper Carboniferous of Northwest Europe (Ede B. M.
Belly and G. Kelling), 38-42. Blackie, Glasgow and London.
Kelling, G. & Williams, B. P. J. 1966. Deformation structures of sedimentary origin in the Lower Limestone Shales (basal
Carboniferous) of South Pembrokeshire, Wales. Journal of Sedimentary Petrology, 36,927-939.
235
Kendall, A. C. 1985. Radiaxial fibrous calcites: a reappraisal. In: Carbonate cements (Eds. N. Schneidermann and P. M. Harris). Special publication of Society of Economic Paleontologists and Mineralogists, 36,59-77.
Kendall, A. C. & Broughton, P. L. 1978. Origin of fabrics in speleothems composed of columnar calcite crystals. Journal of Sedimentary Petrology, 48,519-538.
Kendall, C. G. & Schlager W. 1981. Carbonates and relative changes in sea level. Marine Geology, 44,181-212.
Kent, P. E. 1975. Review of North Sea Basin development. Journal of the Geological Society of London, 131,435-468.
Klein, G. DEV. & Marsaglia, K. M. 1987. Hummocky cross-stratification, tropical hurricanes, and intense winter storms: discussion. Sedimentology, 34,333-359.
Kobluk K. R. & Risk, M. L. 1977. Micritization and carbonate-grain binding by endolithic algae. Bulletin American Association Petroleum Geologists, 61,1069-1081.
Kohout, -F. A., Henry, H. R. & Banks, J. E. 1977. Hydrogeology related to geothermal conditions of the Floridan Plateau. In: Geothermal Nature of the Floridan Plateau (Eds K. L. Smith & G. M. Griffin), 1-34. Fla. Dept. Resour. Bur. Geol. Spec. Publ.
Komar, P. D., Nuedeck, R. H. & Kulm, L. D. 1972. Observations and significance of deep water oscillatory ripple marks on the Oregon continental shelf. In: Shelf Sediment Transport, Process and Pattern, 601-620. (Eds D. J. P. Swift, B. B. Duane & O. H. Pilkey) Dowden, Hutchinson and Ross, Pennsylvania.
Land, S. L. 1980. The isotopes and trace element geochemistry of dolomite: the state of the art. In: Concepts and Models of Dolomitization (Eds. D. H. Zenger, J. B. Dunham, & R. L. Ethington). SEPM Special Publication No. 2$, Tulsa, Oklahoma, USA, 87-110.
Leckie, D. A. 1988. Wave-formed, coarse-grained ripples and their relationship to hummocky cross-stratification. Journal of Sedimentary Petrology, 58,607-622.
Leckie, D. A. & Walker, R. G. 1982. Storm- and tide-dominated shorelines in Cretaceous Moosebar -lower Gates interval- outcrop equivalents of Deep Basin gas trap in western Canada. American Association of Petroleum Geologists, Bulletin, 66,138-157.
Leeder, M. R. 1974. Sedimentary facies and the origins of basin subsidence along the northern margin of the supposed Hercynian ocean. Tectonophysics, 36,167-179.
Leeder, M. R. 1976. Sedimentary facies and origins of basin subsidence along the northern margin of the supposed Hercynian ocean. Tectonophysics, 36,167-179.
236
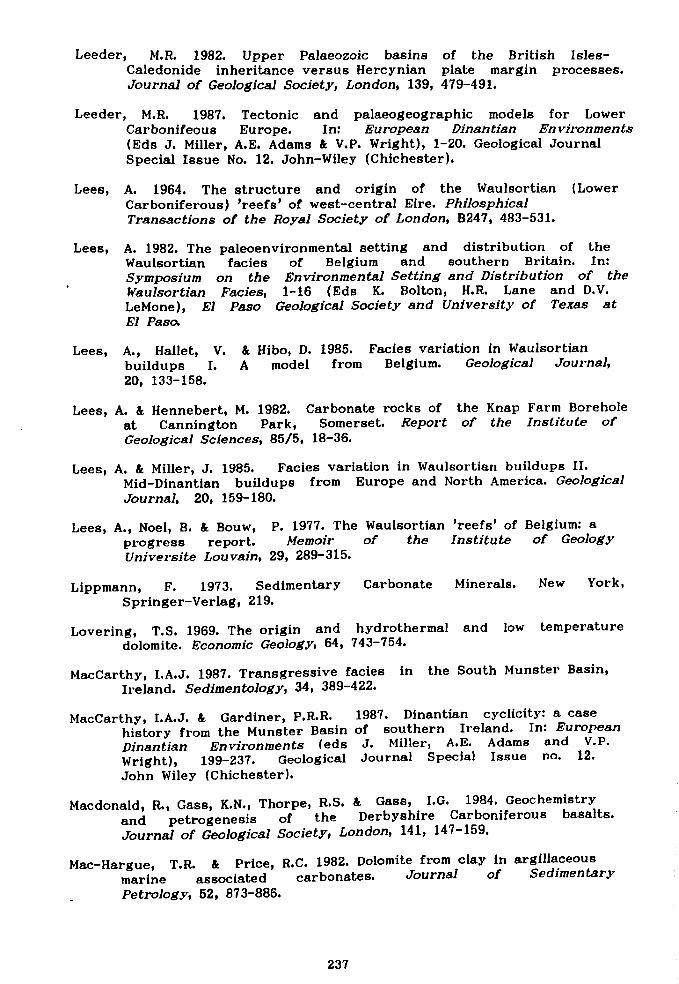
Leeder, M. R. 1982. Upper Palaeozoic basins of the British Isles- Caledonide inheritance versus Hercynian plate margin processes. Journal of Geological Society, London, 139,479-491.
Leeder, M. R. 1987. Tectonic and palaeogeographic models for Lower Carbonifeous Europe. In: European Dinantlan Environments (Eds J. Miller, A. E. Adams & V. P. Wright), 1-20. Geological Journal Special Issue No. 12. John-Wiley (Chichester).
Lees, A. 1964. The structure and origin of the Waulsortian (Lower Carboniferous) 'reefs' of west-central Eire. Philosphical Transactions of the Royal Society of London, B247,483-531.
Lees, A. 1982. The paleoenvironmental setting and distribution of the Waulsortian facies of Belgium and southern Britain. In: Symposium on the Environmental Setting and Distribution of the Waulsortian Facies, 1-16 (Eds K. Bolton, H. R. Lane and D. V. LeMone), El Paso Geological Society and University of Texas at El Paso.
Lees, A., Hallet, V. & Hibo, D. 1985. Facies variation in Waulsortian buildups I. A model from Belgium. Geological Journal, 20,133-158.
Lees, A. & Hennebert, M. 1982. Carbonate rocks of the Knap Farm Borehole
at Cannington Park, Somerset. Report of the Institute of Geological Sciences, 85/5,18-36.
Lees, A. & Miller, J. 1985. Facies variation in Waulsortian buildups H. Mid-Dinantian buildups from Europe and North America. Geological Journal, 20,159-180.
Lees, A., Noel, B. & Bouw, P. 1977. The Waulsortian 'reefs' of Belgium: a progress report. Memoir of the Institute of Geology Universite Louvain, 29,289-315.
Lippmann, F. 1973. Sedimentary Carbonate Minerals. New York,
Springer-Verlag, 219.
Lovering, T. S. 1969. The origin and hydrothermal and low temperature dolomite. Economic Geology, 64,743-754.
MacCarthy, I. A. J. 1987. Transgressive facies in the South Munster Basin,
Ireland. Sedimentology, 34,389-422.
MacCarthy, I. A. J. & Gardiner, P. R. R. 1987. Dinantian cyclicity: a case history from the Munster Basin of southern Ireland. In: European
Dinantian Environments (eds J. Miller, A. E. Adams and V. P.
Wright), 199-237. Geological Journal Special Issue no. 12.
John Wiley (Chichester).
Macdonald, R., Gass, K. N., Thorpe, R. S. & Gass, I. G. 1984. Geochemistry
and petrogenesis of the Derbyshire Carboniferous basalts.
Journal of Geological Society, London, 141,147-159.
Mac-Hargue, T. R. & Price, R. C. 1982. Dolomite from clay in argillaceous
marine associated carbonates. Journal of Sedimentary
Petrology, 52,873-886.
237
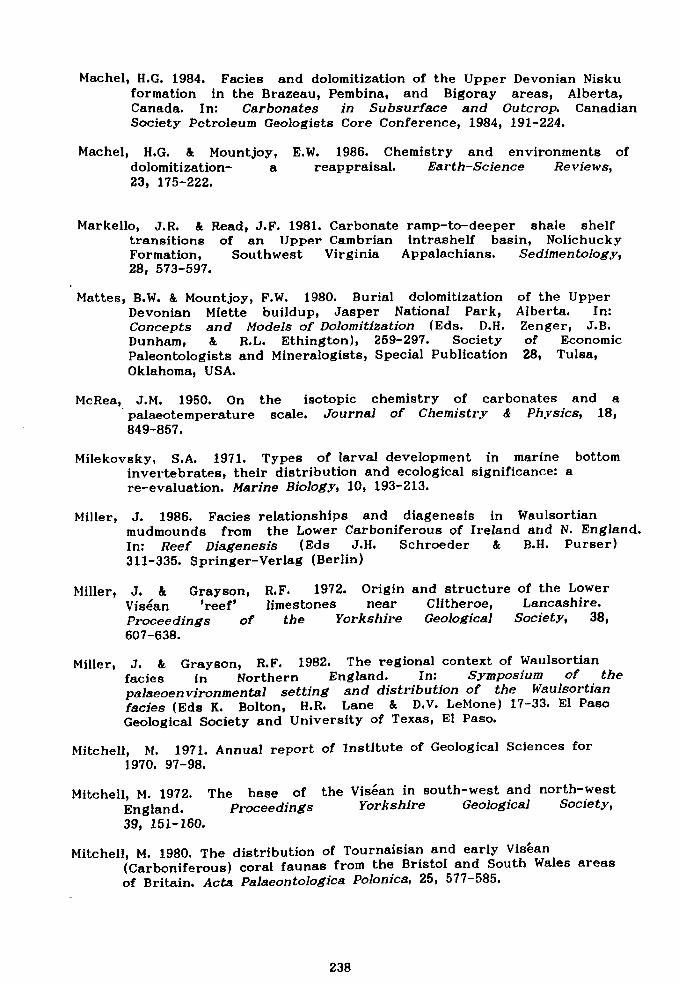
Machel, H. G. 1984. Facies and dolomitization of the Upper Devonian Nisku formation in the Brazeau, Pembina, and Bigoray areas, Alberta, Canada. In: Carbonates in Subsurface and Outcrop. Canadian Society Petroleum Geologists Core Conference, 1984,191-224.
Machel, H. G. & Mountjoy, E. W. 1986. Chemistry and environments of dolomitization- a reappraisal. Earth-Science Reviews, 23,175-222.
Markello, J. R. & Read, J. F. 1981. Carbonate ramp-to-deeper shale shelf transitions of an Upper Cambrian intrashelf basin, Nolichucky Formation, Southwest Virginia Appalachians. Sedimentology, 28,573-597.
Mattes, B. W. & Mountjoy, F. W. 1980. Burial dolomitization of the Upper Devonian Miette buildup, Jasper National Park, Alberta. In: Concepts and Models of Dolomitization (Eds. D. H. Zenger, J. B. Dunham, & R. L. Ethington), 259-297. Society of Economic Paleontologists and Mineralogists, Special Publication 28, Tulsa, Oklahoma, USA.
McRea, J. M. 1950. On the isotopic chemistry of carbonates and a palaeotemperature scale. Journal of Chemistry & Physics, 18, 849-857.
Milekovsky, S. A. 1971. Types of larval development in marine bottom invertebrates, their distribution and ecological significance: a re-evaluation. Marine Biology, 10,193-213.
Miller, J. 1986. Facies relationships and diagenesis in Waulsortian mudmounds from the Lower Carboniferous of Ireland and N. England. In: Reef Diagenesis (Eds J. H. Schroeder & B. H. Purser) 311-335. Springer-Verlag (Berlin)
Miller, J. & Grayson, R. F. 1972. Origin and structure of the Lower Visean 'reef' limestones near Clitheroe, Lancashire. Proceedings of the Yorkshire Geological Society, 38, 607-638.
Miller, J. & Grayson, R. F. 1982. The regional context of Waulsortian facies in Northern England. In: Symposium of the
palaeoenvironmental setting and distribution of the Waulsortian facies (Eds K. Bolton, H. R. Lane & D. V. LeMone) 17-33. El Paso Geological Society and University of Texas, El Paso.
Mitchell, M. 1971. Annual report of Institute of Geological Sciences for 1970.97-98.
Mitchell, M. 1972. The base of the Visean in south-west and north-west England. Proceedings Yorkshire Geological Society,
39,151-160.
Mitchell, M. 1980. The distribution of Tournaisian and early Visean (Carboniferous) coral faunas from the Bristol and South Wales areas
of Britain. Acta Palaeontologica Polonica, 25,577-585.
238
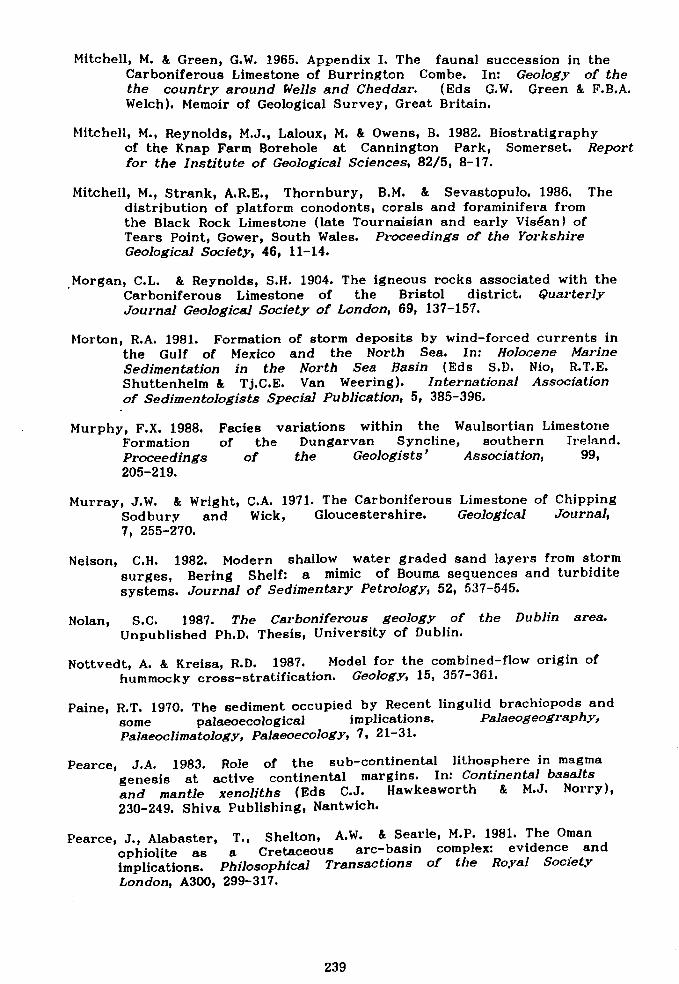
Mitchell, M. & Green, G. W. 1965. Appendix I. The faunal succession in the Carboniferous Limestone of Burrington Combe. In: Geology of the the country around Wells and Cheddar. (Eds G. W. Green & F. B. A. Welch). Memoir of Geological Survey, Great Britain.
Mitchell, M., Reynolds, M. J., Laloux, M. & Owens, B. 1982. Biostratigraphy of the Knap Farm Borehole at Cannington Park, Somerset. Report for the Institute of Geological Sciences, 82/5,8-17.
Mitchell, M., Strank, A. R. E., Thornbury, B. M. & Sevastopulo. 1986. The distribution of platform conodonts, corals and foraminifera from the Black Rock Limestone (late Tournaisian and early Visean) of Tears Point, Gower, South Wales. Proceedings of the Yorkshire Geological Society, 46,11-14.
. Morgan, C. L. & Reynolds, S. H. 1904. The igneous rocks associated with the
Carboniferous Limestone of the Bristol district. Quarterly Journal Geological Society of London, 69,137-157.
Morton, R. A. 1981. Formation of storm deposits by wind-forced currents in the Gulf of Mexico and the North Sea. In: Holocene Marine Sedimentation in the North Sea Basin (Eds S. D. Nio, R. T. E. Shuttenhelm & Tj. C. E. Van Weering). International Association
of Sedimentologists Special Publication, 5,385-396.
Murphy, F. X. 1988. Facies variations within the Waulsortian Limestone Formation of the Dungarvan Syncline, southern Ireland. Proceedings of the Geologists' Association, 99, 205-219.
Murray, J. W. & Wright, C. A. 1971. The Carboniferous Limestone of Chipping Sodbury and Wick, Gloucestershire. Geological Journal, 7,255-270.
Nelson, C. H. 1982. Modern shallow water graded sand layers from storm surges, Bering Shelf: a mimic of Bouma sequences and turbidite
systems. Journal of Sedimentary Petrology, 52,537-545.
Nolan, S. C. 1987. The Carboniferous geology of the Dublin area. Unpublished Ph. D. Thesis, University of Dublin.
Nottvedt, A. & Kreisa, R. D. 1987. Model for the combined-flow origin of hummocky cross-stratification. Geology, 15,357-361.
Paine, R. T. 1970. The sediment occupied by Recent lingulid brachiopods and some palaeoecological implications. Palaeogeography, Palaeoclimatology, Palaeoecology, 7,21-31.
Pearce, J. A. 1983. Role of the sub-continental lithosphere in magma
genesis at active continental margins. In: Continental Gasalts
and mantle xenoliths (Eds C. J. Hawkesworth & M. J. Norry),
230-249. Shiva Publishing, Nantwich.
Pearce, J., Alabaster, T., Shelton, A. W. & Searle, M. P. 1981. The Oman
ophiolite as a Cretaceous arc-basin complex: evidence and implications. Philosophical Transactions of the Royal Society
London, A300,299-317.
239
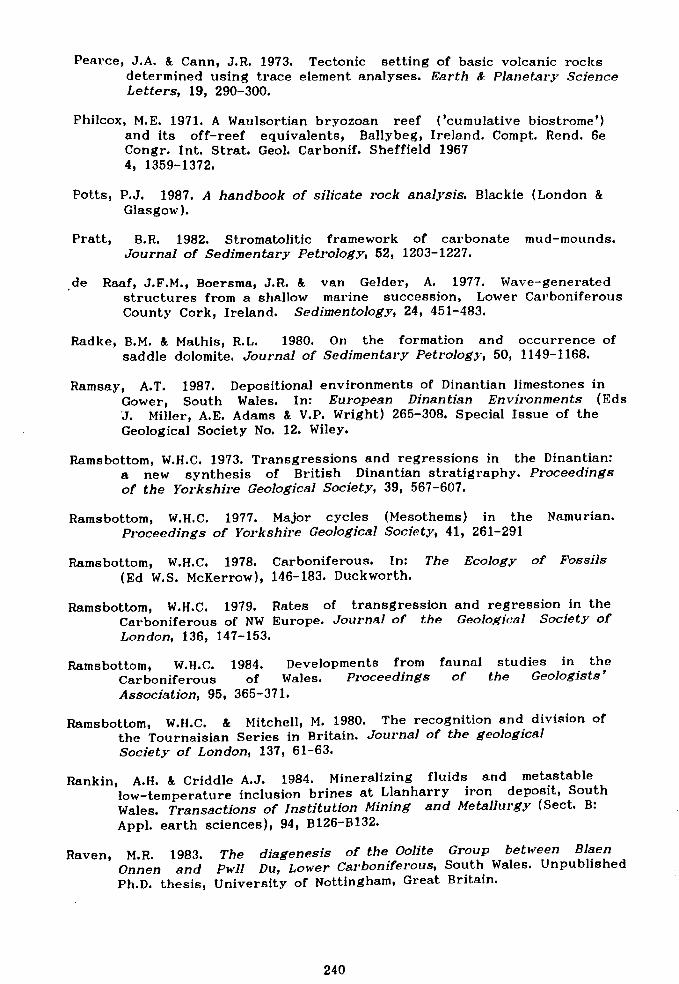
Pearce, J. A. & Cann, J. R. 1973. Tectonic setting of basic volcanic rocks determined using trace element analyses. Earth & Planetary Science Letters, 19,290-300.
Philcox, M. E. 1971. A Waulsortian bryozoan reef ('cumulative biostrome') and its off-reef equivalents, Ballybeg, Ireland. Compt. Rend. 6e Congr. Int. Strat. Geol. Carbonif. Sheffield 1967 4,1359-1372.
Potts, P. J. 1987. A handbook of silicate rock analysis. Blackie (London & Glasgow).
Pratt, B. R. 1982. Stromatolitic framework of carbonate mud-mounds. Journal of Sedimentary Petrology, 52,1203-1227.
, de Raaf, J. F. M., Boersma, J. R. & van Gelder, A. 1977. Wave-generated
structures from a shallow marine succession, Lower Carboniferous County Cork, Ireland. Sedimentology, 24,451-483.
Radke, B. M. & Mathis, R. L. 1980. On the formation and occurrence of saddle dolomite. Journal of Sedimentary Petrology, 50,1149-1168.
Ramsay, A. T. 1987. Depositional environments of Dinantian limestones in Gower, South Wales. In: European Dinantian Environments (Eds J. Miller, A. E. Adams & V. P. Wright) 265-308. Special Issue of the Geological Society No. 12. Wiley.
Ramsbottom, W. H. C. 1973. Transgressions and regressions in the Dinantian:
a new synthesis of British Dinantian stratigraphy. Proceedings of the Yorkshire Geological Society, 39,567-607.
Ramsbottom, W. H. C. 1977. Major cycles (Mesothems) in the Namurian. Proceedings of Yorkshire Geological Society, 41,261-291
Ramsbottom, W. H. C. 1978. Carboniferous. In: The Ecology of Fossils (Ed W. S. McKerrow), 146-183. Duckworth.
Ramsbottom, W. H. C. 1979. Rates of transgression and regression in the Carboniferous of NW Europe. Journal of the Geological Society of London, 136,147-153.
Ramsbottom, W. H. C. 1984. Developments from faunal studies in the
Carboniferous of Wales. Proceedings of the Geologists'
Association, 95,365-371.
Ramsbottom, W. H. C. & Mitchell, M. 1980. The recognition and division of the Tournaisian Series in Britain. Journal of the geological Society of London, 137,61-63.
Rankin, A. H. & Criddle A. J. 1984. Mineralizing fluids and metastable low-temperature inclusion brines at Llanharry iron deposit, South
Wales. Transactions of Institution Mining and Metallurgy (Sect. B:
Appl. earth sciences), 94, B126-B132-
Raven, M. R. 1983. The diagenesis of the Oolite Group between Blaen
Onnen and Pwll Du, Lower Carboniferous, South Wales. Unpublished
Ph. D. thesis, University of Nottingham, Great Britain.
240
Raymond, A., Parker, W. C. & Parrish, J. T. 1985. Phytogeography and paleoclimate of the Early Carboniferous. In: Geological Factors and the Evolution of Plants (Ed. B. H. Tiffney), 169-222. Yale University Press New Haven and London.
Read, J. F. 1982. Carbonate platforms of passive (extensional) continental margins: types, characteristics, and evolution. Tectonophysics, 81,195-212.
Read, J. F. 1985. Carbonate platform facies models. American Association of Petroleum Geologists, Bulletin, 69,1-21.
Reading, H. G. 1973. The tectonic environment of Southwest England. Proceeding Geologist's Association 84,239-242.
Reineck, H. -E. & Singh, I. B. 1972. Genesis of laminated sand and graded rhythmites in storm-sand layers of shelf mud. Sedimentology, 18,123-128.
Reynolds, R. C. 1984. Interstratified clay minerals. In: Crystal
structures of clay minerals and their X-ray identification, 249-304 (Eds G. W. Brindley and G. Brown). Mineralogical Society
of London.
Rhoads-, D. C. 1967. Biogenic reworking of intertidal and subtidal sediments in Barnstable Harbor and Buzzards Bay, Massachusetts. Journal of Geology, 75,461-476.
Rhoads, D. C. & Stanley, D. J. 1965. Biogenic graded bedding. Journal of Sedimentary Petrology, 35,956-963.
Rhodes, F. H. T., Austin, R. L. & Druce, E. C. 1969. British Avonian (Carboniferous) conodont faunas, and their value in local and intercontinental correlation. Bulletin of the Bristish Museum (Natural History) Geology, Supplement 5.
Riding, R. & Jansa, L. F. 1974. Uraloporella Korde in the Devonian of Alberta. Canadian Journal of Earch Sciences, 11,1414-1426.
Riding, R. & Jansa, L. F. 1976. Devonian occurrence of Uraloporella (? foraminifer) in the Canning Basin, Western Australia. Journal
of Paleontology, 50,805-807.
Riding, R. & Wright, V. P. 1981. Palaeosols and tidal-flat/ lagoon
sequences on a Carboniferous carbonate shelf: sedimentary
associations of triple disconformities. Journal of Sedimentary
Petrology, 51,1323-1339.
Robinson, D. & Wright, V. P. 1987. Ordered illite-smectite and kaolinite-smectite: pedogenic minerals in a Lower Carboniferous
paleosol sequence, South Wales. Clay minerals, 22,
109-118.
Ross, C. A. & Ross, J. P. 1985. Late Paleozoic depositional sequences are
synchronous and worldwide. Geology, 13,194-197.
241
Ross, C. A. & Ross, J. P. 1987. Late Paleozoic sea levels and depositional sequences. Cushman Foundation for Foraminiferal Research, Special Publication, 24,137-149.
Rowley, D. B., Raymond, A., Parish, J. T., Lottes, A. L., Scotese, C. R. & Ziegler, A. M. 1985. Carboniferous palaeogeographic, and paleoclimatic reconstructions. International Journal of Coal Geology, 5,7-42.
Schofield, K. & Adams, A. E. 1985. Stratigraphy and depositional environments of the Woo Dale Limestones Formation (Dinantian), Derbyshire. Proceedings of the Yorkshire Geological Society, 45,225-233.
Schofield, K. & Adams, A. E. 1985. Stratigraphy and depositional
environments of the Woo Dale Limestones Formation (Dinantian), Derbyshire. Proceedings of the Yorkshire Geological Society, 45,225-233.
Scotesce, C. R., Bambach, R. K., Banton, C., Van Der Voo, R. & Ziegler, A. M. 1979. Palaeozoic base maps. Journal of Geology, 87, 217-277.
Searl, A. 1988. Pedogenic dolomites from the Oolite Group (Lower Carboniferous) South Wales. Geological Journal, 23, 157-169.
Searl, A. 1989. Pedogenic columnar calcites from the Oolite Group (Lower
Carboniferous), South Wales. Sedimentary Geology, 62,47-58.
Selwood, E. B. & Thomas, J. M. 1987. Dinantian sedimentation in Southwest England. In: European Dinantian Environments (Eds J. Miller, A. E. Adams and V. P. Wright), 189-198. Geological Journal Special Issue No. 12. John Wiley (Chichester).
Sevastopulo, G. D. 1982. The age and depositional setting of the
Waulsortian limestones in Ireland. In: Symposium on the Paleoenvironmental Setting and Distribution of the Waulsortian Facies (Eds K. R. Bolton, R. H. Lane, & D. V. LeMone) 65-79. El
Paso Geological Society and University of Texas at El Paso.
Sevastopulo, G. D. & Nudds, J. R. 1987. Courceyan (Early Dinantian)
biostratigraphy of Britain and Ireland: coral and conodont zones
compared. Cour. Forsch. -Inst. Senckenberg, 98,39-46.
Shinn, E. A., Lloyd, R. M. and Ginsburg, R. M. 1969. Anatomy of a modern
carbonate tidal flat, Andros Island, Bahamas. Journal of
Sedimentary Petrology, 39,1202-1228.
Sibley, D. F. & Gregg, J. M. 1987. Classification of dolomite rock textures.
Journal of Sedimentary Petrology, 57,967-975.
Sibly, T. F. 1905. The Carboniferous Limestone of the Weston-super-Mare
district (Somerset). Quarterly Journal of Geological Society of London, 69,548-563.
242
Simms, M. 1984. Dolomitization by groundwater-flow systems in carbonate platforms. Transactions of Gulf Coast Association Geological Society, 34,411-420.
Simpson, J. 1985. Stylolite-controlled layering in an homogeneous limestone pseudo-bedding produced by burial diagenesis. Sedimentology, 32,495-505.
Simpson, J. 1987. Mud-dominated storm deposits from a Lower Carboniferous ramp. Geological Journal, 22,191-206.
Smith, A. G. 1981. Phanerozoic Equal Area Maps. Geol. Rundsch., 70,91-127.
Smith, A. G., Briden, J. C. & Drewry, G. E. 1973. Phanerozoic World Maps. In: Organsims and Continents through Time 1.42 (Ed. N. F. Hughes). Palaeontological Assocation, London.
Soegaard, K. & Eriksson, K. 1985. Evidence of tide, storm, and wave interaction on a Precambrian siliciclastic shelf: the 1,700 m. y. Ortega Group, New Mexico. Journal of Sedimentary Petrology, 55,672-684.
Somerville, I. D. 1979. Minor cyclicity in late Asbian limestones in the Llangollen district of North Wales. Proceedings of the Yorkshire Geological Society, 42,317-341.
Somerville, I. D. & Jones, G. L. 1985. The Courceyan stratigraphy of the Pallaskenry borehole, County Limerick, Ireland. Geological Journal, 20,377-400.
Somerville, I. D., Strank, A. R. E. & Welsh, A. 1989. Chadian faunas and flora from Dyserth: Depositional environments and palaeogeographic setting of Visean strata in Northeast Wales. Geological Journal, 24,49-66.
Speedyman, D. L. 1977. Volcanic rocks of the Bristol region. In: Geological excursions in the Bristol district (Ed. R. J. G. Savage), 47-54. University of Bristol press.
Starkey, H. C., Blackmon, P. D. & Hauff, P. L. 1984. The routine mineralogical analysis of clay-bearing samples. Bulletin of the US Geological Survey.
Strogen, P. 1988. The Carboniferous lithostratigraphy of southeast County Limerick, Ireland and, the origin of the Shannon Trough. Geological Journal, 23,121-137.
Sullivan, R. 1960. The Mid-Dinantian stratigraphy of a portion of
central Pembrokeshire. Unpublished Ph. D. thesis University of Glasgow, Great Britain.
Sullivan, R. 1965. The Mid-Dinantian stratigraphy of a portion of central Pembrokeshire. Proceedings of the Geologists' Association
London, 76,283-299.
243
Swennen, R., Boonen, P. & Viaene, W. 1982. Stratigraphy and lithogeochemistry of the Walhorn section (lower VisXan; Vesder Basin, E. -Belgium) and its implications. Bulletin de la Societe beige de Geologie, 4,239-258.
Swennen, R., Viaene, W., Jacobs, L. & Van Orsmael, J. 1981. Occurrence of calcite pseudomorphs after gypsum in the Lower Carboniferous of the Vesder region (Belgium). Bulletin de la Societe beige de Geologie, 3,231-247.
Swift, D. J. P., Figueiredo, A. G. (Jr), Freeland, G. L. & Oertel, G. F. 1983. Hummocky cross-stratification and megaripples a geological double standard. Journal of Sedimentary Petrology, 53, 1295-1317.
, Swift, D. J. P., Hudelson, P. M., Brenner, R. L. & Thompson, P. 1987. Shelf
construction in a foreland basin: storm beds, sandbodies, and shelf-slope depositional sequences in the Upper Cretaceous Mesarerde Group, Brook Cliffs, Utah. Sedimentology, 34,423-457.
Swift, D. J. P. & Nummedal, D. 1987. Hummocky cross-stratification, tropical hurricanes, and intense winter storms: discussion. Sedimentology, 34,338-344.
Tertian, R. & Claisse, F. 1982. Principles of quantitative X-ray fluorescence analysis. Haydon (London).
Thomas, L. P. 1974. The Westphalian (coal measures) in South Wales. In: The Upper Palaeozoic and Post-Palaeozoic Rocks of Wales, (Ed. T. R. Owen), 133-160. University of Wales Press, Cardiff.
Tucker, M. E. 1985. Shallow marine carbonate facies and facies models. In Sedinientology: Recent Developments and Applied Aspects (ed. P. J. Brenchley & B. P. J. Williams) 147-169, Geological Society of London, Special Publication no. 18.
Tudhope, A. W. & Scoffin, T. P. 1984. The effects of Callianassa bioturbation on the preservation of carbonate grains in Davies Reef Lagoon, Great Barrier Reef, Australia. Journal Sedimentary Petrology, 54,1091-1096.
Turner, P. & Tarling, D. H. 1975. Implications of new palaeomagnetic results from the Carbonifeus System of Britain. Journal of Geological Society of London, 131,469-488.
Upton B. G. J. 1982. Carboniferous to Permian volcanism in the stable foreland. In: Igneous rocks of the British Isles (Ed. D. S.
Sutherland). Wiley.
Usdowski, H. E. 1968. The formation of dolomite in sediments. In: Recent
Developments in Carbonate Sedimentology in Central Europe (Ed. G. Miller & G. M. Friedman) 21-32. Springer-Verlag, Berlin.
244
Vai, G. B. & Ricci-Lucchi, F. 1977. Algal crusts autochonous and clastic gypsum in a cannibalistic evaporite basin: a case history from the Messinian of the Northern Apennines. Sedimentology, 24, 211-244.
Van Der Zwan, C. J., Bouleter, M. C. & Hubbard, R. N. L. B. 1985. Climatic change during the' Lower Carboniferous in Euramerica, based on multivariate statistical analysis of palynological data. Palaeogeography, Palaeoclimatology, Palaeoecology, 52,1-20.
Varker, W. L. & Sevastopulo, G. D. 1985. The Carboniferous System: Part 1- Conodonts of the Dinantian subsystem from great Britain and Ireland. In: The stratigraphical index of conodonts (Eds A. C. Higgins and R. L. Austin) 167-209. Cardiff: Ellis Horwood Ltd.
Vaughan, A. 1903. Notes on the corals and brachiopods obtained from the Avon section and preserved in the Stoddart Collection. Proceedings of the Bristol Naturalists' Society. (New Series), 10,90-134.
Vaughan, A. 1905. Palaeontological sequence in the Carboniferous Limestone of the Bristol area. Quarterly Journal of the Geological Society
of London, 61,181-307.
Walkden, G. M. 1974. Paleokarstic surfaces in the Upper Vis4an (Carboniferous) limestones of the Derbyshire Block, England. Journal of Sedimentary Petrology, 44,1232-1247.
Walkden, G. M. 1987. Sedimentary and diagenetic styles in late Dinantian
carbonates of Britain. In: European Dinantian Environments (eds J. Miller, A. E. Adams and V. P. Wright), 131-155. Geological Journal Special Issue no. 12. John Wiley (Chichester).
Walker, R. G., Duke, W. L. & Leckie, D. A. 1983. Hummocky stratification significance of its bedding sequence: discussion and reply. Bulletin of the Geological Society of America, 94, 1245-1251.
Wanless, H. R. 1979. Limestone response to stress: pressure-solution and dolomitization. Journal of Sedimentary Petrology, 49,437-462.
Wanless, H. R., Lenore, P. T, & Tyrrell, K. M. 1988. Production of subtidal tubular and surficial tempestites by hurricane Kate, Caicos
Platform, British West Indies. Journal of Sedimentary Petrology, 58,739-750.
Waters, R. A. 1984. Some aspects of the Black Rock Limestone and Gully Oolite in the Eastern Vale of Glamorgan. Proceedings of the Geologist's Association, 95,391-392.
Waters, R. A. & Lawrence, D. J. D. 1987. Geology of the South Wales
Coalfield, Part III, the country around Cardiff. 3rd edition. Memoir Bristish Geological Survey, Sheet 263 (England and Wales).
245
Weedon, M. J. 1988. The analjvsis of a peritidal lithosome: the Lower Carboniferous Clifton Down Muds tone and correlative Chadian/Arundian units. Unpublished MSc thesis University of Bristol, UK.
Weimer, R. J., Howard, J. D. & Lindsay, D. R. 1982. Tidal flats. In: Sandstone Depositional Evironments (Eds by P. A. Scholle & D. Spearing). Memoir of the American Association of Petroleum Geologists, 31,191-245.
Whittaker, A. & Green, G. W. 1983. Geology of the country around Weston-super-Mare. Memoir of the Geological Survey of Great Britain, Sheet 279 with parts of 263 and 295.
Whittaker, A. & Scrivener, R. C. 1982. The Knap Farm Borehole at Cannington Park, Somerset. Report of Institute of Geological Sciences, No. 82/5.1-7.
Williams, G. D. & Chapman, T. J. 1986. The Bristol-Mendip foreland thrust belt. Journal of the Geological Society of London, 143, 63-73.
Wilson, D., Davies, J. R., Smith, M. & Waters, R. A. 1988. Structural controls on Upper Palaeozoic sedimentation in south-east Wales. Journal of the Geological Society, London, 145,901-914.
Wilson, J. L. 1975. Carbonate Facies in Geologic History. Springer (New York).
Wilson, J. L. & Jordan, C. 1983. Middle shelf environment. In: Carbonate depositional environments (Eds P. A. Scholle, D. G. Bebout & C. H. Moore), 298-343. American Association of Petroleum Geologists, Memoir 33.
Woodhead, J. D. 1987. Geochemistry of Mariana Island lavas. Unpublished D. Phil. thesis University of Oxford.
Wright, V. P. 1982a. Uraloporella Korde from the Lower Carboniferous
of South Wales. Bulletin British Natural History Museum (Geology), 36,151-155.
Wright, V. P. 1982b. Calcrete palaeosols from the Lower Carboniferous of South Wales. Sedimentary Geology, 52,1-33.
Wright, V. P. 1982c. Omission surfaces the Lower Carboniferous of South Wales. Neues fur Geol. und Palaeont., Monatshefte 1982, 619-628.
Wright, V. P. 1984a. Facies patterns in the early Carboniferous of South West Britain. European Dinantian Environments, First Meeting 1984, Abstracts, 88-91. Department of Earth Sciences, Open
University, Milton Keynes, U. K.
Wright, V. P. 1984b. Peritidal carbonate facies models: A review. Geological Journal, 19,309-325.
Wright, V. P. 1986. Facies sequences on a carbonate ramp: the Carboniferous Limestone of South Wales. Sedimentology 33,221-241.
246
Wright, V. P. 1987. The evolution of the Early Carboniferous Limestone Province in Southwest Britain. Geological Magazine, 124,477-480.
Wright, V. P. 1989. Reefs. In: Carbonate Sedimentology (Eds M. E. Tucker, V. P. Wright & T. Dickson). in press.. Blackwell Scientific (Oxford).
Wright, V. P. & Peeters, C. submitted. The origins of crystalline calcrete mosaics revealed by cathodoluminescence. Sedimentary Geology.
Wright, V. P. & Robinson, D. 1988. Early Carboniferous floodplain deposits from South Wales: a case study fo the controls on palaeosol development. Journal of the Geological Society, London, 145, 847-857.
Wu, Xian-Tao. 1982. Storm-generated depositional types and associated trace fossils in Lower Carboniferous shallow-marine carbonates of Three Cliffs Bay and Ogmore-by-sea, South Wales. Palaeogeograph3-, Palaeoclimatology, Palaeoecologs-, 39, 187-202.
Zenger, D. H. 1983. Burial dolomitization in the Lost Burro Formation (Devonian) eastcentral California and the significance of late diagenetic dolomitization. Geology, 11,519-522.
247
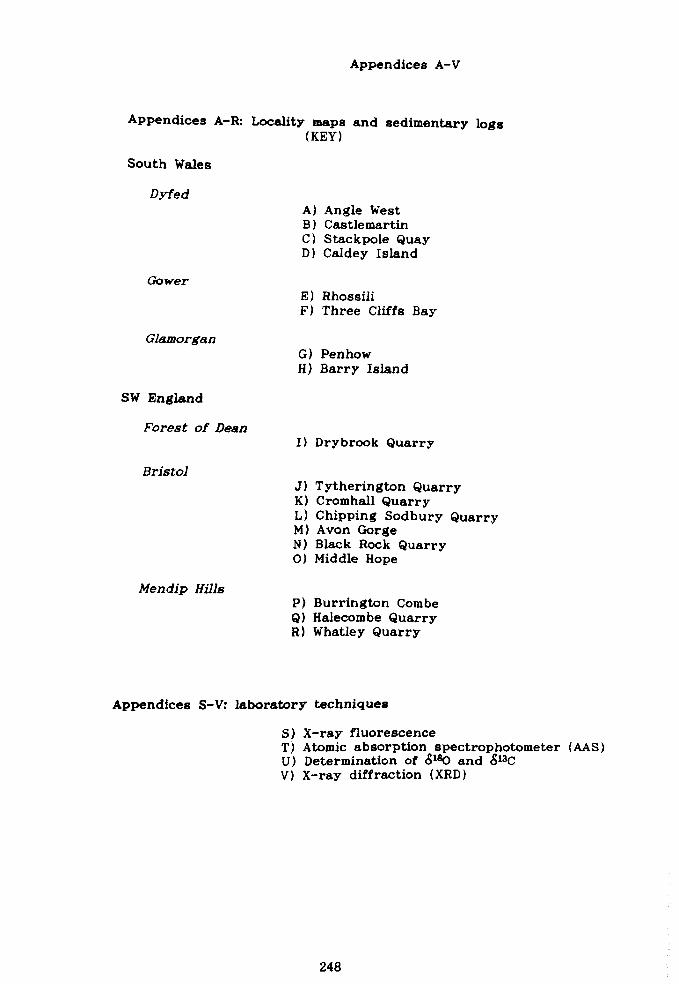
Appendices A-V
Appendices A-R: Locality maps and sedimentary logs (KEY)
South Wales
Dyfed
Gower
Glamorgan
SW England
Forest of Dean
Bristol
Mendip Hills
A) Angle West B) Castlemartin C) Stackpole Quay D) Caldey Island
E) Rhossili F) Three Cliffs Bay
G) Penhow H) Barry Island
I) Drybrook Quarry
J) Tytherington Quarry K) Cromhall Quarry L) Chipping Sodbury Quarry M) Avon Gorge N) Black Rock Quarry 0) Middle Hope
P) Burrington Combe Q) Halecombe Quarry R) Whatley Quarry
Appendices S-V: laboratory techniques
S) X-ray fluorescence T) Atomic absorption spectrophotometer (AAS) U) Determination of S180 and &13C V) X-ray diffraction (XRD)
248
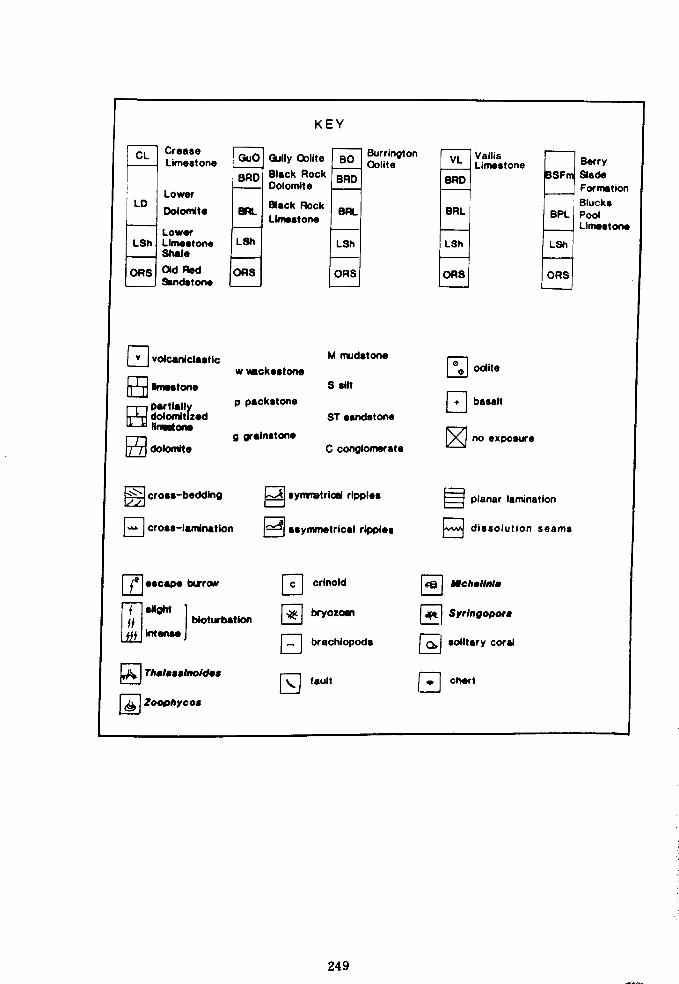
KEY
CL Crease ßu0 Bull Ocýlite O Burrington Vallis Limestone y B Oolite VL t Li BRD Black Rock BRD BRO
one mes
Dolomite Lower
LO Black Rock Dolomite ORL BRL BRL
Lower LSh Limestone LSh LSh LSh
Shale
ORS ad Red OR3 ORS OR3 Sandstone
volcaniciastic M niudstone °
w wacksstone odite o ® limestone S silt
partlally p packstone Q+ basalt
® dolomitized ST sandstone Ikmstone g grainstone
® no exposure
dole nits C conglomerate
cross-bedding
a cross-landnatIon
fe escape txrrcw
f slight ff bioturbation y krtenss
® Tha/ass/nold s
® Ioophycos
P synrretriod ripples
asymmetrical ripples
Fol crinold
bryozosn
D brachiopods
fault
Berry SF Slade
Formation Blucks
BPL Pool Limestone
LSh
ORS
planar lamination
dissolution seams
D MchN/nlo
Syringopors
j ýý solitary coral
" chit
249
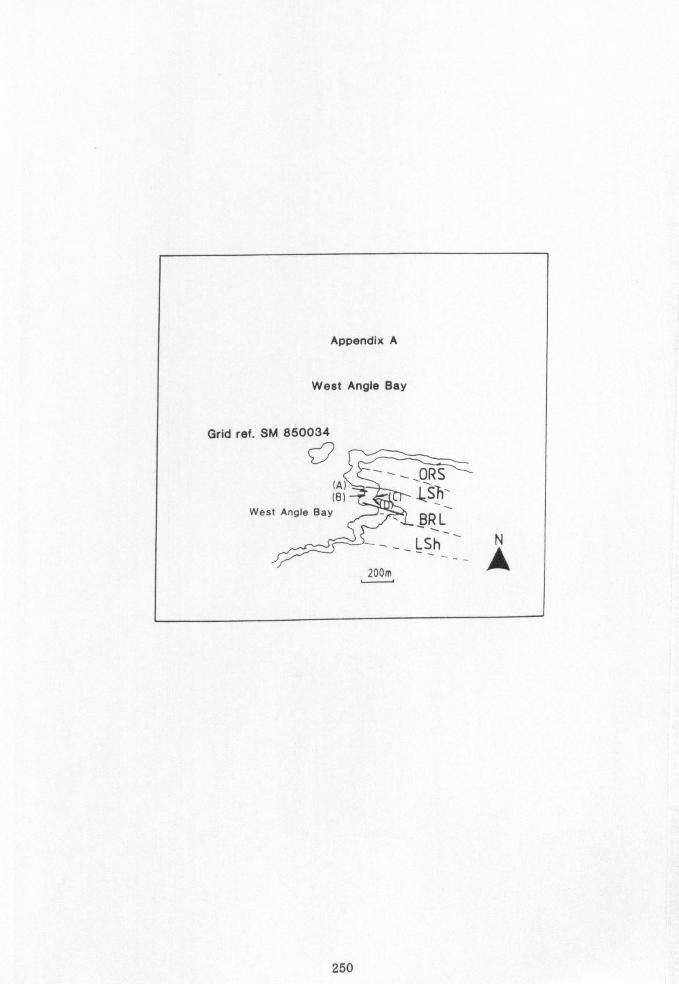
Appendix A
West Angle Bay
Grid ref. SM 850034
(A) , ORS
181 . L'SV
West Angle Bay BR L
-__ LSh 200m
250
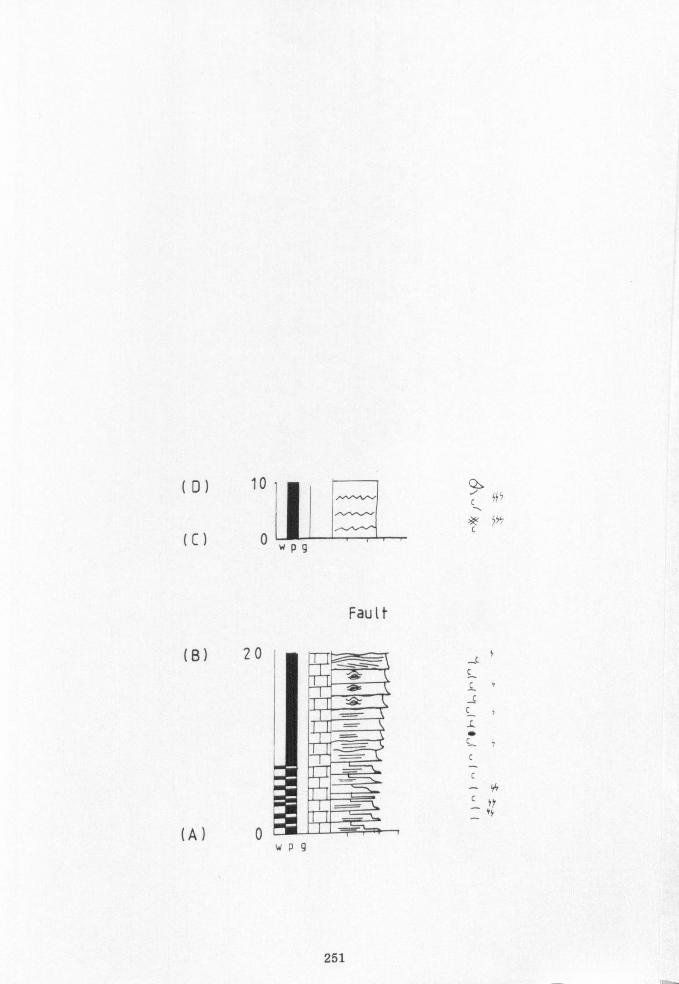
(D) 10'
(C) 0 NP91
Fault
(8) 20
(A) 0
C C_
Cý
_C
L
C
C
` +r by
wp9
251
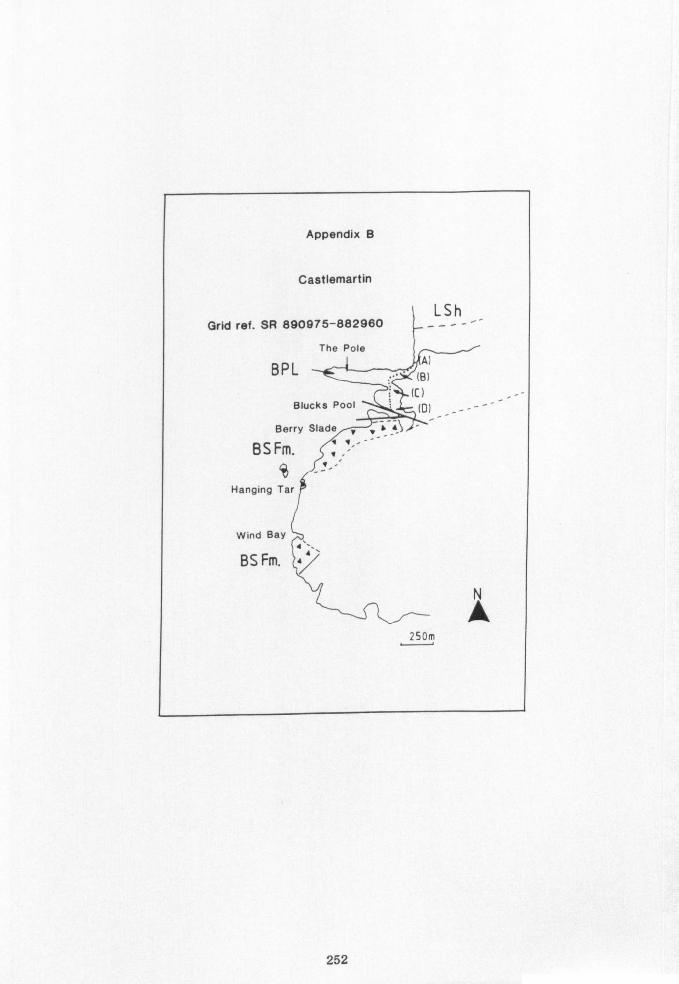
Appendix B
Castlemartin
LSh Grid ref. SR 890975-882960
The Pole
BPL 41 lBl
(C) Blucks Pool ` Cpl _
Berry Slade º ýý
BS Fm. ýý
Hanging Tar
Wind Bay
BS Fm. "
250m
252
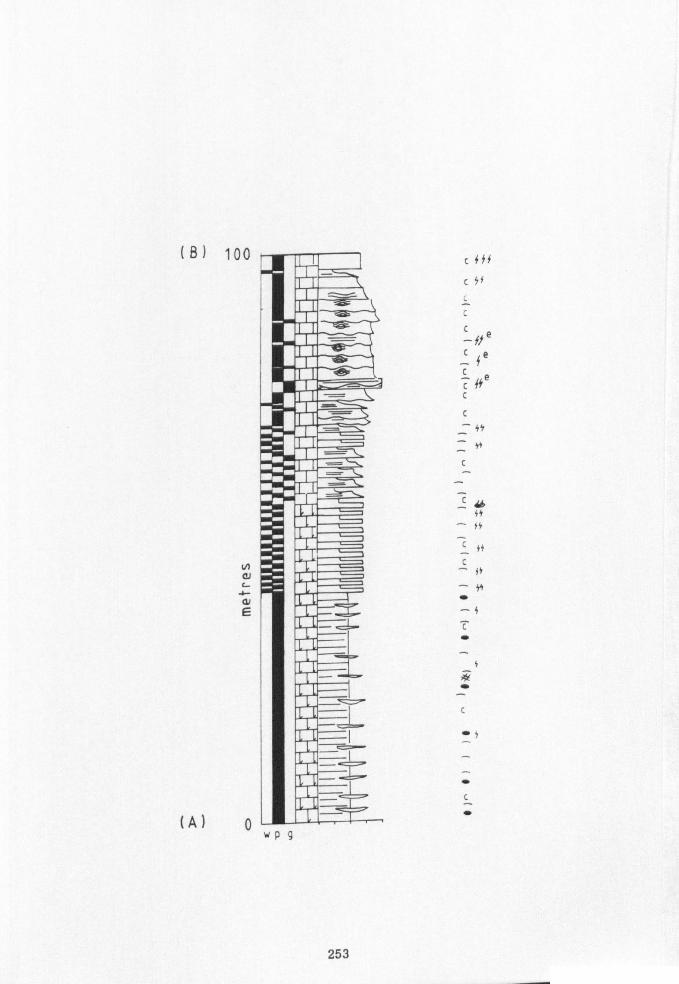
(8) 100
N CJ
4- GJ E
(A) p W hý y
fts
y,
-ffe ý fe
Cffe
_ y5
C
75
- yh
, 1Y
0
0
0
253

(C) 200
(B) 100 WP9
fis
c " ýy
5tf
c ý
ftf
c eý
" "
c I
ý ýyy
c 1
b
cý
254
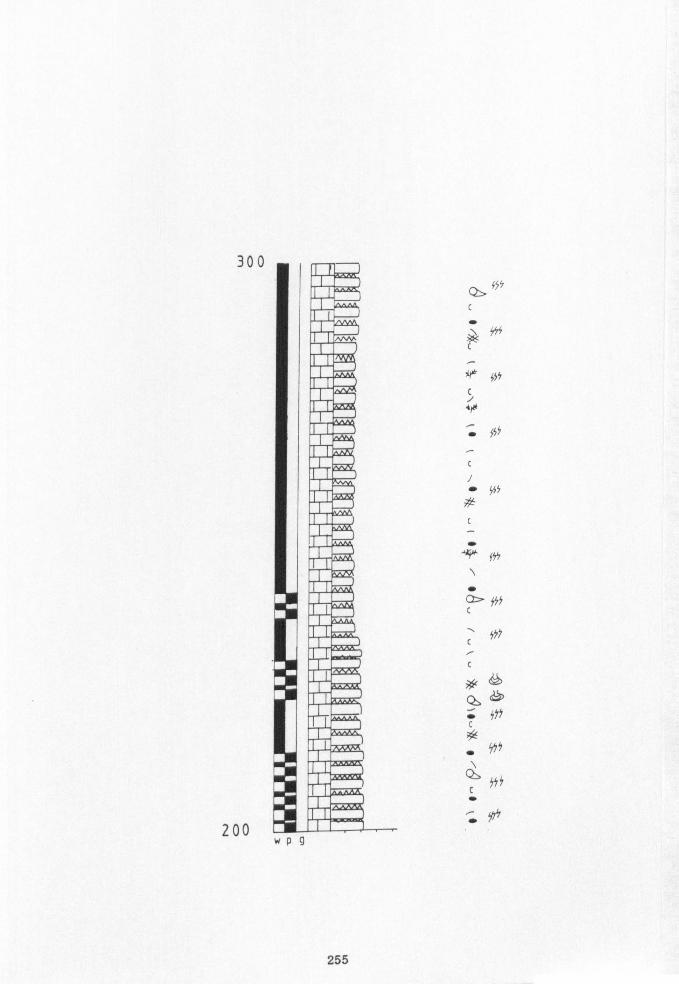
300
200 WP9
ý 555 c aý+
0
C
" sss
r
ý''` 45'ý
ý ý5f c
c yif
c
i fff c
Sys
0 f5i
Yyy
255
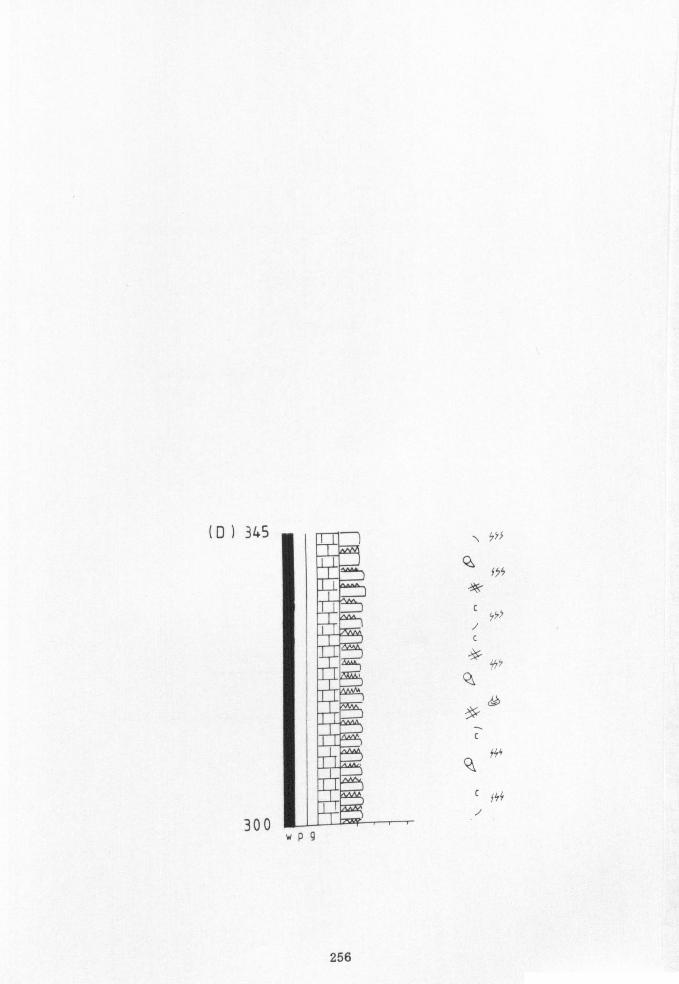
(0)345
300 wp9
ßf5
ý f55
c y55
c
tiny Q4
ý ßy4
C fyy
256
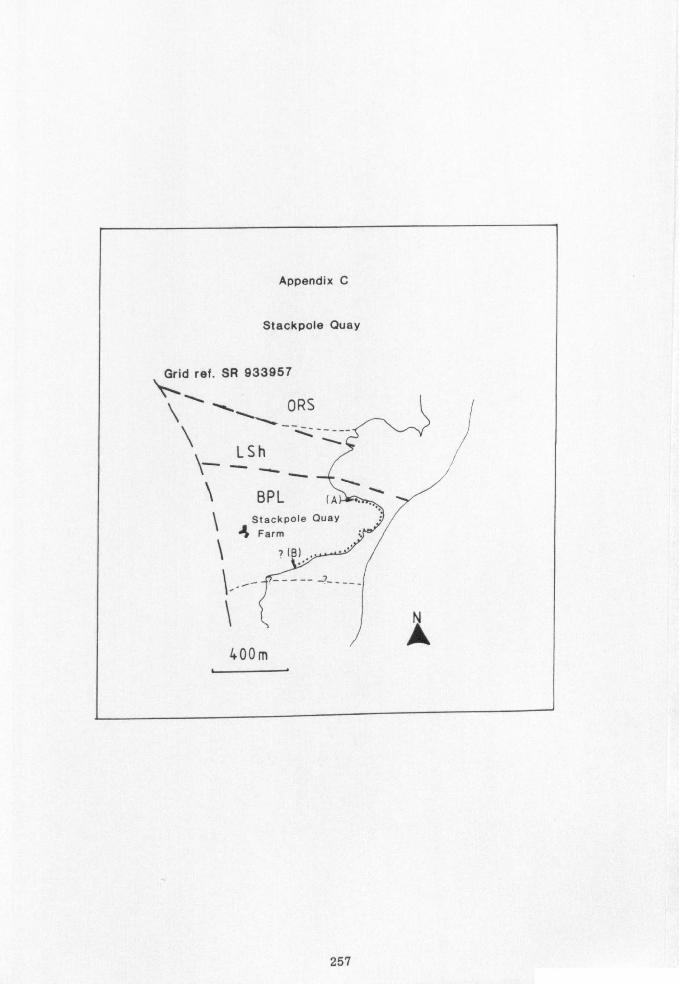
Appendix C
Stackpole Quay
Grid ref. SR 933957
tý ORS
\ LSh
1 BPL ýA .. 1 Stackpole Quay Farm
17 (B)
IN
400m
/1
257
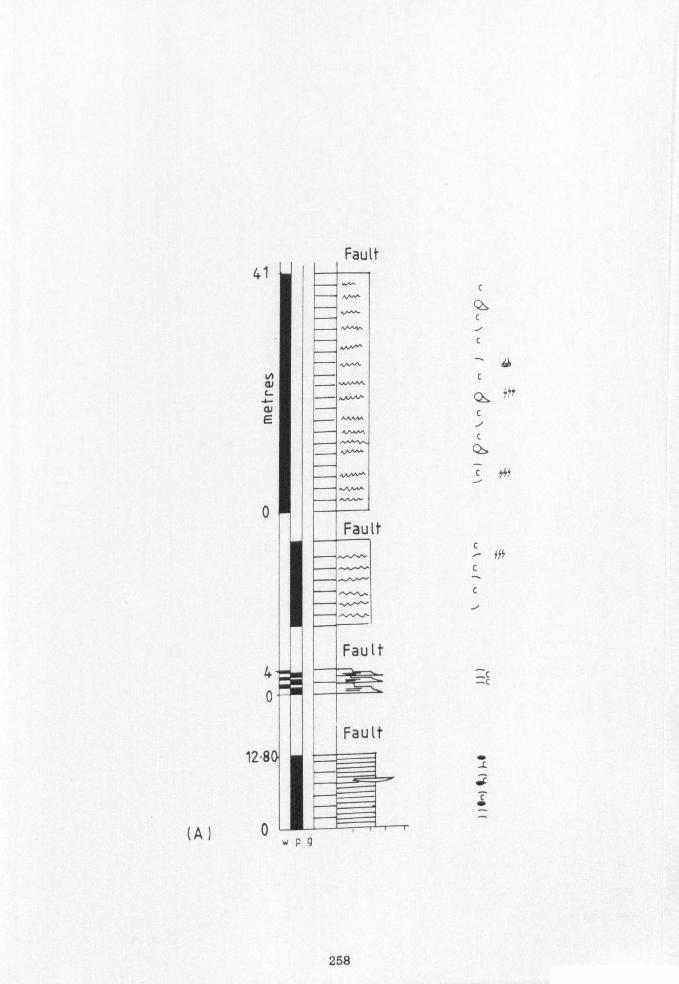
Fault 41
a) 4- n, E
C nM^
Qs
C
c
C
AAý C
C
0
0
ý ýf
Fau It
C
Fault 4
Fault 1280
ýAý 0P9
. _C
C
1 .c
258
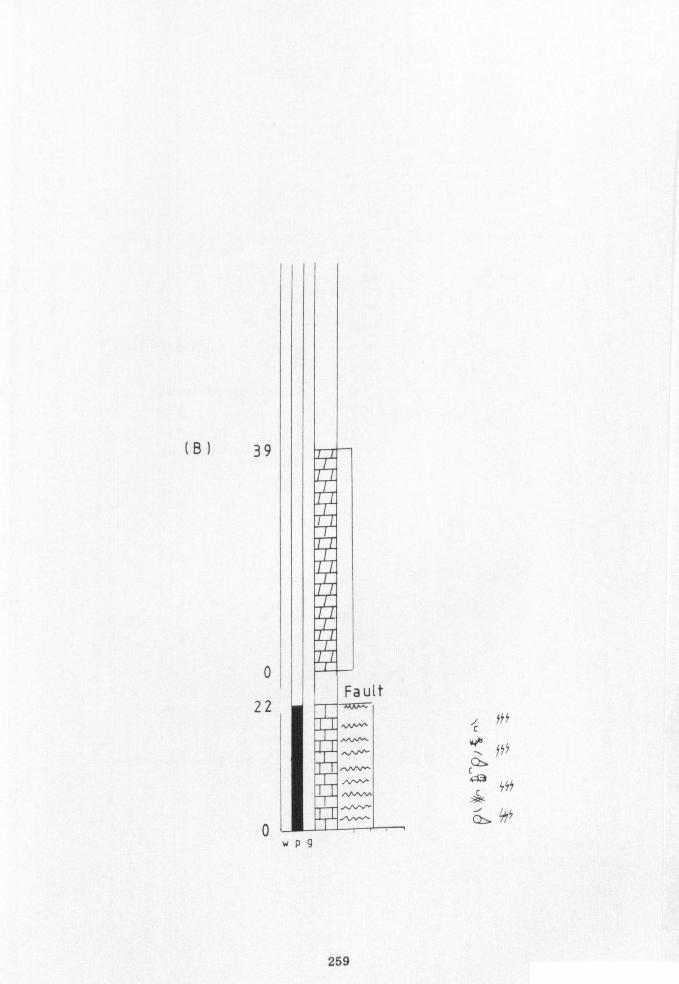
(B) 39
Fault 22
0i wP9
i fi4 c ý try 1
ý Syf
C ýý
259
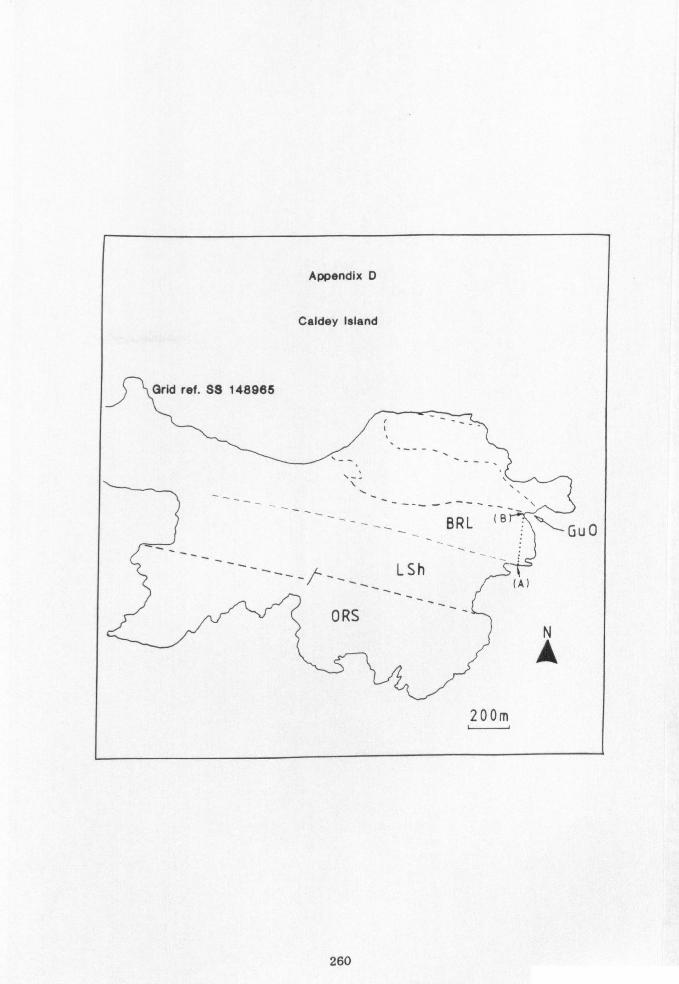
Appendix D
Caldey Island
Grid ref. SS 148965
BRL (8 Gu0
LSh
ORS N
A
200m
260

100
N G1
N
E
(A) 0 wp9
V >f ff
s»
C 5i - 45 c
- is c ý ye
Cy
C
Ch
f
C
C+
Cý
ý. f
Cf
C
CS ,ý
"f C
C
ýC y
261
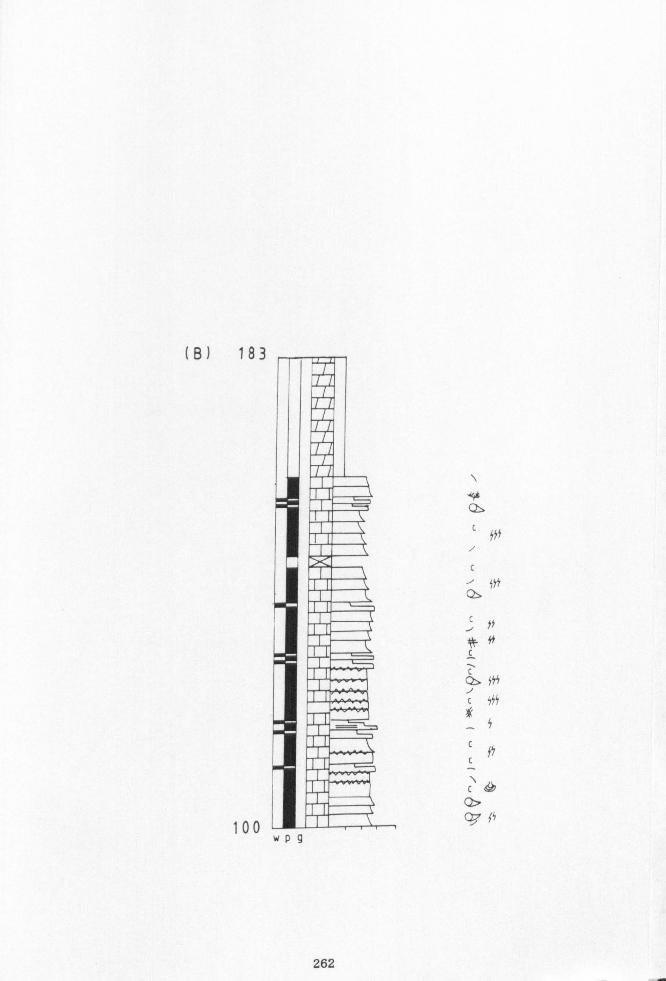
(B) 183
100 P9
'ý4+ý
c ýSý
C
J sys m
c c JL C 5ý/7
7
m is
262
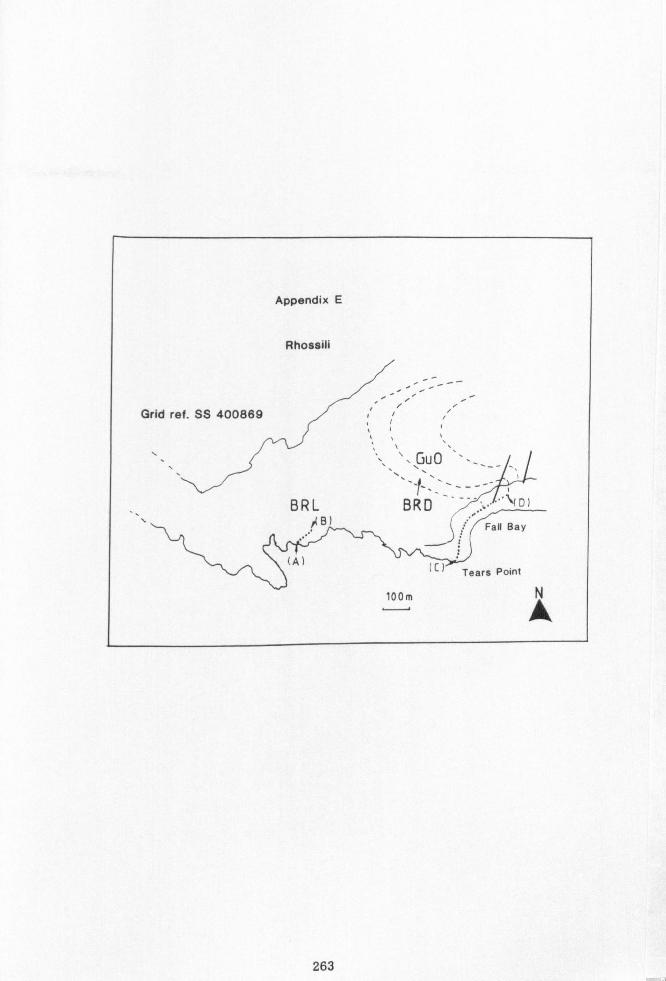
Appendix E
Rhossili
Grid ref. SS 400869 r
Gu0
BRL BRD
ýý r
Fall Bay
Tears Point
loom N A
263
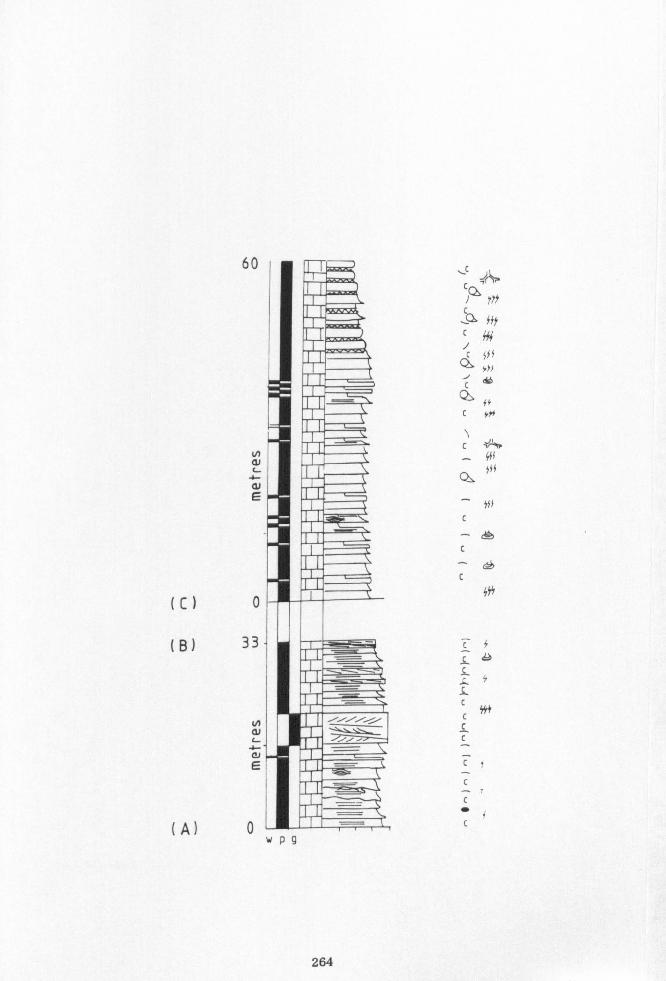
60
i1 a C- a E
(C) 0
(g) 33
N
a-
E
(A) ý wp9
c ýf ý r>t ýý ftt
ff9 C fss
Q, 5
0 tc
c fri
c
_ yys yss Q'I
yf3 C
C
C
Sý
Cf
ýý C
c ýf
264
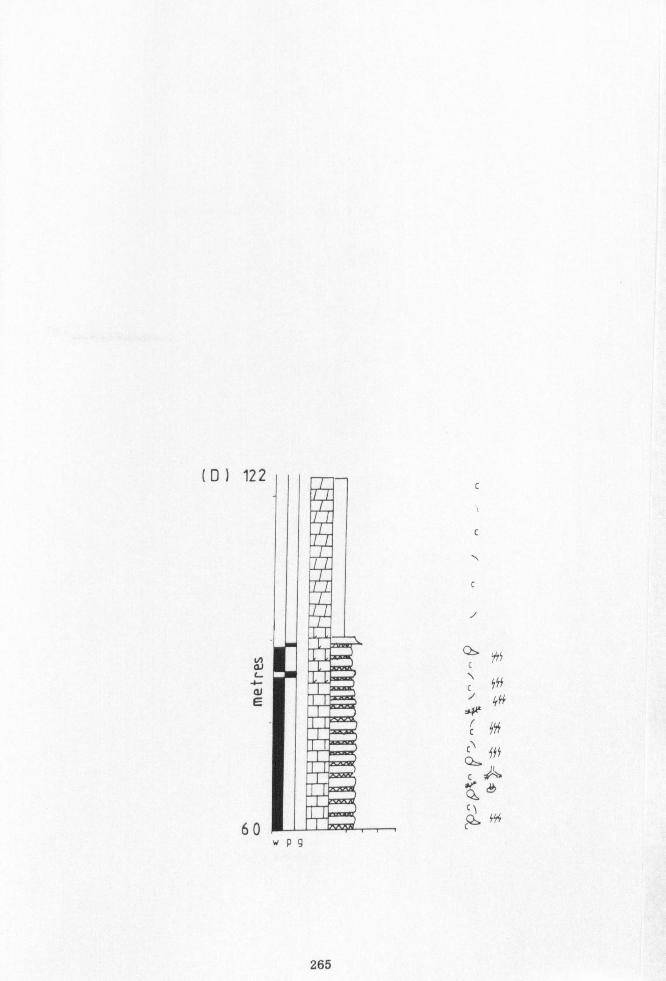
(D) 122
H a
4- aw E
60 WP9
C
i
c
4 Sý
ý sts
0 ý sý
265
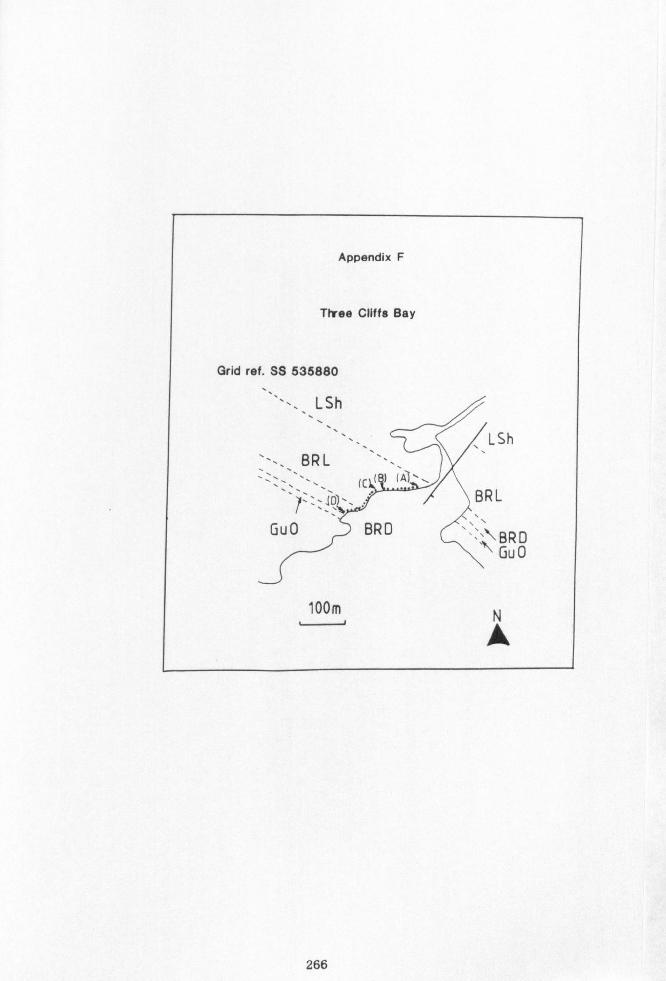
Appendix F
Three Cliffs Bay
Grid ref. SS 535880
LSh
LSh BRL
(C ia)
BRL
Gu0 BRO ,; \BRD Gu0
loom N __j A
266
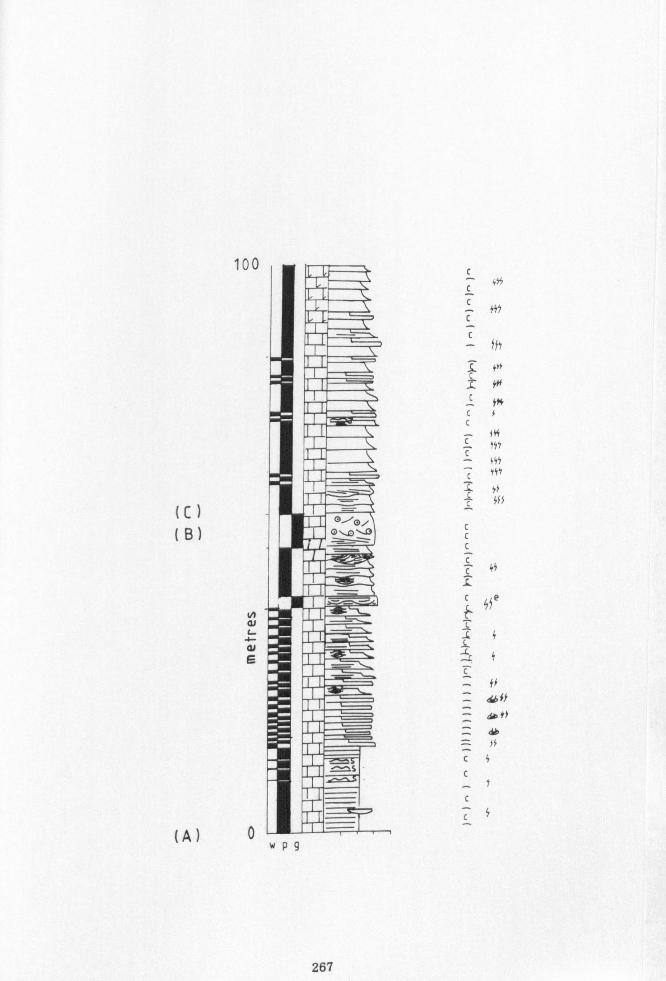
(C) (B)
(A)
100
N GJ L
a-- N
E
0 WP9
49ý
S 4rf ý f*
Ci
fei
- 44y
C yyy _C y1 ý ff3
C
Ste
14
- fi
-- ds ff
c4
CS
267
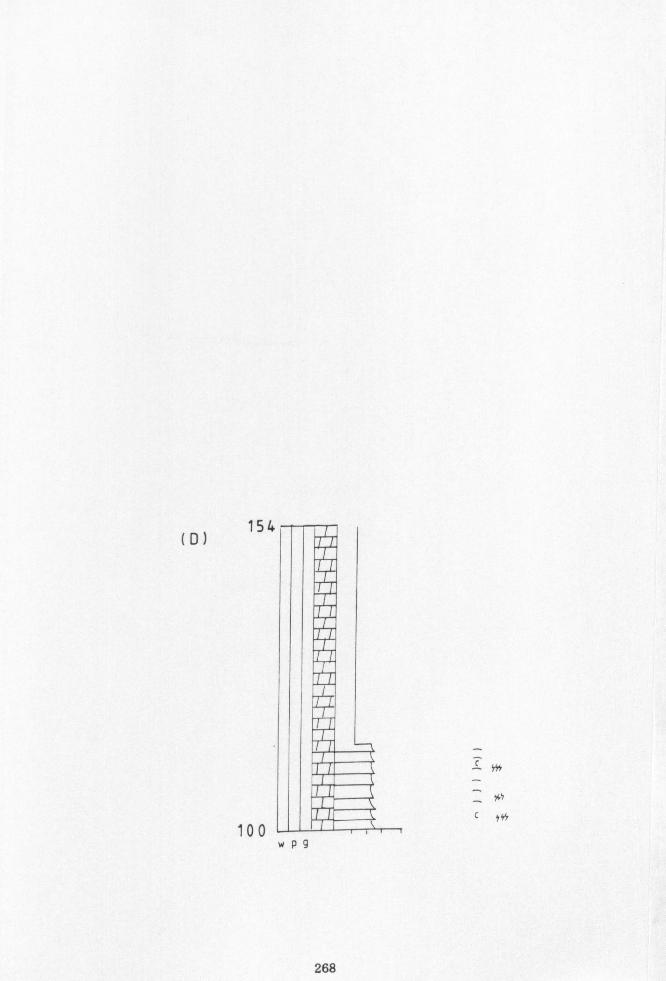
154 (D)
C ;*
_W C yf5
100 wP9
268
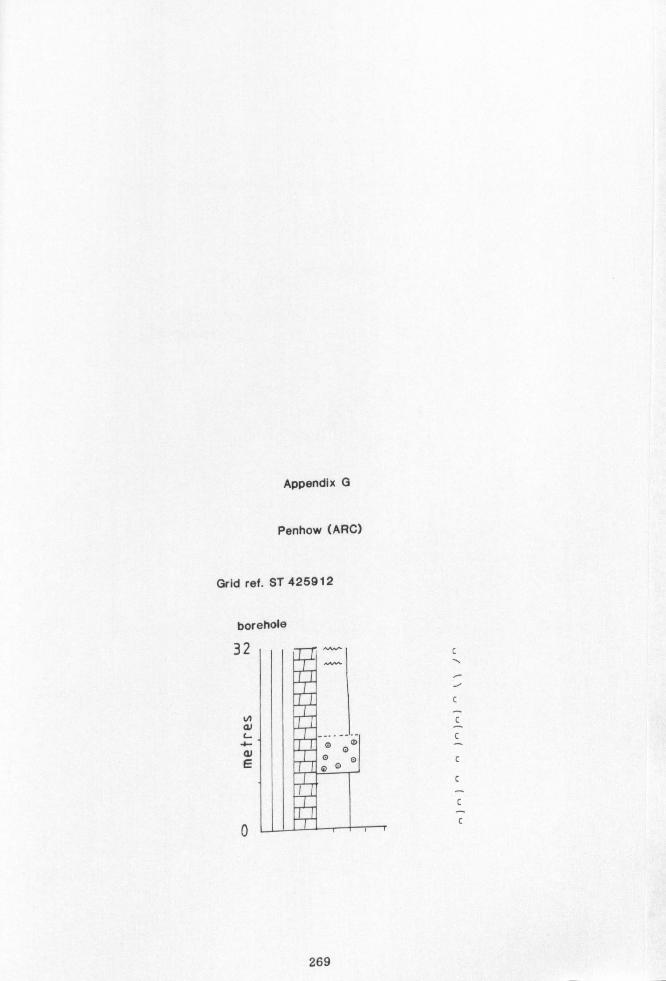
Appendix G
Penhow (ARC)
Grid ref. ST 425912
borehole
321 ,, ,ý-,
N d L
4-
Cl E
C
J
C
C
C
C
269
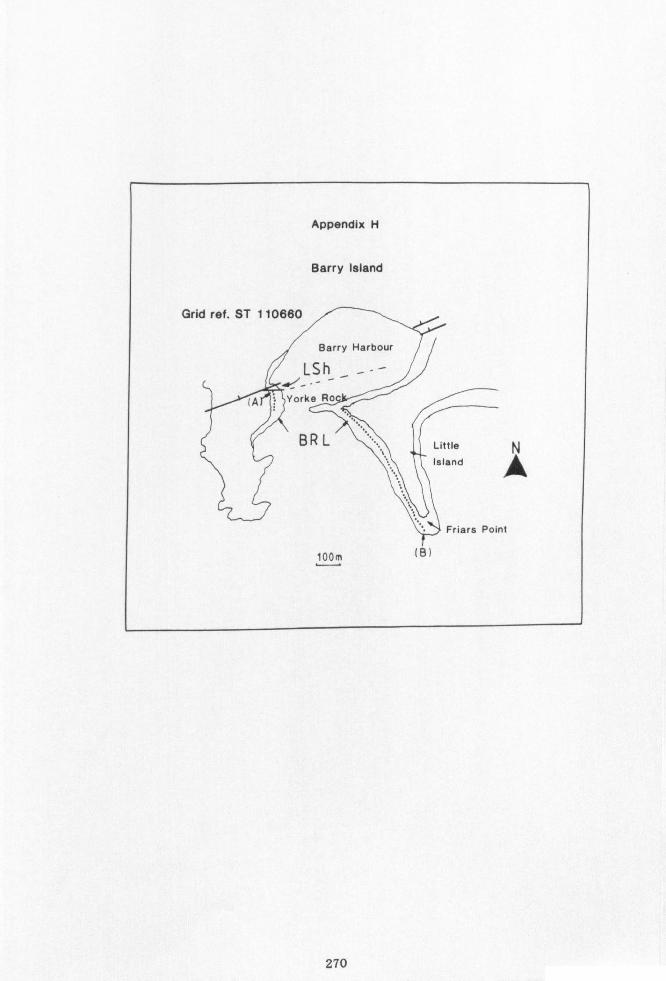
Appendix H
Barry Island
Grid ref. ST 110660
Barry Harbour
LSh _-- (A Yorke Ro
BRL Little N Island A
Friars Point
loom (B)
270
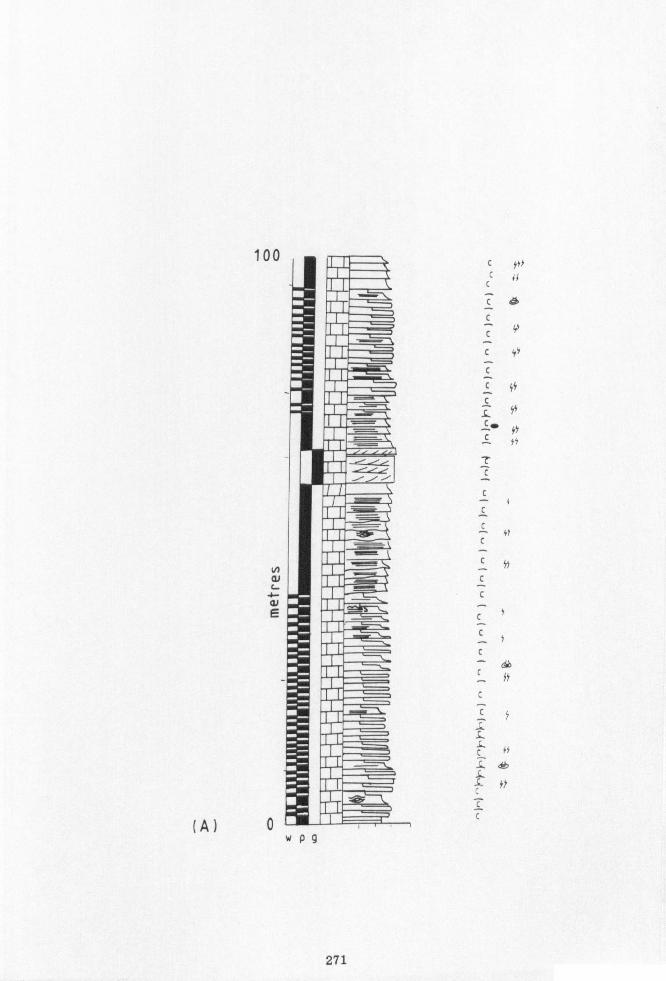
100
N al
4- G1
E
(A) 0 WP9
C fYS
ýi C
Cý
C 1 c
C y' c C 45 c
ý ys y L.
cý fy T C
C
C C
- 41 C
C Sr
C [
Cy
[r C
`_ fr C
CS
.a S.
[ fS
1.
ft
C C
271
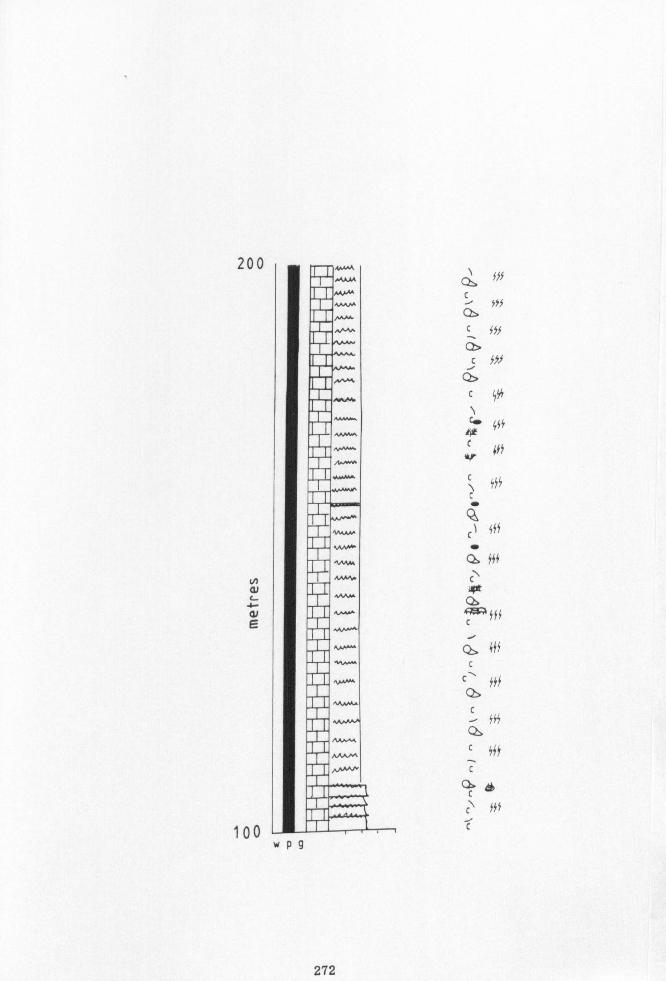
200
4J NI
100 wp9
ý f9f 0
ý Sff
c_ f5f
c ft5
c4w 4fs
ý eft
4fy N
C'
tff
Cý
ý ysf
c c, itf Q5 c
f4i 0 c cu C
Cl. & C
[ý tff
C
272
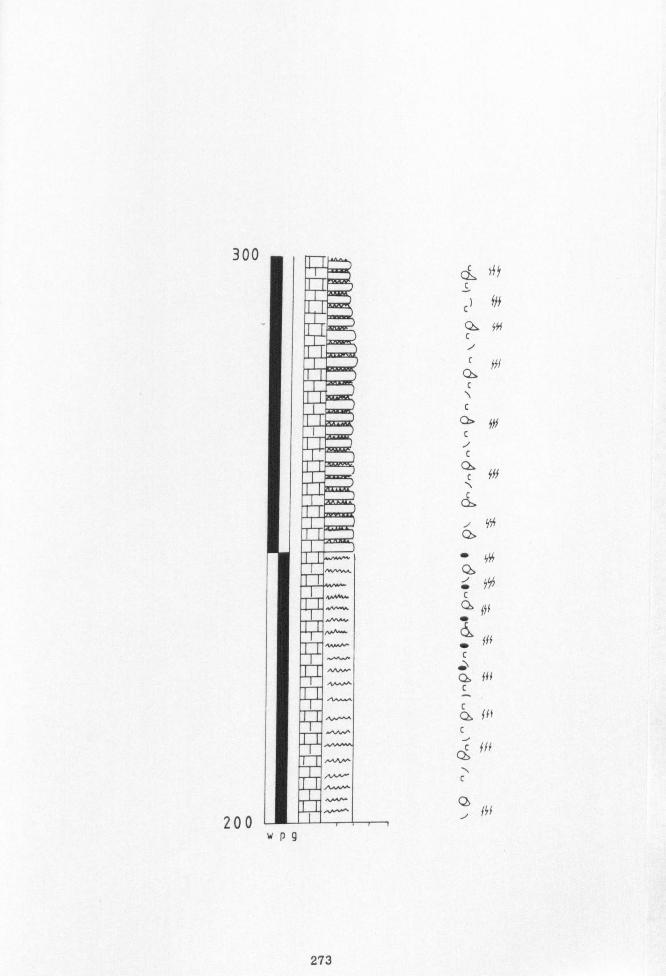
300
200
C2
c1 ftý
0 Sf c i
ý ffý
c
c m itf c i c
ýc fff
m
4ý
" y4 Qs " ý fts
fff
m ffi C m fif c J
[( ilj
ý fSj
WP9
Sý
10
273
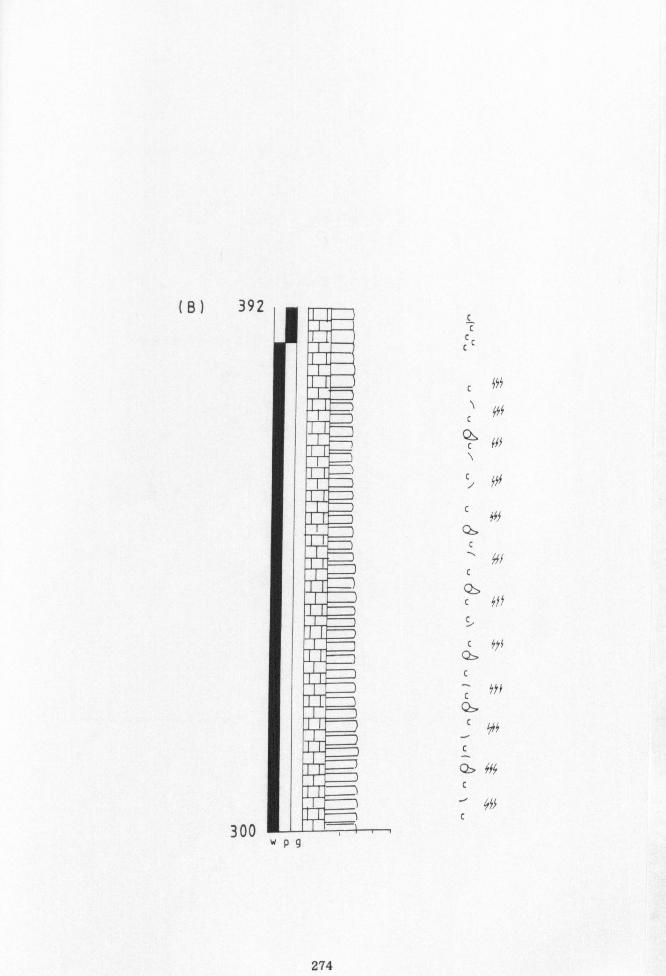
(B) 392
300 WP9
C C
CC C
C fif
ý f5f c
ý fff
C yff
c C& c
4i c 0 c Sft
c ýyf
c ý 9th
` ylý c
ffy c
yss
274
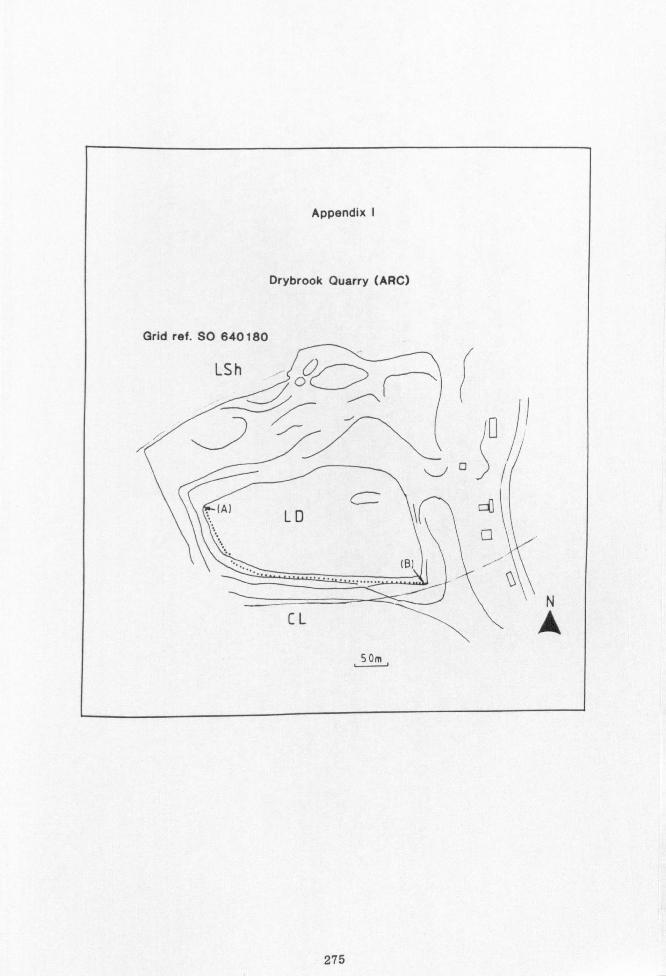
Appendix I
Drybrook Quarry (ARC)
Grid ref. SO 640180
LSh ý
Jl
(A) LDC1
CL
SOm
275
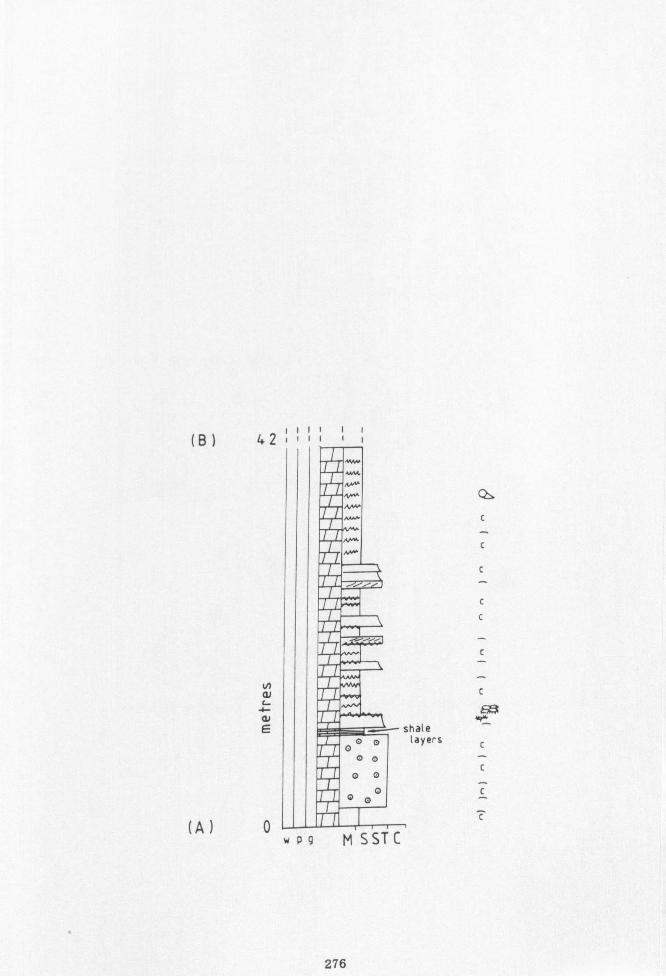
(B) 42: ý1:
0
c
c
C
N N L
411 E
(A) 0
c
; hale layers
c
c
c
276
wv9MS ST C
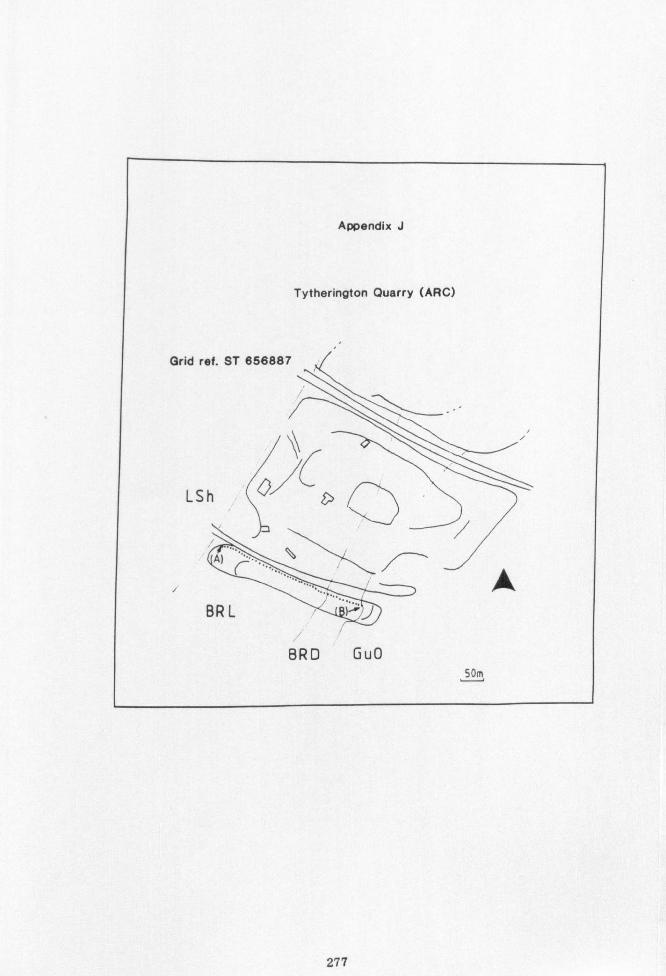
Appendix J
Tytherington Quarry (ARC)
Grid ref. ST 656887
LSh
BR L
BRD GuO 50m
277
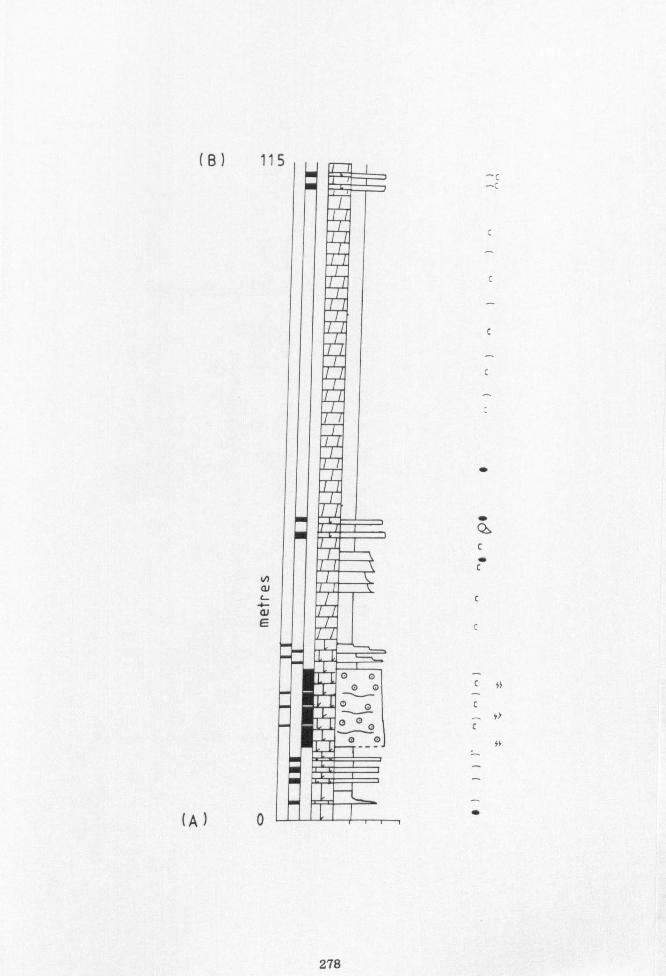
(B) 115
N
a)
a) E
(A) 0
^r
C
C
40
0
c
C
C sr
C
., Yt C
S4
4D
278
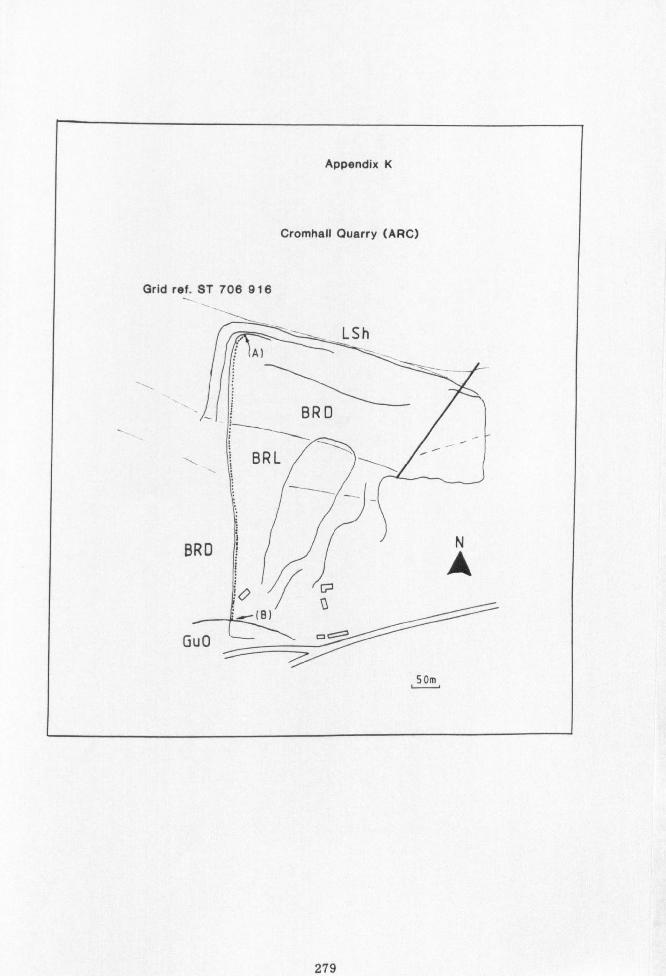
Appendix K
Cromhall Quarry (ARC)
Grid ref. ST 706 916
LSh A)
BRD
BRL
BRD N
(B) Gu0 °°
SOm
279
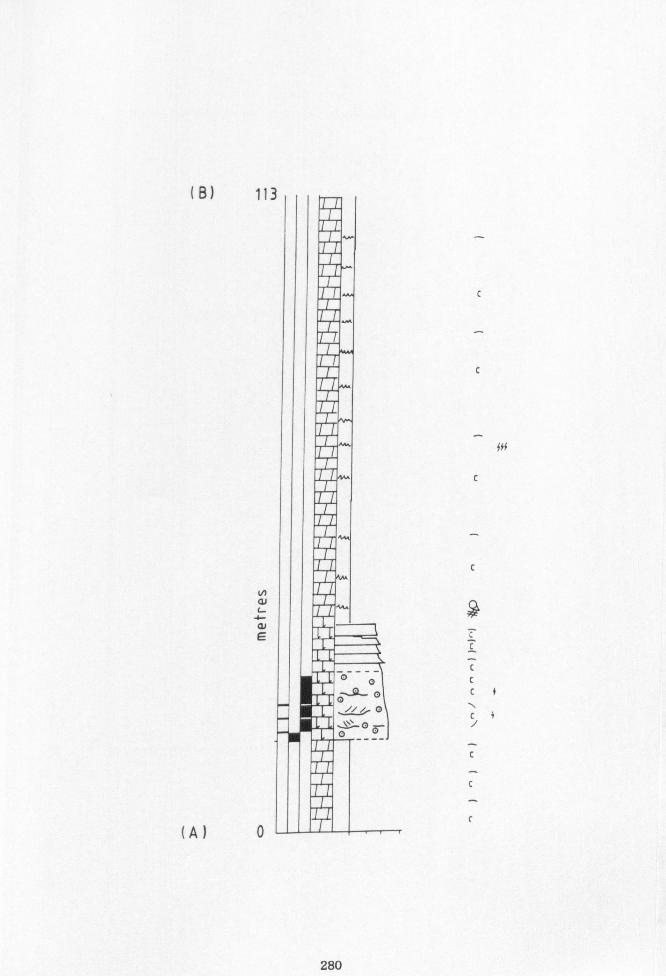
(B) 113
N
4- G1 E
(A) 0
C
C
^ of
C
C
C C
C C C
C
C
C
280
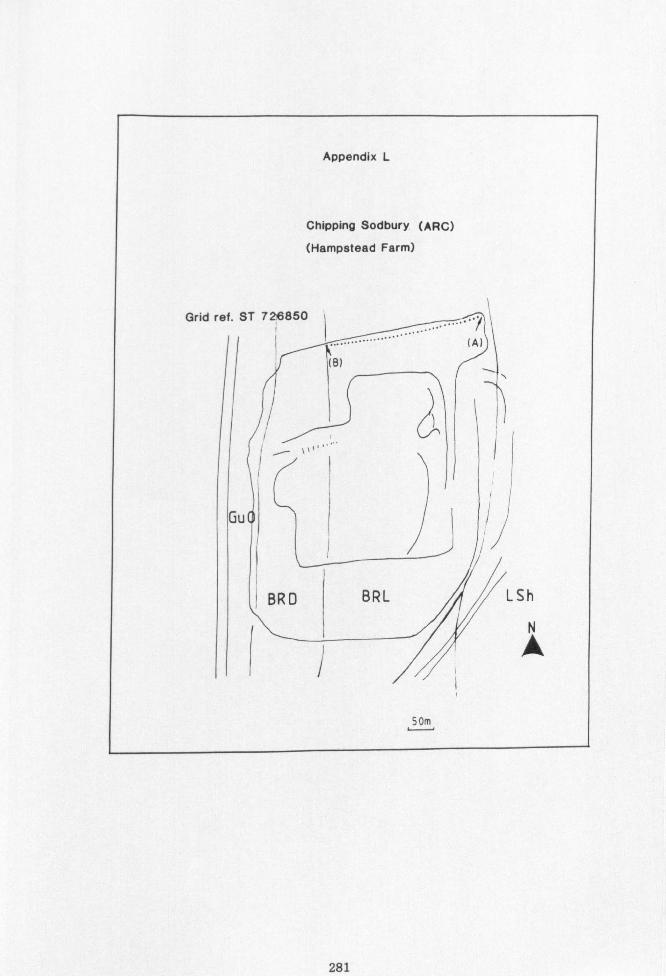
Appendix L
Chipping Sodbury (ARC)
(Hampstead Farm)
Grid ref. ST 726850
........ (A)
(B)
Gu
BRD BRL LSh
N
A
S0m
281
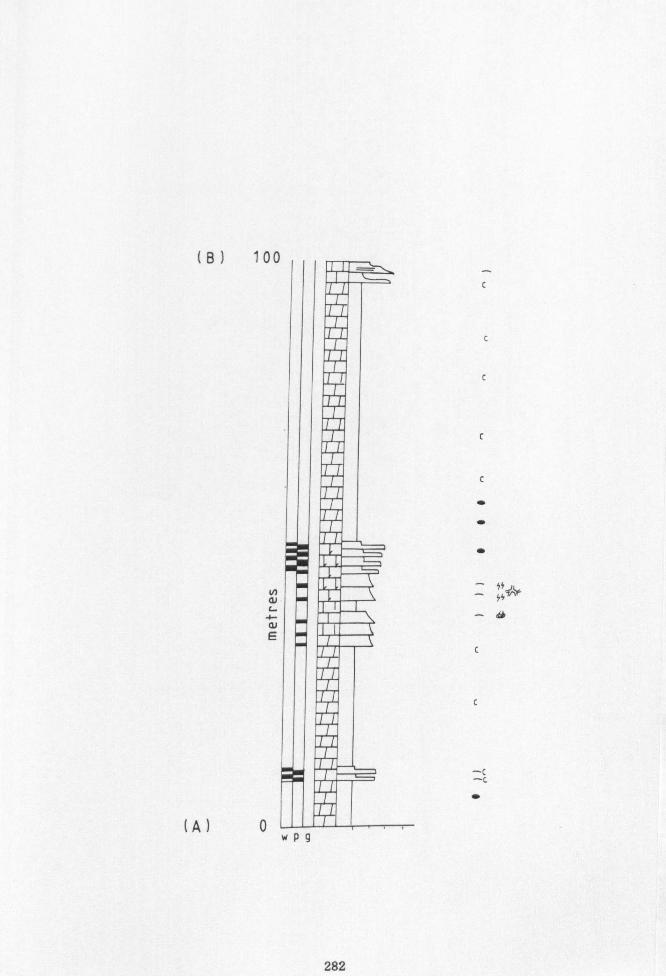
(B) 100
a C
a E
(A) 0 wP9
C
c
-C -c
282
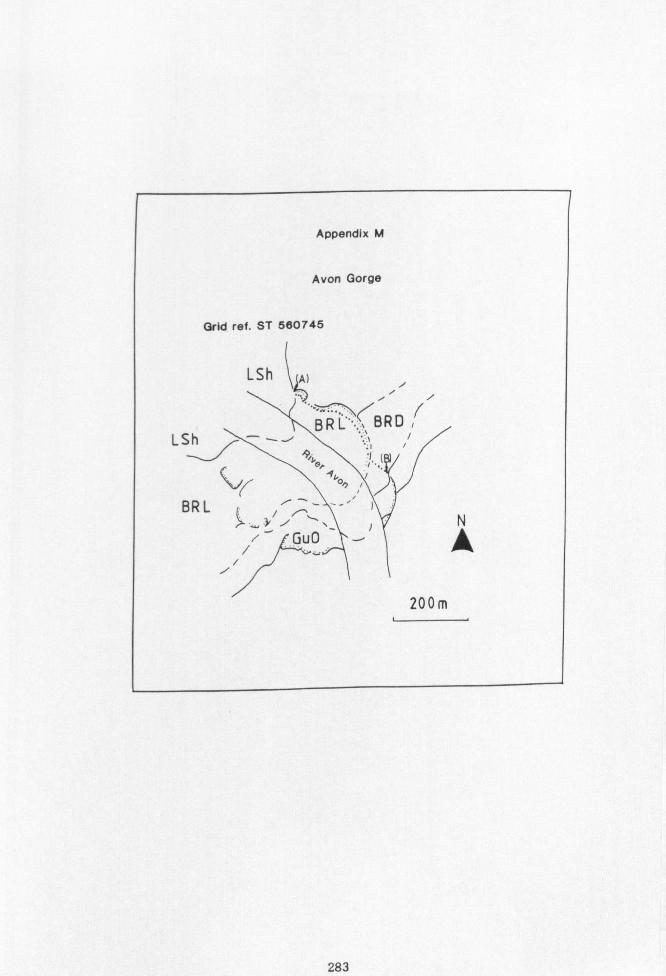
Appendix M
Avon Gorge
Grid ref. ST 560745
LSh A)
BR BRD LSh
BRL`^-
/ vý . A
200m
283
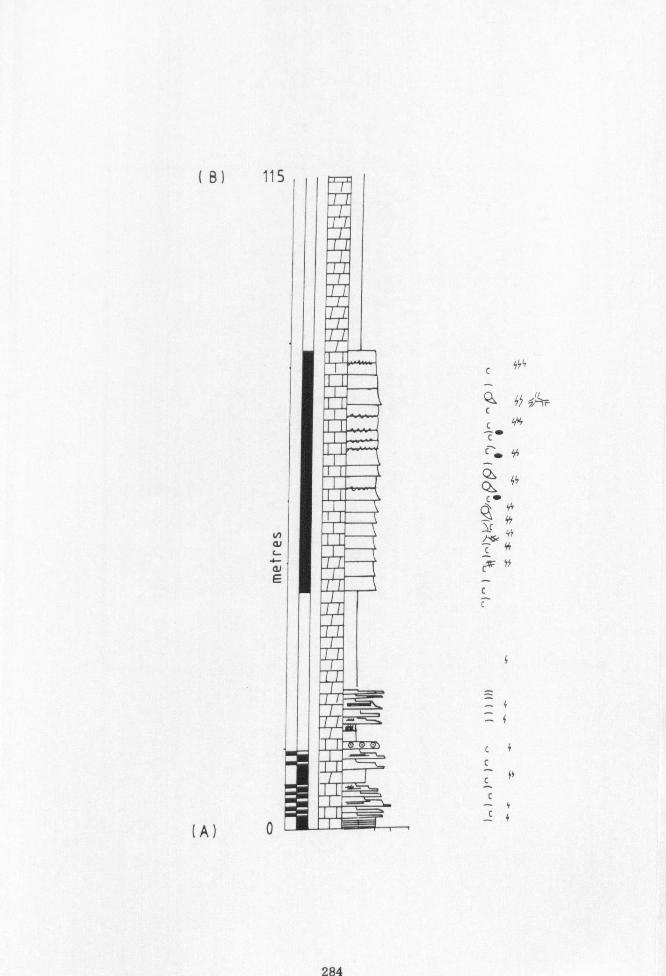
(B) 115
Oy
N al
41 E
(A) 0
C tiK c
ý S5
C"
1c ý'
ýý 4S
5S
- -4
Cº C
f1
C
Cy
284
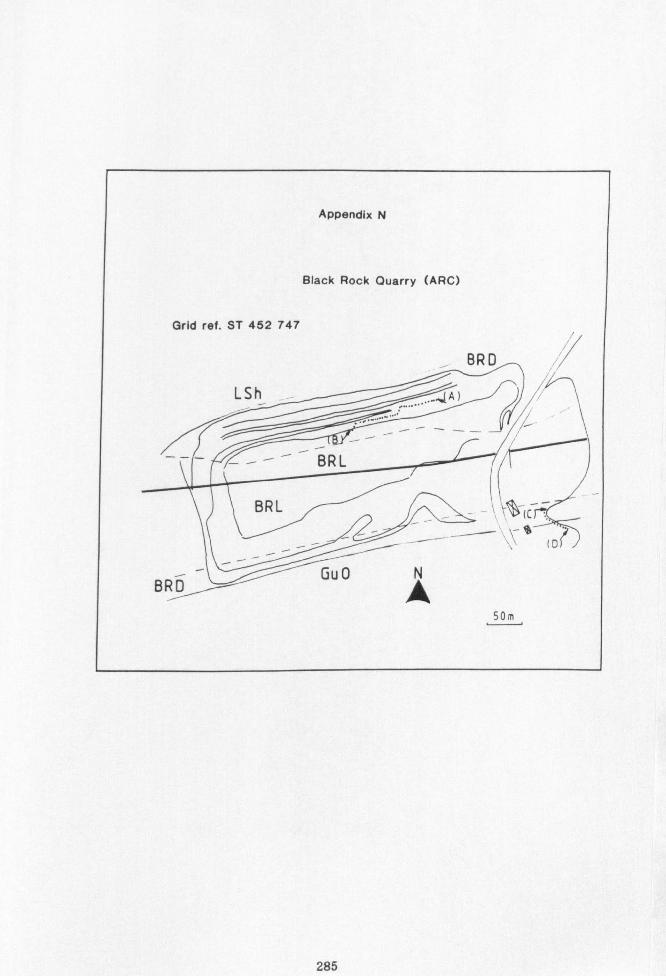
Appendix N
Black Rock Quarry (ARC)
Grid ref. ST 452 747
LSh
-B RL
BRL
BRD
ý" MBA
)
`ý% BRD Gu 0 N
A
SOm
285
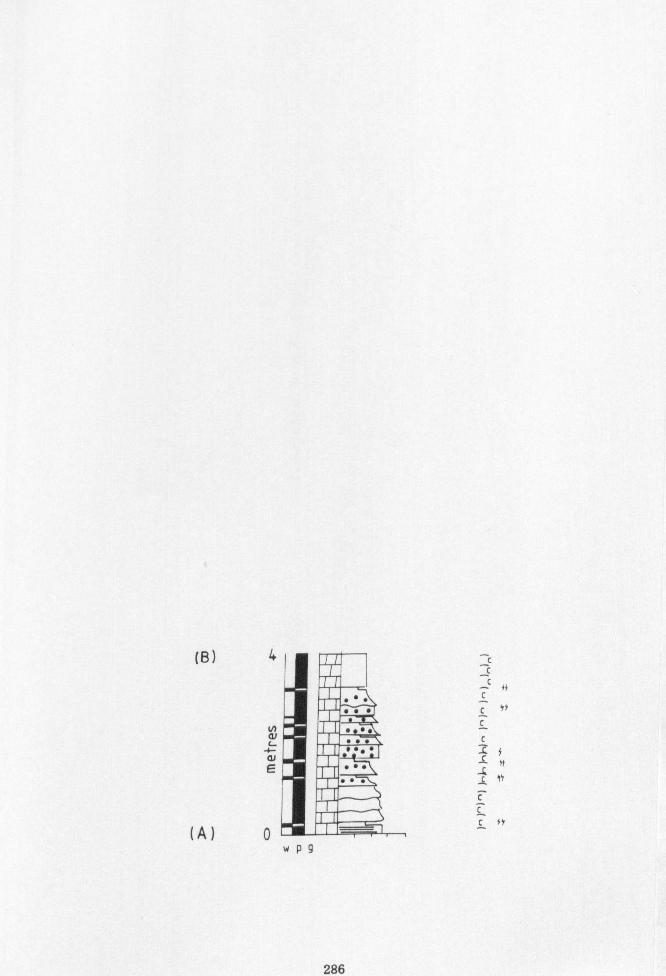
(g) 4
V) w C. -
-4- G1 E
(A) 0 wp9
Cy
C Lf -c 4 S
C
C
C Sf
286
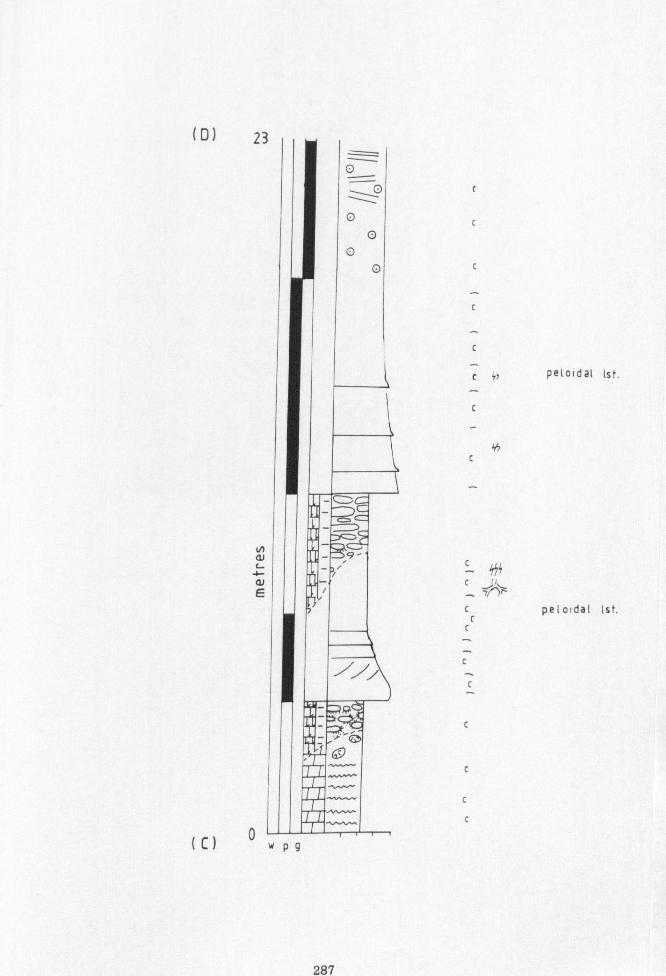
(0) 23
r
c
c
C
peloidat ist.
c
N Ql L
G/
E
C 16
C , ̀ L
c pe1oi da t Ist» c
C
C
C
C
C
C
(c) owp9
287
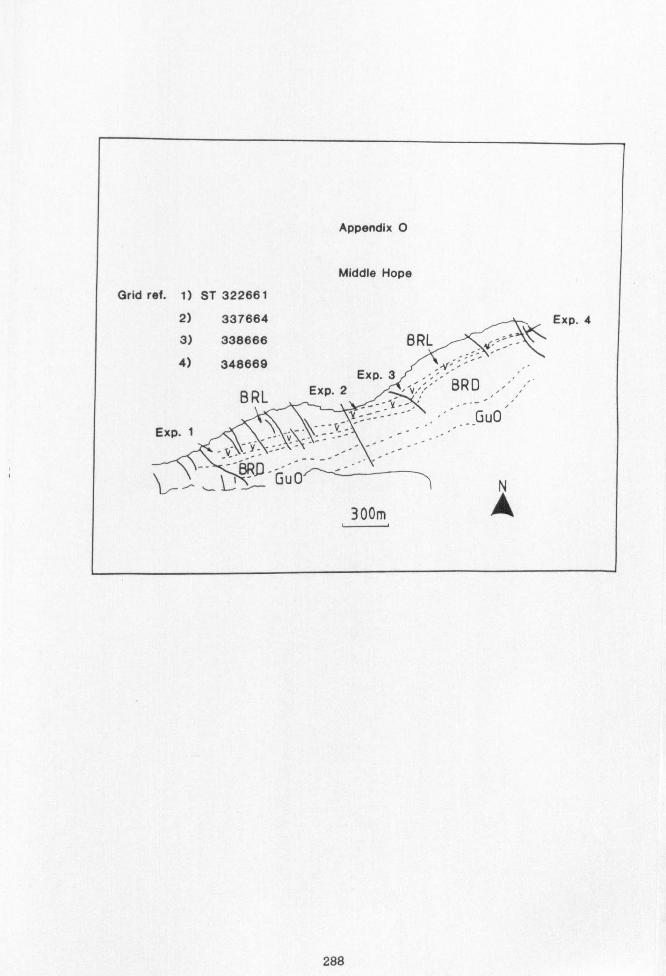
Appendix 0
Middle Hope
Grid ref. 1) ST 322661
2) 337664
3) 338666
4) 348669
BRL
Exp. 1
BRL =I Exp. 3 ýgRD
Exp. 2 ýv,;
Gu0
- GuO
300m N
A
Exp. 4
288
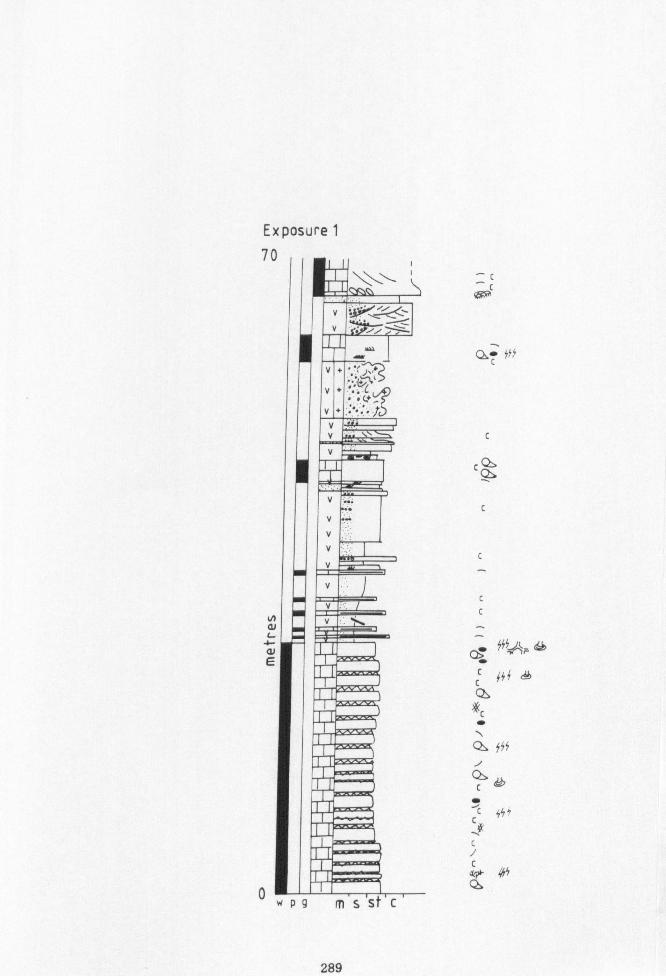
.ý ýý ý'
0
289
ý! fti
C0
c eff 'm c
0 trs i ýý
" cc
yýh
ane 0
Exposure 1 7n
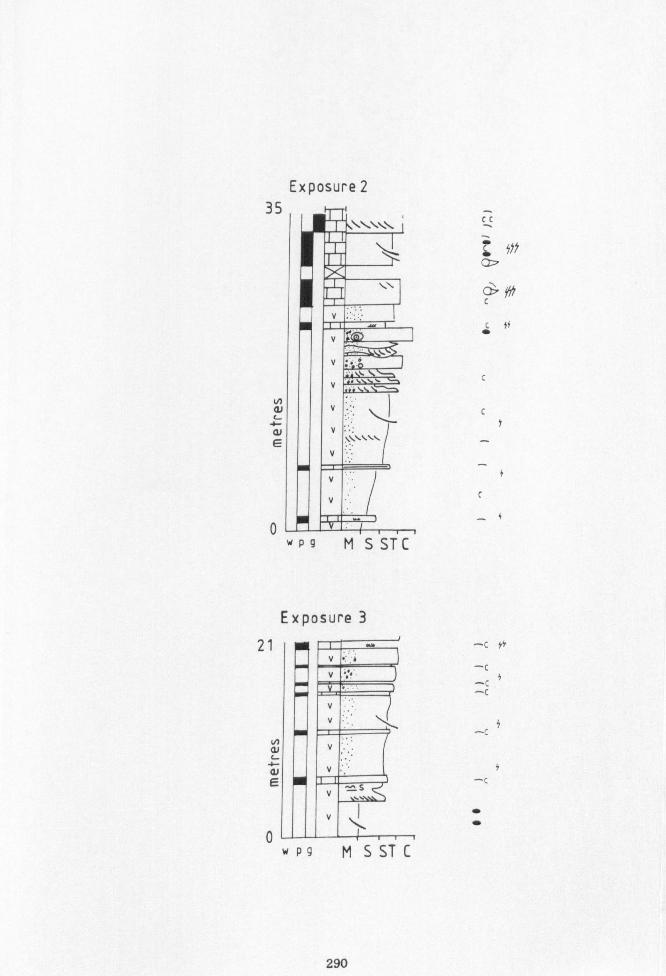
Exposure 2 35..
_ýý
a) C 4- E
o1 rn wp9
Exposure 3
21
N a L
. y- GJ E
w P9
cc
c
C St
C
r
y
C
4
-c yy -C
y -C -C
5 _C
f
290
M SSTC
M SST C
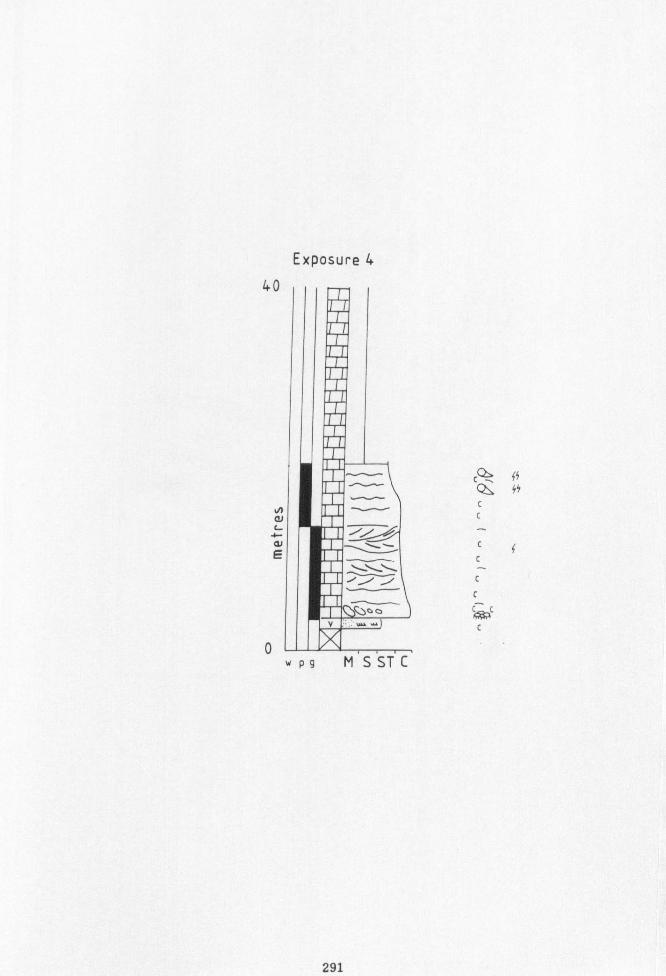
Exposure 4
40
cii
pro v W. ý
0 W p9 M SSTC
291
ý0 ff 0 65 c c
Cf
C
C
C
CSC
C
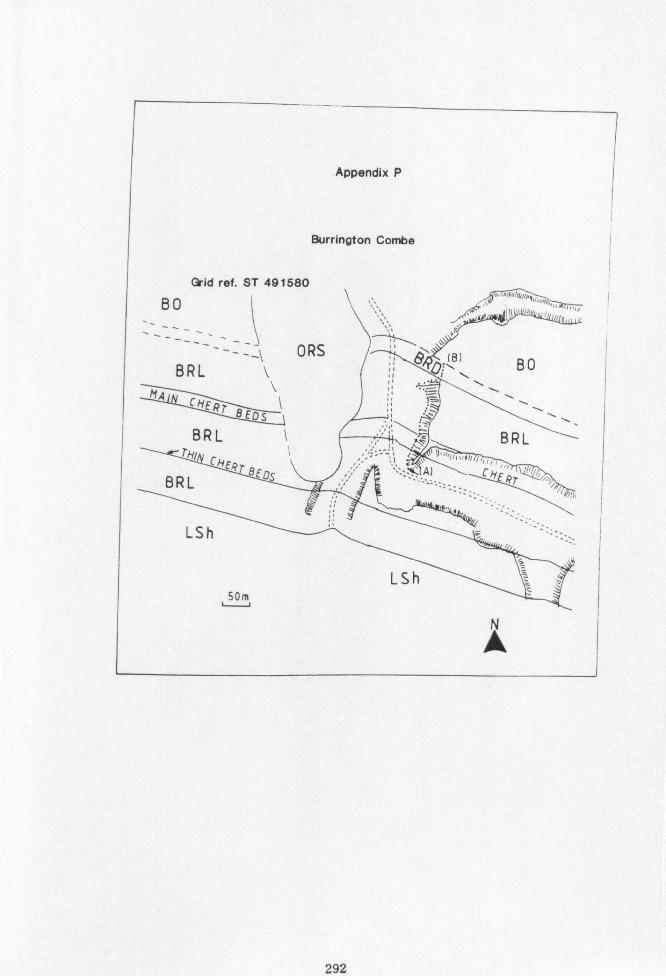
Appendix P
Burrington Combe
Grid ref. ST 491580 80
ORS BRL
Mq CHERr S
BRL Eis
rNI N EHER BEDS
ýý''ý ý 'r!: A)
292
ýý iyw60ei, ý , n , aýn,
, ýýý
B1 B0
BRL
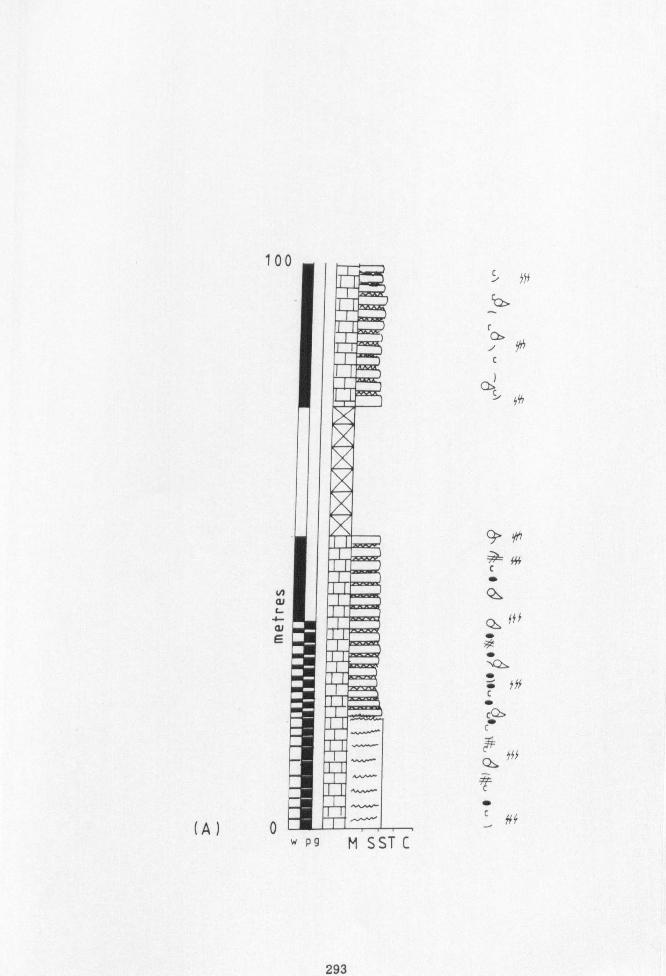
100
N
L
a E
(q) 0
i irf
C Ct>
C
y`h
r44 C
"
" " fý C
Cc
C 41
C 0f
At c "
fý4
293
WP9 MSSTC
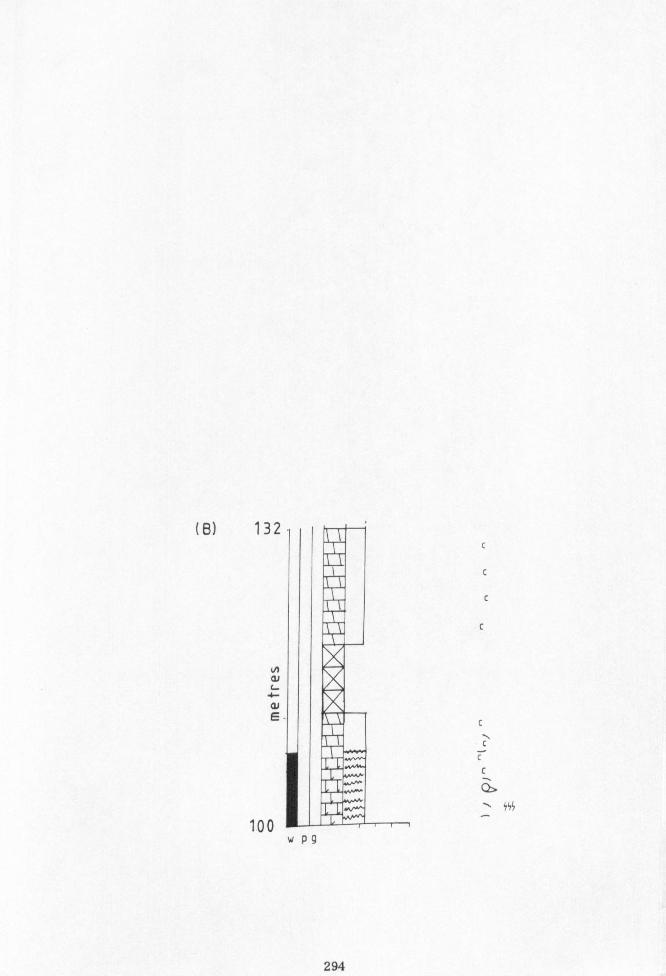
(8) 132
LA L. 4-
C
C
0
sys 100
w P9
294
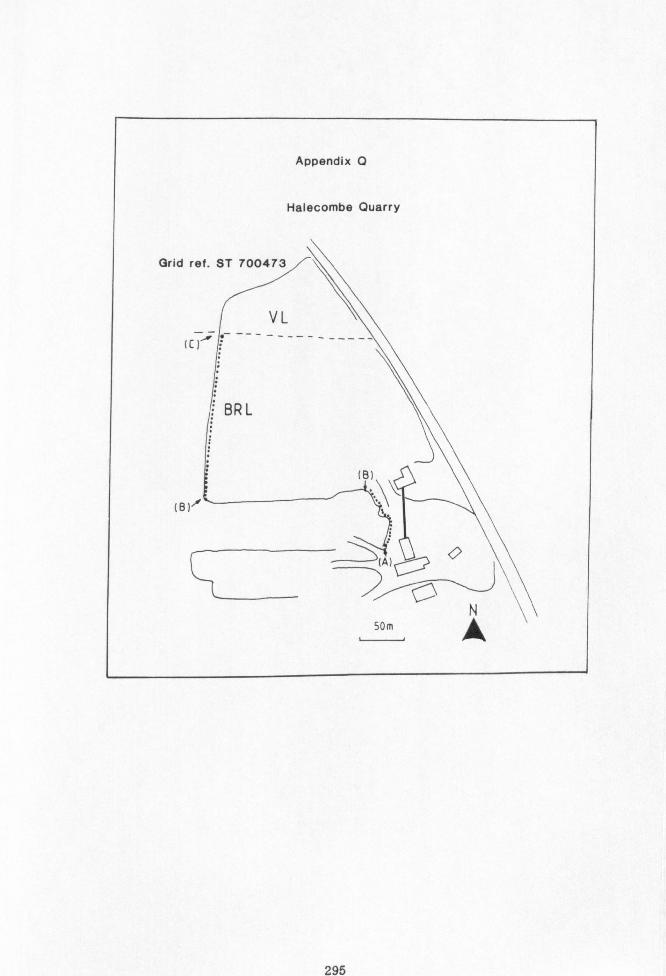
Appendix Q
Halecombe Quarry
Grid ref. ST 700473
VL
BRL
CB)
(Blr s
(A)
N 50m A
295
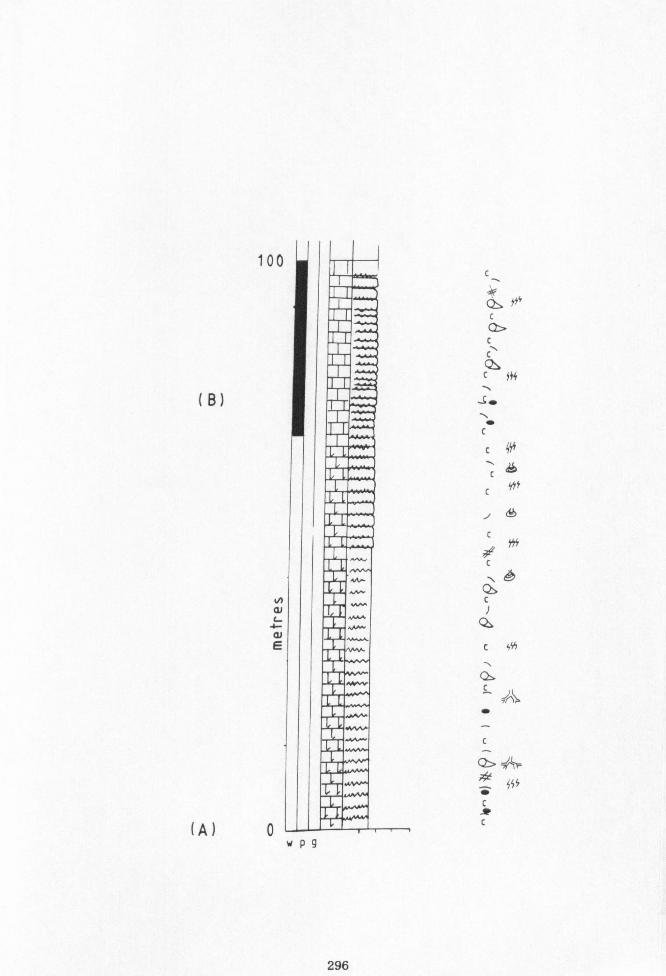
100
(B)
N al
a. -
E
(A) 0 wpg
C
'O y 0 yf
c
C-, c 0 c ffb
s.
c
C ySs
6
c
c
16 0 c J
0
Qýl
40 c
ý SSS
c AP c
296
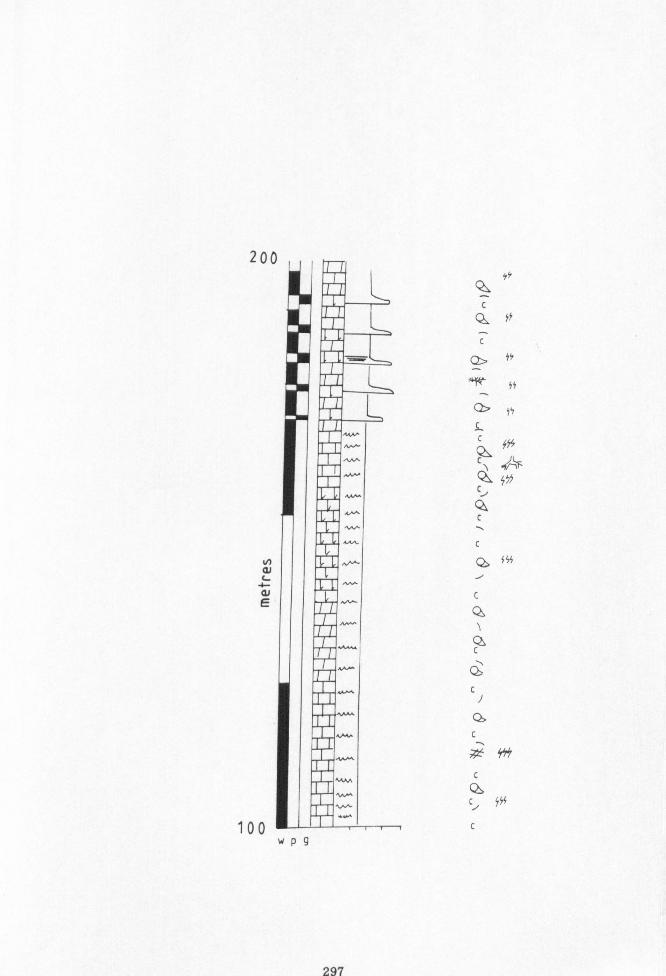
200
N 41 L
41 E
100 WP9
ys
c ý ss
0 555 C/
C
0s ss
c
c
Cýl c
Qýl c
C
(ý ýSi
C
297
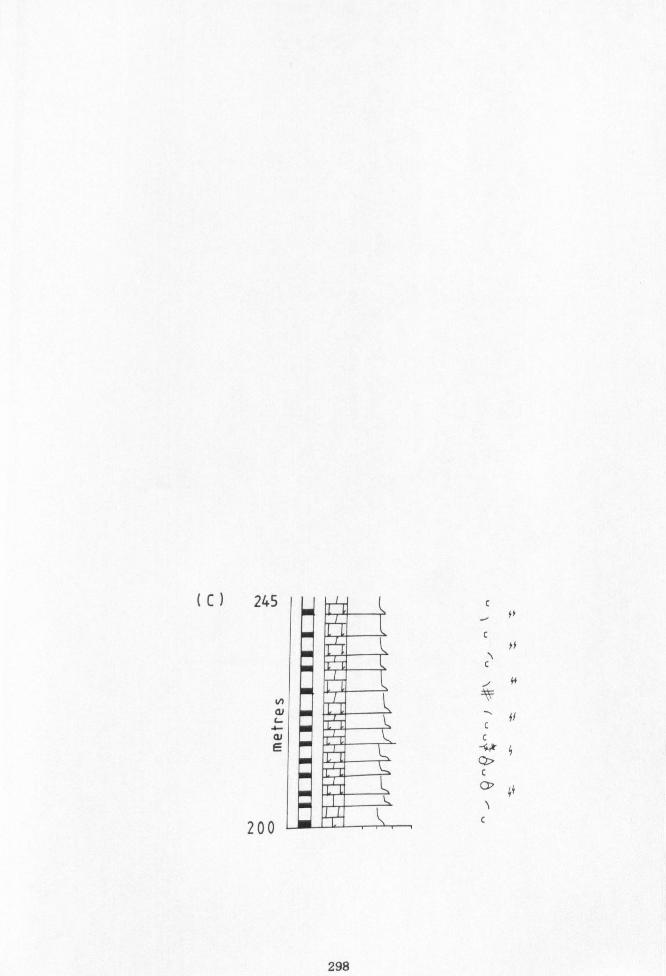
(C) 245 fy
J
yf
V)
a E
200
c
/ 44
fl c c
Q> c ý ýf
298
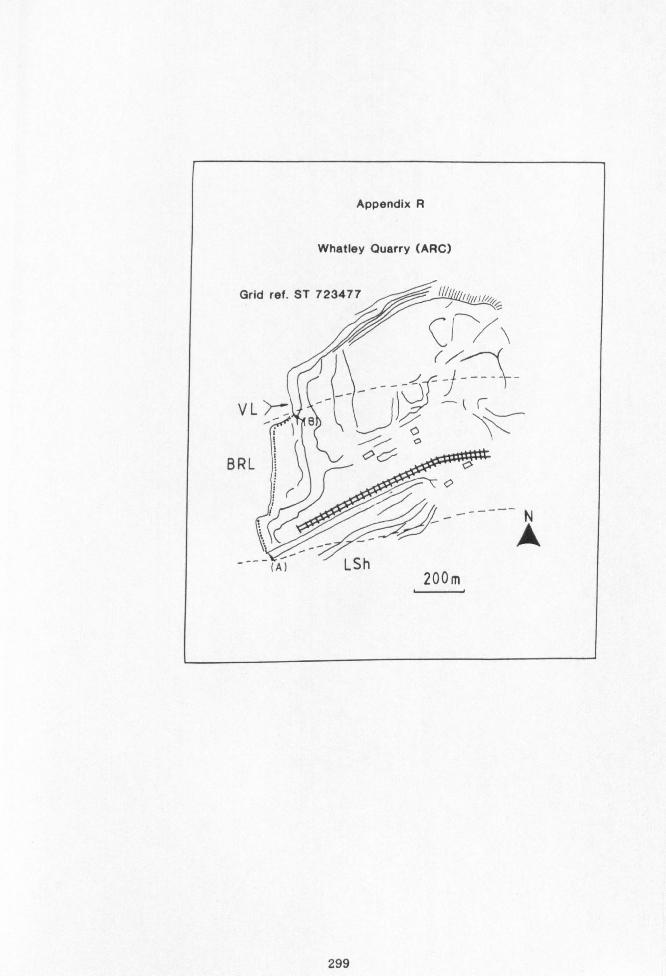
Appendix R
Whatley Quarry (ARC)
Grid ref. ST 723477
VL
BRL ' ýG o
A -"-- (A) LSh
200m
299
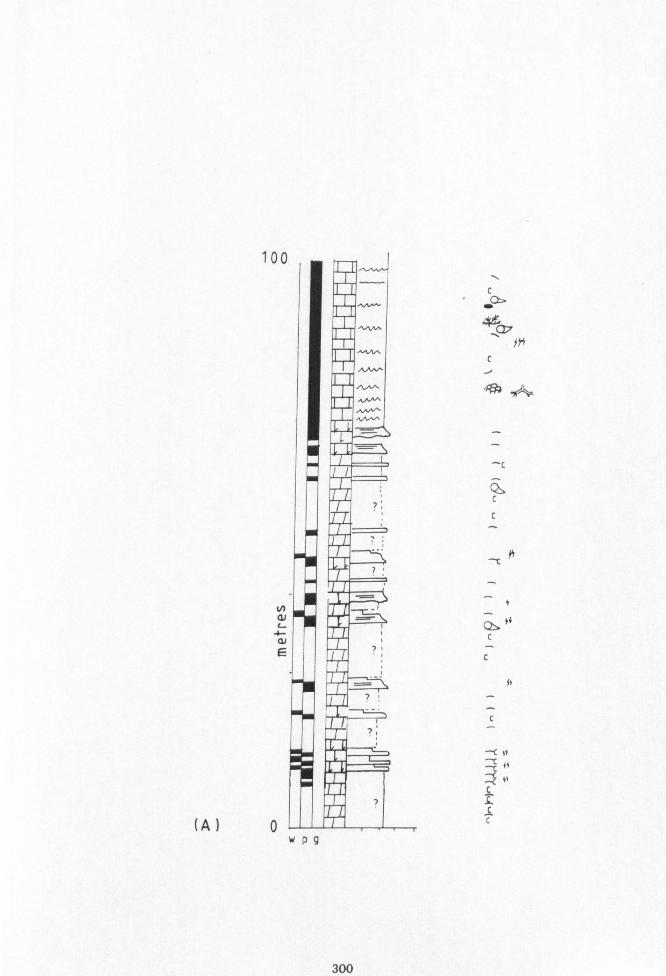
100
N
4- n, E
(A) 0 WP9
C
fn
C J
'ý ýý
-C
C
ý4f
f4
-C 44
--CC 44 -C 4f C
300
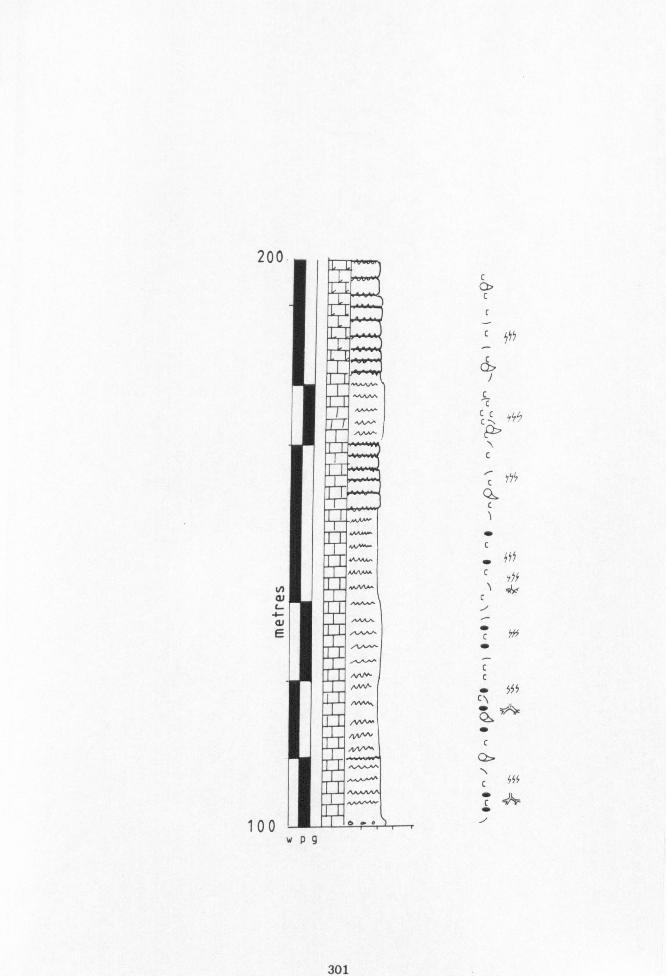
200
LA a) G1
E
100 WP9
C Llýý
C
CC Yy? C
755 Q. c 1
c 40
c r56
c i
" 40
0 Vim
c c
" 55 c"
C
Q>
ý Sfs
301

300
ýi ý. C.
C
G1 4--
G/ E
200
MnNH C
ýnivv C
YAW
rvVVýi e
"vwv
YVVV
C
. VWV
c ff
vwVw C
MýwV
~
J /. (
c
V
W I(V W
AA
AAAAM
nnnnnn C
l. Jy
v ý1!
'V'NHT
302
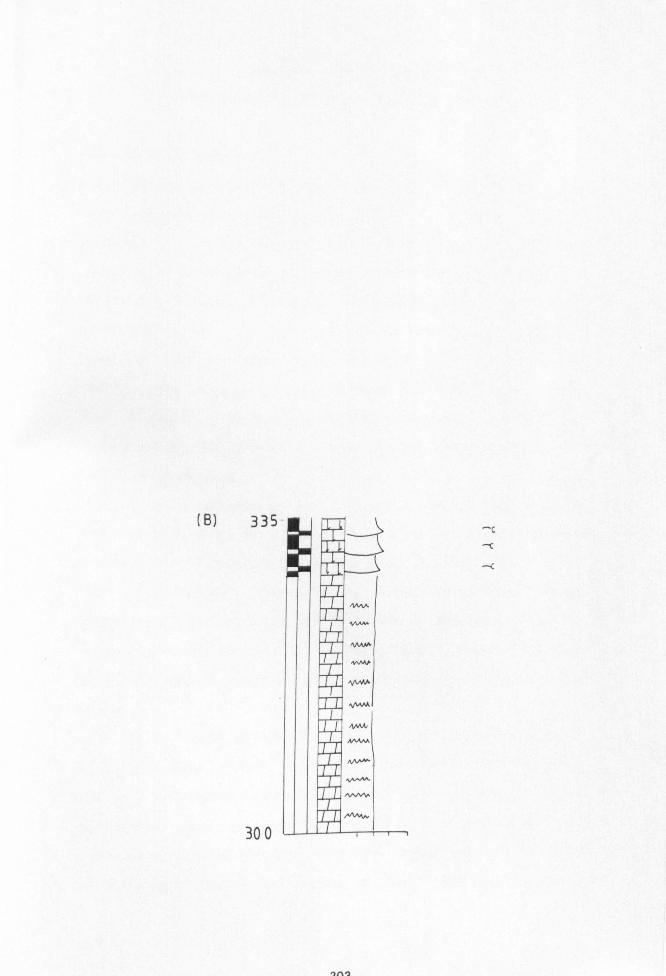
(B) 335 _C
L --c
--c
A, %"
A^AAA
30 0
ene
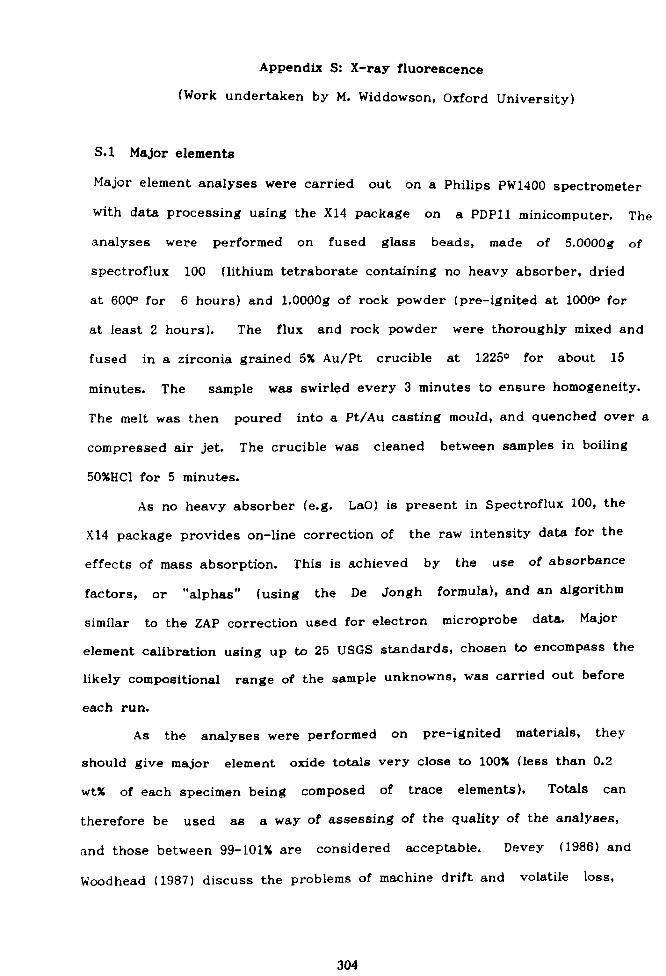
Appendix S: X-ray fluorescence
(Work undertaken by M. Widdowson, Oxford University)
S. 1 Major elements
Major element analyses were carried out on a Philips PW1400 spectrometer
with data processing using the X14 package on a PDP11 minicomputer. The
analyses were performed on fused glass beads, made of 5.0000g of
spectroflux 100 (lithium tetraborate containing no heavy absorber, dried
at 600° for 6 hours) and 1.0000g of rock powder (pre-ignited at 1000° for
at least 2 hours). The flux and rock powder were thoroughly mixed and
fused in a zirconia grained 5% Au/Pt crucible at 1225° for about 15
minutes. The sample was swirled every 3 minutes to ensure homogeneity.
The melt was then poured into a Pt/Au casting mould, and quenched over a
compressed air jet. The crucible was cleaned between samples in boiling
50%HC1 for 5 minutes.
As no heavy absorber (e. g. LaO) is present in Spectroflux 100, the
X14 package provides on-line correction of the raw intensity data for the
effects of mass absorption. This is achieved by the use of absorbance
factors, or "alphas" (using the De Jongh formula), and an algorithm
similar to the ZAP correction used for electron microprobe data. Major
element calibration using up to 25 USGS standards, chosen to encompass the
likely compositional range of the sample unknowns, was carried out before
each run.
As the analyses were performed on pre-ignited materials, they
should give major element oxide totals very close to 100% (less than 0.2
wt% of each specimen being composed of trace elements). Totals can
therefore be used as a way of assessing of the quality of the analyses,
and those between 99-101% are considered acceptable. Devey (1986) and
Woodhead (1987) discuss the problems of machine drift and volatile loss,
304
and demonstrate that these introduce relatively little error. The major
analytical errors seem to be in machine calibration and initial weighing.
S. 2. Trace elements
The concentration of 13 trace elements were determined by the XRF
technique. The elements concerned are Rb, Sr, Y, Zr, Nb, Pb, Zn, Cu, Ni,
Co, Cr, V, and Ba. Analyses were determined on log pressed powder
pellets, using 1.0ml of "Moviol" as a binding agent, and carried out on a
Philips PW1400 spectrometer, with data processing on the PDP11
minicomputer.
Details of counting times and operating conditions for each element
are given in Table S. 1. A Rh anode tube was used in all cases and mass
absorption corrections were made using the Rh Compton scatter peak, plus
corrections for the Fe, Mn and Ti absorption edges, and line overlaps as
necessary.
The precision of XRF data is usually extremely high, and readily
verified from replicate analysis data (Potts 1987), as outlined below.
The accuracy of the technique is however much more difficult to assess,
and in practice this is done by calibrating the instrument against as many
rock reference materials as possible. In the present study, calibration
lines were constructed from analyses of up to 25 USGS recommened
standards.
Data from replicate analyses (Widdowson pers. comm. ) have also been
used to calculate the "limit of determination", which is defined as the
"the smallest signal that can be quantitatively measured" (Potts 1987).
This is calculated at the 12-sigma level using the following equation:
305
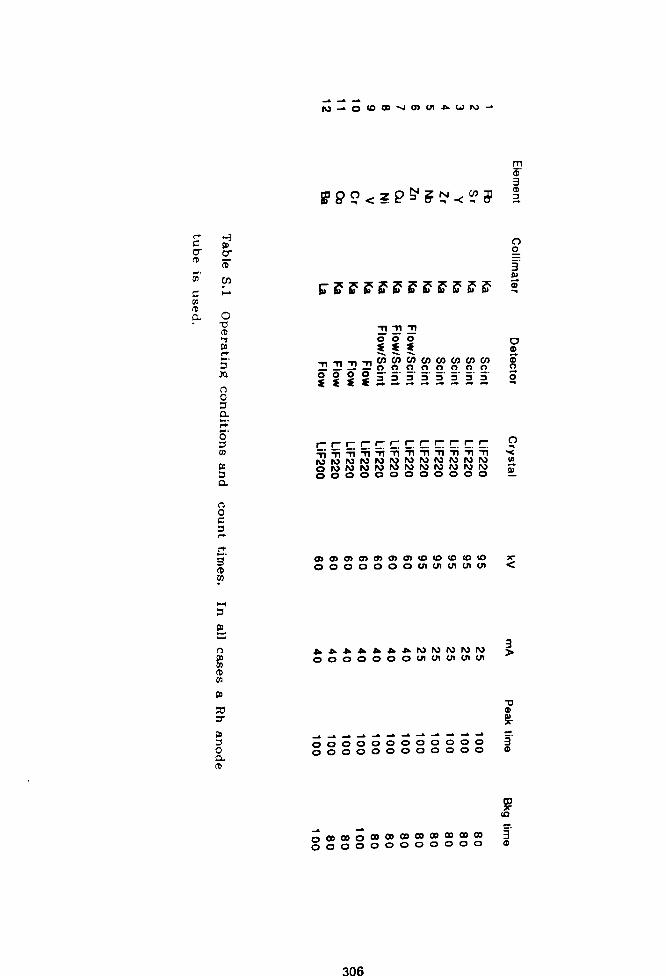
fV O 10 OD V Cf LM AWN
C
rD
rD
m 3
w 0
m
0 CD
JQ A 0
d
Ö
n 0
fD 02
6-4
0
CD
0 cD
w 11 ýý Zl 1111 r 11 11 RF rr
TTýi ÖOO
TTTTÄ0ÄÄ ! 0)
00 CO C/) 0.0
rrrrrrrrrrrr n -n NNNNNN -n NNNNN
000000000000
0 )M 0)0) 0)(0co co (0 (0 0000 00 oCA (. n (A N(A
000000 0ý(A NNN
000000000000 000000000000
00000 CID (» 0w Co Co
000000000
0 0 3 w m 1
v m m A_ O 1
c) Iz Al
3 D
CD
3 m
w co 3
106
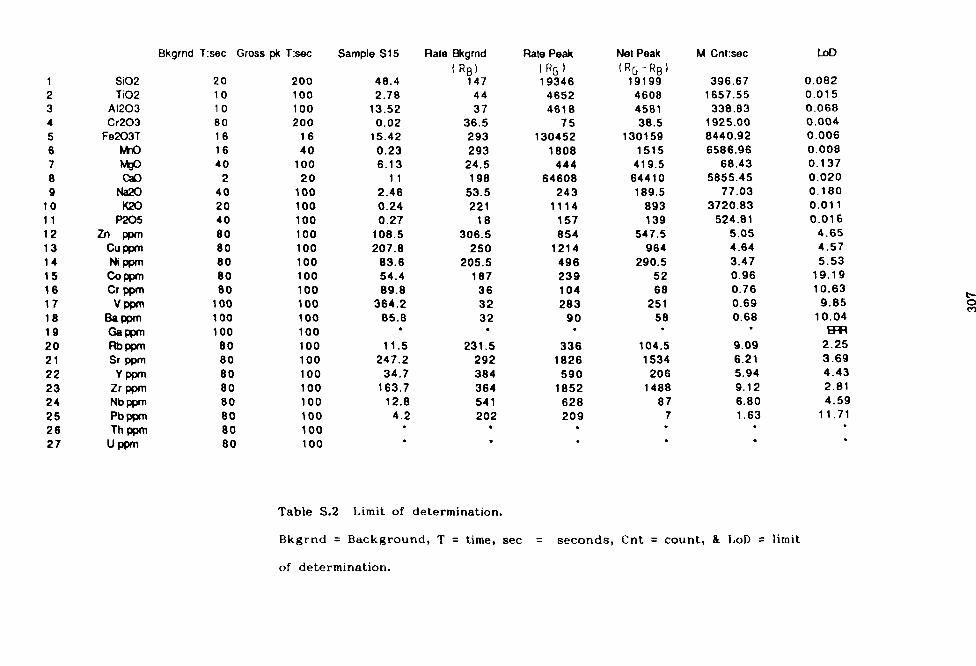
1 2 3 4 5 6 7 6 9
10 11 12 13 14 15 16 17 18 19 20 21 22 23 24 25 26 27
Bkgrnd T: sec Gross pk T: sec Sample S15 Rate Bkgrnd Rate Peak Net Peak M Cnt: sec LoD (R6) (R6) (R6-RB)
Si02 20 200 48.4 147 19346 19199 396.67 0.082 Ti02 10 100 2.78 44 4652 4608 1657.55 0.015
A1203 10 100 13.52 37 4618 4581 338.83 0.068 Cr203 80 200 0.02 36.5 75 38.5 1925.00 0.004
Fe2O3T 16 16 15.42 293 130452 130159 8440.92 0.006 Mn0 16 40 0.23 293 1808 1515 6586.96 0.008 MgD 40 100 6.13 24.5 444 419.5 68.43 0.137 CaD 2 20 11 198 64608 64410 5855.45 0.020
Na2O 40 100 2.46 53.5 243 189.5 77.03 0.180 K20 20 100 0.24 221 1114 893 3720.83 0.011
P205 40 100 0.27 18 157 139 524.81 0.016 Zn ppm 80 100 108.5 306.5 854 547.5 5.05 4.65
Cu ppm 80 100 207.8 250 1214 964 4.64 4.57 Ni ppm 80 100 83.6 205.5 496 290.5 3.47 5.53 Co ppm 80 100 54.4 187 239 52 0.96 19.19 Cr ppm 80 100 89.8 36 104 68 0.76 10.63
V ppm 100 100 364.2 32 283 251 0.69 9.85 Ba ppm 100 100 85.8 32 90 58 0.68 10.04 Ga ppm 100 100 EFIR Rbppm 80 100 11.5 231.5 336 104.5 9.09 2.25 Sr ppm 80 100 247.2 292 1826 1534 6.21 3.69
Y ppm 80 100 34.7 384 590 206 5.94 4.43 Zrppm 80 100 163.7 364 1852 1488 9.12 2.81 Nbppm 80 100 12.8 541 628 87 6.80 4.59 Pbppm 80 100 4.2 202 209 7 1.63 11.71 Th ppm 80 100
U ppm 80 100
Table S. 2 Limit of determination.
Bkgrnd = Background, T= time, sec = seconds, Cnt = count, & LoD = limit
of determination.
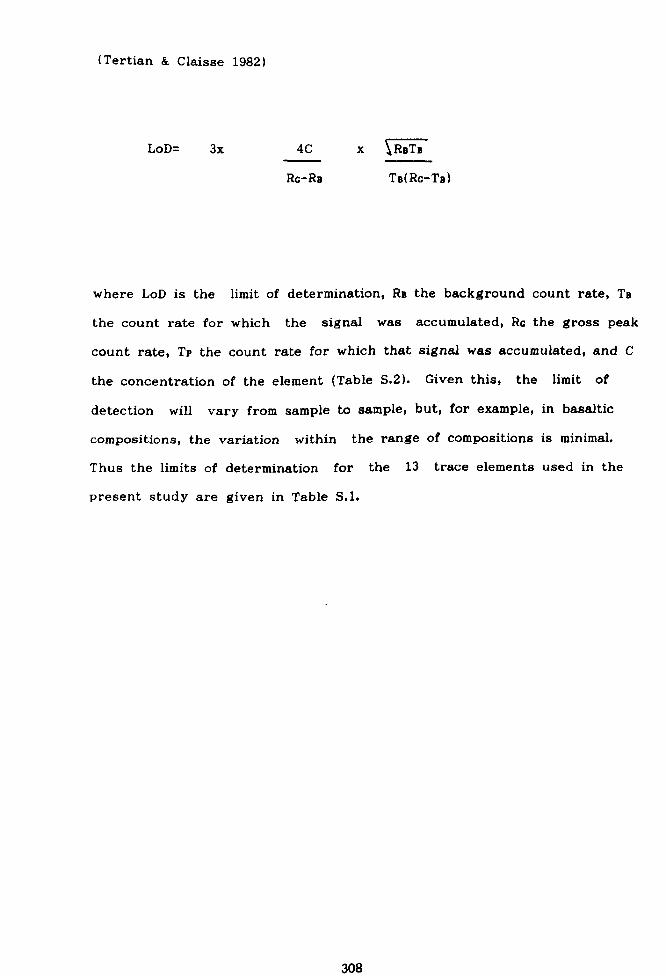
(Tertian & Claisse 1982)
LoD= 3x 4C x RBTB
Rc-Re TB(Rc-TB)
where LoD is the limit of determination, Ra the background count rate, TB
the count rate for which the signal was accumulated, Rs the gross peak
count rate, Tr the count rate for which that signal was accumulated, and C
the concentration of the element (Table S. 2). Given this, the limit of
detection will vary from sample to sample, but, for example, in basaltic
compositions, the variation within the range of compositions is minimal.
Thus the limits of determination for the 13 trace elements used in the
present study are given in Table S. 1.
308
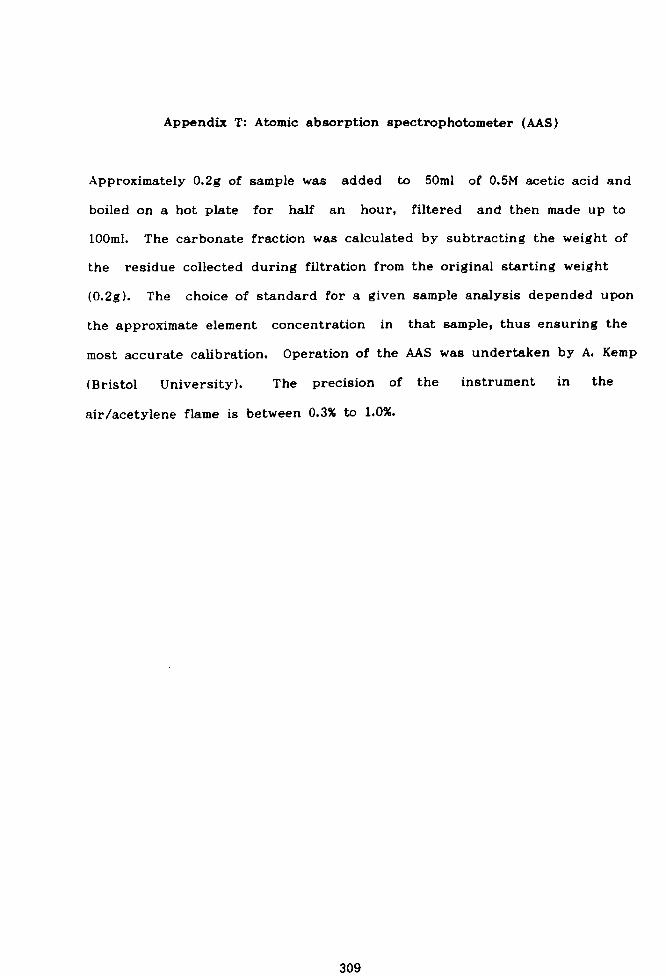
Appendix T: Atomic absorption spectrophotometer (AAS)
Approximately 0.2g of sample was added to 50m1 of 0.5M acetic acid and
boiled on a hot plate for half an hour, filtered and then made up to
100ml. The carbonate fraction was calculated by subtracting the weight of
the residue collected during filtration from the original starting weight
(0.2g). The choice of standard for a given sample analysis depended upon
the approximate element concentration in that sample, thus ensuring the
most accurate calibration. Operation of the AAS was undertaken by A. Kemp
(Bristol University). The precision of the instrument in the
air/acetylene flame is between 0.3% to 1.0%.
309
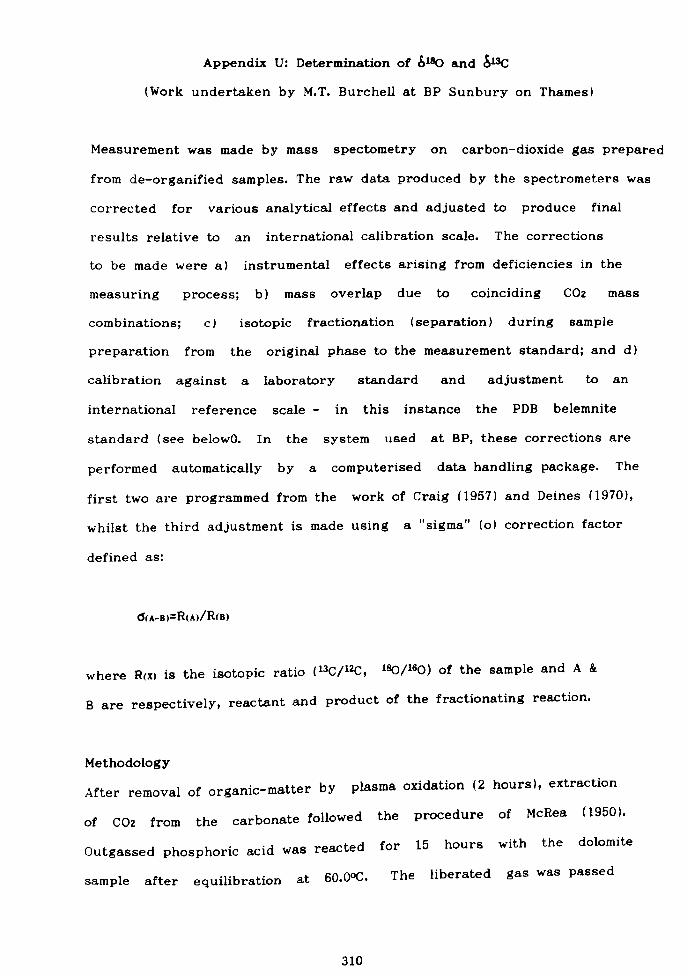
Appendix U: Determination of 6180 and 813C
(Work undertaken by M. T. Burchell at BP Sunbury on Thames)
Measurement was made by mass spectometry on carbon-dioxide gas prepared
from de-organified samples. The raw data produced by the spectrometers was
corrected for various analytical effects and adjusted to produce final
results relative to an international calibration scale. The corrections
to be made were a) instrumental effects arising from deficiencies in the
measuring process; b) mass overlap due to coinciding C02 mass
combinations; c) isotopic fractionation (separation) during sample
preparation from the original phase to the measurement standard; and d)
calibration against a laboratory standard and adjustment to an
international reference scale - in this instance the PDB belemnite
standard (see belowO. In the system used at BP, these corrections are
performed automatically by a computerised data handling package. The
first two are programmed from the work of Craig (1957) and Deines (1970),
whilst the third adjustment is made using a "sigma" (o) correction factor
defined as:
6(A-B) R(A)/R(8)
where R(x) is the isotopic ratio (13C/12C, 180/160) of the sample and A&
B are respectively, reactant and product of the fractionating reaction.
Methodology
After removal of organic-matter by plasma oxidation (2 hours), extraction
of COz from the carbonate followed the procedure of McRea (1950).
Outgassed phosphoric acid was reacted for 15 hours with the dolomite
sample after equilibration at 60.0°C. The liberated gas was passed
310
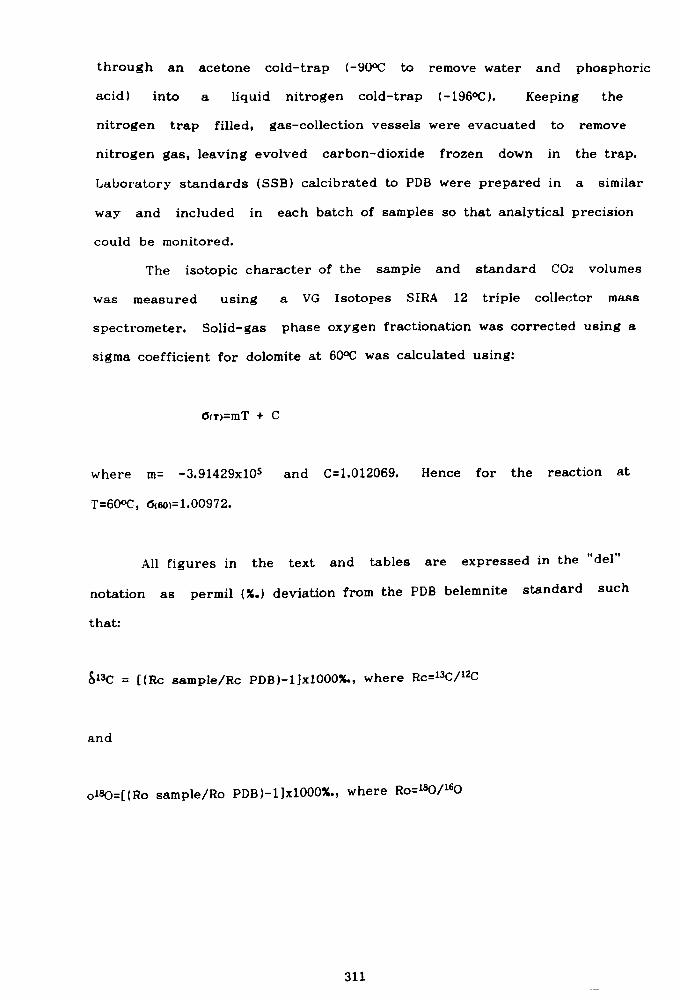
through an acetone cold-trap (-90(IC to remove water and phosphoric
acid) into a liquid nitrogen cold-trap (-196°C). Keeping the
nitrogen trap filled, gas-collection vessels were evacuated to remove
nitrogen gas, leaving evolved carbon-dioxide frozen down in the trap.
Laboratory standards (SSB) calcibrated to PDB were prepared in a similar
way and included in each batch of samples so that analytical precision
could be monitored.
The isotopic character of the sample and standard C02 volumes
was measured using a VG Isotopes SIRA 12 triple collector mass
spectrometer. Solid-gas phase oxygen fractionation was corrected using a
sigma coefficient for dolomite at 60°C was calculated using:
ß(r)=mT +C
where m= -3.91429x10⁵ and C=1.012069. Hence for the reaction at
T=60°C, 6(6o)=1.00972.
All figures in the text and tables are expressed in the "del"
notation as permil (%. ) deviation from the PDB belemnite standard such
that:
S13C =[ (Rc sample/Rc PDB)-1 ]x1000%., where Rc=13C/12C
and
o180=[ (Ro sample/Ro PDB )-1)x1000%., where Ro=180/160
311
Accuracy considerations
Precision of the various isotopic measurements was determined by observing
the variability of results in 25 SSB laboratory standard analyses.
Overall standard error margins were found to be 0.005%. for carbon and
0.10%. for oxygen. The errors in instrumental measurement (quoted for
manufacturer) of 0.02%. should be added to the above to give total
standard error ranges of 0.07%. for 613C and 0.12%. for
a18O.
Although repeat analyses were not generally conducted for actual
unknown samples, the few that were re-analysed showed reproducability
well within these tolerance levels. In such cases the figures quoted as
means.
312
Appendix V: X-ray diffraction (XRD)
(Work undertaken by L. Garvie, University of Bristol)
Two samples from each of the Portishead Paleosol Bed were collected and
analysed. All samples were disaggregated in an ultrasonic tank and the
<2um (e. s. d. ) fraction separated using centrifuge and subsequent
filtration techniques. The collected filtrate was smeared onto a glass
slide to obtain an orientated sample and each mount was irradiated after
the following pre-treatments: 1) air-dried, 2) solvation with ethylene
glycol and heated at 300° for 30 minutes, 3) heating at 500° for 30
minutes. Analysis was undertaken using a Philips 2 kW diffractometer
using Ni-filtered Cu-liaha radation at a setting of 40 kV and 40 mA. An
automatic divergence silt and graphite monochromator were used and
calibration of the instrument checked by using tetradecanol.
The tables of Brindley and Brown (1980) and Starkey et al. (1984)
were used as a guide in determining the mineralogy of the samples from the
XRD traces (pers. comm. L. Garvie).
UNIVERSITY OFB1 STOL
LIA"". Y
313 WILLS M. L.