21616v1.pdf - eLife
66
1 EARLY DYSFUNCTION AND PROGRESSIVE DEGENERATION OF THE SUBTHALAMIC NUCLEUS IN MOUSE 1 MODELS OF HUNTINGTON'S DISEASE 2 Jeremy F. Atherton, Eileen L. McIver, Matthew R.M. Mullen, David Wokosin, D. James Surmeier and 3 Mark D. Bevan 4 Department of Physiology, Feinberg School of Medicine, Northwestern University, Chicago, IL 60611, 5 USA. 6 Contact: Mark D. Bevan, [email protected] 7 8
-
Upload
khangminh22 -
Category
Documents
-
view
2 -
download
0
Transcript of 21616v1.pdf - eLife

1
EARLY DYSFUNCTION AND PROGRESSIVE DEGENERATION OF THE SUBTHALAMIC NUCLEUS IN MOUSE 1
MODELS OF HUNTINGTON'S DISEASE 2
Jeremy F. Atherton, Eileen L. McIver, Matthew R.M. Mullen, David Wokosin, D. James Surmeier and 3
Mark D. Bevan 4
Department of Physiology, Feinberg School of Medicine, Northwestern University, Chicago, IL 60611, 5
USA. 6
Contact: Mark D. Bevan, [email protected] 7
8

2
Abstract 9
The subthalamic nucleus (STN) is an element of cortico-basal ganglia-thalamo-cortical circuitry critical 10
for action suppression. In Huntington's disease (HD) action suppression is impaired, resembling the 11
effects of STN lesioning or inactivation. To explore this potential linkage, the STN was studied in BAC 12
transgenic and Q175 knock-in mouse models of HD. At < 2 and 6 months of age autonomous STN 13
activity was impaired due to activation of KATP channels. STN neurons exhibited prolonged NMDA 14
receptor-mediated synaptic currents, caused by a deficit in glutamate uptake, and elevated 15
mitochondrial oxidant stress, which was ameliorated by NMDA receptor antagonism. STN activity was 16
rescued by NMDA receptor antagonism or breakdown of hydrogen peroxide. At 12 months of age 17
approximately 30% of STN neurons were lost, as in HD. Together these data argue that dysfunction 18
within the STN is an early feature of HD that may contribute to its expression and course. 19
20
3
Introduction 21
The basal ganglia are a network of subcortical brain nuclei that are critical for action selection and 22
central to the expression of several psychomotor disorders (Albin et al., 1989; Wichmann and DeLong, 23
1996). Information flow from the cortex to the output nuclei of the basal ganglia occurs via three major 24
pathways. The so-called direct pathway through the striatum promotes movement and ‘rewarding’ 25
behavior through inhibition of GABAergic basal ganglia output (Chevalier and Deniau, 1990; Kravitz et 26
al., 2010; Kravitz and Kreitzer, 2012). In contrast, the indirect pathway via the striatum, external globus 27
pallidus and subthalamic nucleus (STN) and the hyperdirect pathway through the STN suppress the 28
same processes through elevation of basal ganglia output (Maurice et al., 1999; Tachibana et al., 29
2008; Kravitz et al., 2010; Kravitz and Kreitzer, 2012). Indeed, interruption of the indirect and 30
hyperdirect pathways through lesion or inactivation of the STN is associated with elevated/involuntary 31
movement, impulsivity and psychiatric disturbances such as hypomania and hyper-sexuality 32
(Crossman et al., 1988; Hamada and DeLong, 1992; Baunez and Robbins, 1997; Bickel et al., 2010; 33
Jahanshahi et al., 2015). 34
Huntington's disease (HD) is an autosomal dominant, neurodegenerative disorder caused by an 35
expansion of CAG repeats in the gene (HTT) encoding huntingtin (HTT), a protein involved in vesicle 36
dynamics and intracellular transport (Huntington's Disease Collaborative Research Group, 1993; 37
Saudou and Humbert, 2016). Early symptoms of HD include involuntary movement, compulsive 38
behavior, paranoia, irritability and aggression (Anderson and Marder, 2001; Kirkwood et al., 2001). 39
These symptoms have traditionally been linked to cortico-striatal degeneration, however a role for the 40
STN is suggested by their similarity to those caused by STN inactivation or lesion. The hypoactivity of 41
the STN in HD models in vivo (Callahan and Abercrombie, 2015a, 2015b) and the susceptibility of the 42
STN to degeneration in HD (Lange et al., 1976; Guo et al., 2012) are also consistent with STN 43
dysfunction. 44
4
Several mouse models of HD have been generated, which vary by length and species origin of 45
HTT/Htt, CAG repeat length, and method of genome insertion. For example, one line expresses full-46
length human HTT with 97 mixed CAA-CAG repeats in a bacterial artificial chromosome (BAC; Gray et 47
al., 2008), whereas Q175 knock-in (KI) mice have an inserted chimeric human/mouse exon 1 with a 48
human polyproline region and ~188 CAG repeats in the native Htt (Menalled et al., 2012). 49
Increased mitochondrial oxidant stress exacerbated by abnormal NMDAR-mediated transmission and 50
signaling has been reported in HD and its models (Fan and Raymond, 2007; Song et al., 2011; Johri 51
et al., 2013; Parsons and Raymond, 2014; Martin et al., 2015). Several reports suggest that glutamate 52
uptake is impaired due to reduced expression of the glutamate transporter EAAT2 (GLT-1) and/or 53
GLT-1 dysfunction (Azberger et al., 1997; Liévens et al., 2001; Bherens et al., 2002; Miller et al., 2008; 54
Bradford et al., 2009; Faideau et al., 2010; Huang et al., 2010; Menalled et al., 2012; Dvorzhak et al 55
2016; Jiang et al., 2016). However, others have found no evidence for deficient glutamate uptake 56
(Parsons et al., 2016), suggesting that abnormal NMDAR-mediated transmission is caused by 57
increased expression of extrasynaptic receptors and/or aberrant coupling to signaling pathways (e.g., 58
Parsons and Raymond, 2014). The sensitivity of mitochondria to anomalous NMDAR signaling is likely 59
to be further compounded by their intrinsically compromised status in HD (Song et al., 2011; Johri et 60
al., 2013; Martin et al., 2015). 61
Although HD models exhibit pathogenic processes seen in HD, they do not exhibit similar levels and 62
spatiotemporal patterns of cortico-striatal neurodegeneration. Striatal neuronal loss in aggressive Htt 63
fragment models such as R6/2 mice does occur but only close to death (Stack et al., 2005), whereas 64
full-length models exhibit minimal loss (Gray et al., 2008; Smith et al., 2014). Despite loss and 65
hypoactivity of STN neurons in HD and the similarity of HD symptoms to those arising from STN lesion 66
or inactivation, the role of the STN in HD remains poorly understood. We hypothesized that the 67
abnormal activity and progressive loss of STN neurons in HD may reflect abnormalities within the STN 68
itself. This hypothesis was addressed in the BAC and Q175 KI HD models using a combination of 69

5
cellular and synaptic electrophysiology, optogenetic interrogation, two-photon imaging and 70
stereological cell counting. 71
Results 72
Data are reported as median [interquartile range]. Unpaired and paired statistical comparisons were 73
made with non-parametric Mann-Whitney U and Wilcoxon Signed-Rank tests, respectively. Fisher’s 74
exact test was used for categorical data. p < 0.05 was considered statistically significant; where 75
multiple comparisons were performed this p-value was adjusted using the Holm-Bonferroni method 76
(adjusted p-values are denoted ph; Holm, 1979). Box plots show median (central line), interquartile 77
range (box) and 10–90% range (whiskers). 78
The autonomous activity of STN neurons is disrupted in the BACHD model 79
STN neurons exhibit intrinsic, autonomous firing, which contributes to their role as a driving force of 80
neuronal activity in the basal ganglia (Bevan and Wilson, 1999; Beurrier et al., 2000, Do and Bean, 81
2003). To determine whether this property is compromised in HD mice, the autonomous activity of 82
STN neurons in ex vivo brain slices prepared from BACHD and wild type littermate (WT) mice were 83
compared using non-invasive, loose-seal, cell-attached, patch clamp recordings. 5–7 months old, 84
symptomatic and 1–2 months old, presymptomatic mice were studied (Gray et al., 2008). Recordings 85
focused on the lateral two-thirds of the STN, which receives input from the motor cortex (Kita and Kita, 86
2012; Chu et al., 2015). At 5–7 months, 124/128 (97 %) WT neurons exhibited autonomous activity 87
compared to 110/126 (87 %) BACHD neurons (p = 0.0049; Figure 1A, B). The frequency (WT: 7.9 88
[5.2–12.6] Hz; n = 128; BACHD: 6.3 [1.4–10.2] Hz; n = 126; p = 0.0001) and regularity (WT CV: 0.27 89
[0.14–0.47]; n = 124; BACHD CV: 0.36 [0.20–0.80]; n = 110; p = 0.0012) of firing were reduced in 90
BACHD neurons (Figure 1A, B). The distribution of firing frequency of WT neurons appears unimodal 91
with a mode at ~8–10 Hz (Figure 1C), whereas the distribution of BACHD neurons is relatively 92
bimodal with modes at ~0–2 Hz and ~10–12 Hz (Kolmogorov–Smirnov test, p = 0.0002; Figure 1C). 93
This distribution suggests that BACHD neurons consist of a phenotypic population with compromised 94
6
autonomous firing, and a non-phenotypic population with relatively normal autonomous firing. At 1–2 95
months 136/145 (94 %) WT STN neurons were autonomously active versus 120/143 (84 %) BACHD 96
STN neurons (p = 0.0086). The frequency (WT: 9.8 [6.3–14.8] Hz; n = 145; BACHD: 7.1 [1.8–11.3] Hz; 97
n = 143; p < 0.0001) and regularity (WT CV: 0.17 [0.13–0.26]; n = 136; BACHD CV: 0.23 [0.14–0.76]; 98
n = 120; p = 0.0016) of firing were also reduced in BACHD neurons. Together, these data 99
demonstrate that the autonomous activity of STN neurons in BACHD mice is impaired at both early 100
presymptomatic and later symptomatic ages. 101
NMDAR-mediated EPSCs are prolonged in BACHD STN neurons 102
As described above, the majority of studies report that astrocytic glutamate uptake is diminished in the 103
striatum in HD and its models. To test whether the STN of BACHD mice exhibits a similar deficit, 104
EPSCs arising from the optogenetic stimulation of motor cortical inputs to the STN (as described by 105
Chu et al., 2015) were compared in WT and BACHD mice before and after inhibition of GLT-1 and 106
GLAST with 100 nM TFB-TBOA. STN neurons were recorded in ex vivo brain slices in the whole-cell 107
voltage-clamp configuration using a cesium-based, QX-314-containing internal solution to maximize 108
voltage control. Neurons were held at −40 mV and recorded in the presence of low (0.1 mM) external 109
Mg2+ and the AMPAR antagonist DNQX (20 µM) to maximize and pharmacologically isolate the 110
evoked NMDAR-mediated excitatory postsynaptic current (EPSC); analysis was performed on 111
average EPSCs from 5 trials with 30 s recovery between trials (Figure 1D–H). The amplitude 112
weighted decay time constant of the NMDAR EPSC was moderately but significantly prolonged in 113
BACHD compared to WT neurons (WT: 38.1 [30.0–44.8] ms; n = 12; BACHD: 47.6 [38.7–55.9] ms; n 114
= 11; p = 0.0455; Figure 1E–H). Subsequent application of TFB-TBOA increased the decay time 115
constant of the NMDAR EPSC in STN neurons derived from WT (WT control: 39.0 [35.2–44.0] ms; 116
WT TFB-TBOA: 50.2 [41.7–68.4] ms; n = 9; p = 0.0039; Figure 1E, H) but had no effect in BACHD 117
neurons (BACHD control: 47.9 [38.9–59.4] ms; BACHD TFB-TBOA: 44.9 [34.7–52.2] ms; n = 10; p = 118
0.3223; Figure 1F, H). In control conditions, the amplitudes of EPSCs recorded from WT and BACHD 119
neurons were similar (WT: 50.1 [34.7–61.0] pA; n = 12; BACHD: 45.6 [22.1–78.3] pA; n = 11; ph = 120
7
0.7399; Figure 2A) and there was no correlation between EPSC amplitude and the decay time 121
constant in either group (WT: r2 = 0.16; n = 12; ph = 0.5871; BACHD: r2 = 0.10; n = 12; ph = 0.6686; 122
Figure 2B). In order to increase spillover of glutamate from synaptic release sites, cortico-STN inputs 123
were optogenetically stimulated 5 times at 50 Hz and the resulting compound NMDAR-mediated 124
EPSC was compared in WT and BACHD STN neurons. Interestingly, the decay of compound NMDAR 125
EPSCs under control conditions or following inhibition of glutamate uptake were not different in WT 126
and BACHD mice (WT control: 79.0 [62.6–102.0] ms; n = 6; BACHD control: 65.2 [44.7–111.5] ms; n = 127
6; p = 0.4848; WT TFB-TBOA: 125.4 [106.8–146.6] ms; n = 6; BACHD TFB-TBOA: 108.3 [94.5–128
143.1] ms; n = 6; p = 0.6991; Figure 2C–E). Together these data demonstrate that individual, but not 129
compound, NMDAR-mediated cortico-STN synaptic EPSCs are prolonged in the BACHD model. 130
Blockade of NMDARs rescues the autonomous activity of BACHD STN neurons 131
To test whether disrupted autonomous firing in BACHD is linked to NMDAR activation, brain slices 132
from BACHD mice were incubated in control media or media containing the NMDAR antagonist D-AP5 133
(50 µM) for 3–5 hours prior to loose-seal, cell-attached recordings from STN neurons (Figure 3). D-134
AP5 treatment rescued autonomous firing in slices derived from 5–7 month old BACHD mice 135
compared to untreated control slices (Figure 3A, B). The proportion of autonomously active neurons 136
was greater in D-AP5 pre-treated slices (untreated: 18/30 (60%); D-AP5 treated: 29/30 (97%); p = 137
0.0011). The frequency (untreated: 1.0 [0.0–7.6] Hz; n = 30; D-AP5 treated: 13.2 [7.9–17.4] Hz; n = 138
30; p < 0.0001) and regularity (untreated CV: 0.43 [0.24–1.21]; n = 18; D-AP5 treated: CV: 0.13 [0.09–139
0.20]; n = 29; p < 0.0001) of autonomous firing were also greater in D-AP5 treated slices. In slices 140
derived from 1–2 month old BACHD mice autonomous firing was also more prevalent in D-AP5 141
treated slices than in untreated slices (untreated: 10/30 (33%); D-AP5-treated: 27/30 neurons (90%); p 142
< 0.0001) and the frequency of firing overall was greater (untreated: 0.0 [0.0–1.3] Hz; n = 30; D-AP5 143
treated: 8.7 [4.4–14.5] Hz; n = 30; p < 0.0001; Figure 3B). The regularity of autonomous firing was 144
however not rescued (untreated CV: 0.61 [0.27–0.81]; n = 10; D-AP5-treated CV: 0.25 [0.14–0.69]; n = 145
27; p = 0.1368; Figure 3B). In slices from WT mice the rate (untreated: 10.4 [6.1–14.2] Hz; n = 27; D-146
8
AP5 treated: 5.6 [1.7–15.4] Hz; n = 27; p = 0.1683; Figure 3B), regularity (untreated: 0.18 [0.12–0.27]; 147
n = 24; D-AP5 treated: 0.22 [0.12–0.46]; n = 22; p = 0.4785; Figure 3C) and incidence of firing 148
(untreated: 24/27 (89%); D-AP5 treated 22/27 (81%); p = 0.7040; Figure 3D) were unaltered by D-149
AP5 treatment. Thus, prolonged blockade of NMDARs rescued autonomous firing in BACHD STN 150
neurons but had no effect on autonomous activity in WT STN neurons. Together these data 151
demonstrate that NMDAR activation contributes to the disruption of autonomous activity in BACHD 152
STN neurons. 153
The mitochondria of BACHD STN neurons are subject to elevated oxidant stress 154
NMDAR activation can elevate mitochondrial oxidant stress (Dugan et al., 1995; Moncada and 155
Bolanos, 2006; Brennan et al., 2009; Nakamura and Lipton, 2011). To test whether STN neurons from 156
BACHD mice exhibit increased mitochondrial oxidant stress, a mitochondria-targeted redox probe 157
MTS-roGFP (Hanson et al., 2004) was virally expressed in 5–7-month-old BACHD mice and WT 158
littermates (Figure 4A). 1–2 weeks later MTS-roGFP was imaged in brain slices under two-photon 159
excitation with 890 nm light. Oxidant stress was estimated from the fluorescence of MTS-roGFP in 160
individual neurons under baseline conditions relative to the fluorescence of MTS-roGFP under 161
conditions of full reduction and oxidation in the presence of 2 mM dithiothreitol and 200 µM aldrithiol-4, 162
respectively (Sánchez-Padilla et al., 2014). STN neurons were selected for analysis based on their 163
appearance under two-photon, Dodt contrast imaging and were distinguishable from STN glial cells by 164
their relatively large diameter (Figure 4A). STN neurons are reliably recorded when this selection 165
strategy is employed to guide patch clamp recording (Atherton et al., 2008, Atherton et al., 2010). 166
MTS-roGFP imaging revealed that relative oxidant stress in BACHD STN neurons was elevated 167
compared to WT (WT: 0.35 [0.18–0.42]; n = 23); BACHD: 0.40 [0.37–0.63]; n = 24; p = 0.0332; Figure 168
4B). In a separate experiment (performed 15 months later) to test whether NMDAR activation ex vivo 169
contributed to elevated mitochondrial oxidant stress, brain slices from a different cohort of BACHD 170
mice were treated for >3 hours in 50 µM D-AP5 prior to imaging. MTS-roGFP imaging confirmed that 171
D-AP5-treated slices exhibited lower oxidant stress compared to untreated slices from the same mice 172

9
(untreated: 0.39 [0.35–0.48]; n = 13; D-AP5-treated: 0.32 [0.24–0.42]; n = 17; p = 0.0445; Figure 4C). 173
Thus, STN neurons from BACHD mice exhibit elevated mitochondrial oxidant stress, which can be 174
reduced by antagonism of NMDARs. 175
Impaired autonomous activity of STN neurons in BACHD mice is due to increased activation of KATP 176
channels 177
NMDAR receptor-generated mitochondrial oxidant stress in BACHD may lead to the activation of KATP 178
channels, which act as metabolic sensors and homeostatic regulators of excitability in multiple cell 179
types (Nichols, 2006). STN neurons abundantly express all the molecular components of KATP 180
channels including the Kir6.2 pore-forming subunit of the KATP channel (Thomzig et al., 2005) and the 181
SUR1, SUR2A and SUR2B regulatory subunits (Karschin et al., 1997; Zhou et al., 2012). To 182
determine whether KATP channels are responsible for impaired firing in BACHD mice, the effects of the 183
KATP channel inhibitor glibenclamide (100 nM) on WT and phenotypic BACHD autonomous firing ex 184
vivo were compared. Glibenclamide application increased both the rate (BACHD control: 5.7 [1.4–185
9.1] Hz; BACHD glibenclamide: 11.3 [9.2–13.3] Hz; n = 15; p = 0.0003) and regularity (BACHD control 186
CV: 0.41 [0.16–1.43]; BACHD glibenclamide CV: 0.16 [0.12–0.32]; n = 14; p = 0.0001) of autonomous 187
firing in 5–7-month-old BACHD STN neurons (Figure 5A, B). In contrast KATP channel inhibition had 188
no effect on the firing of WT neurons (WT control frequency: 13.2 [8.4–19.6] Hz; WT glibenclamide 189
frequency: 15.7 [9.7–18.4] Hz; n = 8; p = 0.4609; WT control CV: 0.18 [0.11–0.21]; WT glibenclamide 190
CV: 0.14 [0.11–0.19]; n = 8; p = 0.1094). 191
To further examine the effects of KATP channels on autonomous firing, whole-cell current clamp 192
recordings were obtained from 5–7-month-old BACHD mice and WT littermates (Figure 5C, D). 193
Consistent with the hyperpolarizing and shunting effects of KATP channels, the interspike voltage 194
trajectory was shallower in BACHD neurons compared to WT (WT: 413.8 [317.1–705.0] mV/s; n = 7; 195
BACHD: 125.3 [59.2–298.0] mV/s; n = 7; ph = 0.0210). In addition, the rate, regularity and interspike 196
voltage trajectory of autonomous firing of BACHD STN neurons recorded in this configuration 197
increased following application of glibenclamide (BACHD control frequency: 7.7 [4.5–13.4] Hz; 198
10
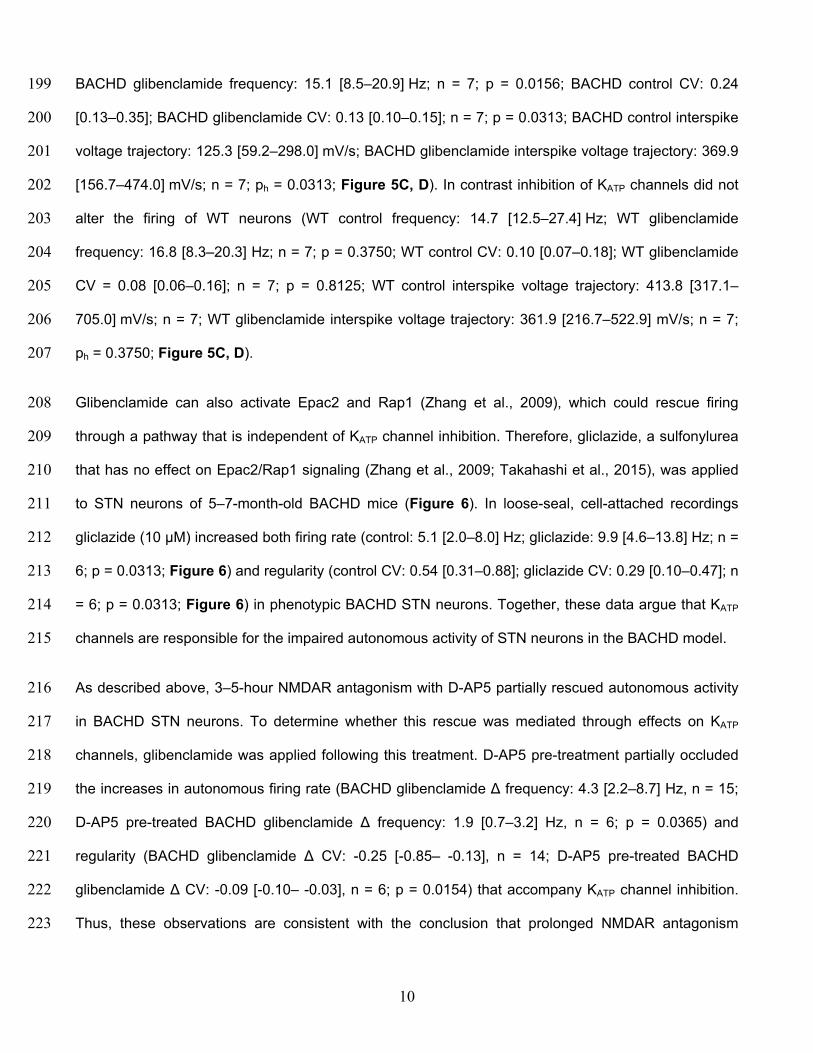
BACHD glibenclamide frequency: 15.1 [8.5–20.9] Hz; n = 7; p = 0.0156; BACHD control CV: 0.24 199
[0.13–0.35]; BACHD glibenclamide CV: 0.13 [0.10–0.15]; n = 7; p = 0.0313; BACHD control interspike 200
voltage trajectory: 125.3 [59.2–298.0] mV/s; BACHD glibenclamide interspike voltage trajectory: 369.9 201
[156.7–474.0] mV/s; n = 7; ph = 0.0313; Figure 5C, D). In contrast inhibition of KATP channels did not 202
alter the firing of WT neurons (WT control frequency: 14.7 [12.5–27.4] Hz; WT glibenclamide 203
frequency: 16.8 [8.3–20.3] Hz; n = 7; p = 0.3750; WT control CV: 0.10 [0.07–0.18]; WT glibenclamide 204
CV = 0.08 [0.06–0.16]; n = 7; p = 0.8125; WT control interspike voltage trajectory: 413.8 [317.1–205
705.0] mV/s; n = 7; WT glibenclamide interspike voltage trajectory: 361.9 [216.7–522.9] mV/s; n = 7; 206
ph = 0.3750; Figure 5C, D). 207
Glibenclamide can also activate Epac2 and Rap1 (Zhang et al., 2009), which could rescue firing 208
through a pathway that is independent of KATP channel inhibition. Therefore, gliclazide, a sulfonylurea 209
that has no effect on Epac2/Rap1 signaling (Zhang et al., 2009; Takahashi et al., 2015), was applied 210
to STN neurons of 5–7-month-old BACHD mice (Figure 6). In loose-seal, cell-attached recordings 211
gliclazide (10 µM) increased both firing rate (control: 5.1 [2.0–8.0] Hz; gliclazide: 9.9 [4.6–13.8] Hz; n = 212
6; p = 0.0313; Figure 6) and regularity (control CV: 0.54 [0.31–0.88]; gliclazide CV: 0.29 [0.10–0.47]; n 213
= 6; p = 0.0313; Figure 6) in phenotypic BACHD STN neurons. Together, these data argue that KATP 214
channels are responsible for the impaired autonomous activity of STN neurons in the BACHD model. 215
As described above, 3–5-hour NMDAR antagonism with D-AP5 partially rescued autonomous activity 216
in BACHD STN neurons. To determine whether this rescue was mediated through effects on KATP 217
channels, glibenclamide was applied following this treatment. D-AP5 pre-treatment partially occluded 218
the increases in autonomous firing rate (BACHD glibenclamide Δ frequency: 4.3 [2.2–8.7] Hz, n = 15; 219
D-AP5 pre-treated BACHD glibenclamide Δ frequency: 1.9 [0.7–3.2] Hz, n = 6; p = 0.0365) and 220
regularity (BACHD glibenclamide Δ CV: -0.25 [-0.85– -0.13], n = 14; D-AP5 pre-treated BACHD 221
glibenclamide Δ CV: -0.09 [-0.10– -0.03], n = 6; p = 0.0154) that accompany KATP channel inhibition. 222
Thus, these observations are consistent with the conclusion that prolonged NMDAR antagonism 223

11
partially rescued autonomous activity in BACHD STN neurons through a reduction in KATP channel-224
mediated firing disruption. 225
NMDAR activation produces a persistent KATP channel-mediated disruption of autonomous activity in 226
WT STN neurons 227
To further examine whether elevated NMDAR activation can trigger a homeostatic KATP channel-228
mediated reduction in autonomous firing in WT STN, brain slices from 2-month-old C57BL/6 mice 229
were incubated in control media or media containing 25 µM NMDA for 1 hour prior to recording 230
(Figure 7). NMDA pre-treatment reduced the proportion of autonomously firing neurons (untreated: 231
66/75 (88%); NMDA: 65/87 (75%); p = 0.0444) and the frequency (untreated: 14.9 [7.8–24.8] Hz; n = 232
75; NMDA: 5.2 [0.0–14.0] Hz; n = 87; ph < 0.0001) and regularity (untreated CV: 0.13 [0.08–0.25]; n = 233
66; NMDA CV: 0.24 [0.10–0.72]; n = 65; ph = 0.0150; Figure 7A–C) of autonomous activity relative to 234
control slices. In a subset of neurons glibenclamide was applied to inhibit KATP channels. In neurons 235
from untreated slices glibenclamide had no effect on firing rate (control: 16.6 [10.9–31.3] Hz; 236
glibenclamide: 25.0 [16.3–32.8] Hz; n = 6; ph = 0.2188; Figure 7A–D) or regularity (control CV: 0.08 237
[0.07–0.37]; glibenclamide CV: 0.08 [0.06–0.09]; n = 6; ph = 0.3125; Figure 7A–D). However, in 238
neurons from NMDA pre-treated slices glibenclamide application elevated firing rate (control: 3.3 [2.3–239
5.1] Hz; glibenclamide: 11.4 [10.8–24.4] Hz; n = 10; ph = 0.0078; Figure 7A–D) and regularity (control 240
CV: 0.83 [0.25–1.03]; glibenclamide CV: 0.12 [0.07–0.16]; n = 8, ph = 0.0208; Figure 7A–D) to levels 241
similar to that seen in untreated slices. Together, these data demonstrate that increased activation of 242
STN NMDARs can lead to a persistent KATP channel-mediated homeostatic reduction in autonomous 243
activity in STN neurons. 244
Break down of H2O2 rescues the firing of BACHD STN neurons to WT levels 245
Mitochondrial oxidative phosphorylation generates superoxide, which may be dismuted by superoxide 246
dismutase to produce H2O2 (Adam-Vizi, 2005). Superoxide and hydrogen peroxide can also be 247
produced by NADPH oxidase (Brennan et al., 2009). Because KATP channels are activated by H2O2 248
12
(Ichinari et al., 1996; Avshalumov et al., 2005), we tested whether H2O2 contributes to KATP channel-249
mediated disruption of ex vivo autonomous activity in the BACHD model. The effect of a membrane 250
permeable form of the enzyme catalase (polyethylene glycol-catalase), which breaks down H2O2, on 251
the autonomous firing of STN neurons from 4–6-month-old BACHD mice was examined (Figure 8). 252
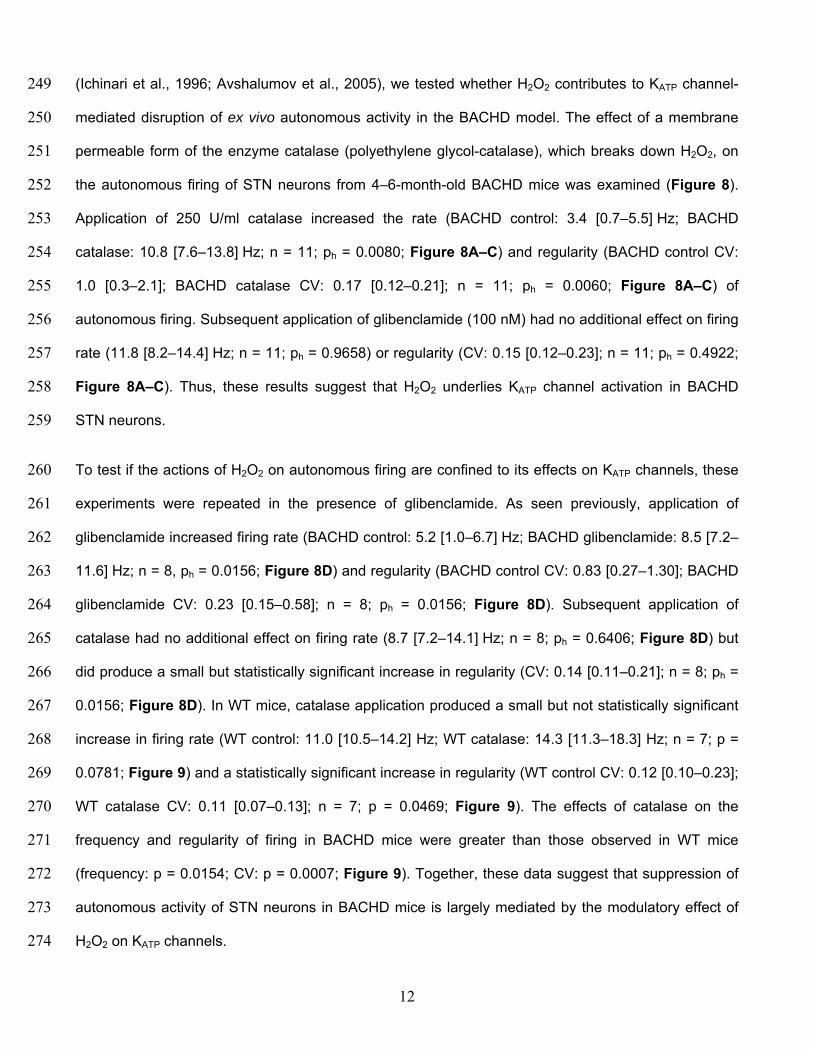
Application of 250 U/ml catalase increased the rate (BACHD control: 3.4 [0.7–5.5] Hz; BACHD 253
catalase: 10.8 [7.6–13.8] Hz; n = 11; ph = 0.0080; Figure 8A–C) and regularity (BACHD control CV: 254
1.0 [0.3–2.1]; BACHD catalase CV: 0.17 [0.12–0.21]; n = 11; ph = 0.0060; Figure 8A–C) of 255
autonomous firing. Subsequent application of glibenclamide (100 nM) had no additional effect on firing 256
rate (11.8 [8.2–14.4] Hz; n = 11; ph = 0.9658) or regularity (CV: 0.15 [0.12–0.23]; n = 11; ph = 0.4922; 257
Figure 8A–C). Thus, these results suggest that H2O2 underlies KATP channel activation in BACHD 258
STN neurons. 259
To test if the actions of H2O2 on autonomous firing are confined to its effects on KATP channels, these 260
experiments were repeated in the presence of glibenclamide. As seen previously, application of 261
glibenclamide increased firing rate (BACHD control: 5.2 [1.0–6.7] Hz; BACHD glibenclamide: 8.5 [7.2–262
11.6] Hz; n = 8, ph = 0.0156; Figure 8D) and regularity (BACHD control CV: 0.83 [0.27–1.30]; BACHD 263
glibenclamide CV: 0.23 [0.15–0.58]; n = 8; ph = 0.0156; Figure 8D). Subsequent application of 264
catalase had no additional effect on firing rate (8.7 [7.2–14.1] Hz; n = 8; ph = 0.6406; Figure 8D) but 265
did produce a small but statistically significant increase in regularity (CV: 0.14 [0.11–0.21]; n = 8; ph = 266
0.0156; Figure 8D). In WT mice, catalase application produced a small but not statistically significant 267
increase in firing rate (WT control: 11.0 [10.5–14.2] Hz; WT catalase: 14.3 [11.3–18.3] Hz; n = 7; p = 268
0.0781; Figure 9) and a statistically significant increase in regularity (WT control CV: 0.12 [0.10–0.23]; 269
WT catalase CV: 0.11 [0.07–0.13]; n = 7; p = 0.0469; Figure 9). The effects of catalase on the 270
frequency and regularity of firing in BACHD mice were greater than those observed in WT mice 271
(frequency: p = 0.0154; CV: p = 0.0007; Figure 9). Together, these data suggest that suppression of 272
autonomous activity of STN neurons in BACHD mice is largely mediated by the modulatory effect of 273
H2O2 on KATP channels. 274

13
To test if elevation of oxidant stress can result in KATP channel activation in WT STN neurons, 275
glutathione peroxidase was inhibited with mercaptosuccinic acid (MCS) (Avshalumov et al., 2005). 276
Following application of 1 mM MCS both the rate (control: 12.0 [7.8–13.5] Hz; MCS: 9.0 [4.8–10.5] Hz; 277
n = 11; ph = 0.0068; Figure 10) and regularity (control CV: 0.21 [0.15–0.22]; MCS CV: 0.30 [0.22–278
0.34]; n = 11; ph = 0.0137) of firing decreased. Subsequent application of glibenclamide rescued both 279
firing rate (14.6 [10.3–19.2] Hz; n = 11; ph = 0.0020) and regularity (CV: 0.12 [0.12-0.17]; n = 11; ph = 280
0.0098; Figure 10)). These data are also consistent with an action of H2O2 on STN KATP channels. 281
The STN degenerates progressively in BACHD mice 282
HD patients exhibit 20–30% STN neuron loss (Lange et al., 1976; Guo et al., 2012). Because 283
mitochondrial oxidant stress and reactive oxygen species can trigger apoptotic pathways leading to 284
cell death (Green and Reed, 1998; Bossy-Wetzel et al, 2008), the number of STN neurons in 12-285
month-old BACHD and WT mice were compared (Figure 11). The brains of BACHD mice and WT 286
littermates were first fixed by transcardial perfusion of formaldehyde, sectioned into 70 µm coronal 287
slices and immunohistochemically labeled for neuronal nuclear protein (NeuN). The total number of 288
NeuN-immunoreactive STN neurons and the volume of the STN were then estimated using unbiased 289
stereological techniques. Both the total number of STN neurons (WT: 10,793 [9,070–11,545]; n = 7; 290
BACHD: 7,307 [7,047–9,285]; n = 7; p = 0.0262) and the volume of the STN (WT: 0.087 [0.084–291
0.095] mm3; n = 7; BACHD: 0.078 [0.059–0.081] mm3; n = 7; p = 0.0111; Figure 11A, B) were 292
reduced in 12-month-old BACHD versus WT mice. The density of STN neurons was not different in 293
BACHD and WT mice (WT: 121,248 [107,180–126,139] neurons/mm3; n = 7; BACHD: 115,273 294
[90,377–135,765] neurons/mm3; n = 7; p = 0.8048; Figure 11A, B). To determine whether the 295
difference in cell number represents an early developmental abnormality or a progressive loss of adult 296
neurons, the numbers of neurons in 2-month-old BACHD and WT mice were also compared. At 2-297
months-old, the total number of STN neurons (WT: 10,373 [9,341–14,414]; n = 7; BACHD: 10,638 298
[10,513–13,877]; n = 7; p = 0.7104; Figure 11C), the volume of the STN (WT: 0.098 [0.090–299
0.125] mm3; n = 7; BACHD: 0.085 [0.080–0.111] mm3; n = 7; p = 0.1649; Figure 11C) and STN 300
14
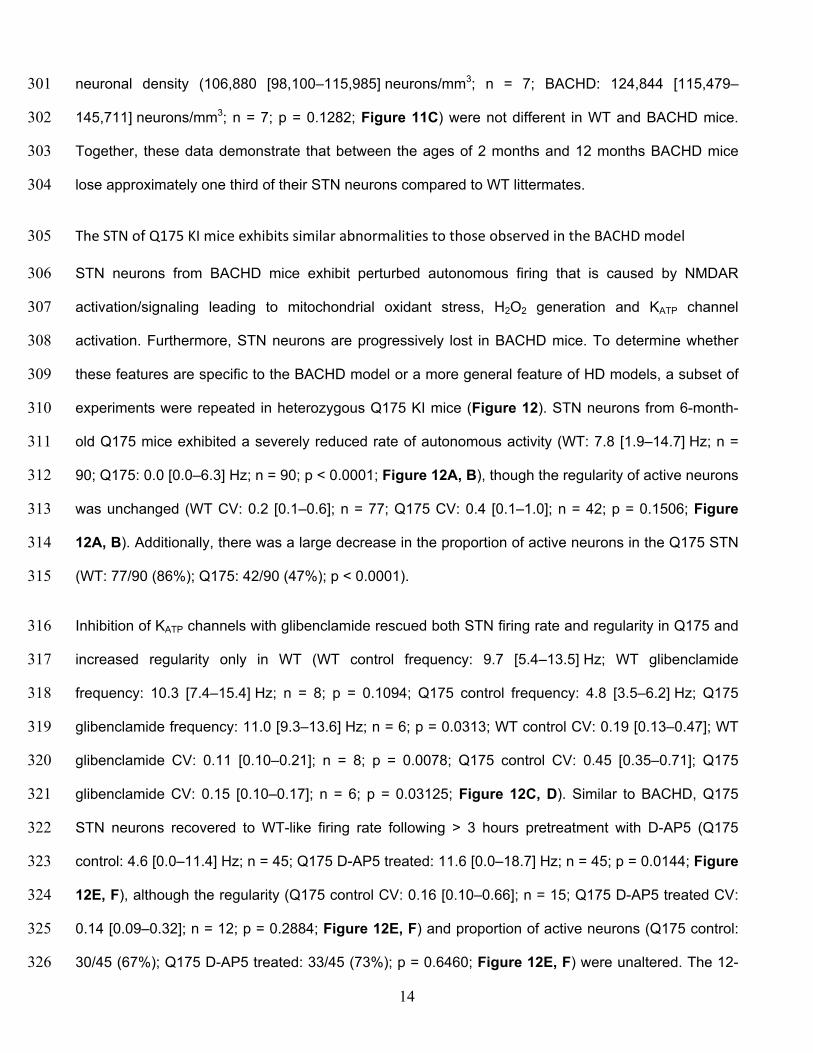
neuronal density (106,880 [98,100–115,985] neurons/mm3; n = 7; BACHD: 124,844 [115,479–301
145,711] neurons/mm3; n = 7; p = 0.1282; Figure 11C) were not different in WT and BACHD mice. 302
Together, these data demonstrate that between the ages of 2 months and 12 months BACHD mice 303
lose approximately one third of their STN neurons compared to WT littermates. 304
The STN of Q175 KI mice exhibits similar abnormalities to those observed in the BACHD model 305
STN neurons from BACHD mice exhibit perturbed autonomous firing that is caused by NMDAR 306
activation/signaling leading to mitochondrial oxidant stress, H2O2 generation and KATP channel 307
activation. Furthermore, STN neurons are progressively lost in BACHD mice. To determine whether 308
these features are specific to the BACHD model or a more general feature of HD models, a subset of 309
experiments were repeated in heterozygous Q175 KI mice (Figure 12). STN neurons from 6-month-310
old Q175 mice exhibited a severely reduced rate of autonomous activity (WT: 7.8 [1.9–14.7] Hz; n = 311
90; Q175: 0.0 [0.0–6.3] Hz; n = 90; p < 0.0001; Figure 12A, B), though the regularity of active neurons 312
was unchanged (WT CV: 0.2 [0.1–0.6]; n = 77; Q175 CV: 0.4 [0.1–1.0]; n = 42; p = 0.1506; Figure 313
12A, B). Additionally, there was a large decrease in the proportion of active neurons in the Q175 STN 314
(WT: 77/90 (86%); Q175: 42/90 (47%); p < 0.0001). 315
Inhibition of KATP channels with glibenclamide rescued both STN firing rate and regularity in Q175 and 316
increased regularity only in WT (WT control frequency: 9.7 [5.4–13.5] Hz; WT glibenclamide 317
frequency: 10.3 [7.4–15.4] Hz; n = 8; p = 0.1094; Q175 control frequency: 4.8 [3.5–6.2] Hz; Q175 318
glibenclamide frequency: 11.0 [9.3–13.6] Hz; n = 6; p = 0.0313; WT control CV: 0.19 [0.13–0.47]; WT 319
glibenclamide CV: 0.11 [0.10–0.21]; n = 8; p = 0.0078; Q175 control CV: 0.45 [0.35–0.71]; Q175 320
glibenclamide CV: 0.15 [0.10–0.17]; n = 6; p = 0.03125; Figure 12C, D). Similar to BACHD, Q175 321
STN neurons recovered to WT-like firing rate following > 3 hours pretreatment with D-AP5 (Q175 322
control: 4.6 [0.0–11.4] Hz; n = 45; Q175 D-AP5 treated: 11.6 [0.0–18.7] Hz; n = 45; p = 0.0144; Figure 323
12E, F), although the regularity (Q175 control CV: 0.16 [0.10–0.66]; n = 15; Q175 D-AP5 treated CV: 324
0.14 [0.09–0.32]; n = 12; p = 0.2884; Figure 12E, F) and proportion of active neurons (Q175 control: 325
30/45 (67%); Q175 D-AP5 treated: 33/45 (73%); p = 0.6460; Figure 12E, F) were unaltered. The 12-326

15
month-old Q175 STN (n = 7) exhibited a median 26% reduction in the total number of STN neurons 327
with no effect on other parameters (WT: 8,661 [7,120–9,376] neurons; Q175: 6,420 [5,792–7,024] 328
neurons; p = 0.0111; WT volume: 0.081 [0.074–0.087] mm3; Q175 volume: 0.079 [0.070–0.091] mm3; 329
p = 0.6200; WT density: 109,477 [82,180–115,301] neurons/mm3; Q175 density: 88,968 [63,624–330
103,020] neurons/mm3; p = 0.2086; Figure 12G, H). Taken together these data show that the STN 331
exhibits similar dysfunction and neuronal loss in both the transgenic BACHD and Q175 KI mouse 332
models of HD. 333
334

16
Discussion 335
Dysfunction of the striatum and cortex has been extensively characterized in HD models, but relatively 336
few studies have examined the extra-striatal basal ganglia. Here, we report early NMDAR, 337
mitochondrial and firing abnormalities together with progressive loss of STN neurons in two HD mouse 338
models. Furthermore, dysfunction was present in HD mice prior to the onset of major symptoms, 339
implying that it occurs early in the disease process (Gray et al., 2008; Menalled et al., 2012). Cell 340
death in the STN also preceded that in the striatum, as STN neuronal loss was observed at 12 months 341
of age in both BACHD and Q175 mice, a time point at which striatal neuronal loss is absent but 342
psychomotor dysfunction is manifest (Gray et al., 2008; Heikkinen et al., 2012; Smith et al., 2014; 343
Mantovani et al., 2016). Together these findings argue that dysfunction within the STN contributes to 344
the pathogenesis of HD. 345
Astrocytes appear to play a pivotal role in HD. Expression of mutant huntingtin in astrocytes alone is 346
sufficient to recapitulate neuronal and neurological abnormalities observed in HD and its models 347
(Bradford et al., 2009; Faideau et al., 2010). Furthermore, astrocyte-specific rescue approaches 348
ameliorate some of the abnormalities observed in HD models (Tong et al., 2014; Oliveira et al., 2016). 349
In the STN, inhibition of GLT-1 (and GLAST) slowed individual NMDAR EPSCs in WT but not BACHD 350
mice and eliminated the differences in their decay kinetics, arguing that impaired uptake of glutamate 351
by astrocytes contributed to the relative prolongation of NMDAR-mediated EPSCs in BACHD STN 352
neurons. Interestingly, and in contrast to the striatum (Milnerwood et al., 2010), when spillover of 353
glutamate onto extrasynaptic receptors was increased by train stimulation and inhibition of astrocytic 354
glutamate uptake, the resulting compound NMDAR EPSC and its prolongation by uptake inhibition 355
were similar in BACHD and WT mice, arguing against an increase in extrasynaptic STN NMDAR 356
expression/function in BACHD mice. Slowing of astrocytic glutamate uptake has recently been shown 357
to occur during increased presynaptic activity (Armbruster et al., 2016). Thus, train stimulation may 358
have sufficiently slowed glutamate uptake that the differences in uptake that were observed in BACHD 359
and WT STN neurons during single stimulation, were occluded/eliminated during train stimulation. 360
17
Whether the modest differences in glutamate uptake that were observed here are sufficient to promote 361
NMDAR-mediated dysfunction in HD STN neurons remains to be determined. 362
NMDARs play a key role in the abnormal activity of STN neurons in HD models. Antagonism of STN 363
NMDARs in BACHD and Q175 brain slices rescued autonomous STN firing. Conversely, acute 364
activation of STN NMDARs persistently disrupted STN firing in WT brain slices. If the relatively low 365
level of glutamatergic transmission present ex vivo is sufficient to impair firing then this impairment is 366
likely to be more severe in vivo where STN neurons are powerfully patterned by glutamatergic 367
transmission arising from the cortex, thalamus, pedunculopontine nucleus and superior colliculus 368
(reviewed by Bevan, 2017). Non-synaptic sources of extracellular glutamate, such as diffusion/release 369
from astrocytes (Cavelier and Attwell, 2005; Lee et al., 2013) may also contribute to excessive 370
NMDAR activation in HD mice. 371
Extended antagonism of NMDARs in BACHD slices also reduced mitochondrial oxidant stress in STN 372
neurons. NMDAR activation can elevate ROS through a variety of Ca2+ and nitric oxide-associated 373
signaling pathways and their associated actions on mitochondria, NADPH oxidase and antioxidant 374
expression (Dugan et al., 1995; Moncada and Bolanos, 2006; Brennan et al., 2009; Nakamura and 375
Lipton, 2011; Valencia et al., 2013). Although we saw no evidence of basal mitochondrial dysfunction 376
that was not attributable to increased NMDAR function, there is considerable evidence that mutant 377
huntingtin causes transcriptional dysregulation, which leads to defective mitochondrial quality control, 378
an increase in the proportion of defective, ROS generating mitochondria and an increase in opening of 379
the permeability transition pore (Milakovic and Johnson, 2005; Panov et al., 2005; Fernandes et al., 380
2007; Song et al., 2011; Chatuverdi et al., 2013; Johri et al., 2013; Martin et al., 2015). Thus, basal 381
mitochondrial dysfunction could render HD STN neurons especially sensitive to NMDAR-mediated 382
transmission and signaling. 383
Catalase rapidly restored autonomous firing in the BACHD model, an effect occluded by inhibition of 384
KATP channels, arguing that H2O2, through its action on KATP channels is the major cause of firing 385
18
disruption. H2O2 can act on KATP channels by decreasing their sensitivity to ATP (Ichinari et al., 1996), 386
reducing the ratio of ATP to ADP (Krippeit-Drews et al., 1999), and/or modulating channel gating 387
through a sGC-cGMP-PKG-ROS(H2O2)-ERK1/2-calmodulin-CaMKII signaling pathway (Zhang et al., 388
2014). H2O2 is likely to directly modulate STN KATP channels in HD mice because disrupted firing was 389
also observed when STN neurons were recorded in the whole-cell configuration with patch pipettes 390
containing exogenous ATP. Furthermore, H2O2 break down rapidly rescued activity, consistent with a 391
direct action on KATP channels. H2O2-dependent modulation of KATP channels has been extensively 392
characterized in midbrain dopamine neurons where it powerfully suppresses cellular excitability and 393
synaptic transmission (Avshalumov et al., 2005; Bao et al., 2009). The activation of KATP channels in 394
STN neurons may represent a form of homeostasis that suppresses firing when mitochondrial oxidant 395
stress is high, limiting the possibility of oxidant damage and bioenergetic failure (Ray et al., 2012; 396
Sena and Chandel, 2012). 397
In HD, chronic oxidant stress can lead to damage, such as lipid and protein peroxidation and 398
nuclear/mitochondrial DNA damage, which profoundly impair cellular function and promote cell death 399
(Perluigi et al., 2005; Browne and Beal, 2006; Acevedo-Torres et al., 2009). Consistent with the 400
negative effects of such processes on neuronal viability, we observed progressive loss of STN 401
neurons in both the BACHD and Q175 models. Furthermore, the level of neuronal loss at 12 months in 402
the BACHD and Q175 models was similar to that observed in HD patients (Lange et al., 1976; Guo et 403
al., 2012). The absence of neuronal loss in the cortex and striatum in the same models at an 404
equivalent time point suggests that STN dysfunction and degeneration may be particularly influential in 405
the early disease process. Although the STN is known to degenerate in HD, it is not clear why 406
neuronal loss is ultimately less than that observed in the striatum at the end stage of the disease, 407
despite the fact that dysfunction and degeneration occur earlier (at least in HD models). Future 408
research will be required to determine whether subtypes of STN neurons exhibit selective vulnerability 409
and/or whether the processes promoting their degeneration, e.g. cortical activation of STN NMDARs, 410
ultimately wane. 411

19
As a key component of the hyperdirect and indirect pathways, the STN is critical for constraining 412
cortico-striatal activity underlying action selection (Albin et al., 1989; Oldenburg and Sabatini, 2015). In 413
the “classical” model of basal ganglia function, degeneration of indirect pathway striatal projection 414
neurons is proposed to underlie the symptoms of early stage HD (Albin et al., 1989). Here we show for 415
the first time that STN dysfunction and neuronal loss precede cortico-striatal abnormalities in HD 416
models. Thus, dysfunction and degeneration of cortical and striatal neurons occurs in concert with 417
profound changes in other elements of the basal ganglia. Therapeutic strategies that target the STN 418
may therefore be useful not only for treating the psychomotor symptoms of early- to mid-stage HD but 419
also for influencing dysfunction and degeneration throughout the cortico-basal ganglia-thalamo-cortical 420
circuit. 421
422
20
Materials and Methods 423
Animals 424
All animal procedures were performed in accordance with the policies of the Society for Neuroscience 425
and the National Institutes of Health, and approved by the Institutional Animal Care and Use 426
Committee of Northwestern University. Adult male hemizygous BACHD mice 427
(RRID:IMSR_JAX:008197) and heterozygous Q175 mice (RRID:IMSR_JAX:027410), their WT litter 428
mates, and C57BL/6 mice (Charles River Laboratories International, Inc., Wilmington, MA, USA) were 429
used in this study. 430
Stereotaxic injection of viral vectors 431
Mice were anesthetized with 1–2% isoflurane (Smiths Medical ASD, Inc., Dublin, OH, USA). AAV 432
vectors (serotype 9; ~1012–13 GC/ml) engineered to express hChR2(H134R)-eYFP under the hSyn 433
promoter (University of Pennsylvania Vector Core, Philadelphia, PA, USA) or MTS-roGFP under the 434
CMV promoter (Sánchez-Padilla et al., 2014) were injected under stereotaxic guidance (Neurostar, 435
Tubingen, Germany). In order to express hChR2(H134R)-eYFP, AAV was injected bilaterally into the 436
primary motor cortex (three injections per hemisphere; coordinates relative to bregma: AP, +0.6 mm, 437
+1.2 mm, and +1.8 mm; ML, +1.5 mm, and −1.5 mm; DV, −1.0 mm; 0.3 μl per injection). In order to 438
express MTS-roGFP, AAV was injected bilaterally into the STN (coordinates: AP, −2.06 mm; ML, 439
+1.4 mm, and −1.4 mm; DV, −4.5 mm; 0.4 µl per injection). Brain slices were prepared from AAV-440
injected mice 10–14 days after injection. 441
Slice preparation 442
Mice were lightly anesthetized with isoflurane, deeply anesthetized with ketamine/xylazine (87/13 443
mg/kg i.p.) and then perfused transcardially with ~10 ml of ice-cold sucrose-based artificial 444
cerebrospinal fluid (sACSF) that contained 230 mM sucrose, 2.5 mM KCl, 1.25 mM NaH2PO4, 0.5 mM 445
CaCl2, 10 mM MgSO4, 10 mM glucose, and 26 mM NaHCO3 equilibrated with 95% O2 and 5% CO2. 446
21
The brain was removed, immersed in sASCF and 250 µm sagittal slices were cut with a vibratome 447
(VT1200S; Leica Microsystems Inc., IL, USA). Slices were then transferred to a holding chamber, 448
immersed in ACSF that contained 125 mM NaCl, 2.5 mM KCl, 1.25 mM NaH2PO4, 2 mM CaCl2, 2 mM 449
MgSO4, 10 mM glucose, 26 mM NaHCO3, 1 mM sodium pyruvate, and 5 µM L-glutathione equilibrated 450
with 95% O2 and 5% CO2, held at 35 ˚C for 30-45 min, then maintained at room temperature. 451
Recording 452
Individual brain slices were placed in a recording chamber where they were perfused at 4–5 ml/min 453
with synthetic interstitial fluid (SIF) at 35 ˚C that contained 126 mM NaCl, 3 mM KCl, 1.25 mM 454
NaH2PO4, 1.6 mM CaCl2, 1.5 mM MgSO4, 10 mM glucose and 26 mM NaHCO3 equilibrated with 95% 455
O2 and 5% CO2. Somatic recordings were obtained under visual guidance (Axioskop FS2, Carl Zeiss, 456
Oberkochen, Germany) using computer-controlled manipulators (Luigs & Neumann, Ratingen, 457
Germany). Loose-seal cell-attached recordings were made using 3–5 MΩ impedance borosilicate 458
glass pipettes (Warner Instruments, Hamden, CT, USA) that were filled with 140 mM NaCl, 23 mM 459
glucose, 15 mM HEPES, 3 mM KCl, 1.5 mM MgCl2, 1.6 mM CaCl2 (pH 7.2 with NaOH, 300–310 460
mOsm/l). Whole-cell voltage clamp recordings were made using 3–5 MΩ pipettes filled with 135 mM 461
CsCH3O3S, 10 mM QX-314, 10 mM HEPES, 5 mM phosphocreatine, 3.8 mM NaCl, 2 mM Mg1.5ATP, 462
1 mM MgCl2, 0.4 mM Na3GTP, 0.1 mM Na4EGTA (pH 7.2 with CsOH, 290 mOsm/l). Whole-cell 463
current clamp recordings were made using 10–15 MΩ pipettes filled with 130 mM KCH3SO4, 3.8 mM 464
NaCl, 1 mM MgCl2, 10 mM HEPES, 5 mM phosphocreatine di(tris) salt, 0.1 mM Na4EGTA, 0.4 mM 465
Na3GTP, and 2 mM Mg1.5ATP (pH 7.3 with KOH; 290 mOsm/l). Electrophysiological records were 466
acquired using a computer running Clampex 10 software (Molecular Devices, Palo Alto, CA, USA; 467
RRID:SCR_011323) connected to a Multiclamp 700B amplifier (Molecular Devices) via a Digidata 468
1322A digitizer (Molecular Devices). Data were low-pass filtered at 10 kHz and sampled at 50 kHz. 469
Liquid junction potentials of 10 and 9 mV were accounted for in whole-cell voltage clamp and current 470
clamp recordings respectively, and in voltage clamp recordings series resistance and membrane 471
capacitance were corrected online. All recordings of autonomous action potential generation were 472

22
made in the acute presence of 50 µM D-AP5, 20 µM DNQX, 10 µM GABAzine, and 2 µM CGP 55845 473
to block synaptic transmission. 474
Two-photon imaging 475
MTS-roGFP-expressing neurons were imaged at 890 nm with 76 MHz pulse repetition and ~250 fs 476
pulse duration at the sample plane. Two-photon excitation was provided by a G8 OPSL pumped Mira 477
900F laser (Coherent, Santa Clara, CA, USA) and sample power was regulated by a Pockels cell 478
electro-optic modulator (model M350-50-02-BK, Con Optics, Danbury, CT, USA). Images were 479
acquired using an Ultima 2P system running PrairieView 5 (Bruker Nano Fluorescence Microscopy, 480
Middleton, WI, USA) and a BX51WI microscope (Olympus, Tokyo, Japan) with a 60× 0.9 NA objective 481
(UIS1 LUMPFL; Olympus). After baseline fluorescence had been measured, the maximum and 482
minimum fluorescence were determined by the application of 2 mM dithiothreitol and then 200 µM 483
aldrithiol-4 to fully reduce and oxidize the tissue, respectively. The relative oxidation at baseline, a 484
measure of oxidative stress, was then calculated (Sánchez-Padilla et al., 2014). 485
Immunohistochemistry and stereology 486
Mice were lightly anesthetized with isoflurane, deeply anesthetized with ketamine/xylazine 487
(87/13 mg/kg i.p.) and then perfused transcardially with ~5 ml of phosphate buffered saline (PBS) 488
followed by 30 ml of 4% formaldehyde in 0.1 M phosphate buffer (pH 7.4). Brains were removed and 489
post-fixed for 2 hr in 4% formaldehyde, then washed in PBS. Brains were blocked and 70 µm thick 490
coronal sections containing the STN were cut using a vibratome (VT1000S; Leica). Sections were 491
washed in PBS and incubated for 48 hr at 4 ˚C in anti-NeuN (clone A60; MilliporeSigma, Darmstadt, 492
Germany; RRID:AB_2298772) at 1:200 in PBS with 0.2% Triton X-100 (MilliporeSigma) and 2% 493
normal donkey serum. Sections were then washed in PBS and incubated for 90 min at room 494
temperature in Alexa Fluor 488 donkey anti-mouse IgG (1:250; Jackson Immunoresearch, West 495
Grove, PA, USA; RRID:AB_2340846) in 0.2% Triton X-100 and 2% normal donkey serum. Then the 496
sections were washed in PBS and mounted on glass slides in Prolong Gold anti-fade medium 497
(Thermo Fisher Scientific, Waltham, MA, USA). 498
23
NeuN labeled sections were imaged using an Axioskop 2 microscope (Carl Zeiss) with a 100× 1.3 NA 499
oil immersion objective (Plan-Neofluar 1018-595; Carl Zeiss). Unbiased stereological counting of STN 500
neurons in a single hemisphere was performed using the optical fractionator technique (West et al., 501
1991) as implemented in Stereo Investigator (MBF Bioscience, Williston, VT, USA; 502
RRID:SCR_002526), using a counting frame of 50 µm × 50 µm × 8 µm and a grid size of 150 µm × 503
150 µm; all sections containing the STN were used for counting (~8 sections). STN volume was 504
calculated from the sum of the areal extent of the STN on each section multiplied by the section 505
thickness (70 µm). For all individual counts the Gundersen Coefficient of Error (CE) (Gundersen et al., 506
1999) was less than 0.1 (0.080 [0.075–0.090]), and the investigator performing the counting was 507
blinded to the genotype of the mouse. 508
Drugs 509
All drugs used in electrophysiology and imaging experiments were diluted to working concentration in 510
SIF and bath applied. D-AP5, CGP 55845, DNQX, GABAzine (SR 95531) and gliclazide were 511
purchased from Abcam (Cambridge, MA, USA). Glibenclamide, TFB-TBOA and DL-Dithiothreitol were 512
purchased from Tocris Bioscience (Bristol, UK). Catalase (polyethylene glycol-catalase), aldrithiol-4 513
and MCS were purchased from Sigma-Aldrich (St. Louis, MO, USA). 514
Data analysis and statistics 515
Electrophysiological data were analyzed using routines running in Igor Pro 6 & 7 (Wavemetrics, 516
Portland, OR, USA; RRID:SCR_000325) or matplotlib (Hunter, 2007; RRID:SCR_008624). The firing 517
rate of STN neurons was calculated from 1 min of recording or 100 action potentials (whichever 518
covered the longer time period). Imaging data was analyzed using FIJI (Schindelin et al., 2012; 519
RRID:SCR_002285). Statistical analyses were performed in Prism 5 (GraphPad Software, San Diego, 520
CA, USA; RRID:SCR_002798) or R (http://www.r-project.org/; RRID:SCR_001905, 521
RRID:SCR_000432). In order to make no assumptions about the distribution of the data, non-522
parametric statistical tests were used, and data are reported as median [interquartile range]; outliers 523
were not excluded from the analysis. An α-level of 0.05 was used for two-way statistical comparisons 524

24
performed with the Mann-Whitney U test for unpaired data (represented with box plots), the Wilcoxon 525
signed rank test for paired data (tilted line segment plots), Fisher's exact test for categorical data (bar 526
plots) or the F-test for linear regression. Where datasets were used in multiple comparisons the p-527
value was adjusted to maintain the family-wise error rate at 0.05 using the Holm-Bonferroni method 528
(Holm, 1979); adjusted p-values are denoted ph. Box plots show median (central line), interquartile 529
range (box) and 10–90% range (whiskers). For the primary findings reported in the manuscript, 530
sample sizes for Mann-Whitney and Wilcoxon tests were estimated to achieve a minimum of 80% 531
power using formulae described by Noether (1987). The effect sizes used in these power calculations 532
were estimated using data randomly drawn from uniform distributions (runif() function in R stats 533
package). For Mann-Whitney tests, with a 50 percentile change in median between groups X and Y 534
(the interquartile ranges of the groups don’t overlap) P(Y > X) ≈ 0.88 giving an estimation that at least 535
10 observations per group would be needed to achieve 80% power; for a 25 percentile change (the 536
median of Y falls outside the interquartile range of X) P(Y > X) ≈ 0.72 and the estimated requirement is 537
at least 27 observations per group. For Wilcoxon tests, if all pairs of observations show the same 538
direction of change, P(X + X’ > 0) = 1 giving an estimation that at least 10 observations would be 539
needed to achieve 80% power (note though that it is possible to show empirically that 6 observations 540
gives 100% power in this case); if 90% of observations show the same direction of change, P(X + X’ > 541
0) ≈ 0.98 and the estimated requirement is at least 12 pairs of observations. 542
543

25
Acknowledgements 544
This study was funded by CHDI Foundation and by NIH NINDS Grants 2R37 NS041280 and 2P50 545
NS047085. We thank Drs. Vahri Beaumont (CHDI) and Ignacio Munoz-Sanjuan (CHDI) for their 546
comments on the work and Sasha Ulrich, Danielle Schowalter, and Marisha Alicea for management of 547
mouse colonies. 548
549

26
References 550
Acevedo-Torres K, Berríos L, Rosario N, Dufault V, Skatchkov S, Eaton MJ, Torres-Ramos CA, Ayala-551
Torres S (2009) Mitochondrial DNA damage is a hallmark of chemically induced and the R6/2 552
transgenic model of Huntington's disease. DNA Repair 8:126–136. 553
Adam-Vizi V (2005) Production of reactive oxygen species in brain mitochondria: contribution by 554
electron transport chain and non–electron transport chain sources. Antioxidants & Redox Signaling 555
7:1140–1149. 556
Albin RL, Young AB, Penney JB (1989) The functional anatomy of basal ganglia disorders. Trends 557
Neurosci 12:366–375. 558
Anderson KE, Marder KS (2001) An overview of psychiatric symptoms in Huntington’s disease. Curr 559
Psychiatry Rep 3:379–388. 560
Armbruster M, Hanson E, Dulla CG (2016) Glutamate clearance is locally modulated by presynaptic 561
neuronal activity in the cerebral cortex. J Neurosci 36:10404–10415. 562
Arzberger T, Krampfl K, Leimgruber S, Weindl A (1997) Changes of NMDA receptor subunit (NR1, 563
NR2B) and glutamate transporter (GLT1) mRNA expression in Huntington’s disease—an in situ 564
hybridization study. J Neuropath Exp Neur 56:440–454. 565
Atherton JF, Wokosin DL, Ramanathan S, and Bevan MD (2008) Autonomous initiation and 566
propagation of action potentials in neurons of the subthalamic nucleus. J Physiol 586:5679–5700. 567
Atherton JF, Kitano K, Baufreton J, Fan K, Wokosin DL, Tkatch T, Shigemoto R, Surmeier DJ, Bevan 568
MD (2010) selective participation of somatodendritic HCN channels in inhibitory but not excitatory 569
synaptic integration in neurons of the subthalamic nucleus. J Neurosci 30:16025–16040. 570

27
Avshalumov MV, Chen BT, Koós T, Tepper JM, Rice ME (2005) Endogenous hydrogen peroxide 571
regulates the excitability of midbrain dopamine neurons via ATP-sensitive potassium channels. J 572
Neurosci 25:4222–4231. 573
Bao L, Avshalumov MV, Patel JC, Lee CR, Miller EW, Chang CJ, Rice ME (2009) Mitochondria Are 574
the Source of Hydrogen Peroxide for Dynamic Brain-Cell Signaling. J Neurosci 29:9002–9010. 575
Baunez C, Robbins TW (1997) Bilateral lesions of the subthalamic nucleus induce multiple deficits in 576
an attentional task in rats. Eur J Neurosci 9:2086–2099. 577
Behrens PF, Franz P, Woodman B, Lindenberg KS, Landwehrmeyer GB (2002) Impaired glutamate 578
transport and glutamate–glutamine cycling: downstream effects of the Huntington mutation. Brain 579
125:1908–1922. 580
Beurrier C, Bioulac B, Hammond C (2000) Slowly inactivating sodium current (I(NaP)) underlies 581
single-spike activity in rat subthalamic neurons. J Neurophysiol 83:1951–1957. 582
Bevan MD (2017) The subthalamic nucleus. In: Handbook of basal ganglia structure and function, 583
Second Edition (Steiner H, Tseng KY eds), pp 277–291. Amsterdam, Netherlands: Academic Press, 584
Elsevier. 585
Bevan MD, Wilson CJ (1999) Mechanisms underlying spontaneous oscillation and rhythmic firing in rat 586
subthalamic neurons. J Neurosci 19:7617–7628. 587
Bickel S, Alvarez L, Macias R, Pavon N, Leon M, Fernandez C, Houghton DJ, Salazar S, Rodríguez-588
Oroz MC, Juncos J, Guridi J, Delong M, Obeso JA, Litvan I (2010) Cognitive and neuropsychiatric 589
effects of subthalamotomy for Parkinson's disease. Parkinsonism Relat Disord 16:535–539. 590
Bossy-Wetzel E, Petrilli A, Knott AB (2008) Mutant huntingtin and mitochondrial dysfunction. Trends 591
Neurosci 31:609–616. 592

28
Bradford J, Shin J-Y, Roberts M, Wang C-E, Li X-J, Li S (2009) Expression of mutant huntingtin in 593
mouse brain astrocytes causes age-dependent neurological symptoms. Proc Natl Acad Sci U S A 594
106:22480–22485. 595
Brennan AM, Suh SW, Won SJ, Narasimhan P, Kauppinen TM, Lee H, Edling Y, Chan PH, Swanson 596
RA (2009) NADPH oxidase is the primary source of superoxide induced by NMDA receptor activation. 597
Nat Neurosci 12:857–863. 598
Browne SE, Beal MF (2006) Oxidative damage in Huntington's disease pathogenesis. Antioxidants & 599
Redox Signaling 8:2061–2073. 600
Callahan JW, Abercrombie ED (2015a) Age-dependent alterations in the cortical entrainment of 601
subthalamic nucleus neurons in the YAC128 mouse model of Huntington's disease. Neurobiol Dis 602
78:88–99. 603
Callahan JW, Abercrombie ED (2015b) Relationship between subthalamic nucleus neuronal activity 604
and electrocorticogram is altered in the R6/2 mouse model of Huntington's disease. J Physiol (Lond) 605
593:3727–3738. 606
Cavelier P, Attwell D (2005) Tonic release of glutamate by a DIDS-sensitive mechanism in rat 607
hippocampal slices. J Physiol (Lond) 564:397–410. 608
Chaturvedi RK, Beal MF (2013) Mitochondrial diseases of the brain. Free Radic Biol Med 63:1–29. 609
Chevalier G, Deniau J-MM (1990) Disinhibition as a basic process in the expression of striatal 610
functions. Trends Neurosci 13:277–280. 611
Chu H-Y, Atherton JF, Wokosin DL, Surmeier DJ, Bevan MD (2015) Heterosynaptic regulation of 612
external globus pallidus inputs to the subthalamic nucleus by the motor cortex. Neuron 85:364–376. 613

29
Crossman AR, Mitchell IJ, Sambrook MA, Jackson A (1988) Chorea and myoclonus in the monkey 614
induced by gamma-aminobutyric acid antagonism in the lentiform complex. Brain 111:1211–1233. 615
Do MT, Bean BP (2003) Subthreshold sodium currents and pacemaking of subthalamic neurons: 616
modulation by slow inactivation. Neuron 39:109–120. 617
Dugan LL, Sensi SL, Canzoniero LM, Handran SD, Rothman SM, Lin TS, Goldberg MP, Choi DW 618
(1995) Mitochondrial production of reactive oxygen species in cortical neurons following exposure to 619
N-methyl-D-aspartate. J Neurosci 15:6377–6388. 620
Dvorzhak A, Vagner T, Kirmse K, Grantyn R (2016) Functional indicators of glutamate transport in 621
single striatal astrocytes and the influence of Kir4.1 in normal and Huntington mice. J Neurosci 622
36:4959–4975. 623
Faideau M, Kim J, Cormier K, Gilmore R, Welch M, Auregan G, Dufour N, Guillermier M, Brouillet E, 624
Hantraye P, Déglon N, Ferrante RJ, Bonvento G (2010) In vivo expression of polyglutamine-expanded 625
huntingtin by mouse striatal astrocytes impairs glutamate transport: a correlation with Huntington's 626
disease subjects. Hum Mol Genet 19:3053–3067. 627
Fan M, Raymond L (2007) N-Methyl-d-aspartate (NMDA) receptor function and excitotoxicity in 628
Huntington's disease. Prog Neurobiol 81:272–293. 629
Fernandes HB, Baimbridge KG, Church J, Hayden MR, Raymond LA (2007) Mitochondrial sensitivity 630
and altered calcium handling underlie enhanced NMDA-induced apoptosis in YAC128 model of 631
Huntington's disease. J Neurosci 27:13614–13623. 632
Gray M, Shirasaki DI, Cepeda C, André VM, Wilburn B, Lu X-H, Tao J, Yamazaki I, Li S-H, Sun YE, Li 633
X-J, Levine MS, Yang XW (2008) Full-length human mutant huntingtin with a stable polyglutamine 634
repeat can elicit progressive and selective neuropathogenesis in BACHD mice. J Neurosci 28:6182–635
6195. 636

30
Green DR, Reed JC (1998) Mitochondria and apoptosis. Science 281:1309–1312. 637
Gundersen HJ, Jensen EB, Kiêu K, Nielsen J (1999) The efficiency of systematic sampling in 638
stereology--reconsidered. J Microsc 193:199–211. 639
Guo Z, Rudow G, Pletnikova O, Codispoti K-E, Orr BA, Crain BJ, Duan W, Margolis RL, Rosenblatt A, 640
Ross CA, Troncoso JC (2012) Striatal neuronal loss correlates with clinical motor impairment in 641
Huntington's disease. Mov Disord 27:1379–1386. 642
Hamada I, DeLong MR (1992) Excitotoxic acid lesions of the primate subthalamic nucleus result in 643
transient dyskinesias of the contralateral limbs. J Neurophysiol 68:1850–1858. 644
Hanson GT, Aggeler R, Oglesbee D, Cannon M, Capaldi RA, Tsien RY, Remington SJ (2004) 645
Investigating mitochondrial redox potential with redox-sensitive green fluorescent protein indicators. J 646
Biol Chem 279:13044–13053. 647
Heikkinen T, Lehtimäki K, Vartiainen N, Puoliväli J, Hendricks SJ, Glaser JR, Bradaia A, Wadel K, 648
Touller C, Kontkanen O, Yrjänheikki JM, Buisson B, Howland D, Beaumont V, Munoz-Sanjuan I, Park 649
LC (2012) Characterization of neurophysiological and behavioral changes, MRI brain volumetry and 650
1H MRS in zQ175 knock-in mouse model of Huntington's disease. PLoS ONE 7:e50717. 651
Holm S (1979) A simple sequentially rejective multiple test procedure. Scandinavian Journal of 652
Statistics 6:65–70. 653
Huang K, Kang MH, Askew C, Kang R, Sanders SS, Wan J, Davis NG, Hayden MR (2010) 654
Palmitoylation and function of glial glutamate transporter-1 is reduced in the YAC128 mouse model of 655
Huntington disease. Neurobiol Dis 40:207–215. 656
Hunter JD (2007) Matplotlib: A 2D graphics environment. Comput Sci Eng 9:90–95. 657
Huntington’s Disease Collaborative Research Group (1993) A novel gene containing a trinucleotide 658
repeat that is expanded and unstable on Huntington’s disease chromosomes. Cell 72:971–983. 659
31
Ichinari K, Kakei M, Matsuoka T, Nakashima H, Tanaka H (1996) Direct activation of the ATP-660
sensitive potassium channel by oxygen free radicals in guinea-pig ventricular cells: its potentiation by 661
MgADP. J Mol Cell Cardiol 28:1867–1877. 662
Jahanshahi M, Obeso I, Baunez C, Alegre M, Krack P (2015) Parkinson's disease, the subthalamic 663
nucleus, inhibition, and impulsivity. Mov Disord 30:128–140. 664
Jiang R, Diaz-Castro B, Looger LL, Khakh BS (2016) Dysfunctional calcium and glutamate signaling in 665
striatal astrocytes from Huntington's disease model mice. J Neurosci 36:3453–3470. 666
Johri A, Chandra A, Beal MF (2013) PGC-1α, mitochondrial dysfunction, and Huntington's disease. 667
Free Radic Biol Med 62:37–46. 668
Karschin C, Ecke C, Ashcroft FM, Karschin A (1997) Overlapping distribution of KATP channel-forming 669
Kir6.2 subunit and the sulfonylurea receptor SUR1 in rodent brain. FEBS Lett 401:59–64. 670
Kirkwood SC, Su JL, Conneally PM, Foroud T (2001) Progression of Symptoms in the Early and 671
Middle Stages of Huntington Disease. Arch Neurol 58:273–278. 672
Kita T, Kita H (2012) The subthalamic nucleus is one of multiple innervation sites for long-range 673
corticofugal axons: a single-axon tracing study in the rat. J Neurosci 32:5990–5999. 674
Kravitz AV, Freeze BS, Parker PRL, Kay K, Thwin MT, Deisseroth K, Kreitzer AC (2010) Regulation of 675
parkinsonian motor behaviours by optogenetic control of basal ganglia circuitry. Nature 466:622–626. 676
Kravitz AV, Kreitzer AC (2012) Striatal mechanisms underlying movement, reinforcement, and 677
punishment. Physiology (Bethesda) 27:167-77. 678
Krippeit-Drews P, Kramer C, Welker S, Lang F, Ammon HPT, Drews G (1999) Interference of H2O2 679
with stimulus-secretion coupling in mouse pancreatic β-cells. J Physiol (Lond) 514:471–481. 680
32
Lange H, Thörner G, Hopf A, Schröder KF (1976) Morphometric studies of the neuropathological 681
changes in choreatic diseases. J Neurol Sci 28:401–425. 682
Lee CR, Witkovsky P, Rice ME (2011) Regulation of substantia nigra pars reticulata GABAergic 683
neuron activity by H2O2 via Flufenamic acid-sensitive channels and KATP Channels. Frontiers in 684
Systems Neuroscience 5:41–52. 685
Lee W, Reyes RC, Gottipati MK, Lewis K, Lesort M, Parpura V, Gray M (2013) Enhanced Ca2+-686
dependent glutamate release from astrocytes of the BACHD Huntington's disease mouse model. 687
Neurobiol Dis 58:192–199. 688
Liévens JC, Woodman B, Mahal A, Spasic-Boscovic O, Samuel D, Kerkerian-Le Goff L, Bates GP 689
(2001) Impaired glutamate uptake in the R6 Huntington's disease transgenic mice. Neurobiol Dis 690
8:807–821. 691
Mantovani S, Gordon R, Li R, Christie DC, Kumar V, Woodruff TM (2016) Motor deficits associated 692
with Huntington's disease occur in the absence of striatal degeneration in BACHD transgenic mice. 693
Hum Mol Genet 25:1780–1791. 694
Martin DDO, Ladha S, Ehrnhoefer DE, Hayden MR (2015) Autophagy in Huntington disease and 695
huntingtin in autophagy. Trends Neurosci 38:26–35. 696
Maurice N, Deniau J-MM, Glowinski J, Thierry A-M (1999) Relationships between the prefrontal cortex 697
and the basal ganglia in the rat: physiology of the cortico-nigral circuits. J Neurosci 19:4674–4681. 698
Menalled LB et al. (2012) Comprehensive behavioral and molecular characterization of a new knock-in 699
mouse model of Huntington's disease: zQ175. PLoS ONE 7:e49838. 700
Milakovic T, Johnson G (2005) Mitochondrial respiration and ATP production are significantly impaired 701
in striatal cells expressing mutant huntingtin. J Biol Chem 280:30773–30782. 702
33
Miller BR, Dorner JL, Shou M, Sari Y, Barton SJ, Sengelaub DR, Kennedy RT, Rebec GV (2008) Up-703
regulation of GLT1 expression increases glutamate uptake and attenuates the Huntington's disease 704
phenotype in the R6/2 mouse. Neuroscience 153:329–337. 705
Milnerwood AJ, Gladding CM, Pouladi MA, Kaufman AM, Hines RM, Boyd JD, Ko RWY, Vasuta OC, 706
Graham RK, Hayden MR, Murphy TH, Raymond LA (2010) Early increase in extrasynaptic NMDA 707
receptor signaling and expression contributes to phenotype onset in Huntington's disease mice. 708
Neuron 65:178–190. 709
Moncada S, Bolaños JP (2006) Nitric oxide, cell bioenergetics and neurodegeneration. J Neurochem 710
97:1676–1689. 711
Nakamura T, Lipton SA (2011) Redox modulation by S-nitrosylation contributes to protein misfolding, 712
mitochondrial dynamics, and neuronal synaptic damage in neurodegenerative diseases. Cell Death 713
Differ 18:1478–1486. 714
Nichols CG (2006) KATP channels as molecular sensors of cellular metabolism. Nature 440:470–476. 715
Noether GE (1987) Sample Size Determination for Some Common Nonparametric Tests. Journal of 716
the American Statistical Association 82:645–647. 717
Oldenburg IA, Sabatini BL (2015) Antagonistic but not symmetric regulation of primary motor cortex by 718
basal ganglia direct and indirect pathways. Neuron 86:1174–1181. 719
Oliveira AO, Osmand A, Outeiro TF, Muchowski PJ, Finkbeiner S (2016) αB-Crystallin overexpression 720
in astrocytes modulates the phenotype of the BACHD mouse model of Huntington's disease. Hum Mol 721
Genet 25:1677–1689. 722
Panov AV, Gutekunst CA, Leavitt BR, Hayden MR, Burke JR, Strittmatter WJ, Greenamyre JT (2002) 723
Early mitochondrial calcium defects in Huntington's disease are a direct effect of polyglutamines. Nat 724
Neurosci 5:731–736. 725

34
Parsons MP, Raymond LA (2014) Extrasynaptic NMDA receptor involvement in central nervous 726
system disorders. Neuron 82:279–293. 727
Parsons MP, Vanni MP, Woodard CL, Kang R, Murphy TH, Raymond LA (2016) Real-time imaging of 728
glutamate clearance reveals normal striatal uptake in Huntington disease mouse models. Nat 729
Commun 7:11251. 730
Perluigi M, Poon HF, Maragos W, Pierce WM, Klein JB, Calabrese V, Cini C, De Marco C, Butterfield 731
DA (2005) Proteomic analysis of protein expression and oxidative modification in r6/2 transgenic mice: 732
a model of Huntington disease. Molecular & Cellular Proteomics 4:1849–1861. 733
Ray PD, Huang B-W, Tsuji Y (2012) Reactive oxygen species (ROS) homeostasis and redox 734
regulation in cellular signaling. Cell Signal 24:981–990. 735
Sánchez-Padilla J, Guzman JN, Ilijic E, Kondapalli J, Galtieri DJ, Yang B, Schieber S, Oertel W, 736
Wokosin DL, Schumacker PT, Surmeier DJ (2014) Mitochondrial oxidant stress in locus coeruleus is 737
regulated by activity and nitric oxide synthase. Nat Neurosci 17:832–840. 738
Saudou F, Humbert S (2016) The biology of huntingtin. Neuron 89:910–926. 739
Sena LA, Chandel NS (2012) Physiological roles of mitochondrial reactive oxygen species. Mol Cell 740
48:158–167. 741
Smith GA, Rocha EM, McLean JR, Hayes MA, Izen SC, Isacson O, Hallett PJ (2014) Progressive 742
axonal transport and synaptic protein changes correlate with behavioral and neuropathological 743
abnormalities in the heterozygous Q175 KI mouse model of Huntington's disease. Hum Mol Genet 744
23:4510–4527. 745
Song W, Chen J, Petrilli A, Liot G, Klinglmayr E, Zhou Y, Poquiz P, Tjong J, Pouladi MA, Hayden MR, 746
Masliah E, Ellisman M, Rouiller I, Schwarzenbacher R, Bossy B, Perkins G, Bossy-Wetzel E (2011) 747

35
Mutant huntingtin binds the mitochondrial fission GTPase dynamin-related protein-1 and increases its 748
enzymatic activity. Nat Med 17:377–382. 749
Stack EC, Kubilus JK, Smith K, Cormier K, Del Signore SJ, Guelin E, Ryu H, Hersch SM, Ferrante RJ 750
(2005) Chronology of behavioral symptoms and neuropathological sequela in R6/2 Huntington's 751
disease transgenic mice. J Comp Neurol 490:354–370. 752
Tachibana Y, Kita H, Chiken S, Takada M, Nambu A (2008) Motor cortical control of internal pallidal 753
activity through glutamatergic and GABAergic inputs in awake monkeys. Eur J Neurosci 27:238–53. 754
Takahashi H, Shibasaki T, Park J-H, Hidaka S, Takahashi T, Ono A, Song D-K, Seino S (2015) Role 755
of Epac2A/Rap1 signaling in interplay between incretin and sulfonylurea in insulin secretion. Diabetes 756
64:1262–1272. 757
Thomzig A, Laube G, Prüss H, Veh RW (2005) Pore-forming subunits of K-ATP channels, Kir6.1 and 758
Kir6.2, display prominent differences in regional and cellular distribution in the rat brain. J Comp 759
Neurol 484:313–30. 760
Tong X, Ao Y, Faas GC, Nwaobi SE, Xu J, Haustein MD, Anderson MA, Mody I, Olsen ML, Sofroniew 761
MV, Khakh BS (2014) Astrocyte Kir4.1 ion channel deficits contribute to neuronal dysfunction in 762
Huntington's disease model mice. Nat Neurosci 17:694–703. 763
Valencia A, Sapp E, Kimm JS, McClory H, Reeves PB, Alexander J, Ansong KA, Masso N, Frosch 764
MP, Kegel KB, Li X, DiFiglia M (2013) Elevated NADPH oxidase activity contributes to oxidative stress 765
and cell death in Huntington's disease. Hum Mol Genet 22:1112–1131. 766
West MJ, Slomianka L, Gundersen HJG (1991) Unbiased stereological estimation of the total number 767
of neurons in the subdivisions of the rat hippocampus using the optical fractionator. Anat Rec 768
231:482–497. 769

36
Wichmann T, DeLong MR (1996) Functional and pathophysiological models of the basal ganglia. Curr 770
Opin Neurobiol 6:751–8. 771
Zhang C-L, Katoh M, Shibasaki T, Minami K, Sunaga Y, Takahashi H, Yokoi N, Iwasaki M, Miki T, 772
Seino S (2009) The cAMP sensor Epac2 is a direct target of antidiabetic sulfonylurea drugs. Science 773
325:607–610. 774
Zhang D-M, Chai Y, Erickson JR, Brown JH, Bers DM, Lin Y-F (2014) Intracellular signalling 775
mechanism responsible for modulation of sarcolemmal ATP-sensitive potassium channels by nitric 776
oxide in ventricular cardiomyocytes. J Physiol (Lond) 592:971–990. 777
Zhou M, He H-J, Tanaka O, Sekiguchi M, Kawahara K, Abe H (2012) Localization of the ATP-sensitive 778
K(+) channel regulatory subunits SUR2A and SUR2B in the rat brain. Neurosci Res 74:91–105. 779

37
Figures 780
781
Figure 1. Abnormal intrinsic and synaptic properties of STN neurons in BACHD mice 782
(A) Representative examples of autonomous STN activity recorded in the loose-seal, cell-attached 783
configuration. The firing of the neuron from a WT mouse was of a higher frequency and regularity than 784

38
the phenotypic neuron from a BACHD mouse. (B) Population data showing (left to right) that the 785
frequency and regularity of firing, and the proportion of active neurons in BACHD mice were reduced 786
relative to WT mice. (C) Histogram showing the distribution of autonomous firing frequencies of 787
neurons in WT (gray) and BACHD (green) mice. (D) Confocal micrographs showing NeuN expressing 788
STN neurons (red) and hChR2(H134R)-eYFP expressing cortico-STN axon terminals (green) in the 789
STN. (E) Examples of optogenetically stimulated NMDAR EPSCs from a WT STN neuron before 790
(black) and after (gray) inhibition of astrocytic glutamate uptake with 100 nM TFB-TBOA. Inset, the 791
same EPSCs scaled to the same amplitude. (F) Examples of optogenetically stimulated NMDAR 792
EPSCs from a BACHD STN neuron before (green) and after (gray) inhibition of astrocytic glutamate 793
uptake with 100 nM TFB-TBOA. (G) WT (black, same as in E) and BACHD (green, same as in F) 794
optogenetically stimulated NMDAR EPSCs overlaid and scaled to the same amplitude. (H) Boxplots of 795
amplitude weighted decay show slowed decay kinetics of NMDAR EPSCs in TFB-TBOA in STN 796
neurons from WT but not BACHD mice. * p < 0.05. ns, not significant. Data for panels B–C provided in 797
Figure 1—source data1; data for panel G provided in Figure 1—source data 2. 798
Figure 1—source data 1 799
Autonomous firing frequency and CV for BACHD and WT STN neurons in Figure 1B–C 800
Figure 1—source data 2 801
Amplitude weighted decay of NMDAR-mediated EPSCs in Figure 1G 802
803

39
804
Figure 2. Cortico-STN EPSCs in WT and BACHD mice 805
(A) Boxplot showing the distribution of single optogenetically stimulated cortico-STN NMDAR EPSC 806
amplitudes in WT and BACHD mice. (B) Scatterplot showing NMDAR EPSC amplitude vs amplitude 807
weighted decay time. There was no correlation between NMDAR EPSC amplitude and decay time in 808
WT or BACHD mice. (C–D) Example of NMDAR EPSCs generated by 5 × 50 Hz optogenetic 809

40
stimulation from a WT STN neuron (C) before (black) and after (gray) inhibition of astrocytic glutamate 810
uptake with 100 nM TFB-TBOA and a BACHD STN neuron (D) before (green) and after (gray) TFB-811
TBOA application. (E) Line segment plots of amplitude weighted decay of compound NMDAR EPSCs 812
before and following TFB-TBOA. The decays of compound NMDAR ESPCs were similar in WT and 813
BACHD before TFB-TBOA application. In addition, inhibition of astrocytic glutamate uptake prolonged 814
the decay of compound NMDAR ESPCs in all neurons tested. ns, not significant. Data for panels A–B 815
provided in Figure 2—source data1; data for panel E provided in Figure 2—source data 2. 816
Figure 2—source data 1 817
Amplitude and amplitude weighted decay of NMDAR-mediated EPSCs in Figure 2A–B 818
Figure 2—source data 2 819
Amplitude weighted decay of compound NMDAR-mediated EPSCs in Figure 2E 820

41
821
Figure 3. Impaired autonomous activity of STN neurons in BACHD mice is rescued by antagonism of 822
NMDARs 823
(A) Examples of loose-seal cell-attached recordings of 6-month-old BACHD STN neurons from an 824
untreated slice (left) and a slice that was treated with 50 µM D-AP5 for 3–5 hours prior to recording. 825
(B) Population data showing elevated autonomous firing in STN neurons from D-AP5 pre-treated 826
slices from 2-month-old and 6-month-old BACHD mice but not in WT mice. (C) Population data 827
showing increased firing regularity in STN neurons from D-AP5 pre-treated slices from 6-month-old 828
BACHD mice but not 2-month-old BACHD mice or WT mice. (D) Population data showing a higher 829
proportion of active neurons in STN neurons from D-AP5 pre-treated slices from 2-month-old and 6-830
month-old BACHD mice but not in WT mice. *, p < 0.05. ns, not significant. Data for panels B–C 831
provided in Figure 3—source data1. 832
Figure 3—source data 1 833
Autonomous firing frequency and CV for BACHD control and D-AP5 pretreated STN neurons in 834
Figure 3B–C 835
42
836
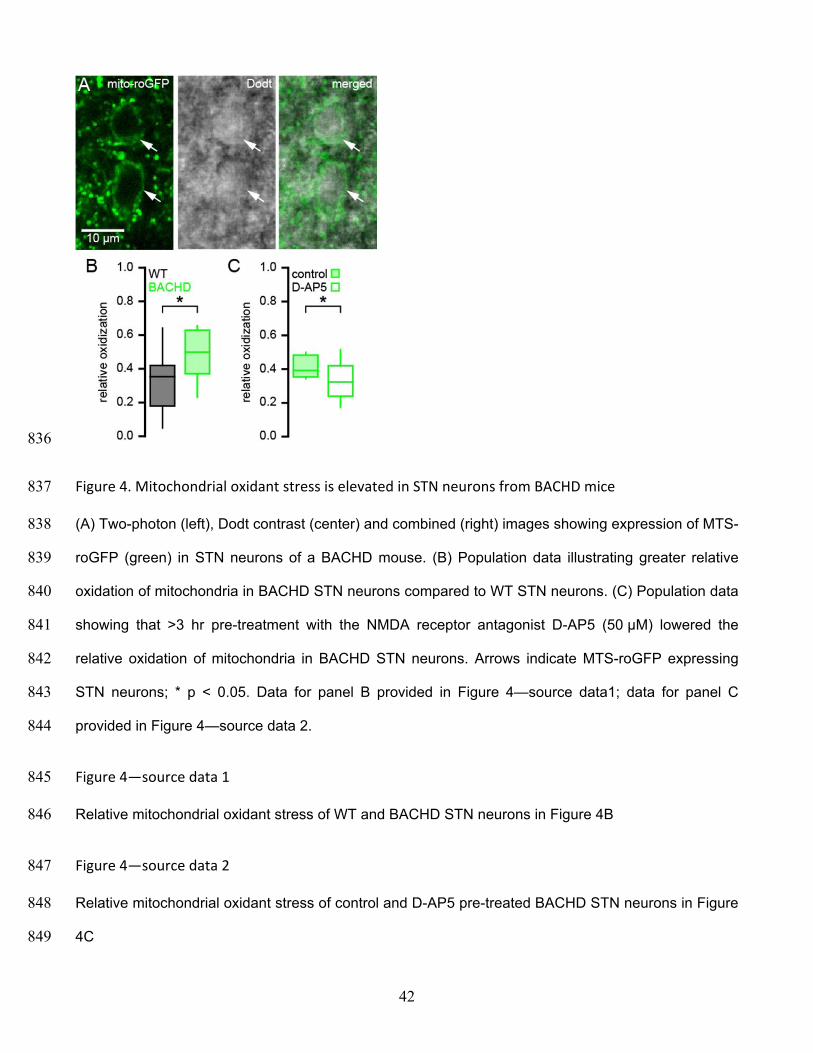
Figure 4. Mitochondrial oxidant stress is elevated in STN neurons from BACHD mice 837
(A) Two-photon (left), Dodt contrast (center) and combined (right) images showing expression of MTS-838
roGFP (green) in STN neurons of a BACHD mouse. (B) Population data illustrating greater relative 839
oxidation of mitochondria in BACHD STN neurons compared to WT STN neurons. (C) Population data 840
showing that >3 hr pre-treatment with the NMDA receptor antagonist D-AP5 (50 µM) lowered the 841
relative oxidation of mitochondria in BACHD STN neurons. Arrows indicate MTS-roGFP expressing 842
STN neurons; * p < 0.05. Data for panel B provided in Figure 4—source data1; data for panel C 843
provided in Figure 4—source data 2. 844
Figure 4—source data 1 845
Relative mitochondrial oxidant stress of WT and BACHD STN neurons in Figure 4B 846
Figure 4—source data 2 847
Relative mitochondrial oxidant stress of control and D-AP5 pre-treated BACHD STN neurons in Figure 848
4C 849
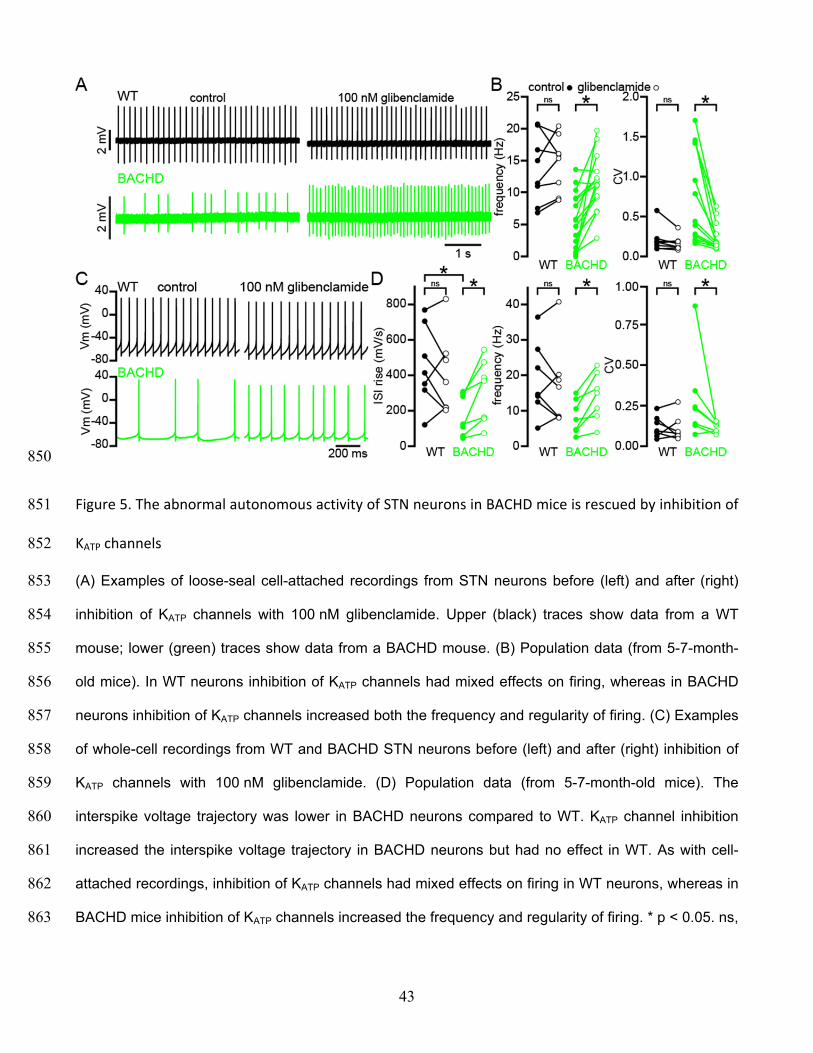
43
850
Figure 5. The abnormal autonomous activity of STN neurons in BACHD mice is rescued by inhibition of 851
KATP channels 852
(A) Examples of loose-seal cell-attached recordings from STN neurons before (left) and after (right) 853
inhibition of KATP channels with 100 nM glibenclamide. Upper (black) traces show data from a WT 854
mouse; lower (green) traces show data from a BACHD mouse. (B) Population data (from 5-7-month-855
old mice). In WT neurons inhibition of KATP channels had mixed effects on firing, whereas in BACHD 856
neurons inhibition of KATP channels increased both the frequency and regularity of firing. (C) Examples 857
of whole-cell recordings from WT and BACHD STN neurons before (left) and after (right) inhibition of 858
KATP channels with 100 nM glibenclamide. (D) Population data (from 5-7-month-old mice). The 859
interspike voltage trajectory was lower in BACHD neurons compared to WT. KATP channel inhibition 860
increased the interspike voltage trajectory in BACHD neurons but had no effect in WT. As with cell-861
attached recordings, inhibition of KATP channels had mixed effects on firing in WT neurons, whereas in 862
BACHD mice inhibition of KATP channels increased the frequency and regularity of firing. * p < 0.05. ns, 863
44
not significant. Data for panel B provided in Figure 5—source data1; data for panel D provided in 864
Figure 5—source data 2. 865
Figure 5—source data 1 866
Autonomous firing frequency and CV for WT and BACHD STN neurons under control conditions and 867
following glibenclamide application in Figure 5B 868
Figure 5—source data 2 869
Autonomous interspike voltage trajectory, firing frequency and CV for whole-cell recordings from WT 870
and BACHD STN neurons in Figure 5D 871
872

45
873
Figure 6. The abnormal autonomous activity of STN neurons in BACHD mice is rescued by inhibition of 874
KATP channels with gliclazide 875
(A) Examples of loose-seal cell-attached recordings of a STN neuron from a 6-month-old BACHD 876
mouse before (upper) and after (lower) inhibition of KATP channels with 10 µM gliclazide. (B) 877
Population data (5-7-month-old). In BACHD STN neurons inhibition of KATP channels with gliclazide 878
increased the frequency and regularity of firing. * p < 0.05. Data for panel B provided in Figure 6—879
source data1. 880
Figure 6—source data 1 881
Autonomous firing frequency and CV for WT and BACHD STN neurons under control conditions and 882
following gliclazide application in Figure 6B 883

46
884
Figure 7. NMDA exposure persistently disrupts autonomous activity 885
(A) Example of a loose-seal cell-attached recording from an STN neuron from an untreated slice from 886
a C57/BL6 mouse before (left) and after (right) inhibition of KATP channels with 100 nM glibenclamide. 887
(B) Example of a loose-seal cell-attached recording from an STN neuron from a slice treated with 888
25 µM NMDA for 1 hour prior to recording, before (left) and after (right) inhibition of KATP channels with 889
100 nM glibenclamide. (C) Population data. Following NMDA pre-treatment STN neurons had a lower 890
frequency and regularity of firing. (D) Inhibition of KATP channels with 100 nM glibenclamide restored 891
firing in STN cells from NMDA pre-treated slices but had no effect on firing from naïve slices. * p < 892
0.05. ns, not significant. Data for panel C provided in Figure 7—source data1; data for panel D 893
provided in Figure 7—source data 2. 894
Figure 7—source data 1 895
Autonomous firing frequency and CV for control and NMDA pre-treated C57BL/6 STN neurons in 896
Figure 7C 897
47
Figure 7—source data 2 898
Autonomous firing frequency and CV for control and NMDA pre-treated C57BL/6 STN neurons in 899
control conditions and following glibenclamide application in Figure 7D 900
901

48
902
Figure 8. Break down of H2O2 by catalase rescues autonomous firing in BACHD STN neurons 903
(A) Example showing the instantaneous firing rate of a BACHD STN neuron in control conditions, 904
during the application of catalase (250 U/ml), and during co-application of catalase and glibenclamide 905
(100 nM). (B1) Example of BACHD STN neuron firing in control conditions (marked 1 in A). (B2) 906
Example of elevated firing during break down of H2O2 by catalase (marked 2 in A). (B3) Example 907
showing no further elevation of firing rate during additional inhibition of KATP channels with 908
glibenclamide (marked 3 in A). (C) Population data from 4–6-month old BACHD mice showing an 909
increase in the frequency and regularity of firing following break down of H2O2, with no further changes 910
upon KATP channel inhibition. (D) Population data showing an increase in the frequency and regularity 911
of firing following KATP channel inhibition with no further change in firing rate and a slight increase in 912
firing regularity upon H2O2 break down. * p < 0.05. ns, not significant. Data for panels C–D provided in 913
Figure 8—source data1. 914

49
Figure 8—source data 1 915
Autonomous firing frequency and CV for WT and BACHD STN neurons under control conditions and 916
following catalase and/or glibenclamide application in Figure 8C–D 917
918
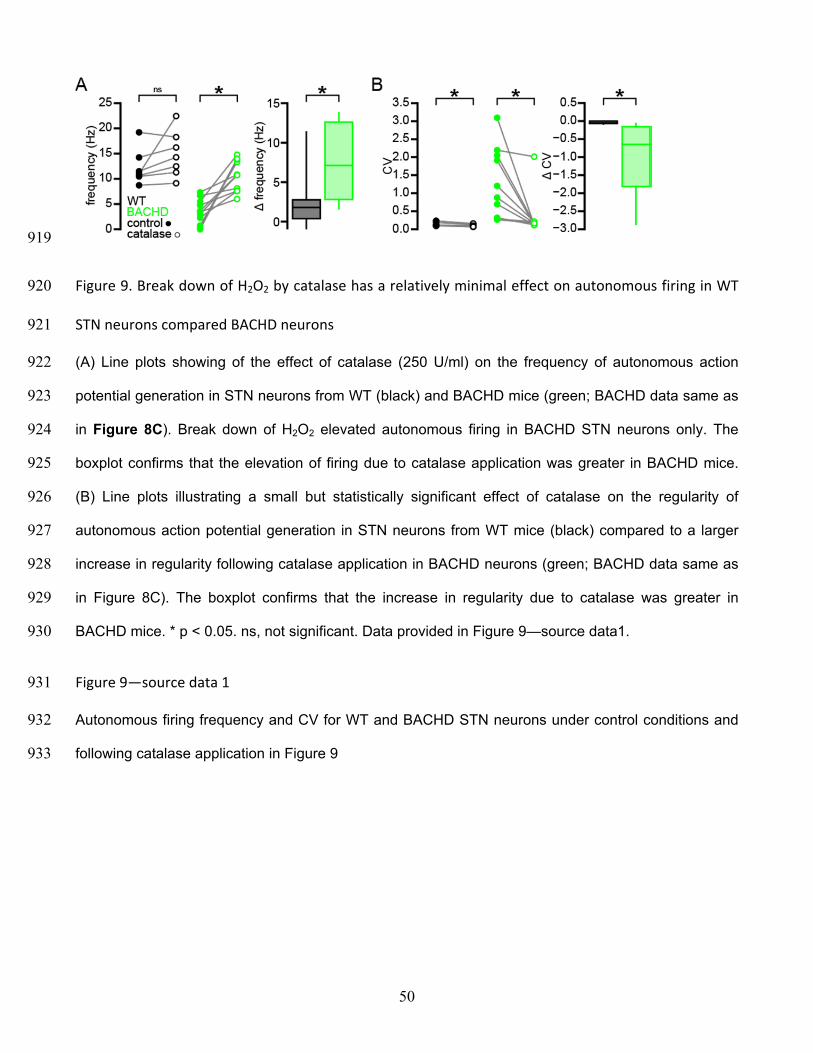
50
919
Figure 9. Break down of H2O2 by catalase has a relatively minimal effect on autonomous firing in WT 920
STN neurons compared BACHD neurons 921
(A) Line plots showing of the effect of catalase (250 U/ml) on the frequency of autonomous action 922
potential generation in STN neurons from WT (black) and BACHD mice (green; BACHD data same as 923
in Figure 8C). Break down of H2O2 elevated autonomous firing in BACHD STN neurons only. The 924
boxplot confirms that the elevation of firing due to catalase application was greater in BACHD mice. 925
(B) Line plots illustrating a small but statistically significant effect of catalase on the regularity of 926
autonomous action potential generation in STN neurons from WT mice (black) compared to a larger 927
increase in regularity following catalase application in BACHD neurons (green; BACHD data same as 928
in Figure 8C). The boxplot confirms that the increase in regularity due to catalase was greater in 929
BACHD mice. * p < 0.05. ns, not significant. Data provided in Figure 9—source data1. 930
Figure 9—source data 1 931
Autonomous firing frequency and CV for WT and BACHD STN neurons under control conditions and 932
following catalase application in Figure 9 933
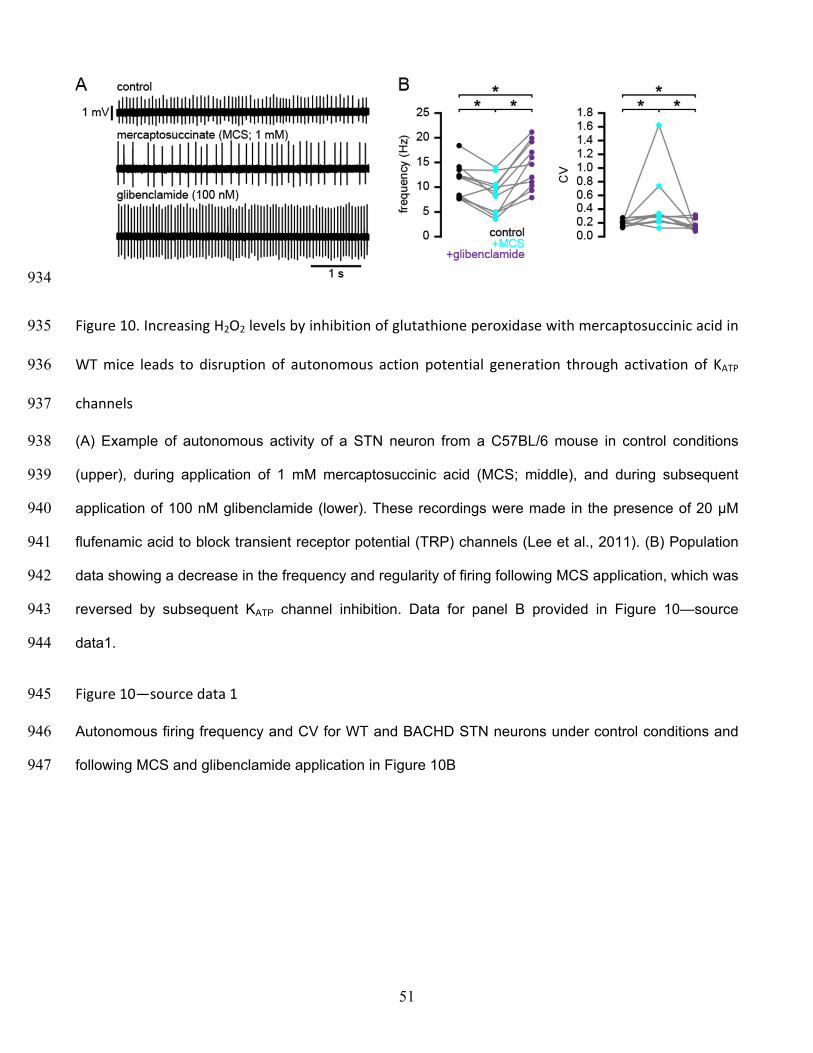
51
934
Figure 10. Increasing H2O2 levels by inhibition of glutathione peroxidase with mercaptosuccinic acid in 935
WT mice leads to disruption of autonomous action potential generation through activation of KATP 936
channels 937
(A) Example of autonomous activity of a STN neuron from a C57BL/6 mouse in control conditions 938
(upper), during application of 1 mM mercaptosuccinic acid (MCS; middle), and during subsequent 939
application of 100 nM glibenclamide (lower). These recordings were made in the presence of 20 µM 940
flufenamic acid to block transient receptor potential (TRP) channels (Lee et al., 2011). (B) Population 941
data showing a decrease in the frequency and regularity of firing following MCS application, which was 942
reversed by subsequent KATP channel inhibition. Data for panel B provided in Figure 10—source 943
data1. 944
Figure 10—source data 1 945
Autonomous firing frequency and CV for WT and BACHD STN neurons under control conditions and 946
following MCS and glibenclamide application in Figure 10B 947

52
948
Figure 11. Degeneration of STN neurons in BACHD mice 949
(A) Expression of NeuN in STN neurons in a BACHD mouse (ZI, zone incerta; ic, internal capsule). (B) 950
Population data showing a 32.3% reduction in median STN neuron number and a 10.3% reduction in 951
STN volume at 12 months old. * p < 0.05. ns, not significant. (C) Population data showing no 952
difference in STN neuron number, STN volume or density between WT and BACHD mice at 2 months 953
old. Data for panels B–C provided in Figure 11—source data1. 954
Figure 11—source data 1 955
BACHD STN neuron counts, density and STN volume in Figure 11B–C 956
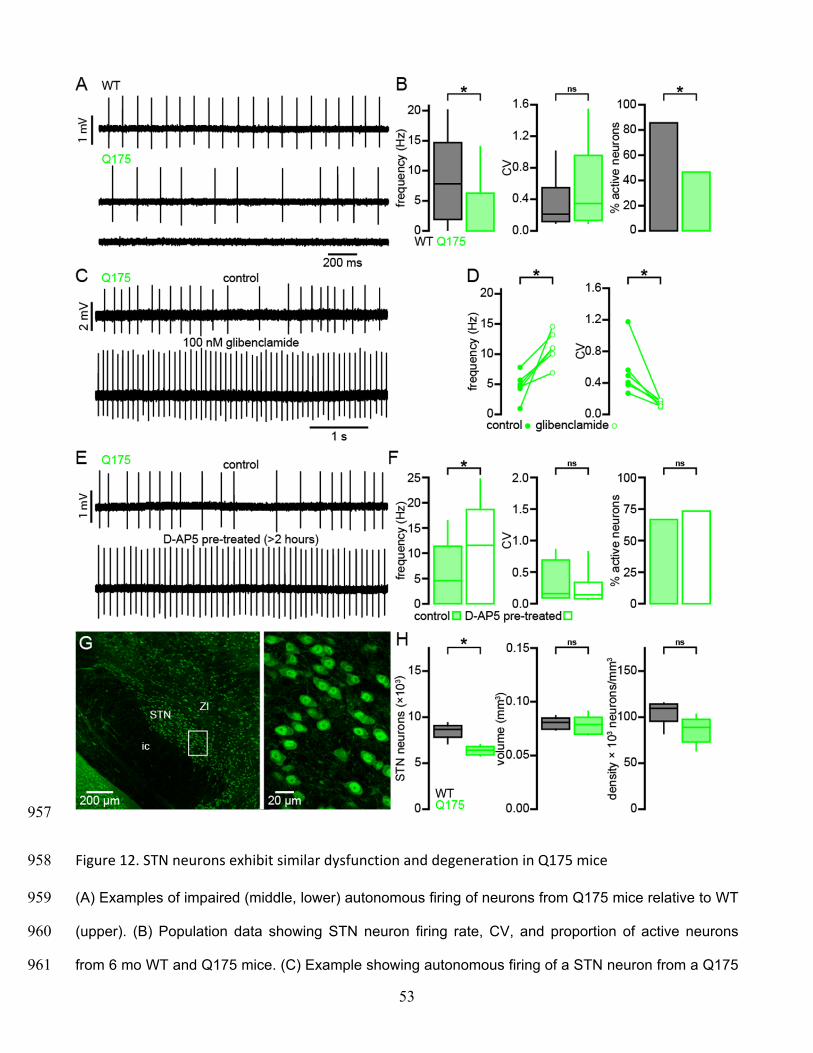
53
957
Figure 12. STN neurons exhibit similar dysfunction and degeneration in Q175 mice 958
(A) Examples of impaired (middle, lower) autonomous firing of neurons from Q175 mice relative to WT 959
(upper). (B) Population data showing STN neuron firing rate, CV, and proportion of active neurons 960
from 6 mo WT and Q175 mice. (C) Example showing autonomous firing of a STN neuron from a Q175 961
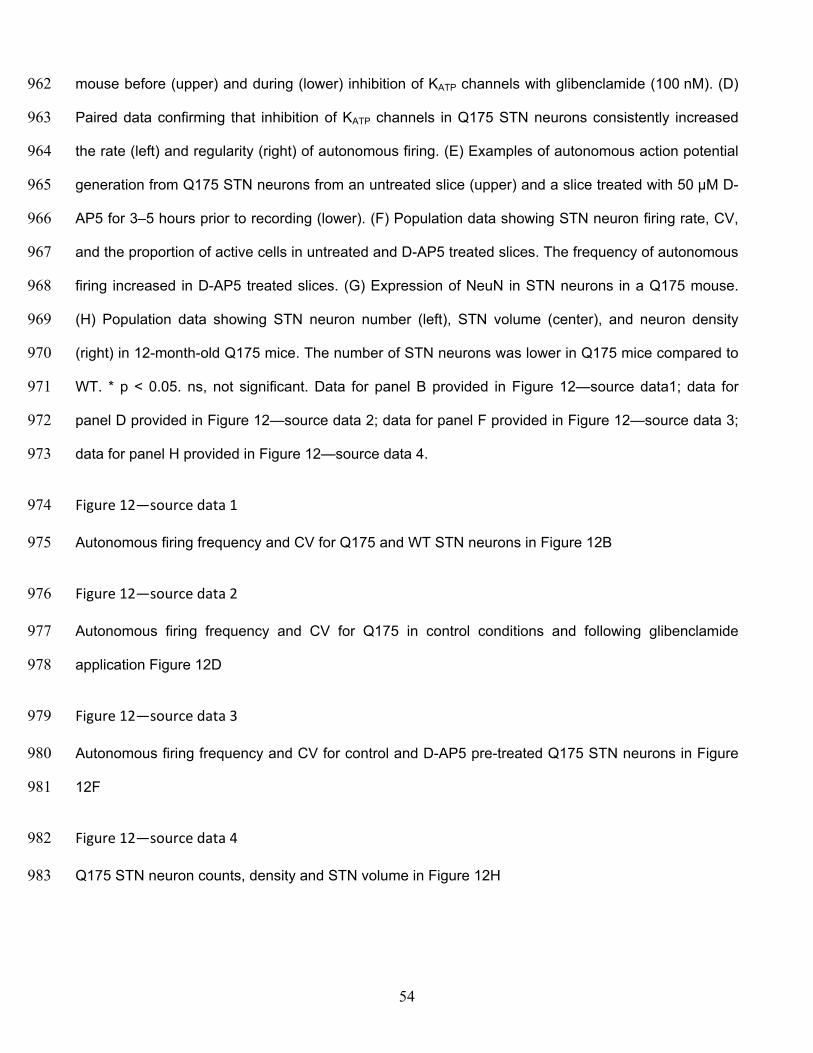
54
mouse before (upper) and during (lower) inhibition of KATP channels with glibenclamide (100 nM). (D) 962
Paired data confirming that inhibition of KATP channels in Q175 STN neurons consistently increased 963
the rate (left) and regularity (right) of autonomous firing. (E) Examples of autonomous action potential 964
generation from Q175 STN neurons from an untreated slice (upper) and a slice treated with 50 µM D-965
AP5 for 3–5 hours prior to recording (lower). (F) Population data showing STN neuron firing rate, CV, 966
and the proportion of active cells in untreated and D-AP5 treated slices. The frequency of autonomous 967
firing increased in D-AP5 treated slices. (G) Expression of NeuN in STN neurons in a Q175 mouse. 968
(H) Population data showing STN neuron number (left), STN volume (center), and neuron density 969
(right) in 12-month-old Q175 mice. The number of STN neurons was lower in Q175 mice compared to 970
WT. * p < 0.05. ns, not significant. Data for panel B provided in Figure 12—source data1; data for 971
panel D provided in Figure 12—source data 2; data for panel F provided in Figure 12—source data 3; 972
data for panel H provided in Figure 12—source data 4. 973
Figure 12—source data 1 974
Autonomous firing frequency and CV for Q175 and WT STN neurons in Figure 12B 975
Figure 12—source data 2 976
Autonomous firing frequency and CV for Q175 in control conditions and following glibenclamide 977
application Figure 12D 978
Figure 12—source data 3 979
Autonomous firing frequency and CV for control and D-AP5 pre-treated Q175 STN neurons in Figure 980
12F 981
Figure 12—source data 4 982
Q175 STN neuron counts, density and STN volume in Figure 12H 983

WT BACHD
200 ms
1 m
VA
D
B C20
15
10
5
0
frequ
ency
(Hz)
*
WTBACHD
1.0
1.2
0.8
0.6
0.4
0.2
0.0
CV
* *
0
20
40
60
80
100
% a
ctiv
e ne
uron
s
E (WT: control = black; TFB-TBOA = gray)
H
F (BACHD: control = green; TFB-TBOA = gray)
G (scaled: WT= black; BACHD = green)
scaled EPSCs
25 ms
50 ms
weighted decay (ms)
WT
BACHD
control TFB-TBOA*ns
*
0 20 40 60 80 100
25 ms
20 pA
20 pA
25 ms
NeuN hChR2(H134R)-eYFP merged
20 µm
0 302826242220181614121086420
10
5
20
15
num
ber o
f neu
rons
frequency (Hz)

A B
0
20
40
60
80
100
WTBACHD
oEP
SC
am
plitu
de (p
A)
ns 80
60
40
20
0100806040200
oEPSC amplitude (pA)
wei
ghte
d de
cay
(ms)
C (WT: control = black; TFB-TBOA = gray)
D (BACHD: control = green; TFB-TBOA = gray)
50 pA200 ms
100 ms
scaled to 1st EPSC
scaled to 1st EPSC
100 ms100 pA
200 ms
E
WTBACHD
controlTFB-TBOA0
50
100
150
200
wei
ghte
d de
cay
(ms)
ns
ns
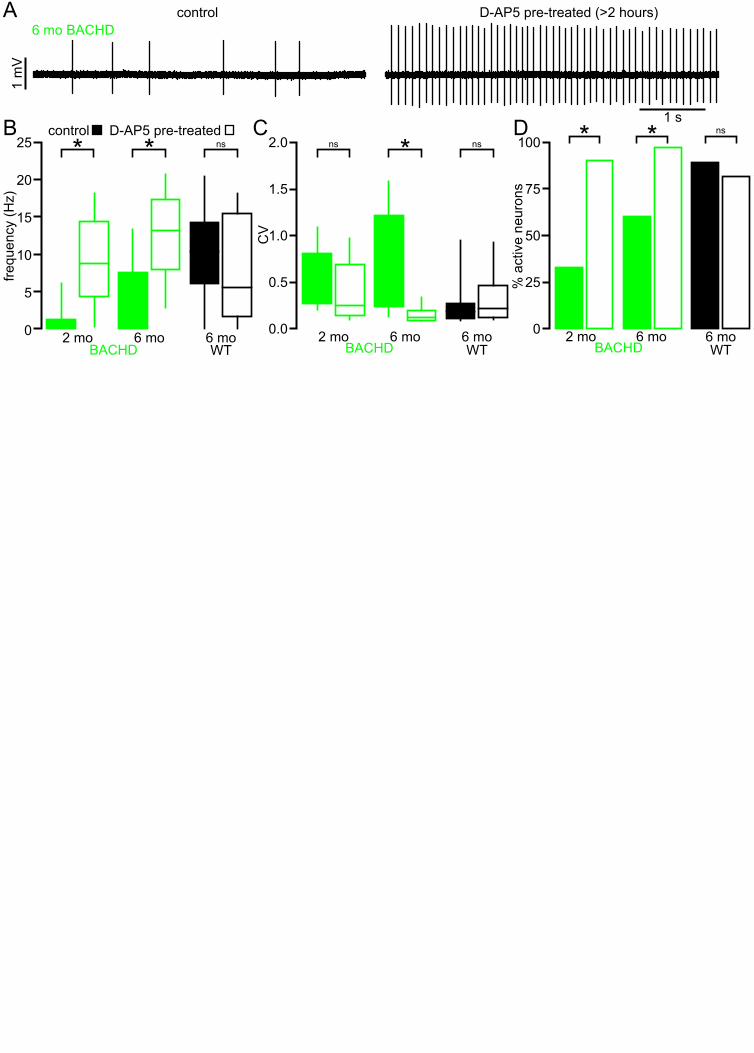
15
20
10
25
5
0 2 mo 6 mo 6 moBACHD WT
frequ
ency
(Hz)
* * nscontrol D-AP5 pre-treated
2.0
1.5
1.0
0.5
0.0 2 mo 6 mo 6 moBACHD
CV
WT
*ns ns
75
50
25
100
% a
ctiv
e ne
uron
s
0 2 mo 6 moBACHD
* * ns
6 moWT
B C D
control D-AP5 pre-treated (>2 hours)
1 s
1 m
VA
6 mo BACHD
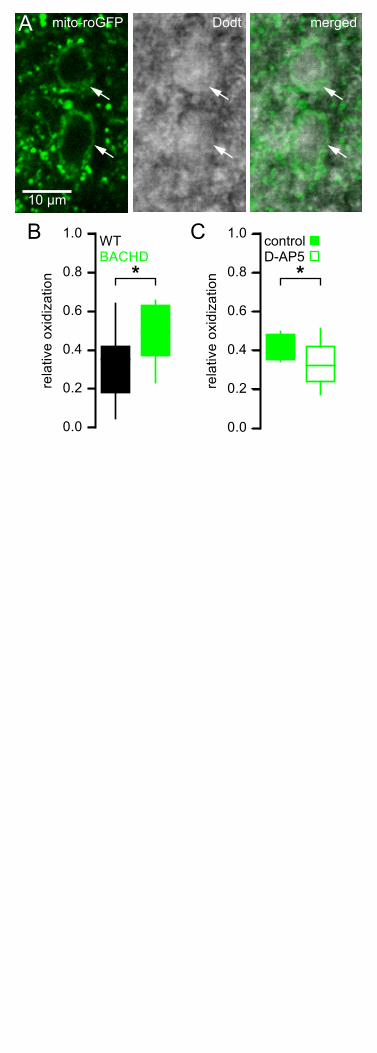
A
WTBACHD
*
B C
0.0
0.2
0.4
0.6
0.8
1.0
rela
tive
oxid
izat
ion
0.0
0.2
0.4
0.6
0.8
1.0re
lativ
e ox
idiz
atio
n *controlD-AP5
10 µm
mito-roGFP mergedDodtA
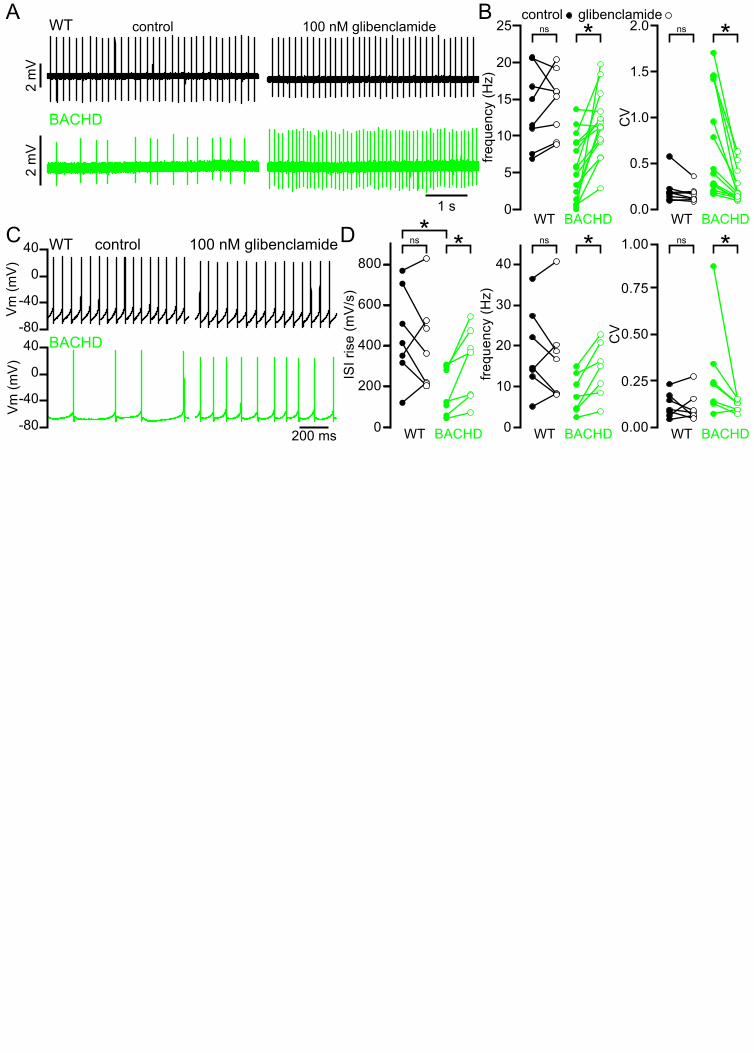
WT
BACHD
control 100 nM glibenclamide2
mV
2 m
V
1 sWT BACHD
25
20
15
10
5
0
frequ
ency
(Hz)
control glibenclamide
*ns 2.0
1.5
1.0
0.5
0.0
CV
WT BACHD
*nsBA
100 nM glibenclamidecontrol
-80
-40
0
40
Vm
(mV
)
200 ms
-80
-40
0
40
Vm
(mV
)
C D
0
10
20
30
40
frequ
ency
(Hz)
WT BACHD
*ns
0.25
0.50
0.75
CV
0.00
1.00
WT BACHD
*nsWT
BACHD
0
200
400
600
800
ISI r
ise
(mV
/s)
WT BACHD
*ns*

15
10
5
0
frequ
ency
(Hz)
1 s
1.5
1.0
0.5
0.0
CV
A B * *
controlgliclazide
control
10 µM gliclazide
1 mV

0.5 s
1 m
Vcontrol 100 nM glibenclamideA naive
B NMDA pre-treated (1 hour in 25 µM NMDA)
C D
0
10
20
30
40
frequ
ency
(Hz)
naiveNMDA pre
*
0.4
0.2
1.0
0.8
0.6
CV
0.0
*40
30
20
10
0
frequ
ency
(Hz)
naive NMDA pre
*nscontrol glibenclamide
1.6
1.2
0.8
0.4
0.0
CV
*ns
naive NMDA pre

25
20
15
10
5
0
frequ
ency
(Hz)
catalase (250 U/ml)
glibenclamide (100 nM)
1 min1
2 3
1 mV
1 s
A
C D
B1 B2 B3
0
1
2
3
CV
* ns*
0
4
8
12
16
frequ
ency
(Hz)
* ns*
0
1
2
3
CV
* **
0
4
8
12
16
frequ
ency
(Hz)
* ns*
control+catalase
+glibenclamide
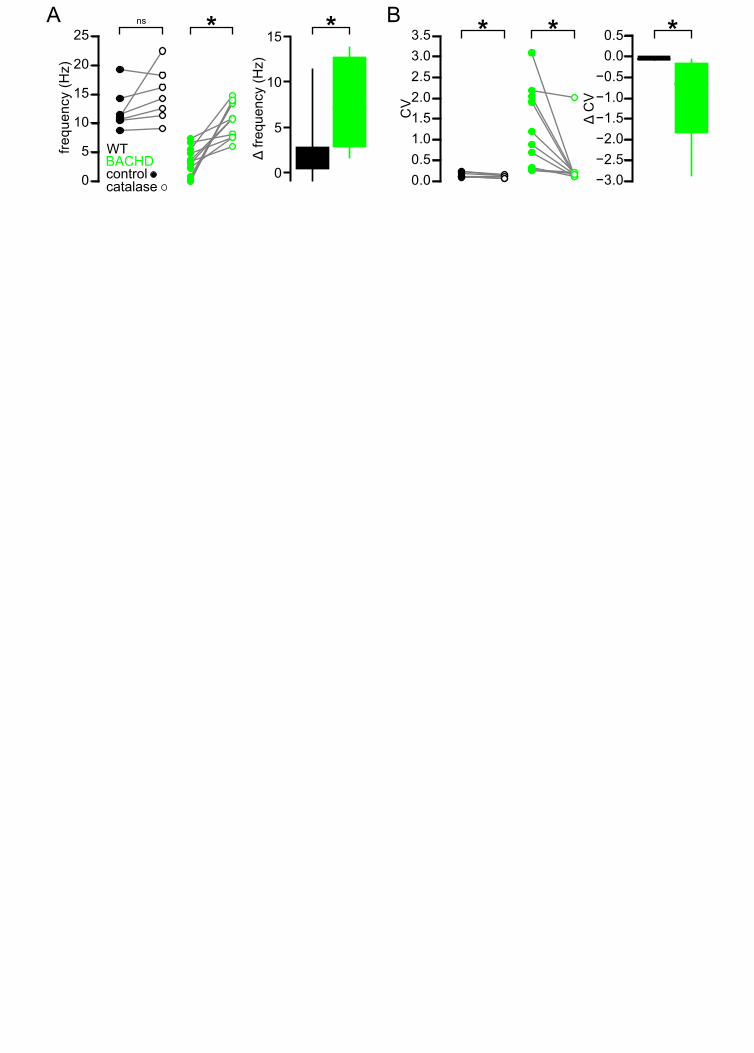
0
5
10
15
20
25
frequ
ency
(Hz)
*ns
15
10
5
0
Δ fre
quen
cy (H
z)
WTBACHD
*
controlcatalase 0.0
0.51.01.52.02.53.03.5
CV
* *
−3.0−2.5−2.0−1.5−1.0−0.5
0.00.5
Δ C
V
*A B

B1 mV
1 s
control
mercaptosuccinate (MCS; 1 mM)
glibenclamide (100 nM)
A* *
*
0
5
10
15
20
25
frequ
ency
(Hz)
* **
0.00.20.40.60.81.01.21.41.61.8
CV
control+MCS
+glibenclamide
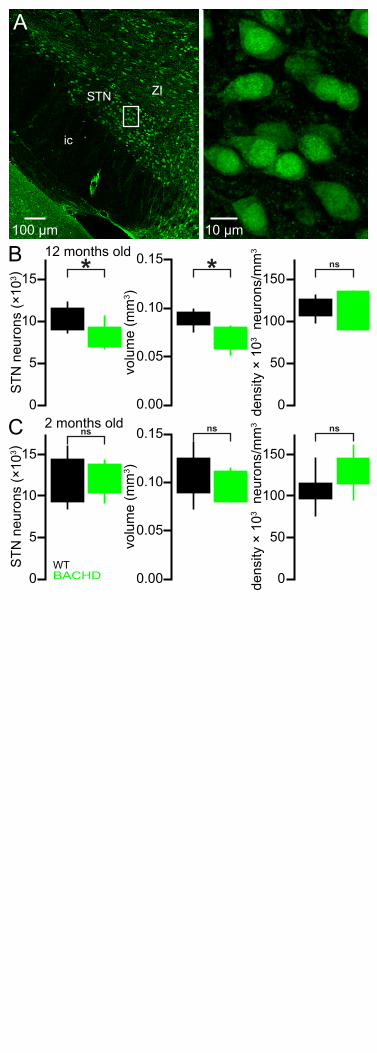
ic
STN ZI
A
C
B
150
100
50
0dens
ity ×
103
neur
ons/
mm
3 ns
volu
me
(mm
3 )
0.15
0.10
0.05
0.00
ns
STN
neu
rons
(×10
3 )
WTBACHD
15
10
5
0
ns
150
100
50
0dens
ity ×
103
neur
ons/
mm
3ns
15
10
5
0
STN
neu
rons
(×10
3 ) *0.10
0.15
0.05
0.00
volu
me
(mm
3 )
*
2 months old
12 months old100 µm 10 µm
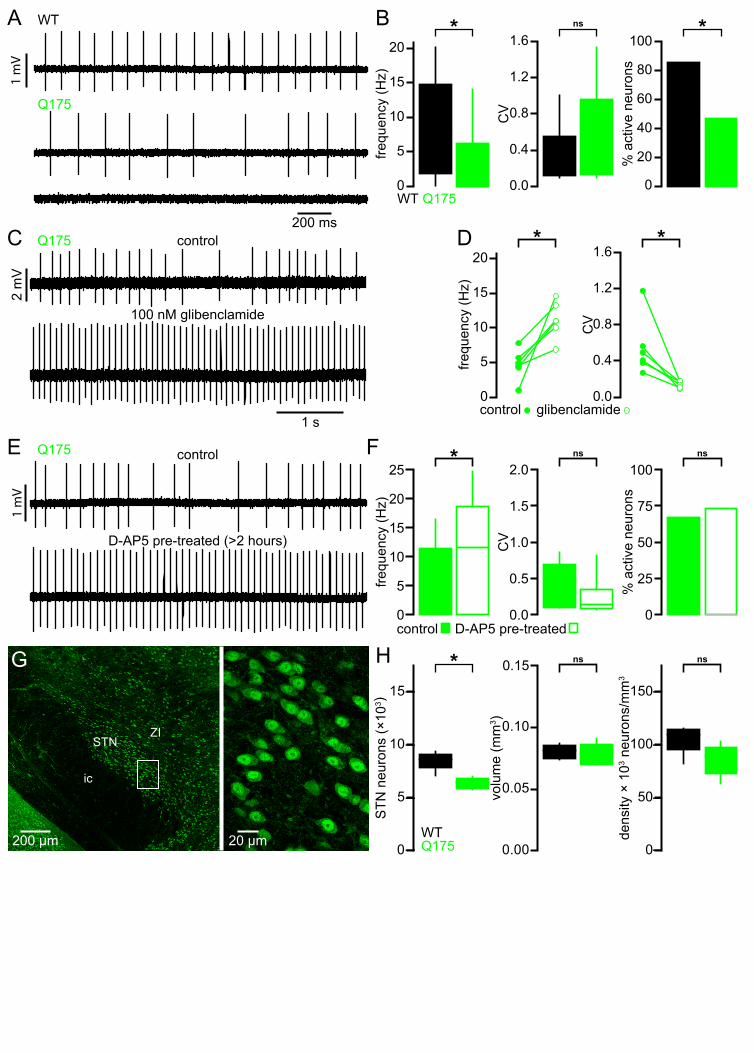
1 m
V
200 ms
WT
Q175
A2
mV
1 s
C Q175 control
100 nM glibenclamide
H
0
5
10
15
0.00
0.05
0.10
0
50
100
150
STN
neu
rons
(×10
3 )
volu
me
(mm
3 )
dens
ity ×
103 n
euro
ns/m
m3
* 0.15
WTQ175
ns ns
20
15
10
5
0
*
frequ
ency
(Hz)
WT Q175
1.6
1.2
0.8
0.4
0.0
CV
ns
0
20
40
60
80
100
% a
ctiv
e ne
uron
s
*B
20
15
10
5
0
frequ
ency
(Hz)
control glibenclamide
*1.6
1.2
0.8
0.4
0.0
CV
*D
E Q175
1 m
V
15
20
10
25
5
0
frequ
ency
(Hz)
*
control D-AP5 pre-treated
2.0
1.5
1.0
0.5
0.0
CV
ns
75
50
25
100
% a
ctiv
e ne
uron
s0
nsFcontrol
D-AP5 pre-treated (>2 hours)
200 µm
G
ic
STNZI
20 µm