2022 Full year presentation - Macquarie
73
Presentation to investors and analysts Result announcement for the full year ended 31 March 2022 6 May 2022
-
Upload
khangminh22 -
Category
Documents
-
view
5 -
download
0
Transcript of 2022 Full year presentation - Macquarie

Presentation to investors and analysts
Result announcement for the full year ended 31 March 2022
6 May 2022

© Macquarie Group Limited 2
Disclaimer
The material in this presentation has been prepared by Macquarie Group Limited ABN 94 122 169 279 (MGL) and is general background information about Macquarie’s (MGL and its subsidiaries) activities current as at the date of this presentation. This information is given in summary form and does not purport to be complete. The material contained in this presentation may include information derived from publicly available sources that have not been independently verified. Information in this presentation should not be considered as advice or a recommendation to investors or potential investors in relation to holding, purchasing or selling securities or other financial products or instruments and does not take into account your particular investment objectives, financial situation or needs. Before acting on any information you should consider the appropriateness of the information having regard to these matters, any relevant offer document and in particular, you should seek independent financial advice. No representation or warranty is made as to the accuracy, completeness or reliability of the information. All securities and financial product or instrument transactions involve risks, which include (among others) the risk of adverse or unanticipated market, financial or political developments and, in international transactions, currency risk.
This presentation may contain forward looking statements – that is, statements related to future, not past, events or other matters – including, without limitation, statements regarding our intent, belief or current expectations with respect to Macquarie’s businesses and operations, market conditions, results of operation and financial condition, capital adequacy, provisions for impairments and risk management practices. Readers are cautioned not to place undue reliance on these forward looking statements. Macquarie does not undertake any obligation to publicly release the result of any revisions to these forward looking statements or to otherwise update any forward looking statements, whether as a result of new information, future events or otherwise, after the date of this presentation. Actual results may vary in a materially positive or negative manner. Forward looking statements and hypothetical examples are subject to uncertainty and contingencies outside Macquarie’s control. Past performance is not a reliable indication of future performance.
Unless otherwise specified all information is for the year ended 31 March 2022.
Certain financial information in this presentation is prepared on a different basis to the Financial Report within the Macquarie Group Financial Report (“the Financial Report”) for the year ended 31 March 2022, which is prepared in accordance with Australian Accounting Standards. Where financial information presented within this presentation does not comply with Australian Accounting Standards, a reconciliation to the statutory information is provided.
This presentation provides further detail in relation to key elements of Macquarie’s financial performance and financial position. It also provides an analysis of the funding profile of Macquarie because maintaining the structural integrity of Macquarie’s balance sheet requires active management of both asset and liability portfolios. Active management of the funded balance sheet enables the Group to strengthen its liquidity and funding position.
Any additional financial information in this presentation which is not included in the Financial Report was not subject to independent audit or review by PricewaterhouseCoopers. Numbers are subject to rounding and may not fully reconcile.

01
Agenda
Introduction
02Overview of Result
03Result Analysis and Financial Management
04Outlook
05Appendices

Introduction
Sam DobsonHead of Investor Relations
01

Shemara WikramanayakeManaging Director and Chief Executive Officer
02Overview of Result

Introduction Overview of Result Result Analysis and Financial Management Outlook Appendices
© Macquarie Group Limited 6
BFS MAM CGM MacCapBanking and Financial Services Macquarie Asset Management Commodities and Global Markets Macquarie Capital
• Macquarie’s retail banking and financial services business with total BFS deposits1 of $A98.0b2, loan portfolio3 of $A110.2b2 and funds on platform of $A118.6b2
• Provides a diverse range of personal banking, wealth management, and business banking products and services to retail clients, advisers, brokers and business clients
• Global specialist asset manager with $A773.1b2of assets under management building sustainable value for clients and communities, investing to deliver positive impact for everyone
• Provides investment solutions to clients across a range of capabilities in Private Markets and Public Investments, including infrastructure, green investments, agriculture and natural assets, real estate, private credit, asset finance, equities, fixed income and multi-asset solutions
Global business offering capital and financing, risk management, market access, physical execution and logistics solutions to its diverse client base
Global capability in:
• Capital and financing: provides clients with financing and asset management solutions across the capital structure
• Risk Management: helping clients manage exposure to price changes in commodities, currencies, credit and equity markets
• Market access: helping clients access assets and prices via liquidity and electronic markets globally
• Physical execution & logistics: supporting clients with access to physical commodities and facilitating their transport from production to consumption
• Advisory and capital raising services, investing alongside partners and clients across the capital structure, providing clients with specialist expertise, advice and flexible capital solutions across a range of sectors
• Development and investment in infrastructure and energy projects and companies, with a focus on transport, digital and social infrastructure
• Equities brokerage, providing clients with access to equity research, sales, execution capabilities and corporate access
About MacquarieAnnuity-style activities | Net Profit Contribution
~44%Markets-facing activities | Net Profit Contribution
~56%
FY22 Net Profit Contribution
Note: Where referenced in this document, net profit contribution is management accounting profit before unallocated corporate costs, profit share and income tax. 1. BFS deposits include home loan offset accounts and exclude corporate/wholesale deposits. 2. As at 31 Mar 22. 3. The loan portfolio comprises home loans, loans to businesses, car loans and credit cards.
MAM | ~23%BFS | ~11% CGM | ~10% CGM | ~31% MacCap | ~25%
Risk Management Group Legal and Governance Financial Management Group Corporate Operations GroupAn independent and centralised function responsible for objective review and challenge, oversight, monitoring and reporting in relation to Macquarie’s material risks.
Provides a full range of legal and corporate governance services, including strategic legal and governance advice and risk assessment.
Provides financial, tax, treasury, corporate affairs and advisory services to all areas of Macquarie.
Provides specialist support services through technology, operations, human resources, workplace, strategy, operational risk management, data and transformation, resilience and global security, and also includes the Macquarie Group Foundation.

Introduction Overview of Result Result Analysis and Financial Management Outlook Appendices
© Macquarie Group Limited 7
2H22 result: $A2,663m up 30% on 1H22; up 31% on 2H21FY22 result: $A4,706m up 56% on FY21
2H22$Am
1H22$Am
2H22 v 1H22
FY22$Am
FY21$Am
FY22 vFY21
Net operating income 9,520 7,804 22% 17,324 12,774 36%
Total operating expenses (5,716) (5,069) 13% (10,785) (8,867) 22%
Operating profit before income tax 3,804 2,735 39% 6,539 3,907 67%
Income tax expense (983) (603) 63% (1,586) (899) 76%
Effective tax rate1 (%) 27.0 22.8 25.2 23.0
(Profit)/Loss attributable to non-controlling interests (158) (89) (247) 7
Profit attributable to MGL shareholders 2,663 2,043 30% 4,706 3,015 56%
Annualised return on equity (%) 19.6 17.8 10% 18.7 14.3 31%
Basic earnings per share $A7.06 $A5.63 25% $A12.72 $A8.43 51%
Dividend per ordinary share $A3.50 $A2.72 29% $A6.22 $A4.70 32%
1. Calculation of the effective tax rate is after adjusting for the impact of non-controlling interests.
á
á
áá
á
á
á
á
á
áá
á
á
á
á
á

Introduction Overview of Result Result Analysis and Financial Management Outlook Appendices
© Macquarie Group Limited 8
2H22 net profit contribution from Operating Groups$A5,478m up 38% on 1H22; up 43% on 2H21
Annuity-style activities
$A1,615m36%
ON 1H22
6%ON 2H21
Markets-facing activities
$A3,863m163%
ON 1H22
83%ON 2H21
Non-Banking Group
on 1H22
Macquarie Asset Management (MAM)Decrease driven by strong comparative period, which included a disposition fee, equity accounted income and an impairment reversal from Macquarie Infrastructure Corporation (MIC)1. Partially offset by base fee growth and higher performance fees in 2H22
on 1H22
Macquarie Capital (MacCap)Increased fee and commission income driven by M&A, partially offset by lower DCM & ECM fee income. Substantial increase in investment-related revenue, primarily due to exceptionally strong asset realisations in the green energy and technology sectors and an increase in the private credit portfolio
Banking Group
on 1H22
Banking and Financial Services (BFS)Growth in the loan portfolio, funds on platform and total BFS deposits; net credit impairment releases, partially offset by increased technology investment and higher average headcount to support business growth and regulatory requirements
on 1H22
Commodities and Global Markets2 (CGM)Strong risk management contribution from Gas and Power businesses, Agriculture and Global Oil driven by increased client hedging activity as a result of elevated volatility, partially offset by the impact of fair value adjustments across the derivatives portfolio. Increased revenue across Commodities from inventory management and trading, primarily due to positive timing of income recognition on Gas storage and transport contracts and gains in North American Gas and Power driven by supply and demand imbalances. Improved contribution from Financial Markets across major products and markets from client and trading activityon 1H22
Commodities and Global Markets2 (CGM)Decreased contribution from Asset Finance largely related to the partial sale of the UK Meters portfolio of assets comprising the industrial and commercial portfolio in May 21 partially offset by increased underlying activity. Commodities lending and financing revenue down on 1H22
1. On 22 Sep 21, Macquarie Infrastructure Corporation completed a corporate reorganisation, becoming a subsidiary of the newly formed Macquarie Infrastructure Holdings, LLC which continues to trade under the New York Stock Exchange symbol of 'MIC’. 2. Note certain assets of the Credit Markets business, certain activities of the Commodity Markets and Finance business, and some other less financially significant activities are undertaken from within the Non-Banking Group.
â
á
á
â
á
â á
áâ

Introduction Overview of Result Result Analysis and Financial Management Outlook Appendices
© Macquarie Group Limited 9
FY22 net profit contribution from Operating Groups $A9,462m up 55% on FY21
Annuity-style activities
$A4,132m 25%ON FY21
Markets-facing activities
$A5,330m 92%ON FY21
Non-Banking Group
on FY21
Macquarie Asset Management (MAM)Increase driven by disposition fee and equity accounted income from MIC as well as base fee growth, partially offset by gain on sale of Macquarie European Rail in the prior year and lower performance fees on FY21
Macquarie Capital (MacCap)Significantly higher fee and commission income due to M&A and DCM, partially offset by lower ECM fee income and brokerage income. Investment-related income up substantially due to material asset realisations in the green energy, technology and business services sectors and an increase in the private credit portfolio
Banking Group
on FY21
Banking and Financial Services (BFS)Growth in the loan portfolio, funds on platform and total BFS deposits; net credit impairment releases, partially offset by increased technology investment and higher average headcount to support business growth and regulatory requirements
on FY21
Commodities and Global Markets1 (CGM)Increased revenue across Commodities with strong risk management from Gas and Power businesses, Resources, Agriculture and Global Oil driven by increased client hedging activity and trading activity as a result of elevated volatility and commodity price movements, partially offset by the impact of fair value adjustments across the derivatives portfolio. Commodities inventory management and trading up on FY21 - strong trading gains from supply and demand imbalances in North American Gas and Power, partially offset by unfavourable impact of timing of income recognition on Gas storage and transport contracts. Continuing strong performance from Financial Markets across major products and markets from client and trading activity
on FY21
Commodities and Global Markets1 (CGM)Increased contribution from Asset Finance largely related to the partial sale of the UK Meters portfolio of assets comprising the industrial and commercial portfolio in May 21 and increased activity across its other sectors. Commodities lending and financing revenue down on FY21
1. Note certain assets of the Credit Markets business, certain activities of the Commodity Markets and Finance business, and some other less financially significant activities are undertaken from within the Non-Banking Group.
á
á á
á
á
á
á

Introduction Overview of Result Result Analysis and Financial Management Outlook Appendices
© Macquarie Group Limited 10
FY22$A6.22
32%ON FY21
FY22$A12.72
51%ON FY21
FY22$A4,706m
56%ON FY21
FY22$A17,324m
36%ON FY21
Financial performance
Operating income Profit
EPS DPS
FY18 FY19 FY20 FY21 FY22—
4,000
8,000
12,000
16,000
20,000
FY18 FY19 FY20 FY21 FY22—
1,000
2,000
3,000
4,000
5,000
$Am
FY18 FY19 FY20 FY21 FY22—
3.00
6.00
9.00
12.00
15.00
$A
FY18 FY19 FY20 FY21 FY22—
2.00
4.00
6.00
8.00
$A
$Am
á á
áá

Introduction Overview of Result Result Analysis and Financial Management Outlook Appendices
© Macquarie Group Limited 11
Assets under management of $A774.8b1
AUM increased 37% from $A563.5b1 as at 31 Mar 21
Increase due to acquisitions of Waddell & Reed Financial, AMP Capital’s public investments business and Central Park Group as well as investments made by Private Markets-managed funds and net inflows in Public Investments
1. Includes MAM and BFS AUM.
$Ab
Fixed Income Infrastructure Equity Equities Other Real Estate
Mar 18 Mar 19 Mar 20 Mar 21 Mar 220
100
200
300
400
500
600
700
800

Introduction Overview of Result Result Analysis and Financial Management Outlook Appendices
© Macquarie Group Limited 12
Diversification by region
Americas EMEA Asia Australia4
International income 75% of total income1 Total staff2 18,133 of which 54% international. A further ~225,000 people employed across managed fund assets and investments3
48%of total income
Total income
3,205 $A8,246mAssets under management
$A371.0bEmploying 54,000+ people3
CANADA USACalgary Boise New YorkMontreal Boston OrlandoToronto Chicago Overland ParkVancouver Dallas Philadelphia
Houston San DiegoLATIN AMERICA Jacksonville San FranciscoMexico City Los Angeles San JoseSao Paulo Minneapolis SeattleSantiago Mission Walnut Creek
Nashville
1. Net operating income excluding earnings on capital and other corporate items. 2. Includes staff employed in certain operationally segregated subsidiaries throughout the presentation. 3. Includes people employed through Private Markets-managed fund assets and investments where Macquarie Capital holds significant influence. 4. Includes New Zealand.
20%of total income
Total income
2,624 $A3,511mAssets under management
$A137.7bEmploying 83,000+ people3
EUROPE MIDDLE-EASTAmsterdam Luxembourg DubaiBraintree MadridCoventry Munich SOUTH AFRICADublin Paris JohannesburgEdinburgh ReadingFrankfurt SolihullGeneva ViennaLimerick WatfordLondon Zurich
7%of total income
Total income
3,972 $A1,137mAssets under management
$A40.0bEmploying 75,000+ people3
ASIABangkok ManilaBeijing MumbaiGurugram SeoulHong Kong ShanghaiHsin-Chu SingaporeJakarta TaipeiKuala Lumpur Tokyo
25%of total income
Total income
8,332 $A4,390mAssets under management
$A226.1bEmploying 15,000+ people3
AUSTRALIA NEW ZEALANDAdelaide Manly AucklandBrisbane Melbourne WellingtonCanberra PerthGold Coast Sydney

Introduction Overview of Result Result Analysis and Financial Management Outlook Appendices
© Macquarie Group Limited 13
Diversification by region75% of total income1 in FY22 was generated offshore
Total income
1. Net operating income excluding earnings on capital and other corporate items.
$Am
FY18 FY19 FY20 FY21 FY22
Americas Europe, Middle East & Africa Asia Australia0
1,000
2,000
3,000
4,000
5,000
6,000
7,000
8,000
9,000

© Macquarie Group Limited
Introduction Overview of Result Result Analysis and Financial Management Outlook Appendices
14
38%ON Mar 21
4%ON FY21
26%ON FY21
Macquarie Asset Management
Operating income
$A4,484m
Net profit contribution
$A2,150m
AUM1
$A773.1bMAM
~23%
MAM
• Continuing to invest in client experience, building long-term strategic partnerships across the platform. The proportion of clients investing in multiple strategies across MAM’s Private Markets and Public Investments businesses is increasing
• Building sustainable value for clients and communities, using MAM’s influence and scale to drive positive outcomes. MAM is integrating sustainability across its activities while progressing the implementation of its 2040 net zero commitment and becoming a signatory to The Climate Pledge
• Investing in our leadership capabilities in strategic growth areas including private credit, sustainability and diversity, equity and inclusion
Private Markets Public Investments
• $A238.0b in assets under management1, up 22%, predominantly due to strong investment activity
• $A158.3b in equity under management2, up 11%, predominantly due to strong fundraising activity
• Raised a record of $A27.0b in new equity from clients for a diverse range of strategies across the platform, including new global infrastructure and real estate funds, and final close of the sixth Americas infrastructure fund
• Invested $A31.0b of equity, a record year, across 91 new investments, including; 34 real assets, 19 real estate, and 38 private credit investments
• $A10.3b of equity returned to clients from divestments, including the sale of Atlantic Aviation and Società Gasdotti Italia
• $A19.9b of equity to deploy in new investments
• Effective 1 Apr 22, the Green Investment Group (GIG) has transferred from Macquarie Capital and is operating as part of MAM. The combined teams significantly enhance MAM’s offering in green investments, with MAM managing a total of 46+ GW of capacity including 16+ GW under operation and more than 250 green energy projects in development or construction totalling over 30 GW3
• Strong momentum across real estate strategies, including new strategic partnerships with leading data centre and sustainable building developers
• Continued expansion of private credit capability with ongoing development of offering in adjacencies including secure income real estate
• No.1 infrastructure investment manager globally since ranking inception4
• $A535.1b in assets under management1, up 46%, due primarily to acquisitions, together with positive net flows - driven by fixed income flows
• Continued strong fund performance, with 71% of assets under management outperforming their respective 3-year benchmarks5
• Delivering scale and expanding capability with the successful acquisitions and ongoing integration of:
– Waddell & Reed Financial: One of the oldest asset managers in the US, with ~$US78.6 billion6 assets under management and a leading offering distributed under the IVY INVESTMENTS® brand
– Central Park Group: An independent investment advisory firm with ~$US3.5 billion7 of assets under management, specialising in alternative investment strategies for high-net-worth investors
– AMP Capital’s public investments business: Specialist fixed income, Australian listed equities, listed real estate and listed infrastructure business with ~$A43 billion7 of assets under management
Note: Chart is based on FY22 net profit contribution from Operating Groups. 1. As at 31 Mar 22 Assets under Management (AUM) is calculated as the proportional ownership interest in the underlying assets of funds and mandated assets that Macquarie actively manages or advises for the purpose of wealth creation, adjusted to exclude cross-holdings in funds and reflect Macquarie’s proportional ownership interest of the fund manager. AUM excludes uninvested equity in Private Markets 2. Private Markets’ total Equity under management includes market capitalisation at measurement date for listed funds, the sum of original committed capital less capital subsequently returned for unlisted funds and mandates as well as invested capital for managed businesses 3. Includes projects and investments held across managed-funds assets and balance sheet investments with varying ownership stakes in each 4. IPE Real Assets (Jul/Aug 2021), measured by infrastructure assets under management 5. As at 31 Mar 22 6. As at acquisition 30 Apr 21 7. As at 31 Dec 21.
á
á
á

© Macquarie Group Limited
Introduction Overview of Result Result Analysis and Financial Management Outlook Appendices
15
Banking and Financial Services
Operating income
$A2,461m18%
ON FY21
Net profit contribution
$A1,001m30%
ON FY21
BFS
~11%
Personal Banking Business Banking Wealth Management
• Home loan portfolio of $A89.5b, up 34% on Mar 21, representing approximately 4.4% of the Australian market
• Home loan growth driven by strong demand in lower loan-to-value ratio (LVR) and owner-occupier lending tiers
• Macquarie named the MFAA’s National Major Lender of the Year at the 2021 MFAA National Excellence Awards for the second year in a row
• Named as the number one bank in the 2022 MPA Brokers on Banks Survey
• Launched Australia’s fastest digital account opening experience for new transaction and savings account customers
• Business Banking loan portfolio of $A11.5b, up 13% on Mar 21
• Business Banking loan growth driven by an increase in client acquisition across core segments and a continued build into emerging segments
• Continued investment in digital solutions for enhanced client experience and to serve clients more efficiently
• Continued expansion of the Macquarie Wrap managed accounts offering, including the addition of a range of sustainability focused SMAs to the platform. Managed accounts funds under administration of $A7.9b, up from $A5.4b at Mar 21
• Macquarie Private Bank named Outstanding Private Bank in the $A10m+ category at the RFI Global Private Banking Awards for the fifth year in a row
Car Loans
• Car loan portfolio of $A8.8b, down 23% on Mar 21, due to the sale of the dealer finance business to Allied Credit, ceasing originations from dealers
• Launched a specialised electric vehicle buying service to help customers transition to an electric vehicle
Deposits
• Awarded Best Cash and Term Deposit Accounts at the 2021 SMSF Adviser Awards
• Named the 2022 Everyday and Savings Bank of the Year at the 2022 Mozo Experts Choice Awards for the second year in a row
Note: Chart is based on FY22 net profit contribution from Operating Groups. 1. Based on accounts still on books. 2. Weighted by size of loan. 3. Property valuation source CoreLogic, Mar 22. 4. Assessed as owner-occupied. 5. For the full year to 31 Mar 22, Administrator view. 6. BFS deposits include home loan offset accounts and exclude corporate/wholesale deposits.
á
• Total BFS deposits6 of $A98.0b, up 21% on Mar 21
• Funds on platform of $A118.6b, up 17% on Mar 21, including strong net flows5 of $A8.2b in the period
á
Home loan portfolio summary 31 Mar 22Average LVR at Origination (%)1,2 64%Average Dynamic LVR (%)2,3 47%% Owner Occupied4 65%% Principal and Interest 78%
Client numbers approximately 1.7 million

© Macquarie Group Limited
Introduction Overview of Result Result Analysis and Financial Management Outlook Appendices
16
Commodities and Global Markets
Operating income
$A6,179m32%
ON FY21
Net profit contribution
$A3,911m50%
ON FY21
CGM
~41%
Asset Finance 9%1 Commodity Markets 65%1 Financial Markets 26%1
• Continued positive performance and contribution across most industries
• Strong origination and portfolio growth in Structured Lending and Shipping Finance
• Total portfolio of $A6.0b, up 2% from $A5.8b at 31 Mar 21
• Gain on partial sale of UK Meters portfolio comprising the industrial and commercial portfolio in May 21
• Increased revenue across Commodities with strong risk management from Gas and Power businesses, Resources, Agriculture and Global Oil driven by increased client hedging activity and trading activity as a result of elevated volatility and commodity price movements
• Increased Commodities inventory management and trading income with strong gains from supply and demand imbalances in North American Gas and Power partially offset by unfavourable impact of timing of income recognition on Gas storage and transport contracts
• Named Oil and Products House of the Year2 as well as Natural Gas/LNG House of the Year2 and Derivatives House of the Year2
• No.4 physical gas marketer in North America3
Foreign exchange, interest rates and credit
• Increased client activity in foreign exchange and interest rates across all regions
• Strong client activity in UK and Australian securitisation
• Continued growth in financing activity with clients engaged in the US corporate direct lending market
Futures
• Improved commission and interest revenues due to elevated commodity price volatility and continued recovery from challenges of FY21
• No.1 Futures Broker on the ASX4
Equity Derivatives and Trading
• Improved results from equity finance
• Increased activity providing solutions for corporate clients
• High levels of financing and trading with corporate clients and event driven trading and financing
• Slightly reduced performance across Lending and Financing activities across Resources, Agriculture and Oil and Gas sectors
Note: Chart is based on FY22 net profit contribution from Operating Groups. 1. Percentages are based on net profit contribution before impairment charges and excluding the gain from the partial sale of the UK Meters portfolio of assets comprising the industrial and commercial portfolio in May 21. 2. Energy Risk Awards 2022 3. Platts Q4-Dec 21. 4. ASX Futures 24 (SFE) Monthly Report Mar 22.
á
á
40+ years of client partnership

© Macquarie Group Limited
Introduction Overview of Result Result Analysis and Financial Management Outlook Appendices
17
Macquarie Capital
Operating income
$A4,213m87%
ON FY21
Net profit contribution
$A2,400m269%
ON FY21
476 transactions
valued at
$A457bin FY221 MacCap
~25%
Summary Transaction Activity
• Maintained a leading market position in ANZ across M&A in 20212
• Maintained our global number one infrastructure financial adviser position for a third consecutive year3
• Principal Finance portfolio of over $A15b4 including $A13b credit portfolio, with record deployment in FY22 through focused investment in credit markets and bespoke financing solutions
• Combination of our existing infrastructure and energy aligned principal investment businesses, with a continued focus on economic & social infrastructure, digital infrastructure, as well as energy transition infrastructure through investment in businesses, platforms, development and construction
• Macquarie Equities maintained market leading ranking in Australia across Research, Trading, ECM and Corporate Access5
• Over 15 infrastructure and energy projects under development or construction6
• GIG continued to expand its development platforms through the year, deploying over $A0.45b7
• Financial adviser to Sydney Aviation Alliance on its ~$A32b14 acquisition of Sydney Airport
• Exclusive financial adviser to Light & Wonder f/k/a Scientific Games Corporation on its $US6.05b sale of its Lottery Business to Brookfield Business Partners and provided debt financing to Brookfield to fund a portion of the acquisition
• Financial adviser to Sandfire Resources on its $US1.9b acquisition of the MATSA mine in Spain from Trafigura and Mubadala, and Joint Lead Manager to Sandfire on its associated $A1.2b equity raising
• Exclusive financial adviser to Manulife Investment Management on the sale of its 49% equity interest in Constellation Renewable Partners to Axium Infrastructure
• Sole financial adviser to Ardian on the sale of its majority stake in SCHWIND eye-tech-solutions to Adagia Partners
• Macquarie-led consortium, Bridging Pennsylvania Partners, has been selected by the Pennsylvania Department of Transport as Preferred Bidder for the $US2b Pathways Major Bridge P3 Initiative involving the design, build, financing and maintenance of nine bridges in Pennsylvania, USA
• Principal Finance has provided more than 30 unitranche financings to clients in FY22, including to support:– Onex’s acquisition of TES Global, a well-established international
provider of comprehensive software solutions for the education sector
– HILB’s M&A pipeline, an insurance broker platform with 100+ offices across 22 states in the US
• Acquisition of Procentrix, supporting the leading US Federal IT services company’s growth and capabilities expansion
• Sale of majority ownership in Dovel Technologies to Guidehouse, a US government services firm. Macquarie also acted as financial adviser to Dovel
• Realisation of Macquarie’s 16% interest in XM Cyber, an Israeli cybersecurity software provider, through an acquisition valuing 100% of the business at $US700m
• Realisation of a number of renewable assets, including Savion (solar energy and storage developer in the US), BRUC Iberia Energy Investment Partners (solar platform in Spain), partial realisation of Green Lighthouse Development (a French solar developer) and assets within the AR Wind Energy portfolio (a Japanese onshore wind development platform)
Awards and Rankings
• M&A Financial Adviser of the Year - Australia8
• Digital Infrastructure Deal of the Year - APAC9
• Direct Investor of the Year - EMEA10
• No. 1 Power Financial Advisor - North America11
• APAC high touch trading team was rated No. 1 for coverage of US accounts for Asian Equities12
• Macquarie Equities, 1st with Australian Investors13:– Corporate Access and best listed and unlisted company access – Trading Strength Index– Research and Sales strength
Note: Chart is based on FY22 net profit contribution from Operating Groups. 1. Source: Dealogic and IJGlobal for Macquarie Group completed M&A, investments, ECM and DCM transactions converted as at the relevant report date. Deal values reflect the full transaction value & not an attributed value. Comparatives are presented as previously reported. 2. Dealogic (CY21 completed by value & deal count). 3. Inspiratia (CY19 by deal count, Equal No.1 in CY20 by deal count, CY21 by deal value). 4. Committed portfolio. 5. Peter Lee Associates 2021 and 2020 Survey of Australian Investors. 6. As at 31 Mar 22. 7. Deployment is based on cash invested during the year, including projects that form part of Corio Generation from Apr 22 8. Mergermarket Australia M&A Awards 2021. 9. IJ Investor Awards 2021. Macquarie Capital advised on the deal. 10. IJ Investor Awards 2021. 11. Inframation (Equal No. 1 CY21 by deal count) 12. Coalition Greenwich US Domiciled Accounts (Asia Trading Results) 2021. 13. Peter Lee Associates 2021 Survey of Australian Investors. 14. Transaction Value based on Enterprise Value.
417 transactions
$A364bIN FY211
á
á

Introduction Overview of Result Result Analysis and Financial Management Outlook Appendices
© Macquarie Group Limited 18
Funded balance sheet remains strong
These charts represent Macquarie’s funded balance sheets at the respective dates noted above. The funded balance sheet is a simple representation of Macquarie’s funding requirements once accounting related gross-ups and self-funded assets have been netted down from the statement of financial position. The funded balance sheet is not a liquidity risk management tool, as it does not consider the granular liquidity profiling of all on and off-balance sheet components considered in both Macquarie’s internal liquidity framework and the regulatory liquidity metrics. For details regarding reconciliation of the funded balance sheet to Macquarie’s statutory balance sheet refer to slide 59. 1. There has been a change in presentation of certain items on the funded balance sheet in the current year. Comparatives have been restated to reflect this change. Refer slide 59 for more details. 2. Other debt maturing in the next 12 months includes Secured funding, Bonds, Other loans, Subordinated debt and Net trade creditors. 3. Debt maturing beyond 12 months includes Subordinated debt, Structured notes, Secured funding (including RBA TFF), Bonds, Syndicated loan facilities and Other loans not maturing within next 12 months. 4. Cash and liquid assets includes self-securitisation of repo eligible Australian assets originated by Macquarie and held as contingent collateral for RBA facilities (such as the CLF). 5. Other loan assets (incl. op lease) > 1 year includes debt investments. 6. Equity investments and PPE includes Macquarie’s co-investments in Macquarie-managed funds and other equity investments. 7. Total customer deposits as per the funded balance sheet ($A101.5b) differs from total deposits as per the statutory balance sheet ($A101.7b). The funded balance sheet reclassifies certain balances to other funded balance sheet categories. 8. Issuances cover a range of tenors, currencies and product types and are AUD equivalent based on FX rates at the time of issuance. Includes refinancing of loan facilities and $A9.5b of RBA TFF drawn since Mar 21. 9. Share Purchase Plan (SPP) was offered to existing shareholders post completion of the institutional placement.
31 Mar 221
Term liabilities exceed Term assets
Equity and hybrids 3 16%
Total customer deposits7
21%FROM MAR 21
Term funding raised8
$Ab $Ab
Funding sources Funded assets0
30
60
90
120
150
180
210
240
270
Equity and hybrids 14%
Debt maturing beyond 12 months3 27%
Customer deposits 45%
Other debt maturing in the next 12 months2 7%
ST wholesale issued paper 7%
Equity investments and PPE6 5%
Other loan assets (incl. op lease) <1 year 6%
Cash and liquid assets4 29%
31 Mar 211
Funding sources Funded assets0
30
60
90
120
150
180
210
240
270
Equity and hybrids 13%
Debt maturing beyond 12 months3 30%
Customer deposits 38%
Other debt maturing in the next 12 months2 6%
ST wholesale issued paper 13%
Equity investments and PPE6 4%
Other loan assets (incl. op lease) > 1 year5 14%
Other loan assets (incl. op lease) <1 year 5%
Cash and liquid assets4 35%
á
Other loan assets (incl. op lease) > 1 year5 17%
Trading assets 14%
Trading assets 11%
Home loans 29%
Home loans 31%
Capital raised
through Institutional Placement and SPP9
SinceMAR 21
$A101.5b
$A48.3b
$A2.8b

Introduction Overview of Result Result Analysis and Financial Management Outlook Appendices
© Macquarie Group Limited 19
Basel III capital position • APRA Basel III Group capital at Mar 22 of $A33.6b; Group capital surplus of $A10.7b1,2
• APRA Basel III Level 2 CET1 ratio: 11.5%; Harmonised Basel III Level 2 CET1 ratio: 14.6%
Group regulatory surplus: Basel III (Mar 22)
1. The capital surplus shown is above regulatory minimums including the capital conservation buffer (CCB), per APRA ADI Prudential Standard 110, calculated at 8.5% RWA on a Level 2 basis for MBL. This surplus also includes provision for internal capital buffers, forthcoming regulatory changes, as well as differences between Level 2 and Level 1 capital requirements, such as the $A500m operational capital overlay imposed by APRA which has been applied to Level 1 only, effective from 1 Apr 21. 2. Based on materiality, the 8.5% used to calculate the Group capital surplus does not include the countercyclical buffer (CCyB) of ~1bps. The individual CCyB varies by jurisdiction and the Bank Group’s CCyB is calculated as a weighted average based on exposures in different jurisdictions. 3. Basel III applies only to the Bank Group and not the Non-Bank Group. ‘Harmonised’ Basel III estimates are calculated in accordance with the BCBS Basel III framework, noting that MBL is not regulated by the BCBS and so impacts shown are indicative only. 4. Offset by Dividend Reinvestment Plan issuance. 5. Includes movements in share-based payment reserve, foreign currency translation reserve and other movements. 6. APRA Basel III ‘super-equivalence’ includes the impact of changes in capital requirements in areas where APRA differs from the BCBS Basel III framework, including the treatment of mortgages $A1.4b; capitalised expenses $A0.6b; equity investments $A0.5b; investment into deconsolidated subsidiaries $A0.2b; DTAs $A0.6b; IRRBB $A0.1b.
$Ab
11.4
(3.0)
8.4
2.7
(0.9)
2.8
(2.2) (0.1)
10.7
3.4
14.1
HarmonisedBasel III
at Sep 21
APRA Basel III'super
equivalence'
APRA Basel IIIat Sep 21
2H22 P&L 1H22 InterimDividend
Capital Issuance Business capitalrequirements
Othermovements
APRA Basel IIIat Mar 22
APRA Basel III'super
equivalence'
HarmonisedBasel III
at Mar 22
0.0
2.0
4.0
6.0
8.0
10.0
12.0
14.0
2H22Other = (0.1b):
1. SBPR: 0.3b2. FCTR: (0.4b)3. Other: 0.0b
$A1.5b Institutional Placement & $A1.3b Share Purchase Plan (SPP)
Harmonised Basel III
at Sep 213
1H22 Interim Dividend
Other movements5
APRA Basel III ‘super
equivalence’6
Capital Issuance
Based on 8.5% (minimum Tier 1 ratio + CCB)
APRA Basel III ‘super
equivalence’
1H22 Interim Dividend4

Introduction Overview of Result Result Analysis and Financial Management Outlook Appendices
© Macquarie Group Limited 20
(0.1)
0.1
1.4
1.1 0.20.5
0.6 0.2
1.5 0.00.4
(0.5)
Mar 21 MAM BFS CGM MacCap Corp FX Sep 21 MAM BFS CGM MacCap Corp FX Mar 2214.0
15.0
16.0
17.0
18.0
19.0
20.0
21.0
22.0
23.0
24.0
2H22 Key driversMAM
• Growth in MAM balance sheet usage from new fund co-investments and underwrites to seed core and adjacent fund strategies
BFS
• Growth in home loans, partially offset by sale of dealer finance portfolio
CGM
• Driven by market movements in commodities, increased client hedging and trading activity in Commodities, and hedging activity in FIC
Macquarie Capital
• New business deployment in private credit and equity offset by investment realisations across all regions
Corporate
• Various movements, including increased liquidity holdings
Business capital requirements1
FY22 business capital requirement growth of $A5.4b2
$Ab
Broadly offset by
FCTR3
$A3.2b increase over 1H22
$A2.2b increase over 2H22
1. Regulatory capital requirements are calculated at 8.5% RWA. 2. Includes FX impacts. 3. The foreign currency translation reserve (FCTR) forms part of capital supply and broadly offsets FX movements in capital requirements.
$A17.5b
$A20.7b
$A22.9b
20
Broadly offset by
FCTR3
MAM2H22growthincludesProjectLuppiter(NationalGridunderwrite)$0.3b,ProjectAshita(NTTunderwrite)$0.2bandMREPcommitment$0.1b
CGMold:“Marketmovementsincommodities,aswellasincreasedclienthedingactivityinCMFandFIC,andmarketrisk”

Introduction Overview of Result Result Analysis and Financial Management Outlook Appendices
© Macquarie Group Limited 21
Strong regulatory ratios
1. Average LCR for Mar 22 quarter is based on an average of daily observations and excludes CLF allocation (195% including CLF allocation). 2. NSFR as at 31 Mar 22 excludes CLF allocation (125% including CLF allocation). 3. APRA imposed a 15% add-on to the Net Cash Outflow component of the LCR calculation, and a 1% decrease to the Available Stable Funding component of the NSFR calculation, effective from 1 Apr 21. The LCR net cash outflow add-on increased to 25% from 1 May 22. 4. ‘Harmonised’ Basel III estimates are calculated in accordance with the BCBS Basel III framework, noting that MBL is not regulated by the BCBS and so impacts shown are indicative only. 5. Includes the capital conservation buffer in the minimum CET1 ratio requirement. APRA released the final 'Prudential Standard APS 110 Capital Adequacy' on 29 Nov 21 which has a minimum requirement for the leverage ratio of 3.5% effective 1 Jan 23.
Bank Group Level 2 Ratios (Mar 22)
2
14.6%
11.5%
CET1 ratio0.0%
3.5%
7.0%
10.5%
14.0%
17.5%
5.6%
5.0%
Leverage ratio0.0%
1.5%
3.0%
4.5%
6.0%
7.5%
175%
LCR40.0%
60.0%
80.0%
100.0%
120.0%
140.0%
160.0%
180.0%
200.0%
121%
NSFR80.0%
90.0%
100.0%
110.0%
120.0%
130.0%
Bank Group (Harmonised4) Bank Group (APRA) Basel lll minimum5
12
33
Introduction Overview of Result Result Analysis and Financial Management Outlook Appendices
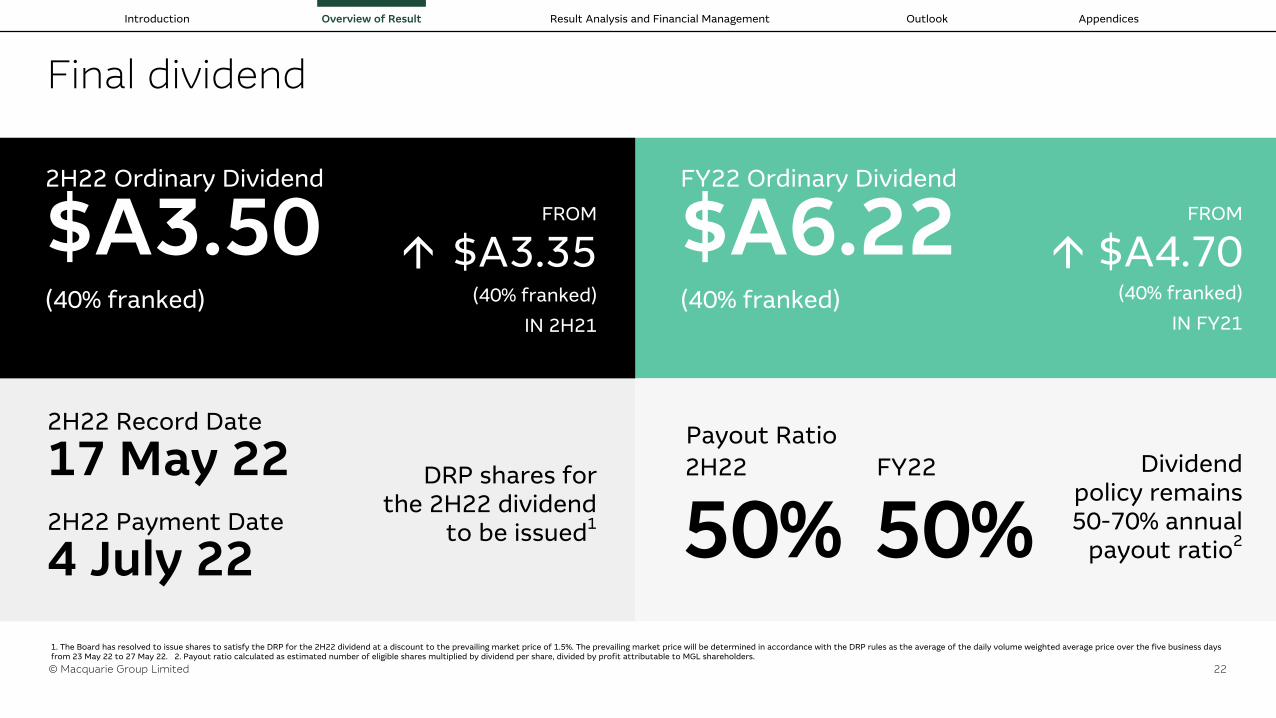
© Macquarie Group Limited 22
2H22 Record Date
17 May 222H22 Payment Date
4 July 22
FY22 Ordinary Dividend
$A6.22(40% franked)
FROM
$A4.70(40% franked)
IN FY21
Final dividend
1. The Board has resolved to issue shares to satisfy the DRP for the 2H22 dividend at a discount to the prevailing market price of 1.5%. The prevailing market price will be determined in accordance with the DRP rules as the average of the daily volume weighted average price over the five business days from 23 May 22 to 27 May 22. 2. Payout ratio calculated as estimated number of eligible shares multiplied by dividend per share, divided by profit attributable to MGL shareholders.
2H22 Ordinary Dividend
$A3.50(40% franked)
FROM
$A3.35(40% franked)
IN 2H21
2H22 FY22
50% 50%Dividend
policy remains 50-70% annual
payout ratio2
DRP shares for the 2H22 dividend
to be issued1
Payout Ratio
áá

Introduction Overview of Result Result Analysis and Financial Management Outlook Appendices
© Macquarie Group Limited 23
Board Update
As previously noted, Peter Warne will step down as Chair of the MGL and MBL Boards on 9 May 2022 and will be replaced by Glenn Stevens. Mr Warne has been Chair since April 2016 and a director of both entities since 2007.
Michael Coleman has announced his intention to retire as a Voting Director of MGL and MBL after 10 years on the Boards. Mr Coleman’s retirement will be effective at the conclusion of the 2022 AGM. As previously noted, Michelle Hinchliffe joined the Macquarie Boards effective 1 March 2022 and will replace Mr Coleman as Chair of the Board Audit Committee.
Glenn StevensPeter WarneMichelle HinchliffeMichael Coleman
As previously noted, Macquarie has been working with APRA to strengthen the voice of MBL within the Group, and making good progress on a comprehensive remediation plan in recent months, including detailed programs of work across governance, remuneration, risk culture, regulatory reporting, prudential risk management, and a simplified group structure. The changes proposed under the plan, on which we will continue to deliver through FY23 and beyond, will have a positive impact on MBL through improved systems, frameworks, processes, and further strengthen its risk culture.
As part of the governance workstream, three bank-only non-executive directors (BONDs) are proposed to be added to the MBL Board. Consistent with similar structures in other markets where a banking entity sits within a broader group structure, this change introduces additional safeguards to better protect the interests of MBL within the Group. After these appointments, the MBL Board will comprise the MGL non-executive directors, Shemara Wikramanayake, Stuart Green and the three BONDs with all MBL Board committees benefiting from BONDs representation.
Ian Saines
We are pleased to announce Ian Saines as the first MBL BOND, subject to completion of necessary approvals. Mr Saines is an experienced leader in commercial and investment banking and asset management, having held senior roles at Commonwealth Bank of Australia, Challenger, Zurich Financial Services and Bankers Trust Australia. He began his career at the Reserve Bank of Australia and has a strong background in financial markets and highly regulated environments combined with audit, risk and investment committee experience. We expect to announce further BONDs appointments in due course.

Alex HarveyChief Financial Officer
03Result Analysis and Financial Management

© Macquarie Group Limited
Introduction Overview of Result Result Analysis and Financial Management Outlook Appendices
25
Net interest and trading income of $A6,856m, up 21% on FY21• Higher commodities income mainly driven by increased risk management income with gains across the
platform, particularly from Gas and Power, Resources, Agriculture, and Global Oil in CGM • Growth in the private credit portfolio in Macquarie Capital• Growth in the average loan portfolio and average deposit volumes in BFS
Partially offset by:• lower income in Corporate due to accounting volatility from changes in the fair value of economic hedges• the impact of fair value adjustments across the derivatives portfolio in CGM
Fee and commission income of $A6,887m, up 33% on FY21 • MAM included higher base fee income primarily driven by the acquisition of Waddell & Reed and a
disposition fee from MIC• Higher mergers and acquisitions fee income and debt capital markets fee income in Macquarie Capital
Partially offset by:• lower performance fees in MAM following a strong prior year• lower equity capital markets fee and brokerage income in Macquarie Capital
Share of net profits from associates and joint ventures of $A240m, significantly up from FY21, primarily driven by increased equity accounted income from MIC and lower equity accounted losses in Macquarie AirFinance in MAM
Decrease in credit and other impairment charges of $A15m driven by the partial release of COVID-19 overlays in BFS and CGM. Credit provisioning levels remain prudent with the combined downside macroeconomic scenarios having a higher weighting than the upside scenario
Partially offset by:• a small number of underperforming equity investments in Macquarie Capital
Investment income of $A3,291m, up 63% on FY21 due to substantially higher revenue from material asset realisations in the green energy, technology and business services sectors and included realisations across all regions. Plus the gain on the partial sale of the UK Meters portfolio of assets in CGM. This was partially offset by the non-recurrence of the gain on sale of Macquarie European Rail in the prior year in MAM
Total operating expenses of $A10,785m, up 22% on FY21. The increase in operating expenses was mainly as a result of the one-off acquisition and ongoing costs related to Waddell & Reed, which had a material impact across all operating expense categories. In addition, the current year included higher employment expenses driven mainly by higher performance-related profit share expense and share-based payments as a result of the performance of the Group, wage inflation and higher average headcount
Profit attributable to non-controlling interests of $A247m was primarily driven by the share of gains on disposal attributable to non-controlling interests
Income statement key drivers2H22$Am
1H22$Am
FY22$Am
FY21 $Am
Net interest and trading income 3,824 3,032 6,856 5,677
Fee and commission income 3,435 3,452 6,887 5,176
Net operating lease income 216 186 402 466
Share of net profits/(losses) from associates and joint ventures (2) 242 240 (3)
Net credit impairment charges (74) (176) (250) (434)
Other impairment charges (205) (54) (259) (90)
Investment income 2,297 994 3,291 2,023
Other income and charges 29 128 157 (41)
Net operating income 9,520 7,804 17,324 12,774
Employment expenses (3,561) (3,164) (6,725) (5,517)
Brokerage, commission and fee expenses (531) (498) (1,029) (879)
Other operating expenses (1,624) (1,407) (3,031) (2,471)
Total operating expenses (5,716) (5,069) (10,785) (8,867)
Operating profit before tax and non-controlling interests 3,804 2,735 6,539 3,907
Income tax expense (983) (603) (1,586) (899)
(Profit)/Loss attributable to non-controlling interests (158) (89) (247) 7
Profit attributable to MGL shareholders 2,663 2,043 4,706 3,015

© Macquarie Group Limited
Introduction Overview of Result Result Analysis and Financial Management Outlook Appendices
26
Key drivers• Base fees up due to:
– Investments made by Private Markets-managed funds and positive market movements in Public Investments funds
– Partially offset by equity returns in Private Markets-managed funds
• Lower performance fees following a strong prior year. Current year includes fees from Macquarie Infrastructure Partners (MIP) III, Macquarie European Infrastructure Fund (MEIF) 4 and other Private Markets-managed funds, managed accounts and co-investors
• Lower Investment-related and other income due to non-recurrence of gains on investments in the prior year, partially offset by lower Macquarie AirFinance equity accounted losses
• Macquarie Infrastructure Corporation (MIC) income includes recognition of a disposition fee and equity accounted income
• Macquarie European Rail (MER) gain on sale in prior year
• Acquisition one-offs, driven by costs which are not expected to be repeated
Macquarie Asset ManagementIncrease driven by income related to the disposition of MIC assets and increased base fees, partially offset by gain on sale of Macquarie European Rail in prior year and lower performance fees
$Am
2,074
185
(258)
1
(18)
523
(328)
287
(316)
2,150
FY21 NPC Base fees Performancefees
Operatingexpenses
Investment-related and
other income
MIC2 MER2 (Rail) AcquisitionsOngoing3
Acquisitions One-offs3
FY22 NPC0
500
1,000
1,500
2,000
2,500
3,000
1. Investment-related income includes net income on equity, debt and other investments and share of net profits/(losses) from associates and joint ventures, credit and other impairment reversals/(charges). Other income includes net interest and trading expense, other fee and commission income, net operating lease income, other income, internal management revenue and non-controlling interests. 2. Macquarie Infrastructure Corporation and Macquarie European Rail include Investment-related and other income, which is excluded from total MAM Investment-related and other income 3. Acquisitions ongoing and one-offs (Waddell & Reed Financial, AMP Capital's public investments business and Central Park Group) include the net impact of all income and expenses excluded from the other categories.
Acquisitions (29)
26
Investment-related and
other income1
MIC2 MER2 (Rail) Acquisitions Ongoing3
Acquisitions One-offs3

© Macquarie Group Limited
Introduction Overview of Result Result Analysis and Financial Management Outlook Appendices
27
MAM AUM movementIncrease due to acquisitions of Waddell & Reed Financial, AMP Capital’s public investments business and Central Park Group as well as investments made by Private Markets-managed funds and net inflows in Public Investments
1. Net Valuation changes include net movements in unlisted valuations of portfolio assets, post distributions paid in the period, and listed share price movements. 2. Acquisitions include Waddell & Reed Financial, AMP Capital’s public investments business and Central Park Group. 3. Public Investments divestments include Jackson Square Partners and the Korea business.
$Ab
31 Mar 21 Investments Private MarketsDivestments
Net ValuationChanges1
Private MarketsFX
Acquisitions2 Net Flows MarketMovements
PublicInvestments
Divestments3
PublicInvestments FX
31 Mar 220
100
200
300
400
500
600
700
800
900
Private Markets 42.9
Public Investments 168.0
MAM 562.251.3
(16.9)
14.4
(5.9)
149.7 10.5 4.6
(4.9)
8.1 MAM 773.1
Public Investments
367.1
Private Markets
195.1
Public Investments
535.1
Private Markets
238.0
Public Investments Divestments3
Acquisitions2Net Valuation Changes1

© Macquarie Group Limited
Introduction Overview of Result Result Analysis and Financial Management Outlook Appendices
28
Banking and Financial ServicesStrong home loan and deposit growth; net credit impairment releases, partially offset by increased technology investment and higher headcount to support business growth and regulatory requirements
$Am
771
206 2681
137
(189) (31)
1,001
FY21 NPC PersonalBanking
BusinessBanking
WealthManagement
Credit & otherimpairments
Expenses Other FY22 NPC
200
400
600
800
1,000
1,200
1. Includes brokerage, commission and fee expenses.
Key drivers• Higher Personal Banking income driven by 27%
growth in average home loans volumes
• Higher Business Banking income driven by 20% growth in average business lending volumes and 21% growth in average business deposit volumes, partially offset by 20% lower average car loan volumes and lower business lending margins
• Higher Wealth income driven by 24% growth in average Platform FUA and 14% growth in average CMA volumes
• Decrease in credit and other impairment charges driven by partial release of COVID-19 overlays. Credit provisioning levels remain prudent with the combined downside macroeconomic scenarios having a higher weighting than the upside scenario
• Higher costs due to increased technology investment and higher average headcount to support business growth and to meet regulatory requirements
• Other includes equity investment related income and the bank levy
28
Personal Banking1
Business Banking1
Wealth Management1

© Macquarie Group Limited
Introduction Overview of Result Result Analysis and Financial Management Outlook Appendices
29
Banking and Financial ServicesStrong growth across home loans, deposits and funds on platform
Note: Data based on spot volumes at period end.
38.5
53.4
86.0
52.1
63.9
79.1
67.0
80.7
101.4
89.598.0
118.6
Home loans BFS deposits Funds on platforms0
20
40
60
80
100
120
8.2
15.2
9.0
13.7
10.211.511.5
8.8
Business Banking loans Car Loans0
2
4
6
8
10
12
14
16
18
31 Mar 19 31 Mar 20 31 Mar 21 31 Mar 22
$Ab $Ab

© Macquarie Group Limited
Introduction Overview of Result Result Analysis and Financial Management Outlook Appendices
30
Commodities and Global Markets Strong underlying client business which benefited from elevated levels of volatility along with partial sale of UK Meters portfolio
$Am
2,601
3,911
FY21 NPC Riskmanagement
Lending andfinancing
Inventorymanagementand trading
FinancialMarkets2
AssetFinance3
Investmentand Other
Income
Credit andOther
ImpairmentCharges
Other FY22 NPC1,500
2,000
2,500
3,000
3,500
4,000
4,500
1. Inventory management and trading increase includes Oil, Gas, Power and Metals trading and timing of income recognition on Oil and Gas storage contracts and transport agreements. 2. Financial Markets includes FX, interest rates and credit and equities. 3. Asset Finance includes net interest and trading income and net operating lease income. 4. Includes net income on equity, debt and other investments, share of net profits from associates and joint ventures, internal management revenue and other income.
Commodities $A653m
572 (22) 103195 (20)
479172 (169)
30
Investment and other income4
Financial Markets2
Asset Finance3
Inventory management and trading¹
Key drivers• Commodities up significantly on FY21
– Increased Risk Management revenue across platform particularly Gas and Power businesses, Resources, Agriculture and Global Oil driven by increased client hedging activity and trading activity as a result of elevated levels of volatility and price movements in Commodity markets, partially offset by the impact of fair value adjustments across the derivatives portfolio
– Lending and Financing down on FY21 with reduced contributions in specific sectors
– Inventory management and trading up on FY21 driven by trading gains from supply and demand imbalances particularly in North American Gas and Power partially offset by unfavourable impact of timing of income recognition on Gas storage and transport contracts
• Financial Markets up on FY21 primarily due to increased client activity in global structured foreign exchange products, growth in securitisation and credit products and improved contribution from Equity Finance
• Asset Finance down in the Technology, Media and Telecoms (TMT) sector due to a reduction in secondary income, partially offset by increased financing income from growth in Structured Lending and Shipping Finance portfolios
• Investment and other income gains primarily due to the gain on partial sale of UK Meters portfolio of assets
• Decrease in credit and other impairment charges driven by partial release of COVID-19 overlays. Credit provisioning levels remain prudent with the combined downside macroeconomic scenarios having a higher weighting than the upside scenario
• Other down on FY21 due to an increase in Operating Expenses driven by higher expenditure on technology platform and infrastructure and increasing compliance and regulatory management spend

© Macquarie Group Limited
Introduction Overview of Result Result Analysis and Financial Management Outlook Appendices
31
Commodities Financial markets and Futures
Mar 18 Mar 19 Mar 20 Mar 21 Mar 22
Majority of income derived from underlying client business
Strong underlying client business
Other Income Foreign exchange, interest rates and credit Equities derivatives and tradingBrokerage and fee income Leasing (operating and finance) income Commodity lending and financingCommodity risk management Investment income Commodity inventory management and trading
FY 18 FY 19 FY 20 FY 21 FY 22
Operating Income (excl. credit and other impairment charges)
Underlying client business1
• 40+ years of client partnerships evolving into niche activities in some markets, and scale in others
• Platform diversity drives earnings stability and de-risks the portfolio
• Dedicated specialist staff with deep sector knowledge and market insights
• Risk management is core• Industry recognition in select markets and
sectors is strong
• Client-led business with deep longstanding client relationships:
– Diverse and growing client base– Strong repeat client business with ~85% of client revenue
generated from existing relationships– Client relationships spread over a full spectrum of products
and services1. Included within Underlying client business is a relatively small (~5%) amount of FX, IR, Credit and EDT trading activity not related to clients. 2. 5-year CAGR of 5% from FY18 to FY22, Financial markets and futures client numbers will differ to previously reported numbers with the inclusion of Equity Derivatives and Trading clients and the transfer of Cash Equities to Macquarie Capital effective 1 Jun 20.
Client numbers2 (excl. Asset Finance)

© Macquarie Group Limited
Introduction Overview of Result Result Analysis and Financial Management Outlook Appendices
32
Group Daily trading profit and loss2 FY18 - FY22 ($Am)
1. Normalised for FX (31 Mar 22) and SA-CCR impacts. Numbers will not reconcile to previously disclosed regulatory capital numbers. 2. The daily profit and loss refers to results that are directly attributable to market-based activity from Macquarie's desk.
Underlying client activity driving regulatory capital and trading revenues
• Majority of capital relates to credit risk reflecting client focused business• Risk management is core: built on 50+ years of accumulated experience
in managing risk for our clients and our business
• Consistency of shape of the curves over the years – Consistent framework and approach to risk management
• Mean clusters between $A0-10m• Trading income largely derived from client franchise activities
Credit Market Operational Equity & Other
Mar 18 Mar 19 Mar 20 Mar 21 Mar 22
Regulatory capital (normalised)1
FY18 FY19 FY20 FY21 FY22
<-65
<-60
<-55
<-50
<-45
<-40
<-35
<-30
<-25
<-20
<-15
<-10 <-
5 <0 >0 >5 >10
>15
>20
>25
>30
>35
>40
>45
>50
>55
>60
>65
0102030405060708090
Days
$Am

© Macquarie Group Limited
Introduction Overview of Result Result Analysis and Financial Management Outlook Appendices
33
651
FY21 NPC Investment-relatedincome1
Fee andcommission
income
Net income onPrincipal Financedebt portfolio2
Operating expenses FY22 NPC0
500
1,000
1,500
2,000
2,500
3,000
Macquarie CapitalResult reflects higher investment-related income, higher fee and commission income and higher net income on private credit portfolio
$Am
1. Includes gains and losses from sale and revaluation of equity, debt and other investments, net interest and trading income (which represents the interest earned from debt investments and the funding costs associated with Macquarie Capital’s balance sheet positions), share of net losses from associates and joint ventures, credit and other impairments, other income/(expenses), internal management revenue and non-controlling interests and excludes net income on the private credit portfolio. 2. Represents the interest earned, net of associated funding costs and credit impairments on the private credit portfolio. 3. FY22 NPC Includes approximately $A850m from GIG.
Investment-related income1
33
Key drivers
• Higher investment-related income primarily driven by:– Substantially higher revenue from material asset
realisations in the green energy, technology and business services sectors and included realisations across all regions
Partially offset by:– Higher impairment charges due to a small number of
underperforming equity investments
• Higher fee and commission income due to higher mergers and acquisitions fee income and debt capital markets fee income, partially offset by lower equity capital markets fee income and brokerage income, which were down on a strong prior year– Mergers and acquisitions fee income increased across
all major regions due to improved market conditions, and was up 90% compared to the prior year
– Debt capital markets fee income was significantly up compared to the prior year
– Fee and commission income was the highest on record, driven by record levels of mergers and acquisitions fee income in ANZ and the Americas
– Fee income in the current year was significantly up across the Education Services, Gaming, Healthcare Services, Critical Minerals, FinTech and Aerospace & Defence sectors
• Higher net income on the private credit portfolio which more than doubled throughout the current year
• Lower operating expenses predominantly driven by lower employment costs
GIG3
Net income on private credit
portfolio2
2,400
899
506
302 42

© Macquarie Group Limited
Introduction Overview of Result Result Analysis and Financial Management Outlook Appendices
34
Macquarie Capital Movement in capital
Debt Conventional Energy Infrastructure Green Energy Technology Real estate Other
31 Mar 21 Investments Realisations 31 Mar 220.0
1.0
2.0
3.0
4.0
5.0
6.0
7.0
$A3.9b
$A2.5b ($A1.5b)
$A4.9b
$Ab
Green Energy1
Note: Impact of foreign exchange immaterial to year ended 31 Mar 22. 1. Green Energy represents GIG.

© Macquarie Group Limited
Introduction Overview of Result Result Analysis and Financial Management Outlook Appendices
35
Total compliance spend1 $A785m in FY22, up 22% on FY21
Costs of compliance
Regulatory project spendFY22$Am
FY21$Am
IBOR Reforms 13 18
Brexit 1 16
OTC Reforms 5 6
Access Management 10 4
Capital and Liquidity Projects 13 12
CGM Transaction Reporting & Data related Projects 14 12
Enterprise Data Management 35 20
Regulatory Remediation Plan 42 0
Other Regulatory Projects 126 108
Total 259 197
Business as usual compliance spendFY22$Am
FY21$Am
National Consumer Credit Protection (NCCP) 7 7
Business Resilience 7 8
Privacy & Data Management 16 15
Regulator Levies 20 18
Regulatory Capital Management 40 30
Tax compliance and reporting 45 45
Financial & Regulatory reporting and compliance 113 93
Risk oversight 191 160Other regulatory compliance activities 87 72Total 526 449Total compliance spend 785 646
• The industry continues to see an increase in regulatory initiatives, resulting in increased compliance requirements across all levels of the organisation
• Direct cost of compliance is approx. $A785m in FY22 (excluding indirect costs), up 22% on FY21
• Regulatory project spends increased 31% from FY21 as a result of number of Technology projects and includes Regulatory Remediation Plan for the first time
• Business as usual (BAU) spend increased 17% from FY21 driven by regulatory projects being completed and moved to BAU functions, increased global regulations and continued focus of management on a range of compliance activities
404 435496
545
646
785
BAU compliance spend Regulatory project spend
FY17 FY18 FY19 FY20 FY21 FY220
100
200
300400
500
600
700800
$Am
1. Excluding indirect costs.
+14%CAGR

© Macquarie Group Limited
Introduction Overview of Result Result Analysis and Financial Management Outlook Appendices
36
Balance sheet highlights
• Balance sheet remains solid and conservative
– Term assets covered by term funding, stable deposits, hybrids and equity
– Short-term wholesale funding covered by cash, liquids and other short-term assets• Total customer deposits1 continuing to grow, up 21% to $A101.5b as at Mar 22 from $A84.0b as at Mar 21
• $A2.8b of equity capital raised through institutional placement and SPP during FY22
• $A48.3b2 of term funding raised during FY22:
– $A21.7b of term wholesale issued paper comprising of $A20.9b of senior unsecured debt and $A0.8b of subordinated unsecured debt
– $A9.5b draw down of the RBA Term Funding Facility (TFF)3
– $A6.8b of PUMA RMBS securitisation issuance
– $A6.6b of syndicated unsecured loan facilities
– $A3.0b refinance of secured trade finance facilities; and
– $A0.7b of BCN3 Hybrid instrument issuance
1. Total customer deposits as per the funded balance sheet ($A101.5b) differs from total deposits as per the statutory balance sheet ($A101.7b). The funded balance sheet reclassifies certain balances to other funded balance sheet categories. 2. Issuances cover a range of tenors, currencies and product types and are AUD equivalent based on FX rates at the time of issuance. Includes refinancing of loan facilities. 3. $A9.5b of Supplementary and Additional Allowance drawn in Jun 21. $A1.7b of Initial Allowance was drawn in Sep 20.

© Macquarie Group Limited
Introduction Overview of Result Result Analysis and Financial Management Outlook Appendices
37
<1yr 1-2yrs 2-3yrs 3-4yrs 4-5yrs >5yrs
>5yrs 48%
Securitisations >1yr 9%
1-2yrs 9%
2-3yrs 17%
3-4yrs 12%
4-5yrs 5%
Term funding as at 31 Mar 22 – diversified by currency1, tenor2 and type
Currency
1. Equity has been allocated to the AUD currency category. 2. Securitisations have been presented on a behavioural basis and represent funding expected to mature in >1yr. 3. Issuances include refinancing of loan facilities and are converted to AUD at the 31 Mar 22 spot rate. 4. Includes RBA TFF. 5. Maturities are shown as at 31 Mar 22. 6. WAM represents weighted average term to maturity of term funding maturing beyond one year excluding equity and securitisations.
Tenor Type
Diversified issuance strategy
Term Issuance and Maturity ProfileMar 22: Weighted average maturity 5.1 years$Ab
5.1 years WAM6
of Term funding excluding TFF (4.7 years including TFF)
AUD 54%
USD 36%
EUR 5% GBP 3%CHF 1%
OTH 1%
FY18 FY19 FY20 FY21 FY220.0
10.020.030.040.050.060.0
Equity andhybrids 30%
Private placement 4%
Secured funding 11%
Senior unsecured35%
Subordinated debt 4%Syndicated loan facilities 8%
PUMA RMBS 8%
Issuances3 Maturities5
Unsecured debt Secured facilities Subordinated debt Equity and hybrids
4
4

© Macquarie Group Limited
Introduction Overview of Result Result Analysis and Financial Management Outlook Appendices
38
Continued customer deposit growthMacquarie has seen continued success in its long-term strategy of diversifying funding sources by growing its deposit base
Note: Total customer deposits include total BFS deposits of $A98.0b and $A3.5b of Corporate/Wholesale deposits as at Mar 22.
39.7 43.647.8 48.1
56.0
67.1
84.0
101.5
Mar 15 Mar 16 Mar 17 Mar 18 Mar 19 Mar 20 Mar 21 Mar 220.0
10.0
20.0
30.040.0
50.0
60.0
70.080.0
90.0
100.0110.0
• Of approximately 1.7 million BFS clients, ~880,000 are depositors
• Focus on the quality and diversification of the deposit base• CMA deposits of $A38.9b, up 23% on Mar 21
$Ab

© Macquarie Group Limited
Introduction Overview of Result Result Analysis and Financial Management Outlook Appendices
39
Loan and lease portfolios1 – funded balance sheet
Operating Group Category
Mar 222 $Ab
Mar 212 $Ab Description
BFS
Home loans 89.9 66.9 Secured by residential propertyBusiness banking 11.8 10.5 Loan portfolio secured largely by working capital, business cash flows and real propertyCar loans 8.7 11.3 Secured by motor vehiclesTotal BFS3 110.4 88.7
CGM
Loans and finance lease assets 3.3 3.9 Operating lease assets 1.9 1.8
Asset finance 5.2 5.7 Predominantly secured by underlying financed assets Loan assets 2.7 2.1 Operating lease assets 0.7 —
Resources and commodities 3.4 2.1 Diversified loan portfolio primarily to the resources sector that are secured by the underlying assets with associated price hedging to mitigate risk
Foreign exchange, interest rate and credit 6.5 4.1 Diversified lending predominantly consisting of loans which are secured by other loan collateral, assets including rights and receivables and warehoused security from mortgages and auto loans
Other 0.3 — Equity collateralised loansTotal CGM 15.4 11.9
MAMOperating lease assets 0.9 0.8 Secured by underlying financed assets including transportation assetsTotal MAM 0.9 0.8
MacCapCorporate and other lending 11.9 6.0 Diversified corporate and real estate lending portfolio, predominantly consisting of loans which
are senior, secured, covenanted and with a hold to maturity horizon
Total MacCap 11.9 6.0
Total loan and lease assets per funded balance sheet4 138.6 107.4
1. Loan assets per the statutory balance sheet of $A134.7b at 31 Mar 22 ($A105.0b at 31 Mar 21) are adjusted to include fundable assets not classified as loans on a statutory basis (e.g. assets subject to operating leases which are recorded in Property, Plant and Equipment in the statutory balance sheet). 2. There has been a change in presentation of certain items on the funded balance sheet in the current year. Comparatives have been restated to reflect this change. Refer slide 59 for more details. 3. Per the funded balance sheet, figures for home loans of $A89.9b, business banking of $A11.8b and car loans of $A8.7b differ from the figures disclosed on slide 15 of $A89.5b, $A11.5b and $A8.8b respectively. The balances on slide 15 excludes capitalised costs, provisions, deferred income, accrued interest, establishment fees and credit cards business. 4. Total loan assets per funded balance sheet includes self-securitised assets.

© Macquarie Group Limited
Introduction Overview of Result Result Analysis and Financial Management Outlook Appendices
40
Equity investments of $A8.3b1
CategoryCarrying value
Mar 22 $AbCarrying value
Mar 21 $Ab Description
Macquarie Asset Management Private Markets-managed funds 1.5 1.5
Includes Macquarie Real Estate Partners Fund, Macquarie Korea Infrastructure Fund, Macquarie Super Core Infrastructure Fund, MIC
Investments acquired to seed new Private Markets-managed products and mandates 0.3 —
Other Macquarie-managed funds 0.3 0.3 Includes MAM Public Investments funds as well as investments that hedge directors’ profit share plan liabilities
Transport, industrial and infrastructure 1.4 1.4 Over 35 separate investments
Telecommunications, IT, media and entertainment 1.2 1.2 Over 45 separate investments
Green energy 1.6 1.3 Over 65 separate investments
Conventional energy, resources and commodities 0.5 0.4 Over 40 separate investments
Real estate investment, property and funds management 1.1 1.0 Over 15 separate investments
Finance, wealth management and exchanges 0.4 0.6 Includes investments in fund managers, investment companies, securities exchanges and other corporations in the financial services industry
Total equity investments 8.3 7.7
1. Equity investments have been revised to include subsidiaries and certain other assets held for investment purposes. Equity investments per the statutory balance sheet of $A6.4b (Mar 21: $A5.7b) have been adjusted to reflect the total net exposure to Macquarie. Total funded equity investments of $A6.3b as at Mar 22 (Mar 21: $A5.7b). Equity investments includes Total interests in associates and joint ventures as per Note 14 of the Financial Report, and interests in associates classified as held for sale.

© Macquarie Group Limited
Introduction Overview of Result Result Analysis and Financial Management Outlook Appendices
41
1. These changes include APS 110, APS 111, APS 112, APS 113, APS 115, APS 116, APS 117, APS 180, APS 220, APS 222. A 12-month period of transition to 1 Jan 23 in relation to APS 222 was granted by APRA on 25 Nov 21. 2. ‘APRA releases updated timelines on the revisions to market risk standards’; 27 Oct 21. 3. ‘APRA finalises new bank capital framework designed to strengthen financial system resilience’; 29 Nov 21. 4. This estimate includes the impact of finalised standards for APS 110, 112, 113 and 115. Assumes a default level Australian CCyB of 1.0%, which combined with the increase in the CCB of 1.25% gives rise to an increase in the regulatory minimum of 1.78% based on Macquarie’s business and geographic mix as at 30 Sep 21. Also, assumes a weighted average mortgage LGD of 15% (mid-point between the existing 20% floor and post-reform 10% floor). LGDs may be more or less than 15% and will be subject to APRA approval with each +/-1% change in the weighted average LGD expected to have a +/- ~$A0.12b impact on the capital surplus. 5. CPS 190 – Financial Contingency Planning and CPS 900 – Resolution Planning, outlined in ‘APRA moves to strengthen crisis preparedness in banking, insurance and superannuation’; 2 Dec 21. 6. ‘APRA releases discussion paper on post-implementation review of Basel III liquidity reforms’; 3 Mar 22. 7. ‘APRA releases final remuneration standard’; 27 Aug 21.
AustraliaUpdate on prudential standardsAPRA has finalised or is in the process of implementing changes to a number of prudential standards1. Macquarie notes the following key updates:
• On 27 Oct 21, APRA provided an update on the extended timelines for revisions and implementation of market risk prudential standards including APS 117 from 1 Jan 23 to 1 Jan 24; implementation of the Basel Committee on Banking Supervision’s fundamental review of the trading book (“FRTB”) through a revised APS 116 and an updated Credit Valuation Adjustment risk framework through a revised APS 180 will be conducted in parallel, with a planned effective date of 1 Jan 25 (previously 1 Jan 24)2.
• On 29 Nov 21, APRA finalised its new bank capital framework, and will continue to consult with the industry on certain areas prior to the 1 Jan 23 implementation date3. Based on current information available, the estimated pro forma impact on MGL’s capital surplus above regulatory minimums as at 30 Sep 21 is a reduction of ~$A2.2b4, largely on account of the increases to regulatory capital buffers. MGL’s capital surplus has included a provision for these regulatory changes for some time.
• On 2 Dec 21, APRA commenced consultation on two new prudential standards to strengthen the preparedness of APRA-regulated entities to respond to future financial crises5. The consultation period closed on 29 Apr 22, with a proposed effective date of 1 Jan 24.
• On 3 Mar 22, APRA commenced a consultation on the post-implementation review of Basel III liquidity reforms focusing on the core measures of the Liquidity Coverage Ratio (“LCR”) and Net Stable Funding Ratio (“NSFR”). The consultation period ended on 14 Apr 226. The review explores the impact of the measures, and determines whether a net benefit has been achieved in implementation. APRA will use outcomes of the analysis to inform a broader review of APRA’s liquidity requirements, scheduled for 2023.
• APRA’s Prudential Standard Remuneration (“CPS 511”) will come into effect for Macquarie on 1 Jan 237. Work is underway to implement changes required to Macquarie’s remuneration framework and we maintain regular dialogue with APRA on this topic. The Board undertook a review of the various components of remuneration to address certain aspects of CPS 511 (including the deferral arrangements for senior executives), as well as the evolving expectations of our stakeholders. As part of this review, the Board considered diverse perspectives, including those of shareholders and regulators, as well as global peer group benchmarking and increased global competition for talent in many of Macquarie’s areas of activity. These changes will be implemented in a phased approach from FY22. Full details are disclosed in the Remuneration Report.
Germany• Macquarie continues to respond to requests for information about its historical activities as part of the ongoing, industry-wide investigation in Germany relating to dividend trading. As previously
noted, in total, the German authorities have designated as suspects approximately 100 current and former Macquarie staff, most of whom are no longer at Macquarie. There are also a number of German civil claims relating to dividend trading. While Macquarie disputes any such claims, it continues to provide for these and other German dividend trading matters.
Regulatory update

© Macquarie Group Limited
Introduction Overview of Result Result Analysis and Financial Management Outlook Appendices
42
14.8%
11.7%
1.3%0.4%
11.5%
3.1%
14.6%
HarmonisedBasel III at Sep 21
APRA Basel III'super equivalence'
APRA Basel IIIat Sep 21
2H22 P&L Business capitalrequirements
Capital Injection APRA Basel IIIat Mar 22
APRA Basel III'super equivalence'
HarmonisedBasel III at Mar 22
0.0%
2.0%
4.0%
6.0%
8.0%
10.0%
12.0%
14.0%
Bank Group Basel III Common Equity Tier 1 (CET1) Ratio• APRA Basel III Level 2 CET1 ratio: 11.5%1
• Harmonised Basel III Level 2 CET1 ratio: 14.6%2
1. Basel III applies only to the Bank Group and not the Non-Bank Group. APRA Basel III Tier 1 ratio at Mar 22: 13.2%. 2. ‘Harmonised’ Basel III estimates are calculated in accordance with the BCBS Basel III framework, noting that MBL is not regulated by the BCBS and so impacts shown are indicative only. Harmonised Basel III Tier 1 ratio at Mar 22: 16.5%. 3. Based on materiality, the countercyclical capital buffer (CCyB) of ~1bps has not been included. The individual CCyB varies by jurisdiction and the Bank Group’s CCyB is calculated as a weighted average based on exposures in different jurisdictions. 4. Includes $A0.5b capital injection from MGL on 30 Dec 21, as well as movements in the foreign currency translation reserve and other movements. 5. APRA Basel III ‘super-equivalence’ includes the impact of changes in capital requirements in areas where APRA differs from the BCBS Basel III framework, including: the treatment of mortgages 1.6%; capitalised expenses 0.5%; equity investments 0.3%; investment into deconsolidated subsidiaries 0.1%; and DTAs 0.5%; IRRBB 0.1%.
Bank Group Level 2 Common Equity Tier 1 Ratio: Basel III (Mar 22)
Basel III minimum CET1 (4.5%)
CCB (2.5%)3
5
(3.1%)(1.9%)
APRA Basel III ‘super equivalence’5
Capital Injection4

© Macquarie Group Limited
Introduction Overview of Result Result Analysis and Financial Management Outlook Appendices
43
174% 179% 175%
Mar 21 Qtr Sep 21 Qtr Mar 22 Qtr0%
50%
100%
150%
200%
• 175% average LCR for Mar 22 quarter, based on daily observations1
– Maintained well above regulatory minimum
– Excludes CLF allocation2
• Reflects longstanding conservative approach to liquidity management
• $A64.9b of unencumbered liquid assets and cash on average over the quarter to Mar 22 (post applicable haircuts)
MBL LCR position1,3
1. APRA imposed a 15% add-on to the net cash outflow component of Macquarie Bank’s LCR calculation effective from 1 Apr 21. This add-on increased to 25% from 1 May 22. 2. LCR average for Mar 22 quarter excludes CLF allocation which reduced from $A9.7b to $A7.3b on 1 Jan 22 in line with APRA’s quarterly phase down timeline (195% including CLF allocation). 3. Represents quarterly average balances. 4. In addition to the portfolio in MBL, unencumbered liquid assets are also maintained in other Macquarie entities such as Macquarie Bank Europe and Macquarie Financial Holdings Pty Ltd. 5. Mar 21 quarter includes TFF allocation. 6. Mar 21 quarter includes CLF and TFF allocations, Sept 21 quarter includes CLF allocation.
Strong liquidity position maintained
$A40.6b
$A52.3b
$A64.9b
25.437.1
51.84.1
6.1
5.8
11.1
9.1
7.3
HQLA Available cash CLF
Mar 21 Qtr Sep 21 Qtr Mar 22 Qtr0
10
20
30
40
50
60
70
MBL Unencumbered Liquid Asset Portfolio3,4
$Ab
Basel lll minimum
6 6 2
5

© Macquarie Group Limited
Introduction Overview of Result Result Analysis and Financial Management Outlook Appendices
44
Capital Raising• Macquarie raised $A2.8b of ordinary share capital through a non-underwritten $A1.5b institutional placement and $A1.3b from a Share Purchase Plan (SPP)
– On 4 Nov 21, Macquarie issued approximately 7.7 million new fully paid ordinary shares in respect of the institutional placement, raising $A1.5b of ordinary equity at a price of $A194 per new share
– On 3 Dec 21, Macquarie issued approximately 6.7 million new fully paid ordinary shares in respect of the SPP, raising $A1.3b of ordinary equity at $A191.28 per new share1
• The capital raised provides additional flexibility to invest in new opportunities where the expected risk-adjusted returns are attractive, while maintaining an appropriate capital surplus.
• On 14 Dec 21, 407,884 ordinary shares were issued and allocated at $A204.28 per share2 under the DRP for a total issuance of $A83m.
Macquarie Group Employee Retained Equity Plan (MEREP) • The Board has resolved to purchase shares3 to satisfy the FY22 MEREP requirements of approximately $A870m. The buying period for MEREP will commence on 16
May 22 and is expected to be completed by 30 Jun 224
• MQG shares sold by staff between 16 May 22 and 10 Jun 225 are expected to be acquired by the MEREP Trustee to meet the MEREP buying requirements• Shares sold by staff during this window are to be acquired off-market at the daily Volume Weighted Average Price (VWAP)6, reducing the number of shares acquired
on-market to meet the MEREP requirements.
Dividend Reinvestment Plan• The Board has resolved to issue shares to satisfy the DRP for the 2H22 dividend at a discount to the prevailing market price7 of 1.5%
Other• Macquarie notes that with the introduction of Design and Distribution Obligation legislation in Oct 21, any future hybrid offers8 are expected to be limited to clients
of brokers who are either wholesale clients or retail clients who have received personal advice from a licensed financial adviser. While Macquarie is not currently considering making a hybrid offer, Macquarie security holders who are interested in participating in future hybrid offers should speak to a broker or financial adviser noting not all brokers and financial advisers will have access to future offers.
Capital management update
1. The same price that was paid by institutional investors under the institutional placement adjusted for the 1H22 dividend. 2. The DRP price was determined in accordance with the DRP Rules, being the arithmetic average of the daily volume-weighted average price of all Macquarie Group shares sold through a normal trade on the ASX automated trading system of the 5 trading days from 15 Nov 21 to 19 Nov 21 inclusive with no discount. 3. Shares may be purchased on-market and off-market. Shares will be issued if purchasing becomes impractical or inadvisable. 4. Actual buying may be completed sooner or later. On-market buying for the MEREP will be suspended during the DRP pricing period (23 May 22 to 27 May 22). 5. This date is subject to change. 6. Trades will be crossed off-market by Macquarie Securities (Australia) Limited and reported to ASX and Chi-X accordingly. 7. Determined in accordance with the DRP rules as the average of the daily volume weighted average price over the five business days from 23 May 22 to 27 May 22. 8. Includes various Macquarie Capital Notes and Macquarie Bank Capital Notes.
Note: Combined previous footnotes 3 and 4 as one - renumbered rest
accordingly

Shemara WikramanayakeManaging Director and Chief Executive Officer
04Outlook

© Macquarie Group Limited
Introduction Overview of Result Result Analysis and Financial Management Outlook Appendices
46
Short-term outlook
Annuity-style businesses Markets-facing businesses
Factors impacting short-term outlook
1. Net Other Operating Income includes all operating income excluding base fees. 2. Certain assets of the Credit Markets business and certain activities of the Commodity Markets and Finance business, and some other less financially significant activities are undertaken from within the Non-Banking Group.
Non-Banking Group
Macquarie Asset Management (MAM)• Base fees expected to be up, driven by raising and deployment in Private Markets and the
impact of recent Public Investments acquisitions • Net Other Operating Income1 expected to be down due to non repeat of MIC gains partially
offset by higher performance fees• Green Investment Group expected to be significantly down due to strong FY22 performance
Macquarie Capital (MacCap) Subject to market conditions:• Transaction activity is expected to be down on a record FY22 • Solid pipeline of investment realisations • Continued balance sheet deployment in both debt and equity investments
Effective 1 Apr 22 Green Investment Group transferred to operate as part of Macquarie Asset Management
Banking Group
Banking and Financial Services (BFS)• Ongoing momentum in loan portfolio and platform volumes and deposits growth• Market dynamics to continue to drive margin pressure• Ongoing monitoring of provisioning • Higher expenses to support volume growth, technology investment and
regulatory requirements
Corporate
• Compensation ratio expected to be within the range of historical levels • The FY23 effective tax rate is expected to be within the range of recent historical outcomes
Commodities and Global Markets2 (CGM)• Commodities income is expected to be significantly down following a strong FY22, albeit
volatility may create opportunities• Consistent contribution from client and trading activity across the financial
markets platform• Continued contribution from Asset Finance across sectors (excluding FY22 gain on
disposal of certain assets)

© Macquarie Group Limited
Introduction Overview of Result Result Analysis and Financial Management Outlook Appendices
47
Short-term outlookThe range of factors that may influence our short-term outlook include:
• Market conditions including: significant volatility events, global inflation and interest rates, and the impact of geopolitical events
• Potential tax or regulatory changes and tax uncertainties
• Completion of period-end reviews and the completion rate of transactions
• The geographic composition of income and the impact of foreign exchange
We continue to maintain a cautious stance, with a conservative approach to capital, funding and liquidity that positions us well to respond to the current environment

© Macquarie Group Limited
Introduction Overview of Result Result Analysis and Financial Management Outlook Appendices
48
Medium-term outlookMacquarie remains well-positioned to deliver superior performance in the medium term
Deep expertise in major markets
Build on our strength in business and geographic diversity and continue to adapt our portfolio mix to changing market conditions
• Annuity-style income is primarily provided by two Operating Groups’ businesses which are delivering superior returns following years of investment and acquisitions
– Macquarie Asset Management and Banking and Financial Services
• Two markets-facing businesses well positioned to benefit from improvements in market conditions with strong platforms and franchise positions
– Commodities and Global Markets and Macquarie Capital
Ongoing program to identify cost saving initiatives and efficiency
Ongoing technology spend across the group
Strong and conservative balance sheet
• Well-matched funding profile with short-term wholesale funding covered by short-term assets and cash and liquid assets
• Surplus funding and capital available to support growth
Proven risk management framework and culture

© Macquarie Group Limited
Introduction Overview of Result Result Analysis and Financial Management Outlook Appendices
49
Medium term
Annuity-style businesses Markets-facing businesses
Non-Banking Group
Macquarie Asset Management (MAM)▪ Global specialist asset manager, well-positioned to respond to current market conditions and
grow assets under management through its diversified product offering, track record and experienced investment teams
• Commitment to achieving net zero emissions across the investment portfolio by 2040; integration of Green Investment Group to provide strong momentum as the low carbon transition accelerates
Macquarie Capital (MacCap) • Opportunities for balance sheet investment alongside clients and project development in the
infrastructure space • Continues to tailor the business offering to current opportunities and market conditions
including providing flexible capital solutions across sectors and regions• Positioned to respond to market facing transaction activity
Banking Group
Banking and Financial Services (BFS)• Growth opportunities through intermediary and direct retail client distribution, platforms and
client service• Opportunities to increase financial services engagement with existing business banking clients
and extend into adjacent segments• Modernising technology to improve client experience and support growth
Commodities and Global Markets1 (CGM)• Opportunities to grow the commodities business, both organically and through acquisition• Development of institutional and corporate coverage for specialised credit, rates and foreign
exchange products• Tailored financing solutions globally across a variety of industries and asset classes• Continued investment in the asset finance portfolio• Supporting the client franchise as markets evolve, particularly as it relates to the
energy transition• Growing the client base across all regions
1. Certain assets of the Credit Markets business and certain activities of the Commodity Markets and Finance business and some other less financially significant activities are undertaken from within the Non-Banking Group.

© Macquarie Group Limited
Introduction Overview of Result Result Analysis and Financial Management Outlook Appendices
50
Approximate business Basel III Capital and ROE
Operating Group APRA Basel III Capital1 @ 8.5% ($Ab)
Approx. FY22 Return on Ordinary Equity2
Approx. 16-year Average Return on Ordinary Equity3
Annuity-style businesses 8.5
Macquarie Asset Management 3.521% 22%
Banking and Financial Services 5.0
Markets-facing businesses 12.8
Commodities and Global Markets 7.930% 16%
Macquarie Capital 4.9
Corporate 1.6
Total regulatory capital requirement @ 8.5% 22.9
Group surplus 10.7
Total APRA Basel III capital supply 33.6 18.7% 14%
Note: Differences in totals due to rounding. 1. Operating Group capital allocations are based on 31 Dec 21 allocations adjusted for material movements over the Mar 22 quarter. 2. NPAT used in the calculation of approximate FY22 ROE is based on Operating Groups’ net profit contribution adjusted for indicative allocations of profit share, tax and other corporate items. Accounting equity is attributed to businesses based on quarterly average allocated ordinary equity. 3. 16-year average covers FY07 to FY22, inclusive, and has not been adjusted for the impact of business restructures or changes in internal P&L and capital attribution. 4. Comprising of $A28.7b of ordinary equity and $A4.9b of hybrids.
31 Mar 22
4
Final 29/04
Draft 28/04

Presentation to investors and analysts
Result announcement for the full year ended 31 March 2022
6 May 2022

Detailed Result Commentary
05Appendix A

© Macquarie Group Limited
Introduction Overview of Result Result Analysis and Financial Management Outlook Appendices
53
• Base fees of $A2,771m, up on FY21 primarily driven by– Acquisition of Waddell & Reed in the current year– Investments by Private Markets–managed funds and mandates and Public Investments
market movements– Partially offset by foreign exchange movements and asset realisations in Private Markets-
managed funds
• Performance fees of $A394m, down on FY21 – FY22 included performance fees from a range of funds including MIP III, MEIF4, and other
Private Market-managed funds, managed accounts and co-investors– FY21 included performance fees from MIP II, MIP III, MEIF4, Macquarie Super Core
Infrastructure Fund (MSCIF) and other Private Market-managed funds, managed accounts and co-investors
• Net operating lease income of $A63m, down on FY21, driven by the sale of the Macquarie European Rail in the prior year and foreign exchange movements
• Investment-related and other income of $A1,144m, up on FY21 primarily driven by– Gain on MIC, including disposition fee and equity accounted income– Waddell & Reed acquisition in FY22– Lower equity accounted losses in Macquarie AirFinance – Partially offset by gain on sale of Macquarie European Rail in FY21
• Credit and other impairment net reversal of $A112m included a reversal of the impairment previously recognised on MAM’s investment in MIC
• Total operating expenses of $A2,329m, up on FY21 primarily driven by one-off acquisition and ongoing costs related to Waddell & Reed
• Headcount of 2,399, up on FY21, primarily driven by the acquisition of Waddell & Reed, AMP and CPG
Macquarie Asset Management
FY22 $Am
FY21 $Am
Base fees 2,771 1,985
Performance fees 394 653
Net operating lease income 63 79
Investment-related and other income1 1,144 752
Credit and other impairment reversal 112 85
Net operating income 4,484 3,554
Brokerage, commission and fee expenses (431) (249)
Other operating expenses (1,898) (1,225)
Total operating expenses (2,329) (1,474)
Non-controlling interests (5) (6)
Net profit contribution 2,150 2,074
AUM ($Ab) 773.1 562.2
Private Markets EUM ($Ab) 158.3 142.0
Headcount 2,399 1,921
Result
1. Investment-related income includes net income on equity, debt and other investments and share of net (losses)/profits from associates and joint ventures. Other income includes other fee and commission income, net interest and trading expense, other income and internal management revenue.

© Macquarie Group Limited
Introduction Overview of Result Result Analysis and Financial Management Outlook Appendices
54
• Net interest and trading income of $A1,972m, up 13% on FY21– 23% growth in the average loan portfolio and 19% growth in the average BFS
deposit volumes
• Fee and commission income of $A457m, up 9% on FY21 – 24% growth in average platform FUA growth resulting in higher administration and
adviser fees• Decrease in credit and other impairment charges driven by partial release of COVID-19
overlays. Credit provisioning levels remain prudent with the combined downside macroeconomic scenarios having a higher weighting than the upside scenario
• Other income down due to revaluation of an equity investment in the prior year
• Total operating expenses of $A1,460m, up 12% on FY21– higher total operating expenses driven by higher average headcount, investment in
technology and digitisation to support business growth and to meet regulatory requirements
– partially offset by lower brokerage, commission and fee expenses largely due to the cessation of grandfathered commission payments to third party advisors in line with legislation. A corresponding benefit, passed on to customers, is reflected in Net interest and trading income
Banking and Financial Services
FY22 $Am
FY21 $Am
Net interest and trading income1 1,972 1,746
Fee and commission income 457 419
Wealth management fee income 304 274
Banking and lending fee income 153 145
Credit and other impairment reversals/(charges) 22 (115)
Other income2 10 28
Net operating income 2,461 2,078
Total operating expenses (1,460) (1,307)
Net profit contribution 1,001 771
Funds on platform ($Ab) 118.6 101.4
Loan portfolio3 ($Ab) 110.2 89.1
BFS Deposits4 ($Ab) 98.0 80.7
Headcount 3,359 2,986
Result
1. Includes net internal transfer pricing on funding between Group Treasury and BFS that is eliminated on consolidation in the Group’s statutory P&L. 2. Includes share of net (losses) from associates and joint ventures, internal management revenue and other income. 3. Loan portfolio comprises home loans, loans to businesses, car loans and credit cards. 4. BFS deposits include home loan offset accounts and exclude corporate/wholesale deposits.

© Macquarie Group Limited
Introduction Overview of Result Result Analysis and Financial Management Outlook Appendices
55
Commodities and Global Markets
FY22 $Am
FY21$Am
Commodities 3,324 2,671
Risk management 2,033 1,461
Lending and financing 212 234
Inventory management and trading 1,079 976
Foreign exchange, interest rates and credit 888 748
Equities 394 339
Asset Finance 126 98
Net interest and trading income1 4,732 3,856 Fee and commission income 507 485
Net operating lease income2 335 383
Investment and other income3 670 191
Credit and other impairment charges (65) (237)
Net operating income 6,179 4,678
Brokerage, commission and fee expenses (389) (388)
Other operating expenses (1,879) (1,689)
Total operating expenses (2,268) (2,077)
Net profit contribution 3,911 2,601
Headcount 2,179 2,133
Result
1. Includes internal net interest expense and transfer pricing on funding provided by Group Treasury that is eliminated on consolidation in the Group’s statutory P&L. 2. Generated from Asset Finance. 3. Includes net income on equity, debt and other investments, share of net profits from associates and joint ventures, internal management revenue and other income.
• Commodities income of $A3,324m, up 24% on FY21; – Risk management up 39% on a strong FY21 with gains across the platform, particularly in Gas and
Power, Resources, Agriculture and Global Oil driven by increased client hedging activity and trading activity due to elevated levels of volatility and price movements in commodity markets partially offset by the impact of fair value adjustments across the derivatives portfolio.
– Lending and financing down 9% on FY21 with reduced contributions in specific sectors. – Inventory management and trading up 11% on FY21 driven by trading gains from supply and demand
imbalances in North American Gas and Power partially offset by unfavourable impact of timing of income recognition on Gas storage and transport contracts.
• Foreign exchange, interest rates and credit income of $A888m, up 19% on FY21 due to increased client activity in global structured foreign exchange products and growth in securitisation and credit products.
• Equities income of $A394m, up 16% on FY21 due to an improved performance in equity finance. In addition, there was a strong contribution from trading activities.
• Asset Finance interest and trading income of $A126m, up 29% on FY21 due to net proceeds from end of lease asset sales and increased earnings from Structured Lending and Shipping Finance portfolios.
• Fee and commission income of $A507m, up 5% on FY21 primarily due to an increase in Futures client activity driven by volatility across commodity markets.
• Net operating lease income of $A335m, down 13% on FY21 due to a reduction in secondary income in Technology, Media and Telecoms and the impact of the partial sale of the UK Meters portfolio of assets, partially offset by an increase in income from other areas of the Macquarie Energy, Resources & Sustainability portfolio.
• Investment and other income of $A670m, up significantly on FY21 largely driven by the gain on partial sale of the UK Meters portfolio of assets.
• Decrease in credit and other impairment charges driven by partial release of COVID-19 overlays. Credit provisioning levels remain prudent with the combined downside macroeconomic scenarios having a higher weighting than the upside scenario
• Brokerage, commission and fee expenses of $A389m, in line with the prior year.
• Other operating expenses of $A1,879m, up 11% on FY21 driven by higher expenditure on technology platform and infrastructure and increasing compliance and regulatory management spend.

© Macquarie Group Limited
Introduction Overview of Result Result Analysis and Financial Management Outlook Appendices
56
Macquarie Capital
FY22 $Am
FY21 $Am
Net interest and trading income1 327 69
Fee and commission income 1,893 1,387
Investment-related income2 (ex non-controlling interests) 2,556 990
Credit and other impairment charges (573) (229)
Internal management revenue3 10 31
Net operating income 4,213 2,248
Total operating expenses (1,572) (1,614)
(Profit)/Loss attributable to non-controlling interests (241) 17
Net profit contribution4 2,400 651
Capital markets activity5:
Number of transactions 476 417
Transactions value ($Ab) 457 364
Headcount 1,843 1,821
Result
1.Represents the interest earned from debt investments and the funding costs associated with Macquarie Capital’s balance sheet positions. 2. Includes gains and losses from sale and revaluation of equity, debt and other investments, share of net losses from associates and joint ventures and, other income/(expenses). 3. Internal revenue allocations are eliminated on consolidation in the Group’s statutory P&L. 4. FY22 includes approximately $A850m of net profit contribution from GIG. 5. Source: Dealogic and IJGlobal for Macquarie Group completed M&A, investments, ECM and DCM transactions converted as at the relevant reporting date. Deal values reflect the full transaction value and not an attributed value.
• Higher net interest and trading income of $A327m, increased significantly compared to the prior year primarily due to higher net interest income driven by the growth in the private credit portfolio, which more than doubled throughout the current year.
• Fee and commission income of $A1,893m, up 36% on FY21 due to higher mergers and acquisitions fee income and debt capital markets fee income, partially offset by lower equity capital markets fee income and brokerage income.
• Investment-related income of $A2,556m, increased substantially on FY21 driven by higher revenue from material asset realisations in the green energy, technology and business services sectors and included realisations across all regions.
• Credit and other impairment charges of $A573m in FY22, compared to charges of $A229m in FY21, increased primarily due to a small number of underperforming equity investments and growth of the private credit portfolio.
• Total operating expenses of $A1,572m, down 3% on FY21 was predominantly driven by lower employment costs.
• Profit attributable to non-controlling interests of $A241m in FY22, compared to a loss of $A17m in FY21. The current year balance was driven by the share of gains on disposal attributable to non-controlling interests.

Additional Information
05Appendix B
Funding
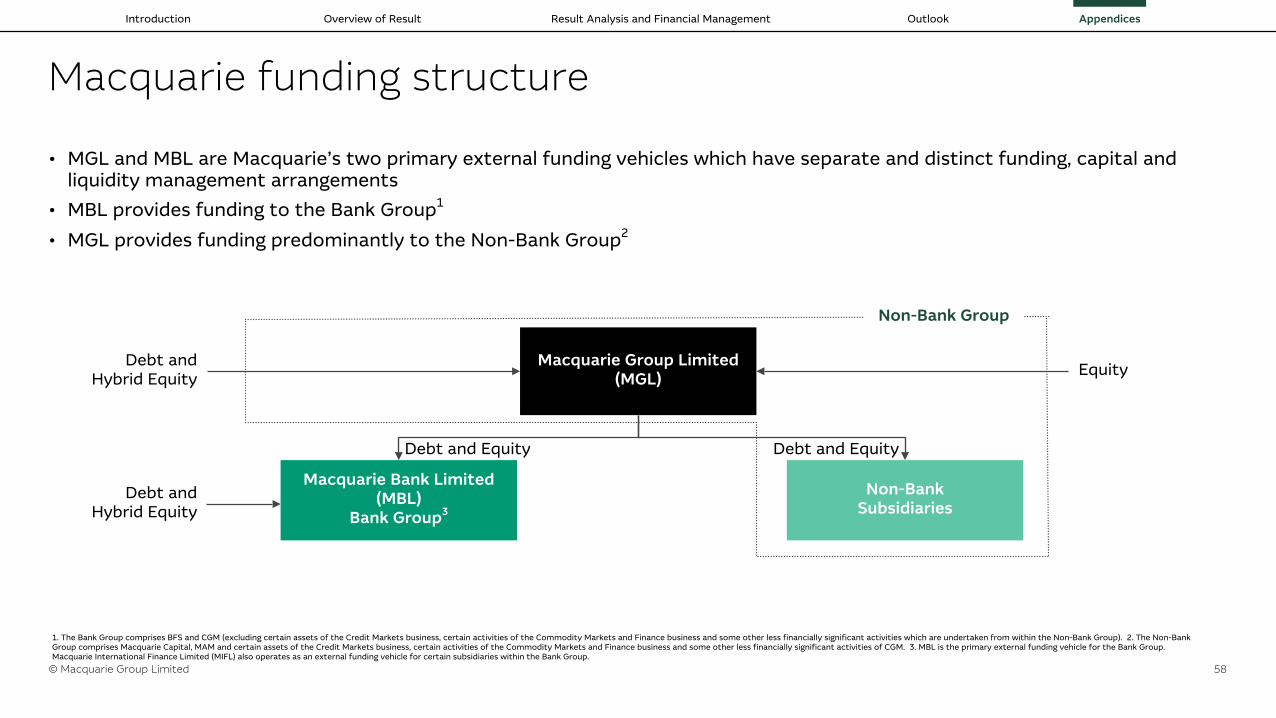
© Macquarie Group Limited
Introduction Overview of Result Result Analysis and Financial Management Outlook Appendices
58
Macquarie Group Limited(MGL)
Non-Bank Subsidiaries
Macquarie Bank Limited(MBL)
Bank Group3
Debt and Equity Debt and Equity
Debt and Hybrid Equity
Debt and Hybrid Equity Equity
Non-Bank Group
1. The Bank Group comprises BFS and CGM (excluding certain assets of the Credit Markets business, certain activities of the Commodity Markets and Finance business and some other less financially significant activities which are undertaken from within the Non-Bank Group). 2. The Non-Bank Group comprises Macquarie Capital, MAM and certain assets of the Credit Markets business, certain activities of the Commodity Markets and Finance business and some other less financially significant activities of CGM. 3. MBL is the primary external funding vehicle for the Bank Group. Macquarie International Finance Limited (MIFL) also operates as an external funding vehicle for certain subsidiaries within the Bank Group.
Macquarie funding structure
• MGL and MBL are Macquarie’s two primary external funding vehicles which have separate and distinct funding, capital and liquidity management arrangements
• MBL provides funding to the Bank Group1
• MGL provides funding predominantly to the Non-Bank Group2

© Macquarie Group Limited
Introduction Overview of Result Result Analysis and Financial Management Outlook Appendices
59
Funded balance sheet reconciliation
Mar 221
$AbMar 211
$Ab
Total assets per statement of financial position 399.2 245.7 Accounting deductions:Derivative revaluation accounting gross-ups (84.5) (17.4) Segregated funds (7.4) (7.7) Outstanding trade settlement balances (5.8) (7.5) Working capital assets (13.4) (9.1) Non-controlling interests (0.2) (0.3) Self-funded assets:Self-funded trading assets (20.7) (15.9) Non-recourse and security backed funding (1.3) (1.4) Net funded assets per funded balance sheet 265.9 186.4
Note: For an explanation of the above deductions refer to slide 63. 1. There has been a change in presentation of certain items on the funded balance sheet in the current year. Comparatives have been restated to reflect this change.
• The funded balance sheet is a simple representation of Macquarie’s funding requirements once accounting related gross-ups and self-funded assets have been netted down from the statement of financial position. The funded balance sheet is not a liquidity risk management tool, as it does not consider the granular liquidity profiling of all on and off-balance sheet components considered in both Macquarie’s internal liquidity framework and the regulatory liquidity metrics
• Given the substantial growth in Macquarie’s home loan portfolio in recent years, the funded balance sheet has been revised to present home loans as its own loan asset category. As a result, external securitisations of home loans (and other relevant assets) which are a source of funding for such assets are no longer netted down on the funded balance sheet. In addition, Australian home loans and other qualifying assets originated by Macquarie that meet the RBA repurchase agreement eligibility criteria are included under Cash and liquid assets if they are held as contingent collateral for RBA facilities (such as the CLF). The remaining portion of self-securitised assets are now presented in the relevant Home loan and Other loan asset categories
• A funded balance sheet reconciliation has been prepared to reconcile the reported assets of Macquarie to the assets that require funding

© Macquarie Group Limited
Introduction Overview of Result Result Analysis and Financial Management Outlook Appendices
60
Funding for MacquarieMar 221
$AbMar 211
$AbFunding sources
Certificates of deposit 0.7 0.4
Commercial paper 35.1 12.9
Net trade creditors 2.4 1.4
Structured notes 1.3 1.1
Secured funding 27.5 13.8
Bonds 48.8 34.3
Other loans 1.4 1.2
Syndicated loan facilities 9.1 5.8
Customer deposits 101.5 84.0
Subordinated debt 4.6 5.1
Equity and hybrids 33.5 26.4
Total funding sources 265.9 186.4
Funded assets
Cash and liquid assets 93.8 55.6
Net trading assets 27.1 25.6
Other loan assets including operating lease assets less than one year 13.2 11.4
Home loans 83.0 54.2
Other loan assets including operating lease assets greater than one year 35.5 29.1
Debt investments 2.5 1.9
Co-investment in Macquarie-managed funds and other equity investments 6.3 5.7
Property, plant and equipment and intangibles 4.5 2.9
Total funded assets 265.9 186.4
• Well diversified funding sources• Term assets covered by term funding, stable deposits, hybrids
and equity• Short-term wholesale funding covered by cash, liquids and other
short-term assets• Deposit base represents 38%2 of total funding sources• Term funding beyond one year (excluding TFF, equity and
securitisations) has a weighted average term to maturity of 5.1 years2 (including TFF 4.7 years)
Debt Subordinated debt Equity and hybrids
1-2yrs 2-3yrs 3-4yrs 4-5yrs 5yrs+0
10
20
30
40
50
60
$Ab
1. There has been a change in presentation of certain items on the funded balance sheet in the current year. Comparatives have been restated to reflect this change. Refer slide 59 for more details. 2. As at 31 Mar 22. 3. Includes drawn term funding facilities only.
Macquarie’s term funding maturing beyond one year (includes Equity and hybrids)3

© Macquarie Group Limited
Introduction Overview of Result Result Analysis and Financial Management Outlook Appendices
61
Funding for the Bank GroupMar 221
$AbMar 211
$AbFunding sources
Certificates of deposit 0.7 0.4
Commercial paper 35.1 12.9
Net trade creditors 1.4 1.3
Structured notes 0.4 0.5
Secured funding 26.6 13.4
Bonds 21.5 19.0
Other loans 1.2 1.0
Syndicated loan facilities 2.8 —
Customer deposits 101.5 84.0
Subordinated debt 4.6 5.1
Equity and hybrids 20.3 15.8
Total funding sources 216.1 153.4
Funded assets
Cash and liquid assets 78.6 51.0
Net trading assets 24.3 24.4
Other loan assets including operating lease assets less than one year 12.2 10.9
Home loans 83.0 54.2
Other loan assets including operating lease assets greater than one year 23.5 22.7
Debt investments 1.4 1.3
Non-Bank Group deposit with MBL (8.3) (12.4)
Co-investment in Macquarie-managed funds and other equity investments 0.6 0.5
Property, plant and equipment and intangibles 0.8 0.8
Total funded assets 216.1 153.4
• Bank balance sheet remains liquid and well capitalised, with a diverse range of funding sources
• Term funding beyond one year (excluding TFF, equity and securitisations) has a weighted average term to maturity of 3.8 years2 (including TFF 3.3 years)
• Accessed term funding across a variety of products and jurisdictions
Debt Subordinated debt Equity and hybrids
1-2yrs 2-3yrs 3-4yrs 4-5yrs 5yrs+0
4
8
12
16
20
24
28
$Ab
1. There has been a change in presentation of certain items on the funded balance sheet in the current year. Comparatives have been restated to reflect this change. Refer slide 59 for more details. 2. As at 31 Mar 22. 3. Includes drawn term funding facilities only.
Bank Group term funding maturing beyond one year (includes Equity and hybrids)3

© Macquarie Group Limited
Introduction Overview of Result Result Analysis and Financial Management Outlook Appendices
62
Funding for the Non-Bank GroupMar 22
$AbMar 21
$AbFunding sources
Net trade creditors 1.0 0.1
Structured notes 0.9 0.6
Secured funding 0.9 0.4
Bonds 27.3 15.3
Other loans 0.2 0.2
Syndicated loan facilities 6.3 5.8
Equity and hybrids 13.2 10.6
Total funding sources 49.8 33.0
Funded assets
Cash and liquid assets 15.2 4.6
Non-Bank Group deposit with MBL 8.3 12.4
Net trading assets 2.8 1.2
Other loan assets including operating lease assets less than one year 1.0 0.5
Other loan assets including operating lease assets greater than one year 12.0 6.4
Debt investments 1.1 0.6
Co-investment in Macquarie-managed funds and other equity investments 5.7 5.2
Property, plant and equipment and intangibles 3.7 2.1
Total funded assets 49.8 33.0
• Non-Bank Group is predominantly term funded
• Term funding beyond one year (excluding equity) has a weighted average term to maturity of 6.1 years1
• Accessed term funding across a variety of products and jurisdictions
Debt Equity and hybrids
1-2yrs 2-3yrs 3-4yrs 4-5yrs 5yrs+0
5
10
15
20
25
30
35
$Ab
1. As at 31 Mar 22. 2. Includes drawn term funding facilities only.
Non-Bank Group term funding maturing beyond one year (includes Equity and hybrids)2

© Macquarie Group Limited
Introduction Overview of Result Result Analysis and Financial Management Outlook Appendices
63
Explanation of funded balance sheet reconciling itemsDerivative revaluation accounting gross-ups
Macquarie’s derivative activities are mostly client driven with client positions hedged by offsetting positions with a variety of counterparties. The derivatives are largely matched and this adjustment reflects that the matched positions do not require funding. The associated margins paid and received are included as part of self-funded trading assets.
Segregated funds
These represent the assets and liabilities that are recognised where Macquarie holds segregated client monies. The client monies will be matched by assets held to the same amount. Any excess client funds placed with Macquarie are netted down against cash and liquid assets.
Outstanding trade settlement balances
At any particular time Macquarie will have outstanding trades to be settled as part of its brokering business and trading activities. These amounts (payables) can be offset in terms of funding by amounts that Macquarie is owed on other trades (receivables).
Working capital assets
As with the outstanding trade settlement balances, Macquarie through its day-to-day operations generates working capital assets (e.g. receivables and prepayments) and working capital liabilities (e.g. creditors and accruals) that produce a ‘net balance’ that either requires or provides funding.
Non-controlling interests
These include the portion of equity ownership in subsidiaries not attributable to Macquarie. As this is not a position that Macquarie is required to fund, it is netted against the consolidated assets and liabilities in preparing the funded balance sheet.
Self-funded trading assets
Macquarie enters into stock borrowing and lending as well as repurchase agreements and reverse repurchase agreements in the normal course of trading activity that it conducts with its clients and counterparties, as well as for liquidity management purposes. Also as part of its trading activities, Macquarie pays and receives margin collateral on its outstanding derivative positions. These trading and liquidity management related asset and liability positions are viewed as being self-funded to the extent that they offset one another and, therefore, are netted as part of this adjustment.
Non-recourse andsecurity backed funding
These include assets funded by third party debt with no recourse to Macquarie beyond the borrowing entity.

© Macquarie Group Limited
Introduction Overview of Result Result Analysis and Financial Management Outlook Appendices
64
Conservative long standing liquidity risk management framework
Liquidity Policy Liquidity Framework
The liquidity risk appetite is intended to ensure that Macquarie is able to meet all of its liquidity obligations during a period of liquidity stress:
• A twelve month period with constrained access to funding markets for MBL, no access to funding markets for MGL and with only a limited reduction in Macquarie’s franchise businesses
Term assets are funded by term funding, stable deposits, hybrids and equity
A robust liquidity risk management framework is designed to ensure that both MGL and MBL are able to meet their funding requirements as they fall due under a range of market conditions. Key tools include:
• Liability driven approach to balance sheet management
• Scenario analysis
• Maintenance of unencumbered liquid asset holdings
Liquidity management is performed centrally by Group Treasury, with oversight from the Asset and Liability Committee and the Risk Management Group
The MGL and MBL Boards approve the liquidity policies and are provided with liquidity reporting on a regular basis

Additional Information
05Appendix C
Capital

© Macquarie Group Limited
Introduction Overview of Result Result Analysis and Financial Management Outlook Appendices
66
Macquarie Basel III regulatory capital
31 Mar 22
Harmonised Basel III1
$Am
APRA Basel III1
$AmMacquarie eligible capitalBank Group Gross Tier 1 capital 20,255 20,255 Non-Bank Group eligible capital 13,315 13,315 Eligible capital 33,570 33,570 (a)Macquarie capital requirement:Bank Group capital requirement
Risk-Weighted Assets (RWA)2 118,289 129,833 Capital required to cover RWA3 at 8.5% 10,055 11,036 Tier 1 deductions 563 2,983
Total Bank Group capital requirement 10,618 14,019 Total Non-Bank Group capital requirement 8,885 8,885 Total Macquarie capital requirement (at 8.5% 3 of the Bank Group RWA) 19,503 22,904 (b)Macquarie regulatory capital surplus (at 8.5% 3 of Bank Group RWA) 14,067 10,666 (a)-(b)
1. ‘Bank Group’ refers to Level 2 regulatory group. 2. In calculating the Bank Group’s contribution to Macquarie’s capital requirement, RWA internal to Macquarie are eliminated (31 Mar 22: $A807m; 30 Sep 21: $A874m). 3. Calculated at 8.5% RWA including capital conservation buffer (CCB), per APRA ADI Prudential Standard 110. Based on materiality, the countercyclical capital buffer (CCyB) of ~1bps has not been included. The individual CCyB varies by jurisdiction and the Bank Group’s CCyB is calculated as a weighted average based on exposures in different jurisdictions.
Surplus calculation
Actuals - 02/05
RWA = 129,833 vs 129,835 next slide

© Macquarie Group Limited
Introduction Overview of Result Result Analysis and Financial Management Outlook Appendices
67
Macquarie APRA Basel III regulatory capital
31 Mar 22
Risk-weighted assets$Am
Tier 1 Deductions$Am
Capital Requirement1
$Am
Credit riskOn balance sheet 56,801 4,828 Off balance sheet 50,879 4,325 Credit risk total2 107,680 9,153 Market risk 10,230 870 Operational risk 10,335 878 Interest rate risk in the banking book 1,588 135 Tier 1 deductions — 2,983 2,983 Contribution to Group capital calculation2 129,833 2,983 14,019
1. Calculated at 8.5% RWA including capital conservation buffer (CCB), per APRA ADI Prudential Standard 110. Based on materiality, the countercyclical capital buffer (CCyB) of ~1bps has not been included. The individual CCyB varies by jurisdiction and the Bank Group’s CCyB is calculated as a weighted average based on exposures in different jurisdictions. 2. In calculating the Bank Group’s contribution to Macquarie’s capital requirement, RWA internal to Macquarie are eliminated (31 Mar 22: $A807m; 30 Sep 21: $A874m).
Bank Group contribution
Actuals - 02/05

© Macquarie Group Limited
Introduction Overview of Result Result Analysis and Financial Management Outlook Appendices
68
Macquarie regulatory capital
Risk1 Basel III ECAM
Credit • Capital requirement generally determined by Basel III IRB formula, with some parameters specified by the regulator (e.g. loss given default)
• Capital requirement generally determined by Basel III IRB formula, but with internal estimates of key parameters
Equity • Harmonised Basel III: 250%, 300% or 400% risk weight, depending on the type of investment. Deduction from Common Equity Tier 1 above a threshold
• APRA Basel III: 100% Common Equity Tier 1 deduction2
• Extension of Basel III credit model to cover equity exposures. Capital requirement between 34% and 85% of face value; average 52%
Market • 3 times 10 day 99% Value at Risk (VaR) plus 3 times 10 day 99% Stressed VaR plus a specific risk charge
• Scenario-based approach
Operational • Advanced Measurement Approach • Advanced Measurement Approach
1. The ECAM also covers non-traded interest rate risk and the risk on assets held as part of business operations, including: fixed assets, goodwill, intangible assets and capitalised expenses. 2. Includes all Banking Book equity investments, plus net long Trading Book holdings in financial institutions.
Non-Bank Group contribution• APRA has specified a regulatory capital framework for Macquarie
• A dollar capital surplus is produced; no capital ratio calculation is specified
• The Non-Bank Group’s capital is calculated using Macquarie’s ECAM
• The ECAM is based on similar principles and models as the Basel III regulatory capital framework for banks, with both calculating capital at a one year 99.9% confidence level
Final

© Macquarie Group Limited
Introduction Overview of Result Result Analysis and Financial Management Outlook Appendices
69
31 Mar 22Assets
$AbCapital Requirement
$AmEquivalent Risk
WeightFunded assets
Cash and liquid assets 15.2 217 18 %
Loan assets1 13.0 1,352 130 %Debt investments 1.1 136 154 %Co-investment in Macquarie-managed funds and other equity investments 5.1 2,402 589 %
Co-investment in Macquarie-managed funds and other equity investments (relating to investments that hedge DPS plan liabilities) 0.6Property, plant & equipment and intangibles 3.7 1,843 623 %
Non-Bank Group deposit with MBL 8.3Net trading assets 2.8
Total funded assets 49.8 5,950 Accounting Deductions
Derivative revaluation accounting gross-ups 0.3Segregated funds 0.6
Outstanding trade settlement balances 4.9Working capital assets 8.3Non-controlling interests 0.2
Self-funded assetsSelf funded trading assets (0.8)
Assets funded non-recourse 1.3Total self-funded and non-recourse assets 14.8
Total Non-Bank Group assets 64.6Equity commitments 1,474
Off balance sheet exposures, operational, market & other risk, and diversification offset2 1,461 Non-Bank Group capital requirement 8,885
Macquarie regulatory capital
1. Includes operating lease assets. 2. Capital associated with net trading assets (e.g. market risk capital) and net trade debtors has been included here.
Non-Bank Group contribution
Draft - 28/04

Glossary
05Appendix D

© Macquarie Group Limited
Introduction Overview of Result Result Analysis and Financial Management Outlook Appendices
71
Glossary$A / AUD Australian Dollar CLF Committed Liquidity Facility$US / USD United States Dollar CMA Cash Management Account£ / GBP Pound Sterling CRM Customer Relationship Management€ Euro CY20 Calendar Year ending 31 December 20201H21 Half Year ended 30 September 2020 CY21 Calendar Year ending 31 December 20211H22 Half Year ended 30 September 2021 DCM Debt Capital Markets1Q22 Three months ended 30 June 2021 DPS Dividends Per Share2H21 Half Year ending 31 March 2021 DRP Dividend Reinvestment Plan2H22 Half Year ending 31 March 2022 DTA Deferred Tax Asset2Q22 Three months ended 30 September 2021 ECAM Economic Capital Adequacy ModelABN Australian Business Number ECM Equity Capital MarketsADI Authorised Deposit-Taking Institution EMEA Europe, the Middle East and AfricaALX Atlas Arteria EPS Earnings Per ShareAML Anti-Money Laundering EUM Equity Under ManagementANZ Australia and New Zealand FCTR Foreign currency translation reserve and net investment hedge reserveApprox. Approximately FX Foreign ExchangeAPRA Australian Prudential Regulation Authority FY17 Full Year ended 31 March 2017ASX Australian Securities Exchange FY18 Full Year ended 31 March 2018AUM Assets under Management FY19 Full Year ended 31 March 2019BCBS Basel Committee on Banking Supervision FY20 Full Year ended 31 March 2020BFS Banking and Financial Services FY21 Full Year ending 31 March 2021Capex Capital Expenditure FY22 Full Year ending 31 March 2022CCB Capital Conservation Buffer FY23 Full Year ending 31 March 2023CET1 Common Equity Tier 1 GIF II Macquarie Global Infrastructure Fund 2CGM Commodities and Global Markets GIF III Macquarie Global Infrastructure Fund 3

© Macquarie Group Limited
Introduction Overview of Result Result Analysis and Financial Management Outlook Appendices
72
GlossaryGIG Green Investment Group MPA Mortgage Professional AustraliaIPO Initial Public Offering MSCIF Macquarie Super Core Infrastructure FundIRB Internal Ratings-Based MW Mega WattIFRS International Financial Reporting Standards MWDC Mega Watt direct currentIMTT International-Matex Tank Terminals MWhr Mega Watt hourIT Information Technology NGLs Natural gas liquidsLBO Leveraged Buyout No. NumberLCR Liquidity Coverage Ratio NPAT Net Profit After TaxM&A Mergers and Acquisitions NPC Net Profit ContributionMacCap Macquarie Capital NSFR Net Stable Funding RatioMAM Macquarie Asset Management OTC Over-The-CounterMBL Macquarie Bank Limited P&L Profit and LossMD&A Management Discussion & Analysis PPE Property, Plant and EquipmentMEIF1 Macquarie European Infrastructure Fund 1 PPP Public Private PartnershipMEIF3 Macquarie European Infrastructure Fund 3 RBA Reserve Bank of AustraliaMEIF4 Macquarie European Infrastructure Fund 4 ROE Return on EquityMEREP Macquarie Group Employee Retained Equity Plan RWA Risk Weighted AssetsMFAA Mortgage and Finance Association of Australia SBI State Bank of IndiaMGL / MQG Macquarie Group Limited SME Small and Medium EnterpriseMGSA Macquarie Group Services Australia SMSF Self Managed Super FundMIC Macquarie Infrastructure Corporation TFF Term Funding FacilityMiFID Markets in Financial Instruments Directive UK United KingdomMIP I Macquarie Infrastructure Partners Fund 1 US United States of AmericaMIP II Macquarie Infrastructure Partners Fund 2 VaR Value at Risk

Presentation to investors and analysts
Result announcement for the full year ended 31 March 2022
6 May 2022