
2022-03-09.pdf - Prudential plc
133
Hong Kong Exchanges and Clearing Limited, The Stock Exchange of Hong Kong Limited and the Singapore Exchange Securities Trading Limited take no responsibility for the contents of this announcement, make no representation as to its accuracy or completeness and expressly disclaim any liability whatsoever for any loss howsoever arising from or in reliance upon the whole or any part of the contents of this announcement. (Incorporated and registered in England and Wales under the number 01397169) (Stock Code: 2378) PRESS RELEASE AND FULL YEAR RESULTS FOR THE YEAR ENDED 31 DECEMBER 2021
-
Upload
khangminh22 -
Category
Documents
-
view
0 -
download
0
Transcript of 2022-03-09.pdf - Prudential plc

Hong Kong Exchanges and Clearing Limited, The Stock Exchange of Hong Kong Limited and the Singapore Exchange Securities
Trading Limited take no responsibility for the contents of this announcement, make no representation as to its accuracy or
completeness and expressly disclaim any liability whatsoever for any loss howsoever arising from or in reliance upon the whole or
any part of the contents of this announcement.
(Incorporated and registered in England and Wales under the number 01397169)
(Stock Code: 2378)
PRESS RELEASE AND FULL YEAR RESULTS
FOR THE YEAR ENDED 31 DECEMBER 2021
1
NEWS RELEASE
9 March 2022
PRUDENTIAL PLC FULL YEAR 2021 RESULTS PRUDENTIAL DELIVERS CONTINUED OPERATIONAL PROGRESS AND COMPLETES STRATEGIC RE-POSITIONING Performance highlights for the continuing business1 on a constant (and actual) exchange rate basis2
• APE sales3 up 8 per cent (10 per cent) to $4,194 million
• New business profit4 up by 13 per cent (15 per cent) to $2,526 million
• Strategic re-positioning to Asia and Africa completed
• Adjusted operating profit5 from continuing operations up 16 per cent (17 per cent) to $3,233 million
• Second interim ordinary dividend of 11.86 cents per share, 17.23 cents per share for the full year
Mike Wells, Group Chief Executive of Prudential plc, said: “Prudential has delivered high-quality, resilient growth as we completed the strategic re-positioning of our business to focus solely on Asia and Africa. We have continued to deliver for our customers against the backdrop of the Covid-19 pandemic, and I would like to record my deep gratitude to our staff and agents for their outstanding efforts. We have announced that I will retire from my role at the end of March 2022. I am grateful to have had the opportunity to work with the staff and Board of Prudential, and look forward to watching the Group’s further success.
“Our digitally enabled, multi-channel and geographically diversified business enabled us to increase APE sales3 by 8 per cent6 and deliver growth6 in 10 of our 14 insurance markets7, despite the obvious challenges of Covid-19. New business levels in Hong Kong remained impacted by the continuing Mainland China border closure. Excluding Hong Kong, 2021 APE sales grew by 16 per cent6 driven by our businesses in Mainland China, India, Malaysia, the Philippines, Singapore and Thailand. We delivered 13 per cent6 growth in Group new business profit4 through an improvement in business mix, and therefore margin, and the growth in new sales. “The Group’s high-quality business, based on regular-premium income, focus on health and protection, and high levels of customer retention, supports resilient, compounding growth. This enabled the Group’s life businesses to deliver adjusted operating profit5 growth of 8 per cent6 despite higher Covid-19-related claims, with seven of our 14 life markets generating double-digit6 adjusted operating profit5 growth. Eastspring’s adjusted operating profit was up 10 per cent6, with its funds under management reaching $258.5 billion, with continued inflows from the Group’s life businesses. Collectively our life and asset management businesses delivered 8 per cent6 growth in adjusted operating profit5 and 7 per cent6 growth in operating free surplus generation8. After delivery of the planned central cost savings, total Group adjusted operating profit for the continuing business was up 16 per cent6. “We continue to invest for the long term in new products, additional distribution capabilities and enhanced digital capabilities, to build our presence as a leading agency and bancassurance player and to access new pools of customers. Our product and other initiatives helped attract over 2.5 million customers in 2021 who were not existing policyholders of Prudential, contributing to an increase in our total life customer base to 18.6 million (2020: 17.4 million excluding Jackson). New business policies sold to both new and existing customers rose 16 per cent to 3.9 million and included 109,000 policies which were sold direct to the consumer through digital systems, including Pulse. These new policies included 2.2 million health and protection cases, reflecting our customers’ increased focus on this area in light of the pandemic. “We have completed the strategic re-positioning of our business into one focused entirely on Asia and Africa. In the fourth quarter, we carried out a successful $2.4 billion9 equity raise in Hong Kong. In December 2021 and January 2022 cash from this issuance was deployed in deleveraging our balance sheet in a $2.25 billion debt reduction programme. These actions, together with the associated reduction in interest costs, have enhanced our financial flexibility in light of the breadth of opportunities to invest for growth in Asia and Africa. “We enter 2022 with a strong balance sheet and capital position. The timing of the opening of the Hong Kong border remains uncertain and Covid-19 will continue to have an impact. The current conflict in Ukraine could have wider implications for global economic and market conditions as well as geopolitical relations. However, we believe our multi-channel approach and focus on quality business and operating efficiency is the right strategy for dealing with volatile operating conditions. We are confident that our investment in new business, distribution and product enhancements will continue to meet the needs of our customers and build value for our shareholders over the long term.”
Summary financials 2021 $m 2020 $m Change on AER basis3
Change on CER basis3
New business profit from continuing operations1,4 2,526 2,201 15% 13% Operating free surplus generated from continuing operations1,8 2,071 1,888 10% 7% Adjusted operating profit from continuing operations1,5 3,233 2,757 17% 16% IFRS profit after tax from continuing operations1 2,214 2,468 (10)% (12)% IFRS (loss) profit for the period after write-down of Jackson to fair value (2,813) 2,185 n/a n/a
31 Dec 2021 31 Dec 2020* Total Per share Total Per share
EEV shareholders’ equity $47.4bn 1,725¢ $54.0bn 2,070¢ IFRS shareholders’ equity $17.1bn 622¢ $20.9bn 800¢ * Includes Jackson. Excluding Jackson EEV of the continuing Group was $41.9bn (1,607¢ per share) and IFRS shareholders’
equity was $12.4bn at 31 December 2020.

2
Notes 1 Continuing operations represents the Asia, Africa and head office functions of the Group following the demerger of Jackson. 2 Further information on actual and constant exchange rate bases is set out in note A1 of the IFRS financial statements. 3 APE sales is a measure of new business activity that comprises the aggregate of annualised regular premiums and one-tenth of single premiums on new business
written during the year for all insurance products, including premiums for contracts designated as investment contracts under IFRS 4. It is not representative of premium income recorded in the IFRS financial statements. See note II of the Additional unaudited financial information for further explanation.
4 New business profit, on a post-tax basis, on business sold in the period, calculated in accordance with EEV Principles. 5 In this press release ‘adjusted operating profit’ refers to adjusted IFRS operating profit based on longer-term investment returns from continuing operations. This
alternative performance measure is reconciled to IFRS profit for the period in note B1.1 of the IFRS financial statements. 6 On a constant exchange rate basis. 7 13 Asia markets plus Africa. 8 Operating free surplus generated from insurance and asset management operations before restructuring costs. For insurance operations, operating free surplus
generated represents amounts emerging from the in-force business during the year net of amounts reinvested in writing new business and excludes non-operating items. For asset management businesses, it equates to post-tax operating profit for the year. Restructuring costs are presented separately from the business unit amount. Further information is set out in ‘movement in Group free surplus’ of the EEV basis results.
9 After deduction of underwriting fees and other estimated expenses connected with the equity raise.
Contact:
Media Investors/analysts Simon Kutner +44 (0)7581 023260 Patrick Bowes +44 (0)20 3977 9702 Tan Ping Ping +65 9845 8904 William Elderkin +44 (0)20 3977 9215
Notes to editors:
a. The results in this announcement are prepared on two bases: International Financial Reporting Standards (IFRS) and European Embedded Value (EEV). The results prepared under IFRS form the basis of the Group’s statutory financial statements. The supplementary EEV basis results have been prepared in accordance with the amended European Embedded Value Principles issued by the European Insurance CFO Forum in 2016. The Group’s EEV basis results are stated on a post-tax basis and include the post-tax IFRS basis results of the Group’s asset management and other operations. The IFRS and EEV results are presented in US dollars and the basis of translation is discussed in note A1 of the IFRS financial statements. Period-on-period percentage increases are stated on a constant exchange rate basis unless otherwise stated. Constant exchange rates are calculated by translating prior period results using the current period foreign exchange rate ie current period average rates for the income statement and current period closing rates for the balance sheet.
b. EEV and adjusted IFRS operating profit for continuing operations is based on longer-term investment returns and is stated after excluding the effect of short-term fluctuations in investment returns against long-term assumptions, which for IFRS in 2021 were driven largely by the movements in interest rates and equity markets in Asia, and other corporate transactions. Furthermore, for EEV basis results, operating profit based on longer-term investment returns excludes the effect of changes in economic assumptions and the mark-to-market value movement on core borrowings. Separately on the IFRS basis, adjusted operating profit also excludes amortisation of acquisition accounting adjustments.
c. Total number of Prudential plc shares in issue as at 31 December 2021 was 2,746,412,265.
d. We expect to announce our Full Year 2021 Results to the Hong Kong Stock Exchange and to the UK Financial Media at 4.00am UKT– 12.00pm HKT on Wednesday, 9 March 2022 – 11.00pm ET on Tuesday, 8 March 2022. The full announcement and associated information will be loaded onto the Group’s website at or shortly following the confirmation of the publication on the Hong Kong Stock Exchange. The announcement will appear on the RNS of the London Stock Exchange at 7.00am UKT – 3.00pm HKT – 2.00am ET on Wednesday, 9 March. Media call – 7.00am UKT – 3.00pm HKT – 2.00am ET If you would like to join the media call, please get in touch with either of the media contacts listed above for joining instructions. Analysts & Investors Q&A call - 8.00am UKT – 4.00pm HKT – 3.00am ET To register to listen into the conference call and submit questions online, please do so via the following link: https://www.investis-live.com/prudential/61f006825acd270d003c0edf/2021fyqa. The call will be available to replay afterwards using the same link. Dial-in details A dial-in facility will be available to listen to the call and ask questions: please allow 15 minutes ahead of the start time to join the call (lines open half an hour before the call is due to start, ie from 7.30am UKT – 3.30pm HKT – 2.30am ET. Dial-in: +44 (0) 20 3936 2999 (UK and international) / 580 33 413 (HK) / 010 5387 5828 (China), Toll free: 0800 640 6441 (UK) / 800 908 350 (HK), Participant access code: 204128. Once participants have entered this code their name and company details will be taken. Transcript Following the call a transcript will be published on the results centre page of the Prudential plc’s website on Friday 11 March 2022. Playback facility Please use the following for a playback facility: +44 (0) 20 3936 3001 (UK and international), replay code 670696. This will be available from approximately 3.00pm UKT – 11.00pm HKT – 10.00am ET on 9 March until 11.59pm UKT – 6.59pm ET on 23 March – 7.59am HK time on 24 March 2022.

3
e. 2021 Second interim ordinary dividend Ex-dividend date 24 March 2022 (UK, Hong Kong and Singapore) Record date 25 March 2022
Payment of dividend 13 May 2022 (UK, Hong Kong and ADR holders)
On or around 20 May 2022 (Singapore)
f. About Prudential plc Prudential plc provides life and health insurance and asset management in Asia and Africa. The business helps people get the most out of life, by making healthcare affordable and accessible and by promoting financial inclusion. Prudential protects people’s wealth, helps them grow their assets, and empowers them to save for their goals. The business has more than 18 million life customers and is listed on stock exchanges in London (PRU), Hong Kong (2378), Singapore (K6S) and New York (PUK). Prudential is not affiliated in any manner with Prudential Financial, Inc. a company whose principal place of business is in the United States of America, nor with The Prudential Assurance Company Limited, a subsidiary of M&G plc, a company incorporated in the United Kingdom. https://www.prudentialplc.com/.
g. Discontinued operations Throughout this results announcement ‘discontinued operations’ refers to the US operations (referred to as Jackson). All amounts presented refer to continuing operations unless otherwise stated, which reflect the Group following the completed demerger of Jackson.
h. Forward-Looking Statements
This document may contain 'forward-looking statements' with respect to certain of Prudential's (and its wholly and jointly owned businesses’) plans and its goals and expectations relating to its future financial condition, performance, results, strategy and objectives. Statements that are not historical facts, including statements about Prudential's (and its wholly and jointly owned businesses’) beliefs and expectations and including, without limitation, statements containing the words 'may', 'will', 'should', 'continue', 'aims', 'estimates', 'projects', 'believes', 'intends', 'expects', 'plans', 'seeks' and 'anticipates', and words of similar meaning, are forward-looking statements. These statements are based on plans, estimates and projections as at the time they are made, and therefore undue reliance should not be placed on them. By their nature, all forward-looking statements involve risk and uncertainty. A number of important factors could cause Prudential's actual future financial condition or performance or other indicated results of the entity referred to in any forward-looking statement to differ materially from those indicated in such forward-looking statement. Such factors include, but are not limited to, the impact of the ongoing Covid-19 pandemic, including adverse financial market and liquidity impacts, responses and actions taken by governments, regulators and supervisors, the impact on sales, claims and assumptions and increased product lapses, disruption to Prudential’s operations (and those of its suppliers and partners), risks associated with new sales processes and technological and information security risks; future market conditions (including fluctuations in interest rates and exchange rates, inflation (including interest rate rises as a response) and deflation, the potential for a return to a sustained low-interest rate environment, the performance of financial markets generally and the impact of economic uncertainty (including as a result of geopolitical tensions and conflicts), asset valuation impacts from the transition to a lower carbon economy and derivative instruments not effectively hedging exposures arising from product guarantees); global political uncertainties, including the potential for increased friction in cross-border trade and the exercise of executive powers to restrict trade, financial transactions, capital movements and/or investment; the policies and actions of regulatory authorities, including, in particular, the policies and actions of the Hong Kong Insurance Authority, as Prudential's Group-wide supervisor, as well as the degree and pace of regulatory changes and new government initiatives generally; given its designation as an Internationally Active Insurance Group (“IAIG”), the impact on Prudential of systemic risk and other group supervision policy standards adopted by the International Association of Insurance Supervisors; the physical, social and financial impacts of climate change and global health crises on Prudential's business and operations; the impact of not adequately responding to environmental, social and governance issues (including not properly considering the interests of Prudential’s stakeholders or failing to maintain high standards of corporate governance); the impact of competition and fast-paced technological change; the effect on Prudential's business and results from, in particular, mortality and morbidity trends, lapse rates and policy renewal rates; the timing, impact and other uncertainties of future acquisitions or combinations within relevant industries; the impact of internal transformation projects and other strategic actions failing to meet their objectives; the availability and effectiveness of reinsurance for Prudential’s businesses; the risk that Prudential's operational resilience (or that of its suppliers and partners) may prove to be inadequate, including in relation to operational disruption due to external events; disruption to the availability, confidentiality or integrity of Prudential's information technology, digital systems and data (or those of its suppliers and partners) including the Pulse platform; any ongoing impact on Prudential of the demerger of M&G plc and the demerger of Jackson Financial Inc.; the increased operational and financial risks and uncertainties associated with operating joint ventures with independent partners, particularly where joint ventures are not controlled by Prudential; the impact of changes in capital, solvency standards, accounting standards or relevant regulatory frameworks, and tax and other legislation and regulations in the jurisdictions in which Prudential and its affiliates operate; and the impact of legal and regulatory actions, investigations and disputes. These and other important factors may, for example, result in changes to assumptions used for determining results of operations or re-estimations of reserves for future policy benefits. Further discussion of these and other important factors that could cause actual future financial condition or performance to differ, possibly materially, from those anticipated in Prudential's forward-looking statements can be found under the 'Risk Factors' heading of this document. These factors are not exhaustive as Prudential operates in a continually changing business environment with new risks emerging from time to time that it may be unable to predict or that it currently does not expect to have a material adverse effect on its business.
Any forward-looking statements contained in this document speak only as of the date on which they are made. Prudential expressly disclaims any obligation to update any of the forward-looking statements contained in this document or any other forward-looking statements it may make, whether as a result of future events, new information or otherwise except as required pursuant to the UK Prospectus Rules, the UK Listing Rules, the UK Disclosure Guidance and Transparency Rules, the Hong Kong Listing Rules, the SGX-ST Listing Rules or other applicable laws and regulations.

4
j. Cautionary Statements
This document does not constitute or form part of any offer or invitation to purchase, acquire, subscribe for, sell, dispose of or issue, or any solicitation of any offer to purchase, acquire, subscribe for, sell or dispose of, any securities in any jurisdiction nor shall it (or any part of it) or the fact of its distribution, form the basis of, or be relied on in connection with, any contract therefor.

5
Strategic and operating review During 2021 we completed the planned strategic re-positioning of our business, while at the same time delivering a resilient financial performance, despite the challenges posed by the continuing Covid-19 pandemic. Over the course of the year, we completed the reshaping of our business into one focused entirely on the long-term opportunities we have identified in Asia and Africa. In the fourth quarter, we carried out a successful $2.4 billion1 equity raise in Hong Kong. In December 2021 and January 2022 cash from this issuance was deployed in deleveraging our balance sheet in a $2.25 billion debt redemption programme. These actions, together with the associated reduction in interest costs, have enhanced our financial flexibility in light of the breadth of opportunities to invest for growth in Asia and Africa. In 2021, despite ongoing disruption, our digitally-enabled, multi-channel and geographically diversified platform delivered 8 per cent growth2 in APE sales3 (10 per cent on an actual exchange rate basis). Sales in Hong Kong continued to be constrained by the ongoing closure of the border with Mainland China. However, excluding Hong Kong, APE sales were 16 per cent2 higher (19 per cent on an actual exchange rate basis). Eight markets in Asia and our Africa business saw double-digit growth including Mainland China, India, Malaysia, the Philippines, Singapore and Thailand. The increase in APE sales, combined with an improvement in new business margins given a favourable shift in business mix, resulted in a 13 per cent2 increase in Group new business profit4. Business mix saw a shift into more profitable shareholder-backed business, particularly in Hong Kong. Our adjusted IFRS operating profit based on longer-term investment returns (adjusted operating profit5) for 2021 from our continuing operations increased by 16 per cent on a constant exchange rate basis (17 per cent on an actual exchange rate basis), reflecting the geographic, product and distribution channel diversification of our Asia and Africa-focused business model. The total IFRS loss after tax for 2021 was $(2,813) million (2020: $2,231 million profit after tax on a constant exchange rate basis, $2,185 million profit after tax on an actual exchange rate basis), which comprised a $2,214 million profit after tax from continuing operations (2020: $2,514 million profit after tax on a constant exchange rate basis, $2,468 million profit after tax on an actual exchange rate basis) and a $(5,027) million loss after tax from discontinued operations (2020: $(283) million loss after tax on a constant and actual exchange rate basis). This loss from discontinued operations is due to the write-down of Jackson to its fair value upon demerger, as required by accounting standards. The Group’s financial performance for the year is further discussed in the Financial Review later in this strategic report. The Covid-19 pandemic has had an ongoing impact on the markets in which we operate and the lives of our customers, and has caused continuing personal and working challenges for all our colleagues. Our people have not only risen to the challenges posed by Covid-19, but have also continued to deliver to the highest standards for our customers and our business. Our purpose is to help people get the most out of life, and both our strategic steps and our service to our customers are enabling us to fulfil that purpose. Our strategy of focusing on our markets in Asia and Africa enables us to devote our resources to serving customers in markets where there are substantial growth opportunities and to be aligned with broader public policy and societal needs. Our range of products, our digitally-enabled multi-channel distribution and the dynamic capabilities of our operations mean that not only can we seek to meet those needs but also to help prevent, postpone and protect customers from threats to their health and wellbeing, as well as support them to achieve their savings goals. Alongside our key strategic steps, during 2021 we supported our key stakeholders in many different ways, particularly in the face of the challenges created by Covid-19. For our customers, we have developed and tailored our range of products, in particular in health and protection, to allow these products to be suitable for a wider range of income groups such as through our ‘bite-sized’ insurance products. These are already offered in a number of markets including Malaysia, the Philippines, Cambodia and Vietnam, and are designed to cater for the specific needs of under-insured consumers and first-time buyers. For our agents, we have delivered significant training and productivity tools, enabling them to continue to retain client contact and accelerate the lead referral process. For our employees, we have paid salaries and wages of $1.0 billion in the year6, as well as providing significant support in terms of wellness, flexible working and helping them to manage their mental health. We have recognised the efforts that our staff have made during the year and have granted $1,000 of Prudential shares to each full-time employee. For our regulators, we have participated in multiple engagements on industry developments including enhanced risk management, monitoring customer outcomes and risk-based capital. The Group continues to make significant tax contributions in the jurisdictions in which it operates, with more than $1 billion remitted to tax authorities in 2021. We have funds under management of $258.5 billion7and are significant investors in Asia and Africa economies. In the near term, our corporate activity is expected to include the reduction of our stake in Jackson to less than 10 per cent and the securing of additional central cost savings of $70 million8 from the start of 2023. We will continue to ensure our central functions remain resilient and compliant. We are ending this historic year of change and development ideally positioned to take advantage of the opportunities in our chosen markets. Through our continually improving range of products, our wide-ranging, digitally-enabled multi-channel distribution and our execution capabilities, we are well placed to continue to build for our customers across our markets well into the future. Group strategy Our strategy is aligned with the supportive structural trends in Asia and Africa. Despite the rapid rise in prosperity in Asia, people still have low levels of insurance cover, with 39 per cent of health and protection spend still paid out-of-pocket9, and an estimated 80 per cent of the population of Asia still without insurance cover10. Combined with rising prosperity and ageing populations, this creates a large and growing health and protection gap that has been estimated at $1.8 trillion11. These long-term trends underpin rising demand for savings and protection across both Asia and Africa, and create significant opportunity for growth and value creation. By delivering products and services that are specific to consumer segments and markets, we are well positioned to meet the growing health, protection and long-term savings needs of customers in these geographies.

6
We are developing the capacity to serve up to 50 million customers by 2025 through investing in our multi-channel distribution capabilities, applying digital capabilities to increase the efficiency of our operations and introducing products and services that allow us to develop more diverse customer bases in our markets. We continue to invest in our people and systems to ensure we have the resources to deliver on our long-term growth strategy and to evolve our operating model to keep pace with our opportunities as an exclusively Asian and African business. We seek to achieve this by:
- Delivering profitable growth in a socially responsible way; - Digitalising our products, services and experiences; and - Humanising our company and advice channels.
We have significant investment appetite that is based on the absolute size and demographic characteristics of each economy and our ability to build competitive advantage, leveraging our scale and expertise. We will continue to build on our leading positions in Hong Kong and South-east Asia, and we see the greatest growth opportunities in the largest economies of China, India, Indonesia and Thailand. At the same time, we are continuing to develop our businesses in Africa, where our investment gives us exposure to a growing, under-served continent whose population is expected to double to more than two billion people by 205012.
Delivering the strategy Our strategy is pursued through providing a wide range of products which are then refined through continued innovation and iterative enhancements driven by customer needs. These products and services are then offered to those customers through our multi-channel distribution suite of channels – agents, bancassurance, digital and other. Increasingly customers are seeking to interact with us through a combination of digital channels and in-person agents. We are adapting our capabilities to match customers’ preferences for engagement during both purchase and servicing of our policies. Our product mix and multi-channel distribution capability have been the key drivers of new business profitability and growth in embedded value. Our products are tailored to the developing requirements of local markets and the fast-changing needs of individual customers. Our focus is on health and protection and savings products, and in 2021 54 per cent of our new business profit was contributed by health and protection solutions, with the rest provided by savings products including participating, linked and other traditional products. We have responded to the changing needs of our customers by broadening coverage for new risks and adding innovative features to existing products. For example, during 2021, we introduced or enhanced more than 200 new products, including more than 90 digital and protection products. Further details are given below in the operational performance by market section. Our product and other initiatives helped attract over 2.5 million customers in 2021 who were not existing policyholders of Prudential. This contributed to an increase in our total life customer base to 18.6 million (2020: 17.4 million excluding Jackson). New business policies sold to both new and existing customers rose to 3.9 million, an increase of 16 per cent over the prior year and included 109,000 polices which were sold direct to the consumer through digital systems, including Pulse. These new policies included 2.2 million health and protection cases, an increase of 41 per cent when compared with the prior year, reflecting our customers’ increased focus on this area in light of the pandemic. To ensure that customers have the best access to our products, we have a multi-channel and integrated distribution strategy that is able to adapt flexibly to changing local market conditions. We have an extensive distribution network encompassing agency, bancassurance and non-traditional partnerships, including digital. Our agency channel is a key component of our success, providing 65 per cent of our new business profit, given the high proportion of high-margin protection products sold through this channel. We have over 540,000 licenced tied agents13 across our life insurance markets. The productivity of our active agents increased by 3 per cent during 202113, based on APE sales per active agent as we, and our customers, focus increasingly on standalone protection products. New business profit from the agency channel fell by (1) per cent2 to $1,646 million in 2021. Excluding Hong Kong the increase was 9 per cent2. Our continued support for our agency channel positions us well for sustainable growth. We have recruited circa 123,000 agents during the year13 and continue to move our recruitment, training and management of agents on-line. The use of virtual sales tools has enabled us to deliver 45 per cent of agency new cases in 2021 virtually, compared with 28 per cent from April to December in 2020, demonstrating our embedding of these processes and building resilience for the future. Agent professionalism and career progression are extremely important to us, and we provide tailored training programmes that share our agents’ experience and best practice across different markets. At the same time, we continually upgrade the tools available to our agents to assist them during the sales process and enhance productivity. Agents that qualified for the Million Dollar Round Table (MDRT) award during 2021 contributed 40 per cent of APE sales in the relevant markets14 in 2021 (2020: 34 per cent14). We have a leading bancassurance franchise, providing access to over 26,000 bank branches through our strategic partnerships with over 160 multinational banks and prominent domestic banks. 2021 saw new business profit through the bancassurance channel increase by 56 per cent to $795 million. Sales made virtually accounted for around 30 per cent of new business cases made through the bancassurance channel in 2021 (2020: 27 per cent from July 2020). Alongside our agency and bancassurance channels, we also have Pulse by Prudential, our digital platform and ecosystem. Our aspiration is that Pulse facilitates customer acquisition at scale, provides an enhanced customer experience and acts as a platform for the business, with scope for delivering future operational efficiency. Our pan-Asia asset manager, Eastspring, is one of the largest pan-Asia asset managers, managing $258.5 billion in assets across 11 markets in Asia15, and is a top-10 asset manager in six of those markets. We continue to diversify Eastspring’s product set and
7
intend to accelerate its development as a leader in Asia by broadening its investment strategies and making wealth services more accessible at lower levels of individual contributions. Eastspring is playing an important role in supporting our commitment to carbon reduction in our insurance company asset portfolio, allowing us to deliver profitable growth alongside a positive social impact. Further details are set out in the operational performance by market section. Pulse and our digital offerings Prudential’s Pulse digital platform is designed to connect with customers and potential customers on key elements in their lives, namely their health and wealth. As well as offering our own products it provides a number of other features to engage and support customers in this area. We work with partners to deliver these additional services and features and to date we have entered into 56 key digital partnerships. We continue to expand our collaboration with new partners helping us widen access to new customer segments and deepen our engagement with our users. Prudential’s widely recognised brand and Pulse’s geographically diverse platform means that we can attract and work with multiple ‘best-in-class’ partners across numerous fields of expertise and sectors. Pulse is active in 17 markets in Asia and Africa and we utilise AI technology to offer users a selection of services, ranging from health assessments, risk factor identification, telemedicine and wellness to digital payment capabilities. Health features such as AI Symptom checker and Digital Twin have been launched in Pulse to most markets in which Pulse is available. These features are paired with health experts online (where available) and fitness communities to help Pulse users stay healthier. Pulse has now been downloaded more than 32 million16 times. Download growth has moderated more recently given that Pulse has now been rolled out to most of the markets we operate in. The focus now is on customer segmentation and engagement campaigns on the installed base so that Pulse now supports all of our distribution channels. APE sales associated with Pulse increased by 73 per cent2 to $364 million in 202117. These sales represented circa 11 per cent of our total APE sales in markets where Pulse is available. This percentage contribution has increased steadily over the second half of the year, ending the last quarter of 2021 at 13 per cent. We believe Pulse provides a wide range of benefits to Prudential, including:
• Efficient model to acquire, engage and serve users at scale, widening access to new customer segments for Prudential. This includes attracting a new, younger generation of customers.
• Reduces marginal customer acquisition costs through targeted marketing campaigns.
• Aggregated data on Pulse helps deliver greater customer insights and supports improved productivity for Prudential’s distribution channels by serving those customers that require a more personal/advice led approach which are often higher margin more complex products.
• Promotes better customer retention characteristics via stronger engagement and frequent contact, particularly for digital-savvy customers or customers who prefer virtual interactions.
Pulse is intended to become in due course a common platform across our markets to provide end-to-end processing, with all policy sales and servicing conducted within the platform for digital products. In addition, it is intended to provide an integrated business solution for our agency sales force, which should assist in creating a future-ready sales force capable of serving technology-savvy customers, as well as customers who prefer to meet virtually or a combination of both. Over the longer term this also has the potential to enhance our current operating model by removing some of the diverse technology systems and manual processes across our markets. Pulse supports the agency channel and its use is demonstrated by the number of leads recorded on Pulse, which totalled 4.3 million in 202118. As an example, our Philippines business saw over 1.9 million leads distributed to agents in 2021. These leads were provided to agents via PRULeads (within Pulse), where agents are provided with lead and campaign details derived from data generated from Pulse. The agents are also provided with suggested introductory discussion points to engage and develop dialogue with customers. Lastly, product information materials specific to the campaign are tagged in PRULeads, allowing agents access to those materials should that be necessary. Pulse also supports our bank partners in bringing digital solutions to customers. In the Philippines for example, Prudential has teamed up with CIMB Bank Philippines (CIMB PH) to make digital financial products and service more accessible. CIMB PH is one of the fastest growing banks in the Philippines, adopting and offering digital banking products to its more than five million customers. We are the first bancassurance partner for CIMB. Pulse products will be made available on CIMB’s platform and vice-versa. It is intended that Pulse will broaden Prudential’s customer reach, improve our channel productivity and generate efficiencies as we scale. Prudential continues to evaluate options for the development of Pulse in India and Mainland China. Our operations there already have sophisticated digital offerings provided by our respective joint venture partners in these technologically advanced multi-channel businesses. Capital allocation We apply a disciplined approach to capital allocation by applying the framework discussed in the Financial Review both to organic investment in new business and to considering inorganic growth options. We aim to deliver ongoing capital generation by investing capital to write products with high rates of return and short payback periods. We expect to generate attractive returns on our new business driven particularly by the focus on health and protection and regular premium products. This creates new capital, which can be reinvested into writing more profitable new business. In 2021, we generated almost five times the new business profit for each $1 invested organically.
8
The operation of our approach to capital management is demonstrated by our delivery of return on shareholders’ equity as set out below:
Operating return19 on shareholders’ equity (%)
2021 2020
Operating return19 on IFRS shareholders’ equity20 18 20 Operating return19 on EEV shareholders’ equity20 8 8
Leadership developments During 2021, a number of leadership changes took place. Our Group Chief Digital Officer retired and was succeeded by his deputy. In Indonesia, Malaysia and the Philippines, new CEOs were appointed following retirements and in all three cases the new appointees brought in additional skill sets including Sharia finance and technology. The CEOs in all our major segments have many years of experience of working in the markets they oversee and are all local to their markets. Environmental, Social and Governance
During 2021, we have strengthened our focus on Environmental, Social and Governance (ESG) matters, building on the new ESG strategic framework which we developed in 2020. Across Prudential, inclusivity runs as a common theme in all of our ESG activity. Within our core business activity of making health accessible, we seek to make our products as inclusive as possible and during 2021, we developed a campaign, We DO Family, to support the development of more inclusive products that recognise the evolution of nuclear families; our approach to climate change is underscored by our commitment to an inclusive transition in our markets; and, we further progressed our diversity and inclusion activity including the launch of PRUCommunities, a safe place for our people to share identities, interests, goals, and the changes they would like to see at Prudential. We consider this focus on inclusivity, both internally and externally, to be pivotal to meeting our purpose. We recognise the importance of targets in evidencing our commitment to progress on ESG topics. As a significant asset manager and asset owner in regions forecast to be impacted severely by climate change, we have a distinctive role to play in the inclusive transition to a low-carbon economy. Recognising this, in May 2021, we set a target to be net zero by 2050 for our insurance assets supported by a 25 per cent reduction in emissions from the portfolio by 2025. In addition, we have established targets for a 25 per cent reduction in Scope 1 and 2 carbon emissions per employee by 2030. Outlook We enter 2022 with a strong balance sheet and capital position. The timing of the opening of the Hong Kong border remains uncertain and Covid-19 will continue to have an impact. The current conflict in Ukraine could have wider implications for global economic and market conditions as well as geopolitical relations. However, we believe our multi-channel approach and focus on quality business and operating efficiency is the right strategy for dealing with volatile operating conditions. We are confident that our investment in new business, distribution and product enhancements will continue to meet the needs of our customers and build value for our shareholders over the long term.
9
Operational performance by market The following commentary provides an update on the operational capabilities and performance for each of the Group’s segments. Discussion of the financial performance of the Group and its segments is contained separately in the Financial Review section of this Strategic Report.
Mainland China – CITIC Prudential Life (CPL)
Actual exchange rate Constant exchange rate
2021 2020 Change 2020 Change
APE sales ($m) 776 582 33% 623 25% New business profit ($m) 352 269 31% 288 22% New business margin (%) 45 46 (1)ppts 46 (1)ppts Adjusted operating profit ($m) 343 251 37% 269 28% IFRS profit after tax ($m) 278 394 (29)% 423 (34)%
Amounts included in the table above represent the Group’s 50 per cent share
Mainland China continues to present significant opportunities for Prudential, driven by the low levels of insurance penetration, conducive regulatory proposals for the long-term development of insurance markets as well as favourable demographics such as an ageing population, emerging middle class and rapid urbanisation. These factors support further growth both in health and protection as well as pension products and services. Prudential’s life business in Mainland China, CPL, is a 50/50 joint venture with CITIC, a leading Chinese state-owned conglomerate. CPL benefits from a balanced distribution network with strength in agency and bancassurance and a well-diversified product range. CPL has a substantial opportunity to expand and deepen its presence across its nationwide footprint of 20 branches covering 99 cities. Our Mainland China business has a particular focus on areas with the greatest economic growth potential, a strategy aligned with the Chinese government’s ‘City Cluster Model’, centred on Beijing, Shanghai and the Greater Bay Area, a region which, if it was a separate economy, would be one of the 10 largest economies in the world46. We customise our solutions for various customer segments. We target the high net worth individuals and families with inter-generational insurance and wealth solutions incorporating legacy planning. We also tailor our protection and education solutions to the needs of the younger generation, which we combine with healthcare and childcare services. Our group life and health solutions are popular with business owners and their employees. New business performance during 2021
CPL became the largest contributor to the Group’s total APE sales in 2021, supported by APE sales growth of 25 per cent2 to $776 million. Our solid and resilient growth has been underpinned by our diversified distribution strategy, with both agency and bancassurance channels delivering double-digit APE sales growth at 25 per cent2 and 28 per cent2 respectively in 2021. Sales volume growth led to a 22 per cent2 increase in overall new business profit compared with the same period in 2020 and significantly exceeded the pre-pandemic level of 2019 by 25 per cent2. In a challenging environment, our agency continued to deliver growth in new business profit at an attractive margin above 70 per cent, driven by strong growth in non-participating products. The bancassurance new business profit margin was stable at 39 per cent with new business profit growth driven by higher sales, notably in the linked segment. CPL continues to outgrow the overall sector. In 2021, CPL increased its overall market share to 0.86 per cent21, from 0.74 per cent21 in 2020. Delivering customer-led solutions Our Mainland China business presents solutions that address the financial security and wellbeing of our customers at different life stages, with built-in related services enriching the overall customer propositions. Our solutions and services are combined in an ecosystem that provides an integrated experience, meets the full demands of customers and strengthens our relationships with them. During 2021, we upgraded our award-winning critical illness solution (‘Hui Kang Zhi Cheng’) by enhancing benefit coverage conditions and reducing waiting periods for certain recurrent claims such as cancer. Beyond protection, we offer a health concierge service that provides preventive healthcare, a panel of specialists for consultation on treatment options, priority hospital access and mental health rehabilitation services. To meet our customers’ desire for a more digital experience, engagement, fulfilment and servicing with customers and distributors are carried out through our mobile first Xin Yi Tong app. Our ‘Virtual Lounge’ leverages technology to humanise connection between the agent and the customer. Digital media recognised the technology’s customer useability. In fact, our CPL business continues to report one of the highest virtual sales rates amongst our business units of over 80 per cent despite the near-normalisation of the Covid-19 situation. Multi-channel distribution We continue to focus on building a professional, high-quality agency force, with suitable knowledge of health and protection products. Our 17,800 agents serve customers across the country. Our agency productivity has improved markedly, with APE sales per active agent rising 61 per cent and over 1,100 agents qualifying for the MDRT award in 2021. Our total agency force reduced during the year in the context of the industry going through a period of rationalisation and our own focus on quality. We are empowering agents with tools and techniques that help engage customers in order to provide customer-centric solutions. Over

10
time, as our agency force continues to mature and build experience, we expect this to result in further enhancement in productivity, providing additional support to our growth trajectory in CPL. Meanwhile, we also continue to build out our bancassurance distribution. We have a network of 48 bancassurance partners with access to over 6,000 branches across Mainland China, supported by over 3,000 insurance specialists catering to the customers of the banks. This has resulted in higher levels of new business from the bank channel and, coupled with further improvement in product mix, new business profit expanded by 31 per cent2 in the bancassurance channel.
Hong Kong
Actual exchange rate Constant exchange rate
2021 2020 Change 2020 Change
APE sales ($m) 550 758 (27)% 757 (27)% New business profit ($m) 736 787 (6)% 786 (6)% New business margin (%) 134 104 30ppts 104 30ppts Adjusted operating profit ($m) 975 891 9% 889 10% IFRS profit after tax ($m) 1,068 994 7% 991 8%
Our Hong Kong business, established over 57 years ago, offers domestic Hong Kong residents and mainland visitors sophisticated critical illness, medical benefits and life insurance protection business, as well as investment products in a UK-style with-profits structure. Our continued pivot to domestic customers, diversification of distribution channels and focus on value creation has resulted in 9 per cent2 growth in new business profit for the domestic segment despite the disruption of Covid-19. We continue to refresh and upgrade our offerings with comprehensive protection and wealth accumulation propositions for the affluent customers, while leveraging our strengths in affordable healthcare products such as VHIS and wellness services via Pulse which appeal to the mass market. For small and medium enterprises (SMEs), we are leveraging our digital Business@Pulse platform to provide group solutions as well as wellness programs aimed at improving employees’ well-being beyond work. Meanwhile, Mainland China customers remain an important customer segment for the Group’s Hong Kong business, although APE sales have been severely curtailed following the closure of the border between Mainland China and Hong Kong implemented in late January 2020. Based on its own and third-party surveys, the Group believes there is latent demand from Mainland China customers for its Hong Kong product suite, driven by the sophistication of the products offered and the high level of medical care available in Hong Kong. As a result, the Group expects to see the return of this important source of new business when the border between Mainland China and Hong Kong reopens and visitor arrivals normalise. Additionally, supportive regulatory developments such as Wealth and Insurance Connect between the Greater Bay Area and Hong Kong will further enhance the Hong Kong business’s ability to serve Mainland China customers. We are well placed to capture the longer-term opportunities in the Greater Bay Area given our solid foothold in Hong Kong and presence in all domestic cities in the Greater Bay Area and our pending application for a licence to operate in Macau. New business performance during 2021
Overall APE sales declined by (27) per cent2 in the year as border closure continued to prevent Mainland China visitors from buying insurance products in Hong Kong. In the domestic segment, we further strengthened our focus on regular-premium health and protection products and also shifted towards higher margin savings solutions. This strategy helped improve the protection mix by 7 percentage points2 and grow protection APE sales by 12 per cent2, although the resultant lower case size led to a 15 per cent2 fall in overall APE sales for the domestic segment. Benefiting from margin improvement, new business profit grew 9 per cent2 for the domestic segment and with significant Mainland China sales in the first quarter of 2020 only and sales being insignificant for the whole of 2021, the overall Hong Kong new business profit dropped by a modest (6) per cent2. Despite the decline in the year, overall new business profit saw strong sequential momentum throughout the year, with quarter on quarter expansion in each quarter since the second quarter of 2021, thanks to our focus on health and protection and higher-margin savings products. Delivering customer-led solutions The business fulfils customer needs via its wide range of protection, savings and investment product offerings. In addition to comprehensive critical illness solutions catering to affluent and high net-worth customers, we also extend access to affordable healthcare by offering a full range of Voluntary Health Insurance Scheme (VHIS) products. The APE sales of VHIS almost tripled in 2021 following the launch of our mid-tier VHIS product. Meanwhile, we have fully embraced the government’s ‘Qualified Deferred Annuity Plan’ (QDAP) for retirement, making us one of the leading players22 in the market. Our investment proposition provides access to international equities and bonds. Our with-profits product offering pools the investments of policyholders and allocates returns based on long-term investment performance (similar to that used historically in the UK). This is a distinct, capital-efficient structure benefiting from significant scale, enabling Prudential to provide differentiated products while generating attractive margins. Multi-channel distribution We operate a digitally enabled multi-distribution platform and provide customers choice on how they prefer to be served. We have the largest agency force of 21,579 agents in the Hong Kong market, and this channel accounted for more than 60 per cent of our APE sales in the year. Despite a challenging operating backdrop, overall agent activity has been broadly stable thanks to intensified agent training and development, enhanced customer engagement tools such as Pulse and PRULeads, as well as broadened product offerings.
11
On the bancassurance side, we have a long-standing strategic alliance with Standard Chartered Bank which has grown from strength to strength for more than 20 years. This channel achieved new business profit growth of 140 per cent2 for the domestic segment driven by product enhancements and higher health and protection sales.
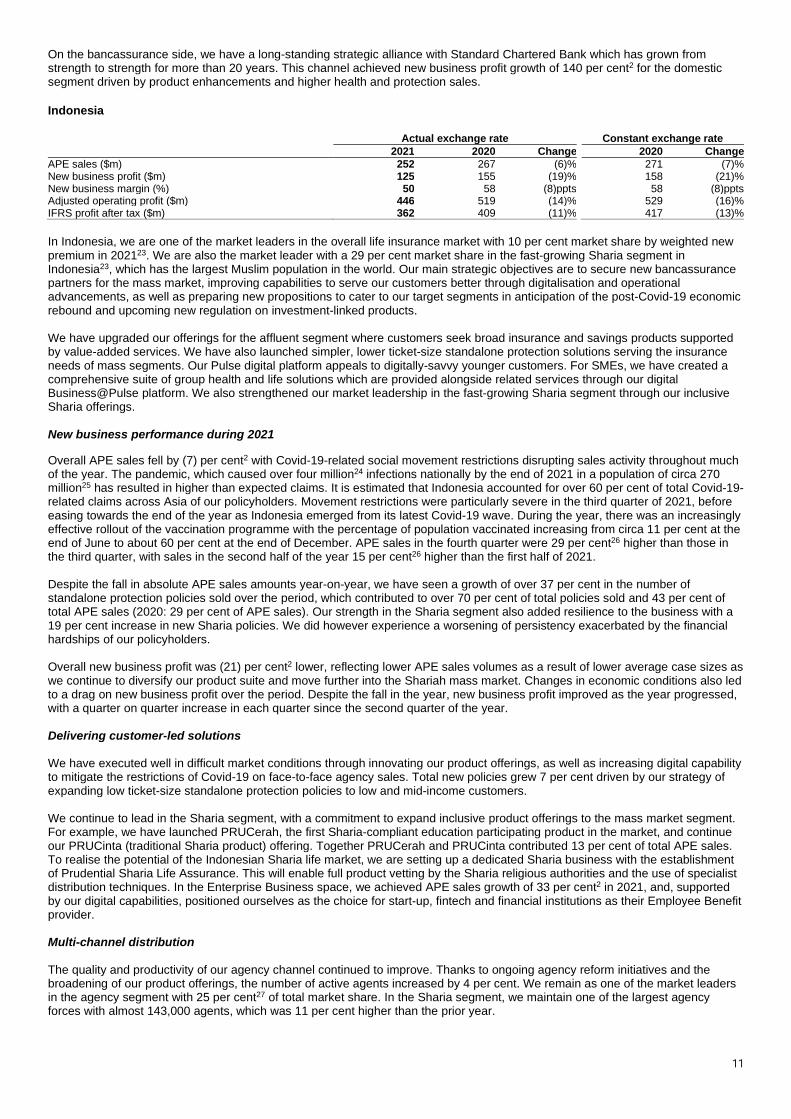
Indonesia
Actual exchange rate Constant exchange rate
2021 2020 Change 2020 Change
APE sales ($m) 252 267 (6)% 271 (7)% New business profit ($m) 125 155 (19)% 158 (21)% New business margin (%) 50 58 (8)ppts 58 (8)ppts Adjusted operating profit ($m) 446 519 (14)% 529 (16)% IFRS profit after tax ($m) 362 409 (11)% 417 (13)%
In Indonesia, we are one of the market leaders in the overall life insurance market with 10 per cent market share by weighted new premium in 202123. We are also the market leader with a 29 per cent market share in the fast-growing Sharia segment in Indonesia23, which has the largest Muslim population in the world. Our main strategic objectives are to secure new bancassurance partners for the mass market, improving capabilities to serve our customers better through digitalisation and operational advancements, as well as preparing new propositions to cater to our target segments in anticipation of the post-Covid-19 economic rebound and upcoming new regulation on investment-linked products. We have upgraded our offerings for the affluent segment where customers seek broad insurance and savings products supported by value-added services. We have also launched simpler, lower ticket-size standalone protection solutions serving the insurance needs of mass segments. Our Pulse digital platform appeals to digitally-savvy younger customers. For SMEs, we have created a comprehensive suite of group health and life solutions which are provided alongside related services through our digital Business@Pulse platform. We also strengthened our market leadership in the fast-growing Sharia segment through our inclusive Sharia offerings. New business performance during 2021
Overall APE sales fell by (7) per cent2 with Covid-19-related social movement restrictions disrupting sales activity throughout much of the year. The pandemic, which caused over four million24 infections nationally by the end of 2021 in a population of circa 270 million25 has resulted in higher than expected claims. It is estimated that Indonesia accounted for over 60 per cent of total Covid-19-related claims across Asia of our policyholders. Movement restrictions were particularly severe in the third quarter of 2021, before easing towards the end of the year as Indonesia emerged from its latest Covid-19 wave. During the year, there was an increasingly effective rollout of the vaccination programme with the percentage of population vaccinated increasing from circa 11 per cent at the end of June to about 60 per cent at the end of December. APE sales in the fourth quarter were 29 per cent26 higher than those in the third quarter, with sales in the second half of the year 15 per cent26 higher than the first half of 2021. Despite the fall in absolute APE sales amounts year-on-year, we have seen a growth of over 37 per cent in the number of standalone protection policies sold over the period, which contributed to over 70 per cent of total policies sold and 43 per cent of total APE sales (2020: 29 per cent of APE sales). Our strength in the Sharia segment also added resilience to the business with a 19 per cent increase in new Sharia policies. We did however experience a worsening of persistency exacerbated by the financial hardships of our policyholders. Overall new business profit was (21) per cent2 lower, reflecting lower APE sales volumes as a result of lower average case sizes as we continue to diversify our product suite and move further into the Shariah mass market. Changes in economic conditions also led to a drag on new business profit over the period. Despite the fall in the year, new business profit improved as the year progressed, with a quarter on quarter increase in each quarter since the second quarter of the year. Delivering customer-led solutions We have executed well in difficult market conditions through innovating our product offerings, as well as increasing digital capability to mitigate the restrictions of Covid-19 on face-to-face agency sales. Total new policies grew 7 per cent driven by our strategy of expanding low ticket-size standalone protection policies to low and mid-income customers. We continue to lead in the Sharia segment, with a commitment to expand inclusive product offerings to the mass market segment. For example, we have launched PRUCerah, the first Sharia-compliant education participating product in the market, and continue our PRUCinta (traditional Sharia product) offering. Together PRUCerah and PRUCinta contributed 13 per cent of total APE sales. To realise the potential of the Indonesian Sharia life market, we are setting up a dedicated Sharia business with the establishment of Prudential Sharia Life Assurance. This will enable full product vetting by the Sharia religious authorities and the use of specialist distribution techniques. In the Enterprise Business space, we achieved APE sales growth of 33 per cent2 in 2021, and, supported by our digital capabilities, positioned ourselves as the choice for start-up, fintech and financial institutions as their Employee Benefit provider. Multi-channel distribution The quality and productivity of our agency channel continued to improve. Thanks to ongoing agency reform initiatives and the broadening of our product offerings, the number of active agents increased by 4 per cent. We remain as one of the market leaders in the agency segment with 25 per cent27 of total market share. In the Sharia segment, we maintain one of the largest agency forces with almost 143,000 agents, which was 11 per cent higher than the prior year.

12
Development of our bancassurance channel also gathered pace. New business profit increased 25 per cent2 despite flat APE sales as a result of higher-margin new products in the traditional, funds and retirement space. We have also started to offer Sharia products through our bank partners, which contributed 4 per cent of total bancassurance APE sales in 2021.
Malaysia
Actual exchange rate Constant exchange rate
2021 2020 Change 2020 Change
APE sales ($m) 461 346 33% 351 31% New business profit ($m) 232 209 11% 212 9% New business margin (%) 50 60 (10)ppts 60 (10)ppts Adjusted operating profit ($m) 350 309 13% 313 12% IFRS profit after tax ($m) 265 256 4% 259 2%
In Malaysia, the Group has leading market positions in both the conventional and Takaful markets28 and has been serving customers for more than 97 years. The Takaful segment has substantial opportunities for growth, and we are the largest player with a 30 per cent market share29. We continuously upgrade our saving and protection solutions to serve the affluent segment, and have supplemented these recently by launching more simple, flexible solutions to serve the mass market. We also continue to broaden our Islamic wealth and protection solutions to strengthen our leadership in the fast-growing mass affluent Takaful segment. New business performance during 2021
APE sales increased by 31 per cent2, driven by growth of 45 per cent in agency production despite the tightening of Covid-19-related movement restrictions at several points throughout the year. The Takaful business achieved APE sales growth of 61 per cent2 fuelled by an increase in active agents. New business profit was 9 per cent2 higher, driven by higher volumes but given the relative weight of health and protection products, this was partly offset by the effect of higher interest rates in the period, tax changes and shift in product mix towards shorter-pay products, which also restricted new business profit and margin. Overall new business profit from health and protection business increased by 28 per cent2, including the benefit from repricing actions during the year. Delivering customer-led solutions With a total of 2.7 million customers, our Malaysia business is focused on providing holistic health and wealth solutions. Customer retention is high in both conventional and Takaful segments with 95 per cent and 87 per cent of customers respectively staying with the business. Most products are regular premium, which accounted for 98 per cent of APE sales in 2021. PruAllCare was launched in the last quarter of 2021 that provides comprehensive critical illness coverage and covers up to 190 conditions. Leveraging our Pulse platform, the business is also reaching out to the underserved communities and providing affordable and accessible healthcare services and wellness awareness to all Malaysians including the Muslim Community. Multi-channel distribution Our Malaysian business benefits from a growing agency force, with over 1,200 MDRT qualifiers, contributing to 36 per cent of total Agency APE sales30. The number of total active agents is up 20 per cent on the prior year. In the Takaful segment, we have one of the largest agency forces with over 18,000 agents, which was 18 per cent higher than the prior year. We also continue to benefit from our established bancassurance partnerships with Standard Charted Bank and UOB. Following the pivot to higher protection and savings sales through our bank partners, new business profit through this channel saw 33 per cent growth.
Singapore
Actual exchange rate Constant exchange rate
2021 2020 Change 2020 Change
APE sales ($m) 743 610 22% 626 19% New business profit ($m) 523 341 53% 350 49% New business margin (%) 70 56 14ppts 56 14ppts Adjusted operating profit ($m) 663 574 16% 589 13% IFRS profit after tax ($m) 394 521 (24)% 535 (26)%
In Singapore, we are one of the market leaders in protection, savings and investment-linked plans31. We have been serving the financial needs of Singapore for more than 90 years, delivering a suite of product offerings and professional advisory through our network of more than 5,000 financial consultants and our bank partners. We see significant prospects to increase our presence in the high net-worth segment by further upgrading our suite of health and legacy planning products, as well as strengthening our position in the affluent segment with flexible health and retirement solutions. We are building capabilities on Pulse to offer simpler insurance products, including our Shield offerings. We also grew our presence in the SME space by leveraging our Business@Pulse platform. New business performance during 2021
Our new business momentum in Singapore continued despite the tightening of Covid-19-related movement restrictions at several points throughout the year. APE sales were 19 per cent2 higher, supported by 10 per cent2 growth across our agency channel and 30 per cent2 growth across our bancassurance channel. New business profit increased by 49 per cent2, reflecting higher sales volumes and a favourable shift in product mix towards newly launched, higher margin investment-linked products, re-pricing of with-profits products, and an increase of high margin protection business (such as PruShield) within the health and protection product
13
group. Overall new business margin, given the weight to savings products in new sales in 2021, was also lifted by improved economics as interest rates increased over the period. Delivering customer-led solutions We saw diversified growth across our wide product offerings in 2021. On the protection side, PRUShield, our MediSave-approved integrated Shield plan, saw APE sales growth of 50 per cent2. On the savings side, investment-linked APE sales increased by 100 per cent2 while participating products achieved 16 per cent2 growth in APE sales. We continued to penetrate the high net-worth segment, which saw 109 per cent growth in APE sales, via our comprehensive product offerings. Our Enterprise Business also delivered good growth with APE sales increasing by 16 per cent2. Multi-channel distribution The diversity of our distribution has been instrumental to new business growth in the year. In particular, bancassurance achieved new business profit growth of 159 per cent2, which was supported by our deeper penetration of the high net-worth segment, successful focus on retirement solutions and a shift towards higher-margin products with an expected longer policy term. In the agency channel, the quality of productivity of our agency force continues to improve significantly. Top-tier agents grew at pace as demonstrated by the more than 9 per cent increase in the number of MDRT qualifiers to over 1,000 in 2021. We continue to rank first32 by regular premium APE sales in our agency channel, with overall active agents increasing by 4 per cent. Productivity as measured by APE sales per active agent rose 6 per cent, supported by higher case counts and also larger case size. Growth Markets and Other Actual exchange rate Constant exchange rate
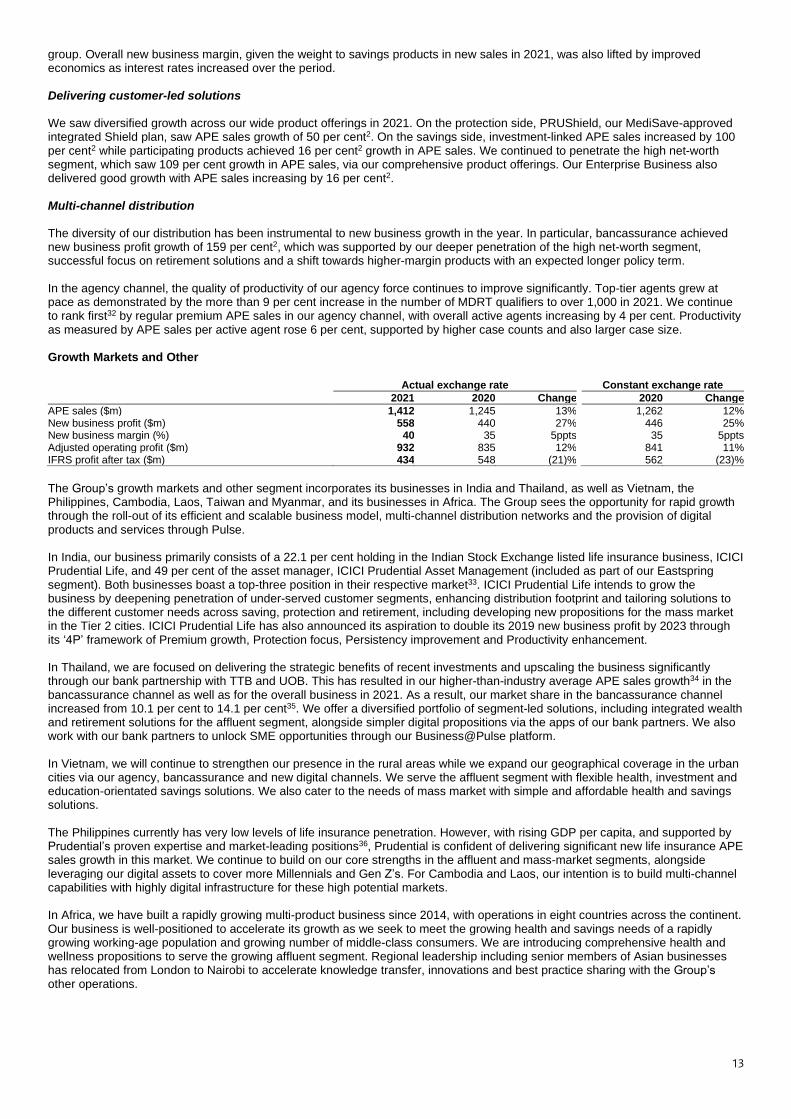
2021 2020 Change 2020 Change
APE sales ($m) 1,412 1,245 13% 1,262 12% New business profit ($m) 558 440 27% 446 25% New business margin (%) 40 35 5ppts 35 5ppts Adjusted operating profit ($m) 932 835 12% 841 11% IFRS profit after tax ($m) 434 548 (21)% 562 (23)%
The Group’s growth markets and other segment incorporates its businesses in India and Thailand, as well as Vietnam, the Philippines, Cambodia, Laos, Taiwan and Myanmar, and its businesses in Africa. The Group sees the opportunity for rapid growth through the roll-out of its efficient and scalable business model, multi-channel distribution networks and the provision of digital products and services through Pulse. In India, our business primarily consists of a 22.1 per cent holding in the Indian Stock Exchange listed life insurance business, ICICI Prudential Life, and 49 per cent of the asset manager, ICICI Prudential Asset Management (included as part of our Eastspring segment). Both businesses boast a top-three position in their respective market33. ICICI Prudential Life intends to grow the business by deepening penetration of under-served customer segments, enhancing distribution footprint and tailoring solutions to the different customer needs across saving, protection and retirement, including developing new propositions for the mass market in the Tier 2 cities. ICICI Prudential Life has also announced its aspiration to double its 2019 new business profit by 2023 through its ‘4P’ framework of Premium growth, Protection focus, Persistency improvement and Productivity enhancement. In Thailand, we are focused on delivering the strategic benefits of recent investments and upscaling the business significantly through our bank partnership with TTB and UOB. This has resulted in our higher-than-industry average APE sales growth34 in the bancassurance channel as well as for the overall business in 2021. As a result, our market share in the bancassurance channel increased from 10.1 per cent to 14.1 per cent35. We offer a diversified portfolio of segment-led solutions, including integrated wealth and retirement solutions for the affluent segment, alongside simpler digital propositions via the apps of our bank partners. We also work with our bank partners to unlock SME opportunities through our Business@Pulse platform. In Vietnam, we will continue to strengthen our presence in the rural areas while we expand our geographical coverage in the urban cities via our agency, bancassurance and new digital channels. We serve the affluent segment with flexible health, investment and education-orientated savings solutions. We also cater to the needs of mass market with simple and affordable health and savings solutions. The Philippines currently has very low levels of life insurance penetration. However, with rising GDP per capita, and supported by Prudential’s proven expertise and market-leading positions36, Prudential is confident of delivering significant new life insurance APE sales growth in this market. We continue to build on our core strengths in the affluent and mass-market segments, alongside leveraging our digital assets to cover more Millennials and Gen Z’s. For Cambodia and Laos, our intention is to build multi-channel capabilities with highly digital infrastructure for these high potential markets. In Africa, we have built a rapidly growing multi-product business since 2014, with operations in eight countries across the continent. Our business is well-positioned to accelerate its growth as we seek to meet the growing health and savings needs of a rapidly growing working-age population and growing number of middle-class consumers. We are introducing comprehensive health and wellness propositions to serve the growing affluent segment. Regional leadership including senior members of Asian businesses has relocated from London to Nairobi to accelerate knowledge transfer, innovations and best practice sharing with the Group’s other operations.
14
New business performance during 2021
The businesses comprising our Growth markets and other segment saw APE sales up 12 per cent2 compared with 2020. Cambodia, India, Myanmar, the Philippines, Thailand and Africa all had double-digit growth despite the difficulties associated with Covid-19. New business profit was up 25 per cent2 exceeding the growth in sales, with Cambodia, India, the Philippines, Myanmar and Thailand all having double-digit growth in new business profit and also reflecting the inclusion of our Africa businesses for the first time in 2021. In India, APE sales grew 29 per cent2 supported by diverse growth across all distribution channels, with both agency and bancassurance channels achieving APE sales growth in 2021, as well as an increased focus on annuity products. Despite the challenges arising from Covid-19 restrictions, new business profit grew by 41 per cent2 in 2021 as a result of favourable product mix. In Thailand, APE sales rose 22 per cent2 helped by the expansion of bancassurance sales in 2021. New business profit margins improved compared with the prior year following favourable product mix and improving interest rates over the period, resulting in a 129 per cent2 increase in new business profit. In Vietnam, sales volume slightly increased despite nationwide Covid-19 lockdowns impacting the agency market. The bancassurance channel performed well despite Covid-19, with APE sales up 17 per cent2, as banks were allowed to remain open as essential services during the lockdown. Prudential also benefited from the expansion of bancassurance agreements and remained the leader in the bancassurance channel with 19.4 per cent market share37. In the Philippines, 2021 APE sales were up 26 per cent2, primarily from the agency channel, and Prudential remains the largest player in the market36. New business profit growth was broadly in line with the increase in APE sales. In Africa, APE sales have grown by 24 per cent2 year-on-year, with growth in all eight countries. The East and Central Africa business (comprising Kenya, Uganda and Zambia) performed particularly well with an APE sales growth of 43 per cent2. Delivering customer-led solutions In Thailand, we have developed a portfolio of segment-led insurance solutions that emulate the needs of our bank partners’ customers. For example, we provided affordable credit life solutions to the banks’ mortgage and personal loan customers; we delivered packaged solutions that combine bank products with insurance offerings including savings and protection products; and we expanded our investment-linked offerings the sales of which, through the bancassurance channel, increased by 88 per cent2 in 2021 as compared with the previous year. Leveraging our Business@Pulse ecosystem, our Employee Benefit business has also gained traction achieving 76 per cent2 growth in APE sales and covering more than 140,000 members. In Vietnam, we launched an innovative digital Personal Accident product (‘PRUGuard 24/7’) as well as a low-cost digital Critical Illness solution (‘PRUCare’) via various digital platforms thereby increasing our penetration into the younger segment of the Vietnamese population. Since launch in late December 2020 and April 2021, we have sold over 42,00038 PRUGuard policies and 3,00038 PRUCare policies respectively. In Cambodia, we introduced our first-in-the-market digital solutions in Dengue and Malaria protection as well as Road Safety protection. In Africa, we continue to pursue customer-led insurance initiatives, particularly with our partners where we have launched a digital ‘Diaspora Funeral Cover’ product with Centenary Bank in Uganda and a degree insurance digital product with MTN in Cameroon. Multi-channel distribution In India, ICICI Prudential Life’s growth ambitions will be driven by enhancing its multi-channel distribution capability. In the agency channel, we have recruited over 27,000 new agents during the year. Outside agency, we have added about 100 new partnerships bringing total partnerships to around 700 including 23 banks. In Thailand, the strategic partnership with TTB, which commenced on 1 January 2021, significantly strengthens our distribution capability in Thailand’s fast-growing life insurance sector, giving us access to an expanded network of 636 branches. We have launched a refreshed set of propositions encompassing the high net-worth, retail, commercial and SME segments and rolled out a new e-POS system. These developments have enabled us to advance our overall market share to 6.5 per cent from 5.1 per cent35 in 2020 and become the third largest player35 in the bancassurance channel in 2021. In the Philippines, we are partnering with CIMB Bank Philippines to help bring more financial products and services to the country’s consumers. Under this partnership, we will provide CIMB’s customers with easy access to our life insurance products through CIMB’s app, and CIMB’s deposit savings and credit products will be made available on our Pulse app. In Africa, we have sought to deepen our health and protection offering, complementing an increasing portfolio of corporate protection across many of our countries. In our agency and bancassurance business we have increasingly equipped our agents and sales people with the skills required to advise their customers on their protection requirements. Compared with the first quarter of 2021, agency protection productivity had increased by 40 per cent by the fourth quarter with an over 20 per cent increase in the number of agents who sold a protection case in the same period. Sales people have been supported in their careers in many markets through earlier training on protection products, creating opportunities to help them serve this significant gap in the market.
15
In other high-potential markets, agent quality and productivity continued to improve. In Vietnam the contribution to APE sales by our MDRT qualifiers increased by 7 percentage points to 45 per cent. Cambodia agency development was encouraging with both number of active agents and APE sales per active agent rising significantly in 2021.
Eastspring, leading asset manager in Asia
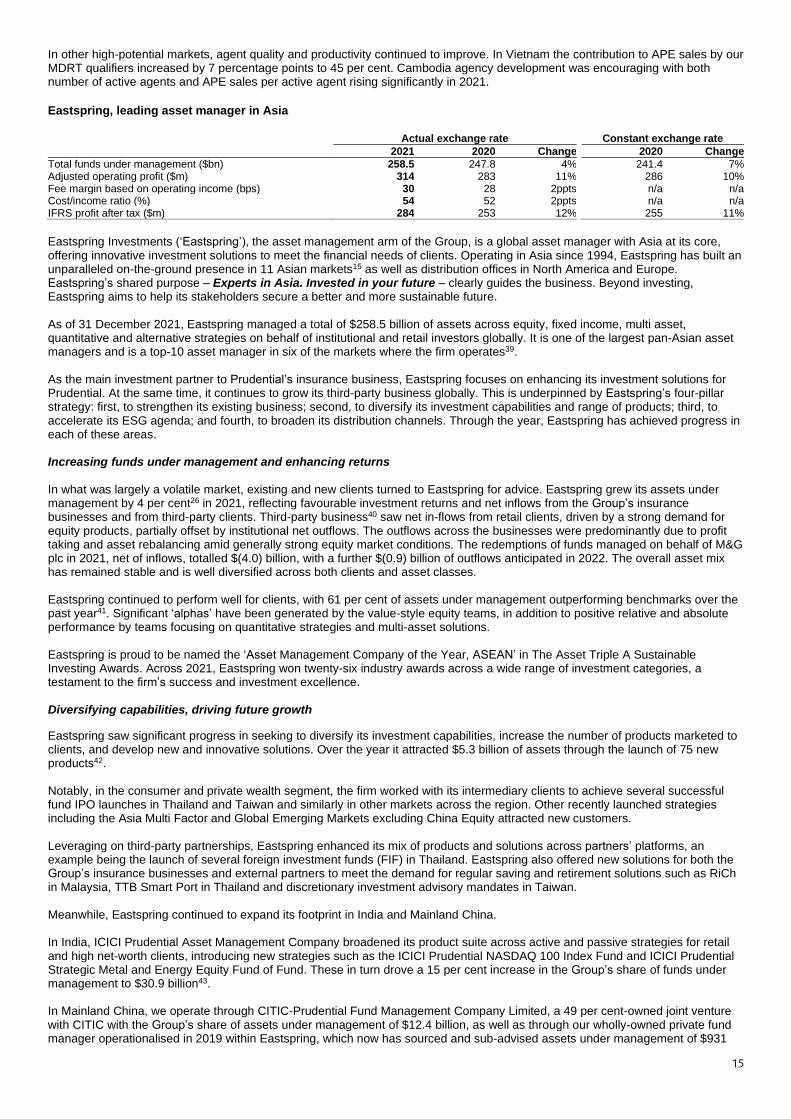
Actual exchange rate Constant exchange rate
2021 2020 Change 2020 Change
Total funds under management ($bn) 258.5 247.8 4% 241.4 7% Adjusted operating profit ($m) 314 283 11% 286 10% Fee margin based on operating income (bps) 30 28 2ppts n/a n/a Cost/income ratio (%) 54 52 2ppts n/a n/a IFRS profit after tax ($m) 284 253 12% 255 11%
Eastspring Investments (‘Eastspring’), the asset management arm of the Group, is a global asset manager with Asia at its core, offering innovative investment solutions to meet the financial needs of clients. Operating in Asia since 1994, Eastspring has built an unparalleled on-the-ground presence in 11 Asian markets15 as well as distribution offices in North America and Europe. Eastspring’s shared purpose – Experts in Asia. Invested in your future – clearly guides the business. Beyond investing, Eastspring aims to help its stakeholders secure a better and more sustainable future. As of 31 December 2021, Eastspring managed a total of $258.5 billion of assets across equity, fixed income, multi asset, quantitative and alternative strategies on behalf of institutional and retail investors globally. It is one of the largest pan-Asian asset managers and is a top-10 asset manager in six of the markets where the firm operates39. As the main investment partner to Prudential’s insurance business, Eastspring focuses on enhancing its investment solutions for Prudential. At the same time, it continues to grow its third-party business globally. This is underpinned by Eastspring’s four-pillar strategy: first, to strengthen its existing business; second, to diversify its investment capabilities and range of products; third, to accelerate its ESG agenda; and fourth, to broaden its distribution channels. Through the year, Eastspring has achieved progress in each of these areas. Increasing funds under management and enhancing returns In what was largely a volatile market, existing and new clients turned to Eastspring for advice. Eastspring grew its assets under management by 4 per cent26 in 2021, reflecting favourable investment returns and net inflows from the Group’s insurance businesses and from third-party clients. Third-party business40 saw net in-flows from retail clients, driven by a strong demand for equity products, partially offset by institutional net outflows. The outflows across the businesses were predominantly due to profit taking and asset rebalancing amid generally strong equity market conditions. The redemptions of funds managed on behalf of M&G plc in 2021, net of inflows, totalled $(4.0) billion, with a further $(0.9) billion of outflows anticipated in 2022. The overall asset mix has remained stable and is well diversified across both clients and asset classes. Eastspring continued to perform well for clients, with 61 per cent of assets under management outperforming benchmarks over the past year41. Significant ‘alphas’ have been generated by the value-style equity teams, in addition to positive relative and absolute performance by teams focusing on quantitative strategies and multi-asset solutions. Eastspring is proud to be named the ‘Asset Management Company of the Year, ASEAN’ in The Asset Triple A Sustainable Investing Awards. Across 2021, Eastspring won twenty-six industry awards across a wide range of investment categories, a testament to the firm’s success and investment excellence. Diversifying capabilities, driving future growth
Eastspring saw significant progress in seeking to diversify its investment capabilities, increase the number of products marketed to clients, and develop new and innovative solutions. Over the year it attracted $5.3 billion of assets through the launch of 75 new products42. Notably, in the consumer and private wealth segment, the firm worked with its intermediary clients to achieve several successful fund IPO launches in Thailand and Taiwan and similarly in other markets across the region. Other recently launched strategies including the Asia Multi Factor and Global Emerging Markets excluding China Equity attracted new customers. Leveraging on third-party partnerships, Eastspring enhanced its mix of products and solutions across partners’ platforms, an example being the launch of several foreign investment funds (FIF) in Thailand. Eastspring also offered new solutions for both the Group’s insurance businesses and external partners to meet the demand for regular saving and retirement solutions such as RiCh in Malaysia, TTB Smart Port in Thailand and discretionary investment advisory mandates in Taiwan. Meanwhile, Eastspring continued to expand its footprint in India and Mainland China. In India, ICICI Prudential Asset Management Company broadened its product suite across active and passive strategies for retail and high net-worth clients, introducing new strategies such as the ICICI Prudential NASDAQ 100 Index Fund and ICICI Prudential Strategic Metal and Energy Equity Fund of Fund. These in turn drove a 15 per cent increase in the Group’s share of funds under management to $30.9 billion43. In Mainland China, we operate through CITIC-Prudential Fund Management Company Limited, a 49 per cent-owned joint venture with CITIC with the Group’s share of assets under management of $12.4 billion, as well as through our wholly-owned private fund manager operationalised in 2019 within Eastspring, which now has sourced and sub-advised assets under management of $931

16
million. 2021 saw it build a portfolio of credible China A Equity growth style funds and China bond funds, which attracted demand from international clients, validating their confidence in the firm’s products. Our Chinese life insurance joint venture has established its own asset management company in 2020, Prudential-CITIC Asset Management Co, which further strengthens our capabilities in savings and retirement products. During the year CITIC Prudential Fund Management Company achieved a successful IPO with the launch of the Fengyu Hybrid fund, achieving assets under management of over RMB 10 billion (approximately $2 billion) through a partnership with CITIC Bank. It achieved strong fund performance with 7 of its 15 equity funds achieving top-decile fund performance, leading to a 27 per cent44 growth in their total assets. Across the Asia region and beyond, Eastspring’s commitment to delivering superior investment outcomes for our investors and clients over the long term has made us a trusted partner, as evidenced in 2021, and the firm will continue to focus on investment excellence going into 2022. Accelerating responsible investing, invested in your future In line with its purpose, Invested in Your Future, Eastspring continued to reinforce its ambition as a leading Asia-based asset manager rooted in ESG and sustainability. To meet client demand for responsible investment portfolios, Eastspring launched its second ESG-focused product, the US ESG Beta Fund in October 2021, followed by the Eastspring IDX ESG Leaders Plus Fund in January 2022. It is in the process of developing several other ESG-focused funds for both Prudential and third-party clients. These include China All Shares Sustainable Fund, China Offshore Sustainable Bond Fund and Japan Sustainable Value Fund. Broadening distribution, increasing digitalisation Eastspring has strengthened its institutional business, winning new mandates with top asset owners, alongside expanded recommendation ratings from investment consultants, both in local markets and globally. Apart from reinforcing its position as Experts in Asia, Eastspring also gained traction outside of Asia, as it continued to build its footprint and relationships in North America and Europe, leveraging on partnerships with third-party distributors. In the retail segment, Eastspring expanded its digitalised distribution capabilities through partnerships with multiple new age digital wealth managers, such as Stashaway, Endowus and Moduit. Promising progress has also been made in its own digitalisation capabilities; as an example, the upgrade of Eastspring Malaysia’s own digital platform with a new ‘Do-It-Yourself’ feature, enabling new and existing retail investors to Buy, Regularly Invest, Sell and Switch transactions directly on the platform. As part of Eastspring’s commitment in advancing financial knowledge for its stakeholders, it produced over 50 thought leadership and insight articles over the year enabling clients to stay on top of financial trends, outlook and knowledge. It also adopted new channels of communication – social media channels (Instagram, Whatsapp and TikTok) and a new podcast, on top of its regular expert webinar series. Eastspring’s brand presence is also amplified through Prudential’s Pulse app via thought leadership content and knowledge sharing. The focus on financial literacy starts from the grassroots level. To this end, Eastspring launched the #MoneyParenting campaign across Asia to empower parents to coach their children towards a financially successful future. This initiative was recognised by the Malaysia Financial Education Network45.
Notes 1 After deduction of underwriting fees and other estimated expenses connected with the equity raise. 2 On a constant exchange rate basis. 3 APE sales is a measure of new business activity that comprises the aggregate of annualised regular premiums and one-tenth of single premiums on new business
written during the year for all insurance products, including premiums for contracts designated as investment contracts under IFRS 4. It is not representative of premium income recorded in the IFRS financial statements. See note II of the Additional unaudited financial information for further explanation.
4 New business profit, on a post-tax basis, on business sold in the period, calculated in accordance with EEV Principles. 5 ‘Adjusted operating profit’ refers to adjusted IFRS operating profit based on longer-term investment returns from continuing operations. This alternative
performance measure is reconciled to IFRS profit for the period in note B1.1 of the IFRS financial statements. 6 To employees of the continuing business. 7 Full year 2021 total funds under management, including external funds under management, money market funds, funds managed on behalf of M&G plc and
internal funds under management, reported based on the country where the funds are managed. 8 Based on full year 2021 exchange rates. 9 Source: World Health Organisation: Global Health Observatory data repository (2019). South-East Asia, out of pocket expenditure as percentage of current health
expenditure. 10 Prudential estimate based on number of in-force policies over total population. 11 Source: Swiss Re Institute: The health protection gap in Asia, October 2018. 12 Source: The Economist, Special report, 28 March 2020 edition. 13 Including India and CPL. 14 Percentage of APE sales in Asia markets, excluding India and including CPL and Malaysia Takaful on a 100 per cent basis. 15 Mainland China, Hong Kong, India, Indonesia, Japan, Malaysia, Singapore, South Korea, Taiwan, Thailand, Vietnam. 16 As at 31 December 2021, in the markets where Pulse is offered. 17 APE sales involving Pulse are sales completed by agents on leads from digital campaigns captured within the Pulse customer management system or on leads
from Pulse registrations, together with a small number of policies purchased via Pulse online. 18 Leads that originate from a digital platform, digital campaign or partner; and other leads, including leads from agents, recorded on PRUleads, part of the Pulse
platform. 19 Operating return on average shareholders equity from continuing operations. 20 See note II of the Additional unaudited financial information for definition and reconciliation. 21 Source: based on life insurance sector gross written premiums data from the China Banking and Insurance Regulatory Commission. 22 Source: based on analysis of newsclips and information collected from the informal market network group. 23 Source: based on weighted new premiums for 2021 from Indonesian Life Insurance Association. 24 Source: Our World in Data: Cumulative confirmed Covid-19 cases. 25 United Nations, Department of Economic and Social Affairs, Population Division, World Population Prospects 2019 Revision (2020 estimates). 26 On an actual exchange rate basis. 27 Source: based on weighted new premiums from Indonesian Life Insurance Association. 28 Source: based on new business APE from the Life insurance association of Malaysia. 29 Source: based on new business APE from the Insurance Service Malaysia Berhad. 30 Including Malaysia Takaful on a 100 per cent basis. 31 Source: based on weighted new business premiums reported within the Singapore Life Insurance Association for full year 2021. 32 Source: based on regular premium APE data from the Singapore Life Insurance Association.

17
33 Source: India Life insurance business: based on calendar year 2021 retail weighted premium of private insurers operating in India; India asset manager: based on Association of mutual funds in India.
34 Source: based on APE sales in the first 11 months of 2021. 35 Source: based on weighted new business premiums from the Thai Life Assurance Association. 36 Source: based on weighted first year premiums from the Insurance Commission. 37 Source: based on full year 2021 APE from the Actuarial Network Data Sharing. 38 As at October 2021. 39 Sources: Singapore and Hong Kong (Morningstar), Malaysia (Lipper), Thailand (Association of Investment Management Companies), Korea (Korea Financial
Investment Association), India (Association of Mutual Funds in India), Japan (Investment Trusts Association, Japan), Taiwan (securities Investment Trust & Consulting Association of R.O.C), China (Wind), Indonesia (Otoritas Jasa Keuangan), Vietnam (State Securities Commission of Vietnam). All markets as of June 2021. Eastspring joint ventures include Hong Kong, India, China. Japan reflects Publicly Offered Investment Trusts market presence. China reflects public mutual funds presence. Vietnam reflects open-ended mutual funds market presence only. Market presence based on whether the AMCs offer onshore domiciled mutual funds. Market ranking based on 100 per cent shareholdings.
40 Excluding money market funds and funds managed on behalf of M&G plc. 41 The value of assets under management at 31 December 2021 in funds which outperform their performance benchmark as a percentage of total assets under
management at 31 December 2021, excluding assets in funds with no performance benchmark. 42 As of December 2021, excluding joint ventures. 43 Group’s share of total assets under management. 44 Growth from end of 2020 to end of Q3 2021. 45 The Financial Education Network (FEN), an initiative by the Malaysian government, is an inter-agency platform comprising of institutions and agencies committed
to improving the financial literacy of Malaysians. 46 Source: based on GDP data sourced from the World Bank and www.bayarea.gov.hk websites.
18
Financial review
2021 saw Prudential grow its continuing business organically across the Group’s key measures of financial performance. This performance, as in prior years, reflects the benefit of our digitally-enabled, multi-channel and geographically diverse platform as well as our focus on writing quality business at attractive margins. Despite the ongoing Covid-19-related disruption, the Group has delivered a robust financial performance as management and staff continued to focus on delivering for our customers. We successfully completed the demerger of Jackson and restructured the Group’s financing through an equity raise and debt redemption programme. As a result, we start 2022 with materially enhanced financial flexibility, with our leverage ratio at the lower end of our medium-term target range and strong levels of regulatory capital. Going forward, we will benefit from lower interest costs following the redemption and refinancing of debt to date, and by the start of 2023 from a further $70 million1 reduction in annual central expenses. We continue to seek increases in the efficiency of our central operations by delayering, de-duplicating and speeding up processes through automation and consolidation of suppliers, while redirecting discretionary spend on IT to support high growth initiatives. Prudential is well placed to profit from the growth opportunities in its Asia and Africa markets on it which it is now entirely focused. 2021 saw continued and varying Covid-19-related disruption in many of our markets. This, and the related continued closure of the Hong Kong-Mainland China border, impacted our overall APE sales performance. The growth of our other markets has, however, mitigated the impact on APE sales and our continued focus on high customer retention and health and protection products has allowed us to continue to grow adjusted IFRS operating profit based on longer-term investment returns (adjusted operating profit2). Over the course of 2021, global equity market performance varied; the MSCI Asia excluding Japan equity index fell (4) per cent, the HKSI fell (14) per cent while the S&P 500 index increased by 27 per cent. Government yields in many of our markets ended the year higher with the US 10-year yield increasing by 59 basis points to 1.53 per cent. During the year, interest rates were volatile as various geopolitical and Covid-19-related economic impacts developed, most importantly the emergence of material inflationary trends. The 2021 IFRS results include Jackson up to the date of demerger (13 September 2021) and for financial reporting purposes Jackson is classified as a discontinued operation, with its results excluded from all of our Group KPIs that are focused entirely on the continuing part of our business. At 31 December 2021 our residual 18.4 per cent interest in Jackson is carried at fair value and was valued at $683 million at this date. The total IFRS loss after tax for 2021 was $(2,813) million (2020: $2,231 million3 profit after tax), which comprised a $2,214 million profit after tax from continuing operations and a $(5,027) million loss after tax from discontinued operations. This loss from discontinued operations is due to the write-down of Jackson to its fair value upon demerger, as required by accounting standards. Further discussion on the loss from discontinued operations is included in the section headed ‘Loss from discontinued operations – Jackson’ which appears later in this report. As a consequence of the demerger of Jackson, IFRS shareholders’ equity fell from $20.9 billion4 at the end of 2020 to $17.1 billion at 31 December 2021. The remainder of this summary will focus on the Group’s continuing operations. As in previous years, we comment on our performance in local currency terms (expressed on a constant exchange rate basis) to show the underlying business trends in periods of currency movement, unless otherwise noted. In 2021, despite on-going disruption, our digitally-enabled, multi-channel and geographically diversified platform delivered 8 per cent growth3 in APE sales5. Excluding Hong Kong, where border restrictions with Mainland China remained in place, APE sales were 16 per cent higher3, with particularly encouraging growth in key markets such as Mainland China, India, Malaysia, the Philippines, Singapore and Thailand. This increase in APE sales was combined with an improvement in new business margins driven by a favourable shift in business mix, which resulted in a 13 per cent increase3 in Group new business profit6. The adjusted operating profit of our life insurance businesses increased by 8 per cent3 despite higher Covid-19-related claims, and reflects the high quality of our in-force portfolio. Asset management adjusted operating profit increased 10 per cent3 driven by higher average funds under management following sustained net inflows from our life businesses and improved asset mix. Eastspring’s overall funds under management reached $258.5 billion7 at 31 December 2021. The Group’s overall adjusted operating profit increased 16 per cent3 reflecting higher life and asset management results and reduced central expenses. Our life and asset management business generated operating free surplus8 of $2,071 million, up 7 per cent3 on the prior year. The Group’s embedded value was $47.4 billion at 31 December 2021, with an operating return on embedded value of 8 per cent9. The increase from the prior year end was driven mainly by the addition of $2.5 billion of new business profit and the $2.4 billion net proceeds10 of our equity raise. Our regulatory capital position and central liquidity positions remain robust. After allowing for the effect of planned high-coupon debt redemption in January 2022, the Group’s GWS shareholder surplus11 was $11.5 billion and cover ratio was 408 per cent. The increase in surplus and cover ratio over 2021 largely reflects the impact of organic capital generation, the proceeds from our equity raise and other positive non-operating movements. The Group’s liquidity position remains very sound with $3.6 billion of holding company cash at the end of the year, of which $1,725 million was utilised in January 2022 to redeem debt, and $2.6 billion of undrawn committed facilities.

19
IFRS profit Actual exchange rate Constant exchange rate
2021 $m 2020 $m Change % 2020 $m Change %
Adjusted operating profit based on longer-term investment returns before tax from continuing operations CPL 343 251 37 269 28 Hong Kong 975 891 9 889 10 Indonesia 446 519 (14) 529 (16) Malaysia 350 309 13 313 12 Singapore 663 574 16 589 13 Growth markets and other12 932 835 12 841 11
Long-term business adjusted operating profit 3,709 3,379 10 3,430 8 Asset management 314 283 11 286 10
Total segment profit from continuing operations 4,023 3,662 10 3,716 8
Investment return and other income 21 (15) n/a (15) n/a Interest payable on core structural borrowings (328) (316) (4) (316) (4) Corporate expenditure (298) (412) 28 (428) 30
Other income and expenditure (605) (743) 19 (759) 20
Total adjusted operating profit before tax and restructuring and IFRS 17 implementation costs 3,418 2,919 17 2,957 16 Restructuring and IFRS 17 implementation costs (185) (162) (14) (167) (11)
Total adjusted operating profit before tax 3,233 2,757 17 2,790 16
Non-operating items: Short-term fluctuations in investment returns on shareholder-backed business (458) (579) 21 (554) 17 Amortisation of acquisition accounting adjustments (5) (5) - (5) - (Loss) Profit attaching to corporate transactions (94) 735 n/a 733 n/a
Profit from continuing operations before tax attributable to shareholders 2,676 2,908 (8) 2,964 (10)
Tax charge attributable to shareholders' returns (462) (440) (5) (450) (3)
Profit from continuing operations for the period 2,214 2,468 (10) 2,514 (12) Loss from discontinued operations for the period, net of related tax (5,027) (283) n/a (283) n/a
(Loss) profit for the period (2,813) 2,185 n/a 2,231 n/a
IFRS earnings per share
Actual exchange rate Constant exchange rate
2021 cents 2020 cents Change % 2020 cents Change %
Basic earnings per share based on adjusted operating profit after tax from continuing operations 101.5 86.6 17 87.6 16 Basic earnings per share based on:
Total profit after tax from continuing operations 83.4 94.6 (12) 96.4 (13) Total profit after tax from discontinued operations (161.1) (13.0) n/a (13.1) n/a
Segment profit from continuing long-term and asset management business increased by 8 per cent3 to $4,023 million. All our major segments, other than Indonesia, delivered growth, with the biggest percentage increase seen in CITIC Prudential Life (CPL). Earnings in the second half of the year were dampened by higher claims costs in Indonesia following a surge of Covid-19 cases in the third quarter, and as medical reimbursement costs continued to trend back to pre-pandemic levels. After allowing for a 20 per cent3 reduction in central expenditure (before restructuring and IFRS 17 implementation costs), total adjusted operating profit before tax increased to $3,233 million, a 16 per cent3 increase compared with the prior period. CPL, our joint venture business in Mainland China, delivered a 28 per cent increase3 in adjusted operating profit to $343 million, primarily driven by growth in our in-force portfolio, evident by a 19 per cent growth in recurring premiums in 2021. In Hong Kong, our adjusted operating profit was up 10 per cent3 to $975 million and is driven by our long-term focus on regular premium business and strong retention of both our domestic and Mainland China customers. It also reflects the on-going growth of our health and protection business and, for our flagship critical illness products, the compounding benefit to adjusted operating profit given the accumulating nature of asset shares. Earnings outperformed growth in renewal premiums, as some policies within the with-profits funds reached the end of their premium paying term, albeit they continue to contribute to annual adjusted operating profit through the with-profits bonus mechanism. In Indonesia, adjusted operating profit reduced by (16) per cent3 reflecting lower APE sales over recent years and adverse Covid-19-related claims experience. In Malaysia adjusted operating profit growth of 12 per cent3 was supported by the growth of our in-force health and protection business, with shareholder-backed renewal premiums increasing by 8 per cent3, and higher fee income as a result of increased funds held within unit-linked funds. In Singapore, adjusted operating profit increased 13 per cent3 reflecting the continued growth of our in-force business, including in protection and savings products where we believe demand will continue as the population ages and seeks to meet its health and retirement needs. The businesses comprising our Growth markets and other segment generated adjusted operating profit growth of 11 per cent3, reflective of in-force growth which is supported by APE sales in recent years. Vietnam, the Philippines and Thailand all reported
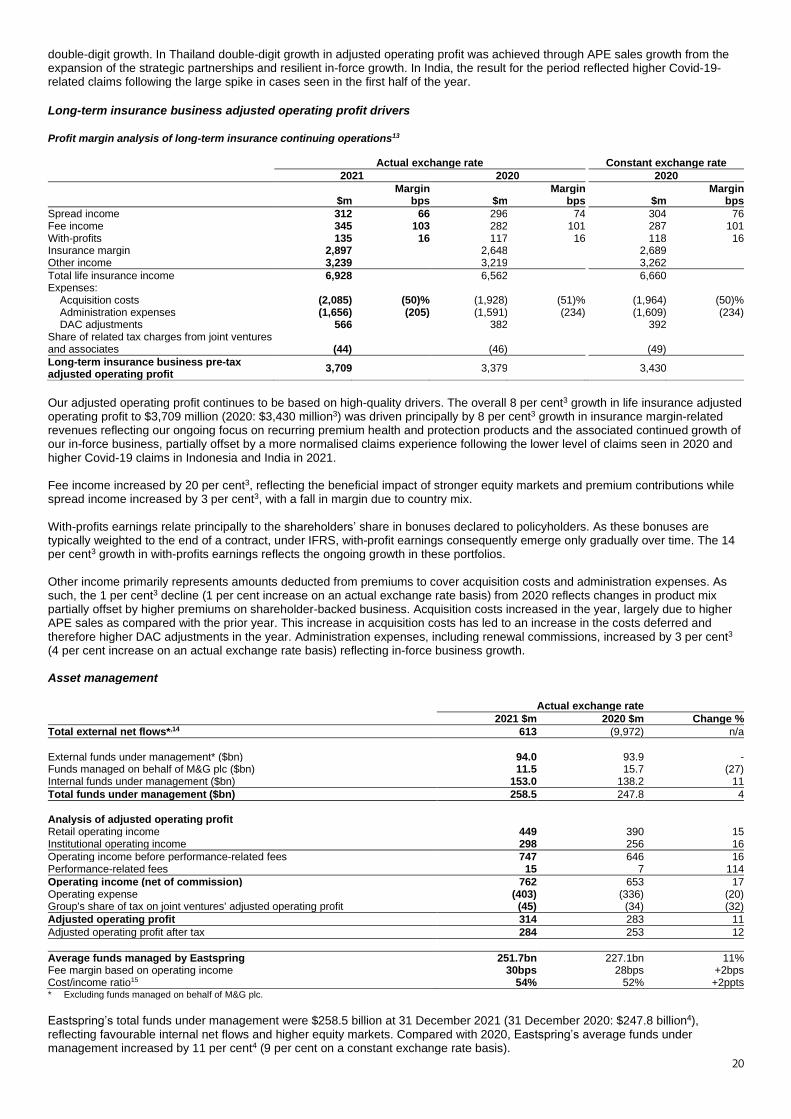
20
double-digit growth. In Thailand double-digit growth in adjusted operating profit was achieved through APE sales growth from the expansion of the strategic partnerships and resilient in-force growth. In India, the result for the period reflected higher Covid-19-related claims following the large spike in cases seen in the first half of the year.
Long-term insurance business adjusted operating profit drivers
Profit margin analysis of long-term insurance continuing operations13 Actual exchange rate Constant exchange rate
2021 2020 2020
Margin Margin Margin $m bps $m bps $m bps
Spread income 312 66 296 74 304 76 Fee income 345 103 282 101 287 101 With-profits 135 16 117 16 118 16 Insurance margin 2,897 2,648 2,689 Other income 3,239 3,219 3,262
Total life insurance income 6,928 6,562 6,660 Expenses:
Acquisition costs (2,085) (50)% (1,928) (51)% (1,964) (50)% Administration expenses (1,656) (205) (1,591) (234) (1,609) (234) DAC adjustments 566 382 392
Share of related tax charges from joint ventures and associates (44) (46) (49)
Long-term insurance business pre-tax adjusted operating profit
3,709 3,379 3,430
Our adjusted operating profit continues to be based on high-quality drivers. The overall 8 per cent3 growth in life insurance adjusted operating profit to $3,709 million (2020: $3,430 million3) was driven principally by 8 per cent3 growth in insurance margin-related revenues reflecting our ongoing focus on recurring premium health and protection products and the associated continued growth of our in-force business, partially offset by a more normalised claims experience following the lower level of claims seen in 2020 and higher Covid-19 claims in Indonesia and India in 2021. Fee income increased by 20 per cent3, reflecting the beneficial impact of stronger equity markets and premium contributions while spread income increased by 3 per cent3, with a fall in margin due to country mix. With-profits earnings relate principally to the shareholders’ share in bonuses declared to policyholders. As these bonuses are typically weighted to the end of a contract, under IFRS, with-profit earnings consequently emerge only gradually over time. The 14 per cent3 growth in with-profits earnings reflects the ongoing growth in these portfolios. Other income primarily represents amounts deducted from premiums to cover acquisition costs and administration expenses. As such, the 1 per cent3 decline (1 per cent increase on an actual exchange rate basis) from 2020 reflects changes in product mix partially offset by higher premiums on shareholder-backed business. Acquisition costs increased in the year, largely due to higher APE sales as compared with the prior year. This increase in acquisition costs has led to an increase in the costs deferred and therefore higher DAC adjustments in the year. Administration expenses, including renewal commissions, increased by 3 per cent3 (4 per cent increase on an actual exchange rate basis) reflecting in-force business growth. Asset management
Actual exchange rate
2021 $m 2020 $m Change %
Total external net flows*,14 613 (9,972) n/a
External funds under management* ($bn) 94.0 93.9 - Funds managed on behalf of M&G plc ($bn) 11.5 15.7 (27) Internal funds under management ($bn) 153.0 138.2 11
Total funds under management ($bn) 258.5 247.8 4
Analysis of adjusted operating profit Retail operating income 449 390 15 Institutional operating income 298 256 16
Operating income before performance-related fees 747 646 16 Performance-related fees 15 7 114
Operating income (net of commission) 762 653 17 Operating expense (403) (336) (20) Group's share of tax on joint ventures' adjusted operating profit (45) (34) (32)
Adjusted operating profit 314 283 11
Adjusted operating profit after tax 284 253 12
Average funds managed by Eastspring 251.7bn 227.1bn 11% Fee margin based on operating income 30bps 28bps +2bps Cost/income ratio15 54% 52% +2ppts * Excluding funds managed on behalf of M&G plc.
Eastspring’s total funds under management were $258.5 billion at 31 December 2021 (31 December 2020: $247.8 billion4), reflecting favourable internal net flows and higher equity markets. Compared with 2020, Eastspring’s average funds under management increased by 11 per cent4 (9 per cent on a constant exchange rate basis).

21
Eastspring saw total net inflows of $5.8 billion over 2021 (2020: $(11.5) billion4) which included internal net inflows from our life businesses of $10.7 billion (2020: $8.5 billion4) and from third-parties (excluding money market funds) of $0.6 billion (2020: $(10.0) billion4 of outflows). Offsetting these amounts were $(4.0) billion of net outflows for funds managed on behalf of M&G plc, with further net outflows of about $(0.9) billion expected in 2022. Third-party net flows were driven by $1.1 billion of retail net inflows, partly offset by net institutional outflows. Overall there were external net inflows into equity funds and external net outflows from fixed income funds, which contributed to an increase in the retail fee margin. Eastspring’s adjusted operating profit of $314 million was up 10 per cent compared with the prior period on a constant exchange rate basis (up 11 per cent on an actual exchange rate basis). Operating income before performance related fees was 16 per cent higher4, driven by higher average funds under management and a 2 basis points increase in fee margin reflecting an improved asset mix. The cost/income ratio increased to 54 per cent (2020: 52 per cent) reflecting both higher staff costs and investments made in strengthening the capabilities of the business across dimensions including footprint, distribution, investment strategies and customer experience.
Other income and expenditure Central corporate expenditure was 30 per cent3 lower than the prior period reflecting the delivery of the $180 million of right-sizing of our head office costs alongside the evolving footprint of the business. Annual head office costs are targeted to reduce further by around $70 million1 from the start of 2023. Interest costs on core structural borrowings of $(328) million (2020: $(316) million3) include interest costs of $(126) million related to the four tranches of debt that were redeemed in December 2021 and January 2022 using the proceeds from the share offer during the year, which are not expected to recur going forward. Restructuring costs of $(185) million (2020: $(162) million4) reflect the Group’s substantial and ongoing IFRS 17 project, and one-off costs associated with cost saving, regulatory and other initiatives in our business. IFRS 17 costs are expected to remain elevated until the standard is fully implemented.
IFRS basis non-operating items from continuing operations Non-operating items from continuing operations in the year consist mainly of short-term fluctuations in investment returns on shareholder-backed business of negative $(458) million, (2020: negative $(554) million3), and $(94) million of costs associated with corporate transactions (2020: gain of $733 million3). Short-term fluctuations reflect the net impact from an increase in interest rates in most Asia markets on bond asset values and on the valuation interest rates (VIRs) used to determine policyholder liabilities. Costs associated with corporate transactions of $(94) million (2020: gain of $733 million3) include the cost incurred by Prudential plc in connection with the separation of Jackson including key management changes. See note D1.1 in the IFRS financial statements for further information.
IFRS effective tax rates for continuing operations In 2021, the effective tax rate on adjusted operating profit was 17 per cent (2020: 18 per cent). The decrease in the 2021 effective tax rate reflects the resolution of some historic issues at lower amounts than had been provided for. The effective tax rate on total IFRS profit in 2021 was 17 per cent (2020: 15 per cent). The increase in the 2021 effective tax rate reflects the adverse impact of investment losses on which no tax credit is recognised. The effective tax rate on adjusted operating profit in 2022 is expected to be similar to 2021. From 2023 onwards, the effective tax rate on adjusted operating profit is likely to be impacted by a combination of the OECD proposals to implement a global minimum tax rate of 15 per cent and some jurisdictions where Prudential operates implementing a domestic minimum tax based on the OECD proposals. The OECD rules are complex and require detailed analysis and consideration which is ongoing. A further update will be provided in the half-year 2022 results. Total tax contributions from continuing operations The Group continues to make significant tax contributions in the jurisdictions in which it operates, with $1,071 million remitted to tax authorities in 2021. This was lower than the equivalent amount of $1,208 million4 remitted in 2020 principally due to the timing of when various tax payments became due. Tax strategy The Group publishes its tax strategy annually which, in addition to complying with the mandatory UK (Finance Act 2016) requirements, also includes a number of additional disclosures, including a country-by-country disclosure of revenues, profits, average employee numbers and taxes for all jurisdictions where more than $5 million tax was paid. This disclosure is included as a way of demonstrating that our tax footprint (ie where we pay taxes) is consistent with our business footprint. An updated version of the tax strategy, including 2021 data, will be available on the Group’s website before 31 May 2022.
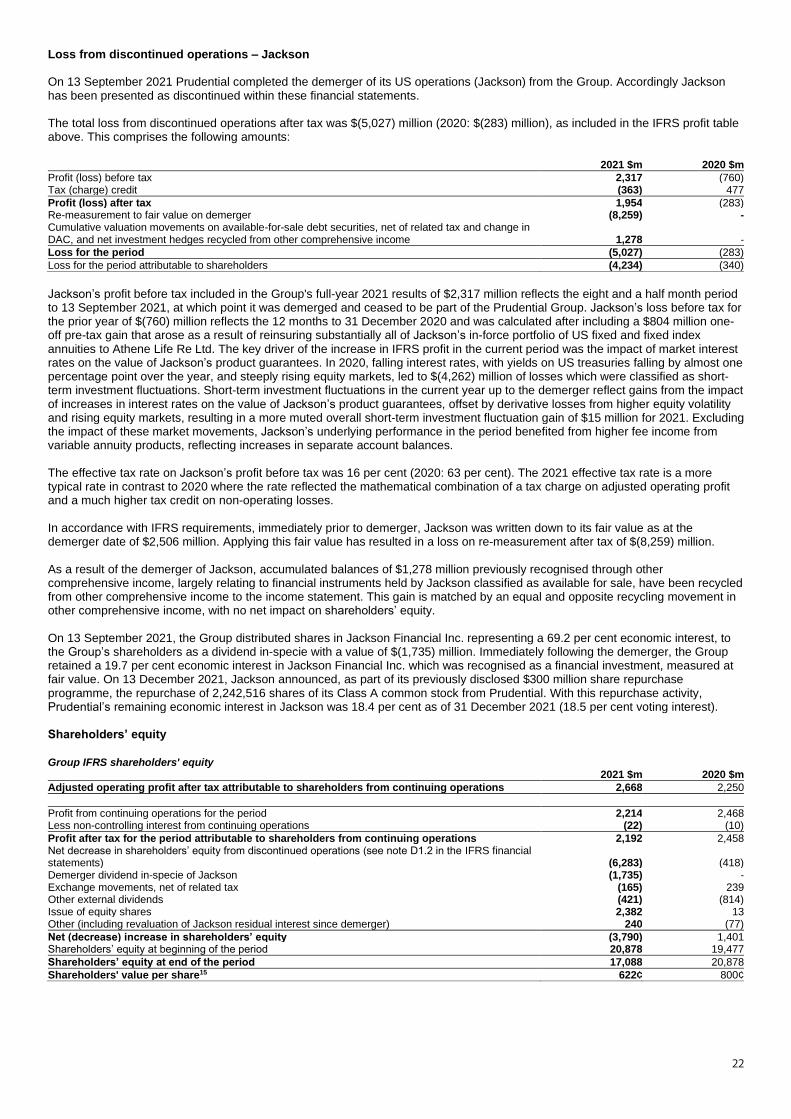
22
Loss from discontinued operations – Jackson On 13 September 2021 Prudential completed the demerger of its US operations (Jackson) from the Group. Accordingly Jackson has been presented as discontinued within these financial statements. The total loss from discontinued operations after tax was $(5,027) million (2020: $(283) million), as included in the IFRS profit table above. This comprises the following amounts:
2021 $m 2020 $m
Profit (loss) before tax 2,317 (760) Tax (charge) credit (363) 477
Profit (loss) after tax 1,954 (283) Re-measurement to fair value on demerger (8,259) - Cumulative valuation movements on available-for-sale debt securities, net of related tax and change in DAC, and net investment hedges recycled from other comprehensive income 1,278 -
Loss for the period (5,027) (283)
Loss for the period attributable to shareholders (4,234) (340)
Jackson’s profit before tax included in the Group's full-year 2021 results of $2,317 million reflects the eight and a half month period to 13 September 2021, at which point it was demerged and ceased to be part of the Prudential Group. Jackson’s loss before tax for the prior year of $(760) million reflects the 12 months to 31 December 2020 and was calculated after including a $804 million one-off pre-tax gain that arose as a result of reinsuring substantially all of Jackson’s in-force portfolio of US fixed and fixed index annuities to Athene Life Re Ltd. The key driver of the increase in IFRS profit in the current period was the impact of market interest rates on the value of Jackson’s product guarantees. In 2020, falling interest rates, with yields on US treasuries falling by almost one percentage point over the year, and steeply rising equity markets, led to $(4,262) million of losses which were classified as short-term investment fluctuations. Short-term investment fluctuations in the current year up to the demerger reflect gains from the impact of increases in interest rates on the value of Jackson’s product guarantees, offset by derivative losses from higher equity volatility and rising equity markets, resulting in a more muted overall short-term investment fluctuation gain of $15 million for 2021. Excluding the impact of these market movements, Jackson’s underlying performance in the period benefited from higher fee income from variable annuity products, reflecting increases in separate account balances. The effective tax rate on Jackson’s profit before tax was 16 per cent (2020: 63 per cent). The 2021 effective tax rate is a more typical rate in contrast to 2020 where the rate reflected the mathematical combination of a tax charge on adjusted operating profit and a much higher tax credit on non-operating losses. In accordance with IFRS requirements, immediately prior to demerger, Jackson was written down to its fair value as at the demerger date of $2,506 million. Applying this fair value has resulted in a loss on re-measurement after tax of $(8,259) million. As a result of the demerger of Jackson, accumulated balances of $1,278 million previously recognised through other comprehensive income, largely relating to financial instruments held by Jackson classified as available for sale, have been recycled from other comprehensive income to the income statement. This gain is matched by an equal and opposite recycling movement in other comprehensive income, with no net impact on shareholders’ equity. On 13 September 2021, the Group distributed shares in Jackson Financial Inc. representing a 69.2 per cent economic interest, to the Group’s shareholders as a dividend in-specie with a value of $(1,735) million. Immediately following the demerger, the Group retained a 19.7 per cent economic interest in Jackson Financial Inc. which was recognised as a financial investment, measured at fair value. On 13 December 2021, Jackson announced, as part of its previously disclosed $300 million share repurchase programme, the repurchase of 2,242,516 shares of its Class A common stock from Prudential. With this repurchase activity, Prudential’s remaining economic interest in Jackson was 18.4 per cent as of 31 December 2021 (18.5 per cent voting interest). Shareholders’ equity
Group IFRS shareholders' equity
2021 $m 2020 $m
Adjusted operating profit after tax attributable to shareholders from continuing operations 2,668 2,250
Profit from continuing operations for the period 2,214 2,468 Less non-controlling interest from continuing operations (22) (10)
Profit after tax for the period attributable to shareholders from continuing operations 2,192 2,458 Net decrease in shareholders’ equity from discontinued operations (see note D1.2 in the IFRS financial statements) (6,283) (418) Demerger dividend in-specie of Jackson (1,735) - Exchange movements, net of related tax (165) 239 Other external dividends (421) (814) Issue of equity shares 2,382 13 Other (including revaluation of Jackson residual interest since demerger) 240 (77)
Net (decrease) increase in shareholders’ equity (3,790) 1,401 Shareholders’ equity at beginning of the period 20,878 19,477
Shareholders’ equity at end of the period 17,088 20,878
Shareholders' value per share15 622¢ 800¢
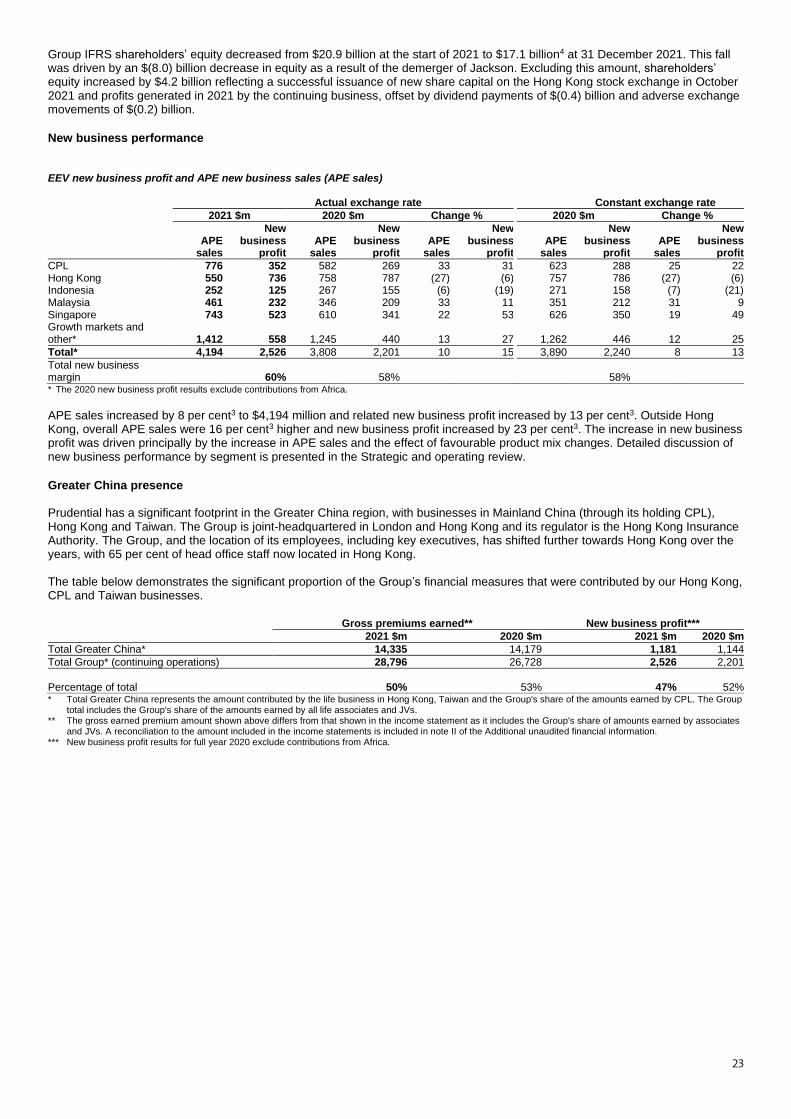
23
Group IFRS shareholders’ equity decreased from $20.9 billion at the start of 2021 to $17.1 billion4 at 31 December 2021. This fall was driven by an $(8.0) billion decrease in equity as a result of the demerger of Jackson. Excluding this amount, shareholders’ equity increased by $4.2 billion reflecting a successful issuance of new share capital on the Hong Kong stock exchange in October 2021 and profits generated in 2021 by the continuing business, offset by dividend payments of $(0.4) billion and adverse exchange movements of $(0.2) billion.
New business performance
EEV new business profit and APE new business sales (APE sales) Actual exchange rate Constant exchange rate
2021 $m 2020 $m Change % 2020 $m Change %
APE
sales
New business
profit APE
sales
New business
profit APE
sales
New business
profit APE
sales
New business
profit APE
sales
New business
profit
CPL 776 352 582 269 33 31 623 288 25 22 Hong Kong 550 736 758 787 (27) (6) 757 786 (27) (6) Indonesia 252 125 267 155 (6) (19) 271 158 (7) (21) Malaysia 461 232 346 209 33 11 351 212 31 9 Singapore 743 523 610 341 22 53 626 350 19 49 Growth markets and other* 1,412 558 1,245 440 13 27 1,262 446 12 25
Total* 4,194 2,526 3,808 2,201 10 15 3,890 2,240 8 13
Total new business margin 60% 58% 58% * The 2020 new business profit results exclude contributions from Africa. APE sales increased by 8 per cent3 to $4,194 million and related new business profit increased by 13 per cent3. Outside Hong Kong, overall APE sales were 16 per cent3 higher and new business profit increased by 23 per cent3. The increase in new business profit was driven principally by the increase in APE sales and the effect of favourable product mix changes. Detailed discussion of new business performance by segment is presented in the Strategic and operating review.
Greater China presence Prudential has a significant footprint in the Greater China region, with businesses in Mainland China (through its holding CPL), Hong Kong and Taiwan. The Group is joint-headquartered in London and Hong Kong and its regulator is the Hong Kong Insurance Authority. The Group, and the location of its employees, including key executives, has shifted further towards Hong Kong over the years, with 65 per cent of head office staff now located in Hong Kong. The table below demonstrates the significant proportion of the Group’s financial measures that were contributed by our Hong Kong, CPL and Taiwan businesses.
Gross premiums earned** New business profit***
2021 $m 2020 $m 2021 $m 2020 $m
Total Greater China* 14,335 14,179 1,181 1,144
Total Group* (continuing operations) 28,796 26,728 2,526 2,201
Percentage of total 50% 53% 47% 52% * Total Greater China represents the amount contributed by the life business in Hong Kong, Taiwan and the Group's share of the amounts earned by CPL. The Group
total includes the Group's share of the amounts earned by all life associates and JVs. ** The gross earned premium amount shown above differs from that shown in the income statement as it includes the Group's share of amounts earned by associates
and JVs. A reconciliation to the amount included in the income statements is included in note II of the Additional unaudited financial information. *** New business profit results for full year 2020 exclude contributions from Africa.
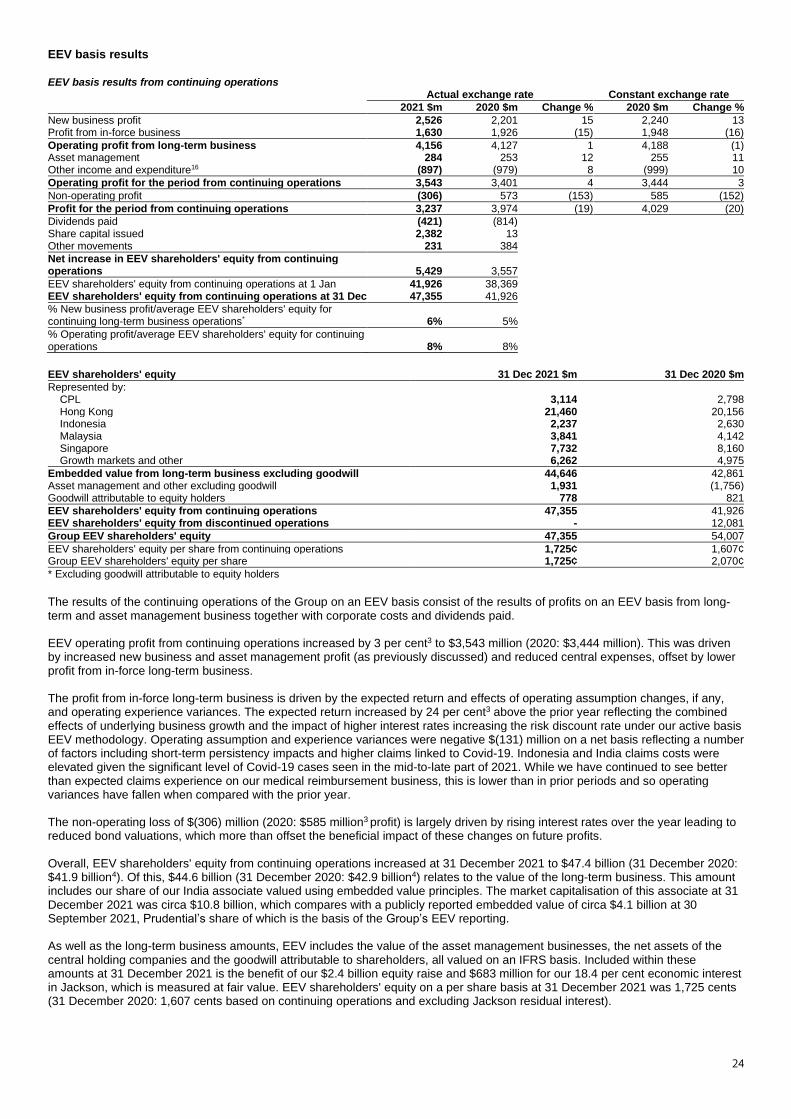
24
EEV basis results
EEV basis results from continuing operations Actual exchange rate Constant exchange rate
2021 $m 2020 $m Change % 2020 $m Change %
New business profit 2,526 2,201 15 2,240 13 Profit from in-force business 1,630 1,926 (15) 1,948 (16)
Operating profit from long-term business 4,156 4,127 1 4,188 (1) Asset management 284 253 12 255 11 Other income and expenditure16 (897) (979) 8 (999) 10
Operating profit for the period from continuing operations 3,543 3,401 4 3,444 3
Non-operating profit (306) 573 (153) 585 (152)
Profit for the period from continuing operations 3,237 3,974 (19) 4,029 (20)
Dividends paid (421) (814) Share capital issued 2,382 13 Other movements 231 384
Net increase in EEV shareholders' equity from continuing operations 5,429 3,557
EEV shareholders' equity from continuing operations at 1 Jan 41,926 38,369 EEV shareholders' equity from continuing operations at 31 Dec 47,355 41,926
% New business profit/average EEV shareholders' equity for continuing long-term business operations* 6% 5%
% Operating profit/average EEV shareholders' equity for continuing operations 8% 8%
EEV shareholders' equity 31 Dec 2021 $m 31 Dec 2020 $m
Represented by: CPL 3,114 2,798 Hong Kong 21,460 20,156 Indonesia 2,237 2,630 Malaysia 3,841 4,142 Singapore 7,732 8,160 Growth markets and other 6,262 4,975
Embedded value from long-term business excluding goodwill 44,646 42,861 Asset management and other excluding goodwill 1,931 (1,756) Goodwill attributable to equity holders 778 821
EEV shareholders' equity from continuing operations 47,355 41,926 EEV shareholders' equity from discontinued operations - 12,081
Group EEV shareholders' equity 47,355 54,007
EEV shareholders' equity per share from continuing operations 1,725¢ 1,607¢ Group EEV shareholders' equity per share 1,725¢ 2,070¢
* Excluding goodwill attributable to equity holders
The results of the continuing operations of the Group on an EEV basis consist of the results of profits on an EEV basis from long-term and asset management business together with corporate costs and dividends paid. EEV operating profit from continuing operations increased by 3 per cent3 to $3,543 million (2020: $3,444 million). This was driven by increased new business and asset management profit (as previously discussed) and reduced central expenses, offset by lower profit from in-force long-term business. The profit from in-force long-term business is driven by the expected return and effects of operating assumption changes, if any, and operating experience variances. The expected return increased by 24 per cent3 above the prior year reflecting the combined effects of underlying business growth and the impact of higher interest rates increasing the risk discount rate under our active basis EEV methodology. Operating assumption and experience variances were negative $(131) million on a net basis reflecting a number of factors including short-term persistency impacts and higher claims linked to Covid-19. Indonesia and India claims costs were elevated given the significant level of Covid-19 cases seen in the mid-to-late part of 2021. While we have continued to see better than expected claims experience on our medical reimbursement business, this is lower than in prior periods and so operating variances have fallen when compared with the prior year. The non-operating loss of $(306) million (2020: $585 million3 profit) is largely driven by rising interest rates over the year leading to reduced bond valuations, which more than offset the beneficial impact of these changes on future profits. Overall, EEV shareholders' equity from continuing operations increased at 31 December 2021 to $47.4 billion (31 December 2020: $41.9 billion4). Of this, $44.6 billion (31 December 2020: $42.9 billion4) relates to the value of the long-term business. This amount includes our share of our India associate valued using embedded value principles. The market capitalisation of this associate at 31 December 2021 was circa $10.8 billion, which compares with a publicly reported embedded value of circa $4.1 billion at 30 September 2021, Prudential’s share of which is the basis of the Group’s EEV reporting. As well as the long-term business amounts, EEV includes the value of the asset management businesses, the net assets of the central holding companies and the goodwill attributable to shareholders, all valued on an IFRS basis. Included within these amounts at 31 December 2021 is the benefit of our $2.4 billion equity raise and $683 million for our 18.4 per cent economic interest in Jackson, which is measured at fair value. EEV shareholders' equity on a per share basis at 31 December 2021 was 1,725 cents (31 December 2020: 1,607 cents based on continuing operations and excluding Jackson residual interest).
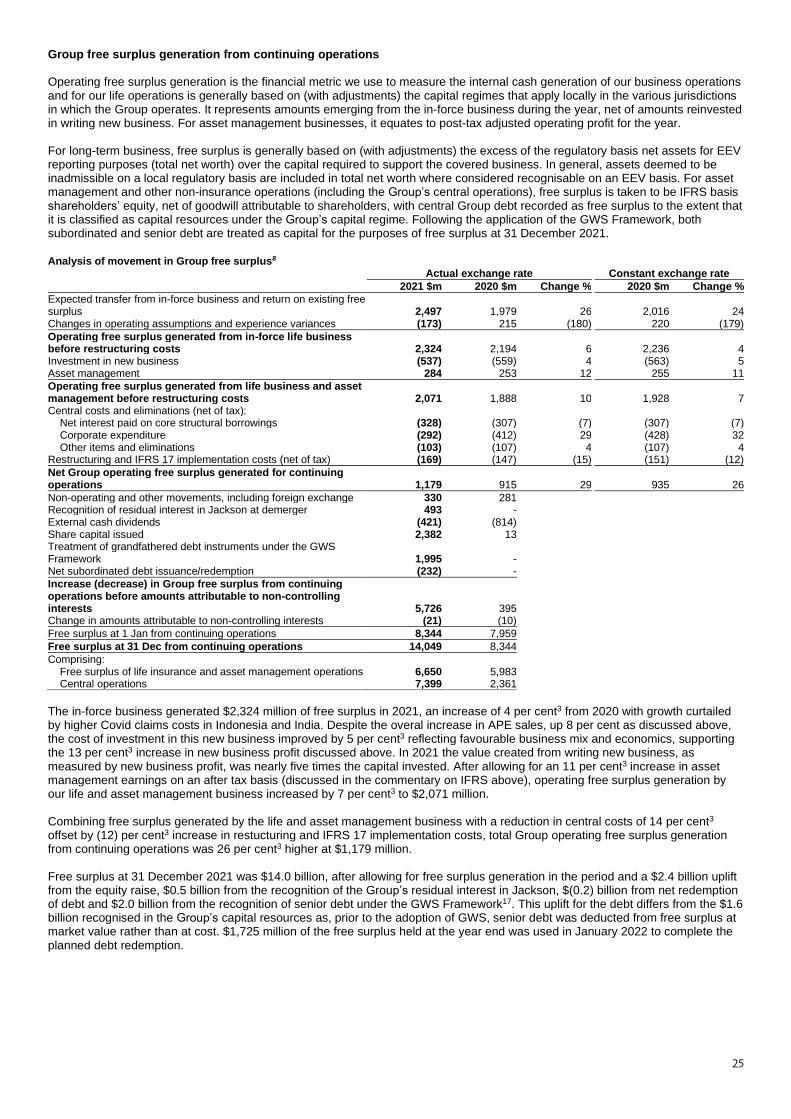
25
Group free surplus generation from continuing operations
Operating free surplus generation is the financial metric we use to measure the internal cash generation of our business operations and for our life operations is generally based on (with adjustments) the capital regimes that apply locally in the various jurisdictions in which the Group operates. It represents amounts emerging from the in-force business during the year, net of amounts reinvested in writing new business. For asset management businesses, it equates to post-tax adjusted operating profit for the year. For long-term business, free surplus is generally based on (with adjustments) the excess of the regulatory basis net assets for EEV reporting purposes (total net worth) over the capital required to support the covered business. In general, assets deemed to be inadmissible on a local regulatory basis are included in total net worth where considered recognisable on an EEV basis. For asset management and other non-insurance operations (including the Group’s central operations), free surplus is taken to be IFRS basis shareholders’ equity, net of goodwill attributable to shareholders, with central Group debt recorded as free surplus to the extent that it is classified as capital resources under the Group’s capital regime. Following the application of the GWS Framework, both subordinated and senior debt are treated as capital for the purposes of free surplus at 31 December 2021.
Analysis of movement in Group free surplus8 Actual exchange rate Constant exchange rate
2021 $m 2020 $m Change % 2020 $m Change %
Expected transfer from in-force business and return on existing free surplus 2,497 1,979 26 2,016 24 Changes in operating assumptions and experience variances (173) 215 (180) 220 (179)
Operating free surplus generated from in-force life business before restructuring costs 2,324 2,194 6 2,236 4 Investment in new business (537) (559) 4 (563) 5 Asset management 284 253 12 255 11
Operating free surplus generated from life business and asset management before restructuring costs 2,071 1,888 10 1,928 7 Central costs and eliminations (net of tax):
Net interest paid on core structural borrowings (328) (307) (7) (307) (7) Corporate expenditure (292) (412) 29 (428) 32 Other items and eliminations (103) (107) 4 (107) 4
Restructuring and IFRS 17 implementation costs (net of tax) (169) (147) (15) (151) (12)
Net Group operating free surplus generated for continuing operations 1,179 915 29 935 26
Non-operating and other movements, including foreign exchange 330 281 Recognition of residual interest in Jackson at demerger 493 - External cash dividends (421) (814) Share capital issued 2,382 13 Treatment of grandfathered debt instruments under the GWS Framework 1,995 - Net subordinated debt issuance/redemption (232) -
Increase (decrease) in Group free surplus from continuing operations before amounts attributable to non-controlling interests 5,726 395 Change in amounts attributable to non-controlling interests (21) (10)
Free surplus at 1 Jan from continuing operations 8,344 7,959
Free surplus at 31 Dec from continuing operations 14,049 8,344
Comprising: Free surplus of life insurance and asset management operations 6,650 5,983 Central operations 7,399 2,361
The in-force business generated $2,324 million of free surplus in 2021, an increase of 4 per cent3 from 2020 with growth curtailed by higher Covid claims costs in Indonesia and India. Despite the overal increase in APE sales, up 8 per cent as discussed above, the cost of investment in this new business improved by 5 per cent3 reflecting favourable business mix and economics, supporting the 13 per cent3 increase in new business profit discussed above. In 2021 the value created from writing new business, as measured by new business profit, was nearly five times the capital invested. After allowing for an 11 per cent3 increase in asset management earnings on an after tax basis (discussed in the commentary on IFRS above), operating free surplus generation by our life and asset management business increased by 7 per cent3 to $2,071 million. Combining free surplus generated by the life and asset management business with a reduction in central costs of 14 per cent3 offset by (12) per cent3 increase in restucturing and IFRS 17 implementation costs, total Group operating free surplus generation from continuing operations was 26 per cent3 higher at $1,179 million. Free surplus at 31 December 2021 was $14.0 billion, after allowing for free surplus generation in the period and a $2.4 billion uplift from the equity raise, $0.5 billion from the recognition of the Group’s residual interest in Jackson, $(0.2) billion from net redemption of debt and $2.0 billion from the recognition of senior debt under the GWS Framework17. This uplift for the debt differs from the $1.6 billion recognised in the Group’s capital resources as, prior to the adoption of GWS, senior debt was deducted from free surplus at market value rather than at cost. $1,725 million of the free surplus held at the year end was used in January 2022 to complete the planned debt redemption.
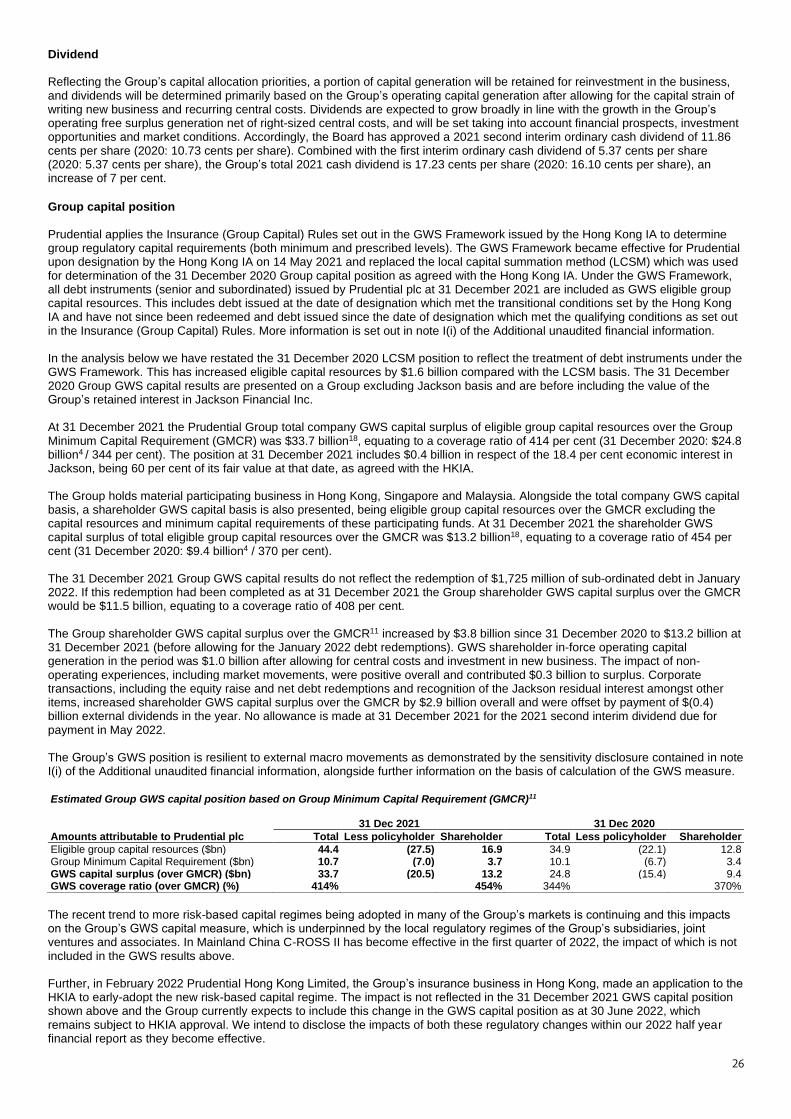
26
Dividend Reflecting the Group’s capital allocation priorities, a portion of capital generation will be retained for reinvestment in the business, and dividends will be determined primarily based on the Group’s operating capital generation after allowing for the capital strain of writing new business and recurring central costs. Dividends are expected to grow broadly in line with the growth in the Group’s operating free surplus generation net of right-sized central costs, and will be set taking into account financial prospects, investment opportunities and market conditions. Accordingly, the Board has approved a 2021 second interim ordinary cash dividend of 11.86 cents per share (2020: 10.73 cents per share). Combined with the first interim ordinary cash dividend of 5.37 cents per share (2020: 5.37 cents per share), the Group’s total 2021 cash dividend is 17.23 cents per share (2020: 16.10 cents per share), an increase of 7 per cent.
Group capital position Prudential applies the Insurance (Group Capital) Rules set out in the GWS Framework issued by the Hong Kong IA to determine group regulatory capital requirements (both minimum and prescribed levels). The GWS Framework became effective for Prudential upon designation by the Hong Kong IA on 14 May 2021 and replaced the local capital summation method (LCSM) which was used for determination of the 31 December 2020 Group capital position as agreed with the Hong Kong IA. Under the GWS Framework, all debt instruments (senior and subordinated) issued by Prudential plc at 31 December 2021 are included as GWS eligible group capital resources. This includes debt issued at the date of designation which met the transitional conditions set by the Hong Kong IA and have not since been redeemed and debt issued since the date of designation which met the qualifying conditions as set out in the Insurance (Group Capital) Rules. More information is set out in note I(i) of the Additional unaudited financial information. In the analysis below we have restated the 31 December 2020 LCSM position to reflect the treatment of debt instruments under the GWS Framework. This has increased eligible capital resources by $1.6 billion compared with the LCSM basis. The 31 December 2020 Group GWS capital results are presented on a Group excluding Jackson basis and are before including the value of the Group’s retained interest in Jackson Financial Inc. At 31 December 2021 the Prudential Group total company GWS capital surplus of eligible group capital resources over the Group Minimum Capital Requirement (GMCR) was $33.7 billion18, equating to a coverage ratio of 414 per cent (31 December 2020: $24.8 billion4 / 344 per cent). The position at 31 December 2021 includes $0.4 billion in respect of the 18.4 per cent economic interest in Jackson, being 60 per cent of its fair value at that date, as agreed with the HKIA. The Group holds material participating business in Hong Kong, Singapore and Malaysia. Alongside the total company GWS capital basis, a shareholder GWS capital basis is also presented, being eligible group capital resources over the GMCR excluding the capital resources and minimum capital requirements of these participating funds. At 31 December 2021 the shareholder GWS capital surplus of total eligible group capital resources over the GMCR was $13.2 billion18, equating to a coverage ratio of 454 per cent (31 December 2020: $9.4 billion4 / 370 per cent). The 31 December 2021 Group GWS capital results do not reflect the redemption of $1,725 million of sub-ordinated debt in January 2022. If this redemption had been completed as at 31 December 2021 the Group shareholder GWS capital surplus over the GMCR would be $11.5 billion, equating to a coverage ratio of 408 per cent. The Group shareholder GWS capital surplus over the GMCR11 increased by $3.8 billion since 31 December 2020 to $13.2 billion at 31 December 2021 (before allowing for the January 2022 debt redemptions). GWS shareholder in-force operating capital generation in the period was $1.0 billion after allowing for central costs and investment in new business. The impact of non-operating experiences, including market movements, were positive overall and contributed $0.3 billion to surplus. Corporate transactions, including the equity raise and net debt redemptions and recognition of the Jackson residual interest amongst other items, increased shareholder GWS capital surplus over the GMCR by $2.9 billion overall and were offset by payment of $(0.4) billion external dividends in the year. No allowance is made at 31 December 2021 for the 2021 second interim dividend due for payment in May 2022. The Group’s GWS position is resilient to external macro movements as demonstrated by the sensitivity disclosure contained in note I(i) of the Additional unaudited financial information, alongside further information on the basis of calculation of the GWS measure.
Estimated Group GWS capital position based on Group Minimum Capital Requirement (GMCR)11 31 Dec 2021 31 Dec 2020
Amounts attributable to Prudential plc Total Less policyholder Shareholder Total Less policyholder Shareholder
Eligible group capital resources ($bn) 44.4 (27.5) 16.9 34.9 (22.1) 12.8 Group Minimum Capital Requirement ($bn) 10.7 (7.0) 3.7 10.1 (6.7) 3.4 GWS capital surplus (over GMCR) ($bn) 33.7 (20.5) 13.2 24.8 (15.4) 9.4 GWS coverage ratio (over GMCR) (%) 414% 454% 344% 370%
The recent trend to more risk-based capital regimes being adopted in many of the Group’s markets is continuing and this impacts on the Group’s GWS capital measure, which is underpinned by the local regulatory regimes of the Group’s subsidiaries, joint ventures and associates. In Mainland China C-ROSS II has become effective in the first quarter of 2022, the impact of which is not included in the GWS results above. Further, in February 2022 Prudential Hong Kong Limited, the Group’s insurance business in Hong Kong, made an application to the HKIA to early-adopt the new risk-based capital regime. The impact is not reflected in the 31 December 2021 GWS capital position shown above and the Group currently expects to include this change in the GWS capital position as at 30 June 2022, which remains subject to HKIA approval. We intend to disclose the impacts of both these regulatory changes within our 2022 half year financial report as they become effective.
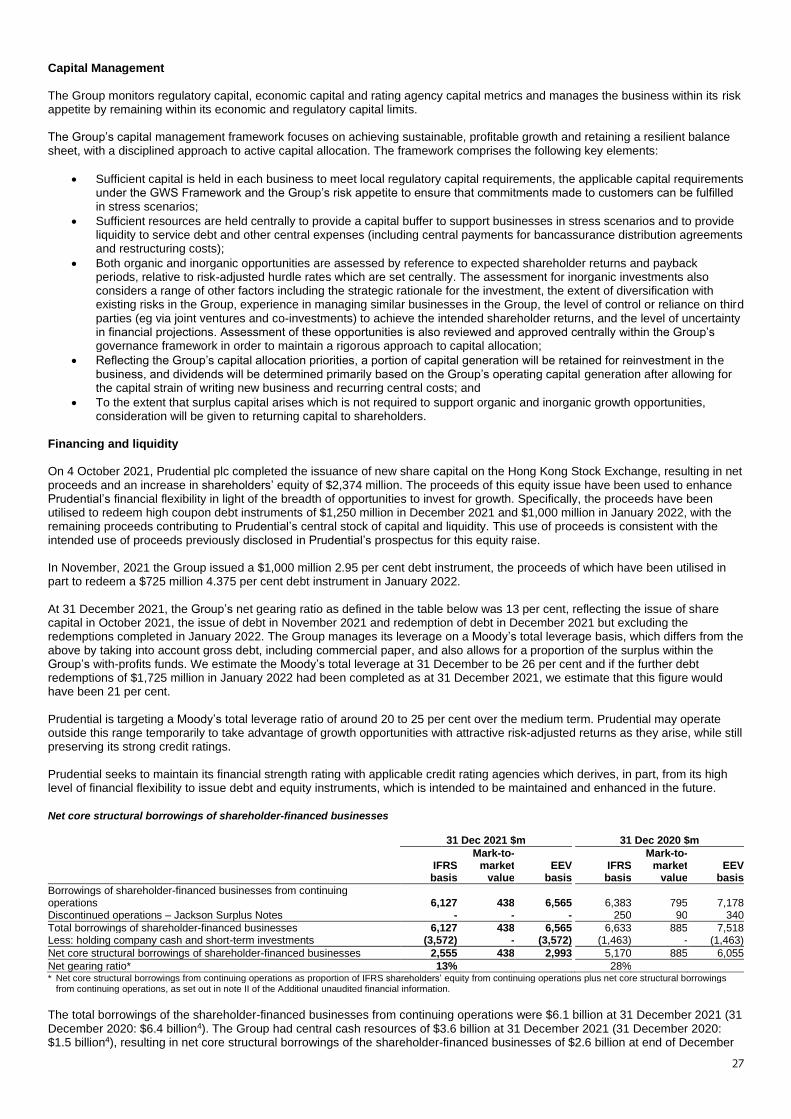
27
Capital Management The Group monitors regulatory capital, economic capital and rating agency capital metrics and manages the business within its risk appetite by remaining within its economic and regulatory capital limits. The Group’s capital management framework focuses on achieving sustainable, profitable growth and retaining a resilient balance sheet, with a disciplined approach to active capital allocation. The framework comprises the following key elements:
• Sufficient capital is held in each business to meet local regulatory capital requirements, the applicable capital requirements under the GWS Framework and the Group’s risk appetite to ensure that commitments made to customers can be fulfilled in stress scenarios;
• Sufficient resources are held centrally to provide a capital buffer to support businesses in stress scenarios and to provide liquidity to service debt and other central expenses (including central payments for bancassurance distribution agreements and restructuring costs);
• Both organic and inorganic opportunities are assessed by reference to expected shareholder returns and payback periods, relative to risk-adjusted hurdle rates which are set centrally. The assessment for inorganic investments also considers a range of other factors including the strategic rationale for the investment, the extent of diversification with existing risks in the Group, experience in managing similar businesses in the Group, the level of control or reliance on third parties (eg via joint ventures and co-investments) to achieve the intended shareholder returns, and the level of uncertainty in financial projections. Assessment of these opportunities is also reviewed and approved centrally within the Group’s governance framework in order to maintain a rigorous approach to capital allocation;
• Reflecting the Group’s capital allocation priorities, a portion of capital generation will be retained for reinvestment in the business, and dividends will be determined primarily based on the Group’s operating capital generation after allowing for the capital strain of writing new business and recurring central costs; and
• To the extent that surplus capital arises which is not required to support organic and inorganic growth opportunities, consideration will be given to returning capital to shareholders.
Financing and liquidity On 4 October 2021, Prudential plc completed the issuance of new share capital on the Hong Kong Stock Exchange, resulting in net proceeds and an increase in shareholders’ equity of $2,374 million. The proceeds of this equity issue have been used to enhance Prudential’s financial flexibility in light of the breadth of opportunities to invest for growth. Specifically, the proceeds have been utilised to redeem high coupon debt instruments of $1,250 million in December 2021 and $1,000 million in January 2022, with the remaining proceeds contributing to Prudential’s central stock of capital and liquidity. This use of proceeds is consistent with the intended use of proceeds previously disclosed in Prudential’s prospectus for this equity raise. In November, 2021 the Group issued a $1,000 million 2.95 per cent debt instrument, the proceeds of which have been utilised in part to redeem a $725 million 4.375 per cent debt instrument in January 2022. At 31 December 2021, the Group’s net gearing ratio as defined in the table below was 13 per cent, reflecting the issue of share capital in October 2021, the issue of debt in November 2021 and redemption of debt in December 2021 but excluding the redemptions completed in January 2022. The Group manages its leverage on a Moody’s total leverage basis, which differs from the above by taking into account gross debt, including commercial paper, and also allows for a proportion of the surplus within the Group’s with-profits funds. We estimate the Moody’s total leverage at 31 December to be 26 per cent and if the further debt redemptions of $1,725 million in January 2022 had been completed as at 31 December 2021, we estimate that this figure would have been 21 per cent. Prudential is targeting a Moody’s total leverage ratio of around 20 to 25 per cent over the medium term. Prudential may operate outside this range temporarily to take advantage of growth opportunities with attractive risk-adjusted returns as they arise, while still preserving its strong credit ratings.
Prudential seeks to maintain its financial strength rating with applicable credit rating agencies which derives, in part, from its high level of financial flexibility to issue debt and equity instruments, which is intended to be maintained and enhanced in the future.
Net core structural borrowings of shareholder-financed businesses 31 Dec 2021 $m 31 Dec 2020 $m
IFRS basis
Mark-to-market
value EEV
basis IFRS basis
Mark-to-market
value EEV
basis
Borrowings of shareholder-financed businesses from continuing operations 6,127 438 6,565 6,383 795 7,178 Discontinued operations – Jackson Surplus Notes - - - 250 90 340
Total borrowings of shareholder-financed businesses 6,127 438 6,565 6,633 885 7,518 Less: holding company cash and short-term investments (3,572) - (3,572) (1,463) - (1,463)
Net core structural borrowings of shareholder-financed businesses 2,555 438 2,993 5,170 885 6,055
Net gearing ratio* 13% 28% * Net core structural borrowings from continuing operations as proportion of IFRS shareholders’ equity from continuing operations plus net core structural borrowings
from continuing operations, as set out in note II of the Additional unaudited financial information. The total borrowings of the shareholder-financed businesses from continuing operations were $6.1 billion at 31 December 2021 (31 December 2020: $6.4 billion4). The Group had central cash resources of $3.6 billion at 31 December 2021 (31 December 2020: $1.5 billion4), resulting in net core structural borrowings of the shareholder-financed businesses of $2.6 billion at end of December
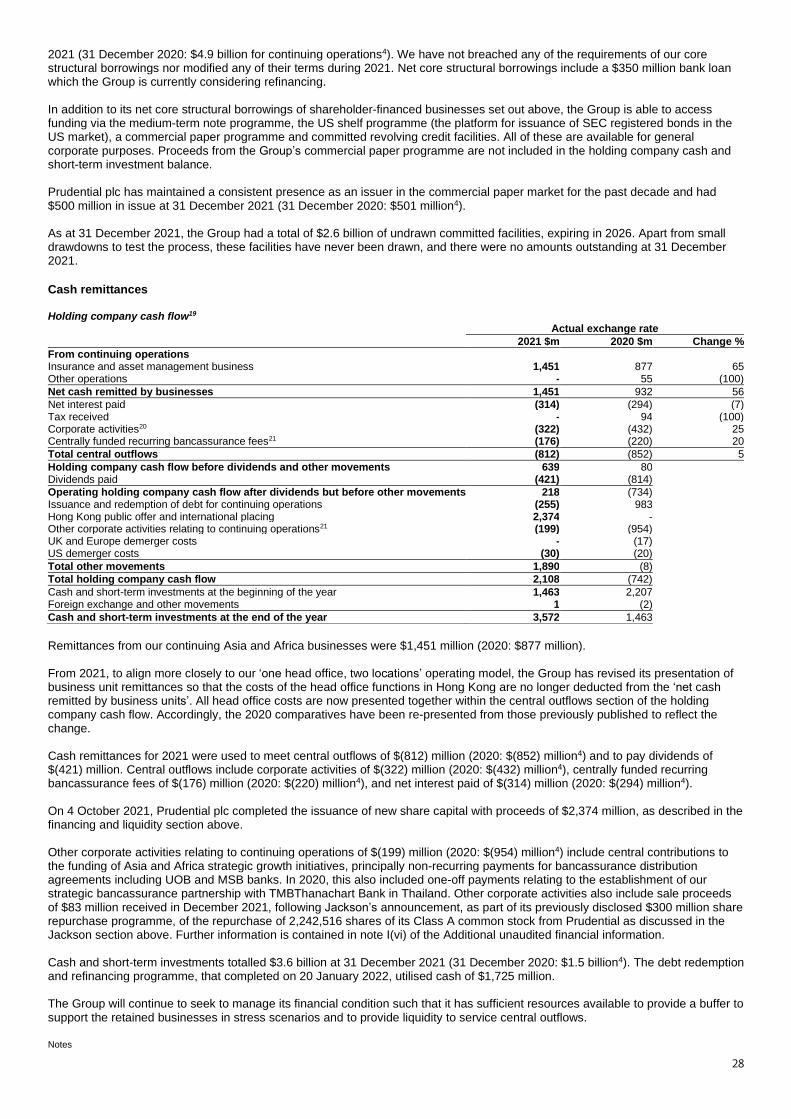
28
2021 (31 December 2020: $4.9 billion for continuing operations4). We have not breached any of the requirements of our core structural borrowings nor modified any of their terms during 2021. Net core structural borrowings include a $350 million bank loan which the Group is currently considering refinancing. In addition to its net core structural borrowings of shareholder-financed businesses set out above, the Group is able to access funding via the medium-term note programme, the US shelf programme (the platform for issuance of SEC registered bonds in the US market), a commercial paper programme and committed revolving credit facilities. All of these are available for general corporate purposes. Proceeds from the Group’s commercial paper programme are not included in the holding company cash and short-term investment balance. Prudential plc has maintained a consistent presence as an issuer in the commercial paper market for the past decade and had $500 million in issue at 31 December 2021 (31 December 2020: $501 million4). As at 31 December 2021, the Group had a total of $2.6 billion of undrawn committed facilities, expiring in 2026. Apart from small drawdowns to test the process, these facilities have never been drawn, and there were no amounts outstanding at 31 December 2021.
Cash remittances Holding company cash flow19 Actual exchange rate
2021 $m 2020 $m Change %
From continuing operations Insurance and asset management business 1,451 877 65 Other operations - 55 (100)
Net cash remitted by businesses 1,451 932 56
Net interest paid (314) (294) (7) Tax received - 94 (100) Corporate activities20 (322) (432) 25 Centrally funded recurring bancassurance fees21 (176) (220) 20
Total central outflows (812) (852) 5
Holding company cash flow before dividends and other movements 639 80 Dividends paid (421) (814)
Operating holding company cash flow after dividends but before other movements 218 (734) Issuance and redemption of debt for continuing operations (255) 983 Hong Kong public offer and international placing 2,374 - Other corporate activities relating to continuing operations21 (199) (954) UK and Europe demerger costs - (17) US demerger costs (30) (20)
Total other movements 1,890 (8)
Total holding company cash flow 2,108 (742)
Cash and short-term investments at the beginning of the year 1,463 2,207 Foreign exchange and other movements 1 (2)
Cash and short-term investments at the end of the year 3,572 1,463
Remittances from our continuing Asia and Africa businesses were $1,451 million (2020: $877 million). From 2021, to align more closely to our ‘one head office, two locations’ operating model, the Group has revised its presentation of business unit remittances so that the costs of the head office functions in Hong Kong are no longer deducted from the ‘net cash remitted by business units’. All head office costs are now presented together within the central outflows section of the holding company cash flow. Accordingly, the 2020 comparatives have been re-presented from those previously published to reflect the change. Cash remittances for 2021 were used to meet central outflows of $(812) million (2020: $(852) million4) and to pay dividends of $(421) million. Central outflows include corporate activities of $(322) million (2020: $(432) million4), centrally funded recurring bancassurance fees of $(176) million (2020: $(220) million4), and net interest paid of $(314) million (2020: $(294) million4). On 4 October 2021, Prudential plc completed the issuance of new share capital with proceeds of $2,374 million, as described in the financing and liquidity section above. Other corporate activities relating to continuing operations of $(199) million (2020: $(954) million4) include central contributions to the funding of Asia and Africa strategic growth initiatives, principally non-recurring payments for bancassurance distribution agreements including UOB and MSB banks. In 2020, this also included one-off payments relating to the establishment of our strategic bancassurance partnership with TMBThanachart Bank in Thailand. Other corporate activities also include sale proceeds of $83 million received in December 2021, following Jackson’s announcement, as part of its previously disclosed $300 million share repurchase programme, of the repurchase of 2,242,516 shares of its Class A common stock from Prudential as discussed in the Jackson section above. Further information is contained in note I(vi) of the Additional unaudited financial information. Cash and short-term investments totalled $3.6 billion at 31 December 2021 (31 December 2020: $1.5 billion4). The debt redemption and refinancing programme, that completed on 20 January 2022, utilised cash of $1,725 million. The Group will continue to seek to manage its financial condition such that it has sufficient resources available to provide a buffer to support the retained businesses in stress scenarios and to provide liquidity to service central outflows.
Notes

29
1 Based on full-year 2021 exchange rates. 2 ‘Adjusted operating profit’ refers to adjusted IFRS operating profit based on longer-term investment returns from continuing operations. This alternative performance
measure is reconciled to IFRS profit for the period in note B1.1 of the IFRS financial statements. 3 On a constant exchange rate basis. 4 On an actual exchange rate basis. 5 APE sales is a measure of new business activity that comprises the aggregate of annualised regular premiums and one-tenth of single premiums on new business
written during the year for all insurance products, including premiums for contracts designated as investment contracts under IFRS 4. It is not representative of premium income recorded in the IFRS financial statements. See note II of the Additional unaudited financial information for further explanation.
6 New business profit, on a post-tax basis, on business sold in the period, calculated in accordance with EEV Principles. 7 Full year 2021 total funds under management, including external funds under management, money market funds, funds managed on behalf of M&G plc and internal
funds under management, reported based on the country where the funds are managed. 8 For insurance operations, operating free surplus generated represents amounts emerging from the in-force business during the year net of amounts reinvested in
writing new business and excludes non-operating items. For asset management businesses, it equates to post-tax operating profit for the year. Restructuring costs are presented separately from the business unit amount. Further information is set out in ‘movement in Group free surplus’ of the EEV basis results.
9 Operating return calculated as operating profit divided by the average EEV shareholders' equity for continuing operations. See note II(x) of the Additional unaudited financial information for definition and calculation.
10 After deduction of the underwriting fees and other estimated expenses payable in connection with the Share Offer. 11 GWS coverage ratio of capital resources over Group minimum capital requirement attributable to shareholder business. Shareholder business excludes the capital
resources and minimum capital requirement of participating business in Hong Kong, Singapore and Malaysia. Under the GWS Framework, all debt instruments (senior and subordinated) issued by Prudential plc at 31 December 2021 are included as GWS eligible group capital resources.
12 For Growth markets and other, adjusted operating profit includes other items of $217 million (2020: $119 million) which primarily comprises of taxes for life joint ventures and associates and other non-recurring items.
13 For discussion on the basis of preparation of the sources of earnings in the table see note I(ii) of the Additional unaudited financial information. 14 Excludes Money Market Funds. 15 See note II of the Additional unaudited financial information for definition and reconciliation to IFRS balances. 16 Other income and expenditure includes restructuring and IFRS 17 implementation costs. 17 Debt not denominated in USD is translated using exchange rates as at 31 December 2020 for the purposes of grandfathering. 18 Before allowing for the 2021 second cash interim ordinary dividend. 19 Net cash amounts remitted by businesses are included in the holding company cash flow, which is disclosed in detail in note I(v) of the Additional unaudited financial
information. This comprises dividends and other transfers from businesses that are reflective of earnings and capital generation. 20 Including IFRS 17 implementation and restructuring costs paid in the period. 21 Other movements include non-recurring payments for bancassurance arrangements including those with UOB, TMB and MSB banks. Central payments for existing
bancassurance distribution agreements are within the central outflows section of the holding company cash flow, reflecting the recurring nature of these amounts.
30
Risk review
Enabling decisions to be taken with confidence Prudential’s Group Risk Framework and risk appetite have allowed the business to control its risk exposure throughout 2021. Its governance, processes and controls enable the Group to deal with uncertainty effectively, which is critical to the achievement of its strategy of capturing long-term structural opportunities and helping customers achieve their long-term financial goals. This section explains the main risks inherent in the business and how Prudential manages those risks, with the aim of ensuring an appropriate risk profile is maintained. 1. Introduction The Group 2021 was a year in which the pace of transformative change continued, both for the Prudential Group and the operating environments in which it operates. In May, the Group-wide Supervision (GWS) Framework became effective for the Group following designation by the Hong Kong Insurance Authority (IA), subject to agreed transitional arrangements. The demerger of the Jackson business completed in September, reshaping the Group into an Asia and Africa-focused business. The subsequent equity raise in October enhanced Prudential’s financial flexibility in light of the breadth of opportunities to invest for growth. The Group Risk, Compliance and Security (RCS) function provided risk opinions, guidance and assurance on these critical activities to enable strategic decisions to be taken with confidence, while retaining its focus on overseeing the risks of ongoing business, providing risk management and compliance advice, together with objective challenge on the execution of the strategic objectives. The core objective of the RCS function continued to be that the Group remained within its risk appetite. During the year, the RCS function continued to take steps to consolidate its position as a group-wide function, effectively leveraging the Group’s risk management and compliance experience in more mature markets and applying it in a nimble way to its emerging markets, appropriate to their unique risks, opportunities, customer needs and customs. With supply chain issues likely to continue to impact the world economy, the risks of persistent higher inflation remain firmly on the agenda. Strategic competition between the US and China is driving further decoupling of areas of their economies as both look to protect national interests. These objectives are increasingly being implemented through new laws and regulations protecting domestic data, technology and financial services. This dynamic increases the strategic, operational, regulatory and reputational risks for businesses operating within and across their spheres of influence. In China, the government’s application of its domestic policy aims has continued against the backdrop of a weakening real estate sector. The cycle of peaks and troughs of Covid-19 infection levels and associated restrictions experienced by the Group’s markets will undoubtedly take a toll on its customers and its people. Prudential continues to focus on delivering accessible and socially inclusive propositions, the fair treatment of its policyholders and all its customers, and the well-being of its employees in a sustainable way. The RCS function will continue to apply the holistic and coordinated approach to support the Group in managing these increasingly dynamic, multi-faceted and often inter-connected risks facing its business. The world economy The world economy remains in recovery following the significant loss of output in 2020. Global growth in 2022 is anticipated to remain above average historical trends although this is expected to slow and remains subject to developments in the pandemic. The pattern of recovery has not been the same across economies. Developed economies have received significant support from unprecedented fiscal stimulus and accommodative monetary policy aimed at maintaining consumption levels, while in emerging economies this support has been more muted and the focus has been on maintaining production levels. As fiscal stimulus is withdrawn and many economies transition to a strategy of treating Covid-19 as endemic, domestic demand is expected to shift from goods towards services in developed economies, reducing pressure on supply chains and inflation on imports. Monetary policy is also expected to become less accommodative, in particular in the US where the Federal Reserve has started to reduce asset purchases and is expected to raise its federal funds rate to address inflation concerns, which are no longer considered transitory. Developments in the labour market are expected to influence the pace and magnitude of monetary policy tightening. In Asia, economic reopening has lagged the West, with prolonged restrictions on movement and relatively slow vaccine rollouts, although growth has also rebounded as a consequence of steady manufacturing activity in the region. A resumption of tourism activities and the consumption of other services would support growth, but the emergence of new Covid-19 variants are a continuing challenge. Another key risk for the region is a property-led slowdown in China, which has the potential to be a drag on economic activity more broadly in the country and the region. The outlook remains highly dependent on the nature of the government response to stabilise demand in the sector. Inflationary pressures in most Asian economies have largely been contained and an abrupt tightening in monetary policy is considered unlikely. However, tightening US monetary policy, combined with any resulting further strengthening of the US dollar, may lead to adverse external financing conditions for emerging economies within the region. In Africa, while countries with more diversified economies and stronger pre-pandemic fundamentals such as Kenya, Ghana and Côte d’Ivoire are expected to perform better, the region as a whole faces significant headwinds. With low vaccination rates, Africa remains highly vulnerable to the health and economic impacts of new Covid-19 infection waves and emerging and new variants. Inflation levels in the region are expected to ease slightly in 2022 but are likely to remain elevated, leaving central banks facing difficult monetary policy choices and governments with limited fiscal space in which to manoeuvre. Financial markets Against a backdrop of the current, emerging and future Covid-19 variants, financial markets in 2021 reflected economic trends. Equity assets continued their rally although with short episodes of volatility, and developed markets closed the year at near all-time highs. Market movements were influenced by a number of factors during the course of the year, including the broad reflation following vaccine rollouts, fiscal stimulus, supply chain issues, increases in global inflation rates, fears of stagflation and the US Federal Reserve’s tapering timeline. Comparatively, emerging markets underperformed, particularly in Q3 due to growth and regulatory concerns in China, which significantly impacted the property sector and resulted in tightened credit conditions. Interest rates were dominated by market expectations for central bank policy responses, while credit spreads in investment grade markets remained relatively muted and continued to tighten, supported by the reopening of economies over the course of the year. The
31
Russia-Ukraine conflict, which was preceded by a period of rising tensions over Q4 2021, has contributed to large market movements and increases in energy prices in Q1 2022, the full extent of which remains uncertain. Increasing inflationary pressure in the US, the expected tightening in financial conditions driven by reduced asset purchases and the anticipated increase in federal fund rates may drive funding costs higher, with implications for global markets. This will increase risks for highly leveraged companies and countries, including those in Asia. Interest rate hikes are expected to support the US dollar while introducing currency depreciation risk for emerging markets. Emerging markets also remain susceptible to a reversal in capital flows, although they may be more resilient to this than in the past, given healthy current account balances, the fact that currencies remain relatively cheap by historical standards and that central banks in the region have pursued relatively conservative monetary policy compared to developed markets in 2021. Geopolitical landscape Governmental strategies in managing Covid-19 have reflected how they have balanced the impacts to people’s health and lives with their individual rights and liberties and the need for economic growth. The way this balance tilts remains a potential source of division both within and between nations, with governments mindful of the risk of falling behind global levels of economic recovery. The experience of the pandemic and the civil unrest seen in recent times has shown that the stability of governments and the resilience of businesses will continue to be tested. The Group has well-established local and global plans to mitigate the business risks from disruption. These have operated well during the pandemic and local outbreaks of unrest in certain markets, and the Group’s operational resilience will continue to be critically evaluated and enhanced. The relationship between the US and China continues to be a key driver of the level of global geopolitical tension, exerting pressure on national policymakers in other countries, including the South-east Asia markets in which the Group operates. As 2021 progressed, with the US and China turning their attention to more domestic matters, diplomatic escalations between the two countries eased albeit against a backdrop of increasing strategic competition. Over Q4 2021 and into 2022, tensions between western powers and Russia have escalated into conflict in Ukraine, following years of hostilities along the Ukraine-Russia border. The conflict is likely to have broad implications for geopolitical relations, which remain to be seen, and may drive the bifurcation of global trade, financial systems and standards. Domestically, the China government has continued to pursue its policy aims with regulatory tightening and actions that have been multi-faceted and ranging across industries including technology, real estate, education and entertainment, and have extended to data usage and the provision of online medical and insurance services and products. Where these actions have implications for interactions with the global environment there may be geopolitical effects which require assessment. The broader long-term impact on business sentiment, and linked economies such as Hong Kong, remains to be seen. Legislative or regulatory changes that adversely impact Hong Kong’s economy or its international trading and economic relationships, as a key market which also hosts Group head office functions, could have an adverse impact on sales and distribution and the operations of the Prudential Group. Meanwhile, the emergence of the Omicron coronavirus variant and the China and Hong Kong governments’ continued application of a ‘zero-Covid-19’ policy has increased uncertainty on the timing of border relaxation between the two territories. Regulations Prudential operates in highly regulated markets, and as the nature and focus of regulation and laws evolve, the complexity of regulatory (including sanctions) compliance continues to increase and represents a challenge for international businesses. Key regulatory compliance risks for the financial services industry include those related to customer-facing conduct, financial crime and sanctions compliance, information security and data privacy and residency, and those associated with third-party management. Prudential’s portfolio of transformation programmes, which include the expansion of the Group’s digital capabilities and improvement of business efficiencies through operating model changes, have the potential to introduce new, or increase existing, regulatory risks and supervisory interest, while increasing the complexity of ensuring concurrent regulatory compliance across markets driven by increasing intra-Group connectivity and dependencies. National and international regulatory developments continue to progress, with a continuing focus on solvency and capital standards, sustainability, technology and data, conduct of business, systemic risk regulation, corporate governance and senior management accountability, and macro prudential policy. Some of these changes will have a significant impact on the way that the Group operates, conducts business and manages its risks. Regulatory developments are monitored at a national and global level and form part of Prudential’s engagement with government policy teams and regulators. The increase in global strategic competition may provide an impetus to the fragmentation or increased regionalisation of trade, investment and standards, increasing the strategic and regulatory risks for businesses, in particular with laws and regulations with extra-territorial application. For internationally active groups such as Prudential, operating across multiple jurisdictions increases the complexity of legal and regulatory compliance. Compliance with the Group’s legal or regulatory obligations (including in respect of international sanctions), in one jurisdiction may conflict with the law or policy objectives of another jurisdiction, or may be seen as supporting the law or policy objectives of that jurisdiction over another, creating additional legal, regulatory compliance and reputational risks. These risks may be increased where the scope of regulatory requirements and obligations are uncertain, and where specific cases applicable to the Prudential Group are complex. The Group has in place risk tolerance frameworks to deal with complex and conflicting risk trade-offs to guide executive decisions. In China, the swiftness with which some of the recent regulatory changes and interventions have been applied has the potential to increase uncertainty and the strategic and regulatory risks for businesses operating in China or those which deal with Chinese companies. The Hong Kong IA’s GWS Framework became effective for Prudential following designation by the Hong Kong IA on 14 May 2021. The Group remains compliant with the Framework, subject to agreed transitional arrangements, and will continue to engage constructively with the Hong Kong IA as its Group-wide supervisor as it ensures ongoing sustainable compliance.

32
Societal developments Societal changes, including those driven by the Covid-19 pandemic and anticipated as part of the transition to a lower carbon economy, can have broad, complex and long-term effects, with the potential to exacerbate structural inequalities within and across countries. Such transitions can compel organisations to re-evaluate how best to serve their customers and the societies in which they operate. A key development of the pandemic has been the acceleration of digitalisation across businesses and their supply chains, with an accompanying increase in the importance of maintaining resilience against cyber incidents and security threats, such as ransomware attacks. The Covid-19 pandemic also provided a prompt for businesses and employees to re-evaluate traditional working practices and has accelerated certain thematic trends around increased flexibility, inclusivity and psychological safety in the workplace to enable employees to openly contribute and challenge. Prudential’s increasing use of digital services, technologies and distribution methods, increased adoption of its Pulse platform and the implementation of virtual face-to-face sales of select ranges of products in many of its markets during the pandemic have broad implications for Prudential and its conduct of business. These developments support the delivery of the Group’s aim to increase the accessibility and inclusiveness of its products and services, but also increase technology, data security or misuse and regulatory risks. Prudential, as a responsible employer, is increasing opportunities for employees to voice their views and responding to feedback with initiatives centred on flexible and new ways of working and on how it incentivises and upskills its workforce. The Group continues to monitor emerging social trends, including those linked to environmental change, and their potential impact on its wide range of stakeholders and how its products and services meet the needs of affected societies. Its risk management framework continues to evolve in order to manage the changing nature of these wide-ranging risks including activities to promote a transparent culture, actively encouraging open discussion and learning from mistakes.
33
2. Risk governance a System of governance Prudential has in place a system of governance that embeds a clear ownership of risk, together with risk policies and standards to enable risks to be identified, measured and assessed, managed and controlled, monitored and reported. The Group Risk Framework, owned by the Board, details Prudential’s risk governance, risk management processes and risk appetite. The Group’s risk governance arrangements are based on the ‘three lines’ model. The ‘first line’ is responsible for taking and managing risk, while the ‘second line’ provides additional challenge, expertise, oversight, and scrutiny. The role of the ‘third line’, assumed by the independent Group-wide Internal Audit function, is to provide objective assurance on the design, effectiveness and implementation of the overall system of internal control. The Group-wide Risk, Compliance and Security (RCS) function reviews, assesses, oversees and reports on the Group’s aggregate risk exposure and solvency position from an economic, regulatory and ratings perspectives. During 2021, the Group continued to review and update its policies and processes for alignment with the requirements of the Hong Kong IA’s GWS Framework, which became effective for the Group on 14 May 2021. The Group has also focused on embedding climate-change as a cross-cutting risk within the Group Risk Framework and development and embedding of its Group-wide customer conduct risk framework and policy; its third-party and outsourcing policy; its data policy and enhancements to its operational resilience. b Group Risk Framework
i. Risk governance and culture Prudential’s risk governance comprises the Board organisational structures, reporting relationships, delegation of authority, roles and responsibilities, and risk policies that have been established to make decisions and control activities on risk-related matters. The risk governance structure is led by the Group Risk Committee, supported by independent Non-executive Directors on risk committees of the Group’s main subsidiaries. The Group Risk Committee approves changes to the Group Risk Framework and the core risk policies that support it. The Group Risk Committee has direct lines of communication, reporting and oversight of the risk committees of the Group’s major businesses. As its adoption across Asia and Africa increases, the application of the Group’s governance framework and policies to the Pulse business has been increased. The Pulse Audit & Risk Committee for Pulse Ecosystems Limited, the holding company for Pulse, was formed and met for the first time in H1 2021. Risk culture is a strategic priority of the Board, which recognises its importance in the way that the Group does business. A Group-wide culture framework is currently being implemented to unify the Group towards its shared purpose of helping people get the most out of life. At the start of the year, the Board established the Responsibility & Sustainability Working Group to support its responsibilities in relation to implementation of the culture framework, as well as embedding the Group’s ESG strategic framework, and progress on diversity and inclusion initiatives. The culture framework includes principles and values that define how the Group expects business to be conducted in order to achieve its strategic objectives, inform expectations of leadership and support the resilience and sustainability of the Group. The components of the culture framework support sound risk management practices by requiring a focus on longer-term goals and sustainability, the avoidance of excessive risk taking and highlighting acceptable and unacceptable behaviours. This is supported through inclusion of risk and sustainability considerations in performance management for key individuals; the building of appropriate skills and capabilities in risk management; and by ensuring that employees understand and care about their role in managing risk through open discussions. The Group Risk Committee has a key role in providing advice to the Remuneration Committee on risk management considerations to be applied in respect of executive remuneration. Prudential’s Group Code of Business Conduct and Group Governance Manual, supported by risk-related policies, include guiding principles on the day-to-day conduct of all its people and any organisations acting on its behalf. Supporting policies include those related to financial crime, covering anti-money laundering, sanctions, anti-bribery and corruption and conduct. The Group’s third-party and outsourcing policy requires that human rights and modern slavery considerations are embedded across all of its supplier and supply chain arrangements. Procedures to allow individuals to speak out safely and anonymously against unethical behaviour and conduct are also in place.
ii. The risk management cycle
Risk identification In accordance with provision 28 of the UK Corporate Governance Code and the GWS guidelines issued by the Hong Kong IA, a top-down and bottom-up process is in place to support Group-wide identification of principal risks. An emerging risk identification framework exists to support the Group’s preparations in managing financial and non-financial risks expected to crystallise beyond the short-term horizon. The Board performs a robust assessment and analysis of these principal and emerging risk themes through the risk identification process, the Group Own Risk and Solvency Assessment (ORSA) report and the risk assessments undertaken as part of the business planning review, including how they are managed and mitigated, which supports decision-making. The ORSA is the ongoing process of identifying, measuring and assessing, managing and controlling, monitoring and reporting the risks to which the business is exposed. It includes an assessment of capital adequacy to ensure that the Group’s solvency needs are met at all times. Stress and scenario testing, which includes reverse stress testing requiring the Group to ascertain the point of business model failure, is another tool that helps to identify the key risks and scenarios that may have a material impact on the Group. The risk profile assessment is a key output from the risk identification and risk measurement processes and is used as a basis for setting Group-wide limits, management information, assessment of solvency needs, and determining appropriate stress and scenario testing. The Group’s annual set of principal risks are given enhanced management and reporting focus.
34
Risk measurement and assessment All identified risks are assessed based on an appropriate methodology for that risk. Quantifiable risks, which are material and mitigated by holding capital, are modelled in the Group’s internal model, which is used to determine the Group Internal Economic Capital Assessment (GIECA) and is subject to independent validation and processes and controls around model changes and limitations. Risk management and control The Group’s control procedures and systems focus on aligning the levels of risk-taking with the Group’s strategy and can only provide reasonable, and not absolute, assurance against material misstatement or loss. The Group’s risk policies define the Group’s appetite to material risks and set out the risk management and control requirements to limit exposure to these risks, see below. These policies also set out the processes to enable the measurement and management of these risks in a consistent and coherent way, including the flows of management information required. The methods and risk management tools employed to mitigate each of its major categories of risks are detailed in section 4 below. Risk monitoring and reporting The Group’s principal risks inform the management information received by the Group Risk Committee and the Board, which also includes key exposures against appetite and developments in the Group’s principal and emerging risks.
iii. Risk appetite, limits and triggers The Group recognises the interests of its broad spectrum of stakeholders (including customers, investors, employees, communities and key business partners) and that a managed acceptance of risk lies at the heart of the business. The Group seeks to generate stakeholder value by selectively taking exposure to risks, reduced to the extent it is cost-effective to do so, where these are an outcome of its chosen business activities and strategy. Those risks for which the Group has no tolerance are actively avoided. The Group’s systems, procedures and controls are designed to manage risk appropriately, and its approach to resilience and recovery aims to maintain the Group’s ability and flexibility to respond in times of stress. Qualitative and quantitative expressions of risk appetite are defined and operationalised through risk limits, triggers and indicators. The RCS function reviews these measures at least annually. The Board approves changes to the Group’s aggregate risk appetite and the Group Risk Committee has delegated authority to approve changes to the system of limits, triggers and indicators. Group risk appetite is defined and monitored in aggregate by the setting of objectives for its liquidity, capital requirements and non-financial risk exposure, covering risks to stakeholders, including those from participating and third-party business. Group limits operate within these expressions of risk appetite to constrain material risks, while triggers and indicators provide additional defined points for escalation. The Group Risk Committee, supported by the RCS function, is responsible for reviewing the risks inherent in the Group’s business plan and for providing the Board with a view on the risk/reward trade-offs and the resulting impact to the Group’s aggregated position relative to Group risk appetite and limits, including non-financial risk considerations. a. Capital requirements. Limits on capital requirements aim to ensure that in business-as-usual and stressed
conditions the Group maintains sufficient capital in excess of internal economic capital requirements, achieves its desired target rating to meet its business objectives, and supervisory intervention is avoided. The two measures in use at the Group level are the GWS group capital requirements and internal economic capital requirements, determined by the Group Internal Economic Capital Assessment (GIECA).
b. Liquidity. The objective of the Group’s liquidity risk appetite is to ensure that sufficient cash resources are available
to meet financial obligations as they fall due in business-as-usual and stressed scenarios. This is measured using a liquidity coverage ratio which considers the sources of liquidity against liquidity requirements under stress scenarios.
Non-financial risks. At the end of 2021 the Group approved a more streamlined and simplified Non-Financial Risk Appetite approach, framed around the perspectives of its varied stakeholders, to be embedded in 2022. The Group accepts a degree of non-financial risk exposure as an outcome of its chosen business activities and strategy. It aims to manage these risks effectively to maintain its operational resilience and its commitments to customers and all stakeholders and avoid material adverse financial loss or impact to its reputation.
35
3. The Group’s principal risks
The delivery of the Group’s strategy in building long-term value for its shareholders and other stakeholders, focusing on high-growth business in Asia and Africa, exposes Prudential to risks. The materialisation of these risks within the Group or at its joint ventures or key third party partners may have a financial impact and may affect the performance of products or services or the fulfilment of commitments to customers and other stakeholders with an adverse impact on Prudential’s brand and reputation. This report is focused mainly on risks to the shareholder but includes those which arise indirectly through policyholder exposures and third-party business. The Group’s principal risks, which are not exhaustive, are detailed below. The Group’s Risk Factor disclosures can be found at the end of this document. Covid-19 – longer-term risks and forward-looking areas of focus As the pandemic and the associated global response have evolved, it has become clear that Covid-19 and its impacts will persist far longer than many would have predicted at the onset of the global outbreak in 2020. The pandemic continues to present risks for the Group, particularly given the on-going uncertainty arising from current, emerging and future variants of the virus, and has also resulted in transformative changes to the business environment and Prudential’s business model, which are likely to persist even after Covid-19 is considered endemic. These longer-term risks and forward-looking areas for the Group are summarised below and, where relevant, further information is provided within the descriptions of the Group’s principal risks.
• People risks: Prudential continues to actively support and enable its employees to work remotely and flexibly and in line with government policy and guidance in the markets in which it operates. It has provided its fullest support to those directly impacted by the coronavirus and their families. The Group is exploring new ways of working, acknowledging that the pandemic may accelerate demand for a permanent shift in the pre-pandemic norms in working arrangements. The duration of the pandemic and related restrictions in some of the Group’s markets has heightened the risks to the physical and mental health of its employees. This is a key area of focus across Prudential, with a coordinated suite of initiatives being progressed designed to measure and support the well-being and potential uncertainty of employees due to the Covid-19 pandemic or changes in the Group as it reshapes into an Asia and Africa focussed business.
• Customer conduct, product and distribution risks: As the initial pandemic-related initiatives and campaigns rolled out across markets to support customers expire (including customer cash benefits, goodwill payments, and extended grace periods for premium payments), the Group is monitoring the impact to customers to ensure they are treated fairly and with due care. The Group’s customer conduct risk framework enshrines its focus on customer outcomes, under which risk monitoring is performed, irrespective of the pandemic.
Prudential rolled out, with appropriate regulatory engagement, virtual face-to-face sales processes and digital product offerings in most its markets during the pandemic. Where these are expected to remain, the Group will ensure these processes are in line with evolving regulations and regulatory expectations, and monitor such developing processes for customer conduct, operational and commercial risks. Regardless of the pandemic, Prudential regularly assesses the suitability and affordability of its products, aiming to reduce their perceived complexity and increase the transparency of their costs and benefits. These aims, as well as the Group’s increasing focus on the sustainable digital distribution of its health and wealth products via its Pulse platform, help to expand the financial inclusion of Prudential’s products in its markets.
• Financial market and economic risks: Throughout 2021, pandemic developments, both positive and negative (such as the emergence of new Covid-19 variants), have contributed to financial market volatility. The Group continues close monitoring of equity, interest rate and credit risks and inflation expectations, as well as the broader macroeconomic impacts of the pandemic, including the effects of an uneven recovery across markets. Risk limits and the appropriateness of the Group’s counter-cyclical capital buffer are regularly reviewed and adjusted where required.
• Information security risks: Office-based working may not return to pre-pandemic levels which, along with the pandemic-accelerated growth in digital operations, products and services, increases organisational exposure to long-term heightened information security risks, increasing the opportunities for cyber-crime and ransomware attacks. The Group continues to strengthen its robust information security management framework and progress its programme to enhance and maintain levels of cyber hygiene, combined with ongoing training and phishing campaigns, aligned with threat intelligence feeds, and simulation exercises to support data privacy and operational resilience.
• Insurance risks: In the short term, the Group has seen an increase in Covid-19-related mortality claims in select markets. A combination of the economic impact of the pandemic and extended restrictions on movement has also increased persistency risk at some of the Group’s businesses. The potential longer-term impacts of the pandemic include lapses, surrenders and premium affordability from the broader economic effects; increased and/or delayed morbidity claims resulting from the deferral of medical treatment by policyholders during the pandemic; latent morbidity impacts from the deferral of medical treatment by policyholders; and the implications from other factors such as long-term post-Covid-19 symptoms (although there is currently no consensus on the longer-term impact on morbidity).
Risks to the Group’s financial situation (including those from the external macroeconomic and geopolitical environment) The global economic and geopolitical environment may impact on the Group directly by affecting trends in financial markets and asset values, as well as driving short-term volatility. Risks in this category include the market risks to our investments and the credit quality of our investment portfolio as well as liquidity risk.
Global economic and geopolitical conditions Macroeconomic and geopolitical developments are considered material to the Group and can increase the operational, business
36
disruption, regulatory and financial market risks to the Group and can directly impact its sales and distribution networks. Changes in global economic conditions can impact Prudential directly; for example, by reducing investment returns and fund performance and liquidity, and increasing the cost of product guarantees. Indirect impacts include higher inflation, which can reduce disposable income and decrease propensity for people to save and buy Prudential’s products, as well as changes in political attitudes towards regulation. As some countries begin to adopt strategies to manage Covid-19 as an endemic disease, variations in the speed of economic recovery from the pandemic between markets, and the subsequent impact on their respective interest rates, inflation expectations and the relative strength of their currencies (and the associated impact on their foreign currency debt obligations), may drive broader long-term economic and financial uncertainty which may disproportionately impact emerging economies. Financial markets, economic sentiment and regulatory compliance risks can be highly susceptible to geopolitical developments. These have been outlined in Section 1. Market risks to our investments This is the potential for reductions in the value of Prudential’s investments driven by fluctuations in equity prices, interest rates, foreign exchange rates and property prices. While interest rates have been rising steadily and may rise further in response to increasing inflationary pressures, a return to a low interest rate environment poses challenges to the capital position of life insurers and new business profitability. The Group has appetite for market risk where it arises from profit-generating insurance activities to the extent that it remains part of a balanced portfolio of sources of income for shareholders and is compatible with a robust solvency position. The Group’s market risks are managed and mitigated by the following: - The Group market risk policy; - Risk appetite statements, limits and triggers; - The Group’s asset liability committees (ALCOs); - Asset and liability management activities, which include management actions such as changes in asset allocation, bonus
revisions, repricing and the use of reinsurance where appropriate; - Hedging using derivatives, including currency forwards, interest rate futures and swaps, and equity futures; - The monitoring and oversight of market risks through the regular reporting of management information; and - Regular deep dive assessments. The Group Critical Incident Procedure (GCIP) defines specific governance to be invoked in the event of a critical incident, such as significant market, liquidity or credit-related event. This includes, where necessary, the convening of a Critical Incident Group (CIG) to oversee, coordinate, and where appropriate, direct activities during a critical incident.
• Interest rate risk, including asset liability management (ALM). Interest rate risk is driven by the valuation of Prudential’s assets (particularly government and corporate bonds) and liabilities, which are dependent on market interest rates. Sustained inflationary pressures which may drive higher interest rates may impact the valuation of fixed income investments and reduce fee income. Some of the Group’s products are sensitive to movements in interest rates. Prudential’s appetite for interest rate risk requires that assets and liabilities should be tightly matched for exposures where assets or derivatives exist that can cover these exposures. Interest rate risk is accepted where this cannot be hedged, provided that this arises from profitable products and to the extent that interest rate risk exposure remains part of a balanced exposure to risks and is compatible with a robust solvency position.
The Group’s exposure to interest rate risk arises from the guarantees of some non-unit-linked products with a savings component, including the Hong Kong and Singapore with-profits and non-profit businesses. This exposure arises from the potential for an asset and liability mismatch, where long-dated liabilities and guarantees are backed by short-dated assets. When this mismatch is not eliminated, it is monitored and managed through local risk and asset liability management committees and Group risk limits consistent with the Group’s appetite for interest rate risk. Unit-linked based businesses, such as Indonesia and Malaysia, are also exposed to interest rate risk resulting from the impact to the present value of future fees from such products. The Group-level ALCOs are risk management advisory committees supporting the identification, assessment and management of key financial risks to the achievement of the Group’s business objectives. They also oversee ALM and solvency risks of the local businesses as well as the declaration and management of non-guaranteed benefits for participating and universal life lines of business. Local business units are responsible for the management of their own asset and liability positions. The objective of the local business unit ALM process is to meet policyholder liabilities with the returns generated from the investment assets held, while maintaining the financial strength of capital and solvency positions. The ALM strategy adopted by the local business units considers the liability profile and related assumptions of in-force business and new products to appropriately manage investment risk within ALM risk appetite, under different scenarios in accordance with policyholders’ reasonable expectations, and economic and local regulatory requirements. Factors such as the availability of matching assets, diversification, currency and duration are considered as appropriate. The assumptions and methodology used in the measurement of assets and liabilities for ALM purposes conform with local solvency regulations. Assessments are carried out on an economic basis which conforms to the Group’s internal economic capital methodology.
• Equity and property investment risk. The shareholder exposure to equity price movements arises from various sources, including from unit-linked products where fee income is linked to the market value of the funds under management. Exposure also arises from with-profits businesses through potential fluctuations in the value of future shareholders’ profits and where bonuses declared are based broadly on historical and current rates of return from the Asia business’s investment portfolios, which include equities. The Group has limited acceptance for exposures to equity risk but accepts the equity exposure that arises on future fees (including shareholder transfers from the with-profits business).
37
The material exposures to equity risk in the Group’s businesses include the following: The China joint venture business is exposed to equity risk through its investments in equity assets for most of its products, including participating and non-participating savings products and protection and investment-linked products. The Hong Kong business and, to a lesser extent, the Singapore business contribute to the Group’s equity risk exposure due to the equity assets backing participating products. The Indonesia and Malaysia businesses are exposed to equity risk through their unit-linked products.
• Foreign exchange risk. The geographical diversity of Prudential’s businesses means that it has some exposure to the risk of foreign exchange rate fluctuations. Some entities within the Group write policies, invest in assets or enter into other transactions in local currencies or currencies not linked to the US dollar. Although this limits the effect of exchange rate movements on local operating results, it can lead to fluctuations in the Group’s US dollar-reported financial statements. This risk is accepted within the Group’s appetite for foreign exchange risk. In cases where a non-US dollar denominated surplus arises in an operation which is to be used to support Group capital, or where a significant cash payment is due from a subsidiary to the Group, this currency exposure may be hedged where considered economically favourable. Further, the Group generally does not have appetite for significant direct shareholder exposure to foreign exchange risks in currencies outside the countries in which it operates, but it does have some appetite for this on fee income and on equity investments within the with-profits fund. Where foreign exchange risk arises outside appetite, currency swaps and other derivatives are used to manage the exposure.
Liquidity risk Prudential’s liquidity risk arises from the need to have sufficient liquid assets to meet policyholder and third-party payments as they fall due, considered under both business-as-usual and stressed conditions. It includes the risk arising from funds composed of illiquid assets and results from a mismatch between the liquidity profile of assets and liabilities. Liquidity risk may impact on market conditions and valuation of assets in a more uncertain way than for other risks like interest rate or credit risk. It may arise, for example, where external capital is unavailable at sustainable cost, increased liquid assets are required to be held as collateral under derivative transactions or where redemption requests are made against Prudential’s external funds. Liquidity risk is considered material at the level of the Group. Prudential has no appetite for any business to have insufficient resources to cover its outgoing cash flows, or for the Group as a whole to not meet cash flow requirements from its debt obligations under any plausible scenario. The Group has significant internal sources of liquidity sufficient to meet its expected cash requirements for at least 12 months from the date the financial statements are approved, without having to resort to external sources of funding. The Group has a total of $2.6 billion of undrawn committed facilities that can be made use of, expiring in 2026. Access to further liquidity is available through the debt capital markets and the Group’s extensive commercial paper programme. Prudential has maintained a consistent presence as an issuer in the market for the past decade. A number of risk management tools are used to manage and mitigate liquidity risk, including the following: - The Group’s liquidity risk policy; - Risk appetite statements, limits and triggers; - Regular assessment by the Group and business units of Liquidity Coverage Ratios which are calculated under both base case
and stressed scenarios and are reported to committees and the Board; - The Group’s Liquidity Risk Management Plan, which includes details of the Group Liquidity Risk Framework as well as analysis
of Group and business units liquidity risks and the adequacy of available liquidity resources under business-as-usual and stressed conditions;
- Its contingency plans and identified sources of liquidity; - The Group’s ability to access the money and debt capital markets; and - The Group’s access to external committed credit facilities. Credit risk Credit risk is the potential for loss resulting from a borrower’s failure to meet its contractual debt obligation(s). Counterparty risk, a type of credit risk, is the probability that a counterparty to a transaction defaults on its contractual obligation(s) causing the other counterparty to suffer a loss. These risks arise from the Group’s investments in bonds, reinsurance arrangements, derivative contracts with third parties, as well as its cash deposits with banks. Credit risk is considered a material risk for the Group’s business units. The Group’s holdings across its life portfolios are mostly in local currency and with a largely domestic investor base, which provides support to these positions. The Group’s portfolios are generally positioned towards high quality names, including those with either government or considerable parent company balance sheet support. Areas which the Group are actively monitoring include the developments in the China property sector and the degree of government support for state-owned entities in Asia, given recent defaults observed in the market by such entities in China and Thailand. The Group’s portfolio is generally well diversified in relation to individual counterparties, although counterparty concentration is monitored, in particular in local markets where depth (and therefore the liquidity of such investments) may be low. Prudential actively reviews its investment portfolio to improve the robustness and resilience of the solvency position. The Group has some appetite to take credit risk to the extent that it remains part of a balanced portfolio of sources of income for shareholders and is compatible with a robust solvency position. Further detail on the Group’s debt portfolio is provided below. A number of risk management tools are used to manage and mitigate credit risk, including the following: - A credit risk policy and dealing and controls policy; - Risk appetite statements and portfolio-level limits that have been defined on issuers, and counterparties; - Collateral arrangements for derivative, secured lending reverse repurchase and reinsurance transactions which aim to provide
a high level of credit protection;
38
- The Group Credit Risk Committee’s oversight of credit and counterparty credit risk and sector and/or name-specific reviews; - Regular assessments of individual and sector exposures subject to elevated credit risks; and - Close monitoring or restrictions on investments that may be of concern. The total debt securities at 31 December 2021 for the Group’s continuing operations were $99.1 billion (31 December 2020: $89.8 billion). The majority (70 per cent) of the portfolio is in unit-linked and with-profits funds. The remaining 30 per cent of the debt portfolio is held to back the shareholder business.
• Group sovereign debt. Prudential invests in bonds issued by national governments. This sovereign debt holding of the Group’s operations represented 47 per cent or $14.2 billion1 of the shareholder debt portfolio of the Group’s operations as at 31 December 2021 (31 December 2020: 45 per cent or $12.8 billion of the shareholder debt portfolio for the Group’s continuing operations). The particular risks associated with holding sovereign debt are detailed further in the disclosures on Risk Factors.
The exposures held by the shareholder-backed business and with-profits funds in sovereign debt securities at 31 December 2021 are given in note C1 of the Group’s IFRS financial statements.
• Corporate debt portfolio. In the shareholder-backed business, corporate debt exposures totalled $14.5 billion of which $12.7 billion or 87 per cent were investment grade rated.
• Bank debt exposure and counterparty credit risk. The banking sector represents a material concentration in the Group’s corporate debt portfolio which largely reflects the composition of the fixed income markets across the regions in which Prudential is invested. As such, exposure to banks is a key part of its core investments, as well as being important for the hedging and other activities undertaken to manage its various financial risks. Exposure to the sector is considered a material risk for the Group. Derivative and reinsurance counterparty credit risk exposure is managed using an array of risk management tools, including a comprehensive system of limits. Prudential manages the level of its counterparty credit risk by reducing its exposure, buying credit protection or using additional collateral arrangements where appropriate.
At 31 December 2021: - 87 per cent of the Group’s shareholder portfolio (excluding all government and government-related debt) is investment grade
rated2. In particular, 52 per cent of the portfolio is rated2 A- and above (or equivalent); and - The Group’s shareholder portfolio is well diversified: no individual sector3 makes up more than 15 per cent of the total portfolio
(excluding the financial and sovereign sectors).
The Group’s Sustainability and ESG-related risks These include sustainability risks associated with environmental considerations such as climate change (including physical and transition risks), social risks arising from diverse stakeholder commitments and expectations and governance-related risks.
Material risks associated with key ESG themes may undermine the sustainability of a business by adversely impacting its reputation and brand, ability to attract and retain customers and employees, and therefore the results of its operations and delivery of its strategy and long-term financial success. Prudential seeks to manage sustainability risks and their potential negative impact on its business and stakeholders through a focus on the Group’s purpose to ‘help people get the most out of life’, and transparent and consistent implementation of its strategy in its key markets and across operational, underwriting and investment activities. The Group’s strategy includes providing greater and more inclusive access to good health and financial security, responsible stewardship in managing the human impact of climate change and building human and social capital with its broad range of stakeholders. It is enabled by strong internal governance, sound business practices and a responsible investment approach, with ESG considerations integrated into investment decisions and the performance of fiduciary and stewardship duties, including voting and active engagement decisions with respect to investee companies, as both an asset owner and an asset manager.
i. Environmental issues
Prudential’s strategic focus on stewarding the human impacts of climate change and decarbonising its operations and investment activities recognises that environmental concerns, such as water pollution, biodiversity degradation and notably those associated with climate change, and their social and economic impacts present long-term risks to the sustainability of Prudential, and may impact its customers and other stakeholders. Prudential’s investment horizons are long term and it is therefore exposed to the potential long-term impact of climate change risks, which include the financial and non-financial impact of transition to a lower carbon economy and physical and litigation risks. The global transition to a lower carbon economy may have an adverse impact on investment valuations as the financial assets of carbon-intensive companies re-price, and this could result in some asset sectors facing significantly higher costs and a reduction in demand for their products and services. The speed of this transition, and the extent to which it is orderly and managed, will be influenced by factors such as public policy, technology and changes in market or investor sentiment. The potential impact of these factors on the valuation of investments may also have a broader economic and social impact that may affect customers and their demand for the Group’s products and services. The transition to a lower carbon economy has the potential to disproportionately impact the Asia and Africa markets in which Prudential operates and invests, and the Group’s stakeholders increasingly expect and/or rely on the Group to support an orderly, inclusive and sustainable transition based on an understanding of relevant country and company-level plans, taking into consideration the impact on the economies, businesses, communities and customers in these markets. The pace and volume of new climate-related regulation and reporting standards emerging across the markets in which the Group operates, the need to deliver on existing and new voluntary exclusions on investments in certain sectors, engagement and reporting commitments and externally assured reporting may give rise to compliance, operational and disclosure risks

39
which may be increased by the multi-jurisdictional coordination required in adopting a consistent risk management approach. Understanding and appropriately reacting to transition risk and implementing carbon reduction commitments requires sufficient and reliable data on carbon exposure and transition plans for the assets in which the Group invests.
The direct physical impacts of climate change, driven by both specific short-term climate-related events such as natural disasters and longer-term changes to climate and the natural environment, are likely to become increasingly significant factors in the mortality and morbidity risk assessments for the Group’s insurance product underwriting and offerings and their associated claims profiles. Climate-driven events in countries in which Prudential or its key third parties operate could adversely impact the Group’s operational resilience and its customers, which may potentially occur through migration or displacement both within and across borders. A failure to understand, manage and provide greater transparency of its exposure to these climate-related risks may have increasing adverse implications for Prudential and its stakeholders.
ii. Social issues
Social risks that could impact Prudential may arise from a failure to consider the rights, diversity, wellbeing, needs and interests of its customers and employees and the communities in which the Group or its third parties operate. These risks are increased as Prudential operates in multiple jurisdictions with distinct local cultures and considerations. Perceived inequalities and income disparities, intensified by the pandemic, have the potential to further erode social cohesion across the Group’s markets, emphasising the importance of an inclusive and sustainable global economic recovery. Evolving social norms and emerging population risks associated with public health trends (such as an increase in obesity and mental health deterioration) and demographic changes (such as population urbanisation and ageing) may affect customer lifestyles and therefore may impact the level of claims against the Group’s insurance product offerings. As a provider of insurance and investment services the Group is committed to playing a role in preventing and postponing illness in order to protect its customers, as well as making health and financial security more inclusive and accessible through enhancements to its products and services and an increased focus on digital innovation, technologies and distribution methods. As a result, Prudential has access to sensitive customer personal data, including data related to personal health, and an increasing ability to analyse and interpret this data through the use of complex tools, machine learning and artificial intelligence technologies. The Group therefore actively manages the regulatory, ethical and reputational risks associated with actual or perceived customer data misuse or security breaches and its operational resilience to support its customers. These risks are outlined below. The increasing digitalisation of products, services and processes may also result in new and unforeseen regulatory requirements and stakeholder expectations for which Prudential monitors, as well as ensuring support for its customers through this transformation. As an employer, the Group aims to attract, retain and develop a diverse group of highly-skilled employees to meet the changing needs of a transformative organisation. This requires the implementation of responsible working practices and recognising the benefits of diversity, ensure psychological safety for employees to contribute and challenge, and promoting a culture of inclusion and sense of belonging. The Group’s reputation extends to its supply chains and its investee companies, which may be exposed to factors such as poor labour standards and abuses of human rights by third parties.
iii. Governance
Maintaining high standards of corporate governance is crucial for the Group and its customers and employees, reducing the risk of poor decision-making and a lack of oversight of its key risks. Poor governance may arise where key governance committees have insufficient independence, a lack of diversity, skills or experience in their members, or unclear (or insufficient) oversight responsibilities and mandates. Inadequate oversight over remuneration also increases the risk of poor senior management behaviours. Prudential operates across multiple jurisdictions and has a Group and subsidiary governance structure which may add further complexity to these considerations. Participation in joint ventures or partnerships where Prudential does not have direct overall control and the use of third-party suppliers increases the potential for reputational risks arising from poor governance.
Prudential is an active contributor to industry fora on sustainability and the Group was a key contributor to the CRO Forum’s November 2021 guidance paper (‘Mind the Sustainability Gap – Integrating sustainability into insurance risk management’), that seeks to define a set of industry best practice guidelines to manage the integration of sustainability into insurers’ risk management frameworks. Risk management and mitigation of ESG sustainability risks at Prudential include the following: - The Group’s strategic focus on providing greater and more inclusive access to good health and financial security,
responsible stewardship in managing the human impact of climate change and building human and social capital with its broad range of stakeholders;
- The Group Code of Business Conduct and Group Governance Manual including ESG-linked policies; - Activities to embed ESG and sustainability risk within the Group Risk Framework including:
o Environmental and social risk identification including through emerging risk processes; and o Deep dives into ESG themes, including climate-related risks;
- Integrating ESG considerations into investment processes and responsible supply chain management; and - Participation in networks to further develop understanding and support collaborative action in relation to ESG sustainability
risks such as climate change.
40
Risks from the nature of our business and our industry These include the Group’s non-financial risks (including operational and financial crime risk), transformation risks from significant change activity and the insurance risks assumed by the Group in providing its products.
Transformation risk Transformation risk remains a material risk for Prudential, with a number of significant change programmes under way, which if not delivered to defined timelines, scope and cost may negatively impact its operational capability; control environment; reputation; and ability to deliver its strategy and maintain market competitiveness. The Group’s transformation and change programmes inherently give rise to design and execution risks, and may introduce new, or increase existing, business risks (including increasing uncertainty for the Group’s employees) and increase intra-Group connectivity and dependencies. While the adoption of technologies related to digital distribution and artificial intelligence has opened up new product distribution and value-added service opportunities, it also exposes Prudential to additional regulatory, information security, data privacy, operational, ethical and conduct risks which, if not managed effectively, could result in customer detriment and reputational damage. The speed of technological change and adoption in the business also increase the risk that all unintended consequences are not anticipated. The Group therefore aims to ensure that, for both transformation and strategic initiatives, strong programme governance is in place with embedded risk expertise to achieve ongoing and nimble risk oversight, with regular risk monitoring and reporting to risk committees. Transformation risk oversight operates alongside the Group’s existing risk policies and frameworks to ensure appropriate governance and controls are in place to mitigate these risks. Prudential’s current portfolio of transformation and significant change programmes include the expansion of the Group’s digital capabilities and use of technology, platforms and analytics, and improvement of business efficiencies through operating model changes. Programmes related to regulatory/industry change such as the development and embedding of the Group Internal Economic Capital Assessment (GIECA) model under the GWS Framework, changes required to effect the discontinuation of inter-bank offered rates (IBORs) in their current form and the implementation of IFRS 17 are also ongoing. Risks associated with the Group’s joint venture and jointly owned businesses Prudential operates, and in certain markets is required by local regulation to operate, through joint ventures and other joint ownership or third-party arrangements. A material proportion of the Group’s business comes from its joint ventures in China and India. For such operations the level of control exercisable by the Group depends on the terms of the contractual agreements between participants. As such the level of oversight, control and access to management information the Group is able to exercise over the extent of the exposure to material risks at these operations may be lower compared to the Group’s wholly owned businesses. Further information on the risks to the Group associated with joint ventures and jointly owned businesses are included in the disclosures on Risk Factors. Non-financial risks The complexity of Prudential, its activities and the extent of transformation in progress creates a challenging operating environment and exposure to non-financial risks. The Group’s appetite framework for non-financial risks considers risks across a broad range of categories which are outlined below. These risks are considered to be material at the level of the Group.
• Operational risk. This is the risk of loss (or unintended gain or profit) arising from inadequate or failed internal processes, personnel or systems and external events, and may arise from employee error, model error, system failures, fraud or other events which disrupt business processes or which have a detrimental impact to customers. Prudential accepts a degree of non-financial risk exposure as an outcome of its chosen business activities and strategy. It aims to manage these risks effectively to maintain its operational resilience and its commitments to customers and all stakeholders and avoid material adverse financial loss or impact on its reputation.
• Outsourcing and third-party risks. The Group’s outsourcing and third-party relationships require distinct oversight and risk management processes. The Group has a number of important third-party relationships, both with market counterparties and outsourcing partners, including distribution, technology and ecosystem providers. In Asia, the Group continues to expand its strategic partnerships and renew bancassurance arrangements. These arrangements support the delivery of high level and cost-effective services to customers, but also create a reliance on the operational resilience and performance of outsourcing and business partners. The Group’s requirements for the management of material outsourcing arrangements have been aligned to the requirements of the Hong Kong IA’s GWS Framework and are included in its Group third party supply and outsourcing policy. Third-party management is also included and embedded in the Group-wide operational risk framework (see below).
• Information security and data privacy risk. This includes risks related to malicious attack on systems, network disruption and the infringement of data security, integrity or privacy. The frequency and sophistication of intrusion activities and criminal capability in this area, including in ransomware (malicious software designed to block access to a computer system until a sum of money is paid), continues to increase globally. The technology landscape of Prudential is transforming at a rapid pace and the underlying technology infrastructure (and support services) has grown in scope and complexity in recent years. This, combined with stakeholder expectations and the potential for reputational and conduct risk from cyber security breaches and data misuse, which can be highly-publicised, mean that these risks are considered material at the level of the Group. As well as having preventative risk management processes in place, it is fundamental that the Group has robust critical recovery systems in place in the event of a successful attack on its infrastructure, a breach of its information security or a failure of its systems in order to retain its customer relationships and trusted reputation. Prudential and the insurance industry are making increasing use of emerging technological tools and digital services, or partnering with third parties that provide these capabilities. While these provide new opportunities, opening up markets, improving insights and increasing scalability, it also comes with additional risks, including operational and data misuse risks, which are managed within the Group’s existing governance and risk management processes. Automated digital distribution channels increase the criticality of system and process resilience in order to deliver uninterrupted service to customers.
41
Globally, ransomware attacks have increased markedly with the shift to remote working practices driven by the Covid-19 pandemic. Prudential has a number of defences in place to protect its systems from this type of attack, including but not limited to: AI-based endpoint security software, continuous security monitoring, network-based intrusion detection, and employee training and awareness campaigns to raise understanding of attacks utilising email phishing techniques. Cyber insurance coverage is in place to provide some protection against potential financial losses and the Group conducts simulation exercises for ransomware attacks to assess and develop the effectiveness of incident responses across its businesses. Data protection requirements continue to evolve, and include developments in China outlined in the overview of the Group’s regulatory risks below. As well as protecting data, stakeholders expect companies and organisations to use personal information transparently and appropriately. Control of data through national data security regimes has become an increasing priority for governments amid the increase in global strategic competition. This adds further complexity to regulatory compliance in this area, in particular in the cross-border transfer or use of data, for global organisations in addition to the existing regulatory, financial and reputational risks of a breach of Prudential’s (or third-party suppliers’) IT systems or loss or misuse of data. In 2021 a new Group Data Policy was approved, establishing the principles and requirements for effective and scalable data management in light of the increase in volume and variety of data expected to be held, as well as the speed at which it is collected, as part of the Group’s digital aspirations. The Group’s Information Security and Data Privacy strategy has four key objectives: business enablement; continuous improvement of cyber defences; automation and optimisation; and governance and assurance to ascertain ongoing robustness of cyber security and privacy measures. In 2021 a focus of Prudential has been ensuring consistent global coverage of security controls, following the operationalisation of a revised organisational structure and governance model for cyber security management. This included the establishment of a centralised Technology Risk Management team, leveraging skills, tools and resources across different technology domains to provide advisory, assurance and operations support for holistic technology risk management including information security and privacy. A Group Technology Risk Committee has been established, providing group-wide oversight of technology risks, including information security and privacy. Risk management is also performed locally within business units, with input from business information security officers and with oversight from local risk committees. The Prudential plc Board is briefed at least twice annually on cyber security by the Group CISO and executive training is provided to ensure that members have the means to enable appropriate oversight and understand the latest threats and regulatory expectations. The Group-wide information security policy was developed in collaboration with industry experts to support a pragmatic approach to the evolving regulatory environment globally and ensure compliance with all applicable privacy laws and regulations and the appropriate and ethical use of customer data. The policy was also developed with reference to international standards, including ISO 27001/2, the NIST Cyber Security Framework and supervisory guidelines. Local standards are aligned to local regulations and laws.
• Model and user developed application (UDA) risk. Erroneous or misinterpreted tools used in core business activities, decision-making and reporting may have adverse consequences for Prudential. The Group utilises various tools to perform a range of operational functions including the calculation of regulatory or internal capital requirements, the valuation of assets and liabilities, determining hedging requirements, and in acquiring new business using artificial intelligence and digital platforms. Many of these tools are an integral part of the information and decision-making frameworks used at Prudential and errors or limitations in these tools, or inappropriate usage, may lead to regulatory breaches, inappropriate decision-making, financial loss, customer detriment, inaccurate external reporting or reputational damage.
The Group has no appetite for model and UDA risk arising as a result of failing to develop, implement and monitor appropriate risk mitigation measures. Prudential’s model and UDA risk framework and policy applies a risk-based approach in order to ensure appropriate and proportionate risk management is applied to all models and UDAs used across the business, depending on the materiality and nature of the data used in these tools, as well as their complexity. Prudential’s model and UDA risk is managed and mitigated using the following: - The Group’s Model and UDA Risk Policy and relevant Guidelines; - Annual risk assessment of all tools used for core business activities, decision-making and reporting; - Maintenance of appropriate documentation for tools used; - Implementation of controls to ensure tools are accurate and appropriately used; - Tools are subject to rigorous and independent model validation; and - Regular reporting to the RCS function and risk committees to support the measurement and management of the risk. In 2021 the Group updated its Group’s Model and User Developed Applications Policy which included a broadening of the considerations when assessing model criticality to include a wider group of stakeholders including policyholders (in addition to shareholders) and associated reputational risk impacts and increased oversight of models in development, including the model being developed for RBC at the Hong Kong business. Technological developments, in particular in the field of AI, pose new questions on risk oversight provided under the Group Risk Framework. An oversight forum for the use of AI was established during 2021 and key ethical principles, which were approved by the Group Risk Committee in 2020, have been adopted to apply to the use of AI by the Group.
• Business disruption risk. The Group continually seeks to increase business resilience through adaptation, planning, preparation and testing of contingency plans and its ability to respond effectively to disruptive incidents. Business resilience is at the core of the Group’s embedded Business continuity management (BCM) programme and framework that help to protect the Group’s systems and its key stakeholders. The BCM programme and framework covers business impact analyses, risk assessments, and the maintenance and exercising of business continuity, incident management and disaster recovery plans. The programme is designed to provide business continuity aligned to the Group’s evolving business needs and the size, complexity and nature of its operations. Business disruption risks are monitored by the Group Security function, with key operational effectiveness metrics and updates on specific activities being reported to the Group Risk Committee.

42
• Financial crime risk. As with all financial services firms, Prudential is exposed to risks relating to money laundering (the risk that the products or services of the Group are used by customers or other third parties to transfer or conceal the proceeds of crime); fraud (the risk that fraudulent insurance claims, transactions, or procurement of services, are made against or through the business); sanctions compliance breaches (the risk that the Group undertakes business with individuals and entities on the lists of the main sanctions regimes); and bribery and corruption (the risk that employees or associated persons seek to influence the behaviour of others to obtain an unfair advantage or receive benefits from others for the same purpose). Prudential operates in some high-risk countries where, for example, the acceptance of cash premiums from customers may be common practice, large-scale agency networks may be in operation where sales are incentivised by commission and fees, where is a higher concentration of exposure to politically-exposed persons, or which otherwise have higher geopolitical risk exposure. The Group-wide policies in place on anti-money laundering, fraud, sanctions and anti-bribery and corruption reflect the values, behaviours and standards that are expected across the business. Screening and transaction monitoring systems are in place and a series of improvements and upgrades are being implemented, and a programme of compliance control monitoring reviews is in place across the Group. Proactive fraud capabilities are in development and being rolled across local businesses. Work is also underway to enhance detective fraud, conflicts and anti-bribery and corruption controls relating to third-party risk management in procurement. Risk assessments are performed annually at higher risk locations. Due diligence reviews and assessments against Prudential’s financial crime policies are performed as part of the Group’s business acquisition process. The Group continues to undertake strategic activity to monitor and evaluate the evolving fraud risk landscape, mitigate the likelihood of fraud occurring and increase the rate of detection. The Group has in place a mature confidential reporting system through which employees and other stakeholders can report concerns relating to potential misconduct. The process and results of this are overseen by the Group Audit Committee.
Group-wide framework and risk management for operational and other non-financial risks The risks detailed above form key elements of the Group’s non-financial risk profile. A Group-wide operational risk framework is in place to identify, measure and assess, manage and control, monitor and report effectively on all material operational risks across the business. The key components of the framework are listed below. Outputs from these processes and activities performed by individual business units are monitored by the RCS function, which provides an aggregated view of the risk profile across the business to the Group Risk Committee and Board. - Application of a risk and control self-assessment (RCSA) process, where risk exposures are identified and assessed as part of
a periodical cycle; - An internal incident management process, which identifies, quantifies and monitors remediation conducted through root cause
analysis and application of action plans for risk events; - An annual scenario analysis process for the quantification of extreme, yet plausible manifestations of key operational risks
across the business on a forward-looking basis; and - A risk appetite framework for non-financial risks that articulates the level of risk exposure the business is willing to tolerate and
defines escalation processes for breaches of appetite. These core framework components are embedded across the Group via the Group Operational Risk Policy and accompanying standards, which set out the key principles and minimum standards for the management of operational risk within risk appetite. These sit alongside other risk policies and standards that individually engage with specific operational risks, including outsourcing and third-party supply, business continuity, financial crime, technology and data, operations processes and extent of transformation. These policies and standards include subject matter expert-led processes that are designed to identify, assess, manage and control operational risks, detailed below. These activities are fundamental in maintaining an effective system of internal control, and ensure that operational risk considerations are embedded in key business decision-making, including material business approvals and in setting and challenging the Group’s strategy.
- Reviews of key operational risks and challenges within Group and business unit business plans during the annual planning cycle, to support business decisions;
- Corporate insurance programmes to limit the financial impact of operational risks;
- Oversight of risk management during the transformation life cycle, project prioritisation and the risks, interdependencies and possible conflicts arising from a large portfolio of transformation activities;
- Regulatory change teams to assist in proactively adapting and complying with regulatory developments;
- Group and business unit-level compliance oversight and risk-based testing in respect of adherence with regulations;
- Screening and transaction monitoring systems for financial crime and a programme of compliance control monitoring reviews and regular risk assessments;
- Internal and external review of cyber security capability and defences; and
- Regular updating and risk-based testing of disaster-recovery plans and the Critical Incident Procedure process. Insurance risks Insurance risk makes up a significant proportion of Prudential’s overall risk exposure. The profitability of its businesses depends on a mix of factors, including levels of, and trends in, mortality (policyholders dying), morbidity (policyholders becoming ill or suffering an accident) and policyholder behaviour (variability in how customers interact with their policies, including utilisation of withdrawals, take-up of options and guarantees and persistency, ie lapsing/surrendering of policies), and increases in the costs of claims over time (claim inflation). The Group has appetite for retaining insurance risks in the areas where it believes it has expertise and operational controls to manage the risk and where it judges it to be more value-creating to do so rather than transferring the risk, and only to the extent that these risks remain part of a balanced portfolio of sources of income for shareholders and is compatible with a robust solvency position.

43
The impact of the Covid-19 pandemic to economic activity and employment levels across the Group’s markets has the potential to elevate the incidence of claims, lapses, or surrenders of policies, and some policyholders may defer or stop paying insurance premiums or reduce deposits into retirement plans. In particular extended restrictions on movement could affect product persistency. The pandemic may also result in elevated claims and policy lapses or surrenders in a less direct way, and with some delay in time before being felt by the Group, due to factors such as policyholders deferring medical treatment during the pandemic, or policyholders lapsing or surrendering their policies on the expiry of grace periods for premium payments provided by the Group’s businesses. Inflationary pressures driving higher interest rates may lead to increased lapses for some guaranteed savings products where higher levels of guarantees are offered by products of the Group’s competitors, reflecting consumer demand for returns at the level of, or exceeding, inflation. The Group’s assessment to date is that elevated mortality claims in some markets can be attributed to Covid-19. These impacts to the business are being closely monitored with targeted management actions being implemented where necessary, which includes additional Incurred But Not Reported (IBNR) claims reserves in some markets, including where deferrals in non-acute medical treatments due to movement restrictions have been observed. The principal drivers of the Group’s insurance risk vary across its business units. In Hong Kong, Singapore, Indonesia and Ma laysia a significant volume of health and protection business is written and the most significant insurance risks are persistency risk, morbidity risk and medical claims inflation risk.
• Medical claims inflation risk: A key assumption in these markets is the rate of medical claims inflation, which is often in excess of general price inflation, while the cost of medical treatment increasing more than expected, resulting in higher than anticipated medical claims cost passed on to Prudential, is a key risk. This risk is best mitigated by retaining the right to reprice products and appropriate overall claims limits within policies, either per type of medical treatment or in total across a policy, annually and/or over the policy lifetime.
• Morbidity risk: Prudential’s morbidity risk is managed through prudent product design, underwriting and claims management, and for certain products, the right to reprice where appropriate. Prudential’s morbidity assumptions reflect its recent experience and expectation of future trends for each relevant line of business.
• Persistency risk: The Group’s persistency assumptions reflect recent experience and expert judgement, especially where a lack of experience data exists, as well as any expected change in future persistency. Persistency risk is managed by appropriate controls across the product life cycle. This includes review and revisions to product design and incentive structures where required, ensuring appropriate training and sales processes, including those ensuring active customer engagement and high service quality, appropriate customer disclosures and product collaterals, use of customer retention initiatives as well as post-sale management through regular experience monitoring. Strong risk management and mitigation of conduct risk and the identification of common characteristics of business with high lapse rates is also crucial. Where appropriate, allowance is made for the relationship (either assumed or observed historically) between persistency and investment returns. Modelling this dynamic policyholder behaviour is particularly important when assessing the likely take-up rate of options embedded within certain products.
Prudential’s insurance risks are managed and mitigated using the following: - The Group’s insurance policy, which sets out the Group’s insurance risk appetite; required standards for effective insurance
risk management by head office and local businesses, including processes to enable the measurement of the Group’s insurance risk profile; management information flows; and escalation mechanisms;
- The Group’s product and underwriting risk policy, which sets out the required standards for effective product and underwriting risk management and approvals for new, or changes to existing, products (including the role of Group); and the processes to enable the measurement of underwriting risk. The policy also describes how the Group’s Customer Conduct Risk Policy is met in relation to new product approvals and current and legacy products;
- In product design and appropriate processes related to the management of policyholder reasonable expectations; - The risk appetite statements, limits and triggers; - Using persistency, morbidity and longevity assumptions that reflect recent experience and expectation of future trends, and
industry data and expert judgement where appropriate; - Using reinsurance to mitigate mortality and morbidity risks; - Ensuring appropriate medical underwriting when policies are issued and appropriate claims management practices when
claims are received in order to mitigate morbidity risk; - Maintaining the quality of sales processes, training and using initiatives to increase customer retention in order to mitigate
persistency risk; - The use of mystery shopping to identify opportunities for improvement in sales processes and training; - Using product repricing and other claims management initiatives in order to mitigate morbidity and medical expense inflation
risk; and - Regular deep dive assessments. Customer conduct risk Prudential’s conduct of business, especially in the design and distribution of its products and the servicing of customers, is crucial in ensuring that the Group’s commitment to meeting its customers’ needs and expectations is met. The Group’s customer conduct risk framework, owned by the Group Chief Executive, reflects management’s focus on customer outcomes. Factors that may increase conduct risks can be found throughout the product life cycle, from the complexity of the Group’s products and services to its diverse distribution channels, which include its agency workforce, virtual face-to-face sales and sales via online digital platforms. In alignment with the Group’s purpose of helping people get the most out of life, Prudential strives towards making health and protection coverage affordable and accessible to all. Through Prudential’s Pulse platform, there is increased focus on making insurance more inclusive to underserved segments of society through bite-size low-cost digital products and services. Prudential has developed a Group Customer Conduct Risk Policy which sets out five customer conduct standards that the business is expected to meet, being: 1 Treat customers fairly, honestly and with integrity; 2 Provide and promote products and services that meet customer needs, are clearly explained and that deliver real value; 3 Manage customer information appropriately, and maintain the confidentiality of customer information;
44
4 Provide and promote high standards of customer service; and 5 Act fairly and timely to address customer complaints and any errors found. Prudential manages conduct risk via a range of controls that are assessed through the Group’s conduct risk assessment framework, reviewed within its monitoring programmes, and overseen within reporting to its Boards and Committees. Management of Prudential’s conduct risk is key to the Group’s strategy. Prudential’s conduct risks are managed and mitigated using the following:
• The Group’s code of business conduct and conduct standards, product underwriting and other related risk policies, and supporting controls including the Group’s fraud risk control programme;
• A culture that supports the fair treatment of the customer, incentivises the right behaviour through proper remuneration structures, and provides a safe environment to report conduct risk related issues via the Group’s internal processes and Speak Out;
• Distribution controls, including monitoring programmes relevant to the type of business (insurance or asset management), distribution channel (agency, bancassurance, or digital) and ecosystem, to ensure sales are conducted in a manner that considers the fair treatment of customers within digital environments;
• Quality of sales processes and training, and using other initiatives such as special requirements for vulnerable customers, to improve customer outcomes;
• Appropriate claims management and complaint handling practices; and
• Regular deep dive assessments on, and monitoring of, conduct risks and periodic conduct risk assessments.
Risks related to regulatory and legal compliance These include risks associated with prospective regulatory and legal changes and compliance with existing regulations and laws – including their retrospective application – with which the Group must comply in the conduct of its business.
Prudential operates under the ever-evolving requirements and expectations of diverse regulatory, legal and tax regimes which may impact its business or the way it is conducted. This covers a broad range of risks including changes in government policy and legislation, capital control measures, and new regulations at either national or international level. The breadth of local and Group-wide regulatory arrangements presents the risk that requirements are not fully met, resulting in specific regulator interventions or actions including retrospective interpretation of standards by regulators. As the industry’s use of emerging technological tools and digital services increases, this is likely to lead to new and unforeseen regulatory issues and the Group is monitoring emerging regulatory developments and standards on the governance and ethical use of technology and data. In certain jurisdictions in which Prudential operates there are also a number of ongoing policy initiatives and regulatory developments which will impact the way Prudential is supervised. These developments continue to be monitored by the Group at a national and global level and these considerations form part of the Group’s ongoing engagement with government policy teams, industry groups and regulators. Further information on specific areas of regulatory and supervisory requirements and changes are included below and in the disclosures on Risk Factors. Risk management and mitigation of regulatory risk at Prudential includes: - Risk assessment of the Business Plan which includes consideration of the Group’s current strategies; - Close monitoring and assessment of our business environment and strategic risks; - The explicit consideration of risk themes in strategic decisions; - Ongoing engagement with national regulators, government policy teams and international standard setters; and - Compliance oversight to ensure adherence with in-force regulations and management of new regulatory developments.
• Group-wide supervision. The GWS Framework became effective for the Group on 14 May 2021 following designation by the Hong Kong IA, subject to transitional arrangements allowed in legislation which have been agreed with the Hong Kong IA. Under the GWS Framework, all debt instruments, both senior and subordinated, issued by Prudential at the date of designation meet the transitional conditions set by the Hong Kong IA and are included as eligible Group capital resources.
• Global regulatory developments: In the Group’s key markets, regulatory changes and reforms are in progress, with some uncertainty on the full impact to Prudential.
• In China, regulatory tightening across a number of industries in 2021 will likely continue across other industries. Regulatory developments in China which may have more direct implications to the Group include the following: - Development of a holistic data governance regime in China, which have recently included the Data Security Law, the
Personal Information Protection Law, and the revised Measures for Cybersecurity Review. - The CBIRC recently released new regulations on internet life insurance sales in China which include restrictions on
the selling of certain long-term products online, effective 31 December 2021. - On 26 October 2021, the National Health Commission released for public comment draft rules on the internet
healthcare services, usage of which has increased rapidly in China which include restrictions on online AI-driven diagnosis and treatments and requirements on meeting financial and operational criteria.
• Regulators in Hong Kong and Malaysia are progressing with plans for their respective risk-based capital (RBC) regimes. The Hong Kong IA is permitting applications for early adoption of its framework. Meanwhile in China, on 30 December 2021, the CBIRC released the official regulation for its China Risk Oriented Solvency System (C-ROSS) II, to be effective for Q1 2022 solvency reporting.
• In Indonesia, regulatory and supervisory focus on the insurance industry remains high, with a recent focus being on insurers’ governance and IT risk management and the requirements of 2014 Insurance Law relating to the separation of conventional and Sharia business.
• The protection of customers is an increasing regulatory theme, with changes to the regulation of investment-linked products (ILP) progressing in Indonesia as well as Malaysia.
• The pace and volume of climate-related regulatory changes both internationally and locally across Asia markets is also increasing. The IAIS published an application paper on the supervision of climate-related risks in the insurance sector in
45
May 2021, while regulators, including the Hong Kong Monetary Authority, the Monetary Authority of Singapore, BNM in Malaysia and the Financial Supervisory Commission in Taiwan, are in the process of developing supervisory and disclosure requirements.
The Group is actively monitoring and engaging with supervisory authorities on these changes, among others. These changes may give rise to compliance, operational and disclosure risks requiring Prudential to coordinate across multiple jurisdictions in order to apply a consistent risk management approach.
• Systemic risk regulation. Efforts to curb systemic risk and promote financial stability are also under way. These include developments by the Financial Stability Board (FSB) and International Association of Insurance Supervisors (IAIS) in the areas of the Common Framework (ComFrame), which establishes supervisory standards and guidance focusing on the effective group-wide supervision of Internationally Active Insurance Groups (IAIGs) such as Prudential, and the Insurance Capital Standard (ICS). Further detail on these developments are included in the disclosures on Risk Factors.
• Inter-bank offered rate reforms. In July 2014, the FSB announced widespread reforms to address the integrity and reliability of IBORs. The discontinuation of IBORs in their current form and their replacement with alternative risk-free reference rates such as the Secured Overnight Financing Rate (SOFR) in the US and the Singapore Swap Offer Rate (SOR) could, among other things, impact the Group through an adverse effect on the value of Prudential’s assets and liabilities which are linked to, or which reference IBORs, a reduction in market liquidity during any period of transition and increased legal and conduct risks to the Group arising from changes required to documentation and its related obligations to its stakeholders.
Notes
1 Excluding assets held to cover linked liabilities and those of the consolidated investment funds. 2 Based on middle rating from Standard & Poor’s, Moody’s and Fitch. If unavailable, NAIC and other external ratings and then internal ratings have been used. 3 Source of segmentation: Bloomberg Sector, Bloomberg Group and Merrill Lynch. Anything that cannot be identified from the three sources noted is classified as
other.

46
Corporate governance The Company has dual primary listings in London (premium listing) and Hong Kong (main board listing) and has therefore adopted a governance structure based on the UK and Hong Kong Corporate Governance Codes (the UK and HK Codes). This report explains how the principles set out in the UK and HK Codes have been applied.
The Board confirms that, for the year under review, the Company has applied the principles and complied with the provisions of the UK Code. The Company has also complied with the provisions of the HK Code, other than as follows: - Provision B.1.2(d) (now provision E.1.2(d)) of the HK Code requires companies, on a comply or explain basis, to have a
remuneration committee which makes recommendations to a main board on the remuneration of non-executive directors. This provision is not compatible with provision 34 of the UK Code which recommends that the remuneration of non-executive directors be determined in accordance with the Articles of Association or, alternatively, by the Board. Prudential has chosen to adopt a practice in line with the recommendations of the UK Code.
- Given the circumstances of the pandemic and UK government guidance, which did not allow large public gatherings as at the date of the 2021 Annual General Meeting (AGM), the Board decided, with regret, that shareholders, external advisers (including the auditor) and the majority of Directors would not be able to attend the AGM in person (and thus provision A.6.7 (now provision C.1.6) of the HK Code could not be fully complied with). The AGM was attended in person by the Chair, the Senior Independent Director, the Group Chief Financial Officer and Chief Operating Officer, and the Company Secretary. The Group Chief Executive and the Chairs of the Board’s principal committees attended the meeting via weblink and were available to shareholders for questions. The auditor also attended via weblink. A recording of the AGM is available on the Company’s website. Prudential continued to keep shareholders informed through its website and released results and other presentations during the year.
- A General Meeting (GM) held on 27 August 2021 was convened for the sole purpose of approving the demerger of Jackson Financial Inc. For this reason, only the Chair, the Group Chief Financial Officer and Chief Operating Officer, and the Company Secretary attended the GM and thus, provision A.6.7 (now provision C.1.6) of the HK Code was not fully complied with.
The UK Code is available from www.frc.org.uk.
The HK Code is available from www.hkex.com.hk. The Board also confirms that the financial results contained in this document have been reviewed by the Group Audit Committee.
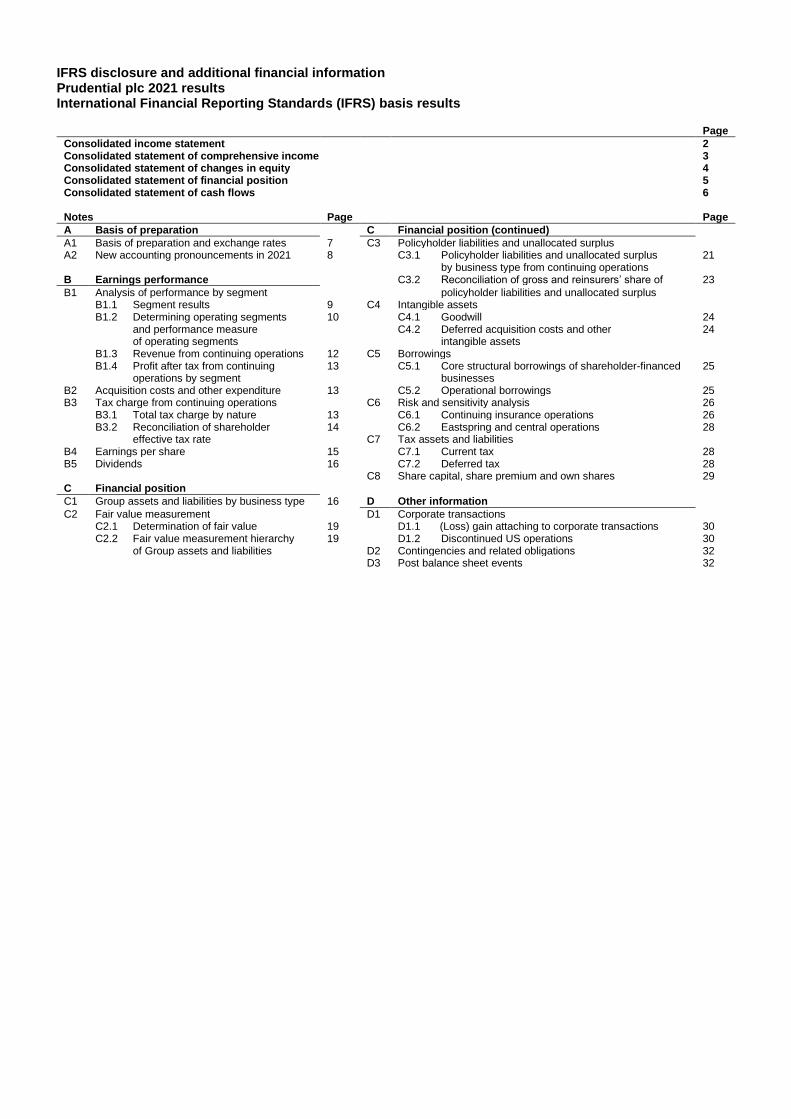
IFRS disclosure and additional financial information Prudential plc 2021 results International Financial Reporting Standards (IFRS) basis results
Page
Consolidated income statement 2 Consolidated statement of comprehensive income 3 Consolidated statement of changes in equity 4 Consolidated statement of financial position 5 Consolidated statement of cash flows 6 Notes Page Page
A Basis of preparation C Financial position (continued)
A1 Basis of preparation and exchange rates 7 C3 Policyholder liabilities and unallocated surplus A2 New accounting pronouncements in 2021 8 C3.1 Policyholder liabilities and unallocated surplus 21 by business type from continuing operations B Earnings performance C3.2 Reconciliation of gross and reinsurers’ share of 23
B1 Analysis of performance by segment policyholder liabilities and unallocated surplus B1.1 Segment results 9 C4 Intangible assets B1.2 Determining operating segments 10 C4.1 Goodwill 24 and performance measure C4.2 Deferred acquisition costs and other 24 of operating segments intangible assets B1.3 Revenue from continuing operations 12 C5 Borrowings B1.4 Profit after tax from continuing 13 C5.1 Core structural borrowings of shareholder-financed 25 operations by segment businesses B2 Acquisition costs and other expenditure 13 C5.2 Operational borrowings 25 B3 Tax charge from continuing operations C6 Risk and sensitivity analysis 26 B3.1 Total tax charge by nature 13 C6.1 Continuing insurance operations 26 B3.2 Reconciliation of shareholder 14 C6.2 Eastspring and central operations 28 effective tax rate C7 Tax assets and liabilities B4 Earnings per share 15 C7.1 Current tax 28 B5 Dividends 16 C7.2 Deferred tax 28 C8 Share capital, share premium and own shares 29 C Financial position
C1 Group assets and liabilities by business type 16 D Other information
C2 Fair value measurement D1 Corporate transactions C2.1 Determination of fair value 19 D1.1 (Loss) gain attaching to corporate transactions 30 C2.2 Fair value measurement hierarchy 19 D1.2 Discontinued US operations 30 of Group assets and liabilities D2 Contingencies and related obligations 32 D3 Post balance sheet events 32
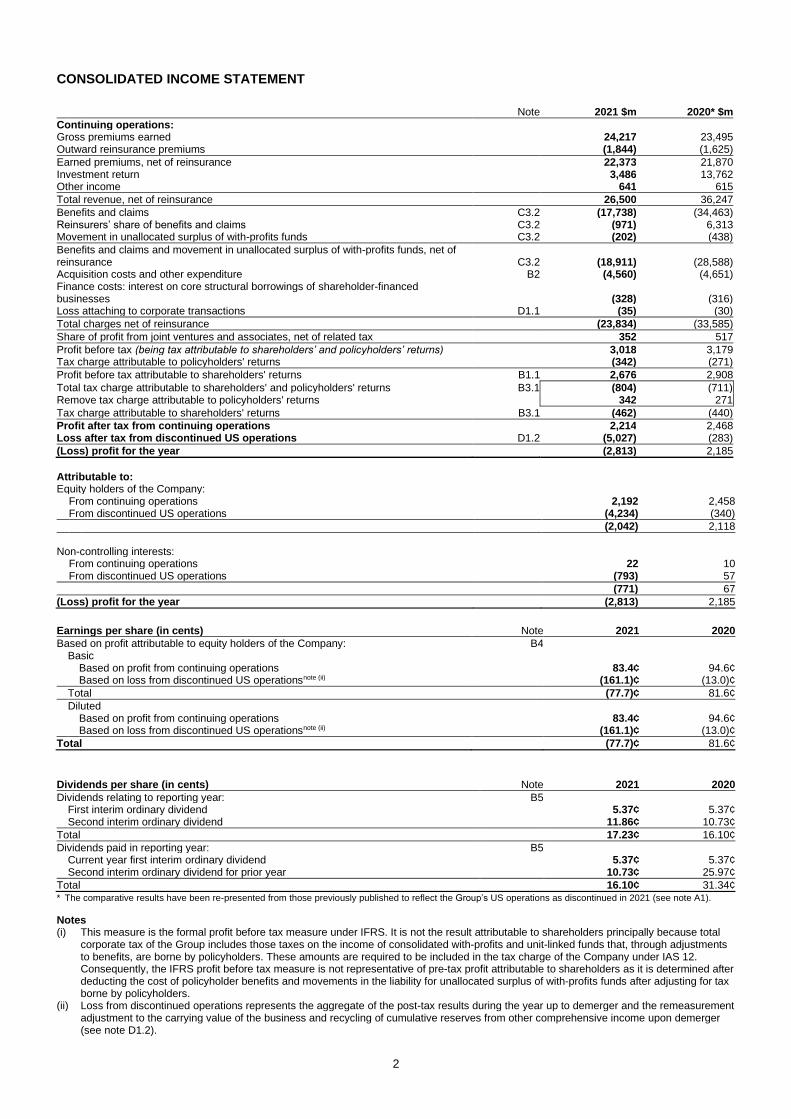
2
CONSOLIDATED INCOME STATEMENT
Note 2021 $m 2020* $m
Continuing operations: Gross premiums earned 24,217 23,495 Outward reinsurance premiums (1,844) (1,625)
Earned premiums, net of reinsurance 22,373 21,870 Investment return 3,486 13,762 Other income 641 615
Total revenue, net of reinsurance 26,500 36,247
Benefits and claims C3.2 (17,738) (34,463) Reinsurers’ share of benefits and claims C3.2 (971) 6,313 Movement in unallocated surplus of with-profits funds C3.2 (202) (438)
Benefits and claims and movement in unallocated surplus of with-profits funds, net of reinsurance C3.2 (18,911) (28,588) Acquisition costs and other expenditure B2 (4,560) (4,651) Finance costs: interest on core structural borrowings of shareholder-financed businesses (328) (316) Loss attaching to corporate transactions D1.1 (35) (30)
Total charges net of reinsurance (23,834) (33,585)
Share of profit from joint ventures and associates, net of related tax 352 517
Profit before tax (being tax attributable to shareholders’ and policyholders’ returns) 3,018 3,179 Tax charge attributable to policyholders' returns (342) (271)
Profit before tax attributable to shareholders' returns B1.1 2,676 2,908
Total tax charge attributable to shareholders' and policyholders' returns B3.1 (804) (711) Remove tax charge attributable to policyholders' returns 342 271
Tax charge attributable to shareholders' returns B3.1 (462) (440)
Profit after tax from continuing operations 2,214 2,468 Loss after tax from discontinued US operations D1.2 (5,027) (283)
(Loss) profit for the year (2,813) 2,185
Attributable to: Equity holders of the Company: From continuing operations 2,192 2,458 From discontinued US operations (4,234) (340)
(2,042) 2,118
Non-controlling interests: From continuing operations 22 10 From discontinued US operations (793) 57
(771) 67
(Loss) profit for the year (2,813) 2,185
Earnings per share (in cents) Note 2021 2020
Based on profit attributable to equity holders of the Company: B4 Basic Based on profit from continuing operations 83.4¢ 94.6¢ Based on loss from discontinued US operationsnote (ii) (161.1)¢ (13.0)¢
Total (77.7)¢ 81.6¢
Diluted Based on profit from continuing operations 83.4¢ 94.6¢ Based on loss from discontinued US operationsnote (ii) (161.1)¢ (13.0)¢
Total (77.7)¢ 81.6¢
Dividends per share (in cents) Note 2021 2020
Dividends relating to reporting year: B5 First interim ordinary dividend 5.37¢ 5.37¢ Second interim ordinary dividend 11.86¢ 10.73¢
Total 17.23¢ 16.10¢
Dividends paid in reporting year: B5 Current year first interim ordinary dividend 5.37¢ 5.37¢ Second interim ordinary dividend for prior year 10.73¢ 25.97¢
Total 16.10¢ 31.34¢ * The comparative results have been re-presented from those previously published to reflect the Group’s US operations as discontinued in 2021 (see note A1).
Notes (i) This measure is the formal profit before tax measure under IFRS. It is not the result attributable to shareholders principally because total
corporate tax of the Group includes those taxes on the income of consolidated with-profits and unit-linked funds that, through adjustments to benefits, are borne by policyholders. These amounts are required to be included in the tax charge of the Company under IAS 12. Consequently, the IFRS profit before tax measure is not representative of pre-tax profit attributable to shareholders as it is determined after deducting the cost of policyholder benefits and movements in the liability for unallocated surplus of with-profits funds after adjusting for tax borne by policyholders.
(ii) Loss from discontinued operations represents the aggregate of the post-tax results during the year up to demerger and the remeasurement adjustment to the carrying value of the business and recycling of cumulative reserves from other comprehensive income upon demerger (see note D1.2).

3
CONSOLIDATED STATEMENT OF COMPREHENSIVE INCOME
Note 2021 $m 2020* $m
Continuing operations: Profit for the year 2,214 2,468 Other comprehensive income (loss): Exchange movements on foreign operations arising during the year (180) 233 Valuation movements on retained interest in Jackson classified as available-for-sale securities 250 –
Total items that may be reclassified subsequently to profit or loss 70 233
Total comprehensive income from continuing operations 2,284 2,701
Discontinued US operations: Loss for the year (5,027) (283) Valuation movements on available-for-sale debt securities, net of related change in amortisation of deferred acquisition costs and related tax (763) 292 Cumulative valuation movements on available-for-sale debt securities, net of related tax and change in DAC, and net investment hedges recycled through profit or loss at the point of demerger (1,278) –
Total comprehensive (loss) income from discontinued US operations D1.2 (7,068) 9
Total comprehensive (loss) income for the year (4,784) 2,710
Attributable to: Equity holders of the Company: From continuing operations 2,277 2,697 From discontinued US operations (6,283) (40)
(4,006) 2,657 Non-controlling interests: From continuing operations 7 4 From discontinued US operations (785) 49
(778) 53
Total comprehensive (loss) income for the year (4,784) 2,710 * The comparative results have been re-presented from those previously published to reflect the Group’s US operations as discontinued in 2021 (see note A1).
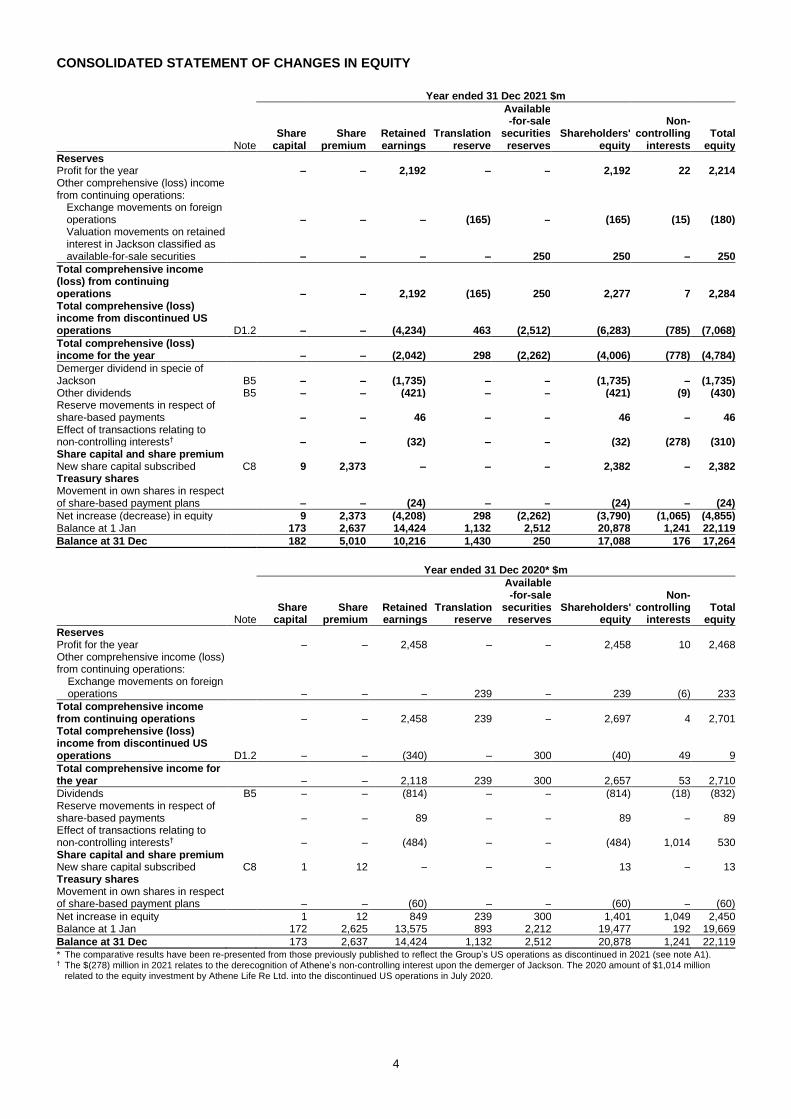
4
CONSOLIDATED STATEMENT OF CHANGES IN EQUITY
Year ended 31 Dec 2021 $m
Note Share
capital Share
premium Retained earnings
Translation reserve
Available -for-sale
securities reserves
Shareholders' equity
Non- controlling
interests Total
equity
Reserves Profit for the year – – 2,192 – – 2,192 22 2,214 Other comprehensive (loss) income from continuing operations:
Exchange movements on foreign operations – – – (165) – (165) (15) (180)
Valuation movements on retained interest in Jackson classified as available-for-sale securities – – – – 250 250 – 250
Total comprehensive income (loss) from continuing operations – – 2,192 (165) 250 2,277 7 2,284 Total comprehensive (loss) income from discontinued US operations D1.2 – – (4,234) 463 (2,512) (6,283) (785) (7,068)
Total comprehensive (loss) income for the year – – (2,042) 298 (2,262) (4,006) (778) (4,784)
Demerger dividend in specie of Jackson B5 – – (1,735) – – (1,735) – (1,735) Other dividends B5 – – (421) – – (421) (9) (430) Reserve movements in respect of share-based payments – – 46 – – 46 – 46 Effect of transactions relating to non-controlling interests† – – (32) – – (32) (278) (310) Share capital and share premium New share capital subscribed C8 9 2,373 – – – 2,382 – 2,382 Treasury shares Movement in own shares in respect of share-based payment plans – – (24) – – (24) – (24)
Net increase (decrease) in equity 9 2,373 (4,208) 298 (2,262) (3,790) (1,065) (4,855) Balance at 1 Jan 173 2,637 14,424 1,132 2,512 20,878 1,241 22,119
Balance at 31 Dec 182 5,010 10,216 1,430 250 17,088 176 17,264
Year ended 31 Dec 2020* $m
Note Share
capital Share
premium Retained earnings
Translation reserve
Available -for-sale
securities reserves
Shareholders' equity
Non- controlling
interests Total
equity
Reserves Profit for the year – – 2,458 – – 2,458 10 2,468 Other comprehensive income (loss) from continuing operations:
Exchange movements on foreign operations – – – 239 – 239 (6) 233
Total comprehensive income from continuing operations – – 2,458 239 – 2,697 4 2,701 Total comprehensive (loss) income from discontinued US operations D1.2 – – (340) – 300 (40) 49 9
Total comprehensive income for the year – – 2,118 239 300 2,657 53 2,710
Dividends B5 – – (814) – – (814) (18) (832) Reserve movements in respect of share-based payments – – 89 – – 89 – 89 Effect of transactions relating to non-controlling interests† – – (484) – – (484) 1,014 530 Share capital and share premium New share capital subscribed C8 1 12 – – – 13 – 13 Treasury shares Movement in own shares in respect of share-based payment plans – – (60) – – (60) – (60)
Net increase in equity 1 12 849 239 300 1,401 1,049 2,450 Balance at 1 Jan 172 2,625 13,575 893 2,212 19,477 192 19,669
Balance at 31 Dec 173 2,637 14,424 1,132 2,512 20,878 1,241 22,119 * The comparative results have been re-presented from those previously published to reflect the Group’s US operations as discontinued in 2021 (see note A1). † The $(278) million in 2021 relates to the derecognition of Athene’s non-controlling interest upon the demerger of Jackson. The 2020 amount of $1,014 million
related to the equity investment by Athene Life Re Ltd. into the discontinued US operations in July 2020.

5
CONSOLIDATED STATEMENT OF FINANCIAL POSITION
Note 31 Dec 2021 $m 31 Dec 2020 $m note (i)
Assets Goodwill C4.1 907 961 Deferred acquisition costs and other intangible assets C4.2 6,858 20,345 Property, plant and equipment 478 893 Reinsurers' share of insurance contract liabilities 9,753 46,595 Deferred tax assets C7.2 266 4,858 Current tax recoverable C7.1 20 444 Accrued investment income 1,171 1,427 Other debtors 1,779 3,171 Investment properties 38 23 Investments in joint ventures and associates accounted for using the equity method 2,183 1,962 Loans C1 2,562 14,588 Equity securities and holdings in collective investment schemesnote (ii) C1 61,601 278,635 Debt securitiesnote (ii) C1 99,094 125,829 Derivative assets 481 2,599 Other investments C2.2 – 1,867 Deposits 4,741 3,882 Cash and cash equivalents 7,170 8,018
Total assets C1 199,102 516,097
Equity Shareholders' equity 17,088 20,878 Non-controlling interests 176 1,241
Total equity C1 17,264 22,119
Liabilities Insurance contract liabilities C3.2 150,755 436,787 Investment contract liabilities with discretionary participation features C3.2 346 479 Investment contract liabilities without discretionary participation features C3.2 814 3,980 Unallocated surplus of with-profits funds C3.2 5,384 5,217 Core structural borrowings of shareholder-financed businesses C5.1 6,127 6,633 Operational borrowings C5.2 861 2,444 Obligations under funding, securities lending and sale and repurchase agreements 223 9,768 Net asset value attributable to unit holders of consolidated investment funds 5,664 5,975 Deferred tax liabilities C7.2 2,862 6,075 Current tax liabilities C7.1 185 280 Accruals, deferred income and other creditors 7,983 15,508 Provisions 372 350 Derivative liabilities 262 482
Total liabilities C1 181,838 493,978
Total equity and liabilities C1 199,102 516,097
Notes (i) The 31 December 2020 comparative statement of financial position included discontinued US operations. (ii) Included within equity securities and holdings in collective investment schemes and debt securities as at 31 December 2021 are $854
million of lent securities and assets subject to repurchase agreements (31 December 2020: $895 million from continuing operations; $1,112 million from discontinued US operations).
6
CONSOLIDATED STATEMENT OF CASH FLOWS
Note 2021 $m 2020* $m
Continuing operations: Cash flows from operating activities Profit before tax (being tax attributable to shareholders' and policyholders' returns) 3,018 3,179 Adjustments to profit before tax for non-cash movements in operating assets and liabilities: Investments (14,553) (20,978) Other non-investment and non-cash assets 2,658 (7,185) Policyholder liabilities (including unallocated surplus of with-profits funds) 9,095 27,670 Other liabilities (including operational borrowings) 16 155 Investment income and interest payments included in profit before tax (3,738) (2,931) Operating cash items: Interest receipts 2,328 1,833 Interest payments (11) (25) Dividend receipts 1,480 1,305 Tax paid (453) (551) Other non-cash items 438 301
Net cash flows from operating activitiesnote (i) 278 2,773
Cash flows from investing activities Purchases of property, plant and equipment (36) (57) Proceeds from disposal of property, plant and equipment – 6 Acquisition of business and intangiblesnote (ii) (773) (1,142) Disposal of businessesnote (iii) 83 –
Net cash flows from investing activities (726) (1,193)
Cash flows from financing activities Structural borrowings of shareholder-financed operations:note (iv) C5.1 Issuance of debt, net of costs 995 983 Redemption of debt (1,250) – Interest paid (314) (294) Payment of principal portion of lease liabilities (118) (128) Equity capital: Issues of ordinary share capital C8 2,382 13 External dividends: Dividends paid to the Company's shareholders B5 (421) (814) Dividends paid to non-controlling interests (9) (18)
Net cash flows from financing activities 1,265 (258)
Net increase (decrease) in cash and cash equivalents from continuing operations 817 1,322 Net decrease in cash and cash equivalents from discontinued US operations D1.2 (1,621) (339)
Cash and cash equivalents at 1 Jan 8,018 6,965 Effect of exchange rate changes on cash and cash equivalents (44) 70
Cash and cash equivalents at 31 Dec 7,170 8,018
Comprising: Cash and cash equivalents from continuing operations 7,170 6,397 Cash and cash equivalents from discontinued US operations – 1,621 * The comparative results have been re-presented from those previously published to reflect the Group’s US operations as discontinued in 2021 (see note A1).
Notes (i) Included in net cash flows from operating activities are dividends from joint ventures and associates of $175 million (2020: $118 million). (ii) Cash flows from the acquisition of business and intangibles include amounts paid for distribution rights. (iii) Disposal of businesses includes sale of subsidiaries, joint ventures and associates and investments that do not form part of the Group’s
operating activities. (iv) Structural borrowings of shareholder-financed businesses exclude borrowings to support short-term fixed income securities programmes,
non-recourse borrowings of investment subsidiaries of shareholder-financed businesses and other borrowings of shareholder-financed businesses. Cash flows in respect of these borrowings are included within cash flows from operating activities. The changes in the carrying value of the structural borrowings of shareholder-financed businesses for the Group are analysed below:
Cash movements $m Non-cash movements $m
Balance at 1 Jan
$m Issuance Redemption
Foreign exchange
movement Demerger
of Jackson Other
movements
Balance at 31 Dec
$m
2021 6,633 995 (1,250) (13) (250) 12 6,127
2020 5,594 983 – 42 – 14 6,633

7
NOTES TO THE FINANCIAL STATEMENTS
A Basis of preparation A1 Basis of preparation and exchange rates These consolidated financial statements have been prepared in accordance with IFRS Standards as issued by the IASB and in accordance with UK-adopted international accounting standards. At 31 December 2021, there were no unadopted standards effective for the year ended 31 December 2021 which impact the consolidated financial statements of the Group, and there were no differences between UK-adopted international accounting standards and IFRS Standards as issued by the IASB in terms of their application to the Group. The Group accounting policies are the same as those applied for the year ended 31 December 2020 with the exception of the adoption of the new and amended IFRS Standards as described in note A2. In 2021, the Group changed its operating segments for financial reporting under IFRS 8 ‘Operating Segments’, as discussed further in note B1.2 and reclassified the US operations as discontinued as discussed further below. The financial information set out in this announcement does not constitute the Company's statutory accounts for the years ended 31 December 2021 but is derived from those accounts. The auditors have reported on the 2021 statutory accounts. Statutory accounts for 2020 have been delivered to the Registrar of Companies, and those for 2021 will be delivered following the Company’s Annual General Meeting. The auditors’ report was: (i) unqualified; (ii) did not include a reference to any matters to which the auditors drew attention by way of emphasis without qualifying their report; and (iii) did not contain a statement under section 498(2) or (3) of the Companies Act 2006. Going concern basis of accounting The Directors have made an assessment of going concern covering a period of at least 12 months from the date that these financial statements are approved. In making this assessment, the Directors have considered both the Group’s current performance, solvency and liquidity and the Group’s business plan taking into account the Group’s principal risks and the mitigations available to it which are described in the Risk review report. The assessment includes consideration of the results of key market risk stress and scenario testing over the assessment period covering the potential impact of up or down interest rate movements, falling equity values, corporate credit spread widening and an elevated level of credit losses. Sales and other scenarios considered include those reflecting the possible impacts of Covid-19 restrictions on new business, including the uncertainty as to the duration of restrictions in individual markets and the length of time for sales to recover to previous levels and different timings of expected regulatory changes. Based on the above, the Directors have a reasonable expectation that the Company and the Group have adequate resources to continue their operations for a period of at least 12 months from the date that these financial statements are approved. No material uncertainties that may cast significant doubt on the ability of the Group to continue as a going concern have been identified. The Directors therefore consider it appropriate to continue to adopt the going concern basis of accounting in preparing these financial statements for the year ended 31 December 2021. Discontinued US operations On 28 January 2021, the Board announced that it had decided to pursue the separation of its US operations (Jackson) from the Group through a demerger, which was completed on 13 September 2021. In accordance with IFRS 5 ‘Non-Current Assets Held for Sale and Discontinued Operations’, the results of the Group’s US operations have been classified as discontinued operations in these consolidated financial statements. In order to present the results of the continuing operations on a comparable basis, and consistent with IFRS 5 requirements, loss after tax attributable to the discontinued US operations in 2021 up to demerger has been shown in a single line in the income statement together with the loss on remeasurement to fair value and the recycling of cumulative reserves from other comprehensive income upon demerger. The loss on remeasurement to fair value has been recognised in accordance with IFRIC 17, ‘Distribution of non-cash assets to owners’, which requires Jackson to be remeasured to fair value at the point of demerger. Comparatives have been restated accordingly, with further analysis provided in note D1.2. Notes B1 to B4 have also been prepared on this basis. IFRS 5 does not permit the comparative 31 December 2020 statements of financial position to be re-presented, as the US operations were not classified as discontinued at that point in time. In the related balance sheet notes, prior period balances have been presented to show the amounts from discontinued US operations separately from continuing operations in order to present the results of the continuing operations on a comparable basis. Additionally, in the analysis of movements in Group’s assets and liabilities between the beginning and end of the years, the balances of the discontinued US operations are removed from the opening balances to show the underlying movements from continuing operations.
8
Exchange rates The exchange rates applied for balances and transactions in currencies other than the presentation currency of the Group, US dollars (USD) were:
Closing rate at year end Average rate for the year to date
USD : local currency 31 Dec 2021 31 Dec 2020 31 Dec 2021 31 Dec 2020
Chinese yuan (CNY) 6.37 6.54 6.45 6.90 Hong Kong dollar (HKD) 7.80 7.75 7.77 7.76 Indian rupee (INR) 74.34 73.07 73.94 74.12 Indonesian rupiah (IDR) 14,252.50 14,050.00 14,294.88 14,541.70 Malaysian ringgit (MYR) 4.17 4.02 4.15 4.20 Singapore dollar (SGD) 1.35 1.32 1.34 1.38 Taiwan dollar (TWD) 27.67 28.10 27.93 29.44 Thai baht (THB) 33.19 30.02 32.01 31.29 UK pound sterling (GBP) 0.74 0.73 0.73 0.78 Vietnamese dong (VND) 22,790.00 23,082.50 22,934.86 23,235.84
Certain notes to the financial statements present comparative information at constant exchange rates (CER), in addition to the reporting at actual exchange rates (AER) used throughout the consolidated financial statements. AER are actual historical exchange rates for the specific accounting year, being the average rates over the year for the income statement and the closing rates at the balance sheet date for the statement of financial position. CER results are calculated by translating prior year results using the current year foreign exchange rate, ie current year average rates for the income statement and current year closing rates for the statement of financial position.
A2 New accounting pronouncements in 2021 The IASB has issued the following new accounting pronouncements to be effective from 1 January 2021, unless otherwise stated:
– Amendments to IFRS 4 ‘Extension of temporary IFRS 9 exemption until 1 January 2023’ issued in June 2020; – Amendments to IFRS 9, IAS 39, IFRS 7, IFRS 4 and IFRS 16 ‘Interest Rate Benchmark Reform – phase 2’ issued in August
2020; and – Amendments to IFRS 16 ‘Covid-19 Related Rent Concession beyond 30 June 2021’ issued in March 2021 and effective
from 1 April 2021.
The adoption of these pronouncements has had no significant impact on the Group financial statements. The Group has taken advantage of the ability to defer IFRS 9 until 2023 when it adopts IFRS 17 ‘Insurance Contracts’.
9
B EARNINGS PERFORMANCE B1 Analysis of performance by segment
B1.1 Segment results 2021 $m 2020* $m 2021 vs 2020 %
AER CER AER CER Note note (i) note (i) note (i) note (i) note (i)
Continuing operations: CPL 343 251 269 37% 28% Hong Kong 975 891 889 9% 10% Indonesia 446 519 529 (14)% (16)% Malaysia 350 309 313 13% 12% Singapore 663 574 589 16% 13% Growth markets and othernote (ii) 932 835 841 12% 11% Eastspring 314 283 286 11% 10%
Total segment profit 4,023 3,662 3,716 10% 8%
Other income and expenditure: Investment return and other income 21 (15) (15) n/a n/a Interest payable on core structural borrowingsnote (iii) (328) (316) (316) (4)% (4)% Corporate expenditurenote (iv) (298) (412) (428) 28% 30%
Total other income and expenditure (605) (743) (759) 19% 20%
Restructuring and IFRS 17 implementation costsnote (v) (185) (162) (167) (14)% (11)%
Adjusted operating profit B1.2 3,233 2,757 2,790 17% 16% Short-term fluctuations in investment returns on shareholder-backed businessnote (vi) (458) (579) (554) 21% 17% Amortisation of acquisition accounting adjustments (5) (5) (5) 0% 0% (Loss) gain attaching to corporate transactions D1.1 (94) 735 733 n/a n/a
Profit before tax attributable to shareholders 2,676 2,908 2,964 (8)% (10)% Tax charge attributable to shareholders' returns B3 (462) (440) (450) (5)% (3)%
Profit for the year from continuing operations 2,214 2,468 2,514 (10)% (12)% Loss from discontinued US operations (5,027) (283) (283) n/a n/a
(Loss) profit for the year (2,813) 2,185 2,231 n/a n/a
Attributable to: Equity holders of the Company From continuing operations 2,192 2,458 2,504 (11)% (12)% From discontinued US operations (4,234) (340) (340) n/a n/a
(2,042) 2,118 2,164 n/a n/a
Non-controlling interests From continuing operations 22 10 10 n/a n/a From discontinued US operations (793) 57 57 n/a n/a
(771) 67 67 n/a n/a
(Loss) profit for the year (2,813) 2,185 2,231 n/a n/a
Basic earnings per share (in cents) 2021 2020 2021 vs 2020 %
AER CER AER CER Note note (i) note (i) note (i) note (i)
Based on adjusted operating profit, net of tax and non-controlling interest from continuing operations B4 101.5¢ 86.6¢ 87.6¢ 17% 16% Based on profit from continuing operations, net of non-controlling interest B4 83.4¢ 94.6¢ 96.4¢ (12)% (13)% Based on loss for the year from discontinued US operations, net of non-controlling interest B4 (161.1)¢ (13.0)¢ (13.1)¢ n/a n/a * The comparative results have been re-presented from those previously published to reflect the Group’s US operations as discontinued in 2021 (see note A1).
Notes (i) Segment results are attributed to the shareholders of the Group before deducting the amount attributable to the non-controlling interests.
This presentation is applied consistently throughout the document. For definitions of AER and CER refer to note A1. (ii) For growth markets and other, adjusted operating profit includes other items of $217 million (2020: $119 million) which primarily comprise
of taxes for life joint ventures and associates and other non-recurring items, which in 2021 largely included the impact of refinements to the run-off of the allowance of prudence within technical provisions.
(iii) Included in the interest on core structural borrowings charged to the income statement of $(328) million was $(126) million related to the four tranches of debt that were redeemed in December 2021 and January 2022 using the proceeds from the share offer during the year.
(iv) Corporate expenditure as shown above is for head office functions in London and Hong Kong. (v) Restructuring and IFRS 17 implementation costs include those incurred in continuing insurance and asset management operations of
$(101) million (2020: $(97) million). (vi) In general, the short-term fluctuations reflect the value movements on shareholders’ assets and policyholder liabilities (net of reinsurance)
arising from market movements in the year. In 2021, rising interest rates across most operations led to unrealised bond losses which more than offset the impact of higher discount rates on policyholder liabilities under the local reserving basis applied and equity gains on shareholder-backed business in the year. This has led to the overall negative short-term investment fluctuations for total insurance and asset management operations.

10
B1.2 Determining operating segments and performance measure of operating segments Operating segments The Group's operating segments for financial reporting purposes are defined and presented in accordance with IFRS 8 ‘Operating Segments’ on the basis of the management reporting structure and its financial management information. Under the Group's management and reporting structure, its chief operating decision maker is the Group Executive Committee (GEC), chaired by the Group Chief Executive. In the management structure, responsibility is delegated to the Chief Executive, Asia and Africa, for the day-to-day management of the insurance and asset management operations (within the framework set out in the Group Governance Manual). This in turn is delegated to the Chief Executives of Hong Kong, Indonesia, Malaysia, Singapore, Growth markets (comprising Africa and the remaining Asia subsidiary operations) and Eastspring, the Group’s Asia asset manager. CPL is managed jointly with CITIC, a Chinese state-owned conglomerate. In the first quarter of 2021, the Group reviewed its operating segments for financial reporting under IFRS 8 following changes to the business and financial management information provided to the GEC. As a result, performance measures for insurance operations are now analysed by geographical areas for the larger business units of CPL, Hong Kong, Indonesia, Malaysia and Singapore, with Eastspring, the asset management business, also analysed separately. All other Asia and Africa insurance operations are included in the ‘Growth markets and other’ segment alongside other amounts that are not included in the segment profit of an individual business unit, including tax on life joint ventures and associates and other items that are not representative of the underlying segment trading for the period. The 2020 comparatives have been re-presented to show the new segments for comparison. On 13 September 2021, the Group completed the demerger of the US operations (Jackson Financial Inc.) from the Prudential plc Group. Accordingly, the US operations do not represent an operating segment at the year end. The results of US operations have been reclassified as discontinued in these consolidated financial statements in accordance with IFRS 5 ‘Non-current Assets Held for Sale and Discontinued Operations’, and have therefore been excluded in the analysis of performance measure of operating segments. Operations which do not form part of any business unit are reported as ‘Unallocated to a segment’ and comprise head office functions in London and Hong Kong. Performance measure The performance measure of operating segments utilised by the Group is IFRS operating profit based on longer-term investment returns (adjusted operating profit), as described below. This measurement basis distinguishes adjusted operating profit from other constituents of total profit or loss for the period as follows:
– Short-term fluctuations in investment returns on shareholder-backed business; – Amortisation of acquisition accounting adjustments arising on the purchase of business; and – Gain or loss on corporate transactions, as discussed in note D1.1.
Determination of adjusted operating profit for investment and liability movements (i) With-profits business For with-profits business in Hong Kong, Singapore and Malaysia, the adjusted operating profit reflects the shareholders’ share in the bonuses declared to policyholders. Value movements in the underlying assets of the with-profits funds only affect the shareholder results through indirect effects of investment performance on declared policyholder bonuses and therefore, do not affect directly the determination of adjusted operating profit. (ii) Assets and liabilities held within unit-linked funds The policyholder unit liabilities are directly reflective of the underlying asset value movements. Accordingly, the adjusted operating profit reflects the current year value movements in both the unit liabilities and the backing assets, which offset one another. (iii) Other shareholder-backed long-term insurance business In the case of other shareholder-financed business, the measurement of adjusted operating profit reflects that, for the long-term insurance business, assets and liabilities are held for the longer term. For this business the Group believes trends in underlying performance are better understood if the effects of short-term fluctuations in market conditions, such as changes in interest rates or equity markets, are excluded. In determining the profit on this basis, the following key elements are applied to the results of the Group’s shareholder-financed businesses. (a) Policyholder liabilities that are sensitive to market conditions Under IFRS, the degree to which the carrying values of liabilities to policyholders are sensitive to current market conditions varies between business units depending upon the nature of the ‘grandfathered’ measurement basis. Taiwan and India apply US GAAP, whose policyholder liabilities are not sensitive to market movements as they are locked in at policy inception.
Movements in liabilities for some types of business do require bifurcation between the elements that relate to longer-term market condition and short-term effects to ensure that at the net level (ie after allocated investment return and charge for policyholder benefits) the adjusted operating profit reflects longer-term market returns. For certain non-participating business, for example in Hong Kong, the economic features are more akin to asset management products with policyholder liabilities reflecting asset shares over the contract term. Consequently, for these products, the charge for policyholder benefits in the adjusted operating profit reflects the asset share feature rather than volatile movements that would otherwise be reflected if the local regulatory basis (as applied for the IFRS balance sheet) was used.
11
For other types of non-participating business, expected longer-term investment returns and interest rates are used to determine the movement in policyholder liabilities for determining adjusted operating profit. This ensures assets and liabilities are reflected on a consistent basis. (b) Assets backing other shareholder-backed long-term insurance business Except in the case of assets backing liabilities which are directly matched (such as unit-linked business) adjusted operating profit for assets backing shareholder-financed business is determined on the basis of expected longer-term investment returns. Longer-term investment returns comprise actual income receivable for the year (interest/dividend income) and longer-term capital returns, determined for debt and equity-type securities on the basis described below. The difference between the actual investment returns in the reporting period and the longer-term investment returns is recognised within short-term fluctuations in investment returns. Debt securities and loans As a general principle, for debt securities and loans, the longer-term investment returns comprise the interest receivable for the year and the amortisation of interest-related realised gains and losses to the date when sold securities would have otherwise matured (or a suitable proxy for this period). All unrealised gains and losses are treated as a component of short-term investment fluctuations. Consideration is given to the need to recognise an expected longer-term level of defaults for the securities within the longer-term investment returns, based on past performance and having regard to the credit quality of the portfolio, with any difference with actual credit-related realised losses arising in the year being included in short-term fluctuations. If, under this analysis, realised gains and losses are principally considered to be interest related with no significant credit-related losses based on past performance, then all realised gains and losses to date for these operations are treated as interest related and amortised to adjusted operating profit over the period to the date those securities would otherwise have matured and no separate charge to longer-term investment returns for credit defaults is made. For Group debt securities at 31 December 2021, the level of interest-related realised gains and losses on previously sold bonds that had yet to be amortised to adjusted operating profit from short-term investment fluctuations was a net gain of $515 million (2020: net gain of $525 million). Equity-type securities For equity-type securities, the longer-term rates of return are estimates of the long-term trend investment returns for income and capital having regard to past performance, current trends and future expectations. Different rates apply to different categories of equity-type securities. For continuing insurance operations, investments in equity-type securities held for non-linked shareholder-backed business amounted to $6,073 million as at 31 December 2021 (31 December 2020: $4,963 million). The longer-term rates of return applied in 2021 ranged from 5.5 per cent to 16.9 per cent (2020: 5.1 per cent to 16.9 per cent) with the rates applied varying by business unit. These rates are broadly stable from year to year but may be different between regions, reflecting, for example, differing expectations of inflation in each local business unit. The assumptions are for the returns expected to apply in equilibrium conditions. The assumed rates of return do not reflect any cyclical variability in economic performance and are not set by reference to prevailing asset valuations. The longer-term investment returns for the insurance joint ventures and associates accounted for using the equity method are determined on a similar basis as the other insurance operations described above. Derivative value movements Generally, derivative value movements are excluded from adjusted operating profit. The exception is where the derivative value movements broadly offset changes in the accounting value of other assets and liabilities included in adjusted operating profit.
(iv) Other non-insurance businesses For these businesses, the determination of adjusted operating profit reflects the underlying economic substance of the arrangements. Generally, realised gains and losses are included in adjusted operating profit with temporary unrealised gains and losses being included in short-term fluctuations. In some instances, realised gains and losses on derivatives and other financial instruments are amortised to adjusted operating profit over a time period that reflects the underlying economic substance of the arrangements.
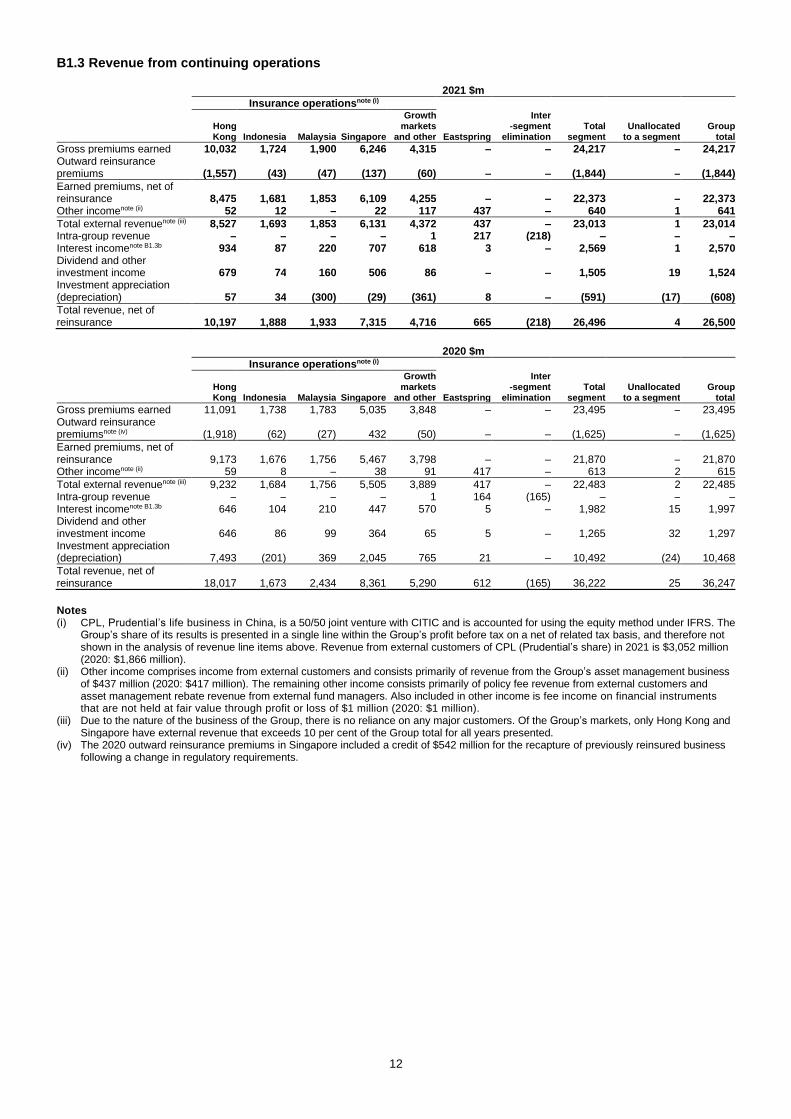
12
B1.3 Revenue from continuing operations 2021 $m
Insurance operationsnote (i)
Hong Kong Indonesia Malaysia Singapore
Growth markets
and other Eastspring
Inter -segment
elimination Total
segment Unallocated
to a segment Group
total
Gross premiums earned 10,032 1,724 1,900 6,246 4,315 – – 24,217 – 24,217 Outward reinsurance premiums (1,557) (43) (47) (137) (60) – – (1,844) – (1,844)
Earned premiums, net of reinsurance 8,475 1,681 1,853 6,109 4,255 – – 22,373 – 22,373 Other incomenote (ii) 52 12 – 22 117 437 – 640 1 641
Total external revenuenote (iii) 8,527 1,693 1,853 6,131 4,372 437 – 23,013 1 23,014 Intra-group revenue – – – – 1 217 (218) – – – Interest incomenote B1.3b 934 87 220 707 618 3 – 2,569 1 2,570 Dividend and other investment income 679 74 160 506 86 – – 1,505 19 1,524 Investment appreciation (depreciation) 57 34 (300) (29) (361) 8 – (591) (17) (608)
Total revenue, net of reinsurance 10,197 1,888 1,933 7,315 4,716 665 (218) 26,496 4 26,500
2020 $m
Insurance operationsnote (i)
Hong Kong Indonesia Malaysia Singapore
Growth markets
and other Eastspring
Inter -segment
elimination Total
segment Unallocated
to a segment Group
total
Gross premiums earned 11,091 1,738 1,783 5,035 3,848 – – 23,495 – 23,495 Outward reinsurance premiumsnote (iv) (1,918) (62) (27) 432 (50) – – (1,625) – (1,625)
Earned premiums, net of reinsurance 9,173 1,676 1,756 5,467 3,798 – – 21,870 – 21,870 Other incomenote (ii) 59 8 – 38 91 417 – 613 2 615
Total external revenuenote (iii) 9,232 1,684 1,756 5,505 3,889 417 – 22,483 2 22,485 Intra-group revenue – – – – 1 164 (165) – – – Interest incomenote B1.3b 646 104 210 447 570 5 – 1,982 15 1,997 Dividend and other investment income 646 86 99 364 65 5 – 1,265 32 1,297 Investment appreciation (depreciation) 7,493 (201) 369 2,045 765 21 – 10,492 (24) 10,468
Total revenue, net of reinsurance 18,017 1,673 2,434 8,361 5,290 612 (165) 36,222 25 36,247
Notes (i) CPL, Prudential’s life business in China, is a 50/50 joint venture with CITIC and is accounted for using the equity method under IFRS. The
Group’s share of its results is presented in a single line within the Group’s profit before tax on a net of related tax basis, and therefore not shown in the analysis of revenue line items above. Revenue from external customers of CPL (Prudential’s share) in 2021 is $3,052 million (2020: $1,866 million).
(ii) Other income comprises income from external customers and consists primarily of revenue from the Group’s asset management business of $437 million (2020: $417 million). The remaining other income consists primarily of policy fee revenue from external customers and asset management rebate revenue from external fund managers. Also included in other income is fee income on financial instruments that are not held at fair value through profit or loss of $1 million (2020: $1 million).
(iii) Due to the nature of the business of the Group, there is no reliance on any major customers. Of the Group’s markets, only Hong Kong and Singapore have external revenue that exceeds 10 per cent of the Group total for all years presented.
(iv) The 2020 outward reinsurance premiums in Singapore included a credit of $542 million for the recapture of previously reinsured business following a change in regulatory requirements.
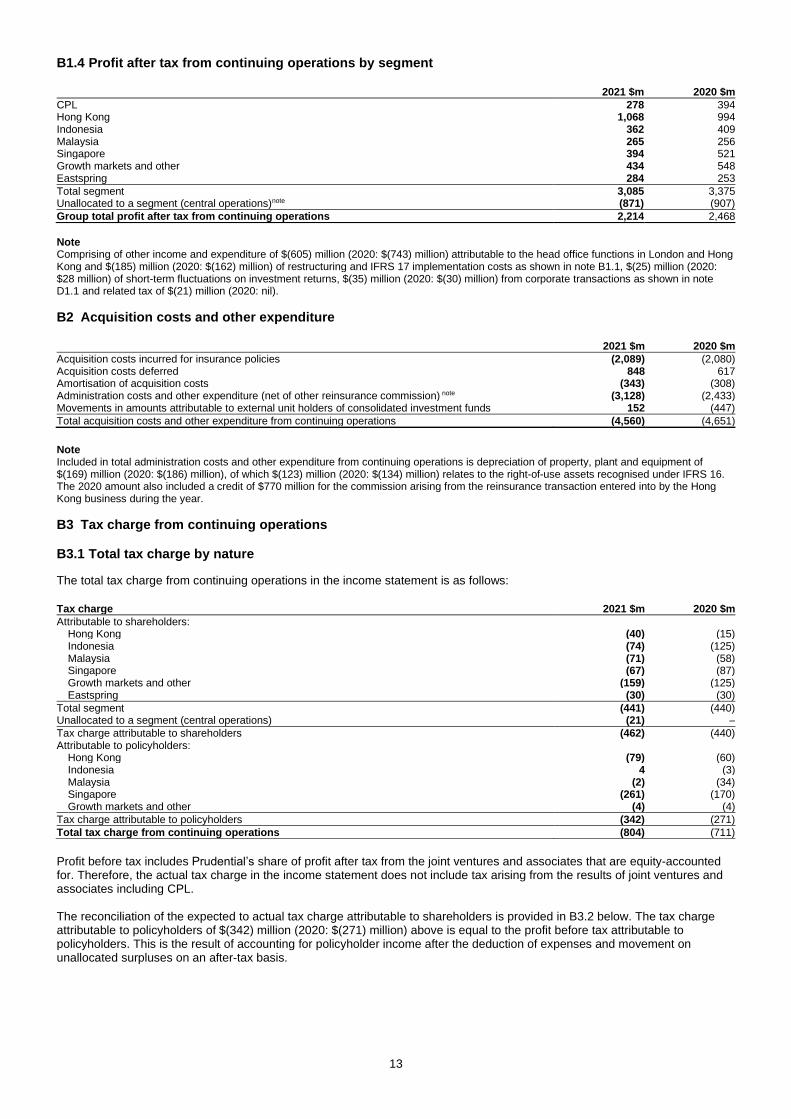
13
B1.4 Profit after tax from continuing operations by segment 2021 $m 2020 $m
CPL 278 394 Hong Kong 1,068 994 Indonesia 362 409 Malaysia 265 256 Singapore 394 521 Growth markets and other 434 548 Eastspring 284 253
Total segment 3,085 3,375 Unallocated to a segment (central operations)note (871) (907)
Group total profit after tax from continuing operations 2,214 2,468
Note Comprising of other income and expenditure of $(605) million (2020: $(743) million) attributable to the head office functions in London and Hong Kong and $(185) million (2020: $(162) million) of restructuring and IFRS 17 implementation costs as shown in note B1.1, $(25) million (2020: $28 million) of short-term fluctuations on investment returns, $(35) million (2020: $(30) million) from corporate transactions as shown in note D1.1 and related tax of $(21) million (2020: nil).
B2 Acquisition costs and other expenditure 2021 $m 2020 $m
Acquisition costs incurred for insurance policies (2,089) (2,080) Acquisition costs deferred 848 617 Amortisation of acquisition costs (343) (308) Administration costs and other expenditure (net of other reinsurance commission) note (3,128) (2,433) Movements in amounts attributable to external unit holders of consolidated investment funds 152 (447)
Total acquisition costs and other expenditure from continuing operations (4,560) (4,651)
Note Included in total administration costs and other expenditure from continuing operations is depreciation of property, plant and equipment of $(169) million (2020: $(186) million), of which $(123) million (2020: $(134) million) relates to the right-of-use assets recognised under IFRS 16. The 2020 amount also included a credit of $770 million for the commission arising from the reinsurance transaction entered into by the Hong Kong business during the year.
B3 Tax charge from continuing operations
B3.1 Total tax charge by nature
The total tax charge from continuing operations in the income statement is as follows:
Tax charge 2021 $m 2020 $m
Attributable to shareholders: Hong Kong (40) (15) Indonesia (74) (125) Malaysia (71) (58) Singapore (67) (87) Growth markets and other (159) (125) Eastspring (30) (30)
Total segment (441) (440) Unallocated to a segment (central operations) (21) –
Tax charge attributable to shareholders (462) (440) Attributable to policyholders: Hong Kong (79) (60) Indonesia 4 (3) Malaysia (2) (34) Singapore (261) (170) Growth markets and other (4) (4)
Tax charge attributable to policyholders (342) (271)
Total tax charge from continuing operations (804) (711)
Profit before tax includes Prudential’s share of profit after tax from the joint ventures and associates that are equity-accounted for. Therefore, the actual tax charge in the income statement does not include tax arising from the results of joint ventures and associates including CPL. The reconciliation of the expected to actual tax charge attributable to shareholders is provided in B3.2 below. The tax charge attributable to policyholders of $(342) million (2020: $(271) million) above is equal to the profit before tax attributable to policyholders. This is the result of accounting for policyholder income after the deduction of expenses and movement on unallocated surpluses on an after-tax basis.

14
B3.2 Reconciliation of shareholder effective tax rate In the reconciliation below, the expected tax rate reflects the corporation tax rates that are expected to apply to the taxable profit or loss of the continuing operations. It reflects the corporation tax rates of each jurisdiction weighted by reference to the amount of profit or loss contributing to the aggregate result from continuing operations.
2021 2020
Tax attributable to shareholders
Percentage impact on ETR
Tax attributable to shareholders
Percentage impact on ETR
Continuing operations: $m % $m %
Adjusted operating profit 3,233 2,757 Non-operating (loss) profitnote (i) (557) 151
Profit before tax 2,676 2,908
Tax charge at the expected rate (539) 20% (602) 21% Effects of recurring tax reconciliation items:
Income not taxable or taxable at concessionary ratesnote (ii) 63 (2)% 102 (4)%
Deductions not allowable for tax purposes (92) 3% (32) 1%
Items related to taxation of life insurance businessesnote (iii) 177 (7)% 152 (5)%
Deferred tax adjustments including unrecognised tax lossesnote (iv) (111) 4% (172) 6%
Effect of results of joint ventures and associatesnote (v) 80 (3)% 129 (4)%
Irrecoverable withholding taxesnote (vi) (60) 2% (35) 1% Other (8) 1% 17 (1)%
Total credit 49 (2)% 161 (6)% Effects of non-recurring tax reconciliation items:
Adjustments to tax charge in relation to prior years (11) 0% (25) 1%
Movements in provisions for open tax mattersnote (vii) 47 (2)% 33 (1)%
Impact of changes in local statutory tax rates 6 0% (1) 0%
Adjustments in relation to business disposals and corporate transactions (14) 1% (6) 0%
Total credit 28 (1)% 1 0%
Total actual tax charge (462) 17% (440) 15%
Analysed into: Tax charge on adjusted operating profit (548) (497) Tax credit on non-operating resultnote (i) 86 57 Actual tax rate on: Adjusted operating profit:
Including non-recurring tax reconciling itemsnote (viii) 17% 18%
Excluding non-recurring tax reconciling items 18% 18% Total profitnote (viii) 17% 15%
Notes (i) ‘Non-operating (loss) profit’ is used to refer to items excluded from adjusted operating profit and includes short-term investment fluctuations
in investment returns on shareholder-backed business, corporate transactions and amortisation of acquisition accounting adjustments. (ii) Income not taxable or taxable at concessionary rates primarily relates to non-taxable investment income in Singapore and Malaysia. (iii) Items related to taxation of life insurance businesses primarily relates to Hong Kong where the taxable profit is computed as 5 per cent of
net insurance premiums. (iv) The unrecognised tax losses reconciling amount reflects losses arising where it is unlikely that relief for the losses will be available in
future periods. (v) Profit before tax includes Prudential’s share of profit after tax from the joint ventures and associates. Therefore, the actual tax charge
does not include tax arising from profit or loss of joint ventures and associates and is reflected as a reconciling item. (vi) The Group incurs withholding tax on remittances received from certain jurisdictions and on certain investment income. Where these
withholding taxes cannot be offset against corporate income tax or otherwise recovered, they represent a cost to the Group. Irrecoverable withholding tax on remittances is included in Other operations and is not allocated to any segment. Irrecoverable withholding tax on investment income is included in the relevant segment where the investment income is reflected.
(vii) The statement of financial position contains the following provisions in relation to open tax matters:
2021 $m
Balance at 1 Jan 113 Removal of discontinued US operations (3) Movements in the current year included in tax charge attributable to shareholders (47) Provisions utilised in the year (4)
Other movements (including interest arising on open tax matters and amounts included in the Group’s share of profits from joint ventures and associates, net of related tax) (17)
Balance at 31 Dec 42

15
(viii) The actual tax rates of the relevant business operations are shown below:
2021 %
Hong Kong Indonesia Malaysia Singapore
Growth markets
and other Eastspring Other
operations
Total attributable to shareholders
Tax rate on adjusted operating profit 5% 17% 21% 15% 22% 10% (3)% 17% Tax rate on profit before tax 4% 17% 21% 15% 27% 10% (2)% 17%
2020 %
Hong Kong Indonesia Malaysia Singapore
Growth markets
and other Eastspring Other
operations
Total attributable to shareholders
Tax rate on adjusted operating profit 3% 24% 18% 14% 22% 11% 0% 18% Tax rate on profit before tax 1% 23% 18% 14% 19% 11% 0% 15%
B4 Earnings per share
2021
Before
tax Tax
Non-controlling
interests
Net of tax and non-
controlling interests
Basic earnings
per share
Diluted earnings
per share Note $m $m $m $m cents cents
Based on adjusted operating profit 3,233 (548) (17) 2,668 101.5¢ 101.5¢ Short-term fluctuations in investment returns on shareholder-backed business (458) 81 (5) (382) (14.5)¢ (14.5)¢ Amortisation of acquisition accounting adjustments (5) – – (5) (0.2)¢ (0.2)¢ Loss attaching to corporate transactions D1.1 (94) 5 – (89) (3.4)¢ (3.4)¢
Based on profit from continuing operations 2,676 (462) (22) 2,192 83.4¢ 83.4¢
Based on loss from discontinued US operations D1.2 (4,234) (161.1)¢ (161.1)¢
Based on loss for the year (2,042) (77.7)¢ (77.7)¢
2020
Before
tax Tax
Non-controlling
interests
Net of tax and non-
controlling interests
Basic earnings
per share
Diluted earnings
per share Note $m $m $m $m cents cents
Based on adjusted operating profit 2,757 (497) (10) 2,250 86.6¢ 86.6¢ Short-term fluctuations in investment returns on shareholder-backed business (579) 49 – (530) (20.4)¢ (20.4)¢ Amortisation of acquisition accounting adjustments (5) – – (5) (0.2)¢ (0.2)¢ Gain attaching to corporate transactions D1.1 735 8 – 743 28.6¢ 28.6¢
Based on profit from continuing operations 2,908 (440) (10) 2,458 94.6¢ 94.6¢
Based on loss from discontinued US operations D1.2 (340) (13.0)¢ (13.0)¢
Based on profit for the year 2,118 81.6¢ 81.6¢
Basic earnings per share are calculated based on earnings attributable to ordinary shareholders, after related tax and non-controlling interests, divided by the weighted average number of ordinary shares outstanding during the year, excluding those held in employee share trusts, which are treated as cancelled. For diluted earnings per share, the weighted average number of shares in issue is adjusted to assume conversion of all dilutive potential ordinary shares. The Group’s only class of potentially dilutive ordinary shares are those share options granted to employees where the exercise price is less than the average market price of the Company’s ordinary shares during the year. No adjustment is made if the impact is anti-dilutive overall. The weighted average number of shares for calculating basic and diluted earnings per share, which excludes those held in employee share trusts, is set out as below:
Number of shares (in millions) 2021 2020
Weighted average number of shares for calculation of basic earnings per share 2,628 2,597 Shares under option at end of year 2 2 Shares that would have been issued at fair value on assumed option price at end of year (2) (2)
Weighted average number of shares for calculation of diluted earnings per share 2,628 2,597

16
B5 Dividends Demerger dividends from discontinued operations On 13 September 2021, following approval by the Group’s shareholders, Prudential plc demerged Jackson, its US operations, via a dividend in specie. At the point of the demerger, the Group retained a non-controlling holding of 19.7 per cent economic interest (19.9 per cent voting interest) in the total common stock of Jackson. As required by IFRIC 17 ‘Distributions of Non-Cash Assets to Owners’, the dividend has been recorded at $1,735 million, being the fair value of those shares distributed to shareholders at the date of the demerger of Jackson. Other dividends
2021 2020
Cents per share $m Cents per share $m
Dividends relating to reporting year: First interim ordinary dividend 5.37¢ 140 5.37¢ 140 Second interim ordinary dividend 11.86¢ 326 10.73¢ 280
Total 17.23¢ 466 16.10¢ 420
Dividends paid in reporting year: Current year first interim ordinary dividend 5.37¢ 138 5.37¢ 140 Second interim ordinary dividend for prior year 10.73¢ 283 25.97¢ 674
Total 16.10¢ 421 31.34¢ 814
First and second interim dividends are recorded in the period in which they are paid. Dividend per share The 2021 first interim dividend of 5.37 cents per ordinary share was paid to eligible shareholders on 28 September 2021. On 13 May 2022, Prudential will pay a second interim dividend of 11.86 cents per ordinary share for the year ended 31 December 2021. The second interim dividend will be paid to shareholders included on the UK register at 6.00pm BST and to shareholders on the HK register at 4.30pm Hong Kong time on 25 March 2022 (Record Date), and also to the Holders of US American Depositary Receipts (ADRs) as at 25 March 2022. The second interim dividend will be paid on or about 20 May 2022 to shareholders with shares standing to the credit of their securities accounts with The Central Depository (Pte) Limited (CDP) at 5.00pm Singapore time on the Record Date. Shareholders holding shares on the UK or Hong Kong share registers will continue to receive their dividend payments in either GBP or HKD respectively, unless they elect otherwise. Shareholders holding shares on the UK or Hong Kong registers may elect to receive dividend payments in USD. Elections must be made through the relevant UK or Hong Kong share registrar on or before 21 April 2022. The corresponding amount per share in GBP and HKD is expected to be announced on or about 28 April 2022. The USD to GBP and HKD conversion rates will be determined by the actual rates achieved by Prudential buying those currencies prior to the subsequent announcement. Holders of ADRs will continue to receive their dividend payments in USD. Shareholders holding an interest in Prudential shares through CDP in Singapore will continue to receive their dividend payments in SGD at an exchange rate determined by CDP. Shareholders on the UK register are eligible to participate in a Dividend Reinvestment Plan.
C FINANCIAL POSITION
C1 Group assets and liabilities by business type The analysis below is structured to show the investments and other assets and liabilities of the Group by reference to the differing degrees of policyholder and shareholder economic interest of the different types of business. Debt securities are analysed below according to the issuing government for sovereign debt and to credit ratings for the rest of the securities. The Group uses the middle of the Standard & Poor’s, Moody’s and Fitch ratings, where available. Where ratings are not available from these rating agencies, local external rating agencies’ ratings and lastly internal ratings have been used. Securities with none of the ratings listed above are classified as unrated and included under the ‘below BBB- and unrated’ category. The total securities from continuing operations (excluding sovereign debt) that were unrated at 31 December 2021 were $1,130 million (31 December 2020: $780 million). Additionally, government debt is shown separately from the rating breakdowns in order to provide a more focused view of the credit portfolio. In the table below, AAA is the highest possible rating. Investment grade financial assets are classified within the range of AAA to BBB- ratings. Financial assets which fall outside this range are classified as below BBB-.

17
31 Dec 2021 $m
Asia and Africa Insurance
With-
profits Unit-
linked Other Eastspring Elimina-
tions Total
Unallo-
cated to a
segment
Elimination
of intra-group debtors and
creditors Group
total note (i) note (i) note (i)
Debt securitiesnote (ii) Sovereign debt Indonesia 414 598 609 11 – 1,632 – – 1,632 Singapore 3,684 550 1,068 126 – 5,428 – – 5,428 Thailand – – 1,577 3 – 1,580 – – 1,580 United Kingdom – 7 – – – 7 226 – 233 United States 28,552 47 3,525 – – 32,124 – – 32,124 Vietnam – 20 3,022 – – 3,042 – – 3,042 Other (predominantly Asia) 2,030 720 4,001 21 – 6,772 – – 6,772
Subtotal 34,680 1,942 13,802 161 – 50,585 226 – 50,811
Other government bonds AAA 1,472 86 246 – – 1,804 – – 1,804 AA+ to AA- 45 2 12 – – 59 – – 59 A+ to A- 667 119 304 – – 1,090 – – 1,090 BBB+ to BBB- 121 16 116 – – 253 – – 253 Below BBB- and unrated 204 15 450 – – 669 – – 669
Subtotal 2,509 238 1,128 – – 3,875 – – 3,875
Corporate bonds AAA 1,222 236 411 – – 1,869 – – 1,869 AA+ to AA- 2,203 359 1,858 – – 4,420 – – 4,420 A+ to A- 9,046 675 5,294 – – 15,015 – – 15,015 BBB+ to BBB- 9,523 1,711 5,105 – – 16,339 – – 16,339 Below BBB- and unrated 4,009 678 1,827 – – 6,514 – – 6,514
Subtotal 26,003 3,659 14,495 – – 44,157 – – 44,157
Asset-backed securities AAA 88 6 74 – – 168 – – 168 AA+ to AA- 6 1 4 – – 11 – – 11 A+ to A- 26 – 17 – – 43 – – 43 BBB+ to BBB- 15 – 9 – – 24 – – 24 Below BBB- and unrated 2 2 1 – – 5 – – 5
Subtotal 137 9 105 – – 251 – – 251
Total debt securities 63,329 5,848 29,530 161 – 98,868 226 – 99,094
Loans Mortgage loans – – 150 – – 150 – – 150 Policy loans 1,365 – 368 – – 1,733 – – 1,733 Other loans 668 – 11 – – 679 – – 679
Total loans 2,033 – 529 – – 2,562 – – 2,562
Equity securities and holdings in collective investment schemes Direct equities 10,290 12,812 2,286 84 – 25,472 683 – 26,155 Collective investment schemes 23,950 7,704 3,787 3 – 35,444 2 – 35,446
Total equity securities and holdings in collective investment schemes 34,240 20,516 6,073 87 – 60,916 685 – 61,601
Other financial investmentsnote (iii) 1,561 149 2,318 106 – 4,134 1,088 – 5,222
Total financial investments 101,163 26,513 38,450 354 – 166,480 1,999 – 168,479
Investment properties – – 38 – – 38 – – 38 Investments in joint ventures and associates accounted for using the equity method – – 1,878 305 – 2,183 – – 2,183 Cash and cash equivalents 905 911 1,444 181 – 3,441 3,729 – 7,170 Reinsurers' share of insurance contract liabilitiesnote C3.3 225 – 9,528 – – 9,753 – – 9,753 Other assets 1,184 166 9,191 759 (51) 11,249 3,608 (3,378) 11,479
Total assets 103,477 27,590 60,529 1,599 (51) 193,144 9,336 (3,378) 199,102
Shareholders' equity – – 14,289 1,120 – 15,409 1,679 – 17,088 Non-controlling interests – – 45 131 – 176 – – 176
Total equity – – 14,334 1,251 – 15,585 1,679 – 17,264
Contract liabilities and unallocated surplus of with-profits funds 94,002 25,651 37,646 – – 157,299 – – 157,299 Core structural borrowings – – – – – – 6,127 – 6,127 Operational borrowings 142 – 106 18 – 266 595 – 861 Other liabilities 9,333 1,939 8,443 330 (51) 19,994 935 (3,378) 17,551
Total liabilities 103,477 27,590 46,195 348 (51) 177,559 7,657 (3,378) 181,838
Total equity and liabilities 103,477 27,590 60,529 1,599 (51) 193,144 9,336 (3,378) 199,102

18
31 Dec 2020 $m
Asia and Africa
Insurance
With-
profits Unit-
linked Other Eastspring Elimina-
tions Total US
discont'd
Unallo- cated
to a segment
Elimination of intra-group
debtors and creditors
Group total
note (i) note (i) note (i)
Debt securitiesnote (ii) Sovereign debt Indonesia 385 658 564 12 – 1,619 – – – 1,619 Singapore 3,939 551 979 117 – 5,586 – – – 5,586 Thailand – – 1,999 11 – 2,010 – – – 2,010 United Kingdom – 7 – – – 7 – – – 7 United States 24,396 21 2,551 – – 26,968 5,126 – – 32,094 Vietnam – 11 2,881 – – 2,892 – – – 2,892 Other (predominantly Asia) 1,322 700 3,681 19 – 5,722 30 – – 5,752
Subtotal 30,042 1,948 12,655 159 – 44,804 5,156 – – 49,960
Other government bonds AAA 1,420 96 405 – – 1,921 377 – – 2,298 AA+ to AA- 129 2 28 – – 159 522 – – 681 A+ to A- 811 131 339 – – 1,281 188 – – 1,469 BBB+ to BBB- 452 16 196 – – 664 3 – – 667 Below BBB- and unrated 631 9 451 – – 1,091 – – – 1,091
Subtotal 3,443 254 1,419 – – 5,116 1,090 – – 6,206
Corporate bonds AAA 1,228 221 540 – – 1,989 265 – – 2,254 AA+ to AA- 1,943 476 1,871 – – 4,290 869 – – 5,159 A+ to A- 7,289 695 5,194 1 – 13,179 10,759 – – 23,938 BBB+ to BBB- 9,005 1,299 4,785 – – 15,089 12,686 – – 27,775 Below BBB- and unrated 2,814 849 1,483 2 – 5,148 1,975 – – 7,123
Subtotal 22,279 3,540 13,873 3 – 39,695 26,554 – – 66,249
Asset-backed securities AAA 74 9 24 – – 107 2,110 – – 2,217 AA+ to AA- 2 1 – – – 3 171 – – 174 A+ to A- 15 – 16 – – 31 741 – – 772 BBB+ to BBB- 12 – 9 – – 21 163 – – 184 Below BBB- and unrated 9 2 8 – – 19 48 – – 67
Subtotal 112 12 57 – – 181 3,233 – – 3,414
Total debt securities 55,876 5,754 28,004 162 – 89,796 36,033 – – 125,829
Loans Mortgage loans – – 158 – – 158 7,833 – – 7,991 Policy loans 1,231 – 351 – – 1,582 4,507 – – 6,089 Other loans 492 – 16 – – 508 – – – 508
Total loans 1,723 – 525 – – 2,248 12,340 – – 14,588
Equity securities and holdings in collective investment schemes Direct equities 15,668 13,064 3,325 71 – 32,128 253 – – 32,381 Collective investment schemes 18,125 7,392 1,638 10 – 27,165 25 2 – 27,192 US separate account assets – – – – – – 219,062 – – 219,062
Total equity securities and holdings in collective investment schemes 33,793 20,456 4,963 81 – 59,293 219,340 2 – 278,635
Other financial investments 1,566 405 2,173 97 – 4,241 4,094 13 – 8,348
Total financial investments 92,958 26,615 35,665 340 – 155,578 271,807 15 – 427,400
Investment properties – – 16 – – 16 7 – – 23 Investments in joint ventures and associates accounted for using the equity method – – 1,689 273 – 1,962 – – – 1,962 Cash and cash equivalents 1,049 587 1,354 156 – 3,146 1,621 3,251 – 8,018 Reinsurers' share of insurance contract liabilitiesnote C3.3 257 – 11,106 – – 11,363 35,232 – – 46,595 Other assets 1,538 252 9,418 839 (62) 11,985 19,813 3,624 (3,323) 32,099
Total assets 95,802 27,454 59,248 1,608 (62) 184,050 328,480 6,890 (3,323) 516,097
Shareholders' equity – – 12,861 1,102 – 13,963 8,511 (1,596) – 20,878 Non-controlling interests – – 34 144 – 178 1,063 – – 1,241
Total equity – – 12,895 1,246 – 14,141 9,574 (1,596) – 22,119
Contract liabilities and unallocated surplus of with-profits funds 86,410 25,433 38,107 – – 149,950 296,513 – – 446,463 Core structural borrowings – – – – – – 250 6,383 – 6,633 Operational borrowings 194 – 105 23 – 322 1,498 624 – 2,444 Other liabilities 9,198 2,021 8,141 339 (62) 19,637 20,645 1,479 (3,323) 38,438
Total liabilities 95,802 27,454 46,353 362 (62) 169,909 318,906 8,486 (3,323) 493,978
Total equity and liabilities 95,802 27,454 59,248 1,608 (62) 184,050 328,480 6,890 (3,323) 516,097

19
Notes (i) ‘With-profits’ comprises the with-profits assets and liabilities of the Hong Kong, Malaysia and Singapore operations. ‘Other’ includes assets
and liabilities of other participating business and other non-linked shareholder-backed business. ‘Unit-linked’ comprises the assets and liabilities held in the unit-linked funds.
(ii) Of the Group’s debt securities, the following amounts were held by the consolidated investment funds from continuing operations.
31 Dec 2021 $m 31 Dec 2020 $m
Total Total
Debt securities held by consolidated investment funds from continuing operations 15,076 15,928
(iii) Other financial investments comprise derivative assets and deposits. For the discontinued US operations, other financial investments in 2020 also included private equity investments in limited partnerships.
C2 Fair value measurement
C2.1 Determination of fair value The fair values of the financial instruments for which fair valuation is required under IFRS Standards are determined by the use of current market bid prices for exchange-quoted investments, or by using quotations from independent third parties, such as brokers and pricing services or by using appropriate valuation techniques. The estimated fair value of derivative financial instruments reflects the estimated amount the Group would receive or pay in an arm’s-length transaction. This amount is determined using quoted prices if exchange listed, quotations from independent third parties or valued internally using standard market practices. Other than the loans which have been designated at fair value through profit or loss, the carrying value of loans and receivables is presented net of provisions for impairment. The fair value of loans is estimated from discounted cash flows expected to be received. The discount rate used is updated for the market rate of interest where applicable. The fair value of the subordinated and senior debt issued by the parent company is determined using quoted prices from independent third parties. The fair value of financial liabilities (other than subordinated debt, senior debt and derivative financial instruments) is determined using discounted cash flows of the amounts expected to be paid.
Valuation approach for level 2 fair valued assets and liabilities A significant proportion of the Group’s level 2 assets are corporate bonds, structured securities and other non-national government debt securities. These assets, in line with market practice, are generally valued using a designated independent pricing service or quote from third-party brokers. These valuations are subject to a number of monitoring controls, such as comparison to multiple pricing sources where available, monthly price variances, stale price reviews and variance analysis on prices achieved on subsequent trades. When prices are not available from pricing services, quotes are sourced directly from brokers. Prudential seeks to obtain a number of quotes from different brokers so as to obtain the most comprehensive information available on their executability. The selected quote is the one which best represents an executable quote for the security at the measurement date. Generally, no adjustment is made to the prices obtained from independent third parties. Adjustments are made in only limited circumstances, where it is determined that the third-party valuations obtained do not reflect fair value (eg either because the value is stale and/or the values are extremely diverse in range). Securities valued in such manner are classified as level 3 where these significant inputs are not based on observable market data. Valuation approach for level 3 fair valued assets and liabilities Investments valued using valuation techniques include financial investments which by their nature do not have an externally quoted price based on regular trades, and financial investments for which markets are no longer active as a result of market conditions, eg market illiquidity. The Group’s valuation policies, procedures and analyses for instruments categorised as level 3 are overseen by Business Unit committees as part of the Group’s wider financial reporting governance processes. The procedures undertaken include approval of valuation methodologies, verification processes, and resolution of significant or complex valuation issues. In addition, the Group has minimum standards for independent price verification to ensure valuation accuracy is regularly independently verified. Adherence to this policy is monitored across the business units.
C2.2 Fair value measurement hierarchy of Group assets and liabilities (a) Assets and liabilities carried at fair value on the statement of financial position The table below shows the assets and liabilities carried at fair value analysed by level of the IFRS 13 ‘Fair Value Measurement’ defined fair value hierarchy. This hierarchy is based on the inputs to the fair value measurement and reflects the lowest level input that is significant to that measurement. All assets and liabilities held at fair value are classified as fair value through profit or loss, except for $909 million of financial assets classified as available-for-sale at 31 December 2021 (31 December 2020: nil for continuing operations), of which $683 million related to the Group’s retained interest in Jackson’s equity securities. All assets and liabilities held at fair value are measured on a recurring basis. As of 31 December 2021, the Group did not have any financial instruments that are measured at fair value on a non-recurring basis.

20
Financial instruments at fair value 31 Dec 2021 $m
Level 1 Level 2 Level 3
Quoted prices (unadjusted)
in active markets
Valuation based on significant
observable market inputs
Valuation based on significant unobservable market inputs Total
Continuing operations note (i) note (ii)
Loans – 616 5 621 Equity securities and holdings in collective investment schemes 54,107 6,917 577 61,601 Debt securities 76,049 22,987 58 99,094 Other investments (including derivative assets) 359 122 – 481 Derivative liabilities (146) (116) – (262)
Total financial investments, net of derivative liabilities 130,369 30,526 640 161,535 Investment contract liabilities without discretionary participation features – (814) – (814) Net asset value attributable to unit holders of consolidated investment funds (5,618) (46) – (5,664) Total financial instruments at fair value for continuing operations 124,751 29,666 640 155,057 Percentage of total (%) 81% 19% 0% 100%
Analysed by business type: Financial investments, net of derivative liabilities at fair value With-profits 82,489 15,438 506 98,433 Unit-linked 24,024 2,343 5 26,372 Non-linked shareholder-backed business 23,856 12,745 129 36,730
Total financial investments net of derivative liabilities, at fair value 130,369 30,526 640 161,535 Percentage of total continuing operations (%) 81% 19% 0% 100% Total financial investments, net of derivative liabilities at fair value 130,369 30,526 640 161,535 Other financial liabilities at fair value (5,618) (860) - (6,478)
Group total financial instruments at fair value 124,751 29,666 640 155,057
31 Dec 2020 $m
Level 1 Level 2 Level 3
Quoted prices (unadjusted)
in active markets
Valuation based
on significant observable
market inputs
Valuation based
on significant unobservable market inputs Total
note (i) note (ii)
Loans – 416 3,461 3,877 Equity securities and holdings in collective investment schemes 272,863 5,224 548 278,635 Debt securities 75,998 49,769 62 125,829 Other investments (including derivative assets) 123 2,477 1,866 4,466 Derivative liabilities (298) (184) – (482)
Total financial investments, net of derivative liabilities 348,686 57,702 5,937 412,325 Investment contract liabilities without discretionary participation features – (792) – (792) Net asset value attributable to unit holders of consolidated investment funds (5,464) (17) (494) (5,975) Other financial liabilities held at fair value – – (3,589) (3,589)
Total financial instruments at fair value 343,222 56,893 1,854 401,969 Percentage of total (%) 86% 14% 0% 100%
Analysed by business type: Financial investments, net of derivative liabilities at fair value, from continuing operations: With-profits 78,203 11,481 395 90,079 Unit-linked 25,144 1,075 – 26,219 Non-linked shareholder-backed business 20,999 12,068 89 33,156
Total financial investments, net of derivative liabilities at fair value 124,346 24,624 484 149,454 Other financial liabilities at fair value (5,464) (809) – (6,273)
Total financial instruments, net of derivative liabilities, at fair value from continuing operations 118,882 23,815 484 143,181
Percentage of total continuing operations (%) 83% 17% 0% 100% Total financial instruments, net of derivative liabilities, at fair value from discontinued US operations 224,340 33,078 1,370 258,788
Group total financial instruments at fair value 343,222 56,893 1,854 401,969

21
Notes (i) For continuing operations, of the total level 2 debt securities of $22,987 million at 31 December 2021 (31 December 2020: $18,868 million),
$24 million (31 December 2020: $140 million) are valued internally. (ii) At 31 December 2021, the Group held $640 million (31 December 2020: $484 million) of net financial instruments at fair value within level 3
from continuing operations. This represents less than 0.5 per cent of the total fair valued financial assets, net of financial liabilities, for both years.
Of this amount, equity securities from continuing operations of $1 million (31 December 2020: $2 million) are internally valued, representing less than 0.1 per cent of the total fair valued financial assets net of financial liabilities for both years. Internal valuations are inherently more subjective than external valuations. The $640 million from continuing operations (31 December 2020: $484 million) referred to above includes the following items:
– Equity securities and holdings in collective investment schemes of $577 million (31 December 2020: $445 million) consisting primarily
of property and infrastructure funds held by the participating funds, which are externally valued using the net asset value of the invested entities; and
– Other sundry individual financial instruments of a net asset of $63 million (31 December 2020: net asset of $39 million). Of the net assets from continuing operations of $640 million (31 December 2020: $484 million) referred to above:
– A net asset of $506 million (31 December 2020: $395 million) is held by the participating funds and therefore shareholders’ profit and
equity are not impacted by movements in the valuation of these financial instruments; and – A net asset of $129 million (31 December 2020: $89 million) is held to support non-linked shareholder-backed business, of which $112
million (31 December 2020: $89 million) are externally valued and are therefore inherently less subjective than internal valuations. If the value of all these level 3 financial instruments decreased by 20 per cent, the change in valuation would be $(26) million (31 December 2020: $(18) million), which would reduce shareholders’ equity by this amount before tax. All of this amount would pass through the income statement substantially as part of short-term fluctuations in investment returns outside of adjusted operating profit.
C3 Policyholder liabilities and unallocated surplus C3.1 Policyholder liabilities and unallocated surplus by business type from continuing operations
(a) Movement in policyholder liabilities and unallocated surplus of with-profits funds The items below represent the amount attributable to changes in policyholder liabilities and unallocated surplus of with-profits funds as a result of each of the components listed for the continuing operations of the Group. The policyholder liabilities shown include investment contracts without discretionary participation features (as defined in IFRS 4) and their full movement in the year. The items are shown gross of external reinsurance.

22
With- Shareholder-backed
business Total
profits
business Unit-linked
liabilities Other
business continuing operations
$m $m $m $m
At 1 Jan 2020 70,308 28,850 33,598 132,756 Comprising:
- Policyholder liabilities on the balance sheet (excludes $269,549 million from discontinued US operations) 65,558 23,571 27,000 116,129 - Unallocated surplus of with-profits funds on the balance sheetnote (viii) 4,750 – – 4,750 - Group's share of policyholder liabilities relating to joint ventures and associatesnote (i) – 5,279 6,598 11,877
Premiums:note (ii) New business 1,338 1,851 2,063 5,252 In-force 8,393 2,358 4,757 15,508
9,731 4,209 6,820 20,760 Surrendersnotes (ii)(iii) (797) (2,982) (951) (4,730) Maturities/deaths/other claim events (1,595) (196) (774) (2,565)
Net flows 7,339 1,031 5,095 13,465 Shareholders' transfers post-tax (116) – – (116) Investment-related items and other movementsnotes (iv)(vii) 8,127 2,107 7,108 17,342 Foreign exchange translation differencesnote (v) 752 518 838 2,108
At 31 Dec 2020/1 Jan 2021 86,410 32,506 46,639 165,555
Comprising:
- Policyholder liabilities on the balance sheet (excludes $296,513 million from discontinued US operations) 81,193 25,433 38,107 144,733 - Unallocated surplus of with-profits funds on the balance sheetnote (viii) 5,217 – – 5,217 - Group's share of policyholder liabilities relating to joint ventures and associatesnote (i) – 7,073 8,532 15,605
Premiums:note (ii) New business 1,990 3,038 2,172 7,200 In-force 7,096 2,406 5,286 14,788
9,086 5,444 7,458 21,988 Surrendersnotes (ii)(iii) (844) (3,326) (734) (4,904) Maturities/deaths/other claim events (2,116) (215) (1,123) (3,454)
Net flows 6,126 1,903 5,601 13,630 Shareholders' transfers post tax (134) – – (134) Investment-related items and other movementsnote (iv) 2,499 897 (3,505) (109) Foreign exchange translation differencesnote (v) (899) (550) (239) (1,688)
At 31 Dec 2021 94,002 34,756 48,496 177,254
Comprising:
- Policyholder liabilities on the balance sheet 88,618 25,651 37,646 151,915 - Unallocated surplus of with-profits funds on the balance sheetnote (viii) 5,384 – – 5,384 - Group's share of policyholder liabilities relating to joint ventures and associatesnote (i) – 9,105 10,850 19,955
Average policyholder liability balancesnote (vi) 2021 84,905 33,631 47,568 166,104 2020 73,375 30,678 40,119 144,172
Notes (i) The Group’s investments in joint ventures and associates are accounted for on an equity method and the Group’s share of the policyholder
liabilities as shown above relate to the life business of CPL, India and the Takaful business in Malaysia. (ii) The analysis includes the impact of premiums, claims and investment movements on policyholders’ liabilities. The impact does not
represent premiums, claims and investment movements as reported in the income statement. For example, premiums shown above exclude any deductions for fees/charges; claims (surrenders, maturities, deaths and other claim events) shown above represent the policyholder liabilities provision released rather than the claims amount paid to the policyholder. The analysis also includes net flows of the Group’s insurance joint ventures and associate.
(iii) The rate of surrenders for shareholder-backed business (expressed as a percentage of opening policyholder liabilities) is 5.1 per cent in 2021 (2020: 6.3 per cent).
(iv) Investment-related items and other movements in 2021 primarily represents the effect of higher interest rates on the discount rates applied in the measurement of the policyholder liabilities for other shareholder-backed business and unrealised losses on fixed income assets, partially offset by a higher level of investment return from equities mainly within with-profits and unit-linked funds.
(v) Movements in the year have been translated at the average exchange rates for the year. The closing balance has been translated at the closing spot rates as at 31 December. Differences upon retranslation are included in foreign exchange translation differences.
(vi) Average policyholder liabilities have been based on opening and closing balances, adjusted for any acquisitions, disposals and other relevant corporate transactions arising in the year, and exclude unallocated surplus of with-profits funds.
(vii) The total movement on Africa policyholder liabilities in 2020 included within other business, apart from foreign exchange movements, was included within investment-related items and other movements.
(viii) Unallocated surplus of with-profits funds represents the excess of assets over policyholder liabilities, determined in accordance with the Group’s accounting policies, that have yet to be appropriated between policyholders and shareholders for the Group’s with-profits funds in Hong Kong and Malaysia. In Hong Kong, the unallocated surplus includes the shareholders’ share of expected future bonuses, with the expected policyholder share being included in policyholder liabilities. Any excess of assets over liabilities and amounts expected to be paid out by the fund on future bonuses is also included in the unallocated surplus.
(b) Duration of policyholder liabilities The table below shows the carrying value of policyholder liabilities from continuing operations and the maturity profile of the cash flows on a discounted basis, taking account of expected future premiums and investment returns:
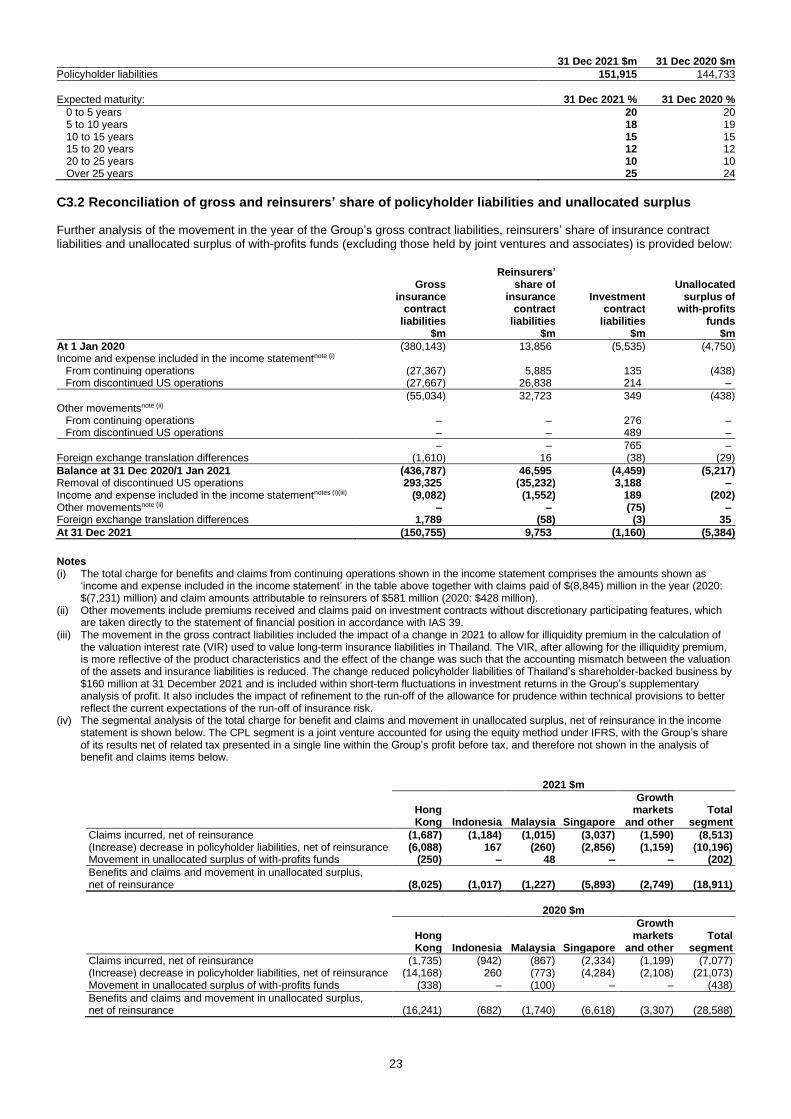
23
31 Dec 2021 $m 31 Dec 2020 $m
Policyholder liabilities 151,915 144,733
Expected maturity: 31 Dec 2021 % 31 Dec 2020 %
0 to 5 years 20 20 5 to 10 years 18 19 10 to 15 years 15 15 15 to 20 years 12 12 20 to 25 years 10 10 Over 25 years 25 24
C3.2 Reconciliation of gross and reinsurers’ share of policyholder liabilities and unallocated surplus Further analysis of the movement in the year of the Group’s gross contract liabilities, reinsurers’ share of insurance contract liabilities and unallocated surplus of with-profits funds (excluding those held by joint ventures and associates) is provided below:
Gross
insurance contract
liabilities
Reinsurers’ share of
insurance contract liabilities
Investment contract
liabilities
Unallocated surplus of
with-profits funds
$m $m $m $m
At 1 Jan 2020 (380,143) 13,856 (5,535) (4,750) Income and expense included in the income statementnote (i) From continuing operations (27,367) 5,885 135 (438) From discontinued US operations (27,667) 26,838 214 –
(55,034) 32,723 349 (438) Other movementsnote (ii) From continuing operations – – 276 – From discontinued US operations – – 489 –
– – 765 – Foreign exchange translation differences (1,610) 16 (38) (29)
Balance at 31 Dec 2020/1 Jan 2021 (436,787) 46,595 (4,459) (5,217) Removal of discontinued US operations 293,325 (35,232) 3,188 – Income and expense included in the income statementnotes (i)(iii) (9,082) (1,552) 189 (202) Other movementsnote (ii) – – (75) – Foreign exchange translation differences 1,789 (58) (3) 35
At 31 Dec 2021 (150,755) 9,753 (1,160) (5,384)
Notes (i) The total charge for benefits and claims from continuing operations shown in the income statement comprises the amounts shown as
‘income and expense included in the income statement’ in the table above together with claims paid of $(8,845) million in the year (2020: $(7,231) million) and claim amounts attributable to reinsurers of $581 million (2020: $428 million).
(ii) Other movements include premiums received and claims paid on investment contracts without discretionary participating features, which are taken directly to the statement of financial position in accordance with IAS 39.
(iii) The movement in the gross contract liabilities included the impact of a change in 2021 to allow for illiquidity premium in the calculation of the valuation interest rate (VIR) used to value long-term insurance liabilities in Thailand. The VIR, after allowing for the illiquidity premium, is more reflective of the product characteristics and the effect of the change was such that the accounting mismatch between the valuation of the assets and insurance liabilities is reduced. The change reduced policyholder liabilities of Thailand’s shareholder-backed business by $160 million at 31 December 2021 and is included within short-term fluctuations in investment returns in the Group’s supplementary analysis of profit. It also includes the impact of refinement to the run-off of the allowance for prudence within technical provisions to better reflect the current expectations of the run-off of insurance risk.
(iv) The segmental analysis of the total charge for benefit and claims and movement in unallocated surplus, net of reinsurance in the income statement is shown below. The CPL segment is a joint venture accounted for using the equity method under IFRS, with the Group’s share of its results net of related tax presented in a single line within the Group’s profit before tax, and therefore not shown in the analysis of benefit and claims items below.
2021 $m
Hong Kong Indonesia Malaysia Singapore
Growth markets
and other Total
segment
Claims incurred, net of reinsurance (1,687) (1,184) (1,015) (3,037) (1,590) (8,513) (Increase) decrease in policyholder liabilities, net of reinsurance (6,088) 167 (260) (2,856) (1,159) (10,196) Movement in unallocated surplus of with-profits funds (250) – 48 – – (202)
Benefits and claims and movement in unallocated surplus, net of reinsurance (8,025) (1,017) (1,227) (5,893) (2,749) (18,911)
2020 $m
Hong Kong Indonesia Malaysia Singapore
Growth markets
and other Total
segment
Claims incurred, net of reinsurance (1,735) (942) (867) (2,334) (1,199) (7,077) (Increase) decrease in policyholder liabilities, net of reinsurance (14,168) 260 (773) (4,284) (2,108) (21,073) Movement in unallocated surplus of with-profits funds (338) – (100) – – (438)
Benefits and claims and movement in unallocated surplus, net of reinsurance (16,241) (682) (1,740) (6,618) (3,307) (28,588)
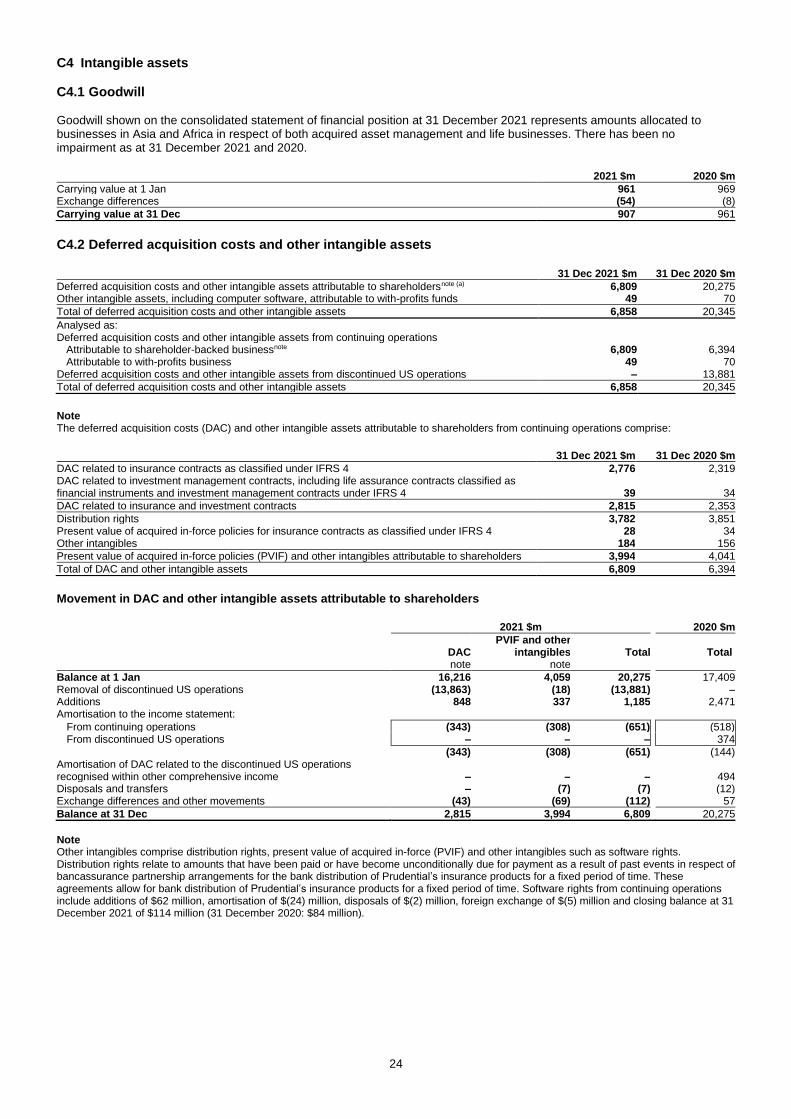
24
C4 Intangible assets
C4.1 Goodwill Goodwill shown on the consolidated statement of financial position at 31 December 2021 represents amounts allocated to businesses in Asia and Africa in respect of both acquired asset management and life businesses. There has been no impairment as at 31 December 2021 and 2020.
2021 $m 2020 $m
Carrying value at 1 Jan 961 969 Exchange differences (54) (8)
Carrying value at 31 Dec 907 961
C4.2 Deferred acquisition costs and other intangible assets 31 Dec 2021 $m 31 Dec 2020 $m
Deferred acquisition costs and other intangible assets attributable to shareholdersnote (a) 6,809 20,275 Other intangible assets, including computer software, attributable to with-profits funds 49 70
Total of deferred acquisition costs and other intangible assets 6,858 20,345
Analysed as: Deferred acquisition costs and other intangible assets from continuing operations Attributable to shareholder-backed businessnote 6,809 6,394 Attributable to with-profits business 49 70 Deferred acquisition costs and other intangible assets from discontinued US operations – 13,881
Total of deferred acquisition costs and other intangible assets 6,858 20,345
Note The deferred acquisition costs (DAC) and other intangible assets attributable to shareholders from continuing operations comprise:
31 Dec 2021 $m 31 Dec 2020 $m
DAC related to insurance contracts as classified under IFRS 4 2,776 2,319 DAC related to investment management contracts, including life assurance contracts classified as financial instruments and investment management contracts under IFRS 4 39 34
DAC related to insurance and investment contracts 2,815 2,353
Distribution rights 3,782 3,851 Present value of acquired in-force policies for insurance contracts as classified under IFRS 4 28 34 Other intangibles 184 156
Present value of acquired in-force policies (PVIF) and other intangibles attributable to shareholders 3,994 4,041
Total of DAC and other intangible assets 6,809 6,394
Movement in DAC and other intangible assets attributable to shareholders
2021 $m 2020 $m
DAC PVIF and other
intangibles Total Total note note
Balance at 1 Jan 16,216 4,059 20,275 17,409 Removal of discontinued US operations (13,863) (18) (13,881) – Additions 848 337 1,185 2,471 Amortisation to the income statement:
From continuing operations (343) (308) (651) (518) From discontinued US operations – – – 374
(343) (308) (651) (144) Amortisation of DAC related to the discontinued US operations recognised within other comprehensive income – – – 494 Disposals and transfers – (7) (7) (12) Exchange differences and other movements (43) (69) (112) 57
Balance at 31 Dec 2,815 3,994 6,809 20,275
Note Other intangibles comprise distribution rights, present value of acquired in-force (PVIF) and other intangibles such as software rights. Distribution rights relate to amounts that have been paid or have become unconditionally due for payment as a result of past events in respect of bancassurance partnership arrangements for the bank distribution of Prudential’s insurance products for a fixed period of time. These agreements allow for bank distribution of Prudential’s insurance products for a fixed period of time. Software rights from continuing operations include additions of $62 million, amortisation of $(24) million, disposals of $(2) million, foreign exchange of $(5) million and closing balance at 31 December 2021 of $114 million (31 December 2020: $84 million).

25
C5 Borrowings
C5.1 Core structural borrowings of shareholder-financed businesses
31 Dec 2021 $m 31 Dec 2020 $m
Continuing operations: Subordinated debt: US$250m 6.75% Notesnote (i) – 250 US$300m 6.5% Notesnote (i) – 300 US$700m 5.25% Notesnote (i) – 700 US$1,000m 5.25% Notesnote (i) 1,000 999 US$725m 4.375% Notesnote (iii) 725 723 US$750m 4.875% Notes 748 746 €20m Medium Term Notes 2023 23 24 £435m 6.125% Notes 2031 584 590 US$1,000m 2.95% Notes 2033note (ii) 995 – Senior debt:note (iv) £300m 6.875% Notes 2023 404 406 £250m 5.875% Notes 2029 313 312 $1,000m 3.125% Notes 2030 985 983 Bank loans: $350m Loan 2024 350 350
Total continuing operations 6,127 6,383
Discontinued US operations: Jackson US$250m 8.15% Surplus Notes 2027 250
Total core structural borrowings of shareholder-financed businesses 6,633
Notes (i) The US$250 million, US$300 million, US$700 million notes were redeemed on 23 December 2021 and the US$1,000 million notes were
redeemed on 20 January 2022 using the proceeds from the issuance of ordinary shares during the year as discussed in note C8. (ii) In November 2021, the Company issued US$1,000 million 2.95 per cent subordinated debt maturing on 3 November 2033 with proceeds,
net of costs, of $995 million. (iii) The US$725 million note was redeemed on 20 January 2022 using the proceeds from the US$1,000 million subordinated debt issued in
November 2021. (iv) The senior debt ranks above subordinated debt in the event of liquidation.
C5.2 Operational borrowings 31 Dec 2021 $m 31 Dec 2020 $m
Shareholder-financed business: Borrowings in respect of short-term fixed income securities programmes – commercial paper 500 501 Lease liabilities under IFRS 16 209 251 Other borrowings 10 –
Operational borrowings from continuing operations 719 752
Discontinued US operationsnote 1,498
Group total operational borrowings attributable to shareholder-financed businesses 2,250
With-profits business: Lease liabilities under IFRS 16 138 194 Other borrowings 4 –
Group total operational borrowings 861 2,444
Note Operational borrowings from discontinued US operations can be analysed as follows: 31 Dec 2020 $m
Non-recourse borrowings of consolidated investment funds 994 Lease liabilities under IFRS 16 51 Senior debt issued through the Federal Home Loan Bank of Indianapolis (FHLB) 453
Operational borrowings from discontinued US operations 1,498
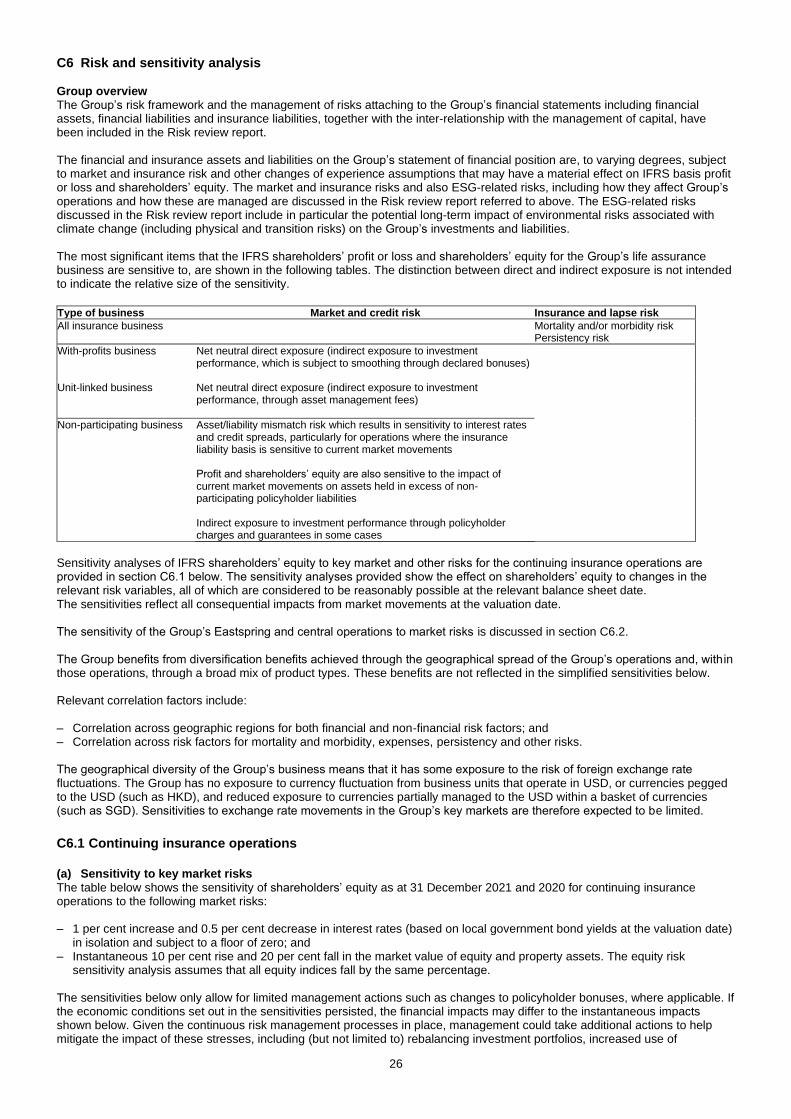
26
C6 Risk and sensitivity analysis Group overview The Group’s risk framework and the management of risks attaching to the Group’s financial statements including financial assets, financial liabilities and insurance liabilities, together with the inter-relationship with the management of capital, have been included in the Risk review report. The financial and insurance assets and liabilities on the Group’s statement of financial position are, to varying degrees, subject to market and insurance risk and other changes of experience assumptions that may have a material effect on IFRS basis profit or loss and shareholders’ equity. The market and insurance risks and also ESG-related risks, including how they affect Group’s operations and how these are managed are discussed in the Risk review report referred to above. The ESG-related risks discussed in the Risk review report include in particular the potential long-term impact of environmental risks associated with climate change (including physical and transition risks) on the Group’s investments and liabilities. The most significant items that the IFRS shareholders’ profit or loss and shareholders’ equity for the Group’s life assurance business are sensitive to, are shown in the following tables. The distinction between direct and indirect exposure is not intended to indicate the relative size of the sensitivity.
Type of business Market and credit risk Insurance and lapse risk
All insurance business
Mortality and/or morbidity risk Persistency risk
With-profits business Net neutral direct exposure (indirect exposure to investment performance, which is subject to smoothing through declared bonuses)
Unit-linked business Net neutral direct exposure (indirect exposure to investment performance, through asset management fees)
Non-participating business Asset/liability mismatch risk which results in sensitivity to interest rates and credit spreads, particularly for operations where the insurance liability basis is sensitive to current market movements Profit and shareholders’ equity are also sensitive to the impact of current market movements on assets held in excess of non-participating policyholder liabilities Indirect exposure to investment performance through policyholder charges and guarantees in some cases
Sensitivity analyses of IFRS shareholders’ equity to key market and other risks for the continuing insurance operations are provided in section C6.1 below. The sensitivity analyses provided show the effect on shareholders’ equity to changes in the relevant risk variables, all of which are considered to be reasonably possible at the relevant balance sheet date. The sensitivities reflect all consequential impacts from market movements at the valuation date. The sensitivity of the Group’s Eastspring and central operations to market risks is discussed in section C6.2. The Group benefits from diversification benefits achieved through the geographical spread of the Group’s operations and, with in those operations, through a broad mix of product types. These benefits are not reflected in the simplified sensitivities below. Relevant correlation factors include: – Correlation across geographic regions for both financial and non-financial risk factors; and – Correlation across risk factors for mortality and morbidity, expenses, persistency and other risks. The geographical diversity of the Group’s business means that it has some exposure to the risk of foreign exchange rate fluctuations. The Group has no exposure to currency fluctuation from business units that operate in USD, or currencies pegged to the USD (such as HKD), and reduced exposure to currencies partially managed to the USD within a basket of currencies (such as SGD). Sensitivities to exchange rate movements in the Group’s key markets are therefore expected to be limited.
C6.1 Continuing insurance operations
(a) Sensitivity to key market risks The table below shows the sensitivity of shareholders’ equity as at 31 December 2021 and 2020 for continuing insurance operations to the following market risks: – 1 per cent increase and 0.5 per cent decrease in interest rates (based on local government bond yields at the valuation date)
in isolation and subject to a floor of zero; and – Instantaneous 10 per cent rise and 20 per cent fall in the market value of equity and property assets. The equity risk
sensitivity analysis assumes that all equity indices fall by the same percentage. The sensitivities below only allow for limited management actions such as changes to policyholder bonuses, where applicable. If the economic conditions set out in the sensitivities persisted, the financial impacts may differ to the instantaneous impacts shown below. Given the continuous risk management processes in place, management could take additional actions to help mitigate the impact of these stresses, including (but not limited to) rebalancing investment portfolios, increased use of
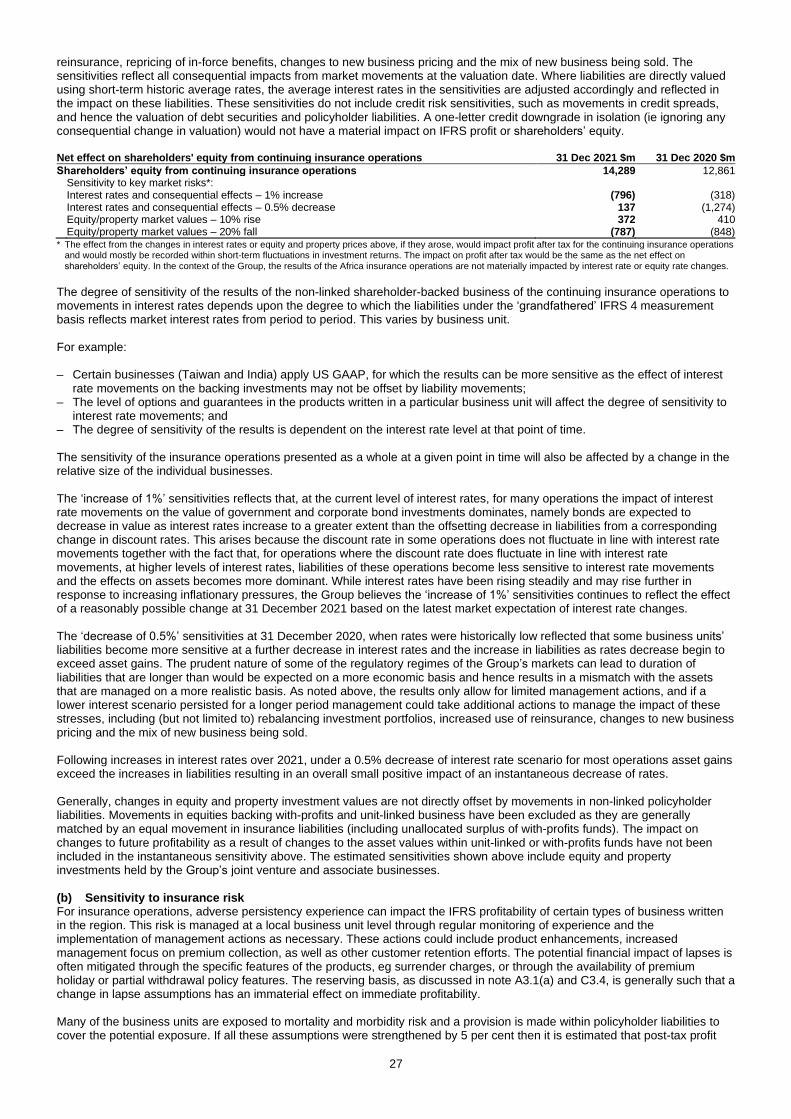
27
reinsurance, repricing of in-force benefits, changes to new business pricing and the mix of new business being sold. The sensitivities reflect all consequential impacts from market movements at the valuation date. Where liabilities are directly valued using short-term historic average rates, the average interest rates in the sensitivities are adjusted accordingly and reflected in the impact on these liabilities. These sensitivities do not include credit risk sensitivities, such as movements in credit spreads, and hence the valuation of debt securities and policyholder liabilities. A one-letter credit downgrade in isolation (ie ignoring any consequential change in valuation) would not have a material impact on IFRS profit or shareholders’ equity. Net effect on shareholders' equity from continuing insurance operations 31 Dec 2021 $m 31 Dec 2020 $m
Shareholders’ equity from continuing insurance operations 14,289 12,861 Sensitivity to key market risks*: Interest rates and consequential effects – 1% increase (796) (318) Interest rates and consequential effects – 0.5% decrease 137 (1,274) Equity/property market values – 10% rise 372 410 Equity/property market values – 20% fall (787) (848) * The effect from the changes in interest rates or equity and property prices above, if they arose, would impact profit after tax for the continuing insurance operations
and would mostly be recorded within short-term fluctuations in investment returns. The impact on profit after tax would be the same as the net effect on shareholders’ equity. In the context of the Group, the results of the Africa insurance operations are not materially impacted by interest rate or equity rate changes.
The degree of sensitivity of the results of the non-linked shareholder-backed business of the continuing insurance operations to movements in interest rates depends upon the degree to which the liabilities under the ‘grandfathered’ IFRS 4 measurement basis reflects market interest rates from period to period. This varies by business unit. For example: – Certain businesses (Taiwan and India) apply US GAAP, for which the results can be more sensitive as the effect of interest
rate movements on the backing investments may not be offset by liability movements; – The level of options and guarantees in the products written in a particular business unit will affect the degree of sensitivity to
interest rate movements; and – The degree of sensitivity of the results is dependent on the interest rate level at that point of time. The sensitivity of the insurance operations presented as a whole at a given point in time will also be affected by a change in the relative size of the individual businesses. The ‘increase of 1%’ sensitivities reflects that, at the current level of interest rates, for many operations the impact of interest rate movements on the value of government and corporate bond investments dominates, namely bonds are expected to decrease in value as interest rates increase to a greater extent than the offsetting decrease in liabilities from a corresponding change in discount rates. This arises because the discount rate in some operations does not fluctuate in line with interest rate movements together with the fact that, for operations where the discount rate does fluctuate in line with interest rate movements, at higher levels of interest rates, liabilities of these operations become less sensitive to interest rate movements and the effects on assets becomes more dominant. While interest rates have been rising steadily and may rise further in response to increasing inflationary pressures, the Group believes the ‘increase of 1%’ sensitivities continues to reflect the effect of a reasonably possible change at 31 December 2021 based on the latest market expectation of interest rate changes. The ‘decrease of 0.5%’ sensitivities at 31 December 2020, when rates were historically low reflected that some business units’ liabilities become more sensitive at a further decrease in interest rates and the increase in liabilities as rates decrease begin to exceed asset gains. The prudent nature of some of the regulatory regimes of the Group’s markets can lead to duration of liabilities that are longer than would be expected on a more economic basis and hence results in a mismatch with the assets that are managed on a more realistic basis. As noted above, the results only allow for limited management actions, and if a lower interest scenario persisted for a longer period management could take additional actions to manage the impact of these stresses, including (but not limited to) rebalancing investment portfolios, increased use of reinsurance, changes to new business pricing and the mix of new business being sold. Following increases in interest rates over 2021, under a 0.5% decrease of interest rate scenario for most operations asset gains exceed the increases in liabilities resulting in an overall small positive impact of an instantaneous decrease of rates. Generally, changes in equity and property investment values are not directly offset by movements in non-linked policyholder liabilities. Movements in equities backing with-profits and unit-linked business have been excluded as they are generally matched by an equal movement in insurance liabilities (including unallocated surplus of with-profits funds). The impact on changes to future profitability as a result of changes to the asset values within unit-linked or with-profits funds have not been included in the instantaneous sensitivity above. The estimated sensitivities shown above include equity and property investments held by the Group’s joint venture and associate businesses. (b) Sensitivity to insurance risk For insurance operations, adverse persistency experience can impact the IFRS profitability of certain types of business written in the region. This risk is managed at a local business unit level through regular monitoring of experience and the implementation of management actions as necessary. These actions could include product enhancements, increased management focus on premium collection, as well as other customer retention efforts. The potential financial impact of lapses is often mitigated through the specific features of the products, eg surrender charges, or through the availability of premium holiday or partial withdrawal policy features. The reserving basis, as discussed in note A3.1(a) and C3.4, is generally such that a change in lapse assumptions has an immaterial effect on immediate profitability. Many of the business units are exposed to mortality and morbidity risk and a provision is made within policyholder liabilities to cover the potential exposure. If all these assumptions were strengthened by 5 per cent then it is estimated that post-tax profit

28
and shareholders’ equity would decrease by approximately $108 million (2020: $77 million). Weakening these assumptions by 5 per cent would have a similar opposite impact.
C6.2 Eastspring and central operations
The profit for the year of Eastspring is sensitive to the level of assets under management, as this significantly affects the value of management fees earned by the business in the current and future periods. Assets under management will rise and fall as market conditions change, with a consequential impact on profitability. Eastspring and central operations do not hold significant financial investments. At 31 December 2020, the financial investments of the central operations were principally short-term treasury bills and money market funds held by the Group’s treasury function for liquidity purposes and so there is limited sensitivity to interest rate movements. At 31 December 2021, in addition to these financial investments, the central operations also held the 18.4 per cent economic interest in the equity securities of Jackson. These equity securities are listed on the New York Stock Exchange and classified as ‘available-for-sale’ with a fair value of $683 million at 31 December 2021. If the value of these securities decreased by 20 per cent, the change in valuation would be $(137) million, which would reduce shareholders’ equity by this amount before tax, all of which would pass through other comprehensive income outside of the profit or loss.
C7 Tax assets and liabilities
C7.1 Current tax At 31 December 2021, of the $20 million (31 December 2020: $11 million) current tax recoverable from continuing operations, the majority is expected to be recovered more than 12 months after the reporting period. At 31 December 2021, the current tax liability from continuing operations of $185 million (31 December 2020: $270 million) includes $42 million (31 December 2020: $110 million) of provisions for uncertain tax matters. Further detail is provided in note B3.2.
C7.2 Deferred tax The statement of financial position contains the following deferred tax assets and liabilities in relation to:
2021 $m
Balance at 1 Jan
Removal of discontinued
US operations
Movement in income
statement
Other movements
including foreign
exchange movements
Balance at 31 Dec
Deferred tax assets Unrealised losses or gains on investments – – 3 – 3 Balances relating to investment and insurance contracts 87 – (16) (37) 34 Short-term temporary differences 4,662 (4,513) 15 (2) 162 Unused tax losses 109 (29) (14) 1 67
Total 4,858 (4,542) (12) (38) 266
Deferred tax liabilities Unrealised losses or gains on investments (1,063) 691 127 3 (242) Balances relating to investment and insurance contracts (1,765) – (433) 73 (2,125) Short-term temporary differences (3,247) 2,832 (87) 7 (495)
Total (6,075) 3,523 (393) 83 (2,862)
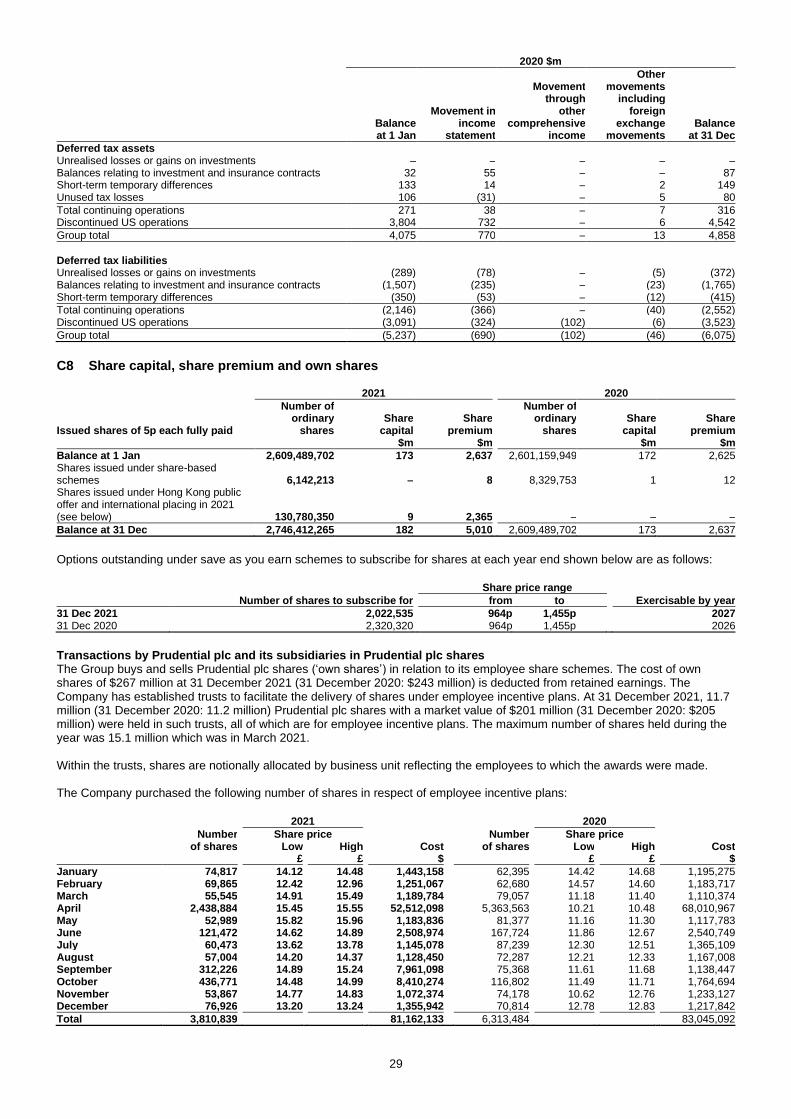
29
2020 $m
Balance at 1 Jan
Movement in income
statement
Movement through
other comprehensive
income
Other movements
including foreign
exchange movements
Balance at 31 Dec
Deferred tax assets Unrealised losses or gains on investments – – – – – Balances relating to investment and insurance contracts 32 55 – – 87 Short-term temporary differences 133 14 – 2 149 Unused tax losses 106 (31) – 5 80
Total continuing operations 271 38 – 7 316 Discontinued US operations 3,804 732 – 6 4,542
Group total 4,075 770 – 13 4,858
Deferred tax liabilities Unrealised losses or gains on investments (289) (78) – (5) (372) Balances relating to investment and insurance contracts (1,507) (235) – (23) (1,765) Short-term temporary differences (350) (53) – (12) (415)
Total continuing operations (2,146) (366) – (40) (2,552) Discontinued US operations (3,091) (324) (102) (6) (3,523)
Group total (5,237) (690) (102) (46) (6,075)
C8 Share capital, share premium and own shares 2021 2020
Issued shares of 5p each fully paid
Number of ordinary
shares Share
capital Share
premium
Number of ordinary
shares Share
capital Share
premium $m $m $m $m
Balance at 1 Jan 2,609,489,702 173 2,637 2,601,159,949 172 2,625 Shares issued under share-based schemes 6,142,213 – 8 8,329,753 1 12 Shares issued under Hong Kong public offer and international placing in 2021 (see below) 130,780,350 9 2,365 – – –
Balance at 31 Dec 2,746,412,265 182 5,010 2,609,489,702 173 2,637
Options outstanding under save as you earn schemes to subscribe for shares at each year end shown below are as follows:
Share price range
Number of shares to subscribe for from to Exercisable by year
31 Dec 2021 2,022,535 964p 1,455p 2027 31 Dec 2020 2,320,320 964p 1,455p 2026
Transactions by Prudential plc and its subsidiaries in Prudential plc shares The Group buys and sells Prudential plc shares (‘own shares’) in relation to its employee share schemes. The cost of own shares of $267 million at 31 December 2021 (31 December 2020: $243 million) is deducted from retained earnings. The Company has established trusts to facilitate the delivery of shares under employee incentive plans. At 31 December 2021, 11.7 million (31 December 2020: 11.2 million) Prudential plc shares with a market value of $201 million (31 December 2020: $205 million) were held in such trusts, all of which are for employee incentive plans. The maximum number of shares held during the year was 15.1 million which was in March 2021. Within the trusts, shares are notionally allocated by business unit reflecting the employees to which the awards were made. The Company purchased the following number of shares in respect of employee incentive plans:
2021 2020
Number Share price Number Share price of shares Low High Cost of shares Low High Cost
£ £ $ £ £ $
January 74,817 14.12 14.48 1,443,158 62,395 14.42 14.68 1,195,275 February 69,865 12.42 12.96 1,251,067 62,680 14.57 14.60 1,183,717 March 55,545 14.91 15.49 1,189,784 79,057 11.18 11.40 1,110,374 April 2,438,884 15.45 15.55 52,512,098 5,363,563 10.21 10.48 68,010,967 May 52,989 15.82 15.96 1,183,836 81,377 11.16 11.30 1,117,783 June 121,472 14.62 14.89 2,508,974 167,724 11.86 12.67 2,540,749 July 60,473 13.62 13.78 1,145,078 87,239 12.30 12.51 1,365,109 August 57,004 14.20 14.37 1,128,450 72,287 12.21 12.33 1,167,008 September 312,226 14.89 15.24 7,961,098 75,368 11.61 11.68 1,138,447 October 436,771 14.48 14.99 8,410,274 116,802 11.49 11.71 1,764,694 November 53,867 14.77 14.83 1,072,374 74,178 10.62 12.76 1,233,127 December 76,926 13.20 13.24 1,355,942 70,814 12.78 12.83 1,217,842
Total 3,810,839 81,162,133 6,313,484 83,045,092

30
The cost in USD shown has been calculated from the share prices in pounds sterling using the monthly average exchange rate for the month in which those shares were purchased. The share transactions in respect of employee incentive plans as shown in the table above were made on an exchange other than the Stock Exchange of Hong Kong. In the future, the Company intends to make share purchases on the Stock Exchange of Hong Kong for the purpose of the employee incentive plans. On 4 October 2021, Prudential completed the issuance of 130.8 million new ordinary shares on the Hong Kong Stock Exchange through a concurrent public offer to Hong Kong retail investors (including eligible employees and agents of Prudential) and international placing to global investors (together, the ‘Share Offer’). Approximately 6.5 million shares were allocated to the public offer and approximately 124.2 million shares were allocated to the international placing. The final offer price was set at HK$143.80 per share and the net proceeds from the Share Offer, after deduction of the underwriting fees and other estimated expenses payable in connection with the Share Offer of US$41 million, was approximately HK$18.5 billion or US$2.4 billion (equating to US$18.34 per share). On 25 September 2021, the day the final offer price was announced, the latest available market price of the issued shares was HK$147.70 per share. The final offer price of HK$143.80 per share, equivalent to £13.51, represented a 2.9 per cent discount to the last London closing price of £13.92 on 24 September 2021. This discount does not take into account the US$41 million of underwriting fees and estimated expenses payable in connection with the Share Offer. The new shares have also been listed on the Singapore Stock Exchange and the London Stock Exchange. In the three-year period preceding the Share Offer, the percentage increase in issued share capital due to non pre-emptive issuances (excluding employee and agency share schemes) for cash was 5 per cent. The majority of the net proceeds (approximately HK$17.5 billion or US$2.3 billion) from the Share Offer have been utilised to redeem four existing high coupon debt in December 2021 and January 2022 as shown in note C5.1, with the remaining net proceeds expected to contribute to Prudential's central stock of liquidity, in order to further increase Prudential's financial flexibility. The above use of proceeds is consistent with the intended use of proceeds previously disclosed in Prudential’s prospectus for this Share Offer.
D OTHER INFORMATION
D1 Corporate transactions
D1.1 (Loss) gain attaching to corporate transactions
2021 $m 2020 $m
Loss attaching to corporate transactions as shown separately on the consolidated income statementnote (35) (30) (Loss) gain arising on reinsurance transaction undertaken by the Hong Kong business (59) 765
Total (loss) gain attaching to corporate transactions from continuing operationsnote B1.1 (94) 735
Note The loss attaching to corporate transactions includes $(30) million incurred by Prudential plc during the year (2020: $(20) million) of costs associated with the separation of Jackson. Additionally, the 2021 amount includes $(28) million of payment for the termination of loss of office made to the former chief executive of Jackson. These charges are partially offset by a gain of $23 million on the repurchase by Jackson of a portion of the Group’s retained interest in the company in December 2021, as described further in note D1.2.
D1.2 Discontinued US operations On 13 September 2021, the Group completed the separation of its US operations (Jackson) through a demerger, whereby shares in Jackson, representing 70.1 per cent voting interest (69.2 per cent economic interest) were distributed to Prudential shareholders. In accordance with IFRS 5 ‘Non-current assets held for sale and discontinued operations’, the US operations have been classified as discontinued within these consolidated financial statements. The 2021 income statement includes the results of Jackson up to 13 September 2021, the date of demerger. At the point of demerger, Prudential plc retained a 19.9 per cent non-controlling voting interest (19.7 per cent economic interest) in Jackson, which is reported within the consolidated financial position as a financial investment at fair value and is included in ‘Unallocated to a segment (central operations)’ for segmental analysis. This investment has been classified as available-for-sale under IAS 39. On 13 December 2021, Jackson announced, as part of its previously disclosed $300 million share repurchase program, the repurchase of 2,242,516 shares of its Class A common stock from Prudential. With this repurchase activity, Prudential’s remaining economic interest in Jackson was 18.4 per cent as of 31 December 2021 (18.5 per cent voting interest). Subject to market conditions, the Group intends to monetise a further portion of this investment to support its investment in Asia within 12 months of the demerger, such that the Group will own less than 10 per cent at the end of such period. In accordance with IFRIC 17, ‘Distribution of non-cash assets to owners’, at the point of demerger, Jackson was remeasured to fair value and a loss on remeasurement to fair value has been recognised of $(8,259) million within the results of discontinued operations. $(7,341) million of this remeasurement relates to the Group’s 88.9 per cent economic interest in Jackson, with the remaining $(918) million attributable to non-controlling interests. The fair value has been determined with reference to the opening quoted price of Jackson shares on the New York Stock Exchange as at the date of demerger on 13 September 2021. Accordingly, the value of the dividend in specie representing a 70.1 per cent voting interest (69.2 per cent economic interest) of Jackson distributed to shareholders was $(1,735) million. At the point of demerger, Athene Life Re Ltd. retained its existing 9.9 per cent voting interest (11.1 per cent economic interest) in Jackson. The results for the discontinued US operations presented in the consolidated financial statements for the period up to the demerger in September 2021 are analysed below.
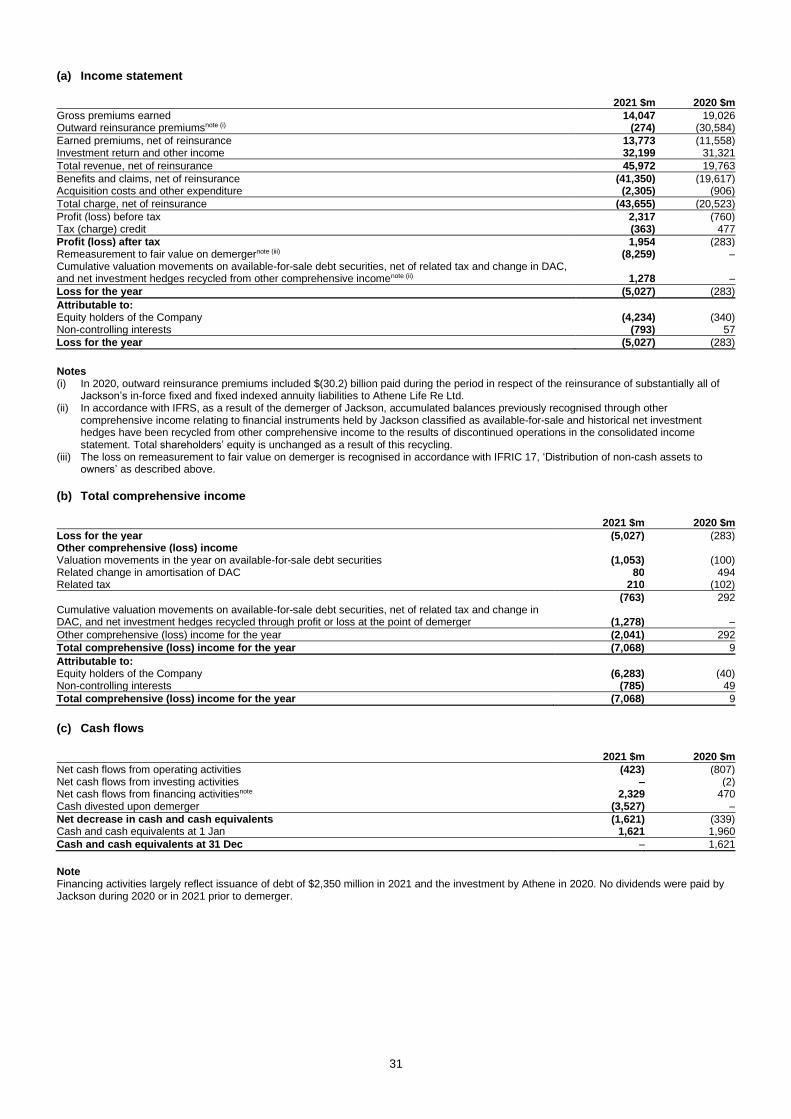
31
(a) Income statement 2021 $m 2020 $m
Gross premiums earned 14,047 19,026 Outward reinsurance premiumsnote (i) (274) (30,584)
Earned premiums, net of reinsurance 13,773 (11,558) Investment return and other income 32,199 31,321
Total revenue, net of reinsurance 45,972 19,763
Benefits and claims, net of reinsurance (41,350) (19,617) Acquisition costs and other expenditure (2,305) (906)
Total charge, net of reinsurance (43,655) (20,523)
Profit (loss) before tax 2,317 (760) Tax (charge) credit (363) 477
Profit (loss) after tax 1,954 (283) Remeasurement to fair value on demergernote (iii) (8,259) – Cumulative valuation movements on available-for-sale debt securities, net of related tax and change in DAC, and net investment hedges recycled from other comprehensive incomenote (ii) 1,278 –
Loss for the year (5,027) (283)
Attributable to: Equity holders of the Company (4,234) (340) Non-controlling interests (793) 57
Loss for the year (5,027) (283)
Notes (i) In 2020, outward reinsurance premiums included $(30.2) billion paid during the period in respect of the reinsurance of substantially all of
Jackson’s in-force fixed and fixed indexed annuity liabilities to Athene Life Re Ltd. (ii) In accordance with IFRS, as a result of the demerger of Jackson, accumulated balances previously recognised through other
comprehensive income relating to financial instruments held by Jackson classified as available-for-sale and historical net investment hedges have been recycled from other comprehensive income to the results of discontinued operations in the consolidated income statement. Total shareholders’ equity is unchanged as a result of this recycling.
(iii) The loss on remeasurement to fair value on demerger is recognised in accordance with IFRIC 17, ‘Distribution of non-cash assets to owners’ as described above.
(b) Total comprehensive income 2021 $m 2020 $m
Loss for the year (5,027) (283) Other comprehensive (loss) income Valuation movements in the year on available-for-sale debt securities (1,053) (100) Related change in amortisation of DAC 80 494 Related tax 210 (102)
(763) 292 Cumulative valuation movements on available-for-sale debt securities, net of related tax and change in DAC, and net investment hedges recycled through profit or loss at the point of demerger (1,278) –
Other comprehensive (loss) income for the year (2,041) 292
Total comprehensive (loss) income for the year (7,068) 9
Attributable to: Equity holders of the Company (6,283) (40) Non-controlling interests (785) 49
Total comprehensive (loss) income for the year (7,068) 9
(c) Cash flows
2021 $m 2020 $m
Net cash flows from operating activities (423) (807) Net cash flows from investing activities – (2) Net cash flows from financing activitiesnote 2,329 470 Cash divested upon demerger (3,527) –
Net decrease in cash and cash equivalents (1,621) (339) Cash and cash equivalents at 1 Jan 1,621 1,960
Cash and cash equivalents at 31 Dec – 1,621
Note Financing activities largely reflect issuance of debt of $2,350 million in 2021 and the investment by Athene in 2020. No dividends were paid by Jackson during 2020 or in 2021 prior to demerger.
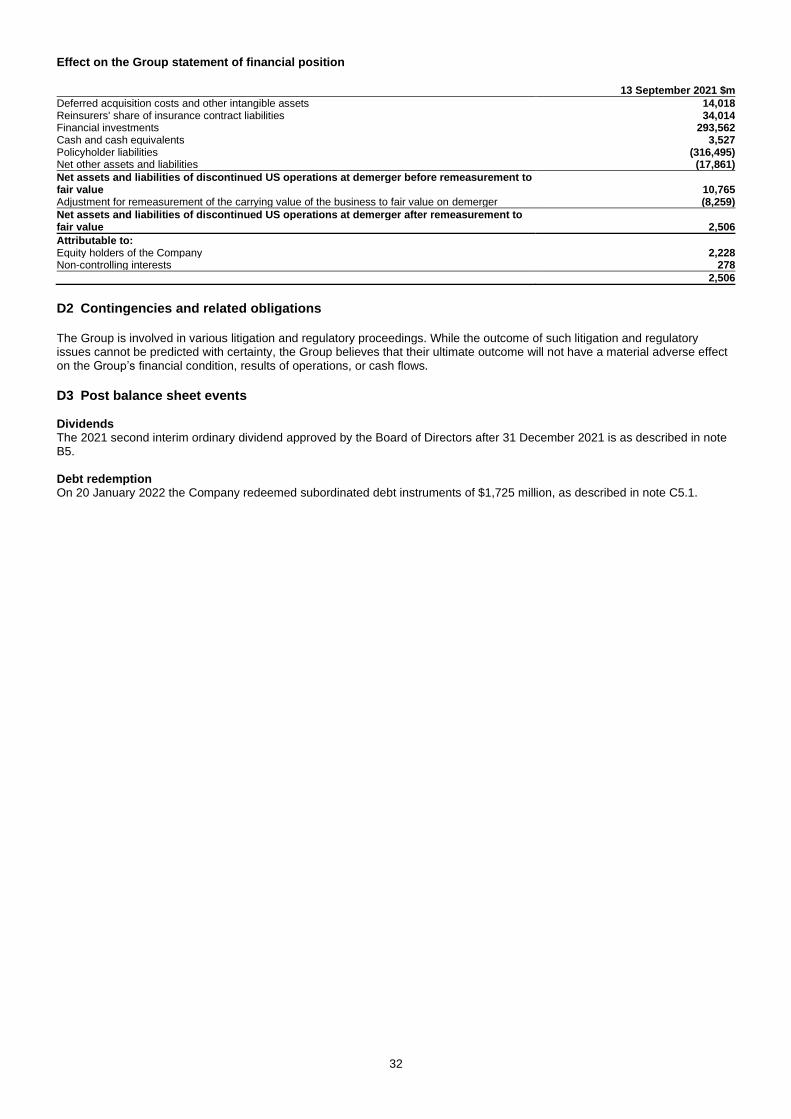
32
Effect on the Group statement of financial position
13 September 2021 $m
Deferred acquisition costs and other intangible assets 14,018 Reinsurers' share of insurance contract liabilities 34,014 Financial investments 293,562 Cash and cash equivalents 3,527 Policyholder liabilities (316,495) Net other assets and liabilities (17,861)
Net assets and liabilities of discontinued US operations at demerger before remeasurement to fair value 10,765 Adjustment for remeasurement of the carrying value of the business to fair value on demerger (8,259)
Net assets and liabilities of discontinued US operations at demerger after remeasurement to fair value 2,506
Attributable to: Equity holders of the Company 2,228 Non-controlling interests 278
2,506
D2 Contingencies and related obligations The Group is involved in various litigation and regulatory proceedings. While the outcome of such litigation and regulatory issues cannot be predicted with certainty, the Group believes that their ultimate outcome will not have a material adverse effect on the Group’s financial condition, results of operations, or cash flows.
D3 Post balance sheet events Dividends The 2021 second interim ordinary dividend approved by the Board of Directors after 31 December 2021 is as described in note B5. Debt redemption On 20 January 2022 the Company redeemed subordinated debt instruments of $1,725 million, as described in note C5.1.
European Embedded Value (EEV) Basis Results
Page Basis of preparation 1 EEV results highlights for continuing operations 2 Movement in Group EEV shareholders’ equity 3 Movement in Group free surplus 5
Notes on the EEV basis results 1 Analysis of new business profit and EEV for long-term business operations 7 2 Analysis of movement in net worth and value of in-force business for long-term business operations 8 3 Sensitivity of results for long-term business operations to alternative economic assumptions 9 4 Expected transfer of value of in-force business and required capital to free surplus for long-term business
operations on a discounted basis 11
5 EEV basis results for other operations 12 6 Net core structural borrowings of shareholder-financed businesses 13 7 Comparison of EEV basis shareholders’ equity with IFRS basis shareholders’ equity 14 8 Methodology and accounting presentation 15 9 Assumptions 19 10 Insurance new business 21 11 Post balance sheet events 21
Description of EEV basis reporting The EEV basis results have been prepared in accordance with the EEV Principles issued by the European Insurance CFO Forum in 2016. All results are stated net of tax and converted using actual exchange rates (AER) unless otherwise stated. AER are actual historical exchange rates for the relevant accounting period. Constant exchange rate (CER) results are calculated by translating prior period results using current period foreign currency exchange rates, ie current period average rates for the income statement and current period closing rates for the balance sheet. Where appropriate, the EEV basis results include the effects of adoption of IFRS Standards. The Directors are responsible for the preparation of the supplementary information in accordance with the EEV Principles. In preparing the EEV basis supplementary information, the Directors have satisfied themselves that the Group remains a going concern. Further information is provided in note A1 of the IFRS financial statements.
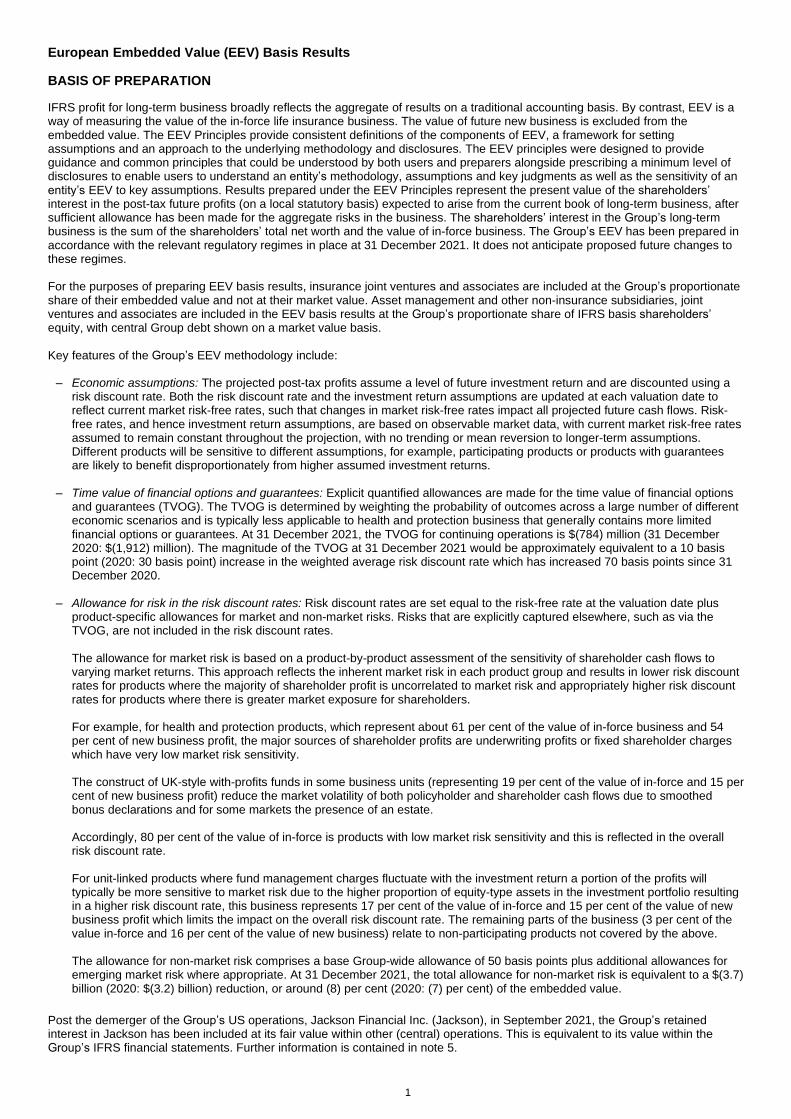
1
European Embedded Value (EEV) Basis Results
BASIS OF PREPARATION
IFRS profit for long-term business broadly reflects the aggregate of results on a traditional accounting basis. By contrast, EEV is a way of measuring the value of the in-force life insurance business. The value of future new business is excluded from the embedded value. The EEV Principles provide consistent definitions of the components of EEV, a framework for setting assumptions and an approach to the underlying methodology and disclosures. The EEV principles were designed to provide guidance and common principles that could be understood by both users and preparers alongside prescribing a minimum level of disclosures to enable users to understand an entity’s methodology, assumptions and key judgments as well as the sensitivity of an entity’s EEV to key assumptions. Results prepared under the EEV Principles represent the present value of the shareholders’ interest in the post-tax future profits (on a local statutory basis) expected to arise from the current book of long-term business, after sufficient allowance has been made for the aggregate risks in the business. The shareholders’ interest in the Group’s long-term business is the sum of the shareholders’ total net worth and the value of in-force business. The Group’s EEV has been prepared in accordance with the relevant regulatory regimes in place at 31 December 2021. It does not anticipate proposed future changes to these regimes. For the purposes of preparing EEV basis results, insurance joint ventures and associates are included at the Group’s proportionate share of their embedded value and not at their market value. Asset management and other non-insurance subsidiaries, joint ventures and associates are included in the EEV basis results at the Group’s proportionate share of IFRS basis shareholders’ equity, with central Group debt shown on a market value basis. Key features of the Group’s EEV methodology include: – Economic assumptions: The projected post-tax profits assume a level of future investment return and are discounted using a
risk discount rate. Both the risk discount rate and the investment return assumptions are updated at each valuation date to reflect current market risk-free rates, such that changes in market risk-free rates impact all projected future cash flows. Risk-free rates, and hence investment return assumptions, are based on observable market data, with current market risk-free rates assumed to remain constant throughout the projection, with no trending or mean reversion to longer-term assumptions. Different products will be sensitive to different assumptions, for example, participating products or products with guarantees are likely to benefit disproportionately from higher assumed investment returns.
– Time value of financial options and guarantees: Explicit quantified allowances are made for the time value of financial options
and guarantees (TVOG). The TVOG is determined by weighting the probability of outcomes across a large number of different economic scenarios and is typically less applicable to health and protection business that generally contains more limited financial options or guarantees. At 31 December 2021, the TVOG for continuing operations is $(784) million (31 December 2020: $(1,912) million). The magnitude of the TVOG at 31 December 2021 would be approximately equivalent to a 10 basis point (2020: 30 basis point) increase in the weighted average risk discount rate which has increased 70 basis points since 31 December 2020.
– Allowance for risk in the risk discount rates: Risk discount rates are set equal to the risk-free rate at the valuation date plus
product-specific allowances for market and non-market risks. Risks that are explicitly captured elsewhere, such as via the TVOG, are not included in the risk discount rates.
The allowance for market risk is based on a product-by-product assessment of the sensitivity of shareholder cash flows to varying market returns. This approach reflects the inherent market risk in each product group and results in lower risk discount rates for products where the majority of shareholder profit is uncorrelated to market risk and appropriately higher risk discount rates for products where there is greater market exposure for shareholders.
For example, for health and protection products, which represent about 61 per cent of the value of in-force business and 54 per cent of new business profit, the major sources of shareholder profits are underwriting profits or fixed shareholder charges which have very low market risk sensitivity. The construct of UK-style with-profits funds in some business units (representing 19 per cent of the value of in-force and 15 per cent of new business profit) reduce the market volatility of both policyholder and shareholder cash flows due to smoothed bonus declarations and for some markets the presence of an estate. Accordingly, 80 per cent of the value of in-force is products with low market risk sensitivity and this is reflected in the overall risk discount rate. For unit-linked products where fund management charges fluctuate with the investment return a portion of the profits will typically be more sensitive to market risk due to the higher proportion of equity-type assets in the investment portfolio resulting in a higher risk discount rate, this business represents 17 per cent of the value of in-force and 15 per cent of the value of new business profit which limits the impact on the overall risk discount rate. The remaining parts of the business (3 per cent of the value in-force and 16 per cent of the value of new business) relate to non-participating products not covered by the above. The allowance for non-market risk comprises a base Group-wide allowance of 50 basis points plus additional allowances for emerging market risk where appropriate. At 31 December 2021, the total allowance for non-market risk is equivalent to a $(3.7) billion (2020: $(3.2) billion) reduction, or around (8) per cent (2020: (7) per cent) of the embedded value.
Post the demerger of the Group’s US operations, Jackson Financial Inc. (Jackson), in September 2021, the Group’s retained interest in Jackson has been included at its fair value within other (central) operations. This is equivalent to its value within the Group’s IFRS financial statements. Further information is contained in note 5.
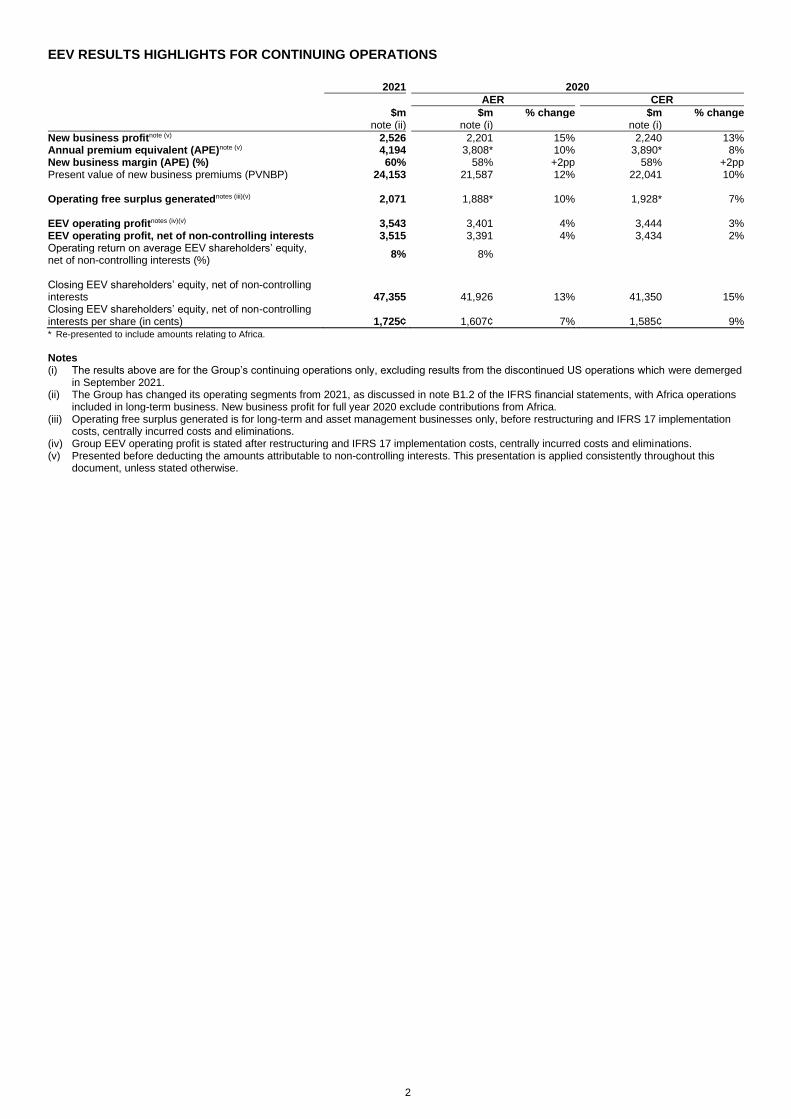
2
EEV RESULTS HIGHLIGHTS FOR CONTINUING OPERATIONS
2021 2020
AER CER
$m $m % change $m % change note (ii) note (i) note (i)
New business profitnote (v) 2,526 2,201 15% 2,240 13% Annual premium equivalent (APE)note (v) 4,194 3,808* 10% 3,890* 8% New business margin (APE) (%) 60% 58% +2pp 58% +2pp Present value of new business premiums (PVNBP) 24,153 21,587 12% 22,041 10% Operating free surplus generatednotes (iii)(v) 2,071 1,888* 10% 1,928* 7% EEV operating profitnotes (iv)(v) 3,543 3,401 4% 3,444 3% EEV operating profit, net of non-controlling interests 3,515 3,391 4% 3,434 2% Operating return on average EEV shareholders’ equity, net of non-controlling interests (%)
8%
8%
Closing EEV shareholders’ equity, net of non-controlling interests 47,355 41,926 13% 41,350 15% Closing EEV shareholders’ equity, net of non-controlling interests per share (in cents) 1,725¢ 1,607¢ 7% 1,585¢ 9% * Re-presented to include amounts relating to Africa.
Notes (i) The results above are for the Group’s continuing operations only, excluding results from the discontinued US operations which were demerged
in September 2021. (ii) The Group has changed its operating segments from 2021, as discussed in note B1.2 of the IFRS financial statements, with Africa operations
included in long-term business. New business profit for full year 2020 exclude contributions from Africa. (iii) Operating free surplus generated is for long-term and asset management businesses only, before restructuring and IFRS 17 implementation
costs, centrally incurred costs and eliminations. (iv) Group EEV operating profit is stated after restructuring and IFRS 17 implementation costs, centrally incurred costs and eliminations. (v) Presented before deducting the amounts attributable to non-controlling interests. This presentation is applied consistently throughout this
document, unless stated otherwise.
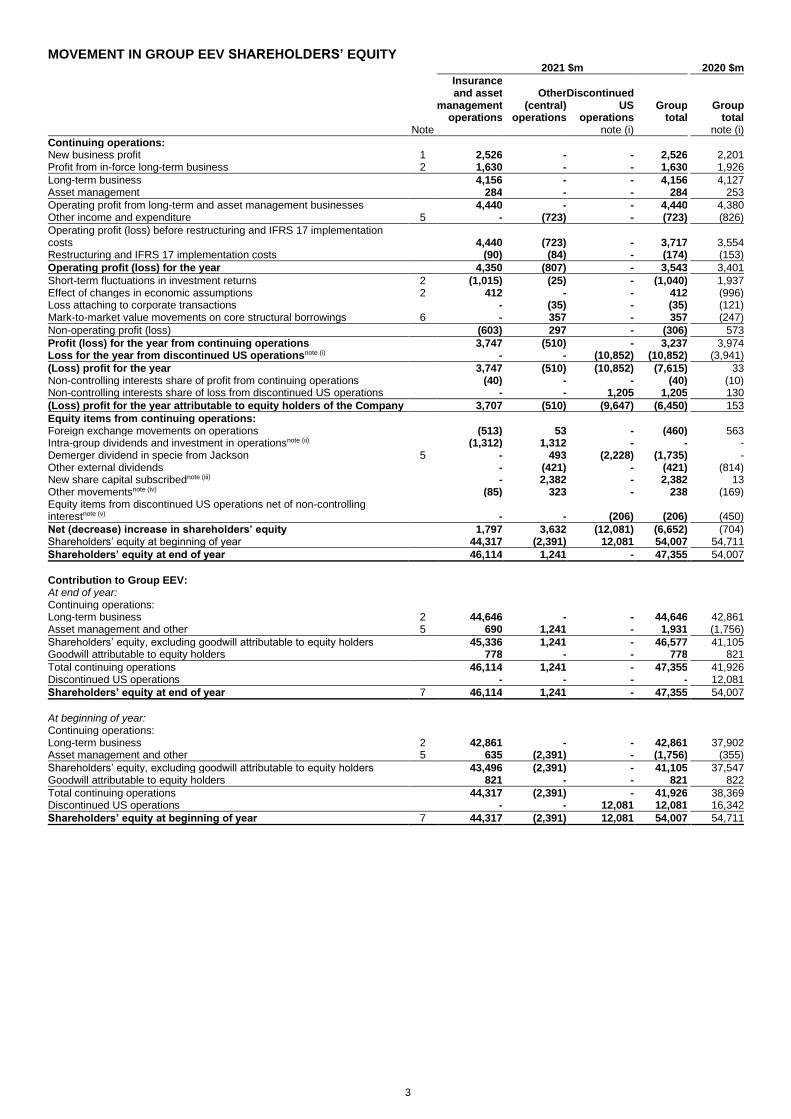
3
MOVEMENT IN GROUP EEV SHAREHOLDERS’ EQUITY 2021 $m 2020 $m
Insurance and asset
management operations
Other (central)
operations
Discontinued US
operations Group
total Group
total Note note (i) note (i)
Continuing operations: New business profit 1 2,526 - - 2,526 2,201 Profit from in-force long-term business 2 1,630 - - 1,630 1,926
Long-term business 4,156 - - 4,156 4,127 Asset management 284 - - 284 253
Operating profit from long-term and asset management businesses 4,440 - - 4,440 4,380 Other income and expenditure 5 - (723) - (723) (826)
Operating profit (loss) before restructuring and IFRS 17 implementation costs 4,440 (723) - 3,717 3,554 Restructuring and IFRS 17 implementation costs (90) (84) - (174) (153)
Operating profit (loss) for the year 4,350 (807) - 3,543 3,401
Short-term fluctuations in investment returns 2 (1,015) (25) - (1,040) 1,937 Effect of changes in economic assumptions 2 412 - - 412 (996) Loss attaching to corporate transactions - (35) - (35) (121) Mark-to-market value movements on core structural borrowings 6 - 357 - 357 (247)
Non-operating profit (loss) (603) 297 - (306) 573
Profit (loss) for the year from continuing operations 3,747 (510) - 3,237 3,974 Loss for the year from discontinued US operationsnote (i) - - (10,852) (10,852) (3,941)
(Loss) profit for the year 3,747 (510) (10,852) (7,615) 33 Non-controlling interests share of profit from continuing operations (40) - - (40) (10) Non-controlling interests share of loss from discontinued US operations - - 1,205 1,205 130
(Loss) profit for the year attributable to equity holders of the Company 3,707 (510) (9,647) (6,450) 153
Equity items from continuing operations: Foreign exchange movements on operations (513) 53 - (460) 563 Intra-group dividends and investment in operationsnote (ii) (1,312) 1,312 - - - Demerger dividend in specie from Jackson 5 - 493 (2,228) (1,735) - Other external dividends - (421) - (421) (814) New share capital subscribednote (iii) - 2,382 - 2,382 13 Other movementsnote (iv) (85) 323 - 238 (169) Equity items from discontinued US operations net of non-controlling interestnote (v) - - (206) (206) (450)
Net (decrease) increase in shareholders’ equity 1,797 3,632 (12,081) (6,652) (704) Shareholders’ equity at beginning of year 44,317 (2,391) 12,081 54,007 54,711
Shareholders’ equity at end of year 46,114 1,241 - 47,355 54,007
Contribution to Group EEV: At end of year: Continuing operations: Long-term business 2 44,646 - - 44,646 42,861 Asset management and other 5 690 1,241 - 1,931 (1,756)
Shareholders’ equity, excluding goodwill attributable to equity holders 45,336 1,241 - 46,577 41,105 Goodwill attributable to equity holders 778 - - 778 821
Total continuing operations 46,114 1,241 - 47,355 41,926 Discontinued US operations - - - - 12,081
Shareholders’ equity at end of year 7 46,114 1,241 - 47,355 54,007
At beginning of year: Continuing operations: Long-term business 2 42,861 - - 42,861 37,902 Asset management and other 5 635 (2,391) - (1,756) (355)
Shareholders’ equity, excluding goodwill attributable to equity holders 43,496 (2,391) - 41,105 37,547 Goodwill attributable to equity holders 821 - - 821 822
Total continuing operations 44,317 (2,391) - 41,926 38,369 Discontinued US operations - - 12,081 12,081 16,342
Shareholders’ equity at beginning of year 7 44,317 (2,391) 12,081 54,007 54,711

4
2021 2020
EEV shareholders’ equity per share (in cents)note (vi)
Insurance and asset
management operations
Other (central)
operations
Discontinued US
operations Group
total Group
total note (i) note (i)
At end of year: Continuing operations: Based on shareholders’ equity, net of goodwill attributable to equity holders 1,651¢ 45¢ - 1,696¢ 1,576¢ Based on shareholders’ equity at end of year 1,680¢ 45¢ - 1,725¢ 1,607¢ Discontinued US operations - - - - 463¢
Group total 1,680¢ 45¢ - 1,725¢ 2,070¢
At beginning of year: Continuing operations: Based on shareholders’ equity, net of goodwill attributable to equity holders 1,668¢ (92)¢ - 1,576¢ 1,444¢ Based on shareholders’ equity at beginning of year 1,699¢ (92)¢ - 1,607¢ 1,475¢ Discontinued US operations - - 463¢ 463¢ 628¢
Group total 1,699¢ (92)¢ 463¢ 2,070¢ 2,103¢
2021 2020
EEV basis basic earnings per share in centsnote (vii)
Before non-controlling
interests
After non- controlling
interests
Basic earnings
per share
Basic earnings
per share $m $m cents cents
Based on operating profit from continuing operations after non-controlling interests 3,543 3,515 133.8¢ 130.6¢ Based on profit for the year attributable to equity holders of the Company: From continuing operations 3,237 3,197 121.7¢ 152.6¢ From discontinued US operations (10,852) (9,647) (367.1)¢ (146.7)¢
Group total (7,615) (6,450) (245.4)¢ 5.9¢
Notes (i) Discontinued operations represent the Group’s US business, Jackson, which was demerged in September 2021. The 2020 comparative
results have been re-presented to show these operations as discontinued accordingly. The retained interest in Jackson is measured for EEV purposes at fair value, consistent with IFRS, and is included in other (central) operations post the demerger. Further information is provided in note 5.
(ii) Intra-group dividends represent dividends that have been declared in the year. Investment in operations reflects movements in share capital. (iii) New share capital subscribed primarily represents the issuance of new ordinary shares on the Hong Kong Stock Exchange in October 2021 as
described in note C8 of the IFRS financial statements. (iv) Other movements include reserve movements in respect of valuation movements on the retained interest in Jackson, share-based payments,
treasury shares and intra-group transfers between operations that have no overall effect on the Group’s shareholders’ equity. (v) Equity items from discontinued US operations include mark-to-market value movements on assets backing net worth of $(206) million for 2021
(2020: $552 million). In addition, 2020 included a charge of $(1,112) million relating to the day one impact of the equity investment by Athene into the US business in July 2020.
(vi) Based on the number of issued shares at 31 December 2021 of 2,746 million shares (31 December 2020: 2,609 million shares). (vii) Based on weighted average number of issued shares of 2,628 million shares in 2021 (2020: 2,597 million shares).

5
MOVEMENT IN GROUP FREE SURPLUS Operating free surplus generation is the financial metric we use to measure the internal cash generation of our business operations and for our life operations is generally based on (with adjustments) the capital regimes that apply locally in the various jurisdictions in which the Group operates. It represents amounts emerging from the in-force business during the year, net of amounts reinvested in writing new business. For asset management businesses, it equates to post-tax adjusted operating profit for the year. For long-term business, free surplus is generally based on (with adjustments) the excess of the regulatory basis net assets for EEV reporting purposes (total net worth) over the capital required to support the covered business. In general, assets deemed to be inadmissible on a local regulatory basis are included in total net worth where considered recognisable on an EEV basis. For asset management and other non-insurance operations (including the Group’s central operations), free surplus is taken to be IFRS basis shareholders’ equity, net of goodwill attributable to shareholders, with central Group debt recorded as free surplus to the extent that it is classified as capital resources under the Group’s capital regime. Following the application of the Group-wide Supervision (GWS) Framework, both subordinated and senior debt are treated as capital for the purposes of free surplus at 31 December 2021. A reconciliation of EEV free surplus to the GWS shareholder capital surplus over group minimum capital requirements is set out in note I(i) of the additional financial information. Further information is provided in note 5 and note 6.
2021 $m 2020 $m
Insurance and asset
management operations
Other (central)
operations
Discontinued US
operations Group
total Group
total Note note (i) note (i)
Continuing operations: Expected transfer from in-force business 2,340 - - 2,340 1,878 Expected return on existing free surplus 157 - - 157 101 Changes in operating assumptions and experience variances (173) - - (173) 215
Operating free surplus generated from in-force long-term business 2 2,324 - - 2,324 2,194 Investment in new businessnote (ii) 2 (537) - - (537) (559)
Long-term business 1,787 - - 1,787 1,635 Asset management 284 - - 284 253
Operating free surplus generated from long-term and asset management businesses 2,071 - - 2,071 1,888 Other income and expenditure 5 - (723) - (723) (826)
Operating free surplus generated before restructuring and IFRS 17 implementation costs 2,071 (723) - 1,348 1,062 Restructuring and IFRS 17 implementation costs (85) (84) - (169) (147)
Operating free surplus generated 1,986 (807) - 1,179 915 Non-operating free surplus generatednote (iii) 142 (60) - 82 316
Free surplus generated from continuing operations 2,128 (867) - 1,261 1,231 Free surplus generated from discontinued US operationsnote (i) - - 770 770 (998)
Free surplus generated for the year 2,128 (867) 770 2,031 233
Equity items from continuing operations: Net cash flows paid to parent companynote (iv) (1,451) 1,451 - - - Demerger dividend in specie from Jackson 5 - 493 (2,228) (1,735) - Other external dividends - (421) - (421) (814) Foreign exchange movements on operations (43) 53 - 10 136 New share capital subscribednote (v) - 2,382 - 2,382 13 Other movements and timing differences 54 184 - 238 (171) Treatment of grandfathered debt instruments under the GWS Framework 5 - 1,995 - 1,995 - Net subordinated debt issuance/redemption 5 - (232) - (232) - Equity items from discontinued US operationsnote (vi) - - (206) (206) 751
Net movement in free surplus before amounts attributable to non-controlling interests 688 5,038 (1,664) 4,062 148 Change in amounts attributable to non-controlling interests (21) - (85) (106) 209
Balance at beginning of year 5,983 2,361 1,749 10,093 9,736 Balance at end of yearnote (vii) 6,650 7,399 - 14,049 10,093
Representing: Free surplus excluding distribution rights and other intangibles 5,651 4,432 - 10,083 6,068 Distribution rights and other intangibles 999 2,967 - 3,966 4,025
Balance at end of year 6,650 7,399 - 14,049 10,093
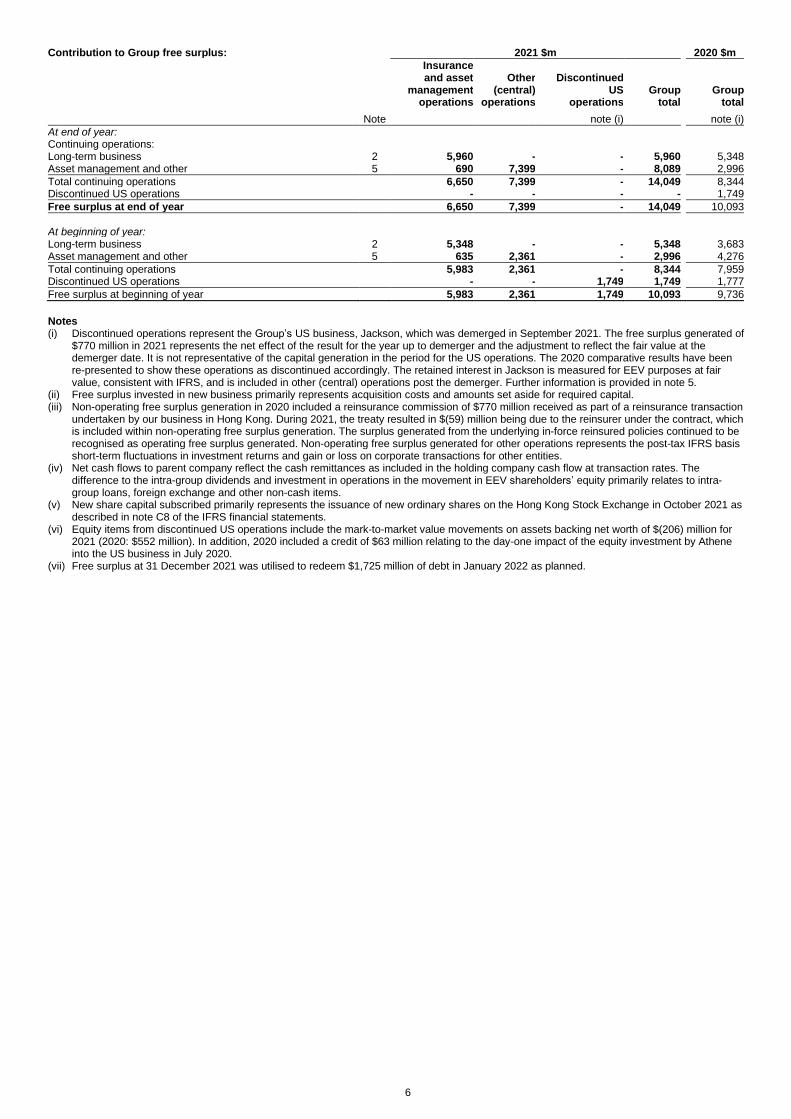
6
Contribution to Group free surplus: 2021 $m 2020 $m
Insurance and asset
management operations
Other (central)
operations
Discontinued US
operations Group
total Group
total
Note note (i) note (i)
At end of year: Continuing operations: Long-term business 2 5,960 - - 5,960 5,348 Asset management and other 5 690 7,399 - 8,089 2,996
Total continuing operations 6,650 7,399 - 14,049 8,344 Discontinued US operations - - - - 1,749
Free surplus at end of year 6,650 7,399 - 14,049 10,093
At beginning of year: Long-term business 2 5,348 - - 5,348 3,683 Asset management and other 5 635 2,361 - 2,996 4,276
Total continuing operations 5,983 2,361 - 8,344 7,959 Discontinued US operations - - 1,749 1,749 1,777
Free surplus at beginning of year 5,983 2,361 1,749 10,093 9,736
Notes (i) Discontinued operations represent the Group’s US business, Jackson, which was demerged in September 2021. The free surplus generated of
$770 million in 2021 represents the net effect of the result for the year up to demerger and the adjustment to reflect the fair value at the demerger date. It is not representative of the capital generation in the period for the US operations. The 2020 comparative results have been re-presented to show these operations as discontinued accordingly. The retained interest in Jackson is measured for EEV purposes at fair value, consistent with IFRS, and is included in other (central) operations post the demerger. Further information is provided in note 5.
(ii) Free surplus invested in new business primarily represents acquisition costs and amounts set aside for required capital. (iii) Non-operating free surplus generation in 2020 included a reinsurance commission of $770 million received as part of a reinsurance transaction
undertaken by our business in Hong Kong. During 2021, the treaty resulted in $(59) million being due to the reinsurer under the contract, which is included within non-operating free surplus generation. The surplus generated from the underlying in-force reinsured policies continued to be recognised as operating free surplus generated. Non-operating free surplus generated for other operations represents the post-tax IFRS basis short-term fluctuations in investment returns and gain or loss on corporate transactions for other entities.
(iv) Net cash flows to parent company reflect the cash remittances as included in the holding company cash flow at transaction rates. The difference to the intra-group dividends and investment in operations in the movement in EEV shareholders’ equity primarily relates to intra-group loans, foreign exchange and other non-cash items.
(v) New share capital subscribed primarily represents the issuance of new ordinary shares on the Hong Kong Stock Exchange in October 2021 as described in note C8 of the IFRS financial statements.
(vi) Equity items from discontinued US operations include the mark-to-market value movements on assets backing net worth of $(206) million for 2021 (2020: $552 million). In addition, 2020 included a credit of $63 million relating to the day-one impact of the equity investment by Athene into the US business in July 2020.
(vii) Free surplus at 31 December 2021 was utilised to redeem $1,725 million of debt in January 2022 as planned.

7
NOTES ON THE EEV BASIS RESULTS
1 Analysis of new business profit and EEV for long-term business operations
2021
New business
profit (NBP)note
Annual premium
equivalent (APE)
Present value of new
business premiums
(PVNBP)
New business
margin (APE)
New business
margin (PVNBP)
Closing EEV shareholders’
equity, excluding
goodwill $m $m $m % % $m
CPL 352 776 3,761 45% 9% 3,114 Hong Kong 736 550 4,847 134% 15% 21,460 Indonesia 125 252 1,067 50% 12% 2,237 Malaysia 232 461 2,137 50% 11% 3,841 Singapore 523 743 6,214 70% 8% 7,732 Growth markets and other 558 1,412 6,127 40% 9% 6,262
Total continuing long-term operations 2,526 4,194 24,153 60% 10% 44,646
2020 (AER)
New business
profit (NBP)note
Annual premium
equivalent (APE)
Present value of new
business premiums
(PVNBP)
New business margin
(APE)
New business margin
(PVNBP)
Closing EEV shareholders’
equity, excluding
goodwill $m $m $m % % $m
CPL 269 582 2,705 46% 10% 2,798 Hong Kong 787 758 5,095 104% 15% 20,156 Indonesia 155 267 1,154 58% 13% 2,630 Malaysia 209 346 2,023 60% 10% 4,142 Singapore 341 610 5,354 56% 6% 8,160 Growth markets and other 440 1,245* 5,256 35% 8% 4,975*
Total continuing long-term operations 2,201 3,808 21,587 58% 10% 42,861
* Re-presented to include amounts relating to Africa. 2020 (CER)
New business
profit (NBP)note
Annual premium
equivalent (APE)
Present value of new
business premiums
(PVNBP)
New business margin
(APE)
New business margin
(PVNBP)
Closing EEV shareholders’
equity, excluding
goodwill $m $m $m % % $m
CPL 288 623 2,894 46% 10% 2,871 Hong Kong 786 757 5,083 104% 15% 20,046 Indonesia 158 271 1,174 58% 13% 2,592 Malaysia 212 351 2,051 60% 10% 3,999 Singapore 350 626 5,495 56% 6% 8,000 Growth markets and other 446 1,262* 5,344 35% 8% 4,852*
Total continuing long-term operations 2,240 3,890 22,041 58% 10% 42,360
* Re-presented to include amounts relating to Africa.
Note The movement in new business profit from continuing long-term operations is analysed as follows:
$m
2020 new business profit 2,201 Foreign exchange movement 39 Sales volume 175 Effect of changes in interest rates and other economic assumptions (59) Business mix, product mix and other items 170
2021 new business profit 2,526
EEV new business profit reflects the value of expected future profits from the new business sold in the year, and demonstrates the business written in the year is expected to be profitable. Information on the Group’s operating experience variances on the in-force business is shown in note 2.
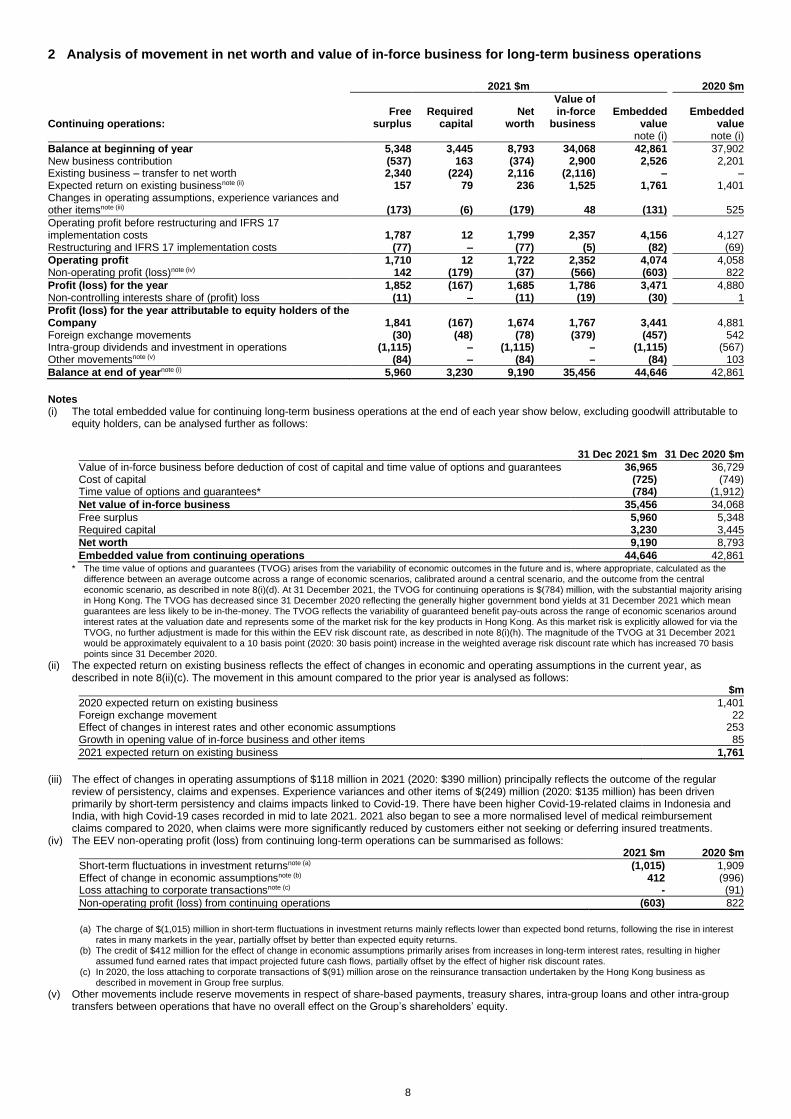
8
2 Analysis of movement in net worth and value of in-force business for long-term business operations
2021 $m 2020 $m
Continuing operations: Free
surplus Required
capital Net
worth
Value of in-force
business Embedded
value Embedded
value note (i) note (i)
Balance at beginning of year 5,348 3,445 8,793 34,068 42,861 37,902 New business contribution (537) 163 (374) 2,900 2,526 2,201 Existing business – transfer to net worth 2,340 (224) 2,116 (2,116) – – Expected return on existing businessnote (ii) 157 79 236 1,525 1,761 1,401 Changes in operating assumptions, experience variances and other itemsnote (iii) (173) (6) (179) 48 (131) 525
Operating profit before restructuring and IFRS 17 implementation costs 1,787 12 1,799 2,357 4,156 4,127 Restructuring and IFRS 17 implementation costs (77) – (77) (5) (82) (69)
Operating profit 1,710 12 1,722 2,352 4,074 4,058 Non-operating profit (loss)note (iv) 142 (179) (37) (566) (603) 822
Profit (loss) for the year 1,852 (167) 1,685 1,786 3,471 4,880 Non-controlling interests share of (profit) loss (11) – (11) (19) (30) 1
Profit (loss) for the year attributable to equity holders of the Company 1,841 (167) 1,674 1,767 3,441 4,881 Foreign exchange movements (30) (48) (78) (379) (457) 542 Intra-group dividends and investment in operations (1,115) – (1,115) – (1,115) (567) Other movementsnote (v) (84) – (84) – (84) 103
Balance at end of yearnote (i) 5,960 3,230 9,190 35,456 44,646 42,861
Notes (i) The total embedded value for continuing long-term business operations at the end of each year show below, excluding goodwill attributable to
equity holders, can be analysed further as follows:
31 Dec 2021 $m 31 Dec 2020 $m
Value of in-force business before deduction of cost of capital and time value of options and guarantees 36,965 36,729 Cost of capital (725) (749) Time value of options and guarantees* (784) (1,912)
Net value of in-force business 35,456 34,068
Free surplus 5,960 5,348 Required capital 3,230 3,445
Net worth 9,190 8,793
Embedded value from continuing operations 44,646 42,861 * The time value of options and guarantees (TVOG) arises from the variability of economic outcomes in the future and is, where appropriate, calculated as the
difference between an average outcome across a range of economic scenarios, calibrated around a central scenario, and the outcome from the central economic scenario, as described in note 8(i)(d). At 31 December 2021, the TVOG for continuing operations is $(784) million, with the substantial majority arising in Hong Kong. The TVOG has decreased since 31 December 2020 reflecting the generally higher government bond yields at 31 December 2021 which mean guarantees are less likely to be in-the-money. The TVOG reflects the variability of guaranteed benefit pay-outs across the range of economic scenarios around interest rates at the valuation date and represents some of the market risk for the key products in Hong Kong. As this market risk is explicitly allowed for via the TVOG, no further adjustment is made for this within the EEV risk discount rate, as described in note 8(i)(h). The magnitude of the TVOG at 31 December 2021 would be approximately equivalent to a 10 basis point (2020: 30 basis point) increase in the weighted average risk discount rate which has increased 70 basis points since 31 December 2020.
(ii) The expected return on existing business reflects the effect of changes in economic and operating assumptions in the current year, as described in note 8(ii)(c). The movement in this amount compared to the prior year is analysed as follows:
$m
2020 expected return on existing business 1,401 Foreign exchange movement 22 Effect of changes in interest rates and other economic assumptions 253 Growth in opening value of in-force business and other items 85
2021 expected return on existing business 1,761
(iii) The effect of changes in operating assumptions of $118 million in 2021 (2020: $390 million) principally reflects the outcome of the regular
review of persistency, claims and expenses. Experience variances and other items of $(249) million (2020: $135 million) has been driven primarily by short-term persistency and claims impacts linked to Covid-19. There have been higher Covid-19-related claims in Indonesia and India, with high Covid-19 cases recorded in mid to late 2021. 2021 also began to see a more normalised level of medical reimbursement claims compared to 2020, when claims were more significantly reduced by customers either not seeking or deferring insured treatments.
(iv) The EEV non-operating profit (loss) from continuing long-term operations can be summarised as follows: 2021 $m 2020 $m
Short-term fluctuations in investment returnsnote (a) (1,015) 1,909 Effect of change in economic assumptionsnote (b) 412 (996) Loss attaching to corporate transactionsnote (c) - (91)
Non-operating profit (loss) from continuing operations (603) 822
(a) The charge of $(1,015) million in short-term fluctuations in investment returns mainly reflects lower than expected bond returns, following the rise in interest
rates in many markets in the year, partially offset by better than expected equity returns. (b) The credit of $412 million for the effect of change in economic assumptions primarily arises from increases in long-term interest rates, resulting in higher
assumed fund earned rates that impact projected future cash flows, partially offset by the effect of higher risk discount rates. (c) In 2020, the loss attaching to corporate transactions of $(91) million arose on the reinsurance transaction undertaken by the Hong Kong business as
described in movement in Group free surplus.
(v) Other movements include reserve movements in respect of share-based payments, treasury shares, intra-group loans and other intra-group transfers between operations that have no overall effect on the Group’s shareholders’ equity.

9
3 Sensitivity of results for long-term business operations to alternative economic assumptions
(i) Sensitivity analysis – economic assumptions The tables below show the sensitivity of the embedded value and the new business profit for continuing long-term business operations to:
– 1 per cent and 2 per cent increases in interest rates and 0.5 per cent decrease in interest rates. This allows for
consequential changes in the assumed investment returns for all asset classes, market values of fixed interest assets, local statutory reserves, capital requirements and risk discount rates (but excludes changes in the allowance for market risk);
– 1 per cent rise in equity and property yields; – 1 per cent and 2 per cent increases in the risk discount rates. The main driver for changes in the risk discount rates from
period to period is changes in interest rates, the impact of which is expected to be partially offset by a corresponding change in assumed investment returns, the effect of which is not included in the risk discount rate sensitivities. The impact of higher investment returns can be approximated as the difference between the sensitivity to increases in interest rates and the sensitivity to increases in risk discount rates;
– 20 per cent fall in the market value of equity and property assets (embedded value only); and – Holding the group minimum capital requirements under the GWS Framework in contrast to EEV basis required capital
(embedded value only). This reduces the level of capital and therefore the level of charge deducted from the embedded value for the cost of locked-in required capital. This has the effect of increasing EEV.
The sensitivities shown below are for the impact of instantaneous and permanent changes (with no trending or mean reversion) on the embedded value of long-term business operations and include the combined effect on the value of in-force business and net assets (including derivatives) held at the valuation dates indicated. The results only allow for limited management actions, such as changes to future policyholder bonuses, where applicable. If such economic conditions persisted, the financial impacts may differ to the instantaneous impacts shown below. In this case, management could also take additional actions to help mitigate the impact of these stresses. No change in the mix of the asset portfolio held at the valuation date is assumed when calculating sensitivities, while changes in the market value of those assets are recognised. The sensitivity impacts are expected to be non-linear. To aid understanding of this non-linearity, impacts of both a 1 per cent and 2 per cent increase to interest rates and risk discount rates are shown. If the changes in assumptions shown in the sensitivities were to occur, the effects shown below would be recorded within two components of the profit analysis for the following period, namely the effect of changes in economic assumptions and short-term fluctuations in investment returns. In addition to the sensitivity effects shown below, the other components of the profit for the following period would be calculated by reference to the altered assumptions, for example new business profit and expected return on existing business.
New business profit from continuing long-term business 2021* $m 2020 $m
New business profit 2,526 2,201
Interest rates and consequential effects – 2% increase 88 107 Interest rates and consequential effects – 1% increase 70 78 Interest rates and consequential effects – 0.5% decrease (64) (98) Equity/property yields – 1% rise 155 140 Risk discount rates – 2% increase (653) (626) Risk discount rates – 1% increase (380) (372) * 2021 new business profit includes Africa operations following the change in the Group’s operating segments in 2021. In the context of the Group, Africa’s results are
not materially impacted by the above sensitivities.

10
Embedded value of continuing long-term business 31 Dec 2021* $m 31 Dec 2020 $m
Embedded value 44,646 42,861
Interest rates and consequential effects – 2% increase (4,782) (3,589) Interest rates and consequential effects – 1% increase (2,228) (1,429) Interest rates and consequential effects – 0.5% decrease 223 177 Equity/property yields – 1% rise 1,909 1,949 Equity/property market values – 20% fall (1,959) (1,912) Risk discount rates – 2% increase (9,717) (9,225) Risk discount rates – 1% increase (5,443) (5,286) Group minimum capital requirements 136 150 * Embedded value includes Africa operations following the change in the Group's operating segments in 2021. In the context of the Group, Africa’s results are not
materially impacted by the above sensitivities.
Overall, the new business profit sensitivities at 31 December 2021 are in line with those at 31 December 2020. For a 1 per cent increase in assumed interest rates, the $(2,228) million negative effect comprises a $(5,443) million negative impact of increasing the risk discount rate by 1 per cent, partially offset by a $3,215 million benefit from assuming 1 per cent higher investment returns. Similarly, for a 2 per cent increase in assumed interest rates the $(4,782) million negative effect comprises a $(9,717) million negative impact of increasing the risk discount rates by 2 per cent, partially offset by a $4,935 million benefit from higher assumed investment returns. Finally, for a 0.5 per cent decrease in assumed interest rates, there would be a $223 million positive effect reflecting the benefit of a 0.5 per cent reduction in risk discount rates being partially offset by lower assumed investment returns. These offsetting impacts are sensitive to economics and the net impact can therefore change from period to period depending on the current level of interest rates. At the current and higher interest rates at 31 December 2021, there is a reduced benefit from further increases in investment returns compared to 31 December 2020, as guarantees written to policyholders are less likely to be in-the-money at current levels. This contrasts with the adverse effect of higher risk discount rates which tends to be more stable from period to period, all other things being equal. In order to illustrate the impact of varying specific economic assumptions, all other assumptions are held constant in the sensitivities above and therefore, the actual changes in embedded value were these economic effects to materialise may differ from the sensitivities shown. For example, market risk allowances would likely be increased within the risk discount rate if interest rates increased by 1 per cent, leading to a reduction of $(2,583) million (compared with the $(2,228) million impact shown above). However, if interest rates actually decreased by 0.5 per cent, it would lead to a $409 million increase (compared with the $223 million increase shown above). (ii) Sensitivity analysis – non-economic assumptions The tables below show the sensitivity of the embedded value and the new business profit for continuing long-term business operations to:
– 10 per cent proportionate decrease in maintenance expenses (for example, a 10 per cent sensitivity on a base assumption of $10 per annum would represent an expense assumption of $9 per annum);
– 10 per cent proportionate decrease in lapse rates (for example, a 10 per cent sensitivity on a base assumption of 5.0 per cent would represent a lapse rate of 4.5 per cent per annum); and
– 5 per cent proportionate decrease in base mortality (ie increased longevity) and morbidity rates.
New business profit from long-term business 2021* $m 2020 $m
New business profit 2,526 2,201
Maintenance expenses – 10% decrease 60 47 Lapse rates – 10% decrease 190 156 Mortality and morbidity – 5% decrease 143 106 * 2021 new business profit includes Africa operations following the change in the Group’s operating segments in 2021. In the context of the Group, Africa’s results are
not materially impacted by the above sensitivities.
Embedded value of long-term business 31 Dec 2021* $m 31 Dec 2020 $m
Embedded value 44,646 42,861
Maintenance expenses – 10% decrease 455 476 Lapse rates – 10% decrease 1,901 1,774 Mortality and morbidity – 5% decrease 1,596 1,689 * Embedded value includes Africa operations following the change in the Group's operating segments in 2021. In the context of the Group, Africa’s results are not
materially impacted by the above sensitivities.
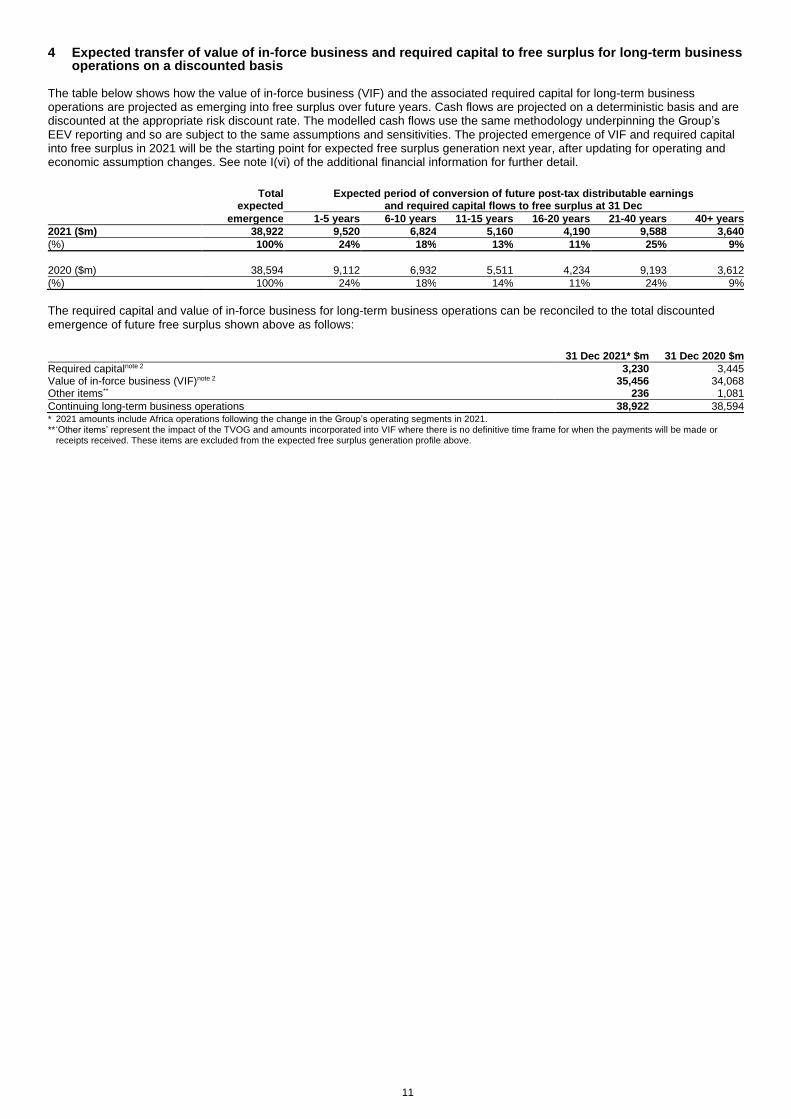
11
4 Expected transfer of value of in-force business and required capital to free surplus for long-term business operations on a discounted basis
The table below shows how the value of in-force business (VIF) and the associated required capital for long-term business operations are projected as emerging into free surplus over future years. Cash flows are projected on a deterministic basis and are discounted at the appropriate risk discount rate. The modelled cash flows use the same methodology underpinning the Group’s EEV reporting and so are subject to the same assumptions and sensitivities. The projected emergence of VIF and required capital into free surplus in 2021 will be the starting point for expected free surplus generation next year, after updating for operating and economic assumption changes. See note I(vi) of the additional financial information for further detail.
Total
expected Expected period of conversion of future post-tax distributable earnings
and required capital flows to free surplus at 31 Dec
emergence 1-5 years 6-10 years 11-15 years 16-20 years 21-40 years 40+ years
2021 ($m) 38,922 9,520 6,824 5,160 4,190 9,588 3,640
(%) 100% 24% 18% 13% 11% 25% 9%
2020 ($m) 38,594 9,112 6,932 5,511 4,234 9,193 3,612
(%) 100% 24% 18% 14% 11% 24% 9%
The required capital and value of in-force business for long-term business operations can be reconciled to the total discounted emergence of future free surplus shown above as follows:
31 Dec 2021* $m 31 Dec 2020 $m
Required capitalnote 2 3,230 3,445 Value of in-force business (VIF)note 2 35,456 34,068 Other items** 236 1,081
Continuing long-term business operations 38,922 38,594 * 2021 amounts include Africa operations following the change in the Group’s operating segments in 2021. ** ‘Other items’ represent the impact of the TVOG and amounts incorporated into VIF where there is no definitive time frame for when the payments will be made or
receipts received. These items are excluded from the expected free surplus generation profile above.
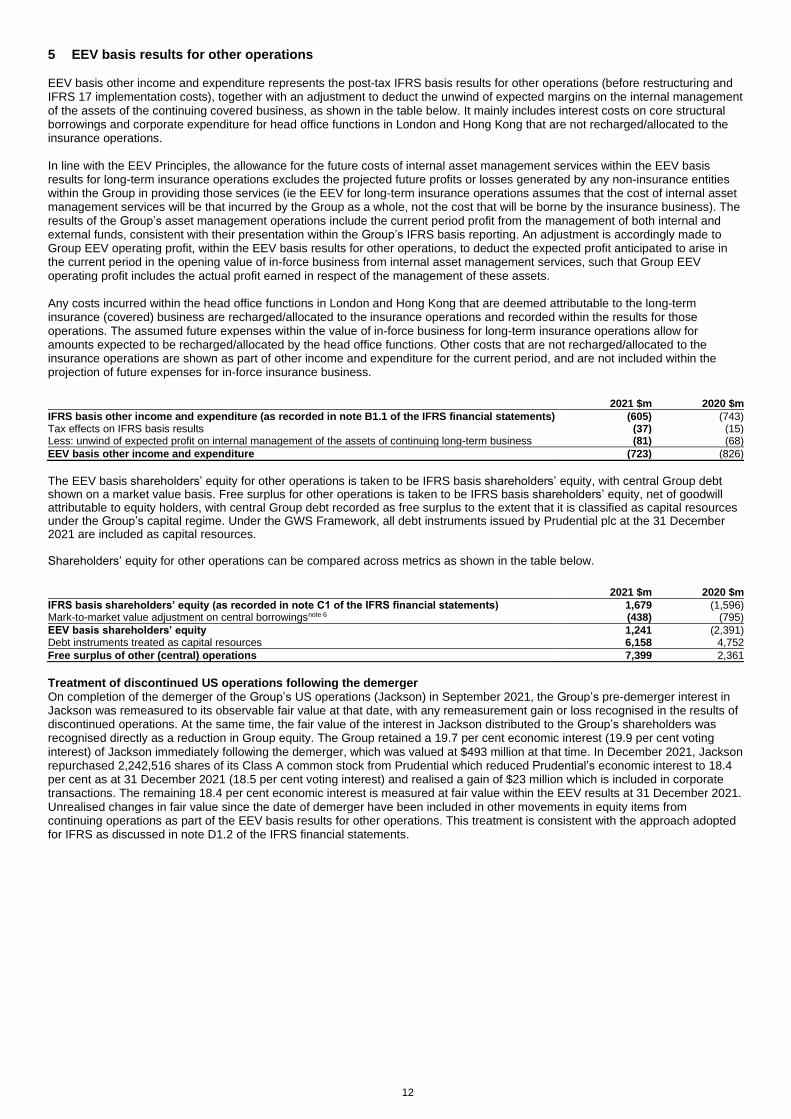
12
5 EEV basis results for other operations EEV basis other income and expenditure represents the post-tax IFRS basis results for other operations (before restructuring and IFRS 17 implementation costs), together with an adjustment to deduct the unwind of expected margins on the internal management of the assets of the continuing covered business, as shown in the table below. It mainly includes interest costs on core structural borrowings and corporate expenditure for head office functions in London and Hong Kong that are not recharged/allocated to the insurance operations. In line with the EEV Principles, the allowance for the future costs of internal asset management services within the EEV basis results for long-term insurance operations excludes the projected future profits or losses generated by any non-insurance entities within the Group in providing those services (ie the EEV for long-term insurance operations assumes that the cost of internal asset management services will be that incurred by the Group as a whole, not the cost that will be borne by the insurance business). The results of the Group’s asset management operations include the current period profit from the management of both internal and external funds, consistent with their presentation within the Group’s IFRS basis reporting. An adjustment is accordingly made to Group EEV operating profit, within the EEV basis results for other operations, to deduct the expected profit anticipated to arise in the current period in the opening value of in-force business from internal asset management services, such that Group EEV operating profit includes the actual profit earned in respect of the management of these assets. Any costs incurred within the head office functions in London and Hong Kong that are deemed attributable to the long-term insurance (covered) business are recharged/allocated to the insurance operations and recorded within the results for those operations. The assumed future expenses within the value of in-force business for long-term insurance operations allow for amounts expected to be recharged/allocated by the head office functions. Other costs that are not recharged/allocated to the insurance operations are shown as part of other income and expenditure for the current period, and are not included within the projection of future expenses for in-force insurance business.
2021 $m 2020 $m
IFRS basis other income and expenditure (as recorded in note B1.1 of the IFRS financial statements) (605) (743) Tax effects on IFRS basis results (37) (15) Less: unwind of expected profit on internal management of the assets of continuing long-term business (81) (68)
EEV basis other income and expenditure (723) (826)
The EEV basis shareholders’ equity for other operations is taken to be IFRS basis shareholders’ equity, with central Group debt shown on a market value basis. Free surplus for other operations is taken to be IFRS basis shareholders’ equity, net of goodwill attributable to equity holders, with central Group debt recorded as free surplus to the extent that it is classified as capital resources under the Group’s capital regime. Under the GWS Framework, all debt instruments issued by Prudential plc at the 31 December 2021 are included as capital resources. Shareholders’ equity for other operations can be compared across metrics as shown in the table below.
2021 $m 2020 $m
IFRS basis shareholders’ equity (as recorded in note C1 of the IFRS financial statements) 1,679 (1,596) Mark-to-market value adjustment on central borrowingsnote 6 (438) (795)
EEV basis shareholders’ equity 1,241 (2,391) Debt instruments treated as capital resources 6,158 4,752
Free surplus of other (central) operations 7,399 2,361
Treatment of discontinued US operations following the demerger On completion of the demerger of the Group’s US operations (Jackson) in September 2021, the Group’s pre-demerger interest in Jackson was remeasured to its observable fair value at that date, with any remeasurement gain or loss recognised in the results of discontinued operations. At the same time, the fair value of the interest in Jackson distributed to the Group’s shareholders was recognised directly as a reduction in Group equity. The Group retained a 19.7 per cent economic interest (19.9 per cent voting interest) of Jackson immediately following the demerger, which was valued at $493 million at that time. In December 2021, Jackson repurchased 2,242,516 shares of its Class A common stock from Prudential which reduced Prudential’s economic interest to 18.4 per cent as at 31 December 2021 (18.5 per cent voting interest) and realised a gain of $23 million which is included in corporate transactions. The remaining 18.4 per cent economic interest is measured at fair value within the EEV results at 31 December 2021. Unrealised changes in fair value since the date of demerger have been included in other movements in equity items from continuing operations as part of the EEV basis results for other operations. This treatment is consistent with the approach adopted for IFRS as discussed in note D1.2 of the IFRS financial statements.

13
6 Net core structural borrowings of shareholder-financed businesses
31 Dec 2021 $m 31 Dec 2020 $m
IFRS basis
Mark-to -market
value adjustment
EEV basis at market
value IFRS basis
Mark-to -market
value adjustment
EEV basis at market
value note (ii) note (iii) note (ii) note (iii)
Holding company cash and short-term investmentsnote (i) (3,572) - (3,572) (1,463) - (1,463) Central borrowings:
Subordinated debt 4,075 196 4,271 4,332 420 4,752 Senior debt 1,702 242 1,944 1,701 375 2,076 Bank loan 350 - 350 350 - 350
Total central borrowings 6,127 438 6,565 6,383 795 7,178
Total net central funds from continuing operations 2,555 438 2,993 4,920 795 5,715
Discontinued US operations (Jackson Surplus Notes) 250 90 340
Net core structural borrowings of shareholder-financed businesses 5,170 885 6,055
Notes (i) Holding company includes centrally managed group holding companies. $1,725 million of the cash held at the year-end was used in January
2022 to complete the planned debt redemptions. (ii) As recorded in note C5.1 of the IFRS financial statements. (iii) The movement in the value of core structural borrowings includes foreign exchange effects for pounds sterling denominated debts. The
movement in the mark-to-market value adjustment from continuing operations can be analysed as follows:
2021 $m 2020 $m
Balance at beginning of year 795 548 (Credit) charge included in the income statement from continuing operations (357) 247
Balance at end of year 438 795
The movement in the value of the Jackson Surplus Notes is included in the results of the discontinued US operations.

14
7 Comparison of EEV basis shareholders’ equity with IFRS basis shareholders’ equity
31 Dec 2021 $m 31 Dec 2020 $m
Assets less liabilities before deduction of insurance funds 164,810 421,987 Less insurance funds (including liabilities in respect of insurance products classified as investment contracts under IFRS 4):
Policyholder liabilities (net of reinsurers’ share) and unallocated surplus of with-profits fundsnote (i) (147,546) (399,868) Shareholders’ accrued interest in the long-term business 30,267 33,129
(117,279) (366,739) Less non-controlling interests (176) (1,241)
Total net assets attributable to equity holders of the Company 47,355 54,007
Share capital 182 173 Share premium 5,010 2,637 IFRS basis shareholders’ reserves 11,896 18,068
IFRS basis shareholders’ equity, net of non-controlling interests 17,088 20,878 Shareholders’ accrued interest in the long-term business 30,267 33,129
EEV basis shareholders’ equity, net of non-controlling interestsnote (ii) 47,355 54,007
Analysed as: Continuing operations 41,926 Discontinued US operations 12,081
EEV basis shareholders’ equity, net of non-controlling interests 54,007
Notes (i) The 2020 “policyholder liabilities (net of reinsurers’ share) and unallocated surplus of with-profits funds” included amounts relating to the
discontinued US operations. (ii) The 31 December 2021 amount includes the Group’s retained 18.4 per cent economic interest (18.5 per cent voting interest) in Jackson post
demerger at fair value.
15
8 Methodology and accounting presentation
The methodology and accounting presentation below are stated for the Group’s continuing business operations only. Following Jackson’s demerger, the Group’s US operations are no longer included in covered business with comparatives being re-presented. Methodology applied for the discontinued US operations in the comparative results is provided in note 8 of the Group’s EEV financial statements for the year ended 31 December 2020. (i) Methodology (a) Covered business The EEV basis results for the Group’s continuing operations are prepared for ‘covered business’ as defined by the EEV Principles. Covered business represents the Group’s long-term insurance business (including the Group’s investments in joint venture and associate insurance operations), for which the value of new and in-force contracts is attributable to shareholders. The definition of long-term insurance business comprises those contracts falling under the definition for regulatory purposes. Africa operations are included within the covered business from 2021 following the change in the Group’s operating segments. Further details on the Group’s segments are provided in note B1.2 of the IFRS basis results. The amounts are shown within the continuing insurance segment for all periods.
The EEV basis results for the Group’s covered business are then combined with the post-tax IFRS basis results of the Group’s asset management and other operations (including interest costs on core structural borrowings and corporate expenditure for head office functions in London and Hong Kong that is not recharged/allocated to the insurance operations), with an adjustment to deduct the unwind of expected margins on the internal management of the assets of the covered business. Under the EEV Principles, the results for covered business incorporate the projected margins of attaching internal asset management, as described in note (g) below.
(b) Valuation of in-force and new business The EEV basis results are prepared incorporating best estimate assumptions about all relevant factors including levels of future investment returns, persistency, mortality, morbidity and expenses, as described in note 9(iii). These assumptions are used to project future cash flows. The present value of the projected future cash flows is then calculated using a discount rate, as shown in note 9(i), which reflects both the time value of money and all other non-diversifiable risks associated with the cash flows that are not otherwise allowed for. The total profit that emerges over the lifetime of an individual contract as calculated under the EEV basis is the same as that calculated under the IFRS basis. Since the EEV basis reflects discounted future cash flows, under the EEV methodology the profit emergence is advanced, thus more closely aligning the timing of the recognition of profit with the efforts and risks of current management actions, particularly with regard to business sold during the period. New business In determining the EEV basis value of new business, premiums are included in projected cash flows on the same basis of distinguishing regular and single premium business as set out in the Group’s new business sales reporting. New business premiums reflect those premiums attaching to the covered business, including premiums for contracts classified as investment contracts under IFRS 4. New business premiums for regular premium products are shown on an annualised basis. New business profit represents profit determined by applying operating and economic assumptions as at the end of the period. New business profitability is a key metric for the Group’s management of the development of the business. In addition, new business margins are shown by reference to annual premium equivalent (APE) and the present value of new business premiums (PVNBP). These margins are calculated as the percentage of the value of new business profit to APE and PVNBP. APE is calculated as the aggregate of regular premiums on new business written in the period and one-tenth of single premiums. PVNBP is calculated as the aggregate of single premiums and the present value of expected future premiums from regular premium new business, allowing for lapses and the other assumptions made in determining the EEV new business profit. Valuation movements on investments Investment gains and losses during the period (to the extent that changes in capital values do not directly match changes in liabilities) are included directly in the profit or loss for the period and shareholders’ equity as they arise. The results for the covered business conceptually reflect the aggregate of the post-tax IFRS basis results and the movements in the additional shareholders’ interest recognised on an EEV basis. Therefore, the starting point for the calculation of the EEV basis results reflects the market value movements recognised on an IFRS basis. (c) Cost of capital A charge is deducted from the embedded value for the cost of locked-in required capital supporting the Group’s long-term business. The cost is the difference between the nominal value of the capital held and the discounted value of the projected releases of this capital, allowing for post-tax investment earnings on the capital. The EEV results are affected by the movement in this cost from period to period, which comprises a charge against new business profit and generally a release in respect of the reduction in capital requirements for business in force as this runs off. Where required capital is held within a with-profits long-term fund, the value placed on surplus assets within the fund is already adjusted to reflect its expected release over time and so no further adjustment to the shareholder position is necessary.
16
(d) Financial options and guarantees Nature of financial options and guarantees Participating products, principally written in Hong Kong, Singapore and Malaysia, have both guaranteed and non-guaranteed elements. These products provide returns to policyholders through bonuses that are smoothed. There are two types of bonuses: regular and final. Regular bonuses are declared once a year and, once credited, are guaranteed in accordance with the terms of the particular products. Final bonuses are guaranteed only until the next bonus declaration. There are also various non-participating long-term products with guarantees. The principal guarantees are those for whole-of-life contracts with floor levels of policyholder benefits that typically accrue at rates set at inception and do not vary subsequently with market conditions. Similar to participating products, the policyholder charges incorporate an allowance for the cost of providing these guarantees, which, for certain whole-of-life products in Hong Kong, remains constant throughout varying economic conditions, rather than reducing as the economic environment improves and vice versa. Time value The value of financial options and guarantees comprises the intrinsic value (arising from a deterministic valuation on best estimate assumptions) and the time value (arising from the variability of economic outcomes in the future). Where appropriate, a full stochastic valuation has been undertaken to determine the time value of financial options and guarantees. The economic assumptions used for the stochastic calculations are consistent with those used for the deterministic calculations. Assumptions specific to the stochastic calculations reflect local market conditions and are based on a combination of actual market data, historic market data and an assessment of long-term economic conditions. Common principles have been adopted across the Group for the stochastic asset models, such as separate modelling of individual asset classes with an allowance for correlations between various asset classes. Details of the key characteristics of each model are given in note 9(ii). In deriving the time value of financial options and guarantees, management actions in response to emerging investment and fund solvency conditions have been modelled. Management actions encompass, but are not confined to, investment allocation decisions, levels of regular and final bonuses and credited rates. Bonus rates are projected from current levels and varied in accordance with assumed management actions applying in the emerging investment and fund solvency conditions. In all instances, the modelled actions are in accordance with approved local practice and therefore reflect the options available to management. (e) Level of required capital In adopting the EEV Principles, Prudential has based required capital on the applicable local statutory regulations, including any amounts considered to be required above the local statutory minimum requirements to satisfy regulatory constraints. For shareholder-backed businesses, the level of required capital has generally been set to an amount at least equal to local statutory notification requirements. For CPL life operations, the level of required capital follows the approach for embedded value reporting issued by the China Association of Actuaries (CAA) reflecting the C-ROSS regime. For Singapore life operations, the level of net worth and required capital is based on the Tier 1 Capital position under the risk-based capital framework (RBC2), which removes certain negative reserves permitted to be recognised in the full RBC2 regulatory position applicable to the Group’s GWS capital position, in order to better reflect free surplus and its generation. (f) With-profits business and the treatment of the estate For the Group’s relevant operations, the proportion of surplus allocated to shareholders from the with-profits funds has been based on the applicable profit distribution between shareholders and policyholders. The EEV methodology includes the value attributed to the shareholders’ interest in the residual estate of the in-force with-profits business. In any scenarios where the total assets of the life fund are insufficient to meet policyholder claims in full, the excess cost is fully attributed to shareholders. As required, adjustments are also made to reflect any capital requirements for with-profits business in excess of the capital resources of the with-profits funds. (g) Internal asset management In line with the EEV Principles, the in-force and new business results from long-term business include the projected future profit or loss from asset management and service companies that support the Group’s covered insurance businesses. The results of the Group’s asset management operations include the current period profit from the management of both internal and external funds. EEV basis shareholders’ other income and expenditure is adjusted to deduct the expected profit anticipated to arise in the current period in the opening VIF from internal asset management and other services. This deduction is on a basis consistent with that used for projecting the results for covered insurance business. Accordingly, Group operating profit includes the actual profit earned in respect of the management of these assets. (h) Allowance for risk and risk discount rates Overview Under the EEV Principles, discount rates used to determine the present value of expected future cash flows are set by reference to risk-free rates plus a risk margin. The risk-free rates are largely based on local government bond yields at the valuation date and are assumed to remain constant throughout the projection, with no trending or mean reversion to longer-term assumptions that cannot be observed in the current market. The risk margin reflects any non-diversifiable risk associated with the emergence of distributable earnings that is not allowed for elsewhere in the valuation. In order to better reflect differences in relative market risk volatility inherent in each product group,

17
Prudential sets the risk discount rates to reflect the expected volatility associated with the expected future shareholder cash flows for each product group in the embedded value model, rather than at a Group level. Since financial options and guarantees are explicitly valued under the EEV methodology, risk discount rates exclude the effect of these product features. The risk margin represents the aggregate of the allowance for market risk and allowance for non-diversifiable non-market risk. No allowance is required for non-market risks where these are assumed to be fully diversifiable. Market risk allowance The allowance for market risk represents the beta multiplied by the equity risk premium. The beta of a portfolio or product measures its relative market risk. The risk discount rates reflect the market risk inherent in each product group and hence the volatility of product-specific cash flows. These are determined by considering how the profit from each product is affected by changes in expected returns across asset classes. By converting this into a relative rate of return, it is possible to derive a product-specific beta. This approach contrasts with a top-down approach to market risk where the risks associated with each product are not directly reflected in the valuation basis. The Group’s methodology allows for credit risk in determining the best estimate returns and through the market risk allowance, which covers expected long-term defaults, a credit risk premium (to reflect the volatility in downgrade and default levels) and short-term downgrades and defaults. Allowance for non-diversifiable non-market risks The majority of non-market and non-credit risks are considered to be diversifiable. An allowance for non-diversifiable non-market risks is estimated as set out below. A base level allowance of 50 basis points is applied to cover the non-diversifiable non-market risks associated with the Group’s covered business. For the Group’s businesses in less mature markets (such as the Philippines, Thailand and Africa) additional allowances of 250 basis points are applied. The level and application of these allowances are reviewed and updated based on an assessment of the Group’s exposure and experience in the markets. For the Group’s business in more mature markets, no additional allowance is necessary. At 31 December 2021, the total allowance for non-diversifiable non-market risk is equivalent to a $(3.7) billion (or (8) per cent) reduction to the embedded value of continuing long-term business operations. (i) Foreign currency translation Foreign currency profits and losses have been translated at average exchange rates for the period. Foreign currency transactions are translated at the spot rate prevailing at the date of the transactions. Foreign currency assets and liabilities have been translated at closing exchange rates. The principal exchange rates are shown in note A1 of the Group IFRS financial statements. (j) Taxation In determining the post-tax profit for the period for covered business, the overall tax rate includes the impact of tax effects determined on a local regulatory basis. Tax payments and receipts included in the projected future cash flows to determine the value of in-force business are calculated using tax rates that have been announced and substantively enacted by the end of the reporting period. (ii) Accounting presentation (a) Analysis of post-tax profit To the extent applicable, the presentation of the EEV basis profit or loss for the period from continuing operations is consistent with the classification between operating and non-operating results that the Group applies for the analysis of IFRS basis results. Operating results are determined as described in note (b) below and incorporate the following: – New business profit, as defined in note (i)(b) above; – Expected return on existing business, as described in note (c) below; – The impact of routine changes of estimates relating to operating assumptions, as described in note (d) below; and – Operating experience variances, as described in note (e) below. In addition, operating results include the effect of changes in tax legislation, unless these changes are one-off and structural in nature, or primarily affect the level of projected investment returns, in which case they are reflected as a non-operating result. Non-operating results comprise: – Short-term fluctuations in investment returns; – Mark-to-market value movements on core structural borrowings; – Effect of changes in economic assumptions; and – The impact of corporate transactions, if any, undertaken in the year. Total profit or loss in the period attributable to shareholders and basic earnings per share include these items, together with actual investment returns. The Group believes that operating profit, as adjusted for these items, better reflects underlying performance. (b) Investment returns included in operating profit For the investment element of the assets covering the total net worth of long-term insurance business, investment returns are recognised in operating results at the expected long-term rates of return. These expected returns are calculated by reference to the asset mix of the portfolio.

18
(c) Expected return on existing business Expected return on existing business comprises the expected unwind of discounting effects on the opening value of in-force business and required capital and the expected return on existing free surplus. The unwind of discount and the expected return on existing free surplus are determined after adjusting for the effect of changes in economic and operating assumptions in the current period on the embedded value at the beginning of the period, for example the unwind of discount on the value of in-force business and required capital is determined after adjusting both the opening value and the risk discount rates for the effect of changes in economic and operating assumptions in the current period. (d) Effect of changes in operating assumptions Operating profit includes the effect of changes to operating assumptions on the value of in-force business at the end of the reporting period. For presentational purposes the effect of changes is delineated to show the effect on the opening value of in-force business as operating assumption changes, with the experience variances subsequently being determined by reference to the assumptions at the end of the reporting period, as discussed below. (e) Operating experience variances Operating profit includes the effect of experience variances on operating assumptions, such as persistency, mortality, morbidity, expenses and other factors, which are calculated with reference to the assumptions at the end of the reporting period. (f) Effect of changes in economic assumptions Movements in the value of in-force business at the beginning of the period caused by changes in economic assumptions, net of the related changes in the time value of financial options and guarantees, are recorded in non-operating results.
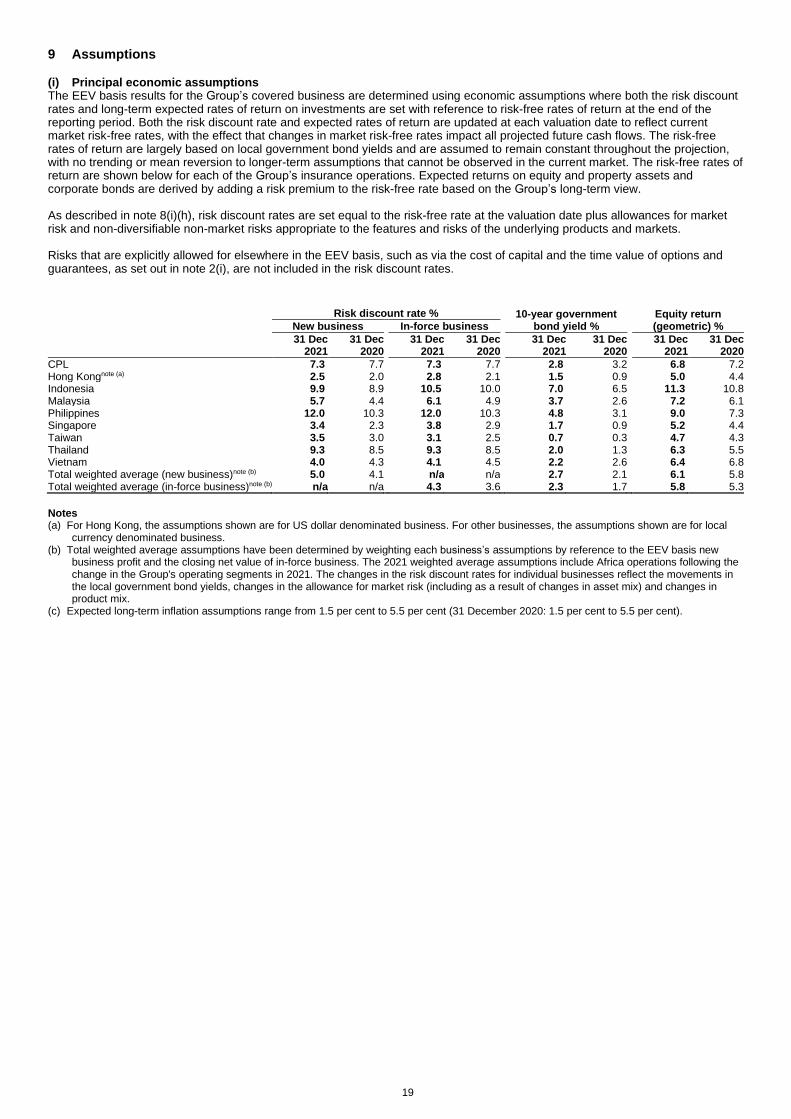
19
9 Assumptions (i) Principal economic assumptions
The EEV basis results for the Group’s covered business are determined using economic assumptions where both the risk discount rates and long-term expected rates of return on investments are set with reference to risk-free rates of return at the end of the reporting period. Both the risk discount rate and expected rates of return are updated at each valuation date to reflect current market risk-free rates, with the effect that changes in market risk-free rates impact all projected future cash flows. The risk-free rates of return are largely based on local government bond yields and are assumed to remain constant throughout the projection, with no trending or mean reversion to longer-term assumptions that cannot be observed in the current market. The risk-free rates of return are shown below for each of the Group’s insurance operations. Expected returns on equity and property assets and corporate bonds are derived by adding a risk premium to the risk-free rate based on the Group’s long-term view. As described in note 8(i)(h), risk discount rates are set equal to the risk-free rate at the valuation date plus allowances for market risk and non-diversifiable non-market risks appropriate to the features and risks of the underlying products and markets. Risks that are explicitly allowed for elsewhere in the EEV basis, such as via the cost of capital and the time value of options and guarantees, as set out in note 2(i), are not included in the risk discount rates.
Risk discount rate % 10-year government
bond yield %
Equity return (geometric) % New business In-force business
31 Dec 31 Dec 31 Dec 31 Dec 31 Dec 31 Dec 31 Dec 31 Dec 2021 2020 2021 2020 2021 2020 2021 2020
CPL 7.3 7.7 7.3 7.7 2.8 3.2 6.8 7.2 Hong Kongnote (a) 2.5 2.0 2.8 2.1 1.5 0.9 5.0 4.4 Indonesia 9.9 8.9 10.5 10.0 7.0 6.5 11.3 10.8 Malaysia 5.7 4.4 6.1 4.9 3.7 2.6 7.2 6.1 Philippines 12.0 10.3 12.0 10.3 4.8 3.1 9.0 7.3 Singapore 3.4 2.3 3.8 2.9 1.7 0.9 5.2 4.4 Taiwan 3.5 3.0 3.1 2.5 0.7 0.3 4.7 4.3 Thailand 9.3 8.5 9.3 8.5 2.0 1.3 6.3 5.5 Vietnam 4.0 4.3 4.1 4.5 2.2 2.6 6.4 6.8 Total weighted average (new business)note (b) 5.0 4.1 n/a n/a 2.7 2.1 6.1 5.8 Total weighted average (in-force business)note (b) n/a n/a 4.3 3.6 2.3 1.7 5.8 5.3
Notes (a) For Hong Kong, the assumptions shown are for US dollar denominated business. For other businesses, the assumptions shown are for local
currency denominated business. (b) Total weighted average assumptions have been determined by weighting each business’s assumptions by reference to the EEV basis new
business profit and the closing net value of in-force business. The 2021 weighted average assumptions include Africa operations following the change in the Group's operating segments in 2021. The changes in the risk discount rates for individual businesses reflect the movements in the local government bond yields, changes in the allowance for market risk (including as a result of changes in asset mix) and changes in product mix.
(c) Expected long-term inflation assumptions range from 1.5 per cent to 5.5 per cent (31 December 2020: 1.5 per cent to 5.5 per cent).

20
(ii) Stochastic assumptions Details are given below of the key characteristics of the models used to determine the time value of financial options and guarantees as referred to in note 8(i)(d).
– The stochastic cost of guarantees is primarily of significance for the Hong Kong, Malaysia, Singapore, Taiwan and Vietnam businesses;
– The principal asset classes are government bonds, corporate bonds and equity; – Interest rates are projected using a stochastic interest rate model calibrated to the current market yields; – Equity returns are assumed to follow a log-normal distribution; – The corporate bond return is calculated based on a risk-free return plus a mean-reverting spread; – The volatility of equity returns ranges from 18 per cent to 35 per cent for both years; and – The volatility of government bond yields ranges from 1.1 per cent to 2.0 per cent for both years.
(iii) Operating assumptions Best estimate assumptions are used for projecting future cash flows, where best estimate is defined as the mean of the distribution of future possible outcomes. The assumptions are reviewed actively and changes are made when evidence exists that material changes in future experience are reasonably certain. Assumptions required in the calculation of the time value of financial options and guarantees, for example relating to volatilities and correlations, or dynamic algorithms linking liabilities to assets, have been set equal to the best estimates and, wherever material and practical, reflect any dynamic relationships between the assumptions and the stochastic variables. Demographic assumptions Persistency, mortality and morbidity assumptions are based on an analysis of recent experience, and reflect expected future experience. When projecting future cash flows for medical reimbursement business that is repriced annually, explicit allowance is made for expected future premium inflation and separately for future medical claims inflation. Expense assumptions Expense levels, including those of the service companies that support the Group’s long-term business, are based on internal expense analysis and are appropriately allocated to acquisition of new business and renewal of in-force business. For mature business, it is Prudential’s policy not to take credit for future cost reduction programmes until the actions to achieve the savings have been delivered. Expense overruns are reported where these are expected to be short-lived, including businesses that are growing rapidly or are sub-scale. Expenses comprise costs borne directly and costs recharged/allocated from the Group head office functions in London and Hong Kong that are attributable to the long-term insurance (covered) business. The assumed future expenses for the long-term insurance business allow for amounts expected to be recharged/allocated by the head office functions. Development expenses are allocated to covered business and are charged as incurred. Corporate expenditure, which is included in other income and expenditure, comprises expenditure of the Group head office functions in London and Hong Kong that is not recharged/allocated to the long-term insurance or asset management operations, primarily for corporate related activities that are charged as incurred, together with restructuring and IFRS 17 implementation costs incurred across the Group. Tax rates The assumed long-term effective tax rates for operations reflect the expected incidence of taxable profit or loss in the projected future cash flows as explained in note 8(i)(j). The local standard corporate tax rates applicable are as follows:
%
CPL 25.0 Hong Kong 16.5 per cent on 5 per cent of premium income Indonesia 22.0 Malaysia 24.0 Philippines Up to 30 June 2020: 30.0; from 1 July 2020: 25.0 Singapore 17.0 Taiwan 20.0 Thailand 20.0 Vietnam 20.0
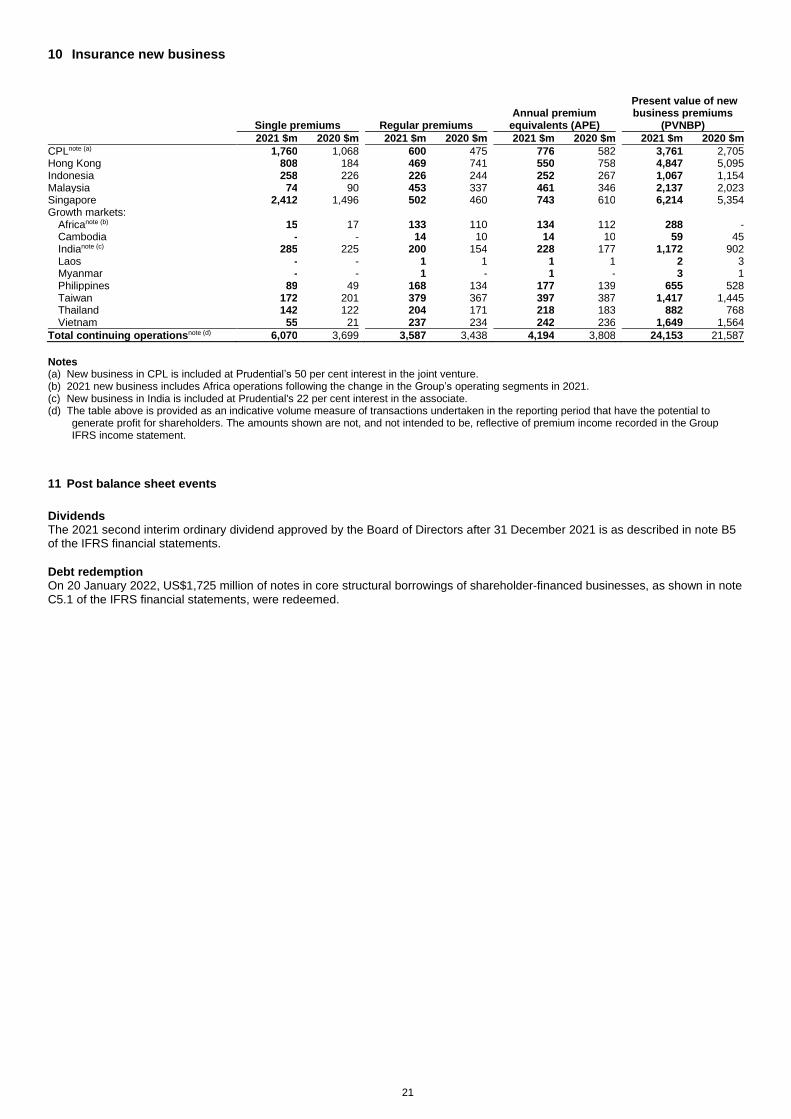
21
10 Insurance new business
Single premiums Regular premiums Annual premium
equivalents (APE)
Present value of new business premiums
(PVNBP)
2021 $m 2020 $m 2021 $m 2020 $m 2021 $m 2020 $m 2021 $m 2020 $m
CPLnote (a) 1,760 1,068 600 475 776 582 3,761 2,705 Hong Kong 808 184 469 741 550 758 4,847 5,095 Indonesia 258 226 226 244 252 267 1,067 1,154 Malaysia 74 90 453 337 461 346 2,137 2,023 Singapore 2,412 1,496 502 460 743 610 6,214 5,354 Growth markets: Africanote (b) 15 17 133 110 134 112 288 - Cambodia - - 14 10 14 10 59 45 Indianote (c) 285 225 200 154 228 177 1,172 902 Laos - - 1 1 1 1 2 3 Myanmar - - 1 - 1 - 3 1 Philippines 89 49 168 134 177 139 655 528 Taiwan 172 201 379 367 397 387 1,417 1,445 Thailand 142 122 204 171 218 183 882 768 Vietnam 55 21 237 234 242 236 1,649 1,564
Total continuing operationsnote (d) 6,070 3,699 3,587 3,438 4,194 3,808 24,153 21,587
Notes (a) New business in CPL is included at Prudential’s 50 per cent interest in the joint venture. (b) 2021 new business includes Africa operations following the change in the Group’s operating segments in 2021. (c) New business in India is included at Prudential's 22 per cent interest in the associate. (d) The table above is provided as an indicative volume measure of transactions undertaken in the reporting period that have the potential to
generate profit for shareholders. The amounts shown are not, and not intended to be, reflective of premium income recorded in the Group IFRS income statement.
11 Post balance sheet events
Dividends The 2021 second interim ordinary dividend approved by the Board of Directors after 31 December 2021 is as described in note B5 of the IFRS financial statements.
Debt redemption On 20 January 2022, US$1,725 million of notes in core structural borrowings of shareholder-financed businesses, as shown in note C5.1 of the IFRS financial statements, were redeemed.
Additional unaudited financial information Page
I Additional financial information
(i) Group capital position 2
(ii) Analysis of adjusted operating profit by driver 6
(iii) Analysis of adjusted operating profit by business unit 7
(iv) Group funds under management 8
(v) Holding company cash flow 9
(vi) Reconciliation of EEV expected transfer of value of in-force business and required capital to free surplus 10
(vii) EEV new business schedules 11
II Calculation of alternative performance measures 15
(i) Reconciliation of adjusted operating profit to profit before tax 15
(ii) Calculation of IFRS gearing ratio from continuing operations 15
(iii) Return on IFRS shareholders’ equity from continuing operations 15
(iv) Calculation of IFRS shareholders’ equity per share 15
(v) Calculation of Eastspring cost/income ratio 15
(vi) Reconciliation of gross premiums earned to renewal insurance premiums 16
(vii) Gross premiums earned including joint ventures and associates 16
(viii) Reconciliation of gross premiums earned to APE new business sales 16
(ix) Reconciliation between IFRS and EEV shareholders’ equity 17
(x) Calculation of return on embedded value 17

2
I Additional financial information
I(i) Group capital position Overview Prudential applies the Insurance (Group Capital) Rules set out in the Group-wide Supervision (GWS) Framework issued by the Hong Kong Insurance Authority (IA) to determine group regulatory capital requirements (both minimum and prescribed levels). The GWS Framework became effective for Prudential upon designation by the Hong Kong IA on 14 May 2021 and replaced the local capital summation method (LCSM) which was used for determination of the 31 December 2020 Group capital position as agreed with the Hong Kong IA. The GWS methodology is largely consistent with that previously applied under LCSM with the exception of the treatment of debt instruments which are subject to transitional arrangements under the GWS Framework. Under the GWS Framework, all debt instruments (senior and subordinated) issued by Prudential plc at the 31 December 2021 are included as GWS eligible group capital resources. This includes debt issued at the date of designation which met the transitional conditions set by the Hong Kong IA and have not since been redeemed and debt issued since the date of designation which met the qualifying conditions as set out in the Insurance (Group Capital) Rules. Under the LCSM, only specific bonds (being those subordinated debt instruments issued by Prudential plc at the date of demerger of M&G plc) were included as eligible group capital resources. For regulated insurance entities, the capital resources and required capital included in the GWS capital measure for Hong Kong IA Group regulatory purposes are based on the local solvency regime applicable in each jurisdiction. The Group holds material participating business in Hong Kong, Singapore and Malaysia. Alongside the total company GWS capital basis, a shareholder GWS capital basis is also presented, being eligible group capital resources over the GMCR and which excludes the capital resources and minimum capital requirements of these participating funds. The table below sets out the Group capital position on these two bases before allowing for the second interim dividend. The GWS group capital adequacy requirements have been met since the GWS Framework became effective for Prudential upon designation, this includes maintaining Tier 1 group capital resources in excess of the group minimum capital requirement of the supervised group. Estimated GWS capital position based on Group Minimum Capital Requirement (GMCR)notes (1)(2)(3) 31 Dec 2021 31 Dec 2020
Amounts attributable to Prudential plc Total Less
policyholder Shareholder Total Less
policyholder Shareholder
Eligible group capital resources ($bn) 44.4 (27.5) 16.9 34.9 (22.1) 12.8 Group Minimum Capital Requirement ($bn) 10.7 (7.0) 3.7 10.1 (6.7) 3.4 GWS capital surplus (over GMCR) ($bn) 33.7 (20.5) 13.2 24.8 (15.4) 9.4 GWS coverage ratio (over GMCR) (%) 414% 454% 344% 370% Allow for January 2022 debt redemption (1.7) - (1.7) n/a n/a n/a GWS capital surplus (over GMCR) after January 2022 debt redemption ($bn) 32.0 (20.5) 11.5 n/a n/a n/a GWS coverage ratio (over GMCR) after January 2022 debt redemption (%) 398% 408% n/a n/a n/a
Further detail on the Group shareholder GWS capital position is presented below at 31 December 2021 and 31 December 2020 for comparison: Shareholder
31 Dec 2021 $bn Total Asia and Africa
Less policyholder Asia and Africa
Unallocated to a segment Group
Eligible group capital resources 40.3 (27.5) 12.8 4.1 16.9 Group Minimum Capital Requirement 10.7 (7.0) 3.7 - 3.7 GWS capital surplus (over GMCR) 29.6 (20.5) 9.1 4.1 13.2
Shareholder
31 Dec 2020 $bn Total Asia and Africa
Less policyholder Asia and Africa
Unallocated to a segment Group
Eligible group capital resources 33.7 (22.1) 11.6 1.2 12.8 Group Minimum Capital Requirement 10.1 (6.7) 3.4 - 3.4 GWS capital surplus (over GMCR) 23.6 (15.4) 8.2 1.2 9.4
Notes (1) The total eligible group capital resources and total GMCR presented in the tables above reflect the Insurance (Group Capital) Rules as set
out in the GWS Framework. In particular, the 31 December 2020 capital results have been restated from those previously disclosed on a LCSM basis to reflect the treatment of grandfathered debt instruments under the GWS Framework, which increased eligible group capital resources by $1.6 billion compared to the LCSM basis. This had the effect of increasing capital surplus over the GMCR from $7.8 billion (equivalent to a coverage ratio of 323 per cent) to $9.4 billion (equivalent to a coverage ratio of 370 per cent) on a shareholder GWS basis. The 31 December 2020 GWS capital results are presented on a Group excluding Jackson basis and are before including the value of the Group’s retained interest in Jackson.
(2) The 31 December 2021 GWS capital results include the value of the Group’s 18.4 per cent retained economic interest in Jackson. As agreed with the Hong Kong IA this retained interest is included within the GWS eligible group capital resources valued at 60 per cent of the listed market value. At 31 December 2021 this is included within “unallocated to a segment” and contributes $0.4 billion to the GWS capital surplus (over GMCR) and 11 percentage points to the shareholder GWS coverage ratio (over GMCR).
(3) The 31 December 2021 GWS capital results do not reflect the impact of the redemption of $1.7 billion of sub-ordinated debt in January 2022 unless otherwise specified.
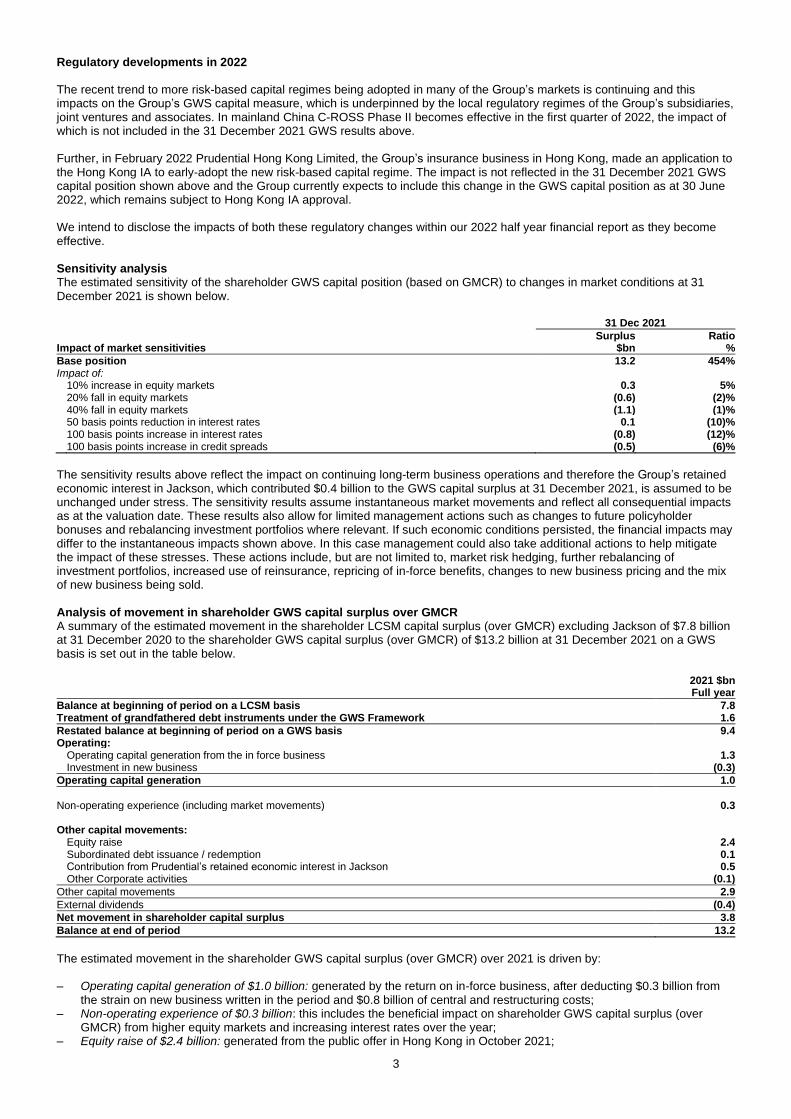
3
Regulatory developments in 2022 The recent trend to more risk-based capital regimes being adopted in many of the Group’s markets is continuing and this impacts on the Group’s GWS capital measure, which is underpinned by the local regulatory regimes of the Group’s subsidiaries, joint ventures and associates. In mainland China C-ROSS Phase II becomes effective in the first quarter of 2022, the impact of which is not included in the 31 December 2021 GWS results above. Further, in February 2022 Prudential Hong Kong Limited, the Group’s insurance business in Hong Kong, made an application to the Hong Kong IA to early-adopt the new risk-based capital regime. The impact is not reflected in the 31 December 2021 GWS capital position shown above and the Group currently expects to include this change in the GWS capital position as at 30 June 2022, which remains subject to Hong Kong IA approval. We intend to disclose the impacts of both these regulatory changes within our 2022 half year financial report as they become effective. Sensitivity analysis The estimated sensitivity of the shareholder GWS capital position (based on GMCR) to changes in market conditions at 31 December 2021 is shown below. 31 Dec 2021
Impact of market sensitivities Surplus
$bn Ratio
%
Base position 13.2 454% Impact of: 10% increase in equity markets 0.3 5% 20% fall in equity markets (0.6) (2)% 40% fall in equity markets (1.1) (1)% 50 basis points reduction in interest rates 0.1 (10)% 100 basis points increase in interest rates (0.8) (12)% 100 basis points increase in credit spreads (0.5) (6)%
The sensitivity results above reflect the impact on continuing long-term business operations and therefore the Group’s retained economic interest in Jackson, which contributed $0.4 billion to the GWS capital surplus at 31 December 2021, is assumed to be unchanged under stress. The sensitivity results assume instantaneous market movements and reflect all consequential impacts as at the valuation date. These results also allow for limited management actions such as changes to future policyholder bonuses and rebalancing investment portfolios where relevant. If such economic conditions persisted, the financial impacts may differ to the instantaneous impacts shown above. In this case management could also take additional actions to help mitigate the impact of these stresses. These actions include, but are not limited to, market risk hedging, further rebalancing of investment portfolios, increased use of reinsurance, repricing of in-force benefits, changes to new business pricing and the mix of new business being sold. Analysis of movement in shareholder GWS capital surplus over GMCR A summary of the estimated movement in the shareholder LCSM capital surplus (over GMCR) excluding Jackson of $7.8 billion at 31 December 2020 to the shareholder GWS capital surplus (over GMCR) of $13.2 billion at 31 December 2021 on a GWS basis is set out in the table below.
2021 $bn Full year
Balance at beginning of period on a LCSM basis 7.8 Treatment of grandfathered debt instruments under the GWS Framework 1.6
Restated balance at beginning of period on a GWS basis 9.4 Operating: Operating capital generation from the in force business 1.3 Investment in new business (0.3)
Operating capital generation 1.0
Non-operating experience (including market movements) 0.3 Other capital movements: Equity raise 2.4 Subordinated debt issuance / redemption 0.1 Contribution from Prudential’s retained economic interest in Jackson 0.5 Other Corporate activities (0.1)
Other capital movements 2.9
External dividends (0.4)
Net movement in shareholder capital surplus 3.8
Balance at end of period 13.2
The estimated movement in the shareholder GWS capital surplus (over GMCR) over 2021 is driven by: – Operating capital generation of $1.0 billion: generated by the return on in-force business, after deducting $0.3 billion from
the strain on new business written in the period and $0.8 billion of central and restructuring costs; – Non-operating experience of $0.3 billion: this includes the beneficial impact on shareholder GWS capital surplus (over
GMCR) from higher equity markets and increasing interest rates over the year; – Equity raise of $2.4 billion: generated from the public offer in Hong Kong in October 2021;
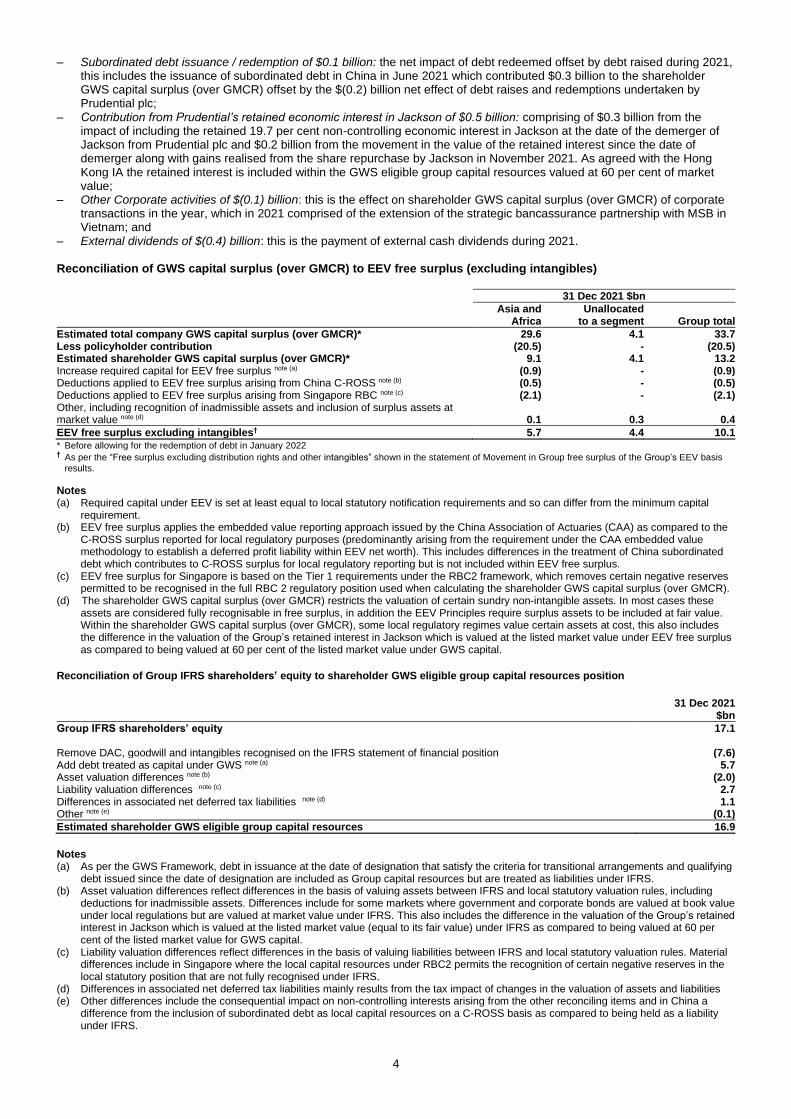
4
– Subordinated debt issuance / redemption of $0.1 billion: the net impact of debt redeemed offset by debt raised during 2021, this includes the issuance of subordinated debt in China in June 2021 which contributed $0.3 billion to the shareholder GWS capital surplus (over GMCR) offset by the $(0.2) billion net effect of debt raises and redemptions undertaken by Prudential plc;
– Contribution from Prudential’s retained economic interest in Jackson of $0.5 billion: comprising of $0.3 billion from the impact of including the retained 19.7 per cent non-controlling economic interest in Jackson at the date of the demerger of Jackson from Prudential plc and $0.2 billion from the movement in the value of the retained interest since the date of demerger along with gains realised from the share repurchase by Jackson in November 2021. As agreed with the Hong Kong IA the retained interest is included within the GWS eligible group capital resources valued at 60 per cent of market value;
– Other Corporate activities of $(0.1) billion: this is the effect on shareholder GWS capital surplus (over GMCR) of corporate transactions in the year, which in 2021 comprised of the extension of the strategic bancassurance partnership with MSB in Vietnam; and
– External dividends of $(0.4) billion: this is the payment of external cash dividends during 2021. Reconciliation of GWS capital surplus (over GMCR) to EEV free surplus (excluding intangibles) 31 Dec 2021 $bn
Asia and
Africa Unallocated
to a segment Group total
Estimated total company GWS capital surplus (over GMCR)* 29.6 4.1 33.7 Less policyholder contribution (20.5) - (20.5) Estimated shareholder GWS capital surplus (over GMCR)* 9.1 4.1 13.2 Increase required capital for EEV free surplus note (a) (0.9) - (0.9) Deductions applied to EEV free surplus arising from China C-ROSS note (b) (0.5) - (0.5) Deductions applied to EEV free surplus arising from Singapore RBC note (c) (2.1) - (2.1) Other, including recognition of inadmissible assets and inclusion of surplus assets at market value note (d) 0.1 0.3 0.4
EEV free surplus excluding intangibles† 5.7 4.4 10.1 * Before allowing for the redemption of debt in January 2022 † As per the “Free surplus excluding distribution rights and other intangibles” shown in the statement of Movement in Group free surplus of the Group’s EEV basis
results.
Notes (a) Required capital under EEV is set at least equal to local statutory notification requirements and so can differ from the minimum capital
requirement. (b) EEV free surplus applies the embedded value reporting approach issued by the China Association of Actuaries (CAA) as compared to the
C-ROSS surplus reported for local regulatory purposes (predominantly arising from the requirement under the CAA embedded value methodology to establish a deferred profit liability within EEV net worth). This includes differences in the treatment of China subordinated debt which contributes to C-ROSS surplus for local regulatory reporting but is not included within EEV free surplus.
(c) EEV free surplus for Singapore is based on the Tier 1 requirements under the RBC2 framework, which removes certain negative reserves permitted to be recognised in the full RBC 2 regulatory position used when calculating the shareholder GWS capital surplus (over GMCR).
(d) The shareholder GWS capital surplus (over GMCR) restricts the valuation of certain sundry non-intangible assets. In most cases these assets are considered fully recognisable in free surplus, in addition the EEV Principles require surplus assets to be included at fair value. Within the shareholder GWS capital surplus (over GMCR), some local regulatory regimes value certain assets at cost, this also includes the difference in the valuation of the Group’s retained interest in Jackson which is valued at the listed market value under EEV free surplus as compared to being valued at 60 per cent of the listed market value under GWS capital.
Reconciliation of Group IFRS shareholders’ equity to shareholder GWS eligible group capital resources position
31 Dec 2021
$bn
Group IFRS shareholders’ equity 17.1 Remove DAC, goodwill and intangibles recognised on the IFRS statement of financial position (7.6) Add debt treated as capital under GWS note (a) 5.7 Asset valuation differences note (b) (2.0) Liability valuation differences note (c) 2.7 Differences in associated net deferred tax liabilities note (d) 1.1 Other note (e) (0.1)
Estimated shareholder GWS eligible group capital resources 16.9
Notes (a) As per the GWS Framework, debt in issuance at the date of designation that satisfy the criteria for transitional arrangements and qualifying
debt issued since the date of designation are included as Group capital resources but are treated as liabilities under IFRS. (b) Asset valuation differences reflect differences in the basis of valuing assets between IFRS and local statutory valuation rules, including
deductions for inadmissible assets. Differences include for some markets where government and corporate bonds are valued at book value under local regulations but are valued at market value under IFRS. This also includes the difference in the valuation of the Group’s retained interest in Jackson which is valued at the listed market value (equal to its fair value) under IFRS as compared to being valued at 60 per cent of the listed market value for GWS capital.
(c) Liability valuation differences reflect differences in the basis of valuing liabilities between IFRS and local statutory valuation rules. Material differences include in Singapore where the local capital resources under RBC2 permits the recognition of certain negative reserves in the local statutory position that are not fully recognised under IFRS.
(d) Differences in associated net deferred tax liabilities mainly results from the tax impact of changes in the valuation of assets and liabilities (e) Other differences include the consequential impact on non-controlling interests arising from the other reconciling items and in China a
difference from the inclusion of subordinated debt as local capital resources on a C-ROSS basis as compared to being held as a liability under IFRS.

5
Basis of preparation for the Group GWS capital position Prudential applies the Insurance (Group Capital) Rules set out in the GWS Framework to determine group regulatory capital requirements (both minimum and prescribed levels). The summation of local statutory capital requirements across the Group is used to determine group regulatory capital requirements, with no allowance for diversification between business operations. The GWS eligible group capital resources is determined by the summation of capital resources across local solvency regimes for regulated entities and IFRS shareholders’ equity (with adjustments described below) for non-regulated entities. In determining the GWS eligible group capital resources and required capital the following principles have been applied:
– For regulated insurance entities, capital resources and required capital are based on the local solvency regime applicable in each jurisdiction, with minimum required capital set at the solo legal entity statutory minimum capital requirements;
– For asset management operations and other regulated entities, the capital position is derived based on the sectoral basis applicable in each jurisdiction, with minimum required capital based on the solo legal entity statutory minimum capital requirement;
– For non-regulated entities, the capital resources are based on IFRS shareholder equity after deducting intangible assets. No required capital is held in respect of unregulated entities;
– For entities where the Group’s shareholding is less than 100 per cent, the contribution of the entity to the GWS eligible group capital resources and required capital represents the Group’s share of these amounts and excludes any amounts attributable to non-controlling interests. This does not apply to investment holdings which are not part of the Group;
– Following the demerger of Jackson from Prudential plc, the Group retains a 18.4 per cent non-controlling economic interest in Jackson. As agreed with the Hong Kong IA this retained interest is included within the GWS eligible group capital resources valued at 60 per cent of the listed market value;
– Investments in subsidiaries, joint ventures and associates (including, if any, loans that are recognised as capital on the receiving entity’s balance sheet) are eliminated from the relevant holding company to prevent the double counting of capital resources; and
– Under the GWS Framework, all debt instruments (senior and subordinated) issued by Prudential plc at the 31 December 2021 are included as GWS eligible group capital resources. This includes debt issued at the date of designation which met the transitional conditions set by the Hong Kong IA and have not since been redeemed and debt issued since the date of designation which met the qualifying conditions as set out in the Insurance (Group Capital) Rules. The eligible amount permitted to be included as Group capital resources for transitional debt is based on the net proceeds amount translated using 31 December 2020 exchange rates for debt not denominated in US dollars.
– The total company GWS capital basis is the capital measure for Hong Kong IA Group regulatory purposes. In addition Prudential also presents a shareholder GWS capital basis which excludes the capital resources and minimum capital requirements of participating business in Hong Kong, Singapore and Malaysia.
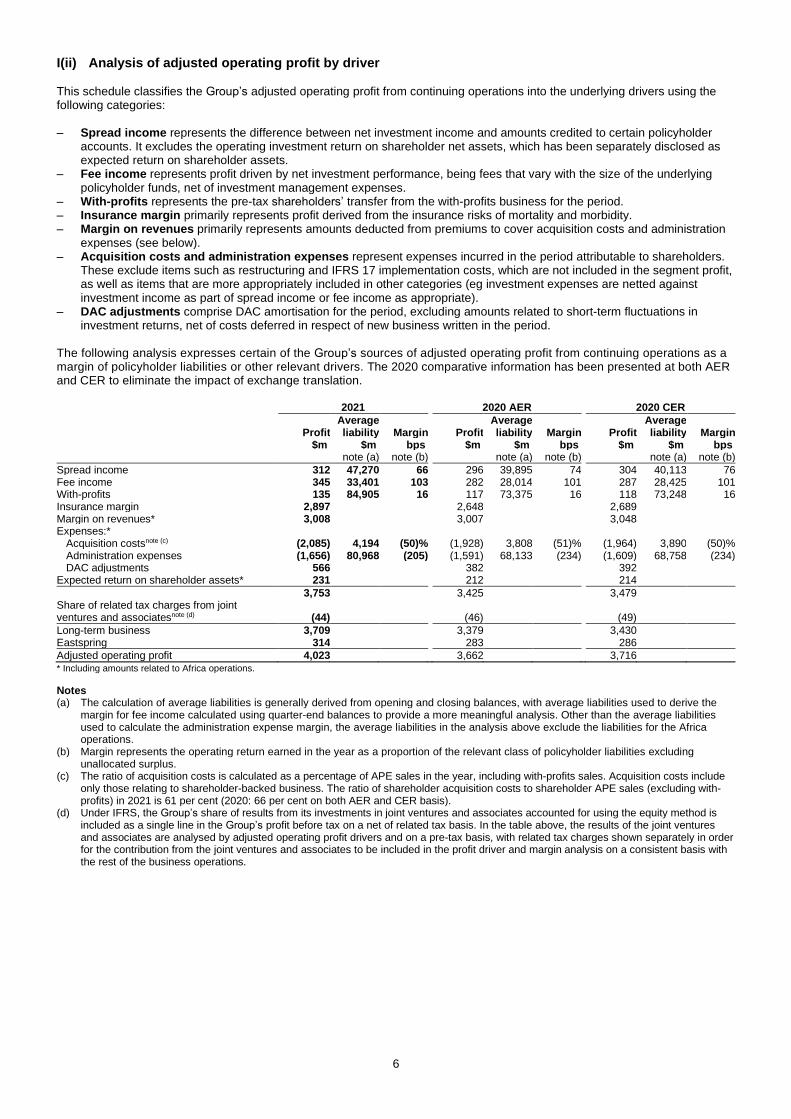
6
I(ii) Analysis of adjusted operating profit by driver This schedule classifies the Group’s adjusted operating profit from continuing operations into the underlying drivers using the following categories: – Spread income represents the difference between net investment income and amounts credited to certain policyholder
accounts. It excludes the operating investment return on shareholder net assets, which has been separately disclosed as expected return on shareholder assets.
– Fee income represents profit driven by net investment performance, being fees that vary with the size of the underlying policyholder funds, net of investment management expenses.
– With-profits represents the pre-tax shareholders’ transfer from the with-profits business for the period. – Insurance margin primarily represents profit derived from the insurance risks of mortality and morbidity. – Margin on revenues primarily represents amounts deducted from premiums to cover acquisition costs and administration
expenses (see below). – Acquisition costs and administration expenses represent expenses incurred in the period attributable to shareholders.
These exclude items such as restructuring and IFRS 17 implementation costs, which are not included in the segment profit, as well as items that are more appropriately included in other categories (eg investment expenses are netted against investment income as part of spread income or fee income as appropriate).
– DAC adjustments comprise DAC amortisation for the period, excluding amounts related to short-term fluctuations in investment returns, net of costs deferred in respect of new business written in the period.
The following analysis expresses certain of the Group’s sources of adjusted operating profit from continuing operations as a margin of policyholder liabilities or other relevant drivers. The 2020 comparative information has been presented at both AER and CER to eliminate the impact of exchange translation.
2021 2020 AER 2020 CER
Average Average Average Profit liability Margin Profit liability Margin Profit liability Margin $m $m bps $m $m bps $m $m bps note (a) note (b) note (a) note (b) note (a) note (b)
Spread income 312 47,270 66 296 39,895 74 304 40,113 76 Fee income 345 33,401 103 282 28,014 101 287 28,425 101 With-profits 135 84,905 16 117 73,375 16 118 73,248 16 Insurance margin 2,897 2,648 2,689 Margin on revenues* 3,008 3,007 3,048 Expenses:*
Acquisition costsnote (c) (2,085) 4,194 (50)% (1,928) 3,808 (51)% (1,964) 3,890 (50)% Administration expenses (1,656) 80,968 (205) (1,591) 68,133 (234) (1,609) 68,758 (234) DAC adjustments 566 382 392
Expected return on shareholder assets* 231 212 214
3,753 3,425 3,479 Share of related tax charges from joint ventures and associatesnote (d) (44) (46) (49)
Long-term business 3,709 3,379 3,430 Eastspring 314 283 286
Adjusted operating profit 4,023 3,662 3,716 * Including amounts related to Africa operations.
Notes (a) The calculation of average liabilities is generally derived from opening and closing balances, with average liabilities used to derive the
margin for fee income calculated using quarter-end balances to provide a more meaningful analysis. Other than the average liabilities used to calculate the administration expense margin, the average liabilities in the analysis above exclude the liabilities for the Africa operations.
(b) Margin represents the operating return earned in the year as a proportion of the relevant class of policyholder liabilities excluding unallocated surplus.
(c) The ratio of acquisition costs is calculated as a percentage of APE sales in the year, including with-profits sales. Acquisition costs include only those relating to shareholder-backed business. The ratio of shareholder acquisition costs to shareholder APE sales (excluding with-profits) in 2021 is 61 per cent (2020: 66 per cent on both AER and CER basis).
(d) Under IFRS, the Group’s share of results from its investments in joint ventures and associates accounted for using the equity method is included as a single line in the Group’s profit before tax on a net of related tax basis. In the table above, the results of the joint ventures and associates are analysed by adjusted operating profit drivers and on a pre-tax basis, with related tax charges shown separately in order for the contribution from the joint ventures and associates to be included in the profit driver and margin analysis on a consistent basis with the rest of the business operations.
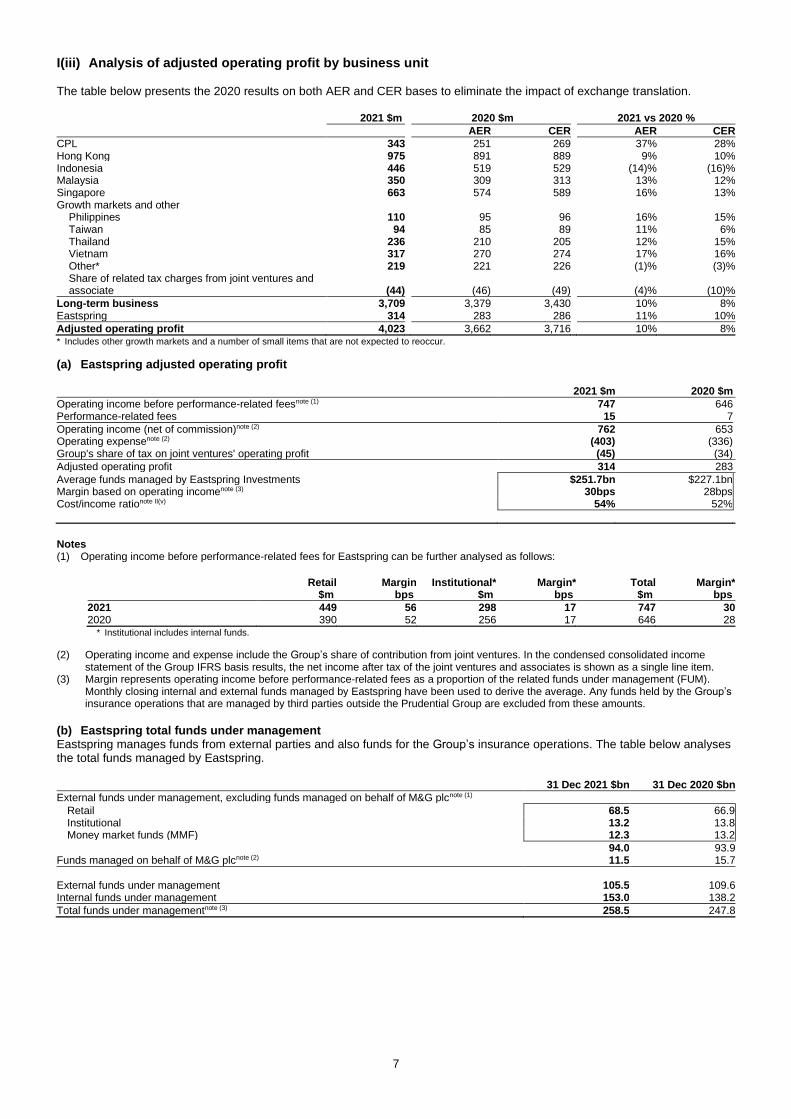
7
I(iii) Analysis of adjusted operating profit by business unit The table below presents the 2020 results on both AER and CER bases to eliminate the impact of exchange translation. 2021 $m 2020 $m 2021 vs 2020 %
AER CER AER CER
CPL 343 251 269 37% 28% Hong Kong 975 891 889 9% 10% Indonesia 446 519 529 (14)% (16)% Malaysia 350 309 313 13% 12% Singapore 663 574 589 16% 13% Growth markets and other Philippines 110 95 96 16% 15% Taiwan 94 85 89 11% 6% Thailand 236 210 205 12% 15% Vietnam 317 270 274 17% 16% Other* 219 221 226 (1)% (3)%
Share of related tax charges from joint ventures and associate (44) (46) (49) (4)% (10)%
Long-term business 3,709 3,379 3,430 10% 8% Eastspring 314 283 286 11% 10%
Adjusted operating profit 4,023 3,662 3,716 10% 8% * Includes other growth markets and a number of small items that are not expected to reoccur.
(a) Eastspring adjusted operating profit 2021 $m 2020 $m
Operating income before performance-related feesnote (1) 747 646 Performance-related fees 15 7
Operating income (net of commission)note (2) 762 653 Operating expensenote (2) (403) (336) Group's share of tax on joint ventures' operating profit (45) (34)
Adjusted operating profit 314 283
Average funds managed by Eastspring Investments $251.7bn $227.1bn Margin based on operating incomenote (3) 30bps 28bps Cost/income rationote II(v) 54% 52%
Notes (1) Operating income before performance-related fees for Eastspring can be further analysed as follows:
Retail Margin Institutional* Margin* Total Margin* $m bps $m bps $m bps
2021 449 56 298 17 747 30 2020 390 52 256 17 646 28
* Institutional includes internal funds.
(2) Operating income and expense include the Group’s share of contribution from joint ventures. In the condensed consolidated income statement of the Group IFRS basis results, the net income after tax of the joint ventures and associates is shown as a single line item.
(3) Margin represents operating income before performance-related fees as a proportion of the related funds under management (FUM). Monthly closing internal and external funds managed by Eastspring have been used to derive the average. Any funds held by the Group’s insurance operations that are managed by third parties outside the Prudential Group are excluded from these amounts.
(b) Eastspring total funds under management Eastspring manages funds from external parties and also funds for the Group’s insurance operations. The table below analyses the total funds managed by Eastspring. 31 Dec 2021 $bn 31 Dec 2020 $bn
External funds under management, excluding funds managed on behalf of M&G plcnote (1)
Retail 68.5 66.9 Institutional 13.2 13.8 Money market funds (MMF) 12.3 13.2
94.0 93.9 Funds managed on behalf of M&G plcnote (2) 11.5 15.7
External funds under management 105.5 109.6 Internal funds under management 153.0 138.2
Total funds under managementnote (3) 258.5 247.8
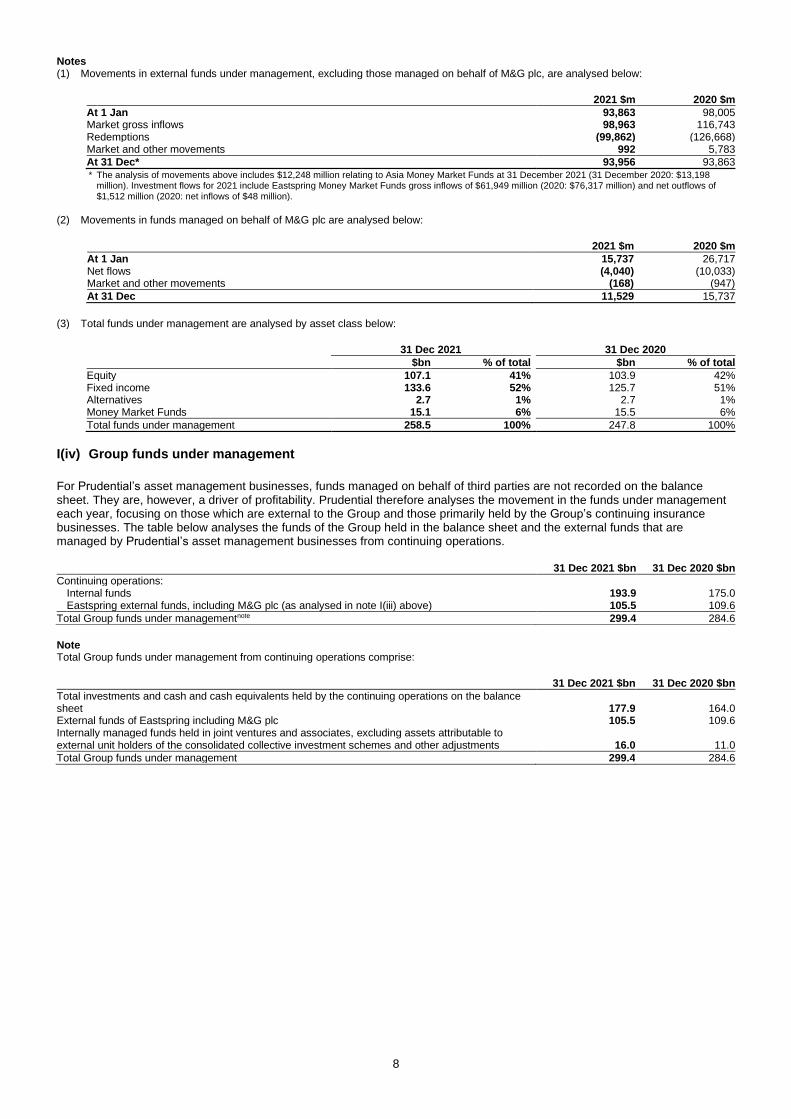
8
Notes (1) Movements in external funds under management, excluding those managed on behalf of M&G plc, are analysed below: 2021 $m 2020 $m
At 1 Jan 93,863 98,005 Market gross inflows 98,963 116,743 Redemptions (99,862) (126,668) Market and other movements 992 5,783
At 31 Dec* 93,956 93,863 * The analysis of movements above includes $12,248 million relating to Asia Money Market Funds at 31 December 2021 (31 December 2020: $13,198
million). Investment flows for 2021 include Eastspring Money Market Funds gross inflows of $61,949 million (2020: $76,317 million) and net outflows of $1,512 million (2020: net inflows of $48 million).
(2) Movements in funds managed on behalf of M&G plc are analysed below: 2021 $m 2020 $m
At 1 Jan 15,737 26,717 Net flows (4,040) (10,033) Market and other movements (168) (947)
At 31 Dec 11,529 15,737
(3) Total funds under management are analysed by asset class below: 31 Dec 2021 31 Dec 2020
$bn % of total $bn % of total
Equity 107.1 41% 103.9 42% Fixed income 133.6 52% 125.7 51% Alternatives 2.7 1% 2.7 1% Money Market Funds 15.1 6% 15.5 6%
Total funds under management 258.5 100% 247.8 100%
I(iv) Group funds under management
For Prudential’s asset management businesses, funds managed on behalf of third parties are not recorded on the balance sheet. They are, however, a driver of profitability. Prudential therefore analyses the movement in the funds under management each year, focusing on those which are external to the Group and those primarily held by the Group’s continuing insurance businesses. The table below analyses the funds of the Group held in the balance sheet and the external funds that are managed by Prudential’s asset management businesses from continuing operations. 31 Dec 2021 $bn 31 Dec 2020 $bn
Continuing operations: Internal funds 193.9 175.0 Eastspring external funds, including M&G plc (as analysed in note I(iii) above) 105.5 109.6
Total Group funds under managementnote 299.4 284.6
Note Total Group funds under management from continuing operations comprise:
31 Dec 2021 $bn 31 Dec 2020 $bn
Total investments and cash and cash equivalents held by the continuing operations on the balance sheet 177.9 164.0 External funds of Eastspring including M&G plc 105.5 109.6 Internally managed funds held in joint ventures and associates, excluding assets attributable to external unit holders of the consolidated collective investment schemes and other adjustments 16.0 11.0
Total Group funds under management 299.4 284.6
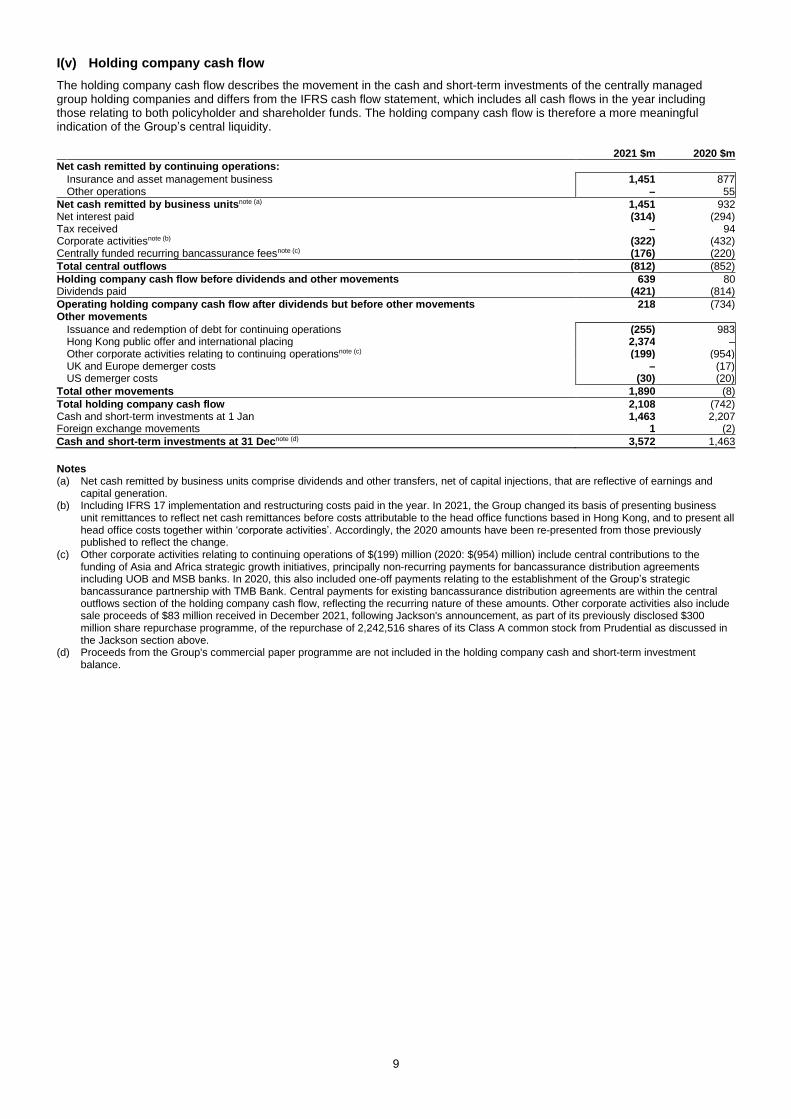
9
I(v) Holding company cash flow
The holding company cash flow describes the movement in the cash and short-term investments of the centrally managed group holding companies and differs from the IFRS cash flow statement, which includes all cash flows in the year including those relating to both policyholder and shareholder funds. The holding company cash flow is therefore a more meaningful indication of the Group’s central liquidity. 2021 $m 2020 $m
Net cash remitted by continuing operations:
Insurance and asset management business 1,451 877 Other operations – 55
Net cash remitted by business unitsnote (a) 1,451 932 Net interest paid (314) (294) Tax received – 94 Corporate activitiesnote (b) (322) (432) Centrally funded recurring bancassurance feesnote (c) (176) (220)
Total central outflows (812) (852)
Holding company cash flow before dividends and other movements 639 80 Dividends paid (421) (814)
Operating holding company cash flow after dividends but before other movements 218 (734) Other movements
Issuance and redemption of debt for continuing operations (255) 983 Hong Kong public offer and international placing 2,374 – Other corporate activities relating to continuing operationsnote (c) (199) (954) UK and Europe demerger costs – (17) US demerger costs (30) (20)
Total other movements 1,890 (8)
Total holding company cash flow 2,108 (742) Cash and short-term investments at 1 Jan 1,463 2,207 Foreign exchange movements 1 (2)
Cash and short-term investments at 31 Decnote (d) 3,572 1,463
Notes (a) Net cash remitted by business units comprise dividends and other transfers, net of capital injections, that are reflective of earnings and
capital generation. (b) Including IFRS 17 implementation and restructuring costs paid in the year. In 2021, the Group changed its basis of presenting business
unit remittances to reflect net cash remittances before costs attributable to the head office functions based in Hong Kong, and to present all head office costs together within ‘corporate activities’. Accordingly, the 2020 amounts have been re-presented from those previously published to reflect the change.
(c) Other corporate activities relating to continuing operations of $(199) million (2020: $(954) million) include central contributions to the funding of Asia and Africa strategic growth initiatives, principally non-recurring payments for bancassurance distribution agreements including UOB and MSB banks. In 2020, this also included one-off payments relating to the establishment of the Group’s strategic bancassurance partnership with TMB Bank. Central payments for existing bancassurance distribution agreements are within the central outflows section of the holding company cash flow, reflecting the recurring nature of these amounts. Other corporate activities also include sale proceeds of $83 million received in December 2021, following Jackson's announcement, as part of its previously disclosed $300 million share repurchase programme, of the repurchase of 2,242,516 shares of its Class A common stock from Prudential as discussed in the Jackson section above.
(d) Proceeds from the Group's commercial paper programme are not included in the holding company cash and short-term investment balance.
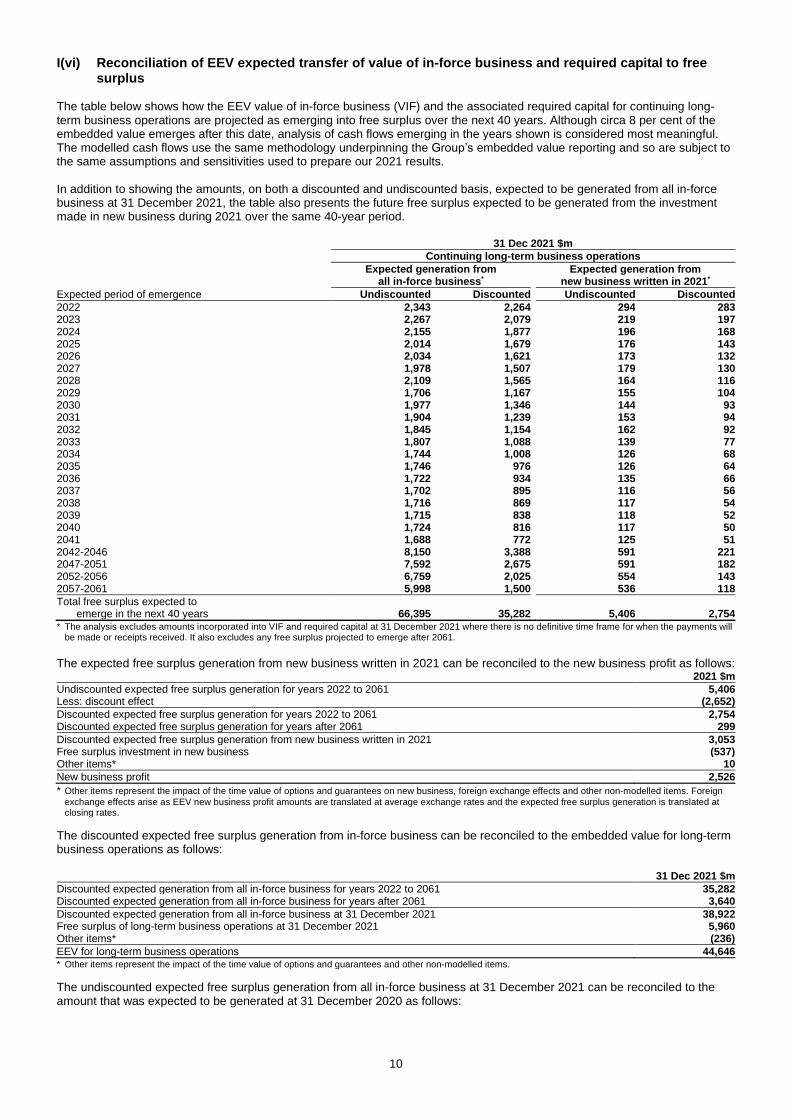
10
I(vi) Reconciliation of EEV expected transfer of value of in-force business and required capital to free surplus
The table below shows how the EEV value of in-force business (VIF) and the associated required capital for continuing long-term business operations are projected as emerging into free surplus over the next 40 years. Although circa 8 per cent of the embedded value emerges after this date, analysis of cash flows emerging in the years shown is considered most meaningful. The modelled cash flows use the same methodology underpinning the Group’s embedded value reporting and so are subject to the same assumptions and sensitivities used to prepare our 2021 results. In addition to showing the amounts, on both a discounted and undiscounted basis, expected to be generated from all in-force business at 31 December 2021, the table also presents the future free surplus expected to be generated from the investment made in new business during 2021 over the same 40-year period. 31 Dec 2021 $m
Continuing long-term business operations
Expected generation from
all in-force business* Expected generation from
new business written in 2021*
Expected period of emergence Undiscounted Discounted Undiscounted Discounted
2022 2,343 2,264 294 283 2023 2,267 2,079 219 197 2024 2,155 1,877 196 168 2025 2,014 1,679 176 143 2026 2,034 1,621 173 132 2027 1,978 1,507 179 130 2028 2,109 1,565 164 116 2029 1,706 1,167 155 104 2030 1,977 1,346 144 93 2031 1,904 1,239 153 94 2032 1,845 1,154 162 92 2033 1,807 1,088 139 77 2034 1,744 1,008 126 68 2035 1,746 976 126 64 2036 1,722 934 135 66 2037 1,702 895 116 56 2038 1,716 869 117 54 2039 1,715 838 118 52 2040 1,724 816 117 50 2041 1,688 772 125 51 2042-2046 8,150 3,388 591 221 2047-2051 7,592 2,675 591 182 2052-2056 6,759 2,025 554 143 2057-2061 5,998 1,500 536 118
Total free surplus expected to emerge in the next 40 years 66,395 35,282 5,406 2,754 * The analysis excludes amounts incorporated into VIF and required capital at 31 December 2021 where there is no definitive time frame for when the payments will
be made or receipts received. It also excludes any free surplus projected to emerge after 2061.
The expected free surplus generation from new business written in 2021 can be reconciled to the new business profit as follows: 2021 $m
Undiscounted expected free surplus generation for years 2022 to 2061 5,406 Less: discount effect (2,652)
Discounted expected free surplus generation for years 2022 to 2061 2,754 Discounted expected free surplus generation for years after 2061 299
Discounted expected free surplus generation from new business written in 2021 3,053 Free surplus investment in new business (537) Other items* 10
New business profit 2,526
* Other items represent the impact of the time value of options and guarantees on new business, foreign exchange effects and other non-modelled items. Foreign
exchange effects arise as EEV new business profit amounts are translated at average exchange rates and the expected free surplus generation is translated at closing rates.
The discounted expected free surplus generation from in-force business can be reconciled to the embedded value for long-term business operations as follows: 31 Dec 2021 $m
Discounted expected generation from all in-force business for years 2022 to 2061 35,282 Discounted expected generation from all in-force business for years after 2061 3,640
Discounted expected generation from all in-force business at 31 December 2021 38,922 Free surplus of long-term business operations at 31 December 2021 5,960 Other items* (236)
EEV for long-term business operations 44,646 * Other items represent the impact of the time value of options and guarantees and other non-modelled items.
The undiscounted expected free surplus generation from all in-force business at 31 December 2021 can be reconciled to the amount that was expected to be generated at 31 December 2020 as follows:
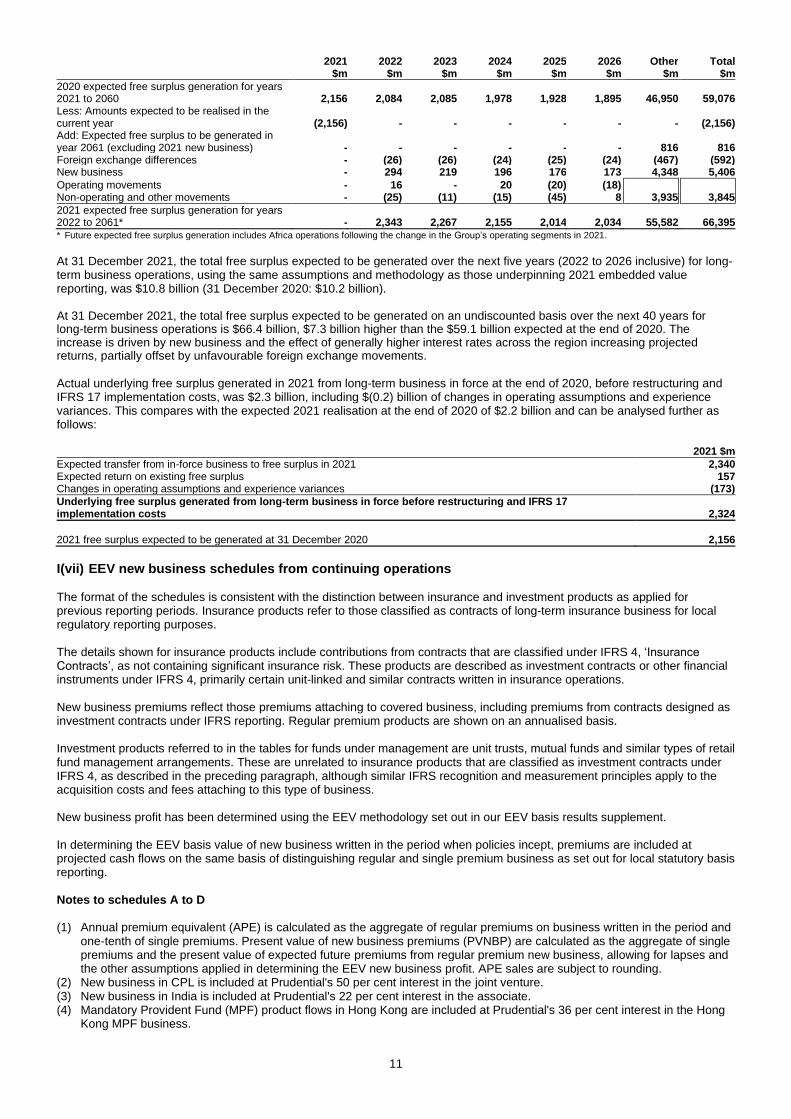
11
2021 2022 2023 2024 2025 2026 Other Total $m $m $m $m $m $m $m $m
2020 expected free surplus generation for years 2021 to 2060 2,156 2,084 2,085 1,978 1,928 1,895 46,950 59,076 Less: Amounts expected to be realised in the current year (2,156) - - - - - - (2,156) Add: Expected free surplus to be generated in year 2061 (excluding 2021 new business) - - - - - - 816 816 Foreign exchange differences - (26) (26) (24) (25) (24) (467) (592) New business - 294 219 196 176 173 4,348 5,406
Operating movements - 16 - 20 (20) (18) Non-operating and other movements - (25) (11) (15) (45) 8 3,935 3,845
2021 expected free surplus generation for years 2022 to 2061* - 2,343 2,267 2,155 2,014 2,034 55,582 66,395 * Future expected free surplus generation includes Africa operations following the change in the Group’s operating segments in 2021.
At 31 December 2021, the total free surplus expected to be generated over the next five years (2022 to 2026 inclusive) for long-term business operations, using the same assumptions and methodology as those underpinning 2021 embedded value reporting, was $10.8 billion (31 December 2020: $10.2 billion). At 31 December 2021, the total free surplus expected to be generated on an undiscounted basis over the next 40 years for long-term business operations is $66.4 billion, $7.3 billion higher than the $59.1 billion expected at the end of 2020. The increase is driven by new business and the effect of generally higher interest rates across the region increasing projected returns, partially offset by unfavourable foreign exchange movements. Actual underlying free surplus generated in 2021 from long-term business in force at the end of 2020, before restructuring and IFRS 17 implementation costs, was $2.3 billion, including $(0.2) billion of changes in operating assumptions and experience variances. This compares with the expected 2021 realisation at the end of 2020 of $2.2 billion and can be analysed further as follows: 2021 $m
Expected transfer from in-force business to free surplus in 2021 2,340 Expected return on existing free surplus 157 Changes in operating assumptions and experience variances (173)
Underlying free surplus generated from long-term business in force before restructuring and IFRS 17 implementation costs 2,324
2021 free surplus expected to be generated at 31 December 2020 2,156
I(vii) EEV new business schedules from continuing operations The format of the schedules is consistent with the distinction between insurance and investment products as applied for previous reporting periods. Insurance products refer to those classified as contracts of long-term insurance business for local regulatory reporting purposes. The details shown for insurance products include contributions from contracts that are classified under IFRS 4, ‘Insurance Contracts’, as not containing significant insurance risk. These products are described as investment contracts or other financial instruments under IFRS 4, primarily certain unit-linked and similar contracts written in insurance operations. New business premiums reflect those premiums attaching to covered business, including premiums from contracts designed as investment contracts under IFRS reporting. Regular premium products are shown on an annualised basis. Investment products referred to in the tables for funds under management are unit trusts, mutual funds and similar types of retail fund management arrangements. These are unrelated to insurance products that are classified as investment contracts under IFRS 4, as described in the preceding paragraph, although similar IFRS recognition and measurement principles apply to the acquisition costs and fees attaching to this type of business. New business profit has been determined using the EEV methodology set out in our EEV basis results supplement. In determining the EEV basis value of new business written in the period when policies incept, premiums are included at projected cash flows on the same basis of distinguishing regular and single premium business as set out for local statutory basis reporting. Notes to schedules A to D (1) Annual premium equivalent (APE) is calculated as the aggregate of regular premiums on business written in the period and
one-tenth of single premiums. Present value of new business premiums (PVNBP) are calculated as the aggregate of single premiums and the present value of expected future premiums from regular premium new business, allowing for lapses and the other assumptions applied in determining the EEV new business profit. APE sales are subject to rounding.
(2) New business in CPL is included at Prudential's 50 per cent interest in the joint venture. (3) New business in India is included at Prudential's 22 per cent interest in the associate. (4) Mandatory Provident Fund (MPF) product flows in Hong Kong are included at Prudential's 36 per cent interest in the Hong
Kong MPF business.
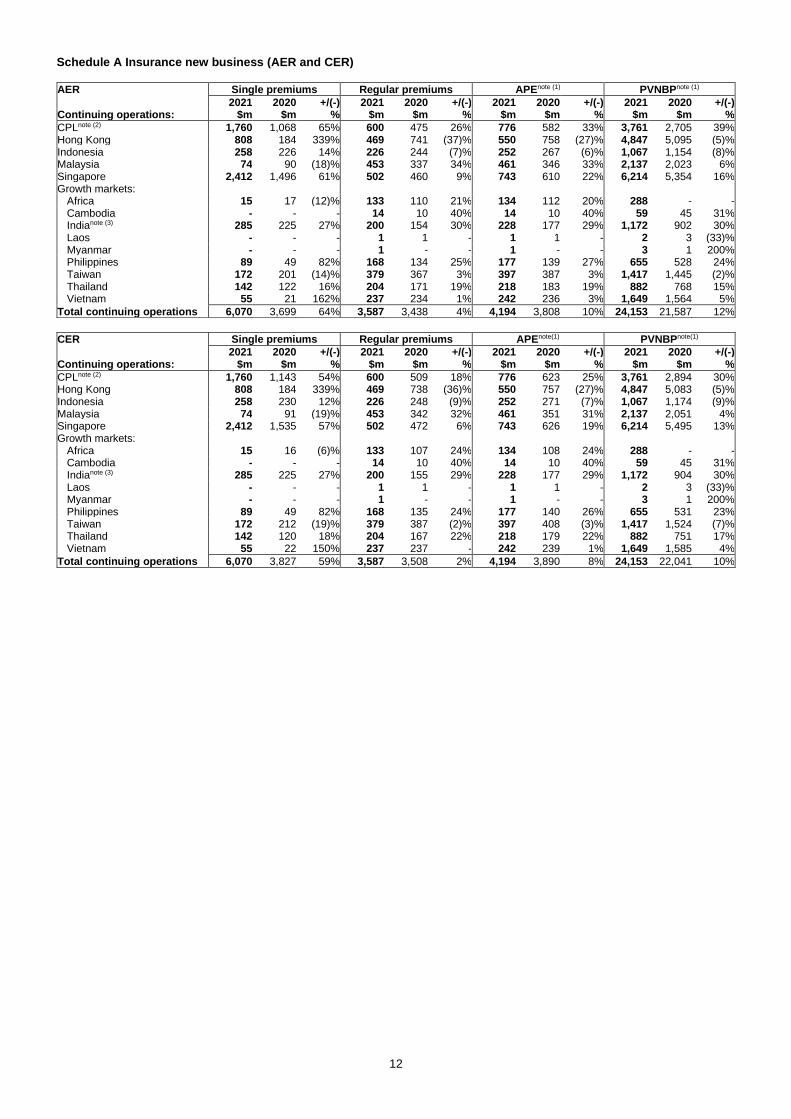
12
Schedule A Insurance new business (AER and CER) AER Single premiums Regular premiums APEnote (1) PVNBPnote (1)
2021 2020 +/(-) 2021 2020 +/(-) 2021 2020 +/(-) 2021 2020 +/(-) Continuing operations: $m $m % $m $m % $m $m % $m $m %
CPLnote (2) 1,760 1,068 65% 600 475 26% 776 582 33% 3,761 2,705 39% Hong Kong 808 184 339% 469 741 (37)% 550 758 (27)% 4,847 5,095 (5)% Indonesia 258 226 14% 226 244 (7)% 252 267 (6)% 1,067 1,154 (8)% Malaysia 74 90 (18)% 453 337 34% 461 346 33% 2,137 2,023 6% Singapore 2,412 1,496 61% 502 460 9% 743 610 22% 6,214 5,354 16% Growth markets: Africa 15 17 (12)% 133 110 21% 134 112 20% 288 - - Cambodia - - - 14 10 40% 14 10 40% 59 45 31% Indianote (3) 285 225 27% 200 154 30% 228 177 29% 1,172 902 30% Laos - - - 1 1 - 1 1 - 2 3 (33)% Myanmar - - - 1 - - 1 - - 3 1 200% Philippines 89 49 82% 168 134 25% 177 139 27% 655 528 24% Taiwan 172 201 (14)% 379 367 3% 397 387 3% 1,417 1,445 (2)% Thailand 142 122 16% 204 171 19% 218 183 19% 882 768 15% Vietnam 55 21 162% 237 234 1% 242 236 3% 1,649 1,564 5%
Total continuing operations 6,070 3,699 64% 3,587 3,438 4% 4,194 3,808 10% 24,153 21,587 12%
CER Single premiums Regular premiums APEnote(1) PVNBPnote(1)
2021 2020 +/(-) 2021 2020 +/(-) 2021 2020 +/(-) 2021 2020 +/(-) Continuing operations: $m $m % $m $m % $m $m % $m $m %
CPLnote (2) 1,760 1,143 54% 600 509 18% 776 623 25% 3,761 2,894 30% Hong Kong 808 184 339% 469 738 (36)% 550 757 (27)% 4,847 5,083 (5)% Indonesia 258 230 12% 226 248 (9)% 252 271 (7)% 1,067 1,174 (9)% Malaysia 74 91 (19)% 453 342 32% 461 351 31% 2,137 2,051 4% Singapore 2,412 1,535 57% 502 472 6% 743 626 19% 6,214 5,495 13% Growth markets: Africa 15 16 (6)% 133 107 24% 134 108 24% 288 - - Cambodia - - - 14 10 40% 14 10 40% 59 45 31% Indianote (3) 285 225 27% 200 155 29% 228 177 29% 1,172 904 30% Laos - - - 1 1 - 1 1 - 2 3 (33)% Myanmar - - - 1 - - 1 - - 3 1 200% Philippines 89 49 82% 168 135 24% 177 140 26% 655 531 23% Taiwan 172 212 (19)% 379 387 (2)% 397 408 (3)% 1,417 1,524 (7)% Thailand 142 120 18% 204 167 22% 218 179 22% 882 751 17% Vietnam 55 22 150% 237 237 - 242 239 1% 1,649 1,585 4%
Total continuing operations 6,070 3,827 59% 3,587 3,508 2% 4,194 3,890 8% 24,153 22,041 10%
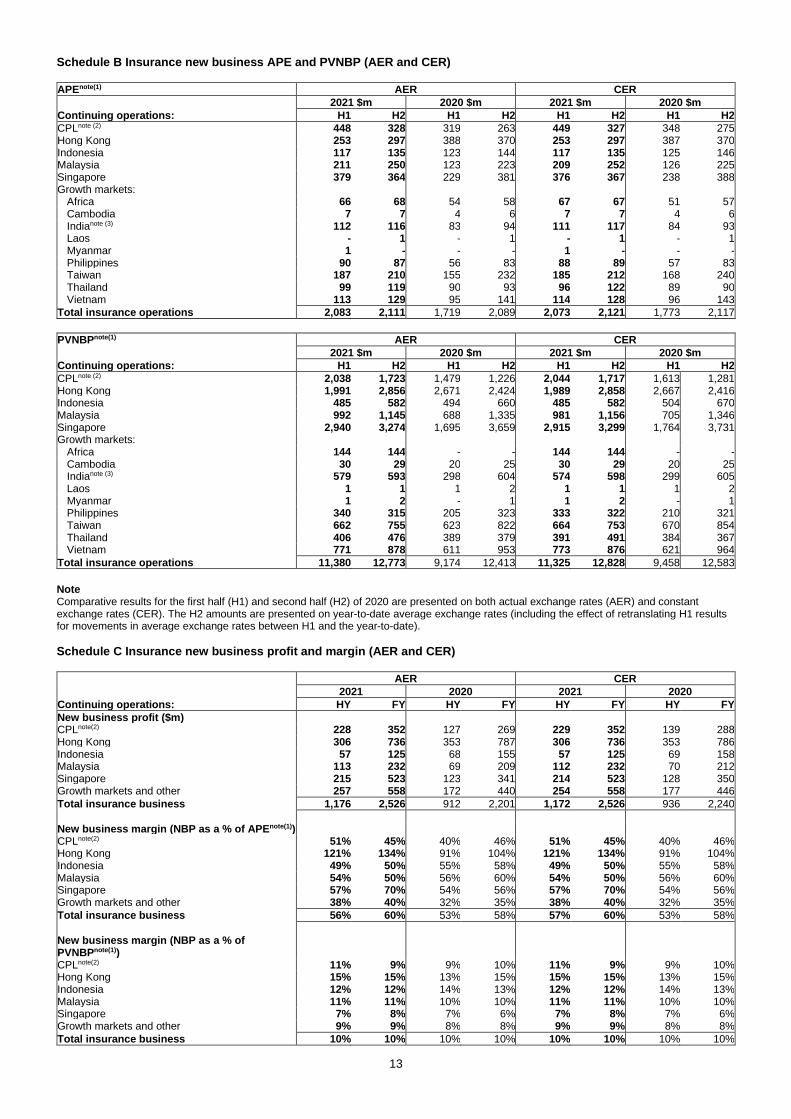
13
Schedule B Insurance new business APE and PVNBP (AER and CER) APEnote(1) AER CER
2021 $m 2020 $m 2021 $m 2020 $m
Continuing operations: H1 H2 H1 H2 H1 H2 H1 H2
CPLnote (2) 448 328 319 263 449 327 348 275 Hong Kong 253 297 388 370 253 297 387 370 Indonesia 117 135 123 144 117 135 125 146 Malaysia 211 250 123 223 209 252 126 225 Singapore 379 364 229 381 376 367 238 388 Growth markets: Africa 66 68 54 58 67 67 51 57 Cambodia 7 7 4 6 7 7 4 6 Indianote (3) 112 116 83 94 111 117 84 93 Laos - 1 - 1 - 1 - 1 Myanmar 1 - - - 1 - - - Philippines 90 87 56 83 88 89 57 83 Taiwan 187 210 155 232 185 212 168 240 Thailand 99 119 90 93 96 122 89 90 Vietnam 113 129 95 141 114 128 96 143
Total insurance operations 2,083 2,111 1,719 2,089 2,073 2,121 1,773 2,117
PVNBPnote(1) AER CER
2021 $m 2020 $m 2021 $m 2020 $m
Continuing operations: H1 H2 H1 H2 H1 H2 H1 H2
CPLnote (2) 2,038 1,723 1,479 1,226 2,044 1,717 1,613 1,281 Hong Kong 1,991 2,856 2,671 2,424 1,989 2,858 2,667 2,416 Indonesia 485 582 494 660 485 582 504 670 Malaysia 992 1,145 688 1,335 981 1,156 705 1,346 Singapore 2,940 3,274 1,695 3,659 2,915 3,299 1,764 3,731 Growth markets: Africa 144 144 - - 144 144 - - Cambodia 30 29 20 25 30 29 20 25 Indianote (3) 579 593 298 604 574 598 299 605 Laos 1 1 1 2 1 1 1 2 Myanmar 1 2 - 1 1 2 - 1 Philippines 340 315 205 323 333 322 210 321 Taiwan 662 755 623 822 664 753 670 854 Thailand 406 476 389 379 391 491 384 367 Vietnam 771 878 611 953 773 876 621 964
Total insurance operations 11,380 12,773 9,174 12,413 11,325 12,828 9,458 12,583
Note Comparative results for the first half (H1) and second half (H2) of 2020 are presented on both actual exchange rates (AER) and constant exchange rates (CER). The H2 amounts are presented on year-to-date average exchange rates (including the effect of retranslating H1 results for movements in average exchange rates between H1 and the year-to-date).
Schedule C Insurance new business profit and margin (AER and CER) AER CER
2021 2020 2021 2020
Continuing operations: HY FY HY FY HY FY HY FY
New business profit ($m) CPLnote(2) 228 352 127 269 229 352 139 288 Hong Kong 306 736 353 787 306 736 353 786 Indonesia 57 125 68 155 57 125 69 158 Malaysia 113 232 69 209 112 232 70 212 Singapore 215 523 123 341 214 523 128 350 Growth markets and other 257 558 172 440 254 558 177 446
Total insurance business 1,176 2,526 912 2,201 1,172 2,526 936 2,240
New business margin (NBP as a % of APEnote(1)) CPLnote(2) 51% 45% 40% 46% 51% 45% 40% 46% Hong Kong 121% 134% 91% 104% 121% 134% 91% 104% Indonesia 49% 50% 55% 58% 49% 50% 55% 58% Malaysia 54% 50% 56% 60% 54% 50% 56% 60% Singapore 57% 70% 54% 56% 57% 70% 54% 56% Growth markets and other 38% 40% 32% 35% 38% 40% 32% 35%
Total insurance business 56% 60% 53% 58% 57% 60% 53% 58%
New business margin (NBP as a % of PVNBPnote(1)) CPLnote(2) 11% 9% 9% 10% 11% 9% 9% 10% Hong Kong 15% 15% 13% 15% 15% 15% 13% 15% Indonesia 12% 12% 14% 13% 12% 12% 14% 13% Malaysia 11% 11% 10% 10% 11% 11% 10% 10% Singapore 7% 8% 7% 6% 7% 8% 7% 6% Growth markets and other 9% 9% 8% 8% 9% 9% 8% 8%
Total insurance business 10% 10% 10% 10% 10% 10% 10% 10%
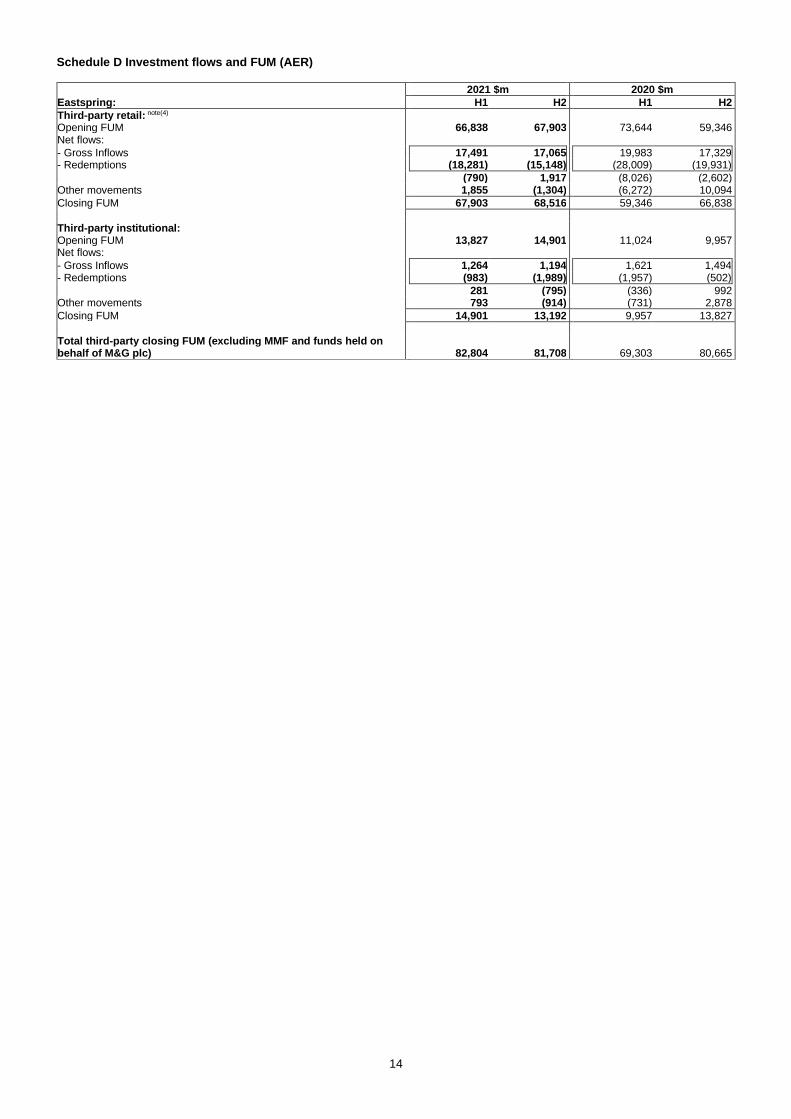
14
Schedule D Investment flows and FUM (AER) 2021 $m 2020 $m
Eastspring: H1 H2 H1 H2
Third-party retail: note(4) Opening FUM 66,838 67,903 73,644 59,346 Net flows:
- Gross Inflows 17,491 17,065 19,983 17,329 - Redemptions (18,281) (15,148) (28,009) (19,931)
(790) 1,917 (8,026) (2,602) Other movements 1,855 (1,304) (6,272) 10,094
Closing FUM 67,903 68,516 59,346 66,838
Third-party institutional: Opening FUM 13,827 14,901 11,024 9,957 Net flows:
- Gross Inflows 1,264 1,194 1,621 1,494 - Redemptions (983) (1,989) (1,957) (502)
281 (795) (336) 992 Other movements 793 (914) (731) 2,878
Closing FUM 14,901 13,192 9,957 13,827
Total third-party closing FUM (excluding MMF and funds held on behalf of M&G plc) 82,804 81,708 69,303 80,665

15
II Calculation of alternative performance measures
Prudential uses alternative performance measures (APMs) to provide more relevant explanations of the Group’s financial position and performance. This section sets out explanations for each APM and reconciliations to relevant IFRS balances.
II(i) Reconciliation of adjusted operating profit to profit before tax
Adjusted operating profit presents the operating performance of the business. This measurement basis adjusts for the following items within total IFRS profit before tax:
– Short-term fluctuations in investment returns on shareholder-backed business;
– Amortisation of acquisition accounting adjustments arising on the purchase of business; and – Gain or loss on corporate transactions, as discussed in note D1.1 to the IFRS basis results.
More details on how adjusted operating profit is determined are included in note B1.2 of the Group IFRS basis results. A full reconciliation to profit after tax is given in note B1.1.
II(ii) Calculation of IFRS gearing ratio from continuing operations
IFRS gearing ratio is calculated as net core structural borrowings of shareholder-financed businesses divided by closing IFRS shareholders’ equity plus net core structural borrowings, all in respect of continuing operations. 31 Dec 2021 $m 31 Dec 2020 $m
Continuing operations: Core structural borrowings of shareholder-financed businesses 6,127 6,383 Less holding company cash and short-term investments (3,572) (1,463)
Net core structural borrowings of shareholder-financed businesses 2,555 4,920 Closing shareholders’ equity 17,088 12,367
Closing shareholders’ equity plus net core structural borrowings 19,643 17,287
IFRS gearing ratio 13% 28%
II(iii) Return on IFRS shareholders’ equity from continuing operations
This measure is calculated as adjusted operating profit from continuing operations, after tax and non-controlling interests, divided by average shareholders’ equity in respect of continuing operations. Detailed reconciliation of adjusted operating profit from continuing operations to IFRS profit before tax for the Group is shown in note B1.1 to the Group IFRS basis results. 2021 $m 2020 $m
Adjusted operating profit 3,233 2,757 Tax on adjusted operating profit (548) (497) Adjusted operating profit attributable to non-controlling interests (17) (10)
Adjusted operating profit, net of tax and non-controlling interests 2,668 2,250
Shareholders’ equity at beginning of year 12,367 10,548 Shareholders’ equity at end of year 17,088 12,367 Average shareholders’ equity 14,728 11,458
Operating return on average shareholders’ equity (%) 18% 20%
II(iv) Calculation of IFRS shareholders’ equity per share
IFRS shareholders’ equity per share is calculated as closing IFRS shareholders’ equity divided by the number of issued shares at the end of the year. 2021 2020
Number of issued shares at the end of the year 2,746 2,609 Closing IFRS shareholders’ equity for continuing operations ($ million) 17,088 12,367 Shareholders’ equity per share (cents) for continuing operations 622¢ 474¢ Closing IFRS shareholders’ equity for discontinuing operations ($ million) – 8,511 Shareholders’ equity per share (cents) for discontinued US operations – 326¢
Group shareholders’ equity per share (cents) 622¢ 800¢
II(v) Calculation of Eastspring cost/income ratio
The cost/income ratio is calculated as operating expenses, adjusted for commissions and share of contribution from joint ventures and associates, divided by operating income, adjusted for commission, share of contribution from joint ventures and associates and performance-related fees.
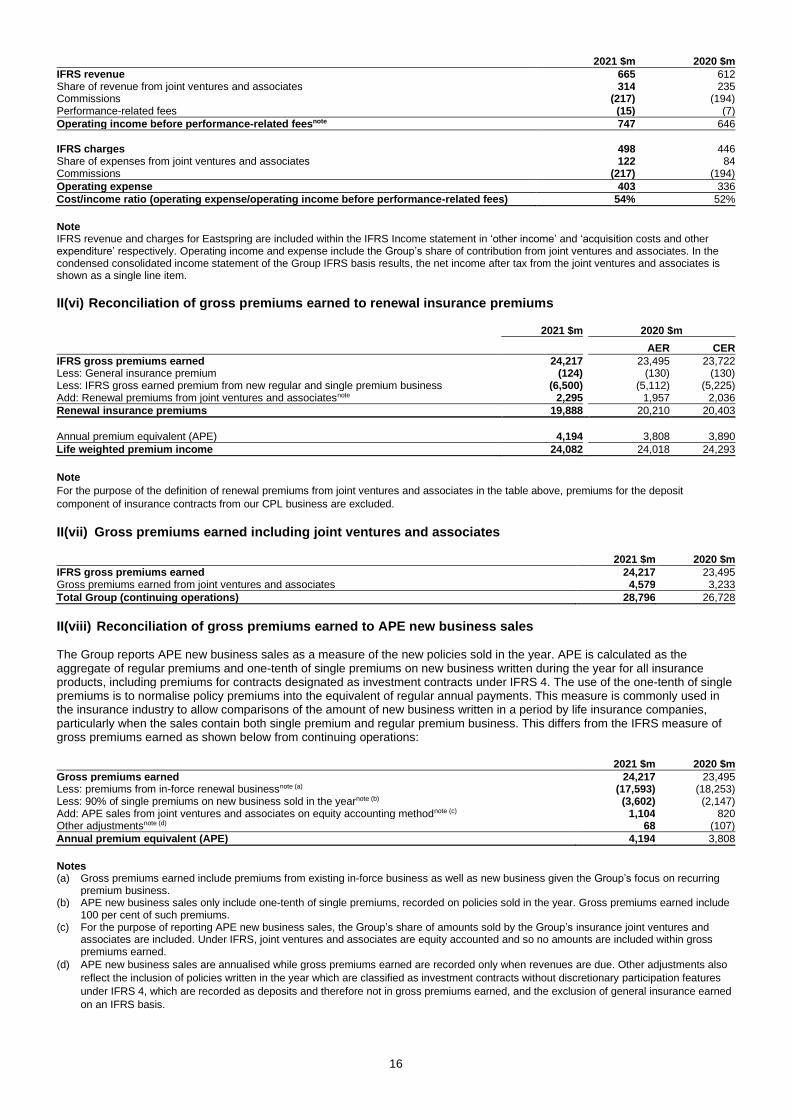
16
2021 $m 2020 $m
IFRS revenue 665 612 Share of revenue from joint ventures and associates 314 235 Commissions (217) (194) Performance-related fees (15) (7)
Operating income before performance-related feesnote 747 646
IFRS charges 498 446 Share of expenses from joint ventures and associates 122 84 Commissions (217) (194)
Operating expense 403 336
Cost/income ratio (operating expense/operating income before performance-related fees) 54% 52%
Note IFRS revenue and charges for Eastspring are included within the IFRS Income statement in ‘other income’ and ‘acquisition costs and other expenditure’ respectively. Operating income and expense include the Group’s share of contribution from joint ventures and associates. In the condensed consolidated income statement of the Group IFRS basis results, the net income after tax from the joint ventures and associates is shown as a single line item.
II(vi) Reconciliation of gross premiums earned to renewal insurance premiums 2021 $m 2020 $m
AER CER
IFRS gross premiums earned 24,217 23,495 23,722 Less: General insurance premium (124) (130) (130) Less: IFRS gross earned premium from new regular and single premium business (6,500) (5,112) (5,225) Add: Renewal premiums from joint ventures and associatesnote 2,295 1,957 2,036
Renewal insurance premiums 19,888 20,210 20,403
Annual premium equivalent (APE) 4,194 3,808 3,890
Life weighted premium income 24,082 24,018 24,293
Note
For the purpose of the definition of renewal premiums from joint ventures and associates in the table above, premiums for the deposit
component of insurance contracts from our CPL business are excluded.
II(vii) Gross premiums earned including joint ventures and associates 2021 $m 2020 $m
IFRS gross premiums earned 24,217 23,495 Gross premiums earned from joint ventures and associates 4,579 3,233
Total Group (continuing operations) 28,796 26,728
II(viii) Reconciliation of gross premiums earned to APE new business sales The Group reports APE new business sales as a measure of the new policies sold in the year. APE is calculated as the aggregate of regular premiums and one-tenth of single premiums on new business written during the year for all insurance products, including premiums for contracts designated as investment contracts under IFRS 4. The use of the one-tenth of single premiums is to normalise policy premiums into the equivalent of regular annual payments. This measure is commonly used in the insurance industry to allow comparisons of the amount of new business written in a period by life insurance companies, particularly when the sales contain both single premium and regular premium business. This differs from the IFRS measure of gross premiums earned as shown below from continuing operations: 2021 $m 2020 $m
Gross premiums earned 24,217 23,495 Less: premiums from in-force renewal businessnote (a) (17,593) (18,253) Less: 90% of single premiums on new business sold in the yearnote (b) (3,602) (2,147) Add: APE sales from joint ventures and associates on equity accounting methodnote (c) 1,104 820 Other adjustmentsnote (d) 68 (107)
Annual premium equivalent (APE) 4,194 3,808
Notes (a) Gross premiums earned include premiums from existing in-force business as well as new business given the Group’s focus on recurring
premium business. (b) APE new business sales only include one-tenth of single premiums, recorded on policies sold in the year. Gross premiums earned include
100 per cent of such premiums. (c) For the purpose of reporting APE new business sales, the Group’s share of amounts sold by the Group’s insurance joint ventures and
associates are included. Under IFRS, joint ventures and associates are equity accounted and so no amounts are included within gross premiums earned.
(d) APE new business sales are annualised while gross premiums earned are recorded only when revenues are due. Other adjustments also
reflect the inclusion of policies written in the year which are classified as investment contracts without discretionary participation features
under IFRS 4, which are recorded as deposits and therefore not in gross premiums earned, and the exclusion of general insurance earned
on an IFRS basis.
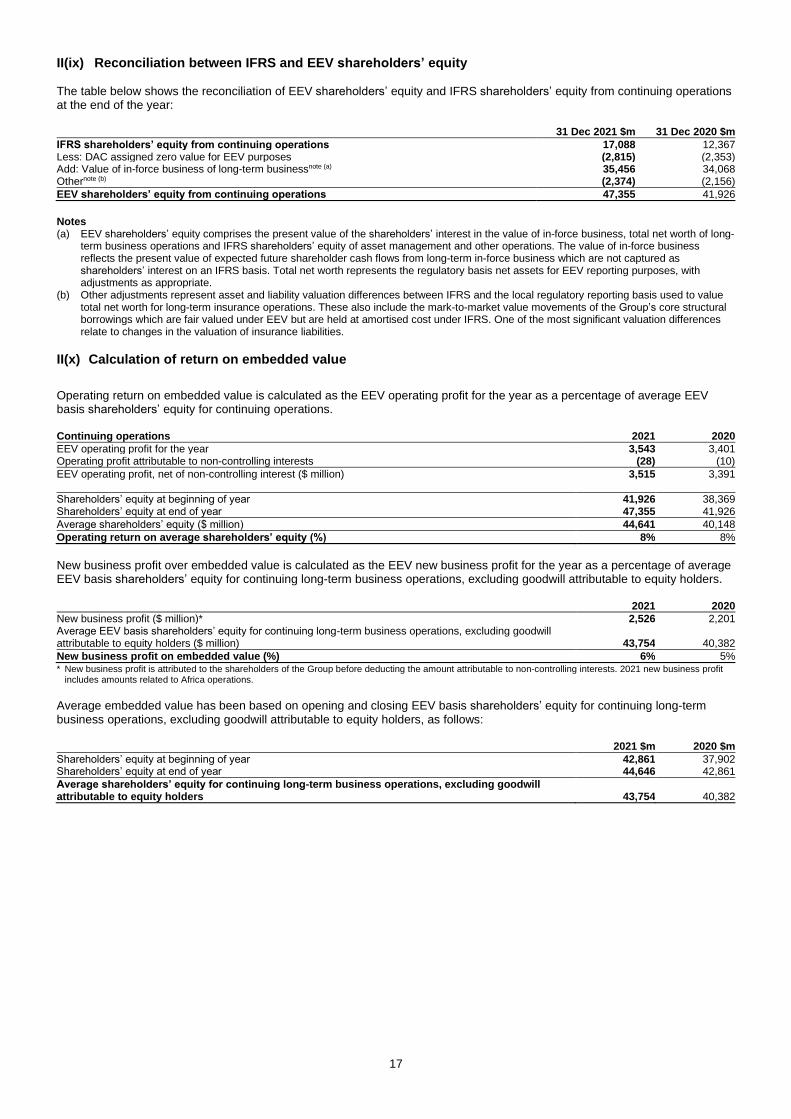
17
II(ix) Reconciliation between IFRS and EEV shareholders’ equity The table below shows the reconciliation of EEV shareholders’ equity and IFRS shareholders’ equity from continuing operations at the end of the year: 31 Dec 2021 $m 31 Dec 2020 $m
IFRS shareholders’ equity from continuing operations 17,088 12,367 Less: DAC assigned zero value for EEV purposes (2,815) (2,353) Add: Value of in-force business of long-term businessnote (a) 35,456 34,068 Othernote (b) (2,374) (2,156)
EEV shareholders’ equity from continuing operations 47,355 41,926
Notes (a) EEV shareholders’ equity comprises the present value of the shareholders’ interest in the value of in-force business, total net worth of long-
term business operations and IFRS shareholders’ equity of asset management and other operations. The value of in-force business reflects the present value of expected future shareholder cash flows from long-term in-force business which are not captured as shareholders’ interest on an IFRS basis. Total net worth represents the regulatory basis net assets for EEV reporting purposes, with adjustments as appropriate.
(b) Other adjustments represent asset and liability valuation differences between IFRS and the local regulatory reporting basis used to value total net worth for long-term insurance operations. These also include the mark-to-market value movements of the Group’s core structural borrowings which are fair valued under EEV but are held at amortised cost under IFRS. One of the most significant valuation differences relate to changes in the valuation of insurance liabilities.
II(x) Calculation of return on embedded value
Operating return on embedded value is calculated as the EEV operating profit for the year as a percentage of average EEV basis shareholders’ equity for continuing operations. Continuing operations 2021 2020
EEV operating profit for the year 3,543 3,401 Operating profit attributable to non-controlling interests (28) (10)
EEV operating profit, net of non-controlling interest ($ million) 3,515 3,391
Shareholders’ equity at beginning of year 41,926 38,369 Shareholders’ equity at end of year 47,355 41,926
Average shareholders’ equity ($ million) 44,641 40,148
Operating return on average shareholders’ equity (%) 8% 8%
New business profit over embedded value is calculated as the EEV new business profit for the year as a percentage of average EEV basis shareholders’ equity for continuing long-term business operations, excluding goodwill attributable to equity holders. 2021 2020
New business profit ($ million)* 2,526 2,201 Average EEV basis shareholders’ equity for continuing long-term business operations, excluding goodwill attributable to equity holders ($ million) 43,754 40,382
New business profit on embedded value (%) 6% 5% * New business profit is attributed to the shareholders of the Group before deducting the amount attributable to non-controlling interests. 2021 new business profit
includes amounts related to Africa operations.
Average embedded value has been based on opening and closing EEV basis shareholders’ equity for continuing long-term business operations, excluding goodwill attributable to equity holders, as follows: 2021 $m 2020 $m
Shareholders’ equity at beginning of year 42,861 37,902 Shareholders’ equity at end of year 44,646 42,861
Average shareholders’ equity for continuing long-term business operations, excluding goodwill attributable to equity holders 43,754 40,382

1
Risk Factors A number of risk factors may affect the financial condition, results of operations and/or prospects of Prudential and its wholly and jointly owned businesses, as a whole, and, accordingly, the trading price of Prudential’s shares. The risk factors mentioned below should not be regarded as a complete and comprehensive statement of all potential risks and uncertainties. The information given is as of the date of this document, and any forward-looking statements are made subject to the factors specified under ‘Forward-looking statements’. Prudential’s approaches to managing risks are explained in the ‘Risk review’ section of this document. 1. RISKS RELATING TO PRUDENTIAL’S FINANCIAL SITUATION 1.1 The Covid-19 pandemic has significantly impacted financial market volatility and global economic activity, increased
operational disruption risks for businesses and has adversely impacted Prudential’s sales in affected markets and its financial condition, results of operations and prospects. The full extent of the longer-term impacts from the pandemic remains uncertain.
The Covid-19 pandemic has added significant uncertainty to the stability and outlook of equity markets, interest rates and credit spreads, and has affected market liquidity and reduced global economic activity. The potential adverse impacts to the Group of these effects are detailed in risk factor 1.2 below. However, while global growth has broadly recovered, the full extent of the long-term impact of the pandemic on financial markets and economic growth remains highly uncertain and unpredictable and will be influenced by the actions of governments, policymakers and the public. These actions, and their effectiveness, vary between markets, and may drive an uneven economic recovery, and include the extent and timing of continued measures to restrict movement and the effectiveness of vaccination programme deployment and uptake in response to current, emerging and future variants of the coronavirus. Where actions and impacts are prolonged, they may affect the solvency position of the Group’s subsidiaries and prevent or limit their ability to make remittances, adversely impacting the financial condition and prospects of the Group. The regulatory and supervisory responses to the Covid-19 pandemic have been broad and have included increased scrutiny of the operational resilience, liquidity and capital strength (including the impact of making dividend payments) of financial services companies. As some countries begin to adopt strategies to manage Covid-19 as an endemic disease, variations in the speed of economic recovery between markets, and the subsequent impact on their respective interest rates, inflation expectations and the relative strength of their currencies (and the associated impact on their foreign currency debt obligations, which may disproportionately impact emerging economies) may have broader long-term adverse economic and financial consequences for the markets in which the Group operates and the full extent of this currently remains uncertain. Various governments have effected, or may effect, the postponement of elections and other constitutional or legislative processes in response to the pandemic, and this may result in an increase in constitutional and political uncertainty in some the markets in which the Group operates. Many governments are implementing Covid-19 vaccination and booster programmes, and variable accessibility to supplies of vaccines that are effective against current, emerging and future variants of the coronavirus has the potential to contribute to an increase in geopolitical and political tensions. The longer term political, regulatory and supervisory developments resulting from the Covid-19 pandemic remain highly uncertain. These may include changes to government fiscal policies, laws and regulations aimed at increasing financial stability and/or measures on businesses or specific industries to contribute to, lessen or otherwise support, the financial cost to governments in addressing the pandemic. This may extend to requirements on private insurance companies and healthcare providers to cover the costs associated with the treatment of Covid-19 beyond contractual or policy terms. The Covid-19 pandemic, and measures to contain it, have slowed economic and social activity in the Group’s geographical markets. While these conditions persist, the level of sales activity in affected markets has been, and will continue to be, adversely impacted through a reduction in travel and agency and bancassurance activity. In particular, sales in the Group’s Hong Kong business continue to be adversely impacted by the border restrictions in place with Mainland China. In FY 2020, during which the border closure occurred in Q1, the APE sales of the Group’s Hong Kong business reduced by $1,258 million (or 62 per cent) compared to 2019. In FY 2021, during which the border remained closed for the entire year, the APE sales of the Hong Kong business reduced by $208 million (or 27 per cent) compared to 2020. These impacts to the APE sales of the Group’s Hong Kong business were largely as a result of the border closure. Recovery in sales levels will be dependent on the timing and extent of the easing of these restrictions, with the emergence of the Covid-19 Omicron variant further increasing uncertainty to the return of Mainland China customers as well as the resumption of their demand for the Group’s products in Hong Kong. These impacts may be prolonged in markets which continue to rely on containment measures based on restrictions of movement. The impact on economic activity and employment levels may result in an elevated incidence of claims, lapses, or surrenders of policies, and some policyholders may choose to defer or stop paying insurance premiums or reduce deposits into retirement plans. The pandemic may also indirectly result in elevated claims and policy lapses or surrenders, with some delay in time before being felt by the Group, due to factors such as policyholders deferring medical treatment during the pandemic, or policyholders lapsing or surrendering their policies on the expiry of grace periods for premium payments provided by the Group’s businesses. The Group’s assessment to date is that elevated mortality claims in some markets can be attributed to Covid-19. The full extent of the impact of the Covid-19 pandemic is currently uncertain and the Group’s claims and persistency experience to date and its current insurance assumptions cannot be taken as an indicator of future potential experience from the Covid-19 pandemic which may deteriorate significantly and have a material adverse effect on Prudential’s business, financial condition, results of operations and prospects. The potential longer-term impacts of the pandemic may include latent morbidity impacts from the deferral of medical treatment by policyholders. It may be a factor in increasing morbidity claims and there may be implications from other factors such as long-term post-Covid-19 symptoms (although there is currently no consensus on the longer term impact on morbidity).
2
Disruption to Prudential’s operations may result where its employees, or those of its service partners and counterparties, contract Covid-19 or are affected by restrictions on movement; where office closures and other measures impacting working practices are effected, such as the imposition of remote working arrangements; and where quarantine requirements and isolation measures under local laws apply, and as a result of social distancing and/or other psychosocial impacts. While such measures are in place, there may also be an increase in attempts to compromise the resilience of IT systems through phishing, social engineering tactics and ransomware. Such measures, and the cycles of their relaxation and re-imposition, may also adversely impact the physical and mental health of the Group’s staff, increasing the risk of operational disruption resulting from performance impairment, an increase in absenteeism, or increased levels of staff turnover, which may affect operational capacity with the potential to be exacerbated by challenges in recruitment. The operations of Prudential’s service partners (which subject the Group to the risks detailed in risk factor 3.7, resulting in certain risks that Prudential does not face with respect to its wholly-owned subsidiaries) may be disrupted in different ways and to a more severe extent than the Group’s operations and may impact service delivery to the Group. In response to pandemic-related restrictions, Prudential implemented changes to its sales and distribution processes in specific markets. These include virtual face-to-face sales of its products and the online recruitment, training and, where possible, licensing of agents. Such changes may increase or introduce new operational and regulatory risks, in particular those focused on customer outcomes and conduct. A failure to implement appropriate governance and management of these new or incremental risks may adversely impact Prudential’s reputation and brand and the results of its operations. In markets where the level of sales under these new processes is material or where such processes become permanent distribution channels, the commercial value of the Group’s existing sale and distribution arrangements, such as bancassurance arrangements, may be adversely impacted. 1.2 Prudential’s businesses are inherently subject to market fluctuations and general economic conditions, each of
which may adversely affect the Group’s business, financial condition, results of operations and prospects. Uncertainty, fluctuations or negative trends in global and national macro-economic conditions and investment climates could have a material adverse effect on Prudential’s business and profitability. Prudential operates in a macroeconomic and global financial market environment that presents significant uncertainties and potential challenges. For example, following a prolonged period of relatively low interest rates in countries relevant to Prudential, the reopening and recovery of some economies during 2021 has resulted in inflationary pressures, which if sustained or increased may drive interest rates higher, impacting the valuation of fixed income assets. Uncertainties also include the impact of factors such as the actions of central banks and governments to mitigate the impact of the Covid-19 pandemic and in response to inflationary pressures. The transition to a lower carbon economy, the timing and speed of which is uncertain, may also result in greater uncertainty, fluctuations or negative trends in asset valuations, particularly for carbon intensive sectors, and will have a bearing on inflation levels. Global financial markets are subject to uncertainty and volatility created by a variety of factors. These factors include actual or expected slowdowns or reversals in world economic growth (particularly where this is abrupt, as has been the case with the early impact of the Covid-19 pandemic), sector specific slowdowns or deteriorations which have the potential to have contagion impacts (such as the negative developments in the China property sector), fluctuations in global energy prices, changes in monetary policy in China, the US and other jurisdictions together with their impact on the valuation of all asset classes and effect on interest rates and inflation expectations, and concerns over sovereign debt. Other factors include the increased level of geopolitical and political risk and policy-related uncertainty (including those resulting from the Russia-Ukraine conflict and the potential impact on business sentiment and the broader market resulting from regulatory tightening across sectors in China) and socio-political, climate-driven and pandemic events. The extent of the financial market and economic impact of these factors may be highly uncertain and unpredictable and influenced by the actions, including the duration and effectiveness of mitigating measures of governments, policymakers and the public. The adverse effects of such factors could be felt principally through the following items: – Lower interest rates and reduced investment returns arising on the Group’s portfolios including impairment of debt securities and
loans, which could reduce Prudential’s capital and impair its ability to write significant volumes of new business, increase the potential adverse impact of product guarantees included in non-unit-linked products with a savings component, increase reinvestment risk for some of the Group’s investments from accelerated prepayments and increased redemptions and/or have a negative impact on its assets under management and profit.
– A reduction in the financial strength and flexibility of corporate entities, as recently experienced by a number of issuers within the
China property sector, which may deteriorate the credit rating profile and valuation of the Group’s invested credit portfolio (and which may result in an increase in regulatory capital requirements for the Group or its businesses), increased credit defaults and debt restructurings and wider credit and liquidity spreads resulting in realised and unrealised credit losses. Regulations imposing or increasing restrictions on the amount of company debt financing, such as those placing limits on debt or liability ratios, may also reduce the financial flexibility of corporate entities. Similarly, securitised assets in the Group's investment portfolio are subject to default risk and may be adversely impacted by delays or failures of borrowers to make payments of principal and interest when due. Where a widespread deterioration in the financial strength of corporate entities occurs, any assumptions on the ability and willingness of governments to provide financial support may need to be revised.
– Failure of counterparties who have transactions with Prudential (such as banks, reinsurers and counterparties to cash
management and risk transfer or hedging transactions) to meet commitments that could give rise to a negative impact on Prudential’s financial position and on the accessibility or recoverability of amounts due or the adequacy of collateral. Geographic or sector concentrations of counterparty credit risk could exacerbate the impact of these events where they materialise.
3
– Estimates of the value of financial instruments becoming more difficult because in certain illiquid or closed markets, determining the value at which financial instruments can be realised is highly subjective. Processes to ascertain such values require substantial elements of judgement, assumptions and estimates (which may change over time). Where the Group is required to sell its investments within a defined timeframe, such market conditions may result in the sale of these investments at below expected or recorded prices.
– The Group holds certain investments that may, by their nature, lack liquidity or have the potential to lose liquidity rapidly, such as
investment funds (including money market funds), privately placed fixed maturity securities, mortgage loans, complex structured securities and alternative investments. If these investments were required to be liquidated on short notice, the Group may experience difficulty in doing so and may be forced to sell them at a lower price than it otherwise would have been able to realise.
– A reduction in revenue from the Group’s products where fee income is linked to account values or the market value of the funds
under management. In particular, decreases in equity prices impact the amount of revenue derived from fees from the unit-linked products. Sustained inflationary pressures which may drive higher interest rates may also impact the valuation of fixed income investments and reduce fee income.
– Increased illiquidity, which includes the risk that expected cash inflows from investments and operations will not be adequate to
meet the Group’s anticipated short-term and long-term policyholder benefits and expense payment obligations. Increased illiquidity also adds to uncertainty over the accessibility of financial resources which in extreme conditions can impact the functioning of markets and may reduce capital resources as valuations decline. This could occur where external capital is unavailable at sustainable cost, increased liquid assets are required to be held as collateral under derivative transactions or redemption restrictions are placed on Prudential’s investments in illiquid funds. In addition, significant redemption requests could also be made on Prudential’s issued funds and while this may not have a direct impact on the Group’s liquidity, it could result in reputational damage to Prudential. The potential impact of increased illiquidity is more uncertain than for other risks such as interest rate or credit risk.
In general, upheavals in the financial markets may affect general levels of economic activity, employment and customer behaviour. As a result, insurers may experience an elevated incidence of claims, lapses, or surrenders of policies, and some policyholders may choose to defer or stop paying insurance premiums or reduce deposits into retirement plans. The demand for insurance products may also be adversely affected. In addition, there may be a higher incidence of counterparty failures. If sustained, this environment is likely to have a negative impact on the insurance sector over time and may consequently have a negative impact on Prudential’s business and its balance sheet and profitability. For example, this could occur if the recoverable value of intangible assets for bancassurance agreements and deferred acquisition costs are reduced. New challenges related to market fluctuations and general economic conditions may continue to emerge. For example, inflationary pressures driving higher interest rates may lead to increased lapses for some guaranteed savings products where higher levels of guarantees are offered by products of the Group’s competitors, reflecting consumer demand for returns at the level of, or exceeding, inflation. Increased inflation may also adversely impact the ability of consumers to purchase insurance products, particularly in lower income customer segments. For some non-unit-linked products with a savings component it may not be possible to hold assets which will provide cash flows to match those relating to policyholder liabilities. This is particularly true in those countries where bond markets are less developed or where the duration of policyholder liabilities is longer than the duration of bonds issued and available in the market, and in certain markets where regulated premium and claim values are set with reference to the interest rate environment prevailing at the time of policy issue. This results in a mismatch due to the duration and uncertainty of the liability cash flows and the lack of sufficient assets of a suitable duration. While this residual asset/liability mismatch risk can be managed, it cannot be eliminated. If interest rates in these markets are lower than those used to calculate premium and claim values over a sustained period, this could have a material adverse effect on Prudential’s reported profit and the solvency of its business units. In addition, part of the profit from the Group’s operations is related to bonuses for policyholders declared on with-profits products, which are impacted by the difference between actual investment returns of the with-profits fund (which are broadly based on historical and current rates of return on equity, real estate and fixed income securities) and minimum guarantee rates offered to policyholders. This profit could be lower in particular in a sustained low interest rate environment. Any of the foregoing factors and events, individually or together, could have a material adverse effect on Prudential’s business, financial condition, results of operations and prospects. 1.3 Geopolitical and political risks and uncertainty may adversely impact economic conditions, increase market
volatility, cause operational disruption to the Group and impact its strategic plans, which could have adverse effects on Prudential’s business, financial condition, results of operations and prospects.
The Group is exposed to geopolitical and political risks and uncertainty in the markets in which it operates. Such risks may include: – The application of government regulations, executive powers, protectionist or restrictive economic and trade policies or
measures adopted by businesses or industries which increase trade barriers or restrict trade, sales, financial transactions, or the transfer of capital, investment, data or other intellectual property, with respect to specific territories, markets, companies or individuals;
– An increase in the volume and pace of domestic regulatory changes, including those applying to specific sectors; – The increased adoption or implementation of laws and regulations which may purport to have extra-territorial application; – International trade disputes such as the implementation of trade tariffs; – Withdrawals or expulsions from existing trading blocs or agreements or financial transaction systems, including those which
facilitate cross-border payments;

4
– The domestic application of measures restricting national airspace with respect to aircraft of specific territories, markets, companies or individuals;
– Measures favouring local enterprises, such as changes to the maximum level of non-domestic ownership by foreign companies or differing treatment of foreign-owned businesses under regulations and tax rules; and
– Measures which require businesses of overseas companies to operate through locally incorporated entities or with requirements on minimum local representation on executive or management committees.
The above measures may have an adverse impact on Prudential through their effects on the macroeconomic outlook and the environment for global financial markets. They may also increase regulatory compliance and reputational risks, or adversely impact Prudential where they apply to, and impact, the economic, business and legal and regulatory environment in specific markets or territories in which the Group, its joint venture or jointly owned businesses, sales and distribution networks, or third party service providers have operations. For internationally active groups such as Prudential, operating across multiple jurisdictions, such measures may also add to the complexity of legal and regulatory compliance and increase the risk of conflicts between the requirements of one jurisdiction and another. See risk factor 4.1 below. Geopolitical and political risks and uncertainty may also adversely impact the Group’s operations and its operational resilience. Increased geopolitical tensions may increase domestic and cross-border cyber intrusion activity and therefore increase cyber security risks. Geopolitical and political tensions may also lead to conflict, civil unrest and/or acts of civil disobedience. Such events could impact operational resilience by disrupting Prudential’s systems, operations, new business sales and renewals, distribution channels and services to customers, which may result in a reduction in contributions from business units to the central cash balances and profit of the Group, decreased profitability, financial loss, adverse customer impacts and reputational damage and may impact Prudential’s business, financial condition, results of operations and prospects. Legislative or regulatory changes which adversely impact Hong Kong’s economy or its international trading and economic relationships, may also result in adverse sales, operational and product distribution impacts to the Group due to the territory being a key market which also hosts Group head office functions. 1.4 As a holding company, Prudential is dependent upon its subsidiaries to cover operating expenses and dividend
payments. The Group’s insurance and investment management operations are generally conducted through direct and indirect subsidiaries, which are subject to the risks discussed elsewhere in this ‘Risk Factors’ section. As a holding company, Prudential’s principal sources of funds are remittances from subsidiaries, shareholder-backed funds, the shareholder transfer from long-term funds and any amounts that may be raised through the issuance of equity, debt and commercial paper. Certain of Prudential’s subsidiaries are subject to insurance, foreign exchange and tax laws, rules and regulations (including in relation to distributable profits that can limit their ability to make remittances). In some circumstances, including where there are changes to general market conditions, this could limit Prudential’s ability to pay dividends to shareholders or to make available funds held in certain subsidiaries to cover operating expenses of other members of the Group. A material change in the financial condition of any of Prudential’s subsidiaries may have a material effect on its business, financial condition, results of operations and prospects. 1.5 Prudential is subject to the risk of potential sovereign debt credit deterioration owing to the amounts of sovereign
debt obligations held in its investment portfolio. Investing in sovereign debt creates exposure to the direct or indirect consequences of political, social or economic changes (including changes in governments, heads of state or monarchs) in the countries in which the issuers of such debt are located and to the creditworthiness of the sovereign. Investment in sovereign debt obligations involves risks not present in debt obligations of corporate issuers. In addition, the issuer of the debt or the governmental authorities that control the repayment of the debt may be unable or unwilling to repay principal or pay interest when due in accordance with the terms of such debt, and Prudential may have limited recourse to compel payment in the event of a default. A sovereign debtor’s willingness or ability to repay principal and to pay interest in a timely manner may be affected by, among other factors, its cash flow situation, its relations with its central bank, the extent of its foreign currency reserves, the availability of sufficient foreign exchange on the date a payment is due, the relative size of the debt service burden to the economy as a whole, the sovereign debtor’s policy toward local and international lenders, and the political constraints to which the sovereign debtor may be subject. Moreover, governments may use a variety of techniques, such as intervention by their central banks or imposition of regulatory controls or taxes, to devalue their currencies’ exchange rates, or may adopt monetary and other policies (including to manage their debt burdens) that have a similar effect, all of which could adversely impact the value of an investment in sovereign debt even in the absence of a technical default. Periods of economic uncertainty may affect the volatility of market prices of sovereign debt to a greater extent than the volatility inherent in debt obligations of other types of issuers. In addition, if a sovereign default or other such events described above were to occur, as has happened on occasion in the past, other financial institutions may also suffer losses or experience solvency or other concerns, which may result in Prudential facing additional risks relating to investments in such financial institutions that are held in the Group’s investment portfolio. There is also risk that public perceptions about the stability and creditworthiness of financial institutions and the financial sector generally might be adversely affected as might counterparty relationships between financial institutions.
5
If a sovereign were to default on its obligations, or adopt policies that devalued or otherwise altered the currencies in which its obligations were denominated, this could have a material adverse effect on Prudential’s business, financial condition, results of operations and prospects. 1.6 Downgrades in Prudential’s financial strength and credit ratings could significantly impact its competitive position
and damage its relationships with creditors or trading counterparties. Prudential’s financial strength and credit ratings, which are used by the market to measure its ability to meet policyholder obligations, are an important factor affecting public confidence in Prudential’s products, and as a result its competitiveness. Downgrades in Prudential’s ratings as a result of, for example, decreased profitability, increased costs, increased indebtedness or other concerns could have an adverse effect on its ability to market products and retain current policyholders, and the Group’s ability to compete for acquisition and strategic opportunities. Downgrades may also impact the Group’s financial flexibility, including its ability to issue commercial paper at current levels and pricing. The interest rates at which Prudential is able to borrow funds are affected by its credit ratings, which are in place to measure the Group’s ability to meet its contractual obligations. In addition, changes in methodologies and criteria used by rating agencies could result in downgrades that do not reflect changes in the general economic conditions or Prudential’s financial condition. In addition, any such downgrades could have a material adverse effect on Prudential’s business, financial condition, results of operations and prospects. Prudential cannot predict what actions rating agencies may take, or what actions Prudential may therefore take in response to the actions of rating agencies, which could adversely affect its business. Any such downgrade of the Group could have an adverse effect on Prudential’s financial flexibility, requirements to post collateral under or in connection with transactions to which they are a party and ability to manage market risk exposures. In addition, the interest rates or other costs that the Group incurs in respect of its financing activities may increase as a result. A credit rating downgrade may also affect public confidence in the Group’s products and may adversely impact on its ability to market products, retain current policyholders or attract new policyholders. 1.7 Prudential is subject to the risk of exchange rate fluctuations owing to the geographical diversity of its businesses. Due to the geographical diversity of Prudential’s businesses, Prudential is subject to the risk of exchange rate fluctuations. Prudential’s operations generally write policies and invest in assets denominated in local currencies. Although this practice limits the effect of exchange rate fluctuations on local operating results, it can lead to fluctuations in Prudential’s consolidated financial statements upon the translation of results into the Group’s presentation currency. This exposure is not currently separately managed. The Group presents its consolidated financial statements in US dollars. The results of some entities within the Group are not denominated in or linked to the US dollar and some enter into transactions which are conducted in non-US dollar currencies. Prudential is subject to the risk of exchange rate fluctuations from the translation of the results of these entities and transactions and the risks from the maintenance of the HK dollar peg to the US dollar. 2. RISKS RELATING TO SUSTAINABILITY AND ENVIRONMENTAL, SOCIAL AND GOVERNANCE (‘ESG’) MATTERS 2.1 The failure to understand and respond effectively to the risks associated with ESG factors could adversely affect
Prudential’s achievement of its long‑term strategy. A failure to manage the material risks associated with key ESG themes detailed below may undermine the sustainability of Prudential by adversely impacting the Group’s reputation and brand, ability to attract and retain customers and employees, and therefore the results of its operations and delivery of its strategy and long-term financial success. (a) Environmental risks Environmental concerns, notably those associated with climate change and their social and economic impacts, present long-term risks to the sustainability of Prudential and may impact its customers and other shareholders. Prudential’s investment horizons are long term and it is therefore exposed to the potential long-term impact of climate change risks, which include the financial and non-financial impact of transition to a lower carbon economy and physical and litigation risks. The global transition to a lower carbon economy may have an adverse impact on investment valuations as the financial assets of carbon intensive companies re-price, and this could result in some asset sectors facing significantly higher costs and a reduction in demand for their products and services. The speed of this transition, and the extent to which it is orderly and managed, will be influenced by factors such as public policy, technology and changes in market or investor sentiment. The potential impact of these factors on the valuation of investments may also have a broader economic impact that may adversely affect customers and their demand for the Group’s products. The transition to a lower carbon economy has the potential to disproportionately impact the Asia and Africa markets in which Prudential operates and invests, and the Group’s stakeholders increasingly expect and/or rely on the Group to support an orderly, inclusive and sustainable transition based on an understanding of relevant country and company-level transition plans taking into consideration the impact on the economies, businesses, communities and customers in these markets. The pace and volume of new climate-related regulation emerging across the markets in which the Group operates, the need to deliver on existing and new voluntary exclusions on investments in certain sectors, engagement and reporting commitments and the demand for externally assured reporting may give rise to compliance, operational and disclosure risks which may be increased by the multi-jurisdictional coordination required in adopting a consistent risk management approach.
6
The Group’s ability to sufficiently understand and appropriately react to transition risk and its ability to deliver on its external carbon reduction commitments may be limited by insufficient or unreliable data on carbon exposure and transition plans for the assets in which it invests. The direct physical impacts of climate change, driven by both specific short-term climate-related events such as natural disasters and longer-term changes to climate and the natural environment, are likely to become increasingly significant factors in the mortality and morbidity risk assessments for the Group’s insurance product underwriting and offerings and their associated claims profiles. Climate-driven events in countries in which Prudential or its key third parties operate could adversely impact the Group’s operational resilience and its customers, which may potentially occur through migration or displacement both within and across borders. A failure to understand, manage and provide greater transparency of its exposure to these climate-related risks may have increasingly adverse implications for Prudential and its stakeholders. (b) Social risks Social risks that could impact Prudential may arise from a failure to consider the rights, diversity, well-being, needs, and interests of its customers and employees and the communities in which the Group or its third parties operate. Perceived inequalities and income disparities, intensified by the pandemic, have the potential to further erode social cohesion across the Group’s markets which may increase operational and disruption risks for Prudential. These risks are increased as Prudential operates in multiple jurisdictions with distinct local cultures and considerations. Evolving social norms and emerging population risks associated with public health trends (such as an increase in obesity and mental health deterioration) and demographic changes (such as population urbanisation and ageing) may affect customer lifestyles and therefore may impact the level of claims under the Group’s insurance product offerings. As a provider of insurance and investment services, the Group is increasingly focused on making its products more accessible through digital innovation, technologies and distribution methods for a broadening range of products and services. As a result, Prudential has access to extensive amounts of customer personal data, including data related to personal health, and an increasing ability to analyse and interpret this data through the use of complex tools, machine learning and artificial intelligence technologies. The Group is therefore exposed to the regulatory, ethical and reputational risks associated with customer data misuse or security breaches. These risks are explained in risk factor 3.5. The increasing digitalisation of products, services and processes may also result in new and unforeseen regulatory requirements and stakeholder expectations, including those relating to how the Group supports its customers through this transformation. As an employer, the Group is also exposed to the risk of being unable to attract, retain and develop a diverse group of highly-skilled employees to meet the changing need of a transformative organisation. This may increase if Prudential does not implement responsible working practices or fails to recognise the benefits of diversity, ensure psychological safety for employees, or promote a culture of inclusion and sense of belonging. The potential for reputational risk extends to the Group’s supply chains and its investee companies, which may be exposed to factors such as poor labour standards and abuses of human rights by third parties. (c) Governance A failure to maintain high standards of corporate governance may adversely impact the Group and its customers and employees and increase the risk of poor decision-making and a lack of oversight and management of its key risks. Poor governance may arise where key governance committees have insufficient independence, a lack of diversity, skills or experience in their members, or unclear (or insufficient) oversight responsibilities and mandates. Inadequate oversight over remuneration also increases the risk of poor senior management behaviours. Prudential operates across multiple jurisdictions and has a group and subsidiary governance structure which may add further complexity to these considerations. Participation in joint ventures or partnerships where Prudential does not have direct overall control and the use of third party service providers increase the potential for reputational risks arising from poor governance. Sustainability and ESG-related risks may directly or indirectly impact Prudential’s business and the achievement of its strategic focus on providing greater and more inclusive access to good health and financial security, responsible stewardship in managing the human impact of climate change and building human and social capital with its broad range of stakeholders, which range from customers, institutional investors, employees and suppliers, to policymakers, regulators, industry organisations and local communities. A failure to transparently and consistently implement the Group’s ESG strategy across operational, underwriting and investment activities, may adversely impact the financial condition and reputation of the Group and may negatively impact the Group’s stakeholders, who all have expectations, concerns and aims related to ESG and sustainability matters, which may differ, both within and across the markets in which the Group operates. In its investment activities, Prudential’s stakeholders increasingly have expectations of, and place reliance on, an approach to responsible investment that demonstrates how ESG and sustainability considerations are effectively integrated into investment decisions and responsible supply chain management and the performance of fiduciary and stewardship duties. These duties include effective implementation of exclusions, voting and active engagement decisions with respect to investee companies, as both an asset owner and an asset manager, in line with internally defined procedures and external commitments.
7
3. RISKS RELATING TO PRUDENTIAL’S BUSINESS ACTIVITIES AND INDUSTRY 3.1 The implementation of large-scale transformation, including complex strategic initiatives, gives rise to significant
design and execution risks and may affect Prudential’s operational capability and capacity. Any failure of these initiatives to meet their objectives may adversely impact the Group and the delivery of its strategy.
Where required in order to implement its business strategies for growth, meet customer needs, improve customer experiences, strengthen operational resilience, meet regulatory and industry requirements and maintain market competitiveness, Prudential from time to time undertakes Group restructuring, transformation programmes and acquisitions and disposals across its business. Many of these change initiatives are complex, interconnected and/or of large scale, and include improvement of business efficiencies through operating model changes, advancing the Group’s digital capability, expanding strategic partnerships and industry and regulatory-driven change. There may be a material adverse effect on Prudential’s business, customers, financial condition, results of operations and prospects if these initiatives incur unplanned costs, are subject to implementation delays, or fail to fully meet their objectives. Large scale restructuring of Prudential, such as the recent Jackson Demerger and changes to the Group’s management and operational model, have increased uncertainty for the Group’s employees, which may affect operational capacity and the ab ility of the Group to deliver its strategy. Additionally, there may be adverse non-financial (including operational, regulatory, conduct and reputational) implications for the Group in undertaking such initiatives, which inherently give rise to design and execution risks, and may increase existing business risks, such as placing additional strain on the operational capacity, or weakening the control environment, of the Group. Implementing further initiatives related to significant regulatory changes, such as IFRS 17, may amplify these risks. Risks relating to these regulatory changes are explained in risk factor 4.1 below. The speed of technological change in the business could outpace the Group’s ability to anticipate all the unintended consequences that may arise from such change. Innovative technologies, such as artificial intelligence, expose Prudential to potential additional regulatory, information security, operational, ethical and conduct risks which, if inadequately managed, could result in customer detriment and reputational damage. 3.2 Prudential is exposed to ongoing risks as a result of the Jackson Demerger, which, if they materialise, could
adversely affect Prudential’s business. (a) The Group continues to hold shares in Jackson but no longer has any control On 13 September 2021, Prudential completed the Jackson Demerger (the ‘Demerger’). As at 31 December 2021, the Group retains an 18.4 per cent. economic interest (and an 18.5 per cent. voting interest) in the total common stock of Jackson. The Group intends to reduce this investment to less than 10 per cent. within 12 months of the completion of the Jackson Demerger. As a result of the Demerger, Prudential no longer has the ability to control Jackson’s strategic, financial and operational decisions. Jackson may fail to develop its business, meet the expectations of investors, may be subject to adverse publicity and increased legal or regulatory scrutiny, or its reported financial position may be adversely impacted by errors or limitations in its modelling and other assumptions related to its business, including the calculation of regulatory or internal capital requirements, the valuation of assets and liabilities, and determining hedging requirements. These factors may have an adverse impact on the market price of Jackson shares, which may be volatile and can go down as well as up. It is therefore possible that the value of Prudential’s shareholding may be lower than anticipated, and the gross proceeds due to Prudential from any future sale may be lower than Prudential might otherwise achieve. (b) Indemnities have been given under a Demerger Agreement by Prudential in favour of the Jackson Group At the time of the Demerger, Prudential and Jackson entered into the Demerger Agreement. This governs the post-Jackson Demerger obligations of the Group and the Jackson Group and contains, among other provisions, indemnities under which Prudential indemnifies the Jackson Group against liabilities that may arise in connection with the business carried on by the Group (other than Jackson’s business) prior to the Jackson Demerger. Prudential has the right to defend any such claim. Although it is not anticipated that Prudential will be required to pay any substantial amount pursuant to such indemnity obligations, if any amounts payable under the indemnities are substantial, this could have a material adverse effect on the financial condition and/or results of Prudential. (c) Prudential may incur liabilities in connection with the Jackson Demerger In addition, in connection with the Jackson Demerger, Prudential may be subject to claims by Jackson’s shareholders and other third parties for any material misstatements or omissions of material facts contained within Jackson’s Form 10 registration document, or for any fraudulent, intentional or reckless misleading disclosure in connection with the Jackson Shares under the US Securities and Exchange Act of 1934. If those claims are not successfully defended, Prudential may have to pay compensation, and where this is substantial may adversely affect Prudential’s business, financial condition, cash flows, results of operations and prospects.
8
3.3 Prudential’s businesses are conducted in highly competitive environments with developing demographic trends. The profitability of the Group’s businesses depend on management’s ability to respond to these pressures and trends.
The markets for financial services are highly competitive, with a number of factors affecting Prudential’s ability to sell its products and profitability, including price and yields offered, financial strength and ratings, range of product lines and product quality, brand strength and name recognition, investment management performance and fund management trends, historical bonus levels, the ability to respond to developing demographic trends, customer appetite for certain savings products and technological advances. In some of its markets, Prudential faces competitors that are larger, have greater financial resources or a greater market share, offer a broader range of products or have higher bonus rates. Further, heightened competition for talented and skilled employees, agents and independent financial advisers may limit Prudential’s potential to grow its business as quickly as planned. Technological advances, including those enabling increased capability for gathering large volumes of customer health data and developments in capabilities and tools in analysing and interpreting such data (such as artificial intelligence and machine learning), may result in increased competition to the Group, both from within and outside the insurance industry, and may increase the competition risks resulting from a failure to be able to attract sufficient numbers of skilled staff. The Group’s principal competitors include global life insurers together with regional insurers and multinational asset managers. In most markets, there are also local companies that have a material market presence. Prudential believes that competition will intensify across all regions in response to consumer demand, digital and other technological advances (including the emergence and maturing of new distribution channels), the need for economies of scale and the consequential impact of consolidation, regulatory actions and other factors. Prudential’s ability to generate an appropriate return depends significantly upon its capacity to anticipate and respond appropriately to these competitive pressures. This includes managing the potential adverse impacts to the commercial value of the Group’s existing sale and distribution arrangements, such as bancassurance arrangements, in markets where new distribution channels develop. Failure to do so may adversely impact Prudential’s ability to attract and retain customers and, importantly, may limit Prudential’s ability to take advantage of new business arising in the markets in which it operates, which may have an adverse impact on the Group’s business, financial condition, results of operations and prospects. 3.4 Adverse experience in the operational risks inherent in Prudential’s business, and those of its material outsourcing
partners, could disrupt its business functions and have a negative impact on its business, financial condition, results of operations and prospects.
Operational risks are present in all of Prudential’s businesses, including the risk of direct or indirect loss resulting from inadequate or failed internal and external processes, systems or human error, fraud, the effects of natural or man-made catastrophic events (such as natural disasters, pandemics, cyber-attacks, acts of terrorism, civil unrest and other catastrophes) or other external events. These risks may also adversely impact Prudential through its partners. Prudential relies on the performance and operations of a number of bancassurance, product distribution, outsourcing (including external technology and data hosting) and service partners. These include back office support functions, such as those relating to IT infrastructure, development and support and customer facing operations and services, such as product distribution and services (including through digital channels) and investment operations. This creates reliance upon the resilient operational performance of these partners and exposes Prudential to the risk that the operations and services provided by these partners are disrupted or fail. Further, Prudential operates in extensive and evolving legal and regulatory environments (including in relation to tax) which adds to the complexity of the governance and operation of its business processes and controls. Exposure to such risks could impact Prudential’s operational resilience and ability to perform necessary business functions by disrupting its systems, operations, new business sales and renewals, distribution channels and services to customers, or result in the loss of confidential or proprietary data. Such risks, as well as any weaknesses in administration systems (such as those relating to policyholder records) or actuarial reserving processes, may also result in increased expenses, as well as legal and regulatory sanctions, decreased profitability, financial loss and customer conduct risk impacts, and may damage Prudential’s reputation and relationship with its customers and business partners. A failure to adequately oversee service partners (or their IT and operational systems and processes) could result in significant service degradation or disruption to Prudential’s business operations and customers, which may have reputational or conduct risk implications and could have a material adverse effect on the Group’s business, financial condition, results of operations and prospects. Prudential’s business requires the processing of a large number of transactions for a diverse range of products. It also employs complex and interconnected IT and finance systems, models, and user developed applications in its processes to perform a range of operational functions. These functions include the calculation of regulatory or internal capital requirements, the valuation of assets and liabilities and the acquisition of new business using artificial intelligence and digital applications. Many of these tools form an integral part of the information and decision-making frameworks used by Prudential and the risk of adverse consequences arising from erroneous or misinterpreted tools used in core business activities, decision-making and reporting exists. Errors or limitations in these tools, or their inappropriate usage, may lead to regulatory breaches, inappropriate decision-making, financial loss, customer detriment, inaccurate external reporting or reputational damage. The long-term nature of much of the Group’s business also means that accurate records have to be maintained securely for significant time periods. The performance of the Group’s core business activities and the uninterrupted availability of services to customers rely significantly on, and require significant investment in, resilient IT applications, infrastructure and security architectural design, data governance and management and other operational systems, personnel, controls and processes. During large-scale disruptive events or times of significant change, the resilience and operational effectiveness of these systems and processes at Prudential and/or its third party service providers may be adversely impacted. In particular, Prudential and its business partners are making increasing use of

9
emerging technological tools and digital services, or forming strategic partnerships with third parties to provide these capabilities. Automated distribution channels to customers increase the criticality of providing uninterrupted services. A failure to implement appropriate governance and management of the incremental operational risks from emerging technologies may adversely impact Prudential’s reputation and brand, the results of its operations, its ability to attract and retain customers and its ability to deliver on its long-term strategy and therefore its competitiveness and long-term financial success. Although Prudential’s IT, compliance and other operational systems, models and processes incorporate governance and controls designed to manage and mitigate the operational and model risks associated with its activities, there can be no complete assurance as to the resilience of these systems and processes to disruption or that governance and controls will always be effective. Due to human error, among other reasons, operational and model risk incidents do occur from time to time and no system or process can entirely prevent them. Prudential’s legacy and other IT systems, data and processes, as with operational systems and processes generally, may also be susceptible to failure or security/data breaches. 3.5 Attempts to access or disrupt Prudential’s IT systems, and loss or misuse of personal data, could result in loss of
trust from Prudential’s customers and employees and reputational damage, which could have material adverse effects on the Group’s business, financial condition, results of operations and prospects.
Prudential and its business partners are increasingly exposed to the risk that individuals (which includes connected persons such as employees, contractors or representatives of Prudential or its third party service providers, and unconnected persons) or groups may intentionally or unintentionally disrupt the availability, confidentiality and integrity of its IT systems or compromise the integrity and security of data (both corporate and customer), including disruption from ransomware, malicious software designed to restrict Prudential’s access to data until the payment of a sum of money. Where these risks materialise, this could result in disruption to key operations, make it difficult to recover critical data or services or damage assets, any of which could result in loss of trust from Prudential’s customers and employees, reputational damage and direct or indirect financial loss. Cyber-security threats continue to evolve globally in sophistication and potential significance. Prudential’s increasing profile in its current markets and those in which it is entering, growing customer interest in interacting with their insurance providers and asset managers through the internet and social media, improved brand awareness, increasing adoption of the Group’s Pulse platform and the 2020 designation of Prudential as an Internationally Active Insurance Group (‘IAIG’) could also increase the likelihood of Prudential being considered a target by cyber criminals. Ransomware campaigns have increased in frequency and represent an increasing threat to the financial services sector, with recent highly publicised attacks on financial services companies. The risk from untargeted but sophisticated and automated attacks remains present. There is an increasing requirement and expectation on Prudential and its business partners not only to hold the data of customers, shareholders and employees securely, but also to ensure its ongoing accuracy and that it is being used in a transparent, appropriate and ethical way, including in decision-making where automated processes are employed. A failure to do so may result in regulatory scrutiny and sanctions and detriment to customers and third party partners, and may adversely impact the reputation and brand of the Group, its ability to attract and retain customers and deliver on its long-term strategy and therefore the results of its operations. The risk to the Group of not meeting these requirements and expectations may be increased by the development of cloud-based infrastructure and the usage of digital distribution and service channels, which can collect a broader range of personal and health-related data from individuals at increased scale and speed, and the use of complex tools, machine learning and artificial intelligence technologies to process, analyse and interpret this data. New and currently unforeseeable regulatory issues may also arise from the increased use of emerging technology. Regulatory developments in cybersecurity and data protection (such as the ongoing development of a holistic data governance regime in China, including the Data Security Law, the Personal Information Protection Law, which came into effect in November 2021, the revised Measures for Cybersecurity Review and recently released draft rules on the provision of internet healthcare services) continue to progress worldwide. Such developments may increase the complexity of requirements and obligations in this area, in particular where they include national security restrictions or impose differing and/or conflicting requirements with those of other jurisdictions. These risks may also increase the financial and reputational implications for Prudential of regulatory non-compliance or a significant breach of IT systems or data, including at its joint venture or third party service providers. The international transfer of data may, as a global organisation, increase regulatory risks for the Group. Although Prudential has experienced or has been affected by cyber and data breaches, to date, it has not identified a failure or breach, or an incident of data misuse in relation to its legacy and other IT systems and processes which has had a material impact on its operations. However, Prudential has been, and likely will continue to be, subject to potential damage from computer viruses, unauthorised access and cyber-security attacks such as ‘denial of service’ attacks (which, for example, can cause temporary disruption to websites and IT networks), phishing and disruptive software campaigns, and there can be no assurance that such events will not take place which may have material adverse consequential effects on Prudential’s business, financial condition, results of operations and prospects. 3.6 Prudential’s Pulse platform may increase existing business risks to the Group or introduce new risks as the markets
in which it operates and its features, partnerships and product offerings develop. Prudential’s digital platform, Pulse, is subject to a number of the risks discussed within this ‘Risk Factors’ section. In particular, these include risks related to legal and regulatory compliance and the conduct of business; the execution of complex change initiatives; information security and data privacy; the use of models (including those using artificial intelligence) and the handling of personal data; the resilience and integrity of IT infrastructure and operations; and those relating to the management of third parties. These existing risks for the Group may be increased due to a number of factors:
10
– The number of current and planned markets in which Pulse operates, each with their own laws and regulations, regulatory and supervisory authorities, the scope of application of which may be uncertain or change at pace, may increase regulatory compliance risks;
– The implementation of planned platform features and offerings may require the delivery of complex, inter-connected change initiatives across current and planned markets. This may give rise to design and execution risks, which could be amplified where these change initiatives are delivered concurrently;
– The platform includes functionality relating to user generated content, which may expose Prudential to legal liability or reputational risk in the hosting of that content;
– The increased volume, breadth and sensitivity of data on which the business model of Pulse is dependent and to which the Group has access, holds, analyses and processes through its models, which increases data security, privacy and usage risks. The use of complex models, including where they use artificial intelligence for critical decision-making, in the application’s features and offerings may give rise to operational, conduct, litigation and reputational risks where they do not function as intended;
– The platform and its services rely on a number of third party partners and providers, which may vary according to the market. This may increase operational disruption risks to the uninterrupted provision of services to customers, regulatory compliance and conduct risks, and the potential for reputational risks; and
– Support for, and development of, the platform may be provided outside of the individual markets in which the platform operates, which may increase the complexity of local legal and regulatory compliance.
New product offerings and functionality may be developed and provided through the platform, which may introduce new regulatory, operational, conduct and strategic risks for the Group. Any slowdown in digitalisation may reduce user adoption rates, the current size of the user base of Pulse and/or the development of product and service offerings, which may impact the ability of the Group to deliver its digital strategy. Regulations may be introduced which limit the permitted scope of online or digitally distributed insurance, asset management or medical services, which may restrict current or planned offerings provided by the Pulse platform. Markets may also introduce regulations with specific licensing requirements or requiring the provision of current or planned services via locally incorporated entities, which increases the regulatory and compliance risks associated with operating the Pulse platform. A failure to implement appropriate governance and management of the incremental and new risks detailed above may adversely impact Prudential’s reputation and brand, its ability to attract and retain customers, its competitiveness and its ability to deliver on its long-term strategy. 3.7 Prudential operates in certain markets with joint venture partners, minority shareholders and other third parties.
These businesses face the same risks as the rest of the Group and also give rise to certain risks to Prudential that the Group does not face with respect to its wholly-owned subsidiaries.
Prudential operates, and in certain markets is required by local regulation to operate, through joint ventures and other joint ownership or third-party arrangements. The financial condition, operations and reputation of Group may be adversely impacted, or the Group may face regulatory censure, in the event that any of its partners fails or is unable to meet its obligations under the arrangements, encounters financial difficulty, or fails to comply with local or international regulation and standards such as those pertaining to the prevention of financial crime. Reputational risks to the Group are amplified where any joint venture or jointly owned businesses carry the Prudential name. A material proportion of the Group’s business comes from its joint ventures in China and India. For such operations the level of control exercisable by the Group depends on the terms of the contractual agreements, in particular, those terms providing for the allocation of control among, and continued cooperation between, the participants. As a result, the level of oversight, control and access to management information the Group is able to exercise over the extent of the exposure to material risks at these operations may be lower compared to the Group’s wholly owned businesses. This may increase the uncertainty for the Group over the financial condition of these operations, including the credit risk profile and valuation of their investment portfolios and the extent of their invested credit and counterparty credit risk exposure, resulting in heightened risks to the Group as whole. This may particularly be the case where the countries in which these operations are located experience market or sector-specific slowdowns, volatility or deterioration (such as the recent negative developments in the China property sector). In addition, the level of control exercisable by the Group could be affected by changes in the maximum level of non-domestic ownership imposed on foreign companies in certain jurisdictions. The exposure of the Group to the risks detailed in risk factor 3.1 above may also increase should the Group’s strategic initiatives include the expansion of the Group’s operations through joint ventures or jointly owned bus inesses. In addition, a significant proportion of the Group’s product distribution is carried out through agency arrangements and contractual arrangements with third party service providers not controlled by Prudential, such as bancassurance arrangements, and the Group is therefore dependent upon the continuation of these relationships. A temporary or permanent disruption to these distribution arrangements, such as through significant deterioration in the reputation, financial position or other circumstances of the third party service providers, material failure in controls (such as those pertaining to the third party service provider system failure or the prevention of financial crime) or failure to meet any regulatory requirements could adversely affect Prudential’s reputation and its business, financial condition, results of operations and prospects. 3.8 Adverse experience relative to the assumptions used in pricing products and reporting business results could
significantly affect Prudential’s business, financial condition, results of operations and prospects. In common with other life insurers, the profitability of the Group’s businesses depends on a mix of factors including mortality and morbidity levels and trends, policy surrenders and take-up rates on guarantee features of products, investment performance and impairments, unit cost of administration and new business acquisition expenses. The Group’s businesses are subject to inflation risk. In particular, the Group’s medical insurance businesses are also exposed to medical inflation risk.
11
Prudential needs to make assumptions about a number of factors in determining the pricing of its products, for setting reserves, and for reporting its capital levels and the results of its long-term business operations. A further factor is the assumption that Prudential makes about future expected levels of the rates of early termination of products by its customers (known as persistency). This is relevant to a number of lines of business in the Group. Prudential’s persistency assumptions reflect a combination of recent past experience for each relevant line of business and expert judgement, especially where a lack of relevant and credible experience data exists. Any expected change in future persistency is also reflected in the assumption. If actual levels of persistency are significantly different than assumed, the Group’s results of operations could be adversely affected. In addition, Prudential’s business may be adversely affected by epidemics, pandemics and other effects that give rise to a large number of deaths or additional sickness claims, as well as increases to the cost of medical claims. Pandemics, significant influenza and other epidemics have occurred a number of times historically but the likelihood, timing, or the severity of future events cannot be predicted. The effectiveness of external parties, including governmental and non-governmental organisations, in combating the spread and severity of any epidemics, as well as pharmaceutical treatments and vaccines (and their roll-outs) and non-pharmaceutical interventions, could have a material impact on the Group’s claims experience. The risks to the Group resulting from the Covid-19 pandemic are included in risk factor 1.1 above. Prudential uses reinsurance to selectively transfer mortality, morbidity and other risks. This exposes the Group to the counterparty risk of a reinsurer being unable to pay reinsurance claims or otherwise meet their commitments; the risk that a reinsurer changes reinsurance terms and conditions of coverage, or increases the price of reinsurance which Prudential is unable to pass on to its customers; the risk of ambiguity in the reinsurance terms and conditions leading to uncertainty whether an event is covered under a reinsurance contract; and the risk of being unable to replace an existing reinsurer, or find a new reinsurer, for the risk transfer being sought. Any of the foregoing, individually or together, could have a material adverse effect on Prudential’s business, financial condition, results of operations and prospects. 4. RISKS RELATING TO LEGAL AND REGULATORY REQUIREMENTS 4.1 Prudential conducts its businesses subject to regulation and associated regulatory risks, including a change to the
basis in the regulatory supervision of the Group, the effects of changes in the laws, regulations, policies and their interpretations and any accounting standards in the markets in which it operates.
Changes in government policy and legislation (including in relation to tax and data security), capital control measures on companies and individuals, regulation or regulatory interpretation applying to companies in the financial services and insurance industries in any of the markets in which Prudential operates (including those related to the conduct of business by Prudential or its third party distributors), or decisions taken by regulators in connection with their supervision of members of the Group, which in some circumstances may be applied retrospectively, may adversely affect Prudential. The impact from any regulatory changes may be material to Prudential, for example changes may be required to its product range, distribution channels, handling and usage of data, competitiveness, profitability, capital requirements, risk management approaches, corporate or governance structure and, consequently, reported results and financing requirements. Also, regulators in jurisdictions in which Prudential operates may impose requirements affecting the allocation of capital and liquidity between different business units in the Group, whether on a geographic, legal entity, product line or other basis. Regulators may also change solvency requirements, methodologies for determining components of the regulatory or statutory balance sheet including the reserves and the level of capital required to be held by individual businesses (with implications to the Group capital position), the regulation and expectations of customers-facing processes including selling practices, and could introduce changes that impact products sold or that may be sold. Furthermore, as a result of interventions by governments in light of financial and global economic conditions, there may continue to be changes in government regulation and supervision of the financial services industry, including the possibility of higher capital requirements, restrictions on certain types of transactions and enhancement of supervisory powers. In the markets in which it operates, Prudential is subject to regulatory requirements and obligations with respect to financial crime, including anti-money laundering, and sanctions compliance, which may either impose obligations on the Group to act in a certain manner or restrict the way that it can act in respect of specified individuals, organisations, businesses and/or governments. A failure to do so may adversely impact the reputation of Prudential and/or result in the imposition of legal or regulatory sanctions or restrictions on the Group. For internationally active groups such as Prudential, operating across multiple jurisdictions increases the complexity of legal and regulatory compliance. Compliance with Prudential’s legal or regulatory obligations, including those in respect of international sanctions, in one jurisdiction may conflict with the law or policy objectives of another jurisdiction, or may be seen as supporting the law or policy objectives of that jurisdiction over another, creating additional legal, regulatory compliance and reputational risks for the Group. These risks may be increased where uncertainty exists on the scope of regulatory requirements and obligations, and where the complexity of specific cases applicable to the Group is high. Further information on specific areas of regulatory and supervisory requirements and changes are included below. (a) Group-wide Supervision The Hong Kong IA has been the Group-wide supervisor of Prudential since 21 October 2019. To align Hong Kong’s regulatory regime with international standards and practices, the Hong Kong IA has developed a GWS Framework for multinational insurance groups under its supervision. The GWS Framework is based on a principle-based and outcome-focused approach, and allows the Hong Kong IA to exercise direct regulatory powers over the designated holding companies of multinational insurance groups. The GWS Framework became effective for Prudential upon designation by the Hong Kong IA on 14 May 2021, subject to transitional arrangements allowed in legislation which have been agreed with the Hong Kong IA.
12
Under the GWS Framework, all debt instruments, both senior and subordinated, issued by Prudential as at the date of designation meet the transitional conditions set by the Hong Kong IA and are included as eligible Group capital resources. Whilst the regulatory requirements have been finalised and are in effect, given the early nature of the regime, there is a risk that the interpretations of the principle-based regulatory requirements made by the Group in complying with the regulatory requirements may differ in some aspects from the interpretations made by the Hong Kong IA in their supervision of these principle-based regulatory requirements or as a result of the potential for further regulatory guidance to be issued. (b) Global regulatory requirements and systemic risk regulation Currently there are also a number of ongoing global regulatory developments which could impact Prudential’s businesses in the many jurisdictions in which they operate. These include the work of the Financial Stability Board (the ‘FSB’) in the area of systemic risk including the reassessment of the designation of G-SIIs, and the Insurance Capital Standard (the 'ICS’) being developed by the International Association of Insurance Supervisors (the ‘IAIS’). In addition, regulators in a number of jurisdictions in which the Group operates are further developing their local capital regimes. There remains a high degree of uncertainty over the potential impact of such changes on the Group. Efforts to curb systemic risk and promote financial stability are also under way. At the international level, the FSB continues to develop recommendations for the asset management and insurance sectors, including ongoing assessment of systemic risk measures. The IAIS has continued to focus on the following key developments. In November 2019 the IAIS adopted the Common Framework (‘ComFrame’) which establishes supervisory standards and guidance focusing on the effective group-wide supervision of Internationally Active Insurance Groups (‘IAIGs’). Prudential was included in the first register of IAIGs released by the IAIS on 1 July 2020 and was designated an IAIG by the Hong Kong IA following an assessment against the established criteria in ComFrame. The IAIS has also been developing the ICS (‘Insurance Capital Standard’) as part of ComFrame. The implementation of ICS wil l be conducted in two phases: a five-year monitoring phase followed by an implementation phase. The Aggregation Method is one of the alternatives being considered to the default approach undertaken for the ICS during the monitoring period and the related proposals are being led by the National Association of Insurance Commissioners (‘NAIC’). In November 2019 the FSB endorsed a new Holistic Framework (‘HF’), intended for the assessment and mitigation of systemic risk in the insurance sector, for implementation by the IAIS in 2020 and has suspended G-SII designations until completion of a review to be undertaken in 2022. Many of the previous G-SII measures have already been adopted into the Insurance Core Principles (‘ICPs’) and ComFrame, as well as under the Hong Kong IA’s GWS Framework. As an IAIG, Prudential is expected to be subject to these measures. The HF also includes a monitoring element for the identification of a build-up of systemic risk and to enable supervisors to take action where appropriate. There continues to be material change in the regulatory guidance in this area, including several areas still in development as part of the IAIS’ HF implementation and any new or changing regulations could have a further impact on Prudential. Recent developments include: – On 18 January 2022, the IAIS released its 2022-23 roadmap. In addition to those related to the HF and ICS, key areas of focus
will include activities and initiatives focusing on operational and cyber resilience in the insurance sector including IT third-party outsourcing, climate change risk, financial inclusion, culture and conduct, diversity, equity and inclusion, fintech and policyholder protection schemes and their role in insurer resolution;
– The IAIS is proposing to introduce liquidity metrics to be used as ancillary indicators, with the phase 2 consultation completed in January 2022;
– A consultation on an application paper on macroprudential supervision was also launched by the IAIS in March 2021; – Following the publication of its 2020 Resolution Report in November 2020, the FSB released practice papers for consultation
on intra-group connectedness and resolution funding for insurers, with input requested by 12 March 2022. Resolution regimes will continue to be a near term focus in the FSB’s financial stability work, potentially being a key tool in informing decisions around the reformed G-SII designation. These consultations constitute the last of the FSB’s systemic risk work for insurers, prior to the designation assessment planned at year end 2022; and
– The IMF released a Financial System Stability Assessment for Hong Kong in June 2021. One of the conclusions of the report was that there is room to further strengthen the macroprudential framework by enhancing systemic risk assessment and communication.
(c) Regional regulatory regime developments, including climate-related regulatory changes In the Group’s key markets, regulatory changes and reforms are in progress, with some uncertainty on the full impact to Prudential: – In China, regulatory tightening across a number of industries in 2021, which may continue across other industries, has driven
market volatility, heightened credit risk, adversely impacted business sentiment, with the potential for broader financial contagion. Other recent regulatory developments in China which may potentially increase compliance risk to the Group include the following:
- Development of a holistic data governance regime in China, which have recently included the Data Security Law, the
Personal Information Protection Law, and the revised Measures for Cybersecurity Review;
13
- The CBIRC recently released new regulations on internet life insurance sales in China which include restrictions on the selling of certain long-term products online, effective 31 December 2021; and
- On 26 October 2021 the National Health Commission released for public comment draft rules on the internet healthcare services, which include restrictions on online AI-driven diagnosis and treatments as well as requirements including real-time supervision by provincial internet supervision platforms and meeting financial and operational criteria, including certain risk management and corporate governance ratings. These rules may have implications for the Group’s plans for its Pulse platform in China.
– In Hong Kong, the Hong Kong IA is seeking to align the territory’s insurance regime with international standards and has been developing a risk-based capital (‘RBC’) framework. The RBC framework will comprise three pillars: quantitative requirements, including assessment of capital adequacy and valuation; qualitative requirements, including corporate governance, Enterprise Risk Management as well as Own Risk and Solvency Assessment; and public disclosures and transparency of information. The Hong Kong IA is permitting applications for early adoption of the framework.
– In Malaysia, Bank Negara Malaysia (‘BNM’), the central bank of Malaysia, has initiated a multi-phase review of its current RBC frameworks for insurers and takaful operators which has been conducted since 2018. The review aims to ensure that the frameworks remain effective under changing market conditions, facilitate consistent and comparable capital adequacy measurement across the insurance and takaful industry, where appropriate, and achieve greater alignment with key elements of the global capital standards such as ICS, where appropriate. The timing of the effective date of the updated rules currently remains uncertain but certain changes, such as the applicable discount rate on liabilities, are expected to come into effect in 2022.
– In China, the China Banking and Insurance Regulatory Commission (‘CBIRC’) announced plans for its China Risk Oriented Solvency System (‘C-ROSS’) Phase II in 2017. Quantitative impact studies have been performed in 2020 and 2021. On 30 December 2021, the CBIRC released the official regulation for C-ROSS II, which is effective for Q1 2022 solvency reporting.
– In Indonesia, regulatory and supervisory focus on the insurance industry remains high. The Financial Services Authority of Indonesia, the Otoritas Jasa Keuangan (‘OJK’) has been revising investment linked products (‘ILP’) regulations with the aim of increasing insurance penetration and better protecting customer interests and improving market conduct. The final regulations are expected to be issued during 2022 and will have implications for the product strategies and insurance and compliance risks for insurers. General supervisory focus on insurer governance has increased, in particular on the autonomy of decision-making of local insurers. The OJK has also focused on consumer protection regulations more broadly and has recently enhanced regulatory requirements on IT risk management. Since the 2014 Insurance Law, the industry has been subject to regulatory expectations on the separation of conventional and Sharia business.
– In Malaysia, BNM issued a circular letter in Q1 2021 specifying requirements for the design and disclosure of ILPs which provide extension of coverage beyond the initial coverage term. These changes aim to improve the appropriateness of product design and the customer disclosures provided on ILP policy documents. The new requirements for ILP products sold since March 2021 came into effect on 22 September 2021, while for all in-force products sold prior to March 2021 the proposed effective date has been extended to 1 April 2022. The changes are expected to materially impact insurer systems, disclosures, customer communications, sales conduct and post-sale processes.
The pace and volume of climate-related regulatory changes is also increasing. Regulators including the Hong Kong Monetary Authority, the Monetary Authority of Singapore, BNM in Malaysia and the Financial Supervisory Commission in Taiwan are in the process of developing supervisory and disclosure requirements or guidelines related to the environment and climate change. It is expected that other regulators will develop similar requirements. These changes may give rise to compliance, operational and disclosure risks requiring Prudential to coordinate across multiple jurisdictions in order to apply a consistent risk management approach. (d) IFRS 17 Prudential’s consolidated accounts are prepared in accordance with current IFRS applicable to the insurance industry. In May 2017, the IASB published its standard on insurance accounting (IFRS 17, 'Insurance Contracts') which replaces the current IFRS 4 standard. Some targeted amendments to this standard, including to the effective date, were issued in June 2020 and December 2021. IFRS 17, 'Insurance Contracts', as amended, will have the effect of introducing fundamental changes to the statutory reporting of insurance entities that prepare accounts according to IFRS from 2023. The standard is subject to endorsement in the UK via the UK Endorsement Board. Prudential has a Group-wide implementation programme underway to implement this new standard. A reliable estimate of the effect of changes required to the Group’s accounting policies as a result of implementing this standard, which is expected to alter the timing of IFRS profit recognition, is not yet available as implementation is underway. The implementation of this standard involves significant enhancements to the IT, actuarial and finance systems of the Group. Apart from IFRS 17, any other changes or modification of IFRS accounting policies may also require a change in the way in which future results will be determined and/or a retrospective adjustment of reported results to ensure consistency. (e) Inter-bank offered rate (‘IBOR’) reforms In July 2014, the FSB announced widespread reforms to address the integrity and reliability of IBORs. The discontinuation of IBORs in their current form and their replacement with alternative risk-free reference rates such as the Secured Overnight Financing Rate (‘SOFR’) in the US and the Singapore Swap Offer Rate (‘SOR’) could, among other things, impact the Group through an adverse effect on the value of Prudential’s assets and liabilities which are linked to or which reference IBORs, a reduction in market liquidity during any period of transition and increased legal and conduct risks to the Group arising from changes required to documentation and its related obligations to its stakeholders. (f) Investor contribution schemes
14
Various jurisdictions in which Prudential operates have created investor compensation schemes that require mandatory contributions from market participants in some instances in the event of a failure of a market participant. As a major participant in the majority of its chosen markets, circumstances could arise in which Prudential, along with other companies, may be required to make such contributions. 4.2 The conduct of business in a way that adversely impacts the fair treatment of customers could have a negative
impact on Prudential’s business, financial condition, results of operations and prospects or on its relations with current and potential customers.
In the course of its operations and at any stage of the product lifecycle, the Group or its intermediaries may conduct business in a way that adversely impacts customer outcomes and the fair treatment of customers (‘conduct risk’). This may arise through a failure to: design, provide and promote suitable products and services to customers that meet their needs, are clearly explained or deliver real value, provide and promote a high standard of customer service, appropriately manage customer information, or appropriately handle and assess complaints. A failure to identify or implement appropriate governance and management of conduct risk may result in harm to customers and regulatory sanctions and restrictions, and may adversely impact Prudential’s reputation and brand, its ability to attract and retain customers, its competitiveness and its ability to deliver on its long-term strategy. Prudential is, and in the future may continue to be, subject to legal and regulatory actions in the ordinary course of its business on matters relevant to the delivery of customer outcomes. Such actions relate, and could in the future relate, to the application of current regulations or the failure to implement new regulations (including those relating to the conduct of business), regulatory reviews of broader industry practices and products sold (including in relation to lines of business already closed) in the past under acceptable industry or market practices at the time and changes to the tax regime affecting products. Regulators may also focus on the approach that product providers use to select third-party distributors and to monitor the appropriateness of sales made by them. In some cases, product providers can be held responsible for the deficiencies of third-party distributors. There is a risk that new regulations introduced may have a material adverse effect on the sales of the products by Prudential and increase Prudential’s exposure to legal risks. Any regulatory action arising out of the Group’s position as a product provider could have an adverse impact on the Group’s business, financial condition, results of operations and prospects, or otherwise harm its reputation. 4.3 Litigation, disputes and regulatory investigations may adversely affect Prudential’s business, financial condition,
cash flows, results of operations and prospects. Prudential is, and may in the future be, subject to legal actions, disputes and regulatory investigations in various contexts, including in the ordinary course of its insurance, investment management and other business operations. These legal actions, disputes and investigations may relate to aspects of Prudential’s businesses and operations that are specific to Prudential, or that are common to companies that operate in Prudential’s markets. Legal actions and disputes may arise under contracts, regulations (including tax) or from a course of conduct taken by Prudential, and may be class actions. Although Prudential believes that it has adequately provided in all material respects for the costs of litigation and regulatory matters, no assurance can be provided that such provisions are sufficient. Given the large or indeterminate amounts of damages sometimes sought, other sanctions that might be imposed and the inherent unpredictability of litigation and disputes, it is possible that an adverse outcome could have an adverse effect on Prudential’s business, financial condition, cash flows, results of operations and prospects. 4.4 Changes in tax legislation may result in adverse tax consequences for the Group’s business, financial condition,
results of operations and prospects. Tax rules, including those relating to the insurance industry, and their interpretation may change, possibly with retrospective effect in any of the jurisdictions in which Prudential operates. Significant tax disputes with tax authorities, and any change in the tax status of any member of the Group or in taxation legislation or its scope or interpretation could affect Prudential’s business, financial condition, results of operations and prospects. The Organisation for Economic Co-operation and Development (‘OECD’) is currently undertaking a project intended to modernise the global international tax system, commonly referred to as Base Erosion and Profit-Shifting 2.0 (‘BEPS 2.0’). The project has two pillars. The first pillar is focused on the allocation of taxing rights between jurisdictions for in-scope multinational enterprises that sell cross-border goods and services into countries with little or no local physical presence. The second pillar is focused on developing a global minimum tax rate of 15 percent applicable to in-scope multinational enterprises. On 8 October 2021 the OECD issued a statement setting out the high level principles which have been agreed by over 130 jurisdictions involved in the project. Based on the 8 October 2021 OECD statement, Prudential does not expect to be affected by proposals under the first pillar given they include an exemption for regulated financial services companies. On 20 December 2021 the OECD published detailed model rules for the second pillar, with implementation of the rules envisaged by 2023. These rules will apply to Prudential where implemented into the national law of jurisdictions where it has entities within the scope of the rules. On 11 January 2022, the UK government issued a consultation on the UK implementation of these rules, with the intention of including required legislation in Finance Bill 2022-23 and for the rules to be effective from 1 April 2023. Detailed guidance from the OECD is awaited to assist with interpreting the model rules. The early indications are that some jurisdictions may also introduce a domestic minimum tax for in-scope multinationals alongside introducing the global rules. As Prudential operates in a number of jurisdictions where the effective tax rate can be less than 15 per cent, the implementation of the model rules and/or equivalent domestic minimum tax rules may have an adverse impact on the Group. Until further clarity is provided on how the OECD model rules are to be interpreted, how relevant jurisdictions will implement them and any domestic minimum tax regimes, the full extent of the long-term impact on Prudential’s business, tax liabilities and profits remain uncertain.

By order of the Board
Prudential plc
Tom Clarkson
Company Secretary
9 March 2022, London
As at the date of this announcement, the Board of Directors of Prudential plc comprises:
Chair
Shriti Vinodkant Vadera
Executive Directors
Michael Andrew Wells (Group Chief Executive), Mark Thomas FitzPatrick CA and Stuart James Turner FCA FCSI FRM
Independent Non-executive Directors
Jeremy David Bruce Anderson CBE, Chua Sock Koong, David John Alexander Law ACA, Ming Lu,
Anthony John Liddell Nightingale CMG SBS JP, The Hon. Philip John Remnant CBE FCA, George David Sartorel,
Alice Davey Schroeder, Thomas Ros Watjen, Jeanette Kai Yuan Wong and Yok Tak Amy Yip
* For identification purposes