
2021 California Behavioral Health Workforce Assessment
64
2021 CALIFORNIA BEHAVIORAL HEALTH WORKFORCE ASSESSMENT Prepared by Center for Applied Research Solutions (CARS) for Advocates for Human Potential (AHP) and California Department of Health Care Services (DHCS) APRIL 2022
-
Upload
khangminh22 -
Category
Documents
-
view
3 -
download
0
Transcript of 2021 California Behavioral Health Workforce Assessment
2021 CALIFORNIA
BEHAVIORALHEALTH WORKFORCE ASSESSMENTPrepared by Center for Applied Research Solutions (CARS)for Advocates for Human Potential (AHP) andCalifornia Department of Health Care Services (DHCS)
APRIL 2022

2021 California Behavioral Health Workforce Assessment Report // 2
Table of Contents | 2
A. Executive Summary | 4
Recommendations & Report Findings | 4
B. Introduction to the Report | 10
C. Background: Building and Diversifying the Workforce | 10
Results in Context: Responding to California’s Workforce Shortage | 11
Promoting Behavioral Health Equity | 11
Expanding California’s Workforce Data | 12
D. Objectives and Methodologies | 13
Survey Development | 14
Survey Outreach | 15
Listening Session Methodology | 16
Survey and Listening Session Limitations | 16
E. Demographics | 17
Gender Identity and Sexual Orientation | 17
Race/Ethnicity | 18
Age | 19
Regional Distribution | 21
F. Lived Experience and the Peer Workforce | 21
Defining Peers | 22
Lived Experience | 22
Peer Workforce Role | 24
Peer Workplace Experiences | 24
Barriers to Integrating Peers | 26
G. Education and Certification | 28
Education | 28
Peer Certification | 30
H. Employment and Roles | 32
TABLE OF CONTENTS

2021 California Behavioral Health Workforce Assessment Report // 3
Primary Roles by Occupation Group | 32
Occupation by Race/Ethnicity | 35
Employment Experience | 36
Employment Status | 37
Number of Positions and Number of Hours Worked | 38
I. Compensation | 40
Compensation by Occupational Grouping | 40
Compensation and Education | 40
Compensation and the Peer Workforce | 42
J. Employment Plans and Motivations | 42
Employment Plans | 42
Employment Plans: Positive Motivating Factors | 45
Employment Plans: Negative Motivating Factors | 46
K. Telehealth | 47
Telehealth Use and Perceptions | 48
Telehealth in Rural Settings | 49
L. Communities Served, Unserved, and Underserved | 50
Populations Served | 50
Populations Underserved | 51
Specific Unmet Needs | 53
Language Usage | 53
M. Recommendations | 55
References | 60
Appendix | 63
Appendix 1. PWI and EPOC Grantees | 63
Appendix 2. Organizational Outreach | 64
TABLE OF CONTENTS

2021 California Behavioral Health Workforce Assessment Report // 4
California’s behavioral health workforce is comprised of a broad range of mental health and substance use prevention, treatment, and recovery professionals and paraprofessionals. In Fall 2021, more than sixteen hundred (1,602) members of the behavioral health workforce responded to the California Behavioral Health Workforce Assessment (BHWA) survey, and 66 representatives of peer-run organizations participated in small-group listening sessions.
Respondents represented a wide array of behavioral health workforce settings; professional and educational backgrounds; and racial, ethnic, and cultural communities. Many have lived experience: 35.4% have been a family member or caregiver of a person with behavioral health needs, 32.0% have experienced a personal mental health challenge, 11.9% have experienced a substance use disorder (SUD). In response to the current focus on expanding peer support services and developing peer specialist certification in California, the project had a special emphasis on the peer support community.
Together, the rich data and perspectives gathered from the survey and listening sessions yielded valuable information about the strengths, challenges, and needs of California’s behavioral health workforce today—and opportunities for tomorrow.
This assessment is part of the California Department of Health Care Services (DHCS) Behavioral Health Workforce Development Project (BHWDP). The goals of the BHWDP are to expand, elevate, enhance, and empower the behavioral health workforce in every California community. The BHWDP supports multiple peer organization grant initiatives that are funded by DHCS and administered by Advocates for Human Potential (AHP). AHP partnered with the Center for Applied Research Solutions (CARS) for the workforce assessment.
RECOMMENDATIONS & REPORT FINDINGSBelow are key findings and abbreviated recommendations from this data collection effort, as well as relevant policy spotlights. These recommendations are based on the survey responses and focus group data, and they are described in greater detail in section M of this report. Note: DHCS does not endorse or advocate for any particular legislation, funding, or expenditure that is discussed in this section.
» Recommendation 1. Support data-driven decision-making and policy by collecting nuanced behavioral health workforce data.
Over the last decade, California has implemented several large-scale, nuanced statewide behavioral health workforce assessments to analyze existing data and expand the data collected. These and other states’ workforce assessments
A. EXECUTIVE SUMMARY
POLICY AND FUNDING SPOTLIGHT
With the 2021-2022 California state budget, the former Office of Statewide Health Planning and Development (OSHPD) has been expanded and modernized as the Department of Health Care Access and Information (HCAI). This transition includes creating a new California Health Workforce Research Data Center as a central hub of the state’s workforce information, updating data programs, and establishing a California Health Workforce Education and Training Council to provide guidance (Department of Health Care Access and Information, 2021).
2021 California Behavioral Health Workforce Assessment Report // 5
have pointed to significant gaps in the public data about the behavioral health workforce, available services, and quality of services, particularly regarding SUD professionals (DHCS, 2022b; Coffman et al., 2019; CARS, 2013). Building on this process can yield value and insights to support California’s workforce development efforts in the long term.
• Implement the BHWA on a two- to three-year cycle to allow for tracking trends over time. Allocate more time for the BHWA planning, implementation, and analysis process.
• Collect data from provider members and make it publicly available. Consider demographic information, years of experience, employment setting, etc.
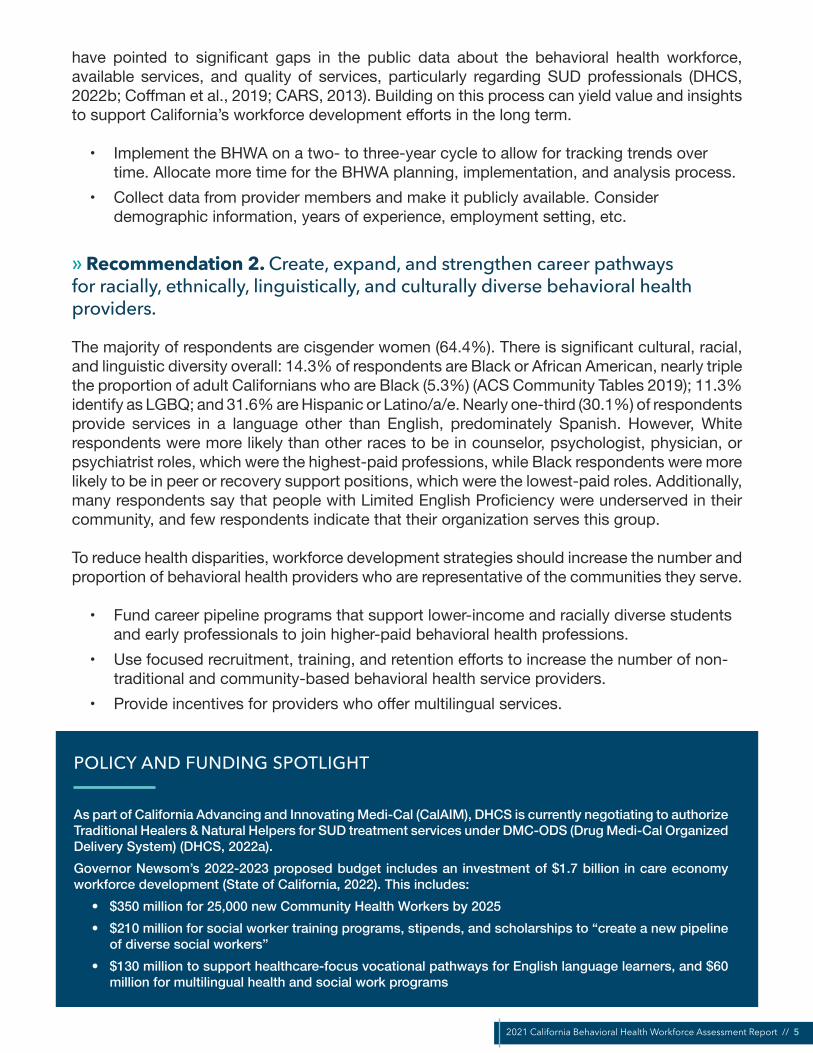
» Recommendation 2. Create, expand, and strengthen career pathways for racially, ethnically, linguistically, and culturally diverse behavioral health providers.
The majority of respondents are cisgender women (64.4%). There is significant cultural, racial, and linguistic diversity overall: 14.3% of respondents are Black or African American, nearly triple the proportion of adult Californians who are Black (5.3%) (ACS Community Tables 2019); 11.3% identify as LGBQ; and 31.6% are Hispanic or Latino/a/e. Nearly one-third (30.1%) of respondents provide services in a language other than English, predominately Spanish. However, White respondents were more likely than other races to be in counselor, psychologist, physician, or psychiatrist roles, which were the highest-paid professions, while Black respondents were more likely to be in peer or recovery support positions, which were the lowest-paid roles. Additionally, many respondents say that people with Limited English Proficiency were underserved in their community, and few respondents indicate that their organization serves this group.
To reduce health disparities, workforce development strategies should increase the number and proportion of behavioral health providers who are representative of the communities they serve.
• Fund career pipeline programs that support lower-income and racially diverse students and early professionals to join higher-paid behavioral health professions.
• Use focused recruitment, training, and retention efforts to increase the number of non-traditional and community-based behavioral health service providers.
• Provide incentives for providers who offer multilingual services.
POLICY AND FUNDING SPOTLIGHT
As part of California Advancing and Innovating Medi-Cal (CalAIM), DHCS is currently negotiating to authorize Traditional Healers & Natural Helpers for SUD treatment services under DMC-ODS (Drug Medi-Cal Organized Delivery System) (DHCS, 2022a).Governor Newsom’s 2022-2023 proposed budget includes an investment of $1.7 billion in care economy workforce development (State of California, 2022). This includes:
• $350 million for 25,000 new Community Health Workers by 2025• $210 million for social worker training programs, stipends, and scholarships to “create a new pipeline
of diverse social workers”• $130 million to support healthcare-focus vocational pathways for English language learners, and $60
million for multilingual health and social work programs

2021 California Behavioral Health Workforce Assessment Report // 6
» Recommendation 3. Increase pay and benefits for the behavioral health workforce. Address disparities between peer and non-peer staff.
Across all major behavioral health occupational groups, the most commonly cited negative factor motivating employment plans was wanting or needing higher pay. Among the peer workforce, fewer than half (48.9%) agreed or strongly agreed that their pay is consistent with that of others in the organization who do not have lived experience. During the listening sessions, participants repeatedly called for better pay and benefits, noting that it was hard to recruit peer supporters when people had better pay from retail jobs or were afraid of losing Medi-Cal insurance.
Focus group and survey responses suggest that strategies to raise compensation, such as the following sample strategies, may help address workforce shortages:
• Increase compensation for existing behavioral health staff, raise salary caps in county and state contracts, and increase reimbursements to allow for ongoing wage increases.
• Utilize American Rescue Plan Act (ARPA) funds for both immediate and long-term workforce development needs.
• Ensure parity of benefits, particularly health care, between clinical and peer staff.
POLICY AND FUNDING SPOTLIGHT
California’s Children and Youth Behavioral Health Initiative (CYBHI) represents an historic investment of $4.4 billion over five years, initiated in 2021-2022. Funding is spread across multiple California Health & Human Services (CalHHS) agencies, including DHCS. Under the Department of Health Care Access and Information (HCAI), $448 million will be used for Broad Behavioral Health Workforce Capacity projects such as peer support, earn-and-learn (apprenticeship) programs, and pipeline programs. These activities also include recruitment and retention activities that include recruitment incentives, loan repayment, and stipend programs (California Health and Human Services Agency, 2021).
The proposed $1.7 billion investment in the care economy workforce referenced above includes $120 million for psychiatric resident programs and $26 million to build out the SUD workforce, with an emphasis on opioid treatment.
» Recommendation 4. Address provider burnout and compassion fatigue. Support parents and caregivers.
Common negative factors motivating employment plans include a lack of support from the organization (need for better pay or benefits, staffing, or family time) as well as burnout or compassion fatigue. Respondents plan to increase their hours, advance their careers, and pursue training or education in the near term (12-month and five-year plans), but many are looking to decrease their hours or retire in the longer term (five to ten years). More than one-third of peers (34.9%) have more than one behavioral health position, compared to 25.9% of survey respondents overall.
• Build awareness about the signs and symptoms, impacts, and mitigating factors of burnout, compassion fatigue, and secondary traumatic stress.
• Implement self-care and wellness supports, connecting spaces, and incentives.

2021 California Behavioral Health Workforce Assessment Report // 7
• Offer Employee Assistance Programs (EAP) to connect employees to more intensive supports.
• Implement policies such as flexible scheduling and mental health days.
» Recommendation 5. Prioritize supports for unserved, underserved, and inappropriately served communities. Invest in equity-driven strategies and wraparound supports.
Considering community needs, survey respondents selected many of the same groups when asked who their organization focuses on and who is underserved in their community: people experiencing homelessness; Hispanic or Latino/a/e, Black or African American, and LGBTQ people; people with disabilities; and youth and young adults with foster care involvement. Listening session participants identified several needs that were unmet in their community: housing, case management services, harm reduction strategies, services for people who are incarcerated or in reentry, and services for youth and young adults of transition age.
• Continue to fund implementation, evaluation, and replication of culturally responsive and community-defined evidence (CDE) practices; e.g., programs such as the California Department of Public Health initiative, the California Reducing Disparities Project (CRDP).
• Invest in innovative programs to support affordable housing supports and infrastructure. Ensure that “housing first” strategies do not prevent people with behavioral health needs from accessing services.
• Interrupt the cycle of hospitalization and incarceration by supporting affordable housing and reentry supports for individuals experiencing homelessness or justice system involvement.
POLICY AND FUNDING SPOTLIGHT
With the establishment of CalAIM, DHCS is strongly encouraging counties to use Medi-Cal funding for in lieu of services (ILOS) that include housing transition navigation services, housing deposits, and housing tenancy and sustaining services, among others (Medi-Cal In Lieu of Services, 2022).
CalAIM includes care coordination, SUD treatment services and medication, and other Medi-Cal services for youth and adults transitioning out of incarceration. DHCS is currently negotiating this component of CalAIM with the Centers for Medicare & Medicaid Services (DHCS, 2022).

2021 California Behavioral Health Workforce Assessment Report // 8
» Recommendation 6. Provide additional training and technical assistance to expand telehealth.
Nearly half (47.8%) of respondents currently use telehealth as a service delivery mechanism. Survey respondents and listening session participants like that telehealth makes services more accessible for many. Three out of five telehealth users (62.8%) even feel that telehealth improves service delivery. However, only 42.0% of current users were confident that they plan to continue utilizing telehealth after the pandemic. Concerns cited include limited access to technology (especially for older adults and people experiencing homelessness) and low comfort with technology.
• Provide clear guidance about telehealth billing parity policies and how they may shift post-pandemic.
• Create learning opportunities for counties and providers to learn about innovative and resource-effective ways that others are engaging communities with limited access to telehealth.
• Educate providers and service recipients about how to use telehealth.
POLICY AND FUNDING SPOTLIGHT
DHCS has committed to permanent Medi-Cal reimbursement parity for an array of services at both video and audio visits. Medi-Cal is unique among state Medicaid programs for its commitment to audio visit payment parity (Augenstein et al., 2022).
In December 2021, the DHCS Medi-Cal Telehealth Advisory Group released a report with policy recommendations to inform the Governor’s 2022-2023 budget. These included supporting patients’ choice of telehealth and in-person modalities; documentation of patients’ consent to telehealth services; and other billing, coding, and monitoring protocols to align telehealth with DHCS’ guiding principles (DHCS Medi-Cal Telehealth Advisory Workgroup, 2021). Similarly, California’s AB 457 (Protection of Patient Choice in Telehealth Provider Act, under review) would implement a “Telehealth Patient Bill of Rights.”
» Recommendation 7. Invest in training initiatives and programs that support integration of peers. Include and promote peer voice and leadership.
Both survey respondents and listening session participants identify a lack of awareness of what is unique and valuable about peer support, and how clinicians and peers can effectively collaborate, as barriers to peer integration. Listening session participants stressed the importance of ongoing training and cross-training for both peer support providers and their non-peer colleagues. One in three members of the peer workforce (32.5%) report having a peer specialist or peer supervisory certification. Further, over sixty percent (61.8%) currently hold, are working toward, or plan to pursue certification. Listening session participants expressed excitement about SB 803, under which DHCS is developing peer support specialist certification program and requirements; however, they also expressed concerns, including how and whether peers are being engaged in the planning process.

2021 California Behavioral Health Workforce Assessment Report // 9
Similar to focus group participants in Assessing the Continuum of Care for Behavioral Health Services in California, another recent DHCS-funded report, BHWA listening session respondents are strongly interested in integrating peer services across different levels of care (e.g., crisis services, faith-based organizations) (DHCS, 2022b).
• Continue to authentically engage a broad community of peers in the planning and implementation of SB 803 certification requirements, at both the state and county levels.
• Market and promote widespread awareness of peer support services, training programs, and certification/SB 803.
• Promote cross-training between peers, non-peer clinicians and leadership, and non-peer staff within behavioral health organizations (e.g., on recovery-oriented language for clinicians, on mental health topics for peers).
• In organizations that employ peers, align workplace training, professional development, and responsibilities with certification requirements. Ensure there are career advancement and leadership opportunities for peer specialist and peer support supervisor staff.
POLICY AND FUNDING SPOTLIGHT
Effective July 2022, the new Peer Support Services benefit in Medi-Cal will allow people with lived experience to provide specialty mental health and SUD treatment services in counties that opt-in. Expanding peer support services through increased county funding options may increase not only the size but also the diversity of the peer support workforce (DHCS, 2022b).
At the federal level, multiple bills are currently under review that would support the integration of peers in traditional behavioral health services or expand virtual peer support services (Promoting Effective and Empowering Recovery Services in Medicare Act of 2021, PEERS Act; Virtual Peer Support Act of 2021). Vermont, Florida, North Carolina, and Washington have all recently introduced bills to support peer specialist certification as a strategy to expand the behavioral health workforce.1
ARPA authorizes an 85% federal funds matching benefit for a Medicaid mobile crisis services benefit, which DHCS will incorporate as soon as January 2023. Additionally, DHCS’ new Crisis Care Mobile Units (CCMU) Program is releasing $205 million from county and city behavioral health agencies to expand behavioral health crisis and non-crisis services. This is important because DHCS strongly encourages grant recipients to integrate peers in their crisis response system (DHCS, 2021); peer support is considered an essential component of SAMHSA’s best practices for comprehensive crisis care (Center for Mental Health Services, 2020).
1 See Vermont HB 560, An act relating to the certification of mental health peer support specialists; Florida SB 282, Mental Health and Substance Use Disorders; North Carolina HB 732, Peer Support Specialist Certification Act; and Washington HB 1865, Addressing the behavioral health workforce shortage and expanding access to peer services by creating the profession of certified peer specialists.

2021 California Behavioral Health Workforce Assessment Report // 10
California’s behavioral health workforce is comprised of a wide range of mental health and substance use prevention, treatment, and recovery professionals and paraprofessionals. Yet many Californians are still unable to access the services they need, and often these barriers are related to a gap between high service demand and low workforce supply. There is growing recognition that the peer support workforce, in particular, is uniquely positioned to support people with recovery needs that might otherwise go unmet. However, there exists a lack of data around key aspects of California’s peer providers, and the broader behavioral health field in general, that limit our understanding of the capacity of the workforce.
This data collection project and the report that follows are intended to help bridge these gaps in understanding. In Fall 2021, more than sixteen hundred (1,602) members of the behavioral health workforce responded to the California Behavioral Health Workforce Assessment survey, and 66 representatives of peer-run organizations participated in small-group listening sessions.
It is important to note that this data collection and analysis effort was conducted in an unprecedented historical context, eighteen months into the pandemic. We are still in the process of understanding how the COVID-19 pandemic and the ways it has changed behavioral health services have impacted—and are continuing to impact—mental health and substance use professionals and paraprofessionals. The survey and listening session questions focused on both stable characteristics of the workforce (e.g., demographics, education) and more recent, timebound topics (e.g., the pandemic, telehealth). Future data collection will allow us to distinguish the long-term workforce trends from the short-term effects of the pandemic. The Background section describes this context in greater detail, and the Methodology section highlights important limitations.
This assessment is part of the California Department of Health Care Services (DHCS) Behavioral Health Workforce Development Project (BHWDP). The goals of the BHWDP are to expand, elevate, enhance, and empower behavioral health workforce in every California community. The BHWDP supports multiple peer organization grant initiatives that are funded by DHCS and administered by Advocates for Human Potential (AHP). AHP partnered with the Center for Applied Research Solutions (CARS) for the workforce assessment component.
Together, the rich data and perspectives gathered from the survey and listening sessions yielded valuable information about the strengths, challenges, and needs of California’s behavioral health workforce today—and opportunities for tomorrow. Leveraging these insights and lessons learned can help create opportunities for capacity building and workforce enrichment, promote the integration of peers and peer-run organizations, and foster the long-term sustainability and expansion of California’s behavioral health workforce.
Over the last two years, California’s behavioral health workforce has been impacted by an array of interconnected factors related to the COVID-19 pandemic. These range from
C. BACKGROUND: BUILDING AND DIVERSIFYING THE WORKFORCE
B. INTRODUCTION TO THE REPORT

2021 California Behavioral Health Workforce Assessment Report // 11
a sudden and unexpected dependence on telehealth as a service delivery mechanism, including in rural regions with limited technological access; to an increase in demand, as individuals throughout the state cope with grief and trauma; to the emotional burnout associated with supporting overwhelming behavioral and mental health needs during these uniquely challenging times.
This section provides additional context for how this report responds to the needs of diverse communities and service providers in this unprecedented historical moment.
RESULTS IN CONTEXT: RESPONDING TO CALIFORNIA’S WORKFORCE SHORTAGE
Even before the pandemic, California—like many other states—was experiencing a major, ongoing behavioral workforce shortage. Nearly one-third of Californians (31.5%) currently live in Mental Health Care Health Professional Shortage Areas, or HPSAs (Bureau of Health Workforce, 2021). Over the next decade, the supply of psychiatrists, psychologists, and licensed clinical social workers is expected to continue to decrease as many professionals retire from the workforce; these shortages are especially dire in rural counties (Finocchio et al., 2021; Coffman et al., 2018). There is also a severe shortage of SUD treatment professionals, with open positions taking months to fill, in part due to low pay (Taylor, 2021; Vestal, 2015). Recruitment is a significant challenge in community-based behavioral health settings (e.g., homeless services, domestic violence centers), which have historically been impacted by low pay and burnout, but are now also a setting for frontline COVID-19 risk (Tobias, 2022; Barna, 2022).
The pandemic has contributed to workplace upheavals across systems and roles, exacerbating workforce shortages in the behavioral health field. This is the historical context in which the data for this report was collected and analyzed, and the responses, conclusions, and recommendations within this report must be understood within this context. Future data collection efforts can help to illuminate which findings arise from the pandemic context, and which are indicative of a long-term trend. Additionally, they will also help us to understand the impacts of California’s planned influx of fundingfor behavioral health services (see Executive Summary).
PROMOTING BEHAVIORAL HEALTH EQUITYThe COVID-19 pandemic has shed light on healthcare disparities and workforce gaps, while also worsening them. Recent studies indicate that Black and Latino/a/e Americans, compared to the general population, are less likely to receive mental health treatment during the pandemic (McKnight-Eily et al., 2021); more likely to perceive a direct, major health and economic threat from COVID-19 (Office of Behavioral Health Equity, 2021); more likely to live and work in settings that involve increased COVID risk (e.g., jail or prison, homeless shelters or camps, low-income and multigenerational housing, essential worker roles) (Office of Behavioral Health Equity, 2021); more likely to experience loss of a family member (Artiga et al., 2021); more likely to report physical symptoms of stress (American Psychological Association, 2021); and more likely to report stress and worry about returning to normal life after the pandemic (American Psychological Association, 2021). Asian, Black, and multiracial non-Hispanic Americans also report higher than average levels of COVID-related stigma and discrimination (Liu et al., 2020; McKnight-Eily et al., 2021).

2021 California Behavioral Health Workforce Assessment Report // 12
Investing in the healthcare workforce to close these gaps is one of the five proposed priorities from the Presidential COVID-19 Health Equity Task Force (October 2021):
“Invest in a representative health care workforce and increase equitable access to quality health care for all. Government entities must significantly invest in the public health and health care workforce and incentivize equitable access and outcomes in health care delivery and public health preparedness, while prioritizing the highest risk populations in response, recovery, and resilience. Priorities should include […] increasing the size and representation of health care, public health, and emergency response workforces.”
This Task Force priority points to the way that diversity, equity, and inclusion are integral to the project of expanding California’s behavioral health workforce, for both the short term and long term. As described in the Executive Summary, California is preparing to invest hundreds of millions of dollars in programs to expand and diversify the workforce. This report collects provider demographic data, as well as information about community needs and which populations are served or underserved, in support of efforts to promote health equity by better aligning the behavioral health system with the needs of underserved populations.
There is growing recognition that the peer support workforce, in particular, is uniquely positioned to support people with recovery needs that might otherwise go unmet. This may be especially true of people from diverse cultural and linguistic backgrounds whom the healthcare system has historically unserved, underserved, or inappropriately served.2 The upcoming implementation of SB 803 (Beall) is intended to support the expansion of high-quality peer specialist services through a state-sanctioned certification process. Within the body of SB 803, the State of California acknowledges that “the use of peers with lived experience” to support recovery “can increase the diversity and effectiveness of the behavioral health workforce.”3 A large number of peer or recovery support providers (456) responded to the survey, including a significant number who are Black, Hispanic or Latino/a/e, or Asian or Asian American. Their responses to questions about peer workforce certification, unmet needs, and challenges to integrating peers can help inform efforts to ensure that the peer workforce advances equitably.
EXPANDING CALIFORNIA’S WORKFORCE DATA State workforce assessments often rely on data from state licensing boards; Medi-Cal; and national sources, such as the Bureau of Labor Statistics (BLS) and American Community Survey (ACS). These data sources are crucial, but have both quantitative and qualitative limitations.
Two important, recent analyses of California’s behavioral health workforce point to several key data gaps that limit our understanding of the workforce and its needs. The following are examples of these data gaps, as identified in DHCS’ Assessing the Continuum of Care for Behavioral Health Services in California: Data, Stakeholder Perspectives, and Implications (2022) and the Healthforce Center at UCSF’s California’s Current and Future Behavioral Health Workforce (2018):
2 This language is drawn from the Mental Health Services Oversight and Accountability Commission’s (MHSOAC) Cultural and Linguistic Competence Technical Resource Group, which is also adopted by the California Department of Public Health, Office of Health Equity’s California Reducing Disparities Project (CRDP).3 SB-803: Mental health services: peer support specialist certification. (2019-2020). Chapter 150.

2021 California Behavioral Health Workforce Assessment Report // 13
• Limited, difficult-to-analyze, or poor-quality quantitative data for an array of services and settings in California, including many outpatient mental health services, peer and recovery supports, residential mental health services, crisis services, and traditional healing practices, among others4
• Limited or inconsistent data on access to and use of behavioral health services, outside of Medi-Cal claims data
• Lack of data from licensing boards on professionals’ demographics or their practice settings
• Lack of data on behavioral health paraprofessionals who are unlicensed• Lack of data on behavioral health professionals’ ability to interact with service recipients
in languages other than English• Inconsistent data collection and availability about the need for services, particularly
among people who are justice involved, experiencing homelessness, or American Indian or Alaska Native
The analysis that follows is intended to complement larger-scale, quantitative data collection efforts that draw from existing, publicly available datasets. In addition to codifying the general characteristics of the workforce, this data collection effort asks members of the workforce how the challenges and opportunities of the current moment are impacting the work that they do and the needs they are responding to in communities.
» Related: Recommendation 1
This report is part of the California Department of Health Care Services (DHCS) Behavioral Health Workforce Development Project (BHWDP). The goals of the BHWDP are to expand, elevate, enhance, and empower behavioral health peer-run organizations in every California community.
DHCS has partnered with Advocates for Human Potential (AHP) to implement the BHWDP, which includes the Peer Workforce Initiative (PWI) and Expanding Peer and Organizational Capacity (EPOC). The appendix provides additional information about these initiatives and the grantees. For the workforce assessment component of the BHWDP, AHP partnered with the Center for Applied Research Solutions (CARS) to collect, analyze, and synthesize the workforce data for this report.
This data collection effort seeks to explore the characteristics of California’s behavioral health workforce as a whole, with a special emphasis on the peer workforce. This project takes seriously the call to center the conversation about workforce expansion on questions of diversity, equity, and inclusion.
The goal of this analysis is to better understand the strengths, challenges, and needs of the behavioral health workforce in this moment, in order to recommend policy changes, practical supports, and trainings and technical assistance that can support both the current and future workforce.
D. OBJECTIVES AND METHODOLOGIES
4 See Assessing the Continuum of Care for Behavioral Health Services in California, pages 31-35, for more detailed discussion.

2021 California Behavioral Health Workforce Assessment Report // 14
This report integrates data from two primary sources: a survey designed for and disseminated to the broadest field of self-identified California behavioral health workers, and a series of small listening sessions held with BHWDP grantees.
SURVEY DEVELOPMENTAt the core of this project’s data collection efforts was the Behavioral Health Workforce Assessment (BHWA) Survey, a 73-question survey that collects a range of demographic, professional, and organizational-level data.
While this survey effort involves a number of custom questions that were designed to capture information about the unique characteristic of the state’s workforce, it draws heavily on the University of Michigan Behavioral Health Workforce Research Center’s Minimum Data Set (MDS):
“The field lacks comprehensive data accurately describing the size, composition, and characteristics of the numerous disciplines comprising the behavioral health workforce, which is a barrier to workforce development and planning. . . . The MDS, which is intended to collect the minimum amount of information needed about workforce composition and characteristics to inform supply and demand modeling, will benefit the behavioral health workforce by improving the validity and quality of data, which can then be used to inform policy makers about staffing patterns.” (Beck et al., 2016)
To this end, the BHWA survey tool has adopted the majority of the questions relating to the following MDS areas. Adaptations were made as necessary to conform to the particularities of California’s behavioral health workforce.
• Demographics• Licensure and Certification• Education and Training• Occupation and Area of Practice• Practice Characteristics and Settings
At the time of survey development and dissemination, the behavioral health workforce is undergoing an array of historically unique and difficult challenges. Several questions were added or adapted in order to explore the impacts of the current moment on the behavioral health workforce. They explore topics such as:5
• If and how the pandemic has impacted professionals’ career motivation and goals • Whether the pandemic has negatively impacted organizations’ ability to partner with
peer organizations or integrate peer staff• If and how current events related to racial equity and violence have impacted
professionals’ career motivation and goals• The extent to which workplace diversity, equity, and inclusions issues impact
employment motivations and the peer workforce• The field’s training gaps for supporting historically unserved, underserved, and
inappropriately served populations
5 These questions are adapted in part from the 2020 Pacific Southwest Mental Health Technology Transfer Center (MHTTC) Field Needs Assessment, developed by CARS.

2021 California Behavioral Health Workforce Assessment Report // 15
Additionally, although the MDS mentions peer and recovery professionals, the BHWA survey was developed with a special emphasis on this sector. Over the last decade, there has been growing recognition in the behavioral health field that peers have a vital role to play in supporting and sustaining individual recovery. There has also been a concomitant push to professionalize the peer workforce, recently culminating in the passage in California of SB 803, which is intended to create a pathway for statewide peer certification. The BHWA survey responds to this changing landscape by addressing the recovery, peer support, and peer supervisory workforce as key survey audiences.
SURVEY OUTREACHThe survey was disseminated widely, leveraging a range of project- and organization-based mailing lists and professional networks. Through these lists, survey announcements were distributed to over 8,800 members of the state’s behavioral health workforce, including the following contact lists:
• All BHWDP peer-run organization grantees (PWI and EPOC)• 58 County Prevention Coordinators• Pacific Southwest Mental Health Technology Transfer Center (MHTTC), funded by
SAMHSA (California contacts only)• Crisis and Recovery Enhancement (CARE) Technical Assistance Center, funded by
DHCS• National Training and Technical Assistance Center for Child, Youth, and Family Mental
Health (NTTAC), funded by SAMHSA (California contacts only)• Internal DHCS contact lists
The survey was also shared through direct outreach with California behavioral health stakeholder organizations (both “cold calling” and warm outreach when possible). These requests included messages asking recipients to support in this landscape effort by distributing the survey link as they felt appropriate. Organizational contacts are included in the Appendix.
To encourage participation, multiple drawings were held offering up to 150 $30 Amazon gift cards to randomly selected respondents who completed the entire survey and provided their email addresses.
Outreach efforts generated strong response from the field. Among states that have conducted large-scale workforce surveys, California’s BHWA survey is comparable in both the number of respondents and the breadth of their professional backgrounds.6
The survey opened on October 27, 2021 and closed 21 days later on November 27, 2021. A total of 1,602 valid surveys were received.
1,602valid surveyresponses
6 For examples, please see Florida Certification Board, 2019; Gattman et al., 2017 (Washington); Hemeida et al., 2019 (Oregon); Jones, 2020 (Maryland); New Mexico Health Care Workforce Committee, 2021 (New Mexico); Bowen Center for Health Workforce Research and Policy, 2021 (Indiana).

2021 California Behavioral Health Workforce Assessment Report // 16
LISTENING SESSION METHODOLOGYA total of six listening sessions were conducted. In total, 66 individuals participated, representing a total of 30 organizations from 18 counties.
The listening sessions were kept intentionally small to allow for deeper conversation and insights from the participants, and the sessions were highly interactive and thoughtful. These sessions were organized around BHWDP grantees, and participants were grouped by both geographical region and their relationship to the peer workforce. Four sessions were designated for peer participants, and two were designated for their non-peer colleagues. However, these divisions were not as clean in reality as they are on paper. Those who identified as “peers” included current peer specialists or peer supervisors, but they also included members of organizational leadership who had previously served as direct peer providers and were able to self-select their session.
Each session ran for approximately two hours, and included both verbal responses and a small number polling questions. Sessions were led by experienced facilitators.
SURVEY AND LISTENING SESSION LIMITATIONSThere were several limitations that were identified after the assessment was underway or completed. Although this data collection effort yielded valuable insights about the behavioral health workforce in California, it is important to view the findings within the context of these limitations and with recognition that this was a one-time data collection effort. Additional assessments (e.g., every 2-3 years) would allow for identifying trends over time; distinguishing between long-term and short-term challenges (including those specific to the pandemic); and understanding more clearly what supports are truly useful for the workforce. Continued periodic behavioral health workforce assessments are strongly recommended.
• Time allotted for assessment process. The development, implementation, and analysis of the assessment took place over a five-month period, which included 21 days when the survey was live to the public. Additional time would have allowed for more outreach as well as targeted outreach to specific groups.
• Survey convenience sample approach. The survey was conducted using convenience sampling as a preferred approach to exploratory research with a complimentary primary research component. Convenience sampling offered the most feasible, cost-efficient option for quickly accessing the largest portion of the respondent population (i.e., members of the behavioral health workforce). The minimum sample size was based on the estimated size of the California behavioral health workforce, a 95 percent confidence interval, and a sampling error of plus-or-minus 3 percent. The final survey sample size of 1,602 exceeds the minimum sample size of 1,054 survey responses based on an estimated workforce size of 80,000 members (Coffman et al., 2018).
• Underrepresented groups. This challenge is related to the two described above. Some counties; professional sectors (e.g., psychiatrists, nurses); and racial, ethnic, or cultural populations (e.g., Middle Eastern or North African) were underrepresented among the respondents. These groups are discussed in more detail throughout the report. Future data collection efforts would benefit from more time for survey collection, to allow for initial review of respondent data and outreach to groups that appear to be underrepresented.
66listening session participants from
30peer-run
organizations
2021 California Behavioral Health Workforce Assessment Report // 17
• Length of survey. As described above, the survey was based in large part on University of Michigan’s MDS, with a number of questions added. Although some questions were removed from the MDS, and many questions were optional or governed by skip logic, the total number of questions (73) likely intimidated some respondents or potential respondents.
• Ambiguous or limiting questions. As with most surveys, only after the survey was released to the public did it become clear that some questions created artificial limitations or caused misunderstandings. For example, although respondents with multiple jobs were asked about the pay ranges for each of their roles, they were not asked about their total pay across roles.
• Listening session representation. The listening sessions focused on the peer-run organizations that had recently received grant funding through the BHWDP. Non-grantees were not included.
• Language access. The survey was distributed only in English, in part because it specifically targeted the behavioral health workforce in California rather than the full population of all Californians. This limited our ability to hear from non-traditional providers that support behavioral health in underserved communities (e.g., promotores). It also likely had the unintended effect of alienating some providers whose first language is not English or for whom linguistic equity is an important value.
» Related: Recommendation 2
The survey included a number of optional questions related to respondent demographics, including gender, race/ethnicity, and sexual orientation. These responses help provide a clearer picture of the state’s workforce, as well as allow for identifying trends discussed elsewhere in the report.
To ensure the privacy of respondents, demographic characteristics that were indicated by a small number of respondents are clustered in various tables and charts. These groupings are noted throughout as relevant. Specifically, fewer than 2% respondents identified as gender nonbinary or gender nonconforming, Transgender, Middle Eastern or North African, or Native Hawaiian or Other Pacific Islander, and approximately 4% identified as Native American or Alaska Native.
GENDER IDENTITY AND SEXUAL ORIENTATIONMore than sixty-four percent (64.4%) of the survey respondents identified as cisgender female; only one in five identified as cisgender male (19.2%).7 An additional 13.9% of survey respondents abstained from answering. These findings, which suggest that the workforce is disproportionately
E. DEMOGRAPHICS
64.4%of respondents were cisgender women
19.2%of respondents were cisgender men
Disclaimer: 13.9% preferred not to answer
7 Accepted terminology continues to evolve. Typically, “cisgender” means that a person’s gender corresponds with the sex they were assigned at birth, “transgender” means that a person’s gender is different from the sex they were assigned at birth, “nonbinary” means that their gender does not align with the two-gender construct, and “nonconforming” means that their gender identity or expression does not adhere to traditional gender expectations. However, individuals may define these terms differently for themselves. Learn more at The Annie E. Casey Foundation (https://www.aecf.org/blog/lgbtq-definitions).
2021 California Behavioral Health Workforce Assessment Report // 18
composed of cisgender women, are aligned with similar assessments of California’s workforce (CARS, 2019; CARS, 2013; Coffman et al., 2018).
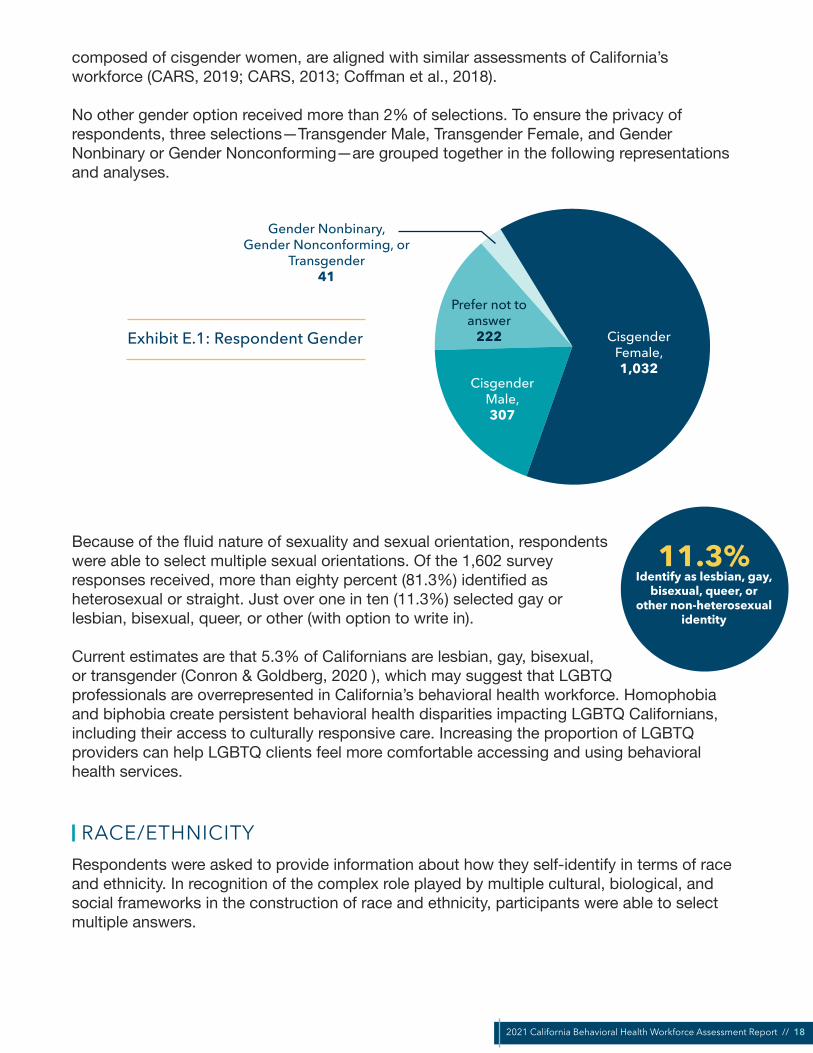
No other gender option received more than 2% of selections. To ensure the privacy of respondents, three selections—Transgender Male, Transgender Female, and Gender Nonbinary or Gender Nonconforming—are grouped together in the following representations and analyses.
CisgenderFemale, 1,032
CisgenderMale, 307
Prefer not to answer
222
Gender Nonbinary, Gender Nonconforming, or
Transgender41
Exhibit E.1: Respondent Gender
Because of the fluid nature of sexuality and sexual orientation, respondents were able to select multiple sexual orientations. Of the 1,602 survey responses received, more than eighty percent (81.3%) identified as heterosexual or straight. Just over one in ten (11.3%) selected gay or lesbian, bisexual, queer, or other (with option to write in).
Current estimates are that 5.3% of Californians are lesbian, gay, bisexual, or transgender (Conron & Goldberg, 2020 ), which may suggest that LGBTQ professionals are overrepresented in California’s behavioral health workforce. Homophobia and biphobia create persistent behavioral health disparities impacting LGBTQ Californians, including their access to culturally responsive care. Increasing the proportion of LGBTQ providers can help LGBTQ clients feel more comfortable accessing and using behavioral health services.
RACE/ETHNICITYRespondents were asked to provide information about how they self-identify in terms of race and ethnicity. In recognition of the complex role played by multiple cultural, biological, and social frameworks in the construction of race and ethnicity, participants were able to select multiple answers.
11.3%Identify as lesbian, gay,
bisexual, queer, orother non-heterosexual
identity

2021 California Behavioral Health Workforce Assessment Report // 19
Exhibit E.2: Respondent Race and Ethnicity
White 40.7%, 652Hispanic or Latino/a/e 31.6%, 506
Black or African American 14.3%, 229Asian or Asian American 9.9%, 158
Native American or Alaska Native 4.1%, 65Native Hawaiian or Other Pacific Islander 1.5%, 24
Middle Eastern or North African 1.2%, 19
0 100 200 300 400 500 600 700 800
Prefer not to answer 7.2%, 115
The most commonly selected race/ethnicity category was White (40.7%; includes Hispanic and non-Hispanic White), followed by Hispanic or Latino/a/e (31.6%), and then Black or African American (14.3%). Notably, recent census data estimates that 6.5% of Californians are Black or African American, so they are overrepresented in the survey sample (U.S. Census Bureau, 2021).
Across all respondents, one in ten (10.4%) respondents selected multiple race/ethnicity categories, including a small percentage (3.3%) who selected both White and Hispanic or Latino/a/e.
AGEIn total, 1,580 respondents provided information about their age.
The distribution of ages was relatively uniform between 25 and 59: between these two ages, no five-year range represented more than 13.2% (35-39) or less than 9.8% (25-29) of respondents. Nearly half (49.0%) of respondents are professionals in their middle earning years (30-49). Around five percent of respondents were in traditional retirement age.
Exhibit E.3: Respondent Ages, All Professions
24 or Younger 3.7%25-34 22.5%35-44 24.4%45-54 24.6%55-64 18.1%65-74 4.7%
75 or Older 0.4%
0% 5% 10% 15% 20% 25% 30%
Prefer not to answer 1.4%
The table below disaggregates the age data by primary occupation, for the four largest occupation categories represented in the survey. The largest concentration for each of the four occupational categories was: 25-34 (Peer or Recovery Support); 35-44 (Counselor

2021 California Behavioral Health Workforce Assessment Report // 20
or Psychologist); and 45-54 (Social Workers or Case Managers; Other Behavioral Health Workers). Additionally:
• Peer or Recovery Supporters were the youngest group: 34.7% (93) of them were under age 35, compared to 26.2% (420) of survey respondents overall.
• Similarly, nearly half of the respondents under age 30 were in roles under the Peer or Recovery Support or Social Worker or Case Manager occupation groups.
• Counselors or Psychologists and Other Behavioral Health Workers are more likely to be older: 40.0% of Counselors or Psychologists (150) and 39.0% of Other Behavioral Health Workers (205) who provided information about their age shared that they were 50 or older. Factors influencing this may include: Counselor or Psychologist roles are more likely to require advanced degrees; many senior-level staff self-selected the Other Behavioral Health Worker occupational category.
Exhibit E.4: Respondent Ages by Major Professional Category
Counselor or Psychologist Social Worker or Case Manager Peer or Recovery Support Other BH Worker
25-34
18.9%23.2%
25.0%18.2%
35-44
28.8%24.2%
19.4%24.5%
45-54
22.9%27.3%
19.4%29.7%
55-64
20.6%14.8%
19.8%19.3%
65-74
5.9%4.5%
5.6%3.8%
75 or Older, or Did Not Answer
1.3%2.4%
1.1%2.1%
24 or Younger
1.6%3.4%
9.7%2.3%
0% 5% 10% 15% 20% 25% 30%
34.7%of Peer or Recovery
Supporters are under age 35

2021 California Behavioral Health Workforce Assessment Report // 21
REGIONAL DISTRIBUTIONThe survey was completed by respondents that live in 54 of the state’s 58 counties. Many of the results came from large counties such as San Bernardino (446 respondents), Los Angeles (172), and Riverside (138). Twenty-five counties provided 10 or more responses.
As noted under Methodology, the concentration of respondents in large, predominately Southern California counties is an important limitation of this survey. Future data collection efforts would benefit from targeted outreach to counties that are underrepresented among respondents, ongoing throughout the data collection period.
Exhibit E.5: Respondent by County
In the analysis that follows, select survey results are disaggregated by rural and non-rural counties to identify unique demographic characteristics and needs of the former group. These distinctions are drawn from the California State Association of Counties, which identifies a total of 27 counties as rural.8
» Related: Recommendation 7
Over the last three decades, the concept of “lived experience” has become increasingly important in mental health and substance use advocacy, treatment, and recovery. Lived experience is integral to peer support, but not synonymous with it. People with lived experience have firsthand, direct experience of mental health challenges, substance use, suicidal ideation or attempts, or other behavioral health challenges and traumatic experiences, whether in their own lives or as families and caregivers of someone with these experiences.
“Lived experience is the most important experience.” - Listening Session Participant
F. LIVED EXPERIENCE AND THE PEER WORKFORCE
8 California County Caucuses. California State Association of Counties. Retrieved 29 November 2021 from https://www.counties.org/sites/main/files/imagecache/overview/main-images/county_caucuses_4_v.8.jpg?1609878058

2021 California Behavioral Health Workforce Assessment Report // 22
People with lived experience (including families/caregivers) bring unique perspectives and understanding of service needs based on their own experiences navigating (or being unable to navigate) complex systems.9
DEFINING PEERSAlthough all peers have lived experience, not all people with lived experience serve as peers. Because of the complex and often contested nature of defining peers and peer specialists, the survey used multiple questions to capture the texture of the peer workforce. Respondents were then grouped in post-hoc analysis.
Throughout the remainder of the report, unless otherwise specified, peers include those who:
(1) identified their primary occupation as peer or recovery support (n = 268, Question 25). These respondents overwhelmingly identified with peer roles, rather than recovery roles.(2) specifically identified as a peer support specialist, peer support supervisor, or other member of the peer workforce (n = 400, Question 66).
Question 25 leads to an important subset of questions about the specific job titles, occupational settings, and compensation of the peer or recovery workforce. However, question 25 alone is not a reliable metric of the peer support workforce, because it only captures those who list peer or recovery support as their primary occupation. For that reason, respondents to questions 25 and 66 were grouped, as described above. Using these criteria, a total of 456 survey respondents were identified as peers.
While this section focuses on peers, other sections in this report (e.g., compensation, education) provide additional, context-specific information about this important subset of the workforce.
LIVED EXPERIENCEOne survey question asked respondents whether or not they self-identified as a person having lived experience with the process of recovery from mental illness, substance use disorder (SUD), or both, either personally or as a family member. Respondents were able to select all that applied. Respondents were able to self-identify based on their own understanding of “lived experience”; they may be someone with lived experience who provides peer support, someone who advocates on the basis of their lived experience, or someone for whom their lived experience is not a direct component of their work.
More than one-third of survey respondents stated that they had lived experience as a family member or caregiver of someone with behavioral health needs (35.4%). Approximately one-third also identified as having experienced a personal mental health challenge (32.0%).
456respondents were peers
More than 1/3
of respondents have lived experience as a family member
Nearly 1/3have lived experience of a
mental health challenge
9 Descriptions of lived experience drawn in part from: Behavioral Health Workforce Development, Peer Workforce Initiative RFA (https://www.ahpnet.com/AHPNet/media/AHPNetMediaLibrary/News/CA_DHCS_Peer_WF_Investment_RFA_2021.pdf); Peer Supporting Recovery From Mental Health Conditions, Bringing Recovery Supports to Scale Technical Assistance Center Strategy (BRSS TACS), SAMHSA (https://www.samhsa.gov/sites/default/files/programs_campaigns/brss_tacs/peers-supporting-recovery-mental-health-conditions-2017.pdf); and Wisconsin Office of Children’s Mental Health, About Lived Experience (https://children.wi.gov/pages/LivedExperience/AboutLivedExperience.aspx).

2021 California Behavioral Health Workforce Assessment Report // 23
A small portion of survey respondents had firsthand experience with more restrictive settings (including residential treatment, involuntary treatment, and justice settings).
Fewer than one-third (29.4%) reported having no lived experience.
Yes, I am a family member or caregiver of a person with a
mental health or substance use disorder (567) 35.4%
Yes, co-occuring mental health and substance use disorder (178) 11.1%
Yes, mental health challenge (512) 32.0%
Yes, substance use disorder (190) 11.9%
No (471) 29.4%
Prefer not to answer (110) 6.9%
Yes, inpatient or residential mental health
treatment settings (102)
6.4%
Yes, juvenile or criminal
justice settings (86)
5.4%
Yes, involuntary mental health treatment (72) 4.5%
Exhibit F.1: Lived Experience
Experienced Challenges Experienced Settings No Identified Experience
During the listening sessions, participants argued that there is a false dichotomy of peers as having lived experience and clinicians as not having lived experience, and that this misconception is often to the detriment of peers. As one listening session participant put it,
“Often […] most of the counselors, psychiatrists, psychologists I’ve been to say, ‘We’re peers […] it just wasn’t thought of that way back in the day.’ They went to school and now they ‘aren’t peers anymore,’ but they do have the experience. And I think that the movement through the levels of professionalism doesn’t
change the fact that they were peers—in fact, the best psychologists, psychiatrists were peers, and do have lived experience.”
- Listening Session Participant

2021 California Behavioral Health Workforce Assessment Report // 24
PEER WORKFORCE ROLEThe 400 respondents who identified as members of the peer workforce (Question 66) were asked to provide detail on their role.10 More than half (57.8%, 231) identified as a peer supporter or other peer support specialist. An additional one-fourth (24.3%, 97) shared that they were in a peer support supervisory role, and the remaining 18.0% (72) classified themselves as other members of the peer workforce.
Exhibit F.2: Peer Workforce Roles Peer Supporter or Other Peer
Support Specialist(231), 57.8%
Peer Supporter Supervisor
(97), 24.3%
Other Member of the Peer Workforce
(72), 18.0%
PEER WORKFORCE EXPERIENCESPeer respondents were asked to provide information about their workplace experiences, including training, interpersonal dynamics, and compensation.
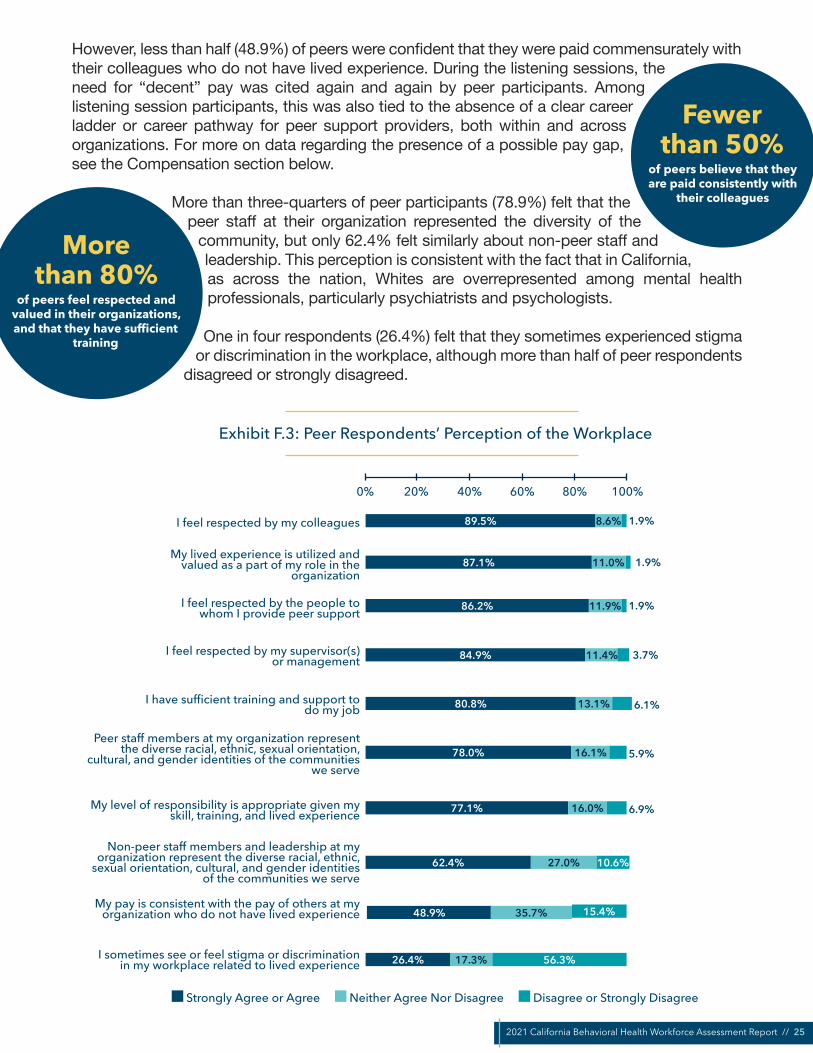
The answers provided by peer respondents suggest a mostly positive work environment (Exhibit F.3). The large majority of respondents strongly agreed or agreed that they were respected by their colleagues, service recipients, and management. More than four-fifths of respondents felt that their lived experience was valued and that they had the training necessary to do their jobs. Listening session participants also spoke about the power of lived experience to lift up people in recovery:
“When you hear the clients that are coming to our program talking about the most important people that they’ve met at our system is through peer support—that just kind of tells you, you know... I’m a licensed social worker in four states,
but what I do is not the same as what a peer support does. And there is that wonderful way by which a peer support can provide—you know, can connect to a client, that a clinician cannot. And I think that’s the reason why we have peer support staff, and that’s the reason why we want to expand it across all of our
system.” - Listening Session Participant (non-peer)
10 Respondents who answered “no” to Question 66 were not asked this follow-up question about role. For this reason, a small number of respondents who identified their primary occupation as Peer or Recovery Support (Question 25) but answered “no” to Question 66 are not captured here.
2021 California Behavioral Health Workforce Assessment Report // 25
However, less than half (48.9%) of peers were confident that they were paid commensurately with their colleagues who do not have lived experience. During the listening sessions, the need for “decent” pay was cited again and again by peer participants. Among listening session participants, this was also tied to the absence of a clear career ladder or career pathway for peer support providers, both within and across organizations. For more on data regarding the presence of a possible pay gap, see the Compensation section below.
More than three-quarters of peer participants (78.9%) felt that the peer staff at their organization represented the diversity of the
community, but only 62.4% felt similarly about non-peer staff and leadership. This perception is consistent with the fact that in California, as across the nation, Whites are overrepresented among mental health professionals, particularly psychiatrists and psychologists.
One in four respondents (26.4%) felt that they sometimes experienced stigma or discrimination in the workplace, although more than half of peer respondents
disagreed or strongly disagreed.
Exhibit F.3: Peer Respondents’ Perception of the Workplace
89.5%
87.1%
86.2%
84.9%
80.8%
78.0%
77.1%
62.4%
48.9%
26.4%
8.6%
11.0%
11.9%
11.4%
13.1%
16.1%
16.0%
27.0%
35.7%
17.3%
10.6%
15.4%
56.3%
I feel respected by my colleagues
My lived experience is utilized and valued as a part of my role in the
organization
I feel respected by the people to whom I provide peer support
I feel respected by my supervisor(s) or management
I have sufficient training and support to do my job
Peer staff members at my organization represent the diverse racial, ethnic, sexual orientation,
cultural, and gender identities of the communities we serve
My level of responsibility is appropriate given my skill, training, and lived experience
Non-peer staff members and leadership at my organization represent the diverse racial, ethnic,
sexual orientation, cultural, and gender identities of the communities we serve
My pay is consistent with the pay of others at my organization who do not have lived experience
I sometimes see or feel stigma or discrimination in my workplace related to lived experience
1.9%
1.9%
1.9%
3.7%
6.1%
5.9%
6.9%
0% 20% 40% 60% 80% 100%
Strongly Agree or Agree Neither Agree Nor Disagree Disagree or Strongly Disagree
More than 80%
of peers feel respected and valued in their organizations, and that they have sufficient
training
Fewer than 50%
of peers believe that theyare paid consistently with
their colleagues

2021 California Behavioral Health Workforce Assessment Report // 26
During the listening sessions, peer supervisors and leaders of peer-run organizations noted that people in recovery are not universally equipped or suited to a traditional workplace or office environment. They noted that it is important to remember that peers are people in recovery, and consider ways to flexibly accommodate them in the workplace, including by providing training:
“There’s some people that can’t hold a 9 to 5 job. [That] doesn’t mean they can’t be successful [at their] job, they just can’t have that structured [of] a job, so you
need to work around that.” - Listening Session Participant
“Training” for the peer workforce can include training related to peer service provision, but it may also include learning and applying other professional workplace skills while providing peer support, such as computer skills, consumer/client interaction, time management, and other “soft skills.” This can involve on-the-job training as well as formal professional development training.
“Just because someone’s been through it, doesn’t mean that they’re equipped to the work that we’re asking them to do, so offering the right kind of training and
education is crucial.” - Listening Session Participant
Peer support providers come to the work from a wide array of professional, educational, cultural, and linguistic backgrounds, and it is important to not make assumptions about their work experience or professional capacity based on their lived experience. With that said, there are reasons why peer support providers may come to the workplace with more limited professional experience—e.g., justice involvement and substance use disorder histories can both make it more difficult to get a job in a traditional workplace; there is a growing group of youth and young adults of transition age in peer roles who have served as advocates, but not formal workers. It is important to recognize these so that peer employees can be appropriately supported and set up for success.
“[W]e as employers need to provide that opportunity for them to even pay for that training […] so that if they decide not to be in the peer support work force anymore, they can transfer those skills [to] something else […] more lucrative.”
- Listening Session Participant (peer supervisor)
BARRIERS TO INTEGRATING PEERSSurvey respondents were asked whether they (or their organization) currently work with peers. Those who said they do not work with peers were asked what, if any, were key challenges or barriers that prevented their organization from working effectively with peers. The purpose of this question was to pinpoint the perceived critical barriers that are currently preventing organizations from working more effectively with peers. Future data collection efforts may also explore what barriers those who do work with peers have overcome, and what challenges persist.
Respondents were given twelve options for potential challenges or barriers. The five most commonly selected were:
1. The pandemic has disrupted our organization's relationship(s) with peer support organizations (250)
2. Peer staff are not brought to the table and made part of leadership or decision-making (172)
2021 California Behavioral Health Workforce Assessment Report // 27
3. Non-peer staff members do not receive training on integrating peer staff into their teams and services (154)
4. Non-peer professional staff members do not understand the value of peer support and lived experience (142)
5. Management or leadership staff members do not understand the value of peer support and lived experience (141)
Responses to the barriers question were disaggregated by peer vs. non-peer; primary occupation type (Peer and Recovery Support, Counselors, etc.); and by White and non-White respondents. Across occupations and racial identities, the pandemic was the most commonly cited barrier to integrating peers and peer-run organizations into traditional behavioral health services.
Respondents also indicated several barriers that are foundational to organizational culture and leadership: e.g., peers are not brought to the table to be part of decision-making, non-peer and leadership staff do not understand the value of peers. In contrast, infrastructural or advanced implementation barriers (e.g., billing, recruitment) were less frequently identified.
These responses may indicate that there is a strong need for foundational education and awareness-building in the traditional behavioral health services community about the value and roles of peers. For many listening session participants, this starts with creating a shared understanding and public perception of what a peer supporter is:
“I would like to have everybody know what peer support means; for it to be a standard sort of word, just like a counselor; and most important just to not have
anybody ask, ‘What does that mean?’ To just say, ‘Hey, I’m a peer counselor,’ and everybody pretty much knows what that entails. And the second thing [I
would like for the future] is to remove the stigma that, you know, you had to have screwed up in several ways in your life to even get to this point [as a peer].”
- Listening Session Participant
Listening session participants also described how, once care teams understand what makes peer support different, care teams also need to understand what makes peer support valuable:
“I have noticed it takes time for clinicians and others to see that we have strengths, values, and skills to offer and it takes time to build trust and rapport.”
- Listening Session Participant
Key differences across occupations and racial identities include the following. Please see Recommendations #4 and #7 for related suggestions.
• “Peer staff do not receive training on collaborating with care teams” was the fifth-highest barrier identified by Peer and Recovery Support occupations, but only ninth overall. This may be related to a challenge that many peers voiced during the listening sessions: their work is viewed as separate from, and lesser than, the work of clinicians and treatment providers.
Foundational awareness-building about the value and role of peers can help overcome barriers

2021 California Behavioral Health Workforce Assessment Report // 28
• “Organization is unsure how to bill insurance for peer services” was the seventh highest concern overall, but the third highest concern among counselors. Peer-related billing may be a more significant challenge for independent mental health and counseling practices.
• Across all twelve possible barriers, the least-identified challenge was “There is a significant racial, ethnic, and/or cultural gap between peer staff and the management, leadership, and non-peer staff members.” However, non-White respondents were twice as likely to select this as a challenge (n=66) than respondents who were White (n=32).11
• None of the barriers related to leadership staff were top five concerns for White respondents. However, among non-White respondents, “Management or leadership staff members do not understand the value of peer support and lived experience” and “Management or leadership staff members do not know how to manage peer staff” were the third and fourth most common barriers, respectively. This discrepancy may indicate that White respondents are more likely to be in management or leadership roles (or on the management track).
When listening session participants were asked about barriers, they repeatedly identified a need for cross-training between peers and clinicians. For example, listening session participants noted that it would be useful for clinicians to learn and become comfortable with recovery community language, and that peers may also be interested in learning about more medical or technical aspects of mental health challenges. Peers also noted that clinicians should receive training and encouragement to refer people to peer support services, because although peers often make referrals to clinicians, clinicians do not necessarily make referrals to them.
“There are a lot of professional people who don’t want […] peers doing motivational interviewing. [W]e have police officers who don’t want peers going
on emergency calls because they see them as a civilian that they’re going to have to protect and we have clinicians who view them still through the lens of being
[…] a patient, as opposed to a helper.” - Listening Session Participant (peer)
Several participants also suggested that it would be useful for other staff in the organization (e.g., administrative support, IT) to learn some of the essential skills of recognizing and responding to someone with behavioral health needs, because many people—regardless of professional background—will encounter someone in their life who would benefit from sensitive support and outreach.
» Related: Recommendation 2 and 7
EDUCATIONThe majority of all survey respondents reported a college or graduate degree (76.1%) or some college coursework (18.7%). Among both peers and non-peers, a total of 94-95% of respondents have completed at least some college coursework. For comparison, 33.1% Californians overall hold a college or graduate degree (U.S. Census Bureau, 2021).
G. EDUCATION AND CERTIFICATION
76.1%respondents have acollege or graduate
degree
11 Respondents were able to select all racial and ethnic identities that applied. Here, “White” includes any respondents who selected White as one of their identities, even if they selected multiple racial or ethnic identities.
2021 California Behavioral Health Workforce Assessment Report // 29
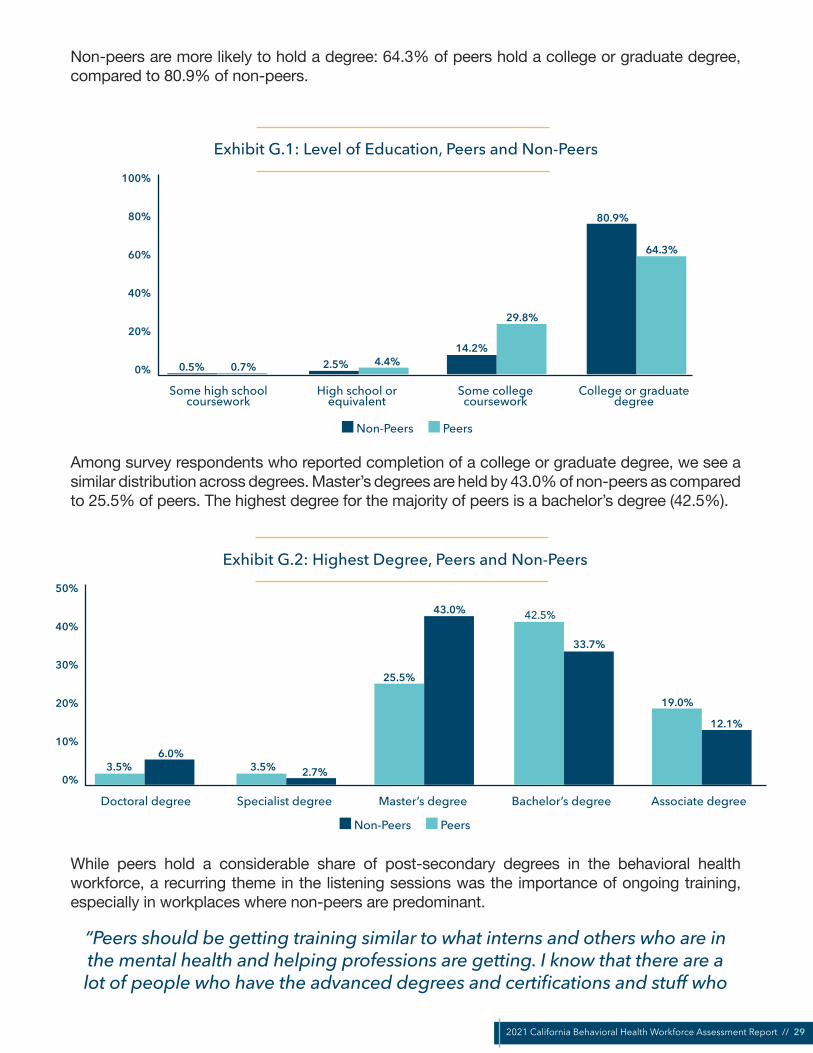
Non-peers are more likely to hold a degree: 64.3% of peers hold a college or graduate degree, compared to 80.9% of non-peers.
Exhibit G.1: Level of Education, Peers and Non-Peers100%
80%
60%
40%
20%
0%
High school or equivalent
Some college coursework
College or graduate degree
Some high school coursework
0.5% 2.5%14.2%
80.9%
0.7% 4.4%
29.8%
64.3%
Non-Peers Peers
Among survey respondents who reported completion of a college or graduate degree, we see a similar distribution across degrees. Master’s degrees are held by 43.0% of non-peers as compared to 25.5% of peers. The highest degree for the majority of peers is a bachelor’s degree (42.5%).
Exhibit G.2: Highest Degree, Peers and Non-Peers50%
40%
30%
20%
10%
0%
Specialist degree Master’s degree Bachelor’s degreeDoctoral degree
3.5% 3.5%
25.5%
42.5%
19.0%
6.0%2.7%
43.0%
33.7%
12.1%
Associate degree
Non-Peers Peers
While peers hold a considerable share of post-secondary degrees in the behavioral health workforce, a recurring theme in the listening sessions was the importance of ongoing training, especially in workplaces where non-peers are predominant.
“Peers should be getting training similar to what interns and others who are in the mental health and helping professions are getting. I know that there are a lot of people who have the advanced degrees and certifications and stuff who

2021 California Behavioral Health Workforce Assessment Report // 30
don’t think that people should be dabbling in that, but I think that there are ways to draw clear boundaries between the people who are, you know, licensed and
authorized to provide counseling and advice, and those who are just learning the skills that can help them help other people and help themselves in the process.”
- Listening Session Participant
PEER CERTIFICATIONRespondents who identified as members of the peer workforce (Question 66) were asked whether they hold a peer specialist or peer supervisory certification.12 Although only 130 (32.5%) self-identified members of the peer workforce reported holding a peer specialist or peer supervisory certification, this number nearly doubles to 247 (61.8%) when expanded to include those currently pursuing or planning to pursue certification.
The most commonly provided reason for not pursuing certification was that it was not required by the respondent’s role (148). Twenty-eight respondents felt confused or unsured about the process, and 11 reported that it was too expensive. Thirty-three shared that they were not interested for a different reason.
Exhibit G. 3: Reason survey respondents do not hold or are not pursuing a peer specialist or peer supervisory certification
Reason CountNot required for my role 148
Confused or unsure about the process 28
Too expensive 11
Do not see a benefit for my career 9
Takes too much time 8
Do not see a benefit for my learning and knowledge development 5
None of these - not interested for a different reason 33
Peer certification repeatedly emerged as a topic of conversation in the listening sessions. Overall, most participants expressed that peers in their organization were excited about the opportunities represented by SB 803. Some also suggested that certification could become part of the onboarding process, to equip peers with the skills from day one.
“I’m excited because I’m seeing like the next generation coming up, the youngsters, because I had the privilege of being part of the first MHSA rollout
15 years ago. So, for me, this is not new, but it’s refreshing. It’s like a refreshment, or you know, almost, for me it feels like a rebirth and opportunity to erase the chalkboard, and let’s just start over and allow everyone the opportunity to be their best selves, and together we can create a wonderful synergy of wellness
and healing.” - Listening Session Participant
61.8%of peer workforcemembers have, are pursuing, or plan
to pursue peer certification
12 Respondents who answered “no” to Question 66 were not asked the follow-up question about certification. For this reason, a small number of respondents who identified their primary occupation as Peer or Recovery Support (Question 25) but answered “no” to Question 66 are not captured here.

2021 California Behavioral Health Workforce Assessment Report // 31
Some listening session participants expressed ambivalence about the certification process under development and its consequences. Challenges and concerns they described included:
• Getting the word out—many peers still do not know about SB 803, and some peers felt that management in some organizations did not want to discuss it out of fear of additional costs
• Split between certified and non-certified workforce—concerns that organizations may not want to hire certified peers because it is too expensive or, conversely, that certified peers may start being treated (and overworked) as case managers or counselors
• Although many peer-run organizations have lobbied for certification so that peers can be paid a decent wage, some are concerned about the impact on their volunteer workforce
• Hope that the certification and training selection processes should also be peer-led, but fear that they will not
• Concern that certification will create a loss if the wellness and recovery-based model of peer support is translated into an illness and deficit-focused model
Additionally, some listening session participants voiced that “certification” is itself a misunderstood concept. It is not yet clear what the state’s certification requirements will be, and how much variation will be allowed. Many peers have already completed trainings, continuing education, and even certifications—including certifications provided by other states, at the county level, or by individual organizations. Some participants questioned what “certification” will actually mean for peers, and others voiced concern that they will not be awarded credit for their past work.Participants named several training programs that they had completed; popular ones are featured in the text box below.
» Crestwood Peer Support Learning for the 21st Century» SHARE! Advanced Peer Support Specialist Training for California peers in the public mental health system» Cal Voices’ WISE University
» NAMI trainings (Peer-to-Peer, In Our Own Voice, Family-to-Family)» DBSA (Depression and Bipolar Support Alliance) Peer Support Specialist Course » Motivational Interviewing (various trainers)
» County-led trainings» Cross-training with partner organizations
Exhibit G.4: Popular Peer Trainings
Listening session participants also noted that peers have put in substantial effort over the last several years to identify their capacity gaps and training needs. Some listening session participants were worried that this knowledge is being lost, rather than built upon, as the new certification requirements are being developed. Listening session participants had useful recommendations for training gaps that should be filled and what kinds of topics the certification training(s) should address.
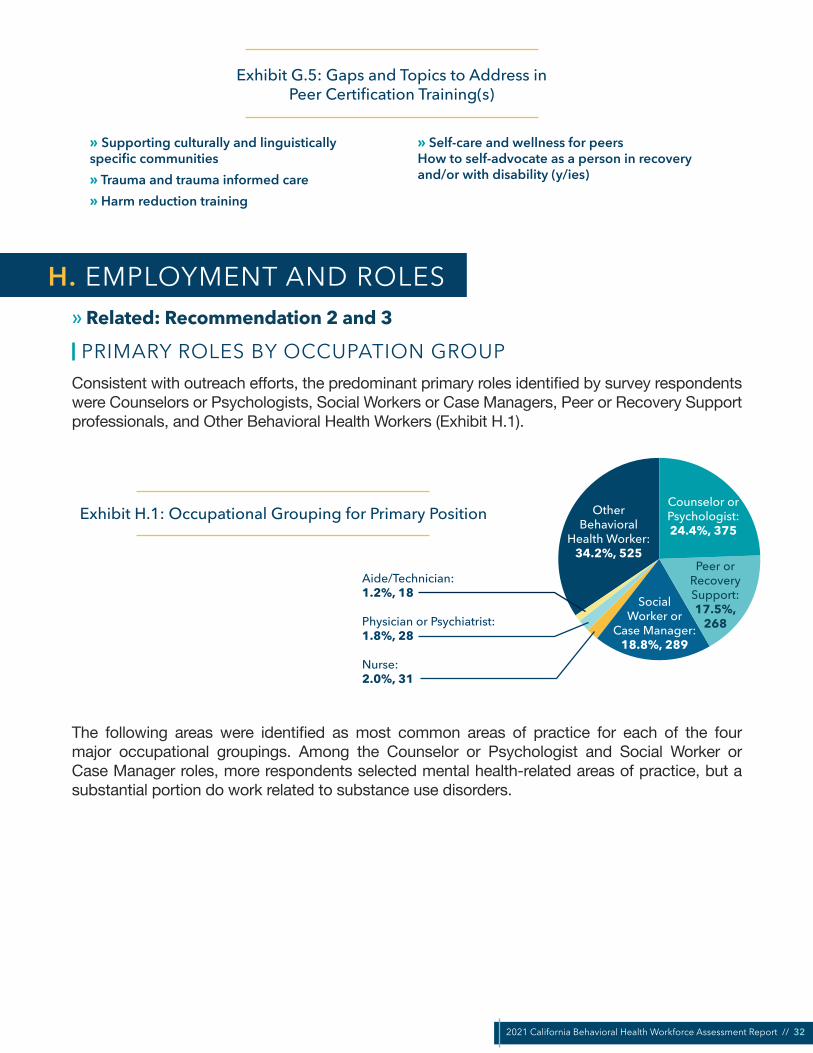
2021 California Behavioral Health Workforce Assessment Report // 32
Exhibit G.5: Gaps and Topics to Address in Peer Certification Training(s)
» Supporting culturally and linguistically specific communities» Trauma and trauma informed care» Harm reduction training
» Self-care and wellness for peers How to self-advocate as a person in recovery and/or with disability (y/ies)
» Related: Recommendation 2 and 3
PRIMARY ROLES BY OCCUPATION GROUPConsistent with outreach efforts, the predominant primary roles identified by survey respondents were Counselors or Psychologists, Social Workers or Case Managers, Peer or Recovery Support professionals, and Other Behavioral Health Workers (Exhibit H.1).
Exhibit H.1: Occupational Grouping for Primary Position Other Behavioral
Health Worker:34.2%, 525
Counselor or Psychologist:24.4%, 375
Peer orRecovery Support:17.5%,
268
SocialWorker or
Case Manager:18.8%, 289
Aide/Technician:1.2%, 18
Physician or Psychiatrist:1.8%, 28
Nurse:2.0%, 31
The following areas were identified as most common areas of practice for each of the four major occupational groupings. Among the Counselor or Psychologist and Social Worker or Case Manager roles, more respondents selected mental health-related areas of practice, but a substantial portion do work related to substance use disorders.
H. EMPLOYMENT AND ROLES

2021 California Behavioral Health Workforce Assessment Report // 33
Exhibit H.2: Top 5 Areas of Practice: Counselor or Psychologist
25%
20%
15%
10%
5%
0%
Clinical Mental Health Counseling
Marriage and Family Therapist
Child/Adolescent Counseling
Behavioral Health Counseling
24.2%22.6%
20.2%
16.8% 16.2%
Addiction Disorder/Substance Use
Disorder Counseling
Percent in this Area of Practice
Exhibit H.3: Top 5 Areas of Practice: Social Worker or Case Manager35%
30%
25%
20%
15%
10%
10%
0%
Case Manager Clinical Social Work Substance Use Disorder Social Work
Mental Health Social Work
31.1% 30.5%
17.3%
11.1% 9.9%
Child and Family Social Work
Percent of Social Workers or Case Managers in this Area of Practice

2021 California Behavioral Health Workforce Assessment Report // 34
Exhibit H.4: Top 3 Areas of Practice: Peer or Recovery Support
50%
40%
30%
20%
10%
0%
Peer Counselor Peer Support SupervisorPeer Support Specialist
47.9%
35.9%
16.2%
Percent of Peer or Recovery Support Providers in this Area of Practice
Exhibit H.5: Top 5 Roles: Other Behavioral Health Worker
80%
60%
40%
20%
0%
Behavioral Health Specialist
County Administrator Prevention CoordinatorExecutive Director or Other Leadership Level
(Behavioral Health Setting)
16.5%10.1% 8.0%
3.8%
61.5%
Other (write in)
Percent of “Other” in this Role
Many of the Other Behavioral Health Workers work in leadership, executive director, or county administration positions. A large number also work in clerical, administrative, or office support positions. This wide array of positions makes it more challenging to draw conclusions about the individuals in this category; future iterations of this survey may benefit from expanding the occupation options available.
Note about the “Other (write in)” option: many respondents wrote occupations into the “other” category that would potentially have been more appropriate as selections elsewhere. For example, it was likely that many “Therapist” write-ins could have selected Counselor or Psychologist instead, but they could also have been occupational therapists, recreational therapists, etc. Because of this ambiguity, “other” write-in respondents were sorted into sub-groups but left as “other.”
For the “Other (write-in)” category, the top responses (sorted post-hoc) were:
• Administrative, Clerical, or Office Support (17.0%)• Therapist, Clinician, Other Mental Health Provider (6.7%)
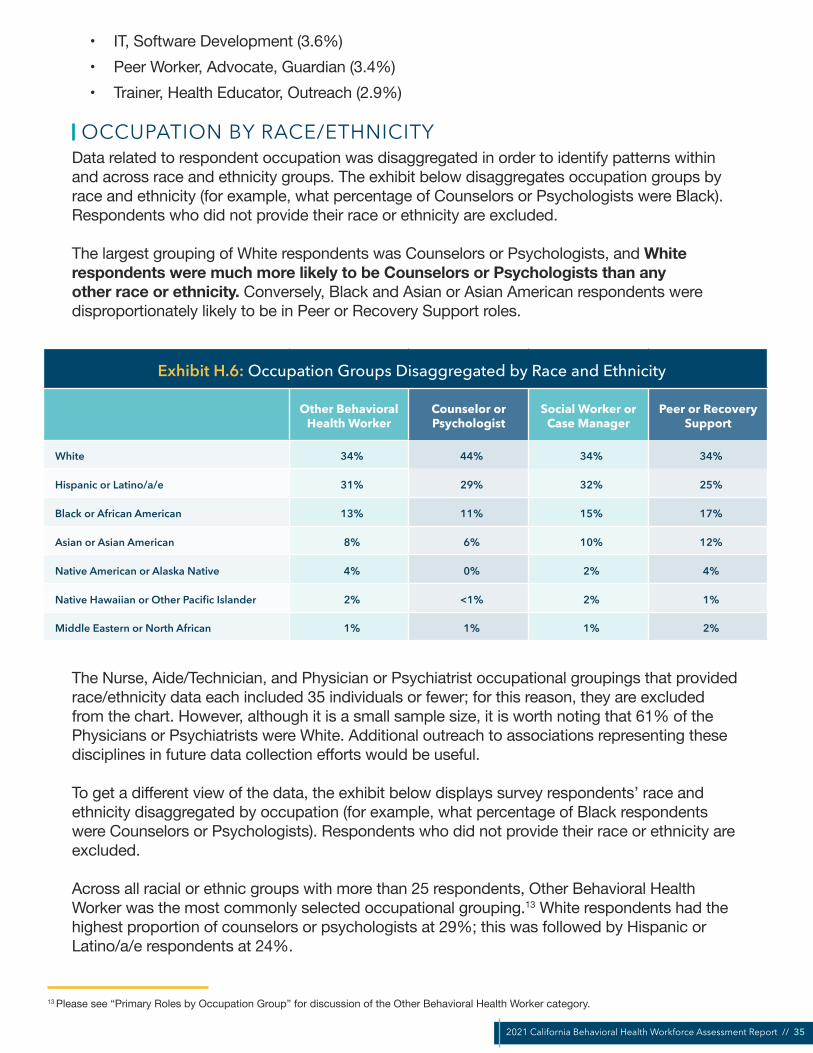
2021 California Behavioral Health Workforce Assessment Report // 35
• IT, Software Development (3.6%)• Peer Worker, Advocate, Guardian (3.4%)• Trainer, Health Educator, Outreach (2.9%)
OCCUPATION BY RACE/ETHNICITYData related to respondent occupation was disaggregated in order to identify patterns within and across race and ethnicity groups. The exhibit below disaggregates occupation groups by race and ethnicity (for example, what percentage of Counselors or Psychologists were Black). Respondents who did not provide their race or ethnicity are excluded.
The largest grouping of White respondents was Counselors or Psychologists, and White respondents were much more likely to be Counselors or Psychologists than any other race or ethnicity. Conversely, Black and Asian or Asian American respondents were disproportionately likely to be in Peer or Recovery Support roles.
Exhibit H.6: Occupation Groups Disaggregated by Race and Ethnicity
Other Behavioral Health Worker
Counselor or Psychologist
Social Worker or Case Manager
Peer or Recovery Support
White 34% 44% 34% 34%
Hispanic or Latino/a/e 31% 29% 32% 25%
Black or African American 13% 11% 15% 17%
Asian or Asian American 8% 6% 10% 12%
Native American or Alaska Native 4% 0% 2% 4%
Native Hawaiian or Other Pacific Islander 2% <1% 2% 1%
Middle Eastern or North African 1% 1% 1% 2%
The Nurse, Aide/Technician, and Physician or Psychiatrist occupational groupings that provided race/ethnicity data each included 35 individuals or fewer; for this reason, they are excluded from the chart. However, although it is a small sample size, it is worth noting that 61% of the Physicians or Psychiatrists were White. Additional outreach to associations representing these disciplines in future data collection efforts would be useful.
To get a different view of the data, the exhibit below displays survey respondents’ race and ethnicity disaggregated by occupation (for example, what percentage of Black respondents were Counselors or Psychologists). Respondents who did not provide their race or ethnicity are excluded.
Across all racial or ethnic groups with more than 25 respondents, Other Behavioral Health Worker was the most commonly selected occupational grouping.13 White respondents had the highest proportion of counselors or psychologists at 29%; this was followed by Hispanic or Latino/a/e respondents at 24%.
13 Please see “Primary Roles by Occupation Group” for discussion of the Other Behavioral Health Worker category.

2021 California Behavioral Health Workforce Assessment Report // 36
Black or African American respondents were more heavily concentrated in Peer or Recovery Support roles. This may be due in part to the fact that a large number of respondents were Peer or Recovery Support providers; however, it is noteworthy because Counselor or Psychologist roles tend to be significantly higher paid.
Exhibit H.7: Race and Ethnicity Disaggregated by Occupation Groups
White Hispanic or Latino/a/e
Black or African American
Asian or Asian American
Native American or
Alaska Native
Other Behavioral Health Worker 32% 37% 32% 32% 39%
Counselor or Psychologist 29% 24% 20% 17% 21%
Peer or Recovery Support 17% 16% 24% 25% 23%
Social Worker or Case Manager 17% 20% 21% 20% 11%
Physician or Psychiatrist 3% 1% 1% 3% 2%
Nurse 1% 2% 1% 3% 4%
Aide/Technician 1% 1% 1% 1% 2%
Native Hawaiian or Other Pacific Islander and Middle Eastern or North African individuals each comprised fewer than 25 respondents. To avoid drawing erroneous conclusions from small sample sizes, they are not included in the chart below. Future behavioral health data collection efforts should include targeted outreach to organizations that focus on these populations and practitioners.
EMPLOYMENT EXPERIENCEAmong both peers and non-peers, the largest proportion of respondents have worked in the behavioral health field for 1-5 years, followed by 6-10 years, and so on decreasing.
However, nearly three-quarters of non-peers (72.3%) have at least six years’ experience in the field, compared to less than half of peers (47.5%). This may be attributable to multiple causes. Many non-peer roles require advanced degrees (e.g., Licensed Clinical Social Worker), and they may be including their years of relevant schooling, internships, residencies, etc. toward their years of experience in the field. Additionally, peer support may be attracting a growing number of new individuals as it becomes more widely recognized and less stigmatized.
41.9%have been in the behavioral health
field for more than10 years

2021 California Behavioral Health Workforce Assessment Report // 37
Exhibit H.8: Years Worked in the Field
<1 year
1-5 years
6-10 years
11-15 years
16-20 years
41
426
304
172
141
0 50 100 150 200 250 300 350 400 450
All Non-Peers Peers
21-25 years
26-30 years
31-35 years
36-40 years
41 or more years
114
65
31
18
17
0 50 100 150
EMPLOYMENT STATUSThe majority of respondents are actively working in a behavioral health position. (For clarity, the survey noted to respondents that “behavioral health position” was defined as any role involved in the “prevention of, treatment for, and/or recovery/from mental health or substance use disorders.”)
Notably, more respondents stated that they work in a behavioral health position that does not require a professional license than those who do. This may be explained by the large portion of survey respondents who work in Peer or Recovery Support roles (who are often paraprofessionals) or Other Behavioral Health Worker roles (e.g., administrators, program managers).
When peer support specialist certification is established in California, it would be useful to compare future workforce data to this data to assess its impact on the proportion of respondents who report that a license is required for their position.

2021 California Behavioral Health Workforce Assessment Report // 38
Exhibit H.9: Employment Status
Actively working in a behavioral health position that requires a professional license 737
Actively working in a behavioral health position that does not require a professional license 513
Actively working in a field other than behavioral health (i.e. providing behavioral health services in a non-behavioral health setting) 147
Actively working in more than one behavioral health position (under the same or different employer)14 113
Actively working as volunteer, student, resident, or other trainee in behavioral health setting 77
Not currently working 51
Retired 16
NUMBER OF POSITIONS AND NUMBER OF HOURS WORKED
One in four respondents (25.9%) reported that they hold more than one behavioral health position, including paid positions as well as volunteer, student, resident, etc. roles. Nearly 35% of people who self-identified as peers held more than one behavioral health employment position, as compared to 22% of their non-peer colleagues. This is likely due in part to the fact that peer support is frequently a voluntary position.
A significant number of people reported working in a second behavioral health-related position (n=247), a third position (n=70), or four positions or more (n=51).
Exhibit H.10: Number of Behavioral Health Positions Held
All Respondents Peers Non-Peers
Count Percentage Count Percentage Count Percentage
1 1053 74.1% 272 65.1% 781 77.9%
2 247 17.4% 98 23.4% 149 14.9%
3 70 4.9% 30 7.2% 40 4.0%
4 or more 51 3.6% 18 4.3% 33 3.3%
Total 1421 100.0% 418 100.0% 1003 100.0%
In primary employment positions (Position 1 in the table below), the highest average number of hours worked per week were reported among Nurses (45.2 hours), Other Behavioral Health Workers (39.0 hours), Counselors/Psychologists (38.8 hours), and Social Workers (38.2 hours). There is an even distribution of average hours worked among those who reported holding a second and third employment position.
It is important to recall that although the average number of hours per week per position is roughly similar, not all positions are equally likely to hold more than one job. In addition, these positions include both paid and unpaid or trainee positions.
25.9%hold more thanone behavioral health position
14 This number is significantly smaller than those who responded that they work 2, 3, or 4 or more behavioral health positions in the following question. This discrepancy is likely due in large part to confusion over what was being asked (e.g., whether a volunteer role is a “position”); based on other responses, “Number of behavioral health positions held” appears to be more accurate overall.
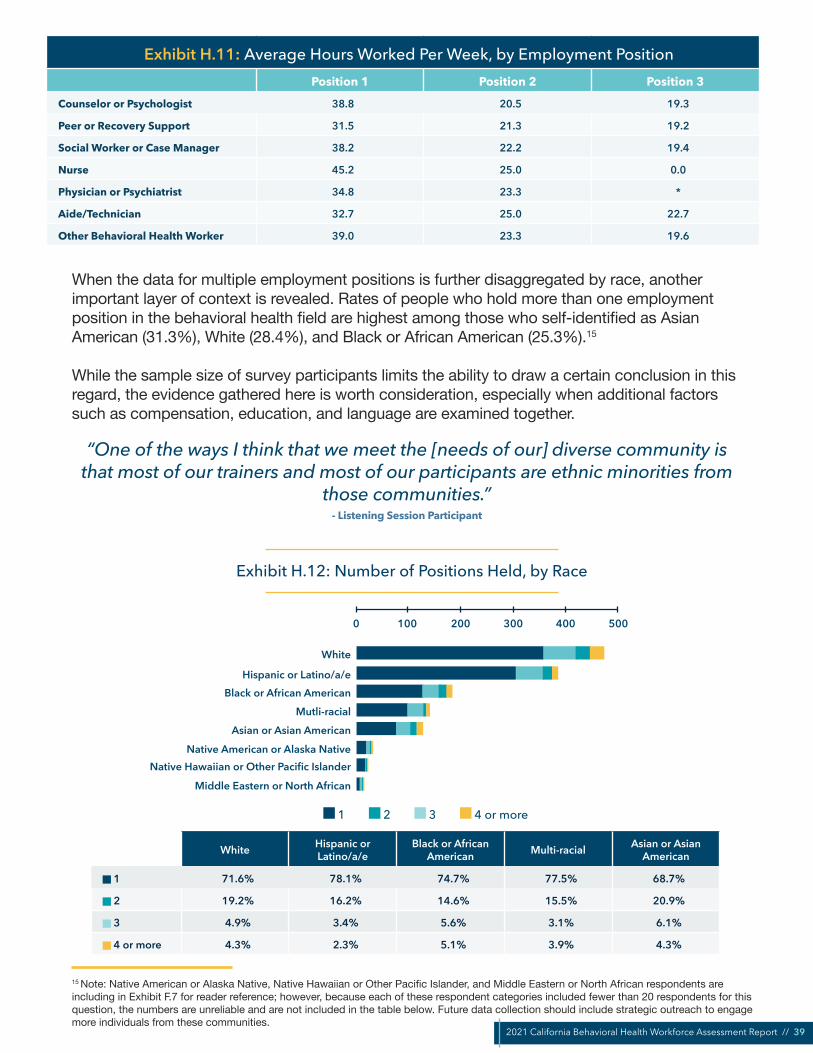
2021 California Behavioral Health Workforce Assessment Report // 39
Exhibit H.11: Average Hours Worked Per Week, by Employment PositionPosition 1 Position 2 Position 3
Counselor or Psychologist 38.8 20.5 19.3
Peer or Recovery Support 31.5 21.3 19.2
Social Worker or Case Manager 38.2 22.2 19.4
Nurse 45.2 25.0 0.0
Physician or Psychiatrist 34.8 23.3 *
Aide/Technician 32.7 25.0 22.7
Other Behavioral Health Worker 39.0 23.3 19.6
When the data for multiple employment positions is further disaggregated by race, another important layer of context is revealed. Rates of people who hold more than one employment position in the behavioral health field are highest among those who self-identified as Asian American (31.3%), White (28.4%), and Black or African American (25.3%).15
While the sample size of survey participants limits the ability to draw a certain conclusion in this regard, the evidence gathered here is worth consideration, especially when additional factors such as compensation, education, and language are examined together.
“One of the ways I think that we meet the [needs of our] diverse community is that most of our trainers and most of our participants are ethnic minorities from
those communities.” - Listening Session Participant
Exhibit H.12: Number of Positions Held, by Race
White
Hispanic or Latino/a/eBlack or African American
Mutli-racialAsian or Asian American
Native American or Alaska NativeNative Hawaiian or Other Pacific Islander
Middle Eastern or North African
0 100 200 300 400 500
1 2 3 4 or more
White Hispanic or Latino/a/e
Black or African American Multi-racial Asian or Asian
American
1 71.6% 78.1% 74.7% 77.5% 68.7%
2 19.2% 16.2% 14.6% 15.5% 20.9%
3 4.9% 3.4% 5.6% 3.1% 6.1%
4 or more 4.3% 2.3% 5.1% 3.9% 4.3%
15 Note: Native American or Alaska Native, Native Hawaiian or Other Pacific Islander, and Middle Eastern or North African respondents are including in Exhibit F.7 for reader reference; however, because each of these respondent categories included fewer than 20 respondents for this question, the numbers are unreliable and are not included in the table below. Future data collection should include strategic outreach to engage more individuals from these communities.

2021 California Behavioral Health Workforce Assessment Report // 40
» Related: Recommendation 3
One of the most commonly cited motivating factors affecting employment plans was compensation. Compensation both positively and negatively influences both the current and future shape of the behavioral health workforce.
Respondents were asked about their compensation on up to three positions held. Because of the relatively small amount of compensation-related data for secondary and tertiary positions, and in order to protect the confidentiality of all respondents, this section focuses on income as it relates to respondents’ primary positions (unless stated otherwise).
A total of 1,393 respondents provided information about compensation at their primary position: 430 respondents reported that their compensation was salaried, with another 905 reporting that they were paid an hourly rate. Although there are important differences between the two pay structures, to enable analysis, hourly rates were converted to salaried rates in the sections that follow.
COMPENSATION BY OCCUPATIONAL GROUPINGFour occupational groupings—Counselor or Psychologist, Social Worker or Case Manager, Peer or Recovery Support, and Other Behavioral Health Worker—provided at least 200 responses each about their primary income.
Approximately three-quarters of survey respondents provided compensation information. Respondents who stated that they were unpaid volunteers were not asked about their compensation.
As the table below shows, there are noticeable differences across these four groups. Note that these represent the compensation ranges (with hourly rates converted to salaries) for a respondent’s primary occupation.16
Exhibit I.1: Compensation for Primary OccupationCounselor or
Psychologist (320)Social Worker or Case
Manager (241)Peer or Recovery
Support (205)Other Behavioral
Health Worker (425)
$24,999 per year or less 0.0% 0.0% 1.0% 0.2%
$25,000-49,999 11.3% 21.2% 73.2% 30.4%
$50,000-74,999 34.4% 48.5% 22.0% 33.6%
$75,000-99,999 25.0% 12.0% 2.9% 20.2%
$100,000-124,999 20.0% 13.7% 1.0% 9.4%
$125,000 or more per year 9.4% 4.6% 1.0% 6.4%
I. COMPENSATION
16 Most respondents who have more than one behavioral health position have one or more part-time positions. There is wide variation in the number of hours respondents work at their non-primary positions. It is difficult to make assumptions about the overall compensation for these part-time/non-primary roles, and it would likely result in incorrect conclusions. For these reasons, we have included compensation only for main roles.

2021 California Behavioral Health Workforce Assessment Report // 41
Counselor or Psychologist roles were highest paid, and Peer or Recovery Support roles were least paid.
More than half (54.4%) of Counselors or Psychologists reported earning at least $75,000 per year. This is significantly higher than the approximately one-third of Other Behavioral Health Workers (36%) and Social Worker or Case Managers (30.3%) earning at least $75,000 annually. It is more than ten times as high as the 4.9% of Peer or Recovery Supporters earning $75,000 or more per year.
The majority of Social Workers or Case Managers (78.8%) and Other Behavioral Health Workers (69.6%) reported earning more than $50,000 per year. Conversely, three-quarters (73.2%) of Peer or Recovery Support respondents reported earning between $25,000 and $49,999 per year.
COMPENSATION AND EDUCATIONThe table below shows annual income from respondents’ primary position, separated by highest obtained degree.
Exhibit I.2: Compensation by Highest Degree Obtained
High School or equivalent
Some college coursework
Associate Degree
Bachelor Degree
MasterDegree
Doctoral Degree or Specialist
Degree
$24,999 per year or less 0.0% 0.4% 1.1% 0.3% 2.1% 0.0%
$25,000-49,999 74.2% 60.6% 53.4% 39.0% 7.5% 7.9%
$50,000-74,999 22.6% 29.7% 39.8% 41.4% 32.8% 22.5%
$75,000-99,999 3.2% 7.2% 3.4% 13.0% 27.8% 14.6%
$100,000-124,999 0.0% 0.4% 2.3% 4.1% 20.9% 29.2%
$125,000 or more per year 0.0% 1.7% 0.0% 2.1% 8.8% 25.8%
As the above table suggests, education has a strong, positive impact on compensation. As respondents’ highest level of education increases, the percentage of respondents in that category who earned less than $50,000 per year decreases; this rate falls from 74.2% (high school or equivalent) to 39.3% (bachelor’s degree), and at the highest education level plummets to 7.9% (doctoral degree or specialist degree).
Higher levels of education steadily reported higher earning rates, and were much more likely to report an income of $100,000 per year or more.
There is greater variance in compensation at higher education levels. The largest proportion of earnings for high school or equivalent-educated individuals is $25,000-49,999 (74.2%). At the other end of the spectrum, the largest proportion of earnings for doctorate holders is $100,000-124,999 (29.2%). Consistently, as education level raises, incomes are less clustered around particular $25,000 increments. This may suggest greater flexibility to choose a wider range of positions (and compensation rates) at a higher education level.
3/4Peer or Recovery Support providers earn $25k-50k
per year
10xas many Counselors or
Psychologists earn $75,000 or more per year
90.3%of those with a
master’s degree earn$50,000 or more,
compared to
60.6%of those witha bachelor’s
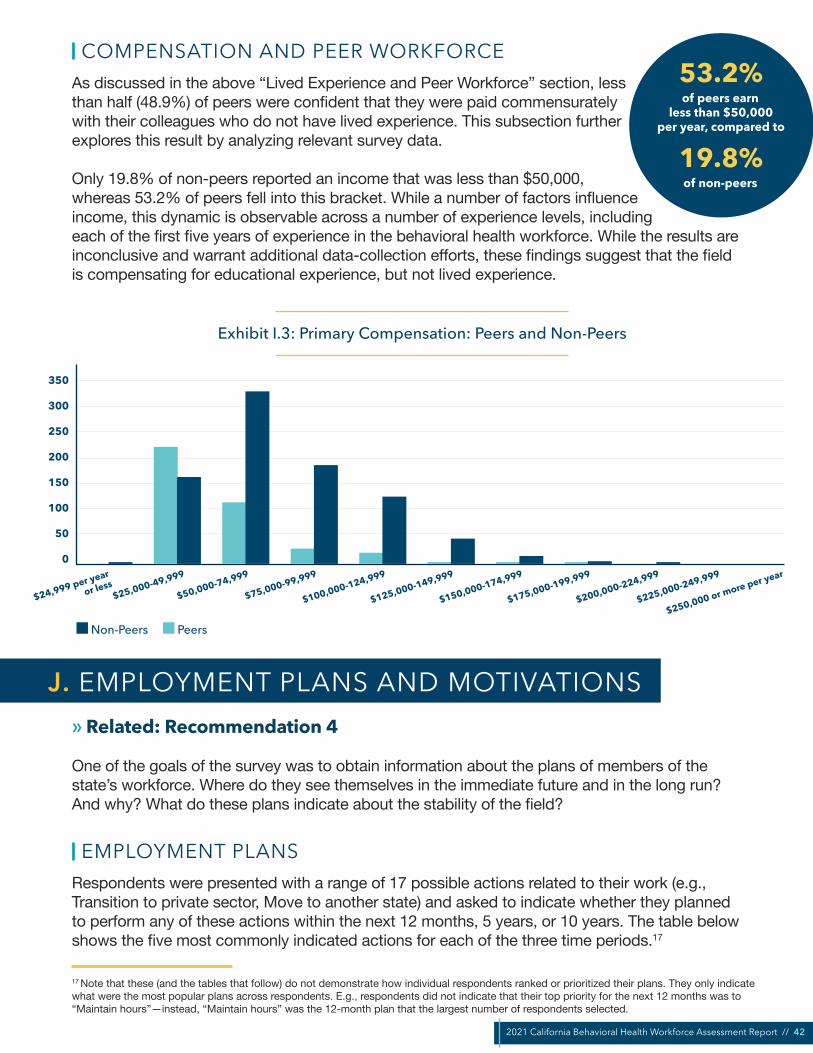
2021 California Behavioral Health Workforce Assessment Report // 42
COMPENSATION AND PEER WORKFORCEAs discussed in the above “Lived Experience and Peer Workforce” section, less than half (48.9%) of peers were confident that they were paid commensurately with their colleagues who do not have lived experience. This subsection further explores this result by analyzing relevant survey data.
Only 19.8% of non-peers reported an income that was less than $50,000, whereas 53.2% of peers fell into this bracket. While a number of factors influence income, this dynamic is observable across a number of experience levels, including each of the first five years of experience in the behavioral health workforce. While the results are inconclusive and warrant additional data-collection efforts, these findings suggest that the field is compensating for educational experience, but not lived experience.
Exhibit I.3: Primary Compensation: Peers and Non-Peers
350
300
250
200
150
100
50
0
$24,999 per year
or less$25,000-49,999
$50,000-74,999
$75,000-99,999
$100,000-124,999
$125,000-149,999
$150,000-174,999
$175,000-199,999
$200,000-224,999
$225,000-249,999
$250,000 or more per year
Non-Peers Peers
» Related: Recommendation 4
One of the goals of the survey was to obtain information about the plans of members of the state’s workforce. Where do they see themselves in the immediate future and in the long run? And why? What do these plans indicate about the stability of the field?
EMPLOYMENT PLANSRespondents were presented with a range of 17 possible actions related to their work (e.g., Transition to private sector, Move to another state) and asked to indicate whether they planned to perform any of these actions within the next 12 months, 5 years, or 10 years. The table below shows the five most commonly indicated actions for each of the three time periods.17
53.2%of peers earn
less than $50,000per year, compared to
19.8%of non-peers
J. EMPLOYMENT PLANS AND MOTIVATIONS
17 Note that these (and the tables that follow) do not demonstrate how individual respondents ranked or prioritized their plans. They only indicate what were the most popular plans across respondents. E.g., respondents did not indicate that their top priority for the next 12 months was to “Maintain hours”—instead, “Maintain hours” was the 12-month plan that the largest number of respondents selected.
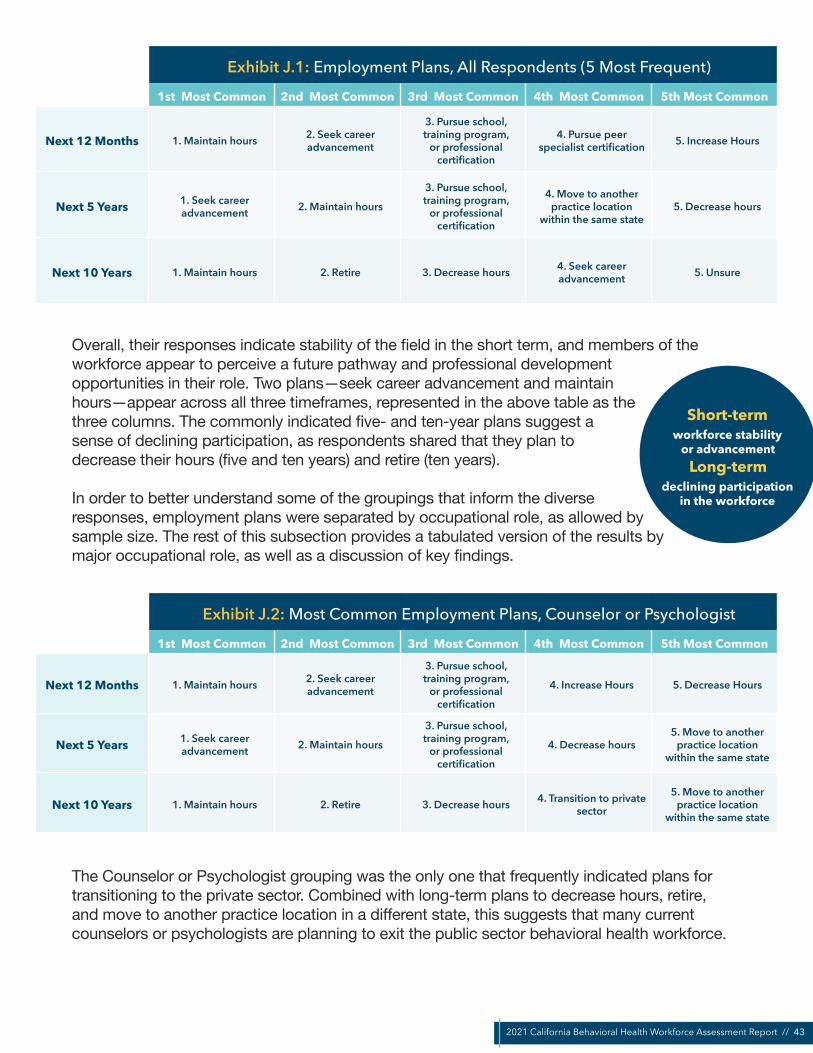
2021 California Behavioral Health Workforce Assessment Report // 43
Exhibit J.1: Employment Plans, All Respondents (5 Most Frequent)
1st Most Common 2nd Most Common 3rd Most Common 4th Most Common 5th Most Common
Next 12 Months 1. Maintain hours 2. Seek career advancement
3. Pursue school, training program,
or professional certification
4. Pursue peer specialist certification 5. Increase Hours
Next 5 Years 1. Seek career advancement 2. Maintain hours
3. Pursue school, training program,
or professional certification
4. Move to another practice location
within the same state5. Decrease hours
Next 10 Years 1. Maintain hours 2. Retire 3. Decrease hours 4. Seek career advancement 5. Unsure
Overall, their responses indicate stability of the field in the short term, and members of the workforce appear to perceive a future pathway and professional development opportunities in their role. Two plans—seek career advancement and maintain hours—appear across all three timeframes, represented in the above table as the three columns. The commonly indicated five- and ten-year plans suggest a sense of declining participation, as respondents shared that they plan to decrease their hours (five and ten years) and retire (ten years).
In order to better understand some of the groupings that inform the diverse responses, employment plans were separated by occupational role, as allowed by sample size. The rest of this subsection provides a tabulated version of the results by major occupational role, as well as a discussion of key findings.
Exhibit J.2: Most Common Employment Plans, Counselor or Psychologist
1st Most Common 2nd Most Common 3rd Most Common 4th Most Common 5th Most Common
Next 12 Months 1. Maintain hours 2. Seek career advancement
3. Pursue school, training program,
or professional certification
4. Increase Hours 5. Decrease Hours
Next 5 Years 1. Seek career advancement 2. Maintain hours
3. Pursue school, training program,
or professional certification
4. Decrease hours5. Move to another
practice location within the same state
Next 10 Years 1. Maintain hours 2. Retire 3. Decrease hours 4. Transition to private sector
5. Move to another practice location
within the same state
The Counselor or Psychologist grouping was the only one that frequently indicated plans for transitioning to the private sector. Combined with long-term plans to decrease hours, retire, and move to another practice location in a different state, this suggests that many current counselors or psychologists are planning to exit the public sector behavioral health workforce.
Short-termworkforce stability
or advancementLong-term
declining participationin the workforce
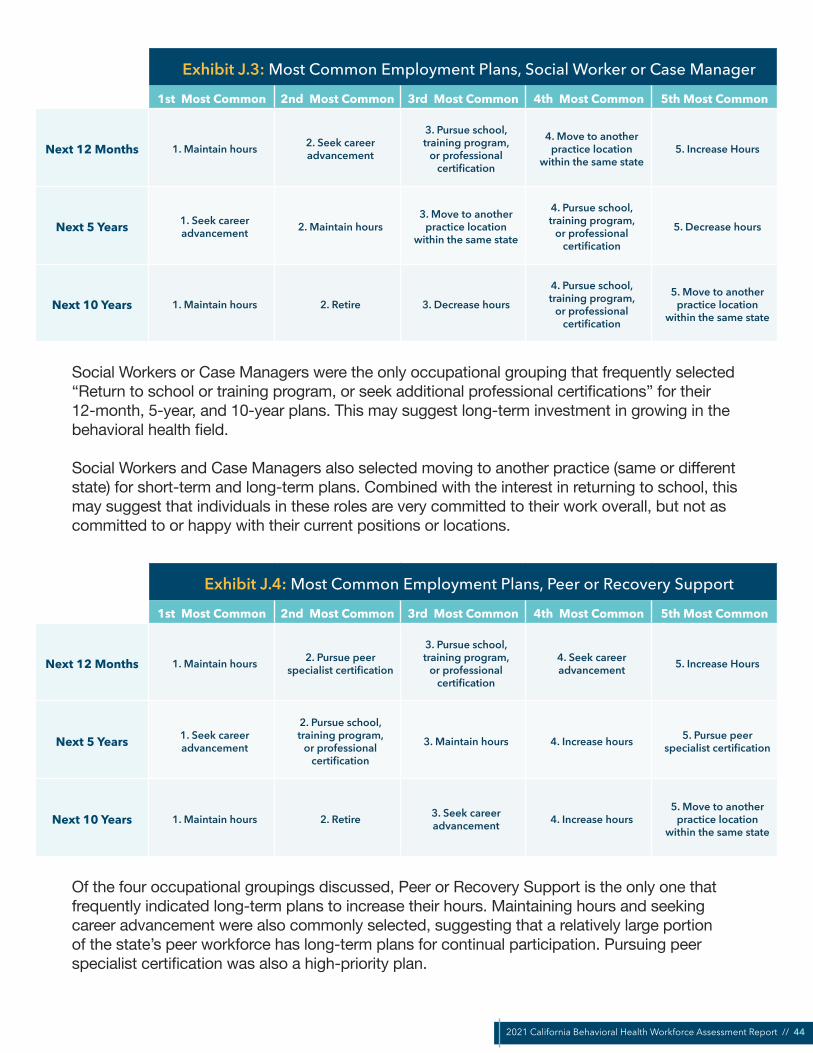
2021 California Behavioral Health Workforce Assessment Report // 44
Exhibit J.3: Most Common Employment Plans, Social Worker or Case Manager
1st Most Common 2nd Most Common 3rd Most Common 4th Most Common 5th Most Common
Next 12 Months 1. Maintain hours 2. Seek career advancement
3. Pursue school, training program,
or professional certification
4. Move to another practice location
within the same state5. Increase Hours
Next 5 Years 1. Seek career advancement 2. Maintain hours
3. Move to another practice location
within the same state
4. Pursue school, training program,
or professional certification
5. Decrease hours
Next 10 Years 1. Maintain hours 2. Retire 3. Decrease hours
4. Pursue school, training program,
or professional certification
5. Move to another practice location
within the same state
Social Workers or Case Managers were the only occupational grouping that frequently selected “Return to school or training program, or seek additional professional certifications” for their 12-month, 5-year, and 10-year plans. This may suggest long-term investment in growing in the behavioral health field.
Social Workers and Case Managers also selected moving to another practice (same or different state) for short-term and long-term plans. Combined with the interest in returning to school, this may suggest that individuals in these roles are very committed to their work overall, but not as committed to or happy with their current positions or locations.
Exhibit J.4: Most Common Employment Plans, Peer or Recovery Support
1st Most Common 2nd Most Common 3rd Most Common 4th Most Common 5th Most Common
Next 12 Months 1. Maintain hours 2. Pursue peer specialist certification
3. Pursue school, training program,
or professional certification
4. Seek career advancement 5. Increase Hours
Next 5 Years 1. Seek career advancement
2. Pursue school, training program,
or professional certification
3. Maintain hours 4. Increase hours 5. Pursue peer specialist certification
Next 10 Years 1. Maintain hours 2. Retire 3. Seek career advancement 4. Increase hours
5. Move to another practice location
within the same state
Of the four occupational groupings discussed, Peer or Recovery Support is the only one that frequently indicated long-term plans to increase their hours. Maintaining hours and seeking career advancement were also commonly selected, suggesting that a relatively large portion of the state’s peer workforce has long-term plans for continual participation. Pursuing peer specialist certification was also a high-priority plan.

2021 California Behavioral Health Workforce Assessment Report // 45
Exhibit J.5: Most Common Employment Plans, Other Behavioral Health Worker
1st Most Common 2nd Most Common 3rd Most Common 4th Most Common 5th Most Common
Next 12 Months 1. Maintain hours 2. Seek career advancement
3. Pursue school, training program,
or professional certification
4. Increase hours5. Move to another
practice location within the same state
Next 5 Years 1. Seek career advancement 2. Maintain hours
3. Pursue school, training program,
or professional certification
4. Retire5. Move to another
practice location within the same state
Next 10 Years 1. Maintain hours 2. Retire 3. Seek career advancement 4. Decrease hours 5. Unsure
Of the four large occupation groups discussed, the Other Behavioral Health Worker group is the only one in which retire appears in the five most commonly indicated employment plans for both the next five and next ten years. Despite this, respondents frequently shared that they planned to seek career advancement, as well as that they planned to return to school or to seek additional training or certification. The presence of both these plans in the five most frequently indicated plans gestures to the heterogenous nature of this group (including administrative support and clerical professionals, therapists of various kinds, and organizational leaders).
EMPLOYMENT PLANS: POSITIVE MOTIVATING FACTORSTo better understand their employment plans, respondents were asked to provide information about the positive factors that motivated them. These results, like the results for employment plans, were disaggregated by primary occupation: ultimately, what is most telling is the similarity across the occupational groups. Participants were provided with a list of 17 different possible factors and asked to select all that applied. Despite the range of choices, the same five choices make up the most commonly selected motivations for each of the four largest occupational groupings.

2021 California Behavioral Health Workforce Assessment Report // 46
Exhibit J.6: What are the positive factors that are motivating youremployment plans?
1st Most Common 2nd Most Common 3rd Most Common 4th Most Common 5th Most Common
Counselor or Psychologist
1. Want to use my lived experience to
help others
2. I am content with my current role and
organization
3. Excited to deepen my professional
knowledge
4. Feel high job satisfaction
5. Driven to work with underserved
populations
Peer or Recovery Support
1. Want to use my lived experience to
help others
2. I am content with my current role and
organization
3. Excited to deepen my professional
knowledge
4. Feel high job satisfaction
5. Driven to work with underserved
populations
Social Worker or Case Manager
1. I am content with my current role and
organization
2. Want to use my lived experience to
help others
3. Excited to deepen my professional
knowledge
4. Driven to work with underserved
populations
5. Feel high job satisfaction
Other Behavioral Health Employee
1. I am content with my current role and
organization
2. Want to use my lived experience to
help others
3. Driven to work with underserved
populations
4. Excited to deepen my professional
knowledge
5. Feel high job satisfaction
Although the order of the top five varies from occupation to occupation, the same five positive factors appear in each column above. These positive factors reinforce commonly voiced beliefs that members of the behavioral health workforce are motivated by intrinsic factors, such as the satisfaction gained from helping those in need and from their own pursuit of self-improvement.
EMPLOYMENT PLANS: NEGATIVE MOTIVATING FACTORSSimilar data was collected about the negative factors that motivated respondents’ employment plans. Respondents were provided with a list of 24 factors and asked to select all that negatively shaped the employment plans they had indicated earlier in the survey. In total, 1,191 respondents selected one or more factors.
The table below shows the five most commonly selected negative factors for each of the primary occupation groups. In comparison to the positive factors, many of the negative factors gestured to extrinsic and organizational factors. Respondents indicated a lack of external support, whether related to compensation (pay or benefits), staffing, or time for family roles.
Burnout or compassion fatigue was a concerningly common motivating factor for members of all of the largest occupational groupings except for Peer or Recovery Support. The pandemic has certainly increased workplace stress for many caring professionals. The lack of external support these respondents indicated are likely key long-term factors contributing to burnout.
Motivators include job satisfaction, making a difference, and learning more
Negative factors include a lack of organizational support and burnout or compassion fatigue

2021 California Behavioral Health Workforce Assessment Report // 47
Exhibit J.7: What are the negative factors that are motivating youremployment plans?
1st Most Common 2nd Most Common 3rd Most Common 4th Most Common 5th Most Common
Counselor or Psychologist
1. Want or need higher pay
2. Experiencing burnout or
compassion fatigue
3. Want more time for my family, parenting,
or caregiving roles
4. Inadequate staffing due to workforce
shortage or capacity
5. Need more/better benefits
Peer or Recovery Support
1. Want or need higher pay
2. Feel that there is an ongoing or growing need for help in my
community
3. Need more/better benefits
4. Need license, credential, or degree to advance in my field
5. Pandemic has motivated me to want
to do more to help others
Social Worker or Case Manager
1. Want or need higher pay
2. Experiencing burnout or
compassion fatigue
3. Inadequate staffing due to workforce
shortage or capacity
4. Need license, credential, or degree to advance in my field
5. Want more time for my family, parenting,
or caregiving roles
Other Behavioral Health Employee
1. Want or need higher pay
2. Experiencing burnout or
compassion fatigue
3. Inadequate staffing due to workforce
shortage or capacity
4. Need more/better benefits
5. Want more time for my family, parenting,
or caregiving roles
While the negative factors show a significant continuity across occupations, there are key differences:
• Peer or Recovery Support: Of the 63 peer or recovery support respondents who shared that their employment plans were motivated by a need for more or better benefits, 48 (76.2%) shared that they planned to pursue peer certification or additional training or education.
• Social Worker or Case Manager: This group commonly cited a need for additional credentials or education as a negative factor motivating their professional plans. This group was the only group other than Peer or Recovery Support for which it showed up in the top five factors. Peer or Recovery Support respondents may be thinking about credentials in the context of SB 803; Social Worker or Case Manager respondents may perceive that they need an advanced clinical degree.
• Other Behavioral Health Employee: Retirement was commonly indicated by members in this group as a five- and ten-year plan, and one possible explanation is burnout and/or emotional fatigue. These feelings might be exacerbated by inadequate staffing: of the 125 respondents from this group that plan to retire within the next 10 years, 42 cited inadequate staffing as motivation for their employment plans, 38 cited burnout and/or emotional fatigue, and 24 cited both.
» Related: Recommendation 6
Telehealth has played an important role in maintaining—and in some cases, expanding—service delivery since the onset of the COVID-19 pandemic in March 2020. Recognizing the historically unique nature of the challenges brought on by the COVID-19 pandemic, the survey included questions about telehealth usage, benefits, and challenges.
K. TELEHEALTH

2021 California Behavioral Health Workforce Assessment Report // 48
TELEHEALTH USE AND PERCEPTIONSOf the 1,295 respondents who provided information about their use of telehealth as a service delivery mechanism, nearly half (47.8%, 619) shared that they are currently using telehealth. Current users indicated that telehealth provides an array of benefits, including improved service delivery (62.8% strongly agree or agree), more accessible services (81.9%), and the ability to provide services to additional or more diverse demographic groups (65.9%).
Despite recognizing the positive role played by telehealth, when asked for information regarding their organizations’ plans for telehealth after the pandemic, only 42.0% of current telehealth users indicated that they planned to sustain or increase telehealth services. The remaining 58.0% was split between reducing telehealth services (32.3%) or undecided or unaware of their organization’s plans (25.6%).
Exhibit K.1: Telehealth Plans
251, 42%153, 26%
193, 32%
We plan to continue telehealth services at the current level or more.
We plan to reduce telehealth services following the pandemic.
Do not know or undecided.
One possible explanation for why organizations might choose to reduce telehealth services while also recognizing their value is the technological challenges associated with them. Approximately sixty percent of respondents who discussed telehealth either strongly agreed or agree that challenges with the technology had been a barrier (60.6%) and/or strongly agreed or agreed that consumers’ lack of comfort level or skill with technology might have prevented them from accessing telehealth services (59.4%).
During the listening sessions, participants discussed this paradox at length: many shared that telehealth was allowing them to reach more community members, more easily (e.g., through virtual events), but they also shared very real concerns that people who needed these kinds of supports during COVID the most—such as older community members and community members experiencing homelessness or housing insecurity—were being left out of efforts. Participants discussed literally going to older adults’ homes to help them apply for COVID relief online, or to pick them up and bring them on-site for Zoom support groups. As they noted, however, providing technical support does take a toll on staff time and energy to be providing peer support.
47.8%currently use telehealth,
but only
42.0%of them plan to continuedoing so post-pandemic
81.9%say telehealth makes
services more accessible, but
59.4%say it has created barriers for some

2021 California Behavioral Health Workforce Assessment Report // 49
Exhibit K.2: Perceptions of Telehealth
81.9%
60.6%
59.4%
65.9%
62.8%
Services more accessible to populations thatpreviously had limited access
Services provided to more diverse or different demographic groups
Improved delivery of services
Challenges with technology have been a challenge or barrier to providing services using telehealth/
telemedicine
Comfort level or skill using telehealth/telemedicine have been a challenge or barrier for people who are
considering or want to receive services but do not have access to in-person services
0% 20% 40% 60% 80% 100%
Strongly Agree or Agree Neither Agree Nor Disagree Disagree or Strongly Disagree
Additionally, organizations might be wary of maintaining services when the financial sustainability of doing so remains in flux. During the COVID-19 Public Health Emergency, DHCS implemented a wide range of flexibilities that allowed providers to bill Medi-Cal for telehealth services at the same rate as in-person services (“payment parity”). At the time of writing, DHCS plans to temporarily continue the flexibilities through the end of 2022, and has put a Telehealth Advisory Workgroup in place to make recommendations for telehealth policies that would promote access and reduce disparities. It is not known yet to what degree or for what services the payment parity policy will remain in place.18
TELEHEALTH IN RURAL SETTINGSDespite the relatively small number of respondents from rural counties, these organizations were more likely to maintain or increase telehealth services, and they also indicated higher levels of satisfaction than their non-rural counterparts. Twenty-four of the 32 respondents (75.0%) who provided information about their organization’s telehealth plans shared that they planned to continue using it at either the same rate or higher, with 5 more respondents responding that they were either unsure or that their organization was undecided.
Similarly, respondents from rural communities—which have long been viewed as ideal beneficiaries for the increased service offerings enabled by telehealth—indicated high levels of benefit: 88.0% indicated that they either strongly agreed or agreed that it made services more accessible to populations that previously had limited access, and 65.0% felt that it improved delivery of services.
18 For more information, visit DHCS’ webpage for Telehealth.

2021 California Behavioral Health Workforce Assessment Report // 50
» Related: Recommendation 5
POPULATIONS SERVEDA total of 1,216 respondents provided information about the populations served as a focus of their organization’s work. The most commonly indicated population was Hispanic and/or Latino/a/e, which was selected by 742 respondents, followed by individuals experiencing homelessness (645) and African American or Black (641).
Almost certainly due to the relatively small number of survey respondents from rural counties, rural or frontier (289) and Tribal (127) were both among the least-frequently selected responses.
Exhibit L.1: Which of the Following Populations do you Serve as a Focus of Your Work?
Hispanic and/or Latino/a/eIndividuals experiencing homelessness
African American or BlackLGBTQUrban
Individuals with disabilitiesYouth or young adults with current or former foster...
Asian or Asian AmericanIndivduals with Limited English Prociciency (LEP)
Native Hawaiian/Pacific IslanderAmerican Indian, Native American, or Alaska Native
Middle Eastern or North AfricanIndividuals with intellectual or developmental...
Veteran or military familiesRural or frontier
Other (please specify)Tribal
742645641
610535
523503490
367340339
337337
304
289251
127
0 100 200 300 400 500 600 700 800
When these rankings were separated based on a number of respondent characteristics, including direct service providers and members of the peer workforce, the five most frequently selected focused populations remained largely unchanged. The largest difference was observed when responses were filtered to include only rural respondents (Exhibit L.2).
L. COMMUNITIES SERVED, UNSERVED, AND UNDERSERVED

2021 California Behavioral Health Workforce Assessment Report // 51
Exhibit L.2: Which of the following population(s) do you serve as a focus of your work? (Most Frequently Selected)
All Survey Respondents Rural County Survey Respondents
Population # Population #
Hispanic and/or Latino/a/e
Individuals experiencing homelessness
African American or Black
LGBTQ
Urban
742
645
641
610
535
Rural or frontier
Individuals experiencing homelessness
Hispanic and/or Latino/a/e
Individuals with disabilities
LGBTQ
41
29
21
21
20
Consistent with the overall results, rural respondents identified Hispanic and/or Latino/a/e, individuals experiencing homelessness, and LGBTQ as populations they commonly serve. However, only among rural respondents were rural or frontier and individuals with disabilities among the five most frequently selected populations of focus. (The small rural sample size makes it difficult to draw conclusions, but this may indicate that they are helping to fill a void for more traditional services for individuals with disabilities.)
Additionally, more than one-third of respondents (35.4%, 431) shared that their organization focuses on eight or more of the sixteen populations listed, and 206 (16.9%) said that their organization focuses on twelve or more of them. These results may suggest that organizations are experiencing challenges balancing between offering services to a wide array of community members and targeting services to priority populations.
POPULATIONS UNDERSERVEDBoth survey respondents and listening session participants were asked to provide additional information about underserved populations in their local communities. In the survey, respondents were presented with a list of 16 populations and asked to select all that they felt were underserved in terms of their behavioral health needs.

2021 California Behavioral Health Workforce Assessment Report // 52
Exhibit L.3: In your opinion, which population(s) are underserved in your community in terms of meeting their behavioral health needs?
Individuals experiencing homelessnessAfrican American or Black
Hispanic and/or Latino/a/eLGBTQ
Indivduals with Limited English Prociciency (LEP)Individuals with disabilities
Youth or young adults with current or former foster...American Indian, Native American, or Alaska Native
Asian or Asian AmericanIndividuals with intellectual or developmental...
Rural or frontierVeteran or military families
Middle Eastern or North AfricanNative Hawaiian/Pacific Islander
TribalI don't know
UrbanOther (please specify)
Prefer not to answer
529476
473451
366363
348344
323
308284
255237234
212182181
7139
0 100 200 300 400 500 600
In many ways, the results of this question closely resemble those for the previous question about the focus populations for respondent organizations: individuals experiencing homelessness, Hispanic and/or Latino/a/e, LGBTQ, individuals with disabilities, and youth or young adults with foster care involvement all appear in the seven most-frequently selected communities for both questions. This continuity indicates alignment between the services being offered and respondents’ perception of the state’s behavioral health needs.
However, it may also suggest a service bias: the populations that organizations serve the most are those whom the providers perceive as having the greatest need. Collecting data on population needs is outside the scope of this project, but could be fruitfully compared with this data on what providers perceive as the needs.
A noteworthy exception to this continuity is individuals with limited English proficiency (LEP). Individuals with LEP were the fifth most commonly identified underserved population, but only ninth on the list of populations that organizations say they serve. While these results are limited by sample size, this disparity might be indicative of a higher level of need throughout the state for additional resources to serve people with language access needs; consider that nearly one in five Californians (18.6%) over age five may be categorized as an individual with LEP.19
People with Limited English Proficiency are underserved by behavioral health organizations
19 PERCENT OF PEOPLE 5 YEARS AND OVER WHO SPEAK A LANGUAGE OTHER THAN ENGLISH AT HOME - United States -- States; and Puerto Rico. (24 October 2017). American FactFinder, U.S. Census Bureau. Retrieved from https://cdn.cnsnews.com/attachments/census-other_than_english.pdf
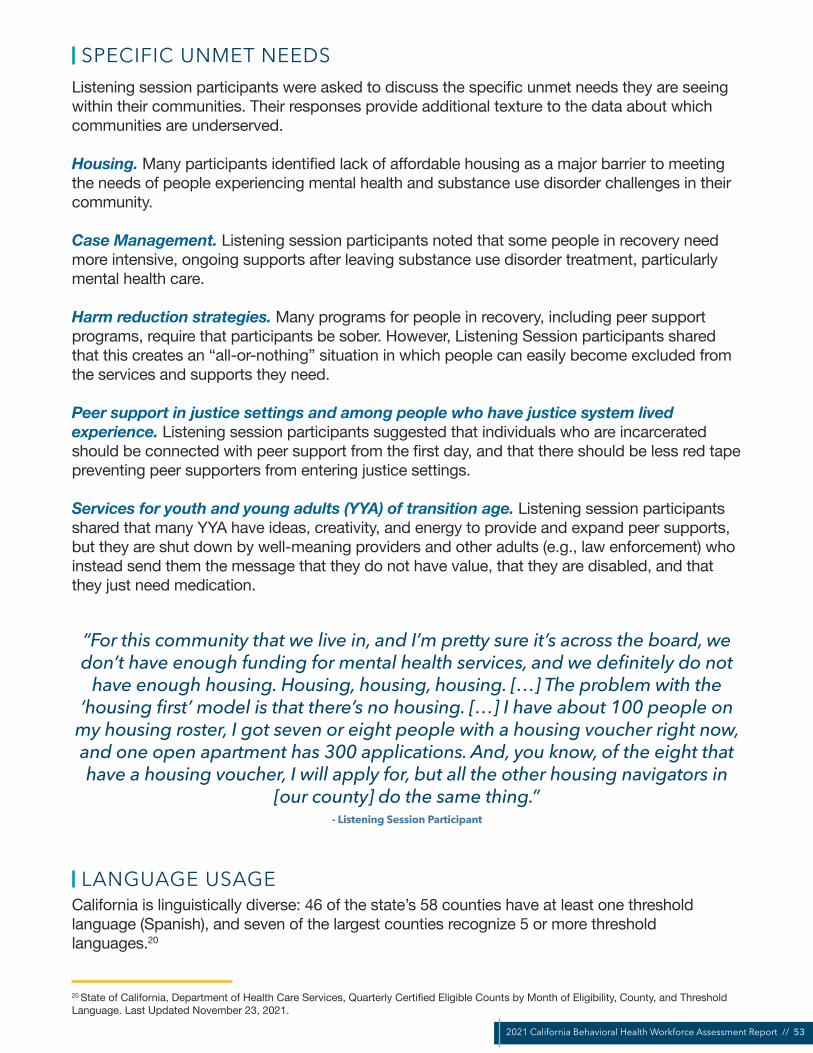
2021 California Behavioral Health Workforce Assessment Report // 53
SPECIFIC UNMET NEEDSListening session participants were asked to discuss the specific unmet needs they are seeing within their communities. Their responses provide additional texture to the data about which communities are underserved.
Housing. Many participants identified lack of affordable housing as a major barrier to meeting the needs of people experiencing mental health and substance use disorder challenges in their community.
Case Management. Listening session participants noted that some people in recovery need more intensive, ongoing supports after leaving substance use disorder treatment, particularly mental health care.
Harm reduction strategies. Many programs for people in recovery, including peer support programs, require that participants be sober. However, Listening Session participants shared that this creates an “all-or-nothing” situation in which people can easily become excluded from the services and supports they need.
Peer support in justice settings and among people who have justice system lived experience. Listening session participants suggested that individuals who are incarcerated should be connected with peer support from the first day, and that there should be less red tape preventing peer supporters from entering justice settings.
Services for youth and young adults (YYA) of transition age. Listening session participants shared that many YYA have ideas, creativity, and energy to provide and expand peer supports, but they are shut down by well-meaning providers and other adults (e.g., law enforcement) who instead send them the message that they do not have value, that they are disabled, and that they just need medication.
“For this community that we live in, and I’m pretty sure it’s across the board, we don’t have enough funding for mental health services, and we definitely do not
have enough housing. Housing, housing, housing. […] The problem with the ‘housing first’ model is that there’s no housing. […] I have about 100 people on
my housing roster, I got seven or eight people with a housing voucher right now, and one open apartment has 300 applications. And, you know, of the eight that have a housing voucher, I will apply for, but all the other housing navigators in
[our county] do the same thing.” - Listening Session Participant
LANGUAGE USAGECalifornia is linguistically diverse: 46 of the state’s 58 counties have at least one threshold language (Spanish), and seven of the largest counties recognize 5 or more threshold languages.20
20 State of California, Department of Health Care Services, Quarterly Certified Eligible Counts by Month of Eligibility, County, and Threshold Language. Last Updated November 23, 2021.

2021 California Behavioral Health Workforce Assessment Report // 54
Language proficiency plays an important role in the delivery of culturally appropriate services, and there is increasing awareness that communicating with patients in their preferred language has a positive and significant impact on a consumer’s health outcomes.
To this end, data was collected about survey respondents’ ability to communicate with patients in a non-English language. Two out of five survey respondents (41.8%, 670) reported that they are able to communicate with patients, clients, and/or peers in a language other than English. Nearly one-third of respondents (30.1%, 482) said that they currently use one or more non-English languages to provide services to clients, patients, and/or peers.21 A small number of respondents (44) answered that they did so with two or more languages.
Previously, survey respondents identified individuals with Limited English Proficiency (LEP) as an underserved population. Future data collection efforts would benefit from asking additional questions to better understand how people with LEP are served. These questions may include the extent to which behavioral health service providers are regularly using a language other than English in their work with clients; which positions or organization types are more likely to have bilingual service providers; and the extent to which the behavioral health workforce is seeing a need for interpreters, and how this need is being met, if at all.
Among multilingual respondents, by far the most commonly indicated language was Spanish, which was selected by 374 of the respondents. In a result that gestures to the incredible linguistic diversity of the state—and its behavioral health workforce—the second most commonly selected response was “Other,” despite the fact that 20 language options were listed. The table below shows the frequency for all language options.
41.8%are able to communicate
in language(s) other than English
30.1%currently use language(s)
other than English to provide services
21 It is worth noting the possibility that these percentages may be slightly inflated by respondents who understood providing services to “peers” to include colleagues, friends, and other informal social networks, rather than “peer support service recipients.” However, given the large number of self-identified Hispanic or Latino/a/e respondents to the survey, it seems unlikely that this potential misunderstanding was a major factor.
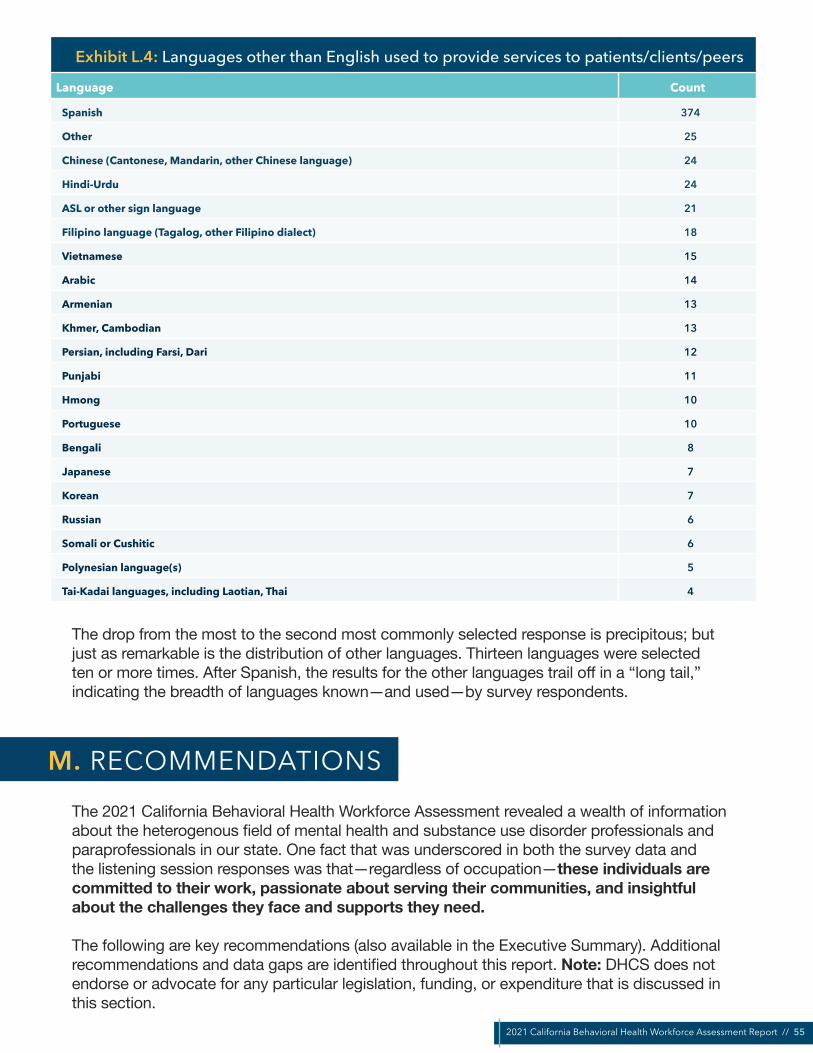
2021 California Behavioral Health Workforce Assessment Report // 55
Exhibit L.4: Languages other than English used to provide services to patients/clients/peers
Language Count
Spanish 374
Other 25
Chinese (Cantonese, Mandarin, other Chinese language) 24
Hindi-Urdu 24
ASL or other sign language 21
Filipino language (Tagalog, other Filipino dialect) 18
Vietnamese 15
Arabic 14
Armenian 13
Khmer, Cambodian 13
Persian, including Farsi, Dari 12
Punjabi 11
Hmong 10
Portuguese 10
Bengali 8
Japanese 7
Korean 7
Russian 6
Somali or Cushitic 6
Polynesian language(s) 5
Tai-Kadai languages, including Laotian, Thai 4
The drop from the most to the second most commonly selected response is precipitous; but just as remarkable is the distribution of other languages. Thirteen languages were selected ten or more times. After Spanish, the results for the other languages trail off in a “long tail,” indicating the breadth of languages known—and used—by survey respondents.
The 2021 California Behavioral Health Workforce Assessment revealed a wealth of information about the heterogenous field of mental health and substance use disorder professionals and paraprofessionals in our state. One fact that was underscored in both the survey data and the listening session responses was that—regardless of occupation—these individuals are committed to their work, passionate about serving their communities, and insightful about the challenges they face and supports they need.
The following are key recommendations (also available in the Executive Summary). Additional recommendations and data gaps are identified throughout this report. Note: DHCS does not endorse or advocate for any particular legislation, funding, or expenditure that is discussed in this section.
M. RECOMMENDATIONS

2021 California Behavioral Health Workforce Assessment Report // 56
» Recommendation 1. Support data-driven decision-making and policy by collecting nuanced behavioral health workforce data.
Over the last decade, California has implemented several large-scale, nuanced statewide behavioral health workforce assessments to analyze existing data and expand the data collected. Building on this process can yield value and insights to support California’s workforce development efforts in the long term.
• Implement the BHWA process on a two- or three-year cycle to assess workforce changes over time (including the short- and long-term impacts of SB 803, to be implemented by July 2022). Allow more time for planning, delivering, and analyzing results of the assessment.
• Strategically revise BHWA questions. It is worthwhile to maintain the same questions over multiple survey iterations, to make the data more comparable. However, as described under limitations, some survey sections should be streamlined or questions revised to minimize confusion.
• Complement the small-group, grantee-focused listening sessions with additional listening sessions open to a larger pool of interested participants, potentially organized by occupation (e.g., social workers, SUD treatment providers).
• Behavioral health associations and networks should collect data from provider members and make it publicly available in order to contribute to a more robust picture of California’s behavioral health landscape. Useful questions that are minimally invasive may include, for example, demographic information; years of experience in the field; occupational role; employment setting; and education and certification.
» Recommendation 2. Create, expand, and strengthen career pathways for racially, ethnically, linguistically, and culturally diverse behavioral health providers.
To reduce health disparities, workforce development strategies should increase the number and proportion of behavioral health providers who are representative of the communities they serve.
• Fund and advocate for policies and career pipelines that support racially and ethnically diverse individuals to pursue careers in psychology, psychiatry, and other highly-paid behavioral health roles.
• Use focused recruitment, training, and retention efforts to increase the number of non-traditional and community-based behavioral health service providers.
• Offer incentives for providers of multilingual services. • Increase support to and contracts with organizations that have provide services to
individuals with Limited English Proficiency. • All behavioral health providers would benefit from training and “boosters” in the National
Culturally and Linguistically Appropriate Services (CLAS) Standards, with targeted, application-focused guidance on how the CLAS Standards may be relevant for their specific role.
2021 California Behavioral Health Workforce Assessment Report // 57
» Recommendation 3. Increase pay and benefits for the behavioral health workforce. Address disparities between peer and non-peer staff.
Across all major behavioral health occupational groups, the most commonly cited negative factor motivating employment plans was wanting or needing higher pay. To address and prevent workforce shortages, DHCS, county agencies, and individual organizations should:
• Increase wages of existing behavioral health staff in qualified programs. Provide hiring bonuses to attract new and former behavioral health staff.
• Raise salary caps in county and state contracts, and increase reimbursements to allow for ongoing wage increases.
• Utilize American Rescue Plan Act (ARPA) funds for both immediate and long-term workforce development needs. Deploy ARPA funds to provide supplemental reimbursements to Medicaid providers, in order to address increased pandemic-related costs and staffing shortages.
• Ensure parity of benefits, particularly health care, between clinical and peer staff. • Increase provider rates to support interns, students, and other new and future members
of the workforce. In the substance use disorder treatment and recovery fields in particular, provide incentives for targeted recruitment of staff with lived experience (e.g., transition-age youth, people who were formerly incarcerated) to broaden the workforce.
» Recommendation 4. Address provider burnout and compassion fatigue. Support parents and caregivers.
Common negative factors motivating employment plans include a lack of support from the organization (need for better pay or benefits, staffing, or family time) as well as burnout or compassion fatigue.
• Build awareness about the signs and symptoms, impacts, and mitigating factors of burnout, compassion fatigue, and secondary traumatic stress.
• Implement self-care and wellness supports, connection spaces, and incentives. • Consider implementing a confidential Employee Assistance Program (EAP) to connect
employees to support for substance use challenges, mental health concerns, and other personal and work-related challenges.
• Promote a culture of understanding around the use of sick days for self-care and mental health. Implement changes such as flexible scheduling to support parents and caregivers.
• Ensure that all staff have access to mental health and substance use services and supports through their benefits packages.
» Recommendation 5. Prioritize supports for unserved, underserved, and inappropriately served communities. Invest in equity-driven strategies and wraparound supports.
Listening session participants identified several needs that were unmet in their community: housing, case management services, harm reduction strategies, services for people who are incarcerated or in reentry, and services for youth and young adults of transition age.
2021 California Behavioral Health Workforce Assessment Report // 58
• Continue to fund innovative programs, such as the California Reducing Disparities Project (CRDP), that are intended to expand access to community-defined effective practices. Allocate funding to research, evaluate, and replicate culturally responsive practices in both the mental health and substance use disorder fields.
• Invest in innovative programs to support affordable housing supports and infrastructure. Ensure that “housing first” strategies do not prevent people with behavioral health needs from accessing services.
• Interrupt the cycle of hospitalization and incarceration by supporting affordable housing and reentry supports for individuals experiencing homelessness or justice system involvement.
• Engage in data collection to better identify who are the underserved populations in the community and what supports they want or would use.
» Recommendation 6. Provide additional training and technical assistance to expand telehealth.
Only 42.0% of current telehealth users were confident that they plan to continue utilizing telehealth after the pandemic.
• Providing clear, easy-to-understand updates and guidance to behavioral health organizations about telehealth billing changes may help organizations feel more confident in continuing to rely on telehealth technologies.
• Continue to provide education and support for employees in telehealth best practices.• County, peer-run, and other behavioral health agencies would benefit from learning
about others’ innovative and resource-effective ways to engage communities impacted by digital inequity (e.g., people experiencing homelessness, older adults, and people with Limited English Proficiency).
• Provide easy-to-understand instructions for all current and new service recipients about accessing services via telehealth; in-person alternatives, if available; and technical support for those unfamiliar or uncomfortable with technology, if available.
» Recommendation 7. Invest in training initiatives and programs that support integration of peers. Include and promote peer voice and leadership.
Both survey respondents and listening session participants identify a lack of awareness of what is unique and valuable about peer support, and how clinicians and peers can effectively collaborate, as barriers to peer integration. Listening session participants expressed excitement about SB 803, under which DHCS is developing peer support specialist certification program and requirements; however, they also expressed concerns, including how and whether peers are being engaged in the planning process.
• Continue to authentically engage a broad community of peers in the planning and implementation of SB 803 certification requirements, at both the state and county levels.
• Market and promote widespread awareness of peer support services, training programs, and certification/SB 803.

2021 California Behavioral Health Workforce Assessment Report // 59
• Promote cross-training between peers, non-peer clinicians and leadership, and non-peer staff within behavioral health organizations (e.g., on recovery-oriented language for clinicians, on mental health topics for peers).
• In organizations that employ peers, align workplace training, professional development, and responsibilities with certification requirements.
• The career pathway or ladder for peers is less straightforward or apparent than it is for many other behavioral health professions. Educate behavioral health organizations about the need for career pathways that lead to senior leadership for peer providers.
• Listening session participants also identified an array of training gaps, specific trainings they liked, and qualities that made trainings worthwhile. This input should be incorporated within the certification planning process. See Education and Certification section.

2021 California Behavioral Health Workforce Assessment Report // 60
American Psychological Association (APA). (11 Mar 2021). Hispanic adults more likely to report physical impacts of stress, Black Americans concerned about life after the pandemic. Stress in America 2021 series. https://www.apa.org/news/press/releases/stress/2021/one-year-pandemic-stress-people-of-color
Artiga, S., Hill, L., & Haldar, S. (8 Oct 2021). COVID-19 Cases and Deaths by Race/Ethnicity: Current Data and Changes Over Time. Kaiser Family Foundation. https://www.kff.org/racial-equity-and-health-policy/issue-brief/covid-19-cases-and-deaths-by-race-ethnicity-current-data-and-changes-over-time
Augenstein, J., Marks, J. D., & Andrade, E. (15 Jan 2022). Executive Summary: Tracking Telehealth Changes State-by-State in Response to COVID-19. Manatt Health. Retrieved from https://www.manatt.com/insights/newsletters/covid-19-update/executive-summary-tracking-telehealth-changes-stat
Barna, M. (Jan 2022). Mental health workforce taxed during COVID-19 pandemic: Worker shortage hinders access. The Nation’s Health January 2022, 51 (10): 1-14. Retrieved from https://www.thenationshealth.org/content/51/10/1.3
Beck, A. J., Singer, P. M., Buche, J., Manderscheid, R. W., Buerhaus, P., Moreno Tuohy, C., & Boulton, M. L. (Dec 2016). A Minimum Data Set for the Behavioral Health Workforce. University of Michigan School of Public Health, Behavioral Health Workforce Research Center. https://www.behavioralhealthworkforce.org/wp-content/uploads/2017/02/FA1_MDS_Full-Report.pdf
Bowen Center for Health Workforce Research and Policy. (2021). Behavioral Health Data Report Series: Behavioral Health & Human Services Professionals. Indiana University School of Medicine. https://scholarworks.iupui.edu/bitstream/handle/1805/25354/BHHS%20Data%20Report-BHHS%202020%20FINAL.pdf?sequence=1&isAllowed=y
Bureau of Health Workforce, Health Resources and Services Administration (HRSA), U.S. Department of Health & Human Services, Designated Health Professional Shortage Areas Statistics: Designated HPSA Quarterly Summary, as of September 30, 2021 available at https://data.hrsa.gov/topics/health-workforce/shortage-areas
California Health and Human Services Agency. Children and Youth Behavioral Health Initiative Timeline: May Revision 2021-22. Retrieved from https://www.chhs.ca.gov/wp-content/uploads/2021/05/Children-and-Youth-Behavioral-Health-Initiative-Timeline-05202021.pdf
Center for Applied Research Solutions (CARS). (September 2013). California’s Substance Abuse Prevention Workforce Development Survey Report. Community Prevention Initiative (CPI). http://www.ca-cpi.org/docs/Resources/SAP_Workforce_Development/CPI-SAP-Workforce-Survey-Report.pdf
Center for Applied Research Solutions (CARS). (2019). A Tale of Two States: The Prevention Workforce in California and Missouri. National Prevention Network Conference 2019. http://npnconference.org/wp-content/uploads/2019/09/NPN-2019-CA-MO-Workforce-8.23.19.pdf
Center for Mental Health Services, Substance Abuse and Mental Health Services Administration. (2020). National Guidelines for Behavioral Health Crisis Care – A Best Practice Toolkit. Retrieved from https://www.samhsa.gov/sites/default/files/national-guidelines-for-behavioral-health-crisis-care-02242020.pdf
Coffman, J., Bates, T., Geyn, I., & Spetz, J. (12 February 2018). California’s Current and Future Behavioral Health Workforce. Healthforce Center at University of California San Francisco. https://healthforce.ucsf.edu/sites/healthforce.ucsf.edu/files/publication-pdf/California%E2%80%99s%20Current%20and%20Future%20Behavioral%20Health%20Workforce.pdf
REFERENCES

2021 California Behavioral Health Workforce Assessment Report // 61
Conron, K. J., & Goldberg, S. K. (July 2020). Adult LGBT Population in the United States. Williams Institute, UCLA School of Law. https://williamsinstitute.law.ucla.edu/publications/adult-lgbt-pop-us/
Department of Health Care Access and Information, HCAI. (4 Oct 2021). Department of Health Care Access and Information Officially Launches With New Name, Expanded Program Portfolio. Retrieved from https://hcai.ca.gov/department-of-health-care-access-and-information-officially-launches-with-new-name-expanded-program-portfolio/
DHCS. (2021). Request for Application: Crisis Care Mobile Units Program. Retrieved from https://www.dhcs.ca.gov/Documents/CSD_YV/BHRRP/DHCS-Mobile-Crisis-and-Non-Crisis-RFA-7-22-21.pdf
DHCS. (January 2022a). Updates on the CalAIM Section 1115 & Section 1915(b) Waivers. Retrieved from https://www.dhcs.ca.gov/provgovpart/Documents/CalAIM-Waiver-Post-Approval-Public-Webinar-1-10-22.pdf
DHCS. (10 Jan 2022b). Assessing the Continuum of Care for Behavioral Health Services in California: Data, Stakeholder Perspectives, and Implications. Retrieved from https://www.dhcs.ca.gov/Documents/Assessing-the-Continuum-of-Care-for-BH-Services-in-California.pdf
DHCS Medi-Cal Telehealth Advisory Workgroup. (December 2021). DHCS Medi-Cal Telehealth Advisory Workgroup Report. Retrieved from https://www.dhcs.ca.gov/services/medi-cal/Documents/DHCS-Telehealth-Advisory-Workgroup-Report-2021-12-02.pdf
Finocchio, L., Newman, M., Paci, J., Davis, C., Yegian, J., & Connolly, K. (Sept 2021). Medi-Cal Behavioral Health Services: Demand Exceeds Supply Despite Expansions. California Health Care Almanac, Regional markets Series. California Health Care Foundation. Retrieved from https://www.chcf.org/wp-content/uploads/2021/09/RegionalMarketAlmanac2020CrossSiteAnalysisBH.pdf
Florida Certification Board. (June 2019). 2019 Florida Behavioral Health Workforce Survey. Florida Department of Children and Families, Office of Substance Abuse and Mental Health. https://www.myflfamilies.com/service-programs/samh/publications/docs/2019%20Florida%20Behavioral%20Health%20Workforce%20Survey-Final.pdf
Gattman, N. E., McCarty, R. L., Balassa, A., & Skillman, S. M. (December 2017). Washington State Behavioral Health Workforce Assessment. Washington Workforce Training and Education Coordinating Board. https://www.wtb.wa.gov/wp-content/uploads/2019/05/WA-Behavioral-Health-Workforce-Assessment-2016-17.pdf
Hemeida, S., Brou, L., Petterson, S., Davidson, A., Chen, Y., Ross, K., Gilchrist, E., Wong, S. L. (March 2019). An Analysis of Oregon’s Behavioral Heath Workforce: Assessing Capacity of Licensed and Unlicensed Providers to Meet Population Needs. Farley Health Policy Center. https://www.oregon.gov/oha/HPA/ANALYTICS/HealthCareWorkforceReporting/2019-03-Analysis-Oregon-BH-Workforce.pdf
Jones, A. (4 Sept 2020). Maryland Behavioral Health Workforce Survey – Results Summary. Maryland Department of Health. https://health.maryland.gov/bha/Documents/Workforce%20Survey%20Summary%20distribution9.4.20%20%282%29%20%282%29.pdf
Liu, Y., Finch, B. K., Brenneke, S. G., Thomas, K., & Le, P. D. (Oct. 2020). Perceived Discrimination and Mental Distress Amid the COVID-19 Pandemic: Evidence from the Understanding America Study. American Journal of Preventive Medicine 59(4), 481-492. doi: 10.1016/j.amepre.2020.06.007
McKnight-Eily, L.R., Okoro, C.A., Strine, T.W., et al. (5 Feb 2021) Racial and Ethnic Disparities in the Prevalence of Stress and Worry, Mental Health Conditions, and Increased Substance Use Among Adults During the COVID-19 Pandemic — United States, April and May 2020. MMWR Morb Mortal Wkly Rep 2021;70:162–166. DOI: http://dx.doi.org/10.15585/mmwr.mm7005a3
https://www.dhcs.ca.gov/provgovpart/Documents/CalAIM-Waiver-Post-Approval-Public-Webinar-1-10-22.pdf

2021 California Behavioral Health Workforce Assessment Report // 62
Medi-Cal In Lieu of Services (ILOS) Policy Guide, DHCS, September 2021. Available at https://www.dhcs.ca.gov/Documents/MCQMD/ILOS-Policy-Guide-September-2021.pdf
New Mexico Health Care Workforce Committee. (2021). 2021 Annual Report. University of New Mexico Health Sciences Center. https://www.nmms.org/wp-content/uploads/2018/08/NMHCWF_2021Report_FINAL_edist.pdf
Office of Behavioral Health Equity. (2020). Double Jeopardy: COVID-19 and Behavioral Health Disparities for Black and Latino Communities in the U.S. Substance Abuse and Mental Health Services Administration. https://www.samhsa.gov/sites/default/files/covid19-behavioral-health-disparities-.black-latino-communities.pdf
State of California. (10 Jan 2022). Governor’s Budget Summary: 2022-23. Retrieved from https://www.ebudget.ca.gov/2022-23/pdf/BudgetSummary/FullBudgetSummary.pdf
Taylor, J. (3 Nov 2021). The Workforce Shortage in Addiction Care Reaches a Crisis Stage. Treatment Magazine. https://treatmentmagazine.com/the-workforce-shortage-in-addiction-care-reaches-a-crisis-stage/
Tobias, M. (27 Jan 2022). Will worker shortage disrupt California homeless strategy? CalMatters. Retrieved from https://calmatters.org/economy/labor/2022/01/california-homeless-worker-shortage/
U.S. Census Bureau. (1 Jul 2021). QuickFacts: California. https://www.census.gov/quickfacts/CA
Vestal, C. (April 2015). How Severe is the Shortage of Substance Abuse Specialists? Stateline Article. The Pew Charitable Trusts. Retrieved from https://www.pewtrusts.org/en/research-and-analysis/blogs/stateline/2015/4/01/how-severe-is-the-shortage-of-substance-abuse-specialists

2021 California Behavioral Health Workforce Assessment Report // 63
APPENDIX 1. PWI AND EPOC GRANTEES
The Peer Workforce Initiative (PWI) grant was awarded to 45 peer-run behavioral health programs across the entire state of California. This grant is part of the California DHCS’ Behavioral Health Workforce Development Project to expand, elevate, enhance, and empower behavioral health peer-run programs in every California community.
Information from the PWI Request for Applications:
This PWI grant provides a rare opportunity to invest in behavioral health peer-run programs’ capacity and infrastructure to “set the table” for the future Medi-Cal peer support services benefit, which is to become available for billing in 2022. The purpose is not narrowly to increase the number of behavioral health peers, but rather to develop such programs’ staff competence, certification, and capacity for increased service volume and collaboration with other provider types as well.
Goals include:• Expand peer-run behavioral health program staffing and capacity to assist people;• Elevate the profile of behavioral health peer-run programs with other entities in their
communities and statewide through outreach and collaboration;• Enhance the quality of peer-run programming statewide through education, training, and
improved monitoring and supervision; and• Empower peer-run programs to realize their full potential, including through strategic planning,
and management support.PWI grants were awarded in amounts up to $500,000 to programs with 49 or fewer employees and up to $750,000 to programs with 50 or more employees per program site for an approximately 19-month period ending February 14, 2023.
The Expanding Peer Organization Capacity (EPOC) grant was awarded to 14 emerging behavioral health peer organizations across the entire state of California. This grant is part of the Behavioral Health Workforce Development Project to expand, elevate, enhance, and empower behavioral health peer-run programs in every California community.
Information from the EPOC Request for Applications:
Grantees are peer-run organizations established in California as nonprofits after July 1, 2019, or peer-run organizations operating with a nonprofit fiscal agent that is authorized to do business in California.
The goal of EPOC is to expand peer-run organizational capacity to provide peer services for mental health and substance use disorder recovery supports and behavioral health services by providing up to $200,000 per selected applicant organization.
Peer services are needed throughout California, with the goal of having behavioral health peer services available in every county and community. The immediate priority is to ensure high-quality services in underserved and high-need communities.
Why: Behavioral health peer specialists will be able to seek certification in California as soon as the guidelines are released in summer 2021. As of January 2022, services provided by certified behavioral health peer specialists will become a benefit of Medi-Cal and eligible for billing to Medi-Cal. Certified behavioral health peer specialists are critical extenders of care and support for people in recovery and wellness maintenance.
APPENDIX
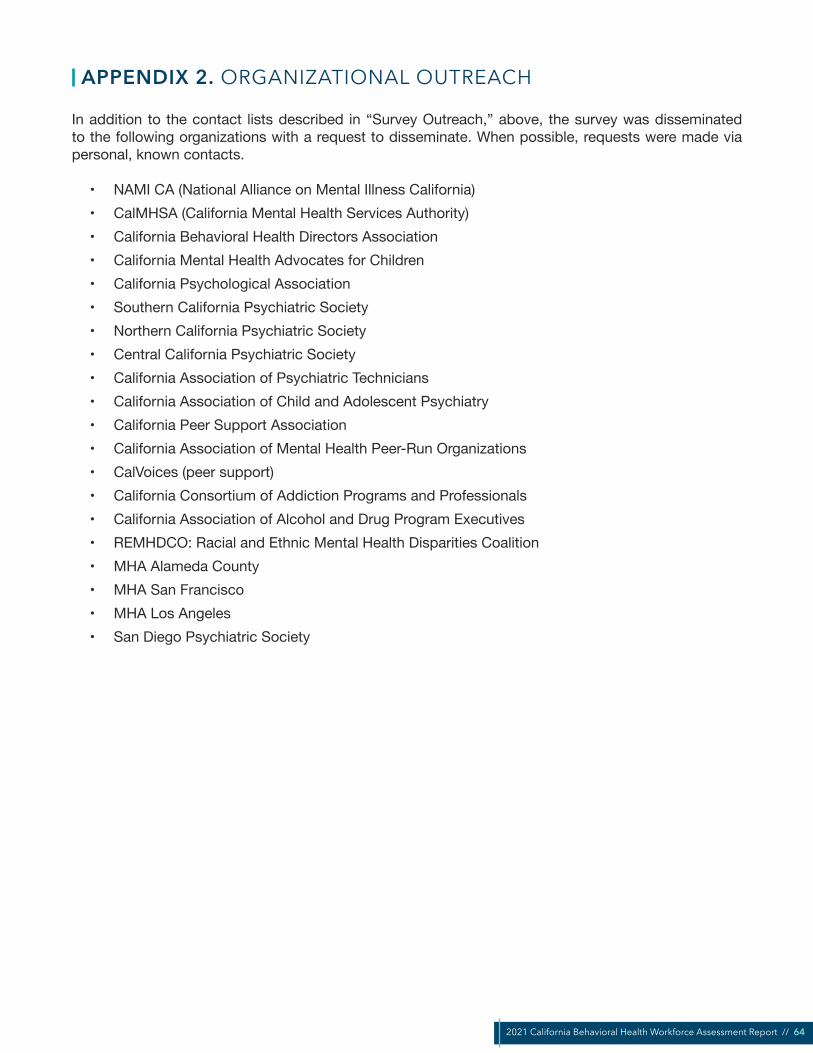
2021 California Behavioral Health Workforce Assessment Report // 64
APPENDIX 2. ORGANIZATIONAL OUTREACH
In addition to the contact lists described in “Survey Outreach,” above, the survey was disseminated to the following organizations with a request to disseminate. When possible, requests were made via personal, known contacts.
• NAMI CA (National Alliance on Mental Illness California)• CalMHSA (California Mental Health Services Authority)• California Behavioral Health Directors Association• California Mental Health Advocates for Children• California Psychological Association• Southern California Psychiatric Society• Northern California Psychiatric Society• Central California Psychiatric Society• California Association of Psychiatric Technicians• California Association of Child and Adolescent Psychiatry• California Peer Support Association• California Association of Mental Health Peer-Run Organizations• CalVoices (peer support)• California Consortium of Addiction Programs and Professionals• California Association of Alcohol and Drug Program Executives• REMHDCO: Racial and Ethnic Mental Health Disparities Coalition• MHA Alameda County• MHA San Francisco• MHA Los Angeles• San Diego Psychiatric Society